Table of Contents
UNITED STATES
SECURITIES AND EXCHANGE COMMISSION
Washington, D.C. 20549
FORM N-CSR
CERTIFIED SHAREHOLDER REPORT OF REGISTERED MANAGEMENT INVESTMENT COMPANIES
Investment Company Act file number: 811-04603
Thrivent Series Fund, Inc.
(Exact name of registrant as specified in charter)
625 Fourth Avenue South
Minneapolis, Minnesota 55415
(Address of principal executive offices) (Zip code)
Michael W. Kremenak, Assistant Secretary
625 Fourth Avenue South
Minneapolis, Minnesota 55415
(Name and address of agent for service)
Registrant’s telephone number, including area code: (612) 844-4198
Date of fiscal year end: December 31
Date of reporting period: June 30, 2014
Table of Contents
| Item 1. | Report to Stockholders |
Table of Contents

Table of Contents
Make variable annuity changes online, quickly and easily
You have more options to manage your variable annuity—in fewer steps
You’ve invested in an annuity—now you have another way to manage it with our online annuity service center. With 24/7 access, it’s there when you want it. Plus, you can make changes any time in seconds.
The online annuity service center offers you more options, including:
|  | |
• Complete reallocation
• Partial reallocation
• New money allocation
• Partial withdrawals
• Transaction status and history |
Just log in* to Thrivent.com and select your variable annuity contract by clicking on Manage Contract to make changes. It’s the easiest and most convenient way to update your annuity. Save time by making changes with just a few easy clicks!
As always, your Thrivent Financial representative is available to answer any questions you may have.
| * | In order to access your variable annuity contract on Thrivent.com, you must be a registered user. If you are not already registered, you can register immediately by clicking on Register Now next to the login area. |
This page is not part of the semiannual report.
Table of Contents
| 2 | ||||
Portfolio Summaries | ||||
| 4 | ||||
| 4 | ||||
| 5 | ||||
| 5 | ||||
| 6 | ||||
| 6 | ||||
| 7 | ||||
| 7 | ||||
| 8 | ||||
| 8 | ||||
| 9 | ||||
| 9 | ||||
| 10 | ||||
| 10 | ||||
| 11 | ||||
| 11 | ||||
| 12 | ||||
| 12 | ||||
| 13 | ||||
| 13 | ||||
| 14 | ||||
| 14 | ||||
| 15 | ||||
| 15 | ||||
| 16 | ||||
| 16 | ||||
| 17 | ||||
| 17 | ||||
| 18 | ||||
| 18 | ||||
| 19 | ||||
| 19 | ||||
| 20 | ||||
| 21 | ||||
Schedules of Investments | ||||
| 24 | ||||
| 34 | ||||
| 57 | ||||
| 80 | ||||
| 100 | ||||
| 114 | ||||
| 129 | ||||
| 144 | ||||
| 157 | ||||
| 159 | ||||
| 161 | ||||
| 163 | ||||
| 166 | ||||
| 169 | ||||
| 172 | ||||
| 175 | ||||
| 178 | ||||
| 186 | ||||
| 189 | ||||
| 192 | ||||
| 195 | ||||
| 201 | ||||
| 224 | ||||
| 227 | ||||
| 230 | ||||
| 233 | ||||
| 235 | ||||
| 241 | ||||
| 248 | ||||
| 256 | ||||
| 269 | ||||
| 275 | ||||
| 287 | ||||
| 290 | ||||
| 296 | ||||
| 302 | ||||
| 314 | ||||
| 332 | ||||
| 350 | ||||
Table of Contents
Financial markets turned in a strong performance during the six-month reporting period ended June 30, 2014, with the stock market hitting a succession of new highs and the bond market posting solid gains on a broad front. Economic news was mixed, with the five-year old economic recovery stalling during the first quarter of the year but showing signs of rebounding during the second quarter.
Economic Review
After growing for 11 consecutive quarters, the U.S. economy reversed course in the first quarter of 2014, with gross domestic product (GDP) contracting at a 2.9% annual rate, according to the Bureau of Economic Analysis (BEA). Many analysts blamed unusually harsh winter weather across much of the U.S., as reflected in a slowdown in discretionary spending by consumers and lower levels of business investment. Consumption was depressed by a surprising downturn in health care expenditures that may have been skewed by the rollout of the Affordable Care Act.
The first-quarter slowdown marked the economy’s weakest performance since the first quarter of 2009 and only the second quarterly contraction since the 2007-2009 recession. However, various data suggested the economy was poised to resume growing in the second quarter. On the labor front, the economy generated more than 1.2 million new nonfarm jobs between February and June, marking the best five-month stretch since early 2006.1 With those gains, the country finally recovered all the jobs lost in the recession and saw the unemployment rate fall to 6.1%, its lowest level since September 2008. Meanwhile, The Conference Board’s Leading Economic Index for the U.S. rose 0.5% in May, its fifth consecutive monthly gain.
Economic conditions were generally favorable in Europe and China, which are important to the U.S. economy and its financial markets. GDP for the 18-country Euro Area grew for a fourth consecutive quarter during the first three months of 2014, expanding by 0.2% from the previous quarter and 0.9% from the year-earlier quarter.2 Meanwhile, China’s economy grew 7.4% in the first quarter from a year earlier. That was down slightly from the 7.7% growth rate it posted in the last quarter of 2013 but still outpaced most of the world’s other large economies by a wide margin.3
Market Review
Stock prices slumped early in 2014 as the harsh winter showed signs of slowing the economy. Investors also were unsettled by Russia’s invasion of the Ukraine’s Crimean region, which heightened geopolitical tensions, and by concerns that after returning more than 30% in calendar 2013,4 gains in the stock market were beginning to outpace gains in corporate profits. In response, some investors began to rotate out of growth stocks and into more defensive, valued-oriented shares. Value stocks in the Russell 3000® Index, which tracks the nation’s 3,000 largest public companies, outperformed growth stocks by an average of two percentage points during the six-month reporting period. Dividend-paying stocks also performed well, with the Dow Jones Utilities Index generating a total return of 18.7%. Investors appeared to be confident that corporate profits would be sufficient to cover dividend payouts, but not so confident that profits would be high enough to drive further broad gains in the stock market.
Improving economic data subsequently led the stock market to resume its advance, however, driving the S&P 500 Index of large-company stocks to a series of new highs between March and June. The index finished the reporting period with a total return of 7.1%.
Stocks outside the U.S. also turned in a solid performance as the improving employment picture in the U.S., combined with the Federal Reserve’s commitment to keeping short-term interest rates low, raised expectations for global economic performance. The MSCI EAFE Index, which tracks developed markets in Europe, Australasia and the Far East, returned 4.8%. Emerging markets, which had slumped late last year amid concerns about China’s economic health rebounded in the first half of this year. The MSCI Emerging Markets Index generated a total return of 6.3%.
The bond market performed better than expected. Heading into 2014, many analysts were anticipating that the upward trend in interest rates that had begun in the second half of 2013 would continue through the new year, depressing bond prices. They theorized that an accelerating economy and the Federal Reserve’s decision to gradually wind down its $85 billion-per-month bond-buying program would keep rates moving higher. Instead, rates began to soften in 2014 as economic growth slowed in the first quarter and the Fed reiterated its commitment to keeping short-term interest rates low for a “considerable time” after ending its bond-buying program. For the reporting period, the broad Barclays U.S. Aggregate Bond Index posted a total return of 3.9%. The Barclays High Yield Index, which tracks noninvestment-grade bonds, returned 5.5%, and the Barclays 20+ Treasury Index, which tracks long-term U.S. government debt, returned 13.2%.
Our Outlook
The first-quarter slowdown in U.S. economic growth was not as worrisome as it appeared at first blush. The downturn in consumer spending was attributed in large part to a surprising decline in health care spending, but it is difficult to reconcile that decline with the recent rollout of the Affordable Care Act, under which millions of Americans obtained health insurance. We would not be surprised if there turns out to be a wide margin of error in data on health care expenditures until the transition to the new health care law is completed. The downturn in GDP also does not square with the strong employment gains we saw during the final five months of the reporting period, or with The Conference Board’s Leading Economic Index for the U.S. rising in May for a fifth consecutive month.
Recently installed Fed Chair Janet Yellen said in May that she expects economic growth in 2014 to exceed the 2.6% pace notched in 2013, despite some renewed weakness in the housing market. Our models suggest the economy will expand at a 2% to 3% rate near-term, roughly in line with what we have averaged over the past few years and enough to keep corporate profits growing.
2
Table of Contents
Offshore, we expect growth in Europe and the U.K. to improve to about a 2% rate over the next several months. The outlook for Japan is less attractive. Despite aggressive new monetary and fiscal policies, Japan faces extreme demographic and government-debt headwinds. Economic data from China is suspect, but the numbers suggest that growth has stabilized at just above a 7% rate in that country.
Meanwhile, the bull market in stocks that began in March 2009 is now more than five years old. Since then, the S&P 500 has nearly tripled in value. While further gains are still possible, particularly if economic growth meets Yellen’s expectations, they will likely be hard won as few asset classes appear to be trading at bargain levels. At the end of the reporting period, the stocks in the S&P 500 Index were collectively trading at about 18 times their per-share earnings, which is not extreme but leans to the full side. We continue to prefer stocks of larger companies with global businesses over their smaller, domestically focused counterparts. We expect stocks of large European companies to outperform large U.S. stocks, with the higher dividend yields available on European shares acting as a small tailwind. The dividend yield on the Euro Stoxx 50 Index stood at 3.3% at the end of the reporting period versus 1.9% for the S&P 500.
With interest rates still at relatively low levels, the most likely direction for rates in the second half of the year remains up. We do not anticipate a dramatic move, but if rates do climb we could see modest losses in the Treasury sector. High-yield bonds could do slightly better, especially if corporate profits and the economy both continue to grow.
As we navigate through the coming months, remember that your Thrivent Financial representative can help you assess how market developments might impact your investment portfolio and ensure that it remains aligned with your investment goals and tolerance for risk.
As always, thank you for the trust you have placed in our entire team of Thrivent Financial investment professionals.
Sincerely,

Russell W. Swansen
President
Thrivent Series Fund, Inc.
| 1 | Bureau of Labor Statistics |
| 2 | Eurostat |
| 3 | National Bureau of Statistics of China |
| 4 | Bloomberg: S&P 500 total return for calendar 2013 was 32.39% |
3
Table of Contents
Thrivent Aggressive Allocation Portfolio
Russell W. Swansen, David C. Francis, CFA and Mark L. Simenstad, CFA, Portfolio Co-Managers
Thrivent Aggressive Allocation Portfolio seeks long-term capital growth.
The Portfolio invests in other Thrivent mutual funds and in directly held equity and debt instruments. The Portfolio is subject to its own operating expenses and the operating expenses of the other funds in which it invests, and is subject to all of the risks of the other funds in which it invests. The value of the Portfolio is influenced by factors impacting the overall market, certain asset classes, certain investment styles, and specific issuers. The Portfolio may incur losses due to incorrect assessments of investments by its investment adviser. Foreign investments involve additional risks, including currency fluctuations, liquidity, political, economic and market instability, and different legal and accounting standards. Bond prices generally fall as interest rates rise. Credit risk is the risk that an issuer of a debt security may not pay its debt, and high yield securities are subject to increased credit risk as well as liquidity risk. The use of equity index futures involves transaction costs and the loss from investing in them can exceed the initial investment.
| Portfolio Composition | Top 10 Holdings | |||||||||||
| (% of Portfolio) | (% of Net Assets) | |||||||||||
Large Cap | 48.8% | Thrivent Partner Worldwide Allocation Portfolio | 13.5% | |||||||||
International | 21.0% | Thrivent Partner Small Cap Growth Portfolio | 7.8% | |||||||||
Small Cap | 11.5% | Thrivent Mid Cap Stock Portfolio | 5.6% | |||||||||
Short-Term Investments | 7.1% | Thrivent Large Cap Value Portfolio | 5.2% | |||||||||
Mid Cap | 6.2% | Thrivent Large Cap Stock Portfolio | 4.5% | |||||||||
Investment Grade Debt | 3.6% | Thrivent Small Cap Stock Portfolio | 3.6% | |||||||||
Municipals | 0.9% | Thrivent Partner Mid Cap Value Portfolio | 3.4% | |||||||||
High Yield | 0.9% | Thrivent Partner Small Cap Value Portfolio | 2.3% | |||||||||
|
| |||||||||||
Total | 100.0% | Thrivent Limited Maturity Bond Portfolio | 1.2% | |||||||||
| Thrivent High Yield Portfolio | 0.9% | |||||||||||
These securities represent 48.0% of the total net assets of the Portfolio.
|
| |||||||||||
Thrivent Moderately Aggressive Allocation Portfolio
Russell W. Swansen, David C. Francis, CFA and Mark L. Simenstad, CFA, Portfolio Co-Managers
Thrivent Moderately Aggressive Allocation Portfolio seeks long-term capital growth.
The Portfolio invests in other Thrivent mutual funds and in directly held equity and debt instruments. The Portfolio is subject to its own operating expenses and the operating expenses of the other funds in which it invests, and is subject to all of the risks of the other funds in which it invests. The value of the Portfolio is influenced by factors impacting the overall market, certain asset classes, certain investment styles, and specific issuers. The Portfolio may incur losses due to incorrect assessments of investments by its investment adviser. Foreign investments involve additional risks, including currency fluctuations, liquidity, political, economic and market instability, and different legal and accounting standards. Bond prices generally fall as interest rates rise. Credit risk is the risk that an issuer of a debt security may not pay its debt, and high yield securities are subject to increased credit risk as well as liquidity risk. The use of equity index futures involves transaction costs and the loss from investing in them can exceed the initial investment.
| Portfolio Composition | Top 10 Holdings | |||||||||||
| (% of Portfolio) | (% of Net Assets) | |||||||||||
| Large Cap | 35.9% | Thrivent Partner Worldwide Allocation Portfolio | 10.5% | |||||||||
| International | 16.0% | Thrivent Large Cap Value Portfolio | 6.7% | |||||||||
| Short-Term Investments | 13.0% | Thrivent Large Cap Stock Portfolio | 6.0% | |||||||||
| Investment Grade Debt | 11.0% | Thrivent Mid Cap Stock Portfolio | 5.9% | |||||||||
| Small Cap | 7.6% | Thrivent Income Portfolio | 3.2% | |||||||||
| Mid Cap | 7.1% | Thrivent High Yield Portfolio | 2.8% | |||||||||
| Floating Rate Debt | 3.8% | Thrivent Partner Mid Cap Value Portfolio | 2.8% | |||||||||
| High Yield | 3.2% | Thrivent Partner Small Cap Growth Portfolio | 2.1% | |||||||||
| Municipals | 2.4% | Thrivent Partner Small Cap Value Portfolio | 2.1% | |||||||||
|
| |||||||||||
| Total | 100.0% | Thrivent Small Cap Stock Portfolio | 1.8% | |||||||||
These securities represent 43.9% of the total net assets of the Portfolio.
|
| |||||||||||
Portfolio Composition illustrates market exposure of all asset classes, including derivatives.
Quoted Portfolio Composition and Top 10 Holdings excludes short-term investments.
The list of Top 10 Holdings exclude short-term investments and collateral held for securities loaned.
4
Table of Contents
Thrivent Moderate Allocation Portfolio
Russell W. Swansen, David C. Francis, CFA and Mark L. Simenstad, CFA, Portfolio Co-Managers
Thrivent Moderate Allocation Portfolio seeks long-term capital growth while providing reasonable stability of principal.
The Portfolio invests in other Thrivent mutual funds and in directly held equity and debt instruments. The Portfolio is subject to its own operating expenses and the operating expenses of the other funds in which it invests, and is subject to all of the risks of the other funds in which it invests. The value of the Portfolio is influenced by factors impacting the overall market, certain asset classes, certain investment styles, and specific issuers. The Portfolio may incur losses due to incorrect assessments of investments by its investment adviser. Foreign investments involve additional risks, including currency fluctuations, liquidity, political, economic and market instability, and different legal and accounting standards. Bond prices generally fall as interest rates rise. Credit risk is the risk that an issuer of a debt security may not pay its debt, and high yield securities are subject to increased credit risk as well as liquidity risk. The use of equity index futures involves transaction costs and the loss from investing in them can exceed the initial investment.
| Portfolio Composition | Top 10 Holdings | |||||||||||
| (% of Portfolio) | (% of Net Assets) | |||||||||||
Large Cap | 25.1% | Thrivent Income Portfolio | 8.1% | |||||||||
Investment Grade Debt | 23.3% | Thrivent Partner Worldwide Allocation Portfolio | 6.8% | |||||||||
Short-Term Investments | 16.2% | Thrivent Large Cap Value Portfolio | 5.3% | |||||||||
International | 11.8% | Thrivent Limited Maturity Bond Portfolio | 4.9% | |||||||||
Floating Rate Debt | 7.6% | Thrivent Large Cap Stock Portfolio | 3.2% | |||||||||
Small Cap | 6.1% | Thrivent Mid Cap Stock Portfolio | 2.8% | |||||||||
Mid Cap | 3.6% | Thrivent High Yield Portfolio | 2.5% | |||||||||
Municipals | 3.5% | Federal National Mortgage Association | ||||||||||
High Yield | 2.8% | Discount Notes | 1.9% | |||||||||
|
| |||||||||||
Total | 100.0% | Federal National Mortgage Association Conventional 30-Yr. Pass Through | 1.6% | |||||||||
| Federal National Mortgage Association Conventional 30-Yr. Pass Through | 1.5% | |||||||||||
These securities represent 38.6% of the total net assets of the Portfolio.
|
| |||||||||||
Thrivent Moderately Conservative Allocation Portfolio
Russell W. Swansen, David C. Francis, CFA and Mark L. Simenstad, CFA, Portfolio Co-Managers
Thrivent Moderately Conservative Allocation Portfolio seeks long-term capital growth while providing reasonable stability of principal.
The Portfolio invests in other Thrivent mutual funds and in directly held equity and debt instruments. The Portfolio is subject to its own operating expenses and the operating expenses of the other funds in which it invests, and is subject to all of the risks of the other funds in which it invests. The value of the Portfolio is influenced by factors impacting the overall market, certain asset classes, certain investment styles, and specific issuers. The Portfolio may incur losses due to incorrect assessments of investments by its investment adviser. Foreign investments involve additional risks, including currency fluctuations, liquidity, political, economic and market instability, and different legal and accounting standards. Bond prices generally fall as interest rates rise. Credit risk is the risk that an issuer of a debt security may not pay its debt, and high yield securities are subject to increased credit risk as well as liquidity risk. The use of equity index futures involves transaction costs and the loss from investing in them can exceed the initial investment.
| Portfolio Composition | Top 10 Holdings | |||||||||||
| (% of Portfolio) | (% of Net Assets) | |||||||||||
Investment Grade Debt | 35.4% | Thrivent Limited Maturity Bond Portfolio | 11.7% | |||||||||
Large Cap | 16.9% | Thrivent Income Portfolio | 7.4% | |||||||||
Short-Term Investments | 14.7% | Thrivent Partner Worldwide Allocation Portfolio | 4.7% | |||||||||
Floating Rate Debt | 9.4% | Thrivent Large Cap Value Portfolio | 3.6% | |||||||||
International | 8.7% | Thrivent High Yield Portfolio | 2.9% | |||||||||
Municipals | 5.0% | Federal National Mortgage Association | ||||||||||
High Yield | 4.4% | Conventional 30-Yr. Pass Through | 2.9% | |||||||||
Small Cap | 3.3% | Federal National Mortgage Association | ||||||||||
Mid Cap | 2.2% | Conventional 30-Yr. Pass Through | 2.8% | |||||||||
|
| |||||||||||
Total | 100.0% | Federal National Mortgage Association | ||||||||||
| Conventional 30-Yr. Pass Through | 2.0% | |||||||||||
| U.S. Treasury Notes | 1.8% | |||||||||||
| Thrivent Mid Cap Stock Portfolio | 1.6% | |||||||||||
These securities represent 41.4% of the total net assets of the Portfolio.
|
| |||||||||||
Portfolio Composition illustrates market exposure of all asset classes, including derivatives.
Quoted Portfolio Composition and Top 10 Holdings excludes short-term investments.
The list of Top 10 Holdings exclude short-term investments and collateral held for securities loaned.
5
Table of Contents
Thrivent Growth and Income Plus Portfolio
David R. Spangler, CFA and Stephen D. Lowe, CFA, Portfolio Co-Managers
Thrivent Growth and Income Plus Portfolio seeks income plus long-term capital growth.
The Portfolio invests in equity securities and debt securities. The value of the Portfolio is influenced by factors impacting the overall market, certain asset classes, certain investment styles, and specific issuers. The Portfolio may incur losses due to incorrect assessments of investments by its investment adviser. Bond prices generally fall as interest rates rise. Credit risk is the risk that an issuer of a debt security may not pay its debt, and high yield securities are subject to increased credit risk as well as liquidity risk. Leveraged loans, preferred securities, sovereign debt, and mortgage-related and other asset-backed securities are subject to additional risks. Foreign investments involve additional risks, including currency fluctuations, liquidity, political, economic and market instability, and different legal and accounting standards; these risks are magnified for investments in emerging markets. Writing options is a highly specialized activity that can lead to losses and transaction costs.
| Portfolio Composition | Major Market Sectors | Top 10 Holdings | ||||||||||||||||||
| (% of Portfolio) | (% of Net Assets) | (% of Net Assets) | ||||||||||||||||||
| Common Stock | 65.7% | Financials | 15.7% | Apple, Inc. | 1.4% | |||||||||||||||
| Long-Term Fixed Income | 13.2% | Information Technology | 12.3% | Exxon Mobil Corporation | 1.1% | |||||||||||||||
| Short-Term Investments | 11.5% | Consumer Discretionary | 11.5% | Federal National Mortgage | ||||||||||||||||
| Bank Loans | 9.6% | Health Care | 8.5% | Association Conventional | ||||||||||||||||
| Total | 100.0% | Industrials | 8.4% | 30-Yr. Pass Through | 0.9% | |||||||||||||||
| Energy | 7.6% | Federal National Mortgage | ||||||||||||||||||
| Consumer Staples | 6.8% | Association Conventional | ||||||||||||||||||
| Telecommunications | 30-Yr. Pass Through | 0.9% | ||||||||||||||||||
| Services | 6.6% | General Electric Company | 0.8% | |||||||||||||||||
| Materials | 4.4% | Wells Fargo & Company | 0.8% | |||||||||||||||||
| Mortgage-Backed | iShares J.P. Morgan USD | |||||||||||||||||||
| Securities | 3.1% | Emerging Markets Bond | ||||||||||||||||||
| ETF | 0.7% | |||||||||||||||||||
| Federal National Mortgage | ||||||||||||||||||||
| Association Conventional | ||||||||||||||||||||
| 30-Yr. Pass Through | 0.7% | |||||||||||||||||||
| Procter & Gamble Company | 0.7% | |||||||||||||||||||
| Pfizer, Inc. | 0.7% | |||||||||||||||||||
These securities represent 8.7% of the total net assets of the Portfolio.
|
| |||||||||||||||||||
Thrivent Balanced Income Plus Portfolio
Darren M. Bagwell, CFA, Michael G. Landreville, CFA and CPA (inactive), and Stephen D. Lowe, CFA, Portfolio Co-Managers
Thrivent Balanced Income Plus Portfolio seeks long-term total return through a balance between income and the potential for long-term capital growth.
The Portfolio invests in equity securities and debt securities. The value of the Portfolio is influenced by factors impacting the overall market, certain asset classes, certain investment styles, and specific issuers. The Portfolio may incur losses due to incorrect assessments of investments by its investment adviser. Bond prices generally fall as interest rates rise. Credit risk is the risk that an issuer of a debt security may not pay its debt, and high yield securities are subject to increased credit risk as well as liquidity risk. Leveraged loans, preferred securities, sovereign debt, and mortgage-related and other asset-backed securities are subject to additional risks. Foreign investments involve additional risks, including currency fluctuations, liquidity, political, economic and market instability, and different legal and accounting standards; these risks are magnified for investments in emerging markets.
| Portfolio Composition | Major Market Sectors | Top 10 Holdings | ||||||||||||||||||
| (% of Portfolio) | (% of Net Assets) | (% of Net Assets) | ||||||||||||||||||
| Common Stock | 49.0% | Financials | 19.5% | Apple, Inc. | 2.2% | |||||||||||||||
| Long-Term Fixed Income | 24.5% | Consumer Discretionary | 12.9% | Comcast Corporation | 2.1% | |||||||||||||||
| Bank Loans | 17.6% | Information Technology | 10.0% | Total SA ADR | 2.0% | |||||||||||||||
| Short-Term Investments | 7.2% | Telecommunications | Johnson & Johnson | 1.7% | ||||||||||||||||
| Preferred Stock | 1.7% | Services | 8.3% | Federal National Mortgage | ||||||||||||||||
Total | 100.0% | Consumer Staples | 7.7% | Association Conventional | ||||||||||||||||
| Energy | 7.5% | 30-Yr. Pass Through | 1.4% | |||||||||||||||||
| Health Care | 6.8% | Pfizer, Inc. | 1.4% | |||||||||||||||||
| Materials | 5.6% | Las Vegas Sands Corporation | 1.4% | |||||||||||||||||
| Industrials | 5.0% | PepsiCo, Inc. | 1.3% | |||||||||||||||||
| Mortgage-Backed | Union Pacific Corporation | 1.2% | ||||||||||||||||||
| Securities | 4.6% | Genworth Financial, Inc. | 1.2% | |||||||||||||||||
These securities represent 15.9% of the total net assets of the Portfolio.
|
| |||||||||||||||||||
Quoted Portfolio Composition, Major Market Sectors and Top 10 Holdings are subject to change.
The lists of Major Market Sectors and Top 10 Holdings exclude short-term investments and collateral held for securities loaned.
The Portfolio Composition chart excludes collateral held for securities loaned.
6
Table of Contents
Thrivent Diversified Income Plus Portfolio
Mark L. Simenstad, CFA, David R. Spangler, CFA and Paul J. Ocenasek, CFA, Portfolio Co-Managers
Thrivent Diversified Income Plus Portfolio seeks to maximize income while maintaining prospects for capital appreciation.
The Portfolio invests in debt securities and equity securities. The value of the Portfolio is influenced by factors impacting the overall market, certain asset classes, certain investment styles, and specific issuers. The Portfolio may incur losses due to incorrect assessments of investments by its investment adviser. Bond prices generally fall as interest rates rise. Credit risk is the risk that an issuer of a debt security may not pay its debt, and high yield securities are subject to increased credit risk as well as liquidity risk. Leveraged loans and mortgage-related and other asset-backed securities are subject to additional risks.
Portfolio Composition (% of Portfolio) | Major Market Sectors (% of Net Assets) | Top 10 Holdings (% of Net Assets) | ||||||||||||||||
Long-Term Fixed Income | 39.2% | Financials | 23.2% | Federal National Mortgage | ||||||||||||||
Common Stock | 33.3% | Collateralized Mortgage | Association Conventional | |||||||||||||||
Bank Loans | 12.7% | Obligations | 15.2% | 30-Yr. Pass Through | 1.7% | |||||||||||||
Short-Term Investments | 11.2% | Consumer Discretionary | 8.2% | Federal National Mortgage | ||||||||||||||
Preferred Stock | 3.6% | Telecommunications Services | 7.8% | Association Conventional | ||||||||||||||
Total | 100.0% | Information Technology | 6.3% | 30-Yr. Pass Through | 1.2% | |||||||||||||
| Consumer Staples | 5.4% | BlackRock Enhanced Equity | ||||||||||||||||
| Energy | 5.2% | Dividend Trust | 0.9% | |||||||||||||||
| Materials | 4.5% | iShares FTSE NAREIT Mortgage | ||||||||||||||||
| Mortgage-Backed Securities | 4.0% | Plus Capped Index Fund | 0.7% | |||||||||||||||
| Health Care | 3.7% | Federal National Mortgage | ||||||||||||||||
| Association Conventional | ||||||||||||||||||
| 15-yr. Pass Through | 0.7% | |||||||||||||||||
| Vanguard REIT ETF | 0.7% | |||||||||||||||||
| Two Harbors Investment | ||||||||||||||||||
| Corporation | 0.6% | |||||||||||||||||
| Apple, Inc. | 0.6% | |||||||||||||||||
| Golub Capital BDC, Inc. | 0.5% | |||||||||||||||||
| Ares Capital Corporation | 0.5% | |||||||||||||||||
These securities represent 8.1% of the total net assets of the Portfolio.
| ||||||||||||||||||
Thrivent Opportunity Income Plus Portfolio
Gregory R. Anderson, CFA, Michael G. Landreville, CFA and CPA (inactive) and Conrad Smith, CFA, Portfolio Co-Managers
Thrivent Opportunity Income Plus Portfolio seeks a combination of current income and long-term capital appreciation.
The Portfolio primarily invests in a broad range of debt securities. The value of the Portfolio is influenced by factors impacting the overall market, certain asset classes, certain investment styles, and specific issuers. The Portfolio may incur losses due to incorrect assessments of investments by its investment adviser. Bond prices generally fall as interest rates rise. Credit risk is the risk that an issuer of a debt security may not pay its debt, and high yield securities are subject to increased credit risk as well as liquidity risk. Leveraged loans, sovereign debt, and mortgage-related and other asset-backed securities are subject to additional risks. Foreign investments involve additional risks, including currency fluctuations, liquidity, political, economic and market instability, and different legal and accounting standards; these risks are magnified for investments in emerging markets. The prices of futures contracts can be highly volatile and the loss from investing in them can exceed the initial investment.
 | Major Market Sectors | Top 10 Holdings | ||||||||||||||
| (% of Net Assets) | (% of Net Assets) | |||||||||||||||
Financials | 18.2% | Federal National Mortgage | ||||||||||||||
Communications Services | 17.4% | Association Conventional | ||||||||||||||
Mortgage-Backed Securities | 9.6% | 30-Yr. Pass Through | 2.7% | |||||||||||||
Consumer Cyclical | 9.5% | IMG Worldwide, Inc., Term Loan | 2.4% | |||||||||||||
Collateralized Mortgage | TransUnion, LLC, Term Loan | 2.4% | ||||||||||||||
Obligations | 9.1% | JBS USA, LLC, Term Loan | 2.3% | |||||||||||||
Consumer Non-Cyclical | 7.1% | Federal National Mortgage | ||||||||||||||
Basic Materials | 5.0% | Association Conventional | ||||||||||||||
Asset-Backed Securities | 4.4% | 30-Yr. Pass Through | 2.2% | |||||||||||||
Technology | 4.3% | Federal National Mortgage | ||||||||||||||
Utilities | 4.1% | Association Conventional | ||||||||||||||
| 30-Yr. Pass Through | 1.8% | |||||||||||||||
| iShares J.P. Morgan USD Emerging | ||||||||||||||||
| Markets Bond ETF | 1.6% | |||||||||||||||
| Mohegan Tribal Gaming Authority, | ||||||||||||||||
| Term Loan | 1.3% | |||||||||||||||
| Calpine Corporation, Term Loan | 1.3% | |||||||||||||||
| SBA Senior Finance II, LLC, Term | ||||||||||||||||
| Loan | 1.3% | |||||||||||||||
| These securities represent 19.3% of the total net assets of the Portfolio.
|
| |||||||||||||||
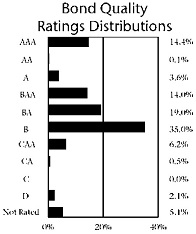
Quoted Portfolio Composition, Bond Quality Ratings Distributions, Major Market Sectors and Top 10 Holdings are subject to change. The lists of Major Market Sectors and Top 10 Holdings exclude short-term investments and collateral held for securities loaned.
The Portfolio Composition and Bond Quality Ratings charts exclude collateral held for securities loaned.
Bond quality ratings are obtained from Moody’s Investors Service, Inc. (“Moody’s”) and Standard & Poor’s Ratings Services (“S&P”). Ratings from S&P, when used, are converted into their equivalent Moody’s ratings. If Moody’s and S&P have assigned different ratings to a security, the lowest rating for the security is used. If a fixed income security is not rated by Moody’s or S&P the Portfolio’s investment adviser has assigned a rating based on its credit evaluation.
7
Table of Contents
Thrivent Partner Technology Portfolio
Subadvised by Goldman Sachs Asset Management, L.P.
Thrivent Partner Technology Portfolio seeks long-term growth of capital.
The Portfolio primarily invests in securities of technology companies, which may be more volatile than, and not move in tandem with, the overall market. The value of the Portfolio is influenced by factors impacting the overall market, certain asset classes, certain investment styles, and specific issuers. The Portfolio may incur losses due to incorrect assessments of investments by its investment advisers. Small and medium-sized companies often have greater price volatility and less liquidity than larger companies. Foreign investments involve additional risks, including currency fluctuations, liquidity, political, economic and market instability, and different legal and accounting standards; these risks are magnified for investments in emerging markets.
| Portfolio Composition | Major Market Sectors | Top 10 Holdings | ||||||||||||||||||
(% of Portfolio)
|
| (% of Net Assets)
|
| (% of Net Assets)
|
| |||||||||||||||
Common Stock | 96.7% | Software | 22.4 | % | Apple, Inc. | 8.7 | % | |||||||||||||
Short-Term Investments | 3.3% | Internet Software & Services | 21.9 | % | QUALCOMM, Inc. | 6.0 | % | |||||||||||||
|
| |||||||||||||||||||
Total | 100.0% | Computers & Peripherals | 14.3 | % | EMC Corporation | 4.1 | % | |||||||||||||
Consumer Discretionary | 7.6 | % | Amazon.com, Inc. | 4.0 | % | |||||||||||||||
Communications Equipment | 6.4 | % | Facebook, Inc. | 3.9 | % | |||||||||||||||
Financials | 6.2 | % | SBA Communications | |||||||||||||||||
Telecommunications | Corporation | 3.9 | % | |||||||||||||||||
Services | 5.7 | % | American Tower | |||||||||||||||||
IT Consulting & Services | 5.3 | % | Corporation | 3.8 | % | |||||||||||||||
Semiconductors & | Oracle Corporation | 3.7 | % | |||||||||||||||||
Semiconductor Equipment | 4.8 | % | ServiceNow, Inc. | 3.6 | % | |||||||||||||||
Electronic Equipment, | Priceline Group, Inc. | 3.6 | % | |||||||||||||||||
Instruments & Components | 2.1 | % | ||||||||||||||||||
These securities represent 45.3% of the total net assets of the Portfolio.
|
| |||||||||||||||||||
Thrivent Partner Healthcare Portfolio
Subadvised by Sectoral Asset Management, Inc.
Thrivent Partner Healthcare Portfolio seeks long-term capital growth.
The Portfolio primarily invests in healthcare companies, which are subject to numerous risks including legislative or regulatory changes and adverse market conditions. The value of the Portfolio is influenced by factors impacting the overall market, certain asset classes, certain investment styles, and specific issuers. The Portfolio may incur losses due to incorrect assessments of investments by its investment advisers. Small and medium-sized companies often have greater price volatility and less liquidity than larger companies. Foreign investments involve additional risks, including currency fluctuations, liquidity, political, economic and market instability, and different legal and accounting standards; these risks are magnified for investments in emerging markets. The Portfolio is non-diversified, which means that it may invest a greater percentage of its assets in the securities of any single issuer compared with diversified funds.
| Portfolio Composition | Major Market Sectors | Top 10 Holdings | ||||||||||||||||||
(% of Portfolio)
|
| (% of Net Assets)
|
| (% of Net Assets)
|
| |||||||||||||||
Common Stock | 95.3 | % | Pharmaceuticals | 49.7 | % | Roche Holding AG | 8.0 | % | ||||||||||||
Short-Term Investments | 4.7 | % | Biotechnology | 21.2 | % | Novartis AG | 7.9 | % | ||||||||||||
Total | 100.0 | % | Health Care Equipment | 18.7 | % | Merck & Company, Inc. | 6.8 | % | ||||||||||||
Health Care Supplies | 2.8 | % | Sanofi | 5.6 | % | |||||||||||||||
Managed Health Care | 2.5 | % | Novo Nordisk AS ADR | 4.3 | % | |||||||||||||||
Biogen Idec, Inc. | 3.9 | % | ||||||||||||||||||
Amgen, Inc. | 3.9 | % | ||||||||||||||||||
Covidien plc | 3.5 | % | ||||||||||||||||||
Intuitive Surgical, Inc. | 2.9 | % | ||||||||||||||||||
Align Technology, Inc. | 2.8 | % | ||||||||||||||||||
These securities represent 49.6% of the total net assets of the Portfolio.
|
| |||||||||||||||||||
Quoted Portfolio Composition, Major Market Sectors and Top 10 Holdings are subject to change.
The lists of Major Market Sectors and Top 10 Holdings exclude short-term investments and collateral held for securities loaned.
The Portfolio Composition chart excludes collateral held for securities loaned.
8
Table of Contents
Thrivent Natural Resources Portfolio
David C. Francis, CFA and Darren M. Bagwell, CFA, Portfolio Co-Managers
Thrivent Natural Resources Portfolio seeks long-term capital growth.
The Portfolio primarily invests in natural resource investments, which historically have been very volatile and are subject to risks that particularly affect the precious metals, oil, gas, mining, energy, chemicals, paper, steel or agricultural sectors. REITs are subject to numerous risks and can be affected by interest rates, the values of the properties they own, and the credit quality of mortgage loans they hold. The value of the Portfolio is influenced by factors impacting the overall market, certain asset classes, certain investment styles, and specific issuers. The Portfolio may incur losses due to incorrect assessments of investments by its investment adviser. Small and medium-sized companies often have greater price volatility and less liquidity than larger companies. Foreign investments involve additional risks, including currency fluctuations, liquidity, political, economic and market instability, and different legal and accounting standards; these risks are magnified for investments in emerging markets. The Portfolio is non-diversified, which means that it may invest a greater percentage of its assets in the securities of any single issuer compared with diversified funds.
| Portfolio Composition | Major Market Sectors | Top 10 Holdings | ||||||||||||||||||
(% of Portfolio)
|
| (% of Net Assets)
|
| (% of Net Assets)
|
| |||||||||||||||
Common Stock | 97.2% | Oil & Gas Exploration & | Schlumberger, Ltd. | 8.5 | % | |||||||||||||||
Short-Term Investments | 2.8% | Production | 25.8 | % | Oasis Petroleum, Inc. | 5.4 | % | |||||||||||||
|
| |||||||||||||||||||
Total | | 100.0% | | Oil & Gas Equipment & | National Oilwell Varco, Inc. | 4.7 | % | |||||||||||||
Services | 25.0 | % | Chevron Corporation | 4.5 | % | |||||||||||||||
Financials | 19.3 | % | Weatherford International, Ltd. | 4.5 | % | |||||||||||||||
Integrated Oil & Gas | 11.2 | % | EOG Resources, Inc. | 4.3 | % | |||||||||||||||
Consumer Staples | 9.7 | % | EQT Corporation | 3.9 | % | |||||||||||||||
Materials | 3.8 | % | Dril-Quip, Inc. | 3.9 | % | |||||||||||||||
Coal & Consumable Fuels | 1.7 | % | Ingredion, Inc. | 3.6 | % | |||||||||||||||
Trading Companies | Cameron International | |||||||||||||||||||
& Distributors | 0.5 | % | Corporation | 3.5 | % | |||||||||||||||
These securities represent 46.8% of the total net assets of the Portfolio.
|
| |||||||||||||||||||
Thrivent Partner Emerging Markets Equity Portfolio
Subadvised by Aberdeen Asset Managers Limited
Thrivent Partner Emerging Markets Equity Portfolio seeks long-term capital growth.
The Portfolio primarily invests in emerging markets equities. Foreign investments involve additional risks, including currency fluctuations, liquidity, political, economic and market instability, and different legal and accounting standards; these risks are magnified for investments in emerging markets. The value of the Portfolio is influenced by factors impacting the overall market, certain asset classes, certain investment styles, and specific issuers. The Portfolio may incur losses due to incorrect assessments of investments by its investment advisers. Small and medium-sized companies often have greater price volatility and less liquidity than larger companies. Large cap companies may be unable to respond quickly to new competitive challenges and may not be able to attain a high growth rate.
| Portfolio Composition | Major Market Sectors | Top 10 Countries | ||||||||||||||||||
(% of Portfolio)
|
| (% of Net Assets)
|
| (% of Net Assets)
|
| |||||||||||||||
Common Stock | 91.2% | Financials | 33.3 | % | Brazil | 13.9 | % | |||||||||||||
Preferred Stock | 7.5% | Consumer Staples | 13.7 | % | India | 13.0 | % | |||||||||||||
Short-Term Investments | 1.3% | Energy | 13.2 | % | Hong Kong | 10.5 | % | |||||||||||||
|
| |||||||||||||||||||
Total | 100.0% | Information Technology | 11.6 | % | Mexico | 7.3 | % | |||||||||||||
Consumer Discretionary | 10.0 | % | South Korea | 6.4 | % | |||||||||||||||
Materials | 8.0 | % | United Kingdom | 5.5 | % | |||||||||||||||
Telecommunications Services | 4.0 | % | Turkey | 5.3 | % | |||||||||||||||
Industrials | 3.6 | % | Thailand | 4.7 | % | |||||||||||||||
Health Care | 1.2 | % | Taiwan | 4.7 | % | |||||||||||||||
Russia | 4.3 | % | ||||||||||||||||||
Investments in securities in these countries represent 75.6% of the total net assets of the Portfolio.
|
| |||||||||||||||||||
Quoted Portfolio Composition, Major Market Sectors, Top 10 Holdings and Top 10 Countries are subject to change.
The lists of Major Market Sectors, Top 10 Holdings and Top 10 Countries exclude short-term investments and collateral held for securities loaned. The Portfolio Composition chart excludes collateral held for securities loaned.
9
Table of Contents
Thrivent Real Estate Securities Portfolio
Reginald L. Pfeifer, CFA, Portfolio Manager
Thrivent Real Estate Securities Portfolio seeks to provide long-term capital appreciation and high current income.
The Portfolio focuses on income-producing equity securities of U.S. real estate companies. Declines in real estate values, changes in interest rates or economic downturns can have a significant negative effect on companies in the real estate industry. Real Estate Investment Trusts are subject to numerous risks and can be affected by interest rates, the values of the properties they own, and the credit quality of mortgage loans they hold. The value of the Portfolio is influenced by factors impacting the overall market, certain asset classes, certain investment styles, and specific issuers. The Portfolio may incur losses due to incorrect assessments of investments by its investment adviser.
| Portfolio Composition | Major Market Sectors | Top 10 Holdings | ||||||||||||||||||
(% of Portfolio)
|
| (% of Net Assets)
|
| (% of Net Assets)
|
| |||||||||||||||
Common Stock | 99.6% | Retail REITS | 25.0 | % | Simon Property Group, Inc. | 9.5 | % | |||||||||||||
Short-Term Investments | 0.4% | Residential REITS | 17.0 | % | Prologis, Inc. | 4.0 | % | |||||||||||||
|
| |||||||||||||||||||
Total | 100.0% | Office REITS | 13.5 | % | Public Storage, Inc. | 3.6 | % | |||||||||||||
Health Care REITs | 10.3 | % | AvalonBay Communities, Inc. | 3.4 | % | |||||||||||||||
Hotel & Resort REITs | 9.1 | % | Boston Properties, Inc. | 3.3 | % | |||||||||||||||
Specialized REITS | 8.7 | % | Equity Residential | 3.3 | % | |||||||||||||||
Diversified REITS | 8.2 | % | Vornado Realty Trust | 3.1 | % | |||||||||||||||
Industrial REITS | 5.9 | % | Host Hotels & Resorts, Inc. | 3.0 | % | |||||||||||||||
Mortgage REITS | 0.7 | % | Ventas, Inc. | 3.0 | % | |||||||||||||||
Real Estate Operating | Essex Property Trust, Inc. | 2.6 | % | |||||||||||||||||
Companies | 0.4 | % | ||||||||||||||||||
These securities represent 38.8% of the total net assets of the Portfolio.
|
| |||||||||||||||||||
Thrivent Partner Small Cap Growth Portfolio
David Lettenberger, CFA, and Matthew D. Finn, CFA, Portfolio Co-Managers*
Thrivent Partner Small Cap Growth Portfolio seeks long-term capital growth.
The Portfolio primarily invests in securities of small companies. Smaller, less seasoned companies often have greater price volatility, lower trading volume, and less liquidity than larger, more established companies. The value of the Portfolio is influenced by factors impacting the overall market, certain asset classes, certain investment styles, and specific issuers. The Portfolio may incur losses due to incorrect assessments of investments by its investment advisers.
* Effective May 27, 2014, David Lettenberger and Matthew Finn became Portfolio Co-Managers. The Portfolio was previously subadvised by Turner Investments, L.P.
| Portfolio Composition | Major Market Sectors | Top 10 Holdings | ||||||||||||||||||
(% of Portfolio)
|
| (% of Net Assets)
|
| (% of Net Assets)
|
| |||||||||||||||
Common Stock | 96.9% | Information Technology | 24.3 | % | Akorn, Inc. | 2.0 | % | |||||||||||||
Short-Term Investments | 3.1% | Health Care | 19.4 | % | Monolithic Power Systems, Inc. | 1.6 | % | |||||||||||||
|
| |||||||||||||||||||
Total | 100.0% | Consumer Discretionary | 16.9 | % | Proofpoint, Inc. | 1.6 | % | |||||||||||||
Industrials | 16.3 | % | Guidewire Software, Inc. | 1.5 | % | |||||||||||||||
Financials | 7.1 | % | G-III Apparel Group, Ltd. | 1.4 | % | |||||||||||||||
Energy | 4.9 | % | On Assignment, Inc. | 1.4 | % | |||||||||||||||
Materials | 4.5 | % | Kodiak Oil & Gas Corporation | 1.4 | % | |||||||||||||||
Consumer Staples | 3.2 | % | Demandware, Inc. | 1.4 | % | |||||||||||||||
United Natural Foods, Inc. | 1.3 | % | ||||||||||||||||||
Cornerstone OnDemand, Inc. | 1.3 | % | ||||||||||||||||||
These securities represent 14.9% of the total net assets of the Portfolio.
|
| |||||||||||||||||||
Quoted Portfolio Composition, Major Market Sectors and Top 10 Holdings are subject to change.
The lists of Major Market Sectors and Top 10 Holdings exclude short-term investments and collateral held for securities loaned.
The Portfolio Composition chart excludes collateral held for securities loaned.
10
Table of Contents
Thrivent Partner Small Cap Value Portfolio
Subadvised by T. Rowe Price Associates, Inc.
Thrivent Partner Small Cap Value Portfolio seeks long-term capital appreciation.
The Portfolio primarily invests in securities of small companies. Smaller, less seasoned companies often have greater price volatility, lower trading volume, and less liquidity than larger, more established companies. The value of the Portfolio is influenced by factors impacting the overall market, certain asset classes, certain investment styles, and specific issuers. The Portfolio may incur losses due to incorrect assessments of investments by its investment advisers. Foreign investments involve additional risks, including currency fluctuations, liquidity, political, economic and market instability, and different legal and accounting standards.
| Portfolio Composition | Major Market Sectors | Top 10 Holdings | ||||||||||||||||||||
(% of Portfolio)
|
| (% of Net Assets)
|
| (% of Net Assets)
|
| |||||||||||||||||
Common Stock | 96.5 | % | Industrials | 26.1 | % | Alaska Air Group, Inc. | 2.1 | % | ||||||||||||||
Short-Term Investments | 3.3 | % | Financials | 24.5 | % | Aaron’s, Inc. | 2.0 | % | ||||||||||||||
Preferred Stock | 0.2 | % | Consumer Discretionary | 14.7 | % | Greenbrier Companies, Inc. | 1.6 | % | ||||||||||||||
Total | 100.0 | % | Information Technology | 9.5 | % | ProAssurance Corporation | 1.6 | % | ||||||||||||||
Materials | 8.5 | % | Cleco Corporation | 1.6 | % | |||||||||||||||||
Utilities | 5.1 | % | East West Bancorp, Inc. | 1.5 | % | |||||||||||||||||
Energy | 4.1 | % | West Pharmaceutical Services, Inc. | 1.4 | % | |||||||||||||||||
Health Care | 3.6 | % | Clearwater Paper Corporation | 1.3 | % | |||||||||||||||||
Consumer Staples | 0.7 | % | Kirby Corporation | 1.3 | % | |||||||||||||||||
Telecommunications Services | 0.3 | % | Synnex Corporation | 1.3 | % | |||||||||||||||||
These securities represent 15.7% of the total net assets of the Portfolio.
|
| |||||||||||||||||||||
Thrivent Small Cap Stock Portfolio
Matthew D. Finn, CFA, Portfolio Manager
Thrivent Small Cap Stock Portfolio seeks long-term capital growth.
The Portfolio primarily invests in securities of small companies. Smaller, less seasoned companies often have greater price volatility, lower trading volume, and less liquidity than larger, more established companies. The value of the Portfolio is influenced by factors impacting the overall market, certain asset classes, certain investment styles, and specific issuers. The Portfolio may incur losses due to incorrect assessments of investments by its investment adviser.
| Portfolio Composition | Major Market Sectors | Top 10 Holdings | ||||||||||||||||||||
(% of Portfolio)
|
| (% of Net Assets)
|
| (% of Net Assets)
|
| |||||||||||||||||
Common Stock | 95.8 | % | Industrials | 20.0 | % | EMCOR Group, Inc. | 2.9 | % | ||||||||||||||
Short-Term Investments | 4.1 | % | Financials | 19.3 | % | NorthWestern Corporation | 2.6 | % | ||||||||||||||
Commercial Paper | 0.1 | % | Information Technology | 17.8 | % | DST Systems, Inc. | 2.6 | % | ||||||||||||||
Total | 100.0 | % | Consumer Discretionary | 10.2 | % | Market Vectors Oil Service ETF | 2.3 | % | ||||||||||||||
Health Care | 8.4 | % | Materials Select Sector SPDR Fund | 2.2 | % | |||||||||||||||||
Energy | 6.3 | % | Broadridge Financial Solutions, Inc. | 2.2 | % | |||||||||||||||||
Materials | 5.5 | % | H.B. Fuller Company | 2.2 | % | |||||||||||||||||
Utilities | 3.6 | % | Landstar System, Inc. | 2.1 | % | |||||||||||||||||
Consumer Staples | 2.7 | % | Affiliated Managers Group, Inc. | 2.0 | % | |||||||||||||||||
Telecommunications Services | 1.0 | % | CNO Financial Group, Inc. | 2.0 | % | |||||||||||||||||
These securities represent 23.1% of the total net assets of the Portfolio.
|
| |||||||||||||||||||||
Quoted Portfolio Composition, Major Market Sectors and Top 10 Holdings are subject to change.
The lists of Major Market Sectors and Top 10 Holdings exclude short-term investments and collateral held for securities loaned.
The Portfolio Composition chart excludes collateral held for securities loaned.
11
Table of Contents
Thrivent Small Cap Index Portfolio
Kevin R. Brimmer, FSA, Portfolio Manager
Thrivent Small Cap Index Portfolio strives for capital growth that tracks the performance of the S&P SmallCap 600 Index.
The Portfolio primarily invests in small company common stocks. Smaller, less seasoned companies often have greater price volatility, lower trading volume, and less liquidity than larger, more established companies. The value of the Portfolio is influenced by factors impacting the overall market, certain asset classes, certain investment styles, and specific issuers.
| Portfolio Composition | Major Market Sectors | Top 10 Holdings | ||||||||||||||||||||
(% of Portfolio)
|
| (% of Net Assets)
|
| (% of Net Assets)
|
| |||||||||||||||||
Common Stock | 95.5 | % | Financials | 20.1 | % | Questcor Pharmaceuticals, Inc. | 0.7 | % | ||||||||||||||
Short-Term Investments | 4.5 | % | Information Technology | 17.0 | % | Centene Corporation | 0.6 | % | ||||||||||||||
Total | 100.0 | % | Industrials | 14.9 | % | Teledyne Technologies, Inc. | 0.5 | % | ||||||||||||||
Consumer Discretionary | 13.8 | % | Toro Company | 0.5 | % | |||||||||||||||||
Health Care | 10.7 | % | Tanger Factory Outlet Centers, Inc. | 0.5 | % | |||||||||||||||||
Materials | 6.1 | % | Darling Ingredients, Inc. | 0.5 | % | |||||||||||||||||
Energy | 4.8 | % | Synaptics, Inc. | 0.5 | % | |||||||||||||||||
Utilities | 3.7 | % | Moog, Inc. | 0.4 | % | |||||||||||||||||
Consumer Staples | 3.4 | % | EnerSys, Inc. | 0.4 | % | |||||||||||||||||
Telecommunications Services | 0.5 | % | Curtiss-Wright Corporation | 0.4 | % | |||||||||||||||||
These securities represent 5.0% of the total net assets of the Portfolio.
|
| |||||||||||||||||||||
Thrivent Mid Cap Growth Portfolio
Andrea J. Thomas, CFA, Portfolio Manager
Thrivent Mid Cap Growth Portfolio seeks long-term growth of capital.
The Portfolio primarily invests in securities of mid-sized companies, which often have greater price volatility, lower trading volume, and less liquidity than larger, more established companies. The value of the Portfolio is influenced by factors impacting the overall market, certain asset classes, certain investment styles, and specific issuers. The Portfolio may incur losses due to incorrect assessments of investments by its investment adviser.
| Portfolio Composition | Major Market Sectors | Top 10 Holdings | ||||||||||||||||||||
(% of Portfolio)
|
| (% of Net Assets)
|
| (% of Net Assets)
|
| |||||||||||||||||
Common Stock | 97.4 | % | Industrials | 20.8 | % | United Rentals, Inc. | 2.3 | % | ||||||||||||||
Short-Term Investments | 2.6 | % | Information Technology | 19.7 | % | Perrigo Company plc | 2.0 | % | ||||||||||||||
Total | 100.0 | % | Consumer Discretionary | 17.0 | % | Affiliated Managers Group, Inc. | 2.0 | % | ||||||||||||||
Health Care | 11.5 | % | Stericycle, Inc. | 2.0 | % | |||||||||||||||||
Financials | 11.0 | % | First Republic Bank | 2.0 | % | |||||||||||||||||
Energy | 7.0 | % | Discover Financial Services | 1.9 | % | |||||||||||||||||
Materials | 3.9 | % | Agilent Technologies, Inc. | 1.9 | % | |||||||||||||||||
Consumer Staples | 3.4 | % | NXP Semiconductors NV | 1.8 | % | |||||||||||||||||
Telecommunications Services | 2.2 | % | AMETEK, Inc. | 1.8 | % | |||||||||||||||||
Marriott International, Inc. | 1.7 | % | ||||||||||||||||||||
These securities represent 19.4% of the total net assets of the Portfolio.
|
| |||||||||||||||||||||
Quoted Portfolio Composition, Major Market Sectors and Top 10 Holdings are subject to change.
The lists of Major Market Sectors and Top 10 Holdings exclude short-term investments and collateral held for securities loaned.
The Portfolio Composition chart excludes collateral held for securities loaned.
12
Table of Contents
Thrivent Partner Mid Cap Value Portfolio
Subadvised by Goldman Sachs Asset Management, L.P.
Thrivent Partner Mid Cap Value Portfolio seeks to achieve long-term capital appreciation.
The Portfolio primarily invests in securities of mid-cap issuers, which often have greater price volatility, lower trading volume, and less liquidity than larger, more established companies. The value of the Portfolio is influenced by factors impacting the overall market, certain asset classes, certain investment styles, and specific issuers. The Portfolio may incur losses due to incorrect assessments of investments by its investment advisers. Foreign investments involve additional risks, including currency fluctuations, liquidity, political, economic and market instability, and different legal and accounting standards; these risks are magnified for investments in emerging markets.
Portfolio Composition |
| Major Market Sectors | Top 10 Holdings | |||||||||||||||||||
(% of Portfolio) |
| (% of Net Assets) | (% of Net Assets) | |||||||||||||||||||
Common Stock | 97.8 | % | Financials | 27.4 | % | CIGNA Corporation | 2.0 | % | ||||||||||||||
Short-Term Investments | 2.2 | % | Industrials | 13.2 | % | Agilent Technologies, Inc. | 2.0 | % | ||||||||||||||
Total | 100.0 | % | Information Technology | 13.1 | % | Cardinal Health, Inc. | 1.9 | % | ||||||||||||||
| Consumer Discretionary | 11.2 | % | Principal Financial Group, Inc. | 1.8 | % | |||||||||||||||||
| Health Care | 7.9 | % | Lincoln National Corporation | 1.7 | % | |||||||||||||||||
| Energy | 7.8 | % | AvalonBay Communities, Inc. | 1.7 | % | |||||||||||||||||
| Utilities | 6.6 | % | M&T Bank Corporation | 1.6 | % | |||||||||||||||||
| Materials | 5.7 | % | Triumph Group, Inc. | 1.6 | % | |||||||||||||||||
| Consumer Staples | 4.3 | % | Kroger Company | 1.5 | % | |||||||||||||||||
| Chesapeake Energy Corporation | 1.5 | % | ||||||||||||||||||||
These securities represent 17.3% of the total net assets of the Portfolio.
|
| |||||||||||||||||||||
Thrivent Mid Cap Stock Portfolio
Brian J. Flanagan, CFA, Portfolio Manager
Thrivent Mid Cap Stock Portfolio seeks long-term capital growth.
The Portfolio primarily invests in securities of mid-sized companies, which often have greater price volatility, lower trading volume, and less liquidity than larger, more established companies. The value of the Portfolio is influenced by factors impacting the overall market, certain asset classes, certain investment styles, and specific issuers. The Portfolio may incur losses due to incorrect assessments of investments by its investment adviser.
Portfolio Composition |
| Major Market Sectors | Top 10 Holdings | |||||||||||||||||||
(% of Portfolio) |
| (% of Net Assets) | (% of Net Assets) | |||||||||||||||||||
Common Stock | 92.6 | % | Financials | 20.6 | % | Alliance Data Systems Corporation | 3.7 | % | ||||||||||||||
Short-Term Investments | 7.4 | % | Information Technology | 19.4 | % | Illumina, Inc. | 3.5 | % | ||||||||||||||
Total | 100.0 | % | Industrials | 16.0 | % | NVIDIA Corporation | 2.6 | % | ||||||||||||||
| Health Care | 12.7 | % | Applied Materials, Inc. | 2.5 | % | |||||||||||||||||
| Consumer Discretionary | 7.2 | % | Oshkosh Corporation | 2.4 | % | |||||||||||||||||
| Energy | 6.2 | % | Southwest Airlines Company | 2.4 | % | |||||||||||||||||
| Consumer Staples | 3.8 | % | ADT Corporation | 2.0 | % | |||||||||||||||||
| Materials | 3.7 | % | DISH Network Corporation | 2.0 | % | |||||||||||||||||
| Utilities | 2.5 | % | Huntington Bancshares, Inc. | 1.9 | % | |||||||||||||||||
| Lazard, Ltd. | 1.7 | % | ||||||||||||||||||||
These securities represent 24.7% of the total net assets of the Portfolio.
|
| |||||||||||||||||||||
Quoted Portfolio Composition, Major Market Sectors and Top 10 Holdings are subject to change.
The lists of Major Market Sectors and Top 10 Holdings exclude short-term investments and collateral held for securities loaned.
The Portfolio Composition chart excludes collateral held for securities loaned.
13
Table of Contents
Thrivent Mid Cap Index Portfolio
Kevin R. Brimmer, FSA, Portfolio Manager
Thrivent Mid Cap Index Portfolio seeks total returns that track the performance of the S&P MidCap 400 Index.
The Portfolio primarily invests in mid-sized company stocks, which often have greater price volatility, lower trading volume, and less liquidity than stocks of larger, more established companies. The value of the Portfolio is influenced by factors impacting the overall market, certain asset classes, certain investment styles, and specific issuers.
| Portfolio Composition | Major Market Sectors | Top 10 Holdings | ||||||||||||||||||
| (% of Portfolio) | (% of Net Assets) | (% of Net Assets) | ||||||||||||||||||
Common Stock | 92.6% | Financials | 20.2% | SL Green Realty Corporation | 0.6% | |||||||||||||||
Short-Term Investments | 7.4% | Industrials | 15.7% | Equinix, Inc. | 0.6% | |||||||||||||||
|
| |||||||||||||||||||
Total | 100.0% | Information Technology | 15.1% | United Rentals, Inc. | 0.6% | |||||||||||||||
| Consumer Discretionary | 12.0% | Henry Schein, Inc. | 0.6% | |||||||||||||||||
| Health Care | 8.8% | Realty Income Corporation | 0.6% | |||||||||||||||||
| Materials | 7.0% | Advance Auto Parts, Inc. | 0.6% | |||||||||||||||||
| Energy | 4.8% | Endo International plc | 0.6% | |||||||||||||||||
| Utilities | 4.4% | Hanesbrands, Inc. | 0.6% | |||||||||||||||||
| Consumer Staples | 3.2% | Trimble Navigation, Ltd. | 0.5% | |||||||||||||||||
| Telecommunications Services | 0.5% | Church & Dwight Company, Inc. | 0.5% | |||||||||||||||||
These securities represent 5.8% of the total net assets of the Portfolio.
|
| |||||||||||||||||||
Thrivent Partner Worldwide Allocation Portfolio
Subadvised by Principal Global Investors, LLC, Mercator Asset Management, LP, DuPont Capital Management Corporation, Aberdeen Asset Managers Limited and Goldman Sachs Asset Management, L.P.
Thrivent Partner Worldwide Allocation Portfolio seeks long-term capital growth.
The Portfolio primarily invests in equity and debt securities of issuers throughout the world. Foreign investments involve additional risks, including currency fluctuations, liquidity, political, economic and market instability, and different legal and accounting standards; these risks are magnified for investments in emerging markets. The value of the Portfolio is influenced by factors impacting the overall market, certain asset classes, certain investment styles, and specific issuers. The Portfolio may incur losses due to incorrect assessments of investments by its investment advisers. Small and medium-sized companies often have greater price volatility and less liquidity than larger companies. Large cap companies may be unable to respond quickly to new competitive challenges and may not be able to attain a high growth rate. Bond prices generally fall as interest rates rise. Credit risk is the risk that an issuer of a debt security may not pay its debt, and high yield securities are subject to increased credit risk as well as liquidity risk. The investment styles employed by the Portfolio’s sub-advisers may not be complementary.
| Portfolio Composition | Major Market Sectors | Top 10 Countries | ||||||||||||||||||
| (% of Portfolio) | (% of Net Assets) | (% of Net Assets) | ||||||||||||||||||
Common Stock | 88.1% | Financials | 21.8% | Japan | 13.4% | |||||||||||||||
Long-Term Fixed Income | 9.1% | Industrials | 15.8% | United Kingdom | 9.6% | |||||||||||||||
Short-Term Investments | 2.0% | Consumer Discretionary | 13.4% | Switzerland | 7.5% | |||||||||||||||
Preferred Stock | 0.8% | Materials | 8.9% | France | 6.4% | |||||||||||||||
|
| |||||||||||||||||||
Total | 100.0% | Energy | 7.3% | Germany | 6.2% | |||||||||||||||
| Health Care | 6.5% | Italy | 3.6% | |||||||||||||||||
| Consumer Staples | 6.4% | South Korea | 3.6% | |||||||||||||||||
| Foreign Government | 6.2% | Canada | 3.5% | |||||||||||||||||
| Information Technology | 5.7% | Australia | 3.5% | |||||||||||||||||
| Utilities | 2.8% | Hong Kong | 3.2% | |||||||||||||||||
Investments in securities in these countries represent 60.5% of the total net assets of the Portfolio.
|
| |||||||||||||||||||
Quoted Portfolio Composition, Major Market Sectors, Top 10 Holdings and Top 10 Countries are subject to change.
The lists of Major Market Sectors, Top 10 Holdings and Top 10 Countries exclude short-term investments and collateral held for securities loaned. The Portfolio Composition chart excludes collateral held for securities loaned.
14
Table of Contents
Thrivent Partner All Cap Portfolio
Subadvised by Pyramis Global Advisors, LLC, an affiliate of Fidelity Investments
Thrivent Partner All Cap Portfolio seeks long-term growth of capital.
The Portfolio primarily invests in common stocks. The value of the Portfolio is influenced by factors impacting the overall market, certain asset classes, certain investment styles, and specific issuers. The Portfolio may incur losses due to incorrect assessments of investments by its investment advisers. Small and medium-sized companies often have greater price volatility and less liquidity than larger companies. Large cap companies may be unable to respond quickly to new competitive challenges and may not be able to attain a high growth rate.
| Portfolio Composition | Major Market Sectors | Top 10 Holdings | ||||||||||||||||||
| (% of Portfolio) | (% of Net Assets) | (% of Net Assets) | ||||||||||||||||||
Common Stock | 98.8% | Information Technology | 19.0% | Microsoft Corporation | 3.0% | |||||||||||||||
Short-Term Investments | 1.2% | Financials | 17.1% | Chevron Corporation | 2.5% | |||||||||||||||
Total | 100.0% | Consumer Discretionary | 12.6% | QUALCOMM, Inc. | 2.1% | |||||||||||||||
| Health Care | 11.8% | Apple, Inc. | 2.1% | |||||||||||||||||
| Industrials | 11.5% | Schlumberger, Ltd. | 1.9% | |||||||||||||||||
| Energy | 9.9% | FedEx Corporation | 1.8% | |||||||||||||||||
| Consumer Staples | 8.3% | Danaher Corporation | 1.8% | |||||||||||||||||
| Materials | 3.7% | Home Depot, Inc. | 1.7% | |||||||||||||||||
| Utilities | 3.0% | Oracle Corporation | 1.6% | |||||||||||||||||
| Telecommunications Services | 2.1% | Gilead Sciences, Inc. | 1.6% | |||||||||||||||||
These securities represent 20.1% of the total net assets of the Portfolio.
|
| |||||||||||||||||||
Thrivent Large Cap Growth Portfolio
David C. Francis, CFA, Portfolio Manager
Thrivent Large Cap Growth Portfolio seeks long-term growth of capital.
The Portfolio primarily invests in securities of large companies, which may be unable to respond quickly to new competitive challenges and may not be able to attain a high growth rate. The value of the Portfolio is influenced by factors impacting the overall market, certain asset classes, certain investment styles, and specific issuers. The Portfolio may incur losses due to incorrect assessments of investments by its investment adviser. Foreign investments involve additional risks, including currency fluctuations, liquidity, political, economic and market instability, and different legal and accounting standards.
| Portfolio Composition | Major Market Sectors | Top 10 Holdings | ||||||||||||||||||
(% of Portfolio) |
| (% of Net Assets) | (% of Net Assets) | |||||||||||||||||
Common Stock | 94.8% | Information Technology | 30.6% | Apple, Inc. | 8.3% | |||||||||||||||
Short-Term Investments | 5.2% | Consumer Discretionary | 19.3% | Gilead Sciences, Inc. | 5.7% | |||||||||||||||
Total | 100.0% | Health Care | 13.6% | Amazon.com, Inc. | 4.3% | |||||||||||||||
| Industrials | 10.6% | Google, Inc., Class A | 3.8% | |||||||||||||||||
| Energy | 9.5% | QUALCOMM, Inc. | 3.8% | |||||||||||||||||
| Financials | 8.1% | Visa, Inc. | 3.2% | |||||||||||||||||
| Materials | 1.9% | Facebook, Inc. | 3.2% | |||||||||||||||||
| Consumer Staples | 1.3% | Delta Air Lines, Inc. | 3.2% | |||||||||||||||||
| Weatherford International, Ltd. | 3.1% | |||||||||||||||||||
| Covidien plc | 3.0% | |||||||||||||||||||
These securities represent 41.6% of the total net assets of the Portfolio.
|
| |||||||||||||||||||
Quoted Portfolio Composition, Major Market Sectors and Top 10 Holdings are subject to change.
The lists of Major Market Sectors and Top 10 Holdings exclude short-term investments and collateral held for securities loaned.
The Portfolio Composition chart excludes collateral held for securities loaned.
15
Table of Contents
Thrivent Partner Growth Stock Portfolio
Subadvised by T. Rowe Price Associates, Inc.
Thrivent Partner Growth Stock Portfolio seeks long-term growth of capital and, secondarily, to increase dividend income.
The Portfolio primarily invests in common stocks. The value of the Portfolio is influenced by factors impacting the overall market, certain asset classes, certain investment styles, and specific issuers. The Portfolio may incur losses due to incorrect assessments of investments by its investment advisers. Foreign investments involve additional risks, including currency fluctuations, liquidity, political, economic and market instability, and different legal and accounting standards.
| Portfolio Composition | Major Market Sectors | Top 10 Holdings | ||||||||||||||||||
| (% of Portfolio) | (% of Net Assets) | (% of Net Assets) | ||||||||||||||||||
Common Stock | 99.2% | Consumer Discretionary | 28.8% | Amazon.com, Inc. | 4.4% | |||||||||||||||
| Short-Term Investments | 0.6% | Information Technology | 20.8% | Priceline Group, Inc. | 3.3% | |||||||||||||||
| Preferred Stock | 0.2% | Health Care | 15.3% | Google, Inc., Class A | 3.1% | |||||||||||||||
| Total | 100.0% | Industrials | 13.7% | Google, Inc. | 3.1% | |||||||||||||||
| Financials | 10.6% | Gilead Sciences, Inc. | 3.0% | |||||||||||||||||
| Energy | 3.7% | Visa, Inc. | 2.7% | |||||||||||||||||
| Consumer Staples | 3.3% | MasterCard, Inc. | 2.1% | |||||||||||||||||
| Materials | 2.1% | Precision Castparts | ||||||||||||||||||
| Telecommunications | Corporation | 2.1% | ||||||||||||||||||
| Services | 1.0% | Biogen Idec, Inc. | 2.1% | |||||||||||||||||
| McKesson Corporation | 2.1% | |||||||||||||||||||
These securities represent 28.0% of the total net assets of the Portfolio.
|
| |||||||||||||||||||
Thrivent Large Cap Value Portfolio
Kurt J. Lauber, CFA, Portfolio Manager
Thrivent Large Cap Value Portfolio seeks long-term growth of capital.
The Portfolio primarily invests in securities of large companies, which may be unable to respond quickly to new competitive challenges and may not be able to attain a high growth rate. The value of the Portfolio is influenced by factors impacting the overall market, certain asset classes, certain investment styles, and specific issuers. The Portfolio may incur losses due to incorrect assessments of investments by its investment adviser. Foreign investments involve additional risks, including currency fluctuations, liquidity, political, economic and market instability, and different legal and accounting standards.
| Portfolio Composition | Major Market Sectors | Top 10 Holdings | ||||||||||||||||||
| (% of Portfolio) | (% of Net Assets) | (% of Net Assets) | ||||||||||||||||||
Common Stock | 99.0% | Financials | 22.3% | Cisco Systems, Inc. | 3.9% | |||||||||||||||
Short-Term Investments | 1.0% | Energy | 14.6% | Merck & Company, Inc. | 3.7% | |||||||||||||||
Total | 100.0% | Health Care | 13.7% | Citigroup, Inc. | 3.4% | |||||||||||||||
| Information Technology | 13.3% | MetLife, Inc. | 3.3% | |||||||||||||||||
| Consumer Discretionary | 9.6% | Total SA ADR | 3.1% | |||||||||||||||||
| Industrials | 9.0% | Bank of America Corporation | 2.7% | |||||||||||||||||
| Consumer Staples | 7.2% | Lowe’s Companies, Inc. | 2.7% | |||||||||||||||||
| Utilities | 4.0% | CVS Caremark Corporation | 2.7% | |||||||||||||||||
| Materials | 3.1% | PG&E Corporation | 2.5% | |||||||||||||||||
| Telecommunications | Schlumberger, Ltd. | 2.2% | ||||||||||||||||||
| Services | 1.9% | |||||||||||||||||||
These securities represent 30.2% of the total net assets of the Portfolio.
|
| |||||||||||||||||||
Quoted Portfolio Composition, Major Market Sectors and Top 10 Holdings are subject to change.
The lists of Major Market Sectors and Top 10 Holdings exclude short-term investments and collateral held for securities loaned.
The Portfolio Composition chart excludes collateral held for securities loaned.
16
Table of Contents
Thrivent Large Cap Stock Portfolio
David C. Francis, CFA and Kurt J. Lauber, CFA, Portfolio Co-Managers
Thrivent Large Cap Stock Portfolio seeks long-term capital growth.
The Portfolio primarily invests in securities of large companies, which may be unable to respond quickly to new competitive challenges and may not be able to attain a high growth rate. The value of the Portfolio is influenced by factors impacting the overall market, certain asset classes, certain investment styles, and specific issuers. The Portfolio may incur losses due to incorrect assessments of investments by its investment adviser. Foreign investments involve additional risks, including currency fluctuations, liquidity, political, economic and market instability, and different legal and accounting standards.
| Portfolio Composition | Major Market Sectors | Top 10 Holdings | ||||||||||||||||||
| (% of Portfolio) | (% of Net Assets) | (% of Net Assets) | ||||||||||||||||||
| Common Stock | 93.8% | Information Technology | 17.5% | Apple, Inc. | 4.3% | |||||||||||||||
| Short-Term Investments | 6.2% | Financials | 15.3% | Weatherford International, Ltd. | 3.0% | |||||||||||||||
| Preferred Stock | < 0.1% | Health Care | 12.4% | Merck & Company, Inc. | 2.8% | |||||||||||||||
| Total | 100.0% | Consumer Discretionary | 12.1% | Johnson & Johnson | 2.5% | |||||||||||||||
| Energy | 10.8% | J.P. Morgan Chase | ||||||||||||||||||
| Industrials | 9.9% | & Company | 2.5% | |||||||||||||||||
Consumer Staples | 8.3% | Kimberly-Clark Corporation | 2.2% | |||||||||||||||||
Utilities | 3.3% | Union Pacific Corporation | 2.2% | |||||||||||||||||
Materials | 2.9% | Boeing Company | 1.9% | |||||||||||||||||
Telecommunications | Marathon Oil Corporation | 1.9% | ||||||||||||||||||
| Services | 1.0% | Philip Morris International, Inc. | 1.8% | |||||||||||||||||
These securities represent 25.1% of the total net assets of the Portfolio.
|
| |||||||||||||||||||
Thrivent Large Cap Index Portfolio
Kevin R. Brimmer, FSA, Portfolio Manager
Thrivent Large Cap Index Portfolio seeks total returns that track the performance of the S&P 500 Index.
The Portfolio primarily invests in large company common stocks. Large companies may be unable to respond quickly to new competitive challenges and may not be able to attain a high growth rate. The value of the Portfolio is influenced by factors impacting the overall market, certain asset classes, certain investment styles, and specific issuers.
| Portfolio Composition | Major Market Sectors | Top 10 Holdings | ||||||||||||||||||
| (% of Portfolio) | (% of Net Assets) | (% of Net Assets) | ||||||||||||||||||
Common Stock | 98.3% | Information Technology | 18.0% | Apple, Inc. | 3.1% | |||||||||||||||
Short-Term Investments | 1.7% | Financials | 16.4% | Exxon Mobil Corporation | 2.4% | |||||||||||||||
Total | 100.0% | Health Care | 13.0% | Microsoft Corporation | 1.8% | |||||||||||||||
| Consumer Discretionary | 11.7% | Johnson & Johnson | 1.7% | |||||||||||||||||
| Energy | 10.6% | General Electric Company | 1.5% | |||||||||||||||||
| Industrials | 10.3% | Wells Fargo & Company | 1.4% | |||||||||||||||||
| Consumer Staples | 9.4% | Chevron Corporation | 1.4% | |||||||||||||||||
| Materials | 3.3% | Berkshire Hathaway, Inc. | 1.3% | |||||||||||||||||
| Utilities | 3.2% | J.P. Morgan Chase | ||||||||||||||||||
Telecommunications | & Company | 1.2% | ||||||||||||||||||
| Services | 2.4% | Procter & Gamble Company | 1.2% | |||||||||||||||||
These securities represent 17.0% of the total net assets of the Portfolio.
|
| |||||||||||||||||||
Quoted Portfolio Composition, Major Market Sectors and Top 10 Holdings are subject to change.
The lists of Major Market Sectors and Top 10 Holdings exclude short-term investments and collateral held for securities loaned.
The Portfolio Composition chart excludes collateral held for securities loaned.
17
Table of Contents
Paul J. Ocenasek, CFA, Portfolio Manager
Thrivent High Yield Portfolio seeks to achieve a higher level of income. The Portfolio will also consider growth of capital as a secondary objective.
The Portfolio primarily invests in high-yield, high-risk bonds, notes, debentures and other debt obligations, or preferred stocks. Credit risk is the risk that an issuer of a debt security may not pay its debt, and high yield securities are subject to increased credit risk as well as liquidity risk. Bond prices generally fall as interest rates rise. Leveraged loans are subject to numerous risks, including liquidity, credit, declines in the value of collateral underlying them, and detrimental legal actions against them. The value of the Portfolio is influenced by factors impacting the overall market, certain asset classes, certain investment styles, and specific issuers. The Portfolio may incur losses due to incorrect assessments of investments by its investment adviser. Foreign investments involve additional risks, including currency fluctuations, liquidity, political, economic and market instability, and different legal and accounting standards.
| Major Market Sectors (% of Net Assets)
|
| Top 10 Holdings (% of Net Assets)
|
| ||||||||||||
| Communications Services | 19.6% | Whiting Petroleum Corporation | 1.1% | |||||||||||||
| Consumer Cyclical | 13.7% | Sprint Communications, Inc. | 1.0% | |||||||||||||
| Energy | 13.3% | Icahn Enterprises, LP | 0.9% | |||||||||||||
| Consumer Non-Cyclical | 10.2% | Intelsat Jackson Holdings SA | 0.8% | |||||||||||||
| Financials | 9.2% | Clear Channel Communications, | ||||||||||||||
| Capital Goods | 7.8% | Inc., Term Loan | 0.8% | |||||||||||||
| Basic Materials | 7.8% | Choice Hotels International, Inc. | 0.8% | |||||||||||||
| Technology | 5.4% | Denali Borrower, LLC | 0.7% | |||||||||||||
| Transportation | 4.9% | Ally Financial, Inc. | 0.7% | |||||||||||||
| Utilities | 4.1% | Hexion US Finance Corporation/ | ||||||||||||||
Hexion Nova Scotia Finance ULC | 0.7% | |||||||||||||||
| Eldorado Resorts, LLC | 0.7% | |||||||||||||||
These securities represent 8.2% of the total net assets of the Portfolio.
|
| |||||||||||||||
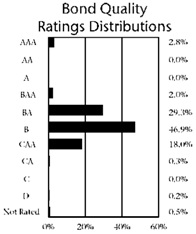
Stephen D. Lowe, CFA, Portfolio Manager
Thrivent Income Portfolio seeks a high level of income over the longer term while providing reasonable safety of capital.
The Portfolio primarily invests in investment-grade corporate bonds, government bonds, asset-backed securities and mortgage-backed securities. The value of the Portfolio is influenced by factors impacting the overall market, certain asset classes, certain investment styles, and specific issuers. The Portfolio may incur losses due to incorrect assessments of investments by its investment adviser. Bond prices generally fall as interest rates rise. Credit risk is the risk that an issuer of a debt security may not pay its debt, and high yield securities are subject to increased credit risk as well as liquidity risk. The value of mortgage-related and other asset-backed securities will be influenced by the factors affecting the housing market and the assets underlying such securities. Foreign investments involve additional risks, including currency fluctuations, liquidity, political, economic and market instability, and different legal and accounting standards. The prices of futures contracts can be highly volatile and the loss from investing in them can exceed the initial investment.
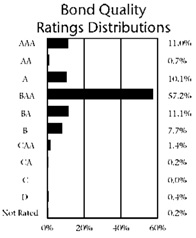 | Major Market Sectors (% of Net Assets)
|
| Top 10 Holdings (% of Net Assets)
|
| ||||||||||||
Financials | 30.1% | Federal National Mortgage | ||||||||||||||
Communications Services | 12.0% | Association Conventional | ||||||||||||||
Energy | 9.8% | 30-Yr. Pass Through | 0.9% | |||||||||||||
Consumer Non-Cyclical | 8.3% | Federal National Mortgage | ||||||||||||||
Consumer Cyclical | 6.1% | Association Conventional | ||||||||||||||
Utilities | 5.9% | 30-Yr. Pass Through | 0.9% | |||||||||||||
Basic Materials | 5.4% | U.S. Treasury Notes | 0.7% | |||||||||||||
U.S. Government and Agencies | 4.1% | U.S. Treasury Notes | 0.5% | |||||||||||||
Transportation | 3.5% | DIRECTV Holdings, LLC | 0.4% | |||||||||||||
Mortgage-Backed Securities | 3.0% | U.S. Treasury Notes | 0.4% | |||||||||||||
| Federal National Mortgage | ||||||||||||||||
| Association Conventional | ||||||||||||||||
| 15-yr. Pass Through | 0.4% | |||||||||||||||
| Pernod Ricard SA | 0.4% | |||||||||||||||
| Federal National Mortgage | ||||||||||||||||
| Association Conventional | ||||||||||||||||
| 30-Yr. Pass Through | 0.4% | |||||||||||||||
| U.S. Treasury Notes | 0.4% | |||||||||||||||
These securities represent 5.4% of the total net assets of the Portfolio.
|
| |||||||||||||||
Quoted Bond Quality Ratings Distributions, Major Market Sectors and Top 10 Holdings are subject to change.
The lists of Major Market Sectors and Top 10 Holdings exclude short-term investments and collateral held for securities loaned.
Bond Quality Ratings Distributions exclude collateral held for securities loaned.
Bond quality ratings are obtained from Moody’s Investors Service, Inc. (“Moody’s”) and Standard & Poor’s Ratings Services (“S&P”). Ratings from S&P, when used, are converted into their equivalent Moody’s ratings. If Moody’s and S&P have assigned different ratings to a security, the lowest rating for the security is used. If a fixed income security is not rated by Moody’s or S&P the Portfolio’s investment adviser has assigned a rating based on its credit evaluation.
18
Table of Contents
Michael G. Landreville, CFA and CPA (inactive), Portfolio Manager
Thrivent Bond Index Portfolio strives for investment results similar to the total return of the Barclays U.S. Aggregate Bond Index.
The Portfolio primarily invests in investment-grade bonds and other debt securities. The value of the Portfolio is influenced by factors impacting the overall market, the debt market in particular, and specific issuers. The Portfolio may incur losses due to incorrect assessments of investments by its investment adviser. Bond prices generally fall as interest rates rise. Credit risk is the risk that an issuer of a debt security may not pay its debt. The value of mortgage-related and other asset-backed securities will be influenced by the factors affecting the housing market and the assets underlying such securities.
| Major Market Sectors | Top 10 Holdings | ||||||||||||||
(% of Net Assets)
|
| (% of Net Assets)
|
| |||||||||||||
| U.S. Government and Agencies | 36.9% | Federal National Mortgage | ||||||||||||||
| Mortgage-Backed Securities | 30.4% | Association Conventional | ||||||||||||||
| Financials | 9.9% | 30-Yr. Pass Through | 7.9% | |||||||||||||
| Foreign Government | 4.3% | Federal National Mortgage | ||||||||||||||
| Utilities | 3.6% | Association Conventional | ||||||||||||||
| Consumer Cyclical | 2.6% | 30-Yr. Pass Through | 7.6% | |||||||||||||
| Consumer Non-Cyclical | 2.4% | Federal National Mortgage | ||||||||||||||
| Asset-Backed Securities | 2.3% | Association Conventional | ||||||||||||||
| Commercial Mortgage-Backed | 30-Yr. Pass Through | 7.2% | ||||||||||||||
| Securities | 2.0% | U.S. Treasury Notes | 5.6% | |||||||||||||
| Communications Services | 1.7% | Federal National Mortgage | ||||||||||||||
| Association Conventional | ||||||||||||||||
| 15-yr. Pass Through | 4.4% | |||||||||||||||
| U.S. Treasury Notes | 3.4% | |||||||||||||||
| U.S. Treasury Bonds | 2.8% | |||||||||||||||
| U.S. Treasury Notes | 2.7% | |||||||||||||||
| U.S. Treasury Notes | 2.4% | |||||||||||||||
| U.S. Treasury Notes | 2.3% | |||||||||||||||
These securities represent 46.3% of the total net assets of the Portfolio.
|
| |||||||||||||||
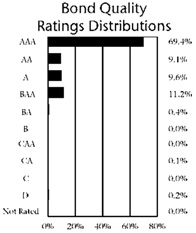
Thrivent Limited Maturity Bond Portfolio
Michael G. Landreville, CFA and CPA (inactive) and Gregory R. Anderson, CFA, Portfolio Co-Managers
Thrivent Limited Maturity Bond Portfolio seeks a high level of current income consistent with stability of principal.
The Portfolio primarily invests in investment-grade debt securities. The value of the Portfolio is influenced by factors impacting the overall market, debt securities in particular, and specific issuers. The Portfolio may incur losses due to incorrect assessments of investments by its investment adviser. Bond prices generally fall as interest rates rise. Credit risk is the risk that an issuer of a debt security may not pay its debt. The value of mortgage-related and other asset-backed securities will be influenced by the factors affecting the housing market and the assets underlying such securities. Foreign investments involve additional risks, including currency fluctuations, liquidity, political, economic and market instability, and different legal and accounting standards. The prices of futures contracts can be highly volatile and the loss from investing in them can exceed the initial investment.
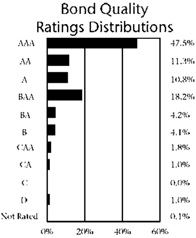 | Major Market Sectors | Top 10 Holdings | ||||||||||||||
(% of Net Assets)
|
| (% of Net Assets)
|
| |||||||||||||
| Financials | 23.7% | U.S. Treasury Notes | 3.3% | |||||||||||||
| Asset-Backed Securities | 18.3% | U.S. Treasury Notes | 1.9% | |||||||||||||
| U.S. Government and Agencies | 11.9% | Federal National Mortgage | ||||||||||||||
| Mortgage-Backed Securities | 6.4% | Association Conventional | ||||||||||||||
| Commercial Mortgage-Backed | 15-yr. Pass Through | 1.8% | ||||||||||||||
| Securities | 6.3% | U.S. Treasury Bonds, TIPS | 1.6% | |||||||||||||
| Foreign Government | 5.7% | Federal Home Loan Mortgage | ||||||||||||||
| Collateralized Mortgage | Corporation Gold 30-Yr. | |||||||||||||||
| Obligations | 4.7% | Pass Through | 1.0% | |||||||||||||
| Communications Services | 4.3% | Master Credit Card Trust | 0.9% | |||||||||||||
| Consumer Non-Cyclical | 3.9% | Nissan Master Owner Trust | ||||||||||||||
| Energy | 2.5% | Receivables | 0.8% | |||||||||||||
| Federal National Mortgage | ||||||||||||||||
| Association Conventional | ||||||||||||||||
30-Yr. Pass Through | 0.8% | |||||||||||||||
| U.S. Treasury Notes, TIPS | 0.8% | |||||||||||||||
| Canada Government International | ||||||||||||||||
| Bond | 0.8% | |||||||||||||||
These securities represent 13.7% of the total net assets of the Portfolio.
|
| |||||||||||||||
Quoted Bond Quality Ratings Distributions, Major Market Sectors and Top 10 Holdings are subject to change.
The lists of Major Market Sectors and Top 10 Holdings exclude short-term investments and collateral held for securities loaned.
Bond Quality Ratings Distributions exclude collateral held for securities loaned.
Bond quality ratings are obtained from Moody’s Investors Service, Inc. (“Moody’s”) and Standard & Poor’s Ratings Services (“S&P”). Ratings from S&P, when used, are converted into their equivalent Moody’s ratings. If Moody’s and S&P have assigned different ratings to a security, the lowest rating for the security is used. If a fixed income security is not rated by Moody’s or S&P the Portfolio’s investment adviser has assigned a rating based on its credit evaluation.
19
Table of Contents
Thrivent Money Market Portfolio
William D. Stouten, Portfolio Manager
Thrivent Money Market Portfolio seeks to achieve the maximum current income that is consistent with stability of capital and maintenance of liquidity.
The Portfolio invests in high quality, short-term money market instruments. Although the Portfolio seeks to preserve the value of your investment at $1.00 per share, it is possible to lose money by investing in the Portfolio. Credit risk is the risk that an issuer of a debt security may not pay its debt. Low or declining short-term interest rates can negatively impact the Portfolio. The financial services industry is particularly vulnerable to certain factors, such as the availability and cost of borrowing and raising additional capital, changes in interest rates, the rate of corporate and consumer debt defaults, and price competition. The Portfolio could experience a loss when selling portfolio securities to meet redemption requests.
Portfolio Composition (% of Portfolio) |
| |||||
Government Agency Debt | 21.9 | % | ||||
Asset Backed Commercial Paper | 17.9 | % | ||||
Other Commercial Paper | 16.8 | % | ||||
Financial Company Commercial Paper | 15.2 | % | ||||
Certificate of Deposit | 10.4 | % | ||||
Other Note | 8.8 | % | ||||
Investment Company | 7.5 | % | ||||
Variable Rate Demand Note | 1.5 | % | ||||
Total | 100.0 | % | ||||
An investment in the Thrivent Money Market Portfolio is not insured or guaranteed by the Federal Deposit
Insurance Corporation (FDIC) or any other government agency.
Although the Portfolio seeks to preserve the value of your investment at $1.00 per share,
it is possible to lose money by investing in the Portfolio.
Quoted Portfolio Composition is subject to change.
20
Table of Contents
(unaudited)
As a shareholder of the Thrivent Series Fund, Inc., you incur ongoing costs, including management fees and other Portfolio expenses. This Shareholder Expense Example is intended to help you understand your ongoing costs (in dollars) of investing in a Portfolio and to compare these costs with the ongoing costs of investing in other mutual funds. The Example is based on an investment of $1,000 invested at the beginning of the period and held for the entire period from January 1, 2014 through June 30, 2014. Shares in a Portfolio are currently sold, without sales charges, only to separate accounts of Thrivent Financial for Lutherans and Thrivent Life Insurance Company, which are used to fund benefits of variable life insurance and variable annuity contracts issued by Thrivent Financial for Lutherans and Thrivent Life Insurance Company, and retirement plans sponsored by Thrivent Financial for Lutherans. Expenses associated with these variable contracts and retirement plans are not included in these examples and had these costs been included, your costs would have been higher.
Actual Expenses
In the table below, the first section, labeled “Actual,” provides information about actual account values and actual expenses. You may use the information in this line, together with the amount you invested, to estimate the expenses that you paid over the period. Simply divide your account value by $1,000 (for example, an $8,600 account value divided by $1,000 = 8.6), then multiply the result by the number in the first line under the heading entitled “Expenses Paid During Period” to estimate the expenses you paid.
Hypothetical Example for Comparison Purposes
In the table below, the second section, labeled “Hypothetical,” provides information about hypothetical account values and hypothetical expenses based on the Portfolio’s actual expense ratio and an assumed rate of return of 5% per year before expenses, which is not the Portfolio’s actual return. The hypothetical account values and expenses may not be used to estimate the actual ending account balance or expenses you paid for the period. You may use this information to compare the ongoing costs of investing in the Portfolio and other funds. To do so, compare this 5% hypothetical example with the 5% hypothetical examples that appear in the shareholder reports of the other funds.
| Beginning Account Value 01/01/2014 | Ending Account Value 06/30/2014 | Expenses Paid During Period 01/01/2014 - 06/30/2014* | Annualized Expense Ratio | |||||||||||||
Thrivent Aggressive Allocation Portfolio | ||||||||||||||||
Actual | $ | 1,000 | $ | 1,054 | $ | 2.42 | 0.47 | % | ||||||||
Hypothetical** | $ | 1,000 | $ | 1,022 | $ | 2.38 | 0.47 | % | ||||||||
Thrivent Moderately Aggressive Allocation Portfolio | ||||||||||||||||
Actual | $ | 1,000 | $ | 1,056 | $ | 2.25 | 0.44 | % | ||||||||
Hypothetical** | $ | 1,000 | $ | 1,023 | $ | 2.22 | 0.44 | % | ||||||||
Thrivent Moderate Allocation Portfolio | ||||||||||||||||
Actual | $ | 1,000 | $ | 1,051 | $ | 2.19 | 0.43 | % | ||||||||
Hypothetical** | $ | 1,000 | $ | 1,023 | $ | 2.16 | 0.43 | % | ||||||||
Thrivent Moderately Conservative Allocation Portfolio | ||||||||||||||||
Actual | $ | 1,000 | $ | 1,047 | $ | 2.20 | 0.43 | % | ||||||||
Hypothetical** | $ | 1,000 | $ | 1,023 | $ | 2.17 | 0.43 | % | ||||||||
Thrivent Growth and Income Plus Portfolio | ||||||||||||||||
Actual | $ | 1,000 | $ | 1,033 | $ | 4.03 | 0.80 | % | ||||||||
Hypothetical** | $ | 1,000 | $ | 1,021 | $ | 4.01 | 0.80 | % | ||||||||
Thrivent Balanced Income Plus Portfolio | ||||||||||||||||
Actual | $ | 1,000 | $ | 1,049 | $ | 3.25 | 0.64 | % | ||||||||
Hypothetical** | $ | 1,000 | $ | 1,022 | $ | 3.20 | 0.64 | % | ||||||||
Thrivent Diversified Income Plus Portfolio | ||||||||||||||||
Actual | $ | 1,000 | $ | 1,045 | $ | 2.46 | 0.48 | % | ||||||||
Hypothetical** | $ | 1,000 | $ | 1,022 | $ | 2.43 | 0.48 | % | ||||||||
21
Table of Contents
| Beginning Account Value 01/01/2014 | Ending Account Value 06/30/2014 | Expenses Paid During Period 01/01/2014 - 06/30/2014* | Annualized Expense Ratio | |||||||||||||
Thrivent Opportunity Income Plus Portfolio |
| |||||||||||||||
Actual | $ | 1,000 | $ | 1,037 | $ | 3.92 | 0.78 | % | ||||||||
Hypothetical** | $ | 1,000 | $ | 1,021 | $ | 3.88 | 0.78 | % | ||||||||
Thrivent Partner Technology Portfolio |
| |||||||||||||||
Actual | $ | 1,000 | $ | 1,041 | $ | 5.23 | 1.03 | % | ||||||||
Hypothetical** | $ | 1,000 | $ | 1,020 | $ | 5.18 | 1.03 | % | ||||||||
Thrivent Partner Healthcare Portfolio |
| |||||||||||||||
Actual | $ | 1,000 | $ | 1,165 | $ | 6.28 | 1.17 | % | ||||||||
Hypothetical** | $ | 1,000 | $ | 1,019 | $ | 5.85 | 1.17 | % | ||||||||
Thrivent Natural Resources Portfolio |
| |||||||||||||||
Actual | $ | 1,000 | $ | 1,132 | $ | 5.39 | 1.02 | % | ||||||||
Hypothetical** | $ | 1,000 | $ | 1,020 | $ | 5.11 | 1.02 | % | ||||||||
Thrivent Partner Emerging Markets Equity Portfolio |
| |||||||||||||||
Actual | $ | 1,000 | $ | 1,071 | $ | 7.19 | 1.40 | % | ||||||||
Hypothetical** | $ | 1,000 | $ | 1,018 | $ | 7.00 | 1.40 | % | ||||||||
Thrivent Real Estate Securities Portfolio |
| |||||||||||||||
Actual | $ | 1,000 | $ | 1,176 | $ | 4.98 | 0.92 | % | ||||||||
Hypothetical** | $ | 1,000 | $ | 1,020 | $ | 4.62 | 0.92 | % | ||||||||
Thrivent Partner Small Cap Growth Portfolio |
| |||||||||||||||
Actual | $ | 1,000 | $ | 991 | $ | 4.79 | 0.97 | % | ||||||||
Hypothetical** | $ | 1,000 | $ | 1,020 | $ | 4.86 | 0.97 | % | ||||||||
Thrivent Partner Small Cap Value Portfolio |
| |||||||||||||||
Actual | $ | 1,000 | $ | 1,024 | $ | 4.32 | 0.86 | % | ||||||||
Hypothetical** | $ | 1,000 | $ | 1,021 | $ | 4.31 | 0.86 | % | ||||||||
Thrivent Small Cap Stock Portfolio |
| |||||||||||||||
Actual | $ | 1,000 | $ | 1,026 | $ | 3.73 | 0.74 | % | ||||||||
Hypothetical** | $ | 1,000 | $ | 1,021 | $ | 3.72 | 0.74 | % | ||||||||
Thrivent Small Cap Index Portfolio |
| |||||||||||||||
Actual | $ | 1,000 | $ | 1,030 | $ | 2.16 | 0.43 | % | ||||||||
Hypothetical** | $ | 1,000 | $ | 1,023 | $ | 2.15 | 0.43 | % | ||||||||
Thrivent Mid Cap Growth Portfolio |
| |||||||||||||||
Actual | $ | 1,000 | $ | 1,018 | $ | 2.29 | 0.46 | % | ||||||||
Hypothetical** | $ | 1,000 | $ | 1,023 | $ | 2.30 | 0.46 | % | ||||||||
Thrivent Partner Mid Cap Value Portfolio |
| |||||||||||||||
Actual | $ | 1,000 | $ | 1,087 | $ | 4.11 | 0.79 | % | ||||||||
Hypothetical** | $ | 1,000 | $ | 1,021 | $ | 3.98 | 0.79 | % | ||||||||
Thrivent Mid Cap Stock Portfolio |
| |||||||||||||||
Actual | $ | 1,000 | $ | 1,099 | $ | 3.69 | 0.71 | % | ||||||||
Hypothetical** | $ | 1,000 | $ | 1,021 | $ | 3.55 | 0.71 | % | ||||||||
Thrivent Mid Cap Index Portfolio |
| |||||||||||||||
Actual | $ | 1,000 | $ | 1,072 | $ | 2.45 | 0.48 | % | ||||||||
Hypothetical** | $ | 1,000 | $ | 1,022 | $ | 2.39 | 0.48 | % | ||||||||
Thrivent Partner Worldwide Allocation Portfolio |
| |||||||||||||||
Actual | $ | 1,000 | $ | 1,042 | $ | 4.61 | 0.91 | % | ||||||||
Hypothetical** | $ | 1,000 | $ | 1,020 | $ | 4.56 | 0.91 | % | ||||||||
Thrivent Partner All Cap Portfolio |
| |||||||||||||||
Actual | $ | 1,000 | $ | 1,054 | $ | 4.84 | 0.95 | % | ||||||||
Hypothetical** | $ | 1,000 | $ | 1,020 | $ | 4.76 | 0.95 | % | ||||||||
22
Table of Contents
| Beginning Account Value 01/01/2014 | Ending Account Value 06/30/2014 | Expenses Paid During Period 01/01/2014 - 06/30/2014* | Annualized Expense Ratio | |||||||||||||
Thrivent Large Cap Growth Portfolio |
| |||||||||||||||
Actual | $ | 1,000 | $ | 1,064 | $ | 2.25 | 0.44 | % | ||||||||
Hypothetical** | $ | 1,000 | $ | 1,023 | $ | 2.20 | 0.44 | % | ||||||||
Thrivent Partner Growth Stock Portfolio |
| |||||||||||||||
Actual | $ | 1,000 | $ | 1,025 | $ | 4.61 | 0.92 | % | ||||||||
Hypothetical** | $ | 1,000 | $ | 1,020 | $ | 4.59 | 0.92 | % | ||||||||
Thrivent Large Cap Value Portfolio |
| |||||||||||||||
Actual | $ | 1,000 | $ | 1,060 | $ | 3.25 | 0.64 | % | ||||||||
Hypothetical** | $ | 1,000 | $ | 1,022 | $ | 3.19 | 0.64 | % | ||||||||
Thrivent Large Cap Stock Portfolio |
| |||||||||||||||
Actual | $ | 1,000 | $ | 1,066 | $ | 3.39 | 0.66 | % | ||||||||
Hypothetical** | $ | 1,000 | $ | 1,022 | $ | 3.31 | 0.66 | % | ||||||||
Thrivent Large Cap Index Portfolio |
| |||||||||||||||
Actual | $ | 1,000 | $ | 1,069 | $ | 2.02 | 0.39 | % | ||||||||
Hypothetical** | $ | 1,000 | $ | 1,023 | $ | 1.98 | 0.39 | % | ||||||||
Thrivent High Yield Portfolio |
| |||||||||||||||
Actual | $ | 1,000 | $ | 1,050 | $ | 2.25 | 0.44 | % | ||||||||
Hypothetical** | $ | 1,000 | $ | 1,023 | $ | 2.22 | 0.44 | % | ||||||||
Thrivent Income Portfolio |
| |||||||||||||||
Actual | $ | 1,000 | $ | 1,058 | $ | 2.23 | 0.44 | % | ||||||||
Hypothetical** | $ | 1,000 | $ | 1,023 | $ | 2.19 | 0.44 | % | ||||||||
Thrivent Bond Index Portfolio |
| |||||||||||||||
Actual | $ | 1,000 | $ | 1,041 | $ | 2.39 | 0.47 | % | ||||||||
Hypothetical** | $ | 1,000 | $ | 1,022 | $ | 2.37 | 0.47 | % | ||||||||
Thrivent Limited Maturity Bond Portfolio |
| |||||||||||||||
Actual | $ | 1,000 | $ | 1,015 | $ | 2.20 | 0.44 | % | ||||||||
Hypothetical** | $ | 1,000 | $ | 1,023 | $ | 2.21 | 0.44 | % | ||||||||
Thrivent Money Market Portfolio |
| |||||||||||||||
Actual | $ | 1,000 | $ | 1,000 | $ | 0.94 | 0.19 | % | ||||||||
Hypothetical** | $ | 1,000 | $ | 1,024 | $ | 0.95 | 0.19 | % | ||||||||
| * | Expenses are equal to the Portfolio’s annualized expense ratio, multiplied by the average account value over the period, multiplied by 181/365 to reflect the one-half year period. |
| ** | Assuming 5% annualized total return before expenses. |
23
Table of Contents
Aggressive Allocation Portfolio
Schedule of Investments as of June 30, 2014
(unaudited)
Shares | Mutual Funds (49.6%) | Value | ||||||
| Equity Mutual Funds (45.8%) | |||||||
| 4,044,547 | Thrivent Partner Small Cap Growth Portfolio | $ | 68,135,254 | |||||
| 708,951 | Thrivent Partner Small Cap Value Portfolio | 19,947,332 | ||||||
| 1,737,044 | Thrivent Small Cap Stock Portfolio | 31,263,836 | ||||||
| 1,693,599 | Thrivent Partner Mid Cap Value Portfolio | 29,402,226 | ||||||
| 2,633,658 | Thrivent Mid Cap Stock Portfolio | 48,756,121 | ||||||
| 11,481,744 | Thrivent Partner Worldwide Allocation Portfolio | 117,617,834 | ||||||
| 2,807,135 | Thrivent Large Cap Value Portfolio | 45,802,907 | ||||||
| 3,155,081 | Thrivent Large Cap Stock Portfolio | 39,382,039 | ||||||
|
| |||||||
| Total | 400,307,549 | |||||||
|
| |||||||
| Fixed Income Mutual Funds (3.8%) | |||||||
| 1,559,508 | Thrivent High Yield Portfolio | 8,060,627 | ||||||
| 710,437 | Thrivent Opportunity Income Plus Portfolio | 7,356,289 | ||||||
| 650,183 | Thrivent Income Portfolio | 6,897,468 | ||||||
| 1,097,030 | Thrivent Limited Maturity Bond Portfolio | 10,843,378 | ||||||
|
| |||||||
| Total | 33,157,762 | |||||||
|
| |||||||
| Total Mutual Funds (cost $376,928,029) | 433,465,311 | |||||||
|
| |||||||
Common Stock (40.4%) | ||||||||
| Consumer Discretionary (6.0%) | |||||||
| 2,350 | Aaron’s, Inc. | 83,754 | ||||||
| 3,100 | Abercrombie & Fitch Company | 134,075 | ||||||
| 12,356 | Amazon.com, Inc.a,b | 4,012,982 | ||||||
| 6,250 | AutoZone, Inc.a | 3,351,500 | ||||||
| 6,800 | Barnes & Noble, Inc.a | 154,972 | ||||||
| 18,600 | Best Buy Company, Inc. | 576,786 | ||||||
| 2,750 | Big Lots, Inc.a | 125,675 | ||||||
| 6,700 | Bloomin’ Brands, Inc.a | 150,281 | ||||||
| 9,260 | BorgWarner, Inc. | 603,659 | ||||||
| 1,150 | Brinker International, Inc. | 55,947 | ||||||
| 18,700 | Cablevision Systems Corporation | 330,055 | ||||||
| 5,230 | CBS Corporation | 324,992 | ||||||
| 31,840 | Cheesecake Factory, Inc. | 1,478,013 | ||||||
| 2,550 | Children’s Place Retail Stores, Inc. | 126,556 | ||||||
| 1,550 | Coinstar, Inc.a | 91,993 | ||||||
| 96,398 | Comcast Corporationb | 5,174,645 | ||||||
| 2,200 | Deckers Outdoor Corporationa | 189,926 | ||||||
| 21,229 | Delphi Automotive plc | 1,459,281 | ||||||
| 1,900 | DeVry Education Group, Inc. | 80,446 | ||||||
| 3,659 | Discovery Communications, Inc.a | 271,791 | ||||||
| 8,450 | DISH Network Corporationa | 549,926 | ||||||
| 16,128 | Dollar Tree, Inc.a | 878,331 | ||||||
| 6,530 | Dunkin’ Brands Group, Inc. | 299,139 | ||||||
| 23,750 | Ford Motor Company | 409,450 | ||||||
| 3,350 | G-III Apparel Group, Ltd.a | 273,561 | ||||||
| 11,130 | GNC Holdings, Inc. | 379,533 | ||||||
| 1,850 | Harman International Industries, Inc. | 198,745 | ||||||
| 32,450 | Home Depot, Inc.b | 2,627,152 | ||||||
| 7,480 | HomeAway, Inc.a | 260,454 | ||||||
| 45,060 | Houghton Mifflin Harcourt Companya | 863,350 | ||||||
| 2,900 | Iconix Brand Group, Inc.a | 124,526 | ||||||
| 40,609 | Ignite Restaurant Group, Inc.a | 591,267 | ||||||
| 3,450 | ITT Educational Services, Inc.a | 57,580 | ||||||
| 1,200 | Jack in the Box, Inc. | 71,808 | ||||||
| 3,600 | Kohl’s Corporation | 189,648 | ||||||
| 5,150 | Lamar Advertising Company | 272,950 | ||||||
| 46,060 | Las Vegas Sands Corporation | 3,510,693 | ||||||
| 6,800 | Liberty Interactive Corporationa | 199,648 | ||||||
| 5,079 | Limited Brands, Inc. | 297,934 | ||||||
| 2,150 | Lions Gate Entertainment Corporation | 61,447 | ||||||
| 11,250 | Live Nation Entertainment, Inc.a | 277,763 | ||||||
| 21,970 | Lowe’s Companies, Inc. | 1,054,340 | ||||||
| 10,600 | Macy’s, Inc. | 615,012 | ||||||
| 10,790 | Marriott International, Inc. | 691,639 | ||||||
| 2,650 | Marriott Vacations Worldwide Corporationa | 155,370 | ||||||
| 55,705 | MDC Partners, Inc. | 1,197,100 | ||||||
| 1,900 | Meredith Corporation | 91,884 | ||||||
| 300 | Michael Kors Holdings, Ltd.a | 26,595 | ||||||
| 2,350 | Multimedia Games Holding Company, Inc.a | 69,654 | ||||||
| 5,300 | Nautilus, Inc.a | 58,777 | ||||||
| 18,360 | News Corporation | 628,463 | ||||||
| 43,050 | NIKE, Inc. | 3,338,527 | ||||||
| 13,663 | NutriSystem, Inc. | 233,774 | ||||||
| 5,800 | Omnicom Group, Inc. | 413,076 | ||||||
| 7,700 | Orbitz Worldwide, Inc.a | 68,530 | ||||||
| 3,408 | O’Reilly Automotive, Inc.a | 513,245 | ||||||
| 12,450 | Papa John’s International, Inc. | 527,755 | ||||||
| 6,742 | PetSmart, Inc. | 403,172 | ||||||
| 3,400 | PVH Corporation | 396,440 | ||||||
| 3,300 | Restoration Hardware Holdings, Inc.a | 307,065 | ||||||
| 2,430 | Ross Stores, Inc. | 160,696 | ||||||
| 6,600 | Scientific Games Corporationa | 73,392 | ||||||
| 4,450 | Scripps Networks Interactive, Inc. | 361,073 | ||||||
| 10,150 | Smith & Wesson Holding Corporationa | 147,581 | ||||||
| 27,670 | Staples, Inc. | 299,943 | ||||||
| 27,600 | Starbucks Corporation | 2,135,688 | ||||||
| 6,960 | Starwood Hotels & Resorts Worldwide, Inc. | 562,507 | ||||||
| 5,280 | Time Warner Cable, Inc. | 777,744 | ||||||
| 14,730 | Toll Brothers, Inc.a | 543,537 | ||||||
| 4,226 | Tractor Supply Company | 255,250 | ||||||
| 63,800 | Tuesday Morning Corporationa | 1,136,916 | ||||||
| 55,850 | Twenty-First Century Fox, Inc. | 1,963,128 | ||||||
| 7,420 | Under Armour, Inc.a | 441,416 | ||||||
| 6,334 | VF Corporation | 399,042 | ||||||
| 5,900 | Wyndham Worldwide Corporation | 446,748 | ||||||
| 2,000 | Wynn Resorts, Ltd. | 415,120 | ||||||
| 3,550 | Zumiez, Inc.a | 97,945 | ||||||
|
| |||||||
| Total | 52,180,378 | |||||||
|
| |||||||
| Consumer Staples (1.6%) | |||||||
| 16,500 | Altria Group, Inc. | 692,010 | ||||||
| 2,295 | Andersons, Inc. | 118,376 | ||||||
| 16,300 | Anheuser-Busch InBev NV ADR | 1,873,522 | ||||||
| 20,773 | Annie’s, Inc.a | 702,543 | ||||||
| 15,100 | Archer-Daniels-Midland Company | 666,061 | ||||||
| 9,200 | Bunge, Ltd. | 695,888 | ||||||
| 4,400 | Coca-Cola Enterprises, Inc. | 210,232 | ||||||
| 1,800 | Colgate-Palmolive Company | 122,724 | ||||||
| 26,900 | CVS Caremark Corporation | 2,027,453 | ||||||
The accompanying Notes to Financial Statements are an integral part of this schedule.
24
Table of Contents
Aggressive Allocation Portfolio
Schedule of Investments as of June 30, 2014
(unaudited)
| Shares | Common Stock (40.4%) | Value | ||||||
| Consumer Staples (1.6%) - continued | |||||||
| 2,850 | Green Mountain Coffee Roasters, Inc. | $ | 355,139 | |||||
| 6,040 | Hain Celestial Group, Inc.a | 535,990 | ||||||
| 13,050 | Ingredion, Inc. | 979,272 | ||||||
| 1,700 | J.M. Smucker Company | 181,169 | ||||||
| 3,300 | Kimberly-Clark Corporation | 367,026 | ||||||
| 3,423 | Kraft Foods Group, Inc. | 205,209 | ||||||
| 4,550 | Kroger Company | 224,907 | ||||||
| 14,470 | Mondelez International, Inc. | 544,217 | ||||||
| 7,280 | Monster Beverage Corporationa | 517,098 | ||||||
| 3,691 | Philip Morris International, Inc. | 311,188 | ||||||
| 7,250 | Pilgrim’s Pride Corporationa | 198,360 | ||||||
| 4,200 | Procter & Gamble Company | 330,078 | ||||||
| 43,200 | Rite Aid Corporationa | 309,744 | ||||||
| 1,000 | Sanderson Farms, Inc. | 97,200 | ||||||
| 3,090 | United Natural Foods, Inc.a | 201,159 | ||||||
| 1,900 | Wal-Mart Stores, Inc. | 142,633 | ||||||
| 43,920 | WhiteWave Foods Companya | 1,421,690 | ||||||
| 2,034 | Whole Foods Market, Inc. | 78,573 | ||||||
|
| |||||||
| Total | 14,109,461 | |||||||
|
| |||||||
| Energy (5.2%) | |||||||
| 71,870 | Alpha Natural Resources, Inc.a | 266,638 | ||||||
| 1,370 | Atwood Oceanics, Inc.a | 71,898 | ||||||
| 2,300 | Baker Hughes, Inc. | 171,235 | ||||||
| 5,500 | Basic Energy Services, Inc.a | 160,710 | ||||||
| 1,485 | Cabot Oil & Gas Corporation | 50,698 | ||||||
| 60,140 | Cameron International Corporationa | 4,072,079 | ||||||
| 11,220 | Chevron Corporation | 1,464,771 | ||||||
| 680 | Cimarex Energy Company | 97,553 | ||||||
| 20,900 | Cobalt International Energy, Inc.a | 383,515 | ||||||
| 8,518 | Concho Resources, Inc.a | 1,230,851 | ||||||
| 1,250 | ConocoPhillips | 107,162 | ||||||
| 3,920 | Denbury Resources, Inc. | 72,363 | ||||||
| 1,000 | Diamondback Energy, Inc.a | 88,800 | ||||||
| 6,900 | Dril-Quip, Inc.a | 753,756 | ||||||
| 500 | Energen Corporation | 44,440 | ||||||
| 950 | Ensco plc | 52,791 | ||||||
| 27,366 | EOG Resources, Inc. | 3,197,991 | ||||||
| 13,591 | EQT Corporation | 1,452,878 | ||||||
| 5,200 | Exterran Holdings, Inc. | 233,948 | ||||||
| 20,450 | Exxon Mobil Corporation | 2,058,906 | ||||||
| 100 | Frank’s International NV | 2,460 | ||||||
| 3,900 | Green Plains, Inc. | 128,193 | ||||||
| 1,200 | Gulfmark Offshore, Inc. | 54,216 | ||||||
| 600 | Gulfport Energy Corporationa | 37,680 | ||||||
| 950 | Helmerich & Payne, Inc. | 110,304 | ||||||
| 1,200 | Hess Corporation | 118,668 | ||||||
| 4,520 | HollyFrontier Corporation | 197,479 | ||||||
| 5,400 | Kosmos Energy, Ltd.a | 60,642 | ||||||
| 108,618 | Marathon Oil Corporation | 4,336,031 | ||||||
| 24,100 | Market Vectors Oil Service ETF | 1,392,016 | ||||||
| 15,300 | Nabors Industries, Ltd. | 449,361 | ||||||
| 11,930 | National Oilwell Varco, Inc. | 982,435 | ||||||
| 1,580 | Noble Corporation | 53,025 | ||||||
| 1,080 | Noble Energy, Inc. | 83,657 | ||||||
| 34,130 | Oasis Petroleum, Inc.a | 1,907,526 | ||||||
| 4,800 | Occidental Petroleum Corporation | 492,624 | ||||||
| 1,025 | Oceaneering International, Inc. | 80,083 | ||||||
| 890 | Oil States International, Inc.a | 57,040 | ||||||
| 3,600 | Patterson-UTI Energy, Inc. | 125,784 | ||||||
| 27,039 | Peabody Energy Corporation | 442,088 | ||||||
| 16,800 | Petroleo Brasileiro SA ADR | 245,784 | ||||||
| 950 | Phillips 66 | 76,409 | ||||||
| 1,960 | Pioneer Natural Resources Company | 450,428 | ||||||
| 1,850 | QEP Resources, Inc. | 63,825 | ||||||
| 685 | Range Resources Corporation | 59,561 | ||||||
| 30,910 | Rex Energy Corporationa | 547,416 | ||||||
| 11,070 | Rosetta Resources, Inc.a | 607,190 | ||||||
| 1,450 | Rowan Companies plc | 46,298 | ||||||
| 8,500 | SandRidge Energy, Inc.a | 60,775 | ||||||
| 43,470 | Schlumberger, Ltd. | 5,127,286 | ||||||
| 13,815 | SM Energy Company | 1,161,841 | ||||||
| 32,410 | Southwestern Energy Companya | 1,474,331 | ||||||
| 6,920 | Superior Energy Services, Inc. | 250,089 | ||||||
| 22,600 | Total SA ADR | 1,631,720 | ||||||
| 39,722 | Trinidad Drilling, Ltd. | 450,807 | ||||||
| 1,150 | Unit Corporationa | 79,154 | ||||||
| 235,966 | Weatherford International, Ltd.a | 5,427,218 | ||||||
| 2,695 | Whiting Petroleum Corporationa | 216,274 | ||||||
|
| |||||||
| Total | 45,120,701 | |||||||
|
| |||||||
| Financials (6.5%) | |||||||
| 4,630 | ACE, Ltd. | 480,131 | ||||||
| 9,942 | Affiliated Managers Group, Inc.a | 2,042,087 | ||||||
| 19,420 | Allied World Assurance Company Holdings AG | 738,348 | ||||||
| 6,590 | Allstate Corporation | 386,965 | ||||||
| 9,500 | American Assets Trust, Inc. | 328,225 | ||||||
| 12,550 | American International Group, Inc. | 684,979 | ||||||
| 5,000 | Ameriprise Financial, Inc. | 600,000 | ||||||
| 2,000 | AmTrust Financial Services, Inc. | 83,620 | ||||||
| 2,062 | Argo Group International Holdings, Ltd. | 105,389 | ||||||
| 62,120 | Bank of America Corporation | 954,784 | ||||||
| 2,550 | Banner Corporation | 101,057 | ||||||
| 31,320 | BBCN Bancorp, Inc. | 499,554 | ||||||
| 12,250 | Berkshire Hathaway, Inc.a | 1,550,360 | ||||||
| 11,200 | Blackstone Group, LPa | 374,528 | ||||||
| 3,005 | Boston Properties, Inc. | 355,131 | ||||||
| 6,150 | Camden Property Trust | 437,572 | ||||||
| 1,900 | CBRE Group, Inc.a | 60,876 | ||||||
| 50,271 | Citigroup, Inc. | 2,367,764 | ||||||
| 2,222 | CNA Financial Corporation | 89,813 | ||||||
| 67,550 | CNO Financial Group, Inc. | 1,202,390 | ||||||
| 11,350 | Comerica, Inc. | 569,316 | ||||||
| 4,050 | Crown Castle International Corporation | 300,753 | ||||||
| 6,900 | DDR Corporation | 121,647 | ||||||
| 8,305 | Deutsche Bank AG | 292,170 | ||||||
| 3,250 | Digital Realty Trust, Inc. | 189,540 | ||||||
| 17,472 | Discover Financial Services | 1,082,915 | ||||||
| 10,600 | Duke Realty Corporation | 192,496 | ||||||
| 29,340 | Education Realty Trust, Inc. | 315,112 | ||||||
| 5,589 | Equity Residential | 352,107 | ||||||
| 5,800 | Extra Space Storage, Inc. | 308,850 | ||||||
| 23,500 | Fifth Third Bancorp | 501,725 | ||||||
| 10,900 | First Horizon National Corporation | 129,274 | ||||||
| 24,350 | First Niagara Financial Group, Inc. | 212,819 | ||||||
| 23,500 | First Republic Bank | 1,292,265 | ||||||
| 7,400 | Fulton Financial Corporation | 91,686 | ||||||
| 7,237 | Gaming and Leisure Properties, Inc. | 245,841 | ||||||
| 2,350 | General Growth Properties, Inc. | 55,366 | ||||||
The accompanying Notes to Financial Statements are an integral part of this schedule.
25
Table of Contents
Aggressive Allocation Portfolio
Schedule of Investments as of June 30, 2014
(unaudited)
| Shares | Common Stock (40.4%) | Value | ||||||
| Financials (6.5%) - continued | |||||||
| 105,314 | Genworth Financial, Inc.a | $ | 1,832,464 | |||||
| 34,040 | Hanmi Financial Corporation | 717,563 | ||||||
| 14,677 | HCC Insurance Holdings, Inc. | 718,292 | ||||||
| 3,354 | Health Care REIT, Inc. | 210,195 | ||||||
| 23,698 | Host Hotels & Resorts, Inc. | 521,593 | ||||||
| 110,300 | Huntington Bancshares, Inc. | 1,052,262 | ||||||
| 1,200 | Intercontinental Exchange, Inc. | 226,680 | ||||||
| 16,730 | Invesco, Ltd. | 631,558 | ||||||
| 10,080 | iShares Russell 2000 Index Fund | 1,197,605 | ||||||
| 33,623 | J.P. Morgan Chase & Company | 1,937,357 | ||||||
| 24,650 | KeyCorp | 353,234 | ||||||
| 9,279 | Kimco Realty Corporation | 213,231 | ||||||
| 9,381 | Lazard, Ltd. | 483,684 | ||||||
| 2,750 | M&T Bank Corporation | 341,137 | ||||||
| 3,150 | Macerich Company | 210,262 | ||||||
| 16,200 | MBIA, Inc.a | 178,848 | ||||||
| 20,830 | MetLife, Inc. | 1,157,315 | ||||||
| 3,450 | Montpelier Re Holdings, Inc. | 110,227 | ||||||
| 22,790 | Morgan Stanley | 736,801 | ||||||
| 12,750 | NASDAQ OMX Group, Inc. | 492,405 | ||||||
| 5,950 | Navient Corporation | 105,375 | ||||||
| 6,700 | Northern Trust Corporation | 430,207 | ||||||
| 3,450 | Old Republic International Corporation | 57,063 | ||||||
| 15,070 | PacWest Bancorp | 650,572 | ||||||
| 15,640 | Parkway Properties, Inc. | 322,966 | ||||||
| 23,710 | Pebblebrook Hotel Trust | 876,322 | ||||||
| 4,350 | Piedmont Office Realty Trust, Inc. | 82,389 | ||||||
| 3,950 | Popular, Inc.a | 135,011 | ||||||
| 2,100 | Portfolio Recovery Associates, Inc.a | 125,013 | ||||||
| 3,400 | Progressive Corporation | 86,224 | ||||||
| 5,000 | Prologis, Inc. | 205,450 | ||||||
| 4,350 | Protective Life Corporation | 301,585 | ||||||
| 7,350 | Prudential Financial, Inc. | 652,459 | ||||||
| 1,153 | Public Storage, Inc. | 197,567 | ||||||
| 12,350 | Radian Group, Inc. | 182,903 | ||||||
| 1,700 | Realty Income Corporation | 75,514 | ||||||
| 6,650 | RLJ Lodging Trust | 192,119 | ||||||
| 2,050 | Ryman Hospitality Properties | 98,707 | ||||||
| 3,310 | Simon Property Group, Inc. | 550,387 | ||||||
| 61,650 | SPDR Euro Stoxx 50 ETF | 2,667,596 | ||||||
| 4,900 | SPDR Gold Trusta | 627,396 | ||||||
| 23,050 | SPDR S&P 500 ETF Trust | 4,511,346 | ||||||
| 2,680 | State Street Corporation | 180,257 | ||||||
| 5,250 | Strategic Hotels & Resorts, Inc.a | 61,478 | ||||||
| 12,740 | SVB Financial Groupa | 1,485,739 | ||||||
| 23,910 | Synovus Financial Corporation | 582,926 | ||||||
| 5,110 | T. Rowe Price Group, Inc. | 431,335 | ||||||
| 3,600 | Tanger Factory Outlet Centers, Inc. | 125,892 | ||||||
| 11,000 | TD Ameritrade Holding Corporation | 344,850 | ||||||
| 24,490 | Terreno Realty Corporation | 473,392 | ||||||
| 15,430 | Texas Capital Bancshares, Inc.a | 832,448 | ||||||
| 16,850 | Visa, Inc. | 3,550,464 | ||||||
| 2,797 | Vornado Realty Trust | 298,524 | ||||||
| 3,850 | W.R. Berkley Corporation | 178,293 | ||||||
| 1,655 | Washington Prime Group, Inc.a | 31,015 | ||||||
| 7,833 | Wells Fargo & Company | 411,702 | ||||||
| 23,890 | Western Alliance Bancorpa | 568,582 | ||||||
| 4,800 | Weyerhaeuser Company | 158,832 | ||||||
| 25,570 | Zions Bancorporation | 753,548 | ||||||
|
| |||||||
| Total | 56,623,616 | |||||||
|
| |||||||
| Health Care (5.1%) | |||||||
| 2,500 | Abbott Laboratories | 102,250 | ||||||
| 19,150 | Acorda Therapeutics, Inc.a | 645,547 | ||||||
| 2,499 | Actavis, Inc.a | 557,402 | ||||||
| 10,050 | Aetna, Inc. | 814,854 | ||||||
| 19,000 | Affymetrix, Inc.a | 169,290 | ||||||
| 27,100 | Akorn, Inc.a | 901,075 | ||||||
| 1,233 | Albany Molecular Research, Inc.a | 24,808 | ||||||
| 9,240 | Align Technology, Inc.a | 517,810 | ||||||
| 26,100 | Allscripts Healthcare Solutions, Inc.a | 418,905 | ||||||
| 5,872 | AmerisourceBergen Corporation | 426,660 | ||||||
| 1,400 | Amgen, Inc. | 165,718 | ||||||
| 5,100 | AMN Healthcare Services, Inc.a | 62,730 | ||||||
| 10,610 | Baxter International, Inc. | 767,103 | ||||||
| 1,200 | Biogen Idec, Inc.a | 378,372 | ||||||
| 7,840 | BioMarin Pharmaceutical, Inc.a | 487,726 | ||||||
| 59,200 | BioScrip, Inc.a | 493,728 | ||||||
| 61,000 | Boston Scientific Corporationa | 778,970 | ||||||
| 7,000 | Bruker Corporationa | 169,890 | ||||||
| 2,358 | C.R. Bard, Inc. | 337,218 | ||||||
| 2,600 | Capital Senior Living Corporationa | 61,984 | ||||||
| 8,450 | Cardinal Health, Inc. | 579,332 | ||||||
| 3,286 | Catamaran Corporationa | 145,110 | ||||||
| 8,450 | Centene Corporationa | 638,904 | ||||||
| 56,410 | Cerner Corporationa | 2,909,628 | ||||||
| 1,650 | Charles River Laboratories International, Inc.a | 88,308 | ||||||
| 600 | Chemed Corporation | 56,232 | ||||||
| 2,950 | Community Health Systems, Inc.a | 133,841 | ||||||
| 2,000 | Cooper Companies, Inc. | 271,060 | ||||||
| 3,200 | Covance, Inc.a | 273,856 | ||||||
| 47,610 | Covidien plc | 4,293,470 | ||||||
| 1,800 | Cubist Pharmaceuticals, Inc.a | 125,676 | ||||||
| 3,000 | DaVita HealthCare Partners, Inc.a | 216,960 | ||||||
| 5,200 | DENTSPLY International, Inc. | 246,220 | ||||||
| 7,020 | Envision Healthcare Holdings, Inc.a | 252,088 | ||||||
| 33,596 | ExamWorks Group, Inc.a | 1,066,001 | ||||||
| 5,000 | Express Scripts Holding Companya | 346,650 | ||||||
| 83,350 | Gilead Sciences, Inc.a | 6,910,548 | ||||||
| 2,350 | Globus Medical, Inc.a | 56,212 | ||||||
| 1,200 | Greatbatch, Inc.a | 58,872 | ||||||
| 5,350 | HCA Holdings, Inc.a | 301,633 | ||||||
| 20,800 | Hologic, Inc.a | 527,280 | ||||||
| 4,100 | Humana, Inc. | 523,652 | ||||||
| 5,400 | Illumina, Inc.a | 964,116 | ||||||
| 2,650 | Impax Laboratories, Inc.a | 79,473 | ||||||
| 41,702 | Johnson & Johnson | 4,362,863 | ||||||
| 1,450 | LifePoint Hospitals, Inc.a | 90,045 | ||||||
| 4,700 | McKesson Corporation | 875,187 | ||||||
| 6,450 | Medicines Companya | 187,437 | ||||||
| 24,980 | Merck & Company, Inc. | 1,445,093 | ||||||
| 2,164 | Mettler-Toledo International, Inc.a | 547,882 | ||||||
| 7,350 | Molina Healthcare, Inc.a | 328,030 | ||||||
| 1,700 | Myriad Genetics, Inc.a | 66,164 | ||||||
| 20,900 | Neurocrine Biosciences, Inc.a | 310,156 | ||||||
| 30,021 | NuVasive, Inc.a | 1,067,847 | ||||||
| 7,950 | PAREXEL International Corporationa | 420,078 | ||||||
| 5,650 | PerkinElmer, Inc. | 264,646 | ||||||
| 5,500 | Perrigo Company plc | 801,680 | ||||||
| 17,100 | Pfizer, Inc. | 507,528 | ||||||
| 3,050 | PharMerica Corporationa | 87,200 | ||||||
| 1,650 | Prestige Brands Holdings, Inc.a | 55,919 | ||||||
The accompanying Notes to Financial Statements are an integral part of this schedule.
26
Table of Contents
Aggressive Allocation Portfolio
Schedule of Investments as of June 30, 2014
(unaudited)
| Shares | Common Stock (40.4%) | Value | ||||||
| Health Care (5.1%) - continued | |||||||
| 1,500 | Providence Service Corporationa | $ | 54,885 | |||||
| 2,600 | Qiagen NVa | 63,570 | ||||||
| 2,500 | Quest Diagnostics, Inc. | 146,725 | ||||||
| 2,150 | Seattle Genetics, Inc.a | 82,237 | ||||||
| 3,750 | Select Medical Holdings Corporation | 58,500 | ||||||
| 7,450 | Spectrum Pharmaceuticals, Inc.a | 60,569 | ||||||
| 2,150 | St. Jude Medical, Inc. | 148,887 | ||||||
| 5,430 | Team Health Holdings, Inc.a | 271,174 | ||||||
| 550 | Thermo Fisher Scientific, Inc. | 64,900 | ||||||
| 15,063 | UnitedHealth Group, Inc. | 1,231,400 | ||||||
| 7,300 | Universal Health Services, Inc. | 699,048 | ||||||
| 900 | Vertex Pharmaceuticals, Inc.a | 85,212 | ||||||
| 3,800 | Volcano Corporationa | 66,918 | ||||||
| 2,200 | Waters Corporationa | 229,768 | ||||||
| 1,950 | WellPoint, Inc. | 209,839 | ||||||
| 3,150 | Zoetis, Inc. | 101,651 | ||||||
|
| |||||||
| Total | 44,340,200 | |||||||
|
| |||||||
| Industrials (5.2%) | |||||||
| 2,150 | 3M Company | 307,966 | ||||||
| 2,300 | AAR Corporation | 63,388 | ||||||
| 4,520 | Acuity Brands, Inc. | 624,890 | ||||||
| 15,850 | ADT Corporation | 553,799 | ||||||
| 3,550 | Aecom Technology Corporationa | 114,310 | ||||||
| 7,050 | AGCO Corporation | 396,351 | ||||||
| 2,433 | Allegion plc | 137,902 | ||||||
| 13,700 | AMETEK, Inc. | 716,236 | ||||||
| 13,950 | Apogee Enterprises, Inc. | 486,297 | ||||||
| 6,006 | B/E Aerospace, Inc.a | 555,495 | ||||||
| 21,700 | Boeing Company | 2,760,891 | ||||||
| 4,057 | Briggs & Stratton Corporation | 83,006 | ||||||
| 1,600 | Caterpillar, Inc. | 173,872 | ||||||
| 15,580 | CLARCOR, Inc. | 963,623 | ||||||
| 1,900 | Colfax Corporationa | 141,626 | ||||||
| 4,900 | Covanta Holding Corporation | 100,989 | ||||||
| 32,655 | CSX Corporation | 1,006,101 | ||||||
| 106,100 | Delta Air Lines, Inc. | 4,108,192 | ||||||
| 33,424 | EMCOR Group, Inc. | 1,488,371 | ||||||
| 6,560 | Esterline Technologies Corporationa | 755,187 | ||||||
| 9,300 | Exelis, Inc. | 157,914 | ||||||
| 5,370 | Fastenal Company | 265,761 | ||||||
| 10,031 | Flowserve Corporation | 745,805 | ||||||
| 39,600 | Fluor Corporation | 3,045,240 | ||||||
| 9,810 | Fortune Brands Home and Security, Inc. | 391,713 | ||||||
| 15,320 | GATX Corporation | 1,025,521 | ||||||
| 5,370 | Graco, Inc. | 419,290 | ||||||
| 15,730 | Granite Construction, Inc. | 565,965 | ||||||
| 33,800 | HNI Corporation | 1,321,918 | ||||||
| 6,365 | Honeywell International, Inc. | 591,627 | ||||||
| 4,800 | Huntington Ingalls Industries, Inc. | 454,032 | ||||||
| 12,950 | Ingersoll-Rand plc | 809,504 | ||||||
| 64,061 | Interface, Inc. | 1,206,909 | ||||||
| 6,320 | Jacobs Engineering Group, Inc.a | 336,730 | ||||||
| 3,730 | JB Hunt Transport Services, Inc. | 275,199 | ||||||
| 1,700 | Joy Global, Inc. | 104,686 | ||||||
| 4,500 | KAR Auction Services, Inc. | 143,415 | ||||||
| 34,850 | Korn/Ferry Internationala | 1,023,545 | ||||||
| 20,900 | Landstar System, Inc. | 1,337,600 | ||||||
| 1,850 | Lockheed Martin Corporation | 297,351 | ||||||
| 13,617 | Manitowoc Company, Inc. | 447,455 | ||||||
| 3,400 | Manpower, Inc. | 288,490 | ||||||
| 5,950 | Meritor, Inc.a | 77,588 | ||||||
| 8,670 | Nielsen Holdings NV | 419,715 | ||||||
| 2,775 | NOW, Inc.a | 100,483 | ||||||
| 2,750 | Old Dominion Freight Line, Inc.a | 175,120 | ||||||
| 19,775 | Oshkosh Corporation | 1,098,106 | ||||||
| 3,178 | Parker Hannifin Corporation | 399,570 | ||||||
| 11,712 | Pentair, Ltd. | 844,669 | ||||||
| 17,430 | Quanta Services, Inc.a | 602,729 | ||||||
| 27,320 | Ritchie Brothers Auctioneers, Inc. | 673,438 | ||||||
| 14,140 | Robert Half International, Inc. | 675,044 | ||||||
| 4,032 | Roper Industries, Inc. | 588,712 | ||||||
| 71,500 | Southwest Airlines Company | 1,920,490 | ||||||
| 1,750 | Spirit Aerosystems Holdings, Inc.a | 58,975 | ||||||
| 3,200 | Spirit Airlines, Inc.a | 202,368 | ||||||
| 6,951 | Stericycle, Inc.a | 823,137 | ||||||
| 15,320 | Tennant Company | 1,169,222 | ||||||
| 37,600 | Union Pacific Corporation | 3,750,600 | ||||||
| 8,670 | United Rentals, Inc.a | 908,009 | ||||||
| 2,298 | United Stationers, Inc. | 95,298 | ||||||
| 1,300 | United Technologies Corporation | 150,085 | ||||||
| 4,800 | Wabash National Corporationa | 68,400 | ||||||
| 3,000 | WABCO Holdings, Inc.a | 320,460 | ||||||
| 650 | WESCO International, Inc.a | 56,147 | ||||||
|
| |||||||
| Total | 45,972,527 | |||||||
|
| |||||||
| Information Technology (8.7%) | |||||||
| 12,907 | Agilent Technologies, Inc. | 741,378 | ||||||
| 4,750 | Akamai Technologies, Inc.a | 290,035 | ||||||
| 3,650 | Alliance Data Systems Corporationa | 1,026,563 | ||||||
| 5,900 | Amdocs, Ltd. | 273,347 | ||||||
| 7,550 | Amphenol Corporation | 727,367 | ||||||
| 5,035 | ANSYS, Inc.a | 381,754 | ||||||
| 86,114 | Apple, Inc.b | 8,002,574 | ||||||
| 31,384 | Applied Materials, Inc. | 707,709 | ||||||
| 11,250 | Arris Group, Inc.a | 365,962 | ||||||
| 3,050 | Aruba Networks, Inc.a | 53,436 | ||||||
| 164,400 | Atmel Corporationa | 1,540,428 | ||||||
| 4,297 | Autodesk, Inc.a | 242,265 | ||||||
| 3,300 | AVG Technologies NVa | 66,429 | ||||||
| 2,550 | Booz Allen Hamilton Holding Corporation | 54,162 | ||||||
| 3,800 | Broadcom Corporation | 141,056 | ||||||
| 31,670 | Broadridge Financial Solutions, Inc. | 1,318,739 | ||||||
| 29,450 | Brocade Communications Systems, Inc. | 270,940 | ||||||
| 2,100 | Cardtronics, Inc.a | 71,568 | ||||||
| 5,750 | CDW Corporation | 183,310 | ||||||
| 11,532 | Ciena Corporationa | 249,783 | ||||||
| 2,550 | Cirrus Logic, Inc.a | 57,987 | ||||||
| 60,850 | Cisco Systems, Inc. | 1,512,122 | ||||||
| 13,510 | Citrix Systems, Inc.a | 845,050 | ||||||
| 6,700 | Computer Sciences Corporation | 423,440 | ||||||
| 3,250 | Convergys Corporation | 69,680 | ||||||
| 6,850 | CoreLogic, Inc.a | 207,966 | ||||||
| 3,700 | Cornerstone OnDemand, Inc.a | 170,274 | ||||||
| 43,800 | Corning, Inc. | 961,410 | ||||||
| 2,150 | Diodes, Inc.a | 62,264 | ||||||
| 20,805 | DST Systems, Inc. | 1,917,597 | ||||||
| 26,051 | E2open, Inc.a | 538,474 | ||||||
| 25,324 | eBay, Inc.a | 1,267,719 | ||||||
| 14,650 | Electronic Arts, Inc.a | 525,495 | ||||||
| 115,300 | EMC Corporation | 3,037,002 | ||||||
The accompanying Notes to Financial Statements are an integral part of this schedule.
27
Table of Contents
Aggressive Allocation Portfolio
Schedule of Investments as of June 30, 2014
(unaudited)
| Shares | Common Stock (40.4%) | Value | ||||||
| Information Technology (8.7%) - continued | |||||||
| 6,695 | Euronet Worldwide, Inc.a | $ | 322,967 | |||||
| 4,682 | F5 Networks, Inc.a | 521,762 | ||||||
| 58,400 | Facebook, Inc.a | 3,929,736 | ||||||
| 14,100 | Fortinet, Inc.a | 354,333 | ||||||
| 6,350 | GameStop Corporation | 256,985 | ||||||
| 5,160 | Gartner, Inc.a | 363,883 | ||||||
| 6,800 | Genpact, Ltd.a | 119,204 | ||||||
| 2,550 | Global Payments, Inc. | 185,767 | ||||||
| 6,173 | Google, Inc.a | 3,551,203 | ||||||
| 7,173 | Google, Inc., Class Aa | 4,193,838 | ||||||
| 15,280 | Guidewire Software, Inc.a | 621,285 | ||||||
| 12,000 | Hewlett-Packard Company | 404,160 | ||||||
| 1,800 | IAC InterActiveCorp | 124,614 | ||||||
| 2,400 | iGATE Corporationa | 87,336 | ||||||
| 3,460 | Imperva, Inc.a | 90,583 | ||||||
| 28,300 | Informatica Corporationa | 1,008,895 | ||||||
| 2,650 | International Business Machines Corporation | 480,365 | ||||||
| 2,350 | j2 Global, Inc. | 119,521 | ||||||
| 39,710 | Juniper Networks, Inc.a | 974,483 | ||||||
| 7,215 | Lexmark International, Inc. | 347,474 | ||||||
| 680 | LinkedIn Corporationa | 116,600 | ||||||
| 3,750 | Liquidity Services, Inc.a | 59,100 | ||||||
| 9,800 | Marvell Technology Group, Ltd. | 140,434 | ||||||
| 2,740 | Measurement Specialties, Inc.a | 235,832 | ||||||
| 4,050 | Mentor Graphics Corporation | 87,359 | ||||||
| 7,472 | Microchip Technology, Inc. | 364,708 | ||||||
| 13,970 | Microsoft Corporation | 582,549 | ||||||
| 86,082 | NetApp, Inc. | 3,143,715 | ||||||
| 3,995 | Nice Systems, Ltd. ADR | 163,036 | ||||||
| 7,893 | Nuance Communications, Inc.a | 148,152 | ||||||
| 60,678 | NVIDIA Corporation | 1,124,970 | ||||||
| 11,120 | NXP Semiconductors NVa | 735,922 | ||||||
| 15,800 | Oracle Corporation | 640,374 | ||||||
| 23,456 | Plantronics, Inc. | 1,127,061 | ||||||
| 4,850 | Polycom, Inc.a | 60,771 | ||||||
| 14,540 | QLIK Technologies, Inc.a | 328,895 | ||||||
| 41,670 | QUALCOMM, Inc.b | 3,300,264 | ||||||
| 7,350 | Red Hat, Inc.a | 406,235 | ||||||
| 44,700 | Salesforce.com, Inc.a | 2,596,176 | ||||||
| 8,650 | Sanmina Corporationa | 197,047 | ||||||
| 6,603 | Sapient Corporationa | 107,299 | ||||||
| 7,310 | ServiceNow, Inc.a | 452,928 | ||||||
| 305 | Skyworks Solutions, Inc. | 14,323 | ||||||
| 9,750 | SunPower Corporationa | 399,555 | ||||||
| 32,580 | Symantec Corporation | 746,082 | ||||||
| 4,500 | Synopsys, Inc.a | 174,690 | ||||||
| 8,100 | Take-Two Interactive Software, Inc.a | 180,144 | ||||||
| 43,100 | Teradata Corporationa | 1,732,620 | ||||||
| 50,164 | Teradyne, Inc. | 983,214 | ||||||
| 22,280 | Texas Instruments, Inc. | 1,064,761 | ||||||
| 19,910 | Textura Corporationa | 470,672 | ||||||
| 22,950 | Ubiquiti Networks, Inc.a | 1,037,111 | ||||||
| 13,023 | VeriFone Systems, Inc.a | 478,595 | ||||||
| 23,745 | Virtusa Corporationa | 850,071 | ||||||
| 57,850 | Vishay Intertechnology, Inc. | 896,096 | ||||||
| 36,350 | VMware, Inc.a | 3,519,044 | ||||||
| 1,300 | WebMD Health Corporationa | 62,790 | ||||||
| 1,900 | Workday, Inc.a | 170,734 | ||||||
| 37,050 | Xerox Corporation | 460,902 | ||||||
| 11,480 | Xilinx, Inc. | 543,119 | ||||||
|
| |||||||
| Total | 76,267,629 | |||||||
|
| |||||||
| Materials (1.2%) | |||||||
| 3,900 | Airgas, Inc. | 424,749 | ||||||
| 3,300 | Albemarle Corporation | 235,950 | ||||||
| 4,150 | Alcoa, Inc. | 61,793 | ||||||
| 2,850 | Berry Plastics Group, Inc.a | 73,530 | ||||||
| 1,000 | Cabot Corporation | 57,990 | ||||||
| 8,368 | Celanese Corporation | 537,895 | ||||||
| 7,000 | Cliffs Natural Resources, Inc. | 105,350 | ||||||
| 850 | Compass Minerals International, Inc. | 81,379 | ||||||
| 2,600 | Crown Holdings, Inc.a | 129,376 | ||||||
| 9,740 | Dow Chemical Company | 501,220 | ||||||
| 10,800 | Eagle Materials, Inc. | 1,018,224 | ||||||
| 2,800 | Eastman Chemical Company | 244,580 | ||||||
| 7,482 | FMC Corporation | 532,644 | ||||||
| 18,300 | Graphic Packaging Holding Companya | 214,110 | ||||||
| 26,860 | H.B. Fuller Company | 1,291,966 | ||||||
| 24,740 | Materials Select Sector SPDR Fund | 1,228,094 | ||||||
| 5,150 | Monsanto Company | 642,411 | ||||||
| 6,300 | Mosaic Company | 311,535 | ||||||
| 6,230 | Nucor Corporation | 306,827 | ||||||
| 9,850 | Owens-Illinois, Inc.a | 341,204 | ||||||
| 4,000 | Packaging Corporation of America | 285,960 | ||||||
| 6,654 | Silgan Holdings, Inc. | 338,156 | ||||||
| 6,243 | Silver Wheaton Corporation | 164,004 | ||||||
| 1,350 | Sonoco Products Company | 59,306 | ||||||
| 3,349 | Southern Copper Corporation | 101,709 | ||||||
| 23,720 | Steel Dynamics, Inc. | 425,774 | ||||||
| 32,100 | Teck Resources, Ltd. | 732,843 | ||||||
| 6,400 | Walter Energy, Inc. | 34,880 | ||||||
| 1,500 | Worthington Industries, Inc. | 64,560 | ||||||
|
| |||||||
| Total | 10,548,019 | |||||||
|
| |||||||
| Telecommunications Services (0.3%) | |||||||
| 15,300 | AT&T, Inc. | 541,008 | ||||||
| 21,456 | Cogent Communications Group, Inc. | 741,305 | ||||||
| 3,546 | SBA Communications Corporationa | 362,755 | ||||||
| 2,300 | Telephone & Data Systems, Inc. | 60,053 | ||||||
| 8,335 | TW Telecom, Inc.a | 335,984 | ||||||
| 16,458 | Verizon Communications, Inc. | 805,290 | ||||||
| 15,200 | Vonage Holdings Corporationa | 57,000 | ||||||
|
| |||||||
| Total | 2,903,395 | |||||||
|
| |||||||
| Utilities (0.6%) | |||||||
| 2,400 | Atmos Energy Corporation | 128,160 | ||||||
| 12,950 | CMS Energy Corporation | 403,393 | ||||||
| 1,100 | Edison International, Inc. | 63,921 | ||||||
| 12,790 | NiSource, Inc. | 503,159 | ||||||
| 28,560 | NorthWestern Corporation | 1,490,546 | ||||||
| 18,390 | PG&E Corporation | 883,088 | ||||||
| 8,650 | Public Service Enterprise Group, Inc. | 352,833 | ||||||
| 3,850 | Southern Company | 174,713 | ||||||
| 11,348 | Southwest Gas Corporation | 599,061 | ||||||
| 1,800 | Westar Energy, Inc. | 68,742 | ||||||
The accompanying Notes to Financial Statements are an integral part of this schedule.
28
Table of Contents
Aggressive Allocation Portfolio
Schedule of Investments as of June 30, 2014
(unaudited)
| Shares | Common Stock (40.4%) | Value | ||||||
| Utilities (0.6%) - continued | |||||||
| 8,700 | Wisconsin Energy Corporation | $ | 408,204 | |||||
|
| |||||||
| Total | 5,075,820 | |||||||
|
| |||||||
| Total Common Stock (cost $273,251,396) | 353,141,746 | |||||||
|
| |||||||
| Principal Amount | Long-Term Fixed Income (3.7%) | |||||||
| Asset-Backed Securities (0.1%) | |||||||
| Renaissance Home Equity Loan Trust | ||||||||
| $650,000 | 6.011%, 5/25/2036 | 476,802 | ||||||
|
| |||||||
| Total | 476,802 | |||||||
|
| |||||||
| Collateralized Mortgage Obligations (0.1%) | |||||||
MASTR Alternative Loans Trust | ||||||||
| 39,476 | 0.602%, 12/25/2035c | 22,381 | ||||||
Residential Asset Securitization Trust | ||||||||
| 50,527 | 0.532%, 8/25/2037c | 20,842 | ||||||
Sequoia Mortgage Trust | ||||||||
| 19,955 | 2.740%, 9/20/2046 | 836 | ||||||
| 169,655 | 2.740%, 9/20/2046 | 145,014 | ||||||
WaMu Mortgage Pass Through Certificates | ||||||||
| 71,743 | 2.344%, 9/25/2036 | 64,380 | ||||||
| 105,296 | 2.383%, 10/25/2036 | 91,858 | ||||||
|
| |||||||
| Total | 345,311 | |||||||
|
| |||||||
| Commercial Mortgage-Backed Securities (<0.1%) | |||||||
Credit Suisse Mortgage Capital Certificates | ||||||||
| 250,000 | 5.509%, 9/15/2039 | 268,911 | ||||||
Government National Mortgage Association | ||||||||
| 43,601 | 2.164%, 3/16/2033 | 43,814 | ||||||
| 19,987 | 3.214%, 1/16/2040 | 20,256 | ||||||
|
| |||||||
| Total | 332,981 | |||||||
|
| |||||||
| Financials (0.1%) | |||||||
Achmea Hypotheekbank NV | ||||||||
| 205,000 | 3.200%, 11/3/2014d | 206,953 | ||||||
Canadian Imperial Bank of Commerce | ||||||||
| 205,000 | 2.600%, 7/2/2015d | 209,674 | ||||||
|
| |||||||
| Total | 416,627 | |||||||
|
| |||||||
| Mortgage-Backed Securities (1.6%) | |||||||
Federal Home Loan Mortgage Corporation Gold 15-Yr. Pass Through | ||||||||
| 875,000 | 3.000%, 7/1/2029e | 906,992 | ||||||
Federal Home Loan Mortgage Corporation Gold 30-Yr. Pass Through | ||||||||
| 875,000 | 4.000%, 7/1/2044e | 926,953 | ||||||
Federal National Mortgage Association Conventional 15-yr. Pass Through | ||||||||
| 1,650,000 | 3.500%, 8/1/2029e | 1,744,359 | ||||||
Federal National Mortgage Association Conventional 30-Yr. Pass Through | ||||||||
| 3,525,000 | 3.500%, 7/1/2044e | 3,628,547 | ||||||
| 3,375,000 | 4.000%, 7/1/2044e | 3,581,719 | ||||||
| 1,045,000 | 4.500%, 7/1/2044e | 1,131,702 | ||||||
| 2,230,000 | 4.500%, 8/1/2044e | 2,409,533 | ||||||
|
| |||||||
| Total | 14,329,805 | |||||||
|
| |||||||
| U.S. Government and Agencies (1.8%) | |||||||
| Federal National Mortgage Association | ||||||||
| 860,000 | 1.375%, 11/15/2016 | 872,380 | ||||||
| 665,000 | 0.875%, 5/21/2018 | 653,839 | ||||||
| Tennessee Valley Authority | ||||||||
| 165,000 | 5.250%, 9/15/2039 | 200,234 | ||||||
| U.S. Treasury Bonds | ||||||||
| 5,540,000 | 3.000%, 5/15/2042 | 5,224,912 | ||||||
| U.S. Treasury Notes | ||||||||
| 1,000,000 | 0.750%, 3/15/2017 | 1,000,000 | ||||||
| 275,000 | 1.625%, 4/30/2019 | 275,516 | ||||||
| 250,000 | 1.625%, 8/15/2022 | 237,344 | ||||||
| 1,500,000 | 1.750%, 5/15/2023 | 1,420,782 | ||||||
| 3,350,000 | 2.500%, 8/15/2023 | 3,369,892 | ||||||
| 1,350,000 | 3.625%, 2/15/2044 | 1,424,671 | ||||||
| U.S. Treasury Notes, TIPS | ||||||||
| 1,333,097 | 0.125%, 4/15/2018 | 1,377,049 | ||||||
|
| |||||||
| Total | 16,056,619 | |||||||
|
| |||||||
| Total Long-Term Fixed Income (cost $31,888,305) | 31,958,145 | |||||||
|
| |||||||
| Shares or Principal Amount | Short-Term Investments (7.3%)f | |||||||
Federal Agricultural Mortgage Corporation | ||||||||
| 4,000,000 | 0.070%, 07/25/2014 | 3,999,813 | ||||||
Federal Home Loan Bank Discount Notes | ||||||||
| 5,000,000 | 0.055%, 07/02/2014 | 4,999,992 | ||||||
| 2,000,000 | 0.057%, 07/07/2014 | 1,999,981 | ||||||
| 8,000,000 | 0.056%, 07/09/2014 | 7,999,901 | ||||||
| 15,000,000 | 0.030%, 07/11/2014 | 14,999,875 | ||||||
| 4,300,000 | 0.053%, 07/18/2014 | 4,299,892 | ||||||
| 1,300,000 | 0.055%, 07/23/2014b | 1,299,956 | ||||||
| 4,250,000 | 0.046%, 07/30/2014b | 4,249,842 | ||||||
| 2,500,000 | 0.067%, 08/01/2014 | 2,499,857 | ||||||
| 300,000 | 0.090%, 08/06/2014b | 299,973 | ||||||
| 3,000,000 | 0.062%, 08/22/2014 | 2,999,731 | ||||||
| 2,000,000 | 0.050%, 08/27/2014b | 1,999,842 | ||||||
| 2,000,000 | 0.070%, 09/03/2014 | 1,999,751 | ||||||
| 200,000 | 0.080%, 09/10/2014b | 199,969 | ||||||
| 6,000,000 | 0.065%, 09/17/2014 | 5,999,155 | ||||||
| 1,780,000 | 0.070%, 09/19/2014 | 1,779,723 | ||||||
The accompanying Notes to Financial Statements are an integral part of this schedule.
29
Table of Contents
Aggressive Allocation Portfolio
Schedule of Investments as of June 30, 2014
(unaudited)
| Shares or Principal Amount | Short-Term Investments (7.3%)f | Value | ||||||
Federal Home Loan Mortgage Corporation Discount Notes | ||||||||
| 2,000,000 | 0.070%, 09/10/2014 | $ | 1,999,724 | |||||
|
| |||||||
| Total Short-Term Investments (at amortized cost) | 63,626,977 | |||||||
|
| |||||||
| Total Investments (cost $745,694,707) 101.0% | $ | 882,192,179 | ||||||
|
| |||||||
| Other Assets and Liabilities, Net (1.0%) | (9,080,443 | ) | ||||||
|
| |||||||
| Total Net Assets 100.0% | $ | 873,111,736 | ||||||
|
| |||||||
| a | Non-income producing security. |
| b | At June 30, 2014, $16,089,332 of investments were held on deposit with the counterparty and pledged as the initial margin deposit for open futures contracts. |
| c | Denotes variable rate securities. Variable rate securities are securities whose yields vary with a designated market index or market rate. The rate shown is as of June 30, 2014. |
| d | Denotes securities sold under Rule 144A of the Securities Act of 1933, which exempts them from registration. These securities have been deemed liquid and may be resold to other dealers in the program or to other qualified institutional buyers. As of June 30, 2014, the value of these investments was $416,627 or 0.0% of total net assets. |
| e | Denotes investments purchased on a when-issued or delayed delivery basis. |
| f | The interest rate shown reflects the yield, coupon rate or the discount rate at the date of purchase. |
Definitions:
| ADR | - | American Depositary Receipt, which are certificates for an underlying foreign security’s shares held by an issuing U.S. depository bank. | ||
ETF | - | Exchange Traded Fund. | ||
REIT | - | Real Estate Investment Trust is a company that buys, develops, manages and/or sells real estate assets. | ||
TIPS | - | Treasury Inflation Protected Security. |
Unrealized Appreciation (Depreciation)
Gross unrealized appreciation and depreciation of investments, based on cost for federal income tax purposes, were as follows:
Gross unrealized appreciation | $ | 147,499,989 | ||
Gross unrealized depreciation | (12,187,073 | ) | ||
|
| |||
Net unrealized appreciation (depreciation) | $ | 135,312,916 | ||
Cost for federal income tax purposes | $ | 746,879,263 | ||
The accompanying Notes to Financial Statements are an integral part of this schedule.
30
Table of Contents
Aggressive Allocation Portfolio
Schedule of Investments as of June 30, 2014
(unaudited)
Fair Valuation Measurements
The following table is a summary of the inputs used, as of June 30, 2014, in valuing Aggressive Allocation Portfolio’s assets carried at fair value.
Investments in Securities | Total | Level 1 | Level 2 | Level 3 | ||||||||||||
Mutual Funds | ||||||||||||||||
Equity Mutual Funds | 400,307,549 | 400,307,549 | — | — | ||||||||||||
Fixed Income Mutual Funds | 33,157,762 | 33,157,762 | — | — | ||||||||||||
Common Stock | ||||||||||||||||
Consumer Discretionary | 52,180,378 | 52,180,378 | — | — | ||||||||||||
Consumer Staples | 14,109,461 | 14,109,461 | — | — | ||||||||||||
Energy | 45,120,701 | 44,669,894 | 450,807 | — | ||||||||||||
Financials | 56,623,616 | 56,623,616 | — | — | ||||||||||||
Health Care | 44,340,200 | 44,340,200 | — | — | ||||||||||||
Industrials | 45,972,527 | 45,972,527 | — | — | ||||||||||||
Information Technology | 76,267,629 | 76,267,629 | — | — | ||||||||||||
Materials | 10,548,019 | 10,548,019 | — | — | ||||||||||||
Telecommunications Services | 2,903,395 | 2,903,395 | — | — | ||||||||||||
Utilities | 5,075,820 | 5,075,820 | — | — | ||||||||||||
Long-Term Fixed Income | ||||||||||||||||
Asset-Backed Securities | 476,802 | — | 476,802 | — | ||||||||||||
Collateralized Mortgage Obligations | 345,311 | — | 345,311 | — | ||||||||||||
Commercial Mortgage-Backed Securities | 332,981 | — | 332,981 | — | ||||||||||||
Financials | 416,627 | — | 416,627 | — | ||||||||||||
Mortgage-Backed Securities | 14,329,805 | — | 14,329,805 | — | ||||||||||||
U.S. Government and Agencies | 16,056,619 | — | 16,056,619 | — | ||||||||||||
Short-Term Investments | 63,626,977 | — | 63,626,977 | — | ||||||||||||
|
|
|
|
|
|
|
| |||||||||
Total | $ | 882,192,179 | $ | 786,156,250 | $ | 96,035,929 | $ | — | ||||||||
|
|
|
|
|
|
|
| |||||||||
Other Financial Instruments | Total | Level 1 | Level 2 | Level 3 | ||||||||||||
Asset Derivatives | ||||||||||||||||
Futures Contracts | 1,701,844 | — | 1,701,844 | — | ||||||||||||
|
|
|
|
|
|
|
| |||||||||
Total Asset Derivatives | $ | 1,701,844 | $ | — | $ | 1,701,844 | $ | — | ||||||||
|
|
|
|
|
|
|
| |||||||||
Liability Derivatives | ||||||||||||||||
Futures Contracts | 4,901,556 | — | 4,901,556 | — | ||||||||||||
|
|
|
|
|
|
|
| |||||||||
Total Liability Derivatives | $ | 4,901,556 | $ | — | $ | 4,901,556 | $ | — | ||||||||
|
|
|
|
|
|
|
| |||||||||
There were no significant transfers between Levels during the period ended June 30, 2014. Transfers between Levels are identified as of the end of the period.
Futures Contracts | Number of Contracts Long/(Short) | Expiration Date | Notional Principal Amount | Value | Unrealized Gain/(Loss) | |||||||||||||||
2-Yr. U.S. Treasury Bond Futures | (15 | ) | September 2014 | ($ | 3,296,504 | ) | ($ | 3,293,907 | ) | $ | 2,597 | |||||||||
5-Yr. U.S. Treasury Bond Futures | (195 | ) | September 2014 | (23,378,976 | ) | (23,294,884 | ) | 84,092 | ||||||||||||
10-Yr. U.S. Treasury Bond Futures | (45 | ) | September 2014 | (5,651,799 | ) | (5,632,734 | ) | 19,065 | ||||||||||||
30-Yr. U.S. Treasury Bond Futures | 60 | September 2014 | 8,280,730 | 8,231,250 | (49,480 | ) | ||||||||||||||
Eurex EURO STOXX 50 Futures | 1,186 | September 2014 | 53,033,082 | 52,406,161 | (626,921 | ) | ||||||||||||||
Mini MSCI EAFE Index Futures | 198 | September 2014 | 19,386,091 | 19,492,110 | 106,019 | |||||||||||||||
Russell 2000 Index Mini-Futures | (646 | ) | September 2014 | (74,636,534 | ) | (76,893,380 | ) | (2,256,846 | ) | |||||||||||
S&P 400 Index Mini-Futures | (562 | ) | September 2014 | (78,411,072 | ) | (80,326,660 | ) | (1,915,588 | ) | |||||||||||
S&P 500 Index Futures | 248 | September 2014 | 119,558,729 | 121,048,800 | 1,490,071 | |||||||||||||||
Ultra Long Term U.S. Treasury Bond Futures | 53 | September 2014 | 7,999,409 | 7,946,688 | (52,721 | ) | ||||||||||||||
Total Futures Contracts | ($ | 3,199,712 | ) | |||||||||||||||||
The accompanying Notes to Financial Statements are an integral part of this schedule.
31
Table of Contents
Aggressive Allocation Portfolio
Schedule of Investments as of June 30, 2014
(unaudited)
The following table summarizes the fair value and Statement of Assets and Liabilities location, as of June 30, 2014, for Aggressive Allocation Portfolio’s investments in financial derivative instruments by primary risk exposure as discussed under item (2) Significant Accounting Policies of the Notes to Financial Statements.
Derivatives by risk category | Statement of Assets and Liabilities Location | Fair Value | ||||
Asset Derivatives | ||||||
Interest Rate Contracts | ||||||
Futures* | Net Assets - Net unrealized appreciation/(depreciation) on Futures contracts | $ | 105,754 | |||
Total Interest Rate Contracts | 105,754 | |||||
Equity Contracts | ||||||
Futures* | Net Assets - Net unrealized appreciation/(depreciation) on Futures contracts | 1,596,090 | ||||
Total Equity Contracts | 1,596,090 | |||||
|
| |||||
Total Asset Derivatives | $ | 1,701,844 | ||||
|
| |||||
Liability Derivatives | ||||||
Interest Rate Contracts | ||||||
Futures* | Net Assets - Net unrealized appreciation/(depreciation) on Futures contracts | 102,201 | ||||
Total Interest Rate Contracts | 102,201 | |||||
Equity Contracts | ||||||
Futures* | Net Assets - Net unrealized appreciation/(depreciation) on Futures contracts | 4,799,355 | ||||
Total Equity Contracts | 4,799,355 | |||||
|
| |||||
Total Liability Derivatives | $ | 4,901,556 | ||||
|
| |||||
| * | Includes cumulative appreciation/depreciation of futures contracts as reported in the Schedule of Investments. Only current day’s variation margin is reported within the Statement of Assets and Liabilities. |
The following table summarizes the net realized gains/(losses) and Statement of Operations location, for the period ended June 30, 2014, for Aggressive Allocation Portfolio’s investments in financial derivative instruments by primary risk exposure.
Derivatives by risk category | Statement of Operations Location | Realized Gains/(Losses) recognized in Income | ||||
Equity Contracts | ||||||
Futures | Net realized gains/(losses) on Futures contracts | 9,014,503 | ||||
Total Equity Contracts | 9,014,503 | |||||
Interest Rate Contracts | ||||||
Futures | Net realized gains/(losses) on Futures contracts | 745,101 | ||||
Total Interest Rate Contracts | 745,101 | |||||
|
| |||||
Total | $ | 9,759,604 | ||||
|
| |||||
The following table summarizes the change in net unrealized appreciation/(depreciation) and Statement of Operations location, for the period ended June 30, 2014, for Aggressive Allocation Portfolio’s investments in financial derivative instruments by primary risk exposure.
Derivatives by risk category | Statement of Operations Location | Change in unrealized appreciation/(depreciation) recognized in Income | ||||
Interest Rate Contracts | ||||||
Futures | Change in net unrealized appreciation/(depreciation) on Futures contracts | (139,392 | ) | |||
Total Interest Rate Contracts | (139,392 | ) | ||||
Equity Contracts | ||||||
Futures | Change in net unrealized appreciation/(depreciation) on Futures contracts | (4,502,622 | ) | |||
Total Equity Contracts | (4,502,622 | ) | ||||
|
| |||||
Total | ($ | 4,642,014 | ) | |||
|
| |||||
The accompanying Notes to Financial Statements are an integral part of this schedule.
32
Table of Contents
Aggressive Allocation Portfolio
Schedule of Investments as of June 30, 2014
(unaudited)
The following table presents Aggressive Allocation Portfolio’s average volume of derivative activity during the period ended June 30, 2014.
Derivative Risk Category | Futures (Notional)* | Futures (Percentage of Average Net Assets) | ||||||
Equity Contracts | $ | 352,019,413 | 42.7 | % | ||||
Interest Rate Contracts | 40,142,007 | 4.9 | ||||||
| * | Notional amount represents long or short, or both, derivative positions held by the Portfolio. |
Investment in Affiliates
Affiliated issuers, as defined under the Investment Company Act of 1940, include those in which the Portfolio’s holdings of an issuer represent 5% or more of the outstanding voting securities of an issuer, or any affiliated mutual fund.
A summary of transactions for the fiscal year to date, in Aggressive Allocation Portfolio, is as follows:
Portfolio | Value December 31, 2013 | Gross Purchases | Gross Sales | Shares Held at June 30, 2014 | Value June 30, 2014 | Income Earned January 1, 2014 - June 30, 2014 | ||||||||||||||||||
Opportunity Income Plus | $ | 7,094,444 | $ | 118,096 | $ | — | 710,437 | $ | 7,356,289 | $ | 118,063 | |||||||||||||
Partner Small Cap Growth | 68,748,387 | 7,785,264 | — | 4,044,547 | 68,135,254 | — | ||||||||||||||||||
Partner Small Cap Value | 19,488,107 | 545,987 | — | 708,951 | 19,947,332 | 42,323 | ||||||||||||||||||
Small Cap Stock | 30,462,701 | 398,737 | — | 1,737,044 | 31,263,836 | 66,315 | ||||||||||||||||||
Partner Mid Cap Value | 27,057,173 | 3,929,059 | — | 1,693,599 | 29,402,226 | 181,886 | ||||||||||||||||||
Mid Cap Stock | 44,367,253 | 2,238,876 | — | 2,633,658 | 48,756,121 | 147,439 | ||||||||||||||||||
Partner Worldwide Allocation | 112,823,728 | 2,293,241 | — | 11,481,744 | 117,617,834 | 2,293,241 | ||||||||||||||||||
Large Cap Value | 43,220,812 | 551,300 | — | 2,807,135 | 45,802,907 | 551,300 | ||||||||||||||||||
Large Cap Stock | 36,941,866 | 335,055 | — | 3,155,081 | 39,382,039 | 335,055 | ||||||||||||||||||
High Yield | 9,193,170 | 568,593 | 1,877,789 | 1,559,508 | 8,060,627 | 267,880 | ||||||||||||||||||
Income | 6,048,407 | 2,443,481 | 1,788,216 | 650,183 | 6,897,468 | 136,491 | ||||||||||||||||||
Limited Maturity Bond | 8,294,764 | 5,318,890 | 2,838,216 | 1,097,030 | 10,843,378 | 93,483 | ||||||||||||||||||
Total Value and Income Earned | 413,740,812 | 433,465,311 | 4,233,476 | |||||||||||||||||||||
The accompanying Notes to Financial Statements are an integral part of this schedule.
33
Table of Contents
Moderately Aggressive Allocation Portfolio
Schedule of Investments as of June 30, 2014
(unaudited)
| Principal Amount | Bank Loans (2.0%)a | Value | ||||||
| Basic Materials (0.2%) | |||||||
| Arch Coal, Inc., Term Loan | ||||||||
| $ 3,203,090 | 6.250%, 5/16/2018 | $ | 3,145,050 | |||||
| Axalta Coating Systems US Holdings, Inc.,Term Loan | ||||||||
| 851,400 | 4.000%, 2/1/2020 | 850,906 | ||||||
| Fortescue Metals Group, Ltd., Term Loan | ||||||||
| 1,031,704 | 3.750%, 6/30/2019 | 1,032,096 | ||||||
| Ineos Group Holdings, Ltd., Term Loan | ||||||||
| 1,375,058 | 3.750%, 5/4/2018 | 1,371,112 | ||||||
| NewPage Corporation, Term Loan | ||||||||
| 1,400,000 | 9.500%, 2/11/2021 | 1,401,750 | ||||||
|
| |||||||
| Total | 7,800,914 | |||||||
|
| |||||||
| Capital Goods (0.1%) | |||||||
| ADS Waste Holdings, Inc., Term Loan | ||||||||
| 1,103,200 | 3.750%, 10/9/2019 | 1,097,187 | ||||||
| Berry Plastics Group, Inc., Term Loan | ||||||||
| 1,812,063 | 3.500%, 2/8/2020 | 1,796,026 | ||||||
| Silver II Borrower, Term Loan | ||||||||
| 469,248 | 4.000%, 12/13/2019 | 467,742 | ||||||
|
| |||||||
| Total | 3,360,955 | |||||||
|
| |||||||
| Communications Services (0.7%) | |||||||
| Atlantic Broadband Penn, LLC, Term Loan | ||||||||
| 575,467 | 3.250%, 11/30/2019 | 573,309 | ||||||
| Cengage Learning Aquisitions, Term Loan | ||||||||
| 2,613,450 | 7.000%, 3/31/2020 | 2,641,231 | ||||||
| Cequel Communications, LLC, Term Loan | ||||||||
| 589,235 | 3.500%, 2/14/2019 | 589,053 | ||||||
| Charter Communications Operating, LLC, Term Loan | ||||||||
| 242,550 | 3.000%, 7/1/2020 | 238,676 | ||||||
| Clear Channel Communications, Inc., Term Loan | ||||||||
| 24,347 | 3.800%, 1/29/2016 | 24,175 | ||||||
| 1,398,024 | 6.900%, 1/30/2019 | 1,390,279 | ||||||
| 449,628 | 7.650%, 7/30/2019 | 450,330 | ||||||
| Cumulus Media Holdings, Inc., Term Loan | ||||||||
| 910,629 | 4.250%, 12/23/2020 | 912,906 | ||||||
| Fairpoint Communications, Term Loan | ||||||||
| 1,209,688 | 7.500%, 2/14/2019 | 1,251,277 | ||||||
| Grande Communications Networks, LLC, Term Loan | ||||||||
| 737,552 | 4.500%, 5/29/2020 | 734,787 | ||||||
| Hargray Communications Group, Inc., Term Loan | ||||||||
| 1,044,450 | 4.750%, 6/26/2019 | 1,047,061 | ||||||
| Integra Telecom Holdings, Inc., Term Loan | ||||||||
| 735,688 | 5.250%, 2/22/2019 | 739,550 | ||||||
| 250,000 | 9.750%, 2/21/2020 | 254,167 | ||||||
| Intelsat Jackson Holdings SA, Term Loan | ||||||||
| 1,097,851 | 3.750%, 6/30/2019 | 1,098,762 | ||||||
| Level 3 Communications, Inc., Term Loan | ||||||||
| 1,555,000 | 4.000%, 1/15/2020 | 1,555,327 | ||||||
| Liberty Cablevision of Puerto Rico, LLC, Term Loan | ||||||||
| 1,830,000 | 0.000%, 12/11/2021b,c | 1,831,519 | ||||||
| Liberty Cablevision of Puerto Rico, Ltd., Term Loan | ||||||||
| 784,000 | 6.000%, 6/9/2017 | 784,000 | ||||||
| LTS Buyer, LLC, Term Loan | ||||||||
| 549,450 | 4.000%, 4/13/2020 | 547,587 | ||||||
| 39,215 | 8.000%, 4/12/2021 | 39,575 | ||||||
| McGraw-Hill Global Education, LLC, Term Loan | ||||||||
| 1,118,928 | 5.750%, 3/22/2019 | 1,137,111 | ||||||
| Mediacom Broadband, LLC, Term Loan | ||||||||
| 628,800 | 4.000%, 1/20/2020 | 627,492 | ||||||
| NEP Broadcasting, LLC, Term Loan | ||||||||
| 68,571 | 9.500%, 7/22/2020 | 70,457 | ||||||
| NEP/NCP Holdco, Inc., Term Loan | ||||||||
| 1,817,046 | 4.250%, 1/22/2020 | 1,816,592 | ||||||
| NTelos, Inc., Term Loan | ||||||||
| 363,525 | 5.750%, 11/9/2019 | 363,223 | ||||||
| Syniverse Holdings, Inc., Term Loan | ||||||||
| 950,131 | 4.000%, 4/23/2019 | 948,943 | ||||||
| TNS, Inc., Term Loan | ||||||||
| 721,908 | 5.000%, 2/14/2020 | 724,615 | ||||||
| Univision Communications, Inc., Term Loan | ||||||||
| 1,680,444 | 4.000%, 3/1/2020 | 1,678,158 | ||||||
| Virgin Media Investment Holdings, Ltd., Term Loan | ||||||||
| 1,505,000 | 3.500%, 6/7/2020 | 1,499,823 | ||||||
| Visant Corporation, Term Loan | ||||||||
| 2,009,246 | 5.250%, 12/22/2016 | 1,999,702 | ||||||
| WideOpenWest Finance, LLC, Term Loan | ||||||||
| 1,609,625 | 4.750%, 4/1/2019 | 1,613,391 | ||||||
| XO Communications, LLC, Term Loan | ||||||||
| 299,250 | 4.250%, 3/20/2021 | 300,794 | ||||||
| Yankee Cable Acquisition, LLC, Term Loan | ||||||||
| 946,092 | 4.500%, 3/1/2020 | 950,529 | ||||||
| Zayo Group, LLC, Term Loan | ||||||||
| 1,469,495 | 4.000%, 7/2/2019 | 1,470,567 | ||||||
|
| |||||||
| Total | 31,904,968 | |||||||
|
| |||||||
| Consumer Cyclical (0.4%) | |||||||
| Bally Technologies, Inc., Term Loan | ||||||||
| 594,391 | 4.250%, 11/25/2020 | 596,620 | ||||||
| Burlington Coat Factory Warehouse Corporation, Term Loan | ||||||||
| 900,823 | 4.250%, 2/23/2017 | 905,706 | ||||||
The accompanying Notes to Financial Statements are an integral part of this schedule.
34
Table of Contents
Moderately Aggressive Allocation Portfolio
Schedule of Investments as of June 30, 2014
(unaudited)
| Principal Amount | Bank Loans (2.0%)a | Value | ||||||
| Consumer Cyclical (0.4%) - continued | |||||||
| Ceridian Corporation, Term Loan | ||||||||
| $ 852,406 | 4.400%, 8/14/2015 | $ | 853,336 | |||||
| Chrysler Group, LLC, Term Loan | ||||||||
| 824,377 | 3.500%, 5/24/2017 | 826,825 | ||||||
| Golden Nugget, Inc., Delayed Draw | ||||||||
| 150,743 | 5.500%, 11/21/2019 | 153,569 | ||||||
| Golden Nugget, Inc., Term Loan | ||||||||
| 351,733 | 5.500%, 11/21/2019 | 358,327 | ||||||
| Hilton Worldwide Finance, LLC, Term Loan | ||||||||
| 886,053 | 3.500%, 10/26/2020 | 884,210 | ||||||
| J.C. Penney Corporation, Inc., Term Loan | ||||||||
| 366,300 | 6.000%, 5/22/2018 | 370,311 | ||||||
| Las Vegas Sands, LLC, Term Loan | ||||||||
| 4,676,500 | 3.250%, 12/19/2020 | 4,673,834 | ||||||
| Marina District Finance Company, Inc., Term Loan | ||||||||
| 3,174,050 | 6.750%, 8/15/2018 | 3,208,742 | ||||||
| MGM Resorts International, Term Loan | ||||||||
| 768,300 | 3.500%, 12/20/2019 | 765,657 | ||||||
| Mohegan Tribal Gaming Authority, Term Loan | ||||||||
| 1,492,500 | 5.500%, 11/19/2019 | 1,515,514 | ||||||
| Rite Aid Corporation, Term Loan | ||||||||
| 183,153 | 3.500%, 2/21/2020 | 182,848 | ||||||
| 365,000 | 5.750%, 8/21/2020 | 372,643 | ||||||
| ROC Finance, LLC, Term Loan | ||||||||
| 1,344,837 | 5.000%, 6/20/2019 | 1,321,303 | ||||||
| Scientific Games International, Inc., Term Loan | ||||||||
| 413,960 | 4.250%, 10/18/2020 | 409,237 | ||||||
| Seminole Indian Tribe of Florida, Term Loan | ||||||||
| 419,750 | 3.000%, 4/29/2020 | 418,877 | ||||||
| Seven Seas Cruises S de RL, LLC, Term Loan | ||||||||
| 1,188,508 | 3.750%, 12/21/2018 | 1,187,022 | ||||||
| Toys R Us, Inc., Term Loan | ||||||||
| 1,233,092 | 5.250%, 5/25/2018 | 996,745 | ||||||
|
| |||||||
| Total | 20,001,326 | |||||||
|
| |||||||
| Consumer Non-Cyclical (0.2%) | |||||||
| Albertsons, Inc., Term Loan | ||||||||
| 1,079,134 | 4.750%, 3/21/2019 | 1,083,850 | ||||||
| Biomet, Inc., Term Loan | ||||||||
| 934,668 | 3.661%, 7/25/2017 | 935,388 | ||||||
| Catalina Marketing Corporation, Term Loan | ||||||||
| 305,000 | 4.500%, 4/9/2021 | 304,872 | ||||||
| CHS/Community Health Systems, Inc., Term Loan | ||||||||
| 217,170 | 3.478%, 1/25/2017 | 217,622 | ||||||
| 578,830 | 4.250%, 1/27/2021 | 581,921 | ||||||
| Del Monte Corporation, Term Loan | ||||||||
| 149,942 | 3.500%, 3/9/2020 | 148,583 | ||||||
| Hologic, Inc., Term Loan | ||||||||
| 765,359 | 3.250%, 8/1/2019 | 764,402 | ||||||
| JBS USA, LLC, Term Loan | ||||||||
| 804,656 | 3.750%, 5/25/2018 | 802,644 | ||||||
| Ortho-Clinical Diagnostics, Inc., Term Loan | ||||||||
| 1,890,000 | 4.750%, 6/30/2021b,c | 1,904,421 | ||||||
| Roundy’s Supermarkets, Inc., Term Loan | ||||||||
| 1,543,222 | 5.750%, 3/3/2021 | 1,545,428 | ||||||
| Supervalu, Inc., Term Loan | ||||||||
| 1,108,130 | 4.500%, 3/21/2019 | 1,106,612 | ||||||
| Van Wagner Communications, LLC, Term Loan | ||||||||
| 670,376 | 6.250%, 8/3/2018 | 677,362 | ||||||
|
| |||||||
| Total | 10,073,105 | |||||||
|
| |||||||
| Energy (<0.1%) | |||||||
| Energy Solutions, LLC, Term Loan | ||||||||
| 605,000 | 6.750%, 5/29/2020 | 611,050 | ||||||
| Fieldwood Energy, LLC, Term Loan | ||||||||
| 96,059 | 8.375%, 9/30/2020 | 98,989 | ||||||
| McJunkin Red Man Corporation, Term Loan | ||||||||
| 615,350 | 5.000%, 11/8/2019 | 618,427 | ||||||
| Offshore Group Investment, Ltd., Term Loan | ||||||||
| 992,437 | 5.750%, 3/28/2019 | 985,818 | ||||||
| Pacific Drilling SA, Term Loan | ||||||||
| 490,050 | 4.500%, 6/3/2018 | 491,427 | ||||||
|
| |||||||
| Total | 2,805,711 | |||||||
|
| |||||||
| Financials (0.1%) | |||||||
| DJO Finance, LLC, Term Loan | ||||||||
| 1,148,846 | 4.250%, 9/15/2017 | 1,152,442 | ||||||
| GEO Group, Inc., Term Loan | ||||||||
| 243,540 | 3.250%, 4/3/2020 | 243,389 | ||||||
| Harland Clarke Holdings Corporation, Term Loan | ||||||||
| 740,625 | 6.000%, 8/4/2019 | 753,031 | ||||||
| MoneyGram International, Inc., Term Loan | ||||||||
| 967,750 | 4.250%, 3/27/2020 | 953,843 | ||||||
| WaveDivision Holdings, LLC, Term Loan | ||||||||
| 1,462,725 | 4.000%, 10/12/2019 | 1,461,335 | ||||||
|
| |||||||
| Total | 4,564,040 | |||||||
|
| |||||||
| Technology (0.1%) | |||||||
| First Data Corporation Extended, Term Loan | ||||||||
| 1,540,000 | 4.154%, 3/23/2018 | 1,541,925 | ||||||
| First Data Corporation, Term Loan | ||||||||
| 640,000 | 4.154%, 9/24/2018 | 640,454 | ||||||
| Freescale Semiconductor, Inc., Term Loan | ||||||||
| 878,908 | 4.250%, 2/28/2020 | 878,179 | ||||||
| 597,485 | 5.000%, 1/15/2021 | 599,630 | ||||||
| Infor US, Inc., Term Loan | ||||||||
| 1,228,465 | 3.750%, 6/3/2020 | 1,219,510 | ||||||
|
| |||||||
| Total | 4,879,698 | |||||||
|
| |||||||
The accompanying Notes to Financial Statements are an integral part of this schedule.
35
Table of Contents
Moderately Aggressive Allocation Portfolio
Schedule of Investments as of June 30, 2014
(unaudited)
| Principal Amount | Bank Loans (2.0%)a | Value | ||||||
| Transportation (0.1%) |
| ||||||
| American Airlines, Inc., Term Loan | ||||||||
| $ 1,039,500 | 3.750%, 6/27/2019 | $ | 1,040,508 | |||||
| Delta Air Lines, Inc., Term Loan | ||||||||
| 1,229,449 | 3.500%, 4/20/2017 | 1,228,576 | ||||||
| United Air Lines, Inc., Term Loan | ||||||||
| 607,313 | 3.750%, 4/1/2019 | 605,145 | ||||||
|
| |||||||
| Total | 2,874,229 | |||||||
|
| |||||||
| Utilities (0.1%) | |||||||
| Calpine Corporation, Term Loan | ||||||||
| 182,176 | 4.000%, 4/1/2018 | 182,687 | ||||||
| 1,257,600 | 4.000%, 10/9/2019 | 1,260,216 | ||||||
| Intergen NV, Term Loan | ||||||||
| 485,100 | 5.500%, 6/15/2020 | 488,336 | ||||||
| NGPL PipeCo, LLC, Term Loan | ||||||||
| 1,065,461 | 6.750%, 9/15/2017 | 1,064,129 | ||||||
|
| |||||||
| Total | 2,995,368 | |||||||
|
| |||||||
Total Bank Loans (cost $91,010,702) | 91,260,314 | |||||||
|
| |||||||
| Shares | Mutual Funds (44.8%) | |||||||
| Equity Mutual Funds (37.9%) | |||||||
| 5,844,908 | Thrivent Partner Small Cap Growth Portfolio | 98,464,484 | ||||||
| 3,483,432 | Thrivent Partner Small Cap Value Portfolio | 98,011,243 | ||||||
| 4,604,230 | Thrivent Small Cap Stock Portfolio | 82,868,320 | ||||||
| 7,570,495 | Thrivent Partner Mid Cap Value Portfolio | 131,429,855 | ||||||
| 14,848,287 | Thrivent Mid Cap Stock Portfolio | 274,881,879 | ||||||
| 47,730,280 | Thrivent Partner Worldwide Allocation Portfolio | 488,944,214 | ||||||
| 19,283,176 | Thrivent Large Cap Value Portfolio | 314,635,868 | ||||||
| 22,340,673 | Thrivent Large Cap Stock Portfolio | 278,858,515 | ||||||
|
| |||||||
| Total | 1,768,094,378 | |||||||
|
| |||||||
| Fixed Income Mutual Funds (6.9%) | |||||||
| 25,494,958 | Thrivent High Yield Portfolio | 131,775,788 | ||||||
| 14,032,536 | Thrivent Income Portfolio | 148,864,162 | ||||||
| 4,307,966 | Thrivent Limited Maturity Bond Portfolio | 42,581,231 | ||||||
|
| |||||||
| Total | 323,221,181 | |||||||
|
| |||||||
Total Mutual Funds (cost $1,731,842,134) | 2,091,315,559 | |||||||
|
| |||||||
Common Stock (27.7%) | ||||||||
| Consumer Discretionary (4.1%) | |||||||
| 9,350 | Aaron’s, Inc. | 333,234 | ||||||
| 12,350 | Abercrombie & Fitch Company | 534,138 | ||||||
| 4,800 | Alpine Electronics, Inc. | 67,695 | ||||||
| 46,742 | Amazon.com, Inc.d | 15,180,867 | ||||||
| 7,700 | Aoyama Trading Company, Ltd. | 210,867 | ||||||
| 23,550 | AutoZone, Inc.d | 12,628,452 | ||||||
| 27,050 | Barnes & Noble, Inc.d,e | 616,470 | ||||||
| 1,900 | Bayerische Motoren Werke AG | 181,910 | ||||||
| 74,000 | Best Buy Company, Inc. | 2,294,740 | ||||||
| 11,000 | Big Lots, Inc.d | 502,700 | ||||||
| 26,700 | Bloomin’ Brands, Inc.d | 598,881 | ||||||
| 30,290 | BorgWarner, Inc. | 1,974,605 | ||||||
| 2,000 | Bridgestone Corporation | 70,047 | ||||||
| 4,550 | Brinker International, Inc. | 221,358 | ||||||
| 74,300 | Cablevision Systems Corporatione | 1,311,395 | ||||||
| 28,650 | CBS Corporatione | 1,780,311 | ||||||
| 69,440 | Cheesecake Factory, Inc. | 3,223,405 | ||||||
| 10,100 | Children’s Place Retail Stores, Inc. | 501,263 | ||||||
| 6,150 | Coinstar, Inc.d | 365,003 | ||||||
| 368,036 | Comcast Corporation | 19,756,172 | ||||||
| 1,800 | Continental AG | 416,179 | ||||||
| 2,300 | Crown Resorts, Ltd. | 32,783 | ||||||
| 300 | Daimler AG | 28,024 | ||||||
| 8,900 | Deckers Outdoor Corporationd | 768,337 | ||||||
| 96,119 | Delphi Automotive plc | 6,607,220 | ||||||
| 7,600 | DeVry Education Group, Inc. | 321,784 | ||||||
| 11,082 | Discovery Communications, Inc.d | 823,171 | ||||||
| 24,050 | DISH Network Corporationd | 1,565,174 | ||||||
| 54,386 | Dollar Tree, Inc.d | 2,961,862 | ||||||
| 20,030 | Dunkin’ Brands Group, Inc. | 917,574 | ||||||
| 12,300 | EDION Corporation | 85,387 | ||||||
| 59,900 | Esprit Holdings, Ltd. | 85,006 | ||||||
| 1,600 | Exedy Corporation | 47,621 | ||||||
| 2,119 | Faurecia | 79,958 | ||||||
| 700 | Flight Centre Travel Group, Ltd. | 29,333 | ||||||
| 100 | Forbo Holding AG | 106,619 | ||||||
| 94,250 | Ford Motor Company | 1,624,870 | ||||||
| 13,400 | G-III Apparel Group, Ltd.d | 1,094,244 | ||||||
| 22,240 | GNC Holdings, Inc. | 758,384 | ||||||
| 21,000 | Halfords Group plc | 169,876 | ||||||
| 7,500 | Harman International Industries, Inc. | 805,725 | ||||||
| 18,300 | Haseko Corporation | 147,253 | ||||||
| 121,200 | Home Depot, Inc. | 9,812,352 | ||||||
| 61,400 | Home Retail Group plc | 185,523 | ||||||
| 23,410 | HomeAway, Inc.d | 815,136 | ||||||
| 7,100 | Honda Motor Company, Ltd.e | 247,753 | ||||||
| 90,040 | Houghton Mifflin Harcourt Companyd | 1,725,166 | ||||||
| 11,550 | Iconix Brand Group, Inc.d | 495,957 | ||||||
| 81,197 | Ignite Restaurant Group, Inc.d | 1,182,228 | ||||||
| 13,550 | ITT Educational Services, Inc.d,e | 226,150 | ||||||
| 33,400 | ITV plc | 101,784 | ||||||
| 4,650 | Jack in the Box, Inc. | 278,256 | ||||||
| 12,200 | JB Hi-Fi, Ltd. | 210,947 | ||||||
| 6,500 | JM AB | 240,909 | ||||||
| 14,150 | Kohl’s Corporation | 745,422 | ||||||
| 200 | Kuoni Reisen Holding AG | 77,401 | ||||||
| 20,550 | Lamar Advertising Company | 1,089,150 | ||||||
| 173,627 | Las Vegas Sands Corporation | 13,233,850 | ||||||
| 96,000 | Li & Fung, Ltd. | 142,195 | ||||||
| 26,900 | Liberty Interactive Corporationd | 789,784 | ||||||
| 15,519 | Limited Brands, Inc. | 910,345 | ||||||
| 8,650 | Lions Gate Entertainment Corporatione | 247,217 | ||||||
| 44,550 | Live Nation Entertainment, Inc.d | 1,099,940 | ||||||
| 117,860 | Lowe’s Companies, Inc. | 5,656,101 | ||||||
| 70,000 | Luk Fook Holdings International, Ltd. | 205,269 | ||||||
| 42,200 | Macy’s, Inc. | 2,448,444 | ||||||
| 33,090 | Marriott International, Inc. | 2,121,069 | ||||||
| 10,550 | Marriott Vacations Worldwide Corporationd | 618,547 | ||||||
| 111,312 | MDC Partners, Inc. | 2,392,095 | ||||||
| 7,600 | Meredith Corporation | 367,536 | ||||||
The accompanying Notes to Financial Statements are an integral part of this schedule.
36
Table of Contents
Moderately Aggressive Allocation Portfolio
Schedule of Investments as of June 30, 2014
(unaudited)
| Shares | Common Stock (27.7%) | Value | ||||||
| Consumer Discretionary (4.1%) - continued |
| ||||||
| 850 | Michael Kors Holdings, Ltd.d | $ | 75,353 | |||||
| 9,350 | Multimedia Games Holding Company, Inc.d | 277,134 | ||||||
| 21,150 | Nautilus, Inc.d | 234,554 | ||||||
| 101,450 | News Corporation | 3,472,634 | ||||||
| 3,500 | Next plc | 387,459 | ||||||
| 162,250 | NIKE, Inc. | 12,582,487 | ||||||
| 27,305 | NutriSystem, Inc. | 467,189 | ||||||
| 16,350 | Omnicom Group, Inc. | 1,164,447 | ||||||
| 30,600 | Orbitz Worldwide, Inc.d | 272,340 | ||||||
| 10,633 | O’Reilly Automotive, Inc.d | 1,601,330 | ||||||
| 24,870 | Papa John’s International, Inc. | 1,054,239 | ||||||
| 6,800 | Persimmon plc | 148,101 | ||||||
| 23,760 | PetSmart, Inc.e | 1,420,848 | ||||||
| 12,100 | Peugeot SAd | 179,027 | ||||||
| 4,400 | Publicis Groupe SA | 372,928 | ||||||
| 10,500 | PVH Corporation | 1,224,300 | ||||||
| 13,050 | Restoration Hardware Holdings, Inc.d | 1,214,303 | ||||||
| 400 | Rinnai Corporation | 38,616 | ||||||
| 7,460 | Ross Stores, Inc. | 493,330 | ||||||
| 1,300 | RTL Group SA | 144,294 | ||||||
| 900 | SA D’Ieteren NV | 37,700 | ||||||
| 59,700 | Samsonite International SA | 196,795 | ||||||
| 26,050 | Scientific Games Corporationd | 289,676 | ||||||
| 13,450 | Scripps Networks Interactive, Inc. | 1,091,333 | ||||||
| 29,000 | Seiko Holdings Corporation | 117,831 | ||||||
| 5,000 | Sekisui House, Ltd. | 68,612 | ||||||
| 12,500 | SHOWA Corporation | 152,288 | ||||||
| 9,172 | Slater & Gordon, Ltd. | 44,672 | ||||||
| 40,350 | Smith & Wesson Holding Corporationd,e | 586,689 | ||||||
| 109,761 | Staples, Inc.e | 1,189,809 | ||||||
| 104,000 | Starbucks Corporation | 8,047,520 | ||||||
| 21,410 | Starwood Hotels & Resorts Worldwide, Inc. | 1,730,356 | ||||||
| 19,100 | Sumitomo Forestry Company, Ltd. | 233,204 | ||||||
| 2,700 | Suzuki Motor Corporation | 84,703 | ||||||
| 29,080 | Time Warner Cable, Inc. | 4,283,484 | ||||||
| 45,340 | Toll Brothers, Inc.d | 1,673,046 | ||||||
| 12,970 | Tractor Supply Company | 783,388 | ||||||
| 127,500 | Tuesday Morning Corporationd | 2,272,050 | ||||||
| 210,350 | Twenty-First Century Fox, Inc. | 7,393,803 | ||||||
| 22,980 | Under Armour, Inc.d | 1,367,080 | ||||||
| 200 | Valora Holding AG | 51,686 | ||||||
| 19,392 | VF Corporation | 1,221,696 | ||||||
| 400 | Volkswagen AG | 104,767 | ||||||
| 6,100 | WH Smith plc | 111,622 | ||||||
| 1,100 | Wolters Kluwer NV | 32,584 | ||||||
| 1,600 | WPP plc | 34,867 | ||||||
| 23,600 | Wyndham Worldwide Corporation | 1,786,992 | ||||||
| 53,200 | Wynn Macau, Ltd. | 208,367 | ||||||
| 6,290 | Wynn Resorts, Ltd. | 1,305,552 | ||||||
| 14,200 | Zumiez, Inc.d,e | 391,778 | ||||||
|
| |||||||
| Total | 193,215,286 | |||||||
|
| |||||||
| Consumer Staples (1.2%) | |||||||
| 800 | AarhusKarlshamn AB | 53,454 | ||||||
| 65,500 | Altria Group, Inc. | 2,747,070 | ||||||
| 9,118 | Andersons, Inc. | 470,306 | ||||||
| 61,600 | Anheuser-Busch InBev NV ADR | 7,080,304 | ||||||
| 41,506 | Annie’s, Inc.d | 1,403,733 | ||||||
| 50,000 | Archer-Daniels-Midland Company | 2,205,500 | ||||||
| 2,800 | Asahi Group Holdings, Ltd. | 87,928 | ||||||
| 11,600 | Britvic plc | 144,413 | ||||||
| 31,900 | Bunge, Ltd. | 2,412,916 | ||||||
| 900 | Carrefour SA | 33,187 | ||||||
| 2,100 | Casino Guichard Perrachon SA | 278,419 | ||||||
| 17,500 | Coca-Cola Enterprises, Inc. | 836,150 | ||||||
| 7,100 | Colgate-Palmolive Company | 484,078 | ||||||
| 126,300 | CVS Caremark Corporation | 9,519,231 | ||||||
| 8,150 | Green Mountain Coffee Roasters, Inc. | 1,015,572 | ||||||
| 16,820 | Greencore Group plc | 76,455 | ||||||
| 18,440 | Hain Celestial Group, Inc.d | 1,636,366 | ||||||
| 800 | Henkel AG & Company KGaA | 80,453 | ||||||
| 800 | Imperial Tobacco Group plc | 35,990 | ||||||
| 41,900 | Ingredion, Inc. | 3,144,176 | ||||||
| 6,750 | J.M. Smucker Company | 719,347 | ||||||
| 2,700 | Kerry Group plc | 201,751 | ||||||
| 4,000 | Kesko Oyj | 158,064 | ||||||
| 18,370 | Kimberly-Clark Corporation | 2,043,111 | ||||||
| 3,861 | Koninklijke Ahold NV | 72,398 | ||||||
| 1,800 | KOSE Corporation | 68,795 | ||||||
| 18,480 | Kraft Foods Group, Inc. | 1,107,876 | ||||||
| 17,950 | Kroger Company | 887,268 | ||||||
| 2,400 | Matsumotokiyoshi Holdings Company, Ltd. | 83,071 | ||||||
| 80,360 | Mondelez International, Inc. | 3,022,340 | ||||||
| 22,610 | Monster Beverage Corporationd | 1,605,988 | ||||||
| 2,000 | Nestle SA | 154,974 | ||||||
| 28,900 | Parmalat SPA | 98,853 | ||||||
| 20,616 | Philip Morris International, Inc. | 1,738,135 | ||||||
| 28,900 | Pilgrim’s Pride Corporationd | 790,704 | ||||||
| 16,600 | Procter & Gamble Company | 1,304,594 | ||||||
| 1,200 | Rallye SA | 65,471 | ||||||
| 6,200 | Reckitt Benckiser Group plc | 540,607 | ||||||
| 171,550 | Rite Aid Corporationd | 1,230,013 | ||||||
| 5,090 | SalMar ASA | 88,823 | ||||||
| 4,100 | Sanderson Farms, Inc.e | 398,520 | ||||||
| 2,000 | Suedzucker AG | 40,386 | ||||||
| 9,540 | United Natural Foods, Inc.d | 621,054 | ||||||
| 10,800 | Wal-Mart Stores, Inc. | 810,756 | ||||||
| 103,800 | WhiteWave Foods Companyd | 3,360,006 | ||||||
| 6,286 | Whole Foods Market, Inc. | 242,828 | ||||||
| 88,000 | Wilmar International, Ltd. | 225,268 | ||||||
|
| |||||||
| Total | 55,426,702 | |||||||
|
| |||||||
| Energy (3.6%) | |||||||
| 227,520 | Alpha Natural Resources, Inc.d,e | 844,099 | ||||||
| 4,000 | Atwood Oceanics, Inc.d | 209,920 | ||||||
| 9,150 | Baker Hughes, Inc. | 681,217 | ||||||
| 22,000 | Basic Energy Services, Inc.d | 642,840 | ||||||
| 40,900 | BP plc | 360,160 | ||||||
| 4,406 | Cabot Oil & Gas Corporation | 150,421 | ||||||
| 229,950 | Cameron International Corporationd | 15,569,915 | ||||||
| 2,500 | CAT Oil AG | 64,077 | ||||||
| 46,580 | Chevron Corporation | 6,081,019 | ||||||
| 1,920 | Cimarex Energy Company | 275,443 | ||||||
| 69,500 | Cobalt International Energy, Inc.d | 1,275,325 | ||||||
| 27,140 | Concho Resources, Inc.d | 3,921,730 | ||||||
| 5,050 | ConocoPhillips | 432,936 | ||||||
| 300 | Delek Group, Ltd. | 124,095 | ||||||
| 11,600 | Denbury Resources, Inc. | 214,136 | ||||||
| 3,800 | Diamondback Energy, Inc.d | 337,440 | ||||||
The accompanying Notes to Financial Statements are an integral part of this schedule.
37
Table of Contents
Moderately Aggressive Allocation Portfolio
Schedule of Investments as of June 30, 2014
(unaudited)
| Shares | Common Stock (27.7%) | Value | ||||||
| Energy (3.6%) - continued | |||||||
| 22,900 | Dril-Quip, Inc.d | $ | 2,501,596 | |||||
| 1,500 | Energen Corporation | 133,320 | ||||||
| 6,100 | Eni SPA | 166,833 | ||||||
| 6,430 | Ensco plc | 357,315 | ||||||
| 112,272 | EOG Resources, Inc. | 13,120,106 | ||||||
| 58,431 | EQT Corporation | 6,246,274 | ||||||
| 5,200 | ERG SPA | 80,246 | ||||||
| 20,800 | Exterran Holdings, Inc. | 935,792 | ||||||
| 81,250 | Exxon Mobil Corporation | 8,180,250 | ||||||
| 400 | Frank’s International NV | 9,840 | ||||||
| 15,500 | Green Plains, Inc. | 509,485 | ||||||
| 4,900 | Gulfmark Offshore, Inc. | 221,382 | ||||||
| 1,700 | Gulfport Energy Corporationd | 106,760 | ||||||
| 2,790 | Helmerich & Payne, Inc. | 323,947 | ||||||
| 4,900 | Hess Corporation | 484,561 | ||||||
| 13,640 | HollyFrontier Corporation | 595,932 | ||||||
| 21,550 | Kosmos Energy, Ltd.d | 242,007 | ||||||
| 437,898 | Marathon Oil Corporation | 17,480,888 | ||||||
| 48,160 | Market Vectors Oil Service ETF | 2,781,722 | ||||||
| 60,700 | Nabors Industries, Ltd. | 1,782,759 | ||||||
| 39,260 | National Oilwell Varco, Inc. | 3,233,061 | ||||||
| 11,200 | Neste Oil Oyj | 218,540 | ||||||
| 4,640 | Noble Corporation | 155,718 | ||||||
| 3,100 | Noble Energy, Inc. | 240,126 | ||||||
| 94,270 | Oasis Petroleum, Inc.d | 5,268,750 | ||||||
| 16,000 | Occidental Petroleum Corporation | 1,642,080 | ||||||
| 2,980 | Oceaneering International, Inc. | 232,827 | ||||||
| 2,665 | Oil States International, Inc.d | 170,800 | ||||||
| 2,600 | Origin Energy, Ltd. | 35,837 | ||||||
| 14,450 | Patterson-UTI Energy, Inc. | 504,883 | ||||||
| 86,839 | Peabody Energy Corporation | 1,419,818 | ||||||
| 55,500 | Petroleo Brasileiro SA ADR | 811,965 | ||||||
| 3,750 | Phillips 66 | 301,613 | ||||||
| 5,940 | Pioneer Natural Resources Company | 1,365,071 | ||||||
| 7,500 | QEP Resources, Inc. | 258,750 | ||||||
| 1,990 | Range Resources Corporation | 173,031 | ||||||
| 61,770 | Rex Energy Corporationd | 1,093,947 | ||||||
| 22,110 | Rosetta Resources, Inc.d | 1,212,734 | ||||||
| 4,250 | Rowan Companies plc | 135,702 | ||||||
| 22,364 | Royal Dutch Shell plc | 923,412 | ||||||
| 157 | Royal Dutch Shell plc, Class A | 6,488 | ||||||
| 15,000 | Royal Dutch Shell plc, Class B | 651,898 | ||||||
| 1,300 | Saipem SPAd | 35,052 | ||||||
| 33,800 | SandRidge Energy, Inc.d,e | 241,670 | ||||||
| 169,220 | Schlumberger, Ltd. | 19,959,499 | ||||||
| 5,300 | Showa Shell Sekiyu KK | 60,245 | ||||||
| 47,230 | SM Energy Company | 3,972,043 | ||||||
| 113,440 | Southwestern Energy Companyd | 5,160,386 | ||||||
| 24,250 | Superior Energy Services, Inc. | 876,395 | ||||||
| 3,400 | Total SA | 245,989 | ||||||
| 107,900 | Total SA ADRe | 7,790,380 | ||||||
| 79,386 | Trinidad Drilling, Ltd. | 900,955 | ||||||
| 4,700 | Unit Corporationd | 323,501 | ||||||
| 871,330 | Weatherford International, Ltd.d | 20,040,590 | ||||||
| 9,790 | Whiting Petroleum Corporationd | 785,648 | ||||||
| 2,300 | Woodside Petroleum, Ltd. | 89,174 | ||||||
|
| |||||||
| Total | 167,984,366 | |||||||
|
| |||||||
| Financials (4.7%) | |||||||
| 25,550 | ACE, Ltd. | 2,649,535 | ||||||
| 24,218 | Affiliated Managers Group, Inc.d | 4,974,377 | ||||||
| 2,500 | Allianz SE | 417,285 | ||||||
| 45,660 | Allied World Assurance Company Holdings AG | 1,735,993 | ||||||
| 36,540 | Allstate Corporation | 2,145,629 | ||||||
| 19,100 | American Assets Trust, Inc. | 659,905 | ||||||
| 49,950 | American International Group, Inc. | 2,726,271 | ||||||
| 15,330 | Ameriprise Financial, Inc. | 1,839,600 | ||||||
| 4,600 | Amlin plc | 36,819 | ||||||
| 7,950 | AmTrust Financial Services, Inc.e | 332,390 | ||||||
| 4,118 | Argo Group International Holdings, Ltd. | 210,471 | ||||||
| 17,200 | Assicurazioni Generali SPA | 376,689 | ||||||
| 19,300 | Aviva plc | 168,387 | ||||||
| 2,900 | AXA SA | 69,291 | ||||||
| 14,600 | Bank Leumi Le-Israel BMd | 56,904 | ||||||
| 345,740 | Bank of America Corporation | 5,314,024 | ||||||
| 1,000 | Bank of Georgia Holdings plc | 40,214 | ||||||
| 10,150 | Banner Corporation | 402,245 | ||||||
| 62,590 | BBCN Bancorp, Inc. | 998,310 | ||||||
| 48,650 | Berkshire Hathaway, Inc.d | 6,157,144 | ||||||
| 61,700 | Blackstone Group, LPd | 2,063,248 | ||||||
| 9,992 | Boston Properties, Inc. | 1,180,855 | ||||||
| 19,200 | Camden Property Trust | 1,366,080 | ||||||
| 4,000 | Catlin Group, Ltd. | 36,605 | ||||||
| 7,600 | CBRE Group, Inc.d | 243,504 | ||||||
| 27,400 | Challenger, Ltd. | 192,202 | ||||||
| 234,917 | Citigroup, Inc. | 11,064,591 | ||||||
| 8,815 | CNA Financial Corporation | 356,302 | ||||||
| 135,000 | CNO Financial Group, Inc. | 2,403,000 | ||||||
| 3,000 | CNP Assurances | 62,265 | ||||||
| 58,000 | Comerica, Inc. | 2,909,280 | ||||||
| 8,600 | Commonwealth Bank of Australia | 655,907 | ||||||
| 12,861 | Credit Agricole SA | 181,583 | ||||||
| 16,100 | Crown Castle International Corporation | 1,195,586 | ||||||
| 3,300 | Daito Trust Construction Company, Ltd. | 388,044 | ||||||
| 28,000 | Daiwa Securities Group, Inc. | 242,600 | ||||||
| 22,800 | DDR Corporation | 401,964 | ||||||
| 46,255 | Deutsche Bank AG | 1,627,251 | ||||||
| 9,550 | Digital Realty Trust, Inc. | 556,956 | ||||||
| 57,979 | Discover Financial Services | 3,593,538 | ||||||
| 31,000 | Duke Realty Corporation | 562,960 | ||||||
| 58,700 | Education Realty Trust, Inc. | 630,438 | ||||||
| 18,288 | Equity Residential | 1,152,144 | ||||||
| 5,000 | EXOR SPA | 205,113 | ||||||
| 11,590 | Extra Space Storage, Inc. | 617,168 | ||||||
| 93,400 | Fifth Third Bancorp | 1,994,090 | ||||||
| 43,400 | First Horizon National Corporation | 514,724 | ||||||
| 96,650 | First Niagara Financial Group, Inc. | 844,721 | ||||||
| 72,300 | First Republic Bank | 3,975,777 | ||||||
| 13,100 | FlexiGroup, Ltd. | 39,139 | ||||||
| 12,132 | Friends Life Group, Ltd. | 65,418 | ||||||
| 29,400 | Fulton Financial Corporation | 364,266 | ||||||
| 21,116 | Gaming and Leisure Properties, Inc. | 717,311 | ||||||
| 9,500 | General Growth Properties, Inc. | 223,820 | ||||||
| 422,473 | Genworth Financial, Inc.d | 7,351,030 | ||||||
| 900 | Grupo Catalana Occidente SA | 32,669 | ||||||
| 68,030 | Hanmi Financial Corporation | 1,434,072 | ||||||
| 400 | Hannover Rueckversicherung SE | 36,021 | ||||||
| 36,522 | HCC Insurance Holdings, Inc. | 1,787,387 | ||||||
| 11,063 | Health Care REIT, Inc. | 693,318 | ||||||
The accompanying Notes to Financial Statements are an integral part of this schedule.
38
Table of Contents
Moderately Aggressive Allocation Portfolio
Schedule of Investments as of June 30, 2014
(unaudited)
| Shares | Common Stock (27.7%) | Value | ||||||
| Financials (4.7%) - continued |
| ||||||
| 6,408 | Hiscox, Ltd. | $ | 77,534 | |||||
| 69,745 | Host Hotels & Resorts, Inc. | 1,535,087 | ||||||
| 373,950 | Huntington Bancshares, Inc. | 3,567,483 | ||||||
| 3,700 | Intercontinental Exchange, Inc. | 698,930 | ||||||
| 29,100 | Intermediate Capital Group plc | 194,234 | ||||||
| 93,010 | Invesco, Ltd. | 3,511,128 | ||||||
| 46,000 | iShares Barclays 1-3 Year Credit Bond Fund | 4,861,280 | ||||||
| 900 | iShares MSCI EAFE Index Fund | 61,533 | ||||||
| 20,150 | iShares Russell 2000 Index Fund | 2,394,021 | ||||||
| 26,600 | Israel Discount Bank, Ltd.d | 45,032 | ||||||
| 126,610 | J.P. Morgan Chase & Company | 7,295,268 | ||||||
| 71,000 | KeyCorp | 1,017,430 | ||||||
| 30,676 | Kimco Realty Corporation | 704,934 | ||||||
| 27,150 | Lazard, Ltd. | 1,399,854 | ||||||
| 8,500 | M&T Bank Corporatione | 1,054,425 | ||||||
| 9,850 | Macerich Company | 657,488 | ||||||
| 64,500 | MBIA, Inc.d | 712,080 | ||||||
| 115,740 | MetLife, Inc. | 6,430,514 | ||||||
| 42,600 | Mizuho Financial Group, Inc. | 87,565 | ||||||
| 13,600 | Montpelier Re Holdings, Inc. | 434,520 | ||||||
| 126,450 | Morgan Stanley | 4,088,128 | ||||||
| 900 | Muenchener Rueckversicherungs- Gesellschaft AG | 199,304 | ||||||
| 36,100 | NASDAQ OMX Group, Inc. | 1,394,182 | ||||||
| 1,100 | National Australia Bank, Ltd. | 34,000 | ||||||
| 12,600 | Natixis | 80,866 | ||||||
| 23,600 | Navient Corporation | 417,956 | ||||||
| 6,700 | NKSJ Holdings, Inc. | 180,532 | ||||||
| 19,900 | Northern Trust Corporation | 1,277,779 | ||||||
| 12,000 | Old Mutual plc | 40,553 | ||||||
| 13,550 | Old Republic International Corporation | 224,117 | ||||||
| 15,000 | Oversea-Chinese Banking Corporation, Ltd. | 115,052 | ||||||
| 30,110 | PacWest Bancorp | 1,299,849 | ||||||
| 7,600 | Paragon Group of Companies plc | 45,749 | ||||||
| 31,250 | Parkway Properties, Inc. | 645,313 | ||||||
| 47,390 | Pebblebrook Hotel Trust | 1,751,534 | ||||||
| 10,000 | Phoenix Group Holdings | 111,070 | ||||||
| 12,600 | Piedmont Office Realty Trust, Inc. | 238,644 | ||||||
| 15,750 | Popular, Inc.d | 538,335 | ||||||
| 8,350 | Portfolio Recovery Associates, Inc.d | 497,076 | ||||||
| 13,550 | Progressive Corporation | 343,628 | ||||||
| 16,700 | Prologis, Inc. | 686,203 | ||||||
| 12,700 | Protective Life Corporation | 880,491 | ||||||
| 29,150 | Prudential Financial, Inc. | 2,587,645 | ||||||
| 3,803 | Public Storage, Inc. | 651,644 | ||||||
| 49,050 | Radian Group, Inc. | 726,430 | ||||||
| 6,850 | Realty Income Corporation | 304,277 | ||||||
| 24,400 | RLJ Lodging Trust | 704,916 | ||||||
| 8,200 | Ryman Hospitality Properties | 394,830 | ||||||
| 1,800 | Sampo Oyj | 90,994 | ||||||
| 800 | Schweizerische National- Versicherungs-Gesellschaft AG | 55,029 | ||||||
| 1,100 | SCOR SE | 37,876 | ||||||
| 10,792 | Simon Property Group, Inc. | 1,794,494 | ||||||
| 231,200 | SPDR Euro Stoxx 50 ETF | 10,004,024 | ||||||
| 16,300 | SPDR Gold Trustd | 2,087,052 | ||||||
| 106,700 | SPDR S&P 500 ETF Trust | 20,883,324 | ||||||
| 14,280 | State Street Corporation | 960,473 | ||||||
| 18,491 | Storebrand ASAd | 104,029 | ||||||
| 20,850 | Strategic Hotels & Resorts, Inc.d | 244,154 | ||||||
| 38,030 | SVB Financial Groupd | 4,435,059 | ||||||
| 100 | Swiss Life Holding AGd | 23,704 | ||||||
| 47,790 | Synovus Financial Corporation | 1,165,120 | ||||||
| 15,740 | T. Rowe Price Group, Inc. | 1,328,613 | ||||||
| 11,700 | Tanger Factory Outlet Centers, Inc. | 409,149 | ||||||
| 33,900 | TD Ameritrade Holding Corporation | 1,062,765 | ||||||
| 48,910 | Terreno Realty Corporation | 945,430 | ||||||
| 30,840 | Texas Capital Bancshares, Inc.d | 1,663,818 | ||||||
| 15,600 | UnipolSai Assicurazioni SPA | 50,114 | ||||||
| 21,614 | United Overseas Bank, Ltd. | 390,840 | ||||||
| 63,575 | Vanguard Short-Term Corporate Bond ETF | 5,109,523 | ||||||
| 63,600 | Visa, Inc. | 13,401,156 | ||||||
| 9,315 | Vornado Realty Trust | 994,190 | ||||||
| 15,450 | W.R. Berkley Corporation | 715,489 | ||||||
| 5,396 | Washington Prime Group, Inc.d | 101,121 | ||||||
| 43,673 | Wells Fargo & Company | 2,295,453 | ||||||
| 47,740 | Western Alliance Bancorpd | 1,136,212 | ||||||
| 16,900 | Westpac Banking Corporation | 540,566 | ||||||
| 19,150 | Weyerhaeuser Company | 633,673 | ||||||
| 72,780 | Zions Bancorporation | 2,144,827 | ||||||
| 2,100 | Zurich Insurance Group AGd | 632,491 | ||||||
|
| |||||||
| Total | 217,915,635 | |||||||
|
| |||||||
| Health Care (3.6%) | |||||||
| 10,050 | Abbott Laboratories | 411,045 | ||||||
| 45,550 | Acorda Therapeutics, Inc.d | 1,535,491 | ||||||
| 7,954 | Actavis, Inc.d | 1,774,140 | ||||||
| 2,900 | Actelion, Ltd. | 367,052 | ||||||
| 39,950 | Aetna, Inc. | 3,239,146 | ||||||
| 75,650 | Affymetrix, Inc.d | 674,041 | ||||||
| 54,150 | Akorn, Inc.d | 1,800,488 | ||||||
| 4,910 | Albany Molecular Research, Inc.d | 98,789 | ||||||
| 18,450 | Align Technology, Inc.d | 1,033,938 | ||||||
| 74,750 | Allscripts Healthcare Solutions, Inc.d | 1,199,738 | ||||||
| 18,164 | AmerisourceBergen Corporation | 1,319,796 | ||||||
| 8,200 | Amgen, Inc. | 970,634 | ||||||
| 20,350 | AMN Healthcare Services, Inc.d | 250,305 | ||||||
| 58,830 | Baxter International, Inc. | 4,253,409 | ||||||
| 4,650 | Biogen Idec, Inc.d | 1,466,191 | ||||||
| 24,070 | BioMarin Pharmaceutical, Inc.d | 1,497,395 | ||||||
| 118,300 | BioScrip, Inc.d,e | 986,622 | ||||||
| 242,350 | Boston Scientific Corporationd | 3,094,809 | ||||||
| 27,850 | Bruker Corporationd | 675,920 | ||||||
| 7,837 | C.R. Bard, Inc. | 1,120,769 | ||||||
| 10,400 | Capital Senior Living Corporationd | 247,936 | ||||||
| 33,550 | Cardinal Health, Inc. | 2,300,188 | ||||||
| 9,984 | Catamaran Corporationd | 440,893 | ||||||
| 29,550 | Centene Corporationd | 2,234,276 | ||||||
| 207,560 | Cerner Corporationd | 10,705,945 | ||||||
| 6,600 | Charles River Laboratories International, Inc.d | 353,232 | ||||||
| 2,550 | Chemed Corporatione | 238,986 | ||||||
| 11,600 | Community Health Systems, Inc.d | 526,292 | ||||||
| 6,100 | Cooper Companies, Inc. | 826,733 | ||||||
| 9,700 | Covance, Inc.d | 830,126 | ||||||
| 192,170 | Covidien plc | 17,329,891 | ||||||
| 5,400 | Cubist Pharmaceuticals, Inc.d | 377,028 | ||||||
| 11,850 | DaVita HealthCare Partners, Inc.d | 856,992 | ||||||
| 20,650 | DENTSPLY International, Inc. | 977,777 | ||||||
The accompanying Notes to Financial Statements are an integral part of this schedule.
39
Table of Contents
Moderately Aggressive Allocation Portfolio
Schedule of Investments as of June 30, 2014
(unaudited)
| Shares | Common Stock (27.7%) | Value | ||||||
| Health Care (3.6%) - continued | |||||||
| 21,240 | Envision Healthcare Holdings, Inc.d | $ | 762,728 | |||||
| 67,144 | ExamWorks Group, Inc.d,e | 2,130,479 | ||||||
| 28,000 | Express Scripts Holding Companyd | 1,941,240 | ||||||
| 313,900 | Gilead Sciences, Inc.d | 26,025,449 | ||||||
| 24,846 | GlaxoSmithKline plc | 661,526 | ||||||
| 9,400 | Globus Medical, Inc.d | 224,848 | ||||||
| 4,850 | Greatbatch, Inc.d | 237,941 | ||||||
| 600 | Grifols SA | 32,784 | ||||||
| 4,400 | H. Lundbeck AS | 108,286 | ||||||
| 21,350 | HCA Holdings, Inc.d | 1,203,713 | ||||||
| 4,000 | Hikma Pharmaceuticals plc | 114,807 | ||||||
| 63,550 | Hologic, Inc.d | 1,610,992 | ||||||
| 16,300 | Humana, Inc. | 2,081,836 | ||||||
| 4,450 | ICON plcd | 209,640 | ||||||
| 15,650 | Illumina, Inc.d | 2,794,151 | ||||||
| 10,650 | Impax Laboratories, Inc.d | 319,394 | ||||||
| 165,916 | Johnson & Johnson | 17,358,132 | ||||||
| 1,000 | Kaken Pharmaceutical Company, Ltd. | 21,160 | ||||||
| 5,900 | LifePoint Hospitals, Inc.d | 366,390 | ||||||
| 18,550 | McKesson Corporation | 3,454,195 | ||||||
| 25,700 | Medicines Companyd | 746,842 | ||||||
| 134,640 | Merck & Company, Inc. | 7,788,924 | ||||||
| 6,650 | Mettler-Toledo International, Inc.d | 1,683,647 | ||||||
| 29,200 | Molina Healthcare, Inc.d | 1,303,196 | ||||||
| 6,850 | Myriad Genetics, Inc.d,e | 266,602 | ||||||
| 41,700 | Neurocrine Biosciences, Inc.d | 618,828 | ||||||
| 8,400 | Novartis AG | 760,690 | ||||||
| 60,114 | NuVasive, Inc.d | 2,138,255 | ||||||
| 31,600 | PAREXEL International Corporationd | 1,669,744 | ||||||
| 22,400 | PerkinElmer, Inc. | 1,049,216 | ||||||
| 17,070 | Perrigo Company plc | 2,488,123 | ||||||
| 94,500 | Pfizer, Inc. | 2,804,760 | ||||||
| 12,100 | PharMerica Corporationd | 345,939 | ||||||
| 6,600 | Prestige Brands Holdings, Inc.d | 223,674 | ||||||
| 6,100 | Providence Service Corporationd | 223,199 | ||||||
| 10,200 | Qiagen NVd,e | 249,390 | ||||||
| 9,750 | Quest Diagnostics, Inc.e | 572,227 | ||||||
| 800 | Roche Holding AG | 238,366 | ||||||
| 8,550 | Seattle Genetics, Inc.d | 327,038 | ||||||
| 14,900 | Select Medical Holdings Corporation | 232,440 | ||||||
| 3,700 | Shire plc | 290,238 | ||||||
| 29,550 | Spectrum Pharmaceuticals, Inc.d,e | 240,242 | ||||||
| 8,600 | St. Jude Medical, Inc. | 595,550 | ||||||
| 17,790 | Team Health Holdings, Inc.d | 888,433 | ||||||
| 700 | Teva Pharmaceutical Industries, Ltd. | 36,773 | ||||||
| 2,250 | Thermo Fisher Scientific, Inc. | 265,500 | ||||||
| 70,736 | UnitedHealth Group, Inc. | 5,782,668 | ||||||
| 24,650 | Universal Health Services, Inc. | 2,360,484 | ||||||
| 2,600 | Vertex Pharmaceuticals, Inc.d | 246,168 | ||||||
| 15,200 | Volcano Corporationd | 267,672 | ||||||
| 8,700 | Waters Corporationd | 908,628 | ||||||
| 7,750 | WellPoint, Inc. | 833,977 | ||||||
| 1,700 | Zeria Pharmaceutical Company, Ltd. | 40,572 | ||||||
| 12,600 | Zoetis, Inc. | 406,602 | ||||||
|
| |||||||
| Total | 166,570,311 | |||||||
|
| |||||||
| Industrials (3.3%) | |||||||
| 8,600 | 3M Company | 1,231,864 | ||||||
| 9,300 | AAR Corporation | 256,308 | ||||||
| 1,200 | Actividades de Construccion y Servicios SA | 54,924 | ||||||
| 9,030 | Acuity Brands, Inc. | 1,248,398 | ||||||
| 700 | Adecco SA | 57,606 | ||||||
| 46,250 | ADT Corporatione | 1,615,975 | ||||||
| 14,100 | Aecom Technology Corporationd | 454,020 | ||||||
| 27,950 | AGCO Corporation | 1,571,349 | ||||||
| 2,100 | Aica Kogyo Company, Ltd. | 44,880 | ||||||
| 28,413 | Air New Zealand, Ltd. | 51,734 | ||||||
| 9,583 | Allegion plc | 543,164 | ||||||
| 42,199 | AMETEK, Inc. | 2,206,164 | ||||||
| 27,880 | Apogee Enterprises, Inc. | 971,897 | ||||||
| 4,082 | Arcadis NV | 140,672 | ||||||
| 700 | Assa Abloy AB | 35,606 | ||||||
| 18,619 | B/E Aerospace, Inc.d | 1,722,071 | ||||||
| 5,100 | BAE Systems plc | 37,774 | ||||||
| 12,700 | Berendsen plc | 212,699 | ||||||
| 6,700 | Bodycote plc | 78,831 | ||||||
| 86,900 | Boeing Company | 11,056,287 | ||||||
| 16,130 | Briggs & Stratton Corporatione | 330,020 | ||||||
| 300 | Bucher Industries AG | 102,943 | ||||||
| 5,900 | Cardno, Ltd. | 35,144 | ||||||
| 6,400 | Caterpillar, Inc. | 695,488 | ||||||
| 31,150 | CLARCOR, Inc. | 1,926,628 | ||||||
| 7,550 | Colfax Corporationd | 562,777 | ||||||
| 19,300 | Covanta Holding Corporation | 397,773 | ||||||
| 153,334 | CSX Corporation | 4,724,221 | ||||||
| 10,100 | Daifuku Company, Ltd. | 141,654 | ||||||
| 395,660 | Delta Air Lines, Inc. | 15,319,955 | ||||||
| 6,900 | Deutsche Lufthansa AG | 148,123 | ||||||
| 1,400 | DKSH Holding AG | 106,368 | ||||||
| 9,000 | Downer EDI, Ltd. | 38,410 | ||||||
| 1,100 | Duerr AG | 97,390 | ||||||
| 2,600 | Elbit Systems, Ltd. | 159,941 | ||||||
| 66,614 | EMCOR Group, Inc. | 2,966,321 | ||||||
| 13,110 | Esterline Technologies Corporationd | 1,509,223 | ||||||
| 36,900 | Exelis, Inc. | 626,562 | ||||||
| 16,520 | Fastenal Companye | 817,575 | ||||||
| 29,928 | Flowserve Corporation | 2,225,147 | ||||||
| 157,450 | Fluor Corporation | 12,107,905 | ||||||
| 30,630 | Fortune Brands Home and Security, Inc. | 1,223,056 | ||||||
| 35,360 | GATX Corporation | 2,366,998 | ||||||
| 200 | Georg Fischer AGd | 143,147 | ||||||
| 1,500 | Go-Ahead Group plc | 60,782 | ||||||
| 16,730 | Graco, Inc. | 1,306,278 | ||||||
| 31,440 | Granite Construction, Inc. | 1,131,211 | ||||||
| 20,000 | Hanwa Company, Ltd. | 86,627 | ||||||
| 5,100 | Hino Motors, Ltd. | 70,361 | ||||||
| 67,500 | HNI Corporation | 2,639,925 | ||||||
| 35,422 | Honeywell International, Inc. | 3,292,475 | ||||||
| 1,900 | Hoshizaki Electric Company, Ltd. | 94,835 | ||||||
| 16,050 | Huntington Ingalls Industries, Inc. | 1,518,170 | ||||||
| 1,000 | Implenia AG | 67,313 | ||||||
| 63,400 | Ingersoll-Rand plc | 3,963,134 | ||||||
| 128,019 | Interface, Inc. | 2,411,878 | ||||||
| 7,600 | Intrum Justitia AB | 226,685 | ||||||
| 17,500 | ITOCHU Corporation | 224,661 | ||||||
| 35,440 | Jacobs Engineering Group, Inc.d | 1,888,243 | ||||||
| 400 | Jardine Matheson Holdings, Ltd. | 23,738 | ||||||
| 11,396 | JB Hunt Transport Services, Inc. | 840,797 | ||||||
| 6,750 | Joy Global, Inc.e | 415,665 | ||||||
The accompanying Notes to Financial Statements are an integral part of this schedule.
40
Table of Contents
Moderately Aggressive Allocation Portfolio
Schedule of Investments as of June 30, 2014
(unaudited)
| Shares | Common Stock (27.7%) | Value | ||||||
| Industrials (3.3%) - continued | |||||||
| 11,000 | Kajima Corporation | $ | 48,656 | |||||
| 1,600 | Kanamoto Company, Ltd. | 63,806 | ||||||
| 7,000 | Kandenko Company, Ltd. | 40,705 | ||||||
| 17,950 | KAR Auction Services, Inc. | 572,067 | ||||||
| 3,500 | Keller Group plc | 55,121 | ||||||
| 6,000 | Kinden Corporation | 58,385 | ||||||
| 4,500 | Komatsu, Ltd. | 104,460 | ||||||
| 800 | KONE Oyj | 33,357 | ||||||
| 69,650 | Korn/Ferry Internationald | 2,045,621 | ||||||
| 46,950 | Landstar System, Inc. | 3,004,800 | ||||||
| 5,700 | Legrand SA | 348,767 | ||||||
| 3,500 | Leighton Holdings, Ltd. | 64,986 | ||||||
| 7,350 | Lockheed Martin Corporation | 1,181,366 | ||||||
| 39,643 | Manitowoc Company, Inc. | 1,302,669 | ||||||
| 9,900 | Manpower, Inc. | 840,015 | ||||||
| 23,650 | Meritor, Inc.d | 308,396 | ||||||
| 7,000 | Mineral Resources, Ltd. | 63,357 | ||||||
| 18,600 | Mitie Group plc | 101,453 | ||||||
| 28,000 | Mitsui Engineering & Shipbuilding Company, Ltd. | 62,883 | ||||||
| 4,800 | Monadelphous Group, Ltd. | 71,078 | ||||||
| 6,000 | NICHIAS Corporation | 41,364 | ||||||
| 26,370 | Nielsen Holdings NV | 1,276,572 | ||||||
| 3,800 | Nitto Kogyo Corporation | 83,654 | ||||||
| 14,729 | Northgate plc | 132,251 | ||||||
| 9,225 | NOW, Inc.d | 334,037 | ||||||
| 29,000 | NTN Corporation | 126,857 | ||||||
| 11,000 | Old Dominion Freight Line, Inc.d | 700,480 | ||||||
| 64,766 | Oshkosh Corporation | 3,596,456 | ||||||
| 1,890 | Osterreichische Post AG | 93,879 | ||||||
| 10,407 | Parker Hannifin Corporation | 1,308,472 | ||||||
| 49,635 | Pentair, Ltd. | 3,579,676 | ||||||
| 58,690 | Quanta Services, Inc.d | 2,029,500 | ||||||
| 4,293 | Randstad Holding NV | 232,720 | ||||||
| 54,590 | Ritchie Brothers Auctioneers, Inc.e | 1,345,644 | ||||||
| 43,260 | Robert Half International, Inc. | 2,065,232 | ||||||
| 12,532 | Roper Industries, Inc. | 1,829,797 | ||||||
| 3,100 | Safran SA | 202,941 | ||||||
| 4,950 | Seaspan Corporatione | 115,880 | ||||||
| 3,000 | Securitas AB | 35,572 | ||||||
| 6,000 | Seino Holdings Company, Ltd. | 68,146 | ||||||
| 6,400 | Seven Group Holdings, Ltd. | 44,737 | ||||||
| 5,000 | ShinMaywa Industries, Ltd. | 44,155 | ||||||
| 4,600 | Siemens AG | 607,357 | ||||||
| 243,650 | Southwest Airlines Company | 6,544,439 | ||||||
| 7,000 | Spirit Aerosystems Holdings, Inc.d | 235,900 | ||||||
| 12,600 | Spirit Airlines, Inc.d | 796,824 | ||||||
| 21,113 | Stericycle, Inc.d | 2,500,201 | ||||||
| 2,500 | Teleperformance SA | 153,155 | ||||||
| 30,630 | Tennant Company | 2,337,682 | ||||||
| 19,000 | Toppan Printing Company, Ltd. | 146,913 | ||||||
| 3,000 | TOTO, Ltd. | 40,458 | ||||||
| 54,900 | Transpacific Industries Group, Ltd.d | 52,534 | ||||||
| 1,300 | Travis Perkins plc | 36,407 | ||||||
| 141,600 | Union Pacific Corporation | 14,124,600 | ||||||
| 26,530 | United Rentals, Inc.d | 2,778,487 | ||||||
| 9,051 | United Stationers, Inc. | 375,345 | ||||||
| 5,100 | United Technologies Corporation | 588,795 | ||||||
| 19,100 | Wabash National Corporationd | 272,175 | ||||||
| 8,800 | WABCO Holdings, Inc.d | 940,016 | ||||||
| 2,650 | WESCO International, Inc.d | 228,907 | ||||||
| 1,200 | Wolseley plc | 65,737 | ||||||
| 1,600 | WS Atkins plc | 36,090 | ||||||
|
| |||||||
| Total | 155,149,762 | |||||||
|
| |||||||
| Information Technology (5.8%) | |||||||
| 40,145 | Agilent Technologies, Inc. | 2,305,929 | ||||||
| 18,950 | Akamai Technologies, Inc.d | 1,157,087 | ||||||
| 10,550 | Alliance Data Systems Corporationd | 2,967,187 | ||||||
| 23,550 | Amdocs, Ltd. | 1,091,071 | ||||||
| 24,020 | Amphenol Corporation | 2,314,087 | ||||||
| 15,394 | ANSYS, Inc.d | 1,167,173 | ||||||
| 323,246 | Apple, Inc.f | 30,039,251 | ||||||
| 90,002 | Applied Materials, Inc. | 2,029,545 | ||||||
| 44,650 | Arris Group, Inc.d | 1,452,464 | ||||||
| 12,150 | Aruba Networks, Inc.d | 212,868 | ||||||
| 4,200 | Ascom Holding AG | 71,233 | ||||||
| 328,600 | Atmel Corporationd | 3,078,982 | ||||||
| 13,238 | Autodesk, Inc.d | 746,358 | ||||||
| 13,250 | AVG Technologies NVd | 266,723 | ||||||
| 77,189 | Blinkx plcd | 83,680 | ||||||
| 10,200 | Booz Allen Hamilton Holding Corporation | 216,648 | ||||||
| 14,950 | Broadcom Corporation | 554,944 | ||||||
| 63,300 | Broadridge Financial Solutions, Inc. | 2,635,812 | ||||||
| 117,000 | Brocade Communications Systems, Inc. | 1,076,400 | ||||||
| 500 | Cap Gemini SA | 35,682 | ||||||
| 8,250 | Cardtronics, Inc.d | 281,160 | ||||||
| 5,400 | Carsales.com, Ltd. | 53,928 | ||||||
| 22,850 | CDW Corporation | 728,458 | ||||||
| 6,200 | Check Point Software Technologies, Ltd.d,e | 415,586 | ||||||
| 35,395 | Ciena Corporationd,e | 766,656 | ||||||
| 10,250 | Cirrus Logic, Inc.d,e | 233,085 | ||||||
| 327,840 | Cisco Systems, Inc. | 8,146,824 | ||||||
| 50,710 | Citrix Systems, Inc.d | 3,171,910 | ||||||
| 26,700 | Computer Sciences Corporation | 1,687,440 | ||||||
| 13,050 | Convergys Corporation | 279,792 | ||||||
| 27,200 | CoreLogic, Inc.d | 825,792 | ||||||
| 11,400 | Cornerstone OnDemand, Inc.d | 524,628 | ||||||
| 174,100 | Corning, Inc. | 3,821,495 | ||||||
| 3,600 | CSR plc | 36,456 | ||||||
| 4,600 | Dialog Semiconductor plcd | 159,169 | ||||||
| 8,550 | Diodes, Inc.d | 247,608 | ||||||
| 49,712 | DST Systems, Inc. | 4,581,955 | ||||||
| 52,061 | E2open, Inc.d,e | 1,076,101 | ||||||
| 94,298 | eBay, Inc.d | 4,720,558 | ||||||
| 4,200 | Econocom Group | 39,829 | ||||||
| 28,200 | Electrocomponents plc | 126,727 | ||||||
| 58,250 | Electronic Arts, Inc.d | 2,089,427 | ||||||
| 441,000 | EMC Corporation | 11,615,940 | ||||||
| 20,434 | Euronet Worldwide, Inc.d | 985,736 | ||||||
| 2,300 | F@N Communications, Inc. | 37,801 | ||||||
| 14,204 | F5 Networks, Inc.d | 1,582,894 | ||||||
| 219,800 | Facebook, Inc.d | 14,790,342 | ||||||
| 43,500 | Fortinet, Inc.d | 1,093,155 | ||||||
| 12,100 | FUJIFILM Holdings NPV | 337,718 | ||||||
| 25,350 | GameStop Corporatione | 1,025,914 | ||||||
| 15,850 | Gartner, Inc.d | 1,117,742 | ||||||
| 27,050 | Genpact, Ltd.d | 474,187 | ||||||
| 10,250 | Global Payments, Inc. | 746,712 | ||||||
| 23,023 | Google, Inc.d | 13,244,671 | ||||||
| 27,023 | Google, Inc., Class Ad | 15,799,537 | ||||||
The accompanying Notes to Financial Statements are an integral part of this schedule.
41
Table of Contents
Moderately Aggressive Allocation Portfolio
Schedule of Investments as of June 30, 2014
(unaudited)
| Shares | Common Stock (27.7%) | Value | ||||||
| Information Technology (5.8%) - continued |
| ||||||
| 30,530 | Guidewire Software, Inc.d | $ | 1,241,350 | |||||
| 47,700 | Hewlett-Packard Company | 1,606,536 | ||||||
| 15,000 | Hitachi Kokusai Electric, Inc. | 207,845 | ||||||
| 1,300 | Hoya Corporation | 43,222 | ||||||
| 5,500 | IAC InterActiveCorp | 380,765 | ||||||
| 9,650 | iGATE Corporationd | 351,164 | ||||||
| 10,770 | Imperva, Inc.d | 281,959 | ||||||
| 5,300 | Indra Sistemas SA | 94,639 | ||||||
| 2,800 | Infineon Technologies AG | 34,953 | ||||||
| 56,600 | Informatica Corporationd | 2,017,790 | ||||||
| 10,600 | International Business Machines Corporation | 1,921,462 | ||||||
| 9,250 | j2 Global, Inc. | 470,455 | ||||||
| 142,827 | Juniper Networks, Inc.d | 3,504,975 | ||||||
| 200 | Keyence Corporation | 87,458 | ||||||
| 6,150 | Kulicke and Soffa Industries, Inc.d | 87,699 | ||||||
| 28,749 | Lexmark International, Inc.e | 1,384,552 | ||||||
| 2,240 | LinkedIn Corporationd | 384,093 | ||||||
| 14,750 | Liquidity Services, Inc.d,e | 232,460 | ||||||
| 39,100 | Marvell Technology Group, Ltd. | 560,303 | ||||||
| 5,480 | Measurement Specialties, Inc.d | 471,664 | ||||||
| 16,150 | Mentor Graphics Corporation | 348,355 | ||||||
| 23,105 | Microchip Technology, Inc.e | 1,127,755 | ||||||
| 51,820 | Microsoft Corporation | 2,160,894 | ||||||
| 3,000 | NEC Networks & System Integration Corporation | 73,204 | ||||||
| 342,839 | NetApp, Inc. | 12,520,480 | ||||||
| 12,311 | Nice Systems, Ltd. ADR | 502,412 | ||||||
| 1,600 | Nice-Systems, Ltd. | 65,480 | ||||||
| 1,300 | NTT Data Corporation | 49,993 | ||||||
| 24,011 | Nuance Communications, Inc.d,e | 450,686 | ||||||
| 179,979 | NVIDIA Corporation | 3,336,811 | ||||||
| 37,810 | NXP Semiconductors NVd | 2,502,266 | ||||||
| 1,300 | OBIC Company, Ltd. | 42,874 | ||||||
| 72,000 | Oki Electric Industry Company, Ltd. | 160,100 | ||||||
| 2,200 | OMRON Corporation | 92,773 | ||||||
| 10,300 | Optimal Payments plcd | 70,509 | ||||||
| 87,700 | Oracle Corporation | 3,554,481 | ||||||
| 12,700 | Pace plc | 77,135 | ||||||
| 46,874 | Plantronics, Inc. | 2,252,296 | ||||||
| 3,300 | Playtech plc | 34,769 | ||||||
| 19,350 | Polycom, Inc.d | 242,455 | ||||||
| 44,550 | QLIK Technologies, Inc.d | 1,007,721 | ||||||
| 157,461 | QUALCOMM, Inc. | 12,470,911 | ||||||
| 21,400 | Red Hat, Inc.d | 1,182,778 | ||||||
| 168,500 | Salesforce.com, Inc.d | 9,786,480 | ||||||
| 34,350 | Sanmina Corporationd | 782,493 | ||||||
| 400 | SAP AG ADR | 30,822 | ||||||
| 26,215 | Sapient Corporationd | 425,994 | ||||||
| 6,800 | Seiko Epson Corporation | 289,301 | ||||||
| 22,520 | ServiceNow, Inc.d | 1,395,339 | ||||||
| 1,221 | Skyworks Solutions, Inc. | 57,338 | ||||||
| 900 | Spectris plc | 34,199 | ||||||
| 27,800 | SunPower Corporationd,e | 1,139,244 | ||||||
| 141,940 | Symantec Corporation | 3,250,426 | ||||||
| 13,940 | Synopsys, Inc.d | 541,151 | ||||||
| 32,200 | Take-Two Interactive Software, Inc.d | 716,128 | ||||||
| 5,100 | TE Connectivity, Ltd. | 315,384 | ||||||
| 174,000 | Teradata Corporationd | 6,994,800 | ||||||
| 117,495 | Teradyne, Inc.e | 2,302,902 | ||||||
| 112,350 | Texas Instruments, Inc. | 5,369,206 | ||||||
| 39,790 | Textura Corporationd,e | 940,636 | ||||||
| 53,280 | Ubiquiti Networks, Inc.d,e | 2,407,723 | ||||||
| 3,300 | ULVAC, Inc.d | 70,346 | ||||||
| 43,370 | VeriFone Systems, Inc.d | 1,593,848 | ||||||
| 47,450 | Virtusa Corporationd | 1,698,710 | ||||||
| 123,700 | Vishay Intertechnology, Inc. | 1,916,113 | ||||||
| 136,950 | VMware, Inc.d | 13,258,130 | ||||||
| 7,700 | VTech Holdings, Ltd. | 102,330 | ||||||
| 5,250 | WebMD Health Corporationd | 253,575 | ||||||
| 2,400 | Wincor Nixdorf AG | 136,684 | ||||||
| 5,550 | Workday, Inc.d | 498,723 | ||||||
| 147,100 | Xerox Corporation | 1,829,924 | ||||||
| 53,790 | Xilinx, Inc. | 2,544,805 | ||||||
|
| |||||||
| Total | 270,745,293 | |||||||
|
| |||||||
| Materials (0.7%) | |||||||
| 11,880 | Airgas, Inc. | 1,293,851 | ||||||
| 10,350 | Albemarle Corporation | 740,025 | ||||||
| 16,500 | Alcoa, Inc. | 245,685 | ||||||
| 164,348 | Arrium, Ltd. | 123,627 | ||||||
| 11,200 | Berry Plastics Group, Inc.d | 288,960 | ||||||
| 1,300 | BHP Billiton plc | 42,261 | ||||||
| 4,000 | Cabot Corporation | 231,960 | ||||||
| 39,367 | Celanese Corporation | 2,530,511 | ||||||
| 23,000 | Cliffs Natural Resources, Inc.e | 346,150 | ||||||
| 3,400 | Compass Minerals International, Inc. | 325,516 | ||||||
| 10,450 | Crown Holdings, Inc.d | 519,992 | ||||||
| 51,930 | Dow Chemical Company | 2,672,318 | ||||||
| 21,700 | Eagle Materials, Inc. | 2,045,876 | ||||||
| 11,100 | Eastman Chemical Company | 969,585 | ||||||
| 13,000 | Ence Energia y Celulosa SAd | 33,952 | ||||||
| 22,796 | FMC Corporation | 1,622,847 | ||||||
| 72,750 | Graphic Packaging Holding Companyd | 851,175 | ||||||
| 53,660 | H.B. Fuller Company | 2,581,046 | ||||||
| 900 | Holmen AB | 32,209 | ||||||
| 49,440 | Materials Select Sector SPDR Fund | 2,454,202 | ||||||
| 1,900 | Mondi plc | 34,494 | ||||||
| 19,500 | Monsanto Company | 2,432,430 | ||||||
| 20,800 | Mosaic Company | 1,028,560 | ||||||
| 27,500 | Nippon Light Metal Holdings Company, Ltd. | 41,887 | ||||||
| 3,000 | Nippon Paint Company, Ltd. | 63,520 | ||||||
| 34,800 | Nucor Corporation | 1,713,900 | ||||||
| 37,000 | Oji Holdings Corporation | 152,255 | ||||||
| 28,300 | Owens-Illinois, Inc.d | 980,312 | ||||||
| 16,050 | Packaging Corporation of America | 1,147,415 | ||||||
| 2,000 | Rio Tinto plc | 107,988 | ||||||
| 20,712 | Silgan Holdings, Inc. | 1,052,584 | ||||||
| 19,242 | Silver Wheaton Corporation | 505,487 | ||||||
| 1,500 | Smurfit Kappa Group plc | 34,332 | ||||||
| 5,350 | Sonoco Products Company | 235,026 | ||||||
| 11,156 | Southern Copper Corporation | 338,808 | ||||||
| 66,070 | Steel Dynamics, Inc. | 1,185,957 | ||||||
| 5,500 | Stora Enso Oyj | 53,472 | ||||||
| 7,000 | Sumitomo Metal Mining Company, Ltd. | 114,254 | ||||||
| 32,000 | Sumitomo Osaka Cement Company, Ltd. | 121,713 | ||||||
| 30,000 | Taiheiyo Cement Corporation | 120,961 | ||||||
| 117,100 | Teck Resources, Ltd.e | 2,673,393 | ||||||
| 13,000 | Toagosei Company, Ltd. | 58,533 | ||||||
The accompanying Notes to Financial Statements are an integral part of this schedule.
42
Table of Contents
Moderately Aggressive Allocation Portfolio
Schedule of Investments as of June 30, 2014
(unaudited)
| Shares | Common Stock (27.7%) | Value | ||||||
| Materials (0.7%) - continued | |||||||
| 13,000 | Tokuyama Corporation | $ | 41,340 | |||||
| 49,000 | Tosoh Corporation | 237,658 | ||||||
| 9,300 | UPM-Kymmene Oyj | 158,858 | ||||||
| 5,200 | Voestalpine AG | 247,900 | ||||||
| 21,200 | Walter Energy, Inc.e | 115,540 | ||||||
| 6,000 | Worthington Industries, Inc. | 258,240 | ||||||
|
| |||||||
| Total | 35,208,565 | |||||||
|
| |||||||
| Telecommunications Services (0.3%) | |||||||
| 60,700 | AT&T, Inc. | 2,146,352 | ||||||
| 142,000 | Bezeq Israel Telecommunication Corporation, Ltd. | 265,766 | ||||||
| 25,901 | BT Group plc | 170,196 | ||||||
| 48,300 | Cogent Communications Group, Inc. | 1,668,765 | ||||||
| 8,500 | Elisa Oyj | 260,016 | ||||||
| 6,700 | Freenet AG | 212,774 | ||||||
| 2,400 | KDDI Corporation | 146,433 | ||||||
| 7,000 | Nippon Telegraph & Telephone Corporation | 436,295 | ||||||
| 10,906 | SBA Communications Corporationd | 1,115,684 | ||||||
| 21,000 | Singapore Telecommunications, Ltd. | 64,905 | ||||||
| 163,000 | Telecom Italia SPAd | 206,309 | ||||||
| 9,050 | Telephone & Data Systems, Inc. | 236,295 | ||||||
| 21,900 | Telstra Corporation, Ltd. | 107,590 | ||||||
| 26,013 | TW Telecom, Inc.d | 1,048,584 | ||||||
| 87,029 | Verizon Communications, Inc. | 4,258,329 | ||||||
| 75,290 | Vodafone Group plc | 251,639 | ||||||
| 60,450 | Vonage Holdings Corporationd | 226,687 | ||||||
|
| |||||||
| Total | 12,822,619 | |||||||
|
| |||||||
| Utilities (0.4%) | |||||||
| 2,500 | AGL Energy, Ltd. | 36,518 | ||||||
| 9,600 | Atmos Energy Corporation | 512,640 | ||||||
| 6,400 | Centrica plc | 34,199 | ||||||
| 34,900 | CMS Energy Corporation | 1,087,135 | ||||||
| 4,400 | Edison International, Inc. | 255,684 | ||||||
| 43,600 | Electricidade de Portugal SA | 218,768 | ||||||
| 2,800 | Electricite de France | 88,166 | ||||||
| 900 | Endesa SA | 34,800 | ||||||
| 62,500 | Enel SPA | 363,540 | ||||||
| 10,000 | Fortum Oyj | 268,520 | ||||||
| 3,500 | Gas Natural SDG SA | 110,576 | ||||||
| 71,010 | NiSource, Inc. | 2,793,533 | ||||||
| 57,080 | NorthWestern Corporation | 2,979,005 | ||||||
| 101,740 | PG&E Corporation | 4,885,555 | ||||||
| 24,750 | Public Service Enterprise Group, Inc. | 1,009,552 | ||||||
| 400 | Red Electrica Corporacion SA | 36,565 | ||||||
| 15,200 | Southern Company | 689,776 | ||||||
| 22,668 | Southwest Gas Corporation | 1,196,644 | ||||||
| 7,250 | Westar Energy, Inc. | 276,878 | ||||||
| 34,500 | Wisconsin Energy Corporation | 1,618,740 | ||||||
|
| |||||||
| Total | 18,496,794 | |||||||
|
| |||||||
Total Common Stock (cost $1,018,393,523) | 1,293,535,333 | |||||||
|
|
| ||||||
| Principal Amount | Long-Term Fixed Income (15.0%) | |||||||
| Asset-Backed Securities (0.8%) |
| ||||||
Access Group, Inc. | ||||||||
| $ | 543,645 | 0.652%, 2/25/2036g,h | 540,585 | |||||
Ally Auto Receivables Trust 2013-SN1 | ||||||||
| 780,000 | 0.720%, 5/20/2016 | 780,861 | ||||||
BA Credit Card Trust | ||||||||
| 650,000 | 0.532%, 6/15/2021h | 650,021 | ||||||
Barclays Dryrock Issuance Trust | ||||||||
| 1,300,000 | 0.512%, 12/16/2019h | 1,301,379 | ||||||
Capital One Multi-Asset Execution Trust | ||||||||
| 800,000 | 0.532%, 1/18/2022h | 800,830 | ||||||
Chase Issuance Trust | ||||||||
| 875,000 | 1.150%, 1/15/2019 | 877,565 | ||||||
Chesapeake Funding, LLC | ||||||||
| 500,000 | 0.601%, 1/7/2025g,h | 500,651 | ||||||
Citibank Credit Card Issuance Trust | ||||||||
| 1,500,000 | 0.025%, 2/22/2019 | 1,499,238 | ||||||
Citibank Omni Master Trust | ||||||||
| 1,300,000 | 4.900%, 11/15/2018g | 1,321,679 | ||||||
Countrywide Asset-Backed Certificates | ||||||||
| 960,724 | 5.530%, 4/25/2047 | 924,969 | ||||||
DT Auto Owner Trust | ||||||||
| 75,457 | 0.750%, 5/16/2016g | 75,480 | ||||||
Edlinc Student Loan Funding Trust | ||||||||
| 433,224 | 3.190%, 10/1/2025h,i | 438,639 | ||||||
Enterprise Fleet Financing, LLC | ||||||||
| 242,748 | 1.060%, 3/20/2019g | 243,790 | ||||||
| 1,000,000 | 0.870%, 9/20/2019g | 999,995 | ||||||
FirstEnergy Ohio PIRB Special Purpose Trust | ||||||||
| 588,657 | 0.679%, 1/15/2019 | 588,729 | ||||||
FNA Trust | ||||||||
| 287,926 | 1.980%, 1/10/2018i | 288,790 | ||||||
Ford Credit Auto Owner Trust | ||||||||
| 485,000 | 2.260%, 11/15/2025g | 489,349 | ||||||
GE Dealer Floorplan Master Note Trust | ||||||||
| 780,000 | 0.553%, 4/20/2018h | 782,239 | ||||||
GE Equipment Transportation, LLC | ||||||||
| 650,000 | 0.690%, 11/25/2016 | 651,176 | ||||||
Golden Credit Card Trust | ||||||||
| 540,000 | 0.402%, 2/15/2018g,h | 540,178 | ||||||
| 250,000 | 0.582%, 9/15/2018g,h | 250,893 | ||||||
GreatAmerica Leasing Receivables | ||||||||
| 1,500,000 | 0.610%, 5/15/2016g | 1,500,347 | ||||||
Hertz Fleet Lease Funding, LP | ||||||||
| 1,050,000 | 0.704%, 12/10/2027g,h | 1,052,258 | ||||||
HLSS Servicer Advance Receivables Backed Notes | ||||||||
| 650,000 | 1.287%, 9/15/2044g | 650,325 | ||||||
Hyundai Auto Receivables Trust | ||||||||
| 780,000 | 0.710%, 9/15/2017 | 782,191 | ||||||
Hyundai Floorplan Master Owner Trust | ||||||||
| 877,500 | 0.502%, 5/15/2018g,h | 879,048 | ||||||
Master Credit Card Trust | ||||||||
| 529,100 | 0.780%, 4/21/2017g | 530,129 | ||||||
The accompanying Notes to Financial Statements are an integral part of this schedule.
43
Table of Contents
Moderately Aggressive Allocation Portfolio
Schedule of Investments as of June 30, 2014
(unaudited)
| Principal Amount | Long-Term Fixed Income (15.0%) | Value | ||||||
| Asset-Backed Securities (0.8%) - continued |
| ||||||
Morgan Stanley Capital, Inc. | ||||||||
| $ | 1,052,780 | 0.302%, 2/25/2037h | $ | 626,780 | ||||
Motor plc | ||||||||
| 684,667 | 0.652%, 2/15/2021g | 685,286 | ||||||
| 909,600 | 0.632%, 8/25/2021g,h | 910,608 | ||||||
Nissan Master Owner Trust Receivables | ||||||||
| 900,000 | 0.452%, 2/15/2018h | 900,445 | ||||||
Penarth Master Issuer plc | ||||||||
| 1,055,000 | 0.544%, 11/18/2017g,h | 1,056,910 | ||||||
Renaissance Home Equity Loan Trust | ||||||||
| 1,478,057 | 5.746%, 5/25/2036 | 1,107,020 | ||||||
| 2,800,000 | 6.011%, 5/25/2036 | 2,053,915 | ||||||
| 1,245,100 | 5.580%, 11/25/2036 | 801,628 | ||||||
SLM Student Loan Trust | ||||||||
| 894,017 | 0.752%, 7/15/2022g,h | 895,779 | ||||||
| 1,419,694 | 0.752%, 8/15/2022g,h | 1,422,329 | ||||||
| 1,173,999 | 0.629%, 4/25/2023g,h | 1,175,896 | ||||||
| 450,000 | 1.202%, 5/17/2027g,h | 454,144 | ||||||
U.S. Small Business Administration | ||||||||
| 570,000 | 3.191%, 3/10/2024 | 590,278 | ||||||
Vericrest Opportunity Loan Transferee | ||||||||
| 1,100,000 | 3.125%, 4/27/2054g | 1,105,610 | ||||||
Volvo Financial Equipment, LLC | ||||||||
| 650,000 | 0.740%, 3/15/2017g | 651,231 | ||||||
| 1,000,000 | 0.820%, 4/16/2018g | 1,000,859 | ||||||
World Financial Network Credit Card Master Trust | ||||||||
| 350,000 | 0.532%, 12/15/2019h | 350,462 | ||||||
| 650,000 | 0.910%, 3/16/2020 | 651,358 | ||||||
World Omni Automobile Lease Securitization Trust | ||||||||
| 650,000 | 1.400%, 2/15/2019 | 657,170 | ||||||
World Omni Master Owner Trust | ||||||||
| 540,000 | 0.502%, 2/15/2018g,h | 540,623 | ||||||
|
| |||||||
| Total | 37,579,665 | |||||||
|
| |||||||
| Basic Materials (0.2%) |
| ||||||
Anglo American Capital plc | ||||||||
| 325,000 | 1.176%, 4/15/2016g,h | 326,032 | ||||||
First Quantum Minerals, Ltd. | ||||||||
| 355,000 | 6.750%, 2/15/2020g | 365,650 | ||||||
| 355,000 | 7.000%, 2/15/2021g | 365,206 | ||||||
FMG Resources Pty. Ltd. | ||||||||
| 1,259,634 | 6.875%, 2/1/2018e,g | 1,322,616 | ||||||
Freeport-McMoRan Copper & Gold, Inc. | ||||||||
| 614,000 | 2.375%, 3/15/2018 | 623,153 | ||||||
Glencore Funding, LLC | ||||||||
| 223,000 | 1.700%, 5/27/2016g | 225,030 | ||||||
| 282,000 | 3.125%, 4/29/2019g | 287,584 | ||||||
Hexion US Finance Corporation/Hexion Nova Scotia Finance ULC | ||||||||
| 630,000 | 8.875%, 2/1/2018 | 655,200 | ||||||
Ineos Finance plc | ||||||||
| 630,000 | 7.500%, 5/1/2020g | 685,912 | ||||||
International Paper Company | ||||||||
| 117,000 | 5.300%, 4/1/2015 | 121,185 | ||||||
LyondellBasell Industries NV | ||||||||
| 392,000 | 6.000%, 11/15/2021 | 468,736 | ||||||
Monsanto Company | ||||||||
| 235,000 | 1.150%, 6/30/2017 | 235,073 | ||||||
Mosaic Company | ||||||||
| 415,000 | 5.450%, 11/15/2033 | 465,022 | ||||||
Rio Tinto Finance USA plc | ||||||||
| 134,000 | 1.375%, 6/17/2016 | 135,448 | ||||||
Sappi Papier Holding GmbH | ||||||||
| 375,000 | 6.625%, 4/15/2021g | 395,625 | ||||||
Vale Overseas, Ltd. | ||||||||
| 359,000 | 6.250%, 1/23/2017 | 401,721 | ||||||
Yamana Gold, Inc. | ||||||||
| 325,000 | 4.950%, 7/15/2024g | 327,137 | ||||||
|
| |||||||
| Total | 7,406,330 | |||||||
|
| |||||||
| Capital Goods (0.1%) |
| ||||||
BAE Systems plc | ||||||||
| 100,000 | 3.500%, 10/11/2016g | 104,080 | ||||||
Caterpillar, Inc. | ||||||||
| 188,000 | 3.400%, 5/15/2024 | 190,140 | ||||||
CNH Capital, LLC | ||||||||
| 630,000 | 3.625%, 4/15/2018 | 643,388 | ||||||
Eaton Corporation | ||||||||
| 189,000 | 4.000%, 11/2/2032 | 189,120 | ||||||
Harsco Corporation | ||||||||
| 349,000 | 2.700%, 10/15/2015 | 352,054 | ||||||
Ingersoll-Rand Global Holding Company, Ltd. | ||||||||
| 384,000 | 6.875%, 8/15/2018 | 457,498 | ||||||
L-3 Communications Corporation | ||||||||
| 384,000 | 1.500%, 5/28/2017 | 384,525 | ||||||
Martin Marietta Materials, Inc. | ||||||||
| 450,000 | 1.331%, 6/30/2017c,g,h | 449,736 | ||||||
Reynolds Group Issuer, Inc. | ||||||||
| 629,634 | 5.750%, 10/15/2020 | 664,264 | ||||||
Roper Industries, Inc. | ||||||||
| 376,000 | 2.050%, 10/1/2018 | 376,610 | ||||||
RSC Equipment Rental, Inc. | ||||||||
| 630,000 | 8.250%, 2/1/2021 | 700,875 | ||||||
Textron, Inc. | ||||||||
| 150,000 | 5.600%, 12/1/2017 | 168,656 | ||||||
|
| |||||||
| Total | 4,680,946 | |||||||
|
| |||||||
| Collateralized Mortgage Obligations (0.5%) |
| ||||||
Apidos CLO XVIII | ||||||||
| 375,000 | 1.643%, 7/22/2026c,h,i | 373,594 | ||||||
Citigroup Mortgage Loan Trust, Inc. | ||||||||
| 526,961 | 5.500%, 11/25/2035 | 481,726 | ||||||
CitiMortgage Alternative Loan Trust | ||||||||
| 1,818,448 | 5.750%, 4/25/2037 | 1,572,539 | ||||||
Countrywide Alternative Loan Trust | ||||||||
| 811,785 | 5.265%, 10/25/2035 | 678,863 | ||||||
| 482,884 | 6.500%, 8/25/2036 | 354,193 | ||||||
| 337,923 | 6.000%, 1/25/2037 | 299,420 | ||||||
| 1,637,098 | 5.500%, 5/25/2037 | 1,376,453 | ||||||
| 1,305,371 | 7.000%, 10/25/2037 | 932,907 | ||||||
Countrywide Home Loans, Inc. | ||||||||
| 685,800 | 5.750%, 4/25/2037 | 618,077 | ||||||
The accompanying Notes to Financial Statements are an integral part of this schedule.
44
Table of Contents
Moderately Aggressive Allocation Portfolio
Schedule of Investments as of June 30, 2014
(unaudited)
| Principal Amount | Long-Term Fixed Income (15.0%) | Value | ||||||
| Collateralized Mortgage Obligations (0.5%) - continued |
| ||||||
| Deutsche Alt-A Securities Mortgage Loan Trust | ||||||||
| $520,871 | 6.000%, 10/25/2021 | $ | 465,485 | |||||
| Deutsche Alt-A Securities, Inc., Mortgage Loan Trust | ||||||||
| 216,130 | 5.500%, 10/25/2021 | 212,108 | ||||||
| Federal Home Loan Mortgage Corporation | ||||||||
| 1,716,203 | 3.000%, 2/15/2033j | 259,721 | ||||||
| Federal National Mortgage Association | ||||||||
| 3,679,233 | 3.500%, 1/25/2033j | 604,332 | ||||||
| HomeBanc Mortgage Trust | ||||||||
| 2,640,007 | 2.240%, 4/25/2037 | 1,965,182 | ||||||
| J.P. Morgan Mortgage Trust | ||||||||
| 157,005 | 2.607%, 10/25/2036 | 132,344 | ||||||
| 1,721,831 | 0.532%, 1/25/2037h | 1,149,572 | ||||||
| 1,873,645 | 6.250%, 8/25/2037 | 1,344,550 | ||||||
| MASTR Alternative Loans Trust | ||||||||
| 358,698 | 6.500%, 7/25/2034 | 367,821 | ||||||
| 967,164 | 0.602%, 12/25/2035h | 548,352 | ||||||
| Merrill Lynch Alternative Note Asset Trust | ||||||||
| 400,182 | 6.000%, 3/25/2037 | 375,459 | ||||||
| Neuberger Berman CLO, Ltd. | ||||||||
| 300,000 | 1.701%, 8/4/2025c,h,k | 300,000 | ||||||
| Residential Asset Securitization Trust | ||||||||
| 1,263,183 | 0.532%, 8/25/2037h | 521,053 | ||||||
| Sequoia Mortgage Trust | ||||||||
| 1,017,931 | 2.740%, 9/20/2046 | 870,083 | ||||||
| 106,424 | 2.740%, 9/20/2046 | 4,457 | ||||||
| WaMu Mortgage Pass Through Certificates | ||||||||
| 260,884 | 2.344%, 9/25/2036 | 234,108 | ||||||
| 515,948 | 2.383%, 10/25/2036 | 450,103 | ||||||
| 3,564,920 | 2.049%, 11/25/2036 | 3,133,037 | ||||||
|
| |||||||
| Total | 19,625,539 | |||||||
|
| |||||||
| Commercial Mortgage-Backed Securities (0.7%) | |||||||
| Banc of America Commercial Mortgage, Inc. | ||||||||
| 2,800,000 | 5.781%, 4/10/2049 | 3,076,870 | ||||||
| 3,675,000 | 5.775%, 6/10/2049 | 4,044,712 | ||||||
| Bear Stearns Commercial Mortgage Securities, Inc. | ||||||||
| 1,646,982 | 5.331%, 2/11/2044 | 1,777,507 | ||||||
| CGBAM Commercial Mortgage Trust | ||||||||
| 350,000 | 1.252%, 5/15/2030g,h | 350,550 | ||||||
| Citigroup/Deutsche Bank Commercial Mortgage | ||||||||
| 3,900,000 | 5.322%, 12/11/2049 | 4,242,974 | ||||||
| Commercial Mortgage Pass- Through Certificates | ||||||||
| 780,000 | 1.201%, 6/8/2030g,h | 782,604 | ||||||
| Credit Suisse First Boston Mortgage Securities | ||||||||
| 2,800,000 | 5.542%, 1/15/2049 | 3,065,082 | ||||||
| Credit Suisse Mortgage Capital Certificates | ||||||||
| 3,350,000 | 5.509%, 9/15/2039 | 3,603,407 | ||||||
| Federal Home Loan Mortgage Corporation Multi Family Structured Pass Thru Certificates | ||||||||
| 837,947 | 0.727%, 12/25/2016 | 834,141 | ||||||
| Federal National Mortgage Association | ||||||||
| 930,250 | 0.478%, 9/25/2015 | 931,137 | ||||||
| 550,000 | 1.272%, 1/25/2017 | 555,077 | ||||||
| Government National Mortgage Association | ||||||||
| 98,900 | 2.164%, 3/16/2033 | 99,382 | ||||||
| 45,337 | 3.214%, 1/16/2040 | 45,946 | ||||||
| Greenwich Capital Commercial Funding Corporation | ||||||||
| 1,750,000 | 5.867%, 12/10/2049 | 1,933,944 | ||||||
| J.P. Morgan Chase Commercial Mortgage Securities Corporation | ||||||||
| 204,722 | 0.852%, 4/15/2028g,h | 204,494 | ||||||
| 850,000 | 1.102%, 12/15/2028g,h | 850,162 | ||||||
| 1,300,000 | 5.892%, 2/12/2049 | 1,415,627 | ||||||
| LSTAR Commercial Mortgage Trust | ||||||||
| 1,219,124 | 1.519%, 1/20/2041g | 1,220,161 | ||||||
| Morgan Stanley Capital, Inc. | ||||||||
| 900,000 | 5.406%, 3/15/2044 | 980,563 | ||||||
| SCG Trust | ||||||||
| 425,000 | 1.552%, 11/15/2026g,h | 426,751 | ||||||
| Wachovia Bank Commercial Mortgage Trust | ||||||||
| 2,100,000 | 5.603%, 10/15/2048 | 2,267,532 | ||||||
|
| |||||||
| Total | 32,708,623 | |||||||
|
| |||||||
| Communications Services (0.3%) | |||||||
| AMC Networks, Inc. | ||||||||
| 630,000 | 4.750%, 12/15/2022 | 630,000 | ||||||
| America Movil SAB de CV | ||||||||
| 425,000 | 1.230%, 9/12/2016h | 430,093 | ||||||
| 328,000 | 5.000%, 10/16/2019 | 368,757 | ||||||
| American Tower Corporation | ||||||||
| 603,000 | 7.000%, 10/15/2017 | 701,744 | ||||||
| AT&T, Inc. | ||||||||
| 245,000 | 1.137%, 11/27/2018h | 249,772 | ||||||
| 349,000 | 3.875%, 8/15/2021 | 371,285 | ||||||
| British Telecommunications plc | ||||||||
| 245,000 | 1.625%, 6/28/2016 | 248,375 | ||||||
| 165,000 | 1.250%, 2/14/2017 | 165,148 | ||||||
| CBS Corporation | ||||||||
| 301,000 | 8.875%, 5/15/2019 | 390,217 | ||||||
| CC Holdings GS V, LLC | ||||||||
| 133,000 | 2.381%, 12/15/2017 | 135,441 | ||||||
| CCO Holdings, LLC | ||||||||
| 630,000 | 7.375%, 6/1/2020 | 686,700 | ||||||
| CenturyLink, Inc. | ||||||||
| 500,000 | 6.450%, 6/15/2021 | 542,500 | ||||||
| Comcast Corporation | ||||||||
| 205,000 | 4.650%, 7/15/2042 | 212,542 | ||||||
| 252,000 | 4.750%, 3/1/2044 | 266,530 | ||||||
The accompanying Notes to Financial Statements are an integral part of this schedule.
45
Table of Contents
Moderately Aggressive Allocation Portfolio
Schedule of Investments as of June 30, 2014
(unaudited)
| Principal Amount | Long-Term Fixed Income (15.0%) | Value | ||||||
| Communications Services (0.3%) - continued |
| ||||||
| Cox Communications, Inc. | ||||||||
| $326,000 | 9.375%, 1/15/2019g | $ | 422,199 | |||||
| Crown Castle Towers, LLC | ||||||||
| 100,000 | 4.174%, 8/15/2017g | 106,179 | ||||||
| DIRECTV Holdings, LLC | ||||||||
| 252,000 | 1.750%, 1/15/2018 | 252,347 | ||||||
| 212,000 | 5.875%, 10/1/2019 | 246,579 | ||||||
| 141,000 | 4.450%, 4/1/2024 | 149,506 | ||||||
| Hughes Satellite Systems Corporation | ||||||||
| 630,000 | 6.500%, 6/15/2019 | 702,450 | ||||||
| Intelsat Jackson Holdings SA | ||||||||
| 630,000 | 7.250%, 4/1/2019 | 670,162 | ||||||
| Level 3 Financing, Inc. | ||||||||
| 630,000 | 8.625%, 7/15/2020 | 705,600 | ||||||
| NBC Universal Enterprise, Inc. | ||||||||
| 390,000 | 0.912%, 4/15/2018g,h | 394,340 | ||||||
| Nippon Telegraph & Telephone Corporation | ||||||||
| 120,000 | 1.400%, 7/18/2017 | 120,709 | ||||||
| Numericable Group SA | ||||||||
| 385,000 | 6.000%, 5/15/2022g | 400,400 | ||||||
| SBA Tower Trust | ||||||||
| 105,000 | 5.101%, 4/17/2017g | 112,435 | ||||||
| SES Global Americas Holdings GP | ||||||||
| 365,000 | 2.500%, 3/25/2019g | 367,600 | ||||||
| Sprint Communications, Inc. | ||||||||
| 629,634 | 9.000%, 11/15/2018g | 763,431 | ||||||
| Telefonica Emisiones SAU | ||||||||
| 329,000 | 3.992%, 2/16/2016 | 344,462 | ||||||
| 319,000 | 3.192%, 4/27/2018 | 333,379 | ||||||
| Time Warner Cable, Inc. | ||||||||
| 210,000 | 5.000%, 2/1/2020 | 235,328 | ||||||
| 336,000 | 6.550%, 5/1/2037 | 418,082 | ||||||
| Unitymedia Hessen GmbH & Company KG | ||||||||
| 385,000 | 5.500%, 1/15/2023g | 398,475 | ||||||
| Univision Communications, Inc. | ||||||||
| 630,000 | 6.875%, 5/15/2019g | 672,525 | ||||||
| UPCB Finance V, Ltd. | ||||||||
| 630,000 | 7.250%, 11/15/2021g | 693,000 | ||||||
| Verizon Communications, Inc. | ||||||||
| 275,000 | 1.350%, 6/9/2017 | 274,908 | ||||||
| 87,000 | 1.100%, 11/1/2017 | 86,206 | ||||||
| 132,000 | 1.981%, 9/14/2018h | 139,267 | ||||||
| 66,000 | 3.650%, 9/14/2018 | 70,586 | ||||||
| 350,000 | 1.002%, 6/17/2019h | 354,249 | ||||||
| 353,000 | 6.400%, 9/15/2033 | 432,403 | ||||||
| 188,000 | 5.050%, 3/15/2034 | 200,646 | ||||||
| 66,000 | 6.550%, 9/15/2043 | 83,057 | ||||||
| Viacom, Inc. | ||||||||
| 206,000 | 2.500%, 9/1/2018 | 210,552 | ||||||
| Wind Acquisition Finance SA | ||||||||
| 435,000 | 7.375%, 4/23/2021g | 464,363 | ||||||
|
| |||||||
| Total | 16,224,529 | |||||||
|
| |||||||
| Consumer Cyclical (0.3%) | |||||||
| Chrysler Group, LLC | ||||||||
| 635,000 | 8.000%, 6/15/2019 | 689,769 | ||||||
| Cinemark USA, Inc. | ||||||||
| 630,000 | 4.875%, 6/1/2023 | 628,425 | ||||||
| Daimler Finance North America, LLC | ||||||||
| 330,000 | 1.085%, 8/1/2018g,h | 333,446 | ||||||
| Delphi Corporation | ||||||||
| 329,000 | 6.125%, 5/15/2021 | 367,690 | ||||||
| Ford Motor Company | ||||||||
| 205,000 | 7.450%, 7/16/2031 | 274,070 | ||||||
| Ford Motor Credit Company, LLC | ||||||||
| 334,000 | 12.000%, 5/15/2015 | 366,942 | ||||||
| 390,000 | 1.474%, 5/9/2016h | 395,748 | ||||||
| 385,000 | 2.375%, 1/16/2018 | 393,281 | ||||||
| 241,000 | 5.000%, 5/15/2018 | 268,101 | ||||||
| Gap, Inc. | ||||||||
| 286,000 | 5.950%, 4/12/2021 | 330,983 | ||||||
| General Motors Company | ||||||||
| 159,000 | 3.500%, 10/2/2018g | 162,578 | ||||||
| 384,000 | 6.250%, 10/2/2043g | 440,640 | ||||||
| General Motors Financial Company, Inc. | ||||||||
| 630,000 | 3.250%, 5/15/2018 | 639,450 | ||||||
| Home Depot, Inc. | ||||||||
| 235,000 | 4.875%, 2/15/2044 | 256,082 | ||||||
| Hyundai Capital America | ||||||||
| 549,000 | 1.450%, 2/6/2017g | 551,068 | ||||||
| Jaguar Land Rover Automotive plc | ||||||||
| 630,000 | 5.625%, 2/1/2023e,g | 669,375 | ||||||
| KB Home | ||||||||
| 328,000 | 4.750%, 5/15/2019 | 330,460 | ||||||
| L Brands, Inc. | ||||||||
| 630,000 | 5.625%, 2/15/2022 | 681,975 | ||||||
| Lennar Corporation | ||||||||
| 630,000 | 4.125%, 12/1/2018 | 643,388 | ||||||
| Macy’s Retail Holdings, Inc. | ||||||||
| 102,000 | 4.375%, 9/1/2023 | 108,092 | ||||||
| 425,000 | 3.625%, 6/1/2024 | 422,848 | ||||||
| Nissan Motor Acceptance Corporation | ||||||||
| 330,000 | 0.777%, 3/3/2017g,h | 330,962 | ||||||
| Toll Brothers Finance Corporation | ||||||||
| 100,000 | 8.910%, 10/15/2017 | 120,000 | ||||||
| 226,000 | 4.000%, 12/31/2018 | 232,780 | ||||||
| Toyota Motor Credit Corporation | ||||||||
| 500,000 | 0.425%, 5/16/2017h | 500,134 | ||||||
| 75,000 | 1.750%, 5/22/2017 | 76,442 | ||||||
| TRW Automotive, Inc. | ||||||||
| 234,000 | 7.250%, 3/15/2017g | 266,175 | ||||||
| Walgreen Company | ||||||||
| 201,000 | 5.250%, 1/15/2019 | 228,074 | ||||||
| Western Union Company | ||||||||
| 256,000 | 2.375%, 12/10/2015 | 261,147 | ||||||
| WMG Acquisition Corporation | ||||||||
| 310,000 | 6.750%, 4/15/2022g | 310,000 | ||||||
| Wynn Las Vegas, LLC | ||||||||
| 630,000 | 5.375%, 3/15/2022e | 655,987 | ||||||
|
| |||||||
| Total | 11,936,112 | |||||||
|
| |||||||
| Consumer Non-Cyclical (0.3%) | |||||||
| AbbVie, Inc. | ||||||||
| 282,000 | 2.000%, 11/6/2018 | 281,651 | ||||||
| Altria Group, Inc. | ||||||||
| 235,000 | 9.700%, 11/10/2018 | 307,928 | ||||||
| 330,000 | 4.000%, 1/31/2024 | 339,085 | ||||||
The accompanying Notes to Financial Statements are an integral part of this schedule.
46
Table of Contents
Moderately Aggressive Allocation Portfolio
Schedule of Investments as of June 30, 2014
(unaudited)
| Principal Amount | Long-Term Fixed Income (15.0%) | Value | ||||||
| Consumer Non-Cyclical (0.3%) - continued |
| ||||||
| Amgen, Inc. | ||||||||
| $355,000 | 0.828%, 5/22/2019h | $ | 355,848 | |||||
| Anheuser-Busch InBev Finance, Inc. | ||||||||
| 296,000 | 0.623%, 2/1/2019h | 296,135 | ||||||
| Anheuser-Busch InBev Worldwide, Inc. | ||||||||
| 380,000 | 7.750%, 1/15/2019 | 469,465 | ||||||
| Boston Scientific Corporation | ||||||||
| 235,000 | 2.650%, 10/1/2018 | 240,225 | ||||||
| Bunge Limited Finance Corporation | ||||||||
| 282,000 | 8.500%, 6/15/2019 | 354,368 | ||||||
| CareFusion Corporation | ||||||||
| 225,000 | 1.450%, 5/15/2017 | 224,832 | ||||||
| 288,000 | 6.375%, 8/1/2019 | 337,185 | ||||||
| Celgene Corporation | ||||||||
| 476,000 | 1.900%, 8/15/2017 | 482,945 | ||||||
| 66,000 | 2.300%, 8/15/2018 | 67,068 | ||||||
| CHS/Community Health Systems, Inc. | ||||||||
| 630,000 | 7.125%, 7/15/2020 | 681,975 | ||||||
| ConAgra Foods, Inc. | ||||||||
| 325,000 | 1.900%, 1/25/2018 | 325,784 | ||||||
| Coventry Health Care, Inc. | ||||||||
| 347,000 | 5.950%, 3/15/2017 | 390,144 | ||||||
| CVS Caremark Corporation | ||||||||
| 116,000 | 1.200%, 12/5/2016 | 116,709 | ||||||
| 188,000 | 6.125%, 9/15/2039 | 234,093 | ||||||
| Endo Finance LLC & Endo Finco, Inc. | ||||||||
| 630,000 | 7.000%, 7/15/2019g | 673,313 | ||||||
| Express Scripts Holding Company | ||||||||
| 188,000 | 2.650%, 2/15/2017 | 195,314 | ||||||
| 150,000 | 1.250%, 6/2/2017 | 149,736 | ||||||
| 210,000 | 2.250%, 6/15/2019 | 209,122 | ||||||
| Forest Laboratories, Inc. | ||||||||
| 425,000 | 4.375%, 2/1/2019g | 458,494 | ||||||
| Fresenius Medical Care US Finance II, Inc. | ||||||||
| 630,000 | 5.875%, 1/31/2022g | 696,150 | ||||||
| Hawk Acquisition Sub, Inc. | ||||||||
| 629,634 | 4.250%, 10/15/2020 | 633,569 | ||||||
| IMS Health, Inc. | ||||||||
| 863,000 | 6.000%, 11/1/2020g | 906,150 | ||||||
| Kroger Company | ||||||||
| 245,000 | 0.756%, 10/17/2016h | 245,559 | ||||||
| 116,000 | 1.200%, 10/17/2016 | 116,381 | ||||||
| Lorillard Tobacco Company | ||||||||
| 235,000 | 2.300%, 8/21/2017e | 239,849 | ||||||
| 252,000 | 8.125%, 6/23/2019 | 314,182 | ||||||
| Mattel, Inc. | ||||||||
| 235,000 | 1.700%, 3/15/2018 | 233,995 | ||||||
| McKesson Corporation | ||||||||
| 190,000 | 1.292%, 3/10/2017 | 190,502 | ||||||
| Medco Health Solutions, Inc. | ||||||||
| 301,000 | 7.125%, 3/15/2018 | 355,548 | ||||||
| Mondelez International, Inc. | ||||||||
| 247,000 | 0.745%, 2/1/2019h | 246,446 | ||||||
| Monsanto Company | ||||||||
| 400,000 | 2.125%, 7/15/2019 | 400,988 | ||||||
| Mylan, Inc. | ||||||||
| 188,000 | 2.600%, 6/24/2018 | 190,959 | ||||||
| 235,000 | 7.875%, 7/15/2020g | 260,112 | ||||||
| Pernod Ricard SA | ||||||||
| 112,000 | 2.950%, 1/15/2017g | 116,472 | ||||||
| 188,000 | 5.750%, 4/7/2021g | 216,115 | ||||||
| Perrigo Company, Ltd. | ||||||||
| 483,000 | 1.300%, 11/8/2016g | 482,281 | ||||||
| 240,000 | 2.300%, 11/8/2018g | 239,901 | ||||||
| Roche Holdings, Inc. | ||||||||
| 50,000 | 7.000%, 3/1/2039g | 71,079 | ||||||
| SABMiller Holdings, Inc. | ||||||||
| 320,000 | 2.450%, 1/15/2017g | 329,758 | ||||||
| Safeway, Inc. | ||||||||
| 50,000 | 3.400%, 12/1/2016 | 52,616 | ||||||
| Spectrum Brands Escrow Corporation | ||||||||
| 630,000 | 6.375%, 11/15/2020 | 677,250 | ||||||
| Thermo Fisher Scientific, Inc. | ||||||||
| 292,000 | 1.300%, 2/1/2017 | 292,430 | ||||||
| 282,000 | 2.400%, 2/1/2019 | 284,870 | ||||||
| Valeant Pharmaceuticals International | ||||||||
| 630,000 | 6.875%, 12/1/2014g | 659,137 | ||||||
| WM Wrigley Jr. Company | ||||||||
| 295,000 | 1.400%, 10/21/2016g | 297,043 | ||||||
| 165,000 | 2.000%, 10/20/2017g | 167,421 | ||||||
|
| |||||||
| Total | 16,108,182 | |||||||
|
| |||||||
| Energy (0.2%) | |||||||
| BP Capital Markets plc | ||||||||
| 174,000 | 1.375%, 11/6/2017 | 174,245 | ||||||
| Buckeye Partners, LP | ||||||||
| 288,000 | 2.650%, 11/15/2018 | 292,803 | ||||||
| Canadian Natural Resources, Ltd. | ||||||||
| 245,000 | 0.609%, 3/30/2016h | 245,531 | ||||||
| CNOOC Nexen Finance 2014 ULC | ||||||||
| 345,000 | 1.625%, 4/30/2017 | 345,886 | ||||||
| CNPC General Capital, Ltd. | ||||||||
| 192,000 | 1.450%, 4/16/2016g | 192,267 | ||||||
| 192,000 | 2.750%, 4/19/2017g | 196,984 | ||||||
| Concho Resources, Inc. | ||||||||
| 629,634 | 5.500%, 10/1/2022 | 677,644 | ||||||
| Continental Resources, Inc. | ||||||||
| 384,000 | 5.000%, 9/15/2022 | 417,600 | ||||||
| Devon Energy Corporation | ||||||||
| 536,000 | 1.200%, 12/15/2016 | 537,625 | ||||||
| Ecopetrol SA | ||||||||
| 192,000 | 5.875%, 5/28/2045 | 198,582 | ||||||
| Enbridge, Inc. | ||||||||
| 437,000 | 0.678%, 6/2/2017h | 437,880 | ||||||
| EQT Corporation | ||||||||
| 162,000 | 5.150%, 3/1/2018 | 176,759 | ||||||
| 118,000 | 8.125%, 6/1/2019 | 147,642 | ||||||
| Hess Corporation | ||||||||
| 352,000 | 8.125%, 2/15/2019 | 442,803 | ||||||
| Linn Energy, LLC | ||||||||
| 629,634 | 6.250%, 11/1/2019g | 659,542 | ||||||
| Lukoil International Finance BV | ||||||||
| 140,000 | 3.416%, 4/24/2018g | 138,950 | ||||||
| MEG Energy Corporation | ||||||||
| 630,000 | 6.500%, 3/15/2021g | 667,800 | ||||||
| Murphy Oil Corporation | ||||||||
| 87,000 | 2.500%, 12/1/2017 | 89,044 | ||||||
The accompanying Notes to Financial Statements are an integral part of this schedule.
47
Table of Contents
Moderately Aggressive Allocation Portfolio
Schedule of Investments as of June 30, 2014
(unaudited)
| Principal Amount | Long-Term Fixed Income (15.0%) | Value | ||||||
| Energy (0.2%) - continued |
| ||||||
| Oasis Petroleum, Inc. | ||||||||
| $630,000 | 6.875%, 1/15/2023 | $ | 686,700 | |||||
| Offshore Group Investment, Ltd. | ||||||||
| 630,000 | 7.500%, 11/1/2019 | 666,225 | ||||||
| Petrobras Global Finance BV | ||||||||
| 423,000 | 2.000%, 5/20/2016 | 423,611 | ||||||
| 300,000 | 3.112%, 3/17/2020h | 308,235 | ||||||
| Petroleos Mexicanos | ||||||||
| 100,000 | 3.500%, 7/18/2018 | 105,100 | ||||||
| Pioneer Natural Resources Company | ||||||||
| 60,000 | 5.875%, 7/15/2016 | 65,656 | ||||||
| Range Resources Corporation | ||||||||
| 630,000 | 5.000%, 8/15/2022 | 667,800 | ||||||
| Sinopec Capital 2013, Ltd. | ||||||||
| 330,000 | 1.250%, 4/24/2016g | 330,112 | ||||||
| Suncor Energy, Inc. | ||||||||
| 197,000 | 6.100%, 6/1/2018 | 228,631 | ||||||
| Total Capital International SA | ||||||||
| 190,000 | 0.580%, 6/19/2019h | 189,999 | ||||||
| Transocean, Inc. | ||||||||
| 345,000 | 6.000%, 3/15/2018 | 389,687 | ||||||
| Weatherford International, Ltd. | ||||||||
| 320,000 | 9.625%, 3/1/2019 | 419,934 | ||||||
| Williams Companies, Inc. | ||||||||
| 192,000 | 3.700%, 1/15/2023 | 184,692 | ||||||
|
| |||||||
| Total | 10,705,969 | |||||||
|
| |||||||
| Financials (1.3%) | |||||||
| Abbey National Treasury Services plc | ||||||||
| 132,000 | 3.050%, 8/23/2018 | 138,234 | ||||||
| ABN AMRO Bank NV | ||||||||
| 359,000 | 2.500%, 10/30/2018g | 364,267 | ||||||
| Achmea Hypotheekbank NV | ||||||||
| 283,000 | 3.200%, 11/3/2014g | 285,696 | ||||||
| American Express Credit Corporation | ||||||||
| 75,000 | 2.375%, 3/24/2017 | 77,536 | ||||||
| 350,000 | 0.781%, 3/18/2019h | 351,943 | ||||||
| American International Group, Inc. | ||||||||
| 165,000 | 3.800%, 3/22/2017 | 176,320 | ||||||
| 480,000 | 8.250%, 8/15/2018 | 596,356 | ||||||
| ANZ National International, Ltd. of London | ||||||||
| 235,000 | 3.125%, 8/10/2015g | 241,746 | ||||||
| ANZ New Zealand International, Ltd. | ||||||||
| 294,000 | 1.400%, 4/27/2017g | 294,560 | ||||||
| Australia and New Zealand Banking Group, Ltd. | ||||||||
| 365,000 | 0.490%, 6/13/2017g,h | 364,784 | ||||||
| Aviation Capital Group Corporation | ||||||||
| 132,000 | 3.875%, 9/27/2016g | 136,620 | ||||||
| Banco Santander Chile | ||||||||
| 435,000 | 1.127%, 4/11/2017g,h | 434,999 | ||||||
| Bank Nederlandse Gemeenten NV | ||||||||
| 227,000 | 1.375%, 3/19/2018g | 227,170 | ||||||
| Bank of America Corporation | ||||||||
| 253,000 | 7.750%, 8/15/2015 | 271,887 | ||||||
| 245,000 | 5.750%, 8/15/2016 | 267,313 | ||||||
| 376,000 | 5.700%, 5/2/2017 | 417,254 | ||||||
| 580,000 | 5.750%, 12/1/2017 | 654,194 | ||||||
| 658,000 | 1.300%, 3/22/2018h | 666,472 | ||||||
| 576,000 | 5.650%, 5/1/2018 | 652,917 | ||||||
| 295,000 | 1.103%, 4/1/2019h | 296,913 | ||||||
| 188,000 | 4.000%, 4/1/2024 | 191,860 | ||||||
| 251,000 | 5.875%, 2/7/2042 | 298,085 | ||||||
| Bank of Montreal | ||||||||
| 370,000 | 0.829%, 4/9/2018h | 372,479 | ||||||
| Bank of Tokyo-Mitsubishi UFJ, Ltd. | ||||||||
| 420,000 | 0.640%, 3/10/2017g,h | 419,893 | ||||||
| Banque Federative du Credit Mutuel SA | ||||||||
| 329,000 | 1.078%, 1/20/2017g,h | 331,821 | ||||||
| Barclays Bank plc | ||||||||
| 280,000 | 10.179%, 6/12/2021g | 387,299 | ||||||
| BBVA Banco Continental SA | ||||||||
| 350,000 | 2.250%, 7/29/2016g | 352,625 | ||||||
| BBVA US Senior SAU | ||||||||
| 419,000 | 4.664%, 10/9/2015 | 438,070 | ||||||
| Berkshire Hathaway Finance Corporation | ||||||||
| 300,000 | 0.377%, 1/10/2017h | 300,076 | ||||||
| 160,000 | 1.600%, 5/15/2017 | 162,516 | ||||||
| 390,000 | 1.300%, 5/15/2018 | 386,645 | ||||||
| BioMed Realty, LP | ||||||||
| 282,000 | 2.625%, 5/1/2019 | 283,695 | ||||||
| BNP Paribas SA | ||||||||
| 231,000 | 1.250%, 12/12/2016 | 231,295 | ||||||
| 386,000 | 2.375%, 9/14/2017 | 395,264 | ||||||
| BPCE SA | ||||||||
| 300,000 | 1.073%, 2/10/2017e,h | 302,548 | ||||||
| 378,000 | 1.625%, 2/10/2017 | 380,782 | ||||||
| Canadian Imperial Bank of Commerce | ||||||||
| 465,000 | 2.600%, 7/2/2015g | 475,602 | ||||||
| Capital One Bank USA NA | ||||||||
| 295,000 | 1.200%, 2/13/2017 | 294,987 | ||||||
| Capital One Financial Corporation | ||||||||
| 260,000 | 0.680%, 3/22/2016h | 260,604 | ||||||
| 379,000 | 6.150%, 9/1/2016 | 419,426 | ||||||
| 235,000 | 2.450%, 4/24/2019 | 237,204 | ||||||
| Citigroup, Inc. | ||||||||
| 1,123,000 | 5.500%, 2/15/2017 | 1,235,034 | ||||||
| 300,000 | 0.770%, 3/10/2017h | 300,163 | ||||||
| 230,000 | 6.000%, 8/15/2017 | 260,331 | ||||||
| 245,000 | 1.000%, 4/8/2019h | 245,342 | ||||||
| 385,000 | 8.500%, 5/22/2019 | 492,104 | ||||||
| 274,000 | 4.050%, 7/30/2022 | 280,712 | ||||||
| CoBank ACB | ||||||||
| 120,000 | 0.831%, 6/15/2022h,i | 110,550 | ||||||
| Cooperatieve Centrale Raiffeisen-Boerenleenbank BA | ||||||||
| 228,000 | 3.950%, 11/9/2022 | 231,791 | ||||||
| Credit Agricole SA | ||||||||
| 535,000 | 1.625%, 4/15/2016g | 542,099 | ||||||
| 290,000 | 1.027%, 4/15/2019g,h | 292,210 | ||||||
| Credit Suisse AG | ||||||||
| 231,000 | 5.400%, 1/14/2020 | 259,575 | ||||||
| CyrusOne, LP | ||||||||
| 630,000 | 6.375%, 11/15/2022 | 678,825 | ||||||
The accompanying Notes to Financial Statements are an integral part of this schedule.
48
Table of Contents
Moderately Aggressive Allocation Portfolio
Schedule of Investments as of June 30, 2014
(unaudited)
| Principal Amount | Long-Term Fixed Income (15.0%) | Value | ||||||
| Financials (1.3%) - continued |
| ||||||
| DDR Corporation | ||||||||
| $384,000 | 9.625%, 3/15/2016 | $ | 439,379 | |||||
| Deutsche Bank AG | ||||||||
| 465,000 | 1.350%, 5/30/2017 | 464,846 | ||||||
| Discover Bank | ||||||||
| 235,000 | 8.700%, 11/18/2019 | 298,673 | ||||||
| Discover Financial Services | ||||||||
| 188,000 | 6.450%, 6/12/2017 | 213,855 | ||||||
| DnB Boligkreditt AS | ||||||||
| 605,000 | 1.450%, 3/21/2018g | 602,142 | ||||||
| Eksportfinans ASA | ||||||||
| 80,000 | 3.000%, 11/17/2014 | 80,488 | ||||||
| 111,000 | 5.500%, 5/25/2016 | 118,215 | ||||||
| Fifth Third Bancorp | ||||||||
| 286,000 | 5.450%, 1/15/2017 | 313,516 | ||||||
| General Electric Capital Corporation | ||||||||
| 475,000 | 0.504%, 5/15/2017h | 475,398 | ||||||
| 961,000 | 6.000%, 8/7/2019 | 1,138,351 | ||||||
| 390,000 | 1.231%, 3/15/2023h | 390,971 | ||||||
| 414,000 | 6.750%, 3/15/2032 | 546,132 | ||||||
| Genworth Financial, Inc. | ||||||||
| 336,000 | 7.700%, 6/15/2020 | 414,083 | ||||||
| Goldman Sachs Group, Inc. | ||||||||
| 410,000 | 2.375%, 1/22/2018 | 416,370 | ||||||
| 390,000 | 1.425%, 4/30/2018h | 396,297 | ||||||
| 205,000 | 1.324%, 11/15/2018h | 207,800 | ||||||
| 271,000 | 7.500%, 2/15/2019 | 330,716 | ||||||
| 374,000 | 5.375%, 3/15/2020 | 423,659 | ||||||
| 491,000 | 5.250%, 7/27/2021 | 551,360 | ||||||
| Hartford Financial Services Group, Inc. | ||||||||
| 177,000 | 4.000%, 10/15/2017 | 190,994 | ||||||
| 309,000 | 5.125%, 4/15/2022 | 351,368 | ||||||
| HBOS plc | ||||||||
| 288,000 | 6.750%, 5/21/2018g | 331,784 | ||||||
| HCP, Inc. | ||||||||
| 67,000 | 6.000%, 1/30/2017 | 75,002 | ||||||
| 75,000 | 6.700%, 1/30/2018 | 87,451 | ||||||
| Health Care REIT, Inc. | ||||||||
| 304,000 | 4.700%, 9/15/2017 | 332,553 | ||||||
| 58,000 | 2.250%, 3/15/2018 | 58,889 | ||||||
| HSBC Bank plc | ||||||||
| 495,000 | 0.864%, 5/15/2018g,h | 499,555 | ||||||
| HSBC Finance Corporation | ||||||||
| 498,000 | 6.676%, 1/15/2021 | 595,559 | ||||||
| HSBC Holdings plc | ||||||||
| 236,000 | 5.250%, 3/14/2044 | 252,709 | ||||||
| HSBC USA, Inc. | ||||||||
| 241,000 | 1.625%, 1/16/2018 | 241,540 | ||||||
| Huntington Bancshares, Inc. | ||||||||
| 66,000 | 2.600%, 8/2/2018 | 67,119 | ||||||
| Huntington National Bank | ||||||||
| 282,000 | 1.350%, 8/2/2016 | 283,981 | ||||||
| Icahn Enterprises, LP | ||||||||
| 500,000 | 6.000%, 8/1/2020 | 535,625 | ||||||
| ING Bank NV | ||||||||
| 282,000 | 4.125%, 11/21/2023 | 290,108 | ||||||
| ING Capital Funding Trust III | ||||||||
| 265,000 | 3.834%, 12/29/2049h,l | 265,000 | ||||||
| International Lease Finance Corporation | ||||||||
| 383,000 | 2.181%, 6/15/2016h | 385,394 | ||||||
| Intesa Sanpaolo SPA | ||||||||
| 317,000 | 3.125%, 1/15/2016 | 325,846 | ||||||
| 141,000 | 3.875%, 1/16/2018 | 148,605 | ||||||
| 288,000 | 3.875%, 1/15/2019 | 302,032 | ||||||
| J.P. Morgan Chase & Company | ||||||||
| 259,000 | 1.125%, 2/26/2016 | 260,218 | ||||||
| 353,000 | 3.450%, 3/1/2016 | 368,363 | ||||||
| 210,000 | 0.744%, 2/15/2017h | 210,764 | ||||||
| 576,000 | 2.000%, 8/15/2017 | 585,765 | ||||||
| 200,000 | 1.800%, 1/25/2018 | 200,967 | ||||||
| 521,000 | 6.300%, 4/23/2019 | 615,989 | ||||||
| 50,000 | 3.200%, 1/25/2023 | 49,644 | ||||||
| 372,000 | 7.900%, 4/29/2049l | 415,710 | ||||||
| KeyBank NA | ||||||||
| 438,000 | 7.413%, 5/6/2015 | 462,807 | ||||||
| Kookmin Bank | ||||||||
| 334,000 | 1.103%, 1/27/2017g,h | 335,822 | ||||||
| Liberty Mutual Group, Inc. | ||||||||
| 60,000 | 4.950%, 5/1/2022g | 65,625 | ||||||
| 56,000 | 6.500%, 5/1/2042g | 70,230 | ||||||
| Liberty Property, LP | ||||||||
| 289,000 | 5.500%, 12/15/2016 | 315,530 | ||||||
| Lloyds Banking Group plc | ||||||||
| 288,000 | 5.920%, 9/29/2049g,l | 290,880 | ||||||
| Macquarie Bank, Ltd. | ||||||||
| 305,000 | 5.000%, 2/22/2017g | 332,389 | ||||||
| 440,000 | 1.021%, 3/24/2017g,h | 441,415 | ||||||
| Manufacturers and Traders Trust Company | ||||||||
| 250,000 | 0.600%, 1/30/2017h | 250,226 | ||||||
| MasterCard, Inc. | ||||||||
| 235,000 | 2.000%, 4/1/2019 | 235,956 | ||||||
| Merrill Lynch & Company, Inc. | ||||||||
| 768,000 | 6.050%, 5/16/2016 | 835,328 | ||||||
| 225,000 | 6.400%, 8/28/2017 | 257,013 | ||||||
| Metropolitan Life Global Funding I | ||||||||
| 230,000 | 0.365%, 6/23/2016c,g,h | 229,910 | ||||||
| 400,000 | 0.607%, 4/10/2017g,h | 400,879 | ||||||
| 282,000 | 1.300%, 4/10/2017g | 282,650 | ||||||
| Mizuho Bank, Ltd. | ||||||||
| 290,000 | 0.659%, 4/16/2017g,h | 290,240 | ||||||
| Mizuho Corporate Bank, Ltd. | ||||||||
| 282,000 | 1.850%, 3/21/2018g | 283,113 | ||||||
| Morgan Stanley | ||||||||
| 150,000 | 1.750%, 2/25/2016 | 152,130 | ||||||
| 391,000 | 4.750%, 3/22/2017 | 425,697 | ||||||
| 270,000 | 6.250%, 8/28/2017 | 307,714 | ||||||
| 384,000 | 6.625%, 4/1/2018 | 448,886 | ||||||
| 260,000 | 1.509%, 4/25/2018h | 265,155 | ||||||
| 250,000 | 4.875%, 11/1/2022 | 268,354 | ||||||
| 329,000 | 4.100%, 5/22/2023 | 333,742 | ||||||
| Murray Street Investment Trust I | ||||||||
| 720,000 | 4.647%, 3/9/2017 | 778,163 | ||||||
| National City Corporation | ||||||||
| 438,000 | 6.875%, 5/15/2019 | 523,113 | ||||||
| Nomura Holdings, Inc. | ||||||||
| 390,000 | 1.680%, 9/13/2016h | 396,466 | ||||||
| 282,000 | 2.000%, 9/13/2016 | 286,602 | ||||||
| 235,000 | 2.750%, 3/19/2019 | 239,065 | ||||||
| Nordea Eiendomskreditt AS | ||||||||
| 453,000 | 2.125%, 9/22/2016g | 465,621 | ||||||
The accompanying Notes to Financial Statements are an integral part of this schedule.
49
Table of Contents
Moderately Aggressive Allocation Portfolio
Schedule of Investments as of June 30, 2014
(unaudited)
| Principal Amount | Long-Term Fixed Income (15.0%) | Value | ||||||
| Financials (1.3%) - continued |
| ||||||
| PNC Bank NA | ||||||||
| $448,000 | 1.150%, 11/1/2016 | $ | 450,316 | |||||
| Prologis, LP | ||||||||
| 370,000 | 7.375%, 10/30/2019 | 457,359 | ||||||
| Prudential Covered Trust | ||||||||
| 312,000 | 2.997%, 9/30/2015i | 319,588 | ||||||
| Realty Income Corporation | ||||||||
| 58,000 | 2.000%, 1/31/2018 | 58,274 | ||||||
| Regions Bank | ||||||||
| 540,000 | 7.500%, 5/15/2018 | 642,714 | ||||||
| Reinsurance Group of America, Inc. | ||||||||
| 105,000 | 5.625%, 3/15/2017 | 114,657 | ||||||
| 252,000 | 5.000%, 6/1/2021 | 277,911 | ||||||
| Reliance Standard Life Global Funding II | ||||||||
| 230,000 | 2.500%, 4/24/2019g | 230,726 | ||||||
| Royal Bank of Canada | ||||||||
| 756,000 | 1.125%, 7/22/2016 | 762,012 | ||||||
| 341,000 | 2.200%, 7/27/2018 | 348,220 | ||||||
| Royal Bank of Scotland Group plc | ||||||||
| 625,000 | 1.174%, 3/31/2017h | 628,039 | ||||||
| 570,000 | 5.125%, 5/28/2024 | 578,777 | ||||||
| Santander US Debt SAU | ||||||||
| 325,000 | 3.724%, 1/20/2015g | 329,809 | ||||||
| 85,000 | 3.781%, 10/7/2015g | 87,799 | ||||||
| Simon Property Group, LP | ||||||||
| 100,000 | 10.350%, 4/1/2019 | 135,486 | ||||||
| Skandinaviska Enskilda Banken AB | ||||||||
| 365,000 | 2.375%, 3/25/2019g | 368,176 | ||||||
| SLM Corporation | ||||||||
| 75,000 | 3.875%, 9/10/2015 | 76,500 | ||||||
| 138,000 | 6.250%, 1/25/2016 | 146,625 | ||||||
| 125,000 | 4.625%, 9/25/2017 | 131,719 | ||||||
| SpareBank 1 Boligkreditt AS | ||||||||
| 605,000 | 1.250%, 5/2/2018g | 596,403 | ||||||
| Sumitomo Mitsui Banking Corporation | ||||||||
| 555,000 | 1.300%, 1/10/2017 | 555,939 | ||||||
| Suncorp-Metway, Ltd. | ||||||||
| 674,000 | 0.934%, 3/28/2017g,h | 673,993 | ||||||
| Svensk Exportkredit AB | ||||||||
| 302,000 | 1.125%, 4/5/2018 | 299,034 | ||||||
| Svenska Handelsbanken AB | ||||||||
| 115,000 | 3.125%, 7/12/2016 | 120,434 | ||||||
| 282,000 | 1.625%, 3/21/2018 | 281,343 | ||||||
| 330,000 | 0.722%, 6/17/2019h | 330,119 | ||||||
| Swedbank Hypotek AB | ||||||||
| 605,000 | 1.375%, 3/28/2018g | 602,385 | ||||||
| Swiss RE Capital I, LP | ||||||||
| 125,000 | 6.854%, 5/29/2049g,l | 133,750 | ||||||
| Toronto-Dominion Bank | ||||||||
| 195,000 | 0.691%, 9/9/2016h | 196,068 | ||||||
| U.S. Bank NA | ||||||||
| 330,000 | 0.455%, 1/30/2017h | 330,162 | ||||||
| UBS AG London | ||||||||
| 605,000 | 0.750%, 3/24/2016g | 606,134 | ||||||
| UBS AG/Stamford, Connecticut | ||||||||
| 116,000 | 5.875%, 12/20/2017 | 132,490 | ||||||
| Ventas Realty, LP | ||||||||
| 313,000 | 1.550%, 9/26/2016 | 316,185 | ||||||
| 235,000 | 1.250%, 4/17/2017 | 235,031 | ||||||
| Voya Financial, Inc. | ||||||||
| 344,000 | 2.900%, 2/15/2018 | 356,467 | ||||||
| Wachovia Corporation | ||||||||
| 370,000 | 0.501%, 6/15/2017h | 369,493 | ||||||
| Wells Fargo & Company | ||||||||
| 754,000 | 1.250%, 7/20/2016 | 760,509 | ||||||
| 355,000 | 2.100%, 5/8/2017 | 364,100 | ||||||
|
| |||||||
| Total | 58,594,945 | |||||||
|
| |||||||
| Foreign Government (0.1%) | |||||||
| Asian Development Bank | ||||||||
| 520,000 | 0.500%, 6/20/2016 | 519,813 | ||||||
| Denmark Government International Bond | ||||||||
| 520,000 | 0.375%, 4/25/2016g | 519,243 | ||||||
| European Investment Bank | ||||||||
| 445,000 | 1.875%, 3/15/2019 | 448,860 | ||||||
| Export-Import Bank of Korea | ||||||||
| 116,000 | 1.250%, 11/20/2015 | 116,599 | ||||||
| International Finance Corporation | ||||||||
| 390,000 | 0.500%, 5/16/2016 | 389,686 | ||||||
| Kommunalbanken AS | ||||||||
| 175,000 | 2.750%, 5/5/2015g | 178,717 | ||||||
| 520,000 | 0.311%, 3/18/2016g,h | 520,227 | ||||||
| Kommuninvest i Sverige AB | ||||||||
| 520,000 | 0.500%, 6/15/2016g | 519,302 | ||||||
| Province of Ontario | ||||||||
| 440,000 | 1.000%, 7/22/2016 | 442,974 | ||||||
| Sweden Government International Bond | ||||||||
| 100,000 | 0.375%, 12/22/2015g | 100,008 | ||||||
| 500,000 | 0.375%, 3/29/2016g | 499,665 | ||||||
|
| |||||||
| Total | 4,255,094 | |||||||
|
| |||||||
| Mortgage-Backed Securities (4.3%) | |||||||
| Federal Home Loan Mortgage Corporation Gold 15-Yr. Pass Through | ||||||||
| 11,500,000 | 3.000%, 7/1/2029c | 11,920,463 | ||||||
| Federal Home Loan Mortgage Corporation Gold 30-Yr. Pass Through | ||||||||
| 432,339 | 1.956%, 6/1/2043h | 440,646 | ||||||
| 11,425,000 | 4.000%, 7/1/2044c | 12,103,359 | ||||||
| Federal National Mortgage Association Conventional 15-yr. Pass Through | ||||||||
| 22,525,000 | 3.500%, 8/1/2029c | 23,813,150 | ||||||
| Federal National Mortgage Association Conventional 30-Yr. Pass Through | ||||||||
| 1,683,371 | 2.071%, 1/1/2043h | 1,732,393 | ||||||
| 3,013,974 | 2.061%, 3/1/2043h | 3,100,186 | ||||||
| 2,685,642 | 1.750%, 7/1/2043h | 2,726,665 | ||||||
| 782,022 | 2.019%, 7/1/2043h | 799,327 | ||||||
| 696,055 | 2.119%, 8/1/2043h | 713,491 | ||||||
| 47,000,000 | 3.500%, 7/1/2044c | 48,380,625 | ||||||
| 45,550,000 | 4.000%, 7/1/2044c | 48,339,938 | ||||||
| 12,357,000 | 4.500%, 7/1/2044c | 13,382,248 | ||||||
| 32,107,000 | 4.500%, 8/1/2044c | 34,691,870 | ||||||
|
| |||||||
| Total | 202,144,361 | |||||||
|
| |||||||
The accompanying Notes to Financial Statements are an integral part of this schedule.
50
Table of Contents
Moderately Aggressive Allocation Portfolio
Schedule of Investments as of June 30, 2014
(unaudited)
| Principal Amount | Long-Term Fixed Income (15.0%) | Value | ||||||
| Technology (0.1%) |
| ||||||
| Amphenol Corporation | ||||||||
| $188,000 | 2.550%, 1/30/2019 | $ | 190,643 | |||||
| Apple, Inc. | ||||||||
| 440,000 | 0.523%, 5/6/2019h | 440,419 | ||||||
| Baidu, Inc. | ||||||||
| 250,000 | 2.750%, 6/9/2019 | 250,974 | ||||||
| Cisco Systems, Inc. | ||||||||
| 300,000 | 0.727%, 3/1/2019h | 301,927 | ||||||
| Computer Sciences Corporation | ||||||||
| 90,000 | 2.500%, 9/15/2015 | 91,609 | ||||||
| EMC Corporation | ||||||||
| 196,000 | 1.875%, 6/1/2018 | 197,295 | ||||||
| Fidelity National Information Services, Inc. | ||||||||
| 336,000 | 1.450%, 6/5/2017 | 335,601 | ||||||
| First Data Corporation | ||||||||
| 630,000 | 7.375%, 6/15/2019g | 676,462 | ||||||
| Hewlett-Packard Company | ||||||||
| 270,000 | 2.125%, 9/13/2015 | 274,759 | ||||||
| 329,000 | 5.400%, 3/1/2017 | 364,606 | ||||||
| 247,000 | 1.167%, 1/14/2019h | 248,968 | ||||||
| Iron Mountain, Inc. | ||||||||
| 630,000 | 6.000%, 8/15/2023 | 681,187 | ||||||
| Micron Semiconductor Asia Pte, Ltd. | ||||||||
| 225,000 | 1.258%, 1/15/2019 | 224,969 | ||||||
| Oracle Corporation | ||||||||
| 245,000 | 0.807%, 1/15/2019h | 246,972 | ||||||
| Samsung Electronics America, Inc. | ||||||||
| 94,000 | 1.750%, 4/10/2017g | 94,440 | ||||||
| Tyco Electronics Group SA | ||||||||
| 368,000 | 6.550%, 10/1/2017 | 425,844 | ||||||
| Xerox Corporation | ||||||||
| 240,000 | 7.200%, 4/1/2016 | 264,710 | ||||||
| Xilinx, Inc. | ||||||||
| 240,000 | 2.125%, 3/15/2019 | 240,424 | ||||||
|
| |||||||
| Total | 5,551,809 | |||||||
|
| |||||||
| Transportation (0.1%) | |||||||
| American Airlines Pass Through Trust | ||||||||
| 145,560 | 4.950%, 1/15/2023g | 157,569 | ||||||
| Avis Budget Car Rental, LLC | ||||||||
| 365,000 | 5.125%, 6/1/2022g | 365,456 | ||||||
| Canadian Pacific Railway Company | ||||||||
| 65,000 | 7.125%, 10/15/2031 | 85,902 | ||||||
| 76,000 | 5.750%, 3/15/2033 | 89,951 | ||||||
| Continental Airlines, Inc. | ||||||||
| 156,879 | 4.150%, 4/11/2024 | 163,154 | ||||||
| CSX Corporation | ||||||||
| 115,000 | 3.700%, 11/1/2023 | 118,436 | ||||||
| Delta Air Lines, Inc. | ||||||||
| 179,000 | 6.750%, 5/23/2017 | 188,397 | ||||||
| 101,514 | 4.950%, 5/23/2019 | 109,635 | ||||||
| 26,904 | 4.750%, 5/7/2020 | 29,191 | ||||||
| ERAC USA Finance, LLC | ||||||||
| 116,000 | 1.400%, 4/15/2016g | 116,892 | ||||||
| 67,000 | 2.800%, 11/1/2018g | 69,200 | ||||||
| Kansas City Southern de Mexico SA de CV | ||||||||
| 295,000 | 0.928%, 10/28/2016h | 296,017 | ||||||
| Korea Expressway Corporation | ||||||||
| 282,000 | 1.625%, 4/28/2017g | 281,706 | ||||||
| Network Rail Infrastructure Finance plc | ||||||||
| 473,000 | 0.234%, 2/13/2017g,h | 472,752 | ||||||
| PACCAR Financial Corporation | ||||||||
| 240,000 | 0.420%, 6/6/2017h | 239,998 | ||||||
| Virgin Australia Holdings, Ltd. | ||||||||
| 106,203 | 5.000%, 10/23/2023g | 112,841 | ||||||
|
| |||||||
| Total | 2,897,097 | |||||||
|
| |||||||
| U.S. Government and Agencies (5.5%) | |||||||
| Federal Agricultural Mortgage Corporation | ||||||||
| 360,000 | 2.125%, 9/15/2015 | 368,080 | ||||||
| Federal Home Loan Bank | ||||||||
| 2,830,000 | 0.875%, 5/24/2017 | 2,830,102 | ||||||
| Federal Home Loan Mortgage Corporation | ||||||||
| 2,835,000 | 1.375%, 5/1/2020 | 2,757,622 | ||||||
| Federal National Mortgage Association | ||||||||
| 700,000 | 4.375%, 10/15/2015 | 736,830 | ||||||
| 3,550,000 | 0.625%, 8/26/2016 | 3,552,141 | ||||||
| 1,870,000 | 1.375%, 11/15/2016 | 1,896,921 | ||||||
| 1,535,000 | 0.875%, 5/21/2018 | 1,509,237 | ||||||
| 405,000 | 6.250%, 5/15/2029 | 543,896 | ||||||
| Tennessee Valley Authority | ||||||||
| 390,000 | 5.250%, 9/15/2039 | 473,280 | ||||||
| U.S. Treasury Bonds | ||||||||
| 920,000 | 7.625%, 2/15/2025 | 1,358,725 | ||||||
| 4,150,000 | 6.500%, 11/15/2026 | 5,813,241 | ||||||
| 2,900,000 | 5.250%, 11/15/2028 | 3,714,720 | ||||||
| 2,050,000 | 4.375%, 5/15/2040 | 2,458,399 | ||||||
| 40,145,000 | 3.000%, 5/15/2042 | 37,861,753 | ||||||
| U.S. Treasury Bonds, TIPS | ||||||||
| 1,719,788 | 0.125%, 4/15/2019 | 1,770,845 | ||||||
| 100,605 | 2.375%, 1/15/2025 | 121,881 | ||||||
| 65,804 | 2.125%, 2/15/2040 | 83,720 | ||||||
| 576,982 | 0.750%, 2/15/2042 | 543,130 | ||||||
| U.S. Treasury Notes | ||||||||
| 1,390,000 | 2.625%, 2/29/2016 | 1,443,373 | ||||||
| 15,000,000 | 0.375%, 3/31/2016 | 15,002,925 | ||||||
| 11,850,000 | 0.625%, 10/15/2016 | 11,862,040 | ||||||
| 1,035,000 | 1.000%, 10/31/2016 | 1,044,703 | ||||||
| 2,250,000 | 0.625%, 12/15/2016 | 2,248,769 | ||||||
| 6,000,000 | 0.750%, 3/15/2017 | 6,000,000 | ||||||
| 3,350,000 | 3.250%, 3/31/2017 | 3,576,125 | ||||||
| 8,945,000 | 0.625%, 5/31/2017 | 8,885,596 | ||||||
| 3,605,000 | 1.000%, 5/31/2018 | 3,565,853 | ||||||
| 38,270,000 | 1.250%, 10/31/2018 | 37,974,020 | ||||||
| 3,865,000 | 1.625%, 4/30/2019 | 3,872,247 | ||||||
| 6,490,000 | 1.625%, 8/15/2022 | 6,161,444 | ||||||
| 2,250,000 | 1.750%, 5/15/2023 | 2,131,173 | ||||||
| 8,050,000 | 2.500%, 8/15/2023 | 8,097,801 | ||||||
| 6,500,000 | 2.750%, 2/15/2024 | 6,647,771 | ||||||
| 4,300,000 | 3.625%, 2/15/2044 | 4,537,842 | ||||||
| U.S. Treasury Notes, TIPS | ||||||||
| 29,738,311 | 0.125%, 4/15/2018 | 30,718,783 | ||||||
| 612,681 | 0.125%, 1/15/2022 | 616,751 | ||||||
| 36,174,631 | 0.125%, 1/15/2023 | 36,050,297 | ||||||
|
| |||||||
| Total | 258,832,036 | |||||||
|
| |||||||
The accompanying Notes to Financial Statements are an integral part of this schedule.
51
Table of Contents
Moderately Aggressive Allocation Portfolio
Schedule of Investments as of June 30, 2014
(unaudited)
| Principal Amount | Long-Term Fixed Income (15.0%) | Value | ||||||
| Utilities (0.2%) |
| ||||||
| AES Corporation | ||||||||
| $630,000 | 7.375%, 7/1/2021 | $ | 737,100 | |||||
| American Electric Power Company, Inc. | ||||||||
| 116,000 | 1.650%, 12/15/2017 | 116,615 | ||||||
| Atlas Pipeline Partners, LP | ||||||||
| 630,000 | 4.750%, 11/15/2021 | 617,400 | ||||||
| Commonwealth Edison Company | ||||||||
| 350,000 | 6.950%, 7/15/2018 | 413,873 | ||||||
| Crestwood Midstream Partners, LP | ||||||||
| 400,000 | 6.125%, 3/1/2022g | 421,000 | ||||||
| Dayton Power and Light Company | ||||||||
| 132,000 | 1.875%, 9/15/2016g | 134,236 | ||||||
| DCP Midstream Operating, LP | ||||||||
| 282,000 | 2.500%, 12/1/2017 | 290,091 | ||||||
| Dominion Resources, Inc. | ||||||||
| 376,000 | 1.250%, 3/15/2017 | 377,479 | ||||||
| Duke Energy Corporation | ||||||||
| 235,000 | 0.610%, 4/3/2017h | 235,705 | ||||||
| 168,000 | 2.100%, 6/15/2018 | 169,852 | ||||||
| Electricite de France | ||||||||
| 308,000 | 0.688%, 1/20/2017g,h | 309,249 | ||||||
| Enel Finance International NV | ||||||||
| 137,000 | 3.875%, 10/7/2014g | 138,093 | ||||||
| 84,000 | 6.250%, 9/15/2017g | 95,848 | ||||||
| Energy Transfer Partners, LP | ||||||||
| 50,000 | 9.700%, 3/15/2019 | 65,539 | ||||||
| 672,000 | 4.650%, 6/1/2021 | 723,872 | ||||||
| Enterprise Products Operating, LLC | ||||||||
| 252,000 | 5.100%, 2/15/2045 | 268,999 | ||||||
| Exelon Generation Company, LLC | ||||||||
| 140,000 | 6.200%, 10/1/2017 | 159,507 | ||||||
| 300,000 | 5.200%, 10/1/2019 | 337,395 | ||||||
| ITC Holdings Corporation | ||||||||
| 67,000 | 4.050%, 7/1/2023 | 69,581 | ||||||
| MidAmerican Energy Holdings Company | ||||||||
| 182,000 | 1.100%, 5/15/2017 | 181,258 | ||||||
| 345,000 | 5.750%, 4/1/2018 | 394,835 | ||||||
| 235,000 | 6.500%, 9/15/2037 | 303,043 | ||||||
| NiSource Finance Corporation | ||||||||
| 288,000 | 6.400%, 3/15/2018 | 330,890 | ||||||
| 166,000 | 6.800%, 1/15/2019 | 197,964 | ||||||
| Northeast Utilities | ||||||||
| 75,000 | 1.450%, 5/1/2018 | 73,650 | ||||||
| Northern States Power Company | ||||||||
| 480,000 | 4.125%, 5/15/2044 | 480,823 | ||||||
| NRG Energy, Inc. | ||||||||
| 630,000 | 6.625%, 3/15/2023 | 681,975 | ||||||
| ONEOK Partners, LP | ||||||||
| 113,000 | 8.625%, 3/1/2019 | 142,660 | ||||||
| Pacific Gas & Electric Company | ||||||||
| 347,000 | 5.625%, 11/30/2017 | 392,377 | ||||||
| PG&E Corporation | ||||||||
| 140,000 | 2.400%, 3/1/2019 | 141,263 | ||||||
| PPL Capital Funding, Inc. | ||||||||
| 461,000 | 1.900%, 6/1/2018 | 460,657 | ||||||
| 144,000 | 3.500%, 12/1/2022 | 146,352 | ||||||
| Sempra Energy | ||||||||
| 340,000 | 6.150%, 6/15/2018 | 394,635 | ||||||
| TransAlta Corporation | ||||||||
| 336,000 | 1.900%, 6/3/2017 | 337,315 | ||||||
| Williams Companies, Inc. | ||||||||
| 192,000 | 7.875%, 9/1/2021 | 238,375 | ||||||
| Williams Partners, LP | ||||||||
| 60,000 | 7.250%, 2/1/2017 | 68,576 | ||||||
|
| |||||||
| Total | 10,648,082 | |||||||
|
| |||||||
| Total Long-Term Fixed Income (cost $692,862,080) | 699,899,319 | |||||||
|
| |||||||
| Shares | Preferred Stock (<0.1%) | |||||||
| Consumer Staples (<0.1%) |
| ||||||
| 400 | Henkel AG & Company KGaA | 46,213 | ||||||
|
| |||||||
| Total | 46,213 | |||||||
|
| |||||||
Total Preferred Stock (cost $36,807) | 46,213 | |||||||
|
| |||||||
Collateral Held for Securities Loaned (0.9%) | ||||||||
| 41,855,148 | Thrivent Cash Management Trust | 41,855,148 | ||||||
|
| |||||||
Total Collateral Held for Securities Loaned (cost $41,855,148) | 41,855,148 | |||||||
|
| |||||||
| Shares or Principal Amount | Short-Term Investments (14.5%)m | |||||||
| Federal Agricultural Mortgage Corporation | ||||||||
| 7,000,000 | 0.070%, 07/25/2014 | 6,999,673 | ||||||
| Federal Home Loan Bank Discount Notes | ||||||||
| 5,000,000 | 0.057%, 07/07/2014 | 4,999,952 | ||||||
| 41,410,000 | 0.051%, 07/09/2014 | 41,409,535 | ||||||
| 56,415,000 | 0.050%, 07/11/2014 | 56,414,215 | ||||||
| 8,000,000 | 0.040%, 07/16/2014 | 7,999,867 | ||||||
| 7,300,000 | 0.053%, 07/18/2014f | 7,299,819 | ||||||
| 34,004,000 | 0.055%, 07/23/2014f | 34,002,857 | ||||||
| 37,100,000 | 0.057%, 07/30/2014f | 37,098,304 | ||||||
| 27,100,000 | 0.057%, 08/01/2014f | 27,098,667 | ||||||
| 96,100,000 | 0.059%, 08/06/2014f | 96,094,344 | ||||||
| 10,000,000 | 0.062%, 08/08/2014 | 9,999,351 | ||||||
| 21,845,000 | 0.050%, 08/27/2014f | 21,843,271 | ||||||
| 50,700,000 | 0.060%, 08/29/2014f | 50,694,980 | ||||||
| 30,000,000 | 0.065%, 09/03/2014 | 29,996,533 | ||||||
| 3,000,000 | 0.075%, 09/03/2014 | 2,999,600 | ||||||
| 2,000,000 | 0.080%, 09/05/2014 | 1,999,707 | ||||||
| 24,400,000 | 0.070%, 09/10/2014f | 24,396,623 | ||||||
| 22,000,000 | 0.075%, 09/12/2014 | 21,996,654 | ||||||
| 20,000,000 | 0.080%, 09/17/2014 | 19,996,533 | ||||||
| 40,400,000 | 0.080%, 09/19/2014f | 40,392,827 | ||||||
| 33,000,000 | 0.076%, 09/24/2014 | 32,994,078 | ||||||
| Federal Home Loan Mortgage Corporation Discount Notes | ||||||||
| 1,505,000 | 0.090%, 07/08/2014f | 1,504,974 | ||||||
| 1,000,000 | 0.050%, 08/04/2014 | 999,953 | ||||||
| 10,000,000 | 0.070%, 09/10/2014 | 9,998,619 | ||||||
The accompanying Notes to Financial Statements are an integral part of this schedule.
52
Table of Contents
Moderately Aggressive Allocation Portfolio
Schedule of Investments as of June 30, 2014
(unaudited)
| Shares or Principal Amount | Short-Term Investments (14.5%)m | Value | ||||||
| Federal National Mortgage Association Discount Notes | ||||||||
| 17,000,000 | 0.040%, 07/14/2014 | $ | 16,999,754 | |||||
| 200,000 | 0.100%, 07/23/2014f | 199,988 | ||||||
| 600,000 | 0.085%, 08/13/2014f | 599,939 | ||||||
| 42,000,000 | 0.045%, 08/20/2014 | 41,997,375 | ||||||
| 28,000,000 | 0.070%, 09/17/2014 | 27,995,753 | ||||||
|
| |||||||
| Total Short-Term Investments (at amortized cost) | 677,023,745 | |||||||
|
| |||||||
| Total Investments (cost $4,253,024,139) 104.9% | $ | 4,894,935,631 | ||||||
|
| |||||||
| Other Assets and Liabilities, Net (4.9%) | (228,146,659 | ) | ||||||
|
| |||||||
| Total Net Assets 100.0% | $ | 4,666,788,972 | ||||||
|
| |||||||
| a | The stated interest rate represents the weighted average of all contracts within the bank loan facility. |
| b | All or a portion of the loan is unfunded. |
| c | Denotes investments purchased on a when-issued or delayed delivery basis. |
| d | Non-income producing security. |
| e | All or a portion of the security is on loan. |
| f | At June 30, 2014, $35,861,492 of investments were held on deposit with the counterparty and pledged as the initial margin deposit for open futures contracts. |
| g | Denotes securities sold under Rule 144A of the Securities Act of 1933, which exempts them from registration. These securities have been deemed liquid and may be resold to other dealers in the program or to other qualified institutional buyers. As of June 30, 2014, the value of these investments was $63,267,311 or 1.4% of total net assets. |
| h | Denotes variable rate securities. Variable rate securities are securities whose yields vary with a designated market index or market rate. The rate shown is as of June 30, 2014. |
| i | Denotes restricted securities. Restricted securities are investment securities which have been deemed illiquid and cannot be offered for public sale without first being registered under the Securities Act of 1933. The following table indicates the acquisition date and cost of restricted securities Moderately Aggressive Allocation Portfolio owned as of June 30, 2014. |
Security | Acquisition Date | Cost | ||||||
Apidos CLO XVIII, 07/22/2026 | 6/25/2014 | $ | 374,063 | |||||
CoBank ACB, 06/15/2022 | 10/18/2013 | 112,053 | ||||||
Edlinc Student Loan Funding Trust, 10/01/2025 | 2/28/2013 | 436,684 | ||||||
FNA Trust, 01/10/2018 | 4/29/2013 | 287,914 | ||||||
Prudential Covered Trust, 09/30/2015 | 4/1/2013 | 318,731 | ||||||
| j | Denotes interest only security. Interest only securities represent the right to receive monthly interest payments on an underlying pool of mortgages or assets. The principal shown is the outstanding par amount of the pool as of the end of the period. The actual effective yield of the security is different than the stated coupon rate. |
| k | Security is fair valued. |
| l | Denotes perpetual securities. Perpetual securities pay an indefinite stream of interest, but may be called by the issuer at an earlier date. |
| m | The interest rate shown reflects the yield, coupon rate or the discount rate at the date of purchase. |
Definitions:
| ADR | - | American Depositary Receipt, which are certificates for an underlying foreign security’s shares held by an issuing U.S. depository bank. | ||
| CLO | - | Collateralized Loan Obligation. | ||
| ETF | - | Exchange Traded Fund. | ||
| REIT | - | Real Estate Investment Trust is a company that buys, develops, manages and/or sells real estate assets. | ||
| TIPS | - | Treasury Inflation Protected Security. |
Unrealized Appreciation (Depreciation)
Gross unrealized appreciation and depreciation of investments, based on cost for federal income tax purposes, were as follows:
Gross unrealized appreciation | $ | 659,766,024 | ||
Gross unrealized depreciation | (21,889,051 | ) | ||
|
| |||
Net unrealized appreciation (depreciation) | $ | 637,876,973 | ||
Cost for federal income tax purposes | $ | 4,257,058,658 | ||
The accompanying Notes to Financial Statements are an integral part of this schedule.
53
Table of Contents
Moderately Aggressive Allocation Portfolio
Schedule of Investments as of June 30, 2014
(unaudited)
Fair Valuation Measurements
The following table is a summary of the inputs used, as of June 30, 2014, in valuing Moderately Aggressive Allocation Portfolio’s assets carried at fair value.
Investments in Securities | Total | Level 1 | Level 2 | Level 3 | ||||||||||||
Bank Loans | ||||||||||||||||
Basic Materials | 7,800,914 | — | 7,800,914 | — | ||||||||||||
Capital Goods | 3,360,955 | — | 3,360,955 | — | ||||||||||||
Communications Services | 31,904,968 | — | 31,904,968 | — | ||||||||||||
Consumer Cyclical | 20,001,326 | — | 20,001,326 | — | ||||||||||||
Consumer Non-Cyclical | 10,073,105 | — | 10,073,105 | — | ||||||||||||
Energy | 2,805,711 | — | 2,805,711 | — | ||||||||||||
Financials | 4,564,040 | — | 4,564,040 | — | ||||||||||||
Technology | 4,879,698 | — | 4,879,698 | — | ||||||||||||
Transportation | 2,874,229 | — | 2,874,229 | — | ||||||||||||
Utilities | 2,995,368 | — | 2,995,368 | — | ||||||||||||
Mutual Funds | ||||||||||||||||
Equity Mutual Funds | 1,768,094,378 | 1,768,094,378 | — | — | ||||||||||||
Fixed Income Mutual Funds | 323,221,181 | 323,221,181 | — | — | ||||||||||||
Common Stock | ||||||||||||||||
Consumer Discretionary | 193,215,286 | 187,294,824 | 5,920,462 | — | ||||||||||||
Consumer Staples | 55,426,702 | 52,837,942 | 2,588,760 | — | ||||||||||||
Energy | 167,984,366 | 164,021,365 | 3,963,001 | — | ||||||||||||
Financials | 217,915,635 | 211,475,346 | 6,440,289 | — | ||||||||||||
Health Care | 166,570,311 | 163,898,057 | 2,672,254 | — | ||||||||||||
Industrials | 155,149,762 | 149,244,973 | 5,904,789 | — | ||||||||||||
Information Technology | 270,745,293 | 267,964,434 | 2,780,859 | — | ||||||||||||
Materials | 35,208,565 | 33,387,351 | 1,821,214 | — | ||||||||||||
Telecommunications Services | 12,822,619 | 10,700,696 | 2,121,923 | — | ||||||||||||
Utilities | 18,496,794 | 17,305,142 | 1,191,652 | — | ||||||||||||
Long-Term Fixed Income | ||||||||||||||||
Asset-Backed Securities | 37,579,665 | — | 35,746,626 | 1,833,039 | ||||||||||||
Basic Materials | 7,406,330 | — | 7,406,330 | — | ||||||||||||
Capital Goods | 4,680,946 | — | 4,680,946 | — | ||||||||||||
Collateralized Mortgage Obligations | 19,625,539 | — | 18,951,945 | 673,594 | ||||||||||||
Commercial Mortgage-Backed | ||||||||||||||||
Securities | 32,708,623 | — | 32,708,623 | — | ||||||||||||
Communications Services | 16,224,529 | — | 16,224,529 | — | ||||||||||||
Consumer Cyclical | 11,936,112 | — | 11,936,112 | — | ||||||||||||
Consumer Non-Cyclical | 16,108,182 | — | 16,108,182 | — | ||||||||||||
Energy | 10,705,969 | — | 10,705,969 | — | ||||||||||||
Financials | 58,594,945 | — | 58,484,395 | 110,550 | ||||||||||||
Foreign Government | 4,255,094 | — | 4,255,094 | — | ||||||||||||
Mortgage-Backed Securities | 202,144,361 | — | 202,144,361 | — | ||||||||||||
Technology | 5,551,809 | — | 5,551,809 | — | ||||||||||||
Transportation | 2,897,097 | — | 2,897,097 | — | ||||||||||||
U.S. Government and Agencies | 258,832,036 | — | 258,832,036 | — | ||||||||||||
Utilities | 10,648,082 | — | 10,648,082 | — | ||||||||||||
Preferred Stock | ||||||||||||||||
Consumer Staples | 46,213 | — | 46,213 | — | ||||||||||||
Collateral Held for Securities Loaned | 41,855,148 | 41,855,148 | — | — | ||||||||||||
Short-Term Investments | 677,023,745 | — | 677,023,745 | — | ||||||||||||
|
|
|
|
|
|
|
| |||||||||
Total | $ | 4,894,935,631 | $ | 3,391,300,837 | $ | 1,501,017,611 | $ | 2,617,183 | ||||||||
|
|
|
|
|
|
|
| |||||||||
Other Financial Instruments | Total | Level 1 | Level 2 | Level 3 | ||||||||||||
Asset Derivatives | ||||||||||||||||
Futures Contracts | 4,895,091 | 4,895,091 | — | — | ||||||||||||
|
|
|
|
|
|
|
| |||||||||
Total Asset Derivatives | $ | 4,895,091 | $ | 4,895,091 | $ | — | $ | — | ||||||||
|
|
|
|
|
|
|
| |||||||||
Liability Derivatives | ||||||||||||||||
Futures Contracts | 9,004,324 | 5,980,199 | 3,024,125 | — | ||||||||||||
|
|
|
|
|
|
|
| |||||||||
Total Liability Derivatives | $ | 9,004,324 | $ | 5,980,199 | $ | 3,024,125 | $ | — | ||||||||
|
|
|
|
|
|
|
| |||||||||
The accompanying Notes to Financial Statements are an integral part of this schedule.
54
Table of Contents
Moderately Aggressive Allocation Portfolio
Schedule of Investments as of June 30, 2014
(unaudited)
There were no significant transfers between Levels during the period ended June 30, 2014. Transfers between Levels are identified as of the end of the period.
Futures Contracts | Number of Contracts Long/(Short) | Expiration Date | Notional Principal Amount | Value | Unrealized Gain/(Loss) | |||||||||||||||
2-Yr. U.S. Treasury Bond Futures | (110 | ) | September 2014 | ($24,174,362 | ) | ($24,155,312 | ) | $19,050 | ||||||||||||
5-Yr. U.S. Treasury Bond Futures | (1,605 | ) | September 2014 | (192,406,393 | ) | (191,734,809 | ) | 671,584 | ||||||||||||
10-Yr. U.S. Treasury Bond Futures | (25 | ) | September 2014 | (3,139,889 | ) | (3,129,298 | ) | 10,591 | ||||||||||||
30-Yr. U.S. Treasury Bond Futures | 900 | September 2014 | 124,210,365 | 123,468,750 | (741,615 | ) | ||||||||||||||
Eurex EURO STOXX 50 Futures | 5,721 | September 2014 | 255,819,785 | 252,795,660 | (3,024,125 | ) | ||||||||||||||
Mini MSCI EAFE Index Futures | 536 | September 2014 | 52,479,519 | 52,766,520 | 287,001 | |||||||||||||||
Russell 2000 Index Mini-Futures | 9 | September 2014 | 1,039,791 | 1,071,270 | 31,479 | |||||||||||||||
S&P 400 Index Mini-Futures | (1,480 | ) | September 2014 | (206,491,790 | ) | (211,536,400 | ) | (5,044,610 | ) | |||||||||||
S&P 500 Index Futures | 645 | September 2014 | 310,949,114 | 314,824,500 | 3,875,386 | |||||||||||||||
Ultra Long Term U.S. Treasury Bond Futures | 195 | September 2014 | 29,431,787 | 29,237,813 | (193,974 | ) | ||||||||||||||
Total Futures Contracts | ($ | 4,109,233) | ||||||||||||||||||
The following table summarizes the fair value and Statement of Assets and Liabilities location, as of June 30, 2014, for Moderately Aggressive Allocation Portfolio’s investments in financial derivative instruments by primary risk exposure as discussed under item (2) Significant Accounting Policies of the Notes to Financial Statements.
Derivatives by risk category | Statement of Assets and Liabilities Location | Fair Value | ||||
Asset Derivatives | ||||||
Interest Rate Contracts | ||||||
Futures* | Net Assets - Net unrealized appreciation/(depreciation) on Futures contracts | $ | 701,225 | |||
Total Interest Rate Contracts | 701,225 | |||||
Equity Contracts | ||||||
Futures* | Net Assets - Net unrealized appreciation/(depreciation) on Futures contracts | 4,193,866 | ||||
Total Equity Contracts | 4,193,866 | |||||
|
| |||||
Total Asset Derivatives | $ | 4,895,091 | ||||
|
| |||||
Liability Derivatives | ||||||
Interest Rate Contracts | ||||||
Futures* | Net Assets - Net unrealized appreciation/(depreciation) on Futures contracts | 935,589 | ||||
Total Interest Rate Contracts | 935,589 | |||||
Equity Contracts | ||||||
Futures* | Net Assets - Net unrealized appreciation/(depreciation) on Futures contracts | 8,068,735 | ||||
Total Equity Contracts | 8,068,735 | |||||
|
| |||||
Total Liability Derivatives | $ | 9,004,324 | ||||
|
| |||||
| * | Includes cumulative appreciation/depreciation of futures contracts as reported in the Schedule of Investments. Only current day’s variation margin is reported within the Statement of Assets and Liabilities. |
The following table summarizes the net realized gains/(losses) and Statement of Operations location, for the period ended June 30, 2014, for Moderately Aggressive Allocation Portfolio’s investments in financial derivative instruments by primary risk exposure.
Derivatives by risk category | Statement of Operations Location | Realized Gains/(Losses) recognized in Income | ||||
Equity Contracts | ||||||
| Futures | Net realized gains/(losses) on Futures contracts | 42,065,104 | ||||
Total Equity Contracts | 42,065,104 | |||||
Interest Rate Contracts | ||||||
| Futures | Net realized gains/(losses) on Futures contracts | 6,826,433 | ||||
Total Interest Rate Contracts | 6,826,433 | |||||
|
| |||||
Total | $ | 48,891,537 | ||||
|
| |||||
The accompanying Notes to Financial Statements are an integral part of this schedule.
55
Table of Contents
Moderately Aggressive Allocation Portfolio
Schedule of Investments as of June 30, 2014
(unaudited)
The following table summarizes the change in net unrealized appreciation/(depreciation) and Statement of Operations location, for the period ended June 30, 2014, for Moderately Aggressive Allocation Portfolio’s investments in financial derivative instruments by primary risk exposure.
Derivatives by risk category | Statement of Operations Location | Change in unrealized appreciation/(depreciation) recognized in Income | ||||
Interest Rate Contracts | ||||||
| Futures | Change in net unrealized appreciation/(depreciation) on Futures contracts | (986,467 | ) | |||
Total Interest Rate Contracts | (986,467 | ) | ||||
Equity Contracts | ||||||
| Futures | Change in net unrealized appreciation/(depreciation) on Futures contracts | (14,047,083 | ) | |||
Total Equity Contracts | (14,047,083 | ) | ||||
|
| |||||
Total | ($ | 15,033,550 | ) | |||
|
| |||||
The following table presents Moderately Aggressive Allocation Portfolio’s average volume of derivative activity during the period ended June 30, 2014.
Derivative Risk Category | Futures (Notional)* | Futures (Percentage of Average Net Assets) | ||||||
Equity Contracts | $ | 852,805,316 | 19.3 | % | ||||
Interest Rate Contracts | 351,911,435 | 8.0 | ||||||
| * | Notional amount represents long or short, or both, derivative positions held by the Portfolio. |
Investment in Affiliates
Affiliated issuers, as defined under the Investment Company Act of 1940, include those in which the Portfolio’s holdings of an issuer represent 5% or more of the outstanding voting securities of an issuer, or any affiliated mutual fund.
A summary of transactions for the fiscal year to date, in Moderately Aggressive Allocation Portfolio, is as follows:
Portfolio | Value December 31, 2013 | Gross Purchases | Gross Sales | Shares Held at June 30, 2014 | Value June 30, 2014 | Income Earned January 1, 2014 - June 30, 2014 | ||||||||||||||||||
Partner Small Cap | ||||||||||||||||||||||||
Growth | $ | 99,350,542 | $ | 11,250,739 | $ | — | 5,844,908 | $ | 98,464,484 | $ | — | |||||||||||||
Partner Small Cap Value | 95,754,838 | 2,682,706 | — | 3,483,432 | 98,011,243 | 207,953 | ||||||||||||||||||
Small Cap Stock | 80,744,824 | 1,056,897 | — | 4,604,230 | 82,868,320 | 175,776 | ||||||||||||||||||
Partner Mid Cap Value | 120,947,314 | 17,563,147 | — | 7,570,495 | 131,429,855 | 813,044 | ||||||||||||||||||
Mid Cap Stock | 250,137,905 | 12,622,547 | — | 14,848,287 | 274,881,879 | 831,246 | ||||||||||||||||||
Partner Worldwide Allocation | 469,014,832 | 9,533,135 | — | 47,730,280 | 488,944,214 | 9,533,135 | ||||||||||||||||||
Large Cap Value | 296,898,574 | 3,787,069 | — | 19,283,176 | 314,635,868 | 3,787,069 | ||||||||||||||||||
Large Cap Stock | 261,579,999 | 2,372,475 | — | 22,340,673 | 278,858,515 | 2,372,475 | ||||||||||||||||||
High Yield | 126,092,487 | 3,790,741 | 600,588 | 25,494,958 | 131,775,788 | 3,790,079 | ||||||||||||||||||
Income | 141,401,371 | 4,530,663 | 692,417 | 14,032,536 | 148,864,162 | 2,764,483 | ||||||||||||||||||
Limited Maturity Bond | 42,310,425 | 359,407 | 369,166 | 4,307,966 | 42,581,231 | 359,942 | ||||||||||||||||||
Cash Management Trust-Collateral Investment | 34,022,252 | 117,277,732 | 109,444,836 | 41,855,148 | 41,855,148 | 125,037 | ||||||||||||||||||
Total Value and Income Earned | 2,018,255,363 | 2,133,170,707 | 24,760,239 | |||||||||||||||||||||
The accompanying Notes to Financial Statements are an integral part of this schedule.
56
Table of Contents
Schedule of Investments as of June 30, 2014
(unaudited)
| Principal Amount | Bank Loans (4.2%)a | Value | ||||||
| Basic Materials (0.4%) | |||||||
| Alpha Natural Resources, Inc., Term Loan | ||||||||
| $ 4,247,739 | 3.500%, 5/22/2020 | $ | 4,100,852 | |||||
| Arch Coal, Inc., Term Loan | ||||||||
| 3,468,814 | 6.250%, 5/16/2018 | 3,405,960 | ||||||
| Axalta Coating Systems US Holdings, Inc., Term Loan | ||||||||
| 2,970,000 | 4.000%, 2/1/2020 | 2,968,277 | ||||||
| Fortescue Metals Group, Ltd., Term Loan | ||||||||
| 2,181,317 | 3.750%, 6/30/2019 | 2,182,146 | ||||||
| HCA, Inc., Term Loan | ||||||||
| 1,488,750 | 2.900%, 3/31/2017 | 1,491,549 | ||||||
| Ineos Group Holdings, Ltd., Term Loan | ||||||||
| 3,879,826 | 3.750%, 5/4/2018 | 3,868,691 | ||||||
| NewPage Corporation, Term Loan | ||||||||
| 8,000,000 | 9.500%, 2/11/2021 | 8,010,000 | ||||||
| Tronox Pigments BV, Term Loan | ||||||||
| 2,992,443 | 0.000%, 3/19/2020b,c | 2,996,932 | ||||||
|
| |||||||
| Total | 29,024,407 | |||||||
|
| |||||||
| Capital Goods (0.1%) | |||||||
| ADS Waste Holdings, Inc., Term Loan | ||||||||
| 2,339,375 | 3.750%, 10/9/2019 | 2,326,625 | ||||||
| Berry Plastics Group, Inc., Term Loan | ||||||||
| 6,339,750 | 3.500%, 2/8/2020 | 6,283,643 | ||||||
| Silver II Borrower, Term Loan | ||||||||
| 1,637,580 | 4.000%, 12/13/2019 | 1,632,324 | ||||||
|
| |||||||
| Total | 10,242,592 | |||||||
|
| |||||||
| Communications Services (1.4%) | |||||||
| Atlantic Broadband Penn, LLC, Term Loan | ||||||||
| 1,218,371 | 3.250%, 11/30/2019 | 1,213,802 | ||||||
| Cengage Learning Aquisitions, Term Loan | ||||||||
| 6,024,900 | 7.000%, 3/31/2020 | 6,088,945 | ||||||
| Cequel Communications, LLC, Term Loan | ||||||||
| 2,064,719 | 3.500%, 2/14/2019 | 2,064,079 | ||||||
| Charter Communications Operating, LLC, Term Loan | ||||||||
| 851,400 | 3.000%, 7/1/2020 | 837,803 | ||||||
| 4,455,000 | 3.000%, 1/3/2021 | 4,384,477 | ||||||
| Clear Channel Communications, Inc., Term Loan | ||||||||
| 63,482 | 3.800%, 1/29/2016 | 63,033 | ||||||
| 3,645,169 | 6.900%, 1/30/2019 | 3,624,975 | ||||||
| 1,172,348 | 7.650%, 7/30/2019 | 1,174,177 | ||||||
| Cumulus Media Holdings, Inc., Term Loan | ||||||||
| 3,182,694 | 4.250%, 12/23/2020 | 3,190,651 | ||||||
| Fairpoint Communications, Term Loan | ||||||||
| 4,226,500 | 7.500%, 2/14/2019 | 4,371,807 | ||||||
| Grande Communications Networks, LLC, Term Loan | ||||||||
| 2,583,909 | 4.500%, 5/29/2020 | 2,574,219 | ||||||
| Hargray Communications Group, Inc., Term Loan | ||||||||
| 3,672,900 | 4.750%, 6/26/2019 | 3,682,082 | ||||||
| Integra Telecom Holdings, Inc., Term Loan | ||||||||
| 2,577,375 | 5.250%, 2/22/2019 | 2,590,906 | ||||||
| 1,010,000 | 9.750%, 2/21/2020 | 1,026,837 | ||||||
| Intelsat Jackson Holdings SA, Term Loan | ||||||||
| 2,274,236 | 3.750%, 6/30/2019 | 2,276,124 | ||||||
| Level 3 Communications, Inc., Term Loan | ||||||||
| 3,305,000 | 4.000%, 1/15/2020 | 3,305,694 | ||||||
| Liberty Cablevision of Puerto Rico, LLC, Term Loan | ||||||||
| 2,290,000 | 0.000%, 12/11/2021b,c | 2,291,901 | ||||||
| 1,000,000 | 0.000%, 6/25/2023b,c | 1,002,500 | ||||||
| Liberty Cablevision of Puerto Rico, Ltd., Term Loan | ||||||||
| 1,661,100 | 6.000%, 6/9/2017 | 1,661,100 | ||||||
| LTS Buyer, LLC, Term Loan | ||||||||
| 3,205,863 | 4.000%, 4/13/2020 | 3,194,995 | ||||||
| 135,988 | 8.000%, 4/12/2021 | 137,235 | ||||||
| McGraw-Hill Global Education, LLC, Term Loan | ||||||||
| 3,513,900 | 5.750%, 3/22/2019 | 3,571,001 | ||||||
| Mediacom Broadband, LLC, Term Loan | ||||||||
| 1,331,288 | 4.000%, 1/20/2020 | 1,328,518 | ||||||
| NEP Broadcasting, LLC, Term Loan | ||||||||
| 242,857 | 9.500%, 7/22/2020 | 249,536 | ||||||
| NEP/NCP Holdco, Inc., Term Loan | ||||||||
| 9,322,236 | 4.250%, 1/22/2020 | 9,319,905 | ||||||
| NTelos, Inc., Term Loan | ||||||||
| 1,252,688 | 5.750%, 11/9/2019 | 1,251,648 | ||||||
| Puerto Rico Cable Acquisition Company, Inc., Term Loan | ||||||||
| 1,413,120 | 5.500%, 7/31/2018 | 1,411,353 | ||||||
| Syniverse Holdings, Inc., Term Loan | ||||||||
| 3,315,763 | 4.000%, 4/23/2019 | 3,311,619 | ||||||
| TNS, Inc., Term Loan | ||||||||
| 5,595,965 | 5.000%, 2/14/2020 | 5,616,950 | ||||||
| Univision Communications, Inc., Term Loan | ||||||||
| 3,784,498 | 4.000%, 3/1/2020 | 3,779,351 | ||||||
| Virgin Media Investment Holdings, Ltd., Term Loan | ||||||||
| 7,500,000 | 3.500%, 6/7/2020 | 7,474,200 | ||||||
| Visant Corporation, Term Loan | ||||||||
| 5,315,017 | 5.250%, 12/22/2016 | 5,289,771 | ||||||
| WideOpenWest Finance, LLC, Term Loan | ||||||||
| 5,628,750 | 4.750%, 4/1/2019 | 5,641,921 | ||||||
| XO Communications, LLC, Term Loan | ||||||||
| 3,890,250 | 4.250%, 3/20/2021 | 3,910,324 | ||||||
| Yankee Cable Acquisition, LLC, Term Loan | ||||||||
| 3,798,848 | 4.500%, 3/1/2020 | 3,816,664 | ||||||
The accompanying Notes to Financial Statements are an integral part of this schedule.
57
Table of Contents
Moderate Allocation Portfolio
Schedule of Investments as of June 30, 2014
(unaudited)
| Principal Amount | Bank Loans (4.2%)a | Value | ||||||
| Communications Services (1.4%) - continued | |||||||
| Zayo Group, LLC, Term Loan | ||||||||
| $ 9,524,740 | 4.000%, 7/2/2019 | $ | 9,531,693 | |||||
|
| |||||||
| Total | 116,261,796 | |||||||
|
| |||||||
| Consumer Cyclical (0.8%) | |||||||
| Bally Technologies, Inc., Term Loan | ||||||||
| 3,046,723 | 4.250%, 11/25/2020 | 3,058,148 | ||||||
| Burlington Coat Factory Warehouse Corporation, Term Loan | ||||||||
| 1,884,432 | 4.250%, 2/23/2017 | 1,894,645 | ||||||
| Ceridian Corporation, Term Loan | ||||||||
| 1,385,161 | 4.400%, 8/14/2015 | 1,386,670 | ||||||
| Chrysler Group, LLC, Term Loan | ||||||||
| 2,907,532 | 3.500%, 5/24/2017 | 2,916,167 | ||||||
| Golden Nugget, Inc., Delayed Draw | ||||||||
| 528,345 | 5.500%, 11/21/2019 | 538,251 | ||||||
| Golden Nugget, Inc., Term Loan | ||||||||
| 1,232,805 | 5.500%, 11/21/2019 | 1,255,920 | ||||||
| Hilton Worldwide Finance, LLC, Term Loan | ||||||||
| 10,980,724 | 3.500%, 10/26/2020 | 10,957,884 | ||||||
| J.C. Penney Corporation, Inc., Term Loan | ||||||||
| 3,940,200 | 6.000%, 5/22/2018 | 3,983,345 | ||||||
| Las Vegas Sands, LLC, Term Loan | ||||||||
| 2,139,250 | 3.250%, 12/19/2020 | 2,138,031 | ||||||
| Marina District Finance Company, Inc., Term Loan | ||||||||
| 2,721,325 | 6.750%, 8/15/2018 | 2,751,069 | ||||||
| MGM Resorts International, Term Loan | ||||||||
| 2,629,950 | 3.500%, 12/20/2019 | 2,620,903 | ||||||
| Mohegan Tribal Gaming Authority, Term Loan | ||||||||
| 6,766,000 | 5.500%, 11/19/2019 | 6,870,332 | ||||||
| Rite Aid Corporation, Term Loan | ||||||||
| 633,612 | 3.500%, 2/21/2020 | 632,554 | ||||||
| 1,285,000 | 5.750%, 8/21/2020 | 1,311,908 | ||||||
| ROC Finance, LLC, Term Loan | ||||||||
| 6,183,275 | 5.000%, 6/20/2019 | 6,075,068 | ||||||
| Scientific Games International, Inc., Term Loan | ||||||||
| 7,995,660 | 4.250%, 10/18/2020 | 7,904,430 | ||||||
| Seminole Indian Tribe of Florida, Term Loan | ||||||||
| 1,473,687 | 3.000%, 4/29/2020 | 1,470,622 | ||||||
| Seven Seas Cruises S de RL, LLC, Term Loan | ||||||||
| 2,517,450 | 3.750%, 12/21/2018 | 2,514,303 | ||||||
| Toys R Us, Inc., Term Loan | ||||||||
| 2,573,796 | 5.250%, 5/25/2018 | 2,080,477 | ||||||
|
| |||||||
| Total | 62,360,727 | |||||||
|
| |||||||
| Consumer Non-Cyclical (0.5%) | |||||||
| Albertsons, Inc., Term Loan | ||||||||
| 6,911,985 | 4.750%, 3/21/2019 | 6,942,191 | ||||||
| Biomet, Inc., Term Loan | ||||||||
| 2,430,137 | 3.661%, 7/25/2017 | 2,432,008 | ||||||
| Catalina Marketing Corporation, Term Loan | ||||||||
| 3,900,000 | 4.500%, 4/9/2021 | 3,898,362 | ||||||
| CHS/Community Health Systems, Inc., Term Loan | ||||||||
| 460,129 | 3.478%, 1/25/2017 | 461,086 | ||||||
| 1,226,396 | 4.250%, 1/27/2021 | 1,232,945 | ||||||
| Del Monte Corporation, Term Loan | ||||||||
| 841,609 | 3.500%, 3/9/2020 | 833,984 | ||||||
| Hologic, Inc., Term Loan | ||||||||
| 1,622,402 | 3.250%, 8/1/2019 | 1,620,374 | ||||||
| JBS USA, LLC, Term Loan | ||||||||
| 2,816,296 | 3.750%, 5/25/2018 | 2,809,255 | ||||||
| Ortho-Clinical Diagnostics, Inc., Term Loan | ||||||||
| 9,665,000 | 4.750%, 6/30/2021b,c | 9,738,744 | ||||||
| Roundy’s Supermarkets, Inc., Term Loan | ||||||||
| 3,495,231 | 5.750%, 3/3/2021 | 3,500,229 | ||||||
| Supervalu, Inc., Term Loan | ||||||||
| 8,122,249 | 4.500%, 3/21/2019 | 8,111,122 | ||||||
| Van Wagner Communications, LLC, Term Loan | ||||||||
| 2,338,978 | 6.250%, 8/3/2018 | 2,363,350 | ||||||
|
| |||||||
| Total | 43,943,650 | |||||||
|
| |||||||
| Energy (0.2%) | |||||||
| Energy Solutions, LLC, Term Loan | ||||||||
| 6,625,000 | 6.750%, 5/29/2020 | 6,691,250 | ||||||
| Fieldwood Energy, LLC, Term Loan | ||||||||
| 2,084,256 | 3.875%, 9/28/2018 | 2,090,342 | ||||||
| 660,000 | 8.375%, 9/30/2020 | 680,130 | ||||||
| McJunkin Red Man Corporation, Term Loan | ||||||||
| 2,148,763 | 5.000%, 11/8/2019 | 2,159,506 | ||||||
| Offshore Group Investment, Ltd., Term Loan | ||||||||
| 3,342,687 | 5.750%, 3/28/2019 | 3,320,392 | ||||||
| Pacific Drilling SA, Term Loan | ||||||||
| 2,400,750 | 4.500%, 6/3/2018 | 2,407,496 | ||||||
|
| |||||||
| Total | 17,349,116 | |||||||
|
| |||||||
| Financials (0.3%) | |||||||
| DJO Finance, LLC, Term Loan | ||||||||
| 2,937,949 | 4.250%, 9/15/2017 | 2,947,145 | ||||||
| GEO Group, Inc., Term Loan | ||||||||
| 852,390 | 3.250%, 4/3/2020 | 851,862 | ||||||
| Harland Clarke Holdings Corporation, Term Loan | ||||||||
| 4,553,250 | 7.000%, 5/22/2018 | 4,624,417 | ||||||
| 493,750 | 6.000%, 8/4/2019 | 502,020 | ||||||
| MoneyGram International, Inc., Term Loan | ||||||||
| 3,401,938 | 4.250%, 3/27/2020 | 3,353,052 | ||||||
| MPH Acquisition Holdings, LLC, Term Loan | ||||||||
| 2,431,818 | 4.000%, 3/31/2021 | 2,423,793 | ||||||
| TransUnion, LLC, Term Loan | ||||||||
| 7,830,375 | 4.000%, 4/9/2021 | 7,827,556 | ||||||
The accompanying Notes to Financial Statements are an integral part of this schedule.
58
Table of Contents
Moderate Allocation Portfolio
Schedule of Investments as of June 30, 2014
(unaudited)
| Principal Amount | Bank Loans (4.2%)a | Value | ||||||
| Financials (0.3%) - continued | |||||||
| WaveDivision Holdings, LLC, Term Loan | ||||||||
| $ 3,605,100 | 4.000%, 10/12/2019 | $ | 3,601,675 | |||||
|
| |||||||
| Total | 26,131,520 | |||||||
|
| |||||||
| Technology (0.3%) | |||||||
| Avago Technologies, Ltd., Term Loan | ||||||||
| 3,000,000 | 3.750%, 5/6/2021 | 3,008,310 | ||||||
| First Data Corporation Extended, Term Loan | ||||||||
| 7,025,000 | 4.154%, 3/23/2018 | 7,033,781 | ||||||
| First Data Corporation, Term Loan | ||||||||
| 1,355,000 | 4.154%, 9/24/2018 | 1,355,962 | ||||||
| Freescale Semiconductor, Inc., Term Loan | ||||||||
| 3,066,304 | 4.250%, 2/28/2020 | 3,063,759 | ||||||
| 3,126,375 | 5.000%, 1/15/2021 | 3,137,599 | ||||||
| Infor US, Inc., Term Loan | ||||||||
| 1,828,408 | 3.750%, 6/3/2020 | 1,815,079 | ||||||
|
| |||||||
| Total | 19,414,490 | |||||||
|
| |||||||
| Transportation (0.1%) | |||||||
| American Airlines, Inc., Term Loan | ||||||||
| 3,672,900 | 3.750%, 6/27/2019 | 3,676,463 | ||||||
| Delta Air Lines, Inc., Term Loan | ||||||||
| 3,003,388 | 3.500%, 4/20/2017 | 3,001,256 | ||||||
| United Air Lines, Inc., Term Loan | ||||||||
| 2,128,063 | 3.750%, 4/1/2019 | 2,120,465 | ||||||
|
| |||||||
| Total | 8,798,184 | |||||||
|
| |||||||
| Utilities (0.1%) | |||||||
| Calpine Corporation, Term Loan | ||||||||
| 630,229 | 4.000%, 4/1/2018 | 632,000 | ||||||
| 2,662,575 | 4.000%, 10/9/2019 | 2,668,113 | ||||||
| Intergen NV, Term Loan | ||||||||
| 1,702,800 | 5.500%, 6/15/2020 | 1,714,158 | ||||||
| NGPL PipeCo, LLC, Term Loan | ||||||||
| 2,264,662 | 6.750%, 9/15/2017 | 2,261,831 | ||||||
|
| |||||||
| Total | 7,276,102 | |||||||
|
| |||||||
Total Bank Loans (cost $339,904,123) | 340,802,584 | |||||||
|
| |||||||
| Shares | Mutual Funds (38.8%) | |||||||
| Equity Mutual Funds (23.3%) | |||||||
| 6,587,309 | Thrivent Partner Small Cap Growth Portfolio | 110,971,127 | ||||||
| 4,493,008 | Thrivent Partner Small Cap Value Portfolio | 126,417,068 | ||||||
| 3,657,193 | Thrivent Small Cap Stock Portfolio | 65,823,250 | ||||||
| 7,195,521 | Thrivent Partner Mid Cap Value Portfolio | 124,919,997 | ||||||
| 12,265,522 | Thrivent Mid Cap Stock Portfolio | 227,067,929 | ||||||
| 54,413,534 | Thrivent Partner Worldwide Allocation Portfolio | 557,406,802 | ||||||
| 26,828,993 | Thrivent Large Cap Value Portfolio | 437,757,949 | ||||||
| 20,701,632 | Thrivent Large Cap Stock Portfolio | 258,399,846 | ||||||
|
| |||||||
| Total | 1,908,763,968 | |||||||
|
| |||||||
| Fixed Income Mutual Funds (15.5%) | |||||||
| 39,822,422 | Thrivent High Yield Portfolio | 205,830,154 | ||||||
| 62,165,958 | Thrivent Income Portfolio | 659,487,566 | ||||||
| 40,647,390 | Thrivent Limited Maturity Bond Portfolio | 401,771,000 | ||||||
|
| |||||||
| Total | 1,267,088,720 | |||||||
|
| |||||||
Total Mutual Funds (cost $2,724,636,660) | 3,175,852,688 | |||||||
|
| |||||||
| Principal Amount | Long-Term Fixed Income (22.7%) | |||||||
| Asset-Backed Securities (1.1%) | |||||||
| Access Group, Inc. | ||||||||
| 1,170,928 | 0.652%, 2/25/2036d,e | 1,164,338 | ||||||
| Ally Auto Receivables Trust 2013- SN1 | ||||||||
| 1,680,000 | 0.720%, 5/20/2016 | 1,681,855 | ||||||
| BA Credit Card Trust | ||||||||
| 1,750,000 | 0.532%, 6/15/2021e | 1,750,056 | ||||||
| Barclays Dryrock Issuance Trust | ||||||||
| 3,500,000 | 0.512%, 12/16/2019e | 3,503,714 | ||||||
| Capital One Multi-Asset Execution Trust | ||||||||
| 2,250,000 | 0.532%, 1/18/2022e | 2,252,333 | ||||||
| Chase Issuance Trust | ||||||||
| 2,400,000 | 1.150%, 1/15/2019 | 2,407,034 | ||||||
| Chesapeake Funding, LLC | ||||||||
| 3,000,000 | 0.601%, 1/7/2025d,e | 3,003,909 | ||||||
| Citibank Credit Card Issuance Trust | ||||||||
| 3,800,000 | 0.025%, 2/22/2019 | 3,798,070 | ||||||
| Countrywide Asset-Backed Certificates | ||||||||
| 1,921,449 | 5.530%, 4/25/2047 | 1,849,938 | ||||||
| DT Auto Owner Trust | ||||||||
| 162,523 | 0.750%, 5/16/2016d | 162,571 | ||||||
| Edlinc Student Loan Funding Trust | ||||||||
| 120,164 | 3.190%, 10/1/2025e,f | 121,666 | ||||||
| Enterprise Fleet Financing, LLC | ||||||||
| 3,786,869 | 1.060%, 3/20/2019d | 3,803,123 | ||||||
| 1,500,000 | 0.870%, 9/20/2019d | 1,499,993 | ||||||
| FirstEnergy Ohio PIRB Special Purpose Trust | ||||||||
| 1,267,876 | 0.679%, 1/15/2019 | 1,268,031 | ||||||
| FNA Trust | ||||||||
| 620,148 | 1.980%, 1/10/2018f | 622,009 | ||||||
| Ford Credit Auto Owner Trust | ||||||||
| 1,350,000 | 2.260%, 11/15/2025d | 1,362,104 | ||||||
| GE Dealer Floorplan Master Note Trust | ||||||||
| 1,680,000 | 0.553%, 4/20/2018e | 1,684,823 | ||||||
| GE Equipment Transportation, LLC | ||||||||
| 1,400,000 | 0.690%, 11/25/2016 | 1,402,534 | ||||||
| Golden Credit Card Trust | ||||||||
| 150,000 | 0.402%, 2/15/2018d,e | 150,049 | ||||||
| 2,000,000 | 0.582%, 9/15/2018d,e | 2,007,146 | ||||||
The accompanying Notes to Financial Statements are an integral part of this schedule.
59
Table of Contents
Moderate Allocation Portfolio
Schedule of Investments as of June 30, 2014
(unaudited)
| Principal Amount | Long-Term Fixed Income (22.7%) | Value | ||||||
| Asset-Backed Securities (1.1%) - continued | |||||||
| GreatAmerica Leasing Receivables | ||||||||
| $ 4,000,000 | 0.610%, 5/15/2016d | $ | 4,000,924 | |||||
| Hertz Fleet Lease Funding, LP | ||||||||
| 3,225,000 | 0.704%, 12/10/2027d,e | 3,231,934 | ||||||
| HLSS Servicer Advance Receivables Backed Notes | ||||||||
| 2,750,000 | 1.287%, 9/15/2044d | 2,751,375 | ||||||
| Hyundai Auto Receivables Trust | ||||||||
| 1,680,000 | 0.710%, 9/15/2017 | 1,684,719 | ||||||
| Hyundai Floorplan Master Owner Trust | ||||||||
| 1,890,000 | 0.502%, 5/15/2018d,e | 1,893,334 | ||||||
| Master Credit Card Trust | ||||||||
| 1,139,600 | 0.780%, 4/21/2017d | 1,141,815 | ||||||
| Morgan Stanley Capital, Inc. | ||||||||
| 3,060,661 | 0.302%, 2/25/2037e | 1,822,186 | ||||||
| Motor plc | ||||||||
| 1,474,667 | 0.652%, 2/15/2021d | 1,476,001 | ||||||
| 1,819,200 | 0.632%, 8/25/2021d,e | 1,821,216 | ||||||
| Nissan Master Owner Trust Receivables | ||||||||
| 250,000 | 0.452%, 2/15/2018e | 250,124 | ||||||
| Ohio Phase-In-Recovery Funding, LLC | ||||||||
| 4,000,000 | 0.958%, 7/2/2018 | 4,015,880 | ||||||
| Penarth Master Issuer plc | ||||||||
| 3,185,000 | 0.544%, 11/18/2017d,e | 3,190,765 | ||||||
| Renaissance Home Equity Loan Trust | ||||||||
| 6,500,000 | 6.011%, 5/25/2036 | 4,768,016 | ||||||
| 3,735,300 | 5.580%, 11/25/2036 | 2,404,883 | ||||||
| SLM Student Loan Trust | ||||||||
| 3,129,061 | 0.752%, 7/15/2022d,e | 3,135,228 | ||||||
| 553,317 | 0.752%, 8/15/2022d,e | 554,343 | ||||||
| 2,934,997 | 0.629%, 4/25/2023d,e | 2,939,740 | ||||||
| 125,000 | 1.202%, 5/17/2027d,e | 126,151 | ||||||
| U.S. Small Business Administration | ||||||||
| 1,000,000 | 3.191%, 3/10/2024 | 1,035,576 | ||||||
| Vericrest Opportunity Loan Transferee | ||||||||
| 2,900,000 | 3.125%, 4/27/2054d | 2,914,790 | ||||||
| Volvo Financial Equipment, LLC | ||||||||
| 1,400,000 | 0.740%, 3/15/2017d | 1,402,652 | ||||||
| 2,000,000 | 0.820%, 4/16/2018d | 2,001,718 | ||||||
| World Financial Network Credit Card Master Trust | ||||||||
| 1,300,000 | 0.532%, 12/15/2019e | 1,301,715 | ||||||
| 1,400,000 | 0.910%, 3/16/2020 | 1,402,926 | ||||||
| World Omni Automobile Lease Securitization Trust | ||||||||
| 2,600,000 | 1.400%, 2/15/2019 | 2,628,681 | ||||||
| World Omni Master Owner Trust | ||||||||
| 150,000 | 0.502%, 2/15/2018d,e | 150,173 | ||||||
|
| |||||||
| Total | 89,542,161 | |||||||
|
| |||||||
| Basic Materials (0.2%) | |||||||
| Anglo American Capital plc | ||||||||
| 925,000 | 1.176%, 4/15/2016d,e | 927,938 | ||||||
| First Quantum Minerals, Ltd. | ||||||||
| 621,000 | 6.750%, 2/15/2020d | 639,630 | ||||||
| 621,000 | 7.000%, 2/15/2021d | 638,854 | ||||||
| FMG Resources Pty. Ltd. | ||||||||
| 2,201,432 | 6.875%, 2/1/2018d,g | 2,311,503 | ||||||
| Freeport-McMoRan Copper & Gold, Inc. | ||||||||
| 1,580,000 | 2.375%, 3/15/2018 | 1,603,553 | ||||||
| Glencore Funding, LLC | ||||||||
| 781,000 | 1.700%, 5/27/2016d | 788,109 | ||||||
| 960,000 | 3.125%, 4/29/2019d | 979,008 | ||||||
| Hexion US Finance Corporation/Hexion Nova Scotia Finance ULC | ||||||||
| 1,100,000 | 8.875%, 2/1/2018 | 1,144,000 | ||||||
| Ineos Finance plc | ||||||||
| 1,100,000 | 7.500%, 5/1/2020d | 1,197,625 | ||||||
| International Paper Company | ||||||||
| 560,000 | 5.300%, 4/1/2015 | 580,032 | ||||||
| LyondellBasell Industries NV | ||||||||
| 1,280,000 | 6.000%, 11/15/2021 | 1,530,566 | ||||||
| Monsanto Company | ||||||||
| 855,000 | 1.150%, 6/30/2017 | 855,264 | ||||||
| Mosaic Company | ||||||||
| 1,339,000 | 5.450%, 11/15/2033 | 1,500,398 | ||||||
| Rio Tinto Finance USA plc | ||||||||
| 588,000 | 1.375%, 6/17/2016 | 594,355 | ||||||
| Sappi Papier Holding GmbH | ||||||||
| 700,000 | 6.625%, 4/15/2021d | 738,500 | ||||||
| Vale Overseas, Ltd. | ||||||||
| 1,202,000 | 6.250%, 1/23/2017 | 1,345,038 | ||||||
| Yamana Gold, Inc. | ||||||||
| 1,285,000 | 4.950%, 7/15/2024d | 1,293,449 | ||||||
|
| |||||||
| Total | 18,667,822 | |||||||
|
| |||||||
| Capital Goods (0.2%) | |||||||
| BAE Systems plc | ||||||||
| 640,000 | 3.500%, 10/11/2016d | 666,109 | ||||||
| Caterpillar, Inc. | ||||||||
| 640,000 | 3.400%, 5/15/2024 | 647,286 | ||||||
| CNH Capital, LLC | ||||||||
| 1,100,000 | 3.625%, 4/15/2018 | 1,123,375 | ||||||
| Eaton Corporation | ||||||||
| 640,000 | 4.000%, 11/2/2032 | 640,408 | ||||||
| Harsco Corporation | ||||||||
| 1,197,000 | 2.700%, 10/15/2015 | 1,207,474 | ||||||
| Ingersoll-Rand Global Holding Company, Ltd. | ||||||||
| 1,328,000 | 6.875%, 8/15/2018 | 1,582,180 | ||||||
| L-3 Communications Corporation | ||||||||
| 1,336,000 | 1.500%, 5/28/2017 | 1,337,828 | ||||||
| Martin Marietta Materials, Inc. | ||||||||
| 1,600,000 | 1.331%, 6/30/2017c,d,e | 1,599,062 | ||||||
| Reynolds Group Issuer, Inc. | ||||||||
| 1,101,432 | 5.750%, 10/15/2020 | 1,162,011 | ||||||
| Roper Industries, Inc. | ||||||||
| 1,280,000 | 2.050%, 10/1/2018 | 1,282,076 | ||||||
| RSC Equipment Rental, Inc. | ||||||||
| 1,100,000 | 8.250%, 2/1/2021 | 1,223,750 | ||||||
| Textron, Inc. | ||||||||
| 785,000 | 5.600%, 12/1/2017 | 882,634 | ||||||
|
| |||||||
| Total | 13,354,193 | |||||||
|
| |||||||
The accompanying Notes to Financial Statements are an integral part of this schedule.
60
Table of Contents
Moderate Allocation Portfolio
Schedule of Investments as of June 30, 2014
(unaudited)
| Principal Amount | Long-Term Fixed Income (22.7%) | Value | ||||||
| Collateralized Mortgage Obligations (0.6%) | |||||||
| Alternative Loan Trust | ||||||||
| $ 1,765,059 | 6.000%, 6/25/2036 | $ | 1,573,707 | |||||
| Apidos CLO XVIII | ||||||||
| 1,400,000 | 1.643%, 7/22/2026c,e,f | 1,394,750 | ||||||
| Citigroup Mortgage Loan Trust, Inc. | ||||||||
| 1,229,575 | 5.500%, 11/25/2035 | 1,124,027 | ||||||
| CitiMortgage Alternative Loan Trust | ||||||||
| 4,156,452 | 5.750%, 4/25/2037 | 3,594,375 | ||||||
| Countrywide Alternative Loan Trust | ||||||||
| 3,070,664 | 5.265%, 10/25/2035 | 2,567,874 | ||||||
| 1,722,630 | 6.000%, 4/25/2036 | 1,502,316 | ||||||
| 788,487 | 6.000%, 1/25/2037 | 698,646 | ||||||
| 4,748,041 | 5.500%, 5/25/2037 | 3,992,096 | ||||||
| 3,781,736 | 7.000%, 10/25/2037 | 2,702,686 | ||||||
| Countrywide Home Loans, Inc. | ||||||||
| 1,543,051 | 5.750%, 4/25/2037 | 1,390,673 | ||||||
| Deutsche Alt-A Securities Mortgage Loan Trust | ||||||||
| 1,197,674 | 6.000%, 10/25/2021 | 1,070,321 | ||||||
| Deutsche Alt-A Securities, Inc., Mortgage Loan Trust | ||||||||
| 504,304 | 5.500%, 10/25/2021 | 494,918 | ||||||
| Federal Home Loan Mortgage Corporation | ||||||||
| 5,780,894 | 3.000%, 2/15/2033h | 874,851 | ||||||
| Federal National Mortgage Association | ||||||||
| 12,500,527 | 3.500%, 1/25/2033h | 2,053,274 | ||||||
| GSR Mortgage Loan Trust | ||||||||
| 1,444,884 | 0.342%, 8/25/2046e | 1,412,766 | ||||||
| HomeBanc Mortgage Trust | ||||||||
| 2,192,909 | 2.240%, 4/25/2037 | 1,632,369 | ||||||
| J.P. Morgan Mortgage Trust | ||||||||
| 879,677 | 2.700%, 6/25/2036 | 748,790 | ||||||
| 366,345 | 2.607%, 10/25/2036 | 308,802 | ||||||
| 4,765,782 | 0.532%, 1/25/2037e | 3,181,851 | ||||||
| 5,029,258 | 6.250%, 8/25/2037 | 3,609,056 | ||||||
| MASTR Alternative Loans Trust | ||||||||
| 833,105 | 6.500%, 7/25/2034 | 854,295 | ||||||
| 2,881,753 | 0.602%, 12/25/2035e | 1,633,864 | ||||||
| Merrill Lynch Alternative Note Asset Trust | ||||||||
| 933,759 | 6.000%, 3/25/2037 | 876,072 | ||||||
| Neuberger Berman CLO, Ltd. | ||||||||
| 1,100,000 | 1.701%, 8/4/2025c,e,i | 1,100,000 | ||||||
| Residential Asset Securitization Trust | ||||||||
| 3,814,813 | 0.532%, 8/25/2037e | 1,573,580 | ||||||
| Sequoia Mortgage Trust | ||||||||
| 268,721 | 2.740%, 9/20/2046 | 11,253 | ||||||
| 4,071,726 | 2.740%, 9/20/2046 | 3,480,332 | ||||||
| WaMu Mortgage Pass Through Certificates | ||||||||
| 365,237 | 2.344%, 9/25/2036 | 327,751 | ||||||
| 1,284,605 | 2.383%, 10/25/2036 | 1,120,665 | ||||||
| 3,564,920 | 2.049%, 11/25/2036 | 3,133,037 | ||||||
|
| |||||||
| Total | 50,038,997 | |||||||
|
| |||||||
| Commercial Mortgage-Backed Securities (0.9%) | |||||||
| Banc of America Commercial Mortgage, Inc. | ||||||||
| $7,200,000 | 5.781%, 4/10/2049 | 7,911,950 | ||||||
| 4,975,000 | 5.775%, 6/10/2049 | 5,475,495 | ||||||
| Bear Stearns Commercial Mortgage Securities, Inc. | ||||||||
| 3,371,016 | 5.331%, 2/11/2044 | 3,638,173 | ||||||
| CGBAM Commercial Mortgage Trust | ||||||||
| 5,460,000 | 1.252%, 5/15/2030d,e | 5,468,583 | ||||||
| Citigroup/Deutsche Bank Commercial Mortgage | ||||||||
| 3,000,000 | 5.322%, 12/11/2049 | 3,263,826 | ||||||
| Commercial Mortgage Pass- Through Certificates | ||||||||
| 1,680,000 | 1.201%, 6/8/2030d,e | 1,685,608 | ||||||
| Credit Suisse First Boston Mortgage Securities | ||||||||
| 7,200,000 | 5.542%, 1/15/2049 | 7,881,638 | ||||||
| Credit Suisse Mortgage Capital Certificates | ||||||||
| 8,875,000 | 5.509%, 9/15/2039 | 9,546,340 | ||||||
| Federal Home Loan Mortgage Corporation Multi Family Structured Pass Thru Certificates | ||||||||
| 232,763 | 0.727%, 12/25/2016 | 231,706 | ||||||
| Federal National Mortgage Association | ||||||||
| 2,976,799 | 0.478%, 9/25/2015 | 2,979,639 | ||||||
| 1,250,000 | 1.272%, 1/25/2017 | 1,261,539 | ||||||
| Government National Mortgage Association | ||||||||
| 129,740 | 2.164%, 3/16/2033 | 130,373 | ||||||
| 59,474 | 3.214%, 1/16/2040 | 60,274 | ||||||
| Greenwich Capital Commercial Funding Corporation | ||||||||
| 4,650,000 | 5.867%, 12/10/2049 | 5,138,766 | ||||||
| J.P. Morgan Chase Commercial Mortgage Securities Corporation | ||||||||
| 440,939 | 0.852%, 4/15/2028d,e | 440,449 | ||||||
| 2,300,000 | 1.102%, 12/15/2028d,e | 2,300,439 | ||||||
| 3,650,000 | 5.892%, 2/12/2049 | 3,974,646 | ||||||
| LSTAR Commercial Mortgage Trust | ||||||||
| 3,145,341 | 1.519%, 1/20/2041d | 3,148,014 | ||||||
| Morgan Stanley Capital, Inc. | ||||||||
| 2,650,000 | 5.406%, 3/15/2044 | 2,887,212 | ||||||
| SCG Trust | ||||||||
| 1,150,000 | 1.552%, 11/15/2026d,e | 1,154,738 | ||||||
| Wachovia Bank Commercial Mortgage Trust | ||||||||
| 5,400,000 | 5.603%, 10/15/2048 | 5,830,796 | ||||||
|
| |||||||
| Total | 74,410,204 | |||||||
|
| |||||||
| Communications Services (0.5%) | |||||||
| AMC Networks, Inc. | ||||||||
| 1,100,000 | 4.750%, 12/15/2022 | 1,100,000 | ||||||
| America Movil SAB de CV | ||||||||
| 1,125,000 | 1.230%, 9/12/2016e | 1,138,482 | ||||||
| 1,114,000 | 5.000%, 10/16/2019 | 1,252,426 | ||||||
The accompanying Notes to Financial Statements are an integral part of this schedule.
61
Table of Contents
Moderate Allocation Portfolio
Schedule of Investments as of June 30, 2014
(unaudited)
| Principal Amount | Long-Term Fixed Income (22.7%) | Value | ||||||
| Communications Services (0.5%) - continued | |||||||
| American Tower Corporation | ||||||||
| $ 2,112,000 | 7.000%, 10/15/2017 | $ | 2,457,851 | |||||
| AT&T, Inc. | ||||||||
| 695,000 | 1.137%, 11/27/2018e | 708,537 | ||||||
| 1,212,000 | 3.875%, 8/15/2021 | 1,289,391 | ||||||
| British Telecommunications plc | ||||||||
| 829,000 | 1.625%, 6/28/2016 | 840,420 | ||||||
| 470,000 | 1.250%, 2/14/2017 | 470,423 | ||||||
| CBS Corporation | ||||||||
| 1,080,000 | 8.875%, 5/15/2019 | 1,400,113 | ||||||
| CC Holdings GS V, LLC | ||||||||
| 690,000 | 2.381%, 12/15/2017 | 702,662 | ||||||
| CCO Holdings, LLC | ||||||||
| 1,100,000 | 7.375%, 6/1/2020 | 1,199,000 | ||||||
| CenturyLink, Inc. | ||||||||
| 1,000,000 | 6.450%, 6/15/2021 | 1,085,000 | ||||||
| Columbus International, Inc. | ||||||||
| 600,000 | 7.375%, 3/30/2021d | 646,500 | ||||||
| Comcast Corporation | ||||||||
| 539,000 | 4.650%, 7/15/2042 | 558,829 | ||||||
| 990,000 | 4.750%, 3/1/2044 | 1,047,080 | ||||||
| Cox Communications, Inc. | ||||||||
| 1,167,000 | 9.375%, 1/15/2019d | 1,511,370 | ||||||
| Crown Castle Towers, LLC | ||||||||
| 540,000 | 4.174%, 8/15/2017d | 573,367 | ||||||
| DIRECTV Holdings, LLC | ||||||||
| 988,000 | 1.750%, 1/15/2018 | 989,360 | ||||||
| 707,000 | 5.875%, 10/1/2019 | 822,318 | ||||||
| 480,000 | 4.450%, 4/1/2024 | 508,956 | ||||||
| Hughes Satellite Systems Corporation | ||||||||
| 1,100,000 | 6.500%, 6/15/2019 | 1,226,500 | ||||||
| Intelsat Jackson Holdings SA | ||||||||
| 1,100,000 | 7.250%, 4/1/2019 | 1,170,125 | ||||||
| Level 3 Financing, Inc. | ||||||||
| 1,100,000 | 8.625%, 7/15/2020 | 1,232,000 | ||||||
| NBC Universal Enterprise, Inc. | ||||||||
| 840,000 | 0.912%, 4/15/2018d,e | 849,348 | ||||||
| Nippon Telegraph & Telephone Corporation | ||||||||
| 584,000 | 1.400%, 7/18/2017 | 587,450 | ||||||
| Numericable Group SA | ||||||||
| 725,000 | 6.000%, 5/15/2022d | 754,000 | ||||||
| SBA Tower Trust | ||||||||
| 575,000 | 5.101%, 4/17/2017d | 615,714 | ||||||
| SES Global Americas Holdings GP | ||||||||
| 1,035,000 | 2.500%, 3/25/2019d | 1,042,372 | ||||||
| Sprint Communications, Inc. | ||||||||
| 1,101,432 | 9.000%, 11/15/2018d | 1,335,486 | ||||||
| Telefonica Emisiones SAU | ||||||||
| 1,120,000 | 3.992%, 2/16/2016 | 1,172,638 | ||||||
| 1,110,000 | 3.192%, 4/27/2018 | 1,160,033 | ||||||
| Time Warner Cable, Inc. | ||||||||
| 825,000 | 5.000%, 2/1/2020 | 924,502 | ||||||
| 1,320,000 | 6.550%, 5/1/2037 | 1,642,464 | ||||||
| Unitymedia Hessen GmbH & Company KG | ||||||||
| 725,000 | 5.500%, 1/15/2023d | 750,375 | ||||||
| Univision Communications, Inc. | ||||||||
| 1,100,000 | 6.875%, 5/15/2019d | 1,174,250 | ||||||
| UPCB Finance V, Ltd. | ||||||||
| 1,100,000 | 7.250%, 11/15/2021d | 1,210,000 | ||||||
| Verizon Communications, Inc. | ||||||||
| 1,000,000 | 1.350%, 6/9/2017 | 999,666 | ||||||
| 453,000 | 1.100%, 11/1/2017 | 448,864 | ||||||
| 608,000 | 1.981%, 9/14/2018e | 641,474 | ||||||
| 304,000 | 3.650%, 9/14/2018 | 325,122 | ||||||
| 945,000 | 1.002%, 6/17/2019e | 956,473 | ||||||
| 1,212,000 | 6.400%, 9/15/2033 | 1,484,625 | ||||||
| 650,000 | 5.050%, 3/15/2034 | 693,723 | ||||||
| 304,000 | 6.550%, 9/15/2043 | 382,566 | ||||||
| Viacom, Inc. | ||||||||
| 640,000 | 2.500%, 9/1/2018 | 654,142 | ||||||
| Wind Acquisition Finance SA | ||||||||
| 820,000 | 7.375%, 4/23/2021d | 875,350 | ||||||
|
| |||||||
| Total | 44,611,347 | |||||||
|
| |||||||
| Consumer Cyclical (0.4%) | |||||||
| American Honda Finance Corporation | ||||||||
| 1,120,000 | 0.602%, 5/26/2016d,e | 1,124,826 | ||||||
| Chrysler Group, LLC | ||||||||
| 1,115,000 | 8.000%, 6/15/2019 | 1,211,169 | ||||||
| Cinemark USA, Inc. | ||||||||
| 1,100,000 | 4.875%, 6/1/2023 | 1,097,250 | ||||||
| Daimler Finance North America, LLC | ||||||||
| 870,000 | 1.085%, 8/1/2018d,e | 879,084 | ||||||
| Delphi Corporation | ||||||||
| 1,118,000 | 6.125%, 5/15/2021 | 1,249,477 | ||||||
| Ford Motor Company | ||||||||
| 625,000 | 7.450%, 7/16/2031 | 835,580 | ||||||
| Ford Motor Credit Company, LLC | ||||||||
| 1,175,000 | 12.000%, 5/15/2015 | 1,290,890 | ||||||
| 840,000 | 1.474%, 5/9/2016e | 852,381 | ||||||
| 1,480,000 | 2.375%, 1/16/2018 | 1,511,835 | ||||||
| 874,000 | 5.000%, 5/15/2018 | 972,282 | ||||||
| Gap, Inc. | ||||||||
| 960,000 | 5.950%, 4/12/2021 | 1,110,993 | ||||||
| General Motors Company | ||||||||
| 586,000 | 3.500%, 10/2/2018d | 599,185 | ||||||
| 1,328,000 | 6.250%, 10/2/2043d | 1,523,880 | ||||||
| General Motors Financial Company, Inc. | ||||||||
| 1,100,000 | 3.250%, 5/15/2018 | 1,116,500 | ||||||
| Home Depot, Inc. | ||||||||
| 800,000 | 4.875%, 2/15/2044 | 871,768 | ||||||
| Hyundai Capital America | ||||||||
| 1,823,000 | 1.450%, 2/6/2017d | 1,829,867 | ||||||
| Jaguar Land Rover Automotive plc | ||||||||
| 1,100,000 | 5.625%, 2/1/2023d,g | 1,168,750 | ||||||
| KB Home | ||||||||
| 615,000 | 4.750%, 5/15/2019 | 619,612 | ||||||
| L Brands, Inc. | ||||||||
| 1,100,000 | 5.625%, 2/15/2022 | 1,190,750 | ||||||
| Lennar Corporation | ||||||||
| 1,100,000 | 4.125%, 12/1/2018 | 1,123,375 | ||||||
| Macy’s Retail Holdings, Inc. | ||||||||
| 419,000 | 4.375%, 9/1/2023 | 444,023 | ||||||
| 1,575,000 | 3.625%, 6/1/2024 | 1,567,026 | ||||||
| Nissan Motor Acceptance Corporation | ||||||||
| 1,130,000 | 0.777%, 3/3/2017d,e | 1,133,293 | ||||||
The accompanying Notes to Financial Statements are an integral part of this schedule.
62
Table of Contents
Moderate Allocation Portfolio
Schedule of Investments as of June 30, 2014
(unaudited)
| Principal Amount | Long-Term Fixed Income (22.7%) | Value | ||||||
| Consumer Cyclical (0.4%) - continued | |||||||
| Toll Brothers Finance Corporation | ||||||||
| $ 620,000 | 8.910%, 10/15/2017 | $ | 744,000 | |||||
| 684,000 | 4.000%, 12/31/2018 | 704,520 | ||||||
| Toyota Motor Credit Corporation | ||||||||
| 1,900,000 | 0.425%, 5/16/2017e | 1,900,509 | ||||||
| 380,000 | 1.750%, 5/22/2017 | 387,306 | ||||||
| TRW Automotive, Inc. | ||||||||
| 860,000 | 7.250%, 3/15/2017d | 978,250 | ||||||
| Walgreen Company | ||||||||
| 892,000 | 5.250%, 1/15/2019 | 1,012,148 | ||||||
| Western Union Company | ||||||||
| 825,000 | 2.375%, 12/10/2015 | 841,586 | ||||||
| WMG Acquisition Corporation | ||||||||
| 590,000 | 6.750%, 4/15/2022d | 590,000 | ||||||
| Wynn Las Vegas, LLC | ||||||||
| 1,100,000 | 5.375%, 3/15/2022g | 1,145,375 | ||||||
|
| |||||||
| Total | 33,627,490 | |||||||
|
| |||||||
| Consumer Non-Cyclical (0.6%) | |||||||
| AbbVie, Inc. | ||||||||
| 960,000 | 2.000%, 11/6/2018 | 958,812 | ||||||
| Altria Group, Inc. | ||||||||
| 800,000 | 9.700%, 11/10/2018 | 1,048,266 | ||||||
| 1,120,000 | 4.000%, 1/31/2024 | 1,150,834 | ||||||
| Amgen, Inc. | ||||||||
| 1,030,000 | 0.828%, 5/22/2019e | 1,032,461 | ||||||
| Anheuser-Busch InBev Finance, Inc. | ||||||||
| 805,000 | 0.623%, 2/1/2019e | 805,366 | ||||||
| Anheuser-Busch InBev Worldwide, Inc. | ||||||||
| 1,265,000 | 7.750%, 1/15/2019 | 1,562,824 | ||||||
| Boston Scientific Corporation | ||||||||
| 800,000 | 2.650%, 10/1/2018 | 817,787 | ||||||
| Bunge Limited Finance Corporation | ||||||||
| 960,000 | 8.500%, 6/15/2019 | 1,206,358 | ||||||
| CareFusion Corporation | ||||||||
| 885,000 | 1.450%, 5/15/2017 | 884,339 | ||||||
| 1,002,000 | 6.375%, 8/1/2019 | 1,173,122 | ||||||
| Celgene Corporation | ||||||||
| 1,590,000 | 1.900%, 8/15/2017 | 1,613,198 | ||||||
| 304,000 | 2.300%, 8/15/2018 | 308,918 | ||||||
| CHS/Community Health Systems, Inc. | ||||||||
| 1,100,000 | 7.125%, 7/15/2020 | 1,190,750 | ||||||
| ConAgra Foods, Inc. | ||||||||
| 1,116,000 | 1.900%, 1/25/2018 | 1,118,691 | ||||||
| Coventry Health Care, Inc. | ||||||||
| 1,158,000 | 5.950%, 3/15/2017 | 1,301,979 | ||||||
| CVS Caremark Corporation | ||||||||
| 608,000 | 1.200%, 12/5/2016 | 611,716 | ||||||
| 652,000 | 6.125%, 9/15/2039 | 811,854 | ||||||
| Endo Finance LLC & Endo Finco, Inc. | ||||||||
| 1,100,000 | 7.000%, 7/15/2019d | 1,175,625 | ||||||
| Express Scripts Holding Company | ||||||||
| 640,000 | 2.650%, 2/15/2017 | 664,898 | ||||||
| 545,000 | 1.250%, 6/2/2017 | 544,042 | ||||||
| 350,000 | 2.250%, 6/15/2019 | 348,536 | ||||||
| Forest Laboratories, Inc. | ||||||||
| 1,500,000 | 4.375%, 2/1/2019d | 1,618,215 | ||||||
| Fresenius Medical Care US Finance II, Inc. | ||||||||
| 1,100,000 | 5.875%, 1/31/2022d | 1,215,500 | ||||||
| Hawk Acquisition Sub, Inc. | ||||||||
| 1,101,432 | 4.250%, 10/15/2020 | 1,108,316 | ||||||
| IMS Health, Inc. | ||||||||
| 1,497,000 | 6.000%, 11/1/2020d | 1,571,850 | ||||||
| Kroger Company | ||||||||
| 665,000 | 0.756%, 10/17/2016e | 666,518 | ||||||
| 608,000 | 1.200%, 10/17/2016 | 609,997 | ||||||
| Lorillard Tobacco Company | ||||||||
| 800,000 | 2.300%, 8/21/2017g | 816,509 | ||||||
| 800,000 | 8.125%, 6/23/2019 | 997,403 | ||||||
| Mattel, Inc. | ||||||||
| 800,000 | 1.700%, 3/15/2018 | 796,580 | ||||||
| McKesson Corporation | ||||||||
| 525,000 | 1.292%, 3/10/2017 | 526,388 | ||||||
| Medco Health Solutions, Inc. | ||||||||
| 1,400,000 | 7.125%, 3/15/2018 | 1,653,709 | ||||||
| Mondelez International, Inc. | ||||||||
| 672,000 | 0.745%, 2/1/2019e | 670,494 | ||||||
| Monsanto Company | ||||||||
| 1,400,000 | 2.125%, 7/15/2019 | 1,403,459 | ||||||
| Mylan, Inc. | ||||||||
| 640,000 | 2.600%, 6/24/2018 | 650,073 | ||||||
| 800,000 | 7.875%, 7/15/2020d | 885,487 | ||||||
| Pernod Ricard SA | ||||||||
| 632,000 | 2.950%, 1/15/2017d | 657,235 | ||||||
| 640,000 | 5.750%, 4/7/2021d | 735,711 | ||||||
| Perrigo Company, Ltd. | ||||||||
| 1,815,000 | 1.300%, 11/8/2016d | 1,812,297 | ||||||
| 835,000 | 2.300%, 11/8/2018d | 834,657 | ||||||
| Roche Holdings, Inc. | ||||||||
| 310,000 | 7.000%, 3/1/2039d | 440,687 | ||||||
| SABMiller Holdings, Inc. | ||||||||
| 1,120,000 | 2.450%, 1/15/2017d | 1,154,153 | ||||||
| Safeway, Inc. | ||||||||
| 310,000 | 3.400%, 12/1/2016 | 326,219 | ||||||
| Spectrum Brands Escrow Corporation | ||||||||
| 1,100,000 | 6.375%, 11/15/2020 | 1,182,500 | ||||||
| Thermo Fisher Scientific, Inc. | ||||||||
| 960,000 | 1.300%, 2/1/2017 | 961,415 | ||||||
| 960,000 | 2.400%, 2/1/2019 | 969,769 | ||||||
| Valeant Pharmaceuticals International | ||||||||
| 1,100,000 | 6.875%, 12/1/2014d | 1,150,875 | ||||||
| WM Wrigley Jr. Company | ||||||||
| 1,210,000 | 1.400%, 10/21/2016d | 1,218,380 | ||||||
| 760,000 | 2.000%, 10/20/2017d | 771,152 | ||||||
|
| |||||||
| Total | 47,735,924 | |||||||
|
| |||||||
| Energy (0.4%) | |||||||
| BP Capital Markets plc | ||||||||
| 906,000 | 1.375%, 11/6/2017 | 907,277 | ||||||
| Buckeye Partners, LP | ||||||||
| 1,182,000 | 2.650%, 11/15/2018 | 1,201,711 | ||||||
| Calumet Specialty Products Partners, LP | ||||||||
| 700,000 | 6.500%, 4/15/2021d | 714,000 | ||||||
| Canadian Natural Resources, Ltd. | ||||||||
| 700,000 | 0.609%, 3/30/2016e | 701,517 | ||||||
The accompanying Notes to Financial Statements are an integral part of this schedule.
63
Table of Contents
Moderate Allocation Portfolio
Schedule of Investments as of June 30, 2014
(unaudited)
| Principal Amount | Long-Term Fixed Income (22.7%) | Value | ||||||
| Energy (0.4%) - continued | |||||||
| CNOOC Nexen Finance 2014 ULC | ||||||||
| $ 983,000 | 1.625%, 4/30/2017 | $ | 985,523 | |||||
| CNPC General Capital, Ltd. | ||||||||
| 668,000 | 1.450%, 4/16/2016d | 668,928 | ||||||
| 668,000 | 2.750%, 4/19/2017d | 685,340 | ||||||
| Concho Resources, Inc. | ||||||||
| 1,101,432 | 5.500%, 10/1/2022 | 1,185,416 | ||||||
| Continental Resources, Inc. | ||||||||
| 1,336,000 | 5.000%, 9/15/2022 | 1,452,900 | ||||||
| Devon Energy Corporation | ||||||||
| 1,478,000 | 1.200%, 12/15/2016 | 1,482,480 | ||||||
| Ecopetrol SA | ||||||||
| 668,000 | 5.875%, 5/28/2045 | 690,899 | ||||||
| Enbridge, Inc. | ||||||||
| 1,368,000 | 0.678%, 6/2/2017e | 1,370,754 | ||||||
| Energy XXI Gulf Coast, Inc. | ||||||||
| 700,000 | 7.750%, 6/15/2019 | 749,000 | ||||||
| EQT Corporation | ||||||||
| 659,000 | 5.150%, 3/1/2018 | 719,040 | ||||||
| 770,000 | 8.125%, 6/1/2019 | 963,429 | ||||||
| Hess Corporation | ||||||||
| 1,330,000 | 8.125%, 2/15/2019 | 1,673,092 | ||||||
| Linn Energy, LLC | ||||||||
| 1,101,432 | 6.250%, 11/1/2019d | 1,153,750 | ||||||
| Lukoil International Finance BV | ||||||||
| 775,000 | 3.416%, 4/24/2018d | 769,187 | ||||||
| MEG Energy Corporation | ||||||||
| 1,100,000 | 6.500%, 3/15/2021d | 1,166,000 | ||||||
| Murphy Oil Corporation | ||||||||
| 450,000 | 2.500%, 12/1/2017 | 460,575 | ||||||
| Oasis Petroleum, Inc. | ||||||||
| 1,100,000 | 6.875%, 1/15/2023 | 1,199,000 | ||||||
| Offshore Group Investment, Ltd. | ||||||||
| 1,100,000 | 7.500%, 11/1/2019 | 1,163,250 | ||||||
| Petrobras Global Finance BV | ||||||||
| 1,440,000 | 2.000%, 5/20/2016 | 1,442,079 | ||||||
| 810,000 | 3.112%, 3/17/2020e | 832,235 | ||||||
| Petroleos Mexicanos | ||||||||
| 441,000 | 3.500%, 7/18/2018 | 463,491 | ||||||
| Pioneer Natural Resources Company | ||||||||
| 294,000 | 5.875%, 7/15/2016 | 321,717 | ||||||
| Range Resources Corporation | ||||||||
| 1,100,000 | 5.000%, 8/15/2022 | 1,166,000 | ||||||
| Sinopec Capital 2013, Ltd. | ||||||||
| 1,120,000 | 1.250%, 4/24/2016d | 1,120,381 | ||||||
| Suncor Energy, Inc. | ||||||||
| 719,000 | 6.100%, 6/1/2018 | 834,446 | ||||||
| Total Capital International SA | ||||||||
| 690,000 | 0.580%, 6/19/2019e | 689,995 | ||||||
| Transocean, Inc. | ||||||||
| 1,279,000 | 6.000%, 3/15/2018 | 1,444,668 | ||||||
| Weatherford International, Ltd. | ||||||||
| 1,085,000 | 9.625%, 3/1/2019 | 1,423,840 | ||||||
| Williams Companies, Inc. | ||||||||
| 751,000 | 3.700%, 1/15/2023 | 722,415 | ||||||
|
| |||||||
| Total | 32,524,335 | |||||||
|
| |||||||
| Financials (2.4%) | |||||||
| Abbey National Treasury Services plc | ||||||||
| 608,000 | 3.050%, 8/23/2018 | 636,712 | ||||||
| ABN AMRO Bank NV | ||||||||
| 1,187,000 | 2.500%, 10/30/2018d | 1,204,413 | ||||||
| Achmea Hypotheekbank NV | ||||||||
| 371,000 | 3.200%, 11/3/2014d | 374,535 | ||||||
| American Express Credit Corporation | ||||||||
| 380,000 | 2.375%, 3/24/2017 | 392,849 | ||||||
| 945,000 | 0.781%, 3/18/2019e | 950,245 | ||||||
| American International Group, Inc. | ||||||||
| 760,000 | 3.800%, 3/22/2017 | 812,142 | ||||||
| 1,660,000 | 8.250%, 8/15/2018 | 2,062,399 | ||||||
| ANZ National International, Ltd. of London | ||||||||
| 800,000 | 3.125%, 8/10/2015d | 822,964 | ||||||
| ANZ New Zealand International, Ltd. | ||||||||
| 1,155,000 | 1.400%, 4/27/2017d | 1,157,201 | ||||||
| Australia and New Zealand | ||||||||
| Banking Group, Ltd. | ||||||||
| 1,295,000 | 0.490%, 6/13/2017d,e | 1,294,233 | ||||||
| Aviation Capital Group Corporation | ||||||||
| 608,000 | 3.875%, 9/27/2016d | 629,280 | ||||||
| Banco Santander Chile | ||||||||
| 1,200,000 | 1.127%, 4/11/2017d,e | 1,199,998 | ||||||
| Bank Nederlandse Gemeenten NV | ||||||||
| 616,000 | 1.375%, 3/19/2018d | 616,460 | ||||||
| Bank of America Corporation | ||||||||
| 1,214,000 | 7.750%, 8/15/2015 | 1,304,626 | ||||||
| 940,000 | 5.750%, 8/15/2016 | 1,025,610 | ||||||
| 1,280,000 | 5.700%, 5/2/2017 | 1,420,440 | ||||||
| 2,015,000 | 5.750%, 12/1/2017 | 2,272,759 | ||||||
| 2,327,000 | 1.300%, 3/22/2018e | 2,356,960 | ||||||
| 1,992,000 | 5.650%, 5/1/2018 | 2,258,006 | ||||||
| 840,000 | 1.103%, 4/1/2019e | 845,447 | ||||||
| 640,000 | 4.000%, 4/1/2024 | 653,140 | ||||||
| 868,000 | 5.875%, 2/7/2042 | 1,030,828 | ||||||
| Bank of Montreal | ||||||||
| 1,325,000 | 0.829%, 4/9/2018e | 1,333,876 | ||||||
| Bank of Tokyo-Mitsubishi UFJ, Ltd. | ||||||||
| 1,650,000 | 0.640%, 3/10/2017d,e | 1,649,579 | ||||||
| Banque Federative du Credit Mutuel SA | ||||||||
| 1,118,000 | 1.078%, 1/20/2017d,e | 1,127,586 | ||||||
| Barclays Bank plc | ||||||||
| 970,000 | 10.179%, 6/12/2021d | 1,341,714 | ||||||
| BBVA Banco Continental SA | ||||||||
| 1,185,000 | 2.250%, 7/29/2016d | 1,193,887 | ||||||
| BBVA US Senior SAU | ||||||||
| 1,508,000 | 4.664%, 10/9/2015 | 1,576,634 | ||||||
| Berkshire Hathaway Finance Corporation | ||||||||
| 1,000,000 | 0.377%, 1/10/2017e | 1,000,252 | ||||||
| 780,000 | 1.600%, 5/15/2017 | 792,268 | ||||||
| 840,000 | 1.300%, 5/15/2018 | 832,774 | ||||||
| BioMed Realty, LP | ||||||||
| 960,000 | 2.625%, 5/1/2019 | 965,772 | ||||||
| BNP Paribas SA | ||||||||
| 798,000 | 1.250%, 12/12/2016 | 799,018 | ||||||
| 1,294,000 | 2.375%, 9/14/2017 | 1,325,057 | ||||||
The accompanying Notes to Financial Statements are an integral part of this schedule.
64
Table of Contents
Moderate Allocation Portfolio
Schedule of Investments as of June 30, 2014
(unaudited)
| Principal Amount | Long-Term Fixed Income (22.7%) | Value | ||||||
| Financials (2.4%) - continued | |||||||
| BPCE SA | ||||||||
| $ 805,000 | 1.073%, 2/10/2017e,g | $ | 811,837 | |||||
| 1,352,000 | 1.625%, 2/10/2017 | 1,361,951 | ||||||
| Canadian Imperial Bank of Commerce | ||||||||
| 610,000 | 2.600%, 7/2/2015d | 623,908 | ||||||
| Capital One Bank USA NA | ||||||||
| 805,000 | 1.200%, 2/13/2017 | 804,965 | ||||||
| Capital One Financial Corporation | ||||||||
| 560,000 | 0.680%, 3/22/2016e | 561,301 | ||||||
| 1,228,000 | 6.150%, 9/1/2016 | 1,358,985 | ||||||
| 820,000 | 2.450%, 4/24/2019 | 827,691 | ||||||
| Citigroup, Inc. | ||||||||
| 4,107,000 | 5.500%, 2/15/2017 | 4,516,727 | ||||||
| 800,000 | 0.770%, 3/10/2017e | 800,434 | ||||||
| 798,000 | 6.000%, 8/15/2017 | 903,235 | ||||||
| 700,000 | 1.000%, 4/8/2019e | 700,976 | ||||||
| 1,261,000 | 8.500%, 5/22/2019 | 1,611,799 | ||||||
| 875,000 | 4.050%, 7/30/2022 | 896,434 | ||||||
| CoBank ACB | ||||||||
| 495,000 | 0.831%, 6/15/2022e,f | 456,019 | ||||||
| Cooperatieve Centrale Raiffeisen- Boerenleenbank BA | ||||||||
| 795,000 | 3.950%, 11/9/2022 | 808,219 | ||||||
| Credit Agricole SA | ||||||||
| 1,340,000 | 1.625%, 4/15/2016d | 1,357,780 | ||||||
| 820,000 | 1.027%, 4/15/2019d,e | 826,250 | ||||||
| Credit Suisse AG | ||||||||
| 808,000 | 5.400%, 1/14/2020 | 907,951 | ||||||
| CyrusOne, LP | ||||||||
| 1,100,000 | 6.375%, 11/15/2022 | 1,185,250 | ||||||
| DDR Corporation | ||||||||
| 1,390,000 | 9.625%, 3/15/2016 | 1,590,462 | ||||||
| Deutsche Bank AG | ||||||||
| 1,700,000 | 1.350%, 5/30/2017 | 1,699,436 | ||||||
| Discover Bank | ||||||||
| 800,000 | 8.700%, 11/18/2019 | 1,016,761 | ||||||
| Discover Financial Services | ||||||||
| 640,000 | 6.450%, 6/12/2017 | 728,015 | ||||||
| DnB Boligkreditt AS | ||||||||
| 1,644,000 | 1.450%, 3/21/2018d | 1,636,234 | ||||||
| Eksportfinans ASA | ||||||||
| 390,000 | 3.000%, 11/17/2014 | 392,379 | ||||||
| 548,000 | 5.500%, 5/25/2016 | 583,620 | ||||||
| Fifth Third Bancorp | ||||||||
| 991,000 | 5.450%, 1/15/2017 | 1,086,344 | ||||||
| General Electric Capital Corporation | ||||||||
| 1,950,000 | 0.504%, 5/15/2017e | 1,951,632 | ||||||
| 3,325,000 | 6.000%, 8/7/2019 | 3,938,622 | ||||||
| 840,000 | 1.231%, 3/15/2023e | 842,092 | ||||||
| 1,367,000 | 6.750%, 3/15/2032 | 1,803,290 | ||||||
| Genworth Financial, Inc. | ||||||||
| 1,320,000 | 7.700%, 6/15/2020 | 1,626,753 | ||||||
| Goldman Sachs Group, Inc. | ||||||||
| 1,505,000 | 2.375%, 1/22/2018 | 1,528,382 | ||||||
| 840,000 | 1.425%, 4/30/2018e | 853,563 | ||||||
| 620,000 | 1.324%, 11/15/2018e | 628,468 | ||||||
| 925,000 | 7.500%, 2/15/2019 | 1,128,829 | ||||||
| 1,410,000 | 5.375%, 3/15/2020 | 1,597,216 | ||||||
| 1,680,000 | 5.250%, 7/27/2021 | 1,886,527 | ||||||
| Hartford Financial Services Group, Inc. | ||||||||
| 841,000 | 4.000%, 10/15/2017 | 907,493 | ||||||
| 865,000 | 5.125%, 4/15/2022 | 983,603 | ||||||
| HBOS plc | ||||||||
| 1,002,000 | 6.750%, 5/21/2018d | 1,154,333 | ||||||
| HCP, Inc. | ||||||||
| 294,000 | 6.000%, 1/30/2017 | 329,114 | ||||||
| 265,000 | 6.700%, 1/30/2018 | 308,994 | ||||||
| Health Care REIT, Inc. | ||||||||
| 1,095,000 | 4.700%, 9/15/2017 | 1,197,847 | ||||||
| 300,000 | 2.250%, 3/15/2018 | 304,599 | ||||||
| HSBC Bank plc | ||||||||
| 1,765,000 | 0.864%, 5/15/2018d,e | 1,781,242 | ||||||
| HSBC Finance Corporation | ||||||||
| 1,607,000 | 6.676%, 1/15/2021 | 1,921,813 | ||||||
| HSBC Holdings plc | ||||||||
| 965,000 | 5.250%, 3/14/2044 | 1,033,322 | ||||||
| HSBC USA, Inc. | ||||||||
| 930,000 | 1.625%, 1/16/2018 | 932,082 | ||||||
| Huntington Bancshares, Inc. | ||||||||
| 304,000 | 2.600%, 8/2/2018 | 309,154 | ||||||
| Huntington National Bank | ||||||||
| 960,000 | 1.350%, 8/2/2016 | 966,743 | ||||||
| �� | Icahn Enterprises, LP | |||||||
| 870,000 | 6.000%, 8/1/2020 | 931,988 | ||||||
| ING Bank NV | ||||||||
| 960,000 | 4.125%, 11/21/2023 | 987,600 | ||||||
| ING Capital Funding Trust III | ||||||||
| 1,015,000 | 3.834%, 12/29/2049e,j | 1,015,000 | ||||||
| International Lease Finance Corporation | ||||||||
| 1,060,000 | 2.181%, 6/15/2016e | 1,066,625 | ||||||
| Intesa Sanpaolo SPA | ||||||||
| 972,000 | 3.125%, 1/15/2016 | 999,123 | ||||||
| 480,000 | 3.875%, 1/16/2018 | 505,890 | ||||||
| 1,000,000 | 3.875%, 1/15/2019 | 1,048,723 | ||||||
| J.P. Morgan Chase & Company | ||||||||
| 890,000 | 1.125%, 2/26/2016 | 894,187 | ||||||
| 1,200,000 | 3.450%, 3/1/2016 | 1,252,224 | ||||||
| 825,000 | 0.744%, 2/15/2017e | 828,001 | ||||||
| 1,992,000 | 2.000%, 8/15/2017 | 2,025,770 | ||||||
| 687,000 | 1.800%, 1/25/2018 | 690,320 | ||||||
| 1,680,000 | 6.300%, 4/23/2019 | 1,986,299 | ||||||
| 320,000 | 3.200%, 1/25/2023 | 317,720 | ||||||
| 1,255,000 | 7.900%, 4/29/2049j | 1,402,462 | ||||||
| KeyBank NA | ||||||||
| 1,465,000 | 7.413%, 5/6/2015 | 1,547,975 | ||||||
| Kookmin Bank | ||||||||
| 1,182,000 | 1.103%, 1/27/2017d,e | 1,188,449 | ||||||
| Liberty Mutual Group, Inc. | ||||||||
| 292,000 | 4.950%, 5/1/2022d | 319,377 | ||||||
| 316,000 | 6.500%, 5/1/2042d | 396,296 | ||||||
| Liberty Property, LP | ||||||||
| 830,000 | 5.500%, 12/15/2016 | 906,195 | ||||||
| Lloyds Banking Group plc | ||||||||
| 1,002,000 | 5.920%, 9/29/2049d,j | 1,012,020 | ||||||
| Macquarie Bank, Ltd. | ||||||||
| 1,025,000 | 5.000%, 2/22/2017d | 1,117,045 | ||||||
| 1,245,000 | 1.021%, 3/24/2017d,e | 1,249,005 | ||||||
| Manufacturers and Traders Trust Company | ||||||||
| 670,000 | 0.600%, 1/30/2017e | 670,604 | ||||||
The accompanying Notes to Financial Statements are an integral part of this schedule.
65
Table of Contents
Moderate Allocation Portfolio
Schedule of Investments as of June 30, 2014
(unaudited)
| Principal Amount | Long-Term Fixed Income (22.7%) | Value | ||||||
| Financials (2.4%) - continued | |||||||
| MasterCard, Inc. | ||||||||
| $ 655,000 | 2.000%, 4/1/2019 | $ | 657,666 | |||||
| Merrill Lynch & Company, Inc. | ||||||||
| 2,656,000 | 6.050%, 5/16/2016 | 2,888,844 | ||||||
| 895,000 | 6.400%, 8/28/2017 | 1,022,340 | ||||||
| Metropolitan Life Global Funding I | ||||||||
| 830,000 | 0.365%, 6/23/2016c,d,e | 829,674 | ||||||
| 1,135,000 | 0.607%, 4/10/2017d,e | 1,137,494 | ||||||
| 930,000 | 1.300%, 4/10/2017d | 932,144 | ||||||
| Mizuho Bank, Ltd. | ||||||||
| 820,000 | 0.659%, 4/16/2017d,e | 820,677 | ||||||
| Mizuho Corporate Bank, Ltd. | ||||||||
| 960,000 | 1.850%, 3/21/2018d | 963,790 | ||||||
| Morgan Stanley | ||||||||
| 480,000 | 1.750%, 2/25/2016 | 486,817 | ||||||
| 1,390,000 | 4.750%, 3/22/2017 | 1,513,347 | ||||||
| 860,000 | 6.250%, 8/28/2017 | 980,127 | ||||||
| 1,328,000 | 6.625%, 4/1/2018 | 1,552,396 | ||||||
| 560,000 | 1.509%, 4/25/2018e | 571,104 | ||||||
| 800,000 | 4.875%, 11/1/2022 | 858,734 | ||||||
| 1,120,000 | 4.100%, 5/22/2023 | 1,136,143 | ||||||
| Murray Street Investment Trust I | ||||||||
| 2,505,000 | 4.647%, 3/9/2017 | 2,707,359 | ||||||
| National City Corporation | ||||||||
| 1,320,000 | 6.875%, 5/15/2019 | 1,576,505 | ||||||
| Nomura Holdings, Inc. | ||||||||
| 840,000 | 1.680%, 9/13/2016e | 853,926 | ||||||
| 960,000 | 2.000%, 9/13/2016 | 975,667 | ||||||
| 820,000 | 2.750%, 3/19/2019 | 834,184 | ||||||
| Nordea Eiendomskreditt AS | ||||||||
| 1,233,000 | 2.125%, 9/22/2016d | 1,267,354 | ||||||
| PNC Bank NA | ||||||||
| 1,887,000 | 1.150%, 11/1/2016 | 1,896,754 | ||||||
| Prologis, LP | ||||||||
| 1,216,000 | 7.375%, 10/30/2019 | 1,503,104 | ||||||
| Prudential Covered Trust | ||||||||
| 672,000 | 2.997%, 9/30/2015f | 688,344 | ||||||
| Realty Income Corporation | ||||||||
| 302,000 | 2.000%, 1/31/2018 | 303,428 | ||||||
| Regions Bank | ||||||||
| 1,773,000 | 7.500%, 5/15/2018 | 2,110,246 | ||||||
| Reinsurance Group of America, Inc. | ||||||||
| 500,000 | 5.625%, 3/15/2017 | 545,987 | ||||||
| 990,000 | 5.000%, 6/1/2021 | 1,091,793 | ||||||
| Reliance Standard Life Global Funding II | ||||||||
| 660,000 | 2.500%, 4/24/2019d | 662,084 | ||||||
| Royal Bank of Canada | ||||||||
| 2,055,000 | 1.125%, 7/22/2016 | 2,071,343 | ||||||
| 1,120,000 | 2.200%, 7/27/2018 | 1,143,713 | ||||||
| Royal Bank of Scotland Group plc | ||||||||
| 1,954,000 | 1.174%, 3/31/2017e | 1,963,500 | ||||||
| 2,044,000 | 5.125%, 5/28/2024 | 2,075,476 | ||||||
| Santander US Debt SAU | ||||||||
| 1,020,000 | 3.724%, 1/20/2015d | 1,035,094 | ||||||
| 400,000 | 3.781%, 10/7/2015d | 413,172 | ||||||
| Simon Property Group, LP | ||||||||
| 620,000 | 10.350%, 4/1/2019 | 840,013 | ||||||
| Skandinaviska Enskilda Banken AB | ||||||||
| 1,025,000 | 2.375%, 3/25/2019d | 1,033,918 | ||||||
| SLM Corporation | ||||||||
| 480,000 | 3.875%, 9/10/2015 | 489,600 | ||||||
| 535,000 | 6.250%, 1/25/2016 | 568,437 | ||||||
| 400,000 | 4.625%, 9/25/2017 | 421,500 | ||||||
| SpareBank 1 Boligkreditt AS | ||||||||
| 1,644,000 | 1.250%, 5/2/2018d | 1,620,639 | ||||||
| Sumitomo Mitsui Banking Corporation | ||||||||
| 1,805,000 | 1.300%, 1/10/2017 | 1,808,054 | ||||||
| Suncorp-Metway, Ltd. | ||||||||
| 2,095,000 | 0.934%, 3/28/2017d,e | 2,094,979 | ||||||
| Svensk Exportkredit AB | ||||||||
| 822,000 | 1.125%, 4/5/2018 | 813,926 | ||||||
| Svenska Handelsbanken AB | ||||||||
| 600,000 | 3.125%, 7/12/2016 | 628,353 | ||||||
| 960,000 | 1.625%, 3/21/2018 | 957,763 | ||||||
| 1,190,000 | 0.722%, 6/17/2019e | 1,190,429 | ||||||
| Swedbank Hypotek AB | ||||||||
| 1,644,000 | 1.375%, 3/28/2018d | 1,636,893 | ||||||
| Swiss RE Capital I, LP | ||||||||
| 750,000 | 6.854%, 5/29/2049d,j | 802,500 | ||||||
| Toronto-Dominion Bank | ||||||||
| 810,000 | 0.691%, 9/9/2016e | 814,436 | ||||||
| U.S. Bank NA | ||||||||
| 895,000 | 0.455%, 1/30/2017e | 895,440 | ||||||
| UBS AG London | ||||||||
| 1,644,000 | 0.750%, 3/24/2016d | 1,647,081 | ||||||
| UBS AG/Stamford, Connecticut | ||||||||
| 351,000 | 5.875%, 12/20/2017 | 400,897 | ||||||
| Ventas Realty, LP | ||||||||
| 1,152,000 | 1.550%, 9/26/2016 | 1,163,724 | ||||||
| 800,000 | 1.250%, 4/17/2017 | 800,106 | ||||||
| Voya Financial, Inc. | ||||||||
| 1,185,000 | 2.900%, 2/15/2018 | 1,227,944 | ||||||
| Wachovia Corporation | ||||||||
| 1,325,000 | 0.501%, 6/15/2017e | 1,323,185 | ||||||
| Wells Fargo & Company | ||||||||
| 2,307,000 | 1.250%, 7/20/2016 | 2,326,916 | ||||||
| 1,071,000 | 2.100%, 5/8/2017 | 1,098,454 | ||||||
|
| |||||||
| Total | 192,264,755 | |||||||
|
| |||||||
| Foreign Government (0.1%) | |||||||
| Asian Development Bank | ||||||||
| 1,120,000 | 0.500%, 6/20/2016 | 1,119,597 | ||||||
| Denmark Government International Bond | ||||||||
| 1,120,000 | 0.375%, 4/25/2016d | 1,118,369 | ||||||
| European Investment Bank | ||||||||
| 1,215,000 | 1.875%, 3/15/2019 | 1,225,539 | ||||||
| Export-Import Bank of Korea | ||||||||
| 600,000 | 1.250%, 11/20/2015 | 603,098 | ||||||
| International Finance Corporation | ||||||||
| 275,000 | 0.500%, 5/16/2016 | 274,779 | ||||||
| Kommunalbanken AS | ||||||||
| 300,000 | 2.750%, 5/5/2015d | 306,372 | ||||||
| 1,120,000 | 0.311%, 3/18/2016d,e | 1,120,488 | ||||||
| Kommuninvest i Sverige AB | ||||||||
| 1,120,000 | 0.500%, 6/15/2016d | 1,118,497 | ||||||
| Province of Ontario | ||||||||
| 1,160,000 | 1.000%, 7/22/2016 | 1,167,841 | ||||||
| Sweden Government International Bond | ||||||||
| 200,000 | 0.375%, 12/22/2015d | 200,016 | ||||||
The accompanying Notes to Financial Statements are an integral part of this schedule.
66
Table of Contents
Moderate Allocation Portfolio
Schedule of Investments as of June 30, 2014
(unaudited)
| Principal Amount | Long-Term Fixed Income (22.7%) | Value | ||||||
| Foreign Government (0.1%) - continued | |||||||
| $ 1,000,000 | 0.375%, 3/29/2016d | $ | 999,330 | |||||
|
| |||||||
| Total | 9,253,926 | |||||||
|
| |||||||
| Mortgage-Backed Securities (7.1%) | |||||||
| Federal Home Loan Mortgage Corporation Gold 15-Yr. Pass Through | ||||||||
| 29,770,000 | 3.000%, 7/1/2029c | 30,858,451 | ||||||
| Federal Home Loan Mortgage Corporation Gold 30-Yr. Pass Through | ||||||||
| 6,774,713 | 1.956%, 6/1/2043e | 6,904,886 | ||||||
| 30,770,000 | 4.000%, 7/1/2044c | 32,596,969 | ||||||
| Federal National Mortgage Association Conventional 15- Yr. Pass Through | ||||||||
| 67,275,000 | 3.500%, 8/1/2029c | 71,122,292 | ||||||
| Federal National Mortgage Association Conventional 30- Yr. Pass Through | ||||||||
| 6,637,662 | 2.071%, 1/1/2043e | 6,830,958 | ||||||
| 11,809,409 | 2.061%, 3/1/2043e | 12,147,207 | ||||||
| 10,540,344 | 1.750%, 7/1/2043e | 10,701,347 | ||||||
| 12,181,022 | 2.019%, 7/1/2043e | 12,450,569 | ||||||
| 10,878,870 | 2.119%, 8/1/2043e | 11,151,382 | ||||||
| 123,225,000 | 3.500%, 7/1/2044c | 126,844,734 | ||||||
| 122,132,500 | 4.000%, 7/1/2044c | 129,613,116 | ||||||
| 16,756,000 | 4.500%, 7/1/2044c | 18,146,228 | ||||||
| 107,088,000 | 4.500%, 8/1/2044c | 115,709,441 | ||||||
|
| |||||||
| Total | 585,077,580 | |||||||
|
| |||||||
| Technology (0.2%) | |||||||
| Amphenol Corporation | ||||||||
| 511,000 | 2.550%, 1/30/2019 | 518,183 | ||||||
| Apple, Inc. | ||||||||
| 1,250,000 | 0.523%, 5/6/2019e | 1,251,190 | ||||||
| Baidu, Inc. | ||||||||
| 1,000,000 | 2.750%, 6/9/2019 | 1,003,895 | ||||||
| Cisco Systems, Inc. | ||||||||
| 800,000 | 0.727%, 3/1/2019e | 805,139 | ||||||
| Computer Sciences Corporation | ||||||||
| 442,000 | 2.500%, 9/15/2015 | 449,903 | ||||||
| EMC Corporation | ||||||||
| 1,106,000 | 1.875%, 6/1/2018 | 1,113,307 | ||||||
| Fidelity National Information Services, Inc. | ||||||||
| 1,169,000 | 1.450%, 6/5/2017 | 1,167,611 | ||||||
| First Data Corporation | ||||||||
| 1,100,000 | 7.375%, 6/15/2019d | 1,181,125 | ||||||
| Hewlett-Packard Company | ||||||||
| 903,000 | 2.125%, 9/13/2015 | 918,915 | ||||||
| 1,120,000 | 5.400%, 3/1/2017 | 1,241,212 | ||||||
| 672,000 | 1.167%, 1/14/2019e | 677,353 | ||||||
| Iron Mountain, Inc. | ||||||||
| 1,100,000 | 6.000%, 8/15/2023 | 1,189,375 | ||||||
| Micron Semiconductor Asia Pte, Ltd. | ||||||||
| 600,000 | 1.258%, 1/15/2019 | 599,916 | ||||||
| Oracle Corporation | ||||||||
| 1,010,000 | 0.807%, 1/15/2019e | 1,018,131 | ||||||
| Samsung Electronics America, Inc. | ||||||||
| 600,000 | 1.750%, 4/10/2017d | 602,806 | ||||||
| Tyco Electronics Group SA | ||||||||
| 1,254,000 | 6.550%, 10/1/2017 | 1,451,111 | ||||||
| Xerox Corporation | ||||||||
| 899,000 | 7.200%, 4/1/2016 | 991,560 | ||||||
| Xilinx, Inc. | ||||||||
| 640,000 | 2.125%, 3/15/2019 | 641,132 | ||||||
|
| |||||||
| Total | 16,821,864 | |||||||
|
| |||||||
| Transportation (0.1%) | |||||||
| American Airlines Pass Through Trust | ||||||||
| 752,060 | 4.950%, 1/15/2023d | 814,105 | ||||||
| Avis Budget Car Rental, LLC | ||||||||
| 635,000 | 5.125%, 6/1/2022d | 635,794 | ||||||
| Canadian Pacific Railway Company | ||||||||
| 405,000 | 7.125%, 10/15/2031 | 535,238 | ||||||
| 480,000 | 5.750%, 3/15/2033 | 568,109 | ||||||
| Continental Airlines, Inc. | ||||||||
| 765,379 | 4.150%, 4/11/2024 | 795,994 | ||||||
| CSX Corporation | ||||||||
| 532,000 | 3.700%, 11/1/2023 | 547,898 | ||||||
| Delta Air Lines, Inc. | ||||||||
| 882,000 | 6.750%, 5/23/2017 | 928,305 | ||||||
| 435,061 | 4.950%, 5/23/2019 | 469,866 | ||||||
| 134,519 | 4.750%, 5/7/2020 | 145,953 | ||||||
| ERAC USA Finance, LLC | ||||||||
| 604,000 | 1.400%, 4/15/2016d | 608,645 | ||||||
| 294,000 | 2.800%, 11/1/2018d | 303,652 | ||||||
| Kansas City Southern de Mexico SA de CV | ||||||||
| 1,337,000 | 0.928%, 10/28/2016e | 1,341,607 | ||||||
| Korea Expressway Corporation | ||||||||
| 960,000 | 1.625%, 4/28/2017d | 959,000 | ||||||
| Network Rail Infrastructure Finance plc | ||||||||
| 1,285,000 | 0.234%, 2/13/2017d,e | 1,284,325 | ||||||
| PACCAR Financial Corporation | ||||||||
| 860,000 | 0.420%, 6/6/2017e | 859,994 | ||||||
| Virgin Australia Holdings, Ltd. | ||||||||
| 429,639 | 5.000%, 10/23/2023d | 456,492 | ||||||
|
| |||||||
| Total | 11,254,977 | |||||||
|
| |||||||
| U.S. Government and Agencies (7.5%) | |||||||
| Federal Agricultural Mortgage Corporation | ||||||||
| 465,000 | 2.125%, 9/15/2015 | 475,437 | ||||||
| Federal Home Loan Bank | ||||||||
| 3,640,000 | 0.875%, 5/24/2017 | 3,640,131 | ||||||
| Federal Home Loan Mortgage Corporation | ||||||||
| 3,535,000 | 1.375%, 5/1/2020 | 3,438,516 | ||||||
| Federal National Mortgage Association | ||||||||
| 750,000 | 4.375%, 10/15/2015 | 789,461 | ||||||
| 5,840,000 | 0.625%, 8/26/2016 | 5,843,522 | ||||||
| 2,400,000 | 1.375%, 11/15/2016 | 2,434,550 | ||||||
| 2,290,000 | 0.875%, 5/21/2018 | 2,251,565 | ||||||
| 540,000 | 6.250%, 5/15/2029 | 725,195 | ||||||
| Tennessee Valley Authority | ||||||||
| 520,000 | 5.250%, 9/15/2039 | 631,040 | ||||||
| U.S. Treasury Bonds | ||||||||
| 1,215,000 | 7.625%, 2/15/2025 | 1,794,403 | ||||||
The accompanying Notes to Financial Statements are an integral part of this schedule.
67
Table of Contents
Moderate Allocation Portfolio
Schedule of Investments as of June 30, 2014
(unaudited)
| Principal Amount | Long-Term Fixed Income (22.7%) | Value | ||||||
| U.S. Government and Agencies (7.5%) - continued | |||||||
| $ 4,750,000 | 5.250%, 11/15/2028 | $ | 6,084,456 | |||||
| 2,975,000 | 4.375%, 5/15/2040 | 3,567,677 | ||||||
| 66,460,000 | 3.000%, 5/15/2042 | 62,680,088 | ||||||
| U.S. Treasury Bonds, TIPS | ||||||||
| 4,350,048 | 0.125%, 4/15/2019 | 4,479,196 | ||||||
| 132,044 | 2.375%, 1/15/2025 | 159,969 | ||||||
| 93,222 | 2.125%, 2/15/2040 | 118,603 | ||||||
| 996,606 | 0.750%, 2/15/2042 | 938,134 | ||||||
| U.S. Treasury Notes | ||||||||
| 1,785,000 | 2.625%, 2/29/2016 | 1,853,540 | ||||||
| 52,000,000 | 0.375%, 3/31/2016 | 52,010,140 | ||||||
| 25,275,000 | 0.625%, 10/15/2016 | 25,300,679 | ||||||
| 1,225,000 | 1.000%, 10/31/2016 | 1,236,484 | ||||||
| 54,680,000 | 0.625%, 12/15/2016 | 54,650,090 | ||||||
| 17,000,000 | 0.750%, 3/15/2017 | 17,000,000 | ||||||
| 4,350,000 | 3.250%, 3/31/2017 | 4,643,625 | ||||||
| 20,000,000 | 0.875%, 5/15/2017 | 20,026,560 | ||||||
| 42,225,000 | 0.625%, 5/31/2017 | 41,944,584 | ||||||
| 20,000,000 | 1.000%, 5/31/2018 | 19,782,820 | ||||||
| 76,505,000 | 1.250%, 10/31/2018 | 75,913,310 | ||||||
| 5,640,000 | 1.625%, 4/30/2019 | 5,650,575 | ||||||
| 6,910,000 | 1.625%, 8/15/2022 | 6,560,181 | ||||||
| 2,300,000 | 1.750%, 5/15/2023 | 2,178,532 | ||||||
| 25,300,000 | 2.500%, 8/15/2023 | 25,450,231 | ||||||
| 42,000,000 | 2.750%, 2/15/2024 | 42,954,828 | ||||||
| 43,800,000 | 3.625%, 2/15/2044 | 46,222,666 | ||||||
| U.S. Treasury Notes, TIPS | ||||||||
| 31,173,953 | 0.125%, 4/15/2018 | 32,201,759 | ||||||
| 806,435 | 0.125%, 1/15/2022 | 811,792 | ||||||
| 34,819,045 | 0.125%, 1/15/2023 | 34,699,371 | ||||||
|
| |||||||
| Total | 611,143,710 | |||||||
|
| |||||||
| Utilities (0.4%) | |||||||
| AES Corporation | ||||||||
| 1,100,000 | 7.375%, 7/1/2021 | 1,287,000 | ||||||
| American Electric Power Company, Inc. | ||||||||
| 600,000 | 1.650%, 12/15/2017 | 603,184 | ||||||
| Atlas Pipeline Partners, LP | ||||||||
| 1,100,000 | 4.750%, 11/15/2021 | 1,078,000 | ||||||
| Commonwealth Edison Company | ||||||||
| 1,260,000 | 6.950%, 7/15/2018 | 1,489,942 | ||||||
| Crestwood Midstream Partners, LP | ||||||||
| 775,000 | 6.125%, 3/1/2022d | 815,687 | ||||||
| Dayton Power and Light Company | ||||||||
| 608,000 | 1.875%, 9/15/2016d | 618,298 | ||||||
| DCP Midstream Operating, LP | ||||||||
| 960,000 | 2.500%, 12/1/2017 | 987,545 | ||||||
| Dominion Resources, Inc. | ||||||||
| 1,280,000 | 1.250%, 3/15/2017 | 1,285,037 | ||||||
| Duke Energy Corporation | ||||||||
| 800,000 | 0.610%, 4/3/2017e | 802,402 | ||||||
| 948,000 | 2.100%, 6/15/2018 | 958,451 | ||||||
| Electricite de France | ||||||||
| 1,068,000 | 0.688%, 1/20/2017d,e | 1,072,330 | ||||||
| Enel Finance International NV | ||||||||
| 773,000 | 3.875%, 10/7/2014d | 779,170 | ||||||
| 474,000 | 6.250%, 9/15/2017d | 540,854 | ||||||
| Energy Transfer Partners, LP | ||||||||
| 310,000 | 9.700%, 3/15/2019 | 406,340 | ||||||
| 2,476,000 | 4.650%, 6/1/2021 | 2,667,125 | ||||||
| Enterprise Products Operating, LLC | ||||||||
| 990,000 | 5.100%, 2/15/2045 | 1,056,780 | ||||||
| Exelon Generation Company, LLC | ||||||||
| 481,000 | 6.200%, 10/1/2017 | 548,020 | ||||||
| 1,077,000 | 5.200%, 10/1/2019 | 1,211,248 | ||||||
| ITC Holdings Corporation | ||||||||
| 294,000 | 4.050%, 7/1/2023 | 305,325 | ||||||
| MidAmerican Energy Holdings Company | ||||||||
| 811,000 | 1.100%, 5/15/2017 | 807,693 | ||||||
| 1,231,000 | 5.750%, 4/1/2018 | 1,408,819 | ||||||
| 775,000 | 6.500%, 9/15/2037 | 999,396 | ||||||
| NiSource Finance Corporation | ||||||||
| 689,000 | 6.400%, 3/15/2018 | 791,608 | ||||||
| 900,000 | 6.800%, 1/15/2019 | 1,073,298 | ||||||
| Northeast Utilities | ||||||||
| 465,000 | 1.450%, 5/1/2018 | 456,630 | ||||||
| Northern States Power Company | ||||||||
| 1,670,000 | 4.125%, 5/15/2044 | 1,672,862 | ||||||
| NRG Energy, Inc. | ||||||||
| 1,100,000 | 6.625%, 3/15/2023 | 1,190,750 | ||||||
| ONEOK Partners, LP | ||||||||
| 640,000 | 8.625%, 3/1/2019 | 807,987 | ||||||
| Pacific Gas & Electric Company | ||||||||
| 1,301,000 | 5.625%, 11/30/2017 | 1,471,130 | ||||||
| PG&E Corporation | ||||||||
| 485,000 | 2.400%, 3/1/2019 | 489,375 | ||||||
| PPL Capital Funding, Inc. | ||||||||
| 1,625,000 | 1.900%, 6/1/2018 | 1,623,791 | ||||||
| 508,000 | 3.500%, 12/1/2022 | 516,296 | ||||||
| Sempra Energy | ||||||||
| 1,200,000 | 6.150%, 6/15/2018 | 1,392,830 | ||||||
| TransAlta Corporation | ||||||||
| 1,213,000 | 1.900%, 6/3/2017 | 1,217,746 | ||||||
| Williams Companies, Inc. | ||||||||
| 664,000 | 7.875%, 9/1/2021 | 824,381 | ||||||
| Williams Partners, LP | ||||||||
| 294,000 | 7.250%, 2/1/2017 | 336,024 | ||||||
|
| |||||||
| Total | 35,593,354 | |||||||
|
| |||||||
Total Long-Term Fixed Income (cost $1,841,877,166) | 1,865,922,639 | |||||||
|
| |||||||
| Shares | Common Stock (21.6%) | |||||||
| Consumer Discretionary (3.1%) | |||||||
| 13,350 | Aaron’s, Inc. | 475,794 | ||||||
| 17,600 | Abercrombie & Fitch Company | 761,200 | ||||||
| 6,400 | Alpine Electronics, Inc. | 90,260 | ||||||
| 65,292 | Amazon.com, Inc.k | 21,205,536 | ||||||
| 10,300 | Aoyama Trading Company, Ltd. | 282,068 | ||||||
| 33,500 | AutoZone, Inc.k | 17,964,040 | ||||||
| 38,600 | Barnes & Noble, Inc.g,k | 879,694 | ||||||
| 2,500 | Bayerische Motoren Werke AG | 239,356 | ||||||
| 105,600 | Best Buy Company, Inc. | 3,274,656 | ||||||
| 15,750 | Big Lots, Inc.k | 719,775 | ||||||
| 38,100 | Bloomin’ Brands, Inc.k | 854,583 | ||||||
| 23,970 | BorgWarner, Inc. | 1,562,604 | ||||||
| 2,600 | Bridgestone Corporation | 91,061 | ||||||
| 6,500 | Brinker International, Inc. | 316,225 | ||||||
| 106,050 | Cablevision Systems Corporationg | 1,871,782 | ||||||
The accompanying Notes to Financial Statements are an integral part of this schedule.
68
Table of Contents
Moderate Allocation Portfolio
Schedule of Investments as of June 30, 2014
(unaudited)
| Shares | Common Stock (21.6%) | Value | ||||||
| Consumer Discretionary (3.1%) - continued | |||||||
| 56,150 | CBS Corporationg | $ | 3,489,161 | |||||
| 71,520 | Cheesecake Factory, Inc. | 3,319,958 | ||||||
| 14,400 | Children’s Place Retail Stores, Inc. | 714,672 | ||||||
| 8,750 | Coinstar, Inc.k | 519,312 | ||||||
| 515,044 | Comcast Corporation | 27,647,562 | ||||||
| 2,300 | Continental AG | 531,785 | ||||||
| 3,100 | Crown Resorts, Ltd. | 44,186 | ||||||
| 500 | Daimler AG | 46,707 | ||||||
| 12,700 | Deckers Outdoor Corporationk | 1,096,391 | ||||||
| 153,408 | Delphi Automotive plc | 10,545,266 | ||||||
| 10,850 | DeVry Education Group, Inc. | 459,389 | ||||||
| 6,417 | Discovery Communications, Inc.k | 476,655 | ||||||
| 22,050 | DISH Network Corporationk | 1,435,014 | ||||||
| 50,180 | Dollar Tree, Inc.k | 2,732,803 | ||||||
| 11,690 | Dunkin’ Brands Group, Inc. | 535,519 | ||||||
| 16,500 | EDION Corporation | 114,543 | ||||||
| 79,867 | Esprit Holdings, Ltd. | 113,342 | ||||||
| 2,200 | Exedy Corporation | 65,479 | ||||||
| 2,826 | Faurecia | 106,636 | ||||||
| 1,000 | Flight Centre Travel Group, Ltd. | 41,904 | ||||||
| 100 | Forbo Holding AG | 106,619 | ||||||
| 134,450 | Ford Motor Company | 2,317,918 | ||||||
| 19,150 | G-III Apparel Group, Ltd.k | 1,563,789 | ||||||
| 23,920 | GNC Holdings, Inc. | 815,672 | ||||||
| 28,000 | Halfords Group plc | 226,502 | ||||||
| 10,700 | Harman International Industries, Inc. | 1,149,501 | ||||||
| 24,300 | Haseko Corporation | 195,532 | ||||||
| 170,500 | Home Depot, Inc. | 13,803,680 | ||||||
| 81,900 | Home Retail Group plc | 247,465 | ||||||
| 13,410 | HomeAway, Inc.k | 466,936 | ||||||
| 9,400 | Honda Motor Company, Ltd.g | 328,011 | ||||||
| 96,830 | Houghton Mifflin Harcourt Companyk | 1,855,263 | ||||||
| 16,450 | Iconix Brand Group, Inc.k | 706,363 | ||||||
| 87,392 | Ignite Restaurant Group, Inc.k | 1,272,428 | ||||||
| 19,300 | ITT Educational Services, Inc.g,k | 322,117 | ||||||
| 44,600 | ITV plc | 135,916 | ||||||
| 6,600 | Jack in the Box, Inc. | 394,944 | ||||||
| 16,200 | JB Hi-Fi, Ltd. | 280,110 | ||||||
| 8,600 | JM AB | 318,742 | ||||||
| 20,150 | Kohl’s Corporation | 1,061,502 | ||||||
| 200 | Kuoni Reisen Holding AG | 77,401 | ||||||
| 29,300 | Lamar Advertising Company | 1,552,900 | ||||||
| 242,965 | Las Vegas Sands Corporation | 18,518,792 | ||||||
| 128,000 | Li & Fung, Ltd. | 189,594 | ||||||
| 38,350 | Liberty Interactive Corporationk | 1,125,956 | ||||||
| 8,965 | Limited Brands, Inc. | 525,887 | ||||||
| 12,350 | Lions Gate Entertainment Corporationg | 352,963 | ||||||
| 63,550 | Live Nation Entertainment, Inc.k | 1,569,049 | ||||||
| 225,370 | Lowe’s Companies, Inc. | 10,815,506 | ||||||
| 94,000 | Luk Fook Holdings International, Ltd. | 275,647 | ||||||
| 60,250 | Macy’s, Inc. | 3,495,705 | ||||||
| 19,230 | Marriott International, Inc. | 1,232,643 | ||||||
| 15,100 | Marriott Vacations Worldwide Corporationk | 885,313 | ||||||
| 119,717 | MDC Partners, Inc. | 2,572,718 | ||||||
| 10,850 | Meredith Corporation | 524,706 | ||||||
| 800 | Michael Kors Holdings, Ltd.k | 70,920 | ||||||
| 13,350 | Multimedia Games Holding Company, Inc.k | 395,694 | ||||||
| 30,200 | Nautilus, Inc.k | 334,918 | ||||||
| 198,570 | News Corporation | 6,797,051 | ||||||
| 4,600 | Next plc | 509,232 | ||||||
| 226,400 | NIKE, Inc. | 17,557,320 | ||||||
| 29,366 | NutriSystem, Inc. | 502,452 | ||||||
| 14,900 | Omnicom Group, Inc. | 1,061,178 | ||||||
| 43,650 | Orbitz Worldwide, Inc.k | 388,485 | ||||||
| 6,173 | O’Reilly Automotive, Inc.k | 929,654 | ||||||
| 26,750 | Papa John’s International, Inc. | 1,133,932 | ||||||
| 9,000 | Persimmon plc | 196,016 | ||||||
| 25,502 | PetSmart, Inc.g | 1,525,020 | ||||||
| 16,100 | Peugeot SAk | 238,210 | ||||||
| 5,900 | Publicis Groupe SA | 500,063 | ||||||
| 6,100 | PVH Corporation | 711,260 | ||||||
| 18,650 | Restoration Hardware Holdings, Inc.k | 1,735,383 | ||||||
| 500 | Rinnai Corporation | 48,270 | ||||||
| 4,300 | Ross Stores, Inc. | 284,359 | ||||||
| 1,700 | RTL Group SA | 188,693 | ||||||
| 1,200 | SA D’Ieteren NV | 50,267 | ||||||
| 79,800 | Samsonite International SA | 263,052 | ||||||
| 37,200 | Scientific Games Corporationk | 413,664 | ||||||
| 12,050 | Scripps Networks Interactive, Inc. | 977,737 | ||||||
| 38,000 | Seiko Holdings Corporation | 154,399 | ||||||
| 6,700 | Sekisui House, Ltd. | 91,941 | ||||||
| 16,600 | SHOWA Corporation | 202,239 | ||||||
| 12,196 | Slater & Gordon, Ltd. | 59,400 | ||||||
| 57,550 | Smith & Wesson Holding Corporationg,k | 836,777 | ||||||
| 156,621 | Staples, Inc.g | 1,697,772 | ||||||
| 145,650 | Starbucks Corporation | 11,270,397 | ||||||
| 12,440 | Starwood Hotels & Resorts Worldwide, Inc. | 1,005,401 | ||||||
| 25,400 | Sumitomo Forestry Company, Ltd. | 310,125 | ||||||
| 3,600 | Suzuki Motor Corporation | 112,938 | ||||||
| 56,710 | Time Warner Cable, Inc. | 8,353,383 | ||||||
| 35,560 | Toll Brothers, Inc.k | 1,312,164 | ||||||
| 7,502 | Tractor Supply Company | 453,121 | ||||||
| 137,130 | Tuesday Morning Corporationk | 2,443,657 | ||||||
| 294,250 | Twenty-First Century Fox, Inc. | 10,342,887 | ||||||
| 13,280 | Under Armour, Inc.k | 790,027 | ||||||
| 200 | Valora Holding AG | 51,686 | ||||||
| 11,312 | VF Corporation | 712,656 | ||||||
| 600 | Volkswagen AG | 157,150 | ||||||
| 8,200 | WH Smith plc | 150,050 | ||||||
| 1,500 | Wolters Kluwer NV | 44,432 | ||||||
| 2,100 | WPP plc | 45,763 | ||||||
| 33,700 | Wyndham Worldwide Corporation | 2,551,764 | ||||||
| 70,800 | Wynn Macau, Ltd. | 277,300 | ||||||
| 3,650 | Wynn Resorts, Ltd. | 757,594 | ||||||
| 20,250 | Zumiez, Inc.g,k | 558,697 | ||||||
|
| |||||||
| Total | 257,465,258 | |||||||
|
| |||||||
| Consumer Staples (1.0%) | |||||||
| 1,100 | AarhusKarlshamn AB | 73,500 | ||||||
| 93,400 | Altria Group, Inc. | 3,917,196 | ||||||
| 12,957 | Andersons, Inc. | 668,322 | ||||||
| 86,300 | Anheuser-Busch InBev NV ADR | 9,919,322 | ||||||
| 44,635 | Annie’s, Inc.k | 1,509,556 | ||||||
| 77,400 | Archer-Daniels-Midland Company | 3,414,114 | ||||||
| 3,800 | Asahi Group Holdings, Ltd. | 119,331 | ||||||
| 15,400 | Britvic plc | 191,721 | ||||||
The accompanying Notes to Financial Statements are an integral part of this schedule.
69
Table of Contents
Moderate Allocation Portfolio
Schedule of Investments as of June 30, 2014
(unaudited)
| Shares | Common Stock (21.6%) | Value | ||||||
| Consumer Staples (1.0%) - continued | |||||||
| 48,200 | Bunge, Ltd. | $ | 3,645,848 | |||||
| 1,300 | Carrefour SA | 47,936 | ||||||
| 2,800 | Casino Guichard Perrachon SA | 371,225 | ||||||
| 24,950 | Coca-Cola Enterprises, Inc. | 1,192,111 | ||||||
| 10,100 | Colgate-Palmolive Company | 688,618 | ||||||
| 216,860 | CVS Caremark Corporation | 16,344,738 | ||||||
| 7,500 | Green Mountain Coffee Roasters, Inc. | 934,575 | ||||||
| 22,360 | Greencore Group plc | 101,636 | ||||||
| 10,700 | Hain Celestial Group, Inc.k | 949,518 | ||||||
| 1,100 | Henkel AG & Company KGaA | 110,622 | ||||||
| 1,100 | Imperial Tobacco Group plc | 49,487 | ||||||
| 58,050 | Ingredion, Inc. | 4,356,072 | ||||||
| 9,650 | J.M. Smucker Company | 1,028,401 | ||||||
| 3,500 | Kerry Group plc | 261,530 | ||||||
| 5,400 | Kesko Oyj | 213,386 | ||||||
| 35,970 | Kimberly-Clark Corporation | 4,000,583 | ||||||
| 5,176 | Koninklijke Ahold NV | 97,056 | ||||||
| 2,400 | KOSE Corporation | 91,727 | ||||||
| 36,117 | Kraft Foods Group, Inc. | 2,165,214 | ||||||
| 25,600 | Kroger Company | 1,265,408 | ||||||
| 3,200 | Matsumotokiyoshi Holdings Company, Ltd. | 110,761 | ||||||
| 157,362 | Mondelez International, Inc. | 5,918,385 | ||||||
| 13,120 | Monster Beverage Corporationk | 931,914 | ||||||
| 2,600 | Nestle SA | 201,466 | ||||||
| 38,600 | Parmalat SPA | 132,032 | ||||||
| 40,316 | Philip Morris International, Inc. | 3,399,042 | ||||||
| 41,250 | Pilgrim’s Pride Corporationk | 1,128,600 | ||||||
| 23,650 | Procter & Gamble Company | 1,858,653 | ||||||
| 1,700 | Rallye SA | 92,751 | ||||||
| 8,300 | Reckitt Benckiser Group plc | 723,716 | ||||||
| 244,750 | Rite Aid Corporationk | 1,754,857 | ||||||
| 6,786 | SalMar ASA | 118,419 | ||||||
| 5,850 | Sanderson Farms, Inc.g | 568,620 | ||||||
| 2,600 | Suedzucker AG | 52,501 | ||||||
| 5,540 | United Natural Foods, Inc.k | 360,654 | ||||||
| 21,100 | Wal-Mart Stores, Inc. | 1,583,977 | ||||||
| 108,430 | WhiteWave Foods Companyk | 3,509,879 | ||||||
| 3,636 | Whole Foods Market, Inc. | 140,459 | ||||||
| 117,000 | Wilmar International, Ltd. | 299,503 | ||||||
|
| |||||||
| Total | 80,614,942 | |||||||
|
| |||||||
| Energy (3.0%) | |||||||
| 208,320 | Alpha Natural Resources, Inc.g,k | 772,867 | ||||||
| 3,730 | Atwood Oceanics, Inc.k | 195,750 | ||||||
| 13,100 | Baker Hughes, Inc. | 975,295 | ||||||
| 31,400 | Basic Energy Services, Inc.k | 917,508 | ||||||
| 54,500 | BP plc | 479,920 | ||||||
| 4,009 | Cabot Oil & Gas Corporation | 136,867 | ||||||
| 330,070 | Cameron International Corporationk | 22,349,040 | ||||||
| 3,300 | CAT Oil AG | 84,581 | ||||||
| 82,060 | Chevron Corporation | 10,712,933 | ||||||
| 1,770 | Cimarex Energy Company | 253,924 | ||||||
| 107,700 | Cobalt International Energy, Inc.k | 1,976,295 | ||||||
| 28,935 | Concho Resources, Inc.k | 4,181,108 | ||||||
| 7,250 | ConocoPhillips | 621,542 | ||||||
| 300 | Delek Group, Ltd. | 124,095 | ||||||
| 10,600 | Denbury Resources, Inc. | 195,676 | ||||||
| 5,450 | Diamondback Energy, Inc.k | 483,960 | ||||||
| 35,400 | Dril-Quip, Inc.k | 3,867,096 | ||||||
| 1,350 | Energen Corporation | 119,988 | ||||||
| 8,100 | Eni SPA | 221,532 | ||||||
| 7,480 | Ensco plc | 415,664 | ||||||
| 180,574 | EOG Resources, Inc. | 21,101,878 | ||||||
| 103,229 | EQT Corporation | 11,035,180 | ||||||
| 6,900 | ERG SPA | 106,481 | ||||||
| 29,650 | Exterran Holdings, Inc. | 1,333,954 | ||||||
| 115,950 | Exxon Mobil Corporation | 11,673,846 | ||||||
| 600 | Frank’s International NV | 14,760 | ||||||
| 22,150 | Green Plains, Inc. | 728,071 | ||||||
| 7,050 | Gulfmark Offshore, Inc. | 318,519 | ||||||
| 1,550 | Gulfport Energy Corporationk | 97,340 | ||||||
| 2,520 | Helmerich & Payne, Inc. | 292,597 | ||||||
| 7,000 | Hess Corporation | 692,230 | ||||||
| 9,480 | HollyFrontier Corporation | 414,181 | ||||||
| 30,800 | Kosmos Energy, Ltd.k | 345,884 | ||||||
| 679,371 | Marathon Oil Corporation | 27,120,490 | ||||||
| 51,790 | Market Vectors Oil Service ETF | 2,991,390 | ||||||
| 86,600 | Nabors Industries, Ltd. | 2,543,442 | ||||||
| 59,470 | National Oilwell Varco, Inc. | 4,897,354 | ||||||
| 15,000 | Neste Oil Oyj | 292,688 | ||||||
| 4,190 | Noble Corporation | 140,616 | ||||||
| 2,830 | Noble Energy, Inc. | 219,212 | ||||||
| 130,750 | Oasis Petroleum, Inc.k | 7,307,618 | ||||||
| 24,800 | Occidental Petroleum Corporation | 2,545,224 | ||||||
| 2,670 | Oceaneering International, Inc. | 208,607 | ||||||
| 2,400 | Oil States International, Inc.k | 153,816 | ||||||
| 3,500 | Origin Energy, Ltd. | 48,243 | ||||||
| 20,600 | Patterson-UTI Energy, Inc. | 719,764 | ||||||
| 99,710 | Peabody Energy Corporation | 1,630,258 | ||||||
| 86,000 | Petroleo Brasileiro SA ADR | 1,258,180 | ||||||
| 5,350 | Phillips 66 | 430,301 | ||||||
| 3,730 | Pioneer Natural Resources Company | 857,191 | ||||||
| 10,750 | QEP Resources, Inc. | 370,875 | ||||||
| 1,840 | Range Resources Corporation | 159,988 | ||||||
| 66,430 | Rex Energy Corporationk | 1,176,475 | ||||||
| 23,770 | Rosetta Resources, Inc.k | 1,303,785 | ||||||
| 3,940 | Rowan Companies plc | 125,804 | ||||||
| 29,820 | Royal Dutch Shell plc | 1,231,271 | ||||||
| 209 | Royal Dutch Shell plc, Class A | 8,636 | ||||||
| 20,000 | Royal Dutch Shell plc, Class B | 869,198 | ||||||
| 1,800 | Saipem SPAk | 48,534 | ||||||
| 48,250 | SandRidge Energy, Inc.g,k | 344,988 | ||||||
| 265,050 | Schlumberger, Ltd. | 31,262,647 | ||||||
| 7,100 | Showa Shell Sekiyu KK | 80,706 | ||||||
| 60,640 | SM Energy Company | 5,099,824 | ||||||
| 135,360 | Southwestern Energy Companyk | 6,157,526 | ||||||
| 29,350 | Superior Energy Services, Inc. | 1,060,709 | ||||||
| 4,500 | Total SA | 325,574 | ||||||
| 199,900 | Total SA ADRg | 14,432,780 | ||||||
| 85,365 | Trinidad Drilling, Ltd. | 968,811 | ||||||
| 6,750 | Unit Corporationk | 464,603 | ||||||
| 1,231,216 | Weatherford International, Ltd.k | 28,317,968 | ||||||
| 12,660 | Whiting Petroleum Corporationk | 1,015,965 | ||||||
| 3,100 | Woodside Petroleum, Ltd. | 120,192 | ||||||
|
| |||||||
| Total | 245,551,815 | |||||||
|
| |||||||
| Financials (3.8%) | |||||||
| 49,950 | ACE, Ltd. | 5,179,815 | ||||||
| 19,965 | Affiliated Managers Group, Inc.k | 4,100,811 | ||||||
| 3,300 | Allianz SE | 550,816 | ||||||
| 53,960 | Allied World Assurance Company Holdings AG | 2,051,559 | ||||||
| 71,500 | Allstate Corporation | 4,198,480 | ||||||
| 20,400 | American Assets Trust, Inc. | 704,820 | ||||||
The accompanying Notes to Financial Statements are an integral part of this schedule.
70
Table of Contents
Moderate Allocation Portfolio
Schedule of Investments as of June 30, 2014
(unaudited)
| Shares | Common Stock (21.6%) | Value | ||||||
| Financials (3.8%) - continued | |||||||
| 71,250 | American International Group, Inc. | $ | 3,888,825 | |||||
| 8,960 | Ameriprise Financial, Inc. | 1,075,200 | ||||||
| 6,100 | Amlin plc | 48,825 | ||||||
| 11,300 | AmTrust Financial Services, Inc.g | 472,453 | ||||||
| 4,427 | Argo Group International Holdings, Ltd. | 226,264 | ||||||
| 22,900 | Assicurazioni Generali SPA | 501,522 | ||||||
| 25,700 | Aviva plc | 224,226 | ||||||
| 3,900 | AXA SA | 93,184 | ||||||
| 19,400 | Bank Leumi Le-Israel BMk | 75,613 | ||||||
| 676,220 | Bank of America Corporation | 10,393,501 | ||||||
| 1,300 | Bank of Georgia Holdings plc | 52,278 | ||||||
| 14,450 | Banner Corporation | 572,654 | ||||||
| 67,330 | BBCN Bancorp, Inc. | 1,073,913 | ||||||
| 69,450 | Berkshire Hathaway, Inc.k | 8,789,592 | ||||||
| 120,500 | Blackstone Group, LPk | 4,029,520 | ||||||
| 15,359 | Boston Properties, Inc. | 1,815,127 | ||||||
| 22,350 | Camden Property Trust | 1,590,202 | ||||||
| 5,400 | Catlin Group, Ltd. | 49,416 | ||||||
| 10,850 | CBRE Group, Inc.k | 347,634 | ||||||
| 36,500 | Challenger, Ltd. | 256,036 | ||||||
| 407,307 | Citigroup, Inc. | 19,184,160 | ||||||
| 12,539 | CNA Financial Corporation | 506,826 | ||||||
| 145,170 | CNO Financial Group, Inc. | 2,584,026 | ||||||
| 3,900 | CNP Assurances | 80,944 | ||||||
| 107,200 | Comerica, Inc. | 5,377,152 | ||||||
| 11,500 | Commonwealth Bank of Australia | 877,085 | ||||||
| 17,047 | Credit Agricole SA | 240,684 | ||||||
| 23,000 | Crown Castle International Corporation | 1,707,980 | ||||||
| 4,300 | Daito Trust Construction Company, Ltd. | 505,633 | ||||||
| 37,000 | Daiwa Securities Group, Inc. | 320,578 | ||||||
| 35,300 | DDR Corporation | 622,339 | ||||||
| 90,338 | Deutsche Bank AGg | 3,178,091 | ||||||
| 8,700 | Digital Realty Trust, Inc. | 507,384 | ||||||
| 50,219 | Discover Financial Services | 3,112,574 | ||||||
| 28,200 | Duke Realty Corporation | 512,112 | ||||||
| 63,110 | Education Realty Trust, Inc. | 677,801 | ||||||
| 28,264 | Equity Residential | 1,780,632 | ||||||
| 6,600 | EXOR SPA | 270,749 | ||||||
| 12,460 | Extra Space Storage, Inc. | 663,495 | ||||||
| 133,250 | Fifth Third Bancorp | 2,844,887 | ||||||
| 61,950 | First Horizon National Corporation | 734,727 | ||||||
| 137,950 | First Niagara Financial Group, Inc. | 1,205,683 | ||||||
| 54,830 | First Republic Bank | 3,015,102 | ||||||
| 17,500 | FlexiGroup, Ltd. | 52,286 | ||||||
| 16,144 | Friends Life Group, Ltd. | 87,052 | ||||||
| 41,900 | Fulton Financial Corporation | 519,141 | ||||||
| 19,162 | Gaming and Leisure Properties, Inc. | 650,933 | ||||||
| 13,550 | General Growth Properties, Inc. | 319,238 | ||||||
| 636,325 | Genworth Financial, Inc.k | 11,072,055 | ||||||
| 1,300 | Grupo Catalana Occidente SA | 47,189 | ||||||
| 73,160 | Hanmi Financial Corporation | 1,542,213 | ||||||
| 500 | Hannover Rueckversicherung SE | 45,026 | ||||||
| 35,263 | HCC Insurance Holdings, Inc. | 1,725,771 | ||||||
| 17,099 | Health Care REIT, Inc. | 1,071,594 | ||||||
| 8,544 | Hiscox, Ltd. | 103,378 | ||||||
| 73,196 | Host Hotels & Resorts, Inc. | 1,611,044 | ||||||
| 452,450 | Huntington Bancshares, Inc. | 4,316,373 | ||||||
| 2,200 | Intercontinental Exchange, Inc. | 415,580 | ||||||
| 38,800 | Intermediate Capital Group plc | 258,979 | ||||||
| 181,780 | Invesco, Ltd. | 6,862,195 | ||||||
| 123,000 | iShares Barclays 1-3 Year Credit Bond Fund | 12,998,640 | ||||||
| 3,000 | iShares MSCI EAFE Index Fund | 205,110 | ||||||
| 21,670 | iShares Russell 2000 Index Fund | 2,574,613 | ||||||
| 35,500 | Israel Discount Bank, Ltd.k | 60,100 | ||||||
| 176,478 | J.P. Morgan Chase & Company | 10,168,662 | ||||||
| 64,700 | KeyCorp | 927,151 | ||||||
| 47,501 | Kimco Realty Corporation | 1,091,573 | ||||||
| 24,557 | Lazard, Ltd. | 1,266,159 | ||||||
| 7,700 | M&T Bank Corporationg | 955,185 | ||||||
| 12,900 | Macerich Company | 861,075 | ||||||
| 92,050 | MBIA, Inc.k | 1,016,232 | ||||||
| 226,620 | MetLife, Inc. | 12,591,007 | ||||||
| 56,800 | Mizuho Financial Group, Inc. | 116,753 | ||||||
| 19,400 | Montpelier Re Holdings, Inc. | 619,830 | ||||||
| 247,400 | Morgan Stanley | 7,998,442 | ||||||
| 1,200 | Muenchener Rueckversicherungs- Gesellschaft AG | 265,738 | ||||||
| 33,200 | NASDAQ OMX Group, Inc. | 1,282,184 | ||||||
| 1,500 | National Australia Bank, Ltd. | 46,363 | ||||||
| 16,800 | Natixis | 107,821 | ||||||
| 33,650 | Navient Corporation | 595,942 | ||||||
| 8,900 | NKSJ Holdings, Inc. | 239,812 | ||||||
| 17,950 | Northern Trust Corporation | 1,152,569 | ||||||
| 16,100 | Old Mutual plc | 54,409 | ||||||
| 19,300 | Old Republic International Corporation | 319,222 | ||||||
| 19,000 | Oversea-Chinese Banking Corporation, Ltd. | 145,732 | ||||||
| 32,380 | PacWest Bancorp | 1,397,845 | ||||||
| 10,100 | Paragon Group of Companies plc | 60,798 | ||||||
| 33,610 | Parkway Properties, Inc. | 694,047 | ||||||
| 50,960 | Pebblebrook Hotel Trust | 1,883,482 | ||||||
| 13,300 | Phoenix Group Holdings | 147,723 | ||||||
| 11,450 | Piedmont Office Realty Trust, Inc. | 216,863 | ||||||
| 22,500 | Popular, Inc.k | 769,050 | ||||||
| 11,900 | Portfolio Recovery Associates, Inc.k | 708,407 | ||||||
| 19,300 | Progressive Corporation | 489,448 | ||||||
| 25,800 | Prologis, Inc. | 1,060,122 | ||||||
| 11,550 | Protective Life Corporation | 800,761 | ||||||
| 41,600 | Prudential Financial, Inc. | 3,692,832 | ||||||
| 5,892 | Public Storage, Inc. | 1,009,594 | ||||||
| 70,000 | Radian Group, Inc. | 1,036,700 | ||||||
| 9,800 | Realty Income Corporation | 435,316 | ||||||
| 36,200 | RLJ Lodging Trust | 1,045,818 | ||||||
| 11,750 | Ryman Hospitality Properties | 565,762 | ||||||
| 2,400 | Sampo Oyj | 121,326 | ||||||
| 1,000 | Schweizerische National- Versicherungs-Gesellschaft AG | 68,787 | ||||||
| 1,500 | SCOR SE | 51,649 | ||||||
| 16,729 | Simon Property Group, Inc. | 2,781,698 | ||||||
| 325,000 | SPDR Euro Stoxx 50 ETF | 14,062,750 | ||||||
| 25,200 | SPDR Gold Trustk | 3,226,608 | ||||||
| 131,300 | SPDR S&P 500 ETF Trust | 25,698,036 | ||||||
| 28,110 | State Street Corporation | 1,890,679 | ||||||
| 24,646 | Storebrand ASAk | 138,657 | ||||||
| 29,750 | Strategic Hotels & Resorts, Inc.k | 348,373 | ||||||
| 53,650 | SVB Financial Groupk | 6,256,663 | ||||||
| 100 | Swiss Life Holding AGk | 23,704 | ||||||
| 51,390 | Synovus Financial Corporation | 1,252,888 | ||||||
| 9,160 | T. Rowe Price Group, Inc. | 773,196 | ||||||
The accompanying Notes to Financial Statements are an integral part of this schedule.
71
Table of Contents
Moderate Allocation Portfolio
Schedule of Investments as of June 30, 2014
(unaudited)
| Shares | Common Stock (21.6%) | Value | ||||||
| Financials (3.8%) - continued | |||||||
| 18,100 | Tanger Factory Outlet Centers, Inc. | $ | 632,957 | |||||
| 19,700 | TD Ameritrade Holding Corporation | 617,595 | ||||||
| 52,580 | Terreno Realty Corporation | 1,016,371 | ||||||
| 33,160 | Texas Capital Bancshares, Inc.k | 1,788,982 | ||||||
| 20,700 | UnipolSai Assicurazioni SPA | 66,497 | ||||||
| 28,819 | United Overseas Bank, Ltd. | 521,126 | ||||||
| 152,425 | Vanguard Short-Term Corporate Bond ETF | 12,250,397 | ||||||
| 88,850 | Visa, Inc. | 18,721,584 | ||||||
| 14,346 | Vornado Realty Trust | 1,531,149 | ||||||
| 22,050 | W.R. Berkley Corporation | 1,021,135 | ||||||
| 8,364 | Washington Prime Group, Inc.k | 156,741 | ||||||
| 85,698 | Wells Fargo & Company | 4,504,287 | ||||||
| 51,340 | Western Alliance Bancorpk | 1,221,892 | ||||||
| 22,500 | Westpac Banking Corporation | 719,689 | ||||||
| 27,350 | Weyerhaeuser Company | 905,011 | ||||||
| 58,090 | Zions Bancorporation | 1,711,912 | ||||||
| 2,900 | Zurich Insurance Group AGk | 873,440 | ||||||
|
| |||||||
| Total | 312,203,648 | |||||||
|
| |||||||
| Health Care (2.8%) | |||||||
| 14,350 | Abbott Laboratories | 586,915 | ||||||
| 45,100 | Acorda Therapeutics, Inc.k | 1,520,321 | ||||||
| 4,590 | Actavis, Inc.k | 1,023,800 | ||||||
| 3,800 | Actelion, Ltd. | 480,965 | ||||||
| 57,050 | Aetna, Inc. | 4,625,614 | ||||||
| 107,950 | Affymetrix, Inc.k | 961,834 | ||||||
| 58,230 | Akorn, Inc.k | 1,936,148 | ||||||
| 7,003 | Albany Molecular Research, Inc.k | 140,900 | ||||||
| 19,850 | Align Technology, Inc.k | 1,112,394 | ||||||
| 67,850 | Allscripts Healthcare Solutions, Inc.k | 1,088,993 | ||||||
| 10,578 | AmerisourceBergen Corporation | 768,597 | ||||||
| 16,000 | Amgen, Inc. | 1,893,920 | ||||||
| 29,000 | AMN Healthcare Services, Inc.k | 356,700 | ||||||
| 115,700 | Baxter International, Inc. | 8,365,110 | ||||||
| 6,600 | Biogen Idec, Inc.k | 2,081,046 | ||||||
| 13,990 | BioMarin Pharmaceutical, Inc.k | 870,318 | ||||||
| 127,200 | BioScrip, Inc.g,k | 1,060,848 | ||||||
| 345,850 | Boston Scientific Corporationk | 4,416,504 | ||||||
| 39,750 | Bruker Corporationk | 964,732 | ||||||
| 7,201 | C.R. Bard, Inc. | 1,029,815 | ||||||
| 14,850 | Capital Senior Living Corporationk | 354,024 | ||||||
| 47,850 | Cardinal Health, Inc. | 3,280,596 | ||||||
| 5,822 | Catamaran Corporationk | 257,100 | ||||||
| 36,150 | Centene Corporationk | 2,733,301 | ||||||
| 273,530 | Cerner Corporationk | 14,108,677 | ||||||
| 9,400 | Charles River Laboratories International, Inc.k | 503,088 | ||||||
| 3,650 | Chemed Corporationg | 342,078 | ||||||
| 16,600 | Community Health Systems, Inc.k | 753,142 | ||||||
| 3,500 | Cooper Companies, Inc. | 474,355 | ||||||
| 5,700 | Covance, Inc.k | 487,806 | ||||||
| 292,060 | Covidien plc | 26,337,971 | ||||||
| 3,100 | Cubist Pharmaceuticals, Inc.k | 216,442 | ||||||
| 16,900 | DaVita HealthCare Partners, Inc.k | 1,222,208 | ||||||
| 29,500 | DENTSPLY International, Inc. | 1,396,825 | ||||||
| 12,320 | Envision Healthcare Holdings, Inc.k | 442,411 | ||||||
| 72,150 | ExamWorks Group, Inc.g,k | 2,289,320 | ||||||
| 54,600 | Express Scripts Holding Companyk | 3,785,418 | ||||||
| 438,850 | Gilead Sciences, Inc.k | 36,385,053 | ||||||
| 33,162 | GlaxoSmithKline plc | 882,940 | ||||||
| 13,400 | Globus Medical, Inc.k | 320,528 | ||||||
| 6,900 | Greatbatch, Inc.k | 338,514 | ||||||
| 800 | Grifols SA | 43,712 | ||||||
| 5,900 | H. Lundbeck AS | 145,201 | ||||||
| 30,500 | HCA Holdings, Inc.k | 1,719,590 | ||||||
| 5,400 | Hikma Pharmaceuticals plc | 154,989 | ||||||
| 63,200 | Hologic, Inc.k | 1,602,120 | ||||||
| 23,250 | Humana, Inc. | 2,969,490 | ||||||
| 5,950 | ICON plck | 280,305 | ||||||
| 14,400 | Illumina, Inc.k | 2,570,976 | ||||||
| 15,200 | Impax Laboratories, Inc.k | 455,848 | ||||||
| 250,853 | Johnson & Johnson | 26,244,241 | ||||||
| 2,000 | Kaken Pharmaceutical Company, Ltd. | 42,321 | ||||||
| 8,400 | LifePoint Hospitals, Inc.k | 521,640 | ||||||
| 26,450 | McKesson Corporation | 4,925,254 | ||||||
| 36,650 | Medicines Companyk | 1,065,049 | ||||||
| 258,620 | Merck & Company, Inc. | 14,961,167 | ||||||
| 3,911 | Mettler-Toledo International, Inc.k | 990,187 | ||||||
| 41,650 | Molina Healthcare, Inc.k | 1,858,839 | ||||||
| 9,800 | Myriad Genetics, Inc.g,k | 381,416 | ||||||
| 44,900 | Neurocrine Biosciences, Inc.k | 666,316 | ||||||
| 11,200 | Novartis AG | 1,014,254 | ||||||
| 64,620 | NuVasive, Inc.k | 2,298,533 | ||||||
| 45,100 | PAREXEL International Corporationk | 2,383,084 | ||||||
| 31,950 | PerkinElmer, Inc. | 1,496,538 | ||||||
| 9,880 | Perrigo Company plc | 1,440,109 | ||||||
| 184,500 | Pfizer, Inc. | 5,475,960 | ||||||
| 17,250 | PharMerica Corporationk | 493,178 | ||||||
| 9,450 | Prestige Brands Holdings, Inc.k | 320,261 | ||||||
| 8,750 | Providence Service Corporationk | 320,163 | ||||||
| 14,550 | Qiagen NVg,k | 355,748 | ||||||
| 13,950 | Quest Diagnostics, Inc.g | 818,725 | ||||||
| 1,000 | Roche Holding AG | 297,957 | ||||||
| 12,250 | Seattle Genetics, Inc.k | 468,563 | ||||||
| 21,300 | Select Medical Holdings Corporation | 332,280 | ||||||
| 5,000 | Shire plc | 392,213 | ||||||
| 42,150 | Spectrum Pharmaceuticals, Inc.g,k | 342,680 | ||||||
| 12,250 | St. Jude Medical, Inc. | 848,312 | ||||||
| 14,150 | Team Health Holdings, Inc.k | 706,651 | ||||||
| 900 | Teva Pharmaceutical Industries, Ltd. | 47,280 | ||||||
| 3,250 | Thermo Fisher Scientific, Inc. | 383,500 | ||||||
| 120,626 | UnitedHealth Group, Inc. | 9,861,175 | ||||||
| 28,800 | Universal Health Services, Inc. | 2,757,888 | ||||||
| 1,500 | Vertex Pharmaceuticals, Inc.k | 142,020 | ||||||
| 21,650 | Volcano Corporationk | 381,257 | ||||||
| 7,600 | Waters Corporationk | 793,744 | ||||||
| 11,050 | WellPoint, Inc. | 1,189,090 | ||||||
| 2,200 | Zeria Pharmaceutical Company, Ltd. | 52,505 | ||||||
| 17,950 | Zoetis, Inc. | 579,247 | ||||||
|
| |||||||
| Total | 229,788,847 | |||||||
|
| |||||||
| Industrials (2.4%) | |||||||
| 12,250 | 3M Company | 1,754,690 | ||||||
| 13,300 | AAR Corporation | 366,548 | ||||||
| 1,500 | Actividades de Construccion y Servicios SA | 68,655 | ||||||
| 9,710 | Acuity Brands, Inc. | 1,342,408 | ||||||
| 900 | Adecco SA | 74,065 | ||||||
The accompanying Notes to Financial Statements are an integral part of this schedule.
72
Table of Contents
Moderate Allocation Portfolio
Schedule of Investments as of June 30, 2014
(unaudited)
| Shares | Common Stock (21.6%) | Value | ||||||
| Industrials (2.4%) - continued | |||||||
| 42,050 | ADT Corporationg | $ | 1,469,227 | |||||
| 20,100 | Aecom Technology Corporationk | 647,220 | ||||||
| 39,900 | AGCO Corporation | 2,243,178 | ||||||
| 2,800 | Aica Kogyo Company, Ltd. | 59,840 | ||||||
| 37,939 | Air New Zealand, Ltd. | 69,079 | ||||||
| 13,683 | Allegion plc | 775,552 | ||||||
| 24,574 | AMETEK, Inc. | 1,284,729 | ||||||
| 29,990 | Apogee Enterprises, Inc. | 1,045,451 | ||||||
| 5,410 | Arcadis NV | 186,437 | ||||||
| 900 | Assa Abloy AB | 45,779 | ||||||
| 10,755 | B/E Aerospace, Inc.k | 994,730 | ||||||
| 6,900 | BAE Systems plc | 51,106 | ||||||
| 16,900 | Berendsen plc | 283,041 | ||||||
| 9,000 | Bodycote plc | 105,892 | ||||||
| 130,200 | Boeing Company | 16,565,346 | ||||||
| 22,978 | Briggs & Stratton Corporationg | 470,130 | ||||||
| 400 | Bucher Industries AG | 137,257 | ||||||
| 7,900 | Cardno, Ltd. | 47,057 | ||||||
| 9,100 | Caterpillar, Inc. | 988,897 | ||||||
| 33,500 | CLARCOR, Inc. | 2,071,975 | ||||||
| 10,750 | Colfax Corporationk | 801,305 | ||||||
| 27,550 | Covanta Holding Corporation | 567,806 | ||||||
| 269,197 | CSX Corporation | 8,293,960 | ||||||
| 13,500 | Daifuku Company, Ltd. | 189,340 | ||||||
| 529,800 | Delta Air Lines, Inc. | 20,513,856 | ||||||
| 9,200 | Deutsche Lufthansa AG | 197,497 | ||||||
| 1,800 | DKSH Holding AG | 136,758 | ||||||
| 12,000 | Downer EDI, Ltd. | 51,213 | ||||||
| 1,500 | Duerr AG | 132,804 | ||||||
| 3,400 | Elbit Systems, Ltd. | 209,154 | ||||||
| 71,281 | EMCOR Group, Inc. | 3,174,143 | ||||||
| 14,100 | Esterline Technologies Corporationk | 1,623,192 | ||||||
| 52,650 | Exelis, Inc. | 893,997 | ||||||
| 9,550 | Fastenal Companyg | 472,629 | ||||||
| 22,568 | Flowserve Corporation | 1,677,931 | ||||||
| 233,700 | Fluor Corporation | 17,971,530 | ||||||
| 17,800 | Fortune Brands Home and Security, Inc. | 710,754 | ||||||
| 31,620 | GATX Corporation | 2,116,643 | ||||||
| 200 | Georg Fischer AGk | 143,147 | ||||||
| 2,000 | Go-Ahead Group plc | 81,043 | ||||||
| 9,740 | Graco, Inc. | 760,499 | ||||||
| 33,810 | Granite Construction, Inc. | 1,216,484 | ||||||
| 27,000 | Hanwa Company, Ltd. | 116,947 | ||||||
| 6,800 | Hino Motors, Ltd. | 93,815 | ||||||
| 72,200 | HNI Corporation | 2,823,742 | ||||||
| 69,572 | Honeywell International, Inc. | 6,466,717 | ||||||
| 2,500 | Hoshizaki Electric Company, Ltd. | 124,783 | ||||||
| 18,100 | Huntington Ingalls Industries, Inc. | 1,712,079 | ||||||
| 1,400 | Implenia AG | 94,238 | ||||||
| 113,500 | Ingersoll-Rand plc | 7,094,885 | ||||||
| 137,658 | Interface, Inc. | 2,593,477 | ||||||
| 10,100 | Intrum Justitia AB | 301,253 | ||||||
| 23,300 | ITOCHU Corporation | 299,120 | ||||||
| 69,070 | Jacobs Engineering Group, Inc.k | 3,680,050 | ||||||
| 400 | Jardine Matheson Holdings, Ltd. | 23,738 | ||||||
| 6,630 | JB Hunt Transport Services, Inc. | 489,161 | ||||||
| 9,650 | Joy Global, Inc.g | 594,247 | ||||||
| 14,000 | Kajima Corporation | 61,926 | ||||||
| 2,100 | Kanamoto Company, Ltd. | 83,745 | ||||||
| 9,000 | Kandenko Company, Ltd. | 52,336 | ||||||
| 25,600 | KAR Auction Services, Inc. | 815,872 | ||||||
| 4,700 | Keller Group plc | 74,019 | ||||||
| 8,000 | Kinden Corporation | 77,847 | ||||||
| 6,100 | Komatsu, Ltd. | 141,601 | ||||||
| 1,100 | KONE Oyj | 45,866 | ||||||
| 74,920 | Korn/Ferry Internationalk | 2,200,400 | ||||||
| 53,900 | Landstar System, Inc. | 3,449,600 | ||||||
| 7,600 | Legrand SA | 465,023 | ||||||
| 4,600 | Leighton Holdings, Ltd. | 85,411 | ||||||
| 10,450 | Lockheed Martin Corporation | 1,679,629 | ||||||
| 36,042 | Manitowoc Company, Inc. | 1,184,340 | ||||||
| 9,000 | Manpower, Inc. | 763,650 | ||||||
| 33,800 | Meritor, Inc.k | 440,752 | ||||||
| 9,300 | Mineral Resources, Ltd. | 84,175 | ||||||
| 24,700 | Mitie Group plc | 134,726 | ||||||
| 38,000 | Mitsui Engineering & Shipbuilding Company, Ltd. | 85,341 | ||||||
| 6,500 | Monadelphous Group, Ltd. | 96,251 | ||||||
| 8,000 | NICHIAS Corporation | 55,152 | ||||||
| 15,300 | Nielsen Holdings NV | 740,673 | ||||||
| 5,100 | Nitto Kogyo Corporation | 112,272 | ||||||
| 19,576 | Northgate plc | 175,772 | ||||||
| 14,325 | NOW, Inc.k | 518,708 | ||||||
| 38,000 | NTN Corporation | 166,226 | ||||||
| 15,700 | Old Dominion Freight Line, Inc.k | 999,776 | ||||||
| 74,508 | Oshkosh Corporation | 4,137,429 | ||||||
| 2,479 | Osterreichische Post AG | 123,135 | ||||||
| 9,581 | Parker Hannifin Corporation | 1,204,619 | ||||||
| 69,792 | Pentair, Ltd. | 5,033,399 | ||||||
| 51,860 | Quanta Services, Inc.k | 1,793,319 | ||||||
| 5,724 | Randstad Holding NV | 310,293 | ||||||
| 58,710 | Ritchie Brothers Auctioneers, Inc.g | 1,447,202 | ||||||
| 25,100 | Robert Half International, Inc. | 1,198,274 | ||||||
| 7,282 | Roper Industries, Inc. | 1,063,245 | ||||||
| 4,100 | Safran SA | 268,406 | ||||||
| 6,600 | Seaspan Corporationg | 154,506 | ||||||
| 4,000 | Securitas AB | 47,429 | ||||||
| 8,000 | Seino Holdings Company, Ltd. | 90,861 | ||||||
| 8,500 | Seven Group Holdings, Ltd. | 59,417 | ||||||
| 6,000 | ShinMaywa Industries, Ltd. | 52,986 | ||||||
| 6,100 | Siemens AG | 805,408 | ||||||
| 279,300 | Southwest Airlines Company | 7,501,998 | ||||||
| 10,000 | Spirit Aerosystems Holdings, Inc.k | 337,000 | ||||||
| 17,950 | Spirit Airlines, Inc.k | 1,135,158 | ||||||
| 12,275 | Stericycle, Inc.k | 1,453,605 | ||||||
| 3,300 | Teleperformance SA | 202,164 | ||||||
| 32,930 | Tennant Company | 2,513,218 | ||||||
| 25,000 | Toppan Printing Company, Ltd. | 193,307 | ||||||
| 4,000 | TOTO, Ltd. | 53,944 | ||||||
| 73,100 | Transpacific Industries Group, Ltd.k | 69,950 | ||||||
| 1,700 | Travis Perkins plc | 47,609 | ||||||
| 198,200 | Union Pacific Corporation | 19,770,450 | ||||||
| 15,390 | United Rentals, Inc.k | 1,611,795 | ||||||
| 12,896 | United Stationers, Inc. | 534,797 | ||||||
| 7,250 | United Technologies Corporation | 837,012 | ||||||
| 27,200 | Wabash National Corporationk | 387,600 | ||||||
| 8,000 | WABCO Holdings, Inc.k | 854,560 | ||||||
| 3,750 | WESCO International, Inc.k | 323,925 | ||||||
| 1,600 | Wolseley plc | 87,649 | ||||||
| 2,100 | WS Atkins plc | 47,369 | ||||||
|
| |||||||
| Total | 192,136,353 | |||||||
|
| |||||||
| Information Technology (4.4%) | |||||||
| 23,254 | Agilent Technologies, Inc. | 1,335,710 | ||||||
| 27,000 | Akamai Technologies, Inc.k | 1,648,620 | ||||||
The accompanying Notes to Financial Statements are an integral part of this schedule.
73
Table of Contents
Moderate Allocation Portfolio
Schedule of Investments as of June 30, 2014
(unaudited)
| Shares | Common Stock (21.6%) | Value | ||||||
| Information Technology (4.4%) - continued | |||||||
| 9,600 | Alliance Data Systems Corporationk | $ | 2,700,000 | |||||
| 33,600 | Amdocs, Ltd. | 1,556,688 | ||||||
| 17,150 | Amphenol Corporation | 1,652,231 | ||||||
| 8,896 | ANSYS, Inc.k | 674,495 | ||||||
| 454,699 | Apple, Inc. | 42,255,178 | ||||||
| 82,031 | Applied Materials, Inc. | 1,849,799 | ||||||
| 63,700 | Arris Group, Inc.k | 2,072,161 | ||||||
| 17,350 | Aruba Networks, Inc.k | 303,972 | ||||||
| 5,600 | Ascom Holding AG | 94,977 | ||||||
| 351,400 | Atmel Corporationk | 3,292,618 | ||||||
| 7,629 | Autodesk, Inc.k | 430,123 | ||||||
| 18,900 | AVG Technologies NVk | 380,457 | ||||||
| 102,794 | Blinkx plck | 111,438 | ||||||
| 14,550 | Booz Allen Hamilton Holding Corporation | 309,042 | ||||||
| 21,300 | Broadcom Corporation | 790,656 | ||||||
| 68,070 | Broadridge Financial Solutions, Inc. | 2,834,435 | ||||||
| 166,950 | Brocade Communications Systems, Inc. | 1,535,940 | ||||||
| 700 | Cap Gemini SA | 49,955 | ||||||
| 11,800 | Cardtronics, Inc.k | 402,144 | ||||||
| 7,200 | Carsales.com, Ltd. | 71,904 | ||||||
| 32,600 | CDW Corporation | 1,039,288 | ||||||
| 8,250 | Check Point Software Technologies, Ltd.g,k | 552,998 | ||||||
| 20,597 | Ciena Corporationg,k | 446,131 | ||||||
| 14,650 | Cirrus Logic, Inc.g,k | 333,141 | ||||||
| 627,270 | Cisco Systems, Inc. | 15,587,659 | ||||||
| 63,540 | Citrix Systems, Inc.k | 3,974,427 | ||||||
| 38,050 | Computer Sciences Corporation | 2,404,760 | ||||||
| 18,600 | Convergys Corporation | 398,784 | ||||||
| 38,800 | CoreLogic, Inc.k | 1,177,968 | ||||||
| 6,600 | Cornerstone OnDemand, Inc.k | 303,732 | ||||||
| 248,450 | Corning, Inc. | 5,453,477 | ||||||
| 4,800 | CSR plc | 48,608 | ||||||
| 6,200 | Dialog Semiconductor plck | 214,532 | ||||||
| 12,200 | Diodes, Inc.k | 353,312 | ||||||
| 59,258 | DST Systems, Inc. | 5,461,810 | ||||||
| 55,992 | E2open, Inc.g,k | 1,157,355 | ||||||
| 126,274 | eBay, Inc.k | 6,321,276 | ||||||
| 5,600 | Econocom Group | 53,106 | ||||||
| 37,600 | Electrocomponents plc | 168,969 | ||||||
| 83,150 | Electronic Arts, Inc.k | 2,982,590 | ||||||
| 620,450 | EMC Corporation | 16,342,653 | ||||||
| 11,848 | Euronet Worldwide, Inc.k | 571,548 | ||||||
| 3,100 | F@N Communications, Inc. | 50,949 | ||||||
| 8,272 | F5 Networks, Inc.k | 921,832 | ||||||
| 306,250 | Facebook, Inc.k | 20,607,563 | ||||||
| 25,200 | Fortinet, Inc.k | 633,276 | ||||||
| 16,100 | FUJIFILM Holdings NPV | 449,361 | ||||||
| 36,150 | GameStop Corporationg | 1,462,991 | ||||||
| 9,210 | Gartner, Inc.k | 649,489 | ||||||
| 38,600 | Genpact, Ltd.k | 676,658 | ||||||
| 14,650 | Global Payments, Inc. | 1,067,252 | ||||||
| 32,334 | Google, Inc.k | 18,601,104 | ||||||
| 37,934 | Google, Inc., Class Ak | 22,178,872 | ||||||
| 32,830 | Guidewire Software, Inc.k | 1,334,868 | ||||||
| 68,050 | Hewlett-Packard Company | 2,291,924 | ||||||
| 20,000 | Hitachi Kokusai Electric, Inc. | 277,127 | ||||||
| 1,700 | Hoya Corporation | 56,521 | ||||||
| 3,200 | IAC InterActiveCorp | 221,536 | ||||||
| 13,800 | iGATE Corporationk | 502,182 | ||||||
| 6,200 | Imperva, Inc.k | 162,316 | ||||||
| 7,100 | Indra Sistemas SA | 126,781 | ||||||
| 3,800 | Infineon Technologies AG | 47,436 | ||||||
| 60,500 | Informatica Corporationk | 2,156,825 | ||||||
| 15,150 | International Business Machines Corporation | 2,746,240 | ||||||
| 13,250 | j2 Global, Inc. | 673,895 | ||||||
| 182,574 | Juniper Networks, Inc.k | 4,480,366 | ||||||
| 300 | Keyence Corporation | 131,186 | ||||||
| 8,200 | Kulicke and Soffa Industries, Inc.k | 116,932 | ||||||
| 41,002 | Lexmark International, Inc.g | 1,974,656 | ||||||
| 1,320 | LinkedIn Corporationk | 226,340 | ||||||
| 21,050 | Liquidity Services, Inc.g,k | 331,748 | ||||||
| 55,800 | Marvell Technology Group, Ltd. | 799,614 | ||||||
| 5,900 | Measurement Specialties, Inc.k | 507,813 | ||||||
| 23,050 | Mentor Graphics Corporation | 497,189 | ||||||
| 13,428 | Microchip Technology, Inc.g | 655,421 | ||||||
| 73,890 | Microsoft Corporation | 3,081,213 | ||||||
| 4,000 | NEC Networks & System Integration Corporation | 97,605 | ||||||
| 507,870 | NetApp, Inc. | 18,547,412 | ||||||
| 7,186 | Nice Systems, Ltd. ADR | 293,261 | ||||||
| 2,100 | Nice-Systems, Ltd. | 85,943 | ||||||
| 1,800 | NTT Data Corporation | 69,222 | ||||||
| 13,986 | Nuance Communications, Inc.g,k | 262,517 | ||||||
| 141,116 | NVIDIA Corporation | 2,616,291 | ||||||
| 24,780 | NXP Semiconductors NVk | 1,639,940 | ||||||
| 1,800 | OBIC Company, Ltd. | 59,364 | ||||||
| 96,000 | Oki Electric Industry Company, Ltd. | 213,467 | ||||||
| 2,900 | OMRON Corporation | 122,292 | ||||||
| 13,700 | Optimal Payments plck | 93,784 | ||||||
| 171,300 | Oracle Corporation | 6,942,789 | ||||||
| 16,900 | Pace plc | 102,644 | ||||||
| 50,406 | Plantronics, Inc. | 2,422,008 | ||||||
| 4,300 | Playtech plc | 45,305 | ||||||
| 27,600 | Polycom, Inc.k | 345,828 | ||||||
| 25,910 | QLIK Technologies, Inc.k | 586,084 | ||||||
| 220,242 | QUALCOMM, Inc. | 17,443,166 | ||||||
| 19,450 | Red Hat, Inc.k | 1,075,002 | ||||||
| 235,850 | Salesforce.com, Inc.k | 13,698,168 | ||||||
| 49,050 | Sanmina Corporationk | 1,117,359 | ||||||
| 600 | SAP AG ADR | 46,233 | ||||||
| 37,360 | Sapient Corporationk | 607,100 | ||||||
| 9,100 | Seiko Epson Corporation | 387,152 | ||||||
| 13,110 | ServiceNow, Inc.k | 812,296 | ||||||
| 1,742 | Skyworks Solutions, Inc. | 81,804 | ||||||
| 1,200 | Spectris plc | 45,598 | ||||||
| 25,200 | SunPower Corporationg,k | 1,032,696 | ||||||
| 224,940 | Symantec Corporation | 5,151,126 | ||||||
| 8,050 | Synopsys, Inc.k | 312,501 | ||||||
| 45,900 | Take-Two Interactive Software, Inc.k | 1,020,816 | ||||||
| 6,800 | TE Connectivity, Ltd. | 420,512 | ||||||
| 263,650 | Teradata Corporationk | 10,598,730 | ||||||
| 117,227 | Teradyne, Inc.g | 2,297,649 | ||||||
| 203,970 | Texas Instruments, Inc. | 9,747,726 | ||||||
| 42,790 | Textura Corporationg,k | 1,011,556 | ||||||
| 53,400 | Ubiquiti Networks, Inc.g,k | 2,413,146 | ||||||
| 4,300 | ULVAC, Inc.k | 91,662 | ||||||
| 36,701 | VeriFone Systems, Inc.k | 1,348,762 | ||||||
| 51,036 | Virtusa Corporationk | 1,827,089 | ||||||
The accompanying Notes to Financial Statements are an integral part of this schedule.
74
Table of Contents
Moderate Allocation Portfolio
Schedule of Investments as of June 30, 2014
(unaudited)
| Shares | Common Stock (21.6%) | Value | ||||||
| Information Technology (4.4%) - continued | |||||||
| 138,650 | Vishay Intertechnology, Inc. | $ | 2,147,688 | |||||
| 191,850 | VMware, Inc.k | 18,572,999 | ||||||
| 10,300 | VTech Holdings, Ltd. | 136,883 | ||||||
| 7,500 | WebMD Health Corporationk | 362,250 | ||||||
| 3,200 | Wincor Nixdorf AG | 182,245 | ||||||
| 5,050 | Workday, Inc.k | 453,793 | ||||||
| 209,900 | Xerox Corporation | 2,611,156 | ||||||
| 88,340 | Xilinx, Inc. | 4,179,365 | ||||||
|
| |||||||
| Total | 358,180,127 | |||||||
|
| |||||||
| Materials (0.6%) | |||||||
| 6,870 | Airgas, Inc. | 748,212 | ||||||
| 5,930 | Albemarle Corporation | 423,995 | ||||||
| 23,500 | Alcoa, Inc. | 349,915 | ||||||
| 219,127 | Arrium, Ltd. | 164,833 | ||||||
| 16,000 | Berry Plastics Group, Inc.k | 412,800 | ||||||
| 1,800 | BHP Billiton plc | 58,516 | ||||||
| 5,700 | Cabot Corporation | 330,543 | ||||||
| 65,635 | Celanese Corporation | 4,219,018 | ||||||
| 35,600 | Cliffs Natural Resources, Inc.g | 535,780 | ||||||
| 4,850 | Compass Minerals International, Inc. | 464,339 | ||||||
| 14,900 | Crown Holdings, Inc.k | 741,424 | ||||||
| 98,900 | Dow Chemical Company | 5,089,394 | ||||||
| 23,200 | Eagle Materials, Inc. | 2,187,296 | ||||||
| 15,850 | Eastman Chemical Company | 1,384,497 | ||||||
| 17,400 | Ence Energia y Celulosa SAk | 45,444 | ||||||
| 13,252 | FMC Corporation | 943,410 | ||||||
| 103,800 | Graphic Packaging Holding Companyk | 1,214,460 | ||||||
| 57,830 | H.B. Fuller Company | 2,781,623 | ||||||
| 1,300 | Holmen AB | 46,525 | ||||||
| 53,160 | Materials Select Sector SPDR Fund | 2,638,862 | ||||||
| 2,600 | Mondi plc | 47,203 | ||||||
| 27,300 | Monsanto Company | 3,405,402 | ||||||
| 32,200 | Mosaic Company | 1,592,290 | ||||||
| 36,700 | Nippon Light Metal Holdings Company, Ltd. | 55,900 | ||||||
| 4,000 | Nippon Paint Company, Ltd. | 84,693 | ||||||
| 68,270 | Nucor Corporation | 3,362,297 | ||||||
| 49,000 | Oji Holdings Corporation | 201,636 | ||||||
| 25,800 | Owens-Illinois, Inc.k | 893,712 | ||||||
| 22,900 | Packaging Corporation of America | 1,637,121 | ||||||
| 2,700 | Rio Tinto plc | 145,784 | ||||||
| 21,324 | Silgan Holdings, Inc. | 1,083,686 | ||||||
| 11,186 | Silver Wheaton Corporation | 293,856 | ||||||
| 2,000 | Smurfit Kappa Group plc | 45,776 | ||||||
| 7,650 | Sonoco Products Company | 336,064 | ||||||
| 17,257 | Southern Copper Corporation | 524,095 | ||||||
| 60,980 | Steel Dynamics, Inc. | 1,094,591 | ||||||
| 7,400 | Stora Enso Oyj | 71,944 | ||||||
| 9,000 | Sumitomo Metal Mining Company, Ltd. | 146,898 | ||||||
| 43,000 | Sumitomo Osaka Cement Company, Ltd. | 163,552 | ||||||
| 40,000 | Taiheiyo Cement Corporation | 161,282 | ||||||
| 167,700 | Teck Resources, Ltd.g | 3,828,591 | ||||||
| 17,000 | Toagosei Company, Ltd. | 76,543 | ||||||
| 17,000 | Tokuyama Corporation | 54,061 | ||||||
| 65,000 | Tosoh Corporation | 315,260 | ||||||
| 12,500 | UPM-Kymmene Oyj | 213,519 | ||||||
| 7,000 | Voestalpine AG | 333,712 | ||||||
| 32,900 | Walter Energy, Inc.g | 179,305 | ||||||
| 8,550 | Worthington Industries, Inc. | 367,992 | ||||||
|
| |||||||
| Total | 45,497,651 | |||||||
|
| |||||||
| Telecommunications Services (0.2%) | |||||||
| 86,600 | AT&T, Inc. | 3,062,176 | ||||||
| 189,300 | Bezeq Israel Telecommunication Corporation, Ltd. | 354,292 | ||||||
| 34,598 | BT Group plc | 227,345 | ||||||
| 44,353 | Cogent Communications Group, Inc. | 1,532,396 | ||||||
| 11,400 | Elisa Oyj | 348,728 | ||||||
| 8,900 | Freenet AG | 282,640 | ||||||
| 3,100 | KDDI Corporation | 189,142 | ||||||
| 9,400 | Nippon Telegraph & Telephone Corporation | 585,882 | ||||||
| 6,336 | SBA Communications Corporationk | 648,173 | ||||||
| 27,000 | Singapore Telecommunications, Ltd. | 83,449 | ||||||
| 217,200 | Telecom Italia SPAk | 274,910 | ||||||
| 12,950 | Telephone & Data Systems, Inc. | 338,124 | ||||||
| 29,200 | Telstra Corporation, Ltd. | 143,453 | ||||||
| 15,105 | TW Telecom, Inc.k | 608,883 | ||||||
| 164,256 | Verizon Communications, Inc. | 8,037,046 | ||||||
| 100,272 | Vodafone Group plc | 335,135 | ||||||
| 86,250 | Vonage Holdings Corporationk | 323,438 | ||||||
|
| |||||||
| Total | 17,375,212 | |||||||
|
| |||||||
| Utilities (0.3%) | |||||||
| 3,300 | AGL Energy, Ltd. | 48,203 | ||||||
| 13,700 | Atmos Energy Corporation | 731,580 | ||||||
| 8,500 | Centrica plc | 45,421 | ||||||
| 32,100 | CMS Energy Corporation | 999,915 | ||||||
| 6,250 | Edison International, Inc. | 363,188 | ||||||
| 58,100 | Electricidade de Portugal SA | 291,523 | ||||||
| 3,700 | Electricite de France | 116,505 | ||||||
| 1,200 | Endesa SA | 46,400 | ||||||
| 83,400 | Enel SPA | 485,108 | ||||||
| 13,300 | Fortum Oyj | 357,131 | ||||||
| 4,700 | Gas Natural SDG SA | 148,488 | ||||||
| 139,090 | NiSource, Inc. | 5,471,801 | ||||||
| 61,380 | NorthWestern Corporation | 3,203,422 | ||||||
| 198,800 | PG&E Corporation | 9,546,376 | ||||||
| 22,650 | Public Service Enterprise Group, Inc. | 923,893 | ||||||
| 500 | Red Electrica Corporacion SA | 45,706 | ||||||
| 21,700 | Southern Company | 984,746 | ||||||
| 24,381 | Southwest Gas Corporation | 1,287,073 | ||||||
| 10,350 | Westar Energy, Inc. | 395,267 | ||||||
| 49,250 | Wisconsin Energy Corporation | 2,310,810 | ||||||
|
| |||||||
| Total | 27,802,556 | |||||||
|
| |||||||
Total Common Stock (cost $1,415,007,739) | 1,766,616,409 | |||||||
|
| |||||||
Preferred Stock (< 0.1%) | ||||||||
| Consumer Staples (< 0.1%) | |||||||
| 600 | Henkel AG & Company KGaA | 69,319 | ||||||
|
| |||||||
| Total | 69,319 | |||||||
|
| |||||||
Total Preferred Stock (cost $55,210) | 69,319 | |||||||
|
| |||||||
The accompanying Notes to Financial Statements are an integral part of this schedule.
75
Table of Contents
Moderate Allocation Portfolio
Schedule of Investments as of June 30, 2014
(unaudited)
| Shares | Collateral Held for Securities Loaned (0.7%) | Value | ||||||
| 53,687,425 | Thrivent Cash Management Trust | $ | 53,687,425 | |||||
|
| |||||||
| Total Collateral Held for Securities Loaned (cost $53,687,425) | 53,687,425 | |||||||
|
| |||||||
| Shares or Principal Amount | Short-Term Investments (19.0%)l | |||||||
| Federal Agricultural Mortgage Corporation | ||||||||
| 14,000,000 | 0.070%, 07/25/2014 | 13,999,347 | ||||||
| Federal Home Loan Bank Discount Notes | ||||||||
| 70,400,000 | 0.099%, 07/07/2014m | 70,399,339 | ||||||
| 89,000,000 | 0.081%, 07/09/2014 | 88,998,987 | ||||||
| 200,090,000 | 0.110%, 07/11/2014m | 200,087,855 | ||||||
| 17,000,000 | 0.034%, 07/16/2014 | 16,999,760 | ||||||
| 79,432,000 | 0.045%, 07/18/2014 | 79,430,297 | ||||||
| 40,500,000 | 0.080%, 07/23/2014m | 40,498,654 | ||||||
| 100,000,000 | 0.055%, 07/25/2014 | 99,996,333 | ||||||
| 58,650,000 | 0.096%, 07/30/2014m | 58,647,298 | ||||||
| 51,821,000 | 0.095%, 08/01/2014m | 51,818,403 | ||||||
| 113,578,000 | 0.117%, 08/06/2014m | 113,571,329 | ||||||
| 28,000,000 | 0.058%, 08/08/2014 | 27,998,279 | ||||||
| 34,000,000 | 0.055%, 08/13/2014m | 33,997,766 | ||||||
| 30,000,000 | 0.060%, 08/22/2014 | 29,997,400 | ||||||
| 27,000,000 | 0.045%, 08/26/2014 | 26,998,110 | ||||||
| 15,725,000 | 0.051%, 08/27/2014m | 15,723,721 | ||||||
| 25,000,000 | 0.060%, 08/29/2014 | 24,997,542 | ||||||
| 3,000,000 | 0.065%, 09/03/2014 | 2,999,653 | ||||||
| 35,799,000 | 0.070%, 09/03/2014 | 35,794,526 | ||||||
| 73,000,000 | 0.070%, 09/10/2014m | 72,989,902 | ||||||
| 15,000,000 | 0.076%, 09/12/2014 | 14,997,688 | ||||||
| 40,000,000 | 0.080%, 09/17/2014 | 39,993,067 | ||||||
| 30,000,000 | 0.080%, 09/19/2014m | 29,994,689 | ||||||
| 30,000,000 | 0.076%, 09/24/2014 | 29,994,617 | ||||||
| 1,500,000 | 0.075%, 09/26/2014m | 1,499,728 | ||||||
| Federal Home Loan Mortgage Corporation Discount Notes | ||||||||
| 15,000,000 | 0.055%, 08/25/2014 | 14,998,740 | ||||||
| 25,000,000 | 0.065%, 09/15/2014 | 24,996,569 | ||||||
| Federal National Mortgage Association Discount Notes | ||||||||
| 153,000,000 | 0.051%, 08/27/2014 | 152,987,705 | ||||||
| Federal National Mortgage Association Discount Notes | ||||||||
| 200,000 | 0.100%, 07/23/2014m | 199,988 | ||||||
| 69,000,000 | 0.045%, 08/20/2014 | 68,995,687 | ||||||
| 76,000,000 | 0.070%, 09/17/2014 | 75,988,473 | ||||||
|
| |||||||
| Total Short-Term Investments (at amortized cost) | 1,560,591,452 | |||||||
|
| |||||||
| Total Investments (cost $7,935,759,775) 107.0% | $ | 8,763,542,516 | ||||||
|
| |||||||
| Other Assets and Liabilities, Net (7.0%) | (571,875,966 | ) | ||||||
|
| |||||||
| Total Net Assets 100.0% | $ | 8,191,666,550 | ||||||
|
| |||||||
| a | The stated interest rate represents the weighted average of all contracts within the bank loan facility. |
| b | All or a portion of the loan is unfunded. |
| c | Denotes investments purchased on a when-issued or delayed delivery basis. |
| d | Denotes securities sold under Rule 144A of the Securities Act of 1933, which exempts them from registration. These securities have been deemed liquid and may be resold to other dealers in the program or to other qualified institutional buyers. As of June 30, 2014, the value of these investments was $172,254,324 or 2.1% of total net assets. |
| e | Denotes variable rate securities. Variable rate securities are securities whose yields vary with a designated market index or market rate. The rate shown is as of June 30, 2014. |
| f | Denotes restricted securities. Restricted securities are investment securities which have been deemed illiquid and cannot be offered for public sale without first being registered under the Securities Act of 1933. The following table indicates the acquisition date and cost of restricted securities Moderate Allocation Portfolio owned as of June 30, 2014. |
Security | Acquisition Date | Cost | ||||||
Apidos CLO XVIII, 07/22/2026 | 6/25/2014 | $ | 1,396,500 | |||||
CoBank ACB, 06/15/2022 | 10/18/2013 | 462,220 | ||||||
Edlinc Student Loan Funding Trust, 10/01/2025 | 2/28/2013 | 121,124 | ||||||
FNA Trust, 01/10/2018 | 4/29/2013 | 620,122 | ||||||
Prudential Covered Trust, 09/30/2015 | 4/1/2013 | 686,498 | ||||||
| g | All or a portion of the security is on loan. |
| h | Denotes interest only security. Interest only securities represent the right to receive monthly interest payments on an underlying pool of mortgages or assets. The principal shown is the outstanding par amount of the pool as of the end of the period. The actual effective yield of the security is different than the stated coupon rate. |
| i | Security is fair valued. |
| j | Denotes perpetual securities. Perpetual securities pay an indefinite stream of interest, but may be called by the issuer at an earlier date. |
| k | Non-income producing security. |
| l | The interest rate shown reflects the yield, coupon rate or the discount rate at the date of purchase. |
| m | At June 30, 2014, $59,896,390 of investments were held on deposit with the counterparty and pledged as the initial margin deposit for open futures contracts. |
Definitions:
| ADR | - | American Depositary Receipt, which are certificates for an underlying foreign security’s shares held by an issuing U.S. depository bank. | ||
| CLO | - | Collateralized Loan Obligation. | ||
| ETF | - | Exchange Traded Fund. | ||
| REIT | - | Real Estate Investment Trust is a company that buys, develops, manages and/or sells real estate assets. | ||
| TIPS | - | Treasury Inflation Protected Security. |
Unrealized Appreciation (Depreciation)
Gross unrealized appreciation and depreciation of investments,based on cost for federal income tax purposes, were as follows:
Gross unrealized appreciation | $ | 852,307,941 | ||
Gross unrealized depreciation | (29,277,157 | ) | ||
|
| |||
Net unrealized appreciation (depreciation) | $ | 823,030,784 | ||
Cost for federal income tax purposes | $ | 7,940,511,732 | ||
The accompanying Notes to Financial Statements are an integral part of this schedule.
76
Table of Contents
Moderate Allocation Portfolio
Schedule of Investments as of June 30, 2014
(unaudited)
Fair Valuation Measurements
The following table is a summary of the inputs used, as of June 30, 2014, in valuing Moderate Allocation Portfolio’s assets carried at fair value.
Investments in Securities | Total | Level 1 | Level 2 | Level 3 | ||||||||||||
Bank Loans | ||||||||||||||||
Basic Materials | 29,024,407 | — | 29,024,407 | — | ||||||||||||
Capital Goods | 10,242,592 | — | 10,242,592 | — | ||||||||||||
Communications Services | 116,261,796 | — | 116,261,796 | — | ||||||||||||
Consumer Cyclical | 62,360,727 | — | 62,360,727 | — | ||||||||||||
Consumer Non-Cyclical | 43,943,650 | — | 43,943,650 | — | ||||||||||||
Energy | 17,349,116 | — | 17,349,116 | — | ||||||||||||
Financials | 26,131,520 | — | 26,131,520 | — | ||||||||||||
Technology | 19,414,490 | — | 19,414,490 | — | ||||||||||||
Transportation | 8,798,184 | — | 8,798,184 | — | ||||||||||||
Utilities | 7,276,102 | — | 7,276,102 | — | ||||||||||||
Mutual Funds | ||||||||||||||||
Equity Mutual Funds | 1,908,763,968 | 1,908,763,968 | — | — | ||||||||||||
Fixed Income Mutual Funds | 1,267,088,720 | 1,267,088,720 | — | — | ||||||||||||
Long-Term Fixed Income | ||||||||||||||||
Asset-Backed Securities | 89,542,161 | — | 85,883,696 | 3,658,465 | ||||||||||||
Basic Materials | 18,667,822 | — | 18,667,822 | — | ||||||||||||
Capital Goods | 13,354,193 | — | 13,354,193 | — | ||||||||||||
Collateralized Mortgage Obligations | 50,038,997 | — | 47,544,247 | 2,494,750 | ||||||||||||
Commercial Mortgage-Backed Securities | 74,410,204 | — | 74,410,204 | — | ||||||||||||
Communications Services | 44,611,347 | — | 44,611,347 | — | ||||||||||||
Consumer Cyclical | 33,627,490 | — | 33,627,490 | — | ||||||||||||
Consumer Non-Cyclical | 47,735,924 | — | 47,735,924 | — | ||||||||||||
Energy | 32,524,335 | — | 32,524,335 | — | ||||||||||||
Financials | 192,264,755 | — | 191,808,736 | 456,019 | ||||||||||||
Foreign Government | 9,253,926 | — | 9,253,926 | — | ||||||||||||
Mortgage-Backed Securities | 585,077,580 | — | 585,077,580 | — | ||||||||||||
Technology | 16,821,864 | — | 16,821,864 | — | ||||||||||||
Transportation | 11,254,977 | — | 11,254,977 | — | ||||||||||||
U.S. Government and Agencies | 611,143,710 | — | 611,143,710 | — | ||||||||||||
Utilities | 35,593,354 | — | 35,593,354 | — | ||||||||||||
Common Stock | ||||||||||||||||
Consumer Discretionary | 257,465,258 | 249,665,166 | 7,800,092 | — | ||||||||||||
Consumer Staples | 80,614,942 | 77,154,636 | 3,460,306 | — | ||||||||||||
Energy | 245,551,815 | 240,541,353 | 5,010,462 | — | ||||||||||||
Financials | 312,203,648 | 303,632,025 | 8,571,623 | — | ||||||||||||
Health Care | 229,788,847 | 226,234,510 | 3,554,337 | — | ||||||||||||
Industrials | 192,136,353 | 184,355,679 | 7,780,674 | — | ||||||||||||
Information Technology | 358,180,127 | 354,447,878 | 3,732,249 | — | ||||||||||||
Materials | 45,497,651 | 43,064,570 | 2,433,081 | — | ||||||||||||
Telecommunications Services | 17,375,212 | 14,550,236 | 2,824,976 | — | ||||||||||||
Utilities | 27,802,556 | 26,218,071 | 1,584,485 | — | ||||||||||||
Preferred Stock | ||||||||||||||||
Consumer Staples | 69,319 | — | 69,319 | — | ||||||||||||
Collateral Held for Securities Loaned | 53,687,425 | 53,687,425 | — | — | ||||||||||||
Short-Term Investments | 1,560,591,452 | — | 1,560,591,452 | — | ||||||||||||
|
|
|
|
|
|
|
| |||||||||
Total | $ | 8,763,542,516 | $ | 4,949,404,237 | $ | 3,807,529,045 | $ | 6,609,234 | ||||||||
|
|
|
|
|
|
|
| |||||||||
Other Financial Instruments | Total | Level 1 | Level 2 | Level 3 | ||||||||||||
Asset Derivatives | ||||||||||||||||
Futures Contracts | 10,024,377 | 10,024,377 | — | — | ||||||||||||
|
|
|
|
|
|
|
| |||||||||
Total Asset Derivatives | $ | 10,024,377 | $ | 10,024,377 | $ | — | $ | — | ||||||||
|
|
|
|
|
|
|
| |||||||||
Liability Derivatives | ||||||||||||||||
Futures Contracts | 10,258,528 | 5,490,586 | 4,767,942 | — | ||||||||||||
|
|
|
|
|
|
|
| |||||||||
Total Liability Derivatives | $ | 10,258,528 | $ | 5,490,586 | $ | 4,767,942 | $ | — | ||||||||
|
|
|
|
|
|
|
| |||||||||
The accompanying Notes to Financial Statements are an integral part of this schedule.
77
Table of Contents
Moderate Allocation Portfolio
Schedule of Investments as of June 30, 2014
(unaudited)
There were no significant transfers between Levels during the period ended June 30, 2014. Transfers between Levels are identified as of the end of the period.
Futures Contracts | Number of Contracts Long/(Short) | Expiration Date | Notional Principal Amount | Value | Unrealized Gain/(Loss) | |||||||||||||||
2-Yr. U.S. Treasury Bond Futures | (295 | ) | September 2014 | ($64,831,244 | ) | ($64,780,156 | ) | $51,088 | ||||||||||||
5-Yr. U.S. Treasury Bond Futures | (3,110 | ) | September 2014 | (372,786,371 | ) | (371,523,524 | ) | 1,262,847 | ||||||||||||
10-Yr. U.S. Treasury Bond Futures | 465 | September 2014 | 57,926,262 | 58,204,924 | 278,662 | |||||||||||||||
30-Yr. U.S. Treasury Bond Futures | 2,430 | September 2014 | 335,366,443 | 333,365,625 | (2,000,818 | ) | ||||||||||||||
Eurex EURO STOXX 50 Futures | 8,899 | September 2014 | 397,997,241 | 393,229,299 | (4,767,942 | ) | ||||||||||||||
Mini MSCI EAFE Index Futures | 1,353 | September 2014 | 132,471,621 | 133,196,085 | 724,464 | |||||||||||||||
Russell 2000 Index Mini-Futures | 1,312 | September 2014 | 151,578,378 | 156,167,360 | 4,588,982 | |||||||||||||||
S&P 400 Index Mini-Futures | (807 | ) | September 2014 | (112,593,834 | ) | (115,344,510 | ) | (2,750,676 | ) | |||||||||||
S&P 500 Index Futures | 519 | September 2014 | 250,205,566 | 253,323,900 | 3,118,334 | |||||||||||||||
Ultra Long Term U.S. Treasury Bond Futures | 743 | September 2014 | 112,142,654 | 111,403,562 | (739,092 | ) | ||||||||||||||
Total Futures Contracts | ($ | 234,151) | ||||||||||||||||||
The following table summarizes the fair value and Statement of Assets and Liabilities location, as of June 30, 2014, for Moderate Allocation Portfolio’s investments in financial derivative instruments by primary risk exposure as discussed under item (2) Significant Accounting Policies of the Notes to Financial Statements.
Derivatives by risk category | Statement of Assets and Liabilities Location | Fair Value | ||||
Asset Derivatives | ||||||
Interest Rate Contracts | ||||||
Futures* | Net Assets - Net unrealized appreciation/(depreciation) on Futures contracts | $ | 1,592,597 | |||
Total Interest Rate Contracts | 1,592,597 | |||||
Equity Contracts | ||||||
Futures* | Net Assets - Net unrealized appreciation/(depreciation) on Futures contracts | 8,431,780 | ||||
Total Equity Contracts | 8,431,780 | |||||
|
| |||||
Total Asset Derivatives | $ | 10,024,377 | ||||
|
| |||||
Liability Derivatives | ||||||
Interest Rate Contracts | ||||||
Futures* | Net Assets - Net unrealized appreciation/(depreciation) on Futures contracts | 2,739,910 | ||||
Total Interest Rate Contracts | 2,739,910 | |||||
Equity Contracts | ||||||
Futures* | Net Assets - Net unrealized appreciation/(depreciation) on Futures contracts | 7,518,618 | ||||
Total Equity Contracts | 7,518,618 | |||||
|
| |||||
Total Liability Derivatives | $ | 10,258,528 | ||||
|
| |||||
| * | Includes cumulative appreciation/depreciation of futures contracts as reported in the Schedule of Investments. Only current day’s variation margin is reported within the Statement of Assets and Liabilities. |
The following table summarizes the net realized gains/(losses) and Statement of Operations location, for the period ended June 30, 2014, for Moderate Allocation Portfolio’s investments in financial derivative instruments by primary risk exposure.
Derivatives by risk category | Statement of Operations Location | Realized Gains/(Losses) recognized in Income | ||||
Equity Contracts | ||||||
| Futures | Net realized gains/(losses) on Futures contracts | 64,288,192 | ||||
Total Equity Contracts | 64,288,192 | |||||
Interest Rate Contracts | ||||||
| Futures | Net realized gains/(losses) on Futures contracts | 23,934,318 | ||||
Total Interest Rate Contracts | 23,934,318 | |||||
|
| |||||
Total | $ | 88,222,510 | ||||
|
| |||||
The accompanying Notes to Financial Statements are an integral part of this schedule.
78
Table of Contents
Moderate Allocation Portfolio
Schedule of Investments as of June 30, 2014
(unaudited)
The following table summarizes the change in net unrealized appreciation/(depreciation) and Statement of Operations location, for the period ended June 30, 2014, for Moderate Allocation Portfolio’s investments in financial derivative instruments by primary risk exposure.
Derivatives by risk category | Statement of Operations Location | Change in unrealized appreciation/(depreciation) recognized in Income | ||||
Interest Rate Contracts | ||||||
| Futures | Change in net unrealized appreciation/(depreciation) on Futures contracts | (816,824 | ) | |||
Total Interest Rate Contracts | (816,824 | ) | ||||
Equity Contracts | ||||||
| Futures | Change in net unrealized appreciation/(depreciation) on Futures contracts | (20,317,293 | ) | |||
Total Equity Contracts | (20,317,293 | ) | ||||
|
| |||||
Total | ($ | 21,134,117 | ) | |||
|
| |||||
The following table presents Moderate Allocation Portfolio’s average volume of derivative activity during the period ended June 30, 2014.
Derivative Risk Category | Futures (Notional)* | Futures (Percentage of Average Net Assets) | ||||||
Equity Contracts | $ | 796,702,030 | 10.5 | % | ||||
Interest Rate Contracts | 869,755,371 | 11.5 | ||||||
| * | Notional amount represents long or short, or both, derivative positions held by the Portfolio. |
Investment in Affiliates
Affiliated issuers, as defined under the Investment Company Act of 1940, include those in which the Portfolio’s holdings of an issuer represent 5% or more of the outstanding voting securities of an issuer, or any affiliated mutual fund.
A summary of transactions for the fiscal year to date, in Moderate Allocation Portfolio, is as follows:
Portfolio | Value December 31, 2013 | Gross Purchases | Gross Sales | Shares Held at June 30, 2014 | Value June 30, 2014 | Income Earned January 1, 2014 - June 30, 2014 | ||||||||||||||||||
Partner Small Cap Growth | $ | 111,969,730 | $ | 12,679,772 | $ | — | 6,587,309 | $ | 110,971,127 | $ | – | |||||||||||||
Partner Small Cap Value | 123,506,706 | 3,460,213 | — | 4,493,008 | 126,417,068 | 268,222 | ||||||||||||||||||
Small Cap Stock | 64,136,532 | 839,506 | — | 3,657,193 | 65,823,250 | 139,621 | ||||||||||||||||||
Partner Mid Cap Value | 114,956,666 | 16,693,226 | — | 7,195,521 | 124,919,997 | 772,773 | ||||||||||||||||||
Mid Cap Stock | 206,628,012 | 10,426,936 | — | 12,265,522 | 227,067,929 | 686,656 | ||||||||||||||||||
Partner Worldwide Allocation | 534,686,884 | 10,867,977 | — | 54,413,534 | 557,406,802 | 10,867,977 | ||||||||||||||||||
Large Cap Value | 413,079,767 | 5,269,010 | — | 26,828,993 | 437,757,949 | 5,269,010 | ||||||||||||||||||
Large Cap Stock | 242,388,982 | 2,198,416 | — | 20,701,632 | 258,399,846 | 2,198,416 | ||||||||||||||||||
High Yield | 196,151,522 | 5,903,396 | 105,757 | 39,822,422 | 205,830,154 | 5,902,364 | ||||||||||||||||||
Income | 623,763,330 | 20,032,949 | 296,118 | 62,165,958 | 659,487,566 | 12,211,890 | ||||||||||||||||||
Limited Maturity Bond | 396,082,117 | 3,373,935 | 317,269 | 40,647,390 | 401,771,000 | 3,378,932 | ||||||||||||||||||
Cash Management Trust- Collateral Investment | 67,924,410 | 230,962,951 | 245,199,936 | 53,687,425 | 53,687,425 | 184,633 | ||||||||||||||||||
Total Value and Income Earned | 3,095,274,658 | 3,229,540,113 | 41,880,494 | |||||||||||||||||||||
The accompanying Notes to Financial Statements are an integral part of this schedule.
79
Table of Contents
Moderately Conservative Allocation Portfolio
Schedule of Investments as of June 30, 2014
(unaudited)
| Principal Amount | Bank Loans (4.3%)a | Value | ||||||
| Basic Materials (0.3%) | |||||||
| Alpha Natural Resources, Inc., Term Loan | ||||||||
| $ 1,927,858 | 3.500%, 5/22/2020 | $ | 1,861,193 | |||||
| Arch Coal, Inc., Term Loan | ||||||||
| 2,658,893 | 6.250%, 5/16/2018 | 2,610,714 | ||||||
| Axalta Coating Systems US Holdings, Inc., Term Loan | ||||||||
| 1,598,850 | 4.000%, 2/1/2020 | 1,597,923 | ||||||
| Fortescue Metals Group, Ltd., Term Loan | ||||||||
| 1,459,124 | 3.750%, 6/30/2019 | 1,459,678 | ||||||
| Ineos Group Holdings, Ltd., Term Loan | ||||||||
| 2,311,661 | 3.750%, 5/4/2018 | 2,305,027 | ||||||
| NewPage Corporation, Term Loan | ||||||||
| 1,050,000 | 9.500%, 2/11/2021 | 1,051,312 | ||||||
|
| |||||||
| Total | 10,885,847 | |||||||
|
| |||||||
| Capital Goods (0.2%) | |||||||
| ADS Waste Holdings, Inc., Term Loan | ||||||||
| 1,792,700 | 3.750%, 10/9/2019 | 1,782,930 | ||||||
| Berry Plastics Group, Inc., Term Loan | ||||||||
| 3,426,625 | 3.500%, 2/8/2020 | 3,396,299 | ||||||
| Silver II Borrower, Term Loan | ||||||||
| 885,826 | 4.000%, 12/13/2019 | 882,982 | ||||||
|
| |||||||
| Total | 6,062,211 | |||||||
|
| |||||||
| Communications Services (1.6%) | |||||||
| Atlantic Broadband Penn, LLC, Term Loan | ||||||||
| 935,133 | 3.250%, 11/30/2019 | 931,627 | ||||||
| Cengage Learning Aquisitions, Term Loan | ||||||||
| 3,915,188 | 7.000%, 3/31/2020 | 3,956,806 | ||||||
| Cequel Communications, LLC, Term Loan | ||||||||
| 1,101,822 | 3.500%, 2/14/2019 | 1,101,481 | ||||||
| Charter Communications Operating, LLC, Term Loan | ||||||||
| 455,400 | 3.000%, 7/1/2020 | 448,127 | ||||||
| 2,227,500 | 3.000%, 1/3/2021 | 2,192,239 | ||||||
| Clear Channel Communications, Inc., Term Loan | ||||||||
| 34,700 | 3.800%, 1/29/2016 | 34,454 | ||||||
| 1,992,484 | 6.900%, 1/30/2019 | 1,981,445 | ||||||
| 640,816 | 7.650%, 7/30/2019 | 641,816 | ||||||
| Cumulus Media Holdings, Inc., Term Loan | ||||||||
| 1,717,573 | 4.250%, 12/23/2020 | 1,721,867 | ||||||
| Fairpoint Communications, Term Loan | ||||||||
| 2,281,125 | 7.500%, 2/14/2019 | 2,359,550 | ||||||
| Grande Communications Networks, LLC, Term Loan | ||||||||
| 1,346,404 | 4.500%, 5/29/2020 | 1,341,355 | ||||||
| Hargray Communications Group, Inc., Term Loan | ||||||||
| 1,915,650 | 4.750%, 6/26/2019 | 1,920,439 | ||||||
| Integra Telecom Holdings, Inc., Term Loan | ||||||||
| 1,347,938 | 5.250%, 2/22/2019 | 1,355,014 | ||||||
| 460,000 | 9.750%, 2/21/2020 | 467,668 | ||||||
| Intelsat Jackson Holdings SA, Term Loan | ||||||||
| 1,255,968 | 3.750%, 6/30/2019 | 1,257,011 | ||||||
| Level 3 Communications, Inc., Term Loan | ||||||||
| 2,540,000 | 4.000%, 1/15/2020 | 2,540,533 | ||||||
| Liberty Cablevision of Puerto Rico, LLC, Term Loan | ||||||||
| 875,000 | 0.000%, 12/11/2021b,c | 875,726 | ||||||
| Liberty Cablevision of Puerto Rico, Ltd., Term Loan | ||||||||
| 1,274,000 | 6.000%, 6/9/2017 | 1,274,000 | ||||||
| LTS Buyer, LLC, Term Loan | ||||||||
| 1,471,267 | 4.000%, 4/13/2020 | 1,466,279 | ||||||
| 72,738 | 8.000%, 4/12/2021 | 73,405 | ||||||
| McGraw-Hill Global Education, LLC, Term Loan | ||||||||
| 1,960,840 | 5.750%, 3/22/2019 | 1,992,704 | ||||||
| Mediacom Broadband, LLC, Term Loan | ||||||||
| 1,021,800 | 4.000%, 1/20/2020 | 1,019,675 | ||||||
| NEP Broadcasting, LLC, Term Loan | ||||||||
| 134,286 | 9.500%, 7/22/2020 | 137,979 | ||||||
| NEP/NCP Holdco, Inc., Term Loan | ||||||||
| 3,406,961 | 4.250%, 1/22/2020 | 3,406,110 | ||||||
| NTelos, Inc., Term Loan | ||||||||
| 674,219 | 5.750%, 11/9/2019 | 672,454 | ||||||
| Puerto Rico Cable Acquisition Company, Inc., Term Loan | ||||||||
| 471,040 | 5.500%, 7/31/2018 | 470,451 | ||||||
| Syniverse Holdings, Inc., Term Loan | ||||||||
| 1,793,615 | 4.000%, 4/23/2019 | 1,791,373 | ||||||
| TNS, Inc., Term Loan | ||||||||
| 1,358,885 | 5.000%, 2/14/2020 | 1,363,981 | ||||||
| Univision Communications, Inc., Term Loan | ||||||||
| 3,008,466 | 4.000%, 3/1/2020 | 3,004,374 | ||||||
| Virgin Media Investment Holdings, Ltd., Term Loan | ||||||||
| 2,825,000 | 3.500%, 6/7/2020 | 2,815,282 | ||||||
| Visant Corporation, Term Loan | ||||||||
| 2,586,507 | 5.250%, 12/22/2016 | 2,574,221 | ||||||
| WideOpenWest Finance, LLC, Term Loan | ||||||||
| 3,006,937 | 4.750%, 4/1/2019 | 3,013,974 | ||||||
| XO Communications, LLC, Term Loan | ||||||||
| 593,513 | 4.250%, 3/20/2021 | 596,575 | ||||||
| Yankee Cable Acquisition, LLC, Term Loan | ||||||||
| 1,785,989 | 4.500%, 3/1/2020 | 1,794,366 | ||||||
| Zayo Group, LLC, Term Loan | ||||||||
| 2,687,121 | 4.000%, 7/2/2019 | 2,689,082 | ||||||
|
| |||||||
| Total | 55,283,443 | |||||||
|
| |||||||
The accompanying Notes to Financial Statements are an integral part of this schedule.
80
Table of Contents
Moderately Conservative Allocation Portfolio
Schedule of Investments as of June 30, 2014
(unaudited)
| Principal Amount | Bank Loans (4.3%)a | Value | ||||||
| Consumer Cyclical (0.9%) | |||||||
| Bally Technologies, Inc., Term Loan | ||||||||
| $ 1,379,437 | 4.250%, 11/25/2020 | $ | 1,384,609 | |||||
| Burlington Coat Factory Warehouse Corporation, Term Loan | ||||||||
| 1,175,963 | 4.250%, 2/23/2017 | 1,182,337 | ||||||
| Ceridian Corporation, Term Loan | ||||||||
| 1,811,364 | 4.404%, 8/14/2015 | 1,813,338 | ||||||
| Chrysler Group, LLC, Term Loan | ||||||||
| 1,515,471 | 3.500%, 5/24/2017 | 1,519,972 | ||||||
| Golden Nugget, Inc., Delayed Draw | ||||||||
| 264,173 | 5.500%, 11/21/2019 | 269,126 | ||||||
| Golden Nugget, Inc., Term Loan | ||||||||
| 616,402 | 5.500%, 11/21/2019 | 627,960 | ||||||
| Hilton Worldwide Finance, LLC, Term Loan | ||||||||
| 2,090,987 | 3.500%, 10/26/2020 | 2,086,637 | ||||||
| J.C. Penney Corporation, Inc., Term Loan | ||||||||
| 1,994,850 | 6.000%, 5/22/2018 | 2,016,694 | ||||||
| Las Vegas Sands, LLC, Term Loan | ||||||||
| 1,990,000 | 3.250%, 12/19/2020 | 1,988,866 | ||||||
| Marina District Finance Company, Inc., Term Loan | ||||||||
| 1,925,325 | 6.750%, 8/15/2018 | 1,946,369 | ||||||
| MGM Resorts International, Term Loan | ||||||||
| 1,413,475 | 3.500%, 12/20/2019 | 1,408,613 | ||||||
| Mohegan Tribal Gaming Authority, Term Loan | ||||||||
| 3,383,000 | 5.500%, 11/19/2019 | 3,435,166 | ||||||
| Rite Aid Corporation, Term Loan | ||||||||
| 341,556 | 3.500%, 2/21/2020 | 340,986 | ||||||
| 695,000 | 5.750%, 8/21/2020 | 709,553 | ||||||
| ROC Finance, LLC, Term Loan | ||||||||
| 2,511,025 | 5.000%, 6/20/2019 | 2,467,082 | ||||||
| Scientific Games International, Inc., Term Loan | ||||||||
| 3,095,223 | 4.250%, 10/18/2020 | 3,059,906 | ||||||
| Seminole Indian Tribe of Florida, Term Loan | ||||||||
| 789,312 | 3.000%, 4/29/2020 | 787,671 | ||||||
| Seven Seas Cruises S de RL, LLC, Term Loan | ||||||||
| 1,934,877 | 3.750%, 12/21/2018 | 1,932,458 | ||||||
| Toys R Us, Inc., Term Loan | ||||||||
| 1,589,612 | 5.250%, 5/25/2018 | 1,284,931 | ||||||
|
| |||||||
| Total | 30,262,274 | |||||||
|
| |||||||
| Consumer Non-Cyclical (0.5%) | |||||||
| Albertsons, Inc., Term Loan | ||||||||
| 3,503,516 | 4.750%, 3/21/2019 | 3,518,827 | ||||||
| Biomet, Inc., Term Loan | ||||||||
| 462,661 | 3.661%, 7/25/2017 | 463,017 | ||||||
| Catalina Marketing Corporation, Term Loan | ||||||||
| 480,000 | 4.500%, 4/9/2021 | 479,798 | ||||||
| CHS/Community Health Systems, Inc., Term Loan | ||||||||
| 352,901 | 3.478%, 1/25/2017 | 353,635 | ||||||
| 940,599 | 4.250%, 1/27/2021 | 945,622 | ||||||
| Del Monte Corporation, Term Loan | ||||||||
| 285,373 | 3.500%, 3/9/2020 | 282,788 | ||||||
| Hologic, Inc., Term Loan | ||||||||
| 1,247,695 | 3.250%, 8/1/2019 | 1,246,135 | ||||||
| JBS USA, LLC, Term Loan | ||||||||
| 1,508,730 | 3.750%, 5/25/2018 | 1,504,958 | ||||||
| Ortho-Clinical Diagnostics, Inc., Term Loan | ||||||||
| 1,400,000 | 4.750%, 6/30/2021b,c | 1,410,682 | ||||||
| Roundy’s Supermarkets, Inc., Term Loan | ||||||||
| 2,069,364 | 5.750%, 3/3/2021 | 2,072,323 | ||||||
| Supervalu, Inc., Term Loan | ||||||||
| 4,242,573 | 4.500%, 3/21/2019 | 4,236,761 | ||||||
| Van Wagner Communications, LLC, Term Loan | ||||||||
| 1,189,062 | 6.250%, 8/3/2018 | 1,201,452 | ||||||
|
| |||||||
| Total | 17,715,998 | |||||||
|
| |||||||
| Energy (0.2%) | |||||||
| Energy Solutions, LLC, Term Loan | ||||||||
| 550,000 | 6.750%, 5/29/2020 | 555,500 | ||||||
| Fieldwood Energy, LLC, Term Loan | ||||||||
| 893,252 | 3.875%, 9/28/2018 | 895,861 | ||||||
| 389,261 | 8.375%, 9/30/2020 | 401,133 | ||||||
| McJunkin Red Man Corporation, Term Loan | ||||||||
| 1,076,863 | 5.000%, 11/8/2019 | 1,082,247 | ||||||
| Offshore Group Investment, Ltd., Term Loan | ||||||||
| 1,826,875 | 5.750%, 3/28/2019 | 1,814,690 | ||||||
| Pacific Drilling SA, Term Loan | ||||||||
| 1,267,200 | 4.500%, 6/3/2018 | 1,270,761 | ||||||
|
| |||||||
| Total | 6,020,192 | |||||||
|
| |||||||
| Financials (0.2%) | |||||||
| DJO Finance, LLC, Term Loan | ||||||||
| 1,949,425 | 4.250%, 9/15/2017 | 1,955,526 | ||||||
| GEO Group, Inc., Term Loan | ||||||||
| 455,400 | 3.250%, 4/3/2020 | 455,118 | ||||||
| Harland Clarke Holdings Corporation, Term Loan | ||||||||
| 2,271,750 | 7.000%, 5/22/2018 | 2,307,257 | ||||||
| 246,875 | 6.000%, 8/4/2019 | 251,010 | ||||||
| MoneyGram International, Inc., Term Loan | ||||||||
| 1,817,000 | 4.250%, 3/27/2020 | 1,790,890 | ||||||
| WaveDivision Holdings, LLC, Term Loan | ||||||||
| 2,477,275 | 4.000%, 10/12/2019 | 2,474,922 | ||||||
|
| |||||||
| Total | 9,234,723 | |||||||
|
| |||||||
| Technology (0.2%) | |||||||
| First Data Corporation Extended, Term Loan | ||||||||
| 2,090,000 | 4.154%, 3/23/2018 | 2,092,613 | ||||||
| First Data Corporation, Term Loan | ||||||||
| 1,040,000 | 4.154%, 9/24/2018 | 1,040,738 | ||||||
The accompanying Notes to Financial Statements are an integral part of this schedule.
81
Table of Contents
Moderately Conservative Allocation Portfolio
Schedule of Investments as of June 30, 2014
(unaudited)
| Principal Amount | Bank Loans (4.3%)a | Value | ||||||
| Technology (0.2%) - continued | |||||||
| Freescale Semiconductor, Inc., Term Loan | ||||||||
| $ 1,649,187 | 4.250%, 2/28/2020 | $ | 1,647,819 | |||||
| Infor US, Inc., Term Loan | ||||||||
| 1,085,975 | 3.750%, 6/3/2020 | 1,078,058 | ||||||
|
| |||||||
| Total | 5,859,228 | |||||||
|
| |||||||
| Transportation (0.1%) | |||||||
| American Airlines, Inc., Term Loan | ||||||||
| 1,915,650 | 3.750%, 6/27/2019 | 1,917,508 | ||||||
| Delta Air Lines, Inc., Term Loan | ||||||||
| 1,557,287 | 3.500%, 4/20/2017 | 1,552,182 | ||||||
| United Air Lines, Inc., Term Loan | ||||||||
| 1,135,625 | 3.750%, 4/1/2019 | 1,131,571 | ||||||
|
| |||||||
| Total | 4,601,261 | |||||||
|
| |||||||
| Utilities (0.1%) | |||||||
| Calpine Corporation, Term Loan | ||||||||
| 339,733 | 4.000%, 4/1/2018 | 340,687 | ||||||
| 2,048,512 | 4.000%, 10/9/2019 | 2,052,773 | ||||||
| Intergen NV, Term Loan | ||||||||
| 886,050 | 5.500%, 6/15/2020 | 891,960 | ||||||
| NGPL PipeCo, LLC, Term Loan | ||||||||
| 1,743,077 | 6.750%, 9/15/2017 | 1,740,898 | ||||||
|
| |||||||
| Total | 5,026,318 | |||||||
|
| |||||||
Total Bank Loans (cost $150,626,275) | 150,951,495 | |||||||
|
| |||||||
| Shares | Mutual Funds (36.0%) | |||||||
| Equity Mutual Funds (14.1%) | |||||||
| 16,163,017 | Thrivent Partner Worldwide Allocation Portfolio | 165,572,326 | ||||||
| 1,342,036 | Thrivent Partner Small Cap Value Portfolio | 37,760,071 | ||||||
| 1,641,909 | Thrivent Small Cap Stock Portfolio | 29,551,572 | ||||||
| 2,622,430 | Thrivent Partner Mid Cap Value Portfolio | 45,527,488 | ||||||
| 3,088,876 | Thrivent Mid Cap Stock Portfolio | 57,183,430 | ||||||
| 7,807,552 | Thrivent Large Cap Value Portfolio | 127,392,711 | ||||||
| 2,334,504 | Thrivent Large Cap Stock Portfolio | 29,139,515 | ||||||
|
| |||||||
| Total | 492,127,113 | |||||||
|
| |||||||
| Fixed Income Mutual Funds (21.9%) | |||||||
| 19,535,460 | Thrivent High Yield Portfolio | 100,972,934 | ||||||
| 24,308,179 | Thrivent Income Portfolio | 257,873,319 | ||||||
| 41,315,102 | Thrivent Limited Maturity Bond Portfolio | 408,370,866 | ||||||
|
| |||||||
| Total | 767,217,119 | |||||||
|
| |||||||
Total Mutual Funds (cost $1,121,249,007) | 1,259,344,232 | |||||||
|
| |||||||
| Principal Amount | Long-Term Fixed Income (36.0%) | |||||||
| Asset-Backed Securities (2.0%) | |||||||
| Access Group, Inc. | ||||||||
| 1,630,935 | 0.652%, 2/25/2036d,e | 1,621,756 | ||||||
| Ally Auto Receivables Trust 2013-SN1 | ||||||||
| 2,340,000 | 0.720%, 5/20/2016 | 2,342,583 | ||||||
| BA Credit Card Trust | ||||||||
| 1,100,000 | 0.532%, 6/15/2021e | 1,100,035 | ||||||
| Barclays Dryrock Issuance Trust | ||||||||
| 1,000,000 | 0.512%, 12/16/2019e | 1,001,061 | ||||||
| Capital One Multi-Asset Execution Trust | ||||||||
| 1,350,000 | 0.532%, 1/18/2022e | 1,351,400 | ||||||
| Chase Issuance Trust | ||||||||
| 1,475,000 | 1.150%, 1/15/2019 | 1,479,323 | ||||||
| Chesapeake Funding, LLC | ||||||||
| 2,300,000 | 0.601%, 1/7/2025d,e | 2,302,997 | ||||||
| Citibank Credit Card Issuance Trust | ||||||||
| 2,000,000 | 0.025%, 2/22/2019 | 1,998,984 | ||||||
| Countrywide Asset-Backed Certificates | ||||||||
| 1,921,449 | 5.530%, 4/25/2047 | 1,849,938 | ||||||
| DT Auto Owner Trust | ||||||||
| 226,371 | 0.750%, 5/16/2016d | 226,439 | ||||||
| Edlinc Student Loan Funding Trust | ||||||||
| 1,307,261 | 3.190%, 10/1/2025e,f | 1,323,602 | ||||||
| FirstEnergy Ohio PIRB Special Purpose Trust | ||||||||
| 1,765,970 | 0.679%, 1/15/2019 | 1,766,186 | ||||||
| FNA Trust | ||||||||
| 863,778 | 1.980%, 1/10/2018f | 866,369 | ||||||
| Ford Credit Auto Owner Trust | ||||||||
| 810,000 | 2.260%, 11/15/2025d | 817,262 | ||||||
| GE Dealer Floorplan Master Note Trust | ||||||||
| 2,340,000 | 0.553%, 4/20/2018e | 2,346,718 | ||||||
| GE Equipment Transportation, LLC | ||||||||
| 1,950,000 | 0.690%, 11/25/2016 | 1,953,529 | ||||||
| Golden Credit Card Trust | ||||||||
| 1,620,000 | 0.402%, 2/15/2018d,e | 1,620,535 | ||||||
| 1,000,000 | 0.582%, 9/15/2018d,e | 1,003,573 | ||||||
| GreatAmerica Leasing Receivables | ||||||||
| 2,500,000 | 0.610%, 5/15/2016d | 2,500,578 | ||||||
| Hertz Fleet Lease Funding, LP | ||||||||
| 2,200,000 | 0.704%, 12/10/2027d,e | 2,204,730 | ||||||
| HLSS Servicer Advance Receivables Backed Notes | ||||||||
| 2,175,000 | 1.287%, 9/15/2044d | 2,176,088 | ||||||
| Hyundai Auto Receivables Trust | ||||||||
| 2,340,000 | 0.710%, 9/15/2017 | 2,346,573 | ||||||
| Hyundai Floorplan Master Owner Trust | ||||||||
| 2,632,500 | 0.502%, 5/15/2018d,e | 2,637,144 | ||||||
| Master Credit Card Trust | ||||||||
| 1,587,300 | 0.780%, 4/21/2017d | 1,590,386 | ||||||
| Morgan Stanley Capital, Inc. | ||||||||
| 2,029,587 | 0.302%, 2/25/2037e | 1,208,329 | ||||||
| Motor plc | ||||||||
| 2,054,000 | 0.652%, 2/15/2021d | 2,055,859 | ||||||
| Nissan Master Owner Trust Receivables | ||||||||
| 2,700,000 | 0.452%, 2/15/2018e | 2,701,336 | ||||||
| Penarth Master Issuer plc | ||||||||
| 2,200,000 | 0.544%, 11/18/2017d,e | 2,203,982 | ||||||
The accompanying Notes to Financial Statements are an integral part of this schedule.
82
Table of Contents
Moderately Conservative Allocation Portfolio
Schedule of Investments as of June 30, 2014
(unaudited)
| Principal Amount | Long-Term Fixed Income (36.0%) | Value | ||||||
| Asset-Backed Securities (2.0%) - continued | |||||||
| Renaissance Home Equity Loan Trust | ||||||||
| $ 5,500,000 | 6.011%, 5/25/2036 | $ | 4,034,475 | |||||
| 2,490,200 | 5.580%, 11/25/2036 | 1,603,256 | ||||||
| SLM Student Loan Trust | ||||||||
| 3,312,619 | 0.752%, 8/15/2022d,e | 3,318,767 | ||||||
| 1,956,665 | 0.629%, 4/25/2023d,e | 1,959,827 | ||||||
| 1,350,000 | 1.202%, 5/17/2027d,e | 1,362,432 | ||||||
| U.S. Small Business Administration | ||||||||
| 430,000 | 3.191%, 3/10/2024 | 445,298 | ||||||
| Vericrest Opportunity Loan Transferee | ||||||||
| 2,175,000 | 3.125%, 4/27/2054d | 2,186,093 | ||||||
| Volvo Financial Equipment, LLC | ||||||||
| 1,950,000 | 0.740%, 3/15/2017d | 1,953,693 | ||||||
| World Financial Network Credit Card Master Trust | ||||||||
| 1,950,000 | 0.910%, 3/16/2020 | 1,954,075 | ||||||
| World Omni Automobile Lease Securitization Trust | ||||||||
| 2,100,000 | 1.400%, 2/15/2019 | 2,123,165 | ||||||
| World Omni Master Owner Trust | ||||||||
| 1,620,000 | 0.502%, 2/15/2018d,e | 1,621,869 | ||||||
|
| |||||||
| Total | 71,160,245 | |||||||
|
| |||||||
| Basic Materials (0.5%) | |||||||
| Anglo American Capital plc | ||||||||
| 550,000 | 1.176%, 4/15/2016d,e | 551,747 | ||||||
| First Quantum Minerals, Ltd. | ||||||||
| 847,000 | 6.750%, 2/15/2020d | 872,410 | ||||||
| 847,000 | 7.000%, 2/15/2021d | 871,351 | ||||||
| FMG Resources Pty. Ltd. | ||||||||
| 2,912,019 | 6.875%, 2/1/2018d,g | 3,057,620 | ||||||
| Freeport-McMoRan Copper & Gold, Inc. | ||||||||
| 1,759,000 | 2.375%, 3/15/2018 | 1,785,221 | ||||||
| Glencore Funding, LLC | ||||||||
| 625,000 | 1.700%, 5/27/2016d | 630,689 | ||||||
| 762,000 | 3.125%, 4/29/2019d | 777,088 | ||||||
| Hexion US Finance Corporation/Hexion Nova Scotia Finance ULC | ||||||||
| 1,500,000 | 8.875%, 2/1/2018 | 1,560,000 | ||||||
| Ineos Finance plc | ||||||||
| 1,500,000 | 7.500%, 5/1/2020d | 1,633,125 | ||||||
| International Paper Company | ||||||||
| 358,000 | 5.300%, 4/1/2015 | 370,806 | ||||||
| LyondellBasell Industries NV | ||||||||
| 1,020,000 | 6.000%, 11/15/2021 | 1,219,670 | ||||||
| Monsanto Company | ||||||||
| 505,000 | 1.150%, 6/30/2017 | 505,156 | ||||||
| Mosaic Company | ||||||||
| 1,095,000 | 5.450%, 11/15/2033 | 1,226,987 | ||||||
| Rio Tinto Finance USA plc | ||||||||
| 300,000 | 1.375%, 6/17/2016 | 303,242 | ||||||
| Sappi Papier Holding GmbH | ||||||||
| 845,000 | 6.625%, 4/15/2021d | 891,475 | ||||||
| Vale Overseas, Ltd. | ||||||||
| 938,000 | 6.250%, 1/23/2017 | 1,049,622 | ||||||
| Yamana Gold, Inc. | ||||||||
| 890,000 | 4.950%, 7/15/2024d | 895,852 | ||||||
|
| |||||||
| Total | 18,202,061 | |||||||
|
| |||||||
| Capital Goods (0.4%) | |||||||
| BAE Systems plc | ||||||||
| 620,000 | 3.500%, 10/11/2016d | 645,293 | ||||||
| Caterpillar, Inc. | ||||||||
| 508,000 | 3.400%, 5/15/2024 | 513,784 | ||||||
| CNH Capital, LLC | ||||||||
| 1,500,000 | 3.625%, 4/15/2018 | 1,531,875 | ||||||
| Eaton Corporation | ||||||||
| 508,000 | 4.000%, 11/2/2032 | 508,324 | ||||||
| Harsco Corporation | ||||||||
| 978,000 | 2.700%, 10/15/2015 | 986,557 | ||||||
| Ingersoll-Rand Global Holding Company, Ltd. | ||||||||
| 992,000 | 6.875%, 8/15/2018 | 1,181,870 | ||||||
| L-3 Communications Corporation | ||||||||
| 992,000 | 1.500%, 5/28/2017 | 993,357 | ||||||
| Martin Marietta Materials, Inc. | ||||||||
| 1,100,000 | 1.331%, 6/30/2017c,d,e | 1,099,355 | ||||||
| Reynolds Group Issuer, Inc. | ||||||||
| 1,412,019 | 5.750%, 10/15/2020 | 1,489,680 | ||||||
| Roper Industries, Inc. | ||||||||
| 1,016,000 | 2.050%, 10/1/2018 | 1,017,648 | ||||||
| RSC Equipment Rental, Inc. | ||||||||
| 1,500,000 | 8.250%, 2/1/2021 | 1,668,750 | ||||||
| Textron, Inc. | ||||||||
| 680,000 | 5.600%, 12/1/2017 | 764,574 | ||||||
|
| |||||||
| Total | 12,401,067 | |||||||
|
| |||||||
| Collateralized Mortgage Obligations (1.1%) | |||||||
| Alternative Loan Trust | ||||||||
| 2,105,685 | 6.000%, 6/25/2036 | 1,877,405 | ||||||
| Apidos CLO XVIII | ||||||||
| 825,000 | 1.643%, 7/22/2026c,e,f | 821,906 | ||||||
| Citigroup Mortgage Loan Trust, Inc. | ||||||||
| 667,483 | 5.500%, 11/25/2035 | 610,186 | ||||||
| CitiMortgage Alternative Loan Trust | ||||||||
| 2,286,049 | 5.750%, 4/25/2037 | 1,976,906 | ||||||
| Countrywide Alternative Loan Trust | ||||||||
| 3,229,492 | 5.265%, 10/25/2035 | 2,700,695 | ||||||
| 1,287,691 | 6.500%, 8/25/2036 | 944,516 | ||||||
| 428,036 | 6.000%, 1/25/2037 | 379,265 | ||||||
| 4,414,702 | 5.500%, 5/25/2037 | 3,711,829 | ||||||
| 2,457,168 | 7.000%, 10/25/2037 | 1,756,060 | ||||||
| Countrywide Home Loans, Inc. | ||||||||
| 857,250 | 5.750%, 4/25/2037 | 772,596 | ||||||
| Deutsche Alt-A Securities Mortgage Loan Trust | ||||||||
| 657,547 | 6.000%, 10/25/2021 | 587,627 | ||||||
| Deutsche Alt-A Securities, Inc., Mortgage Loan Trust | ||||||||
| 273,765 | 5.500%, 10/25/2021 | 268,670 | ||||||
| Federal Home Loan Mortgage Corporation | ||||||||
| 10,063,400 | 3.000%, 4/15/2028h | 1,201,308 | ||||||
| 6,513,017 | 3.000%, 2/15/2033h | 985,647 | ||||||
The accompanying Notes to Financial Statements are an integral part of this schedule.
83
Table of Contents
Moderately Conservative Allocation Portfolio
Schedule of Investments as of June 30, 2014
(unaudited)
| Principal Amount | Long-Term Fixed Income (36.0%) | Value | ||||||
| Collateralized Mortgage Obligations (1.1%) - continued | |||||||
| Federal National Mortgage Association | ||||||||
| $ 14,023,135 | 3.500%, 1/25/2033h | $ | 2,303,370 | |||||
| Greenpoint Mortgage Funding Trust | ||||||||
| 1,432,521 | 0.352%, 10/25/2045e | 1,125,778 | ||||||
| HomeBanc Mortgage Trust | ||||||||
| 1,232,713 | 2.240%, 4/25/2037 | 917,613 | ||||||
| J.P. Morgan Mortgage Trust | ||||||||
| 198,873 | 2.607%, 10/25/2036 | 167,636 | ||||||
| 3,505,156 | 0.532%, 1/25/2037e | 2,340,200 | ||||||
| 3,599,371 | 6.250%, 8/25/2037 | 2,582,952 | ||||||
| MASTR Alternative Loans Trust | ||||||||
| 474,407 | 6.500%, 7/25/2034 | 486,474 | ||||||
| 2,368,564 | 0.602%, 12/25/2035e | 1,342,902 | ||||||
| Merrill Lynch Alternative Note Asset Trust | ||||||||
| 506,898 | 6.000%, 3/25/2037 | 475,582 | ||||||
| Neuberger Berman CLO, Ltd. | ||||||||
| 700,000 | 1.701%, 8/4/2025c,e,i | 700,000 | ||||||
| Residential Accredit Loans, Inc. | ||||||||
| 944,778 | 5.750%, 9/25/2035 | 856,176 | ||||||
| Residential Asset Securitization Trust | ||||||||
| 3,132,694 | 0.532%, 8/25/2037e | 1,292,211 | ||||||
| Sequoia Mortgage Trust | ||||||||
| 99,772 | 2.740%, 9/20/2046 | 4,178 | ||||||
| 3,562,760 | 2.740%, 9/20/2046 | 3,045,291 | ||||||
| WaMu Mortgage Pass Through Certificates | ||||||||
| 502,201 | 2.344%, 9/25/2036 | 450,658 | ||||||
| 477,340 | 2.383%, 10/25/2036 | 416,422 | ||||||
| 1,552,074 | 2.049%, 11/25/2036 | 1,364,043 | ||||||
|
| |||||||
| Total | 38,466,102 | |||||||
|
| |||||||
| Commercial Mortgage-Backed Securities (1.5%) | |||||||
| Banc of America Commercial Mortgage, Inc. | ||||||||
| 4,600,000 | 5.781%, 4/10/2049 | 5,054,857 | ||||||
| 6,000,000 | 5.775%, 6/10/2049 | 6,603,612 | ||||||
| Bear Stearns Commercial Mortgage Securities, Inc. | ||||||||
| 1,926,295 | 5.331%, 2/11/2044 | 2,078,956 | ||||||
| Citigroup/Deutsche Bank Commercial Mortgage | ||||||||
| 1,700,000 | 5.322%, 12/11/2049 | 1,849,501 | ||||||
| Commercial Mortgage Pass- Through Certificates | ||||||||
| 2,340,000 | 1.201%, 6/8/2030d,e | 2,347,811 | ||||||
| Credit Suisse First Boston Mortgage Securities | ||||||||
| 4,600,000 | 5.542%, 1/15/2049 | 5,035,491 | ||||||
| Credit Suisse Mortgage Capital Certificates | ||||||||
| 5,800,000 | 5.509%, 9/15/2039 | 6,238,735 | ||||||
| Federal Home Loan Mortgage Corporation Multi Family Structured Pass Thru Certificates | ||||||||
| 2,513,840 | 0.727%, 12/25/2016 | 2,502,422 | ||||||
| Federal National Mortgage Association | ||||||||
| 1,674,449 | 0.478%, 9/25/2015 | 1,676,047 | ||||||
| 1,700,000 | 1.272%, 1/25/2017 | 1,715,693 | ||||||
| Government National Mortgage Association | ||||||||
| 46,792 | 2.164%, 3/16/2033 | 47,020 | ||||||
| 21,449 | 3.214%, 1/16/2040 | 21,738 | ||||||
| Greenwich Capital Commercial Funding Corporation | ||||||||
| 3,100,000 | 5.867%, 12/10/2049 | 3,425,844 | ||||||
| J.P. Morgan Chase Commercial Mortgage Securities Corporation | ||||||||
| 614,165 | 0.852%, 4/15/2028d,e | 613,482 | ||||||
| 1,450,000 | 1.102%, 12/15/2028d,e | 1,450,277 | ||||||
| 2,300,000 | 5.892%, 2/12/2049 | 2,504,571 | ||||||
| LSTAR Commercial Mortgage Trust | ||||||||
| 1,950,599 | 1.519%, 1/20/2041d | 1,952,257 | ||||||
| Morgan Stanley Capital, Inc. | ||||||||
| 1,750,000 | 5.406%, 3/15/2044 | 1,906,649 | ||||||
| SCG Trust | ||||||||
| 700,000 | 1.552%, 11/15/2026d,e | 702,884 | ||||||
| Wachovia Bank Commercial Mortgage Trust | ||||||||
| 3,450,000 | 5.603%, 10/15/2048 | 3,725,231 | ||||||
|
| |||||||
| Total | 51,453,078 | |||||||
|
| |||||||
| Communications Services (1.1%) | |||||||
| AMC Networks, Inc. | ||||||||
| 1,500,000 | 4.750%, 12/15/2022 | 1,500,000 | ||||||
| America Movil SAB de CV | ||||||||
| 750,000 | 1.230%, 9/12/2016e | 758,988 | ||||||
| 889,000 | 5.000%, 10/16/2019 | 999,467 | ||||||
| American Tower Corporation | ||||||||
| 1,364,000 | 7.000%, 10/15/2017 | 1,587,362 | ||||||
| AT&T, Inc. | ||||||||
| 415,000 | 1.137%, 11/27/2018e | 423,083 | ||||||
| 963,000 | 3.875%, 8/15/2021 | 1,024,491 | ||||||
| British Telecommunications plc | ||||||||
| 635,000 | 1.625%, 6/28/2016 | 643,747 | ||||||
| 280,000 | 1.250%, 2/14/2017 | 280,252 | ||||||
| CBS Corporation | ||||||||
| 806,000 | 8.875%, 5/15/2019 | 1,044,899 | ||||||
| CC Holdings GS V, LLC | ||||||||
| 653,000 | 2.381%, 12/15/2017 | 664,983 | ||||||
| CCO Holdings, LLC | ||||||||
| 1,500,000 | 7.375%, 6/1/2020 | 1,635,000 | ||||||
| CenturyLink, Inc. | ||||||||
| 1,150,000 | 6.450%, 6/15/2021 | 1,247,750 | ||||||
| Comcast Corporation | ||||||||
| 418,000 | 4.650%, 7/15/2042 | 433,378 | ||||||
| 792,000 | 4.750%, 3/1/2044 | 837,664 | ||||||
| Cox Communications, Inc. | ||||||||
| 852,000 | 9.375%, 1/15/2019d | 1,103,417 | ||||||
| Crown Castle Towers, LLC | ||||||||
| 480,000 | 4.174%, 8/15/2017d | 509,660 | ||||||
| DIRECTV Holdings, LLC | ||||||||
| 792,000 | 1.750%, 1/15/2018 | 793,090 | ||||||
| 600,000 | 5.875%, 10/1/2019 | 697,865 | ||||||
| 381,000 | 4.450%, 4/1/2024 | 403,984 | ||||||
The accompanying Notes to Financial Statements are an integral part of this schedule.
84
Table of Contents
Moderately Conservative Allocation Portfolio
Schedule of Investments as of June 30, 2014
(unaudited)
| Principal Amount | Long-Term Fixed Income (36.0%) | Value | ||||||
| Communications Services (1.1%) - continued | |||||||
| Hughes Satellite Systems Corporation | ||||||||
| $ 1,500,000 | 6.500%, 6/15/2019 | $ | 1,672,500 | |||||
| Intelsat Jackson Holdings SA | ||||||||
| 1,500,000 | 7.250%, 4/1/2019 | 1,595,625 | ||||||
| Level 3 Financing, Inc. | ||||||||
| 1,500,000 | 8.625%, 7/15/2020 | 1,680,000 | ||||||
| NBC Universal Enterprise, Inc. | ||||||||
| 1,170,000 | 0.912%, 4/15/2018d,e | 1,183,021 | ||||||
| Nippon Telegraph & Telephone Corporation | ||||||||
| 504,000 | 1.400%, 7/18/2017 | 506,978 | ||||||
| Numericable Group SA | ||||||||
| 875,000 | 6.000%, 5/15/2022d | 910,000 | ||||||
| SBA Tower Trust | ||||||||
| 505,000 | 5.101%, 4/17/2017d | 540,758 | ||||||
| SES Global Americas Holdings GP | ||||||||
| 620,000 | 2.500%, 3/25/2019d | 624,416 | ||||||
| Sprint Communications, Inc. | ||||||||
| 1,412,019 | 9.000%, 11/15/2018d | 1,712,073 | ||||||
| Telefonica Emisiones SAU | ||||||||
| 858,000 | 3.992%, 2/16/2016 | 898,324 | ||||||
| 858,000 | 3.192%, 4/27/2018 | 896,674 | ||||||
| Time Warner Cable, Inc. | ||||||||
| 660,000 | 5.000%, 2/1/2020 | 739,602 | ||||||
| 1,056,000 | 6.550%, 5/1/2037 | 1,313,971 | ||||||
| Unitymedia Hessen GmbH & Company KG | ||||||||
| 875,000 | 5.500%, 1/15/2023d | 905,625 | ||||||
| Univision Communications, Inc. | ||||||||
| 1,500,000 | 6.875%, 5/15/2019d | 1,601,250 | ||||||
| UPCB Finance V, Ltd. | ||||||||
| 1,500,000 | 7.250%, 11/15/2021d | 1,650,000 | ||||||
| Verizon Communications, Inc. | ||||||||
| 150,000 | 1.350%, 6/9/2017 | 149,950 | ||||||
| 398,000 | 1.100%, 11/1/2017 | 394,366 | ||||||
| 564,000 | 1.981%, 9/14/2018e | 595,052 | ||||||
| 282,000 | 3.650%, 9/14/2018 | 301,594 | ||||||
| 590,000 | 1.002%, 6/17/2019e | 597,163 | ||||||
| 996,000 | 6.400%, 9/15/2033 | 1,220,038 | ||||||
| 508,000 | 5.050%, 3/15/2034 | 542,171 | ||||||
| 282,000 | 6.550%, 9/15/2043 | 354,880 | ||||||
| Viacom, Inc. | ||||||||
| 508,000 | 2.500%, 9/1/2018 | 519,225 | ||||||
|
| |||||||
| Total | 39,694,336 | |||||||
|
| |||||||
| Consumer Cyclical (0.9%) | |||||||
| American Honda Finance Corporation | ||||||||
| 1,560,000 | 0.602%, 5/26/2016d,e | 1,566,722 | ||||||
| Chrysler Group, LLC | ||||||||
| 1,430,000 | 8.000%, 6/15/2019 | 1,553,337 | ||||||
| Cinemark USA, Inc. | ||||||||
| 1,500,000 | 4.875%, 6/1/2023 | 1,496,250 | ||||||
| Daimler Finance North America, LLC | ||||||||
| 1,200,000 | 1.085%, 8/1/2018d,e | 1,212,529 | ||||||
| Delphi Corporation | ||||||||
| 858,000 | 6.125%, 5/15/2021 | 958,901 | ||||||
| Ford Motor Company | ||||||||
| 515,000 | 7.450%, 7/16/2031 | 688,518 | ||||||
| Ford Motor Credit Company, LLC | ||||||||
| 884,000 | 12.000%, 5/15/2015 | 971,189 | ||||||
| 1,170,000 | 1.474%, 5/9/2016e | 1,187,245 | ||||||
| 875,000 | 2.375%, 1/16/2018 | 893,821 | ||||||
| 680,000 | 5.000%, 5/15/2018 | 756,467 | ||||||
| Gap, Inc. | ||||||||
| 725,000 | 5.950%, 4/12/2021 | 839,031 | ||||||
| General Motors Company | ||||||||
| 423,000 | 3.500%, 10/2/2018d | 432,518 | ||||||
| 992,000 | 6.250%, 10/2/2043d | 1,138,320 | ||||||
| General Motors Financial Company, Inc. | ||||||||
| 1,500,000 | 3.250%, 5/15/2018 | 1,522,500 | ||||||
| Home Depot, Inc. | ||||||||
| 633,000 | 4.875%, 2/15/2044 | 689,786 | ||||||
| Hyundai Capital America | ||||||||
| 1,233,000 | 1.450%, 2/6/2017d | 1,237,645 | ||||||
| Jaguar Land Rover Automotive plc | ||||||||
| 1,500,000 | 5.625%, 2/1/2023d | 1,593,750 | ||||||
| KB Home | ||||||||
| 729,000 | 4.750%, 5/15/2019 | 734,468 | ||||||
| L Brands, Inc. | ||||||||
| 1,500,000 | 5.625%, 2/15/2022 | 1,623,750 | ||||||
| Lennar Corporation | ||||||||
| 1,500,000 | 4.125%, 12/1/2018g | 1,531,875 | ||||||
| Macy’s Retail Holdings, Inc. | ||||||||
| 375,000 | 4.375%, 9/1/2023 | 397,395 | ||||||
| 992,000 | 3.625%, 6/1/2024 | 986,978 | ||||||
| Nissan Motor Acceptance Corporation | ||||||||
| 890,000 | 0.777%, 3/3/2017d,e | 892,593 | ||||||
| Toll Brothers Finance Corporation | ||||||||
| 580,000 | 8.910%, 10/15/2017 | 696,000 | ||||||
| 462,000 | 4.000%, 12/31/2018 | 475,860 | ||||||
| Toyota Motor Credit Corporation | ||||||||
| 950,000 | 0.425%, 5/16/2017e | 950,255 | ||||||
| 325,000 | 1.750%, 5/22/2017 | 331,248 | ||||||
| TRW Automotive, Inc. | ||||||||
| 669,000 | 7.250%, 3/15/2017d | 760,987 | ||||||
| Walgreen Company | ||||||||
| 862,000 | 5.250%, 1/15/2019 | 978,107 | ||||||
| Western Union Company | ||||||||
| 636,000 | 2.375%, 12/10/2015 | 648,787 | ||||||
| WMG Acquisition Corporation | ||||||||
| 690,000 | 6.750%, 4/15/2022d | 690,000 | ||||||
| Wynn Las Vegas, LLC | ||||||||
| 1,500,000 | 5.375%, 3/15/2022g | 1,561,875 | ||||||
|
| |||||||
| Total | 31,998,707 | |||||||
|
| |||||||
| Consumer Non-Cyclical (1.1%) | |||||||
| AbbVie, Inc. | ||||||||
| 741,000 | 2.000%, 11/6/2018 | 740,083 | ||||||
| Altria Group, Inc. | ||||||||
| 599,000 | 9.700%, 11/10/2018 | 784,889 | ||||||
| 895,000 | 4.000%, 1/31/2024 | 919,639 | ||||||
| Amgen, Inc. | ||||||||
| 580,000 | 0.828%, 5/22/2019e | 581,386 | ||||||
| Anheuser-Busch InBev Finance, Inc. | ||||||||
| 501,000 | 0.623%, 2/1/2019e | 501,228 | ||||||
| Anheuser-Busch InBev Worldwide, Inc. | ||||||||
| 1,015,000 | 7.750%, 1/15/2019 | 1,253,966 | ||||||
The accompanying Notes to Financial Statements are an integral part of this schedule.
85
Table of Contents
Moderately Conservative Allocation Portfolio
Schedule of Investments as of June 30, 2014
(unaudited)
| Principal Amount | Long-Term Fixed Income (36.0%) | Value | ||||||
| Consumer Non-Cyclical (1.1%) - continued | |||||||
| Boston Scientific Corporation | ||||||||
| $ 635,000 | 2.650%, 10/1/2018 | $ | 649,119 | |||||
| Bunge Limited Finance Corporation | ||||||||
| 762,000 | 8.500%, 6/15/2019 | 957,547 | ||||||
| CareFusion Corporation | ||||||||
| 496,000 | 1.450%, 5/15/2017 | 495,629 | ||||||
| 744,000 | 6.375%, 8/1/2019 | 871,060 | ||||||
| Celgene Corporation | ||||||||
| 1,005,000 | 1.900%, 8/15/2017 | 1,019,663 | ||||||
| 282,000 | 2.300%, 8/15/2018 | 286,562 | ||||||
| CHS/Community Health Systems, Inc. | ||||||||
| 1,500,000 | 7.125%, 7/15/2020 | 1,623,750 | ||||||
| ConAgra Foods, Inc. | ||||||||
| 870,000 | 1.900%, 1/25/2018 | 872,098 | ||||||
| Coventry Health Care, Inc. | ||||||||
| 852,000 | 5.950%, 3/15/2017 | 957,933 | ||||||
| CVS Caremark Corporation | ||||||||
| 84,000 | 1.200%, 12/5/2016 | 84,513 | ||||||
| 508,000 | 6.125%, 9/15/2039 | 632,549 | ||||||
| Endo Finance LLC & Endo Finco, Inc. | ||||||||
| 1,500,000 | 7.000%, 7/15/2019d | 1,603,125 | ||||||
| Express Scripts Holding Company | ||||||||
| 508,000 | 2.650%, 2/15/2017 | 527,763 | ||||||
| 330,000 | 1.250%, 6/2/2017 | 329,420 | ||||||
| 100,000 | 2.250%, 6/15/2019 | 99,582 | ||||||
| Forest Laboratories, Inc. | ||||||||
| 1,000,000 | 4.375%, 2/1/2019d | 1,078,810 | ||||||
| Fresenius Medical Care US Finance II, Inc. | ||||||||
| 1,500,000 | 5.875%, 1/31/2022d | 1,657,500 | ||||||
| Hawk Acquisition Sub, Inc. | ||||||||
| 1,502,019 | 4.250%, 10/15/2020 | 1,511,407 | ||||||
| IMS Health, Inc. | ||||||||
| 859,000 | 6.000%, 11/1/2020d | 901,950 | ||||||
| Kroger Company | ||||||||
| 410,000 | 0.756%, 10/17/2016e | 410,936 | ||||||
| 572,000 | 1.200%, 10/17/2016 | 573,878 | ||||||
| Lorillard Tobacco Company | ||||||||
| 604,000 | 2.300%, 8/21/2017g | 616,464 | ||||||
| 635,000 | 8.125%, 6/23/2019 | 791,689 | ||||||
| Mattel, Inc. | ||||||||
| 590,000 | 1.700%, 3/15/2018 | 587,478 | ||||||
| McKesson Corporation | ||||||||
| 325,000 | 1.292%, 3/10/2017 | 325,859 | ||||||
| Medco Health Solutions, Inc. | ||||||||
| 1,110,000 | 7.125%, 3/15/2018 | 1,311,155 | ||||||
| Mondelez International, Inc. | ||||||||
| 418,000 | 0.745%, 2/1/2019e | 417,063 | ||||||
| Monsanto Company | ||||||||
| 500,000 | 2.125%, 7/15/2019 | 501,235 | ||||||
| Mylan, Inc. | ||||||||
| 508,000 | 2.600%, 6/24/2018 | 515,995 | ||||||
| 626,000 | 7.875%, 7/15/2020d | 692,894 | ||||||
| Pernod Ricard SA | ||||||||
| 600,000 | 2.950%, 1/15/2017d | 623,957 | ||||||
| 508,000 | 5.750%, 4/7/2021d | 583,971 | ||||||
| Perrigo Company, Ltd. | ||||||||
| 1,421,000 | 1.300%, 11/8/2016d | 1,418,884 | ||||||
| 603,000 | 2.300%, 11/8/2018d | 602,752 | ||||||
| Roche Holdings, Inc. | ||||||||
| 290,000 | 7.000%, 3/1/2039d | 412,255 | ||||||
| SABMiller Holdings, Inc. | ||||||||
| 930,000 | 2.450%, 1/15/2017d | 958,359 | ||||||
| Safeway, Inc. | ||||||||
| 290,000 | 3.400%, 12/1/2016 | 305,173 | ||||||
| Spectrum Brands Escrow Corporation | ||||||||
| 1,500,000 | 6.375%, 11/15/2020 | 1,612,500 | ||||||
| Thermo Fisher Scientific, Inc. | ||||||||
| 762,000 | 1.300%, 2/1/2017 | 763,123 | ||||||
| 762,000 | 2.400%, 2/1/2019 | 769,754 | ||||||
| Valeant Pharmaceuticals International | ||||||||
| 1,410,000 | 6.875%, 12/1/2014d | 1,475,212 | ||||||
| WM Wrigley Jr. Company | ||||||||
| 965,000 | 1.400%, 10/21/2016d | 971,684 | ||||||
| 705,000 | 2.000%, 10/20/2017d | 715,345 | ||||||
|
| |||||||
| Total | 38,898,786 | |||||||
|
| |||||||
| Energy (0.8%) | |||||||
| BP Capital Markets plc | ||||||||
| 596,000 | 1.375%, 11/6/2017 | 596,840 | ||||||
| Buckeye Partners, LP | ||||||||
| 846,000 | 2.650%, 11/15/2018 | 860,108 | ||||||
| Canadian Natural Resources, Ltd. | ||||||||
| 415,000 | 0.609%, 3/30/2016e | 415,899 | ||||||
| CNOOC Nexen Finance 2014 ULC | ||||||||
| 762,000 | 1.625%, 4/30/2017 | 763,956 | ||||||
| CNPC General Capital, Ltd. | ||||||||
| 496,000 | 1.450%, 4/16/2016d | 496,689 | ||||||
| 496,000 | 2.750%, 4/19/2017d | 508,875 | ||||||
| Concho Resources, Inc. | ||||||||
| 1,412,019 | 5.500%, 10/1/2022 | 1,519,685 | ||||||
| Continental Resources, Inc. | ||||||||
| 992,000 | 5.000%, 9/15/2022 | 1,078,800 | ||||||
| Devon Energy Corporation | ||||||||
| 1,144,000 | 1.200%, 12/15/2016 | 1,147,467 | ||||||
| Ecopetrol SA | ||||||||
| 496,000 | 5.875%, 5/28/2045 | 513,003 | ||||||
| Enbridge, Inc. | ||||||||
| 896,000 | 0.678%, 6/2/2017e | 897,804 | ||||||
| EQT Corporation | ||||||||
| 500,000 | 5.150%, 3/1/2018 | 545,554 | ||||||
| 754,000 | 8.125%, 6/1/2019 | 943,410 | ||||||
| Hess Corporation | ||||||||
| 1,005,000 | 8.125%, 2/15/2019 | 1,264,254 | ||||||
| Linn Energy, LLC | ||||||||
| 1,412,019 | 6.250%, 11/1/2019d | 1,479,090 | ||||||
| Lukoil International Finance BV | ||||||||
| 725,000 | 3.416%, 4/24/2018d | 719,563 | ||||||
| MEG Energy Corporation | ||||||||
| 1,500,000 | 6.500%, 3/15/2021d | 1,590,000 | ||||||
| Murphy Oil Corporation | ||||||||
| 403,000 | 2.500%, 12/1/2017 | 412,471 | ||||||
| Oasis Petroleum, Inc. | ||||||||
| 1,500,000 | 6.875%, 1/15/2023 | 1,635,000 | ||||||
| Offshore Group Investment, Ltd. | ||||||||
| 1,500,000 | 7.500%, 11/1/2019g | 1,586,250 | ||||||
| Petrobras Global Finance BV | ||||||||
| 1,200,000 | 2.000%, 5/20/2016 | 1,201,733 | ||||||
| 505,000 | 3.112%, 3/17/2020e,g | 518,862 | ||||||
The accompanying Notes to Financial Statements are an integral part of this schedule.
86
Table of Contents
Moderately Conservative Allocation Portfolio
Schedule of Investments as of June 30, 2014
(unaudited)
| Principal Amount | Long-Term Fixed Income (36.0%) | Value | ||||||
| Energy (0.8%) - continued | |||||||
| Petroleos Mexicanos | ||||||||
| $ 426,000 | 3.500%, 7/18/2018 | $ | 447,726 | |||||
| Pioneer Natural Resources Company | ||||||||
| 255,000 | 5.875%, 7/15/2016 | 279,040 | ||||||
| Range Resources Corporation | ||||||||
| 1,500,000 | 5.000%, 8/15/2022 | 1,590,000 | ||||||
| Sinopec Capital 2013, Ltd. | ||||||||
| 870,000 | 1.250%, 4/24/2016d | 870,296 | ||||||
| Suncor Energy, Inc. | ||||||||
| 576,000 | 6.100%, 6/1/2018 | 668,485 | ||||||
| Total Capital International SA | ||||||||
| 410,000 | 0.580%, 6/19/2019e | 409,997 | ||||||
| Transocean, Inc. | ||||||||
| 1,029,000 | 6.000%, 3/15/2018 | 1,162,285 | ||||||
| Weatherford International, Ltd. | ||||||||
| 744,000 | 9.625%, 3/1/2019 | 976,348 | ||||||
| Williams Companies, Inc. | ||||||||
| 496,000 | 3.700%, 1/15/2023 | 477,121 | ||||||
|
| |||||||
| Total | 27,576,611 | |||||||
|
| |||||||
| Financials (4.1%) | |||||||
| Abbey National Treasury Services plc | ||||||||
| 564,000 | 3.050%, 8/23/2018 | 590,634 | ||||||
| ABN AMRO Bank NV | ||||||||
| 958,000 | 2.500%, 10/30/2018d | 972,054 | ||||||
| Achmea Hypotheekbank NV | ||||||||
| 220,000 | 3.200%, 11/3/2014d | 222,096 | ||||||
| American Express Credit Corporation | ||||||||
| 325,000 | 2.375%, 3/24/2017 | 335,989 | ||||||
| 590,000 | 0.781%, 3/18/2019e | 593,274 | ||||||
| American International Group, Inc. | ||||||||
| 705,000 | 3.800%, 3/22/2017 | 753,369 | ||||||
| 1,240,000 | 8.250%, 8/15/2018 | 1,540,587 | ||||||
| ANZ National International, Ltd. of London | ||||||||
| 635,000 | 3.125%, 8/10/2015d | 653,228 | ||||||
| ANZ New Zealand International, Ltd. | ||||||||
| 924,000 | 1.400%, 4/27/2017d | 925,761 | ||||||
| Australia and New Zealand Banking Group, Ltd. | ||||||||
| 780,000 | 0.490%, 6/13/2017d,e | 779,538 | ||||||
| Aviation Capital Group Corporation | ||||||||
| 564,000 | 3.875%, 9/27/2016d | 583,740 | ||||||
| Banco Santander Chile | ||||||||
| 710,000 | 1.127%, 4/11/2017d,e | 709,999 | ||||||
| Bank Nederlandse Gemeenten NV | ||||||||
| 384,000 | 1.375%, 3/19/2018d | 384,287 | ||||||
| Bank of America Corporation | ||||||||
| 1,041,000 | 7.750%, 8/15/2015 | 1,118,712 | ||||||
| 680,000 | 5.750%, 8/15/2016 | 741,931 | ||||||
| 1,016,000 | 5.700%, 5/2/2017 | 1,127,475 | ||||||
| 1,490,000 | 5.750%, 12/1/2017 | 1,680,601 | ||||||
| 1,544,000 | 1.300%, 3/22/2018e | 1,563,879 | ||||||
| 1,484,000 | 5.650%, 5/1/2018 | 1,682,169 | ||||||
| 500,000 | 1.103%, 4/1/2019e | 503,242 | ||||||
| 508,000 | 4.000%, 4/1/2024 | 518,430 | ||||||
| 552,000 | 5.875%, 2/7/2042 | 655,550 | ||||||
| Bank of Montreal | ||||||||
| 800,000 | 0.829%, 4/9/2018e | 805,359 | ||||||
| Bank of Tokyo-Mitsubishi UFJ, Ltd. | ||||||||
| 1,320,000 | 0.640%, 3/10/2017d,e | 1,319,663 | ||||||
| Banque Federative du Credit Mutuel SA | ||||||||
| 858,000 | 1.078%, 1/20/2017d,e | 865,356 | ||||||
| Barclays Bank plc | ||||||||
| 770,000 | 10.179%, 6/12/2021d | 1,065,072 | ||||||
| BBVA Banco Continental SA | ||||||||
| 930,000 | 2.250%, 7/29/2016d | 936,975 | ||||||
| BBVA US Senior SAU | ||||||||
| 1,136,000 | 4.664%, 10/9/2015 | 1,187,703 | ||||||
| Berkshire Hathaway Finance Corporation | ||||||||
| 660,000 | 1.600%, 5/15/2017 | 670,380 | ||||||
| 1,170,000 | 1.300%, 5/15/2018 | 1,159,936 | ||||||
| BioMed Realty, LP | ||||||||
| 762,000 | 2.625%, 5/1/2019 | 766,581 | ||||||
| BNP Paribas SA | ||||||||
| 672,000 | 1.250%, 12/12/2016 | 672,857 | ||||||
| 1,031,000 | 2.375%, 9/14/2017 | 1,055,745 | ||||||
| BPCE SA | ||||||||
| 500,000 | 1.073%, 2/10/2017e,g | 504,246 | ||||||
| 1,056,000 | 1.625%, 2/10/2017 | 1,063,772 | ||||||
| Canadian Imperial Bank of Commerce | ||||||||
| 220,000 | 2.600%, 7/2/2015d | 225,016 | ||||||
| Capital One Bank USA NA | ||||||||
| 505,000 | 1.200%, 2/13/2017 | 504,978 | ||||||
| Capital One Financial Corporation | ||||||||
| 780,000 | 0.680%, 3/22/2016e | 781,813 | ||||||
| 1,149,000 | 6.150%, 9/1/2016 | 1,271,558 | ||||||
| 635,000 | 2.450%, 4/24/2019 | 640,956 | ||||||
| Citigroup, Inc. | ||||||||
| 2,728,000 | 5.500%, 2/15/2017 | 3,000,153 | ||||||
| 500,000 | 0.770%, 3/10/2017e | 500,271 | ||||||
| 571,000 | 6.000%, 8/15/2017 | 646,299 | ||||||
| 415,000 | 1.000%, 4/8/2019e | 415,579 | ||||||
| 1,005,000 | 8.500%, 5/22/2019 | 1,284,582 | ||||||
| 690,000 | 4.050%, 7/30/2022 | 706,902 | ||||||
| CoBank ACB | ||||||||
| 395,000 | 0.831%, 6/15/2022e,f | 363,894 | ||||||
| Cooperatieve Centrale Raiffeisen-Boerenleenbank BA | ||||||||
| 650,000 | 3.950%, 11/9/2022 | 660,808 | ||||||
| Credit Agricole SA | ||||||||
| 1,000,000 | 1.625%, 4/15/2016d | 1,013,269 | ||||||
| 485,000 | 1.027%, 4/15/2019d,e | 488,697 | ||||||
| Credit Suisse AG | ||||||||
| 652,000 | 5.400%, 1/14/2020 | 732,654 | ||||||
| CyrusOne, LP | ||||||||
| 1,500,000 | 6.375%, 11/15/2022 | 1,616,250 | ||||||
| DDR Corporation | ||||||||
| 992,000 | 9.625%, 3/15/2016 | 1,135,063 | ||||||
| Deutsche Bank AG | ||||||||
| 1,000,000 | 1.350%, 5/30/2017 | 999,668 | ||||||
| Discover Bank | ||||||||
| 635,000 | 8.700%, 11/18/2019 | 807,054 | ||||||
| Discover Financial Services | ||||||||
| 526,000 | 6.450%, 6/12/2017 | 598,338 | ||||||
The accompanying Notes to Financial Statements are an integral part of this schedule.
87
Table of Contents
Moderately Conservative Allocation Portfolio
Schedule of Investments as of June 30, 2014
(unaudited)
| Principal Amount | Long-Term Fixed Income (36.0%) | Value | ||||||
| Financials (4.1%) - continued | |||||||
| DnB Boligkreditt AS | ||||||||
| $ 1,024,000 | 1.450%, 3/21/2018d | $ | 1,019,163 | |||||
| Eksportfinans ASA | ||||||||
| 330,000 | 3.000%, 11/17/2014 | 332,013 | ||||||
| 465,000 | 5.500%, 5/25/2016 | 495,225 | ||||||
| Fifth Third Bancorp | ||||||||
| 755,000 | 5.450%, 1/15/2017 | 827,639 | ||||||
| General Electric Capital Corporation | ||||||||
| 1,116,000 | 0.504%, 5/15/2017e | 1,116,934 | ||||||
| 2,265,000 | 6.000%, 8/7/2019 | 2,683,001 | ||||||
| 1,170,000 | 1.231%, 3/15/2023e | 1,172,914 | ||||||
| 1,080,000 | 6.750%, 3/15/2032 | 1,424,692 | ||||||
| Genworth Financial, Inc. | ||||||||
| 1,056,000 | 7.700%, 6/15/2020 | 1,301,403 | ||||||
| Goldman Sachs Group, Inc. | ||||||||
| 750,000 | 2.375%, 1/22/2018 | 761,652 | ||||||
| 1,170,000 | 1.425%, 4/30/2018e | 1,188,891 | ||||||
| 430,000 | 1.324%, 11/15/2018e | 435,873 | ||||||
| 740,000 | 7.500%, 2/15/2019 | 903,063 | ||||||
| 950,000 | 5.375%, 3/15/2020 | 1,076,138 | ||||||
| 1,010,000 | 5.250%, 7/27/2021 | 1,134,162 | ||||||
| Hartford Financial Services Group, Inc. | ||||||||
| 715,000 | 4.000%, 10/15/2017 | 771,531 | ||||||
| 700,000 | 5.125%, 4/15/2022 | 795,979 | ||||||
| HBOS plc | ||||||||
| 744,000 | 6.750%, 5/21/2018d | 857,110 | ||||||
| HCP, Inc. | ||||||||
| 284,000 | 6.000%, 1/30/2017 | 317,920 | ||||||
| 250,000 | 6.700%, 1/30/2018 | 291,504 | ||||||
| Health Care REIT, Inc. | ||||||||
| 930,000 | 4.700%, 9/15/2017 | 1,017,349 | ||||||
| 268,000 | 2.250%, 3/15/2018 | 272,108 | ||||||
| HSBC Bank plc | ||||||||
| 1,065,000 | 0.864%, 5/15/2018d,e | 1,074,800 | ||||||
| HSBC Finance Corporation | ||||||||
| 1,246,000 | 6.676%, 1/15/2021 | 1,490,093 | ||||||
| HSBC Holdings plc | ||||||||
| 606,000 | 5.250%, 3/14/2044 | 648,905 | ||||||
| HSBC USA, Inc. | ||||||||
| 705,000 | 1.625%, 1/16/2018 | 706,578 | ||||||
| Huntington Bancshares, Inc. | ||||||||
| 282,000 | 2.600%, 8/2/2018 | 286,781 | ||||||
| Huntington National Bank | ||||||||
| 757,000 | 1.350%, 8/2/2016 | 762,317 | ||||||
| Icahn Enterprises, LP | ||||||||
| 1,100,000 | 6.000%, 8/1/2020 | 1,178,375 | ||||||
| ING Bank NV | ||||||||
| 762,000 | 4.125%, 11/21/2023 | 783,908 | ||||||
| ING Capital Funding Trust III | ||||||||
| 825,000 | 3.834%, 12/29/2049e,j | 825,000 | ||||||
| International Lease Finance Corporation | ||||||||
| 1,093,000 | 2.181%, 6/15/2016e | 1,099,831 | ||||||
| Intesa Sanpaolo SPA | ||||||||
| 762,000 | 3.125%, 1/15/2016 | 783,263 | ||||||
| 381,000 | 3.875%, 1/16/2018 | 401,550 | ||||||
| 705,000 | 3.875%, 1/15/2019 | 739,350 | ||||||
| J.P. Morgan Chase & Company | ||||||||
| 690,000 | 1.125%, 2/26/2016 | 693,246 | ||||||
| 930,000 | 3.450%, 3/1/2016 | 970,474 | ||||||
| 660,000 | 0.744%, 2/15/2017e | 662,401 | ||||||
| 1,437,000 | 2.000%, 8/15/2017 | 1,461,361 | ||||||
| 475,000 | 1.800%, 1/25/2018 | 477,296 | ||||||
| 1,240,000 | 6.300%, 4/23/2019 | 1,466,078 | ||||||
| 310,000 | 3.200%, 1/25/2023 | 307,791 | ||||||
| KeyBank NA | ||||||||
| 1,176,000 | 7.413%, 5/6/2015 | 1,242,606 | ||||||
| Kookmin Bank | ||||||||
| 828,000 | 1.103%, 1/27/2017d,e | 832,518 | ||||||
| Liberty Mutual Group, Inc. | ||||||||
| 252,000 | 4.950%, 5/1/2022d | 275,627 | ||||||
| 300,000 | 6.500%, 5/1/2042d | 376,230 | ||||||
| Liberty Property, LP | ||||||||
| 815,000 | 5.500%, 12/15/2016 | 889,818 | ||||||
| Lloyds Banking Group plc | ||||||||
| 744,000 | 5.920%, 9/29/2049d,j | 751,440 | ||||||
| Macquarie Bank, Ltd. | ||||||||
| 750,000 | 5.000%, 2/22/2017d | 817,350 | ||||||
| 740,000 | 1.021%, 3/24/2017d,e | 742,381 | ||||||
| Manufacturers and Traders Trust Company | ||||||||
| 420,000 | 0.600%, 1/30/2017e | 420,379 | ||||||
| MasterCard, Inc. | ||||||||
| 395,000 | 2.000%, 4/1/2019 | 396,608 | ||||||
| Merrill Lynch & Company, Inc. | ||||||||
| 1,962,000 | 6.050%, 5/16/2016 | 2,134,003 | ||||||
| 705,000 | 6.400%, 8/28/2017 | 805,307 | ||||||
| Metropolitan Life Global Funding I | ||||||||
| 495,000 | 0.365%, 6/23/2016c,d,e | 494,805 | ||||||
| 675,000 | 0.607%, 4/10/2017d,e | 676,483 | ||||||
| 762,000 | 1.300%, 4/10/2017d | 763,756 | ||||||
| Mizuho Bank, Ltd. | ||||||||
| 485,000 | 0.659%, 4/16/2017d,e | 485,401 | ||||||
| Mizuho Corporate Bank, Ltd. | ||||||||
| 762,000 | 1.850%, 3/21/2018d | 765,008 | ||||||
| Morgan Stanley | ||||||||
| 381,000 | 1.750%, 2/25/2016 | 386,411 | ||||||
| 1,075,000 | 4.750%, 3/22/2017 | 1,170,394 | ||||||
| 680,000 | 6.250%, 8/28/2017 | 774,984 | ||||||
| 992,000 | 6.625%, 4/1/2018 | 1,159,621 | ||||||
| 780,000 | 1.509%, 4/25/2018e | 795,466 | ||||||
| 660,000 | 4.875%, 11/1/2022 | 708,456 | ||||||
| 889,000 | 4.100%, 5/22/2023 | 901,813 | ||||||
| Murray Street Investment Trust I | ||||||||
| 1,880,000 | 4.647%, 3/9/2017 | 2,031,870 | ||||||
| National City Corporation | ||||||||
| 1,096,000 | 6.875%, 5/15/2019 | 1,308,977 | ||||||
| Nomura Holdings, Inc. | ||||||||
| 1,170,000 | 1.680%, 9/13/2016e | 1,189,397 | ||||||
| 762,000 | 2.000%, 9/13/2016 | 774,436 | ||||||
| 635,000 | 2.750%, 3/19/2019 | 645,984 | ||||||
| Nordea Eiendomskreditt AS | ||||||||
| 768,000 | 2.125%, 9/22/2016d | 789,398 | ||||||
| PNC Bank NA | ||||||||
| 1,621,000 | 1.150%, 11/1/2016 | 1,629,379 | ||||||
| Prologis, LP | ||||||||
| 950,000 | 7.375%, 10/30/2019 | 1,174,300 | ||||||
| Prudential Covered Trust | ||||||||
| 936,000 | 2.997%, 9/30/2015f | 958,764 | ||||||
| Realty Income Corporation | ||||||||
| 265,000 | 2.000%, 1/31/2018 | 266,253 | ||||||
| Regions Bank | ||||||||
| 1,345,000 | 7.500%, 5/15/2018 | 1,600,835 | ||||||
The accompanying Notes to Financial Statements are an integral part of this schedule.
88
Table of Contents
Moderately Conservative Allocation Portfolio
Schedule of Investments as of June 30, 2014
(unaudited)
| Principal Amount | Long-Term Fixed Income (36.0%) | Value | ||||||
| Financials (4.1%) - continued | |||||||
| Reinsurance Group of America, Inc. | ||||||||
| $ 400,000 | 5.625%, 3/15/2017 | $ | 436,790 | |||||
| 792,000 | 5.000%, 6/1/2021 | 873,434 | ||||||
| Reliance Standard Life Global Funding II | ||||||||
| 395,000 | 2.500%, 4/24/2019d | 396,247 | ||||||
| Royal Bank of Canada | ||||||||
| 1,280,000 | 1.125%, 7/22/2016 | 1,290,180 | ||||||
| 889,000 | 2.200%, 7/27/2018 | 907,822 | ||||||
| Royal Bank of Scotland Group plc | ||||||||
| 1,389,000 | 1.174%, 3/31/2017e | 1,395,753 | ||||||
| 1,488,000 | 5.125%, 5/28/2024 | 1,510,914 | ||||||
| Santander US Debt SAU | ||||||||
| 1,000,000 | 3.724%, 1/20/2015d | 1,014,798 | ||||||
| 110,000 | 3.781%, 10/7/2015d | 113,622 | ||||||
| Simon Property Group, LP | ||||||||
| 580,000 | 10.350%, 4/1/2019 | 785,818 | ||||||
| Skandinaviska Enskilda Banken AB | ||||||||
| 615,000 | 2.375%, 3/25/2019d | 620,350 | ||||||
| SLM Corporation | ||||||||
| 465,000 | 3.875%, 9/10/2015 | 474,300 | ||||||
| 428,000 | 6.250%, 1/25/2016 | 454,750 | ||||||
| 310,000 | 4.625%, 9/25/2017 | 326,662 | ||||||
| SpareBank 1 Boligkreditt AS | ||||||||
| 1,024,000 | 1.250%, 5/2/2018d | 1,009,449 | ||||||
| Sumitomo Mitsui Banking Corporation | ||||||||
| 1,430,000 | 1.300%, 1/10/2017 | 1,432,420 | ||||||
| Suncorp-Metway, Ltd. | ||||||||
| 1,474,000 | 0.934%, 3/28/2017d,e | 1,473,985 | ||||||
| Svensk Exportkredit AB | ||||||||
| 512,000 | 1.125%, 4/5/2018 | 506,971 | ||||||
| Svenska Handelsbanken AB | ||||||||
| 536,000 | 3.125%, 7/12/2016 | 561,329 | ||||||
| 762,000 | 1.625%, 3/21/2018 | 760,225 | ||||||
| 715,000 | 0.722%, 6/17/2019e | 715,258 | ||||||
| Swedbank Hypotek AB | ||||||||
| 1,024,000 | 1.375%, 3/28/2018d | 1,019,573 | ||||||
| Swiss RE Capital I, LP | ||||||||
| 725,000 | 6.854%, 5/29/2049d,j | 775,750 | ||||||
| Toronto-Dominion Bank | ||||||||
| 640,000 | 0.691%, 9/9/2016e | 643,505 | ||||||
| UBS AG London | ||||||||
| 1,024,000 | 0.750%, 3/24/2016d | 1,025,919 | ||||||
| UBS AG/Stamford, Connecticut | ||||||||
| 308,000 | 5.875%, 12/20/2017 | 351,785 | ||||||
| Ventas Realty, LP | ||||||||
| 846,000 | 1.550%, 9/26/2016 | 854,610 | ||||||
| 635,000 | 1.250%, 4/17/2017 | 635,084 | ||||||
| Voya Financial, Inc. | ||||||||
| 948,000 | 2.900%, 2/15/2018 | 982,356 | ||||||
| Wachovia Corporation | ||||||||
| 800,000 | 0.501%, 6/15/2017e | 798,904 | ||||||
| Wells Fargo & Company | ||||||||
| 1,842,000 | 1.250%, 7/20/2016 | 1,857,902 | ||||||
| 970,000 | 2.100%, 5/8/2017 | 994,865 | ||||||
|
| |||||||
| Total | 144,257,442 | |||||||
|
| |||||||
| Foreign Government (0.3%) | |||||||
| Asian Development Bank | ||||||||
| 1,560,000 | 0.500%, 6/20/2016 | 1,559,438 | ||||||
| Denmark Government | ||||||||
| International Bond | ||||||||
| 1,560,000 | 0.375%, 4/25/2016d | 1,557,729 | ||||||
| European Investment Bank | ||||||||
| 755,000 | 1.875%, 3/15/2019 | 761,549 | ||||||
| Export-Import Bank of Korea | ||||||||
| 536,000 | 1.250%, 11/20/2015 | 538,768 | ||||||
| International Finance Corporation | ||||||||
| 1,170,000 | 0.500%, 5/16/2016 | 1,169,058 | ||||||
| Kommunalbanken AS | ||||||||
| 25,000 | 2.750%, 5/5/2015d | 25,531 | ||||||
| 1,560,000 | 0.311%, 3/18/2016d,e | 1,560,680 | ||||||
| Kommuninvest i Sverige AB | ||||||||
| 1,560,000 | 0.500%, 6/15/2016d | 1,557,907 | ||||||
| Province of Ontario | ||||||||
| 1,600,000 | 1.000%, 7/22/2016 | 1,610,814 | ||||||
| Sweden Government International Bond | ||||||||
| 200,000 | 0.375%, 12/22/2015d | 200,016 | ||||||
| 500,000 | 0.375%, 3/29/2016d | 499,665 | ||||||
|
| |||||||
| Total | 11,041,155 | |||||||
|
| |||||||
| Mortgage-Backed Securities (11.9%) | |||||||
| Federal Home Loan Mortgage Corporation Gold 15-Yr. Pass Through | ||||||||
| 23,625,000 | 3.000%, 7/1/2029c | 24,488,777 | ||||||
| Federal Home Loan Mortgage Corporation Gold 30-Yr. Pass Through | ||||||||
| 23,425,000 | 4.000%, 7/1/2044c | 24,815,859 | ||||||
| Federal National Mortgage Association Conventional 15-yr. Pass Through | ||||||||
| 46,450,000 | 3.500%, 8/1/2029c | 49,106,362 | ||||||
| Federal National Mortgage Association Conventional 30-Yr. Pass Through | ||||||||
| 4,809,632 | 2.071%, 1/1/2043e | 4,949,694 | ||||||
| 8,586,238 | 2.061%, 3/1/2043e | 8,831,840 | ||||||
| 7,647,251 | 1.750%, 7/1/2043e | 7,764,062 | ||||||
| 97,200,000 | 3.500%, 7/1/2044c | 100,055,250 | ||||||
| 94,050,000 | 4.000%, 7/1/2044c | 99,810,563 | ||||||
| 25,573,000 | 4.500%, 7/1/2044c | 27,694,766 | ||||||
| 66,223,000 | 4.500%, 8/1/2044c | 71,554,481 | ||||||
|
| |||||||
| Total | 419,071,654 | |||||||
|
| |||||||
| Technology (0.4%) | |||||||
| Amphenol Corporation | ||||||||
| 318,000 | 2.550%, 1/30/2019 | 322,470 | ||||||
| Apple, Inc. | ||||||||
| 745,000 | 0.523%, 5/6/2019e | 745,709 | ||||||
| Baidu, Inc. | ||||||||
| 700,000 | 2.750%, 6/9/2019 | 702,727 | ||||||
| Cisco Systems, Inc. | ||||||||
| 500,000 | 0.727%, 3/1/2019e | 503,212 | ||||||
| Computer Sciences Corporation | ||||||||
| 382,000 | 2.500%, 9/15/2015 | 388,830 | ||||||
| EMC Corporation | ||||||||
| 1,050,000 | 1.875%, 6/1/2018 | 1,056,937 | ||||||
| Fidelity National Information Services, Inc. | ||||||||
| 868,000 | 1.450%, 6/5/2017 | 866,969 | ||||||
The accompanying Notes to Financial Statements are an integral part of this schedule.
89
Table of Contents
Moderately Conservative Allocation Portfolio
Schedule of Investments as of June 30, 2014
(unaudited)
| Principal Amount | Long-Term Fixed Income (36.0%) | Value | ||||||
| Technology (0.4%) - continued | |||||||
| First Data Corporation | ||||||||
| $ 1,500,000 | 7.375%, 6/15/2019d | $ | 1,610,625 | |||||
| Hewlett-Packard Company | ||||||||
| 510,000 | 2.125%, 9/13/2015 | 518,989 | ||||||
| 858,000 | 5.400%, 3/1/2017 | 950,857 | ||||||
| 418,000 | 1.167%, 1/14/2019e | 421,330 | ||||||
| Iron Mountain, Inc. | ||||||||
| 1,410,000 | 6.000%, 8/15/2023 | 1,524,562 | ||||||
| Micron Semiconductor Asia Pte, Ltd. | ||||||||
| 375,000 | 1.258%, 1/15/2019 | 374,948 | ||||||
| Oracle Corporation | ||||||||
| 810,000 | 0.807%, 1/15/2019e | 816,520 | ||||||
| Samsung Electronics America, Inc. | ||||||||
| 590,000 | 1.750%, 4/10/2017d | 592,759 | ||||||
| Tyco Electronics Group SA | ||||||||
| 994,000 | 6.550%, 10/1/2017 | 1,150,243 | ||||||
| Xerox Corporation | ||||||||
| 510,000 | 7.200%, 4/1/2016 | 562,509 | ||||||
| Xilinx, Inc. | ||||||||
| 400,000 | 2.125%, 3/15/2019 | 400,707 | ||||||
|
| |||||||
| Total | 13,510,903 | |||||||
|
| |||||||
| Transportation (0.3%) | |||||||
| American Airlines Pass Through Trust | ||||||||
| 727,800 | 4.950%, 1/15/2023d | 787,844 | ||||||
| Avis Budget Car Rental, LLC | ||||||||
| 865,000 | 5.125%, 6/1/2022d | 866,081 | ||||||
| Canadian Pacific Railway Company | ||||||||
| 400,000 | 7.125%, 10/15/2031 | 528,631 | ||||||
| 472,000 | 5.750%, 3/15/2033 | 558,640 | ||||||
| Continental Airlines, Inc. | ||||||||
| 694,070 | 4.150%, 4/11/2024 | 721,833 | ||||||
| CSX Corporation | ||||||||
| 494,000 | 3.700%, 11/1/2023 | 508,762 | ||||||
| Delta Air Lines, Inc. | ||||||||
| 760,000 | 6.750%, 5/23/2017 | 799,900 | ||||||
| 413,308 | 4.950%, 5/23/2019 | 446,372 | ||||||
| 116,583 | 4.750%, 5/7/2020 | 126,493 | ||||||
| ERAC USA Finance, LLC | ||||||||
| 530,000 | 1.400%, 4/15/2016d | 534,076 | ||||||
| 284,000 | 2.800%, 11/1/2018d | 293,324 | ||||||
| Kansas City Southern de Mexico SA de CV | ||||||||
| 1,170,000 | 0.928%, 10/28/2016e | 1,174,032 | ||||||
| Korea Expressway Corporation | ||||||||
| 762,000 | 1.625%, 4/28/2017d | 761,206 | ||||||
| Network Rail Infrastructure Finance plc | ||||||||
| 625,000 | 0.234%, 2/13/2017d,e | 624,672 | ||||||
| PACCAR Financial Corporation | ||||||||
| 520,000 | 0.420%, 6/6/2017e | 519,996 | ||||||
| Virgin Australia Holdings, Ltd. | ||||||||
| 342,746 | 5.000%, 10/23/2023d | 364,168 | ||||||
|
| |||||||
| Total | 9,616,030 | |||||||
|
| |||||||
| U.S. Government and Agencies (8.7%) | |||||||
| Federal Agricultural Mortgage Corporation | ||||||||
| 175,000 | 2.125%, 9/15/2015 | 178,928 | ||||||
| Federal Home Loan Bank | ||||||||
| 1,355,000 | 0.875%, 5/24/2017 | 1,355,049 | ||||||
| Federal Home Loan Mortgage Corporation | ||||||||
| 1,330,000 | 1.375%, 5/1/2020 | 1,293,699 | ||||||
| Federal National Mortgage Association | ||||||||
| 300,000 | 4.375%, 10/15/2015 | 315,784 | ||||||
| 2,500,000 | 0.625%, 8/26/2016 | 2,501,508 | ||||||
| 870,000 | 1.375%, 11/15/2016 | 882,525 | ||||||
| 870,000 | 0.875%, 5/21/2018 | 855,398 | ||||||
| 205,000 | 6.250%, 5/15/2029 | 275,306 | ||||||
| Tennessee Valley Authority | ||||||||
| 200,000 | 5.250%, 9/15/2039 | 242,708 | ||||||
| U.S. Treasury Bonds | ||||||||
| 440,000 | 7.625%, 2/15/2025 | 649,825 | ||||||
| 1,075,000 | 4.375%, 5/15/2040 | 1,289,160 | ||||||
| 4,720,000 | 3.000%, 5/15/2042 | 4,451,550 | ||||||
| U.S. Treasury Bonds, TIPS | ||||||||
| 2,023,280 | 0.125%, 4/15/2019 | 2,083,347 | ||||||
| 50,303 | 2.375%, 1/15/2025 | 60,941 | ||||||
| 32,902 | 2.125%, 2/15/2040 | 41,860 | ||||||
| 445,850 | 0.750%, 2/15/2042 | 419,692 | ||||||
| U.S. Treasury Notes | ||||||||
| 650,000 | 2.625%, 2/29/2016 | 674,959 | ||||||
| 34,000,000 | 0.375%, 3/31/2016 | 34,006,630 | ||||||
| 325,000 | 0.625%, 10/15/2016 | 325,330 | ||||||
| 475,000 | 1.000%, 10/31/2016 | 479,453 | ||||||
| 37,670,000 | 0.625%, 12/15/2016 | 37,649,395 | ||||||
| 2,000,000 | 1.000%, 3/31/2017 | 2,011,876 | ||||||
| 1,550,000 | 3.250%, 3/31/2017 | 1,654,625 | ||||||
| 6,700,000 | 0.625%, 5/31/2017 | 6,655,505 | ||||||
| 14,485,000 | 1.000%, 5/31/2018 | 14,327,707 | ||||||
| 16,875,000 | 1.250%, 10/31/2018 | 16,744,489 | ||||||
| 2,125,000 | 1.625%, 4/30/2019 | 2,128,984 | ||||||
| 11,750,000 | 1.375%, 1/31/2020 | 11,489,291 | ||||||
| 10,060,000 | 1.625%, 8/15/2022 | 9,550,712 | ||||||
| 1,000,000 | 1.750%, 5/15/2023 | 947,188 | ||||||
| 29,300,000 | 2.500%, 8/15/2023 | 29,473,983 | ||||||
| 20,500,000 | 2.750%, 2/15/2024 | 20,966,047 | ||||||
| 59,500,000 | 3.625%, 2/15/2044 | 62,791,064 | ||||||
| U.S. Treasury Notes, TIPS | ||||||||
| 28,507,760 | 0.125%, 4/15/2018 | 29,447,661 | ||||||
| 282,776 | 0.125%, 1/15/2022 | 284,654 | ||||||
| 7,291,409 | 0.125%, 1/15/2023 | 7,266,348 | ||||||
|
| |||||||
| Total | 305,773,181 | |||||||
|
| |||||||
| Utilities (0.9%) | |||||||
| AES Corporation | ||||||||
| 1,500,000 | 7.375%, 7/1/2021 | 1,755,000 | ||||||
| American Electric Power Company, Inc. | ||||||||
| 536,000 | 1.650%, 12/15/2017 | 538,844 | ||||||
| Atlas Pipeline Partners, LP | ||||||||
| 1,500,000 | 4.750%, 11/15/2021 | 1,470,000 | ||||||
| Commonwealth Edison Company | ||||||||
| 750,000 | 6.950%, 7/15/2018 | 886,871 | ||||||
| Crestwood Midstream Partners, LP | ||||||||
| 850,000 | 6.125%, 3/1/2022d | 894,625 | ||||||
| Dayton Power and Light Company | ||||||||
| 564,000 | 1.875%, 9/15/2016d | 573,552 | ||||||
The accompanying Notes to Financial Statements are an integral part of this schedule.
90
Table of Contents
Moderately Conservative Allocation Portfolio
Schedule of Investments as of June 30, 2014
(unaudited)
| Principal Amount | Long-Term Fixed Income (36.0%) | Value | ||||||
| Utilities (0.9%) - continued | |||||||
| DCP Midstream Operating, LP | ||||||||
| $ 762,000 | 2.500%, 12/1/2017 | $ | 783,864 | |||||
| Dominion Resources, Inc. | ||||||||
| 1,016,000 | 1.250%, 3/15/2017 | 1,019,998 | ||||||
| Duke Energy Corporation | ||||||||
| 635,000 | 0.610%, 4/3/2017e | 636,906 | ||||||
| 900,000 | 2.100%, 6/15/2018 | 909,922 | ||||||
| Electricite de France | ||||||||
| 930,000 | 0.688%, 1/20/2017d,e | 933,770 | ||||||
| Enel Finance International NV | ||||||||
| 740,000 | 3.875%, 10/7/2014d | 745,907 | ||||||
| 450,000 | 6.250%, 9/15/2017d | 513,469 | ||||||
| Energy Transfer Partners, LP | ||||||||
| 290,000 | 9.700%, 3/15/2019 | 380,124 | ||||||
| 1,736,000 | 4.650%, 6/1/2021 | 1,870,004 | ||||||
| Enterprise Products Operating, LLC | ||||||||
| 792,000 | 5.100%, 2/15/2045 | 845,424 | ||||||
| Exelon Generation Company, LLC | ||||||||
| 375,000 | 6.200%, 10/1/2017 | 427,251 | ||||||
| 870,000 | 5.200%, 10/1/2019 | 978,445 | ||||||
| ITC Holdings Corporation | ||||||||
| 284,000 | 4.050%, 7/1/2023 | 294,940 | ||||||
| MidAmerican Energy Holdings Company | ||||||||
| 720,000 | 1.100%, 5/15/2017 | 717,064 | ||||||
| 862,000 | 5.750%, 4/1/2018 | 986,517 | ||||||
| 625,000 | 6.500%, 9/15/2037 | 805,964 | ||||||
| NiSource Finance Corporation | ||||||||
| 421,000 | 6.400%, 3/15/2018 | 483,697 | ||||||
| 850,000 | 6.800%, 1/15/2019 | 1,013,670 | ||||||
| Northeast Utilities | ||||||||
| 435,000 | 1.450%, 5/1/2018 | 427,170 | ||||||
| Northern States Power Company | ||||||||
| 1,240,000 | 4.125%, 5/15/2044 | 1,242,125 | ||||||
| NRG Energy, Inc. | ||||||||
| 1,500,000 | 6.625%, 3/15/2023 | 1,623,750 | ||||||
| ONEOK Partners, LP | ||||||||
| 596,000 | 8.625%, 3/1/2019 | 752,437 | ||||||
| Pacific Gas & Electric Company | ||||||||
| 1,015,000 | 5.625%, 11/30/2017 | 1,147,731 | ||||||
| PG&E Corporation | ||||||||
| 375,000 | 2.400%, 3/1/2019 | 378,383 | ||||||
| PPL Capital Funding, Inc. | ||||||||
| 1,260,000 | 1.900%, 6/1/2018 | 1,259,063 | ||||||
| 372,000 | 3.500%, 12/1/2022 | 378,075 | ||||||
| Sempra Energy | ||||||||
| 965,000 | 6.150%, 6/15/2018 | 1,120,068 | ||||||
| TransAlta Corporation | ||||||||
| 825,000 | 1.900%, 6/3/2017 | 828,228 | ||||||
| Williams Companies, Inc. | ||||||||
| 496,000 | 7.875%, 9/1/2021 | 615,802 | ||||||
| Williams Partners, LP | ||||||||
| 255,000 | 7.250%, 2/1/2017 | 291,449 | ||||||
|
| |||||||
| Total | 30,530,109 | |||||||
|
| |||||||
Total Long-Term Fixed Income (cost $1,246,359,796) | 1,263,651,467 | |||||||
|
| |||||||
| Shares | Common Stock (18.1%) | |||||||
| Consumer Discretionary (2.4%) | |||||||
| 4,800 | Aaron’s, Inc. | 171,072 | ||||||
| 6,400 | Abercrombie & Fitch Company | 276,800 | ||||||
| 20,406 | Amazon.com, Inc.k | 6,627,461 | ||||||
| 10,400 | AutoZone, Inc.k | 5,576,896 | ||||||
| 14,000 | Barnes & Noble, Inc.g,k | 319,060 | ||||||
| 38,350 | Best Buy Company, Inc. | 1,189,233 | ||||||
| 5,700 | Big Lots, Inc.k | 260,490 | ||||||
| 13,850 | Bloomin’ Brands, Inc.k | 310,656 | ||||||
| 3,850 | BorgWarner, Inc. | 250,981 | ||||||
| 2,350 | Brinker International, Inc. | 114,327 | ||||||
| 38,500 | Cablevision Systems Corporationg | 679,525 | ||||||
| 31,050 | CBS Corporation | 1,929,447 | ||||||
| 18,560 | Cheesecake Factory, Inc. | 861,555 | ||||||
| 5,250 | Children’s Place Retail Stores, Inc. | 260,557 | ||||||
| 3,150 | Coinstar, Inc.k | 186,952 | ||||||
| 169,013 | Comcast Corporation | 9,072,618 | ||||||
| 4,600 | Deckers Outdoor Corporationk | 397,118 | ||||||
| 73,669 | Delphi Automotive plc | 5,064,007 | ||||||
| 3,900 | DeVry Education Group, Inc. | 165,126 | ||||||
| 8,750 | DISH Network Corporationk | 569,450 | ||||||
| 11,400 | Dollar Tree, Inc.k | 620,844 | ||||||
| 48,850 | Ford Motor Company | 842,174 | ||||||
| 6,950 | G-III Apparel Group, Ltd.k | 567,537 | ||||||
| 5,080 | GNC Holdings, Inc. | 173,228 | ||||||
| 3,850 | Harman International Industries, Inc. | 413,605 | ||||||
| 53,800 | Home Depot, Inc. | 4,355,648 | ||||||
| 21,010 | Houghton Mifflin Harcourt Companyk | 402,552 | ||||||
| 5,950 | Iconix Brand Group, Inc.k | 255,493 | ||||||
| 18,785 | Ignite Restaurant Group, Inc.k | 273,510 | ||||||
| 7,050 | ITT Educational Services, Inc.g,k | 117,664 | ||||||
| 2,400 | Jack in the Box, Inc. | 143,616 | ||||||
| 7,350 | Kohl’s Corporation | 387,198 | ||||||
| 10,650 | Lamar Advertising Company | 564,450 | ||||||
| 76,126 | Las Vegas Sands Corporation | 5,802,324 | ||||||
| 13,950 | Liberty Interactive Corporationk | 409,572 | ||||||
| 4,450 | Lions Gate Entertainment | |||||||
| Corporation | 127,181 | |||||||
| 23,100 | Live Nation Entertainment, Inc.k | 570,339 | ||||||
| 121,830 | Lowe’s Companies, Inc. | 5,846,622 | ||||||
| 21,850 | Macy’s, Inc. | 1,267,737 | ||||||
| 5,450 | Marriott Vacations Worldwide Corporationk | 319,534 | ||||||
| 25,957 | MDC Partners, Inc. | 557,816 | ||||||
| 3,950 | Meredith Corporation | 191,022 | ||||||
| 350 | Michael Kors Holdings, Ltd.k | 31,028 | ||||||
| 4,850 | Multimedia Games Holding Company, Inc.k | 143,754 | ||||||
| 10,950 | Nautilus, Inc.k | 121,435 | ||||||
| 109,390 | News Corporation | 3,744,420 | ||||||
| 71,200 | NIKE, Inc. | 5,521,560 | ||||||
| 6,370 | NutriSystem, Inc. | 108,991 | ||||||
| 5,950 | Omnicom Group, Inc. | 423,759 | ||||||
| 15,850 | Orbitz Worldwide, Inc.k | 141,065 | ||||||
| 5,810 | Papa John’s International, Inc. | 246,286 | ||||||
| 7,200 | PetSmart, Inc. | 430,560 | ||||||
| 6,800 | Restoration Hardware Holdings, Inc.k | 632,740 | ||||||
| 13,500 | Scientific Games Corporationk | 150,120 | ||||||
| 4,700 | Scripps Networks Interactive, Inc. | 381,358 | ||||||
| 20,900 | Smith & Wesson Holding Corporationg,k | 303,886 | ||||||
| 56,891 | Staples, Inc. | 616,698 | ||||||
The accompanying Notes to Financial Statements are an integral part of this schedule.
91
Table of Contents
Moderately Conservative Allocation Portfolio
Schedule of Investments as of June 30, 2014
(unaudited)
| Shares | Common Stock (18.1%) | Value | ||||||
| Consumer Discretionary (2.4%) - continued | |||||||
| 45,750 | Starbucks Corporation | $ | 3,540,135 | |||||
| 31,340 | Time Warner Cable, Inc. | 4,616,382 | ||||||
| 9,600 | Toll Brothers, Inc.k | 354,240 | ||||||
| 29,730 | Tuesday Morning Corporationk | 529,789 | ||||||
| 92,250 | Twenty-First Century Fox, Inc. | 3,242,587 | ||||||
| 12,200 | Wyndham Worldwide Corporation | 923,784 | ||||||
| 7,350 | Zumiez, Inc.k | 202,787 | ||||||
|
| |||||||
| Total | 84,900,361 | |||||||
|
| |||||||
| Consumer Staples (0.9%) | |||||||
| 33,950 | Altria Group, Inc. | 1,423,863 | ||||||
| 4,716 | Andersons, Inc. | 243,251 | ||||||
| 26,900 | Anheuser-Busch InBev NV ADR | 3,091,886 | ||||||
| 9,686 | Annie’s, Inc.k | 327,581 | ||||||
| 37,200 | Archer-Daniels-Midland Company | 1,640,892 | ||||||
| 21,650 | Bunge, Ltd. | 1,637,606 | ||||||
| 9,050 | Coca-Cola Enterprises, Inc. | 432,409 | ||||||
| 3,700 | Colgate-Palmolive Company | 252,266 | ||||||
| 104,170 | CVS Caremark Corporation | 7,851,293 | ||||||
| 3,000 | Green Mountain Coffee Roasters, Inc. | 373,830 | ||||||
| 27,100 | Ingredion, Inc. | 2,033,584 | ||||||
| 3,500 | J.M. Smucker Company | 372,995 | ||||||
| 19,850 | Kimberly-Clark Corporation | 2,207,717 | ||||||
| 20,063 | Kraft Foods Group, Inc. | 1,202,777 | ||||||
| 9,300 | Kroger Company | 459,699 | ||||||
| 86,689 | Mondelez International, Inc. | 3,260,373 | ||||||
| 22,258 | Philip Morris International, Inc. | 1,876,572 | ||||||
| 14,950 | Pilgrim’s Pride Corporationk | 409,032 | ||||||
| 8,600 | Procter & Gamble Company | 675,874 | ||||||
| 88,900 | Rite Aid Corporationk | 637,413 | ||||||
| 2,100 | Sanderson Farms, Inc. | 204,120 | ||||||
| 11,600 | Wal-Mart Stores, Inc. | 870,812 | ||||||
| 31,670 | WhiteWave Foods Companyk | 1,025,158 | ||||||
|
| |||||||
| Total | 32,511,003 | |||||||
|
| |||||||
| Energy (2.8%) | |||||||
| 58,400 | Alpha Natural Resources, Inc.g,k | 216,664 | ||||||
| 1,470 | Atwood Oceanics, Inc.k | 77,146 | ||||||
| 4,750 | Baker Hughes, Inc. | 353,637 | ||||||
| 11,400 | Basic Energy Services, Inc.k | 333,108 | ||||||
| 1,565 | Cabot Oil & Gas Corporation | 53,429 | ||||||
| 128,585 | Cameron International Corporationk | 8,706,490 | ||||||
| 42,550 | Chevron Corporation | 5,554,902 | ||||||
| 720 | Cimarex Energy Company | 103,291 | ||||||
| 51,500 | Cobalt International Energy, Inc.k | 945,025 | ||||||
| 10,080 | Concho Resources, Inc.k | 1,456,560 | ||||||
| 2,600 | ConocoPhillips | 222,898 | ||||||
| 4,170 | Denbury Resources, Inc. | 76,978 | ||||||
| 2,000 | Diamondback Energy, Inc.k | 177,600 | ||||||
| 17,000 | Dril-Quip, Inc.k | 1,857,080 | ||||||
| 550 | Energen Corporation | 48,884 | ||||||
| 1,050 | Ensco plc | 58,348 | ||||||
| 79,032 | EOG Resources, Inc. | 9,235,680 | ||||||
| 54,009 | EQT Corporation | 5,773,562 | ||||||
| 10,750 | Exterran Holdings, Inc. | 483,643 | ||||||
| 42,100 | Exxon Mobil Corporation | 4,238,628 | ||||||
| 300 | Frank’s International NV | 7,380 | ||||||
| 8,050 | Green Plains, Inc. | 264,604 | ||||||
| 2,550 | Gulfmark Offshore, Inc. | 115,209 | ||||||
| 625 | Gulfport Energy Corporationk | 39,250 | ||||||
| 1,000 | Helmerich & Payne, Inc. | 116,110 | ||||||
| 2,500 | Hess Corporation | 247,225 | ||||||
| 1,585 | HollyFrontier Corporation | 69,249 | ||||||
| 11,150 | Kosmos Energy, Ltd.k | 125,215 | ||||||
| 275,963 | Marathon Oil Corporation | 11,016,443 | ||||||
| 11,240 | Market Vectors Oil Service ETF | 649,222 | ||||||
| 31,450 | Nabors Industries, Ltd. | 923,686 | ||||||
| 28,300 | National Oilwell Varco, Inc. | 2,330,505 | ||||||
| 1,650 | Noble Corporation | 55,374 | ||||||
| 1,100 | Noble Energy, Inc. | 85,206 | ||||||
| 54,540 | Oasis Petroleum, Inc.k | 3,048,241 | ||||||
| 11,900 | Occidental Petroleum Corporation | 1,221,297 | ||||||
| 1,090 | Oceaneering International, Inc. | 85,162 | ||||||
| 930 | Oil States International, Inc.k | 59,604 | ||||||
| 7,450 | Patterson-UTI Energy, Inc. | 260,303 | ||||||
| 37,800 | Peabody Energy Corporation | 618,030 | ||||||
| 41,300 | Petroleo Brasileiro SA ADR | 604,219 | ||||||
| 1,950 | Phillips 66 | 156,839 | ||||||
| 355 | Pioneer Natural Resources Company | 81,583 | ||||||
| 3,900 | QEP Resources, Inc. | 134,550 | ||||||
| 740 | Range Resources Corporation | 64,343 | ||||||
| 14,420 | Rex Energy Corporationk | 255,378 | ||||||
| 5,160 | Rosetta Resources, Inc.k | 283,026 | ||||||
| 1,500 | Rowan Companies plc | 47,895 | ||||||
| 17,500 | SandRidge Energy, Inc.g,k | 125,125 | ||||||
| 111,350 | Schlumberger, Ltd. | 13,133,732 | ||||||
| 23,860 | SM Energy Company | 2,006,626 | ||||||
| 46,100 | Southwestern Energy Companyk | 2,097,089 | ||||||
| 10,980 | Superior Energy Services, Inc. | 396,817 | ||||||
| 107,200 | Total SA ADRg | 7,739,840 | ||||||
| 18,515 | Trinidad Drilling, Ltd. | 210,128 | ||||||
| 2,450 | Unit Corporationk | 168,633 | ||||||
| 420,161 | Weatherford International, Ltd.k | 9,663,703 | ||||||
| 4,650 | Whiting Petroleum Corporationk | 373,162 | ||||||
|
| |||||||
| Total | 98,853,556 | |||||||
|
| |||||||
| Financials (3.4%) | |||||||
| 27,550 | ACE, Ltd. | 2,856,935 | ||||||
| 2,773 | Affiliated Managers Group, Inc.k | 569,574 | ||||||
| 14,620 | Allied World Assurance Company Holdings AG | 555,852 | ||||||
| 39,330 | Allstate Corporation | 2,309,458 | ||||||
| 4,330 | American Assets Trust, Inc. | 149,602 | ||||||
| 25,850 | American International Group, Inc. | 1,410,893 | ||||||
| 4,100 | AmTrust Financial Services, Inc.g | 171,421 | ||||||
| 962 | Argo Group International Holdings, Ltd. | 49,168 | ||||||
| 372,950 | Bank of America Corporation | 5,732,241 | ||||||
| 5,250 | Banner Corporation | 208,058 | ||||||
| 14,590 | BBCN Bancorp, Inc. | 232,711 | ||||||
| 25,250 | Berkshire Hathaway, Inc.k | 3,195,640 | ||||||
| 66,300 | Blackstone Group, LPk | 2,217,072 | ||||||
| 7,397 | Boston Properties, Inc. | 874,177 | ||||||
| 9,800 | Camden Property Trust | 697,270 | ||||||
| 3,950 | CBRE Group, Inc.k | 126,558 | ||||||
| 193,798 | Citigroup, Inc. | 9,127,886 | ||||||
| 4,562 | CNA Financial Corporation | 184,396 | ||||||
| 31,500 | CNO Financial Group, Inc. | 560,700 | ||||||
| 55,900 | Comerica, Inc. | 2,803,944 | ||||||
| 8,350 | Crown Castle International Corporation | 620,071 | ||||||
| 16,900 | DDR Corporation | 297,947 | ||||||
The accompanying Notes to Financial Statements are an integral part of this schedule.
92
Table of Contents
Moderately Conservative Allocation Portfolio
Schedule of Investments as of June 30, 2014
(unaudited)
| Shares | Common Stock (18.1%) | Value | ||||||
| Financials (3.4%) - continued | |||||||
| 49,705 | Deutsche Bank AG | $ | 1,748,622 | |||||
| 3,450 | Digital Realty Trust, Inc. | 201,204 | ||||||
| 10,150 | Discover Financial Services | 629,097 | ||||||
| 11,250 | Duke Realty Corporation | 204,300 | ||||||
| 14,040 | Education Realty Trust, Inc. | 150,790 | ||||||
| 13,569 | Equity Residential | 854,847 | ||||||
| 2,640 | Extra Space Storage, Inc. | 140,580 | ||||||
| 48,400 | Fifth Third Bancorp | 1,033,340 | ||||||
| 22,450 | First Horizon National Corporation | 266,257 | ||||||
| 50,050 | First Niagara Financial Group, Inc. | 437,437 | ||||||
| 11,300 | First Republic Bank | 621,387 | ||||||
| 15,200 | Fulton Financial Corporation | 188,328 | ||||||
| 7,657 | Gaming and Leisure Properties, Inc. | 260,108 | ||||||
| 4,900 | General Growth Properties, Inc. | 115,444 | ||||||
| 236,917 | Genworth Financial, Inc.k | 4,122,356 | ||||||
| 15,880 | Hanmi Financial Corporation | 334,750 | ||||||
| 11,708 | HCC Insurance Holdings, Inc. | 572,990 | ||||||
| 8,149 | Health Care REIT, Inc. | 510,698 | ||||||
| 31,248 | Host Hotels & Resorts, Inc. | 687,768 | ||||||
| 169,850 | Huntington Bancshares, Inc. | 1,620,369 | ||||||
| 100,150 | Invesco, Ltd. | 3,780,663 | ||||||
| 77,000 | iShares Barclays 1-3 Year Credit Bond Fund | 8,137,360 | ||||||
| 4,700 | iShares Russell 2000 Index Fund | 558,407 | ||||||
| 55,464 | J.P. Morgan Chase & Company | 3,195,836 | ||||||
| 25,950 | KeyCorp | 371,863 | ||||||
| 22,832 | Kimco Realty Corporation | 524,679 | ||||||
| 9,788 | Lazard, Ltd. | 504,669 | ||||||
| 2,950 | M&T Bank Corporationg | 365,947 | ||||||
| 5,950 | Macerich Company | 397,163 | ||||||
| 33,400 | MBIA, Inc.k | 368,736 | ||||||
| 124,920 | MetLife, Inc. | 6,940,555 | ||||||
| 7,050 | Montpelier Re Holdings, Inc. | 225,248 | ||||||
| 136,410 | Morgan Stanley | 4,410,135 | ||||||
| 13,300 | NASDAQ OMX Group, Inc. | 513,646 | ||||||
| 12,250 | Navient Corporation | 216,948 | ||||||
| 7,000 | Northern Trust Corporation | 449,470 | ||||||
| 7,050 | Old Republic International Corporation | 116,607 | ||||||
| 7,020 | PacWest Bancorp | 303,053 | ||||||
| 7,290 | Parkway Properties, Inc. | 150,539 | ||||||
| 11,050 | Pebblebrook Hotel Trust | 408,408 | ||||||
| 4,600 | Piedmont Office Realty Trust, Inc. | 87,124 | ||||||
| 8,150 | Popular, Inc.k | 278,567 | ||||||
| 4,300 | Portfolio Recovery Associates, Inc.k | 255,979 | ||||||
| 7,000 | Progressive Corporation | 177,520 | ||||||
| 12,300 | Prologis, Inc. | 505,407 | ||||||
| 4,600 | Protective Life Corporation | 318,918 | ||||||
| 15,100 | Prudential Financial, Inc. | 1,340,427 | ||||||
| 2,851 | Public Storage, Inc. | 488,519 | ||||||
| 25,400 | Radian Group, Inc. | 376,174 | ||||||
| 3,550 | Realty Income Corporation | 157,691 | ||||||
| 15,100 | RLJ Lodging Trust | 436,239 | ||||||
| 4,250 | Ryman Hospitality Properties | 204,637 | ||||||
| 8,098 | Simon Property Group, Inc. | 1,346,535 | ||||||
| 101,300 | SPDR Euro Stoxx 50 ETF | 4,383,251 | ||||||
| 12,000 | SPDR Gold Trustk | 1,536,480 | ||||||
| 46,300 | SPDR S&P 500 ETF Trust | 9,061,836 | ||||||
| 15,550 | State Street Corporation | 1,045,893 | ||||||
| 10,800 | Strategic Hotels & Resorts, Inc.k | 126,468 | ||||||
| 22,290 | SVB Financial Groupk | 2,599,460 | ||||||
| 11,150 | Synovus Financial Corporation | 271,837 | ||||||
| 8,700 | Tanger Factory Outlet Centers, Inc. | 304,239 | ||||||
| 13,973 | Terreno Realty Corporation | 270,098 | ||||||
| 7,200 | Texas Capital Bancshares, Inc.k | 388,440 | ||||||
| 27,850 | Visa, Inc. | 5,868,274 | ||||||
| 6,867 | Vornado Realty Trust | 732,915 | ||||||
| 8,000 | W.R. Berkley Corporation | 370,480 | ||||||
| 4,049 | Washington Prime Group, Inc.k | 75,878 | ||||||
| 47,445 | Wells Fargo & Company | 2,493,709 | ||||||
| 11,140 | Western Alliance Bancorpk | 265,132 | ||||||
| 9,900 | Weyerhaeuser Company | 327,591 | ||||||
| 17,350 | Zions Bancorporation | 511,304 | ||||||
|
| |||||||
| Total | 118,199,200 | |||||||
|
| |||||||
| Health Care (2.4%) | |||||||
| 5,200 | Abbott Laboratories | 212,680 | ||||||
| 13,500 | Acorda Therapeutics, Inc.k | 455,085 | ||||||
| 20,700 | Aetna, Inc. | 1,678,356 | ||||||
| 39,200 | Affymetrix, Inc.k | 349,272 | ||||||
| 12,640 | Akorn, Inc.k | 420,280 | ||||||
| 2,531 | Albany Molecular Research, Inc.k | 50,924 | ||||||
| 4,310 | Align Technology, Inc.k | 241,532 | ||||||
| 27,200 | Allscripts Healthcare Solutions, Inc.k | 436,560 | ||||||
| 8,800 | Amgen, Inc. | 1,041,656 | ||||||
| 10,500 | AMN Healthcare Services, Inc.k | 129,150 | ||||||
| 63,780 | Baxter International, Inc. | 4,611,294 | ||||||
| 2,400 | Biogen Idec, Inc.k | 756,744 | ||||||
| 27,300 | BioScrip, Inc.k | 227,682 | ||||||
| 125,550 | Boston Scientific Corporationk | 1,603,273 | ||||||
| 14,400 | Bruker Corporationk | 349,488 | ||||||
| 2,722 | C.R. Bard, Inc. | 389,273 | ||||||
| 5,400 | Capital Senior Living Corporationk | 128,736 | ||||||
| 17,400 | Cardinal Health, Inc. | 1,192,944 | ||||||
| 13,450 | Centene Corporationk | 1,016,955 | ||||||
| 81,650 | Cerner Corporationk | 4,211,507 | ||||||
| 3,400 | Charles River Laboratories International, Inc.k | 181,968 | ||||||
| 1,300 | Chemed Corporationg | 121,836 | ||||||
| 6,050 | Community Health Systems, Inc.k | 274,488 | ||||||
| 110,450 | Covidien plc | 9,960,381 | ||||||
| 6,150 | DaVita HealthCare Partners, Inc.k | 444,768 | ||||||
| 10,700 | DENTSPLY International, Inc. | 506,645 | ||||||
| 15,680 | ExamWorks Group, Inc.k | 497,526 | ||||||
| 30,100 | Express Scripts Holding Companyk | 2,086,833 | ||||||
| 137,600 | Gilead Sciences, Inc.k | 11,408,416 | ||||||
| 4,850 | Globus Medical, Inc.k | 116,012 | ||||||
| 2,500 | Greatbatch, Inc.k | 122,650 | ||||||
| 11,050 | HCA Holdings, Inc.k | 622,999 | ||||||
| 24,700 | Hologic, Inc.k | 626,145 | ||||||
| 8,450 | Humana, Inc. | 1,079,234 | ||||||
| 5,650 | Illumina, Inc.k | 1,008,751 | ||||||
| 5,500 | Impax Laboratories, Inc.k | 164,945 | ||||||
| 90,176 | Johnson & Johnson | 9,434,213 | ||||||
| 3,050 | LifePoint Hospitals, Inc.k | 189,405 | ||||||
| 9,600 | McKesson Corporation | 1,787,616 | ||||||
| 13,300 | Medicines Companyk | 386,498 | ||||||
| 139,920 | Merck & Company, Inc. | 8,094,372 | ||||||
| 15,100 | Molina Healthcare, Inc.k | 673,913 | ||||||
| 3,550 | Myriad Genetics, Inc.g,k | 138,166 | ||||||
| 9,650 | Neurocrine Biosciences, Inc.k | 143,206 | ||||||
| 13,813 | NuVasive, Inc.k | 491,328 | ||||||
| 16,400 | PAREXEL International Corporationk | 866,576 | ||||||
The accompanying Notes to Financial Statements are an integral part of this schedule.
93
Table of Contents
Moderately Conservative Allocation Portfolio
Schedule of Investments as of June 30, 2014
(unaudited)
| Shares | Common Stock (18.1%) | Value | ||||||
| Health Care (2.4%) - continued | |||||||
| 11,600 | PerkinElmer, Inc. | $ | 543,344 | |||||
| 101,600 | Pfizer, Inc. | 3,015,488 | ||||||
| 6,250 | PharMerica Corporationk | 178,688 | ||||||
| 3,400 | Prestige Brands Holdings, Inc.k | 115,226 | ||||||
| 3,150 | Providence Service Corporationk | 115,259 | ||||||
| 5,300 | Qiagen NVg,k | 129,585 | ||||||
| 5,100 | Quest Diagnostics, Inc.g | 299,319 | ||||||
| 4,450 | Seattle Genetics, Inc.k | 170,213 | ||||||
| 7,700 | Select Medical Holdings | |||||||
| Corporation | 120,120 | |||||||
| 15,300 | Spectrum Pharmaceuticals, Inc.k | 124,389 | ||||||
| 4,450 | St. Jude Medical, Inc. | 308,162 | ||||||
| 2,300 | Team Health Holdings, Inc.k | 114,862 | ||||||
| 1,150 | Thermo Fisher Scientific, Inc. | 135,700 | ||||||
| 57,608 | UnitedHealth Group, Inc. | 4,709,454 | ||||||
| 10,850 | Universal Health Services, Inc. | 1,038,996 | ||||||
| 7,850 | Volcano Corporationk | 138,239 | ||||||
| 2,600 | Waters Corporationk | 271,544 | ||||||
| 4,000 | WellPoint, Inc. | 430,440 | ||||||
| 6,500 | Zoetis, Inc. | 209,755 | ||||||
|
| |||||||
| Total | 83,101,064 | |||||||
|
| |||||||
| Industrials (1.8%) | |||||||
| 4,450 | 3M Company | 637,418 | ||||||
| 4,800 | AAR Corporation | 132,288 | ||||||
| 2,110 | Acuity Brands, Inc. | 291,707 | ||||||
| 16,800 | ADT Corporationg | 586,992 | ||||||
| 7,300 | Aecom Technology Corporationk | 235,060 | ||||||
| 14,500 | AGCO Corporation | 815,190 | ||||||
| 4,967 | Allegion plc | 281,530 | ||||||
| 6,500 | Apogee Enterprises, Inc. | 226,590 | ||||||
| 48,300 | Boeing Company | 6,145,209 | ||||||
| 8,349 | Briggs & Stratton Corporation | 170,821 | ||||||
| 3,300 | Caterpillar, Inc. | 358,611 | ||||||
| 7,270 | CLARCOR, Inc. | 449,649 | ||||||
| 3,900 | Colfax Corporationk | 290,706 | ||||||
| 10,000 | Covanta Holding Corporation | 206,100 | ||||||
| 144,471 | CSX Corporation | 4,451,152 | ||||||
| 164,050 | Delta Air Lines, Inc. | 6,352,016 | ||||||
| 15,240 | EMCOR Group, Inc. | 678,637 | ||||||
| 3,050 | Esterline Technologies Corporationk | 351,116 | ||||||
| 19,150 | Exelis, Inc. | 325,167 | ||||||
| 5,450 | Flowserve Corporation | 405,207 | ||||||
| 84,500 | Fluor Corporation | 6,498,050 | ||||||
| 5,190 | GATX Corporation | 347,419 | ||||||
| 7,330 | Granite Construction, Inc. | 263,733 | ||||||
| 15,350 | HNI Corporation | 600,338 | ||||||
| 38,361 | Honeywell International, Inc. | 3,565,655 | ||||||
| 6,850 | Huntington Ingalls Industries, Inc. | 647,942 | ||||||
| 57,300 | Ingersoll-Rand plc | 3,581,823 | ||||||
| 29,864 | Interface, Inc. | 562,638 | ||||||
| 38,250 | Jacobs Engineering Group, Inc.k | 2,037,960 | ||||||
| 3,500 | Joy Global, Inc. | 215,530 | ||||||
| 9,300 | KAR Auction Services, Inc. | 296,391 | ||||||
| 16,260 | Korn/Ferry Internationalk | 477,556 | ||||||
| 13,720 | Landstar System, Inc. | 878,080 | ||||||
| 3,800 | Lockheed Martin Corporation | 610,774 | ||||||
| 14,404 | Manitowoc Company, Inc. | 473,315 | ||||||
| 3,600 | Manpower, Inc. | 305,460 | ||||||
| 12,250 | Meritor, Inc.k | 159,740 | ||||||
| 6,850 | NOW, Inc.k | 248,039 | ||||||
| 5,700 | Old Dominion Freight Line, Inc.k | 362,976 | ||||||
| 28,167 | Oshkosh Corporation | 1,564,114 | ||||||
| 3,652 | Parker Hannifin Corporation | 459,166 | ||||||
| 32,140 | Pentair, Ltd. | 2,317,937 | ||||||
| 10,900 | Quanta Services, Inc.k | 376,922 | ||||||
| 12,730 | Ritchie Brothers Auctioneers, Inc.g | 313,794 | ||||||
| 96,050 | Southwest Airlines Company | 2,579,903 | ||||||
| 3,600 | Spirit Aerosystems Holdings, Inc.k | 121,320 | ||||||
| 6,550 | Spirit Airlines, Inc.k | 414,222 | ||||||
| 7,140 | Tennant Company | 544,925 | ||||||
| 62,000 | Union Pacific Corporation | 6,184,500 | ||||||
| 4,711 | United Stationers, Inc. | 195,365 | ||||||
| 2,650 | United Technologies Corporation | 305,942 | ||||||
| 9,900 | Wabash National Corporationk | 141,075 | ||||||
| 3,150 | WABCO Holdings, Inc.k | 336,483 | ||||||
| 1,350 | WESCO International, Inc.k | 116,613 | ||||||
|
| |||||||
| Total | 61,496,866 | |||||||
|
| |||||||
| Information Technology (3.4%) | |||||||
| 9,800 | Akamai Technologies, Inc.k | 598,388 | ||||||
| 3,850 | Alliance Data Systems Corporationk | 1,082,813 | ||||||
| 12,200 | Amdocs, Ltd. | 565,226 | ||||||
| 1,950 | Amphenol Corporation | 187,863 | ||||||
| 142,884 | Apple, Inc. | 13,278,210 | ||||||
| 33,005 | Applied Materials, Inc. | 744,263 | ||||||
| 23,150 | Arris Group, Inc.k | 753,069 | ||||||
| 6,300 | Aruba Networks, Inc.k | 110,376 | ||||||
| 74,920 | Atmel Corporationk | 702,000 | ||||||
| 6,850 | AVG Technologies NVk | 137,891 | ||||||
| 5,250 | Booz Allen Hamilton Holding Corporation | 111,510 | ||||||
| 7,750 | Broadcom Corporation | 287,680 | ||||||
| 14,770 | Broadridge Financial Solutions, Inc. | 615,023 | ||||||
| 60,650 | Brocade Communications Systems, Inc. | 557,980 | ||||||
| 4,300 | Cardtronics, Inc.k | 146,544 | ||||||
| 11,800 | CDW Corporation | 376,184 | ||||||
| 5,300 | Cirrus Logic, Inc.g,k | 120,522 | ||||||
| 338,360 | Cisco Systems, Inc. | 8,408,246 | ||||||
| 20,850 | Citrix Systems, Inc.k | 1,304,167 | ||||||
| 13,850 | Computer Sciences Corporation | 875,320 | ||||||
| 6,750 | Convergys Corporation | 144,720 | ||||||
| 14,100 | CoreLogic, Inc.k | 428,076 | ||||||
| 90,200 | Corning, Inc. | 1,979,890 | ||||||
| 4,450 | Diodes, Inc.k | 128,872 | ||||||
| 16,257 | DST Systems, Inc. | 1,498,408 | ||||||
| 12,144 | E2open, Inc.g,k | 251,016 | ||||||
| 46,250 | eBay, Inc.k | 2,315,275 | ||||||
| 30,200 | Electronic Arts, Inc.k | 1,083,274 | ||||||
| 203,400 | EMC Corporation | 5,357,556 | ||||||
| 96,350 | Facebook, Inc.k | 6,483,392 | ||||||
| 13,100 | GameStop Corporationg | 530,157 | ||||||
| 14,000 | Genpact, Ltd.k | 245,420 | ||||||
| 5,300 | Global Payments, Inc. | 386,105 | ||||||
| 10,119 | Google, Inc.k | 5,821,258 | ||||||
| 11,819 | Google, Inc., Class Ak | 6,910,215 | ||||||
| 7,130 | Guidewire Software, Inc.k | 289,906 | ||||||
| 24,700 | Hewlett-Packard Company | 831,896 | ||||||
| 5,000 | iGATE Corporationk | 181,950 | ||||||
| 12,930 | Informatica Corporationk | 460,955 | ||||||
| 5,500 | International Business Machines Corporation | 996,985 | ||||||
| 4,800 | j2 Global, Inc. | 244,128 | ||||||
| 67,607 | Juniper Networks, Inc.k | 1,659,076 | ||||||
The accompanying Notes to Financial Statements are an integral part of this schedule.
94
Table of Contents
Moderately Conservative Allocation Portfolio
Schedule of Investments as of June 30, 2014
(unaudited)
| Shares | Common Stock (18.1%) | Value | ||||||
| Information Technology (3.4%) - continued | |||||||
| 14,863 | Lexmark International, Inc.g | $ | 715,802 | |||||
| 7,650 | Liquidity Services, Inc.g,k | 120,564 | ||||||
| 20,250 | Marvell Technology Group, Ltd. | 290,182 | ||||||
| 1,280 | Measurement Specialties, Inc.k | 110,170 | ||||||
| 8,350 | Mentor Graphics Corporation | 180,109 | ||||||
| 32,480 | Microsoft Corporation | 1,354,416 | ||||||
| 195,787 | NetApp, Inc. | 7,150,141 | ||||||
| 40,456 | NVIDIA Corporation | 750,054 | ||||||
| 94,300 | Oracle Corporation | 3,821,979 | ||||||
| 10,937 | Plantronics, Inc. | 525,523 | ||||||
| 10,000 | Polycom, Inc.k | 125,300 | ||||||
| 70,077 | QUALCOMM, Inc. | 5,550,098 | ||||||
| 7,750 | Red Hat, Inc.k | 428,343 | ||||||
| 73,850 | Salesforce.com, Inc.k | 4,289,208 | ||||||
| 17,800 | Sanmina Corporationk | 405,484 | ||||||
| 13,566 | Sapient Corporationk | 220,447 | ||||||
| 633 | Skyworks Solutions, Inc. | 29,726 | ||||||
| 12,150 | SunPower Corporationg,k | 497,907 | ||||||
| 97,430 | Symantec Corporation | 2,231,147 | ||||||
| 16,700 | Take-Two Interactive Software, Inc.k | 371,408 | ||||||
| 110,600 | Teradata Corporationk | 4,446,120 | ||||||
| 34,495 | Teradyne, Inc.g | 676,102 | ||||||
| 104,880 | Texas Instruments, Inc. | 5,012,215 | ||||||
| 9,280 | Textura Corporationg,k | 219,379 | ||||||
| 15,450 | Ubiquiti Networks, Inc.g,k | 698,186 | ||||||
| 7,050 | VeriFone Systems, Inc.k | 259,088 | ||||||
| 11,069 | Virtusa Corporationk | 396,270 | ||||||
| 33,270 | Vishay Intertechnology, Inc. | 515,352 | ||||||
| 60,050 | VMware, Inc.k | 5,813,441 | ||||||
| 2,700 | WebMD Health Corporationk | 130,410 | ||||||
| 2,000 | Workday, Inc.k | 179,720 | ||||||
| 76,250 | Xerox Corporation | 948,550 | ||||||
| 44,750 | Xilinx, Inc. | 2,117,122 | ||||||
|
| |||||||
| Total | 119,771,768 | |||||||
|
| |||||||
| Materials (0.5%) | |||||||
| 8,550 | Alcoa, Inc. | 127,309 | ||||||
| 5,800 | Berry Plastics Group, Inc.k | 149,640 | ||||||
| 2,050 | Cabot Corporation | 118,879 | ||||||
| 33,600 | Celanese Corporation | 2,159,808 | ||||||
| 17,100 | Cliffs Natural Resources, Inc.g | 257,355 | ||||||
| 1,750 | Compass Minerals International, Inc. | 167,545 | ||||||
| 5,400 | Crown Holdings, Inc.k | 268,704 | ||||||
| 53,010 | Dow Chemical Company | 2,727,895 | ||||||
| 4,920 | Eagle Materials, Inc. | 463,858 | ||||||
| 5,750 | Eastman Chemical Company | 502,262 | ||||||
| 37,700 | Graphic Packaging Holding Companyk | 441,090 | ||||||
| 12,680 | H.B. Fuller Company | 609,908 | ||||||
| 11,540 | Materials Select Sector SPDR Fund | 572,846 | ||||||
| 8,500 | Monsanto Company | 1,060,290 | ||||||
| 15,500 | Mosaic Company | 766,475 | ||||||
| 37,720 | Nucor Corporation | 1,857,710 | ||||||
| 10,400 | Owens-Illinois, Inc.k | 360,256 | ||||||
| 8,300 | Packaging Corporation of America | 593,367 | ||||||
| 8,304 | Silgan Holdings, Inc. | 422,009 | ||||||
| 2,750 | Sonoco Products Company | 120,808 | ||||||
| 8,259 | Southern Copper Corporation | 250,826 | ||||||
| 24,580 | Steel Dynamics, Inc. | 441,211 | ||||||
| 59,950 | Teck Resources, Ltd.g | 1,368,659 | ||||||
| 15,800 | Walter Energy, Inc.g | 86,110 | ||||||
| 3,100 | Worthington Industries, Inc. | 133,424 | ||||||
|
| |||||||
| Total | 16,028,244 | |||||||
|
| |||||||
| Telecommunications Services (0.2%) | |||||||
| 31,450 | AT&T, Inc. | 1,112,072 | ||||||
| 7,715 | Cogent Communications Group, Inc. | 266,553 | ||||||
| 4,700 | Telephone & Data Systems, Inc. | 122,717 | ||||||
| 87,689 | Verizon Communications, Inc. | 4,290,623 | ||||||
| 31,300 | Vonage Holdings Corporationk | 117,375 | ||||||
|
| |||||||
| Total | 5,909,340 | |||||||
|
| |||||||
| Utilities (0.3%) | |||||||
| 4,950 | Atmos Energy Corporation | 264,330 | ||||||
| 12,900 | CMS Energy Corporation | 401,835 | ||||||
| 2,300 | Edison International, Inc. | 133,653 | ||||||
| 76,740 | NiSource, Inc. | 3,018,952 | ||||||
| 13,310 | NorthWestern Corporation | 694,649 | ||||||
| 109,550 | PG&E Corporation | 5,260,591 | ||||||
| 8,750 | Public Service Enterprise Group, Inc. | 356,912 | ||||||
| 7,900 | Southern Company | 358,502 | ||||||
| 5,291 | Southwest Gas Corporation | 279,312 | ||||||
| 3,750 | Westar Energy, Inc. | 143,212 | ||||||
| 17,900 | Wisconsin Energy Corporation | 839,868 | ||||||
|
| |||||||
| Total | 11,751,816 | |||||||
|
| |||||||
Total Common Stock (cost $508,146,535) | 632,523,218 | |||||||
|
| |||||||
Preferred Stock (<0.1%) | ||||||||
| Financials (<0.1%) | |||||||
| 1,010,000 | J.P. Morgan Chase & Companyj | 1,128,675 | ||||||
|
| |||||||
| Total | 1,128,675 | |||||||
|
| |||||||
Total Preferred Stock (cost $1,178,011) | 1,128,675 | |||||||
|
| |||||||
Collateral Held for Securities Loaned (0.7%) | ||||||||
| 22,629,410 | Thrivent Cash Management Trust | 22,629,410 | ||||||
|
| |||||||
Total Collateral Held for Securities Loaned (cost $22,629,410) | 22,629,410 | |||||||
|
| |||||||
The accompanying Notes to Financial Statements are an integral part of this schedule.
95
Table of Contents
Moderately Conservative Allocation Portfolio
Schedule of Investments as of June 30, 2014
(unaudited)
| Shares or Principal Amount | Short-Term Investments (16.8%)l | Value | ||||||
| Federal Home Loan Bank Discount Notes | ||||||||
| 6,100,000 | 0.110%, 07/07/2014m | $ | 6,099,946 | |||||
| 22,000,000 | 0.070%, 07/09/2014 | 21,999,769 | ||||||
| 46,700,000 | 0.057%, 07/11/2014 | 46,699,261 | ||||||
| 25,000,000 | 0.045%, 07/16/2014 | 24,999,531 | ||||||
| 1,500,000 | 0.055%, 07/23/2014m | 1,499,950 | ||||||
| 50,000,000 | 0.055%, 07/25/2014 | 49,998,167 | ||||||
| 43,050,000 | 0.100%, 07/30/2014m | 43,048,122 | ||||||
| 13,000,000 | 0.057%, 08/01/2014 | 12,999,362 | ||||||
| 28,000,000 | 0.060%, 08/06/2014 | 27,998,320 | ||||||
| 15,100,000 | 0.061%, 08/08/2014m | 15,099,033 | ||||||
| 16,000,000 | 0.055%, 08/13/2014 | 15,998,949 | ||||||
| 11,000,000 | 0.060%, 08/15/2014 | 10,999,175 | ||||||
| 19,265,000 | 0.060%, 08/22/2014 | 19,263,330 | ||||||
| 19,000,000 | 0.045%, 08/26/2014 | 18,998,670 | ||||||
| 1,000,000 | 0.065%, 08/27/2014 | 999,897 | ||||||
| 4,000,000 | 0.070%, 09/03/2014 | 3,999,502 | ||||||
| 4,000,000 | 0.080%, 09/05/2014 | 3,999,413 | ||||||
| 45,000,000 | 0.070%, 09/10/2014 | 44,993,788 | ||||||
| 27,000,000 | 0.075%, 09/12/2014 | 26,995,874 | ||||||
| 10,000,000 | 0.080%, 09/17/2014 | 9,998,267 | ||||||
| 49,200,000 | 0.074%, 09/19/2014m | 49,191,858 | ||||||
| 15,000,000 | 0.076%, 09/24/2014 | 14,997,308 | ||||||
| Federal Home Loan Mortgage Corporation Discount Notes | ||||||||
| 800,000 | 0.081%, 07/08/2014m | 799,987 | ||||||
| 18,500,000 | 0.055%, 08/26/2014 | 18,498,417 | ||||||
| Federal National Mortgage Association Discount Notes | ||||||||
| 50,000,000 | 0.050%, 08/27/2014 | 49,996,042 | ||||||
| Federal National Mortgage Association Discount Notes | ||||||||
| 34,000,000 | 0.045%, 08/20/2014 | 33,997,875 | ||||||
| 16,000,000 | 0.070%, 09/17/2014 | 15,997,573 | ||||||
|
| |||||||
| Total Short-Term Investments (at amortized cost) | 590,167,386 | |||||||
|
| |||||||
| Total Investments (cost $3,640,356,420) 111.9% | $ | 3,920,395,883 | ||||||
|
| |||||||
| Other Assets and Liabilities, Net (11.9%) | (415,880,850 | ) | ||||||
|
| |||||||
| Total Net Assets 100.0% | $ | 3,504,515,033 | ||||||
|
| |||||||
| a | The stated interest rate represents the weighted average of all contracts within the bank loan facility. |
| b | All or a portion of the loan is unfunded. |
| c | Denotes investments purchased on a when-issued or delayed delivery basis. |
| d | Denotes securities sold under Rule 144A of the Securities Act of 1933, which exempts them from registration. These securities have been deemed liquid and may be resold to other dealers in the program or to other qualified institutional buyers. As of June 30, 2014, the value of these investments was $138,796,741 or 4.0% of total net assets. |
| e | Denotes variable rate securities. Variable rate securities are securities whose yields vary with a designated market index or market rate. The rate shown is as of June 30, 2014. |
| f | Denotes restricted securities. Restricted securities are investment securities which have been deemed illiquid and cannot be offered for public sale without first being registered under the Securities Act of 1933. The following table indicates the acquisition date and cost of restricted securities Moderately Conservative Allocation Portfolio owned as of June 30, 2014. |
Security | Acquisition Date | Cost | ||||||
Apidos CLO XVIII, 07/22/2026 | 6/25/2014 | $ | 822,938 | |||||
CoBank ACB, 06/15/2022 | 10/18/2013 | 368,842 | ||||||
Edlinc Student Loan Funding Trust, 10/01/2025 | 2/28/2013 | 1,317,702 | ||||||
FNA Trust, 01/10/2018 | 4/29/2013 | 863,741 | ||||||
Prudential Covered Trust, 09/30/2015 | 4/1/2013 | 956,194 | ||||||
| g | All or a portion of the security is on loan. |
| h | Denotes interest only security. Interest only securities represent the right to receive monthly interest payments on an underlying pool of mortgages or assets. The principal shown is the outstanding par amount of the pool as of the end of the period. The actual effective yield of the security is different than the stated coupon rate. |
| i | Security is fair valued. |
| j | Denotes perpetual securities. Perpetual securities pay an indefinite stream of interest, but may be called by the issuer at an earlier date. |
| k | Non-income producing security. |
| l | The interest rate shown reflects the yield, coupon rate or the discount rate at the date of purchase. |
| m | At June 30, 2014, $22,549,002 of investments were held on deposit with the counterparty and pledged as the initial margin deposit for open futures contracts. |
Definitions:
| ADR | - | American Depositary Receipt, which are certificates for an underlying foreign security’s shares held by an issuing U.S. depository bank. | ||
| CLO | - | Collateralized Loan Obligation. | ||
| ETF | - | Exchange Traded Fund. | ||
| REIT | - | Real Estate Investment Trust is a company that buys, develops, manages and/or sells real estate assets. | ||
| TIPS | - | Treasury Inflation Protected Security. |
Unrealized Appreciation (Depreciation)
Gross unrealized appreciation and depreciation of investments, based on cost for federal income tax purposes, were as follows:
Gross unrealized appreciation | $ | 291,926,337 | ||
Gross unrealized depreciation | (13,546,307 | ) | ||
|
| |||
Net unrealized appreciation (depreciation) | $ | 278,380,030 | ||
Cost for federal income tax purposes | $ | 3,642,015,853 | ||
The accompanying Notes to Financial Statements are an integral part of this schedule.
96
Table of Contents
Moderately Conservative Allocation Portfolio
Schedule of Investments as of June 30, 2014
(unaudited)
Fair Valuation Measurements
The following table is a summary of the inputs used, as of June 30, 2014, in valuing Moderately Conservative Allocation Portfolio’s assets carried at fair value.
Investments in Securities | Total | Level 1 | Level 2 | Level 3 | ||||||||||||
Bank Loans | ||||||||||||||||
Basic Materials | 10,885,847 | — | 10,885,847 | — | ||||||||||||
Capital Goods | 6,062,211 | — | 6,062,211 | — | ||||||||||||
Communications Services | 55,283,443 | — | 55,283,443 | — | ||||||||||||
Consumer Cyclical | 30,262,274 | — | 30,262,274 | — | ||||||||||||
Consumer Non-Cyclical | 17,715,998 | — | 17,715,998 | — | ||||||||||||
Energy | 6,020,192 | — | 6,020,192 | — | ||||||||||||
Financials | 9,234,723 | — | 9,234,723 | — | ||||||||||||
Technology | 5,859,228 | — | 5,859,228 | — | ||||||||||||
Transportation | 4,601,261 | — | 4,601,261 | — | ||||||||||||
Utilities | 5,026,318 | — | 5,026,318 | — | ||||||||||||
Long-Term Fixed Income | ||||||||||||||||
Asset-Backed Securities | 71,160,245 | — | 66,784,181 | 4,376,064 | ||||||||||||
Basic Materials | 18,202,061 | — | 18,202,061 | — | ||||||||||||
Capital Goods | 12,401,067 | — | 12,401,067 | — | ||||||||||||
Collateralized Mortgage Obligations | 38,466,102 | — | 36,944,196 | 1,521,906 | ||||||||||||
Commercial Mortgage-Backed | ||||||||||||||||
Securities | 51,453,078 | — | 51,453,078 | — | ||||||||||||
Communications Services | 39,694,336 | — | 39,694,336 | — | ||||||||||||
Consumer Cyclical | 31,998,707 | — | 31,998,707 | — | ||||||||||||
Consumer Non-Cyclical | 38,898,786 | — | 38,898,786 | — | ||||||||||||
Energy | 27,576,611 | — | 27,576,611 | — | ||||||||||||
Financials | 144,257,442 | — | 143,893,548 | 363,894 | ||||||||||||
Foreign Government | 11,041,155 | — | 11,041,155 | — | ||||||||||||
Mortgage-Backed Securities | 419,071,654 | — | 419,071,654 | — | ||||||||||||
Technology | 13,510,903 | — | 13,510,903 | — | ||||||||||||
Transportation | 9,616,030 | — | 9,616,030 | — | ||||||||||||
U.S. Government and Agencies | 305,773,181 | — | 305,773,181 | — | ||||||||||||
Utilities | 30,530,109 | — | 30,530,109 | — | ||||||||||||
Mutual Funds | ||||||||||||||||
Equity Mutual Funds | 492,127,113 | 492,127,113 | — | — | ||||||||||||
Fixed Income Mutual Funds | 767,217,119 | 767,217,119 | — | — | ||||||||||||
Common Stock | ||||||||||||||||
Consumer Discretionary | 84,900,361 | 84,900,361 | — | — | ||||||||||||
Consumer Staples | 32,511,003 | 32,511,003 | — | — | ||||||||||||
Energy | 98,853,556 | 98,643,428 | 210,128 | — | ||||||||||||
Financials | 118,199,200 | 118,199,200 | — | — | ||||||||||||
Health Care | 83,101,064 | 83,101,064 | — | — | ||||||||||||
Industrials | 61,496,866 | 61,496,866 | — | — | ||||||||||||
Information Technology | 119,771,768 | 119,771,768 | — | — | ||||||||||||
Materials | 16,028,244 | 16,028,244 | — | — | ||||||||||||
Telecommunications Services | 5,909,340 | 5,909,340 | — | — | ||||||||||||
Utilities | 11,751,816 | 11,751,816 | — | — | ||||||||||||
Preferred Stock | ||||||||||||||||
Financials | 1,128,675 | — | 1,128,675 | — | ||||||||||||
Collateral Held for Securities Loaned | 22,629,410 | 22,629,410 | — | — | ||||||||||||
Short-Term Investments | 590,167,386 | — | 590,167,386 | — | ||||||||||||
|
|
|
|
|
|
|
| |||||||||
Total | $ | 3,920,395,883 | $ | 1,914,286,732 | $ | 1,999,847,287 | $ | 6,261,864 | ||||||||
|
|
|
|
|
|
|
| |||||||||
Other Financial Instruments | Total | Level 1 | Level 2 | Level 3 | ||||||||||||
Asset Derivatives | ||||||||||||||||
Futures Contracts | 2,217,626 | 2,217,626 | — | — | ||||||||||||
|
|
|
|
|
|
|
| |||||||||
Total Asset Derivatives | $ | 2,217,626 | $ | 2,217,626 | $ | — | $ | — | ||||||||
|
|
|
|
|
|
|
| |||||||||
Liability Derivatives | ||||||||||||||||
Futures Contracts | 4,719,697 | 3,103,236 | 1,616,461 | — | ||||||||||||
|
|
|
|
|
|
|
| |||||||||
Total Liability Derivatives | $ | 4,719,697 | $ | 3,103,236 | $ | 1,616,461 | $ | — | ||||||||
|
|
|
|
|
|
|
| |||||||||
The accompanying Notes to Financial Statements are an integral part of this schedule.
97
Table of Contents
Moderately Conservative Allocation Portfolio
Schedule of Investments as of June 30, 2014
(unaudited)
There were no significant transfers between Levels during the period ended June 30, 2014. Transfers between Levels are identified as of the end of the period.
Futures Contracts | Number of Contracts Long/(Short) | Expiration Date | Notional Principal Amount | Value | Unrealized Gain/(Loss) | |||||||||||||||
2-Yr. U.S. Treasury Bond Futures | (250 | ) | September 2014 | ($ | 54,941,733 | ) | ($ | 54,898,438 | ) | $ | 43,295 | |||||||||
5-Yr. U.S. Treasury Bond Futures | (1,805 | ) | September 2014 | (216,277,310 | ) | (215,626,997 | ) | 650,313 | ||||||||||||
10-Yr. U.S. Treasury Bond Futures | 135 | September 2014 | 16,818,459 | 16,898,203 | 79,744 | |||||||||||||||
30-Yr. U.S. Treasury Bond Futures | 1,455 | September 2014 | 200,804,286 | 199,607,812 | (1,196,474 | ) | ||||||||||||||
Eurex EURO STOXX 50 Futures | 3,058 | September 2014 | 136,741,287 | 135,124,826 | (1,616,461 | ) | ||||||||||||||
Mini MSCI EAFE Index Futures | 509 | September 2014 | 49,835,961 | 50,108,505 | 272,544 | |||||||||||||||
Russell 2000 Index Mini-Futures | 335 | September 2014 | 38,703,321 | 39,875,051 | 1,171,730 | |||||||||||||||
S&P 400 Index Mini-Futures | (255 | ) | September 2014 | (35,577,977 | ) | (36,447,150 | ) | (869,173 | ) | |||||||||||
S&P 500 Index Futures | (114 | ) | September 2014 | (54,810,727 | ) | (55,643,400 | ) | (832,673 | ) | |||||||||||
Ultra Long Term U.S. Treasury Bond Futures | 206 | September 2014 | 31,092,041 | 30,887,125 | (204,916 | ) | ||||||||||||||
Total Futures Contracts | ($ | 2,502,071 | ) | |||||||||||||||||
The following table summarizes the fair value and Statement of Assets and Liabilities location, as of June 30, 2014, for Moderately Conservative Allocation Portfolio’s investments in financial derivative instruments by primary risk exposure as discussed under item (2) Significant Accounting Policies of the Notes to Financial Statements.
Derivatives by risk category | Statement of Assets and Liabilities Location | Fair Value | ||||
Asset Derivatives | ||||||
Interest Rate Contracts | ||||||
Futures* | Net Assets - Net unrealized appreciation/(depreciation) on Futures contracts | $ | 773,352 | |||
Total Interest Rate Contracts | 773,352 | |||||
Equity Contracts | ||||||
Futures* | Net Assets - Net unrealized appreciation/(depreciation) on Futures contracts | 1,444,274 | ||||
Total Equity Contracts | 1,444,274 | |||||
|
| |||||
Total Asset Derivatives | $ | 2,217,626 | ||||
|
| |||||
Liability Derivatives | ||||||
Interest Rate Contracts | ||||||
Futures* | Net Assets - Net unrealized appreciation/(depreciation) on Futures contracts | 1,401,390 | ||||
Total Interest Rate Contracts | 1,401,390 | |||||
Equity Contracts | ||||||
Futures* | Net Assets - Net unrealized appreciation/(depreciation) on Futures contracts | 3,318,307 | ||||
Total Equity Contracts | 3,318,307 | |||||
|
| |||||
Total Liability Derivatives | $ | 4,719,697 | ||||
|
| |||||
| * | Includes cumulative appreciation/depreciation of futures contracts as reported in the Schedule of Investments. Only current day’s variation margin is reported within the Statement of Assets and Liabilities. |
The following table summarizes the net realized gains/(losses) and Statement of Operations location, for the period ended June 30, 2014, for Moderately Conservative Allocation Portfolio’s investments in financial derivative instruments by primary risk exposure.
Derivatives by risk category | Statement of Operations Location | Realized Gains/(Losses) recognized in Income | ||||
Equity Contracts | ||||||
Futures | Net realized gains/(losses) on Futures contracts | 17,524,250 | ||||
Total Equity Contracts | 17,524,250 | |||||
Interest Rate Contracts | ||||||
Futures | Net realized gains/(losses) on Futures contracts | 12,174,897 | ||||
Total Interest Rate Contracts | 12,174,897 | |||||
|
| |||||
Total | $ | 29,699,147 | ||||
|
| |||||
The accompanying Notes to Financial Statements are an integral part of this schedule.
98
Table of Contents
Moderately Conservative Allocation Portfolio
Schedule of Investments as of June 30, 2014
(unaudited)
The following table summarizes the change in net unrealized appreciation/(depreciation) and Statement of Operations location, for the period ended June 30, 2014, for Moderately Conservative Allocation Portfolio’s investments in financial derivative instruments by primary risk exposure.
Derivatives by risk category | Statement of Operations Location | Change in unrealized appreciation/(depreciation) recognized in Income | ||||
Interest Rate Contracts | ||||||
Futures | Change in net unrealized appreciation/(depreciation) on Futures contracts | 409,250 | ||||
Total Interest Rate Contracts | 409,250 | |||||
Equity Contracts | ||||||
Futures | Change in net unrealized appreciation/(depreciation) on Futures contracts | (11,050,132 | ) | |||
Total Equity Contracts | (11,050,132 | ) | ||||
|
| |||||
Total | ($ | 10,640,882 | ) | |||
|
| |||||
The following table presents Moderately Conservative Allocation Portfolio’s average volume of derivative activity during the period ended June 30, 2014.
Derivative Risk Category | Futures (Notional)* | Futures (Percentage of Average Net Assets) | ||||||
Equity Contracts | $ | 279,574,693 | 8.2 | % | ||||
Interest Rate Contracts | 482,694,643 | 14.2 | ||||||
| * | Notional amount represents long or short, or both, derivative positions held by the Portfolio. |
Investment in Affiliates
Affiliated issuers, as defined under the Investment Company Act of 1940, include those in which the Portfolio’s holdings of an issuer represent 5% or more of the outstanding voting securities of an issuer, or any affiliated mutual fund.
A summary of transactions for the fiscal year to date, in Moderately Conservative Allocation Portfolio, is as follows:
Portfolio | Value December 31, 2013 | Gross Purchases | Gross Sales | Shares Held at June 30, 2014 | Value June 30, 2014 | Income Earned January 1, 2014 - June 30, 2014 | ||||||||||||||||||
Partner Small Cap Value | $ | 36,890,762 | $ | 1,033,546 | $ | – | 1,342,036 | $ | 37,760,071 | $ | 80,116 | |||||||||||||
Small Cap Stock | 28,794,314 | 376,899 | – | 1,641,909 | 29,551,572 | 62,683 | ||||||||||||||||||
Partner Mid Cap Value | 41,896,321 | 6,083,899 | – | 2,622,430 | 45,527,488 | 281,639 | ||||||||||||||||||
Mid Cap Stock | 52,035,964 | 2,625,857 | – | 3,088,876 | 57,183,430 | 172,923 | ||||||||||||||||||
Partner Worldwide Allocation | 158,823,593 | 3,228,228 | – | 16,163,017 | 165,572,326 | 3,228,228 | ||||||||||||||||||
Large Cap Value | 120,211,070 | 1,533,344 | – | 7,807,552 | 127,392,711 | 1,533,344 | ||||||||||||||||||
Large Cap Stock | 27,333,984 | 247,913 | – | 2,334,504 | 29,139,515 | 247,913 | ||||||||||||||||||
High Yield | 98,379,586 | 2,923,116 | 2,256,836 | 19,535,460 | 100,972,934 | 2,922,606 | ||||||||||||||||||
Income | 249,327,543 | 7,880,460 | 5,680,378 | 24,308,179 | 257,873,319 | 4,817,147 | ||||||||||||||||||
Limited Maturity Bond | 415,677,168 | 3,472,541 | 13,500,470 | 41,315,102 | 408,370,866 | 3,477,839 | ||||||||||||||||||
Cash Management Trust- Collateral Investment | 53,397,848 | 106,970,952 | 137,739,390 | 22,629,410 | 22,629,410 | 82,832 | ||||||||||||||||||
Total Value and Income Earned | 1,282,768,153 | 1,281,973,642 | 16,907,270 | |||||||||||||||||||||
The accompanying Notes to Financial Statements are an integral part of this schedule.
99
Table of Contents
Growth and Income Plus Portfolio
Schedule of Investments as of June 30, 2014
(unaudited)
Principal Amount | Bank Loans (10.0%)a | Value | ||||||
| Basic Materials (0.9%) | |||||||
| Alpha Natural Resources, Inc., Term Loan | ||||||||
| $ 59,698 | 3.500%, 5/22/2020 | $ | 57,633 | |||||
| Arch Coal, Inc., Term Loan | ||||||||
| 156,532 | 6.250%, 5/16/2018 | 153,696 | ||||||
| Fortescue Metals Group, Ltd., Term Loan | ||||||||
| 106,920 | 3.750%, 6/30/2019 | 106,961 | ||||||
| Ineos Group Holdings, Ltd., Term Loan | ||||||||
| 106,917 | 3.750%, 5/4/2018 | 106,609 | ||||||
| NewPage Corporation, Term Loan | ||||||||
| 135,000 | 9.500%, 2/11/2021 | 135,169 | ||||||
| Tronox Pigments BV, Term Loan | ||||||||
| 114,710 | 0.000%, 3/19/2020b,c | 114,882 | ||||||
|
| |||||||
| Total | 674,950 | |||||||
|
| |||||||
| Capital Goods (0.5%) | |||||||
| ADS Waste Holdings, Inc., Term Loan | ||||||||
| 106,914 | 3.750%, 10/9/2019 | 106,332 | ||||||
| Berry Plastics Group, Inc., Term Loan | ||||||||
| 53,459 | 3.500%, 2/8/2020 | 52,986 | ||||||
| Rexnord, LLC, Term Loan | ||||||||
| 107,190 | 4.000%, 8/21/2020 | 107,029 | ||||||
| Silver II Borrower, Term Loan | ||||||||
| 103,946 | 4.000%, 12/13/2019 | 103,612 | ||||||
|
| |||||||
| Total | 369,959 | |||||||
|
| |||||||
| Communications Services (3.2%) | |||||||
| Cengage Learning Aquisitions, Term Loan | ||||||||
| 89,775 | 7.000%, 3/31/2020 | 90,729 | ||||||
| Charter Communications Operating, LLC, Term Loan | ||||||||
| 53,460 | 3.000%, 1/3/2021 | 52,614 | ||||||
| Cincinnati Bell, Inc., Term Loan | ||||||||
| 107,190 | 4.000%, 9/10/2020 | 107,124 | ||||||
| Clear Channel Communications, Inc., Term Loan | ||||||||
| 108,000 | 6.900%, 1/30/2019 | 107,402 | ||||||
| Cumulus Media Holdings, Inc., Term Loan | ||||||||
| 51,105 | 4.250%, 12/23/2020 | 51,233 | ||||||
| Fairpoint Communications, Term Loan | ||||||||
| 106,917 | 7.500%, 2/14/2019 | 110,593 | ||||||
| Grande Communications Networks, LLC, Term Loan | ||||||||
| 106,920 | 4.500%, 5/29/2020 | 106,519 | ||||||
| Gray Television, Inc., Term Loan | ||||||||
| 55,000 | 0.000%, 6/13/2021b,c | 55,215 | ||||||
| IMG Worldwide, Inc., Term Loan | ||||||||
| 90,000 | 5.250%, 5/6/2021 | 90,540 | ||||||
| Integra Telecom Holdings, Inc., Term Loan | ||||||||
| 106,917 | 5.250%, 2/22/2019 | 107,479 | ||||||
| Intelsat Jackson Holdings SA, Term Loan | ||||||||
| 52,173 | 3.750%, 6/30/2019 | 52,217 | ||||||
| Level 3 Communications, Inc., Term Loan | ||||||||
| 54,000 | 4.000%, 8/1/2019 | 54,045 | ||||||
| Liberty Cablevision of Puerto Rico, | ||||||||
| LLC, Term Loan | ||||||||
| 120,000 | 0.000%, 12/11/2021b,c | 120,100 | ||||||
| LTS Buyer, LLC, Term Loan | ||||||||
| 80,190 | 4.000%, 4/13/2020 | 79,918 | ||||||
| MCC Georgia, LLC, Term Loan | ||||||||
| 80,000 | 0.000%, 6/30/2021b,c | 80,066 | ||||||
| McGraw-Hill Global Education, LLC, Term Loan | ||||||||
| 91,494 | 5.750%, 3/22/2019 | 92,980 | ||||||
| NEP/NCP Holdco, Inc., Term Loan | ||||||||
| 107,189 | 4.250%, 1/22/2020 | 107,162 | ||||||
| NTelos, Inc., Term Loan | ||||||||
| 106,912 | 5.750%, 11/9/2019 | 106,823 | ||||||
| Puerto Rico Cable Acquisition Company, Inc., Term Loan | ||||||||
| 117,760 | 5.500%, 7/31/2018 | 117,613 | ||||||
| SBA Senior Finance II, LLC, Term Loan | ||||||||
| 90,000 | 3.250%, 3/24/2021 | 89,386 | ||||||
| TNS, Inc., Term Loan | ||||||||
| 82,390 | 5.000%, 2/14/2020 | 82,698 | ||||||
| Univision Communications, Inc., Term Loan | ||||||||
| 106,921 | 4.000%, 3/1/2020 | 106,776 | ||||||
| Virgin Media Investment Holdings, Ltd., Term Loan | ||||||||
| 81,000 | 3.500%, 6/7/2020 | 80,721 | ||||||
| Visant Corporation, Term Loan | ||||||||
| 67,500 | 5.250%, 12/22/2016 | 67,179 | ||||||
| WideOpenWest Finance, LLC, Term Loan | ||||||||
| 93,553 | 4.750%, 4/1/2019 | 93,772 | ||||||
| XO Communications, LLC, Term Loan | ||||||||
| 89,775 | 4.250%, 3/20/2021 | 90,238 | ||||||
| Yankee Cable Acquisition, LLC, Term Loan | ||||||||
| 106,238 | 4.500%, 3/1/2020 | 106,736 | ||||||
| Zayo Group, LLC, Term Loan | ||||||||
| 93,546 | 4.000%, 7/2/2019 | 93,614 | ||||||
|
| |||||||
| Total | 2,501,492 | |||||||
|
| |||||||
| Consumer Cyclical (1.7%) | |||||||
| Bally Technologies, Inc., Term Loan | ||||||||
| 63,925 | 4.250%, 11/25/2020 | 64,165 | ||||||
| Burlington Coat Factory Warehouse Corporation, Term Loan | ||||||||
| 77,429 | 4.250%, 2/23/2017 | 77,848 | ||||||
| Ceridian Corporation, Term Loan | ||||||||
| 104,614 | 4.400%, 8/14/2015 | 104,727 | ||||||
| Chrysler Group, LLC, Term Loan | ||||||||
| 89,775 | 3.250%, 12/31/2018 | 89,457 | ||||||
| Golden Nugget, Inc., Delayed Draw | ||||||||
| 19,104 | 5.500%, 11/21/2019 | 19,462 | ||||||
The accompanying Notes to Financial Statements are an integral part of this schedule.
100
Table of Contents
Growth and Income Plus Portfolio
Schedule of Investments as of June 30, 2014
(unaudited)
Principal Amount | Bank Loans (10.0%)a | Value | ||||||
| Consumer Cyclical (1.7%) - continued | |||||||
| Golden Nugget, Inc., Term Loan | ||||||||
| $ 44,576 | 5.500%, 11/21/2019 | $ | 45,412 | |||||
| Hilton Worldwide Finance, LLC, Term Loan | ||||||||
| 82,763 | 3.500%, 10/26/2020 | 82,591 | ||||||
| J.C. Penney Corporation, Inc., Term Loan | ||||||||
| 106,920 | 6.000%, 5/22/2018 | 108,091 | ||||||
| Las Vegas Sands, LLC, Term Loan | ||||||||
| 79,600 | 3.250%, 12/19/2020 | 79,555 | ||||||
| Marina District Finance Company, Inc., Term Loan | ||||||||
| 89,550 | 6.750%, 8/15/2018 | 90,529 | ||||||
| MGM Resorts International, Term Loan | ||||||||
| 40,093 | 3.500%, 12/20/2019 | 39,955 | ||||||
| Michaels Stores, Inc. Term Loan | ||||||||
| 90,000 | 0.000%, 1/28/2020b,c | 89,968 | ||||||
| Mohegan Tribal Gaming Authority, Term Loan | ||||||||
| 95,520 | 5.500%, 11/19/2019 | 96,993 | ||||||
| ROC Finance, LLC, Term Loan | ||||||||
| 107,190 | 5.000%, 6/20/2019 | 105,314 | ||||||
| Scientific Games International, Inc., Term Loan | ||||||||
| 107,460 | 4.250%, 10/18/2020 | 106,234 | ||||||
| Seminole Indian Tribe of Florida, Term Loan | ||||||||
| 88,306 | 0.000%, 4/29/2020b,c | 88,123 | ||||||
| Toys R Us, Inc., Term Loan | ||||||||
| 106,865 | 5.250%, 5/25/2018 | 86,382 | ||||||
|
| |||||||
| Total | 1,374,806 | |||||||
|
| |||||||
| Consumer Non-Cyclical (1.3%) | |||||||
| Albertsons, Inc., Term Loan | ||||||||
| 156,942 | 4.750%, 3/21/2019 | 157,627 | ||||||
| Biomet, Inc., Term Loan | ||||||||
| 93,467 | 3.661%, 7/25/2017 | 93,539 | ||||||
| Catalina Marketing Corporation, Term Loan | ||||||||
| 90,000 | 4.500%, 4/9/2021 | 89,962 | ||||||
| CHS/Community Health Systems, Inc., Term Loan | ||||||||
| 14,659 | 3.478%, 1/25/2017 | 14,689 | ||||||
| 138,571 | 4.250%, 1/27/2021 | 139,311 | ||||||
| Del Monte Corporation, Term Loan | ||||||||
| 53,865 | 3.500%, 3/9/2020 | 53,377 | ||||||
| JBS USA, LLC, Term Loan | ||||||||
| 71,201 | 3.750%, 5/25/2018 | 71,023 | ||||||
| Libbey Glass, Inc., Term Loan | ||||||||
| 45,000 | 3.750%, 4/9/2021 | 44,944 | ||||||
| Ortho-Clinical Diagnostics, Inc., Term Loan | ||||||||
| 110,000 | 4.750%, 6/30/2021b,c | 110,839 | ||||||
| Roundy’s Supermarkets, Inc., Term Loan | ||||||||
| 83,537 | 5.750%, 3/3/2021 | 83,657 | ||||||
| Supervalu, Inc., Term Loan | ||||||||
| 166,259 | 4.500%, 3/21/2019b,c | 166,032 | ||||||
|
| |||||||
| Total | 1,025,000 | |||||||
|
| |||||||
| Energy (0.6%) | |||||||
| Energy Solutions, LLC, Term Loan | ||||||||
| 110,000 | 6.750%, 5/29/2020 | 111,100 | ||||||
| Exgen Renewables I, LLC, Term Loan | ||||||||
| 59,500 | 5.250%, 2/6/2021 | 60,318 | ||||||
| McJunkin Red Man Corporation, Term Loan | ||||||||
| 104,212 | 5.000%, 11/8/2019 | 104,734 | ||||||
| Offshore Group Investment, Ltd., Term Loan | ||||||||
| 89,773 | 0.000%, 3/28/2019b,c | 89,174 | ||||||
| Pacific Drilling SA, Term Loan | ||||||||
| 80,190 | 4.500%, 6/3/2018 | 80,415 | ||||||
|
| |||||||
| Total | 445,741 | |||||||
|
| |||||||
| Financials (0.5%) | |||||||
| Delos Finance Sarl, Term Loan | ||||||||
| 90,000 | 3.500%, 3/6/2021 | 89,887 | ||||||
| DJO Finance, LLC, Term Loan | ||||||||
| 53,459 | 4.250%, 9/15/2017 | 53,626 | ||||||
| Harland Clarke Holdings Corporation, Term Loan | ||||||||
| 105,300 | 7.000%, 5/22/2018 | 106,946 | ||||||
| TransUnion, LLC, Term Loan | ||||||||
| 89,775 | 4.000%, 4/9/2021 | 89,743 | ||||||
| WaveDivision Holdings, LLC, Term Loan | ||||||||
| 66,821 | 4.000%, 10/12/2019 | 66,758 | ||||||
|
| |||||||
| Total | 406,960 | |||||||
|
| |||||||
| Technology (0.7%) | |||||||
| Avago Technologies, Ltd., Term Loan | ||||||||
| 150,000 | 3.750%, 5/6/2021 | 150,416 | ||||||
| BMC Software, Inc., Term Loan | ||||||||
| 107,460 | 5.000%, 9/10/2020 | 107,214 | ||||||
| First Data Corporation Extended, Term Loan | ||||||||
| 108,000 | 4.154%, 3/23/2018 | 108,135 | ||||||
| Freescale Semiconductor, Inc., Term Loan | ||||||||
| 106,922 | 4.250%, 2/28/2020 | 106,833 | ||||||
| Infor US, Inc., Term Loan | ||||||||
| 49,750 | 3.750%, 6/3/2020 | 49,387 | ||||||
| 53,592 | 3.750%, 6/3/2020 | 53,150 | ||||||
|
| |||||||
| Total | 575,135 | |||||||
|
| |||||||
| Transportation (0.3%) | |||||||
| American Airlines, Inc., Term Loan | ||||||||
| 106,920 | 3.750%, 6/27/2019 | 107,024 | ||||||
| Delta Air Lines, Inc., Term Loan | ||||||||
| 119,691 | 0.000%, 4/20/2017b,c | 119,606 | ||||||
|
| |||||||
| Total | 226,630 | |||||||
|
| |||||||
| Utilities (0.3%) | |||||||
| Calpine Corporation, Term Loan | ||||||||
| 40,086 | 4.000%, 4/1/2018 | 40,198 | ||||||
| 69,650 | 4.000%, 10/31/2020 | 69,815 | ||||||
The accompanying Notes to Financial Statements are an integral part of this schedule.
101
Table of Contents
Growth and Income Plus Portfolio
Schedule of Investments as of June 30, 2014
(unaudited)
| Principal Amount | Bank Loans (10.0%)a | Value | ||||||
| Utilities (0.3%) - continued | |||||||
| Intergen NV, Term Loan | ||||||||
| $ 106,920 | 5.500%, 6/15/2020 | $ | 107,633 | |||||
|
| |||||||
| Total | 217,646 | |||||||
|
| |||||||
| Total Bank Loans (cost $7,810,252) | 7,818,319 | |||||||
|
| |||||||
| Shares | Common Stock (68.3%) | |||||||
| Consumer Discretionary (9.0%) | |||||||
| 3,350 | Abercrombie & Fitch Company | 144,887 | ||||||
| 1,800 | Bayerische Motoren Werke AG | 227,934 | ||||||
| 5,900 | Best Buy Company, Inc. | 182,959 | ||||||
| 22,200 | Carphone Warehouse Group plc | 122,510 | ||||||
| 1,650 | Coinstar, Inc.d | 97,928 | ||||||
| 9,153 | Comcast Corporation | 491,333 | ||||||
| 1,700 | Deckers Outdoor Corporationd | 146,761 | ||||||
| 5,500 | E.W. Scripps Companyd | 116,380 | ||||||
| 17,800 | EDION Corporation | 123,567 | ||||||
| 22,150 | Ford Motor Company | 381,866 | ||||||
| 1,650 | G-III Apparel Group, Ltd.d | 134,739 | ||||||
| 3,100 | Hennes & Mauritz AB | 135,345 | ||||||
| 33,600 | Home Retail Group plc | 101,524 | ||||||
| 10,500 | Honda Motor Company, Ltd. | 366,395 | ||||||
| 3,000 | Iconix Brand Group, Inc.d | 128,820 | ||||||
| 59,500 | ITV plc | 181,322 | ||||||
| 7,100 | JB Hi-Fi, Ltd. | 122,764 | ||||||
| 3,300 | Kohl’s Corporation | 173,844 | ||||||
| 114,000 | Li & Fung, Ltd. | 168,857 | ||||||
| 5,700 | Live Nation Entertainment, Inc.d | 140,733 | ||||||
| 7,700 | Lowe’s Companies, Inc. | 369,523 | ||||||
| 46,000 | Luk Fook Holdings International, Ltd. | 134,891 | ||||||
| 2,500 | Madison Square Garden Companyd | 156,125 | ||||||
| 10,550 | Nautilus, Inc.d | 117,000 | ||||||
| 13,300 | Panasonic Corporation | 161,223 | ||||||
| 2,000 | Pandora AS | 153,488 | ||||||
| 2,300 | Renault SA | 207,908 | ||||||
| 1,000 | RTL Group SA | 110,996 | ||||||
| 12,100 | Sekisui House, Ltd. | 166,042 | ||||||
| 67,300 | Seven West Media, Ltd. | 119,185 | ||||||
| 10,300 | SHOWA Corporation | 125,485 | ||||||
| 38,000 | SJM Holdings, Ltd. | 95,196 | ||||||
| 21,800 | Sky Network Television, Ltd. | 131,106 | ||||||
| 5,600 | Societe Television Francaise 1 | 91,700 | ||||||
| 11,300 | Sumitomo Forestry Company, Ltd. | 137,969 | ||||||
| 5,900 | Suzuki Motor Corporation | 185,092 | ||||||
| 1,750 | Tempur-Pedic International, Inc.d | 104,475 | ||||||
| 5,044 | Thomson Reuters Corporation | 183,400 | ||||||
| 39,780 | Trinity Mirror plcd | 103,480 | ||||||
| 1,750 | Viacom, Inc. | 151,778 | ||||||
| 1,200 | Volkswagen AG | 314,300 | ||||||
|
| |||||||
| Total | 7,010,830 | |||||||
|
| |||||||
| Consumer Staples (4.6%) | |||||||
| 9,900 | Altria Group, Inc. | 415,206 | ||||||
| 6,300 | Asahi Group Holdings, Ltd. | 197,838 | ||||||
| 9,191 | Coca-Cola Company | 389,331 | ||||||
| 4,150 | Coca-Cola Enterprises, Inc. | 198,287 | ||||||
| 5,500 | CVS Caremark Corporation | 414,535 | ||||||
| 3,900 | ICA Gruppen AB | 132,879 | ||||||
| 8,000 | Imperial Tobacco Group plc | 359,903 | ||||||
| 2,400 | Interparfums SA | 88,205 | ||||||
| 2,400 | Interparfums SA Rightsd,e,f | 17,641 | ||||||
| 1,700 | Kerry Group plc | 127,029 | ||||||
| 1,600 | Nestle SA | 123,979 | ||||||
| 4,900 | Pilgrim’s Pride Corporationd | 134,064 | ||||||
| 7,142 | Procter & Gamble Company | 561,290 | ||||||
| 1,238 | Wal-Mart Stores, Inc. | 92,937 | ||||||
| 3,052 | Wesfarmers, Ltd. | 120,436 | ||||||
| 4,550 | WhiteWave Foods Companyd | 147,283 | ||||||
| 46,000 | Wilmar International, Ltd. | 117,753 | ||||||
|
| |||||||
| Total | 3,638,596 | |||||||
|
| |||||||
| Energy (6.3%) | |||||||
| 3,800 | Apache Corporation | 382,356 | ||||||
| 20,530 | Bankers Petroleum, Ltd.d | 131,217 | ||||||
| 60,252 | BP plc | 530,572 | ||||||
| 4,600 | CAT Oil AG | 117,901 | ||||||
| 14,400 | Eni SPA | 393,835 | ||||||
| 3,700 | Ensco plc | 205,609 | ||||||
| 7,800 | ERG SPA | 120,370 | ||||||
| 3,100 | Exterran Holdings, Inc. | 139,469 | ||||||
| 8,752 | Exxon Mobil Corporation | 881,151 | ||||||
| 7,600 | Marathon Oil Corporation | 303,392 | ||||||
| 7,550 | Pioneer Energy Services Corporationd | 132,427 | ||||||
| 103 | Royal Dutch Shell plc, Class A | 4,256 | ||||||
| 9,600 | Royal Dutch Shell plc, Class B | 417,215 | ||||||
| 5,550 | RPC, Inc. | 130,370 | ||||||
| 11,700 | Showa Shell Sekiyu KK | 132,994 | ||||||
| 1,900 | SM Energy Company | 159,790 | ||||||
| 4,750 | Southwestern Energy Companyd | 216,077 | ||||||
| 4,800 | Total SA | 347,279 | ||||||
| 2,300 | Whiting Petroleum Corporationd | 184,575 | ||||||
|
| |||||||
| Total | 4,930,855 | |||||||
|
| |||||||
| Financials (13.3%) | |||||||
| 9,997 | Aberdeen Asia-Pacific Income Fund, Inc. | 62,781 | ||||||
| 3,042 | Aflac, Inc. | 189,364 | ||||||
| 3,400 | Australia & New Zealand Banking Group, Ltd. | 106,911 | ||||||
| 37,600 | Bank Leumi Le-Israel BMd | 146,548 | ||||||
| 1,919 | Bank of Nova Scotia | 127,939 | ||||||
| 10,000 | Citigroup, Inc. | 471,000 | ||||||
| 2,200 | Cohen & Steers REIT and Preferred Income Fund, Inc. | 39,666 | ||||||
| 3,738 | Coresite Realty Corporation | 123,616 | ||||||
| 1,500 | Daito Trust Construction Company, Ltd. | 176,384 | ||||||
| 25,000 | Daiwa Securities Group, Inc. | 216,607 | ||||||
| 5,100 | Discover Financial Services | 316,098 | ||||||
| 1,400 | Erie Indemnity Company | 105,364 | ||||||
| 10,250 | F.N.B. Corporation | 131,405 | ||||||
| 10,900 | Fifth Third Bancorp | 232,715 | ||||||
| 7,350 | First Financial Bancorp | 126,494 | ||||||
| 15,350 | First Niagara Financial Group, Inc. | 134,159 | ||||||
| 720 | First Trust High Income Long/Short Fund | 13,068 | ||||||
| 3,150 | Hancock Holding Company | 111,258 | ||||||
| 11,600 | Hang Seng Bank, Ltd. | 189,422 | ||||||
| 3,450 | Horace Mann Educators Corporation | 107,881 | ||||||
| 42,112 | HSBC Holdings plc | 427,227 | ||||||
| 16,550 | Huntington Bancshares, Inc. | 157,887 | ||||||
The accompanying Notes to Financial Statements are an integral part of this schedule.
102
Table of Contents
Growth and Income Plus Portfolio
Schedule of Investments as of June 30, 2014
(unaudited)
| Shares | Common Stock (68.3%) | Value | ||||||
| Financials (13.3%) - continued | |||||||
| 4,000 | iShares FTSE NAREIT Mortgage Plus Capped Index Fund | $ | 50,560 | |||||
| 4,925 | iShares J.P. Morgan USD Emerging Markets Bond ETF | 567,705 | ||||||
| 4,150 | iShares MSCI Emerging Markets Minimum Volatility ETF | 249,457 | ||||||
| 13,473 | iShares S&P U.S. Preferred Stock Index Fund | 537,707 | ||||||
| 69,500 | Israel Discount Bank, Ltd.d | 117,660 | ||||||
| 14,150 | KeyCorp | 202,769 | ||||||
| 3,050 | Lazard, Ltd. | 157,258 | ||||||
| 9,550 | Maiden Holdings, Ltd. | 115,460 | ||||||
| 9,600 | Mediolanum SPA | 73,929 | ||||||
| 11,462 | MFS Intermediate Income Trust | 60,519 | ||||||
| 11,100 | National Australia Bank, Ltd. | 343,088 | ||||||
| 6,968 | Nuveen Quality Preferred Income Fund II | 62,921 | ||||||
| 18,944 | PowerShares Preferred Portfolio | 277,151 | ||||||
| 4,250 | Prudential Financial, Inc. | 377,272 | ||||||
| 8,900 | Radian Group, Inc. | 131,809 | ||||||
| 9,700 | Regions Financial Corporation | 103,014 | ||||||
| 6,272 | Royal Bank of Canada | 448,365 | ||||||
| 8,800 | Sumitomo Mitsui Financial Group, Inc. | 369,221 | ||||||
| 1,200 | Swiss Re AG | 106,701 | ||||||
| 7,733 | Templeton Global Income Fund | 63,875 | ||||||
| 8,498 | Toronto-Dominion Bank | 437,463 | ||||||
| 8,612 | U.S. Bancorp | 373,072 | ||||||
| 4,400 | Vanguard MSCI Emerging Markets ETF | 189,772 | ||||||
| 1,100 | Vanguard Short-Term Corporate Bond ETF | 88,407 | ||||||
| 3,150 | W.R. Berkley Corporation | 145,877 | ||||||
| 12,266 | Wells Fargo & Company | 644,701 | ||||||
| 3,509 | Western Asset Emerging Markets Debt Fund, Inc. | 64,495 | ||||||
| 6,718 | Western Asset High Income Opportunity Fund, Inc. | 40,980 | ||||||
| 1,100 | Zurich Insurance Group AGd | 331,305 | ||||||
|
| |||||||
| Total | 10,446,307 | |||||||
|
| |||||||
| Health Care (8.5%) | |||||||
| 6,950 | AbbVie, Inc. | 392,258 | ||||||
| 1,800 | Actelion, Ltd. | 227,826 | ||||||
| 14,200 | Affymetrix, Inc.d | 126,522 | ||||||
| 1,831 | Albany Molecular Research, Inc.d | 36,840 | ||||||
| 2,506 | AmerisourceBergen Corporation | 182,086 | ||||||
| 1,300 | Bayer AG | 183,395 | ||||||
| 1,050 | Biogen Idec, Inc.d | 331,075 | ||||||
| 1,232 | Boiron SA | 107,140 | ||||||
| 17,550 | Boston Scientific Corporationd | 224,113 | ||||||
| 6,100 | Bruker Corporationd | 148,047 | ||||||
| 4,700 | Capital Senior Living Corporationd | 112,048 | ||||||
| 5,000 | CSL, Ltd. | 313,866 | ||||||
| 2,708 | Eli Lilly and Company | 168,356 | ||||||
| 23,500 | Fisher & Paykel Healthcare Corporation, Ltd. | 97,733 | ||||||
| 17,641 | GlaxoSmithKline plc | 469,693 | ||||||
| 4,950 | Globus Medical, Inc.d | 118,404 | ||||||
| 3,850 | HCA Holdings, Inc.d | 217,063 | ||||||
| 6,000 | Healthways, Inc.d | 105,240 | ||||||
| 3,100 | ICON plcd | 146,041 | ||||||
| 4,502 | Johnson & Johnson | 470,999 | ||||||
| 1,400 | Lonza Group AG | 152,248 | ||||||
| 850 | McKesson Corporation | 158,278 | ||||||
| 4,500 | Medicines Companyd | 130,770 | ||||||
| 6,700 | Merck & Company, Inc. | 387,595 | ||||||
| 18,351 | Pfizer, Inc. | 544,658 | ||||||
| 4,300 | PharMerica Corporationd | 122,937 | ||||||
| 2,400 | Quintiles Transnational Holdings, Inc.d | 127,896 | ||||||
| 6,000 | Recordati SPA | 100,835 | ||||||
| 800 | Roche Holding AG | 238,366 | ||||||
| 600 | Roche Holding AG | 175,271 | ||||||
| 2,900 | WellPoint, Inc. | 312,069 | ||||||
|
| |||||||
| Total | 6,629,668 | |||||||
|
| |||||||
| Industrials (8.4%) | |||||||
| 3,016 | 3M Company | 432,012 | ||||||
| 4,650 | AAR Corporation | 128,154 | ||||||
| 5,000 | Abertis Infraestructuras SA | 115,031 | ||||||
| 3,050 | Altra Industrial Motion Corporation | 110,990 | ||||||
| 3,800 | Caterpillar, Inc. | 412,946 | ||||||
| 4,200 | easyJet plc | 98,081 | ||||||
| 7,413 | Exelis, Inc. | 125,873 | ||||||
| 24,550 | General Electric Company | 645,174 | ||||||
| 200 | Georg Fischer AGd | 143,147 | ||||||
| 30,000 | Hanwa Company, Ltd. | 129,941 | ||||||
| 20,000 | Hutchison Whampoa, Ltd. | 273,531 | ||||||
| 18,200 | ITOCHU Corporation | 233,648 | ||||||
| 4,200 | KAR Auction Services, Inc. | 133,854 | ||||||
| 13,000 | Kinden Corporation | 126,501 | ||||||
| 4,800 | KONE Oyj | 200,141 | ||||||
| 2,148 | Lockheed Martin Corporation | 345,248 | ||||||
| 8,800 | Meritor, Inc.d | 114,752 | ||||||
| 5,600 | Nordex SEd | 124,037 | ||||||
| 999 | Northrop Grumman Corporation | 119,510 | ||||||
| 2,650 | Oshkosh Corporation | 147,155 | ||||||
| 2,046 | Osterreichische Post AG | 101,628 | ||||||
| 3,000 | Patrick Industries, Inc.d | 139,770 | ||||||
| 5,500 | Quad/Graphics, Inc. | 123,035 | ||||||
| 2,664 | Randstad Holding NV | 144,413 | ||||||
| 2,976 | Raytheon Company | 274,536 | ||||||
| 10,800 | Republic Airways Holdings, Inc.d | 117,072 | ||||||
| 2,800 | Safran SA | 183,301 | ||||||
| 3,500 | Siemens AG | 462,120 | ||||||
| 9,000 | Southwest Airlines Company | 241,740 | ||||||
| 1,935 | Stantec, Inc. | 119,830 | ||||||
| 34,000 | Toda Corporation | 132,215 | ||||||
| 10,000 | TOTO, Ltd. | 134,860 | ||||||
| 2,400 | Woodward, Inc. | 120,432 | ||||||
| 5,800 | WS Atkins plc | 130,827 | ||||||
|
| |||||||
| Total | 6,585,505 | |||||||
|
| |||||||
| Information Technology (11.3%) | |||||||
| 1,550 | Accenture plc | 125,302 | ||||||
| 3,200 | Akamai Technologies, Inc.d | 195,392 | ||||||
| 3,800 | Ambarella, Inc.d | 118,484 | ||||||
| 11,450 | Apple, Inc. | 1,064,048 | ||||||
| 5,900 | AVG Technologies NVd | 118,767 | ||||||
| 60,961 | Blinkx plcd | 66,087 | ||||||
| 5,250 | Booz Allen Hamilton Holding Corporation | 111,510 | ||||||
| 15,350 | Brocade Communications Systems, Inc. | 141,220 | ||||||
| 11,750 | Calix, Inc.d | 96,115 | ||||||
| 2,600 | Cap Gemini SA | 185,546 | ||||||
The accompanying Notes to Financial Statements are an integral part of this schedule.
103
Table of Contents
Growth and Income Plus Portfolio
Schedule of Investments as of June 30, 2014
(unaudited)
| Shares | Common Stock (68.3%) | Value | ||||||
| Information Technology (11.3%) - continued | |||||||
| 5,124 | CGI Group, Inc.d | $ | 181,613 | |||||
| 2,750 | Check Point Software Technologies, Ltd.d | 184,333 | ||||||
| 19,260 | Cisco Systems, Inc. | 478,611 | ||||||
| 2,800 | Computer Sciences Corporation | 176,960 | ||||||
| 490 | Constellation Software, Inc. | 124,887 | ||||||
| 4,600 | CoreLogic, Inc.d | 139,656 | ||||||
| 14,350 | Corning, Inc. | 314,982 | ||||||
| 7,450 | eBay, Inc.d | 372,947 | ||||||
| 5,200 | Electronic Arts, Inc.d | 186,524 | ||||||
| 14,150 | EMC Corporation | 372,711 | ||||||
| 7,100 | FUJIFILM Holdings NPV | 198,165 | ||||||
| 3,450 | GameStop Corporation | 139,622 | ||||||
| 7,800 | Genpact, Ltd.d | 136,734 | ||||||
| 11,550 | Hewlett-Packard Company | 389,004 | ||||||
| 9,000 | Hitachi Kokusai Electric, Inc. | 124,707 | ||||||
| 7,700 | Juniper Networks, Inc.d | 188,958 | ||||||
| 500 | Keyence Corporation | 218,644 | ||||||
| 3,000 | Lexmark International, Inc. | 144,480 | ||||||
| 3,900 | ManTech International Corporation | 115,128 | ||||||
| 10,000 | Marvell Technology Group, Ltd. | 143,300 | ||||||
| 2,797 | Melexis NV | 124,012 | ||||||
| 9,573 | ModusLink Global Solutions, Inc.d | 35,803 | ||||||
| 5,250 | NetApp, Inc. | 191,730 | ||||||
| 3,000 | NXP Semiconductors NVd | 198,540 | ||||||
| 3,167 | Open Text Corporation | 151,961 | ||||||
| 4,723 | Oracle Corporation | 191,423 | ||||||
| 5,450 | Pegasystems, Inc. | 115,104 | ||||||
| 9,650 | Polycom, Inc.d | 120,914 | ||||||
| 5,950 | Sanmina Corporationd | 135,541 | ||||||
| 3,700 | SAP AG ADR | 285,102 | ||||||
| 3,000 | Seiko Epson Corporation | 127,633 | ||||||
| 7,900 | Texas Instruments, Inc. | 377,541 | ||||||
| 4,200 | Trend Micro, Inc. | 138,398 | ||||||
| 1,300 | Wincor Nixdorf AG | 74,037 | ||||||
|
| |||||||
| Total | 8,822,176 | |||||||
|
| |||||||
| Materials (2.2%) | |||||||
| 217,113 | Arrium, Ltd. | 163,318 | ||||||
| 7,400 | Dow Chemical Company | 380,804 | ||||||
| 10,200 | James Hardie Industries plc | 133,068 | ||||||
| 86,000 | Kobe Steel, Ltd. | 129,340 | ||||||
| 7,000 | Nippon Paint Company, Ltd. | 148,214 | ||||||
| 7,600 | Rio Tinto plc | 410,354 | ||||||
| 34,000 | Sumitomo Osaka Cement Company, Ltd. | 129,321 | ||||||
| 26,000 | Tosoh Corporation | 126,104 | ||||||
| 2,700 | Voestalpine AG | 128,717 | ||||||
|
| |||||||
| Total | 1,749,240 | |||||||
|
| |||||||
| Telecommunications Services (2.3%) | |||||||
| 3,559 | AT&T, Inc. | 125,846 | ||||||
| 75,300 | Bezeq Israel Telecommunication Corporation, Ltd. | 140,931 | ||||||
| 36,600 | BT Group plc | 240,500 | ||||||
| 4,300 | Nippon Telegraph & Telephone Corporation | 268,010 | ||||||
| 20,500 | QSC AG | 88,047 | ||||||
| 86,000 | Singapore Telecommunications, Ltd. | 265,800 | ||||||
| 3,758 | Verizon Communications, Inc. | 183,879 | ||||||
| 108,645 | Vodafone Group plc | 363,120 | ||||||
| 27,450 | Vonage Holdings Corporationd | 102,937 | ||||||
|
| |||||||
| Total | 1,779,070 | |||||||
|
| |||||||
| Utilities (2.4%) | |||||||
| 99,000 | A2A SPA | 114,010 | ||||||
| 38,300 | Electricidade de Portugal SA | 192,175 | ||||||
| 4,237 | Empire District Electric Company | 108,806 | ||||||
| 3,500 | Endesa SA | 135,334 | ||||||
| 7,200 | Fortum Oyj | 193,334 | ||||||
| 5,900 | Gas Natural SDG SA | 186,400 | ||||||
| 12,700 | GDF Suez | 349,905 | ||||||
| 29,500 | Iberdrola SA | 225,661 | ||||||
| 3,483 | Otter Tail Corporation | 105,500 | ||||||
| 7,700 | Suez Environnement Company SA | 147,302 | ||||||
| 5,000 | Verbund AG | 96,844 | ||||||
|
| |||||||
| Total | 1,855,271 | |||||||
|
| |||||||
| Total Common Stock (cost $50,757,806) | 53,447,518 | |||||||
|
| |||||||
Principal Amount | Long-Term Fixed Income (13.7%) | |||||||
| Asset-Backed Securities (0.3%) | |||||||
| Bayview Opportunity Master Fund Trust IIB, LP | ||||||||
| 139,876 | 3.950%, 1/28/2034g | 140,098 | ||||||
| Countrywide Asset-Backed Certificates | ||||||||
| 61,486 | 5.530%, 4/25/2047 | 59,198 | ||||||
|
| |||||||
| Total | 199,296 | |||||||
|
| |||||||
| Basic Materials (0.4%) | |||||||
| Anglo American Capital plc | ||||||||
| 9,000 | 1.176%, 4/15/2016e,h | 9,029 | ||||||
| ArcelorMittal | ||||||||
| 25,000 | 6.000%, 3/1/2021 | 27,062 | ||||||
| Dow Chemical Company | ||||||||
| 10,000 | 8.550%, 5/15/2019 | 12,853 | ||||||
| First Quantum Minerals, Ltd. | ||||||||
| 30,000 | 7.000%, 2/15/2021h | 30,862 | ||||||
| FMG Resources Pty. Ltd. | ||||||||
| 26,748 | 6.875%, 2/1/2018h | 28,085 | ||||||
| Freeport-McMoRan Copper & Gold, Inc. | ||||||||
| 12,000 | 2.375%, 3/15/2018 | 12,179 | ||||||
| Hexion US Finance Corporation/Hexion Nova Scotia Finance ULC | ||||||||
| 26,748 | 8.875%, 2/1/2018 | 27,818 | ||||||
| Ineos Finance plc | ||||||||
| 31,000 | 7.500%, 5/1/2020h | 33,751 | ||||||
| LyondellBasell Industries NV | ||||||||
| 10,000 | 5.000%, 4/15/2019 | 11,280 | ||||||
| Mosaic Company | ||||||||
| 8,000 | 3.750%, 11/15/2021 | 8,321 | ||||||
| NOVA Chemicals Corporation | ||||||||
| 40,122 | 5.250%, 8/1/2023h | 43,833 | ||||||
| Sappi Papier Holding GmbH | ||||||||
| 35,000 | 6.625%, 4/15/2021h | 36,925 | ||||||
| Trinseo Materials Operating SCA | ||||||||
| 30,000 | 8.750%, 2/1/2019 | 32,325 | ||||||
The accompanying Notes to Financial Statements are an integral part of this schedule.
104
Table of Contents
Growth and Income Plus Portfolio
Schedule of Investments as of June 30, 2014
(unaudited)
| Principal Amount | Long-Term Fixed Income (13.7%) | Value | ||||||
| Basic Materials (0.4%) - continued | |||||||
| Vale Overseas, Ltd. | ||||||||
| $ 12,000 | 6.250%, 1/23/2017 | $ | 13,428 | |||||
| Xstrata Finance Canada, Ltd. | ||||||||
| 8,000 | 2.050%, 10/23/2015h | 8,091 | ||||||
|
| |||||||
| Total | 335,842 | |||||||
|
| |||||||
| Capital Goods (0.4%) | |||||||
| BAE Systems plc | ||||||||
| 14,000 | 3.500%, 10/11/2016h | 14,571 | ||||||
| Cemex Finance, LLC | ||||||||
| 26,748 | 9.375%, 10/12/2017h | 31,462 | ||||||
| CNH Capital, LLC | ||||||||
| 26,748 | 3.625%, 4/15/2018 | 27,316 | ||||||
| Crown Americas Capital Corporation IV | ||||||||
| 30,000 | 4.500%, 1/15/2023 | 29,220 | ||||||
| Harsco Corporation | ||||||||
| 12,000 | 2.700%, 10/15/2015 | 12,105 | ||||||
| Ingersoll-Rand Global Holding Company, Ltd. | ||||||||
| 16,000 | 6.875%, 8/15/2018 | 19,063 | ||||||
| L-3 Communications Corporation | ||||||||
| 13,000 | 1.500%, 5/28/2017 | 13,018 | ||||||
| Martin Marietta Materials, Inc. | ||||||||
| 16,000 | 1.331%, 6/30/2017c,e,h | 15,991 | ||||||
| Nortek, Inc. | ||||||||
| 26,748 | 8.500%, 4/15/2021 | 29,557 | ||||||
| Reynolds Group Issuer, Inc. | ||||||||
| 26,748 | 9.875%, 8/15/2019 | 29,623 | ||||||
| Roper Industries, Inc. | ||||||||
| 11,000 | 2.050%, 10/1/2018 | 11,018 | ||||||
| Textron, Inc. | ||||||||
| 14,000 | 4.625%, 9/21/2016 | 15,007 | ||||||
| United Rentals North America, Inc. | ||||||||
| 33,000 | 7.375%, 5/15/2020 | 36,465 | ||||||
|
| |||||||
| Total | 284,416 | |||||||
|
| |||||||
| Collateralized Mortgage Obligations (2.9%) | |||||||
| Alternative Loan Trust | ||||||||
| 171,214 | 5.500%, 10/25/2035 | 153,192 | ||||||
| Banc of America Alternative Loan Trust | ||||||||
| 75,370 | 6.000%, 11/25/2035 | 64,013 | ||||||
| Citigroup Mortgage Loan Trust, Inc. | ||||||||
| 33,968 | 2.749%, 3/25/2037 | 25,459 | ||||||
| Countrywide Alternative Loan Trust | ||||||||
| 96,577 | 6.500%, 8/25/2036 | 70,839 | ||||||
| 301,533 | 6.000%, 4/25/2037 | 232,573 | ||||||
| Credit Suisse First Boston Mortgage Securities Corporation | ||||||||
| 75,419 | 5.250%, 10/25/2035 | 75,079 | ||||||
| Deutsche Alt-A Securities, Inc., Mortgage Loan Trust | ||||||||
| 83,113 | 5.500%, 11/25/2035 | 77,480 | ||||||
| HomeBanc Mortgage Trust | ||||||||
| 55,355 | 2.240%, 4/25/2037 | 41,205 | ||||||
| J.P. Morgan Alternative Loan Trust | ||||||||
| 108,107 | 6.500%, 3/25/2036 | 94,798 | ||||||
| J.P. Morgan Mortgage Trust | ||||||||
| 103,673 | 2.243%, 6/25/2035 | 104,486 | ||||||
| 121,358 | 2.680%, 6/25/2035 | 123,817 | ||||||
| 85,290 | 2.847%, 8/25/2035 | 85,672 | ||||||
| 104,117 | 2.626%, 1/25/2037 | 93,060 | ||||||
| MortgageIT Trust | ||||||||
| 86,884 | 0.412%, 12/25/2035e | 81,292 | ||||||
| New York Mortgage Trust | ||||||||
| 99,153 | 2.696%, 5/25/2036 | 90,249 | ||||||
| Residential Accredit Loans, Inc. | ||||||||
| 91,832 | 5.750%, 9/25/2035 | 83,220 | ||||||
| RFMSI Trust | ||||||||
| 114,893 | 6.000%, 7/25/2037 | 105,238 | ||||||
| Structured Adjustable Rate Mortgage Loan Trust | ||||||||
| 103,980 | 2.672%, 9/25/2035 | 89,356 | ||||||
| Structured Asset Mortgage Investments, Inc. | ||||||||
| 145,927 | 0.462%, 12/25/2035e | 115,447 | ||||||
| Vericrest Opportunity Loan Transferee | ||||||||
| 166,278 | 3.625%, 3/25/2054g | 167,240 | ||||||
| WaMu Mortgage Pass Through Certificates | ||||||||
| 84,236 | 2.383%, 10/25/2036 | 73,486 | ||||||
| Wells Fargo Mortgage Backed Securities Trust | ||||||||
| 91,381 | 2.613%, 3/25/2036 | 91,509 | ||||||
| 74,861 | 2.609%, 7/25/2036 | 70,768 | ||||||
| 80,313 | 6.000%, 7/25/2037 | 80,051 | ||||||
|
| |||||||
| Total | 2,289,529 | |||||||
|
| |||||||
| Communications Services (1.1%) | |||||||
| AMC Networks, Inc. | ||||||||
| 26,748 | 7.750%, 7/15/2021 | 29,924 | ||||||
| America Movil SAB de CV | ||||||||
| 10,000 | 5.000%, 10/16/2019 | 11,243 | ||||||
| American Tower Corporation | ||||||||
| 16,000 | 7.000%, 10/15/2017 | 18,620 | ||||||
| British Telecommunications plc | ||||||||
| 12,000 | 1.250%, 2/14/2017 | 12,011 | ||||||
| CBS Corporation | ||||||||
| 15,000 | 8.875%, 5/15/2019 | 19,446 | ||||||
| CC Holdings GS V, LLC | ||||||||
| 21,000 | 2.381%, 12/15/2017 | 21,385 | ||||||
| CCO Holdings, LLC | ||||||||
| 26,748 | 7.000%, 1/15/2019 | 28,219 | ||||||
| CenturyLink, Inc. | ||||||||
| 35,000 | 6.450%, 6/15/2021 | 37,975 | ||||||
| Cequel Communications Escrow 1, LLC | ||||||||
| 30,000 | 6.375%, 9/15/2020h | 31,875 | ||||||
| Columbus International, Inc. | ||||||||
| 30,000 | 7.375%, 3/30/2021h | 32,325 | ||||||
| Cox Communications, Inc. | ||||||||
| 12,000 | 9.375%, 1/15/2019h | 15,541 | ||||||
| Digicel, Ltd. | ||||||||
| 26,748 | 6.000%, 4/15/2021h | 27,617 | ||||||
| DIRECTV Holdings, LLC | ||||||||
| 11,000 | 3.500%, 3/1/2016 | 11,478 | ||||||
| 10,000 | 5.875%, 10/1/2019 | 11,631 | ||||||
The accompanying Notes to Financial Statements are an integral part of this schedule.
105
Table of Contents
Growth and Income Plus Portfolio
Schedule of Investments as of June 30, 2014
(unaudited)
| Principal Amount | Long-Term Fixed Income (13.7%) | Value | ||||||
| Communications Services (1.1%) - continued | |||||||
| Hughes Satellite Systems Corporation | ||||||||
| $ 33,000 | 6.500%, 6/15/2019 | $ | 36,795 | |||||
| Intelsat Jackson Holdings SA | ||||||||
| 26,748 | 7.250%, 10/15/2020 | 28,821 | ||||||
| Level 3 Financing, Inc. | ||||||||
| 33,000 | 8.625%, 7/15/2020 | 36,960 | ||||||
| Nara Cable Funding, Ltd. | ||||||||
| 25,000 | 8.875%, 12/1/2018h | 26,687 | ||||||
| NBC Universal Enterprise, Inc. | ||||||||
| 14,000 | 1.662%, 4/15/2018h | 13,991 | ||||||
| Numericable Group SA | ||||||||
| 30,000 | 6.000%, 5/15/2022h | 31,200 | ||||||
| SBA Tower Trust | ||||||||
| 16,000 | 5.101%, 4/17/2017h | 17,133 | ||||||
| Sprint Communications, Inc. | ||||||||
| 26,748 | 9.000%, 11/15/2018h | 32,432 | ||||||
| Telefonica Emisiones SAU | ||||||||
| 10,000 | 3.992%, 2/16/2016 | 10,470 | ||||||
| 12,000 | 3.192%, 4/27/2018 | 12,541 | ||||||
| Time Warner Cable, Inc. | ||||||||
| 26,000 | 5.000%, 2/1/2020 | 29,136 | ||||||
| T-Mobile USA, Inc. | ||||||||
| 40,000 | 6.633%, 4/28/2021 | 43,300 | ||||||
| Univision Communications, Inc. | ||||||||
| 40,000 | 7.875%, 11/1/2020h | 44,000 | ||||||
| UPCB Finance V, Ltd. | ||||||||
| 40,000 | 7.250%, 11/15/2021h | 44,000 | ||||||
| Verizon Communications, Inc. | ||||||||
| 20,000 | 2.500%, 9/15/2016 | 20,615 | ||||||
| 10,000 | 1.981%, 9/14/2018e | 10,551 | ||||||
| 16,000 | 3.650%, 9/14/2018 | 17,112 | ||||||
| 8,000 | 2.550%, 6/17/2019 | 8,116 | ||||||
| WideOpenWest Finance, LLC | ||||||||
| 40,000 | 10.250%, 7/15/2019 | 44,950 | ||||||
| Wind Acquisition Finance SA | ||||||||
| 30,000 | 7.375%, 4/23/2021h | 32,025 | ||||||
| Windstream Corporation | ||||||||
| 25,000 | 7.750%, 10/1/2021 | 27,312 | ||||||
|
| |||||||
| Total | 877,437 | |||||||
|
| |||||||
| Consumer Cyclical (0.8%) | |||||||
| AMC Entertainment, Inc. | ||||||||
| 32,000 | 5.875%, 2/15/2022 | 33,280 | ||||||
| Brookfield Residential Properties, Inc. | ||||||||
| 30,000 | 6.125%, 7/1/2022h | 31,200 | ||||||
| Chrysler Group, LLC | ||||||||
| 26,748 | 8.250%, 6/15/2021 | 30,225 | ||||||
| Cinemark USA, Inc. | ||||||||
| 31,000 | 4.875%, 6/1/2023 | 30,923 | ||||||
| Daimler Finance North America, LLC | ||||||||
| 9,000 | 1.875%, 1/11/2018h | 9,082 | ||||||
| Delphi Corporation | ||||||||
| 12,000 | 6.125%, 5/15/2021 | 13,411 | ||||||
| ERAC USA Finance, LLC | ||||||||
| 16,000 | 2.350%, 10/15/2019h | 15,983 | ||||||
| Ford Motor Credit Company, LLC | ||||||||
| 7,000 | 3.984%, 6/15/2016 | 7,397 | ||||||
| 12,000 | 1.500%, 1/17/2017 | 12,065 | ||||||
| 10,000 | 3.000%, 6/12/2017 | 10,432 | ||||||
| 16,000 | 5.000%, 5/15/2018 | 17,799 | ||||||
| General Motors Company | ||||||||
| 12,000 | 3.500%, 10/2/2018h | 12,270 | ||||||
| General Motors Financial Company, Inc. | ||||||||
| 26,748 | 3.250%, 5/15/2018 | 27,149 | ||||||
| GLP Capital, LP | ||||||||
| 60,000 | 4.875%, 11/1/2020h | 61,800 | ||||||
| Hilton Worldwide Finance, LLC | ||||||||
| 25,000 | 5.625%, 10/15/2021h | 26,563 | ||||||
| Hyundai Capital America | ||||||||
| 12,000 | 1.450%, 2/6/2017h | 12,045 | ||||||
| Jaguar Land Rover Automotive plc | ||||||||
| 33,000 | 5.625%, 2/1/2023h | 35,063 | ||||||
| KB Home | ||||||||
| 29,000 | 4.750%, 5/15/2019 | 29,218 | ||||||
| L Brands, Inc. | ||||||||
| 33,000 | 6.625%, 4/1/2021 | 37,496 | ||||||
| Macy’s Retail Holdings, Inc. | ||||||||
| 14,000 | 7.450%, 7/15/2017 | 16,437 | ||||||
| Nissan Motor Acceptance Corporation | ||||||||
| 8,000 | 0.777%, 3/3/2017e,h | 8,023 | ||||||
| Royal Caribbean Cruises, Ltd. | ||||||||
| 26,748 | 5.250%, 11/15/2022 | 28,085 | ||||||
| Toll Brothers Finance Corporation | ||||||||
| 20,000 | 4.000%, 12/31/2018 | 20,600 | ||||||
| TRW Automotive, Inc. | ||||||||
| 9,000 | 7.250%, 3/15/2017h | 10,238 | ||||||
| West Corporation | ||||||||
| 26,748 | 8.625%, 10/1/2018 | 28,420 | ||||||
| 35,000 | 5.375%, 7/15/2022c,h | 34,650 | ||||||
| Wynn Las Vegas, LLC | ||||||||
| 33,000 | 5.375%, 3/15/2022 | 34,361 | ||||||
|
| |||||||
| Total | 634,215 | |||||||
|
| |||||||
| Consumer Non-Cyclical (0.9%) | |||||||
| AbbVie, Inc. | ||||||||
| 9,000 | 2.000%, 11/6/2018 | 8,989 | ||||||
| Altria Group, Inc. | ||||||||
| 18,000 | 9.700%, 11/10/2018 | 23,586 | ||||||
| Anheuser-Busch InBev Worldwide, Inc. | ||||||||
| 12,000 | 7.750%, 1/15/2019 | 14,825 | ||||||
| Beam, Inc. | ||||||||
| 10,000 | 5.375%, 1/15/2016 | 10,645 | ||||||
| Boston Scientific Corporation | ||||||||
| 12,000 | 2.650%, 10/1/2018 | 12,267 | ||||||
| CareFusion Corporation | ||||||||
| 13,000 | 1.450%, 5/15/2017 | 12,990 | ||||||
| Celgene Corporation | ||||||||
| 20,000 | 1.900%, 8/15/2017 | 20,292 | ||||||
| CHS/Community Health Systems, Inc. | ||||||||
| 33,000 | 7.125%, 7/15/2020 | 35,722 | ||||||
| ConAgra Foods, Inc. | ||||||||
| 25,000 | 2.100%, 3/15/2018 | 25,080 | ||||||
| Cott Beverages, Inc. | ||||||||
| 30,000 | 5.375%, 7/1/2022h | 30,075 | ||||||
| Coventry Health Care, Inc. | ||||||||
| 8,000 | 5.950%, 3/15/2017 | 8,995 | ||||||
| CVS Caremark Corporation | ||||||||
| 10,000 | 2.250%, 12/5/2018 | 10,122 | ||||||
The accompanying Notes to Financial Statements are an integral part of this schedule.
106
Table of Contents
Growth and Income Plus Portfolio
Schedule of Investments as of June 30, 2014
(unaudited)
| Principal Amount | Long-Term Fixed Income (13.7%) | Value | ||||||
| Consumer Non-Cyclical (0.9%) - continued | |||||||
| Express Scripts Holding Company | ||||||||
| $ 12,000 | 2.650%, 2/15/2017 | $ | 12,467 | |||||
| Forest Laboratories, Inc. | ||||||||
| 15,000 | 4.375%, 2/1/2019h | 16,182 | ||||||
| Fresenius Medical Care US Finance, Inc. | ||||||||
| 26,748 | 5.750%, 2/15/2021h | 29,222 | ||||||
| Gilead Sciences, Inc. | ||||||||
| 8,000 | 3.050%, 12/1/2016 | 8,383 | ||||||
| Hawk Acquisition Sub, Inc. | ||||||||
| 33,000 | 4.250%, 10/15/2020 | 33,206 | ||||||
| HCA, Inc. | ||||||||
| 26,748 | 4.750%, 5/1/2023 | 26,715 | ||||||
| IMS Health, Inc. | ||||||||
| 30,000 | 6.000%, 11/1/2020h | 31,500 | ||||||
| JBS Finance II, Ltd. | ||||||||
| 26,748 | 8.250%, 1/29/2018g | 28,353 | ||||||
| Kroger Company | ||||||||
| 20,000 | 1.200%, 10/17/2016 | 20,066 | ||||||
| Lorillard Tobacco Company | ||||||||
| 12,000 | 8.125%, 6/23/2019 | 14,961 | ||||||
| McKesson Corporation | ||||||||
| 18,000 | 1.292%, 3/10/2017 | 18,048 | ||||||
| Medco Health Solutions, Inc. | ||||||||
| 7,000 | 7.125%, 3/15/2018 | 8,269 | ||||||
| Mondelez International, Inc. | ||||||||
| 8,000 | 2.250%, 2/1/2019 | 8,055 | ||||||
| Mylan, Inc. | ||||||||
| 16,000 | 1.350%, 11/29/2016 | 16,027 | ||||||
| Pernod Ricard SA | ||||||||
| 10,000 | 2.950%, 1/15/2017h | 10,399 | ||||||
| 10,000 | 5.750%, 4/7/2021h | 11,495 | ||||||
| Perrigo Company, Ltd. | ||||||||
| 6,000 | 1.300%, 11/8/2016h | 5,991 | ||||||
| 10,000 | 2.300%, 11/8/2018h | 9,996 | ||||||
| Revlon Consumer Products Corporation | ||||||||
| 26,748 | 5.750%, 2/15/2021 | 27,484 | ||||||
| SABMiller plc | ||||||||
| 12,000 | 6.500%, 7/15/2018h | 14,043 | ||||||
| Safeway, Inc. | ||||||||
| 16,000 | 3.400%, 12/1/2016 | 16,837 | ||||||
| Spectrum Brands Escrow Corporation | ||||||||
| 33,000 | 6.375%, 11/15/2020 | 35,475 | ||||||
| Tenet Healthcare Corporation | ||||||||
| 30,000 | 8.125%, 4/1/2022 | 34,725 | ||||||
| Thermo Fisher Scientific, Inc. | ||||||||
| 12,000 | 1.300%, 2/1/2017 | 12,018 | ||||||
| 12,000 | 2.400%, 2/1/2019 | 12,122 | ||||||
| Valeant Pharmaceuticals International | ||||||||
| 26,748 | 7.250%, 7/15/2022h | 28,888 | ||||||
| VPII Escrow Corporation | ||||||||
| 25,000 | 7.500%, 7/15/2021h | 27,687 | ||||||
|
| |||||||
| Total | 732,202 | |||||||
|
| |||||||
| Energy (0.7%) | |||||||
| BP Capital Markets plc | ||||||||
| 12,000 | 0.643%, 11/7/2016e | 12,056 | ||||||
| Buckeye Partners, LP | ||||||||
| 20,000 | 2.650%, 11/15/2018 | 20,334 | ||||||
| CNOOC Nexen Finance 2014 ULC | ||||||||
| 10,000 | 1.625%, 4/30/2017 | 10,026 | ||||||
| CNPC General Capital, Ltd. | ||||||||
| 13,000 | 2.750%, 4/19/2017h | 13,337 | ||||||
| Concho Resources, Inc. | ||||||||
| 26,748 | 6.500%, 1/15/2022 | 29,490 | ||||||
| Continental Resources, Inc. | ||||||||
| 16,000 | 7.125%, 4/1/2021 | 18,120 | ||||||
| Devon Energy Corporation | ||||||||
| 12,000 | 1.200%, 12/15/2016 | 12,036 | ||||||
| Enbridge, Inc. | ||||||||
| 8,000 | 0.678%, 6/2/2017e | 8,016 | ||||||
| Energy Transfer Partners, LP | ||||||||
| 10,000 | 6.700%, 7/1/2018 | 11,709 | ||||||
| Energy XXI Gulf Coast, Inc. | ||||||||
| 35,000 | 7.750%, 6/15/2019 | 37,450 | ||||||
| EQT Corporation | ||||||||
| 10,000 | 8.125%, 6/1/2019 | 12,512 | ||||||
| Harvest Operations Corporation | ||||||||
| 26,748 | 6.875%, 10/1/2017 | 29,022 | ||||||
| Hess Corporation | ||||||||
| 8,000 | 8.125%, 2/15/2019 | 10,064 | ||||||
| Kodiak Oil & Gas Corporation | ||||||||
| 26,748 | 5.500%, 1/15/2021 | 27,885 | ||||||
| Linn Energy, LLC | ||||||||
| 25,000 | 6.250%, 11/1/2019h | 26,187 | ||||||
| 26,748 | 8.625%, 4/15/2020 | 28,888 | ||||||
| Lukoil International Finance BV | ||||||||
| 10,000 | 3.416%, 4/24/2018h | 9,925 | ||||||
| MEG Energy Corporation | ||||||||
| 33,000 | 6.375%, 1/30/2023h | 35,062 | ||||||
| Oasis Petroleum, Inc. | ||||||||
| 33,000 | 6.875%, 1/15/2023 | 35,970 | ||||||
| Offshore Group Investment, Ltd. | ||||||||
| 40,000 | 7.500%, 11/1/2019 | 42,300 | ||||||
| Petrobras Global Finance BV | ||||||||
| 12,000 | 2.000%, 5/20/2016 | 12,017 | ||||||
| 30,000 | 3.112%, 3/17/2020e | 30,823 | ||||||
| Range Resources Corporation | ||||||||
| 37,715 | 5.000%, 8/15/2022 | 39,978 | ||||||
| Suncor Energy, Inc. | ||||||||
| 8,000 | 6.100%, 6/1/2018 | 9,285 | ||||||
| Transocean, Inc. | ||||||||
| 13,000 | 6.000%, 3/15/2018 | 14,684 | ||||||
| Weatherford International, Ltd. | ||||||||
| 11,000 | 6.000%, 3/15/2018 | 12,516 | ||||||
| 6,000 | 9.625%, 3/1/2019 | 7,874 | ||||||
|
| |||||||
| Total | 557,566 | |||||||
|
| |||||||
| Financials (1.9%) | |||||||
| Abbey National Treasury Services plc | ||||||||
| 10,000 | 3.050%, 8/23/2018 | 10,472 | ||||||
| ABN AMRO Bank NV | ||||||||
| 12,000 | 2.500%, 10/30/2018h | 12,176 | ||||||
| Ally Financial, Inc. | ||||||||
| 40,000 | 4.750%, 9/10/2018 | 42,450 | ||||||
| American International Group, Inc. | ||||||||
| 20,000 | 8.250%, 8/15/2018 | 24,848 | ||||||
| ANZ New Zealand International, Ltd. | ||||||||
| 12,000 | 1.400%, 4/27/2017h | 12,023 | ||||||
The accompanying Notes to Financial Statements are an integral part of this schedule.
107
Table of Contents
Growth and Income Plus Portfolio
Schedule of Investments as of June 30, 2014
(unaudited)
| Principal Amount | Long-Term Fixed Income (13.7%) | Value | ||||||
| Financials (1.9%) - continued | |||||||
| Aviation Capital Group Corporation | ||||||||
| $ 8,000 | 3.875%, 9/27/2016h | $ | 8,280 | |||||
| Bank of America Corporation | ||||||||
| 18,000 | 5.750%, 8/15/2016 | 19,639 | ||||||
| 18,000 | 5.700%, 5/2/2017 | 19,975 | ||||||
| 20,000 | 5.750%, 12/1/2017 | 22,558 | ||||||
| 8,000 | 2.000%, 1/11/2018 | 8,052 | ||||||
| 31,000 | 1.300%, 3/22/2018e | 31,399 | ||||||
| 25,000 | 5.650%, 5/1/2018 | 28,338 | ||||||
| Bank of Tokyo-Mitsubishi UFJ, Ltd. | ||||||||
| 16,000 | 0.640%, 3/10/2017e,h | 15,996 | ||||||
| Banque Federative du Credit Mutuel SA | ||||||||
| 12,000 | 1.078%, 1/20/2017e,h | 12,103 | ||||||
| Barclays Bank plc | ||||||||
| 8,000 | 5.140%, 10/14/2020 | 8,762 | ||||||
| BB&T Corporation | ||||||||
| 16,000 | 2.050%, 6/19/2018 | 16,176 | ||||||
| BBVA Banco Continental SA | ||||||||
| 16,000 | 2.250%, 7/29/2016h | 16,120 | ||||||
| BBVA US Senior SAU | ||||||||
| 17,000 | 4.664%, 10/9/2015 | 17,774 | ||||||
| Bear Stearns Companies, LLC | ||||||||
| 20,000 | 6.400%, 10/2/2017 | 23,059 | ||||||
| BNP Paribas SA | ||||||||
| 14,000 | 1.250%, 12/12/2016 | 14,018 | ||||||
| 12,000 | 2.375%, 9/14/2017 | 12,288 | ||||||
| BPCE SA | ||||||||
| 12,000 | 1.625%, 2/10/2017 | 12,088 | ||||||
| Branch Banking and Trust Company | ||||||||
| 12,000 | 0.657%, 12/1/2016e | 12,040 | ||||||
| Caixa Economica Federal | ||||||||
| 35,000 | 4.250%, 5/13/2019h | 35,333 | ||||||
| Capital One Financial Corporation | ||||||||
| 14,000 | 6.150%, 9/1/2016 | 15,493 | ||||||
| CIT Group, Inc. | ||||||||
| 30,000 | 3.875%, 2/19/2019 | 30,468 | ||||||
| Citigroup, Inc. | ||||||||
| 33,000 | 5.500%, 2/15/2017 | 36,292 | ||||||
| 15,000 | 6.000%, 8/15/2017 | 16,978 | ||||||
| 12,000 | 8.500%, 5/22/2019 | 15,338 | ||||||
| Credit Agricole SA | ||||||||
| 12,000 | 1.625%, 4/15/2016h | 12,159 | ||||||
| CyrusOne, LP | ||||||||
| 26,748 | 6.375%, 11/15/2022 | 28,821 | ||||||
| DDR Corporation | ||||||||
| 8,000 | �� | 9.625%, 3/15/2016 | 9,154 | |||||
| Denali Borrower, LLC | ||||||||
| 52,000 | 5.625%, 10/15/2020h | 55,120 | ||||||
| Deutsche Bank AG | ||||||||
| 15,000 | 1.350%, 5/30/2017 | 14,995 | ||||||
| Discover Bank | ||||||||
| 4,000 | 8.700%, 11/18/2019 | 5,084 | ||||||
| Discover Financial Services | ||||||||
| 8,000 | 6.450%, 6/12/2017 | 9,100 | ||||||
| Fifth Third Bancorp | ||||||||
| 20,000 | 5.450%, 1/15/2017 | 21,924 | ||||||
| General Electric Capital Corporation | ||||||||
| 18,000 | 0.504%, 5/15/2017e | 18,015 | ||||||
| 13,000 | 5.625%, 9/15/2017 | 14,716 | ||||||
| 7,000 | 1.625%, 4/2/2018 | 7,011 | ||||||
| Genworth Financial, Inc. | ||||||||
| 13,000 | 7.700%, 6/15/2020 | 16,021 | ||||||
| Goldman Sachs Group, Inc. | ||||||||
| 13,000 | 6.250%, 9/1/2017 | 14,800 | ||||||
| 16,000 | 2.375%, 1/22/2018 | 16,249 | ||||||
| 8,000 | 2.625%, 1/31/2019 | 8,109 | ||||||
| 12,000 | 7.500%, 2/15/2019 | 14,644 | ||||||
| Hartford Financial Services Group, Inc. | ||||||||
| 17,000 | 6.000%, 1/15/2019 | 19,727 | ||||||
| HBOS plc | ||||||||
| 16,000 | 6.750%, 5/21/2018h | 18,432 | ||||||
| HCP, Inc. | ||||||||
| 8,000 | 3.750%, 2/1/2016 | 8,362 | ||||||
| 10,000 | 3.750%, 2/1/2019 | 10,656 | ||||||
| Health Care REIT, Inc. | ||||||||
| 10,000 | 4.700%, 9/15/2017 | 10,939 | ||||||
| HSBC Finance Corporation | ||||||||
| 16,000 | 6.676%, 1/15/2021 | 19,134 | ||||||
| Huntington National Bank | ||||||||
| 7,000 | 1.300%, 11/20/2016 | 7,030 | ||||||
| Icahn Enterprises, LP | ||||||||
| 45,000 | 6.000%, 8/1/2020 | 48,206 | ||||||
| ING Capital Funding Trust III | ||||||||
| 10,000 | 3.834%, 12/29/2049e,i | 10,000 | ||||||
| International Lease Finance Corporation | ||||||||
| 10,000 | 2.181%, 6/15/2016e | 10,062 | ||||||
| 30,000 | 5.875%, 4/1/2019 | 33,000 | ||||||
| Intesa Sanpaolo SPA | ||||||||
| 7,000 | 3.625%, 8/12/2015h | 7,152 | ||||||
| 4,000 | 3.875%, 1/16/2018 | 4,216 | ||||||
| 15,000 | 3.875%, 1/15/2019 | 15,731 | ||||||
| J.P. Morgan Chase & Company | ||||||||
| 16,000 | 3.450%, 3/1/2016 | 16,696 | ||||||
| 8,000 | 0.744%, 2/15/2017e | 8,029 | ||||||
| 15,000 | 2.000%, 8/15/2017 | 15,254 | ||||||
| 8,000 | 6.300%, 4/23/2019 | 9,459 | ||||||
| 16,000 | 7.900%, 4/29/2049i | 17,880 | ||||||
| KeyCorp | ||||||||
| 12,000 | 2.300%, 12/13/2018 | 12,140 | ||||||
| Kookmin Bank | ||||||||
| 12,000 | 1.103%, 1/27/2017e,h | 12,065 | ||||||
| Liberty Mutual Group, Inc. | ||||||||
| 4,000 | 5.000%, 6/1/2021h | 4,400 | ||||||
| Liberty Property, LP | ||||||||
| 17,000 | 5.500%, 12/15/2016 | 18,561 | ||||||
| Macquarie Bank, Ltd. | ||||||||
| 9,000 | 5.000%, 2/22/2017h | 9,808 | ||||||
| Mizuho Corporate Bank, Ltd. | ||||||||
| 14,000 | 1.550%, 10/17/2017h | 13,985 | ||||||
| Morgan Stanley | ||||||||
| 15,000 | 1.750%, 2/25/2016 | 15,213 | ||||||
| 20,000 | 6.250%, 8/28/2017 | 22,794 | ||||||
| 16,000 | 6.625%, 4/1/2018 | 18,704 | ||||||
| 10,000 | 4.875%, 11/1/2022 | 10,734 | ||||||
| Murray Street Investment Trust I | ||||||||
| 24,000 | 4.647%, 3/9/2017 | 25,939 | ||||||
| National City Corporation | ||||||||
| 8,000 | 6.875%, 5/15/2019 | 9,555 | ||||||
The accompanying Notes to Financial Statements are an integral part of this schedule.
108
Table of Contents
Growth and Income Plus Portfolio
Schedule of Investments as of June 30, 2014
(unaudited)
| Principal Amount | Long-Term Fixed Income (13.7%) | Value | ||||||
| Financials (1.9%) - continued | |||||||
| Nomura Holdings, Inc. | ||||||||
| $ 12,000 | 2.000%, 9/13/2016 | $ | 12,196 | |||||
| 8,000 | 2.750%, 3/19/2019 | 8,138 | ||||||
| PNC Bank NA | ||||||||
| 16,000 | 1.150%, 11/1/2016 | 16,083 | ||||||
| Prologis, LP | ||||||||
| 10,000 | 6.625%, 5/15/2018 | 11,671 | ||||||
| Realty Income Corporation | ||||||||
| 12,000 | 2.000%, 1/31/2018 | 12,057 | ||||||
| Regions Bank | ||||||||
| 16,000 | 7.500%, 5/15/2018 | 19,043 | ||||||
| Reinsurance Group of America, Inc. | ||||||||
| 16,000 | 5.625%, 3/15/2017 | 17,472 | ||||||
| Royal Bank of Scotland Group plc | ||||||||
| 12,000 | 5.050%, 1/8/2015 | 12,222 | ||||||
| 9,000 | 1.174%, 3/31/2017e | 9,044 | ||||||
| Santander US Debt SAU | ||||||||
| 15,000 | 3.781%, 10/7/2015h | 15,494 | ||||||
| SLM Corporation | ||||||||
| 8,000 | 6.250%, 1/25/2016 | 8,500 | ||||||
| Societe Generale SA | ||||||||
| 12,000 | 5.750%, 4/20/2016h | 12,875 | ||||||
| Sumitomo Mitsui Banking Corporation | ||||||||
| 24,000 | 1.300%, 1/10/2017 | 24,041 | ||||||
| Suncorp-Metway, Ltd. | ||||||||
| 8,000 | 0.934%, 3/28/2017e,h | 8,000 | ||||||
| Swiss RE Capital I, LP | ||||||||
| 12,000 | 6.854%, 5/29/2049h,i | 12,840 | ||||||
| Ventas Realty, LP | ||||||||
| 9,000 | 1.550%, 9/26/2016 | 9,092 | ||||||
| 9,000 | 1.250%, 4/17/2017 | 9,001 | ||||||
| Voya Financial, Inc. | ||||||||
| 12,000 | 2.900%, 2/15/2018 | 12,435 | ||||||
| Wells Fargo & Company | ||||||||
| 8,000 | 1.250%, 7/20/2016 | 8,069 | ||||||
|
| |||||||
| Total | 1,518,594 | |||||||
|
| |||||||
| Foreign Government (<0.1%) | |||||||
| Uruguay Government International Bond | ||||||||
| 21,000 | 5.100%, 6/18/2050 | 20,737 | ||||||
|
| |||||||
| Total | 20,737 | |||||||
|
| |||||||
| Mortgage-Backed Securities (3.1%) | |||||||
| Federal Home Loan Mortgage Corporation Gold 15-Yr. Pass Through | ||||||||
| 150,000 | 3.000%, 7/1/2029c | 155,484 | ||||||
| Federal Home Loan Mortgage Corporation Gold 30-Yr. Pass Through | ||||||||
| 50,000 | 4.000%, 7/1/2044c | 52,969 | ||||||
| Federal National Mortgage Association Conventional 15- Yr. Pass Through | ||||||||
| 250,000 | 3.500%, 8/1/2029c | 264,297 | ||||||
| Federal National Mortgage Association Conventional 30- Yr. Pass Through | ||||||||
| 700,000 | 3.500%, 7/1/2044c | 720,563 | ||||||
| 650,000 | 4.000%, 7/1/2044c | 689,812 | ||||||
| 525,000 | 4.500%, 8/1/2044c | 567,267 | ||||||
|
| |||||||
| Total | 2,450,392 | |||||||
|
| |||||||
| Technology (0.3%) | |||||||
| Alliance Data Systems Corporation | ||||||||
| 26,748 | 6.375%, 4/1/2020h | 28,487 | ||||||
| Amkor Technology, Inc. | ||||||||
| 25,000 | 6.625%, 6/1/2021 | 26,625 | ||||||
| BMC Software Finance, Inc. | ||||||||
| 26,748 | 8.125%, 7/15/2021h | 27,517 | ||||||
| EMC Corporation | ||||||||
| 8,000 | 1.875%, 6/1/2018 | 8,053 | ||||||
| Fidelity National Information Services, Inc. | ||||||||
| 15,000 | 1.450%, 6/5/2017 | 14,982 | ||||||
| First Data Corporation | ||||||||
| 26,748 | 7.375%, 6/15/2019h | 28,721 | ||||||
| Freescale Semiconductor, Inc. | ||||||||
| 40,000 | 6.000%, 1/15/2022h | 42,600 | ||||||
| Hewlett-Packard Company | ||||||||
| 12,000 | 5.400%, 3/1/2017 | 13,299 | ||||||
| Iron Mountain, Inc. | ||||||||
| 26,748 | 6.000%, 8/15/2023 | 28,921 | ||||||
| Tyco Electronics Group SA | ||||||||
| 16,000 | 6.550%, 10/1/2017 | 18,515 | ||||||
| Xerox Corporation | ||||||||
| 16,000 | 7.200%, 4/1/2016 | 17,647 | ||||||
|
| |||||||
| Total | 255,367 | |||||||
|
| |||||||
| Transportation (0.2%) | |||||||
| American Airlines Pass Through Trust | ||||||||
| 7,763 | 4.950%, 1/15/2023h | 8,404 | ||||||
| Avis Budget Car Rental, LLC | ||||||||
| 15,000 | 5.125%, 6/1/2022h | 15,019 | ||||||
| Continental Airlines, Inc. | ||||||||
| 24,037 | 6.250%, 4/11/2020 | 26,350 | ||||||
| Delta Air Lines, Inc. | ||||||||
| 10,877 | 4.950%, 5/23/2019 | 11,747 | ||||||
| 8,968 | 4.750%, 5/7/2020 | 9,730 | ||||||
| Hertz Corporation | ||||||||
| 33,000 | 6.750%, 4/15/2019 | 34,980 | ||||||
| Korea Expressway Corporation | ||||||||
| 13,000 | 1.625%, 4/28/2017h | 12,986 | ||||||
| United Air Lines, Inc. | ||||||||
| 8,657 | 10.400%, 11/1/2016 | 9,848 | ||||||
|
| |||||||
| Total | 129,064 | |||||||
|
| |||||||
| U.S. Government and Agencies (0.2%) | |||||||
| U.S. Treasury Notes | ||||||||
| 65,000 | 0.250%, 9/30/2015 | 65,069 | ||||||
| 60,000 | 0.375%, 5/31/2016 | 59,946 | ||||||
|
| |||||||
| Total | 125,015 | |||||||
|
| |||||||
| Utilities (0.5%) | |||||||
| Access Midstream Partners, LP | ||||||||
| 40,000 | 4.875%, 5/15/2023 | 42,150 | ||||||
| AES Corporation | ||||||||
| 26,748 | 7.375%, 7/1/2021 | 31,295 | ||||||
| Atlas Pipeline Partners, LP | ||||||||
| 33,000 | 4.750%, 11/15/2021 | 32,340 | ||||||
The accompanying Notes to Financial Statements are an integral part of this schedule.
109
Table of Contents
Growth and Income Plus Portfolio
Schedule of Investments as of June 30, 2014
(unaudited)
| Principal Amount | Long-Term Fixed Income (13.7%) | Value | ||||||
| Utilities (0.5%) - continued | |||||||
| Commonwealth Edison Company | ||||||||
| $ 9,000 | 6.950%, 7/15/2018 | $ | 10,642 | |||||
| DCP Midstream Operating, LP | ||||||||
| 10,000 | 2.500%, 12/1/2017 | 10,287 | ||||||
| Dominion Resources, Inc. | ||||||||
| 16,000 | 1.250%, 3/15/2017 | 16,063 | ||||||
| Electricite de France | ||||||||
| 12,000 | 0.688%, 1/20/2017e,h | 12,049 | ||||||
| Enel Finance International NV | ||||||||
| 10,000 | 5.125%, 10/7/2019h | 11,259 | ||||||
| Exelon Generation Company, LLC | ||||||||
| 8,000 | 5.200%, 10/1/2019 | 8,997 | ||||||
| MidAmerican Energy Holdings Company | ||||||||
| 16,000 | 1.100%, 5/15/2017 | 15,935 | ||||||
| 8,000 | 5.750%, 4/1/2018 | 9,156 | ||||||
| NiSource Finance Corporation | ||||||||
| 16,000 | 6.400%, 3/15/2018 | 18,383 | ||||||
| NRG Energy, Inc. | ||||||||
| 26,748 | 6.625%, 3/15/2023 | 28,955 | ||||||
| ONEOK Partners, LP | ||||||||
| 10,000 | 2.000%, 10/1/2017 | 10,136 | ||||||
| 10,000 | 3.200%, 9/15/2018 | 10,434 | ||||||
| Pacific Gas & Electric Company | ||||||||
| 10,000 | 5.625%, 11/30/2017 | 11,308 | ||||||
| Panhandle Eastern Pipe Line Company, LP | ||||||||
| 12,000 | 6.200%, 11/1/2017 | 13,605 | ||||||
| PG&E Corporation | ||||||||
| 8,000 | 2.400%, 3/1/2019 | 8,072 | ||||||
| PPL Capital Funding, Inc. | ||||||||
| 16,000 | 1.900%, 6/1/2018 | 15,988 | ||||||
| TransAlta Corporation | ||||||||
| 15,000 | 1.900%, 6/3/2017 | 15,059 | ||||||
| Williams Companies, Inc. | ||||||||
| 16,000 | 7.875%, 9/1/2021 | 19,864 | ||||||
|
| |||||||
| Total | 351,977 | |||||||
|
| |||||||
| Total Long-Term Fixed Income (cost $10,496,690) | 10,761,649 | |||||||
|
| |||||||
| Shares or Principal Amount | Short-Term Investments (11.9%)j | |||||||
| Federal Home Loan Bank Discount Notes | ||||||||
| 200,000 | 0.075%, 07/09/2014k | 199,997 | ||||||
| 300,000 | 0.058%, 07/30/2014k | 299,986 | ||||||
| Thrivent Cash Management Trust | ||||||||
| 8,823,580 | 0.050% | 8,823,580 | ||||||
|
| |||||||
| Total Short-Term Investments (at amortized cost) | 9,323,563 | |||||||
|
| |||||||
| Total Investments (cost $78,388,311) 103.9% | $ | 81,351,049 | ||||||
|
| |||||||
| Other Assets and Liabilities, Net (3.9%) | (3,086,400 | ) | ||||||
|
| |||||||
| Total Net Assets 100.0% | $ | 78,264,649 | ||||||
|
| |||||||
| a | The stated interest rate represents the weighted average of all contracts within the bank loan facility. |
| b | All or a portion of the loan is unfunded. |
| c | Denotes investments purchased on a when-issued or delayed delivery basis. |
| d | Non-income producing security. |
| e | Denotes variable rate securities. Variable rate securities are securities whose yields vary with a designated market index or market rate. The rate shown is as of June 30, 2014. |
| f | Security is fair valued. |
| g | Denotes restricted securities. Restricted securities are investment securities which have been deemed illiquid and cannot be offered for public sale without first being registered under the Securities Act of 1933. The following table indicates the acquisition date and cost of restricted securities Growth and Income Plus Portfolio owned as of June 30, 2014. |
Security | Acquisition Date | Cost | ||||||
Bayview Opportunity Master Fund Trust IIB, LP, 01/28/2034 | 1/17/2014 | $ | 139,876 | |||||
JBS Finance II, Ltd., 01/29/2018 | 8/19/2013 | 27,872 | ||||||
Vericrest Opportunity Loan Transferee, 03/25/2054 | 12/11/2013 | 165,558 | ||||||
| h | Denotes securities sold under Rule 144A of the Securities Act of 1933, which exempts them from registration. These securities have been deemed liquid and may be resold to other dealers in the program or to other qualified institutional buyers. As of June 30, 2014, the value of these investments was $1,639,735 or 2.1% of total net assets. |
| i | Denotes perpetual securities. Perpetual securities pay an indefinite stream of interest, but may be called by the issuer at an earlier date. |
| j | The interest rate shown reflects the yield, coupon rate or the discount rate at the date of purchase. |
| k | At June 30, 2014, $499,983 of investments were held on deposit with the counterparty and pledged as the initial margin deposit for open futures contracts. |
Definitions:
| ADR | - | American Depositary Receipt, which are certificates for an underlying foreign security’s shares held by an issuing U.S. depository bank. | ||
| ETF | - | Exchange Traded Fund. | ||
| REIT | - | Real Estate Investment Trust is a company that buys, develops, manages and/or sells real estate assets. |
Unrealized Appreciation (Depreciation)
Gross unrealized appreciation and depreciation of investments, based on cost for federal income tax purposes, were as follows:
Gross unrealized appreciation | $ | 4,151,253 | ||
Gross unrealized depreciation | (1,191,990 | ) | ||
|
| |||
Net unrealized appreciation (depreciation) | $ | 2,959,263 | ||
Cost for federal income tax purposes | $ | 78,391,786 | ||
The accompanying Notes to Financial Statements are an integral part of this schedule.
110
Table of Contents
Growth and Income Plus Portfolio
Schedule of Investments as of June 30, 2014
(unaudited)
Fair Valuation Measurements
The following table is a summary of the inputs used, as of June 30, 2014, in valuing Growth and Income Plus Portfolio’s assets carried at fair value.
Investments in Securities | Total | Level 1 | Level 2 | Level 3 | ||||||||||||
Bank Loans | ||||||||||||||||
Basic Materials | 674,950 | — | 674,950 | — | ||||||||||||
Capital Goods | 369,959 | — | 369,959 | — | ||||||||||||
Communications Services | 2,501,492 | — | 2,501,492 | — | ||||||||||||
Consumer Cyclical | 1,374,806 | — | 1,374,806 | — | ||||||||||||
Consumer Non-Cyclical | 1,025,000 | — | 1,025,000 | — | ||||||||||||
Energy | 445,741 | — | 445,741 | — | ||||||||||||
Financials | 406,960 | — | 406,960 | — | ||||||||||||
Technology | 575,135 | — | 575,135 | — | ||||||||||||
Transportation | 226,630 | — | 226,630 | — | ||||||||||||
Utilities | 217,646 | — | 217,646 | — | ||||||||||||
Common Stock | ||||||||||||||||
Consumer Discretionary | 7,010,830 | 3,222,551 | 3,788,279 | — | ||||||||||||
Consumer Staples | 3,638,596 | 2,352,933 | 1,268,022 | 17,641 | ||||||||||||
Energy | 4,930,855 | 2,735,216 | 2,195,639 | — | ||||||||||||
Financials | 10,446,307 | 6,827,537 | 3,618,770 | — | ||||||||||||
Health Care | 6,629,668 | 4,563,295 | 2,066,373 | — | ||||||||||||
Industrials | 6,585,505 | 3,732,253 | 2,853,252 | — | ||||||||||||
Information Technology | 8,822,176 | 6,821,384 | 2,000,792 | — | ||||||||||||
Materials | 1,749,240 | 380,804 | 1,368,436 | — | ||||||||||||
Telecommunications Services | 1,779,070 | 412,662 | 1,366,408 | — | ||||||||||||
Utilities | 1,855,271 | 214,306 | 1,640,965 | — | ||||||||||||
Long-Term Fixed Income | ||||||||||||||||
Asset-Backed Securities | 199,296 | — | 199,296 | — | ||||||||||||
Basic Materials | 335,842 | — | 335,842 | — | ||||||||||||
Capital Goods | 284,416 | — | 284,416 | — | ||||||||||||
Collateralized Mortgage Obligations | 2,289,529 | — | 2,289,529 | — | ||||||||||||
Communications Services | 877,437 | — | 877,437 | — | ||||||||||||
Consumer Cyclical | 634,215 | — | 634,215 | — | ||||||||||||
Consumer Non-Cyclical | 732,202 | — | 732,202 | — | ||||||||||||
Energy | 557,566 | — | 557,566 | — | ||||||||||||
Financials | 1,518,594 | — | 1,518,594 | — | ||||||||||||
Foreign Government | 20,737 | — | 20,737 | — | ||||||||||||
Mortgage-Backed Securities | 2,450,392 | — | 2,450,392 | — | ||||||||||||
Technology | 255,367 | — | 255,367 | — | ||||||||||||
Transportation | 129,064 | — | 129,064 | — | ||||||||||||
U.S. Government and Agencies | 125,015 | — | 125,015 | — | ||||||||||||
Utilities | 351,977 | — | 351,977 | — | ||||||||||||
Short-Term Investments | 9,323,563 | 8,823,580 | 499,983 | — | ||||||||||||
|
|
|
|
|
|
|
| |||||||||
Total | $ | 81,351,049 | $ | 40,086,521 | $ | 41,246,887 | $ | 17,641 | ||||||||
|
|
|
|
|
|
|
| |||||||||
Other Financial Instruments | Total | Level 1 | Level 2 | Level 3 | ||||||||||||
Asset Derivatives | ||||||||||||||||
Futures Contracts | 38,871 | 38,871 | — | — | ||||||||||||
|
|
|
|
|
|
|
| |||||||||
Total Asset Derivatives | $ | 38,871 | $ | 38,871 | $ | — | $ | — | ||||||||
|
|
|
|
|
|
|
| |||||||||
Liability Derivatives | ||||||||||||||||
Futures Contracts | 2,984 | 2,984 | — | — | ||||||||||||
|
|
|
|
|
|
|
| |||||||||
Total Liability Derivatives | $ | 2,984 | $ | 2,984 | $ | — | $ | — | ||||||||
|
|
|
|
|
|
|
| |||||||||
There were no significant transfers between Levels during the period ended June 30, 2014. Transfers between Levels are identified as of the end of the period.
The accompanying Notes to Financial Statements are an integral part of this schedule.
111
Table of Contents
Growth and Income Plus Portfolio
Schedule of Investments as of June 30, 2014
(unaudited)
Futures Contracts | Number of Contracts Long/(Short) | Expiration Date | Notional Principal Amount | Value | Unrealized Gain/(Loss) | |||||||||||||||
2-Yr. U.S. Treasury Bond Futures | (10 | ) | September 2014 | ($2,196,068 | ) | ($2,195,937 | ) | $131 | ||||||||||||
5-Yr. U.S. Treasury Bond Futures | 3 | September 2014 | 357,570 | 358,383 | 813 | |||||||||||||||
30-Yr. U.S. Treasury Bond Futures | 1 | September 2014 | 135,721 | 137,187 | 1,466 | |||||||||||||||
Mini MSCI EAFE Index Futures | 31 | September 2014 | 3,035,196 | 3,051,795 | 16,599 | |||||||||||||||
S&P 500 Index Mini-Futures | 17 | September 2014 | 1,639,678 | 1,659,540 | 19,862 | |||||||||||||||
Ultra Long Term U.S. Treasury Bond Futures | 3 | September 2014 | 452,797 | 449,813 | (2,984 | ) | ||||||||||||||
Total Futures Contracts | $ | 35,887 | ||||||||||||||||||
The following table summarizes the fair value and Statement of Assets and Liabilities location, as of June 30, 2014, for Growth and Income Plus Portfolio’s investments in financial derivative instruments by primary risk exposure as discussed under item (2) Significant Accounting Policies of the Notes to Financial Statements.
Derivatives by risk category | Statement of Assets and Liabilities Location | Fair Value | ||||
Asset Derivatives | ||||||
Interest Rate Contracts | ||||||
Futures* | Net Assets - Net unrealized appreciation/(depreciation) on Futures contracts | $ | 2,410 | |||
Total Interest Rate Contracts | 2,410 | |||||
Equity Contracts | ||||||
Futures* | Net Assets - Net unrealized appreciation/(depreciation) on Futures contracts | 36,461 | ||||
Total Equity Contracts | 36,461 | |||||
|
| |||||
Total Asset Derivatives | $ | 38,871 | ||||
|
| |||||
Liability Derivatives | ||||||
Interest Rate Contracts | ||||||
Futures* | Net Assets - Net unrealized appreciation/(depreciation) on Futures contracts | 2,984 | ||||
Total Interest Rate Contracts | 2,984 | |||||
|
| |||||
Total Liability Derivatives | $ | 2,984 | ||||
|
| |||||
| * | Includes cumulative appreciation/depreciation of futures contracts as reported in the Schedule of Investments. Only current day’s variation margin is reported within the Statement of Assets and Liabilities. |
The following table summarizes the net realized gains/(losses) and Statement of Operations location, for the period ended June 30, 2014, for Growth and Income Plus Portfolio’s investments in financial derivative instruments by primary risk exposure.
Derivatives by risk category | Statement of Operations Location | Realized Gains/(Losses) recognized in Income | ||||
Equity Contracts | ||||||
| Futures | Net realized gains/(losses) on Futures contracts | 255,903 | ||||
Total Equity Contracts | 255,903 | |||||
Interest Rate Contracts | ||||||
| Futures | Net realized gains/(losses) on Futures contracts | 26,550 | ||||
Total Interest Rate Contracts | 26,550 | |||||
|
| |||||
Total | $ | 282,453 | ||||
|
| |||||
The following table summarizes the change in net unrealized appreciation/(depreciation) and Statement of Operations location, for the period ended June 30, 2014, for Growth and Income Plus Portfolio’s investments in financial derivative instruments by primary risk exposure.
Derivatives by risk category | Statement of Operations Location | Change in unrealized appreciation/(depreciation) recognized in Income | ||||
Interest Rate Contracts | ||||||
| Futures | Change in net unrealized appreciation/(depreciation) on Futures contracts | (574 | ) | |||
Total Interest Rate Contracts | (574 | ) | ||||
Equity Contracts | ||||||
| Futures | Change in net unrealized appreciation/(depreciation) on Futures contracts | (18,509 | ) | |||
Total Equity Contracts | (18,509 | ) | ||||
|
| |||||
Total | ($ | 19,083 | ) | |||
|
| |||||
The accompanying Notes to Financial Statements are an integral part of this schedule.
112
Table of Contents
Growth and Income Plus Portfolio
Schedule of Investments as of June 30, 2014
(unaudited)
The following table presents Growth and Income Plus Portfolio’s average volume of derivative activity during the period ended June 30, 2014.
Derivative Risk Category | Futures (Notional)* | Futures (Percentage of Average Net Assets) | ||||||
Equity Contracts | $ | 4,117,449 | 5.8 | % | ||||
Interest Rate | ||||||||
Contracts | 908,539 | 1.3 | ||||||
| * | Notional amount represents long or short, or both, derivative positions held by the Portfolio. |
Investment in Affiliates
Affiliated issuers, as defined under the Investment Company Act of 1940, include those in which the Portfolio’s holdings of an issuer represent 5% or more of the outstanding voting securities of an issuer, or any affiliated mutual fund.
A summary of transactions for the fiscal year to date, in Growth and Income Plus Portfolio, is as follows:
Portfolio | Value December 31, 2013 | Gross Purchases | Gross Sales | Shares Held at June 30, 2014 | Value June 30, 2014 | Income Earned January 1, 2014 - June 30, 2014 | ||||||||||||||||||
Cash Management Trust-Short Term Investment | $ | 5,486,510 | $ | 23,293,002 | $ | 19,955,932 | 8,823,580 | $ | 8,823,580 | $ | 2,060 | |||||||||||||
Total Value and Income Earned | 5,486,510 | 8,823,580 | 2,060 | |||||||||||||||||||||
The accompanying Notes to Financial Statements are an integral part of this schedule.
113
Table of Contents
Balanced Income Plus Portfolio
Schedule of Investments as of June 30, 2014
(unaudited)
| Principal Amount | Bank Loans (18.6%)a | Value | ||||||
| Basic Materials (1.7%) | |||||||
| Alpha Natural Resources, Inc., Term Loan | ||||||||
| $ 492,506 | 3.500%, 5/22/2020 | $ | 475,475 | |||||
| Arch Coal, Inc., Term Loan | ||||||||
| 618,698 | 6.250%, 5/16/2018 | 607,487 | ||||||
| Fortescue Metals Group, Ltd., Term Loan | ||||||||
| 559,350 | 3.750%, 6/30/2019 | 559,563 | ||||||
| HCA, Inc., Term Loan | ||||||||
| 655,050 | 2.900%, 3/31/2017 | 656,282 | ||||||
| Ineos Group Holdings, Ltd., Term Loan | ||||||||
| 633,579 | 3.750%, 5/4/2018 | 631,760 | ||||||
| NewPage Corporation, Term Loan | ||||||||
| 1,100,000 | 9.500%, 2/11/2021 | 1,101,375 | ||||||
| Tronox Pigments BV, Term Loan | ||||||||
| 822,922 | 0.000%, 3/19/2020b,c | 824,156 | ||||||
|
| |||||||
| Total | 4,856,098 | |||||||
|
| |||||||
| Capital Goods (0.8%) | |||||||
| ADS Waste Holdings, Inc., Term Loan | ||||||||
| 574,171 | 3.750%, 10/9/2019 | 571,042 | ||||||
| Berry Plastics Group, Inc., Term Loan | ||||||||
| 653,383 | 3.500%, 2/8/2020 | 647,601 | ||||||
| Rexnord, LLC, Term Loan | ||||||||
| 635,200 | 4.000%, 8/21/2020 | 634,247 | ||||||
| Silver II Borrower, Term Loan | ||||||||
| 601,539 | 4.000%, 12/13/2019 | 599,607 | ||||||
|
| |||||||
| Total | 2,452,497 | |||||||
|
| |||||||
| Communications Services (6.4%) | |||||||
| Cengage Learning Aquisitions, Term Loan | ||||||||
| 673,313 | 7.000%, 3/31/2020 | 680,470 | ||||||
| Charter Communications Operating, LLC, Term Loan | ||||||||
| 742,500 | 3.000%, 1/3/2021 | 730,746 | ||||||
| Cincinnati Bell, Inc., Term Loan | ||||||||
| 570,687 | 4.000%, 9/10/2020 | 570,334 | ||||||
| Clear Channel Communications, Inc., Term Loan | ||||||||
| 600,000 | 6.900%, 1/30/2019 | 596,676 | ||||||
| Cumulus Media Holdings, Inc., Term Loan | ||||||||
| 709,788 | 4.250%, 12/23/2020 | 711,563 | ||||||
| Fairpoint Communications, Term Loan | ||||||||
| 633,579 | 7.500%, 2/14/2019b,c | 655,367 | ||||||
| Grande Communications Networks, LLC, Term Loan | ||||||||
| 633,602 | 4.500%, 5/29/2020 | 631,226 | ||||||
| Gray Television, Inc., Term Loan | ||||||||
| 425,000 | 0.000%, 6/13/2021b,c | 426,662 | ||||||
| Hargray Communications Group, Inc., Term Loan | ||||||||
| 514,800 | 4.750%, 6/26/2019 | 516,087 | ||||||
| IMG Worldwide, Inc., Term Loan | ||||||||
| 700,000 | 5.250%, 5/6/2021 | 704,200 | ||||||
| Integra Telecom Holdings, Inc., Term Loan | ||||||||
| 589,035 | 5.250%, 2/22/2019 | 592,128 | ||||||
| Intelsat Jackson Holdings SA, Term Loan | ||||||||
| 724,628 | 3.750%, 6/30/2019 | 725,230 | ||||||
| Level 3 Communications, Inc., Term Loan | ||||||||
| 610,000 | 4.000%, 8/1/2019 | 610,506 | ||||||
| Liberty Cablevision of Puerto Rico, LLC, Term Loan | ||||||||
| 415,000 | 0.000%, 12/11/2021b,c | 415,344 | ||||||
| LTS Buyer, LLC, Term Loan | ||||||||
| 693,000 | 4.000%, 4/13/2020 | 690,651 | ||||||
| MCC Georgia, LLC, Term Loan | ||||||||
| 470,000 | 0.000%, 6/30/2021b,c | 470,390 | ||||||
| McGraw-Hill Global Education, LLC, Term Loan | ||||||||
| 599,438 | 5.750%, 3/22/2019 | 609,179 | ||||||
| NEP/NCP Holdco, Inc., Term Loan | ||||||||
| 655,042 | 0.000%, 1/22/2020 | 654,878 | ||||||
| NTelos, Inc., Term Loan | ||||||||
| 991,700 | 5.750%, 11/9/2019 | 989,103 | ||||||
| Puerto Rico Cable Acquisition Company, Inc., Term Loan | ||||||||
| 574,669 | 5.500%, 7/31/2018 | 573,950 | ||||||
| SBA Senior Finance II, LLC, Term Loan | ||||||||
| 700,000 | 3.250%, 3/24/2021 | 695,226 | ||||||
| TNS, Inc., Term Loan | ||||||||
| 717,269 | 5.000%, 2/14/2020 | 719,959 | ||||||
| Univision Communications, Inc., Term Loan | ||||||||
| 589,057 | 4.000%, 3/1/2020 | 588,256 | ||||||
| Virgin Media Investment Holdings, Ltd., Term Loan | ||||||||
| 580,000 | 3.500%, 6/7/2020 | 578,005 | ||||||
| Visant Corporation, Term Loan | ||||||||
| 750,000 | 5.250%, 12/22/2016 | 746,437 | ||||||
| WideOpenWest Finance, LLC, Term Loan | ||||||||
| 603,885 | 4.750%, 4/1/2019 | 605,298 | ||||||
| WMG Acquisition Corporation, Term Loan | ||||||||
| 595,500 | 3.750%, 7/1/2020 | 585,454 | ||||||
| XO Communications, LLC, Term Loan | ||||||||
| 548,625 | 4.250%, 3/20/2021 | 551,456 | ||||||
| Yankee Cable Acquisition, LLC, Term Loan | ||||||||
| 600,048 | 4.500%, 3/1/2020 | 602,862 | ||||||
| Zayo Group, LLC, Term Loan | ||||||||
| 658,704 | 4.000%, 7/2/2019 | 659,184 | ||||||
|
| |||||||
| Total | 18,886,827 | |||||||
|
| |||||||
| Consumer Cyclical (3.1%) | |||||||
| Bally Technologies, Inc., Term Loan | ||||||||
| 594,391 | 4.250%, 11/25/2020 | 596,620 | ||||||
| Booz Allen Hamilton, Inc., Term Loan | ||||||||
| 338,157 | 3.750%, 7/31/2019 | 340,106 | ||||||
The accompanying Notes to Financial Statements are an integral part of this schedule.
114
Table of Contents
Balanced Income Plus Portfolio
Schedule of Investments as of June 30, 2014
(unaudited)
| Principal Amount | Bank Loans (18.6%)a | Value | ||||||
| Consumer Cyclical (3.1%) - continued | |||||||
| Burlington Coat Factory Warehouse Corporation, Term Loan | ||||||||
| $ 583,104 | 4.250%, 2/23/2017 | $ | 586,264 | |||||
| Ceridian Corporation, Term Loan | ||||||||
| 619,932 | 4.400%, 8/14/2015 | 620,608 | ||||||
| Chrysler Group, LLC, Term Loan | ||||||||
| 698,250 | 3.250%, 12/31/2018 | 695,778 | ||||||
| Golden Nugget, Inc., Delayed Draw | ||||||||
| 77,610 | 5.500%, 11/21/2019 | 79,065 | ||||||
| Golden Nugget, Inc., Term Loan | ||||||||
| 181,090 | 5.500%, 11/21/2019 | 184,485 | ||||||
| Hilton Worldwide Finance, LLC, Term Loan | ||||||||
| 404,079 | 3.500%, 10/26/2020 | 403,239 | ||||||
| J.C. Penney Corporation, Inc., Term Loan | ||||||||
| 603,900 | 6.000%, 5/22/2018 | 610,513 | ||||||
| Las Vegas Sands, LLC, Term Loan | ||||||||
| 522,375 | 3.250%, 12/19/2020 | 522,077 | ||||||
| Marina District Finance Company, Inc., Term Loan | ||||||||
| 547,250 | 6.750%, 8/15/2018 | 553,231 | ||||||
| MGM Resorts International, Term Loan | ||||||||
| 544,472 | 3.500%, 12/20/2019 | 542,599 | ||||||
| Michaels Stores, Inc. Term Loan | ||||||||
| 665,000 | 0.000%, 1/28/2020b,c | 664,761 | ||||||
| Mohegan Tribal Gaming Authority, Term Loan | ||||||||
| 517,400 | 5.500%, 11/19/2019 | 525,378 | ||||||
| ROC Finance, LLC, Term Loan | ||||||||
| 744,375 | 5.000%, 6/20/2019 | 731,348 | ||||||
| Scientific Games International, Inc., Term Loan | ||||||||
| 606,950 | 4.250%, 10/18/2020 | 600,025 | ||||||
| Seminole Indian Tribe of Florida, Term Loan | ||||||||
| 555,305 | 3.000%, 4/29/2020b,c | 554,150 | ||||||
| Toys R Us, Inc., Term Loan | ||||||||
| 603,591 | 5.250%, 5/25/2018 | 487,901 | ||||||
|
| |||||||
| Total | 9,298,148 | |||||||
|
| |||||||
| Consumer Non-Cyclical (2.4%) | |||||||
| Albertsons, Inc., Term Loan | ||||||||
| 834,209 | 4.750%, 3/21/2019 | 837,855 | ||||||
| Biomet, Inc., Term Loan | ||||||||
| 560,801 | 3.661%, 7/25/2017 | 561,233 | ||||||
| Catalina Marketing Corporation, Term Loan | ||||||||
| 690,000 | 4.500%, 4/9/2021 | 689,710 | ||||||
| CHS/Community Health Systems, Inc., Term Loan | ||||||||
| 203,597 | 3.478%, 1/25/2017 | 204,020 | ||||||
| 542,653 | 4.250%, 1/27/2021 | 545,551 | ||||||
| Del Monte Corporation, Term Loan | ||||||||
| 658,350 | 3.500%, 3/9/2020 | 652,385 | ||||||
| JBS USA, LLC, Term Loan | ||||||||
| 659,266 | 0.000%, 5/25/2018 | 657,618 | ||||||
| Libbey Glass, Inc., Term Loan | ||||||||
| 345,000 | 3.750%, 4/9/2021 | 344,569 | ||||||
| Ortho-Clinical Diagnostics, Inc., Term Loan | ||||||||
| 725,000 | 4.750%, 6/30/2021b,c | 730,532 | ||||||
| Roundy’s Supermarkets, Inc., Term Loan | ||||||||
| 659,624 | 5.750%, 3/3/2021 | 660,567 | ||||||
| Supervalu, Inc., Term Loan | ||||||||
| 521,458 | 4.500%, 3/21/2019 | 520,744 | ||||||
| Van Wagner Communications, LLC, Term Loan | ||||||||
| 538,259 | 6.250%, 8/3/2018 | 543,867 | ||||||
|
| |||||||
| Total | 6,948,651 | |||||||
|
| |||||||
| Energy (0.9%) | |||||||
| Energy Solutions, LLC, Term Loan | ||||||||
| 825,000 | 6.750%, 5/29/2020 | 833,250 | ||||||
| Exgen Renewables I, LLC, Term Loan | ||||||||
| 451,205 | 5.250%, 2/6/2021 | 457,410 | ||||||
| McJunkin Red Man Corporation, Term Loan | ||||||||
| 526,025 | 5.000%, 11/8/2019 | 528,655 | ||||||
| Offshore Group Investment, Ltd., Term Loan | ||||||||
| 279,293 | 5.750%, 3/28/2019b,c | 277,430 | ||||||
| Pacific Drilling SA, Term Loan | ||||||||
| 589,050 | 4.500%, 6/3/2018 | 590,705 | ||||||
|
| |||||||
| Total | 2,687,450 | |||||||
|
| |||||||
| Financials (1.1%) | |||||||
| Delos Finance Sarl, Term Loan | ||||||||
| 670,000 | 3.500%, 3/6/2021 | 669,162 | ||||||
| DJO Finance, LLC, Term Loan | ||||||||
| 653,388 | 4.250%, 9/15/2017 | 655,433 | ||||||
| Harland Clarke Holdings Corporation, Term Loan | ||||||||
| 580,125 | 7.000%, 5/22/2018 | 589,192 | ||||||
| TransUnion, LLC, Term Loan | ||||||||
| 698,250 | 4.000%, 4/9/2021 | 697,999 | ||||||
| WaveDivision Holdings, LLC, Term Loan | ||||||||
| 742,462 | 4.000%, 10/12/2019 | 741,757 | ||||||
|
| |||||||
| Total | 3,353,543 | |||||||
|
| |||||||
| Technology (1.2%) | |||||||
| Avago Technologies, Ltd., Term Loan | ||||||||
| 1,050,000 | 3.750%, 5/6/2021 | 1,052,909 | ||||||
| BMC Software, Inc., Term Loan | ||||||||
| 547,250 | 5.000%, 9/10/2020 | 545,997 | ||||||
| First Data Corporation Extended, Term Loan | ||||||||
| 670,000 | 4.155%, 3/23/2018 | 670,837 | ||||||
| Freescale Semiconductor, Inc., Term Loan | ||||||||
| 633,339 | 4.250%, 2/28/2020 | 633,082 | ||||||
| Infor US, Inc., Term Loan | ||||||||
| 744,338 | 3.750%, 6/3/2020 | 738,197 | ||||||
|
| |||||||
| Total | 3,641,022 | |||||||
|
| |||||||
The accompanying Notes to Financial Statements are an integral part of this schedule.
115
Table of Contents
Balanced Income Plus Portfolio
Schedule of Investments as of June 30, 2014
(unaudited)
| Principal Amount | Bank Loans (18.6%)a | Value | ||||||
| Transportation (0.6%) | |||||||
| American Airlines, Inc., Term Loan | ||||||||
| $ 1,059,300 | 3.750%, 6/27/2019 | $ | 1,060,327 | |||||
| Delta Air Lines, Inc., Term Loan | ||||||||
| 690,000 | 3.500%, 4/20/2017b,c | 687,738 | ||||||
|
| |||||||
| Total | 1,748,065 | |||||||
|
| |||||||
| Utilities (0.4%) | |||||||
| Calpine Corporation, Term Loan | ||||||||
| 653,248 | 4.000%, 4/1/2018 | 655,084 | ||||||
| Intergen NV, Term Loan | ||||||||
| 589,050 | 5.500%, 6/15/2020 | 592,979 | ||||||
|
| |||||||
| Total | 1,248,063 | |||||||
|
| |||||||
Total Bank Loans (cost $55,120,823) | 55,120,364 | |||||||
|
| |||||||
| Shares | Common Stock (51.7%) | |||||||
| Consumer Discretionary (8.5%) | |||||||
| 4,300 | Amazon.com, Inc.d | 1,396,554 | ||||||
| 2,700 | AutoZone, Inc.d | 1,447,848 | ||||||
| 11,500 | BorgWarner, Inc. | 749,685 | ||||||
| 16,300 | CBS Corporation | 1,012,882 | ||||||
| 117,115 | Comcast Corporation | 6,286,733 | ||||||
| 14,200 | Dollar Tree, Inc.d | 773,332 | ||||||
| 18,000 | GNC Holdings, Inc. | 613,800 | ||||||
| 53,150 | Kohl’s Corporation | 2,799,942 | ||||||
| 52,750 | Las Vegas Sands Corporation | 4,020,605 | ||||||
| 10,800 | Marriott International, Inc. | 692,280 | ||||||
| 42,025 | MDC Partners, Inc. | 903,117 | ||||||
| 18,900 | NIKE, Inc. | 1,465,695 | ||||||
| 17,300 | Papa John’s International, Inc. | 733,347 | ||||||
| 14,000 | Toll Brothers, Inc.d | 516,600 | ||||||
| 47,100 | Tuesday Morning Corporationd | 839,322 | ||||||
| 27,000 | Twenty-First Century Fox, Inc. | 949,050 | ||||||
|
| |||||||
| Total | 25,200,792 | |||||||
|
| |||||||
| Consumer Staples (3.6%) | |||||||
| 29,500 | Anheuser-Busch InBev NV ADR | 3,390,730 | ||||||
| 43,047 | PepsiCo, Inc. | 3,845,819 | ||||||
| 37,800 | Wal-Mart Stores, Inc. | 2,837,646 | ||||||
| 22,300 | WhiteWave Foods Companyd | 721,851 | ||||||
|
| |||||||
| Total | 10,796,046 | |||||||
|
| |||||||
| Energy (5.2%) | |||||||
| 23,450 | Cameron International Corporationd | 1,587,800 | ||||||
| 6,200 | Concho Resources, Inc.d | 895,900 | ||||||
| 13,600 | EOG Resources, Inc. | 1,589,296 | ||||||
| 77,672 | Marathon Oil Corporation | 3,100,666 | ||||||
| 14,675 | Schlumberger, Ltd. | 1,730,916 | ||||||
| 8,400 | SM Energy Company | 706,440 | ||||||
| 82,250 | Total SA ADRe | 5,938,450 | ||||||
|
| |||||||
| Total | 15,549,468 | |||||||
|
| |||||||
| Financials (11.7%) | |||||||
| 69,121 | Aberdeen Asia-Pacific Income Fund, Inc. | 434,080 | ||||||
| 3,300 | Affiliated Managers Group, Inc.d | 677,820 | ||||||
| 16,950 | Alexandria Real Estate Equities, Inc. | 1,315,998 | ||||||
| 20,850 | Axis Capital Holdings, Ltd. | 923,238 | ||||||
| 90,754 | Bank of America Corporation | 1,394,889 | ||||||
| 59,550 | Blackstone Group, LPd | 1,991,352 | ||||||
| 4,300 | Boston Properties, Inc. | 508,174 | ||||||
| 8,800 | Camden Property Trust | 626,120 | ||||||
| 31,388 | Citigroup, Inc. | 1,478,375 | ||||||
| 15,800 | Cohen & Steers REIT and Preferred Income Fund, Inc. | 284,874 | ||||||
| 34,700 | DDR Corporation | 611,761 | ||||||
| 6,600 | Equity Residential | 415,800 | ||||||
| 4,742 | First Trust High Income Long/Short Fund | 86,067 | ||||||
| 198,300 | Genworth Financial, Inc.d | 3,450,420 | ||||||
| 12,500 | HCC Insurance Holdings, Inc. | 611,750 | ||||||
| 9,300 | Host Hotels & Resorts, Inc. | 204,693 | ||||||
| 88,250 | Invesco, Ltd. | 3,331,437 | ||||||
| 28,250 | iShares FTSE NAREIT Mortgage Plus Capped Index Fund | 357,080 | ||||||
| 21,030 | iShares J.P. Morgan USD Emerging Markets Bond ETF | 2,424,128 | ||||||
| 16,760 | iShares MSCI Emerging Markets Minimum Volatility ETF | 1,007,444 | ||||||
| 29,850 | Lazard, Ltd. | 1,539,066 | ||||||
| 21,850 | Macerich Company | 1,458,487 | ||||||
| 31,500 | MetLife, Inc. | 1,750,140 | ||||||
| 79,271 | MFS Intermediate Income Trust | 418,551 | ||||||
| 48,381 | Nuveen Quality Preferred Income Fund II | 436,880 | ||||||
| 14,600 | PacWest Bancorp | 630,282 | ||||||
| 17,600 | Popular, Inc.d | 601,568 | ||||||
| 4,700 | Prologis, Inc. | 193,123 | ||||||
| 3,100 | Public Storage, Inc. | 531,185 | ||||||
| 3,703 | Simon Property Group, Inc. | 615,735 | ||||||
| 53,482 | Templeton Global Income Fund | 441,761 | ||||||
| 21,550 | Vanguard MSCI Emerging Markets ETF | 929,452 | ||||||
| 7,775 | Vanguard Short-Term Corporate Bond ETF | 624,877 | ||||||
| 3,450 | Visa, Inc. | 726,949 | ||||||
| 1,900 | Vornado Realty Trust | 202,787 | ||||||
| 1,851 | Washington Prime Group, Inc.d | 34,688 | ||||||
| 24,263 | Western Asset Emerging Markets Debt Fund, Inc. | 445,954 | ||||||
| 46,185 | Western Asset High Income Opportunity Fund, Inc. | 281,729 | ||||||
| 20,100 | Zions Bancorporation | 592,347 | ||||||
|
| |||||||
| Total | 34,591,061 | |||||||
|
| |||||||
| Health Care (6.8%) | |||||||
| 4,500 | Actavis, Inc.d | 1,003,725 | ||||||
| 18,600 | Amgen, Inc. | 2,201,682 | ||||||
| 14,600 | Becton, Dickinson and Company | 1,727,180 | ||||||
| 27,400 | Covidien plc | 2,470,932 | ||||||
| 15,700 | Gilead Sciences, Inc.d | 1,301,687 | ||||||
| 31,000 | Hologic, Inc.d | 785,850 | ||||||
| 4,900 | Illumina, Inc.d | 874,846 | ||||||
| 49,100 | Johnson & Johnson | 5,136,842 | ||||||
| 136,850 | Pfizer, Inc. | 4,061,708 | ||||||
| 5,600 | Waters Corporationd | 584,864 | ||||||
|
| |||||||
| Total | 20,149,316 | |||||||
|
| |||||||
| Industrials (5.0%) | |||||||
| 18,000 | ADT Corporation | 628,920 | ||||||
| 18,978 | Boeing Company | 2,414,571 | ||||||
| 7,177 | Caterpillar, Inc. | 779,925 | ||||||
The accompanying Notes to Financial Statements are an integral part of this schedule.
116
Table of Contents
Balanced Income Plus Portfolio
Schedule of Investments as of June 30, 2014
(unaudited)
| Shares | Common Stock (51.7%) | Value | ||||||
| Industrials (5.0%) - continued | |||||||
| 46,600 | Delta Air Lines, Inc. | $ | 1,804,352 | |||||
| 14,900 | EMCOR Group, Inc. | 663,497 | ||||||
| 9,200 | Flowserve Corporation | 684,020 | ||||||
| 16,500 | HNI Corporation | 645,315 | ||||||
| 6,400 | Huntington Ingalls Industries, Inc. | 605,376 | ||||||
| 23,500 | Ingersoll-Rand plc | 1,468,985 | ||||||
| 12,676 | Jacobs Engineering Group, Inc.d | 675,377 | ||||||
| 36,600 | Union Pacific Corporation | 3,650,850 | ||||||
| 6,300 | WABCO Holdings, Inc.d | 672,966 | ||||||
|
| |||||||
| Total | 14,694,154 | |||||||
|
| |||||||
| Information Technology (8.2%) | |||||||
| 70,000 | Apple, Inc. | 6,505,100 | ||||||
| 14,150 | Autodesk, Inc.d | 797,777 | ||||||
| 35,408 | E2open, Inc.d,e | 731,883 | ||||||
| 12,650 | Facebook, Inc.d | 851,219 | ||||||
| 2,300 | Google, Inc.d | 1,323,144 | ||||||
| 2,300 | Google, Inc., Class Ad | 1,344,741 | ||||||
| 37,200 | Juniper Networks, Inc.d | 912,888 | ||||||
| 4,900 | LinkedIn Corporationd | 840,203 | ||||||
| 9,600 | MasterCard, Inc. | 705,312 | ||||||
| 29,300 | NetApp, Inc. | 1,070,036 | ||||||
| 28,223 | QLIK Technologies, Inc.d | 638,404 | ||||||
| 28,650 | QUALCOMM, Inc. | 2,269,080 | ||||||
| 4,900 | ServiceNow, Inc.d | 303,604 | ||||||
| 13,900 | Teradata Corporationd | 558,780 | ||||||
| 23,650 | TIBCO Software, Inc.d | 477,020 | ||||||
| 15,800 | Ubiquiti Networks, Inc.d,e | 714,002 | ||||||
| 18,950 | VMware, Inc.d | 1,834,550 | ||||||
| 48,800 | Xilinx, Inc. | 2,308,728 | ||||||
|
| |||||||
| Total | 24,186,471 | |||||||
|
| |||||||
| Materials (1.6%) | |||||||
| 2,200 | Airgas, Inc. | 239,602 | ||||||
| 2,600 | Ashland, Inc. | 282,724 | ||||||
| 5,200 | Crown Holdings, Inc.d | 258,752 | ||||||
| 10,400 | Domtar Corporation | 445,640 | ||||||
| 3,100 | FMC Corporation | 220,689 | ||||||
| 52,200 | Materials Select Sector SPDR Fund | 2,591,208 | ||||||
| 7,100 | Owens-Illinois, Inc.d | 245,944 | ||||||
| 1,300 | PPG Industries, Inc. | 273,195 | ||||||
| 12,400 | Steel Dynamics, Inc. | 222,580 | ||||||
|
| |||||||
| Total | 4,780,334 | |||||||
|
| |||||||
| Utilities (1.1%) | |||||||
| 18,400 | MDU Resources Group, Inc. | 645,840 | ||||||
| 10,600 | Southwest Gas Corporation | 559,574 | ||||||
| 48,600 | Utilities Select Sector SPDR Fund | 2,151,036 | ||||||
|
| |||||||
| Total | 3,356,450 | |||||||
|
| |||||||
Total Common Stock (cost $130,931,493) | 153,304,092 | |||||||
|
| |||||||
| Principal Amount | Long-Term Fixed Income (25.9%) | |||||||
| Asset-Backed Securities (1.2%) | |||||||
| Asset Backed Securities Corporation Home Equity Loan Trust | ||||||||
| $473,760 | 0.292%, 7/25/2036f | 439,244 | ||||||
| Bayview Opportunity Master Fund Trust IIB, LP | ||||||||
| 599,470 | 3.950%, 1/28/2034g | 600,423 | ||||||
| Countrywide Home Loans, Inc. | ||||||||
| 144,210 | 6.085%, 6/25/2021h | 143,283 | ||||||
| Credit Based Asset Servicing and Securitization, LLC | ||||||||
| 280,042 | 3.770%, 12/25/2036 | 187,432 | ||||||
| First Horizon ABS Trust | ||||||||
| 481,304 | 0.312%, 10/25/2034f,h | 411,242 | ||||||
| GMAC Mortgage Corporation Loan Trust | ||||||||
| 818,058 | 0.332%, 8/25/2035f,h | 707,805 | ||||||
| 503,968 | 0.332%, 12/25/2036f,h | 433,475 | ||||||
| IndyMac Seconds Asset-Backed Trust | ||||||||
| 294,407 | 0.492%, 10/25/2036f,h | 126,978 | ||||||
| Wachovia Asset Securitization, Inc. | ||||||||
| 636,268 | 0.292%, 7/25/2037f,g,h | 548,443 | ||||||
|
| |||||||
| Total | 3,598,325 | |||||||
|
| |||||||
| Basic Materials (0.8%) | |||||||
| Anglo American Capital plc | ||||||||
| 65,000 | 1.176%, 4/15/2016f,i | 65,206 | ||||||
| Dow Chemical Company | ||||||||
| 86,000 | 8.550%, 5/15/2019 | 110,533 | ||||||
| FMG Resources Pty. Ltd. | ||||||||
| 227,936 | 6.875%, 2/1/2018i | 239,333 | ||||||
| Freeport-McMoRan Copper & Gold, Inc. | ||||||||
| 80,000 | 2.375%, 3/15/2018 | 81,193 | ||||||
| Groupe Office Cherifien des Phosphates SA | ||||||||
| 170,000 | 5.625%, 4/25/2024i | 178,288 | ||||||
| Hexion US Finance Corporation/Hexion Nova Scotia Finance ULC | ||||||||
| 227,936 | 8.875%, 2/1/2018 | 237,053 | ||||||
| Ineos Finance plc | ||||||||
| 263,000 | 7.500%, 5/1/2020i | 286,341 | ||||||
| LyondellBasell Industries NV | ||||||||
| 80,000 | 5.000%, 4/15/2019 | 90,238 | ||||||
| Minsur SA | ||||||||
| 164,000 | 6.250%, 2/7/2024i | 178,760 | ||||||
| Mosaic Company | ||||||||
| 52,000 | 3.750%, 11/15/2021 | 54,084 | ||||||
| NOVA Chemicals Corporation | ||||||||
| 341,904 | 5.250%, 8/1/2023i | 373,530 | ||||||
| Trinseo Materials Operating SCA | ||||||||
| 238,000 | 8.750%, 2/1/2019 | 256,445 | ||||||
| Vale Overseas, Ltd. | ||||||||
| 80,000 | 6.250%, 1/23/2017 | 89,520 | ||||||
| Xstrata Finance Canada, Ltd. | ||||||||
| 43,000 | 2.050%, 10/23/2015i | 43,487 | ||||||
|
| |||||||
| Total | 2,284,011 | |||||||
|
| |||||||
| Capital Goods (0.7%) | |||||||
| BAE Systems plc | ||||||||
| 132,000 | 3.500%, 10/11/2016i | 137,385 | ||||||
| Cemex Finance, LLC | ||||||||
| 227,936 | 9.375%, 10/12/2017i | 268,110 | ||||||
| CNH Capital, LLC | ||||||||
| 227,936 | 3.625%, 4/15/2018 | 232,780 | ||||||
| Harsco Corporation | ||||||||
| 78,000 | 2.700%, 10/15/2015 | 78,682 | ||||||
The accompanying Notes to Financial Statements are an integral part of this schedule.
117
Table of Contents
Balanced Income Plus Portfolio
Schedule of Investments as of June 30, 2014
(unaudited)
| Principal Amount | Long-Term Fixed Income (25.9%) | Value | ||||||
| Capital Goods (0.7%) - continued | |||||||
| Ingersoll-Rand Global Holding Company, Ltd. | ||||||||
| $ 106,000 | 6.875%, 8/15/2018 | $ | 126,289 | |||||
| L-3 Communications Corporation | ||||||||
| 90,000 | 1.500%, 5/28/2017 | 90,123 | ||||||
| Martin Marietta Materials, Inc. | ||||||||
| 106,000 | 1.331%, 6/30/2017c,f,i | 105,938 | ||||||
| Nortek, Inc. | ||||||||
| 227,936 | 8.500%, 4/15/2021 | 251,869 | ||||||
| Reynolds Group Issuer, Inc. | ||||||||
| 227,936 | 9.875%, 8/15/2019 | 252,439 | ||||||
| Roper Industries, Inc. | ||||||||
| 71,000 | 2.050%, 10/1/2018 | 71,115 | ||||||
| Textron, Inc. | ||||||||
| 132,000 | 4.625%, 9/21/2016 | 141,495 | ||||||
| United Rentals North America, Inc. | ||||||||
| 273,000 | 7.375%, 5/15/2020 | 301,665 | ||||||
|
| |||||||
| Total | 2,057,890 | |||||||
|
| |||||||
| Collateralized Mortgage Obligations (4.3%) | |||||||
| Banc of America Alternative Loan Trust | ||||||||
| 705,837 | 6.000%, 11/25/2035 | 599,486 | ||||||
| Countrywide Alternative Loan Trust | ||||||||
| 579,461 | 6.500%, 8/25/2036 | 425,032 | ||||||
| Credit Suisse First Boston Mortgage Securities Corporation | ||||||||
| 452,515 | 5.250%, 10/25/2035 | 450,474 | ||||||
| Deutsche Alt-A Securities, Inc., Mortgage Loan Trust | ||||||||
| 831,133 | 5.500%, 11/25/2035 | 774,802 | ||||||
| 424,773 | 0.893%, 4/25/2047f | 376,848 | ||||||
| GMACM Mortgage Loan Trust | ||||||||
| 357,367 | 4.621%, 5/25/2035 | 344,453 | ||||||
| HarborView Mortgage Loan Trust | ||||||||
| 313,053 | 2.717%, 12/19/2035 | 282,254 | ||||||
| J.P. Morgan Alternative Loan Trust | ||||||||
| 803,030 | 6.500%, 3/25/2036 | 704,166 | ||||||
| J.P. Morgan Mortgage Trust | ||||||||
| 682,318 | 2.847%, 8/25/2035 | 685,374 | ||||||
| 624,701 | 2.626%, 1/25/2037 | 558,359 | ||||||
| Merrill Lynch Mortgage Investors Trust | ||||||||
| 582,164 | 6.250%, 8/25/2036 | 459,239 | ||||||
| MortgageIT Trust | ||||||||
| 868,842 | 0.412%, 12/25/2035f | 812,919 | ||||||
| 885,740 | 0.352%, 4/25/2036f | 613,610 | ||||||
| New York Mortgage Trust | ||||||||
| 264,408 | 2.696%, 5/25/2036 | 240,665 | ||||||
| Residential Accredit Loans, Inc. | ||||||||
| 491,284 | 5.750%, 9/25/2035 | 445,211 | ||||||
| RFMSI Trust | ||||||||
| 919,140 | 6.000%, 7/25/2037 | 841,907 | ||||||
| Structured Adjustable Rate Mortgage Loan Trust | ||||||||
| 400,888 | 5.171%, 7/25/2035 | 352,290 | ||||||
| 455,801 | 2.672%, 9/25/2035 | 391,697 | ||||||
| Structured Asset Mortgage Investments, Inc. | ||||||||
| 948,522 | 0.462%, 12/25/2035f | 750,404 | ||||||
| Vericrest Opportunity Loan Transferee | ||||||||
| 522,587 | 3.625%, 3/25/2054g | 525,610 | ||||||
| 458,845 | 3.625%, 4/25/2055g | 461,453 | ||||||
| Wells Fargo Mortgage Backed Securities Trust | ||||||||
| 243,684 | 2.613%, 3/25/2036 | 244,023 | ||||||
| 716,759 | 2.609%, 7/25/2036 | 677,564 | ||||||
| 535,419 | 6.000%, 7/25/2037 | 533,672 | ||||||
|
| |||||||
| Total | 12,551,512 | |||||||
|
| |||||||
| Commercial Mortgage-Backed Securities (0.5%) | |||||||
| Banc of America Commercial Mortgage, Inc. | ||||||||
| 600,000 | 5.775%, 6/10/2049 | 660,361 | ||||||
| Commercial Mortgage Pass- Through Certificates | ||||||||
| 351,058 | 0.282%, 12/15/2020f,i | 349,895 | ||||||
| Credit Suisse Mortgage Capital Certificates | ||||||||
| 503,475 | 0.322%, 10/15/2021f,i | 502,507 | ||||||
|
| |||||||
| Total | 1,512,763 | |||||||
|
| |||||||
| Communications Services (1.9%) | |||||||
| AMC Networks, Inc. | ||||||||
| 227,936 | 7.750%, 7/15/2021 | 255,003 | ||||||
| America Movil SAB de CV | ||||||||
| 71,000 | 5.000%, 10/16/2019 | 79,822 | ||||||
| American Tower Corporation | ||||||||
| 130,000 | 7.000%, 10/15/2017 | 151,288 | ||||||
| British Telecommunications plc | ||||||||
| 86,000 | 1.250%, 2/14/2017 | 86,077 | ||||||
| CBS Corporation | ||||||||
| 120,000 | 8.875%, 5/15/2019 | 155,568 | ||||||
| CC Holdings GS V, LLC | ||||||||
| 198,000 | 2.381%, 12/15/2017 | 201,633 | ||||||
| CCO Holdings, LLC | ||||||||
| 227,936 | 7.000%, 1/15/2019 | 240,473 | ||||||
| CenturyLink, Inc. | ||||||||
| 230,000 | 6.450%, 6/15/2021 | 249,550 | ||||||
| Cox Communications, Inc. | ||||||||
| 84,000 | 9.375%, 1/15/2019i | 108,788 | ||||||
| Digicel, Ltd. | ||||||||
| 227,936 | 6.000%, 4/15/2021i | 235,344 | ||||||
| DIRECTV Holdings, LLC | ||||||||
| 85,000 | 3.500%, 3/1/2016 | 88,697 | ||||||
| 86,000 | 5.875%, 10/1/2019 | 100,027 | ||||||
| Hughes Satellite Systems Corporation | ||||||||
| 273,000 | 6.500%, 6/15/2019 | 304,395 | ||||||
| Intelsat Jackson Holdings SA | ||||||||
| 227,936 | 7.250%, 10/15/2020 | 245,601 | ||||||
| Level 3 Financing, Inc. | ||||||||
| 273,000 | 8.625%, 7/15/2020 | 305,760 | ||||||
| NBC Universal Enterprise, Inc. | ||||||||
| 132,000 | 1.662%, 4/15/2018i | 131,914 | ||||||
The accompanying Notes to Financial Statements are an integral part of this schedule.
118
Table of Contents
Balanced Income Plus Portfolio
Schedule of Investments as of June 30, 2014
(unaudited)
| Principal Amount | Long-Term Fixed Income (25.9%) | Value | ||||||
| Communications Services (1.9%) - continued | |||||||
| SBA Tower Trust | ||||||||
| $ 84,000 | 5.101%, 4/17/2017i | $ | 89,948 | |||||
| Sprint Communications, Inc. | ||||||||
| 227,936 | 9.000%, 11/15/2018i | 276,372 | ||||||
| Telefonica Emisiones SAU | ||||||||
| 87,000 | 3.992%, 2/16/2016 | 91,089 | ||||||
| 78,000 | 3.192%, 4/27/2018 | 81,516 | ||||||
| Time Warner Cable, Inc. | ||||||||
| 182,000 | 5.000%, 2/1/2020 | 203,951 | ||||||
| T-Mobile USA, Inc. | ||||||||
| 250,000 | 6.633%, 4/28/2021 | 270,625 | ||||||
| Univision Communications, Inc. | ||||||||
| 325,000 | 7.875%, 11/1/2020i | 357,500 | ||||||
| UPCB Finance V, Ltd. | ||||||||
| 325,000 | 7.250%, 11/15/2021i | 357,500 | ||||||
| Verizon Communications, Inc. | ||||||||
| 122,000 | 2.500%, 9/15/2016 | 125,751 | ||||||
| 89,000 | 1.981%, 9/14/2018f | 93,900 | ||||||
| 104,000 | 3.650%, 9/14/2018 | 111,226 | ||||||
| 56,000 | 2.550%, 6/17/2019 | 56,810 | ||||||
| WideOpenWest Finance, LLC | ||||||||
| 325,000 | 10.250%, 7/15/2019 | 365,219 | ||||||
| Wind Acquisition Finance SA | ||||||||
| 190,000 | 7.375%, 4/23/2021i | 202,825 | ||||||
|
| |||||||
| Total | 5,624,172 | |||||||
|
| |||||||
| Consumer Cyclical (1.3%) | |||||||
| AMC Entertainment, Inc. | ||||||||
| 227,000 | 5.875%, 2/15/2022 | 236,080 | ||||||
| Chrysler Group, LLC | ||||||||
| 227,936 | 8.250%, 6/15/2021 | 257,568 | ||||||
| Cinemark USA, Inc. | ||||||||
| 263,000 | 4.875%, 6/1/2023 | 262,342 | ||||||
| Daimler Finance North America, LLC | ||||||||
| 55,000 | 1.875%, 1/11/2018i | 55,498 | ||||||
| Delphi Corporation | ||||||||
| 78,000 | 6.125%, 5/15/2021 | 87,173 | ||||||
| ERAC USA Finance, LLC | ||||||||
| 106,000 | 2.350%, 10/15/2019i | 105,887 | ||||||
| Ford Motor Credit Company, LLC | ||||||||
| 80,000 | 3.984%, 6/15/2016 | 84,534 | ||||||
| 78,000 | 1.500%, 1/17/2017 | 78,424 | ||||||
| 67,000 | 3.000%, 6/12/2017 | 69,898 | ||||||
| 130,000 | 5.000%, 5/15/2018 | 144,619 | ||||||
| General Motors Company | ||||||||
| 68,000 | 3.500%, 10/2/2018i | 69,530 | ||||||
| General Motors Financial Company, Inc. | ||||||||
| 227,936 | 3.250%, 5/15/2018 | 231,355 | ||||||
| Hyundai Capital America | ||||||||
| 84,000 | 1.450%, 2/6/2017i | 84,316 | ||||||
| Jaguar Land Rover Automotive plc | ||||||||
| 273,000 | 5.625%, 2/1/2023i | 290,062 | ||||||
| KB Home | ||||||||
| 189,000 | 4.750%, 5/15/2019 | 190,418 | ||||||
| L Brands, Inc. | ||||||||
| 273,000 | 6.625%, 4/1/2021 | 310,196 | ||||||
| Macy’s Retail Holdings, Inc. | ||||||||
| 66,000 | 7.450%, 7/15/2017 | 77,491 | ||||||
| Nissan Motor Acceptance Corporation | ||||||||
| 58,000 | 0.777%, 3/3/2017f,i | 58,169 | ||||||
| Royal Caribbean Cruises, Ltd. | ||||||||
| 227,936 | 5.250%, 11/15/2022 | 239,333 | ||||||
| Toll Brothers Finance Corporation | ||||||||
| 176,000 | 4.000%, 12/31/2018 | 181,280 | ||||||
| TRW Automotive, Inc. | ||||||||
| 60,000 | 7.250%, 3/15/2017i | 68,250 | ||||||
| West Corporation | ||||||||
| 227,936 | 8.625%, 10/1/2018 | 242,182 | ||||||
| 210,000 | 5.375%, 7/15/2022c,i | 207,900 | ||||||
| Wynn Las Vegas, LLC | ||||||||
| 273,000 | 5.375%, 3/15/2022 | 284,261 | ||||||
|
| |||||||
| Total | 3,916,766 | |||||||
|
| |||||||
| Consumer Non-Cyclical (1.7%) | |||||||
| AbbVie, Inc. | ||||||||
| 56,000 | 2.000%, 11/6/2018 | 55,931 | ||||||
| Altria Group, Inc. | ||||||||
| 145,000 | 9.700%, 11/10/2018 | 189,998 | ||||||
| Anheuser-Busch InBev Worldwide, Inc. | ||||||||
| 78,000 | 7.750%, 1/15/2019 | 96,364 | ||||||
| Beam, Inc. | ||||||||
| 59,000 | 5.375%, 1/15/2016 | 62,808 | ||||||
| Boston Scientific Corporation | ||||||||
| 84,000 | 2.650%, 10/1/2018 | 85,868 | ||||||
| CareFusion Corporation | ||||||||
| 80,000 | 1.450%, 5/15/2017 | 79,940 | ||||||
| Celgene Corporation | ||||||||
| 118,000 | 1.900%, 8/15/2017 | 119,722 | ||||||
| CHS/Community Health Systems, Inc. | ||||||||
| 273,000 | 7.125%, 7/15/2020 | 295,523 | ||||||
| ConAgra Foods, Inc. | ||||||||
| 104,000 | 2.100%, 3/15/2018 | 104,332 | ||||||
| Cott Beverages, Inc. | ||||||||
| 200,000 | 5.375%, 7/1/2022i | 200,500 | ||||||
| Coventry Health Care, Inc. | ||||||||
| 53,000 | 5.950%, 3/15/2017 | 59,590 | ||||||
| CVS Caremark Corporation | ||||||||
| 86,000 | 2.250%, 12/5/2018 | 87,052 | ||||||
| Express Scripts Holding Company | ||||||||
| 78,000 | 2.650%, 2/15/2017 | 81,035 | ||||||
| Forest Laboratories, Inc. | ||||||||
| 109,000 | 4.375%, 2/1/2019i | 117,590 | ||||||
| Fresenius Medical Care US Finance, Inc. | ||||||||
| 227,936 | 5.750%, 2/15/2021i | 249,020 | ||||||
| Gilead Sciences, Inc. | ||||||||
| 52,000 | 3.050%, 12/1/2016 | 54,492 | ||||||
| Grupo Bimbo SAB de CV | ||||||||
| 160,000 | 3.875%, 6/27/2024i | 159,683 | ||||||
| Hawk Acquisition Sub, Inc. | ||||||||
| 273,000 | 4.250%, 10/15/2020 | 274,706 | ||||||
| HCA, Inc. | ||||||||
| 227,936 | 4.750%, 5/1/2023 | 227,651 | ||||||
| IMS Health, Inc. | ||||||||
| 250,000 | 6.000%, 11/1/2020i | 262,500 | ||||||
| JBS Finance II, Ltd. | ||||||||
| 227,936 | 8.250%, 1/29/2018g | 241,612 | ||||||
The accompanying Notes to Financial Statements are an integral part of this schedule.
119
Table of Contents
Balanced Income Plus Portfolio
Schedule of Investments as of June 30, 2014
(unaudited)
| Principal Amount | Long-Term Fixed Income (25.9%) | Value | ||||||
| Consumer Non-Cyclical (1.7%) - continued | |||||||
| Kroger Company | ||||||||
| $ 160,000 | 1.200%, 10/17/2016 | $ | 160,526 | |||||
| Lorillard Tobacco Company | ||||||||
| 84,000 | 8.125%, 6/23/2019 | 104,727 | ||||||
| McKesson Corporation | ||||||||
| 113,000 | 1.292%, 3/10/2017 | 113,299 | ||||||
| Medco Health Solutions, Inc. | ||||||||
| 50,000 | 7.125%, 3/15/2018 | 59,061 | ||||||
| Mondelez International, Inc. | ||||||||
| 56,000 | 2.250%, 2/1/2019 | 56,383 | ||||||
| Mylan, Inc. | ||||||||
| 104,000 | 1.350%, 11/29/2016 | 104,173 | ||||||
| Pernod Ricard SA | ||||||||
| 42,000 | 2.950%, 1/15/2017i | 43,677 | ||||||
| 80,000 | 5.750%, 4/7/2021i | 91,964 | ||||||
| Perrigo Company, Ltd. | ||||||||
| 39,000 | 1.300%, 11/8/2016i | 38,942 | ||||||
| 88,000 | 2.300%, 11/8/2018i | 87,964 | ||||||
| Revlon Consumer Products Corporation | ||||||||
| 227,936 | 5.750%, 2/15/2021 | 234,204 | ||||||
| SABMiller plc | ||||||||
| 78,000 | 6.500%, 7/15/2018i | 91,281 | ||||||
| Safeway, Inc. | ||||||||
| 83,000 | 3.400%, 12/1/2016 | 87,343 | ||||||
| Spectrum Brands Escrow Corporation | ||||||||
| 273,000 | 6.375%, 11/15/2020 | 293,475 | ||||||
| Thermo Fisher Scientific, Inc. | ||||||||
| 80,000 | 1.300%, 2/1/2017 | 80,118 | ||||||
| 80,000 | 2.400%, 2/1/2019 | 80,814 | ||||||
| Valeant Pharmaceuticals International | ||||||||
| 227,936 | 7.250%, 7/15/2022i | 246,171 | ||||||
| WM Wrigley Jr. Company | ||||||||
| 48,000 | 2.000%, 10/20/2017i | 48,704 | ||||||
|
| |||||||
| Total | 5,128,743 | |||||||
|
| |||||||
| Energy (1.4%) | |||||||
| BP Capital Markets plc | ||||||||
| 68,000 | 0.643%, 11/7/2016f | 68,317 | ||||||
| Buckeye Partners, LP | ||||||||
| 176,000 | 2.650%, 11/15/2018 | 178,935 | ||||||
| CNOOC Nexen Finance 2014 ULC | ||||||||
| 62,000 | 1.625%, 4/30/2017 | 62,159 | ||||||
| CNPC General Capital, Ltd. | ||||||||
| 90,000 | 2.750%, 4/19/2017i | 92,336 | ||||||
| 160,000 | 2.750%, 5/14/2019i | 159,964 | ||||||
| Concho Resources, Inc. | ||||||||
| 227,936 | 6.500%, 1/15/2022 | 251,299 | ||||||
| Continental Resources, Inc. | ||||||||
| 109,000 | 7.125%, 4/1/2021 | 123,443 | ||||||
| Devon Energy Corporation | ||||||||
| 78,000 | 1.200%, 12/15/2016 | 78,236 | ||||||
| Enbridge, Inc. | ||||||||
| 54,000 | 0.678%, 6/2/2017f | 54,109 | ||||||
| Energy Transfer Partners, LP | ||||||||
| 88,000 | 6.700%, 7/1/2018 | 103,038 | ||||||
| EQT Corporation | ||||||||
| 88,000 | 8.125%, 6/1/2019 | 110,106 | ||||||
| Harvest Operations Corporation | ||||||||
| 227,936 | 6.875%, 10/1/2017 | 247,311 | ||||||
| Hess Corporation | ||||||||
| 42,000 | 8.125%, 2/15/2019 | 52,834 | ||||||
| Kodiak Oil & Gas Corporation | ||||||||
| 227,936 | 5.500%, 1/15/2021 | 237,623 | ||||||
| Linn Energy, LLC | ||||||||
| 227,936 | 8.625%, 4/15/2020 | 246,171 | ||||||
| Lukoil International Finance BV | ||||||||
| 80,000 | 3.416%, 4/24/2018i | 79,400 | ||||||
| MEG Energy Corporation | ||||||||
| 273,000 | 6.375%, 1/30/2023i | 290,062 | ||||||
| Oasis Petroleum, Inc. | ||||||||
| 273,000 | 6.875%, 1/15/2023 | 297,570 | ||||||
| Offshore Group Investment, Ltd. | ||||||||
| 325,000 | 7.500%, 11/1/2019 | 343,688 | ||||||
| Petrobras Global Finance BV | ||||||||
| 68,000 | 2.000%, 5/20/2016 | 68,098 | ||||||
| 220,000 | 3.112%, 3/17/2020f | 226,039 | ||||||
| Petroleos Mexicanos | ||||||||
| 119,000 | 3.125%, 1/23/2019i | 123,106 | ||||||
| Range Resources Corporation | ||||||||
| 321,390 | 5.000%, 8/15/2022 | 340,673 | ||||||
| Suncor Energy, Inc. | ||||||||
| 56,000 | 6.100%, 6/1/2018 | 64,992 | ||||||
| Transocean, Inc. | ||||||||
| 90,000 | 6.000%, 3/15/2018 | 101,658 | ||||||
| Weatherford International, Ltd. | ||||||||
| 80,000 | 6.000%, 3/15/2018 | 91,027 | ||||||
| 48,000 | 9.625%, 3/1/2019 | 62,990 | ||||||
|
| |||||||
| Total | 4,155,184 | |||||||
|
| |||||||
| Financials (5.0%) | |||||||
| Abbey National Treasury Services plc | ||||||||
| 80,000 | 3.050%, 8/23/2018 | 83,778 | ||||||
| ABN AMRO Bank NV | ||||||||
| 78,000 | 2.500%, 10/30/2018i | 79,144 | ||||||
| Ally Financial, Inc. | ||||||||
| 325,000 | 4.750%, 9/10/2018 | 344,906 | ||||||
| American International Group, Inc. | ||||||||
| 120,000 | 8.250%, 8/15/2018 | 149,089 | ||||||
| ANZ New Zealand International, Ltd. | ||||||||
| 81,000 | 1.400%, 4/27/2017i | 81,154 | ||||||
| Aviation Capital Group Corporation | ||||||||
| 51,000 | 3.875%, 9/27/2016i | 52,785 | ||||||
| Bank of America Corporation | ||||||||
| 102,000 | 5.750%, 8/15/2016 | 111,290 | ||||||
| 120,000 | 5.700%, 5/2/2017 | 133,166 | ||||||
| 135,000 | 5.750%, 12/1/2017 | 152,269 | ||||||
| 33,000 | 2.000%, 1/11/2018 | 33,213 | ||||||
| 209,000 | 1.300%, 3/22/2018f | 211,691 | ||||||
| 180,000 | 5.650%, 5/1/2018 | 204,037 | ||||||
| Bank of Tokyo-Mitsubishi UFJ, Ltd. | ||||||||
| 112,000 | 0.640%, 3/10/2017f,i | 111,971 | ||||||
| Banque Federative du Credit Mutuel SA | ||||||||
| 78,000 | 1.078%, 1/20/2017f,i | 78,669 | ||||||
| Barclays Bank plc | ||||||||
| 68,000 | 5.140%, 10/14/2020 | 74,480 | ||||||
The accompanying Notes to Financial Statements are an integral part of this schedule.
120
Table of Contents
Balanced Income Plus Portfolio
Schedule of Investments as of June 30, 2014
(unaudited)
| Principal Amount | Long-Term Fixed Income (25.9%) | Value | ||||||
| Financials (5.0%) - continued | |||||||
| BB&T Corporation | ||||||||
| $ 130,000 | 2.050%, 6/19/2018 | $ | 131,431 | |||||
| BBVA Banco Continental SA | ||||||||
| 130,000 | 2.250%, 7/29/2016i | 130,975 | ||||||
| BBVA International Preferred SA Unipersonal | ||||||||
| 640,000 | 5.919%, 12/29/2049j | 667,200 | ||||||
| BBVA US Senior SAU | ||||||||
| 120,000 | 4.664%, 10/9/2015 | 125,462 | ||||||
| Bear Stearns Companies, LLC | ||||||||
| 122,000 | 6.400%, 10/2/2017 | 140,658 | ||||||
| BNP Paribas SA | ||||||||
| 87,000 | 1.250%, 12/12/2016 | 87,111 | ||||||
| 84,000 | 2.375%, 9/14/2017 | 86,016 | ||||||
| BPCE SA | ||||||||
| 80,000 | 1.625%, 2/10/2017 | 80,589 | ||||||
| 320,000 | 5.150%, 7/21/2024i | 337,826 | ||||||
| Branch Banking and Trust Company | ||||||||
| 69,000 | 0.657%, 12/1/2016f | 69,231 | ||||||
| Caixa Economica Federal | ||||||||
| 205,000 | 4.250%, 5/13/2019i | 206,947 | ||||||
| Capital One Financial Corporation | ||||||||
| 97,000 | 6.150%, 9/1/2016 | 107,346 | ||||||
| CIT Group, Inc. | ||||||||
| 225,000 | 3.875%, 2/19/2019 | 228,510 | ||||||
| Citigroup, Inc. | ||||||||
| 216,000 | 5.500%, 2/15/2017 | 237,549 | ||||||
| 118,000 | 6.000%, 8/15/2017 | 133,561 | ||||||
| 103,000 | 8.500%, 5/22/2019 | 131,654 | ||||||
| Cooperatieve Centrale Raiffeisen-Boerenleenbank BA | ||||||||
| 120,000 | 4.625%, 12/1/2023 | 126,833 | ||||||
| Credit Agricole SA | ||||||||
| 76,000 | 1.625%, 4/15/2016i | 77,008 | ||||||
| Credit Suisse Group AG | ||||||||
| 320,000 | 7.500%, 12/11/2049i,j | 354,208 | ||||||
| CyrusOne, LP | ||||||||
| 227,936 | 6.375%, 11/15/2022 | 245,601 | ||||||
| DDR Corporation | ||||||||
| 56,000 | 9.625%, 3/15/2016 | 64,076 | ||||||
| Denali Borrower, LLC | ||||||||
| 425,000 | 5.625%, 10/15/2020i | 450,500 | ||||||
| Deutsche Bank AG | ||||||||
| 109,000 | 1.350%, 5/30/2017 | 108,964 | ||||||
| Discover Bank | ||||||||
| 28,000 | 8.700%, 11/18/2019 | 35,587 | ||||||
| Discover Financial Services | ||||||||
| 47,000 | 6.450%, 6/12/2017 | 53,464 | ||||||
| Fifth Third Bancorp | ||||||||
| 167,000 | 5.450%, 1/15/2017 | 183,067 | ||||||
| General Electric Capital Corporation | ||||||||
| 112,000 | 0.504%, 5/15/2017f | 112,094 | ||||||
| 95,000 | 5.625%, 9/15/2017 | 107,542 | ||||||
| 57,000 | 1.625%, 4/2/2018 | 57,093 | ||||||
| Genworth Financial, Inc. | ||||||||
| 92,000 | 7.700%, 6/15/2020 | 113,380 | ||||||
| Goldman Sachs Group, Inc. | ||||||||
| 80,000 | 6.250%, 9/1/2017 | 91,076 | ||||||
| 100,000 | 2.375%, 1/22/2018 | 101,554 | ||||||
| 52,000 | 2.625%, 1/31/2019 | 52,707 | ||||||
| 78,000 | 7.500%, 2/15/2019 | 95,188 | ||||||
| 316,000 | 5.700%, 12/29/2049j | 326,467 | ||||||
| Hartford Financial Services Group, Inc. | ||||||||
| 120,000 | 6.000%, 1/15/2019 | 139,247 | ||||||
| HBOS plc | ||||||||
| 104,000 | 6.750%, 5/21/2018i | 119,811 | ||||||
| HCP, Inc. | ||||||||
| 66,000 | 3.750%, 2/1/2016 | 68,983 | ||||||
| 88,000 | 3.750%, 2/1/2019 | 93,771 | ||||||
| Health Care REIT, Inc. | ||||||||
| 88,000 | 4.700%, 9/15/2017 | 96,265 | ||||||
| HSBC Finance Corporation | ||||||||
| 103,000 | 6.676%, 1/15/2021 | 123,178 | ||||||
| Huntington National Bank | ||||||||
| 73,000 | 1.300%, 11/20/2016 | 73,318 | ||||||
| Icahn Enterprises, LP | ||||||||
| 300,000 | 6.000%, 8/1/2020 | 321,375 | ||||||
| ING Bank NV | ||||||||
| 320,000 | 5.800%, 9/25/2023i | 360,480 | ||||||
| ING Capital Funding Trust III | ||||||||
| 68,000 | 3.834%, 12/29/2049f,j | 68,000 | ||||||
| International Lease Finance Corporation | ||||||||
| 80,000 | 2.181%, 6/15/2016f | 80,500 | ||||||
| 210,000 | 5.875%, 8/15/2022 | 229,425 | ||||||
| Intesa Sanpaolo SPA | ||||||||
| 63,000 | 3.625%, 8/12/2015i | 64,367 | ||||||
| 30,000 | 3.875%, 1/16/2018 | 31,618 | ||||||
| 132,000 | 3.875%, 1/15/2019 | 138,431 | ||||||
| J.P. Morgan Chase & Company | ||||||||
| 101,000 | 3.450%, 3/1/2016 | 105,396 | ||||||
| 53,000 | 0.744%, 2/15/2017f | 53,193 | ||||||
| 90,000 | 2.000%, 8/15/2017 | 91,526 | ||||||
| 52,000 | 6.300%, 4/23/2019 | 61,481 | ||||||
| 104,000 | 7.900%, 4/29/2049j | 116,220 | ||||||
| 325,000 | 6.750%, 8/29/2049j | 349,781 | ||||||
| KeyCorp | ||||||||
| 68,000 | 2.300%, 12/13/2018 | 68,793 | ||||||
| Kookmin Bank | ||||||||
| 78,000 | 1.103%, 1/27/2017f,i | 78,426 | ||||||
| Liberty Mutual Group, Inc. | ||||||||
| 35,000 | 5.000%, 6/1/2021i | 38,499 | ||||||
| Liberty Property, LP | ||||||||
| 134,000 | 5.500%, 12/15/2016 | 146,301 | ||||||
| Macquarie Bank, Ltd. | ||||||||
| 57,000 | 5.000%, 2/22/2017i | 62,119 | ||||||
| Metropolitan Life Global Funding I | ||||||||
| 60,000 | 1.300%, 4/10/2017i | 60,138 | ||||||
| Mizuho Corporate Bank, Ltd. | ||||||||
| 59,000 | 1.550%, 10/17/2017i | 58,936 | ||||||
| Morgan Stanley | ||||||||
| 106,000 | 1.750%, 2/25/2016 | 107,505 | ||||||
| 165,000 | 6.250%, 8/28/2017 | 188,048 | ||||||
| 106,000 | 6.625%, 4/1/2018 | 123,911 | ||||||
| 75,000 | 4.875%, 11/1/2022 | 80,506 | ||||||
| Murray Street Investment Trust I | ||||||||
| 173,000 | 4.647%, 3/9/2017 | 186,975 | ||||||
| National City Corporation | ||||||||
| 56,000 | 6.875%, 5/15/2019 | 66,882 | ||||||
| Nomura Holdings, Inc. | ||||||||
| 58,000 | 2.000%, 9/13/2016 | 58,947 | ||||||
| 56,000 | 2.750%, 3/19/2019 | 56,969 | ||||||
The accompanying Notes to Financial Statements are an integral part of this schedule.
121
Table of Contents
Balanced Income Plus Portfolio
Schedule of Investments as of June 30, 2014
(unaudited)
| Principal Amount | Long-Term Fixed Income (25.9%) | Value | ||||||
| Financials (5.0%) - continued | |||||||
| Oversea-Chinese Banking Corporation, Ltd. | ||||||||
| $ 165,000 | 4.250%, 6/19/2024i | $ | 165,608 | |||||
| PNC Bank NA | ||||||||
| 64,000 | 1.150%, 11/1/2016 | 64,331 | ||||||
| Preferred Term Securities XXIII, Ltd. | ||||||||
| 788,178 | 0.431%, 12/22/2036f,g,k | 591,134 | ||||||
| Prologis, LP | ||||||||
| 55,000 | 6.625%, 5/15/2018 | 64,191 | ||||||
| Realty Income Corporation | ||||||||
| 95,000 | 2.000%, 1/31/2018 | 95,449 | ||||||
| Regions Bank | ||||||||
| 104,000 | 7.500%, 5/15/2018 | 123,782 | ||||||
| Reinsurance Group of America, Inc. | ||||||||
| 104,000 | 5.625%, 3/15/2017 | 113,565 | ||||||
| Royal Bank of Scotland Group plc | ||||||||
| 68,000 | 5.050%, 1/8/2015 | 69,255 | ||||||
| 60,000 | 1.174%, 3/31/2017f | 60,292 | ||||||
| 320,000 | 7.640%, 3/29/2049j | 342,000 | ||||||
| 320,000 | 7.648%, 8/29/2049j | 387,200 | ||||||
| Santander US Debt SAU | ||||||||
| 137,000 | 3.781%, 10/7/2015i | 141,511 | ||||||
| SLM Corporation | ||||||||
| 52,000 | 6.250%, 1/25/2016 | 55,250 | ||||||
| Societe Generale SA | ||||||||
| 70,000 | 5.750%, 4/20/2016i | 75,106 | ||||||
| State Bank of India | ||||||||
| 170,000 | 3.622%, 4/17/2019i | 171,032 | ||||||
| Sumitomo Mitsui Banking Corporation | ||||||||
| 156,000 | 1.300%, 1/10/2017 | 156,264 | ||||||
| Suncorp-Metway, Ltd. | ||||||||
| 41,000 | 0.934%, 3/28/2017f,i | 41,000 | ||||||
| Swiss RE Capital I, LP | ||||||||
| 80,000 | 6.854%, 5/29/2049i,j | 85,600 | ||||||
| Ventas Realty, LP | ||||||||
| 56,000 | 1.550%, 9/26/2016 | 56,570 | ||||||
| 56,000 | 1.250%, 4/17/2017 | 56,007 | ||||||
| Voya Financial, Inc. | ||||||||
| 84,000 | 2.900%, 2/15/2018 | 87,044 | ||||||
| Washington Mutual Bank | ||||||||
| 500,000 | 5.500%, 1/15/2013k,l | 0 | ||||||
| Wells Fargo & Company | ||||||||
| 27,000 | 1.250%, 7/20/2016 | 27,233 | ||||||
|
| |||||||
| Total | 14,758,862 | |||||||
|
| |||||||
| Foreign Government (0.3%) | |||||||
| Colombia Government International Bond | ||||||||
| 105,000 | 2.625%, 3/15/2023 | 98,175 | ||||||
| Costa Rica Government International Bond | ||||||||
| 170,000 | 7.000%, 4/4/2044i | 176,800 | ||||||
| Hungary Government International Bond | ||||||||
| 240,000 | 4.000%, 3/25/2019 | 247,223 | ||||||
| Poland Government International Bond | ||||||||
| 119,000 | 4.000%, 1/22/2024 | 123,462 | ||||||
| Slovenia Government International Bond | ||||||||
| 195,000 | 4.125%, 2/18/2019i | 205,423 | ||||||
| Uruguay Government International Bond | ||||||||
| 130,000 | 5.100%, 6/18/2050 | 128,375 | ||||||
|
| |||||||
| Total | 979,458 | |||||||
|
| |||||||
| Mortgage-Backed Securities (4.6%) | |||||||
| Federal Home Loan Mortgage Corporation Gold 15-Yr. Pass Through | ||||||||
| 358 | 7.500%, 9/1/2014 | 359 | ||||||
| 112,530 | 5.500%, 12/1/2017 | 119,479 | ||||||
| 630,000 | 3.000%, 7/1/2029c | 653,034 | ||||||
| Federal Home Loan Mortgage Corporation Gold 30-Yr. Pass Through | ||||||||
| 19,561 | 9.000%, 11/1/2024 | 22,374 | ||||||
| 951 | 9.000%, 4/1/2025 | 1,105 | ||||||
| 955 | 7.000%, 9/1/2025 | 1,075 | ||||||
| 774 | 8.500%, 9/1/2025 | 816 | ||||||
| 1,315 | 7.500%, 1/1/2027 | 1,553 | ||||||
| 3,235 | 7.000%, 2/1/2027 | 3,744 | ||||||
| 16,161 | 8.000%, 3/1/2027 | 16,342 | ||||||
| 2,261 | 7.500%, 4/1/2027 | 2,653 | ||||||
| 5,672 | 8.000%, 6/1/2027 | 6,779 | ||||||
| 1,371 | 8.500%, 7/1/2027 | 1,579 | ||||||
| 2,337 | 7.000%, 9/1/2027 | 2,690 | ||||||
| 4,287 | 8.000%, 10/1/2027 | 4,937 | ||||||
| 3,604 | 7.500%, 11/1/2027 | 4,274 | ||||||
| 2,890 | 7.500%, 12/1/2027 | 2,976 | ||||||
| 9,678 | 7.000%, 10/1/2028 | 10,426 | ||||||
| 24,230 | 7.000%, 5/1/2029 | 27,108 | ||||||
| 3,181 | 7.000%, 9/1/2029 | 3,646 | ||||||
| 2,810 | 7.000%, 10/1/2029 | 3,154 | ||||||
| 6,102 | 7.500%, 11/1/2029 | 6,154 | ||||||
| 7,972 | 7.000%, 1/1/2030 | 8,044 | ||||||
| 13,255 | 7.500%, 1/1/2030 | 14,036 | ||||||
| 3,302 | 8.000%, 8/1/2030 | 3,987 | ||||||
| 680,000 | 4.000%, 7/1/2044c | 720,375 | ||||||
| Federal National Mortgage Association Conventional 15-yr. Pass Through | ||||||||
| 1,250,000 | 3.500%, 8/1/2029c | 1,321,484 | ||||||
| Federal National Mortgage Association Conventional 15-Yr. Pass Through | ||||||||
| 154 | 7.500%, 4/1/2015 | 154 | ||||||
| Federal National Mortgage Association Conventional 30-Yr. Pass Through | ||||||||
| 1,793 | 10.500%, 8/1/2020 | 2,016 | ||||||
| 4,454 | 9.500%, 4/1/2025 | 4,474 | ||||||
| 962 | 8.500%, 11/1/2025 | 1,083 | ||||||
| 1,825 | 7.000%, 3/1/2026 | 2,025 | ||||||
| 1,312 | 8.500%, 5/1/2026 | 1,377 | ||||||
| 1,461 | 7.500%, 7/1/2026 | 1,640 | ||||||
| 5,841 | 7.500%, 8/1/2026 | 6,762 | ||||||
| 1,265 | 8.000%, 8/1/2026 | 1,373 | ||||||
| 4,683 | 7.000%, 11/1/2026 | 4,781 | ||||||
| 1,001 | 8.000%, 11/1/2026 | 1,147 | ||||||
| 547 | 7.500%, 12/1/2026 | 566 | ||||||
The accompanying Notes to Financial Statements are an integral part of this schedule.
122
Table of Contents
Balanced Income Plus Portfolio
Schedule of Investments as of June 30, 2014
(unaudited)
| Principal Amount | Long-Term Fixed Income (25.9%) | Value | ||||||
| Mortgage-Backed Securities (4.6%) - continued | |||||||
| $ 1,462 | 7.000%, 3/1/2027 | $ | 1,624 | |||||
| 813 | 7.500%, 5/1/2027 | 820 | ||||||
| 850 | 7.500%, 8/1/2027 | 853 | ||||||
| 15,918 | 8.000%, 9/1/2027 | 18,129 | ||||||
| 2,821 | 7.000%, 10/1/2027 | 3,041 | ||||||
| 3,480 | 8.000%, 12/1/2027 | 3,535 | ||||||
| 21,911 | 7.000%, 8/1/2028 | 24,510 | ||||||
| 881 | 7.000%, 11/1/2028 | 984 | ||||||
| 11,730 | 7.000%, 12/1/2028 | 12,916 | ||||||
| 23,646 | 7.500%, 8/1/2029 | 28,064 | ||||||
| 11,622 | 7.000%, 11/1/2029 | 12,517 | ||||||
| 7,594 | 7.000%, 11/1/2029 | 8,495 | ||||||
| 6,871 | 8.500%, 4/1/2030 | 8,559 | ||||||
| 7,789 | 7.500%, 8/1/2030 | 8,547 | ||||||
| 2,825,000 | 3.500%, 7/1/2044c | 2,907,984 | ||||||
| 2,775,000 | 4.000%, 7/1/2044c | 2,944,969 | ||||||
| 3,875,000 | 4.500%, 8/1/2044c | 4,186,969 | ||||||
| Government National Mortgage Association 30-Yr. Pass Through | ||||||||
| 2,317 | 9.500%, 1/15/2025 | 2,645 | ||||||
| 7,488 | 7.000%, 1/15/2026 | 8,374 | ||||||
| 7,113 | 7.000%, 1/15/2026 | 7,883 | ||||||
| 7,406 | 6.000%, 5/15/2026 | 8,325 | ||||||
| 6,980 | 7.000%, 6/15/2026 | 7,720 | ||||||
| 5,751 | 8.500%, 6/15/2026 | 5,855 | ||||||
| 2,092 | 8.500%, 7/15/2026 | 2,393 | ||||||
| 7,089 | 8.000%, 9/15/2026 | 8,073 | ||||||
| 2,991 | 7.500%, 10/15/2026 | 3,327 | ||||||
| 1,010 | 8.000%, 11/15/2026 | 1,014 | ||||||
| 395 | 8.500%, 11/15/2026 | 397 | ||||||
| 1,463 | 9.000%, 12/15/2026 | 1,818 | ||||||
| 11,222 | 7.500%, 4/15/2027 | 12,614 | ||||||
| 3,485 | 8.000%, 6/20/2027 | 4,203 | ||||||
| 295 | 8.000%, 8/15/2027 | 297 | ||||||
| 25,548 | 6.500%, 10/15/2027 | 29,133 | ||||||
| 9,792 | 7.000%, 10/15/2027 | 11,486 | ||||||
| 939 | 7.000%, 11/15/2027 | 942 | ||||||
| 20,232 | 7.000%, 11/15/2027 | 20,874 | ||||||
| 49,710 | 7.000%, 7/15/2028 | 55,222 | ||||||
| 14,553 | 7.500%, 7/15/2028 | 15,237 | ||||||
| 21,077 | 6.500%, 9/15/2028 | 24,034 | ||||||
| 27,175 | 6.000%, 12/15/2028 | 30,786 | ||||||
| 18,524 | 6.500%, 1/15/2029 | 21,047 | ||||||
| 107,196 | 6.500%, 3/15/2029 | 121,795 | ||||||
| 19,121 | 6.500%, 4/15/2029 | 21,725 | ||||||
| 10,895 | 7.000%, 4/15/2029 | 11,706 | ||||||
| 33,506 | 6.000%, 6/15/2029 | 38,277 | ||||||
| 18,163 | 7.000%, 6/15/2029 | 20,394 | ||||||
| 9,698 | 8.000%, 5/15/2030 | 9,871 | ||||||
| 18,402 | 7.000%, 9/15/2031 | 21,021 | ||||||
| 20,118 | 6.500%, 2/15/2032 | 23,135 | ||||||
|
| |||||||
| Total | 13,715,720 | |||||||
|
| |||||||
| Technology (0.6%) | |||||||
| Alliance Data Systems Corporation | ||||||||
| 227,936 | 6.375%, 4/1/2020i | 242,752 | ||||||
| BMC Software Finance, Inc. | ||||||||
| 227,936 | 8.125%, 7/15/2021i | 234,489 | ||||||
| EMC Corporation | ||||||||
| 56,000 | 1.875%, 6/1/2018 | 56,370 | ||||||
| Fidelity National Information Services, Inc. | ||||||||
| 109,000 | 1.450%, 6/5/2017 | 108,871 | ||||||
| First Data Corporation | ||||||||
| 227,936 | 7.375%, 6/15/2019i | 244,746 | ||||||
| Freescale Semiconductor, Inc. | ||||||||
| 245,000 | 6.000%, 1/15/2022i | 260,925 | ||||||
| Hewlett-Packard Company | ||||||||
| 90,000 | 5.400%, 3/1/2017 | 99,740 | ||||||
| Iron Mountain, Inc. | ||||||||
| 227,936 | 6.000%, 8/15/2023 | 246,456 | ||||||
| Tyco Electronics Group SA | ||||||||
| 130,000 | 6.550%, 10/1/2017 | 150,434 | ||||||
| Xerox Corporation | ||||||||
| 130,000 | 7.200%, 4/1/2016 | 143,385 | ||||||
|
| |||||||
| Total | 1,788,168 | |||||||
|
| |||||||
| Transportation (0.4%) | |||||||
| American Airlines Pass Through Trust | ||||||||
| 54,342 | 4.950%, 1/15/2023i | 58,826 | ||||||
| Avis Budget Car Rental, LLC | ||||||||
| 130,000 | 5.125%, 6/1/2022i | 130,163 | ||||||
| Continental Airlines, Inc. | ||||||||
| 204,834 | 6.250%, 4/11/2020 | 224,549 | ||||||
| Delta Air Lines, Inc. | ||||||||
| 95,713 | 4.950%, 5/23/2019 | 103,370 | ||||||
| 78,918 | 4.750%, 5/7/2020 | 85,626 | ||||||
| Hertz Corporation | ||||||||
| 273,000 | 6.750%, 4/15/2019 | 289,380 | ||||||
| Korea Expressway Corporation | ||||||||
| 93,000 | 1.625%, 4/28/2017i | 92,903 | ||||||
| United Air Lines, Inc. | ||||||||
| 66,897 | 10.400%, 11/1/2016 | 76,095 | ||||||
|
| |||||||
| Total | 1,060,912 | |||||||
|
| |||||||
| U.S. Government and Agencies (0.1%) | |||||||
| U.S. Treasury Notes | ||||||||
| 425,000 | 0.375%, 5/31/2016 | 424,618 | ||||||
|
| |||||||
| Total | 424,618 | |||||||
|
| |||||||
| Utilities (1.1%) | |||||||
| Access Midstream Partners, LP | ||||||||
| 325,000 | 4.875%, 5/15/2023 | 342,469 | ||||||
| AES Corporation | ||||||||
| 227,936 | 7.375%, 7/1/2021 | 266,685 | ||||||
| Atlas Pipeline Partners, LP | ||||||||
| 273,000 | 4.750%, 11/15/2021 | 267,540 | ||||||
| Commonwealth Edison Company | ||||||||
| 60,000 | 6.950%, 7/15/2018 | 70,950 | ||||||
| DCP Midstream Operating, LP | ||||||||
| 86,000 | 2.500%, 12/1/2017 | 88,468 | ||||||
| Dominion Resources, Inc. | ||||||||
| 112,000 | 1.250%, 3/15/2017 | 112,441 | ||||||
| Electricite de France | ||||||||
| 76,000 | 0.688%, 1/20/2017f,i | 76,308 | ||||||
| 320,000 | 5.625%, 12/29/2049i,j | 334,496 | ||||||
| Enel Finance International NV | ||||||||
| 80,000 | 5.125%, 10/7/2019i | 90,070 | ||||||
| Exelon Generation Company, LLC | ||||||||
| 52,000 | 5.200%, 10/1/2019 | 58,482 | ||||||
The accompanying Notes to Financial Statements are an integral part of this schedule.
123
Table of Contents
Balanced Income Plus Portfolio
Schedule of Investments as of June 30, 2014
(unaudited)
| Principal Amount | Long-Term Fixed Income (25.9%) | Value | ||||||
| Utilities (1.1%) - continued | |||||||
| Fermaca Enterprises S de RL de CV | ||||||||
| $ 160,000 | 6.375%, 3/30/2038i | $ | 166,800 | |||||
| MidAmerican Energy Holdings Company | ||||||||
| 116,000 | 1.100%, 5/15/2017 | 115,527 | ||||||
| 42,000 | 5.750%, 4/1/2018 | 48,067 | ||||||
| NiSource Finance Corporation | ||||||||
| 102,000 | 6.400%, 3/15/2018 | 117,190 | ||||||
| NRG Energy, Inc. | ||||||||
| 227,936 | 6.625%, 3/15/2023 | 246,741 | ||||||
| Oleoducto Central SA | ||||||||
| 160,000 | 4.000%, 5/7/2021e,i | 160,000 | ||||||
| ONEOK Partners, LP | ||||||||
| 88,000 | 2.000%, 10/1/2017 | 89,201 | ||||||
| 75,000 | 3.200%, 9/15/2018 | 78,255 | ||||||
| Pacific Gas & Electric Company | ||||||||
| 65,000 | 5.625%, 11/30/2017 | 73,500 | ||||||
| Panhandle Eastern Pipe Line Company, LP | ||||||||
| 78,000 | 6.200%, 11/1/2017 | 88,434 | ||||||
| PG&E Corporation | ||||||||
| 57,000 | 2.400%, 3/1/2019 | 57,514 | ||||||
| PPL Capital Funding, Inc. | ||||||||
| 104,000 | 1.900%, 6/1/2018 | 103,923 | ||||||
| TransAlta Corporation | ||||||||
| 109,000 | 1.900%, 6/3/2017 | 109,426 | ||||||
| Williams Companies, Inc. | ||||||||
| 106,000 | 7.875%, 9/1/2021 | 131,603 | ||||||
|
| |||||||
| Total | 3,294,090 | |||||||
|
| |||||||
Total Long-Term Fixed Income (cost $76,118,752) | 76,851,194 | |||||||
|
| |||||||
| Shares | Preferred Stock (1.8%) | |||||||
| Financials (1.7%) | |||||||
| 16,000 | Affiliated Managers Group, Inc., 5.250% | 420,800 | ||||||
| 4,800 | Agribank FCB, 6.875%j | 510,000 | ||||||
| 288 | Bank of America Corporation, Convertible, 7.250%j | 336,096 | ||||||
| 12,800 | CHS, Inc., 7.100%j | 347,648 | ||||||
| 25,915 | Citigroup, Inc., 6.875%j | 703,333 | ||||||
| 6,250 | Farm Credit Bank of Texas, 6.750%i,j | 654,102 | ||||||
| 17,350 | HSBC USA, Inc., 6.500%j | 441,540 | ||||||
| 520 | M&T Bank Corporation, 6.375%j | 540,638 | ||||||
| 12,800 | Morgan Stanley, 7.125%j | 356,736 | ||||||
| 8,640 | U.S. Bancorp 6.500%j | 244,166 | ||||||
| 320 | Wells Fargo & Company, Convertible, 7.500%j | 388,480 | ||||||
|
| |||||||
| Total | 4,943,539 | |||||||
|
| |||||||
| Utilities (0.1%) | |||||||
| 4,800 | Southern California Edison Company, 4.920%f,j | 491,700 | ||||||
|
| |||||||
| Total | 491,700 | |||||||
|
| |||||||
Total Preferred Stock (cost $5,185,228) | 5,435,239 | |||||||
|
| |||||||
Collateral Held for Securities Loaned (2.6%) | ||||||||
| 7,684,215 | Thrivent Cash Management Trust | 7,684,215 | ||||||
|
| |||||||
Total Collateral Held for Securities Loaned (cost $7,684,215) | 7,684,215 | |||||||
|
| |||||||
| Shares or Principal Amount | Short-Term Investments (7.6%)m | |||||||
| Federal Home Loan Bank Discount Notes | ||||||||
| 300,000 | 0.072%, 07/30/2014n | 299,983 | ||||||
| 100,000 | 0.057%, 08/06/2014n | 99,994 | ||||||
| 22,142,026 | Thrivent Cash Management Trust 0.050% | 22,142,026 | ||||||
|
| |||||||
| Total Short-Term Investments (at amortized cost) | 22,542,003 | |||||||
|
| |||||||
| Total Investments (cost $297,582,514) 108.2% | $ | 320,937,107 | ||||||
|
| |||||||
| Other Assets and Liabilities, Net (8.2%) | (24,314,995 | ) | ||||||
|
| |||||||
| Total Net Assets 100.0% | $ | 296,622,112 | ||||||
|
| |||||||
| a | The stated interest rate represents the weighted average of all contracts within the bank loan facility. |
| b | All or a portion of the loan is unfunded. |
| c | Denotes investments purchased on a when-issued or delayed delivery basis. |
| d | Non-income producing security. |
| e | All or a portion of the security is on loan. |
| f | Denotes variable rate securities. Variable rate securities are securities whose yields vary with a designated market index or market rate. The rate shown is as of June 30, 2014. |
| g | Denotes restricted securities. Restricted securities are investment securities which have been deemed illiquid and cannot be offered for public sale without first being registered under the Securities Act of 1933. The following table indicates the acquisition date and cost of restricted securities Balanced Income Plus Portfolio owned as of June 30, 2014. |
Security | Acquisition Date | Cost | ||||||
Bayview Opportunity Master Fund Trust IIB, LP, 01/28/2034 | 1/17/2014 | $ | 599,470 | |||||
JBS Finance II, Ltd., 01/29/2018 | 8/19/2013 | 237,518 | ||||||
Preferred Term Securities XXIII, Ltd., 12/22/2036 | 9/14/2006 | 788,178 | ||||||
Vericrest Opportunity Loan Transferee, 03/25/2054 | 12/11/2013 | 520,324 | ||||||
Vericrest Opportunity Loan Transferee, 04/25/2055 | 11/21/2013 | 457,085 | ||||||
Wachovia Asset Securitization, Inc., 07/25/2037 | 3/16/2007 | 636,268 | ||||||
| h | All or a portion of the security is insured or guaranteed. |
The accompanying Notes to Financial Statements are an integral part of this schedule.
124
Table of Contents
Balanced Income Plus Portfolio
Schedule of Investments as of June 30, 2014
(unaudited)
| i | Denotes securities sold under Rule 144A of the Securities Act of 1933, which exempts them from registration. These securities have been deemed liquid and may be resold to other dealers in the program or to other qualified institutional buyers. As of June 30, 2014, the value of these investments was $14,424,070 or 4.9% of total net assets. |
| j | Denotes perpetual securities. Perpetual securities pay an indefinite stream of interest, but may be called by the issuer at an earlier date. |
| k | Security is fair valued. |
| l | Defaulted security. Interest is not being accrued. |
| m | The interest rate shown reflects the yield, coupon rate or the discount rate at the date of purchase. |
| n | At June 30, 2014, $399,977 of investments were held on deposit with the counterparty and pledged as the initial margin deposit for open futures contracts. |
Definitions:
ADR | - | American Depositary Receipt, which are certificates for an underlying foreign security’s shares held by an issuing U.S. depository bank. | ||||
ETF | - | Exchange Traded Fund. | ||||
REIT | - | Real Estate Investment Trust is a company that buys, develops, manages and/or sells real estate assets. |
Unrealized Appreciation (Depreciation)
Gross unrealized appreciation and depreciation of investments, based on cost for federal income tax purposes, were as follows:
Gross unrealized appreciation | $ | 26,111,616 | ||
Gross unrealized depreciation | (3,718,208 | ) | ||
|
| |||
Net unrealized appreciation (depreciation) | $ | 22,393,408 | ||
Cost for federal income tax purposes | $ | 298,543,699 | ||
The accompanying Notes to Financial Statements are an integral part of this schedule.
125
Table of Contents
Balanced Income Plus Portfolio
Schedule of Investments as of June 30, 2014
(unaudited)
Fair Valuation Measurements
The following table is a summary of the inputs used, as of June 30, 2014, in valuing Balanced Income Plus Portfolio’s assets carried at fair value.
Investments in Securities | Total | Level 1 | Level 2 | Level 3 | ||||||||||||
Bank Loans | ||||||||||||||||
Basic Materials | 4,856,098 | — | 4,856,098 | — | ||||||||||||
Capital Goods | 2,452,497 | — | 2,452,497 | — | ||||||||||||
Communications Services | 18,886,827 | — | 18,886,827 | — | ||||||||||||
Consumer Cyclical | 9,298,148 | — | 9,298,148 | — | ||||||||||||
Consumer Non-Cyclical | 6,948,651 | — | 6,948,651 | — | ||||||||||||
Energy | 2,687,450 | — | 2,687,450 | — | ||||||||||||
Financials | 3,353,543 | — | 3,353,543 | — | ||||||||||||
Technology | 3,641,022 | — | 3,641,022 | — | ||||||||||||
Transportation | 1,748,065 | — | 1,748,065 | — | ||||||||||||
Utilities | 1,248,063 | — | 1,248,063 | — | ||||||||||||
Common Stock | ||||||||||||||||
Consumer Discretionary | 25,200,792 | 25,200,792 | — | — | ||||||||||||
Consumer Staples | 10,796,046 | 10,796,046 | — | — | ||||||||||||
Energy | 15,549,468 | 15,549,468 | — | — | ||||||||||||
Financials | 34,591,061 | 34,591,061 | — | — | ||||||||||||
Health Care | 20,149,316 | 20,149,316 | — | — | ||||||||||||
Industrials | 14,694,154 | 14,694,154 | — | — | ||||||||||||
Information Technology | 24,186,471 | 24,186,471 | — | — | ||||||||||||
Materials | 4,780,334 | 4,780,334 | — | — | ||||||||||||
Utilities | 3,356,450 | 3,356,450 | — | — | ||||||||||||
Long-Term Fixed Income | ||||||||||||||||
Asset-Backed Securities | 3,598,325 | — | 3,598,325 | — | ||||||||||||
Basic Materials | 2,284,011 | — | 2,284,011 | — | ||||||||||||
Capital Goods | 2,057,890 | — | 2,057,890 | — | ||||||||||||
Collateralized Mortgage Obligations | 12,551,512 | — | 12,551,512 | — | ||||||||||||
Commercial Mortgage-Backed | ||||||||||||||||
Securities | 1,512,763 | — | 1,512,763 | — | ||||||||||||
Communications Services | 5,624,172 | — | 5,624,172 | — | ||||||||||||
Consumer Cyclical | 3,916,766 | — | 3,916,766 | — | ||||||||||||
Consumer Non-Cyclical | 5,128,743 | — | 5,128,743 | — | ||||||||||||
Energy | 4,155,184 | — | 4,155,184 | — | ||||||||||||
Financials^ | 14,758,862 | — | 14,167,728 | 591,134 | ||||||||||||
Foreign Government | 979,458 | — | 979,458 | — | ||||||||||||
Mortgage-Backed Securities | 13,715,720 | — | 13,715,720 | — | ||||||||||||
Technology | 1,788,168 | — | 1,788,168 | — | ||||||||||||
Transportation | 1,060,912 | — | 1,060,912 | — | ||||||||||||
U.S. Government and Agencies | 424,618 | — | 424,618 | — | ||||||||||||
Utilities | 3,294,090 | — | 3,294,090 | — | ||||||||||||
Preferred Stock | ||||||||||||||||
Financials | 4,943,539 | 4,289,437 | 654,102 | — | ||||||||||||
Utilities | 491,700 | — | 491,700 | — | ||||||||||||
Collateral Held for Securities Loaned | 7,684,215 | 7,684,215 | — | — | ||||||||||||
Short-Term Investments | 22,542,003 | 22,142,026 | 399,977 | — | ||||||||||||
|
|
|
|
|
|
|
| |||||||||
Total | $ | 320,937,107 | $ | 187,419,770 | $ | 132,926,203 | $ | 591,134 | ||||||||
|
|
|
|
|
|
|
| |||||||||
Other Financial Instruments | Total | Level 1 | Level 2 | Level 3 | ||||||||||||
Asset Derivatives | ||||||||||||||||
Futures Contracts | 85,603 | 85,603 | — | — | ||||||||||||
|
|
|
|
|
|
|
| |||||||||
Total Asset Derivatives | $ | 85,603 | $ | 85,603 | $ | — | $ | — | ||||||||
|
|
|
|
|
|
|
| |||||||||
Liability Derivatives | ||||||||||||||||
Futures Contracts | 17,906 | 17,906 | — | — | ||||||||||||
|
|
|
|
|
|
|
| |||||||||
Total Liability Derivatives | $ | 17,906 | $ | 17,906 | $ | — | $ | — | ||||||||
|
|
|
|
|
|
|
| |||||||||
There were no significant transfers between Levels during the period ended June 30, 2014. Transfers between Levels are identified as of the end of the period.
The accompanying Notes to Financial Statements are an integral part of this schedule.
126
Table of Contents
Balanced Income Plus Portfolio
Schedule of Investments as of June 30, 2014
(unaudited)
Futures Contracts | Number of Contracts Long/(Short) | Expiration Date | Notional Principal Amount | Value | Unrealized Gain/(Loss) | |||||||||||||||
2-Yr. U.S. Treasury Bond Futures | (85 | ) | September 2014 | ($ | 18,666,581 | ) | ($ | 18,665,469 | ) | $ | 1,112 | |||||||||
5-Yr. U.S. Treasury Bond Futures | (30 | ) | September 2014 | (3,597,096 | ) | (3,583,828 | ) | 13,268 | ||||||||||||
30-Yr. U.S. Treasury Bond Futures | 5 | September 2014 | 678,607 | 685,938 | 7,331 | |||||||||||||||
S&P 500 Index Futures | 11 | September 2014 | 5,305,208 | 5,369,100 | 63,892 | |||||||||||||||
Ultra Long Term U.S. Treasury Bond Futures | 18 | September 2014 | 2,716,780 | 2,698,874 | (17,906 | ) | ||||||||||||||
Total Futures Contracts | $ | 67,697 | ||||||||||||||||||
The following table summarizes the fair value and Statement of Assets and Liabilities location, as of June 30, 2014, for Balanced Income Plus Portfolio’s investments in financial derivative instruments by primary risk exposure as discussed under item (2) Significant Accounting Policies of the Notes to Financial Statements.
Derivatives by risk category | Statement of Assets and Liabilities Location | Fair Value | ||||
Asset Derivatives | ||||||
Interest Rate Contracts | ||||||
Futures* | Net Assets - Net unrealized appreciation/(depreciation) on Futures contracts | $ | 21,711 | |||
Total Interest Rate Contracts | 21,711 | |||||
Equity Contracts | ||||||
Futures* | Net Assets - Net unrealized appreciation/(depreciation) on Futures contracts | 63,892 | ||||
Total Equity Contracts | 63,892 | |||||
|
| |||||
Total Asset Derivatives | $ | 85,603 | ||||
|
| |||||
Liability Derivatives | ||||||
Interest Rate Contracts | ||||||
Futures* | Net Assets - Net unrealized appreciation/(depreciation) on Futures contracts | 17,906 | ||||
Total Interest Rate Contracts | 17,906 | |||||
|
| |||||
Total Liability Derivatives | $ | 17,906 | ||||
|
| |||||
| * | Includes cumulative appreciation/depreciation of futures contracts as reported in the Schedule of Investments. Only current day’s variation margin is reported within the Statement of Assets and Liabilities. |
The following table summarizes the net realized gains/(losses) and Statement of Operations location, for the period ended June 30, 2014, for Balanced Income Plus Portfolio’s investments in financial derivative instruments by primary risk exposure.
Derivatives by risk category | Statement of Operations Location | Realized Gains/(Losses) recognized in Income | ||||
Equity Contracts | ||||||
Futures | Net realized gains/(losses) on Futures contracts | 347,568 | ||||
Total Equity Contracts | 347,568 | |||||
Interest Rate Contracts | ||||||
Futures | Net realized gains/(losses) on Futures contracts | 120,327 | ||||
Total Interest Rate Contracts | 120,327 | |||||
|
| |||||
Total | $ | 467,895 | ||||
|
| |||||
The following table summarizes the change in net unrealized appreciation/(depreciation) and Statement of Operations location, for the period ended June 30, 2014, for Balanced Income Plus Portfolio’s investments in financial derivative instruments by primary risk exposure.
Derivatives by risk category | Statement of Operations Location | Change in unrealized appreciation/(depreciation) recognized in Income | ||||
Interest Rate Contracts | ||||||
Futures | Change in net unrealized appreciation/(depreciation) on Futures contracts | 3,805 | ||||
Total Interest Rate Contracts | 3,805 | |||||
Equity Contracts | ||||||
Futures | Change in net unrealized appreciation/(depreciation) on Futures contracts | (45,059 | ) | |||
Total Equity Contracts | (45,059 | ) | ||||
|
| |||||
Total | ($ | 41,254 | ) | |||
|
| |||||
The accompanying Notes to Financial Statements are an integral part of this schedule.
127
Table of Contents
Balanced Income Plus Portfolio
Schedule of Investments as of June 30, 2014
(unaudited)
The following table presents Balanced Income Plus Portfolio’s average volume of derivative activity during the period ended June 30, 2014.
Derivative Risk Category | Futures (Notional)* | Futures (Percentage of Average Net Assets) | ||||||
Equity Contracts | $ | 4,152,016 | 1.5 | % | ||||
Interest Rate Contracts | 9,431,445 | 3.3 | ||||||
| * | Notional amount represents long or short, or both, derivative positions held by the Portfolio. |
Investment in Affiliates
Affiliated issuers, as defined under the Investment Company Act of 1940, include those in which the Portfolio’s holdings of an issuer represent 5% or more of the outstanding voting securities of an issuer, or any affiliated mutual fund.
A summary of transactions for the fiscal year to date, in Balanced Income Plus Portfolio, is as follows:
Portfolio | Value December 31, 2013 | Gross Purchases | Gross Sales | Shares Held at June 30, 2014 | Value June 30, 2014 | Income Earned January 1, 2014 - June 30, 2014 | ||||||||||||||||||
Cash Management Trust- Collateral Investment | $ | — | $ | 13,236,795 | $ | 5,552,580 | 7,684,215 | $ | 7,684,215 | $ | 2,849 | |||||||||||||
Cash Management Trust- Short Term Investment | 18,302,791 | 67,361,076 | 63,521,841 | 22,142,026 | 22,142,026 | 5,851 | ||||||||||||||||||
Total Value and Income Earned | 18,302,791 | 29,826,241 | 8,700 | |||||||||||||||||||||
The accompanying Notes to Financial Statements are an integral part of this schedule.
128
Table of Contents
Diversified Income Plus Portfolio
Schedule of Investments as of June 30, 2014
(unaudited)
| Principal Amount | Bank Loans (13.2%)a | Value | ||||||
| Basic Materials (1.2%) | |||||||
| Alpha Natural Resources, Inc., Term Loan | ||||||||
| $ 327,513 | 3.500%, 5/22/2020 | $ | 316,187 | |||||
| Arch Coal, Inc., Term Loan | ||||||||
| 794,676 | 6.250%, 5/16/2018 | 780,277 | ||||||
| Fortescue Metals Group, Ltd., Term Loan | ||||||||
| 935,674 | 3.750%, 6/30/2019 | 936,029 | ||||||
| Ineos Group Holdings, Ltd., Term Loan | ||||||||
| 867,663 | 3.750%, 5/4/2018 | 865,173 | ||||||
| NewPage Corporation, Term Loan | ||||||||
| 975,000 | 9.500%, 2/11/2021 | 976,219 | ||||||
| Tronox Pigments BV, Term Loan | ||||||||
| 997,481 | 0.000%, 3/19/2020b,c | 998,978 | ||||||
|
| |||||||
| Total | 4,872,863 | |||||||
|
| |||||||
| Capital Goods (0.6%) | |||||||
| ADS Waste Holdings, Inc., Term Loan | ||||||||
| 591,000 | 3.750%, 10/9/2019 | 587,779 | ||||||
| Berry Plastics Group, Inc., Term Loan | ||||||||
| 592,500 | 3.500%, 2/8/2020 | 587,256 | ||||||
| Rexnord, LLC, Term Loan | ||||||||
| 595,500 | 4.000%, 8/21/2020 | 594,607 | ||||||
| Silver II Borrower, Term Loan | ||||||||
| 577,477 | 4.000%, 12/13/2019 | 575,623 | ||||||
|
| |||||||
| Total | 2,345,265 | |||||||
|
| |||||||
| Communications Services (4.3%) | |||||||
| Cengage Learning Aquisitions, Term Loan | ||||||||
| 628,425 | 7.000%, 3/31/2020 | 635,105 | ||||||
| Charter Communications Operating, LLC, Term Loan | ||||||||
| 594,000 | 3.000%, 1/3/2021 | 584,597 | ||||||
| Cincinnati Bell, Inc., Term Loan | ||||||||
| 297,750 | 4.000%, 9/10/2020 | 297,565 | ||||||
| Clear Channel Communications, Inc., Term Loan | ||||||||
| 7,153 | 3.800%, 1/29/2016 | 7,103 | ||||||
| 570,744 | 6.900%, 1/30/2019 | 567,582 | ||||||
| 132,102 | 7.650%, 7/30/2019 | 132,308 | ||||||
| Cumulus Media Holdings, Inc., Term Loan | ||||||||
| 450,807 | 4.250%, 12/23/2020 | 451,934 | ||||||
| Fairpoint Communications, Term Loan | ||||||||
| 59,398 | 7.500%, 2/14/2019b,c | 61,440 | ||||||
| Grande Communications Networks, LLC, Term Loan | ||||||||
| 792,003 | 4.500%, 5/29/2020 | 789,033 | ||||||
| Gray Television, Inc., Term Loan | ||||||||
| 440,000 | 0.000%, 6/13/2021b,c | 441,720 | ||||||
| Hargray Communications Group, Inc., Term Loan | ||||||||
| 594,000 | 4.750%, 6/26/2019 | 595,485 | ||||||
| IMG Worldwide, Inc., Term Loan | ||||||||
| 650,000 | 5.250%, 5/6/2021 | 653,900 | ||||||
| Integra Telecom Holdings, Inc., Term Loan | ||||||||
| 592,500 | 5.250%, 2/22/2019 | 595,611 | ||||||
| Intelsat Jackson Holdings SA, Term Loan | ||||||||
| 556,029 | 3.750%, 6/30/2019 | 556,490 | ||||||
| Level 3 Communications, Inc., Term Loan | ||||||||
| 800,000 | 4.000%, 1/15/2020 | 800,168 | ||||||
| Liberty Cablevision of Puerto Rico, LLC, Term Loan | ||||||||
| 550,000 | 0.000%, 12/11/2021b,c | 550,457 | ||||||
| LTS Buyer, LLC, Term Loan | ||||||||
| 904,088 | 4.000%, 4/13/2020 | 901,023 | ||||||
| McGraw-Hill Global Education, LLC, Term Loan | ||||||||
| 569,597 | 5.750%, 3/22/2019 | 578,853 | ||||||
| NEP/NCP Holdco, Inc., Term Loan | ||||||||
| 790,020 | 4.250%, 1/22/2020 | 789,823 | ||||||
| NTelos, Inc., Term Loan | ||||||||
| 497,468 | 5.750%, 11/9/2019 | 497,055 | ||||||
| Puerto Rico Cable Acquisition Company, Inc., Term Loan | ||||||||
| 565,248 | 5.500%, 7/31/2018 | 564,541 | ||||||
| SBA Senior Finance II, LLC, Term Loan | ||||||||
| 475,000 | 3.250%, 3/24/2021 | 471,761 | ||||||
| TNS, Inc., Term Loan | ||||||||
| 666,120 | 5.000%, 2/14/2020 | 668,618 | ||||||
| Univision Communications, Inc., Term Loan | ||||||||
| 898,664 | 4.000%, 3/1/2020 | 897,442 | ||||||
| Virgin Media Investment Holdings, Ltd., Term Loan | ||||||||
| 600,000 | 3.500%, 6/7/2020 | 597,936 | ||||||
| Visant Corporation, Term Loan | ||||||||
| 832,162 | 5.250%, 12/22/2016 | 828,209 | ||||||
| WideOpenWest Finance, LLC, Term Loan | ||||||||
| 632,346 | 4.750%, 4/1/2019 | 633,826 | ||||||
| WMG Acquisition Corporation, Term Loan | ||||||||
| 595,500 | 3.750%, 7/1/2020 | 585,454 | ||||||
| XO Communications, LLC, Term Loan | ||||||||
| 648,375 | 4.250%, 3/20/2021 | 651,721 | ||||||
| Yankee Cable Acquisition, LLC, Term Loan | ||||||||
| 579,240 | 4.500%, 3/1/2020 | 581,956 | ||||||
| Zayo Group, LLC, Term Loan | ||||||||
| 680,731 | 4.000%, 7/2/2019 | 681,228 | ||||||
|
| |||||||
| Total | 17,649,944 | |||||||
|
| |||||||
| Consumer Cyclical (2.6%) | |||||||
| Bally Technologies, Inc., Term Loan | ||||||||
| 355,140 | 4.250%, 11/25/2020 | 356,471 | ||||||
| Booz Allen Hamilton, Inc., Term Loan | ||||||||
| 248,062 | 3.750%, 7/31/2019 | 248,858 | ||||||
The accompanying Notes to Financial Statements are an integral part of this schedule.
129
Table of Contents
Diversified Income Plus Portfolio
Schedule of Investments as of June 30, 2014
(unaudited)
| Principal Amount | Bank Loans (13.2%)a | Value | ||||||
| Consumer Cyclical (2.6%) - continued | |||||||
| Burlington Coat Factory Warehouse Corporation, Term Loan | ||||||||
| $543,854 | 4.250%, 2/23/2017 | $ | 546,802 | |||||
| Caesars Entertainment Resot Properties, LLC, Term Loan | ||||||||
| 567,150 | 7.000%, 10/11/2020 | 570,224 | ||||||
| Ceridian Corporation, Term Loan | ||||||||
| 581,186 | 4.400%, 8/14/2015 | 581,820 | ||||||
| Chrysler Group, LLC, Term Loan | ||||||||
| 493,639 | 3.500%, 5/24/2017 | 495,105 | ||||||
| 274,313 | 3.250%, 12/31/2018 | 273,341 | ||||||
| Golden Nugget, Inc., Delayed Draw | ||||||||
| 67,162 | 5.500%, 11/21/2019 | 68,422 | ||||||
| Golden Nugget, Inc., Term Loan | ||||||||
| 156,712 | 5.500%, 11/21/2019 | 159,651 | ||||||
| Hilton Worldwide Finance, LLC, Term Loan | ||||||||
| 559,868 | 3.500%, 10/26/2020 | 558,704 | ||||||
| J.C. Penney Corporation, Inc., Term Loan | ||||||||
| 594,000 | 6.000%, 5/22/2018 | 600,504 | ||||||
| Las Vegas Sands, LLC, Term Loan | ||||||||
| 497,500 | 3.250%, 12/19/2020 | 497,217 | ||||||
| Marina District Finance Company, Inc., Term Loan | ||||||||
| 447,750 | 6.750%, 8/15/2018 | 452,644 | ||||||
| MGM Resorts International, Term Loan | ||||||||
| 1,222,588 | 3.500%, 12/20/2019 | 1,218,382 | ||||||
| Michaels Stores, Inc. Term Loan | ||||||||
| 690,000 | 0.000%, 1/28/2020b,c | 689,752 | ||||||
| Mohegan Tribal Gaming Authority, Term Loan | ||||||||
| 447,750 | 5.500%, 11/19/2019 | 454,654 | ||||||
| Pinnacle Entertainment, Inc., Term Loan | ||||||||
| 511,379 | 3.750%, 8/13/2020 | 512,228 | ||||||
| ROC Finance, LLC, Term Loan | ||||||||
| 595,500 | 5.000%, 6/20/2019 | 585,079 | ||||||
| Scientific Games International, Inc., Term Loan | ||||||||
| 597,000 | 4.250%, 10/18/2020 | 590,188 | ||||||
| Seminole Indian Tribe of Florida, Term Loan | ||||||||
| 547,500 | 3.000%, 4/29/2020 | 546,361 | ||||||
| Toys R Us, Inc., Term Loan | ||||||||
| 835,616 | 5.250%, 5/25/2018 | 675,453 | ||||||
|
| |||||||
| Total | 10,681,860 | |||||||
|
| |||||||
| Consumer Non-Cyclical (1.4%) | |||||||
| Albertsons, Inc., Term Loan | ||||||||
| 693,270 | 4.750%, 3/21/2019 | 696,299 | ||||||
| Biomet, Inc., Term Loan | ||||||||
| 934,668 | 3.661%, 7/25/2017 | 935,388 | ||||||
| Catalina Marketing Corporation, Term Loan | ||||||||
| 615,000 | 4.500%, 4/9/2021 | 614,742 | ||||||
| CHS/Community Health Systems, Inc., Term Loan | ||||||||
| 122,158 | 3.478%, 1/25/2017 | 122,412 | ||||||
| 449,967 | 4.250%, 1/27/2021 | 452,370 | ||||||
| Libbey Glass, Inc., Term Loan | ||||||||
| 307,500 | 3.750%, 4/9/2021 | 307,116 | ||||||
| Ortho-Clinical Diagnostics, Inc., Term Loan | ||||||||
| 620,000 | 4.750%, 6/30/2021b,c | 624,731 | ||||||
| Roundy’s Supermarkets, Inc., Term Loan | ||||||||
| 628,861 | 5.750%, 3/3/2021 | 629,760 | ||||||
| Supervalu, Inc., Term Loan | ||||||||
| 784,982 | 4.500%, 3/21/2019 | 783,906 | ||||||
| Van Wagner Communications, LLC, Term Loan | ||||||||
| 616,551 | 6.250%, 8/3/2018 | 622,975 | ||||||
|
| |||||||
| Total | 5,789,699 | |||||||
|
| |||||||
| Energy (0.6%) | |||||||
| Energy Solutions, LLC, Term Loan | ||||||||
| 700,000 | 6.750%, 5/29/2020 | 707,000 | ||||||
| Exgen Renewables I, LLC, Term Loan | ||||||||
| 436,330 | 5.250%, 2/6/2021 | 442,330 | ||||||
| McJunkin Red Man Corporation, Term Loan | ||||||||
| 446,625 | 5.000%, 11/8/2019 | 448,858 | ||||||
| Offshore Group Investment, Ltd., Term Loan | ||||||||
| 296,250 | 5.750%, 3/28/2019 | 294,274 | ||||||
| Pacific Drilling SA, Term Loan | ||||||||
| 594,000 | 4.500%, 6/3/2018 | 595,669 | ||||||
|
| |||||||
| Total | 2,488,131 | |||||||
|
| |||||||
| Financials (0.9%) | |||||||
| Delos Finance Sarl, Term Loan | ||||||||
| 630,000 | 3.500%, 3/6/2021 | 629,212 | ||||||
| DJO Finance, LLC, Term Loan | ||||||||
| 618,741 | 4.250%, 9/15/2017 | 620,677 | ||||||
| Harland Clarke Holdings Corporation, Term Loan | ||||||||
| 585,000 | 7.000%, 5/22/2018 | 594,144 | ||||||
| MoneyGram International, Inc., Term Loan | ||||||||
| 523,674 | 4.250%, 3/27/2020 | 516,149 | ||||||
| TransUnion, LLC, Term Loan | ||||||||
| 648,375 | 4.000%, 4/9/2021 | 648,142 | ||||||
| WaveDivision Holdings, LLC, Term Loan | ||||||||
| 591,000 | 4.000%, 10/12/2019 | 590,438 | ||||||
|
| |||||||
| Total | 3,598,762 | |||||||
|
| |||||||
| Technology (0.9%) | |||||||
| Avago Technologies, Ltd., Term Loan | ||||||||
| 1,000,000 | 3.750%, 5/6/2021 | 1,002,770 | ||||||
| BMC Software, Inc., Term Loan | ||||||||
| 597,000 | 5.000%, 9/10/2020 | 595,633 | ||||||
| First Data Corporation Extended, Term Loan | ||||||||
| 900,000 | 4.154%, 3/23/2018 | 901,125 | ||||||
| Freescale Semiconductor, Inc., Term Loan | ||||||||
| 592,523 | 4.250%, 2/28/2020 | 592,031 | ||||||
The accompanying Notes to Financial Statements are an integral part of this schedule.
130
Table of Contents
Diversified Income Plus Portfolio
Schedule of Investments as of June 30, 2014
(unaudited)
| Principal Amount | Bank Loans (13.2%)a | Value | ||||||
| Technology (0.9%) - continued | |||||||
| Infor US, Inc., Term Loan | ||||||||
| $ 576,814 | 3.750%, 6/3/2020 | $ | 572,609 | |||||
|
| |||||||
| Total | 3,664,168 | |||||||
|
| |||||||
| Transportation (0.4%) | |||||||
| American Airlines, Inc., Term Loan | ||||||||
| 1,064,250 | 3.750%, 6/27/2019 | 1,065,282 | ||||||
| Delta Air Lines, Inc., Term Loan | ||||||||
| 760,088 | 3.500%, 4/20/2017 | 759,549 | ||||||
|
| |||||||
| Total | 1,824,831 | |||||||
|
| |||||||
| Utilities (0.3%) | |||||||
| Calpine Corporation, Term Loan | ||||||||
| 442,005 | 4.000%, 4/1/2018 | 443,247 | ||||||
| 74,625 | 4.000%, 10/31/2020 | 74,801 | ||||||
| Intergen NV, Term Loan | ||||||||
| 594,000 | 5.500%, 6/15/2020 | 597,962 | ||||||
| NGPL PipeCo, LLC, Term Loan | ||||||||
| 401,220 | 6.750%, 9/15/2017 | 400,718 | ||||||
|
| |||||||
| Total | 1,516,728 | |||||||
|
| |||||||
| Total Bank Loans (cost $54,364,139) | 54,432,251 | |||||||
|
| |||||||
Long-Term Fixed Income (40.9%) | ||||||||
| Asset-Backed Securities (1.1%) | |||||||
| Asset Backed Securities Corporation Home Equity Loan Trust | ||||||||
| 789,599 | 0.292%, 7/25/2036d | 732,073 | ||||||
| 930,038 | 0.312%, 11/25/2036d | 793,210 | ||||||
| Countrywide Asset-Backed Certificates | ||||||||
| 576,435 | 5.530%, 4/25/2047 | 554,981 | ||||||
| GSAA Home Equity Trust | ||||||||
| 889,002 | 0.422%, 7/25/2037d | 764,991 | ||||||
| J.P. Morgan Mortgage Trust | ||||||||
| 617,513 | 2.726%, 2/25/2036 | 551,758 | ||||||
| Renaissance Home Equity Loan Trust | ||||||||
| 420,079 | 5.746%, 5/25/2036 | 314,627 | ||||||
| 632,000 | 6.011%, 5/25/2036 | 463,598 | ||||||
| 945,440 | 5.797%, 8/25/2036 | 625,460 | ||||||
|
| |||||||
| Total | 4,800,698 | |||||||
|
| |||||||
| Basic Materials (1.1%) | |||||||
| Anglo American Capital plc | ||||||||
| 92,000 | 1.176%, 4/15/2016d,e | 92,292 | ||||||
| ArcelorMittal | ||||||||
| 570,000 | 6.000%, 3/1/2021 | 617,025 | ||||||
| Dow Chemical Company | ||||||||
| 64,000 | 8.550%, 5/15/2019 | 82,257 | ||||||
| First Quantum Minerals, Ltd. | ||||||||
| 322,000 | 6.750%, 2/15/2020e | 331,660 | ||||||
| 322,000 | 7.000%, 2/15/2021e | 331,258 | ||||||
| FMG Resources Pty. Ltd. | ||||||||
| 320,000 | 6.875%, 2/1/2018e | 336,000 | ||||||
| Freeport-McMoRan Copper & Gold, Inc. | ||||||||
| 53,000 | 2.375%, 3/15/2018 | 53,790 | ||||||
| Hexion US Finance Corporation/Hexion Nova Scotia Finance ULC | ||||||||
| 670,000 | 8.875%, 2/1/2018 | 696,800 | ||||||
| INEOS Group Holdings SA | ||||||||
| 400,000 | 5.875%, 2/1/2019e | 410,000 | ||||||
| LyondellBasell Industries NV | ||||||||
| 64,000 | 5.000%, 4/15/2019 | 72,191 | ||||||
| Mosaic Company | ||||||||
| 88,000 | 3.750%, 11/15/2021 | 91,527 | ||||||
| Sappi Papier Holding GmbH | ||||||||
| 400,000 | 6.625%, 4/15/2021e | 422,000 | ||||||
| Trinseo Materials Operating SCA | ||||||||
| 570,000 | 8.750%, 2/1/2019 | 614,175 | ||||||
| Vale Overseas, Ltd. | ||||||||
| 46,000 | 6.250%, 1/23/2017 | 51,474 | ||||||
| Yamana Gold, Inc. | ||||||||
| 98,000 | 4.950%, 7/15/2024e | 98,644 | ||||||
|
| |||||||
| Total | 4,301,093 | |||||||
|
| |||||||
| Capital Goods (0.6%) | |||||||
| Cemex Finance, LLC | ||||||||
| 400,000 | 6.000%, 4/1/2024e | 416,500 | ||||||
| Crown Cork & Seal Company, Inc. | ||||||||
| 410,000 | 7.375%, 12/15/2026 | 454,588 | ||||||
| Harsco Corporation | ||||||||
| 132,000 | 2.700%, 10/15/2015 | 133,155 | ||||||
| L-3 Communications Corporation | ||||||||
| 123,000 | 1.500%, 5/28/2017 | 123,168 | ||||||
| Reynolds Group Issuer, Inc. | ||||||||
| 160,000 | 5.750%, 10/15/2020 | 168,800 | ||||||
| 410,000 | 6.875%, 2/15/2021 | 442,441 | ||||||
| RSC Equipment Rental, Inc. | ||||||||
| 160,000 | 8.250%, 2/1/2021 | 178,000 | ||||||
| Textron, Inc. | ||||||||
| 137,000 | 7.250%, 10/1/2019 | 166,106 | ||||||
| United Rentals North America, Inc. | ||||||||
| 410,000 | 7.375%, 5/15/2020 | 453,050 | ||||||
|
| |||||||
| Total | 2,535,808 | |||||||
|
| |||||||
| Collateralized Mortgage Obligations (15.2%) | |||||||
| Adjustable Rate Mortgage Trust | ||||||||
| 1,072,000 | 2.846%, 11/25/2035 | 920,987 | ||||||
| Alternative Loan Trust | ||||||||
| 1,238,638 | 6.000%, 6/25/2036 | 1,104,356 | ||||||
| American Home Mortgage Investment Trust | ||||||||
| 1,499,779 | 6.250%, 12/25/2036 | 696,032 | ||||||
| Banc of America Alternative Loan Trust | ||||||||
| 510,617 | 0.652%, 4/25/2035d | 431,091 | ||||||
| 1,394,339 | 6.000%, 11/25/2035 | 1,184,248 | ||||||
| Banc of America Funding Corporation | ||||||||
| 364,272 | 5.334%, 5/20/2036 | 316,463 | ||||||
| BCAP, LLC Trust | ||||||||
| 1,378,720 | 0.332%, 3/25/2037d | 1,124,047 | ||||||
| Bear Stearns Adjustable Rate Mortgage Trust | ||||||||
| 303,765 | 2.410%, 10/25/2035d | 301,006 | ||||||
| 337,176 | 2.587%, 2/25/2036 | 270,444 | ||||||
The accompanying Notes to Financial Statements are an integral part of this schedule.
131
Table of Contents
Diversified Income Plus Portfolio
Schedule of Investments as of June 30, 2014
(unaudited)
| Principal Amount | Long-Term Fixed Income (40.9%) | Value | ||||||
| Collateralized Mortgage Obligations (15.2%) - continued | |||||||
| Citicorp Mortgage Securities Trust | ||||||||
| $ 523,360 | 6.000%, 5/25/2037 | $ | 537,142 | |||||
| Citigroup Mortgage Loan Trust, Inc. | ||||||||
| 431,650 | 5.500%, 11/25/2035 | 394,597 | ||||||
| 934,130 | 2.749%, 3/25/2037 | 700,116 | ||||||
| CitiMortgage Alternative Loan Trust | ||||||||
| 623,468 | 5.750%, 4/25/2037 | 539,156 | ||||||
| Countrywide Alternative Loan Trust | ||||||||
| 457,045 | 0.552%, 2/25/2035d | 410,559 | ||||||
| 1,072,780 | 2.511%, 10/25/2035 | 948,631 | ||||||
| 776,490 | 5.265%, 10/25/2035 | 649,347 | ||||||
| 487,897 | 5.500%, 2/25/2036 | 448,713 | ||||||
| 265,020 | 6.000%, 4/25/2036 | 231,126 | ||||||
| 643,846 | 6.500%, 8/25/2036 | 472,258 | ||||||
| 225,282 | 6.000%, 1/25/2037 | 199,613 | ||||||
| 975,625 | 5.500%, 5/25/2037 | 820,294 | ||||||
| Countrywide Home Loan Mortgage Pass Through Trust | ||||||||
| 659,502 | 2.564%, 11/25/2035 | 555,323 | ||||||
| 624,957 | 5.049%, 2/20/2036 | 558,960 | ||||||
| Deutsche Alt-A Securities, Inc., Mortgage Loan Trust | ||||||||
| 135,081 | 5.500%, 10/25/2021 | 132,567 | ||||||
| 410,088 | 0.352%, 11/25/2035d | 261,645 | ||||||
| 895,629 | 5.500%, 11/25/2035 | 834,926 | ||||||
| 943,939 | 0.893%, 4/25/2047d | 837,440 | ||||||
| Federal Home Loan Mortgage Corporation | ||||||||
| 8,310,299 | 2.500%, 12/15/2022f | 671,480 | ||||||
| 2,503,020 | 2.500%, 5/15/2027f | 265,109 | ||||||
| 2,831,706 | 2.500%, 2/15/2028f | 331,346 | ||||||
| 8,463,219 | 2.500%, 3/15/2028f | 982,936 | ||||||
| 4,597,933 | 3.000%, 4/15/2028f | 548,874 | ||||||
| 3,613,059 | 3.000%, 2/15/2033f | 546,782 | ||||||
| Federal National Mortgage Association | ||||||||
| 3,608,140 | 2.500%, 2/25/2028f | 411,061 | ||||||
| 3,139,679 | 3.000%, 4/25/2028f | 434,339 | ||||||
| 3,546,249 | 3.500%, 1/25/2033f | 582,489 | ||||||
| First Horizon Alternative Mortgage Securities Trust | ||||||||
| 1,026,086 | 2.250%, 3/25/2035 | 922,313 | ||||||
| First Horizon Mortgage Pass-Through Trust | ||||||||
| 1,033,366 | 2.525%, 8/25/2037 | 859,142 | ||||||
| GMACM Mortgage Loan Trust | ||||||||
| 1,905,957 | 4.621%, 5/25/2035 | 1,837,083 | ||||||
| Government National Mortgage Association | ||||||||
| 4,249,810 | 4.000%, 1/16/2027f | 472,380 | ||||||
| Greenpoint Mortgage Funding Trust | ||||||||
| 744,166 | 0.352%, 10/25/2045d | 584,820 | ||||||
| GSR Mortgage Loan Trust | ||||||||
| 240,814 | 0.342%, 8/25/2046d | 235,461 | ||||||
| HomeBanc Mortgage Trust | ||||||||
| 425,808 | 2.240%, 4/25/2037 | 316,965 | ||||||
| 1,195,350 | 0.452%, 5/25/2037d | 1,085,223 | ||||||
| IndyMac IMJA Mortgage Loan Trust | ||||||||
| 962,283 | 6.250%, 11/25/2037 | 876,666 | ||||||
| IndyMac Index Mortgage Loan Trust | ||||||||
| 1,423,863 | 4.752%, 10/25/2035 | 1,232,461 | ||||||
| J.P. Morgan Alternative Loan Trust | ||||||||
| 1,307,152 | 6.500%, 3/25/2036 | 1,146,224 | ||||||
| J.P. Morgan Mortgage Trust | ||||||||
| 236,630 | 6.500%, 1/25/2035 | 233,031 | ||||||
| 1,134,012 | 2.847%, 8/25/2035 | 1,139,091 | ||||||
| 481,482 | 2.607%, 10/25/2036 | 405,855 | ||||||
| 999,277 | 0.532%, 1/25/2037d | 667,162 | ||||||
| 760,053 | 2.626%, 1/25/2037 | 679,337 | ||||||
| 517,718 | 6.250%, 8/25/2037 | 371,521 | ||||||
| Lehman Mortgage Trust | ||||||||
| 605,368 | 0.902%, 12/25/2035d | 448,482 | ||||||
| Lehman XS Trust | ||||||||
| 960,000 | 5.500%, 9/25/2035 | 843,775 | ||||||
| Master Asset Securitization Trust | ||||||||
| 662,412 | 0.652%, 6/25/2036d | 409,141 | ||||||
| MASTR Alternative Loans Trust | ||||||||
| 223,407 | 6.500%, 7/25/2034 | 229,089 | ||||||
| 552,665 | 0.602%, 12/25/2035d | 313,344 | ||||||
| Merrill Lynch Alternative Note Asset Trust | ||||||||
| 747,007 | 6.000%, 3/25/2037 | 700,857 | ||||||
| Morgan Stanley Mortgage Loan Trust | ||||||||
| 588,050 | 5.253%, 11/25/2035 | 429,207 | ||||||
| MortgageIT Trust | ||||||||
| 1,087,095 | 0.412%, 12/25/2035d | 1,017,124 | ||||||
| New Century Alternative Mortgage Loan Trust | ||||||||
| 1,256,543 | 6.167%, 7/25/2036 | 882,924 | ||||||
| RALI Trust | ||||||||
| 1,716,997 | 5.750%, 4/25/2037 | 1,354,300 | ||||||
| 1,052,129 | 6.250%, 4/25/2037 | 862,245 | ||||||
| 418,205 | 6.000%, 6/25/2037 | 339,196 | ||||||
| Residential Accredit Loans, Inc. | ||||||||
| 850,300 | 5.750%, 9/25/2035 | 770,558 | ||||||
| 970,674 | 6.000%, 1/25/2037 | 808,826 | ||||||
| Residential Asset Securitization Trust | ||||||||
| 663,628 | 5.500%, 4/25/2035 | 672,185 | ||||||
| 858,964 | 0.532%, 8/25/2037d | 354,316 | ||||||
| RFMSI Trust | ||||||||
| 1,015,040 | 5.750%, 2/25/2036 | 938,618 | ||||||
| 1,435,007 | 6.000%, 7/25/2037 | 1,314,427 | ||||||
| Sequoia Mortgage Trust | ||||||||
| 1,696,552 | 2.740%, 9/20/2046 | 1,450,138 | ||||||
| Structured Adjustable Rate Mortgage Loan Trust | ||||||||
| 313,208 | 5.500%, 12/25/2034 | 306,678 | ||||||
| 1,105,899 | 5.171%, 7/25/2035 | 971,834 | ||||||
| 430,163 | 2.672%, 9/25/2035 | 369,664 | ||||||
| 837,935 | 4.750%, 5/25/2036 | 639,142 | ||||||
| Structured Asset Mortgage Investments, Inc. | ||||||||
| 1,601,835 | 0.462%, 12/25/2035d | 1,267,260 | ||||||
| 869,622 | 0.362%, 5/25/2046d | 670,685 | ||||||
The accompanying Notes to Financial Statements are an integral part of this schedule.
132
Table of Contents
Diversified Income Plus Portfolio
Schedule of Investments as of June 30, 2014
(unaudited)
| Principal Amount | Long-Term Fixed Income (40.9%) | Value | ||||||
| Collateralized Mortgage Obligations (15.2%) - continued | |||||||
| Suntrust Alternative Loan Trust | ||||||||
| $ 1,192,713 | 5.750%, 12/25/2035 | $ | 1,070,622 | |||||
| Vericrest Opportunity Loan Transferee | ||||||||
| 950,157 | 3.625%, 3/25/2054g | 955,655 | ||||||
| 642,383 | 3.625%, 4/25/2055g | 646,034 | ||||||
| WaMu Mortgage Pass Through Certificates | ||||||||
| 911,918 | 4.434%, 8/25/2036 | 834,168 | ||||||
| 760,128 | 2.049%, 11/25/2036 | 668,040 | ||||||
| 1,131,604 | 1.850%, 1/25/2037 | 995,477 | ||||||
| 137,143 | 2.376%, 8/25/2046 | 119,822 | ||||||
| 852,823 | 1.951%, 3/25/2047d | 686,359 | ||||||
| Washington Mutual Alternative Mortgage Pass Through Certificates | ||||||||
| 753,989 | 0.752%, 6/25/2035d | 562,616 | ||||||
| 983,686 | 6.000%, 11/25/2035 | 862,627 | ||||||
| 716,890 | 0.873%, 2/25/2047d | 492,242 | ||||||
| Wells Fargo Mortgage Backed Securities Trust | ||||||||
| 1,576,869 | 2.609%, 7/25/2036 | 1,490,640 | ||||||
| 642,503 | 6.000%, 7/25/2037 | 640,406 | ||||||
| 840,771 | 6.000%, 11/25/2037 | 846,889 | ||||||
|
| |||||||
| Total | 62,955,850 | |||||||
|
| |||||||
| Commercial Mortgage-Backed Securities (0.5%) | |||||||
| Credit Suisse Mortgage Capital Certificates | ||||||||
| 1,000,000 | 5.509%, 9/15/2039 | 1,075,644 | ||||||
| Greenwich Capital Commercial Funding Corporation | ||||||||
| 650,000 | 5.867%, 12/10/2049 | 718,322 | ||||||
|
| |||||||
| Total | 1,793,966 | |||||||
|
| |||||||
| Communications Services (2.5%) | |||||||
| AMC Networks, Inc. | ||||||||
| 390,000 | 4.750%, 12/15/2022 | 390,000 | ||||||
| American Tower Corporation | ||||||||
| 165,000 | 7.000%, 10/15/2017 | 192,020 | ||||||
| CBS Corporation | ||||||||
| 96,000 | 8.875%, 5/15/2019 | 124,454 | ||||||
| CC Holdings GS V, LLC | ||||||||
| 160,000 | 2.381%, 12/15/2017 | 162,936 | ||||||
| CCO Holdings, LLC | ||||||||
| 400,000 | 6.500%, 4/30/2021 | 426,000 | ||||||
| CenturyLink, Inc. | ||||||||
| 400,000 | 6.450%, 6/15/2021 | 434,000 | ||||||
| Cequel Communications Escrow 1, LLC | ||||||||
| 410,000 | 6.375%, 9/15/2020e | 435,625 | ||||||
| Columbus International, Inc. | ||||||||
| 400,000 | 7.375%, 3/30/2021e | 431,000 | ||||||
| Digicel, Ltd. | ||||||||
| 390,000 | 6.000%, 4/15/2021e | 402,675 | ||||||
| DIRECTV Holdings, LLC | ||||||||
| 104,000 | 5.875%, 10/1/2019 | 120,963 | ||||||
| DISH DBS Corporation | ||||||||
| 90,000 | 6.750%, 6/1/2021 | 102,600 | ||||||
| 400,000 | 5.000%, 3/15/2023 | 407,500 | ||||||
| Hughes Satellite Systems Corporation | ||||||||
| 570,000 | 6.500%, 6/15/2019 | 635,550 | ||||||
| Level 3 Financing, Inc. | ||||||||
| 730,000 | 8.625%, 7/15/2020 | 817,600 | ||||||
| Nara Cable Funding, Ltd. | ||||||||
| 570,000 | 8.875%, 12/1/2018e | 608,475 | ||||||
| Numericable Group SA | ||||||||
| 400,000 | 6.000%, 5/15/2022e | 416,000 | ||||||
| SBA Tower Trust | ||||||||
| 200,000 | 3.598%, 4/16/2043e | 201,171 | ||||||
| Sprint Communications, Inc. | ||||||||
| 570,000 | 9.000%, 11/15/2018e | 691,125 | ||||||
| Telefonica Emisiones SAU | ||||||||
| 126,000 | 3.192%, 4/27/2018 | �� | 131,679 | |||||
| Time Warner Cable, Inc. | ||||||||
| 240,000 | 5.000%, 2/1/2020 | 268,946 | ||||||
| Univision Communications, Inc. | ||||||||
| 160,000 | 6.875%, 5/15/2019e | 170,800 | ||||||
| 410,000 | 7.875%, 11/1/2020e | 451,000 | ||||||
| UPCB Finance V, Ltd. | ||||||||
| 570,000 | 7.250%, 11/15/2021e | 627,000 | ||||||
| Verizon Communications, Inc. | ||||||||
| 62,000 | 3.650%, 9/14/2018 | 66,308 | ||||||
| 82,000 | 2.550%, 6/17/2019 | 83,186 | ||||||
| Wind Acquisition Finance SA | ||||||||
| 400,000 | 4.750%, 7/15/2020c,e | 403,000 | ||||||
| 390,000 | 7.375%, 4/23/2021e | 416,325 | ||||||
| Windstream Corporation | ||||||||
| 570,000 | 7.750%, 10/1/2021 | 622,725 | ||||||
|
| |||||||
| Total | 10,240,663 | |||||||
|
| |||||||
| Consumer Cyclical (1.7%) | |||||||
| AMC Entertainment, Inc. | ||||||||
| 400,000 | 5.875%, 2/15/2022 | 416,000 | ||||||
| Brookfield Residential Properties, Inc. | ||||||||
| 570,000 | 6.500%, 12/15/2020e | 602,775 | ||||||
| Chrysler Group, LLC | ||||||||
| 530,000 | 8.000%, 6/15/2019 | 575,712 | ||||||
| Delphi Corporation | ||||||||
| 132,000 | 6.125%, 5/15/2021 | 147,523 | ||||||
| Ford Motor Credit Company, LLC | ||||||||
| 93,000 | 3.000%, 6/12/2017 | 97,022 | ||||||
| 130,000 | 5.000%, 5/15/2018 | 144,619 | ||||||
| General Motors Company | ||||||||
| 98,000 | 6.250%, 10/2/2043e | 112,455 | ||||||
| General Motors Financial Company, Inc. | ||||||||
| 570,000 | 3.250%, 5/15/2018 | 578,550 | ||||||
| Hilton Worldwide Finance, LLC | ||||||||
| 570,000 | 5.625%, 10/15/2021e | 605,625 | ||||||
| Jaguar Land Rover Automotive plc | ||||||||
| 200,000 | 4.125%, 12/15/2018e | 206,000 | ||||||
| 420,000 | 5.625%, 2/1/2023e | 446,250 | ||||||
| L Brands, Inc. | ||||||||
| 570,000 | 5.625%, 2/15/2022 | 617,025 | ||||||
| Lennar Corporation | ||||||||
| 410,000 | 12.250%, 6/1/2017 | 520,700 | ||||||
| 160,000 | 4.125%, 12/1/2018 | 163,400 | ||||||
| Macy’s Retail Holdings, Inc. | ||||||||
| 176,000 | 7.450%, 7/15/2017 | 206,643 | ||||||
The accompanying Notes to Financial Statements are an integral part of this schedule.
133
Table of Contents
Diversified Income Plus Portfolio
Schedule of Investments as of June 30, 2014
(unaudited)
| Principal Amount | Long-Term Fixed Income (40.9%) | Value | ||||||
| Consumer Cyclical (1.7%) - continued | |||||||
| Toll Brothers Finance Corporation | ||||||||
| $ 124,000 | 4.000%, 12/31/2018 | $ | 127,720 | |||||
| TRW Automotive, Inc. | ||||||||
| 80,000 | 7.250%, 3/15/2017e | 91,000 | ||||||
| West Corporation | ||||||||
| 390,000 | 5.375%, 7/15/2022c,e | 386,100 | ||||||
| WMG Acquisition Corporation | ||||||||
| 400,000 | 6.750%, 4/15/2022e | 400,000 | ||||||
| Wynn Las Vegas, LLC | ||||||||
| 570,000 | 5.375%, 3/15/2022 | 593,513 | ||||||
|
| |||||||
| Total | 7,038,632 | |||||||
|
| |||||||
| Consumer Non-Cyclical (2.0%) | |||||||
| Altria Group, Inc. | ||||||||
| 114,000 | 9.700%, 11/10/2018 | 149,378 | ||||||
| Anheuser-Busch InBev Worldwide, Inc. | ||||||||
| 128,000 | 7.750%, 1/15/2019 | 158,136 | ||||||
| Aviv Healthcare Properties, LP | ||||||||
| 400,000 | 6.000%, 10/15/2021 | 424,000 | ||||||
| Boston Scientific Corporation | ||||||||
| 129,000 | 2.650%, 10/1/2018 | 131,868 | ||||||
| CareFusion Corporation | ||||||||
| 45,000 | 1.450%, 5/15/2017 | 44,966 | ||||||
| ConAgra Foods, Inc. | ||||||||
| 160,000 | 2.100%, 3/15/2018 | 160,511 | ||||||
| Cott Beverages, Inc. | ||||||||
| 415,000 | 5.375%, 7/1/2022e | 416,037 | ||||||
| CVS Caremark Corporation | ||||||||
| 64,000 | 2.250%, 12/5/2018 | 64,783 | ||||||
| DaVita HealthCare Partners, Inc. | ||||||||
| 790,000 | 5.125%, 7/15/2024 | 794,937 | ||||||
| Endo Finance LLC & Endo Finco, Inc. | ||||||||
| 160,000 | 7.000%, 7/15/2019e | 171,000 | ||||||
| 410,000 | 7.000%, 12/15/2020e | 438,700 | ||||||
| Forest Laboratories, Inc. | ||||||||
| 97,000 | 4.375%, 2/1/2019e | 104,645 | ||||||
| Hawk Acquisition Sub, Inc. | ||||||||
| 570,000 | 4.250%, 10/15/2020 | 573,562 | ||||||
| HCA, Inc. | ||||||||
| 400,000 | 3.750%, 3/15/2019 | 403,500 | ||||||
| Hospira, Inc. | ||||||||
| 560,000 | 5.200%, 8/12/2020 | 612,927 | ||||||
| IMS Health, Inc. | ||||||||
| 320,000 | 6.000%, 11/1/2020e | 336,000 | ||||||
| JBS USA, LLC | ||||||||
| 390,000 | 5.875%, 7/15/2024e | 389,025 | ||||||
| Lorillard Tobacco Company | ||||||||
| 129,000 | 8.125%, 6/23/2019 | 160,831 | ||||||
| Medco Health Solutions, Inc. | ||||||||
| 100,000 | 7.125%, 3/15/2018 | 118,122 | ||||||
| Mondelez International, Inc. | ||||||||
| 86,000 | 2.250%, 2/1/2019 | 86,589 | ||||||
| Ortho-Clinical Diagnostics, Inc. | ||||||||
| 400,000 | 6.625%, 5/15/2022e | 397,000 | ||||||
| Pernod Ricard SA | ||||||||
| 64,000 | 5.750%, 4/7/2021e | 73,571 | ||||||
| Perrigo Company, Ltd. | ||||||||
| 62,000 | 2.300%, 11/8/2018e | 61,975 | ||||||
| SABMiller plc | ||||||||
| 48,000 | 6.500%, 7/15/2018e | 56,173 | ||||||
| Safeway, Inc. | ||||||||
| 185,000 | 3.400%, 12/1/2016 | 194,679 | ||||||
| Spectrum Brands Escrow Corporation | ||||||||
| 570,000 | 6.375%, 11/15/2020 | 612,750 | ||||||
| Tenet Healthcare Corporation | ||||||||
| 400,000 | 8.125%, 4/1/2022 | 463,000 | ||||||
| Thermo Fisher Scientific, Inc. | ||||||||
| 128,000 | 2.400%, 2/1/2019 | 129,303 | ||||||
| Valeant Pharmaceuticals International | ||||||||
| 160,000 | 6.875%, 12/1/2014e | 167,400 | ||||||
| VPII Escrow Corporation | ||||||||
| 410,000 | 7.500%, 7/15/2021e | 454,075 | ||||||
|
| |||||||
| Total | 8,349,443 | |||||||
|
| |||||||
| Energy (1.9%) | |||||||
| Buckeye Partners, LP | ||||||||
| 124,000 | 2.650%, 11/15/2018 | 126,068 | ||||||
| Calumet Specialty Products Partners, LP | ||||||||
| 400,000 | 6.500%, 4/15/2021e | 408,000 | ||||||
| Chaparral Energy, Inc. | ||||||||
| 400,000 | 7.625%, 11/15/2022 | 432,000 | ||||||
| CNPC General Capital, Ltd. | ||||||||
| 123,000 | 2.750%, 4/19/2017e | 126,193 | ||||||
| Concho Resources, Inc. | ||||||||
| 570,000 | 5.500%, 10/1/2022 | 613,463 | ||||||
| Enbridge Energy Partners, LP | ||||||||
| 810,000 | 8.050%, 10/1/2037 | 916,312 | ||||||
| Energy Transfer Partners, LP | ||||||||
| 62,000 | 6.700%, 7/1/2018 | 72,595 | ||||||
| Energy XXI Gulf Coast, Inc. | ||||||||
| 400,000 | 7.500%, 12/15/2021 | 428,000 | ||||||
| EQT Corporation | ||||||||
| 60,000 | 5.150%, 3/1/2018 | 65,466 | ||||||
| 62,000 | 8.125%, 6/1/2019 | 77,575 | ||||||
| Hess Corporation | ||||||||
| 95,000 | 8.125%, 2/15/2019 | 119,507 | ||||||
| Linn Energy, LLC | ||||||||
| 570,000 | 6.250%, 11/1/2019e | 597,075 | ||||||
| Lukoil International Finance BV | ||||||||
| 64,000 | 3.416%, 4/24/2018e | 63,520 | ||||||
| MEG Energy Corporation | ||||||||
| 160,000 | 6.500%, 3/15/2021e | 169,600 | ||||||
| 410,000 | 6.375%, 1/30/2023e | 435,625 | ||||||
| Oasis Petroleum, Inc. | ||||||||
| 570,000 | 6.875%, 1/15/2023 | 621,300 | ||||||
| Offshore Group Investment, Ltd. | ||||||||
| 570,000 | 7.500%, 11/1/2019 | 602,775 | ||||||
| Petrobras Global Finance BV | ||||||||
| 145,000 | 2.000%, 5/20/2016 | 145,209 | ||||||
| Range Resources Corporation | ||||||||
| 570,000 | 5.000%, 8/15/2022 | 604,200 | ||||||
| Rosetta Resources, Inc. | ||||||||
| 400,000 | 5.875%, 6/1/2022 | 418,000 | ||||||
| Sabine Pass Liquefaction, LLC | ||||||||
| 400,000 | 5.750%, 5/15/2024e | 417,000 | ||||||
| Suncor Energy, Inc. | ||||||||
| 86,000 | 6.100%, 6/1/2018 | 99,809 | ||||||
| Transocean, Inc. | ||||||||
| 120,000 | 6.000%, 3/15/2018 | 135,543 | ||||||
The accompanying Notes to Financial Statements are an integral part of this schedule.
134
Table of Contents
Diversified Income Plus Portfolio
Schedule of Investments as of June 30, 2014
(unaudited)
| Principal Amount | Long-Term Fixed Income (40.9%) | Value | ||||||
| Energy (1.9%) - continued | |||||||
| Weatherford International, Ltd. | ||||||||
| $ 80,000 | 6.000%, 3/15/2018 | $ | 91,027 | |||||
| 62,000 | 9.625%, 3/1/2019 | 81,362 | ||||||
| Williams Companies, Inc. | ||||||||
| 98,000 | 3.700%, 1/15/2023 | 94,270 | ||||||
|
| |||||||
| Total | 7,961,494 | |||||||
|
| |||||||
| Financials (7.6%) | |||||||
| Abbey National Treasury Services plc | ||||||||
| 64,000 | 3.050%, 8/23/2018 | 67,022 | ||||||
| ABN AMRO Bank NV | ||||||||
| 132,000 | 2.500%, 10/30/2018e | 133,936 | ||||||
| Aegon NV | ||||||||
| 720,000 | 2.847%, 7/29/2049d,h | 663,840 | ||||||
| AGI Life Holdings, Inc. | ||||||||
| 800,000 | 7.570%, 12/1/2045e | 1,056,000 | ||||||
| Ally Financial, Inc. | ||||||||
| 100,000 | 5.500%, 2/15/2017 | 108,375 | ||||||
| American Express Company | ||||||||
| 750,000 | 6.800%, 9/1/2066 | 825,000 | ||||||
| American International Group, Inc. | ||||||||
| 50,000 | 8.250%, 8/15/2018 | 62,120 | ||||||
| Aviation Capital Group Corporation | ||||||||
| 96,000 | 3.875%, 9/27/2016e | 99,360 | ||||||
| Banco do Brasil SA | ||||||||
| 1,140,000 | 9.000%, 12/31/2049e,h | 1,124,325 | ||||||
| Bank of America Corporation | ||||||||
| 164,000 | 5.700%, 5/2/2017 | 181,994 | ||||||
| 148,000 | 5.650%, 5/1/2018 | 167,763 | ||||||
| Bank of New York Mellon Corporation | ||||||||
| 480,000 | 4.500%, 12/31/2049h | 446,400 | ||||||
| Barclays Bank plc | ||||||||
| 100,000 | 5.140%, 10/14/2020 | 109,530 | ||||||
| BBVA Banco Continental SA | ||||||||
| 117,000 | 2.250%, 7/29/2016e | 117,878 | ||||||
| BBVA International Preferred SA Unipersonal | ||||||||
| 1,030,000 | 5.919%, 12/29/2049h | 1,073,775 | ||||||
| BNP Paribas SA | ||||||||
| 775,000 | 5.186%, 6/29/2049e,h | 789,531 | ||||||
| BPCE SA | ||||||||
| 375,000 | 5.150%, 7/21/2024e | 395,889 | ||||||
| Citigroup, Inc. | ||||||||
| 157,000 | 5.500%, 2/15/2017 | 172,663 | ||||||
| 128,000 | 8.500%, 5/22/2019 | 163,608 | ||||||
| Cooperatieve Centrale Raiffeisen- Boerenleenbank BA | ||||||||
| 525,000 | 11.000%, 12/29/2049e,h | 704,912 | ||||||
| Credit Suisse Group AG | ||||||||
| 400,000 | 7.500%, 12/11/2049e,h | 442,760 | ||||||
| 760,000 | 6.250%, 12/29/2049e,h | 764,750 | ||||||
| CyrusOne, LP | ||||||||
| 570,000 | 6.375%, 11/15/2022 | 614,175 | ||||||
| DDR Corporation | ||||||||
| 86,000 | 9.625%, 3/15/2016 | 98,403 | ||||||
| Denali Borrower, LLC | ||||||||
| 570,000 | 5.625%, 10/15/2020e | 604,200 | ||||||
| Discover Bank | ||||||||
| 43,000 | 8.700%, 11/18/2019 | 54,651 | ||||||
| Discover Financial Services | ||||||||
| 90,000 | 6.450%, 6/12/2017 | 102,377 | ||||||
| Fifth Third Bancorp | ||||||||
| 575,000 | 4.900%, 12/29/2049h | 571,866 | ||||||
| 600,000 | 5.100%, 12/31/2049h | 576,450 | ||||||
| GE Capital Trust I | ||||||||
| 380,000 | 6.375%, 11/15/2067 | 422,750 | ||||||
| General Electric Capital Corporation | ||||||||
| 800,000 | 6.250%, 12/15/2049h | 890,000 | ||||||
| Genworth Financial, Inc. | ||||||||
| 121,000 | 7.700%, 6/15/2020 | 149,119 | ||||||
| Goldman Sachs Group, Inc. | ||||||||
| 45,000 | 6.250%, 9/1/2017 | 51,231 | ||||||
| 43,000 | 2.375%, 1/22/2018 | 43,668 | ||||||
| 88,000 | 2.625%, 1/31/2019 | 89,196 | ||||||
| 122,000 | 7.500%, 2/15/2019 | 148,883 | ||||||
| 800,000 | 5.700%, 12/29/2049h | 826,500 | ||||||
| Hartford Financial Services Group, Inc. | ||||||||
| 106,000 | 6.000%, 1/15/2019 | 123,001 | ||||||
| HBOS plc | ||||||||
| 116,000 | 6.750%, 5/21/2018e | 133,635 | ||||||
| HCP, Inc. | ||||||||
| 64,000 | 3.750%, 2/1/2019 | 68,197 | ||||||
| Health Care REIT, Inc. | ||||||||
| 110,000 | 4.700%, 9/15/2017 | 120,332 | ||||||
| HSBC Finance Corporation | ||||||||
| 155,000 | 6.676%, 1/15/2021 | 185,365 | ||||||
| Icahn Enterprises, LP | ||||||||
| 400,000 | 6.000%, 8/1/2020 | 428,500 | ||||||
| ILFC E-Capital Trust II | ||||||||
| 1,200,000 | 6.250%, 12/21/2065d,e | 1,200,000 | ||||||
| ING Capital Funding Trust III | ||||||||
| 819,000 | 3.834%, 12/29/2049d,h | 819,000 | ||||||
| International Lease Finance Corporation | ||||||||
| 64,000 | 2.181%, 6/15/2016d | 64,400 | ||||||
| 320,000 | 5.875%, 8/15/2022 | 349,600 | ||||||
| Intesa Sanpaolo SPA | ||||||||
| 41,000 | 3.875%, 1/16/2018 | 43,211 | ||||||
| 100,000 | 3.875%, 1/15/2019 | 104,872 | ||||||
| J.P. Morgan Chase & Company | ||||||||
| 88,000 | 6.300%, 4/23/2019 | 104,044 | ||||||
| 77,000 | 7.900%, 4/29/2049h | 86,048 | ||||||
| 750,000 | 6.750%, 8/29/2049h | 807,188 | ||||||
| 190,000 | 5.000%, 12/29/2049h | 189,296 | ||||||
| 200,000 | 6.000%, 12/29/2049h | 204,000 | ||||||
| Liberty Mutual Group, Inc. | ||||||||
| 525,000 | 10.750%, 6/15/2058e | 801,938 | ||||||
| 25,000 | 5.000%, 6/1/2021e | 27,499 | ||||||
| Lincoln National Corporation | ||||||||
| 770,000 | 6.050%, 4/20/2067 | 778,663 | ||||||
| Lloyds Banking Group plc | ||||||||
| 865,000 | 5.920%, 9/29/2049e,h | 873,650 | ||||||
| MetLife Capital Trust IV | ||||||||
| 823,000 | 7.875%, 12/15/2037e | 1,022,578 | ||||||
| MetLife, Inc. | ||||||||
| 400,000 | 6.400%, 12/15/2036 | 447,000 | ||||||
| Morgan Stanley | ||||||||
| 87,000 | 6.250%, 8/28/2017 | 99,152 | ||||||
| 64,000 | 4.875%, 11/1/2022 | 68,699 | ||||||
| 300,000 | 5.450%, 12/29/2049h | 305,472 | ||||||
The accompanying Notes to Financial Statements are an integral part of this schedule.
135
Table of Contents
Diversified Income Plus Portfolio
Schedule of Investments as of June 30, 2014
(unaudited)
| Principal Amount | Long-Term Fixed Income (40.9%) | Value | ||||||
| Financials (7.6%) - continued | |||||||
| Murray Street Investment Trust I | ||||||||
| $ 88,000 | 4.647%, 3/9/2017 | $ | 95,109 | |||||
| National City Corporation | ||||||||
| 86,000 | 6.875%, 5/15/2019 | 102,712 | ||||||
| Nomura Holdings, Inc. | ||||||||
| 85,000 | 2.750%, 3/19/2019 | 86,470 | ||||||
| Prologis, LP | ||||||||
| 106,000 | 6.625%, 5/15/2018 | 123,713 | ||||||
| Prudential Financial, Inc. | ||||||||
| 380,000 | 5.875%, 9/15/2042 | 412,775 | ||||||
| 775,000 | 5.625%, 6/15/2043 | 829,002 | ||||||
| QBE Capital Funding III, Ltd. | ||||||||
| 400,000 | 7.250%, 5/24/2041e | 431,000 | ||||||
| RBS Capital Trust III | ||||||||
| 600,000 | 5.512%, 9/29/2049h | 594,000 | ||||||
| Realty Income Corporation | ||||||||
| 78,000 | 2.000%, 1/31/2018 | 78,369 | ||||||
| Regions Bank | ||||||||
| 67,000 | 7.500%, 5/15/2018 | 79,744 | ||||||
| Reinsurance Group of America, Inc. | ||||||||
| 160,000 | 5.625%, 3/15/2017 | 174,716 | ||||||
| Royal Bank of Scotland Group plc | ||||||||
| 82,000 | 1.174%, 3/31/2017d | 82,399 | ||||||
| 375,000 | 7.648%, 8/29/2049h | 453,750 | ||||||
| SLM Corporation | ||||||||
| 100,000 | 6.250%, 1/25/2016 | 106,250 | ||||||
| Societe Generale SA | ||||||||
| 124,000 | 5.750%, 4/20/2016e | 133,045 | ||||||
| 760,000 | 6.000%, 12/31/2049e,h | 748,600 | ||||||
| Swiss RE Capital I, LP | ||||||||
| 823,000 | 6.854%, 5/29/2049e,h | 880,610 | ||||||
| Voya Financial, Inc. | ||||||||
| 200,000 | 5.650%, 5/15/2053 | 203,500 | ||||||
| 129,000 | 2.900%, 2/15/2018 | 133,675 | ||||||
| Wells Fargo & Company | ||||||||
| 400,000 | 5.900%, 12/29/2049h | 424,300 | ||||||
| ZFS Finance USA Trust II | ||||||||
| 977,000 | 6.450%, 12/15/2065e | 1,052,718 | ||||||
|
| |||||||
| Total | 31,596,697 | |||||||
|
| |||||||
| Foreign Government (0.2%) | |||||||
| Mexico Government International Bond | ||||||||
| 930,000 | 4.000%, 10/2/2023 | 977,430 | ||||||
|
| |||||||
| Total | 977,430 | |||||||
|
| |||||||
| Mortgage-Backed Securities (4.0%) | |||||||
| Federal National Mortgage Association Conventional 15-Yr. Pass Through | ||||||||
| 2,800,000 | 3.500%, 8/1/2029c | 2,960,125 | ||||||
| Federal National Mortgage Association Conventional 30-Yr. Pass Through | ||||||||
| 1,500,000 | 3.500%, 7/1/2044c | 1,544,063 | ||||||
| 6,650,000 | 4.000%, 7/1/2044c | 7,057,312 | ||||||
| 4,400,000 | 4.500%, 8/1/2044c | 4,754,235 | ||||||
|
| |||||||
| Total | 16,315,735 | |||||||
|
| |||||||
| Technology (0.5%) | |||||||
| Amkor Technology, Inc. | ||||||||
| 670,000 | 6.625%, 6/1/2021 | 713,550 | ||||||
| First Data Corporation | ||||||||
| 570,000 | 7.375%, 6/15/2019e | 612,037 | ||||||
| Freescale Semiconductor, Inc. | ||||||||
| 570,000 | 6.000%, 1/15/2022e | 607,050 | ||||||
|
| |||||||
| Total | 1,932,637 | |||||||
|
| |||||||
| Transportation (0.2%) | |||||||
| American Airlines Pass Through Trust | ||||||||
| 83,455 | 4.950%, 1/15/2023e | 90,339 | ||||||
| Avis Budget Car Rental, LLC | ||||||||
| 150,000 | 5.125%, 6/1/2022e | 150,188 | ||||||
| Delta Air Lines, Inc. | ||||||||
| 67,434 | 4.950%, 5/23/2019 | 72,829 | ||||||
| 55,601 | 4.750%, 5/7/2020 | 60,327 | ||||||
| Korea Expressway Corporation | ||||||||
| 123,000 | 1.625%, 4/28/2017e | 122,872 | ||||||
| United Air Lines, Inc. | ||||||||
| 78,702 | 10.400%, 11/1/2016 | 89,524 | ||||||
|
| |||||||
| Total | 586,079 | |||||||
|
| |||||||
| Utilities (1.8%) | |||||||
| Access Midstream Partners, LP | ||||||||
| 390,000 | 4.875%, 5/15/2023 | 410,962 | ||||||
| AES Corporation | ||||||||
| 390,000 | 7.375%, 7/1/2021 | 456,300 | ||||||
| Atlas Pipeline Partners, LP | ||||||||
| 570,000 | 4.750%, 11/15/2021 | 558,600 | ||||||
| Calpine Corporation | ||||||||
| 560,000 | 6.000%, 1/15/2022e | 603,400 | ||||||
| Commonwealth Edison Company | ||||||||
| 82,000 | 6.950%, 7/15/2018 | 96,965 | ||||||
| DCP Midstream Operating, LP | ||||||||
| 129,000 | 2.500%, 12/1/2017 | 132,701 | ||||||
| DCP Midstream, LLC | ||||||||
| 300,000 | 5.850%, 5/21/2043e | 285,000 | ||||||
| Electricite de France SA | ||||||||
| 1,240,000 | 5.250%, 12/29/2049e,h | 1,264,961 | ||||||
| Enel Finance International NV | ||||||||
| 64,000 | 5.125%, 10/7/2019e | 72,056 | ||||||
| Enterprise Products Operating, LLC | ||||||||
| 960,000 | 7.034%, 1/15/2068 | 1,095,744 | ||||||
| 170,000 | 7.000%, 6/1/2067 | 180,200 | ||||||
| Exelon Generation Company, LLC | ||||||||
| 88,000 | 5.200%, 10/1/2019 | 98,969 | ||||||
| MidAmerican Energy Holdings Company | ||||||||
| 88,000 | 5.750%, 4/1/2018 | 100,712 | ||||||
| NRG Energy, Inc. | ||||||||
| 390,000 | 6.625%, 3/15/2023 | 422,175 | ||||||
| ONEOK Partners, LP | ||||||||
| 62,000 | 2.000%, 10/1/2017 | 62,846 | ||||||
| 64,000 | 3.200%, 9/15/2018 | 66,778 | ||||||
| PPL Capital Funding, Inc. | ||||||||
| 159,000 | 1.900%, 6/1/2018 | 158,882 | ||||||
| Southern California Edison Company | ||||||||
| 900,000 | 6.250%, 8/1/2049h | 976,500 | ||||||
The accompanying Notes to Financial Statements are an integral part of this schedule.
136
Table of Contents
Diversified Income Plus Portfolio
Schedule of Investments as of June 30, 2014
(unaudited)
| Principal Amount | Long-Term Fixed Income (40.9%) | Value | ||||||
| Utilities (1.8%) - continued | ||||||||
TransCanada PipeLines, Ltd. | ||||||||
| $ 400,000 | 6.350%, 5/15/2067 | $ | 416,500 | |||||
|
| |||||||
| Total | 7,460,251 | |||||||
|
| |||||||
Total Long-Term Fixed Income (cost $159,634,243) | 168,846,476 | |||||||
|
| |||||||
| Shares | Common Stock (34.8%) | |||||||
| Consumer Discretionary (3.9%) | ||||||||
| 7,700 | Abercrombie & Fitch Company | 333,025 | ||||||
| 4,500 | Bayerische Motoren Werke AG | 569,834 | ||||||
| 13,450 | Best Buy Company, Inc. | 417,085 | ||||||
| 50,800 | Carphone Warehouse Group plc | 280,337 | ||||||
| 3,750 | Coinstar, Inc.i | 222,563 | ||||||
| 21,050 | Comcast Corporation | 1,129,964 | ||||||
| 3,900 | Deckers Outdoor Corporationi | 336,687 | ||||||
| 12,550 | E.W. Scripps Companyi | 265,558 | ||||||
| 40,800 | EDION Corporation | 283,233 | ||||||
| 50,650 | Ford Motor Company | 873,206 | ||||||
| 3,750 | G-III Apparel Group, Ltd.i | 306,225 | ||||||
| 7,100 | Hennes & Mauritz AB | 309,985 | ||||||
| 77,100 | Home Retail Group plc | 232,962 | ||||||
| 24,000 | Honda Motor Company, Ltd.j | 837,474 | ||||||
| 6,950 | Iconix Brand Group, Inc.i | 298,433 | ||||||
| 136,000 | ITV plc | 414,451 | ||||||
| 16,100 | JB Hi-Fi, Ltd. | 278,381 | ||||||
| 7,600 | Kohl’s Corporation | 400,368 | ||||||
| 11 | Lear Corporation, Warrants, $0.01, expires 11/9/2014i | 1,910 | ||||||
| 258,000 | Li & Fung, Ltd. | 382,150 | ||||||
| 13,050 | Live Nation Entertainment, Inc.i | 322,205 | ||||||
| 17,550 | Lowe’s Companies, Inc. | 842,225 | ||||||
| 107,000 | Luk Fook Holdings International, Ltd. | 313,769 | ||||||
| 5,650 | Madison Square Garden Companyi | 352,843 | ||||||
| 24,150 | Nautilus, Inc.i | 267,824 | ||||||
| 30,400 | Panasonic Corporation | 368,510 | ||||||
| 4,500 | Pandora AS | 345,347 | ||||||
| 5,500 | Renault SA | 497,171 | ||||||
| 2,500 | RTL Group SA | 277,489 | ||||||
| 27,500 | Sekisui House, Ltd. | 377,368 | ||||||
| 153,800 | Seven West Media, Ltd. | 272,371 | ||||||
| 23,600 | SHOWA Corporation | 287,520 | ||||||
| 88,000 | SJM Holdings, Ltd. | 220,453 | ||||||
| 49,800 | Sky Network Television, Ltd. | 299,499 | ||||||
| 12,900 | Societe Television Francaise 1 | 211,236 | ||||||
| 25,800 | Sumitomo Forestry Company, Ltd. | 315,009 | ||||||
| 13,500 | Suzuki Motor Corporation | 423,516 | ||||||
| 4,050 | Tempur-Pedic International, Inc.i | 241,785 | ||||||
| 11,550 | Thomson Reuters Corporation | 419,958 | ||||||
| 90,998 | Trinity Mirror plci | 236,714 | ||||||
| 3,950 | Viacom, Inc. | 342,584 | ||||||
| 2,900 | Volkswagen AG | 759,558 | ||||||
|
| |||||||
| Total | 16,168,785 | |||||||
|
| |||||||
| Consumer Staples (2.0%) | ||||||||
| 22,600 | Altria Group, Inc. | 947,844 | ||||||
| 14,500 | Asahi Group Holdings, Ltd. | 455,342 | ||||||
| 21,100 | Coca-Cola Company | 893,796 | ||||||
| 9,500 | Coca-Cola Enterprises, Inc. | 453,910 | ||||||
| 12,450 | CVS Caremark Corporation | 938,356 | ||||||
| 8,800 | ICA Gruppen AB | 299,830 | ||||||
| 18,300 | Imperial Tobacco Group plc | 823,277 | ||||||
| 5,500 | Interparfums SA | 202,136 | ||||||
| 5,500 | Interparfums SA Rightsd,i,k | 40,427 | ||||||
| 4,200 | Kerry Group plc | 313,835 | ||||||
| 4,000 | Nestle SA | 309,948 | ||||||
| 11,250 | Pilgrim’s Pride Corporationi | 307,800 | ||||||
| 16,450 | Procter & Gamble Company | 1,292,806 | ||||||
| 2,800 | Wal-Mart Stores, Inc. | 210,196 | ||||||
| 6,826 | Wesfarmers, Ltd. | 269,364 | ||||||
| 10,450 | WhiteWave Foods Companyi | 338,267 | ||||||
| 107,000 | Wilmar International, Ltd. | 273,905 | ||||||
|
| |||||||
| Total | 8,371,039 | |||||||
|
| |||||||
| Energy (2.7%) | ||||||||
| 8,600 | Apache Corporation | 865,332 | ||||||
| 46,935 | Bankers Petroleum, Ltd.i | 299,983 | ||||||
| 137,916 | BP plc | 1,214,472 | ||||||
| 10,400 | CAT Oil AG | 266,560 | ||||||
| 33,200 | Eni SPA | 908,009 | ||||||
| 8,400 | Ensco plc | 466,788 | ||||||
| 17,900 | ERG SPA | 276,233 | ||||||
| 7,150 | Exterran Holdings, Inc. | 321,679 | ||||||
| 20,100 | Exxon Mobil Corporation | 2,023,668 | ||||||
| 17,450 | Marathon Oil Corporation | 696,604 | ||||||
| 17,200 | Pioneer Energy Services Corporationi | 301,688 | ||||||
| 240 | Royal Dutch Shell plc, Class A | 9,917 | ||||||
| 22,000 | Royal Dutch Shell plc, Class B | 956,117 | ||||||
| 12,650 | RPC, Inc. | 297,148 | ||||||
| 26,700 | Showa Shell Sekiyu KK | 303,499 | ||||||
| 4,400 | SM Energy Company | 370,040 | ||||||
| 10,900 | Southwestern Energy Companyi | 495,841 | ||||||
| 11,300 | Total SA | 817,552 | ||||||
| 5,300 | Whiting Petroleum Corporationi | 425,325 | ||||||
|
| |||||||
| Total | 11,316,455 | |||||||
|
| |||||||
| Financials (10.9%) | ||||||||
| 6,950 | Aflac, Inc. | 432,637 | ||||||
| 62,400 | American Capital Agency Corporation | 1,460,784 | ||||||
| 200,000 | Apollo Investment Corporation | 1,722,000 | ||||||
| 115,400 | Ares Capital Corporation | 2,061,044 | ||||||
| 7,700 | Australia & New Zealand Banking Group, Ltd. | 242,123 | ||||||
| 86,000 | Bank Leumi Le-Israel BMi | 335,190 | ||||||
| 4,389 | Bank of Nova Scotia | 292,614 | ||||||
| 422,520 | BlackRock Enhanced Equity Dividend Trust | 3,544,943 | ||||||
| 23,000 | Citigroup, Inc. | 1,083,300 | ||||||
| 8,478 | Coresite Realty Corporation | 280,367 | ||||||
| 3,500 | Daito Trust Construction Company, Ltd. | 411,562 | ||||||
| 56,000 | Daiwa Securities Group, Inc. | 485,200 | ||||||
| 11,700 | Discover Financial Services | 725,166 | ||||||
| 3,300 | Erie Indemnity Company | 248,358 | ||||||
| 23,450 | F.N.B. Corporation | 300,629 | ||||||
| 25,000 | Fifth Third Bancorp | 533,750 | ||||||
| 16,750 | First Financial Bancorp | 288,268 | ||||||
| 35,100 | First Niagara Financial Group, Inc. | 306,774 | ||||||
| 120,000 | Golub Capital BDC, Inc. | 2,124,000 | ||||||
| 7,250 | Hancock Holding Company | 256,070 | ||||||
| 26,500 | Hang Seng Bank, Ltd. | 432,731 | ||||||
The accompanying Notes to Financial Statements are an integral part of this schedule.
137
Table of Contents
Diversified Income Plus Portfolio
Schedule of Investments as of June 30, 2014
(unaudited)
| Shares | Common Stock (34.8%) | Value | ||||||
| Financials (10.9%) - continued | ||||||||
| 7,950 | Horace Mann Educators Corporation | $ | 248,596 | |||||
| 96,144 | HSBC Holdings plc | 975,383 | ||||||
| 37,850 | Huntington Bancshares, Inc. | 361,089 | ||||||
| 240,000 | iShares FTSE NAREIT Mortgage Plus Capped Index Fund | 3,033,600 | ||||||
| 14,400 | iShares J.P. Morgan USD Emerging Markets Bond ETF | 1,659,888 | ||||||
| 14,400 | iShares MSCI Emerging Markets Minimum Volatility ETF | 865,584 | ||||||
| 27,000 | iShares S&P U.S. Preferred Stock Index Fund | 1,077,570 | ||||||
| 159,000 | Israel Discount Bank, Ltd.i | 269,179 | ||||||
| 32,300 | KeyCorp | 462,859 | ||||||
| 7,000 | Lazard, Ltd. | 360,920 | ||||||
| 21,850 | Maiden Holdings, Ltd. | 264,167 | ||||||
| 21,800 | Mediolanum SPA | 167,880 | ||||||
| 25,500 | National Australia Bank, Ltd. | 788,175 | ||||||
| 9,700 | Prudential Financial, Inc. | 861,069 | ||||||
| 20,350 | Radian Group, Inc. | 301,383 | ||||||
| 22,300 | Regions Financial Corporation | 236,826 | ||||||
| 14,338 | Royal Bank of Canada | 1,024,978 | ||||||
| 93,000 | Solar Capital, Ltd. | 1,979,040 | ||||||
| 20,000 | Sumitomo Mitsui Financial Group, Inc. | 839,138 | ||||||
| 3,000 | Swiss Re AG | 266,752 | ||||||
| 19,428 | Toronto-Dominion Bankj | 1,000,122 | ||||||
| 232,750 | Two Harbors Investment Corporation | 2,439,220 | ||||||
| 19,700 | U.S. Bancorp | 853,404 | ||||||
| 25,000 | Vanguard High Dividend Yield ETF | 1,658,000 | ||||||
| 36,000 | Vanguard REIT ETF | 2,694,240 | ||||||
| 7,300 | W.R. Berkley Corporation | 338,063 | ||||||
| 27,950 | Wells Fargo & Company | 1,469,052 | ||||||
| 2,700 | Zurich Insurance Group AGi | 813,203 | ||||||
|
| |||||||
| Total | 44,876,890 | |||||||
|
| |||||||
| Health Care (3.7%) | ||||||||
| 15,850 | AbbVie, Inc. | 894,574 | ||||||
| 4,200 | Actelion, Ltd. | 531,593 | ||||||
| 32,400 | Affymetrix, Inc.i | 288,684 | ||||||
| 4,153 | Albany Molecular Research, Inc.i | 83,558 | ||||||
| 5,650 | AmerisourceBergen Corporation | 410,529 | ||||||
| 3,100 | Bayer AG | 437,327 | ||||||
| 2,400 | Biogen Idec, Inc.i | 756,744 | ||||||
| 2,929 | Boiron SA | 254,718 | ||||||
| 40,250 | Boston Scientific Corporationi | 513,992 | ||||||
| 14,000 | Bruker Corporationi | 339,780 | ||||||
| 10,700 | Capital Senior Living Corporationi | 255,088 | ||||||
| 11,300 | CSL, Ltd. | 709,336 | ||||||
| 6,100 | Eli Lilly and Company | 379,237 | ||||||
| 53,600 | Fisher & Paykel Healthcare Corporation, Ltd. | 222,915 | ||||||
| 40,273 | GlaxoSmithKline plc | 1,072,271 | ||||||
| 11,350 | Globus Medical, Inc.i | 271,492 | ||||||
| 8,800 | HCA Holdings, Inc.i | 496,144 | ||||||
| 13,750 | Healthways, Inc.i | 241,175 | ||||||
| 7,050 | ICON plci | 332,126 | ||||||
| 10,350 | Johnson & Johnson | 1,082,817 | ||||||
| 3,200 | Lonza Group AG | 347,995 | ||||||
| 2,050 | McKesson Corporation | 381,731 | ||||||
| 10,250 | Medicines Companyi | 297,865 | ||||||
| 15,300 | Merck & Company, Inc. | 885,105 | ||||||
| 42,003 | Pfizer, Inc. | 1,246,649 | ||||||
| 9,950 | PharMerica Corporationi | 284,471 | ||||||
| 5,550 | Quintiles Transnational Holdings, Inc.i | 295,760 | ||||||
| 13,800 | Recordati SPA | 231,920 | ||||||
| 1,300 | Roche Holding AG | 379,754 | ||||||
| 1,800 | Roche Holding AG | 536,322 | ||||||
| 6,650 | WellPoint, Inc. | 715,607 | ||||||
|
| |||||||
| Total | 15,177,279 | |||||||
|
| |||||||
| Industrials (3.7%) | ||||||||
| 6,950 | 3M Company | 995,518 | ||||||
| 10,600 | AAR Corporation | 292,136 | ||||||
| 11,300 | Abertis Infraestructuras SA | 259,971 | ||||||
| 7,000 | Altra Industrial Motion Corporation | 254,730 | ||||||
| 8,650 | Caterpillar, Inc. | 939,995 | ||||||
| 9,600 | easyJet plc | 224,185 | ||||||
| 16,900 | Exelis, Inc. | 286,962 | ||||||
| 56,150 | General Electric Company | 1,475,622 | ||||||
| 400 | Georg Fischer AGi | 286,295 | ||||||
| 67,000 | Hanwa Company, Ltd. | 290,202 | ||||||
| 45,000 | Hutchison Whampoa, Ltd. | 615,445 | ||||||
| 41,600 | ITOCHU Corporation | 534,052 | ||||||
| 9,650 | KAR Auction Services, Inc. | 307,546 | ||||||
| 31,000 | Kinden Corporation | 301,656 | ||||||
| 11,100 | KONE Oyj | 462,826 | ||||||
| 4,950 | Lockheed Martin Corporation | 795,613 | ||||||
| 20,150 | Meritor, Inc.i | 262,756 | ||||||
| 12,600 | Nordex SEi | 279,084 | ||||||
| 2,400 | Northrop Grumman Corporation | 287,112 | ||||||
| 6,050 | Oshkosh Corporation | 335,956 | ||||||
| 4,716 | Osterreichische Post AG | 234,250 | ||||||
| 6,900 | Patrick Industries, Inc.i | 321,471 | ||||||
| 12,650 | Quad/Graphics, Inc. | 282,981 | ||||||
| 6,246 | Randstad Holding NV | 338,591 | ||||||
| 6,850 | Raytheon Company | 631,913 | ||||||
| 24,750 | Republic Airways Holdings, Inc.i | 268,290 | ||||||
| 6,600 | Safran SA | 432,067 | ||||||
| 7,800 | Siemens AG | 1,029,866 | ||||||
| 20,550 | Southwest Airlines Company | 551,973 | ||||||
| 4,424 | Stantec, Inc. | 273,968 | ||||||
| 76,000 | Toda Corporation | 295,539 | ||||||
| 23,000 | TOTO, Ltd. | 310,179 | ||||||
| 5,600 | Woodward, Inc. | 281,008 | ||||||
| 13,300 | WS Atkins plc | 300,001 | ||||||
|
| |||||||
| Total | 15,039,759 | |||||||
|
| |||||||
| Information Technology (4.9%) | ||||||||
| 3,450 | Accenture plc | 278,898 | ||||||
| 7,350 | Akamai Technologies, Inc.i | 448,791 | ||||||
| 8,750 | Ambarella, Inc.i,j | 272,825 | ||||||
| 25,950 | Apple, Inc. | 2,411,533 | ||||||
| 13,550 | AVG Technologies NVi | 272,762 | ||||||
| 139,561 | Blinkx plci | 151,296 | ||||||
| 12,100 | Booz Allen Hamilton Holding Corporation | 257,004 | ||||||
| 35,000 | Brocade Communications Systems, Inc. | 322,000 | ||||||
| 26,900 | Calix, Inc.i | 220,042 | ||||||
| 5,900 | Cap Gemini SA | 421,046 | ||||||
| 11,714 | CGI Group, Inc.i | 415,185 | ||||||
| 6,250 | Check Point Software Technologies, Ltd.i,j | 418,938 | ||||||
The accompanying Notes to Financial Statements are an integral part of this schedule.
138
Table of Contents
Diversified Income Plus Portfolio
Schedule of Investments as of June 30, 2014
(unaudited)
| Shares | Common Stock (34.8%) | Value | ||||||
| Information Technology (4.9%) - continued | ||||||||
| 43,950 | Cisco Systems, Inc. | $ | 1,092,157 | |||||
| 6,350 | Computer Sciences Corporation | 401,320 | ||||||
| 1,122 | Constellation Software, Inc. | 285,965 | ||||||
| 10,450 | CoreLogic, Inc.i | 317,262 | ||||||
| 32,800 | Corning, Inc. | 719,960 | ||||||
| 16,950 | eBay, Inc.i | 848,517 | ||||||
| 11,900 | Electronic Arts, Inc.i | 426,853 | ||||||
| 32,250 | EMC Corporation | 849,465 | ||||||
| 16,200 | FUJIFILM Holdings NPV | 452,152 | ||||||
| 7,850 | GameStop Corporationj | 317,690 | ||||||
| 17,850 | Genpact, Ltd.i | 312,911 | ||||||
| 26,400 | Hewlett-Packard Company | 889,152 | ||||||
| 21,000 | Hitachi Kokusai Electric, Inc. | 290,983 | ||||||
| 17,600 | Juniper Networks, Inc.i | 431,904 | ||||||
| 1,200 | Keyence Corporation | 524,745 | ||||||
| 6,850 | Lexmark International, Inc. | 329,896 | ||||||
| 8,850 | ManTech International Corporation | 261,252 | ||||||
| 22,950 | Marvell Technology Group, Ltd. | 328,874 | ||||||
| 6,343 | Melexis NV | 281,232 | ||||||
| 21,882 | ModusLink Global Solutions, Inc.i,j | 81,839 | ||||||
| 12,050 | NetApp, Inc. | 440,066 | ||||||
| 6,850 | NXP Semiconductors NVi | 453,333 | ||||||
| 7,241 | Open Text Corporation | 347,443 | ||||||
| 10,750 | Oracle Corporation | 435,697 | ||||||
| 12,450 | Pegasystems, Inc. | 262,944 | ||||||
| 22,100 | Polycom, Inc.i | 276,913 | ||||||
| 13,650 | Sanmina Corporationi | 310,947 | ||||||
| 8,700 | SAP AG ADR | 670,376 | ||||||
| 6,700 | Seiko Epson Corporation | 285,046 | ||||||
| 18,000 | Texas Instruments, Inc. | 860,220 | ||||||
| 9,700 | Trend Micro, Inc. | 319,633 | ||||||
| 3,100 | Wincor Nixdorf AG | 176,550 | ||||||
|
| |||||||
| Total | 20,173,617 | |||||||
|
| |||||||
| Materials (1.0%) | ||||||||
| 496,478 | Arrium, Ltd. | 373,463 | ||||||
| 16,850 | Dow Chemical Company | 867,101 | ||||||
| 23,400 | James Hardie Industries plc | 305,273 | ||||||
| 197,000 | Kobe Steel, Ltd. | 296,280 | ||||||
| 17,000 | Nippon Paint Company, Ltd. | 359,947 | ||||||
| 17,400 | Rio Tinto plc | 939,495 | ||||||
| 76,000 | Sumitomo Osaka Cement Company, Ltd. | 289,070 | ||||||
| 61,000 | Tosoh Corporation | 295,860 | ||||||
| 6,300 | Voestalpine AG | 300,341 | ||||||
|
| |||||||
| Total | 4,026,830 | |||||||
|
| |||||||
| Telecommunications Services (1.0%) | ||||||||
| 8,050 | AT&T, Inc. | 284,648 | ||||||
| 172,200 | Bezeq Israel Telecommunication | |||||||
Corporation, Ltd. | 322,288 | |||||||
| 83,800 | BT Group plc | 550,652 | ||||||
| 10,100 | Nippon Telegraph & Telephone Corporation | 629,512 | ||||||
| 46,900 | QSC AG | 201,434 | ||||||
| 198,000 | Singapore Telecommunications, Ltd. | 611,958 | ||||||
| 8,550 | Verizon Communications, Inc. | 418,351 | ||||||
| 248,663 | Vodafone Group plc | 831,097 | ||||||
| 62,750 | Vonage Holdings Corporationi | 235,312 | ||||||
|
| |||||||
| Total | 4,085,252 | |||||||
|
| |||||||
| Utilities (1.0%) | ||||||||
| 226,300 | A2A SPA | 260,611 | ||||||
| 87,400 | Electricidade de Portugal SA | 438,539 | ||||||
| 9,700 | Empire District Electric Company | 249,096 | ||||||
| 7,900 | Endesa SA | 305,467 | ||||||
| 16,500 | Fortum Oyj | 443,058 | ||||||
| 13,600 | Gas Natural SDG SAj | 429,668 | ||||||
| 28,900 | GDF Suez | 796,240 | ||||||
| 67,500 | Iberdrola SA | 516,344 | ||||||
| 8,000 | Otter Tail Corporation | 242,320 | ||||||
| 17,500 | Suez Environnement Company SA | 334,778 | ||||||
| 11,400 | Verbund AG | 220,804 | ||||||
|
| |||||||
| Total | 4,236,925 | |||||||
|
| |||||||
Total Common Stock (cost $135,867,186) | 143,472,831 | |||||||
|
| |||||||
Preferred Stock (3.8%) | ||||||||
| Financials (3.8%) | ||||||||
| 15,000 | Affiliated Managers Group, Inc., 5.250% | 394,500 | ||||||
| 5,625 | Agribank FCB, 6.875%h | 597,656 | ||||||
| 42,000 | Allstate Corporation, 5.100% | 1,055,460 | ||||||
| 39,710 | Annaly Capital Management, Inc., 7.500%h | 962,967 | ||||||
| 800 | Bank of America Corporation, Convertible, 7.250%h | 933,600 | ||||||
| 31,200 | CHS, Inc., 7.100%h | 847,392 | ||||||
| 37,225 | Citigroup, Inc., 6.875%h | 1,010,287 | ||||||
| 13,380 | Cobank ACB, 6.250%e,h | 1,386,085 | ||||||
| 16,000 | Countrywide Capital V, 7.000% | 416,000 | ||||||
| 20,000 | DDR Corporation, 6.250%h | 478,000 | ||||||
| 4,000 | Farm Credit Bank of Texas, 6.750%e,h | 418,625 | ||||||
| 19,600 | Goldman Sachs Group, Inc., 5.500%h | 480,200 | ||||||
| 48,000 | HSBC USA, Inc., 6.500%h | 1,221,552 | ||||||
| 225 | M&T Bank Corporation, 6.375%h | 233,930 | ||||||
| 25,900 | Morgan Stanley, 7.125%h | 721,833 | ||||||
| 24,500 | PNC Financial Services Group, Inc., 6.125%h | 672,770 | ||||||
| 12,000 | Principal Financial Group, Inc., 5.563%h | 1,216,500 | ||||||
| 8,000 | Royal Bank of Scotland Group plc, 7.250%h | 202,000 | ||||||
| 28,000 | U.S. Bancorp 6.500%h | 791,280 | ||||||
| 16,000 | Wells Fargo & Company, 5.850%h | 415,040 | ||||||
| 800 | Wells Fargo & Company, Convertible, 7.500%h | 971,200 | ||||||
|
| |||||||
| Total | 15,426,877 | |||||||
|
| |||||||
| Utilities (<0.1%) | ||||||||
| 1,315 | Southern California Edison Company, 4.920%d,h | 134,705 | ||||||
|
| |||||||
| Total | 134,705 | |||||||
|
| |||||||
| Total Preferred Stock (cost $15,092,115) | 15,561,582 | |||||||
|
| |||||||
The accompanying Notes to Financial Statements are an integral part of this schedule.
139
Table of Contents
Diversified Income Plus Portfolio
Schedule of Investments as of June 30, 2014
(unaudited)
| Shares | Collateral Held for Securities Loaned (0.8%) | Value | ||||||
| 3,372,821 | Thrivent Cash Management Trust | $ | 3,372,821 | |||||
|
| |||||||
| Total Collateral Held for Securities Loaned (cost $3,372,821) | 3,372,821 | |||||||
|
| |||||||
| Shares or Principal Amount | Short-Term Investments (11.7%)l | |||||||
Federal Home Loan Bank Discount Notes | ||||||||
| 100,000 | 0.095%, 07/07/2014m | 99,998 | ||||||
| 100,000 | 0.090%, 07/11/2014 | 99,997 | ||||||
| 400,000 | 0.055%, 07/23/2014m | 399,987 | ||||||
| 100,000 | 0.055%, 07/25/2014m | 99,996 | ||||||
| 700,000 | 0.087%, 07/30/2014m | 699,951 | ||||||
| 100,000 | 0.057%, 08/01/2014m | 99,995 | ||||||
Federal Home Loan Mortgage Corporation Discount Notes | ||||||||
| 100,000 | 0.110%, 07/01/2014 | 100,000 | ||||||
Thrivent Cash Management Trust | ||||||||
| 46,521,573 | 0.050% | 46,521,573 | ||||||
|
| |||||||
| Total Short-Term Investments (at amortized cost) | 48,121,497 | |||||||
|
| |||||||
| Total Investments (cost $416,452,001) 105.2% | $ | 433,807,458 | ||||||
|
| |||||||
| Other Assets and Liabilities, Net (5.2%) | (21,598,759 | ) | ||||||
|
| |||||||
| Total Net Assets 100.0% | $ | 412,208,699 | ||||||
|
| |||||||
| a | The stated interest rate represents the weighted average of all contracts within the bank loan facility. |
| b | All or a portion of the loan is unfunded. |
| c | Denotes investments purchased on a when-issued or delayed delivery basis. |
| d | Denotes variable rate securities. Variable rate securities are securities whose yields vary with a designated market index or market rate. The rate shown is as of June 30, 2014. |
| e | Denotes securities sold under Rule 144A of the Securities Act of 1933, which exempts them from registration. These securities have been deemed liquid and may be resold to other dealers in the program or to other qualified institutional buyers. As of June 30, 2014, the value of these investments was $34,976,796 or 8.5% of total net assets. |
| f | Denotes interest only security. Interest only securities represent the right to receive monthly interest payments on an underlying pool of mortgages or assets. The principal shown is the outstanding par amount of the pool as of the end of the period. The actual effective yield of the security is different than the stated coupon rate. |
| g | Denotes restricted securities. Restricted securities are investment securities which have been deemed illiquid and cannot be offered for public sale without first being registered under the Securities Act of 1933. The following table indicates the acquisition date and cost of restricted securities Diversified Income Plus Portfolio owned as of June 30, 2014. |
Security | Acquisition Date | Cost | ||||||
Vericrest Opportunity Loan Transferee, 04/25/2055 | 11/21/2013 | $ | 639,919 | |||||
Vericrest Opportunity Loan Transferee, 03/25/2054 | 12/11/2013 | 946,044 | ||||||
| h | Denotes perpetual securities. Perpetual securities pay an indefinite stream of interest, but may be called by the issuer at an earlier date. |
| i | Non-income producing security. |
| j | All or a portion of the security is on loan. |
| k | Security is fair valued. |
| l | The interest rate shown reflects the yield, coupon rate or the discount rate at the date of purchase. |
| m | At June 30, 2014, $1,399,927 of investments were held on deposit with the counterparty and pledged as the initial margin deposit for open futures contracts. |
Definitions:
| ADR | - | American Depositary Receipt, which are certificates for an underlying foreign security’s shares held by an issuing U.S. depository bank. | ||
| ETF | - | Exchange Traded Fund. | ||
| REIT | - | Real Estate Investment Trust is a company that buys, develops, manages and/or sells real estate assets. |
Unrealized Appreciation (Depreciation)
Gross unrealized appreciation and depreciation of investments, based on cost for federal income tax purposes, were as follows:
Gross unrealized appreciation | $ | 21,355,047 | ||
Gross unrealized depreciation | (4,026,317 | ) | ||
|
| |||
Net unrealized appreciation (depreciation) | $ | 17,328,730 | ||
Cost for federal income tax purposes | $ | 416,478,728 | ||
The accompanying Notes to Financial Statements are an integral part of this schedule.
140
Table of Contents
Diversified Income Plus Portfolio
Schedule of Investments as of June 30, 2014
(unaudited)
Fair Valuation Measurements
The following table is a summary of the inputs used, as of June 30, 2014, in valuing Diversified Income Plus Portfolio’s assets carried at fair value.
Investments in Securities | Total | Level 1 | Level 2 | Level 3 | ||||||||||||
Bank Loans | ||||||||||||||||
Basic Materials | 4,872,863 | — | 4,872,863 | — | ||||||||||||
Capital Goods | 2,345,265 | — | 2,345,265 | — | ||||||||||||
Communications Services | 17,649,944 | — | 17,649,944 | — | ||||||||||||
Consumer Cyclical | 10,681,860 | — | 10,681,860 | — | ||||||||||||
Consumer Non-Cyclical | 5,789,699 | — | 5,789,699 | — | ||||||||||||
Energy | 2,488,131 | — | 2,488,131 | — | ||||||||||||
Financials | 3,598,762 | — | 3,598,762 | — | ||||||||||||
Technology | 3,664,168 | — | 3,664,168 | — | ||||||||||||
Transportation | 1,824,831 | — | 1,824,831 | — | ||||||||||||
Utilities | 1,516,728 | — | 1,516,728 | — | ||||||||||||
Long-Term Fixed Income | ||||||||||||||||
Asset-Backed Securities | 4,800,698 | — | 4,800,698 | — | ||||||||||||
Basic Materials | 4,301,093 | — | 4,301,093 | — | ||||||||||||
Capital Goods | 2,535,808 | — | 2,535,808 | — | ||||||||||||
Collateralized Mortgage Obligations | 62,955,850 | — | 62,955,850 | — | ||||||||||||
Commercial Mortgage-Backed Securities | 1,793,966 | — | 1,793,966 | — | ||||||||||||
Communications Services | 10,240,663 | — | 10,240,663 | — | ||||||||||||
Consumer Cyclical | 7,038,632 | — | 7,038,632 | — | ||||||||||||
Consumer Non-Cyclical | 8,349,443 | — | 8,349,443 | — | ||||||||||||
Energy | 7,961,494 | — | 7,961,494 | — | ||||||||||||
Financials | 31,596,697 | — | 31,596,697 | — | ||||||||||||
Foreign Government | 977,430 | — | 977,430 | — | ||||||||||||
Mortgage-Backed Securities | 16,315,735 | — | 16,315,735 | — | ||||||||||||
Technology | 1,932,637 | — | 1,932,637 | — | ||||||||||||
Transportation | 586,079 | — | 586,079 | — | ||||||||||||
Utilities | 7,460,251 | — | 7,460,251 | — | ||||||||||||
Common Stock | ||||||||||||||||
Consumer Discretionary | 16,168,785 | 7,374,448 | 8,794,337 | — | ||||||||||||
Consumer Staples | 8,371,039 | 5,382,975 | 2,947,637 | 40,427 | ||||||||||||
Energy | 11,316,455 | 6,264,113 | 5,052,342 | — | ||||||||||||
Financials | 44,876,890 | 36,532,660 | 8,344,230 | — | ||||||||||||
Health Care | 15,177,279 | 10,453,128 | 4,724,151 | — | ||||||||||||
Industrials | 15,039,759 | 8,571,582 | 6,468,177 | — | ||||||||||||
Information Technology | 20,173,617 | 15,551,965 | 4,621,652 | — | ||||||||||||
Materials | 4,026,830 | 867,101 | 3,159,729 | — | ||||||||||||
Telecommunications Services | 4,085,252 | 938,311 | 3,146,941 | — | ||||||||||||
Utilities | 4,236,925 | 491,416 | 3,745,509 | — | ||||||||||||
Preferred Stock | ||||||||||||||||
Financials | 15,426,877 | 13,622,167 | 1,804,710 | — | ||||||||||||
Utilities | 134,705 | — | 134,705 | — | ||||||||||||
Collateral Held for Securities Loaned | 3,372,821 | 3,372,821 | — | — | ||||||||||||
Short-Term Investments | 48,121,497 | 46,521,573 | 1,599,924 | — | ||||||||||||
|
|
|
|
|
|
|
| |||||||||
Total | $ | 433,807,458 | $ | 155,944,260 | $ | 277,822,771 | $ | 40,427 | ||||||||
|
|
|
|
|
|
|
| |||||||||
Other Financial Instruments | Total | Level 1 | Level 2 | Level 3 | ||||||||||||
Asset Derivatives | ||||||||||||||||
Futures Contracts | 70,087 | 70,087 | — | — | ||||||||||||
|
|
|
|
|
|
|
| |||||||||
Total Asset Derivatives | $ | 70,087 | $ | 70,087 | $ | — | $ | — | ||||||||
|
|
|
|
|
|
|
| |||||||||
Liability Derivatives | ||||||||||||||||
Futures Contracts | 177,501 | 177,501 | — | — | ||||||||||||
|
|
|
|
|
|
|
| |||||||||
Total Liability Derivatives | $ | 177,501 | $ | 177,501 | $ | — | $ | — | ||||||||
|
|
|
|
|
|
|
| |||||||||
There were no significant transfers between Levels during the period ended June 30, 2014. Transfers between Levels are identified as of the end of the period.
The accompanying Notes to Financial Statements are an integral part of this schedule.
141
Table of Contents
Diversified Income Plus Portfolio
Schedule of Investments as of June 30, 2014
(unaudited)
Futures Contracts | Number of Contracts Long/(Short) | Expiration Date | Notional Principal Amount | Value | Unrealized Gain/(Loss) | |||||||||||||||
Mini MSCI EAFE Index Futures | 44 | September 2014 | $ | 4,308,020 | $ | 4,331,580 | $ | 23,560 | ||||||||||||
Russell 2000 Index Mini-Futures | (66 | ) | September 2014 | (7,709,316 | ) | (7,855,980 | ) | (146,664 | ) | |||||||||||
S&P 500 Index Mini-Futures | 40 | September 2014 | 3,858,273 | 3,904,800 | 46,527 | |||||||||||||||
Ultra Long Term U.S. Treasury Bond | ||||||||||||||||||||
Futures | 31 | September 2014 | 4,678,899 | 4,648,062 | (30,837 | ) | ||||||||||||||
Total Futures Contracts | ($ | 107,414 | ) | |||||||||||||||||
The following table summarizes the fair value and Statement of Assets and Liabilities location, as of June 30, 2014, for Diversified Income Plus Portfolio’s investments in financial derivative instruments by primary risk exposure as discussed under item (2) Significant Accounting Policies of the Notes to Financial Statements.
Derivatives by risk category | Statement of Assets and Liabilities Location | Fair Value | ||||
Asset Derivatives | ||||||
Equity Contracts | ||||||
Futures* | Net Assets - Net unrealized appreciation/(depreciation) on Futures contracts | $ | 70,087 | |||
Total Equity Contracts | 70,087 | |||||
|
| |||||
Total Asset Derivatives | $ | 70,087 | ||||
|
| |||||
Liability Derivatives | ||||||
Interest Rate Contracts | ||||||
Futures* | Net Assets - Net unrealized appreciation/(depreciation) on Futures contracts | 30,837 | ||||
Total Interest Rate Contracts | 30,837 | |||||
Equity Contracts | ||||||
Futures* | Net Assets - Net unrealized appreciation/(depreciation) on Futures contracts | 146,664 | ||||
Total Equity Contracts | 146,664 | |||||
|
| |||||
Total Liability Derivatives | $ | 177,501 | ||||
|
| |||||
| * | Includes cumulative appreciation/depreciation of futures contracts as reported in the Schedule of Investments. Only current day’s variation margin is reported within the Statement of Assets and Liabilities. |
The following table summarizes the net realized gains/(losses) and Statement of Operations location, for the period ended June 30, 2014, for Diversified Income Plus Portfolio’s investments in financial derivative instruments by primary risk exposure.
Derivatives by risk category | Statement of Operations Location | Realized Gains/(Losses) recognized in Income | ||||
Equity Contracts | ||||||
Futures | Net realized gains/(losses) on Futures contracts | 865,210 | ||||
Total Equity Contracts | 865,210 | |||||
Interest Rate Contracts | ||||||
Futures | Net realized gains/(losses) on Futures contracts | 272,728 | ||||
Total Interest Rate Contracts | 272,728 | |||||
|
| |||||
Total | $ | 1,137,938 | ||||
|
| |||||
The following table summarizes the change in net unrealized appreciation/(depreciation) and Statement of Operations location, for the period ended June 30, 2014, for Diversified Income Plus Portfolio’s investments in financial derivative instruments by primary risk exposure.
Derivatives by risk category | Statement of Operations Location | Change in unrealized appreciation/(depreciation) recognized in Income | ||||
Interest Rate Contracts | ||||||
Futures | Change in net unrealized appreciation/(depreciation) on Futures contracts | (188,685 | ) | |||
Total Interest Rate Contracts | (188,685 | ) | ||||
Equity Contracts | ||||||
Futures | Change in net unrealized appreciation/(depreciation) on Futures contracts | (197,080 | ) | |||
Total Equity Contracts | (197,080 | ) | ||||
|
| |||||
Total | ($ | 385,765 | ) | |||
|
| |||||
The accompanying Notes to Financial Statements are an integral part of this schedule.
142
Table of Contents
Diversified Income Plus Portfolio
Schedule of Investments as of June 30, 2014
(unaudited)
The following table presents Diversified Income Plus Portfolio’s average volume of derivative activity during the period ended June 30, 2014.
Derivative Risk Category | Futures (Notional)* | Futures (Percentage of Average Net Assets) | ||||||
Equity Contracts | $ | 9,307,529 | 2.4 | % | ||||
Interest Rate Contracts | 16,043,867 | 4.2 | ||||||
| * | Notional amount represents long or short, or both, derivative positions held by the Portfolio. |
Investment in Affiliates
Affiliated issuers, as defined under the Investment Company Act of 1940, include those in which the Portfolio’s holdings of an issuer represent 5% or more of the outstanding voting securities of an issuer, or any affiliated mutual fund.
A summary of transactions for the fiscal year to date, in Diversified Income Plus Portfolio, is as follows:
Portfolio | Value December 31, 2013 | Gross Purchases | Gross Sales | Shares Held at June 30, 2014 | Value June 30, 2014 | Income Earned January 1, 2014 - June 30, 2014 | ||||||||||||||||||
Cash Management Trust- Collateral Investment | $ | 3,011,629 | $ | 19,155,599 | $ | 18,794,407 | 3,372,821 | $ | 3,372,821 | $ | 9,428 | |||||||||||||
Cash Management Trust- Short Term Investment | 29,566,956 | 106,788,490 | 89,833,873 | 46,521,573 | 46,521,573 | 9,800 | ||||||||||||||||||
Total Value and Income Earned | 32,578,585 | 49,894,394 | 19,228 | |||||||||||||||||||||
The accompanying Notes to Financial Statements are an integral part of this schedule.
143
Table of Contents
Opportunity Income Plus Portfolio
Schedule of Investments as of June 30, 2014
(unaudited)
| Principal Amount | Bank Loans (39.0%)a | Value | ||||||
| Basic Materials (3.2%) | ||||||||
Alpha Natural Resources, Inc., Term Loan | ||||||||
| $ 437,033 | 3.500%, 5/22/2020 | $ | 421,921 | |||||
Arch Coal, Inc., Term Loan | ||||||||
| 277,177 | 6.250%, 5/16/2018 | 272,154 | ||||||
Fortescue Metals Group, Ltd., Term Loan | ||||||||
| 202,950 | 3.750%, 6/30/2019 | 203,027 | ||||||
Ineos Group Holdings, Ltd., Term Loan | ||||||||
| 252,442 | 3.750%, 5/4/2018 | 251,717 | ||||||
NewPage Corporation, Term Loan | ||||||||
| 420,000 | 9.500%, 2/11/2021 | 420,525 | ||||||
Tronox Pigments BV, Term Loan | ||||||||
| 274,307 | 0.000%, 3/19/2020b,c | 274,719 | ||||||
|
| |||||||
| Total | 1,844,063 | |||||||
|
| |||||||
| Capital Goods (1.4%) | ||||||||
ADS Waste Holdings, Inc., Term Loan | ||||||||
| 252,437 | 3.750%, 10/9/2019 | 251,062 | ||||||
Rexnord, LLC, Term Loan | ||||||||
| 277,900 | 4.000%, 8/21/2020 | 277,483 | ||||||
Silver II Borrower, Term Loan | ||||||||
| 269,490 | 4.000%, 12/13/2019 | 268,624 | ||||||
|
| |||||||
| Total | 797,169 | |||||||
|
| |||||||
| Communications Services (13.8%) | ||||||||
Cengage Learning Aquisitions, Term Loan | ||||||||
| 723,187 | 7.000%, 3/31/2020 | 730,875 | ||||||
Cincinnati Bell, Inc., Term Loan | ||||||||
| 124,062 | 4.000%, 9/10/2020 | 123,986 | ||||||
Clear Channel Communications, Inc., Term Loan | ||||||||
| 255,000 | 6.900%, 1/30/2019 | 253,587 | ||||||
Fairpoint Communications, Term Loan | ||||||||
| 252,443 | 7.500%, 2/14/2019b,c | 261,122 | ||||||
Grande Communications Networks, LLC, Term Loan | ||||||||
| 252,451 | 4.500%, 5/29/2020 | 251,504 | ||||||
Hargray Communications Group, Inc., Term Loan | ||||||||
| 222,750 | 4.750%, 6/26/2019 | 223,307 | ||||||
IMG Worldwide, Inc., Term Loan | ||||||||
| 1,375,000 | 5.250%, 5/6/2021 | 1,383,250 | ||||||
Integra Telecom Holdings, Inc., Term Loan | ||||||||
| 252,444 | 5.250%, 2/22/2019 | 253,769 | ||||||
Level 3 Communications, Inc., Term Loan | ||||||||
| 280,000 | 4.000%, 8/1/2019 | 280,232 | ||||||
Liberty Cablevision of Puerto Rico, LLC, Term Loan | ||||||||
| 300,000 | 0.000%, 12/11/2021b,c | 300,249 | ||||||
LTS Buyer, LLC, Term Loan | ||||||||
| 277,200 | 4.000%, 4/13/2020 | 276,260 | ||||||
McGraw-Hill Global Education, LLC, Term Loan | ||||||||
| 252,614 | 5.750%, 3/22/2019 | 256,719 | ||||||
NTelos, Inc., Term Loan | ||||||||
| 29,698 | 5.750%, 11/9/2019 | 29,673 | ||||||
Puerto Rico Cable Acquisition Company, Inc., Term Loan | ||||||||
| 259,072 | 5.500%, 7/31/2018 | 258,748 | ||||||
SBA Senior Finance II, LLC, Term Loan | ||||||||
| 750,000 | 3.250%, 3/24/2021 | 744,885 | ||||||
TNS, Inc., Term Loan | ||||||||
| 99,918 | 5.000%, 2/14/2020 | 100,293 | ||||||
Univision Communications, Inc., Term Loan | ||||||||
| 252,453 | 4.000%, 3/1/2020 | 252,110 | ||||||
Virgin Media Investment Holdings, Ltd., Term Loan | ||||||||
| 255,000 | 3.500%, 6/7/2020 | 254,123 | ||||||
Visant Corporation, Term Loan | ||||||||
| 250,000 | 5.250%, 12/22/2016 | 248,812 | ||||||
WideOpenWest Finance, LLC, Term Loan | ||||||||
| 252,443 | 4.750%, 4/1/2019 | 253,034 | ||||||
XO Communications, LLC, Term Loan | ||||||||
| 698,250 | 4.250%, 3/20/2021 | 701,853 | ||||||
Yankee Cable Acquisition, LLC, Term Loan | ||||||||
| 250,840 | 4.500%, 3/1/2020 | 252,016 | ||||||
Zayo Group, LLC, Term Loan | ||||||||
| 252,426 | 4.000%, 7/2/2019 | 252,611 | ||||||
|
| |||||||
| Total | 7,943,018 | |||||||
|
| |||||||
| Consumer Cyclical (6.6%) | ||||||||
Bally Technologies, Inc., Term Loan | ||||||||
| 381,308 | 4.250%, 11/25/2020 | 382,738 | ||||||
Booz Allen Hamilton, Inc., Term Loan | ||||||||
| 103,359 | 3.750%, 7/31/2019 | 103,691 | ||||||
Burlington Coat Factory Warehouse Corporation, Term Loan | ||||||||
| 267,654 | 4.250%, 2/23/2017 | 269,105 | ||||||
Ceridian Corporation, Term Loan | ||||||||
| 271,220 | 4.400%, 8/14/2015 | 271,516 | ||||||
Chrysler Group, LLC, Term Loan | ||||||||
| 399,000 | 3.250%, 12/31/2018 | 397,587 | ||||||
Golden Nugget, Inc., Delayed Draw | ||||||||
| 104,475 | 5.500%, 11/21/2019 | 106,434 | ||||||
Golden Nugget, Inc., Term Loan | ||||||||
| 243,775 | 5.500%, 11/21/2019 | 248,346 | ||||||
J.C. Penney Corporation, Inc., Term Loan | ||||||||
| 252,450 | 6.000%, 5/22/2018 | 255,214 | ||||||
Las Vegas Sands, LLC, Term Loan | ||||||||
| 124,375 | 3.250%, 12/19/2020 | 124,304 | ||||||
Marina District Finance Company, Inc., Term Loan | ||||||||
| 368,150 | 6.750%, 8/15/2018 | 372,174 | ||||||
Mohegan Tribal Gaming Authority, Term Loan | ||||||||
| 746,250 | 5.500%, 11/19/2019 | 757,757 | ||||||
The accompanying Notes to Financial Statements are an integral part of this schedule.
144
Table of Contents
Opportunity Income Plus Portfolio
Schedule of Investments as of June 30, 2014
(unaudited)
| Principal Amount | Bank Loans (39.0%)a | Value | ||||||
| Consumer Cyclical (6.6%) - continued | ||||||||
Scientific Games International, Inc., Term Loan | ||||||||
| $ 253,725 | 4.250%, 10/18/2020 | $ | 250,830 | |||||
Toys R Us, Inc., Term Loan | ||||||||
| 277,058 | 5.250%, 5/25/2018 | 223,954 | ||||||
|
| |||||||
| Total | 3,763,650 | |||||||
|
| |||||||
| Consumer Non-Cyclical (4.0%) | ||||||||
Albertsons, Inc., Term Loan | ||||||||
| 277,903 | 4.750%, 3/21/2019 | 279,118 | ||||||
JBS USA, LLC, Term Loan | ||||||||
| 1,318,532 | 3.750%, 5/25/2018 | 1,315,236 | ||||||
Roundy’s Supermarkets, Inc., Term Loan | ||||||||
| 216,579 | 5.750%, 3/3/2021 | 216,888 | ||||||
Supervalu, Inc., Term Loan | ||||||||
| 226,293 | 4.500%, 3/21/2019 | 225,983 | ||||||
Van Wagner Communications, LLC, Term Loan | ||||||||
| 244,663 | 6.250%, 8/3/2018 | 247,212 | ||||||
|
| |||||||
| Total | 2,284,437 | |||||||
|
| |||||||
| Energy (1.3%) | ||||||||
Exgen Renewables I, LLC, Term Loan | ||||||||
| 322,289 | 5.250%, 2/6/2021 | 326,721 | ||||||
McJunkin Red Man Corporation, Term Loan | ||||||||
| 148,875 | 5.000%, 11/8/2019 | 149,619 | ||||||
Pacific Drilling SA, Term Loan | ||||||||
| 252,450 | 4.500%, 6/3/2018 | 253,160 | ||||||
|
| |||||||
| Total | 729,500 | |||||||
|
| |||||||
| Financials (3.0%) | ||||||||
Delos Finance Sarl, Term Loan | ||||||||
| 125,000 | 3.500%, 3/6/2021 | 124,844 | ||||||
Harland Clarke Holdings Corporation, Term Loan | ||||||||
| 248,625 | 7.000%, 5/22/2018 | 252,511 | ||||||
TransUnion, LLC, Term Loan | ||||||||
| 1,371,563 | 4.000%, 4/9/2021 | 1,371,068 | ||||||
|
| |||||||
| Total | 1,748,423 | |||||||
|
| |||||||
| Technology (3.1%) | ||||||||
Avago Technologies, Ltd., Term Loan | ||||||||
| 625,000 | 3.750%, 5/6/2021 | 626,731 | ||||||
BMC Software, Inc., Term Loan | ||||||||
| 278,600 | 5.000%, 9/10/2020 | 277,962 | ||||||
First Data Corporation Extended, Term Loan | ||||||||
| 255,000 | 4.154%, 3/23/2018 | 255,319 | ||||||
Freescale Semiconductor, Inc., Term Loan | ||||||||
| 252,453 | 4.250%, 2/28/2020 | 252,244 | ||||||
Infor US, Inc., Term Loan | ||||||||
| 348,250 | 3.750%, 6/3/2020 | 345,711 | ||||||
|
| |||||||
| Total | 1,757,967 | |||||||
|
| |||||||
| Transportation (0.9%) | ||||||||
American Airlines, Inc., Term Loan | ||||||||
| 499,950 | 3.750%, 6/27/2019 | 500,435 | ||||||
|
| |||||||
| Total | 500,435 | |||||||
|
| |||||||
| Utilities (1.7%) | ||||||||
Calpine Corporation, Term Loan | ||||||||
| 746,250 | 4.000%, 10/31/2020 | 748,011 | ||||||
Intergen NV, Term Loan | ||||||||
| 252,450 | 5.500%, 6/15/2020 | 254,134 | ||||||
|
| |||||||
| Total | 1,002,145 | |||||||
|
| |||||||
Total Bank Loans (cost $22,354,982) | 22,370,807 | |||||||
|
| |||||||
Long-Term Fixed Income (51.7%) | ||||||||
| Asset-Backed Securities (4.4%) | ||||||||
Asset Backed Securities Corporation Home Equity Loan Trust | ||||||||
| 236,880 | 0.292%, 7/25/2036d | 219,622 | ||||||
Bayview Opportunity Master Fund Trust IIB, LP | ||||||||
| 139,876 | 3.950%, 1/28/2034e | 140,099 | ||||||
Countrywide Asset-Backed Certificates | ||||||||
| 177,500 | 5.859%, 10/25/2046 | 137,342 | ||||||
| 208,285 | 5.530%, 4/25/2047 | 200,533 | ||||||
Credit Based Asset Servicing and Securitization, LLC | ||||||||
| 112,017 | 3.770%, 12/25/2036 | 74,973 | ||||||
First Horizon ABS Trust | ||||||||
| 481,304 | 0.312%, 10/25/2034d,f | 411,242 | ||||||
GMAC Mortgage Corporation Loan Trust | ||||||||
| 654,446 | 0.332%, 8/25/2035d,f | 566,244 | ||||||
Popular ABS Mortgage Pass- Through Trust | ||||||||
| 100,000 | 5.297%, 11/25/2035 | 84,619 | ||||||
Renaissance Home Equity Loan Trust | ||||||||
| 248,800 | 5.797%, 8/25/2036 | 164,595 | ||||||
| 195,951 | 5.285%, 1/25/2037 | 114,517 | ||||||
Wachovia Asset Securitization, Inc. | ||||||||
| 424,179 | 0.292%, 7/25/2037d,e,f | 365,629 | ||||||
|
| |||||||
| Total | 2,479,415 | |||||||
|
| |||||||
| Basic Materials (1.8%) | ||||||||
Anglo American Capital plc | ||||||||
| 22,000 | 1.176%, 4/15/2016d,g | 22,070 | ||||||
ArcelorMittal | ||||||||
| 100,000 | 6.000%, 3/1/2021 | 108,250 | ||||||
Dow Chemical Company | ||||||||
| 24,000 | 8.550%, 5/15/2019 | 30,846 | ||||||
First Quantum Minerals, Ltd. | ||||||||
| 75,000 | 7.000%, 2/15/2021g | 77,156 | ||||||
FMG Resources Pty. Ltd. | ||||||||
| 64,810 | 6.875%, 2/1/2018g | 68,051 | ||||||
The accompanying Notes to Financial Statements are an integral part of this schedule.
145
Table of Contents
Opportunity Income Plus Portfolio
Schedule of Investments as of June 30, 2014
(unaudited)
| Principal Amount | Long-Term Fixed Income (51.7%) | Value | ||||||
| Basic Materials (1.8%) - continued | ||||||||
Freeport-McMoRan Copper & Gold, Inc. | ||||||||
| $ 30,000 | 2.375%, 3/15/2018 | $ | 30,447 | |||||
Groupe Office Cherifien des Phosphates SA | ||||||||
| 65,000 | 5.625%, 4/25/2024g | 68,169 | ||||||
Hexion US Finance Corporation/Hexion Nova Scotia Finance ULC | ||||||||
| 64,810 | 8.875%, 2/1/2018 | 67,402 | ||||||
Ineos Finance plc | ||||||||
| 80,000 | 7.500%, 5/1/2020g | 87,100 | ||||||
LyondellBasell Industries NV | ||||||||
| 26,000 | 5.000%, 4/15/2019 | 29,327 | ||||||
Minsur SA | ||||||||
| 63,000 | 6.250%, 2/7/2024g | 68,670 | ||||||
Mosaic Company | ||||||||
| 20,000 | 3.750%, 11/15/2021 | 20,802 | ||||||
NOVA Chemicals Corporation | ||||||||
| 97,215 | 5.250%, 8/1/2023g | 106,207 | ||||||
Sappi Papier Holding GmbH | ||||||||
| 80,000 | 6.625%, 4/15/2021g | 84,400 | ||||||
Trinseo Materials Operating SCA | ||||||||
| 82,000 | 8.750%, 2/1/2019 | 88,355 | ||||||
Vale Overseas, Ltd. | ||||||||
| 30,000 | 6.250%, 1/23/2017 | 33,570 | ||||||
Xstrata Finance Canada, Ltd. | ||||||||
| 20,000 | 2.050%, 10/23/2015g | 20,227 | ||||||
|
| |||||||
| Total | 1,011,049 | |||||||
|
| |||||||
| Capital Goods (1.2%) | ||||||||
BAE Systems plc | ||||||||
| 38,000 | 3.500%, 10/11/2016g | 39,550 | ||||||
Cemex Finance, LLC | ||||||||
| 64,810 | 9.375%, 10/12/2017g | 76,233 | ||||||
CNH Capital, LLC | ||||||||
| 64,810 | 3.625%, 4/15/2018 | 66,187 | ||||||
Crown Americas Capital Corporation IV | ||||||||
| 80,000 | 4.500%, 1/15/2023 | 77,920 | ||||||
Harsco Corporation | ||||||||
| 30,000 | 2.700%, 10/15/2015 | 30,262 | ||||||
Ingersoll-Rand Global Holding Company, Ltd. | ||||||||
| 40,000 | 6.875%, 8/15/2018 | 47,656 | ||||||
L-3 Communications Corporation | ||||||||
| 33,000 | 1.500%, 5/28/2017 | 33,045 | ||||||
Martin Marietta Materials, Inc. | ||||||||
| 40,000 | 1.331%, 6/30/2017c,d,g | 39,977 | ||||||
Nortek, Inc. | ||||||||
| 64,810 | 8.500%, 4/15/2021 | 71,615 | ||||||
Reynolds Group Issuer, Inc. | ||||||||
| 64,810 | 9.875%, 8/15/2019 | 71,777 | ||||||
Roper Industries, Inc. | ||||||||
| 34,000 | 2.050%, 10/1/2018 | 34,055 | ||||||
Textron, Inc. | ||||||||
| 38,000 | 4.625%, 9/21/2016 | 40,734 | ||||||
United Rentals North America, Inc. | ||||||||
| 77,000 | 7.375%, 5/15/2020 | 85,085 | ||||||
|
| |||||||
| Total | 714,096 | |||||||
|
| |||||||
| Collateralized Mortgage Obligations (9.1%) | ||||||||
Bear Stearns Adjustable Rate Mortgage Trust | ||||||||
| 259,719 | 2.410%, 10/25/2035d | 257,360 | ||||||
Bear Stearns ALT-A Trust | ||||||||
| 162,973 | 2.531%, 6/25/2034 | 162,484 | ||||||
CitiMortgage Alternative Loan Trust | ||||||||
| 163,660 | 5.750%, 4/25/2037 | 141,529 | ||||||
Countrywide Alternative Loan Trust | ||||||||
| 196,749 | 5.750%, 8/25/2035 | 179,605 | ||||||
| 226,021 | 5.500%, 10/25/2035 | 209,330 | ||||||
| 79,118 | 5.500%, 2/25/2036 | 72,764 | ||||||
| 112,641 | 6.000%, 1/25/2037 | 99,807 | ||||||
| 243,906 | 5.500%, 5/25/2037 | 205,073 | ||||||
Deutsche Alt-A Securities, Inc., Mortgage Loan Trust | ||||||||
| 141,591 | 0.893%, 4/25/2047d | 125,616 | ||||||
GMAC Mortgage Corporation Loan Trust | ||||||||
| 84,364 | 4.690%, 9/19/2035 | 83,604 | ||||||
GMACM Mortgage Loan Trust | ||||||||
| 218,470 | 4.621%, 5/25/2035 | 210,576 | ||||||
GSR Mortgage Loan Trust | ||||||||
| 29,500 | 0.342%, 8/25/2046d | 28,844 | ||||||
Impac CMB Trust | ||||||||
| 277,067 | 0.672%, 4/25/2035d | 258,777 | ||||||
| 49,442 | 0.792%, 8/25/2035d | 44,279 | ||||||
J.P. Morgan Alternative Loan Trust | ||||||||
| 111,521 | 6.500%, 3/25/2036 | 97,792 | ||||||
J.P. Morgan Mortgage Trust | ||||||||
| 134,090 | 6.500%, 1/25/2035 | 132,051 | ||||||
| 103,673 | 2.243%, 6/25/2035 | 104,486 | ||||||
| 117,789 | 2.680%, 6/25/2035 | 120,175 | ||||||
| 180,897 | 2.607%, 7/25/2035 | 181,401 | ||||||
| 238,811 | 2.847%, 8/25/2035 | 239,881 | ||||||
| 311,156 | 2.350%, 6/25/2036 | 282,945 | ||||||
| 59,139 | 2.607%, 10/25/2036 | 49,850 | ||||||
MLCC Mortgage Investors, Inc. | ||||||||
| 236,055 | 0.812%, 8/25/2029d | 237,755 | ||||||
Morgan Stanley Mortgage Loan Trust | ||||||||
| 148,973 | 5.253%, 11/25/2035 | 108,733 | ||||||
Residential Accredit Loans, Inc. | ||||||||
| 95,645 | 5.500%, 12/25/2034 | 97,315 | ||||||
| 164,190 | 3.571%, 9/25/2035 | 138,362 | ||||||
Sequoia Mortgage Trust | ||||||||
| 261,161 | 0.463%, 11/20/2034d | 260,686 | ||||||
Structured Asset Mortgage Investments, Inc. | ||||||||
| 213,053 | 0.462%, 12/25/2035d | 168,552 | ||||||
Vericrest Opportunity Loan Transferee | ||||||||
| 95,016 | 3.625%, 3/25/2054e | 95,565 | ||||||
WaMu Mortgage Pass Through Certificates | ||||||||
| 151,626 | 2.383%, 10/25/2036 | 132,275 | ||||||
| 45,714 | 2.376%, 8/25/2046 | 39,941 | ||||||
Wells Fargo Mortgage Backed Securities Trust | ||||||||
| 175,156 | 5.000%, 3/25/2021 | 179,152 | ||||||
| 274,144 | 2.613%, 3/25/2036 | 274,526 | ||||||
The accompanying Notes to Financial Statements are an integral part of this schedule.
146
Table of Contents
Opportunity Income Plus Portfolio
Schedule of Investments as of June 30, 2014
(unaudited)
| Principal Amount | Long-Term Fixed Income (51.7%) | Value | ||||||
| Collateralized Mortgage Obligations (9.1%) - continued | ||||||||
| $ 127,026 | 2.623%, 4/25/2036 | $ | 124,439 | |||||
| 65,589 | 6.000%, 7/25/2037 | 65,375 | ||||||
|
| |||||||
| Total | 5,210,905 | |||||||
|
| |||||||
| Commercial Mortgage-Backed Securities (0.4%) | ||||||||
Bear Stearns Commercial Mortgage Securities, Inc. | ||||||||
| 5,931 | 5.846%, 6/11/2040 | 5,933 | ||||||
Credit Suisse Mortgage Capital Certificates | ||||||||
| 118,000 | 5.509%, 9/15/2039 | 126,926 | ||||||
Government National Mortgage Association | ||||||||
| 63,807 | 2.164%, 3/16/2033 | 64,118 | ||||||
LB-UBS Commercial Mortgage Trust | ||||||||
| 50,602 | 4.786%, 10/15/2029 | 50,741 | ||||||
|
| |||||||
| Total | 247,718 | |||||||
|
| |||||||
| Communications Services (3.6%) | ||||||||
AMC Networks, Inc. | ||||||||
| 64,810 | 7.750%, 7/15/2021 | 72,506 | ||||||
America Movil SAB de CV | ||||||||
| 21,000 | 5.000%, 10/16/2019 | 23,609 | ||||||
American Tower Corporation | ||||||||
| 38,000 | 7.000%, 10/15/2017 | 44,223 | ||||||
British Telecommunications plc | ||||||||
| 30,000 | 1.250%, 2/14/2017 | 30,027 | ||||||
CBS Corporation | ||||||||
| 39,000 | 8.875%, 5/15/2019 | 50,560 | ||||||
CC Holdings GS V, LLC | ||||||||
| 67,000 | 2.381%, 12/15/2017 | 68,229 | ||||||
CCO Holdings, LLC | ||||||||
| 64,810 | 7.000%, 1/15/2019 | 68,375 | ||||||
CenturyLink, Inc. | ||||||||
| 90,000 | 6.450%, 6/15/2021 | 97,650 | ||||||
Cequel Communications Escrow 1, LLC | ||||||||
| 80,000 | 6.375%, 9/15/2020g | 85,000 | ||||||
Columbus International, Inc. | ||||||||
| 70,000 | 7.375%, 3/30/2021g | 75,425 | ||||||
Cox Communications, Inc. | ||||||||
| 30,000 | 9.375%, 1/15/2019g | 38,853 | ||||||
Digicel, Ltd. | ||||||||
| 64,810 | 6.000%, 4/15/2021g | 66,916 | ||||||
DIRECTV Holdings, LLC | ||||||||
| 31,000 | 3.500%, 3/1/2016 | 32,348 | ||||||
| 29,000 | 5.875%, 10/1/2019 | 33,730 | ||||||
Hughes Satellite Systems Corporation | ||||||||
| 77,000 | 6.500%, 6/15/2019 | 85,855 | ||||||
Intelsat Jackson Holdings SA | ||||||||
| 64,810 | 7.250%, 10/15/2020 | 69,833 | ||||||
Level 3 Financing, Inc. | ||||||||
| 77,000 | 8.625%, 7/15/2020 | 86,240 | ||||||
NBC Universal Enterprise, Inc. | ||||||||
| 39,000 | 1.662%, 4/15/2018g | 38,974 | ||||||
Numericable Group SA | ||||||||
| 75,000 | 6.000%, 5/15/2022g | 78,000 | ||||||
SBA Tower Trust | ||||||||
| 40,000 | 5.101%, 4/17/2017g | 42,832 | ||||||
Sprint Communications, Inc. | ||||||||
| 64,810 | 9.000%, 11/15/2018g | 78,582 | ||||||
Telefonica Emisiones SAU | ||||||||
| 23,000 | 3.992%, 2/16/2016 | 24,081 | ||||||
| 30,000 | 3.192%, 4/27/2018 | 31,352 | ||||||
Time Warner Cable, Inc. | ||||||||
| 65,000 | 5.000%, 2/1/2020 | 72,840 | ||||||
T-Mobile USA, Inc. | ||||||||
| 125,000 | 6.633%, 4/28/2021 | 135,313 | ||||||
Univision Communications, Inc. | ||||||||
| 100,000 | 7.875%, 11/1/2020g | 110,000 | ||||||
UPCB Finance V, Ltd. | ||||||||
| 100,000 | 7.250%, 11/15/2021g | 110,000 | ||||||
Verizon Communications, Inc. | ||||||||
| 42,000 | 2.500%, 9/15/2016 | 43,291 | ||||||
| 33,000 | 1.981%, 9/14/2018d | 34,817 | ||||||
| 40,000 | 3.650%, 9/14/2018 | 42,779 | ||||||
| 20,000 | 2.550%, 6/17/2019 | 20,289 | ||||||
WideOpenWest Finance, LLC | ||||||||
| 100,000 | 10.250%, 7/15/2019 | 112,375 | ||||||
Wind Acquisition Finance SA | ||||||||
| 75,000 | 7.375%, 4/23/2021g | 80,063 | ||||||
|
| |||||||
| Total | 2,084,967 | |||||||
|
| |||||||
| Consumer Cyclical (2.9%) | ||||||||
AMC Entertainment, Inc. | ||||||||
| 79,000 | 5.875%, 2/15/2022 | 82,160 | ||||||
Brookfield Residential Properties, Inc. | ||||||||
| 100,000 | 6.500%, 12/15/2020g | 105,750 | ||||||
| 75,000 | 6.125%, 7/1/2022g | 78,000 | ||||||
Chrysler Group, LLC | ||||||||
| 64,810 | 8.250%, 6/15/2021 | 73,235 | ||||||
Cinemark USA, Inc. | ||||||||
| 80,000 | 4.875%, 6/1/2023 | 79,800 | ||||||
Daimler Finance North America, LLC | ||||||||
| 21,000 | 1.875%, 1/11/2018g | 21,190 | ||||||
Delphi Corporation | ||||||||
| 30,000 | 6.125%, 5/15/2021 | 33,528 | ||||||
ERAC USA Finance, LLC | ||||||||
| 40,000 | 2.350%, 10/15/2019g | 39,957 | ||||||
Ford Motor Credit Company, LLC | ||||||||
| 32,000 | 3.984%, 6/15/2016 | 33,814 | ||||||
| 28,000 | 1.500%, 1/17/2017 | 28,152 | ||||||
| 25,000 | 3.000%, 6/12/2017 | 26,081 | ||||||
| 38,000 | 5.000%, 5/15/2018 | 42,273 | ||||||
General Motors Company | ||||||||
| 30,000 | 3.500%, 10/2/2018g | 30,675 | ||||||
General Motors Financial Company, Inc. | ||||||||
| 64,810 | 3.250%, 5/15/2018 | 65,782 | ||||||
GLP Capital, LP | ||||||||
| 85,000 | 4.875%, 11/1/2020g | 87,550 | ||||||
Hilton Worldwide Finance, LLC | ||||||||
| 100,000 | 5.625%, 10/15/2021g | 106,250 | ||||||
Hyundai Capital America | ||||||||
| 28,000 | 1.450%, 2/6/2017g | 28,105 | ||||||
Jaguar Land Rover Automotive plc | ||||||||
| 77,000 | 5.625%, 2/1/2023g | 81,813 | ||||||
The accompanying Notes to Financial Statements are an integral part of this schedule.
147
Table of Contents
Opportunity Income Plus Portfolio
Schedule of Investments as of June 30, 2014
(unaudited)
| Principal Amount | Long-Term Fixed Income (51.7%) | Value | ||||||
| Consumer Cyclical (2.9%) - continued | ||||||||
KB Home | ||||||||
| $ 71,000 | 4.750%, 5/15/2019 | $ | 71,533 | |||||
L Brands, Inc. | ||||||||
| 77,000 | 6.625%, 4/1/2021 | 87,491 | ||||||
Macy’s Retail Holdings, Inc. | ||||||||
| 36,000 | 7.450%, 7/15/2017 | 42,268 | ||||||
Nissan Motor Acceptance Corporation | ||||||||
| 22,000 | 0.777%, 3/3/2017d,g | 22,064 | ||||||
Royal Caribbean Cruises, Ltd. | ||||||||
| 64,810 | 5.250%, 11/15/2022 | 68,051 | ||||||
Toll Brothers Finance Corporation | ||||||||
| 52,000 | 4.000%, 12/31/2018 | 53,560 | ||||||
TRW Automotive, Inc. | ||||||||
| 22,000 | 7.250%, 3/15/2017g | 25,025 | ||||||
West Corporation | ||||||||
| 64,810 | 8.625%, 10/1/2018 | 68,861 | ||||||
| 80,000 | 5.375%, 7/15/2022c,g | 79,200 | ||||||
Wynn Las Vegas, LLC | ||||||||
| 77,000 | 5.375%, 3/15/2022 | 80,176 | ||||||
|
| |||||||
| Total | 1,642,344 | |||||||
|
| |||||||
| Consumer Non-Cyclical (3.1%) | ||||||||
AbbVie, Inc. | ||||||||
| 21,000 | 2.000%, 11/6/2018 | 20,974 | ||||||
Altria Group, Inc. | ||||||||
| 48,000 | 9.700%, 11/10/2018 | 62,896 | ||||||
Anheuser-Busch InBev Worldwide, Inc. | ||||||||
| 30,000 | 7.750%, 1/15/2019 | 37,063 | ||||||
Beam, Inc. | ||||||||
| 21,000 | 5.375%, 1/15/2016 | 22,356 | ||||||
Boston Scientific Corporation | ||||||||
| 30,000 | 2.650%, 10/1/2018 | 30,667 | ||||||
CareFusion Corporation | ||||||||
| 32,000 | 1.450%, 5/15/2017 | 31,976 | ||||||
Celgene Corporation | ||||||||
| 48,000 | 1.900%, 8/15/2017 | 48,700 | ||||||
CHS/Community Health Systems, Inc. | ||||||||
| 77,000 | 7.125%, 7/15/2020 | 83,352 | ||||||
ConAgra Foods, Inc. | ||||||||
| 40,000 | 2.100%, 3/15/2018 | 40,128 | ||||||
Cott Beverages, Inc. | ||||||||
| 75,000 | 5.375%, 7/1/2022g | 75,188 | ||||||
Coventry Health Care, Inc. | ||||||||
| 19,000 | 5.950%, 3/15/2017 | 21,362 | ||||||
CVS Caremark Corporation | ||||||||
| 24,000 | 2.250%, 12/5/2018 | 24,294 | ||||||
Express Scripts Holding Company | ||||||||
| 30,000 | 2.650%, 2/15/2017 | 31,167 | ||||||
Forest Laboratories, Inc. | ||||||||
| 37,000 | 4.375%, 2/1/2019g | 39,916 | ||||||
Fresenius Medical Care US Finance, Inc. | ||||||||
| 64,810 | 5.750%, 2/15/2021g | 70,805 | ||||||
Gilead Sciences, Inc. | ||||||||
| 20,000 | 3.050%, 12/1/2016 | 20,958 | ||||||
Grupo Bimbo SAB de CV | ||||||||
| 75,000 | 3.875%, 6/27/2024g | 74,852 | ||||||
Hawk Acquisition Sub, Inc. | ||||||||
| 77,000 | 4.250%, 10/15/2020 | 77,481 | ||||||
HCA, Inc. | ||||||||
| 64,810 | 4.750%, 5/1/2023 | 64,729 | ||||||
IMS Health, Inc. | ||||||||
| 75,000 | 6.000%, 11/1/2020g | 78,750 | ||||||
JBS Finance II, Ltd. | ||||||||
| 64,810 | 8.250%, 1/29/2018e | 68,699 | ||||||
Kroger Company | ||||||||
| 50,000 | 1.200%, 10/17/2016 | 50,164 | ||||||
Lorillard Tobacco Company | ||||||||
| 30,000 | 8.125%, 6/23/2019 | 37,403 | ||||||
McKesson Corporation | ||||||||
| 35,000 | 1.292%, 3/10/2017 | 35,093 | ||||||
Medco Health Solutions, Inc. | ||||||||
| 17,000 | 7.125%, 3/15/2018 | 20,081 | ||||||
Mondelez International, Inc. | ||||||||
| 20,000 | 2.250%, 2/1/2019 | 20,137 | ||||||
Mylan, Inc. | ||||||||
| 34,000 | 1.350%, 11/29/2016 | 34,057 | ||||||
Pernod Ricard SA | ||||||||
| 26,000 | 2.950%, 1/15/2017g | 27,038 | ||||||
| 26,000 | 5.750%, 4/7/2021g | 29,888 | ||||||
Perrigo Company, Ltd. | ||||||||
| 20,000 | 1.300%, 11/8/2016g | 19,970 | ||||||
| 26,000 | 2.300%, 11/8/2018g | 25,989 | ||||||
Revlon Consumer Products Corporation | ||||||||
| 64,810 | 5.750%, 2/15/2021 | 66,592 | ||||||
SABMiller plc | ||||||||
| 30,000 | 6.500%, 7/15/2018g | 35,108 | ||||||
Safeway, Inc. | ||||||||
| 40,000 | 3.400%, 12/1/2016 | 42,093 | ||||||
Spectrum Brands Escrow Corporation | ||||||||
| 77,000 | 6.375%, 11/15/2020 | 82,775 | ||||||
Tenet Healthcare Corporation | ||||||||
| 75,000 | 8.125%, 4/1/2022 | 86,813 | ||||||
Thermo Fisher Scientific, Inc. | ||||||||
| 30,000 | 1.300%, 2/1/2017 | 30,044 | ||||||
| 30,000 | 2.400%, 2/1/2019 | 30,305 | ||||||
Valeant Pharmaceuticals International | ||||||||
| 64,810 | 7.250%, 7/15/2022g | 69,995 | ||||||
WM Wrigley Jr. Company | ||||||||
| 20,000 | 2.000%, 10/20/2017g | 20,293 | ||||||
|
| |||||||
| Total | 1,790,151 | |||||||
|
| |||||||
| Energy (2.5%) | ||||||||
BP Capital Markets plc | ||||||||
| 30,000 | 0.643%, 11/7/2016d | 30,140 | ||||||
Buckeye Partners, LP | ||||||||
| 52,000 | 2.650%, 11/15/2018 | 52,867 | ||||||
CNOOC Nexen Finance 2014 ULC | ||||||||
| 25,000 | 1.625%, 4/30/2017 | 25,064 | ||||||
CNPC General Capital, Ltd. | ||||||||
| 33,000 | 2.750%, 4/19/2017g | 33,857 | ||||||
| 80,000 | 2.750%, 5/14/2019g | 79,982 | ||||||
Concho Resources, Inc. | ||||||||
| 64,810 | 6.500%, 1/15/2022 | 71,453 | ||||||
Continental Resources, Inc. | ||||||||
| 35,000 | 7.125%, 4/1/2021 | 39,638 | ||||||
Devon Energy Corporation | ||||||||
| 28,000 | 1.200%, 12/15/2016 | 28,085 | ||||||
The accompanying Notes to Financial Statements are an integral part of this schedule.
148
Table of Contents
Opportunity Income Plus Portfolio
Schedule of Investments as of June 30, 2014
(unaudited)
| Principal Amount | Long-Term Fixed Income (51.7%) | Value | ||||||
| Energy (2.5%) - continued | ||||||||
Enbridge, Inc. | ||||||||
| $ 19,000 | 0.678%, 6/2/2017d | $ | 19,038 | |||||
Energy Transfer Partners, LP | ||||||||
| 26,000 | 6.700%, 7/1/2018 | 30,443 | ||||||
Energy XXI Gulf Coast, Inc. | ||||||||
| 80,000 | 7.750%, 6/15/2019 | 85,600 | ||||||
EQT Corporation | ||||||||
| 5,000 | 5.150%, 3/1/2018 | 5,456 | ||||||
| 26,000 | 8.125%, 6/1/2019 | 32,531 | ||||||
Harvest Operations Corporation | ||||||||
| 64,810 | 6.875%, 10/1/2017 | 70,319 | ||||||
Hess Corporation | ||||||||
| 20,000 | 8.125%, 2/15/2019 | 25,159 | ||||||
Kodiak Oil & Gas Corporation | ||||||||
| 64,810 | 5.500%, 1/15/2021 | 67,564 | ||||||
Linn Energy, LLC | ||||||||
| 64,810 | 8.625%, 4/15/2020 | 69,995 | ||||||
Lukoil International Finance BV | ||||||||
| 26,000 | 3.416%, 4/24/2018g | 25,805 | ||||||
MEG Energy Corporation | ||||||||
| 77,000 | 6.375%, 1/30/2023g | 81,812 | ||||||
Oasis Petroleum, Inc. | ||||||||
| 77,000 | 6.875%, 1/15/2023 | 83,930 | ||||||
Offshore Group Investment, Ltd. | ||||||||
| 100,000 | 7.500%, 11/1/2019 | 105,750 | ||||||
Petrobras Global Finance BV | ||||||||
| 40,000 | 2.000%, 5/20/2016 | 40,058 | ||||||
| 75,000 | 3.112%, 3/17/2020d | 77,059 | ||||||
Petroleos Mexicanos | ||||||||
| 53,000 | 3.125%, 1/23/2019g | 54,829 | ||||||
Range Resources Corporation | ||||||||
| 91,382 | 5.000%, 8/15/2022 | 96,865 | ||||||
Suncor Energy, Inc. | ||||||||
| 20,000 | 6.100%, 6/1/2018 | 23,211 | ||||||
Transocean, Inc. | ||||||||
| 32,000 | 6.000%, 3/15/2018 | 36,145 | ||||||
Weatherford International, Ltd. | ||||||||
| 28,000 | 6.000%, 3/15/2018 | 31,859 | ||||||
| 18,000 | 9.625%, 3/1/2019 | 23,621 | ||||||
|
| |||||||
| Total | 1,448,135 | |||||||
|
| |||||||
| Financials (8.0%) | ||||||||
Abbey National Treasury Services plc | ||||||||
| 26,000 | 3.050%, 8/23/2018 | 27,228 | ||||||
ABN AMRO Bank NV | ||||||||
| 30,000 | 2.500%, 10/30/2018g | 30,440 | ||||||
Ally Financial, Inc. | ||||||||
| 100,000 | 4.750%, 9/10/2018 | 106,125 | ||||||
American International Group, Inc. | ||||||||
| 40,000 | 8.250%, 8/15/2018 | 49,696 | ||||||
ANZ New Zealand International, Ltd. | ||||||||
| 30,000 | 1.400%, 4/27/2017g | 30,057 | ||||||
Aviation Capital Group Corporation | ||||||||
| 20,000 | 3.875%, 9/27/2016g | 20,700 | ||||||
Bank of America Corporation | ||||||||
| 39,000 | 5.750%, 8/15/2016 | 42,552 | ||||||
| 44,000 | 5.700%, 5/2/2017 | 48,828 | ||||||
| 50,000 | 5.750%, 12/1/2017 | 56,396 | ||||||
| 20,000 | 2.000%, 1/11/2018 | 20,129 | ||||||
| 76,000 | 1.300%, 3/22/2018d | 76,978 | ||||||
| 65,000 | 5.650%, 5/1/2018 | 73,680 | ||||||
Bank of Tokyo-Mitsubishi UFJ, Ltd. | ||||||||
| 36,000 | 0.640%, 3/10/2017d,g | 35,991 | ||||||
Banque Federative du Credit Mutuel SA | ||||||||
| 30,000 | 1.078%, 1/20/2017d,g | 30,257 | ||||||
Barclays Bank plc | ||||||||
| 20,000 | 5.140%, 10/14/2020 | 21,906 | ||||||
BB&T Corporation | ||||||||
| 38,000 | 2.050%, 6/19/2018 | 38,418 | ||||||
BBVA Banco Continental SA | ||||||||
| 38,000 | 2.250%, 7/29/2016g | 38,285 | ||||||
BBVA International Preferred SA Unipersonal | ||||||||
| 115,000 | 5.919%, 12/29/2049h | 119,887 | ||||||
BBVA US Senior SAU | ||||||||
| 43,000 | 4.664%, 10/9/2015 | 44,957 | ||||||
Bear Stearns Companies, LLC | ||||||||
| 45,000 | 6.400%, 10/2/2017 | 51,882 | ||||||
BNP Paribas SA | ||||||||
| 27,000 | 1.250%, 12/12/2016 | 27,034 | ||||||
| 30,000 | 2.375%, 9/14/2017 | 30,720 | ||||||
BPCE SA | ||||||||
| 30,000 | 1.625%, 2/10/2017 | 30,221 | ||||||
| 57,000 | 5.150%, 7/21/2024g | 60,175 | ||||||
Branch Banking and Trust Company | ||||||||
| 30,000 | 0.657%, 12/1/2016d | 30,100 | ||||||
Caixa Economica Federal | ||||||||
| 90,000 | 4.250%, 5/13/2019g | 90,855 | ||||||
Capital One Financial Corporation | ||||||||
| 38,000 | 6.150%, 9/1/2016 | 42,053 | ||||||
CIT Group, Inc. | ||||||||
| 80,000 | 3.875%, 2/19/2019 | 81,248 | ||||||
Citigroup, Inc. | ||||||||
| 83,000 | 5.500%, 2/15/2017 | 91,280 | ||||||
| 42,000 | 6.000%, 8/15/2017 | 47,539 | ||||||
| 30,000 | 8.500%, 5/22/2019 | 38,346 | ||||||
Cooperatieve Centrale Raiffeisen-Boerenleenbank BA | ||||||||
| 45,000 | 4.625%, 12/1/2023 | 47,563 | ||||||
Credit Agricole SA | ||||||||
| 30,000 | 1.625%, 4/15/2016g | 30,398 | ||||||
Credit Suisse Group AG | ||||||||
| 57,000 | 7.500%, 12/11/2049g,h | 63,093 | ||||||
CyrusOne, LP | ||||||||
| 64,810 | 6.375%, 11/15/2022 | 69,833 | ||||||
DDR Corporation | ||||||||
| 20,000 | 9.625%, 3/15/2016 | 22,884 | ||||||
Denali Borrower, LLC | ||||||||
| 122,000 | 5.625%, 10/15/2020g | 129,320 | ||||||
Deutsche Bank AG | ||||||||
| 37,000 | 1.350%, 5/30/2017 | 36,988 | ||||||
Discover Bank | ||||||||
| 10,000 | 8.700%, 11/18/2019 | 12,710 | ||||||
Discover Financial Services | ||||||||
| 20,000 | 6.450%, 6/12/2017 | 22,750 | ||||||
Fifth Third Bancorp | ||||||||
| 48,000 | 5.450%, 1/15/2017 | 52,618 | ||||||
The accompanying Notes to Financial Statements are an integral part of this schedule.
149
Table of Contents
Opportunity Income Plus Portfolio
Schedule of Investments as of June 30, 2014
(unaudited)
| Principal Amount | Long-Term Fixed Income (51.7%) | Value | ||||||
| Financials (8.0%) - continued | ||||||||
General Electric Capital Corporation | ||||||||
| $ 44,000 | 0.504%, 5/15/2017d | $ | 44,037 | |||||
| 35,000 | 5.625%, 9/15/2017 | 39,621 | ||||||
| 18,000 | 1.625%, 4/2/2018 | 18,029 | ||||||
Genworth Financial, Inc. | ||||||||
| 32,000 | 7.700%, 6/15/2020 | 39,436 | ||||||
Goldman Sachs Group, Inc. | ||||||||
| 32,000 | 6.250%, 9/1/2017 | 36,431 | ||||||
| 40,000 | 2.375%, 1/22/2018 | 40,621 | ||||||
| 20,000 | 2.625%, 1/31/2019 | 20,272 | ||||||
| 30,000 | 7.500%, 2/15/2019 | 36,611 | ||||||
| 60,000 | 5.700%, 12/29/2049h | 61,988 | ||||||
Hartford Financial Services Group, Inc. | ||||||||
| 45,000 | 6.000%, 1/15/2019 | 52,218 | ||||||
HBOS plc | ||||||||
| 40,000 | 6.750%, 5/21/2018g | 46,081 | ||||||
HCP, Inc. | ||||||||
| 19,000 | 3.750%, 2/1/2016 | 19,859 | ||||||
| 25,000 | 3.750%, 2/1/2019 | 26,639 | ||||||
Health Care REIT, Inc. | ||||||||
| 26,000 | 4.700%, 9/15/2017 | 28,442 | ||||||
HSBC Finance Corporation | ||||||||
| 40,000 | 6.676%, 1/15/2021 | 47,836 | ||||||
Huntington National Bank | ||||||||
| 30,000 | 1.300%, 11/20/2016 | 30,131 | ||||||
Icahn Enterprises, LP | ||||||||
| 110,000 | 6.000%, 8/1/2020 | 117,838 | ||||||
ING Bank NV | ||||||||
| 57,000 | 5.800%, 9/25/2023g | 64,211 | ||||||
ING Capital Funding Trust III | ||||||||
| 25,000 | 3.834%, 12/29/2049d,h | 25,000 | ||||||
International Lease Finance Corporation | ||||||||
| 26,000 | 2.181%, 6/15/2016d | 26,162 | ||||||
| 85,000 | 5.875%, 4/1/2019 | 93,500 | ||||||
Intesa Sanpaolo SPA | ||||||||
| 18,000 | 3.625%, 8/12/2015g | 18,391 | ||||||
| 10,000 | 3.875%, 1/16/2018 | 10,539 | ||||||
| 32,000 | 3.875%, 1/15/2019 | 33,559 | ||||||
J.P. Morgan Chase & Company | ||||||||
| 40,000 | 3.450%, 3/1/2016 | 41,741 | ||||||
| 20,000 | 0.744%, 2/15/2017d | 20,073 | ||||||
| 35,000 | 2.000%, 8/15/2017 | 35,593 | ||||||
| 20,000 | 6.300%, 4/23/2019 | 23,646 | ||||||
| 49,000 | 7.900%, 4/29/2049h | 54,757 | ||||||
| 125,000 | 6.750%, 8/29/2049h | 134,531 | ||||||
KeyCorp | ||||||||
| 30,000 | 2.300%, 12/13/2018 | 30,350 | ||||||
Kookmin Bank | ||||||||
| 30,000 | 1.103%, 1/27/2017d,g | 30,164 | ||||||
Liberty Mutual Group, Inc. | ||||||||
| 10,000 | 5.000%, 6/1/2021g | 11,000 | ||||||
Liberty Property, LP | ||||||||
| 40,000 | 5.500%, 12/15/2016 | 43,672 | ||||||
Macquarie Bank, Ltd. | ||||||||
| 30,000 | 5.000%, 2/22/2017g | 32,694 | ||||||
Metropolitan Life Global Funding I | ||||||||
| 20,000 | 1.300%, 4/10/2017g | 20,046 | ||||||
Mizuho Corporate Bank, Ltd. | ||||||||
| 25,000 | 1.550%, 10/17/2017g | 24,973 | ||||||
Morgan Stanley | ||||||||
| 40,000 | 1.750%, 2/25/2016 | 40,568 | ||||||
| 50,000 | 6.250%, 8/28/2017 | 56,984 | ||||||
| 40,000 | 6.625%, 4/1/2018 | 46,759 | ||||||
| 26,000 | 4.875%, 11/1/2022 | 27,909 | ||||||
Murray Street Investment Trust I | ||||||||
| 60,000 | 4.647%, 3/9/2017 | 64,847 | ||||||
National City Corporation | ||||||||
| 20,000 | 6.875%, 5/15/2019 | 23,886 | ||||||
Nomura Holdings, Inc. | ||||||||
| 30,000 | 2.000%, 9/13/2016 | 30,490 | ||||||
| 21,000 | 2.750%, 3/19/2019 | 21,363 | ||||||
Oversea-Chinese Banking Corporation, Ltd. | ||||||||
| 75,000 | 4.250%, 6/19/2024g | 75,276 | ||||||
PNC Bank NA | ||||||||
| 40,000 | 1.150%, 11/1/2016 | 40,207 | ||||||
Prologis, LP | ||||||||
| 25,000 | 6.625%, 5/15/2018 | 29,178 | ||||||
Realty Income Corporation | ||||||||
| 33,000 | 2.000%, 1/31/2018 | 33,156 | ||||||
Regions Bank | ||||||||
| 40,000 | 7.500%, 5/15/2018 | 47,608 | ||||||
Reinsurance Group of America, Inc. | ||||||||
| 40,000 | 5.625%, 3/15/2017 | 43,679 | ||||||
Royal Bank of Scotland Group plc | ||||||||
| 30,000 | 5.050%, 1/8/2015 | 30,554 | ||||||
| 22,000 | 1.174%, 3/31/2017d | 22,107 | ||||||
| 57,000 | 7.640%, 3/29/2049h | 60,919 | ||||||
| 57,000 | 7.648%, 8/29/2049h | 68,970 | ||||||
Santander US Debt SAU | ||||||||
| 29,000 | 3.781%, 10/7/2015g | 29,955 | ||||||
SLM Corporation | ||||||||
| 20,000 | 6.250%, 1/25/2016 | 21,250 | ||||||
Societe Generale SA | ||||||||
| 30,000 | 5.750%, 4/20/2016g | 32,188 | ||||||
State Bank of India | ||||||||
| 65,000 | 3.622%, 4/17/2019g | 65,395 | ||||||
Sumitomo Mitsui Banking Corporation | ||||||||
| 60,000 | 1.300%, 1/10/2017 | 60,102 | ||||||
Suncorp-Metway, Ltd. | ||||||||
| 20,000 | 0.934%, 3/28/2017d,g | 20,000 | ||||||
Swiss RE Capital I, LP | ||||||||
| 30,000 | 6.854%, 5/29/2049g,h | 32,100 | ||||||
Ventas Realty, LP | ||||||||
| 22,000 | 1.550%, 9/26/2016 | 22,224 | ||||||
| 22,000 | 1.250%, 4/17/2017 | 22,003 | ||||||
Voya Financial, Inc. | ||||||||
| 30,000 | 2.900%, 2/15/2018 | 31,087 | ||||||
Wells Fargo & Company | ||||||||
| 20,000 | 1.250%, 7/20/2016 | 20,173 | ||||||
|
| |||||||
| Total | 4,623,749 | |||||||
|
| |||||||
| Foreign Government (0.8%) | ||||||||
Azerbaijan Government International Bond | ||||||||
| 35,000 | 4.750%, 3/18/2024g | 36,050 | ||||||
Bahama Government International Bond | ||||||||
| 50,000 | 5.750%, 1/16/2024g | 53,250 | ||||||
The accompanying Notes to Financial Statements are an integral part of this schedule.
150
Table of Contents
Opportunity Income Plus Portfolio
Schedule of Investments as of June 30, 2014
(unaudited)
| Principal Amount | Long-Term Fixed Income (51.7%) | Value | ||||||
| Foreign Government (0.8%) - continued | ||||||||
Colombia Government International Bond | ||||||||
| $ 45,000 | 2.625%, 3/15/2023 | $ | 42,075 | |||||
Costa Rica Government International Bond | ||||||||
| 65,000 | 7.000%, 4/4/2044g | 67,600 | ||||||
Hungary Government International Bond | ||||||||
| 80,000 | 4.000%, 3/25/2019 | 82,408 | ||||||
Poland Government International Bond | ||||||||
| 53,000 | 4.000%, 1/22/2024 | 54,987 | ||||||
Slovenia Government International Bond | ||||||||
| 70,000 | 4.125%, 2/18/2019g | 73,741 | ||||||
Uruguay Government International Bond | ||||||||
| 55,000 | 5.100%, 6/18/2050 | 54,313 | ||||||
|
| |||||||
| Total | 464,424 | |||||||
|
| |||||||
| Mortgage-Backed Securities (9.6%) | ||||||||
Federal Home Loan Mortgage Corporation Gold 15-Yr. Pass Through | ||||||||
| 250,000 | 3.000%, 7/1/2029c | 259,140 | ||||||
Federal Home Loan Mortgage Corporation Gold 20-Yr. Pass Through | ||||||||
| 52,769 | 5.500%, 9/1/2024 | 59,031 | ||||||
Federal Home Loan Mortgage Corporation Gold 30-Yr. Pass Through | ||||||||
| 250,000 | 4.000%, 7/1/2044c | 264,844 | ||||||
Federal National Mortgage Association Conventional 15-yr. Pass Through | ||||||||
| 600,000 | 3.500%, 8/1/2029c | 634,312 | ||||||
Federal National Mortgage Association Conventional 20-Yr. Pass Through | ||||||||
| 380,373 | 6.000%, 8/1/2024 | 428,019 | ||||||
Federal National Mortgage Association Conventional 30-Yr. Pass Through | ||||||||
| 1,200,000 | 3.500%, 7/1/2044c | 1,235,250 | ||||||
| 1,000,000 | 4.000%, 7/1/2044c | 1,061,250 | ||||||
| 1,450,000 | 4.500%, 8/1/2044c | 1,566,737 | ||||||
|
| |||||||
| Total | 5,508,583 | |||||||
|
| |||||||
| Technology (1.2%) | ||||||||
Alliance Data Systems Corporation | ||||||||
| 64,810 | 6.375%, 4/1/2020g | 69,023 | ||||||
Amkor Technology, Inc. | ||||||||
| 100,000 | 6.625%, 6/1/2021 | 106,500 | ||||||
BMC Software Finance, Inc. | ||||||||
| 64,810 | 8.125%, 7/15/2021g | 66,673 | ||||||
EMC Corporation | ||||||||
| 20,000 | 1.875%, 6/1/2018 | 20,132 | ||||||
Fidelity National Information Services, Inc. | ||||||||
| 37,000 | 1.450%, 6/5/2017 | 36,956 | ||||||
First Data Corporation | ||||||||
| 64,810 | 7.375%, 6/15/2019g | 69,590 | ||||||
Freescale Semiconductor, Inc. | ||||||||
| 105,000 | 6.000%, 1/15/2022g | 111,825 | ||||||
Hewlett-Packard Company | ||||||||
| 35,000 | 5.400%, 3/1/2017 | 38,788 | ||||||
Iron Mountain, Inc. | ||||||||
| 64,810 | 6.000%, 8/15/2023 | 70,076 | ||||||
Tyco Electronics Group SA | ||||||||
| 38,000 | 6.550%, 10/1/2017 | 43,973 | ||||||
Xerox Corporation | ||||||||
| 38,000 | 7.200%, 4/1/2016 | 41,912 | ||||||
|
| |||||||
| Total | 675,448 | |||||||
|
| |||||||
| Transportation (0.6%) | ||||||||
American Airlines Pass Through Trust | ||||||||
| 19,408 | 4.950%, 1/15/2023g | 21,009 | ||||||
Avis Budget Car Rental, LLC | ||||||||
| 35,000 | 5.125%, 6/1/2022g | 35,044 | ||||||
Continental Airlines, Inc. | ||||||||
| 58,241 | 6.250%, 4/11/2020 | 63,847 | ||||||
Delta Air Lines, Inc. | ||||||||
| 28,279 | 4.950%, 5/23/2019 | 30,541 | ||||||
| 23,317 | 4.750%, 5/7/2020 | 25,299 | ||||||
Hertz Corporation | ||||||||
| 77,000 | 6.750%, 4/15/2019 | 81,620 | ||||||
Korea Expressway Corporation | ||||||||
| 33,000 | 1.625%, 4/28/2017g | 32,966 | ||||||
United Air Lines, Inc. | ||||||||
| 31,481 | 10.400%, 11/1/2016 | 35,809 | ||||||
|
| |||||||
| Total | 326,135 | |||||||
|
| |||||||
| U.S. Government and Agencies (0.3%) | ||||||||
U.S. Treasury Notes | ||||||||
| 150,000 | 0.375%, 5/31/2016 | 149,865 | ||||||
|
| |||||||
| Total | 149,865 | |||||||
|
| |||||||
| Utilities (2.2%) | ||||||||
Access Midstream Partners, LP | ||||||||
| 100,000 | 4.875%, 5/15/2023 | 105,375 | ||||||
AES Corporation | ||||||||
| 64,810 | 7.375%, 7/1/2021 | 75,828 | ||||||
Atlas Pipeline Partners, LP | ||||||||
| 77,000 | 4.750%, 11/15/2021 | 75,460 | ||||||
Calpine Corporation | ||||||||
| 100,000 | 6.000%, 1/15/2022g | 107,750 | ||||||
Commonwealth Edison Company | ||||||||
| 22,000 | 6.950%, 7/15/2018 | 26,015 | ||||||
DCP Midstream Operating, LP | ||||||||
| 29,000 | 2.500%, 12/1/2017 | 29,832 | ||||||
Dominion Resources, Inc. | ||||||||
| 34,000 | 1.250%, 3/15/2017 | 34,134 | ||||||
Electricite de France | ||||||||
| 30,000 | 0.688%, 1/20/2017d,g | 30,122 | ||||||
| 57,000 | 5.625%, 12/29/2049g,h | 59,582 | ||||||
Enel Finance International NV | ||||||||
| 26,000 | 5.125%, 10/7/2019g | 29,273 | ||||||
Enterprise Products Operating, LLC | ||||||||
| 70,000 | 7.000%, 6/1/2067 | 74,200 | ||||||
Exelon Generation Company, LLC | ||||||||
| 20,000 | 5.200%, 10/1/2019 | 22,493 | ||||||
The accompanying Notes to Financial Statements are an integral part of this schedule.
151
Table of Contents
Opportunity Income Plus Portfolio
Schedule of Investments as of June 30, 2014
(unaudited)
| Principal Amount | Long-Term Fixed Income (51.7%) | Value | ||||||
| Utilities (2.2%) - continued | |||||||
| Fermaca Enterprises S de RL de CV | ||||||||
| $ 80,000 | 6.375%, 3/30/2038g | $ | 83,400 | |||||
MidAmerican Energy Holdings Company | ||||||||
| 39,000 | 1.100%, 5/15/2017 | 38,841 | ||||||
| 20,000 | 5.750%, 4/1/2018 | 22,889 | ||||||
NiSource Finance Corporation | ||||||||
| 40,000 | 6.400%, 3/15/2018 | 45,957 | ||||||
NRG Energy, Inc. | ||||||||
| 64,810 | 6.625%, 3/15/2023 | 70,157 | ||||||
Oleoducto Central SA | ||||||||
| 75,000 | 4.000%, 5/7/2021g | 75,000 | ||||||
ONEOK Partners, LP | ||||||||
| 26,000 | 2.000%, 10/1/2017 | 26,355 | ||||||
| 26,000 | 3.200%, 9/15/2018 | 27,128 | ||||||
Pacific Gas & Electric Company | ||||||||
| 26,000 | 5.625%, 11/30/2017 | 29,400 | ||||||
Panhandle Eastern Pipe Line Company, LP | ||||||||
| 28,000 | 6.200%, 11/1/2017 | 31,746 | ||||||
PG&E Corporation | ||||||||
| 19,000 | 2.400%, 3/1/2019 | 19,171 | ||||||
PPL Capital Funding, Inc. | ||||||||
| 40,000 | 1.900%, 6/1/2018 | 39,970 | ||||||
TransAlta Corporation | ||||||||
| 37,000 | 1.900%, 6/3/2017 | 37,145 | ||||||
Williams Companies, Inc. | ||||||||
| 40,000 | 7.875%, 9/1/2021 | 49,661 | ||||||
|
| |||||||
| Total | 1,266,884 | |||||||
|
| |||||||
Total Long-Term Fixed Income (cost $28,951,200) | 29,643,868 | |||||||
|
| |||||||
| Shares | Common Stock (5.7%) | |||||||
| Financials (5.7%) | |||||||
| 25,785 | Aberdeen Asia-Pacific Income Fund, Inc. | 161,930 | ||||||
| 6,200 | Cohen & Steers REIT and Preferred Income Fund, Inc. | 111,786 | ||||||
| 1,861 | First Trust High Income Long/Short Fund | 33,777 | ||||||
| 10,900 | iShares FTSE NAREIT Mortgage Plus Capped Index Fund | 137,776 | ||||||
| 8,200 | iShares J.P. Morgan USD Emerging Markets Bond ETF | 945,214 | ||||||
| 6,900 | iShares MSCI Emerging Markets Minimum Volatility ETF | 414,759 | ||||||
| 29,597 | MFS Intermediate Income Trust | 156,272 | ||||||
| 18,070 | Nuveen Quality Preferred Income Fund II | 163,172 | ||||||
| 19,964 | Templeton Global Income Fund | 164,903 | ||||||
| 11,100 | Vanguard MSCI Emerging Markets ETF | 478,743 | ||||||
| 2,725 | Vanguard Short-Term Corporate Bond ETF | 219,008 | ||||||
| 9,049 | Western Asset Emerging Markets Debt Fund, Inc. | 166,321 | ||||||
| 16,794 | Western Asset High Income Opportunity Fund, Inc. | 102,443 | ||||||
|
| |||||||
| Total | 3,256,104 | |||||||
|
| |||||||
Total Common Stock (cost $3,084,637) | 3,256,104 | |||||||
�� |
| |||||||
Preferred Stock (1.7%) | ||||||||
| Financials (1.5%) | |||||||
| 2,850 | Affiliated Managers Group, Inc., 5.250% | 74,955 | ||||||
| 855 | Agribank FCB, 6.875%h | 90,844 | ||||||
| 52 | Bank of America Corporation, Convertible, 7.250%h | 60,684 | ||||||
| 2,280 | CHS, Inc., 7.100%h | 61,925 | ||||||
| 4,620 | Citigroup, Inc., 6.875%h | 125,387 | ||||||
| 1,135 | Farm Credit Bank of Texas, 6.750%g,h | 118,785 | ||||||
| 3,275 | HSBC USA, Inc., 6.500%h | 83,345 | ||||||
| 92 | M&T Bank Corporation, 6.375%h | 95,651 | ||||||
| 2,300 | Morgan Stanley, 7.125%h | 64,101 | ||||||
| 1,539 | U.S. Bancorp 6.500%h | 43,492 | ||||||
| 57 | Wells Fargo & Company, Convertible, 7.500%h | 69,198 | ||||||
|
| |||||||
| Total | 888,367 | |||||||
|
| |||||||
| Utilities (0.2%) | |||||||
| 865 | Southern California Edison Company, 4.920%d,h | 88,609 | ||||||
|
| |||||||
| Total | 88,609 | |||||||
|
| |||||||
Total Preferred Stock (cost $932,299) | 976,976 | |||||||
|
| |||||||
| Shares or Principal Amount | Short-Term Investments (11.8%)i | |||||||
Federal Home Loan Bank Discount Notes | ||||||||
| 100,000 | 0.090%, 7/30/2014j | 99,993 | ||||||
| 6,688,772 | Thrivent Cash Management Trust 0.050% | 6,688,772 | ||||||
|
| |||||||
| Total Short-Term Investments (at amortized cost) | 6,788,765 | |||||||
|
| |||||||
Total Investments (cost $62,111,883) 109.9% | $ | 63,036,520 | ||||||
|
| |||||||
| Other Assets and Liabilities, Net (9.9%) | (5,653,061 | ) | ||||||
|
| |||||||
| Total Net Assets 100.0% | $ | 57,383,459 | ||||||
|
| |||||||
| a | The stated interest rate represents the weighted average of all contracts within the bank loan facility. |
| b | All or a portion of the loan is unfunded. |
| c | Denotes investments purchased on a when-issued or delayed delivery basis. |
| d | Denotes variable rate securities. Variable rate securities are securities whose yields vary with a designated market index or market rate. The rate shown is as of June 30, 2014. |
The accompanying Notes to Financial Statements are an integral part of this schedule.
152
Table of Contents
Opportunity Income Plus Portfolio
Schedule of Investments as of June 30, 2014
(unaudited)
| e | Denotes restricted securities. Restricted securities are investment securities which have been deemed illiquid and cannot be offered for public sale without first being registered under the Securities Act of 1933. The following table indicates the acquisition date and cost of restricted securities Opportunity Income Plus Portfolio owned as of June 30, 2014. |
Security | Acquisition Date | Cost | ||||||
Bayview Opportunity Master Fund Trust IIB, LP, 1/28/2034 | 1/17/2014 | $ | 139,876 | |||||
JBS Finance II, Ltd., 1/29/2018 | 8/19/2013 | 67,535 | ||||||
Vericrest Opportunity Loan Transferee, 3/25/2054 | 12/11/2013 | 94,604 | ||||||
Wachovia Asset Securitization, Inc., 7/25/2037 | 3/16/2007 | 424,179 | ||||||
| f | All or a portion of the security is insured or guaranteed. |
| g | Denotes securities sold under Rule 144A of the Securities Act of 1933, which exempts them from registration. These securities have been deemed liquid and may be resold to other dealers in the program or to other qualified institutional buyers. As of June 30, 2014, the value of these investments was $5,314,839 or 9.3% of total net assets. |
| h | Denotes perpetual securities. Perpetual securities pay an indefinite stream of interest, but may be called by the issuer at an earlier date. |
| i | The interest rate shown reflects the yield, coupon rate or the discount rate at the date of purchase. |
| j | At June 30, 2014, $99,993 of investments were held on deposit with the counterparty and pledged as the initial margin deposit for open futures contracts. |
Definitions:
| ETF | - | Exchange Traded Fund. | ||
| REIT | - | Real Estate Investment Trust is a company that buys, develops, manages and/or sells real estate assets. |
Unrealized Appreciation (Depreciation)
Gross unrealized appreciation and depreciation of investments, based on cost for federal income tax purposes, were as follows:
Gross unrealized appreciation | $ | 1,357,921 | ||
Gross unrealized depreciation | (433,284 | ) | ||
|
| |||
Net unrealized appreciation (depreciation) | $ | 924,637 | ||
Cost for federal income tax purposes | $ | 62,111,883 | ||
The accompanying Notes to Financial Statements are an integral part of this schedule.
153
Table of Contents
Opportunity Income Plus Portfolio
Schedule of Investments as of June 30, 2014
(unaudited)
Fair Valuation Measurements
The following table is a summary of the inputs used, as of June 30, 2014, in valuing Opportunity Income Plus Portfolio’s assets carried at fair value.
Investments in Securities | Total | Level 1 | Level 2 | Level 3 | ||||||||||||
Bank Loans | ||||||||||||||||
Basic Materials | 1,844,063 | — | 1,844,063 | — | ||||||||||||
Capital Goods | 797,169 | — | 797,169 | — | ||||||||||||
Communications Services | 7,943,018 | — | 7,943,018 | — | ||||||||||||
Consumer Cyclical | 3,763,650 | — | 3,763,650 | — | ||||||||||||
Consumer Non-Cyclical | 2,284,437 | — | 2,284,437 | — | ||||||||||||
Energy | 729,500 | — | 729,500 | — | ||||||||||||
Financials | 1,748,423 | — | 1,748,423 | — | ||||||||||||
Technology | 1,757,967 | — | 1,757,967 | — | ||||||||||||
Transportation | 500,435 | — | 500,435 | — | ||||||||||||
Utilities | 1,002,145 | — | 1,002,145 | — | ||||||||||||
Long-Term Fixed Income | ||||||||||||||||
Asset-Backed Securities | 2,479,415 | — | 2,479,415 | — | ||||||||||||
Basic Materials | 1,011,049 | — | 1,011,049 | — | ||||||||||||
Capital Goods | 714,096 | — | 714,096 | — | ||||||||||||
Collateralized Mortgage Obligations | 5,210,905 | — | 5,210,905 | — | ||||||||||||
Commercial Mortgage-Backed Securities | 247,718 | — | 247,718 | — | ||||||||||||
Communications Services | 2,084,967 | — | 2,084,967 | — | ||||||||||||
Consumer Cyclical | 1,642,344 | — | 1,642,344 | — | ||||||||||||
Consumer Non-Cyclical | 1,790,151 | — | 1,790,151 | — | ||||||||||||
Energy | 1,448,135 | — | 1,448,135 | — | ||||||||||||
Financials | 4,623,749 | — | 4,623,749 | — | ||||||||||||
Foreign Government | 464,424 | — | 464,424 | — | ||||||||||||
Mortgage-Backed Securities | 5,508,583 | — | 5,508,583 | — | ||||||||||||
Technology | 675,448 | — | 675,448 | — | ||||||||||||
Transportation | 326,135 | — | 326,135 | — | ||||||||||||
U.S. Government and Agencies | 149,865 | — | 149,865 | — | ||||||||||||
Utilities | 1,266,884 | — | 1,266,884 | — | ||||||||||||
Common Stock | ||||||||||||||||
Financials | 3,256,104 | 3,256,104 | — | — | ||||||||||||
Preferred Stock | ||||||||||||||||
Financials | 888,367 | 769,582 | 118,785 | — | ||||||||||||
Utilities | 88,609 | — | 88,609 | — | ||||||||||||
Short-Term Investments | 6,788,765 | 6,688,772 | 99,993 | — | ||||||||||||
|
|
|
|
|
|
|
| |||||||||
Total | $63,036,520 | $10,714,458 | $52,322,062 | $— | ||||||||||||
|
|
|
|
|
|
|
| |||||||||
Other Financial Instruments | Total | Level 1 | Level 2 | Level 3 | ||||||||||||
Asset Derivatives | ||||||||||||||||
Futures Contracts | 4,791 | 4,791 | — | — | ||||||||||||
|
|
|
|
|
|
|
| |||||||||
Total Asset Derivatives | $ | 4,791 | $ | 4,791 | $ | — | $ | — | ||||||||
|
|
|
|
|
|
|
| |||||||||
Liability Derivatives | ||||||||||||||||
Futures Contracts | 6,963 | 6,963 | — | — | ||||||||||||
|
|
|
|
|
|
|
| |||||||||
Total Liability Derivatives | $ | 6,963 | $ | 6,963 | $ | — | $ | — | ||||||||
|
|
|
|
|
|
|
| |||||||||
There were no significant transfers between Levels during the period ended June 30, 2014. Transfers between Levels are identified as of the end of the period.
Futures Contracts | Number of Contracts Long/(Short) | Expiration Date | Notional Principal Amount | Value | Unrealized Gain/(Loss) | |||||||||||||||
2-Yr. U.S. Treasury Bond Futures | (30 | ) | September 2014 | ($ | 6,588,205 | ) | ($ | 6,587,813 | ) | $ | 392 | |||||||||
30-Yr. U.S. Treasury Bond Futures | 3 | September 2014 | 407,164 | 411,563 | 4,399 | |||||||||||||||
Ultra Long Term U.S. Treasury Bond Futures | 7 | September 2014 | 1,056,526 | 1,049,563 | (6,963 | ) | ||||||||||||||
Total Futures Contracts | ($ | 2,172 | ) | |||||||||||||||||
The accompanying Notes to Financial Statements are an integral part of this schedule.
154
Table of Contents
Opportunity Income Plus Portfolio
Schedule of Investments as of June 30, 2014
(unaudited)
The following table summarizes the fair value and Statement of Assets and Liabilities location, as of June 30, 2014, for Opportunity Income Plus Portfolio’s investments in financial derivative instruments by primary risk exposure as discussed under item (2) Significant Accounting Policies of the Notes to Financial Statements.
Derivatives by risk category | Statement of Assets and Liabilities Location | Fair Value | ||||
Asset Derivatives | ||||||
Interest Rate Contracts | ||||||
Futures* | Net Assets - Net unrealized appreciation/(depreciation) on Futures contracts | $ | 4,791 | |||
Total Interest Rate Contracts | 4,791 | |||||
|
| |||||
Total Asset Derivatives | $ | 4,791 | ||||
|
| |||||
Liability Derivatives | ||||||
Interest Rate Contracts | ||||||
Futures* | Net Assets - Net unrealized appreciation/(depreciation) on Futures contracts | 6,963 | ||||
Total Interest Rate Contracts | 6,963 | |||||
|
| |||||
Total Liability Derivatives | $ | 6,963 | ||||
|
| |||||
| * | Includes cumulative appreciation/depreciation of futures contracts as reported in the Schedule of Investments. Only current day’s variation margin is reported within the Statement of Assets and Liabilities. |
The following table summarizes the net realized gains/(losses) and Statement of Operations location, for the period ended June 30, 2014, for Opportunity Income Plus Portfolio’s investments in financial derivative instruments by primary risk exposure.
Derivatives by risk category | Statement of Operations Location | Realized Gains/(Losses) recognized in Income | ||||
Interest Rate Contracts | ||||||
| Futures | Net realized gains/(losses) on Futures contracts | 59,508 | ||||
Total Interest Rate Contracts | 59,508 | |||||
Credit Contracts | ||||||
| Credit Default Swaps | Net realized gains/(losses) on Swap agreements | 818 | ||||
Total Credit Contracts | 818 | |||||
|
| |||||
Total | $ | 60,326 | ||||
|
| |||||
The following table summarizes the change in net unrealized appreciation/(depreciation) and Statement of Operations location, for the period ended June 30, 2014, for Opportunity Income Plus Portfolio’s investments in financial derivative instruments by primary risk exposure.
Derivatives by risk category | Statement of Operations Location | Change in unrealized appreciation/(depreciation) recognized in Income | ||||
Interest Rate Contracts | ||||||
| Futures | Change in net unrealized appreciation/(depreciation) on Futures contracts | (2,172 | ) | |||
Total Interest Rate Contracts | (2,172 | ) | ||||
Credit Contracts | ||||||
| Credit Default Swaps | Change in net unrealized appreciation/(depreciation) on Swap agreements | (2,202 | ) | |||
Total Credit Contracts | (2,202 | ) | ||||
|
| |||||
Total | ($ | 4,374 | ) | |||
|
| |||||
The accompanying Notes to Financial Statements are an integral part of this schedule.
155
Table of Contents
Opportunity Income Plus Portfolio
Schedule of Investments as of June 30, 2014
(unaudited)
The following table presents Opportunity Income Plus Portfolio’s average volume of derivative activity during the period ended June 30, 2014.
Derivative Risk Category | Futures (Notional)* | Futures (Percentage of Average Net Assets) | Swaps (Notional)* | |||||||||
Interest Rate Contracts | $ | 2,615,195 | 5.0 | % | N/A | |||||||
Credit Contracts | N/A | N/A | $ | 1,783 | ||||||||
| * | Notional amount represents long or short, or both, derivative positions held by the Portfolio. |
Investment in Affiliates
Affiliated issuers, as defined under the Investment Company Act of 1940, include those in which the Portfolio’s holdings of an issuer represent 5% or more of the outstanding voting securities of an issuer, or any affiliated mutual fund.
A summary of transactions for the fiscal year to date, in Opportunity Income Plus Portfolio, is as follows:
Portfolio | Value December 31, 2013 | Gross Purchases | Gross Sales | Shares Held at June 30, 2014 | Value June 30, 2014 | Income Earned January 1, 2014 - June 30, 2014 | ||||||||||||||||||
Cash Management Trust-Short Term Investment | $ | 4,568,156 | $ | 28,874,497 | $ | 26,753,881 | 6,688,772 | $ | 6,688,772 | $ | 1,661 | |||||||||||||
Total Value and Income Earned | 4,568,156 | 6,688,772 | 1,661 | |||||||||||||||||||||
The accompanying Notes to Financial Statements are an integral part of this schedule.
156
Table of Contents
Schedule of Investments as of June 30, 2014
(unaudited)
| Shares | Common Stock (96.7%) | Value | ||||||
| Communications Equipment (6.4%) | |||||||
| 272 | Arista Networks, Inc.a | $ | 16,970 | |||||
| 24,587 | Calix, Inc.a | 201,122 | ||||||
| 38,898 | QUALCOMM, Inc. | 3,080,721 | ||||||
|
| |||||||
| Total | 3,298,813 | |||||||
|
| |||||||
| Computers & Peripherals (14.3%) | |||||||
| 47,726 | Apple, Inc. | 4,435,177 | ||||||
| 17,917 | Electronics for Imaging, Inc.a | 809,848 | ||||||
| 78,840 | EMC Corporation | 2,076,646 | ||||||
|
| |||||||
| Total | 7,321,671 | |||||||
|
| |||||||
| Consumer Discretionary (7.6%) | |||||||
| 6,244 | Amazon.com, Inc.a | 2,027,926 | ||||||
| 1,534 | Priceline Group, Inc.a | 1,845,402 | ||||||
|
| |||||||
| Total | 3,873,328 | |||||||
|
| |||||||
| Electronic Equipment, Instruments & Components (2.1%) | |||||||
| 11,431 | Amphenol Corporation | 1,101,262 | ||||||
|
| |||||||
| Total | 1,101,262 | |||||||
|
| |||||||
| Financials (6.2%) | |||||||
| 21,374 | American Tower Corporation | 1,923,233 | ||||||
| 6,635 | Intercontinental Exchange, Inc. | 1,253,351 | ||||||
|
| |||||||
| Total | 3,176,584 | |||||||
|
| |||||||
| Internet Software & Services (21.9%) | |||||||
| 24,528 | eBay, Inc.a | 1,227,872 | ||||||
| 8,435 | Equinix, Inc.a | 1,772,109 | ||||||
| 30,022 | Facebook, Inc.a | 2,020,180 | ||||||
| 2,723 | Google, Inc.a | 1,566,488 | ||||||
| 2,723 | Google, Inc., Class Aa | 1,592,056 | ||||||
| 9,540 | LinkedIn Corporationa | 1,635,824 | ||||||
| 3,048 | Opower, Inc.a | 57,455 | ||||||
| 46,672 | Pandora Media, Inc.a | 1,376,824 | ||||||
|
| |||||||
| Total | 11,248,808 | |||||||
|
| |||||||
| IT Consulting & Services (5.3%) | |||||||
| 20,031 | Cognizant Technology Solutions Corporationa | 979,716 | ||||||
| 7,146 | FleetCor Technologies, Inc.a | 941,843 | ||||||
| 21,513 | InterXion Holding NVa | 589,026 | ||||||
| 8,615 | TriNet Group, Inc.a | 207,363 | ||||||
|
| |||||||
| Total | 2,717,948 | |||||||
|
| |||||||
| Semiconductors & Semiconductor Equipment (4.8%) | |||||||
| 33,679 | Applied Materials, Inc. | 759,462 | ||||||
| 35,872 | Xilinx, Inc. | 1,697,104 | ||||||
|
| |||||||
| Total | 2,456,566 | |||||||
|
| |||||||
| Software (22.4%) | |||||||
| 16,851 | Adobe Systems, Inc.a | 1,219,338 | ||||||
| 15,302 | CommVault Systems, Inc.a | 752,399 | ||||||
| 27,689 | Guidewire Software, Inc.a | 1,125,835 | ||||||
| 19,538 | Microsoft Corporation | 814,735 | ||||||
| 8,952 | NetSuite, Inc.a | 777,750 | ||||||
| 47,173 | Oracle Corporation | 1,911,922 | ||||||
| 30,494 | Salesforce.com, Inc.a | 1,771,091 | ||||||
| 29,825 | ServiceNow, Inc.a | 1,847,957 | ||||||
| 5,407 | VMware, Inc.a | 523,452 | ||||||
| 8,458 | Workday, Inc.a | 760,036 | ||||||
|
| |||||||
| Total | 11,504,515 | |||||||
|
| |||||||
| Telecommunications Services (5.7%) | |||||||
| 19,445 | SBA Communications Corporationa | 1,989,223 | ||||||
| 22,518 | TW Telecom, Inc.a | 907,701 | ||||||
|
| |||||||
| Total | 2,896,924 | |||||||
|
| |||||||
| Total Common Stock (cost $36,822,350) | 49,596,419 | |||||||
|
| |||||||
| Shares or Principal Amount | Short-Term Investments (3.3%)b | |||||||
| 1,686,168 | Thrivent Cash Management Trust 0.050% | 1,686,168 | ||||||
|
| |||||||
| Total Short-Term Investments (at amortized cost) | 1,686,168 | |||||||
|
| |||||||
Total Investments (cost $38,508,518) 100.0% | $ | 51,282,587 | ||||||
|
| |||||||
| Other Assets and Liabilities, Net (<0.1%) | (13,663 | ) | ||||||
|
| |||||||
| Total Net Assets 100.0% | $ | 51,268,924 | ||||||
|
| |||||||
| a | Non-income producing security. |
| b | The interest rate shown reflects the yield, coupon rate or the discount rate at the date of purchase. |
Unrealized Appreciation (Depreciation)
Gross unrealized appreciation and depreciation of investments, based on cost for federal income tax purposes, were as follows:
Gross unrealized appreciation | $ | 13,945,972 | ||
Gross unrealized depreciation | (1,200,786 | ) | ||
|
| |||
Net unrealized appreciation (depreciation) | $ | 12,745,186 | ||
Cost for federal income tax purposes | $ | 38,537,401 | ||
The accompanying Notes to Financial Statements are an integral part of this schedule.
157
Table of Contents
Partner Technology Portfolio
Schedule of Investments as of June 30, 2014
(unaudited)
Fair Valuation Measurements
The following table is a summary of the inputs used, as of June 30, 2014, in valuing Partner Technology Portfolio’s assets carried at fair value.
Investments in Securities | Total | Level 1 | Level 2 | Level 3 | ||||||||||||
Common Stock | ||||||||||||||||
Communications Equipment | 3,298,813 | 3,298,813 | — | — | ||||||||||||
Computers & Peripherals | 7,321,671 | 7,321,671 | — | — | ||||||||||||
Consumer Discretionary | 3,873,328 | 3,873,328 | — | — | ||||||||||||
Electronic Equipment, Instruments & Components | 1,101,262 | 1,101,262 | — | — | ||||||||||||
Financials | 3,176,584 | 3,176,584 | — | — | ||||||||||||
Internet Software & Services | 11,248,808 | 11,248,808 | — | — | ||||||||||||
IT Consulting & Services | 2,717,948 | 2,717,948 | — | — | ||||||||||||
Semiconductors & Semiconductor Equipment | 2,456,566 | 2,456,566 | — | — | ||||||||||||
Software | 11,504,515 | 11,504,515 | — | — | ||||||||||||
Telecommunications Services | 2,896,924 | 2,896,924 | — | — | ||||||||||||
Short-Term Investments | 1,686,168 | 1,686,168 | — | — | ||||||||||||
|
|
|
|
|
|
|
| |||||||||
Total | $ | 51,282,587 | $ | 51,282,587 | $ | — | $ | — | ||||||||
|
|
|
|
|
|
|
| |||||||||
There were no significant transfers between Levels during the period ended June 30, 2014. Transfers between Levels are identified as of the end of the period.
Investment in Affiliates
Affiliated issuers, as defined under the Investment Company Act of 1940, include those in which the Portfolio’s holdings of an issuer represent 5% or more of the outstanding voting securities of an issuer, or any affiliated mutual fund.
A summary of transactions for the fiscal year to date, in Partner Technology Portfolio, is as follows:
Portfolio | Value December 31, 2013 | Gross Purchases | Gross Sales | Shares Held at June 30, 2014 | Value June 30, 2014 | Income Earned January 1, 2014 - June 30, 2014 | ||||||||||||||||||
Cash Management Trust-Short Term Investment | $ | 856,402 | $ | 5,075,123 | $ | 4,245,357 | 1,686,168 | $ | 1,686,168 | $ | 302 | |||||||||||||
Total Value and Income Earned | 856,402 | 1,686,168 | 302 | |||||||||||||||||||||
The accompanying Notes to Financial Statements are an integral part of this schedule.
158
Table of Contents
Schedule of Investments as of June 30, 2014
(unaudited)
| Shares | Common Stock (94.9%) | Value | ||||||
| Biotechnology (21.2%) | |||||||
| 24,830 | Amgen, Inc. | $ | 2,939,127 | |||||
| 9,384 | Biogen Idec, Inc.a | 2,958,869 | ||||||
| 24,100 | BioMarin Pharmaceutical, Inc.a | 1,499,261 | ||||||
| 49,659 | ImmunoGen, Inc.a | 588,459 | ||||||
| 14,300 | Incyte Corporationa | 807,092 | ||||||
| 48,125 | Ironwood Pharmaceuticals, Inc.a | 737,756 | ||||||
| 100,181 | Keryx BioPharmaceuticals, Inc.a | 1,540,784 | ||||||
| 26,700 | NPS Pharmaceuticals, Inc.a | 882,435 | ||||||
| 33,243 | Portola Pharmaceuticals, Inc.a | 970,031 | ||||||
| 45,316 | PTC Therapeutics, Inc.a | 1,184,560 | ||||||
| 19,736 | Vertex Pharmaceuticals, Inc.a | 1,868,605 | ||||||
|
| |||||||
| Total | 15,976,979 | |||||||
|
| |||||||
| Health Care Equipment (18.7%) | |||||||
| 82,239 | Accuray, Inc.a | 723,703 | ||||||
| 131,471 | Boston Scientific Corporationa | 1,678,885 | ||||||
| 29,287 | Covidien plc | 2,641,102 | ||||||
| 39,376 | Dexcom, Inc.a | 1,561,652 | ||||||
| 43,117 | EOS Imaging SAa | 323,938 | ||||||
| 18,088 | HeartWare International, Inc.a | 1,600,788 | ||||||
| 37,243 | Inogen, Inc.a | 840,202 | ||||||
| 5,275 | Intuitive Surgical, Inc.a | 2,172,245 | ||||||
| 61,296 | NxStage Medical, Inc.a | 880,824 | ||||||
| 73,480 | Tornier NVa | 1,717,962 | ||||||
|
| |||||||
| Total | 14,141,301 | |||||||
|
| |||||||
| Health Care Supplies (2.8%) | |||||||
| 38,277 | Align Technology, Inc.a | 2,145,043 | ||||||
|
| |||||||
| Total | 2,145,043 | |||||||
|
| |||||||
| Managed Health Care (2.5%) | |||||||
| 20,300 | CIGNA Corporation | 1,866,991 | ||||||
|
| |||||||
| Total | 1,866,991 | |||||||
|
| |||||||
| Pharmaceuticals (49.7%) | |||||||
| 37,885 | AbbVie, Inc. | 2,138,229 | ||||||
| 61,883 | Aspen Pharmacare Holdings, Ltd. | 1,740,030 | ||||||
| 56,238 | Hikma Pharmaceuticals plc | 1,614,123 | ||||||
| 88,719 | Merck & Company, Inc. | 5,132,394 | ||||||
| 31,691 | Mylan, Inc.a | 1,633,988 | ||||||
| 66,199 | Novartis AG | 5,994,875 | ||||||
| 70,605 | Novo Nordisk AS ADR | 3,261,245 | ||||||
| 20,183 | Roche Holding AG | 6,013,664 | ||||||
| 18,535 | Sagent Pharmaceuticals, Inc.a | 479,315 | ||||||
| 39,871 | Sanofi | 4,237,871 | ||||||
| 11,745 | Sawai Pharmaceutical Company, Ltd. | 692,311 | ||||||
| 5,689 | Shire Pharmaceuticals Group plc ADR | 1,339,703 | ||||||
| 32,981 | Teva Pharmaceutical Industries, Ltd. ADR | 1,728,864 | ||||||
| 17,988 | Towa Pharmaceutical Company, Ltd. | 733,006 | ||||||
| 323,597 | Vectura Group plca | 736,555 | ||||||
|
| |||||||
| Total | 37,476,173 | |||||||
|
| |||||||
| Total Common Stock (cost $55,128,719) | 71,606,487 | |||||||
|
| |||||||
Shares or | Short-Term Investments (4.7%)b | |||||||
| Thrivent Cash Management Trust | ||||||||
| 3,557,874 | 0.050% | $ | 3,557,874 | |||||
|
| |||||||
| Total Short-Term Investments (at amortized cost) | 3,557,874 | |||||||
|
| |||||||
Total Investments (cost $58,686,593) 99.6% | $ | 75,164,361 | ||||||
|
| |||||||
| Other Assets and Liabilities, Net 0.4% | 277,761 | |||||||
|
| |||||||
| Total Net Assets 100.0% | $ | 75,442,122 | ||||||
|
| |||||||
| a | Non-income producing security. |
| b | The interest rate shown reflects the yield, coupon rate or the discount rate at the date of purchase. |
Definitions:
| ADR | - | American Depositary Receipt, which are certificates for an underlying foreign security’s shares held by an issuing U.S. depository bank. |
Unrealized Appreciation (Depreciation)
Gross unrealized appreciation and depreciation of investments, based on cost for federal income tax purposes, were as follows:
Gross unrealized appreciation | $ | 16,722,299 | ||
Gross unrealized depreciation | (352,917 | ) | ||
|
| |||
Net unrealized appreciation (depreciation) | $ | 16,369,382 | ||
Cost for federal income tax purposes | $ | 58,794,979 | ||
The accompanying Notes to Financial Statements are an integral part of this schedule.
159
Table of Contents
Partner Healthcare Portfolio
Schedule of Investments as of June 30, 2014
(unaudited)
Fair Valuation Measurements
The following table is a summary of the inputs used, as of June 30, 2014, in valuing Partner Healthcare Portfolio’s assets carried at fair value.
Investments in Securities | Total | Level 1 | Level 2 | Level 3 | ||||||||||||
Common Stock | ||||||||||||||||
Biotechnology | 15,976,979 | 15,976,979 | — | — | ||||||||||||
Health Care Equipment | 14,141,301 | 13,817,363 | 323,938 | — | ||||||||||||
Health Care Supplies | 2,145,043 | 2,145,043 | — | — | ||||||||||||
Managed Health Care | 1,866,991 | 1,866,991 | — | — | ||||||||||||
Pharmaceuticals | 37,476,173 | 15,713,738 | 21,762,435 | — | ||||||||||||
Short-Term Investments | 3,557,874 | 3,557,874 | — | — | ||||||||||||
|
|
|
|
|
|
|
| |||||||||
Total | $ | 75,164,361 | $ | 53,077,988 | $ | 22,086,373 | $ | — | ||||||||
|
|
|
|
|
|
|
| |||||||||
There were no significant transfers between Levels during the period ended June 30, 2014. Transfers between Levels are identified as of the end of the period.
Investment in Affiliates
Affiliated issuers, as defined under the Investment Company Act of 1940, include those in which the Portfolio’s holdings of an issuer represent 5% or more of the outstanding voting securities of an issuer, or any affiliated mutual fund.
A summary of transactions for the fiscal year to date, in Partner Healthcare Portfolio, is as follows:
Portfolio | Value December 31, 2013 | Gross Purchases | Gross Sales | Shares Held at June 30, 2014 | Value June 30, 2014 | Income Earned January 1, 2014 - June 30, 2014 | ||||||||||||||||||
Cash Management Trust-Short Term Investment | $ | 1,615,477 | $ | 13,437,307 | $ | 11,494,910 | 3,557,874 | $ | 3,557,874 | $ | 840 | |||||||||||||
Total Value and Income Earned | 1,615,477 | 3,557,874 | 840 | |||||||||||||||||||||
The accompanying Notes to Financial Statements are an integral part of this schedule.
160
Table of Contents
Schedule of Investments as of June 30, 2014
(unaudited)
| Shares | Common Stock (97.0%) | Value | ||||||
| Coal & Consumable Fuels (1.7%) | |||||||
| 48,514 | Alpha Natural Resources, Inc.a,b | $ | 179,987 | |||||
| 31,394 | Peabody Energy Corporation | 513,292 | ||||||
|
| |||||||
| Total | 693,279 | |||||||
|
| |||||||
| Consumer Staples (9.7%) | |||||||
| 31,103 | Archer-Daniels-Midland Company | 1,371,953 | ||||||
| 14,360 | Bunge, Ltd. | 1,086,191 | ||||||
| 19,645 | Ingredion, Inc. | 1,474,161 | ||||||
|
| |||||||
| Total | 3,932,305 | |||||||
|
| |||||||
| Financials (19.3%) | |||||||
| 6,235 | Boston Properties, Inc. | 736,852 | ||||||
| 4,700 | Camden Property Trust | 334,405 | ||||||
| 14,300 | DDR Corporation | 252,109 | ||||||
| 11,486 | Equity Residential | 723,618 | ||||||
| 6,921 | Health Care REIT, Inc. | 433,739 | ||||||
| 9,500 | Host Hotels & Resorts, Inc. | 209,095 | ||||||
| 19,200 | Kimco Realty Corporation | 441,216 | ||||||
| 3,900 | Macerich Company | 260,325 | ||||||
| 10,400 | Prologis, Inc. | 427,336 | ||||||
| 2,444 | Public Storage, Inc. | 418,780 | ||||||
| 6,900 | RLJ Lodging Trust | 199,341 | ||||||
| 6,879 | Simon Property Group, Inc. | 1,143,840 | ||||||
| 10,200 | SPDR Gold Trustb | 1,306,008 | ||||||
| 7,300 | Tanger Factory Outlet Centers, Inc. | 255,281 | ||||||
| 5,810 | Vornado Realty Trust | 620,101 | ||||||
| 3,439 | Washington Prime Group, Inc.b | 64,447 | ||||||
|
| |||||||
| Total | 7,826,493 | |||||||
|
| |||||||
| Integrated Oil & Gas (11.2%) | |||||||
| 13,979 | Chevron Corporation | 1,824,959 | ||||||
| 9,982 | Occidental Petroleum Corporation | 1,024,453 | ||||||
| 33,226 | Petroleo Brasileiro SA ADR | 486,096 | ||||||
| 16,400 | Total SA ADRa | 1,184,080 | ||||||
|
| |||||||
| Total | 4,519,588 | |||||||
|
| |||||||
| Materials (3.8%) | |||||||
| 14,000 | Cliffs Natural Resources, Inc.a | 210,700 | ||||||
| 12,800 | Mosaic Company | 632,960 | ||||||
| 6,840 | Southern Copper Corporation | 207,731 | ||||||
| 17,500 | Teck Resources, Ltd.a | 399,525 | ||||||
| 13,075 | Walter Energy, Inc.a | 71,259 | ||||||
|
| |||||||
| Total | 1,522,175 | |||||||
|
| |||||||
| Oil & Gas Equipment & Services (25.0%) | |||||||
| 20,650 | Cameron International Corporationb | 1,398,212 | ||||||
| 14,351 | Dril-Quip, Inc.b | 1,567,703 | ||||||
| 250 | Frank’s International NV | 6,150 | ||||||
| 23,000 | National Oilwell Varco, Inc. | 1,894,050 | ||||||
| 29,050 | Schlumberger, Ltd. | 3,426,447 | ||||||
| 78,600 | Weatherford International, Ltd.b | 1,807,800 | ||||||
|
| |||||||
| Total | 10,100,362 | |||||||
|
| |||||||
| Oil & Gas Exploration & Production (25.8%) | |||||||
| 43,200 | Cobalt International Energy, Inc.b | 792,720 | ||||||
| 7,900 | Concho Resources, Inc.b | 1,141,550 | ||||||
| 14,950 | EOG Resources, Inc. | 1,747,057 | ||||||
| 14,700 | EQT Corporation | 1,571,430 | ||||||
| 30,200 | Marathon Oil Corporation | 1,205,584 | ||||||
| 39,000 | Oasis Petroleum, Inc.b | 2,179,710 | ||||||
| 13,450 | SM Energy Company | 1,131,145 | ||||||
| 15,100 | Southwestern Energy Companyb | 686,899 | ||||||
|
| |||||||
| Total | 10,456,095 | |||||||
|
| |||||||
| Trading Companies & Distributors (0.5%) | |||||||
| 5,750 | NOW, Inc.b | 208,207 | ||||||
|
| |||||||
| Total | 208,207 | |||||||
|
| |||||||
| Total Common Stock (cost $36,098,084) | 39,258,504 | |||||||
|
| |||||||
Collateral Held for Securities Loaned (5.2%) | ||||||||
| 2,085,000 | Thrivent Cash Management Trust | 2,085,000 | ||||||
�� |
| |||||||
| Total Collateral Held for Securities Loaned (cost $2,085,000) | 2,085,000 | |||||||
|
| |||||||
| Shares or Principal Amount | Short-Term Investments (2.8%)c | |||||||
Thrivent Cash Management Trust | ||||||||
| 1,135,733 | 0.050% | 1,135,733 | ||||||
|
| |||||||
| Total Short-Term Investments (at amortized cost) | 1,135,733 | |||||||
|
| |||||||
Total Investments (cost $39,318,817) 105.0% | $ | 42,479,237 | ||||||
|
| |||||||
| Other Assets and Liabilities, Net (5.0%) | (2,029,020 | ) | ||||||
|
| |||||||
| Total Net Assets 100.0% | $ | 40,450,217 | ||||||
|
| |||||||
| a | All or a portion of the security is on loan. |
| b | Non-income producing security. |
| c | The interest rate shown reflects the yield, coupon rate or the discount rate at the date of purchase. |
Definitions:
ADR | - | American Depositary Receipt, which are certificates for an underlying foreign security’s shares held by an issuing U.S. depository bank. | ||
REIT | - | Real Estate Investment Trust is a company that buys, develops, manages and/or sells real estate assets. |
Unrealized Appreciation (Depreciation)
Gross unrealized appreciation and depreciation of investments, based on cost for federal income tax purposes, were as follows:
Gross unrealized appreciation | $ | 9,859,029 | ||
Gross unrealized depreciation | (6,693,063 | ) | ||
|
| |||
Net unrealized appreciation (depreciation) | $ | 3,165,966 | ||
Cost for federal income tax purposes | $ | 39,313,271 | ||
The accompanying Notes to Financial Statements are an integral part of this schedule.
161
Table of Contents
Natural Resources Portfolio
Schedule of Investments as of June 30, 2014
(unaudited)
Fair Valuation Measurements
The following table is a summary of the inputs used, as of June 30, 2014, in valuing Natural Resources Portfolio’s assets carried at fair value.
Investments in Securities | Total | Level 1 | Level 2 | Level 3 | ||||||||||||
Common Stock | ||||||||||||||||
Coal & Consumable Fuels | 693,279 | 693,279 | — | — | ||||||||||||
Consumer Staples | 3,932,305 | 3,932,305 | — | — | ||||||||||||
Financials | 7,826,493 | 7,826,493 | — | — | ||||||||||||
Integrated Oil & Gas | 4,519,588 | 4,519,588 | — | — | ||||||||||||
Materials | 1,522,175 | 1,522,175 | — | — | ||||||||||||
Oil & Gas Equipment & Services | 10,100,362 | 10,100,362 | — | — | ||||||||||||
Oil & Gas Exploration & Production | 10,456,095 | 10,456,095 | — | — | ||||||||||||
Trading Companies & Distributors | 208,207 | 208,207 | — | — | ||||||||||||
Collateral Held for Securities Loaned | 2,085,000 | 2,085,000 | — | — | ||||||||||||
Short-Term Investments | 1,135,733 | 1,135,733 | — | — | ||||||||||||
|
|
|
|
|
|
|
| |||||||||
Total | $ | 42,479,237 | $ | 42,479,237 | $ | — | $ | — | ||||||||
|
|
|
|
|
|
|
| |||||||||
There were no significant transfers between Levels during the period ended June 30, 2014. Transfers between Levels are identified as of the end of the period.
Investment in Affiliates
Affiliated issuers, as defined under the Investment Company Act of 1940, include those in which the Portfolio’s holdings of an issuer represent 5% or more of the outstanding voting securities of an issuer, or any affiliated mutual fund.
A summary of transactions for the fiscal year to date, in Natural Resources Portfolio, is as follows:
Portfolio | Value December 31, 2013 | Gross Purchases | Gross Sales | Shares Held at June 30, 2014 | Value June 30, 2014 | Income Earned January 1, 2014 - June 30, 2014 | ||||||||||||||||||
Cash Management Trust-Collateral Investment | $ | 1,771,801 | $ | 10,469,614 | $ | 10,156,415 | 2,085,000 | $ | 2,085,000 | $ | 8,445 | |||||||||||||
Cash Management Trust-Short Term Investment | 1,879,163 | 2,210,989 | 2,954,419 | 1,135,733 | 1,135,733 | 176 | ||||||||||||||||||
Total Value and Income Earned | 3,650,964 | 3,220,733 | 8,621 | |||||||||||||||||||||
The accompanying Notes to Financial Statements are an integral part of this schedule.
162
Table of Contents
Partner Emerging Markets Equity Portfolio
Schedule of Investments as of June 30, 2014
(unaudited)
| Shares | Common Stock (91.0%) | Value | ||||||
| Brazil (10.6%) | |||||||
| 147,079 | Banco Bradesco SA ADR | $ | 2,135,586 | |||||
| 23,521 | Lojas Renner SA | 753,907 | ||||||
| 29,084 | Multiplan Empreendimentos Imobiliarios SA | 679,219 | ||||||
| 8,900 | Petroleo Brasileiro SA ADRa | 130,207 | ||||||
| 65,500 | Souza Cruz SA | 679,457 | ||||||
| 59,400 | Ultrapar Participacoes SA | 1,403,878 | ||||||
| 106,660 | Vale SA ADRa | 1,411,112 | ||||||
|
| |||||||
| Total | 7,193,366 | |||||||
|
| |||||||
| Chile (1.4%) | |||||||
| 37,090 | Banco Santander Chile SA ADRa | 981,031 | ||||||
|
| |||||||
| Total | 981,031 | |||||||
|
| |||||||
| China (2.6%) | |||||||
| 1,423,000 | PetroChina Company, Ltd. | 1,790,101 | ||||||
|
| |||||||
| Total | 1,790,101 | |||||||
|
| |||||||
| Hong Kong (10.5%) | |||||||
| 339,000 | AIA Group, Ltd. | 1,703,344 | ||||||
| 211,500 | China Mobile, Ltd. | 2,054,245 | ||||||
| 241,000 | Hang Lung Group, Ltd. | 1,304,641 | ||||||
| 132,000 | Hang Lung Properties, Ltd. | 407,066 | ||||||
| 102,000 | Swire Pacific, Ltd., Class A | 1,255,450 | ||||||
| 100,000 | Swire Pacific, Ltd., Class B | 230,490 | ||||||
| 59,500 | Swire Properties, Ltd. | 173,886 | ||||||
|
| |||||||
| Total | 7,129,122 | |||||||
|
| |||||||
| Hungary (1.2%) | |||||||
| 41,710 | Richter Gedeon Nyrt | 800,011 | ||||||
|
| |||||||
| Total | 800,011 | |||||||
|
| |||||||
| India (13.0%) | |||||||
| 514 | GlaxoSmithKline Pharmaceuticals, Ltd. | 21,379 | ||||||
| 5,200 | Grasim Industries, Ltd. | 296,698 | ||||||
| 4,350 | Grasim Industries, Ltd. GDR | 248,996 | ||||||
| 21,000 | Hero Motocorp, Ltd. | 920,317 | ||||||
| 83,000 | Hindustan Unilever, Ltd. | 856,320 | ||||||
| 118,639 | Housing Development Finance Corporationb | 1,958,731 | ||||||
| 30,000 | ICICI Bank, Ltd. | 707,644 | ||||||
| 5,000 | ICICI Bank, Ltd. ADRb | 249,500 | ||||||
| 30,000 | Infosys, Ltd. | 1,618,422 | ||||||
| 3,900 | Infosys, Ltd. ADR | 209,703 | ||||||
| 170,097 | ITC, Ltd. | 919,570 | ||||||
| 15,947 | Ultra Tech Cement, Ltd. | 687,232 | ||||||
| 2,484 | Ultra Tech Cement, Ltd. GDR | 107,048 | ||||||
|
| |||||||
| Total | 8,801,560 | |||||||
|
| |||||||
| Indonesia (3.2%) | |||||||
| 3,507,000 | PT Astra International Tbk PT | 2,153,181 | ||||||
|
| |||||||
| Total | 2,153,181 | |||||||
|
| |||||||
| Luxembourg (2.5%) | |||||||
| 35,965 | Tenaris SA ADR | 1,695,750 | ||||||
|
| |||||||
| Total | 1,695,750 | |||||||
|
| |||||||
| Malaysia (2.2%) | |||||||
| 340,707 | CIMB Group Holdings Berhad | 776,977 | ||||||
| 120,000 | Public Bank Berhad | 731,770 | ||||||
|
| |||||||
| Total | 1,508,747 | |||||||
|
| |||||||
| Mexico (7.3%) | |||||||
| 20,400 | Fomento Economico Mexicano SAB de CV ADR | 1,910,460 | ||||||
| 6,800 | Grupo Aeroportuario del Sureste SAB de CV ADR | 863,736 | ||||||
| 247,577 | Grupo Financiero Banorte SAB de CV ADR | 1,770,547 | ||||||
| 120,300 | Organizacion Soriana SAB de CVb | 396,688 | ||||||
|
| |||||||
| Total | 4,941,431 | |||||||
|
| |||||||
| Philippines (3.6%) | |||||||
| 28,000 | Ayala Corporation | 415,242 | ||||||
| 1,388,900 | Ayala Land, Inc. | 971,030 | ||||||
| 499,862 | Bank of the Philippine Islands | 1,042,190 | ||||||
|
| |||||||
| Total | 2,428,462 | |||||||
|
| |||||||
| Poland (1.6%) | |||||||
| 19,523 | Bank Pekao SA | 1,118,233 | ||||||
|
| |||||||
| Total | 1,118,233 | |||||||
|
| |||||||
| Portugal (0.9%) | |||||||
| 38,000 | Jeronimo Martins SGPS SA | 624,778 | ||||||
|
| |||||||
| Total | 624,778 | |||||||
|
| |||||||
| Russia (4.3%) | |||||||
| 31,400 | Lukoil ADR | 1,870,453 | ||||||
| 3,992 | Magnit OJSC | 1,040,740 | ||||||
|
| |||||||
| Total | 2,911,193 | |||||||
|
| |||||||
| South Africa (2.6%) | |||||||
| 59,921 | Massmart Holdings, Ltd. | 744,097 | ||||||
| 142,193 | Truworths International, Ltd. | 1,003,118 | ||||||
|
| |||||||
| Total | 1,747,215 | |||||||
|
| |||||||
| South Korea (2.2%) | |||||||
| 3,670 | E-Mart Company, Ltd. | 841,677 | ||||||
| 1,230 | Samsung Electronics Company, Ltd. GDR | 642,372 | ||||||
|
| |||||||
| Total | 1,484,049 | |||||||
|
| |||||||
| Taiwan (4.7%) | |||||||
| 215,400 | Taiwan Mobile Company, Ltd. | 666,565 | ||||||
| 602,499 | Taiwan Semiconductor Manufacturing Company, Ltd. | 2,549,502 | ||||||
|
| |||||||
| Total | 3,216,067 | |||||||
|
| |||||||
| Thailand (4.7%) | |||||||
| 107,300 | PTT Exploration & Production pcl | 553,828 | ||||||
| 95,400 | Siam Cement pcl | 1,340,663 | ||||||
| 254,800 | Siam Commercial Bank pcl | 1,322,968 | ||||||
|
| |||||||
| Total | 3,217,459 | |||||||
|
| |||||||
| Turkey (5.3%) | |||||||
| 370,833 | Akbank TAS | 1,363,875 | ||||||
| 46,036 | BIM Birlesik Magazalar AS | 1,056,181 | ||||||
| 301,790 | Turkiye Garanti Bankasi AS | 1,181,866 | ||||||
|
| |||||||
| Total | 3,601,922 | |||||||
|
| |||||||
The accompanying Notes to Financial Statements are an integral part of this schedule.
163
Table of Contents
Partner Emerging Markets Equity Portfolio
Schedule of Investments as of June 30, 2014
(unaudited)
| Shares | Common Stock (91.0%) | Value | ||||||
| United Kingdom (5.5%) | |||||||
| 27,386 | BHP Billiton plc | $ | 891,892 | |||||
| 25,139 | SABMiller plc | 1,457,695 | ||||||
| 66,824 | Standard Chartered plc | 1,365,881 | ||||||
|
| |||||||
| Total | 3,715,468 | |||||||
|
| |||||||
| United States (1.1%) | |||||||
| 9,000 | Yum! Brands, Inc. | 730,800 | ||||||
|
| |||||||
| Total | 730,800 | |||||||
|
| |||||||
| Total Common Stock (cost $51,829,918) | 61,789,946 | |||||||
|
| |||||||
Preferred Stock (7.5%) | ||||||||
| Brazil (3.3%) | |||||||
| 97,500 | Petroleo Brasileiro SA ADR | 1,524,900 | ||||||
| 60,805 | Vale SA ADR | 723,580 | ||||||
|
| |||||||
| Total | 2,248,480 | |||||||
|
| |||||||
| South Korea (4.2%) | |||||||
| 2,695 | Samsung Electronics Company, Ltd. | 2,824,080 | ||||||
|
| |||||||
| Total | 2,824,080 | |||||||
|
| |||||||
| Total Preferred Stock (cost $4,987,647) | 5,072,560 | |||||||
|
| |||||||
Collateral Held for Securities Loaned (3.7%) | ||||||||
| 2,480,650 | Thrivent Cash Management Trust | 2,480,650 | ||||||
|
| |||||||
| Total Collateral Held for Securities Loaned (cost $2,480,650) | 2,480,650 | |||||||
|
| |||||||
| Shares or Principal Amount | Short-Term Investments (1.3%)c | |||||||
Thrivent Cash Management Trust | ||||||||
| 851,161 | 0.050% | 851,161 | ||||||
|
| |||||||
| Total Short-Term Investments (at amortized cost) | 851,161 | |||||||
|
| |||||||
Total Investments (cost $60,149,376) 103.5% | $ | 70,194,317 | ||||||
|
| |||||||
| Other Assets and Liabilities, Net (3.5%) | (2,386,852 | ) | ||||||
|
| |||||||
| Total Net Assets 100.0% | $ | 67,807,465 | ||||||
|
| |||||||
| a | All or a portion of the security is on loan. |
| b | Non-income producing security. |
| c | The interest rate shown reflects the yield, coupon rate or the discount rate at the date of purchase. |
Definitions:
| ADR | - | American Depositary Receipt, which are certificates for an underlying foreign security’s shares held by an issuing U.S. depository bank. | ||
| GDR | - | Global Depository Receipts, which are certificates for shares of an underlying foreign security’s shares held by an issuing depository bank from more than one country. |
Unrealized Appreciation (Depreciation)
Gross unrealized appreciation and depreciation of investments, based on cost for federal income tax purposes, were as follows:
Gross unrealized appreciation | $ | 13,214,588 | ||
Gross unrealized depreciation | (3,275,782 | ) | ||
|
| |||
Net unrealized appreciation (depreciation) | $ | 9,938,806 | ||
Cost for federal income tax purposes | $ | 60,255,511 | ||
The accompanying Notes to Financial Statements are an integral part of this schedule.
164
Table of Contents
Partner Emerging Markets Equity Portfolio
Schedule of Investments as of June 30, 2014
(unaudited)
Fair Valuation Measurements
The following table is a summary of the inputs used, as of June 30, 2014, in valuing Partner Emerging Markets Equity Portfolio’s assets carried at fair value.
Investments in Securities | Total | Level 1 | Level 2 | Level 3 | ||||||||||||
Common Stock | ||||||||||||||||
Consumer Discretionary | 6,799,688 | 730,800 | 6,068,888 | — | ||||||||||||
Consumer Staples | 9,289,298 | 1,910,460 | 7,378,838 | — | ||||||||||||
Energy | 7,444,217 | 1,825,957 | 5,618,260 | — | ||||||||||||
Financials | 22,591,717 | 3,366,117 | 19,225,600 | — | ||||||||||||
Health Care | 821,390 | — | 821,390 | — | ||||||||||||
Industrials | 2,415,884 | 863,736 | 1,552,148 | — | ||||||||||||
Information Technology | 5,019,999 | 209,703 | 4,810,296 | — | ||||||||||||
Materials | 4,686,943 | 1,518,160 | 3,168,783 | — | ||||||||||||
Telecommunications Services | 2,720,810 | — | 2,720,810 | — | ||||||||||||
Preferred Stock | ||||||||||||||||
Energy | 1,524,900 | 1,524,900 | — | — | ||||||||||||
Information Technology | 2,824,080 | — | 2,824,080 | — | ||||||||||||
Materials | 723,580 | 723,580 | — | — | ||||||||||||
Collateral Held for Securities Loaned | 2,480,650 | 2,480,650 | — | — | ||||||||||||
Short-Term Investments | 851,161 | 851,161 | — | — | ||||||||||||
|
|
|
|
|
|
|
| |||||||||
Total | $ | 70,194,317 | $ | 16,005,224 | $ | 54,189,093 | $ | — | ||||||||
|
|
|
|
|
|
|
| |||||||||
There were no significant transfers between Levels during the period ended June 30, 2014. Transfers between Levels are identified as of the end of the period.
Investment in Affiliates
Affiliated issuers, as defined under the Investment Company Act of 1940, include those in which the Portfolio’s holdings of an issuer represent 5% or more of the outstanding voting securities of an issuer, or any affiliated mutual fund.
A summary of transactions for the fiscal year to date, in Partner Emerging Markets Equity Portfolio, is as follows:
Portfolio | Value December 31, 2013 | Gross Purchases | Gross Sales | Shares Held at June 30, 2014 | Value June 30, 2014 | Income Earned January 1, 2014 - June 30, 2014 | ||||||||||||||||||
Cash Management Trust-Collateral Investment | $ | 2,223,998 | $ | 13,367,633 | $ | 13,110,981 | 2,480,650 | $ | 2,480,650 | $ | 3,007 | |||||||||||||
Cash Management Trust-Short Term Investment | 1,837,201 | 5,468,387 | 6,454,427 | 851,161 | 851,161 | 363 | ||||||||||||||||||
Total Value and Income Earned | 4,061,199 | 3,331,811 | 3,370 | |||||||||||||||||||||
The accompanying Notes to Financial Statements are an integral part of this schedule.
165
Table of Contents
Real Estate Securities Portfolio
Schedule of Investments as of June 30, 2014
(unaudited)
| Shares | Common Stock (99.2%) | Value | ||||||
| Casinos & Gaming (0.1%) | |||||||
| 2,500 | Las Vegas Sands Corporation | $ | 190,550 | |||||
|
| |||||||
| Total | 190,550 | |||||||
|
| |||||||
| Consumer Discretionary (0.2%) | |||||||
| 6,000 | CBS Outdoor Americas, Inc. | 196,080 | ||||||
| 5,500 | iShares Dow Jones US Home Construction Index Fund | 136,400 | ||||||
|
| |||||||
| Total | 332,480 | |||||||
|
| |||||||
| Diversified REITS (8.2%) | |||||||
| 6,792 | American Assets Trust, Inc. | 234,664 | ||||||
| 34,345 | American Realty Capital Properties, Inc. | 430,343 | ||||||
| 2,519 | Brookfield Asset Management, Inc. | 110,886 | ||||||
| 62,400 | Cousins Properties, Inc. | 776,880 | ||||||
| 75,120 | Duke Realty Corporation | 1,364,179 | ||||||
| 19,343 | Empire State Realty Trust, Inc. | 319,160 | ||||||
| 20,176 | First Potomac Realty Trust | 264,709 | ||||||
| 3,150 | Gladstone Commercial Corporation | 56,290 | ||||||
| 35,414 | Lexington Realty Trust | 389,908 | ||||||
| 29,643 | Liberty Property Trust | 1,124,359 | ||||||
| 5,270 | PS Business Parks, Inc. | 439,992 | ||||||
| 5,970 | Select Income REIT | 176,951 | ||||||
| 60,610 | Spirit Realty Captial, Inc. | 688,530 | ||||||
| 40,350 | Vornado Realty Trust | 4,306,555 | ||||||
| 12,015 | Washington Real Estate Investment Trust | 312,150 | ||||||
| 6,300 | Whitestone REIT | 93,933 | ||||||
| 17,500 | Winthrop Realty Trust | 268,625 | ||||||
| 2,650 | WP Carey, Inc. | 170,660 | ||||||
|
| |||||||
| Total | 11,528,774 | |||||||
|
| |||||||
| Health Care REITs (10.3%) | |||||||
| 6,400 | Aviv REIT, Inc. | 180,288 | ||||||
| 9,300 | Brookdale Senior Living, Inc.a | 310,062 | ||||||
| 69,442 | HCP, Inc. | 2,873,510 | ||||||
| 58,402 | Health Care REIT, Inc. | 3,660,053 | ||||||
| 24,262 | Healthcare Realty Trust, Inc. | 616,740 | ||||||
| 19,000 | Healthcare Trust of America, Inc. | 228,760 | ||||||
| 7,022 | LTC Properties, Inc. | 274,139 | ||||||
| 20,914 | Medical Properties Trust, Inc. | 276,901 | ||||||
| 3,620 | National Health Investors, Inc. | 226,467 | ||||||
| 7,161 | Omega Healthcare Investors, Inc. | 263,955 | ||||||
| 7,370 | Physicians Realty Trust | 106,054 | ||||||
| 10,371 | Sabra Healthcare REIT, Inc. | 297,752 | ||||||
| 16,416 | Senior Housing Property Trust | 398,745 | ||||||
| 6,706 | Starwood Hotels & Resorts Worldwide, Inc. | 541,979 | ||||||
| 66,720 | Ventas, Inc. | 4,276,752 | ||||||
|
| |||||||
| Total | 14,532,157 | |||||||
|
| |||||||
| Hotel & Resort REITs (9.1%) | |||||||
| 26,928 | Ashford Hospitality Trust, Inc. | 310,749 | ||||||
| 9,877 | Chatham Lodging Trust | 216,306 | ||||||
| 13,933 | Chesapeake Lodging Trust | 421,195 | ||||||
| 29,095 | DiamondRock Hospitality Company | 372,998 | ||||||
| 15,843 | FelCor Lodging Trust, Inc. | 166,510 | ||||||
| �� | 35,147 | Hersha Hospitality Trust | 235,836 | |||||
| 14,600 | Hilton Worldwide Holdings, Inc.a | 340,180 | ||||||
| 33,549 | Hospitality Properties Trust | 1,019,890 | ||||||
| 195,140 | Host Hotels & Resorts, Inc. | 4,295,031 | ||||||
| 7,500 | La Quinta Holdings, Inc.a | 143,550 | ||||||
| 23,190 | LaSalle Hotel Properties | 818,375 | ||||||
| 18,108 | Pebblebrook Hotel Trust | 669,272 | ||||||
| 42,830 | RLJ Lodging Trust | 1,237,359 | ||||||
| 79,774 | Strategic Hotels & Resorts, Inc.a | 934,154 | ||||||
| 42,457 | Summit Hotel Properties, Inc. | 450,044 | ||||||
| 70,423 | Sunstone Hotel Investors, Inc. | 1,051,415 | ||||||
| 2,500 | Wyndham Worldwide Corporation | 189,300 | ||||||
|
| |||||||
| Total | 12,872,164 | |||||||
|
| |||||||
| Industrial REITS (5.9%) | |||||||
| 85,316 | DCT Industrial Trust, Inc. | 700,444 | ||||||
| 7,724 | EastGroup Properties, Inc. | 496,113 | ||||||
| 34,246 | First Industrial Realty Trust, Inc. | 645,195 | ||||||
| 138,923 | Prologis, Inc. | 5,708,346 | ||||||
| 10,000 | Rexford Industrial Realty, Inc. | 142,400 | ||||||
| 16,150 | STAG Industrial, Inc. | 387,761 | ||||||
| 12,523 | Terreno Realty Corporation | 242,070 | ||||||
|
| |||||||
| Total | 8,322,329 | |||||||
|
| |||||||
| Mortgage REITS (0.7%) | |||||||
| 5,000 | Apollo Commercial Real Estate Finance, Inc. | 82,450 | ||||||
| 6,650 | Blackstone Mortgage Trust, Inc. | 192,850 | ||||||
| 4,000 | Colony Financial, Inc. | 92,880 | ||||||
| 15,000 | NorthStar Realty Finance Corporation | 260,700 | ||||||
| 9,950 | Starwood Property Trust, Inc. | 236,511 | ||||||
| 10,150 | Western Asset Mortgage Capital Corporation | 143,826 | ||||||
|
| |||||||
| Total | 1,009,217 | |||||||
|
| |||||||
| Office REITS (13.5%) | |||||||
| 18,712 | Alexandria Real Estate Equities, Inc. | 1,452,800 | ||||||
| 46,162 | BioMed Realty Trust, Inc. | 1,007,716 | ||||||
| 39,868 | Boston Properties, Inc. | 4,711,600 | ||||||
| 27,530 | Brandywine Realty Trust | 429,468 | ||||||
| 9,103 | City Office REIT, Inc.a | 115,426 | ||||||
| 5,646 | Coresite Realty Corporation | 186,713 | ||||||
| 18,957 | Corporate Office Properties Trust | 527,194 | ||||||
| 7,600 | CyrusOne, Inc. | 189,240 | ||||||
| 23,268 | Digital Realty Trust, Inc. | 1,356,990 | ||||||
| 48,757 | Douglas Emmett, Inc. | 1,375,923 | ||||||
| 24,250 | DuPont Fabros Technology, Inc. | 653,780 | ||||||
| 5,800 | Franklin Street Properties Corporation | 72,964 | ||||||
| 20,412 | Highwoods Properties, Inc. | 856,283 | ||||||
| 17,799 | Hudson Pacific Properties, Inc. | 451,027 | ||||||
| 24,163 | Kilroy Realty Corporation | 1,504,872 | ||||||
| 16,405 | Mack-Cali Realty Corporation | 352,379 | ||||||
| 14,270 | Parkway Properties, Inc. | 294,675 | ||||||
| 16,963 | Piedmont Office Realty Trust, Inc. | 321,279 | ||||||
| 2,000 | QTS Realty Trust, Inc. | 57,260 | ||||||
| 29,177 | SL Green Realty Corporation | 3,192,256 | ||||||
|
| |||||||
| Total | 19,109,845 | |||||||
|
| |||||||
| Real Estate Operating Companies (0.4%) | |||||||
| 29,043 | Forest City Enterprises, Inc.a | 577,084 | ||||||
|
| |||||||
| Total | 577,084 | |||||||
|
| |||||||
The accompanying Notes to Financial Statements are an integral part of this schedule.
166
Table of Contents
Real Estate Securities Portfolio
Schedule of Investments as of June 30, 2014
(unaudited)
| Shares | Common Stock (99.2%) | Value | ||||||
| Real Estate Services (0.1%) | |||||||
| 2,000 | CBRE Group, Inc.a | $ | 64,080 | |||||
| 500 | Jones Lang LaSalle, Inc. | 63,195 | ||||||
|
| |||||||
| Total | 127,275 | |||||||
|
| |||||||
| Residential REITS (17.0%) | |||||||
| 25,853 | American Campus Communities, Inc. | 988,619 | ||||||
| 6,300 | American Homes 4 Rent | 111,888 | ||||||
| 41,084 | Apartment Investment & Management Company | 1,325,781 | ||||||
| 10,059 | Associated Estates Realty Corporation | 181,263 | ||||||
| 34,154 | AvalonBay Communities, Inc. | 4,856,357 | ||||||
| 30,051 | Camden Property Trust | 2,138,129 | ||||||
| 21,888 | Campus Crest Communities, Inc. | 189,550 | ||||||
| 55,714 | Education Realty Trust, Inc. | 598,368 | ||||||
| 12,978 | Equity Lifestyle Properties, Inc. | 573,108 | ||||||
| 74,590 | Equity Residential | 4,699,170 | ||||||
| 20,185 | Essex Property Trust, Inc. | 3,732,408 | ||||||
| 9,087 | Home Properties, Inc. | 581,205 | ||||||
| 13,374 | Mid-America Apartment Communities, Inc. | 976,971 | ||||||
| 19,535 | Post Properties, Inc. | 1,044,341 | ||||||
| 11,603 | Sun Communities, Inc. | 578,294 | ||||||
| 48,094 | UDR, Inc. | 1,376,931 | ||||||
|
| |||||||
| Total | 23,952,383 | |||||||
|
| |||||||
| Retail REITS (25.0%) | |||||||
| 22,163 | Acadia Realty Trust | 622,559 | ||||||
| 5,450 | Agree Realty Corporation | 164,753 | ||||||
| 3,915 | AmREIT, Inc. | 71,645 | ||||||
| 14,127 | Brixmor Property Group, Inc. | 324,215 | ||||||
| 39,239 | CBL & Associates Properties, Inc. | 745,541 | ||||||
| 10,925 | Cedar Realty Trust, Inc. | 68,281 | ||||||
| 127,606 | DDR Corporation | 2,249,694 | ||||||
| 16,517 | Equity One, Inc. | 389,636 | ||||||
| 23,632 | Excel Trust, Inc. | 315,015 | ||||||
| 14,295 | Federal Realty Investment Trust | 1,728,551 | ||||||
| 145,405 | General Growth Properties, Inc. | 3,425,742 | ||||||
| 55,924 | Glimcher Realty Trust | 605,657 | ||||||
| 18,332 | Inland Real Estate Corporation | 194,869 | ||||||
| 73,387 | Kimco Realty Corporation | 1,686,433 | ||||||
| 26,747 | Kite Realty Group Trust | 164,227 | ||||||
| 31,166 | Macerich Company | 2,080,330 | ||||||
| 18,286 | National Retail Properties, Inc. | 680,056 | ||||||
| 9,526 | Pennsylvania Real Estate Investment Trust | 179,279 | ||||||
| 24,848 | Ramco-Gershenson Properties Trust | 412,974 | ||||||
| 7,850 | Realty Income Corporation | 348,697 | ||||||
| 23,692 | Regency Centers Corporation | 1,319,171 | ||||||
| 15,272 | Retail Opportunity Investments Corporation | 240,229 | ||||||
| 16,500 | Retail Properties of America, Inc. | 253,770 | ||||||
| 1,138 | Saul Centers, Inc. | 55,307 | ||||||
| 80,961 | Simon Property Group, Inc. | 13,462,195 | ||||||
| 21,363 | Tanger Factory Outlet Centers, Inc. | 747,064 | ||||||
| 15,941 | Taubman Centers, Inc. | 1,208,487 | ||||||
| 6,500 | Urstadt Biddle Properties, Inc. | 135,720 | ||||||
| 30,580 | Washington Prime Group, Inc.a | 573,069 | ||||||
| 23,142 | Weingarten Realty Investors | 759,983 | ||||||
|
| |||||||
| Total | 35,213,149 | |||||||
|
| |||||||
| Specialized REITS (8.7%) | |||||||
| 15,700 | American Tower Corporation | 1,412,686 | ||||||
| 9,444 | Corrections Corporation of America REIT | 310,235 | ||||||
| 5,000 | Crown Castle International Corporation | 371,300 | ||||||
| 53,072 | CubeSmart | 972,279 | ||||||
| 11,308 | EPR Properties | 631,778 | ||||||
| 34,020 | Extra Space Storage, Inc. | 1,811,565 | ||||||
| 2,900 | Geo Group, Inc. | 103,617 | ||||||
| 3,465 | Plum Creek Timber Company, Inc. | 156,271 | ||||||
| 29,283 | Public Storage, Inc. | 5,017,642 | ||||||
| 4,494 | Rayonier, Inc. REIT | 159,762 | ||||||
| 4,099 | Sovran Self Storage, Inc. | 316,648 | ||||||
| 30,800 | Weyerhaeuser Company | 1,019,172 | ||||||
|
| |||||||
| Total | 12,282,955 | |||||||
|
| |||||||
| Total Common Stock (cost $134,984,922) | 140,050,362 | |||||||
|
| |||||||
| Shares or Principal Amount | Short-Term Investments (0.4%)b | |||||||
| Thrivent Cash Management Trust | ||||||||
| 581,516 | 0.050% | 581,516 | ||||||
|
| |||||||
| Total Short-Term Investments (at amortized cost) | 581,516 | |||||||
|
| |||||||
Total Investments (cost $135,566,438) 99.6% | $ | 140,631,878 | ||||||
|
| |||||||
| Other Assets and Liabilities, Net 0.4% | 556,160 | |||||||
|
| |||||||
| Total Net Assets 100.0% | $ | 141,188,038 | ||||||
|
| |||||||
| a | Non-income producing security. |
| b | The interest rate shown reflects the yield, coupon rate or the discount rate at the date of purchase. |
Definitions:
REIT | - | Real Estate Investment Trust is a company that buys, develops, manages and/or sells real estate assets. |
Unrealized Appreciation (Depreciation)
Gross unrealized appreciation and depreciation of investments, based on cost for federal income tax purposes, were as follows:
Gross unrealized appreciation | $ | 21,176,687 | ||
Gross unrealized depreciation | (16,136,894 | ) | ||
|
| |||
Net unrealized appreciation (depreciation) | $ | 5,039,793 | ||
Cost for federal income tax purposes | $ | 135,592,085 | ||
The accompanying Notes to Financial Statements are an integral part of this schedule.
167
Table of Contents
Real Estate Securities Portfolio
Schedule of Investments as of June 30, 2014
(unaudited)
Fair Valuation Measurements
The following table is a summary of the inputs used, as of June 30, 2014, in valuing Real Estate Securities Portfolio’s assets carried at fair value.
Investments in Securities | Total | Level 1 | Level 2 | Level 3 | ||||||||||||
Common Stock | ||||||||||||||||
Casinos & Gaming | 190,550 | 190,550 | — | — | ||||||||||||
Consumer Discretionary | 332,480 | 332,480 | — | — | ||||||||||||
Diversified REITS | 11,528,774 | 11,528,774 | — | — | ||||||||||||
Health Care REITs | 14,532,157 | 14,532,157 | — | — | ||||||||||||
Hotel & Resort REITs | 12,872,164 | 12,872,164 | — | — | ||||||||||||
Industrial REITS | 8,322,329 | 8,322,329 | — | — | ||||||||||||
Mortgage REITS | 1,009,217 | 1,009,217 | — | — | ||||||||||||
Office REITS | 19,109,845 | 19,109,845 | — | — | ||||||||||||
Real Estate Operating Companies | 577,084 | 577,084 | — | — | ||||||||||||
Real Estate Services | 127,275 | 127,275 | — | — | ||||||||||||
Residential REITS | 23,952,383 | 23,952,383 | — | — | ||||||||||||
Retail REITS | 35,213,149 | 35,213,149 | — | — | ||||||||||||
Specialized REITS | 12,282,955 | 12,282,955 | — | — | ||||||||||||
Short-Term Investments | 581,516 | 581,516 | — | — | ||||||||||||
|
|
|
|
|
|
|
| |||||||||
Total | $ | 140,631,878 | $ | 140,631,878 | $ | — | $ | — | ||||||||
|
|
|
|
|
|
|
| |||||||||
There were no significant transfers between Levels during the period ended June 30, 2014. Transfers between Levels are identified as of the end of the period.
Investment in Affiliates
Affiliated issuers, as defined under the Investment Company Act of 1940, include those in which the Portfolio’s holdings of an issuer represent 5% or more of the outstanding voting securities of an issuer, or any affiliated mutual fund.
A summary of transactions for the fiscal year to date, in Real Estate Securities Portfolio, is as follows:
Portfolio | Value December 31, 2013 | Gross Purchases | Gross Sales | Shares Held at June 30, 2014 | Value June 30, 2014 | Income Earned January 1, 2014 - June 30, 2014 | ||||||||||||||||||
Cash Management Trust-Short Term Investment | $ | 359,706 | $ | 9,613,568 | $ | 9,391,758 | 581,516 | $ | 581,516 | $ | 246 | |||||||||||||
Total Value and Income Earned | 359,706 | 581,516 | 246 | |||||||||||||||||||||
The accompanying Notes to Financial Statements are an integral part of this schedule.
168
Table of Contents
Partner Small Cap Growth Portfolio
Schedule of Investments as of June 30, 2014
(unaudited)
| Shares | Common Stock (96.6%) | Value | ||||||
| Consumer Discretionary (16.9%) | |||||||
| 13,730 | American Axle & Manufacturing Holdings, Inc.a | $ | 259,360 | |||||
| 64,055 | ANN, Inc.a | 2,635,223 | ||||||
| 4,490 | Asbury Automotive Group, Inc.a | 308,643 | ||||||
| 28,510 | Boyd Gaming Corporationa | 345,826 | ||||||
| 68,970 | Brunswick Corporation | 2,905,706 | ||||||
| 6,920 | Buffalo Wild Wings, Inc.a | 1,146,713 | ||||||
| 87,321 | Burlington Stores, Inc.a,b | 2,782,047 | ||||||
| 77,070 | Chuy’s Holdings, Inc.a,b | 2,797,641 | ||||||
| 53,160 | Core-Mark Holding Company, Inc. | 2,425,691 | ||||||
| 125,480 | Del Frisco’s Restaurant Group, Inc.a | 3,458,229 | ||||||
| 13,550 | Dorman Products, Inc.a | 668,286 | ||||||
| 68,210 | Five Below, Inc.a,b | 2,722,261 | ||||||
| 31,140 | Fox Factory Holding Corporationa | 547,753 | ||||||
| 60,170 | G-III Apparel Group, Ltd.a | 4,913,482 | ||||||
| 86,990 | HomeAway, Inc.a | 3,028,992 | ||||||
| 73,020 | Imax Corporationa,b | 2,079,609 | ||||||
| 91,650 | Kate Spade & Companya | 3,495,531 | ||||||
| 24,710 | LifeLock, Inc.a | 344,952 | ||||||
| 7,270 | Lithia Motors, Inc. | 683,889 | ||||||
| 103,120 | Multimedia Games Holding Company, Inc.a | 3,056,477 | ||||||
| 11,290 | Oxford Industries, Inc. | 752,704 | ||||||
| 14,900 | Red Robin Gourmet Burgers, Inc.a | 1,060,880 | ||||||
| 9,560 | Rentrak Corporationa | 501,422 | ||||||
| 22,020 | Restoration Hardware Holdings, Inc.a | 2,048,961 | ||||||
| 13,720 | Shutterfly, Inc.a | 590,783 | ||||||
| 55,260 | Skechers USA, Inc.a | 2,525,382 | ||||||
| 65,180 | Tenneco, Inc.a | 4,282,326 | ||||||
| 27,030 | Vail Resorts, Inc. | 2,086,175 | ||||||
| 52,860 | Vitamin Shoppe, Inc.a | 2,274,037 | ||||||
| 15,560 | Zoe’s Kitchen, Inc.a,b | 534,953 | ||||||
|
| |||||||
| Total | 57,263,934 | |||||||
|
| |||||||
| Consumer Staples (3.2%) | |||||||
| 31,650 | B&G Foods, Inc. | 1,034,638 | ||||||
| 17,860 | Boston Beer Company, Inc.a,b | 3,992,067 | ||||||
| 54,170 | Natural Grocers by Vitamin Cottage, Inc.a,b | 1,159,780 | ||||||
| 3,180 | TreeHouse Foods, Inc.a | 254,623 | ||||||
| 69,400 | United Natural Foods, Inc.a | 4,517,940 | ||||||
|
| |||||||
| Total | 10,959,048 | |||||||
|
| |||||||
| Energy (4.9%) | |||||||
| 10,470 | Bonanza Creek Energy, Inc.a | 598,779 | ||||||
| 31,580 | Callon Petroleum Companya | 367,907 | ||||||
| 10,920 | Diamondback Energy, Inc.a | 969,696 | ||||||
| 322,700 | Kodiak Oil & Gas Corporationa | 4,695,285 | ||||||
| 9,850 | PDC Energy, Inc.a | 622,028 | ||||||
| 198,400 | Penn Virginia Corporationa | 3,362,880 | ||||||
| 184,720 | Rex Energy Corporationa | 3,271,391 | ||||||
| 36,120 | SemGroup Corporation | 2,848,062 | ||||||
|
| |||||||
| Total | 16,736,028 | |||||||
|
| |||||||
| Financials (7.1%) | |||||||
| 106,052 | Bank of the Ozarks, Inc. | 3,547,439 | ||||||
| 82,390 | Chesapeake Lodging Trust | 2,490,650 | ||||||
| 34,040 | eHealth, Inc.a | 1,292,499 | ||||||
| 128,320 | Essent Group, Ltd.a | 2,577,949 | ||||||
| 58,110 | Evercore Partners, Inc. | 3,349,460 | ||||||
| 73,770 | Hanmi Financial Corporation | 1,555,072 | ||||||
| 135,000 | Kennedy-Wilson Holdings, Inc. | 3,620,700 | ||||||
| 78,230 | PacWest Bancorp | 3,377,189 | ||||||
| 102,200 | Western Alliance Bancorpa | 2,432,360 | ||||||
|
| |||||||
| Total | 24,243,318 | |||||||
|
| |||||||
| Health Care (19.4%) | |||||||
| 70,970 | Acadia Healthcare Company, Inc.a | 3,229,135 | ||||||
| 12,300 | Air Methods Corporationa,b | 635,295 | ||||||
| 204,394 | Akorn, Inc.a | 6,796,101 | ||||||
| 33,810 | Align Technology, Inc.a | 1,894,712 | ||||||
| 14,400 | AtriCure, Inc.a | 264,672 | ||||||
| 98,490 | Bruker Corporationa | 2,390,352 | ||||||
| 29,850 | Cardiovascular Systems, Inc.a | 930,126 | ||||||
| 34,870 | Centene Corporationa | 2,636,521 | ||||||
| 42,860 | Cubist Pharmaceuticals, Inc.a | 2,992,485 | ||||||
| 66,780 | Cyberonics, Inc.a | 4,171,079 | ||||||
| 255,170 | Depomed, Inc.a | 3,546,863 | ||||||
| 20,520 | Enanta Pharmaceuticals, Inc.a,b | 883,796 | ||||||
| 123,950 | ExamWorks Group, Inc.a | 3,932,934 | ||||||
| 5,880 | Furiex Pharmaceuticals, Inc.a | 624,338 | ||||||
| 137,580 | Impax Laboratories, Inc.a | 4,126,024 | ||||||
| 225,949 | Ironwood Pharmaceuticals, Inc.a | 3,463,798 | ||||||
| 52,470 | LifePoint Hospitals, Inc.a | 3,258,387 | ||||||
| 24,710 | Natus Medical, Inc.a | 621,209 | ||||||
| 149,620 | Neurocrine Biosciences, Inc.a | 2,220,361 | ||||||
| 91,100 | NPS Pharmaceuticals, Inc.a | 3,010,855 | ||||||
| 98,700 | NuVasive, Inc.a | 3,510,759 | ||||||
| 9,170 | PAREXEL International Corporationa | 484,543 | ||||||
| 43,310 | Puma Biotechnology, Inc.a | 2,858,460 | ||||||
| 13,210 | Sarepta Therapeutics, Inc.a,b | 393,526 | ||||||
| 74,300 | Team Health Holdings, Inc.a | 3,710,542 | ||||||
| 31,833 | Teleflex, Inc. | 3,361,565 | ||||||
|
| |||||||
| Total | 65,948,438 | |||||||
|
| |||||||
| Industrials (16.3%) | |||||||
| 14,090 | Acuity Brands, Inc. | 1,947,942 | ||||||
| 2,340 | American Railcar Industries, Inc.b | 158,582 | ||||||
| 8,510 | Chart Industries, Inc.a,b | 704,117 | ||||||
| 5,480 | Circor International, Inc. | 422,672 | ||||||
| 37,620 | Generac Holdings, Inc.a | 1,833,599 | ||||||
| 6,860 | Genesee & Wyoming, Inc.a | 720,300 | ||||||
| 44,300 | Granite Construction, Inc. | 1,593,914 | ||||||
| 65,328 | H&E Equipment Services, Inc.a | 2,374,020 | ||||||
| 54,960 | Heico Corporation | 2,854,622 | ||||||
| 35,400 | Huron Consulting Group, Inc.a | 2,507,028 | ||||||
| 182,610 | Interface, Inc. | 3,440,372 | ||||||
| 67,690 | MasTec, Inc.a | 2,086,206 | ||||||
| 46,920 | Middleby Corporationa | 3,881,222 | ||||||
| 137,460 | On Assignment, Inc.a | 4,889,452 | ||||||
| 48,550 | PGT, Inc.a | 411,219 | ||||||
| 18,370 | Primoris Services Corporation | 529,791 | ||||||
| 49,290 | Proto Labs, Inc.a | 4,037,837 | ||||||
| 97,752 | Ritchie Brothers Auctioneers, Inc.b | 2,409,587 | ||||||
| 91,470 | Saia, Inc.a | 4,018,277 | ||||||
| 67,350 | Spirit Airlines, Inc.a | 4,259,214 | ||||||
| 118,756 | Swift Transportation Companya | 2,996,214 | ||||||
| 61,920 | Tutor Perini Corporationa | 1,965,341 | ||||||
| 11,420 | WageWorks, Inc.a | 550,558 | ||||||
| 28,360 | Watsco, Inc. | 2,914,274 | ||||||
The accompanying Notes to Financial Statements are an integral part of this schedule.
169
Table of Contents
Partner Small Cap Growth Portfolio
Schedule of Investments as of June 30, 2014
(unaudited)
| Shares | Common Stock (96.6%) | Value | ||||||
| Industrials (16.3%) - continued | |||||||
| 32,900 | Watts Water Technologies, Inc. | $ | 2,030,917 | |||||
|
| |||||||
| Total | 55,537,277 | |||||||
|
| |||||||
| Information Technology (24.3%) | |||||||
| 107,530 | A10 Networks, Inc.a | 1,430,149 | ||||||
| 31,040 | Alliance Fiber Optic Products, Inc.b | 561,824 | ||||||
| 34,330 | Ambarella, Inc.a,b | 1,070,409 | ||||||
| 356,740 | Applied Micro Circuits Corporationa | 3,856,359 | ||||||
| 39,490 | Applied Optoelectronics, Inc.a | 916,168 | ||||||
| 96,110 | Aspen Technology, Inc.a | 4,459,504 | ||||||
| 36,210 | Belden, Inc. | 2,830,174 | ||||||
| 66,740 | Bottomline Technologies, Inc.a | 1,996,861 | ||||||
| 21,110 | CalAmp Corporationa | 457,243 | ||||||
| 63,320 | Callidus Software, Inc.a | 756,041 | ||||||
| 83,950 | Cardtronics, Inc.a | 2,861,016 | ||||||
| 85,590 | Cavium, Inc.a | 4,250,399 | ||||||
| 9,070 | ChannelAdvisor Corporationa | 239,085 | ||||||
| 86,630 | Cognex Corporationa | 3,326,592 | ||||||
| 31,830 | Coherent, Inc.a | 2,106,191 | ||||||
| 105,370 | Constant Contact, Inc.a | 3,383,431 | ||||||
| 98,035 | Cornerstone OnDemand, Inc.a | 4,511,571 | ||||||
| 57,620 | Dealertrack Technologies, Inc.a | 2,612,491 | ||||||
| 67,201 | Demandware, Inc.a,b | 4,661,733 | ||||||
| 82,543 | Digimarc Corporation | 2,690,902 | ||||||
| 40,460 | Electronics for Imaging, Inc.a | 1,828,792 | ||||||
| 126,850 | Guidewire Software, Inc.a | 5,157,721 | ||||||
| 4,320 | Heartland Payment Systems, Inc.b | 178,027 | ||||||
| 38,810 | Inphi Corporationa | 569,731 | ||||||
| 8,420 | Interactive Intelligence Groupa | 472,615 | ||||||
| 42,150 | Manhattan Associates, Inc.a | 1,451,224 | ||||||
| 23,320 | MaxLinear, Inc.a | 234,832 | ||||||
| 18,620 | Methode Electronics, Inc. | 711,470 | ||||||
| 126,050 | Monolithic Power Systems, Inc. | 5,338,218 | ||||||
| 141,830 | Proofpoint, Inc.a | 5,312,952 | ||||||
| 278,160 | RF Micro Devices, Inc.a | 2,667,554 | ||||||
| 7,550 | SPS Commerce, Inc.a | 477,085 | ||||||
| 30,350 | SunPower Corporationa,b | 1,243,743 | ||||||
| 18,660 | Synaptics, Inc.a,b | 1,691,342 | ||||||
| 79,480 | The Rubicon Project, Inc.a,b | 1,020,523 | ||||||
| 11,550 | Tyler Technologies, Inc.a | 1,053,476 | ||||||
| 16,650 | Ultimate Software Group, Inc.a | 2,300,530 | ||||||
| 48,146 | Virtusa Corporationa | 1,723,627 | ||||||
|
| |||||||
| Total | 82,411,605 | |||||||
|
| |||||||
| Materials (4.5%) | |||||||
| 98,450 | Chemtura Corporationa | 2,572,499 | ||||||
| 250,270 | Graphic Packaging Holding Companya | 2,928,159 | ||||||
| 36,160 | KapStone Paper and Packaging Corporationa | 1,197,981 | ||||||
| 95,710 | PolyOne Corporation | 4,033,219 | ||||||
| 202,340 | Senomyx, Inc.a,b | 1,750,241 | ||||||
| 51,310 | U.S. Silica Holdings, Inc.b | 2,844,626 | ||||||
|
| |||||||
| Total | 15,326,725 | |||||||
|
| |||||||
| Total Common Stock (cost $258,310,349) | 328,426,373 | |||||||
|
| |||||||
Collateral Held for Securities Loaned (9.3%) | ||||||||
| 31,529,995 | Thrivent Cash Management Trust | 31,529,995 | ||||||
|
| |||||||
| Total Collateral Held for Securities Loaned (cost $31,529,995) | 31,529,995 | |||||||
|
| |||||||
| Shares or Principal Amount | Short-Term Investments (3.1%)c | |||||||
| Thrivent Cash Management Trust | ||||||||
| 10,429,790 | 0.050% | 10,429,790 | ||||||
|
| |||||||
| Total Short-Term Investments (at amortized cost) | 10,429,790 | |||||||
|
| |||||||
Total Investments (cost $300,270,134) 109.0% | $ | 370,386,158 | ||||||
|
| |||||||
| Other Assets and Liabilities, Net (9.0%) | (30,526,892 | ) | ||||||
|
| |||||||
| Total Net Assets 100.0% | $ | 339,859,266 | ||||||
|
| |||||||
| a | Non-income producing security. |
| b | All or a portion of the security is on loan. |
| c | The interest rate shown reflects the yield, coupon rate or the discount rate at the date of purchase. |
Unrealized Appreciation (Depreciation)
Gross unrealized appreciation and depreciation of investments, based on cost for federal income tax purposes, were as follows:
Gross unrealized appreciation | $ | 75,443,303 | ||
Gross unrealized depreciation | (5,682,563 | ) | ||
|
| |||
Net unrealized appreciation (depreciation) | $ | 69,760,740 | ||
Cost for federal income tax purposes | $ | 300,625,418 | ||
The accompanying Notes to Financial Statements are an integral part of this schedule.
170
Table of Contents
Partner Small Cap Growth Portfolio
Schedule of Investments as of June 30, 2014
(unaudited)
Fair Valuation Measurements
The following table is a summary of the inputs used, as of June 30, 2014, in valuing Partner Small Cap Growth Portfolio’s assets carried at fair value.
Investments in Securities | Total | Level 1 | Level 2 | Level 3 | ||||||||||||
Common Stock | ||||||||||||||||
Consumer Discretionary | 57,263,934 | 57,263,934 | — | — | ||||||||||||
Consumer Staples | 10,959,048 | 10,959,048 | — | — | ||||||||||||
Energy | 16,736,028 | 16,736,028 | — | — | ||||||||||||
Financials | 24,243,318 | 24,243,318 | — | — | ||||||||||||
Health Care | 65,948,438 | 65,948,438 | — | — | ||||||||||||
Industrials | 55,537,277 | 55,537,277 | — | — | ||||||||||||
Information Technology | 82,411,605 | 82,411,605 | — | — | ||||||||||||
Materials | 15,326,725 | 15,326,725 | — | — | ||||||||||||
Collateral Held for Securities Loaned | 31,529,995 | 31,529,995 | — | — | ||||||||||||
Short-Term Investments | 10,429,790 | 10,429,790 | — | — | ||||||||||||
|
|
|
|
|
|
|
| |||||||||
Total | $ | 370,386,158 | $ | 370,386,158 | $ | — | $ | — | ||||||||
|
|
|
|
|
|
|
| |||||||||
There were no significant transfers between Levels during the period ended June 30, 2014. Transfers between Levels are identified as of the end of the period.
Investment in Affiliates
Affiliated issuers, as defined under the Investment Company Act of 1940, include those in which the Portfolio’s holdings of an issuer represent 5% or more of the outstanding voting securities of an issuer, or any affiliated mutual fund.
A summary of transactions for the fiscal year to date, in Partner Small Cap Growth Portfolio, is as follows:
Portfolio | Value December 31, 2013 | Gross Purchases | Gross Sales | Shares Held at June 30, 2014 | Value June 30, 2014 | Income Earned January 1, 2014 - June 30, 2014 | ||||||||||||||||||
Cash Management Trust-Collateral Investment | $ | 29,633,978 | $ | 98,678,318 | $ | 96,782,301 | 31,529,995 | $ | 31,529,995 | $ | 46,335 | |||||||||||||
Cash Management Trust-Short Term Investment | 5,913,423 | 57,710,887 | 53,194,520 | 10,429,790 | 10,429,790 | 2,088 | ||||||||||||||||||
Total Value and Income Earned | 35,547,401 | 41,959,785 | 48,423 | |||||||||||||||||||||
The accompanying Notes to Financial Statements are an integral part of this schedule.
171
Table of Contents
Partner Small Cap Value Portfolio
Schedule of Investments as of June 30, 2014
(unaudited)
| Shares | Common Stock (96.9%) | Value | ||||||
| Consumer Discretionary (14.7%) | |||||||
| 218,000 | Aaron’s, Inc. | $ | 7,769,520 | |||||
| 37,800 | American Public Education, Inc.a | 1,299,564 | ||||||
| 17,900 | Ascent Capital Group, Inc.a | 1,181,579 | ||||||
| 156,500 | Belmond, Ltd.a | 2,275,510 | ||||||
| 42,500 | Crocs, Inc.a | 638,775 | ||||||
| 59,000 | CSS Industries, Inc. | 1,555,830 | ||||||
| 81,300 | Dorman Products, Inc.a | 4,009,716 | ||||||
| 96,800 | Drew Industries, Inc. | 4,840,968 | ||||||
| 65,600 | Ethan Allen Interiors, Inc.b | 1,622,944 | ||||||
| 75,000 | Fred’s, Inc. | 1,146,750 | ||||||
| 101,000 | Haverty Furniture Companies, Inc. | 2,538,130 | ||||||
| 45,000 | Hooker Furniture Corporation | 726,300 | ||||||
| 68,000 | M/I Homes, Inc.a | 1,650,360 | ||||||
| 80,500 | MarineMax, Inc.a | 1,347,570 | ||||||
| 77,800 | Matthews International Corporation | 3,234,146 | ||||||
| 106,000 | Meritage Homes Corporationa | 4,474,260 | ||||||
| 151,200 | Modine Manufacturing Companya | 2,379,888 | ||||||
| 151,250 | Pier 1 Imports, Inc. | 2,330,762 | ||||||
| 306,300 | Quiksilver, Inc.a | 1,096,554 | ||||||
| 16,700 | Red Robin Gourmet Burgers, Inc.a | 1,189,040 | ||||||
| 159,400 | Shiloh Industries, Inc.a | 2,942,524 | ||||||
| 190,200 | Sportsman’s Warehouse Holdings, Inc.a | 1,521,600 | ||||||
| 179,000 | Stein Mart, Inc. | 2,486,310 | ||||||
| 43,200 | Steven Madden, Ltd.a | 1,481,760 | ||||||
| 79,400 | Winnebago Industries, Inc.a | 1,999,292 | ||||||
|
| |||||||
| Total | 57,739,652 | |||||||
|
| |||||||
| Consumer Staples (0.7%) | |||||||
| 270,000 | Alliance One International, Inc.a | 675,000 | ||||||
| 95,400 | Spartannash Company | 2,004,354 | ||||||
|
| |||||||
| Total | 2,679,354 | |||||||
|
| |||||||
| Energy (4.1%) | |||||||
| 67,000 | C&J Energy Services, Inc.a | 2,263,260 | ||||||
| 8,300 | CARBO Ceramics, Inc.b | 1,279,196 | ||||||
| 109,000 | Cloud Peak Energy, Inc.a | 2,007,780 | ||||||
| 24,600 | Contango Oil & Gas Companya | 1,040,826 | ||||||
| 96,000 | Gulf Island Fabrication, Inc. | 2,065,920 | ||||||
| 208,300 | Hercules Offshore, Inc.a | 837,366 | ||||||
| 23,900 | PDC Energy, Inc.a | 1,509,285 | ||||||
| 334,600 | Teekay Tankers, Ltd.b | 1,435,434 | ||||||
| 81,200 | Tesco Corporation | 1,732,808 | ||||||
| 152,900 | Tetra Technologies, Inc.a | 1,801,162 | ||||||
|
| |||||||
| Total | 15,973,037 | |||||||
|
| |||||||
| Financials (24.5%) | |||||||
| 155,900 | Ares Capital Corporation | 2,784,374 | ||||||
| 35,000 | Assured Guaranty, Ltd. | 857,500 | ||||||
| 48,800 | Bank of Kentucky Financial Corporation | 1,697,752 | ||||||
| 92,600 | BBCN Bancorp, Inc. | 1,476,970 | ||||||
| 161,800 | CBL & Associates Properties, Inc. | 3,074,200 | ||||||
| 210,800 | Cedar Realty Trust, Inc. | 1,317,500 | ||||||
| 420,000 | CoBiz Financial, Inc. | 4,523,400 | ||||||
| 88,300 | Columbia Banking System, Inc. | 2,323,173 | ||||||
| 98,018 | Compass Diversified Holdings | 1,779,026 | ||||||
| 173,400 | East West Bancorp, Inc. | 6,067,266 | ||||||
| 97,410 | Employers Holdings, Inc. | 2,063,144 | ||||||
| 199,300 | First Potomac Realty Trust | 2,614,816 | ||||||
| 7,200 | Forestar Real Estate Group, Inc.a | 137,448 | ||||||
| 135,600 | Glacier Bancorp, Inc. | 3,848,328 | ||||||
| 100,000 | Golub Capital BDC, Inc. | 1,770,000 | ||||||
| 96,000 | Hatteras Financial Corporation | 1,901,760 | ||||||
| 200,000 | Hercules Technology Growth Capital, Inc. | 3,232,000 | ||||||
| 111,400 | Home Bancshares, Inc. | 3,656,148 | ||||||
| 29,000 | iShares Russell 2000 Value Index Fund | 2,994,540 | ||||||
| 67,000 | JMP Group, Inc. | 507,190 | ||||||
| 26,500 | Kilroy Realty Corporation | 1,650,420 | ||||||
| 371,000 | Kite Realty Group Trust | 2,277,940 | ||||||
| 91,000 | LaSalle Hotel Properties | 3,211,390 | ||||||
| 24,200 | Main Street Capital Corporation | 794,878 | ||||||
| 667 | Markel Corporationa | 437,312 | ||||||
| 211,700 | Meadowbrook Insurance Group, Inc. | 1,522,123 | ||||||
| 65,900 | National Interstate Corporation | 1,846,518 | ||||||
| 19,900 | Piper Jaffray Companiesa | 1,030,223 | ||||||
| 61,200 | Potlatch Corporation | 2,533,680 | ||||||
| 142,500 | ProAssurance Corporation | 6,327,000 | ||||||
| 11,400 | PS Business Parks, Inc. | 951,786 | ||||||
| 119,700 | Radian Group, Inc. | 1,772,757 | ||||||
| 213,200 | Redwood Trust, Inc. | 4,151,004 | ||||||
| 96,600 | Safeguard Scientifics, Inc.a | 2,008,314 | ||||||
| 126,400 | Sandy Spring Bancorp, Inc. | 3,148,624 | ||||||
| 46,600 | State Auto Financial Corporation | 1,091,838 | ||||||
| 39,000 | SVB Financial Groupa | 4,548,180 | ||||||
| 67,685 | TCP Capital Corporation | 1,232,544 | ||||||
| 90,300 | THL Credit, Inc. | 1,264,200 | ||||||
| 67,500 | Washington Real Estate Investment Trust | 1,753,650 | ||||||
| 84,300 | Wintrust Financial Corporation | 3,877,800 | ||||||
|
| |||||||
| Total | 96,058,716 | |||||||
|
| |||||||
| Health Care (3.4%) | |||||||
| 17,300 | Analogic Corporation | 1,353,552 | ||||||
| 7,400 | Atrion Corporation | 2,412,400 | ||||||
| 44,300 | National Healthcare Corporation | 2,493,647 | �� | |||||
| 96,000 | Triple-S Management Corporationa | 1,721,280 | ||||||
| 126,000 | West Pharmaceutical Services, Inc. | 5,314,680 | ||||||
|
| |||||||
| Total | 13,295,559 | |||||||
|
| |||||||
| Industrials (26.1%) | |||||||
| 91,500 | A.O. Smith Corporation | 4,536,570 | ||||||
| 101,000 | Aegion Corporationa | 2,350,270 | ||||||
| 88,000 | Alaska Air Group, Inc.b | 8,364,400 | ||||||
| 41,000 | Applied Industrial Technologies, Inc. | 2,079,930 | ||||||
| 42,700 | Astec Industries, Inc. | 1,873,676 | ||||||
| 148,000 | Beacon Roofing Supply, Inc.a | 4,901,760 | ||||||
| 88,700 | Celadon Group, Inc. | 1,891,084 | ||||||
| 42,100 | Circor International, Inc. | 3,247,173 | ||||||
| 109,000 | Comfort Systems USA, Inc. | 1,722,200 | ||||||
| 80,400 | ESCO Technologies, Inc. | 2,785,056 | ||||||
| 57,000 | Franklin Electric Company, Inc. | 2,298,810 | ||||||
| 35,600 | FTI Consulting, Inc.a | 1,346,392 | ||||||
| 67,000 | G & K Services, Inc. | 3,488,690 | ||||||
| 46,500 | Genesee & Wyoming, Inc.a | 4,882,500 | ||||||
| 82,000 | Gibraltar Industries, Inc.a | 1,271,820 | ||||||
| 111,000 | Greenbrier Companies, Inc.a | 6,393,600 | ||||||
| 45,000 | Hub Group, Inc.a | 2,268,000 | ||||||
| 22,300 | IDEX Corporation | 1,800,502 | ||||||
| 52,000 | Kaman Corporation | 2,221,960 | ||||||
| 136,000 | Kforce, Inc. | 2,944,400 | ||||||
The accompanying Notes to Financial Statements are an integral part of this schedule.
172
Table of Contents
Partner Small Cap Value Portfolio
Schedule of Investments as of June 30, 2014
(unaudited)
| Shares | Common Stock (96.9%) | Value | ||||||
| Industrials (26.1%) - continued | |||||||
| 43,300 | Kirby Corporationa | $ | 5,072,162 | |||||
| 142,000 | Kratos Defense & Security Solutions, Inc.a | 1,107,600 | ||||||
| 67,300 | Landstar System, Inc. | 4,307,200 | ||||||
| 50,000 | Luxfer Holdings plc | 947,500 | ||||||
| 79,100 | Matson, Inc. | 2,123,044 | ||||||
| 125,000 | McGrath Rentcorp | 4,593,750 | ||||||
| 43,700 | Mine Safety Appliances Company | 2,511,876 | ||||||
| 150,500 | Navigant Consulting, Inc.a | 2,626,225 | ||||||
| 33,500 | Nordson Corporation | 2,686,365 | ||||||
| 89,000 | Pike Corporationa | 797,440 | ||||||
| 75,500 | Quanex Building Products Corporation | 1,349,185 | ||||||
| 15,600 | RBC Bearings, Inc. | 999,180 | ||||||
| 36,000 | Sun Hydraulics Corporation | 1,461,600 | ||||||
| 50,600 | Universal Forest Products, Inc. | 2,442,462 | ||||||
| 54,100 | Universal Truckload Services, Inc. | 1,371,976 | ||||||
| 46,100 | Waste Connections, Inc. | 2,238,155 | ||||||
| 59,900 | Woodward, Inc. | 3,005,782 | ||||||
|
| |||||||
| Total | 102,310,295 | |||||||
|
| |||||||
| Information Technology (9.5%) | |||||||
| 65,000 | Advanced Energy Industries, Inc.a | 1,251,250 | ||||||
| 60,000 | Belden, Inc. | 4,689,600 | ||||||
| 111,800 | Brooks Automation, Inc. | 1,204,086 | ||||||
| 67,900 | Cabot Microelectronics Corporationa | 3,031,735 | ||||||
| 36,100 | Cognex Corporationa | 1,386,240 | ||||||
| 69,500 | Cohu, Inc. | 743,650 | ||||||
| 136,200 | Electro Rent Corporation | 2,278,626 | ||||||
| 150,000 | Electro Scientific Industries, Inc. | 1,021,500 | ||||||
| 70,200 | Entegris, Inc.a | 964,899 | ||||||
| 40,700 | Fabrineta | 838,420 | ||||||
| 185,000 | Intevac, Inc.a | 1,481,850 | ||||||
| 22,100 | Littelfuse, Inc. | 2,054,195 | ||||||
| 95,000 | Methode Electronics, Inc. | 3,629,950 | ||||||
| 42,000 | Newport Corporationa | 777,000 | ||||||
| 113,000 | Progress Software Corporationa | 2,716,520 | ||||||
| 202,900 | ShoreTel, Inc.a | 1,322,908 | ||||||
| 330,000 | Sonus Networks, Inc.a | 1,184,700 | ||||||
| 69,000 | Synnex Corporationa | 5,026,650 | ||||||
| 81,000 | Teradyne, Inc.b | 1,587,600 | ||||||
|
| |||||||
| Total | 37,191,379 | |||||||
|
| |||||||
| Materials (8.5%) | |||||||
| 30,800 | American Vanguard Corporation | 407,176 | ||||||
| 74,000 | AptarGroup, Inc. | 4,958,740 | ||||||
| 18,700 | Carpenter Technology Corporation | 1,182,775 | ||||||
| 83,500 | Clearwater Paper Corporationa | 5,153,620 | ||||||
| 25,800 | Franco-Nevada Corporation | 1,480,952 | ||||||
| 25,500 | Haynes International, Inc. | 1,443,045 | ||||||
| 115,600 | Innospec, Inc. | 4,990,452 | ||||||
| 52,000 | Minerals Technologies, Inc. | 3,410,160 | ||||||
| 127,500 | Myers Industries, Inc. | 2,561,475 | ||||||
| 284,700 | Sandstorm Gold Ltd.a,b | 1,970,124 | ||||||
| 42,900 | Schnitzer Steel Industries, Inc. | 1,118,403 | ||||||
| 75,800 | Stillwater Mining Companya | 1,330,290 | ||||||
| 8,750 | Texas Industries, Inc.a,b | 808,150 | ||||||
| 223,000 | Wausau Paper Corporation | 2,412,860 | ||||||
|
| |||||||
| Total | 33,228,222 | |||||||
|
| |||||||
| Telecommunications Services (0.3%) | |||||||
| 91,850 | Premiere Global Services, Inc.a | 1,226,198 | ||||||
|
| |||||||
| Total | 1,226,198 | |||||||
|
| |||||||
| Utilities (5.1%) | |||||||
| 33,100 | Black Hills Corporation | 2,032,009 | ||||||
| 106,000 | Cleco Corporation | 6,248,700 | ||||||
| 71,000 | El Paso Electric Company | 2,854,910 | ||||||
| 58,500 | NorthWestern Corporation | 3,053,115 | ||||||
| 64,300 | PNM Resources, Inc. | 1,885,919 | ||||||
| 69,700 | Southwest Gas Corporation | 3,679,463 | ||||||
|
| |||||||
| Total | 19,754,116 | |||||||
|
| |||||||
| Total Common Stock (cost $233,550,847) | 379,456,528 | |||||||
|
| |||||||
Preferred Stock (0.2%) | ||||||||
| Health Care (0.2%) | |||||||
| 46,367 | National Healthcare Corporation, Convertiblec | 693,187 | ||||||
|
| |||||||
| Total | 693,187 | |||||||
|
| |||||||
Total Preferred Stock (cost $627,545) | 693,187 | |||||||
|
| |||||||
Collateral Held for Securities Loaned (1.8%) | ||||||||
| 7,097,096 | Thrivent Cash Management Trust | 7,097,096 | ||||||
|
| |||||||
| Total Collateral Held for Securities Loaned (cost $7,097,096) | 7,097,096 | |||||||
|
| |||||||
| Shares or Principal Amount | Short-Term Investments (3.3%)d | |||||||
| Thrivent Cash Management Trust | ||||||||
| 13,175,563 | 0.050% | 13,175,563 | ||||||
|
| |||||||
| Total Short-Term Investments (at amortized cost) | 13,175,563 | |||||||
|
| |||||||
Total Investments (cost $254,451,051) 102.2% | $ | 400,422,374 | ||||||
|
| |||||||
| Other Assets and Liabilities, Net (2.2%) | (8,769,313 | ) | ||||||
|
| |||||||
| Total Net Assets 100.0% | $ | 391,653,061 | ||||||
|
| |||||||
| a | Non-income producing security. |
| b | All or a portion of the security is on loan. |
| c | Denotes perpetual securities. Perpetual securities pay an indefinite stream of interest, but may be called by the issuer at an earlier date. |
| d | The interest rate shown reflects the yield, coupon rate or the discount rate at the date of purchase. |
Unrealized Appreciation (Depreciation)
Gross unrealized appreciation and depreciation of investments, based on cost for federal income tax purposes, were as follows:
Gross unrealized appreciation | $ | 152,674,754 | ||
Gross unrealized depreciation | (8,412,658 | ) | ||
|
| |||
Net unrealized appreciation (depreciation) | $ | 144,262,096 | ||
Cost for federal income tax purposes | $ | 256,160,278 | ||
The accompanying Notes to Financial Statements are an integral part of this schedule.
173
Table of Contents
Partner Small Cap Value Portfolio
Schedule of Investments as of June 30, 2014
(unaudited)
Fair Valuation Measurements
The following table is a summary of the inputs used, as of June 30, 2014, in valuing Partner Small Cap Value Portfolio’s assets carried at fair value.
Investments in Securities | Total | Level 1 | Level 2 | Level 3 | ||||||||||||
Common Stock | ||||||||||||||||
Consumer Discretionary | 57,739,652 | 57,739,652 | — | — | ||||||||||||
Consumer Staples | 2,679,354 | 2,679,354 | — | — | ||||||||||||
Energy | 15,973,037 | 15,973,037 | — | — | ||||||||||||
Financials | 96,058,716 | 96,058,716 | — | — | ||||||||||||
Health Care | 13,295,559 | 13,295,559 | — | — | ||||||||||||
Industrials | 102,310,295 | 102,310,295 | — | — | ||||||||||||
Information Technology | 37,191,379 | 37,191,379 | — | — | ||||||||||||
Materials | 33,228,222 | 31,747,270 | 1,480,952 | — | ||||||||||||
Telecommunications Services | 1,226,198 | 1,226,198 | — | — | ||||||||||||
Utilities | 19,754,116 | 19,754,116 | — | — | ||||||||||||
Preferred Stock | ||||||||||||||||
Health Care | 693,187 | 693,187 | — | — | ||||||||||||
Collateral Held for Securities Loaned | 7,097,096 | 7,097,096 | — | — | ||||||||||||
Short-Term Investments | 13,175,563 | 13,175,563 | — | — | ||||||||||||
|
|
|
|
|
|
|
| |||||||||
Total | $ | 400,422,374 | $ | 398,941,422 | $ | 1,480,952 | $ | — | ||||||||
|
|
|
|
|
|
|
| |||||||||
There were no significant transfers between Levels during the period ended June 30, 2014. Transfers between Levels are identified as of the end of the period.
Investment in Affiliates
Affiliated issuers, as defined under the Investment Company Act of 1940, include those in which the Portfolio’s holdings of an issuer represent 5% or more of the outstanding voting securities of an issuer, or any affiliated mutual fund.
A summary of transactions for the fiscal year to date, in Partner Small Cap Value Portfolio, is as follows:
Portfolio | Value December 31, 2013 | Gross Purchases | Gross Sales | Shares Held at June 30, 2014 | Value June 30, 2014 | Income Earned January 1, 2014 - June 30, 2014 | ||||||||||||||||||
Cash Management Trust-Collateral Investment | $ | 6,702,600 | $ | 42,570,790 | $ | 42,176,294 | 7,097,096 | $ | 7,097,096 | $ | 26,789 | |||||||||||||
Cash Management Trust-Short Term Investment | 8,038,467 | 18,087,429 | 12,950,333 | 13,175,563 | 13,175,563 | 2,378 | ||||||||||||||||||
Total Value and Income Earned | 14,741,067 | 20,272,659 | 29,167 | |||||||||||||||||||||
The accompanying Notes to Financial Statements are an integral part of this schedule.
174
Table of Contents
Schedule of Investments as of June 30, 2014
(unaudited)
| Shares | Common Stock (94.8%) | Value | ||||||
| Consumer Discretionary (10.2%) | |||||||
| 151,850 | Cheesecake Factory, Inc. | $ | 7,048,877 | |||||
| 67,810 | GNC Holdings, Inc. | 2,312,321 | ||||||
| 271,230 | Houghton Mifflin Harcourt Companya | 5,196,767 | ||||||
| 244,034 | Ignite Restaurant Group, Inc.a | 3,553,135 | ||||||
| 326,141 | MDC Partners, Inc. | 7,008,770 | ||||||
| 74,356 | NutriSystem, Inc. | 1,272,231 | ||||||
| 74,480 | Papa John’s International, Inc. | 3,157,207 | ||||||
| 388,680 | Tuesday Morning Corporationa | 6,926,278 | ||||||
|
| |||||||
| Total | 36,475,586 | |||||||
|
| |||||||
| Consumer Staples (2.7%) | |||||||
| 124,754 | Annie’s, Inc.a | 4,219,180 | ||||||
| 171,820 | WhiteWave Foods Companya | 5,561,814 | ||||||
|
| |||||||
| Total | 9,780,994 | |||||||
|
| |||||||
| Energy (6.3%) | |||||||
| 143,030 | Market Vectors Oil Service ETF | 8,261,413 | ||||||
| 84,770 | Oasis Petroleum, Inc.a | 4,737,795 | ||||||
| 181,390 | Rex Energy Corporationa | 3,212,417 | ||||||
| 65,600 | Rosetta Resources, Inc.a | 3,598,160 | ||||||
| 219,492 | Trinidad Drilling, Ltd. | 2,491,025 | ||||||
|
| |||||||
| Total | 22,300,810 | |||||||
|
| |||||||
| Financials (19.3%) | |||||||
| 35,596 | Affiliated Managers Group, Inc.a | 7,311,418 | ||||||
| 94,590 | Allied World Assurance Company Holdings AG | 3,596,312 | ||||||
| 70,700 | American Assets Trust, Inc. | 2,442,685 | ||||||
| 10,312 | Argo Group International Holdings, Ltd. | 527,046 | ||||||
| 184,500 | BBCN Bancorp, Inc. | 2,942,775 | ||||||
| 405,160 | CNO Financial Group, Inc. | 7,211,848 | ||||||
| 177,500 | Education Realty Trust, Inc. | 1,906,350 | ||||||
| 35,300 | Extra Space Storage, Inc. | 1,879,725 | ||||||
| 221,160 | Hanmi Financial Corporation | 4,662,053 | ||||||
| 93,800 | HCC Insurance Holdings, Inc. | 4,590,572 | ||||||
| 90,810 | PacWest Bancorp | 3,920,268 | ||||||
| 102,500 | Parkway Properties, Inc. | 2,116,625 | ||||||
| 142,760 | Pebblebrook Hotel Trust | 5,276,410 | ||||||
| 48,060 | SVB Financial Groupa | 5,604,757 | ||||||
| 141,950 | Synovus Financial Corporation | 3,460,741 | ||||||
| 168,450 | Terreno Realty Corporation | 3,256,139 | ||||||
| 91,590 | Texas Capital Bancshares, Inc.a | 4,941,280 | ||||||
| 143,400 | Western Alliance Bancorpa | 3,412,920 | ||||||
|
| |||||||
| Total | 69,059,924 | |||||||
|
| |||||||
| Health Care (8.4%) | |||||||
| 69,600 | Acorda Therapeutics, Inc.a | 2,346,216 | ||||||
| 160,870 | Akorn, Inc.a | 5,348,927 | ||||||
| 54,800 | Align Technology, Inc.a | 3,070,992 | ||||||
| 400,500 | BioScrip, Inc.a,b | 3,340,170 | ||||||
| 214,882 | ExamWorks Group, Inc.a,b | 6,818,206 | ||||||
| 126,900 | Neurocrine Biosciences, Inc.a | 1,883,196 | ||||||
| 200,870 | NuVasive, Inc.a | 7,144,946 | ||||||
|
| |||||||
| Total | 29,952,653 | |||||||
|
| |||||||
| Industrials (20.0%) | |||||||
| 26,700 | Acuity Brands, Inc. | 3,691,275 | ||||||
| 85,080 | Apogee Enterprises, Inc. | 2,965,889 | ||||||
| 93,440 | CLARCOR, Inc. | 5,779,264 | ||||||
| 233,904 | EMCOR Group, Inc. | 10,415,745 | ||||||
| 36,650 | Esterline Technologies Corporationa | 4,219,148 | ||||||
| 59,410 | GATX Corporation | 3,976,905 | ||||||
| 94,360 | Granite Construction, Inc. | 3,395,073 | ||||||
| 137,100 | HNI Corporation | 5,361,981 | ||||||
| 374,600 | Interface, Inc. | 7,057,464 | ||||||
| 209,100 | Korn/Ferry Internationala | 6,141,267 | ||||||
| 116,870 | Landstar System, Inc. | 7,479,680 | ||||||
| 159,000 | Ritchie Brothers Auctioneers, Inc.b | 3,919,350 | ||||||
| 91,920 | Tennant Company | 7,015,334 | ||||||
|
| |||||||
| Total | 71,418,375 | |||||||
|
| |||||||
| Information Technology (17.8%) | |||||||
| 419,310 | Atmel Corporationa | 3,928,935 | ||||||
| 190,690 | Broadridge Financial Solutions, Inc. | 7,940,331 | ||||||
| 99,700 | DST Systems, Inc. | 9,189,349 | ||||||
| 151,692 | E2open, Inc.a,b | 3,135,474 | ||||||
| 90,760 | Guidewire Software, Inc.a | 3,690,302 | ||||||
| 158,240 | Informatica Corporationa | 5,641,256 | ||||||
| 16,460 | Measurement Specialties, Inc.a | 1,416,712 | ||||||
| 148,345 | Plantronics, Inc. | 7,127,977 | ||||||
| 195,720 | Teradyne, Inc.b | 3,836,112 | ||||||
| 119,380 | Textura Corporationa,b | 2,822,143 | ||||||
| 89,600 | Ubiquiti Networks, Inc.a,b | 4,049,024 | ||||||
| 160,702 | Virtusa Corporationa | 5,753,132 | ||||||
| 319,400 | Vishay Intertechnology, Inc. | 4,947,506 | ||||||
|
| |||||||
| Total | 63,478,253 | |||||||
|
| |||||||
| Materials (5.5%) | |||||||
| 43,700 | Eagle Materials, Inc. | 4,120,036 | ||||||
| 160,560 | H.B. Fuller Company | 7,722,936 | ||||||
| 160,290 | Materials Select Sector SPDR Fund | 7,956,795 | ||||||
|
| |||||||
| Total | 19,799,767 | |||||||
|
| |||||||
| Telecommunications Services (1.0%) | |||||||
| 98,247 | Cogent Communications Group, Inc. | 3,394,434 | ||||||
|
| |||||||
| Total | 3,394,434 | |||||||
|
| |||||||
| Utilities (3.6%) | |||||||
| 178,670 | NorthWestern Corporation | 9,324,787 | ||||||
| 67,327 | Southwest Gas Corporation | 3,554,193 | ||||||
|
| |||||||
| Total | 12,878,980 | |||||||
|
| |||||||
Total Common Stock (cost $276,574,316) | 338,539,776 | |||||||
|
| |||||||
Collateral Held for Securities Loaned (6.7%) | ||||||||
| 24,129,625 | Thrivent Cash Management Trust | 24,129,625 | ||||||
|
| |||||||
Total Collateral Held for Securities Loaned (cost $24,129,625) | 24,129,625 | |||||||
|
| |||||||
| Shares or Principal Amount | Short-Term Investments (4.2%)c | |||||||
| Federal Home Loan Bank Discount Notes | ||||||||
| 400,000 | 0.070%, 09/19/2014d | 399,938 | ||||||
The accompanying Notes to Financial Statements are an integral part of this schedule.
175
Table of Contents
Small Cap Stock Portfolio
Schedule of Investments as of June 30, 2014
(unaudited)
| Shares or Principal Amount | Short-Term Investments (4.2%)c | Value | ||||||
| Thrivent Cash Management Trust | ||||||||
| 14,580,278 | 0.050% | $ | 14,580,278 | |||||
|
| |||||||
| Total Short-Term Investments (at amortized cost) | 14,980,216 | |||||||
|
| |||||||
Total Investments (cost $315,684,157) 105.7% | $ | 377,649,617 | ||||||
|
| |||||||
| Other Assets and Liabilities, Net (5.7%) | (20,509,729 | ) | ||||||
|
| |||||||
| Total Net Assets 100.0% | $ | 357,139,888 | ||||||
|
| |||||||
| a | Non-income producing security. |
| b | All or a portion of the security is on loan. |
| c | The interest rate shown reflects the yield, coupon rate or the discount rate at the date of purchase. |
| d | At June 30, 2014, $399,938 of investments were held on deposit with the counterparty and pledged as the initial margin deposit for open futures contracts. |
Definitions:
ETF | - | Exchange Traded Fund. |
Unrealized Appreciation (Depreciation)
Gross unrealized appreciation and depreciation of investments, based on cost for federal income tax purposes, were as follows:
Gross unrealized appreciation | $ | 65,663,455 | ||
Gross unrealized depreciation | (3,687,053 | ) | ||
|
| |||
Net unrealized appreciation (depreciation) | $ | 61,976,402 | ||
Cost for federal income tax purposes | $ | 315,673,215 | ||
Fair Valuation Measurements
The following table is a summary of the inputs used, as of June 30, 2014, in valuing Small Cap Stock Portfolio’s assets carried at fair value.
Investments in Securities | Total | Level 1 | Level 2 | Level 3 | ||||||||||||
Common Stock | ||||||||||||||||
Consumer Discretionary | 36,475,586 | 36,475,586 | — | — | ||||||||||||
Consumer Staples | 9,780,994 | 9,780,994 | — | — | ||||||||||||
Energy | 22,300,810 | 19,809,785 | 2,491,025 | — | ||||||||||||
Financials | 69,059,924 | 69,059,924 | — | — | ||||||||||||
Health Care | 29,952,653 | 29,952,653 | — | — | ||||||||||||
Industrials | 71,418,375 | 71,418,375 | — | — | ||||||||||||
Information Technology | 63,478,253 | 63,478,253 | — | — | ||||||||||||
Materials | 19,799,767 | 19,799,767 | — | — | ||||||||||||
Telecommunications Services | 3,394,434 | 3,394,434 | — | — | ||||||||||||
Utilities | 12,878,980 | 12,878,980 | — | — | ||||||||||||
Collateral Held for Securities Loaned | 24,129,625 | 24,129,625 | — | — | ||||||||||||
Short-Term Investments | 14,980,216 | 14,580,278 | 399,938 | — | ||||||||||||
|
|
|
|
|
|
|
| |||||||||
Total | $ | 377,649,617 | $ | 374,758,654 | $ | 2,890,963 | $ | — | ||||||||
|
|
|
|
|
|
|
| |||||||||
Other Financial Instruments | Total | Level 1 | Level 2 | Level 3 | ||||||||||||
Asset Derivatives | ||||||||||||||||
Futures Contracts | 106,939 | 106,939 | — | — | ||||||||||||
|
|
|
|
|
|
|
| |||||||||
Total Asset Derivatives | $ | 106,939 | $ | 106,939 | $ | — | $ | — | ||||||||
|
|
|
|
|
|
|
| |||||||||
There were no significant transfers between Levels during the period ended June 30, 2014. Transfers between Levels are identified as of the end of the period.
Futures Contracts | Number of Contracts Long/(Short) | Expiration Date | Notional Principal Amount | Value | Unrealized Gain/(Loss) | |||||||||||||||
Russell 2000 Index Mini-Futures | 70 | September 2014 | $8,225,161 | $8,332,100 | $106,939 | |||||||||||||||
Total Futures Contracts | $ | 106,939 | ||||||||||||||||||
The accompanying Notes to Financial Statements are an integral part of this schedule.
176
Table of Contents
Small Cap Stock Portfolio
Schedule of Investments as of June 30, 2014
(unaudited)
The following table summarizes the fair value and Statement of Assets and Liabilities location, as of June 30, 2014, for Small Cap Stock Portfolio’s investments in financial derivative instruments by primary risk exposure as discussed under item (2) Significant Accounting Policies of the Notes to Financial Statements.
Derivatives by risk category | Statement of Assets and Liabilities Location | Fair Value | ||||
Asset Derivatives | ||||||
Equity Contracts | ||||||
Futures* | Net Assets - Net unrealized appreciation/(depreciation) on Futures contracts | $ | 106,939 | |||
Total Equity Contracts | 106,939 | |||||
|
| |||||
Total Asset Derivatives | $ | 106,939 | ||||
|
| |||||
| * | Includes cumulative appreciation/depreciation of futures contracts as reported in the Schedule of Investments. Only current day’s variation margin is reported within the Statement of Assets and Liabilities. |
The following table summarizes the net realized gains/(losses) and Statement of Operations location, for the period ended June 30, 2014, for Small Cap Stock Portfolio’s investments in financial derivative instruments by primary risk exposure.
Derivatives by risk category | Statement of Operations Location | Realized Gains/(Losses) recognized in Income | ||||
Equity Contracts | ||||||
Futures | Net realized gains/(losses) on Futures contracts | 208,035 | ||||
Total Equity Contracts | 208,035 | |||||
|
| |||||
Total | $ | 208,035 | ||||
|
| |||||
The following table summarizes the change in net unrealized appreciation/(depreciation) and Statement of Operations location, for the period ended June 30, 2014, for Small Cap Stock Portfolio’s investments in financial derivative instruments by primary risk exposure.
Derivatives by risk category | Statement of Operations Location | Change in unrealized appreciation/(depreciation) recognized in Income | ||||
Equity Contracts | ||||||
Futures | Change in net unrealized appreciation/(depreciation) on Futures contracts | (1,088,051 | ) | |||
Total Equity Contracts | (1,088,051 | ) | ||||
|
| |||||
Total | ($ | 1,088,051 | ) | |||
|
| |||||
The following table presents Small Cap Stock Portfolio’s average volume of derivative activity during the period ended June 30, 2014.
Derivative Risk Category | Futures (Notional)* | Futures (Percentage of Average Net Assets) | ||||||
Equity Contracts | $ | 15,594,161 | 4.5 | % | ||||
| * | Notional amount represents long or short, or both, derivative positions held by the Portfolio. |
Investment in Affiliates
Affiliated issuers, as defined under the Investment Company Act of 1940, include those in which the Portfolio’s holdings of an issuer represent 5% or more of the outstanding voting securities of an issuer, or any affiliated mutual fund.
A summary of transactions for the fiscal year to date, in Small Cap Stock Portfolio, is as follows:
Portfolio | Value December 31, 2013 | Gross Purchases | Gross Sales | Shares Held at June 30, 2014 | Value June 30, 2014 | Income Earned January 1, 2014 - June 30, 2014 | ||||||||||||||||||
Cash Management Trust-Collateral Investment | $ | 25,019,444 | $ | 50,922,783 | $ | 51,812,602 | 24,129,625 | $ | 24,129,625 | $ | 57,217 | |||||||||||||
Cash Management Trust-Short Term Investment | 25,721,345 | 43,506,287 | 54,647,353 | 14,580,278 | 14,580,278 | 5,056 | ||||||||||||||||||
Total Value and Income Earned | 50,740,789 | 38,709,903 | 62,273 | |||||||||||||||||||||
The accompanying Notes to Financial Statements are an integral part of this schedule.
177
Table of Contents
Schedule of Investments as of June 30, 2014
(unaudited)
| Shares | Common Stock (95.0%) | Value | ||||||
| Consumer Discretionary (13.8%) | |||||||
| 28,700 | Aeropostale, Inc.a,b | $ | 100,163 | |||||
| 6,400 | American Public Education, Inc.b | 220,032 | ||||||
| 4,700 | Arctic Cat, Inc. | 185,274 | ||||||
| 13,550 | Barnes & Noble, Inc.a,b | 308,804 | ||||||
| 6,550 | Big 5 Sporting Goods Corporation | 80,369 | ||||||
| 515 | Biglari Holdings, Inc.b | 217,830 | ||||||
| 9,200 | BJ’s Restaurants, Inc.b | 321,172 | ||||||
| 4,450 | Blue Nile, Inc.b | 124,600 | ||||||
| 9,000 | Bob Evans Farms, Inc.a | 450,450 | ||||||
| 27,700 | Boyd Gaming Corporationb | 336,001 | ||||||
| 15,225 | Brown Shoe Company, Inc. | 435,587 | ||||||
| 10,250 | Buckle, Inc.a | 454,690 | ||||||
| 6,800 | Buffalo Wild Wings, Inc.b | 1,126,828 | ||||||
| 28,300 | Callaway Golf Company | 235,456 | ||||||
| 3,950 | Capella Education Companya | 214,841 | ||||||
| 21,400 | Career Education Corporationb | 100,152 | ||||||
| 9,450 | Cato Corporation | 292,005 | ||||||
| 8,000 | Children’s Place Retail Stores, Inc. | 397,040 | ||||||
| 13,375 | Christopher & Banks Corporationb | 117,165 | ||||||
| 7,550 | Coinstar, Inc.b | 448,092 | ||||||
| 8,700 | Cracker Barrel Old Country Store, Inc. | 866,259 | ||||||
| 32,150 | Crocs, Inc.b | 483,215 | ||||||
| 5,900 | DineEquity, Inc. | 468,991 | ||||||
| 11,200 | Dorman Products, Inc.b | 552,384 | ||||||
| 8,100 | Drew Industries, Inc. | 405,081 | ||||||
| 11,133 | E.W. Scripps Companyb | 235,574 | ||||||
| 9,500 | Ethan Allen Interiors, Inc. | 235,030 | ||||||
| 17,543 | Finish Line, Inc. | 521,729 | ||||||
| 15,400 | Francesca’s Holdings Corporationb | 226,996 | ||||||
| 12,450 | Fred’s, Inc. | 190,360 | ||||||
| 6,890 | FTD Companies, Inc.b | 219,033 | ||||||
| 8,750 | Genesco, Inc.b | 718,637 | ||||||
| 6,800 | G-III Apparel Group, Ltd.b | 555,288 | ||||||
| 7,700 | Group 1 Automotive, Inc. | 649,187 | ||||||
| 16,050 | Harte-Hanks, Inc. | 115,399 | ||||||
| 7,350 | Haverty Furniture Companies, Inc. | 184,705 | ||||||
| 9,750 | Helen of Troy, Ltd.b | 591,143 | ||||||
| 9,400 | Hibbett Sports, Inc.a,b | 509,198 | ||||||
| 23,000 | Hillenbrand, Inc. | 750,260 | ||||||
| 17,700 | Iconix Brand Group, Inc.b | 760,038 | ||||||
| 14,650 | Interval Leisure Group, Inc. | 321,421 | ||||||
| 10,750 | iRobot Corporationa,b | 440,213 | ||||||
| 6,700 | ITT Educational Services, Inc.a,b | 111,823 | ||||||
| 14,650 | Jack in the Box, Inc. | 876,656 | ||||||
| 5,500 | Kirkland’s, Inc.b | 102,025 | ||||||
| 19,100 | La-Z-Boy, Inc. | 442,547 | ||||||
| 8,200 | Lithia Motors, Inc. | 771,374 | ||||||
| 10,000 | Lumber Liquidators Holdings, Inc.b | 759,500 | ||||||
| 8,900 | M/I Homes, Inc.b | 216,003 | ||||||
| 6,600 | Marcus Corporation | 120,450 | ||||||
| 9,050 | MarineMax, Inc.b | 151,497 | ||||||
| 10,850 | Marriott Vacations Worldwide Corporationb | 636,136 | ||||||
| 9,950 | Matthews International Corporation | 413,621 | ||||||
| 16,650 | Men’s Wearhouse, Inc. | 929,070 | ||||||
| 13,300 | Meritage Homes Corporationb | 561,393 | ||||||
| 3,550 | Monarch Casino & Resort, Inc.b | 53,747 | ||||||
| 10,900 | Monro Muffler Brake, Inc. | 579,771 | ||||||
| 6,450 | Movado Group, Inc. | 268,772 | ||||||
| 10,850 | Multimedia Games Holding Company, Inc.b | 321,594 | ||||||
| 10,500 | NutriSystem, Inc. | 179,655 | ||||||
| 5,300 | Oxford Industries, Inc. | 353,351 | ||||||
| 11,200 | Papa John’s International, Inc. | 474,768 | ||||||
| 19,550 | Pep Boys—Manny, Moe & Jackb | 224,043 | ||||||
| 4,550 | Perry Ellis International, Inc.b | 79,352 | ||||||
| 7,400 | PetMed Express, Inc.a | 99,752 | ||||||
| 21,600 | Pinnacle Entertainment, Inc.b | 543,888 | ||||||
| 16,412 | Pool Corporation | 928,263 | ||||||
| 47,400 | Quiksilver, Inc.b | 169,692 | ||||||
| 4,800 | Red Robin Gourmet Burgers, Inc.b | 341,760 | ||||||
| 15,950 | Regis Corporation | 224,576 | ||||||
| 21,250 | Ruby Tuesday, Inc.b | 161,287 | ||||||
| 13,250 | Ruth’s Hospitality Group, Inc. | 163,638 | ||||||
| 17,050 | Ryland Group, Inc. | 672,452 | ||||||
| 9,500 | Scholastic Corporation | 323,855 | ||||||
| 17,450 | Scientific Games Corporationb | 194,044 | ||||||
| 19,800 | Select Comfort Corporationb | 409,068 | ||||||
| 8,450 | Sizmek Inc.b | 80,529 | ||||||
| 14,400 | Skechers USA, Inc.b | 658,080 | ||||||
| 12,450 | Sonic Automotive, Inc. | 332,166 | ||||||
| 18,502 | Sonic Corporationb | 408,524 | ||||||
| 11,450 | Stage Stores, Inc. | 214,001 | ||||||
| 5,400 | Stamps.com, Inc.b | 181,926 | ||||||
| 7,650 | Standard Motor Products, Inc. | 341,725 | ||||||
| 54,850 | Standard Pacific Corporationb | 471,710 | ||||||
| 10,200 | Stein Mart, Inc. | 141,678 | ||||||
| 21,025 | Steven Madden, Ltd.b | 721,158 | ||||||
| 3,950 | Strayer Education, Inc.a,b | 207,414 | ||||||
| 7,050 | Sturm, Ruger & Company, Inc.a | 416,020 | ||||||
| 8,450 | Superior Industries International, Inc. | 174,239 | ||||||
| 21,750 | Texas Roadhouse, Inc. | 565,500 | ||||||
| 13,700 | Tuesday Morning Corporationb | 244,134 | ||||||
| 5,800 | Universal Electronic, Inc.b | 283,504 | ||||||
| 7,900 | Universal Technical Institute, Inc. | 95,906 | ||||||
| 11,300 | Vitamin Shoppe, Inc.b | 486,126 | ||||||
| 7,250 | VOXX International Corporationb | 68,222 | ||||||
| 10,050 | Winnebago Industries, Inc.b | 253,059 | ||||||
| 37,150 | Wolverine World Wide, Inc. | 968,129 | ||||||
| 7,700 | Zumiez, Inc.b | 212,443 | ||||||
|
| |||||||
| Total | 36,552,308 | |||||||
|
| |||||||
| Consumer Staples (3.4%) | |||||||
| 29,700 | Alliance One International, Inc.b | 74,250 | ||||||
| 9,750 | Andersons, Inc. | 502,905 | ||||||
| 6,250 | Annie’s, Inc.a,b | 211,375 | ||||||
| 19,550 | B&G Foods, Inc. | 639,090 | ||||||
| 3,200 | Boston Beer Company, Inc.a,b | 715,264 | ||||||
| 5,100 | Calavo Growers, Inc. | 172,533 | ||||||
| 5,450 | Cal-Maine Foods, Inc. | 405,044 | ||||||
| 14,150 | Casey’s General Stores, Inc. | 994,603 | ||||||
| 14,500 | Central Garden & Pet Companyb | 133,400 | ||||||
| 58,350 | Darling Ingredients, Inc.b | 1,219,515 | ||||||
| 8,000 | Diamond Foods, Inc.a,b | 225,600 | ||||||
| 6,200 | Inter Parfums, Inc. | 183,210 | ||||||
| 5,300 | J & J Snack Foods Corporation | 498,836 | ||||||
| 4,400 | Medifast, Inc.b | 133,804 | ||||||
| 7,400 | Sanderson Farms, Inc.a | 719,280 | ||||||
| 2,600 | Seneca Foods Corporationb | 79,560 | ||||||
| 17,950 | Snyders-Lance, Inc. | 474,957 | ||||||
| 13,750 | Spartannash Company | 288,888 | ||||||
| 13,350 | TreeHouse Foods, Inc.b | 1,068,934 | ||||||
The accompanying Notes to Financial Statements are an integral part of this schedule.
178
Table of Contents
Small Cap Index Portfolio
Schedule of Investments as of June 30, 2014
(unaudited)
| Shares | Common Stock (95.0%) | Value | ||||||
| Consumer Staples (3.4%) - continued | |||||||
| 5,220 | WD-40 Company | $ | 392,648 | |||||
|
| |||||||
| Total | 9,133,696 | |||||||
|
| |||||||
| Energy (4.8%) | |||||||
| 12,850 | Approach Resources, Inc.a,b | 292,081 | ||||||
| 75,800 | Arch Coal, Inc.a | 276,670 | ||||||
| 12,700 | Basic Energy Services, Inc.b | 371,094 | ||||||
| 13,000 | Bristow Group, Inc. | 1,048,060 | ||||||
| 16,800 | C&J Energy Services, Inc.b | 567,504 | ||||||
| 15,100 | Carrizo Oil & Gas, Inc.b | 1,045,826 | ||||||
| 22,100 | Cloud Peak Energy, Inc.b | 407,082 | ||||||
| 16,150 | Comstock Resources, Inc. | 465,766 | ||||||
| 5,700 | Contango Oil & Gas Companyb | 241,167 | ||||||
| 6,850 | Era Group, Inc.b | 196,458 | ||||||
| 21,650 | Exterran Holdings, Inc. | 974,033 | ||||||
| 42,750 | Forest Oil Corporationb | 97,470 | ||||||
| 4,800 | Geospace Technologies Corporationa,b | 264,384 | ||||||
| 11,600 | Green Plains, Inc. | 381,292 | ||||||
| 4,500 | Gulf Island Fabrication, Inc. | 96,840 | ||||||
| 11,850 | Hornbeck Offshore Services, Inc.b | 556,002 | ||||||
| 47,000 | ION Geophysical Corporationb | 198,340 | ||||||
| 9,750 | Matrix Service Companyb | 319,702 | ||||||
| 31,300 | Newpark Resources, Inc.b | 389,998 | ||||||
| 20,350 | Northern Oil and Gas, Inc.a,b | 331,502 | ||||||
| 12,900 | PDC Energy, Inc.b | 814,635 | ||||||
| 19,300 | Penn Virginia Corporationb | 327,135 | ||||||
| 20,950 | PetroQuest Energy, Inc.b | 157,544 | ||||||
| 22,950 | Pioneer Energy Services Corporationb | 402,543 | ||||||
| 7,000 | SEACOR Holdings, Inc.b | 575,750 | ||||||
| 20,150 | Stone Energy Corporationb | 942,818 | ||||||
| 16,000 | Swift Energy Companya,b | 207,680 | ||||||
| 23,750 | Synergy Resources Corporationb | 314,688 | ||||||
| 11,550 | Tesco Corporation | 246,477 | ||||||
| 28,750 | Tetra Technologies, Inc.b | 338,675 | ||||||
|
| |||||||
| Total | 12,849,216 | |||||||
|
| |||||||
| Financials (20.1%) | |||||||
| 20,878 | Acadia Realty Trust | 586,463 | ||||||
| 5,450 | Agree Realty Corporation | 164,753 | ||||||
| 12,900 | American Assets Trust, Inc. | 445,695 | ||||||
| 6,500 | Amerisafe, Inc. | 264,355 | ||||||
| 21,050 | Associated Estates Realty Corporation | 379,321 | ||||||
| 15,800 | Bank Mutual Corporation | 91,640 | ||||||
| 23,500 | Bank of the Ozarks, Inc. | 786,075 | ||||||
| 7,100 | Banner Corporation | 281,373 | ||||||
| 29,300 | BBCN Bancorp, Inc. | 467,335 | ||||||
| 4,550 | Bofi Holding, Inc.b | 334,289 | ||||||
| 29,050 | Boston Private Financial Holdings, Inc. | 390,432 | ||||||
| 26,000 | Brookline Bancorp, Inc. | 243,620 | ||||||
| 7,000 | Calamos Asset Management, Inc. | 93,730 | ||||||
| 34,900 | Capstead Mortgage Corporationa | 458,935 | ||||||
| 11,750 | Cardinal Financial Corporation | 216,905 | ||||||
| 7,150 | Caretrust REIT, Inc.b | 141,570 | ||||||
| 10,350 | Cash America International, Inc. | 459,850 | ||||||
| 24,900 | Cedar Realty Trust, Inc. | 155,625 | ||||||
| 18,300 | Chesapeake Lodging Trust | 553,209 | ||||||
| 5,700 | City Holding Company | 257,184 | ||||||
| 19,350 | Columbia Banking System, Inc. | 509,099 | ||||||
| 14,950 | Community Bank System, Inc. | 541,190 | ||||||
| 7,900 | Coresite Realty Corporation | 261,253 | ||||||
| 67,100 | Cousins Properties, Inc. | 835,395 | ||||||
| 34,450 | CVB Financial Corporation | 552,233 | ||||||
| 71,517 | DiamondRock Hospitality Company | 916,848 | ||||||
| 10,775 | Dime Community Bancshares, Inc. | 170,137 | ||||||
| 11,450 | EastGroup Properties, Inc. | 735,433 | ||||||
| 6,900 | eHealth, Inc.b | 261,993 | ||||||
| 11,400 | Employers Holdings, Inc. | 241,452 | ||||||
| 8,650 | Encore Capital Group, Inc.a,b | 392,883 | ||||||
| 19,500 | EPR Properties | 1,089,465 | ||||||
| 12,700 | Evercore Partners, Inc. | 732,028 | ||||||
| 19,900 | EZCORP, Inc.b | 229,845 | ||||||
| 61,000 | F.N.B. Corporation | 782,020 | ||||||
| 18,900 | Financial Engines, Inc.a | 855,792 | ||||||
| 36,523 | First Bancorpb | 198,685 | ||||||
| 10,650 | First Cash Financial Services, Inc.b | 613,334 | ||||||
| 34,500 | First Commonwealth Financial Corporation | 318,090 | ||||||
| 20,850 | First Financial Bancorp | 358,828 | ||||||
| 22,350 | First Financial Bankshares, Inc.a | 701,119 | ||||||
| 27,712 | First Midwest Bancorp, Inc. | 471,935 | ||||||
| 12,700 | Forestar Real Estate Group, Inc.b | 242,443 | ||||||
| 31,800 | Franklin Street Properties Corporation | 400,044 | ||||||
| 14,200 | FXCM, Inc.a | 212,432 | ||||||
| 26,546 | Geo Group, Inc. | 948,489 | ||||||
| 9,700 | Getty Realty Corporation | 185,076 | ||||||
| 27,500 | Glacier Bancorp, Inc. | 780,450 | ||||||
| 19,900 | Government Properties Income Trust | 505,261 | ||||||
| 11,400 | Green Dot Corporationb | 216,372 | ||||||
| 9,500 | Greenhill & Company, Inc. | 467,875 | ||||||
| 11,612 | Hanmi Financial Corporation | 244,781 | ||||||
| 3,650 | HCI Group, Inc. | 148,190 | ||||||
| 35,200 | Healthcare Realty Trust, Inc. | 894,784 | ||||||
| 12,300 | HFF, Inc. | 457,437 | ||||||
| 17,340 | Home Bancshares, Inc. | 569,099 | ||||||
| 14,950 | Horace Mann Educators Corporation | 467,486 | ||||||
| 8,700 | Independent Bank Corporation | 333,906 | ||||||
| 4,200 | Infinity Property & Casualty Corporation | 282,366 | ||||||
| 30,450 | Inland Real Estate Corporation | 323,683 | ||||||
| 17,650 | Interactive Brokers Group, Inc. | 411,069 | ||||||
| 13,450 | Investment Technology Group, Inc.b | 227,036 | ||||||
| 48,100 | Kite Realty Group Trust | 295,334 | ||||||
| 74,659 | Lexington Realty Trust | 821,996 | ||||||
| 12,700 | LTC Properties, Inc. | 495,808 | ||||||
| 13,800 | MarketAxess Holdings, Inc. | 746,028 | ||||||
| 20,150 | MB Financial, Inc. | 545,057 | ||||||
| 17,074 | Meadowbrook Insurance Group, Inc. | 122,762 | ||||||
| 63,150 | Medical Properties Trust, Inc. | 836,106 | ||||||
| 40,800 | National Penn Bancshares, Inc. | 431,664 | ||||||
| 3,900 | Navigators Group, Inc.b | 261,495 | ||||||
| 16,050 | NBT Bancorp, Inc. | 385,521 | ||||||
| 34,750 | Northwest Bancshares, Inc. | 471,558 | ||||||
| 38,950 | Old National Bancorp | 556,206 | ||||||
| 14,350 | Oritani Financial Corporation | 220,847 | ||||||
| 26,300 | Parkway Properties, Inc. | 543,095 | ||||||
| 25,050 | Pennsylvania Real Estate Investment Trust | 471,441 | ||||||
The accompanying Notes to Financial Statements are an integral part of this schedule.
179
Table of Contents
Small Cap Index Portfolio
Schedule of Investments as of June 30, 2014
(unaudited)
| Shares | Common Stock (95.0%) | Value | ||||||
| Financials (20.1%) - continued | |||||||
| 12,250 | Pinnacle Financial Partners, Inc. | $ | 483,630 | |||||
| 5,950 | Piper Jaffray Companiesb | 308,031 | ||||||
| 18,450 | Portfolio Recovery Associates, Inc.b | 1,098,328 | ||||||
| 19,800 | Post Properties, Inc. | 1,058,508 | ||||||
| 24,600 | PrivateBancorp, Inc. | 714,876 | ||||||
| 21,700 | ProAssurance Corporation | 963,480 | ||||||
| 19,650 | Provident Financial Services, Inc. | 340,338 | ||||||
| 7,400 | PS Business Parks, Inc. | 617,826 | ||||||
| 31,950 | Retail Opportunity Investments Corporation | 502,574 | ||||||
| 12,550 | RLI Corporation | 574,539 | ||||||
| 10,850 | S&T Bancorp, Inc. | 269,623 | ||||||
| 17,250 | Sabra Healthcare REIT, Inc. | 495,248 | ||||||
| 4,700 | Safety Insurance Group, Inc. | 241,486 | ||||||
| 4,650 | Saul Centers, Inc. | 225,990 | ||||||
| 20,650 | Selective Insurance Group, Inc. | 510,468 | ||||||
| 5,900 | Simmons First National Corporation | 232,401 | ||||||
| 12,000 | Sovran Self Storage, Inc. | 927,000 | ||||||
| 28,849 | Sterling Bancorp | 346,188 | ||||||
| 7,600 | Stewart Information Services Corporation | 235,676 | ||||||
| 22,200 | Stifel Financial Corporationb | 1,051,170 | ||||||
| 68,950 | Susquehanna Bancshares, Inc. | 728,112 | ||||||
| 10,676 | SWS Group, Inc.b | 77,721 | ||||||
| 34,900 | Tanger Factory Outlet Centers, Inc. | 1,220,453 | ||||||
| 5,550 | Taylor Capital Group, Inc.b | 118,659 | ||||||
| 15,750 | Texas Capital Bancshares, Inc.b | 849,712 | ||||||
| 4,290 | Tompkins Financial Corporation | 206,692 | ||||||
| 34,932 | Trustco Bank Corporation NY | 233,346 | ||||||
| 13,700 | UMB Financial Corporation | 868,443 | ||||||
| 23,200 | United Bankshares, Inc. | 750,056 | ||||||
| 14,375 | United Community Banks, Inc. | 235,319 | ||||||
| 7,950 | United Fire Group, Inc. | 233,094 | ||||||
| 4,650 | Universal Health Realty Income Trust | 202,182 | ||||||
| 10,650 | Universal Insurance Holdings, Inc. | 138,131 | ||||||
| 9,300 | Urstadt Biddle Properties, Inc. | 194,184 | ||||||
| 13,200 | ViewPoint Financial Group, Inc. | 355,212 | ||||||
| 2,550 | Virtus Investment Partners, Inc.b | 539,963 | ||||||
| 24,900 | Wilshire Bancorp, Inc. | 255,723 | ||||||
| 17,000 | Wintrust Financial Corporation | 782,000 | ||||||
| 3,562 | World Acceptance Corporationa,b | 270,570 | ||||||
|
| |||||||
| Total | 53,521,565 | |||||||
|
| |||||||
| Health Care (10.7%) | |||||||
| 7,700 | Abaxis, Inc. | 341,187 | ||||||
| 12,900 | Abiomed, Inc.a,b | 324,306 | ||||||
| 15,150 | Acorda Therapeutics, Inc.b | 510,707 | ||||||
| 26,450 | Affymetrix, Inc.b | 235,669 | ||||||
| 12,950 | Air Methods Corporationa,b | 668,868 | ||||||
| 25,750 | Akorn, Inc.b | 856,188 | ||||||
| 6,950 | Albany Molecular Research, Inc.b | 139,834 | ||||||
| 3,100 | Almost Family, Inc.b | 68,448 | ||||||
| 12,133 | Amedisys, Inc.b | 203,106 | ||||||
| 17,050 | AMN Healthcare Services, Inc.b | 209,715 | ||||||
| 14,950 | AmSurg Corporationb | 681,271 | ||||||
| 4,500 | Analogic Corporation | 352,080 | ||||||
| 4,300 | Anika Therapeutics, Inc.b | 199,219 | ||||||
| 9,000 | Bio-Reference Laboratories, Inc.a,b | 271,980 | ||||||
| 11,100 | Cambrex Corporationb | 229,770 | ||||||
| 12,325 | Cantel Medical Corporation | 451,342 | ||||||
| 21,100 | Centene Corporationb | 1,595,371 | ||||||
| 6,450 | Chemed Corporationa | 604,494 | ||||||
| 3,800 | Computer Programs and Systems, Inc. | 241,680 | ||||||
| 9,950 | CONMED Corporation | 439,292 | ||||||
| 4,150 | Corvel Corporationb | 187,497 | ||||||
| 9,950 | Cross Country Healthcare, Inc.b | 64,874 | ||||||
| 9,300 | CryoLife, Inc. | 83,235 | ||||||
| 8,850 | Cyberonics, Inc.b | 552,771 | ||||||
| 7,100 | Cynosure, Inc.b | 150,875 | ||||||
| 10,800 | Emergent Biosolutions, Inc.b | 242,568 | ||||||
| 7,300 | Ensign Group, Inc. | 226,884 | ||||||
| 10,750 | Gentiva Health Services, Inc.b | 161,895 | ||||||
| 9,050 | Greatbatch, Inc.b | 443,993 | ||||||
| 19,050 | Haemonetics Corporationb | 672,084 | ||||||
| 12,850 | Hanger, Inc.b | 404,132 | ||||||
| 7,550 | HealthStream, Inc.b | 183,465 | ||||||
| 13,000 | Healthways, Inc.a,b | 228,020 | ||||||
| 4,900 | ICU Medical, Inc.b | 297,969 | ||||||
| 23,850 | Impax Laboratories, Inc.b | 715,261 | ||||||
| 8,650 | Integra LifeSciences Holdings Corporationb | 407,069 | ||||||
| 10,550 | Invacare Corporation | 193,803 | ||||||
| 6,200 | IPC The Hospitalist Company, Inc.b | 274,164 | ||||||
| 23,200 | Kindred Healthcare, Inc. | 535,920 | ||||||
| 3,500 | Landauer, Inc. | 147,000 | ||||||
| 10,100 | Lannett Company, Inc.b | 501,162 | ||||||
| 4,500 | LHC Group, Inc.b | 96,165 | ||||||
| 7,600 | Ligand Pharmaceuticals, Inc.b | 473,404 | ||||||
| 13,750 | Luminex Corporationb | 235,812 | ||||||
| 10,050 | Magellan Health Services, Inc.b | 625,512 | ||||||
| 18,700 | Masimo Corporationb | 441,320 | ||||||
| 23,950 | Medicines Companyb | 695,987 | ||||||
| 18,700 | Medidata Solutions, Inc.b | 800,547 | ||||||
| 15,200 | Meridian Bioscience, Inc. | 313,728 | ||||||
| 14,925 | Merit Medical Systems, Inc.b | 225,367 | ||||||
| 10,500 | Molina Healthcare, Inc.b | 468,615 | ||||||
| 17,050 | Momenta Pharmaceuticals, Inc.b | 205,964 | ||||||
| 4,700 | MWI Veterinary Supply, Inc.b | 667,353 | ||||||
| 10,500 | Natus Medical, Inc.b | 263,970 | ||||||
| 13,425 | Neogen Corporationb | 543,310 | ||||||
| 17,000 | NuVasive, Inc.b | 604,690 | ||||||
| 13,350 | Omnicell, Inc.b | 383,279 | ||||||
| 20,900 | PAREXEL International Corporationb | 1,104,356 | ||||||
| 10,950 | PharMerica Corporationb | 313,061 | ||||||
| 19,150 | Prestige Brands Holdings, Inc.b | 648,994 | ||||||
| 16,100 | Quality Systems, Inc. | 258,405 | ||||||
| 20,450 | Questcor Pharmaceuticals, Inc.a | 1,891,421 | ||||||
| 11,100 | Repligen Corporationb | 252,969 | ||||||
| 7,600 | Sagent Pharmaceuticals, Inc.b | 196,536 | ||||||
| 19,600 | Spectrum Pharmaceuticals, Inc.a,b | 159,348 | ||||||
| 4,950 | SurModics, Inc.b | 106,029 | ||||||
| 13,800 | Symmetry Medical, Inc.b | 122,268 | ||||||
| 25,850 | West Pharmaceutical Services, Inc. | 1,090,353 | ||||||
|
| |||||||
| Total | 28,487,931 | |||||||
|
| |||||||
| Industrials (14.9%) | |||||||
| 10,175 | AAON, Inc. | 341,066 | ||||||
| 14,600 | AAR Corporation | 402,376 | ||||||
| 19,050 | ABM Industries, Inc. | 513,969 | ||||||
| 9,800 | Aceto Corporation | 177,772 | ||||||
| 26,050 | Actuant Corporation | 900,549 | ||||||
The accompanying Notes to Financial Statements are an integral part of this schedule.
180
Table of Contents
Small Cap Index Portfolio
Schedule of Investments as of June 30, 2014
(unaudited)
| Shares | Common Stock (95.0%) | Value | ||||||
| Industrials (14.9%) - continued | |||||||
| 13,850 | Aegion Corporationb | $ | 322,289 | |||||
| 7,150 | Aerovironment, Inc.b | 227,370 | ||||||
| 10,300 | Albany International Corporation | 390,988 | ||||||
| 5,250 | Allegiant Travel Company | 618,293 | ||||||
| 2,900 | American Science & Engineering, Inc. | 201,811 | ||||||
| 4,400 | American Woodmark Corporationb | 140,228 | ||||||
| 10,600 | Apogee Enterprises, Inc. | 369,516 | ||||||
| 14,950 | Applied Industrial Technologies, Inc. | 758,413 | ||||||
| 8,900 | Arcbest Corporation | 387,239 | ||||||
| 6,850 | Astec Industries, Inc. | 300,578 | ||||||
| 9,200 | Atlas Air Worldwide Holdings, Inc.b | 339,020 | ||||||
| 9,300 | AZZ, Inc. | 428,544 | ||||||
| 17,250 | Barnes Group, Inc. | 664,815 | ||||||
| 16,800 | Brady Corporation | 501,816 | ||||||
| 17,100 | Briggs & Stratton Corporation | 349,866 | ||||||
| 17,750 | Brink’s Company | 500,905 | ||||||
| 5,300 | CDI Corporation | 76,373 | ||||||
| 6,400 | Circor International, Inc. | 493,632 | ||||||
| 13,800 | Comfort Systems USA, Inc. | 218,040 | ||||||
| 7,650 | Cubic Corporation | 340,502 | ||||||
| 17,600 | Curtiss-Wright Corporation | 1,153,856 | ||||||
| 3,850 | DXP Enterprises, Inc.b | 290,829 | ||||||
| 12,300 | Dycom Industries, Inc.b | 385,113 | ||||||
| 24,450 | EMCOR Group, Inc. | 1,088,759 | ||||||
| 6,850 | Encore Wire Corporation | 335,924 | ||||||
| 17,200 | EnerSys, Inc. | 1,183,188 | ||||||
| 6,252 | Engility Holdings, Inc.b | 239,202 | ||||||
| 8,250 | EnPro Industries, Inc.b | 603,570 | ||||||
| 9,650 | ESCO Technologies, Inc. | 334,276 | ||||||
| 4,800 | Exponent, Inc. | 355,728 | ||||||
| 22,950 | Federal Signal Corporation | 336,217 | ||||||
| 11,300 | Forward Air Corporation | 540,705 | ||||||
| 14,300 | Franklin Electric Company, Inc. | 576,719 | ||||||
| 7,250 | G & K Services, Inc. | 377,507 | ||||||
| 21,050 | GenCorp, Inc.a,b | 402,055 | ||||||
| 17,750 | General Cable Corporation | 455,465 | ||||||
| 10,500 | Gibraltar Industries, Inc.b | 162,855 | ||||||
| 16,030 | Griffon Corporation | 198,772 | ||||||
| 25,787 | Healthcare Services Group, Inc.a | 759,169 | ||||||
| 18,198 | Heartland Express, Inc. | 388,345 | ||||||
| 5,850 | Heidrick & Struggles International, Inc. | 108,225 | ||||||
| 12,700 | Hub Group, Inc.b | 640,080 | ||||||
| 8,300 | Insperity, Inc. | 273,900 | ||||||
| 21,300 | Interface, Inc. | 401,292 | ||||||
| 10,000 | John Bean Technologies Corporation | 309,900 | ||||||
| 10,050 | Kaman Corporation | 429,436 | ||||||
| 10,000 | Kelly Services, Inc. | 171,700 | ||||||
| 22,100 | Knight Transportation, Inc. | 525,317 | ||||||
| 18,200 | Korn/Ferry Internationalb | 534,534 | ||||||
| 4,700 | Lindsay Manufacturing Companya | 397,009 | ||||||
| 6,150 | Lydall, Inc.b | 168,325 | ||||||
| 15,650 | Matson, Inc. | 420,046 | ||||||
| 15,000 | Mobile Mini, Inc. | 718,350 | ||||||
| 16,250 | Moog, Inc.b | 1,184,463 | ||||||
| 20,600 | Mueller Industries, Inc. | 605,846 | ||||||
| 1,800 | National Presto Industries, Inc.a | 131,112 | ||||||
| 18,050 | Navigant Consulting, Inc.b | 314,972 | ||||||
| 17,100 | On Assignment, Inc.b | 608,247 | ||||||
| 22,150 | Orbital Sciences Corporationb | 654,533 | ||||||
| 9,950 | Orion Marine Group, Inc.b | 107,759 | ||||||
| 11,500 | PGT, Inc.b | 97,405 | ||||||
| 3,400 | Powell Industries, Inc. | 222,292 | ||||||
| 13,625 | Quanex Building Products Corporation | 243,479 | ||||||
| 14,150 | Resources Global Professionals | 185,507 | ||||||
| 9,300 | Roadrunner Transportation Systems, Inc.b | 261,330 | ||||||
| 8,950 | Saia, Inc.b | 393,174 | ||||||
| 14,950 | Simpson Manufacturing Company, Inc. | 543,582 | ||||||
| 18,850 | SkyWest, Inc. | 230,347 | ||||||
| 4,700 | Standex International Corporation | 350,056 | ||||||
| 19,900 | TASER International, Inc.b | 264,670 | ||||||
| 13,750 | Teledyne Technologies, Inc.b | 1,336,087 | ||||||
| 6,700 | Tennant Company | 511,344 | ||||||
| 23,656 | Tetra Tech, Inc. | 650,540 | ||||||
| 19,650 | Titan International, Inc.a | 330,513 | ||||||
| 20,550 | Toro Company | 1,306,980 | ||||||
| 15,100 | TrueBlue, Inc.b | 416,307 | ||||||
| 5,600 | UniFirst Corporation | 593,600 | ||||||
| 14,400 | United Stationers, Inc. | 597,168 | ||||||
| 7,250 | Universal Forest Products, Inc. | 349,957 | ||||||
| 33,350 | UTI Worldwide, Inc.b | 344,839 | ||||||
| 7,500 | Viad Corporation | 178,800 | ||||||
| 6,600 | Vicor Corporationb | 55,308 | ||||||
| 11,000 | WageWorks, Inc.b | 530,310 | ||||||
| 10,400 | Watts Water Technologies, Inc. | 641,992 | ||||||
|
| |||||||
| Total | 39,474,857 | |||||||
|
| |||||||
| Information Technology (17.0%) | |||||||
| 13,750 | Advanced Energy Industries, Inc.b | 264,687 | ||||||
| 5,200 | Agilysys, Inc.b | 73,216 | ||||||
| 9,750 | Anixter International, Inc. | 975,682 | ||||||
| 5,300 | Badger Meter, Inc. | 279,045 | ||||||
| 3,650 | Bel Fuse, Inc. | 93,695 | ||||||
| 19,700 | Benchmark Electronics, Inc.b | 501,956 | ||||||
| 5,700 | Black Box Corporation | 133,608 | ||||||
| 16,850 | Blackbaud, Inc. | 602,219 | ||||||
| 15,500 | Blucora, Inc.b | 292,485 | ||||||
| 13,750 | Bottomline Technologies, Inc.b | 411,400 | ||||||
| 24,507 | Brooks Automation, Inc. | 263,940 | ||||||
| 8,900 | Cabot Microelectronics Corporationb | 397,385 | ||||||
| 8,600 | CACI International, Inc.b | 603,806 | ||||||
| 12,200 | CalAmp Corporationb | 264,252 | ||||||
| 16,400 | Cardtronics, Inc.b | 558,912 | ||||||
| 7,750 | Ceva, Inc.b | 114,468 | ||||||
| 15,250 | Checkpoint Systems, Inc.b | 213,347 | ||||||
| 25,250 | CIBER, Inc.b | 124,735 | ||||||
| 22,400 | Cirrus Logic, Inc.a,b | 509,376 | ||||||
| 29,800 | Cognex Corporationb | 1,144,320 | ||||||
| 9,100 | Coherent, Inc.b | 602,147 | ||||||
| 8,600 | Cohu, Inc. | 92,020 | ||||||
| 11,850 | comScore, Inc.b | 420,438 | ||||||
| 5,850 | Comtech Telecommunications Corporation | 218,381 | ||||||
| 12,500 | CSG Systems International, Inc. | 326,375 | ||||||
| 12,450 | CTS Corporation | 232,815 | ||||||
| 14,000 | Daktronics, Inc. | 166,880 | ||||||
| 15,850 | Dealertrack Technologies, Inc.b | 718,639 | ||||||
| 13,450 | Dice Holdings, Inc.b | 102,355 | ||||||
The accompanying Notes to Financial Statements are an integral part of this schedule.
181
Table of Contents
Small Cap Index Portfolio
Schedule of Investments as of June 30, 2014
(unaudited)
| Shares | Common Stock (95.0%) | Value | ||||||
| Information Technology (17.0%) - continued | |||||||
| 9,300 | Digi International, Inc.b | $ | 87,606 | |||||
| 10,200 | Digital River, Inc.b | 157,386 | ||||||
| 13,350 | Diodes, Inc.b | 386,616 | ||||||
| 8,100 | DSP Group, Inc.b | 68,769 | ||||||
| 6,150 | DTS, Inc.b | 113,221 | ||||||
| 11,600 | Ebix, Inc.a | 165,996 | ||||||
| 9,300 | Electro Scientific Industries, Inc. | 63,333 | ||||||
| 17,050 | Electronics for Imaging, Inc.b | 770,660 | ||||||
| 32,850 | Entropic Communications, Inc.b | 109,391 | ||||||
| 11,350 | EPIQ Systems, Inc. | 159,467 | ||||||
| 17,550 | Exar Corporationb | 198,315 | ||||||
| 11,250 | ExlService Holdings, Inc.b | 331,313 | ||||||
| 10,700 | Fabrinetb | 220,420 | ||||||
| 6,350 | FARO Technologies, Inc.b | 311,912 | ||||||
| 4,450 | Forrester Research, Inc. | 168,566 | ||||||
| 49,950 | GT Advanced Technologies, Inc.a,b | 929,070 | ||||||
| 34,750 | Harmonic, Inc.b | 259,235 | ||||||
| 13,100 | Heartland Payment Systems, Inc.a | 539,851 | ||||||
| 12,100 | Higher One Holdings, Inc.b | 46,101 | ||||||
| 11,450 | Hittite Microwave Corporation | 892,528 | ||||||
| 10,750 | iGATE Corporationb | 391,193 | ||||||
| 19,700 | II-VI, Inc.b | 284,862 | ||||||
| 14,925 | Insight Enterprises, Inc.b | 458,794 | ||||||
| 5,900 | Interactive Intelligence Groupb | 331,167 | ||||||
| 8,700 | Intevac, Inc.b | 69,687 | ||||||
| 21,650 | Ixiab | 247,459 | ||||||
| 16,300 | j2 Global, Inc. | 829,018 | ||||||
| 21,800 | Kopin Corporationb | 71,068 | ||||||
| 28,050 | Kulicke and Soffa Industries, Inc.b | 399,993 | ||||||
| 9,400 | Liquidity Services, Inc.a,b | 148,144 | ||||||
| 8,200 | Littelfuse, Inc. | 762,190 | ||||||
| 17,950 | Liveperson, Inc.b | 182,193 | ||||||
| 8,300 | LogMeIn, Inc.b | 386,946 | ||||||
| 27,850 | Manhattan Associates, Inc.b | 958,875 | ||||||
| 8,750 | ManTech International Corporation | 258,300 | ||||||
| 24,850 | MAXIMUS, Inc. | 1,069,047 | ||||||
| 5,500 | Measurement Specialties, Inc.b | 473,385 | ||||||
| 12,300 | Mercury Computer Systems, Inc.b | 139,482 | ||||||
| 13,150 | Methode Electronics, Inc. | 502,461 | ||||||
| 16,500 | Micrel, Inc. | 186,120 | ||||||
| 34,600 | Microsemi Corporationb | 925,896 | ||||||
| 3,300 | MicroStrategy, Inc.b | 464,046 | ||||||
| 19,450 | MKS Instruments, Inc. | 607,618 | ||||||
| 12,800 | Monolithic Power Systems, Inc. | 542,080 | ||||||
| 14,400 | Monotype Imaging Holdings, Inc. | 405,648 | ||||||
| 33,200 | Monster Worldwide, Inc.b | 217,128 | ||||||
| 5,550 | MTS Systems Corporation | 376,068 | ||||||
| 8,250 | Nanometrics, Inc.b | 150,563 | ||||||
| 13,300 | NETGEAR, Inc.b | 462,441 | ||||||
| 13,450 | NetScout Systems, Inc.b | 596,373 | ||||||
| 14,400 | Newport Corporationb | 266,400 | ||||||
| 21,800 | NIC, Inc. | 345,530 | ||||||
| 8,550 | OpenTable, Inc.b | 885,780 | ||||||
| 6,300 | Oplink Communications, Inc.b | 106,911 | ||||||
| 6,650 | OSI Systems, Inc.b | 443,888 | ||||||
| 7,650 | Park Electrochemical Corporation | 215,806 | ||||||
| 12,700 | Perficient, Inc.b | 247,269 | ||||||
| 7,350 | Pericom Semiconductor Corporationb | 66,444 | ||||||
| 12,400 | Plexus Corporationb | 536,796 | ||||||
| 11,100 | Power Integrations, Inc. | 638,694 | ||||||
| 7,550 | Procera Networks, Inc.b | 76,180 | ||||||
| 18,850 | Progress Software Corporationb | 453,154 | ||||||
| 32,050 | QLogic Corporationb | 323,384 | ||||||
| 10,550 | QuinStreet, Inc.b | 58,131 | ||||||
| 10,300 | Rofin-Sinar Technologies, Inc.b | 247,612 | ||||||
| 6,600 | Rogers Corporationb | 437,910 | ||||||
| 8,600 | Rubicon Technology, Inc.a,b | 75,250 | ||||||
| 12,100 | Rudolph Technologies, Inc.b | 119,548 | ||||||
| 30,200 | Sanmina Corporationb | 687,956 | ||||||
| 10,400 | ScanSource, Inc.b | 396,032 | ||||||
| 12,450 | Super Micro Computer, Inc.b | 314,612 | ||||||
| 14,250 | Sykes Enterprises, Inc.b | 309,652 | ||||||
| 13,300 | Synaptics, Inc.a,b | 1,205,512 | ||||||
| 11,250 | Synchronoss Technologies, Inc.b | 393,300 | ||||||
| 9,800 | Synnex Corporationb | 713,930 | ||||||
| 34,250 | Take-Two Interactive Software, Inc.b | 761,720 | ||||||
| 12,600 | Tangoe, Inc.a,b | 189,756 | ||||||
| 6,800 | TeleTech Holdings, Inc.b | 197,132 | ||||||
| 17,700 | Tessera Technologies, Inc. | 390,816 | ||||||
| 62,300 | TriQuint Semiconductor, Inc.b | 984,963 | ||||||
| 20,250 | TTM Technologies, Inc.b | 166,050 | ||||||
| 10,650 | Tyler Technologies, Inc.b | 971,387 | ||||||
| 10,300 | Ultratech, Inc.b | 228,454 | ||||||
| 10,750 | VASCO Data Security International, Inc.b | 124,700 | ||||||
| 14,700 | Veeco Instruments, Inc.b | 547,722 | ||||||
| 15,550 | Viasat, Inc.b | 901,278 | ||||||
| 9,500 | Virtusa Corporationb | 340,100 | ||||||
| 9,050 | XO Group, Inc.b | 110,591 | ||||||
|
| |||||||
| Total | 45,060,935 | |||||||
|
| |||||||
| Materials (6.1%) | |||||||
| 10,700 | A. Schulman, Inc. | 414,090 | ||||||
| 6,250 | A.M. Castle & Companyb | 69,000 | ||||||
| 49,250 | AK Steel Holding Corporationb | 392,030 | ||||||
| 9,150 | American Vanguard Corporation | 120,963 | ||||||
| 11,150 | Balchem Corporation | 597,194 | ||||||
| 11,550 | Boise Cascade Companyb | 330,792 | ||||||
| 19,500 | Calgon Carbon Corporationb | 435,435 | ||||||
| 18,650 | Century Aluminum Companyb | 292,432 | ||||||
| 7,550 | Clearwater Paper Corporationb | 465,986 | ||||||
| 4,100 | Deltic Timber Corporation | 247,722 | ||||||
| 17,200 | Flotek Industries, Inc.a,b | 553,152 | ||||||
| 8,250 | FutureFuel Corporation | 136,868 | ||||||
| 23,250 | Globe Specialty Metals, Inc. | 483,135 | ||||||
| 18,250 | H.B. Fuller Company | 877,825 | ||||||
| 3,450 | Hawkins, Inc. | 128,133 | ||||||
| 4,500 | Haynes International, Inc. | 254,655 | ||||||
| 26,850 | Headwaters, Inc.b | 372,946 | ||||||
| 8,000 | Innophos Holdings, Inc. | 460,560 | ||||||
| 20,650 | Intrepid Potash, Inc.b | 346,094 | ||||||
| 6,600 | Kaiser Aluminum Corporation | 480,942 | ||||||
| 28,950 | KapStone Paper and Packaging Corporationb | 959,114 | ||||||
| 7,500 | Koppers Holdings, Inc. | 286,875 | ||||||
| 12,000 | Kraton Performance Polymers, Inc.b | 268,680 | ||||||
| 7,000 | LSB Industries, Inc.b | 291,690 | ||||||
| 7,500 | Materion Corporation | 277,425 | ||||||
| 9,563 | Myers Industries, Inc. | 192,121 | ||||||
| 6,050 | Neenah Paper, Inc. | 321,558 | ||||||
| 3,300 | Olympic Steel, Inc. | 81,675 | ||||||
| 11,800 | OM Group, Inc. | 382,674 | ||||||
The accompanying Notes to Financial Statements are an integral part of this schedule.
182
Table of Contents
Small Cap Index Portfolio
Schedule of Investments as of June 30, 2014
(unaudited)
| Shares | Common Stock (95.0%) | Value | ||||||
| Materials (6.1%) - continued | |||||||
| 15,750 | PH Glatfelter Company | $ | 417,847 | |||||
| 4,800 | Quaker Chemical Corporation | 368,592 | ||||||
| 11,150 | RTI International Metals, Inc.b | 296,478 | ||||||
| 11,100 | Schweitzer-Mauduit International, Inc. | 484,626 | ||||||
| 7,000 | Stepan Company | 370,020 | ||||||
| 43,750 | Stillwater Mining Companyb | 767,812 | ||||||
| 25,377 | SunCoke Energy, Inc.b | 545,606 | ||||||
| 7,850 | Texas Industries, Inc.a,b | 725,026 | ||||||
| 9,200 | Tredegar Corporation | 215,372 | ||||||
| 19,200 | U.S. Silica Holdings, Inc. | 1,064,448 | ||||||
| 18,300 | Wausau Paper Corporation | 198,006 | ||||||
| 8,450 | Zep, Inc. | 149,227 | ||||||
|
| |||||||
| Total | 16,124,826 | |||||||
|
| |||||||
| Telecommunications Services (0.5%) | |||||||
| 30,000 | 8x8, Inc.b | 242,400 | ||||||
| 3,650 | Atlantic Tele-Network, Inc. | 211,700 | ||||||
| 10,600 | Cbeyond, Inc.b | 105,470 | ||||||
| 76,150 | Cincinnati Bell, Inc.b | 299,270 | ||||||
| 11,450 | General Communication, Inc.b | 126,866 | ||||||
| 6,500 | Lumos Networks Corporation | 94,055 | ||||||
| 5,650 | NTELOS Holdings Corporationa | 70,399 | ||||||
| 7,900 | USA Mobility, Inc. | 121,660 | ||||||
|
| |||||||
| Total | 1,271,820 | |||||||
|
| |||||||
| Utilities (3.7%) | |||||||
| 14,033 | ALLETE, Inc. | 720,595 | ||||||
| 14,200 | American States Water Company | 471,866 | ||||||
| 21,900 | Avista Corporation | 734,088 | ||||||
| 14,700 | El Paso Electric Company | 591,087 | ||||||
| 15,250 | Laclede Group, Inc. | 740,387 | ||||||
| 15,350 | New Jersey Resources Corporation | 877,406 | ||||||
| 9,900 | Northwest Natural Gas Company | 466,785 | ||||||
| 14,250 | NorthWestern Corporation | 743,707 | ||||||
| 28,400 | Piedmont Natural Gas Company, Inc.a | 1,062,444 | ||||||
| 12,000 | South Jersey Industries, Inc. | 724,920 | ||||||
| 16,900 | Southwest Gas Corporation | 892,151 | ||||||
| 20,566 | UIL Holdings Corporation | 796,110 | ||||||
| 15,200 | UNS Energy Corporation | 918,232 | ||||||
|
| |||||||
| Total | 9,739,778 | |||||||
|
| |||||||
Total Common Stock (cost $155,375,838) | 252,216,932 | |||||||
|
| |||||||
Collateral Held for Securities Loaned (7.5%) | ||||||||
| 19,992,565 | Thrivent Cash Management Trust | 19,992,565 | ||||||
|
| |||||||
Total Collateral Held for Securities Loaned (cost $19,992,565) | 19,992,565 | |||||||
|
| |||||||
| Shares or Principal Amount | Short-Term Investments (4.5%)c | |||||||
Federal Home Loan Bank Discount Notes | ||||||||
| 100,000 | 0.095%, 07/18/2014d | 99,996 | ||||||
| 100,000 | 0.055%, 07/23/2014d | 99,997 | ||||||
| 200,000 | 0.045%, 07/30/2014d | 199,993 | ||||||
| 100,000 | 0.057%, 08/01/2014d | 99,995 | ||||||
| 100,000 | 0.115%, 08/06/2014d | 99,988 | ||||||
| 100,000 | 0.090%, 08/29/2014d | 99,985 | ||||||
Thrivent Cash Management Trust | ||||||||
| 11,281,100 | 0.050% | 11,281,100 | ||||||
|
| |||||||
| Total Short-Term Investments (at amortized cost) | 11,981,054 | |||||||
|
| |||||||
Total Investments (cost $187,349,457) 107.0% | $ | 284,190,551 | ||||||
|
| |||||||
| Other Assets and Liabilities, Net (7.0%) | (18,562,161 | ) | ||||||
|
| |||||||
| Total Net Assets 100.0% | $ | 265,628,390 | ||||||
|
| |||||||
| a | All or a portion of the security is on loan. |
| b | Non-income producing security. |
| c | The interest rate shown reflects the yield, coupon rate or the discount rate at the date of purchase. |
| d | At June 30, 2014, $699,954 of investments were held on deposit with the counterparty and pledged as the initial margin deposit for open futures contracts. |
Definitions:
REIT | - | Real Estate Investment Trust is a company that buys, develops, manages and/or sells real estate assets. |
Unrealized Appreciation (Depreciation)
Gross unrealized appreciation and depreciation of investments, based on cost for federal income tax purposes, were as follows:
Gross unrealized appreciation | $ | 100,782,587 | ||
Gross unrealized depreciation | (8,442,749 | ) | ||
|
| |||
Net unrealized appreciation (depreciation) | $ | 92,339,838 | ||
Cost for federal income tax purposes | $ | 191,850,713 | ||
The accompanying Notes to Financial Statements are an integral part of this schedule.
183
Table of Contents
Small Cap Index Portfolio
Schedule of Investments as of June 30, 2014
(unaudited)
Fair Valuation Measurements
The following table is a summary of the inputs used, as of June 30, 2014, in valuing Small Cap Index Portfolio’s assets carried at fair value.
Investments in Securities | Total | Level 1 | Level 2 | Level 3 | ||||||||||||
Common Stock | ||||||||||||||||
Consumer Discretionary | 36,552,308 | 36,552,308 | — | — | ||||||||||||
Consumer Staples | 9,133,696 | 9,133,696 | — | — | ||||||||||||
Energy | 12,849,216 | 12,849,216 | — | — | ||||||||||||
Financials | 53,521,565 | 53,521,565 | — | — | ||||||||||||
Health Care | 28,487,931 | 28,487,931 | — | — | ||||||||||||
Industrials | 39,474,857 | 39,474,857 | — | — | ||||||||||||
Information Technology | 45,060,935 | 45,060,935 | — | — | ||||||||||||
Materials | 16,124,826 | 16,124,826 | — | — | ||||||||||||
Telecommunications Services | 1,271,820 | 1,271,820 | — | — | ||||||||||||
Utilities | 9,739,778 | 9,739,778 | — | — | ||||||||||||
Collateral Held for Securities Loaned | 19,992,565 | 19,992,565 | — | — | ||||||||||||
Short-Term Investments | 11,981,054 | 11,281,100 | 699,954 | — | ||||||||||||
|
|
|
|
|
|
|
| |||||||||
Total | $ | 284,190,551 | $ | 283,490,597 | $ | 699,954 | $ | — | ||||||||
|
|
|
|
|
|
|
| |||||||||
Other Financial Instruments | Total | Level 1 | Level 2 | Level 3 | ||||||||||||
Asset Derivatives | ||||||||||||||||
Futures Contracts | 298,379 | 298,379 | — | — | ||||||||||||
|
|
|
|
|
|
|
| |||||||||
Total Asset Derivatives | $ | 298,379 | $ | 298,379 | $ | — | $ | — | ||||||||
|
|
|
|
|
|
|
| |||||||||
There were no significant transfers between Levels during the period ended June 30, 2014. Transfers between Levels are identified as of the end of the period.
Futures Contracts | Number of Contracts Long/(Short) | Expiration Date | Notional Principal Amount | Value | Unrealized Gain/(Loss) | |||||||||||||||
Russell 2000 Index Mini-Futures | 96 | September 2014 | $11,128,501 | $11,426,880 | $298,379 | |||||||||||||||
Total Futures Contracts | $ | 298,379 | ||||||||||||||||||
The following table summarizes the fair value and Statement of Assets and Liabilities location, as of June 30, 2014, for Small Cap Index Portfolio’s investments in financial derivative instruments by primary risk exposure as discussed under item (2) Significant Accounting Policies of the Notes to Financial Statements.
Derivatives by risk category | Statement of Assets and Liabilities Location | Fair Value | ||||
Asset Derivatives | ||||||
Equity Contracts | ||||||
Futures* | Net Assets - Net unrealized appreciation/(depreciation) on Futures contracts | $ | 298,379 | |||
Total Equity Contracts | 298,379 | |||||
|
| |||||
Total Asset Derivatives | $ | 298,379 | ||||
|
| |||||
| * | Includes cumulative appreciation/depreciation of futures contracts as reported in the Schedule of Investments. Only current day’s variation margin is reported within the Statement of Assets and Liabilities. |
The following table summarizes the net realized gains/(losses) and Statement of Operations location, for the period ended June 30, 2014, for Small Cap Index Portfolio’s investments in financial derivative instruments by primary risk exposure.
Derivatives by risk category | Statement of Operations Location | Realized Gains/(Losses) recognized in Income | ||||
Equity Contracts | ||||||
Futures | Net realized gains/(losses) on Futures contracts | 414,151 | ||||
Total Equity Contracts | 414,151 | |||||
|
| |||||
Total | $ | 414,151 | ||||
|
| |||||
The accompanying Notes to Financial Statements are an integral part of this schedule.
184
Table of Contents
Small Cap Index Portfolio
Schedule of Investments as of June 30, 2014
(unaudited)
The following table summarizes the change in net unrealized appreciation/(depreciation) and Statement of Operations location, for the period ended June 30, 2014, for Small Cap Index Portfolio’s investments in financial derivative instruments by primary risk exposure.
Derivatives by risk category | Statement of Operations Location | Change in unrealized appreciation/(depreciation) recognized in Income | ||||
Equity Contracts | ||||||
Futures | Change in net unrealized appreciation/(depreciation) on Futures contracts | (122,822 | ) | |||
Total Equity Contracts | (122,822 | ) | ||||
|
| |||||
Total | ($ | 122,822 | ) | |||
|
| |||||
The following table presents Small Cap Index Portfolio’s average volume of derivative activity during the period ended June 30, 2014.
Derivative Risk Category | Futures (Notional)* | Futures (Percentage of Average Net Assets) | ||||||
Equity Contracts | $ | 11,417,879 | 4.4 | % | ||||
| * | Notional amount represents long or short, or both, derivative positions held by the Portfolio. |
Investment in Affiliates
Affiliated issuers, as defined under the Investment Company Act of 1940, include those in which the Portfolio’s holdings of an issuer represent 5% or more of the outstanding voting securities of an issuer, or any affiliated mutual fund.
A summary of transactions for the fiscal year to date, in Small Cap Index Portfolio, is as follows:
Portfolio | Value December 31, 2013 | Gross Purchases | Gross Sales | Shares Held at June 30, 2014 | Value June 30, 2014 | Income Earned January 1, 2014 - June 30, 2014 | ||||||||||||||||||
Cash Management Trust-Collateral Investment | $ | 22,919,937 | $ | 25,945,322 | $ | 28,872,694 | 19,992,565 | $ | 19,992,565 | $ | 71,908 | |||||||||||||
Cash Management Trust-Short Term Investment | 9,202,932 | 17,128,010 | 15,049,842 | 11,281,100 | 11,281,100 | 2,604 | ||||||||||||||||||
Total Value and Income Earned | 32,122,869 | 31,273,665 | 74,512 | |||||||||||||||||||||
The accompanying Notes to Financial Statements are an integral part of this schedule.
185
Table of Contents
Schedule of Investments as of June 30, 2014
(unaudited)
| Shares | Common Stock (96.5%) | Value | ||||||
| Consumer Discretionary (17.0%) | |||||||
| 75,500 | BorgWarner, Inc. | $ | 4,921,845 | |||||
| 60,300 | Delphi Automotive plc | 4,145,022 | ||||||
| 37,302 | Discovery Communications, Inc.a | 2,770,792 | ||||||
| 110,246 | Dollar Tree, Inc.a | 6,003,997 | ||||||
| 68,400 | Dunkin’ Brands Group, Inc. | 3,133,404 | ||||||
| 80,300 | HomeAway, Inc.a | 2,796,046 | ||||||
| 52,787 | Limited Brands, Inc. | 3,096,485 | ||||||
| 111,400 | Marriott International, Inc. | 7,140,740 | ||||||
| 35,786 | O’Reilly Automotive, Inc.a | 5,389,372 | ||||||
| 33,026 | PetSmart, Inc. | 1,974,955 | ||||||
| 34,900 | PVH Corporation | 4,069,340 | ||||||
| 25,400 | Ross Stores, Inc. | 1,679,702 | ||||||
| 70,800 | Starwood Hotels & Resorts | |||||||
Worldwide, Inc. | 5,722,056 | |||||||
| 58,100 | Toll Brothers, Inc.a | 2,143,890 | ||||||
| 43,032 | Tractor Supply Company | 2,599,133 | ||||||
| 77,800 | Under Armour, Inc.a,b | 4,628,322 | ||||||
| 66,372 | VF Corporation | 4,181,436 | ||||||
| 20,700 | Wynn Resorts, Ltd. | 4,296,492 | ||||||
|
| |||||||
| Total | 70,693,029 | |||||||
|
| |||||||
| Consumer Staples (3.4%) | |||||||
| 63,800 | Hain Celestial Group, Inc.a | 5,661,612 | ||||||
| 77,600 | Monster Beverage Corporationa | 5,511,928 | ||||||
| 32,200 | United Natural Foods, Inc.a | 2,096,220 | ||||||
| 21,106 | Whole Foods Market, Inc. | 815,325 | ||||||
|
| |||||||
| Total | 14,085,085 | |||||||
|
| |||||||
| Energy (7.0%) | |||||||
| 509,700 | Alpha Natural Resources, Inc.a,b | 1,890,987 | ||||||
| 85,700 | Cameron International Corporationa | 5,802,747 | ||||||
| 42,717 | Concho Resources, Inc.a | 6,172,606 | ||||||
| 30,600 | HollyFrontier Corporation | 1,336,914 | ||||||
| 128,682 | Peabody Energy Corporationb | 2,103,951 | ||||||
| 16,700 | Pioneer Natural Resources Company | 3,837,827 | ||||||
| 32,400 | SM Energy Company | 2,724,840 | ||||||
| 116,400 | Southwestern Energy Companya | 5,295,036 | ||||||
|
| |||||||
| Total | 29,164,908 | |||||||
|
| |||||||
| Financials (11.0%) | |||||||
| 40,965 | Affiliated Managers Group, Inc.a | 8,414,211 | ||||||
| 52,600 | Ameriprise Financial, Inc. | 6,312,000 | ||||||
| 127,830 | Discover Financial Services | 7,922,903 | ||||||
| 147,400 | First Republic Bank | 8,105,526 | ||||||
| 12,400 | Intercontinental Exchange, Inc. | 2,342,360 | ||||||
| 16,200 | SVB Financial Groupa | 1,889,244 | ||||||
| 54,200 | T. Rowe Price Group, Inc. | 4,575,022 | ||||||
| 114,300 | TD Ameritrade Holding Corporation | 3,583,305 | ||||||
| 87,300 | Zions Bancorporation | 2,572,731 | ||||||
|
| |||||||
| Total | 45,717,302 | |||||||
|
| |||||||
| Health Care (11.5%) | |||||||
| 27,247 | Actavis, Inc.a | 6,077,443 | ||||||
| 62,589 | AmerisourceBergen Corporation | 4,547,717 | ||||||
| 83,200 | BioMarin Pharmaceutical, Inc.a | 5,175,872 | ||||||
| 34,396 | Catamaran Corporationa | 1,518,928 | ||||||
| 70,500 | Cerner Corporationa | 3,636,390 | ||||||
| 20,400 | Cooper Companies, Inc. | 2,764,812 | ||||||
| 32,900 | Covance, Inc.a | 2,815,582 | ||||||
| 17,900 | Cubist Pharmaceuticals, Inc.a | 1,249,778 | ||||||
| 72,600 | Envision Healthcare Holdings, Inc.a | 2,607,066 | ||||||
| 22,635 | Mettler-Toledo International, Inc.a | 5,730,729 | ||||||
| 58,200 | Perrigo Company plc | 8,483,232 | ||||||
| 45,000 | Team Health Holdings, Inc.a | 2,247,300 | ||||||
| 8,800 | Vertex Pharmaceuticals, Inc.a | 833,184 | ||||||
|
| |||||||
| Total | 47,688,033 | |||||||
|
| |||||||
| Industrials (20.8%) | |||||||
| 139,928 | AMETEK, Inc. | 7,315,436 | ||||||
| 61,790 | B/E Aerospace, Inc.a | 5,714,957 | ||||||
| 107,400 | Delta Air Lines, Inc. | 4,158,528 | ||||||
| 56,200 | Fastenal Companyb | 2,781,338 | ||||||
| 50,998 | Flowserve Corporation | 3,791,701 | ||||||
| 105,000 | Fortune Brands Home and Security, Inc. | 4,192,650 | ||||||
| 45,200 | GATX Corporation | 3,025,688 | ||||||
| 57,300 | Graco, Inc. | 4,473,984 | ||||||
| 38,684 | JB Hunt Transport Services, Inc. | 2,854,106 | ||||||
| 87,900 | Nielsen Holdings NV | 4,255,239 | ||||||
| 67,466 | Pentair, Ltd. | 4,865,648 | ||||||
| 129,400 | Quanta Services, Inc.a | 4,474,652 | ||||||
| 144,800 | Robert Half International, Inc. | 6,912,752 | ||||||
| 42,319 | Roper Industries, Inc. | 6,178,997 | ||||||
| 124,400 | Southwest Airlines Company | 3,341,384 | ||||||
| 70,561 | Stericycle, Inc.a | 8,355,834 | ||||||
| 91,700 | United Rentals, Inc.a | 9,603,741 | ||||||
|
| |||||||
| Total | 86,296,635 | |||||||
|
| |||||||
| Information Technology (19.7%) | |||||||
| 137,509 | Agilent Technologies, Inc. | 7,898,517 | ||||||
| 68,400 | Amphenol Corporation | 6,589,656 | ||||||
| 51,635 | ANSYS, Inc.a | 3,914,966 | ||||||
| 44,360 | Autodesk, Inc.a | 2,501,017 | ||||||
| 120,331 | Ciena Corporationa,b | 2,606,369 | ||||||
| 35,500 | Citrix Systems, Inc.a | 2,220,525 | ||||||
| 37,800 | Cornerstone OnDemand, Inc.a | 1,739,556 | ||||||
| 68,998 | Euronet Worldwide, Inc.a | 3,328,463 | ||||||
| 48,097 | F5 Networks, Inc.a | 5,359,930 | ||||||
| 146,200 | Fortinet, Inc.a | 3,674,006 | ||||||
| 53,700 | Gartner, Inc.a | 3,786,924 | ||||||
| 18,700 | IAC InterActiveCorp | 1,294,601 | ||||||
| 36,700 | Imperva, Inc.a | 960,806 | ||||||
| 7,500 | LinkedIn Corporationa | 1,286,025 | ||||||
| 76,481 | Microchip Technology, Inc.b | 3,733,038 | ||||||
| 43,018 | Nice Systems, Ltd. ADR | 1,755,565 | ||||||
| 81,890 | Nuance Communications, Inc.a,b | 1,537,075 | ||||||
| 232,071 | NVIDIA Corporation | 4,302,596 | ||||||
| 114,600 | NXP Semiconductors NVa | 7,584,228 | ||||||
| 150,700 | QLIK Technologies, Inc.a | 3,408,834 | ||||||
| 76,100 | ServiceNow, Inc.a | 4,715,156 | ||||||
| 46,300 | Synopsys, Inc.a | 1,797,366 | ||||||
| 101,937 | VeriFone Systems, Inc.a | 3,746,185 | ||||||
| 42,600 | Xilinx, Inc. | 2,015,406 | ||||||
|
| |||||||
| Total | 81,756,810 | |||||||
|
| |||||||
| Materials (3.9%) | |||||||
| 40,500 | Airgas, Inc. | 4,410,855 | ||||||
| 35,500 | Albemarle Corporation | 2,538,250 | ||||||
| 28,125 | Celanese Corporation | 1,807,875 | ||||||
| 77,010 | FMC Corporation | 5,482,342 | ||||||
The accompanying Notes to Financial Statements are an integral part of this schedule.
186
Table of Contents
Mid Cap Growth Portfolio
Schedule of Investments as of June 30, 2014
(unaudited)
| Shares | Common Stock (96.5%) | Value | ||||||
| Materials (3.9%) - continued | |||||||
| 66,159 | Silver Wheaton Corporationb | $ | 1,737,997 | |||||
|
| |||||||
| Total | 15,977,319 | |||||||
|
| |||||||
| Telecommunications Services (2.2%) | |||||||
| 50,700 | Cogent Communications Group, Inc. | 1,751,685 | ||||||
| 36,252 | SBA Communications Corporationa | 3,708,579 | ||||||
| 89,037 | TW Telecom, Inc.a | 3,589,082 | ||||||
|
| |||||||
| Total | 9,049,346 | |||||||
|
| |||||||
Total Common Stock (cost $295,450,394) | 400,428,467 | |||||||
|
| |||||||
Collateral Held for Securities Loaned (4.5%) | ||||||||
| 18,528,527 | Thrivent Cash Management Trust | 18,528,527 | ||||||
|
| |||||||
Total Collateral Held for Securities Loaned (cost $18,528,527) | 18,528,527 | |||||||
|
| |||||||
| Shares or Principal Amount | Short-Term Investments (2.6%)c | |||||||
Thrivent Cash Management Trust | ||||||||
| 10,659,045 | 0.050% | 10,659,045 | ||||||
|
| |||||||
| Total Short-Term Investments (at amortized cost) | 10,659,045 | |||||||
|
| |||||||
Total Investments (cost $324,637,966) 103.6% | $ | 429,616,039 | ||||||
|
| |||||||
| Other Assets and Liabilities, Net (3.6%) | (14,955,585 | ) | ||||||
|
| |||||||
| Total Net Assets 100.0% | $ | 414,660,454 | ||||||
|
| |||||||
| a | Non-income producing security. |
| b | All or a portion of the security is on loan. |
| c | The interest rate shown reflects the yield, coupon rate or the discount rate at the date of purchase. |
Definitions:
ADR | - | American Depositary Receipt, which are certificates for an underlying foreign security’s shares held by an issuing U.S. depository bank. |
Unrealized Appreciation (Depreciation)
Gross unrealized appreciation and depreciation of investments, based on cost for federal income tax purposes, were as follows:
Gross unrealized appreciation | $ | 114,799,208 | ||
Gross unrealized depreciation | (10,184,539 | ) | ||
|
| |||
Net unrealized appreciation (depreciation) | $ | 104,614,669 | ||
Cost for federal income tax purposes | $ | 325,001,370 | ||
Fair Valuation Measurements
The following table is a summary of the inputs used, as of June 30, 2014, in valuing Mid Cap Growth Portfolio’s assets carried at fair value.
Investments in Securities | Total | Level 1 | Level 2 | Level 3 | ||||||||||||
Common Stock | ||||||||||||||||
Consumer Discretionary | 70,693,029 | 70,693,029 | — | — | ||||||||||||
Consumer Staples | 14,085,085 | 14,085,085 | — | — | ||||||||||||
Energy | 29,164,908 | 29,164,908 | — | — | ||||||||||||
Financials | 45,717,302 | 45,717,302 | — | — | ||||||||||||
Health Care | 47,688,033 | 47,688,033 | — | — | ||||||||||||
Industrials | 86,296,635 | 86,296,635 | — | — | ||||||||||||
Information Technology | 81,756,810 | 81,756,810 | — | — | ||||||||||||
Materials | 15,977,319 | 15,977,319 | — | — | ||||||||||||
Telecommunications Services | 9,049,346 | 9,049,346 | — | — | ||||||||||||
Collateral Held for Securities Loaned | 18,528,527 | 18,528,527 | — | — | ||||||||||||
Short-Term Investments | 10,659,045 | 10,659,045 | — | — | ||||||||||||
|
|
|
|
|
|
|
| |||||||||
Total | $ | 429,616,039 | $ | 429,616,039 | $ | — | $ | — | ||||||||
|
|
|
|
|
|
|
| |||||||||
There were no significant transfers between Levels during the period ended June 30, 2014. Transfers between Levels are identified as of the end of the period.
The accompanying Notes to Financial Statements are an integral part of this schedule.
187
Table of Contents
Mid Cap Growth Portfolio
Schedule of Investments as of June 30, 2014
(unaudited)
Investment in Affiliates
Affiliated issuers, as defined under the Investment Company Act of 1940, include those in which the Portfolio’s holdings of an issuer represent 5% or more of the outstanding voting securities of an issuer, or any affiliated mutual fund.
A summary of transactions for the fiscal year to date, in Mid Cap Growth Portfolio, is as follows:
Portfolio | Value December 31, 2013 | Gross Purchases | Gross Sales | Shares Held at June 30, 2014 | Value June 30, 2014 | Income Earned January 1, 2014 - June 30, 2014 | ||||||||||||||||||
Cash Management Trust-Collateral Investment | $ | 17,677,617 | $ | 40,003,435 | $ | 39,152,525 | 18,528,527 | $ | 18,528,527 | $ | 6,427 | |||||||||||||
Cash Management Trust-Short Term Investment | 12,208,592 | 44,103,373 | 45,652,920 | 10,659,045 | 10,659,045 | 3,158 | ||||||||||||||||||
Total Value and Income Earned | 29,886,209 | 29,187,572 | 9,585 | |||||||||||||||||||||
The accompanying Notes to Financial Statements are an integral part of this schedule.
188
Table of Contents
Partner Mid Cap Value Portfolio
Schedule of Investments as of June 30, 2014
(unaudited)
| Shares | Common Stock (97.2%) | Value | ||||||
| Consumer Discretionary (11.2%) | |||||||
| 43,367 | AMC Networks, Inc.a | $ | 2,666,637 | |||||
| 33,454 | Expedia, Inc. | 2,634,837 | ||||||
| 21,266 | Fossil, Inc.a | 2,222,722 | ||||||
| 115,053 | Gap, Inc. | 4,782,753 | ||||||
| 66,335 | GNC Holdings, Inc. | 2,262,024 | ||||||
| 123,970 | Liberty Interactive Corporationa | 3,639,759 | ||||||
| 31,303 | Liberty Media Corporationa | 4,278,494 | ||||||
| 133,146 | MGM Resorts Internationala | 3,515,055 | ||||||
| 32,911 | PVH Corporation | 3,837,423 | ||||||
| 32,610 | Scripps Networks Interactive, Inc. | 2,645,975 | ||||||
| 293,585 | Staples, Inc. | 3,182,461 | ||||||
| 48,933 | Starwood Hotels & Resorts Worldwide, Inc. | 3,954,765 | ||||||
| 100,178 | Toll Brothers, Inc.a | 3,696,568 | ||||||
|
| |||||||
| Total | 43,319,473 | |||||||
|
| |||||||
| Consumer Staples (4.3%) | |||||||
| 31,006 | ConAgra Foods, Inc. | 920,258 | ||||||
| 21,977 | Constellation Brands, Inc.a | 1,936,833 | ||||||
| 23,651 | Energizer Holdings, Inc. | 2,886,132 | ||||||
| 40,028 | Ingredion, Inc. | 3,003,701 | ||||||
| 120,243 | Kroger Company | 5,943,611 | ||||||
| 53,426 | Tyson Foods, Inc. | 2,005,612 | ||||||
|
| |||||||
| Total | 16,696,147 | |||||||
|
| |||||||
| Energy (7.8%) | |||||||
| 68,067 | Cameron International Corporationa | 4,608,817 | ||||||
| 188,844 | Chesapeake Energy Corporation | 5,869,271 | ||||||
| 40,544 | Cimarex Energy Company | 5,816,442 | ||||||
| 108,888 | Newfield Exploration Companya | 4,812,850 | ||||||
| 48,144 | Oil States International, Inc.a | 3,085,549 | ||||||
| 24,303 | Range Resources Corporation | 2,113,146 | ||||||
| 64,744 | Tesoro Corporation | 3,798,530 | ||||||
|
| |||||||
| Total | 30,104,605 | |||||||
|
| |||||||
| Financials (27.4%) | |||||||
| 75,096 | Arthur J. Gallagher & Company | 3,499,474 | ||||||
| 45,208 | AvalonBay Communities, Inc. | 6,428,126 | ||||||
| 78,737 | Brixmor Property Group, Inc. | 1,807,014 | ||||||
| 42,692 | Camden Property Trust | 3,037,536 | ||||||
| 190,522 | DDR Corporation | 3,358,903 | ||||||
| 2,492 | E*TRADE Financial Corporationa | 52,980 | ||||||
| 27,436 | Everest Re Group, Ltd. | 4,403,204 | ||||||
| 68,697 | First Republic Bank | 3,777,648 | ||||||
| 460,519 | Huntington Bancshares, Inc. | 4,393,351 | ||||||
| 152,253 | Invesco, Ltd. | 5,747,551 | ||||||
| 273,842 | KeyCorp | 3,924,156 | ||||||
| 127,612 | Lincoln National Corporation | 6,564,361 | ||||||
| 49,736 | M&T Bank Corporation | 6,169,751 | ||||||
| 132,147 | NASDAQ OMX Group, Inc. | 5,103,517 | ||||||
| 238,961 | Navient Corporation | 4,231,999 | ||||||
| 139,258 | Principal Financial Group, Inc. | 7,029,744 | ||||||
| 79,062 | Raymond James Financial, Inc. | 4,010,815 | ||||||
| 60,907 | RLJ Lodging Trust | 1,759,603 | ||||||
| 32,261 | Signature Banka | 4,070,693 | ||||||
| 454,781 | SLM Corporation | 3,779,230 | ||||||
| 150,268 | Starwood Property Trust, Inc. | 3,571,870 | ||||||
| 42,913 | Tanger Factory Outlet Centers, Inc. | 1,500,668 | ||||||
| 50,464 | Taubman Centers, Inc. | 3,825,676 | ||||||
| 77,145 | Unum Group | 2,681,560 | ||||||
| 75,566 | Validus Holdings, Ltd. | 2,889,644 | ||||||
| 86,145 | Voya Financial, Inc. | 3,130,509 | ||||||
| 152,180 | XL Group plc | 4,980,851 | ||||||
|
| |||||||
| Total | 105,730,434 | |||||||
|
| |||||||
| Health Care (7.9%) | |||||||
| 24,059 | C.R. Bard, Inc. | 3,440,678 | ||||||
| 104,205 | Cardinal Health, Inc. | 7,144,295 | ||||||
| 83,753 | CIGNA Corporation | 7,702,763 | ||||||
| 35,812 | Endo International plca | 2,507,556 | ||||||
| 28,490 | Laboratory Corporation of America Holdingsa | 2,917,376 | ||||||
| 56,164 | Tenet Healthcare Corporationa | 2,636,338 | ||||||
| 40,102 | Zimmer Holdings, Inc. | 4,164,994 | ||||||
|
| |||||||
| Total | 30,514,000 | |||||||
|
| |||||||
| Industrials (13.2%) | |||||||
| 64,974 | Armstrong World Industries, Inc.a | 3,731,457 | ||||||
| 40,249 | Carlisle Companies, Inc. | 3,486,368 | ||||||
| 50,662 | Crane Company | 3,767,226 | ||||||
| 18,861 | Dun & Bradstreet Corporation | 2,078,482 | ||||||
| 137,423 | Hertz Global Holdings, Inc.a | 3,851,967 | ||||||
| 82,035 | ITT Corporation | 3,945,884 | ||||||
| 27,920 | Kansas City Southern | 3,001,679 | ||||||
| 61,870 | KBR, Inc. | 1,475,600 | ||||||
| 11,867 | Parker Hannifin Corporation | 1,492,038 | ||||||
| 9,148 | Roper Industries, Inc. | 1,335,700 | ||||||
| 72,464 | Terex Corporation | 2,978,270 | ||||||
| 125,360 | Textron, Inc. | 4,800,034 | ||||||
| 77,763 | Timken Company | 5,275,442 | ||||||
| 86,895 | Triumph Group, Inc. | 6,067,009 | ||||||
| 83,855 | United Continental Holdings, Inc.a | 3,443,924 | ||||||
|
| |||||||
| Total | 50,731,080 | |||||||
|
| |||||||
| Information Technology (13.1%) | |||||||
| 132,654 | Agilent Technologies, Inc. | 7,619,646 | ||||||
| 106,790 | Altera Corporation | 3,712,020 | ||||||
| 65,154 | Analog Devices, Inc. | 3,522,877 | ||||||
| 44,690 | AOL, Inc.a | 1,778,215 | ||||||
| 140,336 | Applied Materials, Inc. | 3,164,577 | ||||||
| 289,770 | Atmel Corporationa | 2,715,145 | ||||||
| 52,066 | Check Point Software Technologies, Ltd.a | 3,489,984 | ||||||
| 77,874 | Citrix Systems, Inc.a | 4,871,019 | ||||||
| 35,785 | Global Payments, Inc. | 2,606,937 | ||||||
| 160,430 | Maxim Integrated Products, Inc. | 5,424,138 | ||||||
| 78,637 | NetApp, Inc. | 2,871,823 | ||||||
| 62,650 | PTC, Inc.a | 2,430,820 | ||||||
| 110,551 | TIBCO Software, Inc.a | 2,229,814 | ||||||
| 317,116 | Xerox Corporation | 3,944,923 | ||||||
|
| |||||||
| Total | 50,381,938 | |||||||
|
| |||||||
| Materials (5.7%) | |||||||
| 81,227 | Celanese Corporation | 5,221,272 | ||||||
| 2,152 | CF Industries Holdings, Inc. | 517,621 | ||||||
| 151,048 | Louisiana-Pacific Corporationa | 2,268,741 | ||||||
| 76,918 | Newmont Mining Corporation | 1,956,794 | ||||||
| 62,640 | Packaging Corporation of America | 4,478,134 | ||||||
| 46,474 | Reliance Steel & Aluminum Company | 3,425,598 | ||||||
| 54,434 | Valspar Corporation | 4,147,326 | ||||||
|
| |||||||
| Total | 22,015,486 | |||||||
|
| |||||||
The accompanying Notes to Financial Statements are an integral part of this schedule.
189
Table of Contents
Partner Mid Cap Value Portfolio
Schedule of Investments as of June 30, 2014
(unaudited)
| Shares | Common Stock (97.2%) | Value | ||||||
| Utilities (6.6%) | |||||||
| 128,410 | Calpine Corporationa | $ | 3,057,442 | |||||
| 66,655 | Edison International, Inc. | 3,873,322 | ||||||
| 158,710 | FirstEnergy Corporation | 5,510,411 | ||||||
| 29,559 | PG&E Corporation | 1,419,423 | ||||||
| 51,441 | SCANA Corporation | 2,768,040 | ||||||
| 51,941 | Sempra Energy | 5,438,742 | ||||||
| 102,811 | Xcel Energy, Inc. | 3,313,599 | ||||||
|
| |||||||
| Total | 25,380,979 | |||||||
|
| |||||||
Total Common Stock (cost $309,040,069) | 374,874,142 | |||||||
|
| |||||||
| Shares or Principal Amount | Short-Term Investments (2.2%)b | |||||||
Thrivent Cash Management Trust | ||||||||
| 8,415,523 | 0.050% | 8,415,523 | ||||||
|
| |||||||
| Total Short-Term Investments (at amortized cost) | 8,415,523 | |||||||
|
| |||||||
Total Investments (cost $317,455,592) 99.4% | $ | 383,289,665 | ||||||
|
| |||||||
| Other Assets and Liabilities, Net 0.6% | 2,167,465 | |||||||
|
| |||||||
| Total Net Assets 100.0% | $ | 385,457,130 | ||||||
|
| |||||||
| a | Non-income producing security. |
| b | The interest rate shown reflects the yield, coupon rate or the discount rate at the date of purchase. |
Definitions:
Unrealized Appreciation (Depreciation)
Gross unrealized appreciation and depreciation of investments, based on cost for federal income tax purposes, were as follows:
Gross unrealized appreciation | $ | 68,087,897 | ||
Gross unrealized depreciation | (2,736,488 | ) | ||
|
| |||
Net unrealized appreciation (depreciation) | $ | 65,351,409 | ||
Cost for federal income tax purposes | $ | 317,938,256 | ||
The accompanying Notes to Financial Statements are an integral part of this schedule.
190
Table of Contents
Partner Mid Cap Value Portfolio
Schedule of Investments as of June 30, 2014
(unaudited)
Fair Valuation Measurements
The following table is a summary of the inputs used, as of June 30, 2014, in valuing Partner Mid Cap Value Portfolio’s assets carried at fair value.
Investments in Securities | Total | Level 1 | Level 2 | Level 3 | ||||||||||||
Common Stock | ||||||||||||||||
Consumer Discretionary | 43,319,473 | 43,319,473 | — | — | ||||||||||||
Consumer Staples | 16,696,147 | 16,696,147 | — | — | ||||||||||||
Energy | 30,104,605 | 30,104,605 | — | — | ||||||||||||
Financials | 105,730,434 | 105,730,434 | — | — | ||||||||||||
Health Care | 30,514,000 | 30,514,000 | — | — | ||||||||||||
Industrials | 50,731,080 | 50,731,080 | — | — | ||||||||||||
Information Technology | 50,381,938 | 50,381,938 | — | — | ||||||||||||
Materials | 22,015,486 | 22,015,486 | — | — | ||||||||||||
Utilities | 25,380,979 | 25,380,979 | — | — | ||||||||||||
Short-Term Investments | 8,415,523 | 8,415,523 | — | — | ||||||||||||
|
|
|
|
|
|
|
| |||||||||
Total | $ | 383,289,665 | $ | 383,289,665 | $ | — | $ | — | ||||||||
|
|
|
|
|
|
|
| |||||||||
There were no significant transfers between Levels during the period ended June 30, 2014. Transfers between Levels are identified as of the end of the period.
Investment in Affiliates
Affiliated issuers, as defined under the Investment Company Act of 1940, include those in which the Portfolio’s holdings of an issuer represent 5% or more of the outstanding voting securities of an issuer, or any affiliated mutual fund.
A summary of transactions for the fiscal year to date, in Partner Mid Cap Value Portfolio, is as follows:
Portfolio | Value December 31, 2013 | Gross Purchases | Gross Sales | Shares Held at June 30, 2014 | Value June 30, 2014 | Income Earned January 1, 2014 - June 30, 2014 | ||||||||||||||||||
Cash Management Trust-Short Term Investment | $ | 3,138,588 | $ | 50,507,736 | $ | 45,230,801 | 8,415,523 | $ | 8,415,523 | $ | 1,388 | |||||||||||||
Total Value and Income Earned | 3,138,588 | 8,415,523 | 1,388 | |||||||||||||||||||||
The accompanying Notes to Financial Statements are an integral part of this schedule.
191
Table of Contents
Schedule of Investments as of June 30, 2014
(unaudited)
| Shares | Common Stock (92.1%) | Value | ||||||
| Consumer Discretionary (7.2%) | |||||||
| 169,250 | Cheesecake Factory, Inc. | $ | 7,856,585 | |||||
| 222,200 | DISH Network Corporationa | 14,460,776 | ||||||
| 7,650 | Michael Kors Holdings, Ltd.a | 678,173 | ||||||
| 151,400 | Omnicom Group, Inc. | 10,782,708 | ||||||
| 124,700 | Scripps Networks Interactive, Inc. | 10,118,158 | ||||||
| 261,050 | Toll Brothers, Inc.a | 9,632,745 | ||||||
|
| |||||||
| Total | 53,529,145 | |||||||
|
| |||||||
| Consumer Staples (3.8%) | |||||||
| 74,850 | Green Mountain Coffee Roasters, Inc. | 9,327,059 | ||||||
| 99,800 | Ingredion, Inc. | 7,488,992 | ||||||
| 345,900 | WhiteWave Foods Companya | 11,196,783 | ||||||
|
| |||||||
| Total | 28,012,834 | |||||||
|
| |||||||
| Energy (6.2%) | |||||||
| 39,100 | Atwood Oceanics, Inc.a | 2,051,968 | ||||||
| 41,829 | Cabot Oil & Gas Corporation | 1,428,042 | ||||||
| 26,350 | Cameron International Corporationa | 1,784,158 | ||||||
| 18,950 | Cimarex Energy Company | 2,718,567 | ||||||
| 14,800 | Concho Resources, Inc.a | 2,138,600 | ||||||
| 109,850 | Denbury Resources, Inc. | 2,027,831 | ||||||
| 14,300 | Energen Corporation | 1,270,984 | ||||||
| 26,150 | Ensco plc | 1,453,155 | ||||||
| 15,870 | EQT Corporation | 1,696,503 | ||||||
| 15,750 | Gulfport Energy Corporationa | 989,100 | ||||||
| 26,950 | Helmerich & Payne, Inc.b | 3,129,164 | ||||||
| 42,850 | HollyFrontier Corporation | 1,872,117 | ||||||
| 23,150 | National Oilwell Varco, Inc. | 1,906,402 | ||||||
| 44,250 | Noble Corporation | 1,485,030 | ||||||
| 30,000 | Noble Energy, Inc. | 2,323,800 | ||||||
| 27,250 | Oasis Petroleum, Inc.a | 1,523,003 | ||||||
| 28,500 | Oceaneering International, Inc. | 2,226,705 | ||||||
| 25,450 | Oil States International, Inc.a | 1,631,091 | ||||||
| 9,300 | Pioneer Natural Resources Company | 2,137,233 | ||||||
| 19,400 | Range Resources Corporation | 1,686,830 | ||||||
| 41,300 | Rowan Companies plc | 1,318,709 | ||||||
| 22,350 | SM Energy Company | 1,879,635 | ||||||
| 95,600 | Superior Energy Services, Inc. | 3,454,984 | ||||||
| 25,550 | Whiting Petroleum Corporationa | 2,050,387 | ||||||
|
| |||||||
| Total | 46,183,998 | |||||||
|
| |||||||
| Financials (20.6%) | |||||||
| 109,050 | Camden Property Trust | 7,758,908 | ||||||
| 88,450 | Digital Realty Trust, Inc. | 5,158,404 | ||||||
| 286,350 | Duke Realty Corporation | 5,200,116 | ||||||
| 207,800 | First Republic Bank | 11,426,922 | ||||||
| 194,921 | Gaming and Leisure Properties, Inc. | 6,621,466 | ||||||
| 221,520 | HCC Insurance Holdings, Inc. | 10,841,189 | ||||||
| 494,798 | Host Hotels & Resorts, Inc. | 10,890,504 | ||||||
| 1,451,700 | Huntington Bancshares, Inc. | 13,849,218 | ||||||
| 651,100 | KeyCorp | 9,330,263 | ||||||
| 246,574 | Lazard, Ltd. | 12,713,355 | ||||||
| 80,800 | M&T Bank Corporationb | 10,023,240 | ||||||
| 33,300 | Macerich Company | 2,222,775 | ||||||
| 327,200 | NASDAQ OMX Group, Inc. | 12,636,464 | ||||||
| 179,183 | Northern Trust Corporation | 11,505,340 | ||||||
| 116,250 | Piedmont Office Realty Trust, Inc. | 2,201,775 | ||||||
| 116,950 | Protective Life Corporation | 8,108,144 | ||||||
| 417,772 | Zions Bancorporation | 12,311,741 | ||||||
|
| |||||||
| Total | 152,799,824 | |||||||
|
| |||||||
| Health Care (12.7%) | |||||||
| 211,950 | Acorda Therapeutics, Inc.a | 7,144,835 | ||||||
| 678,700 | Allscripts Healthcare Solutions, Inc.a | 10,893,135 | ||||||
| 73,732 | C.R. Bard, Inc. | 10,544,413 | ||||||
| 108,000 | Centene Corporationa | 8,165,880 | ||||||
| 488,750 | Hologic, Inc.a | 12,389,812 | ||||||
| 143,750 | Illumina, Inc.a,b | 25,665,125 | ||||||
| 115,250 | Universal Health Services, Inc. | 11,036,340 | ||||||
| 78,600 | Waters Corporationa | 8,208,984 | ||||||
|
| |||||||
| Total | 94,048,524 | |||||||
|
| |||||||
| Industrials (16.0%) | |||||||
| 427,344 | ADT Corporationb | 14,931,399 | ||||||
| 261,443 | CSX Corporation | 8,055,059 | ||||||
| 145,750 | Flowserve Corporation | 10,836,512 | ||||||
| 83,950 | Huntington Ingalls Industries, Inc. | 7,940,831 | ||||||
| 363,916 | Manitowoc Company, Inc. | 11,958,280 | ||||||
| 91,308 | Manpower, Inc. | 7,747,484 | ||||||
| 324,734 | Oshkosh Corporation | 18,032,479 | ||||||
| 95,832 | Parker Hannifin Corporation | 12,048,957 | ||||||
| 665,100 | Southwest Airlines Company | 17,864,586 | ||||||
| 81,250 | WABCO Holdings, Inc.a | 8,679,125 | ||||||
|
| |||||||
| Total | 118,094,712 | |||||||
|
| |||||||
| Information Technology (19.4%) | |||||||
| 97,150 | Alliance Data Systems Corporationa | 27,323,438 | ||||||
| 834,533 | Applied Materials, Inc. | 18,818,719 | ||||||
| 152,004 | eBay, Inc.a | 7,609,320 | ||||||
| 378,532 | Juniper Networks, Inc.a | 9,289,175 | ||||||
| 183,600 | NetApp, Inc. | 6,705,072 | ||||||
| 1,027,616 | NVIDIA Corporation | 19,052,001 | ||||||
| 197,800 | Red Hat, Inc.a | 10,932,406 | ||||||
| 253,700 | SunPower Corporationa,b | 10,396,626 | ||||||
| 218,950 | Teradata Corporationa | 8,801,790 | ||||||
| 506,572 | Teradyne, Inc.b | 9,928,811 | ||||||
| 215,300 | Ubiquiti Networks, Inc.a,b | 9,729,407 | ||||||
| 51,450 | Workday, Inc.a | 4,623,297 | ||||||
|
| |||||||
| Total | 143,210,062 | |||||||
|
| |||||||
| Materials (3.7%) | |||||||
| 258,750 | Owens-Illinois, Inc.a | 8,963,100 | ||||||
| 146,912 | Silgan Holdings, Inc. | 7,466,068 | ||||||
| 598,450 | Steel Dynamics, Inc. | 10,742,177 | ||||||
|
| |||||||
| Total | 27,171,345 | |||||||
|
| |||||||
| Utilities (2.5%) | |||||||
| 300,000 | CMS Energy Corporation | 9,345,000 | ||||||
| 232,400 | Public Service Enterprise Group, Inc. | 9,479,596 | ||||||
|
| |||||||
| Total | 18,824,596 | |||||||
|
| |||||||
Total Common Stock (cost $467,609,334) | 681,875,040 | |||||||
|
| |||||||
The accompanying Notes to Financial Statements are an integral part of this schedule.
192
Table of Contents
Mid Cap Stock Portfolio
Schedule of Investments as of June 30, 2014
(unaudited)
| Shares | Collateral Held for Securities Loaned (6.9%) | Value | ||||||
| 51,144,300 | Thrivent Cash Management Trust | $ | 51,144,300 | |||||
|
| |||||||
| Total Collateral Held for Securities Loaned (cost $51,144,300) | 51,144,300 | |||||||
|
| |||||||
| Shares or Principal Amount | Short-Term Investments (7.4%)c | |||||||
| 54,447,473 | Thrivent Cash Management Trust | 54,447,473 | ||||||
0.050% | ||||||||
|
| |||||||
| Total Short-Term Investments (at amortized cost) | 54,447,473 | |||||||
|
| |||||||
Total Investments (cost $573,201,107) 106.4% | $ | 787,466,813 | ||||||
|
| |||||||
| Other Assets and Liabilities, Net (6.4%) | (47,340,574 | ) | ||||||
|
| |||||||
| Total Net Assets 100.0% | $ | 740,126,239 | ||||||
|
| |||||||
| a | Non-income producing security. |
| b | All or a portion of the security is on loan. |
| c | The interest rate shown reflects the yield, coupon rate or the discount rate at the date of purchase. |
Unrealized Appreciation (Depreciation)
Gross unrealized appreciation and depreciation of investments, based on cost for federal income tax purposes, were as follows:
Gross unrealized appreciation | $ | 217,379,771 | ||
Gross unrealized depreciation | (3,800,226 | ) | ||
|
| |||
Net unrealized appreciation (depreciation) | $ | 213,579,545 | ||
Cost for federal income tax purposes | $ | 573,887,268 | ||
Fair Valuation Measurements
The following table is a summary of the inputs used, as of June 30, 2014, in valuing Mid Cap Stock Portfolio’s assets carried at fair value.
Investments in Securities | Total | Level 1 | Level 2 | Level 3 | ||||||||||||
Common Stock | ||||||||||||||||
Consumer Discretionary | 53,529,145 | 53,529,145 | — | — | ||||||||||||
Consumer Staples | 28,012,834 | 28,012,834 | — | — | ||||||||||||
Energy | 46,183,998 | 46,183,998 | — | — | ||||||||||||
Financials | 152,799,824 | 152,799,824 | — | — | ||||||||||||
Health Care | 94,048,524 | 94,048,524 | — | — | ||||||||||||
Industrials | 118,094,712 | 118,094,712 | — | — | ||||||||||||
Information Technology | 143,210,062 | 143,210,062 | — | — | ||||||||||||
Materials | 27,171,345 | 27,171,345 | — | — | ||||||||||||
Utilities | 18,824,596 | 18,824,596 | — | — | ||||||||||||
Collateral Held for Securities Loaned | 51,144,300 | 51,144,300 | — | — | ||||||||||||
Short-Term Investments | 54,447,473 | 54,447,473 | — | — | ||||||||||||
|
|
|
|
|
|
|
| |||||||||
Total | $ | 787,466,813 | $ | 787,466,813 | $ | — | $ | — | ||||||||
|
|
|
|
|
|
|
| |||||||||
There were no significant transfers between Levels during the period ended June 30, 2014. Transfers between Levels are identified as of the end of the period.
The accompanying Notes to Financial Statements are an integral part of this schedule.
193
Table of Contents
Mid Cap Stock Portfolio
Schedule of Investments as of June 30, 2014
(unaudited)
Investment in Affiliates
Affiliated issuers, as defined under the Investment Company Act of 1940, include those in which the Portfolio’s holdings of an issuer represent 5% or more of the outstanding voting securities of an issuer, or any affiliated mutual fund.
A summary of transactions for the fiscal year to date, in Mid Cap Stock Portfolio, is as follows:
Portfolio | Value December 31, 2013 | Gross Purchases | Gross Sales | Shares Held at June 30, 2014 | Value June 30, 2014 | Income Earned January 1, 2014 - June 30, 2014 | ||||||||||||||||||
Cash Management Trust- Collateral Investment | $ | 37,473,212 | $ | 246,521,312 | $ | 232,850,224 | 51,144,300 | $ | 51,144,300 | $ | 88,129 | |||||||||||||
Cash Management Trust-Short Term Investment | 26,698,226 | 56,964,453 | 29,215,206 | 54,447,473 | 54,447,473 | 9,618 | ||||||||||||||||||
Total Value and Income Earned | 64,171,438 | 105,591,773 | 97,747 | |||||||||||||||||||||
The accompanying Notes to Financial Statements are an integral part of this schedule.
194
Table of Contents
Schedule of Investments as of June 30, 2014
(unaudited)
| Shares | Common Stock (91.7%) | Value | ||||||
| Consumer Discretionary (12.0%) | |||||||
| 5,600 | Aaron’s, Inc. | $ | 199,584 | |||||
| 5,650 | Abercrombie & Fitch Companya | 244,362 | ||||||
| 5,650 | Advance Auto Parts, Inc. | 762,298 | ||||||
| 4,600 | AMC Networks, Inc.b | 282,854 | ||||||
| 13,280 | American Eagle Outfitters, Inc. | 149,002 | ||||||
| 3,600 | ANN, Inc.b | 148,104 | ||||||
| 7,700 | Apollo Group, Inc.b | 240,625 | ||||||
| 10,000 | Ascena Retail Group, Inc.b | 171,000 | ||||||
| 3,050 | Bally Technologies, Inc.b | 200,446 | ||||||
| 4,250 | Big Lots, Inc.b | 194,225 | ||||||
| 5,055 | Brinker International, Inc. | 245,926 | ||||||
| 7,150 | Brunswick Corporation | 301,229 | ||||||
| 3,600 | Cabela’s, Inc.b | 224,640 | ||||||
| 4,200 | Carter’s, Inc. | 289,506 | ||||||
| 3,600 | Cheesecake Factory, Inc. | 167,112 | ||||||
| 11,850 | Chico’s FAS, Inc. | 200,976 | ||||||
| 8,050 | Cinemark Holdings, Inc. | 284,648 | ||||||
| 5,850 | CST Brands, Inc. | 201,825 | ||||||
| 2,700 | Deckers Outdoor Corporationb | 233,091 | ||||||
| 4,450 | DeVry Education Group, Inc. | 188,413 | ||||||
| 7,700 | Dick’s Sporting Goods, Inc. | 358,512 | ||||||
| 4,300 | Domino’s Pizza, Inc. | 314,287 | ||||||
| 5,600 | DreamWorks Animation SKG, Inc.b | 130,256 | ||||||
| 11,300 | Foot Locker, Inc. | 573,136 | ||||||
| 11,320 | Gentex Corporation | 329,299 | ||||||
| 4,550 | Guess ?, Inc. | 122,850 | ||||||
| 7,700 | Hanesbrands, Inc. | 757,988 | ||||||
| 2,600 | HSN, Inc. | 154,024 | ||||||
| 19,150 | International Game Technology | 304,676 | ||||||
| 2,170 | International Speedway Corporation | 72,218 | ||||||
| 23,600 | J.C. Penney Company, Inc.a,b | 213,580 | ||||||
| 9,300 | Jarden Corporationb | 551,955 | ||||||
| 3,600 | John Wiley and Sons, Inc. | 218,124 | ||||||
| 9,800 | Kate Spade & Companyb | 373,772 | ||||||
| 7,000 | KB Homea | 130,760 | ||||||
| 5,050 | Lamar Advertising Company | 267,650 | ||||||
| 2,950 | Life Time Fitness, Inc.a,b | 143,783 | ||||||
| 11,050 | Live Nation Entertainment, Inc.b | 272,825 | ||||||
| 23,450 | LKQ Corporationb | 625,881 | ||||||
| 3,000 | M.D.C. Holdings, Inc. | 90,870 | ||||||
| 2,900 | Meredith Corporation | 140,244 | ||||||
| 3,450 | Murphy USA, Inc.b | 168,671 | ||||||
| 9,850 | New York Times Company | 149,818 | ||||||
| 300 | NVR, Inc.b | 345,180 | ||||||
| 37,750 | Office Depot, Inc.b | 214,797 | ||||||
| 2,050 | Panera Bread Companyb | 307,152 | ||||||
| 5,100 | Polaris Industries, Inc.a | 664,224 | ||||||
| 4,100 | Rent-A-Center, Inc. | 117,588 | ||||||
| 16,600 | Service Corporation International | 343,952 | ||||||
| 6,200 | Signet Jewelers, Ltd. | 685,658 | ||||||
| 5,320 | Sotheby’s Holdings, Inc. | 223,387 | ||||||
| 4,700 | Tempur-Pedic International, Inc.b | 280,590 | ||||||
| 3,450 | Thor Industries, Inc. | 196,201 | ||||||
| 8,700 | Time, Inc.b | 210,714 | ||||||
| 12,350 | Toll Brothers, Inc.b | 455,715 | ||||||
| 3,900 | Tupperware Brands Corporation | 326,430 | ||||||
| 20,414 | Wendy’s Company | 174,131 | ||||||
| 6,780 | Williams-Sonoma, Inc. | 486,668 | ||||||
|
| |||||||
| Total | 16,427,432 | |||||||
|
| |||||||
| Consumer Staples (3.2%) | |||||||
| 10,570 | Church & Dwight Company, Inc. | 739,372 | ||||||
| 7,200 | Dean Foods Company | 126,648 | ||||||
| 4,800 | Energizer Holdings, Inc. | 585,744 | ||||||
| 13,575 | Flowers Foods, Inc. | 286,161 | ||||||
| 3,900 | Hain Celestial Group, Inc.b | 346,086 | ||||||
| 9,500 | Hillshire Brands Company | 591,850 | ||||||
| 5,800 | Ingredion, Inc. | 435,232 | ||||||
| 1,540 | Lancaster Colony Corporation | 146,546 | ||||||
| 3,400 | Post Holdings, Inc.b | 173,094 | ||||||
| 15,450 | SUPERVALU, Inc.a,b | 126,999 | ||||||
| 1,603 | Tootsie Roll Industries, Inc.a | 47,192 | ||||||
| 3,800 | United Natural Foods, Inc.b | 247,380 | ||||||
| 1,840 | Universal Corporationa | 101,844 | ||||||
| 13,600 | WhiteWave Foods Companyb | 440,232 | ||||||
|
| |||||||
| Total | 4,394,380 | |||||||
|
| |||||||
| Energy (4.8%) | |||||||
| 4,500 | Atwood Oceanics, Inc.b | 236,160 | ||||||
| 3,800 | Bill Barrett Corporationb | 101,764 | ||||||
| 1,500 | CARBO Ceramics, Inc.a | 231,180 | ||||||
| 5,900 | Dresser-Rand Group, Inc.b | 376,007 | ||||||
| 3,100 | Dril-Quip, Inc.b | 338,644 | ||||||
| 5,600 | Energen Corporation | 497,728 | ||||||
| 6,550 | Gulfport Energy Corporationb | 411,340 | ||||||
| 7,600 | Helix Energy Solutions Group, Inc.b | 199,956 | ||||||
| 15,390 | HollyFrontier Corporation | 672,389 | ||||||
| 8,350 | Oceaneering International, Inc. | 652,385 | ||||||
| 4,150 | Oil States International, Inc.b | 265,974 | ||||||
| 11,200 | Patterson-UTI Energy, Inc. | 391,328 | ||||||
| 4,700 | Rosetta Resources, Inc.b | 257,795 | ||||||
| 5,200 | SM Energy Company | 437,320 | ||||||
| 12,100 | Superior Energy Services, Inc. | 437,294 | ||||||
| 3,850 | Tidewater, Inc. | 216,177 | ||||||
| 3,400 | Unit Corporationb | 234,022 | ||||||
| 5,600 | World Fuel Services Corporation | 275,688 | ||||||
| 15,650 | WPX Energy, Inc.b | 374,192 | ||||||
|
| |||||||
| Total | 6,607,343 | |||||||
|
| |||||||
| Financials (20.2%) | |||||||
| 3,360 | Alexander & Baldwin, Inc. | 139,272 | ||||||
| 5,500 | Alexandria Real Estate Equities, Inc. | 427,020 | ||||||
| 1,300 | Alleghany Corporationb | 569,556 | ||||||
| 8,100 | American Campus Communities, Inc. | 309,744 | ||||||
| 5,535 | American Financial Group, Inc. | 329,665 | ||||||
| 12,200 | Arthur J. Gallagher & Company | 568,520 | ||||||
| 5,050 | Aspen Insurance Holdings, Ltd. | 229,371 | ||||||
| 12,443 | Associated Banc-Corp | 224,969 | ||||||
| 6,570 | Astoria Financial Corporation | 88,366 | ||||||
| 6,550 | BancorpSouth, Inc. | 160,934 | ||||||
| 3,450 | Bank of Hawaii Corporation | 202,480 | ||||||
| 14,900 | BioMed Realty Trust, Inc. | 325,267 | ||||||
| 9,200 | Brown & Brown, Inc. | 282,532 | ||||||
| 6,600 | Camden Property Trust | 469,590 | ||||||
| 5,700 | Cathay General Bancorp | 145,692 | ||||||
| 6,700 | CBOE Holdings, Inc. | 329,707 | ||||||
| 3,720 | City National Corporation | 281,827 | ||||||
| 6,283 | Commerce Bancshares, Inc. | 292,160 | ||||||
| 6,800 | Corporate Office Properties Trust | 189,108 | ||||||
| 8,970 | Corrections Corporation of America REIT | 294,665 | ||||||
| 4,100 | Cullen/Frost Bankers, Inc.a | 325,622 | ||||||
The accompanying Notes to Financial Statements are an integral part of this schedule.
195
Table of Contents
Mid Cap Index Portfolio
Schedule of Investments as of June 30, 2014
(unaudited)
| Shares | Common Stock (91.7%) | Value | ||||||
| Financials (20.2%) - continued | |||||||
| 25,450 | Duke Realty Corporation | $ | 462,172 | |||||
| 11,150 | East West Bancorp, Inc. | 390,138 | ||||||
| 9,400 | Eaton Vance Corporation | 355,226 | ||||||
| 4,900 | Equity One, Inc. | 115,591 | ||||||
| 3,610 | Everest Re Group, Ltd. | 579,369 | ||||||
| 8,500 | Extra Space Storage, Inc. | 452,625 | ||||||
| 5,200 | Federal Realty Investment Trust | 628,784 | ||||||
| 7,300 | Federated Investors, Inc.a | 225,716 | ||||||
| 8,300 | First American Financial Corporation | 230,657 | ||||||
| 18,400 | First Horizon National Corporation | 218,224 | ||||||
| 27,550 | First Niagara Financial Group, Inc. | 240,787 | ||||||
| 12,848 | FirstMerit Corporation | 253,748 | ||||||
| 14,750 | Fulton Financial Corporation | 182,753 | ||||||
| 6,400 | Hancock Holding Company | 226,048 | ||||||
| 3,370 | Hanover Insurance Group, Inc. | 212,815 | ||||||
| 7,750 | HCC Insurance Holdings, Inc. | 379,285 | ||||||
| 6,950 | Highwoods Properties, Inc. | 291,552 | ||||||
| 4,400 | Home Properties, Inc. | 281,424 | ||||||
| 11,550 | Hospitality Properties Trust | 351,120 | ||||||
| 4,400 | International Bancshares Corporation | 118,800 | ||||||
| 11,650 | Janus Capital Group, Inc. | 145,392 | ||||||
| 3,450 | Jones Lang LaSalle, Inc. | 436,045 | ||||||
| 3,950 | Kemper Corporation | 145,597 | ||||||
| 6,350 | Kilroy Realty Corporation | 395,478 | ||||||
| 8,250 | LaSalle Hotel Properties | 291,142 | ||||||
| 11,400 | Liberty Property Trust | 432,402 | ||||||
| 6,850 | Mack-Cali Realty Corporation | 147,138 | ||||||
| 2,800 | Mercury General Corporation | 131,712 | ||||||
| 5,800 | Mid-America Apartment Communities, Inc. | 423,690 | ||||||
| 9,050 | MSCI, Inc.b | 414,943 | ||||||
| 9,500 | National Retail Properties, Inc. | 353,305 | ||||||
| 34,411 | New York Community Bancorp, Inc.a | 549,888 | ||||||
| 18,750 | Old Republic International Corporation | 310,125 | ||||||
| 9,700 | Omega Healthcare Investors, Inc. | 357,542 | ||||||
| 7,450 | PacWest Bancorp | 321,617 | ||||||
| 3,107 | Potlatch Corporation | 128,630 | ||||||
| 4,250 | Primerica, Inc. | 203,363 | ||||||
| 4,700 | Prosperity Bancshares, Inc. | 294,220 | ||||||
| 6,120 | Protective Life Corporation | 424,300 | ||||||
| 9,675 | Raymond James Financial, Inc. | 490,813 | ||||||
| 9,762 | Rayonier, Inc. REIT | 347,039 | ||||||
| 17,250 | Realty Income Corporation | 766,245 | ||||||
| 7,150 | Regency Centers Corporation | 398,112 | ||||||
| 5,400 | Reinsurance Group of America, Inc. | 426,060 | ||||||
| 3,200 | RenaissanceRe Holdings, Ltd. | 342,400 | ||||||
| 11,040 | SEI Investments Company | 361,781 | ||||||
| 15,700 | Senior Housing Property Trust | 381,353 | ||||||
| 3,850 | Signature Bankb | 485,793 | ||||||
| 7,400 | SL Green Realty Corporation | 809,634 | ||||||
| 32,800 | SLM Corporation | 272,568 | ||||||
| 3,400 | StanCorp Financial Group, Inc. | 217,600 | ||||||
| 3,830 | SVB Financial Groupb | 446,655 | ||||||
| 10,750 | Synovus Financial Corporation | 262,085 | ||||||
| 4,900 | Taubman Centers, Inc. | 371,469 | ||||||
| 12,920 | TCF Financial Corporation | 211,500 | ||||||
| 5,200 | Trustmark Corporation | 128,388 | ||||||
| 19,453 | UDR, Inc. | 556,939 | ||||||
| 13,300 | Umpqua Holdings Corporation | 238,336 | ||||||
| 15,534 | Valley National Bancorpa | 153,942 | ||||||
| 8,075 | W.R. Berkley Corporation | 373,953 | ||||||
| 6,590 | Waddell & Reed Financial, Inc. | 412,468 | ||||||
| 7,877 | Washington Federal, Inc. | 176,681 | ||||||
| 11,950 | Washington Prime Group, Inc.b | 223,943 | ||||||
| 6,980 | Webster Financial Corporation | 220,149 | ||||||
| 8,700 | Weingarten Realty Investors | 285,708 | ||||||
| 2,070 | Westamerica Bancorporation | 108,220 | ||||||
|
| |||||||
| Total | 27,759,264 | |||||||
|
| |||||||
| Health Care (8.8%) | |||||||
| 5,600 | Align Technology, Inc.b | 313,824 | ||||||
| 12,450 | Allscripts Healthcare Solutions, Inc.b | 199,823 | ||||||
| 1,550 | Bio-Rad Laboratories, Inc.b | 185,551 | ||||||
| 3,700 | Charles River Laboratories International, Inc.b | 198,024 | ||||||
| 8,866 | Community Health Systems, Inc.b | 402,250 | ||||||
| 3,750 | Cooper Companies, Inc. | 508,237 | ||||||
| 4,460 | Covance, Inc.b | 381,687 | ||||||
| 5,750 | Cubist Pharmaceuticals, Inc.b | 401,465 | ||||||
| 10,850 | Endo International plcb | 759,717 | ||||||
| 6,230 | Health Net, Inc.b | 258,794 | ||||||
| 6,600 | Henry Schein, Inc.b | 783,222 | ||||||
| 4,450 | Hill-Rom Holdings, Inc. | 184,719 | ||||||
| 6,850 | HMS Holdings Corporationb | 139,809 | ||||||
| 21,450 | Hologic, Inc.b | 543,757 | ||||||
| 4,000 | IDEXX Laboratories, Inc.b | 534,280 | ||||||
| 3,450 | LifePoint Hospitals, Inc.b | 214,245 | ||||||
| 4,500 | Mallinckrodt, LLCb | 360,090 | ||||||
| 7,750 | Mednax, Inc.b | 450,662 | ||||||
| 2,300 | Mettler-Toledo International, Inc.b | 582,314 | ||||||
| 7,720 | Omnicare, Inc. | 513,920 | ||||||
| 4,900 | Owens & Minor, Inc. | 166,502 | ||||||
| 10,800 | ResMed, Inc.a | 546,804 | ||||||
| 4,950 | Salix Pharmaceuticals, Ltd.b | 610,583 | ||||||
| 4,300 | Sirona Dental Systems, Inc.b | 354,578 | ||||||
| 4,600 | STERIS Corporation | 246,008 | ||||||
| 2,600 | Techne Corporation | 240,682 | ||||||
| 3,190 | Teleflex, Inc. | 336,864 | ||||||
| 4,400 | Thoratec Corporationb | 153,384 | ||||||
| 3,450 | United Therapeutics Corporationb | 305,291 | ||||||
| 6,950 | Universal Health Services, Inc. | 665,532 | ||||||
| 6,850 | VCA Antech, Inc.b | 240,367 | ||||||
| 3,400 | Wellcare Health Plans, Inc.b | 253,844 | ||||||
|
| |||||||
| Total | 12,036,829 | |||||||
|
| |||||||
| Industrials (15.7%) | |||||||
| 5,900 | A.O. Smith Corporation | 292,522 | ||||||
| 3,350 | Acuity Brands, Inc. | 463,137 | ||||||
| 7,650 | Aecom Technology Corporationb | 246,330 | ||||||
| 6,730 | AGCO Corporation | 378,361 | ||||||
| 5,330 | Alaska Air Group, Inc. | 506,616 | ||||||
| 2,500 | Alliant Techsystems, Inc. | 334,800 | ||||||
| 7,700 | B/E Aerospace, Inc.b | 712,173 | ||||||
| 4,940 | Carlisle Companies, Inc. | 427,903 | ||||||
| 8,350 | Civeo Corporationb | 209,001 | ||||||
| 3,900 | CLARCOR, Inc. | 241,215 | ||||||
| 4,300 | Clean Harbors, Inc.a,b | 276,275 | ||||||
| 4,380 | Con-way, Inc. | 220,796 | ||||||
| 8,700 | Copart, Inc.b | 312,852 | ||||||
| 2,600 | Corporate Executive Board Company | 177,372 | ||||||
The accompanying Notes to Financial Statements are an integral part of this schedule.
196
Table of Contents
Mid Cap Index Portfolio
Schedule of Investments as of June 30, 2014
(unaudited)
| Shares | Common Stock (91.7%) | Value | ||||||
| Industrials (15.7%) - continued | |||||||
| 3,800 | Crane Company | $ | 282,568 | |||||
| 3,900 | Deluxe Corporation | 228,462 | ||||||
| 10,250 | Donaldson Company, Inc. | 433,780 | ||||||
| 2,450 | Esterline Technologies Corporationb | 282,044 | ||||||
| 14,700 | Exelis, Inc. | 249,606 | ||||||
| 12,850 | Fortune Brands Home and Security, Inc. | 513,101 | ||||||
| 3,100 | FTI Consulting, Inc.b | 117,242 | ||||||
| 3,520 | GATX Corporation | 235,629 | ||||||
| 3,950 | Genesee & Wyoming, Inc.b | 414,750 | ||||||
| 4,750 | Graco, Inc. | 370,880 | ||||||
| 2,810 | Granite Construction, Inc. | 101,104 | ||||||
| 6,200 | Harsco Corporation | 165,106 | ||||||
| 4,590 | Herman Miller, Inc. | 138,802 | ||||||
| 3,480 | HNI Corporation | 136,103 | ||||||
| 4,180 | Hubbell, Inc. | 514,767 | ||||||
| 3,801 | Huntington Ingalls Industries, Inc. | 359,537 | ||||||
| 6,250 | IDEX Corporation | 504,625 | ||||||
| 7,100 | ITT Corporation | 341,510 | ||||||
| 7,090 | JB Hunt Transport Services, Inc. | 523,100 | ||||||
| 17,775 | JetBlue Airways Corporationa,b | 192,859 | ||||||
| 11,450 | KBR, Inc. | 273,083 | ||||||
| 6,090 | Kennametal, Inc. | 281,845 | ||||||
| 4,400 | Kirby Corporationb | 515,416 | ||||||
| 3,500 | Landstar System, Inc. | 224,000 | ||||||
| 3,500 | Lennox International, Inc. | 313,495 | ||||||
| 6,250 | Lincoln Electric Holdings, Inc. | 436,750 | ||||||
| 6,170 | Manpower, Inc. | 523,524 | ||||||
| 2,450 | Mine Safety Appliances Company | 140,826 | ||||||
| 3,700 | MSC Industrial Direct Company, Inc. | 353,868 | ||||||
| 4,680 | Nordson Corporation | 375,289 | ||||||
| 8,300 | NOW, Inc.b | 300,543 | ||||||
| 5,400 | Old Dominion Freight Line, Inc.b | 343,872 | ||||||
| 6,550 | Oshkosh Corporation | 363,721 | ||||||
| 15,500 | R.R. Donnelley & Sons Company | 262,880 | ||||||
| 3,500 | Regal-Beloit Corporation | 274,960 | ||||||
| 4,972 | Rollins, Inc. | 149,160 | ||||||
| 3,410 | SPX Corporation | 368,996 | ||||||
| 8,550 | Terex Corporation | 351,405 | ||||||
| 6,000 | Timken Company | 407,040 | ||||||
| 5,000 | Towers Watson & Company | 521,150 | ||||||
| 11,990 | Trinity Industries, Inc.a | 524,203 | ||||||
| 4,050 | Triumph Group, Inc. | 282,771 | ||||||
| 7,498 | United Rentals, Inc.b | 785,266 | ||||||
| 5,350 | URS Corporation | 245,297 | ||||||
| 2,100 | Valmont Industries, Inc.a | 319,095 | ||||||
| 7,450 | Wabtec Corporation | 615,295 | ||||||
| 9,600 | Waste Connections, Inc. | 466,080 | ||||||
| 2,100 | Watsco, Inc. | 215,796 | ||||||
| 3,550 | Werner Enterprises, Inc. | 94,110 | ||||||
| 4,600 | Woodward, Inc. | 230,828 | ||||||
|
| |||||||
| Total | 21,465,492 | |||||||
|
| |||||||
| Information Technology (15.1%) | |||||||
| 7,750 | 3D Systems Corporationa,b | 463,450 | ||||||
| 2,970 | ACI Worldwide, Inc.b | 165,815 | ||||||
| 5,990 | Acxiom Corporationb | 129,923 | ||||||
| 4,430 | ADTRAN, Inc. | 99,941 | ||||||
| 51,750 | Advanced Micro Devices, Inc.a,b | 216,832 | ||||||
| 3,150 | Advent Software, Inc. | 102,596 | ||||||
| 7,200 | ANSYS, Inc.b | 545,904 | ||||||
| 6,200 | AOL, Inc.b | 246,698 | ||||||
| 9,150 | Arris Group, Inc.b | 297,649 | ||||||
| 7,770 | Arrow Electronics, Inc.b | 469,386 | ||||||
| 32,970 | Atmel Corporationb | 308,929 | ||||||
| 10,720 | Avnet, Inc. | 475,003 | ||||||
| 3,250 | Belden, Inc. | 254,020 | ||||||
| 9,350 | Broadridge Financial Solutions, Inc. | 389,334 | ||||||
| 22,330 | Cadence Design Systems, Inc.b | 390,552 | ||||||
| 8,250 | Ciena Corporationb | 178,695 | ||||||
| 3,450 | CommVault Systems, Inc.b | 169,637 | ||||||
| 17,050 | Compuware Corporation | 170,329 | ||||||
| 3,700 | Concur Technologies, Inc.a,b | 345,358 | ||||||
| 7,850 | Convergys Corporation | 168,304 | ||||||
| 4,900 | Conversant, Inc.a,b | 124,460 | ||||||
| 7,150 | CoreLogic, Inc.b | 217,074 | ||||||
| 9,500 | Cree, Inc.a,b | 474,525 | ||||||
| 11,200 | Cypress Semiconductor Corporation | 122,192 | ||||||
| 4,980 | Diebold, Inc.a | 200,047 | ||||||
| 2,710 | DST Systems, Inc. | 249,781 | ||||||
| 3,850 | Equinix, Inc.b | 808,847 | ||||||
| 3,100 | FactSet Research Systems, Inc. | 372,868 | ||||||
| 2,700 | Fair Isaac Corporation | 172,152 | ||||||
| 9,750 | Fairchild Semiconductor International, Inc.b | 152,100 | ||||||
| 3,250 | FEI Company | 294,873 | ||||||
| 10,650 | Fortinet, Inc.b | 267,635 | ||||||
| 7,050 | Gartner, Inc.b | 497,166 | ||||||
| 5,600 | Global Payments, Inc. | 407,960 | ||||||
| 8,500 | Informatica Corporationb | 303,025 | ||||||
| 12,000 | Ingram Micro, Inc.b | 350,520 | ||||||
| 10,600 | Integrated Device Technology, Inc.b | 163,876 | ||||||
| 3,150 | InterDigital, Inc. | 150,570 | ||||||
| 5,550 | International Rectifier Corporationb | 154,845 | ||||||
| 10,000 | Intersil Corporation | 149,500 | ||||||
| 3,050 | Itron, Inc.b | 123,677 | ||||||
| 6,560 | Jack Henry & Associates, Inc. | 389,861 | ||||||
| 18,400 | JDS Uniphase Corporationb | 229,448 | ||||||
| 6,600 | Knowles Corporationb | 202,884 | ||||||
| 4,975 | Leidos Holdings, Inc. | 190,741 | ||||||
| 4,800 | Lexmark International, Inc. | 231,168 | ||||||
| 7,520 | Mentor Graphics Corporation | 162,206 | ||||||
| 5,650 | MICROS Systems, Inc.b | 383,635 | ||||||
| 7,612 | National Instruments Corporation | 246,553 | ||||||
| 13,000 | NCR Corporationb | 456,170 | ||||||
| 4,700 | NeuStar, Inc.a,b | 122,294 | ||||||
| 3,340 | Plantronics, Inc. | 160,487 | ||||||
| 10,690 | Polycom, Inc.b | 133,946 | ||||||
| 9,200 | PTC, Inc.b | 356,960 | ||||||
| 9,000 | Rackspace Hosting, Inc.b | 302,940 | ||||||
| 22,090 | RF Micro Devices, Inc.b | 211,843 | ||||||
| 12,400 | Riverbed Technology, Inc.b | 255,812 | ||||||
| 7,490 | Rovi Corporationb | 179,460 | ||||||
| 3,214 | Science Applications International Corporation | 141,930 | ||||||
| 5,290 | Semtech Corporationb | 138,333 | ||||||
| 3,100 | Silicon Laboratories, Inc.b | 152,675 | ||||||
| 14,750 | Skyworks Solutions, Inc. | 692,660 | ||||||
| 5,100 | Solarwinds, Inc.b | 197,166 | ||||||
| 5,300 | Solera Holdings, Inc. | 355,895 | ||||||
| 19,250 | SunEdison, Inc.b | 435,050 | ||||||
The accompanying Notes to Financial Statements are an integral part of this schedule.
197
Table of Contents
Mid Cap Index Portfolio
Schedule of Investments as of June 30, 2014
(unaudited)
| Shares | Common Stock (91.7%) | Value | ||||||
| Information Technology (15.1%) - continued | |||||||
| 11,980 | Synopsys, Inc.b | $ | 465,064 | |||||
| 2,930 | Tech Data Corporationb | 183,184 | ||||||
| 15,050 | Teradyne, Inc.a | 294,980 | ||||||
| 11,900 | TIBCO Software, Inc.b | 240,023 | ||||||
| 20,250 | Trimble Navigation, Ltd.b | 748,237 | ||||||
| 8,600 | VeriFone Systems, Inc.b | 316,050 | ||||||
| 10,470 | Vishay Intertechnology, Inc. | 162,180 | ||||||
| 3,000 | WEX, Inc.b | 314,910 | ||||||
| 3,900 | Zebra Technologies Corporationb | 321,048 | ||||||
|
| |||||||
| Total | 20,721,841 | |||||||
|
| |||||||
| Materials (7.0%) | |||||||
| 6,170 | Albemarle Corporation | 441,155 | ||||||
| 5,100 | AptarGroup, Inc. | 341,751 | ||||||
| 5,600 | Ashland, Inc. | 608,944 | ||||||
| 4,640 | Cabot Corporation | 269,074 | ||||||
| 4,100 | Carpenter Technology Corporation | 259,325 | ||||||
| 11,600 | Cliffs Natural Resources, Inc.a | 174,580 | ||||||
| 9,100 | Commercial Metals Company | 157,521 | ||||||
| 2,600 | Compass Minerals International, Inc. | 248,924 | ||||||
| 2,760 | Cytec Industries, Inc. | 290,959 | ||||||
| 5,050 | Domtar Corporation | 216,393 | ||||||
| 3,850 | Eagle Materials, Inc. | 362,978 | ||||||
| 2,400 | Greif, Inc. | 130,944 | ||||||
| 10,900 | Louisiana-Pacific Corporationb | 163,718 | ||||||
| 3,570 | Martin Marietta Materials, Inc.a | 471,418 | ||||||
| 2,660 | Minerals Technologies, Inc. | 174,443 | ||||||
| 900 | NewMarket Corporationa | 352,899 | ||||||
| 6,150 | Olin Corporation | 165,558 | ||||||
| 7,650 | Packaging Corporation of America | 546,898 | ||||||
| 7,300 | PolyOne Corporation | 307,622 | ||||||
| 3,253 | Rayonier Advanced Materials, Inc.b | 126,054 | ||||||
| 6,000 | Reliance Steel & Aluminum Company | 442,260 | ||||||
| 5,600 | Rock-Tenn Company | 591,304 | ||||||
| 5,000 | Royal Gold, Inc. | 380,600 | ||||||
| 10,350 | RPM International, Inc. | 477,963 | ||||||
| 3,400 | Scotts Miracle-Gro Company | 193,324 | ||||||
| 3,880 | Sensient Technologies Corporation | 216,194 | ||||||
| 3,400 | Silgan Holdings, Inc. | 172,788 | ||||||
| 7,880 | Sonoco Products Company | 346,168 | ||||||
| 17,350 | Steel Dynamics, Inc. | 311,432 | ||||||
| 6,010 | Valspar Corporation | 457,902 | ||||||
| 4,050 | Worthington Industries, Inc. | 174,312 | ||||||
|
| |||||||
| Total | 9,575,405 | |||||||
|
| |||||||
| Telecommunications Services (0.5%) | |||||||
| 7,645 | Telephone & Data Systems, Inc. | 199,611 | ||||||
| 10,700 | TW Telecom, Inc.b | 431,317 | ||||||
|
| |||||||
| Total | 630,928 | |||||||
|
| |||||||
| Utilities (4.4%) | |||||||
| 8,600 | Alliant Energy Corporation | 523,396 | ||||||
| 13,682 | Aqua America, Inc. | 358,742 | ||||||
| 7,750 | Atmos Energy Corporation | 413,850 | ||||||
| 3,450 | Black Hills Corporation | 211,796 | ||||||
| 4,700 | Cleco Corporation | 277,065 | ||||||
| 11,863 | Great Plains Energy, Inc. | 318,759 | ||||||
| 7,830 | Hawaiian Electric Industries, Inc.a | 198,256 | ||||||
| 3,880 | IDACORP, Inc. | 224,380 | ||||||
| 14,775 | MDU Resources Group, Inc. | 518,602 | ||||||
| 6,500 | National Fuel Gas Company | 508,950 | ||||||
| 15,380 | OGE Energy Corporation | 601,050 | ||||||
| 4,000 | ONE Gas, Inc. | 151,000 | ||||||
| 6,175 | PNM Resources, Inc. | 181,113 | ||||||
| 13,550 | Questar Corporation | 336,040 | ||||||
| 8,900 | UGI Corporation | 449,450 | ||||||
| 6,390 | Vectren Corporation | 271,575 | ||||||
| 9,970 | Westar Energy, Inc. | 380,754 | ||||||
| 4,010 | WGL Holdings, Inc. | 172,831 | ||||||
|
| |||||||
| Total | 6,097,609 | |||||||
|
| |||||||
Total Common Stock (cost $80,355,407) | 125,716,523 | |||||||
|
| |||||||
Collateral Held for Securities Loaned (5.6%) | ||||||||
| 7,711,914 | Thrivent Cash Management Trust | 7,711,914 | ||||||
|
| |||||||
Total Collateral Held for Securities Loaned (cost $7,711,914) | 7,711,914 | |||||||
|
| |||||||
| Shares or Principal Amount | Short-Term Investments (7.3%)c | |||||||
Federal Home Loan Bank Discount Notes | ||||||||
| 100,000 | 0.095%, 07/09/2014d | 99,998 | ||||||
| 300,000 | 0.050%, 07/30/2014d | 299,988 | ||||||
| 100,000 | 0.090%, 08/01/2014d | 99,992 | ||||||
Federal Home Loan Mortgage Corporation Discount Notes | ||||||||
| 100,000 | 0.100%, 07/08/2014d | 99,998 | ||||||
Thrivent Cash Management Trust | ||||||||
| 9,389,017 | 0.050% | 9,389,017 | ||||||
|
| |||||||
| Total Short-Term Investments (at amortized cost) | 9,988,993 | |||||||
|
| |||||||
Total Investments (cost $98,056,314) 104.6% | $ | 143,417,430 | ||||||
|
| |||||||
| Other Assets and Liabilities, Net (4.6%) | (6,321,153 | ) | ||||||
|
| |||||||
| Total Net Assets 100.0% | $ | 137,096,277 | ||||||
|
| |||||||
| a | All or a portion of the security is on loan. |
| b | Non-income producing security. |
| c | The interest rate shown reflects the yield, coupon rate or the discount rate at the date of purchase. |
| d | At June 30, 2014, $599,976 of investments were held on deposit with the counterparty and pledged as the initial margin deposit for open futures contracts. |
The accompanying Notes to Financial Statements are an integral part of this schedule.
198
Table of Contents
Mid Cap Index Portfolio
Schedule of Investments as of June 30, 2014
(unaudited)
Definitions:
REIT | - | Real Estate Investment Trust is a company that buys, develops, manages and/or sells real estate assets. |
Unrealized Appreciation (Depreciation)
Gross unrealized appreciation and depreciation of investments, based on cost for federal income tax purposes, were as follows:
Gross unrealized appreciation | $ | 45,655,310 | ||
Gross unrealized depreciation | (1,901,950 | ) | ||
|
| |||
Net unrealized appreciation (depreciation) | $ | 43,753,360 | ||
Cost for federal income tax purposes | $ | 99,664,070 | ||
Fair Valuation Measurements
The following table is a summary of the inputs used, as of June 30, 2014, in valuing Mid Cap Index Portfolio’s assets carried at fair value.
Investments in Securities | Total | Level 1 | Level 2 | Level 3 | ||||||||||||
Common Stock | ||||||||||||||||
Consumer Discretionary | 16,427,432 | 16,427,432 | — | — | ||||||||||||
Consumer Staples | 4,394,380 | 4,394,380 | — | — | ||||||||||||
Energy | 6,607,343 | 6,607,343 | — | — | ||||||||||||
Financials | 27,759,264 | 27,759,264 | — | — | ||||||||||||
Health Care | 12,036,829 | 12,036,829 | — | — | ||||||||||||
Industrials | 21,465,492 | 21,465,492 | — | — | ||||||||||||
Information Technology | 20,721,841 | 20,721,841 | — | — | ||||||||||||
Materials | 9,575,405 | 9,575,405 | — | — | ||||||||||||
Telecommunications Services | 630,928 | 630,928 | — | — | ||||||||||||
Utilities | 6,097,609 | 6,097,609 | — | — | ||||||||||||
Collateral Held for Securities Loaned | 7,711,914 | 7,711,914 | — | — | ||||||||||||
Short-Term Investments | 9,988,993 | 9,389,017 | 599,976 | — | ||||||||||||
|
|
|
|
|
|
|
| |||||||||
Total | $ | 143,417,430 | $ | 142,817,454 | $ | 599,976 | $ | — | ||||||||
|
|
|
|
|
|
|
| |||||||||
Other Financial Instruments | Total | Level 1 | Level 2 | Level 3 | ||||||||||||
Asset Derivatives | ||||||||||||||||
Futures Contracts | 204,379 | 204,379 | — | — | ||||||||||||
|
|
|
|
|
|
|
| |||||||||
Total Asset Derivatives | $ | 204,379 | $ | 204,379 | $ | — | $ | — | ||||||||
|
|
|
|
|
|
|
| |||||||||
There were no significant transfers between Levels during the period ended June 30, 2014. Transfers between Levels are identified as of the end of the period.
Futures Contracts | Number of Contracts Long/(Short) | Expiration Date | Notional Principal Amount | Value | Unrealized Gain/(Loss) | |||||||||||||||
S&P 400 Index Mini-Futures | 70 | September 2014 | $ | 9,800,721 | $ | 10,005,100 | $ | 204,379 | ||||||||||||
Total Futures Contracts | $ | 204,379 | ||||||||||||||||||
The accompanying Notes to Financial Statements are an integral part of this schedule.
199
Table of Contents
Mid Cap Index Portfolio
Schedule of Investments as of June 30, 2014
(unaudited)
The following table summarizes the fair value and Statement of Assets and Liabilities location, as of June 30, 2014, for Mid Cap Index Portfolio’s investments in financial derivative instruments by primary risk exposure as discussed under item (2) Significant Accounting Policies of the Notes to Financial Statements.
Derivatives by risk category | Statement of Assets and Liabilities Location | Fair Value | ||||
Asset Derivatives | ||||||
Equity Contracts | ||||||
Futures* | Net Assets - Net unrealized appreciation/(depreciation) on Futures contracts | $ | 204,379 | |||
Total Equity Contracts | 204,379 | |||||
|
| |||||
Total Asset Derivatives | $ | 204,379 | ||||
|
| |||||
| * | Includes cumulative appreciation/depreciation of futures contracts as reported in the Schedule of Investments. Only current day’s variation margin is reported within the Statement of Assets and Liabilities. |
The following table summarizes the net realized gains/(losses) and Statement of Operations location, for the period ended June 30, 2014, for Mid Cap Index Portfolio’s investments in financial derivative instruments by primary risk exposure.
Derivatives by risk category | Statement of Operations Location | Realized Gains/(Losses) recognized in Income | ||||
Equity Contracts | ||||||
Futures | Net realized gains/(losses) on Futures contracts | 499,838 | ||||
Total Equity Contracts | 499,838 | |||||
|
| |||||
Total | $ | 499,838 | ||||
|
| |||||
The following table summarizes the change in net unrealized appreciation/(depreciation) and Statement of Operations location, for the period ended June 30, 2014, for Mid Cap Index Portfolio’s investments in financial derivative instruments by primary risk exposure.
Derivatives by risk category | Statement of Operations Location | Change in unrealized appreciation/(depreciation) recognized in Income | ||||
Equity Contracts | ||||||
Futures | Change in net unrealized appreciation/(depreciation) on Futures contracts | 54,981 | ||||
Total Equity Contracts | 54,981 | |||||
|
| |||||
Total | $ | 54,981 | ||||
|
| |||||
The following table presents Mid Cap Index Portfolio’s average volume of derivative activity during the period ended June 30, 2014.
Derivative Risk Category | Futures (Notional)* | Futures (Percentage of Average Net Assets) | ||||||
Equity Contracts | $ | 7,468,372 | 5.8 | % | ||||
| * | Notional amount represents long or short, or both, derivative positions held by the Portfolio. |
Investment in Affiliates
Affiliated issuers, as defined under the Investment Company Act of 1940, include those in which the Portfolio’s holdings of an issuer represent 5% or more of the outstanding voting securities of an issuer, or any affiliated mutual fund.
A summary of transactions for the fiscal year to date, in Mid Cap Index Portfolio, is as follows:
Portfolio | Value December 31, 2013 | Gross Purchases | Gross Sales | Shares Held at June 30, 2014 | Value June 30, 2014 | Income Earned January 1, 2014 - June 30, 2014 | ||||||||||||||||||
Cash Management Trust-Collateral Investment | $ | 8,155,102 | $ | 15,848,139 | $ | 16,291,327 | 7,711,914 | $ | 7,711,914 | $ | 29,746 | |||||||||||||
Cash Management Trust-Short Term Investment | 4,174,053 | 9,551,290 | 4,336,326 | 9,389,017 | 9,389,017 | 1,728 | ||||||||||||||||||
Total Value and Income Earned | 12,329,155 | 17,100,931 | 31,474 | |||||||||||||||||||||
The accompanying Notes to Financial Statements are an integral part of this schedule.
200
Table of Contents
Partner Worldwide Allocation Portfolio
Schedule of Investments as of June 30, 2014
(unaudited)
| Shares | Common Stock (87.3%) | Value | ||||||
| Australia (3.5%) | |||||||
| 82,016 | Abacus Property Group | $ | 193,347 | |||||
| 189,785 | Adelaide Brighton, Ltd. | 617,999 | ||||||
| 158,701 | Amcom Telecommunications, Ltd. | 296,034 | ||||||
| 1,828,902 | Arrium, Ltd. | 1,375,745 | ||||||
| 453,857 | Australand Holdings, Ltd. | 1,899,664 | ||||||
| 333,707 | AWE, Ltd.a | 566,292 | ||||||
| 138,501 | BC Iron, Ltd. | 419,257 | ||||||
| 2,252,068 | Beach Energy, Ltd. | 3,565,696 | ||||||
| 253,462 | BHP Billiton, Ltd. | 8,644,250 | ||||||
| 19,500 | BT Investment Management, Ltd. | 118,597 | ||||||
| 19,730 | Cabcharge Australia, Ltd. | 75,055 | ||||||
| 220,750 | Challenger Diversified Property Groupb | 570,349 | ||||||
| 312,067 | Challenger, Ltd. | 2,189,050 | ||||||
| 116,932 | Charter Hall Group | 469,959 | ||||||
| 538,899 | CSR, Ltd. | 1,774,006 | ||||||
| 79,357 | David Jones, Ltd. | 294,869 | ||||||
| 288,745 | Drillsearch Energy, Ltd.a | 397,422 | ||||||
| 399,439 | DuluxGroup, Ltd. | 2,133,660 | ||||||
| 830,957 | Envestra, Ltd. | 1,064,551 | ||||||
| 77,631 | Flight Centre Travel Group, Ltd.c | 3,253,045 | ||||||
| 363,903 | G8 Education, Ltd. | 1,578,310 | ||||||
| 10,085 | Greencross, Ltd. | 87,891 | ||||||
| 10,034 | GUD Holdings, Ltd. | 58,856 | ||||||
| 72,654 | Hills, Ltd. | 119,032 | ||||||
| 201,907 | iiNet, Ltd. | 1,391,787 | ||||||
| 860,050 | Incitec Pivot, Ltd. | 2,351,339 | ||||||
| 20,478 | Independence Group NL | 84,272 | ||||||
| 547,783 | Investa Office Fund | 1,756,845 | ||||||
| 98,642 | IOOF Holdings, Ltd. | 781,248 | ||||||
| 84,595 | M2 Telecommunications Group, Ltd. | 461,055 | ||||||
| 90,893 | Macquarie Group, Ltd. | 5,113,082 | ||||||
| 31,646 | McMillan Shakespeare, Ltd. | 273,676 | ||||||
| 1,097,425 | Mount Gibson Iron, Ltd. | 716,433 | ||||||
| 196,243 | Navitas, Ltd. | 1,319,429 | ||||||
| 346,487 | Northern Star Resources, Ltd. | 415,784 | ||||||
| 152,796 | Orica, Ltd. | 2,806,316 | ||||||
| 94,518 | Ramsay Health Care, Ltd. | 4,059,657 | ||||||
| 71,627 | RCR Tomlinson, Ltd. | 189,095 | ||||||
| 11,583 | Sandfire Resources NLa | 68,108 | ||||||
| 439,324 | Spark Infrastructure Group | 767,732 | ||||||
| 183,375 | Transpacific Industries Group, Ltd.a | 175,473 | ||||||
| 14,242 | Village Roadshow, Ltd. | 98,841 | ||||||
| 207,932 | Woolworths, Ltd. | 6,904,710 | ||||||
|
| |||||||
| Total | 61,497,818 | |||||||
|
| |||||||
| Austria (0.6%) | |||||||
| 32,639 | ams AG | 5,417,626 | ||||||
| 31,699 | CA Immobilien Anlagen AGa | 601,186 | ||||||
| 12,798 | CAT Oil AG | 328,023 | ||||||
| 4,449 | Flughafen Wien Aktiengesellschaft | 414,257 | ||||||
| 9,055 | Osterreichische Post AG | 449,774 | ||||||
| 895 | Schoeller-Bleckmann Oilfield Equipment AG | 115,493 | ||||||
| 84,690 | Voestalpine AGc | 4,037,437 | ||||||
|
| |||||||
| Total | 11,363,796 | |||||||
|
| |||||||
| Belgium (0.7%) | |||||||
| 88,461 | Anheuser-Busch InBev NV | 10,164,201 | ||||||
| 2,062 | Befimmo SA | 157,184 | ||||||
| 4,957 | Compagnie Maritime Belge | 130,545 | ||||||
| 859 | Elia System Operator SA | 43,391 | ||||||
| 7,656 | Euronav SAa | 93,569 | ||||||
| 23,656 | Exmar NV | 383,814 | ||||||
| 3,003 | Gimv NV | 150,294 | ||||||
| 1,693 | Kinepolis Group NVa | 321,538 | ||||||
| 10,669 | Melexis NV | 473,035 | ||||||
|
| |||||||
| Total | 11,917,571 | |||||||
|
| |||||||
| Bermuda (0.7%) | |||||||
| 127,188 | Archer, Ltd.a | 227,687 | ||||||
| 91,885 | Catlin Group, Ltd. | 840,851 | ||||||
| 176,675 | Jardine Matheson Holdings, Ltd. | 10,484,801 | ||||||
| 1,904,000 | Pacific Basin Shipping, Ltd. | 1,183,911 | ||||||
|
| |||||||
| Total | 12,737,250 | |||||||
|
| |||||||
| Brazil (1.3%) | |||||||
| 201,652 | Banco Bradesco SA ADR | 2,927,988 | ||||||
| 251,900 | BR Properties SA | 1,517,442 | ||||||
| 109,100 | Companhia Paranaense de Energia | 1,666,497 | ||||||
| 349,800 | Embraer SA | 3,182,159 | ||||||
| 193,200 | Even Construtora e Incorporadora SA | 572,736 | ||||||
| 37,849 | Lojas Renner SA | 1,213,155 | ||||||
| 47,962 | Multiplan Empreendimentos Imobiliarios SA | 1,120,090 | ||||||
| 52,800 | Natura Cosmeticos SA | 896,130 | ||||||
| 142,120 | Oi SA | 134,433 | ||||||
| 311,950 | Petroleo Brasileiro SA ADRc | 4,563,828 | ||||||
| 93,500 | Souza Cruz SA | 969,912 | ||||||
| 89,000 | Ultrapar Participacoes SA ADR | 2,100,400 | ||||||
| 133,490 | Vale SA ADRc | 1,766,073 | ||||||
|
| |||||||
| Total | 22,630,843 | |||||||
|
| |||||||
| Canada (3.5%) | |||||||
| 170,181 | Alimentation Couche-Tard, Inc. | 4,661,815 | ||||||
| 73,581 | Baytex Energy Corporationc | 3,396,152 | ||||||
| 168,954 | Brookfield Asset Management, Inc. | 7,443,445 | ||||||
| 51,740 | Canadian Imperial Bank of Commercec | 4,708,265 | ||||||
| 108,146 | Canadian National Railway Companyc | 7,033,721 | ||||||
| 192,251 | Canadian Natural Resources, Ltd. | 8,833,764 | ||||||
| 15,531 | Entertainment One, Ltd.a | 82,397 | ||||||
| 61,686 | Magna International, Inc. | 6,640,039 | ||||||
| 168,408 | Manulife Financial Corporationc | 3,347,485 | ||||||
| 45,616 | Open Text Corporation | 2,188,781 | ||||||
| 65,874 | Royal Bank of Canadac | 4,709,122 | ||||||
| 68,182 | Saputo, Inc. | 4,084,978 | ||||||
| 65,634 | Vermilion Energy, Incc | 4,567,100 | ||||||
|
| |||||||
| Total | 61,697,064 | |||||||
|
| |||||||
| Cayman Islands (0.2%) | |||||||
| 851,600 | MGM China Holdings, Ltd. | 2,953,456 | ||||||
| 1,060,000 | Xinyi Glass Holdings Company, Ltd. | 622,227 | ||||||
|
| |||||||
| Total | 3,575,683 | |||||||
|
| |||||||
| Chile (0.1%) | |||||||
| 1,520,913 | Aguas Andinas SA | 959,249 | ||||||
| 46,315 | Banco Santander Chile SA ADRc | 1,225,032 | ||||||
The accompanying Notes to Financial Statements are an integral part of this schedule.
201
Table of Contents
Partner Worldwide Allocation Portfolio
Schedule of Investments as of June 30, 2014
(unaudited)
| Shares | Common Stock (87.3%) | Value | ||||||
| Chile (0.1%) - continued | |||||||
| 22,333 | Empresa Nacional de | |||||||
| Telecomunicaciones SA | $ | 275,016 | ||||||
|
| |||||||
| Total | 2,459,297 | |||||||
|
| |||||||
| China (1.2%) | |||||||
| 2,426,000 | Air China, Ltd. | 1,421,189 | ||||||
| 1,325,500 | China Shenhua Energy Company, Ltd.a | 3,829,084 | ||||||
| 1,402,000 | CNOOC, Ltd. | 2,520,328 | ||||||
| 2,772,000 | Dongfeng Motor Group Company, Ltd. | 4,965,025 | ||||||
| 1,757,216 | FIH Mobile, Ltd.a | 1,116,585 | ||||||
| 148,000 | Haitian International Holdings, Ltd. | 345,634 | ||||||
| 4,978,000 | PetroChina Company, Ltd. | 6,262,208 | ||||||
|
| |||||||
| Total | 20,460,053 | |||||||
|
| |||||||
| Colombia (0.2%) | |||||||
| 48,903 | Bancolombia SA ADRc | 2,826,593 | ||||||
|
| |||||||
| Total | 2,826,593 | |||||||
|
| |||||||
| Cyprus (<0.1%) | |||||||
| 26,404 | Globaltrans Investment plc | 302,326 | ||||||
|
| |||||||
| Total | 302,326 | |||||||
|
| |||||||
| Czech Republic (0.3%) | |||||||
| 42,469 | CEZ ASa | 1,281,676 | ||||||
| 15,413 | Komercni Banka AS | 3,544,728 | ||||||
|
| |||||||
| Total | 4,826,404 | |||||||
|
| |||||||
| Denmark (1.6%) | |||||||
| 1,818 | A P Moller - Maersk AS | 4,520,066 | ||||||
| 6,851 | Aktieselskabet Schouw & Company | 336,552 | ||||||
| 429 | ALK-Abello AS | 66,373 | ||||||
| 52,475 | Coloplast AS | 4,748,207 | ||||||
| 368,925 | Danske Bank AS | 10,428,961 | ||||||
| 939 | DFDS AS | 83,650 | ||||||
| 7,845 | Jyske Bank ASa | 445,657 | ||||||
| 47,093 | Novo Nordisk AS | 2,173,482 | ||||||
| 27,814 | Pandora AS | 2,134,551 | ||||||
| 14,108 | Royal Unibrew ASa | 2,218,423 | ||||||
| 19,466 | Sydbank ASa | 513,881 | ||||||
| 8,120 | Zealand Pharma ASa | 104,392 | ||||||
|
| |||||||
| Total | 27,774,195 | |||||||
|
| |||||||
| Faroe Islands (<0.1%) | |||||||
| 32,662 | Bakkafrost PF | 636,138 | ||||||
|
| |||||||
| Total | 636,138 | |||||||
|
| |||||||
| Finland (0.3%) | |||||||
| 9,920 | Citycon OYJ | 36,368 | ||||||
| 15,119 | Cramo Oyj | 367,434 | ||||||
| 24,071 | Ramirent Oyj | 269,073 | ||||||
| 38,276 | Sponda Oyj | 204,408 | ||||||
| 419,528 | Stora Enso Oyj | 4,078,705 | ||||||
|
| |||||||
| Total | 4,955,988 | |||||||
|
| |||||||
| France (6.4%) | |||||||
| 9,693 | ABC Arbitrage | 67,558 | ||||||
| 78,570 | Air France-KLMa | 990,307 | ||||||
| 10,513 | Altamir | 163,388 | ||||||
| 11,793 | Assystem | 361,518 | ||||||
| 635,685 | AXA SA | 15,188,637 | ||||||
| 6,441 | Boiron SA | 560,137 | ||||||
| 4,123 | Bourbon SA | 129,708 | ||||||
| 179,998 | Cap Gemini SA | 12,845,340 | ||||||
| 97,881 | Carrefour SA | 3,609,285 | ||||||
| 6,200 | Cegid Group | 265,387 | ||||||
| 56,950 | Christian Dior SA | 11,338,666 | ||||||
| 3,201 | Club Mediterraneea | 85,515 | ||||||
| 233,242 | Compagnie de Saint-Gobainc | 13,160,035 | ||||||
| 18,985 | Etablissements Maurel et Proma | 325,440 | ||||||
| 3,784 | Euler Hermes Group | 454,681 | ||||||
| 396,125 | GDF Suez | 10,913,862 | ||||||
| 15,521 | Ipsen SA | 701,634 | ||||||
| 6,269 | Korian Medica SAa | 239,498 | ||||||
| 29,664 | Mercialys SA | 691,334 | ||||||
| 11,788 | Montupet SA | 1,004,474 | ||||||
| 22,491 | MPI | 125,606 | ||||||
| 618,472 | Natixis | 3,969,293 | ||||||
| 17,939 | Neopost SA | 1,343,537 | ||||||
| 42,882 | Orpeac | 3,007,329 | ||||||
| 43,678 | Plastic Omnium SA | 1,370,002 | ||||||
| 35,366 | Rallye SA | 1,929,552 | ||||||
| 7,263 | Rubis SCA | 463,273 | ||||||
| 85,369 | Safran SA | 5,588,662 | ||||||
| 14,913 | Saft Groupe SA | 571,838 | ||||||
| 1,494 | Societe de la Tour Eiffel | 118,857 | ||||||
| 49,092 | Technicolor SAa | 397,288 | ||||||
| 68,958 | Thales SA | 4,169,505 | ||||||
| 162,675 | Total SA | 11,769,490 | ||||||
| 4,190 | Vicat SA | 365,961 | ||||||
| 77,689 | Vinci SA | 5,807,935 | ||||||
|
| |||||||
| Total | 114,094,532 | |||||||
|
| |||||||
| Germany (6.2%) | |||||||
| 23,255 | Allianz SE | 3,881,582 | ||||||
| 8,738 | Alstria Office REIT AGa | 115,725 | ||||||
| 15,195 | Aurelius AG | 553,788 | ||||||
| 67,852 | Balda AG | 307,438 | ||||||
| 23,404 | BASF SE | 2,722,439 | ||||||
| 34,661 | Bayer AG | 4,889,740 | ||||||
| 588 | Bertrandt AG | 93,441 | ||||||
| 3,043 | Biotest AG | 394,302 | ||||||
| 92,094 | Borussia Dortmund GmbH & Company KGaA | 595,465 | ||||||
| 11,207 | Centrotec Sustainable AG | 278,727 | ||||||
| 1,713 | Cewe Stiftung & Company KGaA | 122,113 | ||||||
| 6,185 | Comdirect Bank AG | 64,111 | ||||||
| 20,525 | Continental AG | 4,745,602 | ||||||
| 196,794 | Daimler AG | 18,383,434 | ||||||
| 6,864 | Deutsche Beteiligungs AG | 202,923 | ||||||
| 134,000 | Deutsche Boerse AG | 10,389,642 | ||||||
| 24,531 | Deutsche EuroShop AG | 1,212,678 | ||||||
| 194,102 | Deutsche Post AG | 7,006,095 | ||||||
| 62,059 | Deutz AG | 493,732 | ||||||
| 68,880 | Duerr AG | 6,098,359 | ||||||
| 23,910 | Freenet AG | 759,316 | ||||||
| 17,267 | Gerresheimer AG | 1,189,726 | ||||||
| 15,335 | Grammer AG | 858,513 | ||||||
| 35,648 | Hochtief AG | 3,085,273 | ||||||
| 6,498 | Homag Group AG | 213,241 | ||||||
| 402,631 | Infineon Technologies AG | 5,026,102 | ||||||
| 24,725 | Leoni AG | 1,964,674 | ||||||
| 31,009 | LPKF Laser & Electronics AG | 639,456 | ||||||
| 687 | Manz AGa | 72,771 | ||||||
The accompanying Notes to Financial Statements are an integral part of this schedule.
202
Table of Contents
Partner Worldwide Allocation Portfolio
Schedule of Investments as of June 30, 2014
(unaudited)
| Shares | Common Stock (87.3%) | Value | ||||||
| Germany (6.2%) - continued | |||||||
| 10,339 | MorphoSys AGa | $ | 967,257 | |||||
| 1,643 | Nemetschek AG | 158,371 | ||||||
| 101,864 | Nordex SEa | 2,256,236 | ||||||
| 1,422 | Norma Group SE | 78,453 | ||||||
| 51,918 | ProSiebenSat.1 Media AGc | 2,310,820 | ||||||
| 19,172 | QSC AG | 82,343 | ||||||
| 1,713 | R. Stahl AB | 93,860 | ||||||
| 28,951 | Rhoen-Klinikum AG | 955,858 | ||||||
| 47,504 | SAF-Holland SA | 747,822 | ||||||
| 8,672 | SAP AG ADRc | 668,219 | ||||||
| 39,989 | Siemens AG | 5,279,913 | ||||||
| 14,104 | Sixt SE | 573,301 | ||||||
| 1,267 | SMA Solar Technology AGa | 47,539 | ||||||
| 23,886 | Symrise AG | 1,301,579 | ||||||
| 15,132 | Takkt AG | 277,360 | ||||||
| 388,200 | ThyssenKrupp AGa | 11,295,283 | ||||||
| 108,879 | TUI AG | 1,829,967 | ||||||
| 90,271 | United Internet AG | 3,965,802 | ||||||
| 12,962 | Wacker Chemie AG | 1,492,281 | ||||||
| 1,980 | Wacker Neuson SE | 46,305 | ||||||
|
| |||||||
| Total | 110,788,977 | |||||||
|
| |||||||
| Hong Kong (3.2%) | |||||||
| 530,800 | AIA Group, Ltd. | 2,667,065 | ||||||
| 985,500 | China Mobile, Ltd. | 9,571,906 | ||||||
| 44,000 | Chow Sang Sang Holdings International, Ltd. | 110,097 | ||||||
| 115,200 | Dah Sing Financial Holdings, Ltd. | 609,414 | ||||||
| 141,000 | Dickson Concepts, Ltd. | 85,941 | ||||||
| 205,000 | Emperor Entertainment Hotel, Ltd. | 76,719 | ||||||
| 198,000 | Emperor International Holdings, Ltd. | 44,975 | ||||||
| 153,500 | Esprit Holdings, Ltd. | 217,837 | ||||||
| 44,000 | Great Eagle Holdings, Ltd. | 160,997 | ||||||
| 4,796,725 | Guangzhou Automobile Group Company, Ltd. | 5,558,107 | ||||||
| 365,000 | Hang Lung Group, Ltd. | 1,975,908 | ||||||
| 444,000 | Hutchison Telecommunications Hong Kong Holdings, Ltd. | 181,028 | ||||||
| 1,156,375 | Hutchison Whampoa, Ltd. | 15,815,237 | ||||||
| 5,472,872 | New World Development Company, Ltd. | 6,230,296 | ||||||
| 542,000 | NewOcean Energy Holdings, Ltd. | 405,451 | ||||||
| 433,000 | Samson Holding, Ltd. | 52,518 | ||||||
| 130,000 | Shenzhou International Group Holdings, Ltd.c | 443,505 | ||||||
| 1,044,000 | Shun Tak Holdings, Ltd.a | 529,401 | ||||||
| 144,000 | Singamas Container Holdings Ltd. | 29,352 | ||||||
| 1,358,500 | Sinotruk Hong Kong, Ltd. | 677,203 | ||||||
| 250,000 | Sunlight Real Estate Investment Trust | 105,513 | ||||||
| 113,000 | Swire Pacific, Ltd., Class A | 1,390,842 | ||||||
| 340,000 | Swire Pacific, Ltd., Class B | 783,667 | ||||||
| 78,700 | Swire Properties, Ltd. | 229,997 | ||||||
| 1,130,000 | Truly International Holdings, Ltd. | 688,614 | ||||||
| 572,000 | United Laboratories International Holdingsa | 390,754 | ||||||
| 65,300 | VTech Holdings, Ltd. | 867,814 | ||||||
| 467,000 | Weichai Power Company, Ltd. | 1,803,616 | ||||||
| 381,000 | Wharf Holdings, Ltd. | 2,743,512 | ||||||
| 410,000 | Wheelock and Company, Ltd. | 1,711,593 | ||||||
|
| |||||||
| Total | 56,158,879 | |||||||
|
| |||||||
| Hungary (0.2%) | |||||||
| 98,348 | OTP Bank Nyrt | 1,889,570 | ||||||
| 82,000 | Richter Gedeon Nyrt | 1,572,786 | ||||||
|
| |||||||
| Total | 3,462,356 | |||||||
|
| |||||||
| India (0.8%) | |||||||
| 606 | GlaxoSmithKline Pharmaceuticals, Ltd. | 25,205 | ||||||
| 7,344 | Grasim Industries, Ltd. | 419,029 | ||||||
| 8,000 | Grasim Industries, Ltd. GDR | 457,924 | ||||||
| 35,500 | Hero Motocorp, Ltd. | 1,555,773 | ||||||
| 122,000 | Hindustan Unilever, Ltd. | 1,258,688 | ||||||
| 167,741 | Housing Development Finance Corporationa | 2,769,406 | ||||||
| 25,000 | ICICI Bank, Ltd. | 589,704 | ||||||
| 10,400 | ICICI Bank, Ltd. ADRa | 518,960 | ||||||
| 26,000 | Infosys, Ltd. | 1,402,633 | ||||||
| 16,504 | Infosys, Ltd. ADR | 887,420 | ||||||
| 265,115 | ITC, Ltd. | 1,433,251 | ||||||
| 42,501 | Reliance Industries, Ltd. GDRd | 1,427,057 | ||||||
| 20,696 | Ultra Tech Cement, Ltd. | 891,889 | ||||||
| 4,570 | Ultra Tech Cement, Ltd. GDR | 196,944 | ||||||
|
| |||||||
| Total | 13,833,883 | |||||||
|
| |||||||
| Indonesia (0.5%) | |||||||
| 1,367,600 | AKR Corporindo Tbk PT | 499,189 | ||||||
| 1,352,600 | Bank Rakyat Indonesia Persero Tbk PT | 1,178,536 | ||||||
| 865,500 | Indo Tambangraya Megah Tbk PT | 1,971,433 | ||||||
| 3,676,000 | PT Astra International Tbk PT | 2,256,942 | ||||||
| 1,269,000 | United Tractors Tbk PT | 2,476,228 | ||||||
|
| |||||||
| Total | 8,382,328 | |||||||
|
| |||||||
| Ireland (0.3%) | |||||||
| 84,522 | Beazley plc | 365,777 | ||||||
| 3,079 | DCC plc | 188,802 | ||||||
| 43,839 | Grafton Group plc | 434,889 | ||||||
| 276,620 | Henderson Group plc | 1,138,551 | ||||||
| 135,718 | Smurfit Kappa Group plc | 3,106,311 | ||||||
|
| |||||||
| Total | 5,234,330 | |||||||
|
| |||||||
| Israel (0.2%) | |||||||
| 467,242 | Israel Chemicals, Ltd. | 4,003,353 | ||||||
|
| |||||||
| Total | 4,003,353 | |||||||
|
| |||||||
| Italy (3.6%) | |||||||
| 1,265,523 | A2A SPA | 1,457,398 | ||||||
| 15,760 | Acea SpA | 230,908 | ||||||
| 53,587 | Ascopiave SPA | 146,753 | ||||||
| 456,975 | Assicurazioni Generali SPA | 10,007,989 | ||||||
| 40,607 | ASTM SPA | 642,390 | ||||||
| 71,089 | Banca Generali SPA | 1,954,444 | ||||||
| 26,925 | Banca IFIS SPA | 499,953 | ||||||
| 1,374,904 | Banca Popolare di Milano SCRLa | 1,230,909 | ||||||
| 288,673 | Beni Stabili SPA | 264,331 | ||||||
| 13,665 | Brembo SPA | 498,848 | ||||||
| 14,469 | Cairo Communication SPA | 124,422 | ||||||
| 82,254 | Cementir Holding SpA | 615,252 | ||||||
| 2,167 | Cosmo Pharmaceuticals SPA | 369,324 | ||||||
| 56,534 | Credito Emiliano SPA | 505,171 | ||||||
| 7,118 | De’Longhi | 153,865 | ||||||
| 863,925 | Enel SPA | 5,025,141 | ||||||
| 537,822 | Eni SPA | 14,709,259 | ||||||
| 60,733 | ERG SPA | 937,233 | ||||||
The accompanying Notes to Financial Statements are an integral part of this schedule.
203
Table of Contents
Partner Worldwide Allocation Portfolio
Schedule of Investments as of June 30, 2014
(unaudited)
| Shares | Common Stock (87.3%) | Value | ||||||
| Italy (3.6%) - continued | |||||||
| 632,106 | Hera SPA | $ | 1,800,329 | |||||
| 27,253 | Immobiliare Grande Distribuzione SPA | 48,099 | ||||||
| 8,991 | Industria Macchine Automatiche SPA | 424,817 | ||||||
| 5,308,025 | Intesa Sanpaolo SPA | 16,377,004 | ||||||
| 488,969 | IREN SpA | 754,531 | ||||||
| 2,856 | Italmobiliare SPA | 77,718 | ||||||
| 96,172 | Maire Tecnimont SPAa | 305,886 | ||||||
| 288,896 | Recordati SPA | 4,855,129 | ||||||
| 2,455 | Reply SPA | 189,076 | ||||||
| 10,717 | Societa Cattolica di Assicurazioni SCRL | 239,216 | ||||||
| 25,844 | Sogefi SPAa | 140,403 | ||||||
|
| |||||||
| Total | 64,585,798 | |||||||
|
| |||||||
| Japan (13.4%) | |||||||
| 71,000 | 77 Bank, Ltd. | 374,515 | ||||||
| 5,100 | Ai Holdings Corporation | 92,765 | ||||||
| 6,500 | Aisan Industry Company, Ltd. | 57,912 | ||||||
| 57,100 | Alpine Electronics, Inc. | 805,288 | ||||||
| 2,800 | Ariake Japan Company, Ltd. | 73,694 | ||||||
| 109,400 | Asahi Group Holdings, Ltd. | 3,435,479 | ||||||
| 56,000 | Ashikaga Holdings Company, Ltd. | 239,234 | ||||||
| 100,538 | Avex Group Holdings, Inc. | 1,771,449 | ||||||
| 183,100 | Bridgestone Corporationc | 6,412,796 | ||||||
| 3,200 | C.Uyemura & Company, Ltd. | 162,993 | ||||||
| 96,000 | Calsonic Kansei Corporation | 640,623 | ||||||
| 31,500 | Capcom Company, Ltd. | 534,088 | ||||||
| 15,200 | Chiyoda Integre Company, Ltd. | 233,138 | ||||||
| 13,000 | Chugoku Marine Paints, Ltd. | 93,923 | ||||||
| 59,100 | CKD Corporation | 569,958 | ||||||
| 19,800 | Coca-Cola West Company, Ltd. | 341,447 | ||||||
| 19,700 | COMSYS Holdings Corporation | 366,276 | ||||||
| 8,100 | Daifuku Company, Ltd. | 113,604 | ||||||
| 57,000 | Daihen Corporation | 266,406 | ||||||
| 23,689 | Daiichikosho Company, Ltd. | 680,393 | ||||||
| 195,000 | Dainippon Screen Manufacturing Company, Ltd. | 912,350 | ||||||
| 9,000 | Daiwa Industries, Ltd. | 62,007 | ||||||
| 133 | Daiwa Office Investment Corporation | 633,158 | ||||||
| 1,052,151 | Daiwa Securities Group, Inc. | 9,116,128 | ||||||
| 23,100 | Doutor Nichires Holdings Company, Ltd. | 409,286 | ||||||
| 29,800 | Eagle Industry Company, Ltd. | 533,339 | ||||||
| 62,700 | EDION Corporation | 435,263 | ||||||
| 16,138 | EIZO Corporation | 428,887 | ||||||
| 4,900 | Eneres Company, Ltd.a | 81,906 | ||||||
| 16,253 | EN-Japan, Inc. | 346,990 | ||||||
| 8,300 | Exedy Corporation | 247,035 | ||||||
| 3,200 | F.C.C. Company, Ltd. | 59,426 | ||||||
| 38,575 | Fancl Corporation | 463,709 | ||||||
| 36,700 | Foster Electric Company, Ltd. | 502,127 | ||||||
| 202,800 | Fuji Heavy Industries, Ltd. | 5,623,393 | ||||||
| 61,949 | Fuji Machine Manufacturing Company, Ltd. | 541,364 | ||||||
| 78,800 | Fuji Oil Company, Ltd. | 1,125,336 | ||||||
| 11,400 | Fuji Soft, Inc. | 253,499 | ||||||
| 114,039 | Fujitsu General, Ltd. | 1,257,948 | ||||||
| 10,900 | Funai Electric Company, Ltd. | 109,949 | ||||||
| 1,300 | Fuyo General Lease Company, Ltd. | 57,445 | ||||||
| 254 | Global One Real Estate Investment Corporation | 748,544 | ||||||
| 25,400 | G-Tekt Corporation | 332,513 | ||||||
| 16,900 | Gulliver International Company, Ltd. | 137,837 | ||||||
| 21,000 | Gunze, Ltd. | 60,332 | ||||||
| 25,000 | H2O Retailing Corporation | 193,824 | ||||||
| 129 | Hankyu REIT, Inc. | 705,712 | ||||||
| 67,000 | Hitachi Capital Corporation | 1,877,002 | ||||||
| 38,000 | Hitachi Kokusai Electric, Inc. | 526,541 | ||||||
| 55,000 | Hitachi Transport System, Ltd. | 858,138 | ||||||
| 541,000 | Hitachi, Ltd. | 3,965,025 | ||||||
| 9,000 | Hokkoku Bank, Ltd. | 30,929 | ||||||
| 8,200 | Horiba, Ltd. | 294,287 | ||||||
| 11,500 | House Foods Group, Inc. | 215,523 | ||||||
| 3,200 | IBJ Leasing Company, Ltd. | 84,388 | ||||||
| 245 | Ichigo Real Estate Investment Corporation | 163,499 | ||||||
| 6,700 | Ikyu Corporation | 92,396 | ||||||
| 4,200 | Inabata & Company, Ltd. | 39,480 | ||||||
| 19 | Industrial & Infrastructure Fund Investment Corporation | 170,137 | ||||||
| 3,600 | Iriso Electronics Company, Ltd. | 211,100 | ||||||
| 67,900 | IT Holdings Corporation | 1,167,054 | ||||||
| 3,000 | IwaiCosmo Holdings, Inc. | 34,807 | ||||||
| 27,000 | Jaccs Company, Ltd. | 134,787 | ||||||
| 33,157 | JAFCO Company, Ltd. | 1,451,698 | ||||||
| 60,100 | Japan Airlines Company, Ltd. | 3,322,900 | ||||||
| 3,500 | Japan Digital Laboratory Company, Ltd. | 61,877 | ||||||
| 15,900 | Japan Petroleum Exploration Company, Ltd. | 663,312 | ||||||
| 855 | Japan Rental Housing Investments, Inc. | 575,856 | ||||||
| 22,200 | Japan Securities Finance Company, Ltd. | 138,159 | ||||||
| 43,000 | Japan Vilene Company, Ltd. | 242,491 | ||||||
| 176,200 | JTEKT Corporation | 2,973,000 | ||||||
| 173,300 | JVC Kenwood Corporationa | 364,414 | ||||||
| 1,900 | Kadokawa Corporation | 60,284 | ||||||
| 3,700 | Kanematsu Electronics, Ltd. | 52,269 | ||||||
| 98,100 | Kao Corporation | 3,863,545 | ||||||
| 16,800 | Kasumi Company, Ltd. | 122,736 | ||||||
| 2,700 | Kato Sangyo Company, Ltd. | 60,757 | ||||||
| 58,000 | Kato Works Company, Ltd. | 413,106 | ||||||
| 826,000 | Kawasaki Kisen Kaisha, Ltd. | 1,729,915 | ||||||
| 104,600 | KDDI Corporation | 6,382,021 | ||||||
| 27,800 | Keihin Corporation | 442,056 | ||||||
| 63,500 | Kewpie Corporation | 1,033,815 | ||||||
| 17,000 | Kinden Corporation | 165,424 | ||||||
| 40,800 | Kissei Pharmaceutical Company, Ltd. | 977,167 | ||||||
| 1,473,000 | Kobe Steel, Ltd. | 2,215,330 | ||||||
| 19,500 | Komori Corporation | 248,474 | ||||||
| 1,600 | Konishi Company, Ltd. | 34,017 | ||||||
| 2,800 | KOSE Corporation | 107,014 | ||||||
| 16,200 | K’s Holdings Corporation | 470,319 | ||||||
| 49,000 | Kurabo Industries, Ltd. | 89,073 | ||||||
| 40,500 | Kuroda Electric Company, Ltd. | 624,904 | ||||||
| 133,000 | KYB Company, Ltd. | 626,612 | ||||||
| 2,900 | Kyokuto Kaihatsu Kogyo Company, Ltd. | 42,801 | ||||||
| 28,400 | Kyokuto Securities Company, Ltd. | 492,222 | ||||||
| 12,400 | KYORIN Holdings, Inc. | 255,154 | ||||||
| 11,024 | Kyoritsu Maintenance Company, Ltd. | 458,713 | ||||||
The accompanying Notes to Financial Statements are an integral part of this schedule.
204
Table of Contents
Partner Worldwide Allocation Portfolio
Schedule of Investments as of June 30, 2014
(unaudited)
| Shares | Common Stock (87.3%) | Value | ||||||
| Japan (13.4%) - continued | |||||||
| 18,300 | Kyowa Exeo Corporation | $ | 260,842 | |||||
| 21,400 | Lifenet Insurance Companya | 96,552 | ||||||
| 311,125 | LIXIL Group Corporation | 8,420,889 | ||||||
| 7,600 | MACNICA, Inc. | 253,914 | ||||||
| 68,000 | Maeda Road Construction Company, Ltd. | 1,178,223 | ||||||
| 7,000 | Makino Milling Machine Company, Ltd. | 60,317 | ||||||
| 301,000 | Marubeni Corporation | 2,203,012 | ||||||
| 22,577 | Matsumotokiyoshi Holdings Company, Ltd. | 781,452 | ||||||
| 29,000 | Megmilk Snow Brand Company, Ltd. | 376,458 | ||||||
| 11,600 | Melco Holdings, Inc. | 235,443 | ||||||
| 13 | MID Reit, Inc. | 30,099 | ||||||
| 90,000 | Minebea Company, Ltd. | 1,005,758 | ||||||
| 26,000 | MIRAIT Holdings Corporation | 260,776 | ||||||
| 28,600 | MISUMI Group, Inc. | 786,859 | ||||||
| 59,600 | Mito Securities Company, Ltd. | 229,069 | ||||||
| 338,400 | Mitsubishi UFJ Financial Group, Inc. | 2,077,342 | ||||||
| 1,057,000 | Mitsui Engineering & Shipbuilding Company, Ltd. | 2,373,838 | ||||||
| 25,200 | Mitsui High-tec, Inc. | 177,168 | ||||||
| 65,000 | Mitsui Mining and Smelting Company, Ltd. | 185,767 | ||||||
| 959,000 | Mitsui O.S.K. Lines, Ltd. | 3,572,732 | ||||||
| 12,000 | Mitsui Sugar Company, Ltd. | 45,362 | ||||||
| 50,600 | Mitsumi Electric Company, Ltd. | 366,461 | ||||||
| 11,000 | Mizuno Corporation | 65,911 | ||||||
| 136,000 | Morinaga Milk Industry Company, Ltd. | 489,181 | ||||||
| 532,720 | MS and AD Insurance Group Holdings, Inc. | 12,875,228 | ||||||
| 21,500 | Musashi Seimitsu Industry Company, Ltd. | 539,411 | ||||||
| 2,400 | Musashino Bank, Ltd. | 84,150 | ||||||
| 194,800 | Namco Bandai Holdings, Inc. | 4,567,212 | ||||||
| 2,600 | NEC Capital Solutions, Ltd. | 51,242 | ||||||
| 25,000 | NEC Networks & System Integration Corporation | 610,034 | ||||||
| 56,700 | Nichicon Corporation | 462,709 | ||||||
| 5,400 | Nichi-iko Pharmaceutical Company, Ltd. | 80,743 | ||||||
| 21,000 | Nichirei Corporation | 100,877 | ||||||
| 10,200 | Nifco, Inc. | 340,352 | ||||||
| 4,000 | Nifty Corporation | 59,818 | ||||||
| 3,600 | Nihon Kohden Corporation | 180,746 | ||||||
| 1,800 | Nihon M&A Center, Inc. | 51,389 | ||||||
| 14,400 | Nihon Nohyaku Company, Ltd. | 173,878 | ||||||
| 71,000 | NIPPO Corporation | 1,196,344 | ||||||
| 63 | Nippon Accommodations Fund, Inc. | 238,954 | ||||||
| 92,000 | Nippon Chemi-Con Corporationa | 267,322 | ||||||
| 52,000 | Nippon Flour Mills Company, Ltd. | 276,580 | ||||||
| 9,000 | Nippon Kayaku Company, Ltd. | 116,851 | ||||||
| 16,000 | Nippon Koei Company, Ltd. | 79,186 | ||||||
| 47,700 | Nippon Light Metal Holdings Company, Ltd. | 72,655 | ||||||
| 32,000 | Nippon Road Company, Ltd. | 180,121 | ||||||
| 5,000 | Nippon Seiki Company, Ltd. | 96,615 | ||||||
| 4,302,475 | Nippon Sheet Glass Companya | 6,082,004 | ||||||
| 2,000 | Nippon Shinyaku Company, Ltd. | 58,321 | ||||||
| 246,800 | Nippon Suisan Kaisha, Ltd.a | 762,608 | ||||||
| 43,800 | Nippon Telegraph & Telephone Corporation | 2,729,961 | ||||||
| 41,000 | Nippon Thompson Company, Ltd. | 214,711 | ||||||
| 3,985,475 | Nippon Yusen Kabushiki Kaisha | 11,496,416 | ||||||
| 6,200 | Nipro Corporation | 55,539 | ||||||
| 1,043,775 | Nissan Motor Company, Ltd. | 9,883,984 | ||||||
| 22,000 | Nisshin Oillio Group, Ltd. | 80,568 | ||||||
| 7,000 | Nisshinbo Holdings, Inc. | 70,196 | ||||||
| 96,000 | Nissin Electric Company, Ltd. | 631,498 | ||||||
| 2,300 | Nissin Kogyo Company, Ltd. | 45,216 | ||||||
| 4,300 | Nitto Kogyo Corporation | 94,661 | ||||||
| 7,000 | NOF Corporation | 50,050 | ||||||
| 154 | Nomura Real Estate Office Fund, Inc. | 727,470 | ||||||
| 71 | Nomura Real Estate Residential Fund, Inc. | 382,793 | ||||||
| 8,400 | Noritz Corporation | 165,671 | ||||||
| 9,300 | NS Solutions Corporation | 253,976 | ||||||
| 102,359 | NS United Kaiun Kaisha, Ltd. | 258,078 | ||||||
| 151,000 | NTN Corporation | 660,529 | ||||||
| 7,500 | Okabe Company, Ltd. | 92,065 | ||||||
| 2,600 | Okinawa Electric Power Company, Inc. | 92,718 | ||||||
| 65,600 | OMRON Corporation | 2,766,325 | ||||||
| 115 | Orix JREIT, Inc. | 161,306 | ||||||
| 19,000 | Pacific Metals Company, Ltd.a | 92,615 | ||||||
| 16,500 | Paltac Corporation | 232,434 | ||||||
| 30,100 | Pioneer Corporationa | 66,353 | ||||||
| 15,700 | Pocket Card Company, Ltd. | 130,415 | ||||||
| 14,300 | Pola Orbis Holdings, Inc. | 577,512 | ||||||
| 68 | Premier Investment Corporation | 270,596 | ||||||
| 15,600 | Resorttrust, Inc. | 311,512 | ||||||
| 10,506 | Riso Kagaku Corporation | 297,975 | ||||||
| 114,199 | ROHTO Pharmaceutical Company, Ltd. | 1,776,349 | ||||||
| 17,300 | Roland Corporation | 317,273 | ||||||
| 7,800 | Roland DG Corporation | 279,662 | ||||||
| 37,000 | Ryobi, Ltd. | 125,048 | ||||||
| 4,900 | Ryohin Keikaku Company, Ltd. | 556,384 | ||||||
| 4,100 | Saint Marc Holdings Company, Ltd. | 219,815 | ||||||
| 3,900 | Sakata INX Corporation | 36,346 | ||||||
| 14,800 | Sakata Seed Corporation | 204,088 | ||||||
| 4,800 | San-A Company, Ltd. | 145,601 | ||||||
| 7,000 | Sanden Corporation | 38,875 | ||||||
| 4,000 | San-in Godo Bank, Ltd. | 29,736 | ||||||
| 73,000 | Sankyu, Inc. | 369,788 | ||||||
| 79,000 | Sanwa Holdings Corporation | 556,082 | ||||||
| 76,000 | Sanyo Special Steel Company, Ltd. | 353,420 | ||||||
| 154,000 | Sapporo Holdings, Ltd. | 620,612 | ||||||
| 22,600 | Seikagaku Corporation | 278,096 | ||||||
| 95,200 | Seiko Epson Corporation | 4,050,206 | ||||||
| 32,000 | Seino Holdings Company, Ltd. | 363,445 | ||||||
| 860 | Sekisui House SI Investment Corporation | 866,202 | ||||||
| 169,100 | Sekisui House, Ltd. | 2,320,473 | ||||||
| 128,000 | SENKO Company, Ltd. | 670,178 | ||||||
| 11,900 | Shimachu Company, Ltd. | 284,379 | ||||||
| 59,000 | Shindengen Electric Manufacturing Company, Ltd. | 330,695 | ||||||
| 81,500 | Shinko Electric Industries Company, Ltd. | 742,350 | ||||||
| 7,900 | SHOWA Corporation | 96,246 | ||||||
The accompanying Notes to Financial Statements are an integral part of this schedule.
205
Table of Contents
Partner Worldwide Allocation Portfolio
Schedule of Investments as of June 30, 2014
(unaudited)
| Shares | Common Stock (87.3%) | Value | ||||||
| Japan (13.4%) - continued | |||||||
| 107,000 | Showa Denko K.K. | $ | 150,899 | |||||
| 30,000 | Sinfonia Technology Company, Ltd. | 47,637 | ||||||
| 38,300 | Skymark Airlines, Inc.a | 107,849 | ||||||
| 64,000 | SMK Corporation | 282,152 | ||||||
| 4,400 | Sohgo Security Services Company, Ltd. | 105,591 | ||||||
| 96,700 | Square ENIX Holdings Company, Ltd. | 1,710,477 | ||||||
| 133,200 | Stanley Electric Company, Ltd. | 3,475,240 | ||||||
| 82,000 | Sumitomo Bakelite Company, Ltd | 325,546 | ||||||
| 856,650 | Sumitomo Corporation | �� | 11,558,910 | |||||
| 10,200 | Sumitomo Densetsu Company, Ltd. | 116,890 | ||||||
| 71,000 | Sumitomo Mitsui Financial Group, Inc. | 2,978,942 | ||||||
| 2,634,050 | Sumitomo Mitsui Trust Holdings, Inc. | 12,038,913 | ||||||
| 19,000 | Sumitomo Seika Chemicals Company, Ltd. | 133,545 | ||||||
| 1,000 | Sundrug Company, Ltd. | 44,544 | ||||||
| 22,579 | Taikisha, Ltd. | 528,343 | ||||||
| 55,359 | Tecmo Koei Holdings Company, Ltd. | 738,803 | ||||||
| 4,500 | TOCALO Company, Ltd. | 75,520 | ||||||
| 21,000 | Toei Company, Ltd. | 113,787 | ||||||
| 46,000 | Tokai Carbon Company, Ltd. | 131,359 | ||||||
| 117,300 | Tokio Marine Holdings, Inc. | 3,860,783 | ||||||
| 56,000 | Tokuyama Corporation | 178,082 | ||||||
| 27,700 | Tokyo Seimitsu Company, Ltd. | 498,543 | ||||||
| 61 | Top REIT, Inc. | 272,848 | ||||||
| 5,700 | Topre Corporation | 77,501 | ||||||
| 5,000 | Toshiba Tec Corporation | 35,007 | ||||||
| 13,600 | Towa Pharmaceutical Company, Ltd. | 554,196 | ||||||
| 16,000 | Toyo Engineering Corporation | 69,645 | ||||||
| 15,500 | Toyo Tire & Rubber Company, Ltd. | 263,892 | ||||||
| 159,000 | Toyota Motor Corporation | 9,519,747 | ||||||
| 1,400 | Tsukishima Kikai Company, Ltd. | 15,821 | ||||||
| 86,000 | Ube Industries, Ltd. | 149,366 | ||||||
| 12,500 | Unipres Corporation | 300,575 | ||||||
| 14,900 | Ushio, Inc. | 192,010 | ||||||
| 15,100 | Valor Company, Ltd. | 250,465 | ||||||
| 57,500 | Wakita & Company, Ltd. | 738,840 | ||||||
| 1,700 | Welcia Holdings Company, Ltd. | 104,188 | ||||||
| 5,600 | Xebio Company, Ltd. | 109,846 | ||||||
| 54,700 | Yokogawa Bridge Holdings Corporation | 793,546 | ||||||
| 15,300 | Yokohama Reito Company, Ltd. | 125,062 | ||||||
| 1,600 | Zeria Pharmaceutical Company, Ltd. | 38,186 | ||||||
|
| |||||||
| Total | 239,748,179 | |||||||
|
| |||||||
| Jersey (0.9%) | |||||||
| 120,083 | Redefine International plc | 110,256 | ||||||
| 698,025 | WPP plc | 15,211,199 | ||||||
|
| |||||||
| Total | 15,321,455 | |||||||
|
| |||||||
| Luxembourg (0.5%) | |||||||
| 51,997 | APERAMa | 1,755,850 | ||||||
| 47,000 | Tenaris SA ADRc | 2,216,050 | ||||||
| 165,976 | Ternium SA ADR | 4,635,710 | ||||||
|
| |||||||
| Total | 8,607,610 | |||||||
|
| |||||||
| Malaysia (0.5%) | |||||||
| 1,265,897 | CIMB Group Holdings Berhad | 2,886,858 | ||||||
| 807,900 | Genting Berhad | 2,513,590 | ||||||
| 589,278 | Malayan Banking Berhad | 1,804,423 | ||||||
| 199,400 | Public Bank Berhad | 1,215,958 | ||||||
|
| |||||||
| Total | 8,420,829 | |||||||
|
| |||||||
| Mexico (0.7%) | |||||||
| 5,641,300 | America Movil SAB de CV | 5,861,543 | ||||||
| 172,000 | Consorcio ARA SAB de CVa | 79,812 | ||||||
| 26,500 | Fomento Economico Mexicano SAB de CV ADR | 2,481,725 | ||||||
| 9,500 | Grupo Aeroportuario del Sureste SAB de CV ADR | 1,206,690 | ||||||
| 359,094 | Grupo Financiero Banorte SAB de CV ADR | 2,568,061 | ||||||
| 259,000 | Organizacion Soriana SAB de CVa | 854,050 | ||||||
|
| |||||||
| Total | 13,051,881 | |||||||
|
| |||||||
| Netherlands (3.0%) | |||||||
| 24,209 | Aalberts Industries NV | 790,687 | ||||||
| 2,107,650 | Aegon NV | 18,385,986 | ||||||
| 104,939 | Airbus Group NV | 7,035,953 | ||||||
| 124,558 | Arcelor Mittalc | 1,856,931 | ||||||
| 14,950 | ASML Holding NV | 1,394,258 | ||||||
| 49,730 | BE Semiconductor Industries NV | 881,193 | ||||||
| 40,143 | BinckBank NV | 507,907 | ||||||
| 9,351 | Brunel International NV | 272,906 | ||||||
| 8,073 | Eurocommercial Properties NV | 398,556 | ||||||
| 186,075 | Koninklijke DSM NV | 13,541,123 | ||||||
| 13,249 | Nutreco NV | 585,172 | ||||||
| 408,722 | PostNL NVa | 1,930,364 | ||||||
| 171,505 | TomTom NVa | 1,341,721 | ||||||
| 43,598 | Unilever NV | 1,908,419 | ||||||
| 4,739 | Vastned Retail NV | 241,410 | ||||||
| 20,354 | Wereldhave NV | 1,893,648 | ||||||
|
| |||||||
| Total | 52,966,234 | |||||||
|
| |||||||
| New Zealand (0.1%) | |||||||
| 879,064 | Air New Zealand, Ltd. | 1,600,603 | ||||||
| 16,176 | Infratil, Ltd. | 34,637 | ||||||
| 71,233 | Summerset Group Holdings, Ltd. | 215,107 | ||||||
|
| |||||||
| Total | 1,850,347 | |||||||
|
| |||||||
| Norway (0.7%) | |||||||
| 8,614 | Austevoll Seafood ASA | 56,541 | ||||||
| 22,173 | Borregaard ASA | 160,314 | ||||||
| 8,739 | Cermaq ASA | 120,389 | ||||||
| 9,990 | Det Norske Oljeselskap ASAa | 109,121 | ||||||
| 120,688 | DnB ASA | 2,205,126 | ||||||
| 243,071 | DNO International ASAa | 933,131 | ||||||
| 14,382 | Kvaerner ASA | 29,414 | ||||||
| 10,562 | Leroy Seafood Group ASA | 385,833 | ||||||
| 32,342 | Nordic Semiconductor ASAa | 160,171 | ||||||
| 9,724 | SalMar ASA | 169,689 | ||||||
| 31,712 | SpareBank 1 SMN | 280,295 | ||||||
| 153,656 | Statoil ASA | 4,723,210 | ||||||
| 3,146 | TGS Nopec Geophysical Company ASA | 100,446 | ||||||
| 64,158 | Yara International ASA | 3,214,254 | ||||||
|
| |||||||
| Total | 12,647,934 | |||||||
|
| |||||||
The accompanying Notes to Financial Statements are an integral part of this schedule.
206
Table of Contents
Partner Worldwide Allocation Portfolio
Schedule of Investments as of June 30, 2014
(unaudited)
| Shares | Common Stock (87.3%) | Value | ||||||
| Peru (0.1%) | |||||||
| 156,398 | Cia de Minas Buenaventura SA ADR | $ | 1,847,060 | |||||
|
| |||||||
| Total | 1,847,060 | |||||||
|
| |||||||
| Philippines (0.2%) | |||||||
| 2,281,000 | Ayala Land, Inc. | 1,594,729 | ||||||
| 601,270 | Bank of the Philippine Islands | 1,253,621 | ||||||
|
| |||||||
| Total | 2,848,350 | |||||||
|
| |||||||
| Poland (0.5%) | |||||||
| 57,225 | Bank Handlowy w Warszawie SA | 2,255,604 | ||||||
| 77,134 | Bank Pekao SA | 4,418,060 | ||||||
| 52,328 | Grupa Lotos SAa | 637,738 | ||||||
| 447,329 | Orange Polska SA | 1,428,790 | ||||||
|
| |||||||
| Total | 8,740,192 | |||||||
|
| |||||||
| Portugal (0.5%) | |||||||
| 8,828,756 | Banco Espirito Santo SAa,c | 7,263,855 | ||||||
| 54,000 | Jeronimo Martins SGPS SA | 887,843 | ||||||
| 79,392 | Mota-Engil, Africa SGPS SA | 621,342 | ||||||
| 76,064 | Portucel SA | 356,124 | ||||||
| 51,603 | Redes Energeticas Nacionais SGPS SA | 190,075 | ||||||
|
| |||||||
| Total | 9,319,239 | |||||||
|
| |||||||
| Russia (0.6%) | |||||||
| 38,500 | Lukoil ADR | 2,293,390 | ||||||
| 5,851 | Magnit OJSC | 1,525,393 | ||||||
| 325,026 | Novolipetsk Steel OJSC GDR | 4,562,677 | ||||||
| 90,291 | Phosagro OAO | 1,124,249 | ||||||
| 95,124 | Sberbank of Russia GDR | 961,164 | ||||||
|
| |||||||
| Total | 10,466,873 | |||||||
|
| |||||||
| Singapore (0.9%) | |||||||
| 16,473 | Cape Plc | 83,307 | ||||||
| 344,000 | DBS Group Holdings, Ltd. | 4,626,696 | ||||||
| 1,118,000 | Ezra Holdings, Ltd. | 995,001 | ||||||
| 58,000 | Frasers Commercial Trusta | 63,083 | ||||||
| 64,000 | Ho Bee Land, Ltd. | 115,517 | ||||||
| 234,000 | Indofood Agri Resources, Ltd. | 184,959 | ||||||
| 1,006,565 | Keppel Corporation, Ltd. | 8,713,301 | ||||||
| 159,000 | Mapletree Industrial Trusta | 182,471 | ||||||
| 730,000 | Mapletree Logistics Trusta | 682,455 | ||||||
| 9,292 | REC Solar ASAa | 141,337 | ||||||
| 44,000 | Venture Corporation, Ltd. | 273,234 | ||||||
| 167,000 | Wing Tai Holdings, Ltd. | 263,987 | ||||||
|
| |||||||
| Total | 16,325,348 | |||||||
|
| |||||||
| South Africa (0.4%) | |||||||
| 89,605 | AngloGold Ashanti, Ltd. ADRa | 1,542,103 | ||||||
| 65,189 | Barclays Africa Group, Ltd. | 989,943 | ||||||
| 2,065 | Bidvest Group, Ltd. | 54,880 | ||||||
| 104,227 | Impala Platinum Holdings, Ltd. | 1,050,528 | ||||||
| 71,584 | Massmart Holdings, Ltd. | 888,928 | ||||||
| 39,850 | MTN Group, Ltd. | 839,393 | ||||||
| 146,190 | Reunert, Ltd. | 892,787 | ||||||
| 197,000 | Truworths International, Ltd. | 1,389,761 | ||||||
|
| |||||||
| Total | 7,648,323 | |||||||
|
| |||||||
| South Korea (3.3%) | |||||||
| 5,401 | E-Mart Company, Ltd. | 1,238,664 | ||||||
| 16,429 | Hyundai Department Store Company, Ltd. | 2,256,853 | ||||||
| 23,332 | Hyundai Heavy Industries Company, Ltd. | 4,082,261 | ||||||
| 16,438 | Hyundai Mobis | 4,616,498 | ||||||
| 69,542 | Hyundai Motor Company | 15,766,617 | ||||||
| 30,030 | Kangwon Land, Inc. | 881,781 | ||||||
| 38,675 | KB Financial Group, Inc. | 1,344,029 | ||||||
| 13,203 | LG Chem, Ltd. | 3,861,187 | ||||||
| 32,500 | POSCO | 9,711,827 | ||||||
| 43,087 | POSCO ADR | 3,207,396 | ||||||
| 2,600 | Samsung Electronics Company, Ltd. | 3,395,469 | ||||||
| 23,800 | Samsung Heavy Industries Company, Ltd. | 636,696 | ||||||
| 21,934 | Samsung Life Insurance Company, Ltd. | 2,211,062 | ||||||
| 71,278 | Shinhan Financial Group Company, Ltd. | 3,288,502 | ||||||
| 8,662 | Shinsegae Company, Ltd. | 1,869,437 | ||||||
|
| |||||||
| Total | 58,368,279 | |||||||
|
| |||||||
| Spain (2.6%) | |||||||
| 51,586 | Abengoa SA | 332,824 | ||||||
| 16,891 | Abengoa SA B shares | 89,056 | ||||||
| 85,452 | Amadeus IT Holding SA | 3,522,613 | ||||||
| 556,345 | Banco Popular Espanol SA | 3,716,592 | ||||||
| 1,033,405 | Banco Santander SA | 10,798,321 | ||||||
| 84,352 | Bankinter SA | 660,130 | ||||||
| 77,246 | Ence Energia y Celulosa SAa | 201,744 | ||||||
| 178,304 | Gamesa Corporacion Tecnologia SAa | 2,223,899 | ||||||
| 138,147 | Gas Natural SDG SAc | 4,364,511 | ||||||
| 67,447 | Grifols SA | 3,685,303 | ||||||
| 1,417,771 | Iberdrola SA | 10,845,298 | ||||||
| 543,645 | Inmobiliaria Colonial SAa | 432,745 | ||||||
| 370,778 | International Consolidated Airlines Group SAa | 2,352,785 | ||||||
| 8,997 | Let’s GOWEX SA | 245,283 | ||||||
| 1,502,926 | Liberbank SAa | 1,437,884 | ||||||
| 17,967 | NH Hoteles SA | 106,902 | ||||||
| 21,421 | Papeles y Cartones de Europa SA | 118,737 | ||||||
| 161,996 | Sacyr SAa | 1,026,221 | ||||||
|
| |||||||
| Total | 46,160,848 | |||||||
|
| |||||||
| Sweden (2.0%) | |||||||
| 8,260 | B&B Tools Aktiebolag | 189,008 | ||||||
| 26,062 | Bilia AB | 788,998 | ||||||
| 7,738 | BioGaia AB | 223,516 | ||||||
| 31,107 | Castellum AB | 551,375 | ||||||
| 61,818 | Fabege AB | 874,650 | ||||||
| 36,110 | Fastighets AB Baldera | 488,603 | ||||||
| 29,962 | Haldex AB | 369,557 | ||||||
| 1,113 | Hexpol AB | 101,046 | ||||||
| 13,642 | Industrial and Financial Systems | 453,267 | ||||||
| 15,741 | Intrum Justitia AB | 469,507 | ||||||
| 116,942 | Investor AB | 4,381,955 | ||||||
| 53,975 | JM AB | 2,000,474 | ||||||
| 34,609 | Klovern AB | 176,099 | ||||||
| 10,196 | Kungsleden AB | 76,662 | ||||||
| 97,139 | Loomis AB | 2,984,135 | ||||||
| 125,141 | Meda AB | 2,172,507 | ||||||
| 100,692 | NCC AB | 3,465,731 | ||||||
The accompanying Notes to Financial Statements are an integral part of this schedule.
207
Table of Contents
Partner Worldwide Allocation Portfolio
Schedule of Investments as of June 30, 2014
(unaudited)
| Shares | Common Stock (87.3%) | Value | ||||||
| Sweden (2.0%) - continued | |||||||
| 7,211 | Net Entertainment NE ABa | $ | 168,638 | |||||
| 63,565 | Nobia AB | 530,378 | ||||||
| 25,822 | Nolato AB | 587,062 | ||||||
| 9,180 | Orexo ABa | 159,187 | ||||||
| 146,230 | SAS ABa | 274,591 | ||||||
| 263,664 | Skandinaviska Enskilda Banken AB | 3,519,322 | ||||||
| 10,777 | Swedish Orphan Biovitrum ABa | 143,979 | ||||||
| 752,825 | Volvo AB | 10,363,855 | ||||||
| 16,175 | Wallenstam AB | 269,290 | ||||||
| 16,976 | Wihlborgs Fastigheter AB | 324,940 | ||||||
|
| |||||||
| Total | 36,108,332 | |||||||
|
| |||||||
| Switzerland (7.5%) | |||||||
| 52,079 | Actelion, Ltd. | 6,591,625 | ||||||
| 200,415 | Adecco SA | 16,492,940 | ||||||
| 36,326 | Aryzta AGa | 3,440,223 | ||||||
| 18,382 | Ascom Holding AG | 311,763 | ||||||
| 3,813 | Autoneum Holding AGa | 764,405 | ||||||
| 104 | Banque Cantonale Vaudoise | 56,703 | ||||||
| 1,224 | Basilea Pharmaceutica AG | 143,073 | ||||||
| 3,147 | Bossard Holding AGa | 374,772 | ||||||
| 372,004 | Credit Suisse Group AG | 10,579,599 | ||||||
| 451 | Daetwyler Holding AG | 68,469 | ||||||
| 113 | Emmi AGa | 40,882 | ||||||
| 1,001 | Flughafen Zuerich AG | 614,963 | ||||||
| 163 | Forbo Holding AG | 173,789 | ||||||
| 1,199 | Galenica AG | 1,170,129 | ||||||
| 1,882 | Georg Fischer AGa | 1,347,016 | ||||||
| 6,374 | Givaudan SAa | 10,618,616 | ||||||
| 379 | Helvetia Holding AG | 174,006 | ||||||
| 119,418 | Holcim, Ltd.a | 10,489,368 | ||||||
| 11,985 | Implenia AG | 806,748 | ||||||
| 2,149 | Inficon Holding AGa | 700,339 | ||||||
| 3,247 | Komax Holding AGa | 542,265 | ||||||
| 15,819 | Kudelski SA | 277,258 | ||||||
| 1,337 | Kuoni Reisen Holding AG | 517,427 | ||||||
| 822 | Lindt & Spruengli AG | 4,184,154 | ||||||
| 102,150 | Logitech International SA | 1,327,570 | ||||||
| 183,421 | Nestle SA | 14,212,735 | ||||||
| 145,497 | Novartis AG | 13,175,974 | ||||||
| 56,840 | OC Oerlikon Corporation AGa | 822,748 | ||||||
| 14,454 | PSP Swiss Property AGa | 1,359,300 | ||||||
| 93,989 | Roche Holding AG | 28,004,671 | ||||||
| 1,235 | Siegfried Holding AGa | 225,609 | ||||||
| 763 | Sika AG | 3,117,317 | ||||||
| 1,889 | Straumann Holding AG | 437,063 | ||||||
| 928 | Tecan Group AG | 106,097 | ||||||
| 9,457 | U-Blox AGa | 1,253,236 | ||||||
| 6,445 | Zehnder Group AG | 276,173 | ||||||
|
| |||||||
| Total | 134,799,025 | |||||||
|
| |||||||
| Taiwan (0.8%) | |||||||
| 1,108,000 | Advanced Semiconductor Engineering, Inc. | 1,435,750 | ||||||
| 126,000 | Chicony Electronics Company, Ltd. | 340,426 | ||||||
| 631,000 | Chipbond Technology Corporation | 1,111,539 | ||||||
| 1,988,000 | Compal Electronics, Inc. | 1,627,249 | ||||||
| 165,000 | Mega Financial Holding Company, Ltd. | 137,304 | ||||||
| 323,000 | Novatek Microelectronics Corporation | 1,588,591 | ||||||
| 87,000 | Powertech Technology, Inc. | 157,455 | ||||||
| 86,000 | Richtek Technology Corporation | 525,150 | ||||||
| 13,000 | Taiwan Life Insurance Company, Ltd.a | 9,252 | ||||||
| 290,300 | Taiwan Mobile Company, Ltd. | 898,346 | ||||||
| 916,951 | Taiwan Semiconductor Manufacturing Company, Ltd. | 3,880,121 | ||||||
| 97,859 | Taiwan Semiconductor Manufacturing Company, Ltd. ADR | 2,093,204 | ||||||
| 57,000 | TPK Holding Company, Ltd. | 569,060 | ||||||
|
| |||||||
| Total | 14,373,447 | |||||||
|
| |||||||
| Thailand (2.0%) | |||||||
| 947,225 | Bangkok Bank pcl | 5,646,919 | ||||||
| 347,900 | Kasikornbank pcl | 2,186,633 | ||||||
| 18,467,475 | Krung Thai Bank pcl | 11,891,590 | ||||||
| 188,200 | PTT Exploration & Production pcl | 971,393 | ||||||
| 803,625 | PTT pcl | 7,879,719 | ||||||
| 133,600 | Siam Cement pcl | 1,877,490 | ||||||
| 361,500 | Siam Commercial Bank pcl | 1,876,973 | ||||||
| 2,115,600 | Thai Oil pcl | 3,391,048 | ||||||
|
| |||||||
| Total | 35,721,765 | |||||||
|
| |||||||
| Turkey (0.4%) | |||||||
| 522,982 | Akbank TAS | 1,923,458 | ||||||
| 55,340 | BIM Birlesik Magazalar AS | 1,269,638 | ||||||
| 75,525 | Ford Otomotiv Sanayi ASa | 941,327 | ||||||
| 539,894 | Turkiye Garanti Bankasi AS | 2,114,326 | ||||||
| 133,027 | Turkiye Halk Bankasi AS | 998,705 | ||||||
|
| |||||||
| Total | 7,247,454 | |||||||
|
| |||||||
| United Kingdom (9.6%) | |||||||
| 17,322 | Abcam plc | 112,650 | ||||||
| 395,744 | Afren plca | 980,379 | ||||||
| 99,708 | Amerisur Resources plca | 109,209 | ||||||
| 60,310 | Amlin plc | 482,724 | ||||||
| 78,894 | Ashmore Group plc | 498,126 | ||||||
| 71,044 | Associated British Foods plc | 3,705,105 | ||||||
| 50,629 | AstraZeneca plc | 3,766,660 | ||||||
| 1,798,075 | BAE Systems plc | 13,317,793 | ||||||
| 21,827 | Bank of Georgia Holdings plc | 877,742 | ||||||
| 173,520 | Bellway plc | 4,648,256 | ||||||
| 44,825 | Berendsen plc | 750,727 | ||||||
| 30,000 | BHP Billiton plc | 977,024 | ||||||
| 45,751 | Big Yellow Group plc | 388,294 | ||||||
| 41,570 | Bodycote plc | 489,105 | ||||||
| 70,670 | Booker Group plc | 156,856 | ||||||
| 423,142 | BP plc | 3,726,137 | ||||||
| 75,982 | British American Tobacco plc | 4,521,078 | ||||||
| 218,657 | Britvic plc | 2,722,149 | ||||||
| 538,511 | BT Group plc | 3,538,573 | ||||||
| 213,368 | Cairn Energy plca | 730,061 | ||||||
| 484,848 | Centamin plca | 526,900 | ||||||
| 44,463 | Chesnara plc | 243,880 | ||||||
| 15,789 | Clinigen Group plc | 102,072 | ||||||
| 2,356 | Close Brothers Group plc | 51,474 | ||||||
| 22,362 | Computacenter plc | 229,238 | ||||||
| 20,484 | Concentric AB | 288,576 | ||||||
| 70,471 | CSR plc | 713,642 | ||||||
| 2,300 | Daily Mail and General Trust plc | 32,731 | ||||||
| 10,687 | Dairy Crest Group plc | 85,976 | ||||||
| 32,512 | Dart Group plc | 114,620 | ||||||
| 41,155 | Diageo plc | 1,310,743 | ||||||
The accompanying Notes to Financial Statements are an integral part of this schedule.
208
Table of Contents
Partner Worldwide Allocation Portfolio
Schedule of Investments as of June 30, 2014
(unaudited)
| Shares | Common Stock (87.3%) | Value | ||||||
| United Kingdom (9.6%) - continued | |||||||
| 40,688 | Dialog Semiconductor plca | $ | 1,407,885 | |||||
| 60,458 | Diploma plc | 663,225 | ||||||
| 330,070 | DS Smith plc | 1,563,066 | ||||||
| 179,920 | easyJet plc | 4,201,596 | ||||||
| 136,134 | Elementis plc | 606,500 | ||||||
| 285,670 | EnQuest plca | 690,317 | ||||||
| 59,488 | Faroe Petroleum plca | 125,871 | ||||||
| 78,074 | Fenner plc | 478,342 | ||||||
| 57,526 | Galliford Try plc | 1,123,253 | ||||||
| 163,166 | GlaxoSmithKline plc | 4,344,304 | ||||||
| 370,925 | Globo plca | 353,900 | ||||||
| 14,248 | Go-Ahead Group plc | 577,348 | ||||||
| 179,956 | Halfords Group plc | 1,455,726 | ||||||
| 389,805 | Hansteen Holdings plc | 685,788 | ||||||
| 70,282 | Hikma Pharmaceuticals plc | 2,017,209 | ||||||
| 26,917 | Hiscox, Ltd. | 325,683 | ||||||
| 352,403 | Home Retail Group plc | 1,064,804 | ||||||
| 22,732 | HomeServe plc | 125,269 | ||||||
| 588,795 | Howden Joinery Group plc | 3,120,059 | ||||||
| 175,950 | HSBC Holdings plc ADRc | 8,938,259 | ||||||
| 17,558 | Hunting plc | 257,728 | ||||||
| 211,193 | IG Group Holdings plc | 2,121,683 | ||||||
| 8,774 | Inchcape plc | 95,180 | ||||||
| 191,484 | Intermediate Capital Group plc | 1,278,101 | ||||||
| 8,350 | International Personal Finance plc | 83,862 | ||||||
| 79,945 | Interserve plc | 820,501 | ||||||
| 1,515,365 | ITV plc | 4,617,978 | ||||||
| 9,005 | J D Wetherspoon plc | 121,902 | ||||||
| 134,133 | John Wood Group plc | 1,849,447 | ||||||
| 37,951 | Keller Group plc | 597,682 | ||||||
| 95,388 | Lancashire Holdings, Ltd. | 1,067,630 | ||||||
| 129,308 | London Stock Exchange Group plc | 4,439,460 | ||||||
| 46,227 | Lookers plc | 105,615 | ||||||
| 651,171 | Man Group plc | 1,171,921 | ||||||
| 68,752 | Micro Focus International plc | 1,020,084 | ||||||
| 11,525 | Mitchells & Butlers plca | 76,825 | ||||||
| 85,012 | Mondi plc | 1,543,377 | ||||||
| 143,188 | Moneysupermarket.com Group plc | 461,789 | ||||||
| 5,175 | Morgan Sindall Group plc | 75,634 | ||||||
| 7,723 | N Brown Group plc | 55,847 | ||||||
| 51,604 | Next plc | 5,712,692 | ||||||
| 41,748 | Northgate plc | 374,854 | ||||||
| 69,797 | Pace plc | 423,920 | ||||||
| 159,987 | Pennon Group plc | 2,150,416 | ||||||
| 187,697 | Persimmon plc | 4,087,960 | ||||||
| 214,679 | Premier Oil plc | 1,225,636 | ||||||
| 235,012 | Prudential plc | 5,384,438 | ||||||
| 146,478 | QinetiQ Group plc | 518,160 | ||||||
| 22,912 | Quindell plc | 90,186 | ||||||
| 11,831 | Restaurant Group plc | 121,574 | ||||||
| 29,287 | Rightmove plc | 1,073,548 | ||||||
| 2,446 | Rotork plc | 111,617 | ||||||
| 7,532 | RPC Group plc | 80,886 | ||||||
| 14,357 | RPS Group plc | 68,306 | ||||||
| 32,588 | SABMiller plc | 1,889,628 | ||||||
| 31,899 | Salamander Energy plca | 76,428 | ||||||
| 25,822 | Senior plc | 125,067 | ||||||
| 124,780 | Shire plc | 9,788,078 | ||||||
| 212,009 | Smith & Nephew plc | 3,752,112 | ||||||
| 74,370 | Soco International plca | 524,280 | ||||||
| 256,773 | Speedy Hire plc | 232,876 | ||||||
| 11,755 | St. Modwen Properties plc | 72,141 | ||||||
| 15,026 | Stagecoach Group plc | 96,651 | ||||||
| 90,183 | Standard Chartered plc | 1,843,339 | ||||||
| 54,910 | Stobart Group, Ltd. | 128,038 | ||||||
| 1,328,329 | Taylor Wimpey plc | 2,588,964 | ||||||
| 1,761,625 | Tesco plc | 8,561,781 | ||||||
| 581,472 | Thomas Cook Group plca | 1,327,143 | ||||||
| 72,940 | Trinity Mirror plca | 189,740 | ||||||
| 92,298 | TT Electronics plc | 326,973 | ||||||
| 563,256 | TUI Travel plc | 3,834,322 | ||||||
| 85,376 | Unilever plcc | 3,870,030 | ||||||
| 108,407 | Vedanta Resources plc | 2,055,969 | ||||||
| 4,082 | Vesuvius plc | 32,006 | ||||||
| 28,828 | Victrex plc | 839,273 | ||||||
| 85,955 | WH Smith plc | 1,572,867 | ||||||
| 15,476 | Workspace Group plc | 150,967 | ||||||
| 11,353 | WS Atkins plc | 256,083 | ||||||
| 15,795 | Xchanging plc | 39,926 | ||||||
|
| |||||||
| Total | 171,528,025 | |||||||
|
| |||||||
| United States (0.5%) | |||||||
| 18,570 | CTC Media, Inc. | 204,456 | ||||||
| 163,254 | iShares MSCI Emerging Markets Index Fund | 7,057,470 | ||||||
| 13,000 | Yum! Brands, Inc. | 1,055,600 | ||||||
|
| |||||||
| Total | 8,317,526 | |||||||
|
| |||||||
| Total Common Stock (cost $1,374,797,205) | 1,552,640,010 | |||||||
|
| |||||||
| Principal Amount | Long-Term Fixed Income (9.1%) | |||||||
| Argentina (0.5%) | |||||||
| Arcos Dorados BV | ||||||||
| 361,000 | 6.625%, 09/27/2023d | 379,050 | ||||||
| Argentina Government International Bond | ||||||||
| 710,000 | 7.000%, 04/17/2017 | 663,140 | ||||||
| 577,964 | 7.820%, 12/31/2033e | 637,082 | ||||||
| 264,212 | 7.820%, 12/31/2033e | 291,237 | ||||||
| 1,629,168 | 8.280%, 12/31/2033 | 1,366,872 | ||||||
| 320,000 | 0.000%, 12/15/2035 | 25,600 | ||||||
| 12,572,000 | 0.000%, 12/15/2035e,f | 1,368,580 | ||||||
| 10,970,000 | 0.000%, 12/15/2035f | 873,212 | ||||||
| 100,000 | 2.260%, 12/31/2038e,g | 60,934 | ||||||
| 1,870,000 | 2.500%, 12/31/2038g | 896,665 | ||||||
|
| |||||||
| Total | 6,562,372 | |||||||
|
| |||||||
| Azerbaijan (<0.1%) | |||||||
| Azerbaijan Government International Bond | ||||||||
| 550,000 | 4.750%, 03/18/2024d | 566,500 | ||||||
| State Oil Company of Azerbaijan Republic | ||||||||
| 400,000 | 5.450%, 02/09/2017 | 423,960 | ||||||
| 460,000 | 4.750%, 03/13/2023 | 457,700 | ||||||
|
| |||||||
| Total | 1,448,160 | |||||||
|
| |||||||
| Belarus (<0.1%) | |||||||
| Belarus Government International Bond | ||||||||
| 289,000 | 8.750%, 08/03/2015 | 297,323 | ||||||
|
| |||||||
| Total | 297,323 | |||||||
|
| |||||||
The accompanying Notes to Financial Statements are an integral part of this schedule.
209
Table of Contents
Partner Worldwide Allocation Portfolio
Schedule of Investments as of June 30, 2014
(unaudited)
| Principal Amount | Long-Term Fixed Income (9.1%) | Value | ||||||
| Belize (<0.1%) | |||||||
| Belize Government International Bond | ||||||||
| $116,500 | 5.000%, 02/20/2038g,h | $ | 81,550 | |||||
|
| |||||||
| Total | 81,550 | |||||||
|
| |||||||
| Brazil (0.5%) | |||||||
| Banco do Estado do Rio Grande do Sul SA | ||||||||
| 200,000 | 7.375%, 02/02/2022 | 214,000 | ||||||
| 680,000 | 7.375%, 02/02/2022d | 727,600 | ||||||
| Brazil Government International Bond | ||||||||
| 1,318,000 | 6.000%, 08/15/2050i | 1,457,965 | ||||||
| 580,000 | 4.875%, 01/22/2021 | 632,200 | ||||||
| 1,310,000 | 4.250%, 01/07/2025 | 1,327,685 | ||||||
| Brazil Letros do Tesouro Nacional | ||||||||
| 190,000 | Zero Coupon, 01/01/2015i | 81,454 | ||||||
| Brazil Loan Trust 1 | ||||||||
| 1,150,000 | 5.477%, 07/24/2023h | 1,191,400 | ||||||
| 1,050,000 | 5.477%, 07/24/2023 | 1,087,800 | ||||||
| Brazil Minas SPE via State of Minas Gerais | ||||||||
| 2,270,000 | 5.333%, 02/15/2028h | 2,290,430 | ||||||
| Independencia International, Ltd. | ||||||||
| 95,246 | 12.000%, 12/30/2016b,h,j | 0 | ||||||
|
| |||||||
| Total | 9,010,534 | |||||||
|
| |||||||
| Canada (<0.1%) | |||||||
| PTTEP Canada International Finance, Ltd. | ||||||||
| 540,000 | 6.350%, 06/12/2042 | 606,162 | ||||||
|
| |||||||
| Total | 606,162 | |||||||
|
| |||||||
| Cayman Islands (<0.1%) | |||||||
| Sun Hung Kai Properties Capital Market, Ltd. | ||||||||
| 380,000 | 4.500%, 02/14/2022 | 400,674 | ||||||
|
| |||||||
| Total | 400,674 | |||||||
|
| |||||||
| Chile (0.2%) | |||||||
| AES Gener SA | ||||||||
| 250,000 | 8.375%, 12/18/2073d | 280,625 | ||||||
| 520,000 | 5.250%, 08/15/2021 | 554,334 | ||||||
| 120,000 | 5.250%, 08/15/2021d | 127,923 | ||||||
| Banco del Estado de Chile | ||||||||
| 500,000 | 4.125%, 10/07/2020 | 529,471 | ||||||
| 260,000 | 4.125%, 10/07/2020d | 275,325 | ||||||
| CFR International SPA | ||||||||
| 340,000 | 5.125%, 12/06/2022 | 367,405 | ||||||
| Chile Government International Bond | ||||||||
| 750,000 | 3.625%, 10/30/2042 | 658,124 | ||||||
| E-CL SA | ||||||||
| 320,000 | 5.625%, 01/15/2021d | 349,111 | ||||||
| Empresa Nacional de Electricidad SA | ||||||||
| 110,000 | 4.250%, 04/15/2024 | 110,612 | ||||||
| Empresa Nacional de Telecomunicaciones SA | ||||||||
| 200,000 | 4.875%, 10/30/2024 | 208,268 | ||||||
| 670,000 | 4.875%, 10/30/2024d | 697,698 | ||||||
| Sociedad Quimica y Minera de Chile SA | ||||||||
| 120,000 | 5.500%, 04/21/2020 | 130,179 | ||||||
| 210,000 | 3.625%, 04/03/2023 | 195,377 | ||||||
|
| |||||||
| Total | 4,484,452 | |||||||
|
| |||||||
| China (0.1%) | |||||||
| CITIC Pacific, Ltd. | ||||||||
| 200,000 | 6.875%, 01/21/2018 | 223,760 | ||||||
| 400,000 | 6.625%, 04/15/2021 | 451,000 | ||||||
| 430,000 | 6.800%, 01/17/2023 | 489,684 | ||||||
| Sinopec Group Overseas Development 2013, Ltd. | ||||||||
| 1,060,000 | 4.375%, 10/17/2023d | 1,106,768 | ||||||
| Sparkle Assets, Ltd. | ||||||||
| 220,000 | 6.875%, 01/30/2020 | 220,314 | ||||||
|
| |||||||
| Total | 2,491,526 | |||||||
|
| |||||||
| Colombia (0.5%) | |||||||
| Banco de Bogota SA | ||||||||
| 650,000 | 5.000%, 01/15/2017 | 693,875 | ||||||
| Bancolombia SA | ||||||||
| 240,000 | 6.125%, 07/26/2020 | 259,800 | ||||||
| 200,000 | 5.950%, 06/03/2021 | 220,500 | ||||||
| Colombia Government International Bond | ||||||||
| 30,000 | 8.250%, 12/22/2014 | 31,020 | ||||||
| 400,000 | 7.375%, 01/27/2017 | 459,400 | ||||||
| 797,000 | 7.375%, 03/18/2019 | 970,347 | ||||||
| 540,000 | 4.375%, 07/12/2021 | 579,420 | ||||||
| 590,000 | 4.000%, 02/26/2024 | 608,290 | ||||||
| 60,000 | 8.125%, 05/21/2024 | 81,000 | ||||||
| 360,000 | 6.125%, 01/18/2041 | 431,100 | ||||||
| 440,000 | 5.625%, 02/26/2044 | 492,800 | ||||||
| Ecopetrol SA | ||||||||
| 130,000 | 7.375%, 09/18/2043 | 160,550 | ||||||
| Empresa de Energia de Bogota SA | ||||||||
| 210,000 | 6.125%, 11/10/2021 | 229,425 | ||||||
| Empresas Publicas de Medellin ESP | ||||||||
| 277,000 | 7.625%, 07/29/2019 | 331,708 | ||||||
| Pacific Rubiales Energy Corporation | ||||||||
| 100,000 | 5.375%, 01/26/2019d | 104,250 | ||||||
| 280,000 | 5.125%, 03/28/2023d | 277,900 | ||||||
| Transportadora de Gas Internacional SA ESP | ||||||||
| 230,000 | 5.700%, 03/20/2022 | 247,250 | ||||||
| 200,000 | 5.700%, 03/20/2022d | 215,000 | ||||||
|
| |||||||
| Total | 6,393,635 | |||||||
|
| |||||||
| Costa Rica (0.3%) | |||||||
| Banco de Costa Rica | ||||||||
| 200,000 | 5.250%, 08/12/2018 | 205,000 | ||||||
| 410,000 | 5.250%, 08/12/2018d | 420,250 | ||||||
| Banco Nacional de Costa Rica | ||||||||
| 410,000 | 4.875%, 11/01/2018d | 420,250 | ||||||
| 890,000 | 6.250%, 11/01/2023d | 912,250 | ||||||
| Costa Rica Government International Bond | ||||||||
| 30,000 | 9.995%, 08/01/2020 | 38,595 | ||||||
| 480,000 | 4.250%, 01/26/2023d | 460,800 | ||||||
| 550,000 | 4.375%, 04/30/2025 | 513,700 | ||||||
The accompanying Notes to Financial Statements are an integral part of this schedule.
210
Table of Contents
Partner Worldwide Allocation Portfolio
Schedule of Investments as of June 30, 2014
(unaudited)
| Principal Amount | Long-Term Fixed Income (9.1%) | Value | ||||||
| Costa Rica (0.3%) - continued | |||||||
| $380,000 | 5.625%, 04/30/2043d | $ | 339,720 | |||||
| 540,000 | 5.625%, 04/30/2043 | 482,760 | ||||||
| 1,430,000 | 7.000%, 04/04/2044 | 1,487,200 | ||||||
|
| |||||||
| Total | 5,280,525 | |||||||
|
| |||||||
| Croatia (0.4%) | |||||||
| Croatia Government International Bond | ||||||||
| 3,509,000 | 6.250%, 04/27/2017 | 3,800,668 | ||||||
| 780,000 | 6.750%, 11/05/2019 | 874,575 | ||||||
| 1,200,000 | 6.375%, 03/24/2021 | 1,318,500 | ||||||
|
| |||||||
| Total | 5,993,743 | |||||||
|
| |||||||
| Dominican Republic (0.4%) | |||||||
| Aeropuertos Dominicanos Siglo XXI SA | ||||||||
| 200,000 | 9.250%, 11/13/2019 | 191,000 | ||||||
| Dominican Republic Government International Bond | ||||||||
| 100,000 | 7.500%, 05/06/2021d | 114,150 | ||||||
| 2,068,000 | 7.500%, 05/06/2021 | 2,360,622 | ||||||
| 2,600,000 | 14.500%, 02/10/2023k | 65,064 | ||||||
| 680,000 | 6.600%, 01/28/2024d | 742,220 | ||||||
| 490,000 | 5.875%, 04/18/2024d | 511,315 | ||||||
| 800,000 | 18.500%, 02/04/2028k | 23,528 | ||||||
| 16,900,000 | 18.500%, 02/04/2028d,k | 497,029 | ||||||
| 1,860,000 | 7.450%, 04/30/2044d | 1,984,620 | ||||||
|
| |||||||
| Total | 6,489,548 | |||||||
|
| |||||||
| Ecuador (0.1%) | |||||||
| Ecuador Government International Bond | ||||||||
| 870,000 | 7.950%, 06/20/2024d | 892,391 | ||||||
|
| |||||||
| Total | 892,391 | |||||||
|
| |||||||
| Egypt (0.1%) | |||||||
| Egypt Government International Bond | ||||||||
| 800,000 | 5.750%, 04/29/2020 | 832,960 | ||||||
| 100,000 | 6.875%, 04/30/2040 | 98,000 | ||||||
|
| |||||||
| Total | 930,960 | |||||||
|
| |||||||
| El Salvador (<0.1%) | |||||||
| El Salvador Government International Bond | ||||||||
| 100,000 | 7.375%, 12/01/2019 | 110,625 | ||||||
| 150,000 | 8.250%, 04/10/2032 | 170,625 | ||||||
| 410,000 | 7.650%, 06/15/2035 | 443,415 | ||||||
| 140,000 | 7.650%, 06/15/2035d | 151,410 | ||||||
| 150,000 | 7.625%, 02/01/2041 | 159,900 | ||||||
|
| |||||||
| Total | 1,035,975 | |||||||
|
| |||||||
| Gabon (<0.1%) | |||||||
| Gabonese Republic Government International Bond | ||||||||
| 140,000 | 8.200%, 12/12/2017 | 159,930 | ||||||
| 620,000 | 6.375%, 12/12/2024 | 677,251 | ||||||
| 575,200 | 6.375%, 12/12/2024d | 628,314 | ||||||
|
| |||||||
| Total | 1,465,495 | |||||||
|
| |||||||
| Ghana (<0.1%) | |||||||
| Ghana Government International Bond | ||||||||
| 620,000 | 8.500%, 10/04/2017 | 651,000 | ||||||
|
| |||||||
| Total | 651,000 | |||||||
|
| |||||||
| Greece (<0.1%) | |||||||
| Hellenic Republic Government International Bond | ||||||||
| 260,000 | 1.015%, 08/10/2014e,f | 353,665 | ||||||
|
| |||||||
| Total | 353,665 | |||||||
|
| |||||||
| Guatemala (0.1%) | |||||||
| Agromercantil Senior Trust | ||||||||
| 320,000 | 6.250%, 04/10/2019d | 334,400 | ||||||
| Guatemala Government International Bond | ||||||||
| 230,000 | 5.750%, 06/06/2022 | 247,480 | ||||||
| 350,000 | 5.750%, 06/06/2022d | 376,600 | ||||||
| 380,000 | 4.875%, 02/13/2028d | 372,780 | ||||||
| 260,000 | 4.875%, 02/13/2028 | 255,060 | ||||||
|
| |||||||
| Total | 1,586,320 | |||||||
|
| |||||||
| Honduras (0.2%) | |||||||
| Honduras Government International Bond | ||||||||
| 220,000 | 8.750%, 12/16/2020 | 243,650 | ||||||
| 1,680,000 | 8.750%, 12/16/2020d | 1,860,600 | ||||||
| 1,160,000 | 7.500%, 03/15/2024d | 1,200,600 | ||||||
| 210,000 | 7.500%, 03/15/2024 | 217,350 | ||||||
|
| |||||||
| Total | 3,522,200 | |||||||
|
| |||||||
| Hong Kong (<0.1%) | |||||||
| China Unicom Hong Kong, Ltd. | ||||||||
| 2,770,000 | 4.000%, 04/16/2017l | 446,454 | ||||||
| Metropolitan Light International, Ltd. | ||||||||
| 400,000 | 5.250%, 01/17/2018 | 407,500 | ||||||
|
| |||||||
| Total | 853,954 | |||||||
|
| |||||||
| Hungary (<0.1%) | |||||||
| Hungary Government International Bond | ||||||||
| 640,000 | 4.000%, 03/25/2019 | 659,261 | ||||||
| 360,000 | 7.625%, 03/29/2041 | 461,024 | ||||||
| MFB Magyar Fejlesztesi Bank Zrt | ||||||||
| 210,000 | 6.250%, 10/21/2020d | 233,024 | ||||||
|
| |||||||
| Total | 1,353,309 | |||||||
|
| |||||||
| India (<0.1%) | |||||||
| Vedanta Resources plc | ||||||||
| 400,000 | 8.250%, 06/07/2021 | 448,000 | ||||||
| 320,000 | 7.125%, 05/31/2023d | 337,600 | ||||||
|
| |||||||
| Total | 785,600 | |||||||
|
| |||||||
| Indonesia (0.4%) | |||||||
| Indonesia Government International Bond | ||||||||
| 320,000 | 3.375%, 04/15/2023d | 296,800 | ||||||
| 200,000 | 5.875%, 01/15/2024d | 220,750 | ||||||
| 835,000 | 8.500%, 10/12/2035 | 1,106,375 | ||||||
| 1,420,000 | 7.750%, 01/17/2038 | 1,767,900 | ||||||
| 350,000 | 5.250%, 01/17/2042 | 332,500 | ||||||
The accompanying Notes to Financial Statements are an integral part of this schedule.
211
Table of Contents
Partner Worldwide Allocation Portfolio
Schedule of Investments as of June 30, 2014
(unaudited)
| Principal Amount | Long-Term Fixed Income (9.1%) | Value | ||||||
| Indonesia (0.4%) - continued | |||||||
| Perusahaan Penerbit SBSN | ||||||||
| $200,000 | 4.000%, 11/21/2018d | $ | 206,500 | |||||
| PT Pertamina Persero | ||||||||
| 590,000 | 5.625%, 05/20/2043d | 529,525 | ||||||
| PT Perusahaan Gas Negara Persero Tbk | ||||||||
| 1,400,000 | 5.125%, 05/16/2024d | 1,387,750 | ||||||
|
| |||||||
| Total | 5,848,100 | |||||||
|
| |||||||
| Iraq (0.1%) | |||||||
| Iraq Government International Bond | ||||||||
| 1,200,000 | 5.800%, 01/15/2028 | 1,080,000 | ||||||
|
| |||||||
| Total | 1,080,000 | |||||||
|
| |||||||
| Ireland (0.1%) | |||||||
| MTS International Funding, Ltd. | ||||||||
| 690,000 | 8.625%, 06/22/2020 | 816,201 | ||||||
| Sibur Securities, Ltd. | ||||||||
| 520,000 | 3.914%, 01/31/2018d | 500,500 | ||||||
|
| |||||||
| Total | 1,316,701 | |||||||
|
| |||||||
| Israel (<0.1%) | |||||||
| Delek and Avner Yam Tethys, Ltd. | ||||||||
| 110,000 | 2.803%, 12/30/2016d | 110,401 | ||||||
| 110,000 | 3.839%, 12/30/2018d | 110,392 | ||||||
| Israel Electric Corporation, Ltd. | ||||||||
| 230,000 | 5.625%, 06/21/2018d | 244,978 | ||||||
|
| |||||||
| Total | 465,771 | |||||||
|
| |||||||
| Italy (<0.1%) | |||||||
| Wind Acquisition Finance SA | ||||||||
| 280,000 | 4.000%, 07/15/2020d,e,m | 382,446 | ||||||
|
| |||||||
| Total | 382,446 | |||||||
|
| |||||||
| Kazakhstan (0.1%) | |||||||
| Kazatomprom Natsionalnaya Atomnaya Kompaniya AO | ||||||||
| 220,000 | 6.250%, 05/20/2015 | 227,291 | ||||||
| KazMunayGas National Company JSC | ||||||||
| 590,000 | 11.750%, 01/23/2015 | 622,822 | ||||||
| 100,000 | 9.125%, 07/02/2018 | 120,485 | ||||||
| 830,000 | 6.375%, 04/09/2021d | 924,205 | ||||||
| 257,000 | 5.750%, 04/30/2043 | 246,720 | ||||||
|
| |||||||
| Total | 2,141,523 | |||||||
|
| |||||||
| Lithuania (0.1%) | |||||||
| Lithuania Government International Bond | ||||||||
| 820,000 | 7.375%, 02/11/2020 | 1,004,500 | ||||||
| 1,200,000 | 6.125%, 03/09/2021 | 1,402,080 | ||||||
|
| |||||||
| Total | 2,406,580 | |||||||
|
| |||||||
| Luxembourg (0.2%) | |||||||
| Gazprom Neft OAO Via GPN Capital SA | ||||||||
| 1,590,000 | 6.000%, 11/27/2023d | 1,631,738 | ||||||
| Millicom International Cellular SA | ||||||||
| 280,000 | 4.750%, 05/22/2020d | 280,000 | ||||||
| Telefonica Celular del Paraguay SA | ||||||||
| 400,000 | 6.750%, 12/13/2022 | 430,000 | ||||||
| Wind Acquisition Finance SA | ||||||||
| 140,000 | 11.750%, 07/15/2017d | 144,575 | ||||||
| 210,000 | 4.750%, 07/15/2020d,m | 211,575 | ||||||
| 1,140,000 | 7.375%, 04/23/2021d | 1,216,950 | ||||||
|
| |||||||
| Total | 3,914,838 | |||||||
|
| |||||||
| Malaysia (<0.1%) | |||||||
| Wakala Global Sukuk Berhad | ||||||||
| 420,000 | 4.646%, 07/06/2021 | 461,840 | ||||||
|
| |||||||
| Total | 461,840 | |||||||
|
| |||||||
| Mexico (0.7%) | |||||||
| America Movil SAB de CV | ||||||||
| 2,600,000 | 6.000%, 06/09/2019n | 204,717 | ||||||
| Grupo Bimbo SAB de CV | ||||||||
| 320,000 | 4.875%, 06/27/2044d | 312,688 | ||||||
| Grupo Cementos de Chihuahua SAB de CV | ||||||||
| 200,000 | 8.125%, 02/08/2020d | 220,000 | ||||||
| Metalsa SA de CV | ||||||||
| 350,000 | 4.900%, 04/24/2023d | 339,500 | ||||||
| Mexican Udibonos | ||||||||
| 6,588,857 | 5.000%, 06/16/2016n | 557,353 | ||||||
| Mexico Cetes | ||||||||
| 89,021,500 | Zero Coupon, 09/18/2014n | 681,815 | ||||||
| 271,305,500 | Zero Coupon, 10/16/2014n | 2,073,098 | ||||||
| Mexico Government International Bond | ||||||||
| 20,000 | 6.625%, 03/03/2015 | 20,750 | ||||||
| 346,000 | 4.000%, 10/02/2023 | 363,646 | ||||||
| 818,000 | 6.050%, 01/11/2040 | 991,416 | ||||||
| 1,060,000 | 4.750%, 03/08/2044 | 1,081,200 | ||||||
| 265,000 | 5.550%, 01/21/2045 | 301,438 | ||||||
| 180,000 | 5.750%, 10/12/2110 | 190,980 | ||||||
| Offshore Drilling Holding SA | ||||||||
| 450,000 | 8.375%, 09/20/2020d | 498,375 | ||||||
| Pemex Project Funding Master Trust | ||||||||
| 300,000 | 6.625%, 06/15/2035 | 353,250 | ||||||
| Petroleos Mexicanos | ||||||||
| 20,000 | 5.500%, 01/21/2021 | 22,450 | ||||||
| 10,000 | 4.875%, 01/24/2022 | 10,818 | ||||||
| 70,000 | 6.500%, 06/02/2041 | 81,375 | ||||||
| 420,000 | 6.375%, 01/23/2045 | 487,725 | ||||||
| 1,520,000 | 6.375%, 01/23/2045d | 1,765,100 | ||||||
| Trust F/1401 | ||||||||
| 210,000 | 6.950%, 01/30/2044h | 233,100 | ||||||
|
| |||||||
| Total | 10,790,794 | |||||||
|
| |||||||
| Mozambique (0.1%) | |||||||
| Mozambique EMATUM Finance 2020 BV | ||||||||
| 1,560,000 | 6.305%, 09/11/2020 | 1,575,600 | ||||||
|
| |||||||
| Total | 1,575,600 | |||||||
|
| |||||||
| Netherlands (0.2%) | |||||||
| Ajecorp BV | ||||||||
| 160,000 | 6.500%, 05/14/2022 | 147,200 | ||||||
| Kazakhstan Temir Zholy Finance BV | ||||||||
| 390,000 | 6.950%, 07/10/2042d | 427,050 | ||||||
The accompanying Notes to Financial Statements are an integral part of this schedule.
212
Table of Contents
Partner Worldwide Allocation Portfolio
Schedule of Investments as of June 30, 2014
(unaudited)
| Principal Amount | Long-Term Fixed Income (9.1%) | Value | ||||||
| Netherlands (0.2%) - continued | |||||||
| Listrindo Capital BV | ||||||||
| $340,000 | 6.950%, 02/21/2019 | $ | 366,350 | |||||
| Petrobras Global Finance BV | ||||||||
| 430,000 | 4.875%, 03/17/2020 | 441,653 | ||||||
| VimpelCom Holdings BV | ||||||||
| 580,000 | 7.504%, 03/01/2022d | 625,675 | ||||||
|
| |||||||
| Total | 2,007,928 | |||||||
|
| |||||||
| Pakistan (0.1%) | |||||||
| Pakistan Government International Bond | ||||||||
| 370,000 | 6.875%, 06/01/2017 | 382,025 | ||||||
| 750,000 | 7.250%, 04/15/2019d | 766,875 | ||||||
| 550,000 | 8.250%, 04/15/2024d | 567,188 | ||||||
| 100,000 | 7.875%, 03/31/2036 | 91,000 | ||||||
|
| |||||||
| Total | 1,807,088 | |||||||
|
| |||||||
| Panama (0.2%) | |||||||
| Panama Government International Bond | ||||||||
| 200,000 | 4.300%, 04/29/2053 | 174,400 | ||||||
| 286,000 | 8.875%, 09/30/2027 | 408,980 | ||||||
| 1,289,000 | 9.375%, 04/01/2029 | 1,918,032 | ||||||
| 950,000 | 6.700%, 01/26/2036 | 1,171,825 | ||||||
| Panama Notas del Tesoro | ||||||||
| 110,000 | 4.875%, 02/05/2021 | 115,536 | ||||||
|
| |||||||
| Total | 3,788,773 | |||||||
|
| |||||||
| Paraguay (0.2%) | |||||||
| Banco Continental SAECA | ||||||||
| 301,000 | 8.875%, 10/15/2017 | 327,338 | ||||||
| 170,000 | 8.875%, 10/15/2017h | 184,875 | ||||||
| Banco Regional SAECA | ||||||||
| 196,000 | 8.125%, 01/24/2019 | 215,600 | ||||||
| 590,000 | 8.125%, 01/24/2019d | 649,000 | ||||||
| Paraguay Government International Bond | ||||||||
| 780,000 | 4.625%, 01/25/2023d | 792,480 | ||||||
| 1,050,000 | 4.625%, 01/25/2023 | 1,066,800 | ||||||
|
| |||||||
| Total | 3,236,093 | |||||||
|
| |||||||
| Peru (0.2%) | |||||||
| Abengoa Transmision Sur SA | ||||||||
| 590,000 | 6.875%, 04/30/2043h | 651,950 | ||||||
| Corporacion Financiera de Desarrollo SA | ||||||||
| 200,000 | 4.750%, 02/08/2022 | 208,500 | ||||||
| 200,000 | 4.750%, 02/08/2022d | 208,500 | ||||||
| Corporacion Lindley SA | ||||||||
| 440,000 | 6.750%, 11/23/2021 | 486,200 | ||||||
| 70,000 | 6.750%, 11/23/2021d | 77,350 | ||||||
| 100,000 | 4.625%, 04/12/2023d | 98,000 | ||||||
| Peru Government International Bond | ||||||||
| 90,000 | 5.625%, 11/18/2050 | 100,755 | ||||||
| 110,000 | 7.350%, 07/21/2025 | 145,750 | ||||||
| 784,000 | 8.750%, 11/21/2033 | 1,193,248 | ||||||
| 670,000 | 6.550%, 03/14/2037 | 841,855 | ||||||
|
| |||||||
| Total | 4,012,108 | |||||||
|
| |||||||
| Philippines (0.2%) | |||||||
| Alliance Global Group, Inc. | ||||||||
| $160,000 | 6.500%, 08/18/2017 | 174,400 | ||||||
| Energy Development Corporation | ||||||||
| 730,000 | 6.500%, 01/20/2021 | 784,750 | ||||||
| Philippines Government International Bond | ||||||||
| 1,292,000 | 4.200%, 01/21/2024 | 1,364,675 | ||||||
| 300,000 | 10.625%, 03/16/2025 | 470,625 | ||||||
| 350,000 | 7.750%, 01/14/2031 | 483,438 | ||||||
| San Miguel Corporation | ||||||||
| 400,000 | 4.875%, 04/26/2023 | 372,000 | ||||||
|
| |||||||
| Total | 3,649,888 | |||||||
|
| |||||||
| Romania (0.3%) | |||||||
| Romania Government International Bond | ||||||||
| 515,000 | 6.500%, 06/18/2018e | 829,731 | ||||||
| 530,000 | 4.875%, 11/07/2019e | 822,578 | ||||||
| 915,000 | 4.625%, 09/18/2020e | 1,407,643 | ||||||
| 650,000 | 6.750%, 02/07/2022 | 775,938 | ||||||
| 240,000 | 4.875%, 01/22/2024d | 255,300 | ||||||
| 490,000 | 3.625%, 04/24/2024e | 702,828 | ||||||
| 310,000 | 6.125%, 01/22/2044d | 352,269 | ||||||
|
| |||||||
| Total | 5,146,287 | |||||||
|
| |||||||
| Russia (0.3%) | |||||||
| AHML Finance, Ltd. | ||||||||
| 10,700,000 | 7.750%, 02/13/2018d,o | 292,690 | ||||||
| EDC Finance, Ltd. | ||||||||
| 300,000 | 4.875%, 04/17/2020d | 293,250 | ||||||
| Gazprom Neft OAO Via GPN Capital SA | ||||||||
| 1,134,000 | 4.375%, 09/19/2022 | 1,051,785 | ||||||
| 200,000 | 6.000%, 11/27/2023 | 205,250 | ||||||
| Lukoil International Finance BV | ||||||||
| 310,000 | 6.125%, 11/09/2020 | 335,188 | ||||||
| Phosagro Bond Funding, Ltd. | ||||||||
| 230,000 | 4.204%, 02/13/2018 | 227,988 | ||||||
| Phosagro OAO via Phosagro Bond Funding, Ltd. | ||||||||
| 310,000 | 4.204%, 02/13/2018d | 307,287 | ||||||
| Russian Government International Bond | ||||||||
| 800,000 | 5.000%, 04/29/2020 | 852,800 | ||||||
| 1,013,800 | 7.500%, 03/31/2030 | 1,174,122 | ||||||
| Uralkali OJSC | ||||||||
| 290,000 | 3.723%, 04/30/2018d | 281,300 | ||||||
|
| |||||||
| Total | 5,021,660 | |||||||
|
| |||||||
| Serbia (0.1%) | |||||||
| Serbia Government International Bond | ||||||||
| 300,000 | 5.250%, 11/21/2017 | 312,750 | ||||||
| 1,080,000 | 5.875%, 12/03/2018d | 1,148,850 | ||||||
|
| |||||||
| Total | 1,461,600 | |||||||
|
| |||||||
| Singapore (<0.1%) | |||||||
| Olam International, Ltd. | ||||||||
| 410,000 | 6.750%, 01/29/2018 | 428,983 | ||||||
| 130,000 | 7.500%, 08/12/2020 | 145,275 | ||||||
|
| |||||||
| Total | 574,258 | |||||||
|
| |||||||
The accompanying Notes to Financial Statements are an integral part of this schedule.
213
Table of Contents
Partner Worldwide Allocation Portfolio
Schedule of Investments as of June 30, 2014
(unaudited)
| Principal Amount | Long-Term Fixed Income (9.1%) | Value | ||||||
| South Africa (0.1%) | |||||||
| South Africa Government International Bond | ||||||||
| $1,140,000 | 5.875%, 05/30/2022 | $ | 1,268,250 | |||||
| 300,000 | 5.875%, 09/16/2025 | 333,450 | ||||||
|
| |||||||
| Total | 1,601,700 | |||||||
|
| |||||||
| Sri Lanka (0.1%) | |||||||
| Sri Lanka Government International Bond | ||||||||
| 560,000 | 6.000%, 01/14/2019d | 589,400 | ||||||
| 200,000 | 5.125%, 04/11/2019 | 203,250 | ||||||
| 540,000 | 6.250%, 10/04/2020 | 571,050 | ||||||
| 250,000 | 6.250%, 07/27/2021 | 263,750 | ||||||
| 220,000 | 5.875%, 07/25/2022 | 226,325 | ||||||
|
| |||||||
| Total | 1,853,775 | |||||||
|
| |||||||
| Supranational (0.1%) | |||||||
| Corporacion Andina de Fomento | ||||||||
| 639,000 | 3.750%, 01/15/2016 | 664,638 | ||||||
| 600,000 | 5.750%, 01/12/2017 | 664,624 | ||||||
| 643,000 | 4.375%, 06/15/2022 | 681,948 | ||||||
|
| |||||||
| Total | 2,011,210 | |||||||
|
| |||||||
| Thailand (0.1%) | |||||||
| PTT Exploration & Production pcl | ||||||||
| 1,580,000 | 4.875%, 12/29/2049d,p | 1,591,060 | ||||||
|
| |||||||
| Total | 1,591,060 | |||||||
|
| |||||||
| Turkey (0.5%) | |||||||
| Export Credit Bank of Turkey | ||||||||
| 200,000 | 5.875%, 04/24/2019 | 211,840 | ||||||
| Hazine Mustesarligi Varlik Kiralama AS | ||||||||
| 360,000 | 2.803%, 03/26/2018 | 355,068 | ||||||
| Turkey Government International Bond | ||||||||
| 330,000 | 7.000%, 03/11/2019 | 379,830 | ||||||
| 1,830,000 | 7.000%, 06/05/2020 | 2,131,401 | ||||||
| 170,000 | 5.625%, 03/30/2021 | 185,300 | ||||||
| 3,480,000 | 5.750%, 03/22/2024 | 3,801,900 | ||||||
| 220,000 | 7.375%, 02/05/2025 | 267,300 | ||||||
| 50,000 | 8.000%, 02/14/2034 | 65,755 | ||||||
| 280,000 | 6.875%, 03/17/2036 | 329,700 | ||||||
| 190,000 | 6.750%, 05/30/2040 | 221,692 | ||||||
| 200,000 | 6.000%, 01/14/2041 | 213,750 | ||||||
| 370,000 | 6.625%, 02/17/2045 | 428,275 | ||||||
|
| |||||||
| Total | 8,591,811 | |||||||
|
| |||||||
| Ukraine (0.3%) | |||||||
| Financing of Infrastructure Projects State Enterprise | ||||||||
| 430,000 | 9.000%, 12/07/2017 | 412,800 | ||||||
| Ukraine Government International Bond | ||||||||
| 1,800,000 | 6.250%, 06/17/2016 | 1,737,360 | ||||||
| 510,000 | 6.580%, 11/21/2016 | 492,150 | ||||||
| 400,000 | 9.250%, 07/24/2017 | 405,000 | ||||||
| 460,000 | 8.375%, 11/03/2017 | 434,700 | ||||||
| 470,000 | 6.750%, 11/14/2017 | 448,380 | ||||||
| 200,000 | 7.400%, 04/20/2018 | 189,000 | ||||||
| 170,000 | 7.750%, 09/23/2020 | 162,180 | ||||||
| 550,000 | 7.500%, 04/17/2023 | 517,000 | ||||||
| Ukreximbank Via Biz Finance plc | ||||||||
| 230,000 | 8.375%, 04/27/2015 | 216,200 | ||||||
| 340,000 | 8.750%, 01/22/2018 | 306,000 | ||||||
|
| |||||||
| Total | 5,320,770 | |||||||
|
| |||||||
| United Arab Emirates (0.1%) | |||||||
| Dolphin Energy, Ltd. | ||||||||
| 469,300 | 5.888%, 06/15/2019 | 519,750 | ||||||
| 200,000 | 5.500%, 12/15/2021 | 227,250 | ||||||
| Ruwais Power Company | ||||||||
| 660,000 | 6.000%, 08/31/2036d | 733,074 | ||||||
| Ruwais Power Company PJSC | ||||||||
| 200,000 | 6.000%, 08/31/2036 | 222,144 | ||||||
|
| |||||||
| Total | 1,702,218 | |||||||
|
| |||||||
| United States (0.1%) | |||||||
| Comcel Trust | ||||||||
| 200,000 | 6.875%, 02/06/2024 | 216,000 | ||||||
| HSBC Bank USA NA | ||||||||
| 688,000 | 10.000%, 01/05/2017q | 300,953 | ||||||
| 680,000 | 6.000%, 08/15/2040r | 759,395 | ||||||
|
| |||||||
| Total | 1,276,348 | |||||||
|
| |||||||
| Uruguay (0.2%) | |||||||
| Uruguay Government International Bond | ||||||||
| 1,908,852 | 5.100%, 06/18/2050 | 1,884,991 | ||||||
| 1,362,247 | 4.500%, 08/14/2024 | 1,445,344 | ||||||
|
| |||||||
| Total | 3,330,335 | |||||||
|
| |||||||
| Venezuela (0.4%) | |||||||
| Petroleos de Venezuela SA | ||||||||
| 1,670,000 | 9.000%, 11/17/2021 | 1,419,333 | ||||||
| 106,000 | 6.000%, 11/15/2026 | 68,370 | ||||||
| 230,000 | 5.375%, 04/12/2027 | 142,370 | ||||||
| 375,000 | 9.750%, 05/17/2035 | 307,125 | ||||||
| 30,000 | 5.500%, 04/12/2037 | 17,970 | ||||||
| Venezuela Government International Bond | ||||||||
| 350,000 | 6.000%, 12/09/2020 | 268,625 | ||||||
| 1,160,000 | 12.750%, 08/23/2022 | 1,191,900 | ||||||
| 500,000 | 9.000%, 05/07/2023 | 427,500 | ||||||
| 3,570,000 | 7.650%, 04/21/2025 | 2,748,900 | ||||||
| 140,000 | 9.250%, 05/07/2028 | 117,600 | ||||||
|
| |||||||
| Total | 6,709,693 | |||||||
|
| |||||||
| Vietnam (<0.1%) | |||||||
| Debt and Asset Trading Corporation | ||||||||
| 200,000 | 1.000%, 10/10/2025 | 103,000 | ||||||
| Vietnam Government International Bond | ||||||||
| 310,000 | 6.875%, 01/15/2016 | 331,700 | ||||||
|
| |||||||
| Total | 434,700 | |||||||
|
| |||||||
| Virgin Islands, British (<0.1%) | |||||||
| Central American Bottling Corporation | ||||||||
| 108,000 | 6.750%, 02/09/2022 | 115,290 | ||||||
| 210,000 | 6.750%, 02/09/2022d | 224,175 | ||||||
The accompanying Notes to Financial Statements are an integral part of this schedule.
214
Table of Contents
Partner Worldwide Allocation Portfolio
Schedule of Investments as of June 30, 2014
(unaudited)
| Principal Amount | Long-Term Fixed Income (9.1%) | Value | ||||||
| Virgin Islands, British (<0.1%) - continued | |||||||
| PCCW Capital No. 4, Ltd. | ||||||||
| $200,000 | 5.750%, 04/17/2022 | $ | 211,380 | |||||
|
| |||||||
| Total | 550,845 | |||||||
|
| |||||||
| Zambia (0.1%) | |||||||
| Zambia Government International Bond | ||||||||
| 400,000 | 5.375%, 09/20/2022d | 375,000 | ||||||
| 1,300,000 | 5.375%, 09/20/2022 | 1,218,750 | ||||||
|
| |||||||
| Total | 1,593,750 | |||||||
|
| |||||||
Total Long-Term Fixed Income (cost $158,460,792) | 160,629,164 | |||||||
|
| |||||||
| Shares | Preferred Stock (0.8%) | |||||||
| Brazil (0.5%) | |||||||
| 1,198,680 | Oi SA | 1,063,323 | ||||||
| 144,000 | Petroleo Brasileiro SA ADR | 2,252,160 | ||||||
| 302,700 | Vale SA | 3,597,601 | ||||||
| 57,532 | Vale SA ADR | 684,631 | ||||||
|
| |||||||
| Total | 7,597,715 | |||||||
|
| |||||||
| Germany (<0.1%) | |||||||
| 7,106 | Sixt SE | 231,682 | ||||||
|
| |||||||
| Total | 231,682 | |||||||
|
| |||||||
| Italy (<0.1%) | |||||||
| 47,347 | Unipol Gruppo Finanziario SPA | 245,254 | ||||||
|
| |||||||
| Total | 245,254 | |||||||
|
| |||||||
| South Korea (0.3%) | |||||||
| 5,150 | Samsung Electronics Company, Ltd. | 5,396,666 | ||||||
|
| |||||||
| Total | 5,396,666 | |||||||
|
| |||||||
Total Preferred Stock (cost $14,055,809) | 13,471,317 | |||||||
|
| |||||||
Collateral Held for Securities Loaned (3.7%) | ||||||||
| 65,064,207 | Thrivent Cash Management Trust | 65,064,207 | ||||||
|
| |||||||
Total Collateral Held for Securities Loaned (cost $65,064,207) | 65,064,207 | |||||||
|
| |||||||
| Shares or Principal Amount | Short-Term Investments (2.0%)s | |||||||
| Federal Home Loan Bank Discount Notes | ||||||||
| 200,000 | 0.115%, 08/06/2014t | 199,977 | ||||||
Thrivent Cash Management Trust | ||||||||
| 34,533,157 | 0.050% | 34,533,157 | ||||||
|
| |||||||
Total Short-Term Investments (at amortized cost) | 34,733,134 | |||||||
|
| |||||||
Total Investments (cost $1,647,111,147) 102.9% | $ | 1,826,537,832 | ||||||
|
| |||||||
Other Assets and Liabilities, Net (2.9%) | (50,668,331 | ) | ||||||
|
| |||||||
Total Net Assets 100.0% | $ | 1,775,869,501 | ||||||
|
| |||||||
| a | Non-income producing security. |
| b | Security is fair valued. |
| c | All or a portion of the security is on loan. |
| d | Denotes securities sold under Rule 144A of the Securities Act of 1933, which exempts them from registration. These securities have been deemed liquid and may be resold to other dealers in the program or to other qualified institutional buyers. As of June 30, 2014, the value of these investments was $41,515,651 or 2.3% of total net assets. |
| e | Principal amount is displayed in Euros. |
| f | Denotes variable rate securities. Variable rate securities are securities whose yields vary with a designated market index or market rate. The rate shown is as of June 30, 2014. |
| g | Denotes step coupon securities. Step coupon securities pay an initial coupon rate for the first period and then different coupon rates for following periods. The rate shown is as of June 30, 2014. |
| h | Denotes restricted securities. Restricted securities are investment securities which have been deemed illiquid and cannot be offered for public sale without first being registered under the Securities Act of 1933. The following table indicates the acquisition date and cost of restricted securities Partner Worldwide Allocation Portfolio owned as of June 30, 2014. |
Security | Acquisition Date | Cost | ||||||
Abengoa Transmision Sur SA, 04/30/2043 | 4/8/2014 | $ | 589,971 | |||||
Banco Continental SAECA, 10/15/2017 | 10/10/2012 | 170,000 | ||||||
Belize Government International Bond, 08/20/2017 | 3/20/2013 | 111,025 | ||||||
Brazil Loan Trust 1, 07/24/2023 | 7/25/2013 | 1,188,845 | ||||||
Brazil Minas SPE via State of Minas Gerais, 02/15/2028 | 3/22/2013 | 2,309,257 | ||||||
Independencia International, Ltd., 12/30/2016 | 3/29/2010 | 100,623 | ||||||
Trust F/1401, 01/30/2044 | 1/23/2014 | 203,883 | ||||||
| i | Principal amount is displayed in Brazilian Real. |
| j | Defaulted security. Interest is not being accrued. |
| k | Principal amount is displayed in Dominican Republic Pesos. |
| l | Principal amount is displayed in Chinese Yuan. |
| m | Denotes investments purchased on a when-issued or delayed delivery basis. |
| n | Principal amount is displayed in Mexican Pesos. |
The accompanying Notes to Financial Statements are an integral part of this schedule.
215
Table of Contents
Partner Worldwide Allocation Portfolio
Schedule of Investments as of June 30, 2014
(unaudited)
| o | Principal amount is displayed in Russian Rubles. |
| p | Denotes perpetual securities. Perpetual securities pay an indefinite stream of interest, but may be called by the issuer at an earlier date. |
| q | Principal amount is displayed in Brazilian Real. Security is linked to Brazilian Government Bonds due January 1, 2017. |
| r | Principal amount is displayed in Brazilian Real. Security is linked to Brazilian Government Bonds due August 15, 2040. |
| s | The interest rate shown reflects the yield, coupon rate or the discount rate at the date of purchase. |
| t | At June 30, 2014, $99,989 of investments were held on deposit with the counterparty and pledged as the initial margin deposit for open futures contracts. |
Definitions:
ADR | - | American Depositary Receipt, which are certificates for an underlying foreign security’s shares held by an issuing U.S. depository bank. | ||
GDR | - | Global Depository Receipts, which are certificates for shares of an underlying foreign security’s shares held by an issuing depository bank from more than one country. | ||
REIT | - | Real Estate Investment Trust is a company that buys, develops, manages and/or sells real estate assets. |
Unrealized Appreciation (Depreciation)
Gross unrealized appreciation and depreciation of investments, based on cost for federal income tax purposes, were as follows:
Gross unrealized appreciation | $ | 236,678,534 | ||
Gross unrealized depreciation | (59,998,022 | ) | ||
|
| |||
Net unrealized appreciation (depreciation) | $ | 176,680,512 | ||
Cost for federal income tax purposes | $ | 1,649,857,320 | ||
The accompanying Notes to Financial Statements are an integral part of this schedule.
216
Table of Contents
Partner Worldwide Allocation Portfolio
Schedule of Investments as of June 30, 2014
(unaudited)
Fair Valuation Measurements
The following table is a summary of the inputs used, as of June 30, 2014, in valuing Partner Worldwide Allocation Portfolio’s assets carried at fair value.
Investments in Securities | Total | Level 1 | Level 2 | Level 3 | ||||||||||||
Common Stock | ||||||||||||||||
Basic Materials | 150,899 | — | 150,899 | — | ||||||||||||
Capital Goods | 133,164 | — | 133,164 | — | ||||||||||||
Communications Services | 856,778 | — | 856,778 | — | ||||||||||||
Consumer Discretionary | 235,880,508 | 1,260,056 | 234,620,452 | — | ||||||||||||
Consumer Staples | 110,657,494 | 2,481,725 | 108,175,769 | — | ||||||||||||
Energy | 108,842,495 | 8,880,278 | 99,962,217 | — | ||||||||||||
Financials | 375,917,628 | 24,455,466 | 350,891,813 | 570,349 | ||||||||||||
Health Care | 116,257,541 | — | 116,257,541 | — | ||||||||||||
Industrials | 281,088,067 | 1,206,690 | 279,881,377 | — | ||||||||||||
Information Technology | 95,054,604 | 2,980,624 | 92,073,980 | — | ||||||||||||
Materials | 149,292,829 | 14,319,535 | 134,973,294 | — | ||||||||||||
Technology | 35,007 | — | 35,007 | — | ||||||||||||
Telecommunications Services | 34,220,050 | — | 34,220,050 | — | ||||||||||||
Utilities | 44,252,946 | — | 44,252,946 | — | ||||||||||||
Long-Term Fixed Income | ||||||||||||||||
Basic Materials | 3,092,175 | — | 3,092,175 | — | ||||||||||||
Capital Goods | 847,814 | — | 847,814 | — | ||||||||||||
Communications Services | 6,091,939 | — | 6,091,939 | — | ||||||||||||
Consumer Cyclical | 1,147,533 | — | 1,147,533 | — | ||||||||||||
Consumer Non-Cyclical^ | 2,147,983 | — | 2,147,983 | 0 | ||||||||||||
Energy | 20,254,839 | — | 20,254,839 | — | ||||||||||||
Financials | 11,738,774 | — | 11,738,774 | — | ||||||||||||
Foreign Government | 109,735,096 | — | 109,149,475 | 585,621 | ||||||||||||
Transportation | 865,300 | — | 865,300 | — | ||||||||||||
Utilities | 4,707,711 | — | 4,707,711 | — | ||||||||||||
Preferred Stock | ||||||||||||||||
Communications Services | 1,063,323 | — | 1,063,323 | — | ||||||||||||
Energy | 2,252,160 | 2,252,160 | — | — | ||||||||||||
Financials | 245,254 | — | 245,254 | — | ||||||||||||
Industrials | 231,682 | — | 231,682 | — | ||||||||||||
Information Technology | 5,396,666 | — | 5,396,666 | — | ||||||||||||
Materials | 4,282,232 | 684,631 | 3,597,601 | — | ||||||||||||
Collateral Held for Securities Loaned | 65,064,207 | 65,064,207 | — | — | ||||||||||||
Short-Term Investments | 34,733,134 | 34,533,157 | 199,977 | — | ||||||||||||
|
|
|
|
|
|
|
| |||||||||
Total | $ | 1,826,537,832 | $ | 158,118,529 | $ | 1,667,263,333 | $ | 1,155,970 | ||||||||
|
|
|
|
|
|
|
| |||||||||
Other Financial Instruments | Total | Level 1 | Level 2 | Level 3 | ||||||||||||
Asset Derivatives | ||||||||||||||||
Futures Contracts | 49,239 | 49,239 | — | — | ||||||||||||
Foreign Currency Forward Contracts | 329,028 | — | 329,028 | — | ||||||||||||
|
|
|
|
|
|
|
| |||||||||
Total Asset Derivatives | $ | 378,267 | $ | 49,239 | $ | 329,028 | $ | — | ||||||||
|
|
|
|
|
|
|
| |||||||||
Liability Derivatives | ||||||||||||||||
Futures Contracts | 215,338 | 188,865 | 26,473 | — | ||||||||||||
Foreign Currency Forward Contracts | 481,055 | — | 481,055 | — | ||||||||||||
|
|
|
|
|
|
|
| |||||||||
Total Liability Derivatives | $ | 696,393 | $ | 188,865 | $ | 507,528 | $ | — | ||||||||
|
|
|
|
|
|
|
| |||||||||
There were no significant transfers between Levels during the period ended June 30, 2014. Transfers between Levels are identified as of the end of the period.
| ^ | Level 3 security in this section is fair valued at <$1. |
The accompanying Notes to Financial Statements are an integral part of this schedule.
217
Table of Contents
Partner Worldwide Allocation Portfolio
Schedule of Investments as of June 30, 2014
(unaudited)
Futures Contracts | Number of Contracts Long/(Short) | Expiration Date | Notional Principal Amount | Value | Unrealized Gain/(Loss) | |||||||||||||||
2-Yr. U.S. Treasury Bond Futures | 16 | September 2014 | $ | 3,516,340 | $ | 3,513,500 | ($ | 2,840 | ) | |||||||||||
5-Yr. U.S. Treasury Bond Futures | (118 | ) | September 2014 | (14,106,901 | ) | (14,096,391 | ) | 10,510 | ||||||||||||
10-Yr. U.S. Treasury Bond Futures | (8 | ) | September 2014 | (996,751 | ) | (1,001,375 | ) | (4,624 | ) | |||||||||||
30-Yr. U.S. Treasury Bond Futures | (9 | ) | September 2014 | (1,233,397 | ) | (1,234,688 | ) | (1,291 | ) | |||||||||||
ASX SPI 200 Index Futures | 3 | September 2014 | 377,736 | 378,643 | 907 | |||||||||||||||
CME 3 Month Eurodollar Futures | (67 | ) | June 2017 | (16,335,675 | ) | (16,350,512 | ) | (14,837 | ) | |||||||||||
CME 3 Month Eurodollar Futures | (141 | ) | December 2016 | (34,460,002 | ) | (34,553,813 | ) | (93,811 | ) | |||||||||||
CME 3 Month Eurodollar Futures | (109 | ) | March 2017 | (26,616,338 | ) | (26,654,588 | ) | (38,250 | ) | |||||||||||
CME 3 Month Eurodollar Futures | (88 | ) | September 2016 | (21,593,071 | ) | (21,622,700 | ) | (29,629 | ) | |||||||||||
Eurex EURO STOXX 50 Futures | 43 | September 2014 | 1,926,528 | 1,900,055 | (26,473 | ) | ||||||||||||||
FTSE 100 Index Futures | 8 | September 2014 | 921,672 | 918,811 | (2,861 | ) | ||||||||||||||
Mini MSCI EAFE Index Futures | 41 | September 2014 | 4,029,724 | 4,036,245 | 6,521 | |||||||||||||||
SGX MSCI Singapore Index Futures | 1 | July 2014 | 59,561 | 59,428 | (133 | ) | ||||||||||||||
Tokyo Price Index Futures | 10 | September 2014 | 1,214,936 | 1,246,237 | 31,301 | |||||||||||||||
Ultra Long Term U.S. Treasury Bond | ||||||||||||||||||||
Futures | 13 | September 2014 | 1,949,777 | 1,949,188 | (589 | ) | ||||||||||||||
Total Futures Contracts | ($ | 166,099 | ) | |||||||||||||||||
The accompanying Notes to Financial Statements are an integral part of this schedule.
218
Table of Contents
Partner Worldwide Allocation Portfolio
Schedule of Investments as of June 30, 2014
(unaudited)
Foreign Currency Forward Contracts | Counterparty | Contracts to Deliver/Receive | Settlement Date | Value on Settlement Date | Value | Unrealized Gain/(Loss) | ||||||||||||||||
Purchases | ||||||||||||||||||||||
Brazilian Real | UBS | 1,406,950 | 7/7/2014 - 7/28/2014 | $ | 625,353 | $ | 633,182 | $ | 7,829 | |||||||||||||
Brazilian Real | MSC | 4,039,059 | 7/9/2014 - 7/23/2014 | 1,765,749 | 1,821,633 | 55,884 | ||||||||||||||||
Brazilian Real | HSBC | 813,887 | 7/7/2014 | 353,000 | 367,591 | 14,591 | ||||||||||||||||
Brazilian Real | RBC | 3,359,557 | 7/3/2014 - 7/7/2014 | 1,471,434 | 1,517,770 | 46,336 | ||||||||||||||||
Chilean Peso | HSBC | 79,137,000 | 7/18/2014 | 142,128 | 142,896 | 768 | ||||||||||||||||
Chilean Peso | CSFB | 117,596,999 | 7/14/2014 | 212,907 | 212,410 | (497 | ) | |||||||||||||||
Chilean Peso | BOA | 194,682,299 | 7/10/2014 | 354,000 | 351,757 | (2,243 | ) | |||||||||||||||
Chinese Yuan | MSC | 4,898,528 | 8/11/2014 | 780,095 | 786,634 | 6,539 | ||||||||||||||||
Chinese Yuan | BB | 22,285,087 | 9/17/2014 | 3,559,000 | 3,572,284 | 13,284 | ||||||||||||||||
Chinese Yuan | CITI | 4,811,383 | 9/5/2014 | 765,498 | 771,756 | 6,258 | ||||||||||||||||
Chinese Yuan | HSBC | 9,477,952 | 7/11/2014 | 1,511,876 | 1,525,760 | 13,884 | ||||||||||||||||
Chinese Yuan | DB | 13,732,687 | 9/5/2014 - 9/17/2014 | 2,193,718 | 2,201,835 | 8,117 | ||||||||||||||||
Euro | BNP | 262,000 | 9/17/2014 | 354,700 | 358,836 | 4,136 | ||||||||||||||||
Euro | MSC | 262,500 | 9/17/2014 | 355,572 | 359,520 | 3,948 | ||||||||||||||||
Euro | CITI | 527,000 | 9/17/2014 | 714,404 | 721,780 | 7,376 | ||||||||||||||||
Euro | BB | 260,000 | 9/17/2014 | 353,369 | 356,096 | 2,727 | ||||||||||||||||
Indian Rupee | SB | 21,536,319 | 8/1/2014 | 356,975 | 355,240 | (1,735 | ) | |||||||||||||||
Indian Rupee | WBC | 41,709,725 | 9/23/2014 | 683,934 | 679,005 | (4,929 | ) | |||||||||||||||
Indian Rupee | CITI | 63,203,539 | 7/21/2014 - 9/26/2014 | 1,037,823 | 1,033,925 | (3,898 | ) | |||||||||||||||
Indian Rupee | RBS | 83,018,520 | 8/8/2014 | 1,368,249 | 1,367,237 | (1,012 | ) | |||||||||||||||
Indian Rupee | BOA | 124,894,770 | 7/2/2014 - 9/5/2014 | 2,083,528 | 2,065,468 | (18,060 | ) | |||||||||||||||
Indian Rupee | JPM | 42,940,333 | 7/17/2014 | 712,943 | 710,926 | (2,017 | ) | |||||||||||||||
Indian Rupee | HSBC | 41,696,483 | 9/26/2014 | 682,095 | 678,228 | (3,867 | ) | |||||||||||||||
Indian Rupee | UBS | 41,819,220 | 9/26/2014 | 683,823 | 680,224 | (3,599 | ) | |||||||||||||||
Indian Rupee | BB | 53,399,000 | 9/23/2014 | 874,032 | 869,298 | (4,734 | ) | |||||||||||||||
Israeli Shekel | BOA | 2,407,344 | 9/17/2014 | 694,219 | 701,455 | 7,236 | ||||||||||||||||
Japanese Yen | JPM | 36,167,063 | 9/17/2014 | 357,000 | 357,275 | 275 | ||||||||||||||||
Japanese Yen | BOA | 72,473,384 | 9/17/2014 | 713,000 | 715,925 | 2,925 | ||||||||||||||||
Malaysian Ringgit | BB | 4,128,824 | 8/5/2014 | 1,276,693 | 1,282,826 | 6,133 | ||||||||||||||||
Malaysian Ringgit | DB | 7,224,452 | 8/18/2014 | 2,243,549 | 2,242,315 | (1,234 | ) | |||||||||||||||
Malaysian Ringgit | SB | 1,825,062 | 7/14/2014 | 560,308 | 567,883 | 7,575 | ||||||||||||||||
Malaysian Ringgit | WBC | 5,013,628 | 8/5/2014 - 8/6/2014 | 1,544,422 | 1,557,633 | 13,211 | ||||||||||||||||
Mexican Peso | JPM | 23,453,220 | 9/17/2014 | 1,798,946 | 1,798,150 | �� | (796 | ) | ||||||||||||||
Mexican Peso | MSC | 24,128,999 | 9/17/2014 | 1,855,292 | 1,849,962 | (5,330 | ) | |||||||||||||||
Mexican Peso | HSBC | 23,104,811 | 9/17/2014 | 1,767,639 | 1,771,438 | 3,799 | ||||||||||||||||
Polish Zloty | CSFB | 956,377 | 9/17/2014 | 312,782 | 313,479 | 697 | ||||||||||||||||
Polish Zloty | JPM | 942,244 | 9/17/2014 | 308,806 | 308,846 | 40 | ||||||||||||||||
Polish Zloty | BOA | 1,089,111 | 9/17/2014 | 358,951 | 356,986 | (1,965 | ) | |||||||||||||||
Polish Zloty | BNP | 2,131,506 | 9/17/2014 | 698,333 | 698,659 | 326 | ||||||||||||||||
Polish Zloty | HSBC | 971,193 | 9/17/2014 | 318,466 | 318,335 | (131 | ) | |||||||||||||||
Polish Zloty | DB | 3,668,074 | 9/17/2014 | 1,208,861 | 1,202,311 | (6,550 | ) | |||||||||||||||
Polish Zloty | BB | 1,087,226 | 9/17/2014 | 358,454 | 356,368 | (2,086 | ) | |||||||||||||||
Russian Ruble | CITI | 74,288,339 | 7/9/2014 | 2,148,428 | 2,182,257 | 33,829 | ||||||||||||||||
Russian Ruble | CSFB | 51,373,725 | 7/9/2014 - 7/21/2014 | 1,473,764 | 1,507,064 | 33,300 | ||||||||||||||||
Turkish Lira | RBS | 3,777,499 | 9/17/2014 | 1,768,375 | 1,754,493 | (13,882 | ) | |||||||||||||||
Turkish Lira | DB | 112,530 | 9/17/2014 | 53,000 | 52,265 | (735 | ) | |||||||||||||||
Turkish Lira | JPM | 1,521,005 | 9/17/2014 | 710,000 | 706,445 | (3,555 | ) | |||||||||||||||
Turkish Lira | HSBC | 1,545,542 | 9/17/2014 | 713,000 | 717,841 | 4,841 | ||||||||||||||||
Total Purchases | $ | 47,238,493 | $ | 47,461,502 | $ | 223,009 | ||||||||||||||||
Sales | ||||||||||||||||||||||
Australian Dollar | JPM | 494,670 | 9/17/2014 | $ | 459,897 | $ | 463,708 | ($ | 3,811 | ) | ||||||||||||
Australian Dollar | DB | 494,670 | 9/17/2014 | 459,872 | 463,708 | (3,836 | ) | |||||||||||||||
Australian Dollar | WBC | 509,660 | 9/17/2014 | 473,762 | 477,759 | (3,997 | ) | |||||||||||||||
Brazilian Real | RBC | 3,944,611 | 7/7/2014 - 8/4/2014 | 1,757,626 | 1,778,425 | (20,799 | ) | |||||||||||||||
Brazilian Real | MSC | 2,395,252 | 7/9/2014 - 7/28/2014 | 1,066,823 | 1,079,139 | (12,316 | ) | |||||||||||||||
Brazilian Real | DB | 3,028,720 | 7/18/2014 | 1,340,082 | 1,363,430 | (23,348 | ) | |||||||||||||||
Brazilian Real | SB | 2,881,203 | 7/18/2014 | 1,272,055 | 1,297,023 | (24,968 | ) | |||||||||||||||
Brazilian Real | BNP | 803,740 | 7/7/2014 | 356,000 | 363,008 | (7,008 | ) | |||||||||||||||
Brazilian Real | UBS | 1,596,589 | 7/3/2014 - 7/23/2014 | 714,820 | 719,814 | (4,994 | ) | |||||||||||||||
Brazilian Real | CITI | 962,650 | 7/7/2014 - 7/9/2014 | 426,838 | 434,564 | (7,726 | ) | |||||||||||||||
Chinese Yuan | SB | 2,375,302 | 9/17/2014 | 379,423 | 380,759 | (1,336 | ) | |||||||||||||||
The accompanying Notes to Financial Statements are an integral part of this schedule.
219
Table of Contents
Partner Worldwide Allocation Portfolio
Schedule of Investments as of June 30, 2014
(unaudited)
Foreign Currency Forward Contracts | Counterparty | Contracts to Deliver/Receive | Settlement Date | Value on Settlement Date | Value | Unrealized Gain/(Loss) | ||||||||||||||||
Sales - continued | ||||||||||||||||||||||
Euro | WBC | 4,971,748 | 7/31/2014 | $ | 6,747,681 | $ | 6,808,122 | ($ | 60,441 | ) | ||||||||||||
Euro | DB | 885,000 | 9/17/2014 | 1,208,861 | 1,212,098 | (3,237 | ) | |||||||||||||||
Euro | BNP | 953,544 | 9/17/2014 | 1,303,217 | 1,305,975 | (2,758 | ) | |||||||||||||||
Euro | BOA | 263,500 | 9/17/2014 | 358,951 | 360,890 | (1,939 | ) | |||||||||||||||
Euro | MSC | 2,353,000 | 9/17/2014 | 3,206,581 | 3,222,673 | (16,092 | ) | |||||||||||||||
Euro | SSB | 259,273 | 9/17/2014 | 353,674 | 355,100 | (1,426 | ) | |||||||||||||||
Euro | BB | 263,000 | 9/17/2014 | 358,454 | 360,205 | (1,751 | ) | |||||||||||||||
Euro | UBS | 1,910,000 | 9/17/2014 | 2,587,467 | 2,615,939 | (28,472 | ) | |||||||||||||||
Hungarian Forint | BOA | 144,765,340 | 9/17/2014 | 647,575 | 638,635 | 8,940 | ||||||||||||||||
Indian Rupee | BOA | 83,263,180 | 7/2/2014 | 1,385,373 | 1,384,374 | 999 | ||||||||||||||||
Israeli Shekel | DB | 4,040,607 | 9/17/2014 | 1,167,782 | 1,177,357 | (9,575 | ) | |||||||||||||||
Israeli Shekel | HSBC | 1,731,798 | 9/17/2014 | 500,332 | 504,613 | (4,281 | ) | |||||||||||||||
Israeli Shekel | BB | 2,505,046 | 9/17/2014 | 723,579 | 729,923 | (6,344 | ) | |||||||||||||||
Israeli Shekel | BOA | 2,032,170 | 9/17/2014 | 587,240 | 592,136 | (4,896 | ) | |||||||||||||||
Israeli Shekel | JPM | 1,728,346 | 9/17/2014 | 500,042 | 503,607 | (3,565 | ) | |||||||||||||||
Japanese Yen | BNP | 26,932,262 | 9/17/2014 | 263,414 | 266,049 | (2,635 | ) | |||||||||||||||
Japanese Yen | SSB | 99,297,595 | 9/17/2014 | 971,686 | 980,907 | (9,221 | ) | |||||||||||||||
Japanese Yen | DB | 27,408,273 | 9/17/2014 | 268,779 | 270,751 | (1,972 | ) | |||||||||||||||
Japanese Yen | UBS | 26,649,044 | 9/17/2014 | 261,361 | 263,251 | (1,890 | ) | |||||||||||||||
Malaysian Ringgit | HSBC | 2,293,660 | 7/14/2014 | 713,000 | 713,691 | (691 | ) | |||||||||||||||
Malaysian Ringgit | CSFB | 1,136,907 | 8/18/2014 | 353,000 | 352,872 | 128 | ||||||||||||||||
Malaysian Ringgit | DB | 2,301,699 | 7/30/2014 | 713,000 | 715,480 | (2,480 | ) | |||||||||||||||
Malaysian Ringgit | CITI | 3,342,468 | 8/5/2014 | 1,029,180 | 1,038,505 | (9,325 | ) | |||||||||||||||
Mexican Peso | DB | 4,616,047 | 9/17/2014 | 353,000 | 353,911 | (911 | ) | |||||||||||||||
Mexican Peso | JPM | 4,624,540 | 9/17/2014 | 353,000 | 354,562 | (1,562 | ) | |||||||||||||||
Mexican Peso | RBC | 13,848,657 | 8/8/2014 | 1,060,478 | 1,064,541 | (4,063 | ) | |||||||||||||||
Mexican Peso | SSB | 52,652,428 | 8/8/2014 - 9/17/2014 | 4,012,298 | 4,045,214 | (32,916 | ) | |||||||||||||||
New Taiwan Dollar | SB | 16,560,165 | 8/22/2014 | 551,914 | 555,001 | (3,087 | ) | |||||||||||||||
New Taiwan Dollar | UBS | 16,817,071 | 8/1/2014 | 561,374 | 563,492 | (2,118 | ) | |||||||||||||||
New Taiwan Dollar | WBC | 33,680,545 | 7/17/2014 | 1,123,059 | 1,128,303 | (5,244 | ) | |||||||||||||||
New Taiwan Dollar | HSBC | 19,252,596 | 7/25/2014 | 639,706 | 645,039 | (5,333 | ) | |||||||||||||||
Russian Ruble | JPM | 12,132,480 | 7/9/2014 | 356,000 | 356,398 | (398 | ) | |||||||||||||||
Russian Ruble | HSBC | 36,162,945 | 7/21/2014 | 1,062,132 | 1,059,512 | 2,620 | ||||||||||||||||
Russian Ruble | MSC | 12,336,106 | 7/9/2014 | 357,000 | 362,379 | (5,379 | ) | |||||||||||||||
Russian Ruble | CSFB | 48,886,561 | 7/9/2014 - 7/21/2014 | 1,420,000 | 1,434,174 | (14,174 | ) | |||||||||||||||
Singapore Dollar | HSBC | 1,104,091 | 9/17/2014 | 882,739 | 885,716 | (2,977 | ) | |||||||||||||||
Singapore Dollar | WBC | 1,082,806 | 9/17/2014 | 865,795 | 868,642 | (2,847 | ) | |||||||||||||||
Singapore Dollar | RBC | 1,071,657 | 9/17/2014 | 857,902 | 859,697 | (1,795 | ) | |||||||||||||||
Singapore Dollar | CITI | 1,071,538 | 9/17/2014 | 857,265 | 859,602 | (2,337 | ) | |||||||||||||||
Thai Baht | DB | 45,605,272 | 7/14/2014 - 9/22/2014 | 1,400,346 | 1,402,896 | (2,550 | ) | |||||||||||||||
Turkish Lira | RBS | 3,851,653 | 9/17/2014 | 1,773,000 | 1,788,935 | (15,935 | ) | |||||||||||||||
Turkish Lira | HSBC | 1,523,727 | 9/17/2014 | 710,000 | 707,709 | 2,291 | ||||||||||||||||
Turkish Lira | DB | 112,514 | 9/17/2014 | 53,000 | 52,258 | 742 | ||||||||||||||||
Total Sales | $ | 54,167,435 | $ | 54,542,471 | ($ | 375,036 | ) | |||||||||||||||
Net Unrealized Gain/(Loss) on Foreign Currency Forward Contracts |
| ($ | 152,027 | ) | ||||||||||||||||||
The accompanying Notes to Financial Statements are an integral part of this schedule.
220
Table of Contents
Partner Worldwide Allocation Portfolio
Schedule of Investments as of June 30, 2014
(unaudited)
Counterparty | ||||||
BOA | - | Bank of America | ||||
BB | - | Barclays Bank | ||||
BNP | - | BNP Paribas | ||||
CITI | - | Citibank | ||||
CSFB | - | CS First Boston Corporation | ||||
DB | - | Deutsche Bank | ||||
HSBC | - | HSBC Securities, Inc. | ||||
JPM | - | J.P. Morgan | ||||
MSC | - | Morgan Stanley & Company | ||||
RBC | - | The Royal Bank of Canada | ||||
RBS | - | The Royal Bank of Scotland | ||||
SB | - | Standard Bank plc | ||||
SSB | - | State Street Bank | ||||
UBS | - | UBS Securities, Ltd. | ||||
WBC | - | Westpac Banking Corporation | ||||
The following table summarizes the fair value and Statement of Assets and Liabilities location, as of June 30, 2014, for Partner Worldwide Allocation Portfolio’s investments in financial derivative instruments by primary risk exposure as discussed under item (2) Significant Accounting Policies of the Notes to Financial Statements.
Derivatives by risk category | Statement of Assets and Liabilities Location | Fair Value | ||||
Asset Derivatives | ||||||
Interest Rate Contracts | ||||||
Futures* | Net Assets - Net unrealized appreciation/(depreciation) on Futures contracts | $ | 10,510 | |||
Total Interest Rate Contracts | 10,510 | |||||
Equity Contracts | ||||||
Futures* | Net Assets - Net unrealized appreciation/(depreciation) on Futures contracts | 38,729 | ||||
Total Equity Contracts | 38,729 | |||||
Foreign Exchange Contracts | ||||||
Forward Contracts | Net Assets - Net unrealized appreciation/(depreciation) on Foreign currency | |||||
| forward contracts | 329,028 | |||||
Total Foreign Exchange Contracts | 329,028 | |||||
|
| |||||
Total Asset Derivatives | $ | 378,267 | ||||
|
| |||||
Liability Derivatives | ||||||
Interest Rate Contracts | ||||||
Futures* | Net Assets - Net unrealized appreciation/(depreciation) on Futures contracts | 185,871 | ||||
Total Interest Rate Contracts | 185,871 | |||||
Equity Contracts | ||||||
Futures* | Net Assets - Net unrealized appreciation/(depreciation) on Futures contracts | 29,467 | ||||
Total Equity Contracts | 29,467 | |||||
Foreign Exchange Contracts | ||||||
Forward Contracts | Net Assets - Net unrealized appreciation/(depreciation) on Foreign currency | |||||
| forward contracts | 481,055 | |||||
Total Foreign Exchange Contracts | 481,055 | |||||
|
| |||||
Total Liability Derivatives | $ | 696,393 | ||||
|
| |||||
| * | Includes cumulative appreciation/depreciation of futures contracts as reported in the Schedule of Investments. Only current day’s variation margin is reported within the Statement of Assets and Liabilities. |
The accompanying Notes to Financial Statements are an integral part of this schedule.
221
Table of Contents
Partner Worldwide Allocation Portfolio
Schedule of Investments as of June 30, 2014
(unaudited)
The following table summarizes the net realized gains/(losses) and Statement of Operations location, for the period ended June 30, 2014, for Partner Worldwide Allocation Portfolio’s investments in financial derivative instruments by primary risk exposure.
Derivatives by risk category | Statement of Operations Location | Realized Gains/(Losses) recognized in Income | ||||
Equity Contracts | ||||||
Futures | Net realized gains/(losses) on Futures contracts | 179,389 | ||||
Total Equity Contracts | 179,389 | |||||
Foreign Exchange Contracts | ||||||
Forward Contracts | Net realized gains/(losses) on Foreign currency transactions | 49,373 | ||||
Total Foreign Exchange Contracts | 49,373 | |||||
Interest Rate Contracts | ||||||
Futures | Net realized gains/(losses) on Futures contracts | 200 | ||||
Total Interest Rate Contracts | 200 | |||||
|
| |||||
Total | $ | 228,962 | ||||
|
| |||||
The following table summarizes the change in net unrealized appreciation/(depreciation) and Statement of Operations location, for the period ended June 30, 2014, for Partner Worldwide Allocation Portfolio’s investments in financial derivative instruments by primary risk exposure.
Derivatives by risk category | Statement of Operations Location | Change in unrealized appreciation/(depreciation) recognized in Income | ||||
Interest Rate Contracts | ||||||
Futures | Change in net unrealized appreciation/(depreciation) on Futures contracts | (566,908) | ||||
Total Interest Rate Contracts | (566,908) | |||||
Equity Contracts | ||||||
Futures | Change in net unrealized appreciation/(depreciation) on Futures contracts | (181,572) | ||||
Total Equity Contracts | (181,572) | |||||
Foreign Exchange Contracts | ||||||
Forward Contracts | Change in net unrealized appreciation/(depreciation) on Foreign currency forward contracts | (170,629) | ||||
Total Foreign Exchange Contracts | (170,629) | |||||
|
| |||||
Total | ($ | 919,109) | ||||
|
| |||||
The following table presents Partner Worldwide Allocation Portfolio’s average volume of derivative activity during the period ended June 30, 2014.
Derivative Risk Category | Futures (Notional)* | Futures (Percentage of Average Net Assets) | Forwards (Notional)* | Forwards (Percentage of Average Net Assets) | ||||||||||||
Equity Contracts | $ | 2,165,781 | 0.1 | % | N/A | N/A | ||||||||||
Interest Rate | ||||||||||||||||
Contracts | 55,041,643 | 3.2 | N/A | N/A | ||||||||||||
Foreign Exchange | ||||||||||||||||
Contracts | N/A | N/A | $ | 115,808,651 | 6.7 | % | ||||||||||
| * | Notional amount represents long or short, or both, derivative positions held by the Portfolio. |
The accompanying Notes to Financial Statements are an integral part of this schedule.
222
Table of Contents
Partner Worldwide Allocation Portfolio
Schedule of Investments as of June 30, 2014
(unaudited)
Investment in Affiliates
Affiliated issuers, as defined under the Investment Company Act of 1940, include those in which the Portfolio’s holdings of an issuer represent 5% or more of the outstanding voting securities of an issuer, or any affiliated mutual fund.
A summary of transactions for the fiscal year to date, in Partner Worldwide Allocation Portfolio, is as follows:
Portfolio | Value December 31, 2013 | Gross Purchases | Gross Sales | Shares Held at June 30, 2014 | Value June 30, 2014 | Income Earned January 1, 2014 - June 30, 2014 | ||||||||||||||||||
Cash Management Trust- Collateral Investment | $ | 50,312,730 | $ | 346,864,365 | $ | 332,112,888 | 65,064,207 | $ | 65,064,207 | $ | 569,531 | |||||||||||||
Cash Management Trust- Short Term Investment | 29,071,341 | 198,973,939 | 193,512,123 | 34,533,157 | 34,533,157 | 6,788 | ||||||||||||||||||
Total Value and Income Earned | 79,384,071 | 99,597,364 | 576,319 | |||||||||||||||||||||
The accompanying Notes to Financial Statements are an integral part of this schedule.
223
Table of Contents
Schedule of Investments as of June 30, 2014
(unaudited)
| Shares | Common Stock (99.0%) | Value | ||||||
| Consumer Discretionary (12.6%) | |||||||
| 6,540 | AMC Networks, Inc.a | $ | 402,145 | |||||
| 7,680 | Brunswick Corporation | 323,558 | ||||||
| 19,200 | Comcast Corporation | 1,030,656 | ||||||
| 8,800 | Delphi Automotive plc | 604,912 | ||||||
| 7,720 | Dick’s Sporting Goods, Inc. | 359,443 | ||||||
| 13,810 | Home Depot, Inc. | 1,118,058 | ||||||
| 8,300 | Jarden Corporationa | 492,605 | ||||||
| 8,740 | Macy’s, Inc. | 507,095 | ||||||
| 4,210 | Mohawk Industries, Inc.a | 582,411 | ||||||
| 25,120 | Service Corporation International | 520,486 | ||||||
| 8,520 | Starbucks Corporation | 659,278 | ||||||
| 10,200 | TJX Companies, Inc. | 542,130 | ||||||
| 20,420 | Twenty-First Century Fox, Inc. | 717,763 | ||||||
| 7,160 | Wyndham Worldwide Corporation | 542,155 | ||||||
|
| |||||||
| Total | 8,402,695 | |||||||
|
| |||||||
| Consumer Staples (8.3%) | |||||||
| 10,160 | Colgate-Palmolive Company | 692,709 | ||||||
| 13,560 | CVS Caremark Corporation | 1,022,017 | ||||||
| 4,600 | Energizer Holdings, Inc. | 561,338 | ||||||
| 9,410 | Estee Lauder Companies, Inc. | 698,787 | ||||||
| 8,760 | Lorillard, Inc. | 534,098 | ||||||
| 11,710 | Natural Grocers by Vitamin Cottage, Inc.a,b | 250,711 | ||||||
| 3,750 | Nu Skin Enterprises, Inc. | 277,350 | ||||||
| 8,530 | PepsiCo, Inc. | 762,070 | ||||||
| 5,880 | Procter & Gamble Company | 462,109 | ||||||
| 8,530 | WhiteWave Foods Companya | 276,116 | ||||||
|
| |||||||
| Total | 5,537,305 | |||||||
|
| |||||||
| Energy (9.9%) | |||||||
| 12,750 | Chevron Corporation | 1,664,512 | ||||||
| 3,950 | Diamondback Energy, Inc.a | 350,760 | ||||||
| 2,990 | Dril-Quip, Inc.a | 326,628 | ||||||
| 7,580 | EQT Corporation | 810,302 | ||||||
| 6,320 | FMC Technologies, Inc.a | 385,962 | ||||||
| 4,330 | Hess Corporation | 428,194 | ||||||
| 5,680 | Marathon Petroleum Corporation | 443,438 | ||||||
| 8,950 | Occidental Petroleum Corporation | 918,538 | ||||||
| 10,600 | Schlumberger, Ltd. | 1,250,270 | ||||||
|
| |||||||
| Total | 6,578,604 | |||||||
|
| |||||||
| Financials (17.1%) | |||||||
| 17,490 | American International Group, Inc. | 954,604 | ||||||
| 6,770 | American Tower Corporation | 609,165 | ||||||
| 63,910 | Bank of America Corporation | 982,297 | ||||||
| 10,620 | Capital One Financial Corporation | 877,212 | ||||||
| 23,000 | CBRE Group, Inc.a | 736,920 | ||||||
| 19,000 | Citigroup, Inc. | 894,900 | ||||||
| 15,530 | Douglas Emmett, Inc. | 438,257 | ||||||
| 5,260 | E*TRADE Financial Corporationa | 111,828 | ||||||
| 14,370 | East West Bancorp, Inc. | 502,806 | ||||||
| 2,200 | Essex Property Trust, Inc. | 406,802 | ||||||
| 25,410 | FirstMerit Corporation | 501,847 | ||||||
| 11,300 | Invesco, Ltd. | 426,575 | ||||||
| 17,260 | J.P. Morgan Chase & Company | 994,521 | ||||||
| 4,810 | M&T Bank Corporation | 596,680 | ||||||
| 4,690 | McGraw-Hill Companies, Inc. | 389,411 | ||||||
| 14,260 | MetLife, Inc. | 792,286 | ||||||
| 35,260 | Regions Financial Corporation | 374,461 | ||||||
| 5,170 | Reinsurance Group of America, Inc. | 407,913 | ||||||
| 6,740 | State Street Corporation | 453,332 | ||||||
|
| |||||||
| Total | 11,451,817 | |||||||
|
| |||||||
| Health Care (11.8%) | |||||||
| 22,090 | Abbott Laboratories | 903,481 | ||||||
| 6,110 | Air Methods Corporationa,b | 315,582 | ||||||
| 8,390 | BioMarin Pharmaceutical, Inc.a | 521,942 | ||||||
| 19,180 | Bristol-Myers Squibb Company | 930,422 | ||||||
| 15,800 | Catamaran Corporationa | 697,728 | ||||||
| 6,650 | Cubist Pharmaceuticals, Inc.a | 464,303 | ||||||
| 6,190 | Endo International plca | 433,424 | ||||||
| 12,950 | Gilead Sciences, Inc.a | 1,073,684 | ||||||
| 10,990 | HCA Holdings, Inc.a | 619,616 | ||||||
| 4,630 | Medivation, Inc.a | 356,880 | ||||||
| 5,940 | Salix Pharmaceuticals, Ltd.a | 732,699 | ||||||
| 6,563 | Valeant Pharmaceuticals International, Inc.a | 827,726 | ||||||
|
| |||||||
| Total | 7,877,487 | |||||||
|
| |||||||
| Industrials (11.5%) | |||||||
| 6,710 | Alaska Air Group, Inc. | 637,785 | ||||||
| 15,150 | Danaher Corporation | 1,192,759 | ||||||
| 8,020 | FedEx Corporation | 1,214,068 | ||||||
| 4,990 | Genesee & Wyoming, Inc.a | 523,950 | ||||||
| 4,410 | IDEX Corporation | 356,063 | ||||||
| 14,100 | Ingersoll-Rand plc | 881,391 | ||||||
| 7,990 | Manpower, Inc. | 677,952 | ||||||
| 10,090 | Pall Corporation | 861,585 | ||||||
| 15,510 | US Airways Group, Inc.a | 666,310 | ||||||
| 6,350 | WABCO Holdings, Inc.a | 678,307 | ||||||
|
| |||||||
| Total | 7,690,170 | |||||||
|
| |||||||
| Information Technology (19.0%) | |||||||
| 11,340 | Adobe Systems, Inc.a | 820,562 | ||||||
| 12,250 | Agilent Technologies, Inc. | 703,640 | ||||||
| 14,940 | Apple, Inc. | 1,388,374 | ||||||
| 6,380 | Cavium, Inc.a | 316,831 | ||||||
| 14,330 | eBay, Inc.a | 717,360 | ||||||
| 10,210 | Facebook, Inc.a | 687,031 | ||||||
| 1,650 | Google, Inc.a | 949,212 | ||||||
| 1,640 | Google, Inc., Class Aa | 958,859 | ||||||
| 48,530 | Microsoft Corporation | 2,023,701 | ||||||
| 12,060 | Monolithic Power Systems, Inc. | 510,741 | ||||||
| 7,900 | NXP Semiconductors NVa | 522,822 | ||||||
| 26,570 | Oracle Corporation | 1,076,882 | ||||||
| 17,790 | QUALCOMM, Inc. | 1,408,968 | ||||||
| 19,450 | Total System Services, Inc. | 610,925 | ||||||
|
| |||||||
| Total | 12,695,908 | |||||||
|
| |||||||
| Materials (3.7%) | |||||||
| 8,440 | Ashland, Inc. | 917,766 | ||||||
| 4,230 | Eagle Materials, Inc. | 398,804 | ||||||
| 5,000 | LyondellBasell Industries NV | 488,250 | ||||||
| 6,510 | Rock-Tenn Company | 687,391 | ||||||
|
| |||||||
| Total | 2,492,211 | |||||||
|
| |||||||
| Telecommunications Services (2.1%) | |||||||
| 8,610 | SBA Communications Corporationa | 880,803 | ||||||
| 15,510 | T-Mobile US, Inc.a | 521,446 | ||||||
|
| |||||||
| Total | 1,402,249 | |||||||
|
| |||||||
The accompanying Notes to Financial Statements are an integral part of this schedule.
224
Table of Contents
Partner All Cap Portfolio
Schedule of Investments as of June 30, 2014
(unaudited)
| Shares | Common Stock (99.0%) | Value | ||||||
| Utilities (3.0%) | |||||||
| 4,540 | Atmos Energy Corporation | 242,436 | ||||||
| 13,760 | Duke Energy Corporation | 1,020,854 | ||||||
| 13,060 | Edison International, Inc. | 758,917 | ||||||
|
| |||||||
| Total | 2,022,207 | |||||||
|
| |||||||
Total Common Stock (cost $59,721,622) | 66,150,653 | |||||||
|
| |||||||
Collateral Held for Securities Loaned (0.9%) | ||||||||
| 574,887 | Thrivent Cash Management Trust | 574,887 | ||||||
|
| |||||||
| Total Collateral Held for Securities Loaned (cost $574,887) | 574,887 | |||||||
|
| |||||||
| Shares or Principal Amount | Short-Term Investments (1.2%)c | |||||||
| Thrivent Cash Management Trust | ||||||||
| 792,957 | 0.050% | 792,957 | ||||||
|
| |||||||
Total Short-Term Investments (at amortized cost) | 792,957 | |||||||
|
| |||||||
Total Investments (cost $61,089,466) 101.1% | $ | 67,518,497 | ||||||
|
| |||||||
Other Assets and Liabilities, Net (1.1%) | (714,538 | ) | ||||||
|
| |||||||
Total Net Assets 100.0% | $ | 66,803,959 | ||||||
|
| |||||||
| a | Non-income producing security. |
| b | All or a portion of the security is on loan. |
| c | The interest rate shown reflects the yield, coupon rate or the discount rate at the date of purchase. |
Unrealized Appreciation (Depreciation)
Gross unrealized appreciation and depreciation of investments, based on cost for federal income tax purposes, were as follows:
Gross unrealized appreciation | $ | 6,895,168 | ||
Gross unrealized depreciation | (483,169 | ) | ||
|
| |||
Net unrealized appreciation (depreciation) | $ | 6,411,999 | ||
Cost for federal income tax purposes | $ | 61,106,498 | ||
The accompanying Notes to Financial Statements are an integral part of this schedule.
225
Table of Contents
Partner All Cap Portfolio
Schedule of Investments as of June 30, 2014
(unaudited)
Fair Valuation Measurements
The following table is a summary of the inputs used, as of June 30, 2014, in valuing Partner All Cap Portfolio’s assets carried at fair value.
Investments in Securities | Total | Level 1 | Level 2 | Level 3 | ||||||||||||
Common Stock | ||||||||||||||||
Consumer Discretionary | 8,402,695 | 8,402,695 | — | — | ||||||||||||
Consumer Staples | 5,537,305 | 5,537,305 | — | — | ||||||||||||
Energy | 6,578,604 | 6,578,604 | — | — | ||||||||||||
Financials | 11,451,817 | 11,451,817 | — | — | ||||||||||||
Health Care | 7,877,487 | 7,877,487 | — | — | ||||||||||||
Industrials | 7,690,170 | 7,690,170 | — | — | ||||||||||||
Information Technology | 12,695,908 | 12,695,908 | — | — | ||||||||||||
Materials | 2,492,211 | 2,492,211 | — | — | ||||||||||||
Telecommunications Services | 1,402,249 | 1,402,249 | — | — | ||||||||||||
Utilities | 2,022,207 | 2,022,207 | — | — | ||||||||||||
Collateral Held for Securities Loaned | 574,887 | 574,887 | — | — | ||||||||||||
Short-Term Investments | 792,957 | 792,957 | — | — | ||||||||||||
|
|
|
|
|
|
|
| |||||||||
Total | $ | 67,518,497 | $ | 67,518,497 | $ | — | $ | — | ||||||||
|
|
|
|
|
|
|
| |||||||||
There were no significant transfers between Levels during the period ended June 30, 2014. Transfers between Levels are identified as of the end of the period.
Investment in Affiliates
Affiliated issuers, as defined under the Investment Company Act of 1940, include those in which the Portfolio’s holdings of an issuer represent 5% or more of the outstanding voting securities of an issuer, or any affiliated mutual fund.
A summary of transactions for the fiscal year to date, in Partner All Cap Portfolio, is as follows:
Portfolio | Value December 31, 2013 | Gross Purchases | Gross Sales | Shares Held at June 30, 2014 | Value June 30, 2014 | Income Earned January 1, 2014 - June 30, 2014 | ||||||||||||||||||
Cash Management Trust-Collateral Investment | $ | 431,587 | $ | 4,615,298 | $ | 4,471,998 | 574,887 | $ | 574,887 | $ | 6,344 | |||||||||||||
Cash Management Trust-Short Term Investment | 818,729 | 6,017,186 | 6,042,958 | 792,957 | 792,957 | 292 | ||||||||||||||||||
Total Value and Income Earned | 1,250,316 | 1,367,844 | 6,636 | |||||||||||||||||||||
The accompanying Notes to Financial Statements are an integral part of this schedule.
226
Table of Contents
Schedule of Investments as of June 30, 2014
(unaudited)
| Shares | Common Stock (94.9%) | Value | ||||||
| Consumer Discretionary (19.3%) | |||||||
| 142,954 | Amazon.com, Inc.a | $ | 46,428,600 | |||||
| 45,400 | AutoZone, Inc.a | 24,345,296 | ||||||
| 526,509 | Comcast Corporation | 28,263,003 | ||||||
| 272,700 | Home Depot, Inc. | 22,077,792 | ||||||
| 333,750 | Las Vegas Sands Corporation | 25,438,425 | ||||||
| 353,550 | NIKE, Inc. | 27,417,803 | ||||||
| 238,850 | Starbucks Corporation | 18,482,213 | ||||||
| 481,900 | Twenty-First Century Fox, Inc. | 16,938,785 | ||||||
|
| |||||||
| Total | 209,391,917 | |||||||
|
| |||||||
| Consumer Staples (1.3%) | |||||||
| 119,150 | Anheuser-Busch InBev NV ADR | 13,695,101 | ||||||
|
| |||||||
| Total | 13,695,101 | |||||||
|
| |||||||
| Energy (9.5%) | |||||||
| 179,550 | Cameron International Corporationa | 12,157,331 | ||||||
| 159,400 | EOG Resources, Inc. | 18,627,484 | ||||||
| 299,000 | Marathon Oil Corporation | 11,936,080 | ||||||
| 229,419 | Schlumberger, Ltd. | 27,059,971 | ||||||
| 1,446,251 | Weatherford International, Ltd.a | 33,263,773 | ||||||
|
| |||||||
| Total | 103,044,639 | |||||||
|
| |||||||
| Financials (8.1%) | |||||||
| 362,777 | Citigroup, Inc. | 17,086,797 | ||||||
| 929,500 | Genworth Financial, Inc.a | 16,173,300 | ||||||
| 347,239 | J.P. Morgan Chase & Company | 20,007,911 | ||||||
| 165,700 | Visa, Inc. | 34,914,647 | ||||||
|
| |||||||
| Total | 88,182,655 | |||||||
|
| |||||||
| Health Care (13.6%) | |||||||
| 438,500 | Cerner Corporationa | 22,617,830 | ||||||
| 359,900 | Covidien plc | 32,455,782 | ||||||
| 742,900 | Gilead Sciences, Inc.a | 61,593,839 | ||||||
| 291,800 | Johnson & Johnson | 30,528,116 | ||||||
|
| |||||||
| Total | 147,195,567 | |||||||
|
| |||||||
| Industrials (10.6%) | |||||||
| 210,250 | Boeing Company | 26,750,107 | ||||||
| 890,950 | Delta Air Lines, Inc. | 34,497,584 | ||||||
| 303,550 | Fluor Corporation | 23,342,995 | ||||||
| 307,600 | Union Pacific Corporation | 30,683,100 | ||||||
|
| |||||||
| Total | 115,273,786 | |||||||
|
| |||||||
| Information Technology (30.6%) | |||||||
| 971,307 | Apple, Inc. | 90,263,559 | ||||||
| 762,450 | EMC Corporation | 20,082,933 | ||||||
| 515,100 | Facebook, Inc.a | 34,661,079 | ||||||
| 55,989 | Google, Inc.a | 32,209,352 | ||||||
| 70,289 | Google, Inc., Class Aa | 41,095,870 | ||||||
| 392,902 | NetApp, Inc. | 14,348,781 | ||||||
| 517,250 | QUALCOMM, Inc. | 40,966,200 | ||||||
| 407,350 | Salesforce.com, Inc.a | 23,658,888 | ||||||
| 223,100 | Teradata Corporationa | 8,968,620 | ||||||
| 270,900 | VMware, Inc.a,b | 26,225,829 | ||||||
|
| |||||||
| Total | 332,481,111 | |||||||
|
| |||||||
| Materials (1.9%) | |||||||
| 141,000 | Monsanto Company | 17,588,340 | ||||||
| 142,100 | Teck Resources, Ltd.b | 3,244,143 | ||||||
|
| |||||||
| Total | 20,832,483 | |||||||
|
| |||||||
Total Common Stock (cost $761,536,023) | 1,030,097,259 | |||||||
|
| |||||||
Collateral Held for Securities Loaned (1.2%) | ||||||||
| 13,227,700 | Thrivent Cash Management Trust | 13,227,700 | ||||||
|
| |||||||
Total Collateral Held for Securities Loaned (cost $13,227,700) | 13,227,700 | |||||||
|
| |||||||
| Shares or Principal Amount | Short-Term Investments (5.2%)c | |||||||
| Federal Home Loan Bank Discount Notes | ||||||||
| 2,100,000 | 0.115%, 08/06/2014d | 2,099,799 | ||||||
| 700,000 | 0.060%, 08/08/2014d | 699,956 | ||||||
| 800,000 | 0.100%, 08/15/2014d | 799,900 | ||||||
Thrivent Cash Management Trust | ||||||||
| 53,166,737 | 0.050% | 53,166,737 | ||||||
|
| |||||||
Total Short-Term Investments (at amortized cost) | 56,766,392 | |||||||
|
| |||||||
| Total Investments (cost $831,530,115) 101.3% | $ | 1,100,091,351 | ||||||
|
| |||||||
| Other Assets and Liabilities, Net (1.3%) | (13,953,653 | ) | ||||||
|
| |||||||
| Total Net Assets 100.0% | $ | 1,086,137,698 | ||||||
|
| |||||||
| a | Non-income producing security. |
| b | All or a portion of the security is on loan. |
| c | The interest rate shown reflects the yield, coupon rate or the discount rate at the date of purchase. |
| d | At June 30, 2014, $2,199,789 of investments were held on deposit with the counterparty and pledged as the initial margin deposit for open futures contracts. |
Definitions:
ADR | - | American Depositary Receipt, which are certificates for an underlying foreign security’s shares held by an issuing U.S. depository bank. |
Unrealized Appreciation (Depreciation)
Gross unrealized appreciation and depreciation of investments, based on cost for federal income tax purposes, were as follows:
Gross unrealized appreciation | $ | 273,450,498 | ||
Gross unrealized depreciation | (4,890,446 | ) | ||
|
| |||
Net unrealized appreciation (depreciation) | $ | 268,560,052 | ||
Cost for federal income tax purposes | $ | 831,531,299 | ||
The accompanying Notes to Financial Statements are an integral part of this schedule.
227
Table of Contents
Large Cap Growth Portfolio
Schedule of Investments as of June 30, 2014
(unaudited)
Fair Valuation Measurements
The following table is a summary of the inputs used, as of June 30, 2014, in valuing Large Cap Growth Portfolio’s assets carried at fair value.
Investments in Securities | Total | Level 1 | Level 2 | Level 3 | ||||||||||||
Common Stock | ||||||||||||||||
Consumer Discretionary | 209,391,917 | 209,391,917 | — | — | ||||||||||||
Consumer Staples | 13,695,101 | 13,695,101 | — | — | ||||||||||||
Energy | 103,044,639 | 103,044,639 | — | — | ||||||||||||
Financials | 88,182,655 | 88,182,655 | — | — | ||||||||||||
Health Care | 147,195,567 | 147,195,567 | — | — | ||||||||||||
Industrials | 115,273,786 | 115,273,786 | — | — | ||||||||||||
Information Technology | 332,481,111 | 332,481,111 | — | — | ||||||||||||
Materials | 20,832,483 | 20,832,483 | — | — | ||||||||||||
Collateral Held for Securities Loaned | 13,227,700 | 13,227,700 | — | — | ||||||||||||
Short-Term Investments | 56,766,392 | 53,166,737 | 3,599,655 | — | ||||||||||||
|
|
|
|
|
|
|
| |||||||||
Total | $ | 1,100,091,351 | $ | 1,096,491,696 | $ | 3,599,655 | $ | — | ||||||||
|
|
|
|
|
|
|
| |||||||||
Other Financial Instruments | Total | Level 1 | Level 2 | Level 3 | ||||||||||||
Liability Derivatives | ||||||||||||||||
Futures Contracts | 309,769 | — | 309,769 | — | ||||||||||||
|
|
|
|
|
|
|
| |||||||||
Total Liability Derivatives | $ | 309,769 | $ | — | $ | 309,769 | $ | — | ||||||||
|
|
|
|
|
|
|
| |||||||||
There were no significant transfers between Levels during the period ended June 30, 2014. Transfers between Levels are identified as of the end of the period.
Futures Contracts | Number of Contracts Long/(Short) | Expiration Date | Notional Principal Amount | Value | Unrealized Gain/(Loss) | |||||||||||||||
Eurex EURO STOXX 50 Futures | 582 | September 2014 | $ | 26,026,789 | $ | 25,717,020 | ($ | 309,769 | ) | |||||||||||
Total Futures Contracts | ($ | 309,769 | ) | |||||||||||||||||
The following table summarizes the fair value and Statement of Assets and Liabilities location, as of June 30, 2014, for Large Cap Growth Portfolio’s investments in financial derivative instruments by primary risk exposure as discussed under item (2) Significant Accounting Policies of the Notes to Financial Statements.
Derivatives by risk category | Statement of Assets and Liabilities Location | Fair Value | ||||
Liability Derivatives | ||||||
Equity Contracts | ||||||
Futures* | Net Assets - Net unrealized appreciation/(depreciation) on Futures contracts | $ | 309,769 | |||
Total Equity Contracts | 309,769 | |||||
|
| |||||
Total Liability Derivatives | $ | 309,769 | ||||
|
| |||||
| * | Includes cumulative appreciation/depreciation of futures contracts as reported in the Schedule of Investments. Only current day’s variation margin is reported within the Statement of Assets and Liabilities. |
The following table summarizes the net realized gains/(losses) and Statement of Operations location, for the period ended June 30, 2014, for Large Cap Growth Portfolio’s investments in financial derivative instruments by primary risk exposure.
Derivatives by risk category | Statement of Operations Location | Realized Gains/(Losses) recognized in Income | ||||
Equity Contracts | ||||||
Futures | Net realized gains/(losses) on Futures contracts | 3,234,991 | ||||
Total Equity Contracts | 3,234,991 | |||||
|
| |||||
Total | $ | 3,234,991 | ||||
|
| |||||
The accompanying Notes to Financial Statements are an integral part of this schedule.
228
Table of Contents
Large Cap Growth Portfolio
Schedule of Investments as of June 30, 2014
(unaudited)
The following table summarizes the change in net unrealized appreciation/(depreciation) and Statement of Operations location, for the period ended June 30, 2014, for Large Cap Growth Portfolio’s investments in financial derivative instruments by primary risk exposure.
Derivatives by risk category | Statement of Operations Location | Change in unrealized appreciation/(depreciation) recognized in Income | ||||
Equity Contracts | ||||||
Futures | Change in net unrealized appreciation/(depreciation) on Futures contracts | (1,539,140 | ) | |||
Total Equity Contracts | (1,539,140 | ) | ||||
|
| |||||
Total | ($ | 1,539,140 | ) | |||
|
| |||||
The following table presents Large Cap Growth Portfolio’s average volume of derivative activity during the period ended June 30, 2014.
Derivative Risk Category | Futures (Notional*) | Futures (Percentage of Average Net Assets) | ||||||
Equity Contracts | $ | 26,741,764 | 2.5 | % | ||||
| * | Notional amount represents long or short, or both, derivative positions held by the Portfolio. |
Investment in Affiliates
Affiliated issuers, as defined under the Investment Company Act of 1940, include those in which the Portfolio’s holdings of an issuer represent 5% or more of the outstanding voting securities of an issuer, or any affiliated mutual fund.
A summary of transactions for the fiscal year to date, in Large Cap Growth Portfolio, is as follows:
Portfolio | Value December 31, 2013 | Gross Purchases | Gross Sales | Shares Held at June 30, 2014 | Value June 30, 2014 | Income Earned January 1, 2014 - June 30, 2014 | ||||||||||||||||||
Cash Management Trust-Collateral Investment | $ | 3,392,112 | $ | 111,543,638 | $ | 101,708,050 | 13,227,700 | $ | 13,227,700 | $ | 5,030 | |||||||||||||
Cash Management Trust-Short Term Investment | 43,932,944 | 76,380,243 | 67,146,450 | 53,166,737 | 53,166,737 | 12,156 | ||||||||||||||||||
Total Value and Income Earned | 47,325,056 | 66,394,437 | 17,186 | |||||||||||||||||||||
The accompanying Notes to Financial Statements are an integral part of this schedule.
229
Table of Contents
Partner Growth Stock Portfolio
Schedule of Investments as of June 30, 2014
(unaudited)
| Shares | Common Stock (99.2%) | Value | ||||||
| Consumer Discretionary (28.7%) | |||||||
| 10,680 | Amazon.com, Inc.a | $ | 3,468,650 | |||||
| 1,600 | AutoZone, Inc.a | 857,984 | ||||||
| 12,900 | CarMax, Inc.a | 670,929 | ||||||
| 1,100 | Charter Communications, Inc.a | 174,218 | ||||||
| 1,200 | Chipotle Mexican Grill, Inc.a | 711,012 | ||||||
| 9,500 | Ctrip.com International, Ltd. ADRa | 608,380 | ||||||
| 12,700 | D.R. Horton, Inc. | 312,166 | ||||||
| 8,600 | Delphi Automotive plc | 591,164 | ||||||
| 3,400 | Dollar Tree, Inc.a | 185,164 | ||||||
| 3,900 | Hanesbrands, Inc. | 383,916 | ||||||
| 4,300 | Harley-Davidson, Inc. | 300,355 | ||||||
| 9,900 | Home Depot, Inc. | 801,504 | ||||||
| 12,900 | Las Vegas Sands Corporation | 983,238 | ||||||
| 7,200 | Lennar Corporation | 302,256 | ||||||
| 20,200 | Lowe’s Companies, Inc. | 969,398 | ||||||
| 24,100 | MGM Resorts Internationala | 636,240 | ||||||
| 1,900 | Netflix, Inc.a | 837,140 | ||||||
| 5,400 | NIKE, Inc. | 418,770 | ||||||
| 2,190 | Priceline Group, Inc.a | 2,634,570 | ||||||
| 5,900 | Ross Stores, Inc. | 390,167 | ||||||
| 4,600 | Sherwin-Williams Company | 951,786 | ||||||
| 15,200 | Starbucks Corporation | 1,176,176 | ||||||
| 4,800 | Starwood Hotels & Resorts Worldwide, Inc. | 387,936 | ||||||
| 2,100 | Tesla Motors, Inc.a,b | 504,127 | ||||||
| 10,000 | Tractor Supply Company | 604,000 | ||||||
| 18,700 | Twenty-First Century Fox, Inc. | 657,305 | ||||||
| 4,300 | Under Armour, Inc.a | 255,807 | ||||||
| 1,700 | Vipshop Holdings, Ltd.a | 319,158 | ||||||
| 7,300 | Walt Disney Company | 625,902 | ||||||
| 98,800 | Wynn Macau, Ltd. | 386,967 | ||||||
| 3,500 | Wynn Resorts, Ltd. | 726,460 | ||||||
|
| |||||||
| Total | 22,832,845 | |||||||
|
| |||||||
| Consumer Staples (3.3%) | |||||||
| 3,900 | Costco Wholesale Corporation | 449,124 | ||||||
| 10,700 | CVS Caremark Corporation | 806,459 | ||||||
| 4,400 | Estee Lauder Companies, Inc. | 326,744 | ||||||
| 2,658 | Nestle SA | 205,960 | ||||||
| 8,700 | PepsiCo, Inc. | 777,258 | ||||||
| 2,700 | Whole Foods Market, Inc. | 104,301 | ||||||
|
| |||||||
| Total | 2,669,846 | |||||||
|
| |||||||
| Energy (3.7%) | |||||||
| 3,100 | Concho Resources, Inc.a | 447,950 | ||||||
| 1,700 | Continental Resources, Inc.a,b | 268,668 | ||||||
| 4,700 | EQT Corporation | 502,430 | ||||||
| 4,600 | Pioneer Natural Resources Company | 1,057,126 | ||||||
| 7,725 | Range Resources Corporation | 671,688 | ||||||
|
| |||||||
| Total | 2,947,862 | |||||||
|
| |||||||
| Financials (10.6%) | |||||||
| 7,900 | American Express Company | 749,473 | ||||||
| 17,000 | American Tower Corporation | 1,529,660 | ||||||
| 1,300 | BlackRock, Inc. | 415,480 | ||||||
| 21,400 | Crown Castle International Corporation | 1,589,164 | ||||||
| 1,700 | Intercontinental Exchange, Inc. | 321,130 | ||||||
| 9,800 | Invesco, Ltd. | 369,950 | ||||||
| 14,600 | Morgan Stanley | 472,018 | ||||||
| 6,200 | State Street Corporation | 417,012 | ||||||
| 13,600 | TD Ameritrade Holding Corporation | 426,360 | ||||||
| 10,100 | Visa, Inc. | 2,128,171 | ||||||
|
| |||||||
| Total | 8,418,418 | |||||||
|
| |||||||
| Health Care (15.3%) | |||||||
| 5,200 | Alexion Pharmaceuticals, Inc.a | 812,500 | ||||||
| 4,200 | Allergan, Inc. | 710,724 | ||||||
| 5,200 | Biogen Idec, Inc.a | 1,639,612 | ||||||
| 9,200 | Celgene Corporationa | 790,096 | ||||||
| 28,700 | Gilead Sciences, Inc.a | 2,379,517 | ||||||
| 3,500 | Humana, Inc. | 447,020 | ||||||
| 2,100 | IDEXX Laboratories, Inc.a | 280,497 | ||||||
| 5,800 | Incyte Corporationa | 327,352 | ||||||
| 1,400 | Intuitive Surgical, Inc.a | 576,520 | ||||||
| 8,800 | McKesson Corporation | 1,638,648 | ||||||
| 2,800 | Pharmacyclics, Inc.a | 251,188 | ||||||
| 1,000 | Regeneron Pharmaceuticals, Inc.a | 282,470 | ||||||
| 6,700 | UnitedHealth Group, Inc. | 547,725 | ||||||
| 7,400 | Valeant Pharmaceuticals International, Inc.a | 933,288 | ||||||
| 5,700 | Vertex Pharmaceuticals, Inc.a | 539,676 | ||||||
|
| |||||||
| Total | 12,156,833 | |||||||
|
| |||||||
| Industrials (13.7%) | |||||||
| 9,100 | Boeing Company | 1,157,793 | ||||||
| 19,800 | Danaher Corporation | 1,558,854 | ||||||
| 8,300 | Delta Air Lines, Inc. | 321,376 | ||||||
| 3,900 | Fastenal Companyb | 193,011 | ||||||
| 3,100 | FedEx Corporation | 469,278 | ||||||
| 2,300 | Flowserve Corporation | 171,005 | ||||||
| 2,800 | JB Hunt Transport Services, Inc. | 206,584 | ||||||
| 6,200 | Kansas City Southern | 666,562 | ||||||
| 6,500 | Precision Castparts Corporation | 1,640,600 | ||||||
| 5,400 | Roper Industries, Inc. | 788,454 | ||||||
| 12,600 | Tyco International, Ltd. | 574,560 | ||||||
| 1,400 | Union Pacific Corporation | 139,650 | ||||||
| 8,700 | United Continental Holdings, Inc.a | 357,309 | ||||||
| 7,100 | United Technologies Corporation | 819,695 | ||||||
| 24,600 | US Airways Group, Inc.a | 1,056,816 | ||||||
| 1,200 | W.W. Grainger, Inc. | 305,124 | ||||||
| 5,900 | Wabtec Corporation | 487,281 | ||||||
|
| |||||||
| Total | 10,913,952 | |||||||
|
| |||||||
| Information Technology (20.8%) | |||||||
| 4,800 | Akamai Technologies, Inc.a | 293,088 | ||||||
| 15,200 | Apple, Inc. | 1,412,536 | ||||||
| 6,300 | ASML Holding NVb | 587,601 | ||||||
| 5,700 | Baidu.com, Inc. ADRa | 1,064,817 | ||||||
| 8,400 | Cognizant Technology Solutions Corporationa | 410,844 | ||||||
| 16,500 | Facebook, Inc.a | 1,110,285 | ||||||
| 5,200 | Fiserv, Inc.a | 313,664 | ||||||
| 4,290 | Google, Inc.a | 2,467,951 | ||||||
| 4,230 | Google, Inc., Class Aa | 2,473,154 | ||||||
| 3,000 | LinkedIn Corporationa | 514,410 | ||||||
| 22,900 | MasterCard, Inc. | 1,682,463 | ||||||
| 473 | NAVER Corporation | 389,736 | ||||||
| 3,400 | NetSuite, Inc.a,b | 295,392 | ||||||
| 2,500 | QUALCOMM, Inc. | 198,000 | ||||||
| 8,200 | Red Hat, Inc.a | 453,214 | ||||||
| 17,700 | Salesforce.com, Inc.a | 1,028,016 | ||||||
The accompanying Notes to Financial Statements are an integral part of this schedule.
230
Table of Contents
Partner Growth Stock Portfolio
Schedule of Investments as of June 30, 2014
(unaudited)
| Shares | Common Stock (99.2%) | Value | ||||||
| Information Technology (20.8%) - continued | |||||||
| 6,100 | ServiceNow, Inc.a | $ | 377,956 | |||||
| 4,000 | Stratasys, Ltd.a | 454,520 | ||||||
| 21,000 | Tencent Holdings, Ltd. | 319,474 | ||||||
| 4,200 | VMware, Inc.a | 406,602 | ||||||
| 3,000 | Workday, Inc.a | 269,580 | ||||||
|
| |||||||
| Total | 16,523,303 | |||||||
|
| |||||||
| Materials (2.1%) | |||||||
| 7,800 | Ecolab, Inc. | 868,452 | ||||||
| 500 | FMC Corporation | 35,595 | ||||||
| 1,900 | Martin Marietta Materials, Inc.b | 250,895 | ||||||
| 3,900 | Praxair, Inc. | 518,076 | ||||||
|
| |||||||
| Total | 1,673,018 | |||||||
|
| |||||||
| Telecommunications Services (1.0%) | |||||||
| 10,400 | Softbank Corporation | 775,039 | ||||||
|
| |||||||
| Total | 775,039 | |||||||
|
| |||||||
Total Common Stock (cost $45,274,983) | 78,911,116 | |||||||
|
| |||||||
Preferred Stock (0.1%) | ||||||||
| Consumer Discretionary (0.1%) | |||||||
| 981 | AirBNB, Inc.a,c | 120,066 | ||||||
|
| |||||||
| Total | 120,066 | |||||||
|
| |||||||
| Information Technology (<0.1%) | |||||||
| 4,432 | LivingSocial.com, Convertiblea,c | 2,039 | ||||||
|
| |||||||
| Total | 2,039 | |||||||
|
| |||||||
Total Preferred Stock (cost $153,901) | 122,105 | |||||||
|
| |||||||
Collateral Held for Securities Loaned (2.6%) | ||||||||
| 2,055,325 | Thrivent Cash Management Trust | 2,055,325 | ||||||
|
| |||||||
Total Collateral Held for Securities Loaned (cost $2,055,325) | 2,055,325 | |||||||
|
| |||||||
| Shares or Principal Amount | Short-Term Investments (0.6%)d | |||||||
| Thrivent Cash Management Trust | ||||||||
| 484,650 | 0.050% | 484,650 | ||||||
|
| |||||||
| Total Short-Term Investments (at amortized cost) | 484,650 | |||||||
|
| |||||||
| Total Investments (cost $47,968,859) 102.5% | $ | 81,573,196 | ||||||
|
| |||||||
| Other Assets and Liabilities, Net (2.5%) | (2,024,528 | ) | ||||||
|
| |||||||
| Total Net Assets 100.0% | $ | 79,548,668 | ||||||
|
| |||||||
| a | Non-income producing security. |
| b | All or a portion of the security is on loan. |
| c | Security is fair valued. |
| d | The interest rate shown reflects the yield, coupon rate or the discount rate at the date of purchase. |
Definitions:
ADR | - | American Depositary Receipt, which are certificates for an underlying foreign security’s shares held by an issuing U.S. depository bank. |
Unrealized Appreciation (Depreciation)
Gross unrealized appreciation and depreciation of investments, based on cost for federal income tax purposes, were as follows:
Gross unrealized appreciation | $ | 33,643,744 | ||
Gross unrealized depreciation | (114,766 | ) | ||
|
| |||
Net unrealized appreciation (depreciation) | $ | 33,528,978 | ||
Cost for federal income tax purposes | $ | 48,044,218 | ||
The accompanying Notes to Financial Statements are an integral part of this schedule.
231
Table of Contents
Partner Growth Stock Portfolio
Schedule of Investments as of June 30, 2014
(unaudited)
Fair Valuation Measurements
The following table is a summary of the inputs used, as of June 30, 2014, in valuing Partner Growth Stock Portfolio’s assets carried at fair value.
Investments in Securities | Total | Level 1 | Level 2 | Level 3 | ||||||||||||
Common Stock | ||||||||||||||||
Consumer Discretionary | 22,832,845 | 22,445,878 | 386,967 | — | ||||||||||||
Consumer Staples | 2,669,846 | 2,463,886 | 205,960 | — | ||||||||||||
Energy | 2,947,862 | 2,947,862 | — | — | ||||||||||||
Financials | 8,418,418 | 8,418,418 | — | — | ||||||||||||
Health Care | 12,156,833 | 12,156,833 | — | — | ||||||||||||
Industrials | 10,913,952 | 10,913,952 | — | — | ||||||||||||
Information Technology | 16,523,303 | 15,814,093 | 709,210 | — | ||||||||||||
Materials | 1,673,018 | 1,673,018 | — | — | ||||||||||||
Telecommunications Services | 775,039 | — | 775,039 | — | ||||||||||||
Preferred Stock | ||||||||||||||||
Consumer Discretionary | 120,066 | — | — | 120,066 | ||||||||||||
Information Technology | 2,039 | — | — | 2,039 | ||||||||||||
Collateral Held for Securities Loaned | 2,055,325 | 2,055,325 | — | — | ||||||||||||
Short-Term Investments | 484,650 | 484,650 | — | — | ||||||||||||
|
|
|
|
|
|
|
| |||||||||
Total | $ | 81,573,196 | $ | 79,373,915 | $ | 2,077,176 | $ | 122,105 | ||||||||
|
|
|
|
|
|
|
| |||||||||
There were no significant transfers between Levels during the period ended June 30, 2014. Transfers between Levels are identified as of the end of the period.
Investment in Affiliates
Affiliated issuers, as defined under the Investment Company Act of 1940, include those in which the Portfolio’s holdings of an issuer represent 5% or more of the outstanding voting securities of an issuer, or any affiliated mutual fund.
A summary of transactions for the fiscal year to date, in Partner Growth Stock Portfolio, is as follows:
Portfolio | Value December 31, 2013 | Gross Purchases | Gross Sales | Shares Held at June 30, 2014 | Value June 30, 2014 | Income Earned January 1, 2014 - June 30, 2014 | ||||||||||||||||||
Cash Management Trust-Collateral Investment | $ | 1,711,975 | $ | 10,958,898 | $ | 10,615,548 | 2,055,325 | $ | 2,055,325 | $ | 1,500 | |||||||||||||
Cash Management Trust-Short Term Investment | 724,634 | 6,468,610 | 6,708,594 | 484,650 | 484,650 | 228 | ||||||||||||||||||
Total Value and Income Earned | 2,436,609 | 2,539,975 | 1,728 | |||||||||||||||||||||
The accompanying Notes to Financial Statements are an integral part of this schedule.
232
Table of Contents
Schedule of Investments as of June 30, 2014
(unaudited)
| Shares | Common Stock (98.7%) | Value | ||||||
| Consumer Discretionary (9.6%) | |||||||
| 168,080 | CBS Corporation | $ | 10,444,491 | |||||
| 359,840 | Delphi Automotive plc | 24,735,402 | ||||||
| 654,100 | Lowe’s Companies, Inc. | 31,390,259 | ||||||
| 615,080 | News Corporation | 21,054,188 | ||||||
| 176,110 | Time Warner Cable, Inc. | 25,941,003 | ||||||
|
| |||||||
| Total | 113,565,343 | |||||||
|
| |||||||
| Consumer Staples (7.2%) | |||||||
| 416,070 | CVS Caremark Corporation | 31,359,196 | ||||||
| 110,500 | Kimberly-Clark Corporation | 12,289,810 | ||||||
| 111,787 | Kraft Foods Group, Inc. | 6,701,631 | ||||||
| 489,572 | Mondelez International, Inc. | 18,412,803 | ||||||
| 124,109 | Philip Morris International, Inc. | 10,463,630 | ||||||
| 66,500 | Wal-Mart Stores, Inc. | 4,992,155 | ||||||
|
| |||||||
| Total | 84,219,225 | |||||||
|
| |||||||
| Energy (14.6%) | |||||||
| 279,400 | Cameron International Corporationa | 18,918,174 | ||||||
| 144,375 | Chevron Corporation | 18,848,156 | ||||||
| 214,138 | EOG Resources, Inc. | 25,024,167 | ||||||
| 205,922 | EQT Corporation | 22,013,062 | ||||||
| 639,751 | Marathon Oil Corporation | 25,538,860 | ||||||
| 221,650 | Schlumberger, Ltd. | 26,143,617 | ||||||
| 499,700 | Total SA ADRb | 36,078,340 | ||||||
|
| |||||||
| Total | 172,564,376 | |||||||
|
| |||||||
| Financials (22.3%) | |||||||
| 153,180 | ACE, Ltd. | 15,884,766 | ||||||
| 221,660 | Allstate Corporation | 13,015,875 | ||||||
| 2,074,990 | Bank of America Corporation | 31,892,596 | ||||||
| 379,900 | Blackstone Group, LPa | 12,703,856 | ||||||
| 856,150 | Citigroup, Inc. | 40,324,665 | ||||||
| 285,000 | Comerica, Inc. | 14,295,600 | ||||||
| 284,433 | Deutsche Bank AGb | 10,006,353 | ||||||
| 498,503 | Genworth Financial, Inc.a | 8,673,952 | ||||||
| 562,960 | Invesco, Ltd. | 21,251,740 | ||||||
| 703,520 | MetLife, Inc. | 39,087,571 | ||||||
| 763,360 | Morgan Stanley | 24,679,429 | ||||||
| 82,980 | State Street Corporation | 5,581,235 | ||||||
| 104,159 | SVB Financial Groupa | 12,147,023 | ||||||
| 261,389 | Wells Fargo & Company | 13,738,606 | ||||||
|
| |||||||
| Total | 263,283,267 | |||||||
|
| |||||||
| Health Care (13.7%) | |||||||
| 50,600 | Amgen, Inc. | 5,989,522 | ||||||
| 358,790 | Baxter International, Inc. | 25,940,517 | ||||||
| 234,090 | Covidien plc | 21,110,236 | ||||||
| 172,300 | Express Scripts Holding Companya | 11,945,559 | ||||||
| 161,785 | Johnson & Johnson | 16,925,947 | ||||||
| 751,700 | Merck & Company, Inc. | 43,485,845 | ||||||
| 580,800 | Pfizer, Inc. | 17,238,144 | ||||||
| 225,347 | UnitedHealth Group, Inc. | 18,422,117 | ||||||
|
| |||||||
| Total | 161,057,887 | |||||||
|
| |||||||
| Industrials (9.0%) | |||||||
| 98,100 | Boeing Company | 12,481,263 | ||||||
| 751,200 | CSX Corporation | 23,144,472 | ||||||
| 151,400 | Fluor Corporation | 11,642,660 | ||||||
| 203,840 | Honeywell International, Inc. | 18,946,928 | ||||||
| 261,800 | Ingersoll-Rand plc | 16,365,118 | ||||||
| 206,600 | Jacobs Engineering Group, Inc.a | 11,007,648 | ||||||
| 180,440 | Pentair, Ltd. | 13,013,333 | ||||||
|
| |||||||
| Total | 106,601,422 | |||||||
|
| |||||||
| Information Technology (13.3%) | |||||||
| 1,833,790 | Cisco Systems, Inc. | 45,569,681 | ||||||
| 483,660 | Microsoft Corporation | 20,168,622 | ||||||
| 392,380 | NetApp, Inc. | 14,329,718 | ||||||
| 539,500 | Oracle Corporation | 21,865,935 | ||||||
| 246,180 | Symantec Corporation | 5,637,522 | ||||||
| 351,000 | Teradata Corporationa | 14,110,200 | ||||||
| 490,190 | Texas Instruments, Inc. | 23,426,180 | ||||||
| 248,650 | Xilinx, Inc. | 11,763,632 | ||||||
|
| |||||||
| Total | 156,871,490 | |||||||
|
| |||||||
| Materials (3.1%) | |||||||
| 188,000 | Celanese Corporation | 12,084,640 | ||||||
| 282,980 | Dow Chemical Company | 14,562,151 | ||||||
| 210,540 | Nucor Corporation | 10,369,095 | ||||||
|
| |||||||
| Total | 37,015,886 | |||||||
|
| |||||||
| Telecommunications Services (1.9%) | |||||||
| 464,714 | Verizon Communications, Inc. | 22,738,456 | ||||||
|
| |||||||
| Total | 22,738,456 | |||||||
|
| |||||||
| Utilities (4.0%) | |||||||
| 429,790 | NiSource, Inc. | 16,907,939 | ||||||
| 615,880 | PG&E Corporation | 29,574,557 | ||||||
|
| |||||||
| Total | 46,482,496 | |||||||
|
| |||||||
Total Common Stock (cost $828,535,773) | 1,164,399,848 | |||||||
|
| |||||||
Collateral Held for Securities Loaned (3.4%) | ||||||||
| 40,273,125 | Thrivent Cash Management Trust | 40,273,125 | ||||||
|
| |||||||
Total Collateral Held for Securities Loaned (cost $40,273,125) | 40,273,125 | |||||||
|
| |||||||
| Shares or Principal Amount | Short-Term Investments (1.1%)c | |||||||
| 12,252,694 | Thrivent Cash Management Trust | 12,252,694 | ||||||
|
| |||||||
| Total Short-Term Investments (at amortized cost) | 12,252,694 | |||||||
|
| |||||||
Total Investments (cost $881,061,592) 103.2% | $ | 1,216,925,667 | ||||||
|
| |||||||
| Other Assets and Liabilities, Net (3.2%) | (37,169,078 | ) | ||||||
|
| |||||||
| Total Net Assets 100.0% | $ | 1,179,756,589 | ||||||
|
| |||||||
| a | Non-income producing security. |
| b | All or a portion of the security is on loan. |
| c | The interest rate shown reflects the yield, coupon rate or the discount rate at the date of purchase. |
The accompanying Notes to Financial Statements are an integral part of this schedule.
233
Table of Contents
Large Cap Value Portfolio
Schedule of Investments as of June 30, 2014
(unaudited)
Definitions:
| ADR | - | American Depositary Receipt, which are certificates for an underlying foreign security’s shares held by an issuing U.S. depository bank. |
Unrealized Appreciation (Depreciation)
Gross unrealized appreciation and depreciation of investments, based on cost for federal income tax purposes, were as follows:
Gross unrealized appreciation | $ | 341,418,399 | ||
Gross unrealized depreciation | (5,959,686 | ) | ||
|
| |||
Net unrealized appreciation (depreciation) | $ | 335,458,713 | ||
Cost for federal income tax purposes | $ | 881,466,954 | ||
Fair Valuation Measurements
The following table is a summary of the inputs used, as of June 30, 2014, in valuing Large Cap Value Portfolio’s assets carried at fair value.
Investments in Securities | Total | Level 1 | Level 2 | Level 3 | ||||||||||||
Common Stock | ||||||||||||||||
Consumer Discretionary | 113,565,343 | 113,565,343 | — | — | ||||||||||||
Consumer Staples | 84,219,225 | 84,219,225 | — | — | ||||||||||||
Energy | 172,564,376 | 172,564,376 | — | — | ||||||||||||
Financials | 263,283,267 | 263,283,267 | — | — | ||||||||||||
Health Care | 161,057,887 | 161,057,887 | — | — | ||||||||||||
Industrials | 106,601,422 | 106,601,422 | — | — | ||||||||||||
Information Technology | 156,871,490 | 156,871,490 | — | — | ||||||||||||
Materials | 37,015,886 | 37,015,886 | — | — | ||||||||||||
Telecommunications Services | 22,738,456 | 22,738,456 | — | — | ||||||||||||
Utilities | 46,482,496 | 46,482,496 | — | — | ||||||||||||
Collateral Held for Securities Loaned | 40,273,125 | 40,273,125 | — | — | ||||||||||||
Short-Term Investments | 12,252,694 | 12,252,694 | — | — | ||||||||||||
|
|
|
|
|
|
|
| |||||||||
Total | $ | 1,216,925,667 | $ | 1,216,925,667 | $ | — | $ | — | ||||||||
|
|
|
|
|
|
|
| |||||||||
There were no significant transfers between Levels during the period ended June 30, 2014. Transfers between Levels are identified as of the end of the period.
Investment in Affiliates
Affiliated issuers, as defined under the Investment Company Act of 1940, include those in which the Portfolio’s holdings of an issuer represent 5% or more of the outstanding voting securities of an issuer, or any affiliated mutual fund.
A summary of transactions for the fiscal year to date, in Large Cap Value Portfolio, is as follows:
Portfolio | Value December 31, 2013 | Gross Purchases | Gross Sales | Shares Held at June 30, 2014 | Value June 30, 2014 | Income Earned January 1, 2014 - June 30, 2014 | ||||||||||||||||||
Cash Management Trust-Collateral Investment | $ | 11,313,000 | $ | 163,927,450 | $ | 134,967,325 | 40,273,125 | $ | 40,273,125 | $ | 38,557 | |||||||||||||
Cash Management Trust-Short Term Investment | 26,006,398 | 17,562,668 | 31,316,372 | 12,252,694 | 12,252,694 | 4,623 | ||||||||||||||||||
Total Value and Income Earned | 37,319,398 | 52,525,819 | 43,180 | |||||||||||||||||||||
The accompanying Notes to Financial Statements are an integral part of this schedule.
234
Table of Contents
Schedule of Investments as of June 30, 2014
(unaudited)
| Shares | Common Stock (93.5%) | Value | ||||||
| Consumer Discretionary (12.1%) | |||||||
| 19,400 | Alpine Electronics, Inc. | $ | 273,600 | |||||
| 41,942 | Amazon.com, Inc.a | 13,621,923 | ||||||
| 30,900 | Aoyama Trading Company, Ltd. | 846,205 | ||||||
| 27,850 | AutoZone, Inc.a | 14,934,284 | ||||||
| 7,800 | Bayerische Motoren Werke AG | 746,790 | ||||||
| 8,100 | Bridgestone Corporationb | 283,690 | ||||||
| 270,250 | Comcast Corporation | 14,507,020 | �� | |||||
| 6,900 | Continental AG | 1,595,355 | ||||||
| 9,500 | Crown Resorts, Ltd. | 135,408 | ||||||
| 1,500 | Daimler AG | 140,122 | ||||||
| 49,900 | EDION Corporation | 346,405 | ||||||
| 241,277 | Esprit Holdings, Ltd. | 342,405 | ||||||
| 6,700 | Exedy Corporation | 199,414 | ||||||
| 8,378 | Faurecia | 316,136 | ||||||
| 3,100 | Flight Centre Travel Group, Ltd. | 129,902 | ||||||
| 400 | Forbo Holding AG | 426,477 | ||||||
| 84,500 | Halfords Group plc | 683,550 | ||||||
| 73,400 | Haseko Corporation | 590,620 | ||||||
| 247,300 | Home Retail Group plc | 747,230 | ||||||
| 28,400 | Honda Motor Company, Ltd.b | 991,011 | ||||||
| 134,800 | ITV plc | 410,794 | ||||||
| 49,100 | JB Hi-Fi, Ltd. | 848,976 | ||||||
| 26,000 | JM AB | 963,637 | ||||||
| 800 | Kuoni Reisen Holding AG | 309,605 | ||||||
| 146,775 | Las Vegas Sands Corporation | 11,187,191 | ||||||
| 388,000 | Li & Fung, Ltd. | 574,706 | ||||||
| 284,000 | Luk Fook Holdings International, Ltd. | 832,807 | ||||||
| 13,800 | Next plc | 1,527,695 | ||||||
| 27,300 | Persimmon plc | 594,582 | ||||||
| 48,500 | Peugeot SAa | 717,589 | ||||||
| 17,800 | Publicis Groupe SAb | 1,508,665 | ||||||
| 1,600 | Rinnai Corporation | 154,464 | ||||||
| 5,300 | RTL Group SA | 588,277 | ||||||
| 3,500 | SA D’Ieteren NV | 146,612 | ||||||
| 240,300 | Samsonite International SA | 792,125 | ||||||
| 114,000 | Seiko Holdings Corporation | 463,196 | ||||||
| 20,000 | Sekisui House, Ltd. | 274,450 | ||||||
| 50,200 | SHOWA Corporation | 611,589 | ||||||
| 36,609 | Slater & Gordon, Ltd. | 178,302 | ||||||
| 139,500 | Starbucks Corporation | 10,794,510 | ||||||
| 76,700 | Sumitomo Forestry Company, Ltd. | 936,479 | ||||||
| 11,100 | Suzuki Motor Corporation | 348,225 | ||||||
| 414,550 | Twenty-First Century Fox, Inc. | 14,571,433 | ||||||
| 800 | Valora Holding AG | 206,745 | ||||||
| 1,800 | Volkswagen AG | 471,450 | ||||||
| 24,600 | WH Smith plc | 450,149 | ||||||
| 4,800 | Wolters Kluwer NV | 142,183 | ||||||
| 6,600 | WPP plc | 143,826 | ||||||
| 214,000 | Wynn Macau, Ltd. | 838,167 | ||||||
|
| |||||||
| Total | 103,445,976 | |||||||
|
| |||||||
| Consumer Staples (8.3%) | ||||||||
| 3,100 | AarhusKarlshamn AB | 207,135 | ||||||
| 122,700 | Anheuser-Busch InBev NV ADR | 14,103,138 | ||||||
| 11,500 | Asahi Group Holdings, Ltd. | 361,134 | ||||||
| 46,500 | Britvic plc | 578,897 | ||||||
| 3,900 | Carrefour SA | 143,809 | ||||||
| 8,400 | Casino Guichard Perrachon SA | 1,113,674 | ||||||
| 106,350 | CVS Caremark Corporation | 8,015,599 | ||||||
| 67,400 | Greencore Group plc | 306,364 | ||||||
| 3,500 | Henkel AG & Company KGaA | 351,980 | ||||||
| 3,300 | Imperial Tobacco Group plc | 148,460 | ||||||
| 10,500 | Kerry Group plc | 784,588 | ||||||
| 16,100 | Kesko Oyj | 636,207 | ||||||
| 171,900 | Kimberly-Clark Corporation | 19,118,718 | ||||||
| 15,815 | Koninklijke Ahold NV | 296,549 | ||||||
| 7,100 | KOSE Corporation | 271,358 | ||||||
| 9,900 | Matsumotokiyoshi Holdings | |||||||
| Company, Ltd. | 342,666 | |||||||
| 7,900 | Nestle SA | 612,147 | ||||||
| 116,400 | Parmalat SPA | 398,148 | ||||||
| 181,725 | Philip Morris International, Inc. | 15,321,235 | ||||||
| 5,100 | Rallye SA | 278,254 | ||||||
| 25,300 | Reckitt Benckiser Group plc | 2,206,026 | ||||||
| 20,510 | SalMar ASA | 357,910 | ||||||
| 8,100 | Suedzucker AGb | 163,562 | ||||||
| 51,700 | Wal-Mart Stores, Inc. | 3,881,119 | ||||||
| 353,000 | Wilmar International, Ltd. | 903,630 | ||||||
|
| |||||||
| Total | 70,902,307 | |||||||
|
| |||||||
| Energy (10.8%) | ||||||||
| 164,900 | BP plc | 1,452,089 | ||||||
| 110,100 | Cameron International Corporationa | 7,454,871 | ||||||
| 10,100 | CAT Oil AG | 258,871 | ||||||
| 1,000 | Delek Group, Ltd. | 413,650 | ||||||
| 24,600 | Eni SPA | 672,802 | ||||||
| 14,900 | Ensco plc | 827,993 | ||||||
| 87,890 | EOG Resources, Inc. | 10,270,825 | ||||||
| 20,900 | ERG SPA | 322,529 | ||||||
| 396,200 | Marathon Oil Corporation | 15,816,304 | ||||||
| 45,500 | Neste Oil Oyj | 887,820 | ||||||
| 10,600 | Origin Energy, Ltd. | 146,106 | ||||||
| 90,297 | Royal Dutch Shell plc | 3,728,372 | ||||||
| 632 | Royal Dutch Shell plc, Class A | 26,116 | ||||||
| 60,600 | Royal Dutch Shell plc, Class B | 2,633,669 | ||||||
| 5,400 | Saipem SPAa | 145,601 | ||||||
| 101,685 | Schlumberger, Ltd. | 11,993,746 | ||||||
| 21,200 | Showa Shell Sekiyu KK | 240,980 | ||||||
| 13,800 | Total SA | 998,426 | ||||||
| 108,800 | Total SA ADRb | 7,855,360 | ||||||
| 1,102,650 | Weatherford International, Ltd.a | 25,360,950 | ||||||
| 9,600 | Woodside Petroleum, Ltd. | 372,206 | ||||||
|
| |||||||
| Total | 91,879,286 | |||||||
|
| |||||||
| Financials (15.3%) | ||||||||
| 101,080 | ACE, Ltd. | 10,481,996 | ||||||
| 10,000 | Allianz SE | 1,669,139 | ||||||
| 18,600 | Amlin plc | 148,875 | ||||||
| 69,200 | Assicurazioni Generali SPA | 1,515,516 | ||||||
| 77,500 | Aviva plc | 676,167 | ||||||
| 11,700 | AXA SA | 279,552 | ||||||
| 58,400 | Bank Leumi Le-Israel BMa | 227,618 | ||||||
| 241,884 | Bank of America Corporation | 3,717,757 | ||||||
| 4,100 | Bank of Georgia Holdings plc | 164,876 | ||||||
| 196,250 | Blackstone Group, LPa | 6,562,600 | ||||||
| 16,400 | Catlin Group, Ltd. | 150,079 | ||||||
| 110,100 | Challenger, Ltd. | 772,316 | ||||||
| 320,830 | Citigroup, Inc. | 15,111,093 | ||||||
| 11,800 | CNP Assurances | 244,908 | ||||||
| 136,900 | Comerica, Inc. | 6,866,904 | ||||||
| 34,500 | Commonwealth Bank of Australia | 2,631,255 | ||||||
| 51,466 | Credit Agricole SA | 726,641 | ||||||
| 12,900 | Daito Trust Construction Company, Ltd. | 1,516,899 | ||||||
| 110,000 | Daiwa Securities Group, Inc. | 953,070 | ||||||
The accompanying Notes to Financial Statements are an integral part of this schedule.
235
Table of Contents
Large Cap Stock Portfolio
Schedule of Investments as of June 30, 2014
(unaudited)
| Shares | Common Stock (93.5%) | Value | ||||||
| Financials (15.3%) - continued | |||||||
| 131,200 | Deutsche Bank AG | $ | 4,615,616 | |||||
| 19,900 | EXOR SPA | 816,348 | ||||||
| 52,900 | FlexiGroup, Ltd. | 158,052 | ||||||
| 48,788 | Friends Life Group, Ltd. | 263,074 | ||||||
| 380,200 | Genworth Financial, Inc.a | 6,615,480 | ||||||
| 3,900 | Grupo Catalana Occidente SA | 141,568 | ||||||
| 1,600 | Hannover Rueckversicherung SE | 144,082 | ||||||
| 200 | Helvetia Holding AG | 91,824 | ||||||
| 25,801 | Hiscox, Ltd. | 312,180 | ||||||
| 117,200 | Intermediate Capital Group plc | 782,276 | ||||||
| 281,810 | Invesco, Ltd. | 10,638,328 | ||||||
| 2,500 | iShares MSCI EAFE Index Fund | 170,925 | ||||||
| 107,500 | Israel Discount Bank, Ltd.a | 181,992 | ||||||
| 366,199 | J.P. Morgan Chase & Company | 21,100,386 | ||||||
| 171,500 | Mizuho Financial Group, Inc. | 352,519 | ||||||
| 3,800 | Muenchener Rueckversicherungs-Gesellschaft AG | 841,504 | ||||||
| 4,600 | National Australia Bank, Ltd. | 142,181 | ||||||
| 50,700 | Natixis | 325,388 | ||||||
| 26,900 | NKSJ Holdings, Inc. | 724,824 | ||||||
| 48,600 | Old Mutual plc | 164,241 | ||||||
| 58,000 | Oversea-Chinese Banking Corporation, Ltd. | 444,867 | ||||||
| 30,700 | Paragon Group of Companies plc | 184,803 | ||||||
| 40,100 | Phoenix Group Holdings | 445,391 | ||||||
| 7,500 | Sampo Oyj | 379,143 | ||||||
| 3,200 | Schweizerische National-Versicherungs-Gesellschaft AG | 220,117 | ||||||
| 4,800 | SCOR SE | 165,278 | ||||||
| 107,431 | State Street Corporation | 7,225,809 | ||||||
| 74,472 | Storebrand ASAa | 418,975 | ||||||
| 600 | Swiss Life Holding AGa | 142,225 | ||||||
| 62,600 | UnipolSai Assicurazioni SPA | 201,097 | ||||||
| 84,817 | United Overseas Bank, Ltd. | 1,533,723 | ||||||
| 222,173 | Wells Fargo & Company | 11,677,413 | ||||||
| 67,900 | Westpac Banking Corporation | 2,171,862 | ||||||
| 8,600 | Zurich Insurance Group AGa | 2,590,202 | ||||||
|
| |||||||
| Total | 130,800,954 | |||||||
|
| |||||||
| Health Care (12.4%) | ||||||||
| 11,600 | Actelion, Ltd. | 1,468,209 | ||||||
| 28,800 | Amgen, Inc. | 3,409,056 | ||||||
| 66,820 | Baxter International, Inc. | 4,831,086 | ||||||
| 126,100 | Cerner Corporationa | 6,504,238 | ||||||
| 79,160 | Covidien plc | 7,138,649 | ||||||
| 182,709 | Gilead Sciences, Inc.a | 15,148,403 | ||||||
| 100,420 | GlaxoSmithKline plc | 2,673,688 | ||||||
| 2,600 | Grifols SA | 142,064 | ||||||
| 17,600 | H. Lundbeck AS | 433,143 | ||||||
| 16,100 | Hikma Pharmaceuticals plc | 462,097 | ||||||
| 17,900 | ICON plca | 843,269 | ||||||
| 203,050 | Johnson & Johnson | 21,243,091 | ||||||
| 7,000 | Kaken Pharmaceutical Company, Ltd. | 148,123 | ||||||
| 412,280 | Merck & Company, Inc. | 23,850,398 | ||||||
| 33,600 | Novartis AG | 3,042,762 | ||||||
| 426,450 | Pfizer, Inc. | 12,657,036 | ||||||
| 2,900 | Roche Holding AG | 864,075 | ||||||
| 15,200 | Shire plc | 1,192,329 | ||||||
| 2,800 | Teva Pharmaceutical Industries, Ltd. | 147,092 | ||||||
| 6,600 | Zeria Pharmaceutical Company, Ltd. | 157,516 | ||||||
|
| |||||||
| Total | 106,356,324 | |||||||
|
| |||||||
| Industrials (9.9%) | ||||||||
| 4,500 | Actividades de Construccion y Servicios SA | 205,966 | ||||||
| 2,800 | Adecco SA | 230,423 | ||||||
| 8,500 | Aica Kogyo Company, Ltd. | 181,657 | ||||||
| 114,665 | Air New Zealand, Ltd. | 208,782 | ||||||
| 16,432 | Arcadis NV | 566,271 | ||||||
| 2,800 | Assa Abloy AB | 142,425 | ||||||
| 20,900 | BAE Systems plc | 154,800 | ||||||
| 51,200 | Berendsen plc | 857,496 | ||||||
| 27,300 | Bodycote plc | 321,207 | ||||||
| 126,150 | Boeing Company | 16,050,064 | ||||||
| 1,200 | Bucher Industries AG | 411,771 | ||||||
| 24,100 | Cardno, Ltd.b | 143,554 | ||||||
| 33,647 | Caterpillar, Inc. | 3,656,419 | ||||||
| 40,600 | Daifuku Company, Ltd. | 569,423 | ||||||
| 307,750 | Delta Air Lines, Inc. | 11,916,080 | ||||||
| 27,800 | Deutsche Lufthansa AG | 596,784 | ||||||
| 5,400 | DKSH Holding AG | 410,276 | ||||||
| 36,300 | Downer EDI, Ltd. | 154,919 | ||||||
| 4,400 | Duerr AG | 389,558 | ||||||
| 10,300 | Elbit Systems, Ltd. | 633,613 | ||||||
| 58,942 | Fluor Corporation | 4,532,640 | ||||||
| 800 | Georg Fischer AGa | 572,589 | ||||||
| 6,100 | Go-Ahead Group plc | 247,180 | ||||||
| 80,000 | Hanwa Company, Ltd. | 346,510 | ||||||
| 20,300 | Hino Motors, Ltd. | 280,066 | ||||||
| 7,400 | Hoshizaki Electric Company, Ltd. | 369,357 | ||||||
| 4,200 | Implenia AG | 282,715 | ||||||
| 30,500 | Intrum Justitia AB | 909,724 | ||||||
| 70,600 | ITOCHU Corporation | 906,348 | ||||||
| 107,327 | Jacobs Engineering Group, Inc.a | 5,718,383 | ||||||
| 2,000 | Jardine Matheson Holdings, Ltd. | 118,690 | ||||||
| 42,000 | Kajima Corporation | 185,778 | ||||||
| 6,200 | Kanamoto Company, Ltd. | 247,248 | ||||||
| 26,000 | Kandenko Company, Ltd. | 151,192 | ||||||
| 14,500 | Keller Group plc | 228,357 | ||||||
| 24,000 | Kinden Corporation | 233,540 | ||||||
| 18,400 | Komatsu, Ltd. | 427,124 | ||||||
| 3,500 | KONE Oyj | 145,936 | ||||||
| 22,800 | Legrand SA | 1,395,068 | ||||||
| 14,200 | Leighton Holdings, Ltd. | 263,659 | ||||||
| 28,200 | Mineral Resources, Ltd. | 255,240 | ||||||
| 74,600 | Mitie Group plc | 406,904 | ||||||
| 113,000 | Mitsui Engineering & Shipbuilding Company, Ltd. | 253,778 | ||||||
| 19,600 | Monadelphous Group, Ltd.b | 290,233 | ||||||
| 22,000 | NICHIAS Corporation | 151,668 | ||||||
| 15,400 | Nitto Kogyo Corporation | 339,019 | ||||||
| 59,194 | Northgate plc | 531,501 | ||||||
| 115,000 | NTN Corporation | 503,052 | ||||||
| 7,616 | Osterreichische Post AG | 378,297 | ||||||
| 17,168 | Randstad Holding NV | 930,663 | ||||||
| 12,200 | Safran SA | 798,670 | ||||||
| 19,850 | Seaspan Corporationb | 464,689 | ||||||
| 12,300 | Securitas AB | 145,844 | ||||||
| 25,000 | Seino Holdings Company, Ltd. | 283,942 | ||||||
| 25,800 | Seven Group Holdings, Ltd. | 180,348 | ||||||
| 18,000 | ShinMaywa Industries, Ltd. | 158,958 | ||||||
| 18,200 | Siemens AG | 2,403,021 | ||||||
The accompanying Notes to Financial Statements are an integral part of this schedule.
236
Table of Contents
Large Cap Stock Portfolio
Schedule of Investments as of June 30, 2014
(unaudited)
| Shares | Common Stock (93.5%) | Value | ||||||
| Industrials (9.9%) - continued | |||||||
| 10,100 | Teleperformance SA | $ | 618,745 | |||||
| 73,000 | Toppan Printing Company, Ltd. | 564,456 | ||||||
| 12,000 | TOTO, Ltd. | 161,832 | ||||||
| 220,800 | Transpacific Industries Group, Ltd.a | 211,286 | ||||||
| 5,400 | Travis Perkins plc | 151,228 | ||||||
| 189,550 | Union Pacific Corporation | 18,907,613 | ||||||
| 5,000 | Wolseley plc | 273,904 | ||||||
| 6,500 | WS Atkins plc | 146,617 | ||||||
|
| |||||||
| Total | 84,875,100 | |||||||
|
| |||||||
| Information Technology (17.5%) | ||||||||
| 395,388 | Apple, Inc. | 36,743,407 | ||||||
| 16,900 | Ascom Holding AG | 286,628 | ||||||
| 310,534 | Blinkx plca | 336,646 | ||||||
| 2,000 | Cap Gemini SA | 142,728 | ||||||
| 21,600 | Carsales.com, Ltd. | 215,713 | ||||||
| 25,000 | Check Point Software Technologies, Ltd.a,b | 1,675,750 | ||||||
| 201,700 | Cisco Systems, Inc. | 5,012,245 | ||||||
| 14,500 | CSR plc | 146,838 | ||||||
| 18,444 | Dialog Semiconductor plca | 638,199 | ||||||
| 16,800 | Econocom Group | 159,317 | ||||||
| 113,600 | Electrocomponents plc | 510,502 | ||||||
| 504,250 | EMC Corporation | 13,281,945 | ||||||
| 9,400 | F@N Communications, Inc. | 154,489 | ||||||
| 101,825 | Facebook, Inc.a | 6,851,804 | ||||||
| 48,700 | FUJIFILM Holdings NPV | 1,359,246 | ||||||
| 19,194 | Google, Inc.a | 11,041,924 | ||||||
| 19,194 | Google, Inc., Class Aa | 11,222,156 | ||||||
| 60,000 | Hitachi Kokusai Electric, Inc. | 831,380 | ||||||
| 5,300 | Hoya Corporation | 176,213 | ||||||
| 21,300 | Indra Sistemas SA | 380,344 | ||||||
| 11,600 | Infineon Technologies AG | 144,805 | ||||||
| 900 | Keyence Corporation | 393,559 | ||||||
| 24,750 | Kulicke and Soffa Industries, Inc.a | 352,935 | ||||||
| 11,800 | NEC Networks & System Integration Corporation | 287,936 | ||||||
| 194,800 | NetApp, Inc. | 7,114,096 | ||||||
| 6,600 | Nice-Systems, Ltd. | 270,106 | ||||||
| 5,400 | NTT Data Corporation | 207,665 | ||||||
| 15,400 | NXP Semiconductors NVa | 1,019,172 | ||||||
| 5,200 | OBIC Company, Ltd. | 171,496 | ||||||
| 289,000 | Oki Electric Industry Company, Ltd. | 642,624 | ||||||
| 8,800 | OMRON Corporation | 371,092 | ||||||
| 41,200 | Optimal Payments plca | 282,037 | ||||||
| 51,200 | Pace plc | 310,969 | ||||||
| 13,000 | Playtech plc | 136,969 | ||||||
| 172,981 | QUALCOMM, Inc. | 13,700,095 | ||||||
| 116,400 | Salesforce.com, Inc.a | 6,760,512 | ||||||
| 1,800 | SAP AG ADR | 138,699 | ||||||
| 27,300 | Seiko Epson Corporation | 1,161,457 | ||||||
| 3,700 | Spectris plc | 140,595 | ||||||
| 177,100 | Symantec Corporation | 4,055,590 | ||||||
| 20,400 | TE Connectivity, Ltd. | 1,261,536 | ||||||
| 140,800 | Teradata Corporationa | 5,660,160 | ||||||
| 13,000 | ULVAC, Inc.a | 277,119 | ||||||
| 93,105 | VMware, Inc.a | 9,013,495 | ||||||
| 31,000 | VTech Holdings, Ltd.b | 411,979 | ||||||
| 9,600 | Wincor Nixdorf AG | 546,734 | ||||||
| 70,720 | Xilinx, Inc. | 3,345,763 | ||||||
|
| |||||||
| Total | 149,346,669 | |||||||
|
| |||||||
| Materials (2.9%) | ||||||||
| 661,833 | Arrium, Ltd. | 497,847 | ||||||
| 5,500 | BHP Billiton plc | 178,799 | ||||||
| 147,000 | Celanese Corporation | 9,449,160 | ||||||
| 159,750 | Dow Chemical Company | 8,220,735 | ||||||
| 52,400 | Ence Energia y Celulosa SAa | 136,854 | ||||||
| 3,900 | Holmen AB | 139,574 | ||||||
| 8,000 | Mondi plc | 145,238 | ||||||
| 110,700 | Nippon Light Metal Holdings Company, Ltd. | 168,615 | ||||||
| 12,000 | Nippon Paint Company, Ltd. | 254,080 | ||||||
| 149,000 | Oji Holdings Corporation | 613,137 | ||||||
| 8,100 | Rio Tinto plc | 437,351 | ||||||
| 6,300 | Smurfit Kappa Group plc | 144,194 | ||||||
| 22,500 | Stora Enso Oyj | 218,748 | ||||||
| 30,000 | Sumitomo Metal Mining Company, Ltd. | 489,659 | ||||||
| 132,000 | Sumitomo Osaka Cement Company, Ltd. | 502,068 | ||||||
| 119,000 | Taiheiyo Cement Corporation | 479,813 | ||||||
| 51,000 | Toagosei Company, Ltd. | 229,629 | ||||||
| 50,000 | Tokuyama Corporation | 159,001 | ||||||
| 196,000 | Tosoh Corporation | 950,632 | ||||||
| 37,800 | UPM-Kymmene Oyj | 645,683 | ||||||
| 20,900 | Voestalpine AGb | 996,368 | ||||||
|
| |||||||
| Total | 25,057,185 | |||||||
|
| |||||||
| Telecommunications Services (1.0%) | ||||||||
| 572,400 | Bezeq Israel Telecommunication Corporation, Ltd. | 1,071,298 | ||||||
| 104,600 | BT Group plc | 687,330 | ||||||
| 34,500 | Elisa Oyj | 1,055,361 | ||||||
| 26,700 | Freenet AG | 847,919 | ||||||
| 9,400 | KDDI Corporation | 573,528 | ||||||
| 28,500 | Nippon Telegraph & Telephone Corporation | 1,776,344 | ||||||
| 82,000 | Singapore Telecommunications, Ltd. | 253,437 | ||||||
| 200 | Swisscom AG | 116,175 | ||||||
| 656,400 | Telecom Italia SPAa | 830,807 | ||||||
| 88,300 | Telstra Corporation, Ltd. | 433,798 | ||||||
| 303,090 | Vodafone Group plc | 1,013,006 | ||||||
|
| |||||||
| Total | 8,659,003 | |||||||
|
| |||||||
| Utilities (3.3%) | ||||||||
| 10,000 | AGL Energy, Ltd. | 146,070 | ||||||
| 25,900 | Centrica plc | 138,399 | ||||||
| 175,300 | Electricidade de Portugal SA | 879,588 | ||||||
| 11,300 | Electricite de Franceb | 355,813 | ||||||
| 3,700 | Endesa SA | 143,067 | ||||||
| 252,100 | Enel SPA | 1,466,375 | ||||||
| 40,000 | Fortum Oyj | 1,074,079 | ||||||
| 14,300 | Gas Natural SDG SAb | 451,783 | ||||||
| 316,080 | NiSource, Inc. | 12,434,587 | ||||||
| 220,800 | PG&E Corporation | 10,602,816 | ||||||
| 1,700 | Red Electrica Corporacion SAb | 155,401 | ||||||
|
| |||||||
| Total | 27,847,978 | |||||||
|
| |||||||
| Total Common Stock (cost $659,271,858) | 799,170,782 | |||||||
|
| |||||||
The accompanying Notes to Financial Statements are an integral part of this schedule.
237
Table of Contents
Large Cap Stock Portfolio
Schedule of Investments as of June 30, 2014
(unaudited)
| Shares | Preferred Stock (<0.1%) | Value | ||||||
| Consumer Staples (<0.1%) | ||||||||
| 1,600 | Henkel AG & Company KGaA | $ | 184,852 | |||||
|
| |||||||
| Total | 184,852 | |||||||
|
| |||||||
| Total Preferred Stock (cost $178,733) | 184,852 | |||||||
|
| |||||||
Collateral Held for Securities Loaned (1.7%) | ||||||||
| 14,482,831 | Thrivent Cash Management Trust | 14,482,831 | ||||||
|
| |||||||
| Total Collateral Held for Securities Loaned (cost $14,482,831) | 14,482,831 | |||||||
|
| |||||||
| Shares or Principal Amount | Short-Term Investments (6.2%)c | |||||||
| Federal Home Loan Bank Discount Notes | ||||||||
| 7,100,000 | 0.095%, 07/25/2014d | 7,099,550 | ||||||
| Thrivent Cash Management Trust | ||||||||
| 45,397,060 | 0.050% | 45,397,060 | ||||||
|
| |||||||
| Total Short-Term Investments (at amortized cost) | 52,496,610 | |||||||
|
| |||||||
| Total Investments (cost $726,430,032) 101.4% | $ | 866,335,075 | ||||||
|
| |||||||
| Other Assets and Liabilities, Net (1.4%) | (11,902,930 | ) | ||||||
|
| |||||||
| Total Net Assets 100.0% | $ | 854,432,145 | ||||||
|
| |||||||
| a | Non-income producing security. |
| b | All or a portion of the security is on loan. |
| c | The interest rate shown reflects the yield, coupon rate or the discount rate at the date of purchase. |
| d | At June 30, 2014, $2,999,810 of investments were held on deposit with the counterparty and pledged as the initial margin deposit for open futures contracts. |
Definitions:
| ADR - | American Depositary Receipt, which are certificates for an underlying foreign security’s shares held by an issuing U.S. depository bank. |
Unrealized Appreciation (Depreciation)
Gross unrealized appreciation and depreciation of investments, based on cost for federal income tax purposes, were as follows:
Gross unrealized appreciation | $ | 145,284,298 | ||
Gross unrealized depreciation | (7,839,030 | ) | ||
|
| |||
Net unrealized appreciation (depreciation) | $ | 137,445,268 | ||
Cost for federal income tax purposes | $ | 728,889,807 | ||
The accompanying Notes to Financial Statements are an integral part of this schedule.
238
Table of Contents
Large Cap Stock Portfolio
Schedule of Investments as of June 30, 2014
(unaudited)
Fair Valuation Measurements
The following table is a summary of the inputs used, as of June 30, 2014, in valuing Large Cap Stock Portfolio’s assets carried at fair value.
Investments in Securities | Total | Level 1 | Level 2 | Level 3 | ||||||||||||
Common Stock | ||||||||||||||||
Consumer Discretionary | 103,445,976 | 79,616,361 | 23,829,615 | — | ||||||||||||
Consumer Staples | 70,902,307 | 60,439,809 | 10,462,498 | — | ||||||||||||
Energy | 91,879,286 | 79,580,049 | 12,299,237 | — | ||||||||||||
Financials | 130,800,954 | 104,784,307 | 26,016,647 | — | ||||||||||||
Health Care | 106,356,324 | 95,625,226 | 10,731,098 | — | ||||||||||||
Industrials | 84,875,100 | 61,245,888 | 23,629,212 | — | ||||||||||||
Information Technology | 149,346,669 | 138,112,585 | 11,234,084 | — | ||||||||||||
Materials | 25,057,185 | 17,669,895 | 7,387,290 | — | ||||||||||||
Telecommunications Services | 8,659,003 | — | 8,659,003 | — | ||||||||||||
Utilities | 27,847,978 | 23,037,403 | 4,810,575 | — | ||||||||||||
Preferred Stock | ||||||||||||||||
Consumer Staples | 184,852 | — | 184,852 | — | ||||||||||||
Collateral Held for Securities Loaned | 14,482,831 | 14,482,831 | — | — | ||||||||||||
Short-Term Investments | 52,496,610 | 45,397,060 | 7,099,550 | — | ||||||||||||
|
|
|
|
|
|
|
| |||||||||
Total | $ | 866,335,075 | $ | 719,991,414 | $ | 146,343,661 | $ | — | ||||||||
|
|
|
|
|
|
|
| |||||||||
Other Financial Instruments | Total | Level 1 | Level 2 | Level 3 | ||||||||||||
Liability Derivatives | ||||||||||||||||
Futures Contracts | 394,865 | — | 394,865 | — | ||||||||||||
|
|
|
|
|
|
|
| |||||||||
Total Liability Derivatives | $ | 394,865 | $ | — | $ | 394,865 | $ | — | ||||||||
|
|
|
|
|
|
|
| |||||||||
There were no significant transfers between Levels during the period ended June 30, 2014. Transfers between Levels are identified as of the end of the period.
Futures Contracts | Number of Contracts Long/(Short) | Expiration Date | Notional Principal Amount | Value | Unrealized Gain/(Loss) | |||||||||||||||
Eurex EURO STOXX 50 Futures | 747 | September 2014 | $ | 33,402,793 | $ | 33,007,928 | ($ | 394,865 | ) | |||||||||||
Total Futures Contracts | �� | ($ | 394,865 | ) | ||||||||||||||||
The following table summarizes the fair value and Statement of Assets and Liabilities location, as of June 30, 2014, for Large Cap Stock Portfolio’s investments in financial derivative instruments by primary risk exposure as discussed under item (2) Significant Accounting Policies of the Notes to Financial Statements.
Derivatives by risk category | Statement of Assets and Liabilities Location | Fair Value | ||||
Liability Derivatives | ||||||
Equity Contracts | ||||||
Futures* | Net Assets - Net unrealized appreciation/(depreciation) on Futures contracts | $ | 394,865 | |||
Total Equity Contracts | 394,865 | |||||
|
| |||||
Total Liability Derivatives | $ | 394,865 | ||||
|
| |||||
| * | Includes cumulative appreciation/depreciation of futures contracts as reported in the Schedule of Investments. Only current day’s variation margin is reported within the Statement of Assets and Liabilities. |
The following table summarizes the net realized gains/(losses) and Statement of Operations location, for the period ended June 30, 2014, for Large Cap Stock Portfolio’s investments in financial derivative instruments by primary risk exposure.
Derivatives by risk category | Statement of Operations Location | Realized Gains/(Losses) recognized in Income | ||||
Equity Contracts | ||||||
Futures | Net realized gains/(losses) on Futures contracts | 5,371,196 | ||||
Total Equity Contracts | 5,371,196 | |||||
|
| |||||
Total | $ | 5,371,196 | ||||
|
| |||||
The accompanying Notes to Financial Statements are an integral part of this schedule.
239
Table of Contents
Large Cap Stock Portfolio
Schedule of Investments as of June 30, 2014
(unaudited)
The following table summarizes the change in net unrealized appreciation/(depreciation) and Statement of Operations location, for the period ended June 30, 2014, for Large Cap Stock Portfolio’s investments in financial derivative instruments by primary risk exposure.
Derivatives by risk category | Statement of Operations Location | Change in unrealized appreciation/(depreciation) recognized in Income | ||||
Equity Contracts | ||||||
Futures | Change in net unrealized appreciation/(depreciation) on Futures contracts | (2,283,490 | ) | |||
Total Equity Contracts | (2,283,490 | ) | ||||
|
| |||||
Total | ($ | 2,283,490 | ) | |||
|
| |||||
The following table presents Large Cap Stock Portfolio’s average volume of derivative activity during the period ended June 30, 2014.
Derivative Risk Category | Futures (Notional)* | Futures (Percentage of Average Net Assets) | ||||||
Equity Contracts | $ | 34,802,691 | 4.2 | % | ||||
| * | Notional amount represents long or short, or both, derivative positions held by the Portfolio. |
Investment in Affiliates
Affiliated issuers, as defined under the Investment Company Act of 1940, include those in which the Portfolio’s holdings of an issuer represent 5% or more of the outstanding voting securities of an issuer, or any affiliated mutual fund.
A summary of transactions for the fiscal year to date, in Large Cap Stock Portfolio, is as follows:
Portfolio | Value December 31, 2013 | Gross Purchases | Gross Sales | Shares Held at June 30, 2014 | Value June 30, 2014 | Income Earned January 1, 2014 - June 30, 2014 | ||||||||||||||||||
Cash Management Trust-Collateral Investment | $ | — | $ | 55,752,904 | $ | 41,270,073 | 14,482,831 | $ | 14,482,831 | $ | 26,128 | |||||||||||||
Cash Management Trust-Short Term Investment | 51,163,767 | 65,320,361 | 71,087,068 | 45,397,060 | 45,397,060 | 10,726 | ||||||||||||||||||
Total Value and Income Earned | 51,163,767 | 59,879,891 | 36,854 | |||||||||||||||||||||
The accompanying Notes to Financial Statements are an integral part of this schedule.
240
Table of Contents
Large Cap Index Portfolio
Schedule of Investments as of June 30, 2014
(unaudited)
| Shares | Common Stock (98.3%) | Value | ||||||
| Consumer Discretionary (11.7%) | |||||||
| 8,800 | Amazon.com, Inc.a | $ | 2,858,064 | |||||
| 1,500 | AutoNation, Inc.a | 89,520 | ||||||
| 800 | AutoZone, Inc.a | 428,992 | ||||||
| 4,800 | Bed Bath & Beyond, Inc.a | 275,424 | ||||||
| 6,525 | Best Buy Company, Inc. | 202,340 | ||||||
| 5,400 | BorgWarner, Inc. | 352,026 | ||||||
| 5,050 | Cablevision Systems Corporationb | 89,133 | ||||||
| 5,250 | CarMax, Inc.a | 273,053 | ||||||
| 10,300 | Carnival Corporation | 387,795 | ||||||
| 12,572 | CBS Corporation | 781,224 | ||||||
| 700 | Chipotle Mexican Grill, Inc.a | 414,757 | ||||||
| 6,500 | Coach, Inc. | 222,235 | ||||||
| 61,415 | Comcast Corporation | 3,296,757 | ||||||
| 6,700 | D.R. Horton, Inc. | 164,686 | ||||||
| 3,100 | Darden Restaurants, Inc. | 143,437 | ||||||
| 6,550 | Delphi Automotive plc | 450,247 | ||||||
| 11,050 | DIRECTVa | 939,361 | ||||||
| 5,200 | Discovery Communications, Inc.a | 386,256 | ||||||
| 7,150 | Dollar General Corporationa | 410,124 | ||||||
| 4,900 | Dollar Tree, Inc.a | 266,854 | ||||||
| 2,450 | Expedia, Inc. | 192,962 | ||||||
| 2,250 | Family Dollar Stores, Inc. | 148,815 | ||||||
| 93,011 | Ford Motor Company | 1,603,510 | ||||||
| 1,150 | Fossil, Inc.a | 120,198 | ||||||
| 5,300 | Gannett Company, Inc. | 165,943 | ||||||
| 6,162 | Gap, Inc. | 256,154 | ||||||
| 2,850 | Garmin, Ltd. | 173,565 | ||||||
| 30,988 | General Motors Company | 1,124,864 | ||||||
| 3,600 | Genuine Parts Company | 316,080 | ||||||
| 6,500 | Goodyear Tire & Rubber Company | 180,570 | ||||||
| 70 | Graham Holdings Company | 50,268 | ||||||
| 6,400 | H&R Block, Inc. | 214,528 | ||||||
| 5,150 | Harley-Davidson, Inc. | 359,727 | ||||||
| 1,600 | Harman International Industries, Inc. | 171,888 | ||||||
| 2,700 | Hasbro, Inc.b | 143,235 | ||||||
| 32,250 | Home Depot, Inc. | 2,610,960 | ||||||
| 9,967 | Interpublic Group of Companies, Inc. | 194,456 | ||||||
| 15,650 | Johnson Controls, Inc. | 781,404 | ||||||
| 4,600 | Kohl’s Corporation | 242,328 | ||||||
| 3,300 | Leggett & Platt, Inc.b | 113,124 | ||||||
| 4,150 | Lennar Corporation | 174,217 | ||||||
| 5,754 | Limited Brands, Inc. | 337,530 | ||||||
| 23,600 | Lowe’s Companies, Inc. | 1,132,564 | ||||||
| 8,518 | Macy’s, Inc. | 494,214 | ||||||
| 5,206 | Marriott International, Inc. | 333,705 | ||||||
| 7,950 | Mattel, Inc. | 309,811 | ||||||
| 23,300 | McDonald’s Corporation | 2,347,242 | ||||||
| 4,200 | Michael Kors Holdings, Ltd.a | 372,330 | ||||||
| 1,400 | Mohawk Industries, Inc.a | 193,676 | ||||||
| 1,400 | Netflix, Inc.a | 616,840 | ||||||
| 6,573 | Newell Rubbermaid, Inc. | 203,697 | ||||||
| 11,725 | News Corporationa | 210,347 | ||||||
| 17,400 | NIKE, Inc. | 1,349,370 | ||||||
| 3,350 | Nordstrom, Inc. | 227,565 | ||||||
| 6,100 | Omnicom Group, Inc. | 434,442 | ||||||
| 2,500 | O’Reilly Automotive, Inc.a | 376,500 | ||||||
| 2,350 | PetSmart, Inc. | 140,530 | ||||||
| 1,200 | Priceline Group, Inc.a | 1,443,600 | ||||||
| 8,042 | Pulte Group, Inc. | 162,127 | ||||||
| 1,900 | PVH Corporation | 221,540 | ||||||
| 1,400 | Ralph Lauren Corporation | 224,966 | ||||||
| 5,050 | Ross Stores, Inc. | 333,956 | ||||||
| 2,550 | Scripps Networks Interactive, Inc. | 206,907 | ||||||
| 2,000 | Sherwin-Williams Company | 413,820 | ||||||
| 1,400 | Snap-On, Inc. | 165,928 | ||||||
| 15,275 | Staples, Inc. | 165,581 | ||||||
| 17,750 | Starbucks Corporation | 1,373,495 | ||||||
| 4,500 | Starwood Hotels & Resorts Worldwide, Inc. | 363,690 | ||||||
| 14,950 | Target Corporation | 866,353 | ||||||
| 2,600 | Tiffany & Company | 260,650 | ||||||
| 6,558 | Time Warner Cable, Inc. | 965,993 | ||||||
| 20,900 | Time Warner, Inc. | 1,468,225 | ||||||
| 16,600 | TJX Companies, Inc. | 882,290 | ||||||
| 3,300 | Tractor Supply Company | 199,320 | ||||||
| 2,600 | TripAdvisor, Inc.a | 282,516 | ||||||
| 45,100 | Twenty-First Century Fox, Inc. | 1,585,265 | ||||||
| 3,800 | Under Armour, Inc.a | 226,062 | ||||||
| 2,400 | Urban Outfitters, Inc.a | 81,264 | ||||||
| 8,150 | VF Corporation | 513,450 | ||||||
| 9,222 | Viacom, Inc. | 799,824 | ||||||
| 38,097 | Walt Disney Company | 3,266,437 | ||||||
| 1,857 | Whirlpool Corporation | 258,532 | ||||||
| 3,022 | Wyndham Worldwide Corporation | 228,826 | ||||||
| 1,900 | Wynn Resorts, Ltd. | 394,364 | ||||||
| 10,430 | Yum! Brands, Inc. | 846,916 | ||||||
|
| |||||||
| Total | 49,053,341 | |||||||
|
| |||||||
| Consumer Staples (9.4%) | ||||||||
| 47,000 | Altria Group, Inc. | 1,971,180 | ||||||
| 15,418 | Archer-Daniels-Midland Company | 680,088 | ||||||
| 10,250 | Avon Products, Inc. | 149,752 | ||||||
| 3,787 | Brown-Forman Corporation | 356,622 | ||||||
| 4,200 | Campbell Soup Company | 192,402 | ||||||
| 3,050 | Clorox Company | 278,770 | ||||||
| 89,500 | Coca-Cola Company | 3,791,220 | ||||||
| 5,550 | Coca-Cola Enterprises, Inc. | 265,179 | ||||||
| 20,550 | Colgate-Palmolive Company | 1,401,099 | ||||||
| 9,900 | ConAgra Foods, Inc. | 293,832 | ||||||
| 3,950 | Constellation Brands, Inc.a | 348,113 | ||||||
| 10,350 | Costco Wholesale Corporation | 1,191,906 | ||||||
| 27,694 | CVS Caremark Corporation | 2,087,297 | ||||||
| 4,650 | Dr Pepper Snapple Group, Inc. | 272,397 | ||||||
| 6,000 | Estee Lauder Companies, Inc. | 445,560 | ||||||
| 14,550 | General Mills, Inc. | 764,457 | ||||||
| 3,000 | Green Mountain Coffee Roasters, Inc. | 373,830 | ||||||
| 3,500 | Hershey Company | 340,795 | ||||||
| 3,200 | Hormel Foods Corporation | 157,920 | ||||||
| 2,451 | J.M. Smucker Company | 261,203 | ||||||
| 6,000 | Kellogg Company | 394,200 | ||||||
| 8,892 | Kimberly-Clark Corporation | 988,968 | ||||||
| 14,117 | Kraft Foods Group, Inc. | 846,314 | ||||||
| 12,100 | Kroger Company | 598,103 | ||||||
| 8,600 | Lorillard, Inc. | 524,342 | ||||||
| 3,100 | McCormick & Company, Inc. | 221,929 | ||||||
| 4,778 | Mead Johnson Nutrition Company | 445,166 | ||||||
| 3,750 | Molson Coors Brewing Company | 278,100 | ||||||
| 40,002 | Mondelez International, Inc. | 1,504,475 | ||||||
| 3,200 | Monster Beverage Corporationa | 227,296 | ||||||
| 35,780 | PepsiCo, Inc. | 3,196,585 | ||||||
| 37,150 | Philip Morris International, Inc. | 3,132,117 | ||||||
| 63,888 | Procter & Gamble Company | 5,020,958 | ||||||
The accompanying Notes to Financial Statements are an integral part of this schedule.
241
Table of Contents
Large Cap Index Portfolio
Schedule of Investments as of June 30, 2014
(unaudited)
| Shares | Common Stock (98.3%) | Value | ||||||
| Consumer Staples (9.4%) - continued | |||||||
| 7,350 | Reynolds American, Inc. | $ | 443,573 | |||||
| 5,450 | Safeway, Inc. | 187,153 | ||||||
| 13,750 | Sysco Corporation | 514,938 | ||||||
| 6,500 | Tyson Foods, Inc. | 244,010 | ||||||
| 20,600 | Walgreen Company | 1,527,078 | ||||||
| 38,150 | Wal-Mart Stores, Inc. | 2,863,921 | ||||||
| 8,700 | Whole Foods Market, Inc. | 336,081 | ||||||
|
| |||||||
| Total | 39,118,929 | |||||||
|
| |||||||
| Energy (10.6%) | ||||||||
| 11,872 | Anadarko Petroleum Corporation | 1,299,628 | ||||||
| 9,070 | Apache Corporation | 912,623 | ||||||
| 10,283 | Baker Hughes, Inc. | 765,569 | ||||||
| 9,900 | Cabot Oil & Gas Corporation | 337,986 | ||||||
| 4,800 | Cameron International Corporationa | 325,008 | ||||||
| 11,950 | Chesapeake Energy Corporation | 371,406 | ||||||
| 44,846 | Chevron Corporation | 5,854,645 | ||||||
| 2,050 | Cimarex Energy Company | 294,093 | ||||||
| 28,799 | ConocoPhillips | 2,468,938 | ||||||
| 5,350 | Consol Energy, Inc. | 246,475 | ||||||
| 8,300 | Denbury Resources, Inc. | 153,218 | ||||||
| 9,000 | Devon Energy Corporation | 714,600 | ||||||
| 1,650 | Diamond Offshore Drilling, Inc.b | 81,890 | ||||||
| 5,450 | Ensco plc | 302,856 | ||||||
| 12,800 | EOG Resources, Inc. | 1,495,808 | ||||||
| 3,550 | EQT Corporation | 379,495 | ||||||
| 101,140 | Exxon Mobil Corporation | 10,182,775 | ||||||
| 5,500 | FMC Technologies, Inc.a | 335,885 | ||||||
| 19,900 | Halliburton Company | 1,413,099 | ||||||
| 2,550 | Helmerich & Payne, Inc. | 296,080 | ||||||
| 6,250 | Hess Corporation | 618,062 | ||||||
| 15,800 | Kinder Morgan, Inc. | 572,908 | ||||||
| 15,968 | Marathon Oil Corporation | 637,443 | ||||||
| 6,884 | Marathon Petroleum Corporation | 537,434 | ||||||
| 3,950 | Murphy Oil Corporation | 262,596 | ||||||
| 6,150 | Nabors Industries, Ltd. | 180,625 | ||||||
| 10,050 | National Oilwell Varco, Inc. | 827,617 | ||||||
| 3,200 | Newfield Exploration Companya | 141,440 | ||||||
| 5,950 | Noble Corporation | 199,682 | ||||||
| 8,450 | Noble Energy, Inc. | 654,537 | ||||||
| 18,500 | Occidental Petroleum Corporation | 1,898,655 | ||||||
| 6,350 | Peabody Energy Corporation | 103,823 | ||||||
| 13,374 | Phillips 66 | 1,075,671 | ||||||
| 3,350 | Pioneer Natural Resources Company | 769,864 | ||||||
| 4,250 | QEP Resources, Inc. | 146,625 | ||||||
| 3,950 | Range Resources Corporation | 343,453 | ||||||
| 2,900 | Rowan Companies plc | 92,597 | ||||||
| 30,644 | Schlumberger, Ltd. | 3,614,460 | ||||||
| 8,350 | Southwestern Energy Companya | 379,842 | ||||||
| 15,754 | Spectra Energy Corporation | 669,230 | ||||||
| 3,050 | Tesoro Corporation | 178,944 | ||||||
| 8,000 | Transocean, Ltd.b | 360,240 | ||||||
| 12,600 | Valero Energy Corporation | 631,260 | ||||||
| 17,250 | Williams Companies, Inc. | 1,004,122 | ||||||
|
| |||||||
| Total | 44,133,207 | |||||||
|
| |||||||
| Financials (16.4%) | ||||||||
| 7,900 | ACE, Ltd. | 819,230 | ||||||
| 1,250 | Affiliated Managers Group, Inc.a | 256,750 | ||||||
| 10,750 | Aflac, Inc. | 669,187 | ||||||
| 10,232 | Allstate Corporation | 600,823 | ||||||
| 21,500 | American Express Company | 2,039,705 | ||||||
| 34,267 | American International Group, Inc. | 1,870,293 | ||||||
| 9,300 | American Tower Corporation | 836,814 | ||||||
| 4,500 | Ameriprise Financial, Inc. | 540,000 | ||||||
| 7,025 | Aon plc | 632,882 | ||||||
| 3,436 | Apartment Investment & Management Company | 110,880 | ||||||
| 1,700 | Assurant, Inc. | 111,435 | ||||||
| 2,901 | AvalonBay Communities, Inc. | 412,493 | ||||||
| 247,610 | Bank of America Corporation | 3,805,766 | ||||||
| 26,902 | Bank of New York Mellon Corporation | 1,008,287 | ||||||
| 17,000 | BB&T Corporation | 670,310 | ||||||
| 42,419 | Berkshire Hathaway, Inc.a | 5,368,549 | ||||||
| 3,000 | BlackRock, Inc. | 958,800 | ||||||
| 3,600 | Boston Properties, Inc. | 425,448 | ||||||
| 13,523 | Capital One Financial Corporation | 1,117,000 | ||||||
| 6,550 | CBRE Group, Inc.a | 209,862 | ||||||
| 27,775 | Charles Schwab Corporation | 747,981 | ||||||
| 5,750 | Chubb Corporation | 529,977 | ||||||
| 3,438 | Cincinnati Financial Corporation | 165,162 | ||||||
| 71,893 | Citigroup, Inc. | 3,386,160 | ||||||
| 7,450 | CME Group, Inc. | 528,577 | ||||||
| 4,300 | Comerica, Inc. | 215,688 | ||||||
| 7,850 | Crown Castle International Corporation | 582,941 | ||||||
| 11,075 | Discover Financial Services | 686,429 | ||||||
| 6,760 | E*TRADE Financial Corporationa | 143,718 | ||||||
| 7,900 | Equity Residential | 497,700 | ||||||
| 1,450 | Essex Property Trust, Inc. | 268,120 | ||||||
| 20,094 | Fifth Third Bancorp | 429,007 | ||||||
| 9,500 | Franklin Resources, Inc. | 549,480 | ||||||
| 12,250 | General Growth Properties, Inc. | 288,610 | ||||||
| 11,700 | Genworth Financial, Inc.a | 203,580 | ||||||
| 9,850 | Goldman Sachs Group, Inc. | 1,649,284 | ||||||
| 10,600 | Hartford Financial Services Group, Inc. | 379,586 | ||||||
| 10,750 | HCP, Inc. | 444,835 | ||||||
| 7,200 | Health Care REIT, Inc. | 451,224 | ||||||
| 17,791 | Host Hotels & Resorts, Inc. | 391,580 | ||||||
| 11,200 | Hudson City Bancorp, Inc. | 110,096 | ||||||
| 19,571 | Huntington Bancshares, Inc. | 186,707 | ||||||
| 2,700 | Intercontinental Exchange, Inc. | 510,030 | ||||||
| 10,200 | Invesco, Ltd. | 385,050 | ||||||
| 89,448 | J.P. Morgan Chase & Company | 5,153,994 | ||||||
| 20,850 | KeyCorp | 298,780 | ||||||
| 9,650 | Kimco Realty Corporation | 221,757 | ||||||
| 2,450 | Legg Mason, Inc.b | 125,709 | ||||||
| 7,451 | Leucadia National Corporation | 195,365 | ||||||
| 6,194 | Lincoln National Corporation | 318,619 | ||||||
| 7,200 | Loews Corporation | 316,872 | ||||||
| 3,050 | M&T Bank Corporationb | 378,353 | ||||||
| 3,300 | Macerich Company | 220,275 | ||||||
| 13,000 | Marsh & McLennan Companies, Inc. | 673,660 | ||||||
| 6,400 | McGraw-Hill Companies, Inc. | 531,392 | ||||||
| 26,532 | MetLife, Inc. | 1,474,118 | ||||||
| 4,450 | Moody’s Corporation | 390,087 | ||||||
| 33,050 | Morgan Stanley | 1,068,506 | ||||||
| 2,750 | NASDAQ OMX Group, Inc. | 106,205 | ||||||
| 9,950 | Navient Corporation | 176,215 | ||||||
| 5,250 | Northern Trust Corporation | 337,102 | ||||||
| 7,300 | People’s United Financial, Inc. | 110,741 | ||||||
| 4,150 | Plum Creek Timber Company, Inc. | 187,165 | ||||||
The accompanying Notes to Financial Statements are an integral part of this schedule.
242
Table of Contents
Large Cap Index Portfolio
Schedule of Investments as of June 30, 2014
(unaudited)
| Shares | Common Stock (98.3%) | Value | ||||||
| Financials (16.4%) - continued |
| ||||||
| 12,564 | PNC Financial Services Group, Inc. | $ | 1,118,824 | |||||
| 6,450 | Principal Financial Group, Inc. | 325,596 | ||||||
| 12,850 | Progressive Corporation | 325,876 | ||||||
| 11,746 | Prologis, Inc. | 482,643 | ||||||
| 10,900 | Prudential Financial, Inc. | 967,593 | ||||||
| 3,400 | Public Storage, Inc. | 582,590 | ||||||
| 32,577 | Regions Financial Corporation | 345,968 | ||||||
| 7,344 | Simon Property Group, Inc. | 1,221,160 | ||||||
| 10,150 | State Street Corporation | 682,689 | ||||||
| 12,550 | SunTrust Banks, Inc. | 502,753 | ||||||
| 6,168 | T. Rowe Price Group, Inc. | 520,641 | ||||||
| 2,100 | Torchmark Corporation | 172,032 | ||||||
| 8,181 | Travelers Companies, Inc. | 769,587 | ||||||
| 42,935 | U.S. Bancorp | 1,859,944 | ||||||
| 6,124 | Unum Group | 212,870 | ||||||
| 6,900 | Ventas, Inc. | 442,290 | ||||||
| 11,900 | Visa, Inc. | 2,507,449 | ||||||
| 4,097 | Vornado Realty Trust | 437,273 | ||||||
| 113,440 | Wells Fargo & Company | 5,962,406 | ||||||
| 13,782 | Weyerhaeuser Company | 456,046 | ||||||
| 6,450 | XL Group plc | 211,109 | ||||||
| 4,350 | Zions Bancorporation | 128,195 | ||||||
|
| |||||||
| Total | 68,716,485 | |||||||
|
| |||||||
| Health Care (13.0%) | ||||||||
| 35,250 | Abbott Laboratories | 1,441,725 | ||||||
| 37,150 | AbbVie, Inc. | 2,096,746 | ||||||
| 4,100 | Actavis, Inc.a | 914,505 | ||||||
| 8,489 | Aetna, Inc. | 688,288 | ||||||
| 4,700 | Alexion Pharmaceuticals, Inc.a | 734,375 | ||||||
| 7,000 | Allergan, Inc. | 1,184,540 | ||||||
| 5,350 | AmerisourceBergen Corporation | 388,731 | ||||||
| 17,890 | Amgen, Inc. | 2,117,639 | ||||||
| 12,750 | Baxter International, Inc. | 921,825 | ||||||
| 4,500 | Becton, Dickinson and Company | 532,350 | ||||||
| 5,600 | Biogen Idec, Inc.a | 1,765,736 | ||||||
| 31,100 | Boston Scientific Corporationa | 397,147 | ||||||
| 38,998 | Bristol-Myers Squibb Company | 1,891,793 | ||||||
| 1,800 | C.R. Bard, Inc. | 257,418 | ||||||
| 8,025 | Cardinal Health, Inc. | 550,194 | ||||||
| 4,887 | CareFusion Corporationa | 216,738 | ||||||
| 18,900 | Celgene Corporationa | 1,623,132 | ||||||
| 6,950 | Cerner Corporationa | 358,481 | ||||||
| 6,400 | CIGNA Corporation | 588,608 | ||||||
| 10,600 | Covidien plc | 955,908 | ||||||
| 4,200 | DaVita HealthCare Partners, Inc.a | 303,744 | ||||||
| 3,350 | DENTSPLY International, Inc. | 158,623 | ||||||
| 2,500 | Edwards Lifesciences Corporationa | 214,600 | ||||||
| 23,200 | Eli Lilly and Company | 1,442,344 | ||||||
| 18,295 | Express Scripts Holding Companya | 1,268,392 | ||||||
| 5,550 | Forest Laboratories, Inc.a | 549,450 | ||||||
| 36,100 | Gilead Sciences, Inc.a | 2,993,051 | ||||||
| 3,930 | Hospira, Inc.a | 201,884 | ||||||
| 3,650 | Humana, Inc. | 466,178 | ||||||
| 900 | Intuitive Surgical, Inc.a | 370,620 | ||||||
| 66,890 | Johnson & Johnson | 6,998,032 | ||||||
| 2,000 | Laboratory Corporation of America Holdingsa | 204,800 | ||||||
| 5,442 | McKesson Corporation | 1,013,355 | ||||||
| 23,500 | Medtronic, Inc. | 1,498,360 | ||||||
| 69,083 | Merck & Company, Inc. | 3,996,452 | ||||||
| 8,800 | Mylan, Inc.a | 453,728 | ||||||
| 1,950 | Patterson Companies, Inc. | 77,044 | ||||||
| 2,650 | PerkinElmer, Inc. | 124,126 | ||||||
| 3,100 | Perrigo Company plc | 451,856 | ||||||
| 150,960 | Pfizer, Inc. | 4,480,493 | ||||||
| 3,400 | Quest Diagnostics, Inc.b | 199,546 | ||||||
| 1,850 | Regeneron Pharmaceuticals, Inc.a | 522,569 | ||||||
| 6,684 | St. Jude Medical, Inc. | 462,867 | ||||||
| 6,950 | Stryker Corporation | 586,024 | ||||||
| 2,325 | Tenet Healthcare Corporationa | 109,136 | ||||||
| 9,350 | Thermo Fisher Scientific, Inc. | 1,103,300 | ||||||
| 23,250 | UnitedHealth Group, Inc. | 1,900,687 | ||||||
| 2,450 | Varian Medical Systems, Inc.a | 203,693 | ||||||
| 5,550 | Vertex Pharmaceuticals, Inc.a | 525,474 | ||||||
| 2,000 | Waters Corporationa | 208,880 | ||||||
| 6,650 | WellPoint, Inc. | 715,607 | ||||||
| 3,950 | Zimmer Holdings, Inc. | 410,247 | ||||||
| 11,800 | Zoetis, Inc. | 380,786 | ||||||
|
| |||||||
| Total | 54,221,827 | |||||||
|
| |||||||
| Industrials (10.3%) | ||||||||
| 14,700 | 3M Company | 2,105,628 | ||||||
| 4,200 | ADT Corporationb | 146,748 | ||||||
| 2,101 | Allegion plc | 119,085 | ||||||
| 5,750 | AMETEK, Inc. | 300,610 | ||||||
| 15,810 | Boeing Company | 2,011,506 | ||||||
| 3,500 | C.H. Robinson Worldwide, Inc. | 223,265 | ||||||
| 14,700 | Caterpillar, Inc. | 1,597,449 | ||||||
| 2,400 | Cintas Corporation | 152,496 | ||||||
| 23,700 | CSX Corporation | 730,197 | ||||||
| 4,050 | Cummins, Inc. | 624,874 | ||||||
| 14,150 | Danaher Corporation | 1,114,029 | ||||||
| 8,600 | Deere & Company | 778,730 | ||||||
| 20,000 | Delta Air Lines, Inc. | 774,400 | ||||||
| 3,950 | Dover Corporation | 359,252 | ||||||
| 900 | Dun & Bradstreet Corporation | 99,180 | ||||||
| 10,994 | Eaton Corporation plc | 848,517 | ||||||
| 16,500 | Emerson Electric Company | 1,094,940 | ||||||
| 2,850 | Equifax, Inc. | 206,739 | ||||||
| 4,700 | Expeditors International of Washington, Inc. | 207,552 | ||||||
| 6,400 | Fastenal Companyb | 316,736 | ||||||
| 6,560 | FedEx Corporation | 993,053 | ||||||
| 1,650 | First Solar, Inc.a | 117,249 | ||||||
| 3,250 | Flowserve Corporation | 241,637 | ||||||
| 3,750 | Fluor Corporation | 288,375 | ||||||
| 7,650 | General Dynamics Corporation | 891,607 | ||||||
| 236,400 | General Electric Company | 6,212,592 | ||||||
| 18,475 | Honeywell International, Inc. | 1,717,251 | ||||||
| 9,000 | Illinois Tool Works, Inc. | 788,040 | ||||||
| 5,950 | Ingersoll-Rand plc | 371,934 | ||||||
| 4,019 | Iron Mountain, Inc. | 142,474 | ||||||
| 3,100 | Jacobs Engineering Group, Inc.a | 165,168 | ||||||
| 2,400 | Joy Global, Inc.b | 147,792 | ||||||
| 2,600 | Kansas City Southern | 279,526 | ||||||
| 2,050 | L-3 Communications Holdings, Inc. | 247,538 | ||||||
| 6,300 | Lockheed Martin Corporation | 1,012,599 | ||||||
| 8,350 | Masco Corporation | 185,370 | ||||||
| 7,150 | Nielsen Holdings NV | 346,132 | ||||||
| 7,300 | Norfolk Southern Corporation | 752,119 | ||||||
| 5,098 | Northrop Grumman Corporation | 609,874 | ||||||
| 8,337 | PACCAR, Inc. | 523,814 | ||||||
| 2,600 | Pall Corporation | 222,014 | ||||||
| 3,475 | Parker Hannifin Corporation | 436,912 | ||||||
| 4,599 | Pentair, Ltd. | 331,680 | ||||||
| 4,750 | Pitney Bowes, Inc. | 131,195 | ||||||
The accompanying Notes to Financial Statements are an integral part of this schedule.
243
Table of Contents
Large Cap Index Portfolio
Schedule of Investments as of June 30, 2014
(unaudited)
| Shares | Common Stock (98.3%) | Value | ||||||
| Industrials (10.3%) - continued | |||||||
| 3,400 | Precision Castparts Corporation | $ | 858,160 | |||||
| 5,100 | Quanta Services, Inc.a | 176,358 | ||||||
| 7,400 | Raytheon Company | 682,650 | ||||||
| 6,320 | Republic Services, Inc. | 239,970 | ||||||
| 3,250 | Robert Half International, Inc. | 155,155 | ||||||
| 3,250 | Rockwell Automation, Inc. | 406,770 | ||||||
| 3,200 | Rockwell Collins, Inc. | 250,048 | ||||||
| 2,350 | Roper Industries, Inc. | 343,124 | ||||||
| 1,250 | Ryder System, Inc. | 110,113 | ||||||
| 16,350 | Southwest Airlines Company | 439,161 | ||||||
| 3,700 | Stanley Black & Decker, Inc. | 324,934 | ||||||
| 2,000 | Stericycle, Inc.a | 236,840 | ||||||
| 6,600 | Textron, Inc. | 252,714 | ||||||
| 10,900 | Tyco International, Ltd. | 497,040 | ||||||
| 21,400 | Union Pacific Corporation | 2,134,650 | ||||||
| 16,600 | United Parcel Service, Inc. | 1,704,156 | ||||||
| 19,900 | United Technologies Corporation | 2,297,455 | ||||||
| 1,400 | W.W. Grainger, Inc. | 355,978 | ||||||
| 10,149 | Waste Management, Inc. | 453,965 | ||||||
| 4,300 | Xylem, Inc. | 168,044 | ||||||
|
| |||||||
| Total | 43,055,163 | |||||||
|
| |||||||
| Information Technology (18.0%) | ||||||||
| 15,000 | Accenture plc | 1,212,600 | ||||||
| 10,900 | Adobe Systems, Inc.a | 788,724 | ||||||
| 7,815 | Agilent Technologies, Inc. | 448,894 | ||||||
| 4,200 | Akamai Technologies, Inc.a | 256,452 | ||||||
| 1,250 | Alliance Data Systems Corporationa | 351,563 | ||||||
| 7,400 | Altera Corporation | 257,224 | ||||||
| 3,700 | Amphenol Corporation | 356,458 | ||||||
| 7,400 | Analog Devices, Inc. | 400,118 | ||||||
| 141,250 | Apple, Inc.c | 13,126,362 | ||||||
| 28,700 | Applied Materials, Inc. | 647,185 | ||||||
| 5,350 | Autodesk, Inc.a | 301,633 | ||||||
| 11,350 | Automatic Data Processing, Inc. | 899,828 | ||||||
| 5,900 | Avago Technologies, Ltd. | 425,213 | ||||||
| 13,150 | Broadcom Corporation | 488,128 | ||||||
| 7,562 | CA, Inc. | 217,332 | ||||||
| 121,000 | Cisco Systems, Inc. | 3,006,850 | ||||||
| 3,850 | Citrix Systems, Inc.a | 240,817 | ||||||
| 14,400 | Cognizant Technology Solutions Corporationa | 704,304 | ||||||
| 3,450 | Computer Sciences Corporation | 218,040 | ||||||
| 30,900 | Corning, Inc. | 678,255 | ||||||
| 26,900 | eBay, Inc.a | 1,346,614 | ||||||
| 7,400 | Electronic Arts, Inc.a | 265,438 | ||||||
| 48,386 | EMC Corporation | 1,274,487 | ||||||
| 1,800 | F5 Networks, Inc.a | 200,592 | ||||||
| 40,650 | Facebook, Inc.a | 2,735,339 | ||||||
| 6,800 | Fidelity National Information Services, Inc. | 372,232 | ||||||
| 5,950 | Fiserv, Inc.a | 358,904 | ||||||
| 3,300 | FLIR Systems, Inc. | 114,609 | ||||||
| 2,750 | GameStop Corporationb | 111,293 | ||||||
| 6,700 | Google, Inc.a | 3,854,376 | ||||||
| 6,700 | Google, Inc., Class Aa | 3,917,289 | ||||||
| 2,500 | Harris Corporation | 189,375 | ||||||
| 44,136 | Hewlett-Packard Company | 1,486,500 | ||||||
| 118,000 | Intel Corporation | 3,646,200 | ||||||
| 22,500 | International Business Machines Corporation | 4,078,575 | ||||||
| 6,700 | Intuit, Inc. | 539,551 | ||||||
| 4,350 | Jabil Circuit, Inc. | 90,915 | ||||||
| 11,150 | Juniper Networks, Inc.a | 273,621 | ||||||
| 3,900 | KLA-Tencor Corporation | 283,296 | ||||||
| 3,800 | Lam Research Corporation | 256,804 | ||||||
| 5,550 | Linear Technology Corporation | 261,238 | ||||||
| 23,850 | MasterCard, Inc. | 1,752,260 | ||||||
| 4,700 | Microchip Technology, Inc.b | 229,407 | ||||||
| 25,050 | Micron Technology, Inc.a | 825,397 | ||||||
| 176,950 | Microsoft Corporation | 7,378,815 | ||||||
| 5,355 | Motorola Solutions, Inc. | 356,482 | ||||||
| 7,800 | NetApp, Inc. | 284,856 | ||||||
| 13,300 | NVIDIA Corporation | 246,582 | ||||||
| 81,037 | Oracle Corporation | 3,284,430 | ||||||
| 7,650 | Paychex, Inc. | 317,934 | ||||||
| 39,900 | QUALCOMM, Inc. | 3,160,080 | �� | |||||
| 4,450 | Red Hat, Inc.a | 245,951 | ||||||
| 13,400 | Salesforce.com, Inc.a | 778,272 | ||||||
| 5,300 | SanDisk Corporation | 553,479 | ||||||
| 7,700 | Seagate Technology plc | 437,514 | ||||||
| 16,424 | Symantec Corporation | 376,110 | ||||||
| 9,650 | TE Connectivity, Ltd. | 596,756 | ||||||
| 3,750 | Teradata Corporationa | 150,750 | ||||||
| 25,500 | Texas Instruments, Inc. | 1,218,645 | ||||||
| 3,900 | Total System Services, Inc. | 122,499 | ||||||
| 2,950 | VeriSign, Inc.a | 143,990 | ||||||
| 4,950 | Western Digital Corporation | 456,885 | ||||||
| 12,780 | Western Union Companyb | 221,605 | ||||||
| 25,685 | Xerox Corporation | 319,521 | ||||||
| 6,300 | Xilinx, Inc. | 298,053 | ||||||
| 22,100 | Yahoo!, Inc.a | 776,373 | ||||||
|
| |||||||
| Total | 75,215,874 | |||||||
|
| |||||||
| Materials (3.3%) | ||||||||
| 5,000 | Air Products and Chemicals, Inc. | 643,100 | ||||||
| 1,600 | Airgas, Inc. | 174,256 | ||||||
| 27,414 | Alcoa, Inc. | 408,194 | ||||||
| 2,569 | Allegheny Technologies, Inc. | 115,862 | ||||||
| 2,300 | Avery Dennison Corporation | 117,875 | ||||||
| 3,350 | Ball Corporation | 209,978 | ||||||
| 2,400 | Bemis Company, Inc. | 97,584 | ||||||
| 1,200 | CF Industries Holdings, Inc. | 288,636 | ||||||
| 28,393 | Dow Chemical Company | 1,461,104 | ||||||
| 21,761 | E.I. du Pont de Nemours and Company | 1,424,040 | ||||||
| 3,600 | Eastman Chemical Company | 314,460 | ||||||
| 6,350 | Ecolab, Inc. | 707,009 | ||||||
| 3,250 | FMC Corporation | 231,367 | ||||||
| 24,342 | Freeport-McMoRan Copper & Gold, Inc. | 888,483 | ||||||
| 1,900 | International Flavors & Fragrances, Inc. | 198,132 | ||||||
| 10,271 | International Paper Company | 518,377 | ||||||
| 9,850 | LyondellBasell Industries NV | 961,853 | ||||||
| 3,981 | MeadWestvaco Corporation | 176,199 | ||||||
| 12,378 | Monsanto Company | 1,544,032 | ||||||
| 7,650 | Mosaic Company | 378,293 | ||||||
| 11,798 | Newmont Mining Corporation | 300,141 | ||||||
| 7,500 | Nucor Corporation | 369,375 | ||||||
| 3,900 | Owens-Illinois, Inc.a | 135,096 | ||||||
| 3,300 | PPG Industries, Inc. | 693,495 | ||||||
| 6,900 | Praxair, Inc. | 916,596 | ||||||
| 4,552 | Sealed Air Corporation | 155,542 | ||||||
| 2,800 | Sigma-Aldrich Corporation | 284,144 | ||||||
| 3,400 | United States Steel Corporationb | 88,536 | ||||||
| 3,050 | Vulcan Materials Company | 194,437 | ||||||
|
| |||||||
| Total | 13,996,196 | |||||||
|
| |||||||
The accompanying Notes to Financial Statements are an integral part of this schedule.
244
Table of Contents
Large Cap Index Portfolio
Schedule of Investments as of June 30, 2014
(unaudited)
| Shares | Common Stock (98.3%) | Value | ||||||
| Telecommunications Services (2.4%) | |||||||
| 122,389 | AT&T, Inc. | $ | 4,327,675 | |||||
| 13,575 | CenturyLink, Inc. | 491,415 | ||||||
| 23,778 | Frontier Communications Corporationb | 138,864 | ||||||
| 98,096 | Verizon Communications, Inc. | 4,799,837 | ||||||
| 14,207 | Windstream Corporationb | 141,502 | ||||||
|
| |||||||
| Total | 9,899,293 | |||||||
|
| |||||||
| Utilities (3.2%) | ||||||||
| 15,500 | AES Corporation | 241,025 | ||||||
| 2,805 | AGL Resources, Inc. | 154,359 | ||||||
| 5,700 | Ameren Corporation | 233,016 | ||||||
| 11,460 | American Electric Power Company, Inc. | 639,124 | ||||||
| 10,023 | CenterPoint Energy, Inc. | 255,987 | ||||||
| 6,300 | CMS Energy Corporation | 196,245 | ||||||
| 6,850 | Consolidated Edison, Inc. | 395,519 | ||||||
| 13,644 | Dominion Resources, Inc. | 975,819 | ||||||
| 4,150 | DTE Energy Company | 323,161 | ||||||
| 16,602 | Duke Energy Corporation | 1,231,702 | ||||||
| 7,650 | Edison International, Inc. | 444,542 | ||||||
| 4,200 | Entergy Corporation | 344,778 | ||||||
| 20,124 | Exelon Corporation | 734,124 | ||||||
| 9,884 | FirstEnergy Corporation | 343,172 | ||||||
| 1,665 | Integrys Energy Group, Inc. | 118,431 | ||||||
| 10,250 | NextEra Energy, Inc. | 1,050,420 | ||||||
| 7,359 | NiSource, Inc. | 289,503 | ||||||
| 7,400 | Northeast Utilities | 349,798 | ||||||
| 7,900 | NRG Energy, Inc. | 293,880 | ||||||
| 4,850 | ONEOK, Inc. | 330,188 | ||||||
| 5,900 | Pepco Holdings, Inc. | 162,132 | ||||||
| 10,900 | PG&E Corporation | 523,418 | ||||||
| 2,600 | Pinnacle West Capital Corporation | 150,384 | ||||||
| 14,850 | PPL Corporation | 527,621 | ||||||
| 11,900 | Public Service Enterprise Group, Inc. | 485,401 | ||||||
| 3,300 | SCANA Corporation | 177,573 | ||||||
| 5,325 | Sempra Energy | 557,581 | ||||||
| 20,950 | Southern Company | 950,711 | ||||||
| 4,800 | TECO Energy, Inc. | 88,704 | ||||||
| 5,400 | Wisconsin Energy Corporation | 253,368 | ||||||
| 11,805 | Xcel Energy, Inc. | 380,475 | ||||||
|
| |||||||
| Total | 13,202,161 | |||||||
|
| |||||||
| Total Common Stock (cost $238,747,488) | 410,612,476 | |||||||
|
| |||||||
Collateral Held for Securities Loaned (0.7%) | ||||||||
| 2,954,940 | Thrivent Cash Management Trust | 2,954,940 | ||||||
|
| |||||||
| Total Collateral Held for Securities Loaned (cost $2,954,940) | 2,954,940 | |||||||
|
| |||||||
| Shares or Principal Amount | Short-Term Investments (1.7%)d | |||||||
| 7,076,297 | Thrivent Cash Management Trust 0.050% | $ | 7,076,297 | |||||
|
| |||||||
| Total Short-Term Investments (at amortized cost) | 7,076,297 | |||||||
|
| |||||||
| Total Investments (cost $248,778,725) 100.7% | $ | 420,643,713 | ||||||
|
| |||||||
| Other Assets and Liabilities, Net (0.7%) | (3,117,046 | ) | ||||||
|
| |||||||
| Total Net Assets 100.0% | $ | 417,526,667 | ||||||
|
| |||||||
| a | Non-income producing security. |
| b | All or a portion of the security is on loan. |
| c | At June 30, 2014, $1,301,020 of investments were held on deposit with the counterparty and pledged as the initial margin deposit for open futures contracts. |
| d | The interest rate shown reflects the yield, coupon rate or the discount rate at the date of purchase. |
Definitions:
REIT | - | Real Estate Investment Trust is a company that buys, develops, manages and/or sells real estate assets. |
Unrealized Appreciation (Depreciation)
Gross unrealized appreciation and depreciation of investments, based on cost for federal income tax purposes, were as follows:
Gross unrealized appreciation | $ | 181,000,812 | ||
Gross unrealized depreciation | (9,135,824 | ) | ||
|
| |||
Net unrealized appreciation (depreciation) | $ | 171,864,988 | ||
Cost for federal income tax purposes | $ | 248,778,725 | ||
The accompanying Notes to Financial Statements are an integral part of this schedule.
245
Table of Contents
Large Cap Index Portfolio
Schedule of Investments as of June 30, 2014
(unaudited)
Fair Valuation Measurements
The following table is a summary of the inputs used, as of June 30, 2014, in valuing Large Cap Index Portfolio’s assets carried at fair value.
Investments in Securities | Total | Level 1 | Level 2 | Level 3 | ||||||||||||
Common Stock | ||||||||||||||||
Consumer Discretionary | 49,053,341 | 49,053,341 | — | — | ||||||||||||
Consumer Staples | 39,118,929 | 39,118,929 | — | — | ||||||||||||
Energy | 44,133,207 | 44,133,207 | — | — | ||||||||||||
Financials | 68,716,485 | 68,716,485 | — | — | ||||||||||||
Health Care | 54,221,827 | 54,221,827 | — | — | ||||||||||||
Industrials | 43,055,163 | 43,055,163 | — | — | ||||||||||||
Information Technology | 75,215,874 | 75,215,874 | — | — | ||||||||||||
Materials | 13,996,196 | 13,996,196 | — | — | ||||||||||||
Telecommunications Services | 9,899,293 | 9,899,293 | — | — | ||||||||||||
Utilities | 13,202,161 | 13,202,161 | — | — | ||||||||||||
Collateral Held for Securities Loaned | 2,954,940 | 2,954,940 | — | — | ||||||||||||
Short-Term Investments | 7,076,297 | 7,076,297 | — | — | ||||||||||||
|
|
|
|
|
|
|
| |||||||||
Total | $ | 420,643,713 | $ | 420,643,713 | $ | — | $ | — | ||||||||
|
|
|
|
|
|
|
| |||||||||
Other Financial Instruments | Total | Level 1 | Level 2 | Level 3 | ||||||||||||
Asset Derivatives | ||||||||||||||||
Futures Contracts | 93,584 | 93,584 | — | — | ||||||||||||
|
|
|
|
|
|
|
| |||||||||
Total Asset Derivatives | $ | 93,584 | $ | 93,584 | $ | — | $ | — | ||||||||
|
|
|
|
|
|
|
| |||||||||
There were no significant transfers between Levels during the period ended June 30, 2014. Transfers between Levels are identified as of the end of the period.
Futures Contracts | Number of Contracts Long/(Short) | Expiration Date | Notional Principal Amount | Value | Unrealized Gain/(Loss) | |||||||||||||||
S&P 500 Index Mini-Futures | 70 | September 2014 | $ | 6,739,816 | $ | 6,833,400 | $ | 93,584 | ||||||||||||
Total Futures Contracts | $ | 93,584 | ||||||||||||||||||
The following table summarizes the fair value and Statement of Assets and Liabilities location, as of June 30, 2014, for Large Cap Index Portfolio’s investments in financial derivative instruments by primary risk exposure as discussed under item (2) Significant Accounting Policies of the Notes to Financial Statements.
Derivatives by risk category | Statement of Assets and Liabilities Location | Fair Value | ||||
Asset Derivatives | ||||||
Equity Contracts | ||||||
Futures* | Net Assets - Net unrealized appreciation/(depreciation) on Futures contracts | $ | 93,584 | |||
Total Equity Contracts | 93,584 | |||||
|
| |||||
Total Asset Derivatives | $ | 93,584 | ||||
|
| |||||
| * | Includes cumulative appreciation/depreciation of futures contracts as reported in the Schedule of Investments. Only current day’s variation margin is reported within the Statement of Assets and Liabilities. |
The following table summarizes the net realized gains/(losses) and Statement of Operations location, for the period ended June 30, 2014, for Large Cap Index Portfolio’s investments in financial derivative instruments by primary risk exposure.
Derivatives by risk category | Statement of Operations Location | Realized Gains/(Losses) recognized in Income | ||||
Equity Contracts | ||||||
Futures | Net realized gains/(losses) on Futures contracts | 587,530 | ||||
Total Equity Contracts | 587,530 | |||||
|
| |||||
Total | $ | 587,530 | ||||
|
| |||||
The accompanying Notes to Financial Statements are an integral part of this schedule.
246
Table of Contents
Large Cap Index Portfolio
Schedule of Investments as of June 30, 2014
(unaudited)
The following table summarizes the change in net unrealized appreciation/(depreciation) and Statement of Operations location, for the period ended June 30, 2014, for Large Cap Index Portfolio’s investments in financial derivative instruments by primary risk exposure.
Derivatives by risk category | Statement of Operations Location | Change in unrealized appreciation/(depreciation) recognized in Income | ||||
Equity Contracts | ||||||
Futures | Change in net unrealized appreciation/(depreciation) on Futures contracts | (162,905 | ) | |||
Total Equity Contracts | (162,905 | ) | ||||
|
| |||||
Total | ($ | 162,905 | ) | |||
|
| |||||
The following table presents Large Cap Index Portfolio’s average volume of derivative activity during the period ended June 30, 2014.
Derivative Risk Category | Futures (Notional)* | Futures (Percentage of Average Net Assets) | ||||||
Equity Contracts | $ | 6,242,545 | 1.6 | % | ||||
| * | Notional amount represents long or short, or both, derivative positions held by the Portfolio. |
Investment in Affiliates
Affiliated issuers, as defined under the Investment Company Act of 1940, include those in which the Portfolio’s holdings of an issuer represent 5% or more of the outstanding voting securities of an issuer, or any affiliated mutual fund.
A summary of transactions for the fiscal year to date, in Large Cap Index Portfolio, is as follows:
Portfolio | Value December 31, 2013 | Gross Purchases | Gross Sales | Shares Held at June 30, 2014 | Value June 30, 2014 | Income Earned January 1, 2014 - June 30, 2014 | ||||||||||||||||||
Cash Management Trust-Collateral Investment | $ | 1,553,927 | $ | 7,129,969 | $ | 5,728,956 | 2,954,940 | $ | 2,954,940 | $ | 3,602 | |||||||||||||
Cash Management Trust-Short Term Investment | 6,939,002 | 9,472,127 | 9,334,832 | 7,076,297 | 7,076,297 | 1,517 | ||||||||||||||||||
Total Value and Income Earned | 8,492,929 | 10,031,237 | 5,119 | |||||||||||||||||||||
The accompanying Notes to Financial Statements are an integral part of this schedule.
247
Table of Contents
Schedule of Investments as of June 30, 2014
(unaudited)
| Principal Amount | Bank Loans (4.4%)a | Value | ||||||
| Communications Services (2.2%) | |||||||
| Cengage Learning Aquisitions, Term Loan | ||||||||
| $5,406,450 | 7.000%, 3/31/2020 | $ | 5,463,921 | |||||
| Clear Channel Communications, Inc., Term Loan | ||||||||
| 134,677 | 3.800%, 1/29/2016 | 133,724 | ||||||
| 7,733,196 | 6.900%, 1/30/2019 | 7,690,354 | ||||||
| 2,487,127 | 7.650%, 7/30/2019 | 2,491,007 | ||||||
| IMG Worldwide, Inc., Term Loan | ||||||||
| 3,250,000 | 8.250%, 5/6/2022 | 3,302,812 | ||||||
| McGraw-Hill Global Education, LLC, Term Loan | ||||||||
| 2,239,366 | 5.750%, 3/22/2019 | 2,275,755 | ||||||
|
| |||||||
| Total | 21,357,573 | |||||||
|
| |||||||
| Consumer Cyclical (0.3%) | |||||||
| Mohegan Tribal Gaming Authority, Term Loan | ||||||||
| 2,696,450 | 5.500%, 11/19/2019 | 2,738,029 | ||||||
|
| |||||||
| Total | 2,738,029 | |||||||
|
| |||||||
| Consumer Non-Cyclical (0.8%) | |||||||
| Albertsons, Inc., Term Loan | ||||||||
| 2,970,094 | 4.750%, 3/21/2019 | 2,983,073 | ||||||
| HCA, Inc., Term Loan | ||||||||
| 4,694,074 | 2.984%, 5/1/2018 | 4,699,191 | ||||||
|
| |||||||
| Total | 7,682,264 | |||||||
|
| |||||||
| Financials (0.6%) | |||||||
| DJO Finance, LLC, Term Loan | ||||||||
| 3,258,331 | 4.250%, 9/15/2017 | 3,268,530 | ||||||
| Nuveen Investments, Inc., Term Loan | ||||||||
| 2,650,000 | 6.500%, 2/28/2019 | 2,672,234 | ||||||
|
| |||||||
| Total | 5,940,764 | |||||||
|
| |||||||
| Technology (0.5%) | |||||||
| First Data Corporation Extended, Term Loan | ||||||||
| 4,280,676 | 4.154%, 3/23/2018 | 4,286,027 | ||||||
|
| |||||||
| Total | 4,286,027 | |||||||
|
| |||||||
Total Bank Loans (cost $41,028,640) | 42,004,657 | |||||||
|
| |||||||
| Principal Amount | Long-Term Fixed Income (91.0%) | |||||||
| Asset-Backed Securities (0.3%) | |||||||
| Renaissance Home Equity Loan Trust | ||||||||
| 2,178,189 | 5.746%, 5/25/2036 | 1,631,398 | ||||||
| 1,800,000 | 6.011%, 5/25/2036 | 1,320,374 | ||||||
|
| |||||||
| Total | 2,951,772 | |||||||
|
| |||||||
| Basic Materials (7.8%) | |||||||
| APERAM | ||||||||
| 2,645,000 | 7.750%, 4/1/2018b | 2,813,619 | ||||||
| Bluescope Steel, Ltd. | ||||||||
| 1,590,000 | 7.125%, 5/1/2018b | 1,707,262 | ||||||
| CONSOL Energy, Inc. | ||||||||
| 2,770,000 | 8.250%, 4/1/2020 | 2,998,525 | ||||||
| First Quantum Minerals, Ltd. | ||||||||
| 3,535,000 | 6.750%, 2/15/2020c | 3,641,050 | ||||||
| 3,535,000 | 7.000%, 2/15/2021c | 3,636,631 | ||||||
| FMG Resources Pty. Ltd. | ||||||||
| 1,590,000 | 6.000%, 4/1/2017c,d | 1,641,675 | ||||||
| 2,165,000 | 6.875%, 2/1/2018c,d | 2,273,250 | ||||||
| 5,550,000 | 8.250%, 11/1/2019c,d | 6,042,562 | ||||||
| Graphic Packaging International, Inc. | ||||||||
| 1,600,000 | 7.875%, 10/1/2018 | 1,685,920 | ||||||
| 790,000 | 4.750%, 4/15/2021 | 805,800 | ||||||
| Hexion US Finance Corporation/Hexion Nova Scotia Finance ULC | ||||||||
| 6,410,000 | 8.875%, 2/1/2018 | 6,666,400 | ||||||
| INEOS Group Holdings SA | ||||||||
| 3,245,000 | 6.125%, 8/15/2018c,d | 3,358,575 | ||||||
| Magnetation, LLC | ||||||||
| 2,640,000 | 11.000%, 5/15/2018c | 2,884,200 | ||||||
| Midwest Vanadium, Pty. Ltd. | ||||||||
| 3,430,000 | 11.500%, 2/15/2018b | 1,474,900 | ||||||
| NOVA Chemicals Corporation | ||||||||
| 5,500,000 | 8.625%, 11/1/2019 | 5,874,000 | ||||||
| Novelis, Inc. | ||||||||
| 3,950,000 | 8.750%, 12/15/2020 | 4,384,500 | ||||||
| Rayonier AM Products, Inc. | ||||||||
| 1,190,000 | 5.500%, 6/1/2024c | 1,210,825 | ||||||
| Resolute Forest Products, Inc. | ||||||||
| 4,960,000 | 5.875%, 5/15/2023 | 4,885,600 | ||||||
| Ryerson, Inc. | ||||||||
| 2,100,000 | 9.000%, 10/15/2017 | 2,247,000 | ||||||
| Sappi Papier Holding GmbH | ||||||||
| 2,645,000 | 8.375%, 6/15/2019c,d | 2,916,112 | ||||||
| Signode Industrial Group Lux SA | ||||||||
| 1,080,000 | 6.375%, 5/1/2022c | 1,093,500 | ||||||
| Tembec Industries, Inc. | ||||||||
| 3,180,000 | 11.250%, 12/15/2018 | 3,442,350 | ||||||
| Trinseo Materials Operating SCA | ||||||||
| 1,085,000 | 8.750%, 2/1/2019 | 1,169,088 | ||||||
| Westmoreland Coal Company | ||||||||
| 3,930,000 | 10.750%, 2/1/2018 | 4,219,838 | ||||||
| Westmoreland Escrow Corporation | ||||||||
| 1,350,000 | 10.750%, 2/1/2018c | 1,449,563 | ||||||
|
| |||||||
| Total | 74,522,745 | |||||||
|
| |||||||
| Capital Goods (7.8%) | ||||||||
| Abengoa Finance SAU | ||||||||
| 3,250,000 | 7.750%, 2/1/2020c | 3,619,688 | ||||||
| Berry Plastics Corporation | ||||||||
| 2,710,000 | 5.500%, 5/15/2022 | 2,725,244 | ||||||
| Brand Energy & Infrastructure Services, Inc. | ||||||||
| 2,170,000 | 8.500%, 12/1/2021c | 2,316,475 | ||||||
| Case New Holland, Inc. | ||||||||
| 2,550,000 | 7.875%, 12/1/2017 | 2,970,750 | ||||||
| Cemex Finance, LLC | ||||||||
| 3,795,000 | 9.375%, 10/12/2017c | 4,463,869 | ||||||
| 270,000 | 6.000%, 4/1/2024c | 281,138 | ||||||
| Cemex SAB de CV | ||||||||
| 3,780,000 | 4.976%, 10/15/2018c,d,e | 4,063,500 | ||||||
| CNH Capital, LLC | ||||||||
| 2,150,000 | 3.625%, 4/15/2018 | 2,195,687 | ||||||
The accompanying Notes to Financial Statements are an integral part of this schedule.
248
Table of Contents
High Yield Portfolio
Schedule of Investments as of June 30, 2014
(unaudited)
| Principal Amount | Long-Term Fixed Income (91.0%) | Value | ||||||
| Capital Goods (7.8%) - continued | |||||||
| CTP Transportation Products, LLC | ||||||||
| $1,910,000 | 8.250%, 12/15/2019c | $ | 2,058,025 | |||||
| Manitowoc Company, Inc. | ||||||||
| 4,730,000 | 8.500%, 11/1/2020 | 5,273,950 | ||||||
| Milacron, LLC | ||||||||
| 2,640,000 | 7.750%, 2/15/2021c | 2,890,800 | ||||||
| Nortek, Inc. | ||||||||
| 3,160,000 | 10.000%, 12/1/2018d | 3,404,900 | ||||||
| 3,640,000 | 8.500%, 4/15/2021 | 4,022,200 | ||||||
| Owens-Illinois, Inc. | ||||||||
| 3,470,000 | 7.800%, 5/15/2018 | 4,051,225 | ||||||
| Reynolds Group Issuer, Inc. | ||||||||
| 1,580,000 | 9.000%, 4/15/2019 | 1,672,825 | ||||||
| 2,160,000 | 9.875%, 8/15/2019 | 2,392,200 | ||||||
| 2,100,000 | 5.750%, 10/15/2020 | 2,215,500 | ||||||
| 2,630,000 | 8.250%, 2/15/2021d | 2,860,125 | ||||||
| RSC Equipment Rental, Inc. | ||||||||
| 3,120,000 | 8.250%, 2/1/2021 | 3,471,000 | ||||||
| Safeway Group Holding, LLC | ||||||||
| 3,175,000 | 7.000%, 5/15/2018c | 3,365,500 | ||||||
| Silgan Holdings, Inc. | ||||||||
| 3,970,000 | 5.000%, 4/1/2020 | 4,069,250 | ||||||
| Tekni-Plex, Inc. | ||||||||
| 2,305,000 | 9.750%, 6/1/2019c | 2,575,837 | ||||||
| United Rentals North America, Inc. | ||||||||
| 1,070,000 | 7.375%, 5/15/2020 | 1,182,350 | ||||||
| 1,625,000 | 6.125%, 6/15/2023 | 1,742,812 | ||||||
| UR Financing Escrow Corporation | ||||||||
| 4,250,000 | 7.625%, 4/15/2022 | 4,770,625 | ||||||
|
| |||||||
| Total | 74,655,475 | |||||||
|
| |||||||
| Communications Services (17.4%) | |||||||
| Altice Financing SA | ||||||||
| 1,080,000 | 6.500%, 1/15/2022c | 1,150,200 | ||||||
| Altice Finco SA | ||||||||
| 1,050,000 | 9.875%, 12/15/2020c | 1,210,125 | ||||||
| 540,000 | 8.125%, 1/15/2024c | 595,350 | ||||||
| Altice SA | ||||||||
| 3,250,000 | 7.750%, 5/15/2022c | 3,469,375 | ||||||
| AMC Networks, Inc. | ||||||||
| 4,810,000 | 7.750%, 7/15/2021 | 5,381,187 | ||||||
| B Communications, Ltd. | ||||||||
| 2,710,000 | 7.375%, 2/15/2021c | 2,913,250 | ||||||
| CCO Holdings, LLC | ||||||||
| 1,610,000 | 7.000%, 1/15/2019 | 1,698,550 | ||||||
| 800,000 | 7.375%, 6/1/2020 | 872,000 | ||||||
| 2,165,000 | 5.250%, 3/15/2021 | 2,219,125 | ||||||
| 2,165,000 | 5.250%, 9/30/2022 | 2,197,475 | ||||||
| CenturyLink, Inc. | ||||||||
| 1,420,000 | 6.450%, 6/15/2021 | 1,540,700 | ||||||
| Cequel Communications Escrow 1, LLC | ||||||||
| 3,500,000 | 6.375%, 9/15/2020c | 3,718,750 | ||||||
| Clear Channel Worldwide Holdings, Inc. | ||||||||
| 5,000,000 | 6.500%, 11/15/2022 | 5,387,500 | ||||||
| Columbus International, Inc. | ||||||||
| 5,060,000 | 7.375%, 3/30/2021c | 5,452,150 | ||||||
| CSC Holdings, LLC | ||||||||
| 2,170,000 | 5.250%, 6/1/2024c | 2,134,738 | ||||||
| Digicel, Ltd. | ||||||||
| 4,210,000 | 8.250%, 9/1/2017c | 4,331,248 | ||||||
| 1,680,000 | 7.000%, 2/15/2020c | 1,772,400 | ||||||
| 3,220,000 | 6.000%, 4/15/2021c | 3,324,650 | ||||||
| DISH DBS Corporation | ||||||||
| 2,645,000 | 5.125%, 5/1/2020 | 2,780,556 | ||||||
| 2,710,000 | 5.000%, 3/15/2023 | 2,760,813 | ||||||
| Eileme 2 AB | ||||||||
| 4,260,000 | 11.625%, 1/31/2020b | 5,090,700 | ||||||
| Frontier Communications Corporation | ||||||||
| 3,255,000 | 8.125%, 10/1/2018 | 3,808,350 | ||||||
| Gray Television, Inc. | ||||||||
| 2,710,000 | 7.500%, 10/1/2020 | 2,920,025 | ||||||
| Hughes Satellite Systems Corporation | ||||||||
| 4,850,000 | 6.500%, 6/15/2019 | 5,407,750 | ||||||
| Intelsat Jackson Holdings SA | ||||||||
| 7,470,000 | 7.250%, 10/15/2020 | 8,048,925 | ||||||
| Level 3 Financing, Inc. | ||||||||
| 4,230,000 | 8.625%, 7/15/2020 | 4,737,600 | ||||||
| 1,620,000 | 6.125%, 1/15/2021c | 1,735,425 | ||||||
| McGraw-Hill Global Education Holdings, LLC | ||||||||
| 5,295,000 | 9.750%, 4/1/2021d | 6,076,012 | ||||||
| MDC Partners, Inc. | ||||||||
| 3,730,000 | 6.750%, 4/1/2020c | 3,935,150 | ||||||
| Nielsen Finance, LLC | ||||||||
| 1,350,000 | 5.000%, 4/15/2022c,f | 1,360,125 | ||||||
| Numericable Group SA | ||||||||
| 4,590,000 | 6.000%, 5/15/2022c | 4,773,600 | ||||||
| 2,710,000 | 6.250%, 5/15/2024c | 2,828,563 | ||||||
| Sprint Communications, Inc. | ||||||||
| 8,180,000 | 9.000%, 11/15/2018c | 9,918,250 | ||||||
| 2,870,000 | 7.000%, 3/1/2020c | 3,300,500 | ||||||
| 4,000,000 | 6.000%, 11/15/2022 | 4,080,000 | ||||||
| Sprint Corporation | ||||||||
| 3,460,000 | 7.125%, 6/15/2024c | 3,667,600 | ||||||
| T-Mobile USA, Inc. | ||||||||
| 3,790,000 | 6.542%, 4/28/2020 | 4,093,200 | ||||||
| 985,000 | 6.633%, 4/28/2021 | 1,066,262 | ||||||
| 1,080,000 | 6.125%, 1/15/2022 | 1,146,150 | ||||||
| 810,000 | 6.731%, 4/28/2022 | 873,787 | ||||||
| 1,080,000 | 6.500%, 1/15/2024 | 1,154,250 | ||||||
| Unitymedia Hessen GmbH & Company KG | ||||||||
| 5,100,000 | 5.500%, 1/15/2023c | 5,278,500 | ||||||
| Univision Communications, Inc. | ||||||||
| 2,713,000 | 6.750%, 9/15/2022c | 3,001,256 | ||||||
| UPCB Finance V, Ltd. | ||||||||
| 1,600,000 | 7.250%, 11/15/2021c | 1,760,000 | ||||||
| Verizon Communications, Inc. | ||||||||
| 1,560,000 | 5.150%, 9/15/2023 | 1,745,785 | ||||||
| WideOpenWest Finance, LLC | ||||||||
| 1,080,000 | 10.250%, 7/15/2019c | 1,213,650 | ||||||
| 5,120,000 | 10.250%, 7/15/2019 | 5,753,600 | ||||||
| Wind Acquisition Finance SA | ||||||||
| 4,660,000 | 4.750%, 7/15/2020c,f | 4,694,950 | ||||||
| 5,465,000 | 7.375%, 4/23/2021c | 5,833,888 | ||||||
| Windstream Corporation | ||||||||
| 2,170,000 | 7.750%, 10/1/2021 | 2,370,725 | ||||||
|
| |||||||
| Total | 166,584,720 | |||||||
|
| |||||||
The accompanying Notes to Financial Statements are an integral part of this schedule.
249
Table of Contents
High Yield Portfolio
Schedule of Investments as of June 30, 2014
(unaudited)
| Principal Amount | Long-Term Fixed Income (91.0%) | Value | ||||||
| Consumer Cyclical (13.4%) | |||||||
| AMC Entertainment, Inc. | ||||||||
| $2,710,000 | 5.875%, 2/15/2022d | $ | 2,818,400 | |||||
| Beazer Homes USA, Inc. | ||||||||
| 2,710,000 | 5.750%, 6/15/2019c,d | 2,710,000 | ||||||
| Best Buy Company, Inc. | ||||||||
| 2,640,000 | 5.000%, 8/1/2018 | 2,768,700 | ||||||
| Brookfield Residential Properties, Inc. | ||||||||
| 2,630,000 | 6.500%, 12/15/2020c | 2,781,225 | ||||||
| 2,110,000 | 6.125%, 7/1/2022c | 2,194,400 | ||||||
| Choice Hotels International, Inc. | ||||||||
| 6,750,000 | 5.750%, 7/1/2022 | 7,244,505 | ||||||
| Chrysler Group, LLC | ||||||||
| 2,770,000 | 8.000%, 6/15/2019 | 3,008,912 | ||||||
| 2,100,000 | 8.250%, 6/15/2021 | 2,373,000 | ||||||
| Churchill Downs, Inc. | ||||||||
| 2,170,000 | 5.375%, 12/15/2021c | 2,224,250 | ||||||
| Cinemark USA, Inc. | ||||||||
| 5,475,000 | 4.875%, 6/1/2023 | 5,461,313 | ||||||
| CST Brands, Inc. | ||||||||
| 2,110,000 | 5.000%, 5/1/2023 | 2,110,000 | ||||||
| Eldorado Resorts, LLC | ||||||||
| 6,015,000 | 8.625%, 6/15/2019b | 6,466,125 | ||||||
| General Motors Financial Company, Inc. | ||||||||
| 2,900,000 | 4.750%, 8/15/2017 | 3,084,875 | ||||||
| 1,310,000 | 6.750%, 6/1/2018 | 1,498,312 | ||||||
| GLP Capital, LP | ||||||||
| 3,245,000 | 5.375%, 11/1/2023c | 3,366,688 | ||||||
| Hilton Worldwide Finance, LLC | ||||||||
| 3,350,000 | 5.625%, 10/15/2021c | 3,559,375 | ||||||
| Jaguar Land Rover Automotive plc | ||||||||
| 2,490,000 | 4.125%, 12/15/2018c | 2,564,700 | ||||||
| 1,050,000 | 5.625%, 2/1/2023c | 1,115,625 | ||||||
| KB Home | ||||||||
| 1,070,000 | 7.250%, 6/15/2018 | 1,203,750 | ||||||
| 1,087,000 | 4.750%, 5/15/2019 | 1,095,153 | ||||||
| 2,000,000 | 8.000%, 3/15/2020 | 2,295,000 | ||||||
| 1,580,000 | 7.500%, 9/15/2022 | 1,753,800 | ||||||
| L Brands, Inc. | ||||||||
| 1,570,000 | 6.625%, 4/1/2021 | 1,783,912 | ||||||
| 1,860,000 | 5.625%, 2/15/2022 | 2,013,450 | ||||||
| Lear Corporation | ||||||||
| 1,540,000 | 8.125%, 3/15/2020 | 1,657,425 | ||||||
| 1,110,000 | 4.750%, 1/15/2023 | 1,104,450 | ||||||
| LKQ Corporation | ||||||||
| 2,910,000 | 4.750%, 5/15/2023 | 2,869,260 | ||||||
| Mohegan Tribal Gaming Authority | ||||||||
| 4,820,000 | 9.750%, 9/1/2021d | 5,350,200 | ||||||
| Neiman Marcus Group, Ltd. | ||||||||
| 3,240,000 | 8.000%, 10/15/2021c | 3,491,100 | ||||||
| 2,160,000 | 8.750%, 10/15/2021c | 2,354,400 | ||||||
| New Cotai, LLC | ||||||||
| 4,932,931 | 10.625%, 5/1/2019c | 5,672,871 | ||||||
| Rite Aid Corporation | ||||||||
| 3,165,000 | 6.750%, 6/15/2021d | 3,426,113 | ||||||
| Scientific Games International, Inc. | ||||||||
| 4,605,000 | 6.625%, 5/15/2021c,d | 4,558,950 | ||||||
| Seminole Indian Tribe of Florida | ||||||||
| 4,290,000 | 7.804%, 10/1/2020b | 4,826,250 | ||||||
| Seven Seas Cruises S de RL, LLC | ||||||||
| 5,270,000 | 9.125%, 5/15/2019c | 5,750,887 | ||||||
| Studio City Finance, Ltd. | ||||||||
| 5,240,000 | 8.500%, 12/1/2020c | 5,803,300 | ||||||
| Tunica-Biloxi Gaming Authority | ||||||||
| 4,770,000 | 9.000%, 11/15/2015b | 2,766,600 | ||||||
| West Corporation | ||||||||
| 4,150,000 | 8.625%, 10/1/2018 | 4,409,375 | ||||||
| 3,790,000 | 5.375%, 7/15/2022c,f | 3,752,100 | ||||||
| WMG Acquisition Corporation | ||||||||
| 2,435,000 | 6.750%, 4/15/2022c | 2,435,000 | ||||||
|
| |||||||
| Total | 127,723,751 | |||||||
|
| |||||||
| Consumer Non-Cyclical (9.4%) | |||||||
| Aviv Healthcare Properties, LP | ||||||||
| 1,700,000 | 6.000%, 10/15/2021 | 1,802,000 | ||||||
| B&G Foods, Inc. | ||||||||
| 3,700,000 | 4.625%, 6/1/2021 | 3,709,250 | ||||||
| Biomet, Inc. | ||||||||
| 3,105,000 | 6.500%, 8/1/2020 | 3,345,637 | ||||||
| Cott Beverages, Inc. | ||||||||
| 1,625,000 | 5.375%, 7/1/2022c | 1,629,063 | ||||||
| Envision Healthcare Corporation | ||||||||
| 3,795,000 | 5.125%, 7/1/2022c | 3,828,206 | ||||||
| Fresenius Medical Care US Finance, Inc. | ||||||||
| 2,660,000 | 6.500%, 9/15/2018c | 3,005,800 | ||||||
| 2,150,000 | 5.750%, 2/15/2021c | 2,348,875 | ||||||
| Grifols Worldwide Operations, Ltd. | ||||||||
| 2,710,000 | 5.250%, 4/1/2022c | 2,811,625 | ||||||
| HCA, Inc. | ||||||||
| 650,000 | 3.750%, 3/15/2019 | 655,688 | ||||||
| 2,645,000 | 6.500%, 2/15/2020 | 2,975,625 | ||||||
| 4,810,000 | 5.875%, 3/15/2022 | 5,212,837 | ||||||
| 3,360,000 | 4.750%, 5/1/2023 | 3,355,800 | ||||||
| JBS Finance II, Ltd. | ||||||||
| 4,550,000 | 8.250%, 1/29/2018b | 4,823,000 | ||||||
| JBS USA, LLC | ||||||||
| 3,250,000 | 5.875%, 7/15/2024c | 3,241,875 | ||||||
| MPH Acquisition Holdings, LLC | ||||||||
| 3,795,000 | 6.625%, 4/1/2022c | 3,975,263 | ||||||
| Ortho-Clinical Diagnostics, Inc. | ||||||||
| 4,600,000 | 6.625%, 5/15/2022c | 4,565,500 | ||||||
| Prestige Brands, Inc. | ||||||||
| 1,080,000 | 5.375%, 12/15/2021c | 1,101,600 | ||||||
| Revlon Consumer Products Corporation | ||||||||
| 4,760,000 | 5.750%, 2/15/2021d | 4,890,900 | ||||||
| Spectrum Brands Escrow Corporation | ||||||||
| 2,220,000 | 6.375%, 11/15/2020 | 2,386,500 | ||||||
| 2,030,000 | 6.625%, 11/15/2022 | 2,197,475 | ||||||
| Teleflex, Inc. | ||||||||
| 1,685,000 | 6.875%, 6/1/2019 | 1,781,887 | ||||||
| 2,525,000 | 5.250%, 6/15/2024c | 2,550,250 | ||||||
| Tenet Healthcare Corporation | ||||||||
| 3,250,000 | 6.000%, 10/1/2020 | 3,526,250 | ||||||
| 4,335,000 | 8.125%, 4/1/2022 | 5,017,762 | ||||||
| TreeHouse Foods, Inc. | ||||||||
| 2,165,000 | 4.875%, 3/15/2022 | 2,224,538 | ||||||
The accompanying Notes to Financial Statements are an integral part of this schedule.
250
Table of Contents
High Yield Portfolio
Schedule of Investments as of June 30, 2014
(unaudited)
| Principal Amount | Long-Term Fixed Income (91.0%) | Value | ||||||
| Consumer Non-Cyclical (9.4%) - continued |
| ||||||
| Valeant Pharmaceuticals International | ||||||||
| $2,600,000 | 7.250%, 7/15/2022c | $ | 2,808,000 | |||||
| Valeant Pharmaceuticals International, Inc. | ||||||||
| 520,000 | 5.625%, 12/1/2021c | 534,950 | ||||||
| Visant Corporation | ||||||||
| 2,700,000 | 10.000%, 10/1/2017 | 2,517,750 | ||||||
| VPII Escrow Corporation | ||||||||
| 1,850,000 | 7.500%, 7/15/2021c | 2,048,875 | ||||||
| Warner Chilcott Company, LLC | ||||||||
| 4,565,000 | 7.750%, 9/15/2018 | 4,799,139 | ||||||
|
| |||||||
| Total | 89,671,920 | |||||||
|
| |||||||
| Energy (13.3%) | |||||||
| Bonanza Creek Energy, Inc. | ||||||||
| 5,085,000 | 6.750%, 4/15/2021 | 5,440,950 | ||||||
| Calumet Specialty Products Partners, LP | ||||||||
| 4,060,000 | 6.500%, 4/15/2021c | 4,141,200 | ||||||
| Chaparral Energy, Inc. | ||||||||
| 4,150,000 | 7.625%, 11/15/2022 | 4,482,000 | ||||||
| Concho Resources, Inc. | ||||||||
| 4,740,000 | 6.500%, 1/15/2022 | 5,225,850 | ||||||
| Diamondback Energy, Inc. | ||||||||
| 3,490,000 | 7.625%, 10/1/2021c | 3,839,000 | ||||||
| Energy XXI Gulf Coast, Inc. | ||||||||
| 2,170,000 | 7.750%, 6/15/2019 | 2,321,900 | ||||||
| 1,360,000 | 6.875%, 3/15/2024c | 1,387,200 | ||||||
| Exterran Partners, LP | ||||||||
| 3,780,000 | 6.000%, 4/1/2021 | 3,817,800 | ||||||
| Harvest Operations Corporation | ||||||||
| 3,250,000 | 6.875%, 10/1/2017 | 3,526,250 | ||||||
| Hornbeck Offshore Services, Inc. | ||||||||
| 1,590,000 | 5.000%, 3/1/2021 | 1,586,025 | ||||||
| Jones Energy Holdings, LLC | ||||||||
| 2,170,000 | 6.750%, 4/1/2022c | 2,289,350 | ||||||
| Kodiak Oil & Gas Corporation | ||||||||
| 3,180,000 | 5.500%, 1/15/2021d | 3,315,150 | ||||||
| 1,580,000 | 5.500%, 2/1/2022 | 1,639,250 | ||||||
| Laredo Petroleum, Inc. | ||||||||
| 4,330,000 | 5.625%, 1/15/2022 | 4,476,138 | ||||||
| Linn Energy, LLC | ||||||||
| 1,750,000 | 8.625%, 4/15/2020 | 1,890,000 | ||||||
| 2,195,000 | 7.750%, 2/1/2021 | 2,367,856 | ||||||
| Markwest Energy Partners, LP | ||||||||
| 1,729,000 | 6.250%, 6/15/2022 | 1,888,932 | ||||||
| MEG Energy Corporation | ||||||||
| 1,055,000 | 6.500%, 3/15/2021c | 1,118,300 | ||||||
| 3,160,000 | 6.375%, 1/30/2023c | 3,357,500 | ||||||
| 1,800,000 | 7.000%, 3/31/2024c | 1,984,500 | ||||||
| Memorial Production Partners, LP | ||||||||
| 3,170,000 | 7.625%, 5/1/2021 | 3,316,613 | ||||||
| Northern Oil and Gas, Inc. | ||||||||
| 3,965,000 | 8.000%, 6/1/2020 | 4,232,638 | ||||||
| Northern Tier Energy, LLC | ||||||||
| 3,020,000 | 7.125%, 11/15/2020 | 3,272,925 | ||||||
| Oasis Petroleum, Inc. | ||||||||
| 2,670,000 | 7.250%, 2/1/2019 | 2,830,200 | ||||||
| 1,590,000 | 6.500%, 11/1/2021 | 1,709,250 | ||||||
| 2,000,000 | 6.875%, 3/15/2022c | 2,180,000 | ||||||
| Offshore Group Investment, Ltd. | ||||||||
| 4,230,000 | 7.125%, 4/1/2023d | 4,293,450 | ||||||
| Pacific Drilling V, Ltd. | ||||||||
| 3,538,000 | 7.250%, 12/1/2017c | 3,741,435 | ||||||
| Precision Drilling Corporation | ||||||||
| 2,450,000 | 6.625%, 11/15/2020 | 2,621,500 | ||||||
| 1,060,000 | 6.500%, 12/15/2021 | 1,152,750 | ||||||
| 1,350,000 | 5.250%, 11/15/2024c | 1,356,750 | ||||||
| Range Resources Corporation | ||||||||
| 4,240,000 | 5.000%, 3/15/2023 | 4,515,600 | ||||||
| Rice Energy, Inc. | ||||||||
| 4,605,000 | 6.250%, 5/1/2022c | 4,720,125 | ||||||
| Rosetta Resources, Inc. | ||||||||
| 3,790,000 | 5.875%, 6/1/2024 | 3,941,600 | ||||||
| Sabine Pass Liquefaction, LLC | ||||||||
| 3,250,000 | 5.750%, 5/15/2024c | 3,388,125 | ||||||
| Samson Investment Company | ||||||||
| 4,050,000 | 10.750%, 2/15/2020c | 4,267,687 | ||||||
| United Refining Company | ||||||||
| 3,062,000 | 10.500%, 2/28/2018 | 3,345,235 | ||||||
| Western Refining, Inc. | ||||||||
| 1,060,000 | 6.250%, 4/1/2021 | 1,107,700 | ||||||
| Whiting Petroleum Corporation | ||||||||
| 10,000,000 | 5.750%, 3/15/2021 | 10,950,000 | ||||||
|
| |||||||
| Total | 127,038,734 | |||||||
|
| |||||||
| Financials (7.7%) | |||||||
| Ally Financial, Inc. | ||||||||
| 5,590,000 | 7.500%, 9/15/2020 | 6,735,950 | ||||||
| Aviv Healthcare Properties, LP | ||||||||
| 5,270,000 | 7.750%, 2/15/2019 | 5,612,550 | ||||||
| Banco do Brasil SA/Cayman Islands | ||||||||
| 1,750,000 | 6.250%, 12/31/2049c,d,g | 1,410,937 | ||||||
| BBVA International Preferred SA Unipersonal | ||||||||
| 1,585,000 | 5.919%, 12/29/2049d,g | 1,652,362 | ||||||
| CIT Group, Inc. | ||||||||
| 3,795,000 | 3.875%, 2/19/2019 | 3,854,202 | ||||||
| CyrusOne, LP | ||||||||
| 4,540,000 | 6.375%, 11/15/2022 | 4,891,850 | ||||||
| DDR Corporation | ||||||||
| 780,000 | 4.625%, 7/15/2022 | 834,637 | ||||||
| Denali Borrower, LLC | ||||||||
| 6,680,000 | 5.625%, 10/15/2020c,d | 7,080,800 | ||||||
| Developers Diversified Realty Corporation | ||||||||
| 3,190,000 | 7.875%, 9/1/2020 | 4,036,502 | ||||||
| Goldman Sachs Group, Inc. | ||||||||
| 815,000 | 5.700%, 12/29/2049g | 841,997 | ||||||
| Icahn Enterprises, LP | ||||||||
| 5,500,000 | 4.875%, 3/15/2019 | 5,665,000 | ||||||
| 8,235,000 | 6.000%, 8/1/2020 | 8,821,744 | ||||||
| 3,240,000 | 5.875%, 2/1/2022 | 3,393,900 | ||||||
| ILFC E-Capital Trust II | ||||||||
| 1,895,000 | 6.250%, 12/21/2065c,e | 1,895,000 | ||||||
| International Lease Finance Corporation | ||||||||
| 2,250,000 | 8.625%, 9/15/2015 | 2,435,625 | ||||||
| 1,600,000 | 8.875%, 9/1/2017 | 1,894,000 | ||||||
| Jefferies Finance, LLC | ||||||||
| 2,650,000 | 7.375%, 4/1/2020b | 2,782,500 | ||||||
| Lloyds Banking Group plc | ||||||||
| 1,080,000 | 6.657%, 1/29/2049c,g | 1,209,600 | ||||||
The accompanying Notes to Financial Statements are an integral part of this schedule.
251
Table of Contents
High Yield Portfolio
Schedule of Investments as of June 30, 2014
(unaudited)
| Principal Amount | Long-Term Fixed Income (91.0%) | Value | ||||||
| Financials (7.7%) - continued |
| ||||||
| Morgan Stanley | ||||||||
| $540,000 | 5.450%, 12/29/2049g | $ | 549,850 | |||||
| Royal Bank of Scotland Group plc | ||||||||
| 2,115,000 | 7.640%, 3/29/2049g | 2,260,406 | ||||||
| Speedy Cash Intermediate Holdings Corporation | ||||||||
| 2,170,000 | 10.750%, 5/15/2018c | 2,202,550 | ||||||
| TMX Finance, LLC | ||||||||
| 1,585,000 | 8.500%, 9/15/2018c | 1,680,100 | ||||||
| XL Group plc | ||||||||
| 1,500,000 | 6.500%, 12/31/2049g | 1,481,250 | ||||||
|
| |||||||
| Total | 73,223,312 | |||||||
|
| |||||||
| Technology (4.9%) | |||||||
| Alliance Data Systems Corporation | ||||||||
| 4,190,000 | 5.250%, 12/1/2017c | 4,378,550 | ||||||
| 3,340,000 | 6.375%, 4/1/2020c | 3,557,100 | ||||||
| Amkor Technology, Inc. | ||||||||
| 3,130,000 | 6.625%, 6/1/2021d | 3,333,450 | ||||||
| BMC Software Finance, Inc. | ||||||||
| 1,625,000 | 8.125%, 7/15/2021c | 1,671,719 | ||||||
| Boxer Parent Company, Inc. | ||||||||
| 1,630,000 | 9.000%, 10/15/2019c | 1,589,250 | ||||||
| Brocade Communications | ||||||||
| Systems, Inc. | ||||||||
| 3,790,000 | 4.625%, 1/15/2023 | 3,676,300 | ||||||
| First Data Corporation | ||||||||
| 500,000 | 7.375%, 6/15/2019c | 536,875 | ||||||
| 1,850,000 | 12.625%, 1/15/2021 | 2,277,812 | ||||||
| 3,250,000 | 11.750%, 8/15/2021 | 3,855,312 | ||||||
| Flextronics International, Ltd. | ||||||||
| 3,000,000 | 4.625%, 2/15/2020 | 3,082,500 | ||||||
| Freescale Semiconductor, Inc. | ||||||||
| 2,110,000 | 8.050%, 2/1/2020d | 2,278,800 | ||||||
| 2,400,000 | 10.750%, 8/1/2020 | 2,712,000 | ||||||
| Infor US, Inc. | ||||||||
| 3,090,000 | 9.375%, 4/1/2019 | 3,441,487 | ||||||
| Micron Technology, Inc. | ||||||||
| 1,625,000 | 5.875%, 2/15/2022c | 1,742,813 | ||||||
| NXP BV/NXP Funding, LLC | ||||||||
| 3,715,000 | 5.750%, 3/15/2023c | 3,905,394 | ||||||
| Sensata Technologies BV | ||||||||
| 2,100,000 | 6.500%, 5/15/2019c | 2,233,875 | ||||||
| 2,650,000 | 4.875%, 10/15/2023c | 2,630,125 | ||||||
|
| |||||||
| Total | 46,903,362 | |||||||
|
| |||||||
| Transportation (4.9%) | |||||||
| Algeco Scotsman Global Finance plc | ||||||||
| 3,680,000 | 8.500%, 10/15/2018c | 3,910,000 | ||||||
| American Airlines Pass Through Trust | ||||||||
| 4,117,024 | 5.600%, 7/15/2020c | 4,333,168 | ||||||
| Avis Budget Car Rental, LLC | ||||||||
| 3,670,000 | 5.125%, 6/1/2022c | 3,674,588 | ||||||
| 3,550,000 | 5.500%, 4/1/2023 | 3,629,875 | ||||||
| Continental Airlines, Inc. | ||||||||
| 3,000,000 | 6.750%, 9/15/2015c | 3,026,250 | ||||||
| 1,560,000 | 6.125%, 4/29/2018 | 1,665,300 | ||||||
| Delta Air Lines Pass Through Trust | ||||||||
| 2,686,598 | 6.875%, 5/7/2019c | 2,982,123 | ||||||
| Eletson Holdings, Inc. | ||||||||
| 2,170,000 | 9.625%, 1/15/2022b | 2,327,325 | ||||||
| HDTFS, Inc. | ||||||||
| 790,000 | 6.250%, 10/15/2022d | 836,412 | ||||||
| Hornbeck Offshore Services, Inc. | ||||||||
| 2,115,000 | 5.875%, 4/1/2020 | 2,189,025 | ||||||
| Navios Maritime Holdings, Inc. | ||||||||
| 2,220,000 | 8.125%, 2/15/2019d | 2,333,775 | ||||||
| 1,895,000 | 8.125%, 11/15/2021c | 1,980,275 | ||||||
| Navios South American Logistics, Inc. | ||||||||
| 1,900,000 | 7.250%, 5/1/2022c | 1,976,000 | ||||||
| Teekay Offshore Partners, LP | ||||||||
| 3,790,000 | 6.000%, 7/30/2019 | 3,808,950 | ||||||
| Ultrapetrol Bahamas, Ltd. | ||||||||
| 3,720,000 | 8.875%, 6/15/2021 | 4,026,900 | ||||||
| United Airlines Pass Through Trust | ||||||||
| 1,560,000 | 5.375%, 8/15/2021 | 1,624,428 | ||||||
| US Airways Group, Inc. | ||||||||
| 2,600,000 | 6.125%, 6/1/2018 | 2,746,250 | ||||||
|
| |||||||
| Total | 47,070,644 | |||||||
|
| |||||||
| Utilities (4.1%) | |||||||
| Access Midstream Partners, LP | ||||||||
| 1,420,000 | 4.875%, 5/15/2023 | 1,496,325 | ||||||
| AES Corporation | ||||||||
| 2,900,000 | 7.375%, 7/1/2021 | 3,393,000 | ||||||
| Atlas Pipeline Partners, LP | ||||||||
| 4,230,000 | 4.750%, 11/15/2021 | 4,145,400 | ||||||
| Chesapeake Midstream Partners, LP | ||||||||
| 930,000 | 6.125%, 7/15/2022 | 1,027,650 | ||||||
| Covanta Holding Corporation | ||||||||
| 2,600,000 | 7.250%, 12/1/2020 | 2,834,000 | ||||||
| 1,850,000 | 6.375%, 10/1/2022 | 2,007,250 | ||||||
| Crestwood Midstream Partners, LP | ||||||||
| 2,435,000 | 6.125%, 3/1/2022c | 2,562,838 | ||||||
| Electricite de France SA | ||||||||
| 2,500,000 | 5.250%, 12/29/2049c,g | 2,550,325 | ||||||
| Energy Future Intermediate Holding Company, LLC | ||||||||
| 2,640,000 | 12.250%, 3/1/2022c | 3,247,200 | ||||||
| Holly Energy Partners, LP | ||||||||
| 930,000 | 6.500%, 3/1/2020 | 1,002,075 | ||||||
| NRG Energy, Inc. | ||||||||
| 4,900,000 | 6.625%, 3/15/2023 | 5,304,250 | ||||||
| Regency Energy Partners, LP | ||||||||
| 3,670,000 | 6.875%, 12/1/2018 | 3,867,262 | ||||||
| 840,000 | 5.500%, 4/15/2023 | 877,800 | ||||||
| Targa Resources Partners, LP | ||||||||
| 4,720,000 | 5.250%, 5/1/2023 | 4,932,400 | ||||||
|
| |||||||
| Total | 39,247,775 | |||||||
|
| |||||||
Total Long-Term Fixed Income (cost $824,632,324) | 869,594,210 | |||||||
|
| |||||||
Shares | Preferred Stock (0.8%) | |||||||
| Financials (0.8%) | |||||||
| 43,350 | CHS, Inc., 7.100%g | 1,177,386 | ||||||
| 62,331 | Citigroup, Inc., 6.875%g | 1,691,663 | ||||||
| 48,000 | Discover Financial Services, | |||||||
| 6.500%g | 1,204,800 | |||||||
The accompanying Notes to Financial Statements are an integral part of this schedule.
252
Table of Contents
High Yield Portfolio
Schedule of Investments as of June 30, 2014
(unaudited)
| Shares | Preferred Stock (0.8%) | Value | ||||||
| Financials (0.8%) - continued | |||||||
| 51,821 | Goldman Sachs Group, Inc., 5.500%g | $ | 1,269,615 | |||||
| 18,720 | PNC Financial Services Group, Inc., 6.125%g | 514,051 | ||||||
| 1,560 | Wells Fargo & Company, Convertible, 7.500%g | 1,893,840 | ||||||
|
| |||||||
| Total | 7,751,355 | |||||||
|
| |||||||
| Total Preferred Stock (cost $7,809,007) | 7,751,355 | |||||||
|
| |||||||
Common Stock (0.1%) | ||||||||
| Consumer Discretionary (<0.1%) | |||||||
| 237 | Lear Corporation, Warrants, $0.01, expires 11/9/2014h | 41,153 | ||||||
| 121,520 | TVMAX Holdings, Inc.h,i | 12 | ||||||
|
| |||||||
| Total | 41,165 | |||||||
|
| |||||||
| Financials (0.1%) | |||||||
| 10 | New Cotai, LLCb,h,i | 387,446 | ||||||
|
| |||||||
| Total | 387,446 | |||||||
|
| |||||||
| Total Common Stock (cost $6,604,199) | 428,611 | |||||||
|
| |||||||
Collateral Held for Securities Loaned (6.2%) | ||||||||
| 59,092,687 | Thrivent Cash Management Trust | 59,092,687 | ||||||
|
| |||||||
Total Collateral Held for Securities Loaned (cost $59,092,687) | 59,092,687 | |||||||
|
| |||||||
| Shares or Principal Amount | Short-Term Investments (3.1%)j | |||||||
| Federal Home Loan Bank Discount Notes | ||||||||
| 600,000 | 0.090%, 08/20/2014k | 599,925 | ||||||
| Thrivent Cash Management Trust | ||||||||
| 29,382,191 | 0.050% | 29,382,191 | ||||||
|
| |||||||
| Total Short-Term Investments (at amortized cost) | 29,982,116 | |||||||
|
| |||||||
| Total Investments (cost $969,148,973) 105.6% | $ | 1,008,853,636 | ||||||
|
| |||||||
| Other Assets and Liabilities, Net (5.6%) | (53,234,721 | ) | ||||||
|
| |||||||
| Total Net Assets 100.0% | $ | 955,618,915 | ||||||
|
| |||||||
| a | The stated interest rate represents the weighted average of all contracts within the bank loan facility. |
| b | Denotes restricted securities. Restricted securities are investment securities which have been deemed illiquid and cannot be offered for public sale without first being registered under the Securities Act of 1933. The following table indicates the acquisition date and cost of restricted securities High Yield Portfolio owned as of June 30, 2014. |
Security | Acquisition Date | Cost | ||||||
APERAM, 04/01/2018 | 3/25/2011 | $ | 2,634,292 | |||||
Bluescope Steel, Ltd., 05/01/2018 | 4/11/2013 | 1,590,000 | ||||||
Eileme 2 AB, 01/31/2020 | 1/19/2012 | 4,179,060 | ||||||
Eldorado Resorts, LLC, 06/15/2019 | 5/19/2011 | 6,015,127 | ||||||
Eletson Holdings, Inc., 01/15/2022 | 12/12/2013 | 2,139,989 | ||||||
JBS Finance II, Ltd., 01/29/2018 | 7/22/2010 | 4,487,847 | ||||||
Jefferies Finance, LLC, 04/01/2020 | 3/19/2013 | 2,650,000 | ||||||
Midwest Vanadium, Pty. Ltd., 02/15/2018 | 2/9/2011 | 3,245,874 | ||||||
New Cotai, LLC | 4/12/2013 | 308,750 | ||||||
Seminole Indian Tribe of Florida, 10/01/2020 | 7/8/2010 | 4,013,871 | ||||||
Tunica-Biloxi Gaming Authority, 11/15/2015 | 11/8/2005 | 4,761,996 | ||||||
| c | Denotes securities sold under Rule 144A of the Securities Act of 1933, which exempts them from registration. These securities have been deemed liquid and may be resold to other dealers in the program or to other qualified institutional buyers. As of June 30, 2014, the value of these investments was $333,679,848 or 34.9% of total net assets. |
| d | All or a portion of the security is on loan. |
| e | Denotes variable rate securities. Variable rate securities are securities whose yields vary with a designated market index or market rate. The rate shown is as of June 30, 2014. |
| f | Denotes investments purchased on a when-issued or delayed delivery basis. |
| g | Denotes perpetual securities. Perpetual securities pay an indefinite stream of interest, but may be called by the issuer at an earlier date. |
| h | Non-income producing security. |
| i | Security is fair valued. |
| j | The interest rate shown reflects the yield, coupon rate or the discount rate at the date of purchase. |
| k | At June 30, 2014, $499,937 of investments were held on deposit with the counterparty and pledged as the initial margin deposit for open futures contracts. |
Unrealized Appreciation (Depreciation)
Gross unrealized appreciation and depreciation of investments, based on cost for federal income tax purposes, were as follows:
Gross unrealized appreciation | $ | 51,084,412 | ||
Gross unrealized depreciation | (11,625,080 | ) | ||
|
| |||
Net unrealized appreciation (depreciation) | $ | 39,459,332 | ||
Cost for federal income tax purposes | $ | 969,394,304 | ||
The accompanying Notes to Financial Statements are an integral part of this schedule.
253
Table of Contents
High Yield Portfolio
Schedule of Investments as of June 30, 2014
(unaudited)
Fair Valuation Measurements
The following table is a summary of the inputs used, as of June 30, 2014, in valuing High Yield Portfolio’s assets carried at fair value.
Investments in Securities | Total | Level 1 | Level 2 | Level 3 | ||||||||||||
Bank Loans | ||||||||||||||||
Communications Services | 21,357,573 | — | 21,357,573 | — | ||||||||||||
Consumer Cyclical | 2,738,029 | — | 2,738,029 | — | ||||||||||||
Consumer Non-Cyclical | 7,682,264 | — | 7,682,264 | — | ||||||||||||
Financials | 5,940,764 | — | 5,940,764 | — | ||||||||||||
Technology | 4,286,027 | — | 4,286,027 | — | ||||||||||||
Long-Term Fixed Income | ||||||||||||||||
Asset-Backed Securities | 2,951,772 | — | 2,951,772 | — | ||||||||||||
Basic Materials | 74,522,745 | — | 74,522,745 | — | ||||||||||||
Capital Goods | 74,655,475 | — | 74,655,475 | — | ||||||||||||
Communications Services | 166,584,720 | — | 166,584,720 | — | ||||||||||||
Consumer Cyclical | 127,723,751 | — | 127,723,751 | — | ||||||||||||
Consumer Non-Cyclical | 89,671,920 | — | 89,671,920 | — | ||||||||||||
Energy | 127,038,734 | — | 127,038,734 | — | ||||||||||||
Financials | 73,223,312 | — | 73,223,312 | — | ||||||||||||
Technology | 46,903,362 | — | 46,903,362 | — | ||||||||||||
Transportation | 47,070,644 | — | 47,070,644 | — | ||||||||||||
Utilities | 39,247,775 | — | 39,247,775 | — | ||||||||||||
Preferred Stock | ||||||||||||||||
Financials | 7,751,355 | 7,751,355 | — | — | ||||||||||||
Common Stock | ||||||||||||||||
Consumer Discretionary | 41,165 | 41,153 | — | 12 | ||||||||||||
Financials | 387,446 | — | — | 387,446 | ||||||||||||
Collateral Held for Securities Loaned | 59,092,687 | 59,092,687 | — | — | ||||||||||||
Short-Term Investments | 29,982,116 | 29,382,191 | 599,925 | — | ||||||||||||
|
|
|
|
|
|
|
| |||||||||
Total | $ | 1,008,853,636 | $ | 96,267,386 | $ | 912,198,792 | $ | 387,458 | ||||||||
|
|
|
|
|
|
|
| |||||||||
Other Financial Instruments | Total | Level 1 | Level 2 | Level 3 | ||||||||||||
Liability Derivatives Futures Contracts | 79,000 | 79,000 | — | — | ||||||||||||
|
|
|
|
|
|
|
| |||||||||
Total Liability Derivatives | $ | 79,000 | $ | 79,000 | $ | — | $ | — | ||||||||
|
|
|
|
|
|
|
| |||||||||
There were no significant transfers between Levels during the period ended June 30, 2014. Transfers between Levels are identified as of the end of the period.
Futures Contracts | Number of Contracts Long/(Short) | Expiration Date | Notional Principal Amount | Value | Unrealized Gain/(Loss) | |||||||||||||||
S&P 500 Index Mini-Futures | (100 | ) | September 2014 | ($ | 9,683,000 | ) | ($ | 9,762,000 | ) | ($ | 79,000 | ) | ||||||||
Total Futures Contracts | ($ | 79,000 | ) | |||||||||||||||||
The following table summarizes the fair value and Statement of Assets and Liabilities location, as of June 30, 2014, for High Yield Portfolio’s investments in financial derivative instruments by primary risk exposure as discussed under item (2) Significant Accounting Policies of the Notes to Financial Statements.
Derivatives by risk category | Statement of Assets and Liabilities Location | Fair Value | ||||
Liability Derivatives | ||||||
Equity Contracts | ||||||
Futures* | Net Assets - Net unrealized appreciation/(depreciation) on Futures contracts | $ | 79,000 | |||
Total Equity Contracts | 79,000 | |||||
|
| |||||
Total Liability Derivatives | $ | 79,000 | ||||
|
| |||||
| * | Includes cumulative appreciation/depreciation of futures contracts as reported in the Schedule of Investments. Only current day’s variation margin is reported within the Statement of Assets and Liabilities. |
The accompanying Notes to Financial Statements are an integral part of this schedule.
254
Table of Contents
High Yield Portfolio
Schedule of Investments as of June 30, 2014
(unaudited)
The following table summarizes the net realized gains/(losses) and Statement of Operations location, for the period ended June 30, 2014, for High Yield Portfolio’s investments in financial derivative instruments by primary risk exposure.
Derivatives by risk category | Statement of Operations Location | Realized Gains/(Losses) recognized in Income | ||||
Equity Contracts | ||||||
Futures | Net realized gains/(losses) on Futures contracts | (453,751 | ) | |||
Total Equity Contracts | (453,751 | ) | ||||
|
| |||||
Total | ($ | 453,751 | ) | |||
|
| |||||
The following table summarizes the change in net unrealized appreciation/(depreciation) and Statement of Operations location, for the period ended June 30, 2014, for High Yield Portfolio’s investments in financial derivative instruments by primary risk exposure.
Derivatives by risk category | Statement of Operations Location | Change in unrealized appreciation/(depreciation) recognized in Income | ||||
Equity Contracts | ||||||
Futures | Change in net unrealized appreciation/(depreciation) on Futures contracts | (79,000 | ) | |||
Total Equity Contracts | (79,000 | ) | ||||
|
| |||||
Total | ($ | 79,000 | ) | |||
|
| |||||
The following table presents High Yield Portfolio’s average volume of derivative activity during the period ended June 30, 2014.
Derivative Risk Category | Futures (Notional)* | Futures (Percentage of Average Net Assets) | ||||||
Equity Contracts | $ | 5,816,450 | 0.6 | % | ||||
| * | Notional amount represents long or short, or both, derivative positions held by the Portfolio. |
Investment in Affiliates
Affiliated issuers, as defined under the Investment Company Act of 1940, include those in which the Portfolio’s holdings of an issuer represent 5% or more of the outstanding voting securities of an issuer, or any affiliated mutual fund.
A summary of transactions for the fiscal year to date, in High Yield Portfolio, is as follows:
Portfolio | Value December 31, 2013 | Gross Purchases | Gross Sales | Shares Held at June 30, 2014 | Value June 30, 2014 | Income Earned January 1, 2014 - June 30, 2014 | ||||||||||||||||||
Cash Management Trust- Collateral Investment | $ | 50,419,210 | $ | 140,594,064 | $ | 131,920,587 | 59,092,687 | $ | 59,092,687 | $ | 73,524 | |||||||||||||
Cash Management Trust- Short Term Investment | 14,622,201 | 145,923,557 | 131,163,567 | 29,382,191 | 29,382,191 | 8,560 | ||||||||||||||||||
Total Value and Income Earned | 65,041,411 | 88,474,878 | 82,084 | |||||||||||||||||||||
The accompanying Notes to Financial Statements are an integral part of this schedule.
255
Table of Contents
Income Portfolio
Schedule of Investments as of June 30, 2014
(unaudited)
| Principal Amount | Bank Loans (4.4%)a | Value | ||||||
| Basic Materials (0.3%) | ||||||||
Arch Coal, Inc., Term Loan | ||||||||
| $ 1,572,933 | 6.250%, 5/16/2018 | $ | 1,544,431 | |||||
Fortescue Metals Group, Ltd., Term Loan | ||||||||
| 1,621,249 | 3.750%, 6/30/2019 | 1,621,865 | ||||||
Ineos Group Holdings, Ltd., Term Loan | ||||||||
| 1,556,768 | 3.750%, 5/4/2018 | 1,552,300 | ||||||
|
| |||||||
| Total | 4,718,596 | |||||||
|
| |||||||
| Capital Goods (0.2%) | ||||||||
ADS Waste Holdings, Inc., Term Loan | ||||||||
| 1,576,000 | 3.750%, 10/9/2019 | 1,567,411 | ||||||
Berry Plastics Group, Inc., Term Loan | ||||||||
| 1,580,000 | 3.500%, 2/8/2020 | 1,566,017 | ||||||
|
| |||||||
| Total | 3,133,428 | |||||||
|
| |||||||
| Communications Services (1.5%) | ||||||||
Charter Communications Operating, LLC, Term Loan | ||||||||
| 950,400 | 3.000%, 1/3/2021 | 935,355 | ||||||
Clear Channel Communications, Inc., Term Loan | ||||||||
| 20,810 | 3.800%, 1/29/2016 | 20,662 | ||||||
| 1,194,893 | 6.900%, 1/30/2019 | 1,188,273 | ||||||
| 384,298 | 7.650%, 7/30/2019 | 384,897 | ||||||
Cumulus Media Holdings, Inc., Term Loan | ||||||||
| 1,442,581 | 4.250%, 12/23/2020 | 1,446,187 | ||||||
Hargray Communications Group, Inc., Term Loan | ||||||||
| 1,564,200 | 4.750%, 6/26/2019 | 1,568,111 | ||||||
Intelsat Jackson Holdings SA, Term Loan | ||||||||
| 1,789,713 | 3.750%, 6/30/2019 | 1,791,199 | ||||||
Level 3 Communications, Inc., Term Loan | ||||||||
| 1,600,000 | 4.000%, 1/15/2020 | 1,600,336 | ||||||
McGraw-Hill Global Education, LLC, Term Loan | ||||||||
| 676,035 | 5.750%, 3/22/2019 | 687,021 | ||||||
NEP/NCP Holdco, Inc., Term Loan | ||||||||
| 1,580,040 | 0.000%, 1/22/2020 | 1,579,645 | ||||||
TNS, Inc., Term Loan | ||||||||
| 1,519,309 | 5.000%, 2/14/2020 | 1,525,007 | ||||||
Univision Communications, Inc., Term Loan | ||||||||
| 1,642,572 | 4.000%, 3/1/2020 | 1,640,338 | ||||||
Virgin Media Investment Holdings, Ltd., Term Loan | ||||||||
| 1,600,000 | 3.500%, 6/7/2020 | 1,594,496 | ||||||
Visant Corporation, Term Loan | ||||||||
| 1,252,653 | 5.250%, 12/22/2016 | 1,246,703 | ||||||
WideOpenWest Finance, LLC, Term Loan | ||||||||
| 1,580,000 | 4.750%, 4/1/2019 | 1,583,697 | ||||||
Yankee Cable Acquisition, LLC, Term Loan | ||||||||
| 1,544,639 | 4.500%, 3/1/2020 | 1,551,884 | ||||||
Zayo Group, LLC, Term Loan | ||||||||
| 1,575,892 | 4.000%, 7/2/2019 | 1,577,043 | ||||||
|
| |||||||
| Total | 21,920,854 | |||||||
|
| |||||||
| Consumer Cyclical (0.6%) | ||||||||
Bally Technologies, Inc., Term Loan | ||||||||
| 613,083 | 4.250%, 11/25/2020 | 615,382 | ||||||
Burlington Coat Factory Warehouse Corporation, Term Loan | ||||||||
| 1,398,573 | 4.250%, 2/23/2017 | 1,406,153 | ||||||
Caesars Entertainment Resot Properties, LLC, Term Loan | ||||||||
| 1,900,450 | 7.000%, 10/11/2020 | 1,910,750 | ||||||
Chrysler Group, LLC, Term Loan | ||||||||
| 1,559,898 | 3.500%, 5/24/2017 | 1,564,531 | ||||||
MGM Resorts International, Term Loan | ||||||||
| 945,600 | 3.500%, 12/20/2019 | 942,347 | ||||||
ROC Finance, LLC, Term Loan | ||||||||
| 1,588,000 | 5.000%, 6/20/2019 | 1,560,210 | ||||||
Toys R Us, Inc., Term Loan | ||||||||
| 1,530,412 | 5.250%, 5/25/2018 | 1,237,078 | ||||||
|
| |||||||
| Total | 9,236,451 | |||||||
|
| |||||||
| Consumer Non-Cyclical (0.5%) | ||||||||
Albertsons, Inc., Term Loan | ||||||||
| 1,713,077 | 4.750%, 3/21/2019 | 1,720,563 | ||||||
Biomet, Inc., Term Loan | ||||||||
| 1,542,202 | 3.661%, 7/25/2017 | 1,543,390 | ||||||
CHS/Community Health Systems, Inc., Term Loan | ||||||||
| 434,340 | 3.478%, 1/25/2017 | 435,243 | ||||||
| 1,157,660 | 4.250%, 1/27/2021 | 1,163,842 | ||||||
Roundy’s Supermarkets, Inc., Term Loan | ||||||||
| 1,345,523 | 5.750%, 3/3/2021 | 1,347,447 | ||||||
Van Wagner Communications, LLC, Term Loan | ||||||||
| 978,652 | 6.250%, 8/3/2018 | 988,849 | ||||||
|
| |||||||
| Total | 7,199,334 | |||||||
|
| |||||||
| Energy (0.1%) | ||||||||
McJunkin Red Man Corporation, Term Loan | ||||||||
| 635,200 | 5.000%, 11/8/2019 | 638,376 | ||||||
Offshore Group Investment, Ltd., Term Loan | ||||||||
| 790,000 | 5.750%, 3/28/2019 | 784,731 | ||||||
|
| |||||||
| Total | 1,423,107 | |||||||
|
| |||||||
| Financials (0.1%) | ||||||||
WaveDivision Holdings, LLC, Term Loan | ||||||||
| 1,576,000 | 4.000%, 10/12/2019 | 1,574,503 | ||||||
|
| |||||||
| Total | 1,574,503 | |||||||
|
| |||||||
| Technology (0.5%) | ||||||||
BMC Software, Inc., Term Loan | ||||||||
| 1,582,050 | 5.000%, 9/10/2020 | 1,578,427 | ||||||
The accompanying Notes to Financial Statements are an integral part of this schedule.
256
Table of Contents
Income Portfolio
Schedule of Investments as of June 30, 2014
(unaudited)
| Principal Amount | Bank Loans (4.4%)a | Value | ||||||
| Technology (0.5%) - continued | |||||||
First Data Corporation Extended, Term Loan | ||||||||
| $1,600,000 | 4.154%, 3/23/2018 | $ | 1,602,000 | |||||
Freescale Semiconductor, Inc., Term Loan | ||||||||
| 1,580,060 | 4.250%, 2/28/2020 | 1,578,749 | ||||||
Infor US, Inc., Term Loan | ||||||||
| 1,131,073 | 3.750%, 6/3/2020 | 1,122,828 | ||||||
SunGard Data Systems, Inc., Term Loan | ||||||||
| 435,845 | 4.000%, 3/8/2020 | 436,564 | ||||||
Syniverse Holdings, Inc., Term Loan | ||||||||
| 614,289 | 4.000%, 4/23/2019 | 613,263 | ||||||
|
| |||||||
| Total | 6,931,831 | |||||||
|
| |||||||
| Transportation (0.3%) | ||||||||
American Airlines, Inc., Term Loan | ||||||||
| 1,564,200 | 3.750%, 6/27/2019 | 1,565,717 | ||||||
Delta Air Lines, Inc., Term Loan | ||||||||
| 2,405,478 | 3.500%, 4/20/2017 | 2,397,592 | ||||||
|
| |||||||
| Total | 3,963,309 | |||||||
|
| |||||||
| Utilities (0.3%) | ||||||||
Calpine Corporation, Term Loan | ||||||||
| 1,268,681 | 4.000%, 4/1/2018 | 1,272,246 | ||||||
| 1,277,250 | 4.000%, 10/9/2019 | 1,279,906 | ||||||
NGPL PipeCo, LLC, Term Loan | ||||||||
| 1,426,559 | 6.750%, 9/15/2017 | 1,424,776 | ||||||
|
| |||||||
| Total | 3,976,928 | |||||||
|
| |||||||
Total Bank Loans (cost $64,089,977) | 64,078,341 | |||||||
|
| |||||||
Long-Term Fixed Income (90.1%) | ||||||||
| Asset-Backed Securities (1.1%) | ||||||||
GMAC Mortgage Corporation Loan Trust | ||||||||
| 3,272,232 | 0.332%, 8/25/2035b,c | 2,831,220 | ||||||
| 3,863,755 | 0.332%, 12/25/2036b,c | 3,323,305 | ||||||
IndyMac Seconds Asset-Backed Trust | ||||||||
| 588,813 | 0.492%, 10/25/2036b,c | 253,956 | ||||||
Renaissance Home Equity Loan Trust | ||||||||
| 2,489,359 | 5.746%, 5/25/2036 | 1,864,455 | ||||||
| 2,000,000 | 6.011%, 5/25/2036 | 1,467,082 | ||||||
Vericrest Opportunity Loan Transferee | ||||||||
| 3,151,005 | 3.625%, 10/27/2053d | 3,177,428 | ||||||
| 3,098,822 | 3.625%, 11/25/2053e | 3,116,878 | ||||||
|
| |||||||
| Total | 16,034,324 | |||||||
|
| |||||||
| Basic Materials (5.1%) | ||||||||
Anglo American Capital plc | ||||||||
| 1,910,000 | 4.125%, 4/15/2021d,f | 1,955,059 | ||||||
ArcelorMittal | ||||||||
| 2,000,000 | 6.125%, 6/1/2018 | 2,195,000 | ||||||
| 2,750,000 | 5.750%, 8/5/2020 | 2,956,250 | ||||||
Barrick Gold Corporation | ||||||||
| 1,920,000 | 3.850%, 4/1/2022 | 1,910,247 | ||||||
Dow Chemical Company | ||||||||
| 2,570,000 | 4.250%, 11/15/2020 | 2,793,816 | ||||||
First Quantum Minerals, Ltd. | ||||||||
| 1,084,000 | 6.750%, 2/15/2020d | 1,116,520 | ||||||
| 1,084,000 | 7.000%, 2/15/2021d | 1,115,165 | ||||||
Freeport-McMoRan Copper & Gold, Inc. | ||||||||
| 4,470,000 | 3.550%, 3/1/2022 | 4,426,641 | ||||||
| 3,175,000 | 3.875%, 3/15/2023 | 3,165,335 | ||||||
Georgia-Pacific, LLC | ||||||||
| 2,190,000 | 5.400%, 11/1/2020d | 2,527,797 | ||||||
| 1,900,000 | 3.734%, 7/15/2023d | 1,946,603 | ||||||
Glencore Funding, LLC | ||||||||
| 3,180,000 | 4.125%, 5/30/2023d | 3,193,804 | ||||||
Hexion US Finance Corporation/Hexion Nova Scotia Finance ULC | ||||||||
| 1,900,000 | 8.875%, 2/1/2018 | 1,976,000 | ||||||
International Paper Company | ||||||||
| 3,190,000 | 4.800%, 6/15/2044 | 3,215,169 | ||||||
Kinross Gold Corporation | ||||||||
| 1,280,000 | 5.950%, 3/15/2024d | 1,331,894 | ||||||
LYB International Finance BV | ||||||||
| 2,555,000 | 4.000%, 7/15/2023 | 2,682,280 | ||||||
| 1,280,000 | 4.875%, 3/15/2044 | 1,334,522 | ||||||
LyondellBasell Industries NV | ||||||||
| 3,170,000 | 6.000%, 11/15/2021 | 3,790,543 | ||||||
Monsanto Company | ||||||||
| 1,280,000 | 2.750%, 7/15/2021 | 1,279,501 | ||||||
| 1,920,000 | 4.400%, 7/15/2044 | 1,924,216 | ||||||
Mosaic Company | ||||||||
| 2,145,000 | 4.250%, 11/15/2023 | 2,264,384 | ||||||
| 1,590,000 | 5.450%, 11/15/2033 | 1,781,652 | ||||||
Rio Tinto Finance USA, Ltd. | ||||||||
| 3,285,000 | 6.500%, 7/15/2018 | 3,877,861 | ||||||
Sappi Papier Holding GmbH | ||||||||
| 1,910,000 | 6.625%, 4/15/2021d | 2,015,050 | ||||||
Teck Resources, Ltd. | ||||||||
| 3,870,000 | 3.750%, 2/1/2023 | 3,757,499 | ||||||
Trinseo Materials Operating SCA | ||||||||
| 1,910,000 | 8.750%, 2/1/2019f | 2,058,025 | ||||||
Vale Overseas, Ltd. | ||||||||
| 1,900,000 | 4.625%, 9/15/2020 | 2,040,068 | ||||||
Vale SA | ||||||||
| 1,930,000 | 5.625%, 9/11/2042 | 1,890,821 | ||||||
Weyerhaeuser Company | ||||||||
| 1,265,000 | 4.625%, 9/15/2023 | 1,369,225 | ||||||
| 2,570,000 | 7.375%, 3/15/2032 | 3,472,504 | ||||||
Xstrata Finance Canada, Ltd. | ||||||||
| 2,560,000 | 4.250%, 10/25/2022d | 2,592,809 | ||||||
Yara International ASA | ||||||||
| 50,000 | 7.875%, 6/11/2019d | 61,220 | ||||||
|
| |||||||
| Total | 74,017,480 | |||||||
|
| |||||||
| Capital Goods (1.8%) | ||||||||
BAE Systems plc | ||||||||
| 3,880,000 | 4.750%, 10/11/2021d | 4,213,218 | ||||||
CNH Capital, LLC | ||||||||
| 450,000 | 6.250%, 11/1/2016 | 488,250 | ||||||
L-3 Communications Corporation | ||||||||
| 2,560,000 | 3.950%, 5/28/2024 | 2,577,477 | ||||||
The accompanying Notes to Financial Statements are an integral part of this schedule.
257
Table of Contents
Income Portfolio
Schedule of Investments as of June 30, 2014
(unaudited)
| Principal Amount | Long-Term Fixed Income (90.1%) | Value | ||||||
| Capital Goods (1.8%) - continued | |||||||
Masco Corporation | ||||||||
| $1,625,000 | 5.950%, 3/15/2022 | $ | 1,795,625 | |||||
Republic Services, Inc. | ||||||||
| 630,000 | 5.500%, 9/15/2019 | 722,982 | ||||||
| 2,200,000 | 5.250%, 11/15/2021 | 2,506,816 | ||||||
| 3,170,000 | 3.550%, 6/1/2022 | 3,276,994 | ||||||
Reynolds Group Issuer, Inc. | ||||||||
| 1,940,000 | 9.875%, 8/15/2019 | 2,148,550 | ||||||
Textron, Inc. | ||||||||
| 2,500,000 | 6.200%, 3/15/2015 | 2,601,965 | ||||||
| 2,360,000 | 5.600%, 12/1/2017 | 2,653,523 | ||||||
| 1,280,000 | 4.300%, 3/1/2024 | 1,325,482 | ||||||
United Rentals North America, Inc. | ||||||||
| 1,300,000 | 5.750%, 7/15/2018 | 1,374,750 | ||||||
| 320,000 | 6.125%, 6/15/2023 | 343,200 | ||||||
|
| |||||||
| Total | 26,028,832 | |||||||
|
| |||||||
| Collateralized Mortgage Obligations (0.9%) | ||||||||
CitiMortgage Alternative Loan Trust | ||||||||
| 2,312,027 | 5.750%, 4/25/2037 | 1,999,371 | ||||||
Countrywide Alternative Loan Trust | ||||||||
| 2,956,827 | 6.000%, 1/25/2037 | 2,619,923 | ||||||
Deutsche Alt-A Securities, Inc., Mortgage Loan Trust | ||||||||
| 2,359,848 | 0.893%, 4/25/2047c | 2,093,600 | ||||||
HomeBanc Mortgage Trust | ||||||||
| 2,448,394 | 2.240%, 4/25/2037 | 1,822,548 | ||||||
Wachovia Mortgage Loan Trust, LLC | ||||||||
| 2,566,874 | 2.754%, 5/20/2036 | 2,242,072 | ||||||
WaMu Mortgage Pass Through Certificates | ||||||||
| 661,972 | 0.442%, 10/25/2045c | 621,772 | ||||||
Washington Mutual Alternative Mortgage Pass Through Certificates | ||||||||
| 4,301,340 | 0.873%, 2/25/2047c | 2,953,451 | ||||||
|
| |||||||
| Total | 14,352,737 | |||||||
|
| |||||||
| Commercial Mortgage-Backed Securities (0.8%) | ||||||||
Bear Stearns Commercial Mortgage Securities, Inc. | ||||||||
| 3,371,017 | 5.331%, 2/11/2044 | 3,638,173 | ||||||
Citigroup/Deutsche Bank Commercial Mortgage | ||||||||
| 1,900,000 | 5.322%, 12/11/2049 | 2,067,090 | ||||||
Commercial Mortgage Pass-Through Certificates | ||||||||
| 351,058 | 0.282%, 12/15/2020c,d | 349,895 | ||||||
Credit Suisse First Boston Mortgage Securities | ||||||||
| 3,200,000 | 5.542%, 1/15/2049 | 3,502,950 | ||||||
Credit Suisse Mortgage Capital Certificates | ||||||||
| 1,888,029 | 0.322%, 10/15/2021c,d | 1,884,399 | ||||||
|
| |||||||
| Total | 11,442,507 | |||||||
|
| |||||||
| Communications Services (10.5%) | ||||||||
America Movil SAB de CV | ||||||||
| 4,100,000 | 1.230%, 9/12/2016c | 4,149,134 | ||||||
| 2,520,000 | 5.000%, 3/30/2020 | 2,793,848 | ||||||
American Tower Corporation | ||||||||
| 3,900,000 | 4.500%, 1/15/2018 | 4,249,409 | ||||||
AT&T, Inc. | ||||||||
| 3,170,000 | 3.000%, 2/15/2022 | 3,155,818 | ||||||
| 2,540,000 | 3.900%, 3/11/2024 | 2,627,849 | ||||||
| 3,190,000 | 4.300%, 12/15/2042 | 3,019,702 | ||||||
CC Holdings GS V, LLC | ||||||||
| 1,280,000 | 3.849%, 4/15/2023 | 1,284,970 | ||||||
CenturyLink, Inc. | ||||||||
| 1,920,000 | 5.625%, 4/1/2020 | 2,025,600 | ||||||
| 2,700,000 | 5.800%, 3/15/2022 | 2,811,375 | ||||||
Clear Channel Worldwide Holdings, Inc. | ||||||||
| 1,930,000 | 6.500%, 11/15/2022 | 2,079,575 | ||||||
Columbus International, Inc. | ||||||||
| 1,910,000 | 7.375%, 3/30/2021d | 2,058,025 | ||||||
Comcast Corporation | ||||||||
| 2,700,000 | 6.400%, 5/15/2038 | 3,441,150 | ||||||
Cox Communications, Inc. | ||||||||
| 1,900,000 | 9.375%, 1/15/2019d | 2,460,671 | ||||||
| 1,920,000 | 3.250%, 12/15/2022d | 1,880,166 | ||||||
Crown Castle Towers, LLC | ||||||||
| 5,050,000 | 4.174%, 8/15/2017d | 5,362,045 | ||||||
DIRECTV Holdings, LLC | ||||||||
| 5,775,000 | 5.000%, 3/1/2021 | 6,446,754 | ||||||
| 3,310,000 | 3.800%, 3/15/2022 | 3,417,959 | ||||||
| 3,190,000 | 4.450%, 4/1/2024 | 3,382,434 | ||||||
DISH DBS Corporation | ||||||||
| 1,920,000 | 5.000%, 3/15/2023 | 1,956,000 | ||||||
Hughes Satellite Systems Corporation | ||||||||
| 2,580,000 | 6.500%, 6/15/2019 | 2,876,700 | ||||||
Intelsat Jackson Holdings SA | ||||||||
| 1,260,000 | 7.500%, 4/1/2021 | 1,379,700 | ||||||
NBC Universal Enterprise, Inc. | ||||||||
| 1,920,000 | 1.974%, 4/15/2019d | 1,903,849 | ||||||
NBCUniversal Media, LLC | ||||||||
| 4,510,000 | 4.375%, 4/1/2021 | 4,976,884 | ||||||
News America, Inc. | ||||||||
| 790,000 | 4.000%, 10/1/2023f | 823,408 | ||||||
| 1,900,000 | 7.625%, 11/30/2028 | 2,477,801 | ||||||
| 2,140,000 | 6.400%, 12/15/2035 | 2,665,098 | ||||||
Numericable Group SA | ||||||||
| 1,280,000 | 6.000%, 5/15/2022d | 1,331,200 | ||||||
Omnicom Group, Inc. | ||||||||
| 4,245,000 | 4.450%, 8/15/2020 | 4,628,888 | ||||||
Qwest Corporation | ||||||||
| 3,200,000 | 6.500%, 6/1/2017 | 3,638,163 | ||||||
SBA Tower Trust | ||||||||
| 3,500,000 | 5.101%, 4/17/2017d | 3,747,825 | ||||||
SES Global Americas Holdings GP | ||||||||
| 3,180,000 | 2.500%, 3/25/2019d | 3,202,651 | ||||||
Sprint Communications, Inc. | ||||||||
| 1,290,000 | 7.000%, 3/1/2020d | 1,483,500 | ||||||
Sprint Corporation | ||||||||
| 1,280,000 | 7.125%, 6/15/2024d | 1,356,800 | ||||||
Telefonica Emisiones SAU | ||||||||
| 4,470,000 | 5.462%, 2/16/2021 | 5,075,547 | ||||||
| 1,600,000 | 4.570%, 4/27/2023 | 1,699,376 | ||||||
The accompanying Notes to Financial Statements are an integral part of this schedule.
258
Table of Contents
Income Portfolio
Schedule of Investments as of June 30, 2014
(unaudited)
| Principal Amount | Long-Term Fixed Income (90.1%) | Value | ||||||
| Communications Services (10.5%) - continued | |||||||
Time Warner Cable, Inc. | ||||||||
| $2,500,000 | 8.250%, 4/1/2019 | $ | 3,167,825 | |||||
| 2,550,000 | 4.125%, 2/15/2021 | 2,753,357 | ||||||
| 3,830,000 | 4.500%, 9/15/2042 | 3,728,432 | ||||||
Time Warner, Inc. | ||||||||
| 3,190,000 | 2.100%, 6/1/2019 | 3,173,766 | ||||||
| 1,600,000 | 7.700%, 5/1/2032 | 2,221,830 | ||||||
T-Mobile USA, Inc. | ||||||||
| 1,910,000 | 6.633%, 4/28/2021 | 2,067,575 | ||||||
Univision Communications, Inc. | ||||||||
| 1,920,000 | 6.750%, 9/15/2022d | 2,124,000 | ||||||
UPCB Finance VI, Ltd. | ||||||||
| 2,600,000 | 6.875%, 1/15/2022d | 2,840,500 | ||||||
Verizon Communications, Inc. | ||||||||
| 3,520,000 | 3.650%, 9/14/2018 | 3,764,573 | ||||||
| 2,550,000 | 4.500%, 9/15/2020 | 2,804,980 | ||||||
| 3,830,000 | 3.450%, 3/15/2021 | 3,957,937 | ||||||
| 5,065,000 | 5.150%, 9/15/2023 | 5,668,206 | ||||||
| 3,820,000 | 6.400%, 9/15/2033 | 4,679,263 | ||||||
| 1,910,000 | 5.050%, 3/15/2034 | 2,038,478 | ||||||
| 3,180,000 | 6.550%, 9/15/2043 | 4,001,842 | ||||||
Windstream Corporation | ||||||||
| 1,910,000 | 7.750%, 10/1/2021 | 2,086,675 | ||||||
|
| |||||||
| Total | 152,949,113 | |||||||
|
| |||||||
| Consumer Cyclical (5.5%) | ||||||||
American Honda Finance Corporation | ||||||||
| 4,400,000 | 3.875%, 9/21/2020d | 4,743,812 | ||||||
Chrysler Group, LLC | ||||||||
| 1,900,000 | 8.000%, 6/15/2019 | 2,063,875 | ||||||
CVS Caremark Corporation | ||||||||
| 3,190,000 | 2.750%, 12/1/2022 | 3,081,157 | ||||||
Daimler Finance North America, LLC | ||||||||
| 2,260,000 | 3.875%, 9/15/2021d | 2,408,844 | ||||||
Ford Motor Credit Company, LLC | ||||||||
| 2,560,000 | 1.474%, 5/9/2016c | 2,597,732 | ||||||
| 3,250,000 | 4.250%, 2/3/2017 | 3,490,292 | ||||||
| 630,000 | 6.625%, 8/15/2017 | 725,202 | ||||||
| 3,830,000 | 2.375%, 3/12/2019 | 3,848,591 | ||||||
| 2,575,000 | 4.250%, 9/20/2022 | 2,746,583 | ||||||
General Motors Company | ||||||||
| 3,170,000 | 3.500%, 10/2/2018d | 3,241,325 | ||||||
General Motors Financial Company, Inc. | ||||||||
| 2,410,000 | 4.750%, 8/15/2017 | 2,563,637 | ||||||
Hilton Worldwide Finance, LLC | ||||||||
| 1,910,000 | 5.625%, 10/15/2021d | 2,029,375 | ||||||
Home Depot, Inc. | ||||||||
| 3,165,000 | 3.750%, 2/15/2024 | 3,308,583 | ||||||
Hyundai Capital America | ||||||||
| 2,065,000 | 2.875%, 8/9/2018d | 2,124,734 | ||||||
Hyundai Motor Manufacturing Czech SRO | ||||||||
| 2,525,000 | 4.500%, 4/15/2015d | 2,595,703 | ||||||
Jaguar Land Rover Automotive plc | ||||||||
| 1,910,000 | 4.125%, 12/15/2018d | 1,967,300 | ||||||
Johnson Controls, Inc. | ||||||||
| 3,150,000 | 5.250%, 12/1/2041 | 3,479,786 | ||||||
KIA Motors Corporation | ||||||||
| 3,260,000 | 3.625%, 6/14/2016d | 3,413,552 | ||||||
L Brands, Inc. | ||||||||
| 1,900,000 | 5.625%, 2/15/2022 | 2,056,750 | ||||||
Macy’s Retail Holdings, Inc. | ||||||||
| 3,570,000 | 3.875%, 1/15/2022 | 3,726,473 | ||||||
| 1,925,000 | 2.875%, 2/15/2023 | 1,847,788 | ||||||
| 3,190,000 | 3.625%, 6/1/2024 | 3,173,849 | ||||||
Marriott International, Inc. | ||||||||
| 3,250,000 | 3.000%, 3/1/2019 | 3,360,233 | ||||||
QVC, Inc. | ||||||||
| 2,235,000 | 4.375%, 3/15/2023 | 2,270,309 | ||||||
Spencer Spirit Holdings, Inc. | ||||||||
| 50,000 | 11.000%, 5/1/2017e | 53,063 | ||||||
Starwood Hotels & Resorts Worldwide, Inc. | ||||||||
| 1,850,000 | 6.750%, 5/15/2018 | 2,177,117 | ||||||
| 3,210,000 | 3.125%, 2/15/2023 | 3,071,126 | ||||||
Toll Brothers Finance Corporation | ||||||||
| 2,000,000 | 6.750%, 11/1/2019 | 2,305,000 | ||||||
| 960,000 | 4.375%, 4/15/2023 | 943,200 | ||||||
Wyndham Worldwide Corporation | ||||||||
| 1,920,000 | 2.500%, 3/1/2018 | 1,949,316 | ||||||
| 3,220,000 | 4.250%, 3/1/2022 | 3,309,455 | ||||||
|
| |||||||
| Total | 80,673,762 | |||||||
|
| |||||||
| Consumer Non-Cyclical (7.8%) | ||||||||
Activis Funding SCS | ||||||||
| 2,555,000 | 3.850%, 6/15/2024d | 2,582,727 | ||||||
Altria Group, Inc. | ||||||||
| 1,595,000 | 4.750%, 5/5/2021 | 1,759,293 | ||||||
| 3,175,000 | 4.000%, 1/31/2024 | 3,262,408 | ||||||
| 804,000 | 9.950%, 11/10/2038 | 1,339,335 | ||||||
Amgen, Inc. | ||||||||
| 3,190,000 | 2.200%, 5/22/2019 | 3,186,293 | ||||||
Baxter International, Inc. | ||||||||
| 2,550,000 | 3.200%, 6/15/2023 | 2,529,174 | ||||||
Biomet, Inc. | ||||||||
| 2,480,000 | 6.500%, 8/1/2020 | 2,672,200 | ||||||
Boston Scientific Corporation | ||||||||
| 3,190,000 | 6.000%, 1/15/2020 | 3,708,385 | ||||||
BRF SA | ||||||||
| 3,830,000 | 4.750%, 5/22/2024d | 3,772,550 | ||||||
Bunge Limited Finance Corporation | ||||||||
| 2,530,000 | 8.500%, 6/15/2019 | 3,179,256 | ||||||
Celgene Corporation | ||||||||
| 2,250,000 | 1.900%, 8/15/2017 | 2,282,827 | ||||||
| 3,770,000 | 3.950%, 10/15/2020 | 3,975,951 | ||||||
ConAgra Foods, Inc. | ||||||||
| 1,895,000 | 2.100%, 3/15/2018 | 1,901,054 | ||||||
| 2,080,000 | 3.200%, 1/25/2023 | 2,004,841 | ||||||
DaVita HealthCare Partners, Inc. | ||||||||
| 1,920,000 | 5.125%, 7/15/2024 | 1,932,000 | ||||||
Edwards Lifesciences Corporation | ||||||||
| 2,375,000 | 2.875%, 10/15/2018 | 2,427,005 | ||||||
Energizer Holdings, Inc. | ||||||||
| 1,450,000 | 4.700%, 5/24/2022 | 1,488,798 | ||||||
Express Scripts Holding Company | ||||||||
| 3,235,000 | 4.750%, 11/15/2021 | 3,580,436 | ||||||
| 1,910,000 | 3.500%, 6/15/2024 | 1,889,991 | ||||||
Fresenius Medical Care US Finance, Inc. | ||||||||
| 1,290,000 | 6.500%, 9/15/2018d | 1,457,700 | ||||||
The accompanying Notes to Financial Statements are an integral part of this schedule.
259
Table of Contents
Income Portfolio
Schedule of Investments as of June 30, 2014
(unaudited)
Principal | Long-Term Fixed Income (90.1%) | Value | ||||||
| Consumer Non-Cyclical (7.8%) - continued | |||||||
Gilead Sciences, Inc. | ||||||||
| $1,600,000 | 4.800%, 4/1/2044 | $ | 1,688,312 | |||||
HCA, Inc. | ||||||||
| 2,560,000 | 4.750%, 5/1/2023 | 2,556,800 | ||||||
Hospira, Inc. | ||||||||
| 2,540,000 | 5.200%, 8/12/2020 | 2,780,060 | ||||||
JBS USA, LLC | ||||||||
| 1,910,000 | 7.250%, 6/1/2021d | 2,048,475 | ||||||
Lorillard Tobacco Company | ||||||||
| 3,170,000 | 8.125%, 6/23/2019 | 3,952,210 | ||||||
McKesson Corporation | ||||||||
| 2,550,000 | 4.883%, 3/15/2044 | 2,677,903 | ||||||
Mondelez International, Inc. | ||||||||
| 3,830,000 | 4.000%, 2/1/2024 | 3,967,087 | ||||||
Mylan, Inc. | ||||||||
| 3,845,000 | 7.875%, 7/15/2020d | 4,255,873 | ||||||
Pernod Ricard SA | ||||||||
| 5,130,000 | 5.750%, 4/7/2021d | 5,897,186 | ||||||
| 1,910,000 | 4.450%, 1/15/2022d | 2,036,261 | ||||||
Perrigo Company, Ltd. | ||||||||
| 950,000 | 2.300%, 11/8/2018d | 949,610 | ||||||
| 2,550,000 | 4.000%, 11/15/2023d | 2,591,733 | ||||||
SABMiller Holdings, Inc. | ||||||||
| 4,425,000 | 3.750%, 1/15/2022d | 4,581,933 | ||||||
Spectrum Brands Escrow Corporation | ||||||||
| 1,460,000 | 6.375%, 11/15/2020 | 1,569,500 | ||||||
Tenet Healthcare Corporation | ||||||||
| 1,910,000 | 8.125%, 4/1/2022 | 2,210,825 | ||||||
Thermo Fisher Scientific, Inc. | ||||||||
| 3,170,000 | 4.150%, 2/1/2024 | 3,315,031 | ||||||
| 630,000 | 5.300%, 2/1/2044 | 699,246 | ||||||
Tyson Foods, Inc. | ||||||||
| 3,190,000 | 4.500%, 6/15/2022 | 3,345,315 | ||||||
Valeant Pharmaceuticals International | ||||||||
| 2,560,000 | 6.375%, 10/15/2020d | 2,720,000 | ||||||
Watson Pharmaceuticals, Inc. | ||||||||
| 3,180,000 | 3.250%, 10/1/2022 | 3,124,274 | ||||||
Whirlpool Corporation | ||||||||
| 3,245,000 | 3.700%, 3/1/2023 | 3,277,038 | ||||||
Zoetis, Inc. | ||||||||
| 3,190,000 | 3.250%, 2/1/2023 | 3,155,535 | ||||||
|
| |||||||
| Total | 114,332,431 | |||||||
|
| |||||||
| Energy (9.7%) | ||||||||
Anadarko Petroleum Corporation | ||||||||
| 3,190,000 | 6.450%, 9/15/2036 | 4,068,038 | ||||||
Buckeye Partners, LP | ||||||||
| 1,910,000 | 4.150%, 7/1/2023 | 1,968,587 | ||||||
| 3,180,000 | 5.850%, 11/15/2043 | 3,543,458 | ||||||
Calumet Specialty Products Partners, LP | ||||||||
| 1,910,000 | 6.500%, 4/15/2021d | 1,948,200 | ||||||
Cameron International Corporation | ||||||||
| 3,200,000 | 3.700%, 6/15/2024 | 3,229,734 | ||||||
Canadian Natural Resources, Ltd. | ||||||||
| 3,190,000 | 6.250%, 3/15/2038 | 3,971,400 | ||||||
Canadian Oil Sands, Ltd. | ||||||||
| 2,600,000 | 4.500%, 4/1/2022d | 2,746,713 | ||||||
Chaparral Energy, Inc. | ||||||||
| 641,000 | 7.625%, 11/15/2022 | 692,280 | ||||||
CNOOC Finance 2013, Ltd. | ||||||||
| 3,200,000 | 3.000%, 5/9/2023 | 3,021,494 | ||||||
Concho Resources, Inc. | ||||||||
| 1,930,000 | 6.500%, 1/15/2022 | 2,127,825 | ||||||
Continental Resources, Inc. | ||||||||
| 3,830,000 | 3.800%, 6/1/2024d | 3,871,383 | ||||||
DCP Midstream Operating, LP | ||||||||
| 2,550,000 | 5.600%, 4/1/2044 | 2,817,097 | ||||||
Ecopetrol SA | ||||||||
| 1,910,000 | 5.875%, 5/28/2045 | 1,975,475 | ||||||
El Paso Pipeline Partners Operating Company, LLC | ||||||||
| 3,850,000 | 5.000%, 10/1/2021 | 4,209,001 | ||||||
| 1,910,000 | 4.300%, 5/1/2024 | 1,923,637 | ||||||
Enbridge Energy Partners, LP | ||||||||
| 2,230,000 | 5.200%, 3/15/2020 | 2,490,295 | ||||||
Enbridge, Inc. | ||||||||
| 800,000 | 3.500%, 6/10/2024 | 796,920 | ||||||
Encana Corporation | ||||||||
| 2,230,000 | 3.900%, 11/15/2021 | 2,356,265 | ||||||
| 1,280,000 | 5.150%, 11/15/2041 | 1,395,265 | ||||||
Energy Transfer Partners, LP | ||||||||
| 4,240,000 | 6.700%, 7/1/2018 | 4,964,565 | ||||||
Energy XXI Gulf Coast, Inc. | ||||||||
| 1,600,000 | 6.875%, 3/15/2024d | 1,632,000 | ||||||
Enterprise Products Operating, LLC | ||||||||
| 1,275,000 | 3.900%, 2/15/2024 | 1,318,935 | ||||||
Key Energy Services, Inc. | ||||||||
| 2,075,000 | 6.750%, 3/1/2021 | 2,158,000 | ||||||
Kinder Morgan Energy Partners, LP | ||||||||
| 1,600,000 | 3.450%, 2/15/2023 | 1,552,710 | ||||||
Linn Energy, LLC | ||||||||
| 1,970,000 | 7.750%, 2/1/2021 | 2,125,137 | ||||||
Marathon Oil Corporation | ||||||||
| 2,364,000 | 5.900%, 3/15/2018 | 2,705,986 | ||||||
| 1,920,000 | 2.800%, 11/1/2022 | 1,866,115 | ||||||
Marathon Petroleum Corporation | ||||||||
| 1,920,000 | 6.500%, 3/1/2041 | 2,371,085 | ||||||
MEG Energy Corporation | ||||||||
| 1,920,000 | 6.375%, 1/30/2023d | 2,040,000 | ||||||
Nexen, Inc. | ||||||||
| 1,920,000 | 6.400%, 5/15/2037 | 2,310,415 | ||||||
Noble Energy, Inc. | ||||||||
| 3,100,000 | 8.250%, 3/1/2019 | 3,908,068 | ||||||
Noble Holding International, Ltd. | ||||||||
| 2,560,000 | 3.950%, 3/15/2022f | 2,622,106 | ||||||
Oasis Petroleum, Inc. | ||||||||
| 1,920,000 | 6.875%, 3/15/2022d | 2,092,800 | ||||||
Offshore Group Investment, Ltd. | ||||||||
| 1,600,000 | 7.500%, 11/1/2019 | 1,692,000 | ||||||
Petrobras Global Finance BV | ||||||||
| 3,190,000 | 4.875%, 3/17/2020 | 3,276,449 | ||||||
Petroleos Mexicanos | ||||||||
| 3,010,000 | 3.500%, 7/18/2018 | 3,163,510 | ||||||
Pioneer Natural Resources Company | ||||||||
| 2,500,000 | 6.875%, 5/1/2018 | 2,954,305 | ||||||
Range Resources Corporation | ||||||||
| 1,280,000 | 5.000%, 3/15/2023 | 1,363,200 | ||||||
Rosetta Resources, Inc. | ||||||||
| 1,920,000 | 5.875%, 6/1/2022 | 2,006,400 | ||||||
The accompanying Notes to Financial Statements are an integral part of this schedule.
260
Table of Contents
Income Portfolio
Schedule of Investments as of June 30, 2014
(unaudited)
| Principal Amount | Long-Term Fixed Income (90.1%) | Value | ||||||
| Energy (9.7%) - continued | |||||||
Rowan Companies, Inc. | ||||||||
| $2,125,000 | 4.875%, 6/1/2022 | $ | 2,276,211 | |||||
| 1,920,000 | 4.750%, 1/15/2024 | 2,031,416 | ||||||
Sabine Pass Liquefaction, LLC | ||||||||
| 1,910,000 | 5.750%, 5/15/2024d | 1,991,175 | ||||||
Spectra Energy Partners, LP | ||||||||
| 3,200,000 | 4.600%, 6/15/2021 | 3,494,246 | ||||||
Suncor Energy, Inc. | ||||||||
| 1,910,000 | 6.100%, 6/1/2018 | 2,216,679 | ||||||
| 1,940,000 | 6.850%, 6/1/2039 | 2,579,758 | ||||||
Sunoco Logistics Partners Operations, LP | ||||||||
| 3,200,000 | 3.450%, 1/15/2023 | 3,156,637 | ||||||
Transocean, Inc. | ||||||||
| 1,920,000 | 7.375%, 4/15/2018 | 2,218,424 | ||||||
| 1,280,000 | 6.375%, 12/15/2021 | 1,480,756 | ||||||
| 2,550,000 | 3.800%, 10/15/2022 | 2,523,794 | ||||||
Weatherford International, Ltd. | ||||||||
| 4,500,000 | 6.000%, 3/15/2018 | 5,120,244 | ||||||
Williams Companies, Inc. | ||||||||
| 2,560,000 | 3.700%, 1/15/2023 | 2,462,559 | ||||||
| 2,550,000 | 4.550%, 6/24/2024 | 2,575,248 | ||||||
Williams Partners, LP | ||||||||
| 2,550,000 | 4.000%, 11/15/2021 | 2,666,487 | ||||||
| 3,810,000 | 4.500%, 11/15/2023 | 4,041,217 | ||||||
| 1,600,000 | 3.900%, 1/15/2025 | 1,607,382 | ||||||
| 1,920,000 | 5.400%, 3/4/2044 | 2,059,836 | ||||||
|
| |||||||
| Total | 141,778,922 | |||||||
|
| |||||||
| Financials (28.0%) | ||||||||
Abbey National Treasury Services plc | ||||||||
| 2,850,000 | 3.050%, 8/23/2018 | 2,984,588 | ||||||
Aegon NV | ||||||||
| 2,600,000 | 2.847%, 7/29/2049c,g | 2,397,200 | ||||||
American International Group, Inc. | ||||||||
| 4,445,000 | 3.375%, 8/15/2020 | 4,618,951 | ||||||
| 3,625,000 | 4.125%, 2/15/2024 | 3,815,802 | ||||||
American Tower Trust I | ||||||||
| 3,200,000 | 1.551%, 3/15/2018d | 3,186,979 | ||||||
Ares Capital Corporation | ||||||||
| 3,190,000 | 4.875%, 11/30/2018 | 3,391,104 | ||||||
Associated Banc Corporation | ||||||||
| 3,180,000 | 5.125%, 3/28/2016 | 3,387,053 | ||||||
Associates Corporation of North America | ||||||||
| 3,800,000 | 6.950%, 11/1/2018 | 4,538,127 | ||||||
Assured Guaranty US Holdings, Inc. | ||||||||
| 3,200,000 | 5.000%, 7/1/2024f | 3,180,941 | ||||||
AXA SA | ||||||||
| 2,580,000 | 8.600%, 12/15/2030 | 3,466,875 | ||||||
Axis Specialty Finance, LLC | ||||||||
| 2,570,000 | 5.875%, 6/1/2020 | 2,951,139 | ||||||
Banco do Brasil SA | ||||||||
| 4,470,000 | 9.000%, 12/31/2049d,g | 4,408,537 | ||||||
Banco Santander Mexico SA Institucion de Banca Multiple Grupo Financiero Santand | ||||||||
| 1,445,000 | 4.125%, 11/9/2022d | 1,466,675 | ||||||
Bank of America Corporation | ||||||||
| 3,840,000 | 1.300%, 3/22/2018c | 3,889,440 | ||||||
| 3,880,000 | 7.625%, 6/1/2019 | 4,792,502 | ||||||
| 1,900,000 | 4.100%, 7/24/2023 | 1,971,947 | ||||||
| 3,830,000 | 4.125%, 1/22/2024 | 3,948,703 | ||||||
| 1,950,000 | 5.875%, 2/7/2042 | 2,315,800 | ||||||
Barclays Bank plc | ||||||||
| 1,910,000 | 10.179%, 6/12/2021d | 2,641,931 | ||||||
BBVA Bancomer SA/Texas | ||||||||
| 3,535,000 | 6.750%, 9/30/2022d | 4,047,575 | ||||||
BPCE SA | ||||||||
| 2,535,000 | 5.700%, 10/22/2023d | 2,791,314 | ||||||
| 3,190,000 | 5.150%, 7/21/2024d | 3,367,699 | ||||||
Caixa Economica Federal | ||||||||
| 3,190,000 | 4.250%, 5/13/2019d,f | 3,220,305 | ||||||
Capital One Bank USA NA | ||||||||
| 5,425,000 | 2.250%, 2/13/2019 | 5,459,438 | ||||||
Capital One Financial Corporation | ||||||||
| 960,000 | 2.450%, 4/24/2019 | 969,004 | ||||||
CIT Group, Inc. | ||||||||
| 3,120,000 | 5.250%, 3/15/2018 | 3,350,100 | ||||||
| 930,000 | 3.875%, 2/19/2019 | 944,508 | ||||||
Citigroup, Inc. | ||||||||
| 3,830,000 | 8.500%, 5/22/2019 | 4,895,472 | ||||||
| 4,475,000 | 3.500%, 5/15/2023 | 4,356,171 | ||||||
| 3,805,000 | 5.500%, 9/13/2025 | 4,244,360 | ||||||
| 1,930,000 | 5.950%, 12/29/2049g | 1,949,300 | ||||||
CNA Financial Corporation | ||||||||
| 3,775,000 | 7.350%, 11/15/2019 | 4,656,564 | ||||||
| 1,300,000 | 5.875%, 8/15/2020 | 1,521,252 | ||||||
Cooperatieve Centrale Raiffeisen-Boerenleenbank BA | ||||||||
| 1,910,000 | 5.750%, 12/1/2043 | 2,200,987 | ||||||
| 1,290,000 | 11.000%, 12/29/2049d,g | 1,732,070 | ||||||
Credit Suisse Group AG | ||||||||
| 1,890,000 | 6.500%, 8/8/2023d | 2,097,900 | ||||||
| 1,260,000 | 7.500%, 12/11/2049d,g | 1,394,694 | ||||||
Developers Diversified Realty Corporation | ||||||||
| 1,290,000 | 7.875%, 9/1/2020 | 1,632,316 | ||||||
Discover Bank | ||||||||
| 2,200,000 | 7.000%, 4/15/2020 | 2,642,556 | ||||||
| 3,505,000 | 4.200%, 8/8/2023 | 3,698,564 | ||||||
Discover Bank of Greenwood Delaware | ||||||||
| 1,600,000 | 4.250%, 3/13/2026 | 1,661,874 | ||||||
Duke Realty, LP | ||||||||
| 3,220,000 | 3.875%, 10/15/2022 | 3,277,661 | ||||||
Essex Portfolio, LP | ||||||||
| 2,560,000 | 3.250%, 5/1/2023 | 2,499,110 | ||||||
Fairfax Financial Holdings, Ltd. | ||||||||
| 1,915,000 | 5.800%, 5/15/2021d | 2,070,404 | ||||||
Fifth Third Bancorp | ||||||||
| 3,825,000 | 4.300%, 1/16/2024 | 3,986,178 | ||||||
GE Capital Trust I | ||||||||
| 4,500,000 | 6.375%, 11/15/2067 | 5,006,250 | ||||||
General Electric Capital Corporation | ||||||||
| 3,225,000 | 3.800%, 6/18/2019d | 3,425,695 | ||||||
| 600,000 | 5.300%, 2/11/2021 | 682,271 | ||||||
| 3,200,000 | 1.231%, 3/15/2023c | 3,207,971 | ||||||
| 1,550,000 | 6.750%, 3/15/2032 | 2,044,696 | ||||||
| 3,200,000 | 7.125%, 12/15/2049g | 3,776,640 | ||||||
Glitnir Banki HF | ||||||||
| 50,000 | Zero Coupon, 1/21/2011e,h | 15,437 | ||||||
The accompanying Notes to Financial Statements are an integral part of this schedule.
261
Table of Contents
Income Portfolio
Schedule of Investments as of June 30, 2014
(unaudited)
| Principal Amount | Long-Term Fixed Income (90.1%) | Value | ||||||
| Financials (28.0%) - continued | |||||||
Goldman Sachs Group, Inc. | ||||||||
| $3,250,000 | 6.250%, 9/1/2017 | $ | 3,699,982 | |||||
| 3,170,000 | 2.900%, 7/19/2018 | 3,265,956 | ||||||
| 2,900,000 | 5.375%, 3/15/2020 | 3,285,053 | ||||||
| 3,275,000 | 5.250%, 7/27/2021 | 3,677,606 | ||||||
| 3,190,000 | 4.000%, 3/3/2024 | 3,247,289 | ||||||
| 3,190,000 | 3.850%, 7/8/2024i | 3,185,789 | ||||||
| 1,260,000 | 6.750%, 10/1/2037 | 1,515,823 | ||||||
| 1,275,000 | 5.700%, 12/29/2049g | 1,317,234 | ||||||
Hartford Financial Services Group, Inc. | ||||||||
| 4,480,000 | 5.125%, 4/15/2022 | 5,094,266 | ||||||
HCP, Inc. | ||||||||
| 3,100,000 | 5.625%, 5/1/2017 | 3,461,076 | ||||||
| 2,250,000 | 2.625%, 2/1/2020 | 2,251,168 | ||||||
| 2,555,000 | 4.200%, 3/1/2024 | 2,633,965 | ||||||
Health Care REIT, Inc. | ||||||||
| 1,280,000 | 6.125%, 4/15/2020 | 1,488,026 | ||||||
| 3,150,000 | 4.950%, 1/15/2021 | 3,498,913 | ||||||
HSBC Finance Corporation | ||||||||
| 3,210,000 | 6.676%, 1/15/2021 | 3,838,842 | ||||||
HSBC Holdings plc | ||||||||
| 3,200,000 | 4.875%, 1/14/2022 | 3,591,174 | ||||||
HSBC USA, Inc. | ||||||||
| 1,900,000 | 5.000%, 9/27/2020 | 2,104,807 | ||||||
| 3,830,000 | 3.500%, 6/23/2024 | 3,840,870 | ||||||
Huntington Bancshares, Inc. | ||||||||
| 2,850,000 | 7.000%, 12/15/2020f | 3,456,534 | ||||||
Icahn Enterprises, LP | ||||||||
| 2,540,000 | 6.000%, 8/1/2020 | 2,720,975 | ||||||
ILFC E-Capital Trust II | ||||||||
| 2,230,000 | 6.250%, 12/21/2065c,d | 2,230,000 | ||||||
ING Bank NV | ||||||||
| 3,165,000 | 5.800%, 9/25/2023d | 3,565,372 | ||||||
International Lease Finance Corporation | ||||||||
| 1,950,000 | 4.875%, 4/1/2015 | 1,998,750 | ||||||
| 1,600,000 | 5.750%, 5/15/2016 | 1,714,000 | ||||||
| 1,280,000 | 2.181%, 6/15/2016c | 1,288,000 | ||||||
| 1,875,000 | 6.750%, 9/1/2016d | 2,076,562 | ||||||
Intesa Sanpaolo SPA | ||||||||
| 2,530,000 | 3.875%, 1/15/2019 | 2,653,269 | ||||||
| 2,550,000 | 5.017%, 6/26/2024d | 2,580,128 | ||||||
J.P. Morgan Chase & Company | ||||||||
| 3,840,000 | 1.129%, 1/25/2018c | 3,894,094 | ||||||
| 3,200,000 | 3.375%, 5/1/2023 | 3,140,861 | ||||||
| 3,150,000 | 5.500%, 10/15/2040 | 3,627,244 | ||||||
| 2,550,000 | 6.750%, 8/29/2049g | 2,744,437 | ||||||
| 2,560,000 | 6.000%, 12/29/2049g | 2,611,200 | ||||||
J.P. Morgan Chase Bank NA | ||||||||
| 2,580,000 | 6.000%, 10/1/2017 | 2,934,673 | ||||||
Liberty Mutual Group, Inc. | ||||||||
| 1,920,000 | 5.000%, 6/1/2021d | 2,111,958 | ||||||
| 3,535,000 | 4.950%, 5/1/2022d | 3,866,431 | ||||||
Liberty Property, LP | ||||||||
| 2,840,000 | 5.500%, 12/15/2016 | 3,100,715 | ||||||
| 1,875,000 | 4.750%, 10/1/2020 | 2,035,669 | ||||||
Lincoln National Corporation | ||||||||
| 5,410,000 | 4.000%, 9/1/2023 | 5,619,811 | ||||||
Lloyds Banking Group plc | ||||||||
| 2,550,000 | 5.920%, 9/29/2049d,g | 2,575,500 | ||||||
Macquarie Bank, Ltd. | ||||||||
| 3,215,000 | 1.650%, 3/24/2017d | 3,233,679 | ||||||
Merrill Lynch & Company, Inc. | ||||||||
| 3,050,000 | 6.875%, 4/25/2018 | 3,593,300 | ||||||
| 3,000,000 | 7.750%, 5/14/2038 | 4,121,154 | ||||||
MetLife Capital Trust IV | ||||||||
| 700,000 | 7.875%, 12/15/2037d | 869,750 | ||||||
MetLife Capital Trust X | ||||||||
| 2,250,000 | 9.250%, 4/8/2038d | 3,195,000 | ||||||
Morgan Stanley | ||||||||
| 3,730,000 | 6.625%, 4/1/2018 | 4,360,269 | ||||||
| 3,195,000 | 2.125%, 4/25/2018 | 3,230,097 | ||||||
| 2,235,000 | 2.500%, 1/24/2019 | 2,260,032 | ||||||
| 3,180,000 | 5.625%, 9/23/2019 | 3,657,665 | ||||||
| 3,400,000 | 5.500%, 1/26/2020 | 3,891,531 | ||||||
| 3,205,000 | 4.875%, 11/1/2022 | 3,440,305 | ||||||
| 2,550,000 | 5.000%, 11/24/2025 | 2,719,748 | ||||||
National Retail Properties, Inc. | ||||||||
| 3,200,000 | 3.900%, 6/15/2024 | 3,218,906 | ||||||
Nomura Holdings, Inc. | ||||||||
| 3,190,000 | 2.750%, 3/19/2019 | 3,245,181 | ||||||
Nordea Bank AB | ||||||||
| 3,170,000 | 4.875%, 5/13/2021d | 3,441,117 | ||||||
Omega Healthcare Investors, Inc. | ||||||||
| 2,960,000 | 5.875%, 3/15/2024 | 3,138,192 | ||||||
ORIX Corporation | ||||||||
| 4,450,000 | 5.000%, 1/12/2016 | 4,717,485 | ||||||
Preferred Term Securities XXIII, Ltd. | ||||||||
| 3,678,167 | 0.431%, 12/22/2036c,e,j | 2,758,625 | ||||||
ProLogis, LP | ||||||||
| 3,200,000 | 6.875%, 3/15/2020 | 3,844,774 | ||||||
Prudential Financial, Inc. | ||||||||
| 1,915,000 | 3.500%, 5/15/2024 | 1,909,242 | ||||||
| 1,425,000 | 6.200%, 11/15/2040 | 1,783,932 | ||||||
| 1,930,000 | 5.875%, 9/15/2042 | 2,096,462 | ||||||
RBS Capital Trust III | ||||||||
| 2,240,000 | 5.512%, 9/29/2049f,g | 2,217,600 | ||||||
Realty Income Corporation | ||||||||
| 3,830,000 | 3.875%, 7/15/2024 | 3,870,165 | ||||||
Regency Centers, LP | ||||||||
| 1,600,000 | 3.750%, 6/15/2024 | 1,605,637 | ||||||
Regions Bank | ||||||||
| 1,910,000 | 7.500%, 5/15/2018 | 2,273,305 | ||||||
Reinsurance Group of America, Inc. | ||||||||
| 1,930,000 | 6.450%, 11/15/2019 | 2,278,884 | ||||||
| 3,815,000 | 4.700%, 9/15/2023 | 4,092,762 | ||||||
Royal Bank of Scotland Group plc | ||||||||
| 2,540,000 | 6.990%, 10/29/2049d,g | 2,959,100 | ||||||
Royal Bank Of Scotland plc | ||||||||
| 1,920,000 | 6.000%, 12/19/2023 | 2,075,914 | ||||||
Santander UK plc | ||||||||
| 960,000 | 5.000%, 11/7/2023d | 1,036,830 | ||||||
Simon Property Group, LP | ||||||||
| 1,250,000 | 10.350%, 4/1/2019 | 1,693,574 | ||||||
| 1,025,000 | 2.750%, 2/1/2023 | 990,175 | ||||||
SLM Corporation | ||||||||
| 2,380,000 | 6.250%, 1/25/2016 | 2,528,750 | ||||||
| 4,515,000 | 6.000%, 1/25/2017 | 4,904,419 | ||||||
| 1,024,000 | 4.625%, 9/25/2017 | 1,079,040 | ||||||
Societe Generale SA | ||||||||
| 1,920,000 | 7.875%, 12/31/2049d,f,g | 2,047,200 | ||||||
The accompanying Notes to Financial Statements are an integral part of this schedule.
262
Table of Contents
Income Portfolio
Schedule of Investments as of June 30, 2014
(unaudited)
| Principal Amount | Long-Term Fixed Income (90.1%) | Value | ||||||
| Financials (28.0%) - continued | |||||||
Sumitomo Mitsui Financial Group, Inc. | ||||||||
| $3,510,000 | 4.436%, 4/2/2024d | $ | 3,668,111 | |||||
Swiss RE Capital I, LP | ||||||||
| 4,200,000 | 6.854%, 5/29/2049d,g | 4,494,000 | ||||||
UnionBanCal Corporation | ||||||||
| 2,580,000 | 3.500%, 6/18/2022 | 2,660,357 | ||||||
Ventas Realty, LP | ||||||||
| 3,200,000 | 4.000%, 4/30/2019 | 3,438,022 | ||||||
Voya Financial, Inc. | ||||||||
| 1,760,000 | 2.900%, 2/15/2018 | 1,823,782 | ||||||
| 3,215,000 | 5.500%, 7/15/2022 | 3,682,197 | ||||||
Wachovia Capital Trust III | ||||||||
| 120,000 | 5.570%, 3/15/2042c,g | 116,400 | ||||||
Wells Fargo & Company | ||||||||
| 3,035,000 | 3.450%, 2/13/2023 | 3,020,150 | ||||||
| 1,910,000 | 4.100%, 6/3/2026 | 1,934,064 | ||||||
| 3,220,000 | 7.980%, 2/28/2049g | 3,662,750 | ||||||
XLIT, Ltd. | ||||||||
| 3,190,000 | 5.250%, 12/15/2043 | 3,507,938 | ||||||
|
| |||||||
| Total | 410,112,224 | |||||||
|
| |||||||
| Foreign Government (1.2%) | ||||||||
Colombia Government International Bond | ||||||||
| 1,940,000 | 2.625%, 3/15/2023 | 1,813,900 | ||||||
| 3,200,000 | 5.625%, 2/26/2044 | 3,584,000 | ||||||
Corporacion Andina de Fomento | ||||||||
| 1,968,000 | 4.375%, 6/15/2022 | 2,087,206 | ||||||
Export-Import Bank of Korea | ||||||||
| 2,580,000 | 4.375%, 9/15/2021 | 2,798,353 | ||||||
Mexico Government International Bond | ||||||||
| 3,150,000 | 5.125%, 1/15/2020 | 3,568,950 | ||||||
| 3,480,000 | 4.000%, 10/2/2023 | 3,657,480 | ||||||
|
| |||||||
| Total | 17,509,889 | |||||||
|
| |||||||
| Mortgage-Backed Securities (3.0%) | ||||||||
Federal Home Loan Mortgage Corporation Gold 15-Yr. Pass Through | ||||||||
| 2,412,500 | 3.000%, 7/1/2029i | 2,500,706 | ||||||
Federal Home Loan Mortgage Corporation Gold 30-Yr. Pass Through | ||||||||
| 2,412,500 | 4.000%, 7/1/2044i | 2,555,742 | ||||||
Federal National Mortgage Association Conventional 15-yr. Pass Through | ||||||||
| 5,700,000 | 3.500%, 8/1/2029i | 6,025,969 | ||||||
Federal National Mortgage Association Conventional 30-Yr. Pass Through | ||||||||
| 5,600,000 | 3.500%, 7/1/2044i | 5,764,500 | ||||||
| 11,937,500 | 4.000%, 7/1/2044i | 12,668,672 | ||||||
| 12,750,000 | 4.500%, 8/1/2044i | 13,776,477 | ||||||
|
| |||||||
| Total | 43,292,066 | |||||||
|
| |||||||
| Technology (1.6%) | ||||||||
Amkor Technology, Inc. | ||||||||
| 1,910,000 | 6.375%, 10/1/2022 | 2,034,150 | ||||||
Fidelity National Information Services, Inc. | ||||||||
| 3,190,000 | 3.875%, 6/5/2024 | 3,205,117 | ||||||
Freescale Semiconductor, Inc. | ||||||||
| 1,910,000 | 5.000%, 5/15/2021d,f | 1,957,750 | ||||||
Hewlett-Packard Company | ||||||||
| 1,890,000 | 2.750%, 1/14/2019 | 1,937,929 | ||||||
| 1,910,000 | 4.650%, 12/9/2021 | 2,083,833 | ||||||
Motorola Solutions, Inc. | ||||||||
| 4,500,000 | 3.750%, 5/15/2022 | 4,473,774 | ||||||
Oracle Corporation | ||||||||
| 3,830,000 | 2.800%, 7/8/2021i | 3,826,361 | ||||||
| 3,200,000 | 2.500%, 10/15/2022 | 3,061,514 | ||||||
Xerox Corporation | ||||||||
| 1,250,000 | 6.400%, 3/15/2016 | 1,365,459 | ||||||
|
| |||||||
| Total | 23,945,887 | |||||||
|
| |||||||
| Transportation (3.2%) | ||||||||
American Airlines Pass Through Trust | ||||||||
| 2,484,831 | 5.600%, 7/15/2020d | 2,615,285 | ||||||
| 2,464,817 | 4.950%, 1/15/2023d | 2,668,164 | ||||||
| 2,490,647 | 4.000%, 7/15/2025d | 2,540,460 | ||||||
Avis Budget Car Rental, LLC | ||||||||
| 1,920,000 | 5.500%, 4/1/2023 | 1,963,200 | ||||||
British Airways plc | ||||||||
| 4,445,288 | 4.625%, 6/20/2024d | 4,695,558 | ||||||
Canadian Pacific Railway Company | ||||||||
| 2,560,000 | 7.125%, 10/15/2031 | 3,383,235 | ||||||
Continental Airlines, Inc. | ||||||||
| 2,200,000 | 6.750%, 9/15/2015d | 2,219,250 | ||||||
| 900,775 | 7.250%, 11/10/2019 | 1,053,906 | ||||||
| 1,374,868 | 4.000%, 10/29/2024 | 1,407,590 | ||||||
CSX Corporation | ||||||||
| 2,225,000 | 3.700%, 11/1/2023 | 2,291,490 | ||||||
| 1,807,000 | 6.220%, 4/30/2040 | 2,269,077 | ||||||
Delta Air Lines, Inc. | ||||||||
| 1,885,263 | 4.950%, 5/23/2019f | 2,036,084 | ||||||
| 1,152,377 | 4.750%, 5/7/2020 | 1,250,329 | ||||||
ERAC USA Finance, LLC | ||||||||
| 3,450,000 | 5.250%, 10/1/2020d | 3,919,076 | ||||||
| 1,915,000 | 4.500%, 8/16/2021d | 2,083,495 | ||||||
Navios South American Logistics, Inc. | ||||||||
| 325,000 | 7.250%, 5/1/2022d | 338,000 | ||||||
Penske Truck Leasing Company, LP | ||||||||
| 1,945,000 | 2.500%, 3/15/2016d | 1,999,314 | ||||||
United Airlines, Inc. | ||||||||
| 2,240,000 | 4.000%, 4/11/2026 | 2,293,312 | ||||||
US Airways Pass Through Trust | ||||||||
| 3,200,000 | 3.950%, 11/15/2025 | 3,264,000 | ||||||
Virgin Australia Holdings, Ltd. | ||||||||
| 2,761,277 | 5.000%, 10/23/2023d | 2,933,857 | ||||||
|
| |||||||
| Total | 47,224,682 | |||||||
|
| |||||||
| U.S. Government and Agencies (4.1%) | ||||||||
U.S. Treasury Bonds | ||||||||
| 1,500,000 | 4.375%, 5/15/2041 | 1,803,282 | ||||||
| 287,000 | 3.125%, 2/15/2042 | 277,673 | ||||||
| 3,449,000 | 3.000%, 5/15/2042 | 3,252,838 | ||||||
| 4,470,000 | 3.750%, 11/15/2043 | 4,827,600 | ||||||
The accompanying Notes to Financial Statements are an integral part of this schedule.
263
Table of Contents
Income Portfolio
Schedule of Investments as of June 30, 2014
(unaudited)
| Principal Amount | Long-Term Fixed Income (90.1%) | Value | ||||||
| U.S. Government and Agencies (4.1%) - continued | |||||||
U.S. Treasury Bonds, TIPS | ||||||||
| $3,240,785 | 0.625%, 1/15/2024 | $ | 3,358,263 | |||||
U.S. Treasury Notes | ||||||||
| 1,410,000 | 2.875%, 3/31/2018 | 1,496,914 | ||||||
| 4,542,000 | 1.000%, 5/31/2018 | 4,492,678 | ||||||
| 6,390,000 | 1.500%, 1/31/2019 | 6,386,006 | ||||||
| 10,023,000 | 1.000%, 6/30/2019 | 9,714,482 | ||||||
| 5,160,000 | 3.625%, 2/15/2020 | 5,675,598 | ||||||
| 7,020,000 | 2.625%, 11/15/2020 | 7,292,025 | ||||||
| 3,300,000 | 1.750%, 5/15/2023 | 3,125,720 | ||||||
U.S. Treasury Notes, TIPS | ||||||||
| 3,355,047 | 0.625%, 7/15/2021 | 3,534,073 | ||||||
| 5,247,761 | 0.125%, 1/15/2023 | 5,229,724 | ||||||
|
| |||||||
| Total | 60,466,876 | |||||||
|
| |||||||
| U.S. Municipals (0.2%) | ||||||||
Denver, CO City & County Airport Rev. | ||||||||
| 2,550,000 | 5.250%, 11/15/2022, Ser. A, AMT | 2,968,710 | ||||||
|
| |||||||
| Total | 2,968,710 | |||||||
|
| |||||||
| Utilities (5.6%) | ||||||||
American Electric Power Company, Inc. | ||||||||
| 2,565,000 | 2.950%, 12/15/2022 | 2,492,588 | ||||||
Arizona Public Service Company | ||||||||
| 2,880,000 | 8.750%, 3/1/2019 | 3,713,207 | ||||||
Atlas Pipeline Partners, LP | ||||||||
| 1,280,000 | 4.750%, 11/15/2021 | 1,254,400 | ||||||
Cleveland Electric Illuminating Company | ||||||||
| 923,000 | 5.700%, 4/1/2017 | 1,007,206 | ||||||
Commonwealth Edison Company | ||||||||
| 1,500,000 | 6.150%, 9/15/2017 | 1,723,629 | ||||||
DCP Midstream Operating, LP | ||||||||
| 2,560,000 | 3.875%, 3/15/2023 | 2,591,813 | ||||||
DCP Midstream, LLC | ||||||||
| 1,750,000 | 5.850%, 5/21/2043d | 1,662,500 | ||||||
DPL, Inc. | ||||||||
| 3,230,000 | 6.500%, 10/15/2016 | 3,480,325 | ||||||
El Paso Pipeline Partners Operating Company, LLC | ||||||||
| 1,280,000 | 4.700%, 11/1/2042 | 1,194,607 | ||||||
Electricite de France SA | ||||||||
| 3,200,000 | 5.250%, 12/29/2049d,g | 3,264,416 | ||||||
Energy Transfer Partners, LP | ||||||||
| 3,380,000 | 4.650%, 6/1/2021 | 3,640,906 | ||||||
Enterprise Products Operating, LLC | ||||||||
| 2,675,000 | 7.034%, 1/15/2068 | 3,053,245 | ||||||
| 1,930,000 | 6.650%, 4/15/2018 | 2,275,337 | ||||||
Exelon Generation Company, LLC | ||||||||
| 1,050,000 | 5.200%, 10/1/2019 | 1,180,883 | ||||||
| 2,500,000 | 4.000%, 10/1/2020 | 2,635,578 | ||||||
FirstEnergy Transmission, LLC | ||||||||
| 3,830,000 | 4.350%, 1/15/2025d | 3,869,529 | ||||||
Great River Energy | ||||||||
| 26,783 | 5.829%, 7/1/2017e | 29,134 | ||||||
ITC Holdings Corporation | ||||||||
| 3,170,000 | 4.050%, 7/1/2023 | 3,292,115 | ||||||
Kinder Morgan Energy Partners, LP | ||||||||
| 2,550,000 | 5.800%, 3/1/2021 | 2,913,390 | ||||||
| 1,890,000 | 4.150%, 2/1/2024 | 1,916,910 | ||||||
| 1,935,000 | 5.000%, 8/15/2042 | 1,923,405 | ||||||
MidAmerican Energy Holdings Company | ||||||||
| 4,450,000 | 3.750%, 11/15/2023f | 4,584,363 | ||||||
Nevada Power Company | ||||||||
| 2,800,000 | 6.750%, 7/1/2037 | 3,831,128 | ||||||
NiSource Finance Corporation | ||||||||
| 2,800,000 | 6.400%, 3/15/2018 | 3,216,984 | ||||||
| 3,200,000 | 5.450%, 9/15/2020 | 3,662,787 | ||||||
Ohio Power Company | ||||||||
| 2,400,000 | 6.050%, 5/1/2018 | 2,763,372 | ||||||
ONEOK Partners, LP | ||||||||
| 635,000 | 3.200%, 9/15/2018 | 662,563 | ||||||
| 1,900,000 | 5.000%, 9/15/2023 | 2,097,881 | ||||||
Pennsylvania Electric Company | ||||||||
| 3,700,000 | 5.200%, 4/1/2020 | 4,097,843 | ||||||
PPL Capital Funding, Inc. | ||||||||
| 3,205,000 | 3.500%, 12/1/2022 | 3,257,341 | ||||||
PSEG Power, LLC | ||||||||
| 1,300,000 | 5.320%, 9/15/2016 | 1,421,303 | ||||||
Southern California Edison Company | ||||||||
| 2,585,000 | 6.250%, 8/1/2049g | 2,804,725 | ||||||
|
| |||||||
| Total | 81,515,413 | |||||||
|
| |||||||
Total Long-Term Fixed Income (cost $1,252,306,022) | 1,318,645,855 | |||||||
|
| |||||||
| Shares | Preferred Stock (2.0%) | |||||||
| Financials (2.0%) | |||||||
| 79,875 | Allstate Corporation, 5.100% | 2,007,259 | ||||||
| 93,500 | Annaly Capital Management, Inc., | |||||||
7.500%g | 2,267,375 | |||||||
| 76,576 | CHS, Inc., 7.100%g | 2,079,804 | ||||||
| 102,122 | Citigroup, Inc., 7.875% | 2,828,779 | ||||||
| 22,500 | Cobank ACB, 6.250%d,g | 2,330,861 | ||||||
| 31,925 | Countrywide Capital V, 7.000% | 830,050 | ||||||
| 64,000 | DDR Corporation, 6.250%g | 1,529,600 | ||||||
| 128,000 | Discover Financial Services, | |||||||
6.500%g | 3,212,800 | |||||||
| 95,940 | Goldman Sachs Group, Inc., | |||||||
5.500%g | 2,350,530 | |||||||
| 102,122 | HSBC USA, Inc., 6.500%g | 2,598,903 | ||||||
| 88,200 | Morgan Stanley, 7.125%g | 2,458,134 | ||||||
| 63,611 | RBS Capital Funding Trust VII, | |||||||
6.080%g | 1,533,025 | |||||||
| 101,500 | Wells Fargo & Company, 5.850%g | 2,632,910 | ||||||
|
| |||||||
| Total | 28,660,030 | |||||||
|
| |||||||
Total Preferred Stock (cost $28,088,583) | 28,660,030 | |||||||
|
| |||||||
The accompanying Notes to Financial Statements are an integral part of this schedule.
264
Table of Contents
Income Portfolio
Schedule of Investments as of June 30, 2014
(unaudited)
| Shares | Collateral Held for Securities Loaned (1.6%) | Value | ||||||
| 23,912,185 | Thrivent Cash Management Trust | $ | 23,912,185 | |||||
|
| |||||||
| Total Collateral Held for Securities Loaned (cost $23,912,185) | 23,912,185 | |||||||
|
| |||||||
| Shares or Principal Amount | Short-Term Investments (5.5%)k | |||||||
Federal Home Loan Bank Discount Notes | ||||||||
| 600,000 | 0.045%, 07/30/2014l | 599,978 | ||||||
Thrivent Cash Management Trust | ||||||||
| 80,031,208 | 0.050% | 80,031,208 | ||||||
U.S. Treasury Bill | ||||||||
| 400,000 | 0.020%, 07/10/2014m | 399,998 | ||||||
|
| |||||||
| Total Short-Term Investments (at amortized cost) | 81,031,184 | |||||||
|
| |||||||
Total Investments (cost $1,449,427,951) 103.6% | $ | 1,516,327,595 | ||||||
|
| |||||||
| Other Assets and Liabilities, Net (3.6%) | (52,828,673 | ) | ||||||
|
| |||||||
| Total Net Assets 100.0% | $ | 1,463,498,922 | ||||||
|
| |||||||
| a | The stated interest rate represents the weighted average of all contracts within the bank loan facility. |
| b | All or a portion of the security is insured or guaranteed. |
| c | Denotes variable rate securities. Variable rate securities are securities whose yields vary with a designated market index or market rate. The rate shown is as of June 30, 2014. |
| d | Denotes securities sold under Rule 144A of the Securities Act of 1933, which exempts them from registration. These securities have been deemed liquid and may be resold to other dealers in the program or to other qualified institutional buyers. As of June 30, 2014, the value of these investments was $247,873,088 or 16.9% of total net assets. |
| e | Denotes restricted securities. Restricted securities are investment securities which have been deemed illiquid and cannot be offered for public sale without first being registered under the Securities Act of 1933. The following table indicates the acquisition date and cost of restricted securities Income Portfolio owned as of June 30, 2014. |
Security | Acquisition Date | Cost | ||||||
Glitnir Banki HF, 01/21/2015 | 5/1/2008 | $ | 50,000 | |||||
Great River Energy, 07/01/2017 | 4/13/2009 | 26,783 | ||||||
Preferred Term Securities XXIII, Ltd., 12/22/2036 | 9/14/2006 | 3,678,167 | ||||||
Spencer Spirit Holdings, Inc., 05/01/2017 | 4/11/2011 | 50,000 | ||||||
Vericrest Opportunity Loan Transferee, 11/25/2053 | 12/18/2013 | 3,086,545 | ||||||
| f | All or a portion of the security is on loan. |
| g | Denotes perpetual securities. Perpetual securities pay an indefinite stream of interest, but may be called by the issuer at an earlier date. |
| h | In bankruptcy. Interest is not being accrued. |
| i | Denotes investments purchased on a when-issued or delayed delivery basis. |
| j | Security is fair valued. |
| k | The interest rate shown reflects the yield, coupon rate or the discount rate at the date of purchase. |
| l | At June 30, 2014, $599,978 of investments were held on deposit with the counterparty and pledged as the initial margin deposit for open futures contracts. |
| m | At June 30, 2014, $399,998 of investments were pledged as collateral with the custodian under the agreement between the counterparty, the custodian and the fund for open swap contracts. |
Definitions:
AMT | - | Subject to Alternative Minimum Tax | ||||
REIT | - | Real Estate Investment Trust is a company that buys, develops, manages and/or sells real estate assets. | ||||
Rev. | - | Revenue | ||||
Ser. | - | Series | ||||
TIPS | - | Treasury Inflation Protected Security. |
Unrealized Appreciation (Depreciation)
Gross unrealized appreciation and depreciation of investments, based on cost for federal income tax purposes, were as follows: | ||||
Gross unrealized appreciation | $ | 74,989,476 | ||
Gross unrealized depreciation | (8,233,059 | ) | ||
|
| |||
Net unrealized appreciation (depreciation) | $ | 66,756,417 | ||
Cost for federal income tax purposes | $ | 1,449,571,178 | ||
The accompanying Notes to Financial Statements are an integral part of this schedule.
265
Table of Contents
Income Portfolio
Schedule of Investments as of June 30, 2014
(unaudited)
Fair Valuation Measurements
The following table is a summary of the inputs used, as of June 30, 2014, in valuing Income Portfolio’s assets carried at fair value.
Investments in Securities | Total | Level 1 | Level 2 | Level 3 | ||||||||||||
Bank Loans | ||||||||||||||||
Basic Materials | 4,718,596 | — | 4,718,596 | — | ||||||||||||
Capital Goods | 3,133,428 | — | 3,133,428 | — | ||||||||||||
Communications Services | 21,920,854 | — | 21,920,854 | — | ||||||||||||
Consumer Cyclical | 9,236,451 | — | 9,236,451 | — | ||||||||||||
Consumer Non-Cyclical | 7,199,334 | — | 7,199,334 | — | ||||||||||||
Energy | 1,423,107 | — | 1,423,107 | — | ||||||||||||
Financials | 1,574,503 | — | 1,574,503 | — | ||||||||||||
Technology | 6,931,831 | — | 6,931,831 | — | ||||||||||||
Transportation | 3,963,309 | — | 3,963,309 | — | ||||||||||||
Utilities | 3,976,928 | — | 3,976,928 | — | ||||||||||||
Long-Term Fixed Income | ||||||||||||||||
Asset-Backed Securities | 16,034,324 | — | 16,034,324 | — | ||||||||||||
Basic Materials | 74,017,480 | — | 74,017,480 | — | ||||||||||||
Capital Goods | 26,028,832 | — | 26,028,832 | — | ||||||||||||
Collateralized Mortgage Obligations | 14,352,737 | — | 14,352,737 | — | ||||||||||||
Commercial Mortgage-Backed | ||||||||||||||||
Securities | 11,442,507 | — | 11,442,507 | — | ||||||||||||
Communications Services | 152,949,113 | — | 152,949,113 | — | ||||||||||||
Consumer Cyclical | 80,673,762 | — | 80,673,762 | — | ||||||||||||
Consumer Non-Cyclical | 114,332,431 | — | 114,332,431 | — | ||||||||||||
Energy | 141,778,922 | — | 141,778,922 | — | ||||||||||||
Financials | 410,112,224 | — | 404,167,810 | 5,944,414 | ||||||||||||
Foreign Government | 17,509,889 | — | 17,509,889 | — | ||||||||||||
Mortgage-Backed Securities | 43,292,066 | — | 43,292,066 | — | ||||||||||||
Technology | 23,945,887 | — | 23,945,887 | — | ||||||||||||
Transportation | 47,224,682 | — | 47,224,682 | — | ||||||||||||
U.S. Government and Agencies | 60,466,876 | — | 60,466,876 | — | ||||||||||||
U.S. Municipals | 2,968,710 | — | 2,968,710 | — | ||||||||||||
Utilities | 81,515,413 | — | 81,515,413 | — | ||||||||||||
Preferred Stock | ||||||||||||||||
Financials | 28,660,030 | 26,329,169 | 2,330,861 | — | ||||||||||||
Collateral Held for Securities Loaned | 23,912,185 | 23,912,185 | — | — | ||||||||||||
Short-Term Investments | 81,031,184 | 80,031,208 | 999,976 | — | ||||||||||||
|
|
|
|
|
|
|
| |||||||||
Total | $ | 1,516,327,595 | $ | 130,272,562 | $ | 1,380,110,619 | $ | 5,944,414 | ||||||||
|
|
|
|
|
|
|
| |||||||||
Other Financial Instruments | Total | Level 1 | Level 2 | Level 3 | ||||||||||||
Asset Derivatives | ||||||||||||||||
Futures Contracts | 635,670 | 635,670 | — | — | ||||||||||||
|
|
|
|
|
|
|
| |||||||||
Total Asset Derivatives | $ | 635,670 | $ | 635,670 | $ | — | $ | — | ||||||||
|
|
|
|
|
|
|
| |||||||||
Liability Derivatives | ||||||||||||||||
Futures Contracts | 568,417 | 568,417 | — | — | ||||||||||||
Credit Default Swaps | 353,273 | — | 353,273 | — | ||||||||||||
|
|
|
|
|
|
|
| |||||||||
Total Liability Derivatives | $ | 921,690 | $ | 568,417 | $ | 353,273 | $ | — | ||||||||
|
|
|
|
|
|
|
| |||||||||
There were no significant transfers between Levels during the period ended June 30, 2014. Transfers between Levels are identified as of the end of the period.
Futures Contracts | Number of Contracts Long/(Short) | Expiration Date | Notional Principal Amount | Value | Unrealized Gain/(Loss) | |||||||||||||
2-Yr. U.S. Treasury Bond Futures | 315 | September 2014 | $ | 69,241,741 | $ | 69,172,032 | ($ | 69,709 | ) | |||||||||
5-Yr. U.S. Treasury Bond Futures | (595 | ) | September 2014 | (71,291,270 | ) | (71,079,260 | ) | 212,010 | ||||||||||
10-Yr. U.S. Treasury Bond Futures | (1,000 | ) | September 2014 | (125,595,540 | ) | (125,171,880 | ) | 423,660 | ||||||||||
30-Yr. U.S. Treasury Bond Futures | 600 | September 2014 | 82,811,208 | 82,312,500 | (498,708 | ) | ||||||||||||
Total Futures Contracts | $ | 67,253 | ||||||||||||||||
The accompanying Notes to Financial Statements are an integral part of this schedule.
266
Table of Contents
Income Portfolio
Schedule of Investments as of June 30, 2014
(unaudited)
Credit Default Swaps and Counterparty | Buy/Sell Protection1 | Termination Date | Notional Principal Amount2 | Value3 | Unrealized Gain/(Loss) | |||||||||||||||
CDX HY 21, 5 Year, at 5.00%; J.P. Morgan Chase and Co. | Buy | 12/20/2018 | $ | 9,504,000 | ($ | 353,273 | ) | ($ | 353,273 | ) | ||||||||||
Total Credit Default Swaps | ($ | 353,273 | ) | ($ | 353,273 | ) | ||||||||||||||
| 1 | As the buyer of protection, Income Portfolio pays periodic fees in return for payment by the seller which is contingent upon an adverse credit event occurring in the underlying issuer or reference entity. As the seller of protection, Income Portfolio collects periodic fees from the buyer and profits if the credit of the underlying issuer or reference entity remains stable or improves while the swap is outstanding, but the seller in a credit default swap contract would be required to pay the amount of credit loss, determined as specified in the agreement, to the buyer in the event of an adverse credit event in the reference entity. |
| 2 | The maximum potential amount of future payments Income Portfolio could be required to make as the seller or receive as the buyer of protection. |
| 3 | The values for credit indexes (CDX or LCDX) serve as an indicator of the current status of the payment/performance risk and represent the liability or profit for the credit default swap contract had the contract been closed as of the reporting date. When protection has been sold, the value of the swap will increase when the swap spread declines representing an improvement in the reference entity’s credit worthiness. The value of the swap will decrease when the swap spread increases representing a deterioration in the reference entity’s credit worthiness. When protection has been purchased, the value of the swap will increase when the swap spread increases representing a deterioration in the reference entity’s credit worthiness. The value of the swap will decrease when the swap spread declines representing an improvement in the reference entity’s credit worthiness. |
The following table summarizes the fair value and Statement of Assets and Liabilities location, as of June 30, 2014, for Income Portfolio’s investments in financial derivative instruments by primary risk exposure as discussed under item (2) Significant Accounting Policies of the Notes to Financial Statements.
Derivatives by risk category | Statement of Assets and Liabilities Location | Fair Value | ||||
Asset Derivatives | ||||||
Interest Rate Contracts | ||||||
Futures* | Net Assets - Net unrealized appreciation/(depreciation) on Futures contracts | $ | 635,670 | |||
Total Interest Rate Contracts | 635,670 | |||||
|
| |||||
Total Asset Derivatives | $ | 635,670 | ||||
|
| |||||
Liability Derivatives | ||||||
Interest Rate Contracts | ||||||
Futures* | Net Assets - Net unrealized appreciation/(depreciation) on Futures contracts | 568,417 | ||||
Total Interest Rate Contracts | 568,417 | |||||
Credit Contracts | ||||||
Credit Default Swaps | Net Assets - Net unrealized appreciation/(depreciation) on Swap agreements | 353,273 | ||||
Total Credit Contracts | 353,273 | |||||
|
| |||||
Total Liability Derivatives | $ | 921,690 | ||||
|
| |||||
| * | Includes cumulative appreciation/depreciation of futures contracts as reported in the Schedule of Investments. Only current day’s variation margin is reported within the Statement of Assets and Liabilities. |
The following table summarizes the net realized gains/(losses) and Statement of Operations location, for the period ended June 30, 2014, for Income Portfolio’s investments in financial derivative instruments by primary risk exposure.
Derivatives by risk category | Statement of Operations Location | Realized Gains/(Losses) recognized in Income | ||||
Interest Rate Contracts | ||||||
Futures | Net realized gains/(losses) on Futures contracts | 2,861,641 | ||||
Total Interest Rate Contracts | 2,861,641 | |||||
Credit Contracts | ||||||
Credit Default Swaps | Net realized gains/(losses) on Swap agreements | (55,097 | ) | |||
Total Credit Contracts | (55,097 | ) | ||||
|
| |||||
Total | $ | 2,806,544 | ||||
|
| |||||
The accompanying Notes to Financial Statements are an integral part of this schedule.
267
Table of Contents
Income Portfolio
Schedule of Investments as of June 30, 2014
(unaudited)
The following table summarizes the change in net unrealized appreciation/(depreciation) and Statement of Operations location, for the period ended June 30, 2014, for Income Portfolio’s investments in financial derivative instruments by primary risk exposure.
Derivatives by risk category | Statement of Operations Location | Change in unrealized appreciation/(depreciation) recognized in Income | ||||
Interest Rate Contracts | ||||||
Futures | Change in net unrealized appreciation/(depreciation) on Futures contracts | (1,659,267 | ) | |||
Total Interest Rate Contracts | (1,659,267 | ) | ||||
Credit Contracts | ||||||
Credit Default Swaps | Change in net unrealized appreciation/(depreciation) on Swap agreements | (353,273 | ) | |||
Total Credit Contracts | (353,273 | ) | ||||
|
| |||||
Total | ($ | 2,012,540 | ) | |||
|
| |||||
The following table presents Income Portfolio’s average volume of derivative activity during the period ended June 30, 2014.
Derivative Risk Category | Futures (Notional)* | Futures (Percentage of Average Net Assets) | Swaps (Notional)* | |||||||||
Interest Rate Contracts | $ | 347,311,873 | 24.1 | % | N/A | |||||||
Credit Contracts | N/A | N/A | $ | 626,635 | ||||||||
| * | Notional amount represents long or short, or both, derivative positions held by the Portfolio. |
Investment in Affiliates
Affiliated issuers, as defined under the Investment Company Act of 1940, include those in which the Portfolio’s holdings of an issuer represent 5% or more of the outstanding voting securities of an issuer, or any affiliated mutual fund.
A summary of transactions for the fiscal year to date, in Income Portfolio, is as follows:
Portfolio | Value December 31, 2013 | Gross Purchases | Gross Sales | Shares Held at June 30, 2014 | Value June 30, 2014 | Income Earned January 1, 2014 - June 30, 2014 | ||||||||||||||||||
Cash Management Trust- Collateral Investment | $ | 21,063,391 | $ | 104,225,289 | $ | 101,376,495 | 23,912,185 | $ | 23,912,185 | $ | 15,768 | |||||||||||||
Cash Management Trust- Short Term Investment | 65,827,337 | 170,914,827 | 156,710,956 | 80,031,208 | 80,031,208 | 17,712 | ||||||||||||||||||
Total Value and Income Earned | 86,890,728 | 103,943,393 | 33,480 | |||||||||||||||||||||
The accompanying Notes to Financial Statements are an integral part of this schedule.
268
Table of Contents
Schedule of Investments as of June 30, 2014
(unaudited)
| Principal Amount | Long-Term Fixed Income (101.7%) | Value | ||||||
| Asset-Backed Securities (2.3%) | |||||||
Conseco Financial Corporation | ||||||||
| $ | 10,560 | 6.330%, 11/1/2029 | $ | 10,927 | ||||
Countrywide Home Loans, Inc. | ||||||||
| 144,210 | 6.085%, 6/25/2021a | 143,283 | ||||||
Credit Based Asset Servicing and Securitization, LLC | ||||||||
| 350,052 | 3.770%, 12/25/2036 | 234,290 | ||||||
First Horizon ABS Trust | ||||||||
| 601,631 | 0.312%, 10/25/2034a,b | 514,053 | ||||||
GMAC Mortgage Corporation Loan Trust | ||||||||
| 818,058 | 0.332%, 8/25/2035a,b | 707,805 | ||||||
| 1,007,936 | 0.332%, 12/25/2036a,b | 866,949 | ||||||
IndyMac Seconds Asset-Backed Trust | ||||||||
| 392,542 | 0.492%, 10/25/2036a,b | 169,304 | ||||||
Wachovia Asset Securitization, Inc. | ||||||||
| 848,358 | 0.292%, 7/25/2037a,b,c | 731,257 | ||||||
|
| |||||||
| Total | 3,377,868 | |||||||
|
| |||||||
| Basic Materials (1.1%) | |||||||
Dow Chemical Company | ||||||||
| 27,000 | 7.375%, 11/1/2029 | 35,971 | ||||||
Georgia-Pacific, LLC | ||||||||
| 250,000 | 3.734%, 7/15/2023d | 256,132 | ||||||
Monsanto Company | ||||||||
| 325,000 | 1.150%, 6/30/2017 | 325,100 | ||||||
Mosaic Company | ||||||||
| 400,000 | 4.250%, 11/15/2023 | 422,263 | ||||||
Packaging Corporation of America | ||||||||
| 200,000 | 4.500%, 11/1/2023 | 214,216 | ||||||
Xstrata Finance Canada, Ltd. | ||||||||
| 325,000 | 2.700%, 10/25/2017d | 333,601 | ||||||
|
| |||||||
| Total | 1,587,283 | |||||||
|
| |||||||
| Capital Goods (0.6%) | |||||||
Precision Castparts Corporation | ||||||||
| 300,000 | 1.250%, 1/15/2018 | 297,942 | ||||||
Roper Industries, Inc. | ||||||||
| 300,000 | 1.850%, 11/15/2017 | 302,498 | ||||||
United Technologies Corporation | ||||||||
| 275,000 | 6.050%, 6/1/2036 | 349,253 | ||||||
|
| |||||||
| Total | 949,693 | |||||||
|
| |||||||
| Commercial Mortgage-Backed Securities (2.0%) | |||||||
Banc of America Commercial Mortgage, Inc. | ||||||||
| 645,000 | 5.775%, 6/10/2049 | 709,888 | ||||||
Commercial Mortgage Pass- Through Certificates | ||||||||
| 438,823 | 0.282%, 12/15/2020b,d | 437,369 | ||||||
| 500,000 | 5.306%, 12/10/2046 | 538,777 | ||||||
Credit Suisse Mortgage Capital Certificates | ||||||||
| 629,343 | 0.322%, 10/15/2021b,d | 628,133 | ||||||
LB-UBS Commercial Mortgage Trust | ||||||||
| 151,804 | 4.786%, 10/15/2029 | 152,224 | ||||||
Morgan Stanley Capital I | ||||||||
| 470,357 | 3.224%, 7/15/2049 | 489,826 | ||||||
|
| |||||||
| Total | 2,956,217 | |||||||
|
| |||||||
| Communications Services (1.7%) | |||||||
America Movil SAB de CV | ||||||||
| 300,000 | 1.230%, 9/12/2016b | 303,595 | ||||||
AT&T, Inc. | ||||||||
| 300,000 | 1.400%, 12/1/2017 | 298,742 | ||||||
British Sky Broadcasting Group plc | ||||||||
| 200,000 | 3.125%, 11/26/2022d | 191,117 | ||||||
British Telecommunications plc | ||||||||
| 200,000 | 2.350%, 2/14/2019 | 201,662 | ||||||
Cox Communications, Inc. | ||||||||
| 135,000 | 6.450%, 12/1/2036d | 157,575 | ||||||
Crown Castle Towers, LLC | ||||||||
| 500,000 | 4.174%, 8/15/2017d | 530,895 | ||||||
DIRECTV Holdings, LLC | ||||||||
| 250,000 | 1.750%, 1/15/2018 | 250,344 | ||||||
NBC Universal Enterprise, Inc. | ||||||||
| 250,000 | 1.662%, 4/15/2018d | 249,837 | ||||||
Verizon Global Funding Corporation | ||||||||
| 27,000 | 7.750%, 12/1/2030 | 37,028 | ||||||
Viacom, Inc. | ||||||||
| 250,000 | 2.500%, 9/1/2018 | 255,524 | ||||||
|
| |||||||
| Total | 2,476,319 | |||||||
|
| |||||||
| Consumer Cyclical (2.6%) | |||||||
California Institute of Technology | ||||||||
| 325,000 | 4.700%, 11/1/2111 | 316,334 | ||||||
Daimler Finance North America, LLC | ||||||||
| 27,000 | 8.500%, 1/18/2031 | 40,956 | ||||||
Dartmouth College | ||||||||
| 250,000 | 3.760%, 6/1/2043 | 236,939 | ||||||
Ford Motor Credit Company, LLC | ||||||||
| 150,000 | 4.207%, 4/15/2016 | 158,311 | ||||||
| 350,000 | 3.000%, 6/12/2017 | 365,137 | ||||||
Home Depot, Inc. | ||||||||
| 320,000 | 2.250%, 9/10/2018 | 327,466 | ||||||
Macy’s Retail Holdings, Inc. | ||||||||
| 200,000 | 4.375%, 9/1/2023 | 211,944 | ||||||
Massachusetts Institute of Technology | ||||||||
| 500,000 | 4.678%, 7/1/2114 | 533,604 | ||||||
President and Fellows of Harvard College | ||||||||
| 500,000 | 3.619%, 10/1/2037 | 475,444 | ||||||
Starbucks Corporation | ||||||||
| 200,000 | 3.850%, 10/1/2023 | 210,153 | ||||||
The Board of Trustees of The Leland Stanford Junior University | ||||||||
| 550,000 | 3.563%, 6/1/2044 | 500,254 | ||||||
Wal-Mart Stores, Inc. | ||||||||
| 327,000 | 7.550%, 2/15/2030 | 465,129 | ||||||
|
| |||||||
| Total | 3,841,671 | |||||||
|
| |||||||
The accompanying Notes to Financial Statements are an integral part of this schedule.
269
Table of Contents
Bond Index Portfolio
Schedule of Investments as of June 30, 2014
(unaudited)
| Principal Amount | Long-Term Fixed Income (101.7%) | Value | ||||||
| Consumer Non-Cyclical (2.4%) | |||||||
Allergan, Inc. | ||||||||
| $ | 325,000 | 1.350%, 3/15/2018 | $ | 313,713 | ||||
Altria Group, Inc. | ||||||||
| 240,000 | 4.000%, 1/31/2024 | 246,607 | ||||||
Cargill, Inc. | ||||||||
| 325,000 | 4.100%, 11/1/2042d | 312,865 | ||||||
ConAgra Foods, Inc. | ||||||||
| 200,000 | 1.900%, 1/25/2018 | 200,482 | ||||||
Dr Pepper Snapple Group, Inc. | ||||||||
| 250,000 | 2.700%, 11/15/2022 | 239,708 | ||||||
Edwards Lifesciences Corporation | ||||||||
| 300,000 | 2.875%, 10/15/2018 | 306,569 | ||||||
Fomento Economico Mexicano SAB de CV | ||||||||
| 200,000 | 2.875%, 5/10/2023 | 190,538 | ||||||
Heineken NV | ||||||||
| 50,000 | 1.400%, 10/1/2017d | 49,976 | ||||||
McKesson Corporation | ||||||||
| 200,000 | 1.292%, 3/10/2017 | 200,529 | ||||||
| 275,000 | 2.700%, 12/15/2022 | 263,191 | ||||||
Sanofi | ||||||||
| 250,000 | 1.250%, 4/10/2018 | 246,720 | ||||||
Thermo Fisher Scientific, Inc. | ||||||||
| 300,000 | 1.300%, 2/1/2017 | 300,442 | ||||||
Unilever Capital Corporation | ||||||||
| 300,000 | 2.200%, 3/6/2019 | 304,341 | ||||||
Wyeth, LLC | ||||||||
| 350,000 | 6.000%, 2/15/2036 | 438,920 | ||||||
|
| |||||||
| Total | 3,614,601 | |||||||
|
| |||||||
| Energy (1.5%) | |||||||
Cameron International Corporation | ||||||||
| 150,000 | 1.400%, 6/15/2017 | 150,491 | ||||||
CNOOC Nexen Finance 2014 ULC | ||||||||
| 250,000 | 1.625%, 4/30/2017 | 250,642 | ||||||
Energy Transfer Partners, LP | ||||||||
| 450,000 | 6.700%, 7/1/2018 | 526,899 | ||||||
Marathon Oil Corporation | ||||||||
| 325,000 | 2.800%, 11/1/2022 | 315,879 | ||||||
Petro-Canada | ||||||||
| 300,000 | 6.800%, 5/15/2038 | 397,120 | ||||||
Petroleos Mexicanos | ||||||||
| 250,000 | 3.125%, 1/23/2019d | 258,625 | ||||||
Phillips 66 | ||||||||
| 325,000 | 1.950%, 3/5/2015 | 328,252 | ||||||
|
| |||||||
| Total | 2,227,908 | |||||||
|
| |||||||
| Financials (9.9%) | |||||||
American Tower Trust I | ||||||||
| 225,000 | 1.551%, 3/15/2018d | 224,084 | ||||||
Australia and New Zealand Banking Group, Ltd. | ||||||||
| 350,000 | 1.000%, 10/6/2015d | 352,443 | ||||||
AXA SA | ||||||||
| 27,000 | 8.600%, 12/15/2030 | 36,281 | ||||||
Bank of America Corporation | ||||||||
| 250,000 | 1.500%, 10/9/2015 | 252,302 | ||||||
Barclays Bank plc | ||||||||
| 300,000 | 5.000%, 9/22/2016 | 326,085 | ||||||
BNZ International Funding, Ltd. | ||||||||
| 400,000 | 2.350%, 3/4/2019d | 401,588 | ||||||
Boston Properties, LP | ||||||||
| 300,000 | 3.125%, 9/1/2023 | 291,330 | ||||||
Caixa Economica Federal | ||||||||
| 200,000 | 4.250%, 5/13/2019d | 201,900 | ||||||
Camden Property Trust | ||||||||
| 100,000 | 2.950%, 12/15/2022 | 96,675 | ||||||
Chubb Corporation | ||||||||
| 350,000 | 6.500%, 5/15/2038 | 469,298 | ||||||
Cooperatieve Centrale Raiffeisen-Boerenleenbank BA | ||||||||
| 50,000 | 4.625%, 12/1/2023 | 52,847 | ||||||
Credit Suisse AG Guernsey | ||||||||
| 650,000 | 1.625%, 3/6/2015d | 655,681 | ||||||
DnB Boligkreditt AS | ||||||||
| 200,000 | 1.450%, 3/21/2018d | 199,055 | ||||||
Duke Realty, LP | ||||||||
| 250,000 | 3.875%, 10/15/2022 | 254,477 | ||||||
General Electric Capital Corporation | ||||||||
| 475,000 | 5.875%, 1/14/2038 | 576,272 | ||||||
Goldman Sachs Group, Inc. | ||||||||
| 500,000 | 2.375%, 1/22/2018 | 507,768 | ||||||
HCP, Inc. | ||||||||
| 325,000 | 3.750%, 2/1/2016 | 339,687 | ||||||
HSBC Holdings plc | ||||||||
| 300,000 | 6.800%, 6/1/2038 | 382,766 | ||||||
ING Bank NV | ||||||||
| 400,000 | 2.625%, 12/5/2022d | 390,960 | ||||||
J.P. Morgan Chase & Company | ||||||||
| 250,000 | 1.129%, 1/25/2018b | 253,522 | ||||||
Liberty Mutual Group, Inc. | ||||||||
| 150,000 | 4.950%, 5/1/2022d | 164,064 | ||||||
| 200,000 | 4.250%, 6/15/2023d | 207,293 | ||||||
Macquarie Bank, Ltd. | ||||||||
| 200,000 | 5.000%, 2/22/2017d | 217,960 | ||||||
Marsh & McLennan Companies, Inc. | ||||||||
| 89,000 | 5.750%, 9/15/2015 | 94,257 | ||||||
| 400,000 | 2.550%, 10/15/2018 | 408,828 | ||||||
MassMutual Global Funding II | ||||||||
| 350,000 | 2.000%, 4/5/2017d | 357,812 | ||||||
MasterCard, Inc. | ||||||||
| 250,000 | 2.000%, 4/1/2019 | 251,018 | ||||||
MetLife, Inc. | ||||||||
| 200,000 | 4.368%, 9/15/2023 | 214,566 | ||||||
Morgan Stanley | ||||||||
| 150,000 | 4.100%, 5/22/2023 | 152,162 | ||||||
| 250,000 | 5.000%, 11/24/2025 | 266,642 | ||||||
National Australia Bank, Ltd. | ||||||||
| 325,000 | 2.000%, 6/20/2017d | 332,488 | ||||||
Nordea Bank AB | ||||||||
| 325,000 | 3.125%, 3/20/2017d | 342,353 | ||||||
North American Development Bank | ||||||||
| 400,000 | 2.300%, 10/10/2018 | 405,935 | ||||||
PNC Financial Services Group, Inc. | ||||||||
| 325,000 | 2.854%, 11/9/2022 | 317,260 | ||||||
Preferred Term Securities XXIII, Ltd. | ||||||||
| 788,179 | 0.431%, 12/22/2036b,c,e | 591,134 | ||||||
Principal Life Global Funding II | ||||||||
| 300,000 | 1.000%, 12/11/2015d | 301,595 | ||||||
The accompanying Notes to Financial Statements are an integral part of this schedule.
270
Table of Contents
Bond Index Portfolio
Schedule of Investments as of June 30, 2014
(unaudited)
| Principal Amount | Long-Term Fixed Income (101.7%) | Value | ||||||
| Financials (9.9%) - continued | |||||||
Prudential Covered Trust | ||||||||
| $ | 240,000 | 2.997%, 9/30/2015c | $ | 245,837 | ||||
Realty Income Corporation | ||||||||
| 300,000 | 2.000%, 1/31/2018 | 301,418 | ||||||
Reliance Standard Life Global Funding II | ||||||||
| 240,000 | 2.500%, 4/24/2019d | 240,758 | ||||||
Skandinaviska Enskilda Banken AB | ||||||||
| 300,000 | 1.750%, 3/19/2018d | 299,670 | ||||||
Standard Chartered plc | ||||||||
| 200,000 | 3.950%, 1/11/2023d | 198,950 | ||||||
Sumitomo Mitsui Financial Group, Inc. | ||||||||
| 250,000 | 4.436%, 4/2/2024d | 261,262 | ||||||
Svenska Handelsbanken AB | ||||||||
| 125,000 | 1.625%, 3/21/2018 | 124,709 | ||||||
Swedbank AB | ||||||||
| 300,000 | 1.750%, 3/12/2018d | 299,585 | ||||||
Swedbank Hypotek AB | ||||||||
| 400,000 | 1.375%, 3/28/2018d | 398,271 | ||||||
Toronto-Dominion Bank | ||||||||
| 325,000 | 0.691%, 9/9/2016b | 326,780 | ||||||
Union Bank NA | ||||||||
| 300,000 | 1.500%, 9/26/2016 | 304,161 | ||||||
UnitedHealth Group, Inc. | ||||||||
| 325,000 | 1.400%, 10/15/2017 | 326,233 | ||||||
Ventas Realty, LP | ||||||||
| 175,000 | 4.250%, 3/1/2022 | 185,898 | ||||||
Washington Mutual Bank | ||||||||
| 500,000 | 5.500%, 1/15/2013e,f | 0 | ||||||
Wells Fargo & Company | ||||||||
| 150,000 | 3.450%, 2/13/2023 | 149,266 | ||||||
Yale University | ||||||||
| 200,000 | 2.086%, 4/15/2019 | 202,061 | ||||||
|
| |||||||
| Total | 14,755,247 | |||||||
|
| |||||||
| Foreign Government (4.3%) | |||||||
African Development Bank | ||||||||
| 250,000 | 6.875%, 10/15/2015 | 266,823 | ||||||
Bank of England | ||||||||
| 1,000,000 | 0.875%, 3/17/2017d | 1,001,562 | ||||||
Chile Government International Bond | ||||||||
| 350,000 | 3.875%, 8/5/2020 | 375,200 | ||||||
Export Development Canada | ||||||||
| 150,000 | 0.750%, 12/15/2017 | 148,024 | ||||||
Hashemite Kingdom of Jordan | ||||||||
| 500,000 | 2.503%, 10/30/2020 | 506,388 | ||||||
Hydro-Quebec | ||||||||
| 27,000 | 8.400%, 1/15/2022 | 35,757 | ||||||
Inter-American Development Bank | ||||||||
| 500,000 | 3.000%, 10/4/2023 | 518,936 | ||||||
| 400,000 | 4.375%, 1/24/2044 | 436,339 | ||||||
Kommunalbanken AS | ||||||||
| 470,000 | 1.000%, 9/26/2017d | 468,209 | ||||||
Kommuninvest I Sverige AB | ||||||||
| 300,000 | 1.000%, 10/24/2017d | 298,418 | ||||||
Mexico Government International Bond | ||||||||
| 100,000 | 3.500%, 1/21/2021 | 103,850 | ||||||
Philippines Government International Bond | ||||||||
| 100,000 | 4.200%, 1/21/2024 | 105,625 | ||||||
Poland Government International Bond | ||||||||
| 250,000 | 4.000%, 1/22/2024 | 259,375 | ||||||
Province of Manitoba | ||||||||
| 600,000 | 1.300%, 4/3/2017 | 606,074 | ||||||
Province of New Brunswick | ||||||||
| 125,000 | 2.750%, 6/15/2018 | 130,875 | ||||||
Province of Quebec | ||||||||
| 400,000 | 7.500%, 7/15/2023 | 531,513 | ||||||
Sweden Government International Bond | ||||||||
| 325,000 | 0.375%, 12/22/2015d | 325,026 | ||||||
| 300,000 | 0.375%, 3/29/2016d | 299,799 | ||||||
Uruguay Government International Bond | ||||||||
| 125,000 | 5.100%, 6/18/2050 | 123,438 | ||||||
|
| |||||||
| Total | 6,541,231 | |||||||
|
| |||||||
| Mortgage-Backed Securities (30.4%) | |||||||
Federal Home Loan Mortgage Corporation Gold 15-Yr. Pass Through | ||||||||
| 37 | 7.000%, 10/1/2014 | 37 | ||||||
| 984 | 6.500%, 3/1/2016 | 1,011 | ||||||
| 3,406 | 6.000%, 6/1/2016 | 3,509 | ||||||
| 2,368 | 6.000%, 9/1/2016 | 2,440 | ||||||
| 49,177 | 7.000%, 6/1/2017 | 51,674 | ||||||
| 56,265 | 5.500%, 12/1/2017 | 59,739 | ||||||
| 2,087,500 | 3.000%, 7/1/2029g | 2,163,823 | ||||||
Federal Home Loan Mortgage Corporation Gold 30-Yr. Pass Through | ||||||||
| 2,154 | 7.000%, 5/1/2024 | 2,468 | ||||||
| 1,046 | 7.500%, 8/1/2025 | 1,118 | ||||||
| 9,477 | 8.500%, 11/1/2025 | 10,851 | ||||||
| 725 | 8.000%, 1/1/2026 | 818 | ||||||
| 1,089 | 7.000%, 4/1/2027 | 1,263 | ||||||
| 1,000 | 7.500%, 7/1/2027 | 1,120 | ||||||
| 2,492 | 7.000%, 8/1/2027 | 2,765 | ||||||
| 1,353 | 7.500%, 10/1/2027 | 1,557 | ||||||
| 1,601 | 7.000%, 5/1/2028 | 1,832 | ||||||
| 5,569 | 7.500%, 10/1/2029 | 6,601 | ||||||
| 2,694 | 7.500%, 11/1/2029 | 3,085 | ||||||
| 3,702 | 7.000%, 6/1/2031 | 4,167 | ||||||
| 3,392 | 7.000%, 6/1/2031 | 3,902 | ||||||
| 4,177 | 7.000%, 9/1/2031 | 4,862 | ||||||
| 10,724 | 7.000%, 5/1/2032 | 12,130 | ||||||
| 2,087,500 | 4.000%, 7/1/2044g | 2,211,445 | ||||||
Federal National Mortgage Association Conventional 15-yr. Pass Through | ||||||||
| 6,250,000 | 3.500%, 8/1/2029g | 6,607,422 | ||||||
Federal National Mortgage Association Conventional 30-Yr. Pass Through | ||||||||
| 1,793 | 10.500%, 8/1/2020 | 2,016 | ||||||
| 1,481 | 8.000%, 12/1/2024 | 1,661 | ||||||
| 2,837 | 7.000%, 10/1/2025 | 3,129 | ||||||
| 343 | 8.500%, 12/1/2025 | 354 | ||||||
| 1,613 | 7.500%, 1/1/2026 | 1,732 | ||||||
The accompanying Notes to Financial Statements are an integral part of this schedule.
271
Table of Contents
Bond Index Portfolio
Schedule of Investments as of June 30, 2014
(unaudited)
| Principal Amount | Long-Term Fixed Income (101.7%) | Value | ||||||
| Mortgage-Backed Securities (30.4%) - continued | |||||||
| $ | 1,308 | 8.000%, 9/1/2026 | $ | 1,365 | ||||
| 4,340 | 7.500%, 2/1/2027 | 4,470 | ||||||
| 3,120 | 7.000%, 3/1/2027 | 3,221 | ||||||
| 3,778 | 9.000%, 11/1/2027 | 4,048 | ||||||
| 22,269 | 7.500%, 2/1/2028 | 25,716 | ||||||
| 5,232 | 7.000%, 10/1/2028 | 5,467 | ||||||
| 18,113 | 7.500%, 11/1/2028 | 21,052 | ||||||
| 2,698 | 7.000%, 3/1/2029 | 2,907 | ||||||
| 4,729 | 7.500%, 8/1/2029 | 5,613 | ||||||
| 2,101 | 7.000%, 10/1/2029 | 2,130 | ||||||
| 3,712 | 7.500%, 12/1/2029 | 4,220 | ||||||
| 2,472 | 8.000%, 4/1/2030 | 2,937 | ||||||
| 1,242 | 7.500%, 12/1/2030 | 1,420 | ||||||
| 16,870 | 7.000%, 5/1/2032 | 18,973 | ||||||
| 10,400,000 | 3.500%, 7/1/2044g | 10,705,500 | ||||||
| 11,062,500 | 4.000%, 7/1/2044g | 11,740,078 | ||||||
| 10,500,000 | 4.500%, 8/1/2044g | 11,345,334 | ||||||
Government National Mortgage Association 30-Yr. Pass Through | ||||||||
| 3,832 | 7.500%, 3/15/2023 | 3,847 | ||||||
| 2,023 | 9.000%, 9/15/2024 | 2,322 | ||||||
| 2,269 | 8.000%, 6/15/2025 | 2,354 | ||||||
| 1,627 | 8.000%, 9/15/2026 | 1,855 | ||||||
| 7,048 | 7.500%, 10/15/2027 | 7,265 | ||||||
| 4,673 | 7.000%, 11/15/2027 | 4,735 | ||||||
| 3,975 | 6.500%, 7/15/2028 | 4,628 | ||||||
| 2,683 | 7.000%, 8/15/2028 | 3,003 | ||||||
| 8,266 | 7.500%, 11/15/2028 | 8,368 | ||||||
| 5,173 | 6.500%, 12/15/2028 | 5,877 | ||||||
| 23,584 | 6.500%, 3/15/2029 | 26,893 | ||||||
| 1,031 | 6.500%, 4/15/2029 | 1,174 | ||||||
| 3,962 | 8.000%, 10/15/2030 | 4,537 | ||||||
| 8,326 | 7.500%, 1/15/2031 | 9,537 | ||||||
| 4,308 | 7.000%, 4/15/2031 | 4,932 | ||||||
| 8,350 | 6.500%, 6/15/2031 | 9,487 | ||||||
| 9,909 | 7.000%, 9/15/2031 | 11,319 | ||||||
| 111,639 | 6.500%, 1/15/2032 | 126,843 | ||||||
| 18,829 | 6.500%, 4/15/2032 | 21,394 | ||||||
|
| |||||||
| Total | 45,323,352 | |||||||
|
| |||||||
| Technology (1.4%) | |||||||
Amphenol Corporation | ||||||||
| 200,000 | 2.550%, 1/30/2019 | 202,811 | ||||||
Apple, Inc. | ||||||||
| 400,000 | 2.100%, 5/6/2019 | 402,017 | ||||||
| 400,000 | 2.400%, 5/3/2023 | 377,876 | ||||||
Micron Semiconductor Asia Pte, Ltd. | ||||||||
| 300,000 | 1.258%, 1/15/2019 | 299,958 | ||||||
Motorola Solutions, Inc. | ||||||||
| 250,000 | 3.500%, 3/1/2023 | 241,877 | ||||||
Oracle Corporation | ||||||||
| 325,000 | 1.200%, 10/15/2017 | 324,565 | ||||||
Xilinx, Inc. | ||||||||
| 250,000 | 2.125%, 3/15/2019 | 250,442 | ||||||
|
| |||||||
| Total | 2,099,546 | |||||||
|
| |||||||
| Transportation (1.0%) | |||||||
American Airlines Pass Through Trust | ||||||||
| 194,889 | 5.600%, 7/15/2020d | 205,120 | ||||||
Continental Airlines, Inc. | ||||||||
| 332,773 | 4.150%, 4/11/2024 | 346,084 | ||||||
Delta Air Lines, Inc. | ||||||||
| 217,530 | 4.950%, 5/23/2019 | 234,933 | ||||||
TTX Company | ||||||||
| 300,000 | 4.125%, 10/1/2023c | 309,749 | ||||||
Union Pacific Corporation | ||||||||
| 437,000 | 4.163%, 7/15/2022 | 476,299 | ||||||
|
| |||||||
| Total | 1,572,185 | |||||||
|
| |||||||
| U.S. Government and Agencies (36.9%) | |||||||
Federal Agricultural Mortgage Corporation | ||||||||
| 1,000,000 | 2.125%, 9/15/2015 | 1,022,444 | ||||||
Federal Farm Credit Bank | ||||||||
| 400,000 | 2.210%, 8/1/2024 | 375,126 | ||||||
Federal Home Loan Mortgage Corporation | ||||||||
| 1,000,000 | 1.250%, 8/1/2019 | 978,570 | ||||||
| 325,000 | 1.250%, 10/2/2019 | 315,648 | ||||||
| 1,300,000 | 1.375%, 5/1/2020 | 1,264,518 | ||||||
| 350,000 | 6.750%, 3/15/2031 | 502,215 | ||||||
Federal National Mortgage Association | ||||||||
| 2,690,000 | 0.875%, 5/21/2018 | 2,644,851 | ||||||
| 500,000 | 5.960%, 9/11/2028 | 645,892 | ||||||
| 100,000 | 6.250%, 5/15/2029 | 134,296 | ||||||
Resolution Funding Corporation | ||||||||
| 200,000 | 8.125%, 10/15/2019 | 262,650 | ||||||
Tennessee Valley Authority | ||||||||
| 350,000 | 5.250%, 9/15/2039 | 424,738 | ||||||
U.S. Treasury Bonds | ||||||||
| 2,500,000 | 5.250%, 11/15/2028 | 3,202,345 | ||||||
| 4,425,000 | 3.000%, 5/15/2042 | 4,173,328 | ||||||
U.S. Treasury Notes | ||||||||
| 2,250,000 | 0.250%, 12/31/2015 | 2,250,176 | ||||||
| 1,425,000 | 2.625%, 2/29/2016 | 1,479,717 | ||||||
| 5,000,000 | 1.000%, 10/31/2016 | 5,046,875 | ||||||
| 8,375,000 | 0.625%, 12/15/2016 | 8,370,419 | ||||||
| 3,250,000 | 3.000%, 2/28/2017 | 3,443,986 | ||||||
| 1,000,000 | 2.250%, 11/30/2017 | 1,039,297 | ||||||
| 2,350,000 | 2.375%, 6/30/2018 | 2,449,325 | ||||||
| 4,000,000 | 1.250%, 10/31/2018 | 3,969,064 | ||||||
| 1,075,000 | 1.625%, 4/30/2019 | 1,077,016 | ||||||
| 2,000,000 | 2.000%, 7/31/2020 | 2,010,782 | ||||||
| 1,870,000 | 1.625%, 8/15/2022 | 1,775,331 | ||||||
| 400,000 | 1.750%, 5/15/2023 | 378,875 | ||||||
| 3,500,000 | 2.750%, 2/15/2024 | 3,579,569 | ||||||
| 2,000,000 | 3.625%, 2/15/2044 | 2,110,624 | ||||||
|
| |||||||
| Total | 54,927,677 | |||||||
|
| |||||||
| Utilities (3.6%) | |||||||
American Electric Power Company, Inc. | ||||||||
| 300,000 | 1.650%, 12/15/2017 | 301,592 | ||||||
CenterPoint Energy Houston Electric, LLC | ||||||||
| 400,000 | 5.600%, 7/1/2023 | 455,530 | ||||||
Commonwealth Edison Company | ||||||||
| 275,000 | 5.900%, 3/15/2036 | 342,945 | ||||||
Dayton Power and Light Company | ||||||||
| 300,000 | 1.875%, 9/15/2016d | 305,081 | ||||||
The accompanying Notes to Financial Statements are an integral part of this schedule.
272
Table of Contents
Bond Index Portfolio
Schedule of Investments as of June 30, 2014
(unaudited)
| Principal Amount | Long-Term Fixed Income (101.7%) | Value | ||||||
| Utilities (3.6%) - continued | |||||||
El Paso Pipeline Partners Operating Company, LLC | ||||||||
| $ | 325,000 | 4.700%, 11/1/2042 | $ | 303,318 | ||||
FirstEnergy Corporation | ||||||||
| 27,000 | 7.375%, 11/15/2031 | 31,910 | ||||||
Kansas City Power & Light Company | ||||||||
| 250,000 | 3.150%, 3/15/2023 | 249,219 | ||||||
MidAmerican Energy Holdings Company | ||||||||
| 155,000 | 1.100%, 5/15/2017 | 154,368 | ||||||
| 185,000 | 5.750%, 4/1/2018 | 211,723 | ||||||
National Rural Utilities Cooperative Finance Corporation | ||||||||
| 28,000 | 4.023%, 11/1/2032c | 28,265 | ||||||
NextEra Energy Capital Holdings, Inc. | ||||||||
| 350,000 | 2.400%, 9/15/2019 | 351,887 | ||||||
NiSource Finance Corporation | ||||||||
| 350,000 | 3.850%, 2/15/2023 | 358,921 | ||||||
NSTAR Electric Company | ||||||||
| 325,000 | 2.375%, 10/15/2022 | 308,674 | ||||||
ONEOK Partners, LP | ||||||||
| 275,000 | 6.650%, 10/1/2036 | 338,455 | ||||||
PPL Capital Funding, Inc. | ||||||||
| 325,000 | 3.500%, 12/1/2022 | 330,308 | ||||||
Public Service Company of Colorado | ||||||||
| 350,000 | 3.600%, 9/15/2042 | 322,006 | ||||||
Public Service Electric And Gas Company | ||||||||
| 360,000 | 1.800%, 6/1/2019 | 356,729 | ||||||
Sempra Energy | ||||||||
| 325,000 | 2.300%, 4/1/2017 | 333,629 | ||||||
Southern California Gas Company | ||||||||
| 325,000 | 3.750%, 9/15/2042 | 307,129 | ||||||
|
| |||||||
| Total | 5,391,689 | |||||||
|
| |||||||
Total Long-Term Fixed Income (cost $149,764,862) | 151,642,487 | |||||||
|
| |||||||
| Shares or Principal Amount | Short-Term Investments (28.1%)h | |||||||
Thrivent Cash Management Trust | ||||||||
| 41,858,270 | 0.050% | 41,858,270 | ||||||
|
| |||||||
| Total Short-Term Investments (at amortized cost) | 41,858,270 | |||||||
|
| |||||||
| Total Investments (cost $191,623,132) 129.8% | $ | 193,500,757 | ||||||
|
| |||||||
| Other Assets and Liabilities, Net (29.8%) | (44,472,407 | ) | ||||||
|
| |||||||
| Total Net Assets 100.0% | $ | 149,028,350 | ||||||
|
| |||||||
| a | All or a portion of the security is insured or guaranteed. |
| b | Denotes variable rate securities. Variable rate securities are securities whose yields vary with a designated market index or market rate. The rate shown is as of June 30, 2014. |
| c | Denotes restricted securities. Restricted securities are investment securities which have been deemed illiquid and cannot be offered for public sale without first being registered under the Securities Act of 1933. The following table indicates the acquisition date and cost of restricted securities Bond Index Portfolio owned as of June 30, 2014. |
| Acquisition | ||||||||
Security | Date | Cost | ||||||
National Rural Utilities Cooperative Finance Corporation, 11/01/2032 | 5/23/2014 | $ | 28,321 | |||||
Preferred Term Securities XXIII, Ltd., 12/22/2036 | 9/14/2006 | 788,178 | ||||||
Prudential Covered Trust, 09/30/2015 | 4/1/2013 | 245,178 | ||||||
TTX Company, 10/01/2023 | 9/19/2013 | 299,997 | ||||||
Wachovia Asset Securitization, Inc., 07/25/2037 | 3/16/2007 | 848,358 | ||||||
| d | Denotes securities sold under Rule 144A of the Securities Act of 1933, which exempts them from registration. These securities have been deemed liquid and may be resold to other dealers in the program or to other qualified institutional buyers. As of June 30, 2014, the value of these investments was $12,357,112 or 8.3% of total net assets. |
| e | Security is fair valued. |
| f | Defaulted security. Interest is not being accrued. |
| g | Denotes investments purchased on a when-issued or delayed delivery basis. |
| h | The interest rate shown reflects the yield, coupon rate or the discount rate at the date of purchase. |
Unrealized Appreciation (Depreciation)
Gross unrealized appreciation and depreciation of investments, based on cost for federal income tax purposes, were as follows:
Gross unrealized appreciation | $ | 3,868,018 | ||
Gross unrealized depreciation | (2,149,909 | ) | ||
|
| |||
Net unrealized appreciation (depreciation) | $ | 1,718,109 | ||
Cost for federal income tax purposes | $ | 191,782,648 | ||
The accompanying Notes to Financial Statements are an integral part of this schedule.
273
Table of Contents
Bond Index Portfolio
Schedule of Investments as of June 30, 2014
(unaudited)
Fair Valuation Measurements
The following table is a summary of the inputs used, as of June 30, 2014, in valuing Bond Index Portfolio’s assets carried at fair value.
Investments in Securities | Total | Level 1 | Level 2 | Level 3 | ||||||||||||
Long-Term Fixed Income | ||||||||||||||||
Asset-Backed Securities | 3,377,868 | — | 3,377,868 | — | ||||||||||||
Basic Materials | 1,587,283 | — | 1,587,283 | — | ||||||||||||
Capital Goods | 949,693 | — | 949,693 | — | ||||||||||||
Commercial Mortgage-Backed | ||||||||||||||||
Securities | 2,956,217 | — | 2,956,217 | — | ||||||||||||
Communications Services | 2,476,319 | — | 2,476,319 | — | ||||||||||||
Consumer Cyclical | 3,841,671 | — | 3,841,671 | — | ||||||||||||
Consumer Non-Cyclical | 3,614,601 | — | 3,614,601 | — | ||||||||||||
Energy | 2,227,908 | — | 2,227,908 | — | ||||||||||||
Financials^ | 14,755,247 | — | 14,164,113 | 591,134 | ||||||||||||
Foreign Government | 6,541,231 | — | 6,541,231 | — | ||||||||||||
Mortgage-Backed Securities | 45,323,352 | — | 45,323,352 | — | ||||||||||||
Technology | 2,099,546 | — | 2,099,546 | — | ||||||||||||
Transportation | 1,572,185 | — | 1,572,185 | — | ||||||||||||
U.S. Government and Agencies | 54,927,677 | — | 54,927,677 | — | ||||||||||||
Utilities | 5,391,689 | — | 5,391,689 | — | ||||||||||||
Short-Term Investments | 41,858,270 | 41,858,270 | — | — | ||||||||||||
|
|
|
|
|
|
|
| |||||||||
Total | $ | 193,500,757 | $ | 41,858,270 | $ | 151,051,353 | $ | 591,134 | ||||||||
|
|
|
|
|
|
|
| |||||||||
There were no significant transfers between Levels during the period ended June 30, 2014. Transfers between Levels are identified as of the end of the period.
^ Level 3 security in this section is fair valued at <$1.
Investment in Affiliates
Affiliated issuers, as defined under the Investment Company Act of 1940, include those in which the Portfolio’s holdings of an issuer represent 5% or more of the outstanding voting securities of an issuer, or any affiliated mutual fund.
A summary of transactions for the fiscal year to date, in Bond Index Portfolio, is as follows:
Portfolio | Value December 31, 2013 | Gross Purchases | Gross Sales | Shares Held at June 30, 2014 | Value June 30, 2014 | Income Earned January 1, 2014 - June 30, 2014 | ||||||||||||||||||
Cash Management Trust- Short Term Investment | $ | 45,080,757 | $ | 18,080,076 | $ | 21,302,563 | 41,858,270 | $ | 41,858,270 | $ | 10,059 | |||||||||||||
Total Value and Income Earned | 45,080,757 | 41,858,270 | 10,059 | |||||||||||||||||||||
The accompanying Notes to Financial Statements are an integral part of this schedule.
274
Table of Contents
Limited Maturity Bond Portfolio
Schedule of Investments as of June 30, 2014
(unaudited)
| Principal Amount | Bank Loans (5.1%)a | Value | ||||||
| Basic Materials (0.3%) | |||||||
Arch Coal, Inc., Term Loan | ||||||||
| $ | 683,043 | 6.250%, 5/16/2018 | $ | 670,666 | ||||
Fortescue Metals Group, Ltd., Term Loan | ||||||||
| 1,059,300 | 3.750%, 6/30/2019 | 1,059,703 | ||||||
Ineos Group Holdings, Ltd., Term Loan | ||||||||
| 1,226,376 | 3.750%, 5/4/2018 | 1,222,856 | ||||||
|
| |||||||
| Total | 2,953,225 | |||||||
|
| |||||||
| Capital Goods (0.3%) | |||||||
ADS Waste Holdings, Inc., Term Loan | ||||||||
| 1,222,761 | 3.750%, 10/9/2019 | 1,216,097 | ||||||
Berry Plastics Group, Inc., Term Loan | ||||||||
| 952,938 | 3.500%, 2/8/2020 | 944,504 | ||||||
Rexnord, LLC, Term Loan | ||||||||
| 684,825 | 4.000%, 8/21/2020 | 683,798 | ||||||
Silver II Borrower, Term Loan | ||||||||
| 664,098 | 4.000%, 12/13/2019 | 661,967 | ||||||
|
| |||||||
| Total | 3,506,366 | |||||||
|
| |||||||
| Communications Services (1.9%) | |||||||
Cincinnati Bell, Inc., Term Loan | ||||||||
| 342,412 | 4.000%, 9/10/2020 | 342,200 | ||||||
Clear Channel Communications, Inc., Term Loan | ||||||||
| 12,551 | 3.800%, 1/29/2016 | 12,462 | ||||||
| 995,670 | 6.900%, 1/30/2019 | 990,154 | ||||||
| 231,780 | 7.650%, 7/30/2019 | 232,141 | ||||||
Fairpoint Communications, Term Loan | ||||||||
| 272,243 | 7.500%, 2/14/2019f,m | 281,603 | ||||||
Grande Communications Networks, LLC, Term Loan | ||||||||
| 955,353 | 4.500%, 5/29/2020 | 951,771 | ||||||
Hargray Communications Group, Inc., Term Loan | ||||||||
| 1,227,600 | 4.750%, 6/26/2019 | 1,230,669 | ||||||
Integra Telecom Holdings, Inc., Term Loan | ||||||||
| 1,200,431 | 5.250%, 2/22/2019 | 1,206,734 | ||||||
Intelsat Jackson Holdings SA, Term Loan | ||||||||
| 1,019,310 | 3.750%, 6/30/2019 | 1,020,157 | ||||||
Level 3 Communications, Inc., Term Loan | ||||||||
| 275,000 | 4.000%, 8/1/2019 | 275,228 | ||||||
| 410,000 | 4.000%, 1/15/2020 | 410,086 | ||||||
LTS Buyer, LLC, Term Loan | ||||||||
| 683,100 | 4.000%, 4/13/2020 | 680,784 | ||||||
McGraw-Hill Global Education, LLC, Term Loan | ||||||||
| 812,259 | 5.750%, 3/22/2019 | 825,458 | ||||||
NEP/NCP Holdco, Inc., Term Loan | ||||||||
| 952,962 | 4.250%, 1/22/2020 | 952,723 | ||||||
NTelos, Inc., Term Loan | ||||||||
| 683,048 | 5.750%, 11/9/2019 | 682,481 | ||||||
Puerto Rico Cable Acquisition Company, Inc., Term Loan | ||||||||
| 1,530,880 | 5.500%, 7/31/2018 | 1,528,966 | ||||||
TNS, Inc., Term Loan | ||||||||
| 1,153,300 | 5.000%, 2/14/2020 | 1,157,625 | ||||||
Univision Communications, Inc., Term Loan | ||||||||
| 1,200,477 | 4.000%, 3/1/2020 | 1,198,844 | ||||||
Virgin Media Investment Holdings, Ltd., Term Loan | ||||||||
| 1,215,000 | 3.500%, 6/7/2020 | 1,210,820 | ||||||
Visant Corporation, Term Loan | ||||||||
| 480,000 | 5.250%, 12/22/2016 | 477,720 | ||||||
WideOpenWest Finance, LLC, Term Loan | ||||||||
| 1,200,431 | 4.750%, 4/1/2019 | 1,203,240 | ||||||
WMG Acquisition Corporation, Term Loan | ||||||||
| 957,762 | 3.750%, 7/1/2020 | 941,605 | ||||||
Yankee Cable Acquisition, LLC, Term Loan | ||||||||
| 1,177,532 | 4.500%, 3/1/2020 | 1,183,055 | ||||||
Zayo Group, LLC, Term Loan | ||||||||
| 1,197,937 | 4.000%, 7/2/2019 | 1,198,811 | ||||||
|
| |||||||
| Total | 20,195,337 | |||||||
|
| |||||||
| Consumer Cyclical (0.9%) | |||||||
Bally Technologies, Inc., Term Loan | ||||||||
| 269,158 | 4.250%, 11/25/2020 | 270,168 | ||||||
Booz Allen Hamilton, Inc., Term Loan | ||||||||
| 339,018 | 3.750%, 7/31/2019 | 340,106 | ||||||
Burlington Coat Factory Warehouse Corporation, Term Loan | ||||||||
| 659,576 | 4.250%, 2/23/2017 | 663,151 | ||||||
Ceridian Corporation, Term Loan | ||||||||
| 1,331,885 | 4.400%, 8/14/2015 | 1,333,337 | ||||||
Chrysler Group, LLC, Term Loan | ||||||||
| 952,723 | 3.500%, 5/24/2017 | 955,552 | ||||||
J.C. Penney Corporation, Inc., Term Loan | ||||||||
| 1,227,600 | 6.000%, 5/22/2018 | 1,241,042 | ||||||
MGM Resorts International, Term Loan | ||||||||
| 1,031,033 | 3.500%, 12/20/2019 | 1,027,486 | ||||||
ROC Finance, LLC, Term Loan | ||||||||
| 957,762 | 5.000%, 6/20/2019 | 941,002 | ||||||
Scientific Games International, Inc., Term Loan | ||||||||
| 1,233,800 | 4.250%, 10/18/2020 | 1,219,722 | ||||||
Seminole Hard Rock Entertainment, Inc., Term Loan | ||||||||
| 480,150 | 3.500%, 5/14/2020 | 478,949 | ||||||
Seminole Indian Tribe of Florida, Term Loan | ||||||||
| 880,562 | 3.000%, 4/29/2020 | 878,731 | ||||||
Toys R Us, Inc., Term Loan | ||||||||
| 682,751 | 5.250%, 5/25/2018 | 551,888 | ||||||
|
| |||||||
| Total | 9,901,134 | |||||||
|
| |||||||
| Consumer Non-Cyclical (0.6%) | |||||||
Albertsons, Inc., Term Loan | ||||||||
| 1,223,371 | 4.750%, 3/21/2019 | 1,228,717 | ||||||
The accompanying Notes to Financial Statements are an integral part of this schedule.
275
Table of Contents
Limited Maturity Bond Portfolio
Schedule of Investments as of June 30, 2014
(unaudited)
| Principal Amount | Bank Loans (5.1%)a | Value | ||||||
| Consumer Non-Cyclical (0.6%) - continued | |||||||
Biomet, Inc., Term Loan | ||||||||
| $ | 1,285,168 | 3.661%, 7/25/2017 | $ | 1,286,158 | ||||
Del Monte Corporation, Term Loan | ||||||||
| 149,942 | 3.500%, 3/9/2020 | 148,584 | ||||||
JBS USA, LLC, Term Loan | ||||||||
| 606,525 | 3.750%, 5/25/2018 | 605,008 | ||||||
Roundy’s Supermarkets, Inc., Term Loan | ||||||||
| 533,712 | 5.750%, 3/3/2021 | 534,475 | ||||||
Supervalu, Inc., Term Loan | ||||||||
| 1,893,208 | 4.500%, 3/21/2019 | 1,890,614 | ||||||
Van Wagner Communications, LLC, Term Loan | ||||||||
| 1,012,904 | 6.250%, 8/3/2018 | 1,023,459 | ||||||
|
| |||||||
| Total | 6,717,015 | |||||||
|
| |||||||
| Energy (0.2%) | |||||||
Offshore Group Investment, Ltd., Term Loan | ||||||||
| 478,937 | 5.750%, 3/28/2019 | 475,743 | ||||||
Pacific Drilling SA, Term Loan | ||||||||
| 1,202,850 | 4.500%, 6/3/2018 | 1,206,230 | ||||||
|
| |||||||
| Total | 1,681,973 | |||||||
|
| |||||||
| Financials (0.2%) | |||||||
Harland Clarke Holdings Corporation, Term Loan | ||||||||
| 1,209,000 | 7.000%, 5/22/2018 | 1,227,897 | ||||||
WaveDivision Holdings, LLC, Term Loan | ||||||||
| 950,525 | 4.000%, 10/12/2019 | 949,622 | ||||||
|
| |||||||
| Total | 2,177,519 | |||||||
|
| |||||||
| Technology (0.4%) | |||||||
BMC Software, Inc., Term Loan | ||||||||
| 1,368,125 | 5.000%, 9/10/2020 | 1,364,992 | ||||||
First Data Corporation Extended, Term Loan | ||||||||
| 1,240,000 | 4.154%, 3/23/2018 | 1,241,550 | ||||||
Freescale Semiconductor, Inc., Term Loan | ||||||||
| 1,200,477 | 4.250%, 2/28/2020 | 1,199,480 | ||||||
SunGard Data Systems, Inc., Term Loan | ||||||||
| 418,411 | 4.000%, 3/8/2020 | 419,102 | ||||||
|
| |||||||
| Total | 4,225,124 | |||||||
|
| |||||||
| Transportation (0.1%) | |||||||
American Airlines, Inc., Term Loan | ||||||||
| 1,361,250 | 3.750%, 6/27/2019 | 1,362,570 | ||||||
|
| |||||||
| Total | 1,362,570 | |||||||
|
| |||||||
| Utilities (0.2%) | |||||||
Calpine Corporation, Term Loan | ||||||||
| 950,267 | 4.000%, 4/1/2018 | 952,937 | ||||||
| 238,800 | 4.000%, 10/31/2020 | 239,364 | ||||||
Intergen NV, Term Loan | ||||||||
| 1,202,850 | 5.500%, 6/15/2020 | 1,210,873 | ||||||
|
| |||||||
| Total | 2,403,174 | |||||||
|
| |||||||
Total Bank Loans (cost $55,131,072) | 55,123,437 | |||||||
|
| |||||||
Long-Term Fixed Income (91.7%) | ||||||||
| Asset-Backed Securities (18.3%) | |||||||
American Homes 4 Rent | ||||||||
| 3,300,000 | 1.250%, 6/17/2031b,c | 3,304,475 | ||||||
BA Credit Card Trust | ||||||||
| 4,800,000 | 0.532%, 6/15/2021c | 4,800,154 | ||||||
Bayview Opportunity Master Fund Trust IIB, LP | ||||||||
| 3,000,000 | 3.228%, 7/28/2034d | 3,000,000 | ||||||
Capital One Multi-Asset Execution Trust | ||||||||
| 2,750,000 | 1.260%, 1/15/2020 | 2,762,430 | ||||||
Chase Issuance Trust | ||||||||
| 6,500,000 | 1.150%, 1/15/2019 | 6,519,051 | ||||||
Chesapeake Funding, LLC | ||||||||
| 2,217,291 | 0.601%, 5/7/2024b,c | 2,220,721 | ||||||
Citibank Credit Card Issuance Trust | ||||||||
| 5,225,000 | 0.025%, 2/22/2019 | 5,222,346 | ||||||
Citibank Omni Master Trust | ||||||||
| 6,000,000 | 4.900%, 11/15/2018b | 6,100,056 | ||||||
Countrywide Home Loans, Inc. | ||||||||
| 865,261 | 6.085%, 6/25/2021e | 859,700 | ||||||
Credit Based Asset Servicing and Securitization, LLC | ||||||||
| 1,680,250 | 3.770%, 12/25/2036 | 1,124,592 | ||||||
Edlinc Student Loan Funding Trust | ||||||||
| 2,845,996 | 3.190%, 10/1/2025c,d | 2,881,571 | ||||||
Education Loan Asset-Backed Trust I | ||||||||
| 1,791,752 | 0.602%, 6/25/2022b,c | 1,794,512 | ||||||
Enterprise Fleet Financing, LLC | ||||||||
| 1,021,011 | 0.720%, 4/20/2018b | 1,021,522 | ||||||
First Franklin Mortgage Loan Asset-Backed Certificates | ||||||||
| 215,069 | 5.500%, 3/25/2036 | 2 | ||||||
Ford Credit Auto Owner Trust | ||||||||
| 3,575,000 | 2.260%, 11/15/2025b | 3,607,053 | ||||||
Fosse Master Issuer plc | ||||||||
| 4,104,048 | 1.628%, 10/18/2054b,c | 4,105,944 | ||||||
GE Dealer Floorplan Master Note Trust | ||||||||
| 6,000,000 | 0.593%, 10/20/2017c | 6,013,362 | ||||||
| 6,500,000 | 0.553%, 4/20/2018c | 6,518,661 | ||||||
GMAC Mortgage Corporation Loan Trust | ||||||||
| 981,670 | 0.332%, 8/25/2035c,e | 849,366 | ||||||
| 1,308,246 | 5.750%, 10/25/2036e | 1,244,307 | ||||||
| 2,351,851 | 0.332%, 12/25/2036c,e | 2,022,881 | ||||||
Golden Credit Card Trust | ||||||||
| 7,200,000 | 0.402%, 2/15/2018b,c | 7,202,376 | ||||||
| 1,000,000 | 0.582%, 9/15/2018b,c | 1,003,573 | ||||||
The accompanying Notes to Financial Statements are an integral part of this schedule.
276
Table of Contents
Limited Maturity Bond Portfolio
Schedule of Investments as of June 30, 2014
(unaudited)
| Principal Amount | Long-Term Fixed Income (91.7%) | Value | ||||||
| Asset-Backed Securities (18.3%) - continued | |||||||
Great America Leasing Receivables | ||||||||
| $ | 3,000,000 | 0.780%, 6/15/2016b | $ | 3,005,220 | ||||
Master Credit Card Trust | ||||||||
| 10,000,000 | 0.780%, 4/21/2017b | 10,019,440 | ||||||
Mortgage Equity Conversion Asset Trust | ||||||||
| 4,838,223 | 0.590%, 1/25/2042c,d | 4,112,490 | ||||||
| 4,861,434 | 0.570%, 2/25/2042c,d | 3,889,147 | ||||||
Motor plc | ||||||||
| 5,230,200 | 0.632%, 8/25/2021b,c | 5,235,995 | ||||||
Nationstar Agency Advance Funding Trust | ||||||||
| 4,200,000 | 0.997%, 2/15/2045b | 4,193,448 | ||||||
Nissan Master Owner Trust Receivables | ||||||||
| 9,000,000 | 0.452%, 2/15/2018c | 9,004,455 | ||||||
Northstar Education Finance, Inc. | ||||||||
| 4,023,635 | 0.852%, 12/26/2031b,c | 4,025,646 | ||||||
Penarth Master Issuer plc | ||||||||
| 5,500,000 | 0.544%, 11/18/2017b,c | 5,509,955 | ||||||
Renaissance Home Equity Loan Trust | ||||||||
| 3,552,403 | 5.608%, 5/25/2036 | 2,511,396 | ||||||
| 1,224,691 | 5.285%, 1/25/2037 | 715,734 | ||||||
Selene Non-Performing Loans, LLC | ||||||||
| 2,000,000 | 2.981%, 5/25/2054d | 2,000,100 | ||||||
SLM Student Loan Trust | ||||||||
| 3,285,930 | 0.299%, 4/27/2020c | 3,283,564 | ||||||
| 1,909,251 | 1.252%, 12/15/2021b,c | 1,916,850 | ||||||
| 3,726,375 | 0.299%, 4/25/2022c | 3,719,321 | ||||||
| 2,402,559 | 0.752%, 8/15/2022b,c | 2,407,018 | ||||||
| 47,756 | 0.309%, 4/25/2023c | 47,747 | ||||||
| 3,577,407 | 0.902%, 10/16/2023b,c | 3,592,364 | ||||||
| 2,176,484 | 0.552%, 3/25/2025c | 2,178,601 | ||||||
| 6,760,819 | 0.672%, 3/25/2026c | 6,787,126 | ||||||
| 2,700,000 | 1.202%, 5/17/2027b,c | 2,724,864 | ||||||
U.S. Residential Opportunity Fund Trust | ||||||||
| 2,590,899 | 3.466%, 3/25/2034d | 2,602,372 | ||||||
Vericrest Opportunity Loan Transferee | ||||||||
| 4,800,000 | 3.125%, 4/27/2054b | 4,824,480 | ||||||
| 4,283,714 | 3.250%, 11/25/2053b | 4,303,201 | ||||||
| 3,178,664 | 3.625%, 11/25/2053b | 3,205,329 | ||||||
| 3,337,193 | 3.625%, 11/25/2053d | 3,356,638 | ||||||
Volvo Financial Equipment, LLC | ||||||||
| 5,000,000 | 0.740%, 3/15/2017b | 5,009,470 | ||||||
Wachovia Asset Securitization, Inc. | ||||||||
| 1,060,447 | 0.292%, 7/25/2037c,d,e | 914,071 | ||||||
Wachovia Student Loan Trust | ||||||||
| 597,297 | 0.339%, 7/27/2020c | 597,156 | ||||||
World Financial Network Credit Card Master Trust | ||||||||
| 3,000,000 | 0.532%, 12/15/2019c | 3,003,957 | ||||||
| 4,000,000 | 0.910%, 3/16/2020 | 4,008,360 | ||||||
World Omni Auto Receivables Trust | ||||||||
| 4,000,000 | 1.330%, 1/15/2018 | 4,041,744 | ||||||
World Omni Master Owner Trust | ||||||||
| 5,400,000 | 0.502%, 2/15/2018b,c | 5,406,232 | ||||||
|
| |||||||
| Total | 196,332,146 | |||||||
|
| |||||||
| Basic Materials (1.0%) | |||||||
Dow Chemical Company | ||||||||
| 2,000,000 | 2.500%, 2/15/2016 | 2,054,772 | ||||||
Freeport-McMoRan Copper & Gold, Inc. | ||||||||
| 1,000,000 | 2.375%, 3/15/2018 | 1,014,907 | ||||||
Goldcorp, Inc. | ||||||||
| 1,000,000 | 3.625%, 6/9/2021 | 1,011,382 | ||||||
Kinross Gold Corporation | ||||||||
| 1,100,000 | 5.950%, 3/15/2024b | 1,144,596 | ||||||
Monsanto Company | ||||||||
| 2,340,000 | 1.150%, 6/30/2017 | 2,340,723 | ||||||
Mosaic Company | ||||||||
| 500,000 | 4.250%, 11/15/2023 | 527,829 | ||||||
Xstrata Finance Canada, Ltd. | ||||||||
| 2,825,000 | 2.700%, 10/25/2017b | 2,899,758 | ||||||
|
| |||||||
| Total | 10,993,967 | |||||||
|
| |||||||
| Capital Goods (0.9%) | |||||||
John Deere Capital Corporation | ||||||||
| 3,000,000 | 0.330%, 10/8/2014c | 3,000,792 | ||||||
Precision Castparts Corporation | ||||||||
| 2,025,000 | 1.250%, 1/15/2018 | 2,011,109 | ||||||
Roper Industries, Inc. | ||||||||
| 2,250,000 | 1.850%, 11/15/2017 | 2,268,733 | ||||||
Textron, Inc. | ||||||||
| 2,700,000 | 6.200%, 3/15/2015 | 2,810,122 | ||||||
|
| |||||||
| Total | 10,090,756 | |||||||
|
| |||||||
| Collateralized Mortgage Obligations (4.7%) | |||||||
American Home Mortgage Assets Trust | ||||||||
| 2,839,922 | 1.043%, 11/25/2046c | 1,582,660 | ||||||
Apidos CLO XVIII | ||||||||
| 3,775,000 | 1.643%, 7/22/2026c,d,f | 3,760,844 | ||||||
BCAP, LLC Trust | ||||||||
| 1,796,036 | 0.332%, 3/25/2037c | 1,464,277 | ||||||
Bear Stearns Adjustable Rate Mortgage Trust | ||||||||
| 1,274,597 | 2.410%, 10/25/2035c | 1,263,023 | ||||||
Countrywide Alternative Loan Trust | ||||||||
| 738,991 | 5.500%, 11/25/2035 | 750,624 | ||||||
| 791,184 | 5.500%, 2/25/2036 | 727,642 | ||||||
| 1,408,013 | 6.000%, 1/25/2037 | 1,247,583 | ||||||
Countrywide Home Loans, Inc. | ||||||||
| 1,866,745 | 2.466%, 3/20/2036 | 1,562,208 | ||||||
| 1,734,471 | 2.514%, 9/20/2036 | 1,277,854 | ||||||
Deutsche Alt-A Securities, Inc., Mortgage Loan Trust | ||||||||
| 3,303,787 | 0.893%, 4/25/2047c | 2,931,040 | ||||||
GSR Mortgage Loan Trust | ||||||||
| 1,714,596 | 0.342%, 8/25/2046c | 1,676,482 | ||||||
HarborView Mortgage Loan Trust | ||||||||
| 1,953,965 | 2.080%, 6/19/2034 | 1,944,963 | ||||||
The accompanying Notes to Financial Statements are an integral part of this schedule.
277
Table of Contents
Limited Maturity Bond Portfolio
Schedule of Investments as of June 30, 2014
(unaudited)
| Principal Amount | Long-Term Fixed Income (91.7%) | Value | ||||||
| Collateralized Mortgage Obligations (4.7%) - continued | |||||||
HomeBanc Mortgage Trust | ||||||||
| $ | 1,703,230 | 2.240%, 4/25/2037 | $ | 1,267,859 | ||||
Impac CMB Trust | ||||||||
| 1,939,473 | 0.672%, 4/25/2035c | 1,811,439 | ||||||
| 592,622 | 0.792%, 8/25/2035c | 530,740 | ||||||
J.P. Morgan Alternative Loan Trust | ||||||||
| 2,779,235 | 2.523%, 3/25/2036 | 2,219,280 | ||||||
J.P. Morgan Mortgage Trust | ||||||||
| 435,427 | 2.607%, 10/25/2036 | 367,034 | ||||||
Master Asset Securitization Trust | ||||||||
| 1,605,077 | 0.652%, 6/25/2036c | 991,380 | ||||||
Neuberger Berman CLO, Ltd. | ||||||||
| 3,000,000 | 1.701%, 8/4/2025c,f,g | 3,000,000 | ||||||
Residential Accredit Loans, Inc. | ||||||||
| 1,459,466 | 3.571%, 9/25/2035 | 1,229,888 | ||||||
Sequoia Mortgage Trust | ||||||||
| 3,450,107 | 1.070%, 9/20/2034c | 3,352,058 | ||||||
Structured Adjustable Rate Mortgage Loan Trust | ||||||||
| 39,939 | 5.500%, 12/25/2034 | 39,107 | ||||||
Wachovia Mortgage Loan Trust, LLC | ||||||||
| 1,555,681 | 2.754%, 5/20/2036 | 1,358,832 | ||||||
WaMu Mortgage Pass Through Certificates | ||||||||
| 945,675 | 0.442%, 10/25/2045c | 888,246 | ||||||
| 2,836,186 | 1.003%, 10/25/2046c | 2,354,465 | ||||||
| 2,826,995 | 0.943%, 12/25/2046c | 2,344,562 | ||||||
| 2,982,054 | 0.863%, 1/25/2047c | 2,482,620 | ||||||
Washington Mutual Alternative Mortgage Pass Through Certificates | ||||||||
| 2,244,684 | 1.043%, 9/25/2046c | 1,497,112 | ||||||
| 3,680,036 | 0.873%, 2/25/2047c | 2,526,841 | ||||||
Wells Fargo Mortgage Backed Securities Trust | ||||||||
| 1,064,998 | 2.612%, 3/25/2036 | 1,038,681 | ||||||
| 1,479,923 | 2.613%, 3/25/2036 | 1,481,985 | ||||||
|
| |||||||
| Total | 50,971,329 | |||||||
|
| |||||||
| Commercial Mortgage-Backed Securities (6.3%) | |||||||
Bear Stearns Commercial Mortgage Securities, Inc. | ||||||||
| 197,711 | 5.846%, 6/11/2040 | 197,765 | ||||||
| 1,926,295 | 5.331%, 2/11/2044 | 2,078,956 | ||||||
Citigroup Commercial Mortgage Trust | ||||||||
| 1,250,000 | 5.899%, 12/10/2049 | 1,380,848 | ||||||
Citigroup/Deutsche Bank Commercial Mortgage | ||||||||
| 3,000,000 | 5.322%, 12/11/2049 | 3,263,826 | ||||||
Commercial Mortgage Pass- Through Certificates | ||||||||
| 5,000,000 | 1.201%, 6/8/2030b,c | 5,016,690 | ||||||
| 1,500,000 | 5.306%, 12/10/2046 | 1,616,331 | ||||||
Credit Suisse First Boston Mortgage Securities Corporation | ||||||||
| 4,249,197 | 4.691%, 4/15/2037 | 4,277,735 | ||||||
Credit Suisse Mortgage Capital Certificates | ||||||||
| 3,690,899 | 5.467%, 9/15/2039 | 3,976,235 | ||||||
Federal National Mortgage Association | ||||||||
| 2,850,000 | 1.272%, 1/25/2017 | 2,876,308 | ||||||
Government National Mortgage Association | ||||||||
| 695,376 | 2.870%, 3/16/2051 | 701,611 | ||||||
| 2,339,581 | 2.164%, 3/16/2033 | 2,350,984 | ||||||
| 1,072,478 | 3.214%, 1/16/2040 | 1,086,899 | ||||||
Greenwich Capital Commercial Funding Corporation | ||||||||
| 5,500,000 | 5.224%, 4/10/2037 | 5,698,028 | ||||||
GS Mortgage Securities Corporation II | ||||||||
| 4,800,000 | 1.001%, 11/8/2029b,c | 4,824,058 | ||||||
J.P. Morgan Chase Commercial Mortgage Securities Corporation | ||||||||
| 4,500,000 | 1.102%, 12/15/2028b,c | 4,500,860 | ||||||
| 6,500,000 | 5.429%, 12/12/2043 | 6,998,134 | ||||||
LSTAR Commercial Mortgage Trust | ||||||||
| 3,901,198 | 1.519%, 1/20/2041b | 3,904,514 | ||||||
Morgan Stanley Capital, Inc. | ||||||||
| 2,040,741 | 5.773%, 4/12/2049 | 2,041,267 | ||||||
NCUA Guaranteed Notes | ||||||||
| 5,000,000 | 2.900%, 10/29/2020 | 5,189,120 | ||||||
SCG Trust | ||||||||
| 3,150,000 | 1.552%, 11/15/2026b,c | 3,162,978 | ||||||
Wachovia Bank Commercial Mortgage Trust | ||||||||
| 2,068,612 | 5.765%, 7/15/2045 | 2,203,773 | ||||||
|
| |||||||
| Total | 67,346,920 | |||||||
|
| |||||||
| Communications Services (2.4%) | |||||||
America Movil SAB de CV | ||||||||
| 3,000,000 | 1.230%, 9/12/2016c | 3,035,952 | ||||||
AT&T, Inc. | ||||||||
| 2,000,000 | 1.400%, 12/1/2017 | 1,991,610 | ||||||
| 1,835,000 | 1.137%, 11/27/2018c | 1,870,742 | ||||||
British Telecommunications plc | ||||||||
| 1,500,000 | 1.625%, 6/28/2016 | 1,520,663 | ||||||
| 750,000 | 1.250%, 2/14/2017 | 750,675 | ||||||
| 722,000 | 2.350%, 2/14/2019 | 728,000 | ||||||
Crown Castle Towers, LLC | ||||||||
| 2,500,000 | 3.214%, 8/15/2015d | 2,539,860 | ||||||
| 1,650,000 | 4.174%, 8/15/2017b | 1,751,955 | ||||||
DIRECTV Holdings, LLC | ||||||||
| 1,125,000 | 1.750%, 1/15/2018 | 1,126,548 | ||||||
NBC Universal Enterprise, Inc. | ||||||||
| 2,250,000 | 1.662%, 4/15/2018b | 2,248,528 | ||||||
SES Global Americas Holdings GP | ||||||||
| 1,375,000 | 2.500%, 3/25/2019b | 1,384,794 | ||||||
Verizon Communications, Inc. | ||||||||
| 1,650,000 | 1.761%, 9/15/2016c | 1,695,453 | ||||||
| 1,000,000 | 0.631%, 6/9/2017c | 1,001,155 | ||||||
| 2,580,000 | 1.002%, 6/17/2019c | 2,611,324 | ||||||
The accompanying Notes to Financial Statements are an integral part of this schedule.
278
Table of Contents
Limited Maturity Bond Portfolio
Schedule of Investments as of June 30, 2014
(unaudited)
| Principal Amount | Long-Term Fixed Income (91.7%) | Value | ||||||
| Communications Services (2.4%) - continued | |||||||
Viacom, Inc. | ||||||||
| $ | 1,250,000 | 2.500%, 9/1/2018 | $ | 1,277,620 | ||||
|
| |||||||
| Total | 25,534,879 | |||||||
|
| |||||||
| Consumer Cyclical (1.1%) | |||||||
Ford Motor Credit Company, LLC | ||||||||
| 2,000,000 | 4.207%, 4/15/2016 | 2,110,808 | ||||||
| 2,050,000 | 3.984%, 6/15/2016 | 2,166,178 | ||||||
| 1,000,000 | 3.000%, 6/12/2017 | 1,043,250 | ||||||
Home Depot, Inc. | ||||||||
| 2,000,000 | 2.250%, 9/10/2018 | 2,046,662 | ||||||
Hyundai Capital America | ||||||||
| 2,750,000 | 1.875%, 8/9/2016b | 2,790,463 | ||||||
| 1,250,000 | 1.450%, 2/6/2017b | 1,254,709 | ||||||
|
| |||||||
| Total | 11,412,070 | |||||||
|
| |||||||
| Consumer Non-Cyclical (3.3%) | |||||||
Allergan, Inc. | ||||||||
| 1,250,000 | 1.350%, 3/15/2018h | 1,206,586 | ||||||
Altria Group, Inc. | ||||||||
| 500,000 | 2.850%, 8/9/2022 | 481,143 | ||||||
Amgen, Inc. | ||||||||
| 2,525,000 | 0.828%, 5/22/2019c | 2,531,032 | ||||||
Celgene Corporation | ||||||||
| 2,500,000 | 1.900%, 8/15/2017 | 2,536,475 | ||||||
ConAgra Foods, Inc. | ||||||||
| 1,400,000 | 1.900%, 1/25/2018 | 1,403,375 | ||||||
Dr Pepper Snapple Group, Inc. | ||||||||
| 500,000 | 2.000%, 1/15/2020 | 490,329 | ||||||
Edwards Lifesciences Corporation | ||||||||
| 1,500,000 | 2.875%, 10/15/2018 | 1,532,846 | ||||||
Express Scripts Holding Company | ||||||||
| 3,000,000 | 2.650%, 2/15/2017 | 3,116,709 | ||||||
| 1,515,000 | 1.250%, 6/2/2017 | 1,512,338 | ||||||
Gilead Sciences, Inc. | ||||||||
| 1,500,000 | 2.050%, 4/1/2019 | 1,501,007 | ||||||
Heineken NV | ||||||||
| 2,650,000 | 1.400%, 10/1/2017b | 2,648,725 | ||||||
Howard Hughes Medical Institute | ||||||||
| 1,500,000 | 3.500%, 9/1/2023 | 1,544,346 | ||||||
Japan Tobacco, Inc. | ||||||||
| 2,500,000 | 2.100%, 7/23/2018b | 2,521,858 | ||||||
Kroger Company | ||||||||
| 1,830,000 | 0.756%, 10/17/2016c | 1,834,178 | ||||||
McKesson Corporation | ||||||||
| 1,400,000 | 1.292%, 3/10/2017 | 1,403,700 | ||||||
Mondelez International, Inc. | ||||||||
| 1,858,000 | 0.745%, 2/1/2019c | 1,853,836 | ||||||
SABMiller Holdings, Inc. | ||||||||
| 2,500,000 | 2.450%, 1/15/2017b | 2,576,235 | ||||||
Thermo Fisher Scientific, Inc. | ||||||||
| 1,700,000 | 1.300%, 2/1/2017 | 1,702,506 | ||||||
Unilever Capital Corporation | ||||||||
| 2,600,000 | 2.200%, 3/6/2019 | 2,637,625 | ||||||
|
| |||||||
| Total | 35,034,849 | |||||||
|
| |||||||
| Energy (2.3%) | |||||||
Cameron International Corporation | ||||||||
| 1,575,000 | 1.400%, 6/15/2017 | 1,580,153 | ||||||
Canadian Natural Resources, Ltd. | ||||||||
| 1,840,000 | 0.609%, 3/30/2016c | 1,843,987 | ||||||
Chevron Corporation | ||||||||
| 3,000,000 | 1.718%, 6/24/2018 | 3,023,562 | ||||||
CNOOC Nexen Finance 2014 ULC | ||||||||
| 2,000,000 | 1.625%, 4/30/2017 | 2,005,134 | ||||||
CNPC General Capital, Ltd. | ||||||||
| 1,000,000 | 2.750%, 5/14/2019b | 999,774 | ||||||
DCP Midstream Operating, LP | ||||||||
| 1,650,000 | 2.700%, 4/1/2019 | 1,671,321 | ||||||
Enable Midstream Partners, LP | ||||||||
| 1,250,000 | 2.400%, 5/15/2019b | 1,251,154 | ||||||
Enbridge, Inc. | ||||||||
| 1,700,000 | 0.678%, 6/2/2017c | 1,703,422 | ||||||
International Petroleum Investment Company, Ltd. | ||||||||
| 2,000,000 | 3.125%, 11/15/2015b | 2,061,880 | ||||||
Petrobras Global Finance BV | ||||||||
| 2,220,000 | 3.112%, 3/17/2020c,h | 2,280,939 | ||||||
Petroleos Mexicanos | ||||||||
| 1,500,000 | 2.248%, 7/18/2018c | 1,557,270 | ||||||
| 1,000,000 | 3.500%, 7/18/2018 | 1,051,000 | ||||||
| 125,000 | 3.125%, 1/23/2019b,h | 129,313 | ||||||
Total Capital International SA | ||||||||
| 1,890,000 | 0.580%, 6/19/2019c | 1,889,987 | ||||||
Weatherford International, Ltd. | ||||||||
| 1,500,000 | 6.000%, 3/15/2018 | 1,706,748 | ||||||
|
| |||||||
| Total | 24,755,644 | |||||||
|
| |||||||
| Financials (23.0%) | |||||||
Achmea Hypotheekbank NV | ||||||||
| 805,000 | 3.200%, 11/3/2014b | 812,669 | ||||||
American Express Credit Corporation | ||||||||
| 2,580,000 | 0.781%, 3/18/2019c | 2,594,319 | ||||||
American International Group, Inc. | ||||||||
| 2,000,000 | 5.050%, 10/1/2015 | 2,108,442 | ||||||
American Tower Trust I | ||||||||
| 1,650,000 | 1.551%, 3/15/2018b | 1,643,286 | ||||||
Australia and New Zealand Banking Group, Ltd. | ||||||||
| 5,000,000 | 2.400%, 11/23/2016b | 5,174,825 | ||||||
Aviation Capital Group Corporation | ||||||||
| 1,350,000 | 3.875%, 9/27/2016b | 1,397,250 | ||||||
Bank Nederlandse Gemeenten NV | ||||||||
| 1,000,000 | 1.375%, 3/19/2018b | 1,000,747 | ||||||
Bank of America Corporation | ||||||||
| 1,500,000 | 1.500%, 10/9/2015 | 1,513,812 | ||||||
| 2,000,000 | 1.300%, 3/22/2018c | 2,025,750 | ||||||
| 2,200,000 | 1.103%, 4/1/2019c | 2,214,267 | ||||||
Bank Of America National Association | ||||||||
| 2,000,000 | 5.300%, 3/15/2017 | 2,199,670 | ||||||
Bank of Montreal | ||||||||
| 6,000,000 | 2.625%, 1/25/2016b | 6,197,220 | ||||||
| 1,500,000 | 0.829%, 4/9/2018c | 1,510,049 | ||||||
Bank of New York Mellon Corporation | ||||||||
| 2,500,000 | 1.077%, 11/24/2014c | 2,508,732 | ||||||
| 675,000 | 4.500%, 12/31/2049i | 627,750 | ||||||
The accompanying Notes to Financial Statements are an integral part of this schedule.
279
Table of Contents
Limited Maturity Bond Portfolio
Schedule of Investments as of June 30, 2014
(unaudited)
| Principal Amount | Long-Term Fixed Income (91.7%) | Value | ||||||
| Financials (23.0%) - continued | |||||||
Bank of Nova Scotia | ||||||||
| $ | 3,000,000 | 2.150%, 8/3/2016b | $ | 3,087,690 | ||||
Barclays Bank plc | ||||||||
| 5,000,000 | 2.500%, 9/21/2015b | 5,123,100 | ||||||
BBVA Banco Continental SA | ||||||||
| 2,000,000 | 2.250%, 7/29/2016b | 2,015,000 | ||||||
Bear Stearns Companies, LLC | ||||||||
| 2,500,000 | 6.400%, 10/2/2017 | 2,882,327 | ||||||
Berkshire Hathaway Finance Corporation | ||||||||
| 400,000 | 0.377%, 1/10/2017c | 400,101 | ||||||
BNZ International Funding, Ltd. | ||||||||
| 3,100,000 | 2.350%, 3/4/2019b | 3,112,307 | ||||||
Caisse Centrale Desjardins du Quebec | ||||||||
| 4,000,000 | 2.550%, 3/24/2016b | 4,134,440 | ||||||
Caixa Economica Federal | ||||||||
| 1,550,000 | 4.250%, 5/13/2019b | 1,564,725 | ||||||
Capital One Financial Corporation | ||||||||
| 3,000,000 | 1.377%, 7/15/2014c | 3,000,000 | ||||||
Citigroup, Inc. | ||||||||
| 2,225,000 | 0.770%, 3/10/2017c | 2,226,206 | ||||||
| 1,840,000 | 1.000%, 4/8/2019c | 1,842,565 | ||||||
CNA Financial Corporation | ||||||||
| 3,000,000 | 6.500%, 8/15/2016 | 3,341,472 | ||||||
CoBank ACB | ||||||||
| 1,965,000 | 0.831%, 6/15/2022c,d | 1,810,256 | ||||||
Commonwealth Bank of Australia | ||||||||
| 3,500,000 | 0.750%, 1/15/2016b | 3,509,170 | ||||||
Cooperatieve Centrale Raiffeisen-Boerenleenbank BA | ||||||||
| 800,000 | 4.625%, 12/1/2023 | 845,556 | ||||||
Credit Agricole SA | ||||||||
| 1,650,000 | 1.027%, 4/15/2019b,c | 1,662,576 | ||||||
Credit Suisse AG Guernsey | ||||||||
| 2,000,000 | 2.600%, 5/27/2016b | 2,071,892 | ||||||
Credit Suisse Group AG | ||||||||
| 1,500,000 | 6.500%, 8/8/2023b | 1,665,000 | ||||||
| 990,000 | 7.500%, 12/11/2049b,i | 1,095,831 | ||||||
DnB Boligkreditt AS | ||||||||
| 4,900,000 | 1.450%, 3/21/2018b | 4,876,852 | ||||||
General Electric Capital Corporation | ||||||||
| 4,500,000 | 1.231%, 3/15/2023c | 4,511,210 | ||||||
Goldman Sachs Group, Inc. | ||||||||
| 3,550,000 | 2.375%, 1/22/2018 | 3,605,153 | ||||||
| 1,915,000 | 1.324%, 11/15/2018c | 1,941,155 | ||||||
| 1,950,000 | 5.700%, 12/29/2049i | 2,014,594 | ||||||
GTP Acquisition Partners I, LLC | ||||||||
| 2,000,000 | 4.347%, 6/15/2016d | 2,068,480 | ||||||
HSBC USA, Inc. | ||||||||
| 1,905,000 | 0.530%, 6/23/2017c | 1,901,621 | ||||||
ING Bank NV | ||||||||
| 5,000,000 | 2.500%, 1/14/2016b | 5,142,300 | ||||||
ING Capital Funding Trust III | ||||||||
| 1,000,000 | 3.834%, 12/29/2049c,i | 1,000,000 | ||||||
International Lease Finance Corporation | ||||||||
| 1,100,000 | 8.625%, 9/15/2015 | 1,190,750 | ||||||
Intesa Sanpaolo SPA | ||||||||
| 1,500,000 | 5.017%, 6/26/2024b | 1,517,723 | ||||||
J.P. Morgan Chase & Company | ||||||||
| 4,000,000 | 1.129%, 1/25/2018c | 4,056,348 | ||||||
| 1,450,000 | 7.900%, 4/29/2049i | 1,620,375 | ||||||
| 375,000 | 6.000%, 12/29/2049i | 382,500 | ||||||
J.P. Morgan Chase Bank NA | ||||||||
| 1,800,000 | 5.875%, 6/13/2016 | 1,969,358 | ||||||
Kilroy Realty, LP | ||||||||
| 750,000 | 3.800%, 1/15/2023 | 756,605 | ||||||
Landwirtschaftliche Rentenbank | ||||||||
| 4,500,000 | 0.431%, 3/15/2016b,c | 4,512,118 | ||||||
Lloyds TSB Bank plc | ||||||||
| 300,000 | 6.500%, 9/14/2020b | 352,131 | ||||||
Macquarie Bank, Ltd. | ||||||||
| 2,275,000 | 5.000%, 2/22/2017b | 2,479,295 | ||||||
Manufacturers and Traders Trust Company | ||||||||
| 1,850,000 | 0.600%, 1/30/2017c | 1,851,669 | ||||||
MassMutual Global Funding II | ||||||||
| 3,500,000 | 2.000%, 4/5/2017b | 3,578,116 | ||||||
MasterCard, Inc. | ||||||||
| 1,750,000 | 2.000%, 4/1/2019 | 1,757,123 | ||||||
Metropolitan Life Global Funding I | ||||||||
| 2,270,000 | 0.365%, 6/23/2016b,c,f | 2,269,108 | ||||||
| 3,250,000 | 3.650%, 6/14/2018b | 3,457,808 | ||||||
Mizuho Bank, Ltd. | ||||||||
| 1,650,000 | 0.659%, 4/16/2017b,c,h | 1,651,363 | ||||||
Mizuho Financial Group Cayman 3, Ltd. | ||||||||
| 825,000 | 4.600%, 3/27/2024b | 869,577 | ||||||
Morgan Stanley | ||||||||
| 975,000 | 4.100%, 5/22/2023 | 989,053 | ||||||
| 1,750,000 | 5.000%, 11/24/2025 | 1,866,494 | ||||||
| 1,000,000 | 5.450%, 12/29/2049i | 1,018,240 | ||||||
Morgan Stanley Mortgage Loan Trust | ||||||||
| 2,000,000 | 5.750%, 10/18/2016 | 2,205,566 | ||||||
National Australia Bank, Ltd. | ||||||||
| 3,350,000 | 2.000%, 6/20/2017b | 3,427,181 | ||||||
National Bank of Canada | ||||||||
| 2,750,000 | 2.200%, 10/19/2016b | 2,839,089 | ||||||
NCUA Guaranteed Notes | ||||||||
| 2,165,598 | 0.501%, 12/7/2020c | 2,169,781 | ||||||
Network Rail Infrastructure Finance plc | ||||||||
| 6,000,000 | 0.875%, 5/15/2018b | 5,891,472 | ||||||
New York Life Global Funding | ||||||||
| 6,000,000 | 3.000%, 5/4/2015b | 6,117,516 | ||||||
Norddeutsche Landesbank Girozentrale | ||||||||
| 2,000,000 | 0.875%, 10/16/2015b | 2,009,380 | ||||||
Nordea Bank AB | ||||||||
| 2,500,000 | 3.125%, 3/20/2017b | 2,633,485 | ||||||
North American Development Bank | ||||||||
| 2,200,000 | 2.300%, 10/10/2018 | 2,232,644 | ||||||
Principal Life Global Funding II | ||||||||
| 2,250,000 | 1.000%, 12/11/2015b | 2,261,963 | ||||||
Prudential Covered Trust | ||||||||
| 3,040,000 | 2.997%, 9/30/2015d | 3,113,936 | ||||||
Realty Income Corporation | ||||||||
| 1,500,000 | 2.000%, 1/31/2018 | 1,507,090 | ||||||
Reliance Standard Life Global Funding II | ||||||||
| 1,740,000 | 2.500%, 4/24/2019b | 1,745,495 | ||||||
The accompanying Notes to Financial Statements are an integral part of this schedule.
280
Table of Contents
Limited Maturity Bond Portfolio
Schedule of Investments as of June 30, 2014
(unaudited)
| Principal Amount | Long-Term Fixed Income (91.7%) | Value | ||||||
| Financials (23.0%) - continued | |||||||
Royal Bank of Canada | ||||||||
| $ | 4,000,000 | 1.200%, 9/19/2017 | $ | 3,989,748 | ||||
Royal Bank of Scotland Group plc | ||||||||
| 2,205,000 | 1.174%, 3/31/2017c | 2,215,721 | ||||||
| 1,000,000 | 6.125%, 12/15/2022 | 1,093,734 | ||||||
| 1,650,000 | 5.125%, 5/28/2024 | 1,675,408 | ||||||
Skandinaviska Enskilda Banken AB | ||||||||
| 2,100,000 | 1.750%, 3/19/2018b | 2,097,690 | ||||||
| 2,500,000 | 1.375%, 5/29/2018b | 2,482,135 | ||||||
SLM Corporation | ||||||||
| 700,000 | 4.625%, 9/25/2017 | 737,625 | ||||||
SpareBank 1 Boligkreditt AS | ||||||||
| 3,000,000 | 1.250%, 5/2/2018b,h | 2,957,370 | ||||||
Stadshypotek AB | ||||||||
| 2,000,000 | 1.875%, 10/2/2019b | 1,975,982 | ||||||
Standard Chartered plc | ||||||||
| 1,225,000 | 3.950%, 1/11/2023b | 1,218,568 | ||||||
Sumitomo Mitsui Financial Group, Inc. | ||||||||
| 1,800,000 | 4.436%, 4/2/2024b | 1,881,083 | ||||||
Suncorp-Metway, Ltd. | ||||||||
| 2,570,000 | 0.934%, 3/28/2017b,c | 2,569,974 | ||||||
Svensk Exportkredit AB | ||||||||
| 3,500,000 | 0.526%, 1/23/2017c | 3,520,612 | ||||||
| 1,500,000 | 1.125%, 4/5/2018 | 1,485,267 | ||||||
Svenska Handelsbanken AB | ||||||||
| 2,750,000 | 0.680%, 3/21/2016c | 2,763,912 | ||||||
| 750,000 | 0.722%, 6/17/2019c | 750,270 | ||||||
Swedbank AB | ||||||||
| 1,750,000 | 1.750%, 3/12/2018b | 1,747,578 | ||||||
Toronto-Dominion Bank | ||||||||
| 3,100,000 | 0.691%, 9/9/2016c | 3,116,979 | ||||||
U.S. Bank National Association | ||||||||
| 4,000,000 | 3.778%, 4/29/2020 | 4,094,108 | ||||||
Union Bank NA | ||||||||
| 1,900,000 | 1.500%, 9/26/2016 | 1,926,353 | ||||||
USAA Capital Corporation | ||||||||
| 2,575,000 | 2.125%, 6/3/2019b | 2,588,802 | ||||||
Voya Financial, Inc. | ||||||||
| 500,000 | 5.650%, 5/15/2053 | 508,750 | ||||||
| 1,500,000 | 2.900%, 2/15/2018 | 1,554,360 | ||||||
Wachovia Corporation | ||||||||
| 1,000,000 | 0.501%, 6/15/2017c | 998,630 | ||||||
WEA Finance, LLC/WT Finance | ||||||||
Australia, Pty, Ltd. | ||||||||
| 3,350,000 | 5.750%, 9/2/2015b | 3,622,653 | ||||||
Wells Fargo & Company | ||||||||
| 4,500,000 | 2.625%, 12/15/2016 | 4,677,354 | ||||||
| 925,000 | 3.450%, 2/13/2023 | 920,474 | ||||||
| 1,100,000 | 4.100%, 6/3/2026 | 1,113,859 | ||||||
Westpac Banking Corporation | ||||||||
| 2,500,000 | 1.250%, 12/15/2017b | 2,485,200 | ||||||
Yale University | ||||||||
| 1,550,000 | 2.086%, 4/15/2019 | 1,565,974 | ||||||
|
| |||||||
| Total | 246,616,892 | |||||||
|
| |||||||
| Foreign Government (5.7%) | |||||||
Bahama Government International Bond | ||||||||
| 275,000 | 5.750%, 1/16/2024b,h | 292,875 | ||||||
Canada Government International Bond | ||||||||
| 8,500,000 | 0.875%, 2/14/2017 | 8,520,408 | ||||||
Eksportfinans ASA | ||||||||
| 2,450,000 | 2.375%, 5/25/2016 | 2,450,000 | ||||||
European Investment Bank | ||||||||
| 6,000,000 | 1.750%, 3/15/2017 | 6,141,168 | ||||||
Hydro Quebec | ||||||||
| 3,000,000 | 2.000%, 6/30/2016 | 3,080,100 | ||||||
Inter-American Development Bank | ||||||||
| 3,750,000 | 0.192%, 2/11/2016c | 3,747,495 | ||||||
International Finance Corporation | ||||||||
| 3,090,000 | 0.500%, 5/16/2016 | 3,087,513 | ||||||
Japan Bank for International Cooperation | ||||||||
| 4,000,000 | 1.750%, 7/31/2018 | 4,032,616 | ||||||
Kommunalbanken AS | ||||||||
| 6,000,000 | 2.750%, 5/5/2015b | 6,127,440 | ||||||
Kommuninvest I Sverige AB | ||||||||
| 3,500,000 | 1.000%, 10/24/2017b | 3,481,544 | ||||||
Mexico Government International Bond | ||||||||
| 1,250,000 | 5.125%, 1/15/2020 | 1,416,250 | ||||||
| 325,000 | 3.500%, 1/21/2021 | 337,513 | ||||||
Philippines Government International Bond | ||||||||
| 325,000 | 4.200%, 1/21/2024 | 343,281 | ||||||
Poland Government International Bond | ||||||||
| 125,000 | 4.000%, 1/22/2024 | 129,688 | ||||||
Province of British Columbia | ||||||||
| 6,500,000 | 2.100%, 5/18/2016 | 6,693,375 | ||||||
Province of Manitoba | ||||||||
| 5,100,000 | 1.300%, 4/3/2017 | 5,151,627 | ||||||
Province of Ontario | ||||||||
| 3,500,000 | 0.274%, 8/13/2015c | 3,501,382 | ||||||
| 2,000,000 | 1.000%, 7/22/2016 | 2,013,518 | ||||||
Slovenia Government International Bond | ||||||||
| 730,000 | 4.125%, 2/18/2019b | 769,019 | ||||||
|
| |||||||
| Total | 61,316,812 | |||||||
|
| |||||||
| Mortgage-Backed Securities (6.4%) | |||||||
Federal Home Loan Mortgage Corporation Gold 15-Yr. Pass Through | ||||||||
| 7,875,000 | 3.000%, 7/1/2029f | 8,162,926 | ||||||
Federal Home Loan Mortgage Corporation Gold 30-Yr. Pass Through | ||||||||
| 911,571 | 6.500%, 9/1/2037 | 1,027,191 | ||||||
| 9,875,000 | 4.000%, 7/1/2044f | 10,461,328 | ||||||
Federal National Mortgage Association Conventional 15-yr. Pass Through | ||||||||
| 18,850,000 | 3.500%, 8/1/2029f | 19,927,985 | ||||||
Federal National Mortgage Association Conventional 15-Yr. Pass Through | ||||||||
| 4,778,746 | 2.250%, 6/25/2025 | 4,872,514 | ||||||
Federal National Mortgage Association Conventional 30-Yr. Pass Through | ||||||||
| 1,353,710 | 5.807%, 9/1/2037c | 1,448,676 | ||||||
| 632,988 | 5.500%, 10/1/2037c | 678,623 | ||||||
The accompanying Notes to Financial Statements are an integral part of this schedule.
281
Table of Contents
Limited Maturity Bond Portfolio
Schedule of Investments as of June 30, 2014
(unaudited)
| Principal Amount | Long-Term Fixed Income (91.7%) | Value | ||||||
| Mortgage-Backed Securities (6.4%) - continued | |||||||
| $ | 4,883,627 | 2.071%, 1/1/2043c | $ | 5,025,843 | ||||
| 8,718,996 | 2.061%, 3/1/2043c | 8,968,396 | ||||||
| 7,829,328 | 1.750%, 7/1/2043c | 7,948,920 | ||||||
|
| |||||||
| Total | 68,522,402 | |||||||
|
| |||||||
| Technology (1.6%) | |||||||
Affiliated Computer Services, Inc. | ||||||||
| 2,000,000 | 5.200%, 6/1/2015 | 2,083,248 | ||||||
Amphenol Corporation | ||||||||
| 1,409,000 | 2.550%, 1/30/2019 | 1,428,805 | ||||||
Apple, Inc. | ||||||||
| 3,300,000 | 0.523%, 5/6/2019c | 3,303,142 | ||||||
Cisco Systems, Inc. | ||||||||
| 2,250,000 | 0.727%, 3/1/2019c | 2,264,454 | ||||||
Hewlett-Packard Company | ||||||||
| 1,858,000 | 1.167%, 1/14/2019c | 1,872,801 | ||||||
Micron Semiconductor Asia Pte, Ltd. | ||||||||
| 1,375,000 | 1.258%, 1/15/2019 | 1,374,807 | ||||||
Oracle Corporation | ||||||||
| 2,750,000 | 2.375%, 1/15/2019 | 2,796,269 | ||||||
Xilinx, Inc. | ||||||||
| 1,750,000 | 2.125%, 3/15/2019 | 1,753,094 | ||||||
|
| |||||||
| Total | 16,876,620 | |||||||
|
| |||||||
| Transportation (1.2%) | |||||||
American Airlines Pass Through Trust | ||||||||
| 1,510,387 | 5.600%, 7/15/2020b | 1,589,683 | ||||||
| 1,455,601 | 4.950%, 1/15/2023b | 1,575,688 | ||||||
British Airways plc | ||||||||
| 1,488,378 | 4.625%, 6/20/2024b | 1,572,173 | ||||||
Continental Airlines, Inc. | ||||||||
| 3,090,039 | 4.150%, 4/11/2024 | 3,213,641 | ||||||
Delta Air Lines, Inc. | ||||||||
| 851,952 | 4.750%, 5/7/2020 | 924,368 | ||||||
Kansas City Southern de Mexico SA de CV | ||||||||
| 1,640,000 | 0.928%, 10/28/2016c | 1,645,651 | ||||||
TTX Company | ||||||||
| 800,000 | 4.125%, 10/1/2023d | 825,997 | ||||||
Virgin Australia Holdings, Ltd. | ||||||||
| 1,786,141 | 5.000%, 10/23/2023b | 1,897,774 | ||||||
|
| |||||||
| Total | 13,244,975 | |||||||
|
| |||||||
| U.S. Government and Agencies (11.9%) | |||||||
Federal Agricultural Mortgage Corporation | ||||||||
| 3,500,000 | 2.000%, 7/27/2016 | 3,603,327 | ||||||
Federal Home Loan Mortgage Corporation | ||||||||
| 500,000 | 1.250%, 8/1/2019 | 489,285 | ||||||
| 4,000,000 | 1.250%, 10/2/2019 | 3,884,900 | ||||||
Federal National Mortgage Association | ||||||||
| 5,000,000 | 0.875%, 5/21/2018 | 4,916,080 | ||||||
| 8,000,000 | 1.875%, 2/19/2019 | 8,106,848 | ||||||
U.S. Treasury Bonds | ||||||||
| 2,200,000 | 3.000%, 5/15/2042 | 2,074,875 | ||||||
U.S. Treasury Bonds, TIPS | ||||||||
| 16,186,224 | 0.125%, 4/15/2019 | 16,666,777 | ||||||
U.S. Treasury Notes | ||||||||
| 1,400,000 | 0.625%, 5/31/2017 | 1,390,703 | ||||||
| 36,100,000 | 0.875%, 1/31/2018 | 35,753,115 | ||||||
| 200,000 | 1.000%, 5/31/2018 | 197,828 | ||||||
| 4,250,000 | 2.375%, 6/30/2018 | 4,429,630 | ||||||
| 20,655,000 | 1.375%, 1/31/2020 | 20,196,707 | ||||||
| 8,000,000 | 3.625%, 2/15/2044 | 8,442,496 | ||||||
U.S. Treasury Notes, TIPS | ||||||||
| 1,563,825 | 0.125%, 4/15/2018 | 1,615,384 | ||||||
| 921,085 | 1.125%, 1/15/2021 | 997,723 | ||||||
| 8,588,016 | 0.125%, 1/15/2022 | 8,645,057 | ||||||
| 7,008,995 | 0.125%, 1/15/2023 | 6,984,905 | ||||||
|
| |||||||
| Total | 128,395,640 | |||||||
|
| |||||||
| Utilities (1.6%) | |||||||
Dayton Power and Light Company | ||||||||
| 1,200,000 | 1.875%, 9/15/2016b | 1,220,324 | ||||||
Electricite de France SA | ||||||||
| 1,500,000 | 5.250%, 12/29/2049b,i | 1,530,195 | ||||||
MidAmerican Energy Holdings Company | ||||||||
| 1,063,000 | 1.100%, 5/15/2017 | 1,058,665 | ||||||
| 1,267,000 | 5.750%, 4/1/2018 | 1,450,019 | ||||||
National Rural Utilities Cooperative Finance Corporation | ||||||||
| 1,150,000 | 4.750%, 4/30/2043 | 1,131,727 | ||||||
NextEra Energy Capital Holdings, Inc. | ||||||||
| 2,575,000 | 2.400%, 9/15/2019 | 2,588,884 | ||||||
Northeast Utilities | ||||||||
| 1,250,000 | 1.450%, 5/1/2018 | 1,227,499 | ||||||
Pacific Gas & Electric Company | ||||||||
| 250,000 | 5.625%, 11/30/2017 | 282,692 | ||||||
PG&E Corporation | ||||||||
| 1,500,000 | 2.400%, 3/1/2019 | 1,513,532 | ||||||
Public Service Electric And Gas Company | ||||||||
| 2,570,000 | 1.800%, 6/1/2019 | 2,546,652 | ||||||
Sempra Energy | ||||||||
| 2,425,000 | 2.300%, 4/1/2017 | 2,489,384 | ||||||
|
| |||||||
| Total | 17,039,573 | |||||||
|
| |||||||
Total Long-Term Fixed Income (cost $984,332,975) | 984,485,474 | |||||||
|
| |||||||
| Shares | Preferred Stock (0.8%) | |||||||
| Financials (0.5%) | |||||||
| 20,000 | Allstate Corporation, 5.100% | 502,600 | ||||||
| 66,000 | Citigroup, Inc., 7.875% | 1,828,200 | ||||||
| 8,125 | Farm Credit Bank of Texas, 6.750%b,i | 850,332 | ||||||
| 23,000 | Goldman Sachs Group, Inc., 5.500%i | 563,500 | ||||||
| 66,000 | HSBC Holdings plc, 8.000%i | 1,786,620 | ||||||
|
| |||||||
| Total | 5,531,252 | |||||||
|
| |||||||
The accompanying Notes to Financial Statements are an integral part of this schedule.
282
Table of Contents
Limited Maturity Bond Portfolio
Schedule of Investments as of June 30, 2014
(unaudited)
| Shares | Preferred Stock (0.8%) | Value | ||||||
| Utilities (0.3%) | |||||||
| 24,375 | Southern California Edison Company, 4.920%c,i | $ | 2,496,914 | |||||
|
| |||||||
| Total | 2,496,914 | |||||||
|
| |||||||
Total Preferred Stock (cost $7,778,319) | 8,028,166 | |||||||
|
| |||||||
| Shares | Collateral Held for Securities Loaned (0.5%) | |||||||
| 4,993,550 | Thrivent Cash Management Trust | 4,993,550 | ||||||
|
| |||||||
Total Collateral Held for Securities Loaned (cost $4,993,550) | 4,993,550 | |||||||
|
| |||||||
| Shares or Principal Amount | Short-Term Investments (6.5%)j | |||||||
Federal Home Loan Bank Discount Notes | ||||||||
| 8,200,000 | 0.025%, 07/16/2014 | 8,199,915 | ||||||
| 10,000,000 | 0.035%, 07/22/2014 | 9,999,796 | ||||||
| 1,300,000 | 0.055%, 07/23/2014k | 1,299,956 | ||||||
| 200,000 | 0.045%, 07/30/2014k | 199,993 | ||||||
Thrivent Cash Management Trust | ||||||||
| 49,093,251 | 0.050% | 49,093,251 | ||||||
U.S. Treasury Bill | ||||||||
| 900,000 | 0.020%, 07/10/2014l | 899,995 | ||||||
|
| |||||||
| Total Short-Term Investments (at amortized cost) | 69,692,906 | |||||||
|
| |||||||
| Total Investments (cost $1,121,928,822) 104.6% | $ | 1,122,323,533 | ||||||
|
| |||||||
| Other Assets and Liabilities, Net (4.6%) | (49,013,824 | ) | ||||||
|
| |||||||
| Total Net Assets 100.0% | $ | 1,073,309,709 | ||||||
|
| |||||||
| a | The stated interest rate represents the weighted average of all contracts within the bank loan facility. |
| b | Denotes securities sold under Rule 144A of the Securities Act of 1933, which exempts them from registration. These securities have been deemed liquid and may be resold to other dealers in the program or to other qualified institutional buyers. As of June 30, 2014, the value of these investments was $292,246,368 or 27.2% of total net assets. |
| c | Denotes variable rate securities. Variable rate securities are securities whose yields vary with a designated market index or market rate. The rate shown is as of June 30, 2014. |
| d | Denotes restricted securities. Restricted securities are investment securities which have been deemed illiquid and cannot be offered for public sale without first being registered under the Securities Act of 1933. The following table indicates the acquisition date and cost of restricted securities Limited Maturity Bond Portfolio owned as of June 30, 2014. |
Security | Acquisition Date | Cost | ||||||
Apidos CLO XVIII, 07/22/2026 | 6/25/2014 | $ | 3,765,562 | |||||
Bayview Opportunity Master Fund Trust IIB, LP, 07/28/2034 | 6/27/2014 | 3,000,000 | ||||||
CoBank ACB, 06/15/2022 | 10/18/2013 | 1,834,871 | ||||||
Crown Castle Towers, LLC, 08/15/2015 | 7/29/2010 | 2,500,000 | ||||||
Edlinc Student Loan Funding Trust, 10/01/2025 | 11/29/2012 | 2,869,961 | ||||||
GTP Acquisition Partners I, LLC, 06/15/2016 | 6/29/2011 | 2,000,000 | ||||||
Mortgage Equity Conversion Asset Trust, 02/25/2042 | 2/14/2007 | 4,861,434 | ||||||
Mortgage Equity Conversion Asset Trust, 01/25/2042 | 1/18/2007 | 4,838,223 | ||||||
Prudential Covered Trust, 09/30/2015 | 4/1/2013 | 3,105,588 | ||||||
Selene Non-Performing Loans, LLC, 05/25/2054 | 5/23/2014 | 2,000,000 | ||||||
TTX Company, 10/01/2023 | 9/19/2013 | 799,992 | ||||||
U.S. Residential Opportunity Fund Trust, 03/25/2034 | 3/14/2014 | 2,590,899 | ||||||
Vericrest Opportunity Loan Transferee, 11/25/2053 | 12/18/2013 | 3,323,971 | ||||||
Wachovia Asset Securitization, Inc., 07/25/2037 | 3/16/2007 | 1,060,447 | ||||||
| e | All or a portion of the security is insured or guaranteed. |
| f | Denotes investments purchased on a when-issued or delayed delivery basis. |
| g | Security is fair valued. |
| h | All or a portion of the security is on loan. |
| i | Denotes perpetual securities. Perpetual securities pay an indefinite stream of interest, but may be called by the issuer at an earlier date. |
| j | The interest rate shown reflects the yield, coupon rate or the discount rate at the date of purchase. |
| k | At June 30, 2014, $1,499,949 of investments were held on deposit with the counterparty and pledged as the initial margin deposit for open futures contracts. |
| l | At June 30, 2014, $899,995 of investments were pledged as collateral with the custodian under the agreement between the counterparty, the custodian and the fund for open swap contracts. |
| m | All or a portion of the loan is unfunded. |
Definitions:
CLO | - | Collateralized Loan Obligation. | ||
TIPS | - | Treasury Inflation Protected Security |
The accompanying Notes to Financial Statements are an integral part of this schedule.
283
Table of Contents
Limited Maturity Bond Portfolio
Schedule of Investments as of June 30, 2014
(unaudited)
Unrealized Appreciation (Depreciation)
Gross unrealized appreciation and depreciation of investments, based on cost for federal income tax purposes, were as follows:
Gross unrealized appreciation | $ | 15,611,449 | ||
Gross unrealized depreciation | (15,224,224 | ) | ||
|
| |||
Net unrealized appreciation (depreciation) | $ | 387,225 | ||
Cost for federal income tax purposes | $ | 1,121,936,308 | ||
Fair Valuation Measurements
The following table is a summary of the inputs used, as of June 30, 2014, in valuing Limited Maturity Bond Portfolio’s assets carried at fair value.
Investments in Securities | Total | Level 1 | Level 2 | Level 3 | ||||||||||||
Bank Loans | ||||||||||||||||
Basic Materials | 2,953,225 | — | 2,953,225 | — | ||||||||||||
Capital Goods | 3,506,366 | — | 3,506,366 | — | ||||||||||||
Communications Services | 20,195,337 | — | 20,195,337 | — | ||||||||||||
Consumer Cyclical | 9,901,134 | — | 9,901,134 | — | ||||||||||||
Consumer Non-Cyclical | 6,717,015 | — | 6,717,015 | — | ||||||||||||
Energy | 1,681,973 | — | 1,681,973 | — | ||||||||||||
Financials | 2,177,519 | — | 2,177,519 | — | ||||||||||||
Technology | 4,225,124 | — | 4,225,124 | — | ||||||||||||
Transportation | 1,362,570 | — | 1,362,570 | — | ||||||||||||
Utilities | 2,403,174 | — | 2,403,174 | — | ||||||||||||
Long-Term Fixed Income | ||||||||||||||||
Asset-Backed Securities | 196,332,146 | — | 173,431,010 | 22,901,136 | ||||||||||||
Basic Materials | 10,993,967 | — | 10,993,967 | — | ||||||||||||
Capital Goods | 10,090,756 | — | 10,090,756 | — | ||||||||||||
Collateralized Mortgage Obligations | 50,971,329 | — | 44,210,485 | 6,760,844 | ||||||||||||
Commercial Mortgage-Backed | ||||||||||||||||
Securities | 67,346,920 | — | 67,346,920 | — | ||||||||||||
Communications Services | 25,534,879 | — | 25,534,879 | — | ||||||||||||
Consumer Cyclical | 11,412,070 | — | 11,412,070 | — | ||||||||||||
Consumer Non-Cyclical | 35,034,849 | — | 35,034,849 | — | ||||||||||||
Energy | 24,755,644 | — | 24,755,644 | — | ||||||||||||
Financials | 246,616,892 | — | 244,806,636 | 1,810,256 | ||||||||||||
Foreign Government | 61,316,812 | — | 61,316,812 | — | ||||||||||||
Mortgage-Backed Securities | 68,522,402 | — | 68,522,402 | — | ||||||||||||
Technology | 16,876,620 | — | 16,876,620 | — | ||||||||||||
Transportation | 13,244,975 | — | 13,244,975 | — | ||||||||||||
U.S. Government and Agencies | 128,395,640 | — | 128,395,640 | — | ||||||||||||
Utilities | 17,039,573 | — | 17,039,573 | — | ||||||||||||
Preferred Stock | ||||||||||||||||
Financials | 5,531,252 | 4,680,920 | 850,332 | — | ||||||||||||
Utilities | 2,496,914 | — | 2,496,914 | — | ||||||||||||
Collateral Held for Securities Loaned | 4,993,550 | 4,993,550 | — | — | ||||||||||||
Short-Term Investments | 69,692,906 | 49,093,251 | 20,599,655 | — | ||||||||||||
|
|
|
|
|
|
|
| |||||||||
Total | $ | 1,122,323,533 | $ | 58,767,721 | $ | 1,032,083,576 | $ | 31,472,236 | ||||||||
|
|
|
|
|
|
|
| |||||||||
Other Financial Instruments | Total | Level 1 | Level 2 | Level 3 | ||||||||||||
Asset Derivatives | ||||||||||||||||
Futures Contracts | 490,012 | 490,012 | — | — | ||||||||||||
|
|
|
|
|
|
|
| |||||||||
Total Asset Derivatives | $ | 490,012 | $ | 490,012 | $ | — | $ | — | ||||||||
|
|
|
|
|
|
|
| |||||||||
Liability Derivatives | ||||||||||||||||
Futures Contracts | 4,156 | 4,156 | — | — | ||||||||||||
Credit Default Swaps | 465,628 | — | 465,628 | — | ||||||||||||
|
|
|
|
|
|
|
| |||||||||
Total Liability Derivatives | $ | 469,784 | $ | 4,156 | $ | 465,628 | $ | — | ||||||||
|
|
|
|
|
|
|
| |||||||||
The accompanying Notes to Financial Statements are an integral part of this schedule.
284
Table of Contents
Limited Maturity Bond Portfolio
Schedule of Investments as of June 30, 2014
(unaudited)
There were no significant transfers between Levels during the period ended June 30, 2014. Transfers between Levels are identified as of the end of the period.
Futures Contracts | Number of Contracts Long/(Short) | Expiration Date | Notional Principal Amount | Value | Unrealized Gain/(Loss) | |||||||||||||
5-Yr. U.S. Treasury Bond Futures | (965 | ) | September 2014 | ($ | 115,623,656 | ) | ($ | 115,279,807 | ) | $ | 343,849 | |||||||
10-Yr. U.S. Treasury Bond Futures | (345 | ) | September 2014 | (43,330,461 | ) | (43,184,298 | ) | 146,163 | ||||||||||
30-Yr. U.S. Treasury Bond Futures | 5 | September 2014 | 690,093 | 685,937 | (4,156 | ) | ||||||||||||
Total Futures Contracts | $ | 485,856 | ||||||||||||||||
Credit Default Swaps and Counterparty | Buy/Sell Protection1 | Termination Date | Notional Principal Amount2 | Value3 | Unrealized Gain/(Loss) | |||||||||||||||
DX HY 22, 5 Year, at 5.00%; J.P. Morgan Chase and Co. | Buy | 6/20/2019 | $ | 21,780,000 | ($ | 465,628 | ) | ($ | 465,628 | ) | ||||||||||
Total Credit Default Swaps | ($ | 465,628 | ) | ($ | 465,628 | ) | ||||||||||||||
| 1 | As the buyer of protection, Limited Maturity Bond Portfolio pays periodic fees in return for payment by the seller which is contingent upon an adverse credit event occurring in the underlying issuer or reference entity. As the seller of protection, Limited Maturity Bond Portfolio collects periodic fees from the buyer and profits if the credit of the underlying issuer or reference entity remains stable or improves while the swap is outstanding, but the seller in a credit default swap contract would be required to pay the amount of credit loss, determined as specified in the agreement, to the buyer in the event of an adverse credit event in the reference entity. |
| 2 | The maximum potential amount of future payments Limited Maturity Bond Portfolio could be required to make as the seller or receive as the buyer of protection. |
| 3 | The values for credit indexes (CDX or LCDX) serve as an indicator of the current status of the payment/performance risk and represent the liability or profit for the credit default swap contract had the contract been closed as of the reporting date. When protection has been sold, the value of the swap will increase when the swap spread declines representing an improvement in the reference entity’s credit worthiness. The value of the swap will decrease when the swap spread increases representing a deterioration in the reference entity’s credit worthiness. When protection has been purchased, the value of the swap will increase when the swap spread increases representing a deterioration in the reference entity’s credit worthiness. The value of the swap will decrease when the swap spread declines representing an improvement in the reference entity’s credit worthiness. |
The following table summarizes the fair value and Statement of Assets and Liabilities location, as of June 30, 2014, for Limited Maturity Bond Portfolio’s investments in financial derivative instruments by primary risk exposure as discussed under item (2) Significant Accounting Policies of the Notes to Financial Statements.
Derivatives by risk category | Statement of Assets and Liabilities Location | Fair Value | ||||
Asset Derivatives | ||||||
Interest Rate Contracts | ||||||
Futures* | Net Assets - Net unrealized appreciation/(depreciation) on Futures contracts | $ | 490,012 | |||
Total Interest Rate Contracts | 490,012 | |||||
|
| |||||
Total Asset Derivatives | $ | 490,012 | ||||
|
| |||||
Liability Derivatives | ||||||
Interest Rate Contracts | ||||||
Futures* | Net Assets - Net unrealized appreciation/(depreciation) on Futures contracts | 4,156 | ||||
Total Interest Rate Contracts | 4,156 | |||||
Credit Contracts | ||||||
Credit Default Swaps | Net Assets - Net unrealized appreciation/(depreciation) on Swap agreements | 465,628 | ||||
Total Credit Contracts | 465,628 | |||||
|
| |||||
Total Liability Derivatives | $ | 469,784 | ||||
|
| |||||
| * | Includes cumulative appreciation/depreciation of futures contracts as reported in the Schedule of Investments. Only current day’s variation margin is reported within the Statement of Assets and Liabilities. |
The accompanying Notes to Financial Statements are an integral part of this schedule.
285
Table of Contents
Limited Maturity Bond Portfolio
Schedule of Investments as of June 30, 2014
(unaudited)
The following table summarizes the net realized gains/(losses) and Statement of Operations location, for the period ended June 30, 2014, for Limited Maturity Bond Portfolio’s investments in financial derivative instruments by primary risk exposure.
Derivatives by risk category | Statement of Operations Location | Realized Gains/(Losses) recognized in Income | ||||
Equity Contracts | ||||||
Options Written | Net realized gains/(losses) on Written option contracts | 47,600 | ||||
Options Purchased | Net realized gains/(losses) on Investments | (415,656 | ) | |||
Total Equity Contracts | (368,056 | ) | ||||
Interest Rate Contracts | ||||||
Futures | Net realized gains/(losses) on Futures contracts | (1,495,867 | ) | |||
Total Interest Rate Contracts | (1,495,867 | ) | ||||
Credit Contracts | ||||||
Credit Default Swaps | Net realized gains/(losses) on Swap agreements | (462,534 | ) | |||
Total Credit Contracts | (462,534 | ) | ||||
|
| |||||
Total | ($ | 2,326,457 | ) | |||
|
| |||||
The following table summarizes the change in net unrealized appreciation/(depreciation) and Statement of Operations location, for the period ended June 30, 2014, for Limited Maturity Bond Portfolio’s investments in financial derivative instruments by primary risk exposure.
Derivatives by risk category | Statement of Operations Location | Change in unrealized appreciation/(depreciation) recognized in Income | ||||
Interest Rate Contracts | ||||||
Futures | Change in net unrealized appreciation/(depreciation) on Futures contracts | (1,882,279 | ) | |||
Total Interest Rate Contracts | (1,882,279 | ) | ||||
Credit Contracts | ||||||
Credit Default Swaps | Change in net unrealized appreciation/(depreciation) on Swap agreements | (33,709 | ) | |||
Total Credit Contracts | (33,709 | ) | ||||
|
| |||||
Total | ($ | 1,915,988 | ) | |||
|
| |||||
The following table presents Limited Maturity Bond Portfolio’s average volume of derivative activity during the period ended June 30, 2014.
Derivative Risk Category | Futures (Notional)* | Futures (Percentage of Average Net Assets) | Swaps (Notional)* | Swaps (Percentage of Average Net Assets) | Options (Contracts) | |||||||||||||||
Equity Contracts | N/A | N/A | N/A | N/A | 220 | |||||||||||||||
Interest Rate Contracts | 160,018,383 | 14.9 | N/A | N/A | N/A | |||||||||||||||
Credit Contracts | N/A | N/A | 1,697,011 | 0.2 | % | N/A | ||||||||||||||
| * | Notional amount represents long or short, or both, derivative positions held by the Portfolio. |
Investment in Affiliates
Affiliated issuers, as defined under the Investment Company Act of 1940, include those in which the Portfolio’s holdings of an issuer represent 5% or more of the outstanding voting securities of an issuer, or any affiliated mutual fund.
A summary of transactions for the fiscal year to date, in Limited Maturity Bond Portfolio, is as follows:
Portfolio | Value December 31, 2013 | Gross Purchases | Gross Sales | Shares Held at June 30, 2014 | Value June 30, 2014 | Income Earned January 1, 2014 - June 30, 2014 | ||||||||||||||||||
Cash Management Trust- Collateral Investment | $ | 4,107,820 | $ | 34,863,365 | $ | 33,977,635 | 4,993,550 | $ | 4,993,550 | $ | 4,616 | |||||||||||||
Cash Management Trust- Short Term Investment | 59,226,574 | 142,985,584 | 153,118,907 | 49,093,251 | 49,093,251 | 13,468 | ||||||||||||||||||
Total Value and Income Earned | 63,334,394 | 54,086,801 | 18,084 | |||||||||||||||||||||
The accompanying Notes to Financial Statements are an integral part of this schedule.
286
Table of Contents
Schedule of Investments as of June 30, 2014
(unaudited)
| Principal Amount | Asset Backed Commercial Paper (18.0%)a | Value | ||||||
Dealers Capital Access Trust, LLC | ||||||||
| $1,320,000 | 0.180%, 07/01/2014b | $ | 1,320,000 | |||||
| 1,300,000 | 0.200%, 07/09/2014b | 1,299,942 | ||||||
Fairway Finance, LLC | ||||||||
| 4,650,000 | 0.060%, 07/01/2014b | 4,650,000 | ||||||
Golden Funding Corporation | ||||||||
| 1,320,000 | 0.200%, 07/25/2014b | 1,319,824 | ||||||
| 1,320,000 | 0.180%, 08/18/2014b | 1,319,683 | ||||||
Kells Funding, LLC | ||||||||
| 1,400,000 | 0.230%, 10/08/2014b,c,d | 1,400,000 | ||||||
| 1,470,000 | 0.232%, 11/17/2014b,c,d | 1,469,997 | ||||||
Liberty Street Funding, LLC | ||||||||
| 1,330,000 | 0.170%, 08/04/2014b | 1,329,786 | ||||||
Nieuw Amsterdam Receivables | ||||||||
| 1,320,000 | 0.160%, 08/12/2014b | 1,319,754 | ||||||
Old Line Funding, LLC | ||||||||
| 1,350,000 | 0.230%, 09/18/2014b | 1,349,319 | ||||||
| 1,320,000 | 0.184%, 11/17/2014b,c,d | 1,320,000 | ||||||
Sydney Capital Corporation | ||||||||
| 1,315,000 | 0.200%, 07/24/2014b | 1,314,832 | ||||||
| 1,300,000 | 0.190%, 09/12/2014b | 1,299,499 | ||||||
Thunder Bay Funding, LLC | ||||||||
| 1,400,000 | 0.190%, 09/29/2014b | 1,399,335 | ||||||
| 1,330,000 | 0.170%, 10/15/2014b | 1,329,334 | ||||||
|
| |||||||
| Total | 23,441,305 | |||||||
|
| |||||||
Certificate of Deposit (10.4%)a | ||||||||
Bank of Montreal Chicago | ||||||||
| 1,370,000 | 0.409%, 07/24/2014d | 1,370,137 | ||||||
| 1,320,000 | 0.231%, 04/09/2015d | 1,320,000 | ||||||
Bank of Nova Scotia/Houston | ||||||||
| 1,500,000 | 0.280%, 10/24/2014d | 1,500,000 | ||||||
JP Morgan Chase Company | ||||||||
| 730,000 | 0.370%, 07/30/2014 | 730,012 | ||||||
Rabobank Nederland | ||||||||
| 1,140,000 | 0.267%, 07/10/2014d | 1,140,000 | ||||||
| 1,380,000 | 0.277%, 12/01/2014d | 1,380,000 | ||||||
Skandinaviska Enskilda Banken AB | ||||||||
| 1,380,000 | 0.281%, 09/16/2014d | 1,380,000 | ||||||
Svenska Handelsbanken NY | ||||||||
| 1,320,000 | 0.160%, 09/10/2014 | 1,320,000 | ||||||
Toronto Dominion Bank of New York | ||||||||
| 1,355,000 | 0.300%, 09/19/2014 | 1,355,300 | ||||||
| 1,440,000 | 0.214%, 11/18/2014d | 1,440,000 | ||||||
Wells Fargo Bank NA | ||||||||
| 700,000 | 0.210%, 08/20/2014 | 700,058 | ||||||
|
| |||||||
| Total | 13,635,507 | |||||||
|
| |||||||
Financial Company Commercial Paper (15.3%)a | ||||||||
AllianceBernstein, LP | ||||||||
| 5,000,000 | 0.140%, 07/01/2014 | 5,000,000 | ||||||
| 1,310,000 | 0.230%, 07/14/2014 | 1,309,891 | ||||||
General Electric Capital Corporation | ||||||||
| 1,320,000 | 0.160%, 09/02/2014b | 1,319,630 | ||||||
Nordea Bank AB | ||||||||
| 1,320,000 | 0.185%, 08/29/2014 | 1,319,600 | ||||||
| 1,285,000 | 0.190%, 09/05/2014 | 1,284,552 | ||||||
Prudential Funding, LLC | ||||||||
| 660,000 | 0.100%, 07/31/2014 | 659,945 | ||||||
US Bank NA | ||||||||
| 6,400,000 | 0.100%, 07/01/2014 | 6,400,000 | ||||||
Westpac Banking Corporation | ||||||||
| 1,310,000 | 0.225%, 08/01/2014c,d | 1,310,051 | ||||||
| 1,380,000 | 0.215%, 09/19/2014c,d | 1,379,973 | ||||||
|
| |||||||
| Total | 19,983,642 | |||||||
|
| |||||||
Government Agency Debt (21.9%)a | ||||||||
Federal Agricultural Mortgage Corporation | ||||||||
| 1,500,000 | 0.360%, 07/01/2015d | 1,502,428 | ||||||
Federal Farm Credit Bank | ||||||||
| 1,140,000 | 0.173%, 04/23/2015d | 1,140,565 | ||||||
| 1,140,000 | 0.151%, 08/03/2015d | 1,140,384 | ||||||
Federal Home Loan Bank | ||||||||
| 1,360,000 | 0.122%, 02/23/2015d | 1,360,000 | ||||||
| 1,980,000 | 0.100%, 03/10/2015 | 1,979,777 | ||||||
Federal Home Loan Mortgage Corporation | ||||||||
| 3,960,000 | 0.142%, 06/26/2015d | 3,961,263 | ||||||
| 650,000 | 0.144%, 07/17/2015d | 650,209 | ||||||
Federal National Mortgage Association | ||||||||
| 1,000,000 | 0.103%, 07/05/2014 | 999,988 | ||||||
Overseas Private Investment Corporation | ||||||||
| 1,034,481 | 0.110%, 07/02/2014d | 1,034,481 | ||||||
| 1,390,000 | 0.110%, 07/07/2014d | 1,390,000 | ||||||
| 1,410,000 | 0.110%, 07/07/2014d | 1,410,000 | ||||||
| 1,420,000 | 0.110%, 07/07/2014d | 1,420,000 | ||||||
| 2,300,000 | 0.120%, 07/07/2014d | 2,300,000 | ||||||
| 809,639 | 0.176%, 09/07/2014 | 813,110 | ||||||
| 2,920,000 | 0.300%, 12/09/2014 | 2,924,893 | ||||||
| 1,094,921 | 0.300%, 12/10/2014 | 1,096,747 | ||||||
| 1,550,000 | 0.420%, 04/15/2015 | 1,551,371 | ||||||
| 1,980,000 | 0.390%, 05/02/2015 | 1,981,269 | ||||||
|
| |||||||
| Total | 28,656,485 | |||||||
|
| |||||||
| Shares | Investment Company (7.6%) | |||||||
BlackRock Cash Funds | ||||||||
| 6,033,000 | 0.080% | 6,033,000 | ||||||
Dreyfus Institutional Cash Advantage Fund | ||||||||
| 670,000 | 0.060% | 670,000 | ||||||
DWS Money Market Series | ||||||||
| 3,150,037 | 0.050% | 3,150,037 | ||||||
|
| |||||||
| Total | 9,853,037 | |||||||
|
| |||||||
| Principal Amount | Other Commercial Paper (16.8%)a | |||||||
Caisse des Depots et Consignations | ||||||||
| $1,330,000 | 0.150%, 08/15/2014 | 1,329,751 | ||||||
| 1,250,000 | 0.165%, 10/17/2014 | 1,249,381 | ||||||
Chevron Corporation | ||||||||
| 1,330,000 | 0.105%, 09/24/2014 | 1,329,671 | ||||||
Coca-Cola Company | ||||||||
| 1,320,000 | 0.100%, 09/08/2014 | 1,319,747 | ||||||
| 1,340,000 | 0.180%, 09/17/2014 | 1,339,477 | ||||||
The accompanying Notes to Financial Statements are an integral part of this schedule.
287
Table of Contents
Money Market Portfolio
Schedule of Investments as of June 30, 2014
(unaudited)
| Principal Amount | Other Commercial Paper (16.8%)a | Value | ||||||
Emerson Electric Company | ||||||||
| $1,320,000 | 0.110%, 07/15/2014 | $ | 1,319,944 | |||||
| 1,320,000 | 0.100%, 07/25/2014 | 1,319,912 | ||||||
John Deere Financial, Ltd. | ||||||||
| 1,320,000 | 0.090%, 07/15/2014 | 1,319,954 | ||||||
Long Island Power Authority | ||||||||
| 1,350,000 | 0.160%, 08/13/2014 | 1,350,000 | ||||||
Proctor & Gamble Company | ||||||||
| 3,500,000 | 0.050%, 07/01/2014 | 3,500,000 | ||||||
| 1,310,000 | 0.090%, 07/31/2014 | 1,309,902 | ||||||
| 1,320,000 | 0.120%, 09/12/2014 | 1,319,679 | ||||||
Reckitt Benckiser Treasury Services plc | ||||||||
| 1,420,000 | 0.350%, 09/12/2014c | 1,418,992 | ||||||
Schlumberger Investment SA | ||||||||
| 1,320,000 | 0.120%, 09/16/2014 | 1,319,661 | ||||||
Wal-Mart Stores, Inc. | ||||||||
| 1,325,000 | 0.070%, 07/07/2014 | 1,324,985 | ||||||
|
| |||||||
| Total | 22,071,056 | |||||||
|
| |||||||
Other Note (8.8%)a | ||||||||
Bank of New York Mellon Corporation | ||||||||
| 1,875,000 | 0.498%, 07/28/2014d | 1,875,388 | ||||||
| 1,150,000 | 1.077%, 11/24/2014d | 1,153,804 | ||||||
General Electric Capital Corporation | ||||||||
| 1,130,000 | 4.750%, 09/15/2014b | 1,140,642 | ||||||
John Deere Capital Corporation | ||||||||
| 1,150,000 | 0.330%, 10/08/2014d | 1,150,270 | ||||||
Nederlandse Waterschapsbank NV | ||||||||
| 1,480,000 | 0.278%, 10/27/2014c,d | 1,480,152 | ||||||
Royal Bank of Canada | ||||||||
| 1,400,000 | 0.328%, 07/03/2014d | 1,400,000 | ||||||
| 700,000 | 0.280%, 07/07/2015c,d | 700,000 | ||||||
Target Corporation | ||||||||
| 708,000 | 0.398%, 07/18/2014d | 708,076 | ||||||
| 500,000 | 1.125%, 07/18/2014 | 500,229 | ||||||
Wells Fargo Bank NA | ||||||||
| 1,370,000 | 0.321%, 07/15/2015d | 1,370,000 | ||||||
|
| |||||||
| Total | 11,478,561 | |||||||
|
| |||||||
Variable Rate Demand Note (1.5%)a | ||||||||
Louisiana Housing Finance Agency Qualified Gulf Opportunity Zone Bonds (Canterbury House Apartments - Sherwood) | ||||||||
| 1,940,000 | 0.060%, 07/07/2014d | 1,940,000 | ||||||
|
| |||||||
| Total | 1,940,000 | |||||||
|
| |||||||
| Total Investments (at amortized cost) 100.3% | $ | 131,059,593 | ||||||
|
| |||||||
| Other Assets and Liabilities, Net (0.3)% | (356,866 | ) | ||||||
|
| |||||||
| Total Net Assets 100.0% | $ | 130,702,727 | ||||||
|
| |||||||
| a | The interest rate shown reflects the yield, coupon rate or the discount rate at the date of purchase. |
| b | Denotes investments that benefit from credit enhancement or liquidity support provided by a third party bank, institution or government. |
| c | Denotes securities sold under Rule 144A of the Securities Act of 1933, which exempts them from registration. These securities have been deemed liquid and may be resold to other dealers in the program or to other qualified institutional buyers. As of June 30, 2014, the value of these investments was $10,479,165 or 8.0% of total net assets. |
| d | Denotes variable rate securities. Variable rate securities are securities whose yields vary with a designated market index or market rate. The rate shown is as of June 30, 2014. |
Cost for federal income tax purposes | $ | 131,059,593 |
The accompanying Notes to Financial Statements are an integral part of this schedule.
288
Table of Contents
Money Market Portfolio
Schedule of Investments as of June 30, 2014
(unaudited)
Fair Valuation Measurements
The following table is a summary of the inputs used, as of June 30, 2014, in valuing Money Market Portfolio’s assets carried at fair value or amortized cost, which approximates fair value.
Investments in Securities | Total | Level 1 | Level 2 | Level 3 | ||||||||||||
Asset Backed Commercial Paper | 23,441,305 | — | 23,441,305 | — | ||||||||||||
Certificate of Deposit | 13,635,507 | — | 13,635,507 | — | ||||||||||||
Financial Company Commercial Paper | 19,983,642 | — | 19,983,642 | — | ||||||||||||
Government Agency Debt | 28,656,485 | — | 28,656,485 | — | ||||||||||||
Investment Company | 9,853,037 | 9,853,037 | — | — | ||||||||||||
Other Commercial Paper | 22,071,056 | — | 22,071,056 | —�� | ||||||||||||
Other Note | 11,478,561 | — | 11,478,561 | — | ||||||||||||
Variable Rate Demand Note | 1,940,000 | — | 1,940,000 | — | ||||||||||||
|
|
|
|
|
|
|
| |||||||||
Total | $ | 131,059,593 | $ | 9,853,037 | $ | 121,206,556 | $ | — | ||||||||
|
|
|
|
|
|
|
| |||||||||
There were no significant transfers between Levels during the period ended June 30, 2014. Transfers between Levels are identified as of the end of the period.
The accompanying Notes to Financial Statements are an integral part of this schedule.
289
Table of Contents
Statement of Assets and Liabilities
As of June 30, 2014 (unaudited) | Aggressive Allocation Portfolio | Moderately Aggressive Allocation Portfolio | Moderate Allocation Portfolio | Moderately Conservative Allocation Portfolio | ||||||||||||
Assets | ||||||||||||||||
Investments at cost | $ | 745,694,707 | $ | 4,253,024,139 | $ | 7,935,759,775 | $ | 3,640,356,420 | ||||||||
Investments in securities at value | 448,726,868 | 2,761,764,924 | 5,534,002,403 | 2,638,422,241 | ||||||||||||
Investments in affiliates at value | 433,465,311 | 2,133,170,707 | 3,229,540,113 | 1,281,973,642 | ||||||||||||
Investments at Value | 882,192,179 | 4,894,935,631 | 8,763,542,516 | 3,920,395,883 | ||||||||||||
Cash | 5,892,095 | (a) | 6,868,141 | (b) | 4,105,218 | (c) | 2,273,717 | (d) | ||||||||
Dividends and interest receivable | 466,511 | 4,273,796 | 10,389,743 | 7,139,508 | ||||||||||||
Prepaid expenses | 6,383 | 20,529 | 32,839 | 16,438 | ||||||||||||
Receivable for investments sold | 5,534,260 | 62,895,597 | 191,772,218 | 122,585,906 | ||||||||||||
Receivable for fund shares sold | 275,068 | 2,094,596 | 10,786,528 | 518 | ||||||||||||
Receivable for variation margin | 188,746 | 493,264 | 3,180,821 | 1,122,418 | ||||||||||||
Total Assets | 894,555,242 | 4,971,581,554 | 8,983,809,883 | 4,053,534,388 | ||||||||||||
Liabilities | ||||||||||||||||
Accrued expenses | 56,438 | 136,394 | 197,052 | 116,814 | ||||||||||||
Other liabilities | — | — | — | — | ||||||||||||
Payable for investments purchased | 19,781,410 | 259,054,928 | 732,177,620 | 523,030,950 | ||||||||||||
Payable upon return of collateral for securities loaned | — | 41,855,148 | 53,687,425 | 22,629,410 | ||||||||||||
Payable for fund shares redeemed | 244,811 | 278,591 | 930,958 | 815,412 | ||||||||||||
Payable for variation margin | 995,548 | 1,423,926 | 1,257,120 | 484,912 | ||||||||||||
Payable to affiliate | 341,050 | 1,712,397 | 2,950,692 | 1,258,474 | ||||||||||||
Mortgage dollar roll deferred revenue | 24,249 | 331,198 | 942,466 | 683,383 | ||||||||||||
Total Liabilities | 21,443,506 | 304,792,582 | 792,143,333 | 549,019,355 | ||||||||||||
Net Assets | ||||||||||||||||
Capital stock (beneficial interest) | 696,459,937 | 3,860,050,912 | 7,109,820,583 | 3,132,135,316 | ||||||||||||
Accumulated undistributed net investment income/(loss) | 5,103,129 | 35,911,106 | 69,332,458 | 36,021,164 | ||||||||||||
Accumulated undistributed net realized gain/(loss) | 38,250,324 | 133,020,446 | 184,958,976 | 58,819,699 | ||||||||||||
Net unrealized appreciation/(depreciation) on: | ||||||||||||||||
Investments | 79,960,190 | 282,438,067 | 376,566,713 | 141,944,238 | ||||||||||||
Affiliated investments | 56,537,282 | 359,473,425 | 451,216,028 | 138,095,225 | ||||||||||||
Futures contracts | (3,199,712 | ) | (4,109,233 | ) | (234,151 | ) | (2,502,071 | ) | ||||||||
Foreign currency transactions | 586 | 4,249 | 5,943 | 1,462 | ||||||||||||
Total Net Assets | $ | 873,111,736 | $ | 4,666,788,972 | $ | 8,191,666,550 | $ | 3,504,515,033 | ||||||||
Shares of beneficial interest outstanding | 56,871,169 | 318,571,328 | 593,487,197 | 273,410,792 | ||||||||||||
Net asset value per share | $ | 15.35 | $ | 14.65 | $ | 13.80 | $ | 12.82 | ||||||||
| (a) | Includes foreign currency holdings of $52,674 (cost $52,674). |
| (b) | Includes foreign currency holdings of $595,812 (cost $594,134). |
| (c) | Includes foreign currency holdings of $140,331 (cost $140,131). |
| (d) | Includes foreign currency holdings of $24,557 (cost $24,557). |
The accompanying Notes to Financial Statements are an integral part of this schedule.
290
Table of Contents
Thrivent Series Fund, Inc.
Statement of Assets and Liabilities – continued
| Growth and Income Plus Portfolio | Balanced Income Plus Portfolio | Diversified Income Plus Portfolio | Opportunity Income Plus Portfolio | Partner Technology Portfolio | Partner Healthcare Portfolio | Natural Resources Portfolio | ||||||||||||||||||||
| $ | 78,388,311 | $ | 297,582,514 | $ | 416,452,001 | $ | 62,111,883 | $ | 38,508,518 | $ | 58,686,593 | $ | 39,318,817 | |||||||||||||
| 72,527,469 | 291,110,866 | 383,913,064 | 56,347,748 | 49,596,419 | 71,606,487 | 39,258,504 | ||||||||||||||||||||
| 8,823,580 | 29,826,241 | 49,894,394 | 6,688,772 | 1,686,168 | 3,557,874 | 3,220,733 | ||||||||||||||||||||
| 81,351,049 | 320,937,107 | 433,807,458 | 63,036,520 | 51,282,587 | 75,164,361 | 42,479,237 | ||||||||||||||||||||
| — | �� | — | 10,371 | (e) | — | — | — | — | ||||||||||||||||||
| 218,337 | 942,304 | 1,994,965 | 303,098 | 18,663 | 133,381 | 52,809 | ||||||||||||||||||||
| 3,437 | 4,262 | 4,646 | 3,358 | 3,349 | 3,408 | 3,294 | ||||||||||||||||||||
| 831,786 | 7,265,736 | 7,716,472 | 2,270,021 | — | — | — | ||||||||||||||||||||
| 144,215 | 124,587 | 946,546 | 75,756 | 38,178 | 232,761 | 69,239 | ||||||||||||||||||||
| 5,098 | 14,319 | 24,444 | 5,438 | — | — | — | ||||||||||||||||||||
| 82,553,922 | 329,288,315 | 444,504,902 | 65,694,191 | 51,342,777 | 75,533,911 | 42,604,579 | ||||||||||||||||||||
| 35,988 | 105,872 | 67,484 | 33,333 | 29,697 | 24,301 | 22,859 | ||||||||||||||||||||
| 364 | (f) | 3,346 | — | 723 | — | — | — | |||||||||||||||||||
| 4,208,128 | 24,554,831 | 28,600,086 | 8,219,806 | — | — | — | ||||||||||||||||||||
| — | 7,684,215 | 3,372,821 | — | — | — | 2,085,000 | ||||||||||||||||||||
| 1,630 | 140,732 | 24,126 | 16,292 | 4,884 | 2,526 | 16,637 | ||||||||||||||||||||
| 313 | 4,766 | 54,780 | 937 | — | — | — | ||||||||||||||||||||
| 38,898 | 148,083 | 150,841 | 29,719 | 39,272 | 64,962 | 29,866 | ||||||||||||||||||||
| 3,952 | 24,358 | 26,065 | 9,922 | — | — | — | ||||||||||||||||||||
| 4,289,273 | 32,666,203 | 32,296,203 | 8,310,732 | 73,853 | 91,789 | 2,154,362 | ||||||||||||||||||||
| 71,202,806 | 264,838,165 | 379,818,531 | 57,938,038 | 36,610,893 | 56,159,921 | 39,560,789 | ||||||||||||||||||||
| 869,167 | 3,110,511 | 7,284,285 | 349 | (103,742 | ) | 250,173 | 109,792 | |||||||||||||||||||
| 3,193,342 | 5,251,146 | 7,856,096 | (1,477,393 | ) | 1,987,704 | 2,552,656 | (2,380,784 | ) | ||||||||||||||||||
| 2,962,738 | 23,354,593 | 17,355,457 | 924,637 | 12,774,069 | 16,477,768 | 3,160,420 | ||||||||||||||||||||
| — | — | — | — | — | — | — | ||||||||||||||||||||
| 35,887 | 67,697 | (107,414 | ) | (2,172 | ) | — | — | — | ||||||||||||||||||
| 709 | — | 1,744 | — | — | 1,604 | — | ||||||||||||||||||||
| $78,264,649 | $ | 296,622,112 | $ | 412,208,699 | $ | 57,383,459 | $ | 51,268,924 | $ | 75,442,122 | $ | 40,450,217 | ||||||||||||||
| 7,224,224 | 20,168,374 | 51,809,436 | 5,541,816 | 5,083,563 | 4,084,574 | 4,768,785 | ||||||||||||||||||||
| $ | 10.83 | $ | 14.71 | $ | 7.96 | $ | 10.35 | $ | 10.09 | $ | 18.47 | $ | 8.48 | |||||||||||||
| (e) | Includes foreign currency holdings of $12,103 (cost $12,027). |
| (f) | Includes foreign currency holdings of ($262) (cost ($261)). |
The accompanying Notes to Financial Statements are an integral part of this schedule.
291
Table of Contents
Thrivent Series Fund, Inc.
Statement of Assets and Liabilities – continued
As of June 30, 2014 (unaudited) | Partner Emerging Markets Equity Portfolio | Real Estate Securities Portfolio | Partner Small Cap Growth Portfolio | Partner Small Cap Value Portfolio | ||||||||||||
Assets | ||||||||||||||||
Investments at cost | $ | 60,149,376 | $ | 135,566,438 | $ | 300,270,134 | $ | 254,451,051 | ||||||||
Investments in securities at value | 66,862,506 | 140,050,362 | 328,426,373 | 380,149,715 | ||||||||||||
Investments in affiliates at value | 3,331,811 | 581,516 | 41,959,785 | 20,272,659 | ||||||||||||
Investments at Value | 70,194,317 | 140,631,878 | 370,386,158 | 400,422,374 | ||||||||||||
Cash | 14,535 | (a) | — | — | — | |||||||||||
Initial margin deposit on open futures contracts | — | — | — | — | ||||||||||||
Dividends and interest receivable | 168,078 | 473,756 | 112,558 | 301,371 | ||||||||||||
Prepaid expenses | 3,392 | 3,660 | 4,480 | 4,667 | ||||||||||||
Receivable for investments sold | 46,722 | 352,865 | 1,212,389 | 688,369 | ||||||||||||
Receivable for fund shares sold | 45,722 | 93,158 | 1,968 | 37,561 | ||||||||||||
Unrealized gain on forward contracts | — | — | — | — | ||||||||||||
Receivable for variation margin | — | — | — | — | ||||||||||||
Total Assets | 70,472,766 | 141,555,317 | 371,717,553 | 401,454,342 | ||||||||||||
Liabilities | ||||||||||||||||
Accrued expenses | 62,174 | 60,138 | 53,805 | 59,883 | ||||||||||||
Other liabilities | — | 60 | — | 4,668 | (b) | |||||||||||
Payable for investments purchased | 32,941 | 150,750 | — | 2,301,736 | ||||||||||||
Payable upon return of collateral for securities loaned | 2,480,650 | — | 31,529,995 | 7,097,096 | ||||||||||||
Payable for fund shares redeemed | 20,343 | 51,907 | 11,995 | 63,842 | ||||||||||||
Unrealized loss on forward contracts | — | — | — | — | ||||||||||||
Payable for variation margin | — | — | — | — | ||||||||||||
Payable to affiliate | 69,193 | 104,424 | 262,492 | 274,056 | ||||||||||||
Total Liabilities | 2,665,301 | 367,279 | 31,858,287 | 9,801,281 | ||||||||||||
Net Assets | ||||||||||||||||
Capital stock (beneficial interest) | 58,004,892 | 132,668,737 | 252,102,635 | 229,244,324 | ||||||||||||
Accumulated undistributed net investment income/(loss) | 322,861 | 1,530,922 | (937,813 | ) | 423,936 | |||||||||||
Accumulated undistributed net realized gain/(loss) | (565,154 | ) | 1,922,965 | 18,578,420 | 16,013,363 | |||||||||||
Net unrealized appreciation/(depreciation) on: | ||||||||||||||||
Investments | 10,044,941 | 5,065,440 | 70,116,024 | 145,971,323 | ||||||||||||
Futures contracts | — | — | — | — | ||||||||||||
Foreign currency forward contracts | — | — | — | — | ||||||||||||
Foreign currency transactions | (75 | ) | (26 | ) | — | 115 | ||||||||||
Total Net Assets | $ | 67,807,465 | $ | 141,188,038 | $ | 339,859,266 | $ | 391,653,061 | ||||||||
Shares of beneficial interest outstanding | 5,124,848 | 6,891,437 | 20,174,289 | 13,919,855 | ||||||||||||
Net asset value per share | $ | 13.23 | $ | 20.49 | $ | 16.85 | $ | 28.14 | ||||||||
| (a) | Includes foreign currency holdings of $14,535 (cost $14,470). |
| (b) | Includes foreign currency holdings of ($4,668) (cost ($4,668)). |
The accompanying Notes to Financial Statements are an integral part of this schedule.
292
Table of Contents
Thrivent Series Fund, Inc.
Statement of Assets and Liabilities – continued
| Small Cap Stock Portfolio | Small Cap Index Portfolio | Mid Cap Growth Portfolio | Partner Mid Cap Value Portfolio | Mid Cap Stock Portfolio | Mid Cap Index Portfolio | Partner Worldwide Allocation Portfolio | ||||||||||||||||||||
| $ | 315,684,157 | $ | 187,349,457 | $ | 324,637,966 | $ | 317,455,592 | $ | 573,201,107 | $ | 98,056,314 | �� | $ | 1,647,111,147 | ||||||||||||
| 338,939,714 | 252,916,886 | 400,428,467 | 374,874,142 | 681,875,040 | 126,316,499 | 1,726,940,468 | ||||||||||||||||||||
| 38,709,903 | 31,273,665 | 29,187,572 | 8,415,523 | 105,591,773 | 17,100,931 | 99,597,364 | ||||||||||||||||||||
| 377,649,617 | 284,190,551 | 429,616,039 | 383,289,665 | 787,466,813 | 143,417,430 | 1,826,537,832 | ||||||||||||||||||||
| 4,282,307 | (c) | — | 1,516,462 | 4,870 | 1,743,791 | — | 10,834,366 | (d) | ||||||||||||||||||
| — | — | — | — | — | — | 555,470 | ||||||||||||||||||||
| 179,993 | 252,408 | 62,984 | 541,300 | 550,411 | 107,937 | 6,806,517 | ||||||||||||||||||||
| 4,538 | 4,182 | 4,775 | 4,583 | 5,912 | 3,660 | 9,885 | ||||||||||||||||||||
| 1,864,692 | 2,682,939 | 4,988,947 | 4,949,288 | 5,027,796 | 1,763,095 | 13,084,938 | ||||||||||||||||||||
| 2,003 | 172,817 | 86,147 | 120,538 | 4,632 | 131,589 | 75,378 | ||||||||||||||||||||
| — | — | — | — | — | — | 329,028 | ||||||||||||||||||||
| 58,100 | 79,719 | — | — | — | 46,817 | 226,316 | ||||||||||||||||||||
| 384,041,250 | 287,382,616 | 436,275,354 | 388,910,244 | 794,799,355 | 145,470,528 | 1,858,459,730 | ||||||||||||||||||||
| 74,421 | 77,381 | 118,159 | 51,902 | 89,770 | 36,878 | 360,028 | ||||||||||||||||||||
| — | — | — | — | — | — | — | ||||||||||||||||||||
| 2,431,476 | 1,540,707 | 2,611,376 | 3,151,893 | 2,938,750 | 545,163 | 15,023,964 | ||||||||||||||||||||
| 24,129,625 | 19,992,565 | 18,528,527 | — | 51,144,300 | 7,711,914 | 65,064,207 | ||||||||||||||||||||
| 51,524 | 55,971 | 203,938 | 2,730 | 73,265 | 31,649 | 141,934 | ||||||||||||||||||||
| — | — | — | — | — | — | 481,055 | ||||||||||||||||||||
| — | — | — | — | — | — | 239,011 | ||||||||||||||||||||
| 214,316 | 87,602 | 152,900 | 246,589 | 427,031 | 48,647 | 1,280,030 | ||||||||||||||||||||
| 26,901,362 | 21,754,226 | 21,614,900 | 3,453,114 | 54,673,116 | 8,374,251 | 82,590,229 | ||||||||||||||||||||
| 269,737,475 | 161,329,177 | 285,415,768 | 289,524,811 | 476,239,791 | 89,873,195 | 1,680,888,650 | ||||||||||||||||||||
| 387,684 | 1,011,577 | 544,266 | 1,263,574 | 2,827,757 | 593,777 | 24,221,810 | ||||||||||||||||||||
| 24,943,038 | 6,148,163 | 23,722,347 | 28,834,672 | 46,792,985 | 1,063,810 | (108,406,008 | ) | |||||||||||||||||||
| 61,965,460 | 96,841,094 | 104,978,073 | 65,834,073 | 214,265,706 | 45,361,116 | 179,426,685 | ||||||||||||||||||||
| 106,939 | 298,379 | — | — | — | 204,379 | (166,099 | ) | |||||||||||||||||||
| — | — | — | — | — | — | (152,027 | ) | |||||||||||||||||||
| (708 | ) | — | — | — | — | — | 56,490 | |||||||||||||||||||
| $357,139,888 | $ | 265,628,390 | $ | 414,660,454 | $ | 385,457,130 | $ | 740,126,239 | $ | 137,096,277 | $ | 1,775,869,501 | ||||||||||||||
| 19,842,817 | 15,574,563 | 17,622,012 | 22,202,970 | 39,979,402 | 8,548,396 | 173,360,583 | ||||||||||||||||||||
| $ | 18.00 | $ | 17.06 | $ | 23.53 | $ | 17.36 | $ | 18.51 | $ | 16.04 | $ | 10.24 | |||||||||||||
| (c) | Includes foreign currency holdings of $336,577 (cost $336,577). |
| (d) | Includes foreign currency holdings of $8,507,024 (cost $8,507,774). |
The accompanying Notes to Financial Statements are an integral part of this schedule.
293
Table of Contents
Thrivent Series Fund, Inc.
Statement of Assets and Liabilities – continued
As of June 30, 2014 (unaudited) | Partner All Cap Portfolio | Large Cap Growth Portfolio | Partner Growth Stock Portfolio | Large Cap Value Portfolio | ||||||||||||
Assets | ||||||||||||||||
Investments at cost | $ | 61,089,466 | $ | 831,530,115 | $ | 47,968,859 | $ | 881,061,592 | ||||||||
Investments in securities at value | 66,150,653 | 1,033,696,914 | 79,033,221 | 1,164,399,848 | ||||||||||||
Investments in affiliates at value | 1,367,844 | 66,394,437 | 2,539,975 | 52,525,819 | ||||||||||||
Investments at Value | 67,518,497 | 1,100,091,351 | 81,573,196 | 1,216,925,667 | ||||||||||||
Cash | — | — | 2,573 | (a) | — | |||||||||||
Dividends and interest receivable | 50,420 | 754,078 | 24,468 | 1,570,081 | ||||||||||||
Prepaid expenses | 3,406 | 7,257 | 3,456 | 7,616 | ||||||||||||
Receivable for investments sold | — | 4,070,932 | 149,913 | 2,348,362 | ||||||||||||
Receivable for fund shares sold | 435 | 124,723 | — | 92,168 | ||||||||||||
Receivable for variation margin | — | 47,816 | — | — | ||||||||||||
Total Assets | 67,572,758 | 1,105,096,157 | 81,753,606 | 1,220,943,894 | ||||||||||||
Liabilities | ||||||||||||||||
Accrued expenses | 34,023 | 298,289 | 33,335 | 143,935 | ||||||||||||
Other liabilities | — | — | — | — | ||||||||||||
Payable for investments purchased | 60,967 | 4,578,374 | 46,917 | — | ||||||||||||
Payable upon return of collateral for securities loaned | 574,887 | 13,227,700 | 2,055,325 | 40,273,125 | ||||||||||||
Payable for fund shares redeemed | 55,674 | 432,978 | 14,646 | 147,616 | ||||||||||||
Payable for variation margin | — | 31,957 | — | — | ||||||||||||
Payable to affiliate | 43,248 | 389,161 | 54,715 | 622,629 | ||||||||||||
Mortgage dollar roll deferred revenue | — | — | — | — | ||||||||||||
Total Liabilities | 768,799 | 18,958,459 | 2,204,938 | 41,187,305 | ||||||||||||
Net Assets | ||||||||||||||||
Capital stock (beneficial interest) | 53,897,213 | 932,431,149 | 41,295,278 | 831,323,758 | ||||||||||||
Accumulated undistributed net investment income/(loss) | 139,118 | 2,976,543 | (82,290 | ) | 7,233,666 | |||||||||||
Accumulated undistributed net realized gain/(loss) | 6,338,597 | (117,523,975 | ) | 4,731,240 | 5,335,090 | |||||||||||
Net unrealized appreciation/(depreciation) on: | ||||||||||||||||
Investments | 6,429,031 | 268,561,236 | 33,604,337 | 335,864,075 | ||||||||||||
Futures contracts | — | (309,769 | ) | — | — | |||||||||||
Foreign currency transactions | — | 2,514 | 103 | — | ||||||||||||
Swap agreements | — | — | — | — | ||||||||||||
Total Net Assets | $ | 66,803,959 | $ | 1,086,137,698 | $ | 79,548,668 | $ | 1,179,756,589 | ||||||||
Shares of beneficial interest outstanding | 5,016,698 | 40,128,591 | 4,500,022 | 72,304,187 | ||||||||||||
Net asset value per share | $ | 13.32 | $ | 27.07 | $ | 17.68 | $ | 16.32 | ||||||||
| (a) | Includes foreign currency holdings of $2,573 (cost $2,546). |
The accompanying Notes to Financial Statements are an integral part of this schedule.
294
Table of Contents
Thrivent Series Fund, Inc.
Statement of Assets and Liabilities – continued
| Large Cap Stock Portfolio | Large Cap Index Portfolio | High Yield Portfolio | Income Portfolio | Bond Index Portfolio | Limited Maturity Bond Portfolio | Money Market Portfolio | ||||||||||||||||||||
| $ | 726,430,032 | $ | 248,778,725 | $ | 969,148,973 | $ | 1,449,427,951 | $ | 191,623,132 | $ | 1,121,928,822 | $ | 131,059,593 | |||||||||||||
| 806,455,184 | 410,612,476 | 920,378,758 | 1,412,384,202 | 151,642,487 | 1,068,236,732 | 131,059,593 | ||||||||||||||||||||
| 59,879,891 | 10,031,237 | 88,474,878 | 103,943,393 | 41,858,270 | 54,086,801 | — | ||||||||||||||||||||
| 866,335,075 | 420,643,713 | 1,008,853,636 | 1,516,327,595 | 193,500,757 | 1,122,323,533 | 131,059,593 | * | |||||||||||||||||||
| 1,361,732 | (b) | 208 | 223,264 | — | — | 783,610 | 5,182 | |||||||||||||||||||
| 1,471,466 | 436,088 | 14,042,062 | 14,071,720 | 636,900 | 3,752,245 | 39,758 | ||||||||||||||||||||
| 6,370 | 4,708 | 6,831 | 8,762 | 3,735 | 7,350 | 3,673 | ||||||||||||||||||||
| 6,918,248 | — | 2,932,934 | 31,274,661 | 17,952,695 | 30,179,683 | — | ||||||||||||||||||||
| 1,364 | 298,947 | 88,262 | 3,087 | 8,137 | 2,828 | 5,844 | ||||||||||||||||||||
| 61,372 | 1,410 | — | 186,704 | — | 22,695 | — | ||||||||||||||||||||
| 876,155,627 | 421,385,074 | 1,026,146,989 | 1,561,872,529 | 212,102,224 | 1,157,071,944 | 131,114,050 | ||||||||||||||||||||
| 160,635 | 111,409 | 153,906 | 226,042 | 62,393 | 172,124 | 14,571 | ||||||||||||||||||||
| — | — | — | 629 | — | — | — | ||||||||||||||||||||
| 6,402,562 | 327,010 | 10,705,637 | 73,275,341 | 62,830,857 | 77,643,081 | — | ||||||||||||||||||||
| 14,482,831 | 2,954,940 | 59,092,687 | 23,912,185 | — | 4,993,550 | — | ||||||||||||||||||||
| 171,794 | 335,682 | 227,903 | 228,572 | 41,592 | 383,797 | 382,360 | ||||||||||||||||||||
| 40,993 | — | 2,000 | 119,965 | — | 94,804 | — | ||||||||||||||||||||
| 464,667 | 129,366 | 345,941 | 524,853 | 53,285 | 388,232 | 14,392 | ||||||||||||||||||||
| — | — | — | 86,020 | 85,747 | 86,647 | — | ||||||||||||||||||||
| 21,723,482 | 3,858,407 | 70,528,074 | 98,373,607 | 63,073,874 | 83,762,235 | 411,323 | ||||||||||||||||||||
| 648,403,415 | 257,388,939 | 991,387,431 | 1,380,055,480 | 148,899,422 | 1,078,562,747 | 130,702,727 | ||||||||||||||||||||
| 5,269,053 | 3,262,215 | 316,906 | 30,495 | (602 | ) | 839,485 | (2,575 | ) | ||||||||||||||||||
| 61,241,174 | (15,083,059 | ) | (75,711,085 | ) | 16,799,323 | (1,748,095 | ) | (6,507,462 | ) | 2,575 | ||||||||||||||||
| 139,905,043 | 171,864,988 | 39,704,663 | 66,899,644 | 1,877,625 | 394,711 | — | ||||||||||||||||||||
| (394,865 | ) | 93,584 | (79,000 | ) | 67,253 | — | 485,856 | — | ||||||||||||||||||
| 8,325 | — | — | — | — | — | — | ||||||||||||||||||||
| — | — | — | (353,273 | ) | — | (465,628 | ) | — | ||||||||||||||||||
| $854,432,145 | $ | 417,526,667 | $ | 955,618,915 | $ | 1,463,498,922 | $ | 149,028,350 | $ | 1,073,309,709 | $ | 130,702,727 | ||||||||||||||
| 68,453,842 | 15,384,043 | 184,884,096 | 137,955,620 | 13,716,675 | 108,586,914 | 130,702,727 | ||||||||||||||||||||
| $ | 12.48 | $ | 27.14 | $ | 5.17 | $ | 10.61 | $ | 10.86 | $ | 9.88 | $ | 1.00 | |||||||||||||
| * | Securities held by this fund are valued on the basis of amortized cost, which approximates market value. |
| (b) | Includes foreign currency holdings of $1,361,732 (cost $1,357,787). |
The accompanying Notes to Financial Statements are an integral part of this schedule.
295
Table of Contents
Statement of Operations
For the six months ended June 30, 2014 (unaudited) | Aggressive Allocation Portfolio | Moderately Aggressive Allocation Portfolio | Moderate Allocation Portfolio | Moderately Conservative Allocation Portfolio | ||||||||||||
Investment Income | ||||||||||||||||
Dividends | $ | 2,302,445 | $ | 9,334,233 | $ | 13,290,475 | $ | 4,821,855 | ||||||||
Interest | 243,954 | 9,027,546 | 23,461,391 | 15,399,075 | ||||||||||||
Income from mortgage dollar rolls | 256,906 | 2,674,709 | 7,181,173 | 6,319,909 | ||||||||||||
Income from securities loaned | — | 125,037 | 184,633 | 82,832 | ||||||||||||
Income from affiliated investments | 4,233,476 | 24,635,202 | 41,695,861 | 16,824,438 | ||||||||||||
Foreign tax withholding | (28,746 | ) | (169,544 | ) | (243,773 | ) | (63,186 | ) | ||||||||
Total Investment Income | 7,008,035 | 45,627,183 | 85,569,760 | 43,384,923 | ||||||||||||
Expenses | ||||||||||||||||
Adviser fees | 1,759,157 | 9,064,112 | 15,238,006 | 6,815,498 | ||||||||||||
Sub-Adviser fees | — | — | — | — | ||||||||||||
Administrative service fees | 115,569 | 445,853 | 736,188 | 352,349 | ||||||||||||
Audit and legal fees | 13,318 | 22,361 | 30,170 | 20,051 | ||||||||||||
Custody fees | 27,328 | 86,367 | 115,828 | 56,120 | ||||||||||||
Insurance expenses | 4,011 | 12,308 | 19,762 | 10,652 | ||||||||||||
Directors’ fees | 9,988 | 40,618 | 72,116 | 37,535 | ||||||||||||
Other expenses | 7,566 | 28,390 | 29,888 | 20,143 | ||||||||||||
Total Expenses Before Reimbursement | 1,936,937 | 9,700,009 | 16,241,958 | 7,312,348 | ||||||||||||
Less: | ||||||||||||||||
Reimbursement from adviser | — | — | — | — | ||||||||||||
Total Net Expenses | 1,936,937 | 9,700,009 | 16,241,958 | 7,312,348 | ||||||||||||
Net Investment Income/(Loss) | 5,071,098 | 35,927,174 | 69,327,802 | 36,072,575 | ||||||||||||
Realized and Unrealized Gains/(Losses) | ||||||||||||||||
Net realized gains/(losses) on: | ||||||||||||||||
Investments | 16,288,192 | 55,773,026 | 72,965,671 | 27,936,315 | ||||||||||||
Affiliated investments | 122,320 | (19,801 | ) | (17,416 | ) | (189,941 | ) | |||||||||
Distributions of realized capital gains from affiliated investments | 14,542,071 | 44,927,633 | 50,112,962 | 12,609,425 | ||||||||||||
Futures contracts | 9,759,604 | 48,891,537 | 88,222,510 | 29,699,147 | ||||||||||||
Foreign currency and forward contract transactions | (8,914 | ) | (37,764 | ) | (59,903 | ) | (22,884 | ) | ||||||||
Swap agreements | — | — | — | — | ||||||||||||
Change in net unrealized appreciation/(depreciation) on: | ||||||||||||||||
Investments | 4,100,510 | 34,596,292 | 69,585,842 | 39,575,118 | ||||||||||||
Affiliated investments | (420,178 | ) | 39,214,892 | 57,493,664 | 22,195,750 | |||||||||||
Futures contracts | (4,642,014 | ) | (15,033,550 | ) | (21,134,117 | ) | (10,640,882 | ) | ||||||||
Foreign currency transactions | (1,004 | ) | (3,339 | ) | (5,175 | ) | (2,317 | ) | ||||||||
Swap agreements | — | — | — | — | ||||||||||||
Net Realized and Unrealized Gains/(Losses) | 39,740,587 | 208,308,926 | 317,164,038 | 121,159,731 | ||||||||||||
Net Increase/(Decrease) in Net Assets Resulting From Operations | $ | 44,811,685 | $ | 244,236,100 | $ | 386,491,840 | $ | 157,232,306 | ||||||||
The accompanying Notes to Financial Statements are an integral part of this schedule.
296
Table of Contents
Thrivent Series Fund, Inc.
Statement of Operations – continued
Growth and Income Plus Portfolio | Balanced Income Plus Portfolio | Diversified Income Plus Portfolio | Opportunity Income Plus Portfolio | Partner Technology Portfolio | Partner Healthcare Portfolio | Natural Resources Portfolio | ||||||||||||||||||||
| $ | 835,365 | $ | 1,520,678 | $ | 2,980,794 | $ | 74,104 | $ | 164,144 | $ | 708,950 | $ | 297,312 | |||||||||||||
| 326,986 | 2,365,099 | 5,125,429 | 918,022 | — | — | — | ||||||||||||||||||||
| 33,104 | 192,063 | 210,534 | 63,427 | — | — | — | ||||||||||||||||||||
| — | 2,849 | 9,428 | — | — | — | 8,445 | ||||||||||||||||||||
| 2,060 | 5,851 | 9,800 | 1,661 | 302 | 840 | 176 | ||||||||||||||||||||
| (36,647 | ) | (31,810 | ) | (85,229 | ) | — | — | (80,376 | ) | (7,351 | ) | |||||||||||||||
| 1,160,868 | 4,054,730 | 8,250,756 | 1,057,214 | 164,446 | 629,414 | 298,582 | ||||||||||||||||||||
| 229,665 | 772,775 | 761,034 | 129,607 | 73,047 | 94,260 | 134,937 | ||||||||||||||||||||
| — | — | — | — | 109,587 | 202,105 | — | ||||||||||||||||||||
| 46,537 | 65,993 | 75,198 | 44,796 | 44,505 | 45,837 | 43,328 | ||||||||||||||||||||
| 11,378 | 13,457 | 12,167 | 11,331 | 11,335 | 11,301 | 10,951 | ||||||||||||||||||||
| 27,793 | 15,027 | 41,639 | 9,538 | 3,032 | 5,254 | 1,641 | ||||||||||||||||||||
| 2,264 | 2,771 | 2,928 | 2,183 | 2,179 | 2,190 | 2,155 | ||||||||||||||||||||
| 3,314 | 10,123 | 9,354 | 3,507 | 3,527 | 3,273 | 3,273 | ||||||||||||||||||||
| 17,202 | 18,227 | 19,627 | 14,216 | 4,447 | 4,784 | 4,492 | ||||||||||||||||||||
| 338,153 | 898,373 | 921,947 | 215,178 | 251,659 | 369,004 | 200,777 | ||||||||||||||||||||
| (55,488 | ) | — | — | (14,206 | ) | — | — | (17,263 | ) | |||||||||||||||||
| 282,665 | 898,373 | 921,947 | 200,972 | 251,659 | 369,004 | 183,514 | ||||||||||||||||||||
| 878,203 | 3,156,357 | 7,328,809 | 856,242 | (87,213 | ) | 260,410 | 115,068 | |||||||||||||||||||
| 3,035,063 | 6,533,054 | 9,205,956 | 185,020 | 2,673,802 | 2,665,282 | 503,891 | ||||||||||||||||||||
| — | — | — | — | — | — | — | ||||||||||||||||||||
| — | — | — | — | — | — | — | ||||||||||||||||||||
| 282,453 | 467,895 | 1,137,938 | 59,508 | — | — | — | ||||||||||||||||||||
| (7,547 | ) | 935 | (17,012 | ) | — | — | (4,240 | ) | — | |||||||||||||||||
| — | — | — | 818 | — | — | — | ||||||||||||||||||||
| (1,608,727 | ) | 3,717,951 | 11,528 | 799,993 | (593,512 | ) | 6,770,767 | 4,045,725 | ||||||||||||||||||
| — | — | — | — | — | — | — | ||||||||||||||||||||
| (19,083 | ) | (41,254 | ) | (385,765 | ) | (2,172 | ) | — | — | — | ||||||||||||||||
| 709 | — | 1,744 | — | — | 42 | — | ||||||||||||||||||||
| — | — | — | (2,202 | ) | — | — | — | |||||||||||||||||||
| 1,682,868 | 10,678,581 | 9,954,389 | 1,040,965 | 2,080,290 | 9,431,851 | 4,549,616 | ||||||||||||||||||||
| $ | 2,561,071 | $ | 13,834,938 | $ | 17,283,198 | $ | 1,897,207 | $ | 1,993,077 | $ | 9,692,261 | $ | 4,664,684 | |||||||||||||
The accompanying Notes to Financial Statements are an integral part of this schedule.
297
Table of Contents
Thrivent Series Fund, Inc.
Statement of Operations – continued
For the six months ended June 30, 2014 (unaudited) | Partner Emerging Markets Equity Portfolio | Real Estate Securities Portfolio | Partner Small Cap Growth Portfolio | Partner Small Cap Value Portfolio | ||||||||||||
Investment Income | ||||||||||||||||
Dividends | $ | 914,234 | $ | 2,176,872 | $ | 730,147 | $ | 3,018,267 | ||||||||
Interest | — | — | — | — | ||||||||||||
Income from securities loaned | 3,007 | — | 46,335 | 26,789 | ||||||||||||
Income from affiliated investments | 363 | 246 | 2,088 | 2,378 | ||||||||||||
Foreign tax withholding | (93,052 | ) | (190 | ) | — | (2,208 | ) | |||||||||
Total Investment Income | 824,552 | 2,176,928 | 778,570 | 3,045,226 | ||||||||||||
Expenses | ||||||||||||||||
Adviser fees | 138,234 | 519,938 | 819,193 | 377,195 | ||||||||||||
Sub-Adviser fees | 219,796 | — | 832,408 | 1,130,487 | ||||||||||||
Administrative service fees | 45,633 | 52,023 | 70,555 | 74,865 | ||||||||||||
Audit and legal fees | 23,397 | 11,644 | 12,117 | 12,224 | ||||||||||||
Custody fees | 29,830 | 3,815 | 17,128 | 8,546 | ||||||||||||
Insurance expenses | 2,226 | 2,411 | 2,872 | 2,995 | ||||||||||||
Directors’ fees | 3,273 | 4,809 | 9,222 | 10,232 | ||||||||||||
Other expenses | 6,305 | 4,977 | 5,398 | 5,428 | ||||||||||||
Total Expenses Before Reimbursement | 468,694 | 599,617 | 1,768,893 | 1,621,972 | ||||||||||||
Less: | ||||||||||||||||
Reimbursement from adviser | (42,416 | ) | — | (165,160 | ) | — | ||||||||||
Total Net Expenses | 426,278 | 599,617 | 1,603,733 | 1,621,972 | ||||||||||||
Net Investment Income/(Loss) | 398,274 | 1,577,311 | (825,163 | ) | 1,423,254 | |||||||||||
Realized and Unrealized Gains/(Losses) | ||||||||||||||||
Net realized gains/(losses) on: | ||||||||||||||||
Investments | 109,575 | (a) | 1,948,810 | 18,854,135 | 16,768,005 | |||||||||||
Distributions of realized capital gains from affiliated investments | — | — | — | — | ||||||||||||
Futures contracts | — | — | — | — | ||||||||||||
Foreign currency and forward contract transactions | 4,532 | — | — | (3,044 | ) | |||||||||||
Change in net unrealized appreciation/(depreciation) on: | ||||||||||||||||
Investments | 3,841,377 | 17,482,483 | (21,201,412 | ) | (9,183,174 | ) | ||||||||||
Futures contracts | — | — | — | — | ||||||||||||
Foreign currency forward contracts | — | — | — | — | ||||||||||||
Foreign currency transactions | 885 | (6 | ) | — | 115 | |||||||||||
Net Realized and Unrealized Gains/(Losses) | 3,956,369 | 19,431,287 | (2,347,277 | ) | 7,581,902 | |||||||||||
Net Increase/(Decrease) in Net Assets Resulting From Operations | $ | 4,354,643 | $ | 21,008,598 | $ | (3,172,440 | ) | $ | 9,005,156 | |||||||
| (a) | Includes foreign capital gain taxes paid of $28,995. |
The accompanying Notes to Financial Statements are an integral part of this schedule.
298
Table of Contents
Thrivent Series Fund, Inc.
Statement of Operations – continued
Small Cap Stock Portfolio | Small Cap Index Portfolio | Mid Cap Growth Portfolio | Partner Mid Cap Value Portfolio | Mid Cap Stock Portfolio | Mid Cap Index Portfolio | Partner Worldwide Allocation Portfolio | ||||||||||||||||||||
| $1,688,165 | $ | 1,545,590 | $ | 1,574,740 | $ | 2,738,028 | $ | 5,482,456 | $ | 886,965 | $ | 32,457,579 | ||||||||||||||
| 181 | 92 | — | — | — | 137 | 3,978,582 | ||||||||||||||||||||
| 57,217 | 71,908 | 6,427 | — | 88,129 | 29,746 | 569,531 | ||||||||||||||||||||
| 5,056 | 2,604 | 3,158 | 1,388 | 9,618 | 1,728 | 6,788 | ||||||||||||||||||||
| (24,490 | ) | (87 | ) | (9,388 | ) | — | — | — | (2,988,035 | ) | ||||||||||||||||
| 1,726,129 | 1,620,107 | 1,574,937 | 2,739,416 | 5,580,203 | 918,576 | 34,024,445 | ||||||||||||||||||||
| 1,172,002 | 445,127 | 816,923 | 465,666 | 2,293,045 | 221,583 | 3,329,580 | ||||||||||||||||||||
| — | — | — | 844,404 | — | — | 3,738,080 | ||||||||||||||||||||
| 71,946 | 63,630 | 77,783 | 73,313 | 103,852 | 51,712 | 197,517 | ||||||||||||||||||||
| 12,145 | 11,903 | 12,328 | 12,499 | 12,992 | 11,533 | 21,771 | ||||||||||||||||||||
| 7,041 | 9,554 | 6,973 | 17,751 | 11,813 | 5,262 | 370,199 | ||||||||||||||||||||
| 2,925 | 2,692 | 3,067 | 2,937 | 3,742 | 2,363 | 6,342 | ||||||||||||||||||||
| 10,165 | 9,085 | 13,181 | 9,464 | 15,620 | 3,784 | 35,761 | ||||||||||||||||||||
| 5,066 | 6,737 | 5,361 | 5,129 | 5,987 | 5,818 | 48,683 | ||||||||||||||||||||
| 1,281,290 | 548,728 | 935,616 | 1,431,163 | 2,447,051 | 302,055 | 7,747,933 | ||||||||||||||||||||
| — | — | — | — | — | — | — | ||||||||||||||||||||
| 1,281,290 | 548,728 | 935,616 | 1,431,163 | 2,447,051 | 302,055 | 7,747,933 | ||||||||||||||||||||
| 444,839 | 1,071,379 | 639,321 | 1,308,253 | 3,133,152 | 616,521 | 26,276,512 | ||||||||||||||||||||
| 25,919,177 | 10,700,452 | 24,091,251 | 29,303,318 | 47,242,329 | 3,457,939 | 81,927,552 | (b) | |||||||||||||||||||
| — | — | — | — | — | — | 262,434 | ||||||||||||||||||||
| 208,035 | 414,151 | — | — | — | 499,838 | 179,589 | ||||||||||||||||||||
| (126 | ) | — | — | — | — | — | (53,759 | ) | ||||||||||||||||||
| (16,366,442 | ) | (4,242,582 | ) | (17,499,689 | ) | 70,337 | 16,313,863 | 4,532,681 | (35,282,356 | ) | ||||||||||||||||
| (1,088,051 | ) | (122,822 | ) | — | — | — | 54,981 | (748,480 | ) | |||||||||||||||||
| — | — | — | — | — | — | (170,629 | ) | |||||||||||||||||||
| (708 | ) | — | — | — | — | — | 20,904 | |||||||||||||||||||
| 8,671,885 | 6,749,199 | 6,591,562 | 29,373,655 | 63,556,192 | 8,545,439 | 46,135,255 | ||||||||||||||||||||
| $ | 9,116,724 | $ | 7,820,578 | $ | 7,230,883 | $ | 30,681,908 | $ | 66,689,344 | $ | 9,161,960 | $ | 72,411,767 | |||||||||||||
| (b) | Includes foreign capital gain taxes paid of $40,634. |
The accompanying Notes to Financial Statements are an integral part of this schedule.
299
Table of Contents
Thrivent Series Fund, Inc.
Statement of Operations – continued
For the six months ended June 30, 2014 (unaudited) | Partner All Cap Portfolio | Large Cap Growth Portfolio | Partner Growth Stock Portfolio | Large Cap Value Portfolio | ||||||||||||
Investment Income | ||||||||||||||||
Dividends | $ | 449,292 | $ | 5,627,333 | $ | 285,951 | $ | 11,070,169 | ||||||||
Interest | — | (6,076 | ) | — | — | |||||||||||
Income from mortgage dollar rolls | — | — | — | — | ||||||||||||
Income from securities loaned | 6,344 | 5,030 | 1,500 | 38,557 | ||||||||||||
Income from affiliated investments | 292 | 12,156 | 228 | 4,623 | ||||||||||||
Foreign tax withholding | — | (86,869 | ) | (1,429 | ) | (157,783 | ) | |||||||||
Total Investment Income | 455,928 | 5,551,574 | 286,250 | 10,955,566 | ||||||||||||
Expenses | ||||||||||||||||
Adviser fees | 111,734 | 2,095,125 | 152,866 | 3,365,045 | ||||||||||||
Sub-Adviser fees | 191,447 | — | 153,211 | — | ||||||||||||
Administrative service fees | 45,904 | 136,899 | 47,078 | 143,755 | ||||||||||||
Audit and legal fees | 11,435 | 13,998 | 11,414 | 14,163 | ||||||||||||
Custody fees | 14,569 | 14,877 | 13,766 | 13,544 | ||||||||||||
Insurance expenses | 2,222 | 4,651 | 2,248 | 4,813 | ||||||||||||
Directors’ fees | 3,502 | 29,658 | 3,569 | 24,512 | ||||||||||||
Other expenses | 4,920 | 6,684 | 5,041 | 6,745 | ||||||||||||
Total Expenses Before Reimbursement | 385,733 | 2,301,892 | 389,193 | 3,572,577 | ||||||||||||
Less: | ||||||||||||||||
Reimbursement from adviser | (82,552 | ) | — | (38,260 | ) | — | ||||||||||
Total Net Expenses | 303,181 | 2,301,892 | 350,933 | 3,572,577 | ||||||||||||
Net Investment Income/(Loss) | 152,747 | 3,249,682 | (64,683 | ) | 7,382,989 | |||||||||||
Realized and Unrealized Gains/(Losses) | ||||||||||||||||
Net realized gains/(losses) on: | ||||||||||||||||
Investments | 6,921,672 | 71,983,170 | 4,806,876 | 32,399,664 | ||||||||||||
Written option contracts | — | — | — | — | ||||||||||||
Futures contracts | — | 3,234,991 | — | — | ||||||||||||
Foreign currency and forward contract transactions | — | (7,407 | ) | (278 | ) | — | ||||||||||
Swap agreements | — | — | — | — | ||||||||||||
Change in net unrealized appreciation/(depreciation) on: | ||||||||||||||||
Investments | (3,636,968 | ) | (10,795,968 | ) | (2,844,952 | ) | 26,820,319 | |||||||||
Futures contracts | — | (1,539,140 | ) | — | — | |||||||||||
Foreign currency transactions | — | (538 | ) | 36 | — | |||||||||||
Swap agreements | — | — | — | — | ||||||||||||
Net Realized and Unrealized Gains/(Losses) | 3,284,704 | 62,875,108 | 1,961,682 | 59,219,983 | ||||||||||||
Net Increase/(Decrease) in Net Assets Resulting From Operations | $ | 3,437,451 | $ | 66,124,790 | $ | 1,896,999 | $ | 66,602,972 | ||||||||
The accompanying Notes to Financial Statements are an integral part of this schedule.
300
Table of Contents
Thrivent Series Fund, Inc.
Statement of Operations – continued
Large Cap Stock Portfolio | Large Cap Index Portfolio | High Yield Portfolio | Income Portfolio | Bond Index Portfolio | Limited Maturity Bond Portfolio | Money Market Portfolio | ||||||||||||||||||||
| $ | 8,395,415 | $ | 4,012,109 | $ | 208,810 | $ | 804,253 | $ | — | $ | 185,364 | $ | 3,715 | |||||||||||||
| (5,300 | ) | (70 | ) | 29,159,673 | 28,896,714 | 1,270,771 | 11,028,477 | 120,689 | ||||||||||||||||||
| — | — | — | 797,714 | 786,894 | 627,007 | — | ||||||||||||||||||||
| 26,128 | 3,602 | 73,524 | 15,768 | — | 4,616 | — | ||||||||||||||||||||
| 10,726 | 1,517 | 8,560 | 17,712 | 10,059 | 13,468 | — | ||||||||||||||||||||
| (299,603 | ) | (427 | ) | — | — | — | — | — | ||||||||||||||||||
| 8,127,366 | 4,016,731 | 29,450,567 | 30,532,161 | 2,067,724 | 11,858,932 | 124,404 | ||||||||||||||||||||
| 2,516,978 | 652,703 | 1,866,579 | 2,861,093 | 260,793 | 2,135,919 | 267,599 | ||||||||||||||||||||
| — | — | — | — | — | — | — | ||||||||||||||||||||
| 115,279 | 76,427 | 126,329 | 172,326 | 53,785 | 138,786 | 52,376 | ||||||||||||||||||||
| 13,724 | 15,136 | 13,634 | 14,933 | 11,607 | 14,052 | 11,358 | ||||||||||||||||||||
| 8,647 | 9,546 | 12,979 | 21,583 | 7,391 | 17,917 | 8,984 | ||||||||||||||||||||
| 4,079 | 3,025 | 4,529 | 6,044 | 2,502 | 5,067 | 2,427 | ||||||||||||||||||||
| 20,184 | 12,508 | 21,750 | 31,347 | 4,741 | 24,305 | 2,806 | ||||||||||||||||||||
| 11,728 | 6,624 | 15,446 | 17,994 | 11,420 | 16,443 | 6,523 | ||||||||||||||||||||
| 2,690,619 | 775,969 | 2,061,246 | 3,125,320 | 352,239 | 2,352,489 | 352,073 | ||||||||||||||||||||
| — | — | — | — | — | — | (225,094 | ) | |||||||||||||||||||
| 2,690,619 | 775,969 | 2,061,246 | 3,125,320 | 352,239 | 2,352,489 | 126,979 | ||||||||||||||||||||
| 5,436,747 | 3,240,762 | 27,389,321 | 27,406,841 | 1,715,485 | 9,506,443 | (2,575 | ) | |||||||||||||||||||
| 65,236,800 | 2,063,351 | 9,542,045 | 15,013,014 | 539,460 | 1,065,207 | 2,575 | ||||||||||||||||||||
| — | — | — | — | — | 47,600 | — | ||||||||||||||||||||
| 5,371,196 | 587,530 | (453,751 | ) | 2,861,641 | — | (1,495,867 | ) | — | ||||||||||||||||||
| (44,757 | ) | — | — | — | — | — | — | |||||||||||||||||||
| — | — | — | (55,097 | ) | — | (462,534 | ) | — | ||||||||||||||||||
| (20,600,321 | ) | 21,310,302 | 9,365,457 | 37,690,475 | 3,785,365 | 9,488,151 | — | |||||||||||||||||||
| (2,283,490 | ) | (162,905 | ) | (79,000 | ) | (1,659,267 | ) | — | (1,882,279 | ) | — | |||||||||||||||
| 7,418 | — | — | — | — | — | — | ||||||||||||||||||||
| — | — | — | (353,273 | ) | — | (33,709 | ) | — | ||||||||||||||||||
| 47,686,846 | 23,798,278 | 18,374,751 | 53,497,493 | 4,324,825 | 6,726,569 | 2,575 | ||||||||||||||||||||
| $ | 53,123,593 | $ | 27,039,040 | $ | 45,764,072 | $ | 80,904,334 | $ | 6,040,310 | $ | 16,233,012 | $ | — | |||||||||||||
The accompanying Notes to Financial Statements are an integral part of this schedule.
301
Table of Contents
Thrivent Series Fund, Inc.
Statement of Changes in Net Assets
| Aggressive Allocation Portfolio | Moderately Aggressive Allocation Portfolio | |||||||||||||||
For the periods ended | 06/30/2014 (unaudited) | 12/31/2013 | 06/30/2014 (unaudited) | 12/31/2013 | ||||||||||||
Operations | ||||||||||||||||
Net investment income/(loss) | $ | 5,071,098 | $ | 3,651,851 | $ | 35,927,174 | $ | 39,069,588 | ||||||||
Net realized gains/(losses) | 40,703,273 | 20,077,762 | 149,534,631 | 105,536,723 | ||||||||||||
Change in net unrealized appreciation/(depreciation) | (962,686 | ) | 141,921,865 | 58,774,295 | 546,205,354 | |||||||||||
Net Change in Net Assets Resulting From Operations | 44,811,685 | 165,651,478 | 244,236,100 | 690,811,665 | ||||||||||||
Distributions to Shareholders | ||||||||||||||||
From net investment income | (3,726,768 | ) | (8,582,861 | ) | (38,731,043 | ) | (52,915,278 | ) | ||||||||
From net realized gains | (23,798,379 | ) | (8,753,472 | ) | (121,445,375 | ) | (77,567,611 | ) | ||||||||
Total Distributions to Shareholders | (27,525,147 | ) | (17,336,333 | ) | (160,176,418 | ) | (130,482,889 | ) | ||||||||
Capital Stock Transactions | ||||||||||||||||
Sold | 46,974,940 | 71,795,448 | 239,350,846 | 567,241,188 | ||||||||||||
Distributions reinvested | 27,525,147 | 17,336,333 | 160,176,418 | 130,482,889 | ||||||||||||
Redeemed | (18,074,601 | ) | (46,235,687 | ) | (41,344,024 | ) | (89,497,182 | ) | ||||||||
In-kind redemptions | — | — | — | — | ||||||||||||
Total Capital Stock Transactions | 56,425,486 | 42,896,094 | 358,183,240 | 608,226,895 | ||||||||||||
Net Increase/(Decrease) in Net Assets | 73,712,024 | 191,211,239 | 442,242,922 | 1,168,555,671 | ||||||||||||
Net Assets, Beginning of Period | 799,399,712 | 608,188,473 | 4,224,546,050 | 3,055,990,379 | ||||||||||||
Net Assets, End of Period | $ | 873,111,736 | $ | 799,399,712 | $ | 4,666,788,972 | $ | 4,224,546,050 | ||||||||
Accumulated Undistributed Net Investment Income/(Loss) | $ | 5,103,129 | $ | 3,758,799 | $ | 35,911,106 | $ | 38,714,975 | ||||||||
Capital Stock Share Transactions | ||||||||||||||||
Sold | 3,099,313 | 5,238,963 | 16,529,680 | 42,282,717 | ||||||||||||
Distributions reinvested | 1,798,324 | 1,308,788 | 10,963,929 | 10,033,441 | ||||||||||||
Redeemed | (1,191,319 | ) | (3,456,690 | ) | (2,837,553 | ) | (6,725,965 | ) | ||||||||
In-kind redemptions | — | — | — | — | ||||||||||||
|
|
|
|
|
|
|
| |||||||||
Total Capital Stock Share Transactions | 3,706,318 | 3,091,061 | 24,656,056 | 45,590,193 | ||||||||||||
|
|
|
|
|
|
|
| |||||||||
The accompanying Notes to Financial Statements are an integral part of this schedule.
302
Table of Contents
Thrivent Series Fund, Inc.
Statement of Changes in Net Assets – continued
| Moderate Allocation Portfolio | Moderately Conservative Allocation Portfolio | Growth and Income Plus Portfolio | Balanced Income Plus Portfolio | |||||||||||||||||||||||||||
| 06/30/2014 (unaudited) | 12/31/2013 | 06/30/2014 (unaudited) | 12/31/2013 | 06/30/2014 (unaudited) | 12/31/2013 | 06/30/2014 (unaudited) | 12/31/2013 | |||||||||||||||||||||||
| $ | 69,327,802 | $ | 91,072,245 | $ | 36,072,575 | $ | 54,615,787 | $ | 878,203 | $ | 1,927,133 | $ | 3,156,357 | $ | 4,635,807 | |||||||||||||||
| 211,223,824 | 180,613,587 | 70,032,062 | 61,088,904 | 3,309,969 | 17,743,134 | 7,001,884 | 56,220,823 | |||||||||||||||||||||||
| 105,940,214 | 604,446,205 | 51,127,669 | 158,181,005 | (1,627,101 | ) | (338,775 | ) | 3,676,697 | (18,617,990 | ) | ||||||||||||||||||||
| 386,491,840 | 876,132,037 | 157,232,306 | 273,885,696 | 2,561,071 | 19,331,492 | 13,834,938 | 42,238,640 | |||||||||||||||||||||||
| (90,042,092 | ) | (94,191,290 | ) | (53,606,712 | ) | (48,161,738 | ) | (1,923,162 | ) | (2,504,677 | ) | (4,580,942 | ) | (4,682,407 | ) | |||||||||||||||
| (208,433,582 | ) | (125,697,258 | ) | (73,822,403 | ) | (62,314,304 | ) | (5,890,712 | ) | — | (51,313,269 | ) | (8,188,843 | ) | ||||||||||||||||
| (298,475,674 | ) | (219,888,548 | ) | (127,429,115 | ) | (110,476,042 | ) | (7,813,874 | ) | (2,504,677 | ) | (55,894,211 | ) | (12,871,250 | ) | |||||||||||||||
| 683,302,419 | 1,088,059,591 | 58,312,522 | 276,455,867 | 12,590,035 | 26,381,957 | 22,684,583 | 23,654,926 | |||||||||||||||||||||||
| 298,475,674 | 219,888,548 | 127,429,115 | 110,476,042 | 7,813,874 | 2,504,677 | 55,894,211 | 12,871,250 | |||||||||||||||||||||||
| (59,251,509 | ) | (121,004,094 | ) | (64,008,664 | ) | (117,686,160 | ) | (2,337,955 | ) | (8,480,857 | ) | (14,914,606 | ) | (30,210,315 | ) | |||||||||||||||
| — | — | — | — | — | (73,842,028 | ) | — | — | ||||||||||||||||||||||
| 922,526,584 | 1,186,944,045 | 121,732,973 | 269,245,749 | 18,065,954 | (53,436,251 | ) | 63,664,188 | 6,315,861 | ||||||||||||||||||||||
| 1,010,542,750 | 1,843,187,534 | 151,536,164 | 432,655,403 | 12,813,151 | (36,609,436 | ) | 21,604,915 | 35,683,251 | ||||||||||||||||||||||
| 7,181,123,800 | 5,337,936,266 | 3,352,978,869 | 2,920,323,466 | 65,451,498 | 102,060,934 | 275,017,197 | 239,333,946 | |||||||||||||||||||||||
| $ | 8,191,666,550 | $ | 7,181,123,800 | $ | 3,504,515,033 | $ | 3,352,978,869 | $ | 78,264,649 | $ | 65,451,498 | $ | 296,622,112 | $ | 275,017,197 | |||||||||||||||
| $ | 69,332,458 | $ | 90,046,748 | $ | 36,021,164 | $ | 53,555,301 | $ | 869,167 | $ | 1,914,126 | $ | 3,110,511 | $ | 4,535,096 | |||||||||||||||
| 49,401,619 | 84,058,196 | 4,512,561 | 22,386,150 | 1,087,717 | 2,411,891 | 1,304,565 | 1,437,170 | |||||||||||||||||||||||
| 21,694,542 | 17,351,357 | 9,975,741 | 9,098,369 | 723,420 | 229,593 | 3,813,482 | 795,037 | |||||||||||||||||||||||
| (4,290,478 | ) | (9,333,911 | ) | (4,971,888 | ) | (9,505,090 | ) | (201,496 | ) | (775,097 | ) | (867,518 | ) | (1,831,808 | ) | |||||||||||||||
| — | — | — | — | — | (6,647,883 | ) | — | — | ||||||||||||||||||||||
|
|
|
|
|
|
|
|
|
|
|
|
|
|
|
| |||||||||||||||
| 66,805,683 | 92,075,642 | 9,516,414 | 21,979,429 | 1,609,641 | (4,781,496 | ) | 4,250,529 | 400,399 | ||||||||||||||||||||||
|
|
|
|
|
|
|
|
|
|
|
|
|
|
|
| |||||||||||||||
The accompanying Notes to Financial Statements are an integral part of this schedule.
303
Table of Contents
Thrivent Series Fund, Inc.
Statement of Changes in Net Assets – continued
| Diversified Income Plus Portfolio | Opportunity Income Plus Portfolio | |||||||||||||||
For the periods ended | 06/30/2014 (unaudited) | 12/31/2013 | 06/30/2014 (unaudited) | 12/31/2013 | ||||||||||||
Operations | ||||||||||||||||
Net investment income/(loss) | $ | 7,328,809 | $ | 11,858,151 | $ | 856,242 | $ | 1,012,530 | ||||||||
Net realized gains/(losses) | 10,326,882 | 9,396,899 | 245,346 | (1,724,664 | ) | |||||||||||
Change in net unrealized appreciation/(depreciation) | (372,493 | ) | 9,521,894 | 795,619 | 288,119 | |||||||||||
Net Change in Net Assets Resulting From Operations | 17,283,198 | 30,776,944 | 1,897,207 | (424,015 | ) | |||||||||||
Distributions to Shareholders | ||||||||||||||||
From net investment income | (11,913,403 | ) | (7,460,218 | ) | (856,646 | ) | (1,012,847 | ) | ||||||||
From net realized gains | — | — | — | (301,210 | ) | |||||||||||
Total Distributions to Shareholders | (11,913,403 | ) | (7,460,218 | ) | (856,646 | ) | (1,314,057 | ) | ||||||||
Capital Stock Transactions | ||||||||||||||||
Sold | 40,814,088 | 117,802,735 | 11,100,453 | 17,096,427 | ||||||||||||
Distributions reinvested | 11,913,403 | 7,460,218 | 856,646 | 1,314,057 | ||||||||||||
Redeemed | (8,600,835 | ) | (15,574,126 | ) | (2,155,384 | ) | (7,403,776 | ) | ||||||||
Total Capital Stock Transactions | 44,126,656 | 109,688,827 | 9,801,715 | 11,006,708 | ||||||||||||
Net Increase/(Decrease) in Net Assets | 49,496,451 | 133,005,553 | 10,842,276 | 9,268,636 | ||||||||||||
Net Assets, Beginning of Period | 362,712,248 | 229,706,695 | 46,541,183 | 37,272,547 | ||||||||||||
Net Assets, End of Period | $ | 412,208,699 | $ | 362,712,248 | $ | 57,383,459 | $ | 46,541,183 | ||||||||
Accumulated Undistributed Net Investment Income/(Loss) | $ | 7,284,285 | $ | 11,868,879 | $ | 349 | $ | 753 | ||||||||
Capital Stock Share Transactions | ||||||||||||||||
Sold | 5,133,717 | 15,537,955 | 1,083,200 | 1,671,877 | ||||||||||||
Distributions reinvested | 1,502,226 | 986,514 | 83,478 | 127,594 | ||||||||||||
Redeemed | (1,086,247 | ) | (2,050,214 | ) | (209,989 | ) | (716,030 | ) | ||||||||
|
|
|
|
|
|
|
| |||||||||
Total Capital Stock Share Transactions | 5,549,696 | 14,474,255 | 956,689 | 1,083,441 | ||||||||||||
|
|
|
|
|
|
|
| |||||||||
The accompanying Notes to Financial Statements are an integral part of this schedule.
304
Table of Contents
Thrivent Series Fund, Inc.
Statement of Changes in Net Assets – continued
| Partner Technology Portfolio | Partner Healthcare Portfolio | Natural Resources Portfolio | Partner Emerging Markets Equity Portfolio | |||||||||||||||||||||||||||
| 06/30/2014 (unaudited) | 12/31/2013 | 06/30/2014 (unaudited) | 12/31/2013 | 06/30/2014 (unaudited) | 12/31/2013 | 06/30/2014 (unaudited) | 12/31/2013 | |||||||||||||||||||||||
| $ | (87,213 | ) | $ | (84,746 | ) | $ | 260,410 | $ | (38,222 | ) | $ | 115,068 | $ | 167,934 | $ | 398,274 | $ | 641,319 | ||||||||||||
| 2,673,802 | 4,503,669 | 2,661,042 | 4,219,641 | 503,891 | (438,132 | ) | 114,107 | (430,928 | ) | |||||||||||||||||||||
| (593,512 | ) | 6,213,839 | 6,770,809 | 5,839,702 | 4,045,725 | 3,320,003 | 3,842,262 | (4,978,975 | ) | |||||||||||||||||||||
| 1,993,077 | 10,632,762 | 9,692,261 | 10,021,121 | 4,664,684 | 3,049,805 | 4,354,643 | (4,768,584 | ) | ||||||||||||||||||||||
| — | — | — | �� | �� | (127,607 | ) | (164,907 | ) | (226,334 | ) | (625,090 | ) | (626,603 | ) | ||||||||||||||||
| — | — | (4,267,782 | ) | (1,382,286 | ) | — | — | — | — | |||||||||||||||||||||
| — | — | (4,267,782 | ) | (1,509,893 | ) | (164,907 | ) | (226,334 | ) | (625,090 | ) | (626,603 | ) | |||||||||||||||||
| 3,881,478 | 6,827,308 | 14,487,402 | 21,399,137 | 2,727,186 | 4,866,233 | 7,607,628 | 21,174,506 | |||||||||||||||||||||||
| — | — | 4,267,782 | 1,509,893 | 164,907 | 226,334 | 625,090 | 626,603 | |||||||||||||||||||||||
| (2,660,425 | ) | (4,902,962 | ) | (2,436,384 | ) | (2,944,132 | ) | (1,893,923 | ) | (4,538,478 | ) | (4,023,652 | ) | (11,204,248 | ) | |||||||||||||||
| 1,221,053 | 1,924,346 | 16,318,800 | 19,964,898 | 998,170 | 554,089 | 4,209,066 | 10,596,861 | |||||||||||||||||||||||
| 3,214,130 | 12,557,108 | 21,743,279 | 28,476,126 | 5,497,947 | 3,377,560 | 7,938,619 | 5,201,674 | |||||||||||||||||||||||
| 48,054,794 | 35,497,686 | 53,698,843 | 25,222,717 | 34,952,270 | 31,574,710 | 59,868,846 | 54,667,172 | |||||||||||||||||||||||
| $ | 51,268,924 | $ | 48,054,794 | $ | 75,442,122 | $ | 53,698,843 | $ | 40,450,217 | $ | 34,952,270 | $ | 67,807,465 | $ | 59,868,846 | |||||||||||||||
| $ | (103,742 | ) | $ | (16,529 | ) | $ | 250,173 | $ | (10,237 | ) | $ | 109,792 | $ | 159,631 | $ | 322,861 | $ | 549,677 | ||||||||||||
| 395,535 | 836,201 | 795,758 | 1,394,927 | 348,115 | 672,269 | 603,475 | 1,596,634 | |||||||||||||||||||||||
| — | — | 234,644 | 100,929 | 19,823 | 31,637 | 46,995 | 50,371 | |||||||||||||||||||||||
| (273,418 | ) | (602,916 | ) | (134,813 | ) | (191,019 | ) | (245,216 | ) | (624,700 | ) | (325,473 | ) | (864,595 | ) | |||||||||||||||
|
|
|
|
|
|
|
|
|
|
|
|
|
|
|
| |||||||||||||||
| 122,117 | 233,285 | 895,589 | 1,304,837 | 122,722 | 79,206 | 324,997 | 782,410 | |||||||||||||||||||||||
|
|
|
|
|
|
|
|
|
|
|
|
|
|
|
| |||||||||||||||
The accompanying Notes to Financial Statements are an integral part of this schedule.
305
Table of Contents
Thrivent Series Fund, Inc.
Statement of Changes in Net Assets – continued
| Real Estate Securities Portfolio | Partner Small Cap Growth Portfolio | |||||||||||||||
For the periods ended | 06/30/2014 (unaudited) | 12/31/2013 | 06/30/2014 (unaudited) | 12/31/2013 | ||||||||||||
Operations | ||||||||||||||||
Net investment income/(loss) | $ | 1,577,311 | $ | 1,999,451 | $ | (825,163 | ) | $ | (1,449,545 | ) | ||||||
Net realized gains/(losses) | 1,948,810 | 3,729,450 | 18,854,135 | 40,580,228 | ||||||||||||
Change in net unrealized appreciation/(depreciation) | 17,482,477 | (3,152,293 | ) | (21,201,412 | ) | 63,097,078 | ||||||||||
Net Change in Net Assets Resulting From Operations | 21,008,598 | 2,576,608 | (3,172,440 | ) | 102,227,761 | |||||||||||
Distributions to Shareholders | ||||||||||||||||
From net investment income | (2,006,084 | ) | (1,880,889 | ) | — | — | ||||||||||
From net realized gains | (2,407,859 | ) | — | (38,837,387 | ) | (6,075,672 | ) | |||||||||
Total Distributions to Shareholders | (4,413,943 | ) | (1,880,889 | ) | (38,837,387 | ) | (6,075,672 | ) | ||||||||
Capital Stock Transactions | ||||||||||||||||
Sold | 9,942,729 | 19,037,347 | 2,931,269 | 6,878,294 | ||||||||||||
Distributions reinvested | 4,413,943 | 1,880,889 | 38,837,387 | 6,075,672 | ||||||||||||
Redeemed | (9,829,131 | ) | (23,990,372 | ) | (4,224,617 | ) | (21,700,165 | ) | ||||||||
Total Capital Stock Transactions | 4,527,541 | (3,072,136 | ) | 37,544,039 | (8,746,199 | ) | ||||||||||
Net Increase/(Decrease) in Net Assets | 21,122,196 | (2,376,417 | ) | (4,465,788 | ) | 87,405,890 | ||||||||||
Net Assets, Beginning of Period | 120,065,842 | 122,442,259 | 344,325,054 | 256,919,164 | ||||||||||||
Net Assets, End of Period | $ | 141,188,038 | $ | 120,065,842 | $ | 339,859,266 | $ | 344,325,054 | ||||||||
Accumulated Undistributed Net Investment Income/(Loss) | $ | 1,530,922 | $ | 1,959,695 | $ | (937,813 | ) | $ | (112,650 | ) | ||||||
Capital Stock Share Transactions | ||||||||||||||||
Sold | 498,648 | 1,004,072 | 156,719 | 402,076 | ||||||||||||
Distributions reinvested | 217,660 | 99,130 | 2,345,324 | 379,533 | ||||||||||||
Redeemed | (501,806 | ) | (1,287,432 | ) | (230,105 | ) | (1,397,890 | ) | ||||||||
|
|
|
|
|
|
|
| |||||||||
Total Capital Stock Share Transactions | 214,502 | (184,230 | ) | 2,271,938 | (616,281 | ) | ||||||||||
|
|
|
|
|
|
|
| |||||||||
The accompanying Notes to Financial Statements are an integral part of this schedule.
306
Table of Contents
Thrivent Series Fund, Inc.
Statement of Changes in Net Assets – continued
| Partner Small Cap Value Portfolio | Small Cap Stock Portfolio | Small Cap Index Portfolio | Mid Cap Growth Portfolio | |||||||||||||||||||||||||||
| 06/30/2014 (unaudited) | 12/31/2013 | 06/30/2014 (unaudited) | 12/31/2013 | 06/30/2014 (unaudited) | 12/31/2013 | 06/30/2014 (unaudited) | 12/31/2013 | |||||||||||||||||||||||
| $ | 1,423,254 | $ | 1,877,079 | $ | 444,839 | $ | 766,894 | $ | 1,071,379 | $ | 1,914,039 | $ | 639,321 | $ | 868,487 | |||||||||||||||
| 16,764,961 | 9,854,389 | 26,127,086 | 30,901,008 | 11,114,603 | 17,444,322 | 24,091,251 | 37,331,666 | |||||||||||||||||||||||
| (9,183,059 | ) | 91,972,307 | (17,455,201 | ) | 63,194,648 | (4,365,404 | ) | 58,011,540 | (17,499,689 | ) | 65,343,840 | |||||||||||||||||||
| 9,005,156 | 103,703,775 | 9,116,724 | 94,862,550 | 7,820,578 | 77,369,901 | 7,230,883 | 103,543,993 | |||||||||||||||||||||||
| (830,710 | ) | (6,212,011 | ) | (760,245 | ) | (1,110,363 | ) | (1,923,687 | ) | (2,774,672 | ) | (878,668 | ) | (1,307,135 | ) | |||||||||||||||
| (9,885,913 | ) | (1,618,481 | ) | (3,810,915 | ) | — | (17,451,260 | ) | (9,403,427 | ) | (37,294,754 | ) | (216,636 | ) | ||||||||||||||||
| (10,716,623 | ) | (7,830,492 | ) | (4,571,160 | ) | (1,110,363 | ) | (19,374,947 | ) | (12,178,099 | ) | (38,173,422 | ) | (1,523,771 | ) | |||||||||||||||
| 3,847,474 | 13,620,695 | 4,755,414 | 8,906,708 | 9,432,745 | 15,094,607 | 6,429,221 | 10,907,279 | |||||||||||||||||||||||
| 10,716,623 | 7,830,492 | 4,571,160 | 1,110,363 | 19,374,947 | 12,178,099 | 38,173,422 | 1,523,771 | |||||||||||||||||||||||
| (5,875,726 | ) | (15,228,121 | ) | (11,305,896 | ) | (18,675,324 | ) | (14,386,781 | ) | (23,380,516 | ) | (23,318,984 | ) | (51,638,208 | ) | |||||||||||||||
| 8,688,371 | 6,223,066 | (1,979,322 | ) | (8,658,253 | ) | 14,420,911 | 3,892,190 | 21,283,659 | (39,207,158 | ) | ||||||||||||||||||||
| 6,976,904 | 102,096,349 | 2,566,242 | 85,093,934 | 2,866,542 | 69,083,992 | (9,658,880 | ) | 62,813,064 | ||||||||||||||||||||||
| 384,676,157 | 282,579,808 | 354,573,646 | 269,479,712 | 262,761,848 | 193,677,856 | 424,319,334 | 361,506,270 | |||||||||||||||||||||||
| $ | 391,653,061 | $ | 384,676,157 | $ | 357,139,888 | $ | 354,573,646 | $ | 265,628,390 | $ | 262,761,848 | $ | 414,660,454 | $ | 424,319,334 | |||||||||||||||
| $ | 423,936 | $ | (168,608 | ) | $ | 387,684 | $ | 703,090 | $ | 1,011,577 | $ | 1,863,885 | $ | 544,266 | $ | 783,613 | ||||||||||||||
| 137,709 | 565,151 | 270,780 | 579,630 | 535,592 | 964,708 | 258,479 | 486,854 | |||||||||||||||||||||||
| 384,844 | 324,118 | 257,462 | 72,690 | 1,146,358 | 810,987 | 1,623,075 | 70,344 | |||||||||||||||||||||||
| (210,240 | ) | (626,924 | ) | (642,565 | ) | (1,233,674 | ) | (815,824 | ) | (1,502,424 | ) | (929,662 | ) | (2,339,125 | ) | |||||||||||||||
|
|
|
|
|
|
|
|
|
|
|
|
|
|
|
| |||||||||||||||
| 312,313 | 262,345 | (114,323 | ) | (581,354 | ) | 866,126 | 273,271 | 951,892 | (1,781,927 | ) | ||||||||||||||||||||
|
|
|
|
|
|
|
|
|
|
|
|
|
|
|
| |||||||||||||||
The accompanying Notes to Financial Statements are an integral part of this schedule.
307
Table of Contents
Thrivent Series Fund, Inc.
Statement of Changes in Net Assets – continued
| Partner Mid Cap Value Portfolio | Mid Cap Stock Portfolio | |||||||||||||||
For the periods ended | 06/30/2014 (unaudited) | 12/31/2013 | 06/30/2014 (unaudited) | 12/31/2013 | ||||||||||||
Operations | ||||||||||||||||
Net investment income/(loss) | $ | 1,308,253 | $ | 2,373,852 | $ | 3,133,152 | $ | 2,224,350 | ||||||||
Net realized gains/(losses) | 29,303,318 | 49,541,187 | 47,242,329 | 56,136,087 | ||||||||||||
Change in net unrealized appreciation/(depreciation) | 70,337 | 34,483,092 | 16,313,863 | 119,829,423 | ||||||||||||
Net Change in Net Assets Resulting From Operations | 30,681,908 | 86,398,131 | 66,689,344 | 178,189,860 | ||||||||||||
Distributions to Shareholders | ||||||||||||||||
From net investment income | (2,382,909 | ) | (3,042,438 | ) | (2,238,163 | ) | (2,176,782 | ) | ||||||||
From net realized gains | (49,092,042 | ) | (13,305,805 | ) | (31,748,560 | ) | — | |||||||||
Total Distributions to Shareholders | (51,474,951 | ) | (16,348,243 | ) | (33,986,723 | ) | (2,176,782 | ) | ||||||||
Capital Stock Transactions | ||||||||||||||||
Sold | 3,236,544 | 11,505,045 | 5,137,409 | 6,010,562 | ||||||||||||
Distributions reinvested | 51,474,951 | 16,348,243 | 33,986,723 | 2,176,782 | ||||||||||||
Redeemed | (1,407,270 | ) | (6,416,261 | ) | (7,122,612 | ) | (15,505,487 | ) | ||||||||
Total Capital Stock Transactions | 53,304,225 | 21,437,027 | 32,001,520 | (7,318,143 | ) | |||||||||||
Net Increase/(Decrease) in Net Assets | 32,511,182 | 91,486,915 | 64,704,141 | 168,694,935 | ||||||||||||
Net Assets, Beginning of Period | 352,945,948 | 261,459,033 | 675,422,098 | 506,727,163 | ||||||||||||
Net Assets, End of Period | $ | 385,457,130 | $ | 352,945,948 | $ | 740,126,239 | $ | 675,422,098 | ||||||||
Accumulated Undistributed Net Investment Income/(Loss) | $ | 1,263,574 | $ | 2,338,230 | $ | 2,827,757 | $ | 1,932,768 | ||||||||
Capital Stock Share Transactions | ||||||||||||||||
Sold | 172,879 | 698,248 | 282,576 | 392,094 | ||||||||||||
Distributions reinvested | 2,975,792 | 994,806 | 1,849,557 | 144,603 | ||||||||||||
Redeemed | (74,844 | ) | (388,569 | ) | (391,335 | ) | (1,023,275 | ) | ||||||||
|
|
|
|
|
|
|
| |||||||||
Total Capital Stock Share Transactions | 3,073,827 | 1,304,485 | 1,740,798 | (486,578 | ) | |||||||||||
|
|
|
|
|
|
|
| |||||||||
The accompanying Notes to Financial Statements are an integral part of this schedule.
308
Table of Contents
Thrivent Series Fund, Inc.
Statement of Changes in Net Assets – continued
| Mid Cap Index Portfolio | Partner Worldwide Allocation Portfolio | Partner All Cap Portfolio | Large Cap Growth Portfolio | |||||||||||||||||||||||||||
| 06/30/2014 (unaudited) | 12/31/2013 | 06/30/2014 (unaudited) | 12/31/2013 | 06/30/2014 (unaudited) | 12/31/2013 | 06/30/2014 (unaudited) | 12/31/2013 | |||||||||||||||||||||||
| $ | 616,521 | $ | 997,123 | $ | 26,276,512 | $ | 31,098,950 | $ | 152,747 | $ | 395,155 | $ | 3,249,682 | $ | 6,199,197 | |||||||||||||||
| 3,957,777 | 5,697,265 | 82,315,816 | 73,417,195 | 6,921,672 | 9,321,198 | 75,210,754 | 92,037,523 | |||||||||||||||||||||||
| 4,587,662 | 22,432,414 | (36,180,561 | ) | 136,848,064 | (3,636,968 | ) | 6,528,169 | (12,335,646 | ) | 195,315,087 | ||||||||||||||||||||
| 9,161,960 | 29,126,802 | 72,411,767 | 241,364,209 | 3,437,451 | 16,244,522 | 66,124,790 | 293,551,807 | |||||||||||||||||||||||
| (1,001,203 | ) | (926,864 | ) | (34,636,379 | ) | (416,617 | ) | (396,564 | ) | (428,025 | ) | (851,764 | ) | (5,999,580 | ) | |||||||||||||||
| (6,112,967 | ) | (3,159,150 | ) | — | — | — | — | — | — | |||||||||||||||||||||
| (7,114,170 | ) | (4,086,014 | ) | (34,636,379 | ) | (416,617 | ) | (396,564 | ) | (428,025 | ) | (851,764 | ) | (5,999,580 | ) | |||||||||||||||
| 10,189,516 | 19,220,321 | 11,993,118 | 19,622,603 | 2,888,110 | 3,795,626 | 14,179,520 | 33,770,524 | |||||||||||||||||||||||
| 7,114,170 | 4,086,014 | 34,636,379 | 416,617 | 396,564 | 428,025 | 851,764 | 5,999,580 | |||||||||||||||||||||||
| (5,247,910 | ) | (10,466,874 | ) | (14,523,969 | ) | (75,334,755 | ) | (3,329,986 | ) | (7,701,099 | ) | (56,138,390 | ) | (125,260,503 | ) | |||||||||||||||
| 12,055,776 | 12,839,461 | 32,105,528 | (55,295,535 | ) | (45,312 | ) | (3,477,448 | ) | (41,107,106 | ) | (85,490,399 | ) | ||||||||||||||||||
| 14,103,566 | 37,880,249 | 69,880,916 | 185,652,057 | 2,995,575 | 12,339,049 | 24,165,920 | 202,061,828 | |||||||||||||||||||||||
| 122,992,711 | 85,112,462 | 1,705,988,585 | 1,520,336,528 | 63,808,384 | 51,469,335 | 1,061,971,778 | 859,909,950 | |||||||||||||||||||||||
| $ | 137,096,277 | $ | 122,992,711 | $ | 1,775,869,501 | $ | 1,705,988,585 | $ | 66,803,959 | $ | 63,808,384 | $ | 1,086,137,698 | $ | 1,061,971,778 | |||||||||||||||
| $ | 593,777 | $ | 978,459 | $ | 24,221,810 | $ | 32,581,677 | $ | 139,118 | $ | 382,935 | $ | 2,976,543 | $ | 578,625 | |||||||||||||||
| 637,821 | 1,350,292 | 1,192,645 | 2,116,956 | 226,152 | 343,947 | 552,037 | 1,524,721 | |||||||||||||||||||||||
| 447,533 | 293,994 | 3,380,214 | 46,389 | 29,955 | 38,956 | 31,702 | 240,562 | |||||||||||||||||||||||
| (328,777 | ) | (736,355 | ) | (1,441,206 | ) | (8,330,270 | ) | (259,473 | ) | (702,140 | ) | (2,173,024 | ) | (5,770,940 | ) | |||||||||||||||
|
|
|
|
|
|
|
|
|
|
|
|
|
|
|
| |||||||||||||||
| 756,577 | 907,931 | 3,131,653 | (6,166,925 | ) | (3,366 | ) | (319,237 | ) | (1,589,285 | ) | (4,005,657 | ) | ||||||||||||||||||
|
|
|
|
|
|
|
|
|
|
|
|
|
|
|
| |||||||||||||||
The accompanying Notes to Financial Statements are an integral part of this schedule.
309
Table of Contents
Thrivent Series Fund, Inc.
Statement of Changes in Net Assets – continued
| Partner Growth Stock Portfolio | Large Cap Value Portfolio | |||||||||||||||
For the periods ended | 06/30/2014 (unaudited) | 12/31/2013 | 06/30/2014 (unaudited) | 12/31/2013 | ||||||||||||
Operations | ||||||||||||||||
Net investment income/(loss) | $ | (64,683 | ) | $ | (156,897 | ) | $ | 7,382,989 | $ | 14,173,723 | ||||||
Net realized gains/(losses) | 4,806,598 | 6,963,318 | 32,399,664 | 52,222,956 | ||||||||||||
Change in net unrealized appreciation/(depreciation) | (2,844,916 | ) | 14,998,010 | 26,820,319 | 204,156,400 | |||||||||||
Net Change in Net Assets Resulting From Operations | 1,896,999 | 21,804,431 | 66,602,972 | 270,553,079 | ||||||||||||
Distributions to Shareholders | ||||||||||||||||
From net investment income | — | (18,555 | ) | (14,210,465 | ) | (14,880,600 | ) | |||||||||
From net realized gains | (6,496,774 | ) | — | — | — | |||||||||||
Total Distributions to Shareholders | (6,496,774 | ) | (18,555 | ) | (14,210,465 | ) | (14,880,600 | ) | ||||||||
Capital Stock Transactions | ||||||||||||||||
Sold | 6,128,739 | 5,772,927 | 6,933,363 | 21,155,090 | ||||||||||||
Issued in connection with merger | — | — | — | — | ||||||||||||
Distributions reinvested | 6,496,774 | 18,555 | 14,210,465 | 14,880,600 | ||||||||||||
Redeemed | (4,711,061 | ) | (9,323,745 | ) | (12,941,785 | ) | (25,189,006 | ) | ||||||||
Total Capital Stock Transactions | 7,914,452 | (3,532,263 | ) | 8,202,043 | 10,846,684 | |||||||||||
Net Increase/(Decrease) in Net Assets | 3,314,677 | 18,253,613 | 60,594,550 | 266,519,163 | ||||||||||||
Net Assets, Beginning of Period | 76,233,991 | 57,980,378 | 1,119,162,039 | 852,642,876 | ||||||||||||
Net Assets, End of Period | $ | 79,548,668 | $ | 76,233,991 | $ | 1,179,756,589 | $ | 1,119,162,039 | ||||||||
Accumulated Undistributed Net Investment Income/(Loss) | $ | (82,290 | ) | $ | (17,607 | ) | $ | 7,233,666 | $ | 14,061,142 | ||||||
Capital Stock Share Transactions | ||||||||||||||||
Sold | 326,696 | 366,880 | 439,978 | 1,506,230 | ||||||||||||
Issued in connection with merger | — | — | — | — | ||||||||||||
Distributions reinvested | 371,456 | 1,209 | 869,333 | 1,059,653 | ||||||||||||
Redeemed | (255,122 | ) | (593,980 | ) | (820,091 | ) | (1,810,189 | ) | ||||||||
|
|
|
|
|
|
|
| |||||||||
Total Capital Stock Share Transactions | 443,030 | (225,891 | ) | 489,220 | 755,694 | |||||||||||
|
|
|
|
|
|
|
| |||||||||
The accompanying Notes to Financial Statements are an integral part of this schedule.
310
Table of Contents
Thrivent Series Fund, Inc.
Statement of Changes in Net Assets – continued
| Large Cap Stock Portfolio | Large Cap Index Portfolio | High Yield Portfolio | Income Portfolio | |||||||||||||||||||||||||||
| 06/30/2014 (unaudited) | 12/31/2013 | 06/30/2014 (unaudited) | 12/31/2013 | 06/30/2014 (unaudited) | 12/31/2013 | 06/30/2014 (unaudited) | 12/31/2013 | |||||||||||||||||||||||
| $ | 5,436,747 | $ | 7,249,881 | $ | 3,240,762 | $ | 5,921,597 | $ | 27,389,321 | $ | 57,959,063 | $ | 27,406,841 | $ | 56,447,660 | |||||||||||||||
| 70,563,239 | 63,213,680 | 2,650,881 | 4,166,717 | 9,088,294 | 16,338,100 | 17,819,558 | 22,402,779 | |||||||||||||||||||||||
| (22,876,393 | ) | 113,722,579 | 21,147,397 | 85,018,738 | 9,286,457 | (13,294,522 | ) | 35,677,935 | (80,301,383 | ) | ||||||||||||||||||||
| 53,123,593 | 184,186,140 | 27,039,040 | 95,107,052 | 45,764,072 | 61,002,641 | 80,904,334 | (1,450,944 | ) | ||||||||||||||||||||||
| (7,274,387 | ) | (8,140,375 | ) | (5,820,275 | ) | (5,733,630 | ) | (27,586,546 | ) | (57,720,706 | ) | (27,258,728 | ) | (56,092,101 | ) | |||||||||||||||
| — | — | (927,955 | ) | (3,429,327 | ) | — | — | (17,510,205 | ) | (3,278,491 | ) | |||||||||||||||||||
| (7,274,387 | ) | (8,140,375 | ) | (6,748,230 | ) | (9,162,957 | ) | (27,586,546 | ) | (57,720,706 | ) | (44,768,933 | ) | (59,370,592 | ) | |||||||||||||||
| 4,091,255 | 6,604,862 | 16,372,308 | 28,709,669 | 17,857,389 | 41,888,839 | 7,186,353 | 25,072,319 | |||||||||||||||||||||||
| — | 31,485,903 | — | — | — | — | — | — | |||||||||||||||||||||||
| 7,274,387 | 8,140,375 | 6,748,230 | 9,162,957 | 27,586,546 | 57,720,706 | 44,768,933 | 59,370,592 | |||||||||||||||||||||||
| (14,658,409 | ) | (32,934,081 | ) | (18,514,722 | ) | (35,155,121 | ) | (29,887,055 | ) | (85,904,394 | ) | (42,200,846 | ) | (181,912,585 | ) | |||||||||||||||
| (3,292,767 | ) | 13,297,059 | 4,605,816 | 2,717,505 | 15,556,880 | 13,705,151 | 9,754,440 | (97,469,674 | ) | |||||||||||||||||||||
| 42,556,439 | 189,342,824 | 24,896,626 | 88,661,600 | 33,734,406 | 16,987,086 | 45,889,841 | (158,291,210 | ) | ||||||||||||||||||||||
| 811,875,706 | 622,532,882 | 392,630,041 | 303,968,441 | 921,884,509 | 904,897,423 | 1,417,609,081 | 1,575,900,291 | |||||||||||||||||||||||
| $ | 854,432,145 | $ | 811,875,706 | $ | 417,526,667 | $ | 392,630,041 | $ | 955,618,915 | $ | 921,884,509 | $ | 1,463,498,922 | $ | 1,417,609,081 | |||||||||||||||
| $ | 5,269,053 | $ | 7,106,693 | $ | 3,262,215 | $ | 5,841,728 | $ | 316,906 | $ | 514,131 | $ | 30,495 | $ | (117,618 | ) | ||||||||||||||
| 340,814 | 628,688 | 626,857 | 1,237,822 | 3,480,177 | 8,267,882 | 680,752 | 2,371,793 | |||||||||||||||||||||||
| — | 2,953,760 | — | — | — | — | — | — | |||||||||||||||||||||||
| 583,594 | 782,300 | 249,150 | 400,945 | 5,376,948 | 11,421,526 | 4,239,476 | 5,650,047 | |||||||||||||||||||||||
| (1,219,663 | ) | (3,141,637 | ) | (708,144 | ) | (1,539,086 | ) | (5,823,944 | ) | (17,037,868 | ) | (4,001,017 | ) | (17,264,108 | ) | |||||||||||||||
|
|
|
|
|
|
|
|
|
|
|
|
|
|
|
| |||||||||||||||
| (295,255 | ) | 1,223,111 | 167,863 | 99,681 | 3,033,181 | 2,651,540 | 919,211 | (9,242,268 | ) | |||||||||||||||||||||
|
|
|
|
|
|
|
|
|
|
|
|
|
|
|
| |||||||||||||||
The accompanying Notes to Financial Statements are an integral part of this schedule.
311
Table of Contents
Thrivent Series Fund, Inc.
Statement of Changes in Net Assets – continued
| Bond Index Portfolio | Limited Maturity Bond Portfolio | |||||||||||||||
For the periods ended | 06/30/2014 (unaudited) | 12/31/2013 | 06/30/2014 (unaudited) | 12/31/2013 | ||||||||||||
Operations | ||||||||||||||||
Net investment income/(loss) | $ | 1,715,485 | $ | 3,328,936 | $ | 9,506,443 | $ | 17,777,172 | ||||||||
Net realized gains/(losses) | 539,460 | (2,176,457 | ) | (845,594 | ) | 8,286,041 | ||||||||||
Change in net unrealized appreciation/(depreciation) | 3,785,365 | (5,573,292 | ) | 7,572,163 | (20,804,818 | ) | ||||||||||
Net Change in Net Assets Resulting From Operations | 6,040,310 | (4,420,813 | ) | 16,233,012 | 5,258,395 | |||||||||||
Distributions to Shareholders | ||||||||||||||||
From net investment income | (1,715,485 | ) | (3,328,936 | ) | (9,098,588 | ) | (17,218,976 | ) | ||||||||
From net realized gains | – | (5,464,327 | ) | – | – | |||||||||||
Total Distributions to Shareholders | (1,715,485 | ) | (8,793,263 | ) | (9,098,588 | ) | (17,218,976 | ) | ||||||||
Capital Stock Transactions | ||||||||||||||||
Sold | 4,031,895 | 13,325,069 | 15,264,349 | 41,686,633 | ||||||||||||
Distributions reinvested | 1,715,485 | 8,793,263 | 9,098,588 | 17,218,976 | ||||||||||||
Redeemed | (13,060,633 | ) | (42,349,648 | ) | (40,715,850 | ) | (164,430,498 | ) | ||||||||
Total Capital Stock Transactions | (7,313,253 | ) | (20,231,316 | ) | (16,352,913 | ) | (105,524,889 | ) | ||||||||
Net Increase/(Decrease) in Net Assets | (2,988,428 | ) | (33,445,392 | ) | (9,218,489 | ) | (117,485,470 | ) | ||||||||
Net Assets, Beginning of Period | 152,016,778 | 185,462,170 | 1,082,528,198 | 1,200,013,668 | ||||||||||||
Net Assets, End of Period | $ | 149,028,350 | $ | 152,016,778 | $ | 1,073,309,709 | $ | 1,082,528,198 | ||||||||
Accumulated Undistributed Net Investment Income/(Loss) | $ | (602 | ) | $ | (602 | ) | $ | 839,485 | $ | 431,630 | ||||||
Capital Stock Share Transactions | ||||||||||||||||
Sold | 375,945 | 1,195,866 | 1,547,780 | 4,221,041 | ||||||||||||
Distributions reinvested | 159,807 | 810,078 | 922,625 | 1,745,050 | ||||||||||||
Redeemed | (1,218,581 | ) | (3,887,287 | ) | (4,129,997 | ) | (16,634,618 | ) | ||||||||
|
|
|
|
|
|
|
| |||||||||
Total Capital Stock Share Transactions | (682,829 | ) | (1,881,343 | ) | (1,659,592 | ) | (10,668,527 | ) | ||||||||
|
|
|
|
|
|
|
| |||||||||
The accompanying Notes to Financial Statements are an integral part of this schedule.
312
Table of Contents
Thrivent Series Fund, Inc.
Statement of Changes in Net Assets – continued
| Money Market Portfolio | ||||||||||||||||||
| 06/30/2014 (unaudited) | 12/31/2013 | |||||||||||||||||
| $ | (2,575 | ) | $ | (4,026 | ) | |||||||||||||
| 2,575 | 4,026 | |||||||||||||||||
| — | — | |||||||||||||||||
| — | — | |||||||||||||||||
| — | — | |||||||||||||||||
| — | — | |||||||||||||||||
| — | — | |||||||||||||||||
| 30,496,128 | 89,452,873 | |||||||||||||||||
| — | — | |||||||||||||||||
| (46,375,115 | ) | (91,133,483 | ) | |||||||||||||||
| (15,878,987 | ) | (1,680,610 | ) | |||||||||||||||
| (15,878,987 | ) | (1,680,610 | ) | |||||||||||||||
| 146,581,714 | 148,262,324 | |||||||||||||||||
| $ | 130,702,727 | $ | 146,581,714 | |||||||||||||||
| $ | (2,575 | ) | $ | — | ||||||||||||||
| 30,496,128 | 89,452,873 | |||||||||||||||||
| — | — | |||||||||||||||||
| (46,375,115 | ) | (91,133,483 | ) | |||||||||||||||
|
|
|
| |||||||||||||||
| (15,878,987 | ) | (1,680,610 | ) | |||||||||||||||
|
|
|
| |||||||||||||||
The accompanying Notes to Financial Statements are an integral part of this schedule.
313
Table of Contents
Thrivent Series Fund, Inc.
Notes to Financial Statements
June 30, 2014
(unaudited)
(1) ORGANIZATION
Thrivent Series Fund, Inc. (the “Fund”), a company organized under the laws of Minnesota, is registered under the Investment Company Act of 1940 (the “1940 Act”). The Fund is divided into thirty-three separate series (each, a “Portfolio”), each with its own investment objective and policies. The Fund consists of four asset allocation portfolios, nineteen equity portfolios, four hybrid portfolios, five fixed-income portfolios, and one money market portfolio. The assets of each Portfolio are segregated, and each has a separate class of capital stock.
Shares in the Fund are currently sold, without sales charges, only to retirement plans sponsored by Thrivent Financial for Lutherans (“Thrivent Financial” or the “Adviser”) or separate accounts of Thrivent Financial or Thrivent Life Insurance Company (“Thrivent Life”), which are used to fund benefits of variable life insurance and variable annuity contracts issued by Thrivent Financial and Thrivent Life.
Under the Fund’s organizational documents, its officers and directors are indemnified against certain liabilities arising out of the performance of their duties to the Fund. In addition, in the normal course of business, the Fund enters into contracts with service providers and others that provide general damage clauses. The Fund’s maximum exposure under these contracts is unknown, as this would involve future claims that may be made against the Fund. However, based on experience, the Fund expects the risk of loss to be remote.
(A) Portfolio Merger – At a meeting held on August 2, 2013, shareholders of Thrivent Partner All Cap Value Portfolio, Thrivent Partner All Cap Growth Portfolio, and Thrivent Partner Socially Responsible Stock Portfolio (the “Target Portfolios”) approved the merger of the Target Portfolios into Thrivent Large Cap Stock Portfolio (the “Acquiring Portfolio”).
Target Portfolios | Acquiring Portfolios | |||
Partner All Cap Value | > | Large Cap Stock | ||
Partner All Cap Growth | > | Large Cap Stock | ||
Partner Socially Responsible Stock | > | Large Cap Stock |
The mergers occurred at the close of business on August 16, 2013. Acquisition of the assets and liabilities of the Target Portfolios by the Acquiring Portfolio were followed by the distribution of the Acquiring Portfolio shares to the Target Portfolios’ shareholders. The shares issued of the Acquiring Portfolio are disclosed in the Statement of Changes in Net Assets.
The mergers were accomplished by tax free exchanges as detailed below:
Portfolio | Description | Net Assets as of August 16, 2013 | ||||
Large Cap Stock | Acquiring Portfolio | $ | 710,028,233 | |||
Partner All Cap Value | Target Portfolio | $ | 6,754,374 | |||
Partner All Cap Growth | Target Portfolio | $ | 13,237,069 | |||
Partner Socially Responsible Stock | Target Portfolio | $ | 11,494,460 | |||
Large Cap Stock | After Acquisition | $ | 741,514,136 | |||
As of August 16, 2013, the net assets of the Target Portfolios were comprised of the following:
Target Portfolio | Unrealized Appreciation | Undistributed Net Investment (Loss) | Accumulated Net Realized (Losses) | Capital Stock | ||||||||||||
Partner All Cap Value | $ | 495,239 | $ | (11,204 | ) | $ | (24,651 | ) | $ | 6,294,990 | ||||||
Partner All Cap Growth | $ | 2,820,455 | $ | (9,152 | ) | $ | (5,699 | ) | $ | 10,431,465 | ||||||
Partner Socially Responsible Stock | $ | 2,159,274 | $ | (9,094 | ) | $ | (644 | ) | $ | 9,344,924 | ||||||
The Target Portfolios’ capital loss carryovers are carried over to the Acquiring Portfolio. The amounts, if any, and applicable limitations are disclosed in Note (4) Tax Information.
314
Table of Contents
Thrivent Series Fund, Inc.
Notes to Financial Statements
June 30, 2014
(unaudited)
Assuming the mergers had been completed on January 1, 2013 the Acquiring Portfolio’s pro-forma results of operations for the year ended December 31, 2013 would be the following:
Acquiring Portfolio | Net Change in Unrealized Appreciation/ (Depreciation) | Net Investment Income | Net Gains/(Losses) on Investments | Net Increase in Net Assets from Operations | ||||||||||||
Large Cap Stock | $ | 116,147,892 | $ | 7,385,559 | $ | 64,446,500 | $ | 187,979,951 | ||||||||
The financial statements reflect the operations of the Portfolios for the period prior to the merger and the combined Portfolios for the period subsequent to the mergers. Because the combined investment portfolios have been managed as a single integrated portfolio since the mergers were completed, it is not practicable to separate the amounts of revenue and earnings of Thrivent Partner All Cap Value Portfolio, Thrivent Partner All Cap Growth Portfolio, and Thrivent Partner Socially Responsible Stock Portfolio that have been included in the combined Portfolio’s Statement of Operations since the mergers were completed.
(2) SIGNIFICANT ACCOUNTING POLICIES
(A) Valuation of Investments – Securities traded on U.S. or foreign securities exchanges or included in a national market system are valued at the official closing price at the close of each business day unless otherwise stated below. Over-the-counter securities and listed securities for which no price is readily available are valued at the current bid price considered best to represent the value at that time. Swap agreements are valued at the latest bid quotation of the contract as furnished by an independent pricing service. Security prices are based on quotes that are obtained from an independent pricing service approved by the Board of Directors (the “Board”). The pricing service, in determining values of fixed-income securities, takes into consideration such factors as current quotations by broker/dealers, coupon, maturity, quality, type of issue, trading characteristics, and other yield and risk factors it deems relevant in determining valuations. Securities which cannot be valued by the approved pricing service are valued using valuations obtained from dealers that make markets in the securities. Exchange-listed options are valued at the last quoted sales price. Futures contracts are valued at the settle price on the exchange on which they trade. Forward foreign currency exchange contracts are marked-to-market based upon foreign currency exchange rates provided by the pricing service. Investments in open-ended mutual funds are valued at their net asset value at the close of each business day. Short-term securities are valued at amortized cost (which approximates market value) to the extent it is not materially different than market value.
Securities held by Money Market Portfolio are valued on the basis of amortized cost, whereby a portfolio security is valued at its cost initially and thereafter valued to reflect a constant amortization to maturity of any discount or premium. Money Market Portfolio and the Adviser follow procedures necessary to maintain a constant net asset value of $1.00 per share.
The Board has delegated responsibility for daily valuation of the Portfolios’ securities to the Adviser, which has formed a Valuation Committee (“Committee”) that is responsible for overseeing the Portfolios’ valuation policies in accordance with Policies and Procedures. The Committee meets on a monthly and on an as-needed basis to review price challenges, price overrides, stale prices, shadow prices, manual prices, money market pricing, international fair valuation, and other securities requiring fair valuation.
The Committee monitors for significant events occurring prior to the close of trading on the New York Stock Exchange that could have a material impact on the value of any securities that are held by the Portfolios. Examples of such events include trading halts, national news/events, and issuer-specific developments. If the Committee decides that such events warrant using fair value estimates, the Committee will take such events into consideration in determining the fair value of such securities. If market quotations or prices are not readily available or determined to be unreliable, the securities will be valued at fair value as determined in good faith pursuant to procedures adopted by the Board.
Financial Accounting Standards Board (FASB) guidelines require increased fair value disclosure intended to improve the consistency and comparability of fair value measurements used in financial reporting. The guidelines define fair value, establish a framework for measuring fair value in U.S. Generally Accepted Accounting Principles (“GAAP”) and expand disclosures about fair value requirements. The various inputs used to determine the fair value of the Portfolios’ investments are summarized in three broad levels: Level 1 includes quoted prices in active markets for identical securities, typically categorized in this level are U.S. equity securities, futures and options; Level 2 includes other significant observable inputs such as quoted prices for similar securities, interest rates, prepayment speeds and credit risk, typically categorized in this level are fixed income securities, international equity securities, swaps and forward contracts; and Level 3 includes significant unobservable inputs such as the Adviser’s own assumptions and broker evaluations in determining the fair value of investments. Of the Level 3 securities, those for which market values were not readily available or were deemed unreliable were fair valued as
315
Table of Contents
Thrivent Series Fund, Inc.
Notes to Financial Statements
June 30, 2014
(unaudited)
determined in good faith under procedures established by the Board. As of June 30, 2014, the following Portfolios held these types of Level 3 securities:
Portfolio | Number of Securities | Percent of Portfolio’s Net Assets | ||||||
Moderately Aggressive Allocation | 1 | 0.01 | % | |||||
Moderate Allocation | 1 | 0.01 | % | |||||
Moderately Conservative Allocation | 1 | 0.02 | % | |||||
Growth and Income Plus | 1 | 0.02 | % | |||||
Balanced Income Plus | 2 | 0.20 | % | |||||
Diversified Income Plus | 1 | 0.01 | % | |||||
Partner Worldwide Allocation | 2 | 0.03 | % | |||||
Partner Growth Stock | 2 | 0.15 | % | |||||
High Yield | 2 | 0.04 | % | |||||
Income | 1 | 0.19 | % | |||||
Bond Index | 2 | 0.40 | % | |||||
Limited Maturity Bond | 1 | 0.28 | % | |||||
The valuation levels are not necessarily an indication of the risk associated with investing in these securities or other investments.
Valuation of International Securities – Because many foreign markets close before the U.S. markets, events may occur between the close of the foreign market and the close of the U.S. markets that could have a material impact on the valuation of foreign securities. The Portfolios, under the supervision of the Board, evaluate the impacts of these events and may adjust the valuation of foreign securities to reflect the fair value as of the close of the U.S. markets. The Board has authorized the Adviser to make fair valuation determinations pursuant to policies approved by the Board.
(B) Foreign Currency Translation – The accounting records of each Portfolio are maintained in U.S. dollars. Securities and other assets and liabilities that are denominated in foreign currencies are translated into U.S. dollars at the daily closing rates of exchange.
Foreign currency amounts related to the purchase or sale of securities and income and expenses are translated at the exchange rate on the transaction date. Net realized and unrealized currency gains and losses are recorded from closed forward currency contracts, disposition of foreign currencies, exchange gains or losses between the trade date and settlement dates on securities transactions, and other translation gains or losses on dividends, interest income and foreign withholding taxes. The Portfolios do not separately report the effect of changes in foreign exchange rates from changes in market prices on securities held. Such changes are included in net realized and unrealized gain or loss from investments in the Statement of Operations.
For federal income tax purposes, the Portfolios treat the effect of changes in foreign exchange rates arising from actual foreign currency transactions and the changes in foreign exchange rates between the trade date and settlement date as ordinary income.
(C) Foreign Denominated Investments – Foreign denominated assets and currency contracts may involve more risks than domestic transactions including currency risk, political and economic risk, regulatory risk, and market risk. Certain Portfolios may also invest in securities of companies located in emerging markets. Future economic or political developments could adversely affect the liquidity or value, or both, of such securities.
(D) Federal Income Taxes – No provision has been made for income taxes because each Portfolio’s policy is to qualify as a regulated investment company under the Internal Revenue Code and distribute substantially all investment company taxable income and net capital gain on a timely basis. It is also the intention of each Portfolio to distribute an amount sufficient to avoid imposition of any federal excise tax. The Portfolios, accordingly, anticipate paying no federal taxes and no federal tax provision was recorded. Each Portfolio is treated as a separate taxable entity for federal income tax purposes. Certain Portfolios may utilize earnings and profits distributed to shareholders on the redemption of shares as part of the dividends paid deduction.
GAAP requires management of the Portfolios (i.e., the Adviser) to make additional tax disclosures with respect to the tax effects of certain income tax positions, whether those positions were taken on previously filed tax returns or are expected to be taken on future returns. These positions must meet a “more likely than not” standard that, based on the technical merits of the position, would have a greater than 50 percent likelihood of being sustained upon examination. In evaluating whether a tax position has met the more-likely-than-not recognition threshold, the Adviser must presume that the position will be examined by the appropriate taxing authority that has full knowledge of all relevant information.
The Adviser analyzed all open tax years, as defined by the statute of limitations, for all major jurisdictions. Open tax years are those that are open for examination by taxing authorities. Major jurisdictions for the Portfolios include U.S. Federal, Minnesota, and Wisconsin, as well as certain foreign countries. As of June 30, 2014, open U.S. Federal, Minnesota, and Wisconsin tax years include the tax years ended December 31, 2010 through 2013. Additionally, as of June 30, 2014, the tax year ended December 31, 2009 is open for Wisconsin. The Portfolios have no examinations in progress and none are expected at this time.
As of June 30, 2014, the Adviser has reviewed all open tax years and major jurisdictions and concluded that there is no effect to the Portfolios’ tax liability, financial position or results of operations. There is no tax liability resulting from unrecognized tax benefits related to uncertain income tax positions taken or expected to be taken in future tax returns. The Portfolios are also not aware of any tax positions for which it is reasonably possible that the total amounts of unrecognized tax benefits will significantly change in the next 12 months.
316
Table of Contents
Thrivent Series Fund, Inc.
Notes to Financial Statements
June 30, 2014
(unaudited)
Foreign Income Taxes – Certain Portfolios are subject to foreign income taxes imposed by certain countries in which they invest. Withholding taxes on foreign dividends have been provided for in accordance with the applicable country’s tax rules and rates. These amounts are shown as foreign dividend tax withholding in the Statement of Operations. The Portfolios pay tax on foreign capital gains, where applicable.
(E) Expenses and Income – Estimated expenses are accrued daily. The Portfolios are charged for those expenses that are directly attributable to them. Expenses that are not directly attributable to a Portfolio are allocated among all appropriate Portfolios in proportion to their respective net assets, number of shareholder accounts or other reasonable basis.
Interest income is accrued daily including accretion of market discount and original issue discount and amortization of premium. Paydown gains and losses on mortgage- and asset-backed securities are recorded as components of interest income. Dividend income is recorded on the ex-dividend date.
For certain securities, including real estate investment trusts, the Fund records distributions received in excess of income as a reduction of cost of investments and/or realized gain. Such amounts are based on estimates if actual amounts are not available. Actual amounts of income, realized gain and return of capital may differ from the estimated amounts. The Fund adjusts the estimated amounts of the components of distributions as adjustments to investment income, unrealized appreciation/depreciation and realized gain/loss on investments as necessary, once the issuers provide information about the actual composition of the distributions.
(F) Custody Earnings Credit – The Portfolios have a deposit arrangement with the custodian whereby interest earned on uninvested cash balances is used to pay a portion of custodian fees. This deposit arrangement is an alternative to overnight investments. Earnings credits are shown as a reduction of total expenses in the Statement of Operations.
(G) Distributions to Shareholders – Dividends and capital gain distributions are recorded on the ex-dividend date. With the exception of Money Market Portfolio, net realized gains from securities transactions, if any, are paid at least annually after the close of the fiscal year. Any Portfolio subject to excise tax would require an additional distribution prior to the close of the fiscal year.
Dividends are declared and reinvested daily for High Yield Portfolio, Income Portfolio, Bond Index Portfolio, Limited Maturity Bond Portfolio and Opportunity Income Plus Portfolio; declared daily and reinvested monthly for Money Market Portfolio; and declared and reinvested at least annually for all other Portfolios.
(H) Derivative Financial Instruments – Each of the Portfolios, except Thrivent Money Market Portfolio, may invest in derivatives. Derivatives, a category that includes options, futures, swaps and hybrid instruments, are financial instruments whose value derives from another security, an index or a currency. Each Portfolio may use derivatives for hedging (attempting to offset a potential loss in one position by establishing an interest in an opposite position). This includes the use of currency-based derivatives for hedging its positions in foreign securities. Each Portfolio may also use derivatives for replication of a certain asset class or speculation (investing for potential income or capital gain). These contracts may be transacted on an exchange or over-the-counter (OTC).
A derivative may incur a mark to market loss if the value if the derivative decreases due to an unfavorable change in the market rates or values of the underlying derivative. Losses can also occur if the counterparty does not perform under the derivative. A Portfolio’s risk of loss from the counterparty credit risk on OTC derivatives is generally limited to the aggregate unrealized gain netted against any collateral held by such Portfolio. With exchange traded futures and centrally cleared swaps, there is minimal counterparty credit risk to the Portfolios because the exchange’s clearinghouse, as counterparty to such derivatives, guarantees against a possible default. The clearing house stands between the buyer and the seller of the derivative; thus, the credit risk is limited to the failure of the clearinghouse. However, credit risk still exists in exchange traded futures and centrally cleared swaps with respect to initial and variation margin that is held in a broker’s customer accounts. While brokers are required to segregate customer margin from their own assets, in the event that a broker becomes insolvent or goes into bankruptcy and at that time there is a shortfall in the aggregate amount of margin held by the broker for all its clients, U.S. bankruptcy laws will typically allocate that shortfall on a pro-rata basis across all the broker’s customers, potentially resulting in losses in the Portfolios. Using derivatives to hedge can guard against potential risks, but it also adds to the Portfolios’ expenses and can eliminate some opportunities for gains. In addition, a derivative used for hedging or replication may not accurately track the value of the underlying asset. Another risk with derivatives is that some types can amplify a gain or loss, potentially earning or losing substantially more money than the actual cost of the derivative.
In order to define their contractual rights and to secure rights that will help the Portfolios mitigate their counterparty risk, the Portfolios may enter into an International Swaps and Derivatives Association, Inc. Master Agreement (“ISDA Master Agreement”) or similar agreement with its derivative contract counterparties. An ISDA Master Agreement is a bilateral agreement between a Portfolio and a counterparty that governs OTC derivatives and foreign exchange contracts and typically includes, among other things, collateral posting terms and netting provisions in the event of a default and/or termination event. Under an ISDA Master Agreement, each Portfolio may, under certain circumstances, offset with the counterparty certain derivative’s
317
Table of Contents
Thrivent Series Fund, Inc.
Notes to Financial Statements
June 30, 2014
(unaudited)
payables and/or receivables with collateral held and/or posted and create one single net payment. The provisions of the ISDA Master Agreement typically permit a single net payment in the event of a default (close-out netting) including the bankruptcy or insolvency of the counterparty. Note, however, that bankruptcy and insolvency laws of a particular jurisdiction may impose restrictions on or prohibitions against the right of offset in bankruptcy, insolvency or other events.
Collateral and margin requirements vary by type of derivative. Margin requirements are established by the broker or clearing house for exchange traded and centrally cleared derivatives (futures, options, and centrally cleared swaps). Brokers can ask for margining in excess of the minimum in certain situations. Collateral terms are contract specific for OTC derivatives (foreign currency exchange contracts, options, swaps). For derivatives traded under an ISDA Master Agreement, the collateral requirements are typically calculated by netting the mark to market amount for each transaction under such agreement and comparing that amount to the value of any collateral currently pledged by the Portfolio and the counterparty. For financial reporting purposes, non-cash collateral that has been pledged to cover obligations of the Portfolio has been noted in the Schedule of Investments. To the extent amounts due to the Portfolio from its counterparties are not fully collateralized, contractually or otherwise, the Portfolio bears the risk of loss from counterparty nonperformance. The Portfolios attempt to mitigate counterparty risk by only entering into agreements with counterparties that they believe have the financial resources to honor their obligations and by monitoring the financial stability of those counterparties.
Options – All Portfolios, with the exception of Money Market Portfolio, may buy put and call options and write put and covered call options. The Portfolios intend to use such derivative instruments as hedges to facilitate buying or selling securities or to provide protection against adverse movements in security prices or interest rates. The Portfolios may also enter into options contracts to protect against adverse foreign exchange rate fluctuations. Option contracts are valued daily and unrealized appreciation or depreciation is recorded. A Portfolio will realize a gain or loss upon expiration or closing of the option transaction. When an option is exercised, the proceeds upon sale for a written call option or the cost of a security for purchased put and call options is adjusted by the amount of premium received or paid.
Buying put options tends to decrease a Portfolio’s exposure to the underlying security while buying call options tends to increase a Portfolio’s exposure to the underlying security. The risk associated with purchasing put and call options is limited to the premium paid. There is no significant counterparty risk on exchange-traded options as the exchange guarantees the contract against default. Writing put options tends to increase a Portfolio’s exposure to the underlying security while writing call options tends to decrease a Portfolio’s exposure to the underlying security. The writer of an option has no control over whether the underlying security may be bought or sold, and therefore bears the market risk of an unfavorable change in the price of the underlying security. The counterparty risk for purchased options arises when the Portfolio has purchased an option, exercises that option, and the counterparty doesn’t buy from the Portfolio or sell to the Portfolio the underlying asset as required. In the case where the Portfolio has written an option, the Portfolio doesn’t have counterparty risk. Counterparty risk on purchased over-the-counter options is partially mitigated by the Portfolio’s collateral posting requirements. As the option increases in value to the Portfolio, the Portfolio receives collateral from the counterparty. Risks of loss may exceed amounts recognized on the Statement of Assets and Liabilities.
Futures Contracts – Certain Portfolios may use futures contracts to manage the exposure to interest rate and market or currency fluctuations. Gains or losses on futures contracts can offset changes in the yield of securities. When a futures contract is opened, cash or other investments equal to the required “initial margin deposit” are held on deposit with and pledged to the broker. Additional securities held by the Portfolios may be earmarked to cover open futures contracts. The futures contract’s daily change in value (“variation margin”) is either paid to or received from the broker, and is recorded as an unrealized gain or loss. When the contract is closed, realized gain or loss is recorded equal to the difference between the value of the contract when opened and the value of the contract when closed. Futures contracts involve, to varying degrees, risk of loss in excess of the variation margin disclosed in the Statement of Assets and Liabilities. Exchange-traded futures have no significant counterparty risk as the exchange guarantees the contracts against default.
Foreign Currency Forward Contracts – In connection with purchases and sales of securities denominated in foreign currencies all Portfolios, except Money Market Portfolio, may enter into foreign currency forward contracts. Additionally, the Portfolios may enter into such contracts to hedge certain other foreign-currency-denominated investments. These contracts are recorded at value and the related realized and unrealized foreign exchange gains and losses are included in the Statement of Operations. In the event that counterparties fail to settle these forward contracts, the Portfolios could be exposed to foreign currency fluctuations. Foreign currency contracts are valued daily and unrealized appreciation or depreciation is recorded daily as the difference between the contract exchange rate and the closing forward rate applied to the face amount of the contract. A realized gain or loss is recorded at the time a forward contract is closed. These contracts are over-the-counter and the Portfolio is exposed to counterparty risk equal to the discounted net amount of payments to the Portfolio. This risk is partially mitigated by the Portfolio’s collateral posting requirements.
Swap Agreements – Certain Portfolios enter into swap transactions, which involve swapping one or more investment characteristics of a security or a basket of securities with another party. Such transactions include market risk, risk of default by
318
Table of Contents
Thrivent Series Fund, Inc.
Notes to Financial Statements
June 30, 2014
(unaudited)
the other party to the transaction, risk of imperfect correlation and manager risk and may involve commissions or other costs. Swap transactions generally do not involve delivery of securities, other underlying assets or principal. Accordingly, the risk of loss with respect to swap transactions is generally limited to the net amount of payments that the Portfolio is contractually obligated to make, or in the case of the counterparty defaulting, the net amount of payments that the Portfolio is contractually entitled to receive. Risks of loss may exceed amounts recognized on the Statement of Assets and Liabilities. If there is a default by the counterparty, the Portfolio may have contractual remedies pursuant to the agreements related to the transaction. The contracts are valued daily and unrealized appreciation or depreciation is recorded. Swap agreements are valued at fair value of the contract as provided by an independent pricing service. The pricing service takes into account such factors as swap curves, default probabilities, recent trades, recovery rates and other factors it deems relevant in determining valuations. Daily fluctuations in the value of the centrally cleared credit default contracts are recorded in variation margin in the Statement of Assets and Liabilities and recorded as unrealized gain or loss. The Portfolio accrues for the periodic payment and amortizes upfront payments, if any, on swap agreements on a daily basis with the net amount recorded as realized gains or losses in the Statement of Operations. Receipts and payments received or made as a result of a credit event or termination of the contract are also recognized as realized gains or losses in the Statement of Operations. Collateral, in the form of cash or securities, may be required to be held with the Portfolio’s custodian, or a third party, in connection with these agreements. These swap agreements are over-the-counter and the Portfolio is exposed to counterparty risk, which is the discounted net amount of payments owed to the Portfolio. This risk is partially mitigated by the Portfolio’s collateral posting requirements. As the swap increases in value to the Portfolio, the Portfolio receives collateral from the counterparty. Certain interest rate and credit default index swaps must be cleared through a clearinghouse or central counterparty.
Credit Default Swaps – A credit default swap is a swap agreement between two parties to exchange the credit risk of a particular issuer, basket of securities or reference entity. In a credit default swap transaction, a buyer pays periodic fees in return for payment by the seller which is contingent upon an adverse credit event occurring in the underlying issuer or reference entity. The seller collects periodic fees from the buyer and profits if the credit of the underlying issuer or reference entity remains stable or improves while the swap is outstanding, but the seller in a credit default swap contract would be required to pay the amount of credit loss, determined as specified in the agreement, to the buyer in the event of an adverse credit event in the reference entity. A buyer of a credit default swap is said to buy protection whereas a seller of a credit default swap is said to sell protection. The Portfolios may be either the protection buyer or the protection seller.
Certain Portfolios enter into credit default derivative contracts directly through credit default swaps (CDS) or through credit default swap indices (CDX Indices). CDX Indices are static pools of equally weighted credit default swaps referencing corporate bonds and/or loans designed to provide diversified credit exposure to these asset classes. Portfolios sell default protection and assume long-risk positions in individual credits or indices. Index positions are entered into to gain exposure to the corporate bond and/or loan markets in a cost-efficient and diversified structure. In the event that a position defaults, by going into bankruptcy and failing to pay interest or principal on borrowed money, within any given CDX Index held, the maximum potential amount of future payments required would be equal to the pro-rata share of that position within the index based on the notional amount of the index. In the event of a default under a CDS contract, the maximum potential amount of future payments would be the notional amount. For CDS, the default events could be bankruptcy and failing to pay interest or principal on borrowed money or a restructuring. A restructuring is a change in the underlying obligations which would include reduction in interest or principal, maturity extension and subordination to other obligations.
For financial reporting purposes, the Portfolios do not offset derivative assets and derivative liabilities that are subject to netting arrangements in the Statement of Assets and Liabilities. The amounts presented in the tables below are offset first by financial instruments that have the right of offset under master netting or similar arrangements, then any remaining amount is reduced by cash and non-cash collateral pledged. The actual amounts of collateral may be greater than amounts presented in the tables.
319
Table of Contents
Thrivent Series Fund, Inc.
Notes to Financial Statements
June 30, 2014
(unaudited)
The following table presents the gross and net information about assets subject to master netting arrangements, as presented in the Statement of Assets and Liabilities:
| Gross Amounts Not Offset in the | ||||||||||||||||||||||||||||
| Statement of Assets and Liabilities | ||||||||||||||||||||||||||||
| Net Amounts | ||||||||||||||||||||||||||||
| Gross Amounts | Gross | of | Cash | Non-Cash | ||||||||||||||||||||||||
| of Recognized | Amounts | Recognized | Financial | Collateral | Collateral | |||||||||||||||||||||||
Portfolio | Assets | Offset | Assets | Instruments | Offset | Pledged* | Net Amount | |||||||||||||||||||||
Aggressive Allocation | ||||||||||||||||||||||||||||
Futures Contracts | 188,746 | — | 188,746 | 188,746 | — | — | — | |||||||||||||||||||||
Moderately Aggressive Allocation | ||||||||||||||||||||||||||||
Futures Contracts | 493,264 | — | 493,264 | 493,264 | — | — | — | |||||||||||||||||||||
Securities Lending | 41,855,148 | — | 41,855,148 | — | 41,855,148 | — | — | |||||||||||||||||||||
Moderate Allocation | ||||||||||||||||||||||||||||
Futures Contracts | 3,180,821 | — | 3,180,821 | 1,257,120 | — | — | 1,923,701 | ** | ||||||||||||||||||||
Securities Lending | 53,687,425 | — | 53,687,425 | — | 53,687,425 | — | — | |||||||||||||||||||||
Moderately Conservative Allocation | ||||||||||||||||||||||||||||
Futures Contracts | 1,122,418 | — | 1,122,418 | 484,912 | — | — | 637,506 | ** | ||||||||||||||||||||
Securities Lending | 22,629,410 | — | 22,629,410 | — | 22,629,410 | — | — | |||||||||||||||||||||
Growth and Income Plus | ||||||||||||||||||||||||||||
Futures Contracts | 5,098 | — | 5,098 | 313 | — | — | 4,785 | ** | ||||||||||||||||||||
Balanced Income Plus | ||||||||||||||||||||||||||||
Futures Contracts | 14,319 | — | 14,319 | 4,766 | — | — | 9,553 | ** | ||||||||||||||||||||
Securities Lending | 7,684,215 | — | 7,684,215 | — | 7,684,215 | — | — | |||||||||||||||||||||
Diversified Income Plus | ||||||||||||||||||||||||||||
Futures Contracts | 24,444 | — | 24,444 | 24,444 | — | — | — | |||||||||||||||||||||
Securities Lending | 3,372,821 | — | 3,372,821 | — | 3,372,821 | — | — | |||||||||||||||||||||
Opportunity Income Plus | ||||||||||||||||||||||||||||
Futures Contracts | 5,438 | — | 5,438 | 937 | — | — | 4,501 | ** | ||||||||||||||||||||
Natural Resources | ||||||||||||||||||||||||||||
Securities Lending | 2,085,000 | — | 2,085,000 | — | 2,085,000 | — | — | |||||||||||||||||||||
Partner Emerging Markets Equity | ||||||||||||||||||||||||||||
Securities Lending | 2,480,650 | — | 2,480,650 | — | 2,480,650 | — | — | |||||||||||||||||||||
Partner Small Cap Growth | ||||||||||||||||||||||||||||
Securities Lending | 31,529,995 | — | 31,529,995 | — | 31,529,995 | — | — | |||||||||||||||||||||
Partner Small Cap Value | ||||||||||||||||||||||||||||
Securities Lending | 7,097,096 | — | 7,097,096 | — | 7,097,096 | — | — | |||||||||||||||||||||
Small Cap Stock | ||||||||||||||||||||||||||||
Futures Contracts | 58,100 | — | 58,100 | — | — | — | 58,100 | ** | ||||||||||||||||||||
Securities Lending | 24,129,625 | — | 24,129,625 | — | 24,129,625 | — | — | |||||||||||||||||||||
Small Cap Index | ||||||||||||||||||||||||||||
Futures Contracts | 79,719 | — | 79,719 | — | — | — | 79,719 | ** | ||||||||||||||||||||
Securities Lending | 19,992,565 | — | 19,992,565 | — | 19,992,565 | — | — | |||||||||||||||||||||
Mid Cap Growth | ||||||||||||||||||||||||||||
Securities Lending | 18,528,527 | — | 18,528,527 | — | 18,528,527 | — | — | |||||||||||||||||||||
Mid Cap Stock | ||||||||||||||||||||||||||||
Securities Lending | 51,144,300 | — | 51,144,300 | — | 51,144,300 | — | — | |||||||||||||||||||||
Mid Cap Index | ||||||||||||||||||||||||||||
Futures Contracts | 46,817 | — | 46,817 | — | — | — | 46,817 | ** | ||||||||||||||||||||
Securities Lending | 7,711,914 | — | 7,711,914 | — | 7,711,914 | — | — | |||||||||||||||||||||
Partner Worldwide Allocation | ||||||||||||||||||||||||||||
Futures Contracts | 226,315 | — | 226,315 | 226,315 | — | — | — | |||||||||||||||||||||
Exchange Contracts | 329,028 | — | 329,028 | 205,724 | — | — | 123,304 | ** | ||||||||||||||||||||
Securities Lending | 65,064,207 | — | 65,064,207 | — | 65,064,207 | — | — | |||||||||||||||||||||
Partner All Cap | ||||||||||||||||||||||||||||
Securities Lending | 574,887 | — | 574,887 | — | 574,887 | — | — | |||||||||||||||||||||
Large Cap Growth | ||||||||||||||||||||||||||||
Futures Contracts | 47,816 | — | �� | 47,816 | 31,957 | — | — | 15,859 | ** | |||||||||||||||||||
Securities Lending | 13,227,700 | — | 13,227,700 | — | 13,227,700 | — | — | |||||||||||||||||||||
320
Table of Contents
Thrivent Series Fund, Inc.
Notes to Financial Statements
June 30, 2014
(unaudited)
| Gross Amounts Not Offset in the | ||||||||||||||||||||||||||||
| Statement of Assets and Liabilities | ||||||||||||||||||||||||||||
| Net Amounts | ||||||||||||||||||||||||||||
| Gross Amounts | Gross | of | Cash | Non-Cash | ||||||||||||||||||||||||
| of Recognized | Amounts | Recognized | Financial | Collateral | Collateral | |||||||||||||||||||||||
Portfolio | Assets | Offset | Assets | Instruments | Offset | Pledged* | Net Amount | |||||||||||||||||||||
Partner Growth Stock | ||||||||||||||||||||||||||||
Securities Lending | 2,055,325 | — | 2,055,325 | — | 2,055,325 | — | — | |||||||||||||||||||||
Large Cap Value | ||||||||||||||||||||||||||||
Securities Lending | 40,273,125 | — | 40,273,125 | — | 40,273,125 | — | — | |||||||||||||||||||||
Large Cap Stock | ||||||||||||||||||||||||||||
Futures Contracts | 61,372 | — | 61,372 | 40,993 | — | — | 20,379 | ** | ||||||||||||||||||||
Securities Lending | 14,482,831 | — | 14,482,831 | — | 14,482,831 | — | — | |||||||||||||||||||||
Large Cap Index | ||||||||||||||||||||||||||||
Futures Contracts | 1,410 | — | 1,410 | — | — | — | 1,410 | ** | ||||||||||||||||||||
Securities Lending | 2,954,940 | — | 2,954,940 | — | 2,954,940 | — | — | |||||||||||||||||||||
High Yield | ||||||||||||||||||||||||||||
Securities Lending | 59,092,687 | — | 59,092,687 | — | 59,092,687 | — | — | |||||||||||||||||||||
Income | ||||||||||||||||||||||||||||
Futures Contracts | 178,594 | — | 178,594 | 119,965 | — | — | 58,629 | ** | ||||||||||||||||||||
Securities Lending | 23,912,185 | — | 23,912,185 | — | 23,912,185 | — | — | |||||||||||||||||||||
Swap Credit Contracts | 8,110 | — | 8,110 | — | — | — | 8,110 | ** | ||||||||||||||||||||
Limited Maturity Bond | ||||||||||||||||||||||||||||
Futures Contracts | 1,406 | — | 1,406 | 1,406 | — | — | — | |||||||||||||||||||||
Securities Lending | 4,993,550 | — | 4,993,550 | — | 4,993,550 | — | — | |||||||||||||||||||||
Swap Credit Contracts | 21,289 | — | 21,289 | — | — | — | 21,289 | ** | ||||||||||||||||||||
| * | Excess of collateral received from the counterparty may not be shown for financial reporting purposes. |
| ** | Net amount represents the net amount receivable from the counterparty in the event of a default. |
321
Table of Contents
Thrivent Series Fund, Inc.
Notes to Financial Statements
June 30, 2014
(unaudited)
The following table presents the gross and net information about liabilities subject to master netting arrangements, as presented in the Statement of Assets and Liabilities:
| Gross Amount Not Offset in the | ||||||||||||||||||||||||||||
| Statement of Assets and Liabilities | ||||||||||||||||||||||||||||
| Net Amounts | ||||||||||||||||||||||||||||
| Gross Amounts | Gross | of | Cash | Non-Cash | ||||||||||||||||||||||||
| of Recognized | Amounts | Recognized | Financial | Collateral | Collateral | |||||||||||||||||||||||
Portfolio | Liabilities | Offset | Liabilities | Instruments | Offset | Pledged* | Net Amount | |||||||||||||||||||||
Aggressive Allocation | ||||||||||||||||||||||||||||
Futures Contracts | 995,548 | — | 995,548 | 188,746 | — | 806,802 | — | |||||||||||||||||||||
Moderately Aggressive Allocation | ||||||||||||||||||||||||||||
Futures Contracts | 1,423,926 | — | 1,423,926 | 493,264 | — | 930,662 | — | |||||||||||||||||||||
Moderate Allocation | ||||||||||||||||||||||||||||
Futures Contracts | 1,257,120 | — | 1,257,120 | 1,257,120 | — | — | — | |||||||||||||||||||||
Moderately Conservative Allocation | ||||||||||||||||||||||||||||
Futures Contracts | 484,912 | — | 484,912 | 484,912 | — | — | — | |||||||||||||||||||||
Growth and Income Plus | ||||||||||||||||||||||||||||
Futures Contracts | 313 | — | 313 | 313 | — | — | — | |||||||||||||||||||||
Balanced Income Plus | ||||||||||||||||||||||||||||
Futures Contracts | 4,766 | — | 4,766 | 4,766 | — | — | — | |||||||||||||||||||||
Diversified Income Plus | ||||||||||||||||||||||||||||
Futures Contracts | 54,780 | — | 54,780 | 24,444 | — | 30,336 | — | |||||||||||||||||||||
Opportunity Income Plus | ||||||||||||||||||||||||||||
Futures Contracts | 937 | — | 937 | 937 | — | — | — | |||||||||||||||||||||
Partner Worldwide Allocation | ||||||||||||||||||||||||||||
Futures Contracts | 239,011 | — | 239,011 | 226,316 | — | 12,695 | — | |||||||||||||||||||||
Exchange Contracts | 481,055 | — | 481,055 | 205,724 | — | — | 275,331 | ** | ||||||||||||||||||||
Large Cap Growth | ||||||||||||||||||||||||||||
Futures Contracts | 31,957 | — | 31,957 | 31,957 | — | — | — | |||||||||||||||||||||
Large Cap Stock | ||||||||||||||||||||||||||||
Futures Contracts | 40,993 | — | 40,993 | 40,993 | — | — | — | |||||||||||||||||||||
High Yield | ||||||||||||||||||||||||||||
Futures Contracts | 2,000 | — | 2,000 | — | — | — | 2,000 | ** | ||||||||||||||||||||
Income | ||||||||||||||||||||||||||||
Futures Contracts | 119,965 | — | 119,965 | 119,965 | — | — | — | |||||||||||||||||||||
Limited Maturity Bond | ||||||||||||||||||||||||||||
Futures Contracts | 94,804 | — | 94,804 | 1,406 | — | 93,398 | — | |||||||||||||||||||||
| * | Excess of collateral pledged to the counterparty may not be shown for financial reporting purposes. |
| ** | Net amount represents the net amount payable to the counterparty in the event of a default. |
(I) Mortgage Dollar Roll Transactions – Certain Portfolios enter into dollar roll transactions on securities issued or to be issued by the Government National Mortgage Association, Federal National Mortgage Association and Federal Home Loan Mortgage Corporation, in which the Portfolios transfer mortgage securities to a counterparty and simultaneously agree to the return of similar (same type and coupon) securities at a later date at an agreed upon price. The Portfolios maintain liquid securities having a value not less than the agreed upon price (including accrued interest) for such dollar rolls. In addition, the Portfolios are required to post or receive margin – depending on market movements – on their mortgage dollar rolls. The value of the securities that the Portfolios are required to accept on return may decline below the agreed upon price of those securities.
During the term of the agreement, the Portfolios forgo principal and interest paid on the mortgage securities transferred. The Portfolios are compensated from negotiated fees paid by brokers offered as an inducement to the Portfolios to “roll over” their commitments, thus enhancing the yield. Mortgage dollar rolls may be renewed with a new return date and agreed upon price and a cash settlement made on settlement date without physical delivery of the securities subject to the contract. The fees received are recognized over the roll period and are included in Income from mortgage dollar rolls in the Statement of Operations.
(J) Securities Lending – The Trust has entered into a Securities Lending Agreement (the “Agreement”) with Deutsche Bank AG (“Deutsche”). The Agreement authorizes Deutsche to lend securities to authorized borrowers on behalf of the Funds.
322
Table of Contents
Thrivent Series Fund, Inc.
Notes to Financial Statements
June 30, 2014
(unaudited)
Pursuant to the Agreement, all loaned securities are initially collateralized by cash equal to at least 102% of the value of the loaned securities. All cash collateral received is invested in Thrivent Cash Management Trust. The Funds receive dividends and interest that would have been earned on the securities loaned while simultaneously seeking to earn income on the investment of cash collateral. Amounts earned on investments in Thrivent Cash Management Trust, net of rebates, fees paid to Deutsche for services provided and any other securities lending expenses, are included in Income from securities loaned on the Statement of Operations. By investing any cash collateral it receives in these transactions, a Fund could realize additional gains or losses. If the borrower fails to return the securities or the invested collateral has declined in value, the Fund could lose money.
As of June 30, 2014, the value of securities on loan is as follows:
| Securities on | ||||
Fund | Loan | |||
Moderately Aggressive Allocation | $ | 41,488,283 | ||
Diversified Income Plus | 7,885,574 | |||
Moderate Allocation | 52,431,507 | |||
Natural Resources | 9,005,279 | |||
Moderately Conservative Allocation | 22,442,842 | |||
Balanced Income Plus | 7,526,821 | |||
Diversified Income Plus | 3,300,999 | |||
Natural Resources | 2,035,437 | |||
Partner Emerging Markets Equity | 2,396,042 | |||
Partner Small Cap Growth | 31,153,335 | |||
Partner Small Cap Value | 6,943,007 | |||
Small Cap Stock | 23,665,625 | |||
Small Cap Index | 19,565,401 | |||
Mid Cap Growth | 18,024,358 | |||
Mid Cap Stock | 50,256,787 | |||
Mid Cap Index | 7,562,043 | |||
Partner Worldwide Allocation | 78,156,988 | |||
Partner All Cap | 564,013 | |||
Large Cap Growth | 12,983,229 | |||
Partner Growth Stock | 2,022,781 | |||
Large Cap Value | 39,367,670 | |||
Large Cap Stock | 15,303,240 | |||
Large Cap Index | 2,891,741 | |||
High Yield | 56,845,446 | |||
Income | 23,176,927 | |||
Limited Maturity Bond | 4,852,561 | |||
(K) When Issued and Delayed Delivery Transactions – Each Portfolio may purchase or sell securities on a when-issued or delayed delivery basis. These transactions involve a commitment by a Portfolio to purchase or sell securities for a predetermined price or yield, with payment and delivery taking place beyond the customary settlement period. When delayed delivery purchases are outstanding, a Portfolio will designate liquid assets in an amount sufficient to meet the purchase price. When purchasing a security on a delayed delivery basis, a Portfolio assumes the rights and risks of ownership of the security, including the risk of price and yield fluctuations, and takes such fluctuations into account when determining its net asset value. A Portfolio may dispose of a delayed delivery transaction after it is entered into, and may sell when-issued securities before they are delivered, which may result in a capital gain or loss. When a Portfolio has sold a security on a delayed delivery basis, a Portfolio does not participate in future gains and losses with respect to the security.
(L) Treasury Inflation Protected Securities – Each Portfolio may invest in treasury inflation protected securities (TIPS). These securities are fixed income securities whose principal value is periodically adjusted to the rate of inflation. The interest rate is generally fixed at issuance. Interest is paid based on the principal value, which is adjusted for inflation. Any increase in the principal amount will be included as taxable interest in the Statement of Operations and received upon maturity or sale of the security.
(M) Repurchase Agreements – Each Portfolio may engage in repurchase agreement transactions in pursuit of its investment objective. A repurchase agreement consists of a purchase and a simultaneous agreement to resell an investment for later delivery at an agreed upon price and rate of interest. The Portfolio uses a third-party custodian to maintain the collateral. If the original seller of a security subject to a repurchase agreement fails to repurchase the security at the agreed upon time, the Portfolio could incur a loss due to a drop in the value of the security during the time it takes the Portfolio to either sell the security or take action to enforce the original seller’s agreement to repurchase the security. Also, if a defaulting original seller filed for bankruptcy or became insolvent, disposition of such security might be delayed by pending legal action. The Portfolio may only enter into repurchase agreements with banks and other recognized financial institutions such as broker/dealers that are found by the Adviser or subadviser to be creditworthy. During the six months ended June 30, 2014, no Portfolios engaged in this type of investment.
(N) Equity-Linked Structured Securities – Certain Portfolios may invest in equity-linked structured notes. Equity-linked structured notes are debt securities which combine the characteristics of common stock and the sale of an option. The return component is based upon the performance of a single equity security, a basket of equity securities, or an equity index and the sale of an option. There is no guaranteed return of principal with these securities. The appreciation potential of these securities may be limited by a maximum payment or call right and can be influenced by many unpredictable factors. In addition to the performance of the equity, the nature and credit of the issuer may also impact return.
(O) Stripped Securities – Certain Portfolios may invest in Interest Only and Principal Only stripped mortgage or asset backed securities. These securities represent a participation in securities that are structured in classes with rights to receive different portions of the interest and principal. Interest only securities receive all the interest and principal only securities
323
Table of Contents
Thrivent Series Fund, Inc.
Notes to Financial Statements
June 30, 2014
(unaudited)
receive all the principal. If the underlying pool of mortgages or assets experience greater than anticipated prepayments of principal, the Portfolio may not fully recoup its initial investment in an interest only security. Principal only securities increase in value if prepayments are greater than anticipated and decline if prepayments are slower than anticipated. The market value of these securities is highly sensitive to changes in interest rates.
(P) Credit Risk – The Portfolios may be susceptible to credit risk to the extent the issuer or counterparty defaults on its payment obligation. The Portfolios’ policy is to monitor the creditworthiness of the issuers. Interest receivable on defaulted securities is monitored for the ability to collect payments in default and adjusted accordingly.
(Q) Accounting Estimates – The preparation of financial statements in conformity with GAAP requires management to make estimates and assumptions that affect the reported amounts of assets and liabilities and disclosure of contingent assets and liabilities at the date of the financial statements and the reported amounts of income and expenses during the reporting period. Actual results could differ from those estimates.
(R) Loan Commitments – Certain Portfolios may enter into loan commitments, which generally have interest rates which are reset daily, monthly, quarterly or semi-annually by reference to a base lending rate, plus a premium. These base rates are primarily the London-Interbank Offered Rate (“LIBOR”), and secondarily the prime rate offered by one or more major United States banks (the “Prime Rate”) and the certificate of deposit (“CD”) rate or other base lending rates used by commercial lenders. Loan commitments often require prepayments from excess cash flows or allow the borrower to repay at its election. The rate at which the borrower repays cannot be predicted with accuracy. Therefore, the remaining maturity may be considerably less than the stated maturity shown in the Schedule of Investments.
All or a portion of these loan commitments may be unfunded. The Portfolio is obligated to fund these commitments at the borrower’s discretion. Therefore, the Portfolio must have funds sufficient to cover its contractual obligation. These unfunded loan commitments, which are marked -to-market daily, are presented in the Schedule of Investments.
(S) Loss Contingencies – High Yield Portfolio and Income Portfolio are defendants in an adversary action filed on July 31, 2009 by the Official Committee of Unsecured Creditors of Motors Liquidation Company, formerly known as General Motors Corporation (GM), against prior and current holders of term loan debt of GM. The suit seeks to determine whether GM’s term loan facility was secured at the time it entered bankruptcy. High Yield Portfolio at one time held term loans in an original principal amount of at least $4,627,531 and, if the plaintiffs are successful, it is reasonably possible that the Portfolio will be required to make payments in some amount. This loss contingency has not been accrued as a liability because the amount of potential damages and the likelihood of loss cannot be reasonably estimated. Thrivent Income Portfolio is named as a defendant in this action, but we do not expect that the Portfolio’s assets will be subject to a loss contingency.
Balanced Portfolio and Large Cap Index Portfolio are defendants in two separate adversary actions: One was filed in federal court on November 1, 2010 by the Official Committee of Unsecured Creditors of Tribune Company (“Tribune”) and the other was filed in the state of Minnesota on June 2, 2011 by the successor trustees of certain series of debt securities issued by Tribune. These actions have since been consolidated and moved to the United States District Court of the Southern District of New York as consolidated multi-district litigation. The actions seek to determine whether stock repurchases of Tribune stock in connection with a leveraged buyout of Tribune in 2007 (the “LBO Transaction”) were fraudulent transactions that can be voided requiring repurchase payments to be returned to the Tribune bankruptcy estate. Balanced Portfolio and Large Cap Index Portfolio tendered Tribune stock in the LBO Transaction in exchange for $115,600 and $219,300 respectively. If the plaintiffs are successful, it is reasonably possible that these Portfolios would be required to return payments in some amount. Management does not believe it is possible at this time to predict with any reasonable certainty the amount or probability of any potential loss.
Mid Cap Index Portfolio is a potential defendant in an adversary action filed on October 22, 2010 by the trustee of the LB Creditor Trust. The suit seeks to determine whether certain pre-bankruptcy distributions in December 2007 by Lyondell Chemical Company (“Lyondell”) to its shareholders were fraudulent transactions that can be voided and repaid to Lyondell’s creditors. Mid Cap Index Portfolio owned shares of Lyondell stock before the merger. On December 21, 2007, Mid Cap Index Portfolio tendered its shares of Lyondell for $1,542,720. Management does not believe it is possible at this time to predict with any reasonable certainty the amount or probability of any potential loss.
(T) Litigation – Awards from class action litigation are recorded as realized gains on payment date.
324
Table of Contents
Thrivent Series Fund, Inc.
Notes to Financial Statements
June 30, 2014
(unaudited)
(U) In-kind Redemptions – During the year ended December 31, 2013, the Thrivent Asset Allocation Portfolios, as the shareholders of underlying series of Thrivent Series Fund, Inc. (the “underlying portfolios”), redeemed their shares in-kind (“in-kind redemption”). The underlying portfolios distributed portfolio securities rather than cash as payment for the redemption of these portfolio shares. For financial reporting purposes, the underlying portfolios recognize gain on these transactions to the extent the value of the distributed securities on the date of redemption exceeds the cost of those securities; they recognize a loss if the cost exceeds the value. Gains or losses on in-kind redemptions are not recognized for tax purposes. The realized gains or losses below are included in the Statement of Operations of the underlying portfolios as net realized gains/losses on in-kind redemptions. The in-kind amounts and shares redeemed are included in the Capital Stock Transactions of the Statement of Changes in Net Assets of the underlying portfolios. These in-kind transactions were conducted at market value. The transactions were as follows:
Underlying | Underlying Shares Redeemed | Date | In-kind Amount | Realized Gain/(Loss) | ||||||||||||||
Aggressive Allocation Portfolio | Growth and Income Plus | 550,683 | 8/6/2013 | $ | 6,116,764 | $ | 792,628 | |||||||||||
Moderately Aggressive Allocation Portfolio | Growth and Income Plus | 2,306,527 | 8/6/2013 | $ | 25,619,981 | $ | 3,136,192 | |||||||||||
Moderate Allocation Portfolio | Growth and Income Plus | 3,039,607 | 8/6/2013 | $ | 33,762,739 | $ | 4,188,389 | |||||||||||
Moderately Conservative Allocation Portfolio | Growth and Income Plus | 751,066 | 8/6/2013 | $ | 8,342,544 | $ | 1,050,476 | |||||||||||
(V) Other – For financial statement purposes, investment security transactions are accounted for on the trade date. Realized gains and losses from investment transactions are determined on a specific cost identification basis, which is the same basis used for federal income tax purposes.
(3) FEES AND COMPENSATION PAID TO AFFILIATES
(A) Investment Advisory Fees – The Fund has entered into an Investment Advisory Agreement with Thrivent Financial, the Adviser. Under the Investment Advisory Agreement, each of the Portfolios pays a fee for investment advisory services. The fees are accrued daily and paid monthly.
The four Asset Allocation Portfolios – Aggressive Allocation Portfolio, Moderately Aggressive Allocation Portfolio, Moderate Allocation Portfolio and Moderately Conservative Allocation Portfolio – pay investment advisory fees for asset allocation services. In addition, for investments (other than underlying Thrivent Portfolios) held directly by the Asset Allocation Portfolios, each Asset Allocation Portfolio will pay an additional advisory fee. The annual rates of fees as a percentage of average daily net assets under the Investment Advisory Agreement are as follows:
Portfolio (M – Millions) | $0 to $500M | $500 to $2,000M | Over $2,000M | |||||||||
Aggressive Allocation | 0.150 | % | 0.125 | % | 0.100 | % | ||||||
Aggressive Allocation – Direct Holdings | 0.600 | % | 0.600 | % | 0.600 | % | ||||||
Moderately Aggressive Allocation | 0.150 | % | 0.125 | % | 0.100 | % | ||||||
Moderately Aggressive Allocation – Direct Holdings | 0.550 | % | 0.550 | % | 0.550 | % | ||||||
Moderate Allocation | 0.150 | % | 0.125 | % | 0.100 | % | ||||||
Moderate Allocation – Direct Holdings | 0.500 | % | 0.500 | % | 0.500 | % | ||||||
Moderately Conservative Allocation | 0.150 | % | 0.125 | % | 0.100 | % | ||||||
Moderately Conservative Allocation – Direct Holdings | 0.450 | % | 0.450 | % | 0.450 | % | ||||||
For all other Portfolios, the annual rates of fees as a percent of average daily net assets under the Investment Advisory Agreement were as follows:
Portfolio (M - Millions) | $0 to $50M | $50 to $200M | $200 to $250M | $250 to $500M | $500 to $750M | $750 to $1,000M | $1,000 to $1,500M | $1,500 to $2,000M | $2,000 to $2,500M | $2,500 to $5,000M | Over $5,000M | |||||||||||||||||||||||||||||||||
Growth and Income Plus | 0.650 | % | 0.650 | % | 0.650 | % | 0.600 | % | 0.600 | % | 0.600 | % | 0.600 | % | 0.600 | % | 0.600 | % | 0.600 | % | 0.600 | % | ||||||||||||||||||||||
Balanced Income Plus | 0.550 | % | 0.550 | % | 0.550 | % | 0.550 | % | 0.500 | % | 0.500 | % | 0.475 | % | 0.475 | % | 0.475 | % | 0.450 | % | 0.425 | % | ||||||||||||||||||||||
325
Table of Contents
Thrivent Series Fund, Inc.
Notes to Financial Statements
June 30, 2014
(unaudited)
Portfolio (M - Millions) | $0 to $50M | $50 to $200M | $200 to $250M | $250 to $500M | $500 to $750M | $750 to $1,000M | $1,000 to $1,500M | $1,500 to $2,000M | $2,000 to $2,500M | $2,500 to $5,000M | Over $5,000M | |||||||||||||||||||||||||||||||||
Diversified Income Plus | 0.400 | % | 0.400 | % | 0.400 | % | 0.400 | % | 0.400 | % | 0.400 | % | 0.400 | % | 0.400 | % | 0.400 | % | 0.400 | % | 0.400 | % | ||||||||||||||||||||||
Opportunity Income Plus | 0.500 | % | 0.500 | % | 0.500 | % | 0.500 | % | 0.500 | % | 0.500 | % | 0.500 | % | 0.500 | % | 0.500 | % | 0.500 | % | 0.500 | % | ||||||||||||||||||||||
Partner Technology | 0.750 | % | 0.750 | % | 0.750 | % | 0.750 | % | 0.750 | % | 0.750 | % | 0.750 | % | 0.750 | % | 0.750 | % | 0.750 | % | 0.750 | % | ||||||||||||||||||||||
Partner Healthcare | 0.950 | % | 0.900 | % | 0.900 | % | 0.900 | % | 0.900 | % | 0.900 | % | 0.900 | % | 0.900 | % | 0.900 | % | 0.900 | % | 0.900 | % | ||||||||||||||||||||||
Natural Resources | 0.750 | % | 0.725 | % | 0.725 | % | 0.725 | % | 0.725 | % | 0.725 | % | 0.725 | % | 0.725 | % | 0.725 | % | 0.725 | % | 0.725 | % | ||||||||||||||||||||||
Partner Emerging Markets Equity | 1.200 | % | 1.070 | % | 1.070 | % | 1.070 | % | 1.070 | % | 1.070 | % | 1.070 | % | 1.070 | % | 1.070 | % | 1.070 | % | 1.070 | % | ||||||||||||||||||||||
Real Estate Securities | 0.800 | % | 0.800 | % | 0.800 | % | 0.800 | % | 0.750 | % | 0.750 | % | 0.750 | % | 0.750 | % | 0.750 | % | 0.750 | % | 0.750 | % | ||||||||||||||||||||||
Partner Small Cap Growth | 1.000 | % | 1.000 | % | 1.000 | % | 1.000 | % | 0.900 | % | 0.900 | % | 0.900 | % | 0.900 | % | 0.900 | % | 0.900 | % | 0.900 | % | ||||||||||||||||||||||
Partner Small Cap Value | 0.800 | % | 0.800 | % | 0.800 | % | 0.800 | % | 0.800 | % | 0.800 | % | 0.800 | % | 0.800 | % | 0.800 | % | 0.800 | % | 0.800 | % | ||||||||||||||||||||||
Small Cap Stock | 0.700 | % | 0.700 | % | 0.650 | % | 0.650 | % | 0.650 | % | 0.650 | % | 0.600 | % | 0.600 | % | 0.600 | % | 0.550 | % | 0.525 | % | ||||||||||||||||||||||
Small Cap Index | 0.350 | % | 0.350 | % | 0.350 | % | 0.300 | % | 0.250 | % | 0.250 | % | 0.200 | % | 0.150 | % | 0.100 | % | 0.100 | % | 0.100 | % | ||||||||||||||||||||||
Mid Cap Growth | 0.400 | % | 0.400 | % | 0.400 | % | 0.400 | % | 0.400 | % | 0.400 | % | 0.400 | % | 0.400 | % | 0.400 | % | 0.400 | % | 0.400 | % | ||||||||||||||||||||||
Partner Mid Cap Value | 0.750 | % | 0.750 | % | 0.700 | % | 0.700 | % | 0.700 | % | 0.700 | % | 0.700 | % | 0.700 | % | 0.700 | % | 0.700 | % | 0.700 | % | ||||||||||||||||||||||
Mid Cap Stock | 0.700 | % | 0.700 | % | 0.650 | % | 0.650 | % | 0.650 | % | 0.650 | % | 0.600 | % | 0.600 | % | 0.600 | % | 0.550 | % | 0.525 | % | ||||||||||||||||||||||
Mid Cap Index | 0.350 | % | 0.350 | % | 0.350 | % | 0.300 | % | 0.250 | % | 0.250 | % | 0.200 | % | 0.150 | % | 0.100 | % | 0.100 | % | 0.100 | % | ||||||||||||||||||||||
Partner Worldwide Allocation | 0.900 | % | 0.900 | % | 0.900 | % | 0.850 | % | 0.850 | % | 0.850 | % | 0.800 | % | 0.750 | % | 0.750 | % | 0.750 | % | 0.750 | % | ||||||||||||||||||||||
Partner All Cap | 0.950 | % | 0.950 | % | 0.950 | % | 0.950 | % | 0.900 | % | 0.900 | % | 0.900 | % | 0.900 | % | 0.900 | % | 0.900 | % | 0.900 | % | ||||||||||||||||||||||
Large Cap Growth | 0.400 | % | 0.400 | % | 0.400 | % | 0.400 | % | 0.400 | % | 0.400 | % | 0.400 | % | 0.400 | % | 0.400 | % | 0.400 | % | 0.400 | % | ||||||||||||||||||||||
Partner Growth Stock | 0.800 | % | 0.800 | % | 0.800 | % | 0.800 | % | 0.700 | % | 0.700 | % | 0.700 | % | 0.700 | % | 0.700 | % | 0.700 | % | 0.700 | % | ||||||||||||||||||||||
Large Cap Value | 0.600 | % | 0.600 | % | 0.600 | % | 0.600 | % | 0.600 | % | 0.600 | % | 0.600 | % | 0.600 | % | 0.600 | % | 0.600 | % | 0.600 | % | ||||||||||||||||||||||
Large Cap Stock | 0.650 | % | 0.650 | % | 0.650 | % | 0.650 | % | 0.575 | % | 0.550 | % | 0.475 | % | 0.475 | % | 0.475 | % | 0.450 | % | 0.425 | % | ||||||||||||||||||||||
Large Cap Index | 0.350 | % | 0.350 | % | 0.350 | % | 0.300 | % | 0.250 | % | 0.250 | % | 0.200 | % | 0.150 | % | 0.100 | % | 0.100 | % | 0.100 | % | ||||||||||||||||||||||
High Yield | 0.400 | % | 0.400 | % | 0.400 | % | 0.400 | % | 0.400 | % | 0.400 | % | 0.400 | % | 0.400 | % | 0.400 | % | 0.400 | % | 0.400 | % | ||||||||||||||||||||||
Income | 0.400 | % | 0.400 | % | 0.400 | % | 0.400 | % | 0.400 | % | 0.400 | % | 0.400 | % | 0.400 | % | 0.400 | % | 0.400 | % | 0.400 | % | ||||||||||||||||||||||
Bond Index | 0.350 | % | 0.350 | % | 0.350 | % | 0.300 | % | 0.250 | % | 0.250 | % | 0.200 | % | 0.150 | % | 0.100 | % | 0.100 | % | 0.100 | % | ||||||||||||||||||||||
Limited Maturity Bond | 0.400 | % | 0.400 | % | 0.400 | % | 0.400 | % | 0.400 | % | 0.400 | % | 0.400 | % | 0.400 | % | 0.400 | % | 0.400 | % | 0.400 | % | ||||||||||||||||||||||
Money Market | 0.400 | % | 0.400 | % | 0.400 | % | 0.400 | % | 0.400 | % | 0.400 | % | 0.400 | % | 0.400 | % | 0.400 | % | 0.400 | % | 0.400 | % | ||||||||||||||||||||||
(B) Sub-Adviser Fees – The following subadvisory fees are charged as part of the total investment advisory fees stated in the table above. The subadvisory fees are borne directly by the Adviser and do not increase the overall fees paid by the Portfolio.
Partner Technology Portfolio
The Adviser has entered into a subadvisory agreement with Goldman Sachs Asset Management, LP (“GSAM”) for the performance of subadvisory services. The fee payable is equal to 0.45% of average daily net assets.
Partner Healthcare Portfolio
The Adviser has entered into a subadvisory agreement with Sectoral Asset Management, Inc. for the performance of subadvisory services. The fee payable is equal to 0.65% of the first $50 million of average daily net assets, 0.60% of the next $50 million, 0.40% of the next $150 million and 0.35% of average daily net assets over $250 million.
Partner Emerging Markets Equity Portfolio
The Adviser has entered into a subadvisory agreement with Aberdeen Asset Managers Limited (“Aberdeen”) for the performance of subadvisory services. The fee payable is equal to 0.85% of the first $50 million of average daily net assets, 0.72% of the next $50 million and 0.68% of average daily net assets over $100 million. Thrivent Partner Worldwide Allocation Portfolio and Thrivent Partner Worldwide Allocation Fund are included in determining breakpoints for the assets managed by Aberdeen.
Partner Small Cap Growth Portfolio
This agreement was terminated on May 27, 2014. The Adviser has entered into a subadvisory agreement with Turner Investments, L.P. (“Turner”) for the performance of subadvisory services. For assets that are invested in companies that have market capitalizations that fall within the bottom half of the Russell 2000® Growth Index (the “microcap portion”), the fee payable is equal to 0.80% of the average daily net assets in that microcap portion. For all other assets, the fee payable is equal to 0.65% of the average daily net assets when the entire portfolio assets (including the microcap portion) are no greater than $100 million, 0.60% of the average daily net assets when the entire portfolio assets are greater than $100 million but no greater than $350 million, and 0.575% of the average daily net assets when the entire portfolio assets are greater than $350 million. Thrivent Partner Small Cap Growth Fund (including the microcap portion of that Fund) is included in determining breakpoints for the assets managed by Turner.
Partner Small Cap Value Portfolio
The Adviser has entered into a subadvisory agreement with T. Rowe Price Associates, Inc. for the performance of subadvisory services. The fee payable is equal to 0.60% of average daily net assets.
326
Table of Contents
Thrivent Series Fund, Inc.
Notes to Financial Statements
June 30, 2014
(unaudited)
Partner Mid Cap Value Portfolio
The Adviser has entered into a subadvisory agreement with GSAM for the performance of subadvisory services. The fee payable is equal to 0.50% of average daily net assets for the first $200 million and 0.45% for assets over $200 million. Thrivent Partner Mid Cap Value Fund is included in determining breakpoints for the assets managed by GSAM.
Partner Worldwide Allocation Portfolio
The Adviser has entered into subadvisory agreements with Mercator Asset Management, LP (“Mercator”), Principal Global Investors, LLC (“Principal”), Aberdeen Asset Managers Limited (“Aberdeen”), DuPont Capital and GSAM for the performance of subadvisory services.
The fee payable for Mercator is equal to 0.75% of the first $25 million of average daily net assets managed by Mercator, 0.60% of the next $25 million, 0.55% of the next $25 million, 0.50% of the next $225 million, 0.40% of the next $200 million and 0.20% of average daily net assets over $500 million. Thrivent Partner Worldwide Allocation Fund is included in determining breakpoints for the assets managed by Mercator.
The fee payable for Principal is equal to 0.35% of the first $500 million of average daily net assets managed by Principal, 0.30% of the next $500 million and 0.25% of average daily net assets over $1 billion. Thrivent Partner Worldwide Allocation Fund is included in determining breakpoints for the assets managed by Principal.
The fee payable for Aberdeen is equal to 0.85% of the first $50 million of average daily net assets managed by Aberdeen, 0.72% of the next $50 million and 0.68% of average daily net assets over $100 million. Thrivent Partner Emerging Markets Equity Portfolio and Partner Worldwide Allocation Fund are included in determining breakpoints for the assets managed by Aberdeen.
The fee payable for GSAM for managing the emerging markets debt portion is equal to 0.50% of the first $200 million of average daily net assets, 0.45% of the next $200 million and 0.40% of average daily net assets over $400 million. The fee payable for GSAM for managing the international small- and mid-cap equities portion is equal to 0.58% of the first $250 million of average daily net assets; and 0.54% of average daily net assets in excess of $250 million. Thrivent Partner Worldwide Allocation Fund is included in determining breakpoints for the assets managed by GSAM.
The fee payable for DuPont Capital is equal to 0.72% of the first $50 million of average daily net assets managed by DuPont Capital and 0.68% of average daily net assets over $50 million. Thrivent Partner Worldwide Allocation Fund and Thrivent Partner Emerging Markets Equity Fund is included in determining breakpoints for the assets managed by DuPont Capital.
Partner All Cap Portfolio
The Adviser has entered into a subadvisory agreement with Pyramis Global Advisors, LLC (“Pyramis Advisors”) for the performance of subadvisory services. Pyramis Advisors is a wholly owned subsidiary of Fidelity Management & Research Corporation. The fee payable is equal to 0.60% of average daily net assets for the first $100 million, 0.55% for the next $400 million, 0.50% for the next $250 million and 0.45% for assets over $750 million.
Partner Growth Stock Portfolio
The Adviser has entered into a subadvisory agreement with T. Rowe Price Associates, Inc. for the performance of subadvisory services. The fee payable is equal to 0.40% of average daily net assets for the first $500 million and 0.35% for assets over $500 million.
(C) Expense Reimbursements – As of June 30, 2014, the following voluntary expense reimbursements, as a percentage of net assets, were in effect:
Portfolio | Expense Reimbursement | Expiration Date | ||||||
Partner Small Cap Growth | 0.10 | % | N/A | |||||
Partner Growth Stock | 0.10 | % | N/A | |||||
Money Market* | 0.10 | % | N/A | |||||
| * | Thrivent Asset Management has voluntarily agreed to reimburse an additional 0.24% of certain portfolio level expenses to the extent necessary in order to maintain a minimum annualized net yield of 0.00%. |
As of June 30, 2014, contractual expense reimbursements to limit expenses to the following percentages were in effect:
Portfolio | Expense Limit | Expiration Date | ||||||
Growth and Income Plus1 | 0.80 | % | 4/30/2015 | |||||
Opportunity Income Plus2 | 0.75 | % | 4/30/2015 | |||||
Partner Healthcare | 1.25 | % | 4/30/2015 | |||||
Natural Resources | 1.02 | % | 4/30/2015 | |||||
Partner Emerging Markets Equity | 1.40 | % | 4/30/2015 | |||||
Partner All Cap | 0.95 | % | 4/30/2015 | |||||
Large Cap Index | 0.40 | % | 4/30/2015 | |||||
| 1 | Prior voluntary expense limit of 0.80% became a contractual expense cap effective May 1, 2014. |
| 2 | Prior contractual expense cap of 0.79% expired on April 30, 2014. |
Thrivent does not recoup amounts previously reimbursed or waived in prior fiscal years.
Each equity, hybrid and fixed income Portfolio may invest cash in High Yield Fund, Money Market Portfolio and Thrivent Cash Management Trust, subject to certain limitations. During the six months ended June 30, 2014, none of the Portfolios invested in High Yield Fund or Money Market Portfolio. During the six months ended June 30, 2014, all
327
Table of Contents
Thrivent Series Fund, Inc.
Notes to Financial Statements
June 30, 2014
(unaudited)
Portfolios, except Aggressive Allocation Portfolio, Moderately Aggressive Allocation Portfolio, Moderate Allocation Portfolio, Moderately Conservative Allocation Portfolio and Money Market Portfolio, invested in Cash Management Trust. These related-party transactions are subject to the same terms as non-related party transactions except that, to avoid duplicate investment advisory fees, Thrivent Financial reimburses an amount equal to the advisory fee which is charged to the Portfolio for its investment in High Yield Fund or Money Market Portfolio.
(D) Other Expenses – The Fund has entered into an accounting and administrative services agreement with the Adviser to provide certain accounting and administrative personnel and services to the Portfolios. For the six months ended June 30, 2014, the Adviser received aggregate fees for accounting and administrative personnel and services of $4,007,927 from the Fund.
Each Director who is not affiliated with the Adviser receives an annual fee from the Fund for services as a Director and is eligible to participate in a deferred compensation plan with respect to these fees. Participants in the plan may designate their deferred Director’s fees as if invested in any one of the portfolios of Thrivent Mutual Funds. The value of each Director’s deferred compensation account will increase or decrease as if it were invested in shares of the selected portfolios of Thrivent Mutual Funds. Their fees as well as the change in value are included in Director’s fees in the Statement of Operations. The deferred fees remain in the appropriate fund until distribution in accordance with the plan. The deferred fee liability, included in accrued expenses in the Statement of Assets and Liabilities, is unsecured.
Those Directors not participating in the above plan received $197,903 in fees from the Fund for the six months ended June 30, 2014. In addition, the Fund reimbursed independent Directors for reasonable expenses incurred in relation to attendance at the meetings and industry conferences. Certain officers and non-independent directors of the Fund are officers and directors of Thrivent Financial and Thrivent Life; however, they receive no compensation from the Fund.
(E) Indirect Expenses – Some Portfolios invest in other mutual funds. Fees and expenses of those underlying funds are not included in the Portfolios’ expense ratios. The Portfolios indirectly bear their proportionate share of the annualized weighted average expense ratio of the underlying funds in which they invest.
(4) TAX INFORMATION
Distributions are based on amounts calculated in accordance with applicable federal income tax regulations, which may differ from GAAP. To the extent that these differences are permanent in nature, such amounts are reclassified within the capital accounts based on their federal tax-basis treatment; temporary differences do not require reclassifications. At fiscal year-end, the character and amount of distributions, on a tax basis and components of distributable earnings, are finalized. Therefore, as of June 30, 2014, the tax-basis balance has not yet been finalized.
At December 31, 2013, the following Portfolios had accumulated net realized capital loss carryovers expiring as follows:
Portfolio | Capital Loss Carryover | Expiration Year | ||||||
Diversified Income Plus | $ | 2,247,582 | 2017 | |||||
|
| |||||||
| $ | 2,247,582 | |||||||
|
| |||||||
Partner Technology | 657,215 | 2017 | ||||||
|
| |||||||
| $ | 657,215 | |||||||
|
| |||||||
Partner Worldwide | ||||||||
Allocation | 2,973,804 | 2015 | ||||||
| 186,079,623 | 2016 | |||||||
|
| |||||||
| $ | 189,053,427 | |||||||
|
| |||||||
Partner All Cap | 563,845 | 2017 | ||||||
|
| |||||||
| $ | 563,845 | |||||||
|
| |||||||
Large Cap Growth | 5,831,793 | 2016 | ||||||
| 185,657,815 | 2017 | |||||||
|
| |||||||
| $ | 191,489,608 | |||||||
|
| |||||||
Large Cap Value | 26,684,113 | 2017 | ||||||
|
| |||||||
| $ | 26,684,113 | |||||||
|
| |||||||
Large Cap Stock | 5,002,652 | 2017 | ||||||
|
| |||||||
| $ | 5,002,652 | |||||||
|
| |||||||
High Yield | 37,716,359 | 2016 | ||||||
| 46,838,004 | 2017 | |||||||
|
| |||||||
| $ | 84,554,363 | |||||||
|
| |||||||
Limited Maturity Bond | 5,004,107 | 2017 | ||||||
|
| |||||||
| $ | 5,004,107 | |||||||
|
| |||||||
To the extent that these Portfolios realize future net capital gains, taxable distributions will be reduced by any unused capital loss carryovers as permitted by the Internal Revenue Code.
Capital losses generated during the year ending December 31, 2012 and later, are subject to the provisions of the Regulated Investment Company Modernization Act of 2010 (the “Act”). Under the Act, if capital losses are not reduced by gains, the losses will be carried forward with no expiration and with the short-term or long-term character of the loss retained. Additionally, these capital losses must be fully utilized before those capital loss carryovers listed with noted expiration dates in the table above, which may make them more likely to expire unused.
At December 31, 2013, the following Portfolios had accumulated net realized capital loss carryovers subject to the Act, as follows:
328
Table of Contents
Thrivent Series Fund, Inc.
Notes to Financial Statements
June 30, 2014
(unaudited)
Portfolio | Capital Loss Carryover | Tax Character | ||||||
Opportunity Income Plus | ||||||||
| 1,722,721 | Short-term | |||||||
|
| |||||||
| $ | 1,722,721 | |||||||
|
| |||||||
Natural Resources | ||||||||
| 979,720 | Short-term | |||||||
| 1,905,739 | Long-term | |||||||
|
| |||||||
| $ | 2,885,459 | |||||||
|
| |||||||
Partner Emerging Markets | ||||||||
Equity | ||||||||
| 638,572 | Long-term | |||||||
|
| |||||||
| $ | 638,572 | |||||||
|
| |||||||
Bond Index | ||||||||
| 2,128,041 | Short-term | |||||||
|
| |||||||
| $ | 2,128,041 | |||||||
|
| |||||||
(5) SECURITY TRANSACTIONS
(A) Purchases and Sales of Investment Securities – For the six months ended June 30, 2014, the cost of purchases and the proceeds from sales of investment securities, other than U.S. Government and short-term securities, were as follows:
| In thousands | ||||||||
Portfolio | Purchases | Sales | ||||||
Aggressive Allocation | $ | 137,040 | $ | 118,241 | ||||
Moderately Aggressive Allocation | 638,949 | 533,995 | ||||||
Moderate Allocation | 1,088,321 | 895,931 | ||||||
Moderately Conservative Allocation | 411,939 | 454,947 | ||||||
Growth and Income Plus | 69,343 | 63,975 | ||||||
Balanced Income Plus | 98,437 | 86,936 | ||||||
Diversified Income Plus | 235,635 | 209,240 | ||||||
Opportunity Income Plus | 22,557 | 14,168 | ||||||
Partner Technology | 8,938 | 8,549 | ||||||
Partner Healthcare | 22,229 | 12,080 | ||||||
Natural Resources | 2,645 | 877 | ||||||
Partner Emerging Markets Equity | 5,648 | 863 | ||||||
Real Estate Securities | 11,278 | 9,698 | ||||||
Partner Small Cap Growth | 189,434 | 195,559 | ||||||
Partner Small Cap Value | 33,302 | 36,236 | ||||||
Small Cap Stock | 96,207 | 94,971 | ||||||
Small Cap Index | 13,738 | 21,402 | ||||||
Mid Cap Growth | 77,588 | 96,096 | ||||||
Partner Mid Cap Value | 158,917 | 162,232 | ||||||
Mid Cap Stock | 116,560 | 146,712 | ||||||
Mid Cap Index | 8,192 | 8,985 | ||||||
Partner Worldwide Allocation | 758,481 | 749,201 | ||||||
Partner All Cap | 51,759 | 51,884 | ||||||
Large Cap Growth | 219,635 | 266,163 | ||||||
Partner Growth Stock | 17,407 | 15,859 | ||||||
Large Cap Value | 138,378 | 124,998 | ||||||
Large Cap Stock | 305,414 | 307,184 | ||||||
Large Cap Index | 6,783 | 4,885 | ||||||
High Yield | 244,361 | 238,380 | ||||||
Income | 372,406 | 396,529 | ||||||
Bond Index | 7,564 | 6,756 | ||||||
Limited Maturity Bond | 195,515 | 169,936 | ||||||
Purchases and Sales of U.S. Government Securities were:
| In thousands | ||||||||
Portfolio | Purchases | Sales | ||||||
Aggressive Allocation | $ | 105,690 | $ | 105,418 | ||||
Moderately Aggressive Allocation | 1,173,005 | 1,170,944 | ||||||
Moderate Allocation | 3,273,716 | 3,066,589 | ||||||
Moderately Conservative Allocation | 2,591,350 | 2,473,427 | ||||||
Growth and Income Plus | 16,043 | 12,578 | ||||||
Balanced Income Plus | 76,161 | 77,214 | ||||||
Diversified Income Plus | 102,083 | 94,827 | ||||||
Opportunity Income Plus | 27,619 | 26,357 | ||||||
Partner Worldwide Allocation | — | 2,471 | ||||||
Income | 335,432 | 340,519 | ||||||
Bond Index | 311,288 | 321,333 | ||||||
Limited Maturity Bond | 346,343 | 402,384 | ||||||
(B) Investments in Restricted Securities – Certain Portfolios may own restricted securities that have been deemed illiquid and were purchased in private placement transactions without registration under the Securities Act of 1933. Unless such securities subsequently become registered, they generally may be resold only in privately negotiated transactions with a limited number of purchasers. As of June 30, 2014, the following Portfolios held restricted securities:
Portfolio | Number of Securities | Percent of Portfolio’s Net Assets | ||||||
Moderately Aggressive | ||||||||
Allocation | 5 | 0.03 | % | |||||
Moderate Allocation | 5 | 0.04 | % | |||||
Moderately Conservative | ||||||||
Allocation | 5 | 0.12 | % | |||||
Growth and Income Plus | 3 | 0.43 | % | |||||
Balanced Income Plus | 6 | 1.00 | % | |||||
Diversified Income Plus | 2 | 0.39 | % | |||||
Opportunity Income Plus | 4 | 1.17 | % | |||||
Partner Worldwide | ||||||||
Allocation | 7 | 0.26 | % | |||||
High Yield | 11 | 3.71 | % | |||||
Income | 5 | 0.41 | % | |||||
Bond Index | 5 | 1.28 | % | |||||
Limited Maturity Bond | 14 | 3.44 | % | |||||
The Portfolios have no right to require registration of unregistered securities.
(C) Investments in High-Yielding Securities – High Yield Portfolio invests primarily in high-yielding fixed income securities. Each of the other Portfolios, except Money Market Portfolio, may also invest in high-yielding securities. These securities will typically be in lower rated categories or will be non-rated and generally will involve more risk than securities in higher rated categories. Lower rated or unrated securities are more likely to react to developments affecting market risk and credit risk than are more highly rated securities, which react primarily to movements in the general level of interest rates.
329
Table of Contents
Thrivent Series Fund, Inc.
Notes to Financial Statements
June 30, 2014
(unaudited)
(D) Investments in Options and Futures Contracts – The movement in the price of the security underlying an option or futures contract may not correlate perfectly with the movement in the prices of the portfolio securities being hedged. A lack of correlation could render the Portfolio’s hedging strategy unsuccessful and could result in a loss to the Portfolio. In the event that a liquid secondary market would not exist, the Portfolio could be prevented from entering into a closing transaction which could result in additional losses to the Portfolio.
(E) Written Option Contracts – The number of contracts and premium amounts associated with covered call option contracts written during the six months ended June 30, 2014, were as follows:
| Number of Contracts | Premium Amount | |||||||
Limited Maturity Bond | ||||||||
Balance at December 31, 2013 | — | $ | — | |||||
Opened | (400 | ) | 61,300 | |||||
Closed | (400 | ) | (61,300 | ) | ||||
Expired | — | — | ||||||
Exercised | — | — | ||||||
|
|
|
| |||||
Balance at June 30, 2014 | — | $ | — | |||||
|
|
|
| |||||
(6) SECURITY TRANSACTIONS WITH AFFILIATED FUNDS
The Portfolios are permitted to purchase or sell securities from or to certain other Portfolios under specified conditions outlined in procedures adopted by the Board. The procedures have been designed to ensure that any purchase or sale of securities by the Portfolio from or to another portfolio or fund that is or could be considered an affiliate by virtue of having a common investment adviser (or affiliated investment advisers), common Directors and/ or common officers complies with Rule 17a-7 of the 1940 Act. Further, as defined under the procedures, each transaction is executed at the current market price.
(7) SHARES OF BENEFICIAL INTEREST
The shares of each Portfolio have equal rights and privileges with all shares of that Portfolio. Shares in the Portfolio are currently sold only to separate accounts of Thrivent Financial, Thrivent Life and retirement plans sponsored by Thrivent Financial.
As of June 30, 2014, authorized capital stock consists of ten billion shares as follows:
Portfolio | Shares Authorized | Par Value | ||||||
Aggressive Allocation | 350,000,000 | $ | 0.01 | |||||
Moderately Aggressive Allocation | 700,000,000 | 0.01 | ||||||
Moderate Allocation | 1,200,000,000 | 0.01 | ||||||
Moderately Conservative Allocation | 800,000,000 | 0.01 | ||||||
Growth and Income Plus | 200,000,000 | 0.01 | ||||||
Balanced Income Plus | 200,000,000 | 0.01 | ||||||
Diversified Income Plus | 250,000,000 | 0.01 | ||||||
Opportunity Income Plus | 50,000,000 | 0.01 | ||||||
Partner Technology | 100,000,000 | 0.01 | ||||||
Partner Healthcare | 50,000,000 | 0.01 | ||||||
Natural Resources | 200,000,000 | 0.01 | ||||||
Partner Emerging Markets Equity | 100,000,000 | 0.01 | ||||||
Real Estate Securities | 100,000,000 | 0.01 | ||||||
Partner Small Cap Growth | 50,000,000 | 0.01 | ||||||
Partner Small Cap Value | 150,000,000 | 0.01 | ||||||
Small Cap Stock | 200,000,000 | 0.01 | ||||||
Small Cap Index | 200,000,000 | 0.01 | ||||||
Mid Cap Growth | 200,000,000 | 0.01 | ||||||
Partner Mid Cap Value | 50,000,000 | 0.01 | ||||||
Mid Cap Stock | 200,000,000 | 0.01 | ||||||
Mid Cap Index | 200,000,000 | 0.01 | ||||||
Partner Worldwide Allocation | 700,000,000 | 0.01 | ||||||
Partner All Cap | 100,000,000 | 0.01 | ||||||
Large Cap Growth | 300,000,000 | 0.01 | ||||||
Partner Growth Stock | 50,000,000 | 0.01 | ||||||
Large Cap Value | 200,000,000 | 0.01 | ||||||
Large Cap Stock | 400,000,000 | 0.01 | ||||||
Large Cap Index | 200,000,000 | 0.01 | ||||||
High Yield | 350,000,000 | 0.01 | ||||||
Income | 300,000,000 | 0.01 | ||||||
Bond Index | 200,000,000 | 0.01 | ||||||
Limited Maturity Bond | 450,000,000 | 0.01 | ||||||
Money Market | 1,200,000,000 | 0.01 | ||||||
(8) SUBSEQUENT EVENTS
Management of the Portfolios has evaluated the impact of subsequent events and, except as already included in the Notes to Financial Statements, has determined that no additional items require disclosure.
330
Table of Contents
THIS PAGE INTENTIONALLY LEFT BLANK
331
Table of Contents
Thrivent Series Fund, Inc.
| FOR A SHARE OUTSTANDING THROUGHOUT EACH PERIOD* | ||||||||||||||||||||||||
| Income from Investment Operations | Less Distributions from | |||||||||||||||||||||||
| Net Asset Value, Beginning of Period | Net Investment Income/(Loss) | Net Realized and Unrealized Gain/(Loss) on Investments(a) | Total from Investment Operations | Net Investment Income | Net Realized Gain on Investments | |||||||||||||||||||
AGGRESSIVE ALLOCATION PORTFOLIO | ||||||||||||||||||||||||
Period Ended 06/30/2014 (unaudited) | $ | 15.04 | $ | 0.09 | $ | 0.72 | $ | 0.81 | $ | (0.07 | ) | $ | (0.43 | ) | ||||||||||
Year Ended 12/31/2013 | 12.15 | 0.07 | 3.17 | 3.24 | (0.17 | ) | (0.18 | ) | ||||||||||||||||
Year Ended 12/31/2012 | 11.40 | 0.17 | 1.18 | 1.35 | (0.08 | ) | (0.52 | ) | ||||||||||||||||
Year Ended 12/31/2011 | 12.22 | 0.06 | (0.52 | ) | (0.46 | ) | (0.16 | ) | (0.20 | ) | ||||||||||||||
Year Ended 12/31/2010 | 10.66 | 0.10 | 1.72 | 1.82 | (0.16 | ) | (0.10 | ) | ||||||||||||||||
Year Ended 12/31/2009 | 8.51 | 0.09 | 2.47 | 2.56 | (0.41 | ) | — | |||||||||||||||||
|
|
|
|
|
|
|
|
|
|
|
| |||||||||||||
MODERATELY AGGRESSIVE ALLOCATION PORTFOLIO | ||||||||||||||||||||||||
Period Ended 06/30/2014 (unaudited) | 14.37 | 0.11 | 0.69 | 0.80 | (0.13 | ) | (0.39 | ) | ||||||||||||||||
Year Ended 12/31/2013 | 12.31 | 0.12 | 2.44 | 2.56 | (0.20 | ) | (0.30 | ) | ||||||||||||||||
Year Ended 12/31/2012 | 11.19 | 0.21 | 1.21 | 1.42 | (0.14 | ) | (0.16 | ) | ||||||||||||||||
Year Ended 12/31/2011 | 11.89 | 0.12 | (0.45 | ) | (0.33 | ) | (0.23 | ) | (0.14 | ) | ||||||||||||||
Year Ended 12/31/2010 | 10.72 | 0.17 | 1.42 | 1.59 | (0.25 | ) | (0.17 | ) | ||||||||||||||||
Year Ended 12/31/2009 | 8.64 | 0.17 | 2.37 | 2.54 | (0.46 | ) | — | |||||||||||||||||
|
|
|
|
|
|
|
|
|
|
|
| |||||||||||||
MODERATE ALLOCATION PORTFOLIO | ||||||||||||||||||||||||
Period Ended 06/30/2014 (unaudited) | 13.63 | 0.10 | 0.60 | 0.70 | (0.16 | ) | (0.37 | ) | ||||||||||||||||
Year Ended 12/31/2013 | 12.28 | 0.16 | 1.66 | 1.82 | (0.20 | ) | (0.27 | ) | ||||||||||||||||
Year Ended 12/31/2012 | 11.25 | 0.20 | 1.10 | 1.30 | (0.19 | ) | (0.08 | ) | ||||||||||||||||
Year Ended 12/31/2011 | 11.79 | 0.17 | (0.28 | ) | (0.11 | ) | (0.26 | ) | (0.17 | ) | ||||||||||||||
Year Ended 12/31/2010 | 10.82 | 0.22 | 1.21 | 1.43 | (0.29 | ) | (0.17 | ) | ||||||||||||||||
Year Ended 12/31/2009 | 8.92 | 0.23 | 2.14 | 2.37 | (0.47 | ) | — | |||||||||||||||||
|
|
|
|
|
|
|
|
|
|
|
| |||||||||||||
MODERATELY CONSERVATIVE ALLOCATION PORTFOLIO | ||||||||||||||||||||||||
Period Ended 06/30/2014 (unaudited) | 12.71 | 0.13 | 0.46 | 0.59 | (0.20 | ) | (0.28 | ) | ||||||||||||||||
Year Ended 12/31/2013 | 12.07 | 0.20 | 0.87 | 1.07 | (0.19 | ) | (0.24 | ) | ||||||||||||||||
Year Ended 12/31/2012 | 11.28 | 0.18 | 0.89 | 1.07 | (0.19 | ) | (0.09 | ) | ||||||||||||||||
Year Ended 12/31/2011 | 11.66 | 0.18 | (0.16 | ) | 0.02 | (0.25 | ) | (0.15 | ) | |||||||||||||||
Year Ended 12/31/2010 | 10.91 | 0.23 | 0.97 | 1.20 | (0.28 | ) | (0.17 | ) | ||||||||||||||||
Year Ended 12/31/2009 | 9.27 | 0.24 | 1.82 | 2.06 | (0.42 | ) | — | |||||||||||||||||
| (a) | The amount shown may not correlate with the change in aggregate gains and losses of portfolio securities due to the timing of sales and redemptions of portfolio shares. |
| * | All per share amounts have been rounded to the nearest cent. |
The accompanying Notes to Financial Statements are an integral part of this schedule.
332
Table of Contents
Thrivent Series Fund, Inc.
Financial Highlights – continued
| RATIOS / SUPPLEMENTAL DATA | ||||||||||||||||||||||||||||||||
| Ratio to Average Net Assets** | Ratios to Average Net Assets Before Expenses Waived, Credited or Paid Indirectly** | |||||||||||||||||||||||||||||||
Total Distributions | Net Asset Value, End of Period | Total Return(b) | Net Assets, End of Period (in millions) | Expenses | Net Investment Income/(Loss) | Expenses | Net Investment Income/(Loss) | Portfolio Turnover Rate | ||||||||||||||||||||||||
$(0.50) | $ | 15.35 | 5.44 | % | $ | 873.1 | 0.47 | % | 1.24 | % | 0.47 | % | 1.24 | % | 29 | % | ||||||||||||||||
(0.35) | 15.04 | 27.05 | % | 799.4 | 0.46 | % | 0.53 | % | 0.47 | % | 0.52 | % | 43 | % | ||||||||||||||||||
(0.60) | 12.15 | 12.25 | % | 608.2 | 0.49 | % | 1.45 | % | 0.49 | % | 1.45 | % | 69 | % | ||||||||||||||||||
(0.36) | 11.40 | (3.93 | )% | 560.6 | 0.42 | % | 0.49 | % | 0.43 | % | 0.47 | % | 74 | % | ||||||||||||||||||
(0.26) | 12.22 | 17.53 | % | 587.1 | 0.34 | % | 0.95 | % | 0.39 | % | 0.90 | % | 68 | % | ||||||||||||||||||
(0.41) | 10.66 | 30.62 | % | 497.6 | 0.23 | % | 1.29 | % | 0.26 | % | 1.27 | % | 22 | % | ||||||||||||||||||
|
|
|
|
|
|
|
|
|
|
|
|
|
|
|
|
| ||||||||||||||||
(0.52) | 14.65 | 5.56 | % | 4,666.8 | 0.44 | % | 1.64 | % | 0.44 | % | 1.64 | % | 42 | % | ||||||||||||||||||
(0.50) | 14.37 | 21.30 | % | 4,224.5 | 0.38 | % | 1.09 | % | 0.40 | % | 1.07 | % | 60 | % | ||||||||||||||||||
(0.30) | 12.31 | 12.87 | % | 3,056.0 | 0.40 | % | 1.83 | % | 0.40 | % | 1.83 | % | 93 | % | ||||||||||||||||||
(0.37) | 11.19 | (2.86 | )% | 2,659.6 | 0.33 | % | 1.22 | % | 0.33 | % | 1.22 | % | 64 | % | ||||||||||||||||||
(0.42) | 11.89 | 15.43 | % | 2,505.6 | 0.28 | % | 1.83 | % | 0.28 | % | 1.83 | % | 39 | % | ||||||||||||||||||
(0.46) | 10.72 | 29.80 | % | 1,983.0 | 0.20 | % | 2.41 | % | 0.20 | % | 2.41 | % | 17 | % | ||||||||||||||||||
|
|
|
|
|
|
|
|
|
|
|
|
|
|
|
|
| ||||||||||||||||
(0.53) | 13.80 | 5.10 | % | 8,191.7 | 0.43 | % | 1.84 | % | 0.43 | % | 1.84 | % | 58 | % | ||||||||||||||||||
(0.47) | 13.63 | 15.12 | % | 7,181.1 | 0.36 | % | 1.46 | % | 0.38 | % | 1.44 | % | 99 | % | ||||||||||||||||||
(0.27) | 12.28 | 11.72 | % | 5,337.9 | 0.38 | % | 1.98 | % | 0.38 | % | 1.98 | % | 121 | % | ||||||||||||||||||
(0.43) | 11.25 | (1.02 | )% | 4,133.6 | 0.29 | % | 1.86 | % | 0.29 | % | 1.86 | % | 53 | % | ||||||||||||||||||
(0.46) | 11.79 | 13.68 | % | 3,569.4 | 0.26 | % | 2.51 | % | 0.26 | % | 2.51 | % | 30 | % | ||||||||||||||||||
(0.47) | 10.82 | 26.89 | % | 2,658.5 | 0.19 | % | 3.16 | % | 0.19 | % | 3.16 | % | 16 | % | ||||||||||||||||||
|
|
|
|
|
|
|
|
|
|
|
|
|
|
|
|
| ||||||||||||||||
(0.48) | 12.82 | 4.70 | % | 3,504.5 | 0.43 | % | 2.14 | % | 0.43 | % | 2.14 | % | 90 | % | ||||||||||||||||||
(0.43) | 12.71 | 9.02 | % | 3,353.0 | 0.37 | % | 1.72 | % | 0.40 | % | 1.68 | % | 198 | % | ||||||||||||||||||
(0.28) | 12.07 | 9.59 | % | 2,920.3 | 0.41 | % | 1.95 | % | 0.41 | % | 1.95 | % | 190 | % | ||||||||||||||||||
(0.40) | 11.28 | 0.20 | % | 2,055.3 | 0.31 | % | 2.14 | % | 0.31 | % | 2.14 | % | 46 | % | ||||||||||||||||||
(0.45) | 11.66 | 11.41 | % | 1,591.3 | 0.28 | % | 2.81 | % | 0.28 | % | 2.81 | % | 30 | % | ||||||||||||||||||
(0.42) | 10.91 | 22.53 | % | 1,075.4 | 0.22 | % | 3.41 | % | 0.22 | % | 3.41 | % | 16 | % | ||||||||||||||||||
| (b) | Total investment return assumes dividend reinvestment and does not reflect any deduction for applicable sales charges. Not annualized for periods less than one year. Total return shown does not reflect charges and expenses imposed on contract holders by the variable accounts. Those charges and expenses reduce the return received by contract holders as compared to the return presented. |
| ** | Computed on an annualized basis for periods less than one year. |
The accompanying Notes to Financial Statements are an integral part of this schedule.
333
Table of Contents
Thrivent Series Fund, Inc.
Financial Highlights – continued
| FOR A SHARE OUTSTANDING THROUGHOUT EACH PERIOD* | ||||||||||||||||||||||||
| Income from Investment Operations | Less Distributions from | |||||||||||||||||||||||
| Net Asset Value, Beginning of Period | Net Investment Income/ (Loss) | Net Realized and Unrealized Gain/(Loss) on Investments(a) | Total from Investment Operations | Net Investment Income | Net Realized Gain on Investments | |||||||||||||||||||
GROWTH AND INCOME PLUS PORTFOLIO | ||||||||||||||||||||||||
Period Ended 06/30/2014 (unaudited) | $ | 11.66 | $ | 0.08 | $ | 0.30 | $ | 0.38 | $ | (0.30 | ) | $ | (0.91 | ) | ||||||||||
Year Ended 12/31/2013 | 9.82 | 0.33 | 1.74 | 2.07 | (0.23 | ) | — | |||||||||||||||||
Year Ended 12/31/2012 | 8.81 | 0.24 | 0.91 | 1.15 | (0.14 | ) | — | |||||||||||||||||
Year Ended 12/31/2011 | 9.06 | 0.15 | (0.37 | ) | (0.22 | ) | (0.03 | ) | — | |||||||||||||||
Year Ended 12/31/2010 | 7.91 | 0.15 | 1.13 | 1.28 | (0.13 | ) | — | |||||||||||||||||
Year Ended 12/31/2009 | 6.89 | 0.14 | 1.01 | 1.15 | (0.13 | ) | — | |||||||||||||||||
|
|
|
|
|
|
|
|
|
|
|
| |||||||||||||
BALANCED INCOME PLUS PORTFOLIO | ||||||||||||||||||||||||
Period Ended 06/30/2014 (unaudited) | 17.28 | 0.15 | 0.69 | 0.84 | (0.28 | ) | (3.13 | ) | ||||||||||||||||
Year Ended 12/31/2013 | 15.42 | 0.30 | 2.42 | 2.72 | (0.31 | ) | (0.55 | ) | ||||||||||||||||
Year Ended 12/31/2012 | 14.48 | 0.33 | 1.42 | 1.75 | (0.34 | ) | (0.47 | ) | ||||||||||||||||
Year Ended 12/31/2011 | 14.72 | 0.34 | 0.26 | 0.60 | (0.34 | ) | (0.50 | ) | ||||||||||||||||
Year Ended 12/31/2010 | 13.44 | 0.34 | 1.39 | 1.73 | (0.36 | ) | (0.09 | ) | ||||||||||||||||
Year Ended 12/31/2009 | 11.75 | 0.38 | 2.06 | 2.44 | (0.55 | ) | (0.20 | ) | ||||||||||||||||
|
|
|
|
|
|
|
|
|
|
|
| |||||||||||||
DIVERSIFIED INCOME PLUS PORTFOLIO | ||||||||||||||||||||||||
Period Ended 06/30/2014 (unaudited) | 7.84 | 0.12 | 0.24 | 0.36 | (0.24 | ) | — | |||||||||||||||||
Year Ended 12/31/2013 | 7.23 | 0.21 | 0.59 | 0.80 | (0.19 | ) | — | |||||||||||||||||
Year Ended 12/31/2012 | 6.56 | 0.19 | 0.74 | 0.93 | (0.26 | ) | — | |||||||||||||||||
Year Ended 12/31/2011 | 6.75 | 0.29 | (0.13 | ) | 0.16 | (0.35 | ) | — | ||||||||||||||||
Year Ended 12/31/2010 | 6.14 | 0.38 | 0.55 | 0.93 | (0.32 | ) | — | |||||||||||||||||
Year Ended 12/31/2009 | 5.01 | 0.43 | 1.15 | 1.58 | (0.45 | ) | — | |||||||||||||||||
|
|
|
|
|
|
|
|
|
|
|
| |||||||||||||
OPPORTUNITY INCOME PLUS PORTFOLIO | ||||||||||||||||||||||||
Period Ended 06/30/2014 (unaudited) | 10.15 | 0.17 | 0.20 | 0.37 | (0.17 | ) | — | |||||||||||||||||
Year Ended 12/31/2013 | 10.64 | 0.26 | (0.40 | ) | (0.14 | ) | (0.26 | ) | (0.09 | ) | ||||||||||||||
Year Ended 12/31/2012 | 10.45 | 0.16 | 0.44 | 0.60 | (0.16 | ) | (0.25 | ) | ||||||||||||||||
Year Ended 12/31/2011 | 10.32 | 0.30 | 0.17 | 0.47 | (0.30 | ) | (0.04 | ) | ||||||||||||||||
Year Ended 12/31/2010 | 9.62 | 0.35 | 0.80 | 1.15 | (0.35 | ) | (0.10 | ) | ||||||||||||||||
Year Ended 12/31/2009 | 8.82 | 0.43 | 0.69 | 1.12 | (0.32 | ) | — | |||||||||||||||||
| (a) | The amount shown may not correlate with the change in aggregate gains and losses of portfolio securities due to the timing of sales and redemptions of portfolio shares. |
| * | All per share amounts have been rounded to the nearest cent. |
The accompanying Notes to Financial Statements are an integral part of this schedule.
334
Table of Contents
Thrivent Series Fund, Inc.
Financial Highlights – continued
| RATIOS / SUPPLEMENTAL DATA | ||||||||||||||||||||||||||||||||||
| Ratio to Average Net Assets** | Ratios to Average Net Assets Before Expenses Waived, Credited or Paid Indirectly** | |||||||||||||||||||||||||||||||||
| Total Distributions | Net Asset Value, End of Period | Total Return(b) | Net Assets, End of Period (in millions) | Expenses | Net Investment Income/(Loss) | Expenses | Net Investment Income/(Loss) | Portfolio Turnover Rate | ||||||||||||||||||||||||||
| $ | (1.21 | ) | $ | 10.83 | 3.32 | % | $ | 78.3 | 0.80 | % | 2.49 | % | 0.96 | % | 2.33 | % | 118 | % | ||||||||||||||||
| (0.23 | ) | 11.66 | 21.24 | % | 65.5 | 0.79 | % | 2.10 | % | 0.85 | % | 2.04 | % | 153 | % | |||||||||||||||||||
| (0.14 | ) | 9.82 | 13.17 | % | 102.1 | 0.81 | % | 2.56 | % | 0.81 | % | 2.56 | % | 160 | % | |||||||||||||||||||
| (0.03 | ) | 8.81 | (2.46 | )% | 88.1 | 0.83 | % | 1.78 | % | 0.83 | % | 1.78 | % | 195 | % | |||||||||||||||||||
| (0.13 | ) | 9.06 | 16.23 | % | 76.3 | 0.85 | % | 2.06 | % | 0.89 | % | 2.02 | % | 362 | % | |||||||||||||||||||
| (0.13 | ) | 7.91 | 16.68 | % | 55.0 | 0.85 | % | 2.24 | % | 0.99 | % | 2.10 | % | 416 | % | |||||||||||||||||||
|
|
|
|
|
|
|
|
|
|
|
|
|
|
|
|
|
| |||||||||||||||||
| (3.41 | ) | 14.71 | 4.93 | % | 296.6 | 0.64 | % | 2.25 | % | 0.64 | % | 2.25 | % | 60 | % | |||||||||||||||||||
| (0.86 | ) | 17.28 | 17.95 | % | 275.0 | 0.53 | % | 1.81 | % | 0.53 | % | 1.81 | % | 216 | % | |||||||||||||||||||
| (0.81 | ) | 15.42 | 12.42 | % | 239.3 | 0.45 | % | 1.93 | % | 0.45 | % | 1.93 | % | 142 | % | |||||||||||||||||||
| (0.84 | ) | 14.48 | 4.18 | % | 240.5 | 0.44 | % | 2.06 | % | 0.44 | % | 2.06 | % | 143 | % | |||||||||||||||||||
| (0.45 | ) | 14.72 | 13.30 | % | 270.6 | 0.44 | % | 2.13 | % | 0.44 | % | 2.13 | % | 136 | % | |||||||||||||||||||
| (0.75 | ) | 13.44 | 21.76 | % | 281.2 | 0.44 | % | 2.55 | % | 0.44 | % | 2.54 | % | 115 | % | |||||||||||||||||||
|
|
|
|
|
|
|
|
|
|
|
|
|
|
|
|
|
| |||||||||||||||||
| (0.24 | ) | 7.96 | 4.53 | % | 412.2 | 0.48 | % | 3.85 | % | 0.48 | % | 3.85 | % | 85 | % | |||||||||||||||||||
| (0.19 | ) | 7.84 | 11.17 | % | 362.7 | 0.49 | % | 3.88 | % | 0.49 | % | 3.88 | % | 150 | % | |||||||||||||||||||
| (0.26 | ) | 7.23 | 14.48 | % | 229.7 | 0.52 | % | 4.58 | % | 0.52 | % | 4.58 | % | 155 | % | |||||||||||||||||||
| (0.35 | ) | 6.56 | 2.32 | % | 118.4 | 0.55 | % | 4.98 | % | 0.55 | % | 4.98 | % | 127 | % | |||||||||||||||||||
| (0.32 | ) | 6.75 | 15.85 | % | 106.0 | 0.57 | % | 6.28 | % | 0.57 | % | 6.28 | % | 116 | % | |||||||||||||||||||
| (0.45 | ) | 6.14 | 33.06 | % | 87.2 | 0.61 | % | 7.08 | % | 0.63 | % | 7.07 | % | 88 | % | |||||||||||||||||||
|
|
|
|
|
|
|
|
|
|
|
|
|
|
|
|
|
| |||||||||||||||||
| (0.17 | ) | 10.35 | 3.69 | % | 57.4 | 0.78 | % | 3.30 | % | 0.83 | % | 3.25 | % | 80 | % | |||||||||||||||||||
| (0.35 | ) | 10.15 | (1.39 | )% | 46.5 | 0.79 | % | 2.58 | % | 0.88 | % | 2.49 | % | 755 | % | |||||||||||||||||||
| (0.41 | ) | 10.64 | 5.99 | % | 37.3 | 0.83 | % | 1.54 | % | 0.88 | % | 1.49 | % | 936 | % | |||||||||||||||||||
| (0.34 | ) | 10.45 | 4.53 | % | 32.4 | 0.90 | % | 2.89 | % | 0.90 | % | 2.89 | % | 854 | % | |||||||||||||||||||
| (0.45 | ) | 10.32 | 12.09 | % | 33.5 | 0.89 | % | 3.43 | % | 0.89 | % | 3.43 | % | 676 | % | |||||||||||||||||||
| (0.32 | ) | 9.62 | 13.02 | % | 31.6 | 0.92 | % | 4.67 | % | 0.92 | % | 4.67 | % | 643 | % | |||||||||||||||||||
| (b) | Total investment return assumes dividend reinvestment and does not reflect any deduction for applicable sales charges. Not annualized for periods less than one year. Total return shown does not reflect charges and expenses imposed on contract holders by the variable accounts. Those charges and expenses reduce the return received by contract holders as compared to the return presented. |
| ** | Computed on an annualized basis for periods less than one year. |
The accompanying Notes to Financial Statements are an integral part of this schedule.
335
Table of Contents
Thrivent Series Fund, Inc.
Financial Highlights – continued
| FOR A SHARE OUTSTANDING THROUGHOUT EACH PERIOD* | ||||||||||||||||||||||||
| Income from Investment Operations | Less Distributions from | |||||||||||||||||||||||
| Net Asset Value, Beginning of Period | Net Investment Income/ (Loss) | Net Realized and Unrealized Gain/(Loss) on Investments(a) | Total from Investment Operations | Net Investment Income | Net Realized Gain on Investments | |||||||||||||||||||
PARTNER TECHNOLOGY PORTFOLIO | ||||||||||||||||||||||||
Period Ended 06/30/2014 (unaudited) | $ | 9.69 | $ | (0.02 | ) | $ | 0.42 | $ | 0.40 | $ | — | $ | — | |||||||||||
Year Ended 12/31/2013 | 7.51 | (0.02 | ) | 2.20 | 2.18 | — | — | |||||||||||||||||
Year Ended 12/31/2012 | 6.20 | (0.03 | ) | 1.34 | 1.31 | — | — | |||||||||||||||||
Year Ended 12/31/2011 | 7.11 | (0.01 | ) | (0.90 | ) | (0.91 | ) | — | — | |||||||||||||||
Year Ended 12/31/2010 | 5.69 | (0.04 | ) | 1.46 | 1.42 | — | — | |||||||||||||||||
Year Ended 12/31/2009 | 3.63 | (0.03 | ) | 2.09 | 2.06 | — | — | |||||||||||||||||
|
|
|
|
|
|
|
|
|
|
|
| |||||||||||||
PARTNER HEALTHCARE PORTFOLIO | ||||||||||||||||||||||||
Period Ended 06/30/2014 (unaudited) | 16.84 | 0.06 | 2.70 | 2.76 | — | (1.13 | ) | |||||||||||||||||
Year Ended 12/31/2013 | 13.39 | (0.02 | ) | 4.10 | 4.08 | (0.05 | ) | (0.58 | ) | |||||||||||||||
Year Ended 12/31/2012 | 11.26 | 0.03 | 2.29 | 2.32 | (0.04 | ) | (0.15 | ) | ||||||||||||||||
Year Ended 12/31/2011 | 12.08 | 0.03 | (0.46 | ) | (0.43 | ) | — | (0.39 | ) | |||||||||||||||
Year Ended 12/31/2010 | 11.08 | (0.02 | ) | 1.22 | 1.20 | (0.02 | ) | (0.18 | ) | |||||||||||||||
Year Ended 12/31/2009 | 8.94 | 0.02 | 2.12 | 2.14 | — | — | ||||||||||||||||||
|
|
|
|
|
|
|
|
|
|
|
| |||||||||||||
NATURAL RESOURCES PORTFOLIO | ||||||||||||||||||||||||
Period Ended 06/30/2014 (unaudited) | 7.52 | 0.02 | 0.97 | 0.99 | (0.03 | ) | — | |||||||||||||||||
Year Ended 12/31/2013 | 6.91 | 0.04 | 0.62 | 0.66 | (0.05 | ) | — | |||||||||||||||||
Year Ended 12/31/2012 | 8.33 | 0.05 | (0.43 | ) | (0.38 | ) | (0.02 | ) | (1.02 | ) | ||||||||||||||
Year Ended 12/31/2011 | 9.56 | 0.02 | (1.24 | ) | (1.22 | ) | (0.01 | ) | — | |||||||||||||||
Year Ended 12/31/2010 | 8.23 | — | 1.34 | 1.34 | (0.01 | ) | — | |||||||||||||||||
Year Ended 12/31/2009 | 5.72 | 0.01 | 2.50 | 2.51 | — | — | ||||||||||||||||||
|
|
|
|
|
|
|
|
|
|
|
| |||||||||||||
PARTNER EMERGING MARKETS EQUITY PORTFOLIO | ||||||||||||||||||||||||
Period Ended 06/30/2014 (unaudited) | 12.47 | 0.07 | 0.81 | 0.88 | (0.12 | ) | — | |||||||||||||||||
Year Ended 12/31/2013 | 13.61 | 0.12 | (1.13 | ) | (1.01 | ) | (0.13 | ) | — | |||||||||||||||
Year Ended 12/31/2012 | 10.92 | 0.14 | 2.68 | 2.82 | (0.07 | ) | (0.06 | ) | ||||||||||||||||
Year Ended 12/31/2011 | 12.38 | 0.15 | (1.48 | ) | (1.33 | ) | (0.13 | ) | — | |||||||||||||||
Year Ended 12/31/2010 | 9.72 | 0.06 | 2.60 | 2.66 | — | — | ||||||||||||||||||
Year Ended 12/31/2009 | 5.59 | 0.04 | 4.13 | 4.17 | (0.04 | ) | — | |||||||||||||||||
| (a) | The amount shown may not correlate with the change in aggregate gains and losses of portfolio securities due to the timing of sales and redemptions of portfolio shares. |
| * | All per share amounts have been rounded to the nearest cent. |
The accompanying Notes to Financial Statements are an integral part of this schedule.
336
Table of Contents
Thrivent Series Fund, Inc.
Financial Highlights – continued
| RATIOS / SUPPLEMENTAL DATA | ||||||||||||||||||||||||||||||||||
| Ratio to Average Net Assets** | Ratios to Average Net Assets Before Expenses Waived, Credited or Paid Indirectly** | |||||||||||||||||||||||||||||||||
Total | Net Asset Value, End of Period | Total Return(b) | Net Assets, End of Period (in millions) | Expenses | Net Investment Income/(Loss) | Expenses | Net Investment Income/ (Loss) | Portfolio Turnover Rate | ||||||||||||||||||||||||||
| $ | — | $ | 10.09 | 4.13 | % | $ | 51.3 | 1.03 | % | (0.36 | )% | 1.03 | % | (0.36 | )% | 18 | % | |||||||||||||||||
| — | 9.69 | 29.01 | % | 48.1 | 1.08 | % | (0.21 | )% | 1.08 | % | (0.21 | )% | 48 | % | ||||||||||||||||||||
| — | 7.51 | 21.09 | % | 35.5 | 1.13 | % | (0.39 | )% | 1.13 | % | (0.39 | )% | 45 | % | ||||||||||||||||||||
| — | 6.20 | (12.83 | )% | 29.6 | 1.13 | % | (0.21 | )% | 1.13 | % | (0.21 | )% | 56 | % | ||||||||||||||||||||
| — | 7.11 | 25.00 | % | 36.3 | 1.15 | % | (0.57 | )% | 1.15 | % | (0.57 | )% | 54 | % | ||||||||||||||||||||
| — | 5.69 | 56.58 | % | 30.9 | 1.22 | % | (0.67 | )% | 1.23 | % | (0.68 | )% | 181 | % | ||||||||||||||||||||
|
|
|
|
|
|
|
|
|
|
|
|
|
|
|
|
|
| |||||||||||||||||
| (1.13) | 18.47 | 16.48 | % | 75.4 | 1.17 | % | 0.83 | % | 1.17 | % | 0.83 | % | 20 | % | ||||||||||||||||||||
| (0.63) | 16.84 | 31.09 | % | 53.7 | 1.25 | % | (0.10 | )% | 1.31 | % | (0.16 | )% | 61 | % | ||||||||||||||||||||
| (0.19) | 13.39 | 20.68 | % | 25.2 | 1.25 | % | 0.26 | % | 1.54 | % | (0.04 | )% | 40 | % | ||||||||||||||||||||
| (0.39) | 11.26 | (3.79 | )% | 18.0 | 1.30 | % | 0.24 | % | 1.64 | % | (0.11 | )% | 66 | % | ||||||||||||||||||||
| (0.20) | 12.08 | 11.13 | % | 17.9 | 1.39 | % | (0.15 | )% | 1.71 | % | (0.47 | )% | 45 | % | ||||||||||||||||||||
| — | 11.08 | 23.83 | % | 13.3 | 1.39 | % | 0.19 | % | 2.10 | % | (0.52 | )% | 80 | % | ||||||||||||||||||||
|
|
|
|
|
|
|
|
|
|
|
|
|
|
|
|
|
| |||||||||||||||||
| (0.03) | 8.48 | 13.22 | % | 40.5 | 1.02 | % | 0.64 | % | 1.12 | % | 0.54 | % | 2 | % | ||||||||||||||||||||
| (0.05) | 7.52 | 9.55 | % | 35.0 | 1.02 | % | 0.50 | % | 1.13 | % | 0.39 | % | 37 | % | ||||||||||||||||||||
| (1.04) | 6.91 | (3.15 | )% | 31.6 | 1.06 | % | 0.70 | % | 1.14 | % | 0.62 | % | 28 | % | ||||||||||||||||||||
| (0.01) | 8.33 | (12.84 | )% | 31.6 | 1.12 | % | 0.17 | % | 1.12 | % | 0.17 | % | 118 | % | ||||||||||||||||||||
| (0.01) | 9.56 | 16.33 | % | 28.7 | 1.20 | % | (0.06 | )% | 1.28 | % | (0.15 | )% | 2 | % | ||||||||||||||||||||
| — | 8.23 | 43.72 | % | 21.1 | 1.19 | % | 0.15 | % | 1.70 | % | (0.36 | )% | 2 | % | ||||||||||||||||||||
|
|
|
|
|
|
|
|
|
|
|
|
|
|
|
|
|
| |||||||||||||||||
| (0.12) | 13.23 | 7.06 | % | 67.8 | 1.40 | % | 1.31 | % | 1.54 | % | 1.17 | % | 1 | % | ||||||||||||||||||||
| (0.13) | 12.47 | (7.34 | )% | 59.9 | 1.40 | % | 1.07 | % | 1.54 | % | 0.92 | % | 5 | % | ||||||||||||||||||||
| (0.13) | 13.61 | 25.98 | % | 54.7 | 1.40 | % | 1.27 | % | 1.62 | % | 1.05 | % | 4 | % | ||||||||||||||||||||
| (0.13) | 10.92 | (10.83 | )% | 38.9 | 1.43 | % | 1.27 | % | 1.66 | % | 1.04 | % | 6 | % | ||||||||||||||||||||
| — | 12.38 | 27.33 | % | 40.9 | 1.50 | % | 0.74 | % | 1.88 | % | 0.36 | % | 4 | % | ||||||||||||||||||||
| (0.04) | 9.72 | 74.70 | % | 17.4 | 1.50 | % | 0.78 | % | 2.91 | % | (0.63 | )% | 13 | % | ||||||||||||||||||||
| (b) | Total investment return assumes dividend reinvestment and does not reflect any deduction for applicable sales charges. Not annualized for periods less than one year. Total return shown does not reflect charges and expenses imposed on contract holders by the variable accounts. Those charges and expenses reduce the return received by contract holders as compared to the return presented. |
| ** | Computed on an annualized basis for periods less than one year. |
The accompanying Notes to Financial Statements are an integral part of this schedule.
337
Table of Contents
Thrivent Series Fund, Inc.
Financial Highlights – continued
| FOR A SHARE OUTSTANDING THROUGHOUT EACH PERIOD* | ||||||||||||||||||||||||||||
| Income from Investment Operations | Less Distributions from | |||||||||||||||||||||||||||
| Net Asset Value, Beginning of Period | Net Investment Income/(Loss) | Net Realized and Unrealized Gain/(Loss) on Investments(a) | Total from Investment Operations | Net Investment Income | Net Realized Gain on Investments | Return of Capital | ||||||||||||||||||||||
REAL ESTATE SECURITIES PORTFOLIO | ||||||||||||||||||||||||||||
Period Ended 06/30/2014 (unaudited) | $ | 17.98 | $ | 0.23 | $ | 2.94 | $ | 3.17 | $ | (0.30 | ) | $ | (0.36 | ) | $ | — | ||||||||||||
Year Ended 12/31/2013 | 17.85 | 0.29 | 0.11 | 0.40 | (0.27 | ) | — | — | ||||||||||||||||||||
Year Ended 12/31/2012 | 15.77 | 0.30 | 2.43 | 2.73 | (0.65 | ) | — | — | ||||||||||||||||||||
Year Ended 12/31/2011(b) | 14.49 | 0.22 | 1.06 | 1.28 | — | — | — | |||||||||||||||||||||
Year Ended 12/31/2010 | 11.67 | 0.22 | 2.99 | 3.21 | (0.39 | ) | — | — | ||||||||||||||||||||
Year Ended 12/31/2009 | 9.34 | 0.29 | 2.44 | 2.73 | (0.29 | ) | — | (0.11 | ) | |||||||||||||||||||
|
|
|
|
|
|
|
|
|
|
|
|
|
| |||||||||||||||
PARTNER SMALL CAP GROWTH PORTFOLIO | ||||||||||||||||||||||||||||
Period Ended 06/30/2014 (unaudited) | 19.23 | (0.04 | ) | (0.16 | ) | (0.20 | ) | — | (2.18 | ) | — | |||||||||||||||||
Year Ended 12/31/2013 | 13.87 | (0.08 | ) | 5.79 | 5.71 | — | (0.35 | ) | — | |||||||||||||||||||
Year Ended 12/31/2012 | 12.42 | (0.01 | ) | 1.46 | 1.45 | — | — | — | ||||||||||||||||||||
Year Ended 12/31/2011 | 12.92 | (0.08 | ) | (0.42 | ) | (0.50 | ) | — | — | — | ||||||||||||||||||
Year Ended 12/31/2010 | 10.03 | (0.07 | ) | 2.96 | 2.89 | — | — | — | ||||||||||||||||||||
Year Ended 12/31/2009 | 7.45 | (0.03 | ) | 2.62 | 2.59 | (0.01 | ) | — | — | |||||||||||||||||||
|
|
|
|
|
|
|
|
|
|
|
|
|
| |||||||||||||||
PARTNER SMALL CAP VALUE PORTFOLIO | ||||||||||||||||||||||||||||
Period Ended 06/30/2014 (unaudited) | 28.27 | 0.10 | 0.56 | 0.66 | (0.06 | ) | (0.73 | ) | — | |||||||||||||||||||
Year Ended 12/31/2013 | 21.17 | 0.14 | 7.55 | 7.69 | (0.47 | ) | (0.12 | ) | — | |||||||||||||||||||
Year Ended 12/31/2012 | 18.64 | 0.38 | 2.28 | 2.66 | (0.13 | ) | — | — | ||||||||||||||||||||
Year Ended 12/31/2011 | 19.06 | 0.10 | (0.48 | ) | (0.38 | ) | (0.04 | ) | — | — | ||||||||||||||||||
Year Ended 12/31/2010 | 15.58 | 0.13 | 3.52 | 3.65 | (0.17 | ) | — | — | ||||||||||||||||||||
Year Ended 12/31/2009 | 12.07 | 0.11 | 3.52 | 3.63 | (0.11 | ) | (0.01 | ) | — | |||||||||||||||||||
|
|
|
|
|
|
|
|
|
|
|
|
|
| |||||||||||||||
SMALL CAP STOCK PORTFOLIO | ||||||||||||||||||||||||||||
Period Ended 06/30/2014 (unaudited) | 17.77 | 0.02 | 0.44 | 0.46 | (0.04 | ) | (0.19 | ) | — | |||||||||||||||||||
Year Ended 12/31/2013 | 13.12 | 0.04 | 4.67 | 4.71 | (0.06 | ) | — | — | ||||||||||||||||||||
Year Ended 12/31/2012 | 11.99 | 0.06 | 1.07 | 1.13 | — | — | — | |||||||||||||||||||||
Year Ended 12/31/2011 | 12.66 | (0.01 | ) | (0.66 | ) | (0.67 | ) | — | — | — | ||||||||||||||||||
Year Ended 12/31/2010 | 10.13 | (0.01 | ) | 2.54 | 2.53 | — | — | — | ||||||||||||||||||||
Year Ended 12/31/2009 | 8.49 | 0.07 | 1.65 | 1.72 | (0.08 | ) | — | — | ||||||||||||||||||||
| (a) | The amount shown may not correlate with the change in aggregate gains and losses of portfolio securities due to the timing of sales and redemptions of portfolio shares. |
| (b) | Per share amounts have been calculated using the average shares outstanding method. |
| * | All per share amounts have been rounded to the nearest cent. |
The accompanying Notes to Financial Statements are an integral part of this schedule.
338
Table of Contents
Thrivent Series Fund, Inc.
Financial Highlights – continued
| RATIOS / SUPPLEMENTAL DATA | ||||||||||||||||||||||||||||||||||
| Ratio to Average Net Assets** | Ratios to Average Net Assets Before Expenses Waived, Credited or Paid Indirectly** | |||||||||||||||||||||||||||||||||
| Total Distributions | Net Asset Value, End of Period | Total Return(c) | Net Assets, End of Period (in millions) | Expenses | Net Investment Income/(Loss) | Expenses | Net Investment Income/(Loss) | Portfolio Turnover Rate | ||||||||||||||||||||||||||
| $ | (0.66) | $ | 20.49 | 17.64 | % | $ | 141.2 | 0.92 | % | 2.43 | % | 0.92 | % | 2.43 | % | 7 | % | |||||||||||||||||
| (0.27) | 17.98 | 2.18 | % | 120.1 | 0.92 | % | 1.53 | % | 0.92 | % | 1.53 | % | 22 | % | ||||||||||||||||||||
| (0.65) | 17.85 | 17.54 | % | 122.4 | 0.93 | % | 1.62 | % | 0.93 | % | 1.62 | % | 32 | % | ||||||||||||||||||||
| — | 15.77 | 8.83 | % | 108.0 | 0.87 | % | 1.47 | % | 0.87 | % | 1.47 | % | 16 | % | ||||||||||||||||||||
| (0.39) | 14.49 | 27.56 | % | 329.5 | 0.87 | % | 1.62 | % | 0.87 | % | 1.62 | % | 15 | % | ||||||||||||||||||||
| (0.40) | 11.67 | 29.08 | % | 265.4 | 0.89 | % | 3.34 | % | 0.90 | % | 3.33 | % | 18 | % | ||||||||||||||||||||
|
|
|
|
|
|
|
|
|
|
|
|
|
|
|
|
|
| |||||||||||||||||
| (2.18) | 16.85 | (0.89) | % | 339.9 | 0.97 | % | (0.50) | % | 1.07 | % | (0.60) | % | 58 | % | ||||||||||||||||||||
| (0.35) | 19.23 | 41.64 | % | 344.3 | 0.98 | % | (0.49) | % | 1.08 | % | (0.59) | % | 85 | % | ||||||||||||||||||||
| — | 13.87 | 11.69 | % | 256.9 | 0.99 | % | (0.12) | % | 1.09 | % | (0.22) | % | 93 | % | ||||||||||||||||||||
| — | 12.42 | (3.85) | % | 197.5 | 1.00 | % | (0.63) | % | 1.10 | % | (0.73) | % | 101 | % | ||||||||||||||||||||
| — | 12.92 | 28.86 | % | 208.5 | 1.01 | % | (0.62) | % | 1.11 | % | (0.72) | % | 100 | % | ||||||||||||||||||||
| (0.01) | 10.03 | 34.75 | % | 160.5 | 1.02 | % | (0.39) | % | 1.14 | % | (0.51) | % | 118 | % | ||||||||||||||||||||
|
|
|
|
|
|
|
|
|
|
|
|
|
|
|
|
|
| |||||||||||||||||
| (0.79) | 28.14 | 2.36 | % | 391.7 | 0.86 | % | 0.76 | % | 0.86 | % | 0.76 | % | 10 | % | ||||||||||||||||||||
| (0.59) | 28.27 | 36.76 | % | 384.7 | 0.86 | % | 0.56 | % | 0.86 | % | 0.56 | % | 11 | % | ||||||||||||||||||||
| (0.13) | 21.17 | 14.37 | % | 282.6 | 0.88 | % | 1.90 | % | 0.88 | % | 1.90 | % | 18 | % | ||||||||||||||||||||
| (0.04) | 18.64 | (1.99) | % | 250.4 | 0.88 | % | 0.52 | % | 0.88 | % | 0.52 | % | 10 | % | ||||||||||||||||||||
| (0.17) | 19.06 | 23.46 | % | 266.9 | 0.88 | % | 0.75 | % | 0.88 | % | 0.75 | % | 19 | % | ||||||||||||||||||||
| (0.12) | 15.58 | 30.24 | % | 226.3 | 0.89 | % | 0.86 | % | 0.90 | % | 0.85 | % | 19 | % | ||||||||||||||||||||
|
|
|
|
|
|
|
|
|
|
|
|
|
|
|
|
|
| |||||||||||||||||
| (0.23) | 18.00 | 2.63 | % | 357.1 | 0.74 | % | 0.26 | % | 0.74 | % | 0.26 | % | 29 | % | ||||||||||||||||||||
| (0.06) | 17.77 | 35.90 | % | 354.6 | 0.75 | % | 0.25 | % | 0.75 | % | 0.25 | % | 62 | % | ||||||||||||||||||||
| — | 13.12 | 9.42 | % | 269.5 | 0.76 | % | 0.49 | % | 0.76 | % | 0.49 | % | 96 | % | ||||||||||||||||||||
| — | 11.99 | (5.31) | % | 263.8 | 0.76 | % | (0.10) | % | 0.76 | % | (0.10) | % | 88 | % | ||||||||||||||||||||
| — | 12.66 | 25.09 | % | 303.2 | 0.77 | % | (0.11) | % | 0.77 | % | (0.11) | % | 208 | % | ||||||||||||||||||||
| (0.08) | 10.13 | 20.38 | % | 258.5 | 0.78 | % | 0.65 | % | 0.78 | % | 0.65 | % | 254 | % | ||||||||||||||||||||
| (c) | Total investment return assumes dividend reinvestment and does not reflect any deduction for applicable sales charges. Not annualized for periods less than one year. Total return shown does not reflect charges and expenses imposed on contract holders by the variable accounts. Those charges and expenses reduce the return received by contract holders as compared to the return presented. |
| ** | Computed on an annualized basis for periods less than one year. |
The accompanying Notes to Financial Statements are an integral part of this schedule.
339
Table of Contents
Thrivent Series Fund, Inc.
Financial Highlights – continued
| FOR A SHARE OUTSTANDING THROUGHOUT EACH PERIOD* | ||||||||||||||||||||||||
| Income from Investment Operations | Less Distributions from | |||||||||||||||||||||||
| Net Asset Value, Beginning of Period | Net Investment Income/(Loss) | Net Realized and Unrealized Gain/(Loss) on Investments(a) | Total from Investment Operations | Net Investment Income | Net Realized Gain on Investments | |||||||||||||||||||
SMALL CAP INDEX PORTFOLIO | ||||||||||||||||||||||||
Period Ended 06/30/2014 (unaudited) | $ | 17.86 | $ | 0.07 | $ | 0.47 | $ | 0.54 | $ | (0.13 | ) | $ | (1.21 | ) | ||||||||||
Year Ended 12/31/2013 | 13.42 | 0.14 | 5.17 | 5.31 | (0.20 | ) | (0.67 | ) | ||||||||||||||||
Year Ended 12/31/2012 | 12.77 | 0.20 | 1.68 | 1.88 | (0.09 | ) | (1.14 | ) | ||||||||||||||||
Year Ended 12/31/2011 | 13.19 | 0.10 | (0.02 | ) | 0.08 | (0.11 | ) | (0.39 | ) | |||||||||||||||
Year Ended 12/31/2010 | 10.57 | 0.11 | 2.60 | 2.71 | (0.09 | ) | — | |||||||||||||||||
Year Ended 12/31/2009 | 10.54 | 0.11 | 2.03 | 2.14 | (0.22 | ) | (1.89 | ) | ||||||||||||||||
|
|
|
|
|
|
|
|
|
|
|
| |||||||||||||
MID CAP GROWTH PORTFOLIO | ||||||||||||||||||||||||
Period Ended 06/30/2014 (unaudited) | 25.45 | 0.04 | 0.42 | 0.46 | (0.06 | ) | (2.32 | ) | ||||||||||||||||
Year Ended 12/31/2013 | 19.59 | 0.06 | 5.89 | 5.95 | (0.08 | ) | (0.01 | ) | ||||||||||||||||
Year Ended 12/31/2012 | 17.50 | 0.07 | 2.06 | 2.13 | (0.04 | ) | — | |||||||||||||||||
Year Ended 12/31/2011 | 18.56 | 0.04 | (1.04 | ) | (1.00 | ) | (0.06 | ) | — | |||||||||||||||
Year Ended 12/31/2010 | 14.42 | 0.06 | 4.12 | 4.18 | (0.04 | ) | — | |||||||||||||||||
Year Ended 12/31/2009 | 9.55 | 0.04 | 4.83 | 4.87 | — | — | ||||||||||||||||||
|
|
|
|
|
|
|
|
|
|
|
| |||||||||||||
PARTNER MID CAP VALUE PORTFOLIO | ||||||||||||||||||||||||
Period Ended 06/30/2014 (unaudited) | 18.45 | 0.06 | 1.53 | 1.59 | (0.12 | ) | (2.56 | ) | ||||||||||||||||
Year Ended 12/31/2013 | 14.67 | 0.12 | 4.57 | 4.69 | (0.17 | ) | (0.74 | ) | ||||||||||||||||
Year Ended 12/31/2012 | 12.51 | 0.17 | 2.10 | 2.27 | (0.11 | ) | — | |||||||||||||||||
Year Ended 12/31/2011 | 13.38 | 0.11 | (0.95 | ) | (0.84 | ) | (0.03 | ) | — | |||||||||||||||
Year Ended 12/31/2010 | 10.82 | 0.08 | 2.58 | 2.66 | (0.10 | ) | — | |||||||||||||||||
Year Ended 12/31/2009 | 8.25 | 0.12 | 2.54 | 2.66 | (0.09 | ) | — | |||||||||||||||||
|
|
|
|
|
|
|
|
|
|
|
| |||||||||||||
MID CAP STOCK PORTFOLIO | ||||||||||||||||||||||||
Period Ended 06/30/2014 (unaudited) | 17.66 | 0.08 | 1.66 | 1.74 | (0.06 | ) | (0.83 | ) | ||||||||||||||||
Year Ended 12/31/2013 | 13.09 | 0.06 | 4.57 | 4.63 | (0.06 | ) | — | |||||||||||||||||
Year Ended 12/31/2012 | 11.48 | 0.06 | 1.58 | 1.64 | (0.03 | ) | — | |||||||||||||||||
Year Ended 12/31/2011 | 12.25 | 0.03 | (0.79 | ) | (0.76 | ) | (0.01 | ) | — | |||||||||||||||
Year Ended 12/31/2010 | 9.80 | 0.05 | 2.45 | 2.50 | (0.05 | ) | — | |||||||||||||||||
Year Ended 12/31/2009 | 7.08 | 0.05 | 2.72 | 2.77 | (0.05 | ) | — | |||||||||||||||||
| (a) | The amount shown may not correlate with the change in aggregate gains and losses of portfolio securities due to the timing of sales and redemptions of portfolio shares. |
| * | All per share amounts have been rounded to the nearest cent. |
The accompanying Notes to Financial Statements are an integral part of this schedule.
340
Table of Contents
Thrivent Series Fund, Inc.
Financial Highlights – continued
| RATIOS / SUPPLEMENTAL DATA | ||||||||||||||||||||||||||||||||||
| Ratio to Average Net Assets** | Ratios to Average Net Assets Before Expenses Waived, Credited or Paid Indirectly** | |||||||||||||||||||||||||||||||||
| Total Distributions | Net Asset Value, End of Period | Total Return(b) | Net Assets, End of Period (in millions) | Expenses | Net Investment Income/(Loss) | Expenses | Net Investment Income/(Loss) Turnover Rate | Portfolio | ||||||||||||||||||||||||||
| $ | (1.34 | ) | $ | 17.06 | 3.05 | % | $ | 265.6 | 0.43 | % | 0.84 | % | 0.43 | % | 0.84 | % | 6 | % | ||||||||||||||||
| (0.87 | ) | 17.86 | 40.83 | % | 262.8 | 0.44 | % | 0.84 | % | 0.44 | % | 0.84 | % | 12 | % | |||||||||||||||||||
| (1.23 | ) | 13.42 | 15.95 | % | 193.7 | 0.46 | % | 1.44 | % | 0.46 | % | 1.44 | % | 9 | % | |||||||||||||||||||
| (0.50 | ) | 12.77 | 0.53 | % | 189.0 | 0.45 | % | 0.63 | % | 0.45 | % | 0.63 | % | 13 | % | |||||||||||||||||||
| (0.09 | ) | 13.19 | 25.88 | % | 220.1 | 0.46 | % | 0.86 | % | 0.46 | % | 0.86 | % | 11 | % | |||||||||||||||||||
| (2.11 | ) | 10.57 | 25.29 | % | 203.9 | 0.47 | % | 0.94 | % | 0.48 | % | 0.94 | % | 13 | % | |||||||||||||||||||
|
|
|
|
|
|
|
|
|
|
|
|
|
|
|
|
|
| |||||||||||||||||
| (2.38) | 23.53 | 1.79 | % | 414.7 | 0.46 | % | 0.31 | % | 0.46 | % | 0.31 | % | 19 | % | ||||||||||||||||||||
| (0.09) | 25.45 | 30.45 | % | 424.3 | 0.46 | % | 0.22 | % | 0.46 | % | 0.22 | % | 38 | % | ||||||||||||||||||||
| (0.04) | 19.59 | 12.22 | % | 361.5 | 0.46 | % | 0.39 | % | 0.46 | % | 0.39 | % | 39 | % | ||||||||||||||||||||
| (0.06) | 17.50 | (5.43 | )% | 348.8 | 0.46 | % | 0.21 | % | 0.46 | % | 0.21 | % | 67 | % | ||||||||||||||||||||
| (0.04) | 18.56 | 29.11 | % | 419.9 | 0.46 | % | 0.34 | % | 0.46 | % | 0.34 | % | 48 | % | ||||||||||||||||||||
| — | 14.42 | 50.94 | % | 365.2 | 0.48 | % | 0.30 | % | 0.48 | % | 0.29 | % | 61 | % | ||||||||||||||||||||
|
|
|
|
|
|
|
|
|
|
|
|
|
|
|
|
|
| |||||||||||||||||
| (2.68) | 17.36 | 8.67 | % | 385.5 | 0.79 | % | 0.73 | % | 0.79 | % | 0.73 | % | 44 | % | ||||||||||||||||||||
| (0.91) | 18.45 | 32.74 | % | 352.9 | 0.79 | % | 0.76 | % | 0.81 | % | 0.75 | % | 108 | % | ||||||||||||||||||||
| (0.11) | 14.67 | 18.27 | % | 261.5 | 0.84 | % | 1.26 | % | 0.84 | % | 1.26 | % | 80 | % | ||||||||||||||||||||
| (0.03) | 12.51 | (6.33 | )% | 215.8 | 0.84 | % | 0.84 | % | 0.84 | % | 0.84 | % | 76 | % | ||||||||||||||||||||
| (0.10) | 13.38 | 24.73 | % | 232.2 | 0.85 | % | 0.72 | % | 0.85 | % | 0.72 | % | 91 | % | ||||||||||||||||||||
| (0.09) | 10.82 | 32.33 | % | 183.7 | 0.87 | % | 1.42 | % | 0.88 | % | 1.41 | % | 114 | % | ||||||||||||||||||||
|
|
|
|
|
|
|
|
|
|
|
|
|
|
|
|
|
| |||||||||||||||||
| (0.89) | 18.51 | 9.89 | % | 740.1 | 0.71 | % | 0.91 | % | 0.71 | % | 0.91 | % | 18 | % | ||||||||||||||||||||
| (0.06) | 17.66 | 35.50 | % | 675.4 | 0.72 | % | 0.38 | % | 0.72 | % | 0.38 | % | 39 | % | ||||||||||||||||||||
| (0.03) | 13.09 | 14.29 | % | 506.7 | 0.73 | % | 0.51 | % | 0.73 | % | 0.51 | % | 47 | % | ||||||||||||||||||||
| (0.01) | 11.48 | (6.29 | )% | 457.0 | 0.72 | % | 0.24 | % | 0.72 | % | 0.24 | % | 35 | % | ||||||||||||||||||||
| (0.05) | 12.25 | 25.60 | % | 511.5 | 0.73 | % | 0.45 | % | 0.73 | % | 0.45 | % | 78 | % | ||||||||||||||||||||
| (0.05) | 9.80 | 39.10 | % | 443.5 | 0.73 | % | 0.55 | % | 0.74 | % | 0.54 | % | 53 | % | ||||||||||||||||||||
| (b) | Total investment return assumes dividend reinvestment and does not reflect any deduction for applicable sales charges. Not annualized for periods less than one year. Total return shown does not reflect charges and expenses imposed on contract holders by the variable accounts. Those charges and expenses reduce the return received by contract holders as compared to the return presented. |
| ** | Computed on an annualized basis for periods less than one year. |
The accompanying Notes to Financial Statements are an integral part of this schedule.
341
Table of Contents
Thrivent Series Fund, Inc.
Financial Highlights – continued
| FOR A SHARE OUTSTANDING THROUGHOUT EACH PERIOD* | ||||||||||||||||||||||||
| Income from Investment Operations | Less Distributions from | |||||||||||||||||||||||
| Net Asset Value, Beginning of Period | Net Investment Income/(Loss) | Net Realized and Unrealized Gain/(Loss) on Investments(a) | Total from Investment Operations | Net Investment Income | Net Realized Gain on Investments | |||||||||||||||||||
MID CAP INDEX PORTFOLIO | ||||||||||||||||||||||||
Period Ended 06/30/2014 (unaudited) | $ | 15.78 | $ | 0.07 | $ | 1.07 | $ | 1.14 | $ | (0.12 | ) | $ | (0.76 | ) | ||||||||||
Year Ended 12/31/2013 | 12.36 | 0.12 | 3.87 | 3.99 | (0.13 | ) | (0.44 | ) | ||||||||||||||||
Year Ended 12/31/2012 | 11.79 | 0.14 | 1.74 | 1.88 | (0.10 | ) | (1.21 | ) | ||||||||||||||||
Year Ended 12/31/2011 | 12.91 | 0.10 | (0.33 | ) | (0.23 | ) | (0.11 | ) | (0.78 | ) | ||||||||||||||
Year Ended 12/31/2010 | 10.37 | 0.11 | 2.55 | 2.66 | (0.12 | ) | — | |||||||||||||||||
Year Ended 12/31/2009 | 8.31 | 0.12 | 2.72 | 2.84 | (0.18 | ) | (0.60 | ) | ||||||||||||||||
|
|
|
|
|
|
|
|
|
|
|
| |||||||||||||
PARTNER WORLDWIDE ALLOCATION PORTFOLIO | ||||||||||||||||||||||||
Period Ended 06/30/2014 (unaudited) | 10.02 | 0.15 | 0.27 | 0.42 | (0.20 | ) | — | |||||||||||||||||
Year Ended 12/31/2013 | 8.62 | 0.18 | 1.22 | 1.40 | — | — | ||||||||||||||||||
Year Ended 12/31/2012 | 7.39 | 0.12 | 1.26 | 1.38 | (0.12 | ) | (0.03 | ) | ||||||||||||||||
Year Ended 12/31/2011 | 8.77 | 0.19 | (1.26 | ) | (1.07 | ) | (0.17 | ) | (0.14 | ) | ||||||||||||||
Year Ended 12/31/2010 | 7.84 | 0.11 | 0.93 | 1.04 | (0.11 | ) | — | |||||||||||||||||
Year Ended 12/31/2009 | 6.03 | 0.10 | 1.81 | 1.91 | (0.10 | ) | — | |||||||||||||||||
|
|
|
|
|
|
|
|
|
|
|
| |||||||||||||
PARTNER ALL CAP PORTFOLIO | ||||||||||||||||||||||||
Period Ended 06/30/2014 (unaudited) | 12.71 | 0.03 | 0.66 | 0.69 | (0.08 | ) | — | |||||||||||||||||
Year Ended 12/31/2013 | 9.64 | 0.08 | 3.07 | 3.15 | (0.08 | ) | — | |||||||||||||||||
Year Ended 12/31/2012 | 8.44 | 0.08 | 1.16 | 1.24 | (0.04 | ) | — | |||||||||||||||||
Year Ended 12/31/2011 | 8.93 | 0.06 | (0.49 | ) | (0.43 | ) | (0.06 | ) | — | |||||||||||||||
Year Ended 12/31/2010 | 7.73 | 0.04 | 1.22 | 1.26 | (0.06 | ) | — | |||||||||||||||||
Year Ended 12/31/2009 | 6.10 | 0.06 | 1.66 | 1.72 | (0.09 | ) | — | |||||||||||||||||
|
|
|
|
|
|
|
|
|
|
|
| |||||||||||||
LARGE CAP GROWTH PORTFOLIO | ||||||||||||||||||||||||
Period Ended 06/30/2014 (unaudited) | 25.46 | 0.08 | 1.55 | 1.63 | (0.02 | ) | — | |||||||||||||||||
Year Ended 12/31/2013 | 18.81 | 0.15 | 6.64 | 6.79 | (0.14 | ) | — | |||||||||||||||||
Year Ended 12/31/2012 | 15.96 | 0.22 | 2.85 | 3.07 | (0.22 | ) | — | |||||||||||||||||
Year Ended 12/31/2011 | 16.98 | 0.10 | (1.02 | ) | (0.92 | ) | (0.10 | ) | — | |||||||||||||||
Year Ended 12/31/2010 | 15.40 | 0.09 | 1.58 | 1.67 | (0.09 | ) | — | |||||||||||||||||
Year Ended 12/31/2009 | 10.96 | 0.11 | 4.43 | 4.54 | (0.10 | ) | — | |||||||||||||||||
| (a) | The amount shown may not correlate with the change in aggregate gains and losses of portfolio securities due to the timing of sales and redemptions of portfolio shares. |
| * | All per share amounts have been rounded to the nearest cent. |
The accompanying Notes to Financial Statements are an integral part of this schedule.
342
Table of Contents
Thrivent Series Fund, Inc.
Financial Highlights – continued
| RATIOS / SUPPLEMENTAL DATA | ||||||||||||||||||||||||||||||||||
| Ratio to Average Net Assets** | Ratios to Average Net Assets Before Expenses Waived, Credited or Paid Indirectly** | |||||||||||||||||||||||||||||||||
| Total Distributions | Net Asset Value, End of Period | Total Return(b) | Net Assets, End of Period (in millions) | Expenses | Net Investment Income/(Loss) | Expenses | Net Investment Income/(Loss) | Portfolio Turnover Rate | ||||||||||||||||||||||||||
| $ | (0.88 | ) | $ | 16.04 | 7.22 | % | $ | 137.1 | 0.48 | % | 0.97 | % | 0.48 | % | 0.97 | % | 7 | % | ||||||||||||||||
| (0.57 | ) | 15.78 | 32.92 | % | 123.0 | 0.50 | % | 0.95 | % | 0.50 | % | 0.95 | % | 12 | % | |||||||||||||||||||
| (1.31 | ) | 12.36 | 17.38 | % | 85.1 | 0.53 | % | 1.11 | % | 0.53 | % | 1.11 | % | 8 | % | |||||||||||||||||||
| (0.89 | ) | 11.79 | (2.23 | )% | 78.1 | 0.53 | % | 0.72 | % | 0.53 | % | 0.72 | % | 16 | % | |||||||||||||||||||
| (0.12 | ) | 12.91 | 25.91 | % | 94.2 | 0.54 | % | 0.81 | % | 0.54 | % | 0.81 | % | 13 | % | |||||||||||||||||||
| (0.78 | ) | 10.37 | 36.69 | % | 86.9 | 0.56 | % | 1.19 | % | 0.57 | % | 1.19 | % | 18 | % | |||||||||||||||||||
|
|
|
|
|
|
|
|
|
|
|
|
|
|
|
|
|
| |||||||||||||||||
| (0.20 | ) | 10.24 | 4.25 | % | 1,775.9 | 0.91 | % | 3.09 | % | 0.91 | % | 3.09 | % | 45 | % | |||||||||||||||||||
| — | 10.02 | 16.31 | % | 1,706.0 | 0.91 | % | 1.97 | % | 0.91 | % | 1.97 | % | 80 | % | ||||||||||||||||||||
| (0.15 | ) | 8.62 | 18.67 | % | 1,520.3 | 0.95 | % | 2.10 | % | 0.95 | % | 2.10 | % | 93 | % | |||||||||||||||||||
| (0.31 | ) | 7.39 | (12.13 | )% | 495.6 | 0.99 | % | 2.25 | % | 0.99 | % | 2.25 | % | 64 | % | |||||||||||||||||||
| (0.11 | ) | 8.77 | 13.43 | % | 522.6 | 1.00 | % | 1.73 | % | 1.05 | % | 1.68 | % | 84 | % | |||||||||||||||||||
| (0.10 | ) | 7.84 | 31.67 | % | 254.9 | 1.00 | % | 2.01 | % | 1.20 | % | 1.81 | % | 80 | % | |||||||||||||||||||
|
|
|
|
|
|
|
|
|
|
|
|
|
|
|
|
|
| |||||||||||||||||
| (0.08 | ) | 13.32 | 5.39 | % | 66.8 | 0.95 | % | 0.48 | % | 1.21 | % | 0.22 | % | 82 | % | |||||||||||||||||||
| (0.08 | ) | 12.71 | 32.85 | % | 63.8 | 0.98 | % | 0.69 | % | 1.23 | % | 0.45 | % | 133 | % | |||||||||||||||||||
| (0.04 | ) | 9.64 | 14.74 | % | 51.5 | 1.04 | % | 0.81 | % | 1.24 | % | 0.61 | % | 116 | % | |||||||||||||||||||
| (0.06 | ) | 8.44 | (4.83 | )% | 51.4 | 1.03 | % | 0.56 | % | 1.23 | % | 0.36 | % | 124 | % | |||||||||||||||||||
| (0.06 | ) | 8.93 | 16.34 | % | 62.4 | 1.02 | % | 0.47 | % | 1.22 | % | 0.27 | % | 180 | % | |||||||||||||||||||
| (0.09 | ) | 7.73 | 28.48 | % | 62.6 | 1.04 | % | 0.76 | % | 1.24 | % | 0.56 | % | 231 | % | |||||||||||||||||||
|
|
|
|
|
|
|
|
|
|
|
|
|
|
|
|
|
| |||||||||||||||||
| (0.02 | ) | 27.07 | 6.41 | % | 1,086.1 | 0.44 | % | 0.62 | % | 0.44 | % | 0.62 | % | 22 | % | |||||||||||||||||||
| (0.14 | ) | 25.46 | 36.14 | % | 1,062.0 | 0.44 | % | 0.66 | % | 0.44 | % | 0.66 | % | 62 | % | |||||||||||||||||||
| (0.22 | ) | 18.81 | 19.18 | % | 859.9 | 0.45 | % | 1.16 | % | 0.45 | % | 1.16 | % | 87 | % | |||||||||||||||||||
| (0.10 | ) | 15.96 | (5.42 | )% | 805.3 | 0.44 | % | 0.55 | % | 0.44 | % | 0.55 | % | 216 | % | |||||||||||||||||||
| (0.09 | ) | 16.98 | 10.90 | % | 983.3 | 0.45 | % | 0.56 | % | 0.45 | % | 0.56 | % | 231 | % | |||||||||||||||||||
| (0.10 | ) | 15.40 | 41.40 | % | 1,025.3 | 0.45 | % | 0.79 | % | 0.45 | % | 0.79 | % | 216 | % | |||||||||||||||||||
| (b) | Total investment return assumes dividend reinvestment and does not reflect any deduction for applicable sales charges. Not annualized for periods less than one year. Total return shown does not reflect charges and expenses imposed on contract holders by the variable accounts. Those charges and expenses reduce the return received by contract holders as compared to the return presented. |
| ** | Computed on an annualized basis for periods less than one year. |
The accompanying Notes to Financial Statements are an integral part of this schedule.
343
Table of Contents
Thrivent Series Fund, Inc.
Financial Highlights – continued
| FOR A SHARE OUTSTANDING THROUGHOUT EACH PERIOD* | ||||||||||||||||||||||||
| Income from Investment Operations | Less Distributions from | |||||||||||||||||||||||
| Net Asset Value, Beginning of Period | Net Investment Income/(Loss) | Net Realized and Unrealized Gain/(Loss) on Investments(a) | Total from Investment Operations | Net Investment Income | Net Realized Gain on Investments | |||||||||||||||||||
PARTNER GROWTH STOCK PORTFOLIO | ||||||||||||||||||||||||
Period Ended 06/30/2014 (unaudited) | $ | 18.79 | $ | (0.01 | ) | $ | 0.47 | $ | 0.46 | $ | — | $ | (1.57 | ) | ||||||||||
Year Ended 12/31/2013 | 13.54 | (0.04 | ) | 5.29 | 5.25 | — | — | |||||||||||||||||
Year Ended 12/31/2012 | 11.41 | — | 2.13 | 2.13 | — | — | ||||||||||||||||||
Year Ended 12/31/2011 | 11.58 | (0.03 | ) | (0.14 | ) | (0.17 | ) | — | — | |||||||||||||||
Year Ended 12/31/2010 | 9.93 | (0.02 | ) | 1.67 | 1.65 | — | — | |||||||||||||||||
Year Ended 12/31/2009 | 6.96 | — | 3.00 | 3.00 | (0.03 | ) | — | |||||||||||||||||
|
|
|
|
|
|
|
|
|
|
|
| |||||||||||||
LARGE CAP VALUE PORTFOLIO | ||||||||||||||||||||||||
Period Ended 06/30/2014 (unaudited) | 15.58 | 0.10 | 0.84 | 0.94 | (0.20 | ) | — | |||||||||||||||||
Year Ended 12/31/2013 | 12.00 | 0.20 | 3.59 | 3.79 | (0.21 | ) | — | |||||||||||||||||
Year Ended 12/31/2012 | 10.39 | 0.21 | 1.59 | 1.80 | (0.19 | ) | — | |||||||||||||||||
Year Ended 12/31/2011 | 10.73 | 0.18 | (0.52 | ) | (0.34 | ) | — | — | ||||||||||||||||
Year Ended 12/31/2010 | 9.65 | 0.14 | 1.08 | 1.22 | (0.14 | ) | — | |||||||||||||||||
Year Ended 12/31/2009 | 8.10 | 0.16 | 1.55 | 1.71 | (0.16 | ) | — | |||||||||||||||||
|
|
|
|
|
|
|
|
|
|
|
| |||||||||||||
LARGE CAP STOCK PORTFOLIO | ||||||||||||||||||||||||
Period Ended 06/30/2014 (unaudited) | 11.81 | 0.08 | 0.70 | 0.78 | (0.11 | ) | — | |||||||||||||||||
Year Ended 12/31/2013 | 9.22 | 0.11 | 2.60 | 2.71 | (0.12 | ) | — | |||||||||||||||||
Year Ended 12/31/2012 | 8.11 | 0.12 | 1.08 | 1.20 | (0.09 | ) | — | |||||||||||||||||
Year Ended 12/31/2011 | 8.50 | 0.09 | (0.48 | ) | (0.39 | ) | — | — | ||||||||||||||||
Year Ended 12/31/2010 | 7.72 | 0.06 | 0.78 | 0.84 | (0.06 | ) | — | |||||||||||||||||
Year Ended 12/31/2009 | 6.11 | 0.07 | 1.61 | 1.68 | (0.07 | ) | — | |||||||||||||||||
|
|
|
|
|
|
|
|
|
|
|
| |||||||||||||
LARGE CAP INDEX PORTFOLIO | ||||||||||||||||||||||||
Period Ended 06/30/2014 (unaudited) | 25.80 | 0.21 | 1.58 | 1.79 | (0.39 | ) | (0.06 | ) | ||||||||||||||||
Year Ended 12/31/2013 | 20.11 | 0.40 | 5.91 | 6.31 | (0.39 | ) | (0.23 | ) | ||||||||||||||||
Year Ended 12/31/2012 | 17.71 | 0.40 | 2.33 | 2.73 | (0.33 | ) | — | |||||||||||||||||
Year Ended 12/31/2011 | 17.71 | 0.34 | (0.04 | ) | 0.30 | (0.30 | ) | — | ||||||||||||||||
Year Ended 12/31/2010 | 15.76 | 0.30 | 1.95 | 2.25 | (0.30 | ) | — | |||||||||||||||||
Year Ended 12/31/2009 | 13.72 | 0.33 | 2.98 | 3.31 | (0.45 | ) | (0.82 | ) | ||||||||||||||||
| (a) | The amount shown may not correlate with the change in aggregate gains and losses of portfolio securities due to the timing of sales and redemptions of portfolio shares. |
| * | All per share amounts have been rounded to the nearest cent. |
The accompanying Notes to Financial Statements are an integral part of this schedule.
344
Table of Contents
Thrivent Series Fund, Inc.
Financial Highlights – continued
| RATIOS / SUPPLEMENTAL DATA | ||||||||||||||||||||||||||||||||||
| Ratio to Average Net Assets** | Ratios to Average Net Assets Before Expenses Waived, Credited or Paid Indirectly** | |||||||||||||||||||||||||||||||||
| Total Distributions | Net Asset Value, End of Period | Total Return(b) | Net Assets, End of Period (in millions) | Expenses | Net Investment Income/(Loss) | Expenses | Net Investment Income/(Loss) | Portfolio Turnover Rate | ||||||||||||||||||||||||||
| $ | (1.57 | ) | $ | 17.68 | 2.50 | % | $ | 79.5 | 0.92 | % | (0.17 | )% | 1.02 | % | (0.27 | )% | 21 | % | ||||||||||||||||
| — | 18.79 | 38.84 | % | 76.2 | 0.94 | % | (0.24 | )% | 1.04 | % | (0.34 | )% | 34 | % | ||||||||||||||||||||
| — | 13.54 | 18.66 | % | 58.0 | 0.96 | % | 0.02 | % | 1.06 | % | (0.08 | )% | 32 | % | ||||||||||||||||||||
| — | 11.41 | (1.49 | )% | 51.1 | 0.96 | % | (0.20 | )% | 1.06 | % | (0.30 | )% | 26 | % | ||||||||||||||||||||
| — | 11.58 | 16.62 | % | 61.4 | 0.95 | % | (0.19 | )% | 1.05 | % | (0.29 | )% | 36 | % | ||||||||||||||||||||
| (0.03 | ) | 9.93 | 43.17 | % | 61.3 | 0.98 | % | 0.01 | % | 1.08 | % | (0.09 | )% | 53 | % | |||||||||||||||||||
|
|
|
|
|
|
|
|
|
|
|
|
|
|
|
|
|
| |||||||||||||||||
| (0.20 | ) | 16.32 | 5.97 | % | 1,179.8 | 0.64 | % | 1.32 | % | 0.64 | % | 1.32 | % | 11 | % | |||||||||||||||||||
| (0.21 | ) | 15.58 | 31.82 | % | 1,119.2 | 0.64 | % | 1.42 | % | 0.64 | % | 1.42 | % | 32 | % | |||||||||||||||||||
| (0.19 | ) | 12.00 | 17.57 | % | 852.6 | 0.64 | % | 1.84 | % | 0.64 | % | 1.84 | % | 90 | % | |||||||||||||||||||
| — | 10.39 | (3.08 | )% | 752.1 | 0.64 | % | 1.70 | % | 0.64 | % | 1.70 | % | 73 | % | ||||||||||||||||||||
| (0.14 | ) | 10.73 | 12.61 | % | 811.3 | 0.65 | % | 1.39 | % | 0.65 | % | 1.39 | % | 109 | % | |||||||||||||||||||
| (0.16 | ) | 9.65 | 21.11 | % | 733.0 | 0.65 | % | 1.77 | % | 0.65 | % | 1.77 | % | 110 | % | |||||||||||||||||||
|
|
|
|
|
|
|
|
|
|
|
|
|
|
|
|
|
| |||||||||||||||||
| (0.11 | ) | 12.48 | 6.60 | % | 854.4 | 0.66 | % | 1.34 | % | 0.66 | % | 1.34 | % | 40 | % | |||||||||||||||||||
| (0.12 | ) | 11.81 | 29.60 | % | 811.9 | 0.67 | % | 1.02 | % | 0.67 | % | 1.02 | % | 73 | % | |||||||||||||||||||
| (0.09 | ) | 9.22 | 14.90 | % | 622.5 | 0.69 | % | 1.35 | % | 0.69 | % | 1.35 | % | 121 | % | |||||||||||||||||||
| — | 8.11 | (4.58 | )% | 565.8 | 0.69 | % | 1.00 | % | 0.69 | % | 1.00 | % | 139 | % | ||||||||||||||||||||
| (0.06 | ) | 8.50 | 10.82 | % | 628.3 | 0.69 | % | 0.74 | % | 0.69 | % | 0.74 | % | 181 | % | |||||||||||||||||||
| (0.07 | ) | 7.72 | 27.59 | % | 617.3 | 0.70 | % | 1.03 | % | 0.71 | % | 1.03 | % | 169 | % | |||||||||||||||||||
|
|
|
|
|
|
|
|
|
|
|
|
|
|
|
|
|
| |||||||||||||||||
| (0.45 | ) | 27.14 | 6.91 | % | 417.5 | 0.39 | % | 1.65 | % | 0.39 | % | 1.65 | % | 1 | % | |||||||||||||||||||
| (0.62 | ) | 25.80 | 31.81 | % | 392.6 | 0.40 | % | 1.71 | % | 0.40 | % | 1.71 | % | 4 | % | |||||||||||||||||||
| (0.33 | ) | 20.11 | 15.54 | % | 304.0 | 0.42 | % | 1.89 | % | 0.42 | % | 1.89 | % | 4 | % | |||||||||||||||||||
| (0.30 | ) | 17.71 | 1.71 | % | 291.3 | 0.42 | % | 1.67 | % | 0.42 | % | 1.67 | % | 4 | % | |||||||||||||||||||
| (0.30 | ) | 17.71 | 14.63 | % | 331.5 | 0.42 | % | 1.64 | % | 0.42 | % | 1.64 | % | 6 | % | |||||||||||||||||||
| (1.27 | ) | 15.76 | 26.20 | % | 338.2 | 0.43 | % | 2.00 | % | 0.43 | % | 2.00 | % | 7 | % | |||||||||||||||||||
| (b) | Total investment return assumes dividend reinvestment and does not reflect any deduction for applicable sales charges. Not annualized for periods less than one year. Total return shown does not reflect charges and expenses imposed on contract holders by the variable accounts. Those charges and expenses reduce the return received by contract holders as compared to the return presented. |
| ** | Computed on an annualized basis for periods less than one year. |
The accompanying Notes to Financial Statements are an integral part of this schedule.
345
Table of Contents
Thrivent Series Fund, Inc.
Financial Highlights – continued
| FOR A SHARE OUTSTANDING THROUGHOUT EACH PERIOD* | ||||||||||||||||||||||||
| Income from Investment Operations | Less Distributions from | |||||||||||||||||||||||
| Net Asset Value, Beginning of Period | Net Investment Income/(Loss) | Net Realized and Unrealized Gain/(Loss) on Investments(a) | Total from Investment Operations | Net Investment Income | Net Realized Gain on Investments | |||||||||||||||||||
HIGH YIELD PORTFOLIO | ||||||||||||||||||||||||
Period Ended 06/30/2014 (unaudited) | $ | 5.07 | $ | 0.15 | $ | 0.10 | $ | 0.25 | $ | (0.15 | ) | $ | — | |||||||||||
Year Ended 12/31/2013 | 5.05 | 0.32 | 0.02 | 0.34 | (0.32 | ) | — | |||||||||||||||||
Year Ended 12/31/2012 | 4.66 | 0.35 | 0.39 | 0.74 | (0.35 | ) | — | |||||||||||||||||
Year Ended 12/31/2011 | 4.81 | 0.37 | (0.15 | ) | 0.22 | (0.37 | ) | — | ||||||||||||||||
Year Ended 12/31/2010 | 4.56 | 0.38 | 0.25 | 0.63 | (0.38 | ) | — | |||||||||||||||||
Year Ended 12/31/2009 | 3.48 | 0.38 | 1.07 | 1.45 | (0.37 | ) | — | |||||||||||||||||
|
|
|
|
|
|
|
|
|
|
|
| |||||||||||||
INCOME PORTFOLIO | ||||||||||||||||||||||||
Period Ended 06/30/2014 (unaudited) | 10.34 | 0.20 | 0.40 | 0.60 | (0.20 | ) | (0.13 | ) | ||||||||||||||||
Year Ended 12/31/2013 | 10.77 | 0.40 | (0.41 | ) | (0.01 | ) | (0.40 | ) | (0.02 | ) | ||||||||||||||
Year Ended 12/31/2012 | 10.09 | 0.40 | 0.68 | 1.08 | (0.40 | ) | — | |||||||||||||||||
Year Ended 12/31/2011 | 9.96 | 0.46 | 0.12 | 0.58 | (0.45 | ) | — | |||||||||||||||||
Year Ended 12/31/2010 | 9.39 | 0.49 | 0.57 | 1.06 | (0.49 | ) | — | |||||||||||||||||
Year Ended 12/31/2009 | 8.20 | 0.50 | 1.19 | 1.69 | (0.50 | ) | — | |||||||||||||||||
|
|
|
|
|
|
|
|
|
|
|
| |||||||||||||
BOND INDEX PORTFOLIO | ||||||||||||||||||||||||
Period Ended 06/30/2014 (unaudited) | 10.56 | 0.12 | 0.30 | 0.42 | (0.12 | ) | — | |||||||||||||||||
Year Ended 12/31/2013 | 11.39 | 0.21 | (0.48 | ) | (0.27 | ) | (0.21 | ) | (0.35 | ) | ||||||||||||||
Year Ended 12/31/2012 | 11.21 | 0.23 | 0.32 | 0.55 | (0.23 | ) | (0.14 | ) | ||||||||||||||||
Year Ended 12/31/2011 | 10.73 | 0.31 | 0.55 | 0.86 | (0.31 | ) | (0.07 | ) | ||||||||||||||||
Year Ended 12/31/2010 | 10.13 | 0.33 | 0.60 | 0.93 | (0.33 | ) | — | |||||||||||||||||
Year Ended 12/31/2009 | 9.72 | 0.37 | 0.43 | 0.80 | (0.39 | ) | — | |||||||||||||||||
|
|
|
|
|
|
|
|
|
|
|
| |||||||||||||
LIMITED MATURITY BOND PORTFOLIO | ||||||||||||||||||||||||
Period Ended 06/30/2014 (unaudited) | 9.82 | 0.09 | 0.05 | 0.14 | (0.08 | ) | — | |||||||||||||||||
Year Ended 12/31/2013 | 9.92 | 0.15 | (0.10 | ) | 0.05 | (0.15 | ) | — | ||||||||||||||||
Year Ended 12/31/2012 | 9.67 | 0.17 | 0.24 | 0.41 | (0.16 | ) | — | |||||||||||||||||
Year Ended 12/31/2011 | 9.80 | 0.23 | (0.14 | ) | 0.09 | (0.22 | ) | — | ||||||||||||||||
Year Ended 12/31/2010 | 9.62 | 0.32 | 0.18 | 0.50 | (0.32 | ) | — | |||||||||||||||||
Year Ended 12/31/2009 | 8.79 | 0.39 | 0.82 | 1.21 | (0.38 | ) | — | |||||||||||||||||
| (a) | The amount shown may not correlate with the change in aggregate gains and losses of portfolio securities due to the timing of sales and redemptions of portfolio shares. |
| * | All per share amounts have been rounded to the nearest cent. |
The accompanying Notes to Financial Statements are an integral part of this schedule.
346
Table of Contents
Thrivent Series Fund, Inc.
Financial Highlights – continued
| RATIOS / SUPPLEMENTAL DATA | ||||||||||||||||||||||||||||||||||
| Ratio to Average Net Assets** | Ratios to Average Net Assets Before Expenses Waived, Credited or Paid Indirectly** | |||||||||||||||||||||||||||||||||
Total | Net Asset Value, End of Period | Total Return(b) | Net Assets, End of Period (in millions) | Expenses | Net Investment Income/(Loss) | Expenses | Net Investment Income/(Loss) | Portfolio Turnover Rate | ||||||||||||||||||||||||||
| $ | (0.15 | ) | $ | 5.17 | 4.99 | % | $ | 955.6 | 0.44 | % | 5.87 | % | 0.44 | % | 5.87 | % | 26 | % | ||||||||||||||||
| (0.32 | ) | 5.07 | 6.91 | % | 921.9 | 0.44 | % | 6.31 | % | 0.44 | % | 6.31 | % | 53 | % | |||||||||||||||||||
| (0.35 | ) | 5.05 | 16.28 | % | 904.9 | 0.44 | % | 7.11 | % | 0.44 | % | 7.11 | % | 57 | % | |||||||||||||||||||
| (0.37 | ) | 4.66 | 4.71 | % | 778.5 | 0.45 | % | 7.81 | % | 0.45 | % | 7.81 | % | 58 | % | |||||||||||||||||||
| (0.38 | ) | 4.81 | 14.58 | % | 783.0 | 0.45 | % | 8.20 | % | 0.45 | % | 8.20 | % | 82 | % | |||||||||||||||||||
| (0.37 | ) | 4.56 | 43.49 | % | 756.0 | 0.45 | % | 9.28 | % | 0.46 | % | 9.28 | % | 61 | % | |||||||||||||||||||
|
|
|
|
|
|
|
|
|
|
|
|
|
|
|
|
|
| |||||||||||||||||
| (0.33 | ) | 10.61 | 5.78 | % | 1,463.5 | 0.44 | % | 3.83 | % | 0.44 | % | 3.83 | % | 50 | % | |||||||||||||||||||
| (0.42 | ) | 10.34 | (0.07 | )% | 1,417.6 | 0.44 | % | 3.78 | % | 0.44 | % | 3.78 | % | 115 | % | |||||||||||||||||||
| (0.40 | ) | 10.77 | 10.98 | % | 1,575.9 | 0.44 | % | 3.84 | % | 0.44 | % | 3.84 | % | 132 | % | |||||||||||||||||||
| (0.45 | ) | 10.09 | 5.96 | % | 1,463.1 | 0.44 | % | 4.53 | % | 0.44 | % | 4.53 | % | 142 | % | |||||||||||||||||||
| (0.49 | ) | 9.96 | 11.55 | % | 1,322.2 | 0.44 | % | 5.06 | % | 0.44 | % | 5.05 | % | 146 | % | |||||||||||||||||||
| (0.50 | ) | 9.39 | 21.29 | % | 1,278.2 | 0.44 | % | 5.72 | % | 0.45 | % | 5.71 | % | 160 | % | |||||||||||||||||||
|
|
|
|
|
|
|
|
|
|
|
|
|
|
|
|
|
| |||||||||||||||||
| (0.12 | ) | 10.86 | 4.10 | % | 149.0 | 0.47 | % | 2.30 | % | 0.47 | % | 2.30 | % | 207 | % | |||||||||||||||||||
| (0.56 | ) | 10.56 | (2.47 | )% | 152.0 | 0.46 | % | 1.94 | % | 0.46 | % | 1.94 | % | 384 | % | |||||||||||||||||||
| (0.37 | ) | 11.39 | 4.94 | % | 185.5 | 0.46 | % | 2.00 | % | 0.46 | % | 2.00 | % | 401 | % | |||||||||||||||||||
| (0.38 | ) | 11.21 | 8.23 | % | 164.5 | 0.46 | % | 2.83 | % | 0.46 | % | 2.83 | % | 415 | % | |||||||||||||||||||
| (0.33 | ) | 10.73 | 9.24 | % | 161.4 | 0.46 | % | 3.12 | % | 0.46 | % | 3.12 | % | 387 | % | |||||||||||||||||||
| (0.39 | ) | 10.13 | 8.47 | % | 156.5 | 0.46 | % | 3.78 | % | 0.47 | % | 3.77 | % | 388 | % | |||||||||||||||||||
|
|
|
|
|
|
|
|
|
|
|
|
|
|
|
|
|
| |||||||||||||||||
| (0.08 | ) | 9.88 | 1.52 | % | 1,073.3 | 0.44 | % | 1.78 | % | 0.44 | % | 1.78 | % | 51 | % | |||||||||||||||||||
| (0.15 | ) | 9.82 | 0.45 | % | 1,082.5 | 0.44 | % | 1.56 | % | 0.44 | % | 1.56 | % | 114 | % | |||||||||||||||||||
| (0.16 | ) | 9.92 | 4.32 | % | 1,200.0 | 0.43 | % | 1.72 | % | 0.44 | % | 1.71 | % | 107 | % | |||||||||||||||||||
| (0.22 | ) | 9.67 | 0.90 | % | 1,497.8 | 0.43 | % | 2.31 | % | 0.44 | % | 2.30 | % | 91 | % | |||||||||||||||||||
| (0.32 | ) | 9.80 | 5.25 | % | 1,318.7 | 0.43 | % | 3.27 | % | 0.44 | % | 3.27 | % | 102 | % | |||||||||||||||||||
| (0.38 | ) | 9.62 | 14.04 | % | 1,105.6 | 0.44 | % | 4.23 | % | 0.45 | % | 4.23 | % | 145 | % | |||||||||||||||||||
| (b) | Total investment return assumes dividend reinvestment and does not reflect any deduction for applicable sales charges. Not annualized for periods less than one year. Total return shown does not reflect charges and expenses imposed on contract holders by the variable accounts. Those charges and expenses reduce the return received by contract holders as compared to the return presented. |
| ** | Computed on an annualized basis for periods less than one year. |
The accompanying Notes to Financial Statements are an integral part of this schedule.
347
Table of Contents
Thrivent Series Fund, Inc.
Financial Highlights – continued
| FOR A SHARE OUTSTANDING THROUGHOUT EACH PERIOD* | ||||||||||||||||||||||||
| Income from Investment Operations | Less Distributions from | |||||||||||||||||||||||
| Net Asset Value, Beginning of Period | Net Investment Income/ (Loss) | Net Realized and Unrealized Gain/(Loss) on Investments(a) | Total from Investment Operations | Net Investment Income | Net Realized Gain on Investments | |||||||||||||||||||
MONEY MARKET PORTFOLIO | ||||||||||||||||||||||||
Period Ended 06/30/2014 (unaudited) | $ | 1.00 | $ | — | $ | — | $ | — | $ | — | $ | — | ||||||||||||
Year Ended 12/31/2013 | 1.00 | — | — | — | — | — | ||||||||||||||||||
Year Ended 12/31/2012 | 1.00 | — | — | — | — | — | ||||||||||||||||||
Year Ended 12/31/2011 | 1.00 | — | — | — | — | — | ||||||||||||||||||
Year Ended 12/31/2010 | 1.00 | — | — | — | — | — | ||||||||||||||||||
Year Ended 12/31/2009 | 1.00 | — | — | — | — | — | ||||||||||||||||||
| (a) | The amount shown may not correlate with the change in aggregate gains and losses of portfolio securities due to the timing of sales and redemptions of portfolio shares. |
| * | All per share amounts have been rounded to the nearest cent. |
The accompanying Notes to Financial Statements are an integral part of this schedule.
348
Table of Contents
Thrivent Series Fund, Inc.
Financial Highlights – continued
| RATIOS / SUPPLEMENTAL DATA | ||||||||||||||||||||||||
Ratio to Average Net Assets** | Ratios to Average Net Assets | |||||||||||||||||||||||
Total | Net Asset Value, End of Period | Total Return(b) | Net Assets, End of Period (in millions) | Expenses | Net | Expenses | Net | Portfolio Rate | ||||||||||||||||
| $ | — | $ | 1.00 | 0.00 | % | $ | 130.7 | 0.19% | 0.00% | 0.53% | (0.34)% | N/A | ||||||||||||
| — | 1.00 | 0.00 | % | 146.6 | 0.22% | 0.00% | 0.52% | (0.30)% | N/A | |||||||||||||||
| — | 1.00 | 0.00 | % | 148.3 | 0.29% | 0.00% | 0.51% | (0.23)% | N/A | |||||||||||||||
| — | 1.00 | 0.00 | % | 170.5 | 0.30% | 0.00% | 0.51% | (0.21)% | N/A | |||||||||||||||
| — | 1.00 | 0.00 | % | 171.8 | 0.31% | (0.01)% | 0.50% | (0.19)% | N/A | |||||||||||||||
| — | 1.00 | 0.43 | % | 246.0 | 0.39% | 0.47% | 0.49% | 0.37% | N/A | |||||||||||||||
| (b) | Total investment return assumes dividend reinvestment and does not reflect any deduction for applicable sales charges. Not annualized for periods less than one year. Total return shown does not reflect charges and expenses imposed on contract holders by the variable accounts. Those charges and expenses reduce the return received by contract holders as compared to the return presented. |
| ** | Computed on an annualized basis for periods less than one year. |
The accompanying Notes to Financial Statements are an integral part of this schedule.
349
Table of Contents
(unaudited)
Proxy Voting
The policies and procedures that the Fund uses to determine how to vote proxies relating to portfolio securities are attached to the Fund’s Statement of Additional Information. You may request a free copy of the Statement of Additional Information or the report of how the Fund voted proxies relating to portfolio securities during the most recent 12-month period ended June 30 by calling 1-800-847-4836. You also may review the Statement of Additional Information or the report of how the Fund voted proxies relating to portfolio securities during the most recent 12-month period ended June 30 at Thrivent.com or www.sec.gov.
Quarterly Schedule of Portfolio Holdings
The Fund files its Schedule of Portfolio Holdings on Form N-Q with the SEC for the first and third quarters of each fiscal year. You may request a free copy of the Fund’s Forms N-Q by calling 1-800-847-4836. The Fund’s most recent Form N-Q Schedule of Investments also is available at Thrivent.com or www.sec.gov. You also may review and copy the Forms N-Q for the Fund at the SEC’s Public Reference Room in Washington, DC. You may get information about the operation of the Public Reference Room by calling 1-800-SEC-0330.
350
Table of Contents
Thrivent Series Fund, Inc.
Supplement to Prospectus dated April 30, 2014
with respect to
Thrivent Partner Technology Portfolio
Effective immediately, the following changes will be made in the sections of the prospectus describing Thrivent Partner Technology Portfolio (the “Portfolio”).
The “Portfolio Manager(s)” section in the “Summary Section” and the disclosure after the first three sentences in the section about the Portfolio in “Portfolio Management” under “Management” are deleted and replaced with the following:
GSAM uses its Growth Investment Team (the “Team”) to manage the Portfolio. Steven Barry, Michael DeSantis, CFA, Jonathan A. Neitzell and Lawrence Tankel are portfolio managers to the Portfolio. Mr. Barry is a Managing Director, Chief Investment Officer of Growth Equity, Chief Investment Officer of Fundamental Equity; and he has been with GSAM since 1999 and has been a portfolio manager of this Portfolio since 2009. Mr. DeSantis, CFA is a Vice President and Portfolio Manager. He has been with GSAM since 2011 and has been a portfolio manager of this Portfolio since 2014. Prior to joining the Team, he worked in Investment Banking at J.P. Morgan. Mr. Neitzell is a Vice President and Portfolio Manager. He has been with GSAM since 2013 and has been a portfolio manager of this Portfolio since 2014. Mr. Neitzell joined the Team the Wells Capital Management, where he served as a senior investment analyst. Mr. Tankel is a Vice President and Portfolio Manager. He has been with GSAM since 2013 and has been a portfolio manager of this Portfolio since 2014. Prior to joining the Team, Mr. Tankel worked for Merrill Lynch for 11 years.
The date of this Supplement is August 14, 2014.
Please include this Supplement with your Prospectus.
28466
351
Table of Contents
THIS PAGE INTENTIONALLY LEFT BLANK
352
Table of Contents
Table of Contents
Table of Contents
| Item 2. | Code of Ethics |
Not applicable to semiannual report
| Item 3. | Audit Committee Financial Expert |
Not applicable to semiannual report
| Item 4. | Principal Accountant Fees and Services |
Not applicable to semiannual report
| Item 5. | Audit Committee of Listed Registrants |
Not applicable.
| Item 6. | Schedule of Investments |
| (1) | Registrant’s Schedule of Investments is included in the report to shareholders filed under Item 1. |
| (2) | Not applicable to this filing. |
| Item 7. | Disclosure of Proxy Voting Policies and Procedures for Closed-End Management Investment Companies |
Not applicable.
| Item 8. | Portfolio Managers of Closed-End Management Investment Companies |
Not applicable.
| Item 9. | Purchases of Equity Securities by Closed-End Management Investment Company and Affiliated Purchasers. |
Not applicable.
| Item 10. | Submission of Matters to a Vote of Security Holders |
There have been no material changes to the procedures by which shareholders may recommend nominees to registrant’s board of directors.
| Item 11. | Controls and Procedures |
(a)(i) Registrant’s President and Treasurer have concluded that registrant’s disclosure controls and procedures (as defined in Rule 30a-3(c) under the Investment Company Act) are effective, based on their evaluation of these controls and procedures as of a date within 90 days of the filing date of this report.
(a)(ii) Registrant’s President and Treasurer are aware of no change in registrant’s internal control over financial reporting (as defined in Rule 30a-3(d) under the Investment Company Act) that occurred during registrant’s most recent fiscal quarter that has materially affected, or is reasonably likely to materially affect, registrant’s internal control over financial reporting.
| Item 12. | Exhibits |
| (a) | Certifications pursuant to Rules 30a-2(a) and 30a-2(b) under the Investment Company Act of 1940 are attached hereto. |
Table of Contents
SIGNATURES
Pursuant to the requirements of the Securities Exchange Act of 1934 and the Investment Company Act of 1940, the registrant has duly caused this report to be signed on its behalf by the undersigned, thereunto duly authorized.
| Date: August 28, 2014 | THRIVENT SERIES FUND, INC. | |||||
| By: | /s/ Russell W. Swansen | |||||
| Russell W. Swansen | ||||||
| President | ||||||
Pursuant to the requirements of the Securities Exchange Act of 1934 and the Investment Company Act of 1940, this report has been signed below by the following persons on behalf of the registrant and in the capacities and on the dates indicated.
| Date: August 28, 2014 | By: | /s/ Russell W. Swansen | ||||
| Russell W. Swansen | ||||||
| President |
| Date: August 28, 2014 | By: | /s/ Gerard V. Vaillancourt | ||||
| Gerard V. Vaillancourt | ||||||
| Treasurer |