Table of Contents
UNITED STATES
SECURITIES AND EXCHANGE COMMISSION
Washington, D.C. 20549
FORM N-CSR
CERTIFIED SHAREHOLDER REPORT OF REGISTERED
MANAGEMENT INVESTMENT COMPANIES
Investment Company Act file number: 811-4603
Thrivent Series Fund, Inc.
(Exact name of registrant as specified in charter)
625 Fourth Avenue South
Minneapolis, Minnesota 55415
(Address of principal executive offices) (Zip code)
Michael W. Kremenak, Secretary and Chief Legal Officer
625 Fourth Avenue South
Minneapolis, Minnesota 55415
(Name and address of agent for service)
Registrant’s telephone number, including area code: (612) 844-4198
Date of fiscal year end: December 31
Date of reporting period: December 31, 2014
Table of Contents
| Item 1. | Report to Stockholders |
Table of Contents

Table of Contents
Make variable annuity changes online, quickly and easily
You have more options to manage your variable annuity—in fewer steps
You’ve invested in an annuity-now you have another way to manage it with our online annuity service center. With 24/7 access, it’s there when you want it. Plus, you can make changes any time in seconds.
The online annuity service center offers you more options, including:
• Complete reallocation • Partial reallocation • New money allocation • Partial withdrawals • Transaction status and history
|  |
Just log in* to Thrivent.com and select your variable annuity contract by clicking on Manage Contract to make changes. It’s the easiest and most convenient way to update your annuity. Save time by making changes with just a few easy clicks!
As always, your Thrivent Financial representative is available to answer any questions you may have.
| * | In order to access your variable annuity contract on Thrivent.com, you must be a registered user. If you are not already registered, you can register immediately by clicking on Register Now next to the login area. |
This page is not part of the annual report.
Table of Contents
Letter From the President | 2 | |||
Portfolio Perspectives | ||||
| 4 | ||||
| 6 | ||||
| 8 | ||||
| 10 | ||||
| 12 | ||||
| 14 | ||||
| 16 | ||||
| 18 | ||||
| 20 | ||||
| 22 | ||||
| 24 | ||||
| 26 | ||||
| 28 | ||||
| 30 | ||||
| 32 | ||||
| 34 | ||||
| 36 | ||||
| 38 | ||||
| 40 | ||||
| 42 | ||||
| 44 | ||||
| 46 | ||||
| 48 | ||||
| 50 | ||||
| 52 | ||||
| 54 | ||||
| 56 | ||||
| 58 | ||||
| 60 | ||||
| 62 | ||||
| 64 | ||||
| 66 | ||||
| 68 | ||||
| 70 | ||||
| 73 | ||||
Schedule of Investments | ||||
| 74 | ||||
| 84 | ||||
| 107 | ||||
| 130 | ||||
| 150 | ||||
| 165 | ||||
| 180 | ||||
| 196 | ||||
| 210 | ||||
| 212 | ||||
| 214 | ||||
| 216 | ||||
| 219 | ||||
| 222 | ||||
| 225 | ||||
| 228 | ||||
| 231 | ||||
| 239 | ||||
| 242 | ||||
| 245 | ||||
| 247 | ||||
| 253 | ||||
| 274 | ||||
| 277 | ||||
| 280 | ||||
| 283 | ||||
| 285 | ||||
| 290 | ||||
| 297 | ||||
| 305 | ||||
| 318 | ||||
| 324 | ||||
| 336 | ||||
| 340 | ||||
| 346 | ||||
| 352 | ||||
| 364 | ||||
| 383 | ||||
| 393 | ||||
| 398 | ||||
| 399 | ||||
Table of Contents
Dear Member:
U.S. financial markets turned in a strong performance in 2014 as an improving U.S. economy finally broke from the lingering grasp of the 2008 financial crisis. With interest rates and inflation both low, the investment outlook remained generally favorable heading into 2015.
Economic Review
After contracting in the first quarter amid unusually harsh winter weather, the U.S. economy accelerated smartly in 2014, bolstered by strong spending by consumers and businesses. The nation’s gross domestic product (GDP)—the sum of all goods and services produced—expanded at a 4.6% annual rate in the second quarter and a 5% rate in the third quarter, the latter marking its fastest pace in 11 years.
The economy’s strength translated into solid corporate profits and a healthier job market. Nearly 3 million new jobs were created over the course of the year, the most since 1999. The unemployment rate fell to 5.6%, its lowest level since June 2008, from 6.7% a year earlier. Nonetheless, many people who would like to be working full time remain trapped in part-time jobs.
With the economy on sounder footing, the Federal Reserve followed through with plans to wind down quantitative easing, the program in which it had sought to stimulate the economy by purchasing tens of billions of dollars of bonds each month to push long-term interest rates low. The Fed continued to hold short-term rates near 0%, however, and pledged to be patient in raising them. Economists and market analysts widely anticipate that will begin sometime in 2015.
In Europe and China, which are important to the U.S. economy and its financial markets, the picture was less bright. In the Euro area, the economy eked out a scant quarter-over-quarter gain of just 0.2% in the third quarter, while in China, the economy grew 7.4% for the year, a seemingly robust pace that nonetheless marked its weakest annual expansion since 1990. China is attempting a delicate transition from an economy based on government investment in industry and infrastructure to one that, as in the U.S., is based more on consumer spending.
Market Review
Enthused by the improving U.S. economic outlook, investors drove several major U.S. stock market indexes to a succession of record highs over the course of the year. The Dow Jones Industrial Average broke above 18,000 for the first time late in the year, and the Standard & Poor’s 500 Index recorded its first breach above 2,000.
The S&P 500, which tracks large-company stocks, finished the year with a total return of 13.7%, its sixth consecutive annual advance and its third consecutive year of double-digit gains. Small-company stocks delivered more modest returns of 4.9%, as measured by the Russell 2000® Index, as investors worried that valuations in that sector of the market may have gotten overextended. In 2013, the index posted a total return of 38.8%.
Reflecting the bleaker economic picture in many overseas markets, international stocks struggled. The MSCI All Country World Index, ex-USA, posted a total return of -3.4% and the MSCI Emerging Markets Index posted a total return of -1.8%.
Contrary to widespread expectations, bond markets also delivered strong results in 2014, particularly in the Treasury sector. Many analysts and investors had assumed that with the Fed winding down its bond-buying program and looking to raise short-term rates in 2015, interest rates would float higher. When rates go up, bond prices fall.
Instead, the weak economic outlook in Europe, nervousness over Russia’s incursion into Ukraine, slowing economic growth in China, a strengthening U.S. dollar, and paltry returns on sovereign bonds outside the U.S. prompted investors to flock to the perceived safety of U.S. Treasury bonds, especially at the longer end of the yield curve where yields still exceeded inflation. Their buying pushed the yield on the 10-year Treasury note down to 2.2% by year-end from 3.0% at the end of 2013, driving a total return for that slice of the Treasury market of 10.8%. The return on 30-year Treasuries was even better at 29.4%. In the private sector, investor appetite for yield and credit quality also translated into gains for longer-term investment-grade corporate bonds. The net result was that despite tepid returns for shorter-maturity bonds, the broad Barclays U.S. Aggregate Bond Index was able to deliver a total return of just under 6.0%.
High-yield bonds participated in the rally during the first half of the year, but gave up much of their gains in the second half as a steep slide in oil prices shook the market. Crude oil prices in New York fell nearly 50% over the second half of the year, calling into question the credit quality of bonds issued by energy companies, which make up about 15% of the high-yield debt market. The Barclays U.S. Corporate High Yield Bond Index finished the year with a total return of 2.5%.
Our Outlook
The U.S. economy looks poised to continue growing, although it is unlikely to maintain the torrid pace established in the second and third quarters of 2014. Leading economic indicators are mostly positive, and low energy prices should boost economic activity by making more money available to consumers to spend on other goods and services. Those gains should offset the negative impact of lower oil prices on the energy sector, including the companies that cater to that sector’s infrastructure needs.
Our models suggest near-term GDP growth in the range of 2.5% to 3.0% in 2015, slightly faster than the average rate of expansion since the recovery began in 2009.
We expect similar results in the U.K., but growth of only about 1.0% for the Euro area. We have tempered our expectations for China, but still anticipate that its economy will be able to grow at about a 6% rate.
2
Table of Contents
Threats to the U.S. economy are not insignificant. If Europe continues to struggle, it will act as a damper on global economic activity, as would any further deceleration of China’s economic growth.
We also have yet to see how the Fed’s transition from the extraordinarily accommodative monetary policy of the past several years to one that returns interest rates to more historically normal levels will play out. The absence of any significant pressure on wages thus far, and inflation levels that have stayed a measure below the Fed’s target of 2%, should allow the Fed to proceed cautiously. That may help to moderate reactions in the financial markets. Average hourly earnings at year-end 2014 were only 1.7% higher than they were at year-end 2013, a gain that barely outpaced the 1.3% rate of inflation as measured by the Consumer Price Index.
If Europe is able to avoid slipping into a recession, perhaps aided by further monetary easing by the European Central Bank, and if oil prices stabilize and perhaps begin some recovery, continued economic growth in the U.S. should allow U.S. equities to post additional gains in 2015. However, with stock valuations at the higher end of their historically normal range, it would be surprising if the S&P 500 Index notches a fourth consecutive year of double-digit gains, something it has managed only four other times since 1926, including two overlapping periods between 1995 and 1999.
For stocks to advance, it will be important for corporate profits to remain strong. While the outlook there is reasonably good, we would note that any additional strengthening of the U.S. dollar against foreign currencies would further diminish the value of profits U.S. companies earn overseas when those profits are translated back to dollars. It also would make U.S. exports less competitive.
We continue to prefer the risk/reward outlook for stocks, particularly large-company stocks, over bonds. We anticipate that continued low energy prices and low inflation, combined with weak economic conditions abroad and a search for yield by fixed-income investors, will again limit potential rate increases at the long end of the yield curve. That may allow bonds to once again deliver positive but modest returns that outpace inflation but likely fall short of the results generated in 2014.
International stocks may have trouble keeping pace with U.S. stocks again in 2015, although lower valuations in those markets could be attractive to long-term investors with an appetite for risk, and could prove particularly rewarding when economic conditions outside the U.S. begin to show signs of improvement.
To ensure that your portfolio is positioned to negotiate the shifting investment environment, we encourage you to meet with your Thrivent Financial representative. He or she can help you keep your portfolio aligned with your financial goals and tolerance for risk.
As always, thank you for the trust you have placed in our entire team of professionals at Thrivent Financial.
Sincerely,

Russell W. Swansen
President
Thrivent Series Fund, Inc.
3
Table of Contents
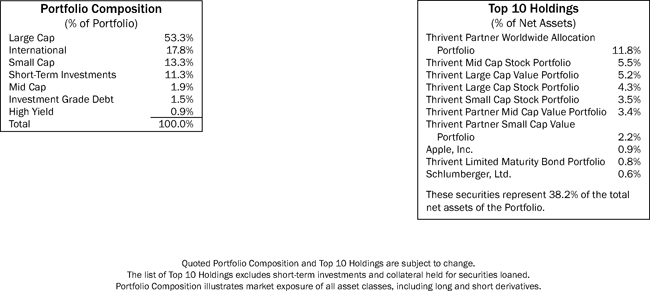
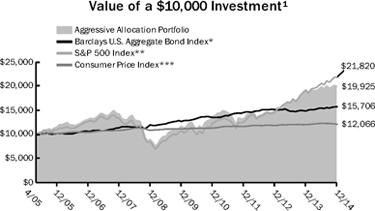
THRIVENT AGGRESSIVE ALLOCATION PORTFOLIO
Russell W. Swansen, David C. Francis, CFA and Mark L. Simenstad, CFA, Portfolio Co-Managers
Thrivent Aggressive Allocation Portfolio seeks long-term capital growth.
The Portfolio invests in other Thrivent mutual funds and in directly held equity and debt instruments. The Portfolio is subject to its own operating expenses and the operating expenses of the other funds in which it invests, and is subject to all of the risks of the other funds in which it invests. The value of the Portfolio is influenced by factors impacting the overall market, certain asset classes, certain investment styles, and specific issuers. The Portfolio may incur losses due to incorrect assessments of investments by its investment adviser. Foreign investments involve additional risks, including currency fluctuations, liquidity, political, economic and market instability, and different legal and accounting standards. Bond prices generally fall as interest rates rise. Credit risk is the risk that an issuer of a debt security may not pay its debt, and high yield securities are subject to increased credit risk as well as liquidity risk. The use of equity index futures involves transaction costs and the loss from investing in them can exceed the initial investment.
How did the Portfolio perform during the 12-month period ended December 31, 2014?
Thrivent Aggressive Allocation Portfolio earned a return of 6.02%, compared with the median return of its peer group, the Lipper Mixed-Asset Target Allocation Aggressive Growth category, of 5.29%. The Portfolio’s market benchmarks, the S&P 500 Index and the Barclays U.S. Aggregate Bond Index, earned returns of 13.69% and 5.97%, respectively.
What factors affected the Portfolio’s performance?
The Portfolio’s fixed-income and equity allocations are dominant performance factors versus the respective public indexes in any given period. Over this past year, fixed-income allocations averaged approximately 8% while equity allocations, both domestic and non-U.S., averaged 92%. Allocations within sectors and market segments in the U.S. equity portion of the Portfolio had a positive impact on returns, as did our positioning of fixed-income assets. However, exposure to markets outside the U.S. limited returns as non-U.S. equity markets generally did not keep pace with strong U.S. returns on a dollar basis. In fixed income, our tactical positioning for below-benchmark duration offset some of the gains in other positions as interest rates in the U.S. generally declined over the period.
In the U.S. equity portfolio, our tactical decision to overweight large-cap stocks and underweight mid and small caps favorably impacted returns. In the second half of the period, investors’ attitudes toward risk shifted dramatically and small-cap stocks in particular began to meaningfully underperform large-cap indexes. Our small-cap stock allocation performed well versus its peers, but the group lagged large-cap indexes by a meaningful margin.
Within the domestic equity segment, many of our allocations performed well versus their respective peer groups, but compared less favorably against their public benchmarks. Active managers generally did not perform well against public benchmarks in 2014 and the reasons varied by category. In mid and small cap, unusually strong returns by utilities and real estate investment trusts (REITs), areas that are often underweighted in active portfolios, were a factor. In large caps, exposure to non-U.S. holdings that are not in the respective domestic public benchmarks played a role.
Our international exposure limited returns since non-U.S. developed markets did not advance as strongly as U.S. large-cap indexes. This distinction was exacerbated in places like Europe by the weakness of the euro versus the dollar. Japanese equities did advance in line with large-cap U.S. stocks, but that advance was offset by a sharp decline in the yen relative to the dollar. We also had allocations within our international segment to emerging market debt and equities that did not keep pace.
In fixed income, we had a tactical allocation to shorter durations, which limited our advance since interest rates generally declined over the period. We were overweighted in credit relative to the fixed-income benchmark and that aided results against all but the longest-maturity Treasury bonds. We also had positioned the fixed-income segment to benefit from a flattening of the yield curve, which happens when shorter-term interest rates rise while longer-term rates decline. Yield curve flattening did, in fact, take place over the period, so our positioning aided results. We also continued to benefit from our unique positioning in select mortgage-backed securities since they outperformed.
What is your outlook?
We believe the most likely outcome for the next fiscal year is continued growth that will be below trend versus history. Interest rates, particularly for developed market sovereign debt, are being artificially depressed by the actions of central banks in order to stimulate faster growth and avoid deflation. Should that strategy prove successful, then interest rates must inevitably rise. While it does not necessarily derail an advance in stock prices, it will likely cause the contour of that advance to be more in line with earnings growth and less with the expansion of valuation metrics.
While fiscal and monetary policies across the globe were in alignment during most of the recovery from the financial crisis, going forward, we expect more regional variations as different economies will require more customized approaches. Energy prices have declined significantly, which is generally positive for global growth because the beneficiaries of lower energy prices far outnumber those that are negatively impacted. That being said, many of the countries that would be negatively affected are also characterized by less stable regimes, increasing the risk of geopolitical consequences. While risk assets are still favored, an overly aggressive posture is not warranted.
4
Table of Contents
Average Annual Total Returns1
As of December 31, 2014
1-Year | 5-Year | From Inception | ||
| 6.02% | 11.29% | 7.38% |
Past performance is not an indication of future results. Total investment return and principal value of your investment will fluctuate and units, when redeemed, may be worth more or less than their original cost. Current performance may be higher or lower than the performance data quoted. Call 800-THRIVENT or visit Thrivent.com for performance results current to the most recent month-end.
| 1 | Average annual total returns represent past performance and reflect changes in share prices, the reinvestment of all dividends and capital gains, and the effects of compounding. Periods of less than one year are not annualized. At various times, the Portfolio’s adviser may have waived its management fee and/or reimbursed Portfolio expenses. If this were the case, the Portfolio’s total returns would have been lower. The returns shown do not reflect charges and expenses imposed on contract holders by the variable accounts. Those charges and expenses reduce the returns received by contract holders as compared to the returns presented. |
The prospectus contains more complete information on the investment objectives, risks, charges and expenses of the investment company, which investors should read and consider carefully before investing. To obtain a prospectus, contact a registered representative or visit Thrivent.com.
| * | The Barclays U.S. Aggregate Bond Index is an index that measures the performance of U.S. investment grade bonds. It is not possible to invest directly in the Index. The performance of the Index does not reflect deductions for fees, expenses or taxes. |
| ** | The S&P 500 Index is an index that represents the average performance of a group of 500 widely held, publicly traded stocks. It is not possible to invest directly in the Index. The performance of the Index does not reflect deductions for fees, expenses or taxes. “S&P 500” is a trademark of The McGraw-Hill Companies, Inc. and has been licensed for use by Thrivent Financial. The product is not sponsored, endorsed or promoted by Standard & Poor’s, and Standard & Poor’s makes no representation regarding the advisability of investing in the product. |
| *** | The Consumer Price Index is an inflationary indicator that measures the change in the cost of a fixed basket of products and services, including housing, electricity, food and transportation. It is not possible to invest directly in the Index. |
5
Table of Contents
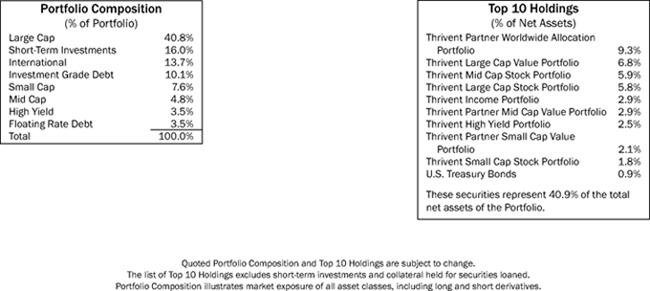
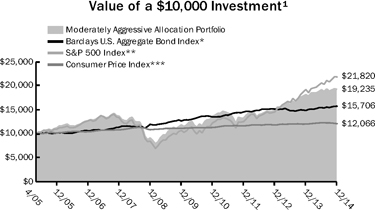
THRIVENT MODERATELY AGGRESSIVE ALLOCATION PORTFOLIO
Russell W. Swansen, David C. Francis, CFA and Mark L. Simenstad, CFA, Portfolio Co-Managers
Thrivent Moderately Aggressive Allocation Portfolio seeks long-term capital growth.
The Portfolio invests in other Thrivent mutual funds and in directly held equity and debt instruments. The Portfolio is subject to its own operating expenses and the operating expenses of the other funds in which it invests, and is subject to all of the risks of the other funds in which it invests. The value of the Portfolio is influenced by factors impacting the overall market, certain asset classes, certain investment styles, and specific issuers. The Portfolio may incur losses due to incorrect assessments of investments by its investment adviser. Foreign investments involve additional risks, including currency fluctuations, liquidity, political, economic and market instability, and different legal and accounting standards. Bond prices generally fall as interest rates rise. Credit risk is the risk that an issuer of a debt security may not pay its debt, and high yield securities are subject to increased credit risk as well as liquidity risk. The use of equity index futures involves transaction costs and the loss from investing in them can exceed the initial investment.
How did the Portfolio perform during the 12-month period ended December 31, 2014?
Thrivent Moderately Aggressive Allocation Portfolio earned a return of 6.05%, compared with the median return of its peer group, the Lipper Mixed-Asset Target Allocation Growth category, of 5.50%. The Portfolio’s market benchmarks, the S&P 500 Index and the Barclays U.S. Aggregate Bond Index, earned returns of 13.69% and 5.97%, respectively.
What factors affected the Portfolio’s performance?
The Portfolio’s fixed-income and equity allocations are dominant performance factors versus the respective public indexes in any given period. Over this past year, the Portfolio’s allocations to fixed income averaged approximately 24% while equity allocations, both domestic and non-U.S., averaged 76%. Allocations within sectors and market segments in the U.S. equity portion of the Portfolio had a positive impact on returns, as did our positioning of fixed-income assets. However, exposure to markets outside the U.S. limited the Portfolio’s returns since non-U.S. equity markets generally did not keep pace with strong U.S. returns on a dollar basis. In fixed income, our tactical positioning for below-benchmark duration offset some of the gains in other positions as interest rates in the U.S. generally declined over the period.
In the U.S. equity portfolio, our tactical decision to overweight large-cap stocks and underweight mid and small caps favorably impacted returns. In the second half of the period, investors’ attitudes toward risk shifted dramatically and small-cap stocks in particular began to meaningfully underperform large-cap indexes. Our small-cap stock allocation performed well versus its peers, but the group lagged large-cap indexes by a meaningful margin.
Within the domestic equity segment, many of our allocations performed well versus their respective peer groups, but compared less favorably against their public benchmarks. Active managers generally did not perform well against public benchmarks in 2014 and the reasons varied by category. In mid and small cap, unusually strong returns by utilities and real estate investment trusts (REITs), areas that are often underweighted in active portfolios, were a factor. In large caps, exposure to non-U.S. holdings that are not in the respective domestic public benchmarks played a role.
Our international exposure limited returns since non-U.S. developed markets did not advance as strongly as U.S. large-cap indexes. This distinction was exacerbated in places like Europe by the weakness of the euro versus the dollar. Japanese equities did advance in line with large-cap U.S. stocks, but that advance was offset by a sharp decline in the yen relative to the dollar. We also had allocations within our international segment to emerging market debt and equities that did not keep pace.
In fixed income, we had a tactical allocation to shorter durations, which limited our advance since interest rates generally declined over the period. We were overweighted in credit relative to the fixed-income benchmark and that aided results against all but the longest-maturity Treasury bonds. We also had positioned the fixed-income segment to benefit from a flattening of the yield curve, which happens when shorter-term interest rates rise while longer-term bond rates decline. Yield curve flattening did, in fact, take place over the period, so our positioning aided results. We also continued to benefit from our unique positioning in select mortgage-backed securities since they outperformed.
What is your outlook?
We believe the most likely outcome for the next fiscal year is continued growth that will be below trend versus history. Interest rates, particularly for developed market sovereign debt, are being artificially depressed by the actions of central banks in order to stimulate faster growth and avoid deflation. Should that strategy prove successful, then interest rates must inevitably rise. While it does not necessarily derail an advance in stock prices, it will likely cause the contour of that advance to be more in line with earnings growth and less with the expansion of valuation metrics.
While fiscal and monetary policies across the globe were in alignment during most of the recovery from the financial crisis, going forward we expect more regional variations as different economies will require more customized approaches. Energy prices have declined significantly, which is generally positive for global growth because the beneficiaries of lower energy prices far outnumber those that are negatively impacted. That being said, many of the countries that would be negatively affected are also characterized by less stable regimes, increasing the risk of geopolitical consequences. While risk assets are still favored, an overly aggressive posture is not warranted.
6
Table of Contents
Average Annual Total Returns1
As of December 31, 2014
1-Year | 5-Year | From Inception | ||
| 6.05% | 10.24% | 6.99% |
Past performance is not an indication of future results. Total investment return and principal value of your investment will fluctuate and units, when redeemed, may be worth more or less than their original cost. Current performance may be higher or lower than the performance data quoted. Call 800-THRIVENT or visit Thrivent.com for performance results current to the most recent month-end.
| 1 | Average annual total returns represent past performance and reflect changes in share prices, the reinvestment of all dividends and capital gains, and the effects of compounding. Periods of less than one year are not annualized. At various times, the Portfolio’s adviser may have waived its management fee and/or reimbursed Portfolio expenses. If this were the case, the Portfolio’s total returns would have been lower. The returns shown do not reflect charges and expenses imposed on contract holders by the variable accounts. Those charges and expenses reduce the returns received by contract holders as compared to the returns presented. |
The prospectus contains more complete information on the investment objectives, risks, charges and expenses of the investment company, which investors should read and consider carefully before investing. To obtain a prospectus, contact a registered representative or visit Thrivent.com.
| * | The Barclays U.S. Aggregate Bond Index is an index that measures the performance of U.S. investment grade bonds. It is not possible to invest directly in the Index. The performance of the Index does not reflect deductions for fees, expenses or taxes. |
| ** | The S&P 500 Index is an index that represents the average performance of a group of 500 widely held, publicly traded stocks. It is not possible to invest directly in the Index. The performance of the Index does not reflect deductions for fees, expenses or taxes. “S&P 500” is a trademark of The McGraw-Hill Companies, Inc. and has been licensed for use by Thrivent Financial. The product is not sponsored, endorsed or promoted by Standard & Poor’s, and Standard & Poor’s makes no representation regarding the advisability of investing in the product. |
| *** | The Consumer Price Index is an inflationary indicator that measures the change in the cost of a fixed basket of products and services, including housing, electricity, food and transportation. It is not possible to invest directly in the Index. |
7
Table of Contents
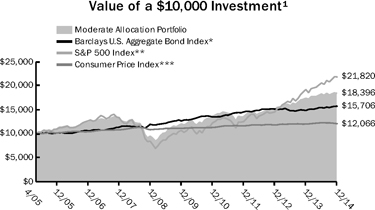
THRIVENT MODERATE ALLOCATION PORTFOLIO
Russell W. Swansen, David C. Francis, CFA and Mark L. Simenstad, CFA, Portfolio Co-Managers
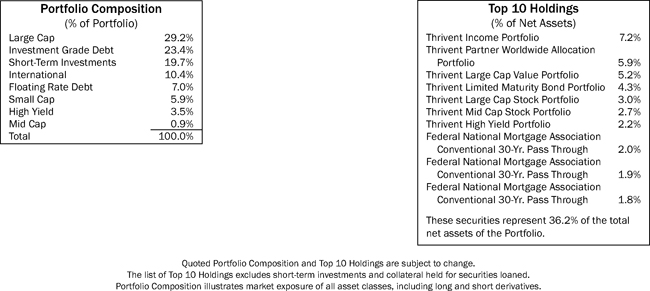
Thrivent Moderate Allocation Portfolio seeks long-term capital growth while providing reasonable stability of principal.
The Portfolio invests in other Thrivent mutual funds and in directly held equity and debt instruments. The Portfolio is subject to its own operating expenses and the operating expenses of the other funds in which it invests, and is subject to all of the risks of the other funds in which it invests. The value of the Portfolio is influenced by factors impacting the overall market, certain asset classes, certain investment styles, and specific issuers. The Portfolio may incur losses due to incorrect assessments of investments by its investment adviser. Foreign investments involve additional risks, including currency fluctuations, liquidity, political, economic and market instability, and different legal and accounting standards. Bond prices generally fall as interest rates rise. Credit risk is the risk that an issuer of a debt security may not pay its debt, and high yield securities are subject to increased credit risk as well as liquidity risk. The use of equity index futures involves transaction costs and the loss from investing in them can exceed the initial investment.
How did the Portfolio perform during the 12-month period ended December 31, 2014?
Thrivent Moderate Allocation Portfolio earned a return of 5.88%, compared with the median return of its peer group, the Lipper Mixed-Asset Target Allocation Moderate category, of 5.35%. The Portfolio’s market benchmarks, the S&P 500 Index and the Barclays U.S. Aggregate Bond Index, earned returns of 13.69% and 5.97%, respectively.
What factors affected the Portfolio’s performance?
The Portfolio’s fixed-income and equity allocations are dominant performance factors versus the respective public indexes in any given period. Over this past year, fixed-income allocations averaged approximately 43% while equity allocations, both domestic and non-U.S., averaged 57%. Allocations within sectors and market segments in the U.S. equity portion of the Portfolio had a positive impact on returns, as did our positioning of fixed-income assets. However, exposure to markets outside the U.S. limited returns as non-U.S. equity markets generally did not keep pace with strong U.S. returns on a dollar basis. In fixed income, our tactical positioning for below-benchmark duration offset some of the gains in other positions as interest rates in the U.S. generally declined over the period.
In the U.S. equity portfolio, our tactical decision to overweight large-cap stocks and underweight mid and small caps favorably impacted returns. In the second half of the period, investors’ attitudes toward risk shifted dramatically and small-cap stocks in particular began to meaningfully underperform large-cap indexes. Our small-cap stock allocation performed well versus its peers, but the group lagged large-cap indexes by a meaningful margin.
Within the domestic equity segment, many of our allocations performed well versus their respective peer groups, but compared less favorably against their public benchmarks. Active managers generally did not perform well against public benchmarks in 2014 and the reasons varied by category. In mid and small cap, unusually strong returns by utilities and real estate investment trusts (REITs), areas that are often underweighted in active portfolios, were a factor. In large caps, exposure to non-U.S. holdings that are not in the respective domestic public benchmarks played a role.
Our international exposure limited returns since non-U.S. developed markets did not advance as strongly as U.S. large-cap indexes. This distinction was exacerbated in places like Europe by the weakness of the euro versus the dollar. Japanese equities did advance in line with large-cap U.S. stocks, but that advance was offset by a sharp decline in the yen relative to the dollar. We also had allocations within our international segment to emerging market debt and equities that did not keep pace.
In fixed income, we had a tactical allocation to shorter durations, which limited our advance since interest rates generally declined over the period. We were overweighted in credit relative to the fixed-income benchmark and that aided results against all but the longest-maturity Treasury bonds. We also had positioned the fixed-income segment to benefit from a flattening of the yield curve, which happens when shorter-term interest rates rise while longer-term rates decline. Yield curve flattening did, in fact, take place over the period, so our positioning aided results. We also continued to benefit from our unique positioning in select mortgage-backed securities as they outperformed.
What is your outlook?
We believe the most likely outcome for the next fiscal year is continued growth that will be below trend versus history. Interest rates, particularly for developed market sovereign debt, are being artificially depressed by the actions of central banks in order to stimulate faster growth and avoid deflation. Should that strategy prove successful, then interest rates must inevitably rise. While it does not necessarily derail the advance in stock prices, it will likely cause the contour of that advance to be more in line with earnings growth and less with the expansion of valuation metrics.
While fiscal and monetary policies across the globe were in alignment during most of the recovery from the financial crisis, going forward we expect more regional variations as different economies will require more customized approaches. Energy prices have declined significantly, which is generally positive for global growth because the beneficiaries of lower energy prices far outnumber those that are negatively impacted. That being said, many of the countries that would be negatively affected are also characterized by less stable regimes, increasing the risk of geopolitical consequences. While risk assets are still favored, an overly aggressive posture is not warranted.
8
Table of Contents
Average Annual Total Returns1
As of December 31, 2014
1-Year | 5-Year | From Inception | ||
| 5.88% | 8.91% | 6.50% |
Past performance is not an indication of future results. Total investment return and principal value of your investment will fluctuate and units, when redeemed, may be worth more or less than their original cost. Current performance may be higher or lower than the performance data quoted. Call 800-THRIVENT or visit Thrivent.com for performance results current to the most recent month-end.
| 1 | Average annual total returns represent past performance and reflect changes in share prices, the reinvestment of all dividends and capital gains, and the effects of compounding. Periods of less than one year are not annualized. At various times, the Portfolio’s adviser may have waived its management fee and/or reimbursed Portfolio expenses. If this were the case, the Portfolio’s total returns would have been lower. The returns shown do not reflect charges and expenses imposed on contract holders by the variable accounts. Those charges and expenses reduce the returns received by contract holders as compared to the returns presented. |
The prospectus contains more complete information on the investment objectives, risks, charges and expenses of the investment company, which investors should read and consider carefully before investing. To obtain a prospectus, contact a registered representative or visit Thrivent.com.
| * | The Barclays U.S. Aggregate Bond Index is an index that measures the performance of U.S. investment grade bonds. It is not possible to invest directly in the Index. The performance of the Index does not reflect deductions for fees, expenses or taxes. |
| ** | The S&P 500 Index is an index that represents the average performance of a group of 500 widely held, publicly traded stocks. It is not possible to invest directly in the Index. The performance of the Index does not reflect deductions for fees, expenses or taxes. “S&P 500” is a trademark of The McGraw-Hill Companies, Inc. and has been licensed for use by Thrivent Financial. The product is not sponsored, endorsed or promoted by Standard & Poor’s, and Standard & Poor’s makes no representation regarding the advisability of investing in the product. |
| *** | The Consumer Price Index is an inflationary indicator that measures the change in the cost of a fixed basket of products and services, including housing, electricity, food and transportation. It is not possible to invest directly in the Index. |
9
Table of Contents
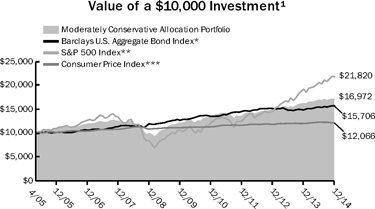
THRIVENT MODERATELY CONSERVATIVE ALLOCATION PORTFOLIO
Russell W. Swansen, David C. Francis, CFA and Mark L. Simenstad, CFA, Portfolio Co-Managers
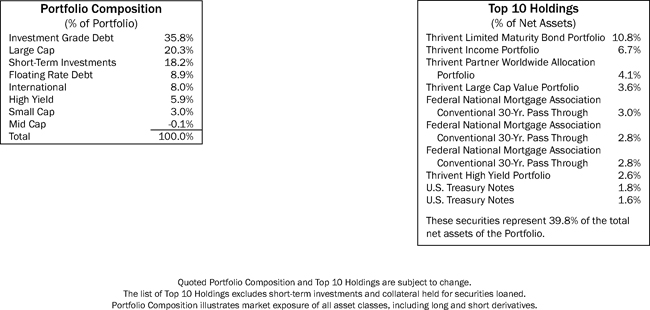
Thrivent Moderately Conservative Allocation Portfolio seeks long-term capital growth while providing reasonable stability of principal.
The Portfolio invests in other Thrivent mutual funds and in directly held equity and debt instruments. The Portfolio is subject to its own operating expenses and the operating expenses of the other funds in which it invests, and is subject to all of the risks of the other funds in which it invests. The value of the Portfolio is influenced by factors impacting the overall market, certain asset classes, certain investment styles, and specific issuers. The Portfolio may incur losses due to incorrect assessments of investments by its investment adviser. Foreign investments involve additional risks, including currency fluctuations, liquidity, political, economic and market instability, and different legal and accounting standards. Bond prices generally fall as interest rates rise. Credit risk is the risk that an issuer of a debt security may not pay its debt, and high yield securities are subject to increased credit risk as well as liquidity risk. The use of equity index futures involves transaction costs and the loss from investing in them can exceed the initial investment.
How did the Portfolio perform during the 12-month period ended December 31, 2014?
Thrivent Moderately Conservative Allocation Portfolio earned a return of 5.32%, compared with the median return of its peer group, the Lipper Mixed-Asset Target Allocation Conservative category, of 4.62%. The Portfolio’s market benchmarks, the S&P 500 Index and the Barclays U.S. Aggregate Bond Index, earned returns of 13.69% and 5.97%, respectively.
What factors affected the Portfolio’s performance?
The Portfolio’s fixed-income and equity allocations are dominant performance factors versus the respective public indexes in any given period. Over this past year, fixed-income allocations averaged approximately 64% while equity allocations, both domestic and non-U.S., averaged 36%. Allocations within sectors and market segments in the U.S. equity portion of the Portfolio had a positive impact on returns, as did our positioning of fixed-income assets. However, exposure to markets outside the U.S. limited returns as non-U.S. equity markets generally did not keep pace with strong U.S. returns on a dollar basis. In fixed income, our tactical positioning for below-benchmark duration offset some of the gains in other positions as interest rates in the U.S. generally declined over the period.
In fixed income, we had a tactical allocation to shorter durations, which limited our advance since interest rates generally declined over the period. We were overweighted in credit relative to the benchmark and that aided results against all but the longest-maturity Treasury bonds. We also had positioned the fixed-income segment to benefit from a flattening of the yield curve, which happens when shorter-term interest rates rise while longer-term rates decline. Yield curve flattening did, in fact, take place over the period, so our positioning aided results. We also continued to benefit from our unique positioning in select mortgage-backed securities as they outperformed.
In the U.S. equity portfolio, our tactical decision to overweight large-cap stocks and underweight mid and small caps favorably impacted returns. In the second half of the period, investors’ attitudes toward risk shifted dramatically and small-cap stocks in particular began to meaningfully underperform large-cap indexes. Our small-cap stock allocation performed well versus its peers, but the group lagged large-cap indexes by a meaningful margin.
Within the domestic equity segment, many of our allocations performed well versus their respective peer groups, but compared less favorably against their public benchmarks. Active managers generally did not perform well against public benchmarks in 2014 and the reasons varied by category. In mid and small cap, unusually strong returns by utilities and real estate investment trusts (REITs), areas that are often underweighted in active portfolios, were a factor. In large caps, exposure to non-U.S. holdings that are not in the respective domestic public benchmarks played a role.
Our international exposure limited returns since non-U.S. developed markets did not advance as strongly as U.S. large-cap indexes. This distinction was exacerbated in places like Europe by the weakness of the euro versus the dollar. Japanese equities did advance in line with large-cap U.S. stocks, but that advance was offset by a sharp decline in the yen relative to the dollar. We also had allocations within our international segment to emerging market debt and equities that did not keep pace.
What is your outlook?
We believe the most likely outcome for the next fiscal year is continued growth that will be below trend versus history. Interest rates, particularly for developed market sovereign debt, are being artificially depressed by the actions of central banks in order to stimulate faster growth and avoid deflation. Should that strategy prove successful, then interest rates must inevitably rise. While it does not necessarily derail an advance in stock prices, it will likely cause the contour of that advance to be more in line with earnings growth and less with the expansion of valuation metrics.
While fiscal and monetary policies across the globe were in alignment during most of the recovery from the financial crisis, going forward we expect more regional variations as different economies will require more customized approaches. Energy prices have declined significantly, which is generally positive for global growth because the beneficiaries of lower energy prices far outnumber those that are negatively impacted. That being said, many of the countries that would be negatively affected are also characterized by less stable regimes, increasing the risk of geopolitical consequences. While risk assets are still favored, an overly aggressive posture is not warranted.
10
Table of Contents
Average Annual Total Returns1
As of December 31, 2014
1-Year | 5-Year | From Inception | ||
| 5.32% | 7.03% | 5.62% |
Past performance is not an indication of future results. Total investment return and principal value of your investment will fluctuate and units, when redeemed, may be worth more or less than their original cost. Current performance may be higher or lower than the performance data quoted. Call 800-THRIVENT or visit Thrivent.com for performance results current to the most recent month-end.
| 1 | Average annual total returns represent past performance and reflect changes in share prices, the reinvestment of all dividends and capital gains, and the effects of compounding. Periods of less than one year are not annualized. At various times, the Portfolio’s adviser may have waived its management fee and/or reimbursed Portfolio expenses. If this were the case, the Portfolio’s total returns would have been lower. The returns shown do not reflect charges and expenses imposed on contract holders by the variable accounts. Those charges and expenses reduce the returns received by contract holders as compared to the returns presented. |
The prospectus contains more complete information on the investment objectives, risks, charges and expenses of the investment company, which investors should read and consider carefully before investing. To obtain a prospectus, contact a registered representative or visit Thrivent.com.
| * | The Barclays U.S. Aggregate Bond Index is an index that measures the performance of U.S. investment grade bonds. It is not possible to invest directly in the Index. The performance of the Index does not reflect deductions for fees, expenses or taxes. |
| ** | The S&P 500 Index is an index that represents the average performance of a group of 500 widely held, publicly traded stocks. It is not possible to invest directly in the Index. The performance of the Index does not reflect deductions for fees, expenses or taxes. “S&P 500” is a trademark of The McGraw-Hill Companies, Inc. and has been licensed for use by Thrivent Financial. The product is not sponsored, endorsed or promoted by Standard & Poor’s, and Standard & Poor’s makes no representation regarding the advisability of investing in the product. |
| *** | The Consumer Price Index is an inflationary indicator that measures the change in the cost of a fixed basket of products and services, including housing, electricity, food and transportation. It is not possible to invest directly in the Index. |
11
Table of Contents
THRIVENT GROWTHAND INCOME PLUS PORTFOLIO
David R. Spangler, CFA and Stephen D. Lowe, CFA, Portfolio Co-Managers
Thrivent Growth and Income Plus Portfolio seeks income plus long-term capital growth.
The Portfolio invests in equity securities and debt securities. The value of the Portfolio is influenced by factors impacting the overall market, certain asset classes, certain investment styles, and specific issuers. The Portfolio may incur losses due to incorrect assessments of investments by its investment adviser. Bond prices generally fall as interest rates rise. Credit risk is the risk that an issuer of a debt security may not pay its debt, and high yield securities are subject to increased credit risk as well as liquidity risk. Leveraged loans, preferred securities, sovereign debt, and mortgage-related and other asset-backed securities are subject to additional risks. Foreign investments involve additional risks, including currency fluctuations, liquidity, political, economic and market instability, and different legal and accounting standards; these risks are magnified for investments in emerging markets. Writing options is a highly specialized activity that can lead to losses and transaction costs.
How did the Portfolio perform during the 12-month period ended December 31, 2014?
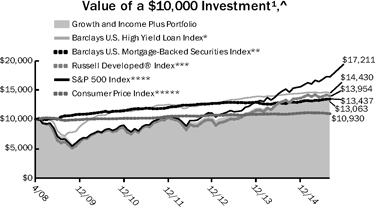
Thrivent Growth and Income Plus Portfolio earned a return of 2.21%, compared with the median return of its peer group, the Lipper Mixed-Asset Target Allocation Growth category, of 5.50%. The Portfolio’s market benchmarks, the Russell Developed® Index, the Barclays U.S. High Yield Loan Index and the Barclays U.S. Mortgage-Backed Securities Index, earned returns of 5.27%, 1.54% and 6.08%, respectively.
What factors affected the Portfolio’s performance?
Strengthening economic conditions in the U.S. drove the domestic stock market to record highs for a second consecutive year. At the same time, deteriorating economic conditions abroad hurt returns for international stocks but helped domestic bond markets.
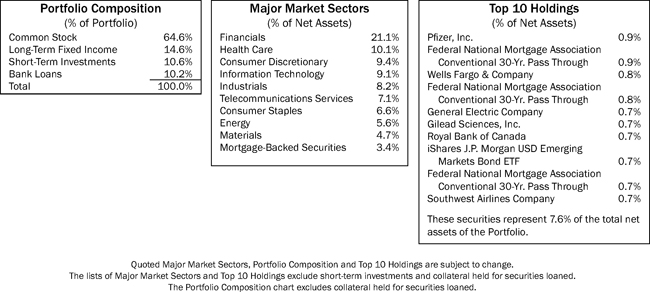
The Portfolio lagged its peer group largely due to weaker performance by its equity portfolio. For the full year, the equity portfolio returned 3.78%, underperforming its benchmark. During the first quarter of the year, however, the Portfolio repositioned its equity holdings to adopt a global rather than domestic equity mandate, funneling about 45% of its equity assets into international shares. The equity portfolio underperformed its benchmark index during this period as stocks in a number of industries that had been performing well at the end of 2013, including energy, materials, industrials and consumer discretionary, reversed course.
Thereafter, the equity portfolio outpaced its benchmark. Top performers included information technology stocks, in which the portfolio was overweighted. Other top performers included consumer staples stocks and consumer discretionary stocks. In all cases, those returns exceeded what those industry groups delivered in the stock market at large. The equity portfolio’s weakest performers included energy, health care, utilities and materials stocks.
The fixed-income portion of the Portfolio generated a return of 4.13% before expenses. Investors had widely expected long-term interest rates to rise in 2014, hurting bond prices, as the Federal Reserve wound down a massive bond-buying program it had been pursuing to stimulate the economy. Instead, rates declined. Investors looked past growing strength in the U.S. economy, which expanded at a 5.0% annual rate in the third quarter, and focused instead on slowing economic growth in China and weak growth in Europe. In response, they piled into U.S. Treasury bonds, which offered significantly higher yields than safe-haven bonds in other countries. The consequent decline in interest rates was a boon for several other sectors of the fixed-income markets, including investment-grade corporate bonds, which generated a return of 2.80% before expenses for the Portfolio. Aided by improving fundamentals in the housing market, mortgage-backed securities did even better, earning 6.89%. Combined, those two groups accounted for about a quarter of the Portfolio’s fixed-income assets.
High-yield bonds initially participated in the rally but later gave back much of their gains after a global oil glut, combined with demand concerns, helped drive crude prices sharply lower during the second half of the year. Investors worried that the slide in oil prices would lead to higher rates of default in the high-yield sector, where energy issues account for about 15% of the market. Meanwhile, because they are floating-rate securities, bank loans did not benefit much from the general decline in longer-term interest rates. Combined, those two sectors accounted for about 65% of the fixed-income portfolio and generated a return of 2.14%.
What is your outlook?
The U.S. economy accelerated during 2014, growing at an annual rate of 5.0% during the third quarter. We anticipate that growth will continue in 2015, but at a more moderate pace. That should create a favorable environment for equities, assuming conditions in Europe and China do not worsen materially. We believe that single-digit returns for stocks in both U.S. and international markets are possible. We expect that domestic shares will perform slightly better than overseas shares.
The Federal Reserve is widely expected to nudge short-term interest rates higher sometime in 2015, but the sluggish economic conditions in Europe and slowing growth in China, combined with low inflation in the U.S., should moderate the Fed’s pace in raising rates. Assuming these conditions hold, we feel that fixed-income assets could generate modestly positive returns in 2015, outpacing inflation but likely trailing the returns delivered in 2014.
12
Table of Contents
Average Annual Total Returns1
As of December 31, 2014
1-Year | 5-Year | From Inception | ||
| 2.21% | 9.72% | 4.08% |
Past performance is not an indication of future results. Total investment return and principal value of your investment will fluctuate and units, when redeemed, may be worth more or less than their original cost. Current performance may be higher or lower than the performance data quoted. Call 800-THRIVENT or visit Thrivent.com for performance results current to the most recent month-end.
| 1 | Average annual total returns represent past performance and reflect changes in share prices, the reinvestment of all dividends and capital gains, and the effects of compounding. Periods of less than one year are not annualized. At various times, the Portfolio’s adviser may have waived its management fee and/or reimbursed Portfolio expenses. If this were the case, the Portfolio’s total returns would have been lower. The returns shown do not reflect charges and expenses imposed on contract holders by the variable accounts. Those charges and expenses reduce the returns received by contract holders as compared to the returns presented. |
The prospectus contains more complete information on the investment objectives, risks, charges and expenses of the investment company, which investors should read and consider carefully before investing. To obtain a prospectus, contact a registered representative or visit Thrivent.com.
| ^ | Effective January 1, 2014, the Portfolio’s benchmark index changed from the S&P 500 Index to the Russell Developed® Index. The Adviser made this benchmark change because of changes to the Portfolio’s principal investment strategies. |
| * | The Barclays U.S. High Yield Loan Index measures U.S. Dollar denominated syndicated term loans. It is not possible to invest directly in the Index. The performance of the Indices does not reflect deductions for fees, expenses or taxes. |
| ** | The Barclays U.S. Mortgage-Backed Securities Index (MBS) is formed by grouping the universe of over 600,000 individual fixed-rates U.S. It is not possible to invest directly in the Index. The performance of the Indices does not reflect deductions for fees, expenses or taxes. |
| *** | The Russell Developed® Index measures the performance of the investable securities in developed countries globally. It is not possible to invest directly in the Index. The performance of the Index does not reflect deductions for fees, expenses or taxes. |
| **** | The S&P 500 Index is an index that represents the average performance of a group of 500 widely held, publicly traded stocks. “S&P 500” is a trademark of The McGraw-Hill Companies, Inc. and has been licensed for use by Thrivent Financial. The product is not sponsored, endorsed or promoted by Standard & Poor’s and Standard & Poor’s makes no representation regarding the advisability of investing in the product. It is not possible to invest directly in the Index. The performance of the Index does not reflect deductions for fees, expenses or taxes. |
| ***** | The Consumer Price Index is an inflationary indicator that measures the change in the cost of a fixed basket of products and services, including housing, electricity, food and transportation. It is not possible to invest directly in the Index. |
13
Table of Contents
THRIVENT BALANCED INCOME PLUS PORTFOLIO
Darren M. Bagwell, CFA, Michael G. Landreville, CFA and CPA (inactive), and Stephen D. Lowe, CFA, Portfolio Co-Managers
Thrivent Balanced Income Plus Portfolio seeks long-term total return through a balance between income and the potential for long-term capital growth.
The Portfolio invests in equity securities and debt securities. The value of the Portfolio is influenced by factors impacting the overall market, certain asset classes, certain investment styles, and specific issuers. The Portfolio may incur losses due to incorrect assessments of investments by its investment adviser. Bond prices generally fall as interest rates rise. Credit risk is the risk that an issuer of a debt security may not pay its debt, and high yield securities are subject to increased credit risk as well as liquidity risk. Leveraged loans, preferred securities, sovereign debt, and mortgage-related and other asset-backed securities are subject to additional risks. Foreign investments involve additional risks, including currency fluctuations, liquidity, political, economic and market instability, and different legal and accounting standards; these risks are magnified for investments in emerging markets.
How did the Portfolio perform during the 12-month period ended December 31, 2014?
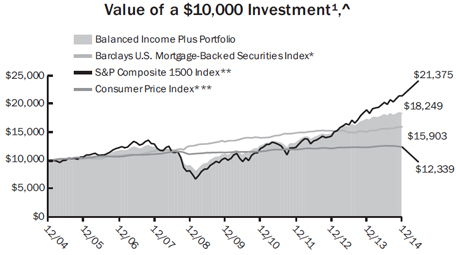
Thrivent Balanced Income Plus Portfolio earned a return of 6.07%, compared with the median return of its peer group, the Lipper Mixed-Asset Target Allocation Moderate category, of 5.35%. The Portfolio’s market benchmarks, the S&P Composite 1500 Index, the Barclays U.S. High Yield Loan Index and the Barclays U.S. Mortgage-Backed Securities Index, returned 13.07%, 1.54% and 6.08%, respectively.
What factors affected the Portfolio’s performance?
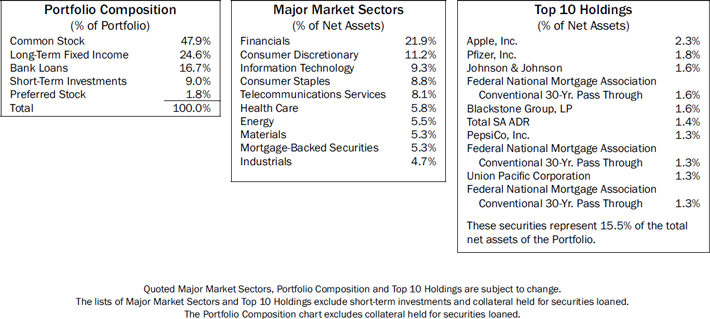
The Portfolio’s assets were divided fairly equally between equities and fixed-income securities, both of which generated positive returns.
The equity portion of the Portfolio earned 9.78% before expenses as an accelerating U.S. economy and healthy corporate profits drove the U.S. stock market to a series of record highs. The nation’s gross domestic product (GDP)—the sum of all goods and services produced—expanded at a 5.0% annual rate in the third quarter, its fastest pace in 11 years.
The Portfolio continued to focus on driving equity returns through individual security selection, while generally remaining sector neutral versus the S&P Composite 1500 Index. The Portfolio’s weakest performers were in the information technology and consumer sectors, where a number of companies reported earnings that failed to meet expectations. This largely accounted for the equity portfolio underperforming its benchmark. Conversely, stock selection was stronger in the health care sector, where several stocks delivered meaningful outperformance.
The fixed-income portion of the Portfolio generated a return before expenses of 4.39%, which handily exceeded the 3.19% return of its internal benchmark. That benchmark is a custom blend of the Barclays high-yield and mortgage-backed indexes cited above, an investment-grade bond component, and an emerging market bond component. About 60% of the fixed-income portfolio was allocated to leveraged loans and other high-yield securities and the balance to mortgage-backed securities, emerging market securities and investment-grade corporate bonds.
Fixed-income markets had been widely expected to suffer in 2014 as the economy raced ahead and the Federal Reserve wound down its bond-buying program in which it had been purchasing $85 billion of bonds each month to keep longer-term interest rates low and stimulate the economy. Instead, longer-term rates fell as investors worried about the potential fallout from sluggish economic growth in Europe, slowing growth in China, and Russia’s incursion into Ukraine. With the U.S. dollar strengthening, global investors flocked to the perceived safety of U.S. Treasury securities, putting downward pressure on longer-term U.S. interest rates and flattening the yield curve.
Emerging market bonds were the Portfolio’s top-performing fixed-income sector, earning 8.84% before expenses. That outpaced the 6.47% return of emerging market bonds in the broader market, in part because the Portfolio emphasized higher-quality securities and underweighted those from riskier markets such as Russia, Argentina and Venezuela. Investment-grade corporate bonds earned 4.7% before expenses, mortgage-backed securities earned 6.2%, and high-yield securities earned 2.9%.
What is your outlook?
We expect U.S. economic growth to moderate to a 2.5% to 3.0% pace in 2015 while inflation remains subdued. U.S. interest rates are likely to remain range-bound or drop further as the yield curve continues to flatten. We believe the Fed may begin to raise short-term interest rates in the latter half of 2015, but at a very gradual pace.
We anticipate shifting the fixed-income portfolio to a slightly more conservative posture, reducing exposure to leveraged bank loans as they tend to be somewhat less liquid than corporate bonds or mortgage-backed securities. We will redeploy the proceeds into emerging market, investment-grade, high-yield and mortgage-backed securities with an eye toward slightly higher credit quality in the corporate segments. We plan to maintain the fixed-income portfolio’s shorter duration to mitigate the effects of interest-rate volatility. As we add exposure to emerging markets, we will continue to avoid trouble areas such as Argentina and Russia.
We believe stocks remain reasonably valued, with room for positive returns driven by earnings growth. That said, we believe strong stock selection will become increasingly important at this extended stage of the bull cycle. We will likely continue to emphasize more cyclically oriented stocks over defensive issues.
14
Table of Contents
Average Annual Total Returns1
As of December 31, 2014
1-Year | 5-Year | 10-Year | ||
| 6.07% | 10.67% | 6.20% |
Past performance is not an indication of future results. Total investment return and principal value of your investment will fluctuate and units, when redeemed, may be worth more or less than their original cost. Current performance may be higher or lower than the performance data quoted. Call 800-THRIVENT or visit Thrivent.com for performance results current to the most recent month-end.
| 1 | Average annual total returns represent past performance and reflect changes in share prices, the reinvestment of all dividends and capital gains, and the effects of compounding. Periods of less than one year are not annualized. At various times, the Portfolio’s adviser may have waived its management fee and/or reimbursed Portfolio expenses. If this were the case, the Portfolio’s total returns would have been lower. The returns shown do not reflect charges and expenses imposed on contract holders by the variable accounts. Those charges and expenses reduce the returns received by contract holders as compared to the returns presented. |
The prospectus contains more complete information on the investment objectives, risks, charges and expenses of the investment company, which investors should read and consider carefully before investing. To obtain a prospectus, contact a registered representative or visit Thrivent.com.
| * | The Barclays U.S. Mortgage-Backed Securities Index (MBS) is formed by grouping the universe of over 600,000 individual fixed-rate U.S. government agency MBS pools into approximately 3,500 generic types of securities. It is not possible to invest directly in the Index. The performance of the Index does not reflect deductions for fees, expenses or taxes. |
| ** | The S&P Composite 1500 Index measures the performance of a group of 1500 publicly traded stocks. “S&P Composite 1500” is a trademark of The McGraw-Hill Companies, Inc. and has been licensed for use by Thrivent Financial. The product is not sponsored, endorsed or promoted by Standard & Poor’s and Standard & Poor’s makes no representation regarding the advisability of investing in the product. It is not possible to invest directly in the Index. The performance of the Index does not reflect deductions for fees, expenses or taxes. |
| *** | The Consumer Price Index is an inflationary indicator that measures the change in the cost of a fixed basket of products and services, including housing, electricity, food and transportation. It is not possible to invest directly in the Index. |
| ^ | The Barclays U.S. High Yield Loan Index incepted in January 2006. This index is not shown in the chart because it does not have 10 years of history and thus an accurate comparison of a $10,000 investment over 10 years cannot be shown. |
15
Table of Contents
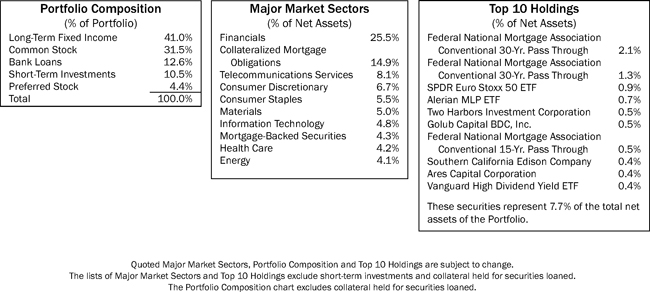
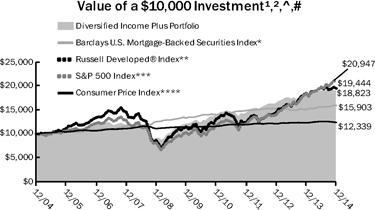
THRIVENT DIVERSIFIED INCOME PLUS PORTFOLIO
Mark L. Simenstad, CFA, David R. Spangler, CFA and Paul J. Ocenasek, CFA, Portfolio Co-Managers
Thrivent Diversified Income Plus Portfolio seeks to maximize income while maintaining prospects for capital appreciation.
The Portfolio invests in debt securities and equity securities. The value of the Portfolio is influenced by factors impacting the overall market, certain asset classes, certain investment styles, and specific issuers. The Portfolio may incur losses due to incorrect assessments of investments by its investment adviser. Bond prices generally fall as interest rates rise. Credit risk is the risk that an issuer of a debt security may not pay its debt, and high yield securities are subject to increased credit risk as well as liquidity risk. Leveraged loans and mortgage-related and other asset-backed securities are subject to additional risks.
How did the Portfolio perform during the 12-month period ended December 31, 2014?
Thrivent Diversified Income Plus Portfolio earned a return of 4.27%, compared with the median return of its peer group, the Lipper Mixed-Asset Target Allocation Conservative category, of 4.62%. The Portfolio’s market benchmarks, the Russell Developed® Index, the Barclays U.S. High Yield Loan Index and the Barclays U.S. Mortgage-Backed Securities Index, returned 5.27%, 1.54% and 6.08%, respectively.
What factors affected the Portfolio’s performance?
Strengthening economic conditions in the U.S. drove the domestic stock market to record highs for a second consecutive year. At the same time, deteriorating economic conditions abroad hurt returns for international stocks but helped domestic bond markets.
For the full year, the equity portfolio returned 4.02%, underperforming its benchmark. During the first quarter of the year, however, the Portfolio repositioned its equity holdings to adopt a global rather than domestic equity mandate, funneling about 45% of its equity assets into international shares. The equity portfolio had underperformed its benchmark index during this period as stocks in a number of industries that had been performing well at the end of 2013, including energy, materials, industrials and consumer discretionary, reversed course.
Thereafter, the equity portfolio outpaced its benchmark. Top performers included information technology stocks, in which the portfolio was overweighted. Other top performers included consumer staples stocks and consumer discretionary stocks. In all cases, those returns exceeded what those industry groups delivered in the stock market at large. The equity portfolio’s weakest performers included energy, health care, utilities and materials stocks.
The fixed-income portion of the Portfolio generated a return of 5.1% before expenses as weak economic growth in Europe, slowing growth in China, nervousness over a Russian incursion into Ukraine, and a strengthening dollar prompted investors to plow money into U.S. Treasury bonds, which they perceived to be a safe haven. This drove down longer-term interest rates, which benefited several other sectors of the bond markets, including investment-grade corporate bonds and mortgage-backed securities.
The impact of declining interest rates on the Portfolio’s fixed-income holdings was muted because the Portfolio had a higher allocation to shorter-duration assets, which are less sensitive to rate changes, and no allocation to Treasuries. The Portfolio’s top performers included investment-grade corporate bonds, which generated a return of about 5% before expenses, and mortgage-backed securities, which earned about 5.8%. Weaker performers included high-yield bonds and leveraged loans. High-yield bonds rallied during the first half of the year but gave back much of those gains in the second half when a sharp decline in oil prices led investors to worry that it would boost default rates on energy company bonds, which make up about 15% of the high-yield market. Because they are floating-rate securities, leveraged loans did not benefit materially from the decline in interest rates.
What is your outlook?
The U.S. economy accelerated during 2014, growing at an annual rate of 5.0% during the third quarter. We anticipate that growth will continue in 2015, but at a more moderate pace, which should create a favorable environment for equities assuming conditions in Europe and China do not worsen materially. We believe that single-digit returns for stocks in both U.S. and international markets are possible. We anticipate that domestic shares will perform slightly better than overseas shares.
The Federal Reserve is widely expected to nudge short-term interest rates higher sometime in 2015, but the sluggish economic conditions in Europe and slowing growth in China, combined with low inflation in the U.S., should moderate the Fed’s pace in raising rates. Assuming these conditions hold, fixed-income assets could generate modestly positive returns in 2015, outpacing inflation but likely trailing the returns delivered in 2014.
16
Table of Contents
Average Annual Total Returns1
As of December 31, 2014
1-Year | 5-Year | 10-Year | ||
| 4.27% | 9.48% | 6.53% |
Past performance is not an indication of future results. Total investment return and principal value of your investment will fluctuate and units, when redeemed, may be worth more or less than their original cost. Current performance may be higher or lower than the performance data quoted. Call 800-THRIVENT or visit Thrivent.com for performance results current to the most recent month-end.
| 1 | Average annual total returns represent past performance and reflect changes in share prices, the reinvestment of all dividends and capital gains, and the effects of compounding. Periods of less than one year are not annualized. At various times, the Portfolio’s adviser may have waived its management fee and/or reimbursed Portfolio expenses. If this were the case, the Portfolio’s total returns would have been lower. The returns shown do not reflect charges and expenses imposed on contract holders by the variable accounts. Those charges and expenses reduce the returns received by contract holders as compared to the returns presented. |
| 2 | Prior to July 3, 2006, the Portfolio, as a high yield fund, invested primarily in “junk bonds”. |
The prospectus contains more complete information on the investment objectives, risks, charges and expenses of the investment company, which investors should read and consider carefully before investing. To obtain a prospectus, contact a registered representative or visit Thrivent.com.
| # | Effective January 1, 2014, the Portfolio’s benchmark index changed from the S&P 500 Index to the Russell Developed® Index. The Adviser made this benchmark change because of changes to the Portfolio’s principal investment strategies. |
| * | The Barclays U.S. Mortgage-Backed Securities Index (MBS) is formed by grouping the universe of over 600,000 individual fixed-rate U.S. government agency MBS pools into approximately 3,500 generic types of securities. It is not possible to invest directly in the Index. The performance of the Index does not reflect deductions for fees, expenses or taxes. |
| ** | The Russell Developed® Index measures the performance of the investable securities in developed countries globally. It is not possible to invest directly in the Index. The performance of the Index does not reflect deductions for fees, expenses or taxes. |
| *** | The S&P 500 Index is an index that represents the average performance of a group of 500 widely held, publicly traded stocks. “S&P 500” is a trade-mark of The McGraw-Hill Companies, Inc. and has been licensed for use by Thrivent Financial. The product is not sponsored, endorsed or promoted by Standard & Poor’s and Standard & Poor’s makes no representation regarding the advisability of investing in the product. It is not possible to invest directly in the Index. The performance of the Index does not reflect deductions for fees, expenses or taxes. |
| **** | The Consumer Price Index is an inflationary indicator that measures the change in the cost of a Fixed basket of products and services, including housing, electricity, food and transportation. It is not possible to invest directly in the Index. |
| ^ | The Barclays U.S. High Yield Loan Index incepted in January 2006. This index is not shown in the chart because it does not have 10 years of history and thus an accurate comparison of a $10,000 investment over 10 years cannot be shown. |
17
Table of Contents
THRIVENT OPPORTUNITY INCOME PLUS PORTFOLIO
Gregory R. Anderson, CFA, Michael G. Landreville, CFA and CPA (inactive) and Conrad Smith, CFA, Portfolio Co-Managers
Thrivent Opportunity Income Plus Portfolio seeks a combination of current income and long-term capital appreciation.
The Portfolio primarily invests in a broad range of debt securities. The value of the Portfolio is influenced by factors impacting the overall market, certain asset classes, certain investment styles, and specific issuers. The Portfolio may incur losses due to incorrect assessments of investments by its investment adviser. Bond prices generally fall as interest rates rise. Credit risk is the risk that an issuer of a debt security may not pay its debt, and high yield securities are subject to increased credit risk as well as liquidity risk. Leveraged loans, sovereign debt, and mortgage-related and other asset-backed securities are subject to additional risks. Foreign investments involve additional risks, including currency fluctuations, liquidity, political, economic and market instability, and different legal and accounting standards; these risks are magnified for investments in emerging markets. The prices of futures contracts can be highly volatile and the loss from investing in them can exceed the initial investment.
How did the Portfolio perform during the 12-month period ended December 31, 2014?
Thrivent Opportunity Income Plus Portfolio generated a return of 3.48%, compared with the median return of its peer group, the Lipper General Bond category, of 3.72%. The Portfolio’s market benchmarks, the Barclays U.S. Mortgage-Backed Securities Index, the Barclays U.S. High Yield Loan Index and the Barclays U.S. High Yield Ba/B 2% Issuer Capped Index, posted returns of 6.08%, 1.54% and 3.45%, respectively.
What factors affected the Portfolio’s performance?
A decline in longer-term interest rates boosted returns on the Portfolio’s investment-grade corporate bonds and mortgage-backed securities. Those gains were tempered by modest returns for high-yield bonds and leveraged bank loans.
Long-term interest rates were widely expected to rise in 2014, hurting bond prices, as the Federal Reserve wound down a massive bond-buying program it had been pursuing to stimulate the economy. Instead, rates declined. Investors looked past growing strength in the U.S. economy, which expanded at a 5.0% annual rate in the third quarter, and focused instead on slowing economic growth in China and weak growth in Europe. In response, they piled into U.S. Treasury bonds, which offered significantly higher yields than safe-haven bonds in other countries. The consequent decline in interest rates was a boon for several other sectors of the fixed-income markets, including investment-grade corporate bonds, which generated a return of 3.7% before expenses for the Portfolio. Aided by improving fundamentals in the housing market, mortgage-backed securities did even better, earning 7.6%. Combined, those two groups accounted for about 29% of the Portfolio’s assets.
High-yield bonds initially participated in the rally but later gave back much of their gains after a global oil glut, combined with demand concerns, helped drive crude prices sharply lower during the second half of the year. Investors worried that the slide in oil prices would lead to higher rates of default in the high-yield sector, where energy issues account for about 15% of the market. Meanwhile, bank loans, because they are floating-rate securities, did not benefit much from the general decline in longer-term interest rates. Combined, those two sectors accounted for about 65% of the Portfolio and generated a return of 2.3%.
The Portfolio lagged its peer group largely because the peer group had a smaller allocation to loans.
What is your outlook?
About half of the Portfolio’s assets are invested in leveraged bank loans and high-yield bonds. Valuations in both sectors were attractive in early 2015 following the sell off of the prior year. Whether any further recovery in their prices takes place will depend to a large degree on the oil market and money flows into and out of leveraged loan and other high-yield funds. If energy prices recover in the $60 to $80 per barrel range and fund outflows stabilize, as we anticipate, prices for both asset classes should firm, allowing both to deliver returns in the mid-single-digit range for 2015.
We plan to moderately reduce our allocation to leveraged bank loans over the course of the year and increase the Portfolio’s allocation to emerging market bonds, which looked even more attractively valued heading into the new year. Assuming no further economic shocks—no further weakening in oil prices or the global economy—we anticipate that returns for the Portfolio in 2015 will again be in the low to mid-single digits.
18
Table of Contents
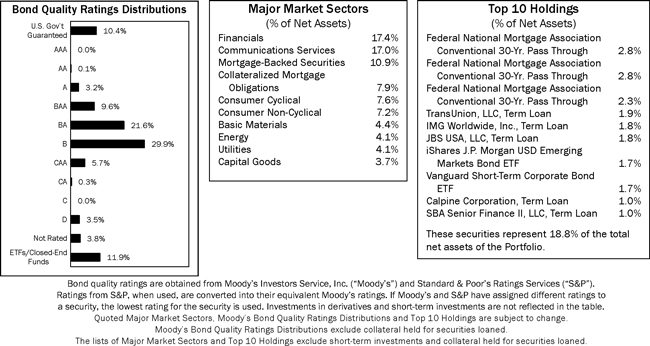
Average Annual Total Returns1
As of December 31, 2014
1-Year | 5-Year | 10-Year | ||
| 3.48% | 4.85% | 4.33% |
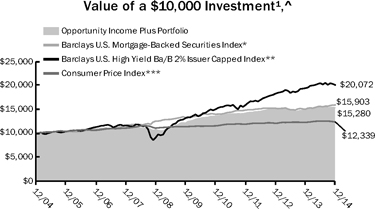
Past performance is not an indication of future results. Total investment return and principal value of your investment will fluctuate and units, when redeemed, may be worth more or less than their original cost. Current performance may be higher or lower than the performance data quoted. Call 800-THRIVENT or visit Thrivent.com for performance results current to the most recent month-end.
| 1 | Average annual total returns represent past performance and reflect changes in share prices, the reinvestment of all dividends and capital gains, and the effects of compounding. Periods of less than one year are not annualized. At various times, the Portfolio’s adviser may have waived its management fee and/or reimbursed Portfolio expenses. If this were the case, the Portfolio’s total returns would have been lower. The returns shown do not reflect charges and expenses imposed on contract holders by the variable accounts. Those charges and expenses reduce the returns received by contract holders as compared to the returns presented. |
The prospectus contains more complete information on the investment objectives, risks, charges and expenses of the investment company, which investors should read and consider carefully before investing. To obtain a prospectus, contact a registered representative or visit Thrivent.com.
| * | The Barclays U.S. Mortgage-Backed Securities Index (MBS) is formed by grouping the universe of over 600,000 individual fixed-rate U.S. government agency MBS pools into approximately 3,500 generic types of securities. It is not possible to invest directly in the Index. The performance of the Index does not reflect deductions for fees, expenses or taxes. |
| ** | The Barclays U.S. High Yield Ba/B2% lssuer Capped Index covers the USD denominated, non-investment grade, Ba or B rated, fixed-rate, taxable corporate bond market. The Index limits issuer exposures to a maximum 2%, redistributing excess market value index-wide on a pro-rata basis. It is not possible to invest directly in the Index. The performance of the Index does not reflect deductions for fees, expenses or taxes. |
| *** | The Consumer Price Index is an inflationary indicator that measures the change in the cost of a fixed basket of products and services, including housing, electricity, food and transportation. It is not possible to invest directly in the Index. |
| ^ | The Barclays U.S. High Yield Loan Index incepted in January 2006. This index is not shown in the chart because it does not have 10 years of history and thus an accurate comparison of a $10,000 investment over 10 years cannot be shown. |
19
Table of Contents

How did the Portfolio perform during the 12-month period ended December 31, 2014?
Thrivent Partner Technology Portfolio earned a return of 10.45%, compared with the median return of its peer group, the Lipper Science & Technology category, of 10.94%. The Portfolio’s market benchmark, the NASDAQ Composite Index, earned a return of 14.83%.
What factors affected the Portfolio’s performance?
Amazon.com, the world’s largest online retailer, was a top detractor from the Portfolio early in the year as the company reported fourth quarter 2013 earnings and revenue growth that were below consensus estimates. Even with the pullback in the stock, Amazon.com remains one of the strongest relative outperformers over the past several years. We continue to believe the company will maintain its dominant market share in the online segment of the retail market. Amazon Web Services, Amazon Fresh and further global expansion of the Kindle market offer compelling opportunities for revenue growth across several categories and geographies. In addition, a potential increase in the annual membership fee for Amazon Prime could drive revenue growth and, in our view, further boost confidence in the loyalty of its customer base.
Another top detractor was leading Internet radio company Pandora Media. Despite announcing positive third quarter results and strong fourth quarter guidance, its shares fell on weaker-than-expected active listener growth. Management also announced that growing active listeners may be more challenging in the future due to an increasingly competitive environment. However, the company continues to see solid advertising and subscription revenue growth.
Apple was a top contributor to performance during the period, reporting strong fiscal third quarter earnings and offering upbeat full-year revenue guidance. Product launches during the year, such as the iPhone 6, have been successful, especially during the holiday season. We are confident Apple will be able to capture revenue upside as it improves its production to meet global demand and will continue to be well received by the market as the company improves its gross margins and strengthens its market share.
Facebook was a top contributor to performance as the company announced second quarter earnings and revenues that exceeded expectations. Results were driven largely by strong advertising revenue growth across all geographic regions and significant operating margin expansion. We believe the company is well positioned to continue to grow in the mobile advertising space as usage shifts from desktop to mobile. Overall, our outlook remains positive for Facebook as we believe the stock is trading at a reasonable valuation, supported by its industry-leading position and considerable opportunity to monetize its extensive user base.
What is your outlook?
As we enter 2015, we continue to believe U.S. equities have further upside potential as the domestic economy accelerates and real earnings growth serves as a fundamental driver of performance going forward. We believe U.S. corporate fundamentals are strong, evidenced by both healthy balance sheets and earnings resilience, which could provide companies with a number of options to increase shareholder value. While we acknowledge that the potential for headwinds—such as geopolitical risks—persists, we ultimately remain constructive on the direction of U.S. equity markets. We believe the U.S. has the best macroeconomic outlook of the developed economies and are optimistic about the strengthening U.S. housing and employment markets, as well as the potential for a continued recovery in consumer spending. Consumption, which accounts for approximately 70% of U.S. gross domestic product (GDP), could benefit from the combination of low energy prices and a strong dollar. Furthermore, we believe that an acceleration in earnings growth could continue in the U.S. because the country is less exposed to weaker segments of the global economy, given its lower reliance on exports.
Looking forward, we believe that as the U.S. economy improves, companies can reinvest for future growth by increasing capital expenditures, research and development, and hiring, and through merger and acquisition activity, rather than keeping excess cash on their balance sheets. In our view, equity valuations are fair considering the positive macro environment and inexpensive relative to fixed-income securities. We believe a forward-looking analysis is critical in this investing environment. We also believe that stock selection will be increasingly important as companies differentiate themselves on earnings growth and valuation.
20
Table of Contents
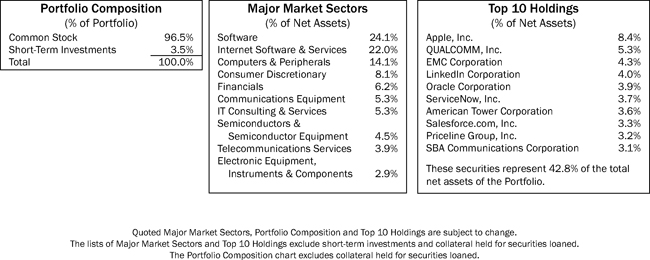
Average Annual Total Returns1
As of December 31, 2014
| 1-Year | 5-Year | 10-Year | ||
| 10.45% | 13.46% | 6.11% |
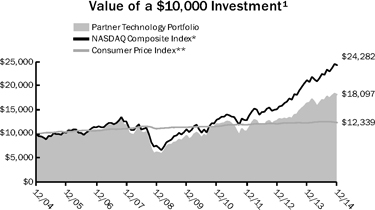
Past performance is not an indication of future results. Total investment return and principal value of your investment will fluctuate and units, when redeemed, may be worth more or less than their original cost. Current performance may be higher or lower than the performance data quoted. Call 800-THRIVENT or visit Thrivent.com for performance results current to the most recent month-end.
| 1 | Average annual total returns represent past performance and reflect changes in share prices, the reinvestment of all dividends and capital gains, and the effects of compounding. Periods of less than one year are not annualized. At various times, the Portfolio’s adviser may have waived its management fee and/or reimbursed Portfolio expenses. If this were the case, the Portfolio’s total returns would have been lower. The returns shown do not reflect charges and expenses imposed on contract holders by the variable accounts. Those charges and expenses reduce the returns received by contract holders as compared to the returns presented. |
The prospectus contains more complete information on the investment objectives, risks, charges and expenses of the investment company, which investors should read and consider carefully before investing. To obtain a prospectus, contact a registered representative or visit Thrivent.com.
| * | The NASDAQ Composite Index is a market capitalization-weighted index of all domestic and foreign securities listed on the NASDAQ Stock Exchange. It is not possible to invest directly in the Index. The performance of the Index does not reflect deductions for fees, expenses or taxes. |
| ** | The Consumer Price Index is an inflationary indicator that measures the change in the cost of a fixed basket of products and services, including housing, electricity, food and transportation. It is not possible to invest directly in the Index. |
21
Table of Contents
 | THRIVENT PARTNER HEALTHCARE PORTFOLIO |
Subadvised by Sectoral Asset Management, Inc.
Thrivent Partner Healthcare Portfolio seeks long-term capital growth.
The Portfolio primarily invests in healthcare companies, which are subject to numerous risks including legislative or regulatory changes and adverse market conditions. The value of the Portfolio is influenced by factors impacting the overall market, certain asset classes, certain investment styles, and specific issuers. The Portfolio may incur losses due to incorrect assessments of investments by its investment advisers. Small and medium-sized companies often have greater price volatility and less liquidity than larger companies. Foreign investments involve additional risks, including currency fluctuations, liquidity, political, economic and market instability, and different legal and accounting standards; these risks are magnified for investments in emerging markets. The Portfolio is nondiversified, which means that it may invest a greater percentage of its assets in the securities of any single issuer compared with diversified funds.
How did the Portfolio perform during the 12-month period ended December 31, 2014?
Thrivent Partner Healthcare Portfolio earned a return of 24.23%, compared with the median return of its peer group, the Lipper Health/Biotechnology category, of 27.80%. The Portfolio’s market benchmark, the Morgan Stanley Capital International (MSCI) World Health Care Net Index, earned a return of 18.10%.
What factors affected the Portfolio’s performance?
Top contributors to performance for the 12-month period included biotechnology companies such as PTC Therapeutics and BioMarin Pharmaceutical, and medical technology firms such as Dexcom, Intuitive Surgical and NxStage Medical. PTC Therapeutics benefited from an earlier approval of Translarna, its drug for treating nonsense mutation Duchene muscular dystrophy, and an associated technology validation. BioMarin Pharmaceutical benefited from the solid launch of its newly approved drug Vimizim and the maturation of its pipeline. Dexcom was aided by a number of key approvals that fueled a strong rollout for its continuous blood glucose monitors. Intuitive Surgical benefited from the strong rollout of its next-generation Xi surgical robot as well as stabilization in procedure volumes with its older robot. NxStage Medical was strong as the company gained momentum with its home hemodialysis equipment.
Key detractors over the past 12 months were pharmaceutical company Sanofi, biotech Halozyme Therapeutics and medtech HeartWare International. Sanofi shares fell based on a weak outlook for its diabetes franchise for 2015 and senior management turnover. Halozyme Therapeutics fell when PEGPH20, a key program for the treatment of pancreatic cancer, was put on hold by the U.S. Food and Drug Administration. HeartWare International was weak due to overall market size concerns for its ventricular assist device, despite share gains from its competitor Thoratec.
Another factor in 2014’s performance was the strengthening of the dollar against most major currencies. Because we manage a global portfolio, having a stronger dollar was an additional detractor from returns versus U.S. benchmarks.
What is your outlook?
We have a positive long-term outlook for the health care sector due to global demographic changes, strong growth in emerging markets and innovation. Pharmaceuticals with meaningful generic hedges, such as biologics exposure and devices, significant exposures to emerging markets, and that are developing interesting pipelines offer the most attractive investment opportunities. In biotech, earnings are expected to grow at 20% while the industry pipeline should continue to advance. Recent drug approvals at companies such as Amgen, Gilead Sciences, Incyte, Medivation and Biogen Idec and pipeline progress at other firms, such as Vertex Pharmaceuticals, BioMarin Pharmaceutical and PTC Therapeutics, position the industry for accelerating top- and bottom-line growth, driving further upside over the medium to long term.
For generics, we expect companies based in emerging pharmaceutical markets to perform well, benefiting from strong domestic growth mainly driven by branded generics. Japan, a potentially huge market for generics that is currently not well penetrated, is showing some signs of progress, but more political support is still needed. The industry remains attractively valued with projected sales and earnings growth of 15% annually over the next five years.
We expect to see continued growth in medtechs, led by companies developing products offering significant innovations with marked improvements over current treatment practices. Among service providers, we favor names leveraged to benefit from economies of scale, the shift from volume-based to value-based pricing and the emergence of the health care consumer.
22
Table of Contents
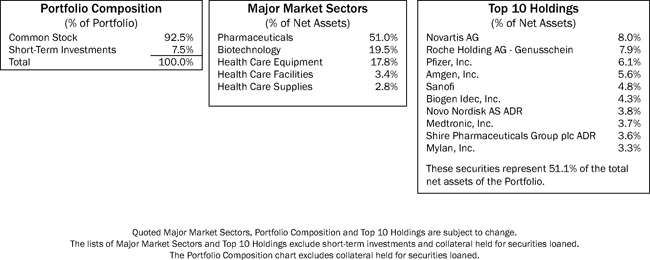
Average Annual Total Returns1
As of December 31, 2014
1-Year | 5-Year | From Inception | ||
| 24.23% | 16.01% | 13.51% |
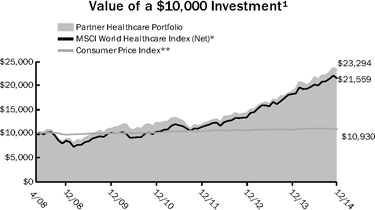
Past performance is not an indication of future results. Total investment return and principal value of your investment will fluctuate and units, when redeemed, may be worth more or less than their original cost. Current performance may be higher or lower than the performance data quoted. Call 800-THRIVENT or visit Thrivent.com for performance results current to the most recent month-end.
| 1 | Average annual total returns represent past performance and reflect changes in share prices, the reinvestment of all dividends and capital gains, and the effects of compounding. Periods of less than one year are not annualized. At various times, the Portfolio’s adviser may have waived its management fee and/or reimbursed Portfolio expenses. If this were the case, the Portfolio’s total returns would have been lower. The returns shown do not reflect charges and expenses imposed on contract holders by the variable accounts. Those charges and expenses reduce the returns received by contract holders as compared to the returns presented. |
The prospectus contains more complete information on the investment objectives, risks, charges and expenses of the investment company, which investors should read and consider carefully before investing. To obtain a prospectus, contact a registered representative or visit Thrivent.com.
| * | The MSCI World Healthcare Index (Net) is a capitalization-weighted index of selected health care stocks from around the world. The index includes reinvestment of dividends, gross of foreign withholding taxes. It is not possible to invest directly in the Index. The performance of the Index does not reflect deductions for fees, expenses or taxes. |
| ** | The Consumer Price Index is an inflationary indicator that measures the change in the cost of a fixed basket of products and services, including housing, electricity, food and transportation. It is not possible to invest directly in the Index. |
23
Table of Contents
THRIVENT NATURAL RESOURCES PORTFOLIO
David C. Francis, CFA and Darren M. Bagwell, CFA, Portfolio Co-Managers
Thrivent Natural Resources Portfolio seeks long-term capital growth.
The Portfolio primarily invests in natural resource investments, which historically have been very volatile and are subject to risks that particularly affect the precious metals, oil, gas, mining, energy, chemicals, paper, steel or agricultural sectors. REITs are subject to numerous risks and can be affected by interest rates, the values of the properties they own, and the credit quality of mortgage loans they hold. The value of the Portfolio is influenced by factors impacting the overall market, certain asset classes, certain investment styles, and specific issuers. The Portfolio may incur losses due to incorrect assessments of investments by its investment adviser. Small and medium-sized companies often have greater price volatility and less liquidity than larger companies. Foreign investments involve additional risks, including currency fluctuations, liquidity, political, economic and market instability, and different legal and accounting standards; these risks are magnified for investments in emerging markets. The Portfolio is non-diversified, which means that it may invest a greater percentage of its assets in the securities of any single issuer compared with diversified funds.
How did the Portfolio perform during the 12-month period ended December 31, 2014?
Thrivent Natural Resources Portfolio earned a return of -18.39%, compared with the median return of its peer group, the Lipper Natural Resources category, of -12.76%. The Portfolio’s market benchmark, the S&P North American Natural Resources Sector Index, earned a return of -9.77%.
What factors affected the Portfolio’s performance?
Oil prices declined during the second half of 2014 at a pace and magnitude that has occurred only twice in the past 20 years. Global oil demand increases in 2014 were subpar given global gross domestic product (GDP) growth levels, while non-OPEC supply growth was the highest it has been in more than 30 years.
Our Portfolio invested in companies that successfully grew production and that provide the tools and services used in field development. To a degree, these companies and investments were victims of their own successes, driving a supply and demand imbalance in the latter stages of 2014.
Over full investment cycles, our bias is toward energy sub-sectors that grow value; however, during 2014, defensive sectors outperformed. Overweighting positions in exploration and production, and in equipment and services, as well as underweighting positions in refiners and integrated companies, detracted from returns. Additionally, stock selection overall did not benefit performance. Exploration and production company investments were most challenged. While low-cost producers with good balance sheets, such as EOG Resources, EQT Corporation and Concho Resources, benefited the Portfolio, this was more than offset by higher volatility operators including Oasis Petroleum and Cobalt International.
Stock selection also lagged within the major integrated oil company category. Because major integrateds are the largest companies in the oil industry—and among the largest in the world—it is difficult for them to grow, or more generally, to change and provide a positive investment thesis. The holdings we own in the Portfolio do have theses for value creation, but in 2014, the sole driver of success among these stocks was defensiveness. As an example, although oil prices dropped by 50% over the second half of 2014, Exxon Mobil, the largest and most defensive company, and which the Portfolio does not own, declined by just 8% during that time frame.
Holdings in steel and coal producers, which were modest exposures when held, were eliminated during 2014. However, during the time we owned these positions, they materially lagged and detracted from the Portfolio’s returns.
What is your outlook?
Commodity industries are cyclical with oil and natural gas prices reverting to norms where industry earns a fair return on capital employed. High prices incent too much exploration and development activity, driving supply up and prices down. Conversely, low commodity prices lead to cuts in activity, less supply and price recovery. At the end of this period, industry was in the low price and activity cut—or actually, activity slash—part of the cycle. In 2015, we expect supply growth to slow and possibly contract. Assuming a normalized demand year, we believe that supply and demand will tighten and oil prices will rise. Our investment disciplines are unchanged and will be applied to a growing opportunity set after a tumultuous and unusually volatile 2014.
24
Table of Contents
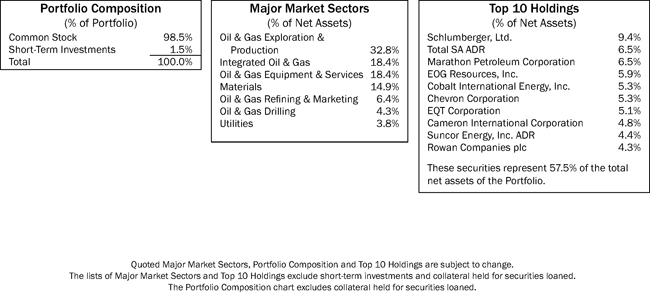
Average Annual Total Returns1
As of December 31, 2014
1-Year | 5-Year | From Inception | ||
| -18.39% | -2.57% | -4.74% |
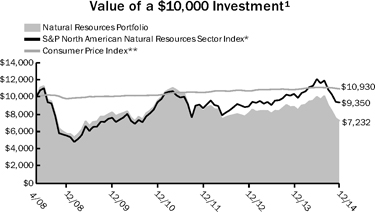
| Past performance is not an indication of future results. Total investment return and principal value of your investment will fluctuate and units, when redeemed, may be worth more or less than their original cost. Current performance may be higher or lower than the performance data quoted. Call 800-THRIVENT or visit Thrivent.com for performance results current to the most recent month-end. |
| 1 | Average annual total returns represent past performance and reflect changes in share prices, the reinvestment of all dividends and capital gains, and the effects of compounding. Periods of less than one year are not annualized. At various times, the Portfolio’s adviser may have waived its management fee and/or reimbursed Portfolio expenses. If this were the case, the Portfolio’s total returns would have been lower. The returns shown do not reflect charges and expenses imposed on contract holders by the variable accounts. Those charges and expenses reduce the returns received by contract holders as compared to the returns presented. |
| The prospectus contains more complete information on the investment objectives, risks, charges and expenses of the investment company, which investors should read and consider carefully before investing. To obtain a prospectus, contact a registered representative or visit Thrivent.com. |
| * | The S&P North American Natural Resources Sector Index is an index of selected U.S. traded natural resource related stocks. The product is not sponsored, endorsed or promoted by Standard & Poor’s, and Standard & Poor’s makes no representation regarding the advisability of investing in the product. It is not possible to invest directly in the Index. The performance of the Index does not reflect deductions for fees, expenses or taxes. |
| ** | The Consumer Price Index is an inflationary indicator that measures the change in the cost of a fixed basket of products and services, including housing, electricity, food and transportation. It is not possible to invest directly in the Index. |
25
Table of Contents
| THRIVENT PARTNER EMERGING MARKETS EQUITY PORTFOLIO |
Subadvised by Aberdeen Asset Managers Limited
Thrivent Partner Emerging Markets Equity Portfolio seeks long-term capital growth.
The Portfolio primarily invests in emerging markets equities. Foreign investments involve additional risks, including currency fluctuations, liquidity, political, economic and market instability, and different legal and accounting standards; these risks are magnified for investments in emerging markets. The value of the Portfolio is influenced by factors impacting the overall market, certain asset classes, certain investment styles, and specific issuers. The Portfolio may incur losses due to incorrect assessments of investments by its investment advisers. Small and medium-sized companies often have greater price volatility and less liquidity than larger companies. Large cap companies may be unable to respond quickly to new competitive challenges and may not be able to attain a high growth rate.
How did the Portfolio perform during the 12-month period ended December 31, 2014?
Thrivent Partner Emerging Markets Equity Portfolio earned a return of -2.29%, compared with the median return of its peer group, the Lipper Emerging Markets category, of -4.98%. The Portfolio’s market benchmark, the MSCI Emerging Markets Index, earned a return of -1.82%.
What factors affected the Portfolio’s performance?
The Portfolio performed broadly in line with the benchmark index. Stock selection in Russia contributed positively to the Portfolio’s relative return. We did not hold index heavyweights such as Gazprom and Sberbank, which fell sharply, although our holdings in Magnit and Lukoil pared some of these gains. Also aiding the Portfolio’s performance were overweightings to Turkey and India, net oil importers that benefited from falling crude prices. Indian shares rose further after the ruling Bharatiya Janata party consolidated its power and the reform momentum grew stronger.
Conversely, our significant underweighting to China detracted as its market bounced on the back of monetary easing. Stock selection in China also proved costly. The Portfolio has no exposure to mainland banks and insurance companies that led the rally, and we remain cautious over the credit environment.
What is your outlook?
Existing headwinds such as the knock-on effect of China’s slowing growth, along with the prospect of a U.S. interest rate hike and a stronger dollar, are expected to hamper emerging markets in the short term. Despite the gloomy backdrop, however, we remain confident in the outlook. The normalization of Federal Reserve policy is based on the assumption of a sustainable U.S. economic recovery, which bodes well for exports. This should benefit emerging market exporters and may help offset some of the effects of a slowdown in China. A strong U.S. dollar is not necessarily bad for emerging markets either.
A key distinction to make is that the current weakness in emerging market currencies is relative to the dollar’s strength. While weaker commodity and oil prices point to a deteriorating outlook for global growth, cheaper oil should benefit emerging markets overall.
26
Table of Contents
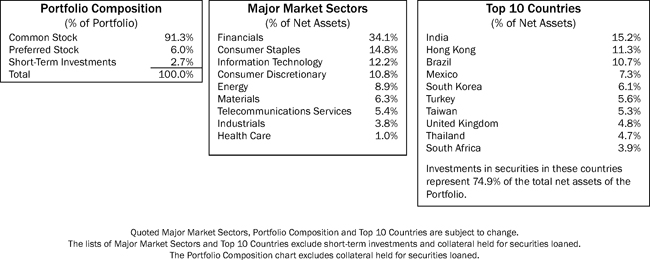
Average Annual Total Returns1
As of December 31, 2014
1-Year | 5-Year | From Inception | ||
| -2.29% | 5.31% | 3.72% |
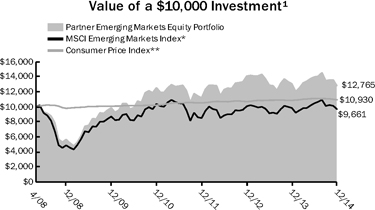
Past performance is not an indication of future results. Total investment return and principal value of your investment will fluctuate and units, when redeemed, may be worth more or less than their original cost. Current performance may be higher or lower than the performance data quoted. Call 800-THRIVENT or visit Thrivent.com for performance results current to the most recent month-end.
| 1 | Average annual total returns represent past performance and reflect changes in share prices, the reinvestment of all dividends and capital gains, and the effects of compounding. Periods of less than one year are not annualized. At various times, the Portfolio’s adviser may have waived its management fee and/or reimbursed Portfolio expenses. If this were the case, the Portfolio’s total returns would have been lower. The returns shown do not reflect charges and expenses imposed on contract holders by the variable accounts. Those charges and expenses reduce the returns received by contract holders as compared to the returns presented. |
The prospectus contains more complete information on the investment objectives, risks, charges and expenses of the investment company, which investors should read and consider carefully before investing. To obtain a prospectus, contact a registered representative or visit Thrivent.com.
| * | The MSCI Emerging Markets Index is a modified capitalization-weighted index of selected emerging economies from around the world. It is not possible to invest directly in the Index. The performance of the Index does not reflect deductions for fees, expenses or taxes. |
| ** | The Consumer Price Index is an inflationary indicator that measures the change in the cost of a fixed basket of products and services, including housing, electricity, food and transportation. It is not possible to invest directly in the Index. |
27
Table of Contents
THRIVENT REAL ESTATE SECURITIES PORTFOLIO
Reginald L. Pfeifer, CFA, Portfolio Manager
Thrivent Real Estate Securities Portfolio seeks to provide long-term capital appreciation and high current income.
The Portfolio focuses on income-producing equity securities of U.S. real estate companies. Declines in real estate values, changes in interest rates or economic downturns can have a significant negative effect on companies in the real estate industry. Real Estate Investment Trusts are subject to numerous risks and can be affected by interest rates, the values of the properties they own, and the credit quality of mortgage loans they hold. The value of the Portfolio is influenced by factors impacting the overall market, certain asset classes, certain investment styles, and specific issuers. The Portfolio may incur losses due to incorrect assessments of investments by its investment adviser.
How did the Portfolio perform during the 12-month period ended December 31, 2014?
Thrivent Real Estate Securities Portfolio earned a return of 30.82%, compared with the median return of its peer group, the Lipper U.S. Real Estate category, of 30.00%. The Portfolio’s market benchmark, the FTSE NAREIT All Equity REITs Index, earned a return of 28.03%.
What factors affected the Portfolio’s performance?
Real estate investment trust (REIT) stock performance in 2014 was positively impacted by the decline in bond yields. The yield-to-maturity of 10-year U.S. Treasury notes declined from 3.03% on December 31, 2013, to 2.17% at year-end 2014. This decline fueled a significant rally in REIT stocks given their meaningfully higher dividend yields compared to general equities. REITs also provided a yield advantage over corporate bonds and, in addition to their average 4% dividend yield, generated more than 9% earnings growth in 2014.
An improving economy provided the underlying support for real estate fundamentals by allowing occupancy rates to remain high and rental rates to increase in all property sectors. The best performing REIT property sectors in 2014 were apartment, lodging, class-A mall, downtown office and health care REITs. Companies with exposure in Houston, Texas, were negatively impacted by the decline in energy prices and the expectation that job growth there will slow.
Fund flows into REIT mutual funds and exchange-traded funds provided evidence of the investment demand for REITs, with flows exceeding $12 billion in 2014, twice the level of 2013 and just behind the record of $14 billion in 2012.
Investment demand for private real estate assets from U.S. investors, sovereign wealth funds and private equity investors resulted in significant appreciation in value for institutional-quality properties. Investment real estate valuations benefit from lower interest rates as investors in direct real estate assets, including REITs, are able to reduce their borrowing costs and generate higher returns on equity, thereby increasing free cash flow or cash available for distribution in the form of dividends.
What is your outlook?
New construction continues to be limited in most property types, with some new supply in apartment, lodging and health care properties. We believe this limited new supply should allow REITs and private real estate owners to maintain occupancy levels in 2015. Rental rates are expected to continue rising in 2015 due to an improving economy and the benefit of lower energy prices, which should result in an increase in discretionary spending. Consensus expectations for the REIT industry are for earnings per share to grow by 6% to 8% in 2015 and, when combined with an estimated 3.5% dividend yield, may generate attractive total returns if valuations are sustained at current levels.
The risk to our outlook is an increase in interest rates, which could trigger valuation declines as investors require higher returns for real estate investments. This may happen in 2015 as interest rate stimulation measures that have been in place and maintained over many years by the Federal Reserve are removed and potentially reversed.
The Portfolio has exposure to companies within each property sector, with the largest concentration in large-capitalization REITs with high-quality real estate portfolios and experienced management teams. We continually search for value in all REIT property sectors, while adjusting positions throughout the year in an effort to maximize Portfolio performance.
28
Table of Contents
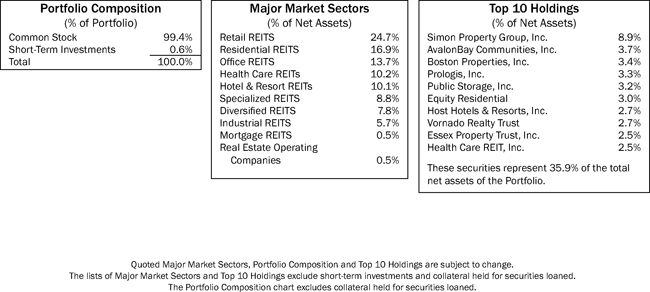
Average Annual Total Returns1
As of December 31, 2014
1-Year | 5-Year | 10-Year | ||
| 30.82% | 16.88% | 8.37% |
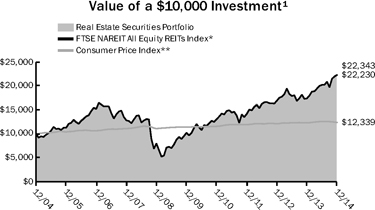
Past performance is not an indication of future results. Total investment return and principal value of your investment will fluctuate and units, when redeemed, may be worth more or less than their original cost. Current performance may be higher or lower than the performance data quoted. Call 800-THRIVENT or visit Thrivent.com for performance results current to the most recent month-end.
| 1 | Average annual total returns represent past performance and reflect changes in share prices, the reinvestment of all dividends and capital gains, and the effects of compounding. Periods of less than one year are not annualized. At various times, the Portfolio’s adviser may have waived its management fee and/or reimbursed Portfolio expenses. If this were the case, the Portfolio’s total returns would have been lower. The returns shown do not reflect charges and expenses imposed on contract holders by the variable accounts. Those charges and expenses reduce the returns received by contract holders as compared to the returns presented. |
The prospectus contains more complete information on the investment objectives, risks, charges and expenses of the investment company, which investors should read and consider carefully before investing. To obtain a prospectus, contact a registered representative or visit Thrivent.com.
| * | The FTSE NAREIT All Equity REITs Index is an unmanaged capitalization-weighted index of all equity real estate investment trusts. It is not possible to invest directly in this Index. The performance of this Index does not reflect deductions for fees, expenses or taxes. |
| ** | The Consumer Price Index is an inflationary indicator that measures the change in the cost of a fixed basket of products and services, including housing, electricity, food and transportation. It is not possible to invest directly in the Index. |
29
Table of Contents
THRIVENT PARTNER SMALL CAP GROWTH PORTFOLIO
David Lettenberger, CFA, and Matthew D. Finn, CFA, Portfolio Co-Mangers*
Thrivent Partner Small Cap Growth Portfolio seeks long-term capital growth.
The Portfolio primarily invests in securities of small companies. Smaller, less seasoned companies often have greater price volatility, lower trading volume, and less liquidity than larger, more established companies. The value of the Portfolio is influenced by factors impacting the overall market, certain asset classes, certain investment styles, and specific issuers. The Portfolio may incur losses due to incorrect assessments of investments by its investment advisers.
| * | Effective May 27, 2014, David Lettenberger and Matthew Finn became Portfolio Co-Mangers. The Portfolio was perviously subadvided by Turner Investments, L.P. |
How did the Portfolio perform during the 12-month period ended December 31, 2014?
Thrivent Partner Small Cap Growth Portfolio earned a return of 2.31%, compared with the median return of its peer group, the Lipper Small Cap Growth category, of 3.83%. The Portfolio’s market benchmark, the Russell 2000® Growth Index, earned a return of 5.60%.
What factors affected the Portfolio’s performance?
Poor stock selection was the primary reason for the Portfolio’s underperformance during 2014, particularly in the technology, energy and financial sectors. Within technology, several holdings in the software industry experienced slower-than-expected revenue and bookings trends, which led to dramatic share price underperformance. Infoblox, A10 Networks, Cornerstone OnDemand and Bottomline Technologies were all detractors in the software space.
The energy sector was the worst performing sector during 2014 following the significant fall in oil prices during the fourth quarter. While the Portfolio was not overexposed to energy, it was overweighted in the higher-growth exploration and production companies whose stocks were particularly hard hit. This included positions in Oasis Petroleum, Whiting Petroleum and Penn Virginia.
Within the financial sector, both eHealth and Wisdomtree Investments detracted from performance following disappointing fundamentals early in the year.
Not all was negative from a stock selection standpoint as several holdings in the industrial and health care sectors partially offset the above-mentioned disappointments. Within industrials, the Portfolio’s investments in the transportation industry performed very well during the year. Shares of Spirit Airlines, a rapidly growing low-cost carrier, responded well to strong revenue growth and yield improvements as the company builds out its service offering. In the trucking industry, both SAIA and Swift Transportation delivered strong returns as a result of improving fundamentals in the trucking industry.
Within health care, stock selection was strong in the health care services, specialty pharmaceutical and biotechnology industries. Team Health, LifePoint Hospitals and Centene were all strong service performers as they benefited from the implementation of the Affordable Care Act. Akorn and Depomed were two standout performers in specialty pharmaceuticals, benefiting from acquisitions they completed as well as a favorable pricing environment. Within biotechnology, both Puma Biotechnology and Neurocrine Biosciences were up substantially based on favorable trial results, and Cubist Pharmaceuticals was acquired late in 2014 at a significant equity premium.
What is your outlook?
There is never a shortage of new growth ideas in the small-cap universe, regardless of what is happening from a macroeconomic perspective. Our goal is to identify companies that not only are growing at a rate faster than their peers, but that have the ability to sustain that growth over an extended period of time.
With these guideposts, we continue to make progress repositioning the Portfolio. We have eliminated many positions that do not fit our sustainable growth mandate, as well as some positions where we did not have confidence in management’s ability to execute a growth plan. In addition, we have added several new securities that exhibit the growth and quality characteristics we are seeking. This repositioning takes time, but we are making good progress. Our goal remains to build a diversified portfolio of 75 to 100 quality companies that offer sustainable, long-term growth potential.
30
Table of Contents
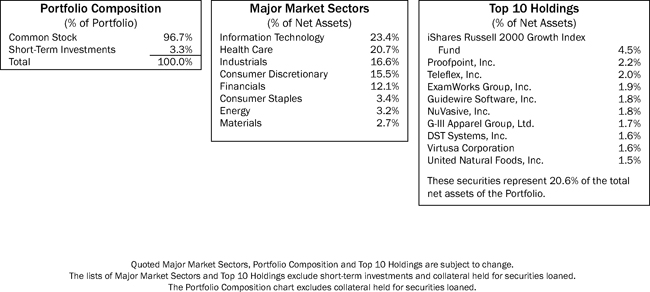
Average Annual Total Returns1
As of December 31, 2014
1-Year | 5-Year | 10-Year | ||
| 2.31% | 14.93% | 6.90% |

Past performance is not an indication of future results. Total investment return and principal value of your investment will fluctuate and units, when redeemed, may be worth more or less than their original cost. Current performance may be higher or lower than the performance data quoted. Call 800-THRIVENT or visit Thrivent.com for performance results current to the most recent month-end.
| 1 | Average annual total returns represent past performance and reflect changes in share prices, the reinvestment of all dividends and capital gains, and the effects of compounding. Periods of less than one year are not annualized. At various times, the Portfolio’s adviser may have waived its management fee and/or reimbursed Portfolio expenses. If this were the case, the Portfolio’s total returns would have been lower. The returns shown do not reflect charges and expenses imposed on contract holders by the variable accounts. Those charges and expenses reduce the returns received by contract holders as compared to the returns presented. |
The prospectus contains more complete information on the investment objectives, risks, charges and expenses of the investment company, which investors should read and consider carefully before investing. To obtain a prospectus, contact a registered representative or visit Thrivent.com.
| * | The Russell 2000® Growth Index is an index comprised of small capitalization companies with a greater than average growth orientation. It is not possible to invest directly in the Index. The performance of the Index does not reflect deductions for fees, expenses or taxes. |
| ** | The Consumer Price Index is an inflationary indicator that measures the change in the cost of a fixed basket of products and services, including housing, electricity, food and transportation. It is not possible to invest directly in the Index. |
31
Table of Contents
| THRIVENT PARTNER SMALL CAP VALUE PORTFOLIO |

Subadvised by T. Rowe Price Associates, Inc.
Thrivent Partner Small Cap Value Portfolio seeks long-term capital appreciation.
The Portfolio primarily invests in securities of small companies. Smaller, less seasoned companies often have greater price volatility, lower trading volume, and less liquidity than larger, more established companies. The value of the Portfolio is influenced by factors impacting the overall market, certain asset classes, certain investment styles, and specific issuers. The Portfolio may incur losses due to incorrect assessments of investments by its investment advisers. Foreign investments involve additional risks, including currency fluctuations, liquidity, political, economic and market instability, and different legal and accounting standards.
How did the Portfolio perform during the 12-month period ended December 31, 2014?
Thrivent Partner Small Cap Value Portfolio earned a return of 2.89%, compared with the median return of its peer group, the Lipper Small Cap Value category, of 4.34%. The Portfolio’s market benchmark, the Russell 2000® Value Index, earned a return of 4.22%.
What factors affected the Portfolio’s performance?
Stock selection in the consumer discretionary sector weighed on performance relative to the index. Quiksilver, a wholesaler of action sportswear known for its Quiksilver, Roxy and DC brands, was a notable detractor. Operational improvements have taken longer than investors had hoped.
The Portfolio’s significant underweighting in the financials sector also weighed on relative results. One factor was the Portfolio’s underweighted position in real estate investment trusts (REITs), which performed well amid a lower-than-expected interest rate environment.
The industrials and business services sector was a bright spot within the Portfolio; however, an overweighting in the sector shaved off some of the positive performance relative to the index. Alaska Air Group was one of the Portfolio’s top contributors. The Seattle-based airline serves primarily the West Coast region, Alaska, Hawaii and Mexico. The company continues to show strong revenues, while the recent decline in oil prices portends a more favorable cost structure for the industry.
Performance relative to the index was also helped by the Portfolio’s underweighted position in energy, the worst-performing sector in the Portfolio and the index.
What is your outlook?
Although energy stocks are a small part of the small-cap value universe, the recent decline in oil prices has a far-reaching impact on small-cap companies. Upcoming earnings reports should provide greater clarity on the broader effects of falling oil prices on small caps. Clearly, energy-using firms and companies poised to benefit from healthier household budgets, which will result from lower prices at the pump, stand to benefit. In addition, the equally surprising decline in long-term interest rates has had a large, positive effect on small-cap value stocks, especially financials.
As always, our focus remains on long-term performance and we believe a contrarian approach will ultimately best serve our shareholders’ interests.
32
Table of Contents
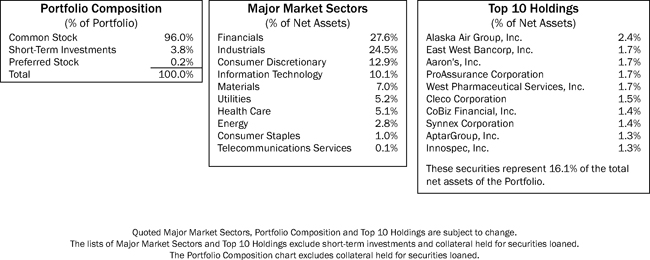
Average Annual Total Returns1
As of December 31, 2014
1-Year | 5-Year | 10-Year | ||
| 2.89% | 14.26% | 8.84% |
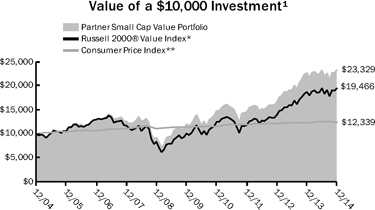
Past performance is not an indication of future results. Total investment return and principal value of your investment will fluctuate and units, when redeemed, may be worth more or less than their original cost. Current performance may be higher or lower than the performance data quoted. Call 800-THRIVENT or visit Thrivent.com for performance results current to the most recent month-end.
| 1 | Average annual total returns represent past performance and reflect changes in share prices, the reinvestment of all dividends and capital gains, and the effects of compounding. Periods of less than one year are not annualized. At various times, the Portfolio’s adviser may have waived its management fee and/or reimbursed Portfolio expenses. If this were the case, the Portfolio’s total returns would have been lower. The returns shown do not reflect charges and expenses imposed on contract holders by the variable accounts. Those charges and expenses reduce the returns received by contract holders as compared to the returns presented. |
The prospectus contains more complete information on the investment objectives, risks, charges and expenses of the investment company, which investors should read and consider carefully before investing. To obtain a prospectus, contact a registered representative or visit Thrivent.com.
| * | The Russell 2000® Value Index measures the performance of small cap value stocks. It is not possible to invest directly in the Index. The performance of the Index does not reflect deductions for fees, expenses or taxes. |
| ** | The Consumer Price Index is an inflationary indicator that measures the change in the cost of a fixed basket of products and services, including housing, electricity, food and transportation. It is not possible to invest directly in the Index. |
33
Table of Contents
THRIVENT SMALL CAP STOCK PORTFOLIO
Matthew D. Finn, CFA, Portfolio Manager
Thrivent Small Cap Stock Portfolio seeks long-term capital growth.
The Portfolio primarily invests in securities of small companies. Smaller, less seasoned companies often have greater price volatility, lower trading volume, and less liquidity than larger, more established companies. The value of the Portfolio is influenced by factors impacting the overall market, certain asset classes, certain investment styles, and specific issuers. The Portfolio may incur losses due to incorrect assessments of investments by its investment adviser.
How did the Portfolio perform during the 12-month period ended December 31, 2014?
Thrivent Small Cap Stock Portfolio earned a return of 4.76%, compared with the median return of its peer group, the Lipper Small Cap Core category, of 4.70%. The Portfolio’s market benchmark, the Russell 2000® Index, earned a return of 4.89%.
What factors affected the Portfolio’s performance?
During the period, stock selection in the industrials, health care, consumer staples and financials sectors added to relative performance. Positions in trucking company Landstar System and mechanical and electrical construction firm EMCOR Group added the most in the industrials sector.
In health care, NuVasive, a developer of medical products for spine surgery, and ExamWorks Group, a provider of independent medical exams, appreciated significantly. In consumer staples, shares of WhiteWave Foods, the maker of organic milk and produce, creamers and plant-based beverages, advanced strongly. In the financials sector, two banks helped the Portfolio’s performance: Synovus Financial and SVB Financial. While all of these holdings remained in the Portfolio as of the fiscal year end, we reduced the position sizes of WhiteWave Foods and SVB Financial.
Stock selection detracted in the energy sector, with particular weakness in our holdings focused on exploration and production, such as Oasis Petroleum, Rex Energy and Rosetta Resources. These companies have direct exposure to falling oil and natural gas prices.
What is your outlook?
At the end of last year, we were in the process of repositioning the Portfolio in an effort to improve its performance through our stock selection process. The Portfolio’s poor relative results in the previous fiscal year were caused by unfavorable sector weighting decisions and stock selection. Over the course of this fiscal year, we have increased the diversification of the Portfolio and raised the quality of the companies we own. We sold 35 of the original 50 stocks and added new positions to increase the total number of holdings in the Portfolio to more than 70.
By investing in companies that have strong competitive advantages and a long runway for growth and operational improvement at attractive prices, we believe the Portfolio can outperform its peer group and benchmark over time.
34
Table of Contents
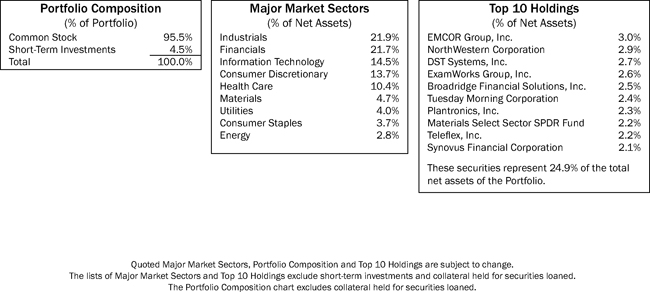
Average Annual Total Returns1
As of December 31, 2014
1-Year | 5-Year | 10-Year | ||
| 4.76% | 13.03% | 6.10% |
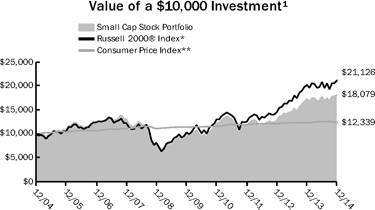
Past performance is not an indication of future results. Total investment return and principal value of your investment will fluctuate and units, when redeemed, may be worth more or less than their original cost. Current performance may be higher or lower than the performance data quoted. Call 800-THRIVENT or visit Thrivent.com for performance results current to the most recent month-end.
| 1 | Average annual total returns represent past performance and reflect changes in share prices, the reinvestment of all dividends and capital gains, and the effects of compounding. Periods of less than one year are not annualized. At various times, the Portfolio’s adviser may have waived its management fee and/or reimbursed Portfolio expenses. If this were the case, the Portfolio’s total returns would have been lower. The returns shown do not reflect charges and expenses imposed on contract holders by the variable accounts. Those charges and expenses reduce the returns received by contract holders as compared to the returns presented. |
The prospectus contains more complete information on the investment objectives, risks, charges and expenses of the investment company, which investors should read and consider carefully before investing. To obtain a prospectus, contact a registered representative or visit Thrivent.com.
| * | The Russell 2000® Index measures the performance of small cap stocks. It is not possible to invest directly in the Index. The performance of the Index does not reflect deductions for fees, expenses or taxes. |
| ** | The Consumer Price Index is an inflationary indicator that measures the change in the cost of a fixed basket of products and services, including housing, electricity, food and transportation. It is not possible to invest directly in the Index. |
35
Table of Contents
THRIVENT SMALL CAP INDEX PORTFOLIO
Kevin R. Brimmer, FSA, Portfolio Manager
Thrivent Small Cap Index Portfolio strives for capital growth that tracks the performance of the S&P SmallCap 600 Index.
The Portfolio primarily invests in small company common stocks. Smaller, less seasoned companies often have greater price volatility, lower trading volume, and less liquidity than larger, more established companies. The value of the Portfolio is influenced by factors impacting the overall market, certain asset classes, certain investment styles, and specific issuers.
How did the Portfolio perform during the 12-month period ended December 31, 2014?
Thrivent Small Cap Index Portfolio earned a return of 5.36%, compared with the median return of its peer group, the Lipper Small Cap Core category, of 4.70%. The Portfolio’s market benchmark, the S&P SmallCap 600 Index, earned a return of 5.76%.
What factors affected the Portfolio’s performance?
The Portfolio’s holdings are aligned with those of the S&P SmallCap 600 Index. As typically occurs in an index portfolio, the difference in performance between the benchmark index and the Portfolio itself can largely be attributed to expenses and minor differences in portfolio composition.
Eight of the 10 sectors in the index and in the Portfolio posted positive returns for the year. Utilities, information technology and health care were the best-performing sectors in the market over the past 12 months, posting the highest returns. Small-cap stocks underperformed both large- and mid-cap stocks over the reporting period. Larger-cap stocks tend to outperform during range-bound, limited-volatility market periods. Materials delivered the lowest positive returns for the 12-month period, while the telecommunications services and energy sectors delivered negative returns.
What is your outlook?
Small-cap stocks underperformed both large-cap stocks and mid caps for the past year during a period of generally positive stock price increases. Worldwide central banks continue to provide stimulus to the global economy and profit margins remain strong. Market multiples still have the potential to expand, even with slightly higher interest rates. Because this would lead to a risk for stocks, we believe investors will tend to favor large caps over mid- and small-capitalized companies.
Since the U.S. dollar has appreciated substantially, further appreciation is less likely. Risk levels will likely fluctuate in a range- bound manner. While opportunities for small caps exist, our view is that larger-cap companies should outperform their small-cap counterparts as this cycle matures.
It appears that the recovery will be sustained both in the U.S. and globally. The recovery has been aided by the recent decline in oil prices. At a minimum, global growth is slowing and the prices of risk assets have adjusted significantly, reflecting the increased uncertainty.
36
Table of Contents
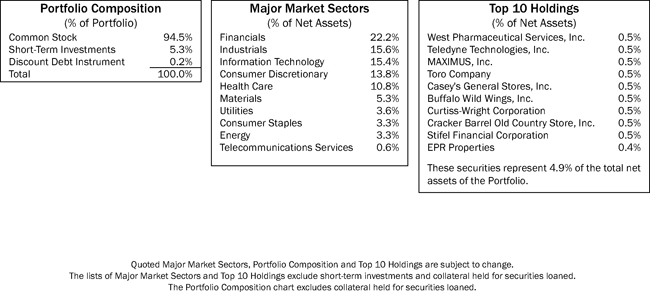
Average Annual Total Returns1
As of December 31, 2014
1-Year | 5-Year | 10-Year | ||
| 5.36% | 16.84% | 8.70% |
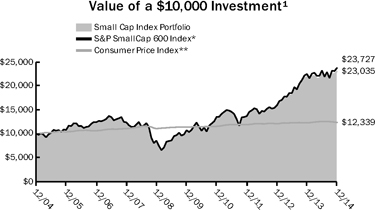
Past performance is not an indication of future results. Total investment return and principal value of your investment will fluctuate and units, when redeemed, may be worth more or less than their original cost. Current performance may be higher or lower than the performance data quoted. Call 800-THRIVENT or visit Thrivent.com for performance results current to the most recent month-end.
| 1 | Average annual total returns represent past performance and reflect changes in share prices, the reinvestment of all dividends and capital gains, and the effects of compounding. Periods of less than one year are not annualized. At various times, the Portfolio’s adviser may have waived its management fee and/or reimbursed Portfolio expenses. If this were the case, the Portfolio’s total returns would have been lower. The returns shown do not reflect charges and expenses imposed on contract holders by the variable accounts. Those charges and expenses reduce the returns received by contract holders as compared to the returns presented. |
The prospectus contains more complete information on the investment objectives, risks, charges and expenses of the investment company, which investors should read and consider carefully before investing. To obtain a prospectus, contact a registered representative or visit Thrivent.com.
| * | The S&P SmallCap 600 Index is an index that represents the average performance of a group of 600 small capitalization stocks. The product is not sponsored, endorsed or promoted by Standard & Poor’s, and Standard & Poor’s makes no representation regarding the advisability of investing in the product. It is not possible to invest directly in the Index. The performance of the Index does not reflect deductions for fees, expenses and taxes. |
| ** | The Consumer Price Index is an inflationary indicator that measures the change in the cost of a fixed basket of products and services, including housing, electricity, food and transportation. It is not possible to invest directly in the Index. |
37
Table of Contents
THRIVENT MID CAP GROWTH PORTFOLIO
Andrea J. Thomas, CFA, Portfolio Manager
Thrivent Mid Cap Growth Portfolio seeks long-term growth of capital.
The Portfolio primarily invests in securities of mid-sized companies, which often have greater price volatility, lower trading volume, and less liquidity than larger, more established companies. The value of the Portfolio is influenced by factors impacting the overall market, certain asset classes, certain investment styles, and specific issuers. The Portfolio may incur losses due to incorrect assessments of investments by its investment adviser.
How did the Portfolio perform during the 12-month period ended December 31, 2014?
Thrivent Mid Cap Growth Portfolio earned a return of 9.71%, compared with the median return of its peer group, the Lipper Mid Cap Growth category, of 8.14%. The Portfolio’s market benchmark, the Russell Midcap® Growth Index, earned a return of 11.90%.
What factors affected the Portfolio’s performance?
The Portfolio outperformed the median return of its peer group for the year. Most of this outperformance came in the second half of the year as high-multiple momentum stocks, which had vastly outperformed most other stocks in the benchmark index earlier in the year, began to falter. However, not being in those companies was the key factor in our underperformance versus the Russell index.
The Portfolio’s performance benefited from both allocation decisions and security selection in the industrial, technology and consumer sectors. In industrials, United Rentals was our most significant contributor to performance. This equipment rental company benefited from a steady, but not rapidly, expanding economy as companies chose to rent instead of buy equipment.
Another strong contributor to performance was NXP Semiconductors, which sells semiconductors into several high-growth segments of the economy, such as mobile communications, security applications and networking equipment.
Finally, we saw positive results from two consumer companies, Marriott International and Monster Beverage. Both of these companies experienced secular trends that allowed them to grow earnings despite a rather tepid economy.
What is your outlook?
We are increasingly concerned about geopolitical events and their effect on global growth, and therefore, U.S. growth. The sanctions levied on Russia are taking a heavy toll on the European economy. The Chinese economy has been slowing because Europe is a major trading partner with them and the country is trying to manage its own credit bubble. Japan, in an attempt to stave off deflation, announced it was embarking on an even bigger quantitative easing program just as the Federal Reserve ended quantitative easing here.
While the U.S. economy appears to be marginally better, we do not see a rapid, broad-based expansion unfolding in the face of these global headwinds. We believe this may result in an increase in volatility in the coming year. We remain focused on growth sectors within the economy, while within each sector, we remain committed to buying solid growth businesses with reasonable valuations.
38
Table of Contents
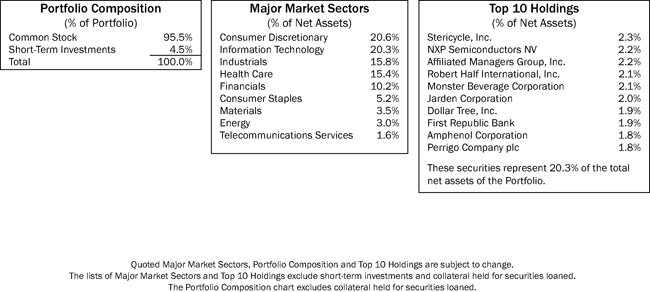
Average Annual Total Returns1
As of December 31, 2014
1-Year | 5-Year | 10-Year | ||
| 9.71% | 14.42% | 9.71% |
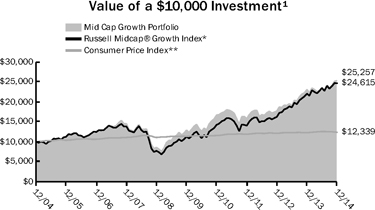
Past performance is not an indication of future results. Total investment return and principal value of your investment will fluctuate and units, when redeemed, may be worth more or less than their original cost. Current performance may be higher or lower than the performance data quoted. Call 800-THRIVENT or visit Thrivent.com for performance results current to the most recent month-end.
| 1 | Average annual total returns represent past performance and reflect changes in share prices, the reinvestment of all dividends and capital gains, and the effects of compounding. Periods of less than one year are not annualized. At various times, the Portfolio’s adviser may have waived its management fee and/or reimbursed Portfolio expenses. If this were the case, the Portfolio’s total returns would have been lower. The returns shown do not reflect charges and expenses imposed on contract holders by the variable accounts. Those charges and expenses reduce the returns received by contract holders as compared to the returns presented. |
The prospectus contains more complete information on the investment objectives, risks, charges and expenses of the investment company, which investors should read and consider carefully before investing. To obtain a prospectus, contact a registered representative or visit Thrivent.com.
| * | The Russell Midcap® Growth Index measures the performance of mid cap growth stocks. It is not possible to invest directly in the Index. The performance of the Index does not reflect deductions for fees, expenses or taxes. |
| ** | The Consumer Price Index is an inflationary indicator that measures the change in the cost of a fixed basket of products and services, including housing, electricity, food and transportation. It is not possible to invest directly in the Index. |
39
Table of Contents

How did the Portfolio perform during the 12-month period ended December 31, 2014?
Thrivent Partner Mid Cap Value Portfolio earned a return of 13.52%, compared with the median return of its peer group, the Lipper Mid Cap Value category, of 10.39%. The Portfolio’s market benchmark, the Russell Midcap® Value Index, earned a return of 14.75%.
What factors affected the Portfolio’s performance?
During the year, stock selection within the consumer staples sector contributed favorably to the Portfolio’s performance, while stock selection in the consumer discretionary sector detracted from results.
Keurig Green Mountain, the leader in specialty coffee and coffeemakers, was the overall top contributor to performance in 2014. We initiated our position in Keurig earlier in the year with a conviction that K-Cups, the company’s single-serve beverage pods, could experience significant growth over the next three years, specifically driven by installed base growth. Keurig’s share price rallied after the announcement that Coca-Cola agreed to purchase a 10% stake in the company. Recognizing the quality of the business, Coca-Cola entered into a 10-year agreement to explore producing Coca-Cola products for use with the company’s cold beverage system. However, following the stock’s strong performance, we exited our position and redeployed capital into names where we saw greater upside potential.
A top detractor from performance was Triumph Group, a supplier of aerospace components and systems. Its shares were under pressure throughout the year due to execution challenges in its 747-8 program, a lackluster growth environment, and the timing of anticipated margin improvements. Despite this underperformance in 2014, we anticipate an improvement in demand in 2015 and remain positive regarding management’s ability to meet expectations. We are also confident in management’s ability to achieve significant synergies from the acquisitions completed in 2014 and to drive long-term shareholder value.
What is your outlook?
As we enter 2015, we continue to believe U.S. equities have further upside potential as the domestic economy accelerates and real earnings growth serves as a fundamental driver of performance going forward. We believe U.S. corporate fundamentals are strong, evidenced by both healthy balance sheets and earnings resilience, which could provide companies with a number of options to increase shareholder value. While we acknowledge that the potential for headwinds—such as geopolitical risks— persists, we ultimately remain constructive on the direction of U.S. equity markets.
We believe the U.S. has the best macroeconomic outlook of the developed economies and are optimistic about the strengthening U.S. housing and employment markets, as well as the potential for a continued recovery in consumer spending. Consumption, which accounts for approximately 70% of U.S. gross domestic product (GDP), could benefit from the combination of low energy prices and a strong dollar. Furthermore, with strong GDP growth momentum from 2014, we believe that an acceleration in earnings growth could continue in the U.S. because the country is less exposed to weaker segments of the global economy, given its lower reliance on exports.
Looking forward, we believe that as the U.S. economy improves, companies can reinvest for future growth by increasing capital expenditures, research and development, and hiring, and through merger and acquisition activity, rather than keeping excess cash on their balance sheets. In our view, equity valuations are fair considering the positive macro environment and inexpensive relative to fixed-income securities.
We believe a forward-looking analysis is critical in this investing environment. We also believe that stock selection will be increasingly important as companies differentiate themselves on earnings growth and valuation.
40
Table of Contents
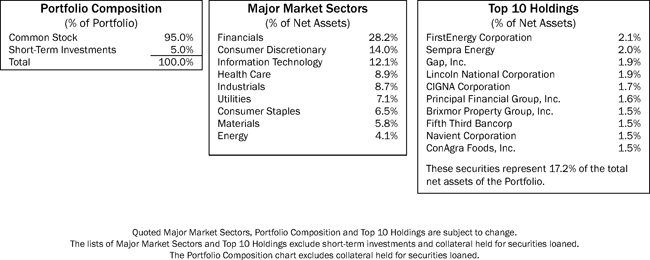
Average Annual Total Returns1
As of December 31, 2014
1-Year | 5-Year | From Inception 4/29/2005 | ||
| 13.52% | 15.80% | 9.77% |
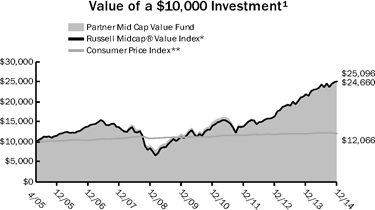
Past performance is not an indication of future results. Total investment return and principal value of your investment will fluctuate and units, when redeemed, may be worth more or less than their original cost. Current performance may be higher or lower than the performance data quoted. Call 800-THRIVENT or visit Thrivent.com for performance results current to the most recent month-end.
| 1 | Average annual total returns represent past performance and reflect changes in share prices, the reinvestment of all dividends and capital gains, and the effects of compounding. Periods of less than one year are not annualized. At various times, the Portfolio’s adviser may have waived its management fee and/or reimbursed Portfolio expenses. If this were the case, the Portfolio’s total returns would have been lower. The returns shown do not reflect charges and expenses imposed on contract holders by the variable accounts. Those charges and expenses reduce the returns received by contract holders as compared to the returns presented. |
The prospectus contains more complete information on the investment objectives, risks, charges and expenses of the investment company, which investors should read and consider carefully before investing. To obtain a prospectus, contact a registered representative or visit Thrivent.com.
| * | The Russell Midcap® Value Index is an index comprised of mid-cap companies with lower than average price-to-book ratios and lower forecasted growth values. It is not possible to invest directly in the Index. The performance of the Index does not reflect deductions for fees, expenses or taxes. |
| ** | The Consumer Price Index is an inflationary indicator that measures the change in the cost of a fixed basket of products and services, including housing, electricity, food and transportation. It is not possible to invest directly in the Index. |
41
Table of Contents
THRIVENT MID CAP STOCK PORTFOLIO
Brian J. Flanagan, CFA, Portfolio Manager
Thrivent Mid Cap Stock Portfolio seeks long-term capital growth.
The Portfolio primarily invests in securities of mid-sized companies, which often have greater price volatility, lower trading volume, and less liquidity than larger, more established companies. The value of the Portfolio is influenced by factors impacting the overall market, certain asset classes, certain investment styles, and specific issuers. The Portfolio may incur losses due to incorrect assessments of investments by its investment adviser.
How did the Portfolio perform during the 12-month period ended December 31, 2014?
Thrivent Mid Cap Stock Portfolio earned a return of 11.93%, compared with the median return of its peer group, the Lipper Mid Cap Core category, of 9.30%. The Portfolio’s market benchmark, the Russell Midcap® Index, earned a return of 13.22%.
What factors affected the Portfolio’s performance?
The Portfolio benefited primarily from sound security selection during the past year that was broad-based among sectors. Only the Portfolio’s energy holdings lagged the peer group. Performance within consumer staples was particularly notable, including an investment in coffee roaster and K-cup maker Keurig Green Mountain. The company benefited from increased product penetration, incremental licensing captures, anticipation of its new cold beverage system, and a significant equity investment by Coca-Cola. Organic beverage and food producer WhiteWave Foods enjoyed better-than-expected customer acceptance of its plant-based foods and drinks, plus the positive impact of increased volumes on profitability.
Industrial sector performance continued to benefit from airline capacity discipline through an investment in Southwest Airlines. A position in Illumina drove health care sector returns as momentum grew in the next-generation sequencing market for the company’s sequencing instruments and consumables. Finally, within information technology, TriQuint Semiconductor appreciated dramatically on the back of strong content wins for the company’s products, significant associated margin expansion, and an agreement to merge with RF Micro Devices.
The Portfolio experienced relatively few detractors at the security level during the period. Most notably, wireless networking product provider Ubiquiti Networks, glass container manufacturer Owens-Illinois, and staffing company ManpowerGroup lagged due to weakness in international demand and, to a lesser extent, because of company-specific operational issues.
What is your outlook?
Market risks have arguably increased over the course of the past year. While opportunities do exist, a mixed macro backdrop warrants a prudent level of caution. Domestic economic growth remains steady, but not spectacular, averaging slightly more than 2.20% since the recovery began in late 2009. Conversely, economic growth in regions outside the U.S., including Europe, China, Russia and Brazil, has slowed.
Currencies have become increasingly volatile as regional levels of monetary stimulus diverge and these currency shifts will impact trade flows. Importantly, the Federal Reserve recently removed a level of policy accommodation when it concluded its latest iteration of quantitative easing in late October. Positively, global monetary policy does remain accommodative with interest rates pegged at generational lows, while inflation is benign.
Almost six years into the market’s recovery from the recession, outsized investment opportunities have become fewer and market leadership has narrowed. Valuation spreads continue to compress and capital expenditures have accelerated. In this environment, we believe security selection will drive relative performance. As the cycle matures, growth factors should begin to dominate over those more tilted toward valuation. We will increasingly emphasize these growth factors in the Portfolio with a focus on relative revenue growth, above-consensus incremental margins, and free cash flow as well as improving returns on capital.
42
Table of Contents
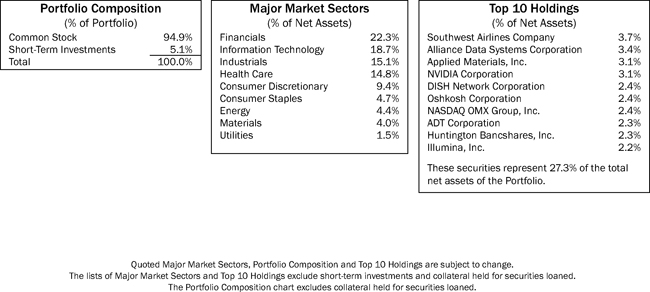
Average Annual Total Returns1
As of December 31, 2014
1-Year | 5-Year | 10-Year | ||
| 11.93% | 15.33% | 8.90% |
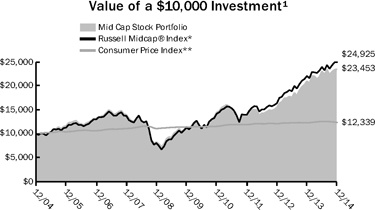
Past performance is not an indication of future results. Total investment return and principal value of your investment will fluctuate and units, when redeemed, may be worth more or less than their original cost. Current performance may be higher or lower than the performance data quoted. Call 800-THRIVENT or visit Thrivent.com for performance results current to the most recent month-end.
| 1 | Average annual total returns represent past performance and reflect changes in share prices, the reinvestment of all dividends and capital gains, and the effects of compounding. Periods of less than one year are not annualized. At various times, the Portfolio’s adviser may have waived its management fee and/or reimbursed Portfolio expenses. If this were the case, the Portfolio’s total returns would have been lower. The returns shown do not reflect charges and expenses imposed on contract holders by the variable accounts. Those charges and expenses reduce the returns received by contract holders as compared to the returns presented. |
The prospectus contains more complete information on the investment objectives, risks, charges and expenses of the investment company, which investors should read and consider carefully before investing. To obtain a prospectus, contact a registered representative or visit Thrivent.com.
| * | The Russell Midcap® Index is an index that measures the performance of the smallest 800 securities in the Russell 1000® Index, as ranked by total market capitalization. It is not possible to invest directly in the Index. The performance of the Index does not reflect deductions for fees, expenses or taxes. |
| ** | The Consumer Price Index is an inflationary indicator that measures the change in the cost of a fixed basket of products and services, including housing, electricity, food and transportation. It is not possible to invest directly in the Index. |
43
Table of Contents
THRIVENT MID CAP INDEX PORTFOLIO
Kevin R. Brimmer, FSA, Portfolio Manager
Thrivent Mid Cap Index Portfolio seeks total returns that track the performance of the S&P MidCap 400 Index.
The Portfolio primarily invests in mid-sized company stocks, which often have greater price volatility, lower trading volume, and less liquidity than stocks of larger, more established companies. The value of the Portfolio is influenced by factors impacting the overall market, certain asset classes, certain investment styles, and specific issuers.
How did the Portfolio perform during the 12-month period ended December 31, 2014?
Thrivent Mid Cap Index Portfolio earned a return of 9.28%, compared with the median return of its peer group, the Lipper Mid Cap Core category, of 9.30%. The Portfolio’s market benchmark, the S&P MidCap 400 Index, earned a return of 9.77%.
What factors affected the Portfolio’s performance?
The Portfolio’s holdings are aligned with those of the S&P MidCap 400 Index. As typically occurs in an index portfolio, the difference in performance between the benchmark index and the Portfolio itself can largely be attributed to expenses and minor differences in portfolio composition.
All but one of the sectors in the index and in the Portfolio posted positive returns for the year. Consumer staples, telecommunication services and health care were the best-performing sectors in the market over the past 12 months, posting the highest returns. Mid-cap stocks outperformed small-cap stocks over the reporting period and underperformed large-cap stocks, as large caps tend to outperform during range-bound, limited-volatility market periods. Materials and industrials delivered the lowest positive returns for the 12-month period, while the energy sector delivered a negative return.
What is your outlook?
Mid-cap stocks outperformed small-cap stocks and underperformed large caps for the past year during a period of generally positive stock price increases. Worldwide, central banks continue to provide stimulus to the global economy and profit margins remain strong. Market multiples still have the potential to expand, even with slightly higher interest rates. Because this would lead to a risk for stocks, we believe investors will tend to favor large caps over mid- and small-capitalized companies.
Since the U.S. dollar has appreciated substantially, further appreciation is less likely. Risk levels will likely fluctuate in a range- bound manner. While opportunities for mid caps exist, our view is that large-cap companies will likely outperform their mid-cap counterparts as this cycle matures.
It appears that the recovery will be sustained both in the U.S. and globally. The recovery has been aided by the recent decline in oil prices. At a minimum, global growth is slowing and the prices of risk assets have adjusted significantly, reflecting the increased uncertainty.
44
Table of Contents
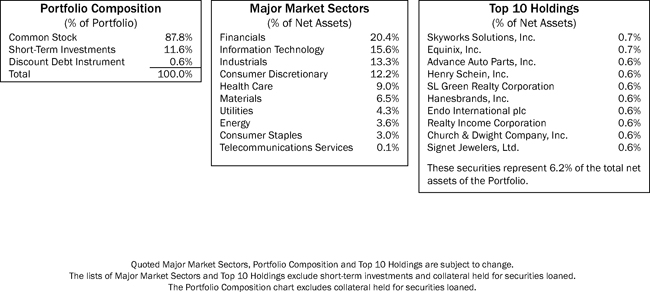
Average Annual Total Returns1
As of December 31, 2014
1-Year | 5-Year | 10-Year | ||
| 9.28% | 15.98% | 9.27% |
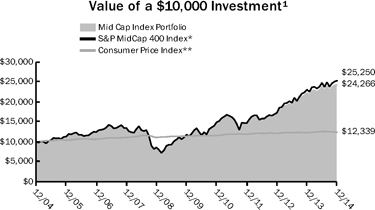
Past performance is not an indication of future results. Total investment return and principal value of your investment will fluctuate and units, when redeemed, may be worth more or less than their original cost. Current performance may be higher or lower than the performance data quoted. Call 800-THRIVENT or visit Thrivent.com for performance results current to the most recent month-end.
| 1 | Average annual total returns represent past performance and reflect changes in share prices, the reinvestment of all dividends and capital gains, and the effects of compounding. Periods of less than one year are not annualized. At various times, the Portfolio’s adviser may have waived its management fee and/or reimbursed Portfolio expenses. If this were the case, the Portfolio’s total returns would have been lower. The returns shown do not reflect charges and expenses imposed on contract holders by the variable accounts. Those charges and expenses reduce the returns received by contract holders as compared to the returns presented. |
The prospectus contains more complete information on the investment objectives, risks, charges and expenses of the investment company, which investors should read and consider carefully before investing. To obtain a prospectus, contact a registered representative or visit Thrivent.com.
| * | The S&P MidCap 400 Index is an index that represents the average performance of a group of 400 medium capitalization stocks. The product is not sponsored, endorsed or promoted by Standard & Poor’s, and Standard & Poor’s makes no representation regarding the advisability of investing in the product. It is not possible to invest directly in the Index. The performance of the Index does not reflect deductions for fees, expenses or taxes. |
| ** | The Consumer Price Index is an inflationary indicator that measures the change in the cost of a fixed basket of products and services, including housing, electricity, food and transportation. It is not possible to invest directly in the Index. |
45
Table of Contents
liquidity, political, economic and market instability, and different legal and accounting standards; these risks are magnified for investments in emerging markets. The value of the Portfolio is influenced by factors impacting the overall market, certain asset classes, certain investment styles, and specific issuers. The Portfolio may incur losses due to incorrect assessments of investments by its investment advisers. Small and medium-sized companies often have greater price volatility and less liquidity than larger companies. Large cap companies may be unable to respond quickly to new competitive challenges and may not be able to attain a high growth rate. Bond prices generally fall as interest rates rise. Credit risk is the risk that an issuer of a debt security may not pay its debt, and high yield securities are subject to increased credit risk as well as liquidity risk. The investment styles employed by the Portfolio’s sub-advisers may not be complementary.
How did the Portfolio perform during the 12-month period ended December 31, 2014?
Thrivent Partner Worldwide Allocation Portfolio earned a return of -5.35%, compared with the median return of its peer group, the Lipper International Core category, of -5.68%. The Portfolio’s market benchmark, the MSCI All Country World ex-USA Index, earned a return of -3.44%.
What factors affected the Portfolio’s performance?
The management of this Portfolio incorporates five distinct investment strategies—an approach that allows for diversified exposure across markets outside of the United States. Approximately 60% of the Portfolio’s assets are allocated to large-cap developed markets, which is split evenly between a growth manager and a value manager. An additional 15% of the Portfolio’s assets are allocated to small-cap Europe, Asia and Australian—or EAFE—markets. The remaining 25% of the Portfolio is allocated to emerging markets, which is split 60/40 between equity and fixed-income securities, respectively. The Portfolio’s relative returns are most significantly impacted by the interplay of these markets, and secondarily, by the performance of the various management teams versus their respective benchmarks.
During the period, the Portfolio’s large-cap growth manager provided excellent results relative to its benchmark; however, the large-cap value manager underperformed its category owing to an overweighting in the financial sector, particularly in Europe. The manager of emerging market equities did not keep pace with its benchmark. However, the manager of emerging market debt provided a significant premium to its benchmark, while this asset class also outperformed both emerging market and developed market equities.
All the major international segments generally did not perform as well as the major indexes in the United States. The strength of the dollar versus most major currencies was an additional headwind for non-U.S. markets.
What is your outlook?
We believe the relative valuations of non-U.S. markets are more attractive than those in the U.S., where we have experienced excellent returns since the end of the financial crisis in 2009. While most non-U.S. markets have moved higher, they have not kept pace with the U.S., due in part to the lack of a strong fundamental recovery in those markets, uneven fiscal policies, or shifts in economic fundamentals. Generally, concerns about growth are a common theme, both real economic growth and signs of deflation—or actual deflation—as seen in the eurozone and Japan, respectively. China’s growth has also downshifted from periods of extremely high growth during the early 2000s to a more moderate mid-to-high single-digit level. While this growth level is more sustainable in the long run, the adjustment process has heightened concerns about chronic overinvestment.
Many of these variables are likely to be resolved favorably over time, but in the near term present a period of heightened policy risks. While the fundamentals of corporate America are at their cyclical peaks, in many cases outside of the U.S., they are still at cyclically low levels, allowing much more room for improvement.
46
Table of Contents
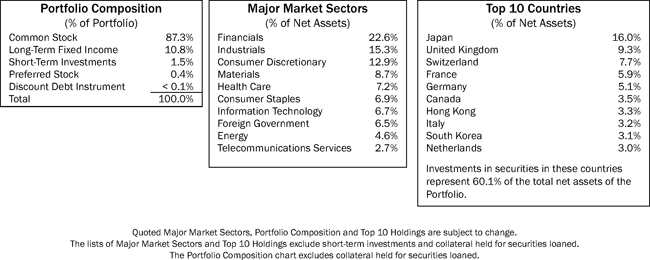
Average Annual Total Returns1
As of December 31, 2014
1-Year | 5-Year | From Inception 4/30/2008 | ||
| -5.35% | 5.42% | 0.65% |
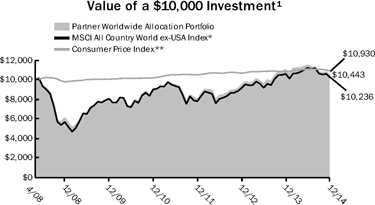
Past performance is not an indication of future results. Total investment return and principal value of your investment will fluctuate and units, when redeemed, may be worth more or less than their original cost. Current performance may be higher or lower than the performance data quoted. Call 800-THRIVENT or visit Thrivent.com for performance results current to the most recent month-end.
| 1 | Average annual total returns represent past performance and reflect changes in share prices, the reinvestment of all dividends and capital gains, and the effects of compounding. Periods of less than one year are not annualized. At various times, the Portfolio’s adviser may have waived its management fee and/or reimbursed Portfolio expenses. If this were the case, the Portfolio’s total returns would have been lower. The returns shown do not reflect charges and expenses imposed on contract holders by the variable accounts. Those charges and expenses reduce the returns received by contract holders as compared to the returns presented. |
The prospectus contains more complete information on the investment objectives, risks, charges and expenses of the investment company, which investors should read and consider carefully before investing. To obtain a prospectus, contact a registered representative or visit Thrivent.com.
| * | The MSCI All Country World ex-USA Index is an unmanaged market capitalization-weighted index that is designed to represent the performance of developed and emerging stock markets throughout the world. It is not possible to invest directly in the Index. The performance of the Index does not reflect deductions for fees, expenses or taxes. |
| ** | The Consumer Price Index is an inflationary indicator that measures the change in the cost of a fixed basket of products and services, including housing, electricity, food and transportation. It is not possible to invest directly in the Index. |
47
Table of Contents
| THRIVENT PARTNER ALL CAP PORTFOLIO |

Subadvised by Pyramis Global Advisors, LLC, an affiliate of Fidelity Investments
Thrivent Partner All Cap Portfolio seeks long-term growth of capital.
The Portfolio primarily invests in common stocks. The value of the Portfolio is influenced by factors impacting the overall market, certain asset classes, certain investment styles, and specific issuers. The Portfolio may incur losses due to incorrect assessments of investments by its investment advisers. Small and medium-sized companies often have greater price volatility and less liquidity than larger companies. Large cap companies may be unable to respond quickly to new competitive challenges and may not be able to attain a high growth rate.
How did the Portfolio perform during the 12-month period ended December 31, 2014?
Thrivent Partner All Cap Portfolio earned a return of 12.26%, compared with the median return of its peer group, the Lipper Multi-Cap Core category, of 9.16%. The Portfolio’s market benchmark, the Russell 3000® Index, earned a return of 12.56%.
What factors affected the Portfolio’s performance?
In the consumer discretionary sector, our overweighting in home improvement store Home Depot was the leading contributor to relative sector performance. Appreciation of Home Depot shares was driven by strong recurring quarterly revenues, a rebounding housing market, and increased homebuilding and home improvement in the United States.
In the industrials sector, an overweighting in express shipping company FedEx was one of the largest contributors to relative performance. Shares of FedEx have steadily appreciated over the period, driven by strong recurring quarterly earnings that continue to beat expectations. In health care, an overweighting in Botox maker Allergan was one of the largest Portfolio contributors. Allergan’s shares rose sharply based on news that Actavis had agreed to acquire the company for $66 billion.
In the information technology sector, our underweighting in chip manufacturer Intel was one of the largest detractors from relative performance. Shares in Intel appreciated after the company announced it would be purchasing a 20% stake in China-owned system-on-chip developers Spreadtrum Communications and RDA Microelectronics. It is expected that the chip designers will develop application processors for mobile devices powered by Intel’s x86 cores, which could greatly increase market share.
In the financials sector, our overweighting in bank holding company Bank of America was one of the largest detractors from relative performance. Shares of Bank of America declined during the period based on headline noise that the company was nearing a settlement with the Department of Justice relating to its mortgage underwriting activity involving Countrywide. The settlement, which was estimated at around $12 billion, would likely wipe out any positive earnings for Bank of America.
Elsewhere in the Portfolio, an underweighting in iPhone and iPad maker Apple was one of the largest detractors from relative performance. Apple’s shares rose as the company reported solid quarterly results during the period, driven by strong iPhone sales. Apple also announced that it was increasing its share buyback by $30 billion.
What is your outlook?
The fourth quarter saw broad gains across equity markets that were driven by increasing consumer confidence, continued declining unemployment and an increase in home sales. Improving corporate earnings and a still-accommodative Federal Reserve also helped the run-up during the quarter, notwithstanding that the central bank is widely expected to begin raising interest rates in the second half of 2015.
Our general outlook continues to be constructive regarding equity markets, notwithstanding that this year compared to 2013 has been a challenging year for active management generally. Although 2014 was characterized by increased volatility, overall we believe the market environment continues to be constructive for equity performance. The Fed’s continued low interest rate policy, coupled with continued market-friendly stimulus policies globally, have helped to support modest growth. While the Fed’s bond-buying program has officially ended, this should not impact the fragile recovery, particularly given that the Fed has agreed in principle to restart its bond buying if warranted by economic data.
Looking ahead to 2015, we remain cautiously optimistic about equity markets and anticipate modest economic growth across developed regions. It seems that synchronized growth with continued loose monetary policy is a likely scenario as central banks attempt to fend off deflationary pressures with monetary stimulus. However, it would not be surprising to see continued market volatility in 2015 as investors respond to ever-shifting macro conditions and central bank announcements. We believe that valuations in this space remain reasonable and see a variety of reasons for dispersions to exist. Although valuations are important, our focus is on looking for fundamental changes, which ultimately drive short- and medium-term moves in stocks and the market. We remain consistent in our portfolio construction process, using fundamental, bottom-up stock selection to build a concentrated portfolio comprised of our best ideas.
48
Table of Contents
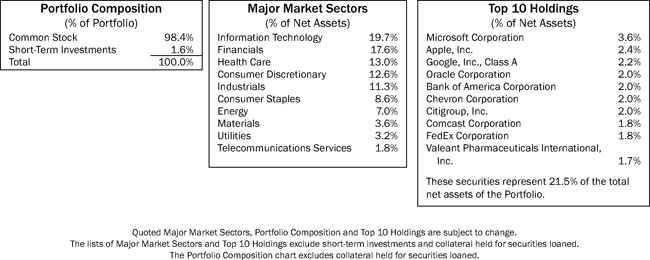
Average Annual Total Returns1
As of December 31, 2014
1-Year | 5-Year | 10-Year | ||
| 12.26% | 13.63% | 8.62% |
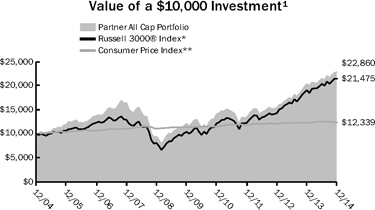
Past performance is not an indication of future results. Total investment return and principal value of your investment will fluctuate and units, when redeemed, may be worth more or less than their original cost. Current performance may be higher or lower than the performance data quoted. Call 800-THRIVENT or visit Thrivent.com for performance results current to the most recent month-end.
| 1 | Average annual total returns represent past performance and reflect changes in share prices, the reinvestment of all dividends and capital gains, and the effects of compounding. Periods of less than one year are not annualized. At various times, the Portfolio’s adviser may have waived its management fee and/or reimbursed Portfolio expenses. If this were the case, the Portfolio’s total returns would have been lower. The returns shown do not reflect charges and expenses imposed on contract holders by the variable accounts. Those charges and expenses reduce the returns received by contract holders as compared to the returns presented. |
The prospectus contains more complete information on the investment objectives, risks, charges and expenses of the investment company, which investors should read and consider carefully before investing. To obtain a prospectus, contact a registered representative or visit Thrivent.com.
| * | The Russell 3000® Index is an index comprised of the 3,000 largest U.S. companies based on market capitalization. It is not possible to invest directly in the Index. The performance of the Index does not reflect deductions for fees, expenses or taxes. |
| ** | The Consumer Price Index is an inflationary indicator that measures the change in the cost of a Axed basket of products and services, including housing, electricity, food and transportation. It is not possible to invest directly in the Index. |
49
Table of Contents
THRIVENT LARGE CAP GROWTH PORTFOLIO
David C. Francis, CFA, Portfolio Manager
Thrivent Large Cap Growth Portfolio seeks long-term growth of capital.
The Portfolio primarily invests in securities of large companies, which may be unable to respond quickly to new competitive challenges and may not be able to attain a high growth rate. The value of the Portfolio is influenced by factors impacting the overall market, certain asset classes, certain investment styles, and specific issuers. The Portfolio may incur losses due to incorrect assessments of investments by its investment adviser. Foreign investments involve additional risks, including currency fluctuations, liquidity, political, economic and market instability, and different legal and accounting standards.
How did the Portfolio perform during the 12-month period ended December 31, 2014?
Thrivent Large Cap Growth Portfolio earned a return of 10.99%, compared with the median return for its peer group, the Lipper Large Cap Growth category, of 9.68%. The Portfolio’s market benchmark, the Russell 1000® Growth Index, earned a return of 13.05%.
What factors affected the Portfolio’s performance?
The primary factor impacting the Portfolio’s performance over the period was stock selection, with a modest contribution from sector and industry allocation decisions. Specifically, the Portfolio achieved strong returns from our positions in information technology, enhanced by an overweighting in the group as our holdings outperformed both the sector and the overall index. In the software and services industry, Facebook and LinkedIn were two strong performers, while our holding in Apple in the hardware segment also performed quite well. The information technology services industry also added to results with favorable performance from our positions in Visa and MasterCard. Both firms are often thought of as financial services companies, but are in fact categorized as technology companies. Offsetting some of those positive results were disappointing returns from our position in VMware.
Stock selection in the health care sector was the next most significant positive contributor to results. In biotechnology, our holding in Gilead Sciences performed extremely well due to the success of its new drug that provides a cure for hepatitis C. Covidien, in the health care equipment industry, also aided returns as it was the target of a merger offer from Medtronic. In the health care technology industry, Cerner also performed well over the period. However, our position in pharmaceutical manufacturer Perrigo did not perform well and we have since eliminated that position.
The Portfolio was underweighted in consumer staples as many of the companies in that sector, in our opinion, were fully valued or expensive. This underweighting aided the Portfolio’s return as the staples group underperformed the overall index.
Offsetting those positives were subpar returns from our holdings in the consumer discretionary sector. Amazon.com provided disappointing returns as the company’s significant spending on infrastructure build-out negatively impacted near-term earnings and cash flow expectations. We continue to believe Amazon.com will dominate the important eCommerce space and maintain our position. Las Vegas Sands also disappointed on the back of weakness in its Macau casino operations as China’s growth has slowed and other disruptive policies were put in place in that country. In the retail sector, Kohl’s also disappointed as its new strategy has been slow to bring improved results to the company’s bottom line. Retail is an increasingly difficult industry, and execution by Kohl’s within the space has been disappointing. New senior managers have been appointed from outside the company, but the expected turnaround has been slow to materialize.
In the financial sector, we briefly held a position in Genworth Financial that declined sharply on the basis of increased reserves required to support its poorly designed long-term care business. It became apparent to us that this would be an ongoing issue and we quickly sold the position.
What is your outlook?
Equity markets have rallied strongly over the past two years on the back of modest earnings growth and the significant expansion of P/E ratios. We believe that valuations are at best full, and in certain segments, are quite high. Further stock market advances would most likely be a function of sustained earnings growth at the aggregate level, which we believe could occur, but will become incrementally more challenging. This is particularly true for the large-cap segment as so many of these companies’ sales are outside the U.S., and recent dollar strength has the potential to impede both sales and earnings growth. Profit margins are also extremely high. Some of that is a function of continued business model discipline, which can be sustained, while some of it is a function of low interest rates and low tax rates in offshore operations. Those have likely reached the limit of their contributions.
We believe the recovery will be sustained both in the U.S. and globally, aided by the recent declines in oil prices, but the risks are high. We continue to invest in companies that we believe have strong business models and excellent management teams that have been prudent shepherds of investors’ capital. The macroeconomic environment in the U.S. is better than most other countries, while geopolitical risks outside the U.S. are elevated.
50
Table of Contents
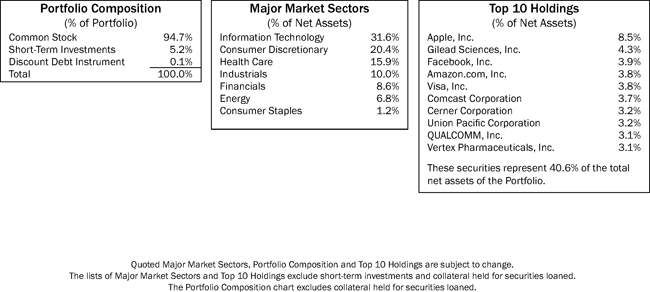
Average Annual Total Returns1
As of December 31, 2014
1-Year | 5-Year | 10-Year | ||
| 10.99% | 13.56% | 7.52% |
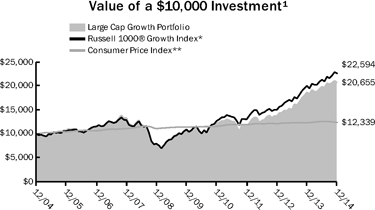
Past performance is not an indication of future results. Total investment return and principal value of your investment will fluctuate and units, when redeemed, may be worth more or less than their original cost. Current performance may be higher or lower than the performance data quoted. Call 800-THRIVENT or visit Thrivent.com for performance results current to the most recent month-end.
| 1 | Average annual total returns represent past performance and reflect changes in share prices, the reinvestment of all dividends and capital gains, and the effects of compounding. Periods of less than one year are not annualized. At various times, the Portfolio’s adviser may have waived its management fee and/or reimbursed Portfolio expenses. If this were the case, the Portfolio’s total returns would have been lower. The returns shown do not reflect charges and expenses imposed on contract holders by the variable accounts. Those charges and expenses reduce the returns received by contract holders as compared to the returns presented. |
The prospectus contains more complete information on the investment objectives, risks, charges and expenses of the investment company, which investors should read and consider carefully before investing. To obtain a prospectus, contact a registered representative or visit Thrivent.com.
| * | The Russell 1000® Growth Index measures the performance of large cap growth stocks. It is not possible to invest directly in the Index. The performance of the Index does not reflect deductions for fees, expenses or taxes. |
| ** | The Consumer Price Index is an inflationary indicator that measures the change in the cost of a Axed basket of products and services, including housing, electricity, food and transportation. It is not possible to invest directly in the Index. |
51
Table of Contents
 | THRIVENT PARTNER GROWTH STOCK PORTFOLIO |
Subadvised by T. Rowe Price Associates, Inc.
Thrivent Partner Growth Stock Portfolio seeks long-term growth of capital and, secondarily, to increase dividend income.
The Portfolio primarily invests in common stocks. The value of the Portfolio is influenced by factors impacting the overall market, certain asset classes, certain investment styles, and specific issuers. The Portfolio may incur losses due to incorrect assessments of investments by its investment advisers. Foreign investments involve additional risks, including currency fluctuations, liquidity, political, economic and market instability, and different legal and accounting standards.
How did the Portfolio perform during the 12-month period ended December 31, 2014?
Thrivent Partner Growth Stock Portfolio earned a return of 8.51%, compared with the median return of its peer group, the Lipper Large Cap Growth category, of 9.68%. The Portfolio’s market benchmark, the S&P 500/Citigroup Growth Index, earned a return of 14.89%.
What factors affected the Portfolio’s performance?
Stock selection was the overwhelming reason for the Portfolio’s relative underperformance, but sector weightings were also negative. Information technology, consumer discretionary and energy were the largest relative detractors. Health care, materials and consumer staples were the leading outperformers.
Information technology was the leading detractor mainly due to stock selection, but an underweighting also hurt. Google’s recent growth disappointed investors as the company made changes to improve the quality of response to mobile ads, at the expense of some volume, in order to preserve pricing power. An underweighting to Apple also detracted. Its shares rose sharply during the period as investors anticipated the release of the iPhone 6 with its larger screen.
The consumer discretionary sector detracted also due to stock selection. Amazon.com reported impressive revenue and unit growth, but posted minimal profits due to an ongoing investment cycle. Wynn Resorts’ stock traded lower due to a slowdown in the VIP and high-end mass gaming business in Macau, China.
Health care was the leading relative outperformer, driven by stock selection. Shares of Vertex Pharmaceuticals soared in June based on news that the company’s cystic fibrosis treatment met its primary endpoint in Phase III trials. The company plans to submit for regulatory approval in both the United States and Europe in the near future. Stock selection also aided the materials sector’s outperformance. Paint manufacturer and retailer Sherwin-Williams experienced strong growth from a combination of commercial demand, home construction and existing home sales.
What is your outlook?
We expect the equities environment to remain favorable in 2015, barring an exogenous event. China still poses some risk, while it is also possible that the eurozone’s sluggish economy and struggle with deflation will linger for longer than expected. But we expect commodities prices and inflation to remain contained, interest rates to stay relatively low, and the earnings outlook for various sectors to be promising. We are focusing on companies with the ability to grow earnings regardless of macroeconomic conditions.
52
Table of Contents
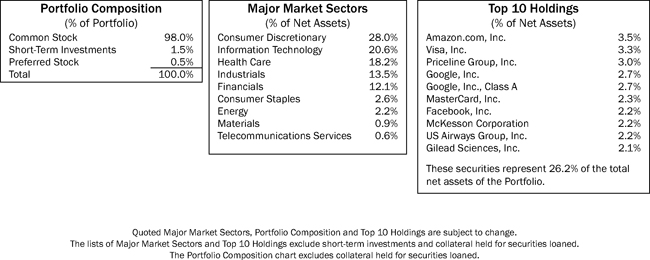
Average Annual Total Returns1
As of December 31, 2014
1-Year | 5-Year | 10-Year | ||
| 8.51% | 15.48% | 8.39% |
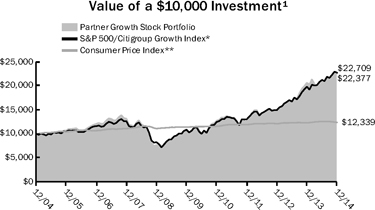
Past performance is not an indication of future results. Total investment return and principal value of your investment will fluctuate and units, when redeemed, may be worth more or less than their original cost. Current performance may be higher or lower than the performance data quoted. Call 800-THRIVENT or visit Thrivent.com for performance results current to the most recent month-end.
| 1 | Average annual total returns represent past performance and reflect changes in share prices, the reinvestment of all dividends and capital gains, and the effects of compounding. Periods of less than one year are not annualized. At various times, the Portfolio’s adviser may have waived its management fee and/or reimbursed Portfolio expenses. If this were the case, the Portfolio’s total returns would have been lower. The returns shown do not reflect charges and expenses imposed on contract holders by the variable accounts. Those charges and expenses reduce the returns received by contract holders as compared to the returns presented. |
The prospectus contains more complete information on the investment objectives, risks, charges and expenses of the investment company, which investors should read and consider carefully before investing. To obtain a prospectus, contact a registered representative or visit Thrivent.com.
| * | The S&P 500/Citigroup Growth Index is a capitalization-weighted index comprised of the highest price-to-book ratio securities in the S&P 500 Index. The S&P 500/Citigroup Growth Index is designed so that approximately one-half of the S&P 500 Index market capitalization is characterized as “value” and the other half as “growth.” The product is not sponsored, endorsed or promoted by Standard & Poor’s, and Standard & Poor’s makes no representation regarding the advisability of investing in the product. It is not possible to invest directly in the Index. The performance of the Index does not reflect deductions for fees, expenses or taxes. |
| ** | The Consumer Price Index is an inflationary indicator that measures the change in the cost of a fixed basket of products and services, including housing, electricity, food and transportation. It is not possible to invest directly in the Index. |
53
Table of Contents
THRIVENT LARGE CAP VALUE PORTFOLIO
Kurt J. Lauber, CFA, Portfolio Manager
Thrivent Large Cap Value Portfolio seeks long-term growth of capital.
The Portfolio primarily invests in securities of large companies, which may be unable to respond quickly to new competitive challenges and may not be able to attain a high growth rate. The value of the Portfolio is influenced by factors impacting the overall market, certain asset classes, certain investment styles, and specific issuers. The Portfolio may incur losses due to incorrect assessments of investments by its investment adviser. Foreign investments involve additional risks, including currency fluctuations, liquidity, political, economic and market instability, and different legal and accounting standards.
How did the Portfolio perform during the 12-month period ended December 31, 2014?
Thrivent Large Cap Value Portfolio earned a return of 9.03%, compared with the median return of its peer group, the Lipper Large Cap Value category, of 10.79%. The Portfolio’s market benchmark, the Russell 1000® Value Index, earned a return of 13.45%.
What factors affected the Portfolio’s performance?
Stock selection was the cause of the Portfolio’s underperformance relative to its peer group and benchmark, as asset allocation decisions were slightly positive. Stock selection detracted in the technology, financial and industrial sectors, while results were favorable in utilities, consumer discretionary and energy.
In technology, the Portfolio benefited from an overweighting in the sector, especially in attractively valued, mature companies such as Microsoft, Cisco Systems and Texas Instruments. However, their favorable performance was not enough to offset the strong results from stocks we did not hold, such as Hewlett-Packard, Apple and Intel. Furthermore, we held a position in security software firm Symantec in anticipation of a potential turnaround, which was derailed by the abrupt firing of the company’s CEO, who was instrumental in the turnaround process.
In financials, our purchase of Deutsche Bank detracted from returns. Also, the Portfolio briefly held Genworth Financial in order to benefit from an anticipated turnaround in its long-term care and mortgage insurance businesses, but this thesis was incorrect and we sold the stock quickly. Industrial performance was hurt by owning two construction and engineering companies, Jacobs Engineering Group and Fluor, as large capital infrastructure projects have been taking longer to materialize.
Our positive results in utilities were driven by outperformance from NiSource and Pacific Gas and Electric Company. NiSource benefited from the need for natural gas infrastructure in the Marcellus shale region, while its shares received an additional boost from the company’s announcement to spin off its natural gas pipeline business into a master limited partnership (MLP).
In consumer discretionary, our general avoidance of auto manufacturers helped results, as did our position in auto parts company Delphi Automotive.
Finally, the Portfolio benefited from our holding of medical device and supply firm Covidien as Medtronic made a bid for the company, which could create even greater shareholder value if completed.
What is your outlook?
As always, our focus is on stock selection and improving our execution in this area. Valuation is our first guide, but as differences in companies’ valuations have narrowed, we are placing more emphasis on improvements in corporate operating performance and incremental returns on invested capital. We believe our deep fundamental analysis approach will help identify companies that have improving operating performance and the catalysts to unlock value.
The two sectors where valuations remain low and company valuation spreads remain wide, thereby providing greater potential for stock selection, are technology and energy. Large, mature technology companies have low valuations because of below-normal technology spending, but also due to the fear of secular demise resulting from products becoming obsolete with the introduction of new technologies, such as cloud computing.
With low natural gas and oil prices driving shares lower, the energy sector has the potential to be an area of absolute positive performance, as well as favorable stock selection due to the wide valuation spreads among energy companies. We will continue to emphasize companies in poorly performing areas, such as exploration and production firms and equipment and services providers, so the Portfolio continues to hold these names.
54
Table of Contents
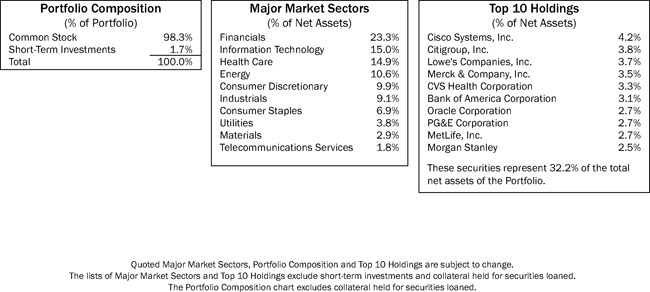
Average Annual Total Returns1
As of December 31, 2014
1-Year | 5-Year | 10-Year | ||
| 9.03% | 13.02% | 6.91% |
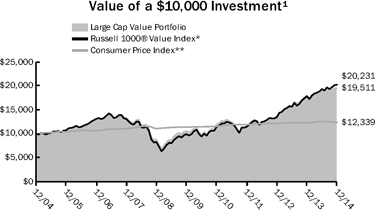
Past performance is not an indication of future results. Total investment return and principal value of your investment will fluctuate and units, when redeemed, may be worth more or less than their original cost. Current performance may be higher or lower than the performance data quoted. Call 800-THRIVENT or visit Thrivent.com for performance results current to the most recent month-end.
| 1 | Average annual total returns represent past performance and reflect changes in share prices, the reinvestment of all dividends and capital gains, and the effects of compounding. Periods of less than one year are not annualized. At various times, the Portfolio’s adviser may have waived its management fee and/or reimbursed Portfolio expenses. If this were the case, the Portfolio’s total returns would have been lower. The returns shown do not reflect charges and expenses imposed on contract holders by the variable accounts. Those charges and expenses reduce the returns received by contract holders as compared to the returns presented. |
The prospectus contains more complete information on the investment objectives, risks, charges and expenses of the investment company, which investors should read and consider carefully before investing. To obtain a prospectus, contact a registered representative or visit Thrivent.com.
| * | The Russell 1000® Value Index measures the performance of large cap value stocks. It is not possible to invest directly in the Index. The performance of the Index does not reflect deductions for fees, expenses or taxes. |
| ** | The Consumer Price Index is an inflationary indicator that measures the change in the cost of a fixed basket of products and services, including housing, electricity, food and transportation. It is not possible to invest directly in the Index. |
55
Table of Contents
THRIVENT LARGE CAP STOCK PORTFOLIO
David C. Francis, CFA and Kurt J. Lauber, CFA, Portfolio Co-Managers
Thrivent Large Cap Stock Portfolio seeks long-term capital growth.
The Portfolio primarily invests in securities of large companies, which may be unable to respond quickly to new competitive challenges and may not be able to attain a high growth rate. The value of the Portfolio is influenced by factors impacting the overall market, certain asset classes, certain investment styles, and specific issuers. The Portfolio may incur losses due to incorrect assessments of investments by its investment adviser. Foreign investments involve additional risks, including currency fluctuations, liquidity, political, economic and market instability, and different legal and accounting standards.
How did the Portfolio perform during the 12-month period ended December 31, 2014?
Thrivent Large Cap Stock Portfolio earned a return of 5.29%, compared with the median return of its peer group, the Lipper Global Large Cap Core category, of 3.79%. The Portfolio’s market benchmark, the Russell Developed Large Cap Index, earned a return of 5.78%.
What factors affected the Portfolio’s performance?
Stock selection benefited the Portfolio’s performance over the reporting period. Allocations within both the domestic and non- U.S. segments of the Portfolio were neutral to their respective benchmarks; however, our active repositioning of the Portfolio into global large-cap companies was not rewarded in the reporting period as U.S. equities provided better returns than large-cap non-U.S. equities.
Information technology (IT) stocks provided the most positive contribution to returns. In the hardware industry, our overweighting in Apple was the most significant factor aiding results. In the IT services industry, holdings in both Twitter and Facebook proved beneficial.
Positions within the health care sector were also significant positive contributors to results. We had particularly good returns from our holdings in the biotechnology industry, including Gilead Sciences, due to strong sales of its new drug that provides a cure for hepatitis C. Amgen and Vertex Pharmaceuticals also provided positive contribution versus both the peer group and the Russell Developed Large Cap Index. Our holding in Australian company CSL Limited, which develops products derived from human plasma, also performed well. In the health care services industry, our position in Express Scripts, a pharmacy benefit management company, achieved good results. In addition, health care equipment provider Covidian lifted returns as it was the target of a merger offer from Medtronic. However, a holding in pharmaceutical manufacturer Perrigo based in Ireland did not perform up to expectations and was sold.
In the financial sector, our holdings in the banking industry, specifically Wells Fargo and JPMorgan Chase, added to results as they both provided strong returns versus their sector and the Russell benchmark. Asset manager Invesco also performed well, lifted by the strong returns of equities over the past two years. However, some of these favorable results were offset by disappointing returns from our positions in Deutsche Bank in Germany and Genworth Financial in the insurance industry.
Our holdings in the utilities and materials segments also contributed positively during the period. In the former, strong returns were realized by our positions in NiSource, an East Coast-based energy holding company, and Pacific Gas and Electric Company on the West Coast, which provides energy services within its markets in California. In materials, Dow Chemical provided a strong return relative to its group and the Portfolio’s benchmarks. Two Japanese companies, Nippon Paint Holdings and NOK Corporation, also performed well. Additionally, an underweighted position in mining helped as the group performed quite poorly.
The Portfolio’s exposure to non-U.S. markets limited performance relative to U.S. indexes as overseas markets generally did not keep pace, particularly in Europe. Japan performed in line with the U.S. on a local currency basis, but that appreciation was all offset by yen weakness. Europe underperformed on both a euro and dollar basis.
What is your outlook?
We strongly believe that relative values favor large-cap non-U.S. companies. While many developed economies outside the U.S. are faced with challenges on the domestic front, the types of companies we purchase—large-cap global companies with significant sales outside domestic markets—should be beneficiaries of the strong dollar versus their respective currencies. We believe this will help to improve the global competitiveness of these companies. Additionally, many of these companies have far more room to recover profit margins and earnings, while the U.S. will increasingly face headwinds. Thus, our plan is to opportunistically increase our holdings in non-U.S. companies to take advantage of the valuation disparities. While we may have been early on this portfolio repositioning, we believe it is the correct position for long-term investors.
56
Table of Contents
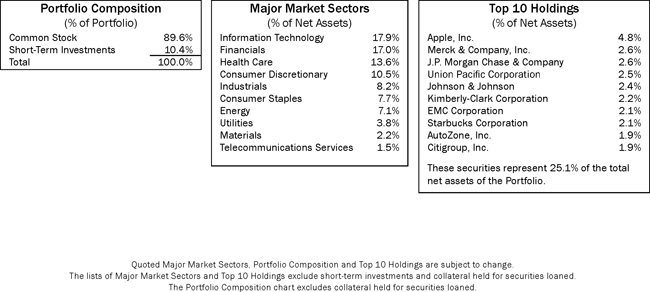
Average Annual Total Returns1
As of December 31, 2014
1-Year | 5-Year | 10-Year | ||
| 5.29% | 10.64% | 5.27% |
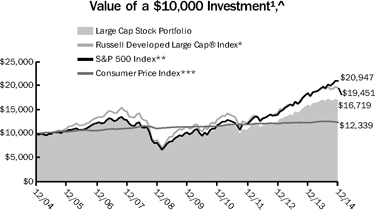
Past performance is not an indication of future results. Total investment return and principal value of your investment will fluctuate and units, when redeemed, may be worth more or less than their original cost. Current performance may be higher or lower than the performance data quoted. Call 800-THRIVENT or visit Thrivent.com for performance results current to the most recent month-end.
| 1 | Average annual total returns represent past performance and reflect changes in share prices, the reinvestment of all dividends and capital gains, and the effects of compounding. Periods of less than one year are not annualized. At various times, the Portfolio’s adviser may have waived its management fee and/or reimbursed Portfolio expenses. If this were the case, the Portfolio’s total returns would have been lower. The returns shown do not reflect charges and expenses imposed on contract holders by the variable accounts. Those charges and expenses reduce the returns received by contract holders as compared to the returns presented. |
The prospectus contains more complete information on the investment objectives, risks, charges and expenses of the investment company, which investors should read and consider carefully before investing. To obtain a prospectus, contact a registered representative or visit Thrivent.com.
| ^ | Effective February 28, 2014, the Portfolio’s benchmark index changed from the S&P 500 Index to the Russell Developed Large Cap® Index. The Adviser made this benchmark change because of changes to the Portfolio’s principal investment strategies. |
| * | The Russell Developed Large Cap® Index measures the performance of the investable large-cap securities in developed countries globally. It is not possible to invest directly in the Index. The performance of the Index does not reflect deductions for fees, expenses or taxes. |
| ** | The S&P 500 Index is an index that represents the average performance of a group of 500 widely held, publicly traded stocks. “S&P 500” is a trade Mark of The McGraw-Hill Companies, Inc. and has been licensed for use by Thrivent Financial. The product is not sponsored, endorsed or promoted by Standard & Poor’s and Standard & Poor’s makes no representation regarding the advisability of investing in the product. It is not possible to invest directly in the Index. The performance of the Index does not reflect deductions for fees, expenses or taxes. |
| *** | The Consumer Price Index is an inflationary indicator that measures the change in the cost of a fixed basket of products and services, including housing, Electricity, food and transportation. It is not possible to invest directly in the Index. |
57
Table of Contents
THRIVENT LARGE CAP INDEX PORTFOLIO
Kevin R. Brimmer, FSA, Portfolio Manager
Thrivent Large Cap Index Portfolio seeks total returns that track the performance of the S&P 500 Index.
The Portfolio primarily invests in large company common stocks. Large companies may be unable to respond quickly to new competitive challenges and may not be able to attain a high growth rate. The value of the Portfolio is influenced by factors impacting the overall market, certain asset classes, certain investment styles, and specific issuers.
How did the Portfolio perform during the 12-month period ended December 31, 2014?
Thrivent Large Cap Index Portfolio earned a return of 13.25%, compared with the median return of its peer group, the Lipper S&P 500 Index Objective category, of 13.26%. The Portfolio’s market benchmark, the S&P 500 Index, earned a return of 13.69%.
What factors affected the Portfolio’s performance?
The Portfolio’s holdings are aligned with those of the S&P 500 Index. As typically occurs in an index portfolio, the difference in performance between the benchmark index and the Portfolio itself can largely be attributed to expenses and minor differences in portfolio composition.
All but one of the sectors in the index and in the Portfolio posted positive returns for the year. Utilities, health care and information technology were the best-performing sectors in the market over the past 12 months, posting the highest returns. Large-cap stocks outperformed small- and mid-cap stocks over the reporting period, as large caps tend to outperform during range-bound, limited-volatility market periods. Materials and telecommunications services delivered the lowest positive returns for the 12-month period, while the energy sector posted a negative return.
What is your outlook?
Large-cap stocks outperformed both mid-cap stocks and small caps for the past year during a period of generally positive stock price increases. Worldwide, central banks continue to provide stimulus to the global economy and profit margins remain strong. Market multiples still have the potential to expand, even with slightly higher interest rates. Because this would lead to a risk for stocks, we believe investors will tend to favor large caps over mid- and small-capitalized companies.
Since the U.S. dollar has appreciated substantially, further appreciation is less likely. Risk levels will likely fluctuate in a range- bound manner. While opportunities for small and mid caps exist, our view is that large-cap companies should outperform their small- and mid-cap counterparts as this cycle matures.
It appears that the recovery will be sustained both in the U.S. and globally. The recovery has been aided by the recent decline in oil prices. At a minimum, global growth is slowing and the prices of risk assets have adjusted significantly, reflecting the increased uncertainty
58
Table of Contents
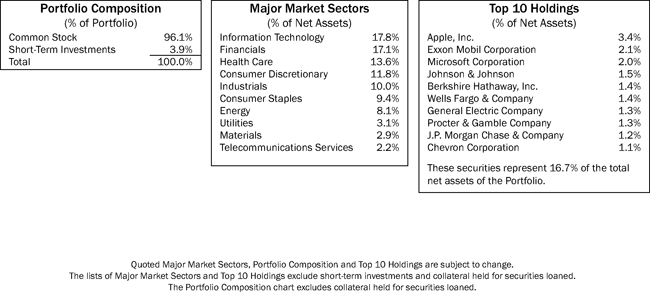
Average Annual Total Returns1
As of December 31, 2014
1-Year | 5-Year | 10-Year | ||
| 13.25% | 14.99% | 7.33% |
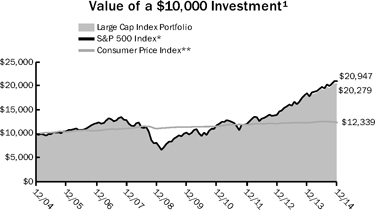
Past performance is not an indication of future results. Total investment return and principal value of your investment will fluctuate and units, when redeemed, may be worth more or less than their original cost. Current performance may be higher or lower than the performance data quoted. Call 800-THRIVENT or visit Thrivent.com for performance results current to the most recent month-end.
| 1 | Average annual total returns represent past performance and reflect changes in share prices, the reinvestment of all dividends and capital gains, and the effects of compounding. Periods of less than one year are not annualized. At various times, the Portfolio’s adviser may have waived its management fee and/or reimbursed Portfolio expenses. If this were the case, the Portfolio’s total returns would have been lower. The returns shown do not reflect charges and expenses imposed on contract holders by the variable accounts. Those charges and expenses reduce the returns received by contract holders as compared to the returns presented. |
The prospectus contains more complete information on the investment objectives, risks, charges and expenses of the investment company, which investors should read and consider carefully before investing. To obtain a prospectus, contact a registered representative or visit Thrivent.com.
| * | The S&P 500 Index is an index that represents the average performance of a group of 500 widely held, publicly traded stocks. “S&P 500” is a trade Mark of The McGraw-Hill Companies, Inc. and has been licensed for use by Thrivent Financial. The product is not sponsored, endorsed or promoted by Standard & Poor’s and Standard & Poor’s makes no representation regarding the advisability of investing in the product. It is not possible to invest directly in the Index. The performance of the Index does not reflect deductions for fees, expenses or taxes. |
| ** | The Consumer Price Index is an inflationary indicator that measures the change in the cost of a fixed basket of products and services, including housing, Electricity, food and transportation. It is not possible to invest directly in the Index. |
59
Table of Contents
Paul J. Ocenasek, CFA, Portfolio Manager
Thrivent High Yield Portfolio seeks to achieve a higher level of income. The Portfolio will also consider growth of capital as a secondary objective.
The Portfolio primarily invests in high-yield, high-risk bonds, notes, debentures and other debt obligations, or preferred stocks. Credit risk is the risk that an issuer of a debt security may not pay its debt, and high yield securities are subject to increased credit risk as well as liquidity risk. Bond prices generally fall as interest rates rise. Leveraged loans are subject to numerous risks, including liquidity, credit, declines in the value of collateral underlying them, and detrimental legal actions against them. The value of the Portfolio is influenced by factors impacting the overall market, certain asset classes, certain investment styles, and specific issuers. The Portfolio may incur losses due to incorrect assessments of investments by its investment adviser. Foreign investments involve additional risks, including currency fluctuations, liquidity, political, economic and market instability, and different legal and accounting standards.
How did the Portfolio perform during the 12-month period ended December 31, 2014?
Thrivent High Yield Portfolio earned a return of 1.96%, compared with the median return of its peer group, the Lipper U.S. High Current Yield category, of 1.20%. The Portfolio’s market benchmark, the Barclays U.S. Corporate High Yield Bond Index, earned a return of 2.45%.
What factors affected the Portfolio’s performance?
High-yield bonds turned in a strong performance during the first half of the year as corporate profits remained healthy and the U.S. economy, after a weak first quarter, began to accelerate, growing at a 5% annual rate in the third quarter. However, demand for high-yield securities began to falter in the second half of the year as investors worried that weak economic conditions in Europe and slowing economic growth in China could ultimately have a negative impact on the U.S. economy. Conditions deteriorated even more in the fourth quarter as a steep slide in oil prices accelerated. This prompted concerns about the health of high-yield debt issued by energy companies, whose bonds account for about 15% of the high-yield sector. From June to year-end, U.S. prices for oil fell from more than $100 a barrel to about $53 a barrel.
The Portfolio outperformed its Lipper peer group in part because the Portfolio held less cash than its peer funds on average, and in part because of favorable security selection in the retailing industry. With minimal exposure to distressed retailers, the Portfolio’s holdings in that industry earned about 7% before expenses, or more than twice what the industry delivered within the Barclays index. Other industries that contributed favorably to performance included: wireline telecommunications, which earned about 9%; banking marketwide, which earned about 8.5%; and health care, which earned about 6.8%. Laggards included commodities, driven in part by the decline in oil prices, and gaming, where overcapacity has become an issue for the casino industry. Oil issues lost about 12% and gaming holdings lost about 5%.
What is your outlook?
Absent any significant changes in economic conditions, we believe it would not be unreasonable to expect the high-yield sector to generate returns in the low single-digit range in 2015. Yields on high-yield bonds were averaging about 6.1% at the start of the new year, or approximately 480 basis points more than comparable-maturity Treasuries. That was up significantly from a spread of about 380 basis points at the start of 2014, and we expect that any retightening of spreads in 2015 would only boost returns.
Positives heading into the new year included a relatively healthy U.S. economy, which our models suggest will moderate from the heady pace of last year’s third quarter but still expand by about 2.5%. Lower oil prices should help the economy by giving consumers more to spend on other goods and services, but would continue to weigh on the energy industry.
Partly as a consequence of that pressure on energy, we anticipate that default rates for the high-yield sector overall could rise in 2015 to about 3%. That would be up from 1.5% to 2% in 2014, although spreads on high-yield debt versus Treasuries were compensating investors for that risk heading into the new year. Much of the sector’s performance will depend on oil prices. If oil remains at extraordinarily low levels for an extended period, default rates in the high-yield sector could be even higher than 3%, pressuring returns. By contrast, we feel that a gradual improvement in oil prices could moderate the default rate and help to boost returns.
60
Table of Contents
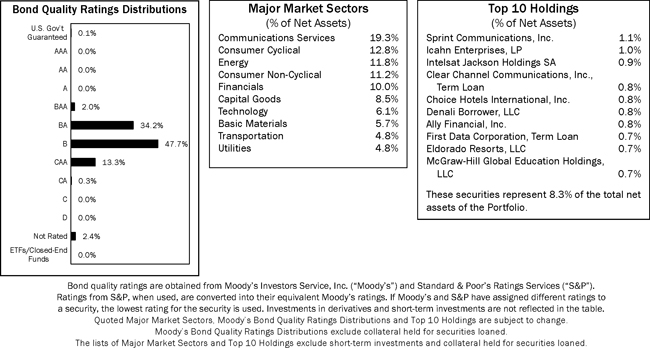
Average Annual Total Returns 1
As of December 31, 2014
1-Year | 5-Year | 10-Year | ||
| 1.96% | 8.75% | 7.34% |
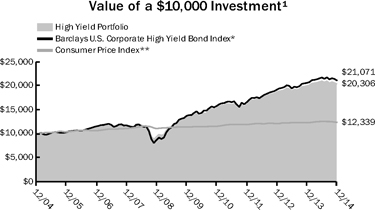
Past performance is not an indication of future results. Total investment return and principal value of your investment will fluctuate and units, when redeemed, may be worth more or less than their original cost. Current performance may be higher or lower than the performance data quoted. Call 800-THRIVENT or visit Thrivent.com for performance results current to the most recent month-end.
| 1 | Average annual total returns represent past performance and reflect changes in share prices, the reinvestment of all dividends and capital gains, and The effects of compounding. Periods of less than one year are not annualized. At various times, the Portfolio’s adviser may have waived its management fee and/or reimbursed Portfolio expenses. If this were the case, the Portfolio’s total returns would have been lower. The returns shown do not reflect charges and expenses imposed on contract holders by the variable accounts. Those charges and expenses reduce the returns received by contract holders as compared to the returns presented. |
The prospectus contains more complete information on the investment objectives, risks, charges and expenses of the investment company, which investors should read and consider carefully before investing. To obtain a prospectus, contact a registered representative or visit Thrivent.com.
| * | The Barclays U.S. Corporate High Yield Bond Index is an index which measures the performance of fixed-rate non-investment grade bonds. It is not possible to invest directly in the Index. The performance of the Index does not reflect deductions for fees, expenses or taxes. |
| ** | The Consumer Price Index is an inflationary indicator that measures the change in the cost of a fixed basket of products and services, including housing, electricity, food and transportation. It is not possible to invest directly in the Index. |
61
Table of Contents
Stephen D. Lowe, CFA, Portfolio Manager
Thrivent Income Portfolio seeks a high level of income over the longer term while providing reasonable safety of capital.
The Portfolio primarily invests in investment-grade corporate bonds, government bonds, asset-backed securities and mortgage-backed securities. The value of the Portfolio is influenced by factors impacting the overall market, certain asset classes, certain investment styles, and specific issuers. The Portfolio may incur losses due to incorrect assessments of investments by its investment adviser. Bond prices generally fall as interest rates rise. Credit risk is the risk that an issuer of a debt security may not pay its debt, and high yield securities are subject to increased credit risk as well as liquidity risk. The value of mortgage-related and other asset-backed securities will be influenced by the factors affecting the housing market and the assets underlying such securities. Foreign investments involve additional risks, including currency fluctuations, liquidity, political, economic and market instability, and different legal and accounting standards. The prices of futures contracts can be highly volatile and the loss from investing in them can exceed the initial investment.
How did the Portfolio perform during the 12-month period ended December 31, 2014?
Thrivent Income Portfolio generated a return of 6.68%, compared with the median return of its peer group, the Lipper Corporate Debt Funds BBB-Rated category, of 5.59%. The Portfolio’s market benchmark, the Barclays U.S. Aggregate Bond Index, earned a return of 5.97%.
What factors affected the Portfolio’s performance?
U.S. fixed-income markets were broadly higher in 2014, confounding market analysts who had expected interest rates to rise as the Federal Reserve wound down quantitative easing—a program in which it had been buying $85 billion of bonds each month to stimulate the economy. Instead, sluggish economic conditions and extremely low interest rates in Europe, slowing economic growth in China, nervousness about Russia’s incursion into Ukraine, and a strengthening dollar all drove global investors to seek security in U.S. bonds, which pushed longer-term interest rates down and bond prices up.
Treasury securities were the principal beneficiaries, with 10-year and 30-year Treasury bonds generating returns of 10.75% and 29.40%, respectively. However, investment-grade corporate bonds, which accounted for about 67% of the Portfolio, also performed well, generating a return of 7.6% before expenses. Investors were attracted to those bonds both for their credit quality and their higher yields relative to Treasuries.
High-yield corporate bonds and leveraged loans were among the Portfolio’s weaker performers, earning only about 2.5% and 1.5%, respectively, as measured by the Barclays bond indexes. The modest returns on high-yield bonds were attributable to a steep decline in oil prices in the second half of the year. Investors worried that the slide would boost defaults on high-yield bonds in the energy sector, which account for about 15% of the high-yield market. Meanwhile, because they are floating-rate instruments, leveraged loans did not benefit as much as other segments of the bond market from the decline in interest rates.
The Portfolio outperformed its peer group and benchmark index largely because it had a modest overweighting in investment-grade corporate bonds and because it concentrated more of its high-yield holdings at the higher end of the credit-quality spectrum. The Portfolio also maintained a slightly longer duration than the index, which proved beneficial as investors flocked to longer-maturity issues.
What is your outlook?
The nation’s economy expanded at a 5% annual pace in the third quarter, the fastest rate of growth recorded in 11 years. We anticipate that growth will moderate to the 2.5% to 3.0% range in 2015, tempered in part by slow growth in Europe and slowing growth in China. Barring a worsening of conditions in those regions, or further deterioration in the energy markets, we anticipate that the Federal Reserve will begin to raise short-term interest rates sometime in 2015, but at a gradual pace. This should create a moderately positive environment for corporate bonds, which were more attractively valued heading into 2015 than they were a year earlier. Nonetheless, it may not be sufficient to allow the Portfolio as a whole to match its 2014 returns, especially if interest rates rise significantly from their current low levels.
62
Table of Contents
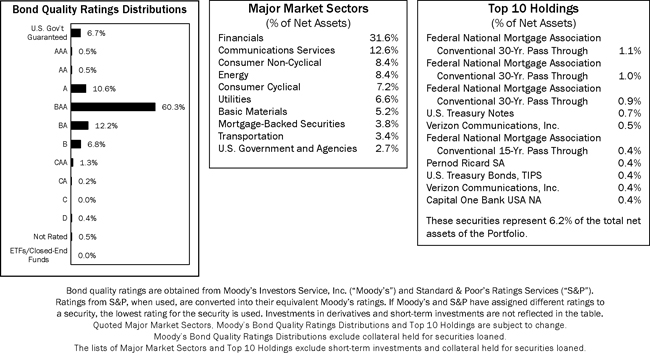
Average Annual Total Returns 1
As of December 31, 2014
1-Year | 5-Year | 10-Year | ||
| 6.68% | 6.94% | 5.40% |
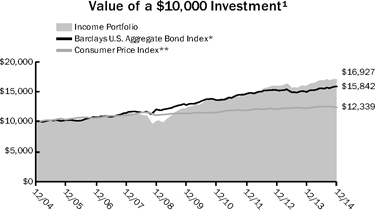
Past performance is not an indication of future results. Total investment return and principal value of your investment will fluctuate and units, when redeemed, may be worth more or less than their original cost. Current performance may be higher or lower than the performance data quoted. Call 800-THRIVENT or visit Thrivent.com for performance results current to the most recent month-end.
| 1 | Average annual total returns represent past performance and reflect changes in share prices, the reinvestment of all dividends and capital gains, and The effects of compounding. Periods of less than one year are not annualized. At various times, the Portfolio’s adviser may have waived its management fee and/or reimbursed Portfolio expenses. If this were the case, the Portfolio’s total returns would have been lower. The returns shown do not reflect charges and expenses imposed on contract holders by the variable accounts. Those charges and expenses reduce the returns received by contract holders as compared to the returns presented. |
The prospectus contains more complete information on the investment objectives, risks, charges and expenses of the investment company, which investors should read and consider carefully before investing. To obtain a prospectus, contact a registered representative or visit Thrivent.com.
| * | The Barclays U.S. Aggregate Bond Index is an index that measures the performance of U.S. investment grade bonds. It is not possible to invest directly in the Index. The performance of the Index does not reflect deductions for fees, expenses or taxes. |
| ** | The Consumer Price Index is an inflationary indicator that measures the change in the cost of a fixed basket of products and services, including housing, electricity, food and transportation. It is not possible to invest directly in the Index. |
63
Table of Contents
Michael G. Landreville, CFA and CPA (inactive), Portfolio Manager
Thrivent Bond Index Portfolio strives for investment results similar to the total return of the Barclays U.S. Aggregate Bond Index.
The Portfolio primarily invests in investment-grade bonds and other debt securities. The value of the Portfolio is influenced by factors impacting the overall market, the debt market in particular, and specific issuers. The Portfolio may incur losses due to incorrect assessments of investments by its investment adviser. Bond prices generally fall as interest rates rise. Credit risk is the risk that an issuer of a debt security may not pay its debt. The value of mortgage-related and other asset-backed securities will be influenced by the factors affecting the housing market and the assets underlying such securities.
How did the Portfolio perform during the 12-month period ended December 31, 2014?
Thrivent Bond Index Portfolio generated a return of 6.52%, compared with 5.97% for the Portfolio’s market benchmark, the Barclays U.S. Aggregate Bond Index.
What factors affected the Portfolio’s performance?
Investors entered 2014 widely anticipating that interest rates would float higher as the Federal Reserve wound down quantitative easing, the program in which it had been purchasing $85 billion of bonds each month to help keep long-term interest rates low. The Fed did wind down the program, but a host of other factors conspired to push interest rates lower rather than higher and boost bond prices. These included continued low inflation in the U.S., sluggish economic growth in Europe, continued strengthening of the U.S. dollar relative to other currencies, heightened geopolitical tensions following an incursion by Russia into Ukraine, and a sharp second-half decline in oil prices.
In response to this confluence of events, fixed-income investors around the globe flocked to the perceived safety of U.S. Treasury securities. They were particularly strong buyers of longer-term Treasuries, which offered yields exceeding the rate of inflation and, in most cases, the yields on sovereign bonds overseas. Their buying activities drove down longer-term interest rates in the U.S. despite an accelerating economy that grew at a 5.0% annual rate in the third quarter, its fastest pace in 11 years. The yield on the 10-year Treasury note fell to 2.12% from 3.03%, generating a 10.75% return for that sector of the market. The yield on 30-year Treasuries fell to 2.75% from 3.97%, generating a return of 29.40%.
Within the Portfolio, Treasuries earned 6.61% before expenses. Investment-grade corporate bonds, aided by the decline in interest rates, earned 7.52%. Agency and sovereign bonds collectively earned 6.89%, and mortgage-backed securities earned 6.34%. The Portfolio was able to outperform its benchmark primarily by maintaining a slightly longer duration, particularly in the Treasury and mortgage-backed securities sectors.
As expected, the Fed kept short-term interest rates near 0% throughout 2014. In December, it reassured investors that it would be patient in deciding when the economy was healthy enough for the Fed to begin pushing short-term rates higher. By early 2015, trading in federal funds futures suggested that most investors are expecting the Fed to start pushing short-term rates up sometime in the latter half of 2015.
The Fed can afford to be patient with its decision on short-term rates because inflation has remained well below its 2% target and there remains in the view of many economists considerable slack in the labor force. Although the U.S. created nearly 3 million new nonfarm jobs last year—the most since 1999—and even though the unemployment rate fell to 5.6%, which is its lowest level since June 2008, wages have not moved meaningfully higher and many people who would prefer full-time jobs are still working part-time.
What is your outlook?
We anticipate that U.S. economic growth will moderate from its mid-2014 pace and expand by about 2.5% to 3.0% in 2015, assuming no further deterioration of conditions in Europe and China and some stabilization of oil prices. This will likely keep inflation below Fed targets. While the Fed may eventually push short-term rates higher, we anticipate a gradual rather than sudden move. Against that backdrop, we believe that bond market returns should be able to outpace inflation, but likely will not match the gains of 2014.
64
Table of Contents
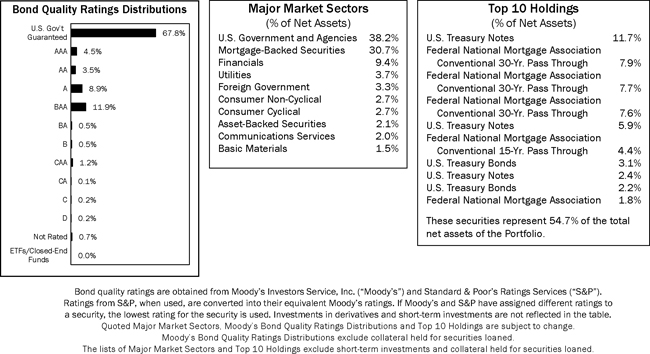
Average Annual Total Returns1
As of December 31, 2014
1-Year | 5-Year | 10-Year | ||
| 6.52% | 5.21% | 4.53% |
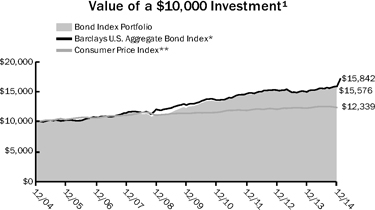
Past performance is not an indication of future results. Total investment return and principal value of your investment will fluctuate and units, when redeemed, may be worth more or less than their original cost. Current performance may be higher or lower than the performance data quoted. Call 800-THRIVENT or visit Thrivent.com for performance results current to the most recent month-end.
| 1 | Average annual total returns represent past performance and reflect changes in share prices, the reinvestment of all dividends and capital gains, and the effects of compounding. Periods of less than one year are not annualized. At various times, the Portfolio’s adviser may have waived its management fee and/or reimbursed Portfolio expenses. If this were the case, the Portfolio’s total returns would have been lower. The returns shown do not reflect charges and expenses imposed on contract holders by the variable accounts. Those charges and expenses reduce the returns received by contract holders as compared to the returns presented. |
The prospectus contains more complete information on the investment objectives, risks, charges and expenses of the investment company, which investors should read and consider carefully before investing. To obtain a prospectus, contact a registered representative or visit Thrivent.com.
| * | The Barclays U.S. Aggregate Bond Index is an index that measures the performance of U.S. investment grade bonds. It is not possible to invest directly in the Index. The performance of the Index does not reflect deductions for fees, expenses or taxes. |
| ** | The Consumer Price Index is an inflationary indicator that measures the change in the cost of a fixed basket of products and services, including housing, electricity, food and transportation. It is not possible to invest directly in the Index. |
65
Table of Contents
THRIVENT LIMITED MATURITY BOND PORTFOLIO
Michael G. Landreville, CFA and CPA (inactive) and Gregory R. Anderson, CFA, Portfolio Co-Managers
Thrivent Limited Maturity Bond Portfolio seeks a high level of current income with stability of principal.
The Portfolio primarily invests in investment-grade debt securities. The value of the Portfolio is influenced by factors impacting the overall market, debt securities in particular, and specific issuers. The Portfolio may incur losses due to incorrect assessments of investments by its investment adviser. Bond prices generally fall as interest rates rise. Credit risk is the risk that an issuer of a debt security may not pay its debt. The value of mortgage-related and other asset-backed securities will be influenced by the factors affecting the housing market and the assets underlying such securities. Foreign investments involve additional risks, including currency fluctuations, liquidity, political, economic and market instability, and different legal and accounting standards. The prices of futures contracts can be highly volatile and the loss from investing in them can exceed the initial investment.
How did the Portfolio perform during the 12-month period ended December 31, 2014?
Thrivent Limited Maturity Bond Portfolio earned a return of 1.68%, compared with the median return of its peer group, the Lipper Short-Intermediate Investment Grade Debt category, of 0.92%. The Portfolio’s market benchmark, the Barclays Government/Credit 1-3 Year Bond Index, earned a return of 0.77%.
What factors affected the Portfolio’s performance?
After contracting in the first quarter of 2014, U.S. economic growth accelerated dramatically. By the third quarter, it was growing at a 5.0% annual rate, its fastest pace in 11 years. By contrast, the Euro Area barely grew at all, and China’s rate of growth slowed. Combined with a strengthening U.S. dollar, this led to heavy buying of U.S. Treasury bonds, which offered significantly higher yields than safe-haven bonds of other countries.
Despite the improving economic climate in the U.S., the Federal Reserve continued to hold short-term interest rates near 0%, although it did wind down its “quantitative easing” bond-buying program, which it had been using to keep longer-term rates low. As the year progressed, investors anticipated that the Fed would bump up short-term rates in mid-2015. As a result, most of the buying in the Treasury market was concentrated in the longer end of the yield curve. This translated into modest returns for the Portfolio, which primarily holds bonds maturing in three years or less.
The Portfolio was able to outperform its benchmark and peer group by investing some of its assets in bonds with maturities of five years or more, where yields and returns proved more attractive. For example, while two-year Treasury notes generated a total return of 0.65%, five-year Treasuries earned 2.89%.
To keep the Portfolio’s duration close to that of its benchmark and peer group while still holding those longer-dated maturities, the Portfolio sold some two-year Treasury futures, which also proved beneficial to returns.
Treasuries represented the Portfolio’s top-performing asset class, generating a return before expenses of 2.7%. Corporate bonds, which accounted for the largest share of the Portfolio’s holdings at 41% of assets, earned 2.34%. Securitized assets, including floating-rate notes, earned 2.15%, and government agency securities earned 1.99%.
What is your outlook?
A steep decline in oil prices during the second half of 2014 translated into sharply lower gasoline prices, which should help the U.S. economy heading into 2015 by leaving consumers with more money to spend on other goods and services. However, weaker economic conditions in Europe and slowing growth in China, combined with low inflation in the U.S., will likely keep at least a temporary lid on long-term interest rates, in our opinion. The rate outlook could change if oil prices stabilize and economies in Europe and China generate stronger growth, putting pressure on bond prices. A decision by the Federal Reserve to start pushing short-term interest rates higher in the latter half of 2015, as investors were widely anticipating at the start of the year, would likely put still more pressure on bond prices.
For the near-term, we intend to maintain our slight bias toward longer-maturity securities, but we are prepared to adopt a more neutral stance if global economic conditions begin to improve and long-term interest rates start to rise. We anticipate that the yield on the Portfolio’s holdings will largely offset any decline in bond prices in 2015, which could lead to another year of modestly positive returns.
66
Table of Contents
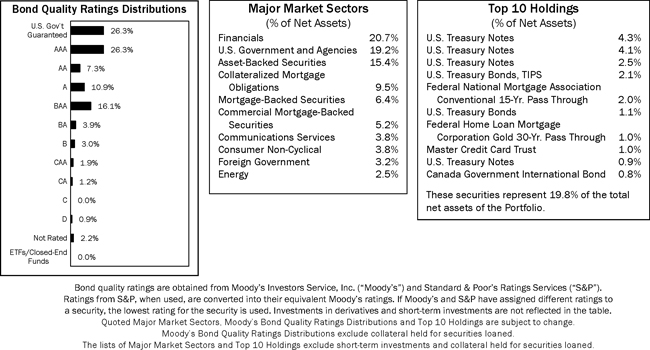
Average Annual Total Returns 1
As of December 31, 2014
1-Year | 5-Year | 10-Year | ||
| 1.68% | 2.50% | 2.96% |
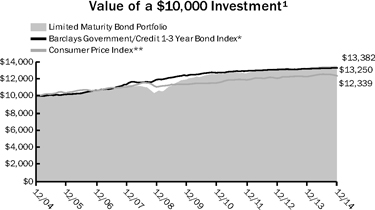
Past performance is not an indication of future results. Total investment return and principal value of your investment will fluctuate and units, when redeemed, may be worth more or less than their original cost. Current performance may be higher or lower than the performance data quoted. Call 800-THRIVENT or visit Thrivent.com for performance results current to the most recent month-end.
| 1 | Average annual total returns represent past performance and reflect changes in share prices, the reinvestment of all dividends and capital gains, and the effects of compounding. Periods of less than one year are not annualized. At various times, the Portfolio’s adviser may have waived its management fee and/or reimbursed Portfolio expenses. If this were the case, the Portfolio’s total returns would have been lower. The returns shown do not reflect charges and expenses imposed on contract holders by the variable accounts. Those charges and expenses reduce the returns received by contract holders as compared to the returns presented. |
The prospectus contains more complete information on the investment objectives, risks, charges and expenses of the investment company, which investors should read and consider carefully before investing. To obtain a prospectus, contact a registered representative or visit Thrivent.com.
| * | The Barclays Government/Credit l-3 Year Bond Index is an index that measures the performance of government and corporate fixed-rate debt securities with maturities of 1-3 years. It is not possible to invest directly in the Index. The performance of the Index does not reflect deductions for fees, expenses or taxes. |
| ** | The Consumer Price Index is an inflationary indicator that measures the change in the cost of a fixed basket of products and services, including housing, electricity, food and transportation. It is not possible to invest directly in the Index. |
67
Table of Contents
THRIVENT MONEY MARKET PORTFOLIO
William D. Stouten, Portfolio Manager
Thrivent Money Market Portfolio seeks to achieve the maximum current income that is consistent with stability of capital and maintenance of liquidity.
The Portfolio invests in high quality, short-term money market instruments. Although the Portfolio seeks to preserve the value of your investment at $1.00 per share, it is possible to lose money by investing in the Portfolio. Credit risk is the risk that an issuer of a debt security may not pay its debt. Low or declining short-term interest rates can negatively impact the Portfolio. The financial services industry is particularly vulnerable to certain factors, such as the availability and cost of borrowing and raising additional capital, changes in interest rates, the rate of corporate and consumer debt defaults, and price competition. The Portfolio could experience a loss when selling portfolio securities to meet redemption requests.
How did the Portfolio perform during the 12-month period ended December 31, 2014?
Thrivent Money Market Portfolio produced a 0.00% return during the period, mirroring the 0.00% median net return reported by its peer group, the Lipper Money Market category.
What factors affected the Portfolio’s performance?
Money market funds generated negligible returns for a fifth consecutive year as the Federal Reserve kept interest rates low in its bid to boost the economy. For the year, the Fed kept its target for the federal funds rate—the rate at which banks borrow from each other overnight—in a range of 0% to 0.25%. This widely followed benchmark sets the tone for short-term interest rates across the credit markets.
The pressure on money market funds was exacerbated by a limited supply, relative to demand, of the short-term, high-quality securities in which they invest. This imbalance was attributable to a combination of factors, including new regulations that discourage financial companies from issuing short-term debt and a move by some corporations to replace short-term debt with longer-term debt amid an overall low interest-rate environment.
With yields on short-term securities hovering near historic lows, it was difficult for money market funds to generate positive returns after accounting for trading and operating expenses. As it has done for the past several years, the Portfolio’s investment adviser continued to waive fees on the Portfolio to ensure that investors would not experience a negative return. The Portfolio also maintained exposure to floating-rate notes issued by government agencies, allowing it to capture some additional yield without taking additional credit risk.
In keeping with its conservative mandate, the Portfolio continued to invest in securities offering high credit quality and liquidity. It also continued to hold a smaller percentage of foreign securities than many of its competitors.
What is your outlook?
With U.S. economic conditions improving last year—the economy grew at an average annual rate of 4.8% during the second and third quarters after contracting at a 2.1% rate in the first—it is becoming increasingly likely that the Fed will allow short-term interest rates to begin edging higher in 2015 even if, as expected, growth moderates a bit from here on out. This could help boost returns for money market funds. Still, Fed officials said in a December statement that they would be “patient” in deciding when to change course. In addition, the supply/demand imbalance in short-term, high-quality securities is likely to persist through 2015.
The ability of money market funds to capitalize on any rise in short-term rates could be tempered by new rules handed down by the Securities and Exchange Commission (SEC) last year. Beginning in 2016, money market funds will be allowed to impose redemption fees of up to 2% or to temporarily suspend redemptions if their “weekly liquid assets” fall below 30% of total assets. As defined by the SEC, weekly liquid assets include cash, U.S. Treasury securities, certain other government securities with remaining maturities of 60 days or less, and securities that convert to cash within one week. To reassure investors that redemption fees or suspensions are not likely, some funds may choose to allocate more than 30% of their portfolios to weekly liquid assets. The increased demand for those securities could depress yields in that sector of the market, putting even more pressure on money market fund returns.
The SEC also ruled that money market funds catering to institutional investors must adopt floating net asset values (NAV) beginning in 2016 rather than maintain a constant NAV of $1 per share, which has been the industry norm. The SEC excluded retail mutual funds from this requirement, but will require retail funds to begin daily reporting of the mark-to-market value of their portfolios—also known as the “shadow NAV”—beginning in 2016. For purposes of these rules, the Thrivent Money Market Portfolio qualifies as a retail fund.
We will be monitoring industry developments over the course of the year as we determine how best to respond to the new rules and shifting market conditions. As always, we will continue to invest in a manner designed to meet the Portfolio’s primary objectives of safety and liquidity.
An investment in the Thrivent Money Market Fund is not insured
or guaranteed by the FDIC or any other government agency.
Although the Fund seeks to preserve the value of your investment at $1.00 per share,
it is possible to lose money by investing in the Portfolio.
68
Table of Contents
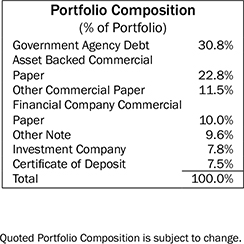
Average Annual Total Returns 1
As of December 31, 2014
1-Year | 5-Year | 10-Year | ||
| 0.00% | 0.00% | 1.60% |
Money Market Portfolio Yields *
As of December 31, 2014
| Portfolio | ||||
7-Day Yield | 0.00 | % | ||
7-Day Yield Gross of Waivers | -0.42 | % | ||
7-Day Effective Yield | 0.00 | % | ||
7-Day Effective Yield Gross of Waivers | -0.42 | % | ||
Past performance is not an indication of future results. Total investment return and principal value of your investment will fluctuate and units, when redeemed, may be worth more or less than their original cost. Current performance may be higher or lower than the performance data quoted. Call 800-THRIVENT or visit Thrivent.com for performance results current to the most recent month-end.
| 1 | Average annual total returns represent past performance and reflect changes in share prices, the reinvestment of all dividends and capital gains, and the effects of compounding. Periods of less than one year are not annualized. At various times, the Portfolio’s adviser may have waived its management fee and/or reimbursed Portfolio expenses. If this were the case, the Portfolio’s total returns would have been lower. The returns shown do not reflect charges and expenses imposed on contract holders by the variable accounts. Those charges and expenses reduce the returns received by contract holders as compared to the returns presented. |
The prospectus contains more complete information on the investment objectives, risks, charges and expenses of the investment company, which investors should read and consider carefully before investing. To obtain a prospectus, contact a registered representative or visit Thrivent.com.
| * | Seven-day yields of Thrivent Money Market Fund refer to the income generated by an investment in the Fund over a specified seven-day period. Effective yields reflect the reinvestment of income. A yield gross of waivers represents what the yield would have been if the Adviser were not waiving or reimbursing certain expenses associated with the Fund. Yields are subject to daily fluctuation and should not be considered an indication of future results. |
69
Table of Contents
(unaudited)
As a shareholder of the Thrivent Series Fund, Inc., you incur ongoing costs, including management fees and other Portfolio expenses. This Shareholder Expense Example is intended to help you understand your ongoing costs (in dollars) of investing in a Portfolio and to compare these costs with the ongoing costs of investing in other mutual funds. The Example is based on an investment of $1,000 invested at the beginning of the period and held for the entire period from July 1, 2014 through December 31, 2014. Shares in a Portfolio are currently sold, without sales charges, only to separate accounts of Thrivent Financial for Lutherans and Thrivent Life Insurance Company, which are used to fund benefits of variable life insurance and variable annuity contracts issued by Thrivent Financial for Lutherans and Thrivent Life Insurance Company, and retirement plans sponsored by Thrivent Financial for Lutherans. Expenses associated with these variable contracts and retirement plans are not included in these examples and had these costs been included, your costs would have been higher.
Actual Expenses
In the table below, the first section, labeled “Actual,” provides information about actual account values and actual expenses. You may use the information in this line, together with the amount you invested, to estimate the expenses that you paid over the period. Simply divide your account value by $1,000 (for example, an $8,600 account value divided by $1,000 = 8.6), then multiply the result by the number in the first line under the heading entitled “Expenses Paid During Period” to estimate the expenses you paid.
Hypothetical Example for Comparison Purposes
In the table below, the second section, labeled “Hypothetical,” provides information about hypothetical account values and hypothetical expenses based on the Portfolio’s actual expense ratio and an assumed rate of return of 5% per year before expenses, which is not the Portfolio’s actual return. The hypothetical account values and expenses may not be used to estimate the actual ending account balance or expenses you paid for the period. You may use this information to compare the ongoing costs of investing in the Portfolio and other funds. To do so, compare this 5% hypothetical example with the 5% hypothetical examples that appear in the shareholder reports of the other funds.
| Beginning Account Value 7/1/2014 | Ending Account Value 12/31/2014 | Expenses Paid During Period 7/1/2014 - 12/31/2014* | Annualized Expense Ratio | |||||||||||||
Thrivent Aggressive Allocation Portfolio |
| |||||||||||||||
Actual | $ | 1,000 | $ | 1,006 | $ | 2.61 | 0.52 | % | ||||||||
Hypothetical** | $ | 1,000 | $ | 1,023 | $ | 2.64 | 0.52 | % | ||||||||
Thrivent Moderately Aggressive Allocation Portfolio |
| |||||||||||||||
Actual | $ | 1,000 | $ | 1,005 | $ | 2.31 | 0.46 | % | ||||||||
Hypothetical** | $ | 1,000 | $ | 1,023 | $ | 2.33 | 0.46 | % | ||||||||
Thrivent Moderate Allocation Portfolio |
| |||||||||||||||
Actual | $ | 1,000 | $ | 1,007 | $ | 2.29 | 0.45 | % | ||||||||
Hypothetical** | $ | 1,000 | $ | 1,023 | $ | 2.31 | 0.45 | % | ||||||||
Thrivent Moderately Conservative Allocation Portfolio |
| |||||||||||||||
Actual | $ | 1,000 | $ | 1,006 | $ | 2.23 | 0.44 | % | ||||||||
Hypothetical**
| $ | 1,000 | $ | 1,023 | $ | 2.25 | 0.44 | % | ||||||||
Thrivent Growth and Income Plus Portfolio |
| |||||||||||||||
Actual | $ | 1,000 | $ | 989 | $ | 4.01 | 0.80 | % | ||||||||
Hypothetical** | $ | 1,000 | $ | 1,021 | $ | 4.08 | 0.80 | % | ||||||||
Thrivent Balanced Income Plus Portfolio |
| |||||||||||||||
Actual | $ | 1,000 | $ | 1,011 | $ | 3.22 | 0.63 | % | ||||||||
Hypothetical** | $ | 1,000 | $ | 1,022 | $ | 3.23 | 0.63 | % | ||||||||
Thrivent Diversified Income Plus Portfolio |
| |||||||||||||||
Actual | $ | 1,000 | $ | 998 | $ | 2.43 | 0.48 | % | ||||||||
Hypothetical** | $ | 1,000 | $ | 1,023 | $ | 2.46 | 0.48 | % | ||||||||
Thrivent Opportunity Income Plus Portfolio |
| |||||||||||||||
Actual | $ | 1,000 | $ | 998 | $ | 3.78 | 0.75 | % | ||||||||
Hypothetical** | $ | 1,000 | $ | 1,021 | $ | 3.82 | 0.75 | % | ||||||||
70
Table of Contents
| Beginning Account Value 7/1/2014 | Ending Account Value 12/31/2014 | Expenses Paid During Period 7/1/2014 - 12/31/2014* | Annualized Expense Ratio | |||||||||||||
Thrivent Partner Technology Portfolio |
| |||||||||||||||
Actual | $ | 1,000 | $ | 1,061 | $ | 5.21 | 1.00 | % | ||||||||
Hypothetical** | $ | 1,000 | $ | 1,020 | $ | 5.11 | 1.00 | % | ||||||||
Thrivent Partner Healthcare Portfolio |
| |||||||||||||||
Actual | $ | 1,000 | $ | 1,067 | $ | 5.77 | 1.11 | % | ||||||||
Hypothetical** | $ | 1,000 | $ | 1,020 | $ | 5.64 | 1.11 | % | ||||||||
Thrivent Natural Resources Portfolio |
| |||||||||||||||
Actual | $ | 1,000 | $ | 721 | $ | 4.42 | 1.02 | % | ||||||||
Hypothetical** | $ | 1,000 | $ | 1,020 | $ | 5.19 | 1.02 | % | ||||||||
Thrivent Partner Emerging Markets Equity Portfolio |
| |||||||||||||||
Actual | $ | 1,000 | $ | 913 | $ | 6.75 | 1.40 | % | ||||||||
Hypothetical** | $ | 1,000 | $ | 1,018 | $ | 7.12 | 1.40 | % | ||||||||
Thrivent Real Estate Securities Portfolio |
| |||||||||||||||
Actual | $ | 1,000 | $ | 1,112 | $ | 4.89 | 0.92 | % | ||||||||
Hypothetical** | $ | 1,000 | $ | 1,021 | $ | 4.68 | 0.92 | % | ||||||||
Thrivent Partner Small Cap Growth Portfolio |
| |||||||||||||||
Actual | $ | 1,000 | $ | 1,032 | $ | 4.92 | 0.96 | % | ||||||||
Hypothetical** | $ | 1,000 | $ | 1,020 | $ | 4.89 | 0.96 | % | ||||||||
Thrivent Partner Small Cap Value Portfolio |
| |||||||||||||||
Actual | $ | 1,000 | $ | 1,005 | $ | 4.36 | 0.86 | % | ||||||||
Hypothetical** | $ | 1,000 | $ | 1,021 | $ | 4.39 | 0.86 | % | ||||||||
Thrivent Small Cap Stock Portfolio |
| |||||||||||||||
Actual | $ | 1,000 | $ | 1,021 | $ | 3.84 | 0.75 | % | ||||||||
Hypothetical** | $ | 1,000 | $ | 1,021 | $ | 3.84 | 0.75 | % | ||||||||
Thrivent Small Cap Index Portfolio |
| |||||||||||||||
Actual | $ | 1,000 | $ | 1,022 | $ | 2.18 | 0.43 | % | ||||||||
Hypothetical** | $ | 1,000 | $ | 1,023 | $ | 2.18 | 0.43 | % | ||||||||
Thrivent Mid Cap Growth Portfolio |
| |||||||||||||||
Actual | $ | 1,000 | $ | 1,078 | $ | 2.40 | 0.46 | % | ||||||||
Hypothetical** | $ | 1,000 | $ | 1,023 | $ | 2.33 | 0.46 | % | ||||||||
Thrivent Partner Mid Cap Value Portfolio |
| |||||||||||||||
Actual | $ | 1,000 | $ | 1,045 | $ | 4.07 | 0.79 | % | ||||||||
Hypothetical** | $ | 1,000 | $ | 1,021 | $ | 4.03 | 0.79 | % | ||||||||
Thrivent Mid Cap Stock Portfolio |
| |||||||||||||||
Actual | $ | 1,000 | $ | 1,019 | $ | 3.59 | 0.71 | % | ||||||||
Hypothetical** | $ | 1,000 | $ | 1,022 | $ | 3.60 | 0.71 | % | ||||||||
Thrivent Mid Cap Index Portfolio |
| |||||||||||||||
Actual | $ | 1,000 | $ | 1,019 | $ | 2.38 | 0.47 | % | ||||||||
Hypothetical** | $ | 1,000 | $ | 1,023 | $ | 2.39 | 0.47 | % | ||||||||
Thrivent Partner Worldwide Allocation Portfolio |
| |||||||||||||||
Actual | $ | 1,000 | $ | 908 | $ | 4.41 | 0.92 | % | ||||||||
Hypothetical** | $ | 1,000 | $ | 1,021 | $ | 4.67 | 0.92 | % | ||||||||
Thrivent Partner All Cap Portfolio |
| |||||||||||||||
Actual | $ | 1,000 | $ | 1,065 | $ | 4.95 | 0.95 | % | ||||||||
Hypothetical** | $ | 1,000 | $ | 1,020 | $ | 4.84 | 0.95 | % | ||||||||
71
Table of Contents
| Beginning Account Value 7/1/2014 | Ending Account Value 12/31/2014 | Expenses Paid During Period 7/1/2014 - 12/31/2014* | Annualized Expense Ratio | |||||||||||||
Thrivent Large Cap Growth Portfolio |
| |||||||||||||||
Actual | $ | 1,000 | $ | 1,043 | $ | 2.26 | 0.44 | % | ||||||||
Hypothetical** | $ | 1,000 | $ | 1,023 | $ | 2.24 | 0.44 | % | ||||||||
Thrivent Partner Growth Stock Portfolio |
| |||||||||||||||
Actual | $ | 1,000 | $ | 1,059 | $ | 4.67 | 0.90 | % | ||||||||
Hypothetical** | $ | 1,000 | $ | 1,021 | $ | 4.59 | 0.90 | % | ||||||||
Thrivent Large Cap Value Portfolio |
| |||||||||||||||
Actual | $ | 1,000 | $ | 1,029 | $ | 3.25 | 0.64 | % | ||||||||
Hypothetical** | $ | 1,000 | $ | 1,022 | $ | 3.24 | 0.64 | % | ||||||||
Thrivent Large Cap Stock Portfolio |
| |||||||||||||||
Actual | $ | 1,000 | $ | 988 | $ | 3.42 | 0.68 | % | ||||||||
Hypothetical** | $ | 1,000 | $ | 1,022 | $ | 3.48 | 0.68 | % | ||||||||
Thrivent Large Cap Index Portfolio |
| |||||||||||||||
Actual | $ | 1,000 | $ | 1,059 | $ | 2.00 | 0.39 | % | ||||||||
Hypothetical** | $ | 1,000 | $ | 1,023 | $ | 1.97 | 0.39 | % | ||||||||
Thrivent High Yield Portfolio |
| |||||||||||||||
Actual | $ | 1,000 | $ | 971 | $ | 2.19 | 0.44 | % | ||||||||
Hypothetical** | $ | 1,000 | $ | 1,023 | $ | 2.25 | 0.44 | % | ||||||||
Thrivent Income Portfolio |
| |||||||||||||||
Actual | $ | 1,000 | $ | 1,009 | $ | 2.21 | 0.44 | % | ||||||||
Hypothetical** | $ | 1,000 | $ | 1,023 | $ | 2.22 | 0.44 | % | ||||||||
Thrivent Bond Index Portfolio |
| |||||||||||||||
Actual | $ | 1,000 | $ | 1,023 | $ | 2.38 | 0.47 | % | ||||||||
Hypothetical** | $ | 1,000 | $ | 1,023 | $ | 2.38 | 0.47 | % | ||||||||
Thrivent Limited Maturity Bond Portfolio |
| |||||||||||||||
Actual | $ | 1,000 | $ | 1,002 | $ | 2.23 | 0.44 | % | ||||||||
Hypothetical** | $ | 1,000 | $ | 1,023 | $ | 2.25 | 0.44 | % | ||||||||
Thrivent Money Market Portfolio |
| |||||||||||||||
Actual | $ | 1,000 | $ | 1,000 | $ | 0.86 | 0.17 | % | ||||||||
Hypothetical** | $ | 1,000 | $ | 1,024 | $ | 0.87 | 0.17 | % | ||||||||
| * | Expenses are equal to the Fund’s annualized expense ratio, multiplied by the average account value over the period, multiplied by 184/365 to reflect the one-half year period. |
| ** | Assuming 5% annualized total return before expenses. |
72
Table of Contents
 | Report of Independent Registered Public Accounting Firm |
To the Board of Directors and Shareholders of the Thrivent Series Fund, Inc.:
In our opinion, the accompanying statements of assets and liabilities, including the schedules of investments, and the related statements of operations and of changes in net assets and the financial highlights present fairly, in all material respects, the financial position of each of the thirty-three funds constituting Thrivent Series Fund, Inc. (hereafter referred to as the “Funds”) at December 31, 2014, the results of each of their operations for the year then ended, the changes in each of their net assets for each of the two years in the period then ended and their financial highlights for each of the periods presented, in conformity with accounting principles generally accepted in the United States of America. These financial statements and financial highlights (hereafter referred to as “financial statements”) are the responsibility of the Funds’ management. Our responsibility is to express an opinion on these financial statements based on our audits. We conducted our audits of these financial statements in accordance with the standards of the Public Company Accounting Oversight Board (United States). Those standards require that we plan and perform the audit to obtain reasonable assurance about whether the financial statements are free of material misstatement. An audit includes examining, on a test basis, evidence supporting the amounts and disclosures in the financial statements, assessing the accounting principles used and significant estimates made by management, and evaluating the overall financial statement presentation. We believe that our audits, which included confirmation of securities at December 31, 2014 by correspondence with the custodian, agent banks, transfer agent and brokers provides a reasonable basis for our opinion.
February 18, 2015
PricewaterhouseCoopers LLP, Suite 1400, 225 South Sixth Street, Minneapolis, MN 55402
T: (612) 596 6000, F: (612) 373 7160, www.pwc.com/us
73
Table of Contents
AGGRESSIVE ALLOCATION PORTFOLIO
Schedule of Investments as of December 31, 2014
| Shares | Common Stock (47.6%) | Value | ||||||
| Consumer Discretionary (7.3%) | ||||||||
| 12,450 | Aaron’s, Inc. | $ | 380,596 | |||||
| 11,706 | Amazon.com, Inc.a,b | 3,632,957 | ||||||
| 4,250 | Apollo Group, Inc.a | 144,967 | ||||||
| 5,900 | AutoZone, Inc.a | 3,652,749 | ||||||
| 14,300 | Barnes & Noble, Inc.a | 332,046 | ||||||
| 7,700 | Best Buy Company, Inc. | 300,146 | ||||||
| 1,450 | Big Lots, Inc. | 58,029 | ||||||
| 1,850 | BorgWarner, Inc. | 101,657 | ||||||
| 1,250 | Brinker International, Inc. | 73,362 | ||||||
| 19,637 | Brunswick Corporation | 1,006,593 | ||||||
| 17,556 | Burlington Stores, Inc.a | 829,697 | ||||||
| 3,200 | Carnival Corporation | 145,056 | ||||||
| 6,250 | Cato Corporation | 263,625 | ||||||
| 10,030 | CBS Corporation | 555,060 | ||||||
| 25,460 | Cheesecake Factory, Inc. | 1,280,893 | ||||||
| 5,845 | Chuy’s Holdings, Inc.a | 114,971 | ||||||
| 2,500 | Coach, Inc. | 93,900 | ||||||
| 2,600 | Coinstar, Inc.a | 195,572 | ||||||
| 93,448 | Comcast Corporationb | 5,420,918 | ||||||
| 10,688 | Core-Mark Holding Company, Inc. | 661,908 | ||||||
| 25,228 | Del Frisco’s Restaurant Group, Inc.a | 598,913 | ||||||
| 18,097 | �� | Delphi Automotive plc | 1,316,014 | |||||
| 1,900 | DeVry Education Group, Inc. | 90,193 | ||||||
| 4,089 | Discovery Communications, Inc., Class Aa | 140,866 | ||||||
| 8,650 | DISH Network Corporationa | 630,498 | ||||||
| 21,331 | Dollar Tree, Inc.a | 1,501,276 | ||||||
| 13,714 | Five Below, Inc.a | 559,943 | ||||||
| 24,550 | Ford Motor Company | 380,525 | ||||||
| 21,137 | G-III Apparel Group, Ltd.a | 2,135,048 | ||||||
| 6,811 | Harman International Industries, Inc. | 726,802 | ||||||
| 12,000 | Hilton Worldwide Holdings, Inc.a | 313,080 | ||||||
| 30,800 | Home Depot, Inc. | 3,233,076 | ||||||
| 42,730 | Houghton Mifflin Harcourt Companya | 884,938 | ||||||
| 14,681 | Imax Corporationa | 453,643 | ||||||
| 18,853 | Jarden Corporationa | 902,682 | ||||||
| 28,727 | Kate Spade & Companya | 919,551 | ||||||
| 5,050 | Kirkland’s, Inc.a | 119,382 | ||||||
| 28,200 | Kohl’s Corporation | 1,721,328 | ||||||
| 43,660 | Las Vegas Sands Corporation | 2,539,266 | ||||||
| 6,950 | Liberty Interactive Corporationa | 204,469 | ||||||
| 988 | Liberty Venturesa | 37,267 | ||||||
| 8,906 | Limited Brands, Inc. | 770,814 | ||||||
| 4,562 | Lithia Motors, Inc. | 395,480 | ||||||
| 15,120 | Lowe’s Companies, Inc. | 1,040,256 | ||||||
| 11,000 | Macy’s, Inc. | 723,250 | ||||||
| 9,864 | Marriott International, Inc. | 769,688 | ||||||
| 1,000 | Marriott Vacations Worldwide Corporation | 74,540 | ||||||
| 47,775 | MDC Partners, Inc. | 1,085,448 | ||||||
| 5,750 | Nautilus, Inc.a | 87,285 | ||||||
| 30,750 | NIKE, Inc. | 2,956,612 | ||||||
| 52,040 | NutriSystem, Inc. | 1,017,382 | ||||||
| 5,850 | Omnicom Group, Inc. | 453,199 | ||||||
| 7,850 | Orbitz Worldwide, Inc.a | 64,606 | ||||||
| 3,854 | O’Reilly Automotive, Inc.a | 742,357 | ||||||
| 29,410 | Oxford Industries, Inc. | 1,623,726 | ||||||
| 11,810 | Papa John’s International, Inc. | 658,998 | ||||||
| 5,029 | PVH Corporation | 644,567 | ||||||
| 1,749 | Ralph Lauren Corporation | 323,845 | ||||||
| 8,291 | Red Robin Gourmet Burgers, Inc.a | 638,200 | ||||||
| 4,427 | Restoration Hardware Holdings, Inc.a | 425,036 | ||||||
| 8,073 | Ross Stores, Inc. | 760,961 | ||||||
| 1,400 | Royal Caribbean Cruises, Ltd. | 115,402 | ||||||
| 9,850 | Ruby Tuesday, Inc.a | 67,374 | ||||||
| 6,650 | Scientific Games Corporationa | 84,655 | ||||||
| 4,800 | Scripps Networks Interactive, Inc. | 361,296 | ||||||
| 9,650 | Select Comfort Corporationa | 260,839 | ||||||
| 2,758 | Shutterfly, Inc.a | 114,995 | ||||||
| 8,710 | Skechers USA, Inc.a | 481,228 | ||||||
| 39,700 | Starbucks Corporation | 3,257,385 | ||||||
| 7,901 | Starwood Hotels & Resorts Worldwide, Inc. | 640,534 | ||||||
| 13,105 | Tenneco, Inc.a | 741,874 | ||||||
| 3,680 | Time Warner Cable, Inc. | 559,581 | ||||||
| 16,636 | Toll Brothers, Inc.a | 570,116 | ||||||
| 2,850 | Tower International, Inc.a | 72,818 | ||||||
| 4,768 | Tractor Supply Company | 375,814 | ||||||
| 60,530 | Tuesday Morning Corporationa | 1,313,501 | ||||||
| 4,919 | Ulta Salon Cosmetics & Fragrance, Inc.a | 628,845 | ||||||
| 5,380 | Under Armour, Inc.a | 365,302 | ||||||
| 7,835 | Vail Resorts, Inc. | 714,004 | ||||||
| 7,149 | VF Corporation | 535,460 | ||||||
| 6,050 | Wyndham Worldwide Corporation | 518,848 | ||||||
|
| |||||||
Total | 65,689,583 | |||||||
|
| |||||||
| Consumer Staples (1.9%) | ||||||||
| 15,450 | Anheuser-Busch InBev NV ADR | 1,735,344 | ||||||
| 3,700 | Archer-Daniels-Midland Company | 192,400 | ||||||
| 9,500 | Avon Products, Inc. | 89,205 | ||||||
| 6,363 | B&G Foods, Inc. | 190,254 | ||||||
| 2,791 | Boston Beer Company, Inc.a | 808,106 | ||||||
| 1,300 | Coca-Cola Enterprises, Inc. | 57,486 | ||||||
| 24,500 | CVS Health Corporation | 2,359,595 | ||||||
| 12,136 | Hain Celestial Group, Inc.a | 707,407 | ||||||
| 3,800 | Ingredion, Inc. | 322,392 | ||||||
| 2,850 | Keurig Green Mountain, Inc. | 377,326 | ||||||
| 2,600 | Kimberly-Clark Corporation | 300,404 | ||||||
| 1,550 | Kroger Company | 99,525 | ||||||
| 3,350 | Molson Coors Brewing Company | 249,642 | ||||||
| 22,170 | Mondelez International, Inc. | 805,325 | ||||||
| 8,209 | Monster Beverage Corporationa | 889,445 | ||||||
| 9,893 | Natural Grocers by Vitamin Cottage, Inc.a | 278,686 | ||||||
| 2,891 | Philip Morris International, Inc. | 235,472 | ||||||
| 2,000 | Pilgrim’s Pride Corporationa | 65,580 | ||||||
| 8,900 | Pinnacle Foods, Inc. | 314,170 | ||||||
| 44,500 | Rite Aid Corporationa | 334,640 | ||||||
| 14,350 | TreeHouse Foods, Inc.a | 1,227,356 | ||||||
| 6,700 | Tyson Foods, Inc. | 268,603 | ||||||
| 20,689 | United Natural Foods, Inc.a | 1,599,777 | ||||||
| 20,800 | Wal-Mart Stores, Inc. | 1,786,304 | ||||||
| 34,180 | WhiteWave Foods Companya | 1,195,958 | ||||||
| 7,133 | Whole Foods Market, Inc. | 359,646 | ||||||
|
| |||||||
Total | 16,850,048 | |||||||
|
| |||||||
| Energy (5.6%) | ||||||||
| 1,520 | Atwood Oceanics, Inc.a | 43,122 | ||||||
| 21,500 | Cabot Oil & Gas Corporation | 636,615 | ||||||
| 84,154 | Cameron International Corporationa | 4,203,492 | ||||||
| 43,850 | Canadian Natural Resources, Ltd. | 1,354,088 | ||||||
| 3,250 | Chesapeake Energy Corporation | 63,602 | ||||||
| 19,120 | Chevron Corporation | 2,144,882 | ||||||
| 730 | Cimarex Energy Company | 77,380 | ||||||
| 171,946 | Cobalt International Energy, Inc.a | 1,528,600 | ||||||
| 7,250 | Comstock Resources, Inc. | 49,373 | ||||||
| 13,047 | Concho Resources, Inc.a | 1,301,438 | ||||||
| 1,250 | ConocoPhillips | 86,325 | ||||||
| 4,270 | Denbury Resources, Inc. | 34,715 | ||||||
| 2,196 | Diamondback Energy, Inc.a | 131,277 | ||||||
The accompanying Notes to Financial Statements are an integral part of this schedule.
74
Table of Contents
AGGRESSIVE ALLOCATION PORTFOLIO
Schedule of Investments as of December 31, 2014
| Shares | Common Stock (47.6%) | Value | ||||||
| Energy (5.6%) - continued | ||||||||
| 550 | Energen Corporation | $ | 35,068 | |||||
| 950 | Ensco plc | 28,452 | ||||||
| 62,866 | EOG Resources, Inc. | 5,788,073 | ||||||
| 28,591 | EQT Corporation | 2,164,339 | ||||||
| 1,400 | Exterran Holdings, Inc. | 45,612 | ||||||
| 18,950 | Exxon Mobil Corporation | 1,751,927 | ||||||
| 2,650 | Green Plains, Inc. | 65,667 | ||||||
| 1,500 | Gulfmark Offshore, Inc. | 36,630 | ||||||
| 650 | Gulfport Energy Corporationa | 27,131 | ||||||
| 31,000 | Halliburton Company | 1,219,230 | ||||||
| 2,500 | Helix Energy Solutions Group, Inc.a | 54,250 | ||||||
| 1,000 | Helmerich & Payne, Inc. | 67,420 | ||||||
| 4,969 | HollyFrontier Corporation | 186,238 | ||||||
| 6,250 | Kosmos Energy, Ltd.a | 52,438 | ||||||
| 64,818 | Marathon Oil Corporation | 1,833,701 | ||||||
| 24,550 | Marathon Petroleum Corporation | 2,215,883 | ||||||
| 19,110 | Market Vectors Oil Service ETF | 686,431 | ||||||
| 22,350 | Nabors Industries, Ltd. | 290,103 | ||||||
| 880 | National Oilwell Varco, Inc. | 57,666 | ||||||
| 1,450 | Newfield Exploration Companya | 39,324 | ||||||
| 1,680 | Noble Corporation | 27,838 | ||||||
| 1,130 | Noble Energy, Inc. | 53,596 | ||||||
| 86,094 | Oasis Petroleum, Inc.a | 1,423,995 | ||||||
| 1,075 | Oceaneering International, Inc. | 63,221 | ||||||
| 940 | Oil States International, Inc.a | 45,966 | ||||||
| 2,550 | Patterson-UTI Energy, Inc. | 42,304 | ||||||
| 1,980 | PDC Energy, Inc.a | 81,715 | ||||||
| 39,889 | Penn Virginia Corporationa | 266,459 | ||||||
| 105,000 | Petroleo Brasileiro SA ADR | 766,500 | ||||||
| 340 | Pioneer Natural Resources Company | 50,609 | ||||||
| 1,800 | QEP Resources, Inc. | 36,396 | ||||||
| 43,835 | Rex Energy Corporationa | 223,559 | ||||||
| 10,500 | Rosetta Resources, Inc.a | 234,255 | ||||||
| 64,650 | Rowan Companies plc | 1,507,638 | ||||||
| 67,870 | Schlumberger, Ltd. | 5,796,777 | ||||||
| 3,550 | Seadrill, Ltd. | 42,387 | ||||||
| 7,262 | SemGroup Corporation | 496,648 | ||||||
| 4,374 | SM Energy Company | 168,749 | ||||||
| 71,465 | Southwestern Energy Companya | 1,950,280 | ||||||
| 45,800 | Suncor Energy, Inc. ADR | 1,455,524 | ||||||
| 7,270 | Superior Energy Services, Inc. | 146,490 | ||||||
| 52,600 | Total SA ADR | 2,693,120 | ||||||
| 59,812 | Trinidad Drilling, Ltd. | 267,707 | ||||||
| 22,366 | U.S. Silica Holdings, Inc. | 574,583 | ||||||
| 300,816 | Weatherford International, Ltd.a | 3,444,343 | ||||||
| 10,282 | Whiting Petroleum Corporationa | 339,306 | ||||||
| 2,900 | WPX Energy, Inc.a | 33,727 | ||||||
|
| |||||||
Total | 50,534,184 | |||||||
|
| |||||||
| Financials (7.3%) | ||||||||
| 2,730 | ACE, Ltd. | 313,622 | ||||||
| 9,343 | Affiliated Managers Group, Inc.a | 1,982,958 | ||||||
| 11,060 | Allied World Assurance Company Holdings AG | 419,395 | ||||||
| 5,090 | Allstate Corporation | 357,572 | ||||||
| 9,010 | American Assets Trust, Inc. | 358,688 | ||||||
| 3,700 | American Express Company | 344,248 | ||||||
| 1,950 | American Financial Group, Inc. | 118,404 | ||||||
| 11,300 | American International Group, Inc. | 632,913 | ||||||
| 3,733 | Ameriprise Financial, Inc. | 493,689 | ||||||
| 6,650 | AmTrust Financial Services, Inc. | 374,063 | ||||||
| 7,414 | Argo Group International Holdings, Ltd. | 411,255 | ||||||
| 1,700 | Assurant, Inc. | 116,331 | ||||||
| 18,790 | Assured Guaranty, Ltd. | 488,352 | ||||||
| 70,370 | Bank of America Corporation | 1,258,919 | ||||||
| 21,322 | Bank of the Ozarks, Inc. | 808,530 | ||||||
| 2,550 | Banner Corporation | 109,701 | ||||||
| 29,700 | BBCN Bancorp, Inc. | 427,086 | ||||||
| 12,600 | Berkshire Hathaway, Inc.a | 1,891,890 | ||||||
| 8,700 | Blackstone Group, LP | 294,321 | ||||||
| 4,700 | Boston Private Financial Holdings, Inc. | 63,309 | ||||||
| 10,150 | Brixmor Property Group, Inc. | 252,126 | ||||||
| 3,350 | Camden Property Trust | 247,364 | ||||||
| 6,100 | Capital One Financial Corporation | 503,555 | ||||||
| 5,500 | CBL & Associates Properties, Inc. | 106,810 | ||||||
| 1,900 | CBRE Group, Inc.a | 65,075 | ||||||
| 16,565 | Chesapeake Lodging Trust | 616,384 | ||||||
| 43,171 | Citigroup, Inc. | 2,335,983 | ||||||
| 1,772 | CNA Financial Corporation | 68,594 | ||||||
| 64,060 | CNO Financial Group, Inc. | 1,103,113 | ||||||
| 12,400 | Comerica, Inc. | 580,816 | ||||||
| 3,350 | Corporate Office Properties Trust | 95,040 | ||||||
| 10,750 | Crown Castle International Corporation | 846,025 | ||||||
| 3,300 | DDR Corporation | 60,588 | ||||||
| 6,405 | Deutsche Bank AG | 192,278 | ||||||
| 3,650 | Digital Realty Trust, Inc. | 241,995 | ||||||
| 13,649 | Discover Financial Services | 893,873 | ||||||
| 15,800 | Duke Realty Corporation | 319,160 | ||||||
| 9,273 | Education Realty Trust, Inc. | 339,299 | ||||||
| 25,799 | Essent Group, Ltd.a | 663,292 | ||||||
| 18,183 | Evercore Partners, Inc. | 952,244 | ||||||
| 5,500 | Extra Space Storage, Inc. | 322,520 | ||||||
| 4,450 | FBR & Companya | 109,426 | ||||||
| 11,300 | First Horizon National Corporation | 153,454 | ||||||
| 13,100 | First Niagara Financial Group, Inc. | 110,433 | ||||||
| 25,648 | First Republic Bank | 1,336,774 | ||||||
| 7,850 | Fulton Financial Corporation | 97,026 | ||||||
| 2,500 | General Growth Properties, Inc. | 70,325 | ||||||
| 3,850 | Government Properties Income Trust | 88,589 | ||||||
| 4,550 | Green Dot Corporationa | 93,230 | ||||||
| 3,600 | Hancock Holding Company | 110,520 | ||||||
| 54,662 | Hanmi Financial Corporation | 1,192,178 | ||||||
| 1,750 | Hanover Insurance Group, Inc. | 124,810 | ||||||
| 14,647 | HCC Insurance Holdings, Inc. | 783,907 | ||||||
| 19,248 | Host Hotels & Resorts, Inc. | 457,525 | ||||||
| 110,350 | Huntington Bancshares, Inc. | 1,160,882 | ||||||
| 3,839 | Intercontinental Exchange, Inc. | 841,854 | ||||||
| 19,280 | Invesco, Ltd. | 761,946 | ||||||
| 24,015 | iShares Russell 2000 Growth Index Fund | 3,419,256 | ||||||
| 23,390 | iShares Russell 2000 Index Fund | 2,799,081 | ||||||
| 31,873 | J.P. Morgan Chase & Company | 1,994,612 | ||||||
| 27,142 | Kennedy-Wilson Holdings, Inc. | 686,693 | ||||||
| 25,300 | KeyCorp | 351,670 | ||||||
| 9,581 | Lazard, Ltd. | 479,337 | ||||||
| 3,100 | M&T Bank Corporation | 389,422 | ||||||
| 30,000 | MasterCard, Inc. | 2,584,800 | ||||||
| 7,700 | MBIA, Inc.a | 73,458 | ||||||
| 15,230 | MetLife, Inc. | 823,791 | ||||||
| 1,100 | Mid-America Apartment Communities, Inc. | 82,148 | ||||||
| 23,740 | Morgan Stanley | 921,112 | ||||||
| 12,750 | NASDAQ OMX Group, Inc. | 611,490 | ||||||
| 6,950 | Northern Trust Corporation | 468,430 | ||||||
| 30,019 | PacWest Bancorp | 1,364,664 | ||||||
| 14,830 | Parkway Properties, Inc. | 272,724 | ||||||
| 17,480 | Pebblebrook Hotel Trust | 797,612 | ||||||
| 25,200 | Progressive Corporation | 680,148 | ||||||
| 7,100 | Prudential Financial, Inc. | 642,266 | ||||||
The accompanying Notes to Financial Statements are an integral part of this schedule.
75
Table of Contents
AGGRESSIVE ALLOCATION PORTFOLIO
Schedule of Investments as of December 31, 2014
| Shares | Common Stock (47.6%) | Value | ||||||
| Financials (7.3%) - continued | ||||||||
| 2,600 | RLJ Lodging Trust | $ | 87,178 | |||||
| 750 | Sovran Self Storage, Inc. | 65,415 | ||||||
| 86,500 | SPDR Euro Stoxx 50 ETF | 3,188,390 | ||||||
| 20,971 | SPDR S&P 500 ETF Trust | 4,309,540 | ||||||
| 19,900 | Summit Hotel Properties, Inc. | 247,556 | ||||||
| 4,200 | Sunstone Hotel Investors, Inc. | 69,342 | ||||||
| 6,222 | SVB Financial Groupa | 722,188 | ||||||
| 46,090 | Synovus Financial Corporation | 1,248,578 | ||||||
| 17,009 | TD Ameritrade Holding Corporation | 608,582 | ||||||
| 23,923 | Terreno Realty Corporation | 493,531 | ||||||
| 5,130 | Texas Capital Bancshares, Inc.a | 278,713 | ||||||
| 16,200 | Unum Group | 565,056 | ||||||
| 10,700 | Visa, Inc. | 2,805,540 | ||||||
| 3,950 | W.R. Berkley Corporation | 202,477 | ||||||
| 4,450 | Wells Fargo & Company | 243,949 | ||||||
| 43,208 | Western Alliance Bancorpa | 1,201,182 | ||||||
| 2,200 | Weyerhaeuser Company | 78,958 | ||||||
| 26,109 | Zions Bancorporation | 744,368 | ||||||
|
| |||||||
Total | 66,167,516 | |||||||
|
| |||||||
| Health Care (7.0%) | ||||||||
| 1,200 | Abaxis, Inc. | 68,196 | ||||||
| 2,550 | Abbott Laboratories | 114,801 | ||||||
| 14,269 | Acadia Healthcare Company, Inc.a | 873,405 | ||||||
| 1,900 | Acceleron Pharma, Inc.a | 74,024 | ||||||
| 29,470 | Acorda Therapeutics, Inc.a | 1,204,439 | ||||||
| 18,477 | Actavis plca | 4,756,165 | ||||||
| 12,200 | Aetna, Inc. | 1,083,726 | ||||||
| 18,650 | Affymetrix, Inc.a | 184,075 | ||||||
| 39,124 | Akorn, Inc.a | 1,416,289 | ||||||
| 21,158 | Align Technology, Inc.a | 1,182,944 | ||||||
| 19,750 | Allscripts Healthcare Solutions, Inc.a | 252,207 | ||||||
| 6,657 | AmerisourceBergen Corporation | 600,195 | ||||||
| 9,000 | Amgen, Inc. | 1,433,610 | ||||||
| 29,272 | AMN Healthcare Services, Inc.a | 573,731 | ||||||
| 1,600 | AmSurg Corporationa | 87,568 | ||||||
| 3,650 | Anthem, Inc. | 458,695 | ||||||
| 8,210 | Baxter International, Inc. | 601,711 | ||||||
| 700 | Biogen Idec, Inc.a | 237,615 | ||||||
| 7,572 | BioMarin Pharmaceutical, Inc.a | 684,509 | ||||||
| 62,950 | Boston Scientific Corporationa | 834,087 | ||||||
| 8,200 | Bruker Corporationa | 160,884 | ||||||
| 2,808 | C.R. Bard, Inc. | 467,869 | ||||||
| 18,250 | Cambrex Corporationa | 394,565 | ||||||
| 23,557 | Cardiovascular Systems, Inc.a | 708,595 | ||||||
| 9,142 | Catamaran Corporationa | 473,099 | ||||||
| 14,961 | Cantene Corporationa | 1,553,700 | ||||||
| 71,948 | Cerner Corporationa | 4,652,158 | ||||||
| 1,650 | Charles River Laboratories International, Inc.a | 105,006 | ||||||
| 2,237 | Cooper Companies, Inc. | 362,595 | ||||||
| 5,810 | Covidien plc | 594,247 | ||||||
| 13,426 | Cyberonics, Inc.a | 747,560 | ||||||
| 55,803 | Depomed, Inc.a | 898,986 | ||||||
| 1,800 | Edwards Lifesciences Corporationa | 229,284 | ||||||
| 3,900 | Endo International plca | 281,268 | ||||||
| 12,291 | Envision Healthcare Holdings, Inc.a | 426,375 | ||||||
| 63,952 | ExamWorks Group, Inc.a | 2,659,764 | ||||||
| 3,900 | Express Scripts Holding Companya | 330,213 | ||||||
| 52,800 | Gilead Sciences, Inc.a | 4,976,928 | ||||||
| 1,200 | Greatbatch, Inc.a | 59,160 | ||||||
| 4,150 | HCA Holdings, Inc.a | 304,569 | ||||||
| 14,050 | Hologic, Inc.a | 375,697 | ||||||
| 3,100 | lllumina, Inc.a | 572,198 | ||||||
| 27,661 | Impax Laboratories, Inc.a | 876,300 | ||||||
| 45,428 | Ironwood Pharmaceuticals, Inc.a | 695,957 | ||||||
| 30,902 | Johnson & Johnson | 3,231,422 | ||||||
| 5,357 | LifePoint Hospitals, Inc.a | 385,222 | ||||||
| 2,600 | Mallinckrodt, LLCa | 257,478 | ||||||
| 2,550 | McKesson Corporation | 529,329 | ||||||
| 17,480 | Merck & Company, Inc. | 992,689 | ||||||
| 2,128 | Mettler-Toledo International, Inc.a | 643,635 | ||||||
| 4,285 | Mylan, Inc.a | 241,545 | ||||||
| 49,902 | Neurocrine Biosciences, Inc.a | 1,114,811 | ||||||
| 13,700 | Novavax, Inc.a | 81,241 | ||||||
| 12,116 | NPS Pharmaceuticals, Inc.a | 433,389 | ||||||
| 48,851 | NuVasive, Inc.a | 2,303,813 | ||||||
| 7,700 | PAREXEL International Corporationa | 427,812 | ||||||
| 4,770 | Perrigo Company plc | 797,353 | ||||||
| 24,500 | Pfizer, Inc. | 763,175 | ||||||
| 2,750 | PharMerica Corporationa | 56,953 | ||||||
| 1,550 | Providence Service Corporationa | 56,482 | ||||||
| 1,887 | Puma Biotechnology, Inc.a | 357,152 | ||||||
| 2,450 | Qiagen NVa | 57,477 | ||||||
| 1,650 | Quintiles Transnational Holdings, Inc.a | 97,136 | ||||||
| 8,400 | Spectrum Pharmaceuticals, Inc.a | 58,212 | ||||||
| 1,900 | St. Jude Medical, Inc. | 123,557 | ||||||
| 22,258 | Team Health Holdings, Inc.a | 1,280,503 | ||||||
| 27,087 | Teleflex, Inc. | 3,110,129 | ||||||
| 600 | Thermo Fisher Scientific, Inc. | 75,174 | ||||||
| 13,763 | UnitedHealth Group, Inc. | 1,391,302 | ||||||
| 5,874 | Universal Health Services, Inc. | 653,541 | ||||||
| 32,755 | Vertex Pharmaceuticals, Inc.a | 3,891,294 | ||||||
| 3,100 | Waters Corporationa | 349,432 | ||||||
|
| |||||||
Total | 63,390,227 | |||||||
|
| |||||||
| Industrials (6.4%) | ||||||||
| 2,150 | AAR Corporation | 59,727 | ||||||
| 16,450 | ADT Corporation | 595,984 | ||||||
| 9,400 | Allison Transmission Holdings, Inc. | 318,660 | ||||||
| 13,230 | Apogee Enterprises, Inc. | 560,555 | ||||||
| 2,700 | Argan, Inc. | 90,828 | ||||||
| 5,266 | B/E Aerospace, Inc.a | 305,533 | ||||||
| 3,200 | Boeing Company | 415,936 | ||||||
| 3,307 | Briggs & Stratton Corporation | 67,529 | ||||||
| 3,650 | Caterpillar, Inc. | 334,084 | ||||||
| 18,600 | CLARCOR, Inc. | 1,239,504 | ||||||
| 8,500 | Con-way, Inc. | 418,030 | ||||||
| 17,300 | CSX Corporation | 626,779 | ||||||
| 12,280 | Curtiss-Wright Corporation | 866,845 | ||||||
| 93,400 | Delta Air Lines, Inc. | 4,594,346 | ||||||
| 31,694 | EMCOR Group, Inc. | 1,410,066 | ||||||
| 9,800 | Esterline Technologies Corporationa | 1,074,864 | ||||||
| 2,858 | Fastenal Company | 135,926 | ||||||
| 7,550 | Federal Signal Corporation | 116,572 | ||||||
| 17,290 | Flowserve Corporation | 1,034,461 | ||||||
| 37,650 | Fluor Corporation | 2,282,719 | ||||||
| 11,017 | Fortune Brands Home and Security, Inc. | 498,740 | ||||||
| 3,281 | GATX Corporation | 188,789 | ||||||
| 7,564 | Generac Holdings, Inc.a | 353,693 | ||||||
| 6,010 | Graco, Inc. | 481,882 | ||||||
| 30,068 | Granite Construction, Inc. | 1,143,185 | ||||||
| 13,134 | H&E Equipment Services, Inc. | 368,934 | ||||||
| 32,110 | Healthcare Services Group, Inc. | 993,162 | ||||||
| 11,050 | Heico Corporation | 667,420 | ||||||
| 28,150 | HNI Corporation | 1,437,339 | ||||||
| 4,965 | Honeywell International, Inc. | 496,103 | ||||||
| 3,900 | Huntington Ingalls Industries, Inc. | 438,594 | ||||||
| 8,717 | Huron Consulting Group, Inc.a | 596,156 | ||||||
| 41,750 | Ingersoll-Rand plc | 2,646,532 | ||||||
The accompanying Notes to Financial Statements are an integral part of this schedule.
76
Table of Contents
AGGRESSIVE ALLOCATION PORTFOLIO
Schedule of Investments as of December 31, 2014
| Shares | Common Stock (47.6%) | Value | ||||||
| Industrials (6.4%) - continued | ||||||||
| 6,000 | Insperity, Inc. | $ | 203,340 | |||||
| 71,625 | Interface, Inc. | 1,179,664 | ||||||
| 13,020 | Jacobs Engineering Group, Inc.a | 581,864 | ||||||
| 5,574 | JB Hunt Transport Services, Inc. | 469,610 | ||||||
| 1,200 | Kansas City Southern | 146,436 | ||||||
| 9,300 | KAR Auction Services, Inc. | 322,245 | ||||||
| 2,633 | KLX, Inc.a | 108,611 | ||||||
| 35,600 | Korn/Ferry Internationala | 1,023,856 | ||||||
| 12,970 | Landstar System, Inc. | 940,714 | ||||||
| 3,500 | Manpower, Inc. | 238,595 | ||||||
| 17,409 | MasTec, Inc.a | 393,617 | ||||||
| 4,550 | Meritor, Inc.a | 68,932 | ||||||
| 9,465 | Middleby Corporationa | 937,982 | ||||||
| 4,300 | Mistras Group, Inc.a | 78,819 | ||||||
| 9,800 | Mueller Water Products, Inc. | 100,352 | ||||||
| 9,813 | Nielsen NV | 438,935 | ||||||
| 4,350 | Old Dominion Freight Line, Inc.a | 337,734 | ||||||
| 27,637 | On Assignment, Inc.a | 917,272 | ||||||
| 12,675 | Oshkosh Corporation | 616,639 | ||||||
| 3,728 | Parker Hannifin Corporation | 480,726 | ||||||
| 14,570 | Pentair, Ltd. | 967,739 | ||||||
| 23,835 | PGT, Inc.a | 229,531 | ||||||
| 37,870 | Progressive Waste Solutions, Ltd. | 1,139,130 | ||||||
| 18,100 | Proto Labs, Inc.a | 1,215,596 | ||||||
| 11,400 | Quanta Services, Inc.a | 323,646 | ||||||
| 45,563 | Ritchie Brothers Auctioneers, Inc. | 1,225,189 | ||||||
| 15,892 | Robert Half International, Inc. | 927,775 | ||||||
| 4,228 | Roper Industries, Inc. | 661,048 | ||||||
| 13,690 | Saia, Inc.a | 757,878 | ||||||
| 64,015 | Southwest Airlines Company | 2,709,115 | ||||||
| 1,750 | Spirit Aerosystems Holdings, Inc.a | 75,320 | ||||||
| 17,691 | Spirit Airlines, Inc.a | 1,337,086 | ||||||
| 7,826 | Stericycle, Inc.a | 1,025,832 | ||||||
| 23,876 | Swift Transportation Companya | 683,570 | ||||||
| 12,066 | Tennant Company | 870,803 | ||||||
| 35,650 | Union Pacific Corporation | 4,246,984 | ||||||
| 5,850 | United Continental Holdings, Inc.a | 391,307 | ||||||
| 7,132 | United Rentals, Inc.a | 727,535 | ||||||
| 1,300 | United Technologies Corporation | 149,500 | ||||||
| 3,100 | WABCO Holdings, Inc.a | 324,818 | ||||||
| 2,296 | WageWorks, Inc.a | 148,253 | ||||||
| 5,702 | Watsco, Inc. | 610,114 | ||||||
| 6,615 | Watts Water Technologies, Inc. | 419,656 | ||||||
|
| |||||||
Total | 57,612,845 | |||||||
|
| |||||||
| Information Technology (9.8%) | ||||||||
| 21,619 | A10 Networks, Inc.a | 94,259 | ||||||
| 10,219 | Agilent Technologies, Inc. | 418,366 | ||||||
| 10,500 | Akamai Technologies, Inc.a | 661,080 | ||||||
| 11,685 | Alibaba Group Holding, Ltd. ADRa | 1,214,539 | ||||||
| 3,050 | Alliance Data Systems Corporationa | 872,453 | ||||||
| 6,902 | Ambarella, Inc.a | 350,069 | ||||||
| 2,850 | Amdocs, Ltd. | 132,967 | ||||||
| 14,845 | Amphenol Corporation | 798,809 | ||||||
| 5,668 | ANSYS, Inc.a | 464,776 | ||||||
| 72,614 | Apple, Inc.b | 8,015,133 | ||||||
| 32,484 | Applied Materials, Inc. | 809,501 | ||||||
| 71,724 | Applied Micro Circuits Corporationa | 467,640 | ||||||
| 11,116 | Applied Optoelectronics, Inc.a | 124,722 | ||||||
| 26,823 | Aspen Technology, Inc.a | 939,341 | ||||||
| 155,910 | Atmel Corporationa | 1,308,864 | ||||||
| 3,691 | Autodesk, Inc.a | 221,681 | ||||||
| 3,400 | AVG Technologies NVa | 67,116 | ||||||
| 7,280 | Belden, Inc. | 573,737 | ||||||
| 2,750 | Booz Allen Hamilton Holding Corporation | 72,958 | ||||||
| 17,650 | Broadcom Corporation | 764,775 | ||||||
| 30,030 | Broadridge Financial Solutions, Inc. | 1,386,785 | ||||||
| 30,350 | Brocade Communications Systems, Inc. | 359,344 | ||||||
| 16,879 | Cardtronics, Inc.a | 651,192 | ||||||
| 10,099 | Cavium, Inc.a | 624,320 | ||||||
| 5,850 | CDW Corporation | 205,745 | ||||||
| 17,325 | ChannelAdvisor Corporationa | 373,874 | ||||||
| 13,080 | Ciena Corporationa | 253,883 | ||||||
| 3,150 | Cirrus Logic, Inc.a | 74,246 | ||||||
| 48,750 | Cisco Systems, Inc. | 1,355,981 | ||||||
| 4,450 | Citrix Systems, Inc.a | 283,910 | ||||||
| 12,230 | Cognex Corporationa | 505,466 | ||||||
| 6,400 | Coherent, Inc.a | 388,608 | ||||||
| 6,850 | Computer Sciences Corporation | 431,892 | ||||||
| 16,279 | Constant Contact, Inc.a | 597,439 | ||||||
| 19,710 | Cornerstone OnDemand, Inc.a | 693,792 | ||||||
| 45,250 | Corning, Inc. | 1,037,583 | ||||||
| 15,885 | Dealertrack Technologies, Inc.a | 703,864 | ||||||
| 13,511 | Demandware, Inc.a | 777,423 | ||||||
| 3,300 | Diodes, Inc.a | 90,981 | ||||||
| 27,820 | DST Systems, Inc. | 2,619,253 | ||||||
| 5,874 | eBay, Inc.a | 329,649 | ||||||
| 7,500 | Electronic Arts, Inc.a | 352,613 | ||||||
| 8,135 | Electronics for Imaging, Inc.a | 348,422 | ||||||
| 141,600 | EMC Corporation | 4,211,184 | ||||||
| 9,386 | EVERTEC, Inc. | 207,712 | ||||||
| 5,312 | F5 Networks, Inc.a | 693,030 | ||||||
| 55,350 | Facebook, Inc.a | 4,318,407 | ||||||
| 9,350 | Fairchild Semiconductor International, Inc.a | 157,828 | ||||||
| 8,470 | FEI Company | 765,265 | ||||||
| 21,582 | Fortinet, Inc.a | 661,704 | ||||||
| 8,000 | Gartner, Inc.a | 673,680 | ||||||
| 5,373 | Google, Inc.a | 2,828,347 | ||||||
| 6,023 | Google, Inc., Class Aa | 3,196,165 | ||||||
| 39,994 | Guidewire Software, Inc.a | 2,024,896 | ||||||
| 25,949 | HomeAway, Inc.a | 772,761 | ||||||
| 6,717 | IAC InterActiveCorp | 408,326 | ||||||
| 1,650 | iGATE Corporationa | 65,142 | ||||||
| 5,728 | Imperva, Inc.a | 283,135 | ||||||
| 1,600 | International Business Machines Corporation | 256,704 | ||||||
| 24,010 | Juniper Networks, Inc. | 535,903 | ||||||
| 5,086 | Keysight Technologies, Inc.a | 171,754 | ||||||
| 9,914 | Linkedln Corporationa | 2,277,345 | ||||||
| 4,200 | Liquidity Services, Inc.a | 34,314 | ||||||
| 8,474 | Manhattan Associates, Inc.a | 345,061 | ||||||
| 18,450 | Marvell Technology Group, Ltd. | 267,525 | ||||||
| 4,900 | Maxim Integrated Products, Inc. | 156,163 | ||||||
| 55,777 | MaxLinear, Inc.a | 413,308 | ||||||
| 7,044 | Methode Electronics, Inc. | 257,176 | ||||||
| 10,870 | Microsoft Corporation | 504,912 | ||||||
| 11,159 | Monolithic Power Systems, Inc. | 555,049 | ||||||
| 89,232 | NetApp, Inc. | 3,698,666 | ||||||
| 3,527 | Newport Corporationa | 67,401 | ||||||
| 4,481 | Nice Systems, Ltd. ADR | 226,963 | ||||||
| 8,565 | Nuance Communications, Inc.a | 122,223 | ||||||
| 55,414 | NVIDIA Corporation | 1,111,051 | ||||||
| 12,620 | NXP Semiconductors NVa | 964,168 | ||||||
| 16,700 | Oracle Corporation | 750,999 | ||||||
| 22,246 | Plantronics, Inc. | 1,179,483 | ||||||
| 4,950 | Polycom, Inc.a | 66,825 | ||||||
| 31,216 | Proofpoint, Inc.a | 1,505,548 | ||||||
| 19,746 | QLIK Technologies, Inc.a | 609,954 | ||||||
| 47,070 | QUALCOMM, Inc.b | 3,498,713 | ||||||
The accompanying Notes to Financial Statements are an integral part of this schedule.
77
Table of Contents
AGGRESSIVE ALLOCATION PORTFOLIO
Schedule of Investments as of December 31, 2014
| Shares | Common Stock (47.6%) | Value | ||||||
| Information Technology (9.8%) - continued | ||||||||
| 1,550 | Rackspace Hosting, Inc.a | $ | 72,556 | |||||
| 7,650 | Red Hat, Inc.a | 528,921 | ||||||
| 52,000 | Salesforce.com, Inc.a | 3,084,120 | ||||||
| 6,300 | Sanmina Corporationa | 148,239 | ||||||
| 7,431 | ServiceNow, Inc.a | 504,193 | ||||||
| 4,059 | Skyworks Solutions, Inc. | 295,130 | ||||||
| 26,747 | Sonus Networks, Inc.a | 106,186 | ||||||
| 1,518 | SPS Commerce, Inc.a | 85,964 | ||||||
| 7,850 | Symantec Corporation | 201,392 | ||||||
| 3,752 | Synaptics, Inc.a | 258,288 | ||||||
| 5,052 | Synopsys, Inc.a | 219,610 | ||||||
| 3,150 | Take-Two Interactive Software, Inc.a | 88,295 | ||||||
| 9,500 | Teradata Corporationa | 414,960 | ||||||
| 19,551 | Teradyne, Inc. | 386,914 | ||||||
| 9,730 | Texas Instruments, Inc. | 520,214 | ||||||
| 12,124 | Textura Corporationa | 345,170 | ||||||
| 8,600 | Total System Services, Inc. | 292,056 | ||||||
| 2,322 | Tyler Technologies, Inc.a | 254,120 | ||||||
| 22,830 | Ubiquiti Networks, Inc. | 676,681 | ||||||
| 5,626 | Ultimate Software Group, Inc.a | 825,981 | ||||||
| 2,700 | Unisys Corporationa | 79,596 | ||||||
| 6,600 | Vantiv, Inc.a | 223,872 | ||||||
| 7,797 | VeriFone Systems, Inc.a | 290,048 | ||||||
| 55,148 | Virtusa Corporationa | 2,298,017 | ||||||
| 27,700 | VMware, Inc.a | 2,285,804 | ||||||
| 2,500 | WebMD Health Corporationa | 98,875 | ||||||
| 38,250 | Xerox Corporation | 530,145 | ||||||
|
| |||||||
Total | 88,779,188 | |||||||
|
| |||||||
| Materials (1.7%) | ||||||||
| 3,850 | Agnico Eagle Mines, Ltd. | 95,826 | ||||||
| 4,410 | Airgas, Inc. | 507,944 | ||||||
| 3,744 | Albemarle Corporation | 225,127 | ||||||
| 23,650 | Alcoa, Inc. | 373,433 | ||||||
| 2,700 | Avery Dennison Corporation | 140,076 | ||||||
| 3,800 | Ball Corporation | 259,046 | ||||||
| 23,100 | Barrick Gold Corporation | 248,325 | ||||||
| 7,407 | Celanese Corporation | 444,124 | ||||||
| 31,994 | Chemtura Corporationa | 791,212 | ||||||
| 1,300 | Clearwater Paper Corporationa | 89,115 | ||||||
| 850 | Compass Minerals International, Inc. | 73,805 | ||||||
| 6,900 | Crown Holdings, Inc.a | 351,210 | ||||||
| 6,590 | Dow Chemical Company | 300,570 | ||||||
| 11,140 | Eagle Materials, Inc. | 846,974 | ||||||
| 2,800 | Eastman Chemical Company | 212,408 | ||||||
| 13,200 | Eldorado Gold Corporation | 80,256 | ||||||
| 6,050 | Ferro Corporationa | 78,408 | ||||||
| 8,485 | FMC Corporation | 483,900 | ||||||
| 3,000 | Franco-Nevada Corporation | 147,570 | ||||||
| 23,650 | Freeport-McMoRan, Inc. | 552,464 | ||||||
| 16,050 | Goldcorp, Inc. | 297,246 | ||||||
| 61,968 | Graphic Packaging Holding Companya | 844,004 | ||||||
| 37,450 | Horsehead Holding Corporationa | 592,833 | ||||||
| 1,550 | Innophos Holdings, Inc. | 90,598 | ||||||
| 11,550 | International Paper Company | 618,849 | ||||||
| 21,800 | Kinross Gold Corporationa | 61,476 | ||||||
| 850 | LyondellBasell Industries NV | 67,482 | ||||||
| 1,150 | Martin Marietta Materials, Inc. | 126,868 | ||||||
| 23,460 | Materials Select Sector SPDR Fund | 1,139,687 | ||||||
| 4,100 | MeadWestvaco Corporation | 181,999 | ||||||
| 9,750 | Newmont Mining Corporation | 184,275 | ||||||
| 4,830 | Nucor Corporation | 236,911 | ||||||
| 15,700 | Owens-Illinois, Inc.a | 423,743 | ||||||
| 6,700 | Packaging Corporation of America | 522,935 | ||||||
| 19,243 | PolyOne Corporation | 729,502 | ||||||
| 3,700 | Rock-Tenn Company | 225,626 | ||||||
| 6,950 | Royal Gold, Inc. | 435,765 | ||||||
| 5,000 | Sealed Air Corporation | 212,150 | ||||||
| 6,904 | Silgan Holdings, Inc. | 370,054 | ||||||
| 14,738 | Silver Wheaton Corporation | 299,624 | ||||||
| 1,450 | Sonoco Products Company | 63,365 | ||||||
| 10,000 | Southern Copper Corporation | 282,000 | ||||||
| 23,370 | Steel Dynamics, Inc. | 461,324 | ||||||
| 13,350 | Teck Resources, Ltd. | 182,094 | ||||||
| 2,200 | Tronox, Ltd. | 52,536 | ||||||
| 2,450 | Vulcan Materials Company | 161,038 | ||||||
| 1,350 | Westlake Chemical Corporation | 82,472 | ||||||
| 1,450 | Worthington Industries, Inc. | 43,630 | ||||||
| 17,600 | Yamana Gold, Inc. | 70,752 | ||||||
|
| |||||||
Total | 15,362,631 | |||||||
|
| |||||||
| Telecommunications Services (0.1%) | ||||||||
| 2,985 | Level 3 Communications, Inc.a | 147,399 | ||||||
| 5,174 | SBA Communications Corporationa | 573,072 | ||||||
| 10,658 | Verizon Communications, Inc. | 498,581 | ||||||
| 16,750 | Vonage Holdings Corporationa | 63,818 | ||||||
|
| |||||||
Total | 1,282,870 | |||||||
|
| |||||||
| Utilities (0.5%) | ||||||||
| 2,400 | Atmos Energy Corporation | 133,776 | ||||||
| 5,950 | Edison International, Inc. | 389,606 | ||||||
| 5,920 | Laclede Group, Inc. | 314,944 | ||||||
| 6,890 | NiSource, Inc. | 292,274 | ||||||
| 27,080 | NorthWestern Corporation | 1,532,186 | ||||||
| 14,290 | PG&E Corporation | 760,800 | ||||||
| 8,340 | Portland General Electric Company | 315,502 | ||||||
| 9,050 | Public Service Enterprise Group, Inc. | 374,761 | ||||||
| 3,900 | Southern Company | 191,529 | ||||||
| 2,100 | Vectren Corporation | 97,083 | ||||||
| 5,950 | Wisconsin Energy Corporation | 313,803 | ||||||
|
| |||||||
Total | 4,716,264 | |||||||
|
| |||||||
Total Common Stock (cost $355,904,483) | 430,385,356 | |||||||
|
| |||||||
Affiliated Mutual Funds (38.3%) | ||||||||
| Equity Mutual Funds (35.9%) | ||||||||
| 708,951 | Thrivent Partner Small Cap Value Portfolio | 20,049,563 | ||||||
| 1,737,044 | Thrivent Small Cap Stock Portfolio | 31,911,232 | ||||||
| 1,693,599 | Thrivent Partner Mid Cap Value Portfolio | 30,716,459 | ||||||
| 2,633,658 | Thrivent Mid Cap Stock Portfolio | 49,659,992 | ||||||
| 11,481,744 | Thrivent Partner Worldwide Allocation Portfolio | 106,787,106 | ||||||
| 2,807,135 | Thrivent Large Cap Value Portfolio | 47,124,226 | ||||||
| 3,155,081 | Thrivent Large Cap Stock Portfolio | 38,896,156 | ||||||
|
| |||||||
Total | 325,144,734 | |||||||
|
| |||||||
| Fixed Income Mutual Funds (2.4%) | ||||||||
| 1,158,209 | Thrivent High Yield Portfolio | 5,644,416 | ||||||
| 447,538 | Thrivent Opportunity Income Plus Portfolio | 4,542,552 | ||||||
| 426,005 | Thrivent Income Portfolio | 4,473,519 | ||||||
The accompanying Notes to Financial Statements are an integral part of this schedule.
78
Table of Contents
AGGRESSIVE ALLOCATION PORTFOLIO
Schedule of Investments as of December 31, 2014
| Shares | Affiliated Mutual Funds (38.3%) | Value | ||||||
| Fixed Income Mutual Funds (2.4%) - continued | ||||||||
| 747,607 | Thrivent Limited Maturity Bond Portfolio | $ | 7,337,690 | |||||
|
| |||||||
Total | 21,998,177 | |||||||
|
| |||||||
Total Affiliated Mutual Funds (cost $313,923,488) | 347,142,911 | |||||||
|
| |||||||
| Principal Amount | Long-Term Fixed Income (2.6%) | |||||||
| Asset-Backed Securities (0.1%) | ||||||||
Renaissance Home Equity Loan Trust | ||||||||
| $650,000 | 6.011%, 5/25/2036c | 459,911 | ||||||
|
| |||||||
Total | 459,911 | |||||||
|
| |||||||
| Collateralized Mortgage Obligations (0.1%) | ||||||||
MASTR Alternative Loans Trust | ||||||||
| 37,075 | 0.620%, 12/25/2035d | 20,208 | ||||||
Residential Asset Securitization Trust | ||||||||
| 49,717 | 0.550%, 8/25/2037d | 18,240 | ||||||
Sequoia Mortgage Trust | ||||||||
| 151,449 | 2.657%, 9/20/2046 | 125,543 | ||||||
WaMu Mortgage Pass Through Certificates | ||||||||
| 67,519 | 2.233%, 9/25/2036 | 60,411 | ||||||
| 99,927 | 2.274%, 10/25/2036 | 88,183 | ||||||
|
| |||||||
Total | 312,585 | |||||||
|
| |||||||
| Commercial Mortgage-Backed Securities (<0.1%) | ||||||||
Credit Suisse Mortgage Capital Certificates | ||||||||
| 250,000 | 5.509%, 9/15/2039 | 264,394 | ||||||
Government National Mortgage Association | ||||||||
| 14,958 | 2.164%, 3/16/2033 | 14,976 | ||||||
| 8,706 | 3.214%, 1/16/2040 | 8,757 | ||||||
|
| |||||||
Total | 288,127 | |||||||
|
| |||||||
| Energy (0.3%) | ||||||||
Antero Resources Corporation | ||||||||
| 195,000 | 5.125%, 12/1/2022e | 183,788 | ||||||
Bonanza Creek Energy, Inc. | ||||||||
| 140,000 | 6.750%, 4/15/2021 | 123,200 | ||||||
California Resources Corporation | ||||||||
| 195,000 | 6.000%, 11/15/2024e | 164,775 | ||||||
Chaparral Energy, Inc. | ||||||||
| 195,000 | 7.625%, 11/15/2022 | 127,725 | ||||||
Chesapeake Energy Corporation | ||||||||
| 120,000 | 4.875%, 4/15/2022 | 116,700 | ||||||
Concho Resources, Inc. | ||||||||
| 155,000 | 5.500%, 10/1/2022 | 156,550 | ||||||
Energy XXI Gulf Coast, Inc. | ||||||||
| 195,000 | 7.500%, 12/15/2021f | 105,300 | ||||||
Halcon Resources Corporation | ||||||||
| 195,000 | 8.875%, 5/15/2021f | 146,737 | ||||||
Hornbeck Offshore Services, Inc. | ||||||||
| 110,000 | 5.000%, 3/1/2021 | 90,200 | ||||||
Jones Energy Holdings, LLC | ||||||||
| 195,000 | 6.750%, 4/1/2022e | 148,200 | ||||||
Laredo Petroleum, Inc. | ||||||||
| 195,000 | 5.625%, 1/15/2022 | 170,625 | ||||||
Linn Energy, LLC | ||||||||
| 155,000 | 8.625%, 4/15/2020 | 134,850 | ||||||
MEG Energy Corporation | ||||||||
| 210,000 | 7.000%, 3/31/2024e | 190,050 | ||||||
Oasis Petroleum, Inc.e | ||||||||
| 80,000 | 6.875%, 3/15/2022 | 72,800 | ||||||
Offshore Group Investment, Ltd. | ||||||||
| 155,000 | 7.125%, 4/1/2023 | 110,050 | ||||||
Pacific Drilling SA | ||||||||
| 155,000 | 5.375%, 6/1/2020e | 126,325 | ||||||
Precision Drilling Corporation | ||||||||
| 155,000 | 5.250%, 11/15/2024e | 127,100 | ||||||
Range Resources Corporation | ||||||||
| 195,000 | 5.000%, 3/15/2023 | 195,000 | ||||||
| �� | Rosetta Resources, Inc. | |||||||
| 150,000 | 5.875%, 6/1/2024 | 133,500 | ||||||
Samson Investment Company | ||||||||
| 195,000 | 9.750%, 2/15/2020 | 80,803 | ||||||
Whiting Petroleum Corporation | ||||||||
| 155,000 | 5.750%, 3/15/2021 | 143,762 | ||||||
|
| |||||||
Total | 2,848,040 | |||||||
|
| |||||||
| Mortgage-Backed Securities (0.9%) | ||||||||
Federal Home Loan Mortgage Corporation Gold 15-Yr. Pass Through | ||||||||
| 875,000 | 3.000%, 1/1/2030g | 908,175 | ||||||
Federal Home Loan Mortgage Corporation Gold 30-Yr. Pass Through | ||||||||
| 875,000 | 4.000%, 1/1/2045g | 932,695 | ||||||
Federal National Mortgage Association Conventional 15-Yr. Pass Through | ||||||||
| 900,000 | 3.500%, 1/1/2030g | 950,766 | ||||||
Federal National Mortgage Association Conventional 30-Yr. Pass Through | ||||||||
| 1,825,000 | 3.500%, 1/1/2045g | 1,902,420 | ||||||
| 1,675,000 | 4.000%, 1/1/2045g | 1,787,650 | ||||||
| 1,575,000 | 4.500%, 1/1/2045g | 1,709,613 | ||||||
|
| |||||||
Total | 8,191,319 | |||||||
|
| |||||||
| Transportation (<0.1%) | ||||||||
Hornbeck Offshore Services, Inc. | ||||||||
| 40,000 | 5.875%, 4/1/2020 | 35,400 | ||||||
|
| |||||||
Total | 35,400 | |||||||
|
| |||||||
| U.S. Government and Agencies (1.2%) | ||||||||
Federal National Mortgage Association | ||||||||
| 665,000 | 0.875%, 5/21/2018 | 653,942 | ||||||
Tennessee Valley Authority | ||||||||
| 165,000 | 5.250%, 9/15/2039 | 210,056 | ||||||
U.S. Treasury Bonds | ||||||||
| 2,540,000 | 3.000%, 5/15/2042 | 2,669,779 | ||||||
U.S. Treasury Notes | ||||||||
| 225,000 | 0.625%, 10/15/2016 | 225,070 | ||||||
| 425,000 | 1.500%, 10/31/2019 | 422,410 | ||||||
| 1,400,000 | 1.875%, 6/30/2020 | 1,409,407 | ||||||
| 250,000 | 2.125%, 9/30/2021 | 252,812 | ||||||
The accompanying Notes to Financial Statements are an integral part of this schedule.
79
Table of Contents
AGGRESSIVE ALLOCATION PORTFOLIO
Schedule of Investments as of December 31, 2014
| Principal Amount | Long-Term Fixed Income (2.6%) | Value | ||||||
| U.S. Government and Agencies (1.2%) - continued | ||||||||
| $250,000 | 1.625%, 8/15/2022 | $ | 243,164 | |||||
| 100,000 | 2.250%, 11/15/2024 | 100,672 | ||||||
| 2,800,000 | 3.625%, 2/15/2044 | 3,295,032 | ||||||
U.S. Treasury Notes, TIPS | ||||||||
| 1,335,386 | 0.125%, 4/15/2018 | 1,330,378 | ||||||
|
| |||||||
Total | 10,812,722 | |||||||
|
| |||||||
Total Long-Term Fixed Income (cost $22,025,240) | 22,948,104 | |||||||
|
| |||||||
| Shares | Collateral Held for Securities Loaned (<0.1%) | |||||||
| 241,100 | Thrivent Cash Management Trust | 241,100 | ||||||
|
| |||||||
Total Collateral Held for Securities Loaned (cost $241,100) | 241,100 | |||||||
|
| |||||||
| Shares or Principal Amount | Short-Term Investments (12.2%)h | |||||||
Federal Home Loan Bank Discount Notes | ||||||||
| 2,000,000 | 0.040%, 1/2/2015 | 1,999,998 | ||||||
| 5,000,000 | 0.060%, 1/6/2015 | 4,999,958 | ||||||
| 3,000,000 | 0.057%, 1/9/2015 | 2,999,962 | ||||||
| 2,000,000 | 0.070%, 1/16/2015 | 1,999,942 | ||||||
| 6,000,000 | 0.063%, 1/21/2015 | 5,999,789 | ||||||
| 4,000,000 | 0.070%, 1/23/2015 | 3,999,829 | ||||||
| 2,000,000 | 0.060%, 1/30/2015 | 1,999,903 | ||||||
| 4,000,000 | 0.073%, 2/4/2015 | 3,999,726 | ||||||
| 10,000,000 | 0.080%, 2/10/2015 | 9,999,111 | ||||||
| 5,000,000 | 0.095%, 2/11/2015b | 4,999,459 | ||||||
| 2,000,000 | 0.050%, 3/2/2015 | 1,999,833 | ||||||
| 6,000,000 | 0.100%, 3/4/2015 | 5,998,967 | ||||||
| 6,200,000 | 0.105%, 3/6/2015b | 6,198,842 | ||||||
| 20,000,000 | 0.113%, 3/13/2015 | 19,995,563 | ||||||
| 2,200,000 | 0.090%, 4/24/2015b | 2,199,379 | ||||||
Federal Home Loan Mortgage Corporation Discount Notes | ||||||||
| 1,768,000 | 0.080%, 2/2/2015 | 1,767,874 | ||||||
Federal National Mortgage Association Discount Notes | ||||||||
| 29,000,000 | 0.046%, 1/5/2015 | 28,999,852 | ||||||
|
| |||||||
Total Short-Term Investments (at amortized cost) | 110,157,987 | |||||||
|
| |||||||
Total Investments (cost $802,252,298) 100.7% | $ | 910,875,458 | ||||||
|
| |||||||
Other Assets and Liabilities, Net (0.7%) | (5,985,552 | ) | ||||||
|
| |||||||
Total Net Assets 100.0% | $ | 904,889,906 | ||||||
|
| |||||||
| a | Non-income producing security. |
| b | At December 31, 2014, $14,734,682 of investments were held on deposit with the counterparty and pledged as the initial margin deposit for open futures contracts. |
| c | Denotes step coupon securities. Step coupon securities pay an initial coupon rate for the first period and then different coupon rates for following periods. The rate shown is as of December 31, 2014. |
| d | Denotes variable rate securities. Variable rate securities are securities whose yields vary with a designated market index or market rate. The rate shown is as of December 31, 2014. |
| e | Denotes securities sold under Rule 144A of the Securities Act of 1933, which exempts them from registration. These securities have been deemed liquid and may be resold to other dealers in the program or to other qualified institutional buyers. As of December 31, 2014, the value of these investments was $940,238 or 0.1% of total net assets. |
| f | All or a portion of the security is on loan. |
| g | Denotes investments purchased on a when-issued or delayed delivery basis. |
| h | The interest rate shown reflects the yield, coupon rate or the discount rate at the date of purchase. |
Definitions:
ADR | - | American Depositary Receipt, which are certificates for an underlying foreign security’s shares held by an issuing U.S. depository bank. | ||
ETF | - | Exchange Traded Fund. | ||
TIPS | - | Treasury Inflation Protected Security. |
Unrealized Appreciation (Depreciation)
Gross unrealized appreciation and depreciation of investments, based on cost for federal income tax purposes, were as follows:
Gross unrealized appreciation | $ | 139,269,377 | ||
Gross unrealized depreciation | (31,651,461 | ) | ||
|
| |||
Net unrealized appreciation (depreciation) | $ | 107,617,916 | ||
Cost for federal income tax purposes | $ | 803,257,542 | ||
The accompanying Notes to Financial Statements are an integral part of this schedule.
80
Table of Contents
AGGRESSIVE ALLOCATION PORTFOLIO
Schedule of Investments as of December 31, 2014
Fair Valuation Measurements
The following table is a summary of the inputs used, as of December 31, 2014, in valuing Aggressive Allocation Portfolio’s assets carried at fair value.
Investments in Securities | Total | Level 1 | Level 2 | Level 3 | ||||||||||||
Common Stock | ||||||||||||||||
Consumer Discretionary | 65,689,583 | 65,689,583 | — | — | ||||||||||||
Consumer Staples | 16,850,048 | 16,850,048 | — | — | ||||||||||||
Energy | 50,534,184 | 50,266,477 | 267,707 | — | ||||||||||||
Financials | 66,167,516 | 66,167,516 | — | — | ||||||||||||
Health Care | 63,390,227 | 63,390,227 | — | — | ||||||||||||
Industrials | 57,612,845 | 57,612,845 | — | — | ||||||||||||
Information Technology | 88,779,188 | 88,779,188 | — | — | ||||||||||||
Materials | 15,362,631 | 15,362,631 | — | — | ||||||||||||
Telecommunications Services | 1,282,870 | 1,282,870 | — | — | ||||||||||||
Utilities | 4,716,264 | 4,716,264 | — | — | ||||||||||||
Affiliated Mutual Funds | ||||||||||||||||
Equity Mutual Funds | 325,144,734 | 325,144,734 | — | — | ||||||||||||
Fixed Income Mutual Funds | 21,998,177 | 21,998,177 | — | — | ||||||||||||
Long-Term Fixed Income | ||||||||||||||||
Asset-Backed Securities | 459,911 | — | 459,911 | — | ||||||||||||
Collateralized Mortgage Obligations | 312,585 | — | 312,585 | — | ||||||||||||
Commercial Mortgage-Backed Securities | 288,127 | — | 288,127 | — | ||||||||||||
Energy | 2,848,040 | — | 2,848,040 | — | ||||||||||||
Mortgage-Backed Securities | 8,191,319 | — | 8,191,319 | — | ||||||||||||
Transportation | 35,400 | — | 35,400 | — | ||||||||||||
U.S. Government and Agencies | 10,812,722 | — | 10,812,722 | — | ||||||||||||
Collateral Held for Securities Loaned | 241,100 | 241,100 | — | — | ||||||||||||
Short-Term Investments | 110,157,987 | — | 110,157,987 | — | ||||||||||||
|
|
|
|
|
|
|
| |||||||||
Total | $ | 910,875,458 | $ | 777,501,660 | $ | 133,373,798 | $ | — | ||||||||
|
|
|
|
|
|
|
| |||||||||
Other Financial Instruments | Total | Level 1 | Level 2 | Level 3 | ||||||||||||
Asset Derivatives | ||||||||||||||||
Futures Contracts | 9,904,142 | 9,904,142 | — | — | ||||||||||||
|
|
|
|
|
|
|
| |||||||||
Total Asset Derivatives | $ | 9,904,142 | $ | 9,904,142 | $ | — | $ | — | ||||||||
|
|
|
|
|
|
|
| |||||||||
Liability Derivatives | ||||||||||||||||
Futures Contracts | 7,616,334 | 7,616,334 | — | — | ||||||||||||
|
|
|
|
|
|
|
| |||||||||
Total Liability Derivatives | $ | 7,616,334 | $ | 7,616,334 | $ | — | $ | — | ||||||||
|
|
|
|
|
|
|
| |||||||||
There were no significant transfers between Levels during the period ended December 31, 2014. Transfers between Levels are identified as of the end of the period.
Futures Contracts | Number of Contracts Long/(Short) | Expiration Date | Notional Principal Amount | Value | Unrealized Gain/(Loss) | |||||||||||||||
2-Yr. U.S. Treasury Bond Futures | (75 | ) | March 2015 | ($ | 16,413,053 | ) | ($ | 16,394,532 | ) | $ | 18,521 | |||||||||
5-Yr. U.S. Treasury Bond Futures | (144 | ) | March 2015 | (17,108,561 | ) | (17,125,875 | ) | (17,314 | ) | |||||||||||
10-Yr. U.S. Treasury Bond Futures | (45 | ) | March 2015 | (5,668,457 | ) | (5,705,860 | ) | (37,403 | ) | |||||||||||
30-Yr. U.S. Treasury Bond Futures | 60 | March 2015 | 8,434,402 | 8,673,750 | 239,348 | |||||||||||||||
Eurex EURO STOXX 50 Futures | 1,356 | March 2015 | 48,766,339 | 51,325,226 | 2,558,887 | |||||||||||||||
Mini MSCI EAFE Index Futures | 184 | March 2015 | 16,023,399 | 16,172,680 | 149,281 | |||||||||||||||
Russell 2000 Index Mini-Futures | (440 | ) | March 2015 | (50,251,344 | ) | (52,830,800 | ) | (2,579,456 | ) | |||||||||||
S&P 400 Index Mini-Futures | (824 | ) | March 2015 | (114,382,479 | ) | (119,364,640 | ) | (4,982,161 | ) | |||||||||||
S&P 500 Index Futures | 378 | March 2015 | 187,418,486 | 193,951,800 | 6,533,314 | |||||||||||||||
Ultra Long Term U.S. Treasury Bond Futures | 53 | March 2015 | 8,350,146 | 8,754,937 | 404,791 | |||||||||||||||
Total Futures Contracts | $ | 2,287,808 | ||||||||||||||||||
The accompanying Notes to Financial Statements are an integral part of this schedule.
81
Table of Contents
AGGRESSIVE ALLOCATION PORTFOLIO
Schedule of Investments as of December 31, 2014
The following table summarizes the fair value and Statement of Assets and Liabilities location, as of December 31, 2014, for Aggressive Allocation Portfolio’s investments in financial derivative instruments by primary risk exposure as discussed under item (2) Significant Accounting Policies of the Notes to Financial Statements.
Derivatives by risk category | Statement of Assets and Liabilities Location | Fair Value | ||||
| Asset Derivatives | ||||||
Interest Rate Contracts | ||||||
Futures* | Net Assets - Net unrealized appreciation/(depreciation) on Futures contracts | $ | 662,660 | |||
Total Interest Rate Contracts | 662,660 | |||||
Equity Contracts | ||||||
Futures* | Net Assets - Net unrealized appreciation/(depreciation) on Futures contracts | 9,241,482 | ||||
Total Equity Contracts | 9,241,482 | |||||
|
| |||||
Total Asset Derivatives | $ | 9,904,142 | ||||
|
| |||||
Liability Derivatives | ||||||
Interest Rate Contracts | ||||||
Futures* | Net Assets - Net unrealized appreciation/(depreciation) on Futures contracts | 54,717 | ||||
Total Interest Rate Contracts | 54,717 | |||||
Equity Contracts | ||||||
Futures* | Net Assets - Net unrealized appreciation/(depreciation) on Futures contracts | 7,561,617 | ||||
Total Equity Contracts | 7,561,617 | |||||
|
| |||||
Total Liability Derivatives | $ | 7,616,334 | ||||
|
| |||||
| * | Includes cumulative appreciation/depreciation of futures contracts as reported in the Schedule of Investments. Only current day’s variation margin is reported within the Statement of Assets and Liabilities. |
The following table summarizes the net realized gains/(losses) and Statement of Operations location, for the period ended December 31, 2014, for Aggressive Allocation Portfolio’s investments in financial derivative instruments by primary risk exposure.
Derivatives by risk category | Statement of Operations Location | Realized Gains/(Losses) recognized in Income | ||||
Equity Contracts | ||||||
Futures | Net realized gains/(losses) on Futures contracts | 7,640,216 | ||||
Total Equity Contracts | 7,640,216 | |||||
Interest Rate Contracts | ||||||
Futures | Net realized gains/(losses) on Futures contracts | 1,320,625 | ||||
Total Interest Rate Contracts | 1,320,625 | |||||
|
| |||||
Total | $ | 8,960,841 | ||||
|
| |||||
The following table summarizes the change in net unrealized appreciation/(depreciation) and Statement of Operations location, for the period ended December 31, 2014, for Aggressive Allocation Portfolio’s investments in financial derivative instruments by primary risk exposure.
Derivatives by risk category | Statement of Operations Location | Change in unrealized appreciation/(depreciation) recognized in Income | ||||
Interest Rate Contracts | ||||||
Futures | Change in net unrealized appreciation/(depreciation) on Futures contracts | 464,998 | ||||
Total Interest Rate Contracts | 464,998 | |||||
Equity Contracts | ||||||
Futures | Change in net unrealized appreciation/(depreciation) on Futures contracts | 380,508 | ||||
Total Equity Contracts | 380,508 | |||||
|
| |||||
Total | $ | 845,506 | ||||
|
| |||||
The following table presents Aggressive Allocation Portfolio’s average volume of derivative activity during the period ended December 31, 2014.
Derivative Risk Category | Futures (Notional)* | Futures (Percentage of Average Net Assets) | ||||||
Equity Contracts | $ | 369,237,539 | 43.3 | % | ||||
Interest Rate Contracts | 47,404,968 | 5.6 | ||||||
| * | Notional amount represents long or short, or both, derivative positions held by the Portfolio. |
The accompanying Notes to Financial Statements are an integral part of this schedule.
82
Table of Contents
AGGRESSIVE ALLOCATION PORTFOLIO
Schedule of Investments as of December 31, 2014
Investment in Affiliates
Affiliated issuers, as defined under the Investment Company Act of 1940, include those in which the Portfolio’s holdings of an issuer represent 5% or more of the outstanding voting securities of an issuer, or any affiliated mutual fund.
A summary of transactions for the fiscal year to date, in Aggressive Allocation Portfolio, is as follows:
Portfolio | Value December 31, 2013 | Gross Purchases | Gross Sales | Shares Held at December 31, 2014 | Value December 31, 2014 | Income Earned January 1, 2014 - December 31, 2014 | ||||||||||||||||||
Opportunity Income Plus | $ | 7,094,444 | $ | 222,724 | $ | 2,800,000 | 447,538 | $ | 4,542,552 | $ | 222,483 | |||||||||||||
Partner Small Cap Growth | 68,748,387 | 7,785,264 | 64,802,142 | — | — | — | ||||||||||||||||||
Partner Small Cap Value | 19,488,107 | 545,987 | — | 708,951 | 20,049,563 | 42,323 | ||||||||||||||||||
Small Cap Stock | 30,462,701 | 398,737 | — | 1,737,044 | 31,911,232 | 66,315 | ||||||||||||||||||
Partner Mid Cap Value | 27,057,173 | 3,929,059 | — | 1,693,599 | 30,716,459 | 181,886 | ||||||||||||||||||
Mid Cap Stock | 44,367,253 | 2,238,876 | — | 2,633,658 | 49,659,992 | 147,439 | ||||||||||||||||||
Partner Worldwide Allocation | 112,823,728 | 2,293,241 | — | 11,481,744 | 106,787,106 | 2,293,241 | ||||||||||||||||||
Large Cap Value | 43,220,812 | 551,300 | — | 2,807,135 | 47,124,226 | 551,300 | ||||||||||||||||||
Large Cap Stock | 36,941,866 | 335,055 | — | 3,155,081 | 38,896,156 | 335,055 | ||||||||||||||||||
High Yield | 9,193,170 | 2,093,755 | 5,429,185 | 1,158,209 | 5,644,416 | 464,546 | ||||||||||||||||||
Income | 6,048,407 | 2,992,854 | 4,687,919 | 426,005 | 4,473,519 | 240,995 | ||||||||||||||||||
Limited Maturity Bond | 8,294,764 | 6,392,791 | 7,351,763 | 747,607 | 7,337,690 | 170,998 | ||||||||||||||||||
Cash Management | — | 3,127,369 | 2,886,269 | 241,100 | 241,100 | 349 | ||||||||||||||||||
Total Value and Income Earned | 413,740,812 | 347,384,011 | 4,716,930 | |||||||||||||||||||||
The accompanying Notes to Financial Statements are an integral part of this schedule.
83
Table of Contents
MODERATELY AGGRESSIVE ALLOCATION PORTFOLIO
Schedule of Investments as of December 31, 2014
| Principal Amount | Bank Loans (1.9%)a | Value | ||||||
| Basic Materials (0.1%) | |||||||
Axalta Coating Systems US Holdings, Inc., Term Loan | ||||||||
| $ | 809,709 | 3.750%, 2/1/2020 | $ | 786,810 | ||||
Fortescue Metals Group, Ltd., Term Loan | ||||||||
| 1,026,506 | 3.750%, 6/30/2019 | 930,015 | ||||||
Ineos Group Holdings, Ltd., Term Loan | ||||||||
| 1,368,137 | 3.750%, 5/4/2018 | 1,323,522 | ||||||
NewPage Corporation, Term Loan | ||||||||
| 1,400,000 | 9.500%, 2/11/2021 | 1,327,662 | ||||||
Wausau Paper Corporation, Term Loan | ||||||||
| 796,000 | 6.500%, 7/30/2020 | 788,040 | ||||||
|
| |||||||
Total | 5,156,049 | |||||||
|
| |||||||
| Capital Goods (0.1%) | |||||||
ADS Waste Holdings, Inc., Term Loan | ||||||||
| 1,088,267 | 3.750%, 10/9/2019 | 1,054,596 | ||||||
Berry Plastics Group, Inc., Term Loan | ||||||||
| 1,802,887 | 3.500%, 2/8/2020 | 1,741,066 | ||||||
Silver II Borrower, Term Loan | ||||||||
| 448,533 | 4.000%, 12/13/2019 | 415,875 | ||||||
STHI Holding Corporation, Term Loan | ||||||||
| 279,300 | 4.500%, 8/6/2021 | 276,739 | ||||||
|
| |||||||
Total | 3,488,276 | |||||||
|
| |||||||
| Communications Services (0.7%) | |||||||
Atlantic Broadband Penn, LLC, Term Loan | ||||||||
| 562,842 | 3.250%, 11/30/2019 | 550,178 | ||||||
Birch Communication Inc., Term Loan | ||||||||
| 1,408,715 | 7.750%, 7/17/2020 | 1,380,541 | ||||||
Cable & Wireless Communications plc, Term Loan | ||||||||
| 256,000 | 0.000%, 11/25/2016b,c | 254,720 | ||||||
Cengage Learning Aquisitions, Term Loan | ||||||||
| 2,600,350 | 7.000%, 3/31/2020 | 2,571,096 | ||||||
Cequel Communications, LLC, Term Loan | ||||||||
| 572,638 | 3.500%, 2/14/2019 | 562,937 | ||||||
Charter Communications Operating, LLC, Term Loan | ||||||||
| 241,325 | 3.000%, 7/1/2020 | 236,349 | ||||||
Clear Channel Communications, Inc., Term Loan | ||||||||
| 11,795 | 3.819%, 1/29/2016 | 11,659 | ||||||
| 1,398,024 | 6.919%, 1/30/2019 | 1,315,136 | ||||||
| 449,628 | 7.669%, 7/30/2019 | 427,709 | ||||||
Cumulus Media Holdings, Inc., Term Loan | ||||||||
| 1,250,519 | 4.250%, 12/23/2020b,c | 1,210,915 | ||||||
Fairpoint Communications, Term Loan | ||||||||
| 1,203,563 | 7.500%, 2/14/2019 | 1,190,781 | ||||||
Grande Communications Networks, LLC, Term Loan | ||||||||
| 733,832 | 4.500%, 5/29/2020 | 723,742 | ||||||
Hargray Communications Group, Inc., Term Loan | ||||||||
| 1,436,210 | 5.250%, 6/26/2019 | 1,425,438 | ||||||
Integra Telecom Holdings, Inc., Term Loan | ||||||||
| 731,963 | 5.250%, 2/22/2019 | 710,465 | ||||||
| 250,000 | 9.750%, 2/21/2020 | 247,812 | ||||||
Intelsat Jackson Holdings SA, Term Loan | ||||||||
| 1,097,851 | 3.750%, 6/30/2019 | 1,080,011 | ||||||
Level 3 Communications, Inc., Term Loan | ||||||||
| 1,555,000 | 4.000%, 1/15/2020 | 1,541,394 | ||||||
Level 3 Financing, Inc., Term Loan | ||||||||
| 640,000 | 4.500%, 1/31/2022 | 639,802 | ||||||
Liberty Cablevision of Puerto Rico, LLC, Term Loan | ||||||||
| 935,000 | 0.000%, 1/7/2022b,c | 906,950 | ||||||
| 1,830,000 | 4.500%, 1/7/2022 | 1,779,675 | ||||||
LTS Buyer, LLC, Term Loan | ||||||||
| 546,675 | 4.000%, 4/13/2020 | 534,036 | ||||||
| 39,215 | 8.000%, 4/12/2021 | 38,480 | ||||||
McGraw-Hill Global Education, LLC, Term Loan | ||||||||
| 1,113,305 | 5.750%, 3/22/2019 | 1,107,394 | ||||||
Mediacom Broadband, LLC, Term Loan | ||||||||
| 625,600 | 4.000%, 1/20/2020 | 611,005 | ||||||
NEP Broadcasting, LLC, Term Loan | ||||||||
| 68,572 | 9.500%, 7/22/2020 | 67,114 | ||||||
NEP/NCP Holdco, Inc., Term Loan | ||||||||
| 1,807,961 | 4.250%, 1/22/2020 | 1,765,781 | ||||||
NTelos, Inc., Term Loan | ||||||||
| 361,675 | 5.750%, 11/9/2019 | �� | 314,657 | |||||
Syniverse Holdings, Inc., Term Loan | ||||||||
| 950,131 | 4.000%, 4/23/2019 | 921,627 | ||||||
TNS, Inc., Term Loan | ||||||||
| 715,986 | 5.000%, 2/14/2020 | 707,931 | ||||||
Univision Communications, Inc., Term Loan | ||||||||
| 1,671,841 | 4.000%, 3/1/2020 | 1,632,553 | ||||||
Virgin Media Investment Holdings, Ltd., Term Loan | ||||||||
| 1,505,000 | 3.500%, 6/7/2020 | 1,475,818 | ||||||
WideOpenWest Finance, LLC, Term Loan | ||||||||
| 1,601,475 | 4.750%, 4/1/2019 | 1,588,471 | ||||||
XO Communications, LLC, Term Loan | ||||||||
| 297,750 | 4.250%, 3/20/2021 | 291,795 | ||||||
Yankee Cable Acquisition, LLC, Term Loan | ||||||||
| 929,204 | 4.500%, 3/1/2020 | 923,396 | ||||||
Zayo Group, LLC, Term Loan | ||||||||
| 1,462,005 | 4.000%, 7/2/2019 | 1,444,315 | ||||||
|
| |||||||
Total | 32,191,683 | |||||||
|
| |||||||
| Consumer Cyclical (0.3%) | |||||||
Amaya Gaming Group, Inc., Term Loan | ||||||||
| 1,032,413 | 5.000%, 8/1/2021b,c | 1,021,314 | ||||||
Burlington Coat Factory Warehouse Corporation, Term Loan | ||||||||
| 898,571 | 4.250%, 8/13/2021 | 885,659 | ||||||
Ceridian HCM Holding, Inc., Term Loan | ||||||||
| 348,998 | 4.500%, 9/15/2020 | 342,674 | ||||||
The accompanying Notes to Financial Statements are an integral part of this schedule.
84
Table of Contents
MODERATELY AGGRESSIVE ALLOCATION PORTFOLIO
Schedule of Investments as of December 31, 2014
| Principal Amount | Bank Loans (1.9%)a | Value | ||||||
| Consumer Cyclical (0.3%) - continued | |||||||
Chrysler Group, LLC, Term Loan | ||||||||
| $ | 820,127 | 3.500%, 5/24/2017 | $ | 814,124 | ||||
Golden Nugget, Inc., Delayed Draw | ||||||||
| 149,985 | 5.500%, 11/21/2019 | 147,830 | ||||||
Golden Nugget, Inc., Term Loan | ||||||||
| 349,965 | 5.500%, 11/21/2019 | 344,936 | ||||||
Hilton Worldwide Finance, LLC, Term Loan | ||||||||
| 798,246 | 3.500%, 10/26/2020 | 787,932 | ||||||
J.C. Penney Corporation, Inc., Term Loan | ||||||||
| 364,450 | 6.000%, 5/22/2018 | 356,858 | ||||||
Las Vegas Sands, LLC, Term Loan | ||||||||
| 4,653,000 | 3.250%, 12/19/2020 | 4,620,057 | ||||||
Marina District Finance Company, Inc., Term Loan | ||||||||
| 2,918,850 | 6.750%, 8/15/2018 | 2,892,697 | ||||||
MGM Resorts lnternational, Term Loan | ||||||||
| 764,400 | 3.500%, 12/20/2019 | 742,905 | ||||||
Mohegan Tribal Gaming Authority, Term Loan | ||||||||
| 1,485,000 | 5.500%, 11/19/2019 | 1,424,278 | ||||||
Rite Aid Corporation, Term Loan | ||||||||
| 182,235 | 3.500%, 2/21/2020 | 181,096 | ||||||
| 365,000 | 5.750%, 8/21/2020 | 365,610 | ||||||
ROC Finance, LLC, Term Loan | ||||||||
| 1,338,062 | 5.000%, 6/20/2019 | 1,237,708 | ||||||
Scientific Games International, Inc., Term Loan | ||||||||
| 411,880 | 6.000%, 10/18/2020 | 405,393 | ||||||
Seminole Indian Tribe of Florida, Term Loan | ||||||||
| 403,650 | 3.000%, 4/29/2020 | 401,297 | ||||||
|
| |||||||
Total | 16,972,368 | |||||||
|
| |||||||
| Consumer Non-Cyclical (0.2%) | |||||||
Albertsons, Inc., Term Loan | ||||||||
| 1,079,134 | 4.750%, 3/21/2019 | 1,071,041 | ||||||
Biomet, Inc., Term Loan | ||||||||
| 929,638 | 3.670%, 7/25/2017 | 923,995 | ||||||
Catalina Marketing Corporation, Term Loan | ||||||||
| 303,475 | 4.500%, 4/9/2021 | 288,113 | ||||||
CHS/Community Health Systems, Inc., Term Loan | ||||||||
| 216,079 | 3.486%, 1/25/2017 | 214,637 | ||||||
| 575,921 | 4.250%, 1/27/2021 | 573,883 | ||||||
Del Monte Corporation, Term Loan | ||||||||
| 149,190 | 3.500%, 3/9/2020 | 142,477 | ||||||
Hologic, Inc., Term Loan | ||||||||
| 560,486 | 3.250%, 8/1/2019 | 554,495 | ||||||
JBS USA, LLC, Term Loan | ||||||||
| 804,656 | 3.750%, 5/25/2018 | 792,586 | ||||||
Ortho-Clinical Diagnostics, Inc., Term Loan | ||||||||
| 1,880,550 | 4.750%, 6/30/2021 | 1,847,170 | ||||||
Roundy’s Supermarkets, Inc., Term Loan | ||||||||
| 1,495,632 | 5.750%, 3/3/2021 | 1,399,657 | ||||||
Supervalu, Inc., Term Loan | ||||||||
| 1,108,130 | 4.500%, 3/21/2019 | 1,086,588 | ||||||
Visant Corporation, Term Loan | ||||||||
| 1,974,697 | 7.000%, 9/23/2021 | 1,915,456 | ||||||
|
| |||||||
Total | 10,810,098 | |||||||
|
| |||||||
| Energy (0.1%) | |||||||
Arch Coal, Inc., Term Loan | ||||||||
| 3,186,785 | 6.250%, 5/16/2018 | 2,630,436 | ||||||
Energy Solutions, LLC, Term Loan | ||||||||
| 601,975 | 6.750%, 5/29/2020 | 599,152 | ||||||
Expro Holdings UK 2, Ltd., Term Loan | ||||||||
| 448,875 | 5.750%, 9/2/2021 | 365,833 | ||||||
Fieldwood Energy, LLC, Term Loan | ||||||||
| 96,059 | 8.375%, 9/30/2020 | 69,763 | ||||||
Houston Fuel Oil Terminal, LLC, Term Loan | ||||||||
| 952,613 | 4.250%, 8/19/2021b,c | 909,745 | ||||||
McJunkin Red Man Corporation, Term Loan | ||||||||
| 612,250 | 5.000%, 11/8/2019 | 561,739 | ||||||
Offshore Group Investment, Ltd., Term Loan | ||||||||
| 987,413 | 5.750%, 3/28/2019 | 735,622 | ||||||
Pacific Drilling SA, Term Loan | ||||||||
| 487,575 | 4.500%, 6/3/2018 | 400,626 | ||||||
TerraForm Power Operating, LLC, Term Loan | ||||||||
| 303,475 | 4.750%, 7/23/2019 | 301,958 | ||||||
|
| |||||||
Total | 6,574,874 | |||||||
|
| |||||||
| Financials (0.1%) | |||||||
DJO Finance, LLC, Term Loan | ||||||||
| 1,143,087 | 4.250%, 9/15/2017 | 1,115,459 | ||||||
GEO Group, Inc., Term Loan | ||||||||
| 242,310 | 3.250%, 4/3/2020 | 239,482 | ||||||
Harland Clarke Holdings Corporation, Term Loan | ||||||||
| 731,250 | 6.000%, 8/4/2019 | 726,680 | ||||||
MoneyGram International, Inc., Term Loan | ||||||||
| 962,850 | 4.250%, 3/27/2020 | 880,526 | ||||||
WaveDivision Holdings, LLC, Term Loan | ||||||||
| 1,455,300 | 4.000%, 10/15/2019 | 1,431,040 | ||||||
|
| |||||||
Total | 4,393,187 | |||||||
|
| |||||||
| Technology (0.1 %) | |||||||
First Data Corporation, Term Loan | ||||||||
| 1,540,000 | 3.667%, 3/23/2018 | 1,508,245 | ||||||
| 640,000 | 3.667%, 9/24/2018 | 624,960 | ||||||
Freescale Semiconductor, Inc., Term Loan | ||||||||
| 874,492 | 4.250%, 2/28/2020 | 852,088 | ||||||
| 594,475 | 5.000%, 1/15/2021 | 592,097 | ||||||
Infor US, Inc., Term Loan | ||||||||
| 1,198,642 | 3.750%, 6/3/2020 | 1,161,268 | ||||||
|
| |||||||
Total | 4,738,658 | |||||||
|
| |||||||
| Transportation ( 0.1%) | |||||||
American Airlines, Inc., Term Loan | ||||||||
| 1,034,250 | 3.750%, 6/27/2019 | 1,021,756 | ||||||
The accompanying Notes to Financial Statements are an integral part of this schedule.
85
Table of Contents
MODERATELY AGGRESSIVE ALLOCATION PORTFOLIO
Schedule of Investments as of December 31, 2014
| Principal Amount | Bank Loans (1.9%)a | Value | ||||||
| Transportation (0.1%) - continued | |||||||
Delta Air Lines, Inc., Term Loan | ||||||||
| $ | 1,223,112 | 3.250%, 4/20/2017b,c | $ | 1,207,823 | ||||
OSG Bulk Ships, Inc., Term Loan | ||||||||
| 746,2 50 | 5.250%, 8/5/2019 | 725,728 | ||||||
United Airlines, Inc., Term Loan | ||||||||
| 604,237 | 3.500%, 4/1/2019 | 592,908 | ||||||
| 129,675 | 3.750%, 9/15/2021 | 128,271 | ||||||
|
| |||||||
Total | 3,676,486 | |||||||
|
| |||||||
| Utilities (0.1%) | |||||||
Calpine Corporation, Term Loan | ||||||||
| 181,234 | 4.000%, 4/1/2018 | 179,014 | ||||||
| 1,251,200 | 4.000%, 10/9/2019 | 1,233,220 | ||||||
Intergen NV, Term Loan | ||||||||
| 482,650 | 5.500%, 6/15/2020 | 478,224 | ||||||
NGPL PipeCo, LLC, Term Loan | ||||||||
| 1,020,923 | 6.750%, 9/15/2017 | 989,019 | ||||||
|
| |||||||
Total | 2,879,477 | |||||||
|
| |||||||
Total Bank Loans (cost $93,493,510) | 90,881,156 | |||||||
|
| |||||||
| Shares | Affiliated Mutual Funds (40.6%) | Value | ||||||
| Equity Mutual Funds (34.4%) | |||||||
| 3,483,432 | Thrivent Partner Small Cap Value Portfolio | 98,513,554 | ||||||
| 4,604,230 | Thrivent Small Cap Stock Portfolio | 84,584,317 | ||||||
| 7,570,495 | Thrivent Partner Mid Cap Value Portfolio | 137,304,560 | ||||||
| 14,848,287 | Thrivent Mid Cap Stock Portfolio | 279,977,811 | ||||||
| 47,730,299 | Thrivent Partner Worldwide Allocation Portfolio | 443,920,241 | ||||||
| 19,283,176 | Thrivent Large Cap Value Portfolio | 323,712,459 | ||||||
| 22,340,673 | Thrivent Large Cap Stock Portfolio | 275,418,051 | ||||||
|
| |||||||
Total | 1,643,430,993 | |||||||
|
| |||||||
| Fixed Income Mutual Funds (6.2%) | |||||||
| 24,608,174 | Thrivent High Yield Portfolio | 119,925,476 | ||||||
| 13,188,704 | Thrivent Income Portfolio | 138,495,900 | ||||||
| 3,867,565 | Thrivent Limited Maturity Bond Portfolio | 37,959,766 | ||||||
|
| |||||||
| Total | 296,381,142 | |||||||
|
| |||||||
Total Affiliated Mutual Funds (cost $1,637,450,465) | 1,939,812,135 | |||||||
|
| |||||||
| Shares | Common Stock (29.8%) | Value | ||||||
| Consumer Discretionary (4.4%) | |||||||
| 28,400 | Aaron’s, Inc. | 868,188 | ||||||
| 44,192 | Amazon.com, Inc.d | 13,714,987 | ||||||
| 2,600 | Aoyama Trading Company, Ltd. | 56,810 | ||||||
| 15,100 | Apollo Group, Inc.d | 515,061 | ||||||
| 22,250 | AutoZone, Inc.d | 13,775,198 | ||||||
| 50,850 | Barnes & Noble, Inc.d | 1,180,737 | ||||||
| 800 | Bayerische Motoren Werke AG | 65,360 | ||||||
| 27,400 | Best Buy Company, Inc. | 1,068,052 | ||||||
| 5,200 | Big Lots, Inc. | 208,104 | ||||||
| 6,700 | BorgWarner, Inc. | 368,165 | ||||||
| 1,000 | Brembo SPA | 33,517 | ||||||
| 2,000 | Bridgestone Corporation | 69,364 | ||||||
| 4,550 | Brinker International, Inc. | 267,040 | ||||||
| 28,378 | Brunswick Corporation | 1,454,656 | ||||||
| 25,371 | Burlington Stores, Inc.d | 1,199,033 | ||||||
| 11,400 | Carnival Corporation | 516,762 | ||||||
| 21,950 | Cato Corporation | 925,851 | ||||||
| 62,650 | CBS Corporation | 3,467,051 | ||||||
| 56,960 | Cheesecake Factory, Inc. | 2,865,658 | ||||||
| 1,600 | Chiyoda Company, Ltd. | 31,496 | ||||||
| 8,446 | Chuy’s Holdings, Inc.d | 166,133 | ||||||
| 8,900 | Coach, Inc. | 334,284 | ||||||
| 9,250 | Coinstar, Inc.d | 695,785 | ||||||
| 345,786 | Comcast Corporation | 20,059,046 | ||||||
| 15,446 | Core-Mark Holding Company, Inc. | 956,571 | ||||||
| 36,458 | Del Frisco’s Restaurant Group, Inc.d | 865,513 | ||||||
| 93,094 | Delphi Automotive plc | 6,769,796 | ||||||
| 6,800 | DeVry Education Group, Inc. | 322,796 | ||||||
| 12,352 | Discovery Communications, Inc., Class Ad | 425,526 | ||||||
| 25,650 | DISH Network Corporationd | 1,869,629 | ||||||
| 69,750 | Dollar Tree, Inc.d | 4,909,005 | ||||||
| 20,900 | EDION Corporation | 146,188 | ||||||
| 19,818 | Five Below, Inc.d,e | 809,169 | ||||||
| 87,050 | Ford Motor Company | 1,349,275 | ||||||
| 35,402 | G-III Apparel Group, Ltd.d | 3,575,956 | ||||||
| 10,600 | Hakuhodo Dy Holdings, Inc. | 101,441 | ||||||
| 21,466 | Harman International Industries, Inc. | 2,290,637 | ||||||
| 10,600 | Haseko Corporation | 85,254 | ||||||
| 1,600 | Heiwa Corporation | 31,880 | ||||||
| 42,700 | Hilton Worldwide Holdings, Inc.d | 1,114,043 | ||||||
| 114,500 | Home Depot, Inc. | 12,019,065 | ||||||
| 84,640 | Houghton Mifflin Harcourt Companyd | 1,752,894 | ||||||
| 21,216 | Imax Corporationd,e | 655,574 | ||||||
| 5,700 | Informa plc | 41,629 | ||||||
| 57,859 | Jarden Corporationd | 2,770,289 | ||||||
| 6,600 | JM AB | 209,211 | ||||||
| 41,629 | Kate Spade & Companyd | 1,332,544 | ||||||
| 17,900 | Kirkland’s, Inc.d | 423,156 | ||||||
| 106,050 | Kohl’s Corporation | 6,473,292 | ||||||
| 47,107 | Kongsberg Automotive ASAd | 36,140 | ||||||
| 164,127 | Las Vegas Sands Corporation | 9,545,626 | ||||||
| 52,000 | Li & Fung, Ltd. | 48,683 | ||||||
| 24,700 | Liberty Interactive Corporationd | 726,674 | ||||||
| 3,523 | Liberty Venturesd | 132,888 | ||||||
| 27,259 | Limited Brands, Inc. | 2,359,266 | ||||||
| 6,512 | Lithia Motors, Inc. | 564,525 | ||||||
| 95,060 | Lowe’s Companies, Inc. | 6,540,128 | ||||||
| 26,000 | Luk Fook Holdings International, Ltd. | 97,503 | ||||||
| 39,200 | Macy’s, Inc. | 2,577,400 | ||||||
| 30,411 | Marriott International, Inc. | 2,372,970 | ||||||
| 3,500 | Marriott Vacations Worldwide Corporation | 260,890 | ||||||
| 94,622 | MDC Partners, Inc. | 2,149,812 | ||||||
| 20,500 | Nautilus, Inc.d | 311,190 | ||||||
| 2,800 | Next plc | 296,960 | ||||||
| 115,550 | NIKE, Inc. | 11,110,133 | ||||||
| 9,200 | NOK Corporation | 234,172 | ||||||
| 103,100 | NutriSystem, Inc. | 2,015,605 | ||||||
| 17,350 | Omnicom Group, Inc. | 1,344,105 | ||||||
| 27,950 | Orbitz Worldwide, Inc.d | 230,029 | ||||||
| 12,037 | O’Reilly Automotive, Inc.d | 2,318,567 | ||||||
| 49,030 | Oxford Industries, Inc. | 2,706,946 | ||||||
| 23,380 | Papa John’s International, Inc. | 1,304,604 | ||||||
| 9,900 | Persimmon plc | 241,797 | ||||||
| 15,554 | PVH Corporation | 1,993,556 | ||||||
| 5,482 | Ralph Lauren Corporation | 1,015,047 | ||||||
| 11,958 | Red Robin Gourmet Burgers, Inc.d | 920,467 | ||||||
| 6,398 | Restoration Hardware Holdings, Inc.d | 614,272 | ||||||
The accompanying Notes to Financial Statements are an integral part of this schedule.
86
Table of Contents
MODERATELY AGGRESSIVE ALLOCATION PORTFOLIO
Schedule of Investments as of December 31, 2014
| Shares | Common Stock (29.8%) | Value | ||||||
| Consumer Discretionary (4.4%) - continued | |||||||
| 500 | Rinnai Corporation | $ | 33,596 | |||||
| 24,802 | Ross Stores, Inc. | 2,337,837 | ||||||
| 5,100 | Royal Caribbean Cruises, Ltd. | 420,393 | ||||||
| 35,050 | Ruby Tuesday, Inc.d | 239,742 | ||||||
| 23,700 | Scientific Games Corporationd,e | 301,701 | ||||||
| 14,300 | Scripps Networks Interactive, Inc. | 1,076,361 | ||||||
| 34,350 | Select Comfort Corporationd | 928,481 | ||||||
| 3,986 | Shutterfly, Inc.d | 166,196 | ||||||
| 12,556 | Skechers USA, Inc.d | 693,719 | ||||||
| 11,464 | Slater & Gordon, Ltd. | 59,454 | ||||||
| 149,200 | Starbucks Corporation | 12,241,860 | ||||||
| 24,280 | Starwood Hotels & Resorts Worldwide, Inc. | 1,968,380 | ||||||
| 11,100 | Sumitomo Forestry Company, Ltd. | 108,553 | ||||||
| 2,500 | Sumitomo Rubber Industries, Ltd. | 37,165 | ||||||
| 8,800 | Suzuki Motor Corporation | 263,713 | ||||||
| 18,938 | Tenneco, Inc.d | 1,072,080 | ||||||
| 22,780 | Time Warner Cable, Inc. | 3,463,927 | ||||||
| 49,967 | Toll Brothers, Inc.d | 1,712,369 | ||||||
| 10,250 | Tower International, Inc.d | 261,888 | ||||||
| 14,655 | Tractor Supply Company | 1,155,107 | ||||||
| 119,919 | Tuesday Morning Corporationd,e | 2,602,242 | ||||||
| 16,612 | Ulta Salon Cosmetics & Fragrance, Inc.d | 2,123,678 | ||||||
| 16,492 | Under Armour, Inc.d | 1,119,807 | ||||||
| 11,354 | Vail Resorts, Inc. | 1,034,690 | ||||||
| 200 | Valora Holding AG | 45,902 | ||||||
| 21,876 | VF Corporation | 1,638,512 | ||||||
| 6,200 | WH Smith plc | 129,653 | ||||||
| 2,900 | Wolters Kluwer NV | 88,494 | ||||||
| 1,800 | WPP plc | 37,425 | ||||||
| 21,550 | Wyndham Worldwide Corporation | 1,848,128 | ||||||
|
| |||||||
Total | 208,487,679 | |||||||
|
| |||||||
| Consumer Staples (1.2%) | |||||||
| 58,250 | Anheuser-Busch InBev NV ADR | 6,542,640 | ||||||
| 13,200 | Archer-Daniels-Midland Company | 686,400 | ||||||
| 373 | Associated British Foods plc | 18,236 | ||||||
| 33,700 | Avon Products, Inc. | 316,443 | ||||||
| 9,196 | B&G Foods, Inc. | 274,960 | ||||||
| 3,989 | Boston Beer Company, Inc.d,e | 1,154,975 | ||||||
| 13,798 | Britvic plc | 144,307 | ||||||
| 4,600 | Coca-Cola Enterprises, Inc. | 203,412 | ||||||
| 113,350 | CVS Health Corporation | 10,916,739 | ||||||
| 37,386 | Hain Celestial Group, Inc.d | 2,179,230 | ||||||
| 11,500 | Ingredion, Inc. | 975,660 | ||||||
| 8,200 | J Sainsbury plc | 31,313 | ||||||
| 4,000 | Kesko OYJ | 145,475 | ||||||
| 8,600 | Keurig Green Mountain, Inc. | 1,138,597 | ||||||
| 16,170 | Kimberly-Clark Corporation | 1,868,282 | ||||||
| 1,400 | KOSE Corporation | 54,726 | ||||||
| 5,500 | Kroger Company | 353,155 | ||||||
| 10,050 | Molson Coors Brewing Company | 748,926 | ||||||
| 104,210 | Mondelez International, Inc. | 3,785,428 | ||||||
| 25,488 | Monster Beverage Corporationd | 2,761,625 | ||||||
| 14,297 | Natural Grocers by Vitamin Cottage, Inc.d,e | 402,747 | ||||||
| 2,000 | Nestle SA | 145,802 | ||||||
| 18,116 | Philip Morris International, Inc. | 1,475,548 | ||||||
| 7,200 | Pilgrim’s Pride Corporationd,e | 236,088 | ||||||
| 31,650 | Pinnacle Foods, Inc. | 1,117,245 | ||||||
| 5,970 | Reckitt Benckiser Group plc | 483,535 | ||||||
| 157,950 | Rite Aid Corporationd | 1,187,784 | ||||||
| 5,287 | SalMar ASA | 90,003 | ||||||
| 5,400 | Suedzucker AG | 77,640 | ||||||
| 10,000 | Tate & Lyle plc | 93,695 | ||||||
| 29,300 | TreeHouse Foods, Inc.d | 2,506,029 | ||||||
| 24,000 | Tyson Foods, Inc. | 962,160 | ||||||
| 40,998 | United Natural Foods, Inc.d | 3,170,170 | ||||||
| 77,800 | Wal-Mart Stores, Inc. | 6,681,464 | ||||||
| 75,850 | WhiteWave Foods Companyd | 2,653,992 | ||||||
| 24,364 | Whole Foods Market, Inc. | 1,228,433 | ||||||
|
| |||||||
Total | 56,812,864 | |||||||
|
| |||||||
| Energy (4.0%) | |||||||
| 4,450 | Atwood Oceanics, Inc.d | 126,246 | ||||||
| 86,497 | BP plc | 549,047 | ||||||
| 45,762 | BW Offshore, Ltd. | 45,901 | ||||||
| 76,500 | Cabot Oil & Gas Corporation | 2,265,165 | ||||||
| 330,027 | Cameron International Corporationd | 16,484,849 | ||||||
| 169,950 | Canadian Natural Resources, Ltd. | 5,248,056 | ||||||
| 11,550 | Chesapeake Energy Corporation | 226,033 | ||||||
| 81,880 | Chevron Corporation | 9,185,298 | ||||||
| 2,170 | Cimarex Energy Company | 230,020 | ||||||
| 654,074 | Cobalt International Energy, Inc.d | 5,814,718 | ||||||
| 25,750 | Comstock Resources, Inc.e | 175,357 | ||||||
| 47,114 | Concho Resources, Inc.d | 4,699,622 | ||||||
| 4,500 | ConocoPhillips | 310,770 | ||||||
| 12,700 | Denbury Resources, Inc. | 103,251 | ||||||
| 3,173 | Diamondback Energy, Inc.d | 189,682 | ||||||
| 1,600 | Energen Corporation | 102,016 | ||||||
| 2,980 | Ensco plc | 89,251 | ||||||
| 251,622 | EOG Resources, Inc. | 23,166,838 | ||||||
| 121,431 | EQT Corporation | 9,192,327 | ||||||
| 11,000 | ERG SPA | 123,189 | ||||||
| 4,950 | Exterran Holdings, Inc. | 161,271 | ||||||
| 67,250 | Exxon Mobil Corporation | 6,217,262 | ||||||
| 9,400 | Green Plains, Inc. | 232,932 | ||||||
| 5,400 | Gulfmark Offshore, Inc. | 131,868 | ||||||
| 1,800 | Gulfport Energy Corporationd | 75,132 | ||||||
| 110,000 | Halliburton Company | 4,326,300 | ||||||
| 7,450 | Helix Energy Solutions Group, Inc.d | 161,665 | ||||||
| 3,040 | Helmerich & Payne, Inc. | 204,957 | ||||||
| 15,324 | HollyFrontier Corporation | 574,344 | ||||||
| 22,150 | Kosmos Energy, Ltd.d | 185,839 | ||||||
| 285,348 | Marathon Oil Corporation | 8,072,495 | ||||||
| 95,150 | Marathon Petroleum Corporation | 8,588,239 | ||||||
| 37,840 | Market Vectors Oil Service ETF | 1,359,213 | ||||||
| 79,250 | Nabors Industries, Ltd. | 1,028,665 | ||||||
| 2,610 | National Oilwell Varco, Inc. | 171,033 | ||||||
| 4,300 | Newfield Exploration Companyd | 116,616 | ||||||
| 5,090 | Noble Corporation | 84,341 | ||||||
| 3,450 | Noble Energy, Inc. | 163,633 | ||||||
| 244,973 | Oasis Petroleum, Inc.d | 4,051,853 | ||||||
| 3,230 | Oceaneering International, Inc. | 189,956 | ||||||
| 2,915 | Oil States International, Inc.d | 142,543 | ||||||
| 9,000 | Patterson-UTI Energy, Inc. | 149,310 | ||||||
| 2,862 | PDC Energy, Inc.d | 118,115 | ||||||
| 57,645 | Penn Virginia Corporationd | 385,069 | ||||||
| 407,000 | Petroleo Brasileiro SA ADR | 2,971,100 | ||||||
| 1,020 | Pioneer Natural Resources Company | 151,827 | ||||||
| 11,400 | Premier Oil plc | 29,486 | ||||||
| 6,400 | QEP Resources, Inc. | 129,408 | ||||||
| 71,392 | Rex Energv Corporationd,e | 364,099 | ||||||
| 20,780 | Rosetta Resources, Inc.d | 463,602 | ||||||
| 249,250 | Rowan Companies plc | 5,812,510 | ||||||
| 22,942 | Royal Dutch Shell plc | 764,640 | ||||||
| 15,700 | Royal Dutch Shell plc, Class B | 542,453 | ||||||
| 272,170 | Schlumberger, Ltd. | 23,246,040 | ||||||
| 12,600 | Seadrill, Ltd.e | 150,444 | ||||||
| 10,495 | SemGroup Corporation | 717,753 | ||||||
| 18,400 | Showa Shell Sekiyu KK | 181,248 | ||||||
The accompanying Notes to Financial Statements are an integral part of this schedule.
87
Table of Contents
MODERATELY AGGRESSIVE ALLOCATION PORTFOLIO
Schedule of Investments as of December 31, 2014
| Shares | Common Stock (29.8%) | Value | ||||||
| Energy (4.0%) - continued | |||||||
| 13,484 | SM Energy Company | $ | 520,213 | |||||
| 261,682 | Southwestern Energy Companyd | 7,141,302 | ||||||
| 2,613 | Statoil ASA | 46,007 | ||||||
| 177,550 | Suncor Energy, Inc. ADR | 5,642,539 | ||||||
| 23,850 | Superior Energy Services, Inc. | 480,577 | ||||||
| 3,100 | Total SA | 158,820 | ||||||
| 231,450 | Total SA ADRe | 11,850,240 | ||||||
| 118,486 | Trinidad Drilling, Ltd. | 530,321 | ||||||
| 34,508 | U.S. Silica Holdings, Inc.e | 886,511 | ||||||
| 1,144,830 | Weatherford International, Ltd.d | 13,108,303 | ||||||
| 20,232 | Whiting Petroleum Corporationd | 667,656 | ||||||
| 12,000 | Woodside Petroleum, Ltd. | 371,128 | ||||||
| 10,300 | WPX Energy, Inc.d | 119,789 | ||||||
|
| |||||||
Total | 192,268,303 | |||||||
|
| |||||||
| Financials (5.1%) | |||||||
| 17,150 | ACE, Ltd. | 1,970,192 | ||||||
| 23,462 | Affiliated Managers Group, Inc.d | 4,979,575 | ||||||
| 5,300 | Allianz SE | 877,821 | ||||||
| 27,470 | Allied World Assurance Company Holdings AG | 1,041,662 | ||||||
| 32,040 | Allstate Corporation | 2,250,810 | ||||||
| 17,950 | American Assets Trust, Inc. | 714,590 | ||||||
| 13,200 | American Express Company | 1,228,128 | ||||||
| 6,900 | American Financial Group, Inc. | 418,968 | ||||||
| 40,200 | American International Group, Inc. | 2,251,602 | ||||||
| 11,482 | Ameriprise Financial, Inc. | 1,518,494 | ||||||
| 6,824 | Amlin plc | 50,619 | ||||||
| 23,700 | AmTrust Financial Services, Inc.e | 1,333,125 | ||||||
| 14,682 | Argo Group International Holdings, Ltd. | 814,411 | ||||||
| 17,700 | Assicurazioni Generali SPA | 363,432 | ||||||
| 6,100 | Assurant, Inc. | 417,423 | ||||||
| 37,330 | Assured Guaranty, Ltd. | 970,207 | ||||||
| 2,900 | AXA SA | 66,825 | ||||||
| 35,500 | Banco Santander SA | 297,957 | ||||||
| 60,500 | Bank Hapoalim, Ltd. | 284,479 | ||||||
| 381,990 | Bank of America Corporation | 6,833,801 | ||||||
| 7,200 | Bank of Queensland, Ltd. | 70,934 | ||||||
| 30,813 | Bank of the Ozarks, Inc. | 1,168,429 | ||||||
| 9,150 | Banner Corporation | 393,633 | ||||||
| 58,840 | BBCN Bancorp, Inc. | 846,119 | ||||||
| 44,800 | Berkshire Hathaway, Inc.d | 6,726,720 | ||||||
| 3,600 | BinckBank NV | 30,606 | ||||||
| 54,200 | Blackstone Group, LP | 1,833,586 | ||||||
| 800 | Bolsas y Mercados Espanoles SA | 30,984 | ||||||
| 16,700 | Boston Private Financial Holdings, Inc. | 224,949 | ||||||
| 30,300 | Brixmor Property Group, Inc. | 752,652 | ||||||
| 9,900 | Camden Property Trust | 731,016 | ||||||
| 38,600 | Capital One Financial Corporation | 3,186,430 | ||||||
| 19,600 | CBL & Associates Properties, Inc. | 380,632 | ||||||
| 6,800 | CBRE Group, Inc.d | 232,900 | ||||||
| 23,938 | Chesapeake Lodging Trust | 890,733 | ||||||
| 36,000 | Cheung Kong Holdings, Ltd. | 602,886 | ||||||
| 212,467 | Citigroup, Inc. | 11,496,589 | ||||||
| 6,365 | CNA Financial Corporation | 246,389 | ||||||
| 126,900 | CNO Financial Group, Inc. | 2,185,218 | ||||||
| 5,800 | CNP Assurances | 102,824 | ||||||
| 68,700 | Comerica, Inc. | 3,217,908 | ||||||
| 6,900 | Commonwealth Bank of Australia | 479,404 | ||||||
| 12,000 | Corporate Office Properties Trust | 340,440 | ||||||
| 38,250 | Crown Castle International Corporation | 3,010,275 | ||||||
| 2,600 | Daito Trust Construction Company, Ltd. | 294,938 | ||||||
| 7 | Daiwa House REIT Investment Corporation | 34,994 | ||||||
| 10,000 | Daiwa Securities Group, Inc. | 78,301 | ||||||
| 11,750 | DDR Corporation | 215,730 | ||||||
| 1,535 | Delta Lloyd NV | 33,755 | ||||||
| 40,555 | Deutsche Bank AG | 1,217,461 | ||||||
| 1,000 | Deutsche Boerse AG | 71,062 | ||||||
| 10,800 | Digital Realty Trust, Inc. | 716,040 | ||||||
| 32,400 | Direct Line Insurance Group plc | 146,565 | ||||||
| 44,215 | Discover Financial Services | 2,895,640 | ||||||
| 10,304 | DnB ASA | 151,990 | ||||||
| 46,950 | Duke Realty Corporation | 948,390 | ||||||
| 18,393 | Education Realty Trust, Inc. | 673,000 | ||||||
| 37,283 | Essent Group, Ltd.d | 958,546 | ||||||
| 26,284 | Evercore Partners, Inc. | 1,376,493 | ||||||
| 10,890 | Extra Space Storage, Inc. | 638,590 | ||||||
| 15,950 | FBR & Companyd | 392,211 | ||||||
| 40,200 | First Horizon National Corporation | 545,916 | ||||||
| 46,650 | First Niagara Financial Group, Inc. | 393,260 | ||||||
| 78,721 | First Republic Bank | 4,102,939 | ||||||
| 18,600 | FlexiGroup, Ltd. | 45,157 | ||||||
| 41,000 | Fukuoka Financial Group, Inc. | 211,374 | ||||||
| 27,900 | Fulton Financial Corporation | 344,844 | ||||||
| 1,900 | GAM Holding AGd | 34,158 | ||||||
| 8,850 | General Growth Properties, Inc. | 248,950 | ||||||
| 13,500 | Government Properties Income Trust | 310,635 | ||||||
| 16,150 | Green Dot Corporationd | 330,914 | ||||||
| 12,800 | Hancock Holding Company | 392,960 | ||||||
| 100,334 | Hanmi Financial Corporation | 2,188,285 | ||||||
| 600 | Hannover Rueckversicherung SE | 54,127 | ||||||
| 6,250 | Hanover Insurance Group, Inc. | 445,750 | ||||||
| 45,800 | Hansteen Holdings plc | 76,809 | ||||||
| 37,362 | HCC Insurance Holdings, Inc. | 1,999,614 | ||||||
| 57,145 | Host Hotels & Resorts, Inc. | 1,358,337 | ||||||
| 358,350 | Huntington Bancshares, Inc. | 3,769,842 | ||||||
| 7,000 | IG Group Holdings plc | 78,222 | ||||||
| 15,869 | Intercontinental Exchange, Inc. | 3,479,913 | ||||||
| 31,084 | Intermediate Capital Group plc | 222,062 | ||||||
| 104,260 | Invesco, Ltd. | 4,120,355 | ||||||
| 34,200 | Investec plc | 286,538 | ||||||
| 35,000 | iShares Barclays 1-3 Year Credit Bond Fund | 3,681,300 | ||||||
| 70,500 | iShares iBoxx $ High Yield Corporate Bond ETF | 6,316,800 | ||||||
| 27,500 | iShares iBoxx $ Investment Grade Corporate Bond ETF | 3,283,775 | ||||||
| 33,500 | iShares Intermediate Credit Bond ETF | 3,662,555 | ||||||
| 8,100 | iShares MSCI EAFE Index Fund | 492,804 | ||||||
| 34,766 | iShares Russell 2000 Growth Index Fund | 4,949,983 | ||||||
| 52,340 | iShares Russell 2000 Index Fund | 6,263,528 | ||||||
| 119,710 | J.P. Morgan Chase & Company | 7,491,452 | ||||||
| 9 | Japan Prime Realty Investment Corporation | 31,315 | ||||||
| 39,224 | Kennedy-Wilson Holdings, Inc. | 992,367 | ||||||
| 75,000 | KeyCorp | 1,042,500 | ||||||
| 28,600 | Lazard, Ltd. | 1,430,858 | ||||||
| 21,500 | Link REIT | 134,606 | ||||||
| 9,400 | M&T Bank Corporation | 1,180,828 | ||||||
| 73,600 | Man Group plc | 183,144 | ||||||
| 112,700 | MasterCard, Inc. | 9,710,232 | ||||||
| 27,500 | MBIA, Inc.d | 262,350 | ||||||
| 91,740 | MetLife, Inc. | 4,962,217 | ||||||
| 3,900 | Mid-America Apartment Communities, Inc. | 291,252 | ||||||
The accompanying Notes to Financial Statements are an integral part of this schedule.
88
Table of Contents
MODERATELY AGGRESSIVE ALLOCATION PORTFOLIO
Schedule of Investments as of December 31, 2014
| Shares | Common Stock (29.8%) | Value | ||||||
| Financials (5.1%) - continued |
| ||||||
| 44,000 | Mizuho Financial Group, Inc. | $ | 73,757 | |||||
| 132,500 | Morgan Stanley | 5,141,000 | ||||||
| 1,900 | Muenchener Rueckversicherungs-Gesellschaft AG | 378,362 | ||||||
| 37,850 | NASDAQ OMX Group, Inc. | 1,815,286 | ||||||
| 1,700 | National Australia Bank, Ltd. | 46,359 | ||||||
| 20,750 | Northern Trust Corporation | 1,398,550 | ||||||
| 16,400 | Old Mutual plc | 48,334 | ||||||
| 15,297 | Oversea-Chinese Banking Corporation, Ltd. | 120,356 | ||||||
| 51,030 | PacWest Bancorp | 2,319,824 | ||||||
| 29,380 | Parkway Properties, Inc. | 540,298 | ||||||
| 34,630 | Pebblebrook Hotel Trust | 1,580,167 | ||||||
| 14,300 | Phoenix Group Holdings | 184,238 | ||||||
| 89,400 | Progressive Corporation | 2,412,906 | ||||||
| 25,200 | Prudential Financial, Inc. | 2,279,592 | ||||||
| 18,200 | Resona Holdings, Inc. | 91,937 | ||||||
| 9,350 | RLJ Lodging Trust | 313,506 | ||||||
| 1,800 | Sampo Oyj | 84,266 | ||||||
| 1,500 | SCOR SE | 45,451 | ||||||
| 29,800 | Skandinaviska Enskilda Banken AB | 378,417 | ||||||
| 2,650 | Sovran Self Storage, Inc. | 231,133 | ||||||
| 325,000 | SPDR Euro Stoxx 50 ETF | 11,979,500 | ||||||
| 97,949 | SPDR S&P 500 ETF Trust | 20,128,519 | ||||||
| 4,300 | Standard Chartered plc | 64,310 | ||||||
| 65,700 | Stockland | 219,562 | ||||||
| 70,634 | Summit Hotel Properties, Inc. | 878,687 | ||||||
| 3,000 | Sun Hung Kai Properties, Ltd. | 45,451 | ||||||
| 15,000 | Sunstone Hotel Investors, Inc. | 247,650 | ||||||
| 22,622 | SVB Financial Groupd | 2,625,736 | ||||||
| 12,700 | Swedbank AB | 315,099 | ||||||
| 200 | Swiss Life Holding AGd | 47,270 | ||||||
| 5,900 | Swiss Re AG | 494,253 | ||||||
| 91,300 | Synovus Financial Corporation | 2,473,317 | ||||||
| 52,334 | TD Ameritrade Holding Corporation | 1,872,511 | ||||||
| 47,601 | Terreno Realty Corporation | 982,009 | ||||||
| 10,160 | Texas Capital Bancshares, Inc.d | 551,993 | ||||||
| 300 | Tryg AS | 33,521 | ||||||
| 19,500 | UNIQA Insurance Group AG | 183,008 | ||||||
| 21,614 | United Overseas Bank, Ltd. | 398,866 | ||||||
| 21 | United Urban Investment Corporation | 33,057 | ||||||
| 57,800 | Unum Group | 2,016,064 | ||||||
| 40,300 | Visa, Inc. | 10,566,660 | ||||||
| 14,000 | W.R. Berkley Corporation | 717,640 | ||||||
| 15,800 | Wells Fargo & Company | 866,156 | ||||||
| 74,574 | Western Alliance Bancorpd | 2,073,157 | ||||||
| 18,405 | Westpac Banking Corporation | 495,017 | ||||||
| 7,850 | Weyerhaeuser Company | 281,736 | ||||||
| 78,202 | Zions Bancorporation | 2,229,539 | ||||||
| 3,500 | Zurich lnsurance Group AGd | 1,093,758 | ||||||
|
| |||||||
Total | 243,512,695 | |||||||
|
| |||||||
| Health Care (4.1%) |
| ||||||
| 4,300 | Abaxis, Inc. | 244,369 | ||||||
| 9,100 | Abbott Laboratories | 409,682 | ||||||
| 20,620 | Acadia Healthcare Company, Inc.d | 1,262,150 | ||||||
| 6,850 | Acceleron Pharma, Inc.d,e | 266,876 | ||||||
| 61,000 | Acorda Therapeutics, Inc.d | 2,493,070 | ||||||
| 67,827 | Actavis plcd | 17,459,348 | ||||||
| 1,600 | Actelion, Ltd. | 184,194 | ||||||
| 43,450 | Aetna, Inc. | 3,859,663 | ||||||
| 66,300 | Affymetrix, Inc.d,e | 654,381 | ||||||
| 63,197 | Akorn, Inc.d | 2,287,731 | ||||||
| 35,264 | Align Technology, Inc.d | 1,971,610 | ||||||
| 59,000 | Allscripts Healthcare Solutions, Inc.d | 753,430 | ||||||
| 20,581 | AmerisourceBergen Corporation | 1,855,583 | ||||||
| 39,950 | Amgen, Inc. | 6,363,636 | ||||||
| 73,964 | AMN Healthcare Services, Inc.d | 1,449,694 | ||||||
| 5,700 | AmSurg Corporationd | 311,961 | ||||||
| 13,000 | Anthem, Inc. | 1,633,710 | ||||||
| 51,630 | Baxter International, Inc. | 3,783,963 | ||||||
| 2,500 | Biogen Idee, Inc.d | 848,625 | ||||||
| 23,314 | BioMarin Pharmaceutical, Inc.d | 2,107,586 | ||||||
| 223,450 | Boston Scientific Corporationd | 2,960,713 | ||||||
| 29,250 | Bruker Corporationd | 573,885 | ||||||
| 8,537 | C.R. Bard, Inc. | 1,422,435 | ||||||
| 64,850 | Cambrex Corporationd | 1,402,057 | ||||||
| 33,954 | Cardiovascular Systems, Inc.d | 1,021,336 | ||||||
| 27,477 | Catamaran Corporationd | 1,421,935 | ||||||
| 35,981 | Centene Corporationd | 3,736,627 | ||||||
| 263,543 | Cerner Corporationd | 17,040,690 | ||||||
| 5,900 | Charles River Laboratories International, Inc.d | 375,476 | ||||||
| 6,893 | Cooper Companies, Inc. | 1,117,286 | ||||||
| 36,170 | Covidien plc | 3,699,468 | ||||||
| 700 | CSL, Ltd. | 49,172 | ||||||
| 19,403 | Cyberonics, Inc.d | 1,080,359 | ||||||
| 80,640 | Depomed, Inc.d | 1,299,110 | ||||||
| 5,500 | Edwards Lifesciences Corporationd | 700,590 | ||||||
| 13,800 | Endo International plcd | 995,256 | ||||||
| 37,865 | Envision Healthcare Holdings, Inc.d | 1,313,537 | ||||||
| 109,503 | ExamWorks Group, Inc.d,e | 4,554,230 | ||||||
| 24,600 | Express Scripts Holding Companyd | 2,082,882 | ||||||
| 198,350 | Gilead Sciences, Inc.d | 18,696,471 | ||||||
| 18,381 | GlaxoSmithKline plc | 394,339 | ||||||
| 4,350 | Greatbatch, Inc.d | 214,455 | ||||||
| 3,000 | H. Lundbeck AS | 59,548 | ||||||
| 14,800 | HCA Holdings, Inc.d | 1,086,172 | ||||||
| 5,400 | Hikma Pharmaceuticals plc | 165,680 | ||||||
| 41,850 | Hologic, Inc.d | 1,119,069 | ||||||
| 4,660 | ICON plcd | 237,613 | ||||||
| 9,350 | Illumina, Inc.d | 1,725,823 | ||||||
| 39,974 | Impax Laboratories, Inc.d | 1,266,376 | ||||||
| 5,970 | Indivior plcd | 13,901 | ||||||
| 65,650 | Ironwood Pharmaceuticals, Inc.d | 1,005,758 | ||||||
| 123,666 | Johnson & Johnson | 12,931,754 | ||||||
| 2,000 | Kaken Pharmaceutical Company, Ltd. | 38,672 | ||||||
| 7,000 | KYORIN Holdings, Inc. | 129,719 | ||||||
| 7,733 | LifePoint Hospitals, Inc.d | 556,080 | ||||||
| 7,850 | Mallinckrodt, LLCd | 777,386 | ||||||
| 8,800 | McKesson Corporation | 1,826,704 | ||||||
| 109,840 | Merck & Company, Inc. | 6,237,814 | ||||||
| 400 | Merck KGaA | 37,643 | ||||||
| 6,458 | Mettler-Toledo International, Inc.d | 1,953,287 | ||||||
| 13,300 | Mylan, Inc.d | 749,721 | ||||||
| 82,672 | Neurocrine Biosciences, Inc.d | 1,846,892 | ||||||
| 8,600 | Novartis AG | 797,594 | ||||||
| 48,600 | Novavax, Inc.d,e | 288,198 | ||||||
| 17,569 | NPS Pharmaceuticals, Inc.d | 628,443 | ||||||
| 82,328 | NuVasive, Inc.d | 3,882,588 | ||||||
| 13,500 | Otsuka Holdings Company, Ltd. | 404,746 | ||||||
| 27,500 | PAREXEL International Corporationd | 1,527,900 | ||||||
| 14,520 | Perrigo Company plc | 2,427,163 | ||||||
| 116,800 | Pfizer, Inc. | 3,638,320 | ||||||
| 9,800 | PharMerica Corporationd | 202,958 | ||||||
| 5,600 | Providence Service Corporationd | 204,064 | ||||||
| 2,705 | Puma Biotechnology, Inc.d | 511,975 | ||||||
| 8,750 | Qiagen NVd | 205,275 | ||||||
| 5,950 | Quintiles Transnational Holdings, Inc.d | 350,277 | ||||||
| 1,700 | Sanofi | 154,990 | ||||||
The accompanying Notes to Financial Statements are an integral part of this schedule.
89
Table of Contents
MODERATELY AGGRESSIVE ALLOCATION PORTFOLIO
Schedule of Investments as of December 31, 2014
| Shares | Common Stock (29.8%) | Value | ||||||
| Health Care (4.1%) - continued |
| ||||||
| 18,800 | Sonic Healthcare, Ltd. | $ | 282,838 | |||||
| 29,900 | Spectrum Pharmaceuticals, Inc.d,e | 207,207 | ||||||
| 6,950 | St. Jude Medical, Inc. | 451,959 | ||||||
| 42,088 | Team Health Holdings, Inc.d | 2,421,323 | ||||||
| 52,196 | Teleflex, Inc. | 5,993,145 | ||||||
| 1,000 | Teva Pharmaceutical Industries, Ltd. | 57,325 | ||||||
| 2,050 | Thermo Fisher Scientific, Inc. | 256,845 | ||||||
| 63,386 | UnitedHealth Group, Inc. | 6,407,691 | ||||||
| 17,737 | Universal Health Services, Inc. | 1,973,419 | ||||||
| 121,831 | Vertex Pharmaceuticals, Inc.d | 14,473,523 | ||||||
| 9,250 | Waters Corporationd | 1,042,660 | ||||||
|
| |||||||
Total | 198,911,609 | |||||||
|
| |||||||
| Industrials (3.5%) |
| ||||||
| 7,750 | AAR Corporation | 215,295 | ||||||
| 48,850 | ADT Corporatione | 1,769,836 | ||||||
| 36,913 | Air New Zealand, Ltd. | 70,901 | ||||||
| 33,500 | Allison Transmission Holdings, Inc. | 1,135,650 | ||||||
| 26,210 | Apogee Enterprises, Inc. | 1,110,518 | ||||||
| 4,082 | Arcadis NV | 122,430 | ||||||
| 9,600 | Argan, Inc. | 322,944 | ||||||
| 1,300 | Atlas Copco AB | 33,277 | ||||||
| 16,146 | B/E Aerospace, Inc.d | 936,791 | ||||||
| 12,200 | Berendsen plc | 208,525 | ||||||
| 17,450 | Boeing Company | 2,268,151 | ||||||
| 11,830 | Briggs & Stratton Corporation | 241,569 | ||||||
| 300 | Bucher Industries AG | 74,815 | ||||||
| 9,433 | Cardno, Ltd. | 26,121 | ||||||
| 6,700 | Carillion plc | 34,717 | ||||||
| 13,000 | Caterpillar, Inc. | 1,189,890 | ||||||
| 36,840 | CLARCOR, Inc. | 2,455,018 | ||||||
| 13,500 | COMSYS Holdings Corporation | 184,677 | ||||||
| 30,400 | Con-way, Inc. | 1,495,072 | ||||||
| 108,800 | CSX Corporation | 3,941,824 | ||||||
| 3,400 | CTT-Correios de Portugal SA | 32,838 | ||||||
| 24,340 | Curtiss-Wright Corporation | 1,718,161 | ||||||
| 4,000 | Dai Nippon Printing Company, Ltd. | 36,026 | ||||||
| 344,650 | Delta Air Lines, Inc. | 16,953,333 | ||||||
| 62,614 | EMCOR Group, Inc. | 2,785,697 | ||||||
| 19,420 | Esterline Technologies Corporationd | 2,129,986 | ||||||
| 8,858 | Fastenal Company | 421,286 | ||||||
| 26,850 | Federal Signal Corporation | 414,564 | ||||||
| 56,971 | Flowserve Corporation | 3,408,575 | ||||||
| 152,700 | Fluor Corporation | 9,258,201 | ||||||
| 34,420 | Fortune Brands Home and Security, Inc. | 1,558,193 | ||||||
| 9,989 | GATX Corporation | 574,767 | ||||||
| 10,931 | Generac Holdings, Inc.d,e | 511,134 | ||||||
| 1,500 | Go-Ahead Group plc | 57,178 | ||||||
| 18,737 | Graco, Inc. | 1,502,333 | ||||||
| 54,794 | Granite Construction, Inc. | 2,083,268 | ||||||
| 18,981 | H&E Equipment Services, Inc. | 533,176 | ||||||
| 46,426 | Healthcare Services Group, Inc. | 1,435,956 | ||||||
| 15,969 | Heico Corporation | 964,528 | ||||||
| 3,900 | Hino Motors, Ltd. | 51,337 | ||||||
| 55,750 | HNI Corporation | 2,846,595 | ||||||
| 31,122 | Honeywell International, Inc. | 3,109,710 | ||||||
| 1,900 | Hoshizaki Electric Company, Ltd. | 91,557 | ||||||
| 12,050 | Huntington Ingalls Industries, Inc. | 1,355,143 | ||||||
| 12,585 | Huron Consulting Group, Inc.d | 860,688 | ||||||
| 1,100 | Inaba Denki Sangyo Company, Ltd. | 35,516 | ||||||
| 172,100 | Ingersoll-Rand plc | 10,909,419 | ||||||
| 21,300 | Insperity, Inc. | 721,857 | ||||||
| 122,197 | Interface, Inc. | 2,012,585 | ||||||
| 8,000 | Intrum Justitia AB | 236,940 | ||||||
| 18,100 | ITOCHU Corporation | 193,219 | ||||||
| 60,140 | Jacobs Engineering Group, Inc.d | 2,687,657 | ||||||
| 1,207 | Jardine Matheson Holdings, Ltd. | 73,343 | ||||||
| 17,243 | JB Hunt Transport Services, Inc. | 1,452,723 | ||||||
| 800 | Kanamoto Company, Ltd. | 21,632 | ||||||
| 4,550 | Kansas City Southern | 555,236 | ||||||
| 33,150 | KAR Auction Services, Inc. | 1,148,648 | ||||||
| 9,700 | KITZ Corporation | 39,618 | ||||||
| 8,073 | KLX, Inc.d | 333,011 | ||||||
| 10,300 | Komatsu, Ltd. | 227,712 | ||||||
| 74,570 | Korn/Ferry Internationald | 2,144,633 | ||||||
| 29,840 | Landstar System, Inc. | 2,164,295 | ||||||
| 2,800 | Legrand SA | 147,537 | ||||||
| 6,400 | Leighton Holdings, Ltd. | 116,535 | ||||||
| 10,600 | Manpower, Inc. | 722,602 | ||||||
| 25,159 | MasTec, Inc.d | 568,845 | ||||||
| 16,200 | Meritor, Inc.d | 245,430 | ||||||
| 13,681 | Middleby Corporationd | 1,355,787 | ||||||
| 15,250 | Mistras Group, Inc.d | 279,532 | ||||||
| 4,000 | Mitsuboshi Belting, Ltd. | 29,394 | ||||||
| 34,900 | Mueller Water Products, Inc. | 357,376 | ||||||
| 29,854 | Nielsen NV | 1,335,369 | ||||||
| 6,200 | Nitto Kogyo Corporation | 120,512 | ||||||
| 13,877 | Old Dominion Freight Line, Inc.d | 1,077,410 | ||||||
| 39,939 | On Assignment, Inc.d | 1,325,575 | ||||||
| 37,466 | Oshkosh Corporation | 1,822,721 | ||||||
| 11,257 | Parker Hannifin Corporation | 1,451,590 | ||||||
| 63,290 | Pentair, Ltd. | 4,203,722 | ||||||
| 34,445 | PGT, Inc.d | 331,705 | ||||||
| 75,030 | Progressive Waste Solutions, Ltd. | 2,256,902 | ||||||
| 27,661 | Proto Labs, Inc.d,e | 1,857,713 | ||||||
| 40,650 | Quanta Services, Inc.d | 1,154,053 | ||||||
| 79,722 | Ritchie Brothers Auctioneers, Inc.e | 2,143,725 | ||||||
| 48,572 | Robert Half International, Inc. | 2,835,633 | ||||||
| 12,882 | Roper Industries, Inc. | 2,014,101 | ||||||
| 19,677 | Saia, Inc.d | 1,089,319 | ||||||
| 7,300 | Securitas AB | 88,313 | ||||||
| 4,600 | Siemens AG | 516,139 | ||||||
| 208,698 | Southwest Airlines Company | 8,832,099 | ||||||
| 6,250 | Spirit Aerosystems Holdings, Inc.d | 269,000 | ||||||
| 34,369 | Spirit Airlines, Inc.d | 2,597,609 | ||||||
| 23,758 | Stericycle, Inc.d | 3,114,199 | ||||||
| 34,505 | Swift Transportation Companyd | 987,878 | ||||||
| 2,700 | Takasago Thermal Engineering Company, Ltd. | 34,588 | ||||||
| 2,200 | Teleperformance SA | 149,755 | ||||||
| 24,030 | Tennant Company | 1,734,245 | ||||||
| 7,000 | Toppan Printing Company, Ltd. | 45,482 | ||||||
| 133,850 | Union Pacific Corporation | 15,945,550 | ||||||
| 20,800 | United Continental Holdings, Inc.d | 1,391,312 | ||||||
| 21,859 | United Rentals, Inc.d | 2,229,837 | ||||||
| 4,700 | United Technologies Corporation | 540,500 | ||||||
| 9,350 | WABCO Holdings, Inc.d | 979,693 | ||||||
| 3,318 | WageWorks, Inc.d | 214,243 | ||||||
| 8,240 | Watsco, Inc. | 881,680 | ||||||
| 9,559 | Watts Water Technologies, Inc. | 606,423 | ||||||
|
| |||||||
Total | 167,491,928 | |||||||
|
| |||||||
| Information Technology (5.9%) |
| ||||||
| 31,243 | A10 Networks, Inc.d | 136,219 | ||||||
| 31,270 | Agilent Technologies, Inc. | 1,280,194 | ||||||
| 37,400 | Akamai Technologies, Inc.d | 2,354,704 | ||||||
| 43,870 | Alibaba Group Holding, Ltd. ADRd | 4,559,848 | ||||||
| 9,150 | Alliance Data Systems Corporationd | 2,617,357 | ||||||
| 9,975 | Ambarella, Inc.d,e | 505,932 | ||||||
| 10,200 | Amdocs, Ltd. | 475,881 | ||||||
| 45,444 | Amphenol Corporation | 2,445,342 | ||||||
The accompanying Notes to Financial Statements are an integral part of this schedule.
90
Table of Contents
MODERATELY AGGRESSIVE ALLOCATION PORTFOLIO
Schedule of Investments as of December 31, 2014
| Shares | Common Stock (29.8%) | Value | ||||||
| Information Technology (5.9%) - continued |
| ||||||
| 17,371 | ANSYS, Inc.d | $ | 1,424,422 | |||||
| 271,646 | Apple, Inc.f | 29,984,285 | ||||||
| 96,402 | Applied Materials, Inc. | 2,402,338 | ||||||
| 103,651 | Applied Micro Circuits Corporationd | 675,805 | ||||||
| 16,065 | Applied Optoelectronics, Inc.d | 180,249 | ||||||
| 54,525 | Aspen Technology, Inc.d | 1,909,465 | ||||||
| 308,890 | Atmel Corporationd | 2,593,132 | ||||||
| 11,377 | Autodesk, Inc.d | 683,303 | ||||||
| 12,150 | AVG Technologies NVd | 239,841 | ||||||
| 10,521 | Belden, Inc. | 829,160 | ||||||
| 9,750 | Booz Allen Hamilton Holding Corporation | 258,668 | ||||||
| 62,850 | Broadcom Corporation | 2,723,290 | ||||||
| 59,500 | Broadridge Financial Solutions, Inc. | 2,747,710 | ||||||
| 107,550 | Brocade Communications Systems, Inc. | 1,273,392 | ||||||
| 1,900 | Brother Industries, Ltd. | 34,442 | ||||||
| 15,800 | Canon, Inc. | 502,183 | ||||||
| 24,392 | Cardtronics, Inc.d | 941,043 | ||||||
| 14,653 | Cavium, Inc.d | 905,848 | ||||||
| 20,750 | CDW Corporation | 729,778 | ||||||
| 25,037 | ChannelAdvisor Corporationd,e | 540,298 | ||||||
| 5,450 | Check Point Software Technologies, Ltd.d | 428,207 | ||||||
| 40,111 | Ciena Corporationd | 778,555 | ||||||
| 11,300 | Cirrus Logic, Inc.d | 266,341 | ||||||
| 288,590 | Cisco Systems, Inc. | 8,027,131 | ||||||
| 15,700 | Citrix Systems, Inc.d | 1,001,660 | ||||||
| 17,674 | Cognex Corporationd | 730,466 | ||||||
| 9,248 | Coherent, Inc.d | 561,539 | ||||||
| 24,400 | Computer Sciences Corporation | 1,538,420 | ||||||
| 23,526 | Constant Contact, Inc.d | 863,404 | ||||||
| 28,484 | Cornerstone OnDemand, Inc.d,e | 1,002,637 | ||||||
| 160,700 | Corning, Inc. | 3,684,851 | ||||||
| 22,942 | Dealertrack Technologies, Inc.d | 1,016,560 | ||||||
| 19,525 | Demandware, Inc.d | 1,123,469 | ||||||
| 2,900 | Dialog Semiconductor plcd | 101,256 | ||||||
| 11,800 | Diodes, Inc.d | 325,326 | ||||||
| 48,713 | DST Systems, Inc. | 4,586,329 | ||||||
| 17,598 | eBay, Inc.d | 987,600 | ||||||
| 26,600 | Electronic Arts, Inc.d | 1,250,599 | ||||||
| 11,756 | Electronics for Imaging, Inc.d | 503,509 | ||||||
| 559,300 | EMC Corporation | 16,633,582 | ||||||
| 33,317 | EVERTEC, Inc. | 737,305 | ||||||
| 16,120 | F5 Networks, Inc.d | 2,103,096 | ||||||
| 207,800 | Facebook, Inc.d | 16,212,556 | ||||||
| 33,150 | Fairchild Semiconductor International, Inc.d | 559,572 | ||||||
| 16,790 | FEI Company | 1,516,976 | ||||||
| 66,131 | Fortinet, Inc.d | 2,027,576 | ||||||
| 14,500 | FUJIFILM Holdings NPV | 442,447 | ||||||
| 24,646 | Gartner, Inc.d | 2,075,440 | ||||||
| 19,973 | Google, Inc.d | 10,513,787 | ||||||
| 22,723 | Google, Inc., Class Ad | 12,058,187 | ||||||
| 65,556 | Guidewire Software, Inc.d | 3,319,100 | ||||||
| 6,000 | Hitachi Kokusai Electric, Inc. | 83,926 | ||||||
| 2,100 | Hitachi Maxell, Ltd. | 33,083 | ||||||
| 51,710 | HomeAway, Inc.d | 1,539,924 | ||||||
| 6,300 | Hoya Corporation | 213,096 | ||||||
| 22,970 | IAC InterActiveCorp | 1,396,346 | ||||||
| 5,950 | iGATE Corporationd | 234,906 | ||||||
| 17,749 | Imperva, Inc.d | 877,333 | ||||||
| 5,650 | International Business Machines Corporation | 906,486 | ||||||
| 76,727 | Juniper Networks, Inc. | 1,712,547 | ||||||
| 15,582 | Keysight Technologies, Inc.d | 526,204 | ||||||
| 36,990 | Linkedln Corporationd | 8,496,973 | ||||||
| 15,050 | Liquidity Services, Inc.d | 122,959 | ||||||
| 12,247 | Manhattan Associates, Inc.d | 498,698 | ||||||
| 65,750 | Marvell Technology Group, Ltd. | 953,375 | ||||||
| 17,500 | Maxim Integrated Products, Inc. | 557,725 | ||||||
| 80,605 | MaxLinear, Inc.d | 597,283 | ||||||
| 10,110 | Methode Electronics, Inc. | 369,116 | ||||||
| 45,520 | Microsoft Corporation | 2,114,404 | ||||||
| 16,017 | Monolithic Power Systems, Inc. | 796,686 | ||||||
| 3,800 | NEC Networks & System Integration Corporation | 78,756 | ||||||
| 347,639 | NetApp, Inc. | 14,409,637 | ||||||
| 12,498 | Newport Corporationd | 238,837 | ||||||
| 13,806 | Nice Systems, Ltd. ADR | 699,274 | ||||||
| 26,060 | Nuance Communications, Inc.d | 371,876 | ||||||
| 165,919 | NVIDIA Corporation | 3,326,676 | ||||||
| 38,576 | NXP Semiconductors NVd | 2,947,206 | ||||||
| 54,000 | Oki Electric Industry Company, Ltd. | 102,938 | ||||||
| 7,700 | Optimal Payments plcd | 40,871 | ||||||
| 104,900 | Oracle Corporation | 4,717,353 | ||||||
| 2,150 | Orbotech, Ltd.d | 31,820 | ||||||
| 900 | Otsuka Corporation | 28,538 | ||||||
| 34,064 | Pace plc | 182,643 | ||||||
| 44,064 | Plantronics, Inc. | 2,336,273 | ||||||
| 17,650 | Polycom, Inc.d | 238,275 | ||||||
| 45,109 | Proofpoint, Inc.d | 2,175,607 | ||||||
| 60,607 | QLIK Technologies, Inc.d | 1,872,150 | ||||||
| 174,511 | QUALCOMM, Inc. | 12,971,403 | ||||||
| 4,650 | Rackspace Hosting, Inc.d | 217,667 | ||||||
| 22,800 | Red Hat, Inc.d | 1,576,392 | ||||||
| 900 | Rohm Company, Ltd. | 54,228 | ||||||
| 195,400 | Salesforce.com, Inc.d | 11,589,174 | ||||||
| 22,450 | Sanmina Corporationd | 528,249 | ||||||
| 22,858 | ServiceNow, Inc.d | 1,550,915 | ||||||
| 12,660 | Skyworks Solutions, Inc. | 920,509 | ||||||
| 94,987 | Sonus Networks, Inc.d | 377,098 | ||||||
| 2,194 | SPS Commerce, Inc.d | 124,246 | ||||||
| 27,950 | Symantec Corporation | 717,057 | ||||||
| 5,422 | Synaptics, Inc. d | 373,250 | ||||||
| 15,674 | Synopsys, Inc.d | 681,349 | ||||||
| 11,250 | Take-Two Interactive Software, Inc.d | 315,337 | ||||||
| 4,600 | TE Connectivity, Ltd. | 290,950 | ||||||
| 35,000 | Telefonaktiebolaget LM Ericsson | 423,784 | ||||||
| 59,900 | Teradata Corporationd | 2,616,432 | ||||||
| 57,954 | Teradyne, Inc. | 1,146,910 | ||||||
| 61,000 | Texas Instruments, Inc. | 3,261,365 | ||||||
| 23,943 | Textura Corporationd,e | 681,657 | ||||||
| 30,700 | Total System Services, Inc. | 1,042,572 | ||||||
| 3,356 | Tyler Technologies, Inc.d | �� | 367,281 | |||||
| 53,830 | Ubiquiti Networks, Inc.e | 1,595,521 | ||||||
| 9,578 | Ultimate Software Group, Inc.d | 1,406,194 | ||||||
| 9,600 | Unisys Corporationd | 283,008 | ||||||
| 23,500 | Vantiv, Inc.d | 797,120 | ||||||
| 24,072 | VeriFone Systems, Inc.d | 895,478 | ||||||
| 95,109 | Virtusa Corporationd | 3,963,192 | ||||||
| 104,250 | VMware, Inc.d | 8,602,710 | ||||||
| 8,800 | WebMD Health Corporation d | 348,040 | ||||||
| 135,850 | Xerox Corporation | 1,882,881 | ||||||
|
| |||||||
Total | 280,363,381 | |||||||
|
| |||||||
| Materials (1.0%) | |||||||
| 15,000 | Agnico Eagle Mines, Ltd.e | 373,350 | ||||||
| 13,481 | Airgas, Inc. | 1,552,742 | ||||||
| 11,744 | Albemarle Corporation | 706,167 | ||||||
| 91,550 | Alcoa, Inc. | 1,445,574 | ||||||
| 5,000 | Asahi Kasei Corporation | 45,612 | ||||||
The accompanying Notes to Financial Statements are an integral part of this schedule.
91
Table of Contents
MODERATELY AGGRESSIVE ALLOCATION PORTFOLIO
Schedule of Investments as of December 31, 2014
| Shares | Common Stock (29.8%) | Value | ||||||
| Materials (1.0%) - continued |
| ||||||
| 10,500 | Avery Dennison Corporation | $ | 544,740 | |||||
| 14,650 | Ball Corporation | 998,690 | ||||||
| 89,500 | Barrick Gold Corporation | 962,125 | ||||||
| 36,587 | Celanese Corporation | 2,193,757 | ||||||
| 43,496 | Centamin plc | 39,938 | ||||||
| 52,805 | Chemtura Corporationd,e | 1,305,868 | ||||||
| 4,750 | Clearwater Paper Corporationd | 325,612 | ||||||
| 3,050 | Compass Minerals International, Inc. | 264,831 | ||||||
| 25,950 | Crown Holdings, Inc.d | 1,320,855 | ||||||
| 41,180 | Dow Chemical Company | 1,878,220 | ||||||
| 23,950 | Eagle Materials, Inc. | 1,820,918 | ||||||
| 10,100 | Eastman Chemical Company | 766,186 | ||||||
| 51,250 | Eldorado Gold Corporation | 311,600 | ||||||
| 21,400 | Ferro Corporationd | 277,344 | ||||||
| 25,823 | FMC Corporation | 1,472,686 | ||||||
| 11,650 | Franco-Nevada Corporation | 573,064 | ||||||
| 91,550 | Freeport-McMoRan, Inc. | 2,138,608 | ||||||
| 62,300 | Goldcorp, Inc. | 1,153,796 | ||||||
| 114,216 | Graphic Packaging Holding Companyd | 1,555,622 | ||||||
| 6,000 | Hitachi Metals, Ltd. | 101,945 | ||||||
| 1,500 | Holmen AB | 50,970 | ||||||
| 74,190 | Horsehead Holding Corporationd | 1,174,428 | ||||||
| 5,550 | Innophos Holdings, Inc. | 324,398 | ||||||
| 44,850 | International Paper Company | 2,403,063 | ||||||
| 84,450 | Kinross Gold Corporationd | 238,149 | ||||||
| 10,000 | Kureha Corporation | 41,823 | ||||||
| 3,000 | LyondellBasell Industries NV | 238,170 | ||||||
| 4,500 | Martin Marietta Materials, Inc.e | 496,440 | ||||||
| 46,470 | Materials Select Sector SPDR Fund | 2,257,513 | ||||||
| 15,950 | MeadWestvaco Corporation | 708,020 | ||||||
| 37,700 | Newmont Mining Corporation | 712,530 | ||||||
| 1,600 | Novozvmes AS | 67,350 | ||||||
| 30,500 | Nucor Corporation | 1,496,025 | ||||||
| 51,800 | Owens-Illinois, Inc.d | 1,398,082 | ||||||
| 24,750 | Packaging Corporation of America | 1,931,737 | ||||||
| 27,809 | PolvOne Corporation | 1,054,239 | ||||||
| 14,250 | Rock-Tenn Company | 868,965 | ||||||
| 25,150 | Royal Gold, Inc. | 1,576,905 | ||||||
| 19,350 | Sealed Air Corporation | 821,020 | ||||||
| 21,262 | Silgan Holdings, Inc. | 1,139,643 | ||||||
| 51,465 | Silver Wheaton Corporation | 1,046,283 | ||||||
| 5,200 | Sonoco Products Company | 227,240 | ||||||
| 35,550 | Southern Copper Corporation | 1,002,510 | ||||||
| 69,270 | Steel Dynamics, Inc. | 1,367,390 | ||||||
| 7,200 | Stora Enso OYJ | 64,375 | ||||||
| 13,000 | Sumitomo Metal Mining Company, Ltd. | 193,894 | ||||||
| 5,000 | Sumitomo Seika Chemicals Company, Ltd. | 33,299 | ||||||
| 51,800 | Teck Resources, Ltd.e | 706,552 | ||||||
| 7,750 | Tronox, Ltd. | 185,070 | ||||||
| 9,600 | UPM-Kymmene OYJ | 157,327 | ||||||
| 9,550 | Vulcan Materials Company | 627,721 | ||||||
| 4,900 | Westlake Chemical Corporation | 299,341 | ||||||
| 5,200 | Worthington Industries, Inc. | 156,468 | ||||||
| 68,300 | Yamana Gold, Inc. | 274,566 | ||||||
|
| |||||||
Total | 49,471,356 | |||||||
|
| |||||||
| Telecommunications Services (0.2%) | |||||||
| 4,900 | Belgacom SA | 177,790 | ||||||
| 140,900 | Bezeq Israel Telecommunication Corporation, Ltd. | 249,931 | ||||||
| 27,915 | BT Group plc | 173,633 | ||||||
| 8,700 | Elisa Oyj | 237,467 | ||||||
| 6,800 | Freenet AG | 193,340 | ||||||
| 6,300 | iiNet, Ltd. | 40,257 | ||||||
| 107,330 | KCOM Group plc | 149,338 | ||||||
| 9,287 | Level 3 Communications, Inc.d | 458,592 | ||||||
| 12,000 | M1, Ltd. | 32,615 | ||||||
| 11,400 | Nippon Telegraph & Telephone Corporation | 582,342 | ||||||
| 26,500 | Orange SA | 450,679 | ||||||
| 15,896 | SBA Communications Corporationd | 1,760,641 | ||||||
| 40,000 | Singapore Telecommunications, Ltd. | 117,412 | ||||||
| 3,480 | TDC AS | 26,542 | ||||||
| 5,000 | Tele2 AB | 60,588 | ||||||
| 22,600 | Telstra Corporation, Ltd. | 109,719 | ||||||
| 67,079 | Verizon Communications, Inc. | 3,137,956 | ||||||
| 3,900 | Vivendi SAd | 97,073 | ||||||
| 59,550 | Vonage Holdings Corporationd | 226,885 | ||||||
|
| |||||||
Total | 8,282,800 | |||||||
|
| |||||||
| Utilities (0.4%) | |||||||
| 201,700 | A2A SPA | 204,381 | ||||||
| 8,650 | Atmos Energy Corporation | 482,151 | ||||||
| 5,500 | E.ON SE | 94,005 | ||||||
| 21,150 | Edison International, Inc. | 1,384,902 | ||||||
| 85,300 | Electricidade de Portugal SA | 330,764 | ||||||
| 5,000 | Endesa SA | 100,097 | ||||||
| 59,400 | Enel SPA | 264,777 | ||||||
| 10,200 | Fortum OYJ | 221,458 | ||||||
| 5,300 | Hokuriku Electric Power Company | 67,683 | ||||||
| 26,100 | IREN SPA | 28,542 | ||||||
| 11,730 | Laclede Group, Inc. | 624,036 | ||||||
| 2,300 | National Grid plc | 32,635 | ||||||
| 43,410 | NiSource, Inc. | 1,841,452 | ||||||
| 53,660 | NorthWestern Corporation | 3,036,083 | ||||||
| 89,340 | PG&E Corporation | 4,756,462 | ||||||
| 16,530 | Portland General Electric Company | 625,330 | ||||||
| 26,900 | Public Service Enterprise Group, Inc. | 1,113,929 | ||||||
| 600 | Red Electrica Corporacion SA | 52,891 | ||||||
| 11,100 | Redes Energeticas Nacionais SGPS SA | 32,202 | ||||||
| 1,000 | Severn Trent plc | 31,189 | ||||||
| 13,900 | Southern Company | 682,629 | ||||||
| 28,200 | United Utilities Group plc | 400,551 | ||||||
| 7,600 | Vectren Corporation | 351,348 | ||||||
| 21,150 | Wisconsin Energy Corporatione | 1,115,451 | ||||||
|
| |||||||
Total | 17,874,948 | |||||||
|
| |||||||
| Total Common Stock (cost $1,177,922,565) | 1,423,477,563 | |||||||
|
| |||||||
| Principal Amount | Long-Term Fixed Income (13.0%) | |||||||
| Asset-Backed Securities (0.8%) | |||||||
Access Group, Inc. | ||||||||
| 495,621 | 0.670%, 2/25/2036g,h | 489,616 | ||||||
Ally Auto Receivables Trust 2013-SN1 | ||||||||
| 459,470 | 0.720%, 5/20/2016 | 459,624 | ||||||
ARES CLO, Ltd. | ||||||||
| 750,000 | 1.714%, 11/15/2025*,h | 750,000 | ||||||
BA Credit Card Trust | ||||||||
| 650,000 | 0.541%, 6/15/2021h | 649,489 | ||||||
Barclays Dryrock Issuance Trust | ||||||||
| 1,300,000 | 0.521%, 12/16/2019h | 1,298,361 | ||||||
The accompanying Notes to Financial Statements are an integral part of this schedule.
92
Table of Contents
MODERATELY AGGRESSIVE ALLOCATION PORTFOLIO
Schedule of Investments as of December 31, 2014
| Principal Amount | Long-Term Fixed Income (13.0%) | Value | ||||||
| Asset-Backed Securities (0.8%) - continued |
| ||||||
Capital One Multi-Asset Execution Trust | ||||||||
| $ | 800,000 | 0.541%, 1/18/2022h | $ | 799,118 | ||||
Chase Issuance Trust | ||||||||
| 875,000 | 1.150%, 1/15/2019 | 874,570 | ||||||
Chesapeake Funding, LLC | ||||||||
| 410,516 | 0.607%, 1/7/2025g,h | 410,129 | ||||||
Citibank Credit Card Issuance Trust | ||||||||
| 1,500,000 | 1.020%, 2/22/2019 | 1,494,233 | ||||||
Countrywide Asset-Backed Certificates | ||||||||
| 827,386 | 5.530%, 4/25/2047 | 813,557 | ||||||
Edlinc Student Loan Funding Trust | ||||||||
| 393,359 | 3.160%, 10/1/2025*,h | 398,276 | ||||||
Enterprise Fleet Financing, LLC | ||||||||
| 187,114 | 1.060%, 3/20/2019g | 187,473 | ||||||
| 996,198 | 0.870%, 9/20/2019g | 995,833 | ||||||
FirstEnergy Ohio PIRB Special Purpose Trust | ||||||||
| 370,662 | 0.679%, 1/15/2019 | 370,554 | ||||||
FNA Trust | ||||||||
| 173,556 | 1.980%, 1/10/2018* | 173,903 | ||||||
Ford Credit Auto Owner Trust | ||||||||
| 485,000 | 2.260%, 11/15/2025g | 487,589 | ||||||
GE Equipment Transportation, LLC | ||||||||
| 634,227 | 0.690%, 11/25/2016 | 634,464 | ||||||
Golden Credit Card Trust | ||||||||
| 540,000 | 0.411%, 2/15/2018g,h | 539,815 | ||||||
| 250,000 | 0.591%, 9/15/2018g,h | 250,561 | ||||||
GoldenTree Loan Opportunities IX, Ltd. | ||||||||
| 400,000 | 1.829%, 10/29/2026*,h | 396,863 | ||||||
GreatAmerica Leasing Receivables | ||||||||
| 1,466,269 | 0.610%, 5/15/2016g | 1,466,371 | ||||||
Hertz Fleet Lease Funding, LP | ||||||||
| 1,050,000 | 0.712%, 12/10/2027g,h | 1,050,400 | ||||||
Hyundai Floorplan Master Owner Trust | ||||||||
| 877,500 | 0.511%, 5/15/2018g,h | 878,170 | ||||||
Master Credit Card Trust | ||||||||
| 529,100 | 0.780%, 4/21/2017g | 529,269 | ||||||
Morgan Stanley Bank of America Merrill Lynch Trust | ||||||||
| 1,425,000 | 3.176%, 8/15/2045 | 1,458,973 | ||||||
| 1,425,000 | 3.246%, 12/15/2047 | 1,439,803 | ||||||
Morgan Stanley Capital, Inc. | ||||||||
| 1,021,488 | 0.320%, 2/25/2037h | 638,956 | ||||||
Motor plc | ||||||||
| 320,667 | 0.670%, 2/15/2021g | 320,768 | ||||||
| 649,600 | 0.650%, 8/25/2021g,h | 650,161 | ||||||
OZLM VIII, Ltd. | ||||||||
| 385,000 | 1.715%, 10/17/2026*,h | 383,153 | ||||||
Penarth Master Issuer plc | ||||||||
| 1,055,000 | 0.552%, 11/18/2017g,h | 1,055,278 | ||||||
Renaissance Home Equity Loan Trust | ||||||||
| 1,386,151 | 5.746%, 5/25/2036i | 1,008,540 | ||||||
| 2,800,000 | 6.011%, 5/25/2036i | 1,981,154 | ||||||
| 1,231,805 | 5.580%, 11/25/2036i | 759,385 | ||||||
SLM Student Loan Trust | ||||||||
| 775,835 | 0.761%, 7/15/2022g,h | 775,371 | ||||||
| 1,222,230 | 0.761%, 8/15/2022g,h | 1,223,488 | ||||||
| 935,457 | 0.634%, 4/25/2023g,h | 935,875 | ||||||
| Asset-Backed Securities (0.8%) - continued |
| ||||||
| 450,000 | 1.211%, 5/17/2027g,h | 452,937 | ||||||
U.S. Small Business Administration | ||||||||
| 569,428 | 3.191%, 3/10/2024 | 590,053 | ||||||
Vericrest Opportunity Loan Transferee | ||||||||
| 1,973,042 | 3.125%, 4/27/2054g | 1,961,559 | ||||||
Volvo Financial Equipment, LLC | ||||||||
| 650,000 | 0.740%, 3/15/2017g | 650,552 | ||||||
| 1,000,000 | 0.820%, 4/16/2018g | 998,225 | ||||||
World Financial Network Credit Card Master Trust | ||||||||
| 350,000 | 0.541%, 12/15/2019h | 350,137 | ||||||
| 650,000 | 0.910%, 3/16/2020 | 649,061 | ||||||
World Omni Automobile Lease Securitization Trust | ||||||||
| 650,000 | 1.400%, 2/15/2019 | 654,088 | ||||||
World Omni Master Owner Trust | ||||||||
| 540,000 | 0.505%, 2/15/2018 g,h | 540,031 | ||||||
|
| |||||||
Total | 35,875,786 | |||||||
|
| |||||||
| Basic Materials (0.1%) | |||||||
Albemarle Corporation | ||||||||
| 105,000 | 3.000%, 12/1/2019 | 105,016 | ||||||
ArcelorMittal | ||||||||
| 670,000 | 6.000%, 3/1/2021 | 696,800 | ||||||
Eastman Chemical Company | ||||||||
| 205,000 | 2.700%, 1/15/2020 | 206,163 | ||||||
First Quantum Minerals, Ltd. | ||||||||
| 355,000 | 6.750%, 2/15/2020g | 321,275 | ||||||
| 355,000 | 7.000%, 2/15/2021g | 319,500 | ||||||
FMG Resources August 2006 Pty., Ltd. | ||||||||
| 297,778 | 6.875%, 2/1/2018e,g | 270,233 | ||||||
Freeport-McMoRan, Inc. | ||||||||
| 614,000 | 2.375%, 3/15/2018 | 607,249 | ||||||
Georgia-Pacific, LLC | ||||||||
| 245,000 | 2.539%, 11/15/2019g | 244,915 | ||||||
Goldcorp, Inc. | ||||||||
| 310,000 | 2.125%, 3/15/2018 | 306,393 | ||||||
Hexion US Finance Corporation/Hexion Nova Scotia Finance ULC | ||||||||
| 630,000 | 8.875%, 2/1/2018 | 560,700 | ||||||
Ineos Finance plc | ||||||||
| 630,000 | 7.500%, 5/1/2020g | 661,500 | ||||||
LyondellBasell Industries NV | ||||||||
| 392,000 | 6.000%, 11/15/2021 | 451,176 | ||||||
Sappi Papier Holding GmbH | ||||||||
| 375,000 | 6.625%, 4/15/2021g | 384,375 | ||||||
Vale Overseas, Ltd. | ||||||||
| 359,000 | 6.250%, 1/23/2017 | 382,913 | ||||||
Yamana Gold, Inc. | ||||||||
| 325,000 | 4.950%, 7/15/2024 | 317,193 | ||||||
|
| |||||||
Total | 5,835,401 | |||||||
|
| |||||||
| Capital Goods (0.1%) | |||||||
BAE Systems plc | ||||||||
| 100,000 | 3.500%, 10/11/2016g | 103,875 | ||||||
CNH Capital, LLC | ||||||||
| 630,000 | 3.625%, 4/15/2018 | 620,550 | ||||||
The accompanying Notes to Financial Statements are an integral part of this schedule.
93
Table of Contents
MODERATELY AGGRESSIVE ALLOCATION PORTFOLIO
Schedule of Investments as of December 31, 2014
| Principal Amount | Long-Term Fixed Income (13.0%) | Value | ||||||
| Capital Goods (0.1%) - continued |
| ||||||
Crown Americas Capital Corporation IV | ||||||||
| $ | 670,000 | 4.500%, 1/15/2023 | $ | 649,900 | ||||
Harsco Corporation | ||||||||
| 349,000 | 2.700%, 10/15/2015 | 348,564 | ||||||
Hutchison Whampoa Finance CI, Ltd. | ||||||||
| 266,000 | 1.625%, 10/31/2017g | 263,808 | ||||||
Ingersoll-Rand Global Holding Company, Ltd. | ||||||||
| 384,000 | 6.875%, 8/15/2018 | 445,772 | ||||||
L-3 Communications Corporation | ||||||||
| 384,000 | 1.500%, 5/28/2017 | 380,223 | ||||||
Martin Marietta Materials, Inc. | ||||||||
| 230,000 | 1.357%, 6/30/2017h | 232,522 | ||||||
Owens-Brockway Glass Container, Inc. | ||||||||
| 450,000 | 5.000%, 1/15/2022g | 459,000 | ||||||
Raytheon Company | ||||||||
| 264,000 | 4.200%, 12/15/2044 | 274,215 | ||||||
Reynolds Group Issuer, Inc. | ||||||||
| 629,634 | 5.750%, 10/15/2020 | 645,375 | ||||||
Roper Industries, Inc. | ||||||||
| 376,000 | 2.050%, 10/1/2018 | 372,896 | ||||||
RSC Equipment Rental, Inc. | ||||||||
| 630,000 | 8.250%, 2/1/2021 | 686,700 | ||||||
Textron, Inc. | ||||||||
| 150,000 | 5.600%, 12/1/2017 | 164,836 | ||||||
|
| |||||||
Total | 5,648,236 | |||||||
|
| |||||||
| Collateralized Mortgage Obligations (0.5%) |
| ||||||
Alm Loan Funding CLO | ||||||||
| 385,000 | 1.664%, 10/17/2026*,h | 382,948 | ||||||
Apidos CLO XVIII | ||||||||
| 375,000 | 1.646%, 7/22/2026*,h | 370,533 | ||||||
Babson CLO, Ltd. 2014-II | ||||||||
| 385,000 | 1.656%, 10/17/2026*,h | 382,209 | ||||||
Birchwood Park CLO, Ltd. | ||||||||
| 385,000 | 1.674%, 7/15/2026*,h | 383,138 | ||||||
BlueMountain CLO, Ltd. | ||||||||
| 385,000 | 1.480%, 10/15/2026*,h | 381,475 | ||||||
Carlyle Global Market Strategies CLO, Ltd. | ||||||||
| 385,000 | 1.531%, 7/20/2023*,h | 381,918 | ||||||
| 400,000 | 1.733%, 10/15/2026 *,h | 399,223 | ||||||
Cent CLO 16, LP | ||||||||
| 385,000 | 1.482%, 8/1/2024*,h | 381,632 | ||||||
Cent CLO 22, Ltd. | ||||||||
| 400,000 | 1.713%, 11/7/2026*,h | 396,212 | ||||||
Citigroup Mortgage Loan Trust, Inc. | ||||||||
| 502,642 | 5.500%, 11/25/2035 | 463,734 | ||||||
CitiMortgage Alternative Loan Trust | ||||||||
| 1,692,369 | 5.750%, 4/25/2037 | 1,453,160 | ||||||
Countrywide Alternative Loan Trust | ||||||||
| 744,665 | 5.220%, 10/25/2035 | 632,396 | ||||||
| 452,163 | 6.500%, 8/25/2036 | 344,341 | ||||||
| 316,229 | 6.000%, 1/25/2037 | 291,783 | ||||||
| 1,538,283 | 5.500%, 5/25/2037 | 1,333,321 | ||||||
| 1,260,352 | 7.000%, 10/25/2037 | 931,589 | ||||||
Countrywide Home Loans, Inc. | ||||||||
| 622,131 | 5.750%, 4/25/2037 | 575,131 | ||||||
Deutsche Alt-A Securities Mortgage Loan Trust | ||||||||
| 492,440 | 6.000%, 10/25/2021 | 434,119 | ||||||
Deutsche Alt-A Securities, Inc., Mortgage Loan Trust | ||||||||
| 187,827 | 5.500%, 10/25/2021 | 180,575 | ||||||
Dryden 34 Senior Loan Fund CLO | ||||||||
| 385,000 | 1.717%, 10/15/2026*,h | 382,968 | ||||||
Federal Home Loan Mortgage Corporation | ||||||||
| 1,638,215 | 3.000%, 2/15/2033j | 221,064 | ||||||
Federal National Mortgage Association | ||||||||
| 3,454,290 | 3.500%, 1/25/2033j | 493,358 | ||||||
HomeBanc Mortgage Trust | ||||||||
| 2,510,428 | 2.197%, 4/25/2037 | 1,868,045 | ||||||
J.P. Morgan Mortgage Trust | ||||||||
| 151,334 | 2.537%, 10/25/2036 | 135,842 | ||||||
| 1,551,761 | 0.550%, 1/25/2037h | 1,007,093 | ||||||
| 1,690,665 | 6.250%, 8/25/2037 | 1,396,999 | ||||||
Limerock CLO III, LLC | ||||||||
| 1,150,000 | 1.759%, 10/20/2026*,h | 1,142,137 | ||||||
Madison Park Funding XIV CLO, Ltd. | ||||||||
| 425,000 | 1.681%, 7/20/2026*,h | 423,238 | ||||||
MASTR Alternative Loans Trust | ||||||||
| 348,642 | 6.500%, 7/25/2034 | 357,163 | ||||||
| 908,342 | 0.620%, 12/25/2035h | 495,082 | ||||||
Merrill Lynch Alternative Note Asset Trust | ||||||||
| 383,203 | 6.000%, 3/25/2037 | 356,507 | ||||||
Neuberger Berman CLO, Ltd. | ||||||||
| 300,000 | 1.626%, 8/4/2025*,h | 297,228 | ||||||
Octagon Investment Partners XX CLO, Ltd. | ||||||||
| 385,000 | 1.675%, 8/12/2026*,h | 380,772 | ||||||
OHA Loan Funding 2014-1, Ltd. | ||||||||
| 1,150,000 | 1.762%, 10/20/2026*,h | 1,141,959 | ||||||
Residential Asset Securitization Trust | ||||||||
| 1,242,914 | 0.550%, 8/25/2037h | 456,008 | ||||||
Sequoia Mortgage Trust | ||||||||
| 908,696 | 2.657%, 9/20/2046 | 753,259 | ||||||
Symphony CLO XV, Ltd. | ||||||||
| 1,150,000 | 1.653%, 10/17/2026*,h | 1,137,661 | ||||||
Symphony CLO, Ltd. | ||||||||
| 385,000 | 1.331%, 1/9/2023*,h | 382,835 | ||||||
Voya CLO 2014-3, Ltd. | ||||||||
| 385,000 | 1.649%, 7/25/2026*,h | 380,534 | ||||||
WaMu Mortgage Pass Through Certificates | ||||||||
|
| 245,525 489,641 |
| 2.233%, 9/25/2036 | 219,677 | ||||
2.274%, 10/25/2036 | 432,098 | |||||||
| 3,374,518 | 1.957%, 11/25/2036 | 2,978,120 | ||||||
|
| |||||||
Total | 26,939,084 | |||||||
|
| |||||||
| Commercial Mortgage-Backed Securities (0.5%) | |||||||
Banc of America Commercial Mortgage, Inc. | ||||||||
| 2,800,000 | 5.612%, 4/10/2049 | 2,995,927 | ||||||
Bear Stearns Commercial Mortgage Securities, Inc. | ||||||||
| 1,484,479 | 5.331%, 2/11/2044 | 1,586,065 | ||||||
The accompanying Notes to Financial Statements are an integral part of this schedule.
94
Table of Contents
MODERATELY AGGRESSIVE ALLOCATION PORTFOLIO
Schedule of Investments as of December 31, 2014
| Principal Amount | Long-Term Fixed Income (13.0%) | Value | ||||||
|
| |||||||
| Commercial Mortgage-Backed Securities (0.5%) - continued | |||||||
Citigroup/Deutsche Bank Commercial Mortgage | ||||||||
| $ | 3,900,000 | 5.322%, 12/11/2049 | $ | 4,129,172 | ||||
Commercial Mortgage Pass-Through Certificates | ||||||||
| 780,000 | 1.208%, 6/8/2030g,h | 779,695 | ||||||
Credit Suisse First Boston Mortgage Securities | ||||||||
| 2,800,000 | 5.542%, 1/15/2049 | 2,999,453 | ||||||
Credit Suisse Mortgage Capital Certificates | ||||||||
| 3,350,000 | 5.509%, 9/15/2039 | 3,542,880 | ||||||
Federal Home Loan Mortgage Corporation Multi Family Structured Pass Thru Certificates | ||||||||
| 507,482 | 0.727%, 12/25/2016 | 506,775 | ||||||
Federal National Mortgage Association | ||||||||
| 550,000 | 1.272%, 1/25/2017 | 552,885 | ||||||
Government National Mortgage Association | ||||||||
| 33,929 | 2.164%, 3/16/2033 | 33,969 | ||||||
| 19,748 | 3.214%, 1/16/2040 | 19,863 | ||||||
Greenwich Capital Commercial Funding Corporation | ||||||||
| 1,750,000 | 5.867%, 12/10/2049 | 1,896,746 | ||||||
J.P. Morgan Chase Commercial Mortgage Securities Corporation | ||||||||
| 850,000 | 1.111%, 12/15/2028g,h | 850,123 | ||||||
| 1,300,000 | 5.698%, 2/12/2049 | 1,372,678 | ||||||
JPMBB Commercial Mortgage Securities Trust | ||||||||
| 1,175,000 | 3.231%, 1/15/2048 | 1,181,138 | ||||||
LSTAR Commercial Mortgage Trust | ||||||||
| 671,712 | 1.519%, 1/20/2041g | 671,672 | ||||||
Morgan Stanley Capital, Inc. | ||||||||
| 900,000 | 5.406%, 3/15/2044 | 957,904 | ||||||
SCG Trust 2013-SRP1 | ||||||||
| 425,000 | 1.561%, 11/15/2026g,h | 425,516 | ||||||
|
| |||||||
Total | 24,502,461 | |||||||
|
| |||||||
| Communications Services (0.4%) | |||||||
21st Century Fox America, Inc. | ||||||||
| 350,000 | 6.900%, 3/1/2019 | 412,703 | ||||||
AMC Networks, Inc. | ||||||||
| 630,000 | 4.750%, 12/15/2022 | 611,100 | ||||||
America Movil SAB de CV | ||||||||
| 425,000 | 1.241%, 9/12/2016h | 428,040 | ||||||
| 288,000 | 5.000%, 10/16/2019 | 317,926 | ||||||
American Tower Corporation | ||||||||
| 184,000 | 7.000%, 10/15/2017 | 207,743 | ||||||
| 345,000 | 3.450%, 9/15/2021 | 339,183 | ||||||
AT&T, Inc. | ||||||||
| 349,000 | 3.875%, 8/15/2021 | 365,161 | ||||||
British Sky Broadcasting Group plc | ||||||||
| 320,000 | 2.625%, 9/16/2019g | 320,119 | ||||||
CBS Corporation | ||||||||
| 180,000 | 2.300%, 8/15/2019 | 177,850 | ||||||
CC Holdings GS V, LLC | ||||||||
| 133,000 | 2.381%, 12/15/2017 | 134,179 | ||||||
CCO Holdings, LLC | ||||||||
| 630,000 | 7.375%, 6/1/2020 | 667,800 | ||||||
CenturyLink, Inc. | ||||||||
| 500,000 | 6.450%, 6/15/2021 | 536,250 | ||||||
Columbus International, Inc. | ||||||||
| 355,000 | 7.375%, 3/30/2021g | 369,200 | ||||||
Comcast Corporation | ||||||||
| 140,000 | 4.650%, 7/15/2042 | 153,232 | ||||||
| 252,000 | 4.750%, 3/1/2044 | 280,827 | ||||||
Cox Communications, Inc. | ||||||||
| 184,000 | 9.375%, 1/15/2019g | 231,568 | ||||||
Crown Castle Towers, LLC | ||||||||
| 100,000 | 4.174%, 8/15/2017g | 104,644 | ||||||
Digicel, Ltd. | ||||||||
| 670,000 | 6.000%, 4/15/2021g | 626,450 | ||||||
DIRECTV Holdings, LLC | ||||||||
| 252,000 | 1.750%, 1/15/2018 | 250,339 | ||||||
| 212,000 | 5.875%, 10/1/2019 | 242,492 | ||||||
| 141,000 | 4.450%, 4/1/2024 | 147,529 | ||||||
Equinix, Inc. | ||||||||
| 450,000 | 5.750%, 1/1/2025 | 453,938 | ||||||
FairPoint Communications, Inc. | ||||||||
| 600,000 | 8.750%, 8/15/2019g | 603,000 | ||||||
Frontier Communications Corporation | ||||||||
| 450,000 | 6.875%, 1/15/2025 | 450,000 | ||||||
Hughes Satellite Systems Corporation | ||||||||
| 630,000 | 6.500%, 6/15/2019 | 675,675 | ||||||
Intelsat Jackson Holdings SA | ||||||||
| 630,000 | 7.250%, 4/1/2019 | 657,562 | ||||||
Level 3 Financing, Inc. | ||||||||
| 630,000 | 8.625%, 7/15/2020 | 679,613 | ||||||
Nippon Telegraph & Telephone Corporation | ||||||||
| 120,000 | 1.400%, 7/18/2017 | 119,648 | ||||||
Numericable-SFR | ||||||||
| 670,000 | 6.000%, 5/15/2022g | 673,685 | ||||||
SES Global Americas Holdings GP | ||||||||
| 365,000 | 2.500%, 3/25/2019g | 363,166 | ||||||
Sprint Communications, Inc. | ||||||||
| 629,634 | 9.000%, 11/15/2018g | 716,146 | ||||||
Telefonica Emisiones SAU | ||||||||
| 329,000 | 3.992%, 2/16/2016 | 338,374 | ||||||
| 319,000 | 3.192%, 4/27/2018 | 328,040 | ||||||
Time Warner Cable, Inc. | ||||||||
| 440,000 | 8.250%, 4/1/2019 | 538,623 | ||||||
| 210,000 | 5.000%, 2/1/2020 | 231,417 | ||||||
T-Mobile USA, Inc. | ||||||||
| 670,000 | 6.125%, 1/15/2022 | 680,050 | ||||||
Unitymedia Hessen GmbH & Company KG | ||||||||
| 385,000 | 5.500%, 1/15/2023g | 402,325 | ||||||
Univision Communications, Inc. | ||||||||
| 630,000 | 6.875%, 5/15/2019g | 655,987 | ||||||
UPCB Finance V, Ltd. | ||||||||
| 630,000 | 7.250%, 11/15/2021g | 689,062 | ||||||
Verizon Communications, Inc. | ||||||||
| 350,000 | 1.013%, 6/17/2019h | 351,812 | ||||||
| 70,000 | 2.625%, 2/21/2020g | 69,200 | ||||||
| 525,000 | 3.000%, 11/1/2021 | 517,773 | ||||||
| 276,000 | 5.150%, 9/15/2023 | 304,768 | ||||||
| 353,000 | 6.400%, 9/15/2033 | 434,819 | ||||||
The accompanying Notes to Financial Statements are an integral part of this schedule.
95
Table of Contents
MODERATELY AGGRESSIVE ALLOCATION PORTFOLIO
Schedule of Investments as of December 31, 2014
| Principal Amount | Long-Term Fixed Income (13.0%) | Value | ||||||
| Communications Services (0.4%) - continued | |||||||
| $ | 188,000 | 5.050%, 3/15/2034 | $ | 200,544 | ||||
| 66,000 | 6.550%, 9/15/2043 | 84,556 | ||||||
Viacom, Inc. | ||||||||
| 206,000 | 2.500%, 9/1/2018 | 207,821 | ||||||
Wind Acquisition Finance SA | ||||||||
| 260,000 | 4.750%, 7/15/2020g | 243,100 | ||||||
| 75,000 | 7.375%, 4/23/2021g | 70,785 | ||||||
|
| |||||||
Total | 18,665,824 | |||||||
|
| |||||||
| Consumer Cyclical (0.2%) | |||||||
Chrysler Group, LLC | ||||||||
| 635,000 | 8.000%, 6/15/2019 | 667,544 | ||||||
Cinemark USA, Inc. | ||||||||
| 630,000 | 4.875%, 6/1/2023 | 595,350 | ||||||
Delphi Corporation | ||||||||
| 329,000 | 6.125%, 5/15/2021 | 358,610 | ||||||
Ford Motor Company | ||||||||
| 205,000 | 7.450%, 7/16/2031 | 278,307 | ||||||
Ford Motor Credit Company, LLC | ||||||||
| 396,000 | 1.684%, 9/8/2017 | 392,849 | ||||||
| 241,000 | 5.000%, 5/15/2018 | 261,858 | ||||||
| 350,000 | 2.597%, 11/4/2019 | 348,117 | ||||||
General Motors Company | ||||||||
| 159,000 | 3.500%, 10/2/2018 | 162,180 | ||||||
| 314,000 | 6.250%, 10/2/2043 | 375,104 | ||||||
General Motors Financial Company, Inc. | ||||||||
| 630,000 | 3.250%, 5/15/2018 | 630,788 | ||||||
Hilton Worldwide Finance, LLC | ||||||||
| 670,000 | 5.625%, 10/15/2021 | 700,150 | ||||||
Home Depot, Inc. | ||||||||
| 205,000 | 4.875%, 2/15/2044 | 238,269 | ||||||
Hyundai Capital America | ||||||||
| 273,000 | 1.450%, 2/6/2017g | 271,974 | ||||||
Jaguar Land Rover Automotive plc | ||||||||
| 630,000 | 5.625%, 2/1/2023g | 663,075 | ||||||
KB Home | ||||||||
| 328,000 | 4.750%, 5/15/2019 | 323,080 | ||||||
L Brands, Inc. | ||||||||
| 630,000 | 5.625%, 2/15/2022 | 677,250 | ||||||
Lennar Corporation | ||||||||
| 630,000 | 4.125%, 12/1/2018 | 623,700 | ||||||
Macy’s Retail Holdings, Inc. | ||||||||
| 102,000 | 4.375%, 9/1/2023 | 109,572 | ||||||
| 275,000 | 3.625%, 6/1/2024 | 278,237 | ||||||
Nissan Motor Acceptance Corporation | ||||||||
| 330,000 | 0.785%, 3/3/2017g,h | 331,050 | ||||||
Toll Brothers Finance Corporation | ||||||||
| 100,000 | 8.910%, 10/15/2017 | 116,000 | ||||||
| 186,000 | 4.000%, 12/31/2018 | 186,930 | ||||||
TRW Automotive, Inc. | ||||||||
| 234,000 | 7.250%, 3/15/2017g | 258,570 | ||||||
Volkswagen Group of America Finance, LLC | ||||||||
| 264,000 | 0.672%, 11/20/2017g,h | 263,616 | ||||||
Walgreens Boots Alliance, Inc. | ||||||||
| 220,000 | 2.700%, 11/18/2019 | 221,119 | ||||||
Wynn Las Vegas, LLC | ||||||||
| 630,000 | 5.375%, 3/15/2022 | 639,450 | ||||||
|
| |||||||
Total | 9,972,749 | |||||||
|
| |||||||
| Consumer Non-Cyclical (0.4%) | |||||||
AbbVie, Inc. | ||||||||
| 459,000 | 2.000%, 11/6/2018 | 457,460 | ||||||
Actavis Funding SCS | ||||||||
| 352,000 | 4.850%, 6/15/2044 | 357,187 | ||||||
Altria Group, Inc. | ||||||||
| 235,000 | 9.700%, 11/10/2018 | 298,405 | ||||||
Anheuser-Busch InBev Finance, Inc. | ||||||||
| 296,000 | 0.632%, 2/1/2019h | 294,456 | ||||||
Bayer U.S. Finance, LLC | ||||||||
| 200,000 | 1.500%, 10/6/2017g | 200,128 | ||||||
Becton, Dickinson and Company | ||||||||
| 200,000 | 2.675%, 12/15/2019 | 202,630 | ||||||
Boston Scientific Corporation | ||||||||
| 397,000 | 2.650%, 10/1/2018 | 397,467 | ||||||
Bunge Limited Finance Corporation | ||||||||
| 282,000 | 8.500%, 6/15/2019 | 345,602 | ||||||
CareFusion Corporation | ||||||||
| 288,000 | 6.375%, 8/1/2019 | 333,215 | ||||||
Celgene Corporation | ||||||||
| 476,000 | 1.900%, 8/15/2017 | 477,677 | ||||||
| 66,000 | 2.300%, 8/15/2018 | 66,545 | ||||||
CHS/Community Health Systems, Inc. | ||||||||
| 630,000 | 7.125%, 7/15/2020 | 671,738 | ||||||
Church & Dwight Company, Inc. | ||||||||
| 140,000 | 2.450%, 12/15/2019 | 139,926 | ||||||
ConAgra Foods, Inc. | ||||||||
| 325,000 | 1.900%, 1/25/2018 | 322,835 | ||||||
Coventry Health Care, Inc. | ||||||||
| 347,000 | 5.950%, 3/15/2017 | 379,523 | ||||||
CVS Health Corporation | ||||||||
| 110,000 | 2.250%, 8/12/2019 | 109,541 | ||||||
| 188,000 | 6.125%, 9/15/2039 | 242,914 | ||||||
Endo Finance LLC & Endo Finco, Inc. | ||||||||
| 630,000 | 7.000%, 7/15/2019g | 657,563 | ||||||
Forest Laboratories, Inc. | ||||||||
| 425,000 | 4.375%, 2/1/2019g | 448,957 | ||||||
Fresenius Medical Care US Finance II, Inc. | ||||||||
| 630,000 | 5.875%, 1/31/2022g | 683,550 | ||||||
Gilead Sciences, Inc. | ||||||||
| 264,000 | 4.500%, 2/1/2045 | 282,163 | ||||||
Hawk Acquisition Sub, Inc. | ||||||||
| 629,634 | 4.250%, 10/15/2020 | 635,930 | ||||||
HCA, Inc. | ||||||||
| 670,000 | 3.750%, 3/15/2019 | 670,838 | ||||||
IMS Health, Inc. | ||||||||
| 863,000 | 6.000%, 11/1/2020g | 888,890 | ||||||
JBS Finance II, Ltd. | ||||||||
| 670,000 | 8.250%, 1/29/2018* | 685,075 | ||||||
Kroger Company | ||||||||
| 116,000 | 1.200%, 10/17/2016 | 115,747 | ||||||
Lorillard Tobacco Company | ||||||||
| 235,000 | 2.300%, 8/21/2017e | 236,500 | ||||||
| 252,000 | 8.125%, 6/23/2019 | 305,506 | ||||||
The accompanying Notes to Financial Statements are an integral part of this schedule.
96
Table of Contents
MODERATELY AGGRESSIVE ALLOCATION PORTFOLIO
Schedule of Investments as of December 31, 2014
| Principal Amount | Long-Term Fixed Income (13.0%) | Value | ||||||
| Consumer Non-Cyclical (0.4%) - continued | |||||||
Mattel, Inc. | ||||||||
| $ | 235,000 | 1.700%, 3/15/2018 | $ | 232,049 | ||||
Medco Health Solutions, Inc. | ||||||||
| 301,000 | 7.125%, 3/15/2018 | 347,522 | ||||||
Medtronic, Inc. | ||||||||
| 375,000 | 4.375%, 3/15/2035g | 397,821 | ||||||
Mondelez International, Inc. | ||||||||
| 247,000 | 0.752%, 2/1/2019h | 244,244 | ||||||
Mylan, Inc. | ||||||||
| 235,000 | 7.875%, 7/15/2020g | 250,321 | ||||||
Pernod Ricard SA | ||||||||
| 112,000 | 2.950%, 1/15/2017g | 114,592 | ||||||
| 188,000 | 5.750%, 4/7/2021g | 215,951 | ||||||
Perrigo Company, Ltd. | ||||||||
| 483,000 | 1.300%, 11/8/2016 | 480,885 | ||||||
Safeway, Inc. | ||||||||
| 10,000 | 3.400%, 12/1/2016 | 10,159 | ||||||
Spectrum Brands Escrow Corporation | ||||||||
| 630,000 | 6.375%, 11/15/2020 | 656,775 | ||||||
Sysco Corporation | ||||||||
| 132,000 | 2.350%, 10/2/2019 | 132,719 | ||||||
| 88,000 | 4.350%, 10/2/2034 | 94,740 | ||||||
Tenet Healthcare Corporation | ||||||||
| 670,000 | 8.125%, 4/1/2022 | 748,725 | ||||||
Thermo Fisher Scientific, Inc. | ||||||||
| 282,000 | 2.400%, 2/1/2019 | 282,421 | ||||||
Tyson Foods, Inc. | ||||||||
| 207,000 | 4.500%, 6/15/2022 | 224,116 | ||||||
UnitedHealth Group, Inc. | ||||||||
| 105,000 | 2.875%, 12/15/2021 | 106,195 | ||||||
Valeant Pharmaceuticals International | ||||||||
| 333,000 | 6.875%, 12/1/2018g | 343,490 | ||||||
Whirlpool Corporation | ||||||||
| 220,000 | 1.650%, 11/1/2017 | 219,270 | ||||||
WM Wrigley Jr. Company | ||||||||
| 165,000 | 2.000%, 10/20/2017g | 166,190 | ||||||
|
| |||||||
Total | 16,176,153 | |||||||
|
| |||||||
| Energy (0.6%) | |||||||
Antero Resources Corporation | ||||||||
| 1,025,000 | 5.125%, 12/1/2022g | 966,063 | ||||||
Boardwalk Pipelines, Ltd. | ||||||||
| 310,000 | 5.875%, 11/15/2016 | 329,139 | ||||||
Bonanza Creek Energy, Inc. | ||||||||
| 725,000 | 6.750%, 4/15/2021 | 638,000 | ||||||
Buckeye Partners, LP | ||||||||
| 288,000 | 2.650%, 11/15/2018 | 283,661 | ||||||
California Resources Corporation | ||||||||
| 1,025,000 | 6.000%, 11/15/2024g | 866,125 | ||||||
Calumet Specialty Products Partners, LP | ||||||||
| 670,000 | 6.500%, 4/15/2021g | 596,300 | ||||||
Canadian Natural Resources, Ltd. | ||||||||
| 310,000 | 1.750%, 1/15/2018 | 308,176 | ||||||
Chaparral Energy, Inc. | ||||||||
| 1,025,000 | 7.625%, 11/15/2022 | 671,375 | ||||||
Chesapeake Energy Corporation | ||||||||
| 610,000 | 4.875%, 4/15/2022e | 593,225 | ||||||
CNOOC Nexen Finance 2014 ULC | ||||||||
| 345,000 | 1.625%, 4/30/2017 | 343,315 | ||||||
CNPC General Capital, Ltd. | ||||||||
| 192,000 | 1.450%, 4/16/2016g | 191,572 | ||||||
| 192,000 | 2.750%, 4/19/2017g | 194,225 | ||||||
Concho Resources, Inc. | ||||||||
| 1,449,634 | 5.500%, 10/1/2022 | 1,464,130 | ||||||
Continental Resources, Inc. | ||||||||
| 310,000 | 5.000%, 9/15/2022 | 299,925 | ||||||
Crestwood Midstream Partners, LP | ||||||||
| 400,000 | 6.125%, 3/1/2022 | 382,000 | ||||||
EI Paso, LLC | ||||||||
| 230,000 | 7.800%, 8/1/2031 | 280,055 | ||||||
| 420,000 | Enbridge, Inc. 0.684%, 6/2/2017h | 418,183 | ||||||
Energy XXI Gulf Coast, Inc. | ||||||||
| 1,695,000 | 7.500%, 12/15/2021e | 915,300 | ||||||
Ensco plc | ||||||||
| 220,000 | 4.500%, 10/1/2024 | 213,835 | ||||||
Enterprise Products Operating, LLC | ||||||||
| 352,000 | 2.550%, 10/15/2019 | 348,456 | ||||||
EQT Corporation | ||||||||
| 162,000 | 5.150%, 3/1/2018 | 173,058 | ||||||
| 118,000 | 8.125%, 6/1/2019 | 142,258 | ||||||
Halcon Resources Corporation | ||||||||
| 1,025,000 | 8.875%, 5/15/2021e | 771,312 | ||||||
Hess Corporation | ||||||||
| 322,000 | 8.125%, 2/15/2019 | 383,113 | ||||||
Hornbeck Offshore Services, Inc. | ||||||||
| 560,000 | 5.000%, 3/1/2021 | 459,200 | ||||||
Jones Energy Holdings, LLC | ||||||||
| 1,025,000 | 6.750%, 4/1/2022g | 779,000 | ||||||
Kinder Morgan, Inc. | ||||||||
| 220,000 | 5.000%, 2/15/2021g | 228,878 | ||||||
| 242,000 | 5.300%, 12/1/2034 | 245,644 | ||||||
Laredo Petroleum, Inc. | ||||||||
| 1,025,000 | 5.625%, 1/15/2022 | 896,875 | ||||||
Linn Energy, LLC | ||||||||
| 629,634 | 6.250%, 11/1/2019 | 532,041 | ||||||
| 820,000 | 8.625%, 4/15/2020 | 713,400 | ||||||
Marathon Petroleum Corporation | ||||||||
| 88,000 | 3.625%, 9/15/2024 | 86,240 | ||||||
| 176,000 | 4.750%, 9/15/2044 | 166,215 | ||||||
MEG Energy Corporation | ||||||||
| 630,000 | 6.500%, 3/15/2021g | 574,875 | ||||||
| 1,105,000 | 7.000%, 3/31/2024g | 1,000,025 | ||||||
Oasis Petroleum, Inc. | ||||||||
| 410,000 | 6.875%, 3/15/2022 | 373,100 | ||||||
Offshore Group Investment, Ltd. | ||||||||
| 630,000 | 7.500%, 11/1/2019e | 469,350 | ||||||
| 820,000 | 7.125%, 4/1/2023 | 582,200 | ||||||
Pacific Drilling SA | ||||||||
| 820,000 | 5.375%, 6/1/2020g | 668,300 | ||||||
Petrobras Global Finance BV | ||||||||
| 423,000 | 2.000%, 5/20/2016 | 404,028 | ||||||
Petroleos Mexicanos | ||||||||
| 210,000 | 2.378%, 4/15/2025 | 207,658 | ||||||
Plains All American Pipeline, LP | ||||||||
| 300,000 | 3.600%, 11/1/2024 | 294,515 | ||||||
The accompanying Notes to Financial Statements are an integral part of this schedule.
97
Table of Contents
MODERATELY AGGRESSIVE ALLOCATION PORTFOLIO
Schedule of Investments as of December 31, 2014
| Principal Amount | Long-Term Fixed Income (13.0%) | Value | ||||||
| Energy (0.6%) - continued | |||||||
Precision Drilling Corporation | ||||||||
| $ | 820,000 | 5.250%, 11/15/2024g | $ | 672,400 | ||||
Range Resources Corporation | ||||||||
| 1,025,000 | 5.000%, 3/15/2023 | 1,025,000 | ||||||
Regency Energy Partners, LP | ||||||||
| 670,000 | 5.000%, 10/1/2022 | 633,150 | ||||||
Rosetta Resources, Inc. | ||||||||
| 790,000 | 5.875%, 6/1/2024 | 703,100 | ||||||
Sabine Pass Liquefaction, LLC | ||||||||
| 670,000 | 5.750%, 5/15/2024 | 657,438 | ||||||
Samson Investment Company | ||||||||
| 1,025,000 | 9.750%, 2/15/2020 | 424,734 | ||||||
Sinopec Capital 2013, Ltd. | ||||||||
| 330,000 | 1.250%, 4/24/2016g | 329,040 | ||||||
Southwestern Energy Company | ||||||||
| 220,000 | 7.500%, 2/1/2018 | 247,836 | ||||||
Suncor Energy, Inc. | ||||||||
| 197,000 | 6.100%, 6/1/2018 | 220,977 | ||||||
| 270,000 | 3.600%, 12/1/2024 | 266,802 | ||||||
Transocean, Inc. | ||||||||
| 345,000 | 6.000%, 3/15/2018 | 331,841 | ||||||
Weatherford International, Ltd. | ||||||||
| 320,000 | 9.625%, 3/1/2019 | 379,546 | ||||||
Whiting Petroleum Corporation | ||||||||
| 820,000 | 5.750%, 3/15/2021 | 760,550 | ||||||
Williams Companies, Inc. | ||||||||
| 157,000 | 3.700%, 1/15/2023 | 141,000 | ||||||
|
| |||||||
Total | 27,247,759 | |||||||
|
| |||||||
| Financials (0.9%) | |||||||
Abbey National Treasury Services plc | ||||||||
| 283,000 | 0.665%, 9/29/2017h | 282,295 | ||||||
| 132,000 | 3.050%, 8/23/2018 | 136,662 | ||||||
ABN AMRO Bank NV | ||||||||
| 359,000 | 2.500%, 10/30/2018g | 362,596 | ||||||
Air Lease Corporation | ||||||||
| 220,000 | 2.125%, 1/15/2018 | 216,150 | ||||||
Ally Financial, Inc. | ||||||||
| 440,000 | 3.750%, 11/18/2019 | 433,400 | ||||||
American Express Credit Corporation | ||||||||
| 350,000 | 0.793%, 3/18/2019h | 348,541 | ||||||
American International Group, Inc. | ||||||||
| 145,000 | 2.300%, 7/16/2019 | 145,148 | ||||||
ANZ New Zealand International, Ltd. | ||||||||
| 294,000 | 1.400%, 4/27/2017g | 293,414 | ||||||
Australia and New Zealand Banking Group, Ltd. | ||||||||
| 365,000 | 0.501%, 6/13/2017g,h | 364,461 | ||||||
Aviation Capital Group Corporation | ||||||||
| 132,000 | 3.875%, 9/27/2016g | 135,323 | ||||||
Banco Santander Chile | ||||||||
| 435,000 | 1.130%, 4/11/2017g,h | 433,058 | ||||||
Bank of America Corporation | ||||||||
| 264,000 | 1.700%, 8/25/2017 | 264,060 | ||||||
| 455,000 | 5.750%, 12/1/2017 | 502,728 | ||||||
| 578,000 | 1.317%, 3/22/2018h | 582,223 | ||||||
| 476,000 | 5.650%, 5/1/2018 | 528,823 | ||||||
| 295,000 | 1.105%, 4/1/2019h | 295,488 | ||||||
| 150,000 | 4.000%, 4/1/2024 | 156,184 | ||||||
| 201,000 | 5.875%, 2/7/2042 | 251,524 | ||||||
| 323,000 | 8.000%, 12/29/2049k | 346,821 | ||||||
Bank of Tokyo-Mitsubishi UFJ, Ltd. | ||||||||
| 145,000 | 2.850%, 9/8/2021g | 143,010 | ||||||
Barclays Bank plc | ||||||||
| 280,000 | 10.179%, 6/12/2021g | 375,925 | ||||||
Barclays plc | ||||||||
| 264,000 | 2.750%, 11/8/2019 | 262,387 | ||||||
BB&T Corporation | ||||||||
| 150,000 | 0.950%, 1/15/2020h | 149,958 | ||||||
BBVA Banco Continental SA | ||||||||
| 350,000 | 2.250%, 7/29/2016g | 349,125 | ||||||
Berkshire Hathaway Finance Corporation | ||||||||
| 160,000 | 1.600%, 5/15/2017 | 161,368 | ||||||
BioMed Realty, LP | ||||||||
| 282,000 | 2.625%, 5/1/2019 | 281,752 | ||||||
BNP Paribas SA | ||||||||
| 386,000 | 2.375%, 9/14/2017 | 392,602 | ||||||
BPCE SA | ||||||||
| 300,000 | 1.082%, 2/10/2017e,h | 301,987 | ||||||
| 378,000 | 1.625%, 2/10/2017 | 378,786 | ||||||
Capital One Financial Corporation | ||||||||
| 379,000 | 6.150%, 9/1/2016 | 407,287 | ||||||
| 235,000 | 2.450%, 4/24/2019 | 234,462 | ||||||
Citigroup, Inc. | ||||||||
| 230,000 | 6.000%, 8/15/2017 | 254,465 | ||||||
| 352,000 | 1.850%, 11/24/2017 | 351,596 | ||||||
| 245,000 | 1.003%, 4/8/2019h | 245,919 | ||||||
| 335,000 | 8.500%, 5/22/2019 | 417,433 | ||||||
| 244,000 | 4.050%, 7/30/2022 | 252,457 | ||||||
| 352,000 | 3.750%, 6/16/2024 | 359,479 | ||||||
CoBank ACB | ||||||||
| 120,000 | 0.841%, 6/15/2022*,h | 113,691 | ||||||
Compass Bank | ||||||||
| 308,000 | 1.850%, 9/29/2017 | 306,686 | ||||||
| 264,000 | 2.750%, 9/29/2019 | 264,270 | ||||||
Cooperatieve Centrale Raiffeisen-Boerenleenbank BA | ||||||||
| 228,000 | 3.950%, 11/9/2022 | 232,247 | ||||||
Credit Agricole SA | ||||||||
| 290,000 | 1.031%, 4/15/2019g,h | 292,223 | ||||||
| 308,000 | 6.625%, 9/29/2049g,k | 298,529 | ||||||
Credit Suisse AG | ||||||||
| 231,000 | 5.400%, 1/14/2020 | 258,324 | ||||||
CyrusOne, LP | ||||||||
| 630,000 | 6.375%, 11/15/2022 | 672,525 | ||||||
DDR Corporation | ||||||||
| 384,000 | 9.625%, 3/15/2016 | 421,539 | ||||||
Denali Borrower, LLC | ||||||||
| 670,000 | 5.625%, 10/15/2020g | 697,135 | ||||||
Deutsche Bank AG | ||||||||
| 315,000 | 1.350%, 5/30/2017 | 312,346 | ||||||
Discover Bank | ||||||||
| 235,000 | 8.700%, 11/18/2019 | 290,610 | ||||||
Discover Financial Services | ||||||||
| 188,000 | 6.450%, 6/12/2017 | 207,719 | ||||||
DnB Boligkreditt AS | ||||||||
| 605,000 | 1.450%, 3/21/2018g | 602,330 | ||||||
Duke Realty, LP | ||||||||
| 88,000 | 3.875%, 2/15/2021 | 91,399 | ||||||
| 264,000 | 4.375%, 6/15/2022 | 279,460 | ||||||
The accompanying Notes to Financial Statements are an integral part of this schedule.
98
Table of Contents
MODERATELY AGGRESSIVE ALLOCATION PORTFOLIO
Schedule of Investments as of December 31, 2014
| Principal Amount | Long-Term Fixed Income (13.0%) | Value | ||||||
| Financials (0.9%) - continued | |||||||
Eksportfinans ASA | ||||||||
| $ | 111,000 | 5.500%, 5/25/2016 | $ | 115,978 | ||||
European Investment Bank | ||||||||
| 445,000 | 1.875%, 3/15/2019 | 449,481 | ||||||
| 330,000 | 2.125%, 10/15/2021 | 330,861 | ||||||
Fifth Third Bancorp | ||||||||
| 286,000 | 5.450%, 1/15/2017 | 306,911 | ||||||
| 145,000 | 2.875%, 10/1/2021 | 144,985 | ||||||
General Electric Capital Corporation | ||||||||
| 661,000 | 6.000%, 8/7/2019 | 768,857 | ||||||
| 390,000 | 1.241%, 3/15/2023h | 395,490 | ||||||
| 350,000 | 6.750%, 3/15/2032 | 478,059 | ||||||
Genworth Financial, Inc. | ||||||||
| 336,000 | 7.700%, 6/15/2020 | 335,151 | ||||||
Goldman Sachs Group, Inc. | ||||||||
| 285,000 | 2.375%, 1/22/2018 | 287,878 | ||||||
| 390,000 | 1.433%, 4/30/2018h | 394,576 | ||||||
| 205,000 | 1.332%, 11/15/2018h | 207,009 | ||||||
| 271,000 | 7.500%, 2/15/2019 | 322,344 | ||||||
| 310,000 | 2.550%, 10/23/2019 | 308,868 | ||||||
| 374,000 | 5.375%, 3/15/2020 | 419,141 | ||||||
| 336,000 | 5.250%, 7/27/2021 | 379,230 | ||||||
Hartford Financial Services Group, Inc. | ||||||||
| 177,000 | 4.000%, 10/15/2017 | 188,191 | ||||||
| 249,000 | 5.125%, 4/15/2022 | 279,898 | ||||||
HBOS plc | ||||||||
| 288,000 | 6.750%, 5/21/2018g | 320,975 | ||||||
Health Care REIT, Inc. | ||||||||
| 264,000 | 4.700%, 9/15/2017 | 283,655 | ||||||
| 58,000 | 2.250%, 3/15/2018 | 58,363 | ||||||
HSBC Bank plc | ||||||||
| 495,000 | 0.872%, 5/15/2018g,h | 496,977 | ||||||
HSBC Holdings plc | ||||||||
| 176,000 | 5.250%, 3/14/2044 | 197,147 | ||||||
| 440,000 | 5.625%, 12/29/2049k | 441,540 | ||||||
HSBC USA, Inc. | ||||||||
| 241,000 | 1.625%, 1/16/2018 | 240,072 | ||||||
Huntington Bancshares, Inc. | ||||||||
| 66,000 | 2.600%, 8/2/2018 | 66,802 | ||||||
Huntington National Bank | ||||||||
| 282,000 | 1.350%, 8/2/2016 | 282,150 | ||||||
Icahn Enterprises, LP | ||||||||
| 500,000 | 6.000%, 8/1/2020 | 515,100 | ||||||
ING Bank NV | ||||||||
| 282,000 | 4.125%, 11/21/2023 | 286,533 | ||||||
ING Capital Funding Trust III | ||||||||
| 265,000 | 3.855%, 12/29/2049h,k | 264,338 | ||||||
International Lease Finance Corporation | ||||||||
| 383,000 | 2.191%, 6/15/2016h | 382,521 | ||||||
Intesa Sanpaolo SPA | ||||||||
| 317,000 | 3.125%, 1/15/2016 | 322,010 | ||||||
| 141,000 | 3.875%, 1/16/2018 | 146,803 | ||||||
| 288,000 | 3.875%, 1/15/2019 | 298,193 | ||||||
J.P. Morgan Chase & Company | ||||||||
| 210,000 | 0.752%, 2/15/2017h | 209,470 | ||||||
| 451,000 | 2.000%, 8/15/2017 | 455,289 | ||||||
| 200,000 | 1.800%, 1/25/2018 | 199,844 | ||||||
| 326,000 | 6.300%, 4/23/2019 | 378,674 | ||||||
| 50,000 | 3.200%, 1/25/2023 | 50,056 | ||||||
| 352,000 | 3.625%, 5/13/2024 | 360,308 | ||||||
| 166,000 | 3.875%, 9/10/2024 | 166,141 | ||||||
| 332,000 | 7.900%, 4/29/2049k | 357,332 | ||||||
Kookmin Bank | ||||||||
| 294,000 | 1.109%, 1/27/2017g,h | 295,949 | ||||||
Liberty Mutual Group, Inc. | ||||||||
| 60,000 | 4.950%, 5/1/2022g | 64,912 | ||||||
| 56,000 | 6.500%, 5/1/2042g | 68,479 | ||||||
Liberty Property, LP | ||||||||
| 289,000 | 5.500%, 12/15/2016 | 310,295 | ||||||
Lloyds Banking Group plc | ||||||||
| 288,000 | 5.920%, 9/29/2049g,k | 285,840 | ||||||
Macquarie Bank, Ltd. | ||||||||
| 305,000 | 5.000%, 2/22/2017g | 325,314 | ||||||
Merrill Lynch & Company, Inc. | ||||||||
| 610,000 | 6.050%, 5/16/2016 | 645,945 | ||||||
| 225,000 | 6.400%, 8/28/2017 | 250,687 | ||||||
MetLife, Inc. | ||||||||
| 220,000 | 1.903%, 12/15/2017 | 220,501 | ||||||
Mizuho Bank, Ltd. | ||||||||
| 282,000 | 1.850%, 3/21/2018g | 280,467 | ||||||
Morgan Stanley | ||||||||
| 270,000 | 6.250%, 8/28/2017 | 299,933 | ||||||
| 308,000 | 1.875%, 1/5/2018 | 306,873 | ||||||
| 498,000 | 6.625%, 4/1/2018 | 567,239 | ||||||
| 260,000 | 1.514%, 4/25/2018h | 264,137 | ||||||
| 155,000 | 4.875%, 11/1/2022 | 164,622 | ||||||
| 329,000 | 4.100%, 5/22/2023 | 333,092 | ||||||
Murray Street Investment Trust I | ||||||||
| 572,000 | 4.647%, 3/9/2017 | 603,687 | ||||||
National City Corporation | ||||||||
| 288,000 | 6.875%, 5/15/2019 | 338,330 | ||||||
PNC Bank NA | ||||||||
| 198,000 | 1.150%, 11/1/2016 | 198,264 | ||||||
Pricoa Global Funding I | ||||||||
| 368,000 | 1.350%, 8/18/2017g | 366,485 | ||||||
Prologis, LP | ||||||||
| 370,000 | 7.375%, 10/30/2019 | 444,985 | ||||||
Prudential Financial, Inc. | ||||||||
| 145,000 | 2.350%, 8/15/2019 | 145,086 | ||||||
RBS Capital Trust III | ||||||||
| 115,000 | 2.095%, 9/29/2049e,h,k | 114,368 | ||||||
Realty Income Corporation | ||||||||
| 58,000 | 2.000%, 1/31/2018 | 58,107 | ||||||
Regions Bank | ||||||||
| 465,000 | 7.500%, 5/15/2018 | 539,816 | ||||||
Reinsurance Group of America, Inc. | ||||||||
| 105,000 | 5.625%, 3/15/2017 | 113,546 | ||||||
| 252,000 | 5.000%, 6/1/2021 | 277,547 | ||||||
Reliance Standard Life Global Funding II | ||||||||
| 230,000 | 2.500%, 4/24/2019g | 231,061 | ||||||
Royal Bank of Canada | ||||||||
| 341,000 | 2.200%, 7/27/2018 | 344,785 | ||||||
Royal Bank of Scotland Group plc | ||||||||
| 295,000 | 1.197%, 3/31/2017h | 295,912 | ||||||
| 596,000 | 5.125%, 5/28/2024 | 606,246 | ||||||
Simon Property Group, LP | ||||||||
| 100,000 | 10.350%, 4/1/2019 | 130,799 | ||||||
Skandinaviska Enskilda Banken AB | ||||||||
| 365,000 | 2.375%, 3/25/2019g | 367,365 | ||||||
The accompanying Notes to Financial Statements are an integral part of this schedule.
99
Table of Contents
MODERATELY AGGRESSIVE ALLOCATION PORTFOLIO
Schedule of Investments as of December 31, 2014
| Principal Amount | Long-Term Fixed Income (13.0%) | Value | ||||||
| Financials (0.9%) - continued | |||||||
SLM Corporation | ||||||||
| $ | 75,000 | 3.875%, 9/10/2015 | $ | 75,563 | ||||
SpareBank 1 Boligkreditt AS | ||||||||
| 605,000 | 1.250%, 5/2/2018g | 595,854 | ||||||
Sumitomo Mitsui Banking Corporation | ||||||||
| 485,000 | 1.300%, 1/10/2017 | 484,081 | ||||||
Suncorp-Metway, Ltd. | ||||||||
| 674,000 | 0.955%, 3/28/2017g,h | 675,002 | ||||||
Svenska Handelsbanken AB | ||||||||
| 252,000 | 1.625%, 3/21/2018 | 251,609 | ||||||
| 330,000 | 0.733%, 6/17/2019h | 330,272 | ||||||
Swedbank Hypotek AB | ||||||||
| 605,000 | 1.375%, 3/28/2018g | 599,101 | ||||||
Swiss RE Capital I, LP | ||||||||
| 125,000 | 6.854%, 5/29/2049g,k | 130,938 | ||||||
Synchrony Financial | ||||||||
| 155,000 | 3.000%, 8/15/2019 | 156,696 | ||||||
| 160,000 | 3.750%, 8/15/2021 | 163,438 | ||||||
Toronto-Dominion Bank | ||||||||
| 185,000 | 0.792%, 11/5/2019h | 185,347 | ||||||
UBS AG/Stamford, Connecticut | ||||||||
| 116,000 | 5.875%, 12/20/2017 | 129,525 | ||||||
Voya Financial, Inc. | ||||||||
| 344,000 | 2.900%, 2/15/2018 | 352,171 | ||||||
WEA Finance, LLC | ||||||||
| 288,000 | 1.750%, 9/15/2017g | 286,450 | ||||||
Wells Fargo & Company | ||||||||
| 264,000 | 1.400%, 9/8/2017 | 263,786 | ||||||
|
| |||||||
Total | 44,173,638 | |||||||
|
| |||||||
| Foreign Government (<0.1%) | |||||||
Kommunalbanken AS | ||||||||
| 335,000 | 1.500%, 10/22/2019g | 330,560 | ||||||
|
| |||||||
Total | 330,560 | |||||||
|
| |||||||
| Mortgage-Backed Securities (3.6%) | |||||||
Federal Home Loan Mortgage Corporation Gold 15-Yr. Pass Through | ||||||||
| 11,900,000 | 3.000%, 1/1/2030c | 12,351,179 | ||||||
Federal Home Loan Mortgage Corporation Gold 30-Yr. Pass Through | ||||||||
| 404,338 | 1.961%, 6/1/2043h | 413,737 | ||||||
| 12,300,000 | 4.000%, 1/1/2045c | 13,111,031 | ||||||
Federal National Mortgage Association Conventional 15-Yr. Pass Through | ||||||||
| 17,775,000 | 3.500%, 1/1/2030c | 18,777,620 | ||||||
Federal National Mortgage Association Conventional 30-Yr. Pass Through | ||||||||
| 1,566,127 | 2.073%, 1/1/2043h | 1,623,365 | ||||||
| 2,672,903 | 2.058%, 3/1/2043h | 2,772,498 | ||||||
| 2,511,456 | 1.739%, 7/1/2043h | 2,558,016 | ||||||
| 726,580 | 2.017%, 7/1/2043h | 745,493 | ||||||
| 635,908 | 2.101%, 8/1/2043h | 653,824 | ||||||
| 39,850,000 | 3.500%, 1/1/2045c | 41,540,517 | ||||||
| 34,550,000 | 4.000%, 1/1/2045c | 36,873,622 | ||||||
| 34,714,000 | 4.500%, 1/1/2045c | 37,680,964 | ||||||
|
| |||||||
Total | 169,101,866 | |||||||
|
| |||||||
| Technology (0.1%) | |||||||
Alibaba Group Holding, Ltd. | ||||||||
| 350,000 | 2.500%, 11/28/2019g | 345,281 | ||||||
Amphenol Corporation | ||||||||
| 188,000 | 2.550%, 1/30/2019 | 189,307 | ||||||
Apple, Inc. | ||||||||
| 440,000 | 0.532%, 5/6/2019h | 440,179 | ||||||
Baidu, Inc. | ||||||||
| 250,000 | 2.750%, 6/9/2019 | 248,901 | ||||||
EMC Corporation | ||||||||
| 196,000 | 1.875%, 6/1/2018 | 195,334 | ||||||
Fidelity National Information Services, Inc. | ||||||||
| 336,000 | 1.450%, 6/5/2017 | 334,118 | ||||||
First Data Corporation | ||||||||
| 630,000 | 7.375%, 6/15/2019e,g | 663,075 | ||||||
Freescale Semiconductor, Inc. | ||||||||
| 670,000 | 6.000%, 1/15/2022g | 700,150 | ||||||
Hewlett-Packard Company | ||||||||
| 329,000 | 5.400%, 3/1/2017 | 355,156 | ||||||
Iron Mountain, Inc. | ||||||||
| 630,000 | 6.000%, 8/15/2023 | 655,200 | ||||||
Micron Semiconductor Asia Pte, Ltd. | ||||||||
| 202,500 | 1.258%, 1/15/2019 | 202,173 | ||||||
Samsung Electronics America, Inc. | ||||||||
| 94,000 | 1.750%, 4/10/2017g | 94,285 | ||||||
Tyco Electronics Group SA | ||||||||
| 368,000 | 6.550%, 10/1/2017 | 414,231 | ||||||
Xerox Corporation | ||||||||
| 240,000 | 7.200%, 4/1/2016 | 256,987 | ||||||
Xilinx, Inc. | ||||||||
| 240,000 | 2.125%, 3/15/2019 | 238,458 | ||||||
|
| |||||||
Total | 5,332,835 | |||||||
|
| |||||||
| Transportation (0.1%) | |||||||
American Airlines Pass Through Trust | ||||||||
| 141,595 | 4.950%, 1/15/2023 | 151,153 | ||||||
Avis Budget Car Rental, LLC | ||||||||
| 365,000 | 5.125%, 6/1/2022g | 368,650 | ||||||
Canadian Pacific Railway Company | ||||||||
| 65,000 | 7.125%, 10/15/2031 | 89,395 | ||||||
| 76,000 | 5.750%, 3/15/2033 | 92,452 | ||||||
Continental Airlines, Inc. | ||||||||
| 152,818 | 4.150%, 4/11/2024 | 156,926 | ||||||
CSX Corporation | ||||||||
| 115,000 | 3.700%, 11/1/2023 | 120,565 | ||||||
Delta Air Lines, Inc. | ||||||||
| 204,000 | 6.750%, 5/23/2017 | 212,670 | ||||||
| 94,958 | 4.950%, 5/23/2019 | 101,605 | ||||||
| 25,945 | 4.750%, 5/7/2020 | 27,600 | ||||||
ERAC USA Finance, LLC | ||||||||
| 116,000 | 1.400%, 4/15/2016g | 116,272 | ||||||
| 67,000 | 2.800%, 11/1/2018g | 68,437 | ||||||
Hornbeck Offshore Services, Inc. | ||||||||
| 205,000 | 5.875%, 4/1/2020 | 181,425 | ||||||
Korea Expressway Corporation | ||||||||
| 282,000 | 1.625%, 4/28/2017g | 280,424 | ||||||
The accompanying Notes to Financial Statements are an integral part of this schedule.
100
Table of Contents
MODERATELY AGGRESSIVE ALLOCATION PORTFOLIO
Schedule of Investments as of December 31, 2014
| Principal Amount | Long-Term Fixed Income (13.0%) | Value | ||||||
| Transportation (0.1%) - continued | |||||||
Southwest Airlines Company | ||||||||
| $ | 285,000 | 2.750%, 11/6/2019g | $ | 286,311 | ||||
Virgin Australia Holdings, Ltd. | ||||||||
| 98,452 | 5.000%, 10/23/2023g | 100,913 | ||||||
|
| |||||||
Total | 2,354,798 | |||||||
|
| |||||||
| U.S. Government and Agencies (4.5%) | |||||||
Federal Home Loan Bank | ||||||||
| 2,830,000 | 0.875%, 5/24/2017 | 2,824,784 | ||||||
Federal National Mortgage Association | ||||||||
| 1,535,000 | 0.875%, 5/21/2018 | 1,509,476 | ||||||
| 2,835,000 | 2.625%, 9/6/2024 | 2,871,064 | ||||||
| 405,000 | 6.250%, 5/15/2029 | 564,268 | ||||||
Tennessee Valley Authority | ||||||||
| 390,000 | 5.250%, 9/15/2039 | 496,495 | ||||||
U.S. Treasury Bonds | ||||||||
| 4,150,000 | 6.500%, 11/15/2026 | 5,973,730 | ||||||
| 2,900,000 | 5.250%, 11/15/2028 | 3,888,039 | ||||||
| 2,050,000 | 4.375%, 5/15/2040 | 2,694,949 | ||||||
| 39,845,000 | 3.000%, 5/15/2042 | 41,880,841 | ||||||
U.S. Treasury Bonds, TIPS | ||||||||
| 1,722,729 | 0.125%, 4/15/2019 | 1,703,752 | ||||||
| 100,777 | 2.375%, 1/15/2025 | 118,319 | ||||||
| 65,917 | 2.125%, 2/15/2040 | 85,444 | ||||||
| 577,973 | 0.750%, 2/15/2042 | 561,582 | ||||||
U.S. Treasury Notes | ||||||||
| 1,500,000 | 0.625%, 10/15/2016 | 1,500,468 | ||||||
| 5,335,000 | 0.875%, 11/15/2017 | 5,309,573 | ||||||
| 22,365,000 | 1.500%, 10/31/2019 | 22,228,708 | ||||||
| 27,965,000 | 1.875%, 6/30/2020 | 28,152,897 | ||||||
| 685,000 | 1.625%, 8/15/2022 | 666,269 | ||||||
| 9,850,000 | 2.250%, 11/15/2024 | 9,916,182 | ||||||
| 14,300,000 | 3.625%, 2/15/2044 | 16,828,197 | ||||||
U.S. Treasury Notes, TIPS | ||||||||
| 29,789,380 | 0.125%, 4/15/2018 | 29,677,670 | ||||||
| 613,735 | 0.125%, 1/15/2022 | 596,953 | ||||||
| 36,236,662 | 0.125%, 1/15/2023 | 35,039,149 | ||||||
|
| |||||||
Total | 215,088,809 | |||||||
|
| |||||||
| Utilities (0.2%) | |||||||
AES Corporation | ||||||||
| 630,000 | 7.375%, 7/1/2021 | 711,900 | ||||||
American Electric Power Company, Inc. | ||||||||
| 116,000 | 1.650%, 12/15/2017 | 116,030 | ||||||
Atlas Pipeline Partners, LP | ||||||||
| 630,000 | 4.750%, 11/15/2021 | 598,500 | ||||||
Berkshire Hathaway Energy Company | ||||||||
| 132,000 | 2.400%, 2/1/2020g | 131,425 | ||||||
Calpine Corporation | ||||||||
| 670,000 | 5.375%, 1/15/2023 | 676,700 | ||||||
Commonwealth Edison Company | ||||||||
| 128,000 | 6.950%, 7/15/2018 | 147,953 | ||||||
Dayton Power and Light Company | ||||||||
| 132,000 | 1.875%, 9/15/2016 | 133,458 | ||||||
DCP Midstream Operating, LP | ||||||||
| 282,000 | 2.500%, 12/1/2017 | 281,676 | ||||||
Dominion Gas Holdings, LLC | ||||||||
| 140,000 | 2.500%, 12/15/2019 | 140,347 | ||||||
DTE Energy Company |
| |||||||
| 422,000 | 2.400%, 12/1/2019 | 422,070 | ||||||
Duke Energy Corporation |
| |||||||
| 235,000 | 0.613%, 4/3/2017h | 235,314 | ||||||
| 168,000 | 2.100%, 6/15/2018 | 169,535 | ||||||
Dynegy Finance I, Inc./ Dynegy Finance II, Inc. |
| |||||||
| 430,000 | 6.750%, 11/1/2019g | 437,525 | ||||||
EDP Finance BV |
| |||||||
| 262,000 | 4.125%, 1/15/2020g | 263,467 | ||||||
Enel Finance International NV |
| |||||||
| 84,000 | 6.250%, 9/15/2017g | 93,235 | ||||||
Energy Transfer Partners, LP |
| |||||||
| 50,000 | 9.700%, 3/15/2019 | 62,756 | ||||||
| 308,000 | 4.650%, 6/1/2021 | 321,964 | ||||||
Enterprise Products Operating, LLC |
| |||||||
| 252,000 | 5.100%, 2/15/2045 | 270,948 | ||||||
| 180,000 | 7.034%, 1/15/2068 | 197,437 | ||||||
Exelon Generation Company, LLC |
| |||||||
| 300,000 | 5.200%, 10/1/2019 | 331,506 | ||||||
ITC Holdings Corporation |
| |||||||
| 67,000 | 4.050%, 7/1/2023 | 69,816 | ||||||
MarkWest Energy Partners, LP |
| |||||||
| 665,000 | 4.875%, 12/1/2024e | 650,038 | ||||||
MidAmerican Energy Holdings Company |
| |||||||
| 120,000 | 1.100%, 5/15/2017 | 118,775 | ||||||
| 222,000 | 5.750%, 4/1/2018 | 248,783 | ||||||
| 205,000 | 6.500%, 9/15/2037 | 268,302 | ||||||
NiSource Finance Corporation |
| |||||||
| 166,000 | 6.800%, 1/15/2019 | 194,884 | ||||||
Northeast Utilities |
| |||||||
| 75,000 | 1.450%, 5/1/2018 | 73,861 | ||||||
Northern States Power Company |
| |||||||
| 410,000 | 4.125%, 5/15/2044 | 433,771 | ||||||
NRG Energy, Inc. |
| |||||||
| 630,000 | 6.625%, 3/15/2023 | 655,200 | ||||||
Pacific Gas & Electric Company |
| |||||||
| 347,000 | 5.625%, 11/30/2017 | 385,678 | ||||||
PG&E Corporation |
| |||||||
| 140,000 | 2.400%, 3/1/2019 | 140,212 | ||||||
PPL Capital Funding, Inc. |
| |||||||
| 461,000 | 1.900%, 6/1/2018 | 460,217 | ||||||
| 144,000 | 3.500%, 12/1/2022 | 145,847 | ||||||
Sempra Energy |
| |||||||
| 440,000 | 6.150%, 6/15/2018 | 498,655 | ||||||
Southern Company |
| |||||||
| 220,000 | 1.300%, 8/15/2017 | 219,097 | ||||||
TransAlta Corporation |
| |||||||
| 336,000 | 1.900%, 6/3/2017 | 334,577 | ||||||
Williams Companies, Inc. |
| |||||||
| 192,000 | 7.875%, 9/1/2021 | 221,793 | ||||||
Williams Partners, LP |
| |||||||
| 60,000 | 7.250%, 2/1/2017 | 66,133 | ||||||
|
| |||||||
Total | 10,929,385 | |||||||
|
| |||||||
Total Long-Term Fixed Income (cost $611,048,673) | 618,175,344 | |||||||
|
| |||||||
The accompanying Notes to Financial Statements are an integral part of this schedule.
101
Table of Contents
MODERATELY AGGRESSIVE ALLOCATION PORTFOLIO
Schedule of Investments as of December 31, 2014
| Shares | Collateral Held for Securities Loaned (0.8%) | Value | ||||||
| 39,076,872 | Thrivent Cash Management Trust | $ | 39,076,872 | |||||
|
| |||||||
Total Collateral Held for Securities Loaned (cost $39,076,872) | 39,076,872 | |||||||
|
| |||||||
| Shares or Principal Amount | Short-Term Investments (18.1%)i | |||||||
Federal Home Loan Bank Discount Notes | ||||||||
| 6,000,000 | 0.040%, 1/2/2015 | 5,999,993 | ||||||
| 38,850,000 | 0.051%, 1/7/2015 | 38,849,673 | ||||||
| 12,500,000 | 0.047%, 1/9/2015 | 12,499,868 | ||||||
| 4,000,000 | 0.040%, 1/12/2015f | 3,999,951 | ||||||
| 25,000,000 | 0.050%, 1/14/2015 | 24,999,549 | ||||||
| 27,828,000 | 0.055%, 1/16/2015 | 27,827,354 | ||||||
| 32,000,000 | 0.080%, 1/21/2015 | 31,998,578 | ||||||
| 5,000,000 | 0.063%, 1/23/2015 | 4,999,807 | ||||||
| 32,000,000 | 0.063%, 1/28/2015 | 31,998,500 | ||||||
| 69,000,000 | 0.066%, 1/30/2015 | 68,996,356 | ||||||
| 136,224,000 | 0.075%, 2/4/2015 | 136,214,346 | ||||||
| 94,000,000 | 0.080%, 2/10/2015 | 93,991,644 | ||||||
| 99,500,000 | 0.087%, 2/11/2015 | 99,490,198 | ||||||
| 57,000,000 | 0.090%, 2/13/2015 | 56,993,873 | ||||||
| 40,600,000 | 0.091%, 2/20/2015f | 40,594,883 | ||||||
| 2,000,000 | 0.050%, 3/2/2015 | 1,999,833 | ||||||
| 52,100,000 | 0.101%, 3/4/2015 | 52,090,964 | ||||||
| 27,900,000 | 0.105%, 3/6/2015 | 27,894,771 | ||||||
| 10,000,000 | 0.110%, 3/11/2015 | 9,997,892 | ||||||
| 31,000,000 | 0.116%, 3/13/2015 | 30,992,880 | ||||||
| 23,000,000 | 0.130%, 3/18/2015 | 22,993,688 | ||||||
| 6,800,000 | 0.090%, 4/24/2015f | 6,798,079 | ||||||
Federal Home Loan Mortgage Corporation Discount Notes | ||||||||
| 5,000,000 | 0.053%, 1/26/2015 | 4,999,816 | ||||||
Federal National Mortgage Association Discount Notes | ||||||||
| 3,000,000 | 0.045%, 1/5/2015 | 2,999,985 | ||||||
| 23,000,000 | 0.035%, 1/14/2015f | 22,999,709 | ||||||
U.S. Treasury Bills | ||||||||
| 200,000 | 0.030%, 3/19/2015 | 199,987 | ||||||
|
| |||||||
Total Short-Term Investments (at amortized cost) | 863,422,177 | |||||||
|
| |||||||
Total Investments (cost $4,422,414,262) 104.2% | $ | 4,974,845,247 | ||||||
|
| |||||||
Other Assets and Liabilities, Net (4.2%) | (199,847,681 | ) | ||||||
|
| |||||||
Total Net Assets 100.0% | $ | 4,774,997,566 | ||||||
|
| |||||||
| a | The stated interest rate represents the weighted average of all contracts within the bank loan facility. |
| b | All or a portion of the loan is unfunded. |
| c | Denotes investments purchased on a when-issued or delayed delivery basis. |
| d | Non-income producing security. |
| e | All or a portion of the security is on loan. |
| f | At December 31, 2014, $44,185,726 of investments were held on deposit with the counterparty and pledged as the initial margin deposit for open futures contracts. |
| g | Denotes securities sold under Rule 144A of the Securities Act of 1933, which exempts them from registration. These securities have been deemed liquid and may be resold to other dealers in the program or to other qualified institutional buyers. As of December 31, 2014, the value of these investments was $55,697,933 or 1.2% of total net assets. |
| h | Denotes variable rate securities. Variable rate securities are securities whose yields vary with a designated market index or market rate. The rate shown is as of December 31, 2014. |
| i | Denotes step coupon securities. Step coupon securities pay an initial coupon rate for the first period and then different coupon rates for following periods. The rate shown is as of December 31, 2014. |
| j | Denotes interest only security. Interest only securities represent the right to receive monthly interest payments on an underlying pool of mortgages or assets. The principal shown is the outstanding par amount of the pool as of the end of the period. The actual effective yield of the security is different than the stated coupon rate. |
| k | Denotes perpetual securities. Perpetual securities pay an indefinite stream of interest, but may be called by the issuer at an earlier date. |
| l | The interest rate shown reflects the yield, coupon rate or the discount rate at the date of purchase. |
| * | Denotes restricted securities. Restricted securities are investment securities which have been deemed illiquid and cannot be offered for public sale without first being registered under the Securities Act of 1933. The following table indicates the acquisition date and cost of restricted securities Moderately Aggressive Allocation Portfolio owned as of December 31, 2014. |
Security | Acquisition Date | Cost | ||||||
Alm Loan Funding CLO, 10/17/2026 | 7/31/2014 | $ | 384,808 | |||||
Apidos CLO XVIII, 7/22/2026 | 6/25/2014 | 374,062 | ||||||
ARES CLO, Ltd., 11/15/2025 | 11/26/2014 | 750,000 | ||||||
Babson CLO, Ltd. 2014-II, 10/17/2026 | 8/15/2014 | 384,808 | ||||||
Birchwood Park CLO, Ltd., 7/15/2026 | 7/31/2014 | 385,000 | ||||||
BlueMountain CLO, Ltd., 10/15/2026 | 8/27/2014 | 384,611 | ||||||
Carlyle Global Market Strategies CLO, Ltd., 10/15/2026 | 9/19/2014 | 400,000 | ||||||
Carlyle Global Market Strategies CLO, Ltd., 7/20/2023 | 7/3/2014 | 385,000 | ||||||
Cent CLO 16, LP, 8/1/2024 | 9/5/2014 | 385,000 | ||||||
Cent CLO 22, Ltd., 11/7/2026 | 9/19/2014 | 400,000 | ||||||
CoBank ACB, 6/15/2022 | 10/18/2013 | 113,354 | ||||||
Dryden 34 Senior Loan Fund CLO, 10/15/2026 | 7/21/2014 | 385,000 | ||||||
Edlinc Student Loan Funding Trust, 10/1/2025 | 2/28/2013 | 396,384 | ||||||
FNA Trust, 1/10/2018 | 4/29/2013 | 173,549 | ||||||
GoldenTree Loan Opportunities IX, Ltd., 10/29/2026 | 10/3/2014 | 399,600 | ||||||
JBS Finance II, Ltd., 1/29/2018 | 8/11/2014 | 700,115 | ||||||
Limerock CLO III, LLC, 10/20/2026 | 10/16/2014 | 1,150,000 | ||||||
Madison Park Funding XIV CLO, Ltd., 7/20/2026 | 7/3/2014 | 424,490 | ||||||
Neuberger Berman CLO, Ltd., 8/4/2025 | 6/19/2014 | 300,000 | ||||||
Octagon Investment Partners XX CLO, Ltd., 8/12/2026 | 7/10/2014 | 385,000 | ||||||
OHA Loan Funding 2014-1, Ltd., 10/20/2026 | 11/6/2014 | 1,147,125 | ||||||
OZLM VIII, Ltd., 10/17/2026 | 8/7/2014 | 382,805 | ||||||
Symphony CLO XV, Ltd., 10/17/2026 | 10/17/2014 | 1,141,375 | ||||||
Symphony CLO, Ltd., 1/9/2023 | 9/15/2014 | 385,000 | ||||||
Voya CLO 2014-3, Ltd., 7/25/2026 | 7/10/2014 | 384,422 | ||||||
The accompanying Notes to Financial Statements are an integral part of this schedule.
102
Table of Contents
MODERATELY AGGRESSIVE ALLOCATION PORTFOLIO
Schedule of Investments as of December 31, 2014
Definitions:
ADR | - | American Depositary Receipt, which are certificates for an underlying foreign security’s shares held by an issuing U.S. depository bank. | ||
CLO | - | Collateralized Loan Obligation | ||
ETF | - | Exchange Traded Fund. | ||
REIT | - | Real Estate Investment Trust is a company that buys, develops, manages and/or sells real estate assets. | ||
TIPS | - | Treasury Inflation Protected Security. |
Unrealized Appreciation (Depreciation)
Gross unrealized appreciation and depreciation of investments, based on cost for federal income tax purposes, were as follows:
Gross unrealized appreciation | $ | 625,513,523 | ||
Gross unrealized depreciation | (77,157,779 | ) | ||
|
| |||
Net unrealized appreciation (depreciation) | $ | 548,355,744 | ||
Cost for federal income tax purposes | $ | 4,426,489,503 | ||
The accompanying Notes to Financial Statements are an integral part of this schedule.
103
Table of Contents
MODERATELY AGGRESSIVE ALLOCATION PORTFOLIO
Schedule of Investments as of December 31, 2014
Fair Valuation Measurements
The following table is a summary of the inputs used, as of December 31, 2014, in valuing Moderately Aggressive Allocation Portfolio’s assets carried at fair value.
Investments in Securities | Total | Level 1 | Level 2 | Level 3 | ||||||||||||
Bank Loans | ||||||||||||||||
Basic Materials | 5,156,049 | — | 5,156,049 | — | ||||||||||||
Capital Goods | 3,488,276 | — | 3,488,276 | — | ||||||||||||
Communications Services | 32,191,683 | — | 29,334,815 | 2,856,868 | ||||||||||||
Consumer Cyclical | 16,972,368 | — | 16,972,368 | — | ||||||||||||
Consumer Non-Cyclical | 10,810,098 | — | 9,875,035 | 935,063 | ||||||||||||
Energy | 6,574,874 | — | 5,299,296 | 1,275,578 | ||||||||||||
Financials | 4,393,187 | — | 4,393,187 | — | ||||||||||||
Technology | 4,738,658 | — | 4,738,658 | — | ||||||||||||
Transportation | 3,676,486 | — | 2,950,758 | 725,728 | ||||||||||||
Utilities | 2,879,477 | — | 2,879,477 | — | ||||||||||||
Affiliated Mutual Funds | ||||||||||||||||
Equity Mutual Funds | 1,643,430,993 | 1,643,430,993 | — | — | ||||||||||||
Fixed Income Mutual Funds | 296,381,142 | 296,381,142 | — | — | ||||||||||||
Common Stock | ||||||||||||||||
Consumer Discretionary | 208,487,679 | 205,856,319 | 2,631,360 | — | ||||||||||||
Consumer Staples | 56,812,864 | 55,528,132 | 1,284,732 | — | ||||||||||||
Energy | 192,268,303 | 188,926,063 | 3,342,240 | — | ||||||||||||
Financials | 243,512,695 | 233,210,158 | 10,302,537 | — | ||||||||||||
Health Care | 198,911,609 | 196,141,248 | 2,770,361 | — | ||||||||||||
Industrials | 167,491,928 | 164,391,294 | 3,100,634 | — | ||||||||||||
Information Technology | 280,363,381 | 278,041,190 | 2,322,191 | — | ||||||||||||
Materials | 49,471,356 | 48,674,823 | 796,533 | — | ||||||||||||
Telecommunications Services | 8,282,800 | 5,584,074 | 2,698,726 | — | ||||||||||||
Utilities | 17,874,948 | 16,013,773 | 1,861,175 | — | ||||||||||||
Long-Term Fixed Income | ||||||||||||||||
Asset-Backed Securities | 35,875,786 | — | 34,553,607 | 1,322,179 | ||||||||||||
Basic Materials | 5,835,401 | — | 5,835,401 | — | ||||||||||||
Capital Goods | 5,648,236 | — | 5,648,236 | — | ||||||||||||
Collateralized Mortgage Obligations | 26,939,084 | — | 26,939,084 | — | ||||||||||||
Commercial Mortgage-Backed Securities | 24,502,461 | — | 24,502,461 | — | ||||||||||||
Communications Services | 18,665,824 | — | 18,665,824 | — | ||||||||||||
Consumer Cyclical | 9,972,749 | — | 9,972,749 | — | ||||||||||||
Consumer Non-Cyclical | 16,176,153 | — | 16,176,153 | — | ||||||||||||
Energy | 27,247,759 | — | 27,247,759 | — | ||||||||||||
Financials | 44,173,638 | — | 44,173,638 | — | ||||||||||||
Foreign Government | 330,560 | — | 330,560 | — | ||||||||||||
Mortgage-Backed Securities | 169,101,866 | — | 169,101,866 | — | ||||||||||||
Technology | 5,332,835 | — | 5,332,835 | — | ||||||||||||
Transportation | 2,354,798 | — | 2,354,798 | — | ||||||||||||
U.S. Government and Agencies | 215,088,809 | — | 215,088,809 | — | ||||||||||||
Utilities | 10,929,385 | — | 10,929,385 | — | ||||||||||||
Collateral Held for Securities Loaned | 39,076,872 | 39,076,872 | — | — | ||||||||||||
Short-Term Investments | 863,422,177 | — | 863,422,177 | — | ||||||||||||
|
|
|
|
|
|
|
| |||||||||
Total | $ | 4,974,845,247 | $ | 3,371,256,081 | $ | 1,596,473,750 | $ | 7,115,416 | ||||||||
|
|
|
|
|
|
|
| |||||||||
| Other Financial Instruments | Total | Level 1 | Level 2 | Level 3 | ||||||||||||
Asset Derivatives | ||||||||||||||||
Futures Contracts | 39,301,633 | 39,301,633 | — | — | ||||||||||||
|
|
|
|
|
|
|
| |||||||||
Total Asset Derivatives | $ | 39,301,633 | $ | 39,301,633 | $ | — | $ | — | ||||||||
|
|
|
|
|
|
|
| |||||||||
Liability Derivatives | ||||||||||||||||
Futures Contracts | 14,335,343 | 14,335,343 | — | — | ||||||||||||
|
|
|
|
|
|
|
| |||||||||
Total Liability Derivatives | $ | 14,335,343 | $ | 14,335,343 | $ | — | $ | — | ||||||||
|
|
|
|
|
|
|
| |||||||||
There were no significant transfers between Levels during the period ended December 31, 2014. Transfers between Levels are identified as of the end of the period.
The accompanying Notes to Financial Statements are an integral part of this schedule.
104
Table of Contents
MODERATELY AGGRESSIVE ALLOCATION PORTFOLIO
Schedule of Investments as of December 31, 2014
Futures Contracts | Number of Contracts Long/(Short) | Expiration Date | Notional Principal Amount | Value | Unrealized Gain/(Loss) | |||||||||||||||
2-Yr. U.S. Treasury Bond Futures | (1,155 | ) | March 2015 | ($ | 252,760,822 | ) | ($ | 252,475,781 | ) | $ | 285,041 | |||||||||
5-Yr. U.S. Treasury Bond Futures | (335 | ) | March 2015 | (39,823,491 | ) | (39,841,446 | ) | (17,955 | ) | |||||||||||
10-Yr. U.S. Treasury Bond Futures | 257 | March 2015 | 32,380,777 | 32,586,798 | 206,021 | |||||||||||||||
30-Yr. U.S. Treasury Bond Futures | 901 | March 2015 | 126,656,597 | 130,250,812 | 3,594,215 | |||||||||||||||
Eurex EURO STOXX 50 Futures | 5,921 | March 2015 | 212,939,156 | 224,112,584 | 11,173,428 | |||||||||||||||
Mini MSCI EAFE Index Futures | 480 | March 2015 | 41,800,171 | 42,189,600 | 389,429 | |||||||||||||||
Russell 2000 Index Mini-Futures | 131 | March 2015 | 14,935,535 | 15,729,170 | 793,635 | |||||||||||||||
S&P 400 Index Mini-Futures | (2,368 | ) | March 2015 | (328,711,092 | ) | (343,028,480 | ) | (14,317,388 | ) | |||||||||||
S&P 500 Index Futures | 1,236 | March 2015 | 612,828,700 | 634,191,600 | 21,362,900 | |||||||||||||||
Ultra Long Term U.S. Treasury Bond Futures | 196 | March 2015 | 30,879,786 | 32,376,750 | 1,496,964 | |||||||||||||||
Total Futures Contracts | $ | 24,966,290 | ||||||||||||||||||
The following table summarizes the fair value and Statement of Assets and Liabilities location, as of December 31, 2014, for Moderately Aggressive Allocation Portfolio’s investments in financial derivative instruments by primary risk exposure as discussed under item (2) Significant Accounting Policies of the Notes to Financial Statements.
Derivatives by risk category | Statement of Assets and Liabilities Location | Fair Value | ||||
| Asset Derivatives | ||||||
Interest Rate Contracts | ||||||
Futures* | Net Assets - Net unrealized appreciation/(depreciation) on Futures contracts | $ | 5,582,241 | |||
Total Interest Rate Contracts | 5,582,241 | |||||
Equity Contracts | ||||||
Futures* | Net Assets - Net unrealized appreciation/(depreciation) on Futures contracts | 33,719,392 | ||||
Total Equity Contracts | 33,719,392 | |||||
|
| |||||
Total Asset Derivatives | $ | 39,301,633 | ||||
|
| |||||
| Liability Derivatives | ||||||
Interest Rate Contracts | ||||||
Futures* | Net Assets - Net unrealized appreciation/(depreciation) on Futures contracts | 17,955 | ||||
Total Interest Rate Contracts | 17,955 | |||||
Equity Contracts | ||||||
Futures* | Net Assets - Net unrealized appreciation/(depreciation) on Futures contracts | 14,317,388 | ||||
Total Equity Contracts | 14,317,388 | |||||
|
| |||||
Total Liability Derivatives | $ | 14,335,343 | ||||
|
| |||||
| * | Includes cumulative appreciation/depreciation of futures contracts as reported in the Schedule of Investments. Only current day’s variation margin is reported within the Statement of Assets and Liabilities. |
The following table summarizes the net realized gains/(losses) and Statement of Operations location, for the period ended December 31, 2014, for Moderately Aggressive Allocation Portfolio’s investments in financial derivative instruments by primary risk exposure.
Derivatives by risk category | Statement of Operations Location | Realized Gains/(Losses) recognized in Income | ||||
| Equity Contracts | ||||||
Futures | Net realized gains/(losses) on Futures contracts | 33,666,503 | ||||
Total Equity Contracts | 33,666,503 | |||||
Interest Rate Contracts | ||||||
Futures | Net realized gains/(losses) on Futures contracts | 13,037,080 | ||||
Total Interest Rate Contracts | 13,037,080 | |||||
Credit Contracts | ||||||
Credit Default Swaps | Net realized gains/(losses) on Swap agreements | 49,276 | ||||
Total Credit Contracts | 49,276 | |||||
|
| |||||
Total | $ | 46,752,859 | ||||
|
| |||||
The accompanying Notes to Financial Statements are an integral part of this schedule.
105
Table of Contents
MODERATELY AGGRESSIVE ALLOCATION PORTFOLIO
Schedule of Investments as of December 31, 2014
The following table summarizes the change in net unrealized appreciation/(depreciation) and Statement of Operations location, for the period ended December 31, 2014, for Moderately Aggressive Allocation Portfolio’s investments in financial derivative instruments by primary risk exposure.
Derivatives by risk category | Statement of Operations Location | Change in unrealized appreciation/(depreciation) recognized in Income | ||||
Interest Rate Contracts | ||||||
Futures | Change in net unrealized appreciation/(depreciation) on Futures contracts | 4,812,183 | ||||
Total Interest Rate Contracts | 4,812,183 | |||||
Equity Contracts | ||||||
Futures | Change in net unrealized appreciation/(depreciation) on Futures contracts | 9,229,790 | ||||
Total Equity Contracts | 9,229,790 | |||||
|
| |||||
Total | $ | 14,041,973 | ||||
|
| |||||
The following table presents Moderately Aggressive Allocation Portfolio’s average volume of derivative activity during the period ended December 31 2014.
Derivative Risk Category | Futures (Notional)* | Futures (Percentage of Average Net Assets) | Swaps (Notional)* | |||||||||
Equity Contracts | $ | 941,514,778 | 20.7 | % | N/A | |||||||
Interest Rate Contracts | 426,249,522 | 9.4 | N/A | |||||||||
Credit Contracts | N/A | N/A | $ | 21,344 | ||||||||
| * | Notional amount represents long or short, or both, derivative positions held by the Portfolio. |
Investment in Affiliates
Affiliated issuers, as defined under the Investment Company Act of 1940, include those in which the Portfolio’s holdings of an issuer represent 5% or more of the outstanding voting securities of an issuer, or any affiliated mutual fund.
A summary of transactions for the fiscal year to date, in Moderately Aggressive Allocation Portfolio, is as follows:
Portfolio | Value December 31, 2013 | Gross Purchases | Gross Sales | Shares Held at December 31, 2014 | Value December 31, 2014 | Income Earned January 1, 2014 - December 31, 2014 | ||||||||||||||||||
Partner Small Cap Growth | $ | 99,350,542 | $ | 11,250,739 | $ | 93,647,695 | — | $ | — | $ | — | |||||||||||||
Partner Small Cap Value | 95,754,838 | 2,682,706 | — | 3,483,432 | 98,513,554 | 207,953 | ||||||||||||||||||
Small Cap Stock | 80,744,824 | 1,056,897 | — | 4,604,230 | 84,584,317 | 175,776 | ||||||||||||||||||
Partner Mid Cap Value | 120,947,314 | 17,563,147 | — | 7,570,495 | 137,304,560 | 813,044 | ||||||||||||||||||
Mid Cap Stock | 250,137,905 | 12,622,547 | — | 14,848,287 | 279,977,811 | 831,246 | ||||||||||||||||||
Partner Worldwide Allocation | 469,014,832 | 9,533,135 | — | 47,730,299 | 443,920,241 | 9,533,135 | ||||||||||||||||||
Large Cap Value | 296,898,574 | 3,787,069 | — | 19,283,176 | 323,712,459 | 3,787,069 | ||||||||||||||||||
Large Cap Stock | 261,579,999 | 2,372,475 | — | 22,340,673 | 275,418,051 | 2,372,475 | ||||||||||||||||||
High Yield | 126,092,487 | 7,555,210 | 8,782,046 | 24,608,174 | 119,925,476 | 7,554,992 | ||||||||||||||||||
Income | 141,401,371 | 7,215,970 | 12,273,875 | 13,188,704 | 138,495,900 | 5,436,133 | ||||||||||||||||||
Limited Maturity Bond | 42,310,425 | 715,211 | 5,059,894 | 3,867,565 | 37,959,766 | 715,720 | ||||||||||||||||||
Cash Management Trust- Collateral Investment | 34,022,252 | 286,233,951 | 281,179,331 | 39,076,872 | 39,076,872 | 369,519 | ||||||||||||||||||
Total Value and Income Earned | 2,018,255,363 | 1,978,889,007 | 31,797,062 | |||||||||||||||||||||
The accompanying Notes to Financial Statements are an integral part of this schedule.
106
Table of Contents
Schedule of Investments as of December 31, 2014
| Principal Amount | Bank Loans (4.1%)a | Value | ||||||
| Basic Materials (0.3%) | |||||||
Alpha Natural Resources, Inc., Term Loan | ||||||||
| $ | 4,226,231 | 3.500%, 5/22/2020 | $ | 3,341,385 | ||||
Axalta Coating Systems US Holdings, Inc., Term Loan | ||||||||
| 2,824,565 | 3.750%, 2/1/2020 | 2,744,687 | ||||||
Fortescue Metals Group, Ltd., Term Loan | ||||||||
| 2,170,328 | 3.750%, 6/30/2019 | 1,966,317 | ||||||
Ineos Group Holdings, Ltd., Term Loan | ||||||||
| 3,860,299 | 3.750%, 5/4/2018 | 3,734,415 | ||||||
NewPage Corporation, Term Loan | ||||||||
| 8,000,000 | 9.500%, 2/11/2021 | 7,586,640 | ||||||
Tronox Pigments BV, Term Loan | ||||||||
| 2,972,330 | 4.000%, 3/19/2020 | 2,917,847 | ||||||
Wausau Paper Corporation, Term Loan | ||||||||
| 5,373,000 | 6.500%, 7/30/2020 | 5,319,270 | ||||||
|
| |||||||
| Total | 27,610,561 | |||||||
|
| |||||||
| Capital Goods (0.1%) | |||||||
ADS Waste Holdings, Inc., Term Loan | ||||||||
| 2,307,708 | 3.750%, 10/9/2019 | 2,236,308 | ||||||
Berry Plastics Group, Inc., Term Loan | ||||||||
| 6,307,650 | 3.500%, 2/8/2020 | 6,091,361 | ||||||
Silver II Borrower, Term Loan | ||||||||
| 1,565,288 | 4.000%, 12/13/2019 | 1,451,319 | ||||||
STHI Holding Corporation, Term Loan | ||||||||
| 1,855,350 | 4.500%, 8/6/2021 | 1,838,336 | ||||||
|
| |||||||
| Total | 11,617,324 | |||||||
|
| |||||||
| Communications Services (1.4%) | |||||||
Atlantic Broadband Penn, LLC, Term Loan | ||||||||
| 1,191,643 | 3.250%, 11/30/2019 | 1,164,831 | ||||||
Birch Communication Inc., Term Loan | ||||||||
| 7,893,663 | 7.750%, 7/17/2020 | 7,735,790 | ||||||
Cable & Wireless Communications plc, Term Loan | ||||||||
| 640,000 | 0.000%, 11/25/2016b,c | 636,800 | ||||||
Cengage Learning Aquisitions, Term Loan | ||||||||
| 5,994,700 | 7.000%, 3/31/2020 | 5,927,260 | ||||||
Cequel Communications, LLC, Term Loan | ||||||||
| 2,006,560 | 3.500%, 2/14/2019 | 1,972,569 | ||||||
Charter Communications Operating, LLC, Term Loan | ||||||||
| 847,100 | 3.000%, 7/1/2020 | 829,633 | ||||||
| 4,432,500 | 3.000%, 1/3/2021 | 4,339,240 | ||||||
Clear Channel Communications, Inc., Term Loan | ||||||||
| 30,753 | 3.819%, 1/29/2016 | 30,400 | ||||||
| 3,645,169 | 6.919%, 1/30/2019 | 3,429,047 | ||||||
| 1,172,348 | 7.669%, 7/30/2019 | 1,115,196 | ||||||
Cumulus Media Holdings, Inc., Term Loan | ||||||||
| 3,890,667 | 4.250%, 12/23/2020b,c | 3,767,450 | ||||||
Fairpoint Communications, Term Loan | ||||||||
| 4,205,100 | 7.500%, 2/14/2019 | 4,160,442 | ||||||
Grande Communications Networks, LLC, Term Loan | ||||||||
| 2,570,876 | 4.500%, 5/29/2020 | 2,535,526 | ||||||
Hargray Communications Group, Inc., Term Loan | ||||||||
| 4,682,753 | 5.250%, 6/26/2019 | 4,647,632 | ||||||
Integra Telecom Holdings, Inc., Term Loan | ||||||||
| 2,564,325 | 5.250%, 2/22/2019 | 2,489,011 | ||||||
| 1,010,000 | 9.750%, 2/21/2020 | 1,001,162 | ||||||
Intelsat Jackson Holdings SA, Term Loan | ||||||||
| 2,274,236 | 3.750%, 6/30/2019 | 2,237,280 | ||||||
Level 3 Communications, Inc., Term Loan | ||||||||
| 3,305,000 | 4.000%, 1/15/2020 | 3,276,081 | ||||||
Level 3 Financing, Inc., Term Loan | ||||||||
| 1,680,000 | 4.500%, 1/31/2022 | 1,679,479 | ||||||
Liberty Cablevision of Puerto Rico, LLC, Term Loan | ||||||||
| 2,090,000 | 0.000%, 1/7/2022b,c | 2,027,300 | ||||||
| 2,290,000 | 4.500%, 1/7/2022 | 2,227,025 | ||||||
| 1,000,000 | 7.750%, 7/7/2023 | 1,000,000 | ||||||
LTS Buyer, LLC, Term Loan | ||||||||
| 3,189,672 | 4.000%, 4/13/2020 | 3,115,927 | ||||||
| 135,988 | 8.000%, 4/12/2021 | 133,438 | ||||||
McGraw-Hill Global Education, LLC, Term Loan | ||||||||
| 3,496,242 | 5.750%, 3/22/2019 | 3,477,677 | ||||||
Mediacom Broadband, LLC, Term Loan | ||||||||
| 1,324,513 | 4.000%, 1/20/2020 | 1,293,612 | ||||||
NEP Broadcasting, LLC, Term Loan | ||||||||
| 242,857 | 9.500%, 7/22/2020 | 237,696 | ||||||
NEP/NCP Holdco, Inc., Term Loan | ||||||||
| 9,275,625 | 4.250%, 1/22/2020 | 9,059,224 | ||||||
NTelos, Inc., Term Loan | ||||||||
| 1,246,313 | 5.750%, 11/9/2019 | 1,084,292 | ||||||
Puerto Rico Cable Acquisition Company, Inc., Term Loan | ||||||||
| 1,363,603 | 5.500%, 7/31/2018 | 1,353,376 | ||||||
Syniverse Holdings, Inc., Term Loan | ||||||||
| 3,315,763 | 4.000%, 4/23/2019 | 3,216,291 | ||||||
TNS, Inc., Term Loan | ||||||||
| 5,550,059 | 5.000%, 2/14/2020 | 5,487,621 | ||||||
Univision Communications, Inc., Term Loan | ||||||||
| 3,765,124 | 4.000%, 3/1/2020 | 3,676,644 | ||||||
Virgin Media Investment Holdings, Ltd., Term Loan | ||||||||
| 7,500,000 | 3.500%, 6/7/2020 | 7,354,575 | ||||||
WideOpenWest Finance, LLC, Term Loan | ||||||||
| 5,600,250 | 4.750%, 4/1/2019 | 5,554,776 | ||||||
XO Communications, LLC, Term Loan | ||||||||
| 3,870,750 | 4.250%, 3/20/2021 | 3,793,335 | ||||||
Yankee Cable Acquisition, LLC, Term Loan | ||||||||
| 3,731,036 | 4.500%, 3/1/2020 | 3,707,717 | ||||||
Zayo Group, LLC, Term Loan | ||||||||
| 9,476,197 | 4.000%, 7/2/2019 | 9,361,534 | ||||||
|
| |||||||
Total | 120,136,889 | |||||||
|
| |||||||
The accompanying Notes to Financial Statements are an integral part of this schedule.
107
Table of Contents
MODERATE ALLOCATION PORTFOLIO
Schedule of Investments as of December 31, 2014
| Principal Amount | Bank Loans (4.1%)a | Value | ||||||
| Consumer Cyclical (0.7%) | |||||||
Amaya Gaming Group, Inc., Term Loan | ||||||||
| $ | 4,663,312 | 5.000%, 8/1/2021b,c | $ | 4,613,182 | ||||
Burlington Coat Factory Warehouse Corporation, Term Loan | ||||||||
| 1,879,720 | 4.250%, 8/13/2021 | 1,852,709 | ||||||
Ceridian HCM Holding, Inc., Term Loan | ||||||||
| 2,494,039 | 4.500%, 9/15/2020 | 2,448,847 | ||||||
Chrysler Group, LLC, Term Loan | ||||||||
| 2,892,545 | 3.500%, 5/24/2017 | 2,871,371 | ||||||
Golden Nugget, Inc., Delayed Draw | ||||||||
| 525,690 | 5.500%, 11/21/2019 | 518,136 | ||||||
Golden Nugget, Inc., Term Loan | ||||||||
| 1,226,610 | 5.500%, 11/21/2019 | 1,208,984 | ||||||
Hilton Worldwide Finance, LLC, Term Loan | ||||||||
| 9,892,544 | 3.500%, 10/26/2020 | 9,764,732 | ||||||
J.C. Penney Corporation, Inc., Term Loan | ||||||||
| 3,920,300 | 6.000%, 5/22/2018 | 3,838,640 | ||||||
Las Vegas Sands, LLC, Term Loan | ||||||||
| 2,128,500 | 3.250%, 12/19/2020 | 2,113,430 | ||||||
Marina District Finance Company, Inc., Term Loan | ||||||||
| 2,502,525 | 6.750%, 8/15/2018 | 2,480,102 | ||||||
MGM Resorts International, Term Loan | ||||||||
| 2,616,600 | 3.500%, 12/20/2019 | 2,543,021 | ||||||
Mohegan Tribal Gaming Authority, Term Loan | ||||||||
| 6,732,000 | 5.500%, 11/19/2019 | 6,456,729 | ||||||
Rite Aid Corporation, Term Loan | ||||||||
| 630,436 | 3.500%, 2/21/2020 | 626,496 | ||||||
| 1,285,000 | 5.750%, 8/21/2020 | 1,287,146 | ||||||
ROC Finance, LLC, Term Loan | ||||||||
| 6,152,125 | 5.000%, 6/20/2019 | 5,690,716 | ||||||
Scientific Games International, Inc., Term Loan | ||||||||
| 7,955,481 | 6.000%, 10/18/2020 | 7,830,182 | ||||||
Seminole Indian Tribe of Florida, Term Loan | ||||||||
| 1,417,162 | 3.000%, 4/29/2020 | 1,408,900 | ||||||
|
| |||||||
Total | 57,553,323 | |||||||
|
| |||||||
| Consumer Non-Cyclical (0.5%) | |||||||
Albertsons, Inc., Term Loan | ||||||||
| 6,911,985 | 4.750%, 3/21/2019 | 6,860,145 | ||||||
Biomet, Inc., Term Loan | ||||||||
| 2,417,058 | 3.670%, 7/25/2017 | 2,402,387 | ||||||
Catalina Marketing Corporation, Term Loan | ||||||||
| 3,880,500 | 4.500%, 4/9/2021 | 3,684,069 | ||||||
CHS/Community Health Systems, Inc., Term Loan | ||||||||
| 457,817 | 3.486%, 1/25/2017 | 454,763 | ||||||
| 1,220,233 | 4.250%, 1/27/2021 | 1,215,914 | ||||||
Del Monte Corporation, Term Loan | ||||||||
| 837,390 | 3.500%, 3/9/2020 | 799,708 | ||||||
HCA, Inc., Term Loan | ||||||||
| 1,481,250 | 2.919%, 3/31/2017 | 1,468,289 | ||||||
Hologic, Inc., Term Loan | ||||||||
| 1,188,114 | 3.250%, 8/1/2019 | 1,175,413 | ||||||
JBS USA, LLC, Term Loan | ||||||||
| 2,816,296 | 3.750%, 5/25/2018 | 2,774,051 | ||||||
Ortho-Clinical Diagnostics, Inc., Term Loan | ||||||||
| 9,616,675 | 4.750%, 6/30/2021 | 9,445,979 | ||||||
Roundy’s Supermarkets, Inc., Term Loan | ||||||||
| 3,387,446 | 5.750%, 3/3/2021 | 3,170,073 | ||||||
Supervalu, Inc., Term Loan | ||||||||
| 8,122,249 | 4.500%, 3/21/2019 | 7,964,353 | ||||||
Visant Corporation, Term Loan | ||||||||
| 5,223,627 | 7.000%, 9/23/2021 | 5,066,918 | ||||||
|
| |||||||
Total | 46,482,062 | |||||||
|
| |||||||
| Energy (0.3%) | |||||||
Arch Coal, Inc., Term Loan | ||||||||
| 3,451,157 | 6.250%, 5/16/2018 | 2,848,654 | ||||||
Energy Solutions, LLC, Term Loan | ||||||||
| 6,591,875 | 6.750%, 5/29/2020 | 6,560,959 | ||||||
Expro Holdings UK 2, Ltd., Term Loan | ||||||||
| 2,992,500 | 5.750%, 9/2/2021 | 2,438,887 | ||||||
Fieldwood Energy, LLC, Term Loan | ||||||||
| 2,073,762 | 3.875%, 9/28/2018 | 1,959,705 | ||||||
| 660,000 | 8.375%, 9/30/2020 | 479,325 | ||||||
Houston Fuel Oil Terminal, LLC, Term Loan | ||||||||
| 3,720,675 | 4.250%, 8/19/2021b,c | 3,553,245 | ||||||
McJunkin Red Man Corporation, Term Loan | ||||||||
| 2,137,938 | 5.000%, 11/8/2019 | 1,961,558 | ||||||
Offshore Group Investment, Ltd., Term Loan | ||||||||
| 3,325,762 | 5.750%, 3/28/2019 | 2,477,693 | ||||||
Pacific Drilling SA, Term Loan | ||||||||
| 2,388,625 | 4.500%, 6/3/2018 | 1,962,661 | ||||||
TerraForm Power Operating, LLC, Term Loan | ||||||||
| 2,064,625 | 4.750%, 7/23/2019 | 2,054,302 | ||||||
|
| |||||||
Total | 26,296,989 | |||||||
|
| |||||||
| Financials (0.3%) | |||||||
DJO Finance, LLC, Term Loan | ||||||||
| 2,923,223 | 4.250%, 9/15/2017 | 2,852,568 | ||||||
GEO Group, Inc., Term Loan | ||||||||
| 848,085 | 3.250%, 4/3/2020 | 838,188 | ||||||
Harland Clarke Holdings Corporation, Term Loan | ||||||||
| 4,494,875 | 7.000%, 5/22/2018 | 4,499,370 | ||||||
| 487,500 | 6.000%, 8/4/2019 | 484,453 | ||||||
MoneyGram International, Inc., Term Loan | ||||||||
| 3,384,713 | 4.250%, 3/27/2020 | 3,095,320 | ||||||
MPH Acquisition Holdings, LLC, Term Loan | ||||||||
| 2,272,727 | 3.750%, 3/31/2021 | 2,205,682 | ||||||
TransUnion, LLC, Term Loan | ||||||||
| 7,791,125 | 4.000%, 4/9/2021 | 7,664,519 | ||||||
WaveDivision Holdings, LLC, Term Loan | ||||||||
| 3,586,800 | 4.000%, 10/15/2019 | 3,527,008 | ||||||
|
| |||||||
Total | 25,167,108 | |||||||
|
| |||||||
��
The accompanying Notes to Financial Statements are an integral part of this schedule.
108
Table of Contents
MODERATE ALLOCATION PORTFOLIO
Schedule of Investments as of December 31, 2014
| Principal Amount | Bank Loans (4.1%)a | Value | ||||||
| Technology (0.2%) | |||||||
Avago Technologies, Ltd., Term Loan | ||||||||
| $ | 2,985,000 | 3.750%, 5/6/2021 | $ | 2,971,329 | ||||
First Data Corporation, Term Loan | ||||||||
| 7,025,000 | 3.667%, 3/23/2018 | 6,880,145 | ||||||
| 1,355,000 | 3.667%, 9/24/2018 | 1,323,158 | ||||||
Freescale Semiconductor, Inc., Term Loan | ||||||||
| 3,050,895 | 4.250%, 2/28/2020 | 2,972,731 | ||||||
| 3,110,625 | 5.000%, 1/15/2021 | 3,098,182 | ||||||
Infor US, Inc., Term Loan | ||||||||
| 1,784,020 | 3.750%, 6/3/2020 | 1,728,394 | ||||||
|
| |||||||
Total | 18,973,939 | |||||||
|
| |||||||
| Transportation (0.2%) | |||||||
American Airlines, Inc., Term Loan | ||||||||
| 3,654,350 | 3.750%, 6/27/2019 | 3,610,206 | ||||||
Delta Air Lines, Inc., Term Loan | ||||||||
| 2,987,907 | 3.250%, 4/20/2017b,c | 2,950,558 | ||||||
OSG Bulk Ships, Inc., Term Loan | ||||||||
| 4,910,325 | 5.250%, 8/5/2019 | 4,775,291 | ||||||
United Airlines, Inc., Term Loan | ||||||||
| 2,117,288 | 3.500%, 4/1/2019 | 2,077,588 | ||||||
| 897,750 | 3.750%, 9/15/2021 | 888,027 | ||||||
|
| |||||||
Total | 14,301,670 | |||||||
|
| |||||||
| Utilities (0.1%) | |||||||
Calpine Corporation, Term Loan | ||||||||
| 626,972 | 4.000%, 4/1/2018 | 619,292 | ||||||
| 2,649,025 | 4.000%, 10/9/2019 | 2,610,958 | ||||||
Intergen NV, Term Loan | ||||||||
| 1,694,200 | 5.500%, 6/15/2020 | 1,678,664 | ||||||
NGPL PipeCo, LLC, Term Loan | ||||||||
| 2,169,995 | 6.750%, 9/15/2017 | 2,102,183 | ||||||
|
| |||||||
Total | 7,011,097 | |||||||
|
| |||||||
| Total Bank Loans (cost $365,077,817) | 355,150,962 | |||||||
|
| |||||||
| Shares | Affiliated Mutual Funds (34.3%) | |||||||
| Equity Mutual Funds (20.5%) | |||||||
| 4,493,008 | Thrivent Partner Small Cap Value Portfolio | 127,064,959 | ||||||
| 3,657,193 | Thrivent Small Cap Stock Portfolio | 67,186,286 | ||||||
| 7,195,521 | Thrivent Partner Mid Cap Value Portfolio | 130,503,721 | ||||||
| 12,265,522 | Thrivent Mid Cap Stock Portfolio | 231,277,457 | ||||||
| 54,413,534 | Thrivent Partner Worldwide Allocation Portfolio | 506,078,515 | ||||||
| 26,828,993 | Thrivent Large Cap Value Portfolio | 450,386,356 | ||||||
| 20,701,632 | Thrivent Large Cap Stock Portfolio | 255,211,795 | ||||||
|
| |||||||
Total | 1,767,709,089 | |||||||
|
| |||||||
| Fixed Income Mutual Funds (13.8%) | |||||||
| 38,748,320 | Thrivent High Yield Portfolio | 188,836,063 | ||||||
| 59,336,507 | Thrivent Income Portfolio | 623,098,599 | ||||||
| 37,948,191 | Thrivent Limited Maturity Bond Portfolio | 372,457,698 | ||||||
|
| |||||||
Total | 1,184,392,360 | |||||||
|
| |||||||
| Total Affiliated Mutual Funds (cost $2,576,270,394) | 2,952,101,449 | |||||||
|
| |||||||
| Principal Amount | Long-Term Fixed Income (23.3%) | |||||||
| Asset-Backed Securities (1.1%) | |||||||
Access Group, Inc. | ||||||||
| 1,067,492 | 0.670%, 2/25/2036d,e | 1,054,559 | ||||||
Ally Auto Receivables Trust 2013-SN1 | ||||||||
| 989,627 | 0.720%, 5/20/2016 | 989,960 | ||||||
ARES CLO, Ltd. | ||||||||
| 2,750,000 | 1.714%, 11/15/2025*,e | 2,750,000 | ||||||
BA Credit Card Trust | ||||||||
| 1,750,000 | 0.541%, 6/15/2021e | 1,748,624 | ||||||
Barclays Dryrock Issuance Trust | ||||||||
| 3,500,000 | 0.521%, 12/16/2019e | 3,495,586 | ||||||
Capital One Multi-Asset Execution Trust | ||||||||
| 2,250,000 | 0.541%, 1/18/2022e | 2,247,518 | ||||||
Chase Issuance Trust | ||||||||
| 2,400,000 | 1.150%, 1/15/2019 | 2,398,822 | ||||||
Chesapeake Funding, LLC | ||||||||
| 2,463,098 | 0.607%, 1/7/2025d,e | 2,460,776 | ||||||
Citibank Credit Card Issuance Trust | ||||||||
| 3,800,000 | 1.020%, 2/22/2019 | 3,785,389 | ||||||
Countrywide Asset-Backed Certificates | ||||||||
| 1,654,772 | 5.530%, 4/25/2047 | 1,627,114 | ||||||
Edlinc Student Loan Funding Trust | ||||||||
| 109,107 | 3.160%, 10/1/2025*,e | 110,471 | ||||||
Enterprise Fleet Financing, LLC | ||||||||
| 2,918,981 | 1.060%, 3/20/2019d | 2,924,577 | ||||||
| 1,494,296 | 0.870%, 9/20/2019d | 1,493,749 | ||||||
FirstEnergy Ohio PIRB Special Purpose Trust | ||||||||
| 798,349 | 0.679%, 1/15/2019 | 798,117 | ||||||
FNA Trust | ||||||||
| 373,813 | 1.980%, 1/10/2018* | 374,561 | ||||||
Ford Credit Auto Owner Trust | ||||||||
| 1,350,000 | 2.260%, 11/15/2025d | 1,357,206 | ||||||
GE Equipment Transportation, LLC | ||||||||
| 1,366,027 | 0.690%, 11/25/2016 | 1,366,538 | ||||||
Golden Credit Card Trust | ||||||||
| 150,000 | 0.411%, 2/15/2018d,e | 149,949 | ||||||
| 2,000,000 | 0.591%, 9/15/2018d,e | 2,004,488 | ||||||
GoldenTree Loan Opportunities IX, Ltd. | ||||||||
| 1,400,000 | 1.829%, 10/29/2026*,e | 1,389,019 | ||||||
GreatAmerica Leasing Receivables | ||||||||
| 3,910,052 | 0.610%, 5/15/2016d | 3,910,321 | ||||||
Hertz Fleet Lease Funding, LP | ||||||||
| 3,225,000 | 0.712%, 12/10/2027d,e | 3,226,229 | ||||||
Hyundai Floorplan Master Owner Trust | ||||||||
| 1,890,000 | 0.511%, 5/15/2018d,e | 1,891,444 | ||||||
Master Credit Card Trust | ||||||||
| 1,139,600 | 0.780%, 4/21/2017d | 1,139,965 | ||||||
The accompanying Notes to Financial Statements are an integral part of this schedule.
109
Table of Contents
MODERATE ALLOCATION PORTFOLIO
Schedule of Investments as of December 31, 2014
| Principal Amount | Long-Term Fixed Income (23.3%) | Value | ||||||
| Asset-Backed Securities (1.1%) - continued | |||||||
Morgan Stanley Bank of America Merrill Lynch Trust | ||||||||
| $ | 5,400,000 | 3.176%, 8/15/2045 | $ | 5,528,742 | ||||
| 5,400,000 | 3.246%, 12/15/2047 | 5,456,095 | ||||||
Morgan Stanley Capital, Inc. | ||||||||
| 2,969,686 | 0.320%, 2/25/2037e | 1,857,583 | ||||||
Motor plc | ||||||||
| 690,667 | 0.670%, 2/15/2021d | 690,884 | ||||||
| 1,299,200 | 0.650%, 8/25/2021d,e | 1,300,322 | ||||||
Ohio Phase-In-Recovery Funding, LLC | ||||||||
| 3,152,542 | 0.958%, 7/2/2018 | 3,156,476 | ||||||
OZLM VIII, Ltd. | ||||||||
| 1,400,000 | 1.715%, 10/17/2026*,e | 1,393,285 | ||||||
Penarth Master Issuer plc | ||||||||
| 3,185,000 | 0.552%, 11/18/2017d,e | 3,185,839 | ||||||
Renaissance Home Equity Loan Trust | ||||||||
| 6,500,000 | 6.011%, 5/25/2036f | 4,599,107 | ||||||
| 3,695,417 | 5.580%, 11/25/2036f | 2,278,154 | ||||||
SLM Student Loan Trust | ||||||||
| 2,715,422 | 0.761%, 7/15/2022d,e | 2,713,798 | ||||||
| 476,356 | 0.761%, 8/15/2022d,e | 476,847 | ||||||
| 2,338,642 | 0.634%, 4/25/2023d,e | 2,339,687 | ||||||
| 125,000 | 1.211%, 5/17/2027d,e | 125,816 | ||||||
U.S. Small Business Administration | ||||||||
| 998,996 | 3.191%, 3/10/2024 | 1,035,180 | ||||||
Vericrest Opportunity Loan Transferee | ||||||||
| 6,384,675 | 3.125%, 4/27/2054d | 6,347,516 | ||||||
Volvo Financial Equipment, LLC | ||||||||
| 1,400,000 | 0.740%, 3/15/2017d | 1,401,189 | ||||||
| 2,000,000 | 0.820%, 4/16/2018d | 1,996,450 | ||||||
World Financial Network Credit Card Master Trust | ||||||||
| 1,300,000 | 0.541%, 12/15/2019e | 1,300,510 | ||||||
| 1,400,000 | 0.910%, 3/16/2020 | 1,397,978 | ||||||
World Omni Automobile Lease Securitization Trust | ||||||||
| 2,600,000 | 1.400%, 2/15/2019 | 2,616,351 | ||||||
World Omni Master Owner Trust | ||||||||
| 150,000 | 0.505%, 2/15/2018d,e | 150,009 | ||||||
|
| |||||||
Total | 96,042,800 | |||||||
|
| |||||||
| Basic Materials (0.2%) | |||||||
Albemarle Corporation | ||||||||
| 395,000 | 3.000%, 12/1/2019 | 395,060 | ||||||
ArcelorMittal | ||||||||
| 1,425,000 | 6.000%, 3/1/2021 | 1,482,000 | ||||||
Eastman Chemical Company | ||||||||
| 775,000 | 2.700%, 1/15/2020 | 779,398 | ||||||
First Quantum Minerals, Ltd. | ||||||||
| 621,000 | 6.750%, 2/15/2020d | 562,005 | ||||||
| 621,000 | 7.000%, 2/15/2021d | 558,900 | ||||||
FMG Resources August 2006 Pty., Ltd. | ||||||||
| 653,333 | 6.875%, 2/1/2018d,g | 592,900 | ||||||
Freeport-McMoRan, Inc. | ||||||||
| 1,580,000 | 2.375%, 3/15/2018 | 1,562,628 | ||||||
| 960,000 | 4.000%, 11/14/2021 | 951,170 | ||||||
Georgia-Pacific, LLC | ||||||||
| 920,000 | 2.539%, 11/15/2019d | 919,682 | ||||||
Goldcorp, Inc. | ||||||||
| 1,135,000 | 2.125%, 3/15/2018 | 1,121,793 | ||||||
Hexion US Finance Corporation/Hexion Nova Scotia Finance ULC | ||||||||
| 1,100,000 | 8.875%, 2/1/2018 | 979,000 | ||||||
Ineos Finance plc | ||||||||
| 1,100,000 | 7.500%, 5/1/2020d | 1,155,000 | ||||||
LyondellBasell Industries NV | ||||||||
| 1,280,000 | 6.000%, 11/15/2021 | 1,473,228 | ||||||
Sappi Papier Holding GmbH | ||||||||
| 700,000 | 6.625%, 4/15/2021d | 717,500 | ||||||
Vale Overseas, Ltd. | ||||||||
| 1,202,000 | 6.250%, 1/23/2017 | 1,282,065 | ||||||
Yamana Gold, Inc. | ||||||||
| 1,285,000 | 4.950%, 7/15/2024 | 1,254,130 | ||||||
|
| |||||||
Total | 15,786,459 | |||||||
|
| |||||||
| Capital Goods (0.2%) | |||||||
BAE Systems plc | ||||||||
| 640,000 | 3.500%, 10/11/2016d | 664,802 | ||||||
Brand Energy & Infrastructure Services, Inc. | ||||||||
| 625,000 | 8.500%, 12/1/2021d | 562,500 | ||||||
CNH Capital, LLC | ||||||||
| 1,100,000 | 3.625%, 4/15/2018 | 1,083,500 | ||||||
Crown Americas Capital Corporation IV | ||||||||
| 1,470,000 | 4.500%, 1/15/2023 | 1,425,900 | ||||||
Harsco Corporation | ||||||||
| 1,197,000 | 2.700%, 10/15/2015 | 1,195,504 | ||||||
Hutchison Whampoa Finance CI, Ltd. | ||||||||
| 990,000 | 1.625%, 10/31/2017d | 981,842 | ||||||
Ingersoll-Rand Global Holding Company, Ltd. | ||||||||
| 1,328,000 | 6.875%, 8/15/2018 | 1,541,630 | ||||||
L-3 Communications Corporation | ||||||||
| 1,336,000 | 1.500%, 5/28/2017 | 1,322,858 | ||||||
Martin Marietta Materials, Inc. | ||||||||
| 960,000 | 1.357%, 6/30/2017e | 970,525 | ||||||
Owens-Brockway Glass Container, Inc. | ||||||||
| 960,000 | 5.000%, 1/15/2022 d | 979,200 | ||||||
Raytheon Company | ||||||||
| 990,000 | 4.200%, 12/15/2044 | 1,028,307 | ||||||
Reynolds Group Issuer, Inc. | ||||||||
| 1,101,432 | 5.750%, 10/15/2020 | 1,128,968 | ||||||
Roper Industries, Inc. | ||||||||
| 1,280,000 | 2.050%, 10/1/2018 | 1,269,435 | ||||||
RSC Equipment Rental, Inc. | ||||||||
| 1,100,000 | 8.250%, 2/1/2021 | 1,199,000 | ||||||
Textron, Inc. | ||||||||
| 785,000 | 5.600%, 12/1/2017 | 862,641 | ||||||
|
| |||||||
Total | 16,216,612 | |||||||
|
| |||||||
| Collateralized Mortgage Obligations (1.1%) | |||||||
Alm Loan Funding CLO | ||||||||
| 1,400,000 | 1.664%, 10/17/2026*,e | 1,392,539 | ||||||
Alternative Loan Trust | ||||||||
| 1,639,393 | 6.000%, 6/25/2036 | 1,469,583 | ||||||
The accompanying Notes to Financial Statements are an integral part of this schedule.
110
Table of Contents
MODERATE ALLOCATION PORTFOLIO
Schedule of Investments as of December 31, 2014
| Principal Amount | Long-Term Fixed Income (23.3%) | Value | ||||||
| Collateralized Mortgage Obligations (1.1%) - continued | |||||||
Apidos CLO XVIII | ||||||||
| $ | 1,400,000 | 1.646%, 7/22/2026*,e | $ | 1,383,323 | ||||
Babson CLO, Ltd. 2014-II | ||||||||
| 1,400,000 | 1.656%, 10/17/2026*,e | 1,389,850 | ||||||
Birchwood Park CLO, Ltd. | ||||||||
| 1,400,000 | 1.674%, 7/15/2026*,e | 1,393,227 | ||||||
BlueMountain CLO, Ltd. | ||||||||
| 1,400,000 | 1.480%, 10/15/2026*,e | 1,387,182 | ||||||
Carlyle Global Market Strategies CLO, Ltd. | ||||||||
| 1,400,000 | 1.531%, 7/20/2023*,e | 1,388,794 | ||||||
| 1,400,000 | 1.733%, 10/15/2026*,e | 1,397,280 | ||||||
Cent CLO 16, LP | ||||||||
| 1,400,000 | 1.482%, 8/1/2024*,e | 1,387,751 | ||||||
Cent CLO 22, Ltd. | ||||||||
| 1,400,000 | 1.713%, 11/7/2026*,e | 1,386,743 | ||||||
Citigroup Mortgage Loan Trust, Inc. | ||||||||
| 1,172,831 | 5.500%, 11/25/2035 | 1,082,046 | ||||||
CitiMortgage Alternative Loan Trust | ||||||||
| 3,868,272 | 5.750%, 4/25/2037 | 3,321,507 | ||||||
Countrywide Alternative Loan Trust | ||||||||
| 2,816,775 | 5.220%, 10/25/2035 | 2,392,107 | ||||||
| 1,591,146 | 6.000%, 4/25/2036 | 1,374,492 | ||||||
| 737,869 | 6.000%, 1/25/2037 | 680,826 | ||||||
| 4,461,449 | 5.500%, 5/25/2037 | 3,867,001 | ||||||
| 3,651,314 | 7.000%, 10/25/2037 | 2,698,869 | ||||||
Countrywide Home Loans, Inc. | ||||||||
| 1,399,794 | 5.750%, 4/25/2037 | 1,294,045 | ||||||
Deutsche Alt-A Securities Mortgage Loan Trust | ||||||||
| 1,132,301 | 6.000%, 10/25/2021 | 998,199 | ||||||
Deutsche Alt-A Securities, Inc., Mortgage Loan Trust | ||||||||
| 438,263 | 5.500%, 10/25/2021 | 421,342 | ||||||
Dryden 34 Senior Loan Fund CLO | ||||||||
| 1,400,000 | 1.717%, 10/15/2026*,e | 1,392,610 | ||||||
Federal Home Loan Mortgage Corporation | ||||||||
| 5,518,198 | 3.000%, 2/15/2033h | 744,637 | ||||||
Federal National Mortgage Association | ||||||||
| 11,736,263 | 3.500%, 1/25/2033h | 1,676,227 | ||||||
First Horizon Alternative Mortgage Securities Trust 2006-FA4 | ||||||||
| 3,606,638 | 6.000%, 8/25/2036e | 3,006,901 | ||||||
GSR Mortgage Loan Trust | ||||||||
| 1,289,949 | 0.360%, 8/25/2046e | 1,238,759 | ||||||
HomeBanc Mortgage Trust | ||||||||
| 2,085,275 | 2.197%, 4/25/2037 | 1,551,682 | ||||||
J.P. Morgan Alternative Loan Trust | ||||||||
| 2,224,085 | 6.500%, 3/25/2036 | 1,961,438 | ||||||
J.P. Morgan Mortgage Trust | ||||||||
| 804,430 | 2.663%, 6/25/2036 | 683,252 | ||||||
| 353,113 | 2.537%, 10/25/2036 | 316,965 | ||||||
| 4,295,052 | 0.550%, 1/25/2037e | 2,787,489 | ||||||
| 4,538,100 | 6.250%, 8/25/2037 | 3,749,841 | ||||||
Limerock CLO III, LLC | ||||||||
| 4,500,000 | 1.759%, 10/20/2026*,e | 4,469,232 | ||||||
Madison Park Funding XIV CLO, Ltd. | ||||||||
| 1,525,000 | 1.681%, 7/20/2026*,e | 1,518,679 | ||||||
MASTR Alternative Loans Trust |
| |||||||
| 809,748 | 6.500%, 7/25/2034 | 829,541 | ||||||
| 2,706,489 | 0.620%, 12/25/2035e | 1,475,142 | ||||||
Merrill Lynch Alternative Note Asset Trust |
| |||||||
| 894,140 | 6.000%, 3/25/2037 | 831,851 | ||||||
Neuberger Berman CLO, Ltd. |
| |||||||
| 1,100,000 | 1.626%, 8/4/2025*,e | 1,089,837 | ||||||
Octagon Investment Partners XX CLO, Ltd. |
| |||||||
| 1,400,000 | 1.675%, 8/12/2026*,e | 1,384,624 | ||||||
OHA Loan Funding 2014-1, Ltd. |
| |||||||
| 4,500,000 | 1.762%, 10/20/2026*,e | 4,468,536 | ||||||
RALI Trust |
| |||||||
| 9,522,381 | 0.350%, 11/25/2036e | 6,861,514 | ||||||
Residential Asset Securitization Trust |
| |||||||
| 3,753,600 | 0.550%, 8/25/2037e | 1,377,143 | ||||||
Sequoia Mortgage Trust |
| |||||||
| 3,634,783 | 2.657%, 9/20/2046 | 3,013,035 | ||||||
Symphony CLO XV, Ltd. |
| |||||||
| 4,500,000 | 1.653%, 10/17/2026*,e | 4,451,718 | ||||||
Symphony CLO, Ltd. |
| |||||||
| 1,400,000 | 1.331%, 1/9/2023*,e | 1,392,126 | ||||||
Voya CLO 2014-3, Ltd. |
| |||||||
| 1,400,000 | 1.649%, 7/25/2026*,e | 1,383,762 | ||||||
WaMu Mortgage Pass Through Certificates |
| |||||||
| 343,735 | 2.233%, 9/25/2036 | 307,548 | ||||||
| 1,219,107 | 2.274%, 10/25/2036 | 1,075,836 | ||||||
| 3,374,518 | 1.957%, 11/25/2036 | 2,978,120 | ||||||
| 3,923,247 | 1.822%, 1/25/2037 | 3,326,972 | ||||||
|
| |||||||
Total | 93,451,723 | |||||||
|
| |||||||
| Commercial Mortgage-Backed Securities (0.7%) | |||||||
Banc of America Commercial Mortgage, Inc. |
| |||||||
| 7,200,000 | 5.612%, 4/10/2049 | 7,703,813 | ||||||
Bear Stearns Commercial Mortgage Securities, Inc. |
| |||||||
| 3,038,407 | 5.331%, 2/11/2044 | 3,246,331 | ||||||
Citigroup/Deutsche Bank Commercial Mortgage |
| |||||||
| 3,000,000 | 5.322%, 12/11/2049 | 3,176,286 | ||||||
Commercial Mortgage Pass-Through Certificates |
| |||||||
| 1,680,000 | 1.208%, 6/8/2030d,e | 1,679,343 | ||||||
Credit Suisse First Boston Mortgage Securities |
| |||||||
| 7,200,000 | 5.542%, 1/15/2049 | 7,712,878 | ||||||
Credit Suisse Mortgage Capital Certificates |
| |||||||
| 8,875,000 | 5.509%, 9/15/2039 | 9,385,987 | ||||||
Federal Home Loan Mortgage Corporation Multi Family Structured Pass Thru Certificates |
| |||||||
| 140,967 | 0.727%, 12/25/2016 | 140,771 | ||||||
Federal National Mortgage Association |
| |||||||
| 1,250,000 | 1.272%, 1/25/2017 | 1,256,557 | ||||||
Government National Mortgage Association |
| |||||||
| 44,510 | 2.164%, 3/16/2033 | 44,562 | ||||||
The accompanying Notes to Financial Statements are an integral part of this schedule.
111
Table of Contents
MODERATE ALLOCATION PORTFOLIO
Schedule of Investments as of December 31, 2014
| Principal Amount | Long-Term Fixed Income (23.3%) | Value | ||||||
| Commercial Mortgage-Backed Securities (0.7%) - continued | |||||||
| $ | 25,906 | 3.214%, 1/16/2040 | $ | 26,056 | ||||
Greenwich Capital Commercial Funding Corporation | ||||||||
| 4,650,000 | 5.867%, 12/10/2049 | 5,039,926 | ||||||
J.P. Morgan Chase Commercial Mortgage Securities Corporation | ||||||||
| 2,300,000 | 1.111%, 12/15/2028d,e | 2,300,331 | ||||||
| 3,650,000 | 5.698%, 2/12/2049 | 3,854,057 | ||||||
JPMBB Commercial Mortgage Securities Trust | ||||||||
| 4,500,000 | 3.231%, 1/15/2048 | 4,523,508 | ||||||
LSTAR Commercial Mortgage Trust | ||||||||
| 1,733,016 | 1.519%, 1/20/2041d | 1,732,914 | ||||||
Morgan Stanley Capital, Inc. | ||||||||
| 2,650,000 | 5.406%, 3/15/2044 | 2,820,496 | ||||||
SCG Trust 2013-SRP1 | ||||||||
| 1,150,000 | 1.561%, 11/15/2026d,e | 1,151,397 | ||||||
|
| |||||||
Total | 55,795,213 | |||||||
|
| |||||||
| Communications Services (0.6%) | |||||||
21st Century Fox America, Inc. | ||||||||
| 1,250,000 | 6.900%, 3/1/2019 | 1,473,940 | ||||||
AMC Networks, Inc. | ||||||||
| 1,100,000 | 4.750%, 12/15/2022 | 1,067,000 | ||||||
America Movil SAB de CV | ||||||||
| 1,125,000 | 1.241%, 9/12/2016e | 1,133,047 | ||||||
| 1,039,000 | 5.000%, 10/16/2019 | 1,146,963 | ||||||
American Tower Corporation | ||||||||
| 672,000 | 7.000%, 10/15/2017 | 758,712 | ||||||
| 1,240,000 | 3.450%, 9/15/2021 | 1,219,094 | ||||||
AT&T, Inc. | ||||||||
| 1,212,000 | 3.875%, 8/15/2021 | 1,268,124 | ||||||
British Sky Broadcasting Group plc | ||||||||
| 1,130,000 | 2.625%, 9/16/2019d | 1,130,419 | ||||||
CBS Corporation | ||||||||
| 665,000 | 2.300%, 8/15/2019 | 657,056 | ||||||
CC Holdings GS V, LLC | ||||||||
| 690,000 | 2.381%, 12/15/2017 | 696,118 | ||||||
CCO Holdings, LLC | ||||||||
| 1,100,000 | 7.375%, 6/1/2020 | 1,166,000 | ||||||
CenturyLink, Inc. | ||||||||
| 1,000,000 | 6.450%, 6/15/2021 | 1,072,500 | ||||||
Cequel Communications Escrow 1, LLC | ||||||||
| 1,440,000 | 6.375%, 9/15/2020d | 1,490,400 | ||||||
Columbus International, Inc. | ||||||||
| 1,470,000 | 7.375%, 3/30/2021d | 1,528,800 | ||||||
Comcast Corporation | ||||||||
| 539,000 | 4.650%, 7/15/2042 | 589,942 | ||||||
| 878,000 | 4.750%, 3/1/2044 | 978,436 | ||||||
Cox Communications, Inc. | ||||||||
| 672,000 | 9.375%, 1/15/2019d | 845,727 | ||||||
Crown Castle Towers, LLC | ||||||||
| 540,000 | 4.174%, 8/15/2017d | 565,078 | ||||||
Digicel, Ltd. | ||||||||
| 1,490,000 | 6.000%, 4/15/2021d | 1,393,150 | ||||||
DIRECTV Holdings, LLC | ||||||||
| 963,000 | 1.750%, 1/15/2018 | 956,651 | ||||||
| 707,000 | 5.875%, 10/1/2019 | 808,689 | ||||||
| 480,000 | 4.450%, 4/1/2024 | 502,226 | ||||||
Equinix, Inc. | ||||||||
| 970,000 | 5.750%, 1/1/2025 | 978,488 | ||||||
Frontier Communications Corporation | ||||||||
| 950,000 | 6.875%, 1/15/2025 | 950,000 | ||||||
Hughes Satellite Systems Corporation | ||||||||
| 1,100,000 | 6.500%, 6/15/2019 | 1,179,750 | ||||||
Intelsat Jackson Holdings SA | ||||||||
| 1,100,000 | 7.250%, 4/1/2019 | 1,148,125 | ||||||
Level 3 Financing, Inc. | ||||||||
| 1,100,000 | 8.625%, 7/15/2020 | 1,186,625 | ||||||
Nippon Telegraph & Telephone Corporation | ||||||||
| 584,000 | 1.400%, 7/18/2017 | 582,285 | ||||||
Numericable-SFR | ||||||||
| 1,470,000 | 6.000%, 5/15/2022d | 1,478,085 | ||||||
SES Global Americas Holdings GP | ||||||||
| 1,035,000 | 2.500%, 3/25/2019d | 1,029,799 | ||||||
Sprint Communications, Inc. | ||||||||
| 1,101,432 | 9.000%, 11/15/2018d | 1,252,769 | ||||||
Telefonica Emisiones SAU | ||||||||
| 1,120,000 | 3.992%, 2/16/2016 | 1,151,911 | ||||||
| 1,110,000 | 3.192%, 4/27/2018 | 1,141,456 | ||||||
Time Warner Cable, Inc. | ||||||||
| 1,650,000 | 8.250%, 4/1/2019 | 2,019,836 | ||||||
| 825,000 | 5.000%, 2/1/2020 | 909,138 | ||||||
T-Mobile USA, Inc. | ||||||||
| 1,470,000 | 6.125%, 1/15/2022 | 1,492,050 | ||||||
Unitymedia Hessen GmbH & Company KG | ||||||||
| 725,000 | 5.500%, 1/15/2023d | 757,625 | ||||||
Univision Communications, Inc. | ||||||||
| 1,100,000 | 6.875%, 5/15/2019d | 1,145,375 | ||||||
UPCB Finance V, Ltd. | ||||||||
| 1,100,000 | 7.250%, 11/15/2021d | 1,203,125 | ||||||
Verizon Communications, Inc. | ||||||||
| 945,000 | 1.013%, 6/17/2019e | 949,893 | ||||||
| 326,000 | 2.625%, 2/21/2020d | 322,273 | ||||||
| 1,985,000 | 3.000%, 11/1/2021 | 1,957,674 | ||||||
| 1,008,000 | 5.150%, 9/15/2023 | 1,113,067 | ||||||
| 1,212,000 | 6.400%, 9/15/2033 | 1,492,921 | ||||||
| 650,000 | 5.050%, 3/15/2034 | 693,371 | ||||||
| 304,000 | 6.550%, 9/15/2043 | 389,469 | ||||||
Viacom, Inc. | ||||||||
| 640,000 | 2.500%, 9/1/2018 | 645,659 | ||||||
West Corporation | ||||||||
| 1,470,000 | 5.375%, 7/15/2022d | 1,407,525 | ||||||
Wind Acquisition Finance SA | ||||||||
| 570,000 | 4.750%, 7/15/2020d | 532,950 | ||||||
| 160,000 | 7.375%, 4/23/2021d | 151,008 | ||||||
|
| |||||||
Total | 51,710,324 | |||||||
|
| |||||||
| Consumer Cyclical (0.3%) | |||||||
Chrysler Group, LLC | ||||||||
| 1,115,000 | 8.000%, 6/15/2019 | 1,172,144 | ||||||
Cinemark USA, Inc. | ||||||||
| 1,100,000 | 4.875%, 6/1/2023 | 1,039,500 | ||||||
Delphi Corporation | ||||||||
| 1,118,000 | 6.125%, 5/15/2021 | 1,218,620 | ||||||
The accompanying Notes to Financial Statements are an integral part of this schedule.
112
Table of Contents
MODERATE ALLOCATION PORTFOLIO
Schedule of Investments as of December 31, 2014
| Principal Amount | Long-Term Fixed Income (23.3%) | Value | ||||||
| Consumer Cyclical (0.3%) - continued | |||||||
Ford Motor Company | ||||||||
| $ | 625,000 | 7.450%, 7/16/2031 | $ | 848,497 | ||||
Ford Motor Credit Company, LLC | ||||||||
| 1,424,000 | 1.684%, 9/8/2017 | 1,412,669 | ||||||
| 874,000 | 5.000%, 5/15/2018 | 949,643 | ||||||
| 1,350,000 | 2.597%, 11/4/2019 | 1,342,738 | ||||||
General Motors Company | ||||||||
| 586,000 | 3.500%, 10/2/2018 | 597,720 | ||||||
| 1,236,000 | 6.250%, 10/2/2043 | 1,476,526 | ||||||
General Motors Financial Company, Inc. | ||||||||
| 1,100,000 | 3.250%, 5/15/2018 | 1,101,375 | ||||||
GLP Capital, LP | ||||||||
| 1,465,000 | 4.875%, 11/1/2020 | 1,483,312 | ||||||
Hilton Worldwide Finance, LLC | ||||||||
| 1,465,000 | 5.625%, 10/15/2021 | 1,530,925 | ||||||
Home Depot, Inc. | ||||||||
| 720,000 | 4.875%, 2/15/2044 | 836,847 | ||||||
Hyundai Capital America | ||||||||
| 1,072,000 | 1.450%, 2/6/2017d | 1,067,971 | ||||||
Jaguar Land Rover Automotive plc | ||||||||
| 1,100,000 | 5.625%, 2/1/2023d | 1,157,750 | ||||||
KB Home | ||||||||
| 615,000 | 4.750%, 5/15/2019 | 605,775 | ||||||
L Brands, Inc. | ||||||||
| 1,100,000 | 5.625%, 2/15/2022 | 1,182,500 | ||||||
Lennar Corporation | ||||||||
| 1,100,000 | 4.125%, 12/1/2018 | 1,089,000 | ||||||
Macy’s Retail Holdings, Inc. | ||||||||
| 419,000 | 4.375%, 9/1/2023 | 450,104 | ||||||
| 1,075,000 | 3.625%, 6/1/2024 | 1,087,652 | ||||||
Nissan Motor Acceptance Corporation | ||||||||
| 1,130,000 | 0.785%, 3/3/2017d,e | 1,133,594 | ||||||
Royal Caribbean Cruises, Ltd. | ||||||||
| 1,450,000 | 5.250%, 11/15/2022 | 1,522,500 | ||||||
Toll Brothers Finance Corporation | ||||||||
| 620,000 | 8.910%, 10/15/2017 | 719,200 | ||||||
| 609,000 | 4.000%, 12/31/2018 | 612,045 | ||||||
TRW Automotive, Inc. | ||||||||
| 860,000 | 7.250%, 3/15/2017d | 950,300 | ||||||
Volkswagen Group of America Finance, LLC | ||||||||
| 990,000 | 0.672%, 11/20/2017d,e | 988,561 | ||||||
Walgreens Boots Alliance, Inc. | ||||||||
| 825,000 | 2.700%, 11/18/2019 | 829,198 | ||||||
Wynn Las Vegas, LLC | ||||||||
| 1,100,000 | 5.375%, 3/15/2022 | 1,116,500 | ||||||
|
| |||||||
Total | 29,523,166 | |||||||
|
| |||||||
| Consumer Non-Cyclical (0.6%) | |||||||
AbbVie, Inc. | ||||||||
| 1,695,000 | 2.000%, 11/6/2018 | 1,689,313 | ||||||
Actavis Funding SCS | ||||||||
| 1,320,000 | 4.850%, 6/15/2044 | 1,339,452 | ||||||
Altria Group, Inc. | ||||||||
| 800,000 | 9.700%, 11/10/2018 | 1,015,846 | ||||||
Anheuser-Busch InBev Finance, Inc. | ||||||||
| 805,000 | 0.632%, 2/1/2019e | 800,802 | ||||||
Bayer U.S. Finance, LLC | ||||||||
| 650,000 | 1.500%, 10/6/2017d | 650,417 | ||||||
Becton, Dickinson and Company | ||||||||
| 800,000 | 2.675%, 12/15/2019 | 810,521 | ||||||
Boston Scientific Corporation | ||||||||
| 1,485,000 | 2.650%, 10/1/2018 | 1,486,748 | ||||||
Bunge Limited Finance Corporation | ||||||||
| 960,000 | 8.500%, 6/15/2019 | 1,176,518 | ||||||
CareFusion Corporation | ||||||||
| 1,002,000 | 6.375%, 8/1/2019 | 1,159,312 | ||||||
Celgene Corporation | ||||||||
| 1,590,000 | 1.900%, 8/15/2017 | 1,595,603 | ||||||
| 304,000 | 2.300%, 8/15/2018 | 306,511 | ||||||
CHS/Community Health Systems, Inc. | ||||||||
| 1,100,000 | 7.125%, 7/15/2020 | 1,172,875 | ||||||
Church & Dwight Company, Inc. | ||||||||
| 530,000 | 2.450%, 12/15/2019 | 529,721 | ||||||
ConAgra Foods, Inc. | ||||||||
| 1,116,000 | 1.900%, 1/25/2018 | 1,108,565 | ||||||
Cott Beverages, Inc. | ||||||||
| 1,470,000 | 5.375%, 7/1/2022d | 1,348,725 | ||||||
Coventry Health Care, Inc. | ||||||||
| 1,158,000 | 5.950%, 3/15/2017 | 1,266,534 | ||||||
CVS Health Corporation | ||||||||
| 400,000 | 2.250%, 8/12/2019g | 398,329 | ||||||
| 652,000 | 6.125%, 9/15/2039 | 842,447 | ||||||
Endo Finance LLC & Endo Finco, Inc. | ||||||||
| 1,100,000 | 7.000%, 7/15/2019d | 1,148,125 | ||||||
Envision Healthcare Corporation | ||||||||
| 1,450,000 | 5.125%, 7/1/2022d | 1,439,125 | ||||||
Forest Laboratories, Inc. | ||||||||
| 1,500,000 | 4.375%, 2/1/2019d | 1,584,555 | ||||||
Fresenius Medical Care US Finance II, Inc. | ||||||||
| 1,100,000 | 5.875%, 1/31/2022d | 1,193,500 | ||||||
Gilead Sciences, Inc. | ||||||||
| 990,000 | 4.500%, 2/1/2045 | 1,058,111 | ||||||
Hawk Acquisition Sub, Inc. | ||||||||
| 1,101,432 | 4.250%, 10/15/2020 | 1,112,446 | ||||||
HCA, Inc. | ||||||||
| 1,470,000 | 3.750%, 3/15/2019 | 1,471,837 | ||||||
IMS Health, Inc. | ||||||||
| 1,497,000 | 6.000%, 11/1/2020d | 1,541,910 | ||||||
JBS Finance II, Ltd. | ||||||||
| 1,470,000 | 8.250%, 1/29/2018* | 1,503,075 | ||||||
Kroger Company | ||||||||
| 608,000 | 1.200%, 10/17/2016 | 606,674 | ||||||
Lorillard Tobacco Company | ||||||||
| 800,000 | 2.300%, 8/21/2017g | 805,107 | ||||||
| 800,000 | 8.125%, 6/23/2019 | 969,862 | ||||||
Mattel, Inc. | ||||||||
| 800,000 | 1.700%, 3/15/2018 | 789,954 | ||||||
Medco Health Solutions, Inc. | ||||||||
| 1,400,000 | 7.125%, 3/15/2018 | 1,616,380 | ||||||
Medtronic, Inc. | ||||||||
| 1,475,000 | 4.375%, 3/15/2035d | 1,564,763 | ||||||
Mondelez International, Inc. | ||||||||
| 672,000 | 0.752%, 2/1/2019 e | 664,502 | ||||||
The accompanying Notes to Financial Statements are an integral part of this schedule.
113
Table of Contents
MODERATE ALLOCATION PORTFOLIO
Schedule of Investments as of December 31, 2014
| Principal Amount | Long-Term Fixed Income (23.3%) | Value | ||||||
| Consumer Non-Cyclical (0.6%) - continued | |||||||
Mylan, Inc. | ||||||||
| $ | 800,000 | 7.875%, 7/15/2020d | $ | 852,156 | ||||
Ortho-Clinical Diagnostics, Inc. | ||||||||
| 1,500,000 | 6.625%, 5/15/2022d | 1,348,125 | ||||||
Pernod Ricard SA | ||||||||
| 632,000 | 2.950%, 1/15/2017d | 646,628 | ||||||
| 640,000 | 5.750%, 4/7/2021d | 735,153 | ||||||
Perrigo Company, Ltd. | ||||||||
| 1,815,000 | 1.300%, 11/8/2016 | 1,807,052 | ||||||
Safeway, Inc. | ||||||||
| 62,000 | 3.400%, 12/1/2016 | 62,986 | ||||||
Spectrum Brands Escrow Corporation | ||||||||
| 1,100,000 | 6.375%, 11/15/2020 | 1,146,750 | ||||||
Sysco Corporation | ||||||||
| 480,000 | 2.350%, 10/2/2019 | 482,613 | ||||||
| 320,000 | 4.350%, 10/2/2034 | 344,507 | ||||||
Tenet Healthcare Corporation | ||||||||
| 1,470,000 | 8.125%, 4/1/2022 | 1,642,725 | ||||||
Thermo Fisher Scientific, Inc. | ||||||||
| 960,000 | 2.400%, 2/1/2019 | 961,431 | ||||||
Tyson Foods, Inc. | ||||||||
| 756,000 | 4.500%, 6/15/2022 | 818,511 | ||||||
UnitedHealth Group, Inc. | ||||||||
| 400,000 | 2.875%, 12/15/2021 | 404,551 | ||||||
Valeant Pharmaceuticals International | ||||||||
| 582,000 | 6.875%, 12/1/2018d | 600,333 | ||||||
Whirlpool Corporation | ||||||||
| 825,000 | 1.650%, 11/1/2017 | 822,263 | ||||||
WM Wrigley Jr. Company | ||||||||
| 760,000 | 2.000%, 10/20/2017d | 765,483 | ||||||
|
| |||||||
Total | 51,209,432 | |||||||
|
| |||||||
| Energy (0.7%) | |||||||
Antero Resources Corporation | ||||||||
| 1,855,000 | 5.125%, 12/1/2022d | 1,748,338 | ||||||
Boardwalk Pipelines, Ltd. | ||||||||
| 1,140,000 | 5.875%, 11/15/2016 | 1,210,382 | ||||||
Bonanza Creek Energy, Inc. | ||||||||
| 1,317,000 | 6.750%, 4/15/2021 | 1,158,960 | ||||||
Buckeye Partners, LP | ||||||||
| 1,182,000 | 2.650%, 11/15/2018 | 1,164,193 | ||||||
California Resources Corporation | ||||||||
| 1,855,000 | 6.000%, 11/15/2024d | 1,567,475 | ||||||
Calumet Specialty Products Partners, LP | ||||||||
| 1,470,000 | 6.500%, 4/15/2021d | 1,308,300 | ||||||
Canadian Natural Resources, Ltd. | ||||||||
| 1,155,000 | 1.750%, 1/15/2018 | 1,148,205 | ||||||
Chaparral Energy, Inc. | ||||||||
| 1,880,000 | 7.625%, 11/15/2022 | 1,231,400 | ||||||
Chesapeake Energy Corporation | ||||||||
| 1,110,000 | 4.875%, 4/15/2022g | 1,079,475 | ||||||
CNOOC Nexen Finance 2014 ULC | ||||||||
| 983,000 | 1.625%, 4/30/2017 | 978,200 | ||||||
CNPC General Capital, Ltd. | ||||||||
| 668,000 | 1.450%, 4/16/2016d | 666,510 | ||||||
| 668,000 | 2.750%, 4/19/2017d | 675,742 | ||||||
Concho Resources, Inc. | ||||||||
| 2,586,432 | 5.500%, 10/1/2022 | 2,612,296 | ||||||
Continental Resources, Inc. | ||||||||
| 1,286,000 | 5.000%, 9/15/2022 | 1,244,205 | ||||||
Crestwood Midstream Partners, LP | ||||||||
| 775,000 | 6.125%, 3/1/2022 | 740,125 | ||||||
El Paso, LLC | ||||||||
| 870,000 | 7.800%, 8/1/2031 | 1,059,339 | ||||||
Enbridge, Inc. | ||||||||
| 1,341,000 | 0.684%, 6/2/2017e | 1,335,199 | ||||||
Energy XXI Gulf Coast, Inc. | ||||||||
| 700,000 | 7.750%, 6/15/2019 | 416,500 | ||||||
| 2,625,000 | 7.500%, 12/15/2021g | 1,417,500 | ||||||
Ensco plc | ||||||||
| 800,000 | 4.500%, 10/1/2024g | 777,582 | ||||||
Enterprise Products Operating, LLC | ||||||||
| 1,280,000 | 2.550%, 10/15/2019 | 1,267,113 | ||||||
EQT Corporation | ||||||||
| 659,000 | 5.150%, 3/1/2018 | 703,983 | ||||||
| 770,000 | 8.125%, 6/1/2019 | 928,292 | ||||||
Halcon Resources Corporation | ||||||||
| 1,855,000 | 8.875%, 5/15/2021g | 1,395,888 | ||||||
Hess Corporation | ||||||||
| 1,210,000 | 8.125%, 2/15/2019 | 1,439,648 | ||||||
Hornbeck Offshore Services, Inc. | ||||||||
| 1,020,000 | 5.000%, 3/1/2021 | 836,400 | ||||||
Jones Energy Holdings, LLC | ||||||||
| 1,860,000 | 6.750%, 4/1/2022d | 1,413,600 | ||||||
Kinder Morgan, Inc. | ||||||||
| 800,000 | 5.000%, 2/15/2021d | 832,283 | ||||||
| 908,000 | 5.300%, 12/1/2034 | 921,671 | ||||||
Laredo Petroleum, Inc. | ||||||||
| 1,855,000 | 5.625%, 1/15/2022 | 1,623,125 | ||||||
Linn Energy, LLC | ||||||||
| 1,101,432 | 6.250%, 11/1/2019g | 930,710 | ||||||
| 1,485,000 | 8.625%, 4/15/2020 | 1,291,950 | ||||||
Marathon Petroleum Corporation | ||||||||
| 320,000 | 3.625%, 9/15/2024 | 313,601 | ||||||
| 640,000 | 4.750%, 9/15/2044 | 604,420 | ||||||
MEG Energy Corporation | ||||||||
| 1,100,000 | 6.500%, 3/15/2021d | 1,003,750 | ||||||
| 2,010,000 | 7.000%, 3/31/2024d | 1,819,050 | ||||||
Oasis Petroleum, Inc. | ||||||||
| 740,000 | 6.875%, 3/15/2022g | 673,400 | ||||||
Offshore Group Investment, Ltd. | ||||||||
| 1,100,000 | 7.500%, 11/1/2019g | 819,500 | ||||||
| 1,485,000 | 7.125%, 4/1/2023 | 1,054,350 | ||||||
Pacific Drilling SA | ||||||||
| 1,485,000 | 5.375%, 6/1/2020 d | 1,210,275 | ||||||
Petrobras Global Finance BV | ||||||||
| 1,440,000 | 2.000%, 5/20/2016 | 1,375,416 | ||||||
Petroleos Mexicanos | ||||||||
| 800,000 | 2.378%, 4/15/2025 | 791,079 | ||||||
Plains All American Pipeline, LP | ||||||||
| 1,140,000 | 3.600%, 11/1/2024 | 1,119,156 | ||||||
Precision Drilling Corporation | ||||||||
| 1,490,000 | 5.250%, 11/15/2024d | 1,221,800 | ||||||
Range Resources Corporation | ||||||||
| 1,860,000 | 5.000%, 3/15/2023 | 1,860,000 | ||||||
The accompanying Notes to Financial Statements are an integral part of this schedule.
114
Table of Contents
MODERATE ALLOCATION PORTFOLIO
Schedule of Investments as of December 31, 2014
| Principal Amount | Long-Term Fixed Income (23.3%) | Value | ||||||
| Energy (0.7%) - continued | |||||||
Regency Energy Partners, LP | ||||||||
| $ | 1,470,000 | 5.000%, 10/1/2022 | $ | 1,389,150 | ||||
Rosetta Resources, Inc. | ||||||||
| 1,430,000 | 5.875%, 6/1/2024 | 1,272,700 | ||||||
Sabine Pass Liquefaction, LLC | ||||||||
| 1,470,000 | 5.750%, 5/15/2024 | 1,442,438 | ||||||
Samson Investment Company | ||||||||
| 1,855,000 | 9.750%, 2/15/2020 | 768,666 | ||||||
Sinopec Capital 2013, Ltd. | ||||||||
| 1,120,000 | 1.250%, 4/24/2016d | 1,116,741 | ||||||
Southwestern Energy Company | ||||||||
| 825,000 | 7.500%, 2/1/2018 | 929,385 | ||||||
Suncor Energy, Inc. | ||||||||
| 704,000 | 6.100%, 6/1/2018 | 789,683 | ||||||
| 990,000 | 3.600%, 12/1/2024 | 978,272 | ||||||
Transocean, Inc. | ||||||||
| 1,279,000 | 6.000%, 3/15/2018 | 1,230,216 | ||||||
Weatherford International, Ltd. | ||||||||
| 1,085,000 | 9.625%, 3/1/2019 | 1,286,897 | ||||||
Whiting Petroleum Corporation | ||||||||
| 1,485,000 | 5.750%, 3/15/2021 | 1,377,338 | ||||||
Williams Companies, Inc. | ||||||||
| 633,000 | 3.700%, 1/15/2023 | 568,488 | ||||||
|
| |||||||
Total | 64,140,360 | |||||||
|
| |||||||
| Financials (1.8%) | |||||||
Abbey National Treasury Services plc | ||||||||
| 1,060,000 | 0.665%, 9/29/2017e | 1,057,360 | ||||||
| 608,000 | 3.050%, 8/23/2018 | 629,474 | ||||||
ABN AMRO Bank NV | ||||||||
| 1,187,000 | 2.500%, 10/30/2018d | 1,198,889 | ||||||
Air Lease Corporation | ||||||||
| 800,000 | 2.125%, 1/15/2018 | 786,000 | ||||||
Ally Financial, Inc. | ||||||||
| 960,000 | 3.750%, 11/18/2019 | 945,600 | ||||||
American Express Credit Corporation | ||||||||
| 945,000 | 0.793%, 3/18/2019e | 941,059 | ||||||
American International Group, Inc. | ||||||||
| 525,000 | 2.300%, 7/16/2019 | 525,534 | ||||||
ANZ New Zealand International, Ltd. | ||||||||
| 1,051,000 | 1.400%, 4/27/2017d | 1,048,906 | ||||||
Australia and New Zealand Banking Group, Ltd. | ||||||||
| 1,295,000 | 0.501%, 6/13/2017d,e | 1,293,087 | ||||||
Aviation Capital Group Corporation | ||||||||
| 608,000 | 3.875%, 9/27/2016d | 623,308 | ||||||
Banco Santander Chile | ||||||||
| 1,200,000 | 1.130%, 4/11/2017d,e | 1,194,643 | ||||||
Bank of America Corporation | ||||||||
| 960,000 | 1.700%, 8/25/2017 | 960,218 | ||||||
| 1,615,000 | 5.750%, 12/1/2017 | 1,784,409 | ||||||
| 2,125,000 | 1.317%, 3/22/2018e | 2,140,525 | ||||||
| 1,712,000 | 5.650%, 5/1/2018 | 1,901,986 | ||||||
| 840,000 | 1.105%, 4/1/2019e | 841,390 | ||||||
| 640,000 | 4.000%, 4/1/2024 | 666,384 | ||||||
| 718,000 | 5.875%, 2/7/2042 | 898,478 | ||||||
| 1,236,000 | 8.000%, 12/29/2049i | 1,327,155 | ||||||
Bank of Tokyo-Mitsubishi UFJ, Ltd. | ||||||||
| 530,000 | 2.850%, 9/8/2021d | 522,725 | ||||||
Barclays Bank plc | ||||||||
| 970,000 | 10.179%, 6/12/2021d | 1,302,311 | ||||||
Barclays plc | ||||||||
| 990,000 | 2.750%, 11/8/2019 | 983,951 | ||||||
BB&T Corporation | ||||||||
| 560,000 | 0.950%, 1/15/2020e | 559,843 | ||||||
BBVA Banco Continental SA | ||||||||
| 1,185,000 | 2.250%, 7/29/2016d | 1,182,038 | ||||||
Berkshire Hathaway Finance Corporation | ||||||||
| 780,000 | 1.600%, 5/15/2017 | 786,668 | ||||||
BioMed Realty, LP | ||||||||
| 960,000 | 2.625%, 5/1/2019 | 959,157 | ||||||
BNP Paribas SA | ||||||||
| 1,294,000 | 2.375%, 9/14/2017 | 1,316,133 | ||||||
BPCE SA | ||||||||
| 805,000 | 1.082%, 2/10/2017e | 810,332 | ||||||
| 1,352,000 | 1.625%, 2/10/2017 | 1,354,811 | ||||||
Capital One Financial Corporation | ||||||||
| 1,228,000 | 6.150%, 9/1/2016 | 1,319,654 | ||||||
| 820,000 | 2.450%, 4/24/2019 | 818,121 | ||||||
Citigroup, Inc. | ||||||||
| 798,000 | 6.000%, 8/15/2017 | 882,882 | ||||||
| 1,320,000 | 1.850%, 11/24/2017 | 1,318,483 | ||||||
| 700,000 | 1.003%, 4/8/2019e | 702,626 | ||||||
| 1,216,000 | 8.500%, 5/22/2019 | 1,515,218 | ||||||
| 850,000 | 4.050%, 7/30/2022 | 879,461 | ||||||
| 1,320,000 | 3.750%, 6/16/2024 | 1,348,047 | ||||||
CoBank ACB | ||||||||
| 495,000 | 0.841%, 6/15/2022*,e | 468,976 | ||||||
Compass Bank | ||||||||
| 1,120,000 | 1.850%, 9/29/2017 | 1,115,223 | ||||||
| 920,000 | 2.750%, 9/29/2019 | 920,940 | ||||||
Cooperatieve Centrale Raiffeisen- Boerenleenbank BA | ||||||||
| 795,000 | 3.950%, 11/9/2022 | 809,810 | ||||||
Credit Agricole SA | ||||||||
| 820,000 | 1.031%, 4/15/2019d,e | 826,286 | ||||||
| 1,135,000 | 6.625%, 9/29/2049d,i | 1,100,099 | ||||||
Credit Suisse AG | ||||||||
| 808,000 | 5.400%, 1/14/2020 | 903,576 | ||||||
CyrusOne, LP | ||||||||
| 1,100,000 | 6.375%, 11/15/2022 | 1,174,250 | ||||||
DDR Corporation | ||||||||
| 1,390,000 | 9.625%, 3/15/2016 | 1,525,882 | ||||||
Denali Borrower, LLC | ||||||||
| 1,470,000 | 5.625%, 10/15/2020d | 1,529,535 | ||||||
Deutsche Bank AG | ||||||||
| 1,110,000 | 1.350%, 5/30/2017 | 1,100,647 | ||||||
Discover Bank | ||||||||
| 800,000 | 8.700%, 11/18/2019 | 989,312 | ||||||
Discover Financial Services | ||||||||
| 640,000 | 6.450%, 6/12/2017 | 707,127 | ||||||
DnB Boligkreditt AS | ||||||||
| 1,644,000 | 1.450%, 3/21/2018d | 1,636,745 | ||||||
Duke Realty, LP | ||||||||
| 330,000 | 3.875%, 2/15/2021 | 342,748 | ||||||
| 990,000 | 4.375%, 6/15/2022 | 1,047,976 | ||||||
Eksportfinans ASA | ||||||||
| 548,000 | 5.500%, 5/25/2016 | 572,578 | ||||||
The accompanying Notes to Financial Statements are an integral part of this schedule.
115
Table of Contents
MODERATE ALLOCATION PORTFOLIO
Schedule of Investments as of December 31, 2014
| Principal Amount | Long-Term Fixed Income (23.3%) | Value | ||||||
| Financials (1.8%) - continued | |||||||
European Investment Bank | ||||||||
| $ | 1,215,000 | 1.875%, 3/15/2019 | $ | 1,227,235 | ||||
| 1,195,000 | 2.125%, 10/15/2021 | 1,198,119 | ||||||
Fifth Third Bancorp | ||||||||
| 991,000 | 5.450%, 1/15/2017 | 1,063,458 | ||||||
| 530,000 | 2.875%, 10/1/2021 | 529,947 | ||||||
General Electric Capital Corporation | ||||||||
| 2,425,000 | 6.000%, 8/7/2019 | 2,820,695 | ||||||
| 840,000 | 1.241%, 3/15/2023e | 851,825 | ||||||
| 1,319,000 | 6.750%, 3/15/2032 | 1,801,598 | ||||||
Genworth Financial, Inc. | ||||||||
| 1,320,000 | 7.700%, 6/15/2020 | 1,316,664 | ||||||
Goldman Sachs Group, Inc. | ||||||||
| 1,030,000 | 2.375%, 1/22/2018 | 1,040,402 | ||||||
| 840,000 | 1.433%, 4/30/2018e | 849,856 | ||||||
| 620,000 | 1.332%, 11/15/2018e | 626,075 | ||||||
| 925,000 | 7.500%, 2/15/2019 | 1,100,251 | ||||||
| 1,150,000 | 2.550%, 10/23/2019 | 1,145,800 | ||||||
| 1,220,000 | 5.375%, 3/15/2020 | 1,367,250 | ||||||
| 1,250,000 | 5.250%, 7/27/2021 | 1,410,828 | ||||||
Hartford Financial Services Group, Inc. | ||||||||
| 841,000 | 4.000%, 10/15/2017 | 894,174 | ||||||
| 760,000 | 5.125%, 4/15/2022 | 854,307 | ||||||
HBOS plc | ||||||||
| 1,002,000 | 6.750%, 5/21/2018d | 1,116,725 | ||||||
Health Care REIT, Inc. | ||||||||
| 1,065,000 | 4.700%, 9/15/2017 | 1,144,288 | ||||||
| 300,000 | 2.250%, 3/15/2018 | 301,877 | ||||||
HSBC Bank plc | ||||||||
| 1,765,000 | 0.872%, 5/15/2018d,e | 1,772,049 | ||||||
HSBC Holdings plc | ||||||||
| 665,000 | 5.250%, 3/14/2044 | 744,903 | ||||||
| 1,600,000 | 5.625%, 12/29/2049i | 1,605,600 | ||||||
HSBC USA, Inc. | ||||||||
| 930,000 | 1.625%, 1/16/2018 | 926,419 | ||||||
Huntington Bancshares, Inc. | ||||||||
| 304,000 | 2.600%, 8/2/2018 | 307,695 | ||||||
Huntington National Bank | ||||||||
| 960,000 | 1.350%, 8/2/2016 | 960,511 | ||||||
Icahn Enterprises, LP | ||||||||
| 1,430,000 | 6.000%, 8/1/2020 | 1,473,186 | ||||||
ING Bank NV | ||||||||
| 960,000 | 4.125%, 11/21/2023 | 975,431 | ||||||
ING Capital Funding Trust III | ||||||||
| 1,015,000 | 3.855%, 12/29/2049e,i | 1,012,463 | ||||||
International Lease Finance Corporation | ||||||||
| 1,060,000 | 2.191%, 6/15/2016e | 1,058,675 | ||||||
Intesa Sanpaolo SPA | ||||||||
| 972,000 | 3.125%, 1/15/2016 | 987,362 | ||||||
| 480,000 | 3.875%, 1/16/2018 | 499,754 | ||||||
| 1,000,000 | 3.875%, 1/15/2019 | 1,035,393 | ||||||
J.P. Morgan Chase & Company | ||||||||
| 825,000 | 0.752%, 2/15/2017e | 822,917 | ||||||
| 1,617,000 | 2.000%, 8/15/2017 | 1,632,378 | ||||||
| 687,000 | 1.800%, 1/25/2018 | 686,466 | ||||||
| 1,215,000 | 6.300%, 4/23/2019 | 1,411,314 | ||||||
| 320,000 | 3.200%, 1/25/2023 | 320,361 | ||||||
| 1,320,000 | 3.625%, 5/13/2024 | 1,351,156 | ||||||
| 610,000 | 3.875%, 9/10/2024 | 610,519 | ||||||
| 1,215,000 | 7.900%, 4/29/2049i | 1,307,705 | ||||||
Kookmin Bank | ||||||||
| 1,110,000 | 1.109%, 1/27/2017d,e | 1,117,359 | ||||||
Liberty Mutual Group, Inc. | ||||||||
| 292,000 | 4.950%, 5/1/2022d | 315,906 | ||||||
| 316,000 | 6.500%, 5/1/2042d | 386,415 | ||||||
Liberty Property, LP | ||||||||
| 830,000 | 5.500%, 12/15/2016 | 891,159 | ||||||
Lloyds Banking Group plc | ||||||||
| 1,002,000 | 5.920%, 9/29/2049d,i | 994,485 | ||||||
Macquarie Bank, Ltd. | ||||||||
| 1,025,000 | 5.000%, 2/22/2017d | 1,093,269 | ||||||
Merrill Lynch & Company, Inc. | ||||||||
| 2,240,000 | 6.050%, 5/16/2016 | 2,371,994 | ||||||
| 895,000 | 6.400%, 8/28/2017 | 997,179 | ||||||
MetLife, Inc. | ||||||||
| 800,000 | 1.903%, 12/15/2017 | 801,823 | ||||||
Mizuho Bank, Ltd. | ||||||||
| 960,000 | 1.850%, 3/21/2018d | 954,780 | ||||||
Morgan Stanley | ||||||||
| 860,000 | 6.250%, 8/28/2017 | 955,343 | ||||||
| 1,155,000 | 1.875%, 1/5/2018 | 1,150,773 | ||||||
| 1,865,000 | 6.625%, 4/1/2018 | 2,124,300 | ||||||
| 560,000 | 1.514%, 4/25/2018e | 568,911 | ||||||
| 670,000 | 4.875%, 11/1/2022 | 711,592 | ||||||
| 1,120,000 | 4.100%, 5/22/2023 | 1,133,931 | ||||||
Murray Street Investment Trust I | ||||||||
| 2,005,000 | 4.647%, 3/9/2017 | 2,116,071 | ||||||
National City Corporation | ||||||||
| 975,000 | 6.875%, 5/15/2019 | 1,145,389 | ||||||
PNC Bank NA | ||||||||
| 912,000 | 1.150%, 11/1/2016 | 913,217 | ||||||
Pricoa Global Funding I | ||||||||
| 1,344,000 | 1.350%, 8/18/2017d | 1,338,467 | ||||||
Prologis, LP | ||||||||
| 1,216,000 | 7.375%, 10/30/2019 | 1,462,438 | ||||||
Prudential Financial, Inc. | ||||||||
| 530,000 | 2.350%, 8/15/2019 | 530,313 | ||||||
RBS Capital Trust III | ||||||||
| 415,000 | 2.095%, 9/29/2049e,g,i | 412,718 | ||||||
Realty Income Corporation | ||||||||
| 302,000 | 2.000%, 1/31/2018 | 302,557 | ||||||
Regions Bank | ||||||||
| 1,743,000 | 7.500%, 5/15/2018 | 2,023,440 | ||||||
Reinsurance Group of America, Inc. | ||||||||
| 500,000 | 5.625%, 3/15/2017 | 540,696 | ||||||
| 990,000 | 5.000%, 6/1/2021 | 1,090,362 | ||||||
Reliance Standard Life Global Funding II | ||||||||
| 660,000 | 2.500%, 4/24/2019d | 663,044 | ||||||
Royal Bank of Canada | ||||||||
| 1,120,000 | 2.200%, 7/27/2018 | 1,132,432 | ||||||
Royal Bank of Scotland Group plc | ||||||||
| 835,000 | 1.197%, 3/31/2017e | 837,580 | ||||||
| 2,190,000 | 5.125%, 5/28/2024 | 2,227,648 | ||||||
Simon Property Group, LP | ||||||||
| 620,000 | 10.350%, 4/1/2019 | 810,953 | ||||||
Skandinaviska Enskilda Banken AB | ||||||||
| 1,025,000 | 2.375%, 3/25/2019d | 1,031,642 | ||||||
SLM Corporation | ||||||||
| 480,000 | 3.875%, 9/10/2015 | 483,600 | ||||||
The accompanying Notes to Financial Statements are an integral part of this schedule.
116
Table of Contents
MODERATE ALLOCATION PORTFOLIO
Schedule of Investments as of December 31, 2014
| Principal Amount | Long-Term Fixed Income (23.3%) | Value | ||||||
| Financials (1.8%) - continued | |||||||
SpareBank 1 Boligkreditt AS | ||||||||
| $ | 1,644,000 | 1.250%, 5/2/2018d | $ | 1,619,146 | ||||
Sumitomo Mitsui Banking Corporation | ||||||||
| 1,755,000 | 1.300%, 1/10/2017g | 1,751,674 | ||||||
Suncorp-Metway, Ltd. | ||||||||
| 2,095,000 | 0.955%, 3/28/2017d,e | 2,098,115 | ||||||
Svenska Handelsbanken AB | ||||||||
| 890,000 | 1.625%, 3/21/2018 | 888,621 | ||||||
| 1,190,000 | 0.733%, 6/17/2019e | 1,190,982 | ||||||
Swedbank Hypotek AB | ||||||||
| 1,644,000 | 1.375%, 3/28/2018d | 1,627,969 | ||||||
Swiss RE Capital I, LP | ||||||||
| 750,000 | 6.854%, 5/29/2049d,i | 785,625 | ||||||
Synchrony Financial | �� | |||||||
| 560,000 | 3.000%, 8/15/2019 | 566,128 | ||||||
| 600,000 | 3.750%, 8/15/2021 | 612,893 | ||||||
Toronto-Dominion Bank | ||||||||
| 695,000 | 0.792%, 11/5/2019e | 696,303 | ||||||
UBS AG/Stamford, Connecticut | ||||||||
| 351,000 | 5.875%, 12/20/2017 | 391,923 | ||||||
Voya Financial, Inc. | ||||||||
| 1,185,000 | 2.900%, 2/15/2018 | 1,213,147 | ||||||
WEA Finance, LLC | ||||||||
| 1,060,000 | 1.750%, 9/15/2017d | 1,054,295 | ||||||
Wells Fargo & Company | ||||||||
| 960,000 | 1.400%, 9/8/2017 | 959,221 | ||||||
|
| |||||||
Total | 151,350,035 | |||||||
|
| |||||||
| Foreign Government (<0.1%) | |||||||
Kommunalbanken AS | ||||||||
| 1,270,000 | 1.500%, 10/22/2019d | 1,253,169 | ||||||
|
| |||||||
Total | 1,253,169 | |||||||
|
| |||||||
| Mortgage-Backed Securities (8.4%) | |||||||
Federal Home Loan Mortgage Corporation Gold 15-Yr. Pass Through | ||||||||
| 46,895,000 | 3.000%, 1/1/2030c | 48,672,986 | ||||||
Federal Home Loan Mortgage Corporation Gold 30-Yr. Pass Through | ||||||||
| 6,335,944 | 1.961%, 6/1/2043e | 6,483,230 | ||||||
| 48,845,000 | 4.000%, 1/1/2045c | 52,065,717 | ||||||
Federal National Mortgage Association Conventional 15-Yr. Pass Through | ||||||||
| 73,925,000 | 3.500%, 1/1/2030c | 78,094,828 | ||||||
Federal National Mortgage Association Conventional 30-Yr. Pass Through | ||||||||
| 6,175,358 | 2.073%, 1/1/2043e | 6,401,052 | ||||||
| 10,473,017 | 2.058%, 3/1/2043e | 10,863,251 | ||||||
| 9,856,718 | 1.739%, 7/1/2043e | 10,039,453 | ||||||
| 11,317,452 | 2.017%, 7/1/2043e | 11,612,042 | ||||||
| 9,938,811 | 2.101%, 8/1/2043e | 10,218,816 | ||||||
| 152,400,000 | 3.500%, 1/1/2045c | 158,865,113 | ||||||
| 150,932,500 | 4.000%, 1/1/2045c | 161,083,299 | ||||||
| 156,444,000 | 4.500%, 1/1/2045c | 169,815,081 | ||||||
|
| |||||||
Total | 724,214,868 | |||||||
|
| |||||||
| Technology (0.2%) | |||||||
Alibaba Group Holding, Ltd. | ||||||||
| 1,325,000 | 2.500%, 11/28/2019d | 1,307,135 | ||||||
Amphenol Corporation | ||||||||
| 511,000 | 2.550%, 1/30/2019 | 514,553 | ||||||
Apple, Inc. | ||||||||
| 1,250,000 | 0.532%, 5/6/2019e | 1,250,509 | ||||||
Baidu, Inc. | ||||||||
| 1,000,000 | 2.750%, 6/9/2019 | 995,602 | ||||||
EMC Corporation | ||||||||
| 1,106,000 | 1.875%, 6/1/2018 | 1,102,241 | ||||||
Fidelity National Information Services, Inc. | ||||||||
| 1,169,000 | 1.450%, 6/5/2017 | 1,162,452 | ||||||
First Data Corporation | ||||||||
| 1,100,000 | 7.375%, 6/15/2019d,g | 1,157,750 | ||||||
Freescale Semiconductor, Inc. | ||||||||
| 1,470,000 | 6.000%, 1/15/2022d | 1,536,150 | ||||||
Hewlett-Packard Company | ||||||||
| 1,120,000 | 5.400%, 3/1/2017 | 1,209,043 | ||||||
Iron Mountain, Inc. | ||||||||
| 1,100,000 | 6.000%, 8/15/2023 | 1,144,000 | ||||||
Micron Semiconductor Asia Pte, Ltd. | ||||||||
| 540,000 | 1.258%, 1/15/2019 | 539,127 | ||||||
Samsung Electronics America, Inc. | ||||||||
| 600,000 | 1.750%, 4/10/2017d | 601,819 | ||||||
Tyco Electronics Group SA | ||||||||
| 1,254,000 | 6.550%, 10/1/2017 | 1,411,539 | ||||||
Xerox Corporation | ||||||||
| 899,000 | 7.200%, 4/1/2016 | 962,629 | ||||||
Xilinx, Inc. | ||||||||
| 640,000 | 2.125%, 3/15/2019 | 635,888 | ||||||
|
| |||||||
Total | 15,530,437 | |||||||
|
| |||||||
| Transportation (0.1%) | |||||||
American Airlines Pass Through Trust | ||||||||
| 731,575 | 4.950%, 1/15/2023 | 780,957 | ||||||
Avis Budget Car Rental, LLC | ||||||||
| 1,475,000 | 5.125%, 6/1/2022d | 1,489,750 | ||||||
Canadian Pacific Railway Company | ||||||||
| 405,000 | 7.125%, 10/15/2031 | 557,000 | ||||||
| 480,000 | 5.750%, 3/15/2033 | 583,908 | ||||||
Continental Airlines, Inc. | ||||||||
| 745,569 | 4.150%, 4/11/2024 | 765,609 | ||||||
CSX Corporation | ||||||||
| 532,000 | 3.700%, 11/1/2023 | 557,744 | ||||||
Delta Air Lines, Inc. | ||||||||
| 1,082,000 | 6.750%, 5/23/2017 | 1,127,985 | ||||||
| 406,963 | 4.950%, 5/23/2019 | 435,450 | ||||||
| 129,725 | 4.750%, 5/7/2020 | 138,002 | ||||||
ERAC USA Finance, LLC | ||||||||
| 604,000 | 1.400%, 4/15/2016d | 605,418 | ||||||
| 294,000 | 2.800%, 11/1/2018d | 300,303 | ||||||
Hornbeck Offshore Services, Inc. | ||||||||
| 370,000 | 5.875%, 4/1/2020 | 327,450 | ||||||
Korea Expressway Corporation | ||||||||
| 960,000 | 1.625%, 4/28/2017d | 954,634 | ||||||
Southwest Airlines Company | ||||||||
| 1,075,000 | 2.750%, 11/6/2019 | 1,079,946 | ||||||
The accompanying Notes to Financial Statements are an integral part of this schedule.
117
Table of Contents
MODERATE ALLOCATION PORTFOLIO
Schedule of Investments as of December 31, 2014
| Principal Amount | Long-Term Fixed Income (23.3%) | Value | ||||||
| Transportation (0.1%) - continued | |||||||
Virgin Australia Holdings, Ltd. | ||||||||
| $ | 398,281 | 5.000%, 10/23/2023d | $ | 408,238 | ||||
|
| |||||||
Total | 10,112,394 | |||||||
|
| |||||||
| U.S. Government and Agencies (6.9%) | |||||||
Federal Home Loan Bank | ||||||||
| 3,640,000 | 0.875%, 5/24/2017 | 3,633,291 | ||||||
Federal National Mortgage Association | ||||||||
| 2,290,000 | 0.875%, 5/21/2018 | 2,251,922 | ||||||
| 3,535,000 | 2.625%, 9/6/2024 | 3,579,969 | ||||||
| 540,000 | 6.250%, 5/15/2029 | 752,357 | ||||||
Tennessee Valley Authority | ||||||||
| 520,000 | 5.250%, 9/15/2039 | 661,994 | ||||||
U.S. Treasury Bonds | ||||||||
| 4,750,000 | 5.250%, 11/15/2028 | 6,368,339 | ||||||
| 2,975,000 | 4.375%, 5/15/2040 | 3,910,962 | ||||||
| 66,460,000 | 3.000%, 5/15/2042 | 69,855,707 | ||||||
U.S. Treasury Bonds, TIPS | ||||||||
| 4,357,491 | 0.125%, 4/15/2019 | 4,309,489 | ||||||
| 132,270 | 2.375%, 1/15/2025 | 155,294 | ||||||
| 93,382 | 2.125%, 2/15/2040 | 121,046 | ||||||
| 998,317 | 0.750%, 2/15/2042 | 970,006 | ||||||
U.S. Treasury Notes | ||||||||
| 38,475,000 | 0.625%, 10/15/2016 | 38,487,004 | ||||||
| 105,185,000 | 0.875%, 11/15/2017 | 104,683,688 | ||||||
| 110,895,000 | 1.500%, 10/31/2019 | 110,219,206 | ||||||
| 44,030,000 | 1.875%, 6/30/2020 | 44,325,838 | ||||||
| 1,000,000 | 2.125%, 9/30/2021 | 1,011,250 | ||||||
| 6,910,000 | 1.625%, 8/15/2022 | 6,721,053 | ||||||
| 64,600,000 | 2.250%, 11/15/2024 | 65,034,047 | ||||||
| 50,250,000 | 3.625%, 2/15/2044 | 59,134,049 | ||||||
U.S. Treasury Notes, TIPS | ||||||||
| 31,227,488 | 0.125%, 4/15/2018 | 31,110,385 | ||||||
| 807,822 | 0.125%, 1/15/2022 | 785,733 | ||||||
| 34,878,752 | 0.125%, 1/15/2023 | 33,726,114 | ||||||
|
| |||||||
Total | 591,808,743 | |||||||
|
| |||||||
| Utilities (0.4%) | |||||||
AES Corporation | ||||||||
| 1,100,000 | 7.375%, 7/1/2021 | 1,243,000 | ||||||
American Electric Power Company, Inc. | ||||||||
| 600,000 | 1.650%, 12/15/2017 | 600,154 | ||||||
Atlas Pipeline Partners, LP | ||||||||
| 1,100,000 | 4.750%, 11/15/2021 | 1,045,000 | ||||||
Berkshire Hathaway Energy Company | ||||||||
| 495,000 | 2.400%, 2/1/2020d | 492,845 | ||||||
Calpine Corporation | ||||||||
| 1,470,000 | 5.375%, 1/15/2023 | 1,484,700 | ||||||
Commonwealth Edison Company | ||||||||
| 480,000 | 6.950%, 7/15/2018 | 554,822 | ||||||
Dayton Power and Light Company | ||||||||
| 608,000 | 1.875%, 9/15/2016 | 614,717 | ||||||
DCP Midstream Operating, LP | ||||||||
| 960,000 | 2.500%, 12/1/2017 | 958,897 | ||||||
Dominion Gas Holdings, LLC | ||||||||
| 530,000 | 2.500%, 12/15/2019 | 531,315 | ||||||
DTE Energy Company | ||||||||
| 1,585,000 | 2.400%, 12/1/2019 | 1,585,262 | ||||||
Duke Energy Corporation | ||||||||
| 800,000 | 0.613%, 4/3/2017e | 801,070 | ||||||
| 948,000 | 2.100%, 6/15/2018 | 956,660 | ||||||
Dynegy Finance I, Inc./ Dynegy Finance II, Inc. | ||||||||
| 800,000 | 6.750%, 11/1/2019d | 814,000 | ||||||
EDP Finance BV | ||||||||
| 992,000 | 4.125%, 1/15/2020d | 997,555 | ||||||
Enel Finance International NV | ||||||||
| 474,000 | 6.250%, 9/15/2017d | 526,110 | ||||||
Energy Transfer Partners, LP | ||||||||
| 310,000 | 9.700%, 3/15/2019 | 389,086 | ||||||
| 1,324,000 | 4.650%, 6/1/2021 | 1,384,026 | ||||||
Enterprise Products Operating, LLC | ||||||||
| 990,000 | 5.100%, 2/15/2045 | 1,064,439 | ||||||
| 650,000 | 7.034%, 1/15/2068 | 712,969 | ||||||
Exelon Generation Company, LLC | ||||||||
| 1,077,000 | 5.200%, 10/1/2019 | 1,190,107 | ||||||
ITC Holdings Corporation | ||||||||
| 294,000 | 4.050%, 7/1/2023 | 306,356 | ||||||
MarkWest Energy Partners, LP | ||||||||
| 1,450,000 | 4.875%, 12/1/2024g | 1,417,375 | ||||||
MidAmerican Energy Holdings Company | ||||||||
| 555,000 | 1.100%, 5/15/2017 | 549,335 | ||||||
| 851,000 | 5.750%, 4/1/2018 | 953,670 | ||||||
| 700,000 | 6.500%, 9/15/2037 | 916,154 | ||||||
NiSource Finance Corporation | ||||||||
| 900,000 | 6.800%, 1/15/2019 | 1,056,601 | ||||||
Northeast Utilities | ||||||||
| 465,000 | 1.450%, 5/1/2018 | 457,939 | ||||||
Northern States Power Company | ||||||||
| 1,670,000 | 4.125%, 5/15/2044 | 1,766,825 | ||||||
NRG Energy, Inc. | ||||||||
| 1,100,000 | 6.625%, 3/15/2023 | 1,144,000 | ||||||
Pacific Gas & Electric Company | ||||||||
| 1,301,000 | 5.625%, 11/30/2017 | 1,446,013 | ||||||
PG&E Corporation | ||||||||
| 485,000 | 2.400%, 3/1/2019 | 485,734 | ||||||
PPL Capital Funding, Inc. | ||||||||
| 1,625,000 | 1.900%, 6/1/2018 | 1,622,239 | ||||||
| 508,000 | 3.500%, 12/1/2022 | 514,516 | ||||||
Sempra Energy | ||||||||
| 1,640,000 | 6.150%, 6/15/2018 | 1,858,622 | ||||||
Southern Company | ||||||||
| 800,000 | 1.300%, 8/15/2017 | 796,715 | ||||||
TransAlta Corporation | ||||||||
| 1,213,000 | 1.900%, 6/3/2017 | 1,207,863 | ||||||
Williams Companies, Inc. | ||||||||
| 664,000 | 7.875%, 9/1/2021 | 767,036 | ||||||
Williams Partners, LP | ||||||||
| 294,000 | 7.250%, 2/1/2017 | 324,052 | ||||||
|
| |||||||
Total | 35,537,779 | |||||||
|
| |||||||
Total Long-Term Fixed Income (cost $1,979,237,989) | 2,003,683,514 | |||||||
|
| |||||||
| Shares | Common Stock (22.4%) | |||||||
| Consumer Discretionary (3.0%) | |||||||
| 32,100 | Aaron’s, Inc. | 981,297 | ||||||
| 60,592 | Amazon.com, Inc.j | 18,804,727 | ||||||
The accompanying Notes to Financial Statements are an integral part of this schedule.
118
Table of Contents
MODERATE ALLOCATION PORTFOLIO
Schedule of Investments as of December 31, 2014
| Shares | Common Stock (22.4%) | Value | ||||||
| Consumer Discretionary (3.0%) - continued | ||||||||
| 3,400 | Aoyama Trading Company, Ltd. | $ | 74,290 | |||||
| 20,800 | Apollo Group, Inc.j | 709,488 | ||||||
| 31,100 | AutoZone, Inc.j | 19,254,321 | ||||||
| 70,300 | Barnes & Noble, Inc.j | 1,632,366 | ||||||
| 1,100 | Bayerische Motoren Werke AG | 89,870 | ||||||
| 37,800 | Best Buy Company, Inc. | 1,473,444 | ||||||
| 7,200 | Big Lots, Inc. | 288,144 | ||||||
| 9,300 | BorgWarner, Inc. | 511,035 | ||||||
| 1,300 | Brembo SPA | 43,572 | ||||||
| 2,600 | Bridgestone Corporation | 90,173 | ||||||
| 6,300 | Brinker International, Inc. | 369,747 | ||||||
| 29,383 | Brunswick Corporation | 1,506,173 | ||||||
| 26,294 | Burlington Stores, Inc.j | 1,242,654 | ||||||
| 15,750 | Carnival Corporation | 713,947 | ||||||
| 30,300 | Cato Corporation | 1,278,054 | ||||||
| 122,450 | CBS Corporation | 6,776,383 | ||||||
| 54,370 | Cheesecake Factory, Inc. | 2,735,355 | ||||||
| 2,100 | Chiyoda Company, Ltd. | 41,339 | ||||||
| 8,719 | Chuy’s Holdings, Inc.g,j | 171,503 | ||||||
| 12,300 | Coach, Inc. | 461,988 | ||||||
| 12,750 | Coinstar, Inc.j | 959,055 | ||||||
| 473,394 | Comcast Corporation | 27,461,586 | ||||||
| 16,008 | Core-Mark Holding Company, Inc. | 991,375 | ||||||
| 37,789 | Del Frisco’s Restaurant Group, Inc.j | 897,111 | ||||||
| 142,311 | Delphi Automotive plc | 10,348,856 | ||||||
| 9,350 | DeVry Education Group, Inc. | 443,844 | ||||||
| 7,147 | Discovery Communications, Inc., Class Aj | 246,214 | ||||||
| 21,050 | DISH Network Corporationj | 1,534,334 | ||||||
| 67,073 | Dollar Tree, Inc.j | 4,720,598 | ||||||
| 27,900 | EDION Corporation | 195,151 | ||||||
| 20,536 | Five Below, Inc.g,j | 838,485 | ||||||
| 120,150 | Ford Motor Company | 1,862,325 | ||||||
| 36,513 | G-III Apparel Group, Ltd.j | 3,688,178 | ||||||
| 14,100 | Hakuhodo Dy Holdings, Inc. | 134,936 | ||||||
| 17,831 | Harman International Industries, Inc. | 1,902,746 | ||||||
| 14,100 | Haseko Corporation | 113,404 | ||||||
| 2,100 | Heiwa Corporation | 41,842 | ||||||
| 59,000 | Hilton Worldwide Holdings, Inc.j | 1,539,310 | ||||||
| 158,150 | Home Depot, Inc. | 16,601,005 | ||||||
| 86,970 | Houghton Mifflin Harcourt Companyj | 1,801,149 | ||||||
| 22,011 | Imax Corporationg,j | 680,140 | ||||||
| 7,700 | Informa plc | 56,236 | ||||||
| 33,626 | Jarden Corporationj | 1,610,013 | ||||||
| 8,800 | JM AB | 278,947 | ||||||
| 43,111 | Kate Spade & Companyj | 1,379,983 | ||||||
| 24,750 | Kirkland’s, Inc.j | 585,090 | ||||||
| 145,750 | Kohl’s Corporation | 8,896,580 | ||||||
| 62,817 | Kongsberg Automotive ASAj | 48,193 | ||||||
| 225,565 | Las Vegas Sands Corporation | 13,118,860 | ||||||
| 68,000 | Li & Fung, Ltd. | 63,662 | ||||||
| 34,100 | Liberty Interactive Corporationj | 1,003,222 | ||||||
| 4,851 | Liberty Venturesj | 182,980 | ||||||
| 15,798 | Limited Brands, Inc. | 1,367,317 | ||||||
| 6,781 | Lithia Motors, Inc. | 587,845 | ||||||
| 185,670 | Lowe’s Companies, Inc. | 12,774,096 | ||||||
| 34,000 | Luk Fook Holdings International, Ltd. | 127,504 | ||||||
| 54,200 | Macy’s, Inc. | 3,563,650 | ||||||
| 17,717 | Marriott International, Inc. | 1,382,458 | ||||||
| 4,800 | Marriott Vacations Worldwide Corporation | 357,792 | ||||||
| 97,207 | MDC Partners, Inc. | 2,208,543 | ||||||
| 28,300 | Nautilus, Inc.j | 429,594 | ||||||
| 3,700 | Next plc | 392,411 | ||||||
| 158,150 | NIKE, Inc. | 15,206,122 | ||||||
| 12,200 | NOK Corporation | 310,533 | ||||||
| 105,930 | NutriSystem, Inc. | 2,070,931 | ||||||
| 14,250 | Omnicom Group, Inc. | 1,103,947 | ||||||
| 38,650 | Orbitz Worldwide, Inc.j | 318,089 | ||||||
| 6,991 | O’Reilly Automotive, Inc.j | 1,346,606 | ||||||
| 50,597 | Oxford Industries, Inc. | 2,793,460 | ||||||
| 24,030 | Papa John’s International, Inc. | 1,340,874 | ||||||
| 13,200 | Persimmon plc | 322,396 | ||||||
| 8,958 | PVH Corporation | 1,148,147 | ||||||
| 3,172 | Ralph Lauren Corporation | 587,328 | ||||||
| 12,458 | Red Robin Gourmet Burgers, Inc.j | 958,955 | ||||||
| 6,611 | Restoration Hardware Holdings, Inc.j | 634,722 | ||||||
| 700 | Rinnai Corporation | 47,035 | ||||||
| 14,369 | Ross Stores, Inc. | 1,354,422 | ||||||
| 7,050 | Royal Caribbean Cruises, Ltd. | 581,131 | ||||||
| 48,400 | Ruby Tuesday, Inc.j | 331,056 | ||||||
| 32,700 | Scientific Games Corporationg,j | 416,271 | ||||||
| 11,750 | Scripps Networks Interactive, Inc. | 884,423 | ||||||
| 47,400 | Select Comfort Corporationj | 1,281,222 | ||||||
| 4,093 | Shutterfly, Inc.j | 170,658 | ||||||
| 13,095 | Skechers USA, Inc.j | 723,499 | ||||||
| 15,319 | Slater & Gordon, Ltd. | 79,447 | ||||||
| 205,050 | Starbucks Corporation | 16,824,352 | ||||||
| 14,125 | Starwood Hotels & Resorts Worldwide, Inc. | 1,145,114 | ||||||
| 14,800 | Sumitomo Forestry Company, Ltd. | 144,738 | ||||||
| 3,400 | Sumitomo Rubber Industries, Ltd. | 50,545 | ||||||
| 11,800 | Suzuki Motor Corporation | 353,615 | ||||||
| 19,644 | Tenneco, Inc.j | 1,112,047 | ||||||
| 44,310 | Time Warner Cable, Inc. | 6,737,779 | ||||||
| 36,274 | Toll Brothers, Inc.j | 1,243,110 | ||||||
| 14,150 | Tower International, Inc.j | 361,533 | ||||||
| 8,477 | Tractor Supply Company | 668,157 | ||||||
| 123,286 | Tuesday Morning Corporationg,j | 2,675,306 | ||||||
| 18,452 | Ulta Salon Cosmetics & Fragrance, Inc.j | 2,358,904 | ||||||
| 9,573 | Under Armour, Inc.j | 650,007 | ||||||
| 11,751 | Vail Resorts, Inc. | 1,070,869 | ||||||
| 200 | Valora Holding AG | 45,902 | ||||||
| 12,762 | VF Corporation | 955,874 | ||||||
| 8,300 | WH Smith plc | 173,567 | ||||||
| 3,900 | Wolters Kluwer NV | 119,010 | ||||||
| 2,400 | WPP plc | 49,900 | ||||||
| 29,750 | Wyndham Worldwide Corporation | 2,551,360 | ||||||
|
| |||||||
Total | 259,969,453 | |||||||
|
| |||||||
| Consumer Staples (0.9%) | |||||||
| 80,100 | Anheuser-Busch InBev NV ADR | 8,996,832 | ||||||
| 18,250 | Archer-Daniels-Midland Company | 949,000 | ||||||
| 497 | Associated British Foods plc | 24,298 | ||||||
| 46,600 | Avon Products, Inc. | 437,574 | ||||||
| 9,564 | B&G Foods, Inc. | 285,964 | ||||||
| 4,148 | Boston Beer Company, Inc.g,j | 1,201,012 | ||||||
| 18,430 | Britvic plc | 192,751 | ||||||
| 6,350 | Coca-Cola Enterprises, Inc. | 280,797 | ||||||
| 191,410 | CVS Health Corporation | 18,434,697 | ||||||
| 21,830 | Hain Celestial Group, Inc.j | 1,272,471 | ||||||
| 9,400 | Ingredion, Inc. | 797,496 | ||||||
| 11,000 | J Sainsbury plc | 42,006 | ||||||
| 5,400 | Kesko OYJ | 196,391 | ||||||
| 7,050 | Keurig Green Mountain, Inc. | 933,385 | ||||||
| 31,570 | Kimberly-Clark Corporation | 3,647,598 | ||||||
| 1,900 | KOSE Corporation | 74,271 | ||||||
| 7,600 | Kroger Company | 487,996 | ||||||
| 8,250 | Molson Coors Brewing Company | 614,790 | ||||||
| 178,012 | Mondelez International, Inc. | 6,466,286 | ||||||
| 14,800 | Monster Beverage Corporationj | 1,603,580 | ||||||
The accompanying Notes to Financial Statements are an integral part of this schedule.
119
Table of Contents
MODERATE ALLOCATION PORTFOLIO
Schedule of Investments as of December 31, 2014
| Shares | Common Stock (22.4%) | Value | ||||||
| Consumer Staples (0.9%) - continued | |||||||
| 14,859 | Natural Grocers by Vitamin Cottage, Inc.j | $ | 418,578 | |||||
| 2,600 | Nestle SA | 189,543 | ||||||
| 35,416 | Philip Morris International, Inc. | 2,884,633 | ||||||
| 9,950 | Pilgrim’s Pride Corporationg,j | 326,260 | ||||||
| 43,650 | Pinnacle Foods, Inc. | 1,540,845 | ||||||
| 7,993 | Reckitt Benckiser Group plc | 647,386 | ||||||
| 218,050 | Rite Aid Corporationj | 1,639,736 | ||||||
| 7,050 | SalMar ASA | 120,016 | ||||||
| 7,200 | Suedzucker AGg | 103,521 | ||||||
| 13,400 | Tate & Lyle plc | 125,551 | ||||||
| 29,530 | TreeHouse Foods, Inc.j | 2,525,701 | ||||||
| 33,250 | Tyson Foods, Inc. | 1,332,992 | ||||||
| 33,053 | United Natural Foods, Inc.j | 2,555,823 | ||||||
| 112,800 | Wal-Mart Stores, Inc. | 9,687,264 | ||||||
| 77,780 | WhiteWave Foods Companyj | 2,721,522 | ||||||
| 27,913 | Whole Foods Market, Inc. | 1,407,373 | ||||||
|
| |||||||
Total | 75,165,939 | |||||||
|
| |||||||
| Energy (3.6%) | |||||||
| 3,630 | Atwood Oceanics, Inc.j | 102,983 | ||||||
| 115,429 | BP plc | 732,696 | ||||||
| 61,024 | BW Offshore, Ltd. | 61,209 | ||||||
| 105,650 | Cabot Oil & Gas Corporation | 3,128,296 | ||||||
| 511,136 | Cameron International Corporationj | 25,531,243 | ||||||
| 307,350 | Canadian Natural Resources, Ltd. | 9,490,968 | ||||||
| 15,950 | Chesapeake Energy Corporation | 312,142 | ||||||
| 151,210 | Chevron Corporation | 16,962,738 | ||||||
| 1,770 | Cimarex Energy Company | 187,620 | ||||||
| 1,163,691 | Cobalt International Energy, Inc.j | 10,345,213 | ||||||
| 35,600 | Comstock Resources, Inc.g | 242,436 | ||||||
| 70,812 | Concho Resources, Inc.j | 7,063,497 | ||||||
| 6,250 | ConocoPhillips | 431,625 | ||||||
| 10,400 | Denbury Resources, Inc. | 84,552 | ||||||
| 3,276 | Diamondback Energy, Inc.j | 195,839 | ||||||
| 1,300 | Energen Corporation | 82,888 | ||||||
| 2,480 | Ensco plc | 74,276 | ||||||
| 398,874 | EOG Resources, Inc. | 36,724,329 | ||||||
| 222,229 | EQT Corporation | 16,822,735 | ||||||
| 14,600 | ERG SPA | 163,506 | ||||||
| 6,850 | Exterran Holdings, Inc. | 223,173 | ||||||
| 92,750 | Exxon Mobil Corporation | 8,574,737 | ||||||
| 13,000 | Green Plains, Inc. | 322,140 | ||||||
| 7,400 | Gulfmark Offshore, Inc.g | 180,708 | ||||||
| 1,450 | Gulfport Energy Corporationj | 60,523 | ||||||
| 151,900 | Halliburton Company | 5,974,227 | ||||||
| 6,150 | Helix Energy Solutions Group, Inc.j | 133,455 | ||||||
| 2,470 | Helmerich & Payne, Inc. | 166,527 | ||||||
| 10,107 | HollyFrontier Corporation | 378,810 | ||||||
| 30,600 | Kosmos Energy, Ltd.j | 256,734 | ||||||
| 522,921 | Marathon Oil Corporation | 14,793,435 | ||||||
| 172,050 | Marathon Petroleum Corporation | 15,529,233 | ||||||
| 38,880 | Market Vectors Oil Service ETF | 1,396,570 | ||||||
| 109,450 | Nabors Industries, Ltd. | 1,420,661 | ||||||
| 2,170 | National Oilwell Varco, Inc. | 142,200 | ||||||
| 3,500 | Newfield Exploration Companyj | 94,920 | ||||||
| 4,140 | Noble Corporation | 68,600 | ||||||
| 2,780 | Noble Energy, Inc. | 131,855 | ||||||
| 385,314 | Oasis Petroleum, Inc.j | 6,373,094 | ||||||
| 2,670 | Oceaneering International, Inc. | 157,023 | ||||||
| 2,400 | Oil States International, Inc.j | 117,360 | ||||||
| 12,400 | Patterson-UTI Energy, Inc. | 205,716 | ||||||
| 2,925 | PDC Energy, Inc.j | 120,715 | ||||||
| 59,767 | Penn Virginia Corporationj | 399,244 | ||||||
| 736,000 | Petroleo Brasileiro SA ADRg | 5,372,800 | ||||||
| 840 | Pioneer Natural Resources Company | 125,034 | ||||||
| 15,200 | Premier Oil plc | 39,314 | ||||||
| 8,850 | QEP Resources, Inc. | 178,947 | ||||||
| 73,701 | Rex Energy Corporationg,j | 375,875 | ||||||
| 21,350 | Rosetta Resources, Inc.j | 476,319 | ||||||
| 446,040 | Rowan Companies plc | 10,401,653 | ||||||
| 30,692 | Royal Dutch Shell plc | 1,022,941 | ||||||
| 20,968 | Royal Dutch Shell plc, Class B | 724,468 | ||||||
| 457,250 | Schlumberger, Ltd. | 39,053,722 | ||||||
| 17,450 | Seadrill, Ltd.g | 208,353 | ||||||
| 10,828 | SemGroup Corporation | 740,527 | ||||||
| 24,600 | Showa Shell Sekiyu KK | 242,321 | ||||||
| 8,391 | SM Energy Company | 323,725 | ||||||
| 403,396 | Southwestern Energy Companyj | 11,008,677 | ||||||
| 3,484 | Statoil ASA | 61,342 | ||||||
| 321,050 | Suncor Energy, Inc. ADRg | 10,202,969 | ||||||
| 26,750 | Superior Energy Services, Inc. | 539,013 | ||||||
| 4,200 | Total SA | 215,175 | ||||||
| 428,750 | Total SA ADRg | 21,952,000 | ||||||
| 121,675 | Trinidad Drilling, Ltd. | 544,595 | ||||||
| 37,002 | U.S. Silica Holdings, Inc.g | 950,581 | ||||||
| 1,777,016 | Weatherford International, Ltd.j | 20,346,833 | ||||||
| 22,494 | Whiting Petroleum Corporationj | 742,302 | ||||||
| 16,000 | Woodside Petroleum, Ltd. | 494,837 | ||||||
| 14,200 | WPX Energy, Inc.j | 165,146 | ||||||
|
| |||||||
Total | 312,471,920 | |||||||
|
| |||||||
| Financials (4.2%) | |||||||
| 33,450 | ACE, Ltd. | 3,842,736 | ||||||
| 17,941 | Affiliated Managers Group, Inc.j | 3,807,798 | ||||||
| 7,100 | Allianz SE | 1,175,949 | ||||||
| 32,640 | Allied World Assurance Company Holdings AG | 1,237,709 | ||||||
| 62,700 | Allstate Corporation | 4,404,675 | ||||||
| 18,320 | American Assets Trust, Inc. | 729,319 | ||||||
| 18,200 | American Express Company | 1,693,328 | ||||||
| 9,550 | American Financial Group, Inc. | 579,876 | ||||||
| 55,500 | American International Group, Inc. | 3,108,555 | ||||||
| 6,705 | Ameriprise Financial, Inc. | 886,736 | ||||||
| 9,165 | Amlin plc | 67,984 | ||||||
| 32,800 | AmTrust Financial Services, Inc.g | 1,845,000 | ||||||
| 15,091 | Argo Group International Holdings, Ltd. | 837,098 | ||||||
| 23,600 | Assicurazioni Generali SPA | 484,577 | ||||||
| 8,450 | Assurant, Inc. | 578,233 | ||||||
| 38,390 | Assured Guaranty, Ltd. | 997,756 | ||||||
| 3,900 | AXA SA | 89,868 | ||||||
| 47,300 | Banco Santander SA | 396,996 | ||||||
| 80,600 | Bank Hapoalim, Ltd. | 378,992 | ||||||
| 701,670 | Bank of America Corporation | 12,552,876 | ||||||
| 9,600 | Bank of Queensland, Ltd. | 94,579 | ||||||
| 31,927 | Bank of the Ozarks, Inc. | 1,210,672 | ||||||
| 12,600 | Banner Corporation | 542,052 | ||||||
| 60,470 | BBCN Bancorp, Inc. | 869,559 | ||||||
| 61,850 | Berkshire Hathaway, Inc.j | 9,286,777 | ||||||
| 4,800 | BinckBank NV | 40,808 | ||||||
| 105,700 | Blackstone Group, LP | 3,575,831 | ||||||
| 1,100 | Bolsas y Mercados Espanoles SA | 42,604 | ||||||
| 23,050 | Boston Private Financial Holdings, Inc. | 310,483 | ||||||
| 24,800 | Brixmor Property Group, Inc. | 616,032 | ||||||
| 8,100 | Camden Property Trust | 598,104 | ||||||
| 75,500 | Capital One Financial Corporation | 6,232,525 | ||||||
| 27,100 | CBL & Associates Properties, Inc. | 526,282 | ||||||
| 9,450 | CBRE Group, Inc.j | 323,662 | ||||||
| 24,779 | Chesapeake Lodging Trust | 922,027 | ||||||
| 49,000 | Cheung Kong Holdings, Ltd. | 820,594 | ||||||
The accompanying Notes to Financial Statements are an integral part of this schedule.
120
Table of Contents
MODERATE ALLOCATION PORTFOLIO
Schedule of Investments as of December 31, 2014
| Shares | Common Stock (22.4%) | Value | ||||||
| Financials (4.2%) - continued |
| ||||||
| 363,907 | Citigroup, Inc. | $ | 19,691,008 | |||||
| 8,789 | CNA Financial Corporation | 340,222 | ||||||
| 130,380 | CNO Financial Group, Inc. | 2,245,144 | ||||||
| 7,800 | CNP Assurances | 138,280 | ||||||
| 127,650 | Comerica, Inc. | 5,979,126 | ||||||
| 9,300 | Commonwealth Bank of Australia | 646,153 | ||||||
| 16,550 | Corporate Office Properties Trust | 469,523 | ||||||
| 52,850 | Crown Castle International Corporation | 4,159,295 | ||||||
| 3,400 | Daito Trust Construction Company, Ltd. | 385,689 | ||||||
| 9 | Daiwa House REIT Investment Corporation | 44,992 | ||||||
| 13,000 | Daiwa Securities Group, Inc. | 101,792 | ||||||
| 16,250 | DDR Corporation | 298,350 | ||||||
| 2,047 | Delta Lloyd NV | 45,014 | ||||||
| 79,238 | Deutsche Bank AG | 2,378,725 | ||||||
| 1,300 | Deutsche Boerse AG | 92,381 | ||||||
| 8,850 | Digital Realty Trust, Inc. | 586,755 | ||||||
| 43,200 | Direct Line Insurance Group plc | 195,420 | ||||||
| 39,912 | Discover Financial Services | 2,613,837 | ||||||
| 13,741 | DnB ASA | 202,688 | ||||||
| 38,600 | Duke Realty Corporation | 779,720 | ||||||
| 18,893 | Education Realty Trust, Inc. | 691,295 | ||||||
| 38,619 | Essent Group, Ltd.j | 992,894 | ||||||
| 27,228 | Evercore Partners, Inc. | 1,425,930 | ||||||
| 11,190 | Extra Space Storage, Inc. | 656,182 | ||||||
| 22,050 | FBR & Companyj | 542,210 | ||||||
| 55,550 | First Horizon National Corporation | 754,369 | ||||||
| 64,450 | First Niagara Financial Group, Inc. | 543,313 | ||||||
| 56,135 | First Republic Bank | 2,925,756 | ||||||
| 24,800 | FlexiGroup, Ltd. | 60,210 | ||||||
| 55,000 | Fukuoka Financial Group, Inc. | 283,551 | ||||||
| 38,600 | Fulton Financial Corporation | 477,096 | ||||||
| 2,600 | GAM Holding AGj | 46,743 | ||||||
| 12,250 | General Growth Properties, Inc. | 344,592 | ||||||
| 18,750 | Government Properties Income Trust | 431,437 | ||||||
| 22,250 | Green Dot Corporationj | 455,903 | ||||||
| 17,700 | Hancock Holding Company | 543,390 | ||||||
| 103,226 | Hanmi Financial Corporation | 2,251,359 | ||||||
| 800 | Hannover Rueckversicherung SE | 72,169 | ||||||
| 8,650 | Hanover Insurance Group, Inc. | 616,918 | ||||||
| 61,100 | Hansteen Holdings plc | 102,468 | ||||||
| 32,983 | HCC Insurance Holdings, Inc. | 1,765,250 | ||||||
| 46,996 | Host Hotels & Resorts, Inc. | 1,117,095 | ||||||
| 401,150 | Huntington Bancshares, Inc. | 4,220,098 | ||||||
| 9,400 | IG Group Holdings plc | 105,041 | ||||||
| 20,443 | Intercontinental Exchange, Inc. | 4,482,945 | ||||||
| 41,412 | Intermediate Capital Group plc | 295,844 | ||||||
| 190,730 | Invesco, Ltd. | 7,537,650 | ||||||
| 45,600 | Investec plc | 382,050 | ||||||
| 123,000 | iShares Barclays 1-3 Year Credit Bond Fund | 12,937,140 | ||||||
| 164,900 | iShares iBoxx $ High Yield Corporate Bond ETF | 14,775,040 | ||||||
| 117,200 | iShares iBoxx $ Investment Grade Corporate Bond ETF | 13,994,852 | ||||||
| 190,900 | iShares Intermediate Credit Bond ETF | 20,871,097 | ||||||
| 7,950 | iShares MSCI EAFE Index Fund | 483,678 | ||||||
| 35,997 | iShares Russell 2000 Growth Index Fund | 5,125,253 | ||||||
| 58,400 | iShares Russell 2000 Index Fund | 6,988,728 | ||||||
| 163,828 | J.P. Morgan Chase & Company | 10,252,356 | ||||||
| 12 | Japan Prime Realty Investment Corporation | 41,753 | ||||||
| 40,606 | Kennedy-Wilson Holdings, Inc. | 1,027,332 | ||||||
| 61,550 | KeyCorp | 855,545 | ||||||
| 23,407 | Lazard, Ltd. | 1,171,052 | ||||||
| 28,500 | Link REIT | 178,432 | ||||||
| 7,700 | M&T Bank Corporation | 967,274 | ||||||
| 98,200 | Man Group plc | 244,358 | ||||||
| 154,900 | MasterCard, Inc. | 13,346,184 | ||||||
| 37,900 | MBIA, Inc.j | 361,566 | ||||||
| 176,420 | MetLife, Inc. | 9,542,558 | ||||||
| 5,450 | Mid-America Apartment Communities, Inc. | 407,006 | ||||||
| 58,700 | Mizuho Financial Group, Inc. | 98,399 | ||||||
| 246,750 | Morgan Stanley | 9,573,900 | ||||||
| 2,500 | Muenchener Rueckversicherungs-Gesellschaft AG | 497,845 | ||||||
| 31,100 | NASDAQ OMX Group, Inc. | 1,491,556 | ||||||
| 2,300 | National Australia Bank, Ltd. | 62,722 | ||||||
| 17,000 | Northern Trust Corporation | 1,145,800 | ||||||
| 21,900 | Old Mutual plc | 64,543 | ||||||
| 19,377 | Oversea-Chinese Banking Corporation, Ltd. | 152,458 | ||||||
| 52,597 | PacWest Bancorp | 2,391,060 | ||||||
| 30,190 | Parkway Properties, Inc. | 555,194 | ||||||
| 35,580 | Pebblebrook Hotel Trust | 1,623,515 | ||||||
| 19,000 | Phoenix Group Holdings | 244,792 | ||||||
| 123,550 | Progressive Corporation | 3,334,614 | ||||||
| 34,900 | Prudential Financial, Inc. | 3,157,054 | ||||||
| 24,300 | Resona Holdings, Inc. | 122,751 | ||||||
| 12,950 | RLJ Lodging Trust | 434,214 | ||||||
| 2,400 | Sampo Oyj | 112,355 | ||||||
| 2,100 | SCOR SE | 63,631 | ||||||
| 39,700 | Skandinaviska Enskilda Banken AB | 504,133 | ||||||
| 3,650 | Sovran Self Storage, Inc. | 318,353 | ||||||
| 446,700 | SPDR Euro Stoxx 50 ETF | 16,465,362 | ||||||
| 118,915 | SPDR S&P 500 ETF Trust | 24,437,032 | ||||||
| 100 | St. Galler Kantonalbank AG | 36,311 | ||||||
| 5,800 | Standard Chartered plc | 86,744 | ||||||
| 87,600 | Stockland | 292,749 | ||||||
| 97,619 | Summit Hotel Properties, Inc. | 1,214,380 | ||||||
| 5,000 | Sun Hung Kai Properties, Ltd. | 75,752 | ||||||
| 20,650 | Sunstone Hotel Investors, Inc. | 340,931 | ||||||
| 32,210 | SVB Financial Groupj | 3,738,615 | ||||||
| 16,900 | Swedbank AB | 419,305 | ||||||
| 300 | Swiss Life HoldingAGj | 70,906 | ||||||
| 7,900 | Swiss Re AG | 661,797 | ||||||
| 93,770 | Synovus Financial Corporation | 2,540,229 | ||||||
| 30,484 | TD Ameritrade Holding Corporation | 1,090,718 | ||||||
| 50,186 | Terreno Realty Corporation | 1,035,337 | ||||||
| 10,450 | Texas Capital Bancshares, Inc.j | 567,748 | ||||||
| 400 | Tryg AS | 44,695 | ||||||
| 26,000 | UNIQA Insurance Group AG | 244,011 | ||||||
| 28,819 | United Overseas Bank, Ltd. | 531,827 | ||||||
| 29 | United Urban Investment Corporation | 45,650 | ||||||
| 79,750 | Unum Group | 2,781,680 | ||||||
| 55,250 | Visa, Inc. | 14,486,550 | ||||||
| 19,350 | W.R. Berkley Corporation | 991,881 | ||||||
| 21,800 | Wells Fargo & Company | 1,195,076 | ||||||
| 76,876 | Western Alliance Bancorpj | 2,137,153 | ||||||
| 24,541 | Westpac Banking Corporation | 660,050 | ||||||
| 10,850 | Weyerhaeuser Company | 389,406 | ||||||
| 57,107 | Zions Bancorporation | 1,628,121 | ||||||
| 4,700 | Zurich Insurance Group AGj | 1,468,761 | ||||||
|
| |||||||
Total | 360,425,394 | |||||||
|
| |||||||
| Health Care (3.0%) |
| ||||||
| 5,900 | Abaxis, Inc. | 335,297 | ||||||
The accompanying Notes to Financial Statements are an integral part of this schedule.
121
Table of Contents
MODERATE ALLOCATION PORTFOLIO
Schedule of Investments as of December 31, 2014
| Shares | Common Stock (22.4%) | Value | ||||||
| Health Care (3.0%) - continued |
| ||||||
| 12,550 | Abbott Laboratories | $ | 565,001 | |||||
| 21,340 | Acadia Healthcare Company, Inc.j | 1,306,221 | ||||||
| 9,500 | Acceleron Pharma, Inc.g,j | 370,120 | ||||||
| 57,730 | Acorda Therapeutics, Inc.j | 2,359,425 | ||||||
| 86,017 | Actavis plcj | 22,141,636 | ||||||
| 2,200 | Actelion, Ltd. | 253,266 | ||||||
| 60,050 | Aetna, Inc. | 5,334,241 | ||||||
| 91,650 | Affymetrix, Inc.g,j | 904,585 | ||||||
| 65,240 | Akorn, Inc.g,j | 2,361,688 | ||||||
| 36,401 | Align Technology, Inc.j | 2,035,180 | ||||||
| 48,350 | Allscripts Healthcare Solutions, Inc.j | 617,429 | ||||||
| 11,998 | AmerisourceBergen Corporation | 1,081,740 | ||||||
| 65,500 | Amgen, Inc. | 10,433,495 | ||||||
| 90,444 | AMN Healthcare Services, Inc.j | 1,772,702 | ||||||
| 7,950 | AmSurg Corporationj | 435,103 | ||||||
| 17,950 | Anthem, Inc. | 2,255,776 | ||||||
| 101,500 | Baxter International, Inc. | 7,438,935 | ||||||
| 3,500 | Biogen Idec, Inc.j | 1,188,075 | ||||||
| 13,526 | BioMarin Pharmaceutical, Inc.j | 1,222,750 | ||||||
| 308,550 | Boston Scientific Corporationj | 4,088,287 | ||||||
| 40,350 | Bruker Corporationj | 791,667 | ||||||
| 7,001 | C.R. Bard, Inc. | 1,166,507 | ||||||
| 89,600 | Cambrex Corporationj | 1,937,152 | ||||||
| 35,258 | Cardiovascular Systems, Inc.j | 1,060,561 | ||||||
| 16,343 | Catamaran Corporationj | 845,750 | ||||||
| 39,318 | Centene Corporationj | 4,083,174 | ||||||
| 337,310 | Cerner Corporationj | 21,810,465 | ||||||
| 8,150 | Charles River Laboratories International, Inc.j | 518,666 | ||||||
| 3,953 | Cooper Companies, Inc. | 640,742 | ||||||
| 70,810 | Covidien plc | 7,242,447 | ||||||
| 900 | CSL, Ltd. | 63,221 | ||||||
| 20,067 | Cyberonics, Inc.j | 1,117,331 | ||||||
| 83,457 | Depomed, Inc.j | 1,344,492 | ||||||
| 4,500 | Edwards Lifesciences Corporationj | 573,210 | ||||||
| 19,000 | Endo International plcj | 1,370,280 | ||||||
| 22,024 | Envision Healthcare Holdings, Inc.j | 764,013 | ||||||
| 112,858 | ExamWorks Group, Inc.g,j | 4,693,764 | ||||||
| 47,900 | Express Scripts Holding Companyj | 4,055,693 | ||||||
| 272,200 | Gilead Sciences, Inc.j | 25,657,572 | ||||||
| 24,610 | GlaxoSmithKline plc | 527,974 | ||||||
| 6,000 | Greatbatch, Inc.j | 295,800 | ||||||
| 4,000 | H. Lundbeck AS | 79,398 | ||||||
| 20,450 | HCA Holdings, Inc.j | 1,500,826 | ||||||
| 7,300 | Hikma Pharmaceuticals plc | 223,975 | ||||||
| 34,300 | Hologic, Inc.j | 917,182 | ||||||
| 6,333 | ICON plcj | 322,920 | ||||||
| 7,650 | Illumina, Inc.j | 1,412,037 | ||||||
| 41,451 | Impax Laboratories, Inc.j | 1,313,168 | ||||||
| 7,993 | Indivior plcj | 18,612 | ||||||
| 67,988 | Ironwood Pharmaceuticals, Inc.j | 1,041,576 | ||||||
| 184,503 | Johnson & Johnson | 19,293,479 | ||||||
| 3,000 | Kaken Pharmaceutical Company, Ltd. | 58,009 | ||||||
| 9,300 | KYORIN Holdings, Inc. | 172,341 | ||||||
| 8,049 | LifePoint Hospitals, Inc.j | 578,804 | ||||||
| 6,450 | Mallinckrodt, LLCj | 638,744 | ||||||
| 12,200 | McKesson Corporation | 2,532,476 | ||||||
| 214,920 | Merck & Company, Inc. | 12,205,307 | ||||||
| 500 | Merck KGaA | 47,054 | ||||||
| 3,783 | Mettler-Toledo International, Inc.j | 1,144,206 | ||||||
| 7,732 | Mylan, Inc.j | 435,853 | ||||||
| 85,324 | Neurocrine Biosciences, Inc.j | 1,906,138 | ||||||
| 11,500 | Novartis AG | 1,066,550 | ||||||
| 67,100 | Novavax, Inc.g,j | 397,903 | ||||||
| 18,131 | NPS Pharmaceuticals, Inc.j | 648,546 | ||||||
| 84,913 | NuVasive, Inc.j | 4,004,497 | ||||||
| 18,000 | Otsuka Holdings Company, Ltd. | 539,662 | ||||||
| 37,950 | PAREXEL International Corporationj | 2,108,502 | ||||||
| 8,468 | Perrigo Company plc | 1,415,511 | ||||||
| 200,150 | Pfizer, Inc. | 6,234,672 | ||||||
| 13,550 | PharMerica Corporationj | 280,621 | ||||||
| 7,750 | Providence Service Corporationj | 282,410 | ||||||
| 2,890 | Puma Biotechnology, Inc.j | 546,990 | ||||||
| 12,100 | Qiagen NVj | 283,866 | ||||||
| 8,200 | Quintiles Transnational Holdings, Inc.j | 482,734 | ||||||
| 2,300 | Sanofi | 209,693 | ||||||
| 25,100 | Sonic Healthcare, Ltd. | 377,618 | ||||||
| 41,250 | Spectrum Pharmaceuticals, Inc.g,j | 285,863 | ||||||
| 9,600 | St. Jude Medical, Inc. | 624,288 | ||||||
| 35,141 | Team Health Holdings, Inc.j | 2,021,662 | ||||||
| 47,796 | Teleflex, Inc. | 5,487,937 | ||||||
| 1,300 | Teva Pharmaceutical Industries, Ltd. | 74,522 | ||||||
| 2,850 | Thermo Fisher Scientific, Inc. | 357,076 | ||||||
| 106,276 | UnitedHealth Group, Inc. | 10,743,441 | ||||||
| 13,487 | Universal Health Services, Inc. | 1,500,564 | ||||||
| 164,946 | Vertex Pharmaceuticals, Inc.j | 19,595,585 | ||||||
| 7,600 | Waters Corporationj | 856,672 | ||||||
|
| |||||||
Total | 255,330,923 | |||||||
|
| |||||||
| Industrials (2.4%) |
| ||||||
| 10,700 | AAR Corporation | 297,246 | ||||||
| 40,100 | ADT Corporationg | 1,452,823 | ||||||
| 49,139 | Air New Zealand, Ltd. | 94,384 | ||||||
| 46,300 | Allison Transmission Holdings, Inc. | 1,569,570 | ||||||
| 26,940 | Apogee Enterprises, Inc. | 1,141,448 | ||||||
| 5,510 | Arcadis NV | 165,260 | ||||||
| 13,250 | Argan, Inc. | 445,730 | ||||||
| 1,700 | Atlas Copco AB | 43,516 | ||||||
| 9,333 | B/E Aerospace, Inc.j | 541,501 | ||||||
| 16,200 | Berendsen plc | 276,894 | ||||||
| 32,050 | Boeing Company | 4,165,859 | ||||||
| 16,378 | Briggs & Stratton Corporation | 334,439 | ||||||
| 400 | Bucher Industries AG | 99,753 | ||||||
| 12,613 | Cardno, Ltd. | 34,927 | ||||||
| 8,900 | Carillion plc | 46,116 | ||||||
| 17,900 | Caterpillar, Inc. | 1,638,387 | ||||||
| 37,850 | CLARCOR, Inc. | 2,522,324 | ||||||
| 18,000 | COMSYS Holdings Corporation | 246,236 | ||||||
| 41,950 | Con-way, Inc. | 2,063,101 | ||||||
| 212,700 | CSX Corporation | 7,706,121 | ||||||
| 4,600 | CTT-Correios de Portugal SA | 44,427 | ||||||
| 25,000 | Curtiss-Wright Corporation | 1,764,750 | ||||||
| 6,000 | Dai Nippon Printing Company, Ltd. | 54,039 | ||||||
| 474,450 | Delta Air Lines, Inc. | 23,338,196 | ||||||
| 64,021 | EMCOR Group, Inc. | 2,848,294 | ||||||
| 19,940 | Esterline Technologies Corporationj | 2,187,019 | ||||||
| 5,151 | Fastenal Company | 244,982 | ||||||
| 37,050 | Federal Signal Corporation | 572,052 | ||||||
| 63,291 | Flowserve Corporation | 3,786,701 | ||||||
| 225,200 | Fluor Corporation | 13,653,876 | ||||||
| 20,029 | Fortune Brands Home and Security, Inc. | 906,713 | ||||||
| 5,820 | GATX Corporation | 334,883 | ||||||
| 11,319 | Generac Holdings, Inc.g,j | 529,276 | ||||||
| 2,000 | Go-Ahead Group plc | 76,237 | ||||||
| 10,916 | Graco, Inc. | 875,245 | ||||||
| 56,378 | Granite Construction, Inc. | 2,143,492 | ||||||
| 19,692 | H&E Equipment Services, Inc. | 553,148 | ||||||
| 48,166 | Healthcare Services Group, Inc. | 1,489,774 | ||||||
| 16,497 | Heico Corporation | 996,419 | ||||||
The accompanying Notes to Financial Statements are an integral part of this schedule.
122
Table of Contents
MODERATE ALLOCATION PORTFOLIO
Schedule of Investments as of December 31, 2014
| Shares | Common Stock (22.4%) | Value | ||||||
| Industrials (2.4%) - continued |
| ||||||
| 5,300 | Hino Motors, Ltd. | $ | 69,766 | |||||
| 57,270 | HNI Corporation | 2,924,206 | ||||||
| 61,072 | Honeywell International, Inc. | 6,102,314 | ||||||
| 2,500 | Hoshizaki Electric Company, Ltd. | 120,470 | ||||||
| 11,200 | Huntington Ingalls Industries, Inc. | 1,259,552 | ||||||
| 12,992 | Huron Consulting Group, Inc.j | 888,523 | ||||||
| 1,400 | Inaba Denki Sangyo Company, Ltd. | 45,202 | ||||||
| 258,800 | Ingersoll-Rand plc | 16,405,332 | ||||||
| 29,500 | Insperity, Inc. | 999,755 | ||||||
| 126,011 | Interface, Inc. | 2,075,401 | ||||||
| 10,700 | Intrum Justitia AB | 316,908 | ||||||
| 24,100 | ITOCHU Corporation | 257,270 | ||||||
| 100,570 | Jacobs Engineering Group, Inc.j | 4,494,473 | ||||||
| 1,609 | Jardine Matheson Holdings, Ltd. | 97,770 | ||||||
| 9,984 | JB Hunt Transport Services, Inc. | 841,152 | ||||||
| 1,100 | Kanamoto Company, Ltd. | 29,744 | ||||||
| 6,200 | Kansas City Southern | 756,586 | ||||||
| 45,850 | KAR Auction Services, Inc. | 1,588,703 | ||||||
| 12,900 | KITZ Corporation | 52,688 | ||||||
| 4,666 | KLX, Inc.j | 192,473 | ||||||
| 13,800 | Komatsu, Ltd. | 305,089 | ||||||
| 79,840 | Korn/Ferry Internationalj | 2,296,198 | ||||||
| 34,000 | Landstar System, Inc. | 2,466,020 | ||||||
| 3,800 | Legrand SA | 200,229 | ||||||
| 8,500 | Leighton Holdings, Ltd. | 154,772 | ||||||
| 8,650 | Manpower, Inc. | 589,671 | ||||||
| 26,054 | MasTec, Inc.j | 589,081 | ||||||
| 22,400 | Meritor, Inc.j | 339,360 | ||||||
| 14,214 | Middleby Corporationj | 1,408,607 | ||||||
| 21,050 | Mistras Group, Inc.j | 385,847 | ||||||
| 6,000 | Mitsuboshi Belting, Ltd. | 44,091 | ||||||
| 48,200 | Mueller Water Products, Inc. | 493,568 | ||||||
| 17,332 | Nielsen NV | 775,260 | ||||||
| 8,200 | Nitto Kogyo Corporation | 159,387 | ||||||
| 11,620 | Old Dominion Freight Line, Inc.j | 902,177 | ||||||
| 41,412 | On Assignment, Inc.j | 1,374,464 | ||||||
| 30,808 | Oshkosh Corporation | 1,498,809 | ||||||
| 9,231 | Parker Hannifin Corporation | 1,190,337 | ||||||
| 102,540 | Pentair, Ltd. | 6,810,707 | ||||||
| 35,720 | PGT, Inc.j | 343,984 | ||||||
| 77,090 | Progressive Waste Solutions, Ltd. | 2,318,867 | ||||||
| 28,530 | Proto Labs, Inc.g,j | 1,916,075 | ||||||
| 56,150 | Quanta Services, Inc.j | 1,594,099 | ||||||
| 82,139 | Ritchie Brothers Auctioneers, Inc.g | 2,208,718 | ||||||
| 28,200 | Robert Half International, Inc. | 1,646,316 | ||||||
| 7,486 | Roper Industries, Inc. | 1,170,436 | ||||||
| 20,452 | Saia, Inc.j | 1,132,223 | ||||||
| 9,800 | Securitas AB | 118,557 | ||||||
| 6,100 | Siemens AG | 684,445 | ||||||
| 218,787 | Southwest Airlines Company | 9,259,066 | ||||||
| 8,650 | Spirit Aerosystems Holdings, Inc.j | 372,296 | ||||||
| 40,704 | Spirit Airlines, Inc.j | 3,076,408 | ||||||
| 13,816 | Stericycle, Inc.j | 1,811,001 | ||||||
| 35,787 | Swift Transportation Companyj | 1,024,582 | ||||||
| 3,600 | Takasago Thermal Engineering Company, Ltd. | 46,117 | ||||||
| 2,900 | Teleperformance SA | 197,404 | ||||||
| 25,455 | Tennant Company | 1,837,087 | ||||||
| 9,000 | Toppan Printing Company, Ltd. | 58,477 | ||||||
| 184,000 | Union Pacific Corporation | 21,919,920 | ||||||
| 28,700 | United Continental Holdings, Inc.j | 1,919,743 | ||||||
| 12,694 | United Rentals, Inc.j | 1,294,915 | ||||||
| 6,450 | United Technologies Corporation | 741,750 | ||||||
| 7,600 | WABCO Holdings, Inc.j | 796,328 | ||||||
| 3,440 | WageWorks, Inc.j | 222,121 | ||||||
| 8,587 | Watsco, Inc. | 918,809 | ||||||
| 9,873 | Watts Water Technologies, Inc. | 626,343 | ||||||
|
| |||||||
Total | 202,043,207 | |||||||
|
| |||||||
| Information Technology (4.1%) |
| ||||||
| 32,411 | A10 Networks, Inc.j | 141,312 | ||||||
| 18,190 | Agilent Technologies, Inc. | 744,699 | ||||||
| 51,650 | Akamai Technologies, Inc.j | 3,251,884 | ||||||
| 60,286 | Alibaba Group Holding, Ltd. ADRj | 6,266,127 | ||||||
| 7,500 | Alliance Data Systems Corporationj | 2,145,375 | ||||||
| 10,342 | Ambarella, Inc.g,j | 524,546 | ||||||
| 14,100 | Amdocs, Ltd. | 657,835 | ||||||
| 26,317 | Amphenol Corporation | 1,416,118 | ||||||
| 10,031 | ANSYS, Inc.j | 822,542 | ||||||
| 375,399 | Apple, Inc. | 41,436,542 | ||||||
| 79,231 | Applied Materials, Inc. | 1,974,437 | ||||||
| 107,416 | Applied Micro Circuits Corporationj | 700,352 | ||||||
| 16,605 | Applied Optoelectronics, Inc.g,j | 186,308 | ||||||
| 65,722 | Aspen Technology, Inc.j | 2,301,584 | ||||||
| 315,610 | Atmel Corporationj | 2,649,546 | ||||||
| 6,626 | Autodesk, Inc.j | 397,958 | ||||||
| 16,750 | AVG Technologies NVj | 330,645 | ||||||
| 10,857 | Belden, Inc. | 855,640 | ||||||
| 13,450 | Booz Allen Hamilton Holding Corporation | 356,829 | ||||||
| 86,800 | Broadcom Corporation | 3,761,044 | ||||||
| 61,140 | Broadridge Financial Solutions, Inc. | 2,823,445 | ||||||
| 148,550 | Brocade Communications Systems, Inc. | 1,758,832 | ||||||
| 2,600 | Brother Industries, Ltd. | 47,131 | ||||||
| 21,100 | Canon, Inc. | 670,637 | ||||||
| 25,290 | Cardtronics, Inc.j | 975,688 | ||||||
| 15,180 | Cavium, Inc.j | 938,428 | ||||||
| 28,650 | CDW Corporation | 1,007,621 | ||||||
| 25,917 | ChannelAdvisor Corporationg,j | 559,289 | ||||||
| 7,300 | Check Point Software Technologies, Ltd.j | 573,561 | ||||||
| 23,357 | Ciena Corporationj | 453,359 | ||||||
| 15,600 | Cirrus Logic, Inc.j | 367,692 | ||||||
| 550,420 | Cisco Systems, Inc. | 15,309,932 | ||||||
| 21,700 | Citrix Systems, Inc.j | 1,384,460 | ||||||
| 18,319 | Cognex Corporationj | 757,124 | ||||||
| 9,623 | Coherent, Inc.j | 584,309 | ||||||
| 33,650 | Computer Sciences Corporation | 2,121,632 | ||||||
| 24,414 | Constant Contact, Inc.j | 895,994 | ||||||
| 29,502 | Cornerstone OnDemand, Inc.g,j | 1,038,470 | ||||||
| 222,000 | Corning, Inc. | 5,090,460 | ||||||
| 23,768 | Dealertrack Technologies, Inc.j | 1,053,160 | ||||||
| 20,205 | Demandware, Inc.g,j | 1,162,596 | ||||||
| 3,900 | Dialog Semiconductor plcj | 136,172 | ||||||
| 16,350 | Diodes, Inc.j | 450,769 | ||||||
| 50,168 | DST Systems, Inc. | 4,723,317 | ||||||
| 14,424 | eBay, Inc.j | 809,475 | ||||||
| 36,800 | Electronic Arts, Inc.j | 1,730,152 | ||||||
| 12,149 | Electronics for Imaging, Inc.j | 520,342 | ||||||
| 818,800 | EMC Corporation | 24,351,112 | ||||||
| 46,001 | EVERTEC, Inc. | 1,018,002 | ||||||
| 9,380 | F5 Networks, Inc.j | 1,223,762 | ||||||
| 284,300 | Facebook, Inc.j | 22,181,086 | ||||||
| 45,800 | Fairchild Semiconductor International, Inc.j | 773,104 | ||||||
| 17,270 | FEI Company | 1,560,344 | ||||||
| 38,469 | Fortinet, Inc.j | 1,179,460 | ||||||
| 19,400 | FUJIFILM Holdings NPV | 591,963 | ||||||
| 14,354 | Gartner, Inc.j | 1,208,750 | ||||||
| 27,534 | Google, Inc.j | 14,493,898 | ||||||
| 31,284 | Google, Inc., Class Aj | 16,601,167 | ||||||
The accompanying Notes to Financial Statements are an integral part of this schedule.
123
Table of Contents
MODERATE ALLOCATION PORTFOLIO
Schedule of Investments as of December 31, 2014
| Shares | Common Stock (22.4%) | Value | ||||||
| Information Technology (4.1%) - continued | |||||||
| 67,628 | Guidewire Software, Inc.j | $ | 3,424,006 | |||||
| 8,000 | Hitachi Kokusai Electric, Inc. | 111,901 | ||||||
| 2,800 | Hitachi Maxell, Ltd. | 44,111 | ||||||
| 41,348 | HomeAway, Inc.j | 1,231,343 | ||||||
| 8,400 | Hoya Corporation | 284,129 | ||||||
| 26,891 | IAC InterActiveCorp | 1,634,704 | ||||||
| 8,200 | iGATE Corporationj | 323,736 | ||||||
| 10,310 | Imperva, Inc.j | 509,623 | ||||||
| 7,850 | International Business Machines Corporation | 1,259,454 | ||||||
| 81,524 | Juniper Networks, Inc. | 1,819,616 | ||||||
| 9,060 | Keysight Technologies, Inc.j | 305,956 | ||||||
| 48,838 | Linkedln Corporationj | 11,218,577 | ||||||
| 20,750 | Liquidity Services, Inc.j | 169,528 | ||||||
| 12,702 | Manhattan Associates, Inc.j | 517,225 | ||||||
| 90,800 | Marvell Technology Group, Ltd. | 1,316,600 | ||||||
| 24,200 | Maxim Integrated Products, Inc. | 771,254 | ||||||
| 83,543 | MaxLinear, Inc.j | 619,054 | ||||||
| 10,597 | Methode Electronics, Inc. | 386,896 | ||||||
| 64,790 | Microsoft Corporation | 3,009,495 | ||||||
| 16,632 | Monolithic Power Systems, Inc. | 827,276 | ||||||
| 5,100 | NEC Networks & System Integration Corporation | 105,699 | ||||||
| 492,720 | NetApp, Inc. | 20,423,244 | ||||||
| 17,238 | Newport Corporationj | 329,418 | ||||||
| 8,066 | Nice Systems, Ltd. ADRg | 408,543 | ||||||
| 15,187 | Nuance Communications, Inc.j | 216,718 | ||||||
| 124,919 | NVIDIA Corporation | 2,504,626 | ||||||
| 22,405 | NXP Semiconductors NVj | 1,711,742 | ||||||
| 72,000 | Oki Electric Industry Company, Ltd. | 137,250 | ||||||
| 10,300 | Optimal Payments plcj | 54,672 | ||||||
| 204,800 | Oracle Corporation | 9,209,856 | ||||||
| 2,900 | Orbotech, Ltd.j | 42,920 | ||||||
| 1,200 | Otsuka Corporation | 38,050 | ||||||
| 45,523 | Pace plc | 244,084 | ||||||
| 45,276 | Plantronics, Inc. | 2,400,534 | ||||||
| 24,400 | Polycom, Inc.j | 329,400 | ||||||
| 46,743 | Proofpoint, Inc.j | 2,254,415 | ||||||
| 35,199 | QLIK Technologies, Inc.j | 1,087,297 | ||||||
| 239,542 | QUALCOMM, Inc. | 17,805,157 | ||||||
| 3,800 | Rackspace Hosting, Inc.j | 177,878 | ||||||
| 18,700 | Red Hat, Inc.j | 1,292,918 | ||||||
| 1,200 | Rohm Company, Ltd. | 72,304 | ||||||
| 268,500 | Salesforce.com, Inc.j | 15,924,735 | ||||||
| 31,000 | Sanmina Corporationj | 729,430 | ||||||
| 13,295 | ServiceNow, Inc.j | 902,066 | ||||||
| 7,297 | Skyworks Solutions, Inc. | 530,565 | ||||||
| 131,168 | Sonus Networks, Inc.j | 520,737 | ||||||
| 2,272 | SPS Commerce, Inc.j | 128,663 | ||||||
| 38,600 | Symantec Corporation | 990,283 | ||||||
| 5,610 | Synaptics, Inc.j | 386,192 | ||||||
| 9,058 | Synopsys, Inc.j | 393,751 | ||||||
| 15,550 | Take-Two Interactive Software, Inc.j | 435,866 | ||||||
| 6,150 | TE Connectivity, Ltd. | 388,988 | ||||||
| 46,700 | Telefonaktiebolaget LM Ericsson | 565,449 | ||||||
| 117,200 | Teradata Corporationj | 5,119,296 | ||||||
| 47,627 | Teradyne, Inc. | 942,538 | ||||||
| 118,920 | Texas Instruments, Inc. | 6,358,058 | ||||||
| 24,605 | Textura Corporationg,j | 700,504 | ||||||
| 42,400 | Total System Services, Inc. | 1,439,904 | ||||||
| 3,482 | Tyler Technologies, Inc.j | 381,070 | ||||||
| 50,020 | Ubiquiti Networks, Inc.g | 1,482,593 | ||||||
| 8,595 | Ultimate Software Group, Inc.j | 1,261,875 | ||||||
| 13,250 | Unisys Corporationj | 390,610 | ||||||
| 32,500 | Vantiv, Inc.j | 1,102,400 | ||||||
| 13,974 | VeriFone Systems, Inc.j | 519,833 | ||||||
| 98,009 | Virtusa Corporationj | 4,084,035 | ||||||
| 143,450 | VMware, Inc.j | 11,837,494 | ||||||
| 12,200 | WebMD Health Corporationj | 482,510 | ||||||
| 187,650 | Xerox Corporation | 2,600,829 | ||||||
|
| |||||||
Total | 355,279,501 | |||||||
|
| |||||||
| Materials (0.8%) | |||||||
| 27,150 | Agnico Eagle Mines, Ltd.g | 675,764 | ||||||
| 7,794 | Airgas, Inc. | 897,713 | ||||||
| 6,726 | Albemarle Corporation | 404,434 | ||||||
| 165,600 | Alcoa, Inc. | 2,614,824 | ||||||
| 7,000 | Asahi Kasei Corporation | 63,857 | ||||||
| 19,000 | Avery Dennison Corporation | 985,720 | ||||||
| 26,450 | Ball Corporation | 1,803,096 | ||||||
| 161,850 | Barrick Gold Corporation | 1,739,887 | ||||||
| 58,717 | Celanese Corporation | 3,520,671 | ||||||
| 58,087 | Centamin plc | 53,335 | ||||||
| 54,538 | Chemtura Corporationg,j | 1,348,725 | ||||||
| 6,550 | Clearwater Paper Corporationj | 449,003 | ||||||
| 4,200 | Compass Minerals International, Inc. | 364,686 | ||||||
| 42,750 | Crown Holdings, Inc.j | 2,175,975 | ||||||
| 80,400 | Dow Chemical Company | 3,667,044 | ||||||
| 27,290 | Eagle Materials, Inc. | 2,074,859 | ||||||
| 13,950 | Eastman Chemical Company | 1,058,247 | ||||||
| 92,650 | Eldorado Gold Corporationg | 563,312 | ||||||
| 29,550 | Ferro Corporationj | 382,968 | ||||||
| 15,016 | FMC Corporation | 856,362 | ||||||
| 21,050 | Franco-Nevada Corporationg | 1,035,450 | ||||||
| 165,600 | Freeport-McMoRan, Inc. | 3,868,416 | ||||||
| 112,650 | Goldcorp, Inc. | 2,086,278 | ||||||
| 132,652 | Graphic Packaging Holding Companyj | 1,806,720 | ||||||
| 8,000 | Hitachi Metals, Ltd. | 135,927 | ||||||
| 2,000 | Holmen AB | 67,960 | ||||||
| 76,230 | Horsehead Holding Corporationj | 1,206,721 | ||||||
| 7,650 | Innophos Holdings, Inc. | 447,143 | ||||||
| 81,100 | International Paper Company | 4,345,338 | ||||||
| 152,700 | Kinross Gold Corporationj | 430,614 | ||||||
| 13,000 | Kureha Corporation | 54,370 | ||||||
| 4,150 | LyondellBasell Industries NV | 329,469 | ||||||
| 8,150 | Martin Marietta Materials, Inc.g | 899,108 | ||||||
| 47,750 | Materials Select Sector SPDR Fund | 2,319,695 | ||||||
| 28,850 | MeadWestvaco Corporation | 1,280,651 | ||||||
| 68,200 | Newmont Mining Corporation | 1,288,980 | ||||||
| 2,100 | Novozymes AS | 88,396 | ||||||
| 59,870 | Nucor Corporation | 2,936,623 | ||||||
| 64,150 | Owens-Illinois, Inc.j | 1,731,409 | ||||||
| 38,450 | Packaging Corporation of America | 3,001,023 | ||||||
| 28,841 | PolyOne Corporation | 1,093,362 | ||||||
| 25,800 | Rock-Tenn Company | 1,573,284 | ||||||
| 37,000 | Royal Gold, Inc. | 2,319,900 | ||||||
| 34,950 | Sealed Air Corporation | 1,482,929 | ||||||
| 19,874 | Silgan Holdings, Inc. | 1,065,246 | ||||||
| 66,301 | Silver Wheaton Corporation | 1,347,899 | ||||||
| 7,200 | Sonoco Products Company | 314,640 | ||||||
| 49,150 | Southern Copper Corporation | 1,386,030 | ||||||
| 56,930 | Steel Dynamics, Inc. | 1,123,798 | ||||||
| 9,600 | Stora Enso OYJ | 85,833 | ||||||
| 18,000 | Sumitomo Metal Mining Company, Ltd. | 268,468 | ||||||
| 7,000 | Sumitomo Seika Chemicals Company, Ltd. | 46,618 | ||||||
| 93,650 | Teck Resources, Ltd.g | 1,277,386 | ||||||
| 10,750 | Tronox, Ltd. | 256,710 | ||||||
| 12,900 | UPM-Kymmene OYJ | 211,408 | ||||||
| 17,300 | Vulcan Materials Company | 1,137,129 | ||||||
| 6,750 | Westlake Chemical Corporation | 412,358 | ||||||
The accompanying Notes to Financial Statements are an integral part of this schedule.
124
Table of Contents
MODERATE ALLOCATION PORTFOLIO
Schedule of Investments as of December 31, 2014
| Shares | Common Stock (22.4%) | Value | ||||||
| Materials (0.8%) - continued | |||||||
| 7,200 | Worthington Industries, Inc. | $ | 216,648 | |||||
| 123,500 | Yamana Gold, Inc. | 496,470 | ||||||
|
| |||||||
Total | 71,176,889 | |||||||
|
| |||||||
| Telecommunications Services (0.1%) | |||||||
| 6,600 | Belgacom SA | 239,472 | ||||||
| 187,900 | Bezeq Israel Telecommunication Corporation, Ltd. | 333,300 | ||||||
| 37,282 | BT Group plc | 231,897 | ||||||
| 11,700 | Elisa Oyj | 319,353 | ||||||
| 9,100 | Freenet AG | 258,734 | ||||||
| 8,400 | iiNet, Ltd. | 53,676 | ||||||
| 143,127 | KCOM Group plc | 199,145 | ||||||
| 5,337 | Level 3 Communications, Inc.j | 263,541 | ||||||
| 16,000 | M1, Ltd. | 43,486 | ||||||
| 15,200 | Nippon Telegraph & Telephone Corporation | 776,456 | ||||||
| 35,400 | Orange SA | 602,039 | ||||||
| 9,222 | SBA Communications Corporationj | 1,021,429 | ||||||
| 54,000 | Singapore Telecommunications, Ltd. | 158,506 | ||||||
| 100 | Swisscom AG | 52,474 | ||||||
| 4,640 | TDC AS | 35,389 | ||||||
| 6,600 | Tele2 AB | 79,977 | ||||||
| 30,200 | Telstra Corporation, Ltd. | 146,616 | ||||||
| 130,806 | Verizon Communications, Inc. | 6,119,105 | ||||||
| 5,200 | Vivendi SAj | 129,431 | ||||||
| 82,350 | Vonage Holdings Corporationj | 313,753 | ||||||
|
| |||||||
Total | 11,377,779 | |||||||
|
| |||||||
| Utilities (0.3%) | |||||||
| 268,900 | A2A SPA | 272,474 | ||||||
| 11,950 | Atmos Energy Corporation | 666,093 | ||||||
| 7,400 | E.ON SE | 126,479 | ||||||
| 29,300 | Edison International, Inc. | 1,918,564 | ||||||
| 113,800 | Electricidade de Portugal SA | 441,277 | ||||||
| 6,700 | Endesa SA | 134,130 | ||||||
| 79,300 | Enel SPA | 353,482 | ||||||
| 13,600 | Fortum OYJ | 295,278 | ||||||
| 7,100 | Hokuriku Electric Power Company | 90,670 | ||||||
| 34,800 | IREN SPA | 38,056 | ||||||
| 12,050 | Laclede Group, Inc. | 641,060 | ||||||
| 3,100 | National Grid plc | 43,987 | ||||||
| 85,090 | NiSource, Inc. | 3,609,518 | ||||||
| 55,130 | NorthWestern Corporation | 3,119,255 | ||||||
| 174,400 | PG&E Corporation | 9,285,056 | ||||||
| 16,970 | Portland General Electric Company | 641,975 | ||||||
| 22,100 | Public Service Enterprise Group, Inc. | 915,161 | ||||||
| 800 | Red Electrica Corporacion SA | 70,521 | ||||||
| 14,800 | Redes Energeticas Nacionais SGPS SA | 42,935 | ||||||
| 1,400 | Severn Trent plc | 43,665 | ||||||
| 19,200 | Southern Company | 942,912 | ||||||
| 37,500 | United Utilities Group plc | 532,648 | ||||||
| 10,500 | Vectren Corporation | 485,415 | ||||||
| 29,300 | Wisconsin Energy Corporationg | 1,545,282 | ||||||
|
| |||||||
Total | 26,255,893 | |||||||
|
| |||||||
Total Common Stock (cost $1,636,830,502) | 1,929,496,898 | |||||||
|
| |||||||
Collateral Held for Securities Loaned (0.8%) | ||||||||
| 67,749,452 | Thrivent Cash Management Trust | $ | 67,749,452 | |||||
|
| |||||||
Total Collateral Held for Securities Loaned (cost $67,749,452) | 67,749,452 | |||||||
|
| |||||||
| Shares or Principal Amount | Short-Term Investments (23.7%)k | |||||||
Federal Home Loan Bank Discount Notes | ||||||||
| 9,000,000 | 0.040%, 1/2/2015 | 8,999,990 | ||||||
| 237,800,000 | 0.045%, 1/7/2015 | 237,798,184 | ||||||
| 60,000,000 | 0.045%, 1/9/2015 | 59,999,403 | ||||||
| 10,000,000 | 0.040%, 1/12/2015 | 9,999,878 | ||||||
| 27,000,000 | 0.050%, 1/14/2015 | 26,999,512 | ||||||
| 238,000,000 | 0.054%, 1/16/2015 | 237,994,635 | ||||||
| 128,500,000 | 0.080%, 1/21/2015 | 128,494,289 | ||||||
| 138,000,000 | 0.069%, 1/23/2015 | 137,994,213 | ||||||
| 100,000,000 | 0.063%, 1/28/2015 | 99,995,313 | ||||||
| 138,000,000 | 0.067%, 1/30/2015 | 137,992,582 | ||||||
| 152,800,000 | 0.075%, 2/4/2015l | 152,789,116 | ||||||
| 98,000,000 | 0.080%, 2/10/2015 | 97,991,289 | ||||||
| 62,000,000 | 0.086%, 2/11/2015 | 61,993,941 | ||||||
| 44,000,000 | 0.090%, 2/13/2015 | 43,995,270 | ||||||
| 56,000,000 | 0.090%, 2/20/2015 | 55,993,000 | ||||||
| 6,000,000 | 0.050%, 3/2/2015 | 5,999,500 | ||||||
| 49,000,000 | 0.100%, 3/4/2015 | 48,991,561 | ||||||
| 117,100,000 | 0.104%, 3/6/2015l | 117,078,367 | ||||||
| 21,000,000 | 0.110%, 3/11/2015 | 20,995,572 | ||||||
| 90,000,000 | 0.115%, 3/13/2015 | 89,979,528 | ||||||
| 5,000,000 | 0.130%, 3/18/2015 | 4,998,628 | ||||||
| 24,400,000 | 0.090%, 4/24/2015l | 24,393,107 | ||||||
Federal Home Loan Mortgage Corporation Discount Notes | ||||||||
| 47,000,000 | 0.037%, 1/12/2015l | 46,999,469 | ||||||
| 14,000,000 | 0.053%, 1/26/2015 | 13,999,485 | ||||||
| 3,000,000 | 0.085%, 1/28/2015 | 2,999,809 | ||||||
| 5,000,000 | 0.095%, 3/6/2015 | 4,999,156 | ||||||
Federal National Mortgage Association Discount Notes | ||||||||
| 34,950,000 | 0.046%, 1/5/2015 | 34,949,823 | ||||||
| 36,000,000 | 0.035%, 1/14/2015l | 35,999,545 | ||||||
| 26,000,000 | 0.070%, 2/18/2015 | 25,997,573 | ||||||
U.S. Treasury Bills | ||||||||
| 400,000 | 0.300%, 3/19/2015 | 399,974 | ||||||
| 62,000,000 | 0.040%, 4/9/2015 | 61,993,249 | ||||||
|
| |||||||
Total Short-Term Investments (at amortized cost) | 2,039,804,961 | |||||||
|
| |||||||
Total Investments (cost $8,664,971,115) 108.6% | $ | 9,347,987,236 | ||||||
|
| |||||||
Other Assets and Liabilities, Net (8.6%) | (740,224,835 | ) | ||||||
|
| |||||||
Total Net Assets 100.0% | $ | 8,607,762,401 | ||||||
|
| |||||||
The accompanying Notes to Financial Statements are an integral part of this schedule.
125
Table of Contents
MODERATE ALLOCATION PORTFOLIO
Schedule of Investments as of December 31, 2014
| a | The stated interest rate represents the weighted average of all contracts within the bank loan facility. |
| b | All or a portion of the loan is unfunded. |
| c | Denotes investments purchased on a when-issued or delayed delivery basis. |
| d | Denotes securities sold under Rule 144A of the Securities Act of 1933, which exempts them from registration. These securities have been deemed liquid and may be resold to other dealers in the program or to other qualified institutional buyers. As of December 31, 2014, the value of these investments was $152,307,821 or 1.8% of total net assets. |
| e | Denotes variable rate securities. Variable rate securities are securities whose yields vary with a designated market index or market rate. The rate shown is as of December 31, 2014. |
| f | Denotes step coupon securities. Step coupon securities pay an initial coupon rate for the first period and then different coupon rates for following periods. The rate shown is as of December 31, 2014. |
| g | All or a portion of the security is on loan. |
| h | Denotes interest only security. Interest only securities represent the right to receive monthly interest payments on an underlying pool of mortgages or assets. The principal shown is the outstanding par amount of the pool as of the end of the period. The actual effective yield of the security is different than the stated coupon rate. |
| i | Denotes perpetual securities. Perpetual securities pay an indefinite stream of interest, but may be called by the issuer at an earlier date. |
| j | Non-income producing security. |
| k | The interest rate shown reflects the yield, coupon rate or the discount rate at the date of purchase. |
| l | At December 31, 2014, $77,989,532 of investments were held on deposit with the counterparty and pledged as the initial margin deposit for open futures contracts. |
| * | Denotes restricted securities. Restricted securities are investment securities which have been deemed illiquid and cannot be offered for public sale without first being registered under the Securities Act of 1933. The following table indicates the acquisition date and cost of restricted securities Moderate Allocation Portfolio owned as of December 31, 2014. |
Security | Acquisition Date | Cost | ||||||
Alm Loan Funding CLO, 10/17/2026 | 7/31/2014 | $ | 1,399,300 | |||||
Apidos CLO XVIII, 7/22/2026 | 6/25/2014 | 1,396,500 | ||||||
ARES CLO, Ltd., 11/15/2025 | 11/26/2014 | 2,750,000 | ||||||
Babson CLO, Ltd. 2014-II, 10/17/2026 | 8/15/2014 | 1,399,300 | ||||||
Birchwood Park CLO, Ltd., 7/15/2026 | 7/31/2014 | 1,400,000 | ||||||
BlueMountain CLO, Ltd., 10/15/2026 | 8/27/2014 | 1,398,586 | ||||||
Carlyle Global Market Strategies CLO, Ltd., 10/15/2026 | 9/19/2014 | 1,400,000 | ||||||
Carlyle Global Market Strategies CLO, Ltd., 7/20/2023 | 7/3/2014 | 1,400,000 | ||||||
Cent CLO 16, LP, 8/1/2024 | 9/5/2014 | 1,400,000 | ||||||
Cent CLO 22, Ltd., 11/7/2026 | 9/19/2014 | 1,400,000 | ||||||
CoBank ACB, 6/15/2022 | 10/18/2013 | 467,587 | ||||||
Dryden 34 Senior Loan Fund CLO, 10/15/2026 | 7/21/2014 | 1,400,000 | ||||||
Edlinc Student Loan Funding Trust, 10/1/2025 | 2/28/2013 | 109,946 | ||||||
FNA Trust, 1/10/2018 | 4/29/2013 | 373,797 | ||||||
GoldenTree Loan Opportunities IX, Ltd., 10/29/2026 | 10/3/2014 | 1,398,600 | ||||||
JBS Finance II, Ltd., 1/29/2018 | 8/11/2014 | 1,536,071 | ||||||
Limerock CLO III, LLC, 10/20/2026 | 10/16/2014 | 4,500,000 | ||||||
Madison Park Funding XIV CLO, Ltd., 7/20/2026 | 7/3/2014 | 1,523,170 | ||||||
Neuberger Berman CLO, Ltd., 8/4/2025 | 6/19/2014 | 1,100,000 | ||||||
Octagon Investment Partners XX CLO, Ltd., 8/12/2026 | 7/10/2014 | 1,400,000 | ||||||
OHA Loan Funding 2014-1, Ltd., 10/20/2026 | 11/6/2014 | 4,488,750 | ||||||
OZLM VIII, Ltd., 10/17/2026 | 8/7/2014 | 1,392,020 | ||||||
Symphony CLO XV, Ltd., 10/17/2026 | 10/17/2014 | 4,466,250 | ||||||
Symphony CLO, Ltd., 1/9/2023 | 9/15/2014 | 1,400,000 | ||||||
Voya CLO 2014-3, Ltd., 7/25/2026 | 7/10/2014 | 1,397,900 | ||||||
Definitions:
| ADR | - | American Depositary Receipt, which are certificates for an underlying foreign security’s shares held by an issuing U.S. Depository bank. | ||
| CLO | - | Collateralized Loan Obligation | ||
| ETF | - | Exchange Traded Fund. | ||
| REIT | - | Real Estate Investment Trust is a company that buys, develops, manages and/or sells real estate assets. | ||
| TIPS | - | Treasury Inflation Protected Security. |
Unrealized Appreciation (Depreciation)
Gross unrealized appreciation and depreciation of investments, based on cost for federal income tax purposes, were as follows:
Gross unrealized appreciation | $ | 779,329,760 | ||
Gross unrealized depreciation | (101,562,663 | ) | ||
|
| |||
Net unrealized appreciation (depreciation) | $ | 677,767,097 | ||
Cost for federal income tax purposes | $ | 8,670,220,139 | ||
The accompanying Notes to Financial Statements are an integral part of this schedule.
126
Table of Contents
MODERATE ALLOCATION PORTFOLIO
Schedule of Investments as of December 31, 2014
Fair Valuation Measurements
The following table is a summary of the inputs used, as of December 31, 2014, in valuing Moderate Allocation Portfolio’s assets carried at fair value.
Investments in Securities | Total | Level 1 | Level 2 | Level 3 | ||||||||||||
Bank Loans | ||||||||||||||||
Basic Materials | 27,610,561 | — | 27,610,561 | — | ||||||||||||
Capital Goods | 11,617,324 | — | 11,617,324 | — | ||||||||||||
Communications Services | 120,136,889 | — | 107,299,331 | 12,837,558 | ||||||||||||
Consumer Cyclical | 57,553,323 | — | 57,553,323 | — | ||||||||||||
Consumer Non-Cyclical | 46,482,062 | — | 42,908,303 | 3,573,759 | ||||||||||||
Energy | 26,296,989 | — | 18,345,152 | 7,951,837 | ||||||||||||
Financials | 25,167,108 | — | 25,167,108 | — | ||||||||||||
Technology | 18,973,939 | — | 18,973,939 | — | ||||||||||||
Transportation | 14,301,670 | — | 9,526,379 | 4,775,291 | ||||||||||||
Utilities | 7,011,097 | — | 7,011,097 | — | ||||||||||||
Affiliated Mutual Funds | ||||||||||||||||
Equity Mutual Funds | 1,767,709,089 | 1,767,709,089 | — | — | ||||||||||||
Fixed Income Mutual Funds | 1,184,392,360 | 1,184,392,360 | — | — | ||||||||||||
Long-Term Fixed Income | ||||||||||||||||
Asset-Backed Securities | 96,042,800 | — | 92,807,768 | 3,235,032 | ||||||||||||
Basic Materials | 15,786,459 | — | 15,786,459 | — | ||||||||||||
Capital Goods | 16,216,612 | — | 16,216,612 | — | ||||||||||||
Collateralized Mortgage Obligations | 93,451,723 | — | 93,451,723 | — | ||||||||||||
Commercial Mortgage-Backed Securities | 55,795,213 | — | 55,795,213 | — | ||||||||||||
Communications Services | 51,710,324 | — | 51,710,324 | — | ||||||||||||
Consumer Cyclical | 29,523,166 | — | 29,523,166 | — | ||||||||||||
Consumer Non-Cyclical | 51,209,432 | — | 51,209,432 | — | ||||||||||||
Energy | 64,140,360 | — | 64,140,360 | — | ||||||||||||
Financials | 151,350,035 | — | 151,350,035 | — | ||||||||||||
Foreign Government | 1,253,169 | — | 1,253,169 | — | ||||||||||||
Mortgage-Backed Securities | 724,214,868 | — | 724,214,868 | — | ||||||||||||
Technology | 15,530,437 | — | 15,530,437 | — | ||||||||||||
Transportation | 10,112,394 | — | 10,112,394 | — | ||||||||||||
U.S. Government and Agencies | 591,808,743 | — | 591,808,743 | — | ||||||||||||
Utilities | 35,537,779 | — | 35,537,779 | — | ||||||||||||
Common Stock | ||||||||||||||||
Consumer Discretionary | 259,969,453 | 256,481,235 | 3,488,218 | — | ||||||||||||
Consumer Staples | 75,165,939 | 73,450,205 | 1,715,734 | — | ||||||||||||
Energy | 312,471,920 | 308,169,516 | 4,302,404 | — | ||||||||||||
Financials | 360,425,394 | 346,605,228 | 13,820,166 | — | ||||||||||||
Health Care | 255,330,923 | 251,619,028 | 3,711,895 | — | ||||||||||||
Industrials | 202,043,207 | 197,903,032 | 4,140,175 | — | ||||||||||||
Information Technology | 355,279,501 | 352,175,949 | 3,103,552 | — | ||||||||||||
Materials | 71,176,889 | 70,100,717 | 1,076,172 | — | ||||||||||||
Telecommunications Services | 11,377,779 | 7,717,828 | 3,659,951 | — | ||||||||||||
Utilities | 26,255,893 | 23,770,291 | 2,485,602 | — | ||||||||||||
Collateral Held for Securities Loaned | 67,749,452 | 67,749,452 | — | — | ||||||||||||
Short-Term Investments | 2,039,804,961 | — | 2,039,804,961 | — | ||||||||||||
|
|
|
|
|
|
|
| |||||||||
Total | $ | 9,347,987,236 | $ | 4,907,843,930 | $ | 4,407,769,829 | $ | 32,373,477 | ||||||||
|
|
|
|
|
|
|
| |||||||||
Other Financial Instruments | Total | Level 1 | Level 2 | Level 3 | ||||||||||||
Asset Derivatives | ||||||||||||||||
Futures Contracts | 75,567,377 | 75,567,377 | — | — | ||||||||||||
|
|
|
|
|
|
|
| |||||||||
Total Asset Derivatives | $ | 75,567,377 | $ | 75,567,377 | $ | — | $ | — | ||||||||
|
|
|
|
|
|
|
| |||||||||
Liability Derivatives | ||||||||||||||||
Futures Contracts | 15,502,217 | 15,502,217 | — | — | ||||||||||||
|
|
|
|
|
|
|
| |||||||||
Total Liability Derivatives | $ | 15,502,217 | $ | 15,502,217 | $ | — | $ | — | ||||||||
|
|
|
|
|
|
|
| |||||||||
There were no significant transfers between Levels during the period ended December 31, 2014. Transfers between Levels are identified as of the end of the period.
The accompanying Notes to Financial Statements are an integral part of this schedule.
127
Table of Contents
MODERATE ALLOCATION PORTFOLIO
Schedule of Investments as of December 31, 2014
Futures Contracts | Number of Contracts Long/(Short) | Expiration Date | Notional Principal Amount | Value | Unrealized Gain/(Loss) | |||||||||||||||
2-Yr. U.S. Treasury Bond Futures | (3,627 | ) | March 2015 | ($ | 793,734,733 | ) | ($ | 792,839,531 | ) | $ | 895,202 | |||||||||
5-Yr. U.S. Treasury Bond Futures | 232 | March 2015 | 27,603,747 | 27,591,689 | (12,058 | ) | ||||||||||||||
10-Yr. U.S. Treasury Bond Futures | 1,579 | March 2015 | 198,946,484 | 200,212,274 | 1,265,790 | |||||||||||||||
30-Yr. U.S. Treasury Bond Futures | 2,431 | March 2015 | 341,733,838 | 351,431,437 | 9,697,599 | |||||||||||||||
Eurex EURO STOXX 50 Futures | 10,174 | March 2015 | 365,891,399 | 385,090,597 | 19,199,198 | |||||||||||||||
Mini MSCI EAFE Index Futures | 1,701 | March 2015 | 148,129,357 | 149,509,395 | 1,380,038 | |||||||||||||||
Russell 2000 Index Mini-Futures | 1,587 | March 2015 | 180,936,600 | 190,551,090 | 9,614,490 | |||||||||||||||
S&P 400 Index Mini-Futures | (2,562 | ) | March 2015 | (355,641,161 | ) | (371,131,320 | ) | (15,490,159 | ) | |||||||||||
S&P 500 Index Futures | 1,609 | March 2015 | 797,768,105 | 825,577,900 | 27,809,795 | |||||||||||||||
Ultra Long Term U.S. Treasury Bond Futures | 747 | March 2015 | 117,689,798 | 123,395,063 | 5,705,265 | |||||||||||||||
Total Futures Contracts | $ | 60,065,160 | ||||||||||||||||||
The following table summarizes the fair value and Statement of Assets and Liabilities location, as of December 31, 2014, for Moderate Allocation Portfolio’s investments in financial derivative instruments by primary risk exposure as discussed under item (2) Significant Accounting Policies of the Notes to Financial Statements.
Derivatives by risk category | Statement of Assets and Liabilities Location | Fair Value | ||||
Asset Derivatives | ||||||
Interest Rate Contracts | ||||||
Futures* | Net Assets - Net unrealized appreciation/(depreciation) on Futures contracts | $ | 17,563,856 | |||
Total Interest Rate Contracts | 17,563,856 | |||||
Equity Contracts | ||||||
Futures* | Net Assets - Net unrealized appreciation/(depreciation) on Futures contracts | 58,003,521 | ||||
Total Equity Contracts | 58,003,521 | |||||
|
| |||||
Total Asset Derivatives | $ | 75,567,377 | ||||
|
| |||||
Liability Derivatives | ||||||
Interest Rate Contracts | ||||||
Futures* | Net Assets - Net unrealized appreciation/(depreciation) on Futures contracts | 12,058 | ||||
Total Interest Rate Contracts | 12,058 | |||||
Equity Contracts | ||||||
Futures* | Net Assets - Net unrealized appreciation/(depreciation) on Futures contracts | 15,490,159 | ||||
Total Equity Contracts | 15,490,159 | |||||
|
| |||||
Total Liability Derivatives | $ | 15,502,217 | ||||
|
| |||||
| * | Includes cumulative appreciation/depreciation of futures contracts as reported in the Schedule of Investments. Only current day’s variation margin is reported within the Statement of Assets and Liabilities. |
The following table summarizes the net realized gains/(losses) and Statement of Operations location, for the period ended December 31, 2014, for Moderate Allocation Portfolio’s investments in financial derivative instruments by primary risk exposure.
Derivatives by risk category | Statement of Operations Location | Realized Gains/(Losses) recognized in Income | ||||
Equity Contracts | ||||||
Futures | Net realized gains/(losses) on Futures contracts | 42,627,465 | ||||
Total Equity Contracts | 42,627,465 | |||||
Interest Rate Contracts | ||||||
Futures | Net realized gains/(losses) on Futures contracts | 45,491,771 | ||||
Total Interest Rate Contracts | 45,491,771 | |||||
Credit Contracts | ||||||
Credit Default Swaps | Net realized gains/(losses) on Swap agreements | 94,659 | ||||
Total Credit Contracts | 94,659 | |||||
|
| |||||
Total | $ | 88,213,895 | ||||
|
| |||||
The accompanying Notes to Financial Statements are an integral part of this schedule.
128
Table of Contents
MODERATE ALLOCATION PORTFOLIO
Schedule of Investments as of December 31, 2014
The following table summarizes the change in net unrealized appreciation/(depreciation) and Statement of Operations location, for the period ended December 31, 2014, for Moderate Allocation Portfolio’s investments in financial derivative instruments by primary risk exposure.
Derivatives by risk category | Statement of Operations Location | Change in unrealized appreciation/(depreciation) recognized in Income | ||||
Interest Rate Contracts | ||||||
Futures | Change in net unrealized appreciation/(depreciation) on Futures contracts | 17,882,287 | ||||
Total Interest Rate Contracts | 17,882,287 | |||||
Equity Contracts | ||||||
Futures | Change in net unrealized appreciation/(depreciation) on Futures contracts | 21,282,907 | ||||
Total Equity Contracts | 21,282,907 | |||||
|
| |||||
Total | $ | 39,165,194 | ||||
|
| |||||
The following table presents Moderate Allocation Portfolio’s average volume of derivative activity during the period ended December 31, 2014.
Derivative Risk Category | Futures (Notional)* | Futures (Percentage of Average Net Assets) | Swaps (Notional)* | |||||||||
Equity Contracts | $ | 1,152,229,525 | 14.4 | % | N/A | |||||||
Interest Rate Contracts | 1,141,904,719 | 14.2 | N/A | |||||||||
Credit Contracts | N/A | N/A | $ | 41,484 | ||||||||
| * | Notional amount represents long or short, or both, derivative positions held by the Portfolio. |
Investment in Affiliates
Affiliated issuers, as defined under the Investment Company Act of 1940, include those in which the Portfolio’s holdings of an issuer represent 5% or more of the outstanding voting securities of an issuer, or any affiliated mutual fund.
A summary of transactions for the fiscal year to date, in Moderate Allocation Portfolio, is as follows:
Portfolio | Value December 31, 2013 | Gross Purchases | Gross Sales | Shares Held at December 31, 2014 | Value December 31, 2014 | Income Earned January 1, 2014 - December 31, 2014 | ||||||||||||||||||
Partner Small Cap Growth | $ | 111,969,730 | $ | 12,679,772 | $ | 105,542,526 | — | $ | — | $ | — | |||||||||||||
Partner Small Cap Value | 123,506,706 | 3,460,213 | — | 4,493,008 | 127,064,959 | 268,222 | ||||||||||||||||||
Small Cap Stock | 64,136,532 | 839,506 | — | 3,657,193 | 67,186,286 | 139,621 | ||||||||||||||||||
Partner Mid Cap Value | 114,956,666 | 16,693,226 | — | 7,195,521 | 130,503,721 | 772,773 | ||||||||||||||||||
Mid Cap Stock | 206,628,012 | 10,426,936 | — | 12,265,522 | 231,277,457 | 686,656 | ||||||||||||||||||
Partner Worldwide Allocation | 534,686,884 | 10,867,977 | — | 54,413,534 | 506,078,515 | 10,867,977 | ||||||||||||||||||
Large Cap Value | 413,079,767 | 5,269,010 | — | 26,828,993 | 450,386,356 | 5,269,010 | ||||||||||||||||||
Large Cap Stock | 242,388,982 | 2,198,417 | — | 20,701,632 | 255,211,795 | 2,198,417 | ||||||||||||||||||
High Yield | 196,151,522 | 11,834,563 | 11,319,065 | 38,748,320 | 188,836,063 | 11,834,225 | ||||||||||||||||||
Income | 623,763,330 | 32,100,290 | 42,148,275 | 59,336,507 | 623,098,599 | 24,218,735 | ||||||||||||||||||
Limited Maturity Bond | 396,082,117 | 6,792,998 | 30,288,311 | 37,948,191 | 372,457,698 | 6,797,681 | ||||||||||||||||||
Cash Management Trust- Collateral Investment | 67,924,410 | 1,028,320,690 | 1,028,495,648 | 67,749,452 | 67,749,452 | 540,459 | ||||||||||||||||||
Total Value and | 3,095,274,658 | 3,019,850,901 | 63,593,776 | |||||||||||||||||||||
The accompanying Notes to Financial Statements are an integral part of this schedule.
129
Table of Contents
MODERATELY CONSERVATIVE ALLOCATION PORTFOLIO
Schedule of Investments as of December 31, 2014
| Principal Amount | Bank Loans (4.0%)a | Value | ||||||
| Basic Materials (0.2%) |
| ||||||
Alpha Natural Resources, Inc., Term Loan |
| |||||||
| $ | 1,918,097 | 3.500%, 5/22/2020 | $ | 1,516,505 | ||||
Axalta Coating Systems US Holdings, Inc., Term Loan |
| |||||||
| 1,520,558 | 3.750%, 2/1/2020 | 1,477,556 | ||||||
Fortescue Metals Group, Ltd., Term Loan |
| |||||||
| 1,451,773 | 3.750%, 6/30/2019 | 1,315,306 | ||||||
Ineos Group Holdings, Ltd., Term Loan |
| |||||||
| 2,300,026 | 3.750%, 5/4/2018 | 2,225,023 | ||||||
NewPage Corporation, Term Loan |
| |||||||
| 1,050,000 | 9.500%, 2/11/2021 | 995,747 | ||||||
Wausau Paper Corporation, Term Loan |
| |||||||
| 1,293,500 | 6.500%, 7/30/2020 | 1,280,565 | ||||||
|
| |||||||
Total | 8,810,702 | |||||||
|
| |||||||
| Capital Goods (0.2%) |
| ||||||
ADS Waste Holdings, Inc., Term Loan |
| |||||||
| 1,768,433 | 3.750%, 10/9/2019 | 1,713,718 | ||||||
Berry Plastics Group, Inc., Term Loan |
| |||||||
| 3,409,275 | 3.500%, 2/8/2020 | 3,292,371 | ||||||
Silver II Borrower, Term Loan |
| |||||||
| 846,720 | 4.000%, 12/13/2019 | 785,070 | ||||||
STHI Holding Corporation, Term Loan |
| |||||||
| 463,838 | 4.500%, 8/6/2021 | 459,584 | ||||||
|
| |||||||
Total | 6,250,743 | |||||||
|
| |||||||
| Communications Services (1.5%) |
| ||||||
Atlantic Broadband Penn, LLC, Term Loan |
| |||||||
| 914,619 | 3.250%, 11/30/2019 | 894,040 | ||||||
Birch Communication Inc., Term Loan |
| |||||||
| 1,943,056 | 7.750%, 7/17/2020 | 1,904,194 | ||||||
Cable & Wireless Communications plc, Term Loan |
| |||||||
| 336,000 | 0.000%, 11/25/2016b,c | 334,320 | ||||||
Cengage Learning Aquisitions, Term Loan |
| |||||||
| 3,895,563 | 7.000%, 3/31/2020 | 3,851,737 | ||||||
Cequel Communications, LLC, Term Loan |
| |||||||
| 1,070,786 | 3.500%, 2/14/2019 | 1,052,647 | ||||||
Charter Communications Operating, LLC, Term Loan |
| |||||||
| 453,100 | 3.000%, 7/1/2020 | 443,757 | ||||||
| 2,216,250 | 3.000%, 1/3/2021 | 2,169,620 | ||||||
Clear Channel Communications, Inc., Term Loan |
| |||||||
| 16,810 | 3.819%, 1/29/2016 | 16,617 | ||||||
| 1,992,484 | 6.919%, 1/30/2019 | 1,874,349 | ||||||
| 640,816 | 7.669%, 7/30/2019 | 609,577 | ||||||
Cumulus Media Holdings, Inc., Term Loan |
| |||||||
| 2,133,096 | 4.250%, 12/23/2020b,c | 2,065,541 | ||||||
Fairpoint Communications, Term Loan |
| |||||||
| 2,269,575 | 7.500%, 2/14/2019 | 2,245,472 | ||||||
Grande Communications Networks, LLC, Term Loan | ||||||||
| 1,339,613 | 4.500%, 5/29/2020 | 1,321,194 | ||||||
Hargray Communications Group, Inc., Term Loan | ||||||||
| 2,394,796 | 5.250%, 6/26/2019 | 2,376,835 | ||||||
Integra Telecom Holdings, Inc., Term Loan | ||||||||
| 1,341,112 | 5.250%, 2/22/2019 | 1,301,724 | ||||||
| 460,000 | 9.750%, 2/21/2020 | 455,975 | ||||||
Intelsat Jackson Holdings SA, Term Loan | ||||||||
| 1,255,968 | 3.750%, 6/30/2019 | 1,235,559 | ||||||
Level 3 Communications, Inc., Term Loan | ||||||||
| 2,540,000 | 4.000%, 1/15/2020 | 2,517,775 | ||||||
Level 3 Financing, Inc., Term Loan | ||||||||
| 840,000 | 4.500%, 1/31/2022 | 839,740 | �� | |||||
Liberty Cablevision of Puerto Rico, LLC, Term Loan | ||||||||
| 1,210,000 | 0.000%, 1/7/2022b,c | 1,173,700 | ||||||
| 875,000 | 4.500%, 1/7/2022 | 850,938 | ||||||
LTS Buyer, LLC, Term Loan | ||||||||
| 1,463,836 | 4.000%, 4/13/2020 | 1,429,992 | ||||||
| 72,737 | 8.000%, 4/12/2021 | 71,374 | ||||||
McGraw-Hill Global Education, LLC, Term Loan | ||||||||
| 1,950,987 | 5.750%, 3/22/2019 | 1,940,627 | ||||||
Mediacom Broadband, LLC, Term Loan | ||||||||
| 1,016,600 | 4.000%, 1/20/2020 | 992,883 | ||||||
NEP Broadcasting, LLC, Term Loan | ||||||||
| 134,286 | 9.500%, 7/22/2020 | 131,432 | ||||||
NEP/NCP Holdco, Inc., Term Loan | ||||||||
| 3,389,926 | 4.250%, 1/22/2020 | 3,310,839 | ||||||
NTelos, Inc., Term Loan | ||||||||
| 669,587 | 5.750%, 11/9/2019 | 582,541 | ||||||
Puerto Rico Cable Acquisition Company, Inc., Term Loan | ||||||||
| 454,534 | 5.500%, 7/31/2018 | 451,125 | ||||||
Syniverse Holdings, Inc., Term Loan | ||||||||
| 1,793,615 | 4.000%, 4/23/2019 | 1,739,806 | ||||||
TNS, Inc., Term Loan | ||||||||
| 1,347,738 | 5.000%, 2/14/2020 | 1,332,576 | ||||||
Univision Communications, Inc., Term Loan | ||||||||
| 2,993,065 | 4.000%, 3/1/2020 | 2,922,728 | ||||||
Virgin Media Investment Holdings, Ltd., Term Loan | ||||||||
| 2,825,000 | 3.500%, 6/7/2020 | 2,770,223 | ||||||
WideOpenWest Finance, LLC, Term Loan | ||||||||
| 2,991,712 | 4.750%, 4/1/2019 | 2,967,420 | ||||||
XO Communications, LLC, Term Loan | ||||||||
| 590,538 | 4.250%, 3/20/2021 | 578,727 | ||||||
Yankee Cable Acquisition, LLC, Term Loan | ||||||||
| 1,754,109 | 4.500%, 3/1/2020 | 1,743,145 | ||||||
Zayo Group, LLC, Term Loan | ||||||||
| 2,673,426 | 4.000%, 7/2/2019 | 2,641,077 | ||||||
|
| |||||||
Total | 55,141,826 | |||||||
|
| |||||||
The accompanying Notes to Financial Statements are an integral part of this schedule.
130
Table of Contents
MODERATELY CONSERVATIVE ALLOCATION PORTFOLIO
Schedule of Investments as of December 31, 2014
| Principal Amount | Bank Loans (4.0%)a | Value | ||||||
| Consumer Cyclical (0.7%) | ||||||||
Amaya Gaming Group, Inc., Term Loan | ||||||||
| $ | 1,536,150 | 5.000%, 8/1/2021b,c | $ | 1,519,636 | ||||
Burlington Coat Factory Warehouse Corporation, Term Loan | ||||||||
| 1,173,024 | 4.250%, 8/13/2021 | 1,156,167 | ||||||
Ceridian HCM Holding, Inc., Term Loan | ||||||||
| 581,663 | 4.500%, 9/15/2020 | 571,124 | ||||||
Chrysler Group, LLC, Term Loan | ||||||||
| 1,507,659 | 3.500%, 5/24/2017 | 1,496,623 | ||||||
Golden Nugget, Inc., Delayed Draw | ||||||||
| 262,845 | 5.500%, 11/21/2019 | 259,068 | ||||||
Golden Nugget, Inc., Term Loan | ||||||||
| 613,305 | 5.500%, 11/21/2019 | 604,492 | ||||||
Hilton Worldwide Finance, LLC, Term Loan | ||||||||
| 1,883,772 | 3.500%, 10/26/2020 | 1,859,434 | ||||||
J.C. Penney Corporation, Inc., Term Loan | ||||||||
| 1,984,775 | 6.000%, 5/22/2018 | 1,943,432 | ||||||
Las Vegas Sands, LLC, Term Loan | ||||||||
| 1,980,000 | 3.250%, 12/19/2020 | 1,965,982 | ||||||
Marina District Finance Company, Inc., Term Loan | ||||||||
| 1,770,525 | 6.750%, 8/15/2018 | 1,754,661 | ||||||
MGM Resorts International, Term Loan | ||||||||
| 1,406,300 | 3.500%, 12/20/2019 | 1,366,755 | ||||||
Mohegan Tribal Gaming Authority, Term Loan | ||||||||
| 3,366,000 | 5.500%, 11/19/2019 | 3,228,364 | ||||||
Rite Aid Corporation, Term Loan | ||||||||
| 339,844 | 3.500%, 2/21/2020 | 337,720 | ||||||
| 695,000 | 5.750%, 8/21/2020 | 696,161 | ||||||
ROC Finance, LLC, Term Loan | ||||||||
| 2,498,375 | 5.000%, 6/20/2019 | 2,310,997 | ||||||
Scientific Games International, Inc., Term Loan | ||||||||
| 3,079,669 | 6.000%, 10/18/2020 | 3,031,164 | ||||||
Seminole Indian Tribe of Florida, Term Loan | ||||||||
| 759,038 | 3.000%, 4/29/2020 | 754,612 | ||||||
|
| |||||||
Total | 24,856,392 | |||||||
|
| |||||||
| Consumer Non-Cyclical (0.5%) | ||||||||
Albertsons, Inc., Term Loan | ||||||||
| 3,503,516 | 4.750%, 3/21/2019 | 3,477,240 | ||||||
Biomet, Inc., Term Loan | ||||||||
| 460,171 | 3.670%, 7/25/2017 | 457,377 | ||||||
Catalina Marketing Corporation, Term Loan | ||||||||
| 477,600 | 4.500%, 4/9/2021 | 453,424 | ||||||
CHS/Community Health Systems, Inc., Term Loan | ||||||||
| 351,128 | 3.486%, 1/25/2017 | 348,786 | ||||||
| 935,872 | 4.250%, 1/27/2021 | 932,559 | ||||||
Del Monte Corporation, Term Loan | ||||||||
| 283,943 | 3.500%, 3/9/2020 | 271,165 | ||||||
Hologic, Inc., Term Loan | ||||||||
| 913,709 | 3.250%, 8/1/2019 | 903,942 | ||||||
JBS USA, LLC, Term Loan | ||||||||
| 1,508,730 | 3.750%, 5/25/2018 | 1,486,099 | ||||||
Ortho-Clinical Diagnostics, Inc., Term Loan | ||||||||
| 1,393,000 | 4.750%, 6/30/2021 | 1,368,274 | ||||||
Roundy’s Supermarkets, Inc., Term Loan | ||||||||
| 2,005,549 | 5.750%, 3/3/2021 | 1,876,853 | ||||||
Supervalu, Inc., Term Loan | ||||||||
| 4,242,573 | 4.500%, 3/21/2019 | 4,160,098 | ||||||
Visant Corporation, Term Loan | ||||||||
| 2,542,033 | 7.000%, 9/23/2021 | 2,465,772 | ||||||
|
| |||||||
Total | 18,201,589 | |||||||
|
| |||||||
| Energy (0.3%) | ||||||||
Arch Coal, Inc., Term Loan | ||||||||
| 2,645,358 | 6.250%, 5/16/2018 | 2,183,532 | ||||||
Energy Solutions, LLC, Term Loan | ||||||||
| 547,250 | 6.750%, 5/29/2020 | 544,683 | ||||||
Expro Holdings UK 2, Ltd., Term Loan | ||||||||
| 748,125 | 5.750%, 9/2/2021 | 609,722 | ||||||
Fieldwood Energy, LLC, Term Loan | ||||||||
| 888,755 | 3.875%, 9/28/2018 | 839,873 | ||||||
| 389,261 | 8.375%, 9/30/2020 | 282,701 | ||||||
Houston Fuel Oil Terminal, LLC, Term Loan | ||||||||
| 1,366,575 | 4.250%, 8/19/2021b,c | 1,305,079 | ||||||
McJunkin Red Man Corporation, Term Loan | ||||||||
| 1,071,438 | 5.000%, 11/8/2019 | 983,044 | ||||||
Offshore Group Investment, Ltd., Term Loan | ||||||||
| 1,817,625 | 5.750%, 3/28/2019 | 1,354,131 | ||||||
Pacific Drilling SA, Term Loan | ||||||||
| 1,260,800 | 4.500%, 6/3/2018 | 1,035,961 | ||||||
TerraForm Power Operating, LLC, Term Loan | ||||||||
| 507,450 | 4.750%, 7/23/2019 | 504,913 | ||||||
|
| |||||||
Total | 9,643,639 | |||||||
|
| |||||||
| Financials (0.2%) | ||||||||
DJO Finance, LLC, Term Loan | ||||||||
| 1,939,653 | 4.250%, 9/15/2017 | 1,892,772 | ||||||
GEO Group, Inc., Term Loan | ||||||||
| 453,100 | 3.250%, 4/3/2020 | 447,812 | ||||||
Harland Clarke Holdings Corporation, Term Loan | ||||||||
| 2,242,625 | 7.000%, 5/22/2018 | 2,244,868 | ||||||
| 243,750 | 6.000%, 8/4/2019 | 242,227 | ||||||
MoneyGram International, Inc., Term Loan | ||||||||
| 1,807,800 | 4.250%, 3/27/2020 | 1,653,233 | ||||||
WaveDivision Holdings, LLC, Term Loan | ||||||||
| 2,464,700 | 4.000%, 10/15/2019 | 2,423,613 | ||||||
|
| |||||||
Total | 8,904,525 | |||||||
|
| |||||||
| Technology (0.1%) | ||||||||
First Data Corporation, Term Loan | ||||||||
| 2,090,000 | 3.667%, 3/23/2018 | 2,046,904 | ||||||
| 1,040,000 | 3.667%, 9/24/2018 | 1,015,560 | ||||||
Freescale Semiconductor, Inc., Term Loan | ||||||||
| 1,640,900 | 4.250%, 2/28/2020 | 1,598,861 | ||||||
The accompanying Notes to Financial Statements are an integral part of this schedule.
131
Table of Contents
MODERATELY CONSERVATIVE ALLOCATION PORTFOLIO
Schedule of Investments as of December 31, 2014
| Principal Amount | Bank Loans (4.0%)a | Value | ||||||
| Technology (0.1%) - continued | |||||||
Infor US, Inc., Term Loan | ||||||||
| $ | 1,059,611 | 3.750%, 6/3/2020 | $ | 1,026,572 | ||||
|
| |||||||
Total | 5,687,897 | |||||||
|
| |||||||
| Transportation (0.2%) | |||||||
American Airlines, Inc., Term Loan | ||||||||
| 1,905,975 | 3.750%, 6/27/2019 | 1,882,950 | ||||||
Delta Air Lines, Inc., Term Loan | ||||||||
| 1,545,278 | 3.250%, 4/20/2017b,c | 1,525,962 | ||||||
OSG Bulk Ships, Inc., Term Loan | ||||||||
| 1,194,000 | 5.250%, 8/5/2019 | 1,161,165 | ||||||
United Airlines, Inc., Term Loan | ||||||||
| 1,129,875 | 3.500%, 4/1/2019 | 1,108,690 | ||||||
| 224,437 | 3.750%, 9/15/2021 | 222,007 | ||||||
|
| |||||||
Total | 5,900,774 | |||||||
|
| |||||||
| Utilities (0.1%) | |||||||
Calpine Corporation, Term Loan | ||||||||
| 337,977 | 4.000%, 4/1/2018 | 333,837 | ||||||
| 2,038,087 | 4.000%, 10/9/2019 | 2,008,800 | ||||||
Intergen NV, Term Loan | ||||||||
| 881,575 | 5.500%, 6/15/2020 | 873,491 | ||||||
NGPL PipeCo, LLC, Term Loan | ||||||||
| 1,670,213 | 6.750%, 9/15/2017 | 1,618,019 | ||||||
|
| |||||||
Total | 4,834,147 | |||||||
|
| |||||||
Total Bank Loans (cost $152,806,734) | 148,232,234 | |||||||
|
| |||||||
Long-Term Fixed Income (34.7%) | ||||||||
| Asset-Backed Securities (1.9%) | |||||||
Access Group, Inc. | ||||||||
| 1,486,864 | 0.670%, 2/25/2036d,e | 1,468,849 | ||||||
Ally Auto Receivables Trust 2013-SN1 | ||||||||
| 1,378,410 | 0.720%, 5/20/2016 | 1,378,873 | ||||||
ARES CLO, Ltd. | ||||||||
| 1,500,000 | 1.714%, 11/15/2025*,e | 1,500,000 | ||||||
BA Credit Card Trust | ||||||||
| 1,100,000 | 0.541%, 6/15/2021e | 1,099,135 | ||||||
Barclays Dryrock Issuance Trust | ||||||||
| 1,000,000 | 0.521%, 12/16/2019e | 998,739 | ||||||
Capital One Multi-Asset Execution Trust | ||||||||
| 1,350,000 | 0.541%, 1/18/2022e | 1,348,511 | ||||||
Chase Issuance Trust | ||||||||
| 1,475,000 | 1.150%, 1/15/2019 | 1,474,276 | ||||||
Chesapeake Funding, LLC | ||||||||
| 1,888,375 | 0.607%, 1/7/2025d,e | 1,886,595 | ||||||
Citibank Credit Card Issuance Trust | ||||||||
| 2,000,000 | 1.020%, 2/22/2019 | 1,992,310 | ||||||
Countrywide Asset-Backed Certificates | ||||||||
| 1,654,772 | 5.530%, 4/25/2047 | 1,627,114 | ||||||
Edlinc Student Loan Funding Trust | ||||||||
| 1,186,969 | 3.160%, 10/1/2025*,e | 1,201,806 | ||||||
FirstEnergy Ohio PIRB Special Purpose Trust | ||||||||
| 1,111,987 | 0.679%, 1/15/2019 | 1,111,663 | ||||||
FNA Trust | ||||||||
| 520,668 | 1.980%, 1/10/2018* | 521,709 | ||||||
Ford Credit Auto Owner Trust | ||||||||
| 810,000 | 2.260%, 11/15/2025d | 814,324 | ||||||
GE Equipment Transportation, LLC | ||||||||
| 1,902,680 | 0.690%, 11/25/2016 | 1,903,392 | ||||||
Golden Credit Card Trust | ||||||||
| 1,620,000 | 0.411%, 2/15/2018d,e | 1,619,446 | ||||||
| 1,000,000 | 0.591%, 9/15/2018d,e | 1,002,244 | ||||||
GoldenTree Loan Opportunities IX, Ltd. | ||||||||
| 825,000 | 1.829%, 10/29/2026*,e | 818,529 | ||||||
GreatAmerica Leasing Receivables | ||||||||
| 2,443,782 | 0.610%, 5/15/2016d | 2,443,951 | ||||||
Hertz Fleet Lease Funding, LP | ||||||||
| 2,200,000 | 0.712%, 12/10/2027d,e | 2,200,838 | ||||||
Hyundai Floorplan Master Owner Trust | ||||||||
| 2,632,500 | 0.511%, 5/15/2018d,e | 2,634,511 | ||||||
Master Credit Card Trust | ||||||||
| 1,587,300 | 0.780%, 4/21/2017d | 1,587,808 | ||||||
Morgan Stanley Bank of America Merrill Lynch Trust | ||||||||
| 3,400,000 | 3.176%, 8/15/2045 | 3,481,060 | ||||||
| 3,400,000 | 3.246%, 12/15/2047 | 3,435,319 | ||||||
Morgan Stanley Capital, Inc. | ||||||||
| 1,969,260 | 0.320%, 2/25/2037e | 1,231,802 | ||||||
Motor plc | ||||||||
| 962,000 | 0.670%, 2/15/2021d | 962,303 | ||||||
OZLM VIII, Ltd. | ||||||||
| 825,000 | 1.715%, 10/17/2026*,e | 821,043 | ||||||
Penarth Master Issuer plc | ||||||||
| 2,200,000 | 0.552%, 11/18/2017d,e | 2,200,579 | ||||||
Renaissance Home Equity Loan Trust | ||||||||
| 5,500,000 | 6.011%, 5/25/2036f | 3,891,553 | ||||||
| 2,463,611 | 5.580%, 11/25/2036f | 1,518,770 | ||||||
SLM Student Loan Trust | ||||||||
| 2,851,869 | 0.761%, 8/15/2022d,e | 2,854,806 | ||||||
| 1,559,095 | 0.634%, 4/25/2023d,e | 1,559,791 | ||||||
| 1,350,000 | 1.211%, 5/17/2027d,e | 1,358,810 | ||||||
U.S. Small Business Administration | ||||||||
| 429,568 | 3.191%, 3/10/2024 | 445,127 | ||||||
Vericrest Opportunity Loan Transferee | ||||||||
| 4,322,957 | 3.125%, 4/27/2054d | 4,297,798 | ||||||
Volvo Financial Equipment, LLC | ||||||||
| 1,950,000 | 0.740%, 3/15/2017d | 1,951,656 | ||||||
World Financial Network Credit Card Master Trust | ||||||||
| 1,950,000 | 0.910%, 3/16/2020 | 1,947,184 | ||||||
World Omni Automobile Lease Securitization Trust | ||||||||
| 2,100,000 | 1.400%, 2/15/2019 | 2,113,207 | ||||||
World Omni Master Owner Trust | ||||||||
| 1,620,000 | 0.505%, 2/15/2018d,e | 1,620,092 | ||||||
|
| |||||||
Total | 68,325,523 | |||||||
|
| |||||||
| Basic Materials (0.4%) | |||||||
Albemarle Corporation | ||||||||
| 230,000 | 3.000%, 12/1/2019 | 230,035 | ||||||
The accompanying Notes to Financial Statements are an integral part of this schedule.
132
Table of Contents
MODERATELY CONSERVATIVE ALLOCATION PORTFOLIO
Schedule of Investments as of December 31, 2014
| Principal Amount | Long-Term Fixed Income (34.7%) | Value | ||||||
| Basic Materials (0.4%) - continued | |||||||
ArcelorMittal | ||||||||
| $ | 1,300,000 | 6.000%, 3/1/2021 | $ | 1,352,000 | ||||
Eastman Chemical Company | ||||||||
| 450,000 | 2.700%, 1/15/2020 | 452,554 | ||||||
First Quantum Minerals, Ltd. | ||||||||
| 847,000 | 6.750%, 2/15/2020d | 766,535 | ||||||
| 847,000 | 7.000%, 2/15/2021d | 762,300 | ||||||
FMG Resources August 2006 Pty., Ltd. | ||||||||
| 644,445 | 6.875%, 2/1/2018d,g | 584,833 | ||||||
Freeport-McMoRan, Inc. | ||||||||
| 1,759,000 | 2.375%, 3/15/2018 | 1,739,660 | ||||||
Georgia-Pacific, LLC | ||||||||
| 535,000 | 2.539%, 11/15/2019d | 534,815 | ||||||
Goldcorp, Inc. | ||||||||
| 900,000 | 2.125%, 3/15/2018 | 889,528 | ||||||
Hexion US Finance Corporation/Hexion Nova Scotia Finance ULC | ||||||||
| 1,500,000 | 8.875%, 2/1/2018 | 1,335,000 | ||||||
Ineos Finance plc | ||||||||
| 1,500,000 | 7.500%, 5/1/2020d | 1,575,000 | ||||||
LyondellBasell Industries NV | ||||||||
| 1,020,000 | 6.000%, 11/15/2021 | 1,173,978 | ||||||
Sappi Papier Holding GmbH | ||||||||
| 845,000 | 6.625%, 4/15/2021d | 866,125 | ||||||
Vale Overseas, Ltd. | ||||||||
| 938,000 | 6.250%, 1/23/2017 | 1,000,480 | ||||||
Yamana Gold, Inc. | ||||||||
| 890,000 | 4.950%, 7/15/2024 | 868,619 | ||||||
|
| |||||||
Total | 14,131,462 | |||||||
|
| |||||||
| Capital Goods (0.4%) | |||||||
BAE Systems plc | ||||||||
| 620,000 | 3.500%, 10/11/2016d | 644,027 | ||||||
CNH Capital, LLC | ||||||||
| 1,500,000 | 3.625%, 4/15/2018 | 1,477,500 | ||||||
Crown Americas Capital Corporation IV | ||||||||
| 1,450,000 | 4.500%, 1/15/2023 | 1,406,500 | ||||||
Harsco Corporation | ||||||||
| 978,000 | 2.700%, 10/15/2015 | 976,777 | ||||||
Hutchison Whampoa Finance CI, Ltd. | ||||||||
| 785,000 | 1.625%, 10/31/2017d | 778,532 | ||||||
Ingersoll-Rand Global Holding Company, Ltd. | ||||||||
| 992,000 | 6.875%, 8/15/2018 | 1,151,579 | ||||||
L-3 Communications Corporation | ||||||||
| 992,000 | 1.500%, 5/28/2017 | 982,242 | ||||||
Martin Marietta Materials, Inc. | ||||||||
| 750,000 | 1.357%, 6/30/2017e | 758,223 | ||||||
Owens-Brockway Glass Container, Inc. | ||||||||
| 970,000 | 5.000%, 1/15/2022d | 989,400 | ||||||
Raytheon Company | ||||||||
| 780,000 | 4.200%, 12/15/2044 | 810,181 | ||||||
Reynolds Group Issuer, Inc. | ||||||||
| 1,412,019 | 5.750%, 10/15/2020 | 1,447,319 | ||||||
Roper Industries, Inc. | ||||||||
| 1,016,000 | 2.050%, 10/1/2018 | 1,007,614 | ||||||
RSC Equipment Rental, Inc. | ||||||||
| 1,500,000 | 8.250%, 2/1/2021 | 1,635,000 | ||||||
Textron, Inc. | ||||||||
| 680,000 | 5.600%, 12/1/2017 | 747,256 | ||||||
|
| |||||||
Total | 14,812,150 | |||||||
|
| |||||||
| Collateralized Mortgage Obligations (1.6%) | |||||||
Alm Loan Funding CLO | ||||||||
| 825,000 | 1.664%, 10/17/2026*,e | 820,603 | ||||||
Alternative Loan Trust | ||||||||
| 1,955,767 | 6.000%, 6/25/2036 | 1,753,186 | ||||||
Apidos CLO XVIII | ||||||||
| 825,000 | 1.646%, 7/22/2026*,e | 815,173 | ||||||
Babson CLO, Ltd. 2014-II | ||||||||
| 825,000 | 1.656%, 10/17/2026*,e | 819,019 | ||||||
Birchwood Park CLO, Ltd. | ||||||||
| 825,000 | 1.674%, 7/15/2026*,e | 821,009 | ||||||
BlueMountain CLO, Ltd. | ||||||||
| 825,000 | 1.480%, 10/15/2026*,e | 817,447 | ||||||
Carlyle Global Market Strategies CLO, Ltd. | ||||||||
| 825,000 | 1.531%, 7/20/2023*,e | 818,396 | ||||||
| 825,000 | 1.733%, 10/15/2026*,e | 823,397 | ||||||
Cent CLO 16, LP | ||||||||
| 825,000 | 1.482%, 8/1/2024*,e | 817,782 | ||||||
Cent CLO 22, Ltd. | ||||||||
| 825,000 | 1.713%, 11/7/2026*,e | 817,188 | ||||||
Citigroup Mortgage Loan Trust, Inc. | ||||||||
| 636,680 | 5.500%, 11/25/2035 | 587,396 | ||||||
CitiMortgage Alternative Loan Trust | ||||||||
| 2,127,550 | 5.750%, 4/25/2037 | 1,826,829 | ||||||
Countrywide Alternative Loan Trust | ||||||||
| 2,962,471 | 5.220%, 10/25/2035 | 2,515,837 | ||||||
| 1,205,767 | 6.500%, 8/25/2036 | 918,244 | ||||||
| 400,557 | 6.000%, 1/25/2037 | 369,592 | ||||||
| 4,148,231 | 5.500%, 5/25/2037 | 3,595,517 | ||||||
| 2,372,427 | 7.000%, 10/25/2037 | 1,753,580 | ||||||
Countrywide Home Loans, Inc. | ||||||||
| 777,664 | 5.750%, 4/25/2037 | 718,914 | ||||||
Deutsche Alt-A Securities Mortgage Loan Trust | ||||||||
| 621,655 | 6.000%, 10/25/2021 | 548,031 | ||||||
Deutsche Alt-A Securities, Inc., Mortgage Loan Trust | ||||||||
| 237,914 | 5.500%, 10/25/2021 | 228,729 | ||||||
Dryden 34 Senior Loan Fund CLO | ||||||||
| 825,000 | 1.717%, 10/15/2026*,e | 820,645 | ||||||
Federal Home Loan Mortgage Corporation | ||||||||
| 9,371,654 | 3.000%, 4/15/2028h | 1,046,789 | ||||||
| 6,217,052 | 3.000%, 2/15/2033h | 838,941 | ||||||
Federal National Mortgage Association | ||||||||
| 13,165,781 | 3.500%, 1/25/2033h | 1,880,397 | ||||||
Greenpoint Mortgage Funding Trust | ||||||||
| 1,389,035 | 0.370%, 10/25/2045e | 1,093,567 | ||||||
HomeBanc Mortgage Trust | ||||||||
| 1,172,208 | 2.197%, 4/25/2037 | 872,256 | ||||||
J.P. Morgan Mortgage Trust | ||||||||
| 191,690 | 2.537%, 10/25/2036 | 172,066 | ||||||
| 3,158,941 | 0.550%, 1/25/2037e | 2,050,153 | ||||||
| 3,247,856 | 6.250%, 8/25/2037 | 2,683,710 | ||||||
The accompanying Notes to Financial Statements are an integral part of this schedule.
133
Table of Contents
MODERATELY CONSERVATIVE ALLOCATION PORTFOLIO
Schedule of Investments as of December 31, 2014
| Principal Amount | Long-Term Fixed Income (34.7%) | Value | ||||||
| Collateralized Mortgage Obligations (1.6%) - continued | |||||||
Limerock CLO III, LLC | ||||||||
| $ | 2,500,000 | 1.759%, 10/20/2026*,e | $ | 2,482,907 | ||||
Madison Park Funding XIV CLO, Ltd. | ||||||||
| 900,000 | 1.681%, 7/20/2026*,e | 896,269 | ||||||
MASTR Alternative Loans Trust | ||||||||
| 461,107 | 6.500%, 7/25/2034 | 472,378 | ||||||
| 2,224,512 | 0.620%, 12/25/2035e | 1,212,446 | ||||||
Merrill Lynch Alternative Note Asset Trust | ||||||||
| 485,390 | 6.000%, 3/25/2037 | 451,576 | ||||||
Neuberger Berman CLO, Ltd. | ||||||||
| 700,000 | 1.626%, 8/4/2025*,e | 693,533 | ||||||
Octagon Investment Partners XX CLO, Ltd. | ||||||||
| 825,000 | 1.675%, 8/12/2026*,e | 815,939 | ||||||
OHA Loan Funding 2014-1, Ltd. | ||||||||
| 2,500,000 | 1.762%, 10/20/2026*,e | 2,482,520 | ||||||
RALI Trust | ||||||||
| 4,846,721 | 0.350%, 11/25/2036e | 3,492,387 | ||||||
Residential Accredit Loans, Inc. | ||||||||
| 900,715 | 5.750%, 9/25/2035 | 814,415 | ||||||
Residential Asset Securitization Trust | ||||||||
| 3,082,427 | 0.550%, 8/25/2037e | 1,130,899 | ||||||
Sequoia Mortgage Trust | ||||||||
| 3,180,435 | 2.657%, 9/20/2046 | 2,636,406 | ||||||
Symphony CLO XV, Ltd. | ||||||||
| 2,500,000 | 1.653%, 10/17/2026*,e | 2,473,177 | ||||||
Symphony CLO, Ltd. | ||||||||
| 825,000 | 1.331%, 1/9/2023*,e | 820,360 | ||||||
Voya CLO 2014-3, Ltd. | ||||||||
| 825,000 | 1.649%, 7/25/2026*,e | 815,431 | ||||||
WaMu Mortgage Pass Through Certificates | ||||||||
| 472,636 | 2.233%, 9/25/2036 | 422,878 | ||||||
| 453,001 | 2.274%, 10/25/2036 | 399,764 | ||||||
| 1,469,178 | 1.957%, 11/25/2036 | 1,296,596 | ||||||
| 2,246,386 | 1.822%, 1/25/2037 | 1,904,969 | ||||||
|
| |||||||
Total | 59,359,243 | |||||||
|
| |||||||
| Commercial Mortgage-Backed Securities (1.1%) | |||||||
Banc of America Commercial Mortgage, Inc. | ||||||||
| 4,600,000 | 5.612%, 4/10/2049 | 4,921,880 | ||||||
Bear Stearns Commercial Mortgage Securities, Inc. | ||||||||
| 1,736,233 | 5.331%, 2/11/2044 | 1,855,046 | ||||||
Citigroup/Deutsche Bank Commercial Mortgage | ||||||||
| 1,700,000 | 5.322%, 12/11/2049 | 1,799,895 | ||||||
Commercial Mortgage Pass-Through Certificates | ||||||||
| 2,340,000 | 1.208%, 6/8/2030d,e | 2,339,085 | ||||||
Credit Suisse First Boston Mortgage Securities | ||||||||
| 4,600,000 | 5.542%, 1/15/2049 | 4,927,672 | ||||||
Credit Suisse Mortgage Capital Certificates | ||||||||
| 5,800,000 | 5.509%, 9/15/2039 | 6,133,941 | ||||||
Federal Home Loan Mortgage Corporation Multi Family Structured Pass Thru Certificates | ||||||||
| 1,522,446 | 0.727%, 12/25/2016 | 1,520,326 | ||||||
Federal National Mortgage Association | ||||||||
| 1,700,000 | 1.272%, 1/25/2017 | 1,708,918 | ||||||
Government National Mortgage Association | ||||||||
| 16,052 | 2.164%, 3/16/2033 | 16,072 | ||||||
| 9,343 | 3.214%, 1/16/2040 | 9,397 | ||||||
Greenwich Capital Commercial Funding Corporation | ||||||||
| 3,100,000 | 5.867%, 12/10/2049 | 3,359,950 | ||||||
J.P. Morgan Chase Commercial Mortgage Securities Corporation | ||||||||
| 1,450,000 | 1.111%, 12/15/2028d,e | 1,450,209 | ||||||
| 2,300,000 | 5.698%, 2/12/2049 | 2,428,584 | ||||||
JPMBB Commercial Mortgage Securities Trust | ||||||||
| 2,850,000 | 3.231%, 1/15/2048 | 2,864,888 | ||||||
LSTAR Commercial Mortgage Trust | ||||||||
| 1,074,739 | 1.519%, 1/20/2041d | 1,074,675 | ||||||
Morgan Stanley Capital, Inc. | ||||||||
| 1,750,000 | 5.406%, 3/15/2044 | 1,862,592 | ||||||
SCG Trust 2013-SRP1 | ||||||||
| 700,000 | 1.561%, 11/15/2026d,e | 700,851 | ||||||
|
| |||||||
Total | 38,973,981 | |||||||
|
| |||||||
| Communications Services (1.2%) | |||||||
21st Century Fox America, Inc. | ||||||||
| 960,000 | 6.900%, 3/1/2019 | 1,131,986 | ||||||
AMC Networks, Inc. | ||||||||
| 1,500,000 | 4.750%, 12/15/2022 | 1,455,000 | ||||||
America Movil SAB de CV | ||||||||
| 750,000 | 1.241%, 9/12/2016e | 755,365 | ||||||
| 829,000 | 5.000%, 10/16/2019 | 915,141 | ||||||
American Tower Corporation | ||||||||
| 496,000 | 7.000%, 10/15/2017 | 560,002 | ||||||
| 950,000 | 3.450%, 9/15/2021 | 933,983 | ||||||
AT&T, Inc. | ||||||||
| 963,000 | 3.875%, 8/15/2021 | 1,007,594 | ||||||
British Sky Broadcasting Group plc | ||||||||
| 880,000 | 2.625%, 9/16/2019d | 880,326 | ||||||
CBS Corporation | ||||||||
| 390,000 | 2.300%, 8/15/2019 | 385,341 | ||||||
CC Holdings GS V, LLC | ||||||||
| 653,000 | 2.381%, 12/15/2017 | 658,790 | ||||||
CCO Holdings, LLC | ||||||||
| 1,500,000 | 7.375%, 6/1/2020 | 1,590,000 | ||||||
CenturyLink, Inc. | ||||||||
| 1,150,000 | 6.450%, 6/15/2021 | 1,233,375 | ||||||
Columbus International, Inc. | ||||||||
| 1,175,000 | 7.375%, 3/30/2021d | 1,222,000 | ||||||
Comcast Corporation | ||||||||
| 418,000 | 4.650%, 7/15/2042 | 457,506 | ||||||
| 702,000 | 4.750%, 3/1/2044 | 782,303 | ||||||
Cox Communications, Inc. | ||||||||
| 496,000 | 9.375%, 1/15/2019d | 624,227 | ||||||
Crown Castle Towers, LLC | ||||||||
| 480,000 | 4.174%, 8/15/2017d | 502,292 | ||||||
Digicel, Ltd. | ||||||||
| 650,000 | 6.000%, 4/15/2021d | 607,750 | ||||||
The accompanying Notes to Financial Statements are an integral part of this schedule.
134
Table of Contents
MODERATELY CONSERVATIVE ALLOCATION PORTFOLIO
Schedule of Investments as of December 31, 2014
| Principal Amount | Long-Term Fixed Income (34.7%) | Value | ||||||
| Communications Services (1.2%) - continued | |||||||
DIRECTV Holdings, LLC | ||||||||
| $ | 767,000 | 1.750%, 1/15/2018 | $ | 761,943 | ||||
| 600,000 | 5.875%, 10/1/2019 | 686,299 | ||||||
| 381,000 | 4.450%, 4/1/2024 | 398,642 | ||||||
Equinix, Inc. | ||||||||
| 970,000 | 5.750%, 1/1/2025 | 978,488 | ||||||
FairPoint Communications, Inc. | ||||||||
| 970,000 | 8.750%, 8/15/2019d | 974,850 | ||||||
Frontier Communications Corporation | ||||||||
| 970,000 | 6.875%, 1/15/2025 | 970,000 | ||||||
Hughes Satellite Systems Corporation | ||||||||
| 1,500,000 | 6.500%, 6/15/2019 | 1,608,750 | ||||||
Intelsat Jackson Holdings SA | ||||||||
| 1,500,000 | 7.250%, 4/1/2019 | 1,565,625 | ||||||
Level 3 Financing, Inc. | ||||||||
| 1,500,000 | 8.625%, 7/15/2020 | 1,618,125 | ||||||
Nippon Telegraph & Telephone Corporation | ||||||||
| 504,000 | 1.400%, 7/18/2017 | 502,520 | ||||||
Numericable-SFR | ||||||||
| 1,450,000 | 6.000%, 5/15/2022d | 1,457,975 | ||||||
SES Global Americas Holdings GP | ||||||||
| 620,000 | 2.500%, 3/25/2019d | 616,885 | ||||||
Sprint Communications, Inc. | ||||||||
| 1,412,019 | 9.000%, 11/15/2018d | 1,606,030 | ||||||
Telefonica Emisiones SAU | ||||||||
| 858,000 | 3.992%, 2/16/2016 | 882,446 | ||||||
| 858,000 | 3.192%, 4/27/2018 | 882,315 | ||||||
Time Warner Cable, Inc. | ||||||||
| 1,300,000 | 8.250%, 4/1/2019 | 1,591,386 | ||||||
| 660,000 | 5.000%, 2/1/2020 | 727,310 | ||||||
T-Mobile USA, Inc. | ||||||||
| 1,450,000 | 6.125%, 1/15/2022 | 1,471,750 | ||||||
Unitymedia Hessen GmbH & Company KG | ||||||||
| 875,000 | 5.500%, 1/15/2023d | 914,375 | ||||||
Univision Communications, Inc. | ||||||||
| 1,500,000 | 6.875%, 5/15/2019d | 1,561,875 | ||||||
UPCB Finance V, Ltd. | ||||||||
| 1,500,000 | 7.250%, 11/15/2021d | 1,640,625 | ||||||
Verizon Communications, Inc. | ||||||||
| 590,000 | 1.013%, 6/17/2019e | 593,055 | ||||||
| 302,000 | 2.625%, 2/21/2020d | 298,547 | ||||||
| 1,405,000 | 3.000%, 11/1/2021 | 1,385,659 | ||||||
| 744,000 | 5.150%, 9/15/2023 | 821,549 | ||||||
| 996,000 | 6.400%, 9/15/2033 | 1,226,856 | ||||||
| 508,000 | 5.050%, 3/15/2034 | 541,896 | ||||||
| 282,000 | 6.550%, 9/15/2043 | 361,284 | ||||||
Viacom, Inc. | ||||||||
| 508,000 | 2.500%, 9/1/2018 | 512,492 | ||||||
Wind Acquisition Finance SA | ||||||||
| 570,000 | 4.750%, 7/15/2020d | 532,950 | ||||||
|
| |||||||
Total | 45,395,483 | |||||||
|
| |||||||
| Consumer Cyclical (0.7%) | |||||||
Chrysler Group, LLC | ||||||||
| 1,430,000 | 8.000%, 6/15/2019 | 1,503,288 | ||||||
Cinemark USA, Inc. | ||||||||
| 1,500,000 | 4.875%, 6/1/2023 | 1,417,500 | ||||||
Delphi Corporation | ||||||||
| 858,000 | 6.125%, 5/15/2021 | 935,220 | ||||||
Ford Motor Company | ||||||||
| 515,000 | 7.450%, 7/16/2031 | 699,161 | ||||||
Ford Motor Credit Company, LLC | ||||||||
| 1,125,000 | 1.684%, 9/8/2017 | 1,116,048 | ||||||
| 680,000 | 5.000%, 5/15/2018 | 738,853 | ||||||
| 1,050,000 | 2.597%, 11/4/2019 | 1,044,352 | ||||||
General Motors Company | ||||||||
| 423,000 | 3.500%, 10/2/2018 | 431,460 | ||||||
| 992,000 | 6.250%, 10/2/2043 | 1,185,043 | ||||||
General Motors Financial Company, Inc. | ||||||||
| 1,500,000 | 3.250%, 5/15/2018 | 1,501,875 | ||||||
Hilton Worldwide Finance, LLC | ||||||||
| 1,450,000 | 5.625%, 10/15/2021 | 1,515,250 | ||||||
Home Depot, Inc. | ||||||||
| 573,000 | 4.875%, 2/15/2044 | 665,990 | ||||||
Hyundai Capital America | ||||||||
| 858,000 | 1.450%, 2/6/2017d | 854,776 | ||||||
Jaguar Land Rover Automotive plc | ||||||||
| 1,500,000 | 5.625%, 2/1/2023d | 1,578,750 | ||||||
KB Home | ||||||||
| 729,000 | 4.750%, 5/15/2019 | 718,065 | ||||||
L Brands, Inc. | ||||||||
| 1,500,000 | 5.625%, 2/15/2022 | 1,612,500 | ||||||
Lennar Corporation | ||||||||
| 1,500,000 | 4.125%, 12/1/2018 | 1,485,000 | ||||||
Macy’s Retail Holdings, Inc. | ||||||||
| 375,000 | 4.375%, 9/1/2023 | 402,837 | ||||||
| 820,000 | 3.625%, 6/1/2024 | 829,651 | ||||||
Nissan Motor Acceptance Corporation | ||||||||
| 890,000 | 0.785%, 3/3/2017d,e | 892,831 | ||||||
Toll Brothers Finance Corporation | ||||||||
| 580,000 | 8.910%, 10/15/2017 | 672,800 | ||||||
| 462,000 | 4.000%, 12/31/2018 | 464,310 | ||||||
TRW Automotive, Inc. | ||||||||
| 669,000 | 7.250%, 3/15/2017d | 739,245 | ||||||
Volkswagen Group of America Finance, LLC | ||||||||
| 780,000 | 0.672%, 11/20/2017d,e | 778,867 | ||||||
Walgreens Boots Alliance, Inc. | ||||||||
| 650,000 | 2.700%, 11/18/2019 | 653,307 | ||||||
Wynn Las Vegas, LLC | ||||||||
| 1,500,000 | 5.375%, 3/15/2022g | 1,522,500 | ||||||
|
| |||||||
Total | 25,959,479 | |||||||
|
| |||||||
| Consumer Non-Cyclical (1.1%) | |||||||
AbbVie, Inc. | ||||||||
| 1,325,000 | 2.000%, 11/6/2018 | 1,320,555 | ||||||
Actavis Funding SCS | ||||||||
| 1,040,000 | 4.850%, 6/15/2044 | 1,055,325 | ||||||
Altria Group, Inc. | ||||||||
| 595,000 | 9.700%, 11/10/2018 | 755,536 | ||||||
Anheuser-Busch InBev Finance, Inc. | ||||||||
| 501,000 | 0.632%, 2/1/2019 e | 498,387 | ||||||
Bayer U.S. Finance, LLC | ||||||||
| 500,000 | 1.500%, 10/6/2017 d | 500,321 | ||||||
The accompanying Notes to Financial Statements are an integral part of this schedule.
135
Table of Contents
MODERATELY CONSERVATIVE ALLOCATION PORTFOLIO
Schedule of Investments as of December 31, 2014
| Principal Amount | Long-Term Fixed Income (34.7%) | Value | ||||||
| Consumer Non-Cyclical (1.1%) - continued | |||||||
Becton, Dickinson and Company | ||||||||
| $ | 635,000 | 2.675%, 12/15/2019 | $ | 643,351 | ||||
Boston Scientific Corporation | ||||||||
| 1,170,000 | 2.650%, 10/1/2018 | 1,171,377 | ||||||
Bunge Limited Finance Corporation | ||||||||
| 762,000 | 8.500%, 6/15/2019 | 933,861 | ||||||
CareFusion Corporation | ||||||||
| 744,000 | 6.375%, 8/1/2019 | 860,807 | ||||||
Celgene Corporation | ||||||||
| 1,005,000 | 1.900%, 8/15/2017 | 1,008,542 | ||||||
| 282,000 | 2.300%, 8/15/2018 | 284,329 | ||||||
CHS/Community Health Systems, Inc. | ||||||||
| 1,500,000 | 7.125%, 7/15/2020 | 1,599,375 | ||||||
Church & Dwight Company, Inc. | ||||||||
| 310,000 | 2.450%, 12/15/2019 | 309,837 | ||||||
ConAgra Foods, Inc. | ||||||||
| 870,000 | 1.900%, 1/25/2018 | 864,204 | ||||||
Coventry Health Care, Inc. | ||||||||
| 852,000 | 5.950%, 3/15/2017 | 931,854 | ||||||
CVS Health Corporation | ||||||||
| 235,000 | 2.250%, 8/12/2019 | 234,018 | ||||||
| 508,000 | 6.125%, 9/15/2039 | 656,385 | ||||||
Endo Finance LLC & Endo Finco, Inc. | ||||||||
| 1,500,000 | 7.000%, 7/15/2019d | 1,565,625 | ||||||
Forest Laboratories, Inc. | ||||||||
| 1,000,000 | 4.375%, 2/1/2019d | 1,056,370 | ||||||
Fresenius Medical Care US Finance II, Inc. | ||||||||
| 1,500,000 | 5.875%, 1/31/2022d | 1,627,500 | ||||||
Gilead Sciences, Inc. | ||||||||
| 780,000 | 4.500%, 2/1/2045 | 833,663 | ||||||
Hawk Acquisition Sub, Inc. | ||||||||
| 1,502,019 | 4.250%, 10/15/2020 | 1,517,039 | ||||||
HCA, Inc. | ||||||||
| 1,450,000 | 3.750%, 3/15/2019 | 1,451,812 | ||||||
IMS Health, Inc. | ||||||||
| 859,000 | 6.000%, 11/1/2020d | 884,770 | ||||||
JBS Finance II, Ltd. | ||||||||
| 1,450,000 | 8.250%, 1/29/2018* | 1,482,625 | ||||||
Kroger Company | ||||||||
| 572,000 | 1.200%, 10/17/2016 | 570,752 | ||||||
Lorillard Tobacco Company | ||||||||
| 604,000 | 2.300%, 8/21/2017g | 607,856 | ||||||
| 635,000 | 8.125%, 6/23/2019 | 769,828 | ||||||
Mattel, Inc. | ||||||||
| 590,000 | 1.700%, 3/15/2018 | 582,591 | ||||||
Medco Health Solutions, Inc. | ||||||||
| 1,110,000 | 7.125%, 3/15/2018 | 1,281,558 | ||||||
Medtronic, Inc. | ||||||||
| 1,170,000 | 4.375%, 3/15/2035d | 1,241,202 | ||||||
Mondelez International, Inc. | ||||||||
| 418,000 | 0.752%, 2/1/2019e | 413,336 | ||||||
Mylan, Inc. | ||||||||
| 626,000 | 7.875%, 7/15/2020d | 666,812 | ||||||
Pernod Ricard SA | ||||||||
| 600,000 | 2.950%, 1/15/2017d | 613,888 | ||||||
| 508,000 | 5.750%, 4/7/2021d | 583,528 | ||||||
Perrigo Company, Ltd. | ||||||||
| 1,421,000 | 1.300%, 11/8/2016 | 1,414,777 | ||||||
Safeway, Inc. | ||||||||
| 58,000 | 3.400%, 12/1/2016 | 58,922 | ||||||
Spectrum Brands Escrow Corporation | ||||||||
| 1,500,000 | 6.375%, 11/15/2020 | 1,563,750 | ||||||
Sysco Corporation | ||||||||
| 375,000 | 2.350%, 10/2/2019 | 377,042 | ||||||
| 250,000 | 4.350%, 10/2/2034 | 269,147 | ||||||
Tenet Healthcare Corporation | ||||||||
| 1,450,000 | 8.125%, 4/1/2022 | 1,620,375 | ||||||
Thermo Fisher Scientific, Inc. | ||||||||
| 762,000 | 2.400%, 2/1/2019 | 763,136 | ||||||
Tyson Foods, Inc. | ||||||||
| 558,000 | 4.500%, 6/15/2022 | 604,139 | ||||||
UnitedHealth Group, Inc. | ||||||||
| 230,000 | 2.875%, 12/15/2021 | 232,617 | ||||||
Valeant Pharmaceuticals International | ||||||||
| 746,000 | 6.875%, 12/1/2018d | 769,499 | ||||||
Whirlpool Corporation | ||||||||
| 650,000 | 1.650%, 11/1/2017 | 647,843 | ||||||
WM Wrigley Jr. Company | ||||||||
| 705,000 | 2.000%, 10/20/2017d | 710,086 | ||||||
|
| |||||||
Total | 40,410,152 | |||||||
|
| |||||||
| Energy (1.2%) | |||||||
Antero Resources Corporation | ||||||||
| 795,000 | 5.125%, 12/1/2022d | 749,288 | ||||||
Boardwalk Pipelines, Ltd. | ||||||||
| 888,000 | 5.875%, 11/15/2016 | 942,824 | ||||||
Bonanza Creek Energy, Inc. | ||||||||
| 560,000 | 6.750%, 4/15/2021 | 492,800 | ||||||
Buckeye Partners, LP | ||||||||
| 846,000 | 2.650%, 11/15/2018 | 833,255 | ||||||
California Resources Corporation | ||||||||
| 795,000 | 6.000%, 11/15/2024d | 671,775 | ||||||
Calumet Specialty Products Partners, LP | ||||||||
| 1,460,000 | 6.500%, 4/15/2021d | 1,299,400 | ||||||
Canadian Natural Resources, Ltd. | ||||||||
| 910,000 | 1.750%, 1/15/2018 | 904,646 | ||||||
Chaparral Energy, Inc. | ||||||||
| 795,000 | 7.625%, 11/15/2022 | 520,725 | ||||||
Chesapeake Energy Corporation | ||||||||
| 480,000 | 4.875%, 4/15/2022g | 466,800 | ||||||
CNOOC Nexen Finance 2014 ULC | ||||||||
| 762,000 | 1.625%, 4/30/2017 | 758,279 | ||||||
CNPC General Capital, Ltd. | ||||||||
| 496,000 | 1.450%, 4/16/2016d | 494,894 | ||||||
| 496,000 | 2.750%, 4/19/2017d | 501,749 | ||||||
Concho Resources, Inc. | ||||||||
| 2,047,019 | 5.500%, 10/1/2022 | 2,067,489 | ||||||
Continental Resources, Inc. | ||||||||
| 947,000 | 5.000%, 9/15/2022 | 916,222 | ||||||
Crestwood Midstream Partners, LP | ||||||||
| 850,000 | 6.125%, 3/1/2022 | 811,750 | ||||||
El Paso, LLC | ||||||||
| 630,000 | 7.800%, 8/1/2031 | 767,108 | ||||||
Enbridge, Inc. | ||||||||
| 873,000 | 0.684%, 6/2/2017e | 869,223 | ||||||
The accompanying Notes to Financial Statements are an integral part of this schedule.
136
Table of Contents
MODERATELY CONSERVATIVE ALLOCATION PORTFOLIO
Schedule of Investments as of December 31, 2014
| Principal Amount | Long-Term Fixed Income (34.7%) | Value | ||||||
| Energy (1.2%) - continued | |||||||
Energy XXI Gulf Coast, Inc. | ||||||||
| $ | 795,000 | 7.500%, 12/15/2021g | $ | 429,300 | ||||
Ensco plc | ||||||||
| 625,000 | 4.500%, 10/1/2024g | 607,486 | ||||||
Enterprise Products Operating, LLC | ||||||||
| 1,000,000 | 2.550%, 10/15/2019 | 989,932 | ||||||
EQT Corporation | ||||||||
| 500,000 | 5.150%, 3/1/2018 | 534,130 | ||||||
| 754,000 | 8.125%, 6/1/2019 | 909,003 | ||||||
Halcon Resources Corporation | ||||||||
| 795,000 | 8.875%, 5/15/2021g | 598,237 | ||||||
Hess Corporation | ||||||||
| 1,005,000 | 8.125%, 2/15/2019 | 1,195,741 | ||||||
Hornbeck Offshore Services, Inc. | ||||||||
| 440,000 | 5.000%, 3/1/2021 | 360,800 | ||||||
Jones Energy Holdings, LLC | ||||||||
| 790,000 | 6.750%, 4/1/2022d | 600,400 | ||||||
Kinder Morgan, Inc. | ||||||||
| 625,000 | 5.000%, 2/15/2021d | 650,221 | ||||||
| 714,000 | 5.300%, 12/1/2034 | 724,750 | ||||||
Laredo Petroleum, Inc. | ||||||||
| 795,000 | 5.625%, 1/15/2022 | 695,625 | ||||||
Linn Energy, LLC | ||||||||
| 1,412,019 | 6.250%, 11/1/2019g | 1,193,156 | ||||||
| 635,000 | 8.625%, 4/15/2020 | 552,450 | ||||||
Marathon Petroleum Corporation | ||||||||
| 250,000 | 3.625%, 9/15/2024 | 245,001 | ||||||
| 500,000 | 4.750%, 9/15/2044 | 472,203 | ||||||
MEG Energy Corporation | ||||||||
| 1,500,000 | 6.500%, 3/15/2021d | 1,368,750 | ||||||
| 855,000 | 7.000%, 3/31/2024d | 773,775 | ||||||
Oasis Petroleum, Inc. | ||||||||
| 320,000 | 6.875%, 3/15/2022 | 291,200 | ||||||
Offshore Group Investment, Ltd. | ||||||||
| 1,500,000 | 7.500%, 11/1/2019g | 1,117,500 | ||||||
| 635,000 | 7.125%, 4/1/2023 | 450,850 | ||||||
Pacific Drilling SA | ||||||||
| 635,000 | 5.375%, 6/1/2020d | 517,525 | ||||||
Petrobras Global Finance BV | ||||||||
| 1,200,000 | 2.000%, 5/20/2016 | 1,146,180 | ||||||
Petroleos Mexicanos | ||||||||
| 460,000 | 2.378%, 4/15/2025 | 454,871 | ||||||
Plains All American Pipeline, LP | ||||||||
| 905,000 | 3.600%, 11/1/2024 | 888,453 | ||||||
Precision Drilling Corporation | ||||||||
| 635,000 | 5.250%, 11/15/2024d | 520,700 | ||||||
Range Resources Corporation | ||||||||
| 795,000 | 5.000%, 3/15/2023 | 795,000 | ||||||
Regency Energy Partners, LP | ||||||||
| 1,450,000 | 5.000%, 10/1/2022 | 1,370,250 | ||||||
Rosetta Resources, Inc. | ||||||||
| 610,000 | 5.875%, 6/1/2024 | 542,900 | ||||||
Sabine Pass Liquefaction, LLC | ||||||||
| 1,450,000 | 5.750%, 5/15/2024 | 1,422,813 | ||||||
Samson Investment Company | ||||||||
| 795,000 | 9.750%, 2/15/2020 | 329,428 | ||||||
Sinopec Capital 2013, Ltd. | ||||||||
| 870,000 | 1.250%, 4/24/2016d | 867,468 | ||||||
Southwestern Energy Company | ||||||||
| 650,000 | 7.500%, 2/1/2018 | 732,243 | ||||||
Suncor Energy, Inc. | ||||||||
| 576,000 | 6.100%, 6/1/2018 | 646,104 | ||||||
| 780,000 | 3.600%, 12/1/2024 | 770,760 | ||||||
Transocean, Inc. | ||||||||
| 1,029,000 | 6.000%, 3/15/2018 | 989,752 | ||||||
Weatherford International, Ltd. | ||||||||
| 744,000 | 9.625%, 3/1/2019 | 882,444 | ||||||
Whiting Petroleum Corporation | ||||||||
| 635,000 | 5.750%, 3/15/2021 | 588,962 | ||||||
Williams Companies, Inc. | ||||||||
| 446,000 | 3.700%, 1/15/2023 | 400,546 | ||||||
|
| |||||||
Total | 42,695,136 | |||||||
|
| |||||||
| Financials (3.2%) | |||||||
Abbey National Treasury Services plc | ||||||||
| 825,000 | 0.665%, 9/29/2017e | 822,945 | ||||||
| 564,000 | 3.050%, 8/23/2018 | 583,920 | ||||||
ABN AMRO Bank NV | ||||||||
| 958,000 | 2.500%, 10/30/2018d | 967,595 | ||||||
Air Lease Corporation | ||||||||
| 625,000 | 2.125%, 1/15/2018 | 614,063 | ||||||
Ally Financial, Inc. | ||||||||
| 960,000 | 3.750%, 11/18/2019 | 945,600 | ||||||
American Express Credit Corporation | ||||||||
| 590,000 | 0.793%, 3/18/2019e | 587,540 | ||||||
American International Group, Inc. | ||||||||
| 315,000 | 2.300%, 7/16/2019 | 315,321 | ||||||
ANZ New Zealand International, Ltd. | ||||||||
| 834,000 | 1.400%, 4/27/2017d | 832,339 | ||||||
Australia and New Zealand Banking Group, Ltd. | ||||||||
| 780,000 | 0.501%, 6/13/2017d,e | 778,848 | ||||||
Aviation Capital Group Corporation | ||||||||
| 564,000 | 3.875%, 9/27/2016d | 578,200 | ||||||
Banco Santander Chile | ||||||||
| 710,000 | 1.130%, 4/11/2017d,e | 706,831 | ||||||
Bank of America Corporation | ||||||||
| 750,000 | 1.700%, 8/25/2017 | 750,170 | ||||||
| 1,290,000 | 5.750%, 12/1/2017 | 1,425,317 | ||||||
| 1,425,000 | 1.317%, 3/22/2018e | 1,435,411 | ||||||
| 1,334,000 | 5.650%, 5/1/2018 | 1,482,038 | ||||||
| 500,000 | 1.105%, 4/1/2019e | 500,828 | ||||||
| 508,000 | 4.000%, 4/1/2024 | 528,942 | ||||||
| 552,000 | 5.875%, 2/7/2042 | 690,752 | ||||||
| 992,000 | 8.000%, 12/29/2049i | 1,065,160 | ||||||
Bank of Tokyo-Mitsubishi UFJ, Ltd. | ||||||||
| 315,000 | 2.850%, 9/8/2021d | 310,676 | ||||||
Barclays Bank plc | ||||||||
| 770,000 | 10.179%, 6/12/2021d | 1,033,794 | ||||||
Barclays plc | ||||||||
| 780,000 | 2.750%, 11/8/2019 | 775,234 | ||||||
BB&T Corporation | ||||||||
| 325,000 | 0.950%, 1/15/2020e | 324,909 | ||||||
BBVA Banco Continental SA | ||||||||
| 930,000 | 2.250%, 7/29/2016d | 927,675 | ||||||
Berkshire Hathaway Finance Corporation | ||||||||
| 660,000 | 1.600%, 5/15/2017 | 665,642 | ||||||
BioMed Realty, LP | ||||||||
| 762,000 | 2.625%, 5/1/2019 | 761,331 | ||||||
The accompanying Notes to Financial Statements are an integral part of this schedule.
137
Table of Contents
MODERATELY CONSERVATIVE ALLOCATION PORTFOLIO
Schedule of Investments as of December 31, 2014
| Principal Amount | Long-Term Fixed Income (34.7%) | Value | ||||||
| Financials (3.2%) - continued | |||||||
BNP Paribas SA | ||||||||
| $ | 1,031,000 | 2.375%, 9/14/2017 | $ | 1,048,634 | ||||
BPCE SA | ||||||||
| 500,000 | 1.082%, 2/10/2017e,g | 503,312 | ||||||
| 1,056,000 | 1.625%, 2/10/2017 | 1,058,195 | ||||||
Capital One Financial Corporation | ||||||||
| 1,149,000 | 6.150%, 9/1/2016 | 1,234,758 | ||||||
| 635,000 | 2.450%, 4/24/2019 | 633,545 | ||||||
Citigroup, Inc. | ||||||||
| 571,000 | 6.000%, 8/15/2017 | 631,737 | ||||||
| 1,040,000 | 1.850%, 11/24/2017 | 1,038,805 | ||||||
| 415,000 | 1.003%, 4/8/2019e | 416,557 | ||||||
| 970,000 | 8.500%, 5/22/2019 | 1,208,685 | ||||||
| 690,000 | 4.050%, 7/30/2022 | 713,915 | ||||||
| 1,040,000 | 3.750%, 6/16/2024 | 1,062,098 | ||||||
CoBank ACB | ||||||||
| 395,000 | 0.841%, 6/15/2022*,e | 374,233 | ||||||
Compass Bank | ||||||||
| 875,000 | 1.850%, 9/29/2017 | 871,268 | ||||||
| 750,000 | 2.750%, 9/29/2019 | 750,767 | ||||||
Cooperatieve Centrale Raiffeisen-Boerenleenbank BA | ||||||||
| 650,000 | 3.950%, 11/9/2022 | 662,109 | ||||||
Credit Agricole SA | ||||||||
| 485,000 | 1.031%, 4/15/2019d,e | 488,718 | ||||||
| 900,000 | 6.625%, 9/29/2049d,i | 872,325 | ||||||
Credit Suisse AG | ||||||||
| 652,000 | 5.400%, 1/14/2020 | 729,123 | ||||||
CyrusOne, LP | ||||||||
| 1,500,000 | 6.375%, 11/15/2022 | 1,601,250 | ||||||
DDR Corporation | ||||||||
| 992,000 | 9.625%, 3/15/2016 | 1,088,975 | ||||||
Denali Borrower, LLC | ||||||||
| 1,450,000 | 5.625%, 10/15/2020d | 1,508,725 | ||||||
Deutsche Bank AG | ||||||||
| 745,000 | 1.350%, 5/30/2017 | 738,723 | ||||||
Discover Bank | ||||||||
| 635,000 | 8.700%, 11/18/2019 | 785,266 | ||||||
Discover Financial Services | ||||||||
| 526,000 | 6.450%, 6/12/2017 | 581,170 | ||||||
DnB Boligkreditt AS | ||||||||
| 1,024,000 | 1.450%, 3/21/2018d | 1,019,481 | ||||||
Duke Realty, LP | ||||||||
| 260,000 | 3.875%, 2/15/2021 | 270,044 | ||||||
| 780,000 | 4.375%, 6/15/2022 | 825,678 | ||||||
Eksportfinans ASA | ||||||||
| 465,000 | 5.500%, 5/25/2016 | 485,855 | ||||||
European Investment Bank | ||||||||
| 755,000 | 1.875%, 3/15/2019 | 762,603 | ||||||
| 705,000 | 2.125%, 10/15/2021 | 706,840 | ||||||
Fifth Third Bancorp | ||||||||
| 755,000 | 5.450%, 1/15/2017 | 810,203 | ||||||
| 310,000 | 2.875%, 10/1/2021 | 309,969 | ||||||
General Electric Capital Corporation | ||||||||
| 1,665,000 | 6.000%, 8/7/2019 | 1,936,683 | ||||||
| 1,170,000 | 1.241%, 3/15/2023e | 1,186,470 | ||||||
| 1,040,000 | 6.750%, 3/15/2032 | 1,420,517 | ||||||
Genworth Financial, Inc. | ||||||||
| 1,056,000 | 7.700%, 6/15/2020 | 1,053,331 | ||||||
Goldman Sachs Group, Inc. | ||||||||
| 750,000 | 2.375%, 1/22/2018 | 757,574 | ||||||
| 1,170,000 | 1.433%, 4/30/2018e | 1,183,728 | ||||||
| 430,000 | 1.332%, 11/15/2018e | 434,214 | ||||||
| 740,000 | 7.500%, 2/15/2019 | 880,201 | ||||||
| 900,000 | 2.550%, 10/23/2019 | 896,713 | ||||||
| 950,000 | 5.375%, 3/15/2020 | 1,064,662 | ||||||
| 865,000 | 5.250%, 7/27/2021 | 976,293 | ||||||
Hartford Financial Services Group, Inc. | ||||||||
| 715,000 | 4.000%, 10/15/2017 | 760,207 | ||||||
| 615,000 | 5.125%, 4/15/2022 | 691,314 | ||||||
HBOS plc | ||||||||
| 744,000 | 6.750%, 5/21/2018d | 829,185 | ||||||
Health Care REIT, Inc. | ||||||||
| 930,000 | 4.700%, 9/15/2017 | 999,238 | ||||||
| 268,000 | 2.250%, 3/15/2018 | 269,677 | ||||||
HSBC Bank plc | ||||||||
| 1,065,000 | 0.872%, 5/15/2018d,e | 1,069,254 | ||||||
HSBC Holdings plc | ||||||||
| 526,000 | 5.250%, 3/14/2044 | 589,202 | ||||||
| 1,250,000 | 5.625%, 12/29/2049i | 1,254,375 | ||||||
HSBC USA, Inc. | ||||||||
| 705,000 | 1.625%, 1/16/2018 | 702,285 | ||||||
Huntington Bancshares, Inc. | ||||||||
| 282,000 | 2.600%, 8/2/2018 | 285,428 | ||||||
Huntington National Bank | ||||||||
| 757,000 | 1.350%, 8/2/2016 | 757,403 | ||||||
Icahn Enterprises, LP | ||||||||
| 1,100,000 | 6.000%, 8/1/2020 | 1,133,220 | ||||||
ING Bank NV | ||||||||
| 762,000 | 4.125%, 11/21/2023 | 774,248 | ||||||
ING Capital Funding Trust III | ||||||||
| 825,000 | 3.855%, 12/29/2049e,i | 822,937 | ||||||
International Lease Finance Corporation | ||||||||
| 1,093,000 | 2.191%, 6/15/2016e | 1,091,634 | ||||||
Intesa Sanpaolo SPA | ||||||||
| 762,000 | 3.125%, 1/15/2016 | 774,043 | ||||||
| 381,000 | 3.875%, 1/16/2018 | 396,680 | ||||||
| 705,000 | 3.875%, 1/15/2019 | 729,952 | ||||||
J.P. Morgan Chase & Company | ||||||||
| 660,000 | 0.752%, 2/15/2017e | 658,334 | ||||||
| 1,287,000 | 2.000%, 8/15/2017 | 1,299,239 | ||||||
| 475,000 | 1.800%, 1/25/2018 | 474,630 | ||||||
| 980,000 | 6.300%, 4/23/2019 | 1,138,343 | ||||||
| 310,000 | 3.200%, 1/25/2023 | 310,350 | ||||||
| 1,040,000 | 3.625%, 5/13/2024 | 1,064,547 | ||||||
| 480,000 | 3.875%, 9/10/2024 | 480,408 | ||||||
| 980,000 | 7.900%, 4/29/2049i | 1,054,774 | ||||||
Kookmin Bank | ||||||||
| 828,000 | 1.109%, 1/27/2017d,e | 833,490 | ||||||
Liberty Mutual Group, Inc. | ||||||||
| 252,000 | 4.950%, 5/1/2022d | 272,631 | ||||||
| 300,000 | 6.500%, 5/1/2042d | 366,850 | ||||||
Liberty Property, LP | ||||||||
| 815,000 | 5.500%, 12/15/2016 | 875,054 | ||||||
Lloyds Banking Group plc | ||||||||
| 744,000 | 5.920%, 9/29/2049d,i | 738,420 | ||||||
Macquarie Bank, Ltd. | ||||||||
| 750,000 | 5.000%, 2/22/2017d | 799,953 | ||||||
Merrill Lynch & Company, Inc. | ||||||||
| 1,750,000 | 6.050%, 5/16/2016 | 1,853,120 | ||||||
| 705,000 | 6.400%, 8/28/2017 | 785,487 | ||||||
The accompanying Notes to Financial Statements are an integral part of this schedule.
138
Table of Contents
MODERATELY CONSERVATIVE ALLOCATION PORTFOLIO
Schedule of Investments as of December 31, 2014
| Principal Amount | Long-Term Fixed Income (34.7%) | Value | ||||||
| Financials (3.2%) - continued | |||||||
MetLife, Inc. | ||||||||
| $ | 625,000 | 1.903%, 12/15/2017 | $ | 626,424 | ||||
Mizuho Bank, Ltd. | ||||||||
| 762,000 | 1.850%, 3/21/2018d | 757,856 | ||||||
Morgan Stanley | ||||||||
| 680,000 | 6.250%, 8/28/2017 | 755,388 | ||||||
| 910,000 | 1.875%, 1/5/2018 | 906,669 | ||||||
| 1,455,000 | 6.625%, 4/1/2018 | 1,657,296 | ||||||
| 780,000 | 1.514%, 4/25/2018e | 792,412 | ||||||
| 660,000 | 4.875%, 11/1/2022 | 700,971 | ||||||
| 889,000 | 4.100%, 5/22/2023 | 900,057 | ||||||
Murray Street Investment Trust I | ||||||||
| 1,590,000 | 4.647%, 3/9/2017 | 1,678,081 | ||||||
National City Corporation | ||||||||
| 776,000 | 6.875%, 5/15/2019 | 911,612 | ||||||
PNC Bank NA | ||||||||
| 846,000 | 1.150%, 11/1/2016 | 847,129 | ||||||
Pricoa Global Funding I | ||||||||
| 992,000 | 1.350%, 8/18/2017d | 987,916 | ||||||
Prologis, LP | ||||||||
| 950,000 | 7.375%, 10/30/2019 | 1,142,530 | ||||||
Prudential Financial, Inc. | ||||||||
| 315,000 | 2.350%, 8/15/2019 | 315,186 | ||||||
RBS Capital Trust III | ||||||||
| 245,000 | 2.095%, 9/29/2049e,i | 243,652 | ||||||
Realty Income Corporation | ||||||||
| 265,000 | 2.000%, 1/31/2018 | 265,488 | ||||||
Regions Bank | ||||||||
| 1,320,000 | 7.500%, 5/15/2018 | 1,532,381 | ||||||
Reinsurance Group of America, Inc. | ||||||||
| 400,000 | 5.625%, 3/15/2017 | 432,557 | ||||||
| 792,000 | 5.000%, 6/1/2021 | 872,290 | ||||||
Reliance Standard Life Global Funding II | ||||||||
| 395,000 | 2.500%, 4/24/2019d | 396,822 | ||||||
Royal Bank of Canada | ||||||||
| 889,000 | 2.200%, 7/27/2018 | 898,868 | ||||||
Royal Bank of Scotland Group plc | ||||||||
| 500,000 | 1.197%, 3/31/2017e | 501,545 | ||||||
| 1,720,000 | 5.125%, 5/28/2024 | 1,749,569 | ||||||
Simon Property Group, LP | ||||||||
| 580,000 | 10.350%, 4/1/2019 | 758,633 | ||||||
Skandinaviska Enskilda Banken AB | ||||||||
| 615,000 | 2.375%, 3/25/2019d | 618,985 | ||||||
SLM Corporation | ||||||||
| 465,000 | 3.875%, 9/10/2015 | 468,487 | ||||||
SpareBank 1 Boligkreditt AS | ||||||||
| 1,024,000 | 1.250%, 5/2/2018d | 1,008,519 | ||||||
Sumitomo Mitsui Banking Corporation | ||||||||
| 1,390,000 | 1.300%, 1/10/2017 | 1,387,366 | ||||||
Suncorp-Metway, Ltd. | ||||||||
| 1,474,000 | 0.955%, 3/28/2017d,e | 1,476,192 | ||||||
Svenska Handelsbanken AB | ||||||||
| 707,000 | 1.625%, 3/21/2018 | 705,904 | ||||||
| 715,000 | 0.733%, 6/17/2019e | 715,590 | ||||||
Swedbank Hypotek AB | ||||||||
| 1,024,000 | 1.375%, 3/28/2018d | 1,014,015 | ||||||
Swiss RE Capital 1, LP | ||||||||
| 725,000 | 6.854%, 5/29/2049d,i | 759,437 | ||||||
Synchrony Financial | ||||||||
| 330,000 | 3.000%, 8/15/2019 | 333,611 | ||||||
| 480,000 | 3.750%, 8/15/2021 | 490,315 | ||||||
Toronto-Dominion Bank | ||||||||
| 400,000 | 0.792%, 11/5/2019e | 400,750 | ||||||
UBS AG/Stamford, Connecticut | ||||||||
| 308,000 | 5.875%, 12/20/2017 | 343,910 | ||||||
Voya Financial, Inc. | ||||||||
| 948,000 | 2.900%, 2/15/2018 | 970,518 | ||||||
WEA Finance, LLC | ||||||||
| 825,000 | 1.750%, 9/15/2017d | 820,560 | ||||||
Wells Fargo & Company | ||||||||
| 750,000 | 1.400%, 9/8/2017 | 749,391 | ||||||
|
| |||||||
Total | 117,825,827 | |||||||
|
| |||||||
| Foreign Government (<0.1%) | |||||||
Kommunalbanken AS | ||||||||
| 735,000 | 1.500%, 10/22/2019d | 725,259 | ||||||
|
| |||||||
Total | 725,259 | |||||||
|
| |||||||
| Mortgage-Backed Securities (11.8%) | |||||||
Federal Home Loan Mortgage Corporation Gold 15-Yr. Pass Through | ||||||||
| 23,800,000 | 3.000%, 1/1/2030c | 24,702,358 | ||||||
Federal Home Loan Mortgage Corporation Gold 30-Yr. Pass Through | ||||||||
| 30,600,000 | 4.000%, 1/1/2045c | 32,617,688 | ||||||
Federal National Mortgage Association Conventional 15-Yr. Pass Through | ||||||||
| 41,800,000 | 3.500%, 1/1/2030c | 44,157,779 | ||||||
Federal National Mortgage Association Conventional 30-Yr. Pass Through | ||||||||
| 4,474,648 | 2.073%, 1/1/2043e | 4,638,185 | ||||||
| 7,614,590 | 2.058%, 3/1/2043e | 7,898,317 | ||||||
| 7,151,265 | 1.739%, 7/1/2043e | 7,283,843 | ||||||
| 99,050,000 | 3.500%, 1/1/2045c | 103,251,899 | ||||||
| 102,050,000 | 4.000%, 1/1/2045c | 108,913,261 | ||||||
| 93,496,000 | 4.500%, 1/1/2045c | 101,486,991 | ||||||
|
| |||||||
Total | 434,950,321 | |||||||
|
| |||||||
| Technology (0.4%) | |||||||
Alibaba Group Holding, Ltd. | ||||||||
| 1,050,000 | 2.500%, 11/28/2019d | 1,035,843 | ||||||
Amphenol Corporation | ||||||||
| 318,000 | 2.550%, 1/30/2019 | 320,211 | ||||||
Apple, Inc. | ||||||||
| 745,000 | 0.532%, 5/6/2019e | 745,303 | ||||||
Baidu, Inc. | ||||||||
| 700,000 | 2.750%, 6/9/2019 | 696,922 | ||||||
EMC Corporation | ||||||||
| 1,050,000 | 1.875%, 6/1/2018 | 1,046,431 | ||||||
Fidelity National Information Services, Inc. | ||||||||
| 868,000 | 1.450%, 6/5/2017 | 863,138 | ||||||
First Data Corporation | ||||||||
| 1,500,000 | 7.375%, 6/15/2019d,g | 1,578,750 | ||||||
The accompanying Notes to Financial Statements are an integral part of this schedule.
139
Table of Contents
MODERATELY CONSERVATIVE ALLOCATION PORTFOLIO
Schedule of Investments as of December 31, 2014
| Principal Amount | Long-Term Fixed Income (34.7%) | Value | ||||||
| Technology (0.4%) - continued | |||||||
Freescale Semiconductor, Inc. | ||||||||
| $ | 1,450,000 | 6.000%, 1/15/2022d | $ | 1,515,250 | ||||
Hewlett-Packard Company | ||||||||
| 858,000 | 5.400%, 3/1/2017 | 926,214 | ||||||
Iron Mountain, Inc. | ||||||||
| 1,410,000 | 6.000%, 8/15/2023 | 1,466,400 | ||||||
Micron Semiconductor Asia Pte, Ltd. | ||||||||
| 337,500 | 1.258%, 1/15/2019 | 336,954 | ||||||
Samsung Electronics America, Inc. | ||||||||
| 590,000 | 1.750%, 4/10/2017d | 591,788 | ||||||
Tyco Electronics Group SA | ||||||||
| 994,000 | 6.550%, 10/1/2017 | 1,118,875 | ||||||
Xerox Corporation | ||||||||
| 510,000 | 7.200%, 4/1/2016 | 546,097 | ||||||
Xilinx, Inc. | ||||||||
| 400,000 | 2.125%, 3/15/2019 | 397,430 | ||||||
|
| |||||||
Total | 13,185,606 | |||||||
|
| |||||||
| Transportation (0.2%) | |||||||
American Airlines Pass Through Trust | ||||||||
| 707,976 | 4.950%, 1/15/2023 | 755,765 | ||||||
Avis Budget Car Rental, LLC | ||||||||
| 865,000 | 5.125%, 6/1/2022d | 873,650 | ||||||
Canadian Pacific Railway Company | ||||||||
| 400,000 | 7.125%, 10/15/2031 | 550,124 | ||||||
| 472,000 | 5.750%, 3/15/2033 | 574,176 | ||||||
Continental Airlines, Inc. | ||||||||
| 676,106 | 4.150%, 4/11/2024 | 694,279 | ||||||
CSX Corporation | ||||||||
| 494,000 | 3.700%, 11/1/2023 | 517,906 | ||||||
Delta Air Lines, Inc. | ||||||||
| 885,000 | 6.750%, 5/23/2017 | 922,613 | ||||||
| 386,614 | 4.950%, 5/23/2019 | 413,677 | ||||||
| 112,428 | 4.750%, 5/7/2020 | 119,601 | ||||||
ERAC USA Finance, LLC | ||||||||
| 530,000 | 1.400%, 4/15/2016d | 531,244 | ||||||
| 284,000 | 2.800%, 11/1/2018d | 290,089 | ||||||
Hornbeck Offshore Services, Inc. | ||||||||
| 160,000 | 5.875%, 4/1/2020 | 141,600 | ||||||
Korea Expressway Corporation | ||||||||
| 762,000 | 1.625%, 4/28/2017d | 757,740 | ||||||
Southwest Airlines Company | ||||||||
| 845,000 | 2.750%, 11/6/2019 | 848,888 | ||||||
Virgin Australia Holdings, Ltd. | ||||||||
| 317,730 | 5.000%, 10/23/2023d | 325,673 | ||||||
|
| |||||||
Total | 8,317,025 | |||||||
|
| |||||||
| U.S. Government and Agencies (8.7%) | |||||||
Federal Home Loan Bank | ||||||||
| 1,355,000 | 0.875%, 5/24/2017 | 1,352,503 | ||||||
Federal National Mortgage Association | ||||||||
| 870,000 | 0.875%, 5/21/2018 | 855,534 | ||||||
| 1,330,000 | 2.625%, 9/6/2024 | 1,346,919 | ||||||
| 205,000 | 6.250%, 5/15/2029 | 285,617 | ||||||
Tennessee Valley Authority | ||||||||
| 200,000 | 5.250%, 9/15/2039 | 254,613 | ||||||
U.S. Treasury Bonds | ||||||||
| 1,075,000 | 4.375%, 5/15/2040 | 1,413,205 | ||||||
U.S. Treasury Bonds, TIPS | ||||||||
| 2,026,740 | 0.125%, 4/15/2019 | 2,004,413 | ||||||
| 50,389 | 2.375%, 1/15/2025 | 59,160 | ||||||
| 32,958 | 2.125%, 2/15/2040 | 42,722 | ||||||
| 446,616 | 0.750%, 2/15/2042 | 433,950 | ||||||
U.S. Treasury Notes | ||||||||
| 23,200,000 | 0.625%, 10/15/2016 | 23,207,238 | ||||||
| 28,170,000 | 0.875%, 11/15/2017 | 28,035,742 | ||||||
| 40,910,000 | 1.500%, 10/31/2019 | 40,660,694 | ||||||
| 58,625,000 | 1.875%, 6/30/2020 | 59,018,901 | ||||||
| 10,060,000 | 1.625%, 8/15/2022 | 9,784,919 | ||||||
| 48,300,000 | 2.250%, 11/15/2024 | 48,624,528 | ||||||
| 56,100,000 | 3.625%, 2/15/2044 | 66,018,312 | ||||||
U.S. Treasury Notes, TIPS | ||||||||
| 28,556,716 | 0.125%, 4/15/2018 | 28,449,628 | ||||||
| 283,262 | 0.125%, 1/15/2022 | 275,517 | ||||||
| 7,303,912 | 0.125%, 1/15/2023 | 7,062,540 | ||||||
|
| |||||||
Total | 319,186,655 | |||||||
|
| |||||||
| Utilities (0.8%) | |||||||
AES Corporation | ||||||||
| 1,500,000 | 7.375%, 7/1/2021 | 1,695,000 | ||||||
American Electric Power Company, Inc. | ||||||||
| 536,000 | 1.650%, 12/15/2017 | 536,138 | ||||||
Atlas Pipeline Partners, LP | ||||||||
| 1,500,000 | 4.750%, 11/15/2021 | 1,425,000 | ||||||
Berkshire Hathaway Energy Company | ||||||||
| 390,000 | 2.400%, 2/1/2020d | 388,302 | ||||||
Calpine Corporation | ||||||||
| 1,450,000 | 5.375%, 1/15/2023 | 1,464,500 | ||||||
Commonwealth Edison Company | ||||||||
| 375,000 | 6.950%, 7/15/2018 | 433,455 | ||||||
Dayton Power and Light Company | ||||||||
| 564,000 | 1.875%, 9/15/2016 | 570,231 | ||||||
DCP Midstream Operating, LP | ||||||||
| 762,000 | 2.500%, 12/1/2017 | 761,124 | ||||||
Dominion Gas Holdings, LLC | ||||||||
| 310,000 | 2.500%, 12/15/2019 | 310,769 | ||||||
DTE Energy Company | ||||||||
| 1,195,000 | 2.400%, 12/1/2019 | 1,195,197 | ||||||
Duke Energy Corporation | ||||||||
| 635,000 | 0.613%, 4/3/2017e | 635,849 | ||||||
| 900,000 | 2.100%, 6/15/2018 | 908,221 | ||||||
Dynegy Finance 1, Inc./ Dynegy Finance II, Inc. | ||||||||
| 940,000 | 6.750%, 11/1/2019d | 956,450 | ||||||
EDP Finance BV | ||||||||
| 780,000 | 4.125%, 1/15/2020d | 784,368 | ||||||
Enel Finance International NV | ||||||||
| 450,000 | 6.250%, 9/15/2017d | 499,472 | ||||||
Energy Transfer Partners, LP | ||||||||
| 290,000 | 9.700%, 3/15/2019 | 363,984 | ||||||
| 979,000 | 4.650%, 6/1/2021 | 1,023,385 | ||||||
Enterprise Products Operating, LLC | ||||||||
| 792,000 | 5.100%, 2/15/2045 | 851,551 | ||||||
| 390,000 | 7.034%, 1/15/2068 | 427,781 | ||||||
Exelon Generation Company, LLC | ||||||||
| 870,000 | 5.200%, 10/1/2019 | 961,367 | ||||||
ITC Holdings Corporation | ||||||||
| 284,000 | 4.050%, 7/1/2023 | 295,936 | ||||||
The accompanying Notes to Financial Statements are an integral part of this schedule.
140
Table of Contents
MODERATELY CONSERVATIVE ALLOCATION PORTFOLIO
Schedule of Investments as of December 31, 2014
| Principal Amount | Long-Term Fixed Income (34.7%) | Value | ||||||
| Utilities (0.8%) - continued | |||||||
MarkWest Energy Partners, LP | ||||||||
| $ | 1,445,000 | 4.875%, 12/1/2024g | $ | 1,412,487 | ||||
MidAmerican Energy Holdings Company | ||||||||
| 515,000 | 1.100%, 5/15/2017 | 509,743 | ||||||
| 617,000 | 5.750%, 4/1/2018 | 691,439 | ||||||
| 560,000 | 6.500%, 9/15/2037 | 732,924 | ||||||
NiSource Finance Corporation | ||||||||
| 850,000 | 6.800%, 1/15/2019 | 997,901 | ||||||
Northeast Utilities | ||||||||
| 435,000 | 1.450%, 5/1/2018 | 428,395 | ||||||
Northern States Power Company | ||||||||
| 1,240,000 | 4.125%, 5/15/2044 | 1,311,894 | ||||||
NRG Energy, Inc. | ||||||||
| 1,500,000 | 6.625%, 3/15/2023 | 1,560,000 | ||||||
Pacific Gas & Electric Company | ||||||||
| 1,015,000 | 5.625%, 11/30/2017 | 1,128,135 | ||||||
PG&E Corporation | ||||||||
| 375,000 | 2.400%, 3/1/2019 | 375,568 | ||||||
PPL Capital Funding, Inc. | ||||||||
| 1,260,000 | 1.900%, 6/1/2018 | 1,257,859 | ||||||
| 372,000 | 3.500%, 12/1/2022 | 376,772 | ||||||
Sempra Energy | ||||||||
| 1,285,000 | 6.150%, 6/15/2018 | 1,456,298 | ||||||
Southern Company | ||||||||
| 625,000 | 1.300%, 8/15/2017 | 622,434 | ||||||
TransAlta Corporation | ||||||||
| 825,000 | 1.900%, 6/3/2017 | 821,506 | ||||||
Williams Companies, Inc. | ||||||||
| 496,000 | 7.875%, 9/1/2021 | 572,966 | ||||||
Williams Partners, LP | ||||||||
| 255,000 | 7.250%, 2/1/2017 | 281,066 | ||||||
|
| |||||||
Total | 31,025,467 | |||||||
|
| |||||||
Total Long-Term Fixed Income (cost $1,260,829,622) | 1,275,278,769 | |||||||
|
| |||||||
| Shares | Affiliated Mutual Funds (33.3%) | |||||||
| Equity Mutual Funds (13.2%) | |||||||
| 1,342,036 | Thrivent Partner Small Cap Value Portfolio | 37,953,593 | ||||||
| 1,641,909 | Thrivent Small Cap Stock Portfolio | 30,163,511 | ||||||
| 2,622,430 | Thrivent Partner Mid Cap Value Portfolio | 47,562,494 | ||||||
| 3,088,876 | Thrivent Mid Cap Stock Portfolio | 58,243,532 | ||||||
| 16,163,017 | Thrivent Partner Worldwide Allocation Portfolio | 150,325,753 | ||||||
| 7,807,552 | Thrivent Large Cap Value Portfolio | 131,067,726 | ||||||
| 2,334,504 | Thrivent Large Cap Stock Portfolio | 28,780,001 | ||||||
|
| |||||||
Total | 484,096,610 | |||||||
|
| |||||||
| Fixed Income Mutual Funds (20.1%) | |||||||
| 19,692,510 | Thrivent High Yield Portfolio | 95,969,477 | ||||||
| 23,568,312 | Thrivent Income Portfolio | 247,493,205 | ||||||
| 40,471,873 | Thrivent Limited Maturity Bond Portfolio | 397,227,386 | ||||||
|
| |||||||
Total | 740,690,068 | |||||||
|
| |||||||
Total Affiliated Mutual Funds (cost $1,105,869,035) | L,224,786,678 | |||||||
|
| |||||||
| Shares | Common Stock (18.4%) | |||||||
| Consumer Discretionary (2.1%) |
| ||||||
| 8,050 | Aaron’s, Inc. | 246,089 | ||||||
| 18,456 | Amazon.com, Inc.j | 5,727,820 | ||||||
| 7,400 | Apollo Group, Inc.j | 252,414 | ||||||
| 9,400 | AutoZone, Inc.j | 5,819,634 | ||||||
| 24,800 | Barnes & Noble, Inc.j | 575,856 | ||||||
| 13,300 | Best Buy Company, Inc. | 518,434 | ||||||
| 2,500 | Big Lots, Inc. | 100,050 | ||||||
| 3,300 | BorgWarner, Inc. | 181,335 | ||||||
| 2,250 | Brinker International, Inc. | 132,053 | ||||||
| 5,550 | Carnival Corporation | 251,581 | ||||||
| 10,700 | Cato Corporation | 451,326 | ||||||
| 69,650 | CBS Corporation | 3,854,431 | ||||||
| 14,050 | Cheesecake Factory, Inc. | 706,855 | ||||||
| 4,300 | Coach, Inc. | 161,508 | ||||||
| 4,550 | Coinstar, Inc.j | 342,251 | ||||||
| 151,013 | Comcast Corporation | 8,760,264 | ||||||
| 63,719 | Delphi Automotive plc | 4,633,646 | ||||||
| 3,300 | DeVry Education Group, Inc. | 156,651 | ||||||
| 8,450 | DISH Network Corporationj | 615,921 | ||||||
| 16,150 | Dollar Tree, Inc.j | 1,136,637 | ||||||
| 42,400 | Ford Motor Company | 657,200 | ||||||
| 3,650 | G-lll Apparel Group, Ltd.j | 368,687 | ||||||
| 4,725 | Harman International Industries, Inc. | 504,205 | ||||||
| 20,800 | Hilton Worldwide Holdings, Inc.j | 542,672 | ||||||
| 48,500 | Home Depot, Inc. | 5,091,045 | ||||||
| 17,240 | Houghton Mifflin Harcourt Companyj | 357,040 | ||||||
| 8,750 | Kirkland’s, Inc.j | 206,850 | ||||||
| 44,250 | Kohl’s Corporation | 2,701,020 | ||||||
| 68,776 | Las Vegas Sands Corporation | 4,000,012 | ||||||
| 12,000 | Liberty Interactive Corporationj | 353,040 | ||||||
| 1,733 | Liberty Venturesj | 65,369 | ||||||
| 105,730 | Lowe’s Companies, Inc. | 7,274,224 | ||||||
| 19,150 | Macy’s, Inc. | 1,259,112 | ||||||
| 1,700 | Marriott Vacations Worldwide Corporation | 126,718 | ||||||
| 19,277 | MDC Partners, Inc. | 437,973 | ||||||
| 10,000 | Nautilus, Inc.j | 151,800 | ||||||
| 48,500 | NIKE, Inc. | 4,663,275 | ||||||
| 21,000 | NutriSystem, Inc. | 410,550 | ||||||
| 5,750 | Omnicom Group, Inc. | 445,452 | ||||||
| 13,600 | Orbitz Worldwide, Inc.j | 111,928 | ||||||
| 4,850 | Oxford Industries, Inc. | 267,768 | ||||||
| 4,770 | Papa John’s International, Inc. | 266,166 | ||||||
| 2,500 | Royal Caribbean Cruises, Ltd. | 206,075 | ||||||
| 17,050 | Ruby Tuesday, Inc.j | 116,622 | ||||||
| 11,550 | Scientific Games Corporationg,j | 147,032 | ||||||
| 4,750 | Scripps Networks Interactive, Inc. | 357,533 | ||||||
| 16,700 | Select Comfort Corporationj | 451,401 | ||||||
| 62,300 | Starbucks Corporation | 5,111,715 | ||||||
| 25,240 | Time Warner Cable, Inc. | 3,837,994 | ||||||
| 10,050 | Toll Brothers, Inc.j | 344,413 | ||||||
| 5,000 | Tower International, Inc.j | 127,750 | ||||||
| 24,448 | Tuesday Morning Corporationj | 530,522 | ||||||
| 5,400 | Ulta Salon Cosmetics & Fragrance, Inc.j | 690,336 | ||||||
| 10,500 | Wyndham Worldwide Corporation | 900,480 | ||||||
|
| |||||||
Total | 77,708,735 | |||||||
|
| |||||||
| Consumer Staples (0.7%) | |||||||
| 24,300 | Anheuser-Busch InBev NVADR | 2,729,376 | ||||||
| 6,450 | Archer-Daniels-Midland Company | 335,400 | ||||||
| 16,400 | Avon Products, Inc. | 153,996 | ||||||
| 2,250 | Coca-Cola Enterprises, Inc. | 99,495 | ||||||
| 93,020 | CVS Health Corporation | 8,958,756 | ||||||
| 3,750 | Ingredion, Inc. | 318,150 | ||||||
| 2,800 | Keurig Green Mountain, Inc. | 370,706 | ||||||
The accompanying Notes to Financial Statements are an integral part of this schedule.
141
Table of Contents
MODERATELY CONSERVATIVE ALLOCATION PORTFOLIO
Schedule of Investments as of December 31, 2014
| Shares | Common Stock (18.4%) | Value | ||||||
| Consumer Staples (0.7%) - continued | |||||||
| 17,950 | Kimberly-Clark Corporation | $ | 2,073,943 | |||||
| 2,700 | Kroger Company | 173,367 | ||||||
| 3,300 | Molson Coors Brewing Company | 245,916 | ||||||
| 87,739 | Mondelez International, Inc. | 3,187,119 | ||||||
| 20,158 | Philip Morris International, Inc. | 1,641,869 | ||||||
| 3,550 | Pilgrim’s Pride Corporationg,j | 116,405 | ||||||
| 15,400 | Pinnacle Foods, Inc. | 543,620 | ||||||
| 77,050 | Rite Aid Corporationj | 579,416 | ||||||
| 6,250 | TreeHouse Foods, Inc.j | 534,563 | ||||||
| 11,700 | Tyson Foods, Inc. | 469,053 | ||||||
| 43,850 | Wal-Mart Stores, Inc. | 3,765,838 | ||||||
| 19,460 | WhiteWave Foods Companyj | 680,905 | ||||||
| 8,400 | Whole Foods Market, Inc. | 423,528 | ||||||
|
| |||||||
Total | 27,401,421 | |||||||
|
| |||||||
| Energy (3.4%) | |||||||
| 1,420 | Atwood Oceanics, Inc.j | 40,285 | ||||||
| 37,300 | Cabot Oil & Gas Corporation | 1,104,453 | ||||||
| 199,385 | Cameron International Corporationj | 9,959,281 | ||||||
| 130,000 | Canadian Natural Resources, Ltd. | 4,014,400 | ||||||
| 5,650 | Chesapeake Energy Corporation | 110,571 | ||||||
| 69,850 | Chevron Corporation | 7,835,773 | ||||||
| 720 | Cimarex Energy Company | 76,320 | ||||||
| 498,502 | Cobalt International Energy, Inc.j | 4,431,683 | ||||||
| 12,550 | Comstock Resources, Inc.g | 85,466 | ||||||
| 27,380 | Concho Resources, Inc.j | 2,731,155 | ||||||
| 2,200 | ConocoPhillips | 151,932 | ||||||
| 4,170 | Denbury Resources, Inc. | 33,902 | ||||||
| 500 | Energen Corporation | 31,880 | ||||||
| 1,000 | Ensco plc | 29,950 | ||||||
| 155,032 | EOG Resources, Inc. | 14,273,796 | ||||||
| 102,309 | EQT Corporation | 7,744,791 | ||||||
| 2,400 | Exterran Holdings, Inc. | 78,192 | ||||||
| 32,800 | Exxon Mobil Corporation | 3,032,360 | ||||||
| 4,600 | Green Plains, Inc. | 113,988 | ||||||
| 2,600 | Gulfmark Offshore, Inc. | 63,492 | ||||||
| 575 | Gulfport Energy Corporationj | 24,001 | ||||||
| 53,600 | Halliburton Company | 2,108,088 | ||||||
| 2,450 | Helix Energy Solutions Group, Inc.j | 53,165 | ||||||
| 1,000 | Helmerich & Payne, Inc. | 67,420 | ||||||
| 1,585 | HollyFrontier Corporation | 59,406 | ||||||
| 10,800 | Kosmos Energy, Ltd.j | 90,612 | ||||||
| 245,963 | Marathon Oil Corporation | 6,958,293 | ||||||
| 72,750 | Marathon Petroleum Corporation | 6,566,415 | ||||||
| 7,710 | Market Vectors Oil Service ETF | 276,943 | ||||||
| 38,600 | Nabors Industries, Ltd. | 501,028 | ||||||
| 850 | National Oilwell Varco, Inc. | 55,700 | ||||||
| 1,400 | Newfield Exploration Companyj | 37,968 | ||||||
| 1,650 | Noble Corporation | 27,340 | ||||||
| 1,100 | Noble Energy, Inc. | 52,173 | ||||||
| 140,590 | Oasis Petroleum, Inc.j | 2,325,359 | ||||||
| 1,090 | Oceaneering International, Inc. | 64,103 | ||||||
| 930 | Oil States International, Inc.j | 45,477 | ||||||
| 4,450 | Patterson-UTI Energy, Inc. | 73,825 | ||||||
| 311,250 | Petroleo Brasileiro SA ADR | 2,272,125 | ||||||
| 355 | Pioneer Natural Resources Company | 52,842 | ||||||
| 3,100 | QEP Resources, Inc. | 62,682 | ||||||
| 6,060 | Rex Energy Corporationj | 30,906 | ||||||
| 4,230 | Rosetta Resources, Inc.j | 94,371 | ||||||
| 188,550 | Rowan Companies plc | 4,396,986 | ||||||
| 186,850 | Schlumberger, Ltd. | 15,958,858 | ||||||
| 6,200 | Seadrill, Ltd. | 74,028 | ||||||
| 810 | SM Energy Company | 31,250 | ||||||
| 156,050 | Southwestern Energy Companyj | 4,258,605 | ||||||
| 135,750 | Suncor Energy, Inc. ADR | 4,314,135 | ||||||
| 9,830 | Superior Energy Services, Inc. | 198,075 | ||||||
| 201,600 | Total SA ADRg | 10,321,920 | ||||||
| 24,115 | Trinidad Drilling, Ltd. | 107,934 | ||||||
| 1,800 | U.S. Silica Holdings, Inc. | 46,242 | ||||||
| 647,161 | Weatherford International, Ltd.j | 7,409,993 | ||||||
| 4,050 | Whiting Petroleum Corporationj | 133,650 | ||||||
| 5,000 | WPX Energy, Inc.j | 58,150 | ||||||
|
| |||||||
Total | 125,153,738 | |||||||
|
| |||||||
| Financials (4.3%) | |||||||
| 19,050 | ACE, Ltd. | 2,188,464 | ||||||
| 1,963 | Affiliated Managers Group, Inc.j | 416,627 | ||||||
| 9,150 | Allied World Assurance Company Holdings AG | 346,968 | ||||||
| 35,630 | Allstate Corporation | 2,503,007 | ||||||
| 3,550 | American Assets Trust, Inc. | 141,326 | ||||||
| 6,450 | American Express Company | 600,108 | ||||||
| 3,350 | American Financial Group, Inc. | 203,412 | ||||||
| 19,550 | American International Group, Inc. | 1,094,995 | ||||||
| 11,550 | AmTrust Financial Services, Inc.g | 649,687 | ||||||
| 2,994 | Argo Group International Holdings, Ltd. | 166,077 | ||||||
| 3,000 | Assurant, Inc. | 205,290 | ||||||
| 7,540 | Assured Guaranty, Ltd. | 195,965 | ||||||
| 375,850 | Bank of America Corporation | 6,723,956 | ||||||
| 4,450 | Banner Corporation | 191,439 | ||||||
| 11,970 | BBCN Bancorp, Inc. | 172,129 | ||||||
| 21,800 | Berkshire Hathaway, Inc.j | 3,273,270 | ||||||
| 60,000 | Blackstone Group, LP | 2,029,800 | ||||||
| 8,150 | Boston Private Financial Holdings, Inc. | 109,780 | ||||||
| 9,950 | Brixmor Property Group, Inc. | 247,158 | ||||||
| 3,300 | Camden Property Trust | 243,672 | ||||||
| 42,800 | Capital One Financial Corporation | 3,533,140 | ||||||
| 9,600 | CBL & Associates Properties, Inc. | 186,432 | ||||||
| 3,300 | CBRE Group, Inc.j | 113,025 | ||||||
| 175,398 | Citigroup, Inc. | 9,490,786 | ||||||
| 3,062 | CNA Financial Corporation | 118,530 | ||||||
| 25,850 | CNO Financial Group, Inc. | 445,137 | ||||||
| 69,050 | Comerica, Inc. | 3,234,302 | ||||||
| 5,850 | Corporate Office Properties Trust | 165,964 | ||||||
| 18,600 | Crown Castle International Corporation | 1,463,820 | ||||||
| 5,750 | DDR Corporation | 105,570 | ||||||
| 45,005 | Deutsche Bank AG | 1,351,050 | ||||||
| 3,600 | Digital Realty Trust, Inc. | 238,680 | ||||||
| 8,650 | Discover Financial Services | 566,488 | ||||||
| 15,550 | Duke Realty Corporation | 314,110 | ||||||
| 3,840 | Education Realty Trust, Inc. | 140,506 | ||||||
| 2,170 | Extra Space Storage, Inc. | 127,249 | ||||||
| 7,750 | FBR & Companyj | 190,573 | ||||||
| 19,600 | First Horizon National Corporation | 266,168 | ||||||
| 22,700 | First Niagara Financial Group, Inc. | 191,361 | ||||||
| 10,700 | First Republic Bank | 557,684 | ||||||
| 13,600 | Fulton Financial Corporation | 168,096 | ||||||
| 4,350 | General Growth Properties, Inc. | 122,365 | ||||||
| 6,600 | Government Properties Income Trust | 151,866 | ||||||
| 7,850 | Green Dot Corporationj | 160,847 | ||||||
| 6,200 | Hancock Holding Company | 190,340 | ||||||
| 16,070 | Hanmi Financial Corporation | 350,487 | ||||||
| 3,000 | Hanover Insurance Group, Inc. | 213,960 | ||||||
| 10,828 | HCC Insurance Holdings, Inc. | 579,515 | ||||||
| 18,948 | Host Hotels & Resorts, Inc. | 450,394 | ||||||
| 148,700 | Huntington Bancshares, Inc. | 1,564,324 | ||||||
| 9,100 | Intercontinental Exchange, Inc. | 1,995,539 | ||||||
| 101,650 | Invesco, Ltd. | 4,017,208 | ||||||
The accompanying Notes to Financial Statements are an integral part of this schedule.
142
Table of Contents
MODERATELY CONSERVATIVE ALLOCATION PORTFOLIO
Schedule of Investments as of December 31, 2014
| Shares | Common Stock (18.4%) | Value | ||||||
| Financials (4.3%) - continued | |||||||
| 72,000 | iShares Barclays 1-3 Year Credit Bond Fund | $ | 7,572,960 | |||||
| 152,800 | iShares iBoxx $ High Yield Corporate Bond ETF | 13,690,880 | ||||||
| 105,300 | iShares iBoxx $ Investment Grade Corporate Bond ETF | 12,573,873 | ||||||
| 178,900 | iShares Intermediate Credit Bond ETF | 19,559,137 | ||||||
| 13,860 | iShares Russell 2000 Index Fund | 1,658,626 | ||||||
| 50,114 | J.P. Morgan Chase & Company | 3,136,134 | ||||||
| 24,850 | KeyCorp | 345,415 | ||||||
| 9,488 | Lazard, Ltd. | 474,685 | ||||||
| 3,050 | M&T Bank Corporation | 383,141 | ||||||
| 47,050 | MasterCard, Inc. | 4,053,828 | ||||||
| 13,350 | MBIA, Inc.j | 127,359 | ||||||
| 98,670 | MetLife, Inc. | 5,337,060 | ||||||
| 1,900 | Mid-America Apartment Communities, Inc. | 141,892 | ||||||
| 134,010 | Morgan Stanley | 5,199,588 | ||||||
| 12,550 | NASDAQ OMX Group, Inc. | 601,898 | ||||||
| 6,850 | Northern Trust Corporation | 461,690 | ||||||
| 5,760 | PacWest Bancorp | 261,850 | ||||||
| 5,980 | Parkway Properties, Inc. | 109,972 | ||||||
| 7,060 | Pebblebrook Hotel Trust | 322,148 | ||||||
| 43,600 | Progressive Corporation | 1,176,764 | ||||||
| 12,300 | Prudential Financial, Inc. | 1,112,658 | ||||||
| 4,550 | RLJ Lodging Trust | 152,562 | ||||||
| 1,300 | Sovran Self Storage, Inc. | 113,386 | ||||||
| 135,750 | SPDR Euro Stoxx 50 ETF | 5,003,745 | ||||||
| 41,937 | SPDR S&P 500 ETF Trust | 8,618,053 | ||||||
| 34,449 | Summit Hotel Properties, Inc. | 428,546 | ||||||
| 7,300 | Sunstone Hotel Investors, Inc. | 120,523 | ||||||
| 14,670 | SVB Financial Groupj | 1,702,747 | ||||||
| 18,590 | Synovus Financial Corporation | 503,603 | ||||||
| 12,852 | Terreno Realty Corporation | 265,137 | ||||||
| 2,080 | Texas Capital Bancshares, Inc.j | 113,006 | ||||||
| 28,150 | Unum Group | 981,872 | ||||||
| 16,900 | Visa, Inc. | 4,431,180 | ||||||
| 6,800 | W.R. Berkley Corporation | 348,568 | ||||||
| 7,700 | Wells Fargo & Company | 422,114 | ||||||
| 9,140 | Western Alliance Bancorpj | 254,092 | ||||||
| 3,800 | Weyerhaeuser Company | 136,382 | ||||||
| 16,100 | Zions Bancorporation | 459,011 | ||||||
|
| |||||||
Total | 156,824,731 | |||||||
|
| |||||||
| Health Care (2.2%) | |||||||
| 2,050 | Abaxis, Inc. | 116,502 | ||||||
| 4,400 | Abbott Laboratories | 198,088 | ||||||
| 3,350 | Acceleron Pharma, Inc.j | 130,516 | ||||||
| 12,370 | Acorda Therapeutics, Inc.j | 505,562 | ||||||
| 24,550 | Actavis plcj | 6,319,416 | ||||||
| 21,150 | Aetna, Inc. | 1,878,754 | ||||||
| 32,350 | Affymetrix, Inc.g,j | 319,294 | ||||||
| 5,150 | Akorn, Inc.j | 186,430 | ||||||
| 3,540 | Align Technology, Inc.j | 197,921 | ||||||
| 19,450 | Allscripts Healthcare Solutions, Inc.j | 248,377 | ||||||
| 30,650 | Amgen, Inc. | 4,882,238 | ||||||
| 26,254 | AMN Healthcare Services, Inc.j | 514,578 | ||||||
| 2,750 | AmSurg Corporationj | 150,508 | ||||||
| 6,350 | Anthem, Inc. | 798,005 | ||||||
| 57,780 | Baxter International, Inc. | 4,234,696 | ||||||
| 1,200 | Biogen Idee, Inc.j | 407,340 | ||||||
| 109,000 | Boston Scientific Corporationj | 1,444,250 | ||||||
| 14,250 | Bruker Corporationj | 279,585 | ||||||
| 2,822 | C.R. Bard, Inc. | 470,202 | ||||||
| 31,600 | Cambrex Corporationj | 683,192 | ||||||
| 10,650 | Centene Corporationj | 1,106,003 | ||||||
| 97,000 | Cerner Corporationj | 6,272,020 | ||||||
| 2,850 | Charles River Laboratories International, Inc.j | 181,374 | ||||||
| 40,250 | Covidien plc | 4,116,770 | ||||||
| 1,800 | Edwards Lifesciences Corporationj | 229,284 | ||||||
| 6,700 | Endo International plcj | 483,204 | ||||||
| 12,870 | ExamWorks Group, Inc.j | 535,263 | ||||||
| 27,200 | Express Scripts Holding Companyj | 2,303,024 | ||||||
| 83,200 | Gilead Sciences, Inc.j | 7,842,432 | ||||||
| 2,100 | Greatbatch, Inc.j | 103,530 | ||||||
| 7,250 | HCA Holdings, Inc.j | 532,078 | ||||||
| 13,800 | Hologic, Inc.j | 369,012 | ||||||
| 3,050 | Illumina, Inc.j | 562,969 | ||||||
| 65,676 | Johnson & Johnson | 6,867,739 | ||||||
| 2,600 | Mallinckrodt, LLCj | 257,478 | ||||||
| 4,300 | McKesson Corporation | 892,594 | ||||||
| 122,220 | Merck & Company, Inc. | 6,940,874 | ||||||
| 7,920 | Neurocrine Biosciences, Inc.j | 176,933 | ||||||
| 23,700 | Novavax, Inc.j | 140,541 | ||||||
| 8,833 | NuVasive, Inc.j | 416,564 | ||||||
| 13,350 | PAREXEL International Corporationj | 741,726 | ||||||
| 99,350 | Pfizer, Inc. | 3,094,752 | ||||||
| 4,800 | PharMerica Corporationj | 99,408 | ||||||
| 2,750 | Providence Service Corporationj | 100,210 | ||||||
| 4,250 | Qiagen NVj | 99,705 | ||||||
| 2,900 | Quintiles Transnational Holdings, Inc.j | 170,723 | ||||||
| 14,600 | Spectrum Pharmaceuticals, Inc.g,j | 101,178 | ||||||
| 3,350 | St. Jude Medical, Inc. | 217,850 | ||||||
| 4,430 | Teleflex, Inc. | 508,653 | ||||||
| 950 | Thermo Fisher Scientific, Inc. | 119,025 | ||||||
| 51,408 | UnitedHealth Group, Inc. | 5,196,835 | ||||||
| 4,400 | Universal Health Services, Inc. | 489,544 | ||||||
| 49,650 | Vertex Pharmaceuticals, Inc.j | 5,898,420 | ||||||
| 3,000 | Waters Corporationj | 338,160 | ||||||
|
| |||||||
Total | 81,471,329 | |||||||
|
| |||||||
| Industrials (1.6%) | |||||||
| 3,800 | AAR Corporation | 105,564 | ||||||
| 16,200 | ADT Corporationg | 586,926 | ||||||
| 16,300 | Allison Transmission Holdings, Inc. | 552,570 | ||||||
| 5,330 | Apogee Enterprises, Inc. | 225,832 | ||||||
| 4,650 | Argan, Inc. | 156,426 | ||||||
| 17,300 | Boeing Company | 2,248,654 | ||||||
| 5,749 | Briggs & Stratton Corporation | 117,395 | ||||||
| 6,300 | Caterpillar, Inc. | 576,639 | ||||||
| 7,500 | CLARCOR, Inc. | 499,800 | ||||||
| 14,800 | Con-way, Inc. | 727,864 | ||||||
| 121,000 | CSX Corporation | 4,383,830 | ||||||
| 4,960 | Curtiss-Wright Corporation | 350,126 | ||||||
| 151,450 | Delta Air Lines, Inc. | 7,449,825 | ||||||
| 12,510 | EMCOR Group, Inc. | 556,570 | ||||||
| 3,950 | Esterline Technologies Corporationj | 433,236 | ||||||
| 13,100 | Federal Signal Corporation | 202,264 | ||||||
| 21,500 | Flowserve Corporation | 1,286,345 | ||||||
| 82,500 | Fluor Corporation | 5,001,975 | ||||||
| 8,533 | Granite Construction, Inc. | 324,425 | ||||||
| 11,360 | HNI Corporation | 580,042 | ||||||
| 34,761 | Honeywell International, Inc. | 3,473,319 | ||||||
| 4,350 | Huntington Ingalls Industries, Inc. | 489,201 | ||||||
| 98,400 | Ingersoll-Rand plc | 6,237,576 | ||||||
| 10,400 | Insperity, Inc. | 352,456 | ||||||
| 14,083 | Interface, Inc. | 231,947 | ||||||
| 48,750 | Jacobs Engineering Group, Inc.j | 2,178,637 | ||||||
| 2,200 | Kansas City Southern | 268,466 | ||||||
The accompanying Notes to Financial Statements are an integral part of this schedule.
143
Table of Contents
MODERATELY CONSERVATIVE ALLOCATION PORTFOLIO
Schedule of Investments as of December 31, 2014
| Shares | Common Stock (18.4%) | Value | ||||||
| Industrials (1.6%) - continued |
| ||||||
| 16,150 | KAR Auction Services, Inc. | $ | 559,598 | |||||
| 17,790 | Korn/Ferry Internationalj | 511,640 | ||||||
| 8,740 | Landstar System, Inc. | 633,912 | ||||||
| 3,450 | Manpower, Inc. | 235,186 | ||||||
| 7,900 | Meritor, Inc.j | 119,685 | ||||||
| 7,450 | Mistras Group, Inc.j | 136,559 | ||||||
| 17,000 | Mueller Water Products, Inc. | 174,080 | ||||||
| 2,150 | Old Dominion Freight Line, Inc.j | 166,926 | ||||||
| 12,417 | Oshkosh Corporation | 604,087 | ||||||
| 3,702 | Parker Hannifin Corporation | 477,373 | ||||||
| 47,240 | Pentair, Ltd. | 3,137,681 | ||||||
| 15,210 | Progressive Waste Solutions, Ltd. | 457,517 | ||||||
| 1,080 | Proto Labs, Inc.j | 72,533 | ||||||
| 19,850 | Quanta Services, Inc.j | 563,541 | ||||||
| 10,450 | Ritchie Brothers Auctioneers, Inc. | 281,000 | ||||||
| 71,300 | Southwest Airlines Company | 3,017,416 | ||||||
| 3,000 | Spirit Aerosystems Holdings, Inc.j | 129,120 | ||||||
| 7,250 | Spirit Airlines, Inc.j | 547,955 | ||||||
| 5,380 | Tennant Company | 388,275 | ||||||
| 56,000 | Union Pacific Corporation | 6,671,280 | ||||||
| 10,100 | United Continental Holdings, Inc.j | 675,589 | ||||||
| 2,250 | United Technologies Corporation | 258,750 | ||||||
| 3,050 | WABCO Holdings, Inc.j | 319,579 | ||||||
|
| |||||||
Total | 59,737,192 | |||||||
|
| |||||||
| Information Technology (3.0%) | |||||||
| 18,200 | Akamai Technologies, Inc.j | 1,145,872 | ||||||
| 18,331 | Alibaba Group Holding, Ltd. ADRj | 1,905,324 | ||||||
| 3,000 | Alliance Data Systems Corporationj | 858,150 | ||||||
| 4,950 | Amdocs, Ltd. | 230,942 | ||||||
| 114,934 | Apple, Inc. | 12,686,415 | ||||||
| 32,055 | Applied Materials, Inc. | 798,811 | ||||||
| 13,000 | Aspen Technology, Inc.j | 455,260 | ||||||
| 61,480 | Atmel Corporationj | 516,125 | ||||||
| 5,900 | AVG Technologies NVj | 116,466 | ||||||
| 4,750 | Booz Allen Hamilton Holding Corporation | 126,018 | ||||||
| 30,600 | Broadcom Corporation | 1,325,898 | ||||||
| 12,120 | Broadridge Financial Solutions, Inc. | 559,702 | ||||||
| 52,450 | Brocade Communications Systems, Inc. | 621,008 | ||||||
| 10,100 | CDW Corporation | 355,217 | ||||||
| 5,500 | Cirrus Logic, Inc.j | 129,635 | ||||||
| 305,610 | Cisco Systems, Inc. | 8,500,542 | ||||||
| 7,650 | Citrix Systems, Inc.j | 488,070 | ||||||
| 11,900 | Computer Sciences Corporation | 750,295 | ||||||
| 78,350 | Corning, Inc. | 1,796,565 | ||||||
| 5,750 | Diodes, Inc.j | 158,527 | ||||||
| 6,380 | DST Systems, Inc. | 600,677 | ||||||
| 5,800 | eBay, Inc.j | 325,496 | ||||||
| 13,000 | Electronic Arts, Inc.j | 611,195 | ||||||
| 301,300 | EMC Corporation | 8,960,662 | ||||||
| 16,235 | EVERTEC, Inc. | 359,281 | ||||||
| 87,050 | Facebook, Inc.j | 6,791,641 | ||||||
| 16,150 | Fairchild Semiconductor International, Inc.j | 272,612 | ||||||
| 3,380 | FEI Company | 305,383 | ||||||
| 8,369 | Google, Inc.j | 4,405,442 | ||||||
| 9,519 | Google, Inc., Class Aj | 5,051,353 | ||||||
| 5,850 | Guidewire Software, Inc.j | 296,185 | ||||||
| 8,200 | IAC InterActiveCorp | 498,478 | ||||||
| 2,900 | iGATE Corporationj | 114,492 | ||||||
| 2,750 | International Business Machines Corporation | 441,210 | ||||||
| 30,557 | Juniper Networks, Inc. | 682,032 | ||||||
| 14,350 | Linkedln Corporationj | 3,296,338 | ||||||
| 7,300 | Liquidity Services, Inc.j | 59,641 | ||||||
| 32,050 | Marvell Technology Group, Ltd. | 464,725 | ||||||
| 8,500 | Maxim Integrated Products, Inc. | 270,895 | ||||||
| 29,380 | Microsoft Corporation | 1,364,701 | ||||||
| 184,687 | NetApp, Inc. | 7,655,276 | ||||||
| 6,072 | Newport Corporationj | 116,036 | ||||||
| 39,256 | NVIDIA Corporation | 787,083 | ||||||
| 116,300 | Oracle Corporation | 5,230,011 | ||||||
| 8,977 | Plantronics, Inc. | 475,961 | ||||||
| 8,600 | Polycom, Inc.j | 116,100 | ||||||
| 75,727 | QUALCOMM, Inc. | 5,628,788 | ||||||
| 1,500 | Rackspace Hosting, Inc.j | 70,215 | ||||||
| 7,550 | Red Hat, Inc.j | 522,007 | ||||||
| 81,800 | Salesforce.com, Inc.j | 4,851,558 | ||||||
| 10,950 | Sanmina Corporationj | 257,653 | ||||||
| 46,319 | Sonus Networks, Inc.j | 183,886 | ||||||
| 13,600 | Symantec Corporation | 348,908 | ||||||
| 5,500 | Take-Two Interactive Software, Inc.j | 154,165 | ||||||
| 66,500 | Teradata Corporationj | 2,904,720 | ||||||
| 19,253 | Teradyne, Inc. | 381,017 | ||||||
| 67,880 | Texas Instruments, Inc. | 3,629,204 | ||||||
| 4,908 | Textura Corporationg,j | 139,731 | ||||||
| 14,900 | Total System Services, Inc. | 506,004 | ||||||
| 14,240 | Ubiquiti Networks, Inc.g | 422,074 | ||||||
| 4,650 | Unisys Corporationj | 137,082 | ||||||
| 11,400 | Vantiv, Inc.j | 386,688 | ||||||
| 11,429 | Virtusa Corporationj | 476,246 | ||||||
| 43,750 | VMware, Inc.j | 3,610,250 | ||||||
| 4,300 | WebMD Health Corporationj | 170,065 | ||||||
| 66,200 | Xerox Corporation | 917,532 | ||||||
|
| |||||||
Total | 108,775,541 | |||||||
|
| |||||||
| Materials (0.7%) | |||||||
| 11,500 | Agnico Eagle Mines, Ltd.g | 286,235 | ||||||
| 70,050 | Alcoa, Inc. | 1,106,089 | ||||||
| 8,050 | Avery Dennison Corporation | 417,634 | ||||||
| 11,200 | Ball Corporation | 763,504 | ||||||
| 68,450 | Barrick Gold Corporation | 735,837 | ||||||
| 30,400 | Celanese Corporation | 1,822,784 | ||||||
| 4,900 | Chemtura Corporationj | 121,177 | ||||||
| 2,300 | Clearwater Paper Corporationj | 157,665 | ||||||
| 1,450 | Compass Minerals International, Inc. | 125,904 | ||||||
| 17,150 | Crown Holdings, Inc.j | 872,935 | ||||||
| 45,610 | Dow Chemical Company | 2,080,272 | ||||||
| 6,790 | Eagle Materials, Inc. | 516,244 | ||||||
| 4,900 | Eastman Chemical Company | 371,714 | ||||||
| 39,200 | Eldorado Gold Corporation | 238,336 | ||||||
| 10,450 | Ferro Corporationj | 135,432 | ||||||
| 8,900 | Franco-Nevada Corporation | 437,791 | ||||||
| 70,050 | Freeport-McMoRan, Inc. | 1,636,368 | ||||||
| 47,650 | Goldcorp, Inc. | 882,478 | ||||||
| 20,250 | Graphic Packaging Holding Companyj | 275,805 | ||||||
| 15,110 | Horsehead Holding Corporationj | 239,191 | ||||||
| 2,700 | Innophos Holdings, Inc. | 157,815 | ||||||
| 34,300 | International Paper Company | 1,837,794 | ||||||
| 64,600 | Kinross Gold Corporationj | 182,172 | ||||||
| 1,450 | LyondellBasell Industries NV | 115,116 | ||||||
| 3,450 | Martin Marietta Materials, Inc.g | 380,604 | ||||||
| 9,470 | Materials Select Sector SPDR Fund | 460,053 | ||||||
| 12,200 | MeadWestvaco Corporation | 541,558 | ||||||
| 28,850 | Newmont Mining Corporation | 545,265 | ||||||
| 34,120 | Nucor Corporation | 1,673,586 | ||||||
| 26,700 | Owens-Illinois, Inc.j | 720,633 | ||||||
| 14,850 | Packaging Corporation of America | 1,159,042 | ||||||
| 10,900 | Rock-Tenn Company | 664,682 | ||||||
| 13,700 | Royal Gold, Inc. | 858,990 | ||||||
The accompanying Notes to Financial Statements are an integral part of this schedule.
144
Table of Contents
MODERATELY CONSERVATIVE ALLOCATION PORTFOLIO
Schedule of Investments as of December 31, 2014
| Shares | Common Stock (18.4%) | Value | ||||||
| Materials (0.7%) - continued | |||||||
| 14,800 | Sealed Air Corporation | $ | 627,964 | |||||
| 7,704 | Silgan Holdings, Inc. | 412,934 | ||||||
| 22,650 | Silver Wheaton Corporation | 460,475 | ||||||
| 2,500 | Sonoco Products Company | 109,250 | ||||||
| 17,300 | Southern Copper Corporation | 487,860 | ||||||
| 23,030 | Steel Dynamics, Inc. | 454,612 | ||||||
| 39,600 | Teck Resources, Ltd.g | 540,144 | ||||||
| 3,800 | Tronox, Ltd. | 90,744 | ||||||
| 7,300 | Vulcan Materials Company | 479,829 | ||||||
| 2,400 | Westlake Chemical Corporation | 146,616 | ||||||
| 2,500 | Worthington Industries, Inc. | 75,225 | ||||||
| 52,250 | Yamana Gold, Inc. | 210,045 | ||||||
|
| |||||||
Total | 26,616,403 | |||||||
|
| |||||||
| Telecommunications Services (0.1%) | |||||||
| 74,389 | Verizon Communications, Inc. | 3,479,917 | ||||||
| 29,050 | Vonage Holdings Corporationj | 110,681 | ||||||
|
| |||||||
Total | 3,590,598 | |||||||
|
| |||||||
| Utilities (0.3%) | |||||||
| 4,200 | Atmos Energy Corporation | 234,108 | ||||||
| 10,300 | Edison International, Inc. | 674,444 | ||||||
| 2,390 | Laclede Group, Inc. | 127,148 | ||||||
| 48,540 | NiSource, Inc. | 2,059,067 | ||||||
| 10,920 | NorthWestern Corporation | 617,854 | ||||||
| 99,150 | PG&E Corporation | 5,278,746 | ||||||
| 3,360 | Portland General Electric Company | 127,109 | ||||||
| 8,900 | Public Service Enterprise Group, Inc. | 368,549 | ||||||
| 6,750 | Southern Company | 331,492 | ||||||
| 3,700 | Vectren Corporation | 171,051 | ||||||
| 10,300 | Wisconsin Energy Corporationg | 543,222 | ||||||
|
| |||||||
Total | 10,532,790 | |||||||
|
| |||||||
Total Common Stock (cost $582,152,978) | 677,812,478 | |||||||
|
| |||||||
Collateral Held for Securities Loaned (0.6%) | ||||||||
| 24,079,812 | Thrivent Cash Management Trust | 24,079,812 | ||||||
|
| |||||||
Total Collateral Held for Securities Loaned (cost $24,079,812) | 24,079,812 | |||||||
|
| |||||||
| Shares or Principal Amount | Short-Term Investments (20.7%)k | |||||||
Federal Home Loan Bank Discount Notes | ||||||||
| 3,000,000 | 0.040%, 1/2/2015 | 2,999,997 | ||||||
| 4,000,000 | 0.060%, 1/6/2015 | 3,999,967 | ||||||
| 14,000,000 | 0.049%, 1/7/2015 | 13,999,885 | ||||||
| 14,000,000 | 0.045%, 1/9/2015 | 13,999,860 | ||||||
| 9,000,000 | 0.040%, 1/12/2015 | 8,999,890 | ||||||
| 54,000,000 | 0.050%, 1/16/2015 | 53,998,867 | ||||||
| 54,000,000 | 0.080%, 1/21/2015 | 53,997,600 | ||||||
| 8,000,000 | 0.063%, 1/23/2015 | 7,999,692 | ||||||
| 65,000,000 | 0.063%, 1/28/2015l | 64,996,942 | ||||||
| 66,000,000 | 0.066%, 1/30/2015 | 65,996,509 | ||||||
| 73,000,000 | 0.076%, 2/4/2015 | 72,994,734 | ||||||
| 5,000,000 | 0.080%, 2/6/2015 | 4,999,600 | ||||||
| 33,000,000 | 0.080%, 2/10/2015 | 32,997,067 | ||||||
| 72,000,000 | 0.086%, 2/11/2015 | 71,992,959 | ||||||
| 67,000,000 | 0.090%, 2/13/2015 | 66,992,798 | ||||||
| 67,600,000 | 0.091%, 2/20/2015 | 67,591,458 | ||||||
| 4,000,000 | 0.050%, 3/2/2015 | 3,999,667 | ||||||
| 7,000,000 | 0.100%, 3/4/2015 | 6,998,794 | ||||||
| 47,000,000 | 0.101%, 3/6/2015l | 46,991,550 | ||||||
| 2,000,000 | 0.110%, 3/11/2015 | 1,999,578 | ||||||
| 20,000,000 | 0.116%, 3/13/2015 | 19,995,444 | ||||||
| 6,000,000 | 0.130%, 3/18/2015 | 5,998,353 | ||||||
| 2,049,000 | 0.080%, 3/30/2015 | 2,048,599 | ||||||
| 16,300,000 | 0.090%, 4/24/2015l | 16,295,395 | ||||||
Federal Home Loan Mortgage Corporation Discount Notes | ||||||||
| 22,000,000 | 0.037%, 1/12/2015l | 21,999,751 | ||||||
| 5,000,000 | 0.053%, 1/26/2015 | 4,999,816 | ||||||
Federal National Mortgage Association Discount Notes | ||||||||
| 16,000,000 | 0.052%, 1/5/2015 | 15,999,908 | ||||||
| 4,000,000 | 0.035%, 1/14/2015 | 3,999,949 | ||||||
U.S. Treasury Bills | ||||||||
| 600,000 | 0.030%, 3/19/2015 | 599,962 | ||||||
|
| |||||||
Total Short-Term Investments (at amortized cost) | 760,484,591 | |||||||
|
| |||||||
Total Investments (cost $3,886,222,772)111.7% | $ | 4,110,674,562 | ||||||
|
| |||||||
Other Assets and Liabilities, Net (11.7%) | (431,319,482 | ) | ||||||
|
| |||||||
Total Net Assets 100.0% | $ | 3,679,355,080 | ||||||
|
| |||||||
The accompanying Notes to Financial Statements are an integral part of this schedule.
145
Table of Contents
MODERATELY CONSERVATIVE ALLOCATION PORTFOLIO
Schedule of Investments as of December 31, 2014
| a | The stated interest rate represents the weighted average of all contracts within the bank loan facility. |
| b | All or a portion of the loan is unfunded. |
| c | Denotes investments purchased on a when-issued or delayed delivery basis. |
| d | Denotes securities sold under Rule 144A of the Securities Act of 1933, which exempts them from registration. These securities have been deemed liquid and may be resold to other dealers in the program or to other qualified institutional buyers. As of December 31, 2014, the value of these investments was $116,680,680 or 3.2% of total net assets. |
| e | Denotes variable rate securities. Variable rate securities are securities whose yields vary with a designated market index or market rate. The rate shown is as of December 31, 2014. |
| f | Denotes step coupon securities. Step coupon securities pay an initial coupon rate for the first period and then different coupon rates for following periods. The rate shown is as of December 31, 2014. |
| g | All or a portion of the security is on loan. |
| h | Denotes interest only security. Interest only securities represent the right to receive monthly interest payments on an underlying pool of mortgages or assets. The principal shown is the outstanding par amount of the pool as of the end of the period. The actual effective yield of the security is different than the stated coupon rate. |
| i | Denotes perpetual securities. Perpetual securities pay an indefinite stream of interest, but may be called by the issuer at an earlier date. |
| j | Non-income producing security. |
| k | The interest rate shown reflects the yield, coupon rate or the discount rate at the date of purchase. |
| l | At December 31, 2014, $22,794,730 of investments were held on deposit with the counterparty and pledged as the initial margin deposit for open futures contracts. |
| * | Denotes restricted securities. Restricted securities are investment securities which have been deemed illiquid and cannot be offered for public sale without first being registered under the Securities Act of 1933. The following table indicates the acquisition date and cost of restricted securities Moderately Conservative Allocation Portfolio owned as of December 31, 2014. |
Security | Acquisition Date | Cost | ||||||
Alm Loan Funding CLO, 10/17/2026 | 7/31/2014 | $ | 824,588 | |||||
Apidos CLO XVIII, 7/22/2026 | 6/25/2014 | 822,937 | ||||||
ARES CLO, Ltd., 11/15/2025 | 11/26/2014 | 1,500,000 | ||||||
Babson CLO, Ltd. 2014-II, 10/17/2026 | 8/15/2015 | 824,588 | ||||||
Birchwood Park CLO, Ltd., 7/15/2026 | 7/31/2014 | 825,000 | ||||||
BlueMountain CLO, Ltd., 10/15/2026 | 8/27/2014 | 824,167 | ||||||
Carlyle Global Market Strategies CLO, Ltd., 10/15/2026 | 9/19/2014 | 825,000 | ||||||
Carlyle Global Market Strategies CLO, Ltd., 7/20/2023 | 7/3/2014 | 825,000 | ||||||
Cent CLO 16, LP, 8/1/2024 | 9/5/2014 | 825,000 | ||||||
Cent CLO 22, Ltd., 11/7/2026 | 9/19/2014 | 825,000 | ||||||
CoBank ACB, 6/15/2022 | 10/18/2013 | 373,125 | ||||||
Dryden 34 Senior Loan Fund CLO, 10/15/2026 | 7/21/2014 | 825,000 | ||||||
Edlinc Student Loan Funding Trust, 10/1/2025 | 2/28/2013 | 1,196,098 | ||||||
FNA Trust, 1/10/2018 | 4/29/2013 | 520,646 | ||||||
GoldenTree Loan Opportunities IX, Ltd., 10/29/2026 | 10/3/2014 | 824,175 | ||||||
JBS Finance II, Ltd., 1/29/2018 | 8/11/2014 | 1,515,175 | ||||||
Limerock CLO III, LLC, 10/20/2026 | 10/16/2014 | 2,500,000 | ||||||
Madison Park Funding XIV CLO, Ltd., 7/20/2026 | 7/3/2014 | 898,920 | ||||||
Neuberger Berman CLO, Ltd., 8/4/2025 | 6/19/2014 | 700,000 | ||||||
Octagon Investment Partners XX CLO, Ltd., 8/12/2026 | 7/10/2014 | 825,000 | ||||||
OHA Loan Funding 2014-1, Ltd., 10/20/2026 | 11/6/2014 | 2,493,750 | ||||||
OZLM VIII, Ltd., 10/17/2026 | 8/7/2014 | 820,298 | ||||||
Symphony CLO XV, Ltd., 10/17/2026 | 10/17/2014 | 2,481,250 | ||||||
Symphony CLO, Ltd., 1/9/2023 | 9/15/2014 | 825,000 | ||||||
Voya CLO 2014-3, Ltd., 7/25/2026 | 7/10/2014 | 823,762 | ||||||
Definitions:
| ADR | - | American Depositary Receipt, which are certificates for an underlying foreign security’s shares held by an issuing U.S. depository bank. | ||
| CLO | - | Collateralized Loan Obligation | ||
| ETF | - | Exchange Traded Fund. | ||
| REIT | - | Real Estate Investment Trust is a company that buys, develops, manages and/or sells real estate assets. | ||
| TIPS | - | Treasury Inflation Protected Security. |
Unrealized Appreciation (Depreciation)
Gross unrealized appreciation and depreciation of investments, based on cost for federal income tax purposes, were as follows:
Gross unrealized appreciation | $ | 258,840,033 | ||
Gross unrealized depreciation | (36,495,246 | ) | ||
|
| |||
Net unrealized appreciation (depreciation) | $ | 222,344,787 | ||
Cost for federal income tax purposes | $ | 3,888,329,775 | ||
The accompanying Notes to Financial Statements are an integral part of this schedule.
146
Table of Contents
MODERATELY CONSERVATIVE ALLOCATION PORTFOLIO
Schedule of Investments as of December 31, 2014
Fair Valuation Measurements
The following table is a summary of the inputs used, as of December 31, 2014, in valuing Moderately Conservative Allocation Portfolio’s assets carried at fair value.
Investments in Securities | Total | Level 1 | Level 2 | Level 3 | ||||||||||||
Bank Loans | ||||||||||||||||
Basic Materials | 8,810,702 | — | 8,810,702 | — | ||||||||||||
Capital Goods | 6,250,743 | — | 6,250,743 | — | ||||||||||||
Communications Services | 55,141,826 | — | 50,695,946 | 4,445,880 | ||||||||||||
Consumer Cyclical | 24,856,392 | — | 24,856,392 | — | ||||||||||||
Consumer Non-Cyclical | 18,201,589 | — | 16,444,325 | 1,757,264 | ||||||||||||
Energy | 9,643,639 | — | 6,888,965 | 2,754,674 | ||||||||||||
Financials | 8,904,525 | — | 8,904,525 | — | ||||||||||||
Technology | 5,687,897 | — | 5,687,897 | — | ||||||||||||
Transportation | 5,900,774 | — | 4,739,609 | 1,161,165 | ||||||||||||
Utilities | 4,834,147 | — | 4,834,147 | — | ||||||||||||
Long-Term Fixed Income | ||||||||||||||||
Asset-Backed Securities | 68,325,523 | — | 65,102,008 | 3,223,515 | ||||||||||||
Basic Materials | 14,131,462 | — | 14,131,462 | — | ||||||||||||
Capital Goods | 14,812,150 | — | 14,812,150 | — | ||||||||||||
Collateralized Mortgage Obligations | 59,359,243 | — | 59,359,243 | — | ||||||||||||
Commercial Mortgage-Backed Securities | 38,973,981 | — | 38,973,981 | — | ||||||||||||
Communications Services | 45,395,483 | — | 45,395,483 | — | ||||||||||||
Consumer Cyclical | 25,959,479 | — | 25,959,479 | — | ||||||||||||
Consumer Non-Cyclical | 40,410,152 | — | 40,410,152 | — | ||||||||||||
Energy | 42,695,136 | — | 42,695,136 | — | ||||||||||||
Financials | 117,825,827 | — | 117,825,827 | — | ||||||||||||
Foreign Government | 725,259 | — | 725,259 | — | ||||||||||||
Mortgage-Backed Securities | 434,950,321 | — | 434,950,321 | — | ||||||||||||
Technology | 13,185,606 | — | 13,185,606 | — | ||||||||||||
Transportation | 8,317,025 | — | 8,317,025 | — | ||||||||||||
U.S. Government and Agencies | 319,186,655 | — | 319,186,655 | — | ||||||||||||
Utilities | 31,025,467 | — | 31,025,467 | — | ||||||||||||
Affiliated Mutual Funds | ||||||||||||||||
Equity Mutual Funds | 484,096,610 | 484,096,610 | — | — | ||||||||||||
Fixed Income Mutual Funds | 740,690,068 | 740,690,068 | — | — | ||||||||||||
Common Stock | ||||||||||||||||
Consumer Discretionary | 77,708,735 | 77,708,735 | — | — | ||||||||||||
Consumer Staples | 27,401,421 | 27,401,421 | — | — | ||||||||||||
Energy | 125,153,738 | 125,045,804 | 107,934 | — | ||||||||||||
Financials | 156,824,731 | 156,824,731 | — | — | ||||||||||||
Health Care | 81,471,329 | 81,471,329 | — | — | ||||||||||||
Industrials | 59,737,192 | 59,737,192 | — | — | ||||||||||||
Information Technology | 108,775,541 | 108,775,541 | — | — | ||||||||||||
Materials | 26,616,403 | 26,616,403 | — | — | ||||||||||||
Telecommunications Services | 3,590,598 | 3,590,598 | — | — | ||||||||||||
Utilities | 10,532,790 | 10,532,790 | — | — | ||||||||||||
Collateral Held for Securities Loaned | 24,079,812 | 24,079,812 | — | — | ||||||||||||
Short-Term Investments | 760,484,591 | — | 760,484,591 | — | ||||||||||||
|
|
|
|
|
|
|
| |||||||||
Total | $ | 4,110,674,562 | $ | 1,926,571,034 | $ | 2,170,761,030 | $ | 13,342,498 | ||||||||
|
|
|
|
|
|
|
| |||||||||
Other Financial Instruments | Total | Level 1 | Level 2 | Level 3 | ||||||||||||
Asset Derivatives | ||||||||||||||||
Futures Contracts | 20,694,597 | 20,694,597 | — | — | ||||||||||||
|
|
|
|
|
|
|
| |||||||||
Total Asset Derivatives | $ | 20,694,597 | $ | 20,694,597 | $ | — | $ | — | ||||||||
|
|
|
|
|
|
|
| |||||||||
Liability Derivatives | ||||||||||||||||
Futures Contracts | 5,507,884 | 5,507,884 | — | — | ||||||||||||
|
|
|
|
|
|
|
| |||||||||
Total Liability Derivatives | $ | 5,507,884 | $ | 5,507,884 | $ | — | $ | — | ||||||||
|
|
|
|
|
|
|
| |||||||||
There were no significant transfers between Levels during the period ended December 31, 2014. Transfers between Levels are identified as of the end of the period.
The accompanying Notes to Financial Statements are an integral part of this schedule.
147
Table of Contents
MODERATELY CONSERVATIVE ALLOCATION PORTFOLIO
Schedule of Investments as of December 31, 2014
Futures Contracts | Number of Contracts Long/(Short) | Expiration Date | Notional Principal Amount | Value | Unrealized Gain/(Loss) | |||||||||||||||
2-Yr. U.S. Treasury Bond Futures | (2,222 | ) | March 2015 | ($ | 486,263,176 | ) | ($ | 485,715,312 | ) | $ | 547,864 | |||||||||
5-Yr. U.S. Treasury Bond Futures | 508 | March 2015 | 60,342,896 | 60,416,282 | 73,386 | |||||||||||||||
10-Yr. U.S. Treasury Bond Futures | 615 | March 2015 | 77,487,073 | 77,980,082 | 493,009 | |||||||||||||||
30-Yr. U.S. Treasury Bond Futures | 1,457 | March 2015 | 204,815,386 | 210,627,563 | 5,812,177 | |||||||||||||||
Eurex EURO STOXX 50 Futures | 3,258 | March 2015 | 117,168,683 | 123,316,804 | 6,148,121 | |||||||||||||||
Mini MSCI EAFE Index Futures | 721 | March 2015 | 62,787,340 | 63,372,294 | 584,954 | |||||||||||||||
Russell 2000 Index Mini-Futures | 292 | March 2015 | 33,291,422 | 35,060,440 | 1,769,018 | |||||||||||||||
S&P 400 Index Mini-Futures | (911 | ) | March 2015 | (126,459,576 | ) | (131,967,460 | ) | (5,507,884 | ) | |||||||||||
S&P 500 Index Futures | 211 | March 2015 | 104,617,197 | 108,264,100 | 3,646,903 | |||||||||||||||
Ultra Long Term U.S. Treasury Bond Futures | 212 | March 2015 | 33,400,585 | 35,019,750 | 1,619,165 | |||||||||||||||
Total Futures Contracts | $ | 15,186,713 | ||||||||||||||||||
The following table summarizes the fair value and Statement of Assets and Liabilities location, as of December 31, 2014, for Moderately Conservative Allocation Portfolio’s investments in financial derivative instruments by primary risk exposure as discussed under item (2) Significant Accounting Policies of the Notes to Financial Statements.
Derivatives by risk category | Statement of Assets and Liabilities Location | Fair Value | ||||
Asset Derivatives | ||||||
Interest Rate Contracts | ||||||
Futures* | Net Assets - Net unrealized appreciation/(depreciation) on Futures contracts | $ | 8,545,601 | |||
Total Interest Rate Contracts | 8,545,601 | |||||
Equity Contracts | ||||||
Futures* | Net Assets - Net unrealized appreciation/(depreciation) on Futures contracts | 12,148,996 | ||||
Total Equity Contracts | 12,148,996 | |||||
|
| |||||
Total Asset Derivatives | $ | 20,694,597 | ||||
|
| |||||
Liability Derivatives | ||||||
Equity Contracts | ||||||
Futures* | Net Assets - Net unrealized appreciation/(depreciation) on Futures contracts | 5,507,884 | ||||
Total Equity Contracts | 5,507,884 | |||||
|
| |||||
Total Liability Derivatives | $ | 5,507,884 | ||||
|
| |||||
| * | Includes cumulative appreciation/depreciation of futures contracts as reported in the Schedule of Investments. Only current day’s variation margin is reported within the Statement of Assets and Liabilities. |
The following table summarizes the net realized gains/(losses) and Statement of Operations location, for the period ended December 31, 2014, for Moderately Conservative Allocation Portfolio’s investments in financial derivative instruments by primary risk exposure.
Derivatives by risk category | Statement of Operations Location | Realized Gains/(Losses) recognized in Income | ||||
Equity Contracts | ||||||
Futures | Net realized gains/(losses) on Futures contracts | 5,167,839 | ||||
Total Equity Contracts | 5,167,839 | |||||
Interest Rate Contracts | ||||||
Futures | Net realized gains/(losses) on Futures contracts | 22,117,506 | ||||
Total Interest Rate Contracts | 22,117,506 | |||||
Credit Contracts | ||||||
Credit Default Swaps | Net realized gains/(losses) on Swap agreements | 163,007 | ||||
Total Credit Contracts | 163,007 | |||||
|
| |||||
Total | $ | 27,448,352 | ||||
|
| |||||
The accompanying Notes to Financial Statements are an integral part of this schedule.
148
Table of Contents
MODERATELY CONSERVATIVE ALLOCATION PORTFOLIO
Schedule of Investments as of December 31, 2014
The following table summarizes the change in net unrealized appreciation/(depreciation) and Statement of Operations location, for the period ended December 31, 2014, for Moderately Conservative Allocation Portfolio’s investments in financial derivative instruments by primary risk exposure.
Derivatives by risk category | Statement of Operations Location | Change in unrealized appreciation/(depreciation) recognized in Income | ||||
Interest Rate Contracts | ||||||
Futures | Change in net unrealized appreciation/(depreciation) on Futures contracts | 9,582,889 | ||||
Total Interest Rate Contracts | 9,582,889 | |||||
Equity Contracts | ||||||
Futures | Change in net unrealized appreciation/(depreciation) on Futures contracts | (2,534,987 | ) | |||
Total Equity Contracts | (2,534,987 | ) | ||||
|
| |||||
Total | $ | 7,047,902 | ||||
|
| |||||
The following table presents Moderately Conservative Allocation Portfolio’s average volume of derivative activity during the period ended December 31, 2014.
Derivative Risk Category | Futures (Notional)* | Futures (Percentage of Average Net Assets) | Swaps (Notional)* | |||||||||
Equity Contracts | $ | 329,464,992 | 9.5 | % | N/A | |||||||
Interest Rate Contracts | 641,461,387 | 18.4 | N/A | |||||||||
Credit Contracts | N/A | N/A | $ | 71,445 | ||||||||
| * | Notional amount represents long or short, or both, derivative positions held by the Portfolio. |
Investment in Affiliates
Affiliated issuers, as defined under the Investment Company Act of 1940, include those in which the Portfolio’s holdings of an issuer represent 5% or more of the outstanding voting securities of an issuer, or any affiliated mutual fund.
A summary of transactions for the fiscal year to date, in Moderately Conservative Allocation Portfolio, is as follows:
Portfolio | Value December 31, 2013 | Gross Purchases | Gross Sales | Shares Held at December 31, 2014 | Value December 31, 2014 | Income Earned January 1, 2014 - December 31, 2014 | ||||||||||||||||||
Partner Small Cap Value | $ | 36,890,762 | $ | 1,033,546 | $ | — | 1,342,036 | $ | 37,953,593 | $ | 80,118 | |||||||||||||
Small Cap Stock | 28,794,314 | 376,899 | — | 1,641,909 | 30,163,511 | 62,683 | ||||||||||||||||||
Partner Mid Cap Value | 41,896,321 | 6,083,899 | — | 2,622,430 | 47,562,494 | 281,639 | ||||||||||||||||||
Mid Cap Stock | 52,035,964 | 2,625,857 | — | 3,088,876 | 58,243,532 | 172,923 | ||||||||||||||||||
Partner Worldwide Allocation | 158,823,593 | 3,228,228 | — | 16,163,017 | 150,325,753 | 3,228,228 | ||||||||||||||||||
Large Cap Value | 120,211,070 | 1,533,344 | — | 7,807,552 | 131,067,726 | 1,533,344 | ||||||||||||||||||
Large Cap Stock | 27,333,984 | 247,913 | — | 2,334,504 | 28,780,001 | 247,913 | ||||||||||||||||||
High Yield | 98,379,586 | 5,818,996 | 4,398,608 | 19,692,510 | 95,969,477 | 5,818,827 | ||||||||||||||||||
Income | 249,327,543 | 12,533,479 | 18,177,845 | 23,568,312 | 247,493,205 | 9,446,502 | ||||||||||||||||||
Limited Maturity Bond | 415,677,168 | 6,922,706 | 25,280,213 | 40,471,873 | 397,227,386 | 6,927,588 | ||||||||||||||||||
Cash Management Trust-Collateral Investment | 53,397,848 | 291,905,871 | 321,223,907 | 24,079,812 | 24,079,812 | 189,491 | ||||||||||||||||||
Total Value and Income Earned | 1,282,768,153 | 1,248,866,490 | 27,989,256 | |||||||||||||||||||||
The accompanying Notes to Financial Statements are an integral part of this schedule.
149
Table of Contents
GROWTHAND INCOME PLUS PORTFOLIO
Schedule of Investments as of December 31, 2014
| Principal Amount | Bank Loans (10.5%)a | Value | ||||||
| Basic Materials (0.8%) |
| ||||||
Alpha Natural Resources, Inc., Term Loan | ||||||||
| $ | 59,396 | 3.500%, 5/22/2020 | $ | 46,960 | ||||
Crown Americas, LLC, Term Loan | ||||||||
| 62,500 | 0.000%, 10/20/2021b,c | 62,422 | ||||||
Fortescue Metals Group, Ltd., Term Loan | ||||||||
| 119,316 | 3.750%, 6/30/2019 | 108,100 | ||||||
Ineos Group Holdings, Ltd., Term Loan | ||||||||
| 106,378 | 3.750%, 5/4/2018 | 102,909 | ||||||
NewPage Corporation, Term Loan | ||||||||
| 135,000 | 9.500%, 2/11/2021 | 128,024 | ||||||
Tronox Pigments BV, Term Loan | ||||||||
| 113,939 | 4.000%, 3/19/2020 | 111,851 | ||||||
Wausau Paper Corporation, Term Loan | ||||||||
| 74,625 | 6.500%, 7/30/2020 | 73,879 | ||||||
|
| |||||||
Total | 634,145 | |||||||
|
| |||||||
| Capital Goods (0.6%) | |||||||
ADS Waste Holdings, Inc., Term Loan | ||||||||
| 105,467 | 3.750%, 10/9/2019 | 102,204 | ||||||
Berry Plastics Group, Inc., Term Loan | ||||||||
| 78,062 | 3.500%, 2/8/2020 | 75,385 | ||||||
Rexnord, LLC, Term Loan | ||||||||
| 106,650 | 4.000%, 8/21/2020 | 104,304 | ||||||
Silver II Borrower, Term Loan | ||||||||
| 99,357 | 4.000%, 12/13/2019 | 92,123 | ||||||
STHI Holding Corporation, Term Loan | ||||||||
| 99,750 | 4.500%, 8/6/2021 | 98,835 | ||||||
|
| |||||||
Total | 472,851 | |||||||
|
| |||||||
| Communications Services (3.3%) | |||||||
Atlantic Broadband Penn, LLC, Term Loan | ||||||||
| 48,903 | 3.250%, 11/30/2019 | 47,803 | ||||||
Birch Communication Inc., Term Loan | ||||||||
| 106,868 | 7.750%, 7/17/2020 | 104,731 | ||||||
Cengage Learning Aquisitions, Term Loan | ||||||||
| 89,325 | 7.000%, 3/31/2020 | 88,320 | ||||||
Charter Communications Operating, LLC, Term Loan | ||||||||
| 25,869 | 3.000%, 7/1/2020 | 25,335 | ||||||
| 53,190 | 3.000%, 1/3/2021 | 52,071 | ||||||
Cincinnati Bell, Inc., Term Loan | ||||||||
| 106,650 | 4.000%, 9/10/2020 | 105,317 | ||||||
Clear Channel Communications, Inc., Term Loan | ||||||||
| 108,000 | 6.919%, 1/30/2019 | 101,597 | ||||||
Cumulus Media Holdings, Inc., Term Loan | ||||||||
| 58,347 | 4.250%, 12/23/2020 | 56,499 | ||||||
Fairpoint Communications, Term Loan | ||||||||
| 106,376 | 7.500%, 2/14/2019 | 105,246 | ||||||
Grande Communications Networks, LLC, Term Loan | ||||||||
| 106,381 | 4.500%, 5/29/2020 | 104,918 | ||||||
Gray Television, Inc., Term Loan | ||||||||
| 66,772 | 3.750%, 6/13/2021 | 65,604 | ||||||
Hargray Communications Group, Inc., Term Loan | ||||||||
| 49,463 | 5.250%, 6/26/2019 | 49,092 | ||||||
IMG Worldwide, Inc., Term Loan | ||||||||
| 89,550 | 5.250%, 5/6/2021 | 86,360 | ||||||
Integra Telecom Holdings, Inc., Term Loan | ||||||||
| 106,376 | 5.250%, 2/22/2019 | 103,252 | ||||||
Intelsat Jackson Holdings SA, Term Loan | ||||||||
| 77,173 | 3.750%, 6/30/2019 | 75,919 | ||||||
Level 3 Communications, Inc., Term Loan | ||||||||
| 79,000 | 4.000%, 8/1/2019 | 78,359 | ||||||
Liberty Cablevision of Puerto Rico, LLC, Term Loan | ||||||||
| 25,000 | 0.000%, 1/7/2022b,c | 24,250 | ||||||
| 120,000 | 4.500%, 1/7/2022 | 116,700 | ||||||
LTS Buyer, LLC, Term Loan | ||||||||
| 89,734 | 4.000%, 4/13/2020 | 87,660 | ||||||
MCC Georgia, LLC, Term Loan | ||||||||
| 79,600 | 3.750%, 6/30/2021 | 77,676 | ||||||
McGraw-Hill Global Education, LLC, Term Loan | ||||||||
| 91,034 | 5.750%, 3/22/2019 | 90,550 | ||||||
NEP/NCP Holdco, Inc., Term Loan | ||||||||
| 106,653 | 4.250%, 1/22/2020 | 104,165 | ||||||
NTelos, Inc., Term Loan | ||||||||
| 106,368 | 5.750%, 11/9/2019 | 92,540 | ||||||
Puerto Rico Cable Acquisition Company, Inc., Term Loan | ||||||||
| 113,633 | 5.500%, 7/31/2018 | 112,781 | ||||||
SBA Senior Finance II, LLC, Term Loan | ||||||||
| 99,500 | 3.250%, 3/24/2021 | 97,240 | ||||||
TNS, Inc., Term Loan | ||||||||
| 81,714 | 5.000%, 2/14/2020 | 80,794 | ||||||
Univision Communications, Inc., Term Loan | ||||||||
| 106,374 | 4.000%, 3/1/2020 | 103,874 | ||||||
Virgin Media Investment Holdings, Ltd., Term Loan | ||||||||
| 81,000 | 3.500%, 6/7/2020 | 79,430 | ||||||
WideOpenWest Finance, LLC, Term Loan | ||||||||
| 93,079 | 4.750%, 4/1/2019 | 92,323 | ||||||
XO Communications, LLC, Term Loan | ||||||||
| 99,275 | 4.250%, 3/20/2021b,c | 97,289 | ||||||
Yankee Cable Acquisition, LLC, Term Loan | ||||||||
| 104,342 | 4.500%, 3/1/2020 | 103,690 | ||||||
Zayo Group, LLC, Term Loan | ||||||||
| 93,069 | 4.000%, 7/2/2019 | 91,943 | ||||||
|
| |||||||
Total | 2,703,328 | |||||||
|
| |||||||
| Consumer Cyclical (1.7%) | |||||||
Amaya Gaming Group, Inc., Term Loan | ||||||||
| 87,281 | 5.000%, 8/1/2021 | 86,343 | ||||||
The accompanying Notes to Financial Statements are an integral part of this schedule.
150
Table of Contents
GROWTHAND INCOME PLUS PORTFOLIO
Schedule of Investments as of December 31, 2014
| Principal Amount | Bank Loans (10.5%)a | Value | ||||||
| Consumer Cyclical (1.7%) - continued |
| ||||||
Burlington Coat Factory Warehouse Corporation, Term Loan | ||||||||
| $ | 92,197 | 4.250%, 8/13/2021 | $ | 90,872 | ||||
Ceridian HCM Holding, Inc., Term Loan | ||||||||
| 52,307 | 4.500%, 9/15/2020 | 51,359 | ||||||
Chrysler Group, LLC, Term Loan | ||||||||
| 89,325 | 3.250%, 12/31/2018 | 88,320 | ||||||
Golden Nugget, Inc., Delayed Draw | ||||||||
| 19,008 | 5.500%, 11/21/2019 | 18,735 | ||||||
Golden Nugget, Inc., Term Loan | ||||||||
| 44,352 | 5.500%, 11/21/2019 | 43,715 | ||||||
Hilton Worldwide Finance, LLC, Term Loan | ||||||||
| 83,821 | 3.500%, 10/26/2020 | 82,738 | ||||||
J.C. Penney Corporation, Inc., Term Loan | ||||||||
| 106,380 | 6.000%, 5/22/2018 | 104,164 | ||||||
Las Vegas Sands, LLC, Term Loan | ||||||||
| 79,200 | 3.250%, 12/19/2020 | 78,639 | ||||||
Marina District Finance Company, Inc., Term Loan | ||||||||
| 82,350 | 6.750%, 8/15/2018 | 81,612 | ||||||
MGM Resorts International, Term Loan | ||||||||
| 69,737 | 3.500%, 12/20/2019 | 67,776 | ||||||
Michaels Stores, Inc., Term Loan | ||||||||
| 89,775 | 4.000%, 1/28/2020 | 88,092 | ||||||
Mohegan Tribal Gaming Authority, Term Loan | ||||||||
| 95,040 | 5.500%, 11/19/2019 | 91,154 | ||||||
Pinnacle Entertainment, Inc., Term Loan | ||||||||
| 45,073 | 3.750%, 8/13/2020 | 44,341 | ||||||
ROC Finance, LLC, Term Loan | ||||||||
| 106,650 | 5.000%, 6/20/2019 | 98,651 | ||||||
Scientific Games International, Inc., Term Loan | ||||||||
| 106,920 | 6.000%, 10/18/2020 | 105,236 | ||||||
Seminole Hard Rock Entertainment, Inc., Term Loan | ||||||||
| 49,748 | 3.500%, 5/14/2020 | 47,882 | ||||||
Seminole Indian Tribe of Florida, Term Loan | ||||||||
| 84,919 | 3.000%, 4/29/2020 | 84,424 | ||||||
|
| |||||||
Total | 1,354,053 | |||||||
|
| |||||||
| Consumer Non-Cyclical (1.4%) |
| ||||||
Albertsons, Inc., Term Loan | ||||||||
| 156,942 | 4.750%, 3/21/2019 | 155,765 | ||||||
Biomet, Inc., Term Loan | ||||||||
| 92,964 | 3.670%, 7/25/2017 | 92,400 | ||||||
Catalina Marketing Corporation, Term Loan | ||||||||
| 89,550 | 4.500%, 4/9/2021 | 85,017 | ||||||
CHS/Community Health Systems, Inc., Term Loan | ||||||||
| 14,585 | 3.486%, 1/25/2017 | 14,488 | ||||||
| 137,875 | 4.250%, 1/27/2021 | 137,387 | ||||||
Del Monte Corporation, Term Loan | ||||||||
| 63,545 | 3.500%, 3/9/2020 | 60,685 | ||||||
JBS USA, LLC, Term Loan | ||||||||
| 71,201 | 3.750%, 5/25/2018 | 70,133 | ||||||
| 9,950 | 3.750%, 9/18/2020 | 9,713 | ||||||
Libbey Glass, Inc., Term Loan | ||||||||
| 74,625 | 3.750%, 4/9/2021 | 73,366 | ||||||
Ortho-Clinical Diagnostics, Inc., Term Loan | ||||||||
| 109,450 | 4.750%, 6/30/2021 | 107,507 | ||||||
Roundy’s Supermarkets, Inc., Term Loan | ||||||||
| 80,961 | 5.750%, 3/3/2021 | 75,766 | ||||||
Supervalu, Inc., Term Loan | ||||||||
| 166,259 | 4.500%, 3/21/2019 | 163,027 | ||||||
Visant Corporation, Term Loan | ||||||||
| 66,339 | 7.000%, 9/23/2021 | 64,349 | ||||||
|
| |||||||
Total | 1,109,603 | |||||||
|
| |||||||
| Energy (0.8%) |
| ||||||
Arch Coal, Inc., Term Loan | ||||||||
| 155,735 | 6.250%, 5/16/2018 | 128,547 | ||||||
Energy Solutions, LLC, Term Loan | ||||||||
| 109,450 | 6.750%, 5/29/2020 | 108,937 | ||||||
Exgen Renewables I, LLC, Term Loan | ||||||||
| 56,312 | 5.250%, 2/6/2021 | 56,312 | ||||||
McJunkin Red Man Corporation, Term Loan | ||||||||
| 113,637 | 5.000%, 11/8/2019 | 104,262 | ||||||
Offshore Group Investment, Ltd., Term Loan | ||||||||
| 99,268 | 5.750%, 3/28/2019 | 73,954 | ||||||
Pacific Drilling SA, Term Loan | ||||||||
| 79,785 | 4.500%, 6/3/2018 | 65,557 | ||||||
TerraForm Power Operating, LLC, Term Loan | ||||||||
| 109,450 | 4.750%, 7/23/2019 | 108,903 | ||||||
|
| |||||||
Total | 646,472 | |||||||
|
| |||||||
| Financials (0.6%) |
| ||||||
Delos Finance Sarl, Term Loan | ||||||||
| 100,000 | 3.500%, 3/6/2021 | 98,958 | ||||||
DJO Finance, LLC, Term Loan | ||||||||
| 78,066 | 4.250%, 9/15/2017 | 76,179 | ||||||
Harland Clarke Holdings Corporation, Term Loan | ||||||||
| 103,950 | 7.000%, 5/22/2018 | 104,054 | ||||||
MPH Acquisition Holdings, LLC, Term Loan | ||||||||
| 46,729 | 3.750%, 3/31/2021 | 45,350 | ||||||
TransUnion, LLC, Term Loan | ||||||||
| 89,325 | 4.000%, 4/9/2021 | 87,874 | ||||||
WaveDivision Holdings, LLC, Term Loan | ||||||||
| 86,381 | 4.000%, 10/15/2019 | 84,941 | ||||||
|
| |||||||
Total | 497,356 | |||||||
|
| |||||||
| Technology (0.7%) |
| ||||||
Avago Technologies, Ltd., Term Loan | ||||||||
| 149,250 | 3.750%, 5/6/2021 | 148,566 | ||||||
BMC Software, Inc., Term Loan | ||||||||
| 103,170 | 5.000%, 9/10/2020 | 100,140 | ||||||
First Data Corporation, Term Loan | ||||||||
| 108,000 | 3.667%, 3/23/2018 | 105,773 | ||||||
The accompanying Notes to Financial Statements are an integral part of this schedule.
151
Table of Contents
GROWTHAND INCOME PLUS PORTFOLIO
Schedule of Investments as of December 31, 2014
| Principal Amount | Bank Loans (10.5%)a | Value | ||||||
| Technology (0.7%) - continued |
| ||||||
Freescale Semiconductor, Inc., Term Loan | ||||||||
| $106,384 | 4.250%, 2/28/2020 | $ | 103,658 | |||||
Infor US, Inc., Term Loan | ||||||||
| 48,542 | 3.750%, 6/3/2020 | 47,029 | ||||||
| 62,510 | 3.750%, 6/3/2020 | 60,486 | ||||||
|
| |||||||
Total | 565,652 | |||||||
|
| |||||||
| Transportation (0.4%) |
| ||||||
American Airlines, Inc., Term Loan | ||||||||
| 106,380 | 3.750%, 6/27/2019 | 105,095 | ||||||
Delta Air Lines, Inc., Term Loan | ||||||||
| 119,075 | 3.250%, 4/20/2017b,c | 117,586 | ||||||
OSG Bulk Ships, Inc., Term Loan | ||||||||
| 104,475 | 5.250%, 8/5/2019 | 101,602 | ||||||
|
| |||||||
Total | 324,283 | |||||||
|
| |||||||
| Utilities (0.2%) |
| ||||||
Calpine Corporation, Term Loan | ||||||||
| 39,878 | 4.000%, 4/1/2018 | 39,390 | ||||||
| 69,300 | 4.000%, 10/31/2020 | 68,135 | ||||||
Intergen NV, Term Loan | ||||||||
| 106,380 | 5.500%, 6/15/2020 | 105,405 | ||||||
|
| |||||||
Total | 212,930 | |||||||
|
| |||||||
Total Bank Loans (cost $8,769,818) | 8,520,673 | |||||||
|
| |||||||
| Shares | Common Stock (66.9%) | |||||||
| Consumer Discretionary (6.8%) |
| ||||||
| 6,700 | Barnes & Noble, Inc.d | 155,574 | ||||||
| 1,900 | Bayerische Motoren Werke AG | 205,045 | ||||||
| 13,800 | Best Buy Company, Inc. | 537,924 | ||||||
| 4,700 | Canon Marketing Japan, Inc. | 79,654 | ||||||
| 4,400 | Coach, Inc. | 165,264 | ||||||
| 9,203 | Comcast Corporation | 533,866 | ||||||
| 22,400 | Dixons Carphone plc | 161,436 | ||||||
| 7,650 | Dollar Tree, Inc.d | 538,407 | ||||||
| 11,400 | EDION Corporation | 79,739 | ||||||
| 3,500 | Gap, Inc. | 147,385 | ||||||
| 8,700 | Hakuhodo Dy Holdings, Inc. | 83,258 | ||||||
| 3,100 | Hennes & Mauritz AB | 128,790 | ||||||
| 2,900 | Hilton Worldwide Holdings, Inc.d | 75,661 | ||||||
| 24,412 | Home Retail Group plc | 78,674 | ||||||
| 10,000 | Honda Motor Company, Ltd. | 293,383 | ||||||
| 26,078 | ITV plc | 86,989 | ||||||
| 4,550 | Kohl’s Corporation | 277,732 | ||||||
| 7,700 | Lowe’s Companies, Inc. | 529,760 | ||||||
| 38,000 | Luk Fook Holdings International, Ltd. | 142,505 | ||||||
| 2,350 | Madison Square Garden Companyd | 176,861 | ||||||
| 900 | RTL Group SA | 85,821 | ||||||
| 6,100 | Ruth’s Hospitality Group, Inc. | 91,500 | ||||||
| 11,600 | Sekisui House, Ltd. | 152,633 | ||||||
| 38,000 | SJM Holdings, Ltd. | 60,074 | ||||||
| 21,900 | Sky Network Television, Ltd. | 102,813 | ||||||
| 5,200 | Stage Stores, Inc. | 107,640 | ||||||
| 7,500 | Sumitomo Forestry Company, Ltd. | 73,347 | ||||||
| 11,200 | Suzuki Motor Corporation | 335,634 | ||||||
|
| |||||||
Total | 5,487,369 | |||||||
|
| |||||||
| Consumer Staples (4.1%) |
| ||||||
| 5,600 | Associated British Foods plc | 273,779 | ||||||
| 1,416 | British American Tobacco plc | 76,735 | ||||||
| 9,241 | Coca-Cola Company | 390,155 | ||||||
| 4,000 | Coca-Cola Enterprises, Inc. | 176,880 | ||||||
| 5,800 | CVS Health Corporation | 558,598 | ||||||
| 8,119 | Imperial Tobacco Group plc | 357,395 | ||||||
| 5,000 | Japan Tobacco, Inc. | 137,614 | ||||||
| 1,700 | Nestle SA | 123,932 | ||||||
| 25,750 | Rite Aid Corporationd | 193,640 | ||||||
| 6,300 | Tyson Foods, Inc. | 252,567 | ||||||
| 2,738 | Wal-Mart Stores, Inc. | 235,139 | ||||||
| 3,095 | Wesfarmers, Ltd. | 104,789 | ||||||
| 4,550 | WhiteWave Foods Companyd | 159,205 | ||||||
| 4,100 | Whole Foods Market, Inc. | 206,722 | ||||||
| 47,000 | Wilmar International, Ltd. | 114,522 | ||||||
|
| |||||||
Total | 3,361,672 | |||||||
|
| |||||||
| Energy (3.9%) |
| ||||||
| 62,483 | BP plc | 396,616 | ||||||
| 10,646 | BW LPG, Ltd. | 74,146 | ||||||
| 2,450 | Cabot Oil & Gas Corporation | 72,545 | ||||||
| 4,700 | CAT Oil AG | 83,088 | ||||||
| 14,600 | Eni SPA | 255,741 | ||||||
| 5,450 | EOG Resources, Inc. | 501,782 | ||||||
| 11,300 | ERG SPA | 126,549 | ||||||
| 13,000 | Halliburton Company | 511,290 | ||||||
| 20,800 | Patterson-UTI Energy, Inc. | 345,072 | ||||||
| 12,800 | Pioneer Energy Services Corporationd | 70,912 | ||||||
| 9,117 | Royal Dutch Shell plc, Class B | 315,003 | ||||||
| 3,400 | Southwestern Energy Companyd | 92,786 | ||||||
| 4,700 | Total SA | 240,791 | ||||||
| 2,300 | Whiting Petroleum Corporationd | 75,900 | ||||||
|
| |||||||
Total | 3,162,221 | |||||||
|
| |||||||
| Financials (18.6%) |
| ||||||
| 12,047 | Aberdeen Asia-Pacific Income Fund, Inc. | 66,861 | ||||||
| 100 | Acadia Realty Trust | 3,203 | ||||||
| 3,042 | Aflac, Inc. | 185,836 | ||||||
| 200 | Agree Realty Corporation | 6,218 | ||||||
| 700 | Alexandria Real Estate Equities, Inc. | 62,118 | ||||||
| 1,800 | Allianz SE | 298,128 | ||||||
| 9,800 | AmTrust Financial Services, Inc. | 551,250 | ||||||
| 1,000 | Apartment Investment & Management Company | 37,150 | ||||||
| 3,479 | Australia & New Zealand Banking Group, Ltd. | 90,523 | ||||||
| 600 | AvalonBay Communities, Inc. | 98,034 | ||||||
| 3,400 | AXA SA | 78,347 | ||||||
| 19,700 | Banco Santander SA | 165,345 | ||||||
| 44,100 | Bank Leumi Le-Israel BMd | 150,655 | ||||||
| 27,350 | Bank of America Corporation | 489,291 | ||||||
| 1,956 | Bank of Nova Scotia | 111,639 | ||||||
| 800 | BioMed Realty Trust, Inc. | 17,232 | ||||||
| 800 | Boston Properties, Inc. | 102,952 | ||||||
| 1,600 | Brixmor Property Group, Inc. | 39,744 | ||||||
| 500 | Camden Property Trust | 36,920 | ||||||
| 3,150 | Cash America International, Inc. | 71,253 | ||||||
| 8,200 | Charles Schwab Corporation | 247,558 | ||||||
| 23,000 | Cheung Kong Holdings, Ltd. | 385,177 | ||||||
| 10,000 | Citigroup, Inc. | 541,100 | ||||||
| 94 | City Office REIT, Inc. | 1,203 | ||||||
| 2,200 | Cohen & Steers REIT and Preferred Income Fund, Inc. | 41,778 | ||||||
| 900 | CubeSmart | 19,863 | ||||||
| 8,000 | DBS Group Holdings, Ltd. | 123,851 | ||||||
The accompanying Notes to Financial Statements are an integral part of this schedule.
152
Table of Contents
GROWTHAND INCOME PLUS PORTFOLIO
Schedule of Investments as of December 31, 2014
| Shares | Common Stock (66.9%) | Value | ||||||
| Financials (18.6%) - continued |
| ||||||
| 300 | Digital Realty Trust, Inc. | $ | 19,890 | |||||
| 5,100 | Discover Financial Services | 333,999 | ||||||
| 3,250 | Doubleline Income Solutions Fund | 64,675 | ||||||
| 4,200 | Duke Realty Corporation | 84,840 | ||||||
| 3,700 | Employers Holdings, Inc. | 86,987 | ||||||
| 3,250 | Enova International, Inc.d | 72,345 | ||||||
| 500 | EPR Properties | 28,815 | ||||||
| 400 | Equity Lifestyle Properties, Inc. | 20,620 | ||||||
| 1,100 | Equity Residential | 79,024 | ||||||
| 1,400 | Erie Indemnity Company | 127,078 | ||||||
| 200 | Essex Property Trust, Inc. | 41,320 | ||||||
| 9,950 | F.N.B. Corporation | 132,534 | ||||||
| 7,300 | First Financial Bancorp | 135,707 | ||||||
| 1,895 | First Trust High Income Long/Short Fund | 30,320 | ||||||
| 9,800 | Forestar Real Estate Group, Inc.d | 150,920 | ||||||
| 2,439 | General Growth Properties, Inc. | 68,609 | ||||||
| 200 | Geo Group, Inc. | 8,072 | ||||||
| 2,900 | Hancock Holding Company | 89,030 | ||||||
| 11,700 | Hang Seng Bank, Ltd. | 194,459 | ||||||
| 1,800 | HCP, Inc. | 79,254 | ||||||
| 400 | Health Care REIT, Inc. | 30,268 | ||||||
| 1,600 | Healthcare Trust of America, Inc. | 43,104 | ||||||
| 900 | Highwoods Properties, Inc. | 39,852 | ||||||
| 3,000 | Horace Mann Educators Corporation | 99,540 | ||||||
| 3,900 | Host Hotels & Resorts, Inc. | 92,703 | ||||||
| 47,597 | HSBC Holdings plc | 449,781 | ||||||
| 16,150 | Huntington Bancshares, Inc. | 169,898 | ||||||
| 5,225 | iShares J.P. Morgan USD Emerging Markets Bond ETF | 573,235 | ||||||
| 3,635 | iShares MSCI Emerging Markets Minimum Volatility ETF | 205,850 | ||||||
| 13,473 | iShares S&P U.S. Preferred Stock Index Fund | 531,375 | ||||||
| 14,200 | KeyCorp | 197,380 | ||||||
| 4,000 | Kimco Realty Corporation | 100,560 | ||||||
| 50 | LaSalle Hotel Properties | 2,023 | ||||||
| 3,050 | Lazard, Ltd. | 152,591 | ||||||
| 10,250 | MetLife, Inc. | 554,422 | ||||||
| 11,462 | MFS Intermediate Income Trust | 54,788 | ||||||
| 600 | Mid-America Apartment Communities, Inc. | 44,808 | ||||||
| 600 | Muenchener Rueckversicherungs-Gesellschaft AG | 119,483 | ||||||
| 10,500 | National Australia Bank, Ltd. | 286,338 | ||||||
| 300 | National Health Investors, Inc. | 20,988 | ||||||
| 700 | National Retail Properties, Inc. | 27,559 | ||||||
| 6,968 | Nuveen Quality Preferred Income Fund II | 62,015 | ||||||
| 5,500 | OFG Bancorp | 91,575 | ||||||
| 200 | Omega Healthcare Investors, Inc. | 7,814 | ||||||
| 300 | Parkway Properties, Inc. | 5,517 | ||||||
| 4,377 | PIMCO Dynamic Credit Income Fund | 90,385 | ||||||
| 18,944 | PowerShares Preferred Portfolio | 278,477 | ||||||
| 3,500 | Principal Financial Group, Inc. | 181,790 | ||||||
| 2,400 | Prologis, Inc. | 103,272 | ||||||
| 4,200 | Prudential Financial, Inc. | 379,932 | ||||||
| 500 | Public Storage, Inc. | 92,425 | ||||||
| 10,250 | Regions Financial Corporation | 108,240 | ||||||
| 1,200 | RLJ Lodging Trust | 40,236 | ||||||
| 8,697 | Royal Bank of Canada | 600,660 | ||||||
| 400 | Sabra Healthcare REIT, Inc. | 12,148 | ||||||
| 1,000 | Simon Property Group, Inc. | 182,110 | ||||||
| 117 | Sovran Self Storage, Inc. | 10,205 | ||||||
| 3,800 | Spirit Realty Capital, Inc. | 45,182 | ||||||
| 146 | Store Capital Corporation | 3,155 | ||||||
| 26,124 | Summit Hotel Properties, Inc. | 324,983 | ||||||
| 1,300 | Swiss Re AG | 108,903 | ||||||
| 1,050 | T. Rowe Price Group, Inc. | 90,153 | ||||||
| 733 | Tanger Factory Outlet Centers, Inc. | 27,092 | ||||||
| 221 | Tubman Centers, Inc. | 16,889 | ||||||
| 9,283 | Templeton Global Income Fund | 66,745 | ||||||
| 150 | Terreno Realty Corporation | 3,095 | ||||||
| 8,575 | Toronto-Dominion Bank | 409,708 | ||||||
| 7,762 | U.S. Bancorp | 348,902 | ||||||
| 300 | UDR, Inc. | 9,246 | ||||||
| 4,010 | Vanguard MSCI Emerging Markets ETF | 160,480 | ||||||
| 300 | Vanguard REIT ETF | 24,300 | ||||||
| 1,400 | Ventas, Inc. | 100,380 | ||||||
| 900 | Vornado Realty Trust | 105,939 | ||||||
| 3,200 | W.R. Berkley Corporation | 164,032 | ||||||
| 12,266 | Wells Fargo & Company | 672,422 | ||||||
| 4,234 | Western Asset Emerging Markets Debt Fund, Inc. | 66,728 | ||||||
| 6,718 | Western Asset High Income Opportunity Fund, Inc. | 36,076 | ||||||
| 1,200 | Zurich Insurance Group AGd | 375,003 | ||||||
|
| |||||||
Total | 15,074,487 | |||||||
|
| |||||||
| Health Care (10.1%) |
| ||||||
| 2,600 | Abaxis, Inc. | 147,758 | ||||||
| 1,450 | AbbVie, Inc. | 94,888 | ||||||
| 1,100 | Actelion, Ltd. | 126,633 | ||||||
| 5,250 | Aetna, Inc. | 466,357 | ||||||
| 2,506 | AmerisourceBergen Corporation | 225,941 | ||||||
| 5,787 | AMN Healthcare Services, Inc.d | 113,425 | ||||||
| 2,900 | Anthem, Inc. | 364,443 | �� | |||||
| 9,200 | Astellas Pharmaceutical, Inc. | 128,083 | ||||||
| 1,300 | Bayer AG | 177,201 | ||||||
| 1,150 | Biogen Idec, Inc.d | 390,368 | ||||||
| 1,232 | Boiron SA | 104,084 | ||||||
| 17,650 | Boston Scientific Corporationd | 233,863 | ||||||
| 6,050 | Bruker Corporationd | 118,701 | ||||||
| 2,450 | Centene Corporationd | 254,433 | ||||||
| 2,300 | CSL, Ltd. | 161,565 | ||||||
| 1,400 | Cyberonics, Inc.d | 77,952 | ||||||
| 2,708 | Eli Lilly and Company | 186,825 | ||||||
| 20,659 | Fisher & Paykel Healthcare Corporation, Ltd. | 100,719 | ||||||
| 6,400 | Gilead Sciences, Inc.d | 603,264 | ||||||
| 6,373 | GlaxoSmithKline plc | 136,724 | ||||||
| 4,150 | HCA Holdings, Inc.d | 304,569 | ||||||
| 12,800 | Healthways, Inc.d | 254,464 | ||||||
| 4,287 | ICON plcd | 218,594 | ||||||
| 4,502 | Johnson & Johnson | 470,774 | ||||||
| 800 | Lonza Group AG | 90,073 | ||||||
| 750 | McKesson Corporation | 155,685 | ||||||
| 6,700 | Merck & Company, Inc. | 380,493 | ||||||
| 7,200 | Otsuka Holdings Company, Ltd. | 215,865 | ||||||
| 4,400 | PAREXEL International Corporationd | 244,464 | ||||||
| 24,050 | Pfizer, Inc. | 749,158 | ||||||
| 2,500 | Quintiles Transnational Holdings, Inc.d | 147,175 | ||||||
| 6,000 | Recordati SPA | 93,020 | ||||||
| 600 | Roche Holding AG - BR | 161,653 | ||||||
| 500 | Roche Holding AG - Genusschein | 135,471 | ||||||
| 5,400 | Sagent Pharmaceuticals, Inc.d | 135,594 | ||||||
| 1,800 | Sanofi | 164,107 | ||||||
| 6,400 | Sonic Healthcare, Ltd. | 96,285 | ||||||
|
| |||||||
Total | 8,230,671 | |||||||
|
| |||||||
The accompanying Notes to Financial Statements are an integral part of this schedule.
153
Table of Contents
GROWTHAND INCOME PLUS PORTFOLIO
Schedule of Investments as of December 31, 2014
| Shares | Common Stock (66.9%) | Value | ||||||
| Industrials (8.2%) |
| ||||||
| 3,500 | Abertis Infraestructuras SA | $ | 69,404 | |||||
| 4,400 | Allison Transmission Holdings, Inc. | 149,160 | ||||||
| 3,800 | Caterpillar, Inc. | 347,814 | ||||||
| 5,000 | COMSYS Holdings Corporation | 68,399 | ||||||
| 7,800 | Con-way, Inc. | 383,604 | ||||||
| 7,500 | Delta Air Lines, Inc. | 368,925 | ||||||
| 3,500 | easyJet plc | 90,577 | ||||||
| 8,000 | Flowserve Corporation | 478,640 | ||||||
| 23,950 | General Electric Company | 605,216 | ||||||
| 20,000 | Hutchison Whampoa, Ltd. | 228,631 | ||||||
| 19,200 | ITOCHU Corporation | 204,962 | ||||||
| 2,700 | Jacobs Engineering Group, Inc.d | 120,663 | ||||||
| 8,500 | KAR Auction Services, Inc. | 294,525 | ||||||
| 4,800 | KONE OYJ | 218,534 | ||||||
| 1,498 | Lockheed Martin Corporation | 288,470 | ||||||
| 1,800 | Mabuchi Motor Company, Ltd. | 71,446 | ||||||
| 8,350 | Meritor, Inc.d | 126,503 | ||||||
| 7,500 | Pentair, Ltd. | 498,150 | ||||||
| 12,100 | Performant Financial Corporationd | 80,465 | ||||||
| 4,400 | Quad/Graphics, Inc. | 101,024 | ||||||
| 2,900 | Safran SA | 178,916 | ||||||
| 3,400 | Siemens AG | 381,494 | ||||||
| 13,250 | Southwest Airlines Company | 560,740 | ||||||
| 3,798 | Stantec, Inc. | 104,381 | ||||||
| 19,000 | Toda Corporation | 74,936 | ||||||
| 10,000 | TOTO, Ltd. | 116,327 | ||||||
| 7,601 | Wajax Corporation | 201,311 | ||||||
| 2,100 | Woodward, Inc. | 103,383 | ||||||
| 5,897 | WS Atkins plc | 124,890 | ||||||
|
| |||||||
Total | 6,641,490 | |||||||
|
| |||||||
| Information Technology (8.1%) |
| ||||||
| 1,300 | Accenture plc | 116,103 | ||||||
| 8,200 | Akamai Technologies, Inc.d | 516,272 | ||||||
| 7,400 | Aspen Technology, Inc.d | 259,148 | ||||||
| 12,450 | Broadcom Corporation | 539,459 | ||||||
| 38,850 | Brocade Communications Systems, Inc. | 459,984 | ||||||
| 2,809 | CGI Group, Inc.d | 107,084 | ||||||
| 14,000 | Cirrus Logic, Inc.d | 329,980 | ||||||
| 19,360 | Cisco Systems, Inc. | 538,498 | ||||||
| 2,300 | Computer Sciences Corporation | 145,015 | ||||||
| 467 | Constellation Software, Inc. | 138,854 | ||||||
| 14,450 | Corning, Inc. | 331,339 | ||||||
| 5,200 | Electronic Arts, Inc.d | 244,478 | ||||||
| 17,950 | EMC Corporation | 533,833 | ||||||
| 600 | F5 Networks, Inc.d | 78,279 | ||||||
| 9,100 | FUJIFILM Holdings NPV | 277,673 | ||||||
| 23,200 | Global Cash Access Holdings, Inc.d | 165,880 | ||||||
| 4,400 | Hoya Corporation | 148,829 | ||||||
| 7,700 | Juniper Networks, Inc. | 171,864 | ||||||
| 2,550 | Lexmark International, Inc. | 105,239 | ||||||
| 10,450 | Marvell Technology Group, Ltd. | 151,525 | ||||||
| 2,697 | Melexis NV | 122,038 | ||||||
| 5,150 | NetApp, Inc. | 213,468 | ||||||
| 1,684 | Newport Corporationd | 32,181 | ||||||
| 1,700 | NXP Semiconductors NVd | 129,880 | ||||||
| 5,300 | Pegasystems, Inc. | 110,081 | ||||||
| 6,300 | Skyworks Solutions, Inc. | 458,073 | ||||||
| 8,900 | Vishay Intertechnology, Inc. | 125,935 | ||||||
|
| |||||||
Total | 6,550,992 | |||||||
|
| |||||||
| Materials (2.4%) |
| ||||||
| 20,400 | Acacia Mining plc | 80,820 | ||||||
| 187,750 | Centamin plc | 172,390 | ||||||
| 7,400 | Dow Chemical Company | 337,514 | ||||||
| 7,500 | James Hardie Industries plc | 80,064 | ||||||
| 87,000 | Kobe Steel, Ltd. | 149,857 | ||||||
| 4,900 | LyondellBasell Industries NV | 389,011 | ||||||
| 1,400 | Nitto Denko Corporation | 78,226 | ||||||
| 6,033 | Rio Tinto plc | 278,104 | ||||||
| 3,000 | Southern Copper Corporation | 84,600 | ||||||
| 2,500 | Voestalpine AG | 98,783 | ||||||
| 3,350 | Westlake Chemical Corporation | 204,652 | ||||||
|
| |||||||
Total | 1,954,021 | |||||||
|
| |||||||
| Telecommunications Services (2.5%) |
| ||||||
| 229,200 | Bezeq Israel Telecommunication Corporation, Ltd. | 406,559 | ||||||
| 40,256 | BT Group plc | 250,395 | ||||||
| 8,500 | KDDI Corporation | 534,004 | ||||||
| 8,000 | Nippon Telegraph & Telephone Corporation | 408,661 | ||||||
| 105,000 | Singapore Telecommunications, Ltd. | 308,207 | ||||||
| 27,550 | Vonage Holdings Corporationd | 104,966 | ||||||
|
| |||||||
Total | 2,012,792 | |||||||
|
| |||||||
| Utilities (2.2%) |
| ||||||
| 107,700 | A2A SPA | 109,131 | ||||||
| 109,800 | Electricidade de Portugal SA | 425,766 | ||||||
| 9,100 | Endesa SA | 182,176 | ||||||
| 25,900 | Enel SPA | 115,450 | ||||||
| 7,200 | Fortum OYJ | 156,324 | ||||||
| 6,000 | Gas Natural SDG SA | 150,724 | ||||||
| 12,700 | GDF Suez | 296,153 | ||||||
| 34,000 | Iberdrola SA | 229,186 | ||||||
| 5,000 | Verbund AG | 92,595 | ||||||
|
| |||||||
Total | 1,757,505 | |||||||
|
| |||||||
Total Common Stock (cost $52,624,351) | 54,233,220 | |||||||
|
| |||||||
| Principal Amount | Long-Term Fixed Income (15.0%) | |||||||
| Asset-Backed Securities (0.2%) |
| ||||||
Bayview Opportunity Master Fund Trust IIB, LP | ||||||||
| 90,604 | 3.950%, 1/28/2034*,e | 91,053 | ||||||
Countrywide Asset-Backed Certificates | ||||||||
| 52,953 | 5.530%, 4/25/2047 | 52,068 | ||||||
|
| |||||||
Total | 143,121 | |||||||
|
| |||||||
| Basic Materials (0.4%) |
| ||||||
Albemarle Corporation | ||||||||
| 14,000 | 3.000%, 12/1/2019 | 14,002 | ||||||
Anglo American Capital plc | ||||||||
| 9,000 | 1.181%, 4/15/2016f,g | 9,009 | ||||||
ArcelorMittal | ||||||||
| 50,000 | 6.000%, 3/1/2021 | 52,000 | ||||||
Dow Chemical Company | ||||||||
| 10,000 | 8.550%, 5/15/2019 | 12,433 | ||||||
First Quantum Minerals, Ltd. | ||||||||
| 55,000 | 7.000%, 2/15/2021f | 49,500 | ||||||
FMG Resources August 2006 Pty., Ltd. | ||||||||
| 11,888 | 6.875%, 2/1/2018f | 10,788 | ||||||
The accompanying Notes to Financial Statements are an integral part of this schedule.
154
Table of Contents
GROWTHAND INCOME PLUS PORTFOLIO
Schedule of Investments as of December 31, 2014
| Principal Amount | Long-Term Fixed Income (15.0%) | Value | ||||||
| Basic Materials (0.4%) - continued |
| ||||||
Freeport-McMoRan, Inc. | ||||||||
| $ | 7,000 | 2.300%, 11/14/2017 | $ | 7,008 | ||||
| 12,000 | 2.375%, 3/15/2018 | 11,868 | ||||||
Goldcorp, Inc. | ||||||||
| 14,000 | 2.125%, 3/15/2018 | 13,837 | ||||||
Hexion US Finance Corporation/Hexion Nova Scotia Finance ULC | ||||||||
| 26,748 | 8.875%, 2/1/2018 | 23,806 | ||||||
Ineos Finance plc | ||||||||
| 31,000 | 7.500%, 5/1/2020f | 32,550 | ||||||
LyondellBasell Industries NV | ||||||||
| 10,000 | 5.000%, 4/15/2019 | 10,908 | ||||||
Mosaic Company | ||||||||
| 8,000 | 3.750%, 11/15/2021 | 8,327 | ||||||
NOVA Chemicals Corporation | ||||||||
| 40,122 | 5.250%, 8/1/2023f | 40,523 | ||||||
Sappi Papier Holding GmbH | ||||||||
| 35,000 | 6.625%, 4/15/2021f | 35,875 | ||||||
Vale Overseas, Ltd. | ||||||||
| 12,000 | 6.250%, 1/23/2017 | 12,799 | ||||||
|
| |||||||
Total | 345,233 | |||||||
|
| |||||||
| Capital Goods (0.5%) |
| ||||||
BAE Systems plc | ||||||||
| 14,000 | 3.500%, 10/11/2016f | 14,543 | ||||||
Brand Energy & Infrastructure Services, Inc. | ||||||||
| 25,000 | 8.500%, 12/1/2021f | 22,500 | ||||||
Cemex SAB de CV | ||||||||
| 55,000 | 5.700%, 1/11/2025f | 53,350 | ||||||
CNH Capital, LLC | ||||||||
| 26,748 | 3.625%, 4/15/2018 | 26,347 | ||||||
Crown Americas Capital Corporation IV | ||||||||
| 50,000 | 4.500%, 1/15/2023 | 48,500 | ||||||
Harsco Corporation | ||||||||
| 12,000 | 2.700%, 10/15/2015 | 11,985 | ||||||
Hutchison Whampoa Finance CI, Ltd. | ||||||||
| 15,000 | 1.625%, 10/31/2017f | 14,876 | ||||||
Ingersoll-Rand Global Holding Company, Ltd. | ||||||||
| 16,000 | 6.875%, 8/15/2018 | 18,574 | ||||||
L-3 Communications Corporation | ||||||||
| 13,000 | 1.500%, 5/28/2017 | 12,872 | ||||||
Martin Marietta Materials, Inc. | ||||||||
| 16,000 | 1.357%, 6/30/2017g | 16,176 | ||||||
Nortek, Inc. | ||||||||
| 26,748 | 8.500%, 4/15/2021 | 28,620 | ||||||
Owens-Brockway Glass Container, Inc. | ||||||||
| 55,000 | 5.000%, 1/15/2022f | 56,100 | ||||||
Reynolds Group Issuer, Inc. | ||||||||
| 26,748 | 9.875%, 8/15/2019 | 28,353 | ||||||
Roper Industries, Inc. | ||||||||
| 11,000 | 2.050%, 10/1/2018 | 10,909 | ||||||
Textron, Inc. | ||||||||
| 14,000 | 4.625%, 9/21/2016 | 14,812 | ||||||
United Rentals North America, Inc. | ||||||||
| 33,000 | 7.375%, 5/15/2020 | 35,640 | ||||||
|
| |||||||
Total | 414,157 | |||||||
|
| |||||||
| Collateralized Mortgage Obligations (2.9%) |
| ||||||
Alternative Loan Trust | ||||||||
| 158,440 | 5.500%, 10/25/2035 | 144,276 | ||||||
Banc of America Alternative Loan Trust | ||||||||
| 71,792 | 6.000%, 11/25/2035 | 62,742 | ||||||
CHL Mortgage Pass-Through Trust | ||||||||
| 114,291 | 4.966%, 1/25/2036 | 106,744 | ||||||
Citigroup Mortgage Loan Trust, Inc. | ||||||||
| 33,734 | 2.778%, 3/25/2037 | 26,077 | ||||||
CitiMortgage Alternative Loan Trust | ||||||||
| 108,795 | 5.750%, 4/25/2037 | 93,418 | ||||||
Countrywide Alternative Loan Trust | ||||||||
| 90,433 | 6.500%, 8/25/2036 | 68,868 | ||||||
| 281,435 | 6.000%, 4/25/2037 | 208,545 | ||||||
Credit Suisse First Boston Mortgage Securities Corporation | ||||||||
| 69,028 | 5.250%, 10/25/2035 | 68,688 | ||||||
Deutsche Alt-A Securities, Inc., Mortgage Loan Trust | ||||||||
| 74,783 | 5.500%, 11/25/2035 | 70,718 | ||||||
HomeBanc Mortgage Trust | ||||||||
| 52,638 | 2.197%, 4/25/2037 | 39,169 | ||||||
J.P. Morgan Alternative Loan Trust | ||||||||
| 165,863 | 6.500%, 3/25/2036 | 146,276 | ||||||
J.P. Morgan Mortgage Trust | ||||||||
| 95,624 | 2.253%, 6/25/2035 | 95,656 | ||||||
| 108,012 | 2.658%, 6/25/2035 | 109,300 | ||||||
| 78,846 | 2.653%, 8/25/2035 | 78,433 | ||||||
| 97,376 | 2.695%, 1/25/2037 | 88,898 | ||||||
MortgageIT Trust | ||||||||
| 82,401 | 0.430%, 12/25/2035g | 75,588 | ||||||
New York Mortgage Trust | ||||||||
| 91,227 | 2.630%, 5/25/2036 | 82,296 | ||||||
Residential Accredit Loans, Inc. | ||||||||
| 87,549 | 5.750%, 9/25/2035 | 79,161 | ||||||
RFMSI Trust | ||||||||
| 103,112 | 6.000%, 7/25/2037 | 93,376 | ||||||
Structured Adjustable Rate Mortgage Loan Trust | ||||||||
| 101,546 | 2.633%, 9/25/2035 | 86,327 | ||||||
Structured Asset Mortgage Investments, Inc. | ||||||||
| 145,927 | 0.480%, 12/25/2035g | 111,562 | ||||||
WaMu Mortgage Pass Through Certificates | ||||||||
| 79,941 | 2.274%, 10/25/2036 | 70,547 | ||||||
| 145,607 | 0.853%, 1/25/2047g | 119,506 | ||||||
Wells Fargo Mortgage Backed Securities Trust | ||||||||
| 83,553 | 2.612%, 3/25/2036 | 83,207 | ||||||
| 73,084 | 2.609%, 7/25/2036 | 71,277 | ||||||
| 69,848 | 6.000%, 7/25/2037 | 69,119 | ||||||
|
| |||||||
Total | 2,349,774 | |||||||
|
| |||||||
The accompanying Notes to Financial Statements are an integral part of this schedule.
155
Table of Contents
GROWTHAND INCOME PLUS PORTFOLIO
Schedule of Investments as of December 31, 2014
| Principal Amount | Long-Term Fixed Income (15.0%) | Value | ||||||
| Communications Services (1.3%) |
| ||||||
21st Century Fox America, Inc. | ||||||||
| $14,000 | 6.900%, 3/1/2019 | $ | 16,508 | |||||
AMC Networks, Inc. | ||||||||
| 46,748 | 7.750%, 7/15/2021 | 50,020 | ||||||
America Movil SAB de CV | ||||||||
| 10,000 | 5.000%, 10/16/2019 | 11,039 | ||||||
American Tower Corporation | ||||||||
| 16,000 | 7.000%, 10/15/2017 | 18,065 | ||||||
British Sky Broadcasting Group plc | ||||||||
| 14,000 | 2.625%, 9/16/2019f | 14,005 | ||||||
British Telecommunications plc | ||||||||
| 12,000 | 1.250%, 2/14/2017 | 11,940 | ||||||
CC Holdings GS V, LLC | ||||||||
| 21,000 | 2.381%, 12/15/2017 | 21,186 | ||||||
CCO Holdings, LLC | ||||||||
| 26,748 | 7.000%, 1/15/2019 | 27,751 | ||||||
CenturyLink, Inc. | ||||||||
| 35,000 | 6.450%, 6/15/2021 | 37,538 | ||||||
Cequel Communications Escrow 1, LLC | ||||||||
| 50,000 | 6.375%, 9/15/2020f | 51,750 | ||||||
Columbus International, Inc. | ||||||||
| 50,000 | 7.375%, 3/30/2021f | 52,000 | ||||||
Cox Communications, Inc. | ||||||||
| 12,000 | 9.375%, 1/15/2019f | 15,102 | ||||||
Digicel, Ltd. | ||||||||
| 56,748 | 6.000%, 4/15/2021f | 53,059 | ||||||
DIRECTV Holdings, LLC | ||||||||
| 11,000 | 3.500%, 3/1/2016 | 11,287 | ||||||
| 10,000 | 5.875%, 10/1/2019 | 11,438 | ||||||
Equinix, Inc. | ||||||||
| 40,000 | 5.750%, 1/1/2025 | 40,350 | ||||||
Frontier Communications Corporation | ||||||||
| 55,000 | 6.875%, 1/15/2025 | 55,000 | ||||||
Hughes Satellite Systems Corporation | ||||||||
| 33,000 | 6.500%, 6/15/2019 | 35,393 | ||||||
Intelsat Jackson Holdings SA | ||||||||
| 26,748 | 7.250%, 10/15/2020 | 28,253 | ||||||
Level 3 Financing, Inc. | ||||||||
| 33,000 | 8.625%, 7/15/2020 | 35,599 | ||||||
Numericable-SFR | ||||||||
| 50,000 | 6.000%, 5/15/2022f | 50,275 | ||||||
SBA Tower Trust | ||||||||
| 16,000 | 5.101%, 4/17/2017f | 16,841 | ||||||
Sprint Communications, Inc. | ||||||||
| 26,748 | 9.000%, 11/15/2018f | 30,423 | ||||||
Telefonica Emisiones SAU | ||||||||
| 10,000 | 3.992%, 2/16/2016 | 10,285 | ||||||
| 12,000 | 3.192%, 4/27/2018 | 12,340 | ||||||
Time Warner Cable, Inc. | ||||||||
| 7,000 | 8.250%, 4/1/2019 | 8,569 | ||||||
| 26,000 | 5.000%, 2/1/2020 | 28,652 | ||||||
T-Mobile USA, Inc. | ||||||||
| 40,000 | 6.633%, 4/28/2021 | 41,050 | ||||||
Univision Communications, Inc. | ||||||||
| 40,000 | 7.875%, 11/1/2020 f | 42,600 | ||||||
UPCB Finance V, Ltd. | ||||||||
| 40,000 | 7.250%, 11/15/2021f | 43,750 | ||||||
Verizon Communications, Inc. | ||||||||
| 37,000 | 2.625%, 2/21/2020f | 36,577 | ||||||
| 16,000 | 4.500%, 9/15/2020 | 17,372 | ||||||
West Corporation | ||||||||
| 50,000 | 5.375%, 7/15/2022 f | 47,875 | ||||||
Wind Acquisition Finance SA | ||||||||
| 30,000 | 4.750%, 7/15/2020f | 28,050 | ||||||
| 10,000 | 7.375%, 4/23/2021f | 9,438 | ||||||
|
| |||||||
Total | 1,021,380 | |||||||
|
| |||||||
| Consumer Cyclical (0.9%) |
| ||||||
AMC Entertainment, Inc. | ||||||||
| 32,000 | 5.875%, 2/15/2022 | 32,480 | ||||||
Brookfield Residential Properties, Inc. | ||||||||
| 30,000 | 6.125%, 7/1/2022f | 31,200 | ||||||
Chrysler Group, LLC | ||||||||
| 26,748 | 8.250%, 6/15/2021 | 29,623 | ||||||
Cinemark USA, Inc. | ||||||||
| 31,000 | 4.875%, 6/1/2023 | 29,295 | ||||||
Daimler Finance North America, LLC | ||||||||
| 9,000 | 1.875%, 1/11/2018f | 9,031 | ||||||
Delphi Corporation | ||||||||
| 12,000 | 6.125%, 5/15/2021 | 13,080 | ||||||
ERAC USA Finance, LLC | ||||||||
| 16,000 | 2.350%, 10/15/2019f | 15,881 | ||||||
Ford Motor Credit Company, LLC | ||||||||
| 28,000 | 1.684%, 9/8/2017 | 27,777 | ||||||
| 16,000 | 5.000%, 5/15/2018 | 17,385 | ||||||
| 14,000 | 2.597%, 11/4/2019 | 13,925 | ||||||
General Motors Financial Company, Inc. | ||||||||
| 26,748 | 3.250%, 5/15/2018 | 26,781 | ||||||
| 21,000 | 4.375%, 9/25/2021 | 21,919 | ||||||
GLP Capital, LP | ||||||||
| 60,000 | 4.875%, 11/1/2020 | 60,750 | ||||||
Hilton Worldwide Finance, LLC | ||||||||
| 50,000 | 5.625%, 10/15/2021 | 52,250 | ||||||
Hyundai Capital America | ||||||||
| 12,000 | 1.450%, 2/6/2017f | 11,955 | ||||||
Jaguar Land Rover Automotive plc | ||||||||
| 30,000 | 4.250%, 11/15/2019f | 30,225 | ||||||
| 33,000 | 5.625%, 2/1/2023f | 34,733 | ||||||
KB Home | ||||||||
| 29,000 | 4.750%, 5/15/2019 | 28,565 | ||||||
L Brands, Inc. | ||||||||
| 33,000 | 6.625%, 4/1/2021 | 37,125 | ||||||
Lennar Corporation | ||||||||
| 50,000 | 4.750%, 11/15/2022 | 49,000 | ||||||
Macy’s Retail Holdings, Inc. | ||||||||
| 14,000 | 7.450%, 7/15/2017 | 15,917 | ||||||
Nissan Motor Acceptance Corporation | ||||||||
| 8,000 | 0.785%, 3/3/2017 f,g | 8,025 | ||||||
Royal Caribbean Cruises, Ltd. | ||||||||
| 51,748 | 5.250%, 11/15/2022 | 54,335 | ||||||
Toll Brothers Finance Corporation | ||||||||
| 20,000 | 4.000%, 12/31/2018 | 20,100 | ||||||
TRW Automotive, Inc. | ||||||||
| 9,000 | 7.250%, 3/15/2017f | 9,945 | ||||||
The accompanying Notes to Financial Statements are an integral part of this schedule.
156
Table of Contents
GROWTHAND INCOME PLUS PORTFOLIO
Schedule of Investments as of December 31, 2014
| Principal Amount | Long-Term Fixed Income (15.0%) | Value | ||||||
| Consumer Cyclical (0.9%) - continued |
| ||||||
Volkswagen Group of America Finance, LLC | ||||||||
| $14,000 | 0.672%, 11/20/2017f,g | $ | 13,980 | |||||
Walgreens Boots Alliance, Inc. | ||||||||
| 14,000 | 2.700%, 11/18/2019 | 14,071 | ||||||
Wynn Las Vegas, LLC | ||||||||
| 33,000 | 5.375%, 3/15/2022 | 33,495 | ||||||
|
| |||||||
Total | 742,848 | |||||||
|
| |||||||
| Consumer Non-Cyclical (1.1%) |
| ||||||
AbbVie, Inc. | ||||||||
| 14,000 | 2.000%, 11/6/2018 | 13,953 | ||||||
Altria Group, Inc. | ||||||||
| 18,000 | 9.700%, 11/10/2018 | 22,857 | ||||||
Beam, Inc. | ||||||||
| 10,000 | 5.375%, 1/15/2016 | 10,455 | ||||||
Becton, Dickinson and Company | ||||||||
| 14,000 | 2.675%, 12/15/2019 | 14,184 | ||||||
Boston Scientific Corporation | ||||||||
| 14,000 | 2.650%, 10/1/2018 | 14,016 | ||||||
CareFusion Corporation | ||||||||
| 13,000 | 1.450%, 5/15/2017 | 12,908 | ||||||
Celgene Corporation | ||||||||
| 20,000 | 1.900%, 8/15/2017 | 20,070 | ||||||
CHS/Community Health Systems, Inc. | ||||||||
| 33,000 | 7.125%, 7/15/2020 | 35,186 | ||||||
ConAgra Foods, Inc. | ||||||||
| 25,000 | 2.100%, 3/15/2018 | 24,919 | ||||||
Cott Beverages, Inc. | ||||||||
| 55,000 | 5.375%, 7/1/2022f | 50,463 | ||||||
Coventry Health Care, Inc. | ||||||||
| 8,000 | 5.950%, 3/15/2017 | 8,750 | ||||||
CVS Health Corporation | ||||||||
| 10,000 | 2.250%, 12/5/2018 | 10,090 | ||||||
Envision Healthcare Corporation | ||||||||
| 50,000 | 5.125%, 7/1/2022f | 49,625 | ||||||
Express Scripts Holding Company | ||||||||
| 12,000 | 2.650%, 2/15/2017 | 12,270 | ||||||
Forest Laboratories, Inc. | ||||||||
| 15,000 | 4.375%, 2/1/2019f | 15,846 | ||||||
| 15,000 | 5.000%, 12/15/2021f | 16,242 | ||||||
Fresenius Medical Care US Finance, Inc. | ||||||||
| 26,748 | 5.750%, 2/15/2021f | 28,520 | ||||||
Gilead Sciences, Inc. | ||||||||
| 8,000 | 3.050%, 12/1/2016 | 8,301 | ||||||
| 14,000 | 2.350%, 2/1/2020 | 14,075 | ||||||
Hawk Acquisition Sub, Inc. | ||||||||
| 33,000 | 4.250%, 10/15/2020 | 33,330 | ||||||
HCA, Inc. | ||||||||
| 26,748 | 4.750%, 5/1/2023 | 27,216 | ||||||
IMS Health, Inc. | ||||||||
| 30,000 | 6.000%, 11/1/2020f | 30,900 | ||||||
JBS Finance II, Ltd. | ||||||||
| 26,748 | 8.250%, 1/29/2018* | 27,350 | ||||||
Kroger Company | ||||||||
| 20,000 | 1.200%, 10/17/2016 | 19,956 | ||||||
Lorillard Tobacco Company | ||||||||
| 12,000 | 8.125%, 6/23/2019 | 14,548 | ||||||
McKesson Corporation | ||||||||
| 18,000 | 1.292%, 3/10/2017 | 17,908 | ||||||
Medco Health Solutions, Inc. | ||||||||
| 7,000 | 7.125%, 3/15/2018 | 8,082 | ||||||
Medtronic, Inc. | ||||||||
| 14,000 | 2.500%, 3/15/2020f | 14,037 | ||||||
Mondelez International, Inc. | ||||||||
| 8,000 | 2.250%, 2/1/2019 | 7,967 | ||||||
Ortho-Clinical Diagnostics, Inc. | ||||||||
| 50,000 | 6.625%, 5/15/2022f | 44,938 | ||||||
Pernod Ricard SA | ||||||||
| 10,000 | 2.950%, 1/15/2017f | 10,231 | ||||||
| 10,000 | 5.750%, 4/7/2021f | 11,487 | ||||||
Perrigo Company, Ltd. | ||||||||
| 6,000 | 1.300%, 11/8/2016 | 5,974 | ||||||
Revlon Consumer Products Corporation | ||||||||
| 26,748 | 5.750%, 2/15/2021 | 26,748 | ||||||
SABMiller plc | ||||||||
| 12,000 | 6.500%, 7/15/2018f | 13,700 | ||||||
Safeway, Inc. | ||||||||
| 3,000 | 3.400%, 12/1/2016 | 3,048 | ||||||
Spectrum Brands Escrow Corporation | ||||||||
| 33,000 | 6.375%, 11/15/2020 | 34,402 | ||||||
Sysco Corporation | ||||||||
| 21,000 | 2.350%, 10/2/2019 | 21,114 | ||||||
Tenet Healthcare Corporation | ||||||||
| 50,000 | 8.125%, 4/1/2022 | 55,875 | ||||||
Thermo Fisher Scientific, Inc. | ||||||||
| 12,000 | 2.400%, 2/1/2019 | 12,018 | ||||||
Tyson Foods, Inc. | ||||||||
| 16,000 | 2.650%, 8/15/2019 | 16,146 | ||||||
Valeant Pharmaceuticals International | ||||||||
| 26,748 | 7.250%, 7/15/2022f | 28,520 | ||||||
VPII Escrow Corporation | ||||||||
| 25,000 | 7.500%, 7/15/2021f | 27,000 | ||||||
Whirlpool Corporation | ||||||||
| 14,000 | 1.650%, 11/1/2017 | 13,954 | ||||||
|
| |||||||
Total | 909,179 | |||||||
|
| |||||||
| Energy (0.9%) |
| ||||||
Boardwalk Pipelines, Ltd. | ||||||||
| 11,000 | 5.875%, 11/15/2016 | 11,679 | ||||||
BP Capital Markets plc | ||||||||
| 12,000 | 0.652%, 11/7/2016g | 12,002 | ||||||
Buckeye Partners, LP | ||||||||
| 17,000 | 2.650%, 11/15/2018 | 16,744 | ||||||
Calumet Specialty Products Partners, LP | ||||||||
| 50,000 | 6.500%, 4/15/2021f | 44,500 | ||||||
Canadian Natural Resources, Ltd. | ||||||||
| 14,000 | 1.750%, 1/15/2018 | 13,918 | ||||||
CNOOC Nexen Finance 2014 ULC | ||||||||
| 10,000 | 1.625%, 4/30/2017 | 9,951 | ||||||
CNPC General Capital, Ltd. | ||||||||
| 13,000 | 2.750%, 4/19/2017f | 13,151 | ||||||
Concho Resources, Inc. | ||||||||
| 51,748 | 6.500%, 1/15/2022 | 54,077 | ||||||
The accompanying Notes to Financial Statements are an integral part of this schedule.
157
Table of Contents
GROWTHAND INCOME PLUS PORTFOLIO
Schedule of Investments as of December 31, 2014
| Principal Amount | Long-Term Fixed Income (15.0%) | Value | ||||||
| Energy (0.9%) - continued |
| ||||||
Continental Resources, Inc. | ||||||||
| $16,000 | 7.125%, 4/1/2021 | $ | 17,200 | |||||
Enbridge, Inc. | ||||||||
| 8,000 | 0.684%, 6/2/2017g | 7,965 | ||||||
Energy Transfer Partners, LP | ||||||||
| 10,000 | 6.700%, 7/1/2018 | 11,245 | ||||||
Energy XXI Gulf Coast, Inc. | ||||||||
| 35,000 | 7.750%, 6/15/2019 | 20,825 | ||||||
| 15,000 | 7.500%, 12/15/2021 | 8,100 | ||||||
Enterprise Products Operating, LLC | ||||||||
| 21,000 | 2.550%, 10/15/2019 | 20,789 | ||||||
EQT Corporation | ||||||||
| 10,000 | 8.125%, 6/1/2019 | 12,056 | ||||||
Harvest Operations Corporation | ||||||||
| 26,748 | 6.875%, 10/1/2017 | 25,778 | ||||||
Hess Corporation | ||||||||
| 8,000 | 8.125%, 2/15/2019 | 9,518 | ||||||
Kinder Morgan, Inc. | ||||||||
| 8,000 | 3.050%, 12/1/2019 | 7,936 | ||||||
| 14,000 | 5.000%, 2/15/2021f | 14,565 | ||||||
Kodiak Oil & Gas Corporation | ||||||||
| 26,748 | 5.500%, 1/15/2021 | 26,815 | ||||||
Linn Energy, LLC | ||||||||
| 25,000 | 6.250%, 11/1/2019 | 21,125 | ||||||
| 26,748 | 8.625%, 4/15/2020 | 23,271 | ||||||
MEG Energy Corporation | ||||||||
| 33,000 | 6.375%, 1/30/2023f | 29,452 | ||||||
Offshore Group Investment, Ltd. | ||||||||
| 40,000 | 7.500%, 11/1/2019 | 29,800 | ||||||
Petrobras Global Finance BV | ||||||||
| 12,000 | 2.000%, 5/20/2016 | 11,462 | ||||||
Petroleos Mexicanos | ||||||||
| 30,000 | 4.250%, 1/15/2025f | 29,805 | ||||||
Regency Energy Partners, LP | ||||||||
| 50,000 | 5.000%, 10/1/2022 | 47,250 | ||||||
Rosetta Resources, Inc. | ||||||||
| 55,000 | 5.875%, 6/1/2022 | 49,500 | ||||||
Sabine Pass Liquefaction, LLC | ||||||||
| 50,000 | 5.750%, 5/15/2024 | 49,062 | ||||||
Southwestern Energy Company | ||||||||
| 14,000 | 7.500%, 2/1/2018 | 15,771 | ||||||
Suncor Energy, Inc. | ||||||||
| 8,000 | 6.100%, 6/1/2018 | 8,974 | ||||||
Transocean, Inc. | ||||||||
| 13,000 | 6.000%, 3/15/2018 | 12,504 | ||||||
Weatherford International, Ltd. | ||||||||
| 11,000 | 6.000%, 3/15/2018 | 11,743 | ||||||
| 6,000 | 9.625%, 3/1/2019 | 7,116 | ||||||
|
| |||||||
Total | 705,649 | |||||||
|
| |||||||
| Financials (1.9%) |
| ||||||
Abbey National Treasury Services plc | ||||||||
| 14,000 | 0.665%, 9/29/2017g | 13,965 | ||||||
| 10,000 | 3.050%, 8/23/2018 | 10,353 | ||||||
ABN AMRO Bank NV | ||||||||
| 12,000 | 2.500%, 10/30/2018f | 12,120 | ||||||
Air Lease Corporation | ||||||||
| 14,000 | 2.125%, 1/15/2018 | 13,755 | ||||||
Ally Financial, Inc. | ||||||||
| 40,000 | 4.750%, 9/10/2018 | 41,400 | ||||||
ANZ New Zealand International, Ltd. | ||||||||
| 12,000 | 1.400%, 4/27/2017f | 11,976 | ||||||
Aviation Capital Group Corporation | ||||||||
| 8,000 | 3.875%, 9/27/2016f | 8,201 | ||||||
Bank of America Corporation | ||||||||
| 18,000 | 5.700%, 5/2/2017 | 19,458 | ||||||
| 16,000 | 1.700%, 8/25/2017 | 16,004 | ||||||
| 20,000 | 5.750%, 12/1/2017 | 22,098 | ||||||
| 31,000 | 1.317%, 3/22/2018g | 31,226 | ||||||
| 25,000 | 5.650%, 5/1/2018 | 27,774 | ||||||
| 15,000 | 8.000%, 12/29/2049h | 16,106 | ||||||
Banque Federative du Credit Mutuel SA | ||||||||
| 12,000 | 1.081%, 1/20/2017f,g | 12,082 | ||||||
Barclays Bank plc | ||||||||
| 8,000 | 5.140%, 10/14/2020 | 8,604 | ||||||
Barclays plc | ||||||||
| 14,000 | 2.750%, 11/8/2019 | 13,914 | ||||||
BB&T Corporation | ||||||||
| 16,000 | 2.050%, 6/19/2018 | 16,105 | ||||||
BBVA Banco Continental SA | ||||||||
| 16,000 | 2.250%, 7/29/2016f | 15,960 | ||||||
Bear Stearns Companies, LLC | ||||||||
| 20,000 | 6.400%, 10/2/2017 | 22,398 | ||||||
BNP Paribas SA | ||||||||
| 12,000 | 2.375%, 9/14/2017 | 12,205 | ||||||
BPCE SA | ||||||||
| 12,000 | 1.625%, 2/10/2017 | 12,025 | ||||||
Branch Banking and Trust Company | ||||||||
| 12,000 | 0.664%, 12/1/2016g | 12,011 | ||||||
Caixa Economica Federal | ||||||||
| 35,000 | 4.250%, 5/13/2019f | 34,125 | ||||||
Capital One Financial Corporation | ||||||||
| 14,000 | 6.150%, 9/1/2016 | 15,045 | ||||||
CIT Group, Inc. | ||||||||
| 30,000 | 3.875%, 2/19/2019 | 29,925 | ||||||
Citigroup, Inc. | ||||||||
| 21,000 | 5.500%, 2/15/2017 | 22,575 | ||||||
| 15,000 | 6.000%, 8/15/2017 | 16,596 | ||||||
| 21,000 | 1.850%, 11/24/2017 | 20,976 | ||||||
| 12,000 | 8.500%, 5/22/2019 | 14,953 | ||||||
Compass Bank | ||||||||
| 14,000 | 1.850%, 9/29/2017 | 13,940 | ||||||
Credit Agricole SA | ||||||||
| 14,000 | 6.625%, 9/29/2049f,h | 13,570 | ||||||
CyrusOne, LP | ||||||||
| 26,748 | 6.375%, 11/15/2022 | 28,553 | ||||||
DDR Corporation | ||||||||
| 8,000 | 9.625%, 3/15/2016 | 8,782 | ||||||
Denali Borrower, LLC | ||||||||
| 52,000 | 5.625%, 10/15/2020f | 54,106 | ||||||
Deutsche Bank AG | ||||||||
| 15,000 | 1.350%, 5/30/2017 | 14,874 | ||||||
Discover Bank | ||||||||
| 4,000 | 8.700%, 11/18/2019 | 4,947 | ||||||
Discover Financial Services | ||||||||
| 8,000 | 6.450%, 6/12/2017 | 8,839 | ||||||
Duke Realty, LP | ||||||||
| 14,000 | 8.250%, 8/15/2019 | 17,272 | ||||||
The accompanying Notes to Financial Statements are an integral part of this schedule.
158
Table of Contents
GROWTHAND INCOME PLUS PORTFOLIO
Schedule of Investments as of December 31, 2014
| Principal Amount | Long-Term Fixed Income (15.0%) | Value | ||||||
| Financials (1.9%) - continued |
| ||||||
Fifth Third Bancorp | ||||||||
| $20,000 | 5.450%, 1/15/2017 | $ | 21,462 | |||||
General Electric Capital Corporation | ||||||||
| 13,000 | 5.625%, 9/15/2017 | 14,431 | ||||||
| 7,000 | 1.625%, 4/2/2018 | 7,011 | ||||||
Genworth Financial, Inc. | ||||||||
| 13,000 | 7.700%, 6/15/2020 | 12,967 | ||||||
Goldman Sachs Group, Inc. | ||||||||
| 13,000 | 6.250%, 9/1/2017 | 14,464 | ||||||
| 16,000 | 2.375%, 1/22/2018 | 16,162 | ||||||
| 8,000 | 2.625%, 1/31/2019 | 8,049 | ||||||
| 12,000 | 7.500%, 2/15/2019 | 14,274 | ||||||
| 14,000 | 2.550%, 10/23/2019 | 13,949 | ||||||
Hartford Financial Services Group, Inc. | ||||||||
| 17,000 | 6.000%, 1/15/2019 | 19,280 | ||||||
HBOS plc | ||||||||
| 16,000 | 6.750%, 5/21/2018f | 17,832 | ||||||
HCP, Inc. | ||||||||
| 8,000 | 3.750%, 2/1/2016 | 8,222 | ||||||
| 10,000 | 3.750%, 2/1/2019 | 10,496 | ||||||
Health Care REIT, Inc. | ||||||||
| 10,000 | 4.700%, 9/15/2017 | 10,744 | ||||||
HSBC Holdings plc | ||||||||
| 21,000 | 5.625%, 12/29/2049h | 21,073 | ||||||
Huntington National Bank | ||||||||
| 7,000 | 1.300%, 11/20/2016 | 6,971 | ||||||
Icahn Enterprises, LP | ||||||||
| 50,000 | 6.000%, 8/1/2020 | 51,510 | ||||||
ING Capital Funding Trust III | ||||||||
| 10,000 | 3.855%, 12/29/2049g,h | 9,975 | ||||||
International Lease Finance Corporation | ||||||||
| 10,000 | 2.191%, 6/15/2016g | 9,987 | ||||||
| 30,000 | 5.875%, 4/1/2019 | 32,325 | ||||||
Intesa Sanpaolo SPA | ||||||||
| 7,000 | 3.625%, 8/12/2015f | 7,095 | ||||||
| 4,000 | 3.875%, 1/16/2018 | 4,165 | ||||||
| 15,000 | 3.875%, 1/15/2019 | 15,531 | ||||||
J.P. Morgan Chase & Company | ||||||||
| 16,000 | 3.450%, 3/1/2016 | 16,422 | ||||||
| 8,000 | 0.752%, 2/15/2017g | 7,980 | ||||||
| 8,000 | 2.000%, 8/15/2017 | 8,076 | ||||||
| 8,000 | 6.300%, 4/23/2019 | 9,293 | ||||||
| 16,000 | 7.900%, 4/29/2049h | 17,221 | ||||||
KeyCorp | ||||||||
| 12,000 | 2.300%, 12/13/2018 | 12,041 | ||||||
Kookmin Bank | ||||||||
| 12,000 | 1.109%, 1/27/2017f,g | 12,080 | ||||||
Liberty Mutual Group, Inc. | ||||||||
| 4,000 | 5.000%, 6/1/2021f | 4,357 | ||||||
Liberty Property, LP | ||||||||
| 17,000 | 5.500%, 12/15/2016 | 18,253 | ||||||
Macquarie Bank, Ltd. | ||||||||
| 9,000 | 5.000%, 2/22/2017f | 9,599 | ||||||
MetLife, Inc. | ||||||||
| 14,000 | 1.903%, 12/15/2017 | 14,032 | ||||||
Mizuho Corporate Bank, Ltd. | ||||||||
| 14,000 | 1.550%, 10/17/2017f | 13,867 | ||||||
Morgan Stanley | ||||||||
| 15,000 | 1.750%, 2/25/2016 | 15,081 | ||||||
| 20,000 | 6.250%, 8/28/2017 | 22,217 | ||||||
| 14,000 | 1.875%, 1/5/2018 | 13,949 | ||||||
| 16,000 | 6.625%, 4/1/2018 | 18,225 | ||||||
| 10,000 | 4.875%, 11/1/2022 | 10,621 | ||||||
Murray Street Investment Trust I | ||||||||
| 24,000 | 4.647%, 3/9/2017 | 25,330 | ||||||
National City Corporation | ||||||||
| 8,000 | 6.875%, 5/15/2019 | 9,398 | ||||||
Nomura Holdings, Inc. | ||||||||
| 12,000 | 2.000%, 9/13/2016 | 12,097 | ||||||
| 8,000 | 2.750%, 3/19/2019 | 8,088 | ||||||
PNC Bank NA | ||||||||
| 16,000 | 1.150%, 11/1/2016 | 16,021 | ||||||
Pricoa Global Funding I | ||||||||
| 16,000 | 1.350%, 8/18/2017f | 15,934 | ||||||
Realty Income Corporation | ||||||||
| 12,000 | 2.000%, 1/31/2018 | 12,022 | ||||||
Regions Bank | ||||||||
| 16,000 | 7.500%, 5/15/2018 | 18,574 | ||||||
Reinsurance Group of America, Inc. | ||||||||
| 16,000 | 5.625%, 3/15/2017 | 17,302 | ||||||
Royal Bank of Scotland Group plc | ||||||||
| 12,000 | 5.050%, 1/8/2015 | 12,002 | ||||||
| 9,000 | 1.197%, 3/31/2017g | 9,028 | ||||||
Societe Generale SA | ||||||||
| 12,000 | 5.750%, 4/20/2016f | 12,565 | ||||||
Sumitomo Mitsui Banking Corporation | ||||||||
| 24,000 | 1.300%, 1/10/2017 | 23,955 | ||||||
Suncorp-Metway, Ltd. | ||||||||
| 8,000 | 0.955%, 3/28/2017f,g | 8,012 | ||||||
Swiss RE Capital I, LP | ||||||||
| 12,000 | 6.854%, 5/29/2049f,h | 12,570 | ||||||
Synchrony Financial | ||||||||
| 22,000 | 1.875%, 8/15/2017 | 22,043 | ||||||
Ventas Realty, LP | ||||||||
| 9,000 | 1.250%, 4/17/2017 | 8,916 | ||||||
Voya Financial, Inc. | ||||||||
| 12,000 | 2.900%, 2/15/2018 | 12,285 | ||||||
WEA Finance, LLC | ||||||||
| 14,000 | 1.750%, 9/15/2017f | 13,925 | ||||||
Wells Fargo & Company | ||||||||
| 32,000 | 1.400%, 9/8/2017 | 31,974 | ||||||
|
| |||||||
Total | 1,562,148 | |||||||
|
| |||||||
| Foreign Government (<0.1%) |
| ||||||
Uruguay Government International Bond | ||||||||
| 21,000 | 5.100%, 6/18/2050 | 21,315 | ||||||
|
| |||||||
Total | 21,315 | |||||||
|
| |||||||
| Mortgage-Backed Securities (3.4%) |
| ||||||
Federal Home Loan Mortgage Corporation Gold 15-Yr. Pass Through | ||||||||
| 350,000 | 3.000%, 1/1/2030c | 363,270 | ||||||
Federal Home Loan Mortgage Corporation Gold 30-Yr. Pass Through | ||||||||
| 250,000 | 4.000%, 1/1/2045c | 266,484 | ||||||
The accompanying Notes to Financial Statements are an integral part of this schedule.
159
Table of Contents
GROWTHAND INCOME PLUS PORTFOLIO
Schedule of Investments as of December 31, 2014
| Principal Amount | Long-Term Fixed Income (15.0%) | Value | ||||||
| Mortgage-Backed Securities (3.4%) - continued |
| ||||||
Federal National Mortgage Association Conventional 15-Yr. Pass Through | ||||||||
| $250,000 | 3.500%, 1/1/2030c | $ | 264,102 | |||||
Federal National Mortgage Association Conventional 30-Yr. Pass Through | ||||||||
| 600,000 | 3.500%, 1/1/2045c | 625,453 | ||||||
| 650,000 | 4.000%, 1/1/2045c | 693,715 | ||||||
| 525,000 | 4.500%, 1/1/2045c | 569,871 | ||||||
|
| |||||||
Total | 2,782,895 | |||||||
|
| |||||||
| Technology (0.3%) |
| ||||||
Alibaba Group Holding, Ltd. | ||||||||
| 15,000 | 2.500%, 11/28/2019f | 14,798 | ||||||
Alliance Data Systems Corporation | ||||||||
| 30,000 | 5.375%, 8/1/2022f | 29,625 | ||||||
Amkor Technology, Inc. | ||||||||
| 25,000 | 6.625%, 6/1/2021 | 24,750 | ||||||
EMC Corporation | ||||||||
| 8,000 | 1.875%, 6/1/2018 | 7,973 | ||||||
Fidelity National Information Services, Inc. | ||||||||
| 15,000 | 1.450%, 6/5/2017 | 14,916 | ||||||
First Data Corporation | ||||||||
| 26,748 | 7.375%, 6/15/2019f | 28,152 | ||||||
Freescale Semiconductor, Inc. | ||||||||
| 40,000 | 6.000%, 1/15/2022f | 41,800 | ||||||
Hewlett-Packard Company | ||||||||
| 12,000 | 5.400%, 3/1/2017 | 12,954 | ||||||
Iron Mountain, Inc. | ||||||||
| 26,748 | 6.000%, 8/15/2023 | 27,818 | ||||||
Sensata Technologies BV | ||||||||
| 50,000 | 4.875%, 10/15/2023f | 49,750 | ||||||
Tyco Electronics Group SA | ||||||||
| 16,000 | 6.550%, 10/1/2017 | 18,010 | ||||||
Xerox Corporation | ||||||||
| 16,000 | 7.200%, 4/1/2016 | 17,132 | ||||||
|
| |||||||
Total | 287,678 | |||||||
|
| |||||||
| Transportation (0.2%) |
| ||||||
American Airlines Pass Through Trust | ||||||||
| 7,552 | 4.950%, 1/15/2023 | 8,062 | ||||||
Avis Budget Car Rental, LLC | ||||||||
| 50,000 | 5.125%, 6/1/2022f | 50,500 | ||||||
Continental Airlines, Inc. | ||||||||
| 22,681 | 6.250%, 4/11/2020 | 23,830 | ||||||
Delta Air Lines, Inc. | ||||||||
| 15,000 | 6.750%, 5/23/2017 | 15,638 | ||||||
| 10,174 | 4.950%, 5/23/2019 | 10,886 | ||||||
| 8,648 | 4.750%, 5/7/2020 | 9,200 | ||||||
Korea Expressway Corporation | ||||||||
| 13,000 | 1.625%, 4/28/2017f | 12,927 | ||||||
Southwest Airlines Company | ||||||||
| 14,000 | 2.750%, 11/6/2019 | 14,064 | ||||||
United Air Lines, Inc. | ||||||||
| 7,019 | 10.400%, 11/1/2016 | 7,808 | ||||||
|
| |||||||
Total | 152,915 | |||||||
|
| |||||||
| U.S. Government and Agencies (0.3%) |
| ||||||
U.S. Treasury Notes | ||||||||
| 130,000 | 1.875%, 6/30/2020 | 130,874 | ||||||
| 72,000 | 3.625%, 2/15/2044 | 84,729 | ||||||
|
| |||||||
Total | 215,603 | |||||||
|
| |||||||
| Utilities (0.7%) |
| ||||||
Access Midstream Partners, LP | ||||||||
| 40,000 | 4.875%, 5/15/2023 | 40,600 | ||||||
AES Corporation | ||||||||
| 26,748 | 7.375%, 7/1/2021 | 30,225 | ||||||
Atlas Pipeline Partners, LP | ||||||||
| 33,000 | 4.750%, 11/15/2021 | 31,350 | ||||||
Berkshire Hathaway Energy Company | ||||||||
| 14,000 | 2.400%, 2/1/2020f | 13,939 | ||||||
Calpine Corporation | ||||||||
| 50,000 | 5.375%, 1/15/2023 | 50,500 | ||||||
Commonwealth Edison Company | ||||||||
| 9,000 | 6.950%, 7/15/2018 | 10,403 | ||||||
DCP Midstream Operating, LP | ||||||||
| 10,000 | 2.500%, 12/1/2017 | 9,989 | ||||||
DTE Energy Company | ||||||||
| 14,000 | 2.400%, 12/1/2019 | 14,002 | ||||||
Dynegy Finance I, Inc. | ||||||||
| 55,000 | 7.375%, 11/1/2022f | 55,963 | ||||||
EDP Finance BV | ||||||||
| 14,000 | 4.125%, 1/15/2020f | 14,078 | ||||||
El Paso Corporation | ||||||||
| 7,000 | 7.000%, 6/15/2017 | 7,717 | ||||||
Electricite de France SA | ||||||||
| 12,000 | 0.691%, 1/20/2017f,g | 12,033 | ||||||
Enel Finance International NV | ||||||||
| 10,000 | 5.125%, 10/7/2019f | 11,049 | ||||||
Exelon Generation Company, LLC | ||||||||
| 8,000 | 5.200%, 10/1/2019 | 8,840 | ||||||
MarkWest Energy Partners, LP | ||||||||
| 55,000 | 4.875%, 12/1/2024 | 53,763 | ||||||
MidAmerican Energy Holdings Company | ||||||||
| 16,000 | 1.100%, 5/15/2017 | 15,837 | ||||||
| 8,000 | 5.750%, 4/1/2018 | 8,965 | ||||||
NiSource Finance Corporation | ||||||||
| 16,000 | 6.400%, 3/15/2018 | 18,223 | ||||||
NRG Energy, Inc. | ||||||||
| 26,748 | 6.625%, 3/15/2023 | 27,818 | ||||||
ONEOK Partners, LP | ||||||||
| 10,000 | 2.000%, 10/1/2017 | 9,944 | ||||||
Pacific Gas & Electric Company | ||||||||
| 10,000 | 5.625%, 11/30/2017 | 11,115 | ||||||
Panhandle Eastern Pipe Line Company, LP | ||||||||
| 12,000 | 6.200%, 11/1/2017 | 13,337 | ||||||
PG&E Corporation | ||||||||
| 8,000 | 2.400%, 3/1/2019 | 8,012 | ||||||
PPL Capital Funding, Inc. | ||||||||
| 16,000 | 1.900%, 6/1/2018 | 15,973 | ||||||
Sempra Energy | ||||||||
| 14,000 | 6.150%, 6/15/2018 | 15,866 | ||||||
Southern Company | ||||||||
| 16,000 | 1.300%, 8/15/2017 | 15,934 | ||||||
The accompanying Notes to Financial Statements are an integral part of this schedule.
160
Table of Contents
GROWTHAND INCOME PLUS PORTFOLIO
Schedule of Investments as of December 31, 2014
| Principal Amount | Long-Term Fixed Income (15.0%) | Value | ||||||
| Utilities (0.7%) - continued |
| ||||||
TransAlta Corporation | ||||||||
| $15,000 | 1.900%, 6/3/2017 | $ | 14,936 | |||||
Williams Companies, Inc. | ||||||||
| 16,000 | 7.875%, 9/1/2021 | 18,483 | ||||||
|
| |||||||
Total | 558,894 | |||||||
|
| |||||||
Total Long-Term Fixed Income (cost $12,171,955) | 12,212,789 | |||||||
|
| |||||||
| Shares or Principal Amount | Short-Term Investments (11.0%)i | |||||||
Federal Home Loan Bank Discount Notes | ||||||||
| 300,000 | 0.090%, 4/24/2015j | 299,915 | ||||||
Thrivent Cash Management Trust | ||||||||
| 8,619,908 | 0.060% | 8,619,908 | ||||||
|
| |||||||
Total Short-Term Investments (at amortized cost) | 8,919,823 | |||||||
|
| |||||||
Total Investments (cost $82,485,947) 103.4% | $ | 83,886,505 | ||||||
|
| |||||||
Other Assets and Liabilities, Net (3.4%) | (2,767,012 | ) | ||||||
|
| |||||||
Total Net Assets 100.0% | $ | 81,119,493 | ||||||
|
| |||||||
| a | The stated interest rate represents the weighted average of all contracts within the bank loan facility. |
| b | All or a portion of the loan is unfunded. |
| c | Denotes investments purchased on a when-issued or delayed delivery basis. |
| d | Non-income producing security. |
| e | Denotes step coupon securities. Step coupon securities pay an initial coupon rate for the first period and then different coupon rates for following periods. The rate shown is as of December 31, 2014. |
| f | Denotes securities sold under Rule 144A of the Securities Act of 1933, which exempts them from registration. These securities have been deemed liquid and may be resold to other dealers in the program or to other qualified institutional buyers. As of December 31, 2014, the value of these investments was $2,093,906 or 2.6% of total net assets. |
| g | Denotes variable rate securities. Variable rate securities are securities whose yields vary with a designated market index or market rate. The rate shown is as of December 31, 2014. |
| h | Denotes perpetual securities. Perpetual securities pay an indefinite stream of interest, but may be called by the issuer at an earlier date. |
| i | The interest rate shown reflects the yield, coupon rate or the discount rate at the date of purchase. |
| j | At December 31, 2014, $299,915 of investments were held on deposit with the counterparty and pledged as the initial margin deposit for open futures contracts. |
| * | Denotes restricted securities. Restricted securities are investment securities which have been deemed illiquid and cannot be offered for public sale without first being registered under the Securities Act of 1933. The following table indicates the acquisition date and cost of restricted securities Growth and Income Plus Portfolio owned as of December 31, 2014. |
Security | Acquisition Date | Cost | ||||||
Bayview Opportunity Master Fund Trust IIB, LP, 1/28/2034 | 1/17/2014 | $ | 90,604 | |||||
JBS Finance II, Ltd., 1/29/2018 | 8/19/2013 | 27,854 | ||||||
Definitions:
| ETF | - | Exchange Traded Fund. | ||
| REIT | - | Real Estate Investment Trust is a company that buys, develops, manages and/or sells real estate assets. |
Unrealized Appreciation (Depreciation)
Gross unrealized appreciation and depreciation of investments, based on cost for federal income tax purposes, were as follows:
Gross unrealized appreciation | $ | 4,389,940 | ||
Gross unrealized depreciation | (3,031,593 | ) | ||
|
| |||
Net unrealized appreciation (depreciation) | $ | 1,358,347 | ||
Cost for federal income tax purposes | $ | 82,528,158 | ||
The accompanying Notes to Financial Statements are an integral part of this schedule.
161
Table of Contents
GROWTHAND INCOME PLUS PORTFOLIO
Schedule of Investments as of December 31, 2014
Fair Valuation Measurements
The following table is a summary of the inputs used, as of December 31, 2014, in valuing Growth and Income Plus Portfolio’s assets carried at fair value.
Investments in Securities | Total | Level 1 | Level 2 | Level 3 | ||||||||||||
Bank Loans | ||||||||||||||||
Basic Materials | 634,145 | — | 634,145 | — | ||||||||||||
Capital Goods | 472,851 | — | 472,851 | — | ||||||||||||
Communications Services | 2,703,328 | — | 2,369,026 | 334,302 | ||||||||||||
Consumer Cyclical | 1,354,053 | — | 1,354,053 | — | ||||||||||||
Consumer Non-Cyclical | 1,109,603 | — | 978,785 | 130,818 | ||||||||||||
Energy | 646,472 | — | 590,160 | 56,312 | ||||||||||||
Financials | 497,356 | — | 497,356 | — | ||||||||||||
Technology | 565,652 | — | 565,652 | — | ||||||||||||
Transportation | 324,283 | — | 222,681 | 101,602 | ||||||||||||
Utilities | 212,930 | — | 212,930 | — | ||||||||||||
Common Stock | ||||||||||||||||
Consumer Discretionary | 5,487,369 | 3,337,574 | 2,149,795 | — | ||||||||||||
Consumer Staples | 3,361,672 | 2,172,906 | 1,188,766 | — | ||||||||||||
Energy | 3,162,221 | 1,670,287 | 1,491,934 | — | ||||||||||||
Financials | 15,074,487 | 11,126,487 | 3,948,000 | — | ||||||||||||
Health Care | 8,230,671 | 6,339,188 | 1,891,483 | — | ||||||||||||
Industrials | 6,641,490 | 4,507,282 | 2,134,208 | — | ||||||||||||
Information Technology | 6,550,992 | 5,756,514 | 794,478 | — | ||||||||||||
Materials | 1,954,021 | 1,015,777 | 938,244 | — | ||||||||||||
Telecommunications Services | 2,012,792 | 104,966 | 1,907,826 | — | ||||||||||||
Utilities | 1,757,505 | — | 1,757,505 | — | ||||||||||||
Long-Term Fixed Income | ||||||||||||||||
Asset-Backed Securities | 143,121 | — | 143,121 | — | ||||||||||||
Basic Materials | 345,233 | — | 345,233 | — | ||||||||||||
Capital Goods | 414,157 | — | 414,157 | — | ||||||||||||
Collateralized Mortgage Obligations | 2,349,774 | — | 2,349,774 | — | ||||||||||||
Communications Services | 1,021,380 | — | 1,021,380 | — | ||||||||||||
Consumer Cyclical | 742,848 | — | 742,848 | — | ||||||||||||
Consumer Non-Cyclical | 909,179 | — | 909,179 | — | ||||||||||||
Energy | 705,649 | — | 705,649 | — | ||||||||||||
Financials | 1,562,148 | — | 1,562,148 | — | ||||||||||||
Foreign Government | 21,315 | — | 21,315 | — | ||||||||||||
Mortgage-Backed Securities | 2,782,895 | — | 2,782,895 | — | ||||||||||||
Technology | 287,678 | — | 287,678 | — | ||||||||||||
Transportation | 152,915 | — | 152,915 | — | ||||||||||||
U.S. Government and Agencies | 215,603 | — | 215,603 | — | ||||||||||||
Utilities | 558,894 | — | 558,894 | — | ||||||||||||
Short-Term Investments | 8,919,823 | 8,619,908 | 299,915 | — | ||||||||||||
|
|
|
|
|
|
|
| |||||||||
Total | $ | 83,886,505 | $ | 44,650,889 | $ | 38,612,582 | $ | 623,034 | ||||||||
|
|
|
|
|
|
|
| |||||||||
Other Financial Instruments | Total | Level 1 | Level 2 | Level 3 | ||||||||||||
Asset Derivatives | ||||||||||||||||
Futures Contracts | 124,209 | 124,209 | — | — | ||||||||||||
|
|
|
|
|
|
|
| |||||||||
Total Asset Derivatives | $ | 124,209 | $ | 124,209 | $ | — | $ | — | ||||||||
|
|
|
|
|
|
|
| |||||||||
There were no significant transfers between Levels during the period ended December 31, 2014. Transfers between Levels are identified as of the end of the period.
Futures Contracts | Number of Contracts Long/(Short) | Expiration Date | Notional Principal Amount | Value | Unrealized Gain/(Loss) | |||||||||||||||
2-Yr. U.S. Treasury Bond Futures | (31 | ) | March 2015 | ($ | 6,784,062 | ) | ($ | 6,776,407 | ) | $ | 7,655 | |||||||||
5-Yr. U.S. Treasury Bond Futures | 18 | March 2015 | 2,138,680 | 2,140,735 | 2,055 | |||||||||||||||
30-Yr. U.S. Treasury Bond Futures | 1 | March 2015 | 140,573 | 144,562 | 3,989 | |||||||||||||||
Mini MSCI EAFE Index Futures | 15 | March 2015 | 1,306,255 | 1,318,425 | 12,170 | |||||||||||||||
S&P 500 Index Mini-Futures | 26 | March 2015 | 2,592,693 | 2,668,120 | 75,427 | |||||||||||||||
Ultra Long Term U.S. Treasury Bond Futures | 3 | March 2015 | 472,650 | 495,563 | 22,913 | |||||||||||||||
Total Futures Contracts | $ | 124,209 | ||||||||||||||||||
The accompanying Notes to Financial Statements are an integral part of this schedule.
162
Table of Contents
GROWTHAND INCOME PLUS PORTFOLIO
Schedule of Investments as of December 31, 2014
The following table summarizes the fair value and Statement of Assets and Liabilities location, as of December 31, 2014, for Growth and Income Plus Portfolio’s investments in financial derivative instruments by primary risk exposure as discussed under item (2) Significant Accounting Policies of the Notes to Financial Statements.
Derivatives by risk category | Statement of Assets and Liabilities Location | Fair Value | ||||
Asset Derivatives | ||||||
Interest Rate Contracts | ||||||
Futures* | Net Assets - Net unrealized appreciation/(depreciation) on Futures contracts | $ | 36,612 | |||
Total Interest Rate Contracts | 36,612 | |||||
Equity Contracts | ||||||
Futures* | Net Assets - Net unrealized appreciation/(depreciation) on Futures contracts | 87,597 | ||||
Total Equity Contracts | 87,597 | |||||
|
| |||||
Total Asset Derivatives | $ | 124,209 | ||||
|
| |||||
| * | Includes cumulative appreciation/depreciation of futures contracts as reported in the Schedule of Investments. Only current day’s variation margin is reported within the Statement of Assets and Liabilities. |
The following table summarizes the net realized gains/(losses) and Statement of Operations location, for the period ended December 31, 2014, for Growth and Income Plus Portfolio’s investments in financial derivative instruments by primary risk exposure.
Derivatives by risk category | Statement of Operations Location | Realized Gains/(Losses) recognized in Income | ||||
Equity Contracts | ||||||
Futures | Net realized gains/(losses) on Futures contracts | (13,467 | ) | |||
Total Equity Contracts | (13,467 | ) | ||||
Interest Rate Contracts | ||||||
Futures | Net realized gains/(losses) on Futures contracts | 54,161 | ||||
Total Interest Rate Contracts | 54,161 | |||||
|
| |||||
Total | $ | 40,694 | ||||
|
| |||||
The following table summarizes the change in net unrealized appreciation/(depreciation) and Statement of Operations location, for the period ended December 31, 2014, for Growth and Income Plus Portfolio’s investments in financial derivative instruments by primary risk exposure.
Derivatives by risk category | Statement of Operations Location | Change in unrealized appreciation/(depreciation) recognized in Income | ||||
Interest Rate Contracts | ||||||
Futures | Change in net unrealized appreciation/(depreciation) on Futures contracts | 36,612 | ||||
Total Interest Rate Contracts | 36,612 | |||||
Equity Contracts | ||||||
Futures | Change in net unrealized appreciation/(depreciation) on Futures contracts | 32,627 | ||||
Total Equity Contracts | 32,627 | |||||
|
| |||||
Total | $ | 69,239 | ||||
|
| |||||
The following table presents Growth and Income Plus Portfolio’s average volume of derivative activity during the period ended December 31, 2014.
Derivative Risk Category | Futures (Notional)* | Futures (Percentage of Average Net Assets) | ||||||
Equity Contracts | $ | 4,300,051 | 5.7 | % | ||||
Interest Rate Contracts | 4,636,981 | 6.2 | ||||||
| * | Notional amount represents long or short, or both, derivative positions held by the Portfolio. |
The accompanying Notes to Financial Statements are an integral part of this schedule.
163
Table of Contents
GROWTHAND INCOME PLUS PORTFOLIO
Schedule of Investments as of December 31, 2014
Investment in Affiliates
Affiliated issuers, as defined under the Investment Company Act of 1940, include those in which the Portfolio’s holdings of an issuer represent 5% or more of the outstanding voting securities of an issuer, or any affiliated mutual fund.
A summary of transactions for the fiscal year to date, in Growth and Income Plus Portfolio, is as follows:
Portfolio | Value December 31, 2013 | Gross Purchases | Gross Sales | Shares Held at December 31, 2014 | Value December 31, 2014 | Income Earned January 1, 2014 - December 31, 2014 | ||||||||||||||||||
Cash Management Trust-Short Term Investment | $ | 5,486,510 | $ | 42,703,915 | $ | 39,570,517 | 8,619,908 | $ | 8,619,908 | $ | 4,320 | |||||||||||||
Total Value and Income Earned | 5,486,510 | 8,619,908 | 4,320 | |||||||||||||||||||||
The accompanying Notes to Financial Statements are an integral part of this schedule.
164
Table of Contents
BALANCED INCOME PLUS PORTFOLIO
Schedule of Investments as of December 31, 2014
| Principal Amount | Bank Loans (17.6%)a | Value | ||||||
| Basic Materials (1.3%) | |||||||
Alpha Natural Resources, Inc., Term Loan | ||||||||
| $ | 490,012 | 3.500%, 5/22/2020 | $ | 387,419 | ||||
Crown Americas, LLC, Term Loan | ||||||||
| 520,000 | 0.000%, 10/20/2021b,c | 519,350 | ||||||
Fortescue Metals Group, Ltd., Term Loan | ||||||||
| 586,381 | 3.750%, 6/30/2019 | 531,261 | ||||||
Ineos Group Holdings, Ltd., Term Loan | ||||||||
| 630,390 | 3.750%, 5/4/2018 | 609,833 | ||||||
NewPage Corporation, Term Loan | ||||||||
| 1,100,000 | 9.500%, 2/11/2021 | 1,043,163 | ||||||
Tronox Pigments BV, Term Loan | ||||||||
| 817,391 | 4.000%, 3/19/2020 | 802,408 | ||||||
|
| |||||||
Total | 3,893,434 | |||||||
|
| |||||||
| Capital Goods (0.8%) | |||||||
ADS Waste Holdings, Inc., Term Loan | ||||||||
| 566,399 | 3.750%, 10/9/2019 | 548,874 | ||||||
Berry Plastics Group, Inc., Term Loan | ||||||||
| 650,075 | 3.500%, 2/8/2020 | 627,784 | ||||||
Rexnord, LLC, Term Loan | ||||||||
| 632,000 | 4.000%, 8/21/2020 | 618,096 | ||||||
Silver II Borrower, Term Loan | ||||||||
| 574,983 | 4.000%, 12/13/2019 | 533,119 | ||||||
STHI Holding Corporation, Term Loan | ||||||||
| 49,875 | 4.500%, 8/6/2021 | 49,418 | ||||||
|
| |||||||
Total | 2,377,291 | |||||||
|
| |||||||
| Communications Services (6.1%) | |||||||
Atlantic Broadband Penn, LLC, Term Loan | ||||||||
| 44,013 | 3.250%, 11/30/2019 | 43,023 | ||||||
Birch Communication Inc., Term Loan | ||||||||
| 544,056 | 7.750%, 7/17/2020 | 533,174 | ||||||
Cengage Learning Aquisitions, Term Loan | ||||||||
| 669,937 | 7.000%, 3/31/2020 | 662,401 | ||||||
Charter Communications Operating, LLC, Term Loan | ||||||||
| 738,750 | 3.000%, 1/3/2021 | 723,207 | ||||||
Cincinnati Bell, Inc., Term Loan | ||||||||
| 567,812 | 4.000%, 9/10/2020 | 560,715 | ||||||
Clear Channel Communications, Inc., Term Loan | ||||||||
| 600,000 | 6.919%, 1/30/2019 | 564,426 | ||||||
Cumulus Media Holdings, Inc., Term Loan | ||||||||
| 677,750 | 4.250%, 12/23/2020 | 656,285 | ||||||
Fairpoint Communications, Term Loan | ||||||||
| 630,376 | 7.500%, 2/14/2019 | 623,681 | ||||||
Grande Communications Networks, LLC, Term Loan | ||||||||
| 630,406 | 4.500%, 5/29/2020 | 621,738 | ||||||
Gray Television, Inc., Term Loan | ||||||||
| 378,377 | 3.750%, 6/13/2021 | 371,756 | ||||||
Hargray Communications Group, Inc., Term Loan | ||||||||
| 641,531 | 5.250%, 6/26/2019 | 636,719 | ||||||
IMG Worldwide, Inc., Term Loan | ||||||||
| 696,500 | 5.250%, 5/6/2021 | 671,691 | ||||||
Integra Telecom Holdings, Inc., Term Loan | ||||||||
| 586,053 | 5.250%, 2/22/2019 | 568,840 | ||||||
Intelsat Jackson Holdings SA, Term Loan | ||||||||
| 724,628 | 3.750%, 6/30/2019 | 712,853 | ||||||
Level 3 Communications, Inc., Term Loan | ||||||||
| 610,000 | 4.000%, 8/1/2019 | 605,047 | ||||||
Liberty Cablevision of Puerto Rico, LLC, Term Loan | ||||||||
| 330,000 | 0.000%, 1/7/2022b,c | 320,100 | ||||||
| 415,000 | 4.500%, 1/7/2022 | 403,587 | ||||||
LTS Buyer, LLC, Term Loan | ||||||||
| 689,500 | 4.000%, 4/13/2020 | 673,559 | ||||||
MCC Georgia, LLC, Term Loan | ||||||||
| 467,650 | 3.750%, 6/30/2021 | 456,347 | ||||||
McGraw-Hill Global Education, LLC, Term Loan | ||||||||
| 596,426 | 5.750%, 3/22/2019 | 593,259 | ||||||
NEP/NCP Holdco, Inc., Term Loan | ||||||||
| 651,766 | 4.250%, 1/22/2020 | 636,561 | ||||||
NTelos, Inc., Term Loan | ||||||||
| 984,887 | 5.750%, 11/9/2019 | 856,851 | ||||||
Puerto Rico Cable Acquisition Company, Inc., Term Loan | ||||||||
| 554,532 | 5.500%, 7/31/2018 | 550,373 | ||||||
SBA Senior Finance II, LLC, Term Loan | ||||||||
| 696,500 | 3.250%, 3/24/2021 | 680,682 | ||||||
TNS, Inc., Term Loan | ||||||||
| 711,385 | 5.000%, 2/14/2020 | 703,382 | ||||||
Univision Communications, Inc., Term Loan | ||||||||
| 586,042 | 4.000%, 3/1/2020 | 572,270 | ||||||
Virgin Media Investment Holdings, Ltd., Term Loan | ||||||||
| 580,000 | 3.500%, 6/7/2020 | 568,754 | ||||||
WideOpenWest Finance, LLC, Term Loan | ||||||||
| 600,827 | 4.750%, 4/1/2019 | 595,948 | ||||||
WMG Acquisition Corporation, Term Loan | ||||||||
| 592,500 | 3.750%, 7/1/2020 | 568,800 | ||||||
XO Communications, LLC, Term Loan | ||||||||
| 545,875 | 4.250%, 3/20/2021 | 534,957 | ||||||
Yankee Cable Acquisition, LLC, Term Loan | ||||||||
| 589,337 | 4.500%, 3/1/2020 | 585,654 | ||||||
Zayo Group, LLC, Term Loan | ||||||||
| 655,346 | 4.000%, 7/2/2019 | 647,417 | ||||||
|
| |||||||
Total | 18,504,057 | |||||||
|
| |||||||
| Consumer Cyclical (2.6%) | |||||||
Amaya Gaming Group, Inc., Term Loan | ||||||||
| 189,525 | 5.000%, 8/1/2021b,c | 187,488 | ||||||
Book Allen Hamilton, Inc., Term Loan | ||||||||
| 339,018 | 3.750%, 7/31/2019 | 337,041 | ||||||
The accompanying Notes to Financial Statements are an integral part of this schedule.
165
Table of Contents
BALANCED INCOME PLUS PORTFOLIO
Schedule of Investments as of December 31, 2014
| Principal Amount | Bank Loans (17.6%)a | Value | ||||||
| Consumer Cyclical (2.6%) - continued | |||||||
Burlington Coat Factory Warehouse Corporation, Term Loan | ||||||||
| $581,646 | 4.250%, 8/13/2021 | $ | 573,287 | |||||
Ceridian HCM Holding, Inc., Term Loan | ||||||||
| 309,966 | 4.500%, 9/15/2020 | 304,349 | ||||||
Chrysler Group, LLC, Term Loan | ||||||||
| 694,750 | 3.250%, 12/31/2018 | 686,934 | ||||||
Golden Nugget, Inc., Delayed Draw | ||||||||
| 77,220 | 5.500%, 11/21/2019 | 76,110 | ||||||
Golden Nugget, Inc., Term Loan | ||||||||
| 180,180 | 5.500%, 11/21/2019 | 177,591 | ||||||
Hilton Worldwide Finance, LLC, Term Loan | ||||||||
| 364,035 | 3.500%, 10/26/2020 | 359,332 | ||||||
J.C. Penney Corporation, Inc., Term Loan | ||||||||
| 600,850 | 6.000%, 5/22/2018 | 588,334 | ||||||
Las Vegas Sands, LLC, Term Loan | ||||||||
| 519,750 | 3.250%, 12/19/2020 | 516,070 | ||||||
Marina District Finance Company, Inc., Term Loan | ||||||||
| 503,250 | 6.750%, 8/15/2018 | 498,741 | ||||||
MGM Resorts lnternational, Term Loan | ||||||||
| 541,708 | 3.500%, 12/20/2019 | 526,476 | ||||||
Michaels Stores, Inc., Term Loan | ||||||||
| 663,337 | 4.000%, 1/28/2020 | 650,900 | ||||||
Mohegan Tribal Gaming Authority, Term Loan | ||||||||
| 514,800 | 5.500%, 11/19/2019 | 493,750 | ||||||
Pinnacle Entertainment, Inc., Term Loan | ||||||||
| 40,566 | 3.750%, 8/13/2020 | 39,907 | ||||||
ROC Finance, LLC, Term Loan | ||||||||
| 740,625 | 5.000%, 6/20/2019 | 685,078 | ||||||
Scientific Games International, Inc., Term Loan | ||||||||
| 603,900 | 6.000%, 10/18/2020 | 594,389 | ||||||
Seminole Hard Rock Entertainment, Inc., Term Loan | ||||||||
| 44,773 | 3.500%, 5/14/2020 | 43,094 | ||||||
Seminole Indian Tribe of Florida, Term Loan | ||||||||
| 534,005 | 3.000%, 4/29/2020 | 530,892 | ||||||
|
| |||||||
Total | 7,869,763 | |||||||
|
| |||||||
| Consumer Non-Cyclical (2.5%) | |||||||
Albertsons, Inc., Term Loan | ||||||||
| 834,209 | 4.750%, 3/21/2019 | 827,953 | ||||||
Biomet, Inc., Term Loan | ||||||||
| 557,783 | 3.670%, 7/25/2017 | 554,397 | ||||||
Catalina Marketing Corporation, Term Loan | ||||||||
| 686,550 | 4.500%, 4/9/2021 | 651,797 | ||||||
CHS/Community Health Systems, Inc., Term Loan | ||||||||
| 202,574 | 3.486%, 1/25/2017 | 201,222 | ||||||
| 539,926 | 4.250%, 1/27/2021 | 538,015 | ||||||
Del Monte Corporation, Term Loan | ||||||||
| 655,050 | 3.500%, 3/9/2020 | 625,573 | ||||||
HCA, Inc., Term Loan | ||||||||
| 651,750 | 2.919%, 3/31/2017 | 646,047 | ||||||
JBS USA, LLC, Term Loan | ||||||||
| 659,266 | 3.750%, 5/25/2018 | 649,377 | ||||||
Libbey Glass, Inc., Term Loan | ||||||||
| 343,275 | 3.750%, 4/9/2021 | 337,484 | ||||||
Ortho-Clinical Diagnostics, Inc., Term Loan | ||||||||
| 721,375 | 4.750%, 6/30/2021 | 708,570 | ||||||
Roundy’s Supermarkets, Inc., Term Loan | ||||||||
| 639,283 | 5.750%, 3/3/2021 | 598,260 | ||||||
Supervalu, Inc., Term Loan | ||||||||
| 521,458 | 4.500%, 3/21/2019 | 511,321 | ||||||
Visant Corporation, Term Loan | ||||||||
| 737,104 | 7.000%, 9/23/2021 | 714,991 | ||||||
|
| |||||||
Total | 7,565,007 | |||||||
|
| |||||||
| Energy (1.0%) | |||||||
Arch Coal, Inc., Term Loan | ||||||||
| 615,549 | 6.250%, 5/16/2018 | 508,086 | ||||||
Energy Solutions, LLC, Term Loan | ||||||||
| 820,875 | 6.750%, 5/29/2020 | 817,025 | ||||||
Exgen Renewables I, LLC, Term Loan | ||||||||
| 427,036 | 5.250%, 2/6/2021 | 427,036 | ||||||
McJunkin Red Man Corporation, Term Loan | ||||||||
| 523,375 | 5.000%, 11/8/2019 | 480,197 | ||||||
Offshore Group Investment, Ltd., Term Loan | ||||||||
| 312,702 | 5.750%, 3/28/2019 | 232,963 | ||||||
Pacific Drilling SA, Term Loan | ||||||||
| 586,075 | 4.500%, 6/3/2018 | 481,560 | ||||||
|
| |||||||
Total | 2,946,867 | |||||||
|
| |||||||
| Financials (1.1%) | |||||||
Delos Finance Sarl, Term Loan | ||||||||
| 670,000 | 3.500%, 3/6/2021 | 663,019 | ||||||
DJO Finance, LLC, Term Loan | ||||||||
| 650,112 | 4.250%, 9/15/2017 | 634,399 | ||||||
Harland Clarke Holdings Corporation, Term Loan | ||||||||
| 572,688 | 7.000%, 5/22/2018 | 573,260 | ||||||
MPH Acquisition Holdings, LLC, Term Loan | ||||||||
| 79,439 | 3.750%, 3/31/2021 | 77,096 | ||||||
TransUnion, LLC, Term Loan | ||||||||
| 694,750 | 4.000%, 4/9/2021 | 683,460 | ||||||
WaveDivision Holdings, LLC, Term Loan | ||||||||
| 738,694 | 4.000%, 10/15/2019 | 726,379 | ||||||
|
| |||||||
Total | 3,357,613 | |||||||
|
| |||||||
| Technology (1.2%) | |||||||
Avago Technologies, Ltd., Term Loan | ||||||||
| 1,044,750 | 3.750%, 5/6/2021 | 1,039,965 | ||||||
BMC Software, Inc., Term Loan | ||||||||
| 525,403 | 5.000%, 9/10/2020 | 509,972 | ||||||
First Data Corporation, Term Loan | ||||||||
| 670,000 | 3.667%, 3/23/2018 | 656,185 | ||||||
Freescale Semiconductor, Inc., Term Loan | ||||||||
| 630,424 | 4.250%, 2/28/2020 | 614,272 | ||||||
The accompanying Notes to Financial Statements are an integral part of this schedule.
166
Table of Contents
BALANCED INCOME PLUS PORTFOLIO
Schedule of Investments as of December 31, 2014
| Principal Amount | Bank Loans (17.6%)a | Value | ||||||
| Technology (1.2%) - continued | |||||||
Infor US, Inc., Term Loan | ||||||||
| $ | 730,009 | 3.750%, 6/3/2020 | $ | 706,379 | ||||
|
| |||||||
Total | 3,526,773 | |||||||
|
| |||||||
| Transportation (0.6%) | |||||||
American Airlines, Inc., Term Loan | ||||||||
| 1,053,950 | 3.750%, 6/27/2019 | 1,041,218 | ||||||
Delta Air Lines, Inc., Term Loan | ||||||||
| 684,679 | 3.250%, 4/20/2017b,c | 676,120 | ||||||
OSG Bulk Ships, Inc., Term Loan | ||||||||
| 268,650 | 5.250%, 8/5/2019 | 261,262 | ||||||
|
| |||||||
Total | 1,978,600 | |||||||
|
| |||||||
| Utilities (0.4%) | |||||||
Calpine Corporation, Term Loan | ||||||||
| 649,872 | 4.000%, 4/1/2018 | 641,911 | ||||||
Intergen NV, Term Loan | ||||||||
| 586,075 | 5.500%, 6/15/2020 | 580,701 | ||||||
|
| |||||||
Total | 1,222,612 | |||||||
|
| |||||||
Total Bank Loans (cost $54,814,882) | 53,242,017 | |||||||
|
| |||||||
| Shares | Common Stock (50.4%) | |||||||
| Consumer Discretionary (7.2%) | |||||||
| 4,050 | Amazon.com, Inc.d | 1,256,918 | ||||||
| 2,500 | AutoZone, Inc.d | 1,547,775 | ||||||
| 18,700 | Best Buy Company, Inc. | 728,926 | ||||||
| 10,250 | BorgWarner, Inc. | 563,238 | ||||||
| 15,200 | CBS Corporation | 841,168 | ||||||
| 62,915 | Comcast Corporation | 3,649,699 | ||||||
| 5,400 | Harman International Industries, Inc. | 576,234 | ||||||
| 53,150 | Kohl’s Corporation | 3,244,276 | ||||||
| 53,550 | Las Vegas Sands Corporation | 3,114,468 | ||||||
| 9,150 | Marriott International, Inc. | 713,974 | ||||||
| 40,675 | MDC Partners, Inc. | 924,136 | ||||||
| 15,600 | Papa John’s International, Inc. | 870,480 | ||||||
| 29,300 | Starbucks Corporation | 2,404,065 | ||||||
| 17,400 | Toll Brothers, Inc.d | 596,298 | ||||||
| 31,300 | Tuesday Morning Corporationd,e | 679,210 | ||||||
|
| |||||||
Total | 21,710,865 | |||||||
|
| |||||||
| Consumer Staples (4.5%) | |||||||
| 30,050 | Anheuser-Busch InBev NV ADR | 3,375,216 | ||||||
| 44,750 | Coca-Cola Company | 1,889,345 | ||||||
| 43,247 | PepsiCo, Inc. | 4,089,436 | ||||||
| 122,550 | Rite Aid Corporationd | 921,576 | ||||||
| 35,300 | Wal-Mart Stores, Inc. | 3,031,564 | ||||||
| 13,150 | WhiteWave Foods Companyd | 460,119 | ||||||
|
| |||||||
Total | 13,767,256 | |||||||
|
| |||||||
| Energy (3.3%) | |||||||
| 21,900 | Cameron International Corporationd | 1,093,905 | ||||||
| 42,850 | Cobalt International Energy, Inc.d | 380,937 | ||||||
| 6,200 | Concho Resources, Inc.d | 618,450 | ||||||
| 15,150 | EOG Resources, Inc. | 1,394,860 | ||||||
| 13,700 | EQT Corporation | 1,037,090 | ||||||
| 13,675 | Schlumberger, Ltd. | 1,167,982 | ||||||
| 81,700 | Total SA ADRe | 4,183,040 | ||||||
|
| |||||||
Total | 9,876,264 | |||||||
|
| |||||||
| 82,771 | Aberdeen Asia-Pacific Income Fund, Inc. | 459,379 | ||||||
| 350 | Acadia Realty Trust | 11,211 | ||||||
| 3,200 | Affiliated Managers Group, Inc.d | 679,168 | ||||||
| 500 | Agree Realty Corporation | 15,545 | ||||||
| 18,250 | Alexandria Real Estate Equities, Inc. | 1,619,505 | ||||||
| 4,000 | Apartment Investment & Management Company | 148,600 | ||||||
| 29,850 | Assured Guaranty, Ltd. | 775,802 | ||||||
| 2,200 | AvalonBay Communities, Inc. | 359,458 | ||||||
| 73,204 | Bank of America Corporation | 1,309,620 | ||||||
| 3,000 | BioMed Realty Trust, Inc. | 64,620 | ||||||
| 139,150 | Blackstone Group, LP | 4,707,445 | ||||||
| 6,950 | Boston Properties, Inc. | 894,395 | ||||||
| 73,900 | Brixmor Property Group, Inc. | 1,835,676 | ||||||
| 9,300 | Camden Property Trust | 686,712 | ||||||
| 17,700 | Capital One Financial Corporation | 1,461,135 | ||||||
| 25,288 | Citigroup, Inc. | 1,368,334 | ||||||
| 326 | City Office REIT, Inc. | 4,173 | ||||||
| 23,700 | CNO Financial Group, Inc. | 408,114 | ||||||
| 15,800 | Cohen & Steers REIT and Preferred Income Fund, Inc. | 300,042 | ||||||
| 3,500 | CubeSmart | 77,245 | ||||||
| 31,750 | DDR Corporation | 582,930 | ||||||
| 1,300 | Digital Realty Trust, Inc. | 86,190 | ||||||
| 21,125 | Doubleline Income Solutions Fund | 420,388 | ||||||
| 15,800 | Duke Realty Corporation | 319,160 | ||||||
| 2,000 | EPR Properties | 115,260 | ||||||
| 1,500 | Equity Lifestyle Properties, Inc. | 77,325 | ||||||
| 10,350 | Equity Residential | 743,544 | ||||||
| 700 | Essex PropertyTrust, Inc. | 144,620 | ||||||
| 13,042 | First Trust High Income Long/Short Fund | 208,672 | ||||||
| 8,986 | General Growth Properties, Inc. | 252,776 | ||||||
| 700 | Geo Group, Inc. | 28,252 | ||||||
| 6,900 | HCP, Inc. | 303,807 | ||||||
| 1,500 | Health Care REIT, Inc. | 113,505 | ||||||
| 6,000 | Healthcare Trust of America, Inc. | 161,640 | ||||||
| 3,500 | Highwoods Properties, Inc. | 154,980 | ||||||
| 23,200 | Host Hotels & Resorts, Inc. | 551,464 | ||||||
| 86,200 | Invesco, Ltd. | 3,406,624 | ||||||
| 21,030 | iShares J.P. Morgan USD Emerging Markets Bond ETF | 2,307,201 | ||||||
| 10,090 | iShares MSCI Emerging Markets Minimum Volatility ETFe | 571,397 | ||||||
| 110,500 | KeyCorp | 1,535,950 | ||||||
| 15,000 | Kimco Realty Corporation | 377,100 | ||||||
| 200 | LaSalle Hotel Properties | 8,094 | ||||||
| 26,250 | Lazard, Ltd. | 1,313,288 | ||||||
| 13,500 | MasterCard, Inc. | 1,163,160 | ||||||
| 29,450 | MetLife, Inc. | 1,592,950 | ||||||
| 79,271 | MFS Intermediate Income Trust | 378,915 | ||||||
| 2,600 | Mid-America Apartment Communities, Inc. | 194,168 | ||||||
| 1,200 | National Health Investors, Inc. | 83,952 | ||||||
| 2,800 | National Retail Properties, Inc. | 110,236 | ||||||
| 48,381 | Nuveen Quality Preferred Income Fund II | 430,591 | ||||||
| 800 | Omega Healthcare Investors, Inc. | 31,256 | ||||||
| 38,550 | PacWest Bancorp | 1,752,483 | ||||||
| 1,200 | Parkway Properties, Inc. | 22,068 | ||||||
| 25,714 | PIMCO Dynamic Credit Income Fund | 530,994 | ||||||
| 13,200 | Prologis, Inc. | 567,996 | ||||||
| 4,950 | Public Storage, Inc. | 915,007 | ||||||
| 4,600 | RLJ Lodging Trust | 154,238 | ||||||
| 1,600 | Sabra Healthcare REIT, Inc. | 48,592 | ||||||
The accompanying Notes to Financial Statements are an integral part of this schedule.
167
Table of Contents
BALANCED INCOME PLUS PORTFOLIO
Schedule of Investments as of December 31, 2014
| Shares | Common Stock (50.4%) | Value | ||||||
| Financials (14.5%) - continued |
| ||||||
| 7,253 | Simon Property Group, Inc. | $ | 1,320,844 | |||||
| 527 | Sovran Self Storage, Inc. | 45,965 | ||||||
| 14,300 | Spirit Realty Capital, Inc. | 170,027 | ||||||
| 502 | Store Capital Corporation | 10,848 | ||||||
| 6,400 | Summit Hotel Properties, Inc. | 79,616 | ||||||
| 2,732 | Tanger Factory Outlet Centers, Inc. | 100,975 | ||||||
| 784 | Tubman Centers, Inc. | 59,913 | ||||||
| 63,832 | Templeton Global Income Fund | 458,952 | ||||||
| 600 | Terreno Realty Corporation | 12,378 | ||||||
| 1,200 | UDR, Inc. | 36,984 | ||||||
| 12,615 | Vanguard MSCI Emerging Markets ETF | 504,852 | ||||||
| 5,400 | Ventas, Inc. | 387,180 | ||||||
| 5,000 | Vornado Realty Trust | 588,550 | ||||||
| 29,063 | Western Asset Emerging Markets Debt Fund, Inc. | 458,033 | ||||||
| 46,185 | Western Asset High Income Opportunity Fund, Inc. | 248,013 | ||||||
| 19,650 | Zions Bancorporation | 560,221 | ||||||
|
| |||||||
Total | 43,990,303 | |||||||
|
| |||||||
| Health Care (5.8%) | |||||||
| 39,250 | Abbott Laboratories | 1,767,035 | ||||||
| 3,450 | Actavis plcd | 888,065 | ||||||
| 8,600 | Amgen, Inc. | 1,369,894 | ||||||
| 6,600 | Gilead Sciences, Inc.d | 622,116 | ||||||
| 27,400 | Hologic, Inc.d | 732,676 | ||||||
| 3,250 | Illumina, Inc.d | 599,885 | ||||||
| 47,050 | Johnson & Johnson | 4,920,018 | ||||||
| 173,350 | Pfizer, Inc. | 5,399,852 | ||||||
| 5,100 | Vertex Pharmaceuticals, Inc.d | 605,880 | ||||||
| 5,000 | Waters Corporationd | 563,600 | ||||||
|
| |||||||
Total | 17,469,021 | |||||||
|
| |||||||
| Industrials (4.7%) | |||||||
| 15,850 | ADT Corporatione | 574,246 | ||||||
| 15,778 | Boeing Company | 2,050,824 | ||||||
| 37,000 | Delta Air Lines, Inc. | 1,820,030 | ||||||
| 13,500 | EMCOR Group, Inc. | 600,615 | ||||||
| 9,750 | FedEx Corporation | 1,693,185 | ||||||
| 8,350 | Flowserve Corporation | 499,581 | ||||||
| 13,150 | HNI Corporation | 671,439 | ||||||
| 27,150 | Ingersoll-Rand plc | 1,721,038 | ||||||
| 33,050 | Union Pacific Corporation | 3,937,246 | ||||||
| 6,250 | WABCO Holdings, Inc.d | 654,875 | ||||||
|
| |||||||
Total | 14,223,079 | |||||||
|
| |||||||
| Information Technology (7.5%) | |||||||
| 7,833 | Alibaba Group Holding, Ltd. ADRd | 814,162 | ||||||
| 63,950 | Apple, Inc. | 7,058,801 | ||||||
| 8,600 | Autodesk, Inc.d | 516,516 | ||||||
| 73,258 | E2open, Inc.d,e | 704,009 | ||||||
| 41,150 | EMC Corporation | 1,223,801 | ||||||
| 16,550 | Facebook, Inc.d | 1,291,231 | ||||||
| 1,900 | Google, Inc.d | 1,000,160 | ||||||
| 1,900 | Google, Inc., Class Ad | 1,008,254 | ||||||
| 31,600 | Juniper Networks, Inc. | 705,312 | ||||||
| 4,400 | Linkedln Corporationd | 1,010,724 | ||||||
| 22,500 | NetApp, Inc. | 932,625 | ||||||
| 28,023 | QLIK Technologies, Inc.d | 865,630 | ||||||
| 26,950 | QUALCOMM, Inc. | 2,003,193 | ||||||
| 20,100 | Salesforce.com, Inc.d | 1,192,131 | ||||||
| 8,950 | ServiceNow, Inc.d | 607,258 | ||||||
| 12,100 | Teradata Corporationd | 528,528 | ||||||
| 21,250 | Ubiquiti Networks, Inc.e | 629,850 | ||||||
| 3,700 | Ultimate Software Group, Inc.d | 543,216 | ||||||
|
| |||||||
Total | 22,635,401 | |||||||
|
| |||||||
| Materials (1.5%) | |||||||
| 2,000 | Airgas, Inc. | 230,360 | ||||||
| 2,200 | Ashland, Inc. | 263,472 | ||||||
| 4,950 | Crown Holdings, Inc.d | 251,955 | ||||||
| 10,950 | Domtar Corporation | 440,409 | ||||||
| 4,050 | FMC Corporation | 230,972 | ||||||
| 49,300 | Materials Select Sector SPDR Fund | 2,394,994 | ||||||
| 8,550 | Owens-Illinois, Inc.d | 230,765 | ||||||
| 1,250 | PPG Industries, Inc. | 288,937 | ||||||
| 10,750 | Steel Dynamics, Inc. | 212,205 | ||||||
|
| |||||||
Total | 4,544,069 | |||||||
|
| |||||||
| Utilities (1.4%) | |||||||
| 18,300 | MDU Resources Group, Inc. | 430,050 | ||||||
| 32,850 | NorthWestern Corporation | 1,858,653 | ||||||
| 44,750 | Utilities Select Sector SPDR Fund | 2,113,095 | ||||||
|
| |||||||
Total | 4,401,798 | |||||||
|
| |||||||
Total Common Stock (cost $131,933,726) | 152,618,056 | |||||||
|
| |||||||
| Principal Amount | Long-Term Fixed Income (25.8%) | |||||||
| Asset-Backed Securities (1.2%) |
| ||||||
Asset Backed Securities Corporation Home Equity Loan Trust | ||||||||
| 439,281 | 0.310%, 7/25/2036f | 393,236 | ||||||
Bayview Opportunity Master Fund Trust IIB, LP | ||||||||
| 388,303 | 3.950%, 1/28/2034*,g | 390,227 | ||||||
| 408,909 | 3.228%, 7/28/2034* | 409,991 | ||||||
Countrywide Home Loans, Inc. | ||||||||
| 96,801 | 6.085%, 6/25/2021g,h | 96,402 | ||||||
Credit Based Asset Servicing and Securitization, LLC | ||||||||
| 278,671 | 3.666%, 12/25/2036g | 194,997 | ||||||
First Horizon ABS Trust | ||||||||
| 423,181 | 0.330%, 10/25/2034f,h | 373,542 | ||||||
GMAC Mortgage Corporation Loan Trust | ||||||||
| 752,311 | 0.350%, 8/25/2035f,h | 665,147 | ||||||
| 472,642 | 0.350%, 12/25/2036f,h | 412,628 | ||||||
IndyMac Seconds Asset-Backed Trust | ||||||||
| 275,476 | 0.510%, 10/25/2036f,h | 166,476 | ||||||
Wachovia Asset Securitization, Inc. | ||||||||
| 596,716 | 0.310%, 7/25/2037*,f,h | 523,324 | ||||||
|
| |||||||
Total | 3,625,970 | |||||||
|
| |||||||
| Basic Materials (0.8%) | |||||||
Albemarle Corporation | ||||||||
| 96,000 | 3.000%, 12/1/2019 | 96,015 | ||||||
Anglo American Capital plc | ||||||||
| 65,000 | 1.181%, 4/15/2016f,i | 65,065 | ||||||
ArcelorMittal | ||||||||
| 190,000 | 6.000%, 3/1/2021 | 197,600 | ||||||
Dow Chemical Company | ||||||||
| 86,000 | 8.550%, 5/15/2019 | 106,919 | ||||||
Fermaca Enterprises S de RL de CV | ||||||||
| 160,000 | 6.375%, 3/30/2038i | 162,800 | ||||||
The accompanying Notes to Financial Statements are an integral part of this schedule.
168
Table of Contents
BALANCED INCOME PLUS PORTFOLIO
Schedule of Investments as of December 31, 2014
| Principal Amount | Long-Term Fixed Income (25.8%) | Value | ||||||
| Basic Materials (0.8%) - continued | |||||||
FMG Resources August 2006 Pty., Ltd. | ||||||||
| $101,305 | 6.875%, 2/1/2018e,i | $ | 91,934 | |||||
Freeport-McMoRan, Inc. | ||||||||
| 48,000 | 2.300%, 11/14/2017 | 48,058 | ||||||
| 80,000 | 2.375%, 3/15/2018 | 79,120 | ||||||
Goldcorp, Inc. | ||||||||
| 100,000 | 2.125%, 3/15/2018 | 98,836 | ||||||
Groupe Office Cherifien des Phosphates SA | ||||||||
| 170,000 | 5.625%, 4/25/2024i | 178,500 | ||||||
Hexion US Finance Corporation/Hexion Nova Scotia Finance ULC | ||||||||
| 227,936 | 8.875%, 2/1/2018 | 202,863 | ||||||
Ineos Finance plc | ||||||||
| 263,000 | 7.500%, 5/1/2020i | 276,150 | ||||||
LyondellBasell Industries NV | ||||||||
| 80,000 | 5.000%, 4/15/2019 | 87,261 | ||||||
Minsur SA | ||||||||
| 164,000 | 6.250%, 2/7/2024i | 177,120 | ||||||
Mosaic Company | ||||||||
| 52,000 | 3.750%, 11/15/2021 | 54,122 | ||||||
NOVA Chemicals Corporation | ||||||||
| 341,904 | 5.250%, 8/1/2023i | 345,323 | ||||||
Samarco Mineracao SA | ||||||||
| 150,000 | 5.375%, 9/26/2024i | 139,050 | ||||||
Vale Overseas, Ltd. | ||||||||
| 80,000 | 6.250%, 1/23/2017 | 85,329 | ||||||
|
| |||||||
Total | 2,492,065 | |||||||
|
| |||||||
| Capital Goods (0.8%) | |||||||
BAE Systems plc | ||||||||
| 132,000 | 3.500%, 10/11/2016i | 137,115 | ||||||
Brand Energy & Infrastructure Services, Inc. | ||||||||
| 145,000 | 8.500%, 12/1/2021i | 130,500 | ||||||
Cemex SAB de CV | ||||||||
| 300,000 | 5.700%, 1/11/2025i | 291,000 | ||||||
CNH Capital, LLC | ||||||||
| 227,936 | 3.625%, 4/15/2018 | 224,517 | ||||||
Crown Americas Capital Corporation IV | ||||||||
| 190,000 | 4.500%, 1/15/2023 | 184,300 | ||||||
Harsco Corporation | ||||||||
| 78,000 | 2.700%, 10/15/2015 | 77,902 | ||||||
Hutchison Whampoa Finance CI, Ltd. | ||||||||
| 99,000 | 1.625%, 10/31/2017i | 98,184 | ||||||
Ingersoll-Rand Global Holding Company, Ltd. | ||||||||
| 106,000 | 6.875%, 8/15/2018 | 123,052 | ||||||
L-3 Communications Corporation | ||||||||
| 90,000 | 1.500%, 5/28/2017 | 89,115 | ||||||
Martin Marietta Materials, Inc. | ||||||||
| 106,000 | 1.357%, 6/30/2017f | 107,162 | ||||||
Nortek, Inc. | ||||||||
| 227,936 | 8.500%, 4/15/2021 | 243,892 | ||||||
Reynolds Group Issuer, Inc. | ||||||||
| 227,936 | 9.875%, 8/15/2019 | 241,612 | ||||||
Roper Industries, Inc. | ||||||||
| 71,000 | 2.050%, 10/1/2018 | 70,414 | ||||||
Textron, Inc. | ||||||||
| 132,000 | 4.625%, 9/21/2016 | 139,658 | ||||||
United Rentals North America, Inc. | ||||||||
| 273,000 | 7.375%, 5/15/2020 | 294,840 | ||||||
|
| |||||||
Total | 2,453,263 | |||||||
|
| |||||||
| Collateralized Mortgage Obligations (3.8%) | |||||||
Banc of America Alternative Loan Trust | ||||||||
| 672,330 | 6.000%, 11/25/2035 | 587,576 | ||||||
Countrywide Alternative Loan Trust | ||||||||
| 542,595 | 6.500%, 8/25/2036 | 413,210 | ||||||
Countrywide Home Loan Mortgage Pass Through Trust | ||||||||
| 468,128 | 2.465%, 11/25/2035 | 395,889 | ||||||
Credit Suisse First Boston Mortgage Securities Corporation | ||||||||
| 414,169 | 5.250%, 10/25/2035 | 412,128 | ||||||
Deutsche Alt-A Securities Mortgage Loan Trust | ||||||||
| 410,212 | 0.883%, 4/25/2047f | 351,130 | ||||||
Deutsche Alt-A Securities, Inc., Mortgage Loan Trust | ||||||||
| 747,829 | 5.500%, 11/25/2035 | 707,184 | ||||||
GMACM Mortgage Loan Trust | ||||||||
| 324,396 | 4.566%, 5/25/2035 | 311,480 | ||||||
HarborView Mortgage Loan Trust | ||||||||
| 292,565 | 2.649%, 12/19/2035 | 258,093 | ||||||
J.P. Morgan Alternative Loan Trust | ||||||||
| 753,615 | 6.500%, 3/25/2036 | 664,619 | ||||||
J.P. Morgan Mortgage Trust | ||||||||
| 630,768 | 2.653%, 8/25/2035 | 627,460 | ||||||
| 584,254 | 2.695%, 1/25/2037 | 533,391 | ||||||
Merrill Lynch Mortgage Investors Trust | ||||||||
| 542,326 | 6.250%, 8/25/2036 | 444,307 | ||||||
MortgageIT Trust | ||||||||
| 824,013 | 0.430%, 12/25/2035f | 755,879 | ||||||
| 850,339 | 0.370%, 4/25/2036f | 642,384 | ||||||
New York Mortgage Trust | ||||||||
| 243,272 | 2.630%, 5/25/2036 | 219,456 | ||||||
Residential Accredit Loans, Inc. | ||||||||
| 468,372 | 5.750%, 9/25/2035 | 423,496 | ||||||
RFMSI Trust | ||||||||
| 824,897 | 6.000%, 7/25/2037 | 747,010 | ||||||
Structured Adjustable Rate Mortgage Loan Trust | ||||||||
| 362,267 | 5.081%, 7/25/2035 | 312,290 | ||||||
| 445,133 | 2.633%, 9/25/2035 | 378,420 | ||||||
Structured Asset Mortgage Investments, Inc. | ||||||||
| 948,522 | 0.480%, 12/25/2035f | 725,151 | ||||||
WaMu Mortgage Pass Through Certificates | ||||||||
| 366,513 | 0.853%, 1/25/2047f | 300,815 | ||||||
Wells Fargo Mortgage Backed Securities Trust | ||||||||
| 222,809 | 2.612%, 3/25/2036 | 221,886 | ||||||
| 699,741 | 2.609%, 7/25/2036 | 682,437 | ||||||
| 465,655 | 6.000%, 7/25/2037 | 460,792 | ||||||
|
| |||||||
Total | 11,576,483 | |||||||
|
| |||||||
The accompanying Notes to Financial Statements are an integral part of this schedule.
169
Table of Contents
BALANCED INCOME PLUS PORTFOLIO
Schedule of Investments as of December 31, 2014
| Principal Amount | Long-Term Fixed Income (25.8%) | Value | ||||||
| Communications Services (2.0%) |
| ||||||
21st Century Fox America, Inc. | $ | 112,019 | ||||||
| $ | 95,000 | 6.900%, 3/1/2019 | ||||||
AMC Networks, Inc. | ||||||||
| 227,936 | 7.750%, 7/15/2021 | 243,892 | ||||||
America Movil SAB de CV | ||||||||
| 71,000 | 5.000%, 10/16/2019 | 78,378 | ||||||
American Tower Corporation | ||||||||
| 130,000 | 7.000%, 10/15/2017 | 146,775 | ||||||
British Sky Broadcasting Group plc | ||||||||
| 102,000 | 2.625%, 9/16/2019i | 102,038 | ||||||
British Telecommunications plc | ||||||||
| 86,000 | 1.250%, 2/14/2017 | 85,572 | ||||||
CC Holdings GS V, LLC | ||||||||
| 198,000 | 2.381%, 12/15/2017 | 199,756 | ||||||
CCO Holdings, LLC | ||||||||
| 227,936 | 7.000%, 1/15/2019 | 236,484 | ||||||
CenturyLink, Inc. | ||||||||
| 230,000 | 6.450%, 6/15/2021 | 246,675 | ||||||
Columbus International, Inc. | ||||||||
| 205,000 | 7.375%, 3/30/2021i | 213,200 | ||||||
Cox Communications, Inc. | ||||||||
| 84,000 | 9.375%, 1/15/2019i | 105,716 | ||||||
Digicel, Ltd. | ||||||||
| 257,936 | 6.000%, 4/15/2021i | 241,170 | ||||||
DIRECTV Holdings, LLC | ||||||||
| 86,000 | 5.875%, 10/1/2019 | 98,370 | ||||||
Equinix, Inc. | ||||||||
| 200,000 | 5.750%, 1/1/2025 | 201,750 | ||||||
Frontier Communications Corporation | ||||||||
| 300,000 | 6.875%, 1/15/2025 | 300,000 | ||||||
Hughes Satellite Systems Corporation | ||||||||
| 273,000 | 6.500%, 6/15/2019 | 292,792 | ||||||
Intelsat Jackson Holdings SA | ||||||||
| 227,936 | 7.250%, 10/15/2020 | 240,757 | ||||||
Level 3 Financing, Inc. | ||||||||
| 273,000 | 8.625%, 7/15/2020 | 294,499 | ||||||
SBA Tower Trust | ||||||||
| 84,000 | 5.101%, 4/17/2017i | 88,416 | ||||||
Sprint Communications, Inc. | ||||||||
| 227,936 | 9.000%, 11/15/2018i | 259,254 | ||||||
Telefonica Emisiones SAU | ||||||||
| 87,000 | 3.992%, 2/16/2016 | 89,479 | ||||||
| 78,000 | 3.192%, 4/27/2018 | 80,210 | ||||||
Time Warner Cable, Inc. | ||||||||
| 48,000 | 8.250%, 4/1/2019 | 58,759 | ||||||
| 182,000 | 5.000%, 2/1/2020 | 200,561 | ||||||
T-Mobile USA, Inc. | ||||||||
| 250,000 | 6.633%, 4/28/2021 | 256,562 | ||||||
Univision Communications, Inc. | ||||||||
| 325,000 | 7.875%, 11/1/2020i | 346,125 | ||||||
UPCB Finance V, Ltd. | ||||||||
| 325,000 | 7.250%, 11/15/2021i | 355,469 | ||||||
Verizon Communications, Inc. | ||||||||
| 237,000 | 2.625%, 2/21/2020i | 234,290 | ||||||
| 106,000 | 4.500%, 9/15/2020 | 115,090 | ||||||
West Corporation | ||||||||
| 210,000 | 5.375%, 7/15/2022i | 201,075 | ||||||
Wind Acquisition Finance SA | ||||||||
| 120,000 | 4.750%, 7/15/2020i | 112,200 | ||||||
| 40,000 | 7.375%, 4/23/2021i | 37,752 | ||||||
|
| |||||||
Total | 5,875,085 | |||||||
|
| |||||||
| Consumer Cyclical (1.4%) | |||||||
AMC Entertainment, Inc. | ||||||||
| 227,000 | 5.875%, 2/15/2022 | 230,405 | ||||||
Chrysler Group, LLC | ||||||||
| 227,936 | 8.250%, 6/15/2021 | 252,439 | ||||||
Cinemark USA, Inc. | ||||||||
| 263,000 | 4.875%, 6/1/2023 | 248,535 | ||||||
Daimler Finance North America, LLC | ||||||||
| 55,000 | 1.875%, 1/11/2018i | 55,191 | ||||||
Delphi Corporation | ||||||||
| 78,000 | 6.125%, 5/15/2021 | 85,020 | ||||||
ERAC USA Finance, LLC | ||||||||
| 106,000 | 2.350%, 10/15/2019i | 105,210 | ||||||
Ford Motor Credit Company, LLC | ||||||||
| 150,000 | 1.684%, 9/8/2017 | 148,806 | ||||||
| 130,000 | 5.000%, 5/15/2018 | 141,251 | ||||||
| 87,000 | 2.597%, 11/4/2019 | 86,532 | ||||||
General Motors Financial Company, Inc. | ||||||||
| 227,936 | 3.250%, 5/15/2018 | 228,221 | ||||||
| 150,000 | 4.375%, 9/25/2021 | 156,563 | ||||||
Hyundai Capital America | ||||||||
| 84,000 | 1.450%, 2/6/2017i | 83,684 | ||||||
Jaguar Land Rover Automotive plc | ||||||||
| 273,000 | 5.625%, 2/1/2023i | 287,332 | ||||||
KB Home | ||||||||
| 189,000 | 4.750%, 5/15/2019 | 186,165 | ||||||
L Brands, Inc. | ||||||||
| 273,000 | 6.625%, 4/1/2021 | 307,125 | ||||||
Lennar Corporation | ||||||||
| 225,000 | 4.500%, 11/15/2019 | 223,313 | ||||||
Macy’s Retail Holdings, Inc. | ||||||||
| 66,000 | 7.450%, 7/15/2017 | 75,035 | ||||||
Nissan Motor Acceptance Corporation | ||||||||
| 58,000 | 0.785%, 3/3/2017f,i | 58,185 | ||||||
Royal Caribbean Cruises, Ltd. | ||||||||
| 517,936 | 5.250%, 11/15/2022 | 543,833 | ||||||
Toll Brothers Finance Corporation | ||||||||
| 76,000 | 4.000%, 12/31/2018 | 76,380 | ||||||
TRW Automotive, Inc. | ||||||||
| 60,000 | 7.250%, 3/15/2017i | 66,300 | ||||||
Volkswagen Group of America Finance, LLC | ||||||||
| 96,000 | 0.672%, 11/20/2017f,i | 95,861 | ||||||
Walgreens Boots Alliance, Inc. | ||||||||
| 96,000 | 2.700%, 11/18/2019 | 96,488 | ||||||
Wynn Las Vegas, LLC | ||||||||
| 273,000 | 5.375%, 3/15/2022 | 277,095 | ||||||
|
| |||||||
Total | 4,114,969 | |||||||
|
| |||||||
| Consumer Non-Cyclical (1.8%) | |||||||
AbbVie, Inc. | ||||||||
| 85,000 | 2.000%, 11/6/2018 | 84,715 | ||||||
The accompanying Notes to Financial Statements are an integral part of this schedule.
170
Table of Contents
BALANCED INCOME PLUS PORTFOLIO
Schedule of Investments as of December 31, 2014
| Principal Amount | Long-Term Fixed Income (25.8%) | Value | ||||||
| Consumer Non-Cyclical (1.8%) - continued |
| ||||||
Altria Group, Inc. | ||||||||
| $ | 45,000 | 9.700%, 11/10/2018 | $ | 57,141 | ||||
Beam, Inc. | ||||||||
| 59,000 | 5.375%, 1/15/2016 | 61,686 | ||||||
Becton, Dickinson and Company | ||||||||
| 96,000 | 2.675%, 12/15/2019 | 97,263 | ||||||
Boston Scientific Corporation | ||||||||
| 96,000 | 2.650%, 10/1/2018 | 96,113 | ||||||
CareFusion Corporation | ||||||||
| 80,000 | 1.450%, 5/15/2017 | 79,434 | ||||||
Celgene Corporation | ||||||||
| 118,000 | 1.900%, 8/15/2017 | 118,416 | ||||||
CHS/Community Health Systems, Inc. | ||||||||
| 273,000 | 7.125%, 7/15/2020 | 291,086 | ||||||
ConAgra Foods, Inc. | ||||||||
| 104,000 | 2.100%, 3/15/2018 | 103,663 | ||||||
Cott Beverages, Inc. | ||||||||
| 200,000 | 5.375%, 7/1/2022i | 183,500 | ||||||
Coventry Health Care, Inc. | ||||||||
| 53,000 | 5.950%, 3/15/2017 | 57,967 | ||||||
CVS Health Corporation | ||||||||
| 86,000 | 2.250%, 12/5/2018 | 86,770 | ||||||
Envision Healthcare Corporation | ||||||||
| 295,000 | 5.125%, 7/1/2022i | 292,787 | ||||||
Express Scripts Holding Company | ||||||||
| 78,000 | 2.650%, 2/15/2017 | 79,755 | ||||||
Forest Laboratories, Inc. | ||||||||
| 109,000 | 4.375%, 2/1/2019i | 115,144 | ||||||
| 84,000 | 5.000%, 12/15/2021i | 90,957 | ||||||
Fresenius Medical Care US Finance, Inc. | ||||||||
| 227,936 | 5.750%, 2/15/2021i | 243,037 | ||||||
Gilead Sciences, Inc. | ||||||||
| 52,000 | 3.050%, 12/1/2016 | 53,958 | ||||||
| 96,000 | 2.350%, 2/1/2020 | 96,517 | ||||||
Grupo Bimbo SAB de CV | ||||||||
| 160,000 | 3.875%, 6/27/2024i | 160,629 | ||||||
Hawk Acquisition Sub, Inc. | ||||||||
| 273,000 | 4.250%, 10/15/2020 | 275,730 | ||||||
HCA, Inc. | ||||||||
| 227,936 | 4.750%, 5/1/2023 | 231,925 | ||||||
IMS Health, Inc. | ||||||||
| 250,000 | 6.000%, 11/1/2020i | 257,500 | ||||||
JBS Finance II, Ltd. | ||||||||
| 227,936 | 8.250%, 1/29/2018* | 233,065 | ||||||
Kroger Company | ||||||||
| 10,000 | 1.200%, 10/17/2016 | 9,978 | ||||||
Lorillard Tobacco Company | ||||||||
| 84,000 | 8.125%, 6/23/2019 | 101,835 | ||||||
McKesson Corporation | ||||||||
| 113,000 | 1.292%, 3/10/2017 | 112,423 | ||||||
Medco Health Solutions, Inc. | ||||||||
| 50,000 | 7.125%, 3/15/2018 | 57,728 | ||||||
Medtronic, Inc. | ||||||||
| 96,000 | 2.500%, 3/15/2020i | 96,252 | ||||||
Mondelez International, Inc. | ||||||||
| 56,000 | 2.250%, 2/1/2019 | 55,770 | ||||||
Pernod Ricard SA | ||||||||
| 42,000 | 2.950%, 1/15/2017i | 42,972 | ||||||
| 80,000 | 5.750%, 4/7/2021i | 91,894 | ||||||
Perrigo Company, Ltd. | ||||||||
| 39,000 | 1.300%, 11/8/2016 | 38,829 | ||||||
Revlon Consumer Products Corporation | ||||||||
| 227,936 | 5.750%, 2/15/2021 | 227,936 | ||||||
SABMiller plc | ||||||||
| 78,000 | 6.500%, 7/15/2018i | 89,050 | ||||||
Safeway, Inc. | ||||||||
| 17,000 | 3.400%, 12/1/2016 | 17,270 | ||||||
Spectrum Brands Escrow Corporation | ||||||||
| 273,000 | 6.375%, 11/15/2020 | 284,602 | ||||||
Sysco Corporation | ||||||||
| 150,000 | 2.350%, 10/2/2019 | 150,817 | ||||||
Thermo Fisher Scientific, Inc. | ||||||||
| 80,000 | 2.400%, 2/1/2019 | 80,119 | ||||||
Tyson Foods, Inc. | ||||||||
| 106,000 | 2.650%, 8/15/2019 | 106,966 | ||||||
Valeant Pharmaceuticals International | ||||||||
| 227,936 | 7.250%, 7/15/2022i | 243,037 | ||||||
Whirlpool Corporation | ||||||||
| 96,000 | 1.650%, 11/1/2017 | 95,681 | ||||||
WM Wrigley Jr. Company | ||||||||
| 48,000 | 2.000%, 10/20/2017i | 48,346 | ||||||
|
| |||||||
Total | 5,400,263 | |||||||
|
| |||||||
| Energy (1.2%) | |||||||
Boardwalk Pipelines, Ltd. | ||||||||
| 79,000 | 5.875%, 11/15/2016 | 83,877 | ||||||
BP Capital Markets plc | ||||||||
| 68,000 | 0.652%, 11/7/2016f | 68,011 | ||||||
Buckeye Partners, LP | ||||||||
| 100,000 | 2.650%, 11/15/2018 | 98,494 | ||||||
Calumet Specialty Products Partners, LP | ||||||||
| 190,000 | 6.500%, 4/15/2021i | 169,100 | ||||||
Canadian Natural Resources, Ltd. | ||||||||
| 96,000 | 1.750%, 1/15/2018 | 95,435 | ||||||
CNOOC Nexen Finance 2014 ULC | ||||||||
| 62,000 | 1.625%, 4/30/2017 | 61,697 | ||||||
CNPC General Capital, Ltd. | ||||||||
| 90,000 | 2.750%, 4/19/2017i | 91,043 | ||||||
| 160,000 | 2.750%, 5/14/2019i | 158,915 | ||||||
Concho Resources, Inc. | ||||||||
| 277,936 | 6.500%, 1/15/2022 | 290,443 | ||||||
Continental Resources, Inc. | ||||||||
| 109,000 | 7.125%, 4/1/2021 | 117,175 | ||||||
Enbridge, Inc. | ||||||||
| 54,000 | 0.684%, 6/2/2017f | 53,767 | ||||||
Energy Transfer Partners, LP | ||||||||
| 88,000 | 6.700%, 7/1/2018 | 98,954 | ||||||
Enterprise Products Operating, LLC | ||||||||
| 150,000 | 2.550%, 10/15/2019 | 148,490 | ||||||
EQT Corporation | ||||||||
| 88,000 | 8.125%, 6/1/2019 | 106,091 | ||||||
Harvest Operations Corporation | ||||||||
| 227,936 | 6.875%, 10/1/2017 | 219,673 | ||||||
Hess Corporation | ||||||||
| 42,000 | 8.125%, 2/15/2019 | 49,971 | ||||||
The accompanying Notes to Financial Statements are an integral part of this schedule.
171
Table of Contents
BALANCED INCOME PLUS PORTFOLIO
Schedule of Investments as of December 31, 2014
| Principal Amount | Long-Term Fixed Income (25.8%) | Value | ||||||
| Energy (1.2%) - continued |
| ||||||
Kinder Morgan, Inc. | ||||||||
| $ | 48,000 | 3.050%, 12/1/2019 | $ | 47,618 | ||||
| 100,000 | 5.000%, 2/15/2021i | 104,035 | ||||||
Kodiak Oil & Gas Corporation | ||||||||
| 227,936 | 5.500%, 1/15/2021 | 228,506 | ||||||
Linn Energy, LLC | ||||||||
| 227,936 | 8.625%, 4/15/2020 | 198,304 | ||||||
MEG Energy Corporation | ||||||||
| 273,000 | 6.375%, 1/30/2023i | 243,653 | ||||||
Offshore Group Investment, Ltd. | ||||||||
| 325,000 | 7.500%, 11/1/2019 | 242,125 | ||||||
Petrobras Global Finance BV | ||||||||
| 68,000 | 2.000%, 5/20/2016 | 64,950 | ||||||
Petroleos Mexicanos | ||||||||
| 90,000 | 4.250%, 1/15/2025i | 89,415 | ||||||
Sabine Pass Liquefaction, LLC | ||||||||
| 190,000 | 5.750%, 5/15/2024 | 186,438 | ||||||
Southwestern Energy Company | ||||||||
| 100,000 | 7.500%, 2/1/2018 | 112,653 | ||||||
Suncor Energy, Inc. | ||||||||
| 56,000 | 6.100%, 6/1/2018 | 62,816 | ||||||
Transocean, Inc. | ||||||||
| 90,000 | 6.000%, 3/15/2018 | 86,567 | ||||||
Weatherford International, Ltd. | ||||||||
| 80,000 | 6.000%, 3/15/2018 | 85,401 | ||||||
| 48,000 | 9.625%, 3/1/2019 | 56,932 | ||||||
|
| |||||||
Total | 3,720,549 | |||||||
|
| |||||||
| Financials (4.7%) | |||||||
Abbey National Treasury Services plc | ||||||||
| 100,000 | 0.665%, 9/29/2017f | 99,751 | ||||||
| 80,000 | 3.050%, 8/23/2018 | 82,825 | ||||||
ABN AMRO Bank NV | ||||||||
| 78,000 | 2.500%, 10/30/2018i | 78,781 | ||||||
Air Lease Corporation | ||||||||
| 100,000 | 2.125%, 1/15/2018 | 98,250 | ||||||
Ally Financial, Inc. | ||||||||
| 325,000 | 4.750%, 9/10/2018 | 336,375 | ||||||
ANZ New Zealand International, Ltd. | ||||||||
| 81,000 | 1.400%, 4/27/2017i | 80,839 | ||||||
Aviation Capital Group Corporation | ||||||||
| 51,000 | 3.875%, 9/27/2016i | 52,284 | ||||||
Bank of America Corporation | ||||||||
| 120,000 | 5.700%, 5/2/2017 | 129,721 | ||||||
| 102,000 | 1.700%, 8/25/2017 | 102,023 | ||||||
| 135,000 | 5.750%, 12/1/2017 | 149,161 | ||||||
| 209,000 | 1.317%, 3/22/2018f | 210,527 | ||||||
| 80,000 | 5.650%, 5/1/2018 | 88,878 | ||||||
| 104,000 | 8.000%, 12/29/2049j | 111,670 | ||||||
Banque Federative du Credit Mutuel SA | ||||||||
| 78,000 | 1.081%, 1/20/2017f,i | 78,536 | ||||||
Barclays Bank plc | ||||||||
| 68,000 | 5.140%, 10/14/2020 | 73,133 | ||||||
Barclays plc | ||||||||
| 96,000 | 2.750%, 11/8/2019 | 95,413 | ||||||
BB&T Corporation | ||||||||
| 130,000 | 2.050%, 6/19/2018 | 130,857 | ||||||
BBVA Banco Continental SA | ||||||||
| 130,000 | 2.250%, 7/29/2016i | 129,675 | ||||||
BBVA International Preferred SA Unipersonal | ||||||||
| 640,000 | 5.919%, 12/29/2049j | 651,392 | ||||||
Bear Stearns Companies, LLC | ||||||||
| 122,000 | 6.400%, 10/2/2017 | 136,629 | ||||||
BNP Paribas SA | ||||||||
| 84,000 | 2.375%, 9/14/2017 | 85,437 | ||||||
BPCE SA | ||||||||
| 80,000 | 1.625%, 2/10/2017 | 80,166 | ||||||
| 320,000 | 5.150%, 7/21/2024i | 329,751 | ||||||
Branch Banking and Trust Company | ||||||||
| 69,000 | 0.664%, 12/1/2016f | 69,063 | ||||||
Caixa Economica Federal | ||||||||
| 205,000 | 4.250%, 5/13/2019i | 199,875 | ||||||
Capital One Financial Corporation | ||||||||
| 97,000 | 6.150%, 9/1/2016 | 104,240 | ||||||
CIT Group, Inc. | ||||||||
| 225,000 | 3.875%, 2/19/2019 | 224,437 | ||||||
Citigroup, Inc. | ||||||||
| 150,000 | 5.500%, 2/15/2017 | 161,248 | ||||||
| 8,000 | 6.000%, 8/15/2017 | 8,851 | ||||||
| 144,000 | 1.850%, 11/24/2017 | 143,835 | ||||||
| 63,000 | 8.500%, 5/22/2019 | 78,502 | ||||||
Compass Bank | ||||||||
| 97,000 | 1.850%, 9/29/2017 | 96,586 | ||||||
Cooperatieve Centrale Raiffeisen-Boerenleenbank BA | ||||||||
| 120,000 | 4.625%, 12/1/2023 | 127,286 | ||||||
Credit Agricole SA | ||||||||
| 100,000 | 6.625%, 9/29/2049i,j | 96,925 | ||||||
Credit Suisse Group AG | ||||||||
| 320,000 | 7.500%, 12/11/2049i,j | 332,800 | ||||||
CyrusOne, LP | ||||||||
| 227,936 | 6.375%, 11/15/2022 | 243,322 | ||||||
DDR Corporation | ||||||||
| 56,000 | 9.625%, 3/15/2016 | 61,474 | ||||||
Denali Borrower, LLC | ||||||||
| 425,000 | 5.625%, 10/15/2020i | 442,212 | ||||||
Deutsche Bank AG | ||||||||
| 109,000 | 1.350%, 5/30/2017 | 108,082 | ||||||
Discover Bank | ||||||||
| 28,000 | 8.700%, 11/18/2019 | 34,626 | ||||||
Discover Financial Services | ||||||||
| 47,000 | 6.450%, 6/12/2017 | 51,930 | ||||||
Duke Realty, LP | ||||||||
| 96,000 | 8.250%, 8/15/2019 | 118,435 | ||||||
Fifth Third Bancorp | ||||||||
| 167,000 | 5.450%, 1/15/2017 | 179,210 | ||||||
General Electric Capital Corporation | ||||||||
| 95,000 | 5.625%, 9/15/2017 | 105,455 | ||||||
| 57,000 | 1.625%, 4/2/2018 | 57,087 | ||||||
Genworth Financial, Inc. | ||||||||
| 92,000 | 7.700%, 6/15/2020 | 91,767 | ||||||
Goldman Sachs Group, Inc. | ||||||||
| 80,000 | 6.250%, 9/1/2017 | 89,012 | ||||||
| 100,000 | 2.375%, 1/22/2018 | 101,010 | ||||||
| 52,000 | 2.625%, 1/31/2019 | 52,317 | ||||||
| 78,000 | 7.500%, 2/15/2019 | 92,778 | ||||||
| 100,000 | 2.550%, 10/23/2019 | 99,635 | ||||||
The accompanying Notes to Financial Statements are an integral part of this schedule.
172
Table of Contents
BALANCED INCOME PLUS PORTFOLIO
Schedule of Investments as of December 31, 2014
| Principal Amount | Long-Term Fixed Income (25.8%) | Value | ||||||
| Financials (4.7%) - continued |
| ||||||
Hartford Financial Services Group, Inc. | ||||||||
| $120,000 | 6.000%, 1/15/2019 | $ | 136,092 | |||||
HBOS plc | ||||||||
| 104,000 | 6.750%, 5/21/2018i | 115,908 | ||||||
HCP, Inc. | ||||||||
| 66,000 | 3.750%, 2/1/2016 | 67,831 | ||||||
| 88,000 | 3.750%, 2/1/2019 | 92,361 | ||||||
Health Care REIT, Inc. | ||||||||
| 88,000 | 4.700%, 9/15/2017 | 94,551 | ||||||
HSBC Holdings plc | ||||||||
| 150,000 | 5.625%, 12/29/2049j | 150,525 | ||||||
Huntington National Bank | ||||||||
| 73,000 | 1.300%, 11/20/2016 | 72,699 | ||||||
Icahn Enterprises, LP | ||||||||
| 300,000 | 6.000%, 8/1/2020 | 309,060 | ||||||
ING Bank NV | ||||||||
| 320,000 | 5.800%, 9/25/2023i | 354,969 | ||||||
ING Capital Funding Trust III | ||||||||
| 68,000 | 3.855%, 12/29/2049f,j | 67,830 | ||||||
International Lease Finance Corporation | ||||||||
| 80,000 | 2.191%, 6/15/2016f | 79,900 | ||||||
| 250,000 | 5.875%, 8/15/2022 | 271,250 | ||||||
Intesa Sanpaolo SPA | ||||||||
| 63,000 | 3.625%, 8/12/2015i | 63,851 | ||||||
| 30,000 | 3.875%, 1/16/2018 | 31,235 | ||||||
| 132,000 | 3.875%, 1/15/2019 | 136,672 | ||||||
J.P. Morgan Chase & Company | ||||||||
| 101,000 | 3.450%, 3/1/2016 | 103,667 | ||||||
| 53,000 | 0.752%, 2/15/2017f | 52,866 | ||||||
| 53,000 | 2.000%, 8/15/2017 | 53,504 | ||||||
| 52,000 | 6.300%, 4/23/2019 | 60,402 | ||||||
| 104,000 | 7.900%, 4/29/2049j | 111,935 | ||||||
| 325,000 | 6.750%, 8/29/2049j | 342,875 | ||||||
KeyCorp | ||||||||
| 68,000 | 2.300%, 12/13/2018 | 68,235 | ||||||
Liberty Mutual Group, Inc. | ||||||||
| 35,000 | 5.000%, 6/1/2021i | 38,126 | ||||||
Liberty Property, LP | ||||||||
| 134,000 | 5.500%, 12/15/2016 | 143,874 | ||||||
Macquarie Bank, Ltd. | ||||||||
| 57,000 | 5.000%, 2/22/2017i | 60,796 | ||||||
MetLife, Inc. | ||||||||
| 100,000 | 1.903%, 12/15/2017 | 100,228 | ||||||
Mizuho Corporate Bank, Ltd. | ||||||||
| 59,000 | 1.550%, 10/17/2017i | 58,441 | ||||||
Morgan Stanley | ||||||||
| 106,000 | 1.750%, 2/25/2016 | 106,575 | ||||||
| 165,000 | 6.250%, 8/28/2017 | 183,293 | ||||||
| 96,000 | 1.875%, 1/5/2018 | 95,649 | ||||||
| 106,000 | 6.625%, 4/1/2018 | 120,738 | ||||||
| 75,000 | 4.875%, 11/1/2022 | 79,656 | ||||||
Murray Street Investment Trust I | ||||||||
| 173,000 | 4.647%, 3/9/2017 | 182,584 | ||||||
National City Corporation | ||||||||
| 56,000 | 6.875%, 5/15/2019 | 65,786 | ||||||
Nomura Holdings, Inc. | ||||||||
| 58,000 | 2.000%, 9/13/2016 | 58,468 | ||||||
| 56,000 | 2.750%, 3/19/2019 | 56,613 | ||||||
Oversea-Chinese Banking Corporation, Ltd. | ||||||||
| 165,000 | 4.250%, 6/19/2024i | 168,843 | ||||||
PNC Bank NA | ||||||||
| 64,000 | 1.150%, 11/1/2016 | 64,085 | ||||||
Preferred Term Securities XXIII, Ltd. | ||||||||
| 772,387 | 0.441%, 12/22/2036*,f | 587,014 | ||||||
Pricoa Global Funding I | ||||||||
| 106,000 | 1.350%, 8/18/2017i | 105,564 | ||||||
Realty Income Corporation | ||||||||
| 95,000 | 2.000%, 1/31/2018 | 95,175 | ||||||
Regions Bank | ||||||||
| 104,000 | 7.500%, 5/15/2018 | 120,733 | ||||||
Reinsurance Group of America, Inc. | ||||||||
| 104,000 | 5.625%, 3/15/2017 | 112,465 | ||||||
Royal Bank of Scotland Group plc | ||||||||
| 68,000 | 5.050%, 1/8/2015 | 68,014 | ||||||
| 60,000 | 1.197%, 3/31/2017f | 60,185 | ||||||
| 320,000 | 7.640%, 3/29/2049j | 336,000 | ||||||
| 320,000 | 7.648%, 8/29/2049j | 372,800 | ||||||
Societe Generale SA | ||||||||
| 70,000 | 5.750%, 4/20/2016i | 73,297 | ||||||
State Bank of India | ||||||||
| 170,000 | 3.622%, 4/17/2019i | 172,393 | ||||||
Sumitomo Mitsui Banking Corporation | ||||||||
| 156,000 | 1.300%, 1/10/2017 | 155,704 | ||||||
Suncorp-Metway, Ltd. | ||||||||
| 41,000 | 0.955%, 3/28/2017f,i | 41,061 | ||||||
Swiss RE Capital I, LP | ||||||||
| 80,000 | 6.854%, 5/29/2049i,j | 83,800 | ||||||
Synchrony Financial | ||||||||
| 159,000 | 1.875%, 8/15/2017 | 159,309 | ||||||
Ventas Realty, LP | ||||||||
| 56,000 | 1.250%, 4/17/2017 | 55,478 | ||||||
Voya Financial, Inc. | ||||||||
| 84,000 | 2.900%, 2/15/2018 | 85,995 | ||||||
Washington Mutual Bank | ||||||||
| 500,000 | 5.500%, 1/15/2013k,l | 0 | ||||||
WEA Finance, LLC | ||||||||
| 100,000 | 1.750%, 9/15/2017i | 99,462 | ||||||
|
| |||||||
Total | 14,190,496 | |||||||
|
| |||||||
| Foreign Government (0.5%) | |||||||
Brazil Government International Bond | ||||||||
| 160,000 | 5.000%, 1/27/2045 | 156,800 | ||||||
Colombia Government International Bond | ||||||||
| 105,000 | 2.625%, 3/15/2023 | 97,493 | ||||||
| 150,000 | 4.000%, 2/26/2024 | 153,375 | ||||||
Costa Rica Government International Bond | ||||||||
| 170,000 | 7.000%, 4/4/2044i | 166,600 | ||||||
Hungary Government International Bond | ||||||||
| 240,000 | 4.000%, 3/25/2019 | 246,600 | ||||||
Mexico Government International Bond | ||||||||
| 300,000 | 3.600%, 1/30/2025 | 298,950 | ||||||
The accompanying Notes to Financial Statements are an integral part of this schedule.
173
Table of Contents
BALANCED INCOME PLUS PORTFOLIO
Schedule of Investments as of December 31, 2014
| Principal Amount | Long-Term Fixed Income (25.8%) | Value | ||||||
| Foreign Government (0.5%) - continued |
| ||||||
Poland Government International Bond | ||||||||
| $ | 119,000 | 4.000%, 1/22/2024 | $ | 126,289 | ||||
Slovenia Government International Bond | ||||||||
| 195,000 | 4.125%, 2/18/2019i | 204,266 | ||||||
South Africa Government International Bond | ||||||||
| 160,000 | 5.375%, 7/24/2044 | 169,000 | ||||||
Uruguay Government International Bond | ||||||||
| 130,000 | 5.100%, 6/18/2050 | 131,950 | ||||||
|
| |||||||
Total | 1,751,323 | |||||||
|
| |||||||
| Mortgage-Backed Securities (5.3%) | |||||||
Federal Home Loan Mortgage Corporation Gold 15-Yr. Pass Through | ||||||||
| 80,860 | 5.500%, 12/1/2017 | 85,524 | ||||||
| 630,000 | 3.000%, 1/1/2030c | 653,886 | ||||||
Federal Home Loan Mortgage Corporation Gold 30-Yr. Pass Through | ||||||||
| 13,205 | 9.000%, 11/1/2024 | 14,744 | ||||||
| 892 | 9.000%, 4/1/2025 | 1,056 | ||||||
| 745 | 8.500%, 9/1/2025 | 783 | ||||||
| 15,657 | 8.000%, 3/1/2027 | 15,802 | ||||||
| 5,407 | 8.000%, 6/1/2027 | 6,629 | ||||||
| 1,336 | 8.500%, 7/1/2027 | 1,543 | ||||||
| 3,770 | 8.000%, 10/1/2027 | 4,403 | ||||||
| 2,471 | 8.000%, 8/1/2030 | 2,765 | ||||||
| 680,000 | 4.000%, 1/1/2045c | 724,838 | ||||||
Federal National Mortgage Association Conventional 15-Yr. Pass Through | ||||||||
| 62 | 7.500%, 4/1/2015 | 62 | ||||||
| 1,250,000 | 3.500%, 1/1/2030c | 1,320,508 | ||||||
Federal National Mortgage Association Conventional 30-Yr. Pass Through | ||||||||
| 1,638 | 10.500%, 8/1/2020 | 1,823 | ||||||
| 4,285 | 9.500%, 4/1/2025 | 4,306 | ||||||
| 896 | 8.500%, 11/1/2025 | 1,010 | ||||||
| 1,278 | 8.500%, 5/1/2026 | 1,339 | ||||||
| 1,223 | 8.000%, 8/1/2026 | 1,322 | ||||||
| 967 | 8.000%, 11/1/2026 | 1,177 | ||||||
| 14,261 | 8.000%, 9/1/2027 | 16,794 | ||||||
| 3,403 | 8.000%, 12/1/2027 | 3,453 | ||||||
| 6,306 | 8.500%, 4/1/2030 | 7,819 | ||||||
| 4,525,000 | 3.500%, 1/1/2045c | 4,716,960 | ||||||
| 3,775,000 | 4.000%, 1/1/2045c | 4,028,883 | ||||||
| 3,625,000 | 4.500%, 1/1/2045c | 3,934,824 | ||||||
Government National Mortgage Association 30-Yr. Pass Through | ||||||||
| 2,064 | 9.500%, 1/15/2025 | 2,365 | ||||||
| 7,242 | 7.000%, 1/15/2026 | 8,280 | ||||||
| 6,864 | 7.000%, 1/15/2026 | 7,643 | ||||||
| 6,958 | 6.000%, 5/15/2026 | 7,863 | ||||||
| 6,717 | 7.000%, 6/15/2026 | 7,466 | ||||||
| 5,584 | 8.500%, 6/15/2026 | 5,682 | ||||||
| 2,031 | 8.500%, 7/15/2026 | 2,329 | ||||||
| 6,826 | 8.000%, 9/15/2026 | 7,921 | ||||||
| 2,878 | 7.500%, 10/15/2026 | 3,200 | ||||||
| 778 | 8.000%, 11/15/2026 | 781 | ||||||
| 330 | 8.500%, 11/15/2026 | 331 | ||||||
| 1,360 | 9.000%, 12/15/2026 | 1,675 | ||||||
| 10,860 | 7.500%, 4/15/2027 | 12,275 | ||||||
| 2,955 | 8.000%, 6/20/2027 | 3,394 | ||||||
| 257 | 8.000%, 8/15/2027 | 258 | ||||||
| 24,953 | 6.500%, 10/15/2027 | 28,474 | ||||||
| 9,154 | 7.000%, 10/15/2027 | 10,769 | ||||||
| 888 | 7.000%, 11/15/2027 | 891 | ||||||
| 19,738 | 7.000%, 11/15/2027 | 20,337 | ||||||
| 48,042 | 7.000%, 7/15/2028 | 53,399 | ||||||
| 14,251 | 7.500%, 7/15/2028 | 14,893 | ||||||
| 19,976 | 6.500%, 9/15/2028 | 22,795 | ||||||
| 26,436 | 6.000%, 12/15/2028 | 30,035 | ||||||
| 18,007 | 6.500%, 1/15/2029 | 20,643 | ||||||
| 105,101 | 6.500%, 3/15/2029 | 119,930 | ||||||
| 18,742 | 6.500%, 4/15/2029 | 21,386 | ||||||
| 10,652 | 7.000%, 4/15/2029 | 11,401 | ||||||
| 32,412 | 6.000%, 6/15/2029 | 37,184 | ||||||
| 17,817 | 7.000%, 6/15/2029 | 20,059 | ||||||
| 9,537 | 8.000%, 5/15/2030 | 9,699 | ||||||
| 16,646 | 7.000%, 9/15/2031 | 19,426 | ||||||
| 17,797 | 6.500%, 2/15/2032 | 20,402 | ||||||
|
| |||||||
Total | 16,085,439 | |||||||
|
| |||||||
| Technology (0.6%) | |||||||
Alibaba Group Holding, Ltd. | ||||||||
| 86,000 | 2.500%, 11/28/2019i | 84,840 | ||||||
Alliance Data Systems Corporation | ||||||||
| 195,000 | 5.375%, 8/1/2022i | 192,563 | ||||||
EMC Corporation | ||||||||
| 56,000 | 1.875%, 6/1/2018 | 55,810 | ||||||
Fidelity National Information Services, Inc. | ||||||||
| 109,000 | 1.450%, 6/5/2017 | 108,389 | ||||||
First Data Corporation | ||||||||
| 227,936 | 7.375%, 6/15/2019i | 239,903 | ||||||
Freescale Semiconductor, Inc. | ||||||||
| 245,000 | 6.000%, 1/15/2022i | 256,025 | ||||||
Hewlett-Packard Company | ||||||||
| 90,000 | 5.400%, 3/1/2017 | 97,155 | ||||||
Iron Mountain, Inc. | ||||||||
| 227,936 | 6.000%, 8/15/2023 | 237,053 | ||||||
Sensata Technologies BV | ||||||||
| 280,000 | 4.875%, 10/15/2023i | 278,600 | ||||||
Tyco Electronics Group SA | ||||||||
| 130,000 | 6.550%, 10/1/2017 | 146,332 | ||||||
Xerox Corporation | ||||||||
| 130,000 | 7.200%, 4/1/2016 | 139,201 | ||||||
|
| |||||||
Total | 1,835,871 | |||||||
|
| |||||||
| Transportation (0.3%) | |||||||
American Airlines Pass Through Trust | ||||||||
| 52,862 | 4.950%, 1/15/2023 | 56,430 | ||||||
Avis Budget Car Rental, LLC | ||||||||
| 130,000 | 5.125%, 6/1/2022i | 131,300 | ||||||
Continental Airlines, Inc. | ||||||||
| 193,283 | 6.250%, 4/11/2020 | 203,067 | ||||||
Delta Air Lines, Inc. | ||||||||
| 107,000 | 6.750%, 5/23/2017 | 111,548 | ||||||
| 89,532 | 4.950%, 5/23/2019 | 95,799 | ||||||
| 76,105 | 4.750%, 5/7/2020 | 80,961 | ||||||
The accompanying Notes to Financial Statements are an integral part of this schedule.
174
Table of Contents
BALANCED INCOME PLUS PORTFOLIO
Schedule of Investments as of December 31, 2014
| Principal Amount | Long-Term Fixed Income (25.8%) | Value | ||||||
| Transportation (0.3%) - continued |
| ||||||
Korea Expressway Corporation | ||||||||
| $ | 93,000 | 1.625%, 4/28/2017i | $ | 92,480 | ||||
Southwest Airlines Company | ||||||||
| 96,000 | 2.750%, 11/6/2019 | 96,442 | ||||||
United Air Lines, Inc. | ||||||||
| 54,235 | 10.400%, 11/1/2016 | 60,336 | ||||||
|
| |||||||
Total | 928,363 | |||||||
|
| |||||||
| U.S. Government and Agencies (<0.1%) | |||||||
U.S. Treasury Notes | ||||||||
| 95,000 | 3.625%, 2/15/2044 | 111,796 | ||||||
|
| |||||||
Total | 111,796 | |||||||
|
| |||||||
| Utilities (1.4%) | |||||||
Access Midstream Partners, LP | ||||||||
| 325,000 | 4.875%, 5/15/2023 | 329,875 | ||||||
AES Corporation | ||||||||
| 227,936 | 7.375%, 7/1/2021 | 257,568 | ||||||
Atlas Pipeline Partners, LP | ||||||||
| 273,000 | 4.750%, 11/15/2021 | 259,350 | ||||||
Berkshire Hathaway Energy Company | ||||||||
| 96,000 | 2.400%, 2/1/2020i | 95,582 | ||||||
Calpine Corporation | ||||||||
| 210,000 | 5.375%, 1/15/2023 | 212,100 | ||||||
Commonwealth Edison Company | ||||||||
| 60,000 | 6.950%, 7/15/2018 | 69,353 | ||||||
DCP Midstream Operating, LP | ||||||||
| 86,000 | 2.500%, 12/1/2017 | 85,901 | ||||||
DTE Energy Company | ||||||||
| 96,000 | 2.400%, 12/1/2019 | 96,016 | ||||||
Dynegy Finance I, Inc. | ||||||||
| 160,000 | 7.375%, 11/1/2022i | 162,800 | ||||||
EDP Finance BV | ||||||||
| 96,000 | 4.125%, 1/15/2020i | 96,538 | ||||||
El Paso Corporation | ||||||||
| 50,000 | 7.000%, 6/15/2017 | 55,125 | ||||||
Electricite de France SA | ||||||||
| 76,000 | 0.691%, 1/20/2017f,i | 76,207 | ||||||
| 320,000 | 5.625%, 12/29/2049i,j | 337,200 | ||||||
Enel Finance International NV | ||||||||
| 80,000 | 5.125%, 10/7/2019i | 88,396 | ||||||
Exelon Generation Company, LLC | ||||||||
| 52,000 | 5.200%, 10/1/2019 | 57,461 | ||||||
MarkWest Energy Partners, LP | ||||||||
| 300,000 | 4.875%, 12/1/2024 | 293,250 | ||||||
MidAmerican Energy Holdings Company | ||||||||
| 116,000 | 1.100%, 5/15/2017 | 114,816 | ||||||
| 42,000 | 5.750%, 4/1/2018 | 47,067 | ||||||
NiSource Finance Corporation | ||||||||
| 102,000 | 6.400%, 3/15/2018 | 116,171 | ||||||
NRG Energy, Inc. | ||||||||
| 227,936 | 6.625%, 3/15/2023 | 237,053 | ||||||
Oleoducto Central SA | ||||||||
| 160,000 | 4.000%, 5/7/2021i | 152,800 | ||||||
ONEOK Partners, LP | ||||||||
| 88,000 | 2.000%, 10/1/2017 | 87,509 | ||||||
Pacific Gas & Electric Company | ||||||||
| 65,000 | 5.625%, 11/30/2017 | 72,245 | ||||||
Panhandle Eastern Pipe Line Company, LP | ||||||||
| 78,000 | 6.200%, 11/1/2017 | 86,688 | ||||||
PG&E Corporation | ||||||||
| 57,000 | 2.400%, 3/1/2019 | 57,086 | ||||||
PPL Capital Funding, Inc. | ||||||||
| 104,000 | 1.900%, 6/1/2018 | 103,823 | ||||||
Sempra Energy | ||||||||
| 100,000 | 6.150%, 6/15/2018 | 113,331 | ||||||
Southern Company | ||||||||
| 102,000 | 1.300%, 8/15/2017 | 101,581 | ||||||
TransAlta Corporation | ||||||||
| 109,000 | 1.900%, 6/3/2017 | 108,538 | ||||||
Transelec SA | ||||||||
| 160,000 | 4.250%, 1/14/2025i | 159,298 | ||||||
Williams Companies, Inc. | 122,449 | |||||||
| 106,000 | 7.875%, 9/1/2021 | |||||||
|
| |||||||
Total | 4,253,177 | |||||||
|
| |||||||
Total Long-Term Fixed Income (cost $78,894,476) | 78,415,112 | |||||||
|
| |||||||
| Shares | Preferred Stock (1.9%) | |||||||
| Financials (1.6%) | |||||||
| 16,000 | Affiliated Managers Group, Inc., 5.250% | 413,920 | ||||||
| 4,800 | Agribank FCB, 6.875%j | 504,450 | ||||||
| 288 | Bank of America Corporation, Convertible, 7.250%j | 334,936 | ||||||
| 25,915 | Citigroup, Inc., 6.875%j | 688,821 | ||||||
| 6,250 | Farm Credit Bank of Texas, 6.750%i,j | 646,680 | ||||||
| 13,000 | Goldman Sachs Group, Inc., 5.500%j | 317,200 | ||||||
| 17,350 | HSBC USA, Inc., 6.500%j | 438,608 | ||||||
| 520 | M&T Bank Corporation, 6.375%j | 537,225 | ||||||
| 12,800 | Morgan Stanley, 7.125%j | 352,384 | ||||||
| 8,640 | U.S. Bancorp 6.500%j | 254,448 | ||||||
| 320 | Wells Fargo & Company, Convertible, 7.500%j | 385,920 | ||||||
|
| |||||||
Total | 4,874,592 | |||||||
|
| |||||||
| Materials (0.1%) | |||||||
| 12,800 | CHS, Inc., 7.100%j | 336,128 | ||||||
|
| |||||||
Total | 336,128 | |||||||
|
| |||||||
| Utilities (0.2%) | |||||||
| 4,800 | Southern California Edison Company, 4.510%j | 482,250 | ||||||
|
| |||||||
Total | 482,250 | |||||||
|
| |||||||
Total Preferred Stock (cost $5,503,411) | 5,692,970 | |||||||
|
| |||||||
Collateral Held for Securities Loaned (2.2%) | ||||||||
| 6,533,365 | Thrivent Cash Management Trust | 6,533,365 | ||||||
|
| |||||||
Total Collateral Held for Securities Loaned (cost $6,533,365) | 6,533,365 | |||||||
|
| |||||||
The accompanying Notes to Financial Statements are an integral part of this schedule.
175
Table of Contents
BALANCED INCOME PLUS PORTFOLIO
Schedule of Investments as of December 31, 2014
| Shares or Principal Amount | Short-Term Investments (9.4%)m | Value | ||||||
Federal Home Loan Bank Discount Notes | ||||||||
| 100,000 | 0.106%, 3/6/2015n | $ | 99,981 | |||||
| 200,000 | 0.150%, 4/24/2015n | 199,906 | ||||||
Federal Home Loan Mortgage Corporation Discount Notes | ||||||||
| 100,000 | 0.080%, 3/6/2015n | 99,986 | ||||||
Thrivent Cash Management Trust | ||||||||
| 28,196,804 | 0.060% | 28,196,804 | ||||||
|
| |||||||
Total Short-Term Investments (at amortized cost) | 28,596,677 | |||||||
|
| |||||||
Total Investments (cost $306,276,537) 107.3% | $ | 325,098,197 | ||||||
|
| |||||||
Other Assets and Liabilities, Net (7.3%) | (22,059,710 | ) | ||||||
|
| |||||||
Total Net Assets 100.0% | $ | 303,038,487 | ||||||
|
| |||||||
| a | The stated interest rate represents the weighted average of all contracts within the bank loan facility. |
| b | All or a portion of the loan is unfunded. |
| c | Denotes investments purchased on a when-issued or delayed delivery basis. |
| d | Non-income producing security. |
| e | All or a portion of the security is on loan. |
| f | Denotes variable rate securities. Variable rate securities are securities whose yields vary with a designated market index or market rate. The rate shown is as of December 31, 2014. |
| g | Denotes step coupon securities. Step coupon securities pay an initial coupon rate for the first period and then different coupon rates for following periods. The rate shown is as of December 31, 2014. |
| h | All or a portion of the security is insured or guaranteed. |
| i | Denotes securities sold under Rule 144A of the Securities Act of 1933, which exempts them from registration. These securities have been deemed liquid and may be resold to other dealers in the program or to other qualified institutional buyers. As of December 31, 2014, the value of these investments was $14,672,742 or 4.8% of total net assets. |
| j | Denotes perpetual securities. Perpetual securities pay an indefinite stream of interest, but may be called by the issuer at an earlier date. |
| k | Defaulted security. Interest is not being accrued. |
| l | Security is valued at fair value. Market quotations or prices were not readily available or were determined to be unreliable. Fair value was determined in good faith pursuant to procedures adopted by the Board. Further information on fair valuation can be found in section (2)(A) of the Notes to Financial Statements. |
| m | The interest rate shown reflects the yield, coupon rate or the discount rate at the date of purchase. |
| n | At December 31, 2014, $399,873 of investments were held on deposit with the counterparty and pledged as the initial margin deposit for open futures contracts. |
| * | Denotes restricted securities. Restricted securities are investment securities which have been deemed illiquid and cannot be offered for public sale without first being registered under the Securities Act of 1933. The following table indicates the acquisition date and cost of restricted securities Balanced Income Plus Portfolio owned as of December 31, 2014. |
Security | Acquisition Date | Cost | ||||||
Bayview Opportunity Master Fund Trust IIB, LP, 7/28/2034 | 11/12/2014 | $ | 407,887 | |||||
Bayview Opportunity Master Fund Trust IIB, LP, 1/28/2034 | 1/17/2014 | 388,303 | ||||||
JBS Finance II, Ltd., 1/29/2018 | 8/19/2013 | 237,363 | ||||||
Preferred Term Securities XXIII, Ltd., 12/22/2036 | 9/14/2006 | 772,387 | ||||||
Wachovia Asset Securitization, Inc., 7/25/2037 | 3/16/2007 | 596,716 | ||||||
Definitions:
ADR | - | American Depositary Receipt, which are certificates for an underlying foreign security’s shares held by an issuing U.S. depository bank. | ||
ETF | - | Exchange Traded Fund. | ||
REIT | - | Real Estate Investment Trust is a company that | ||
| buys, develops, manages and/or sells real estate | ||||
| assets. |
Unrealized Appreciation (Depreciation)
Gross unrealized appreciation and depreciation of investments, based on cost for federal income tax purposes, were as follows:
Gross unrealized appreciation | $ | 23,816,345 | ||
Gross unrealized depreciation | (5,555,906 | ) | ||
|
| |||
Net unrealized appreciation (depreciation) | $ | 18,260,439 | ||
Cost for federal income tax purposes | $ | 306,837,758 | ||
The accompanying Notes to Financial Statements are an integral part of this schedule.
176
Table of Contents
BALANCED INCOME PLUS PORTFOLIO
Schedule of Investments as of December 31, 2014
Fair Valuation Measurements
The following table is a summary of the inputs used, as of December 31, 2014, in valuing Balanced Income Plus Portfolio’s assets carried at fair value.
Investments in Securities | Total | Level 1 | Level 2 | Level 3 | ||||||||||||
Bank Loans | ||||||||||||||||
Basic Materials | 3,893,434 | — | 3,893,434 | — | ||||||||||||
Capital Goods | 2,377,291 | — | 2,377,291 | — | ||||||||||||
Communications Services | 18,504,057 | — | 16,243,559 | 2,260,498 | ||||||||||||
Consumer Cyclical | 7,869,763 | — | 7,869,763 | — | ||||||||||||
Consumer Non-Cyclical | 7,565,007 | — | 6,290,057 | 1,274,950 | ||||||||||||
Energy | 2,946,867 | — | 2,519,831 | 427,036 | ||||||||||||
Financials | 3,357,613 | — | 3,357,613 | — | ||||||||||||
Technology | 3,526,773 | — | 3,526,773 | — | ||||||||||||
Transportation | 1,978,600 | — | 1,717,338 | 261,262 | ||||||||||||
Utilities | 1,222,612 | — | 1,222,612 | — | ||||||||||||
Common Stock | ||||||||||||||||
Consumer Discretionary | 21,710,865 | 21,710,865 | — | — | ||||||||||||
Consumer Staples | 13,767,256 | 13,767,256 | — | — | ||||||||||||
Energy | 9,876,264 | 9,876,264 | — | — | ||||||||||||
Financials | 43,990,303 | 43,990,303 | — | — | ||||||||||||
Health Care | 17,469,021 | 17,469,021 | — | — | ||||||||||||
Industrials | 14,223,079 | 14,223,079 | — | — | ||||||||||||
Information Technology | 22,635,401 | 22,635,401 | — | — | ||||||||||||
Materials | 4,544,069 | 4,544,069 | — | — | ||||||||||||
Utilities | 4,401,798 | 4,401,798 | — | — | ||||||||||||
Long-Term Fixed Income | ||||||||||||||||
Asset-Backed Securities | 3,625,970 | — | 3,625,970 | — | ||||||||||||
Basic Materials | 2,492,065 | — | 2,492,065 | — | ||||||||||||
Capital Goods | 2,453,263 | — | 2,453,263 | — | ||||||||||||
Collateralized Mortgage Obligations | 11,576,483 | — | 11,576,483 | — | ||||||||||||
Communications Services | 5,875,085 | — | 5,875,085 | — | ||||||||||||
Consumer Cyclical | 4,114,969 | — | 4,114,969 | — | ||||||||||||
Consumer Non-Cyclical | 5,400,263 | — | 5,400,263 | — | ||||||||||||
Energy | 3,720,549 | — | 3,720,549 | — | ||||||||||||
Financials^ | 14,190,496 | — | 13,603,482 | 587,014 | ||||||||||||
Foreign Government | 1,751,323 | — | 1,751,323 | — | ||||||||||||
Mortgage-Backed Securities | 16,085,439 | — | 16,085,439 | — | ||||||||||||
Technology | 1,835,871 | — | 1,835,871 | — | ||||||||||||
Transportation | 928,363 | — | 928,363 | — | ||||||||||||
U.S. Government and Agencies | 111,796 | — | 111,796 | — | ||||||||||||
Utilities | 4,253,177 | — | 4,253,177 | — | ||||||||||||
Preferred Stock | ||||||||||||||||
Financials | 4,874,592 | 3,723,462 | 1,151,130 | — | ||||||||||||
Materials | 336,128 | 336,128 | — | — | ||||||||||||
Utilities | 482,250 | — | 482,250 | — | ||||||||||||
Collateral Held for Securities Loaned | 6,533,365 | 6,533,365 | — | — | ||||||||||||
Short-Term Investments | 28,596,677 | 28,196,804 | 399,873 | — | ||||||||||||
|
|
|
|
|
|
|
| |||||||||
Total | $ | 325,098,197 | $ | 191,407,815 | $ | 128,879,622 | $ | 4,810,760 | ||||||||
|
|
|
|
|
|
|
| |||||||||
Other Financial Instruments | Total | Level 1 | Level 2 | Level 3 | ||||||||||||
Asset Derivatives | ||||||||||||||||
Futures Contracts | 324,015 | 324,015 | — | — | ||||||||||||
|
|
|
|
|
|
|
| |||||||||
Total Asset Derivatives | $ | 324,015 | $ | 324,015 | $ | — | $ | — | ||||||||
|
|
|
|
|
|
|
| |||||||||
There were no significant transfers between Levels during the period ended December 31, 2014. Transfers between Levels are identified as of the end of the period.
The accompanying Notes to Financial Statements are an integral part of this schedule.
177
Table of Contents
BALANCED INCOME PLUS PORTFOLIO
Schedule of Investments as of December 31, 2014
Futures Contracts | Number of Contracts Long/(Short) | Expiration Date | Notional Principal Amount | Value | Unrealized Gain/(Loss) | |||||||||||||||
2-Yr. U.S. Treasury Bond Futures | (220 | ) | March 2015 | ($ | 48,144,954 | ) | ($ | 48,090,625 | ) | $ | 54,329 | |||||||||
5-Yr. U.S. Treasury Bond Futures | 75 | March 2015 | 8,911,166 | 8,919,727 | 8,561 | |||||||||||||||
30-Yr. U.S. Treasury Bond Futures | 5 | March 2015 | 702,867 | 722,813 | 19,946 | |||||||||||||||
S&P 500 Index Futures | 6 | March 2015 | 2,974,897 | 3,078,600 | 103,703 | |||||||||||||||
Ultra Long Term U.S. Treasury Bond Futures | 18 | March 2015 | 2,835,899 | 2,973,375 | 137,476 | |||||||||||||||
Total Futures Contracts | $ | 324,015 | ||||||||||||||||||
The following table summarizes the fair value and Statement of Assets and Liabilities location, as of December 31, 2014, for Balanced Income Plus Portfolio’s investments in financial derivative instruments by primary risk exposure as discussed under item (2) Significant Accounting Policies of the Notes to Financial Statements.
Derivatives by risk category | Statement of Assets and Liabilities Location | Fair Value | ||||
Asset Derivatives | ||||||
Interest Rate Contracts | ||||||
Futures* | Net Assets - Net unrealized appreciation/(depreciation) on Futures contracts | $ | 220,312 | |||
Total Interest Rate Contracts | 220,312 | |||||
Equity Contracts | ||||||
Futures* | Net Assets - Net unrealized appreciation/(depreciation) on Futures contracts | 103,703 | ||||
Total Equity Contracts | 103,703 | |||||
|
| |||||
Total Asset Derivatives | $ | 324,015 | ||||
|
| |||||
| * | Includes cumulative appreciation/depreciation of futures contracts as reported in the Schedule of Investments. Only current day’s variation margin is reported within the Statement of Assets and Liabilities. |
The following table summarizes the net realized gains/(losses) and Statement of Operations location, for the period ended December 31, 2014, for Balanced Income Plus Portfolio’s investments in financial derivative instruments by primary risk exposure.
Derivatives by risk category | Statement of Operations Location | Realized Gains/(Losses) recognized in Income | ||||
Equity Contracts | ||||||
Futures | Net realized gains/(losses) on Futures contracts | 433,800 | ||||
Total Equity Contracts | 433,800 | |||||
Interest Rate Contracts | ||||||
Futures | Net realized gains/(losses) on Futures contracts | 228,169 | ||||
Total Interest Rate Contracts | 228,169 | |||||
|
| |||||
Total | $ | 661,969 | ||||
|
| |||||
The following table summarizes the change in net unrealized appreciation/(depreciation) and Statement of Operations location, for the period ended December 31, 2014, for Balanced Income Plus Portfolio’s investments in financial derivative instruments by primary risk exposure.
Derivatives by risk category | Statement of Operations Location | Change in unrealized appreciation/(depreciation) recognized in Income | ||||
Interest Rate Contracts | ||||||
Futures | Change in net unrealized appreciation/(depreciation) on Futures contracts | 220,312 | ||||
Total Interest Rate Contracts | 220,312 | |||||
Equity Contracts | ||||||
Futures | Change in net unrealized appreciation/(depreciation) on Futures contracts | (5,248 | ) | |||
Total Equity Contracts | (5,248 | ) | ||||
|
| |||||
Total | $ | 215,064 | ||||
|
| |||||
The accompanying Notes to Financial Statements are an integral part of this schedule.
178
Table of Contents
BALANCED INCOME PLUS PORTFOLIO
Schedule of Investments as of December 31, 2014
The following table presents Balanced Income Plus Portfolio’s average volume of derivative activity during the period ended December 31, 2014.
Derivative Risk Category | Futures (Notional)* | Futures (Percentage of Average Net Assets) | ||||||
Equity Contracts | $ | 4,432,169 | 1.5 | % | ||||
Interest Rate Contracts | 31,679,630 | 10.9 | ||||||
| * | Notional amount represents long or short, or both, derivative positions held by the Portfolio. |
Investment in Affiliates
Affiliated issuers, as defined under the Investment Company Act of 1940, include those in which the Portfolio’s holdings of an issuer represent 5% or more of the outstanding voting securities of an issuer, or any affiliated mutual fund.
A summary of transactions for the fiscal year to date, in Balanced Income Plus Portfolio, is as follows:
Portfolio | Value December 31, 2013 | Gross Purchases | Gross Sales | Shares Held at December 31, 2014 | Value December 31, 2014 | Income Earned January 1, 2014 - December 31, 2014 | ||||||||||||||||||
Cash Management Trust-Collateral Investment | $ | — | $ | 39,390,056 | $ | 32,856,691 | 6,533,365 | $ | 6,533,365 | $ | 23,017 | |||||||||||||
Cash Management Trust-Short Term Investment | 18,302,791 | 126,944,849 | 117,050,836 | 28,196,804 | 28,196,804 | 11,983 | ||||||||||||||||||
Total Value and Income Earned | 18,302,791 | 34,730,169 | 35,000 | |||||||||||||||||||||
The accompanying Notes to Financial Statements are an integral part of this schedule.
179
Table of Contents
DIVERSIFIED INCOME PLUS PORTFOLIO
Schedule of Investments as of December 31, 2014
| Principal Amount | Bank Loans (13.2%)a | Value | ||||||
| Basic Materials (1.2%) | |||||||
Alpha Natural Resources, Inc., Term Loan | ||||||||
| $ | 325,854 | 3.500%, 5/22/2020 | $ | 257,630 | ||||
Crown Americas, LLC, Term Loan | ||||||||
| 540,000 | 0.000%, 10/20/2021b,c | 539,325 | ||||||
Fortescue Metals Group, Ltd., Term Loan | ||||||||
| 930,960 | 3.750%, 6/30/2019 | 843,450 | ||||||
Ineos Group Holdings, Ltd., Term Loan | ||||||||
| 863,297 | 3.750%, 5/4/2018 | 835,144 | ||||||
NewPage Corporation, Term Loan | ||||||||
| 975,000 | 9.500%, 2/11/2021 | 924,622 | ||||||
Tronox Pigments BV, Term Loan | ||||||||
| 1,297,498 | 4.000%, 3/19/2020b,c | 1,273,715 | ||||||
Wausau Paper Corporation, Term Loan | ||||||||
| 597,000 | 6.500%, 7/30/2020 | 591,030 | ||||||
|
| |||||||
Total | 5,264,916 | |||||||
|
| |||||||
| Capital Goods (0.7%) | |||||||
ADS Waste Holdings, Inc., Term Loan | ||||||||
| 583,000 | 3.750%, 10/9/2019 | 564,962 | ||||||
Berry Plastics Group, Inc., Term Loan | ||||||||
| 589,500 | 3.500%, 2/8/2020 | 569,286 | ||||||
Rexnord, LLC, Term Loan | ||||||||
| 592,500 | 4.000%, 8/21/2020 | 579,465 | ||||||
Silver II Borrower, Term Loan | ||||||||
| 551,984 | 4.000%, 12/13/2019 | 511,794 | ||||||
STHI Holding Corporation, Term Loan | ||||||||
| 598,500 | 4.500%, 8/6/2021 | 593,012 | ||||||
|
| |||||||
Total | 2,818,519 | |||||||
|
| |||||||
| Communications Services (4.3%) | |||||||
Atlantic Broadband Penn, LLC, Term Loan | ||||||||
| 107,587 | 3.250%, 11/30/2019 | 105,166 | ||||||
Birch Communication Inc., Term Loan | ||||||||
| 680,069 | 7.750%, 7/17/2020 | 666,468 | ||||||
Block Communications, Inc., Term Loan | ||||||||
| 473,813 | 5.750%, 11/7/2021 | 470,557 | ||||||
Cable & Wireless Communications plc, Term Loan | ||||||||
| 304,000 | 0.000%, 11/25/2016b,c | 302,480 | ||||||
Cengage Learning Acquisition, Term Loan | ||||||||
| 625,275 | 7.000%, 3/31/2020 | 618,241 | ||||||
Charter Communications Operating, LLC, Term Loan | ||||||||
| 59,697 | 3.000%, 7/1/2020 | 58,466 | ||||||
| 591,000 | 3.000%, 1/3/2021 | 578,565 | ||||||
Cincinnati Bell, Inc., Term Loan | ||||||||
| 680,113 | 4.000%, 9/10/2020b,c | 671,611 | ||||||
Clear Channel Communications, Inc., Term Loan | ||||||||
| 3,465 | 3.819%, 1/29/2016 | 3,426 | ||||||
| 570,744 | 6.919%, 1/30/2019 | 536,905 | ||||||
| 132,102 | 7.669%, 7/30/2019 | 125,662 | ||||||
Cumulus Media Holdings, Inc., Term Loan | ||||||||
| 690,138 | 4.250%, 12/23/2020b,c | 668,282 | ||||||
Fairpoint Communications, Term Loan | ||||||||
| 59,097 | 7.500%, 2/14/2019 | 58,470 | ||||||
Grande Communications Networks, LLC, Term Loan | ||||||||
| 788,008 | 4.500%, 5/29/2020 | 777,173 | ||||||
Gray Television, Inc., Term Loan | ||||||||
| 431,796 | 3.750%, 6/13/2021 | 424,239 | ||||||
Hargray Communications Group, Inc., Term Loan | ||||||||
| 665,273 | 5.250%, 6/26/2019 | 660,283 | ||||||
IMG Worldwide, Inc., Term Loan | ||||||||
| 646,750 | 5.250%, 5/6/2021 | 623,713 | ||||||
Integra Telecom Holdings, Inc., Term Loan | ||||||||
| 589,500 | 5.250%, 2/22/2019 | 572,186 | ||||||
Intelsat Jackson Holdings SA, Term Loan | ||||||||
| 556,029 | 3.750%, 6/30/2019 | 546,993 | ||||||
Level 3 Communications, Inc., Term Loan | ||||||||
| 800,000 | 4.000%, 1/15/2020 | 793,000 | ||||||
Liberty Cablevision of Puerto Rico, LLC, Term Loan | ||||||||
| 175,000 | 0.000%, 1/7/2022b,c | 169,750 | ||||||
| 550,000 | 4.500%, 1/7/2022 | 534,875 | ||||||
LTS Buyer, LLC, Term Loan | ||||||||
| 899,522 | 4.000%, 4/13/2020 | 878,725 | ||||||
McGraw-Hill Global Education, LLC, Term Loan | ||||||||
| 566,734 | 5.750%, 3/22/2019 | 563,725 | ||||||
NEP/NCP Holdco, Inc., Term Loan | ||||||||
| 786,070 | 4.250%, 1/22/2020 | 767,731 | ||||||
NTelos, Inc., Term Loan | ||||||||
| 574,530 | 5.750%, 11/9/2019 | 499,841 | ||||||
Puerto Rico Cable Acquisition Company, Inc., Term Loan | ||||||||
| 545,441 | 5.500%, 7/31/2018 | 541,350 | ||||||
SBA Senior Finance II, LLC, Term Loan | ||||||||
| 472,625 | 3.250%, 3/24/2021 | 461,892 | ||||||
TNS, Inc., Term Loan | ||||||||
| 660,656 | 5.000%, 2/14/2020 | 653,223 | ||||||
Univision Communications, Inc., Term Loan | ||||||||
| 894,063 | 4.000%, 3/1/2020 | 873,053 | ||||||
Virgin Media Investment Holdings, Ltd., Term Loan | ||||||||
| 600,000 | 3.500%, 6/7/2020 | 588,366 | ||||||
WideOpenWest Finance, LLC, Term Loan | ||||||||
| 629,145 | 4.750%, 4/1/2019 | 624,036 | ||||||
WMG Acquisition Corporation, Term Loan | ||||||||
| 592,500 | 3.750%, 7/1/2020 | 568,800 | ||||||
XO Communications, LLC, Term Loan | ||||||||
| 645,125 | 4.250%, 3/20/2021 | 632,223 | ||||||
Yankee Cable Acquisition, LLC, Term Loan | ||||||||
| 568,900 | 4.500%, 3/1/2020 | 565,344 | ||||||
The accompanying Notes to Financial Statements are an integral part of this schedule.
180
Table of Contents
DIVERSIFIED INCOME PLUS PORTFOLIO
Schedule of Investments as of December 31, 2014
| Principal Amount | Bank Loans (13.2%)a | Value | ||||||
| Communications Services (4.3%) - continued |
| ||||||
Zayo Group, LLC, Term Loan | ||||||||
| $ | 677,261 | 4.000%, 7/2/2019 | $ | 669,067 | ||||
|
| |||||||
Total | 18,853,887 | |||||||
|
| |||||||
| Consumer Cyclical (2.2%) | |||||||
Amaya Gaming Group, Inc., Term Loan | ||||||||
| 528,675 | 5.000%, 8/1/2021 | 522,992 | ||||||
Booz Allen Hamilton, Inc., Term Loan | ||||||||
| 248,062 | 3.750%, 7/31/2019 | 246,615 | ||||||
Burlington Coat Factory Warehouse Corporation, Term Loan | ||||||||
| 542,494 | 4.250%, 8/13/2021 | 534,699 | ||||||
Ceridian HCM Holding, Inc., Term Loan | ||||||||
| 290,593 | 4.500%, 9/15/2020 | 285,328 | ||||||
Chrysler Group, LLC, Term Loan | ||||||||
| 491,094 | 3.500%, 5/24/2017 | 487,499 | ||||||
| 272,938 | 3.250%, 12/31/2018 | 269,867 | ||||||
Golden Nugget, Inc., Delayed Draw | ||||||||
| 66,825 | 5.500%, 11/21/2019 | 65,865 | ||||||
Golden Nugget, Inc., Term Loan | ||||||||
| 155,925 | 5.500%, 11/21/2019 | 153,684 | ||||||
Hilton Worldwide Finance, LLC, Term Loan | ||||||||
| 504,386 | 3.500%, 10/26/2020 | 497,869 | ||||||
J.C. Penney Corporation, Inc., Term Loan | ||||||||
| 591,000 | 6.000%, 5/22/2018 | 578,689 | ||||||
Las Vegas Sands, LLC, Term Loan | ||||||||
| 495,000 | 3.250%, 12/19/2020 | 491,495 | ||||||
Marina District Finance Company, Inc., Term Loan | ||||||||
| 411,750 | 6.750%, 8/15/2018 | 408,061 | ||||||
MGM Resorts lnternational, Term Loan | ||||||||
| 1,216,382 | 3.500%, 12/20/2019 | 1,182,177 | ||||||
Michaels Stores, Inc., Term Loan | ||||||||
| 688,275 | 4.000%, 1/28/2020 | 675,370 | ||||||
Mohegan Tribal Gaming Authority, Term Loan | ||||||||
| 445,500 | 5.500%, 11/19/2019 | 427,284 | ||||||
Pinnacle Entertainment, Inc., Term Loan | ||||||||
| 630,963 | 3.750%, 8/13/2020b,c | 620,710 | ||||||
ROC Finance, LLC, Term Loan | ||||||||
| 592,500 | 5.000%, 6/20/2019 | 548,063 | ||||||
Scientific Games International, Inc., Term Loan | ||||||||
| 594,000 | 6.000%, 10/18/2020 | 584,645 | ||||||
| 100,000 | 6.000%, 10/1/2021 | 98,417 | ||||||
Seminole Hard Rock Entertainment, Inc., Term Loan | ||||||||
| 313,926 | 3.500%, 5/14/2020b,c | 302,153 | ||||||
Seminole Indian Tribe of Florida, Term Loan | ||||||||
| 526,500 | 3.000%, 4/29/2020 | 523,431 | ||||||
|
| |||||||
Total | 9,504,913 | |||||||
|
| |||||||
| Consumer Non-Cyclical (1.5%) | |||||||
Albertsons, Inc., Term Loan | ||||||||
| 693,270 | 4.750%, 3/21/2019 | 688,070 | ||||||
Biomet, Inc., Term Loan | ||||||||
| 929,638 | 3.670%, 7/25/2017 | 923,995 | ||||||
Catalina Marketing Corporation, Term Loan | ||||||||
| 611,925 | 4.500%, 4/9/2021 | 580,949 | ||||||
CHS/Community Health Systems, Inc., Term Loan | ||||||||
| 121,544 | 3.486%, 1/25/2017 | 120,734 | ||||||
| 447,706 | 4.250%, 1/27/2021 | 446,121 | ||||||
Del Monte Corporation, Term Loan | ||||||||
| 109,449 | 3.500%, 3/9/2020 | 104,523 | ||||||
HCA, Inc., Term Loan | ||||||||
| 713,194 | 0.000%, 3/31/2017b,c | 706,954 | ||||||
Libbey Glass, Inc., Term Loan | ||||||||
| 305,962 | 3.750%, 4/9/2021 | 300,801 | ||||||
Ortho-Clinical Diagnostics, Inc., Term Loan | ||||||||
| 616,900 | 4.750%, 6/30/2021 | 605,950 | ||||||
Roundy’s Supermarkets, Inc., Term Loan | ||||||||
| 609,468 | 5.750%, 3/3/2021 | 570,359 | ||||||
Supervalu, Inc., Term Loan | ||||||||
| 784,982 | 4.500%, 3/21/2019 | 769,722 | ||||||
Visant Corporation, Term Loan | ||||||||
| 817,853 | 7.000%, 9/23/2021 | 793,317 | ||||||
|
| |||||||
Total | 6,611,495 | |||||||
|
| |||||||
| Energy (0.8%) | |||||||
Arch Coal, Inc., Term Loan | ||||||||
| 790,631 | 6.250%, 5/16/2018 | 652,603 | ||||||
Energy Solutions, LLC, Term Loan | ||||||||
| 696,500 | 6.750%, 5/29/2020 | 693,233 | ||||||
Exgen Renewables I, LLC, Term Loan | ||||||||
| 412,958 | 5.250%, 2/6/2021 | 412,958 | ||||||
McJunkin Red Man Corporation, Term Loan | ||||||||
| 444,375 | 5.000%, 11/8/2019 | 407,714 | ||||||
Offshore Group Investment, Ltd., Term Loan | ||||||||
| 404,193 | 5.750%, 3/28/2019 | 301,124 | ||||||
Pacific Drilling SA, Term Loan | ||||||||
| 591,000 | 4.500%, 6/3/2018 | 485,607 | ||||||
TerraForm Power Operating, LLC, Term Loan | ||||||||
| 318,400 | 4.750%, 7/23/2019 | 316,808 | ||||||
|
| |||||||
Total | 3,270,047 | |||||||
|
| |||||||
| Financials (0.8%) | |||||||
Delos Finance Sarl, Term Loan | ||||||||
| 630,000 | 3.500%, 3/6/2021 | 623,435 | ||||||
DJO Finance, LLC, Term Loan | ||||||||
| 615,639 | 4.250%, 9/15/2017 | 600,759 | ||||||
Harland Clarke Holdings Corporation, Term Loan | ||||||||
| 577,500 | 7.000%, 5/22/2018 | 578,078 | ||||||
MoneyGram International, Inc., Term Loan | ||||||||
| 521,023 | 4.250%, 3/27/2020 | 476,475 | ||||||
MPH Acquisition Holdings, LLC, Term Loan | ||||||||
| 177,570 | 3.750%, 3/31/2021 | 172,332 | ||||||
The accompanying Notes to Financial Statements are an integral part of this schedule.
181
Table of Contents
DIVERSIFIED INCOME PLUS PORTFOLIO
Schedule of Investments as of December 31, 2014
| Principal Amount | Bank Loans (13.2%)a | Value | ||||||
| Financials (0.8%) - continued |
| ||||||
TransUnion, LLC, Term Loan | ||||||||
| $ | 645,125 | 4.000%, 4/9/2021 | $ | 634,642 | ||||
WaveDivision Holdings, LLC, Term Loan | ||||||||
| 588,000 | 4.000%, 10/15/2019 | 578,198 | ||||||
|
| |||||||
Total | 3,663,919 | |||||||
|
| |||||||
| Technology (0.8%) | |||||||
Avago Technologies, Ltd., Term Loan | ||||||||
| 1,095,000 | 3.750%, 5/6/2021b,c | 1,089,985 | ||||||
BMC Software, Inc., Term Loan | ||||||||
| 573,167 | 5.000%, 9/10/2020 | 556,333 | ||||||
First Data Corporation, Term Loan | ||||||||
| 900,000 | 3.667%, 3/23/2018 | 881,442 | ||||||
Freescale Semiconductor, Inc., Term Loan | ||||||||
| 589,545 | 4.250%, 2/28/2020 | 574,441 | ||||||
Infor US, Inc., Term Loan | ||||||||
| 562,811 | 3.750%, 6/3/2020 | 545,262 | ||||||
|
| |||||||
Total | 3,647,463 | |||||||
|
| |||||||
| Transportation (0.6%) | |||||||
American Airlines, Inc., Term Loan | ||||||||
| 1,058,875 | 3.750%, 6/27/2019 | 1,046,084 | ||||||
Delta Air Lines, Inc., Term Loan | ||||||||
| 756,170 | 3.250%, 4/20/2017b,c | 746,718 | ||||||
OSG Bulk Ships, Inc.,Term Loan | ||||||||
| 701,475 | 5.250%, 8/5/2019 | 682,184 | ||||||
|
| |||||||
Total | 2,474,986 | |||||||
|
| |||||||
| Utilities (0.3%) | |||||||
Calpine Corporation, Term Loan | ||||||||
| 439,721 | 4.000%, 4/1/2018 | 434,334 | ||||||
| 74,250 | 4.000%, 10/31/2020 | 73,002 | ||||||
Intergen NV, Term Loan | ||||||||
| 591,000 | 5.500%, 6/15/2020 | 585,581 | ||||||
NGPL PipeCo, LLC, Term Loan | ||||||||
| 384,448 | 6.750%, 9/15/2017 | 372,434 | ||||||
|
| |||||||
Total | 1,465,351 | |||||||
|
| |||||||
Total Bank Loans (cost $59,080,965) | 57,575,496 | |||||||
|
| |||||||
Long-Term Fixed Income (42.9%) | ||||||||
| Asset-Backed Securities (1.2%) | |||||||
Asset Backed Securities Corporation Home Equity Loan Trust | ||||||||
| 732,135 | 0.310%, 7/25/2036d | 655,394 | ||||||
| 847,124 | 0.330%, 11/25/2036d | 730,725 | ||||||
Bayview Opportunity Master Fund Trust IIB, LP | ||||||||
| 1,007,331 | 3.623%, 7/28/2019* | 1,000,621 | ||||||
Countrywide Asset-Backed Certificates | ||||||||
| 496,432 | 5.530%, 4/25/2047 | 488,134 | ||||||
GSAA Home Equity Trust | ||||||||
| 835,524 | 0.440%, 7/25/2037d | 705,392 | ||||||
J.P. Morgan Mortgage Trust | ||||||||
| 566,386 | 2.651%, 2/25/2036 | 511,384 | ||||||
Renaissance Home Equity Loan Trust | ||||||||
| 393,959 | 5.746%, 5/25/2036e | 286,638 | ||||||
| 632,000 | 6.011%, 5/25/2036e | 447,175 | ||||||
| 931,245 | 5.797%, 8/25/2036e | 596,906 | ||||||
|
| |||||||
Total | 5,422,369 | |||||||
|
| |||||||
| Basic Materials (0.8%) | |||||||
Anglo American Capital plc | ||||||||
| 92,000 | 1.181%, 4/15/2016d,f | 92,092 | ||||||
ArcelorMittal | ||||||||
| 730,000 | 6.000%, 3/1/2021 | 759,200 | ||||||
Dow Chemical Company | ||||||||
| 64,000 | 8.550%, 5/15/2019 | 79,568 | ||||||
First Quantum Minerals, Ltd. | ||||||||
| 322,000 | 6.750%, 2/15/2020f | 291,410 | ||||||
| 322,000 | 7.000%, 2/15/2021f | 289,800 | ||||||
FMG Resources August 2006 Pty., Ltd. | ||||||||
| 142,222 | 6.875%, 2/1/2018f | 129,067 | ||||||
Freeport-McMoRan, Inc. | ||||||||
| 53,000 | 2.375%, 3/15/2018 | 52,417 | ||||||
Hexion US Finance Corporation/Hexion Nova Scotia Finance ULC | ||||||||
| 670,000 | 8.875%, 2/1/2018 | 596,300 | ||||||
INEOS Group Holdings SA | ||||||||
| 400,000 | 5.875%, 2/1/2019f | 379,000 | ||||||
LyondellBasell Industries NV | ||||||||
| 64,000 | 5.000%, 4/15/2019 | 69,809 | ||||||
Mosaic Company | ||||||||
| 88,000 | 3.750%, 11/15/2021 | 91,590 | ||||||
Sappi Papier Holding GmbH | ||||||||
| 400,000 | 6.625%, 4/15/2021f | 410,000 | ||||||
Vale Overseas, Ltd. | ||||||||
| 46,000 | 6.250%, 1/23/2017 | 49,064 | ||||||
Yamana Gold, Inc. | ||||||||
| 98,000 | 4.950%, 7/15/2024 | 95,646 | ||||||
|
| |||||||
Total | 3,384,963 | |||||||
|
| |||||||
| Capital Goods (1.0%) | |||||||
Brand Energy& Infrastructure Services, Inc. | ||||||||
| 375,000 | 8.500%, 12/1/2021f | 337,500 | ||||||
Cemex SAB de CV | ||||||||
| 775,000 | 5.700%, 1/11/2025f | 751,750 | ||||||
Crown Americas Capital Corporation IV | ||||||||
| 730,000 | 4.500%, 1/15/2023 | 708,100 | ||||||
Crown Cork & Seal Company, Inc. | ||||||||
| 410,000 | 7.375%, 12/15/2026 | 453,050 | ||||||
Harsco Corporation | ||||||||
| 132,000 | 2.700%, 10/15/2015 | 131,835 | ||||||
Ingersoll-Rand Luxembourg Finance SA | ||||||||
| 190,000 | 2.625%, 5/1/2020 | 188,770 | ||||||
L-3 Communications Corporation | ||||||||
| 123,000 | 1.500%, 5/28/2017 | 121,790 | ||||||
Reynolds Group Issuer, Inc. | ||||||||
| 160,000 | 5.750%, 10/15/2020 | 164,000 | ||||||
| 410,000 | 6.875%, 2/15/2021 | 427,938 | ||||||
RSC Equipment Rental, Inc. | ||||||||
| 160,000 | 8.250%, 2/1/2021 | 174,400 | ||||||
The accompanying Notes to Financial Statements are an integral part of this schedule.
182
Table of Contents
DIVERSIFIED INCOME PLUS PORTFOLIO
Schedule of Investments as of December 31, 2014
| Principal Amount | Long-Term Fixed Income (42.9%) | Value | ||||||
| Capital Goods (1.0%) - continued |
| ||||||
Sealed Air Corporation | ||||||||
| $ | 500,000 | 4.875%, 12/1/2022f | $ | 496,250 | ||||
Textron, Inc. | ||||||||
| 137,000 | 7.250%, 10/1/2019 | 162,626 | ||||||
United Rentals North America, Inc. | ||||||||
| 410,000 | 7.375%, 5/15/2020 | 442,800 | ||||||
|
| |||||||
Total | 4,560,809 | |||||||
|
| |||||||
| Collateralized Mortgage Obligations (14.9%) | |||||||
Adjustable Rate Mortgage Trust | ||||||||
| 1,072,000 | 2.802%, 11/25/2035 | 922,130 | ||||||
Alternative Loan Trust | ||||||||
| 1,150,451 | 6.000%, 6/25/2036 | 1,031,286 | ||||||
American Home Mortgage Assets Trust | ||||||||
| 1,474,718 | 6.250%, 12/25/2036 | 698,246 | ||||||
| 1,722,029 | 0.360%, 12/25/2046d | 1,204,072 | ||||||
| 1,785,752 | 0.360%, 6/25/2047d | 1,206,041 | ||||||
Banc of America Alternative Loan Trust | ||||||||
| 474,263 | 0.670%, 4/25/2035d | 410,111 | ||||||
| 1,328,148 | 6.000%, 11/25/2035 | 1,160,722 | ||||||
Banc of America Funding Corporation | ||||||||
| 330,859 | 4.828%, 5/20/2036 | 270,333 | ||||||
BCAP, LLC Trust | ||||||||
| 1,299,108 | 0.350%, 3/25/2037d | 1,079,984 | ||||||
Bear Stearns Adjustable Rate Mortgage Trust | ||||||||
| 276,364 | 2.430%, 10/25/2035d | 272,467 | ||||||
| 316,498 | 2.557%, 2/25/2036 | 246,752 | ||||||
Citicorp Mortgage Securities Trust | ||||||||
| 460,240 | 6.000%, 5/25/2037 | 474,726 | ||||||
Citigroup Mortgage Loan Trust, Inc. | ||||||||
| 411,730 | 5.500%, 11/25/2035 | 379,859 | ||||||
| 927,684 | 2.778%, 3/25/2037 | 717,116 | ||||||
CitiMortgage Alternative Loan Trust | ||||||||
| 580,241 | 5.750%, 4/25/2037 | 498,226 | ||||||
Countrywide Alternative Loan Trust | ||||||||
| 374,137 | 0.570%, 2/25/2035d | 344,205 | ||||||
| 1,000,010 | 2.405%, 10/25/2035 | 879,634 | ||||||
| 712,288 | 5.220%, 10/25/2035 | 604,901 | ||||||
| 455,880 | 5.500%, 2/25/2036 | 423,916 | ||||||
| 244,792 | 6.000%, 4/25/2036 | 211,460 | ||||||
| 602,884 | 6.500%, 8/25/2036 | 459,122 | ||||||
| 210,820 | 6.000%, 1/25/2037 | 194,522 | ||||||
| 916,736 | 5.500%, 5/25/2037 | 794,589 | ||||||
Countrywide Home Loan Mortgage Pass Through Trust | ||||||||
| 1,373,176 | 2.465%, 11/25/2035 | 1,161,273 | ||||||
| 571,349 | 4.932%, 2/20/2036 | 511,127 | ||||||
Deutsche Alt-A Securities Mortgage Loan Trust | ||||||||
| 911,582 | 0.883%, 4/25/2047d | 780,290 | ||||||
| 1,450,120 | 0.390%, 8/25/2047d | 1,227,520 | ||||||
Deutsche Alt-A Securities, Inc., Mortgage Loan Trust | ||||||||
| 117,392 | 5.500%, 10/25/2021 | 112,860 | ||||||
| 368,336 | 0.370%, 11/25/2035d | 237,939 | ||||||
| 805,860 | 5.500%, 11/25/2035 | 762,062 | ||||||
Federal Home Loan Mortgage Corporation | ||||||||
| 7,608,725 | 2.500%, 12/15/2022g | 554,766 | ||||||
| 2,281,827 | 2.500%, 5/15/2027g | 199,550 | ||||||
| 2,643,400 | 2.500%, 2/15/2028g | 265,225 | ||||||
| 7,892,222 | 2.500%, 3/15/2028g | 792,432 | ||||||
| 4,281,876 | 3.000%, 4/15/2028g | 478,274 | ||||||
| 3,448,874 | 3.000%, 2/15/2033g | 465,398 | ||||||
Federal National Mortgage Association | ||||||||
| 3,400,792 | 2.500%, 2/25/2028g | 342,135 | ||||||
| 2,923,000 | 3.000%, 4/25/2028g | 360,037 | ||||||
| 3,329,436 | 3.500%, 1/25/2033g | 475,525 | ||||||
First Horizon Alternative Mortgage Securities Trust | ||||||||
| 1,009,350 | 2.250%, 3/25/2035 | 904,133 | ||||||
First Horizon Alternative Mortgage Securities Trust 2006-FA4 | ||||||||
| 1,127,074 | 6.000%, 8/25/2036d | 939,657 | ||||||
First Horizon Mortgage Pass-Through Trust | ||||||||
| 984,746 | 2.582%, 8/25/2037 | 807,196 | ||||||
GMACM Mortgage Loan Trust | ||||||||
| 1,730,114 | 4.566%, 5/25/2035 | 1,661,227 | ||||||
Government National Mortgage Association | ||||||||
| 3,799,490 | 4.000%, 1/16/2027g | 485,672 | ||||||
Greenpoint Mortgage Funding Trust | ||||||||
| 721,577 | 0.370%, 10/25/2045d | 568,087 | ||||||
GSR Mortgage Loan Trust | ||||||||
| 214,992 | 0.360%, 8/25/2046d | 206,460 | ||||||
HomeBanc Mortgage Trust | ||||||||
| 404,908 | 2.197%, 4/25/2037 | 301,298 | ||||||
IndyMac IMJA Mortgage Loan Trust | ||||||||
| 898,720 | 6.250%, 11/25/2037 | 803,210 | ||||||
IndyMac INDX Mortgage Loan Trust | ||||||||
| 1,295,343 | 4.654%, 10/25/2035 | 1,097,579 | ||||||
J.P. Morgan Alternative Loan Trust | ||||||||
| 1,226,716 | 6.500%, 3/25/2036 | 1,081,851 | ||||||
J.P. Morgan Mortgage Trust | ||||||||
| 225,186 | 6.500%, 1/25/2035 | 223,981 | ||||||
| 1,048,336 | 2.653%, 8/25/2035 | 1,042,839 | ||||||
| 464,091 | 2.537%, 10/25/2036 | 416,582 | ||||||
| 900,575 | 0.550%, 1/25/2037d | 584,473 | ||||||
| 710,842 | 2.695%, 1/25/2037 | 648,959 | ||||||
| 467,157 | 6.250%, 8/25/2037 | 386,013 | ||||||
Lehman Mortgage Trust | ||||||||
| 569,524 | 0.920%, 12/25/2035d | 412,501 | ||||||
Master Asset Securitization Trust | ||||||||
| 617,830 | 0.670%, 6/25/2036d | 370,415 | ||||||
MASTR Alternative Loans Trust | ||||||||
| 217,143 | 6.500%, 7/25/2034 | 222,451 | ||||||
| 519,053 | 0.620%, 12/25/2035d | 282,904 | ||||||
Merrill Lynch Alternative Note Asset Trust | ||||||||
| 715,312 | 6.000%, 3/25/2037 | 665,481 | ||||||
Morgan Stanley Mortgage Loan Trust | ||||||||
| 550,390 | 5.241%, 11/25/2035 | 424,326 | ||||||
MortgagelT Trust | ||||||||
| 1,031,005 | 0.430%, 12/25/2035d | 945,755 | ||||||
New Century Alternative Mortgage Loan Trust | ||||||||
| 1,203,039 | 6.167%, 7/25/2036e | 823,155 | ||||||
RALI Trust | ||||||||
| 1,130,005 | 6.000%, 4/25/2036 | 935,303 | ||||||
| 1,140,405 | 0.350%, 11/25/2036d | 821,738 | ||||||
The accompanying Notes to Financial Statements are an integral part of this schedule.
183
Table of Contents
DIVERSIFIED INCOME PLUS PORTFOLIO
Schedule of Investments as of December 31, 2014
| Principal Amount | Long-Term Fixed Income (42.9%) | Value | ||||||
| Collateralized Mortgage Obligations (14.9%) - continued | |||||||
| $ | 1,594,580 | 5.750%, 4/25/2037 | $ | 1,275,665 | ||||
| 977,115 | 6.250%, 4/25/2037 | 809,178 | ||||||
| 391,380 | 6.000%, 6/25/2037 | 323,148 | ||||||
| 1,530,895 | 0.360%, 7/25/2037d | 1,285,525 | ||||||
Residential Accredit Loans, Inc. | ||||||||
| 810,644 | 5.750%, 9/25/2035 | 732,974 | ||||||
| 927,543 | 6.000%, 1/25/2037 | 789,494 | ||||||
Residential Asset Securitization Trust | ||||||||
| 1,069,334 | 5.407%, 8/25/2022 | 970,967 | ||||||
| 605,366 | 5.500%, 4/25/2035 | 607,458 | ||||||
| 845,182 | 0.550%, 8/25/2037d | 310,085 | ||||||
RFMSI Trust | ||||||||
| 902,440 | 5.750%, 2/25/2036 | 834,077 | ||||||
| 1,287,870 | 6.000%, 7/25/2037 | 1,166,270 | ||||||
Sequoia Mortgage Trust | ||||||||
| 1,514,493 | 2.657%, 9/20/2046 | 1,255,431 | ||||||
Structured Adjustable Rate Mortgage Loan Trust | ||||||||
| 277,679 | 5.500%, 12/25/2034 | 269,657 | ||||||
| 999,357 | 5.081%, 7/25/2035 | 861,490 | ||||||
| 420,094 | 2.633%, 9/25/2035 | 357,134 | ||||||
| 743,686 | 4.956%, 5/25/2036 | 559,734 | ||||||
Structured Asset Mortgage Investments, Inc. | ||||||||
| 1,601,835 | 0.480%, 12/25/2035d | 1,224,613 | ||||||
| 858,131 | 0.380%, 5/25/2046d | 626,166 | ||||||
Suntrust Alternative Loan Trust | ||||||||
| 1,116,526 | 5.750%, 12/25/2035 | 996,705 | ||||||
WaMu Mortgage Pass Through Certificates | ||||||||
| 843,895 | 4.330%, 8/25/2036 | 758,465 | ||||||
| 719,530 | 1.957%, 11/25/2036 | 635,008 | ||||||
| 1,456,767 | 1.822%, 1/25/2037 | 1,235,360 | ||||||
| 130,202 | 2.239%, 8/25/2046 | 112,711 | ||||||
| 838,873 | 1.913%, 3/25/2047d | 677,473 | ||||||
Washington Mutual Alternative Mortgage Pass Through Certificates | ||||||||
| 694,176 | 0.770%, 6/25/2035d | 519,801 | ||||||
| 915,374 | 6.000%, 11/25/2035 | 831,763 | ||||||
| 1,291,699 | 0.863%, 2/25/2047d | 906,378 | ||||||
Wells Fargo Mortgage Backed Securities Trust | ||||||||
| 1,539,431 | 2.609%, 7/25/2036 | 1,501,361 | ||||||
| 558,786 | 6.000%, 7/25/2037 | 552,951 | ||||||
| 735,812 | 6.000%, 11/25/2037 | 732,020 | ||||||
|
| |||||||
Total | 64,993,141 | |||||||
|
| |||||||
| Commercial Mortgage-Backed Securities (0.4%) | |||||||
Credit Suisse Mortgage Capital Certificates | ||||||||
| 1,000,000 | 5.509%, 9/15/2039 | 1,057,576 | ||||||
Greenwich Capital Commercial Funding Corporation | ||||||||
| 650,000 | 5.867%, 12/10/2049 | 704,506 | ||||||
|
| |||||||
Total | 1,762,082 | |||||||
|
| |||||||
| Communications Services (2.8%) | |||||||
21st Century Fox America, Inc. | ||||||||
| 80,000 | 3.700%, 9/15/2024f | 82,290 | ||||||
AMC Networks, Inc. | ||||||||
| 390,000 | 4.750%, 12/15/2022 | 378,300 | ||||||
American Tower Corporation | ||||||||
| 106,000 | 7.000%, 10/15/2017 | 119,678 | ||||||
| 98,000 | 3.450%, 9/15/2021 | 96,348 | ||||||
CC Holdings GS V, LLC | ||||||||
| 160,000 | 2.381%, 12/15/2017 | 161,419 | ||||||
CCO Holdings, LLC | ||||||||
| 400,000 | 6.500%, 4/30/2021 | 420,000 | ||||||
CenturyLink, Inc. | ||||||||
| 400,000 | 6.450%, 6/15/2021 | 429,000 | ||||||
Cequel Communications Escrow 1, LLC | ||||||||
| 750,000 | 6.375%, 9/15/2020f | 776,250 | ||||||
Columbus International, Inc. | ||||||||
| 750,000 | 7.375%, 3/30/2021f | 780,000 | ||||||
Digicel, Ltd. | ||||||||
| 760,000 | 6.000%, 4/15/2021f | 710,600 | ||||||
DIRECTV Holdings, LLC | ||||||||
| 104,000 | 5.875%, 10/1/2019 | 118,959 | ||||||
DISH DBS Corporation | ||||||||
| 400,000 | 5.000%, 3/15/2023 | 387,000 | ||||||
Equinix, Inc. | ||||||||
| 515,000 | 5.750%, 1/1/2025 | 519,506 | ||||||
Frontier Communications Corporation | ||||||||
| 775,000 | 6.875%, 1/15/2025 | 775,000 | ||||||
Hughes Satellite Systems Corporation | ||||||||
| 570,000 | 6.500%, 6/15/2019 | 611,325 | ||||||
Level 3 Escrow II, Inc. | ||||||||
| 400,000 | 5.375%, 8/15/2022f | 402,000 | ||||||
Numericable-SFR | ||||||||
| 770,000 | 6.000%, 5/15/2022f | 774,235 | ||||||
SBA Tower Trust | ||||||||
| 200,000 | 3.598%, 4/16/2043f | 200,489 | ||||||
SprintCommunications, Inc. | ||||||||
| 570,000 | 9.000%, 11/15/2018f | 648,318 | ||||||
Telefonica Emisiones SAU | ||||||||
| 126,000 | 3.192%, 4/27/2018 | 129,571 | ||||||
Time Warner Cable, Inc. | ||||||||
| 240,000 | 5.000%, 2/1/2020 | 264,476 | ||||||
T-Mobile USA, Inc. | ||||||||
| 770,000 | 6.125%, 1/15/2022 | 781,550 | ||||||
Univision Communications, Inc. | ||||||||
| 160,000 | 6.875%, 5/15/2019f | 166,600 | ||||||
| 410,000 | 7.875%, 11/1/2020f | 436,650 | ||||||
UPCB Finance V, Ltd. | ||||||||
| 570,000 | 7.250%, 11/15/2021f | 623,437 | ||||||
Verizon Communications, Inc. | ||||||||
| 66,000 | 2.625%, 2/21/2020f | 65,245 | ||||||
| 98,000 | 4.500%, 9/15/2020 | 106,404 | ||||||
| 98,000 | 5.150%, 9/15/2023 | 108,215 | ||||||
West Corporation | ||||||||
| 770,000 | 5.375%, 7/15/2022f | 737,275 | ||||||
Wind Acquisition Finance SA | ||||||||
| 460,000 | 4.750%, 7/15/2020f | 430,100 | ||||||
| 70,000 | 7.375%, 4/23/2021f | 66,066 | ||||||
|
| |||||||
Total | 12,306,306 | |||||||
|
| |||||||
The accompanying Notes to Financial Statements are an integral part of this schedule.
184
Table of Contents
DIVERSIFIED INCOME PLUS PORTFOLIO
Schedule of Investments as of December 31, 2014
| Principal Amount | Long-Term Fixed Income (42.9%) | Value | ||||||
| Consumer Cyclical (1.7%) |
| ||||||
AMC Entertainment, Inc. | ||||||||
| $ | 400,000 | 5.875%, 2/15/2022 | $ | 406,000 | ||||
Brookfield Residential Properties, Inc. | ||||||||
| 570,000 | 6.500%, 12/15/2020f | 595,650 | ||||||
Chrysler Group, LLC | ||||||||
| 530,000 | 8.000%, 6/15/2019 | 557,162 | ||||||
Delphi Corporation | ||||||||
| 132,000 | 6.125%, 5/15/2021 | 143,880 | ||||||
Ford Motor Credit Company, LLC | ||||||||
| 130,000 | 5.000%, 5/15/2018 | 141,251 | ||||||
| 95,000 | 2.597%, 11/4/2019 | 94,489 | ||||||
General Motors Company | ||||||||
| 98,000 | 6.250%, 10/2/2043 | 117,071 | ||||||
General Motors Financial Company, Inc. | ||||||||
| 570,000 | 3.250%, 5/15/2018 | 570,713 | ||||||
| 83,000 | 4.375%, 9/25/2021 | 86,631 | ||||||
Hilton Worldwide Finance, LLC | ||||||||
| 730,000 | 5.625%, 10/15/2021 | 762,850 | ||||||
Jaguar Land Rover Automotive plc | ||||||||
| 200,000 | 4.125%, 12/15/2018f | 201,000 | ||||||
| 125,000 | 4.250%, 11/15/2019f | 125,938 | ||||||
| 420,000 | 5.625%, 2/1/2023f | 442,050 | ||||||
L Brands, Inc. | ||||||||
| 570,000 | 5.625%, 2/15/2022 | 612,750 | ||||||
Lennar Corporation | ||||||||
| 410,000 | 12.250%, 6/1/2017 | 487,900 | ||||||
| 160,000 | 4.125%, 12/1/2018 | 158,400 | ||||||
Macy’s Retail Holdings, Inc. | ||||||||
| 176,000 | 7.450%, 7/15/2017 | 200,093 | ||||||
Royal Caribbean Cruises, Ltd. | ||||||||
| 750,000 | 5.250%, 11/15/2022 | 787,500 | ||||||
Toll Brothers Finance Corporation | ||||||||
| 124,000 | 4.000%, 12/31/2018 | 124,620 | ||||||
TRW Automotive, Inc. | ||||||||
| 80,000 | 7.250%, 3/15/2017f | 88,400 | ||||||
Wynn Las Vegas, LLC | ||||||||
| 570,000 | 5.375%, 3/15/2022 | 578,550 | ||||||
|
| |||||||
Total | 7,282,898 | |||||||
|
| |||||||
| Consumer Non Cyclical (2.3%) |
| ||||||
Actavis Funding SCS | ||||||||
| 95,000 | 4.850%, 6/15/2044 | 96,400 | ||||||
Altria Group, Inc. | ||||||||
| 114,000 | 9.700%, 11/10/2018 | 144,758 | ||||||
Aviv Healthcare Properties, LP | ||||||||
| 400,000 | 6.000%, 10/15/2021 | 416,000 | ||||||
CareFusion Corporation | ||||||||
| 45,000 | 1.450%, 5/15/2017 | 44,682 | ||||||
ConAgra Foods, Inc. | ||||||||
| 127,000 | 2.100%, 3/15/2018 | 126,588 | ||||||
Cott Beverages, Inc. | ||||||||
| 770,000 | 5.375%, 7/1/2022f | 706,475 | ||||||
CVS Health Corporation | ||||||||
| 64,000 | 2.250%, 12/5/2018 | 64,573 | ||||||
Endo Finance LLC & Endo Finco, Inc. | ||||||||
| 160,000 | 7.000%, 7/15/2019f | 167,000 | ||||||
| 410,000 | 7.000%, 12/15/2020f | 430,500 | ||||||
Envision Healthcare Corporation | ||||||||
| 750,000 | 5.125%, 7/1/2022f | 744,375 | ||||||
Forest Laboratories, Inc. | ||||||||
| 97,000 | 4.375%, 2/1/2019f | 102,468 | ||||||
Hawk Acquisition Sub, Inc. | ||||||||
| 570,000 | 4.250%, 10/15/2020 | 575,700 | ||||||
HCA, Inc. | ||||||||
| 575,000 | 3.750%, 3/15/2019 | 575,719 | ||||||
Hospira, Inc. | ||||||||
| 560,000 | 5.200%, 8/12/2020 | 600,783 | ||||||
IMS Health, Inc. | ||||||||
| 320,000 | 6.000%, 11/1/2020f | 329,600 | ||||||
JBS Finance II, Ltd. | ||||||||
| 730,000 | 8.250%, 1/29/2018* | 746,425 | ||||||
JBS USA, LLC | ||||||||
| 390,000 | 5.875%, 7/15/2024f | 383,175 | ||||||
Lorillard Tobacco Company | ||||||||
| 129,000 | 8.125%, 6/23/2019 | 156,390 | ||||||
Medco Health Solutions, Inc. | ||||||||
| 100,000 | 7.125%, 3/15/2018 | 115,456 | ||||||
Medtronic, Inc. | ||||||||
| 190,000 | 4.375%, 3/15/2035f | 201,563 | ||||||
Mondelez International, Inc. | ||||||||
| 86,000 | 2.250%, 2/1/2019 | 85,647 | ||||||
Ortho-Clinical Diagnostics, Inc. | ||||||||
| 750,000 | 6.625%, 5/15/2022f | 674,062 | ||||||
Pernod Ricard SA | ||||||||
| 64,000 | 5.750%, 4/7/2021f | 73,515 | ||||||
SABMiller plc | ||||||||
| 48,000 | 6.500%, 7/15/2018f | 54,800 | ||||||
Safeway, Inc. | ||||||||
| 37,000 | 3.400%, 12/1/2016 | 37,588 | ||||||
Spectrum Brands Escrow Corporation | ||||||||
| 570,000 | 6.375%, 11/15/2020 | 594,225 | ||||||
Tenet Healthcare Corporation | ||||||||
| 730,000 | 8.125%, 4/1/2022 | 815,775 | ||||||
Thermo Fisher Scientific, Inc. | ||||||||
| 128,000 | 2.400%, 2/1/2019 | 128,191 | ||||||
Tyson Foods, Inc. | ||||||||
| 98,000 | 4.500%, 6/15/2022 | 106,103 | ||||||
Valeant Pharmaceuticals International | ||||||||
| 85,000 | 6.875%, 12/1/2018f | 87,677 | ||||||
VPII Escrow Corporation | ||||||||
| 410,000 | 7.500%, 7/15/2021f | 442,800 | ||||||
|
| |||||||
Total | 9,829,013 | |||||||
|
| |||||||
| Energy (1.8%) |
| ||||||
Buckeye Partners, LP | ||||||||
| 98,000 | 2.650%, 11/15/2018 | 96,524 | ||||||
Calumet Specialty Products Partners, LP | ||||||||
| 400,000 | 6.500%, 4/15/2021f | 356,000 | ||||||
Chaparral Energy, Inc. | ||||||||
| 400,000 | 7.625%, 11/15/2022 | 262,000 | ||||||
CNPC General Capital, Ltd. | ||||||||
| 123,000 | 2.750%, 4/19/2017f | 124,426 | ||||||
Concho Resources, Inc. | ||||||||
| 570,000 | 5.500%, 10/1/2022 | 575,700 | ||||||
The accompanying Notes to Financial Statements are an integral part of this schedule.
185
Table of Contents
DIVERSIFIED INCOME PLUS PORTFOLIO
Schedule of Investments as of December 31, 2014
| Principal Amount | Long-Term Fixed Income (42.9%) | Value | ||||||
| Energy (1.8%) - continued |
| ||||||
El Paso, LLC | ||||||||
| $ | 80,000 | 7.800%, 8/1/2031 | $ | 97,410 | ||||
Enbridge Energy Partners, LP | ||||||||
| 810,000 | 8.050%, 10/1/2037 | 878,850 | ||||||
Energy Transfer Partners, LP | ||||||||
| 62,000 | 6.700%, 7/1/2018 | 69,718 | ||||||
Energy XXI Gulf Coast, Inc. | ||||||||
| 770,000 | 7.500%, 12/15/2021 | 415,800 | ||||||
Ensco plc | ||||||||
| 83,000 | 4.500%, 10/1/2024 | 80,674 | ||||||
Enterprise Products Operating, LLC | ||||||||
| 83,000 | 2.550%, 10/15/2019 | 82,164 | ||||||
EQT Corporation | ||||||||
| 60,000 | 5.150%, 3/1/2018 | 64,096 | ||||||
| 62,000 | 8.125%, 6/1/2019 | 74,746 | ||||||
EQT Midstream Partners, LP | ||||||||
| 98,000 | 4.000%, 8/1/2024 | 97,046 | ||||||
Hess Corporation | ||||||||
| 95,000 | 8.125%, 2/15/2019 | 113,030 | ||||||
Kinder Morgan, Inc. | ||||||||
| 95,000 | 5.300%, 12/1/2034 | 96,430 | ||||||
Linn Energy, LLC | ||||||||
| 570,000 | 6.250%, 11/1/2019 | 481,650 | ||||||
Marathon Petroleum Corporation | ||||||||
| 75,000 | 3.625%, 9/15/2024 | 73,500 | ||||||
MEG Energy Corporation | ||||||||
| 160,000 | 6.500%, 3/15/2021f | 146,000 | ||||||
| 410,000 | 6.375%, 1/30/2023f | 365,925 | ||||||
Offshore Group Investment, Ltd. | ||||||||
| 570,000 | 7.500%, 11/1/2019 | 424,650 | ||||||
Petrobras Global Finance BV | ||||||||
| 145,000 | 2.000%, 5/20/2016 | 138,497 | ||||||
Plains All American Pipeline, LP | ||||||||
| 94,000 | 3.600%, 11/1/2024 | 92,281 | ||||||
Regency Energy Partners, LP | ||||||||
| 730,000 | 5.000%, 10/1/2022 | 689,850 | ||||||
Rosetta Resources, Inc. | ||||||||
| 550,000 | 5.875%, 6/1/2022 | 495,000 | ||||||
Sabine Pass Liquefaction, LLC | ||||||||
| 730,000 | 5.750%, 5/15/2024 | 716,312 | ||||||
Suncor Energy, Inc. | ||||||||
| 86,000 | 6.100%, 6/1/2018 | 96,467 | ||||||
| 75,000 | 3.600%, 12/1/2024 | 74,112 | ||||||
Transocean, Inc. | ||||||||
| 120,000 | 6.000%, 3/15/2018 | 115,423 | ||||||
Weatherford International, Ltd. | ||||||||
| 80,000 | 6.000%, 3/15/2018 | 85,401 | ||||||
| 62,000 | 9.625%, 3/1/2019 | 73,537 | ||||||
Williams Companies, Inc. | ||||||||
| 98,000 | 3.700%, 1/15/2023 | 88,012 | ||||||
|
| |||||||
Total | 7,641,231 | |||||||
|
| |||||||
| Financials (8.0%) |
| ||||||
Abbey National Treasury Services plc | ||||||||
| 64,000 | 3.050%, 8/23/2018 | 66,260 | ||||||
ABN AMRO Bank NV | ||||||||
| 132,000 | 2.500%, 10/30/2018f | 133,322 | ||||||
Aegon NV | ||||||||
| 720,000 | 2.549%, 7/29/2049d,h | 594,000 | ||||||
AGI Life Holdings, Inc. | ||||||||
| $800,000 | 7.570%, 12/1/2045* | 1,057,156 | ||||||
Ally Financial, Inc. | ||||||||
| 600,000 | 3.750%, 11/18/2019 | 591,000 | ||||||
American Express Company | ||||||||
| 750,000 | 6.800%, 9/1/2066 | 785,625 | ||||||
Aviation Capital Group Corporation | ||||||||
| 96,000 | 3.875%, 9/27/2016f | 98,417 | ||||||
Banco de Brasil SA | ||||||||
| 1,140,000 | 9.000%, 12/31/2049f,h | 1,060,200 | ||||||
Bank of America Corporation | ||||||||
| 164,000 | 5.700%, 5/2/2017 | 177,285 | ||||||
| 148,000 | 5.650%, 5/1/2018 | 164,424 | ||||||
| 380,000 | 6.250%, 9/29/2049h | 375,606 | ||||||
| 90,000 | 8.000%, 12/29/2049h | 96,637 | ||||||
Bank of New York Mellon Corporation | ||||||||
| 480,000 | 4.500%, 12/31/2049h | 442,500 | ||||||
Barclays Bank plc | ||||||||
| 100,000 | 5.140%, 10/14/2020 | 107,549 | ||||||
BBVA Banco Continental SA | ||||||||
| 117,000 | 2.250%, 7/29/2016f | 116,708 | ||||||
BBVA International Preferred SA Unipersonal | ||||||||
| 1,030,000 | 5.919%, 12/29/2049h | 1,048,334 | ||||||
BNP Paribas SA | ||||||||
| 775,000 | 5.186%, 6/29/2049f,h | 775,000 | ||||||
BPCE SA | ||||||||
| 375,000 | 5.150%, 7/21/2024f | 386,427 | ||||||
Citigroup, Inc. | ||||||||
| 97,000 | 1.850%, 11/24/2017 | 96,889 | ||||||
| 128,000 | 8.500%, 5/22/2019 | 159,497 | ||||||
| 95,000 | 3.750%, 6/16/2024 | 97,019 | ||||||
Cooperative Central Raiffeisen- Boerenleenbank BA | ||||||||
| 525,000 | 11.000%, 12/29/2049f,h | 675,675 | ||||||
Credit Agricole SA | ||||||||
| 380,000 | 6.625%, 9/29/2049f,h | 368,315 | ||||||
Credit Suisse Group AG | ||||||||
| 400,000 | 7.500%, 12/11/2049f,h | 416,000 | ||||||
| 760,000 | 6.250%, 12/29/2049f,h | 730,930 | ||||||
CyrusOne, LP | ||||||||
| 570,000 | 6.375%, 11/15/2022 | 608,475 | ||||||
DDR Corporation | ||||||||
| 86,000 | 9.625%, 3/15/2016 | 94,407 | ||||||
Denali Borrower, LLC | ||||||||
| 760,000 | 5.625%, 10/15/2020f | 790,780 | ||||||
Discover Bank | ||||||||
| 43,000 | 8.700%, 11/18/2019 | 53,176 | ||||||
Discover Financial Services | ||||||||
| 90,000 | 6.450%, 6/12/2017 | 99,440 | ||||||
Duke Realty, LP | ||||||||
| 95,000 | 4.375%, 6/15/2022 | 100,563 | ||||||
Fifth Third Bancorp | ||||||||
| 575,000 | 4.900%, 12/29/2049h | 556,313 | ||||||
| 600,000 | 5.100%, 12/31/2049h | 555,750 | ||||||
GE Capital Trust I | ||||||||
| 380,000 | 6.375%, 11/15/2067 | 409,280 | ||||||
General Electric Capital Corporation | ||||||||
| 800,000 | 6.250%, 12/15/2049h | 871,000 | ||||||
Genworth Financial, Inc. | ||||||||
| 121,000 | 7.700%, 6/15/2020 | 120,694 | ||||||
The accompanying Notes to Financial Statements are an integral part of this schedule.
186
Table of Contents
DIVERSIFIED INCOME PLUS PORTFOLIO
Schedule of Investments as of December 31, 2014
| Principal Amount | Long-Term Fixed Income (42.9%) | Value | ||||||
| Financials (8.0%) - continued |
| ||||||
Goldman Sachs Group, Inc. | ||||||||
| $ | 45,000 | 6.250%, 9/1/2017 | $ | 50,069 | ||||
| 43,000 | 2.375%, 1/22/2018 | 43,434 | ||||||
| 88,000 | 2.625%, 1/31/2019 | 88,537 | ||||||
| 122,000 | 7.500%, 2/15/2019 | 145,114 | ||||||
Hartford Financial Services Group, Inc. | ||||||||
| 106,000 | 6.000%, 1/15/2019 | 120,215 | ||||||
HBOS plc | ||||||||
| 116,000 | 6.750%, 5/21/2018f | 129,282 | ||||||
HCP, Inc. | ||||||||
| 64,000 | 3.750%, 2/1/2019 | 67,171 | ||||||
Health Care REIT, Inc. | ||||||||
| 110,000 | 4.700%, 9/15/2017 | 118,189 | ||||||
HSBC Holdings plc | ||||||||
| 750,000 | 5.625%, 12/29/2049h | 752,625 | ||||||
| 380,000 | 6.375%, 12/29/2049h | 383,800 | ||||||
Icahn Enterprises, LP | ||||||||
| 770,000 | 6.000%, 8/1/2020 | 793,254 | ||||||
ILFC E-Capital Trust II | ||||||||
| 1,575,000 | 6.250%, 12/21/2065d,f | 1,519,875 | ||||||
ING Capital Funding Trust III | ||||||||
| 819,000 | 3.855%, 12/29/2049d,h | 816,952 | ||||||
International Lease Finance Corporation | ||||||||
| 64,000 | 2.191%, 6/15/2016d | 63,920 | ||||||
| 390,000 | 5.875%, 8/15/2022 | 423,150 | ||||||
Antes Sanpaolo SPA | ||||||||
| 41,000 | 3.875%, 1/16/2018 | 42,687 | ||||||
| 100,000 | 3.875%, 1/15/2019 | 103,539 | ||||||
J.P. Morgan Chase & Company | ||||||||
| 88,000 | 6.300%, 4/23/2019 | 102,219 | ||||||
| 95,000 | 3.625%, 5/13/2024 | 97,242 | ||||||
| 166,000 | 3.875%, 9/10/2024 | 166,141 | ||||||
| 77,000 | 7.900%, 4/29/2049h | 82,875 | ||||||
| 750,000 | 6.750%, 8/29/2049h | 791,250 | ||||||
| 190,000 | 5.000%, 12/29/2049h | 185,903 | ||||||
| 200,000 | 6.000%, 12/29/2049h | 197,500 | ||||||
Liberty Mutual Group, Inc. | ||||||||
| 525,000 | 10.750%, 6/15/2058f | 810,399 | ||||||
| 25,000 | 5.000%, 6/1/2021f | 27,233 | ||||||
Lincoln National Corporation | ||||||||
| 770,000 | 6.050%, 4/20/2067 | 770,000 | ||||||
Lloyds Banking Group plc | ||||||||
| 800,000 | 6.413%, 1/29/2049f,h | 852,000 | ||||||
| 865,000 | 5.920%, 9/29/2049f,h | 858,513 | ||||||
MetLife Capital Trust IV | ||||||||
| 823,000 | 7.875%, 12/15/2037f | 1,051,382 | ||||||
MetLife, Inc. | ||||||||
| 400,000 | 6.400%, 12/15/2036 | 446,000 | ||||||
Morgan Stanley | ||||||||
| 87,000 | 6.250%, 8/28/2017 | 96,645 | ||||||
| 64,000 | 4.875%, 11/1/2022 | 67,973 | ||||||
Murray Street Investment Trust I | ||||||||
| 88,000 | 4.647%, 3/9/2017 | 92,875 | ||||||
National City Corporation | ||||||||
| 86,000 | 6.875%, 5/15/2019 | 101,029 | ||||||
Nomura Holdings, Inc. | ||||||||
| 85,000 | 2.750%, 3/19/2019 | 85,931 | ||||||
Prudential Financial, Inc. | ||||||||
| 380,000 | 5.875%, 9/15/2042 | 400,900 | ||||||
| 775,000 | 5.625%, 6/15/2043 | 792,283 | ||||||
QBE Capital Funding III, Ltd. | ||||||||
| 400,000 | 7.250%, 5/24/2041f | 436,000 | ||||||
RBS Capital Trust III | ||||||||
| 1,000,000 | 2.095%, 9/29/2049d,h | 994,500 | ||||||
Realty Income Corporation | ||||||||
| 78,000 | 2.000%, 1/31/2018 | 78,144 | ||||||
Regions Bank | ||||||||
| 67,000 | 7.500%, 5/15/2018 | 77,780 | ||||||
Reinsurance Group of America, Inc. | ||||||||
| 160,000 | 5.625%, 3/15/2017 | 173,023 | ||||||
Royal Bank of Scotland Group plc | ||||||||
| 82,000 | 1.197%, 3/31/2017d | 82,253 | ||||||
| 83,000 | 5.125%, 5/28/2024 | 84,427 | ||||||
| 375,000 | 7.648%, 8/29/2049h | 436,875 | ||||||
Societe Generale SA | ||||||||
| 124,000 | 5.750%, 4/20/2016f | 129,841 | ||||||
| 760,000 | 6.000%, 12/31/2049f,h | 691,600 | ||||||
| 400,000 | 7.875%, 12/31/2049f,h | 387,500 | ||||||
Swiss RE Capital I, LP | ||||||||
| 823,000 | 6.854%, 5/29/2049f,h | 862,092 | ||||||
Synchrony Financial | ||||||||
| 94,000 | 1.875%, 8/15/2017 | 94,183 | ||||||
| 94,000 | 3.750%, 8/15/2021 | 96,020 | ||||||
Voya Financial, Inc. | ||||||||
| 129,000 | 2.900%, 2/15/2018 | 132,064 | ||||||
| 200,000 | 5.650%, 5/15/2053 | 198,000 | ||||||
Wells Fargo & Company | ||||||||
| 400,000 | 5.900%, 12/29/2049h | 403,000 | ||||||
ZFS Finance USA Trust II | ||||||||
| 977,000 | 6.450%, 12/15/2065f | 1,029,436 | ||||||
|
| |||||||
Total | 35,005,497 | |||||||
|
| |||||||
| Foreign Government (0.2%) |
| ||||||
Mexico Government International Bond | ||||||||
| 930,000 | 4.000%, 10/2/2023 | 964,875 | ||||||
|
| |||||||
Total | 964,875 | |||||||
|
| |||||||
| Mortgage-Backed Securities (4.3%) |
| ||||||
Federal National Mortgage Association Conventional 15-Yr. Pass Through | ||||||||
| 2,000,000 | 3.500%, 1/1/2030c | 2,112,812 | ||||||
Federal National Mortgage Association Conventional 30-Yr. Pass Through | ||||||||
| 1,500,000 | 3.500%, 1/1/2045c | 1,563,633 | ||||||
| 8,650,000 | 4.000%, 1/1/2045c | 9,231,746 | ||||||
| 5,400,000 | 4.500%, 1/1/2045c | 5,861,532 | ||||||
|
| |||||||
Total | 18,769,723 | |||||||
|
| |||||||
| Technology (0.7%) |
| ||||||
Alliance Data Systems Corporation | ||||||||
| 420,000 | 5.375%, 8/1/2022f | 414,750 | ||||||
Amkor Technology, Inc. | ||||||||
| 670,000 | 6.625%, 6/1/2021 | 663,300 | ||||||
First Data Corporation | ||||||||
| 570,000 | 7.375%, 6/15/2019f | 599,925 | ||||||
Freescale Semiconductor, Inc. | ||||||||
| 570,000 | 6.000%, 1/15/2022f | 595,650 | ||||||
The accompanying Notes to Financial Statements are an integral part of this schedule.
187
Table of Contents
DIVERSIFIED INCOME PLUS PORTFOLIO
Schedule of Investments as of December 31, 2014
| Principal Amount | Long-Term Fixed Income (42.9%) | Value | ||||||
| Technology (0.7%) - continued |
| ||||||
Sensata Technologies BV | ||||||||
| $725,000 | 4.875%, 10/15/2023f | $ | 721,375 | |||||
|
| |||||||
Total | 2,995,000 | |||||||
|
| |||||||
| Transportation (0.3%) |
| ||||||
American Airlines Pass Through Trust | ||||||||
| 81,181 | 4.950%, 1/15/2023 | 86,661 | ||||||
Avis Budget Car Rental, LLC | ||||||||
| 770,000 | 5.125%, 6/1/2022 f | 777,700 | ||||||
Burlington Northern Santa Fe, LLC | ||||||||
| 94,000 | 3.400%, 9/1/2024 | 95,716 | ||||||
Delta Air Lines, Inc. | ||||||||
| 63,079 | 4.950%, 5/23/2019 | 67,495 | ||||||
| 53,620 | 4.750%, 5/7/2020 | 57,040 | ||||||
Korea Expressway Corporation | ||||||||
| 123,000 | 1.625%, 4/28/2017f | 122,312 | ||||||
Southwest Airlines Company | ||||||||
| 95,000 | 2.750%, 11/6/2019 | 95,437 | ||||||
United Air Lines, Inc. | ||||||||
| 63,806 | 10.400%, 11/1/2016 | 70,984 | ||||||
|
| |||||||
Total | 1,373,345 | |||||||
|
| |||||||
| U.S. Government and Agencies (0.2%) |
| ||||||
U.S. Treasury Notes | ||||||||
| 1,000,000 | 0.500%, 7/31/2016 | 1,000,469 | ||||||
|
| |||||||
Total | 1,000,469 | |||||||
|
| |||||||
| Utilities (2.3%) |
| ||||||
Access Midstream Partners, LP | ||||||||
| 390,000 | 4.875%, 5/15/2023 | 395,850 | ||||||
AES Corporation | ||||||||
| 390,000 | 7.375%, 7/1/2021 | 440,700 | ||||||
Atlas Pipeline Partners, LP | ||||||||
| 570,000 | 4.750%, 11/15/2021 | 541,500 | ||||||
Calpine Corporation | ||||||||
| 560,000 | 6.000%, 1/15/2022f | 596,400 | ||||||
| 730,000 | 5.375%, 1/15/2023 | 737,300 | ||||||
Commonwealth Edison Company | ||||||||
| 82,000 | 6.950%, 7/15/2018 | 94,782 | ||||||
DCP Midstream Operating, LP | ||||||||
| 129,000 | 2.500%, 12/1/2017 | 128,852 | ||||||
DCP Midstream, LLC | ||||||||
| 300,000 | 5.850%, 5/21/2043f | 291,000 | ||||||
Dynegy Finance I, Inc. | ||||||||
| 700,000 | 7.375%, 11/1/2022f | 712,250 | ||||||
Electricity de France SA | ||||||||
| 1,240,000 | 5.250%, 12/29/2049f,h | 1,271,000 | ||||||
Enel Finance International NV | ||||||||
| 64,000 | 5.125%, 10/7/2019f | 70,717 | ||||||
Enterprise Products Operating, LLC | ||||||||
| 960,000 | 7.034%, 1/15/2068 | 1,053,000 | ||||||
Exelon Generation Company, LLC | ||||||||
| 88,000 | 5.200%, 10/1/2019 | 97,241 | ||||||
MarkWest Energy Partners, LP | ||||||||
| 780,000 | 4.875%, 12/1/2024 | 762,450 | ||||||
MidAmerican Energy Holdings Company | ||||||||
| 88,000 | 5.750%, 4/1/2018 | 98,617 | ||||||
NRG Energy, Inc. | ||||||||
| 390,000 | 6.625%, 3/15/2023 | 405,600 | ||||||
ONEOK Partners, LP | ||||||||
| 62,000 | 2.000%, 10/1/2017 | 61,654 | ||||||
PPL Capital Funding, Inc. | ||||||||
| 159,000 | 1.900%, 6/1/2018 | 158,730 | ||||||
Southern California Edison Company | ||||||||
| 1,700,000 | 6.250%, 8/1/2049h | 1,884,875 | ||||||
TransCanada PipeLines, Ltd. | ||||||||
| 400,000 | 6.350%, 5/15/2067 | 388,000 | ||||||
|
| |||||||
Total | 10,190,518 | |||||||
|
| |||||||
Total Long-Term Fixed Income (cost $183,033,731) | 187,482,239 | |||||||
|
| |||||||
| Shares | Common Stock (32.9%) | |||||||
| Consumer Discretionary (2.8%) |
| ||||||
| 14,750 | Barnes & Noble, Inc.i | 342,495 | ||||||
| 4,000 | Bayerische Motoren Werke AG | 431,674 | ||||||
| 30,400 | Best Buy Company, Inc. | 1,184,992 | ||||||
| 10,500 | Canon Marketing Japan, Inc. | 177,950 | ||||||
| 9,700 | Coach, Inc. | 364,332 | ||||||
| 20,300 | Comcast Corporation | 1,177,603 | ||||||
| 49,400 | Dixons Carphone plc | 356,025 | ||||||
| 16,850 | Dollar Tree, Inc.i | 1,185,903 | ||||||
| 25,200 | EDION Corporation | 176,265 | ||||||
| 7,800 | Gap, Inc. | 328,458 | ||||||
| 19,100 | Hakuhodo Dy Holdings, Inc. | 182,786 | ||||||
| 7,000 | Hennes & Mauritz AB | 290,815 | ||||||
| 6,500 | Hilton Worldwide Holdings, Inc.i | 169,585 | ||||||
| 53,656 | Home Retail Group plc | 172,920 | ||||||
| 22,100 | Honda Motor Company, Ltd. | 648,376 | ||||||
| 57,393 | ITV plc | 191,447 | ||||||
| 10,050 | Kohl’s Corporation | 613,452 | ||||||
| 21 | Lear Corporation | 2,060 | ||||||
| 16,900 | Lowe’s Companies, Inc. | 1,162,720 | ||||||
| 84,000 | Luk Fook Holdings International, Ltd. | 315,011 | ||||||
| 5,150 | Madison Square Garden Companyi | 387,589 | ||||||
| 2,200 | RTL Group SA | 209,784 | ||||||
| 13,400 | Ruth’s Hospitality Group, Inc. | 201,000 | ||||||
| 25,600 | Sekisui House, Ltd. | 336,844 | ||||||
| 84,000 | SJM Holdings, Ltd. | 132,795 | ||||||
| 48,400 | Sky Network Television, Ltd. | 227,222 | ||||||
| 11,600 | Stage Stores, Inc. | 240,120 | ||||||
| 16,500 | Sumitomo Forestry Company, Ltd. | 161,363 | ||||||
| 24,800 | Suzuki Motor Corporation | 743,191 | ||||||
|
| |||||||
Total | 12,114,777 | |||||||
|
| |||||||
| Consumer Staples (1.7%) |
| ||||||
| 12,400 | Associated British Foods plc | 606,226 | ||||||
| 3,239 | British American Tobacco plc | 175,525 | ||||||
| 20,400 | Coca-Cola Company | 861,288 | ||||||
| 8,800 | Coca-Cola Enterprises, Inc. | 389,136 | ||||||
| 12,950 | CVS Health Corporation | 1,247,214 | ||||||
| 17,973 | Imperial Tobacco Group plc | 791,164 | ||||||
| 11,100 | Japan Tobacco, Inc. | 305,503 | ||||||
| 3,800 | Nestle SA | 277,024 | ||||||
| 56,800 | Rite Aid Corporationi | 427,136 | ||||||
| 13,900 | Tyson Foods, Inc. | 557,251 | ||||||
| 6,100 | Wal-Mart Stores, Inc. | 523,868 | ||||||
| 6,728 | Wesfarmers, Ltd. | 227,794 | ||||||
| 10,050 | WhiteWave Foods Companyi | 351,650 | ||||||
| 9,050 | Whole Foods Market, Inc. | 456,301 | ||||||
The accompanying Notes to Financial Statements are an integral part of this schedule.
188
Table of Contents
DIVERSIFIED INCOME PLUS PORTFOLIO
Schedule of Investments as of December 31, 2014
| Shares | Common Stock (32.9%) | Value | ||||||
| Consumer Staples (1.7%) - continued |
| ||||||
| 104,000 | Wilmar International, Ltd. | $ | 253,410 | |||||
|
| |||||||
Total | 7,450,490 | |||||||
|
| |||||||
| Energy (1.5%) |
| ||||||
| 137,680 | BP plc | 873,936 | ||||||
| 23,461 | BW LPG, Ltd. | 163,399 | ||||||
| 5,350 | Cabot Oil & Gas Corporation | 158,413 | ||||||
| 10,500 | CAT Oil AG | 185,623 | ||||||
| 32,300 | Eni SPA | 565,784 | ||||||
| 12,050 | EOG Resources, Inc. | 1,109,443 | ||||||
| 24,900 | ERG SPA | 278,856 | ||||||
| 28,700 | Halliburton Company | 1,128,771 | ||||||
| 45,700 | Patterson-UTI Energy, Inc. | 758,163 | ||||||
| 28,400 | Pioneer Energy Services Corporationi | 157,336 | ||||||
| 19,957 | Royal Dutch Shell plc, Class B | 689,537 | ||||||
| 7,450 | Southwestern Energy Companyi | 203,311 | ||||||
| 10,300 | Total SA | 527,691 | ||||||
| 5,100 | Whiting Petroleum Corporationi | 168,300 | ||||||
|
| |||||||
Total | 6,968,563 | |||||||
|
| |||||||
| Financials (12.4%) |
| ||||||
| 500 | Acadia Realty Trust | 16,015 | ||||||
| 6,700 | Aflac, Inc. | 409,303 | ||||||
| 700 | Agree Realty Corporation | 21,763 | ||||||
| 3,700 | Alexandria Real Estate Equities, Inc. | 328,338 | ||||||
| 4,100 | Allianz SE | 679,069 | ||||||
| 21,400 | AmTrust Financial Services, Inc.j | 1,203,750 | ||||||
| 5,700 | Apartment Investment & Management Company | 211,755 | ||||||
| 200,000 | Apollo Investment Corporation | 1,484,000 | ||||||
| 115,400 | Ares Capital Corporation | 1,800,817 | ||||||
| 7,684 | Australia & New Zealand Banking Group, Ltd. | 199,937 | ||||||
| 3,100 | AvalonBay Communities, Inc. | 506,509 | ||||||
| 7,600 | AXA SA | 175,128 | ||||||
| 43,400 | Banco Santander SA | 364,262 | ||||||
| 97,200 | Bank Leumi Le-lsrael BMi | 332,056 | ||||||
| 60,400 | Bank ofAmerica Corporation | 1,080,556 | ||||||
| 4,310 | Bank of Nova Scotia | 245,994 | ||||||
| 4,200 | BioMed Realty Trust, Inc. | 90,468 | ||||||
| 4,200 | Boston Properties, Inc. | 540,498 | ||||||
| 8,800 | Brixmor Property Group, Inc. | 218,592 | ||||||
| 2,400 | Camden Property Trust | 177,216 | ||||||
| 6,900 | Cash America International, Inc. | 156,078 | ||||||
| 18,150 | Charles Schwab Corporation | 547,948 | ||||||
| 52,000 | Cheung Kong Holdings, Ltd. | 870,835 | ||||||
| 22,000 | Citigroup, Inc. | 1,190,420 | ||||||
| 414 | City Office REIT, Inc. | 5,299 | ||||||
| 4,900 | CubeSmart | 108,143 | ||||||
| 18,000 | DBS Group Holdings, Ltd. | 278,664 | ||||||
| 1,800 | Digital Realty Trust, Inc. | 119,340 | ||||||
| 11,250 | Discover Financial Services | 736,763 | ||||||
| 22,100 | Duke Realty Corporation | 446,420 | ||||||
| 8,200 | Employers Holdings, Inc. | 192,782 | ||||||
| 7,266 | Enova International, Inc.i | 161,741 | ||||||
| 2,800 | EPR Properties | 161,364 | ||||||
| 2,100 | Equity Lifestyle Properties, Inc. | 108,255 | ||||||
| 5,700 | Equity Residential | 409,488 | ||||||
| 3,100 | Erie Indemnity Company | 281,387 | ||||||
| 1,000 | Essex Property Trust, Inc. | 206,600 | ||||||
| 22,000 | F.N.B. Corporation | 293,040 | ||||||
| 16,050 | First Financial Bancorp | 298,370 | ||||||
| 21,600 | Forestar Real Estate Group, Inc.j | 332,640 | ||||||
| 12,667 | General Growth Properties, Inc. | 356,323 | ||||||
| 1,000 | Geo Group, Inc. | 40,360 | ||||||
| 120,000 | Golub Capital BDC, Inc. | 2,151,600 | ||||||
| 6,400 | Hancock Holding Company | 196,480 | ||||||
| 25,800 | Hang Seng Bank, Ltd. | 428,808 | ||||||
| 9,700 | HCP, Inc. | 427,091 | ||||||
| 2,100 | Health Care REIT, Inc. | 158,907 | ||||||
| 8,400 | Healthcare Trust of America, Inc. | 226,296 | ||||||
| 5,000 | Highwoods Properties, Inc. | 221,400 | ||||||
| 6,600 | Horace Mann Educators Corporation | 218,988 | ||||||
| 20,600 | Host Hotels & Resorts, Inc. | 489,662 | ||||||
| 104,867 | HSBC Holdings plc | 990,970 | ||||||
| 35,700 | Huntington Bancshares, Inc. | 375,564 | ||||||
| 9,100 | iShares Intermediate Credit Bond ETF | 994,903 | ||||||
| 14,400 | iShares J.P. Morgan USD Emerging Markets Bond ETF | 1,579,824 | ||||||
| 14,400 | iShares MSCI Emerging Markets Minimum Volatility ETF | 815,472 | ||||||
| 27,000 | iShares S&P U.S. Preferred Stock Index Fund | 1,064,880 | ||||||
| 31,350 | KeyCorp | 435,765 | ||||||
| 21,100 | Kimco Realty Corporation | 530,454 | ||||||
| 300 | LaSalle Hotel Properties | 12,141 | ||||||
| 6,850 | Lazard, Ltd. | 342,705 | ||||||
| 22,700 | MetLife, Inc. | 1,227,843 | ||||||
| 3,600 | Mid-America Apartment Communities, Inc. | 268,848 | ||||||
| 1,500 | Muenchener Rueckversicherungs- Gesellschaft AG | 298,707 | ||||||
| 23,100 | National Australia Bank, Ltd. | 629,943 | ||||||
| 1,600 | National Health Investors, Inc. | 111,936 | ||||||
| 4,100 | National Retail Properties, Inc. | 161,417 | ||||||
| 12,300 | OFG Bancorp | 204,795 | ||||||
| 1,100 | Omega Healthcare Investors, Inc. | 42,977 | ||||||
| 1,700 | Parkway Properties, Inc. | 31,263 | ||||||
| 7,750 | Principal Financial Group, Inc. | 402,535 | ||||||
| 12,700 | Prologis, Inc. | 546,481 | ||||||
| 9,200 | Prudential Financial, Inc. | 832,232 | ||||||
| 2,800 | Public Storage, Inc. | 517,580 | ||||||
| 22,600 | Regions Financial Corporation | 238,656 | ||||||
| 6,500 | RLJ Lodging Trust | 217,945 | ||||||
| 19,164 | Royal Bank of Canada | 1,323,566 | ||||||
| 2,400 | Sabra Healthcare REIT, Inc. | 72,888 | ||||||
| 5,200 | Simon Property Group, Inc. | 946,972 | ||||||
| 93,000 | Solar Capital, Ltd. | 1,674,930 | ||||||
| 703 | Sovran Self Storage, Inc. | 61,316 | ||||||
| 111,000 | SPDR Euro Stoxx 50 ETF | 4,091,460 | ||||||
| 20,000 | Spirit Realty Capital, Inc. | 237,800 | ||||||
| 706 | Store Capital Corporation | 15,257 | ||||||
| 62,824 | Summit Hotel Properties, Inc. | 781,531 | ||||||
| 3,000 | Swiss Re AG | 251,315 | ||||||
| 2,350 | T. Rowe Price Group, Inc. | 201,771 | ||||||
| 3,864 | Tanger Factory Outlet Centers, Inc. | 142,813 | ||||||
| 1,166 | Tubman Centers, Inc. | 89,106 | ||||||
| 850 | Terreno Realty Corporation | 17,536 | ||||||
| 18,897 | Toronto-Dominion Bankj | 902,886 | ||||||
| 232,750 | Two Harbors Investment Corporation | 2,332,155 | ||||||
| 17,050 | U.S. Bancorp | 766,397 | ||||||
| 1,700 | UDR, Inc. | 52,394 | ||||||
| 25,000 | Vanguard High Dividend Yield ETF | 1,718,750 | ||||||
| 7,500 | Ventas, Inc. | 537,750 | ||||||
| 4,800 | Vornado Realty Trust | 565,008 | ||||||
| 7,100 | W.R. Berkley Corporation | 363,946 | ||||||
| 27,150 | Wells Fargo & Company | 1,488,363 | ||||||
| 2,700 | Zurich Insurance Group AGi | 843,756 | ||||||
|
| |||||||
Total | 54,263,020 | |||||||
|
| |||||||
The accompanying Notes to Financial Statements are an integral part of this schedule.
189
Table of Contents
DIVERSIFIED INCOME PLUS PORTFOLIO
Schedule of Investments as of December 31, 2014
| Shares | Common Stock (32.9%) | Value | ||||||
| Health Care (4.2%) |
| ||||||
| 5,700 | Abaxis, Inc. | $ | 323,931 | |||||
| 3,200 | AbbVie, Inc. | 209,408 | ||||||
| 2,500 | Actelion, Ltd. | 287,803 | ||||||
| 11,550 | Aetna, Inc. | 1,025,986 | ||||||
| 5,450 | AmerisourceBergen Corporation | 491,372 | ||||||
| 12,854 | AMN Healthcare Services, Inc.i | 251,938 | ||||||
| 6,400 | Anthem, Inc. | 804,288 | ||||||
| 20,400 | Astellas Pharmaceutical, Inc. | 284,011 | ||||||
| 3,000 | Bayer AG | 408,926 | ||||||
| 2,550 | Biogen Idec, Inc.i | 865,597 | ||||||
| 2,829 | Boiron SA | 239,004 | ||||||
| 39,050 | Boston Scientific Corporationi | 517,413 | ||||||
| 13,250 | Bruker Corporationi | 259,965 | ||||||
| 5,450 | Centene Corporationi | 565,983 | ||||||
| 5,100 | CSL, Ltd. | 358,253 | ||||||
| 3,200 | Cyberonics, Inc.i | 178,176 | ||||||
| 5,950 | Eli Lilly and Company | 410,491 | ||||||
| 45,689 | Fisher & Paykel Healthcare Corporation, Ltd. | 222,748 | ||||||
| 14,150 | Gilead Sciences, Inc.i | 1,333,779 | ||||||
| 14,071 | GlaxoSmithKline plc | 301,874 | ||||||
| 9,150 | HCA Holdings, Inc.i | 671,519 | ||||||
| 28,300 | Healthways, Inc.i | 562,604 | ||||||
| 9,461 | ICON plci | 482,416 | ||||||
| 9,950 | Johnson & Johnson | 1,040,471 | ||||||
| 1,700 | Lonza Group AG | 191,406 | ||||||
| 1,650 | McKesson Corporation | 342,507 | ||||||
| 14,850 | Merck & Company, Inc. | 843,332 | ||||||
| 15,900 | Otsuka Holdings Company, Ltd. | 476,701 | ||||||
| 9,600 | PAREXEL International Corporationi | 533,376 | ||||||
| 53,100 | Pfizer, Inc. | 1,654,065 | ||||||
| 5,550 | Quintiles Transnational Holdings, Inc.i | 326,729 | ||||||
| 13,300 | Recordati SPA | 206,195 | ||||||
| 1,300 | Roche Holding AG - BR | 350,248 | ||||||
| 1,100 | Roche Holding AG - Genusschein | 298,036 | ||||||
| 11,900 | Sagent Pharmaceuticals, Inc.i | 298,809 | ||||||
| 3,900 | Sanofi | 355,566 | ||||||
| 14,100 | Sonic Healthcare, Ltd. | 212,128 | ||||||
|
| |||||||
Total | 18,187,054 | |||||||
|
| |||||||
| Industrials (4.1%) |
| ||||||
| 7,700 | Abertis Infrastructures SA | 152,690 | ||||||
| 180,500 | Alerian MLP ETF | 3,162,360 | ||||||
| 9,700 | Allison Transmission Holdings, Inc. | 328,830 | ||||||
| 8,400 | Caterpillar, Inc. | 768,852 | ||||||
| 11,100 | COMSYS Holdings Corporation | 151,845 | ||||||
| 17,100 | Con-way, Inc. | 840,978 | ||||||
| 16,500 | Delta Air Lines, Inc. | 811,635 | ||||||
| 7,800 | easyJet plc | 201,857 | ||||||
| 17,800 | Flowserve Corporation | 1,064,974 | ||||||
| 52,850 | General Electric Company | 1,335,520 | ||||||
| 44,000 | Hutchison Whampoa, Ltd. | 502,989 | ||||||
| 42,200 | ITOCHU Corporation | 450,489 | ||||||
| 6,100 | Jacobs Engineering Group, Inc.i | 272,609 | ||||||
| 18,700 | KAR Auction Services, Inc. | 647,955 | ||||||
| 10,800 | KONE OYJ | 491,701 | ||||||
| 3,250 | Lockheed Martin Corporation | 625,853 | ||||||
| 4,200 | Mabuchi Motor Company, Ltd. | 166,708 | ||||||
| 18,300 | Meritor, Inc.i | 277,245 | ||||||
| 16,500 | Pentair, Ltd. | 1,095,930 | ||||||
| 26,800 | Performant Financial Corporationi | 178,220 | ||||||
| 9,550 | Quad/Graphics, Inc. | 219,268 | ||||||
| 6,300 | Safran SA | 388,679 | ||||||
| 7,500 | Siemens AG | 841,531 | ||||||
| 29,150 | Southwest Airlines Company | 1,233,628 | ||||||
| 8,368 | Stantec, Inc. | 229,980 | ||||||
| 40,000 | Toda Corporation | 157,760 | ||||||
| 23,000 | TOTO, Ltd. | 267,552 | ||||||
| 16,751 | Wajax Corporation | 443,646 | ||||||
| 4,600 | Woodward, Inc. | 226,458 | ||||||
| 13,024 | WS Atkins plc | 275,830 | ||||||
|
| |||||||
Total | 17,813,572 | |||||||
|
| |||||||
| Information Technology (3.3%) |
| ||||||
| 2,800 | Accenture plc | 250,068 | ||||||
| 18,000 | Akamai Technologies, Inc.i | 1,133,280 | ||||||
| 16,250 | Aspen Technology, Inc.i | 569,075 | ||||||
| 27,350 | Broadcom Corporation | 1,185,076 | ||||||
| 85,700 | Brocade Communications Systems, Inc. | 1,014,688 | ||||||
| 6,190 | CGI Group, Inc.i | 235,974 | ||||||
| 30,900 | Cirrus Logic, Inc.i | 728,313 | ||||||
| 42,700 | Cisco Systems, Inc. | 1,187,700 | ||||||
| 5,000 | Computer Sciences Corporation | 315,250 | ||||||
| 1,028 | Constellation Software, Inc. | 305,657 | ||||||
| 31,850 | Corning, Inc. | 730,320 | ||||||
| 11,450 | Electronic Arts, Inc.i | 538,322 | ||||||
| 39,600 | EMC Corporation | 1,177,704 | ||||||
| 1,300 | F5 Networks, Inc.i | 169,605 | ||||||
| 20,100 | FUJIFILM Holdings NPV | 613,323 | ||||||
| 51,300 | Global Cash Access Holdings, Inc.i | 366,795 | ||||||
| 9,600 | Hoya Corporation | 324,718 | ||||||
| 17,100 | Juniper Networks, Inc. | 381,672 | ||||||
| 5,500 | Lexmark International, Inc. | 226,985 | ||||||
| 23,200 | Marvell Technology Group, Ltd. | 336,400 | ||||||
| 5,943 | Melexis NV | 268,918 | ||||||
| 11,300 | NetApp, Inc. | 468,385 | ||||||
| 3,683 | Newport Corporationi | 70,382 | ||||||
| 3,650 | NXP Semiconductors NV.i | 278,860 | ||||||
| 11,600 | Pegasystems, Inc. | 240,932 | ||||||
| 13,800 | Skyworks Solutions, Inc. | 1,003,398 | ||||||
| 19,700 | Vishay Intertechnology, Inc. | 278,755 | ||||||
|
| |||||||
Total | 14,400,555 | |||||||
|
| |||||||
| Materials (1.0%) |
| ||||||
| 45,000 | Acacia Mining plc | 178,280 | ||||||
| 413,670 | Centamin plc | 379,827 | ||||||
| 16,350 | Dow Chemical Company | 745,723 | ||||||
| 16,500 | James Hardie Industries plc | 176,142 | ||||||
| 192,000 | Kobe Steel, Ltd. | 330,720 | ||||||
| 10,900 | LyondellBasell Industries NV | 865,351 | ||||||
| 3,100 | Nitto Denko Corporation | 173,214 | ||||||
| 13,205 | Rio Tinto plc | 608,713 | ||||||
| 6,550 | Southern Copper Corporation | 184,710 | ||||||
| 5,500 | Voestalpine AG | 217,323 | ||||||
| 7,350 | Westlake Chemical Corporation | 449,011 | ||||||
|
| |||||||
Total | 4,309,014 | |||||||
|
| |||||||
| Telecommunications Services (1.0%) |
| ||||||
| 505,200 | Bezeq Israel Telecommunication Corporation, Ltd. | 896,132 | ||||||
| 88,834 | BT Group plc | 552,554 | ||||||
| 18,600 | KDDI Corporation | 1,168,528 | ||||||
| 17,600 | Nippon Telegraph & Telephone Corporation | 899,054 | ||||||
| 233,000 | Singapore Telecommunications, Ltd. | 683,926 | ||||||
| 60,700 | Vonage Holdings Corporationi | 231,267 | ||||||
|
| |||||||
Total | 4,431,461 | |||||||
|
| |||||||
The accompanying Notes to Financial Statements are an integral part of this schedule.
190
Table of Contents
DIVERSIFIED INCOME PLUS PORTFOLIO
Schedule of Investments as of December 31, 2014
| Shares | Common Stock (32.9%) | Value | ||||||
| Utilities (0.9%) |
| ||||||
| 237,500 | A2A SPA | $ | 240,656 | |||||
| 242,000 | Electricidade de Portugal SA | 938,392 | ||||||
| 20,100 | Endesa SA | 402,389 | ||||||
| 57,200 | Enel SPA | 254,971 | ||||||
| 16,000 | Fortum OYJ | 347,386 | ||||||
| 13,200 | Gas Natural SDG SA | 331,593 | ||||||
| 28,100 | GDF Suez | 655,267 | ||||||
| 75,000 | Iberdrola SA | 505,557 | ||||||
| 11,100 | Verbund AG | 205,561 | ||||||
|
| |||||||
Total | 3,881,772 | |||||||
|
| |||||||
Total Common Stock (cost $139,767,121) | 143,820,278 | |||||||
|
| |||||||
Preferred Stock (4.6%) | ||||||||
| Financials (4.3%) |
| ||||||
| 30,000 | Affiliated Managers Group, Inc., 5.250% | 776,100 | ||||||
| 5,625 | Agribank FCB, 6.875%h | 591,153 | ||||||
| 42,000 | Allstate Corporation, 5.100% | 1,063,860 | ||||||
| 39,710 | Annaly Capital Management, Inc., 7.500%h | 986,793 | ||||||
| 800 | Bank of America Corporation, Convertible, 7.250%h | 930,376 | ||||||
| 37,225 | Citigroup, Inc., 6.875%h | 989,441 | ||||||
| 26,020 | Citigroup, Inc., 7.875% | 691,612 | ||||||
| 13,380 | Cobank ACB, 6.250%h | 1,348,454 | ||||||
| 16,000 | Countrywide Capital V, 7.000% | 412,000 | ||||||
| 4,000 | Farm Credit Bank of Texas, 6.750%f,h | 413,875 | ||||||
| 28,500 | GMAC Capital Trust 1, 8.125% | 751,830 | ||||||
| 50,800 | Goldman Sachs Group, Inc., 5.500%h | 1,239,520 | ||||||
| 48,000 | HSBC USA, Inc., 6.500%h | 1,213,440 | ||||||
| 225 | M&T Bank Corporation, 6.375%h | 232,453 | ||||||
| 30,420 | Morgan Stanley, 6.875%h | 809,476 | ||||||
| 25,900 | Morgan Stanley, 7.125%h | 713,027 | ||||||
| 24,500 | PNC Financial Services Group, Inc., 6.125%h | 680,120 | ||||||
| 12,000 | Principal Financial Group, Inc., 5.563%h | 1,208,250 | ||||||
| 38,000 | RBS Capital Funding Trust V, 5.900%h | 923,400 | ||||||
| 8,000 | Royal Bank of Scotland Group plc, 7.250%h | 203,920 | ||||||
| 28,000 | U.S. Bancorp 6.500%h | 824,600 | ||||||
| 16,000 | Wells Fargo & Company, 5.850%h | 410,400 | ||||||
| 1,125 | Wells Fargo & Company, Convertible, 7.500%h | 1,356,750 | ||||||
|
| |||||||
Total | 18,770,850 | |||||||
|
| |||||||
| Materials (0.3%) |
| ||||||
| 19,000 | CHS, Inc., 6.750%h | 482,980 | ||||||
| 31,200 | CHS, Inc., 7.100%h | 819,312 | ||||||
|
| |||||||
Total | 1,302,292 | |||||||
|
| |||||||
| Utilities (<0.1%) |
| ||||||
| 1,315 | Southern California Edison Company, 4.510%h | 132,116 | ||||||
|
| |||||||
Total | 132,116 | |||||||
|
| |||||||
Total Preferred Stock (cost $19,964,568) | 20,205,258 | |||||||
|
| |||||||
Collateral Held for Securities Loaned (0.5%) | ||||||||
| 2,146,445 | Thrivent Cash Management Trust | $ | 2,146,445 | |||||
|
| |||||||
Total Collateral Held for Securities Loaned (cost $2,146,445) | 2,146,445 | |||||||
|
| |||||||
| Shares or Principal Amount | Short-Term Investments (10.9%)k | |||||||
Federal Home Loan Bank Discount Notes | ||||||||
| 500,000 | 0.050%, 1/9/2015l | 499,994 | ||||||
| 100,000 | 0.060%, 1/21/2015l | 99,997 | ||||||
| 200,000 | 0.115%, 2/6/2015l | 199,977 | ||||||
| 400,000 | 0.135%, 4/29/2015l | 399,823 | ||||||
Federal Home Loan Mortgage Corporation Discount Notes | ||||||||
| 100,000 | 0.060%, 2/6/2015 | 99,994 | ||||||
Thrivent Cash Management Trust | ||||||||
| 46,646,332 | 0.060% | 46,646,332 | ||||||
|
| |||||||
Total Short-Term Investments (at amortized cost) | 47,946,117 | |||||||
|
| |||||||
Total Investments (cost $451,938,947) 105.0% | $ | 459,175,833 | ||||||
|
| |||||||
Other Assets and Liabilities, Net (5.0%) | (21,840,201 | ) | ||||||
|
| |||||||
Total Net Assets 100.0% | $ | 437,335,632 | ||||||
|
| |||||||
| a | The stated interest rate represents the weighted average of all contracts within the bank loan facility. |
| b | All ora portion of the loan is unfunded. |
| c | Denotes investments purchased on a when-issued or delayed delivery basis. |
| d | Denotes variable rate securities. Variable rate securities are securities whose yields vary with a designated market index or market rate. The rate shown is as of December 31, 2014. |
| e | Denotes step coupon securities. Step coupon securities pay an initial coupon rate for the first period and then different coupon rates for following periods. The rate shown is as of December 31, 2014. |
| f | Denotes securities sold under Rule 144A of the Securities Act of 1933, which exempts them from registration. These securities have been deemed liquid and may be resold to other dealers in the program or to other qualified institutional buyers. As of December 31, 2014, the value of these investments was $37,843,704 or 8.7% of total net assets. |
| g | Denotes interest only security. Interest only securities represent the right to receive monthly interest payments on an underlying pool of mortgages or assets. The principal shown is the outstanding paramount of the pool as of the end of the period. The actual effective yield of the security is different than the stated coupon rate. |
| h | Denotes perpetual securities. Perpetual securities pay an indefinite stream of interest, but may be called by the issuer at an earlier date. |
| i | Non-income producing security. |
| j | All or a portion of the security is on loan. |
| k | The interest rate shown reflects the yield, coupon rate or the discount rate at the date of purchase. |
| l | At December 31, 2014, $899,794 of investments were held on deposit with the counterparty and pledged as the initial margin deposit for open futures contracts. |
The accompanying Notes to Financial Statements are an integral part of this schedule.
191
Table of Contents
DIVERSIFIED INCOME PLUS PORTFOLIO
Schedule of Investments as of December 31, 2014
| * | Denotes restricted securities. Restricted securities are investment securities which have been deemed illiquid and cannot be offered for public sale without first being registered under the Securities Act of 1933. The following table indicates the acquisition date and cost of restricted securities Diversified Income Plus Portfolio owned as of December 31, 2014. |
Security | Acquisition Date | Cost | ||||||
AGI Life Holdings, Inc., 12/1/2045 | 7/19/2012 | $ | 839,208 | |||||
Bayview Opportunity Master Fund Trust IIB, LP, 7/28/2019 | 7/30/2014 | 1,007,331 | ||||||
JBS Finance II, Ltd., 1/29/2018 | 8/11/2014 | 762,810 | ||||||
Definitions:
| ETF | - | Exchange Traded Fund. | ||
| REIT. | - | Real Estate lnvestment Trust is a company that buys, develops, manages and/or sells real estate assets. |
Unrealized Appreciation (Depreciation)
Gross unrealized appreciation and depreciation of investments, based on cost for federal income tax purposes, were as follows:
Gross unrealized appreciation | $ | 18,184,073 | ||
Gross unrealized depreciation | (11,222,400 | ) | ||
|
| |||
Net unrealized appreciation (depreciation) | $ | 6,961,673 | ||
Cost for federal income tax purposes | $ | 452,214,160 | ||
The accompanying Notes to Financial Statements are an integral part of this schedule.
192
Table of Contents
DIVERSIFIED INCOME PLUS PORTFOLIO
Schedule of Investments as of December 31, 2014
Fair Valuation Measurements
The following table is a summary of the inputs used, as of December 31, 2014, in valuing Diversified Income Plus Portfolio’s assets carried at fair value.
Investments in Securities | Total | Level 1 | Level 2 | Level 3 | ||||||||||||
Bank Loans | ||||||||||||||||
Basic Materials | 5,264,916 | — | 5,264,916 | — | ||||||||||||
Capital Goods | 2,818,519 | — | 2,818,519 | — | ||||||||||||
Communications Services | 18,853,887 | — | 16,673,998 | 2,179,889 | ||||||||||||
Consumer Cyclical | 9,504,913 | — | 9,504,913 | — | ||||||||||||
Consumer Non-Cyclical | 6,611,495 | — | 6,506,972 | 104,523 | ||||||||||||
Energy | 3,270,047 | — | 2,857,089 | 412,958 | ||||||||||||
Financials | 3,663,919 | — | 3,663,919 | — | ||||||||||||
Technology | 3,647,463 | — | 3,647,463 | — | ||||||||||||
Transportation | 2,474,986 | — | 1,792,802 | 682,184 | ||||||||||||
Utilities | 1,465,351 | — | 1,465,351 | — | ||||||||||||
Long-Term Fixed Income | ||||||||||||||||
Asset-Backed Securities | 5,422,369 | — | 5,422,369 | — | ||||||||||||
Basic Materials | 3,384,963 | — | 3,384,963 | — | ||||||||||||
Capital Goods | 4,560,809 | — | 4,560,809 | — | ||||||||||||
Collateralized Mortgage Obligations | 64,993,141 | — | 64,993,141 | — | ||||||||||||
Commercial Mortgage-Backed Securities | 1,762,082 | — | 1,762,082 | — | ||||||||||||
Communications Services | 12,306,306 | — | 12,306,306 | — | ||||||||||||
Consumer Cyclical | 7,282,898 | — | 7,282,898 | — | ||||||||||||
Consumer Non-Cyclical | 9,829,013 | — | 9,829,013 | — | ||||||||||||
Energy | 7,641,231 | — | 7,641,231 | — | ||||||||||||
Financials | 35,005,497 | — | 35,005,497 | — | ||||||||||||
Foreign Government | 964,875 | — | 964,875 | — | ||||||||||||
Mortgage-Backed Securities | 18,769,723 | — | 18,769,723 | — | ||||||||||||
Technology | 2,995,000 | — | 2,995,000 | — | ||||||||||||
Transportation | 1,373,345 | — | 1,373,345 | — | ||||||||||||
U.S. Government and Agencies | 1,000,469 | — | 1,000,469 | — | ||||||||||||
Utilities | 10,190,518 | — | 10,190,518 | — | ||||||||||||
Common Stock | ||||||||||||||||
Consumer Discretionary | 12,114,777 | 7,360,309 | 4,754,468 | — | ||||||||||||
Consumer Staples | 7,450,490 | 4,813,844 | 2,636,646 | — | ||||||||||||
Energy | 6,968,563 | 3,683,737 | 3,284,826 | — | ||||||||||||
Financials | 54,263,020 | 45,447,124 | 8,815,896 | — | ||||||||||||
Health Care | 18,187,054 | 13,994,155 | 4,192,899 | — | ||||||||||||
Industrials | 17,813,572 | 13,090,315 | 4,723,257 | — | ||||||||||||
Information Technology | 14,400,555 | 12,651,965 | 1,748,590 | — | ||||||||||||
Materials | 4,309,014 | 2,244,795 | 2,064,219 | — | ||||||||||||
Telecommunications Services | 4,431,461 | 231,267 | 4,200,194 | — | ||||||||||||
Utilities | 3,881,772 | — | 3,881,772 | — | ||||||||||||
Preferred Stock | ||||||||||||||||
Financials | 18,770,850 | 16,417,368 | 2,353,482 | — | ||||||||||||
Materials | 1,302,292 | 1,302,292 | — | — | ||||||||||||
Utilities | 132,116 | — | 132,116 | — | ||||||||||||
Collateral Held for Securities Loaned | 2,146,445 | 2,146,445 | — | — | ||||||||||||
Short-Term Investments | 47,946,117 | 46,646,332 | 1,299,785 | ��� | ||||||||||||
|
|
|
|
|
|
|
| |||||||||
Total | $ | 459,175,833 | $ | 170,029,948 | $ | 285,766,331 | $ | 3,379,554 | ||||||||
|
|
|
|
|
|
|
| |||||||||
Other Financial Instruments | Total | Level 1 | Level 2 | Level 3 | ||||||||||||
Asset Derivatives | ||||||||||||||||
Futures Contracts | 456,735 | 456,735 | — | — | ||||||||||||
|
|
|
|
|
|
|
| |||||||||
Total Asset Derivatives | $ | 456,735 | $ | 456,735 | $ | — | $ | — | ||||||||
|
|
|
|
|
|
|
| |||||||||
Liability Derivatives | ||||||||||||||||
Futures Contracts | 7,791 | 7,791 | — | — | ||||||||||||
|
|
|
|
|
|
|
| |||||||||
Total Liability Derivatives | $ | 7,791 | $ | 7,791 | $ | — | $ | — | ||||||||
|
|
|
|
|
|
|
| |||||||||
There were no significant transfers between Levels during the period ended December 31, 2014. Transfers between Levels are identified as of the end of the period.
The accompanying Notes to Financial Statements are an integral part of this schedule.
193
Table of Contents
DIVERSIFIED INCOME PLUS PORTFOLIO
Schedule of Investments as of December 31, 2014
Futures Contracts | Number of Contracts Long/(Short) | Expiration Date | Notional Principal Amount | Value | Unrealized Gain/(Loss) | |||||||||||||||
2-Yr. U.S. Treasury Bond Futures | (270 | ) | March 2015 | ($ | 59,086,989 | ) | ($ | 59,020,313 | ) | $ | 66,676 | |||||||||
5-Yr. U.S. Treasury Bond Futures | 225 | March 2015 | 26,733,499 | 26,759,180 | 25,681 | |||||||||||||||
Mini MSCI EAFE Index Futures | 2 | March 2015 | 174,167 | 175,790 | 1,623 | |||||||||||||||
S&P 500 Index Futures | (10 | ) | March 2015 | (5,123,209 | ) | (5,131,000 | ) | (7,791 | ) | |||||||||||
S&P 500 Index Mini-Futures | 46 | March 2015 | 4,594,530 | 4,720,520 | 125,990 | |||||||||||||||
Ultra Long Term U.S. Treasury Bond Futures | 31 | March 2015 | 4,884,048 | 5,120,813 | 236,765 | |||||||||||||||
Total Futures Contracts | $ | 448,944 | ||||||||||||||||||
The following table summarizes the fair value and Statement of Assets and Liabilities location, as of December 31, 2014, for Diversified Income Plus Portfolio’s investments in financial derivative instruments by primary risk exposure as discussed under item (2) Significant Accounting Policies of the Notes to Financial Statements.
Derivatives by risk category | Statement of Assets and Liabilities Location | Fair Value | ||||
| Asset Derivatives | ||||||
Interest Rate Contracts | ||||||
Futures* | Net Assets - Net unrealized appreciation/(depreciation) on Futures contracts | $ | 329,122 | |||
Total Interest Rate Contracts | 329,122 | |||||
Equity Contracts | ||||||
Futures* | Net Assets - Net unrealized appreciation/(depreciation) on Futures contracts | 127,613 | ||||
Total Equity Contracts | 127,613 | |||||
|
| |||||
Total Asset Derivatives | $ | 456,735 | ||||
|
| |||||
| Liability Derivatives | ||||||
Equity Contracts | ||||||
Futures* | Net Assets - Net unrealized appreciation/(depreciation) on Futures contracts | 7,791 | ||||
Total Equity Contracts | 7,791 | |||||
|
| |||||
Total Liability Derivatives | $ | 7,791 | ||||
|
| |||||
| * | Includes cumulative appreciation/depreciation of futures contracts as reported in the Schedule of Investments. Only current day’s variation margin is reported within the Statement of Assets and Liabilities. |
The following table summarizes the net realized gains/(losses) and Statement of Operations location, for the period ended December 31, 2014, for Diversified Income Plus Portfolio’s investments in financial derivative instruments by primary risk exposure.
Derivatives by risk category | Statement of Operations Location | Realized Gains/(Losses) recognized in Income | ||||
| Equity Contracts | ||||||
Futures | Net realized gains/(losses) on Futures contracts | 600,864 | ||||
Total Equity Contracts | 600,864 | |||||
| Interest Rate Contracts | ||||||
Futures | Net realized gains/(losses) on Futures contracts | 546,081 | ||||
Total Interest Rate Contracts | 546,081 | |||||
|
| |||||
Total | $ | 1,146,945 | ||||
|
| |||||
The following table summarizes the change in net unrealized appreciation/(depreciation) and Statement of Operations location, for the period ended December 31, 2014, for Diversified Income Plus Portfolio’s investments in financial derivative instruments by primary risk exposure.
Derivatives by risk category | Statement of Operations Location | Change in unrealized appreciation/(depreciation) recognized in Income | ||||
Interest Rate Contracts | ||||||
Futures | Change in net unrealized appreciation/(depreciation) on Futures contracts | 171,274 | ||||
Total Interest Rate Contracts | 171,274 | |||||
Equity Contracts | ||||||
Futures | Change in net unrealized appreciation/(depreciation) on Futures contracts | (681 | ) | |||
Total Equity Contracts | (681 | ) | ||||
|
| |||||
Total | $ | 170,593 | ||||
|
| |||||
The accompanying Notes to Financial Statements are an integral part of this schedule.
194
Table of Contents
DIVERSIFIED INCOME PLUS PORTFOLIO
Schedule of Investments as of December 31, 2014
The following table presents Diversified Income Plus Portfolio’s average volume of derivative activity during the period ended December 31, 2014.
Derivative Risk Category | Futures (Notional)* | Futures (Percentage of Average Net Assets) | ||||||
Equity Contracts | $ | 10,442,443 | 2.6 | % | ||||
Interest Rate Contracts | 45,250,831 | 11.2 | ||||||
| * | Notional amount represents long or short, or both, derivative positions held by the Portfolio. |
Investment in Affiliates
Affiliated issuers, as defined under the Investment Company Act of 1940, include those in which the Portfolio’s holdings fan issuer represent 5% or more of the outstanding voting securities of an issuer, or any affiliated mutual fund.
A summary of transactions for the fiscal year to date, in Diversified Income Plus Portfolio, is as follows:
Portfolio | Value December 31, 2013 | Gross Purchases | Gross Sales | Shares Held at December 31, 2014 | Value December 31, 2014 | Income Earned January 1, 2014- December 31, 2014 | ||||||||||||||||||
Cash Management Trust-Collateral Investment | $ | 3,011,629 | $ | 33,862,938 | $ | 34,728,122 | 2,146,445 | $ | 2,146,445 | $ | 107,386 | |||||||||||||
Cash Management Trust-Short Term Investment | 29,566,956 | 217,454,217 | 200,374,841 | 46,646,332 | 46,646,332 | 20,959 | ||||||||||||||||||
Total Value and Income Earned | 32,578,585 | 48,792,777 | 128,345 | |||||||||||||||||||||
The accompanying Notes to Financial Statements are an integral part of this schedule.
195
Table of Contents
OPPORTUNITY INCOME PLUS PORTFOLIO
Schedule of Investments as of December 31, 2014
| Principal Amount | Bank Loans (35.5%)a | Value | ||||||
| Basic Materials (2.7%) |
| ||||||
Alpha Natural Resources, Inc., Term Loan | ||||||||
| $ | 434,820 | 3.500%, 5/22/2020 | $ | 343,782 | ||||
Crown Americas, LLC, Term Loan | ||||||||
| 240,000 | 0.000%, 10/20/2021b,c | 239,700 | ||||||
Fortescue Metals Group, Ltd., Term Loan | ||||||||
| 251,676 | 3.750%, 6/30/2019 | 228,018 | ||||||
Ineos Group Holdings, Ltd., Term Loan | ||||||||
| 251,171 | 3.750%, 5/4/2018 | 242,980 | ||||||
NewPage Corporation, Term Loan | ||||||||
| 420,000 | 9.500%, 2/11/2021 | 398,299 | ||||||
Tronox Pigments BV, Term Loan | ||||||||
| 272,464 | 4.000%, 3/19/2020 | 267,469 | ||||||
Wausau Paper Corporation, Term Loan | ||||||||
| 248,750 | 6.500%, 7/30/2020 | 246,263 | ||||||
|
| |||||||
Total | 1,966,511 | |||||||
|
| |||||||
| Capital Goods (1.6%) |
| ||||||
ADS Waste Holdings, Inc., Term Loan | ||||||||
| 249,020 | 3.750%, 10/9/2019 | 241,316 | ||||||
Rexnord, LLC, Term Loan | ||||||||
| 276,500 | 4.000%, 8/21/2020 | 270,417 | ||||||
Silver II Borrower, Term Loan | ||||||||
| 257,593 | 4.000%, 12/13/2019 | 238,837 | ||||||
STHI Holding Corporation, Term Loan | ||||||||
| 394,012 | 4.500%, 8/6/2021 | 390,399 | ||||||
|
| |||||||
Total | 1,140,969 | |||||||
|
| |||||||
| Communications Services (13.0%) |
| ||||||
Atlantic Broadband Penn, LLC, Term Loan | ||||||||
| 78,245 | 3.250%, 11/30/2019 | 76,484 | ||||||
Birch Communication Inc., Term Loan | ||||||||
| 655,781 | 7.750%, 7/17/2020 | 642,666 | ||||||
Cable & Wireless Communications plc, Term Loan | ||||||||
| 140,000 | 0.000%, 11/25/2016b,c | 139,300 | ||||||
Cengage Learning Aquisitions, Term Loan | ||||||||
| 719,563 | 7.000%, 3/31/2020 | 711,467 | ||||||
Charter Communications Operating, LLC, Term Loan | ||||||||
| 248,737 | 3.000%, 7/1/2020 | 243,608 | ||||||
Cincinnati Bell, Inc., Term Loan | ||||||||
| 254,513 | 4.000%, 9/10/2020b,c | 251,331 | ||||||
Clear Channel Communications, Inc., Term Loan | ||||||||
| 255,000 | 6.919%, 1/30/2019 | 239,881 | ||||||
Cumulus Media Holdings, Inc., Term Loan | ||||||||
| 272,835 | 0.000%, 12/23/2020b,c | 264,194 | ||||||
Fairpoint Communications, Term Loan | ||||||||
| 251,164 | 7.500%, 2/14/2019 | 248,497 | ||||||
Grande Communications Networks, LLC, Term Loan | ||||||||
| 251,178 | 4.500%, 5/29/2020 | 247,724 | ||||||
Hargray Communications Group, Inc., Term Loan | ||||||||
| 219,800 | 5.250%, 6/26/2019 | 218,151 | ||||||
IMG Worldwide, Inc., Term Loan | ||||||||
| 1,368,125 | 5.250%, 5/6/2021 | 1,319,392 | ||||||
Integra Telecom Holdings, Inc., Term Loan | ||||||||
| 251,165 | 5.250%, 2/22/2019 | 243,789 | ||||||
Intelsat Jackson Holdings SA, Term Loan | ||||||||
| 160,000 | 3.750%, 6/30/2019 | 157,400 | ||||||
Level 3 Communications, Inc., Term Loan | ||||||||
| 280,000 | 4.000%, 8/1/2019 | 277,726 | ||||||
Liberty Cablevision of Puerto Rico, LLC, Term Loan | ||||||||
| 175,000 | 0.000%, 1/7/2022b,c | 169,750 | ||||||
| 300,000 | 4.500%, 1/7/2022 | 291,750 | ||||||
LTS Buyer, LLC, Term Loan | ||||||||
| 275,800 | 4.000%, 4/13/2020 | 269,423 | ||||||
McGraw-Hill Global Education, LLC, Term Loan | ||||||||
| 251,344 | 5.750%, 3/22/2019 | 250,010 | ||||||
NTelos, Inc., Term Loan | ||||||||
| 59,394 | 5.750%, 11/9/2019 | 51,673 | ||||||
Puerto Rico Cable Acquisition Company, Inc., Term Loan | ||||||||
| 249,994 | 5.500%, 7/31/2018 | 248,119 | ||||||
SBA Senior Finance II, LLC, Term Loan | ||||||||
| 746,250 | 3.250%, 3/24/2021 | 729,303 | ||||||
TNS, Inc., Term Loan | ||||||||
| 99,098 | 5.000%, 2/14/2020 | 97,984 | ||||||
Univision Communications, Inc., Term Loan | ||||||||
| 251,161 | 4.000%, 3/1/2020 | 245,259 | ||||||
Virgin Media Investment Holdings, Ltd., Term Loan | ||||||||
| 255,000 | 3.500%, 6/7/2020 | 250,056 | ||||||
WideOpenWest Finance, LLC, Term Loan | ||||||||
| 251,165 | 4.750%, 4/1/2019 | 249,126 | ||||||
XO Communications, LLC, Term Loan | ||||||||
| 694,750 | 4.250%, 3/20/2021 | 680,855 | ||||||
Yankee Cable Acquisition, LLC, Term Loan | ||||||||
| 246,362 | 4.500%, 3/1/2020 | 244,822 | ||||||
Zayo Group, LLC, Term Loan | ||||||||
| 251,140 | 4.000%, 7/2/2019 | 248,101 | ||||||
|
| |||||||
Total | 9,307,841 | |||||||
|
| |||||||
| Consumer Cyclical (4.9%) |
| ||||||
Amaya Gaming Group, Inc., Term Loan | ||||||||
| 359,100 | 5.000%, 8/1/2021 | 355,240 | ||||||
Booz Allen Hamilton, Inc., Term Loan | ||||||||
| 103,359 | 3.750%, 7/31/2019 | 102,756 | ||||||
Burlington Coat Factory Warehouse Corporation, Term Loan | ||||||||
| 266,985 | 4.250%, 8/13/2021 | 263,148 | ||||||
Ceridian HCM Holding, Inc., Term Loan | ||||||||
| 135,610 | 4.500%, 9/15/2020 | 133,153 | ||||||
The accompanying Notes to Financial Statements are an integral part of this schedule.
196
Table of Contents
OPPORTUNITY INCOME PLUS PORTFOLIO
Schedule of Investments as of December 31, 2014
| Principal Amount | Bank Loans (35.5%)a | Value | ||||||
| Consumer Cyclical (4.9%) - continued | |||||||
Chrysler Group, LLC, Term Loan | ||||||||
| $ | 397,000 | 3.250%, 12/31/2018 | $ | 392,534 | ||||
Golden Nugget, Inc., Delayed Draw | ||||||||
| 103,950 | 5.500%, 11/21/2019 | 102,456 | ||||||
Golden Nugget, Inc., Term Loan | ||||||||
| 242,550 | 5.500%, 11/21/2019 | 239,064 | ||||||
Hilton Worldwide Finance, LLC, Term Loan | ||||||||
| 74,074 | 3.500%, 10/26/2020 | 73,117 | ||||||
J.C. Penney Corporation, Inc., Term Loan | ||||||||
| 251,175 | 6.000%, 5/22/2018 | 245,943 | ||||||
Las Vegas Sands, LLC, Term Loan | ||||||||
| 123,750 | 3.250%, 12/19/2020 | 122,874 | ||||||
Marina District Finance Company, Inc., Term Loan | ||||||||
| 338,550 | 6.750%, 8/15/2018 | 335,517 | ||||||
Mohegan Tribal Gaming Authority, Term Loan | ||||||||
| 742,500 | 5.500%, 11/19/2019 | 712,139 | ||||||
Pinnacle Entertainment, Inc., Term Loan | ||||||||
| 72,118 | 3.750%, 8/13/2020 | 70,946 | ||||||
Scientific Games International, Inc., Term Loan | ||||||||
| 252,450 | 6.000%, 10/18/2020 | 248,474 | ||||||
Seminole Hard Rock Entertainment, Inc., Term Loan | ||||||||
| 119,394 | 3.500%, 5/14/2020 | 114,917 | ||||||
|
| |||||||
Total | 3,512,278 | |||||||
|
| |||||||
| Consumer Non Cyclical (3.7%) | |||||||
Albertsons, Inc., Term Loan | ||||||||
| 277,903 | 4.750%, 3/21/2019 | 275,819 | ||||||
Del Monte Corporation, Term Loan | ||||||||
| 79,599 | 3.500%, 3/9/2020 | 76,017 | ||||||
JBS USA, LLC, Term Loan | ||||||||
| 1,318,532 | 3.750%, 5/25/2018 | 1,298,754 | ||||||
Ortho-Clinical Diagnostics, Inc., Term Loan | ||||||||
| 349,123 | 0.000%, 6/30/2021b,c | 342,926 | ||||||
Roundy’s Supermarkets, Inc., Term Loan | ||||||||
| 209,900 | 5.750%, 3/3/2021 | 196,431 | ||||||
Supervalu, Inc., Term Loan | ||||||||
| 226,293 | 4.500%, 3/21/2019 | 221,894 | ||||||
Visant Corporation, Term Loan | ||||||||
| 245,701 | 7.000%, 9/23/2021 | 238,330 | ||||||
|
| |||||||
Total | 2,650,171 | |||||||
|
| |||||||
| Energy (1.4%) | |||||||
Arch Coal, Inc., Term Loan | ||||||||
| 275,766 | 6.250%, 5/16/2018 | 227,623 | ||||||
Exgen Renewables I, LLC, Term Loan | ||||||||
| 305,026 | 5.250%, 2/6/2021 | 305,026 | ||||||
McJunkin Red Man Corporation, Term Loan | ||||||||
| 148,125 | 5.000%, 11/8/2019 | 135,905 | ||||||
Offshore Group Investment, Ltd., Term Loan | ||||||||
| 198,987 | 5.750%, 3/28/2019 | 148,245 | ||||||
Pacific Drilling SA, Term Loan | ||||||||
| 251,175 | 4.500%, 6/3/2018 | 206,383 | ||||||
|
| |||||||
Total | 1,023,182 | |||||||
|
| |||||||
| Financials (2.9%) | |||||||
Delos Finance Sarl, Term Loan | ||||||||
| 125,000 | 3.500%, 3/6/2021 | 123,698 | ||||||
Harland Clarke Holdings Corporation, Term Loan | ||||||||
| 245,437 | 7.000%, 5/22/2018 | 245,683 | ||||||
MPH Acquisition Holdings, LLC, Term Loan | ||||||||
| 303,738 | 3.750%, 3/31/2021 | 294,778 | ||||||
TransUnion, LLC, Term Loan | ||||||||
| 1,364,688 | 4.000%, 4/9/2021 | 1,342,511 | ||||||
WaveDivision Holdings, LLC, Term Loan | ||||||||
| 79,594 | 4.000%, 10/15/2019 | 78,267 | ||||||
|
| |||||||
Total | 2,084,937 | |||||||
|
| |||||||
| Technology (2.4%) | |||||||
Avago Technologies, Ltd., Term Loan | ||||||||
| 621,875 | 3.750%, 5/6/2021 | 619,027 | ||||||
BMC Software, Inc., Term Loan | ||||||||
| 267,478 | 5.000%, 9/10/2020 | 259,622 | ||||||
First Data Corporation, Term Loan | ||||||||
| 255,000 | 3.667%, 3/23/2018 | 249,742 | ||||||
Freescale Semiconductor, Inc., Term Loan | ||||||||
| 251,185 | 4.250%, 2/28/2020 | 244,749 | ||||||
Infor US, Inc., Term Loan | ||||||||
| 339,795 | 3.750%, 6/3/2020 | 329,201 | ||||||
|
| |||||||
Total | 1,702,341 | |||||||
|
| |||||||
| Transportation (1.5%) | |||||||
American Airlines, Inc., Term Loan | ||||||||
| 497,425 | 3.750%, 6/27/2019 | 491,416 | ||||||
OSG Bulk Ships, Inc., Term Loan | ||||||||
| 646,750 | 5.250%, 8/5/2019 | 628,964 | ||||||
|
| |||||||
Total | 1,120,380 | |||||||
|
| |||||||
| Utilities (1.4%) | |||||||
Calpine Corporation, Term Loan | ||||||||
| 742,500 | 4.000%, 10/31/2020 | 730,018 | ||||||
Intergen NV, Term Loan | ||||||||
| 251,175 | 5.500%, 6/15/2020 | 248,872 | ||||||
|
| |||||||
Total | 978,890 | |||||||
|
| |||||||
Total Bank Loans (cost $26,188,473) | 25,487,500 | |||||||
|
| |||||||
Long-Term Fixed Income (53.0%) | ||||||||
| Asset-Backed Securities (3.4%) | |||||||
Asset Backed Securities Corporation Home Equity Loan Trust | ||||||||
| 219,641 | 0.310%, 7/25/2036d | 196,618 | ||||||
Bayview Opportunity Master Fund Trust IIB, LP | ||||||||
| 143,904 | 3.623%, 7/28/2019* | 142,946 | ||||||
The accompanying Notes to Financial Statements are an integral part of this schedule.
197
Table of Contents
OPPORTUNITY INCOME PLUS PORTFOLIO
Schedule of Investments as of December 31, 2014
| Principal Amount | Long-Term Fixed Income (53.0%) | Value | ||||||
| Asset-Backed Securities (3.4%) – continued | |||||||
| $ | 90,604 | 3.950%, 1/28/2034*,e | $ | 91,053 | ||||
Countrywide Asset-Backed Certificates | ||||||||
| 164,963 | 5.859%, 10/25/2046 | 128,689 | ||||||
| 179,377 | 5.530%, 4/25/2047 | 176,379 | ||||||
Credit Based Asset Servicing and Securitization, LLC | ||||||||
| 111,469 | 3.666%, 12/25/2036e | 77,999 | ||||||
First Horizon ABS Trust | ||||||||
| 423,181 | 0.330%, 10/25/2034d,f | 373,542 | ||||||
GMAC Mortgage Corporation Loan Trust | ||||||||
| 601,849 | 0.350%, 8/25/2035d,f | 532,117 | ||||||
Popular ABS Mortgage Pass-Through Trust | ||||||||
| 100,000 | 5.297%, 11/25/2035e | 85,272 | ||||||
Renaissance Home Equity Loan Trust | ||||||||
| 245,065 | 5.797%, 8/25/2036e | 157,081 | ||||||
| 194,619 | 5.285%, 1/25/2037e | 111,217 | ||||||
Wachovia Asset Securitization, Inc. | ||||||||
| 397,810 | 0.310%, 7/25/2037*,d,f | 348,882 | ||||||
|
| |||||||
Total | 2,421,795 | |||||||
|
| |||||||
| Basic Materials (1.6%) | |||||||
Albemarle Corporation | ||||||||
| 46,000 | 3.000%, 12/1/2019 | 46,007 | ||||||
Anglo American Capital plc | ||||||||
| 22,000 | 1.181%, 4/15/2016d,g | 22,022 | ||||||
ArcelorMittal | ||||||||
| 120,000 | 6.000%, 3/1/2021 | 124,800 | ||||||
Dow Chemical Company | ||||||||
| 24,000 | 8.550%, 5/15/2019 | 29,838 | ||||||
Fermaca Enterprises S de RL de CV | ||||||||
| 80,000 | 6.375%, 3/30/2038g | 81,400 | ||||||
First Quantum Minerals, Ltd. | ||||||||
| 130,000 | 7.000%, 2/15/2021g | 117,000 | ||||||
FMG Resources August 2006 Pty., Ltd. | ||||||||
| 28,804 | 6.875%, 2/1/2018g | 26,140 | ||||||
Freeport-McMoRan, Inc. | ||||||||
| 23,000 | 2.300%, 11/14/2017 | 23,028 | ||||||
| 30,000 | 2.375%, 3/15/2018 | 29,670 | ||||||
Goldcorp, Inc. | ||||||||
| 43,000 | 2.125%, 3/15/2018 | 42,500 | ||||||
Groupe Office Cherifien des Phosphates SA | ||||||||
| 65,000 | 5.625%, 4/25/2024g | 68,250 | ||||||
Hexion US Finance Corporation/ Hexion Nova Scotia Finance ULC | ||||||||
| 64,810 | 8.875%, 2/1/2018 | 57,681 | ||||||
Ineos Finance plc | ||||||||
| 80,000 | 7.500%, 5/1/2020g | 84,000 | ||||||
LyondellBasell Industries NV | ||||||||
| 26,000 | 5.000%, 4/15/2019 | 28,360 | ||||||
Minsur SA | ||||||||
| 63,000 | 6.250%, 2/7/2024g | 68,040 | ||||||
Mosaic Company | ||||||||
| 20,000 | 3.750%, 11/15/2021 | 20,816 | ||||||
NOVA Chemicals Corporation | ||||||||
| 97,215 | 5.250%, 8/1/2023g | 98,187 | ||||||
Samarco Mineracao SA | ||||||||
| 75,000 | 5.375%, 9/26/2024g | 69,525 | ||||||
Sappi Papier Holding GmbH | ||||||||
| 80,000 | 6.625%, 4/15/2021g | 82,000 | ||||||
Vale Overseas, Ltd. | ||||||||
| 30,000 | 6.250%, 1/23/2017 | 31,998 | ||||||
|
| |||||||
Total | 1,151,262 | |||||||
|
| |||||||
| Capital Goods (2.1%) | |||||||
BAE Systems plc | ||||||||
| 38,000 | 3.500%, 10/11/2016g | 39,473 | ||||||
Brand Energy & Infrastructure Services, Inc. | ||||||||
| 60,000 | 8.500%, 12/1/2021g | 54,000 | ||||||
Cemex SAB de CV | ||||||||
| 130,000 | 5.700%, 1/11/2025g | 126,100 | ||||||
CNH Capital, LLC | ||||||||
| 64,810 | 3.625%, 4/15/2018 | 63,838 | ||||||
Crown Americas Capital Corporation IV | ||||||||
| 120,000 | 4.500%, 1/15/2023 | 116,400 | ||||||
Harsco Corporation | ||||||||
| 30,000 | 2.700%, 10/15/2015 | 29,962 | ||||||
Huntington Ingalls Industries, Inc. | ||||||||
| 155,000 | 5.000%, 12/15/2021g | 157,712 | ||||||
Hutchison Whampoa Finance Cl, Ltd. | ||||||||
| 46,000 | 1.625%, 10/31/2017g | 45,621 | ||||||
Ingersoll-Rand Global Holding Company, Ltd. | ||||||||
| 40,000 | 6.875%, 8/15/2018 | 46,435 | ||||||
L-3 Communications Corporation | ||||||||
| 33,000 | 1.500%, 5/28/2017 | 32,675 | ||||||
Martin Marietta Materials, Inc. | ||||||||
| 40,000 | 1.357%, 6/30/2017d | 40,439 | ||||||
Moog, Inc. | ||||||||
| 155,000 | 5.250%, 12/1/2022g | 156,937 | ||||||
Nortek, Inc. | ||||||||
| 64,810 | 8.500%, 4/15/2021 | 69,347 | ||||||
Owens-Brockway Glass Container, Inc. | ||||||||
| 155,000 | 5.000%, 1/15/2022g | 158,100 | ||||||
Reynolds Group Issuer, Inc. | ||||||||
| 64,810 | 9.875%, 8/15/2019 | 68,699 | ||||||
Roper Industries, Inc. | ||||||||
| 34,000 | 2.050%, 10/1/2018 | 33,719 | ||||||
Sealed Air Corporation | ||||||||
| 155,000 | 4.875%, 12/1/2022g | 153,837 | ||||||
Textron, Inc. | ||||||||
| 38,000 | 4.625%, 9/21/2016 | 40,205 | ||||||
United Rentals North America, Inc. | ||||||||
| 77,000 | 7.375%, 5/15/2020 | 83,160 | ||||||
|
| |||||||
Total | 1,516,659 | |||||||
|
| |||||||
| Collateralized Mortgage Obligations (7.9%) | |||||||
American Home Mortgage Assets Trust | ||||||||
| 264,928 | 0.360%, 12/25/2046d | 185,242 | ||||||
Bear Stearns Adjustable Rate Mortgage Trust | ||||||||
| 236,291 | 2.430%, 10/25/2035d | 232,959 | ||||||
Bear Stearns ALT-A Trust | ||||||||
| 148,970 | 2.577%, 6/25/2034 | 147,808 | ||||||
The accompanying Notes to Financial Statements are an integral part of this schedule.
198
Table of Contents
OPPORTUNITY INCOME PLUS PORTFOLIO
Schedule of Investments as of December 31, 2014
| Principal Amount | Long-Term Fixed Income (53.0%) | Value | ||||||
| Collateralized Mortgage Obligations (7.9%) - continued | |||||||
CitiMortgage Alternative Loan Trust | ||||||||
| $ | 345,727 | 5.750%, 4/25/2037 | $ | 296,860 | ||||
Countrywide Alternative Loan Trust | ||||||||
| 183,931 | 5.750%, 8/25/2035 | 171,536 | ||||||
| 209,272 | 5.500%, 10/25/2035 | 198,882 | ||||||
| 73,926 | 5.500%, 2/25/2036 | 68,743 | ||||||
| 105,410 | 6.000%, 1/25/2037 | 97,261 | ||||||
| 229,184 | 5.500%, 5/25/2037 | 198,647 | ||||||
Deutsche Alt-A Securities Mortgage Loan Trust | ||||||||
| 136,737 | 0.883%, 4/25/2047d | 117,044 | ||||||
GMAC Mortgage Corporation Loan Trust | ||||||||
| 74,357 | 4.553%, 9/19/2035 | 70,581 | ||||||
GMACM Mortgage Loan Trust | ||||||||
| 198,314 | 4.566%, 5/25/2035 | 190,418 | ||||||
GSR Mortgage Loan Trust | ||||||||
| 26,336 | 0.360%, 8/25/2046d | 25,291 | ||||||
HarborView Mortgage Loan Trust | ||||||||
| 195,043 | 2.649%, 12/19/2035 | 172,062 | ||||||
Impac CMB Trust | ||||||||
| 260,580 | 0.690%, 4/25/2035d | 238,311 | ||||||
| 46,503 | 0.810%, 8/25/2035d | 41,489 | ||||||
J.P. Morgan Alternative Loan Trust | ||||||||
| 169,066 | 6.500%, 3/25/2036 | 149,101 | ||||||
J.P. Morgan Mortgage Trust | ||||||||
| 127,605 | 6.500%, 1/25/2035 | 126,922 | ||||||
| 95,624 | 2.253%, 6/25/2035 | 95,657 | ||||||
| 104,835 | 2.658%, 6/25/2035 | 106,085 | ||||||
| 160,262 | 2.485%, 7/25/2035 | 159,489 | ||||||
| 220,769 | 2.653%, 8/25/2035 | 219,611 | ||||||
| 286,095 | 2.376%, 6/25/2036 | 260,072 | ||||||
| 57,003 | 2.537%, 10/25/2036 | 51,167 | ||||||
MLCC Mortgage Investors, Inc. | ||||||||
| 165,710 | 0.830%, 8/25/2029d | 165,108 | ||||||
Morgan Stanley Mortgage Loan Trust | ||||||||
| 139,432 | 5.241%, 11/25/2035 | 107,496 | ||||||
Residential Accredit Loans, Inc. | ||||||||
| 75,762 | 5.500%, 12/25/2034 | 77,320 | ||||||
| 158,094 | 3.535%, 9/25/2035 | 134,605 | ||||||
Sequoia Mortgage Trust | ||||||||
| 247,832 | 0.476%, 11/20/2034d | 236,821 | ||||||
Structured Asset Mortgage Investments, Inc. | ||||||||
| 417,350 | 0.480%, 12/25/2035d | 319,067 | ||||||
WaMu Mortgage Pass Through Certificates | ||||||||
| 143,895 | 2.274%, 10/25/2036 | 126,984 | ||||||
| 43,401 | 2.239%, 8/25/2046 | 37,571 | ||||||
| 187,209 | 0.853%, 1/25/2047d | 153,651 | ||||||
Washington Mutual Alternative Mortgage Pass Through Certificates | ||||||||
| 224,643 | 0.863%, 2/25/2047d | 157,631 | ||||||
Wells Fargo Mortgage Backed Securities Trust | ||||||||
| 145,485 | 5.000%, 3/25/2021 | 148,599 | ||||||
| 250,660 | 2.612%, 3/25/2036 | 249,622 | ||||||
| 112,235 | 2.600%, 4/25/2036 | 109,147 | ||||||
| 57,043 | 6.000%, 7/25/2037 | 56,447 | ||||||
|
| |||||||
Total | 5,701,307 | |||||||
|
| |||||||
| Commercial Mortgage-Backed Securities (0.2%) | |||||||
Bear Stearns Commercial Mortgage Securities, Inc. | ||||||||
| 5,689 | 5.655%, 6/11/2040 | 5,752 | ||||||
Credit Suisse Mortgage Capital Certificates | ||||||||
| 118,000 | 5.509%, 9/15/2039 | 124,794 | ||||||
Government National Mortgage Association | ||||||||
| 21,890 | 2.164%, 3/16/2033 | 21,916 | ||||||
|
| |||||||
Total | 152,462 | |||||||
|
| |||||||
| Communications Services (4.0%) | |||||||
21st Century Fox America, Inc. | ||||||||
| 37,000 | 6.900%, 3/1/2019 | 43,629 | ||||||
AMC Networks, Inc. | ||||||||
| 134,810 | 7.750%, 7/15/2021 | 144,247 | ||||||
America Movil SAB de CV | ||||||||
| 21,000 | 5.000%, 10/16/2019 | 23,182 | ||||||
American Tower Corporation | ||||||||
| 38,000 | 7.000%, 10/15/2017 | 42,903 | ||||||
British Sky Broadcasting Group plc | ||||||||
| 36,000 | 2.625%, 9/16/2019g | 36,013 | ||||||
British Telecommunications plc | ||||||||
| 30,000 | 1.250%, 2/14/2017 | 29,851 | ||||||
CC Holdings GS V, LLC | ||||||||
| 67,000 | 2.381%, 12/15/2017 | 67,594 | ||||||
CCO Holdings, LLC | ||||||||
| 64,810 | 7.000%, 1/15/2019 | 67,241 | ||||||
CenturyLink, Inc. | ||||||||
| 90,000 | 6.450%, 6/15/2021 | 96,525 | ||||||
Cequel Communications Escrow 1, LLC | ||||||||
| 130,000 | 6.375%, 9/15/2020g | 134,550 | ||||||
Columbus International, Inc. | ||||||||
| 120,000 | 7.375%, 3/30/2021g | 124,800 | ||||||
Cox Communications, Inc. | ||||||||
| 30,000 | 9.375%, 1/15/2019g | 37,756 | ||||||
Digicel, Ltd. | ||||||||
| 184,810 | 6.000%, 4/15/2021g | 172,797 | ||||||
DIRECTV Holdings, LLC | ||||||||
| 31,000 | 3.500%, 3/1/2016 | 31,809 | ||||||
| 29,000 | 5.875%, 10/1/2019 | 33,171 | ||||||
DISH DBS Corporation | ||||||||
| 80,000 | 5.000%, 3/15/2023 | 77,400 | ||||||
Equinix, Inc. | ||||||||
| 155,000 | 5.750%, 1/1/2025 | 156,356 | ||||||
FairPoint Communications, Inc. | ||||||||
| 155,000 | 8.750%, 8/15/2019g | 155,775 | ||||||
Frontier Communications Corporation | ||||||||
| 130,000 | 6.875%, 1/15/2025 | 130,000 | ||||||
Hughes Satellite Systems Corporation | ||||||||
| 77,000 | 6.500%, 6/15/2019 | 82,583 | ||||||
Intelsat Jackson Holdings SA | ||||||||
| 64,810 | 7.250%, 10/15/2020 | 68,456 | ||||||
Level 3 Financing, Inc. | ||||||||
| 77,000 | 8.625%, 7/15/2020 | 83,064 | ||||||
Numericable-SFR | ||||||||
| 120,000 | 6.000%, 5/15/2022g | 120,660 | ||||||
The accompanying Notes to Financial Statements are an integral part of this schedule.
199
Table of Contents
OPPORTUNITY INCOME PLUS PORTFOLIO
Schedule of Investments as of December 31, 2014
| Principal Amount | Long-Term Fixed Income (53.0%) | Value | ||||||
| Communications Services (4.0%) - continued | |||||||
SBA Tower Trust | ||||||||
| $ | 40,000 | 5.101%, 4/17/2017g | $ | 42,103 | ||||
Sprint Communications, Inc. | ||||||||
| 64,810 | 9.000%, 11/15/2018g | 73,715 | ||||||
Telefonica Emisiones SAU | ||||||||
| 23,000 | 3.992%, 2/16/2016 | 23,655 | ||||||
| 30,000 | 3.192%, 4/27/2018 | 30,850 | ||||||
Time Warner Cable, Inc. | ||||||||
| 23,000 | 8.250%, 4/1/2019 | 28,155 | ||||||
| 65,000 | 5.000%, 2/1/2020 | 71,629 | ||||||
T-Mobile USA, Inc. | ||||||||
| 125,000 | 6.633%, 4/28/2021 | 128,281 | ||||||
Univision Communications, Inc. | ||||||||
| 100,000 | 7.875%, 11/1/2020g | 106,500 | ||||||
UPCB Finance V, Ltd. | ||||||||
| 100,000 | 7.250%, 11/15/2021g | 109,375 | ||||||
Verizon Communications, Inc. | ||||||||
| 85,000 | 2.625%, 2/21/2020g | 84,028 | ||||||
| 40,000 | 4.500%, 9/15/2020 | 43,430 | ||||||
West Corporation | ||||||||
| 120,000 | 5.375%, 7/15/2022g | 114,900 | ||||||
Wind Acquisition Finance SA | ||||||||
| 60,000 | 4.750%, 7/15/2020g | 56,100 | ||||||
| 15,000 | 7.375%, 4/23/2021g | 14,157 | ||||||
|
| |||||||
Total | 2,887,240 | |||||||
|
| |||||||
| Consumer Cyclical (2.7%) | |||||||
AMC Entertainment, Inc. | ||||||||
| 79,000 | 5.875%, 2/15/2022 | 80,185 | ||||||
Brookfield Residential Properties, Inc. | ||||||||
| 100,000 | 6.500%, 12/15/2020g | 104,500 | ||||||
| 75,000 | 6.125%, 7/1/2022g | 78,000 | ||||||
Chrysler Group, LLC | ||||||||
| 64,810 | 8.250%, 6/15/2021 | 71,777 | ||||||
Cinemark USA, Inc. | ||||||||
| 80,000 | 4.875%, 6/1/2023 | 75,600 | ||||||
Daimler Finance North America, LLC | ||||||||
| 21,000 | 1.875%, 1/11/2018g | 21,073 | ||||||
Delphi Corporation | ||||||||
| 30,000 | 6.125%, 5/15/2021 | 32,700 | ||||||
ERAC USA Finance, LLC | ||||||||
| 40,000 | 2.350%, 10/15/2019g | 39,702 | ||||||
Ford Motor Credit Company, LLC | ||||||||
| 72,000 | 1.684%, 9/8/2017 | 71,427 | ||||||
| 38,000 | 5.000%, 5/15/2018 | 41,289 | ||||||
| 50,000 | 2.597%, 11/4/2019 | 49,731 | ||||||
General Motors Financial Company, Inc. | ||||||||
| 64,810 | 3.250%, 5/15/2018 | 64,891 | ||||||
| 56,000 | 4.375%, 9/25/2021 | 58,450 | ||||||
GLP Capital, LP | ||||||||
| 120,000 | 4.875%, 11/1/2020 | 121,500 | ||||||
Hilton Worldwide Finance, LLC | ||||||||
| 120,000 | 5.625%, 10/15/2021 | 125,400 | ||||||
Hyundai Capital America | ||||||||
| 28,000 | 1.450%, 2/6/2017g | 27,895 | ||||||
Jaguar Land Rover Automotive plc | ||||||||
| 75,000 | 4.250%, 11/15/2019g | 75,563 | ||||||
| 77,000 | 5.625%, 2/1/2023g | 81,043 | ||||||
KB Home | ||||||||
| 71,000 | 4.750%, 5/15/2019 | 69,935 | ||||||
L Brands, Inc. | ||||||||
| 77,000 | 6.625%, 4/1/2021 | 86,625 | ||||||
Lennar Corporation | ||||||||
| 150,000 | 4.750%, 11/15/2022 | 147,000 | ||||||
Macy’s Retail Holdings, Inc. | ||||||||
| 36,000 | 7.450%, 7/15/2017 | 40,928 | ||||||
Nissan Motor Acceptance Corporation | ||||||||
| 22,000 | 0.785%, 3/3/2017d,g | 22,070 | ||||||
Royal Caribbean Cruises, Ltd. | ||||||||
| 119,810 | 5.250%, 11/15/2022 | 125,800 | ||||||
Toll Brothers Finance Corporation | ||||||||
| 52,000 | 4.000%, 12/31/2018 | 52,260 | ||||||
TRW Automotive, Inc. | ||||||||
| 22,000 | 7.250%, 3/15/2017g | 24,310 | ||||||
Volkswagen Group of America Finance, LLC | ||||||||
| 46,000 | 0.672%, 11/20/2017d,g | 45,933 | ||||||
Walgreens Boots Alliance, Inc. | ||||||||
| 46,000 | 2.700%, 11/18/2019 | 46,234 | ||||||
Wynn Las Vegas, LLC | ||||||||
| 77,000 | 5.375%, 3/15/2022 | 78,155 | ||||||
|
| |||||||
Total | 1,959,976 | |||||||
|
| |||||||
| Consumer Non-Cyclical (3.5%) | |||||||
AbbVie, Inc. | ||||||||
| 46,000 | 2.000%, 11/6/2018 | 45,846 | ||||||
Altria Group, Inc. | ||||||||
| 48,000 | 9.700%, 11/10/2018 | 60,951 | ||||||
Beam, Inc. | ||||||||
| 21,000 | 5.375%, 1/15/2016 | 21,956 | ||||||
Becton, Dickinson and Company | ||||||||
| 46,000 | 2.675%, 12/15/2019 | 46,605 | ||||||
Boston Scientific Corporation | ||||||||
| 46,000 | 2.650%, 10/1/2018 | 46,054 | ||||||
CareFusion Corporation | ||||||||
| 32,000 | 1.450%, 5/15/2017 | 31,774 | ||||||
Celgene Corporation | ||||||||
| 48,000 | 1.900%, 8/15/2017 | 48,169 | ||||||
CHS/Community Health Systems, Inc. | ||||||||
| 77,000 | 7.125%, 7/15/2020 | 82,101 | ||||||
ConAgra Foods, Inc. | ||||||||
| 40,000 | 2.100%, 3/15/2018 | 39,870 | ||||||
Cott Beverages, Inc. | ||||||||
| 120,000 | 5.375%, 7/1/2022g | 110,100 | ||||||
Coventry Health Care, Inc. | ||||||||
| 19,000 | 5.950%, 3/15/2017 | 20,781 | ||||||
CVS Health Corporation | ||||||||
| 24,000 | 2.250%, 12/5/2018 | 24,215 | ||||||
Envision Healthcare Corporation | ||||||||
| 155,000 | 5.125%, 7/1/2022g | 153,837 | ||||||
Express Scripts Holding Company | ||||||||
| 30,000 | 2.650%, 2/15/2017 | 30,675 | ||||||
Forest Laboratories, Inc. | ||||||||
| 37,000 | 4.375%, 2/1/2019g | 39,086 | ||||||
| 46,000 | 5.000%, 12/15/2021g | 49,810 | ||||||
The accompanying Notes to Financial Statements are an integral part of this schedule.
200
Table of Contents
OPPORTUNITY INCOME PLUS PORTFOLIO
Schedule of Investments as of December 31, 2014
| Principal Amount | Long-Term Fixed Income (53.0%) | Value | ||||||
| Consumer Non-Cyclical (3.5%) - continued | |||||||
Fresenius Medical Care US Finance, Inc. | ||||||||
| $ | 64,810 | 5.750%, 2/15/2021g | $ | 69,104 | ||||
Gilead Sciences, Inc. | ||||||||
| 20,000 | 3.050%, 12/1/2016 | 20,753 | ||||||
| 46,000 | 2.350%, 2/1/2020 | 46,248 | ||||||
Grupo Bimbo SAB de CV | ||||||||
| 75,000 | 3.875%, 6/27/2024g | 75,295 | ||||||
Hawk Acquisition Sub, Inc. | ||||||||
| 77,000 | 4.250%, 10/15/2020 | 77,770 | ||||||
HCA, Inc. | ||||||||
| 64,810 | 4.750%, 5/1/2023 | 65,944 | ||||||
IMS Health, Inc. | ||||||||
| 75,000 | 6.000%, 11/1/2020g | 77,250 | ||||||
JBS Finance II, Ltd. | ||||||||
| 64,810 | 8.250%, 1/29/2018* | 66,268 | ||||||
Kindred Escrow Corporation II | ||||||||
| 155,000 | 8.750%, 1/15/2023g | 166,819 | ||||||
Kroger Company | ||||||||
| 50,000 | 1.200%, 10/17/2016 | 49,891 | ||||||
Lorillard Tobacco Company | ||||||||
| 30,000 | 8.125%, 6/23/2019 | 36,370 | ||||||
McKesson Corporation | ||||||||
| 35,000 | 1.292%, 3/10/2017 | 34,821 | ||||||
Medco Health Solutions, Inc. | ||||||||
| 17,000 | 7.125%, 3/15/2018 | 19,627 | ||||||
Medtronic, Inc. | ||||||||
| 48,000 | 2.500%, 3/15/2020g | 48,126 | ||||||
Mondelez International, Inc. | ||||||||
| 20,000 | 2.250%, 2/1/2019 | 19,918 | ||||||
Omnicare, Inc. | ||||||||
| 155,000 | 4.750%, 12/1/2022 | 156,937 | ||||||
Pernod Ricard SA | ||||||||
| 26,000 | 2.950%, 1/15/2017g | 26,602 | ||||||
| 26,000 | 5.750%, 4/7/2021g | 29,866 | ||||||
Perrigo Company, Ltd. | ||||||||
| 20,000 | 1.300%, 11/8/2016 | 19,912 | ||||||
Revlon Consumer Products Corporation | ||||||||
| 64,810 | 5.750%, 2/15/2021 | 64,810 | ||||||
SABMiller plc | ||||||||
| 30,000 | 6.500%, 7/15/2018g | 34,250 | ||||||
Safeway, Inc. | ||||||||
| 8,000 | 3.400%, 12/1/2016 | 8,127 | ||||||
Spectrum Brands Escrow Corporation | ||||||||
| 77,000 | 6.375%, 11/15/2020 | 80,272 | ||||||
Sysco Corporation | ||||||||
| 54,000 | 2.350%, 10/2/2019 | 54,294 | ||||||
Tenet Healthcare Corporation | ||||||||
| 120,000 | 8.125%, 4/1/2022 | 134,100 | ||||||
Thermo Fisher Scientific, Inc. | ||||||||
| 30,000 | 2.400%, 2/1/2019 | 30,045 | ||||||
Tyson Foods, Inc. | ||||||||
| 40,000 | 2.650%, 8/15/2019 | 40,364 | ||||||
Valeant Pharmaceuticals International | ||||||||
| 64,810 | 7.250%, 7/15/2022g | 69,104 | ||||||
Whirlpool Corporation | ||||||||
| 46,000 | 1.650%, 11/1/2017 | 45,847 | ||||||
WM Wrigley Jr. Company | ||||||||
| 20,000 | 2.000%, 10/20/2017g | 20,144 | ||||||
|
| |||||||
Total | 2,540,708 | |||||||
|
| |||||||
| Energy (2.7%) | |||||||
Boardwalk Pipelines, Ltd. | ||||||||
| 29,000 | 5.875%, 11/15/2016 | 30,790 | ||||||
BP Capital Markets plc | ||||||||
| 30,000 | 0.652%, 11/7/2016d | 30,005 | ||||||
Buckeye Partners, LP | ||||||||
| 22,000 | 2.650%, 11/15/2018 | 21,669 | ||||||
Calumet Specialty Products Partners, LP | ||||||||
| 120,000 | 6.500%, 4/15/2021g | 106,800 | ||||||
Canadian Natural Resources, Ltd. | ||||||||
| 46,000 | 1.750%, 1/15/2018 | 45,729 | ||||||
Chesapeake Energy Corporation | ||||||||
| 120,000 | 4.875%, 4/15/2022 | 116,700 | ||||||
CNOOC Nexen Finance 2014 ULC | ||||||||
| 25,000 | 1.625%, 4/30/2017 | 24,878 | ||||||
CNPC General Capital, Ltd. | ||||||||
| 33,000 | 2.750%, 4/19/2017g | 33,382 | ||||||
| 80,000 | 2.750%, 5/14/2019g | 79,458 | ||||||
Concho Resources, Inc. | ||||||||
| 139,810 | 6.500%, 1/15/2022 | 146,101 | ||||||
Continental Resources, Inc. | ||||||||
| 35,000 | 7.125%, 4/1/2021 | 37,625 | ||||||
Enbridge, Inc. | ||||||||
| 19,000 | 0.684%, 6/2/2017d | 18,918 | ||||||
Energy Transfer Partners, LP | ||||||||
| 26,000 | 6.700%, 7/1/2018 | 29,236 | ||||||
Energy XXI Gulf Coast, Inc. | ||||||||
| 80,000 | 7.750%, 6/15/2019 | 47,600 | ||||||
| 40,000 | 7.500%, 12/15/2021 | 21,600 | ||||||
Enterprise Products Operating, LLC | ||||||||
| 54,000 | 2.550%, 10/15/2019 | 53,456 | ||||||
EQT Corporation | ||||||||
| 5,000 | 5.150%, 3/1/2018 | 5,341 | ||||||
| 26,000 | 8.125%, 6/1/2019 | 31,345 | ||||||
Harvest Operations Corporation | ||||||||
| 64,810 | 6.875%, 10/1/2017 | 62,461 | ||||||
Hess Corporation | ||||||||
| 20,000 | 8.125%, 2/15/2019 | 23,796 | ||||||
Kinder Morgan, Inc. | ||||||||
| 30,000 | 3.050%, 12/1/2019 | 29,762 | ||||||
| 36,000 | 5.000%, 2/15/2021g | 37,453 | ||||||
Kodiak Oil & Gas Corporation | ||||||||
| 64,810 | 5.500%, 1/15/2021 | 64,972 | ||||||
Linn Energy, LLC | ||||||||
| 64,810 | 8.625%, 4/15/2020 | 56,385 | ||||||
MEG Energy Corporation | ||||||||
| 77,000 | 6.375%, 1/30/2023g | 68,723 | ||||||
Offshore Group Investment, Ltd. | ||||||||
| 100,000 | 7.500%, 11/1/2019 | 74,500 | ||||||
Petrobras Global Finance BV | ||||||||
| 40,000 | 2.000%, 5/20/2016 | 38,206 | ||||||
Petroleos Mexicanos | ||||||||
| 45,000 | 4.250%, 1/15/2025g | 44,708 | ||||||
Regency Energy Partners, LP | ||||||||
| 120,000 | 5.000%, 10/1/2022 | 113,400 | ||||||
The accompanying Notes to Financial Statements are an integral part of this schedule.
201
Table of Contents
OPPORTUNITY INCOME PLUS PORTFOLIO
Schedule of Investments as of December 31, 2014
| Principal Amount | Long-Term Fixed Income (53.0%) | Value | ||||||
| Energy (2.7%) - continued | |||||||
Rosetta Resources, Inc. | ||||||||
| $ | 155,000 | 5.875%, 6/1/2022 | $ | 139,500 | ||||
Sabine Pass Liquefaction, LLC | ||||||||
| 120,000 | 5.750%, 5/15/2024 | 117,750 | ||||||
Southwestern Energy Company | ||||||||
| 47,000 | 7.500%, 2/1/2018 | 52,947 | ||||||
Suncor Energy, Inc. | ||||||||
| 20,000 | 6.100%, 6/1/2018 | 22,434 | ||||||
Transocean, Inc. | ||||||||
| 32,000 | 6.000%, 3/15/2018 | 30,779 | ||||||
Weatherford International, Ltd. | ||||||||
| 28,000 | 6.000%, 3/15/2018 | 29,890 | ||||||
| 18,000 | 9.625%, 3/1/2019 | 21,349 | ||||||
|
| |||||||
Total | 1,909,648 | |||||||
|
| |||||||
| Financials (7.0%) | |||||||
Abbey National Treasury Services plc | ||||||||
| 40,000 | 0.665%, 9/29/2017d | 39,900 | ||||||
| 26,000 | 3.050%, 8/23/2018 | 26,918 | ||||||
ABN AMRO Bank NV | ||||||||
| 30,000 | 2.500%, 10/30/2018g | 30,300 | ||||||
Air Lease Corporation | ||||||||
| 36,000 | 2.125%, 1/15/2018 | 35,370 | ||||||
Ally Financial, Inc. | ||||||||
| 100,000 | 4.750%, 9/10/2018 | 103,500 | ||||||
ANZ New Zealand International, Ltd. | ||||||||
| 30,000 | 1.400%, 4/27/2017g | 29,940 | ||||||
Aviation Capital Group Corporation | ||||||||
| 20,000 | 3.875%, 9/27/2016g | 20,504 | ||||||
Bank of America Corporation | ||||||||
| 44,000 | 5.700%, 5/2/2017 | 47,564 | ||||||
| 40,000 | 1.700%, 8/25/2017 | 40,009 | ||||||
| 50,000 | 5.750%, 12/1/2017 | 55,245 | ||||||
| 76,000 | 1.317%, 3/22/2018d | 76,555 | ||||||
| 15,000 | 5.650%, 5/1/2018 | 16,665 | ||||||
| 38,000 | 8.000%, 12/29/2049h | 40,802 | ||||||
Banque Federative du Credit Mutuel SA | ||||||||
| 30,000 | 1.081%, 1/20/2017d,g | 30,206 | ||||||
Barclays Bank plc | ||||||||
| 20,000 | 5.140%, 10/14/2020 | 21,510 | ||||||
Barclays plc | ||||||||
| 46,000 | 2.750%, 11/8/2019 | 45,719 | ||||||
BB&T Corporation | ||||||||
| 38,000 | 2.050%, 6/19/2018 | 38,250 | ||||||
BBVA Banco Continental SA | ||||||||
| 38,000 | 2.250%, 7/29/2016g | 37,905 | ||||||
BBVA International Preferred SA Unipersonal | ||||||||
| 115,000 | 5.919%, 12/29/2049h | 117,047 | ||||||
Bear Stearns Companies, LLC | ||||||||
| 45,000 | 6.400%, 10/2/2017 | 50,396 | ||||||
BNP Paribas SA | ||||||||
| 30,000 | 2.375%, 9/14/2017 | 30,513 | ||||||
BPCE SA | ||||||||
| 30,000 | 1.625%, 2/10/2017 | 30,062 | ||||||
| 57,000 | 5.150%, 7/21/2024g | 58,737 | ||||||
Branch Banking and Trust Company | ||||||||
| 30,000 | 0.664%, 12/1/2016d | 30,027 | ||||||
Caixa Economica Federal | ||||||||
| 90,000 | 4.250%, 5/13/2019g | 87,750 | ||||||
Capital One Financial Corporation | ||||||||
| 38,000 | 6.150%, 9/1/2016 | 40,836 | ||||||
CIT Group, Inc. | ||||||||
| 80,000 | 3.875%, 2/19/2019 | 79,800 | ||||||
Citigroup, Inc. | ||||||||
| 54,000 | 5.500%, 2/15/2017 | 58,049 | ||||||
| 42,000 | 6.000%, 8/15/2017 | 46,467 | ||||||
| 69,000 | 1.850%, 11/24/2017 | 68,921 | ||||||
| 30,000 | 8.500%, 5/22/2019 | 37,382 | ||||||
Compass Bank | ||||||||
| 36,000 | 1.850%, 9/29/2017 | 35,846 | ||||||
Cooperatieve Centrale Raiffeisen-Boerenleenbank BA | ||||||||
| 45,000 | 4.625%, 12/1/2023 | 47,732 | ||||||
Credit Agricole SA | ||||||||
| 38,000 | 6.625%, 9/29/2049g,h | 36,832 | ||||||
Credit Suisse Group AG | ||||||||
| 57,000 | 7.500%, 12/11/2049g,h | 59,280 | ||||||
CyrusOne, LP | ||||||||
| 64,810 | 6.375%, 11/15/2022 | 69,185 | ||||||
DDR Corporation | ||||||||
| 20,000 | 9.625%, 3/15/2016 | 21,955 | ||||||
Denali Borrower, LLC | ||||||||
| 122,000 | 5.625%, 10/15/2020g | 126,941 | ||||||
Deutsche Bank AG | ||||||||
| 37,000 | 1.350%, 5/30/2017 | 36,688 | ||||||
Discover Bank | ||||||||
| 10,000 | 8.700%, 11/18/2019 | 12,366 | ||||||
Discover Financial Services | ||||||||
| 20,000 | 6.450%, 6/12/2017 | 22,098 | ||||||
Duke Realty, LP | ||||||||
| 46,000 | 8.250%, 8/15/2019 | 56,750 | ||||||
Fifth Third Bancorp | ||||||||
| 48,000 | 5.450%, 1/15/2017 | 51,510 | ||||||
General Electric Capital Corporation | ||||||||
| 44,000 | 0.512%, 5/15/2017d | 43,926 | ||||||
| 35,000 | 5.625%, 9/15/2017 | 38,852 | ||||||
| 18,000 | 1.625%, 4/2/2018 | 18,028 | ||||||
Genworth Financial, Inc. | ||||||||
| 32,000 | 7.700%, 6/15/2020 | 31,919 | ||||||
Goldman Sachs Group, Inc. | ||||||||
| 32,000 | 6.250%, 9/1/2017 | 35,605 | ||||||
| 40,000 | 2.375%, 1/22/2018 | 40,404 | ||||||
| 20,000 | 2.625%, 1/31/2019 | 20,122 | ||||||
| 30,000 | 7.500%, 2/15/2019 | 35,684 | ||||||
| 45,000 | 2.550%, 10/23/2019 | 44,836 | ||||||
Hartford Financial Services Group, Inc. | ||||||||
| 45,000 | 6.000%, 1/15/2019 | 51,035 | ||||||
HBOS plc | ||||||||
| 40,000 | 6.750%, 5/21/2018g | 44,580 | ||||||
HCP, Inc. | ||||||||
| 19,000 | 3.750%, 2/1/2016 | 19,527 | ||||||
| 25,000 | 3.750%, 2/1/2019 | 26,239 | ||||||
Health Care REIT, Inc. | ||||||||
| 26,000 | 4.700%, 9/15/2017 | 27,936 | ||||||
HSBC Holdings plc | ||||||||
| 54,000 | 5.625%, 12/29/2049h | 54,189 | ||||||
The accompanying Notes to Financial Statements are an integral part of this schedule.
202
Table of Contents
OPPORTUNITY INCOME PLUS PORTFOLIO
Schedule of Investments as of December 31, 2014
| Principal Amount | Long-Term Fixed Income (53.0%) | Value | ||||||
| Financials (7.0%) - continued | |||||||
Huntington National Bank | ||||||||
| $ | 30,000 | 1.300%, 11/20/2016 | $ | 29,876 | ||||
Icahn Enterprises, LP | ||||||||
| 110,000 | 6.000%, 8/1/2020 | 113,322 | ||||||
ING Bank NV | ||||||||
| 57,000 | 5.800%, 9/25/2023g | 63,229 | ||||||
ING Capital Funding Trust III | ||||||||
| 25,000 | 3.855%, 12/29/2049d,h | 24,937 | ||||||
International Lease Finance Corporation | ||||||||
| 26,000 | 2.191%, 6/15/2016d | 25,968 | ||||||
| 85,000 | 5.875%, 4/1/2019 | 91,588 | ||||||
Intesa Sanpaolo SPA | ||||||||
| 18,000 | 3.625%, 8/12/2015g | 18,243 | ||||||
| 10,000 | 3.875%, 1/16/2018 | 10,412 | ||||||
| 32,000 | 3.875%, 1/15/2019 | 33,133 | ||||||
J.P. Morgan Chase & Company | ||||||||
| 40,000 | 3.450%, 3/1/2016 | 41,056 | ||||||
| 20,000 | 0.752%, 2/15/2017d | 19,950 | ||||||
| 20,000 | 2.000%, 8/15/2017 | 20,190 | ||||||
| 20,000 | 6.300%, 4/23/2019 | 23,231 | ||||||
| 49,000 | 7.900%, 4/29/2049h | 52,739 | ||||||
| 125,000 | 6.750%, 8/29/2049h | 131,875 | ||||||
KeyCorp | ||||||||
| 30,000 | 2.300%, 12/13/2018 | 30,104 | ||||||
Kookmin Bank | ||||||||
| 30,000 | 1.109%, 1/27/2017d,g | 30,199 | ||||||
Liberty Mutual Group, Inc. | ||||||||
| 10,000 | 5.000%, 6/1/2021g | 10,893 | ||||||
Liberty Property, LP | ||||||||
| 40,000 | 5.500%, 12/15/2016 | 42,947 | ||||||
Macquarie Bank, Ltd. | ||||||||
| 30,000 | 5.000%, 2/22/2017g | 31,998 | ||||||
MetLife, Inc. | ||||||||
| 36,000 | 1.903%, 12/15/2017 | 36,082 | ||||||
Mizuho Corporate Bank, Ltd. | ||||||||
| 25,000 | 1.550%, 10/17/2017g | 24,763 | ||||||
Morgan Stanley | ||||||||
| 40,000 | 1.750%, 2/25/2016 | 40,217 | ||||||
| 50,000 | 6.250%, 8/28/2017 | 55,543 | ||||||
| 46,000 | 1.875%, 1/5/2018 | 45,832 | ||||||
| 40,000 | 6.625%, 4/1/2018 | 45,561 | ||||||
| 26,000 | 4.875%, 11/1/2022 | 27,614 | ||||||
MPT Operating Partnership, LP | ||||||||
| 160,000 | 6.875%, 5/1/2021 | 171,200 | ||||||
Murray Street Investment Trust I | ||||||||
| 60,000 | 4.647%, 3/9/2017 | 63,324 | ||||||
National City Corporation | ||||||||
| 20,000 | 6.875%, 5/15/2019 | 23,495 | ||||||
Nomura Holdings, Inc. | ||||||||
| 30,000 | 2.000%, 9/13/2016 | 30,242 | ||||||
| 21,000 | 2.750%, 3/19/2019 | 21,230 | ||||||
Oversea-Chinese Banking Corporation, Ltd. | ||||||||
| 75,000 | 4.250%, 6/19/2024g | 76,747 | ||||||
PNC Bank NA | ||||||||
| 40,000 | 1.150%, 11/1/2016 | 40,053 | ||||||
Pricoa Global Funding 1 | ||||||||
| 40,000 | 1.350%, 8/18/2017g | 39,835 | ||||||
Realty Income Corporation | ||||||||
| 33,000 | 2.000%, 1/31/2018 | 33,061 | ||||||
Regions Bank | ||||||||
| 40,000 | 7.500%, 5/15/2018 | 46,436 | ||||||
Reinsurance Group of America, Inc. | ||||||||
| 40,000 | 5.625%, 3/15/2017 | 43,256 | ||||||
Royal Bank of Scotland Group plc | ||||||||
| 30,000 | 5.050%, 1/8/2015 | 30,006 | ||||||
| 22,000 | 1.197%, 3/31/2017d | 22,068 | ||||||
| 57,000 | 7.640%, 3/29/2049h | 59,850 | ||||||
| 57,000 | 7.648%, 8/29/2049h | 66,405 | ||||||
RPH Hotel Properties, LP | ||||||||
| 105,000 | 5.000%, 4/15/2021 | 104,475 | ||||||
Societe Generale SA | ||||||||
| 30,000 | 5.750%, 4/20/2016g | 31,413 | ||||||
State Bank of India | ||||||||
| 65,000 | 3.622%, 4/17/2019g | 65,915 | ||||||
Sumitomo Mitsui Banking Corporation | ||||||||
| 60,000 | 1.300%, 1/10/2017 | 59,886 | ||||||
Suncorp-Metway, Ltd. | ||||||||
| 20,000 | 0.955%, 3/28/2017d,g | 20,030 | ||||||
Swiss RE Capital 1, LP | ||||||||
| 30,000 | 6.854%, 5/29/2049g,h | 31,425 | ||||||
Synchrony Financial | ||||||||
| 56,000 | 1.875%, 8/15/2017 | 56,109 | ||||||
Ventas Realty, LP | ||||||||
| 22,000 | 1.250%, 4/17/2017 | 21,795 | ||||||
Voya Financial, Inc. | ||||||||
| 30,000 | 2.900%, 2/15/2018 | 30,713 | ||||||
WEA Finance, LLC | ||||||||
| 36,000 | 1.750%, 9/15/2017g | 35,806 | ||||||
Wells Fargo & Company | ||||||||
| 80,000 | 1.400%, 9/8/2017 | 79,935 | ||||||
|
| |||||||
Total | 5,009,126 | |||||||
|
| |||||||
| Foreign Government (1.2%) | |||||||
Azerbaijan Government International Bond | ||||||||
| 35,000 | 4.750%, 3/18/2024g | 34,388 | ||||||
Bahama Government International Bond | ||||||||
| 50,000 | 5.750%, 1/16/2024g | 53,250 | ||||||
Brazil Government International Bond | ||||||||
| 75,000 | 5.000%, 1/27/2045 | 73,500 | ||||||
Colombia Government International Bond | ||||||||
| 45,000 | 2.625%, 3/15/2023 | 41,782 | ||||||
| 85,000 | 4.000%, 2/26/2024 | 86,912 | ||||||
Costa Rica Government International Bond | ||||||||
| 65,000 | 7.000%, 4/4/2044g | 63,700 | ||||||
Hungary Government International Bond | ||||||||
| 80,000 | 4.000%, 3/25/2019 | 82,200 | ||||||
Mexico Government International Bond | ||||||||
| 200,000 | 3.600%, 1/30/2025 | 199,300 | ||||||
Poland Government International Bond | ||||||||
| 53,000 | 4.000%, 1/22/2024 | 56,246 | ||||||
The accompanying Notes to Financial Statements are an integral part of this schedule.
203
Table of Contents
OPPORTUNITY INCOME PLUS PORTFOLIO
Schedule of Investments as of December 31, 2014
| Principal Amount | Long-Term Fixed Income (53.0%) | Value | ||||||
| Foreign Government (1.2%) - continued | |||||||
Slovenia Government International Bond | ||||||||
| $ | 70,000 | 4.125%, 2/18/2019g | $ | 73,326 | ||||
South Africa Government International Bond | ||||||||
| 75,000 | 5.375%, 7/24/2044 | 79,219 | ||||||
Uruguay Government International Bond | ||||||||
| 55,000 | 5.100%, 6/18/2050 | 55,825 | ||||||
|
| |||||||
Total | 899,648 | |||||||
|
| |||||||
| Mortgage-Backed Securities (10.9%) | |||||||
Federal Home Loan Mortgage Corporation Gold 15-Yr. Pass Through | ||||||||
| 550,000 | 3.000%, 1/1/2030c | 570,853 | ||||||
Federal Home Loan Mortgage Corporation Gold 20-Yr. Pass Through | ||||||||
| 45,568 | 5.500%, 9/1/2024 | 50,847 | ||||||
Federal Home Loan Mortgage Corporation Gold 30-Yr. Pass Through | ||||||||
| 400,000 | 4.000%, 1/1/2045c | 426,375 | ||||||
Federal National Mortgage Association Conventional 20-Yr. Pass Through | ||||||||
| 341,670 | 6.000%, 8/1/2024 | 387,191 | ||||||
Federal National Mortgage Association Conventional 15-Yr. Pass Through | ||||||||
| 650,000 | 3.500%, 1/1/2030c | 686,664 | ||||||
Federal National Mortgage Association Conventional 30-Yr. Pass Through | ||||||||
| 1,900,000 | 3.500%, 1/1/2045c | 1,980,602 | ||||||
| 1,900,000 | 4.000%, 1/1/2045c | 2,027,782 | ||||||
| 1,550,000 | 4.500%, 1/1/2045c | 1,682,477 | ||||||
|
| |||||||
Total | 7,812,791 | |||||||
|
| |||||||
| Technology (1.1%) | |||||||
Alibaba Group Holding, Ltd. | ||||||||
| 46,000 | 2.500%, 11/28/2019g | 45,380 | ||||||
Alliance Data Systems Corporation | ||||||||
| 75,000 | 5.375%, 8/1/2022g | 74,062 | ||||||
Amkor Technology, Inc. | ||||||||
| 100,000 | 6.625%, 6/1/2021 | 99,000 | ||||||
EMC Corporation | ||||||||
| 20,000 | 1.875%, 6/1/2018 | 19,932 | ||||||
Fidelity National Information Services, Inc. | ||||||||
| 37,000 | 1.450%, 6/5/2017 | 36,793 | ||||||
First Data Corporation | ||||||||
| 64,810 | 7.375%, 6/15/2019g | 68,212 | ||||||
Freescale Semiconductor, Inc. | ||||||||
| 105,000 | 6.000%, 1/15/2022g | 109,725 | ||||||
Hewlett-Packard Company | ||||||||
| 35,000 | 5.400%, 3/1/2017 | 37,783 | ||||||
Iron Mountain, Inc. | ||||||||
| 64,810 | 6.000%, 8/15/2023 | 67,402 | ||||||
Sensata Technologies BV | ||||||||
| 130,000 | 4.875%, 10/15/2023g | 129,350 | ||||||
Tyco Electronics Group SA | ||||||||
| 38,000 | 6.550%, 10/1/2017 | 42,774 | ||||||
Xerox Corporation | ||||||||
| 38,000 | 7.200%, 4/1/2016 | 40,690 | ||||||
|
| |||||||
Total | 771,103 | |||||||
|
| |||||||
| Transportation (0.5%) | |||||||
American Airlines Pass Through Trust | ||||||||
| 18,879 | 4.950%, 1/15/2023 | 20,154 | ||||||
Avis Budget Car Rental, LLC | ||||||||
| 105,000 | 5.125%, 6/1/2022g | 106,050 | ||||||
Continental Airlines, Inc. | ||||||||
| 54,957 | 6.250%, 4/11/2020 | 57,739 | ||||||
Delta Air Lines, Inc. | ||||||||
| 36,000 | 6.750%, 5/23/2017 | 37,530 | ||||||
| 26,453 | 4.950%, 5/23/2019 | 28,304 | ||||||
| 22,486 | 4.750%, 5/7/2020 | 23,920 | ||||||
Korea Expressway Corporation | ||||||||
| 33,000 | 1.625%, 4/28/2017g | 32,816 | ||||||
Southwest Airlines Company | ||||||||
| 46,000 | 2.750%, 11/6/2019 | 46,212 | ||||||
United Air Lines, Inc. | ||||||||
| 25,522 | 10.400%, 11/1/2016 | 28,393 | ||||||
|
| |||||||
Total | 381,118 | |||||||
|
| |||||||
| U.S. Government and Agencies (1.6%) | |||||||
U.S. Treasury Notes | ||||||||
| 500,000 | 0.875%, 10/15/2017 | 498,086 | ||||||
| 375,000 | 1.875%, 6/30/2020 | 377,520 | ||||||
| 205,000 | 3.625%, 2/15/2044 | 241,243 | ||||||
|
| |||||||
Total | 1,116,849 | |||||||
|
| |||||||
| Utilities (2.6%) | |||||||
Access Midstream Partners, LP | ||||||||
| 100,000 | 4.875%, 5/15/2023 | 101,500 | ||||||
AES Corporation | ||||||||
| 64,810 | 7.375%, 7/1/2021 | 73,235 | ||||||
Atlas Pipeline Partners, LP | ||||||||
| 77,000 | 4.750%, 11/15/2021 | 73,150 | ||||||
Berkshire Hathaway Energy Company | ||||||||
| 48,000 | 2.400%, 2/1/2020g | 47,791 | ||||||
Calpine Corporation | ||||||||
| 100,000 | 6.000%, 1/15/2022g | 106,500 | ||||||
| 120,000 | 5.375%, 1/15/2023 | 121,200 | ||||||
Commonwealth Edison Company | ||||||||
| 22,000 | 6.950%, 7/15/2018 | 25,429 | ||||||
DCP Midstream Operating, LP | ||||||||
| 29,000 | 2.500%, 12/1/2017 | 28,967 | ||||||
DTE Energy Company | ||||||||
| 46,000 | 2.400%, 12/1/2019 | 46,008 | ||||||
Dynegy Finance I, Inc. | ||||||||
| 140,000 | 7.375%, 11/1/2022g | 142,450 | ||||||
EDP Finance BV | ||||||||
| 46,000 | 4.125%, 1/15/2020g | 46,258 | ||||||
El Paso Corporation | ||||||||
| 18,000 | 7.000%, 6/15/2017 | 19,845 | ||||||
Electricite de France SA | ||||||||
| 30,000 | 0.691%, 1/20/2017d,g | 30,082 | ||||||
| 57,000 | 5.625%, 12/29/2049g,h | 60,064 | ||||||
The accompanying Notes to Financial Statements are an integral part of this schedule.
204
Table of Contents
OPPORTUNITY INCOME PLUS PORTFOLIO
Schedule of Investments as of December 31, 2014
| Principal Amount | Long-Term Fixed Income (53.0%) | Value | ||||||
| Utilities (2.6%) - continued | |||||||
Enel Finance International NV | ||||||||
| $ | 26,000 | 5.125%, 10/7/2019g | $ | 28,729 | ||||
Enterprise Products Operating, LLC | ||||||||
| 70,000 | 7.000%, 6/1/2067 | 72,712 | ||||||
Exelon Generation Company, LLC | ||||||||
| 20,000 | 5.200%, 10/1/2019 | 22,100 | ||||||
MarkWest Energy Partners, LP | ||||||||
| 155,000 | 4.875%, 12/1/2024 | 151,512 | ||||||
MidAmerican Energy Holdings Company | ||||||||
| 39,000 | 1.100%, 5/15/2017 | 38,602 | ||||||
| 20,000 | 5.750%, 4/1/2018 | 22,413 | ||||||
NiSource Finance Corporation | ||||||||
| 40,000 | 6.400%, 3/15/2018 | 45,557 | ||||||
NRG Energy, Inc. | ||||||||
| 64,810 | 6.625%, 3/15/2023 | 67,402 | ||||||
Oleoducto Central SA | ||||||||
| 75,000 | 4.000%, 5/7/2021g | 71,625 | ||||||
ONEOK Partners, LP | ||||||||
| 26,000 | 2.000%, 10/1/2017 | 25,855 | ||||||
Pacific Gas & Electric Company | ||||||||
| 26,000 | 5.625%, 11/30/2017 | 28,898 | ||||||
Panhandle Eastern Pipe Line Company, LP | ||||||||
| 28,000 | 6.200%, 11/1/2017 | 31,119 | ||||||
PG&E Corporation | ||||||||
| 19,000 | 2.400%, 3/1/2019 | 19,029 | ||||||
PPL Capital Funding, Inc. | ||||||||
| 40,000 | 1.900%, 6/1/2018 | 39,932 | ||||||
Sempra Energy | ||||||||
| 36,000 | 6.150%, 6/15/2018 | 40,799 | ||||||
Southern Company | ||||||||
| 40,000 | 1.300%, 8/15/2017 | 39,836 | ||||||
TransAlta Corporation | ||||||||
| 37,000 | 1.900%, 6/3/2017 | 36,843 | ||||||
Transelec SA | ||||||||
| 75,000 | 4.250%, 1/14/2025g | 74,671 | ||||||
Williams Companies, Inc. | ||||||||
| 40,000 | 7.875%, 9/1/2021 | 46,207 | ||||||
|
| |||||||
Total | 1,826,320 | |||||||
|
| |||||||
Total Long-Term Fixed Income (cost $37,892,692) | 38,058,012 | |||||||
|
| |||||||
| Shares | Common Stock (6.3%) | |||||||
| Financials (6.3%) | |||||||
| 32,160 | Aberdeen Asia-Pacific Income Fund, Inc. | 178,488 | ||||||
| 6,200 | Cohen & Steers REIT and Preferred Income Fund, Inc. | 117,738 | ||||||
| 9,425 | Doubleline Income Solutions Fund | 187,557 | ||||||
| 5,211 | First Trust High Income Long/Short Fund | 83,376 | ||||||
| 11,400 | iShares J.P. Morgan USD Emerging Markets Bond ETF | 1,250,694 | ||||||
| 4,495 | iShares MSCI Emerging Markets Minimum Volatility ETF | 254,552 | ||||||
| 29,597 | MFS Intermediate Income Trust | 141,474 | ||||||
| 18,070 | Nuveen Quality Preferred Income Fund II | 160,823 | ||||||
| 10,814 | PIMCO Dynamic Credit Income Fund | 223,309 | ||||||
| 24,789 | Templeton Global Income Fund | 178,233 | ||||||
| 6,695 | Vanguard MSCI Emerging Markets ETF | 267,934 | ||||||
| 15,000 | Vanguard Short-Term Corporate Bond ETF | 1,194,450 | ||||||
| 11,299 | Western Asset Emerging Markets Debt Fund, Inc. | 178,072 | ||||||
| 16,794 | Western Asset High Income Opportunity Fund, Inc. | 90,184 | ||||||
|
| |||||||
Total | 4,506,884 | |||||||
|
| |||||||
Total Common Stock (cost $4,597,108) | 4,506,884 | |||||||
|
| |||||||
Preferred Stock (1.4%) | ||||||||
| Financials (1.2%) | |||||||
| 2,850 | Affiliated Managers Group, Inc., 5.250% | 73,730 | ||||||
| 855 | Agribank FCB, 6.875%h | 89,855 | ||||||
| 52 | Bank of America Corporation, Convertible, 7.250%h | 60,474 | ||||||
| 4,620 | Citigroup, Inc., 6.875%h | 122,800 | ||||||
| 1,135 | Farm Credit Bank of Texas, 6.750%g,h | 117,437 | ||||||
| 2,500 | Goldman Sachs Group, Inc., 5.500%h | 61,000 | ||||||
| 3,275 | HSBC USA, Inc., 6.500%h | 82,792 | ||||||
| 92 | M&T Bank Corporation, 6.375%h | 95,047 | ||||||
| 2,300 | Morgan Stanley, 7.125%h | 63,319 | ||||||
| 1,539 | U.S. Bancorp 6.500%h | 45,324 | ||||||
| 57 | Wells Fargo & Company, Convertible, 7.500%h | 68,742 | ||||||
|
| |||||||
Total | 880,520 | |||||||
|
| |||||||
| Materials (0.1%) | |||||||
| 2,280 | CHS, Inc., 7.100%h | 59,873 | ||||||
|
| |||||||
Total | 59,873 | |||||||
|
| |||||||
| Utilities (0.1%) | |||||||
| 865 | Southern California Edison Company, 4.510%h | 86,905 | ||||||
|
| |||||||
Total | 86,905 | |||||||
|
| |||||||
Total Preferred Stock (cost $993,487) | 1,027,298 | |||||||
|
| |||||||
| Shares or Principal Amount | Short-Term Investments (15.1%)i | |||||||
Federal Home Loan Bank Discount Notes | ||||||||
| 100,000 | 0.150%, 4/24/2015j | 99,953 | ||||||
Thrivent Cash Management Trust | ||||||||
| 10,695,094 | 0.060% | 10,695,094 | ||||||
|
| |||||||
Total Short-Term Investments (at amortized cost) | 10,795,047 | |||||||
|
| |||||||
Total Investments (cost $80,466,807) 111.3% | $ | 79,874,741 | ||||||
|
| |||||||
Other Assets and Liabilities, Net (11.3%) | (8,113,556 | ) | ||||||
|
| |||||||
Total Net Assets 100.0% | $ | 71,761,185 | ||||||
|
| |||||||
The accompanying Notes to Financial Statements are an integral part of this schedule.
205
Table of Contents
OPPORTUNITY INCOME PLUS PORTFOLIO
Schedule of Investments as of December 31, 2014
| a | The stated interest rate represents the weighted average of all contracts within the bank loan facility. |
| b | All or a portion of the loan is unfunded. |
| c | Denotes investments purchased on a when-issued or delayed delivery basis. |
| d | Denotes variable rate securities. Variable rate securities are securities whose yields vary with a designated market index or market rate. The rate shown is as of December 31, 2014. |
| e | Denotes step coupon securities. Step coupon securities pay an initial coupon rate for the first period and then different coupon rates for following periods. The rate shown is as of December 31, 2014. |
| f | All or a portion of the security is insured or guaranteed. |
| g | Denotes securities sold under Rule 144A of the Securities Act of 1933, which exempts them from registration. These securities have been deemed liquid and may be resold to other dealers in the program or to other qualified institutional buyers. As of December 31, 2014, the value of these investments was $7,410,916 or 10.3% of total net assets. |
| h | Denotes perpetual securities. Perpetual securities pay an indefinite stream of interest, but may be called by the issuer at an earlier date. |
| i | The interest rate shown reflects the yield, coupon rate or the discount rate at the date of purchase. |
| j | At December 31, 2014, $99,953 of investments were held on deposit with the counterparty and pledged as the initial margin deposit for open futures contracts. |
| * | Denotes restricted securities. Restricted securities are investment securities which have been deemed illiquid and cannot be offered for public sale without first being registered under the Securities Act of 1933. The following table indicates the acquisition date and cost of restricted securities Opportunity Income Plus Portfolio owned as of December 31, 2014. |
Security | Acquisition Date | Cost | ||||||
Bayview Opportunity Master Fund Trust IIB, LP, 7/28/2019 | 7/30/2014 | $ | 143,905 | |||||
Bayview Opportunity Master Fund Trust IIB, LP, 1/28/2034 | 1/17/2014 | 90,604 | ||||||
JBS Finance II, Ltd., 1/29/2018 | 8/19/2013 | 67,490 | ||||||
Wachovia Asset Securitization, Inc., 7/25/2037 | 3/16/2007 | 397,810 | ||||||
Definitions:
| ETF | - | Exchange Traded Fund. | ||
| REIT | - | Real Estate Investment Trust is a company that buys, develops, manages and/or sells real estate assets. |
Unrealized Appreciation (Depreciation)
Gross unrealized appreciation and depreciation of investments, based on cost for federal income tax purposes, were as follows:
Gross unrealized appreciation | $ | 829,849 | ||
Gross unrealized depreciation | (1,422,454 | ) | ||
|
| |||
Net unrealized appreciation (depreciation) | $ | (592,605 | ) | |
Cost for federal income tax purposes | $ | 80,467,346 | ||
The accompanying Notes to Financial Statements are an integral part of this schedule.
206
Table of Contents
OPPORTUNITY INCOME PLUS PORTFOLIO
Schedule of Investments as of December 31, 2014
Fair Valuation Measurements
The following table is a summary of the inputs used, as of December 31, 2014, in valuing Opportunity Income Plus Portfolio’s assets carried at fair value.
Investments in Securities | Total | Level 1 | Level 2 | Level 3 | ||||||||||||
Bank Loans | ||||||||||||||||
Basic Materials | 1,966,511 | — | 1,966,511 | — | ||||||||||||
Capital Goods | 1,140,969 | — | 1,140,969 | — | ||||||||||||
Communications Services | 9,307,841 | — | 8,056,333 | 1,251,508 | ||||||||||||
Consumer Cyclical | 3,512,278 | — | 3,512,278 | — | ||||||||||||
Consumer Non-Cyclical | 2,650,171 | — | 1,275,400 | 1,374,771 | ||||||||||||
Energy | 1,023,182 | — | 718,156 | 305,026 | ||||||||||||
Financials | 2,084,937 | — | 2,084,937 | — | ||||||||||||
Technology | 1,702,341 | — | 1,702,341 | — | ||||||||||||
Transportation | 1,120,380 | — | 491,416 | 628,964 | ||||||||||||
Utilities | 978,890 | — | 978,890 | — | ||||||||||||
Long-Term Fixed Income | ||||||||||||||||
Asset-Backed Securities | 2,421,795 | — | 2,421,795 | — | ||||||||||||
Basic Materials | 1,151,262 | — | 1,151,262 | — | ||||||||||||
Capital Goods | 1,516,659 | — | 1,516,659 | — | ||||||||||||
Collateralized Mortgage Obligations | 5,701,307 | — | 5,701,307 | — | ||||||||||||
Commercial Mortgage-Backed Securities | 152,462 | — | 152,462 | — | ||||||||||||
Communications Services | 2,887,240 | — | 2,887,240 | — | ||||||||||||
Consumer Cyclical | 1,959,976 | — | 1,959,976 | — | ||||||||||||
Consumer Non-Cyclical | 2,540,708 | — | 2,540,708 | — | ||||||||||||
Energy | 1,909,648 | — | 1,909,648 | — | ||||||||||||
Financials | 5,009,126 | — | 5,009,126 | — | ||||||||||||
Foreign Government | 899,648 | — | 899,648 | — | ||||||||||||
Mortgage-Backed Securities | 7,812,791 | — | 7,812,791 | — | ||||||||||||
Technology | 771,103 | — | 771,103 | — | ||||||||||||
Transportation | 381,118 | — | 381,118 | — | ||||||||||||
U.S. Government and Agencies | 1,116,849 | — | 1,116,849 | — | ||||||||||||
Utilities | 1,826,320 | — | 1,826,320 | — | ||||||||||||
Common Stock | ||||||||||||||||
Financials | 4,506,884 | 4,506,884 | — | — | ||||||||||||
Preferred Stock | ||||||||||||||||
Financials | 880,520 | 673,228 | 207,292 | — | ||||||||||||
Materials | 59,873 | 59,873 | — | — | ||||||||||||
Utilities | 86,905 | — | 86,905 | — | ||||||||||||
Short-Term Investments | 10,795,047 | 10,695,094 | 99,953 | — | ||||||||||||
|
|
|
|
|
|
|
| |||||||||
Total | $ | 79,874,741 | $ | 15,935,079 | $ | 60,379,393 | $ | 3,560,269 | ||||||||
|
|
|
|
|
|
|
| |||||||||
Other Financial Instruments | Total | Level 1 | Level 2 | Level 3 | ||||||||||||
Asset Derivatives | ||||||||||||||||
Futures Contracts | 91,653 | 91,653 | — | — | ||||||||||||
|
|
|
|
|
|
|
| |||||||||
Total Asset Derivatives | $ | 91,653 | $ | 91,653 | $ | — | $ | — | ||||||||
|
|
|
|
|
|
|
| |||||||||
There were no significant transfers between Levels 1 and 2 during the period ended December 31, 2014. Transfers between Levels are identified as of the end of the period.
The following table is a reconciliation of assets in which significant unobservable inputs (Level 3) were used in determining fair value for Opportunity Income Plus Portfolio as discussed in the Notes to Financial Statements.
Investments in Securities | Beginning Value January 1, 2014 | Realized Gain/ (Loss) | Change in Unrealized Appreciation/ (Depreciation) | Purchases | Sales | Transfers Into Level 3 | Transfers Out of Level 3 | Ending Value December 31, 2014 | ||||||||||||||||||||||||
Bank Loans | ||||||||||||||||||||||||||||||||
Communications Services | — | 441 | (10,110 | ) | 1,000,845 | (39,446 | ) | 299,778 | — | 1,251,508 | ||||||||||||||||||||||
Consumer Non-Cyclical | — | (1,565 | ) | (20,995 | ) | 79,200 | (178,100 | ) | 1,496,231 | — | 1,374,771 | |||||||||||||||||||||
Energy | — | (276 | ) | (4,599 | ) | 329,875 | (19,974 | ) | — | — | 305,026 | |||||||||||||||||||||
Transportation | — | 3 | (17,289 | ) | 649,500 | (3,250 | ) | — | — | 628,964 | ||||||||||||||||||||||
|
|
|
|
|
|
|
|
|
|
|
|
|
|
|
| |||||||||||||||||
Total | $ | — | ($ | 1,397 | ) | ($ | 52,993 | ) | $ | 2,059,420 | ($ | 240,770 | ) | $ | 1,796,009 | $ | — | $ | 3,560,269 | |||||||||||||
|
|
|
|
|
|
|
|
|
|
|
|
|
|
|
| |||||||||||||||||
The accompanying Notes to Financial Statements are an integral part of this schedule.
207
Table of Contents
OPPORTUNITY INCOME PLUS PORTFOLIO
Schedule of Investments as of December 31, 2014
The significant unobservable inputs used in the fair value measurement of the reporting entity’s Bank Loans Communications Services Securities are recent market activity based on comparable trades, market color and credit spread of the issuer. A significant increase or decrease in the inputs in isolation would result in a significantly lower or higher fair value measurement.
The significant unobservable inputs used in the fair value measurement of the reporting entity’s Bank Loans Consumer Non-Cyclical Securities are recent market activity based on comparable trades, market color and credit spread of the issuer. A significant increase or decrease in the inputs in isolation would result in a significantly lower or higher fair value measurement.
The significant unobservable inputs used in the fair value measurement of the reporting entity’s Bank Loans Energy Securities are recent market activity based on comparable trades, market color and credit spread of the issuer. A significant increase or decrease in the inputs in isolation would result in a significantly lower or higher fair value measurement.
The significant unobservable inputs used in the fair value measurement of the reporting entity’s Bank Loans Transportation Securities are recent market activity based on comparable trades, market color and credit spread of the issuer. A significant increase or decrease in the inputs in isolation would result in a significantly lower or higher fair value measurement.
Futures Contracts | Number of Contracts Long/(Short) | Expiration Date | Notional Principal Amount | Value | Unrealized Gain/(Loss) | |||||||||||||
2-Yr. U.S. Treasury Bond Futures | (84 | ) | March 2015 | ($ | 18,382,619 | ) | ($ | 18,361,875 | ) | $ | 20,744 | |||||||
5-Yr. U.S. Treasury Bond Futures | 48 | March 2015 | 5,703,146 | 5,708,625 | 5,479 | |||||||||||||
30-Yr. U.S. Treasury Bond Futures | 3 | March 2015 | 421,720 | 433,687 | 11,967 | |||||||||||||
Ultra Long Term U.S. Treasury Bond Futures | 7 | March 2015 | 1,102,850 | 1,156,313 | 53,463 | |||||||||||||
Total Futures Contracts | $ | 91,653 | ||||||||||||||||
The following table summarizes the fair value and Statement of Assets and Liabilities location, as of December 31, 2014, for Opportunity Income Plus Portfolio’s investments in financial derivative instruments by primary risk exposure as discussed under item (2) Significant Accounting Policies of the Notes to Financial Statements.
Derivatives by risk category | Statement of Assets and Liabilities Location | Fair Value | ||||
Asset Derivatives | ||||||
Interest Rate Contracts | ||||||
Futures* | Net Assets - Net unrealized appreciation/(depreciation) on Futures contracts | $ | 91,653 | |||
Total Interest Rate Contracts | 91,653 | |||||
|
| |||||
Total Asset Derivatives | $ | 91,653 | ||||
|
| |||||
| * | Includes cumulative appreciation/depreciation of futures contracts as reported in the Schedule of Investments. Only current day’s variation margin is reported within the Statement of Assets and Liabilities. |
The following table summarizes the net realized gains/(losses) and Statement of Operations location, for the period ended December 31, 2014, for Opportunity Income Plus Portfolio’s investments in financial derivative instruments by primary risk exposure.
Derivatives by risk category | Statement of Operations Location | Realized Gains/(Losses) recognized in Income | ||||
Interest Rate Contracts | ||||||
Futures | Net realized gains/(losses) on Futures contracts | 123,983 | ||||
Total Interest Rate Contracts | 123,983 | |||||
Credit Contracts | ||||||
Credit Default Swaps | Net realized gains/(losses) on Swap agreements | 818 | ||||
Total Credit Contracts | 818 | |||||
|
| |||||
Total | $ | 124,801 | ||||
|
| |||||
The accompanying Notes to Financial Statements are an integral part of this schedule.
208
Table of Contents
OPPORTUNITY INCOME PLUS PORTFOLIO
Schedule of Investments as of December 31, 2014
The following table summarizes the change in net unrealized appreciation/(depreciation) and Statement of Operations location, for the period ended December 31, 2014, for Opportunity Income Plus Portfolio’s investments in financial derivative instruments by primary risk exposure.
Derivatives by risk category | Statement of Operations Location | Change in unrealized appreciation/(depreciation) recognized in Income | ||||
Interest Rate Contracts | ||||||
Futures | Change in net unrealized appreciation/(depreciation) on Futures contracts | 91,653 | ||||
Total Interest Rate Contracts | 91,653 | |||||
Credit Contracts | ||||||
Credit Default Swaps | Change in net unrealized appreciation/(depreciation) on Swap agreements | (2,202 | ) | |||
Total Credit Contracts | (2,202 | ) | ||||
|
| |||||
Total | $ | 89,451 | ||||
|
| |||||
The following table presents Opportunity Income Plus Portfolio’s average volume of derivative activity during the period ended December 31, 2014.
Derivative Risk Category | Futures (Notional)* | Futures (Percentage of Average Net Assets) | Swaps (Notional)* | |||||||||
Interest Rate Contracts | $ | 12,501,873 | 21.5 | % | N/A | |||||||
Credit Contracts | N/A | N/A | $ | 882 | ||||||||
| * | Notional amount represents long or short, or both, derivative positions held by the Portfolio. |
Investment in Affiliates
Affiliated issuers, as defined under the Investment Company Act of 1940, include those in which the Portfolio’s holdings of an issuer represent 5% or more of the outstanding voting securities of an issuer, or any affiliated mutual fund.
A summary of transactions for the fiscal year to date, in Opportunity Income Plus Portfolio, is as follows:
Portfolio | Value December 31, 2013 | Gross Purchases | Gross Sales | Shares Held at December 31, 2014 | Value December 31, 2014 | Income Earned January 1, 2014 - December 31, 2014 | ||||||||||||||||||
Cash Management Trust-Short Term Investment | $ | 4,568,156 | $ | 66,418,058 | $ | 60,291,120 | 10,695,094 | $ | 10,695,094 | $ | 3,762 | |||||||||||||
Total Value and Income Earned | 4,568,156 | 10,695,094 | 3,762 | |||||||||||||||||||||
The accompanying Notes to Financial Statements are an integral part of this schedule.
209
Table of Contents
Schedule of Investments as of December 31, 2014
| Shares | Common Stock (96.4%) | Value | ||||||
| Communications Equipment (5.3%) | |||||||
| 40,294 | QUALCOMM, Inc. | $ | 2,995,053 | |||||
|
| |||||||
Total | 2,995,053 | |||||||
|
| |||||||
| Computers & Peripherals (14.1%) | |||||||
| 42,887 | Apple, Inc. | 4,733,867 | ||||||
| 18,909 | Electronics for Imaging, Inc.a | 809,872 | ||||||
| 82,575 | EMC Corporation | 2,455,781 | ||||||
|
| |||||||
Total | 7,999,520 | |||||||
|
| |||||||
| Consumer Discretionary (8.1%) | |||||||
| 5,324 | Amazon.com, Inc.a | 1,652,303 | ||||||
| 1,602 | Priceline Group, Inc.a | 1,826,617 | ||||||
| 2,164 | Tesla Motors, Inc.a | 481,295 | ||||||
| 8,224 | TripAdvisor, Inc.a | 614,004 | ||||||
|
| |||||||
Total | 4,574,219 | |||||||
|
| |||||||
| Electronic Equipment, Instruments & Components (2.9%) | |||||||
| 31,000 | Amphenol Corporation | 1,668,110 | ||||||
|
| |||||||
Total | 1,668,110 | |||||||
|
| |||||||
| Financials (6.2%) | |||||||
| 20,820 | American Tower Corporation | 2,058,057 | ||||||
| 6,773 | Intercontinental Exchange, Inc. | 1,485,251 | ||||||
|
| |||||||
Total | 3,543,308 | |||||||
|
| |||||||
| Internet Software & Services (22.0%) | |||||||
| 2,397 | Alibaba Group Holding, Ltd. ADRa | 249,144 | ||||||
| 6,136 | Demandware, Inc.a | 353,065 | ||||||
| 25,365 | eBay, Inc.a | 1,423,484 | ||||||
| 7,365 | Equinix, Inc. | 1,669,866 | ||||||
| 20,030 | Facebook, Inc.a | 1,562,741 | ||||||
| 11,612 | Fidelity National Information Services, Inc. | 722,266 | ||||||
| 2,825 | Google, Inc.a | 1,487,080 | ||||||
| 2,816 | Google, Inc., Class Aa | 1,494,339 | ||||||
| 5,552 | LendingClub Corporationa | 140,466 | ||||||
| 9,992 | Linkedln Corporationa | 2,295,262 | ||||||
| 29,464 | Pandora Media, Inc.a | 525,343 | ||||||
| 11,303 | Yahoo!, Inc.a | 570,915 | ||||||
|
| |||||||
Total | 12,493,971 | |||||||
|
| |||||||
| IT Consulting & Services (5.3%) | |||||||
| 23,748 | Cognizant Technology Solutions Corporationa | 1,250,570 | ||||||
| 7,485 | FleetCor Technologies, Inc.a | 1,113,094 | ||||||
| 22,721 | InterXion Holding NVa | 621,192 | ||||||
|
| |||||||
Total | 2,984,856 | |||||||
|
| |||||||
| Semiconductors & Semiconductor Equipment (4.5%) | |||||||
| 45,468 | Applied Materials, Inc. | 1,133,063 | ||||||
| 32,152 | Broadcom Corporation | 1,393,146 | ||||||
|
| |||||||
Total | 2,526,209 | |||||||
|
| |||||||
| Software (24.1%) | |||||||
| 19,116 | Adobe Systems, Inc.a | 1,389,733 | ||||||
| 28,594 | Guidewire Software, Inc.a | 1,447,714 | ||||||
| 17,083 | Microsoft Corporation | 793,505 | ||||||
| 9,185 | NetSuite, Inc.a | 1,002,727 | ||||||
| 48,911 | Oracle Corporation | 2,199,528 | ||||||
| 17,697 | Red Hat, Inc.a | 1,223,571 | ||||||
| 31,540 | Salesforce.com, Inc.a | 1,870,637 | ||||||
| 30,851 | ServiceNow, Inc.a | 2,093,240 | ||||||
| 10,957 | VMware, Inc.a | 904,172 | ||||||
| 8,677 | Workday, Inc.a | 708,130 | ||||||
|
| |||||||
Total | 13,632,957 | |||||||
|
| |||||||
| Telecommunications Services (3.9%) | |||||||
| 9,207 | Level 3 Communications, Inc.a | 454,642 | ||||||
| 16,050 | SBA Communications Corporationa | 1,777,698 | ||||||
|
| |||||||
Total | 2,232,340 | |||||||
|
| |||||||
Total Common Stock (cost $39,683,994) | 54,650,543 | |||||||
|
| |||||||
| Shares or Principal Amount | Short-Term Investments (3.5%)b | Value | ||||||
Thrivent Cash Management Trust | ||||||||
| 1,993,717 | 0.060% | 1,993,717 | ||||||
|
| |||||||
Total Short-Term Investments (at amortized cost) | 1,993,717 | |||||||
|
| |||||||
Total Investments (cost $41,677,711) 99.9% | $ | 56,644,260 | ||||||
|
| |||||||
Other Assets and Liabilities, Net 0.1% | 29,905 | |||||||
|
| |||||||
Total Net Assets 100.0% | $ | 56,674,165 | ||||||
|
| |||||||
| a | Non-income producing security. |
| b | The interest rate shown reflects the yield, coupon rate or the discount rate at the date of purchase. |
Definitions:
| ADR | - | American Depositary Receipt, which are certificates for an underlying foreign security’s shares held by an issuing U.S. depository bank. |
Unrealized Appreciation (Depreciation)
Gross unrealized appreciation and depreciation of investments, based on cost for federal income tax purposes, were as follows:
Gross unrealized appreciation | $ | 15,356,085 | ||
Gross unrealized depreciation | (413,683 | ) | ||
|
| |||
Net unrealized appreciation (depreciation) | $ | 14,942,402 | ||
Cost for federal income tax purposes | $ | 41,701,858 | ||
The accompanying Notes to Financial Statements are an integral part of this schedule.
210
Table of Contents
PARTNER TECHNOLOGY PORTFOLIO
Schedule of Investments as of December 31, 2014
Fair Valuation Measurements
The following table is a summary of the inputs used, as of December 31, 2014, in valuing Partner Technology Portfolio’s assets carried at fair value.
Investments in Securities | Total | Level 1 | Level 2 | Level 3 | ||||||||||||
Common Stock | ||||||||||||||||
Communications Equipment | 2,995,053 | 2,995,053 | — | — | ||||||||||||
Computers & Peripherals | 7,999,520 | 7,999,520 | — | — | ||||||||||||
Consumer Discretionary | 4,574,219 | 4,574,219 | — | — | ||||||||||||
Electronic Equipment, Instruments & Components | 1,668,110 | 1,668,110 | — | — | ||||||||||||
Financials | 3,543,308 | 3,543,308 | — | — | ||||||||||||
Internet Software & Services | 12,493,971 | 12,493,971 | — | — | ||||||||||||
IT Consulting & Services | 2,984,856 | 2,984,856 | — | — | ||||||||||||
Semiconductors & Semiconductor Equipment | 2,526,209 | 2,526,209 | — | — | ||||||||||||
Software | 13,632,957 | 13,632,957 | — | — | ||||||||||||
Telecommunications Services | 2,232,340 | 2,232,340 | — | — | ||||||||||||
Short-Term Investments | 1,993,717 | 1,993,717 | — | — | ||||||||||||
|
|
|
|
|
|
|
| |||||||||
Total | $ | 56,644,260 | $ | 56,644,260 | $ | — | $ | — | ||||||||
|
|
|
|
|
|
|
| |||||||||
There were no significant transfers between Levels during the period ended December 31, 2014. Transfers between Levels are identified as of the end of the period.
Investment in Affiliates
Affiliated issuers, as defined under the Investment Company Act of 1940, include those in which the Portfolio’s holdings of an issuer represent 5% or more of the outstanding voting securities of an issuer, or any affiliated mutual fund.
A summary of transactions for the fiscal year to date, in Partner Technology Portfolio, is as follows:
Portfolio | Value December 31, 2013 | Gross Purchases | Gross Sales | Shares Held at December 31, 2014 | Value December 31, 2014 | Income Earned January 1, 2014 - December 31, 2014 | ||||||||||||||||||
Cash Management Trust-Short Term Investment | $ | 856,402 | $ | 10,232,450 | $ | 9,095,135 | 1,993,717 | $ | 1,993,717 | $ | 565 | |||||||||||||
Total Value and Income Earned | 856,402 | 1,993,717 | 565 | |||||||||||||||||||||
The accompanying Notes to Financial Statements are an integral part of this schedule.
211
Table of Contents
Schedule of Investments as of December 31, 2014
| Shares | Common Stock (94.5%) | Value | ||||||
| Biotechnology (19.5%) |
| ||||||
| 36,030 | Amgen, Inc. | $ | 5,739,219 | |||||
| 126,741 | Amicus Therapeutics, Inc.a | 1,054,485 | ||||||
| 13,084 | Biogen Idec, Inc.a | 4,441,364 | ||||||
| 22,900 | BioMarin Pharmaceutical, Inc.a | 2,070,160 | ||||||
| 19,900 | Incyte Corporationa | 1,454,889 | ||||||
| 105,544 | Innate Pharma SAa | 994,280 | ||||||
| 72,648 | Keryx BioPharmaceuticals, Inc.a | 1,027,969 | ||||||
| 10,000 | Medivation, Inc.a | 996,100 | ||||||
| 54,228 | Oncomed Pharmaceuticals, Inc.a | 1,180,001 | ||||||
| 17,887 | PTC Therapeutics, Inc.a | 926,010 | ||||||
|
| |||||||
Total | 19,884,477 | |||||||
|
| |||||||
| Health Care Equipment (17.8%) | |||||||
| 67,500 | Abbott Laboratories | 3,038,850 | ||||||
| 50,876 | Dexcom, Inc.a | 2,800,724 | ||||||
| 28,588 | HeartWare International, Inc.a | 2,099,217 | ||||||
| 35,015 | Inogen, Inc.a | 1,098,421 | ||||||
| 5,775 | Intuitive Surgical, Inc.a | 3,054,628 | ||||||
| 52,800 | Medtronic, Inc. | 3,812,160 | ||||||
| 128,327 | NxStage Medical, Inc.a | 2,300,903 | ||||||
|
| |||||||
Total | 18,204,903 | |||||||
|
| |||||||
| Health Care Facilities (3.4%) | |||||||
| 30,400 | HCA Holdings, Inc.a | 2,231,056 | ||||||
| 10,800 | Universal Health Services, Inc. | 1,201,608 | ||||||
|
| |||||||
Total | 3,432,664 | |||||||
|
| |||||||
| Health Care Supplies (2.8%) | |||||||
| 52,077 | Align Technology, Inc.a | 2,911,625 | ||||||
|
| |||||||
Total | 2,911,625 | |||||||
|
| |||||||
| Pharmaceuticals (51.0%) | |||||||
| 73,583 | Aspen Pharmacare Holdings, Ltd.a | 2,567,023 | ||||||
| 45,000 | Dr. Reddy’s Laboratories, Ltd. ADR | 2,270,250 | ||||||
| 45,338 | Hikma Pharmaceuticals plc | 1,391,040 | ||||||
| 60,291 | Mylan, Inc.a | 3,398,604 | ||||||
| 87,699 | Novartis AG | 8,133,510 | ||||||
| 92,005 | Novo Nordisk AS ADR | 3,893,652 | ||||||
| 199,600 | Pfizer, Inc. | 6,217,540 | ||||||
| 29,883 | Roche Holding AG - Genusschein | 8,096,566 | ||||||
| 39,333 | Sagent Pharmaceuticals, Inc.a | 987,652 | ||||||
| 53,771 | Sanofi | 4,902,340 | ||||||
| 17,545 | Sawai Pharmaceutical Company, Ltd. | 1,007,961 | ||||||
| 17,289 | Shire Pharmaceuticals Group plc ADR | 3,674,604 | ||||||
| 2,300,800 | Sihuan Pharmaceutical Holdings Group, Ltd. | 1,530,397 | ||||||
| 53,881 | Teva Pharmaceutical Industries, Ltd. ADR | 3,098,696 | ||||||
| 449,497 | Vectura Group plca | 893,052 | ||||||
|
| |||||||
Total | 52,062,887 | |||||||
|
| |||||||
Total Common Stock (cost $80,500,470) | 96,496,556 | |||||||
|
| |||||||
| Shares or Principal Amount | Short-Term Investments (7.6%)b | |||||||
| 7,778,026 | Thrivent Cash Management Trust 0.060% | $ | 7,778,026 | |||||
|
| |||||||
Total Short-Term Investments (at amortized cost) | 7,778,026 | |||||||
|
| |||||||
Total Investments (cost $88,278,496) 102.1% | $ | 104,274,582 | ||||||
|
| |||||||
Other Assets and Liabilities, Net (2.1%) | (2,152,997 | ) | ||||||
|
| |||||||
Total Net Assets 100.0% | $ | 102,121,585 | ||||||
|
| |||||||
| a | Non-income producing security. |
| b | The interest rate shown reflects the yield, coupon rate or the discount rate at the date of purchase. |
Definitions:
| ADR | - | American Depositary Receipt, which are certificates for an underlying foreign security’s shares held by an issuing U.S. depository bank. |
Unrealized Appreciation (Depreciation)
Gross unrealized appreciation and depreciation of investments, based on cost for federal income tax purposes, were as follows:
Gross unrealized appreciation | $ | 16,785,583 | ||
Gross unrealized depreciation | (873,496 | ) | ||
|
| |||
Net unrealized appreciation (depreciation) | $ | 15,912,087 | ||
Cost for federal income tax purposes | $ | 88,362,495 | ||
The accompanying Notes to Financial Statements are an integral part of this schedule.
212
Table of Contents
PARTNER HEALTHCARE PORTFOLIO
Schedule of Investments as of December 31, 2014
Fair Valuation Measurements
The following table is a summary of the inputs used, as of December 31, 2014, in valuing Partner Healthcare Portfolio’s assets carried at fair value.
Investments in Securities | Total | Level 1 | Level 2 | Level 3 | ||||||||||||
Common Stock | ||||||||||||||||
Biotechnology | 19,884,477 | 18,890,197 | 994,280 | — | ||||||||||||
Health Care Equipment | 18,204,903 | 18,204,903 | — | — | ||||||||||||
Health Care Facilities | 3,432,664 | 3,432,664 | — | — | ||||||||||||
Health Care Supplies | 2,911,625 | 2,911,625 | — | — | ||||||||||||
Pharmaceuticals | 52,062,887 | 23,540,998 | 28,521,889 | — | ||||||||||||
Short-Term Investments | 7,778,026 | 7,778,026 | — | — | ||||||||||||
|
|
|
|
|
|
|
| |||||||||
Total | $ | 104,274,582 | $ | 74,758,413 | $ | 29,516,169 | $ | — | ||||||||
|
|
|
|
|
|
|
| |||||||||
There were no significant transfers between Levels during the period ended December 31, 2014. Transfers between Levels are identified as of the end of the period.
Investment in Affiliates
Affiliated issuers, as defined under the Investment Company Act of 1940, include those in which the Portfolio’s holdings of an issuer represent 5% or more of the outstanding voting securities of an issuer, or any affiliated mutual fund.
A summary of transactions for the fiscal year to date, in Partner Healthcare Portfolio, is as follows:
Portfolio | Value December 31, 2013 | Gross Purchases | Gross Sales | Shares Held at December 31, 2014 | Value December 31, 2014 | Income Earned January 1, 2014 - December 31, 2014 | ||||||||||||||||||
Cash Management Trust-Short Term Investment | $ | 1,615,477 | $ | 33,556,232 | $ | 27,393,683 | 7,778,026 | $ | 7,778,026 | $ | 2,172 | |||||||||||||
Total Value and Income Earned | 1,615,477 | 7,778,026 | 2,172 | |||||||||||||||||||||
The accompanying Notes to Financial Statements are an integral part of this schedule.
213
Table of Contents
Schedule of Investments as of December 31, 2014
| Shares | Common Stock (99.0%) | Value | ||||||
| Integrated Oil & Gas (18.4%) | |||||||
| 14,779 | Chevron Corporation | $ | 1,657,908 | |||||
| 95,726 | Petroleo Brasileiro SA ADR | 698,800 | ||||||
| 42,850 | Suncor Energy, Inc. ADR | 1,361,773 | ||||||
| 39,900 | Total SA ADRa | 2,042,880 | ||||||
|
| |||||||
Total | 5,761,361 | |||||||
|
| |||||||
| Materials (14.9%) | |||||||
| 3,500 | Agnico Eagle Mines, Ltd. | 87,115 | ||||||
| 21,550 | Alcoa, Inc. | 340,274 | ||||||
| 2,500 | Avery Dennison Corporation | 129,700 | ||||||
| 3,450 | Ball Corporation | 235,186 | ||||||
| 21,050 | Barrick Gold Corporation | 226,287 | ||||||
| 3,850 | Crown Holdings, Inc.b | 195,965 | ||||||
| 800 | Eagle Materials, Inc. | 60,824 | ||||||
| 12,050 | Eldorado Gold Corporation | 73,264 | ||||||
| 2,700 | Franco-Nevada Corporation | 132,813 | ||||||
| 21,550 | Freeport-McMoRan, Inc. | 503,408 | ||||||
| 14,650 | Goldcorp, Inc. | 271,318 | ||||||
| 10,500 | International Paper Company | 562,590 | ||||||
| 19,850 | Kinross Gold Corporationb | 55,977 | ||||||
| 1,100 | Martin Marietta Materials, Inc. | 121,352 | ||||||
| 3,750 | MeadWestvaco Corporation | 166,462 | ||||||
| 8,900 | Newmont Mining Corporation | 168,210 | ||||||
| 5,150 | Owens-Illinois, Inc.b | 138,999 | ||||||
| 2,400 | Packaging Corporation of America | 187,320 | ||||||
| 3,300 | Rock-Tenn Company | 201,234 | ||||||
| 1,250 | Royal Gold, Inc. | 78,375 | ||||||
| 4,550 | Sealed Air Corporation | 193,057 | ||||||
| 7,000 | Silver Wheaton Corporation | 142,310 | ||||||
| 12,200 | Teck Resources, Ltd. | 166,408 | ||||||
| 2,250 | Vulcan Materials Company | 147,893 | ||||||
| 16,050 | Yamana Gold, Inc. | 64,521 | ||||||
|
| |||||||
Total | 4,650,862 | |||||||
|
| |||||||
| Oil & Gas Drilling (4.3%) | |||||||
| 57,500 | Rowan Companies plc | 1,340,900 | ||||||
|
| |||||||
Total | 1,340,900 | |||||||
|
| |||||||
| Oil & Gas Equipment & Services (18.4%) | |||||||
| 30,150 | Cameron International Corporationb | 1,505,993 | ||||||
| 34,550 | Schlumberger, Ltd. | 2,950,915 | ||||||
| 113,600 | Weatherford International, Ltd.b | 1,300,720 | ||||||
|
| |||||||
Total | 5,757,628 | |||||||
|
| |||||||
| Oil & Gas Exploration & Production (32.8%) | |||||||
| 41,800 | Canadian Natural Resources, Ltd. | 1,290,784 | ||||||
| 187,000 | Cobalt International Energy, Inc.b | 1,662,430 | ||||||
| 7,900 | Concho Resources, Inc.b | 788,025 | ||||||
| 20,050 | EOG Resources, Inc. | 1,846,004 | ||||||
| 21,250 | EQT Corporation | 1,608,625 | ||||||
| 43,850 | Marathon Oil Corporation | 1,240,516 | ||||||
| 40,450 | Oasis Petroleum, Inc.b | 669,043 | ||||||
| 42,500 | Southwestern Energy Companyb | 1,159,825 | ||||||
|
| |||||||
Total | 10,265,252 | |||||||
|
| |||||||
| Oil & Gas Refining & Marketing (6.4%) | |||||||
| 22,400 | Marathon Petroleum Corporation | 2,021,824 | ||||||
|
| |||||||
Total | 2,021,824 | |||||||
|
| |||||||
| Utilities (3.8%) | |||||||
| 30,800 | iShares North American Natural Resources ETF | $ | 1,180,256 | |||||
|
| |||||||
Total | 1,180,256 | |||||||
|
| |||||||
Total Common Stock (cost $37,587,383) | 30,978,083 | |||||||
|
| |||||||
Collateral Held for Securities Loaned (6.3%) | ||||||||
| 1,983,400 | Thrivent Cash Management Trust | 1,983,400 | ||||||
|
| |||||||
Total Collateral Held for Securities Loaned (cost $1,983,400) | 1,983,400 | |||||||
|
| |||||||
| Shares or Principal Amount | Short-Term Investments (1.5%)c | |||||||
Thrivent Cash Management Trust | ||||||||
| 466,869 | 0.060% | 466,869 | ||||||
|
| |||||||
Total Short-Term Investments (at amortized cost) | 466,869 | |||||||
|
| |||||||
Total Investments (cost $40,037,652) 106.8% | $ | 33,428,352 | ||||||
|
| |||||||
Other Assets and Liabilities, Net (6.8%) | (2,136,116 | ) | ||||||
|
| |||||||
Total Net Assets 100.0% | $ | 31,292,236 | ||||||
|
| |||||||
| a | All or a portion of the security is on loan. |
| b | Non-income producing security. |
| c | The interest rate shown reflects the yield, coupon rate or the discount rate at the date of purchase. |
Definitions:
| ADR | - | American Depositary Receipt, which are certificates for an Underlying foreign security’s shares held by an issuing U.S. depository bank. | ||
| ETF | - | Exchange Traded Fund. |
Unrealized Appreciation (Depreciation)
Gross unrealized appreciation and depreciation of investments, based on cost for federal income tax purposes, were as follows:
Gross unrealized appreciation | $ | 1,580,609 | ||
Gross unrealized depreciation | (8,237,235 | ) | ||
|
| |||
Net unrealized appreciation (depreciation) | $ | (6,656,626 | ) | |
Cost for federal income tax purposes | $ | 40,084,978 | ||
The accompanying Notes to Financial Statements are an integral part of this schedule.
214
Table of Contents
NATURAL RESOURCES PORTFOLIO
Schedule of Investments as of December 31, 2014
Fair Valuation Measurements
The following table is a summary of the inputs used, as of December 31, 2014, in valuing Natural Resources Portfolio’s assets carried at fair value.
Investments in Securities | Total | Level 1 | Level 2 | Level 3 | ||||||||||||
Common Stock | ||||||||||||||||
Integrated Oil & Gas | 5,761,361 | 5,761,361 | — | — | ||||||||||||
Materials | 4,650,862 | 4,650,862 | — | — | ||||||||||||
Oil & Gas Drilling | 1,340,900 | 1,340,900 | — | — | ||||||||||||
Oil & Gas Equipment & Services | 5,757,628 | 5,757,628 | — | — | ||||||||||||
Oil & Gas Exploration & Production | 10,265,252 | 10,265,252 | — | — | ||||||||||||
Oil & Gas Refining & Marketing | 2,021,824 | 2,021,824 | — | — | ||||||||||||
Utilities | 1,180,256 | 1,180,256 | — | — | ||||||||||||
Collateral Held for Securities Loaned | 1,983,400 | 1,983,400 | — | — | ||||||||||||
Short-Term Investments | 466,869 | 466,869 | — | — | ||||||||||||
|
|
|
|
|
|
|
| |||||||||
Total | $ | 33,428,352 | $ | 33,428,352 | $ | — | $ | — | ||||||||
|
|
|
|
|
|
|
| |||||||||
There were no significant transfers between Levels during the period ended December 31, 2014. Transfers between Levels are identified as of the end of the period.
Investment in Affiliates
Affiliated issuers, as defined under the Investment Company Act of 1940, include those in which the Portfolio’s holdings of an issuer represent 5% or more of the outstanding voting securities of an issuer, or any affiliated mutual fund.
A summary of transactions for the fiscal year to date, in Natural Resources Portfolio, is as follows:
Portfolio | Value December 31, 2013 | Gross Purchases | Gross Sales | Shares Held at December 31, 2014 | Value December 31, 2014 | Income Earned January 1, 2014 - December 31, 2014 | ||||||||||||||||||
Cash Management Trust-Collateral Investment | $ | 1,771,801 | $ | 30,333,263 | $ | 30,121,664 | 1,983,400 | $ | 1,983,400 | $ | 13,789 | |||||||||||||
Cash Management Trust-Short Term Investment | 1,879,163 | 6,428,508 | 7,840,802 | 466,869 | 466,869 | 340 | ||||||||||||||||||
Total Value and Income Earned | 3,650,964 | 2,450,269 | 14,129 | |||||||||||||||||||||
The accompanying Notes to Financial Statements are an integral part of this schedule.
215
Table of Contents
PARTNER EMERGING MARKETS EQUITY PORTFOLIO
Schedule of Investments as of December 31, 2014
| Shares | Common Stock (91.3%) | Value | ||||||
| Brazil (9.6%) |
| ||||||
| 105,279 | Banco Bradesco SA ADR | $ | 1,407,580 | |||||
| 18,521 | Lojas Renner SA | 532,804 | ||||||
| 25,584 | Multiplan Empreendimentos Imobiliarios SA | 456,589 | ||||||
| 76,600 | Souza Cruz SA | 556,735 | ||||||
| 61,800 | Ultrapar Participacoes SA | 1,196,152 | ||||||
| 60,660 | Vale SA ADRa | 496,199 | ||||||
|
| |||||||
| Total | 4,646,059 | |||||||
|
| |||||||
| Chile (1.1%) |
| ||||||
| 26,090 | Banco Santander Chile SA ADR | 514,495 | ||||||
|
| |||||||
Total | 514,495 | |||||||
|
| |||||||
| China (1.9%) |
| ||||||
| 842,000 | PetroChina Company, Ltd. | 934,693 | ||||||
|
| |||||||
Total | 934,693 | |||||||
|
| |||||||
| Hong Kong (11.3%) |
| ||||||
| 254,000 | AlA Group, Ltd. | 1,400,929 | ||||||
| 139,000 | China Mobile, Ltd. | 1,628,072 | ||||||
| 167,000 | Hang Lung Group, Ltd. | 757,279 | ||||||
| 132,000 | Hang Lung Properties, Ltd. | 368,241 | ||||||
| 71,000 | Swire Pacific, Ltd., Class A | 921,614 | ||||||
| 100,000 | Swire Pacific, Ltd., Class B | 237,937 | ||||||
| 59,500 | Swire Properties, Ltd. | 175,074 | ||||||
|
| |||||||
Total | 5,489,146 | |||||||
|
| |||||||
| Hungary (1.0%) |
| ||||||
| 37,710 | Richter Gedeon Nyrt | 507,839 | ||||||
|
| |||||||
Total | 507,839 | |||||||
|
| |||||||
| India (15.2%) |
| ||||||
| 5,200 | Grasim Industries, Ltd. | 278,235 | ||||||
| 4,350 | Grasim Industries, Ltd. GDR | 232,943 | ||||||
| 14,000 | Hero Motocorp, Ltd. | 686,960 | ||||||
| 67,000 | Hindustan Unilever, Ltd. | 805,179 | ||||||
| 85,639 | Housing Development Finance Corporation | 1,535,709 | ||||||
| 150,000 | ICICI Bank, Ltd. | 834,742 | ||||||
| 49,600 | Infosys, Ltd. | 1,538,972 | ||||||
| 181,893 | ITC, Ltd. | 1,059,593 | ||||||
| 8,947 | Ultra Tech Cement, Ltd. | 377,867 | ||||||
|
| |||||||
Total | 7,350,200 | |||||||
|
| |||||||
| Indonesia (3.1%) |
| ||||||
| 2,522,000 | Astra International Tbk PT | 1,504,082 | ||||||
|
| |||||||
Total | 1,504,082 | |||||||
|
| |||||||
| Luxembourg (1.7%) |
| ||||||
| 26,965 | Tenaris SA ADR | 814,613 | ||||||
|
| |||||||
Total | 814,613 | |||||||
|
| |||||||
| Malaysia (2.1%) |
| ||||||
| 249,707 | CIMB Group Holdings Berhad | 396,314 | ||||||
| 120,000 | Public Bank Berhad | 626,916 | ||||||
|
| |||||||
Total | 1,023,230 | |||||||
|
| |||||||
| Mexico (7.3%) |
| ||||||
| 17,400 | Fomento Economico Mexicano SAB de CV ADRb | 1,531,722 | ||||||
| 4,800 | Grupo Aeroportuario del Sureste SAB de CV ADRb | 632,832 | ||||||
| 199,577 | Grupo Financiero Banorte SAB de CV ADR | 1,098,409 | ||||||
| 97,300 | Organizacion Soriana SAB de CV | 265,776 | ||||||
|
| |||||||
Total | 3,528,739 | |||||||
|
| |||||||
| Philippines (3.9%) |
| ||||||
| 28,000 | Ayala Corporation | 432,590 | ||||||
| 917,900 | Ayala Land, Inc. | 684,457 | ||||||
| 367,862 | Bank of the Philippine Islands | 769,552 | ||||||
|
| |||||||
Total | 1,886,599 | |||||||
|
| |||||||
| Poland (1.8%) |
| ||||||
| 17,523 | Bank Pekao SA | 880,639 | ||||||
|
| |||||||
Total | 880,639 | |||||||
|
| |||||||
| Portugal (0.9%) |
| ||||||
| 41,629 | Jeronimo Martins SGPS SA | 417,140 | ||||||
|
| |||||||
Total | 417,140 | |||||||
|
| |||||||
| Russia (3.4%) |
| ||||||
| 28,186 | Lukoil ADR | 1,115,170 | ||||||
| 3,492 | Magnit PJSCb | 551,911 | ||||||
|
| |||||||
Total | 1,667,081 | |||||||
|
| |||||||
| South Africa (3.9%) |
| ||||||
| 44,921 | Massmart Holdings, Ltd. | 550,504 | ||||||
| 21,121 | MTN Group, Ltd. | 401,775 | ||||||
| 142,193 | Truworths International, Ltd. | 944,270 | ||||||
|
| |||||||
Total | 1,896,549 | |||||||
|
| |||||||
| South Korea (1.2%) |
| ||||||
| 3,170 | E-Mart Company, Ltd.b | 586,632 | ||||||
|
| |||||||
Total | 586,632 | |||||||
|
| |||||||
| Taiwan (5.3%) |
| ||||||
| 175,400 | Taiwan Mobile Company, Ltd. | 580,004 | ||||||
| 452,499 | Taiwan Semiconductor Manufacturing Company, Ltd. | 1,993,472 | ||||||
|
| |||||||
Total | 2,573,476 | |||||||
|
| |||||||
| Thailand (4.7%) |
| ||||||
| 70,300 | PTT Exploration & Production pcl | 238,063 | ||||||
| 70,400 | Siam Cement pcl | 960,588 | ||||||
| 196,800 | Siam Commercial Bank pcl | 1,083,912 | ||||||
|
| |||||||
Total | 2,282,563 | |||||||
|
| |||||||
| Turkey (5.6%) |
| ||||||
| 274,433 | Akbank TAS | 1,013,258 | ||||||
| 33,036 | BIM Birlesik Magazalar AS | 706,471 | ||||||
| 248,190 | Turkiye Garanti Bankasi AS | 997,013 | ||||||
|
| |||||||
Total | 2,716,742 | |||||||
|
| |||||||
| United Kingdom (4.8%) |
| ||||||
| 21,386 | BHP Billiton plca | 457,481 | ||||||
| 19,139 | SABMiller plc | 996,641 | ||||||
| 57,824 | Standard Chartered plc | 864,812 | ||||||
|
| |||||||
Total | 2,318,934 | |||||||
|
| |||||||
The accompanying Notes to Financial Statements are an integral part of this schedule.
216
Table of Contents
PARTNER EMERGING MARKETS EQUITY PORTFOLIO
Schedule of Investments as of December 31, 2014
| Shares | Common Stock (91.3%) | Value | ||||||
| United States (1.5%) |
| ||||||
| 9,800 | Yum! Brands, Inc. | $ | 713,930 | |||||
|
| |||||||
Total | 713,930 | |||||||
|
| |||||||
Total Common Stock (cost $38,225,627) | 44,253,381 | |||||||
|
| |||||||
Preferred Stock (6.0%) | ||||||||
| Brazil (1.1%) |
| ||||||
| 71,605 | Vale SA ADRa | 519,852 | ||||||
|
| |||||||
Total | 519,852 | |||||||
|
| |||||||
| South Korea (4.9%) |
| ||||||
| 2,532 | Samsung Electronics Company, Ltd. | 2,381,525 | ||||||
|
| |||||||
Total | 2,381,525 | |||||||
|
| |||||||
Total Preferred Stock (cost $2,195,813) | 2,901,377 | |||||||
|
| |||||||
Collateral Held for Securities Loaned (3.1%) | ||||||||
| 1,509,100 | Thrivent Cash Management Trust | 1,509,100 | ||||||
|
| |||||||
Total Collateral Held for Securities Loaned (cost $1,509,100) | 1,509,100 | |||||||
|
| |||||||
| Shares or Principal Amount | Short-Term Investments (2.7%)c | |||||||
Thrivent Cash Management Trust | ||||||||
| 1,287,032 | 0.060% | 1,287,032 | ||||||
|
| |||||||
Total Short-Term Investments (at amortized cost) | 1,287,032 | |||||||
|
| |||||||
Total Investments (cost $43,217,572) 103.1% | $ | 49,950,890 | ||||||
|
| |||||||
Other Assets and Liabilities, Net (3.1%) | (1,489,268 | ) | ||||||
|
| |||||||
Total Net Assets 100.0% | $ | 48,461,622 | ||||||
|
| |||||||
| a | All or a portion of the security is on loan. |
| b | Non-income producing security. |
| c | The interest rate shown reflects the yield, coupon rate or the discount rate at the date of purchase. |
Definitions:
| ADR | - | American Depositary Receipt, which are certificates for an underlying foreign security’s shares held by an issuing U.S. depository bank. | ||
| GDR | - | Global Depository Receipts, which are certificates for shares of an underlying foreign security’s shares held by an issuing depository bank from more than one country. |
Unrealized Appreciation (Depreciation)
Gross unrealized appreciation and depreciation of investments, based on cost for federal income tax purposes, were as follows:
Gross unrealized appreciation | $ | 10,431,947 | ||
Gross unrealized depreciation | (3,869,150 | ) | ||
|
| |||
Net unrealized appreciation (depreciation) | $ | 6,562,797 | ||
Cost for federal income tax purposes | $ | 43,388,093 | ||
The accompanying Notes to Financial Statements are an integral part of this schedule.
217
Table of Contents
PARTNER EMERGING MARKETS EQUITY PORTFOLIO
Schedule of Investments as of December 31, 2014
Fair Valuation Measurements
The following table is a summary of the inputs used, as of December 31, 2014, in valuing Emerging Markets Equity Portfolio’s assets carried at fair value.
Investments in Securities | Total | Level 1 | Level 2 | Level 3 | ||||||||||||
Common Stock | ||||||||||||||||
Consumer Discretionary | 5,234,454 | 713,930 | 4,520,524 | — | ||||||||||||
Consumer Staples | 7,175,896 | 1,531,722 | 5,644,174 | — | ||||||||||||
Energy | 4,298,691 | 814,613 | 3,484,078 | — | ||||||||||||
Financials | 16,536,447 | 1,922,075 | 14,614,372 | — | ||||||||||||
Health Care | 507,839 | — | 507,839 | — | ||||||||||||
Industrials | 1,832,681 | 632,832 | 1,199,849 | — | ||||||||||||
Information Technology | 3,532,444 | — | 3,532,444 | — | ||||||||||||
Materials | 2,525,078 | 496,199 | 2,028,879 | — | ||||||||||||
Telecommunications Services | 2,609,851 | — | 2,609,851 | — | ||||||||||||
Preferred Stock | ||||||||||||||||
Information Technology | 2,381,525 | — | 2,381,525 | — | ||||||||||||
Materials | 519,852 | 519,852 | — | — | ||||||||||||
Collateral Held for Securities Loaned | 1,509,100 | 1,509,100 | — | — | ||||||||||||
Short-Term Investments | 1,287,032 | 1,287,032 | — | — | ||||||||||||
|
|
|
|
|
|
|
| |||||||||
Total | $ | 49,950,890 | $ | 9,427,355 | $ | 40,523,535 | $ | — | ||||||||
|
|
|
|
|
|
|
| |||||||||
There were no significant transfers between Levels during the period ended December 31, 2014. Transfers between Levels are identified as of the end of the period.
Investment in Affiliates
Affiliated issuers, as defined under the Investment Company Act of 1940, include those in which the Portfolio’s holdings of an issuer represent 5% or more of the outstanding voting securities of an issuer, or any affiliated mutual fund.
A summary of transactions for the fiscal year to date, in Partner Emerging Markets Equity Portfolio, is as follows:
Portfolio | Value December 31, 2013 | Gross Purchases | Gross Sales | Shares Held at December 31, 2014 | Value December 31, 2014 | Income Earned January 1, 2014 - December 31, 2014 | ||||||||||||||||||
Cash Management Trust-Collateral Investment | $ | 2,223,998 | $ | 19,378,608 | $ | 20,093,506 | 1,509,100 | $ | 1,509,100 | $ | 3,902 | |||||||||||||
Cash Management Trust-Short Term Investment | 1,837,201 | 18,983,314 | 19,533,483 | 1,287,032 | 1,287,032 | 688 | ||||||||||||||||||
Total Value and Income Earned | 4,061,199 | 2,796,132 | 4,590 | |||||||||||||||||||||
The accompanying Notes to Financial Statements are an integral part of this schedule.
218
Table of Contents
REAL ESTATE SECURITIES PORTFOLIO
Schedule of Investments as of December 31, 2014
| Shares | Common Stock (99.2%) | Value | ||||||
| Consumer Discretionary (<0.1%) | ||||||||
| 182 | OutFront Media | $ | 4,885 | |||||
|
| |||||||
Total | 4,885 | |||||||
|
| |||||||
| Diversified REITS (7.8%) | ||||||||
| 6,792 | American Assets Trust, Inc. | 270,390 | ||||||
| 51,213 | American Realty Capital Properties, Inc. | 463,478 | ||||||
| 6,700 | Armada Hoffler Properties, Inc. | 63,583 | ||||||
| 2,019 | Brookfield Asset Management, Inc. | 101,212 | ||||||
| 66,500 | Cousins Properties, Inc. | 759,430 | ||||||
| 7,300 | Crown Castle International Corporation | 574,510 | ||||||
| 81,620 | Duke Realty Corporation | 1,648,724 | ||||||
| 19,343 | Empire State RealtyTrust, Inc. | 340,050 | ||||||
| 20,176 | First Potomac Realty Trust | 249,375 | ||||||
| 3,150 | Gladstone Commercial Corporation | 54,085 | ||||||
| 35,414 | Lexington Realty Trust | 388,846 | ||||||
| 25,443 | Liberty Property Trust | 957,420 | ||||||
| 5,270 | PS Business Parks, Inc. | 419,176 | ||||||
| 33,150 | Vornado Realty Trust | 3,902,086 | ||||||
| 9,515 | Washington Real Estate Investment Trust | 263,185 | ||||||
| 6,300 | Whitestone REIT | 95,193 | ||||||
| 10,500 | Winthrop Realty Trust | 163,695 | ||||||
| 6,650 | WP Carey, Inc. | 466,165 | ||||||
|
| |||||||
Total | 11,180,603 | |||||||
|
| |||||||
| Health Care REITs (10.2%) | ||||||||
| 6,400 | Aviv REIT, Inc. | 220,672 | ||||||
| 8,850 | Brookdale Senior Living, Inc.a | 324,530 | ||||||
| 5,000 | Capital Senior Living Corporationa | 124,550 | ||||||
| 57,742 | HCP, Inc. | 2,542,380 | ||||||
| 46,552 | Health Care REIT, Inc. | 3,522,590 | ||||||
| 24,262 | Healthcare Realty Trust, Inc. | 662,838 | ||||||
| 25,269 | Healthcare Trust of America, Inc. | 680,747 | ||||||
| 7,022 | LTC Properties, Inc. | 303,140 | ||||||
| 7,414 | Medical Properties Trust, Inc. | 102,165 | ||||||
| 15,320 | National Health Investors, Inc. | 1,071,787 | ||||||
| 7,161 | Omega Healthcare Investors, Inc. | 279,780 | ||||||
| 17,570 | Physicians Realty Trust | 291,662 | ||||||
| 17,071 | Sabra Healthcare REIT, Inc. | 518,446 | ||||||
| 15,872 | Senior Housing Property Trust | 350,930 | ||||||
| 48,520 | Ventas, Inc. | 3,478,884 | ||||||
|
| |||||||
Total | 14,475,101 | |||||||
|
| |||||||
| Hotel & Resort REITs (10.1%) | ||||||||
| 26,928 | Ashford Hospitality Trust, Inc. | 282,206 | ||||||
| 19,927 | Chatham Lodging Trust | 577,285 | ||||||
| 21,433 | Chesapeake Lodging Trust | 797,522 | ||||||
| 29,095 | DiamondRock Hospitality Company | 432,643 | ||||||
| 14,143 | FelCor Lodging Trust, Inc. | 153,027 | ||||||
| 35,147 | Hersha Hospitality Trust | 247,083 | ||||||
| 19,600 | Hilton Worldwide Holdings, Inc.a | 511,364 | ||||||
| 19,549 | Hospitality Properties Trust | 606,019 | ||||||
| 164,240 | Host Hotels & Resorts, Inc. | 3,903,985 | ||||||
| 2,500 | Hyatt Hotels Corporationa | 150,525 | ||||||
| 32,290 | LaSalle Hotel Properties | 1,306,776 | ||||||
| 1,000 | Marriott International, Inc. | 78,030 | ||||||
| 24,308 | Pebblebrook Hotel Trust | 1,109,174 | ||||||
| 36,830 | RLJ Lodging Trust | 1,234,910 | ||||||
| 6,706 | Starwood Hotels & Resorts Worldwide, Inc. | 543,655 | ||||||
| 68,574 | Strategic Hotels & Resorts, Inc.a | 907,234 | ||||||
| 42,457 | Summit Hotel Properties, Inc. | 528,165 | ||||||
| 60,523 | Sunstone Hotel Investors, Inc. | 999,235 | ||||||
| 1,000 | Wyndham Worldwide Corporation | 85,760 | ||||||
|
| |||||||
Total | 14,454,598 | |||||||
|
| |||||||
| Industrial REITS (5.7%) | ||||||||
| 23,016 | DCT Industrial Trust, Inc. | 820,751 | ||||||
| 7,724 | EastGroup Properties, Inc. | 489,084 | ||||||
| 34,246 | First Industrial Realty Trust, Inc. | 704,098 | ||||||
| 108,423 | Prologis, Inc. | 4,665,442 | ||||||
| 13,150 | Rexford Industrial Realty, Inc. | 206,586 | ||||||
| 22,900 | STAG Industrial, Inc. | 561,050 | ||||||
| 34,223 | Terreno Realty Corporation | 706,020 | ||||||
|
| |||||||
Total | 8,153,031 | |||||||
|
| |||||||
| Mortgage REITS (0.5%) | ||||||||
| 5,000 | Apollo Commercial Real Estate Finance, Inc. | 81,800 | ||||||
| 8,750 | Blackstone Mortgage Trust, Inc. | 254,975 | ||||||
| 7,350 | Colony Financial, Inc. | 175,077 | ||||||
| 5,000 | NorthStar Realty Finance Corporation | 87,900 | ||||||
| 3,550 | Starwood Property Trust, Inc. | 82,502 | ||||||
| 7,150 | Western Asset Mortgage Capital Corporation | 105,105 | ||||||
|
| |||||||
Total | 787,359 | |||||||
|
| |||||||
| Office REITS (13.7%) | ||||||||
| 17,012 | Alexandria Real Estate Equities, Inc. | 1,509,645 | ||||||
| 36,162 | BioMed Realty Trust, Inc. | 778,930 | ||||||
| 37,168 | Boston Properties, Inc. | 4,783,150 | ||||||
| 35,930 | Brandywine Realty Trust | 574,161 | ||||||
| 22,351 | City Office REIT, Inc. | 286,093 | ||||||
| 5,646 | Coresite Realty Corporation | 220,476 | ||||||
| 19,857 | Corporate Office Properties Trust | 563,343 | ||||||
| 7,600 | CyrusOne, Inc. | 209,380 | ||||||
| 16,968 | Digital Realty Trust, Inc. | 1,124,978 | ||||||
| 44,457 | Douglas Emmett, Inc. | 1,262,579 | ||||||
| 16,750 | DuPont Fabros Technology, Inc. | 556,770 | ||||||
| 5,800 | Franklin Street Properties Corporation | 71,166 | ||||||
| 23,512 | Highwoods Properties, Inc. | 1,041,111 | ||||||
| 17,799 | Hudson Pacific Properties, Inc. | 535,038 | ||||||
| 20,763 | Kilroy Realty Corporation | 1,434,101 | ||||||
| 16,405 | Mack-Cali Realty Corporation | 312,679 | ||||||
| 24,900 | Paramount Group, Inc.a | 462,891 | ||||||
| 22,270 | Parkway Properties, Inc. | 409,545 | ||||||
| 16,963 | Piedmont Office Realty Trust, Inc. | 319,583 | ||||||
| 1,500 | QTS Realty Trust, Inc. | 50,760 | ||||||
| 25,077 | SL Green Realty Corporation | 2,984,665 | ||||||
|
| |||||||
Total | 19,491,044 | |||||||
|
| |||||||
| Real Estate Operating Companies (0.5%) | ||||||||
| 29,043 | Forest City Enterprises, Inc.a | 618,616 | ||||||
| 6,000 | Store Capital Corporation | 129,660 | ||||||
|
| |||||||
Total | 748,276 | |||||||
|
| |||||||
| Real Estate Services (0.3%) | ||||||||
| 3,119 | CBRE Group, Inc.a | 106,826 | ||||||
| 1,700 | Jones Lang LaSalle, Inc. | 254,881 | ||||||
|
| |||||||
Total | 361,707 | |||||||
|
| |||||||
| Residential REITS (16.9%) | ||||||||
| 22,253 | American Campus Communities, Inc. | 920,384 | ||||||
| 21,700 | American Homes 4 Rent | 369,551 | ||||||
The accompanying Notes to Financial Statements are an integral part of this schedule.
219
Table of Contents
REAL ESTATE SECURITIES PORTFOLIO
Schedule of Investments as of December 31, 2014
| Shares | Common Stock (99.2%) | Value | ||||||
| Residential REITS (16.9%) - continued | ||||||||
| 35,284 | Apartment Investment & Management Company | $ | 1,310,801 | |||||
| 10,059 | Associated Estates Realty Corporation | 233,469 | ||||||
| 31,854 | AvalonBay Communities, Inc. | 5,204,625 | ||||||
| 24,851 | Camden Property Trust | 1,834,998 | ||||||
| 21,888 | Campus Crest Communities, Inc. | 160,001 | ||||||
| 13,928 | Equity Lifestyle Properties, Inc. | 717,989 | ||||||
| 60,090 | Equity Residential | 4,316,866 | ||||||
| 17,385 | Essex Property Trust, Inc. | 3,591,741 | ||||||
| 8,087 | Home Properties, Inc. | 530,507 | ||||||
| 7,000 | Independence Realty Trust, Inc. | 65,170 | ||||||
| 11,474 | Mid-America Apartment Communities, Inc. | 856,878 | ||||||
| 17,835 | Post Properties, Inc. | 1,048,163 | ||||||
| 65,610 | Spirit Realty Capital, Inc. | 780,103 | ||||||
| 10,303 | Sun Communities, Inc. | 622,919 | ||||||
| 48,094 | UDR, Inc. | 1,482,257 | ||||||
|
| |||||||
Total | 24,046,422 | |||||||
|
| |||||||
| Retail REITS (24.7%) | ||||||||
| 35,513 | Acadia Realty Trust | 1,137,481 | ||||||
| 6,750 | Agree Realty Corporation | 209,857 | ||||||
| 4,043 | AmREIT, Inc. | 107,301 | ||||||
| 37,027 | Brixmor Property Group, Inc. | 919,751 | ||||||
| 39,239 | CBL & Associates Properties, Inc. | 762,021 | ||||||
| 10,925 | Cedar Realty Trust, Inc. | 80,190 | ||||||
| 109,706 | DDR Corporation | 2,014,202 | ||||||
| 16,517 | Equity One, Inc. | 418,871 | ||||||
| 23,632 | Excel Trust, Inc. | 316,432 | ||||||
| 12,295 | Federal Realty Investment Trust | 1,640,891 | ||||||
| 122,505 | General Growth Properties, Inc. | 3,446,066 | ||||||
| 30,124 | Glimcher Realty Trust | 413,904 | ||||||
| 18,332 | Inland Real Estate Corporation | 200,735 | ||||||
| 56,687 | Kimco Realty Corporation | 1,425,111 | ||||||
| 9,436 | Kite Realty Group Trust | 271,191 | ||||||
| 17,766 | Mace rich Company | 1,481,862 | ||||||
| 23,286 | National Retail Properties, Inc. | 916,770 | ||||||
| 9,526 | Pennsylvania Real Estate Investment Trust | 223,480 | ||||||
| 31,548 | Ramco-Gershenson Properties Trust | 591,210 | ||||||
| 7,850 | Realty Income Corporation | 374,523 | ||||||
| 20,392 | Regency Centers Corporation | 1,300,602 | ||||||
| 15,272 | Retail Opportunity Investments Corporation | 256,417 | ||||||
| 16,500 | Retail Properties of America, Inc. | 275,385 | ||||||
| 1,138 | Saul Centers, Inc. | 65,082 | ||||||
| 69,661 | Simon Property Group, Inc. | 12,685,965 | ||||||
| 21,363 | Tanger Factory Outlet Centers, Inc. | 789,576 | ||||||
| 18,241 | Taubman Centers, Inc. | 1,393,977 | ||||||
| 6,500 | Urstadt Biddle Properties, Inc. | 142,220 | ||||||
| 30,580 | Washington Prime Group, Inc. | 526,588 | ||||||
| 23,142 | Weingarten Realty Investors | 808,119 | ||||||
|
| |||||||
Total | 35,195,780 | |||||||
|
| |||||||
| Specialized REITS (8.8%) | ||||||||
| 15,000 | American Tower Corporation | 1,482,750 | ||||||
| 7,500 | Catchmark Timber Trust, Inc. | 84,900 | ||||||
| 7,744 | Corrections Corporation of America | 281,417 | ||||||
| 53,172 | CubeSmart | 1,173,506 | ||||||
| 12,938 | Education Realty Trust, Inc. | 473,401 | ||||||
| 16,227 | EPR Properties | 935,162 | ||||||
| 29,220 | Extra Space Storage, Inc. | 1,713,461 | ||||||
| 4,500 | Geo Group, Inc. | 181,620 | ||||||
| 4,957 | Iron Mountain, Inc. | 191,638 | ||||||
| 3,465 | Plum Creek Timber Company, Inc. | 148,267 | ||||||
| 24,683 | Public Storage, Inc. | 4,562,653 | ||||||
| 1,794 | Rayonier, Inc. REIT | 50,124 | ||||||
| 5,036 | Sovran Self Storage, Inc. | 439,240 | ||||||
| 22,007 | Weyerhaeuser Company | 789,831 | ||||||
|
| |||||||
Total | 12,507,970 | |||||||
|
| |||||||
Total Common Stock (cost $126,849,256) | 141,406,776 | |||||||
|
| |||||||
| Shares or Principal Amount | Short-Term Investments (0.6%)b | |||||||
| Thrivent Cash Management Trust | ||||||||
| 910,489 | 0.060% | 910,489 | ||||||
|
| |||||||
Total Short-Term Investments (at amortized cost) | 910,489 | |||||||
|
| |||||||
Total Investments (cost $127,759,745) 99.8% | $ | 142,317,265 | ||||||
|
| |||||||
Other Assets and Liabilities, Net 0.2% | 227,599 | |||||||
|
| |||||||
Total Net Assets 100.0% | $ | 142,544,864 | ||||||
|
| |||||||
| a | Non-income producing security. |
| b | The interest rate shown reflects the yield, coupon rate or the discount rate at the date of purchase. |
Definitions:
| REIT | - | Real Estate Investment Trust is a company that buys, develops, manages and/or sells real estate assets. |
Unrealized Appreciation (Depreciation)
Gross unrealized appreciation and depreciation of investments, based on cost for federal income tax purposes. were as follows:
Gross unrealized appreciation | $ | 28,343,095 | ||
Gross unrealized depreciation | (13,865,300 | ) | ||
|
| |||
Net unrealized appreciation (depreciation) | $ | 14,477,795 | ||
Cost for federal income tax purposes | $ | 127,839,470 | ||
The accompanying Notes to Financial Statements are an integral part of this schedule.
220
Table of Contents
REAL ESTATE SECURITIES PORTFOLIO
Schedule of Investments as of December 31, 2014
Fair Valuation Measurements
The following table is a summary of the inputs used, as of December 31, 2014, in valuing Real Estate Securities Portfolio’s assets carried at fair value.
Investments in Securities | Total | Level 1 | Level 2 | Level 3 | ||||||||||||
Common Stock | ||||||||||||||||
Consumer Discretionary | 4,885 | 4,885 | — | — | ||||||||||||
Diversified REITS | 11,180,603 | 11,180,603 | — | — | ||||||||||||
Health Care REITs | 14,475,101 | 14,475,101 | — | — | ||||||||||||
Hotel & Resort REITs | 14,454,598 | 14,454,598 | — | — | ||||||||||||
Industrial REITS | 8,153,031 | 8,153,031 | — | — | ||||||||||||
Mortgage REITS | 787,359 | 787,359 | — | — | ||||||||||||
Office REITS | 19,491,044 | 19,491,044 | — | — | ||||||||||||
Real Estate Operating Companies | 748,276 | 748,276 | — | — | ||||||||||||
Real Estate Services | 361,707 | 361,707 | — | — | ||||||||||||
Residential REITS | 24,046,422 | 24,046,422 | — | — | ||||||||||||
Retail REITS | 35,195,780 | 35,195,780 | — | — | ||||||||||||
Specialized REITS | 12,507,970 | 12,507,970 | — | — | ||||||||||||
Short-Term Investments | 910,489 | 910,489 | — | — | ||||||||||||
|
|
|
|
|
|
|
| |||||||||
Total | $ | 142,317,265 | $ | 142,317,265 | $ | — | $ | — | ||||||||
|
|
|
|
|
|
|
| |||||||||
There were no significant transfers between Levels during the period ended December 31, 2014. Transfers between Levels are identified as of the end of the period.
Investment in Affiliates
Affiliated issuers, as defined under the Investment Company Act of 1940, include those in which the Portfolio’s holdings of an issuer represent 5% or more of the outstanding voting securities of an issuer, or any affiliated mutual fund.
A summary of transactions for the fiscal year to date, in Real Estate Securities Portfolio, is as follows:
Portfolio | Value December 31, 2013 | Gross Purchases | Gross Sales | Shares Held at December 31, 2014 | Value December 31, 2014 | Income Earned January 1, 2014 - December 31, 2014 | ||||||||||||||||||
Cash Management Trust-Short Term Investment | $ | 359,706 | $ | 19,400,202 | $ | 18,849,419 | 910,489 | $ | 910,489 | $ | 411 | |||||||||||||
Total Value and Income Earned | 359,706 | 910,489 | 411 | |||||||||||||||||||||
The accompanying Notes to Financial Statements are an integral part of this schedule.
221
Table of Contents
PARTNER SMALL CAP GROWTH PORTFOLIO
Schedule of Investments as of December 31, 2014
| Shares | Common Stock (97.6%) | Value | ||||||
| Consumer Discretionary (15.5%) | |||||||
| 13,423 | Brunswick Corporation | $ | 688,063 | |||||
| 12,002 | Burlington Stores, Inc.a | 567,214 | ||||||
| 3,995 | Chuy’s Holdings, Inc.a | 78,582 | ||||||
| 7,306 | Core-Mark Holding Company, Inc. | 452,461 | ||||||
| 17,246 | Del Frisco’s Restaurant Group, Inc.a | 409,420 | ||||||
| 9,375 | Five Below, Inc.a,b | 382,781 | ||||||
| 8,270 | G-lll Apparel Group, Ltd.a | 835,353 | ||||||
| 10,036 | Imax Corporationa | 310,112 | ||||||
| 19,696 | Kate Spade & Companya | 630,469 | ||||||
| 3,099 | Lithia Motors, Inc. | 268,652 | ||||||
| 11,849 | Oxford Industries, Inc. | 654,183 | ||||||
| 5,692 | Red Robin Gourmet Burgers, Inc.a | 438,142 | ||||||
| 3,026 | Restoration Hardware Holdings, Inc.a,b | 290,526 | ||||||
| 1,886 | Shutterfly, Inc.a | 78,637 | ||||||
| 5,995 | Skechers USA, Inc.a | 331,224 | ||||||
| 8,958 | Tenneco, Inc.a | 507,112 | ||||||
| 5,314 | Vail Resorts, Inc. | 484,265 | ||||||
|
| |||||||
Total | 7,407,196 | |||||||
|
| |||||||
| Consumer Staples (3.4%) | |||||||
| 4,350 | B&G Foods, Inc. | 130,065 | ||||||
| 1,883 | Boston Beer Company, Inc.a,b | 545,204 | ||||||
| 6,780 | Natural Grocers by Vitamin Cottage, Inc.a,b | 190,993 | ||||||
| 9,539 | United Natural Foods, Inc.a | 737,603 | ||||||
|
| |||||||
Total | 1,603,865 | |||||||
|
| |||||||
| Energy (3.2%) | |||||||
| 1,500 | Diamondback Energy, Inc.a | 89,670 | ||||||
| 13,611 | Oasis Petroleum, Inc.a | 225,126 | ||||||
| 1,354 | PDC Energy, Inc.a | 55,879 | ||||||
| 27,269 | Penn Virginia Corporationa | 182,157 | ||||||
| 19,698 | Rex Energy Corporationa,b | 100,460 | ||||||
| 4,964 | SemGroup Corporation | 339,488 | ||||||
| 14,422 | U.S. Silica Holdings, Inc.b | 370,501 | ||||||
| 5,152 | Whiting Petroleum Corporationa | 170,016 | ||||||
|
| |||||||
Total | 1,533,297 | |||||||
|
| |||||||
| Financials (12.1%) | |||||||
| 14,577 | Bank of the Ozarks, Inc. | 552,760 | ||||||
| 11,324 | Chesapeake Lodging Trust | 421,366 | ||||||
| 17,637 | Essent Group, Ltd.a | 453,447 | ||||||
| 12,487 | Evercore Partners, Inc. | 653,944 | ||||||
| 10,139 | Hanmi Financial Corporation | 221,132 | ||||||
| 14,989 | iShares Russell 2000 Growth Index Fund | 2,134,134 | ||||||
| 18,555 | Kennedy-Wilson Holdings, Inc. | 469,442 | ||||||
| 10,751 | PacWest Bancorp | 488,740 | ||||||
| 14,046 | Western Alliance Bancorpa | 390,479 | ||||||
|
| |||||||
Total | 5,785,444 | |||||||
|
| |||||||
| Health Care (20.7%) | |||||||
| 9,754 | Acadia Healthcare Company, Inc.a | 597,042 | ||||||
| 7,200 | Acorda Therapeutics, Inc.a | 294,264 | ||||||
| 18,141 | Akorn, Inc.a,b | 656,704 | ||||||
| 8,458 | Align Technology, Inc.a | 472,887 | ||||||
| 15,955 | Cardiovascular Systems, Inc.a | 479,926 | ||||||
| 4,793 | Centene Corporationa | 497,753 | ||||||
| 9,179 | Cyberonics, Inc.a | 511,087 | ||||||
| 37,870 | Depomed, Inc.a | 610,086 | ||||||
| 21,996 | ExamWorks Group, Inc.a | 914,814 | ||||||
| 5,880 | Furiex Pharmaceuticals, Inc. Contigent Value Righta,c | 57,330 | ||||||
| 18,909 | Impax Laboratories, Inc.a | 599,037 | ||||||
| 31,054 | Ironwood Pharmaceuticals, Inc.a | 475,747 | ||||||
| 3,745 | LifePoint Hospitals, Inc.a | 269,303 | ||||||
| 20,564 | Neurocrine Biosciences, Inc.a | 459,400 | ||||||
| 8,343 | NPS Pharmaceuticals, Inc.a | 298,429 | ||||||
| 18,491 | NuVasive, Inc.a | 872,036 | ||||||
| 1,275 | Puma Biotechnology, Inc.a | 241,319 | ||||||
| 11,085 | Team Health Holdings, Inc.a | 637,720 | ||||||
| 8,177 | Teleflex, Inc. | 938,883 | ||||||
|
| |||||||
Total | 9,883,767 | |||||||
|
| |||||||
| Industrials (16.6%) | |||||||
| 5,170 | Generac Holdings, Inc.a | 241,749 | ||||||
| 6,089 | Granite Construction, Inc. | 231,504 | ||||||
| 8,979 | H&E Equipment Services, Inc. | 252,220 | ||||||
| 21,951 | Healthcare Services Group, Inc. | 678,944 | ||||||
| 7,553 | Heico Corporation | 456,201 | ||||||
| 5,866 | Huron Consulting Group, Inc.a | 401,176 | ||||||
| 25,098 | Interface, Inc. | 413,364 | ||||||
| 11,901 | MasTec, Inc.a | 269,082 | ||||||
| 6,470 | Middleby Corporationa | 641,177 | ||||||
| 18,893 | On Assignment, Inc.a | 627,059 | ||||||
| 16,293 | PGT, Inc.a | 156,902 | ||||||
| 10,489 | Proto Labs, Inc.a,b | 704,441 | ||||||
| 13,436 | Ritchie Brothers Auctioneers, Inc. | 361,294 | ||||||
| 9,272 | Saia, Inc.a | 513,298 | ||||||
| 9,256 | Spirit Airlines, Inc.a | 699,568 | ||||||
| 16,322 | Swift Transportation Companya | 467,299 | ||||||
| 1,569 | WageWorks, Inc.a | 101,310 | ||||||
| 3,897 | Watsco, Inc. | 416,979 | ||||||
| 4,522 | Watts Water Technologies, Inc. | 286,876 | ||||||
|
| |||||||
Total | 7,920,443 | |||||||
|
| |||||||
| Information Technology (23.4%) | |||||||
| 14,779 | A10 Networks, Inc.a | 64,436 | ||||||
| 4,718 | Ambarella, Inc.a,b | 239,297 | ||||||
| 49,031 | Applied Micro Circuits Corporationa | 319,682 | ||||||
| 7,599 | Applied Optoelectronics, Inc.a | 85,261 | ||||||
| 13,209 | Aspen Technology, Inc.a | 462,579 | ||||||
| 4,977 | Belden, Inc. | 392,237 | ||||||
| 11,537 | Cardtronics, Inc.a | 445,097 | ||||||
| 6,956 | Cavium, Inc.a | 430,020 | ||||||
| 11,843 | ChannelAdvisor Corporationa,b | 255,572 | ||||||
| 8,361 | Cognex Corporationa | 345,560 | ||||||
| 4,374 | Coherent, Inc.a | 265,589 | ||||||
| 11,129 | Constant Contact, Inc.a | 408,434 | ||||||
| 13,474 | Cornerstone OnDemand, Inc.a,b | 474,285 | ||||||
| 10,819 | Dealertrack Technologies, Inc.a | 479,390 | ||||||
| 9,237 | Demandware, Inc.a | 531,497 | ||||||
| 8,233 | DST Systems, Inc. | 775,137 | ||||||
| 5,560 | Electronics for Imaging, Inc.a | 238,135 | ||||||
| 17,434 | Guidewire Software, Inc.a | 882,683 | ||||||
| 11,956 | HomeAway, Inc.a | 356,050 | ||||||
| 5,793 | Manhattan Associates, Inc.a | 235,891 | ||||||
| 38,128 | MaxLinear, Inc.a | 282,529 | ||||||
| 4,762 | Methode Electronics, Inc. | 173,861 | ||||||
| 7,628 | Monolithic Power Systems, Inc. | 379,417 | ||||||
| 21,392 | Proofpoint, Inc.a | 1,031,736 | ||||||
| 1,038 | SPS Commerce, Inc.a | 58,782 | ||||||
| 2,564 | Synaptics, Inc.a | 176,506 | ||||||
| 1,588 | Tyler Technologies, Inc.a | 173,791 | ||||||
| 3,199 | Ultimate Software Group, Inc.a | 469,661 | ||||||
| 18,346 | Virtusa Corporationa | 764,478 | ||||||
|
| |||||||
Total | 11,197,593 | |||||||
|
| |||||||
The accompanying Notes to Financial Statements are an integral part of this schedule.
222
Table of Contents
PARTNER SMALL CAP GROWTH PORTFOLIO
Schedule of Investments as of December 31, 2014
| Shares | Common Stock (97.6%) | Value | ||||||
| Materials (2.7%) | |||||||
| 13,531 | Chemtura Corporationa,b | $ | 334,622 | |||||
| 34,397 | Graphic Packaging Holding Companya | 468,487 | ||||||
| 13,154 | PolyOne Corporation | 498,668 | ||||||
|
| |||||||
Total | 1,301,777 | |||||||
|
| |||||||
Total Common Stock (cost $42,737,096) | 46,633,382 | |||||||
|
| |||||||
Collateral Held for Securities Loaned (8.4%) | ||||||||
| 4,013,248 | Thrivent Cash Management Trust | 4,013,248 | ||||||
|
| |||||||
Total Collateral Held for Securities Loaned (cost $4,013,248) | 4,013,248 | |||||||
|
| |||||||
| Shares or Principal Amount | Short-Term Investments (3.3%)d | |||||||
Thrivent Cash Management Trust | 1,581,539 | |||||||
| 1,581,539 | 0.060% | |||||||
|
| |||||||
Total Short-Term Investments (at amortized cost) | 1,581,539 | |||||||
|
| |||||||
Total Investments (cost $48,331,883) 109.3% | $ | 52,228,169 | ||||||
|
| |||||||
Other Assets and Liabilities, Net (9.3%) | (4,427,143 | ) | ||||||
|
| |||||||
Total Net Assets 100.0% | $ | 47,801,026 | ||||||
|
| |||||||
| a | Non-income producing security. |
| b | All or a portion of the security is on loan. |
| c | Security is valued at fair value. Market quotations or prices were not readily available or were determined to be unreliable. Fair value was determined in good faith pursuant to procedures adopted by the Board. Further information on fair valuation can be found in section (2)(A) of the Notes to Financial Statements. |
| d | The interest rate shown reflects the yield, coupon rate or the discount rate at the date of purchase. |
Unrealized Appreciation (Depreciation)
Gross unrealized appreciation and depreciation of investments, based on cost for federal income tax purposes, were as follows:
Gross unrealized appreciation | $ | 7,276,989 | ||
Gross unrealized depreciation | (3,439,368 | ) | ||
|
| |||
Net unrealized appreciation (depreciation) | $ | 3,837,621 | ||
Cost for federal income tax purposes | $ | 48,390,548 | ||
The accompanying Notes to Financial Statements are an integral part of this schedule.
223
Table of Contents
PARTNER SMALL CAP GROWTH PORTFOLIO
Schedule of Investments as of December 31, 2014
Fair Valuation Measurements
The following table is a summary of the inputs used, as of December 31, 2014, in valuing Partner Small Cap Growth Portfolio’s assets carried at fair value.
Investments in Securities | Total | Level 1 | Level 2 | Level 3 | ||||||||||||
Common Stock Consumer Discretionary | 7,407,196 | 7,407,196 | ||||||||||||||
Consumer Staples | 1,603,865 | 1,603,865 | — | — | ||||||||||||
Energy | 1,533,297 | 1,533,297 | — | — | ||||||||||||
Financials | 5,785,444 | 5,785,444 | — | — | ||||||||||||
Health Care | 9,883,767 | 9,826,437 | — | 57,330 | ||||||||||||
Industrials | 7,920,443 | 7,920,443 | — | — | ||||||||||||
Information Technology | 11,197,593 | 11,197,593 | — | — | ||||||||||||
Materials | 1,301,777 | 1,301,777 | — | — | ||||||||||||
Collateral Held for Securities Loaned | 4,013,248 | 4,013,248 | — | — | ||||||||||||
Short-Term Investments | 1,581,539 | 1,581,539 | — | — | ||||||||||||
|
|
|
|
|
|
|
| |||||||||
Total | $ | 52,228,169 | $ | 52,170,839 | $ | — | $ | 57,330 | ||||||||
|
|
|
|
|
|
|
| |||||||||
There were no significant transfers between Levels during the period ended December 31, 2014. Transfers between Levels are identified as of the end of the period.
Investment in Affiliates
Affiliated issuers, as defined under the Investment Company Act of 1940, include those in which the Portfolio’s holdings of an issuer represent 5% or more of the outstanding voting securities of an issuer, or any affiliated mutual fund.
A summary of transactions for the fiscal year to date, in Partner Small Cap Growth Portfolio, is as follows:
Portfolio | Value December 31, 2013 | Gross Purchases | Gross Sales | Shares Held at December 31, 2014 | Value December 31, 2014 | Income Earned January 1, 2014 - December 31, 2014 | ||||||||||||||||||
Cash Management Trust- | $ | 29,633,978 | $ | 172,018,613 | $ | 197,639,343 | 4,013,248 | $ | 4,013,248 | $ | 78,263 | |||||||||||||
Cash Management Trust- | 5,913,423 | 77,191,758 | 81,523,642 | 1,581,539 | 1,581,539 | 3,783 | ||||||||||||||||||
Total Value and Income Earned | 35,547,401 | 5,594,787 | 82,046 | |||||||||||||||||||||
The accompanying Notes to Financial Statements are an integral part of this schedule.
224
Table of Contents
PARTNER SMALL CAP VALUE PORTFOLIO
Schedule of Investments as of December 31, 2014
| Shares | Common Stock (96.1%) | Value | ||||||
| Consumer Discretionary (12.9%) |
| ||||||
| 218,000 | Aaron’s, Inc. | $ | 6,664,260 | |||||
| 37,800 | American Public Education, Inc.a | 1,393,686 | ||||||
| 13,400 | Ascent Capital Group, Inc.a | 709,262 | ||||||
| 41,800 | Brunswick Corporation | 2,142,668 | ||||||
| 66,600 | Crocs, Inc.a | 831,834 | ||||||
| 59,000 | CSS Industries, Inc. | 1,630,760 | ||||||
| 72,200 | Culp, Inc. | 1,565,296 | ||||||
| 60,800 | Dorman Products, Inc.a,b | 2,934,816 | ||||||
| 82,800 | Drew Industries, Inc.a | 4,228,596 | ||||||
| 65,600 | Ethan Allen Interiors, Inc.b | 2,031,632 | ||||||
| 87,900 | Fred’s, Inc. | 1,530,339 | ||||||
| 101,000 | Haverty Furniture Companies, Inc. | 2,223,010 | ||||||
| 41,400 | Hooker Furniture Corporation | 710,838 | ||||||
| 9,000 | Interval Leisure Group, Inc. | 188,010 | ||||||
| 63,800 | M/I Homes, Inc.a | 1,464,848 | ||||||
| 83,100 | Meritage Homes Corporationa | 2,990,769 | ||||||
| 147,200 | Modine Manufacturing Companya | 2,001,920 | ||||||
| 16,700 | National CineMedia, Inc. | 239,979 | ||||||
| 87,600 | New Media Investment Group, Inc. | 2,069,988 | ||||||
| 57,600 | Orient-Express Hotels, Ltd.a | 712,512 | ||||||
| 162,950 | Pier 1 Imports, Inc. | 2,509,430 | ||||||
| 306,300 | Quiksilver, Inc.a,b | 676,923 | ||||||
| 16,700 | Red Robin Gourmet Burgers, Inc.a | 1,285,482 | ||||||
| 126,400 | Shiloh Industries, Inc.a | 1,988,272 | ||||||
| 190,200 | Sportsman’s Warehouse Holdings, Inc.a,b | 1,392,264 | ||||||
| 179,000 | Stein Mart, Inc. | 2,616,980 | ||||||
| 43,200 | Steven Madden, Ltd.a | 1,375,056 | ||||||
|
| |||||||
Total | 50,109,430 | |||||||
|
| |||||||
| Consumer Staples (1.0%) | |||||||
| 249,600 | Alliance One International, Inc.a | 394,368 | ||||||
| 29,500 | Pinnacle Foods, Inc. | 1,041,350 | ||||||
| 95,400 | Spartannash Company | 2,493,756 | ||||||
|
| |||||||
Total | 3,929,474 | |||||||
|
| |||||||
| Energy (2.8%) | |||||||
| 36,700 | Atwood Oceanics, Inc.a | 1,041,179 | ||||||
| 12,300 | Bristow Group, Inc. | 809,217 | ||||||
| 24,500 | CARBO Ceramics, Inc.b | 981,225 | ||||||
| 15,200 | Clayton Williams Energy, Inc.a | 969,760 | ||||||
| 119,600 | Cloud Peak Energy, Inc.a | 1,097,928 | ||||||
| 37,825 | Gulf Island Fabrication, Inc. | 733,427 | ||||||
| 26,300 | PDC Energy, Inc.a | 1,085,401 | ||||||
| 398,200 | Teekay Tankers, Ltd.b | 2,014,892 | ||||||
| 93,800 | Tesco Corporation | 1,202,516 | ||||||
| 152,900 | Tetra Technologies, Inc.a | 1,021,372 | ||||||
|
| |||||||
Total | 10,956,917 | |||||||
|
| |||||||
| Financials (27.6%) | |||||||
| 146,800 | Ares Capital Corporation | 2,290,814 | ||||||
| 76,100 | Associated Estates Realty Corporation | 1,766,281 | ||||||
| 61,600 | Assured Guaranty, Ltd. | 1,600,984 | ||||||
| 107,800 | BBCN Bancorp, Inc. | 1,550,164 | ||||||
| 63,850 | Catchmark Timber Trust, Inc. | 722,782 | ||||||
| 161,800 | CBL & Associates Properties, Inc. | 3,142,156 | ||||||
| 210,800 | Cedar Realty Trust, Inc. | 1,547,272 | ||||||
| 420,000 | CoBiz Financial, Inc. | 5,514,600 | ||||||
| 88,300 | Columbia Banking System, Inc. | 2,437,963 | ||||||
| 98,018 | Compass Diversified Holdings | 1,592,793 | ||||||
| 173,400 | East West Bancorp, Inc. | 6,712,314 | ||||||
| 97,410 | Employers Holdings, Inc. | 2,290,109 | ||||||
| 3,500 | Enstar Group, Ltd.a | 535,115 | ||||||
| 199,300 | First Potomac Realty Trust | 2,463,348 | ||||||
| 24,100 | Forestar Real Estate Group, Inc.a | 371,140 | ||||||
| 135,600 | Glacier Bancorp, Inc. | 3,765,612 | ||||||
| 100,000 | Golub Capital BDC, Inc. | 1,793,000 | ||||||
| 125,600 | Hatteras Financial Corporation | 2,314,808 | ||||||
| 200,000 | Hercules Technology Growth Capital, Inc. | 2,976,000 | ||||||
| 120,000 | Home Bancshares, Inc. | 3,859,200 | ||||||
| 26,500 | Home Properties, Inc. | 1,738,400 | ||||||
| 21,500 | iShares Russell 2000 Value Index Fund | 2,186,120 | ||||||
| 89,400 | Janus Capital Group, Inc. | 1,442,022 | ||||||
| 67,000 | JMP Group, Inc. | 510,540 | ||||||
| 26,500 | Kilroy Realty Corporation | 1,830,355 | ||||||
| 92,750 | Kite Realty Group Trust | 2,665,635 | ||||||
| 94,300 | LaSalle Hotel Properties | 3,816,321 | ||||||
| 29,500 | Main Street Capital Corporation | 862,580 | ||||||
| 211,700 | Meadowbrook Insurance Group, Inc. | 1,790,982 | ||||||
| 70,000 | National Interstate Corporation | 2,086,000 | ||||||
| 19,900 | Piper Jaffray Companiesa | 1,155,991 | ||||||
| 61,200 | Potlatch Corporation | 2,562,444 | ||||||
| 146,000 | ProAssurance Corporation | 6,591,900 | ||||||
| 14,200 | PS Business Parks, Inc. | 1,129,468 | ||||||
| 138,200 | Radian Group, Inc.b | 2,310,704 | ||||||
| 213,200 | Redwood Trust, Inc. | 4,200,040 | ||||||
| 96,600 | Safeguard Scientifics, Inc.a | 1,914,612 | ||||||
| 6,200 | Safety Insurance Group, Inc. | 396,862 | ||||||
| 126,400 | Sandy Spring Bancorp, Inc. | 3,296,512 | ||||||
| 53,700 | State Auto Financial Corporation | 1,193,214 | ||||||
| 129,500 | Strategic Hotels & Resorts, Inc.a | 1,713,285 | ||||||
| 39,000 | SVB Financial Groupa | 4,526,730 | ||||||
| 67,685 | TCP Capital Corporation | 1,135,754 | ||||||
| 90,300 | THL Credit, Inc. | 1,061,928 | ||||||
| 70,300 | Washington Real Estate Investment Trust | 1,944,498 | ||||||
| 84,300 | Wintrust Financial Corporation | 3,941,868 | ||||||
|
| |||||||
Total | 107,251,220 | |||||||
|
| |||||||
| Health Care (4.9%) | |||||||
| 17,300 | Analogic Corporation | 1,463,753 | ||||||
| 7,400 | Atrion Corporation | 2,516,074 | ||||||
| 71,800 | Halyard Health, Inc.a,b | 3,264,746 | ||||||
| 44,300 | National Healthcare Corporation | 2,783,812 | ||||||
| 96,000 | Triple-S Management Corporationa | 2,295,360 | ||||||
| 3,000 | Wellcare Health Plans, Inc.a | 246,180 | ||||||
| 120,900 | West Pharmaceutical Services, Inc. | 6,436,716 | ||||||
|
| |||||||
Total | 19,006,641 | |||||||
|
| |||||||
| Industrials (24.5%) | |||||||
| 82,600 | A.O. Smith Corporation | 4,659,466 | ||||||
| 101,000 | Aegion Corporationa | 1,879,610 | ||||||
| 153,200 | Alaska Air Group, Inc. | 9,155,232 | ||||||
| 41,000 | Applied Industrial Technologies, Inc. | 1,869,190 | ||||||
| 42,700 | Astec Industries, Inc. | 1,678,537 | ||||||
| 148,000 | Beacon Roofing Supply, Inc.a | 4,114,400 | ||||||
| 82,196 | Celadon Group, Inc. | 1,865,027 | ||||||
| 42,100 | Circor International, Inc. | 2,537,788 | ||||||
| 109,000 | Comfort Systems USA, Inc. | 1,866,080 | ||||||
| 80,400 | ESCO Technologies, Inc. | 2,966,760 | ||||||
| 57,000 | Franklin Electric Company, Inc. | 2,139,210 | ||||||
| 49,800 | FTI Consulting, Inc.a | 1,923,774 | ||||||
| 67,000 | G& K Services, Inc. | 4,746,950 | ||||||
| 46,500 | Genesee & Wyoming, Inc.a | 4,181,280 | ||||||
| 107,700 | Gibraltar Industries, Inc.a | 1,751,202 | ||||||
| 24,200 | Hillenbrand, Inc. | 834,900 | ||||||
| 45,000 | Hub Group, Inc.a | 1,713,600 | ||||||
The accompanying Notes to Financial Statements are an integral part of this schedule.
225
Table of Contents
PARTNER SMALL CAP VALUE PORTFOLIO
Schedule of Investments as of December 31, 2014
| Shares | Common Stock (96.1%) | Value | ||||||
| Industrials (24.5%) - continued | |||||||
| 52,000 | Kaman Corporation | $ | 2,084,680 | |||||
| 128,200 | Kforce, Inc. | 3,093,466 | ||||||
| 37,300 | Kirby Corporationa | 3,011,602 | ||||||
| 13,100 | Kratos Defense & Security Solutions, Inc.a | 65,762 | ||||||
| 67,300 | Landstar System, Inc. | 4,881,269 | ||||||
| 50,000 | Luxfer Holdings plc ADR | 746,500 | ||||||
| 79,100 | Matson, Inc. | 2,730,532 | ||||||
| 77,800 | Matthews International Corporation | 3,786,526 | ||||||
| 125,000 | McGrath Rentcorp | 4,482,500 | ||||||
| 43,700 | Mine Safety Appliances Company | 2,320,033 | ||||||
| 150,500 | Navigant Consulting, Inc.a | 2,313,185 | ||||||
| 33,500 | Nordson Corporation | 2,611,660 | ||||||
| 28,500 | Quanex Building Products Corporation | 535,230 | ||||||
| 15,600 | RBC Bearings, Inc. | 1,006,668 | ||||||
| 36,000 | Sun Hydraulics Corporation | 1,417,680 | ||||||
| 48,800 | Universal Forest Products, Inc. | 2,596,160 | ||||||
| 63,600 | Universal Truckload Services, Inc. | 1,813,236 | ||||||
| 108,900 | UTI Worldwide, Inc.a,b | 1,314,423 | ||||||
| 46,100 | Waste Connections, Inc. | 2,027,939 | ||||||
| 46,800 | Woodward, Inc. | 2,303,964 | ||||||
|
| |||||||
Total | 95,026,021 | |||||||
|
| |||||||
| Information Technology (10.1%) | |||||||
| 71,500 | Advanced Energy Industries, Inc.a | 1,694,550 | ||||||
| 9,900 | Badger Meter, Inc. | 587,565 | ||||||
| 58,900 | Belden, Inc. | 4,641,909 | ||||||
| 111,800 | Brooks Automation, Inc. | 1,425,450 | ||||||
| 67,900 | Cabot Microelectronics Corporationa | 3,213,028 | ||||||
| 16,800 | Cognex Corporationa | 694,344 | ||||||
| 69,500 | Cohu, Inc. | 827,050 | ||||||
| 136,200 | Electro Rent Corporation | 1,912,248 | ||||||
| 150,000 | Electro Scientific Industries, Inc. | 1,164,000 | ||||||
| 70,200 | Entegris, Inc.a | 927,342 | ||||||
| 102,000 | Fabrineta | 1,809,480 | ||||||
| 40,700 | Intersil Corporation | 588,929 | ||||||
| 185,000 | Intevac, Inc.a | 1,437,450 | ||||||
| 170,400 | lxiaa | 1,917,000 | ||||||
| 22,100 | Littelfuse, Inc. | 2,136,407 | ||||||
| 43,600 | Methode Electronics, Inc. | 1,591,836 | ||||||
| 42,000 | Newport Corporationa | 802,620 | ||||||
| 81,100 | Progress Software Corporationa | 2,191,322 | ||||||
| 202,900 | ShoreTel, Inc.a | 1,491,315 | ||||||
| 330,000 | Sonus Networks, Inc.a | 1,310,100 | ||||||
| 69,000 | Synnex Corporation | 5,393,040 | ||||||
| 81,000 | Teradyne, Inc. | 1,602,990 | ||||||
|
| |||||||
Total | 39,359,975 | |||||||
|
| |||||||
| Materials (7.0%) | |||||||
| 61,200 | American Vanguard Corporationb | 711,144 | ||||||
| 74,000 | AptarGroup, Inc. | 4,946,160 | ||||||
| 18,700 | Carpenter Technology Corporation | 920,975 | ||||||
| 50,500 | Clearwater Paper Corporationa | 3,461,775 | ||||||
| 25,100 | Franco-Nevada Corporation | 1,235,988 | ||||||
| 115,600 | Innospec, Inc. | 4,936,120 | ||||||
| 55,600 | Minerals Technologies, Inc. | 3,861,420 | ||||||
| 127,500 | Myers Industries, Inc. | 2,244,000 | ||||||
| 44,600 | Ryerson Holding Corporationa | 442,878 | ||||||
| 42,900 | Schnitzer Steel Industries, Inc. | 967,824 | ||||||
| 75,800 | Stillwater Mining Companya | 1,117,292 | ||||||
| 223,000 | Wausau Paper Corporation | 2,535,510 | ||||||
|
| |||||||
Total | 27,381,086 | |||||||
|
| |||||||
| Telecommunications Services (0.1%) | |||||||
| 21,080 | Premiere Global Services, Inc.a | 223,870 | ||||||
|
| |||||||
Total | 223,870 | |||||||
|
| |||||||
| Utilities (5.2%) | |||||||
| 33,100 | Black Hills Corporation | 1,755,624 | ||||||
| 106,000 | Cleco Corporation | 5,781,240 | ||||||
| 71,000 | El Paso Electric Company | 2,844,260 | ||||||
| 58,500 | NorthWestern Corporation | 3,309,930 | ||||||
| 77,200 | PNM Resources, Inc. | 2,287,436 | ||||||
| 69,700 | Southwest Gas Corporation | 4,308,157 | ||||||
|
| |||||||
Total | 20,286,647 | |||||||
|
| |||||||
Total Common Stock (cost $240,602,839) | 373,531,281 | |||||||
|
| |||||||
Preferred Stock (0.2%) | ||||||||
| Health Care (0.2%) | |||||||
| 43,967 | National Healthcare Corporation, Convertiblec | 683,687 | ||||||
|
| |||||||
Total | 683,687 | |||||||
|
| |||||||
Total Preferred Stock (cost $594,223) | 683,687 | |||||||
|
| |||||||
Collateral Held for Securities Loaned (3.2%) | ||||||||
| 12,670,650 | Thrivent Cash Management Trust | 12,670,650 | ||||||
|
| |||||||
Total Collateral Held for Securities Loaned (cost $12,670,650) | 12,670,650 | |||||||
|
| |||||||
| Shares or Principal Amount | Short-Term Investments (3.8%)d | |||||||
Thrivent Cash Management Trust | ||||||||
| 14,642,525 | 0.060% | 14,642,525 | ||||||
|
| |||||||
Total Short-Term Investments (at amortized cost) | 14,642,525 | |||||||
|
| |||||||
Total Investments (cost $268,510,237) 103.3% | $ | 401,528,143 | ||||||
|
| |||||||
Other Assets and Liabilities, Net (3.3%) | (12,895,537 | ) | ||||||
|
| |||||||
Total Net Assets 100.0% | $ | 388,632,606 | ||||||
|
| |||||||
| a | Non-income producing security. |
| b | All or a portion of the security is on loan. |
| c | Denotes perpetual securities. Perpetual securities pay an indefinite stream of interest, but may be called by the issuer at an earlier date. |
| d | The interest rate shown reflects the yield, coupon rate or the discount rate at the date of purchase. |
Definitions:
ADR | - | American Depositary Receipt, which are certificates for an underlying foreign security’s shares held by an issuing U.S. depository bank. |
The accompanying Notes to Financial Statements are an integral part of this schedule.
226
Table of Contents
PARTNER SMALL CAP VALUE PORTFOLIO
Schedule of Investments as of December 31, 2014
Unrealized Appreciation (Depreciation)
Gross unrealized appreciation and depreciation of investments, based on cost for federal income tax purposes, were as follows:
Gross unrealized appreciation | $ | 142,351,507 | ||
Gross unrealized depreciation | (10,227,527 | ) | ||
|
| |||
Net unrealized appreciation (depreciation) | $ | 132,123,980 | ||
Cost for federal income tax purposes | $ | 269,404,163 | ||
Fair Valuation Measurements
The following table is a summary of the inputs used, as of December 31, 2014, in valuing Partner Small Cap Value Portfolio’s assets carried at fair value.
Investments in Securities | Total | Level 1 | Level 2 | Level 3 | ||||||||||||
Common Stock | ||||||||||||||||
Consumer Discretionary | 50,109,430 | 50,109,430 | — | — | ||||||||||||
Consumer Staples | 3,929,474 | 3,929,474 | — | — | ||||||||||||
Energy | 10,956,917 | 10,956,917 | — | — | ||||||||||||
Financials | 107,251,220 | 107,251,220 | — | — | ||||||||||||
Health Care | 19,006,641 | 19,006,641 | — | — | ||||||||||||
Industrials | 95,026,021 | 95,026,021 | — | — | ||||||||||||
Information Technology | 39,359,975 | 39,359,975 | — | — | ||||||||||||
Materials | 27,381,086 | 26,145,098 | 1,235,988 | — | ||||||||||||
Telecommunications Services | 223,870 | 223,870 | — | — | ||||||||||||
Utilities | 20,286,647 | 20,286,647 | — | — | ||||||||||||
Preferred Stock | ||||||||||||||||
Health Care | 683,687 | 683,687 | — | — | ||||||||||||
Collateral Held for Securities Loaned | 12,670,650 | 12,670,650 | — | — | ||||||||||||
Short-Term Investments | 14,642,525 | 14,642,525 | — | — | ||||||||||||
|
|
|
|
|
|
|
| |||||||||
Total | $ | 401,528,143 | $ | 400,292,155 | $ | 1,235,988 | $ | — | ||||||||
|
|
|
|
|
|
|
| |||||||||
There were no significant transfers between Levels during the period ended December 31, 2014. Transfers between Levels are identified as of the end of the period.
Investment in Affiliates
Affiliated issuers, as defined under the Investment Company Act of 1940, include those in which the Portfolio’s holdings of an issuer represent 5% or more of the outstanding voting securities of an issuer, or any affiliated mutual fund.
A summary of transactions for the fiscal year to date, in Partner Small Cap Value Portfolio, is as follows:
Portfolio | Value December 31, 2013 | Gross Purchases | Gross Sales | Shares Held at December 31, 2014 | Value December 31, 2014 | Income Earned January 1, 2014 - December 31, 2014 | ||||||||||||||||||
Cash Management Trust- Collateral Investment | $ | 6,702,600 | $ | 94,032,214 | $ | 88,064,164 | 12,670,650 | $ | 12,670,650 | $ | 64,016 | |||||||||||||
Cash Management Trust- Short Term Investment | 8,038,467 | 37,152,133 | 30,548,075 | 14,642,525 | 14,642,525 | 4,900 | ||||||||||||||||||
Total Value and Income Earned | 14,741,067 | 27,313,175 | 68,916 | |||||||||||||||||||||
The accompanying Notes to Financial Statements are an integral part of this schedule.
227
Table of Contents
Schedule of Investments as of December 31, 2014
| Shares | Common Stock (97.4%) | Value | ||||||
| Consumer Discretionary (13.7%) | |||||||
| 53,100 | Aaron’s, Inc. | $ | 1,623,267 | |||||
| 99,490 | Cheesecake Factory, Inc. | 5,005,342 | ||||||
| 47,580 | G-lll Apparel Group, Ltd.a | 4,806,056 | ||||||
| 238,070 | Houghton Mifflin HarcourtCompanya | 4,930,429 | ||||||
| 252,051 | MDC Partners, Inc. | 5,726,599 | ||||||
| 274,720 | NutriSystem, Inc. | 5,370,776 | ||||||
| 63,400 | Oxford Industries, Inc. | 3,500,314 | ||||||
| 65,380 | Papa John’s International, Inc. | 3,648,204 | ||||||
| 341,160 | Tuesday Morning Corporationa,b | 7,403,172 | ||||||
|
| |||||||
Total | 42,014,159 | |||||||
|
| |||||||
| Consumer Staples (3.7%) | |||||||
| 71,360 | TreeHouse Foods, Inc.a | 6,103,421 | ||||||
| 150,810 | WhiteWave Foods Companya | 5,276,842 | ||||||
|
| |||||||
Total | 11,380,263 | |||||||
|
| |||||||
| Energy (2.8%) | |||||||
| 100,910 | Market Vectors Oil Service ETF | 3,624,687 | ||||||
| 111,400 | Oasis Petroleum, Inc.a | 1,842,556 | ||||||
| 89,670 | Rex Energy Corporationa,b | 457,317 | ||||||
| 57,580 | Rosetta Resources, Inc.a | 1,284,610 | ||||||
| 315,142 | Trinidad Drilling, Ltd. | 1,410,517 | ||||||
|
| |||||||
Total | 8,619,687 | |||||||
|
| |||||||
| Financials (21.7%) | |||||||
| 25,756 | Affiliated Managers Group, Inc.a | 5,466,453 | ||||||
| 39,970 | Allied World Assurance Company Holdings AG | 1,515,662 | ||||||
| 62,040 | American Assets Trust, Inc. | 2,469,812 | ||||||
| 39,139 | Argo Group International Holdings, Ltd. | 2,171,040 | ||||||
| 100,080 | Assured Guaranty, Ltd. | 2,601,079 | ||||||
| 161,950 | BBCN Bancorp, Inc. | 2,328,841 | ||||||
| 355,640 | CNO Financial Group, Inc. | 6,124,121 | ||||||
| 51,930 | Education Realty Trust, Inc. | 1,900,119 | ||||||
| 30,990 | Extra Space Storage, Inc. | 1,817,254 | ||||||
| 235,670 | Hanmi Financial Corporation | 5,139,963 | ||||||
| 57,820 | HCC Insurance Holdings, Inc. | 3,094,526 | ||||||
| 51,300 | iShares Russell 2000 Index Fund | 6,139,071 | ||||||
| 79,710 | PacWest Bancorp | 3,623,617 | ||||||
| 89,980 | Parkway Properties, Inc. | 1,654,732 | ||||||
| 92,520 | Pebblebrook Hotel Trust | 4,221,688 | ||||||
| 13,270 | SVB Financial Groupa | 1,540,249 | ||||||
| 242,850 | Synovus Financial Corporation | 6,578,807 | ||||||
| 147,860 | Terreno Realty Corporation | 3,050,352 | ||||||
| 27,070 | Texas Capital Bancshares, Inc.a | 1,470,713 | ||||||
| 125,870 | Western Alliance Bancorpa | 3,499,186 | ||||||
|
| |||||||
Total | 66,407,285 | |||||||
|
| |||||||
| Health Care (10.4%) | |||||||
| 61,100 | Acorda Therapeutics, Inc.a | 2,497,157 | ||||||
| 66,500 | Akorn, Inc.a,b | 2,407,300 | ||||||
| 48,090 | Align Technology, Inc.a | 2,688,712 | ||||||
| 96,460 | AMN Healthcare Services, Inc.a | 1,890,616 | ||||||
| 188,622 | ExamWorks Group, Inc.a,b | 7,844,789 | ||||||
| 111,400 | Neurocrine Biosciences, Inc.a | 2,488,676 | ||||||
| 115,250 | NuVasive, Inc.a | 5,435,190 | ||||||
| 58,020 | Teleflex, Inc. | 6,661,856 | ||||||
|
| |||||||
Total | 31,914,296 | |||||||
|
| |||||||
| Industrials (21.9%) | |||||||
| 74,680 | Apogee Enterprises, Inc. | 3,164,192 | ||||||
| 98,510 | CLARCOR, Inc. | 6,564,706 | ||||||
| 64,870 | Curtiss-Wright Corporation | 4,579,173 | ||||||
| 205,304 | EMCOR Group, Inc. | 9,133,975 | ||||||
| 51,600 | Esterline Technologies Corporationa | 5,659,488 | ||||||
| 112,036 | Granite Construction, Inc. | 4,259,609 | ||||||
| 120,340 | HNI Corporation | 6,144,560 | ||||||
| 183,735 | Interface, Inc. | 3,026,116 | ||||||
| 183,530 | Korn/Ferry Internationala | 5,278,323 | ||||||
| 54,580 | Landstar System, Inc. | 3,958,687 | ||||||
| 200,880 | Progressive Waste Solutions, Ltd. | 6,042,470 | ||||||
| 14,250 | Proto Labs, Inc.a,b | 957,030 | ||||||
| 139,570 | Ritchie Brothers Auctioneers, Inc.b | 3,753,037 | ||||||
| 61,680 | Tennant Company | 4,451,446 | ||||||
|
| |||||||
Total | 66,972,812 | |||||||
|
| |||||||
| Information Technology (14.5%) | |||||||
| 368,050 | Atmel Corporationa | 3,089,780 | ||||||
| 167,380 | Broadridge Financial Solutions, Inc. | 7,729,608 | ||||||
| 87,510 | DST Systems, Inc. | 8,239,066 | ||||||
| 45,000 | FEI Company | 4,065,750 | ||||||
| 79,660 | Guidewire Software, Inc.a | 4,033,186 | ||||||
| 130,215 | Plantronics, Inc. | 6,903,999 | ||||||
| 63,470 | Textura Corporationa,b | 1,806,991 | ||||||
| 78,640 | Ubiquiti Networks, Inc.b | 2,330,890 | ||||||
| 149,952 | Virtusa Corporationa | 6,248,500 | ||||||
|
| |||||||
Total | 44,447,770 | |||||||
|
| |||||||
| Materials (4.7%) | |||||||
| 64,400 | Chemtura Corporationa,b | 1,592,612 | ||||||
| 38,350 | Eagle Materials, Inc. | 2,915,750 | ||||||
| 197,860 | Horsehead Holding Corporationa | 3,132,124 | ||||||
| 140,700 | Materials Select Sector SPDR Fund | 6,835,206 | ||||||
|
| |||||||
Total | 14,475,692 | |||||||
|
| |||||||
| Utilities (4.0%) | |||||||
| 30,750 | Laclede Group, Inc. | 1,635,900 | ||||||
| 156,820 | NorthWestern Corporation | 8,872,876 | ||||||
| 42,300 | Portland General Electric Company | 1,600,209 | ||||||
|
| |||||||
Total | 12,108,985 | |||||||
|
| |||||||
Total Common Stock (cost $247,791,572) | 298,340,949 | |||||||
|
| |||||||
Collateral Held for Securities Loaned (8.0%) | ||||||||
| 24,447,972 | Thrivent Cash Management Trust | 24,447,972 | ||||||
|
| |||||||
Total Collateral Held for Securities Loaned (cost $24,447,972) | 24,447,972 | |||||||
|
| |||||||
| Shares or Principal Amount | Short-Term Investments (4.6%)c | |||||||
Thrivent Cash Management Trust | ||||||||
| 14,077,311 | 0.060% | 14,077,311 | ||||||
|
| |||||||
Total Short-Term Investments (at amortized cost) | 14,077,311 | |||||||
|
| |||||||
Total Investments (cost $286,316,855) 110.0% | $ | 336,866,232 | ||||||
|
| |||||||
Other Assets and Liabilities, Net (10.0%) | (30,528,197 | ) | ||||||
|
| |||||||
Total Net Assets 100.0% | $ | 306,338,035 | ||||||
|
| |||||||
The accompanying Notes to Financial Statements are an integral part of this schedule.
228
Table of Contents
SMALL CAP STOCK PORTFOLIO
Schedule of Investments as of December 31, 2014
| a | Non-income producing security. |
| b | All or a portion of the security is on loan. |
| c | The interest rate shown reflects the yield, coupon rate or the discount rate at the date of purchase. |
Definitions:
| ETF | - | Exchange Traded Fund. |
Unrealized Appreciation (Depreciation)
Gross unrealized appreciation and depreciation of investments, based on cost for federal income tax purposes, were as follows:
Gross unrealized appreciation | $ | 60,415,524 | ||
Gross unrealized depreciation | (9,886,973 | ) | ||
|
| |||
Net unrealized appreciation (depreciation) | $ | 50,528,551 | ||
Cost for federal income tax purposes | $ | 286,337,681 | ||
Fair Valuation Measurements
The following table is a summary of the inputs used, as of December 31, 2014, in valuing Small Cap Stock Portfolio’s assets carried at fair value.
Investments in Securities | Total | Level 1 | Level 2 | Level 3 | ||||||||||||
Common Stock | ||||||||||||||||
Consumer Discretionary | 42,014,159 | 42,014,159 | — | — | ||||||||||||
Consumer Staples | 11,380,263 | 11,380,263 | — | — | ||||||||||||
Energy | 8,619,687 | 7,209,170 | 1,410,517 | — | ||||||||||||
Financials | 66,407,285 | 66,407,285 | — | — | ||||||||||||
Health Care | 31,914,296 | 31,914,296 | — | — | ||||||||||||
Industrials | 66,972,812 | 66,972,812 | — | — | ||||||||||||
Information Technology | 44,447,770 | 44,447,770 | — | — | ||||||||||||
Materials | 14,475,692 | 14,475,692 | — | — | ||||||||||||
Utilities | 12,108,985 | 12,108,985 | — | — | ||||||||||||
Collateral Held for Securities Loaned | 24,447,972 | 24,447,972 | — | — | ||||||||||||
Short-Term Investments | 14,077,311 | 14,077,311 | — | — | ||||||||||||
|
|
|
|
|
|
|
| |||||||||
Total | $ | 336,866,232 | $ | 335,455,715 | $ | 1,410,517 | $ | — | ||||||||
|
|
|
|
|
|
|
| |||||||||
There were no significant transfers between Levels during the period ended December 31, 2014. Transfers between Levels are identified as of the end of the period.
The following table summarizes the net realized gains/(losses) and Statement of Operations location, for the period ended December 31, 2014, for Small Cap Stock Portfolio’s investments in financial derivative instruments by primary risk exposure.
Derivatives by risk category | Statement of Operations Location | Realized Gains/(Losses) recognized in Income | ||||
Equity Contracts | ||||||
Futures | Net realized gains/(losses) on Futures contracts | (585,340 | ) | |||
Total Equity Contracts | (585,340 | ) | ||||
|
| |||||
Total | ($ | 585,340 | ) | |||
|
| |||||
The following table summarizes the change in net unrealized appreciation/(depreciation) and Statement of Operations location, for the period ended December 31, 2014, for Small Cap Stock Portfolio’s investments in financial derivative instruments by primary risk exposure.
Derivatives by risk category | Statement of Operations Location | Change in unrealized appreciation/(depreciation) recognized in Income | ||||
Equity Contracts | ||||||
Futures | Change in net unrealized appreciation/(depreciation) on Futures contracts | (1,194,990 | ) | |||
Total Equity Contracts | (1,194,990 | ) | ||||
|
| |||||
Total | ($ | 1,194,990 | ) | |||
|
| |||||
The following table presents Small Cap Stock Portfolio’s average volume of derivative activity during the period ended December 31, 2014.
Derivative Risk Category | Futures (Notional)* | Futures (Percentage of Average Net Assets) | ||||||
Equity Contracts | $ | 10,008,634 | 3.1 | % | ||||
| * | Notional amount represents long or short, or both, derivative positions held by the Portfolio. |
The accompanying Notes to Financial Statements are an integral part of this schedule.
229
Table of Contents
SMALL CAP STOCK PORTFOLIO
Schedule of Investments as of December 31, 2014
Investment in Affiliates
Affiliated issuers, as defined under the Investment Company Act of 1940, include those in which the Portfolio’s holdings of an issuer represent 5% or more of the outstanding voting securities of an issuer, or any affiliated mutual fund.
A summary of transactions for the fiscal year to date, in Small Cap Stock Portfolio, is as follows:
Portfolio | Value December 31, 2013 | Gross Purchases | Gross Sales | Shares Held at December 31, 2014 | Value December 31, 2014 | Income Earned January 1, 2014 - December 31, 2014 | ||||||||||||||||||
Cash Management Trust- | $ | 25,019,444 | $ | 105,537,202 | $ | 106,108,674 | 24,447,972 | $ | 24,447,972 | $ | 373,549 | |||||||||||||
Cash Management Trust- | 25,721,345 | 128,823,821 | 140,467,855 | 14,077,311 | 14,077,311 | 8,120 | ||||||||||||||||||
Total Value and Income Earned | 50,740,789 | 38,525,283 | 381,669 | |||||||||||||||||||||
The accompanying Notes to Financial Statements are an integral part of this schedule.
230
Table of Contents
Schedule of Investments as of December 31, 2014
| Shares | Common Stock (93.9%) | Value | ||||||
| Consumer Discretionary (13.8%) |
| ||||||
| 28,850 | Aeropostale, Inc.a,b | $ | 66,932 | |||||
| 6,300 | American Public Education, Inc.b | 232,281 | ||||||
| 4,700 | Arctic Cat, Inc. | 166,850 | ||||||
| 15,450 | Barnes & Noble, Inc.b | 358,749 | ||||||
| 6,600 | Big 5 Sporting Goods Corporation | 96,558 | ||||||
| 618 | Biglari Holdings, Inc.b | 246,897 | ||||||
| 7,900 | BJ’s Restaurants, Inc.b | 396,659 | ||||||
| 4,300 | Blue Nile, Inc.b | 154,843 | ||||||
| 8,600 | Bob Evans Farms, Inc. | 440,148 | ||||||
| 28,300 | Boyd Gaming Corporationb | 361,674 | ||||||
| 15,775 | Brown Shoe Company, Inc. | 507,166 | ||||||
| 10,200 | Buckle, Inc.a | 535,704 | ||||||
| 6,850 | Buffalo Wild Wings, Inc.b | 1,235,603 | ||||||
| 28,250 | Callaway Golf Company | 217,525 | ||||||
| 3,950 | Capella Education Company | 303,992 | ||||||
| 21,550 | Career Education Corporationb | 149,988 | ||||||
| 9,300 | Cato Corporation | 392,274 | ||||||
| 7,700 | Children’s Place Retail Stores, Inc. | 438,900 | ||||||
| 13,375 | Christopher & Banks Corporationb | 76,371 | ||||||
| 6,900 | Coinstar, Inc.b | 519,018 | ||||||
| 8,700 | Cracker Barrel Old Country Store, Inc. | 1,224,612 | ||||||
| 30,000 | Crocs, Inc.b | 374,700 | ||||||
| 6,050 | DineEquity, Inc. | 627,022 | ||||||
| 11,150 | Dorman Products, Inc.a,b | 538,211 | ||||||
| 8,600 | Drew Industries, Inc.b | 439,202 | ||||||
| 10,883 | E.W. Scripps Companyb | 243,235 | ||||||
| 9,500 | Ethan Allen Interiors, Inc. | 294,215 | ||||||
| 17,343 | Finish Line, Inc. | 421,608 | ||||||
| 15,400 | Francesca’s Holdings Corporationb | 257,180 | ||||||
| 12,600 | Fred’s, Inc. | 219,366 | ||||||
| 6,990 | FTD Companies, Inc.a,b | 243,392 | ||||||
| 8,750 | Genesco, Inc.b | 670,425 | ||||||
| 6,950 | G-III Apparel Group, Ltd.b | 702,020 | ||||||
| 7,750 | Group 1 Automotive, Inc. | 694,555 | ||||||
| 15,650 | Harte-Hanks, Inc. | 121,131 | ||||||
| 7,600 | Haverty Furniture Companies, Inc. | 167,276 | ||||||
| 9,650 | Helen of Troy, Ltd.b | 627,829 | ||||||
| 9,100 | Hibbett Sports, Inc.b | 440,713 | ||||||
| 17,450 | Iconix Brand Group, Inc.b | 589,636 | ||||||
| 14,300 | Interval Leisure Group, Inc. | 298,727 | ||||||
| 10,800 | iRobot Corporationa,b | 374,976 | ||||||
| 14,050 | Jack in the Box, Inc. | 1,123,438 | ||||||
| 5,400 | Kirkland’s, Inc.b | 127,656 | ||||||
| 18,850 | La-Z-Boy, Inc. | 505,934 | ||||||
| 8,250 | Lithia Motors, Inc. | 715,193 | ||||||
| 9,900 | Lumber Liquidators Holdings, Inc.a,b | 656,469 | ||||||
| 8,850 | M/I Homes, Inc.b | 203,196 | ||||||
| 6,650 | Marcus Corporation | 123,091 | ||||||
| 9,050 | MarineMax, Inc.b | 181,453 | ||||||
| 10,300 | Marriott Vacations Worldwide Corporation | 767,762 | ||||||
| 16,500 | Men’s Wearhouse, Inc. | 728,475 | ||||||
| 13,450 | Meritage Homes Corporationb | 484,066 | ||||||
| 3,650 | Monarch Casino & Resort, Inc.b | 60,554 | ||||||
| 11,450 | Monro Muffler Brake, Inc.a | 661,810 | ||||||
| 6,600 | Movado Group, Inc. | 187,242 | ||||||
| 10,450 | NutriSystem, Inc. | 204,298 | ||||||
| 5,300 | Oxford Industries, Inc. | 292,613 | ||||||
| 10,750 | Papa John’s International, Inc. | 599,850 | ||||||
| 19,550 | Pep Boys - Manny, Moe & Jackb | 191,981 | ||||||
| 4,400 | Perry Ellis International, Inc.b | 114,092 | ||||||
| 7,350 | PetMed Express, Inc.a | 105,620 | ||||||
| 21,750 | Pinnacle Entertainment, Inc.b | 483,937 | ||||||
| 15,912 | Pool Corporation | 1,009,457 | ||||||
| 44,350 | Quiksilver, Inc.a,b | 98,013 | ||||||
| 5,100 | Red Robin Gourmet Burgers, Inc.b | 392,572 | ||||||
| 16,250 | Regis Corporationb | 272,350 | ||||||
| 22,600 | Ruby Tuesday, Inc.b | 154,584 | ||||||
| 12,900 | Ruth’s Hospitality Group, Inc. | 193,500 | ||||||
| 16,650 | Ryland Group, Inc. | 642,024 | ||||||
| 9,700 | Scholastic Corporation | 353,274 | ||||||
| 17,700 | Scientific Games Corporationa,b | 225,321 | ||||||
| 19,350 | Select Comfort Corporationb | 523,031 | ||||||
| 8,050 | Sizmek, Inc.b | 50,393 | ||||||
| 15,000 | Skechers USA, Inc.b | 828,750 | ||||||
| 12,150 | Sonic Automotive, Inc. | 328,536 | ||||||
| 18,252 | Sonic Corporation | 497,002 | ||||||
| 11,550 | Stage Stores, Inc. | 239,085 | ||||||
| 5,350 | Stamps.com, Inc.b | 256,747 | ||||||
| 7,600 | Standard Motor Products, Inc. | 289,712 | ||||||
| 54,650 | Standard Pacific Corporationa,b | 398,398 | ||||||
| 10,250 | Stein Mart, Inc. | 149,855 | ||||||
| 20,475 | Steven Madden, Ltd.b | 651,719 | ||||||
| 3,950 | Strayer Education, Inc.a,b | 293,406 | ||||||
| 7,050 | Sturm, Ruger & Company, Inc.a | 244,141 | ||||||
| 8,450 | Superior Industries International, Inc. | 167,225 | ||||||
| 22,650 | Texas Roadhouse, Inc. | 764,664 | ||||||
| 15,950 | Tuesday Morning Corporationa,b | 346,115 | ||||||
| 5,200 | Unifi, Inc.b | 154,596 | ||||||
| 5,750 | Universal Electronic, Inc.b | 373,922 | ||||||
| 7,850 | Universal Technical Institute, Inc. | 77,244 | ||||||
| 11,200 | Vitamin Shoppe, Inc.b | 544,096 | ||||||
| 7,250 | VOXX International Corporationb | 63,510 | ||||||
| 9,850 | Winnebago Industries, Inc. | 214,336 | ||||||
| 36,750 | Wolverine World Wide, Inc. | 1,083,022 | ||||||
| 7,800 | Zumiez, Inc.b | 301,314 | ||||||
|
| |||||||
| Total | 37,168,807 | |||||||
|
| |||||||
| Consumer Staples (3.3%) | |||||||
| 29,950 | Alliance One International, Inc.b | 47,321 | ||||||
| 9,800 | Andersons, Inc. | 520,772 | ||||||
| 19,500 | B&G Foods, Inc. | 583,050 | ||||||
| 3,200 | Boston Beer Company, Inc.a,b | 926,528 | ||||||
| 5,600 | Calavo Growers, Inc. | 264,880 | ||||||
| 10,900 | Cal-Maine Foods, Inc.a | 425,427 | ||||||
| 13,950 | Casey’s General Stores, Inc. | 1,259,964 | ||||||
| 15,650 | Central Garden & Pet Companyb | 149,457 | ||||||
| 60,050 | Darling Ingredients, Inc.b | 1,090,508 | ||||||
| 9,550 | Diamond Foods, Inc.b | 269,597 | ||||||
| 6,200 | Inter Parfums, Inc. | 170,190 | ||||||
| 5,400 | J & J Snack Foods Corporation | 587,358 | ||||||
| 4,100 | Medifast, Inc.b | 137,555 | ||||||
| 7,500 | Sanderson Farms, Inc.a | 630,187 | ||||||
| 2,550 | Seneca Foods Corporationb | 68,927 | ||||||
| 18,850 | Snyders-Lance, Inc. | 575,867 | ||||||
| 13,700 | Spartannash Company | 358,118 | ||||||
| 8,450 | Universal Corporation | 371,631 | ||||||
| 5,020 | WD-40 Company | 427,102 | ||||||
|
| |||||||
| Total | 8,864,439 | |||||||
|
| |||||||
| Energy (3.3%) | |||||||
| 13,000 | Approach Resources, Inc.a,b | 83,070 | ||||||
| 76,200 | Arch Coal, Inc.a | 135,636 | ||||||
| 12,250 | Basic Energy Services, Inc.b | 85,872 | ||||||
| 17,650 | Bill Barrett Corporationb | 201,033 | ||||||
| 12,200 | Bonanza Creek Energy, Inc.b | 292,800 | ||||||
| 12,700 | Bristow Group, Inc. | 835,533 | ||||||
| 16,400 | C&J Energy Services, Inc.b | 216,644 | ||||||
| 15,400 | Carrizo Oil & Gas, Inc.b | 640,640 | ||||||
| 22,100 | Cloud Peak Energy, Inc.b | 202,878 | ||||||
| 16,150 | Comstock Resources, Inc.a | 109,981 | ||||||
The accompanying Notes to Financial Statements are an integral part of this schedule.
231
Table of Contents
SMALL CAP INDEX PORTFOLIO
Schedule of Investments as of December 31, 2014
| Shares | Common Stock (93.9%) | Value | ||||||
| Energy (3.3%) - continued |
| ||||||
| 5,850 | Contango Oil & Gas Companyb | $ | 171,054 | |||||
| 7,050 | Era Group, Inc.b | 149,108 | ||||||
| 24,750 | Exterran Holdings, Inc. | 806,355 | ||||||
| 4,700 | Geospace Technologies Corporationb | 124,550 | ||||||
| 12,350 | Green Plains, Inc. | 306,033 | ||||||
| 4,850 | Gulf Island Fabrication, Inc. | 94,042 | ||||||
| 9,450 | Gulfmark Offshore, Inc.a | 230,769 | ||||||
| 11,600 | Hornbeck Offshore Services, Inc.b | 289,652 | ||||||
| 46,150 | ION Geophysical Corporationb | 126,912 | ||||||
| 9,600 | Matrix Service Companyb | 214,272 | ||||||
| 30,350 | Newpark Resources, Inc.b | 289,539 | ||||||
| 20,850 | Northern Oil and Gas, Inc.a,b | 117,803 | ||||||
| 30,450 | Paragon Offshore plca | 84,347 | ||||||
| 13,000 | PDC Energy, Inc.b | 536,510 | ||||||
| 25,500 | Penn Virginia Corporationb | 170,340 | ||||||
| 21,600 | PetroQuest Energy, Inc.b | 80,784 | ||||||
| 22,700 | Pioneer Energy Services Corporationb | 125,758 | ||||||
| 17,850 | Rex Energy Corporationa,b | 91,035 | ||||||
| 6,350 | SEACOR Holdings, Inc.b | 468,693 | ||||||
| 20,300 | Stone Energy Corporationb | 342,664 | ||||||
| 15,600 | Swift Energy Companya,b | 63,180 | ||||||
| 24,700 | Synergy Resources Corporationb | 309,738 | ||||||
| 13,000 | Tesco Corporation | 166,660 | ||||||
| 28,400 | Tetra Technologies, Inc.b | 189,712 | ||||||
| 19,650 | U.S. Silica Holdings, Inc.a | 504,809 | ||||||
|
| |||||||
| Total | 8,858,406 | |||||||
|
| |||||||
| Financials (22.2%) | |||||||
| 24,628 | Acadia Realty Trust | 788,835 | ||||||
| 6,300 | Agree Realty Corporation | 195,867 | ||||||
| 13,450 | American Assets Trust, Inc. | 535,445 | ||||||
| 27,400 | American Equity Investment Life Holding Company | 799,806 | ||||||
| 6,800 | Amerisafe, Inc. | 288,048 | ||||||
| 20,900 | Associated Estates Realty Corporation | 485,089 | ||||||
| 8,950 | Aviv REIT, Inc. | 308,596 | ||||||
| 15,850 | Bank Mutual Corporation | 108,731 | ||||||
| 23,600 | Bank of the Ozarks, Inc. | 894,912 | ||||||
| 7,150 | Banner Corporation | 307,593 | ||||||
| 28,950 | BBCN Bancorp, Inc. | 416,301 | ||||||
| 4,750 | Bofi Holding, Inc.b | 369,598 | ||||||
| 30,250 | Boston Private Financial Holdings, Inc. | 407,467 | ||||||
| 25,400 | Brookline Bancorp, Inc. | 254,762 | ||||||
| 6,150 | Calamos Asset Management, Inc. | 81,918 | ||||||
| 34,750 | Capstead Mortgage Corporationa | 426,730 | ||||||
| 11,700 | Cardinal Financial Corporation | 232,011 | ||||||
| 10,172 | Caretrust REIT, Inc. | 125,421 | ||||||
| 10,500 | Cash America International, Inc. | 237,510 | ||||||
| 25,050 | Cedar Realty Trust, Inc. | 183,867 | ||||||
| 9,750 | Central Pacific Financial Corporation | 209,625 | ||||||
| 20,050 | Chesapeake Lodging Trust | 746,061 | ||||||
| 5,550 | City Holding Companya | 258,242 | ||||||
| 19,600 | Columbia Banking System, Inc. | 541,156 | ||||||
| 14,800 | Community Bank System, Inc. | 564,324 | ||||||
| 7,850 | Coresite Realty Corporation | 306,543 | ||||||
| 74,600 | Cousins Properties, Inc. | 851,932 | ||||||
| 35,250 | CVB Financial Corporation | 564,705 | ||||||
| 71,217 | DiamondRock Hospitality Company | 1,058,997 | ||||||
| 10,925 | Dime Community Bancshares, Inc. | 177,859 | ||||||
| 11,600 | EastGroup Properties, Inc. | 734,512 | ||||||
| 17,233 | Education Realty Trust, Inc. | 630,555 | ||||||
| 6,500 | eHealth, Inc.b | 161,980 | ||||||
| 11,400 | Employers Holdings, Inc. | 268,014 | ||||||
| 8,650 | Encore Capital Group, Inc.b | 384,060 | ||||||
| 9,607 | Enova International, Inc.b | 213,852 | ||||||
| 20,750 | EPR Properties | 1,195,823 | ||||||
| 13,100 | Evercore Partners, Inc. | 686,047 | ||||||
| 17,700 | EZCORP, Inc.a,b | 207,975 | ||||||
| 63,350 | F.N.B. Corporation | 843,822 | ||||||
| 18,700 | Financial Engines, Inc.a | 683,485 | ||||||
| 38,073 | First Bancorpb | 223,489 | ||||||
| 10,300 | First Cash Financial Services, Inc.b | 573,401 | ||||||
| 33,600 | First Commonwealth Financial Corporation | 309,792 | ||||||
| 22,300 | First Financial Bancorp | 414,557 | ||||||
| 23,450 | First Financial Bankshares, Inc.a | 700,686 | ||||||
| 27,412 | First Midwest Bancorp, Inc. | 469,019 | ||||||
| 12,700 | Forestar Real Estate Group, Inc.b | 195,580 | ||||||
| 32,400 | Franklin Street Properties Corporation | 397,548 | ||||||
| 15,350 | FXCM, Inc.a | 254,350 | ||||||
| 26,946 | Geo Group, Inc. | 1,087,541 | ||||||
| 9,450 | Getty Realty Corporation | 172,084 | ||||||
| 27,500 | Glacier Bancorp, Inc. | 763,675 | ||||||
| 25,500 | Government Properties Income Trust | 586,755 | ||||||
| 13,150 | Green Dot Corporationb | 269,444 | ||||||
| 9,650 | Greenhill & Company, Inc.a | 420,740 | ||||||
| 11,662 | Hanmi Financial Corporation | 254,348 | ||||||
| 3,350 | HCI Group, Inc. | 144,854 | ||||||
| 35,600 | Healthcare Realty Trust, Inc. | 972,592 | ||||||
| 11,900 | HFF, Inc. | 427,448 | ||||||
| 21,640 | Home Bancshares, Inc. | 695,942 | ||||||
| 15,200 | Horace Mann Educators Corporation | 504,336 | ||||||
| 8,750 | Independent Bank Corporationa | 374,588 | ||||||
| 4,200 | Infinity Property & Casualty Corporation | 324,492 | ||||||
| 32,000 | Inland Real Estate Corporation | 350,400 | ||||||
| 21,200 | Interactive Brokers Group, Inc. | 618,192 | ||||||
| 12,750 | Investment Technology Group, Inc.b | 265,455 | ||||||
| 30,325 | Kite Realty Group Trust | 871,540 | ||||||
| 75,809 | Lexington Realty Trust | 832,383 | ||||||
| 12,650 | LTC Properties, Inc. | 546,100 | ||||||
| 13,600 | MarketAxess Holdings, Inc. | 975,256 | ||||||
| 23,469 | MB Financial, Inc. | 771,191 | ||||||
| 16,824 | Meadowbrook Insurance Group, Inc. | 142,331 | ||||||
| 62,750 | Medical Properties Trust, Inc. | 864,695 | ||||||
| 13,350 | Montpelier Re Holdings, Inc. | 478,197 | ||||||
| 45,150 | National Penn Bancshares, Inc. | 475,204 | ||||||
| 3,950 | Navigators Group, Inc.b | 289,693 | ||||||
| 16,000 | NBT Bancorp, Inc. | 420,320 | ||||||
| 34,500 | Northwest Bancshares, Inc. | 432,285 | ||||||
| 16,250 | OFG Bancorpa | 270,563 | ||||||
| 39,150 | Old National Bancorp | 582,552 | ||||||
| 13,900 | Oritani Financial Corporation | 214,060 | ||||||
| 30,550 | Parkway Properties, Inc. | 561,814 | ||||||
| 25,000 | Pennsylvania Real Estate Investment Trust | 586,500 | ||||||
| 12,050 | Pinnacle Financial Partners, Inc. | 476,457 | ||||||
| 5,950 | Piper Jaffray Companiesb | 345,635 | ||||||
| 19,750 | Post Properties, Inc. | 1,160,707 | ||||||
| 18,150 | PRA Group, Inc.a,b | 1,051,429 | ||||||
| 25,700 | PrivateBancorp, Inc. | 858,380 | ||||||
| 20,750 | ProAssurance Corporation | 936,862 | ||||||
| 19,650 | Provident Financial Services, Inc. | 354,879 | ||||||
| 7,050 | PS Business Parks, Inc. | 560,757 | ||||||
| 33,650 | Retail Opportunity Investments Corporation | 564,984 | ||||||
| 13,400 | RLI Corporation | 661,960 | ||||||
| 10,850 | S&T Bancorp, Inc. | 323,439 | ||||||
| 19,800 | Sabra Healthcare REIT, Inc. | 601,326 | ||||||
The accompanying Notes to Financial Statements are an integral part of this schedule.
232
Table of Contents
SMALL CAP INDEX PORTFOLIO
Schedule of Investments as of December 31, 2014
| Shares | Common Stock (93.9%) | Value | ||||||
| Financials (22.2%) - continued |
| ||||||
| 4,600 | Safety Insurance Group, Inc. | $ | 294,446 | |||||
| 4,100 | Saul Centers, Inc. | 234,479 | ||||||
| 20,450 | Selective Insurance Group, Inc. | 555,626 | ||||||
| 5,800 | Simmons First National Corporation | 235,770 | ||||||
| 12,250 | Sovran Self Storage, Inc. | 1,068,445 | ||||||
| 30,549 | Sterling Bancorp | 439,295 | ||||||
| 8,050 | Stewart Information Services Corporation | 298,172 | ||||||
| 23,900 | Stifel Financial Corporationb | 1,219,378 | ||||||
| 65,850 | Susquehanna Bancshares, Inc. | 884,365 | ||||||
| 16,650 | Texas Capital Bancshares, Inc.b | 904,594 | ||||||
| 4,290 | Tompkins Financial Corporation | 237,237 | ||||||
| 34,382 | Trustco Bank Corporation NY | 249,613 | ||||||
| 13,850 | UMB Financial Corporation | 787,927 | ||||||
| 23,150 | United Bankshares, Inc.a | 866,967 | ||||||
| 16,675 | United Community Banks, Inc. | 315,824 | ||||||
| 7,650 | United Fire Group, Inc. | 227,434 | ||||||
| 4,750 | Universal Health Realty Income Trust | 228,570 | ||||||
| 10,650 | Universal Insurance Holdings, Inc. | 217,793 | ||||||
| 10,050 | Urstadt Biddle Properties, Inc. | 219,894 | ||||||
| 13,350 | Viewpoint Financial Group, Inc. | 318,398 | ||||||
| 2,550 | Virtus Investment Partners, Inc. | 434,750 | ||||||
| 9,400 | Westamerica Bancorporationa | 460,788 | ||||||
| 25,550 | Wilshire Bancorp, Inc. | 258,821 | ||||||
| 17,050 | Wintrust Financial Corporation | 797,258 | ||||||
| 3,262 | World Acceptance Corporationa,b | 259,166 | ||||||
|
| |||||||
| Total | 59,735,893 | |||||||
|
| |||||||
| Health Care (10 .8%) | |||||||
| 7,750 | Abaxis, Inc. | 440,433 | ||||||
| 13,350 | Abiomed, Inc.a,b | 508,101 | ||||||
| 15,350 | Acorda Therapeutics, Inc.b | 627,354 | ||||||
| 26,700 | Affymetrix, Inc.a,b | 263,529 | ||||||
| 12,950 | Air Methods Corporationa,b | 570,188 | ||||||
| 27,300 | Akorn, Inc.a,b | 988,260 | ||||||
| 8,600 | Albany Molecular Research, Inc.b | 140,008 | ||||||
| 2,850 | Almost Family, Inc.b | 82,508 | ||||||
| 11,833 | Amedisys, Inc.b | 347,299 | ||||||
| 17,000 | AMN Healthcare Services, Inc.b | 333,200 | ||||||
| 17,500 | AmSurg Corporationb | 957,775 | ||||||
| 4,500 | Analogic Corporation | 380,745 | ||||||
| 9,350 | Angiodynamics, Inc.b | 177,743 | ||||||
| 5,250 | Anika Therapeutics, Inc.b | 213,885 | ||||||
| 9,000 | Bio-Reference Laboratories, Inc.a,b | 289,170 | ||||||
| 11,300 | Cambrex Corporationb | 244,306 | ||||||
| 12,875 | Cantel Medical Corporation | 556,973 | ||||||
| 6,250 | Chemed Corporationa | 660,437 | ||||||
| 3,800 | Computer Programs and Systems, Inc. | 230,850 | ||||||
| 9,950 | CONMED Corporation | 447,352 | ||||||
| 3,250 | Corvel Corporationb | 120,965 | ||||||
| 10,600 | Cross Country Healthcare, Inc.b | 132,288 | ||||||
| 9,100 | CryoLife, Inc. | 103,103 | ||||||
| 9,550 | Cyberonics, Inc.b | 531,744 | ||||||
| 7,850 | Cynosure, Inc.b | 215,247 | ||||||
| 21,450 | Depomed, Inc.b | 345,559 | ||||||
| 10,800 | Emergent Biosolutions, Inc.b | 294,084 | ||||||
| 7,350 | Ensign Group, Inc. | 326,267 | ||||||
| 12,800 | ExamWorks Group, Inc.b | 532,352 | ||||||
| 11,400 | Gentiva Health Services, Inc.b | 217,170 | ||||||
| 9,050 | Greatbatch, Inc.b | 446,165 | ||||||
| 18,800 | Haemonetics Corporationb | 703,496 | ||||||
| 12,800 | Hanger, Inc.a,b | 280,320 | ||||||
| 7,700 | HealthStream, Inc.b | 226,996 | ||||||
| 12,850 | Healthways, Inc.b | 255,458 | ||||||
| 4,900 | ICU Medical, Inc.b | 401,310 | ||||||
| 24,050 | Impax Laboratories, Inc.b | 761,904 | ||||||
| 9,150 | Integra LifeSciences Holdings Corporationb | 496,204 | ||||||
| 10,650 | Invacare Corporation | 178,494 | ||||||
| 6,250 | IPC The Hospitalist Company, Inc.b | 286,813 | ||||||
| 25,100 | Kindred Healthcare, Inc. | 456,318 | ||||||
| 3,500 | Landauer, Inc. | 119,490 | ||||||
| 9,600 | Lannett Company, Inc.a,b | 411,648 | ||||||
| 4,450 | LHC Group, Inc.b | 138,751 | ||||||
| 6,650 | Ligand Pharmaceuticals, Inc.b | 353,847 | ||||||
| 13,850 | Luminex Corporationb | 259,826 | ||||||
| 10,050 | Magellan Health Services, Inc.b | 603,301 | ||||||
| 17,450 | Masimo Corporationb | 459,633 | ||||||
| 21,850 | MedAssets, Inc.b | 431,756 | ||||||
| 23,800 | Medicines Companyb | 658,546 | ||||||
| 19,900 | Medidata Solutions, Inc.b | 950,225 | ||||||
| 15,100 | Meridian Bioscience, Inc. | 248,546 | ||||||
| 15,875 | Merit Medical Systems, Inc.b | 275,114 | ||||||
| 11,500 | Molina Healthcare, Inc.b | 615,595 | ||||||
| 17,100 | Momenta Pharmaceuticals, Inc.b | 205,884 | ||||||
| 4,700 | MWI Veterinary Supply, Inc.b | 798,577 | ||||||
| 11,800 | Natus Medical, Inc.b | 425,272 | ||||||
| 13,375 | Neogen Corporationb | 663,266 | ||||||
| 17,100 | NuVasive, Inc.b | 806,436 | ||||||
| 12,950 | Omnicell, Inc.b | 428,904 | ||||||
| 19,950 | PAREXEL International Corporationb | 1,108,422 | ||||||
| 11,300 | PharMerica Corporationb | 234,023 | ||||||
| 18,950 | Prestige Brands Holdings, Inc.b | 657,944 | ||||||
| 4,350 | Providence Service Corporationb | 158,514 | ||||||
| 15,950 | Quality Systems, Inc. | 248,660 | ||||||
| 11,300 | Repligen Corporationb | 223,740 | ||||||
| 8,250 | Sagent Pharmaceuticals, Inc.b | 207,158 | ||||||
| 21,200 | Spectrum Pharmaceuticals, Inc.a,b | 146,916 | ||||||
| 4,700 | SurModics, Inc.b | 103,870 | ||||||
| 25,800 | West Pharmaceutical Services, Inc. | 1,373,592 | ||||||
|
| |||||||
| Total | 29,089,829 | |||||||
|
| |||||||
| Industrials (15.6%) | |||||||
| 15,262 | AAON, Inc. | 341,716 | ||||||
| 13,850 | AAR Corporation | 384,753 | ||||||
| 18,850 | ABM Industries, Inc. | 540,052 | ||||||
| 9,950 | Aceto Corporation | 215,915 | ||||||
| 23,550 | Actuant Corporation | 641,502 | ||||||
| 13,550 | Aegion Corporationb | 252,165 | ||||||
| 7,350 | Aerovironment, Inc.b | 200,288 | ||||||
| 10,450 | Albany International Corporation | 396,995 | ||||||
| 4,950 | Allegiant Travel Company | 744,134 | ||||||
| 2,900 | American Science & Engineering, Inc. | 150,510 | ||||||
| 4,550 | American Woodmark Corporationb | 184,002 | ||||||
| 10,400 | Apogee Enterprises, Inc. | 440,648 | ||||||
| 15,000 | Applied Industrial Technologies, Inc. | 683,850 | ||||||
| 8,800 | Arcbest Corporation | 408,056 | ||||||
| 6,900 | Astec Industries, Inc. | 271,239 | ||||||
| 9,050 | Atlas Air Worldwide Holdings, Inc.b | 446,165 | ||||||
| 9,300 | AZZ, Inc. | 436,356 | ||||||
| 17,700 | Barnes Group, Inc. | 655,077 | ||||||
| 17,400 | Brady Corporation | 475,716 | ||||||
| 16,550 | Briggs & Stratton Corporation | 337,951 | ||||||
| 17,750 | Brink’s Company | 433,277 | ||||||
| 5,250 | CDI Corporation | 92,977 | ||||||
| 7,950 | Celadon Group, Inc. | 180,386 | ||||||
| 6,400 | Circor International, Inc. | 385,792 | ||||||
| 13,600 | Comfort Systems USA, Inc. | 232,832 | ||||||
| 7,900 | Cubic Corporation | 415,856 | ||||||
| 17,500 | Curtiss-Wright Corporation | 1,235,325 | ||||||
The accompanying Notes to Financial Statements are an integral part of this schedule.
233
Table of Contents
SMALL CAP INDEX PORTFOLIO
Schedule of Investments as of December 31, 2014
| Shares | Common Stock (93.9%) | Value | ||||||
| Industrials (15.6%) - continued |
| ||||||
| 4,700 | DXP Enterprises, Inc.b | $ | 237,491 | |||||
| 12,350 | Dycom Industries, Inc.b | 433,361 | ||||||
| 23,550 | EMCOR Group, Inc. | 1,047,740 | ||||||
| 6,850 | Encore Wire Corporation | 255,711 | ||||||
| 16,550 | EnerSys, Inc. | 1,021,466 | ||||||
| 6,402 | Engility Holdings, Inc.b | 274,006 | ||||||
| 8,700 | EnPro Industries, Inc.b | 546,012 | ||||||
| 9,600 | ESCO Technologies, Inc. | 354,240 | ||||||
| 4,700 | Exponent, Inc. | 387,750 | ||||||
| 22,800 | Federal Signal Corporation | 352,032 | ||||||
| 11,050 | Forward Air Corporation | 556,588 | ||||||
| 14,350 | Franklin Electric Company, Inc. | 538,556 | ||||||
| 7,250 | G & K Services, Inc. | 513,662 | ||||||
| 21,400 | GenCorp, Inc.a,b | 391,620 | ||||||
| 17,600 | General Cable Corporation | 262,240 | ||||||
| 10,600 | Gibraltar Industries, Inc.b | 172,356 | ||||||
| 15,330 | Griffon Corporation | 203,889 | ||||||
| 25,637 | Healthcare Services Group, Inc.a | 792,952 | ||||||
| 20,148 | Heartland Express, Inc. | 544,197 | ||||||
| 5,950 | Heidrick & Struggles International, Inc. | 137,147 | ||||||
| 22,900 | Hillenbrand, Inc. | 790,050 | ||||||
| 12,600 | Hub Group, Inc.b | 479,808 | ||||||
| 8,200 | Insperity, Inc. | 277,898 | ||||||
| 23,850 | Interface, Inc. | 392,809 | ||||||
| 10,600 | John Bean Technologies Corporation | 348,316 | ||||||
| 9,850 | Kaman Corporation | 394,886 | ||||||
| 10,800 | Kelly Services, Inc. | 183,816 | ||||||
| 22,150 | Knight Transportation, Inc. | 745,569 | ||||||
| 18,250 | Korn/Ferry Internationalb | 524,870 | ||||||
| 4,450 | Lindsay Manufacturing Companya | 381,543 | ||||||
| 6,200 | Lydall, Inc.b | 203,484 | ||||||
| 15,650 | Matson, Inc. | 540,238 | ||||||
| 10,700 | Matthews International Corporation | 520,769 | ||||||
| 16,800 | Mobile Mini, Inc. | 680,568 | ||||||
| 14,750 | Moog, Inc.b | 1,091,943 | ||||||
| 20,600 | Mueller Industries, Inc. | 703,284 | ||||||
| 1,800 | National Presto Industries, Inc.a | 104,472 | ||||||
| 17,650 | Navigant Consulting, Inc.b | 271,280 | ||||||
| 17,000 | On Assignment, Inc.b | 564,230 | ||||||
| 22,050 | Orbital Sciences Corporationb | 592,924 | ||||||
| 9,950 | Orion Marine Group, Inc.b | 109,948 | ||||||
| 17,350 | PGT, Inc.b | 167,081 | ||||||
| 3,350 | Powell Industries, Inc. | 164,385 | ||||||
| 13,575 | Quanex Building Products Corporation | 254,939 | ||||||
| 13,800 | Resources Global Professionals | 227,010 | ||||||
| 10,100 | Roadrunner Transportation Systems, Inc.b | 235,835 | ||||||
| 9,000 | Saia, Inc.b | 498,240 | ||||||
| 15,150 | Simpson Manufacturing Company, Inc. | 524,190 | ||||||
| 18,650 | SkyWest, Inc. | 247,672 | ||||||
| 4,650 | Standex International Corporation | 359,259 | ||||||
| 19,100 | TASER International, Inc.a,b | 505,768 | ||||||
| 13,300 | Teledyne Technologies, Inc.b | 1,366,442 | ||||||
| 6,700 | Tennant Company | 483,539 | ||||||
| 22,756 | Tetra Tech, Inc. | 607,585 | ||||||
| 19,400 | Titan International, Inc.a | 206,222 | ||||||
| 20,300 | Toro Company | 1,295,343 | ||||||
| 15,300 | TrueBlue, Inc.b | 340,425 | ||||||
| 7,850 | U.S. Ecology, Inc.a | 314,942 | ||||||
| 5,650 | UniFirst Corporation | 686,193 | ||||||
| 14,150 | United Stationers, Inc. | 596,564 | ||||||
| 7,300 | Universal Forest Products, Inc. | 388,360 | ||||||
| 33,450 | UTI Worldwide, Inc.a,b | 403,742 | ||||||
| 2,950 | Veritiv Corporationb | 153,017 | ||||||
| 7,300 | Viad Corporation | 194,618 | ||||||
| 6,050 | Vicor Corporationb | 73,205 | ||||||
| 11,800 | WageWorks, Inc.b | 761,926 | ||||||
| 10,300 | Watts Water Technologies, Inc. | 653,432 | ||||||
|
| |||||||
| Total | 41,819,190 | |||||||
|
| |||||||
| Information Technology (15.4%) | |||||||
| 19,750 | ADTRAN, Inc. | 430,550 | ||||||
| 13,700 | Advanced Energy Industries, Inc.b | 324,690 | ||||||
| 5,350 | Agilysys, Inc.b | 67,356 | ||||||
| 9,800 | Anixter International, Inc.b | 866,908 | ||||||
| 5,200 | Badger Meter, Inc. | 308,620 | ||||||
| 3,850 | Bel Fuse, Inc. | 105,259 | ||||||
| 19,300 | Benchmark Electronics, Inc.b | 490,992 | ||||||
| 5,550 | Black Box Corporation | 132,645 | ||||||
| 16,800 | Blackbaud, Inc. | 726,768 | ||||||
| 14,900 | Blucora, Inc.b | 206,365 | ||||||
| 13,850 | Bottomline Technologies, Inc.b | 350,128 | ||||||
| 24,207 | Brooks Automation, Inc. | 308,639 | ||||||
| 8,650 | Cabot Microelectronics Corporationb | 409,318 | ||||||
| 8,600 | CACI International, Inc.b | 741,148 | ||||||
| 13,150 | CalAmp Corporationa,b | 240,645 | ||||||
| 16,150 | Cardtronics, Inc.b | 623,067 | ||||||
| 7,350 | Ceva, Inc.b | 133,329 | ||||||
| 15,150 | Checkpoint Systems, Inc.b | 208,009 | ||||||
| 25,550 | CIBER, Inc.b | 90,702 | ||||||
| 22,900 | Cirrus Logic, Inc.b | 539,753 | ||||||
| 9,150 | Coherent, Inc.b | 555,588 | ||||||
| 9,150 | Cohu, Inc. | 108,885 | ||||||
| 12,450 | comScore, Inc.b | 578,054 | ||||||
| 5,850 | Comtech Telecommunications Corporation | 184,392 | ||||||
| 12,500 | CSG Systems International, Inc. | 313,375 | ||||||
| 12,200 | CTS Corporation | 217,526 | ||||||
| 14,150 | Daktronics, Inc. | 177,017 | ||||||
| 16,150 | Dealertrack Technologies, Inc.b | 715,607 | ||||||
| 13,600 | Dice Holdings, Inc.b | 136,136 | ||||||
| 9,000 | Digi International, Inc.b | 83,610 | ||||||
| 11,550 | Digital River, Inc.b | 285,631 | ||||||
| 13,250 | Diodes, Inc.b | 365,303 | ||||||
| 7,950 | DSP Group, Inc.b | 86,416 | ||||||
| 6,250 | DTS, Inc.b | 192,188 | ||||||
| 10,750 | Ebix, Inc.a | 182,643 | ||||||
| 9,650 | Electro Scientific Industries, Inc. | 74,884 | ||||||
| 17,050 | Electronics for Imaging, Inc.b | 730,251 | ||||||
| 32,700 | Entropic Communications, Inc.b | 82,731 | ||||||
| 11,300 | EPIQ Systems, Inc. | 193,004 | ||||||
| 17,200 | Exar Corporationb | 175,440 | ||||||
| 11,300 | ExlService Holdings, Inc.b | 324,423 | ||||||
| 10,650 | Fabrinetb | 188,931 | ||||||
| 6,350 | FARO Technologies, Inc.b | 398,018 | ||||||
| 4,000 | Forrester Research, Inc. | 157,440 | ||||||
| 32,000 | Harmonic, Inc.b | 224,320 | ||||||
| 13,300 | Heartland Payment Systems, Inc. | 717,535 | ||||||
| 12,850 | iGATE Corporationb | 507,318 | ||||||
| 18,900 | II-VI, Inc.b | 257,985 | ||||||
| 14,975 | Insight Enterprises, Inc.b | 387,703 | ||||||
| 6,050 | Interactive Intelligence Groupb | 289,795 | ||||||
| 21,250 | Ixiab | 239,062 | ||||||
| 16,500 | j2 Global, Inc. | 1,023,000 | ||||||
| 22,000 | Kopin Corporationb | 79,640 | ||||||
| 27,950 | Kulicke and Soffa Industries, Inc.b | 404,157 | ||||||
| 8,850 | Liquidity Services, Inc.b | 72,305 | ||||||
| 8,200 | Littelfuse, Inc. | 792,694 | ||||||
| 18,100 | Liveperson, Inc.b | 255,210 | ||||||
The accompanying Notes to Financial Statements are an integral part of this schedule.
234
Table of Contents
SMALL CAP INDEX PORTFOLIO
Schedule of Investments as of December 31, 2014
| Shares | Common Stock (93.9%) | Value | ||||||
| Information Technology (15.4%) - continued |
| ||||||
| 8,850 | LogMeln, Inc.b | $ | 436,659 | |||||
| 27,050 | Manhattan Associates, Inc.b | 1,101,476 | ||||||
| 8,550 | ManTech International Corporation | 258,467 | ||||||
| 23,900 | MAXIMUS, Inc. | 1,310,676 | ||||||
| 11,650 | Mercury Computer Systems, Inc.b | 162,168 | ||||||
| 13,850 | Methode Electronics, Inc. | 505,663 | ||||||
| 16,200 | Micrel, Inc. | 235,062 | ||||||
| 34,450 | Microsemi Corporationb | 977,691 | ||||||
| 3,300 | MicroStrategy, Inc.b | 535,920 | ||||||
| 19,250 | MKS Instruments, Inc. | 704,550 | ||||||
| 13,100 | Monolithic Power Systems, Inc. | 651,594 | ||||||
| 14,250 | Monotype Imaging Holdings, Inc. | 410,828 | ||||||
| 32,000 | Monster Worldwide, Inc.b | 147,840 | ||||||
| 5,500 | MTS Systems Corporation | 412,665 | ||||||
| 8,800 | Nanometrics, Inc.b | 148,016 | ||||||
| 12,600 | NETGEAR, Inc.b | 448,308 | ||||||
| 13,550 | NetScout Systems, Inc.b | 495,117 | ||||||
| 14,450 | Newport Corporationb | 276,139 | ||||||
| 22,100 | NIC, Inc. | 397,579 | ||||||
| 6,750 | OSI Systems, Inc.b | 477,698 | ||||||
| 7,600 | Park Electrochemical Corporation | 189,468 | ||||||
| 12,550 | Perficient, Inc.b | 233,807 | ||||||
| 7,250 | Pericom Semiconductor Corporationb | 98,165 | ||||||
| 12,250 | Plexus Corporationb | 504,822 | ||||||
| 10,800 | Power Integrations, Inc. | 558,792 | ||||||
| 18,250 | Progress Software Corporationb | 493,115 | ||||||
| 31,950 | QLogic Corporationb | 425,574 | ||||||
| 12,700 | QuinStreet, Inc.b | 77,089 | ||||||
| 10,200 | Rofin-Sinar Technologies, Inc.b | 293,454 | ||||||
| 6,600 | Rogers Corporationb | 537,504 | ||||||
| 12,050 | Rudolph Technologies, Inc.b | 123,272 | ||||||
| 29,950 | Sanmina Corporationb | 704,724 | ||||||
| 10,450 | ScanSource, Inc.b | 419,672 | ||||||
| 12,600 | Super Micro Computer, Inc.b | 439,488 | ||||||
| 14,150 | Sykes Enterprises, Inc.b | 332,100 | ||||||
| 13,400 | Synaptics, Inc.b | 922,456 | ||||||
| 13,000 | Synchronoss Technologies, Inc.b | 544,180 | ||||||
| 10,100 | Synnex Corporation | 789,416 | ||||||
| 30,700 | Take-Two Interactive Software, Inc.b | 860,521 | ||||||
| 13,200 | Tangoe, Inc.a,b | 171,996 | ||||||
| 6,400 | TeleTech Holdings, Inc.b | 151,552 | ||||||
| 17,000 | Tessera Technologies, Inc. | 607,920 | ||||||
| 19,400 | TTM Technologies, Inc.a,b | 146,082 | ||||||
| 10,300 | Ultratech, Inc.b | 191,168 | ||||||
| 10,750 | VASCO Data Security International, Inc.b | 303,258 | ||||||
| 14,600 | Veeco Instruments, Inc.b | 509,248 | ||||||
| 15,550 | Viasat, Inc.a,b | 980,116 | ||||||
| 9,700 | Virtusa Corporationb | 404,199 | ||||||
| 8,750 | XO Group, Inc.b | 159,337 | ||||||
|
| |||||||
| Total | 41,329,719 | |||||||
|
| |||||||
| Materials (5.3%) | |||||||
| 10,600 | A. Schulman, Inc. | 429,618 | ||||||
| 6,300 | A.M. Castle & Compnyb | 50,274 | ||||||
| 64,250 | AK Steel Holding Corporationb | 381,645 | ||||||
| 9,150 | American Vanguard Corporation | 106,323 | ||||||
| 11,200 | Balchem Corporation | 746,368 | ||||||
| 14,350 | Boise Cascade Companyb | 533,103 | ||||||
| 19,200 | Calgon Carbon Corporationb | 398,976 | ||||||
| 18,800 | Century Aluminum Companyb | 458,720 | ||||||
| 7,150 | Clearwater Paper Corporationb | 490,133 | ||||||
| 4,050 | Deltic Timber Corporation | 277,020 | ||||||
| 18,250 | Flotek Industries, Inc.a,b | 341,823 | ||||||
| 8,100 | FutureFuel Corporation | 105,462 | ||||||
| 23,350 | Globe Specialty Metals, Inc. | 402,321 | ||||||
| 18,250 | H.B. Fuller Company | 812,672 | ||||||
| 3,450 | Hawkins, Inc. | 149,489 | ||||||
| 4,500 | Haynes International, Inc. | 218,250 | ||||||
| 26,600 | Headwaters, Inc.b | 398,734 | ||||||
| 7,900 | Innophos Holdings, Inc. | 461,755 | ||||||
| 20,350 | Intrepid Potash, Inc.a,b | 282,458 | ||||||
| 6,500 | Kaiser Aluminum Corporation | 464,295 | ||||||
| 30,900 | KapStone Paper and Packaging Corporation | 905,679 | ||||||
| 7,450 | Koppers Holdings, Inc. | 193,551 | ||||||
| 11,900 | Kraton Performance Polymers, Inc.b | 247,401 | ||||||
| 7,000 | LSB Industries, Inc.b | 220,080 | ||||||
| 7,350 | Materion Corporation | 258,940 | ||||||
| 9,113 | Myers Industries, Inc. | 160,389 | ||||||
| 6,050 | Neenah Paper, Inc. | 364,633 | ||||||
| 3,300 | Olympic Steel, Inc. | 58,674 | ||||||
| 11,300 | OM Group, Inc. | 336,740 | ||||||
| 15,500 | PH Glatfelter Company | 396,335 | ||||||
| 4,800 | Quaker Chemical Corporation | 441,792 | ||||||
| 15,550 | Rayonier Advanced Materials, Inc.a | 346,765 | ||||||
| 11,150 | RTI International Metals, Inc.b | 281,649 | ||||||
| 11,150 | Schweitzer-Mauduit International, Inc. | 471,645 | ||||||
| 6,950 | Stepan Company | 278,556 | ||||||
| 43,950 | Stillwater Mining Companyb | 647,823 | ||||||
| 23,977 | SunCoke Energy, Inc. | 463,715 | ||||||
| 9,350 | Tredegar Corporation | 210,281 | ||||||
| 18,150 | Wausau Paper Corporation | 206,365 | ||||||
| 8,350 | Zep, Inc. | 126,503 | ||||||
|
| |||||||
| Total | 14,126,955 | |||||||
|
| |||||||
| Telecommunications Services (0.6%) | |||||||
| 32,400 | 8x8, Inc.b | 296,784 | ||||||
| 3,650 | Atlantic Tele-Network, Inc. | 246,704 | ||||||
| 75,950 | Cincinnati Bell, Inc.b | 242,280 | ||||||
| 17,050 | Consolidated Communications Holdings, Inc.a | 474,502 | ||||||
| 11,200 | General Communication, Inc.b | 154,000 | ||||||
| 6,900 | Lumos Networks Corporation | 116,058 | ||||||
| 6,150 | NTELOS Holdings Corporation | 25,768 | ||||||
| 7,950 | USA Mobility, Inc. | 138,012 | ||||||
|
| |||||||
| Total | 1,694,108 | |||||||
|
| |||||||
| Utilities (3.6%) | |||||||
| 13,983 | ALLETE, Inc. | 771,023 | ||||||
| 14,050 | American States Water Company | 529,123 | ||||||
| 20,850 | Avista Corporation | 737,047 | ||||||
| 14,650 | El Paso Electric Company | 586,879 | ||||||
| 15,650 | Laclede Group, Inc. | 832,580 | ||||||
| 15,350 | New Jersey Resources Corporation | 939,420 | ||||||
| 9,900 | Northwest Natural Gas Companya | 494,010 | ||||||
| 16,700 | NorthWestern Corporation | 944,886 | ||||||
| 28,450 | Piedmont Natural Gas Company, Inc.a | 1,121,214 | ||||||
| 12,250 | South Jersey Industries, Inc. | 721,893 | ||||||
| 16,850 | Southwest Gas Corporation | 1,041,498 | ||||||
| 20,516 | UIL Holdings Corporation | 893,267 | ||||||
|
| |||||||
| Total | 9,612,840 | |||||||
|
| |||||||
Total Common Stock (cost $159,598,500) | 252,300,186 | |||||||
|
| |||||||
The accompanying Notes to Financial Statements are an integral part of this schedule.
235
Table of Contents
SMALL CAP INDEX PORTFOLIO
Schedule of Investments as of December 31, 2014
| Shares | Collateral Held for Securities Loaned (8.8%) | Value | ||||||
| 23,621,082 | Thrivent Cash Management Trust | $ | 23,621,082 | |||||
|
| |||||||
Total Collateral Held for Securities Loaned (cost $23,621,082) | 23,621,082 | |||||||
|
| |||||||
| Shares or Principal Amount | Short-Term Investments (5.5%)c | |||||||
| Federal Home Loan Bank Discount Notes | ||||||||
| 200,000 | 0.073%, 2/4/2015d | 199,986 | ||||||
| 300,000 | 0.090%, 4/24/2015d | 299,915 | ||||||
| 200,000 | 0.135%, 4/29/2015d | 199,912 | ||||||
| Thrivent Cash Management Trust | ||||||||
| 13,989,739 | 0.060% | 13,989,739 | ||||||
|
| |||||||
| Total Short-Term Investments (at amortized cost) | 14,689,552 | |||||||
|
| |||||||
| Total Investments (cost $197,909,134) 108.2% | $ | 290,610,820 | ||||||
|
| |||||||
| Other Assets and Liabilities, Net (8.2%) | (21,984,234 | ) | ||||||
|
| |||||||
| Total Net Assets 100.0% | $ | 268,626,586 | ||||||
|
| |||||||
| a | All or a portion of the security is on loan. |
| b | Non-income producing security. |
| c | The interest rate shown reflects the yield, coupon rate or the discount rate at the date of purchase. |
| d | At December 31, 2014, $699,813 of investments were held on deposit with the counterparty and pledged as the initial margin deposit for open futures contracts. |
Definitions:
REIT - Real Estate Investment Trust is a company that buys, develops, manages and/or sells real estate assets.
Unrealized Appreciation (Depreciation)
Gross unrealized appreciation and depreciation of investments, based on cost for federal income tax purposes, were as follows:
Gross unrealized appreciation | $ | 99,546,243 | ||
Gross unrealized depreciation | (10,899,327 | ) | ||
|
| |||
Net unrealized appreciation (depreciation) | $ | 88,646,916 | ||
Cost for federal income tax purposes | $ | 201,963,904 | ||
The accompanying Notes to Financial Statements are an integral part of this schedule.
236
Table of Contents
SMALL CAP INDEX PORTFOLIO
Schedule of Investments as of December 31, 2014
Fair Valuation Measurements
The following table is a summary of the inputs used, as of December 31, 2014, in valuing Small Cap Index Portfolio’s assets carried at fair value.
Investments in Securities | Total | Level 1 | Level 2 | Level 3 | ||||||||||||
Common Stock | ||||||||||||||||
Consumer Discretionary | 37,168,807 | 37,168,807 | — | — | ||||||||||||
Consumer Staples | 8,864,439 | 8,864,439 | — | — | ||||||||||||
Energy | 8,858,406 | 8,858,406 | — | — | ||||||||||||
Financials | 59,735,893 | 59,735,893 | — | — | ||||||||||||
Health Care | 29,089,829 | 29,089,829 | — | — | ||||||||||||
Industrials | 41,819,190 | 41,819,190 | — | — | ||||||||||||
Information Technology | 41,329,719 | 41,329,719 | — | — | ||||||||||||
Materials | 14,126,955 | 14,126,955 | — | — | ||||||||||||
Telecommunications Services | 1,694,108 | 1,694,108 | — | — | ||||||||||||
Utilities | 9,612,840 | 9,612,840 | — | — | ||||||||||||
Collateral Held for Securities Loaned | 23,621,082 | 23,621,082 | — | — | ||||||||||||
Short-Term Investments | 14,689,552 | 13,989,739 | 699,813 | — | ||||||||||||
|
|
|
|
|
|
|
| |||||||||
Total | $ | 290,610,820 | $ | 289,911,007 | $ | 699,813 | $ | — | ||||||||
|
|
|
|
|
|
|
| |||||||||
Other Financial Instruments | Total | Level 1 | Level 2 | Level 3 | ||||||||||||
Asset Derivatives | ||||||||||||||||
Futures Contracts | 723,502 | 723,502 | — | — | ||||||||||||
|
|
|
|
|
|
|
| |||||||||
Total Asset Derivatives | $ | 723,502 | $ | 723,502 | $ | — | $ | — | ||||||||
|
|
|
|
|
|
|
| |||||||||
There were no significant transfers between Levels during the period ended December 31, 2014. Transfers between Levels are identified as of the end of the period.
Futures Contracts | Number of Contracts Long/(Short) | Expiration Date | Notional Principal Amount | Value | Unrealized Gain/(Loss) | |||||||||||||||
Russell 2000 Index Mini-Futures | 121 | March 2015 | $ | 13,804,968 | $ | 14,528,470 | $ | 723,502 | ||||||||||||
Total Futures Contracts | $ | 723,502 | ||||||||||||||||||
The following table summarizes the fair value and Statement of Assets and Liabilities location, as of December 31, 2014, for Small Cap Index Portfolio’s investments in financial derivative instruments by primary risk exposure as discussed under item (2) Significant Accounting Policies of the Notes to Financial Statements.
Derivatives by risk category | Statement of Assets and Liabilities Location | Fair Value | ||||
Asset Derivatives | ||||||
Equity Contracts | ||||||
Futures* | Net Assets - Net unrealized appreciation/(depreciation) on Futures contracts | $ | 723,502 | |||
Total Equity Contracts | 723,502 | |||||
|
| |||||
Total Asset Derivatives | $ | 723,502 | ||||
|
| |||||
| * | Includes cumulative appreciation/depreciation of futures contracts as reported in the Schedule of Investments. Only current day’s variation margin is reported within the Statement of Assets and Liabilities. |
The following table summarizes the net realized gains/(losses) and Statement of Operations location, for the period ended December 31, 2014, for Small Cap Index Portfolio’s investments in financial derivative instruments by primary risk exposure.
Derivatives by risk category | Statement of Operations Location | Realized Gains/(Losses) recognized in Income | ||||
Equity Contracts | ||||||
Futures | Net realized gains/(losses) on Futures contracts | 237,655 | ||||
Total Equity Contracts | 237,655 | |||||
|
| |||||
Total | $ | 237,655 | ||||
|
| |||||
The accompanying Notes to Financial Statements are an integral part of this schedule.
237
Table of Contents
SMALL CAP INDEX PORTFOLIO
Schedule of Investments as of December 31, 2014
The following table summarizes the change in net unrealized appreciation/(depreciation) and Statement of Operations location, for the period ended December 31, 2014, for Small Cap Index Portfolio’s investments in financial derivative instruments by primary risk exposure.
Derivatives by risk category | Statement of Operations Location | Change in unrealized appreciation/(depreciation) recognized in Income | ||||
Equity Contracts | ||||||
Futures | Change in net unrealized appreciation/(depreciation) on Futures contracts | 302,301 | ||||
Total Equity Contracts | 302,301 | |||||
|
| |||||
Total | $ | 302,301 | ||||
|
| |||||
The following table presents Small Cap Index Portfolio’s average volume of derivative activity during the period ended December 31, 2014.
Derivative Risk Category | Futures (Notional)* | Futures (Percentage of Average Net Assets) | ||||||
Equity Contracts | $ | 12,251,343 | 4.8 | % | ||||
| * | Notional amount represents long or short, or both, derivative positions held by the Portfolio. |
Investment in Affiliates
Affiliated issuers, as defined under the Investment Company Act of 1940, include those in which the Portfolio’s holdings of an issuer represent 5% or more of the outstanding voting securities of an issuer, or any affiliated mutual fund.
A summary of transactions for the fiscal year to date, in Small Cap Index Portfolio, is as follows:
Portfolio | Value December 31, 2013 | Gross Purchases | Gross Sales | Shares Held at December 31, 2014 | Value December 31, 2014 | Income Earned January 1, 2014 - December 31, 2014 | ||||||||||||||||||
Cash Management Trust- Collateral Investment | $ | 22,919,937 | $ | 63,884,416 | $ | 63,183,271 | 23,621,082 | $ | 23,621,082 | $ | 152,888 | |||||||||||||
Cash Management Trust- Short Term Investment | 9,202,932 | 34,492,785 | 29,705,978 | 13,989,739 | 13,989,739 | 5,855 | ||||||||||||||||||
Total Value and Income Earned | 32,122,869 | 37,610,821 | 158,743 | |||||||||||||||||||||
The accompanying Notes to Financial Statements are an integral part of this schedule.
238
Table of Contents
Schedule of Investments as of December 31, 2014
| Shares | Common Stock (95.6%) | Value | ||||||
| Consumer Discretionary (20.6%) |
| ||||||
| 63,146 | Delphi Automotive plc | $ | 4,591,977 | |||||
| 39,272 | Discovery Communications, Inc., Class Aa | 1,352,920 | ||||||
| 117,397 | Dollar Tree, Inc.a | 8,262,401 | ||||||
| 28,538 | Harman International Industries, Inc. | 3,045,290 | ||||||
| 182,120 | Jarden Corporationa | 8,719,906 | ||||||
| 86,070 | Limited Brands, Inc. | 7,449,358 | ||||||
| 96,242 | Marriott International, Inc. | 7,509,763 | ||||||
| 38,122 | O’Reilly Automotive, Inc.a | 7,343,060 | ||||||
| 49,120 | PVH Corporation | 6,295,710 | ||||||
| 17,420 | Ralph Lauren Corporation | 3,225,487 | ||||||
| 78,262 | Ross Stores, Inc. | 7,376,976 | ||||||
| 75,499 | Starwood Hotels & Resorts Worldwide, Inc. | 6,120,704 | ||||||
| 61,966 | Toll Brothers, Inc.a | 2,123,575 | ||||||
| 45,775 | Tractor Supply Company | 3,607,986 | ||||||
| 17,555 | Ulta Salon Cosmetics & Fragrance, Inc.a | 2,244,231 | ||||||
| 52,123 | Under Armour, Inc.a | 3,539,152 | ||||||
| 70,511 | VF Corporation | 5,281,274 | ||||||
|
| |||||||
| Total | 88,089,770 | |||||||
|
| |||||||
| Consumer Staples (5.2%) | |||||||
| 117,990 | Hain Celestial Group, Inc.a | 6,877,637 | ||||||
| 82,385 | Monster Beverage Corporationa | 8,926,415 | ||||||
| 65,744 | United Natural Foods, Inc.a | 5,083,655 | ||||||
| 22,507 | Whole Foods Market, Inc. | 1,134,803 | ||||||
|
| |||||||
| Total | 22,022,510 | |||||||
|
| |||||||
| Energy (3.0%) | |||||||
| 76,681 | Cameron International Corporationa | 3,830,216 | ||||||
| 32,463 | Concho Resources, Inc.a | 3,238,184 | ||||||
| 32,656 | HollyFrontier Corporation | 1,223,947 | ||||||
| 34,583 | SM Energy Company | 1,334,212 | ||||||
| 124,149 | Southwestern Energy Companya | 3,388,026 | ||||||
|
| |||||||
| Total | 13,014,585 | |||||||
|
| |||||||
| Financials (10.2%) | |||||||
| 43,444 | Affiliated Managers Group, Inc.a | 9,220,555 | ||||||
| 36,373 | Ameriprise Financial, Inc. | 4,810,329 | ||||||
| 83,495 | Discover Financial Services | 5,468,088 | ||||||
| 156,316 | First Republic Bank | 8,147,190 | ||||||
| 24,312 | Intercontinental Exchange, Inc. | 5,331,379 | ||||||
| 17,220 | SVB Financial Groupa | 1,998,725 | ||||||
| 163,107 | TD Ameritrade Holding Corporation | 5,835,968 | ||||||
| 93,028 | Zions Bancorporation | 2,652,228 | ||||||
|
| |||||||
| Total | 43,464,462 | |||||||
|
| |||||||
| Health Care (15.4%) | |||||||
| 29,083 | Actavis plca | 7,486,255 | ||||||
| 66,724 | AmerisourceBergen Corporation | 6,015,836 | ||||||
| 73,832 | BioMarin Pharmaceutical, Inc.a | 6,674,413 | ||||||
| 87,383 | Catamaran Corporationa | 4,522,070 | ||||||
| 99,308 | Cerner Corporationa | 6,421,255 | ||||||
| 21,692 | Cooper Companies, Inc. | 3,516,056 | ||||||
| 120,070 | Envision Healthcare Holdings, Inc.a | 4,165,228 | ||||||
| 20,560 | Mettler-Toledo International, Inc.a | 6,218,578 | ||||||
| 42,150 | Mylan, Inc.a | 2,375,996 | ||||||
| 45,781 | Perrigo Company plc | 7,652,752 | ||||||
| 58,831 | Team Health Holdings, Inc.a | 3,384,547 | ||||||
| 41,831 | Teleflex, Inc. | 4,803,035 | ||||||
| 14,293 | Universal Health Services, Inc. | 1,590,239 | ||||||
| 9,362 | Vertex Pharmaceuticals, Inc.a | 1,112,206 | ||||||
|
| |||||||
| Total | 65,938,466 | |||||||
|
| |||||||
| Industrials (15.8%) | |||||||
| 50,552 | B/E Aerospace, Inc.a | 2,933,027 | ||||||
| 27,916 | Fastenal Companyb | 1,327,685 | ||||||
| 23,549 | Flowserve Corporation | 1,408,937 | ||||||
| 111,232 | Fortune Brands Home and Security, Inc. | 5,035,473 | ||||||
| 31,665 | GATX Corporation | 1,822,004 | ||||||
| 60,571 | Graco, Inc. | 4,856,583 | ||||||
| 54,322 | JB Hunt Transport Services, Inc. | 4,576,628 | ||||||
| 25,276 | KLX, Inc.a | 1,042,635 | ||||||
| 93,596 | Nielsen NV | 4,186,549 | ||||||
| 29,840 | Old Dominion Freight Line, Inc.a | 2,316,777 | ||||||
| 153,301 | Robert Half International, Inc. | 8,949,712 | ||||||
| 40,825 | Roper Industries, Inc. | 6,382,989 | ||||||
| 132,676 | Southwest Airlines Company | 5,614,848 | ||||||
| 74,846 | Stericycle, Inc.a | 9,810,814 | ||||||
| 68,894 | United Rentals, Inc.a | 7,027,877 | ||||||
|
| |||||||
| Total | 67,292,538 | |||||||
|
| |||||||
| Information Technology (20.3%) | |||||||
| 98,860 | Agilent Technologies, Inc. | 4,047,328 | ||||||
| 144,911 | Amphenol Corporation | 7,797,661 | ||||||
| 54,832 | ANSYS, Inc.a | 4,496,224 | ||||||
| 35,762 | Autodesk, Inc.a | 2,147,866 | ||||||
| 128,252 | Ciena Corporationa | 2,489,371 | ||||||
| 51,310 | F5 Networks, Inc.a | 6,694,159 | ||||||
| 209,862 | Fortinet, Inc.a | 6,434,369 | ||||||
| 78,004 | Gartner, Inc.a | 6,568,717 | ||||||
| 85,371 | HomeAway, Inc.a | 2,542,348 | ||||||
| 19,802 | IAC InterActiveCorp | 1,203,764 | ||||||
| 55,294 | Imperva, Inc.a | 2,733,182 | ||||||
| 49,306 | Keysight Technologies, Inc.a | 1,665,064 | ||||||
| 8,010 | Linkedln Corporationa | 1,839,977 | ||||||
| 45,503 | Nice Systems, Ltd. ADR | 2,304,727 | ||||||
| 84,571 | Nuance Communications, Inc.a | 1,206,828 | ||||||
| 151,413 | NVIDIA Corporation | 3,035,831 | ||||||
| 122,228 | NXP Semiconductors NVa | 9,338,219 | ||||||
| 191,483 | QLIK Technologies, Inc.a | 5,914,910 | ||||||
| 71,941 | ServiceNow, Inc.a | 4,881,197 | ||||||
| 39,944 | Skyworks Solutions, Inc. | 2,904,328 | ||||||
| 49,067 | Synopsys, Inc.a | 2,132,942 | ||||||
| 9,100 | Ultimate Software Group, Inc.a | 1,336,017 | ||||||
| 75,835 | VeriFone Systems, Inc.a | 2,821,062 | ||||||
|
| |||||||
| Total | 86,536,091 | |||||||
|
| |||||||
| Materials (3.5%) | |||||||
| 43,177 | Airgas, Inc. | 4,973,127 | ||||||
| 37,889 | Albemarle Corporationb | 2,278,266 | ||||||
| 29,841 | Celanese Corporation | 1,789,266 | ||||||
| 82,042 | FMC Corporation | 4,678,855 | ||||||
| 70,553 | Silver Wheaton Corporation | 1,434,343 | ||||||
|
| |||||||
| Total | 15,153,857 | |||||||
|
| |||||||
| Telecommunications Services (1.6%) | |||||||
| 29,238 | Level 3 Communications, Inc.a | 1,443,773 | ||||||
| 50,186 | SBA Communications Corporationa | 5,558,601 | ||||||
|
| |||||||
| Total | 7,002,374 | |||||||
|
| |||||||
| Total Common Stock (cost $285,980,355) | 408,514,653 | |||||||
|
| |||||||
The accompanying Notes to Financial Statements are an integral part of this schedule.
239
Table of Contents
Schedule of Investments as of December 31, 2014
Shares | Collateral Held for Securities Loaned (0.7%) | Value | ||||
3,029,925 | Thrivent Cash Management Trust | $ | 3,029,925 | |||
|
| |||||
Total Collateral Held for Securities Loaned (cost $3,029,925) | 3,029,925 | |||||
|
| |||||
Shares or | Short-Term Investments (4.5%)c | Value | ||||
Thrivent Cash Management Trust | ||||||
19,034,912 | 0.060% | 19,034,912 | ||||
|
| |||||
| Total Short-Term Investments (at amortized cost) | 19,034,912 | |||||
|
| |||||
| Total Investments (cost $308,045,192) 100.8% | $ | 430,579,490 | ||||
|
| |||||
| Other Assets and Liabilities, Net (0.8%) | (3,426,268 | ) | ||||
|
| |||||
| Total Net Assets 100.0% | $ | 427,153,222 | ||||
|
| |||||
| a | Non-income producing security. |
| b | All or a portion of the security is on loan. |
| c | The interest rate shown reflects the yield, coupon rate or the discount rate at the date of purchase. |
Definitions:
ADR | - | American Depositary Receipt, which are certificates for an underlying foreign security’s shares held by an issuing U.S. depository bank. |
Unrealized Appreciation (Depreciation)
Gross unrealized appreciation and depreciation of investments, based on cost for federal income tax purposes, were as follows:
Gross unrealized appreciation | $ | 127,017,859 | ||
Gross unrealized depreciation | (4,939,485 | ) | ||
|
| |||
Net unrealized appreciation (depreciation) | $ | 122,078,374 | ||
Cost for federal income tax purposes | $ | 308,501,116 | ||
The accompanying Notes to Financial Statements are an integral part of this schedule.
240
Table of Contents
MID CAP GROWTH PORTFOLIO
Schedule of Investments as of December 31, 2014
Fair Valuation Measurements
The following table is a summary of the inputs used, as of December 31, 2014, in valuing Mid Cap Growth Portfolio’s assets carried at fair value.
Investments in Securities | Total | Level 1 | Level 2 | Level 3 | ||||||||||||
Common Stock | ||||||||||||||||
Consumer Discretionary | 88,089,770 | 88,089,770 | — | — | ||||||||||||
Consumer Staples | 22,022,510 | 22,022,510 | — | — | ||||||||||||
Energy | 13,014,585 | 13,014,585 | — | — | ||||||||||||
Financials | 43,464,462 | 43,464,462 | — | — | ||||||||||||
Health Care | 65,938,466 | 65,938,466 | — | — | ||||||||||||
Industrials | 67,292,538 | 67,292,538 | — | — | ||||||||||||
Information Technology | 86,536,091 | 86,536,091 | — | — | ||||||||||||
Materials | 15,153,857 | 15,153,857 | — | — | ||||||||||||
Telecommunications Services | 7,002,374 | 7,002,374 | — | — | ||||||||||||
Collateral Held for Securities Loaned | 3,029,925 | 3,029,925 | — | — | ||||||||||||
Short-Term Investments | 19,034,912 | 19,034,912 | — | — | ||||||||||||
|
|
|
|
|
|
|
| |||||||||
Total | $ | 430,579,490 | $ | 430,579,490 | $ | — | $ | — | ||||||||
|
|
|
|
|
|
|
| |||||||||
There were no significant transfers between Levels during the period ended December 31, 2014. Transfers between Levels are identified as of the end of the period.
Investment in Affiliates
Affiliated issuers, as defined under the Investment Company Act of 1940, include those in which the Portfolio’s holdings of an issuer represent 5% or more of the outstanding voting securities of an issuer, or any affiliated mutual fund.
A summary of transactions for the fiscal year to date, in Mid Cap Growth Portfolio, is as follows:
Portfolio | Value December 31, 2013 | Gross Purchases | Gross Sales | Shares Held at December 31, 2014 | Value December 31, 2014 | Income Earned January 1, 2014 - December 31, 2014 | ||||||||||||||||||
Cash Management Trust-Collateral Investment | $ | 17,677,617 | $ | 84,213,047 | $ | 98,860,739 | 3,029,925 | $ | 3,029,925 | $ | 10,898 | |||||||||||||
Cash Management Trust-Short Term Investment | 12,208,592 | 106,231,062 | 99,404,742 | 19,034,912 | 19,034,912 | 7,679 | ||||||||||||||||||
Total Value and Income Earned | 29,886,209 | 22,064,837 | 18,577 | |||||||||||||||||||||
The accompanying Notes to Financial Statements are an integral part of this schedule.
241
Table of Contents
PARTNER MID CAP VALUE PORTFOLIO
Schedule of Investments as of December 31, 2014
| Shares | Common Stock (95.4%) | Value | ||||||
| Consumer Discretionary (14.0%) |
| ||||||
| 65,606 | AMC Networks, Inc.a | $ | 4,183,695 | |||||
| 26,875 | Expedia, Inc. | 2,294,050 | ||||||
| 24,405 | Fossil, Inc.a | 2,702,610 | ||||||
| 181,914 | Gap, Inc. | 7,660,399 | ||||||
| 46,149 | GNC Holdings, Inc. | 2,167,157 | ||||||
| 5,805 | Liberty Broadband Corporation Rightsa | 55,147 | ||||||
| 9,454 | Liberty Broadband Corporation, Class Aa | 473,551 | ||||||
| 19,575 | Liberty Broadband Corporation, Class Ca | 975,226 | ||||||
| 102,486 | Liberty Interactive Corporationa | 3,015,138 | ||||||
| 37,817 | Liberty Media Corporation, Class Aa | 1,333,806 | ||||||
| 98,858 | Liberty Media Corporation, Class Ca | 3,462,996 | ||||||
| 205,387 | MGM Resorts Internationala | 4,391,174 | ||||||
| 26,243 | Mohawk Industries, Inc.a | 4,077,112 | ||||||
| 20,182 | PVH Corporation | 2,586,727 | ||||||
| 22,169 | Scripps Networks Interactive, Inc. | 1,668,661 | ||||||
| 213,352 | Staples, Inc. | 3,865,938 | ||||||
| 60,673 | Starwood Hotels & Resorts Worldwide, Inc. | 4,918,760 | ||||||
| 110,613 | Toll Brothers, Inc.a | 3,790,707 | ||||||
| 75,789 | Urban Outfitters, Inc.a | 2,662,468 | ||||||
|
| |||||||
Total | 56,285,322 | |||||||
|
| |||||||
| Consumer Staples (6.5%) |
| ||||||
| 162,949 | ConAgra Foods, Inc. | 5,911,790 | ||||||
| 35,330 | Energizer Holdings, Inc. | 4,542,025 | ||||||
| 50,090 | Kroger Company | 3,216,279 | ||||||
| 40,885 | Molson Coors Brewing Company | 3,046,750 | ||||||
| 143,076 | Tyson Foods, Inc. | 5,735,917 | ||||||
| 74,519 | Whole Foods Market, Inc. | 3,757,247 | ||||||
|
| |||||||
Total | 26,210,008 | |||||||
|
| |||||||
| Energy (4.1%) |
| ||||||
| 207,297 | Chesapeake Energy Corporation | 4,056,802 | ||||||
| 19,773 | Cimarex Energy Company | 2,095,938 | ||||||
| 5,296 | Energen Corporation | 337,673 | ||||||
| 24,360 | Oil States International, Inc.a | 1,191,204 | ||||||
| 192,906 | Southwestern Energy Companya | 5,264,405 | ||||||
| 48,599 | Tesoro Corporation | 3,613,336 | ||||||
|
| |||||||
Total | 16,559,358 | |||||||
|
| |||||||
| Financials (28.2%) |
| ||||||
| 78,243 | Arthur J. Gallagher & Company | 3,683,680 | ||||||
| 33,055 | AvalonBay Communities, Inc. | 5,400,856 | ||||||
| 246,362 | Brixmor Property Group, Inc. | 6,119,632 | ||||||
| 257,148 | DDR Corporation | 4,721,237 | ||||||
| 27,436 | Everest Re Group, Ltd. | 4,672,351 | ||||||
| 299,927 | Fifth Third Bancorp | 6,111,013 | ||||||
| 136,586 | Genworth Financial, Inc.a | 1,160,981 | ||||||
| 560,210 | Huntington Bancshares, Inc. | 5,893,409 | ||||||
| 135,325 | Invesco, Ltd. | 5,348,044 | ||||||
| 132,725 | Lincoln National Corporation | 7,654,251 | ||||||
| 34,400 | M&T Bank Corporation | 4,321,328 | ||||||
| 69,609 | NASDAQ OMX Group, Inc. | 3,338,448 | ||||||
| 275,948 | Navient Corporation | 5,963,236 | ||||||
| 125,601 | Principal Financial Group, Inc. | 6,523,716 | ||||||
| 81,185 | Raymond James Financial, Inc. | 4,651,089 | ||||||
| 124,613 | RLJ Lodging Trust | 4,178,274 | ||||||
| 29,785 | Signature Banka | 3,751,719 | ||||||
| 454,781 | SLM Corporation | 4,634,218 | ||||||
| 212,502 | Starwood Property Trust, Inc. | 4,938,546 | ||||||
| 37,466 | Taubman Centers, Inc. | 2,863,152 | ||||||
| 80,377 | Unum Group | 2,803,550 | ||||||
| 77,595 | Validus Holdings, Ltd. | 3,224,848 | ||||||
| 86,145 | Voya Financial, Inc. | 3,650,825 | ||||||
| 156,265 | XL Group plc | 5,370,828 | ||||||
| 89,490 | Zions Bancorporation | 2,551,360 | ||||||
|
| |||||||
Total | 113,530,591 | |||||||
|
| |||||||
| Health Care (8.9%) |
| ||||||
| 165,588 | Allscripts Healthcare Solutions, Inc.a | 2,114,559 | ||||||
| 59,855 | Cardinal Health, Inc. | 4,832,094 | ||||||
| 68,002 | CIGNA Corporation | 6,998,086 | ||||||
| 80,256 | Endo International plca | 5,788,063 | ||||||
| 54,836 | Envision Healthcare Holdings, Inc.a | 1,902,261 | ||||||
| 49,328 | Laboratory Corporation of America Holdingsa | 5,322,491 | ||||||
| 64,763 | Mylan, Inc.a | 3,650,690 | ||||||
| 47,424 | Zimmer Holdings, Inc. | 5,378,830 | ||||||
|
| |||||||
Total | 35,987,074 | |||||||
|
| |||||||
| Industrials (8.7%) |
| ||||||
| 43,248 | Alliant Techsystems, Inc. | 5,027,580 | ||||||
| 60,488 | Armstrong World Industries, Inc.a | 3,092,146 | ||||||
| 12,080 | Dun & Bradstreet Corporation | 1,461,197 | ||||||
| 87,788 | Fortune Brands Home and Security, Inc. | 3,974,163 | ||||||
| 192,820 | Hertz Global Holdings, Inc.a | 4,808,931 | ||||||
| 26,806 | Kansas City Southern | 3,271,136 | ||||||
| 101,019 | Terex Corporation | 2,816,410 | ||||||
| 103,355 | Textron, Inc. | 4,352,279 | ||||||
| 70,275 | Triumph Group, Inc. | 4,723,885 | ||||||
| 25,376 | United Continental Holdings, Inc.a | 1,697,401 | ||||||
|
| |||||||
Total | 35,225,128 | |||||||
|
| |||||||
| Information Technology (12.1%) |
| ||||||
| 98,579 | Altera Corporation | 3,641,508 | ||||||
| 47,282 | Analog Devices, Inc. | 2,625,097 | ||||||
| 48,979 | AOL, Inc.a | 2,261,360 | ||||||
| 363,849 | Atmel Corporationa | 3,054,512 | ||||||
| 63,533 | Broadcom Corporation | 2,752,885 | ||||||
| 296,857 | Brocade Communications Systems, Inc. | 3,514,787 | ||||||
| 36,873 | Check Point Software Technologies, Ltd.a | 2,897,112 | ||||||
| 44,248 | Citrix Systems, Inc.a | 2,823,022 | ||||||
| 63,466 | Informatica Corporationa | 2,420,276 | ||||||
| 144,755 | Juniper Networks, Inc. | 3,230,932 | ||||||
| 35,581 | Keysight Technologies, Inc.a | 1,201,570 | ||||||
| 185,004 | Maxim Integrated Products, Inc. | 5,896,078 | ||||||
| 67,494 | NetApp, Inc. | 2,797,626 | ||||||
| 122,382 | Pandora Media, Inc.a | 2,182,071 | ||||||
| 33,164 | Red Hat, Inc.a | 2,292,959 | ||||||
| 362,263 | Xerox Corporation | 5,020,965 | ||||||
|
| |||||||
Total | 48,612,760 | |||||||
|
| |||||||
| Materials (5.8%) |
| ||||||
| 96,875 | Axalta Coating Systems, Ltd.a | 2,520,688 | ||||||
| 57,632 | Carpenter Technology Corporation | 2,838,376 | ||||||
| 50,565 | Celanese Corporation | 3,031,877 | ||||||
| 14,120 | CF Industries Holdings, Inc. | 3,848,265 | ||||||
| 52,969 | Packaging Corporation of America | 4,134,230 | ||||||
| 29,279 | Reliance Steel & Aluminum Company | 1,793,924 | ||||||
| 49,179 | Timkensteel Corporation | 1,821,098 | ||||||
| 36,481 | Valspar Corporation | 3,154,877 | ||||||
|
| |||||||
Total | 23,143,335 | |||||||
|
| |||||||
The accompanying Notes to Financial Statements are an integral part of this schedule.
242
Table of Contents
PARTNER MID CAP VALUE PORTFOLIO
Schedule of Investments as of December 31, 2014
| Shares | Common Stock (95.4%) | Value | ||||||
| Utilities (7.1%) |
| ||||||
| 212,871 | FirstEnergy Corporation | $ | 8,299,840 | |||||
| 132,445 | NRG Energy, Inc. | 3,569,393 | ||||||
| 107,339 | PG&E Corporation | 5,714,728 | ||||||
| 52,822 | SCANA Corporation | 3,190,449 | ||||||
| 70,757 | Sempra Energy | 7,879,500 | ||||||
|
| |||||||
Total | 28,653,910 | |||||||
|
| |||||||
Total Common Stock (cost $319,371,925) | 384,207,486 | |||||||
|
| |||||||
| Shares or Principal Amount | Short-Term Investments (5.0%)b | Value | ||||||
Thrivent Cash Management Trust | ||||||||
| 20,179,241 | 0.060% | 20,179,241 | ||||||
|
| |||||||
Total Short-Term Investments (at amortized cost) | 20,179,241 | |||||||
|
| |||||||
Total Investments (cost $339,551,166) 100.4% | $ | 404,386,727 | ||||||
|
| |||||||
Other Assets and Liabilities, Net (0.4%) | (1,529,622 | ) | ||||||
|
| |||||||
Total Net Assets 100.0% | $ | 402,857,105 | ||||||
|
| |||||||
| a | Non-income producing security. |
| b | The interest rate shown reflects the yield, coupon rate or the discount rate at the date of purchase. |
Unrealized Appreciation (Depreciation)
Gross unrealized appreciation and depreciation of investments, based on cost for federal income tax purposes, were as follows:
Gross unrealized appreciation | $ | 68,145,023 | ||
Gross unrealized depreciation | (4,365,765 | ) | ||
|
| |||
Net unrealized appreciation (depreciation) | $ | 63,779,258 | ||
Cost for federal income tax purposes | $ | 340,607,469 | ||
The accompanying Notes to Financial Statements are an integral part of this schedule.
243
Table of Contents
PARTNER MID CAP VALUE PORTFOLIO
Schedule of Investments as of December 31, 2014
Fair Valuation Measurements
The following table is a summary of the inputs used, as of December 31, 2014, in valuing Partner Mid Cap Value Portfolio’s assets carried at fair value.
Investments in Securities | Total | Level 1 | Level 2 | Level 3 | ||||||||||||
Common Stock | ||||||||||||||||
Consumer Discretionary | 56,285,322 | 56,285,322 | — | — | ||||||||||||
Consumer Staples | 26,210,008 | 26,210,008 | — | — | ||||||||||||
Energy | 16,559,358 | 16,559,358 | — | — | ||||||||||||
Financials | 113,530,591 | 113,530,591 | — | — | ||||||||||||
Health Care | 35,987,074 | 35,987,074 | — | — | ||||||||||||
Industrials | 35,225,128 | 35,225,128 | — | — | ||||||||||||
Information Technology | 48,612,760 | 48,612,760 | — | — | ||||||||||||
Materials | 23,143,335 | 23,143,335 | — | — | ||||||||||||
Utilities | 28,653,910 | 28,653,910 | — | — | ||||||||||||
Short-Term Investments | 20,179,241 | 20,179,241 | — | — | ||||||||||||
|
|
|
|
|
|
|
| |||||||||
Total | $404,386,727 | $ | 404,386,727 | $ | — | $ | — | |||||||||
|
|
|
|
|
|
|
| |||||||||
There were no significant transfers between Levels during the period ended December 31, 2014. Transfers between Levels are identified as of the end of the period.
Investment in Affiliates
Affiliated issuers, as defined under the Investment Company Act of 1940, include those in which the Portfolio’s holdings of an issuer represent 5% or more of the outstanding voting securities of an issuer, or any affiliated mutual fund.
A summary of transactions for the fiscal year to date, in Partner Mid Cap Value Portfolio, is as follows:
Portfolio | Value December 31, 2013 | Gross Purchases | Gross Sales | Shares Held at December 31, 2014 | Value December 31, 2014 | Income Earned January 1, 2014 - December 31, 2014 | ||||||||||||||||||
Cash Management Trust-Short Term Investment | $ | 3,138,588 | $ | 107,928,317 | $ | 90,887,664 | 20,179,241 | $ | 20,179,241 | $ | 4,099 | |||||||||||||
Total Value and Income Earned | 3,138,588 | 20,179,241 | 4,099 | |||||||||||||||||||||
The accompanying Notes to Financial Statements are an integral part of this schedule.
244
Table of Contents
Schedule of Investments as of December 31, 2014
| Shares | Common Stock (94.9%) | Value | ||||||
| Consumer Discretionary (9.4%) |
| ||||||
| 191,300 | Cheesecake Factory, Inc. | $ | 9,624,303 | |||||
| 250,100 | DISH Network Corporationa | 18,229,789 | ||||||
| 83,800 | Harman International Industries, Inc. | 8,942,298 | ||||||
| 169,150 | Omnicom Group, Inc. | 13,104,050 | ||||||
| 139,600 | Scripps Networks Interactive, Inc. | 10,507,692 | ||||||
| 295,600 | Toll Brothers, Inc.a | 10,130,212 | ||||||
|
| |||||||
Total | 70,538,344 | |||||||
|
| |||||||
| Consumer Staples (4.7%) |
| ||||||
| 112,050 | Ingredion, Inc. | 9,506,322 | ||||||
| 84,000 | Keurig Green Mountain, Inc. | 11,121,180 | ||||||
| 100,750 | Molson Coors Brewing Company | 7,507,890 | ||||||
| 25,900 | TreeHouse Foods, Inc.a | 2,215,227 | ||||||
| 141,500 | WhiteWave Foods Companya | 4,951,085 | ||||||
|
| |||||||
Total | 35,301,704 | |||||||
|
| |||||||
| Energy (4.4%) |
| ||||||
| 43,750 | Atwood Oceanics, Inc.a | 1,241,187 | ||||||
| 29,700 | Cameron International Corporationa | 1,483,515 | ||||||
| 21,100 | Cimarex Energy Company | 2,236,600 | ||||||
| 16,700 | Concho Resources, Inc.a | 1,665,825 | ||||||
| 123,950 | Denbury Resources, Inc.b | 1,007,714 | ||||||
| 15,950 | Energen Corporation | 1,016,972 | ||||||
| 29,550 | Ensco plc | 885,022 | ||||||
| 17,720 | EQT Corporation | 1,341,404 | ||||||
| 17,600 | Gulfport Energy Corporationa | 734,624 | ||||||
| 75,050 | Helix Energy Solutions Group, Inc.a | 1,628,585 | ||||||
| 30,250 | Helmerich & Payne, Inc. | 2,039,455 | ||||||
| 48,050 | HollyFrontier Corporation | 1,800,914 | ||||||
| 26,000 | National Oilwell Varco, Inc. | 1,703,780 | ||||||
| 43,350 | Newfield Exploration Companya | 1,175,652 | ||||||
| 49,600 | Noble Corporation | 821,872 | ||||||
| 33,850 | Noble Energy, Inc. | 1,605,506 | ||||||
| 30,150 | Oasis Petroleum, Inc.a | 498,681 | ||||||
| 32,100 | Oceaneering International, Inc. | 1,887,801 | ||||||
| 28,650 | Oil States International, Inc.a | 1,400,985 | ||||||
| 10,300 | Pioneer Natural Resources Company | 1,533,155 | ||||||
| 46,550 | Rowan Companies plc | 1,085,546 | ||||||
| 25,050 | SM Energy Company | 966,429 | ||||||
| 107,600 | Superior Energy Services, Inc. | 2,168,140 | ||||||
| 28,800 | Whiting Petroleum Corporationa | 950,400 | ||||||
|
| |||||||
Total | 32,879,764 | |||||||
|
| |||||||
| Financials (22.3%) |
| ||||||
| 306,700 | Brixmor Property Group, Inc. | 7,618,428 | ||||||
| 99,900 | Camden Property Trust | 7,376,616 | ||||||
| 109,050 | Digital Realty Trust, Inc. | 7,230,015 | ||||||
| 458,000 | Duke Realty Corporation | 9,251,600 | ||||||
| 233,100 | First Republic Bank | 12,149,172 | ||||||
| 248,370 | HCC Insurance Holdings, Inc. | 13,292,762 | ||||||
| 557,748 | Host Hotels & Resorts, Inc. | 13,257,670 | ||||||
| 1,636,300 | Huntington Bancshares, Inc. | 17,213,876 | ||||||
| 731,350 | KeyCorp | 10,165,765 | ||||||
| 278,574 | Lazard, Ltd. | 13,937,057 | ||||||
| 91,500 | M&T Bank Corporationb | 11,494,230 | ||||||
| 369,300 | NASDAQ OMX Group, Inc. | 17,711,628 | ||||||
| 202,333 | Northern Trust Corporation | 13,637,244 | ||||||
| 474,572 | Zions Bancorporation | 13,530,048 | ||||||
|
| |||||||
Total | 167,866,111 | |||||||
|
| |||||||
| Health Care (14.8%) |
| ||||||
| 238,700 | Acorda Therapeutics, Inc.a | 9,755,669 | ||||||
| 598,700 | Allscripts Healthcare Solutions, Inc.a | 7,645,399 | ||||||
| 83,682 | C.R. Bard, Inc. | 13,943,095 | ||||||
| 121,400 | Centene Corporationa | 12,607,390 | ||||||
| 55,800 | Edwards Lifesciences Corporationa | 7,107,804 | ||||||
| 423,300 | Hologic, Inc.a | 11,319,042 | ||||||
| 91,250 | Illumina, Inc.a | 16,842,925 | ||||||
| 78,700 | Mallinckrodt, LLCa | 7,793,661 | ||||||
| 128,900 | Universal Health Services, Inc. | 14,341,414 | ||||||
| 90,450 | Waters Corporationa | 10,195,524 | ||||||
|
| |||||||
Total | 111,551,923 | |||||||
|
| |||||||
| Industrials (15.1%) |
| ||||||
| 476,594 | ADT Corporationb | 17,267,001 | ||||||
| 165,200 | Flowserve Corporation | 9,883,916 | ||||||
| 94,850 | Huntington Ingalls Industries, Inc. | 10,666,831 | ||||||
| 102,958 | Manpower, Inc. | 7,018,647 | ||||||
| 365,584 | Oshkosh Corporation | 17,785,661 | ||||||
| 109,832 | Parker Hannifin Corporation | 14,162,836 | ||||||
| 649,300 | Southwest Airlines Company | 27,478,376 | ||||||
| 90,900 | WABCO Holdings, Inc.a | 9,524,502 | ||||||
|
| |||||||
Total | 113,787,770 | |||||||
|
| |||||||
| Information Technology (18.7%) |
| ||||||
| 89,750 | Alliance Data Systems Corporationa | 25,672,988 | ||||||
| 940,933 | Applied Materials, Inc. | 23,448,050 | ||||||
| 171,904 | eBay, Inc.a | 9,647,252 | ||||||
| 426,382 | Juniper Networks, Inc. | 9,516,846 | ||||||
| 323,300 | NetApp, Inc. | 13,400,785 | ||||||
| 1,152,516 | NVIDIA Corporation | 23,107,946 | ||||||
| 47,350 | Rackspace Hosting, Inc.a | 2,216,454 | ||||||
| 222,750 | Red Hat, Inc.a | 15,400,935 | ||||||
| 565,972 | Teradyne, Inc. | 11,200,586 | ||||||
| 251,200 | Ubiquiti Networks, Inc.b | 7,445,568 | ||||||
|
| |||||||
Total | 141,057,410 | |||||||
|
| |||||||
| Materials (4.0%) |
| ||||||
| 291,150 | Owens-Illinois, Inc.a | 7,858,139 | ||||||
| 165,712 | Silgan Holdings, Inc. | 8,882,163 | ||||||
| 676,450 | Steel Dynamics, Inc. | 13,353,123 | ||||||
|
| |||||||
Total | 30,093,425 | |||||||
|
| |||||||
| Utilities (1.5%) |
| ||||||
| 262,250 | Public Service Enterprise Group, Inc. | 10,859,773 | ||||||
|
| |||||||
Total | 10,859,773 | |||||||
|
| |||||||
Total Common Stock (cost $521,717,427) | 713,936,224 | |||||||
|
| |||||||
Collateral Held for Securities Loaned (3.9%) | ||||||||
| 29,599,525 | Thrivent Cash Management Trust | 29,599,525 | ||||||
|
| |||||||
Total Collateral Held for Securities Loaned (cost $29,599,525) | 29,599,525 | |||||||
|
| |||||||
The accompanying Notes to Financial Statements are an integral part of this schedule.
245
Table of Contents
MID CAP STOCK PORTFOLIO
Schedule of Investments as of December 31, 2014
| Shares or Principal Amount | Short-Term Investments (5.1%)c | Value | ||||||
Thrivent Cash Management Trust | ||||||||
| 38,432,404 | 0.060% | $ | 38,432,404 | |||||
|
| |||||||
Total Short-Term Investments (at amortized cost) | 38,432,404 | |||||||
|
| |||||||
Total Investments (cost $589,749,356) 103.9% | $ | 781,968,153 | ||||||
|
| |||||||
Other Assets and Liabilities, Net (3.9%) | (29,349,714 | ) | ||||||
|
| |||||||
Total Net Assets 100.0% | $ | 752,618,439 | ||||||
|
| |||||||
| a | Non-income producing security. |
| b | All or a portion of the security is on loan, |
| c | The interest rate shown reflects the yield, coupon rate or the discount rate at the date of purchase. |
Unrealized Appreciation (Depreciation)
Gross unrealized appreciation and depreciation of investments, based on cost for federal income tax purposes, were as follows:
Gross unrealized appreciation | $ | 206,528,759 | ||
Gross unrealized depreciation | (14,637,500 | ) | ||
|
| |||
Net unrealized appreciation (depreciation) | $ | 191,891,259 | ||
Cost for federal income tax purposes | $ | 590,076,894 | ||
Fair Valuation Measurements
The following table is a summary of the inputs used, as of December 31, 2014, in valuing Mid Cap Stock Portfolio’s assets carried at fair value.
Investments in Securities | Total | Level 1 | Level 2 | Level 3 | ||||||||||||
Common Stock | ||||||||||||||||
Consumer Discretionary | 70,538,344 | 70,538,344 | — | — | ||||||||||||
Consumer Staples | 35,301,704 | 35,301,704 | — | — | ||||||||||||
Energy | 32,879,764 | 32,879,764 | — | — | ||||||||||||
Financials | 167,866,111 | 167,866,111 | — | — | ||||||||||||
Health Care | 111,551,923 | 111,551,923 | — | — | ||||||||||||
Industrials | 113,787,770 | 113,787,770 | — | — | ||||||||||||
Information Technology | 141,057,410 | 141,057,410 | — | — | ||||||||||||
Materials | 30,093,425 | 30,093,425 | — | — | ||||||||||||
Utilities | 10,859,773 | 10,859,773 | — | — | ||||||||||||
Collateral Held for Securities Loaned | 29,599,525 | 29,599,525 | — | — | ||||||||||||
Short-Term Investments | 38,432,404 | 38,432,404 | — | — | ||||||||||||
|
|
|
|
|
|
|
| |||||||||
Total | $781,968,153 | $ | 781,968,153 | $ | — | $ | — | |||||||||
|
|
|
|
|
|
|
| |||||||||
There were no significant transfers between Levels during the period ended December 31, 2014. Transfers between Levels are identified as of the end of the period.
Investment in Affiliates
Affiliated issuers, as defined under the Investment Company Act of 1940, include those in which the Portfolio’s holdings of an issuer represent 5% or more of the outstanding voting securities of an issuer, or any affiliated mutual fund.
A summary of transactions for the fiscal year to date, in Mid Cap Stock Portfolio, is an follows:
Portfolio | Value December 31, 2013 | Gross Purchases | Gross Sales | Shares Held at December 31, 2014 | Value December 31, 2014 | Income Earned January 1, 2014 - December 31, 2014 | ||||||||||||||||||
Cash Management Trust-Collateral Investment | $ | 37,473,212 | $ | 328,104,857 | $ | 335,978,544 | 29,599,525 | $ | 29,599,525 | $ | 206,831 | |||||||||||||
Cash Management Trust-Short Term Investment | 26,698,226 | 120,907,896 | 109,173,718 | 38,432,404 | 38,432,404 | 21,297 | ||||||||||||||||||
Total Value and Income Earned | 64,171,438 | 68,031,929 | 228,128 | |||||||||||||||||||||
The accompanying Notes to Financial Statements are an integral part of this schedule.
246
Table of Contents
Schedule of Investments as of December 31, 2014
| Shares | Common Stock (88.0%) | Value | ||||||
| Consumer Discretionary (12.2%) |
| ||||||
| 5,000 | Aaron’s, Inc. | $ | 152,850 | |||||
| 5,600 | Abercrombie & Fitch Company | 160,384 | ||||||
| 5,700 | Advance Auto Parts, Inc. | 907,896 | ||||||
| 4,600 | AMC Networks, Inc.a | 293,342 | ||||||
| 13,730 | American Eagle Outfitters, Inc.b | 190,572 | ||||||
| 3,600 | ANN, Inc.a | 131,328 | ||||||
| 7,600 | Apollo Group, Inc.a | 259,236 | ||||||
| 10,300 | Ascena Retail Group, Inc.a | 129,368 | ||||||
| 4,200 | Big Lots, Inc. | 168,084 | ||||||
| 5,005 | Brinker International, Inc. | 293,743 | ||||||
| 7,250 | Brunswick Corporation | 371,635 | ||||||
| 3,700 | Cabela’s, Inc.a,b | 195,027 | ||||||
| 4,150 | Carter’s, Inc. | 362,337 | ||||||
| 3,600 | Cheesecake Factory, Inc. | 181,116 | ||||||
| 11,900 | Chico’s FAS, Inc. | 192,899 | ||||||
| 8,150 | Cinemark Holdings, Inc. | 289,977 | ||||||
| 6,050 | CST Brands, Inc. | 263,841 | ||||||
| 2,700 | Deckers Outdoor Corporationa | 245,808 | ||||||
| 4,450 | DeVry Education Group, Inc. | 211,241 | ||||||
| 7,650 | Dick’s Sporting Goods, Inc. | 379,823 | ||||||
| 4,300 | Domino’s Pizza, Inc. | 404,931 | ||||||
| 5,650 | DreamWorks Animation SKG, Inc.a | 126,165 | ||||||
| 11,150 | Foot Locker, Inc. | 626,407 | ||||||
| 11,420 | Gentex Corporation | 412,605 | ||||||
| 300 | Graham Holdings Company | 259,113 | ||||||
| 5,000 | Guess ?, Inc. | 105,400 | ||||||
| 7,800 | Hanesbrands, Inc. | 870,636 | ||||||
| 2,550 | HSN, Inc. | 193,800 | ||||||
| 19,300 | International Game Technology | 332,925 | ||||||
| 2,170 | International Speedway Corporation | 68,680 | ||||||
| 23,800 | J.C. Penney Company, Inc.a,b | 154,224 | ||||||
| 14,000 | Jarden Corporationa | 670,320 | ||||||
| 3,650 | John Wiley and Sons, Inc. | 216,226 | ||||||
| 9,900 | Kate Spade & Companya | 316,899 | ||||||
| 7,100 | KB Homeb | 117,505 | ||||||
| 6,250 | Lamar Advertising Company | 335,250 | ||||||
| 2,850 | Life Time Fitness, Inc.a | 161,367 | ||||||
| 11,300 | Live Nation Entertainment, Inc.a | 295,043 | ||||||
| 23,650 | LKQ Corporationa | 665,038 | ||||||
| 3,000 | M.D.C. Holdings, Inc. | 79,410 | ||||||
| 2,850 | Meredith Corporation | 154,812 | ||||||
| 3,400 | Murphy USA, Inc.a | 234,124 | ||||||
| 10,200 | New York Times Company | 134,844 | ||||||
| 300 | NVR, Inc.a | 382,599 | ||||||
| 38,350 | Office Depot, Inc.a | 328,851 | ||||||
| 2,000 | Panera Bread Companya | 349,600 | ||||||
| 4,750 | Polaris Industries, Inc. | 718,390 | ||||||
| 4,100 | Rent-A-Center, Inc. | 148,912 | ||||||
| 16,300 | Service Corporation International | 370,010 | ||||||
| 6,250 | Signet Jewelers, Ltd. | 822,313 | ||||||
| 4,820 | Sotheby’s Holdings, Inc. | 208,128 | ||||||
| 4,700 | Tempur-Pedic International, Inc.a | 258,077 | ||||||
| 3,600 | Thor Industries, Inc. | 201,132 | ||||||
| 8,500 | Time, Inc. | 209,185 | ||||||
| 12,650 | Toll Brothers, Inc.a | 433,515 | ||||||
| 3,900 | Tupperware Brands Corporation | 245,700 | ||||||
| 21,364 | Wendy’s Company | 192,917 | ||||||
| 6,730 | Williams-Sonoma, Inc. | 509,326 | ||||||
|
| |||||||
Total | 17,694,886 | |||||||
|
| |||||||
| Consumer Staples (3.0%) |
| ||||||
| 10,470 | Church & Dwight Company, Inc. | 825,141 | ||||||
| 7,300 | Dean Foods Company | 141,474 | ||||||
| 4,850 | Energizer Holdings, Inc. | 623,516 | ||||||
| 14,425 | Flowers Foods, Inc. | 276,816 | ||||||
| 7,900 | Hain Celestial Group, Inc.a | 460,491 | ||||||
| 5,650 | Ingredion, Inc. | 479,346 | ||||||
| 1,540 | Lancaster Colony Corporation | 144,206 | ||||||
| 3,500 | Post Holdings, Inc.a | 146,615 | ||||||
| 16,100 | SUPERVALU, Inc.a | 156,170 | ||||||
| 1,603 | Tootsie Roll Industries, Inc.b | 49,132 | ||||||
| 3,300 | TreeHouse Foods, Inc.a | 282,249 | ||||||
| 3,900 | United Natural Foods, Inc.a | 301,567 | ||||||
| 13,650 | WhiteWave Foods Companya | 477,613 | ||||||
|
| |||||||
Total | 4,364,336 | |||||||
|
| |||||||
| Energy (3.6%) |
| ||||||
| 4,600 | Atwood Oceanics, Inc.a | 130,502 | ||||||
| 23,850 | California Resources Corporationa | 131,414 | ||||||
| 1,550 | CARBO Ceramics, Inc.b | 62,077 | ||||||
| 5,950 | Dresser-Rand Group, Inc.a | 486,710 | ||||||
| 3,100 | Dril-Quip, Inc.a | 237,863 | ||||||
| 5,700 | Energen Corporation | 363,432 | ||||||
| 6,650 | Gulfport Energy Corporationa | 277,571 | ||||||
| 7,650 | Helix Energy Solutions Group, Inc.a | 166,005 | ||||||
| 15,340 | HollyFrontier Corporation | 574,943 | ||||||
| 8,200 | Oceaneering International, Inc. | 482,242 | ||||||
| 4,100 | Oil States International, Inc.a | 200,490 | ||||||
| 11,350 | Patterson-UTI Energy, Inc. | 188,296 | ||||||
| 21,250 | Peabody Energy Corporation | 164,475 | ||||||
| 4,750 | Rosetta Resources, Inc.a | 105,973 | ||||||
| 9,650 | Rowan Companies plc | 225,038 | ||||||
| 5,250 | SM Energy Company | 202,545 | ||||||
| 11,850 | Superior Energy Services, Inc. | 238,778 | ||||||
| 3,850 | Tidewater, Inc.b | 124,778 | ||||||
| 3,550 | Unit Corporationa | 121,055 | ||||||
| 5,750 | Western Refining, Inc. | 217,235 | ||||||
| 5,600 | World Fuel Services Corporation | 262,808 | ||||||
| 15,750 | WPX Energy, Inc.a | 183,173 | ||||||
|
| |||||||
Total | 5,147,403 | |||||||
|
| |||||||
| Financials (20.4%) |
| ||||||
| 3,510 | Alexander & Baldwin, Inc. | 137,803 | ||||||
| 5,600 | Alexandria Real Estate Equities, Inc. | 496,944 | ||||||
| 1,300 | Alleghany Corporationa | 602,550 | ||||||
| 8,200 | American Campus Communities, Inc. | 339,152 | ||||||
| 5,785 | American Financial Group, Inc. | 351,265 | ||||||
| 12,600 | Arthur J. Gallagher & Company | 593,208 | ||||||
| 4,900 | Aspen Insurance Holdings, Ltd. | 214,473 | ||||||
| 11,943 | Associated Banc-Corp | 222,498 | ||||||
| 6,870 | Astoria Financial Corporation | 91,783 | ||||||
| 6,650 | BancorpSouth, Inc. | 149,692 | ||||||
| 3,450 | Bank of Hawaii Corporation | 204,619 | ||||||
| 15,400 | BioMed Realty Trust, Inc. | 331,716 | ||||||
| 9,200 | Brown & Brown, Inc. | 302,772 | ||||||
| 6,750 | Camden Property Trust | 498,420 | ||||||
| 5,800 | Cathay General Bancorp | 148,422 | ||||||
| 6,600 | CBOE Holdings, Inc. | 418,572 | ||||||
| 3,770 | City National Corporation | 304,654 | ||||||
| 6,489 | Commerce Bancshares, Inc. | 282,207 | ||||||
| 7,250 | Corporate Office Properties Trust | 205,683 | ||||||
| 9,070 | Corrections Corporation of America | 329,604 | ||||||
| 4,250 | Cullen/Frost Bankers, Inc. | 300,220 | ||||||
| 26,750 | Duke Realty Corporation | 540,350 | ||||||
| 11,300 | East West Bancorp, Inc. | 437,423 | ||||||
| 9,250 | Eaton Vance Corporation | 378,602 | ||||||
| 6,000 | Equity One, Inc. | 152,160 | ||||||
| 3,560 | Everest Re Group, Ltd. | 606,268 | ||||||
| 8,600 | Extra Space Storage, Inc. | 504,304 | ||||||
| 5,300 | Federal Realty Investment Trust | 707,338 | ||||||
| 7,450 | Federated Investors, Inc.b | 245,329 | ||||||
The accompanying Notes to Financial Statements are an integral part of this schedule.
247
Table of Contents
MID CAP INDEX PORTFOLIO
Schedule of Investments as of December 31, 2014
| Shares | Common Stock (88.0%) | Value | ||||||
| Financials (20.4%) - continued |
| ||||||
| 8,350 | First American Financial Corporation | $ | 283,065 | |||||
| 18,450 | First Horizon National Corporation | 250,551 | ||||||
| 27,700 | First Niagara Financial Group, Inc. | 233,511 | ||||||
| 12,998 | FirstMerit Corporation | 245,532 | ||||||
| 14,600 | Fulton Financial Corporation | 180,456 | ||||||
| 6,400 | Hancock Holding Company | 196,480 | ||||||
| 3,420 | Hanover Insurance Group, Inc. | 243,914 | ||||||
| 7,600 | HCC Insurance Holdings, Inc. | 406,752 | ||||||
| 7,100 | Highwoods Properties, Inc. | 314,388 | ||||||
| 4,450 | Home Properties, Inc. | 291,920 | ||||||
| 11,700 | Hospitality Properties Trust | 362,700 | ||||||
| 4,550 | International Bancshares Corporation | 120,757 | ||||||
| 11,550 | Janus Capital Group, Inc. | 186,301 | ||||||
| 3,500 | Jones Lang LaSalle, Inc. | 524,755 | ||||||
| 3,950 | Kemper Corporation | 142,634 | ||||||
| 6,550 | Kilroy Realty Corporation | 452,409 | ||||||
| 8,800 | LaSalle Hotel Properties | 356,136 | ||||||
| 11,600 | Liberty Property Trust | 436,508 | ||||||
| 6,550 | Mack-Cali Realty Corporation | 124,843 | ||||||
| 2,800 | Mercury General Corporation | 158,676 | ||||||
| 5,850 | Mid-America Apartment Communities, Inc. | 436,878 | ||||||
| 8,750 | MSCI, Inc. | 415,100 | ||||||
| 10,300 | National Retail Properties, Inc. | 405,511 | ||||||
| 34,611 | New York Community Bancorp, Inc. | 553,776 | ||||||
| 18,950 | Old Republic International Corporation | 277,238 | ||||||
| 10,000 | Omega Healthcare Investors, Inc. | 390,700 | ||||||
| 7,600 | PacWest Bancorp | 345,496 | ||||||
| 3,157 | Potlatch Corporation | 132,184 | ||||||
| 4,200 | Primerica, Inc. | 227,892 | ||||||
| 4,700 | Prosperity Bancshares, Inc. | 260,192 | ||||||
| 6,120 | Protective Life Corporation | 426,258 | ||||||
| 9,825 | Raymond James Financial, Inc. | 562,874 | ||||||
| 9,862 | Rayonier, Inc. REIT | 275,544 | ||||||
| 17,400 | Realty Income Corporation | 830,154 | ||||||
| 7,250 | Regency Centers Corporation | 462,405 | ||||||
| 5,400 | Reinsurance Group of America, Inc. | 473,148 | ||||||
| 3,050 | RenaissanceRe Holdings, Ltd. | 296,521 | ||||||
| 10,190 | SEI Investments Company | 408,008 | ||||||
| 15,900 | Senior Housing Property Trust | 351,549 | ||||||
| 3,900 | Signature Banka | 491,244 | ||||||
| 7,500 | SL Green Realty Corporation | 892,650 | ||||||
| 33,000 | SLM Corporation | 336,270 | ||||||
| 3,300 | StanCorp Financial Group, Inc. | 230,538 | ||||||
| 3,980 | SVB Financial Groupa | 461,959 | ||||||
| 10,700 | Synovus Financial Corporation | 289,863 | ||||||
| 7,500 | Tanger Factory Outlet Centers, Inc. | 277,200 | ||||||
| 4,950 | Taubman Centers, Inc. | 378,279 | ||||||
| 13,070 | TCF Financial Corporation | 207,682 | ||||||
| 5,250 | Trustmark Corporation | 128,835 | ||||||
| 19,903 | UDR, Inc. | 613,410 | ||||||
| 17,100 | Umpqua Holdings Corporation | 290,871 | ||||||
| 17,234 | Valley National Bancorpb | 167,342 | ||||||
| 7,975 | W.R. Berkley Corporation | 408,799 | ||||||
| 6,540 | Waddell & Reed Financial, Inc. | 325,823 | ||||||
| 7,727 | Washington Federal, Inc. | 171,153 | ||||||
| 12,100 | Washington Prime Group, Inc. | 208,362 | ||||||
| 7,080 | Webster Financial Corporation | 230,312 | ||||||
| 8,750 | Weingarten Realty Investors | 305,550 | ||||||
|
| |||||||
Total | 29,557,889 | |||||||
|
| |||||||
| Health Care (9.0%) |
| ||||||
| 5,650 | Align Technology, Inc.a | 315,892 | ||||||
| 13,200 | Allscripts Healthcare Solutions, Inc.a | 168,564 | ||||||
| 1,600 | Bio-Rad Laboratories, Inc.a | 192,896 | ||||||
| 2,850 | Bio-Techne Corporation | 263,340 | ||||||
| 4,600 | Centene Corporationa | 477,710 | ||||||
| 3,650 | Charles River Laboratories International, Inc.a | 232,286 | ||||||
| 9,066 | Community Health Systems, Inc.a | 488,839 | ||||||
| 3,750 | Cooper Companies, Inc. | 607,837 | ||||||
| 4,460 | Covance, Inc.a | 463,126 | ||||||
| 5,950 | Cubist Pharmaceuticals, Inc.a | 598,868 | ||||||
| 11,950 | Endo International plca | 861,834 | ||||||
| 3,600 | Halyard Health, Inc.a,b | 163,692 | ||||||
| 6,130 | Health Net, Inc.a | 328,139 | ||||||
| 6,600 | Henry Schein, Inc.a | 898,590 | ||||||
| 4,500 | Hill-Rom Holdings, Inc. | 205,290 | ||||||
| 6,850 | HMS Holdings Corporationa | 144,809 | ||||||
| 19,050 | Hologic, Inc.a | 509,397 | ||||||
| 3,700 | IDEXX Laboratories, Inc.a | 548,599 | ||||||
| 3,500 | LifePoint Hospitals, Inc.a | 251,685 | ||||||
| 7,850 | Mednax, Inc.a | 518,963 | ||||||
| 2,250 | Mettler-Toledo International, Inc.a | 680,535 | ||||||
| 7,720 | Omnicare, Inc. | 563,020 | ||||||
| 4,900 | Owens & Minor, Inc. | 172,039 | ||||||
| 10,950 | ResMed, Inc.b | 613,857 | ||||||
| 4,950 | Salix Pharmaceuticals, Ltd.a | 568,953 | ||||||
| 4,300 | Sirona Dental Systems, Inc.a | 375,691 | ||||||
| 4,650 | STERIS Corporationb | 301,552 | ||||||
| 3,240 | Teleflex, Inc. | 372,017 | ||||||
| 4,350 | Thoratec Corporationa | 141,201 | ||||||
| 3,700 | United Therapeutics Corporationa | 479,113 | ||||||
| 6,600 | VCA Antech, Inc.a | 321,882 | ||||||
| 3,450 | Wellcare Health Plans, Inc.a | 283,107 | ||||||
|
| |||||||
Total | 13,113,323 | |||||||
|
| |||||||
| Industrials (13.3%) |
| ||||||
| 5,900 | A.O. Smith Corporation | 332,819 | ||||||
| 3,400 | Acuity Brands, Inc. | 476,238 | ||||||
| 11,950 | Aecom Technology Corporationa | 362,922 | ||||||
| 6,530 | AGCO Corporationb | 295,156 | ||||||
| 10,360 | Alaska Air Group, Inc. | 619,114 | ||||||
| 2,500 | Alliant Techsystems, Inc. | 290,625 | ||||||
| 8,200 | B/E Aerospace, Inc.a | 475,764 | ||||||
| 4,990 | Carlisle Companies, Inc. | 450,298 | ||||||
| 3,900 | CLARCOR, Inc. | 259,896 | ||||||
| 4,300 | Clean Harbors, Inc.a,b | 206,615 | ||||||
| 4,530 | Con-way, Inc. | 222,785 | ||||||
| 8,850 | Copart, Inc.a | 322,936 | ||||||
| 2,650 | Corporate Executive Board Company | 192,204 | ||||||
| 3,850 | Crane Company | 225,995 | ||||||
| 3,900 | Deluxe Corporation | 242,775 | ||||||
| 10,000 | Donaldson Company, Inc. | 386,300 | ||||||
| 2,500 | Esterline Technologies Corporationa | 274,200 | ||||||
| 14,650 | Exelis, Inc. | 256,815 | ||||||
| 12,350 | Fortune Brands Home and Security, Inc. | 559,085 | ||||||
| 3,200 | FTI Consulting, Inc.a | 123,616 | ||||||
| 3,470 | GATX Corporation | 199,664 | ||||||
| 3,950 | Genesee & Wyoming, Inc.a | 355,184 | ||||||
| 4,700 | Graco, Inc. | 376,846 | ||||||
| 2,810 | Granite Construction, Inc. | 106,836 | ||||||
| 6,300 | Harsco Corporation | 119,007 | ||||||
| 4,640 | Herman Miller, Inc. | 136,555 | ||||||
| 3,530 | HNI Corporation | 180,242 | ||||||
| 4,230 | Hubbell, Inc. | 451,891 | ||||||
| 3,801 | Huntington Ingalls Industries, Inc. | 427,460 | ||||||
| 6,200 | IDEX Corporation | 482,608 | ||||||
| 7,150 | ITT Corporation | 289,289 | ||||||
The accompanying Notes to Financial Statements are an integral part of this schedule.
248
Table of Contents
MID CAP INDEX PORTFOLIO
Schedule of Investments as of December 31, 2014
| Shares | Common Stock (88.0%) | Value | ||||||
| Industrials (13.3%) - continued |
| ||||||
| 7,240 | JB Hunt Transport Services, Inc. | $ | 609,970 | |||||
| 19,175 | JetBlue Airways Corporationa,b | 304,116 | ||||||
| 11,350 | KBR, Inc. | 192,383 | ||||||
| 6,140 | Kennametal, Inc. | 219,751 | ||||||
| 4,450 | Kirby Corporationa | 359,293 | ||||||
| 4,075 | KLX, Inc.a | 168,094 | ||||||
| 3,500 | Landstar System, Inc. | 253,855 | ||||||
| 3,450 | Lennox International, Inc. | 327,991 | ||||||
| 6,100 | Lincoln Electric Holdings, Inc. | 421,449 | ||||||
| 6,220 | Manpower, Inc. | 424,017 | ||||||
| 2,450 | Mine Safety Appliances Company | 130,070 | ||||||
| 3,950 | MSC Industrial Direct Company, Inc. | 320,938 | ||||||
| 4,580 | Nordson Corporation | 357,057 | ||||||
| 8,300 | NOW, Inc.a,b | 213,559 | ||||||
| 5,350 | Old Dominion Freight Line, Inc.a | 415,374 | ||||||
| 6,250 | Oshkosh Corporation | 304,062 | ||||||
| 15,600 | R.R. Donnelley & Sons Company | 262,158 | ||||||
| 3,500 | Regal-Beloit Corporation | 263,200 | ||||||
| 4,972 | Rollins, Inc. | 164,573 | ||||||
| 3,210 | SPX Corporation | 275,803 | ||||||
| 8,500 | Terex Corporation | 236,980 | ||||||
| 5,850 | Timken Company | 249,678 | ||||||
| 5,500 | Towers Watson & Company | 622,435 | ||||||
| 12,140 | Trinity Industries, Inc. | 340,041 | ||||||
| 4,000 | Triumph Group, Inc. | 268,880 | ||||||
| 1,950 | Valmont Industries, Inc.b | 247,650 | ||||||
| 7,500 | Wabtec Corporation | 651,675 | ||||||
| 9,650 | Waste Connections, Inc. | 424,503 | ||||||
| 2,100 | Watsco, Inc. | 224,700 | ||||||
| 3,500 | Werner Enterprises, Inc. | 109,025 | ||||||
| 4,600 | Woodward, Inc. | 226,458 | ||||||
|
| |||||||
Total | 19,291,478 | |||||||
|
| |||||||
| Information Technology (15.6%) |
| ||||||
| 8,150 | 3D Systems Corporationa,b | 267,891 | ||||||
| 8,960 | ACI Worldwide, Inc.a | 180,723 | ||||||
| 6,040 | Acxiom Corporationa | 122,431 | ||||||
| 48,550 | Advanced Micro Devices, Inc.a,b | 129,628 | ||||||
| 3,450 | Advent Software, Inc. | 105,708 | ||||||
| 7,200 | ANSYS, Inc.a | 590,400 | ||||||
| 6,100 | AOL, Inc.a | 281,637 | ||||||
| 10,300 | Arris Group, Inc.a | 310,957 | ||||||
| 7,570 | Arrow Electronics, Inc.a | 438,227 | ||||||
| 32,720 | Atmel Corporationa | 274,684 | ||||||
| 10,720 | Avnet, Inc. | 461,174 | ||||||
| 3,350 | Belden, Inc. | 264,014 | ||||||
| 9,350 | Broadridge Financial Solutions, Inc. | 431,783 | ||||||
| 22,930 | Cadence Design Systems, Inc.a | 434,982 | ||||||
| 12,550 | CDK Global, Inc. | 511,538 | ||||||
| 8,350 | Ciena Corporationa | 162,074 | ||||||
| 6,800 | Cognex Corporationa | 281,044 | ||||||
| 3,400 | CommVault Systems, Inc.a | 175,746 | ||||||
| 7,850 | Convergys Corporation | 159,904 | ||||||
| 7,050 | CoreLogic, Inc.a | 222,709 | ||||||
| 9,350 | Cree, Inc.a,b | 301,257 | ||||||
| 11,600 | Cypress Semiconductor Corporationb | 165,648 | ||||||
| 5,030 | Diebold, Inc.b | 174,239 | ||||||
| 2,310 | DST Systems, Inc. | 217,487 | ||||||
| 4,247 | Equinix, Inc. | 962,922 | ||||||
| 3,050 | FactSet Research Systems, Inc. | 429,288 | ||||||
| 2,500 | Fair Isaac Corporation | 180,750 | ||||||
| 9,350 | Fairchild Semiconductor International, Inc.a | 157,828 | ||||||
| 3,250 | FEI Company | 293,638 | ||||||
| 10,850 | Fortinet, Inc.a | 332,661 | ||||||
| 6,900 | Gartner, Inc.a | 581,049 | ||||||
| 5,250 | Global Payments, Inc. | 423,833 | ||||||
| 8,550 | Informatica Corporationa | 326,054 | ||||||
| 12,150 | Ingram Micro, Inc.a | 335,826 | ||||||
| 11,600 | Integrated Device Technology, Inc.a | 227,360 | ||||||
| 2,950 | InterDigital, Inc. | 156,055 | ||||||
| 5,550 | International Rectifier Corporationa | 221,445 | ||||||
| 10,100 | Intersil Corporation | 146,147 | ||||||
| 2,750 | IPG Photonics Corporationa,b | 206,030 | ||||||
| 3,050 | Itron, Inc.a | 128,985 | ||||||
| 15,150 | Jabil Circuit, Inc. | 330,724 | ||||||
| 6,460 | Jack Henry & Associates, Inc. | 401,424 | ||||||
| 18,100 | JDS Uniphase Corporationa | 248,332 | ||||||
| 13,100 | Keysight Technologies, Inc.a | 442,387 | ||||||
| 6,650 | Knowles Corporationa | 156,608 | ||||||
| 4,875 | Leidos Holdings, Inc. | 212,160 | ||||||
| 4,800 | Lexmark International, Inc. | 198,096 | ||||||
| 7,670 | Mentor Graphics Corporation | 168,126 | ||||||
| 7,812 | National Instruments Corporation | 242,875 | ||||||
| 13,100 | NCR Corporationa | 381,734 | ||||||
| 4,300 | NeuStar, Inc.a,b | 119,540 | ||||||
| 3,340 | Plantronics, Inc. | 177,087 | ||||||
| 10,690 | Polycom, Inc.a | 144,315 | ||||||
| 9,100 | PTC, Inc.a | 333,515 | ||||||
| 9,300 | Rackspace Hosting, Inc.a | 435,333 | ||||||
| 45,190 | RF Micro Devices, Inc.a | 749,702 | ||||||
| 12,150 | Riverbed Technology, Inc.a | 247,982 | ||||||
| 7,440 | Rovi Corporationa | 168,070 | ||||||
| 3,164 | Science Applications International Corporation | 156,713 | ||||||
| 5,290 | Semtech Corporationa | 145,845 | ||||||
| 3,100 | Silicon Laboratories, Inc.a | 147,622 | ||||||
| 14,900 | Skyworks Solutions, Inc. | 1,083,379 | ||||||
| 5,150 | Solarwinds, Inc.a | 256,625 | ||||||
| 5,350 | Solera Holdings, Inc. | 273,813 | ||||||
| 19,850 | SunEdison, Inc.a,b | 387,274 | ||||||
| 12,180 | Synopsys, Inc.a | 529,465 | ||||||
| 2,980 | Tech Data Corporationa | 188,425 | ||||||
| 16,950 | Teradyne, Inc. | 335,440 | ||||||
| 20,250 | Trimble Navigation, Ltd.a | 537,435 | ||||||
| 2,600 | Tyler Technologies, Inc.a | 284,544 | ||||||
| 2,200 | Ultimate Software Group, Inc.a | 322,993 | ||||||
| 8,900 | VeriFone Systems, Inc.a | 331,080 | ||||||
| 10,570 | Vishay Intertechnology, Inc. | 149,565 | ||||||
| 3,000 | WEX, Inc.a | 296,760 | ||||||
| 3,950 | Zebra Technologies Corporationa | 305,769 | ||||||
|
| |||||||
Total | 22,666,513 | |||||||
|
| |||||||
| Materials (6.5%) |
| ||||||
| 6,120 | Albemarle Corporation | 367,996 | ||||||
| 5,100 | AptarGroup, Inc. | 340,884 | ||||||
| 5,050 | Ashland, Inc. | 604,788 | ||||||
| 7,800 | Bemis Company, Inc. | 352,638 | ||||||
| 5,040 | Cabot Corporation | 221,054 | ||||||
| 4,150 | Carpenter Technology Corporation | 204,387 | ||||||
| 12,050 | Cliffs Natural Resources, Inc.b | 86,037 | ||||||
| 9,200 | Commercial Metals Company | 149,868 | ||||||
| 2,600 | Compass Minerals International, Inc. | 225,758 | ||||||
| 5,620 | Cytec Industries, Inc. | 259,475 | ||||||
| 5,050 | Domtar Corporation | 203,111 | ||||||
| 3,900 | Eagle Materials, Inc. | 296,517 | ||||||
| 2,600 | Greif, Inc. | 122,798 | ||||||
| 11,100 | Louisiana-Pacific Corporationa,b | 183,816 | ||||||
| 2,710 | Minerals Technologies, Inc. | 188,209 | ||||||
| 850 | NewMarket Corporation | 343,001 | ||||||
| 6,150 | Olin Corporation | 140,036 | ||||||
| 7,700 | Packaging Corporation of America | 600,985 | ||||||
The accompanying Notes to Financial Statements are an integral part of this schedule.
249
Table of Contents
MID CAP INDEX PORTFOLIO
Schedule of Investments as of December 31, 2014
| Shares | Common Stock (88.0%) | Value | ||||||
| Materials (6.5%) - continued |
| ||||||
| 7,150 | PolyOne Corporation | $ | 271,056 | |||||
| 6,050 | Reliance Steel & Aluminum Company | 370,684 | ||||||
| 11,000 | Rock-Tenn Company | 670,780 | ||||||
| 5,150 | Royal Gold, Inc. | 322,905 | ||||||
| 10,450 | RPM International, Inc. | 529,920 | ||||||
| 3,450 | Scotts Miracle-Gro Company | 215,004 | ||||||
| 3,780 | Sensient Technologies Corporation | 228,085 | ||||||
| 3,400 | Silgan Holdings, Inc. | 182,240 | ||||||
| 7,930 | Sonoco Products Company | 346,541 | ||||||
| 18,750 | Steel Dynamics, Inc. | 370,125 | ||||||
| 3,000 | Timkensteel Corporation | 111,090 | ||||||
| 11,350 | United States Steel Corporationb | 303,499 | ||||||
| 6,010 | Valspar Corporation | 519,745 | ||||||
| 3,950 | Worthington Industries, Inc. | 118,855 | ||||||
|
| |||||||
Total | 9,451,887 | |||||||
|
| |||||||
| Telecommunications Services (0.1%) |
| ||||||
| 7,695 | Telephone & Data Systems, Inc. | 194,299 | ||||||
|
| |||||||
Total | 194,299 | |||||||
|
| |||||||
| Utilities (4.3%) |
| ||||||
| 8,650 | Alliant Energy Corporation | 574,533 | ||||||
| 13,832 | Aqua America, Inc. | 369,314 | ||||||
| 7,850 | Atmos Energy Corporation | 437,559 | ||||||
| 3,500 | Black Hills Corporation | 185,640 | ||||||
| 4,700 | Cleco Corporation | 256,338 | ||||||
| 12,013 | Great Plains Energy, Inc. | 341,289 | ||||||
| 8,030 | Hawaiian Electric Industries, Inc. | 268,844 | ||||||
| 3,930 | IDACORP, Inc. | 260,127 | ||||||
| 15,175 | MDU Resources Group, Inc. | 356,613 | ||||||
| 6,550 | National Fuel Gas Company | 455,422 | ||||||
| 15,580 | OGE Energy Corporation | 552,778 | ||||||
| 4,100 | ONE Gas, Inc. | 169,002 | ||||||
| 6,225 | PNM Resources, Inc. | 184,447 | ||||||
| 13,700 | Questar Corporation | 346,336 | ||||||
| 13,500 | UGI Corporation | 512,730 | ||||||
| 6,440 | Vectren Corporation | 297,721 | ||||||
| 10,220 | Westar Energy, Inc. | 421,473 | ||||||
| 3,910 | WGL Holdings, Inc. | 213,564 | ||||||
|
| |||||||
Total | 6,203,730 | |||||||
|
| |||||||
Total Common Stock (cost $83,510,842) | 127,685,744 | |||||||
|
| |||||||
Collateral Held for Securities Loaned (4.0%) | ||||||||
| 5,801,543 | Thrivent Cash Management Trust | 5,801,543 | ||||||
|
| |||||||
Total Collateral Held for Securities Loaned (cost $5,801,543) | 5,801,543 | |||||||
|
| |||||||
| Shares or Principal Amount | Short-Term Investments (12.3%)c | |||||||
Federal Home Loan Bank Discount Notes | ||||||||
| 100,000 | 0.160%, 4/6/2015d | 99,958 | ||||||
| 700,000 | 0.090%, 4/24/2015d | 699,802 | ||||||
Federal National Mortgage Association | ||||||||
| 100,000 | 0.080%, 2/17/2015d | 99,989 | ||||||
| 16,844,745 | Thrivent Cash Management Trust 0.060% | 16,844,745 | ||||||
|
| |||||||
Total Short-Term Investments (at amortized cost) | 17,744,494 | |||||||
|
| |||||||
Total Investments (cost $107,056,879) 104.3% | $ | 151,231,781 | ||||||
|
| |||||||
Other Assets and Liabilities, Net (4.3%) | (6,168,293 | ) | ||||||
|
| |||||||
Total Net Assets 100.0% | $ | 145,063,488 | ||||||
|
| |||||||
| a | Non-income producing security. |
| b | All or a portion of the security is on loan. |
| c | The interest rate shown reflects the yield, coupon rate or the discount rate at the date of purchase. |
| d | At December 31, 2014, $899,749 of investments were held on deposit with the counterparty and pledged as the initial margin deposit for open futures contracts. |
Definitions:
REIT | - | Real Estate Investment Trust is a company that buys, develops, manages and/or sells real estate assets. |
Unrealized Appreciation (Depreciation)
Gross unrealized appreciation and depreciation of investments, based on cost for federal income tax purposes, were as follows:
Gross unrealized appreciation | $ | 46,234,415 | ||
Gross unrealized depreciation | (3,491,465 | ) | ||
|
| |||
Net unrealized appreciation (depreciation) | $ | 42,742,950 | ||
Cost for federal income tax purposes | $ | 108,488,831 | ||
The accompanying Notes to Financial Statements are an integral part of this schedule.
250
Table of Contents
MID CAP INDEX PORTFOLIO
Schedule of Investments as of December 31, 2014
Fair Valuation Measurements
The following table is a summary of the inputs used, as of December 31, 2014, in valuing Mid Cap Index Portfolio’s assets carried at fair value.
Investments in Securities | Total | Level 1 | Level 2 | Level 3 | ||||||||||||
Common Stock | ||||||||||||||||
Consumer Discretionary | 17,694,886 | 17,694,886 | ||||||||||||||
Consumer Staples | 4,364,336 | 4,364,336 | — | — | ||||||||||||
Energy | 5,147,403 | 5,147,403 | — | — | ||||||||||||
Financials | 29,557,889 | 29,557,889 | — | — | ||||||||||||
Health Care | 13,113,323 | 13,113,323 | — | — | ||||||||||||
Industrials | 19,291,478 | 19,291,478 | — | — | ||||||||||||
Information Technology | 22,666,513 | 22,666,513 | — | — | ||||||||||||
Materials | 9,451,887 | 9,451,887 | — | — | ||||||||||||
Telecommunications Services | 194,299 | 194,299 | — | — | ||||||||||||
Utilities | 6,203,730 | 6,203,730 | — | — | ||||||||||||
Collateral Held for Securities Loaned | 5,801,543 | 5,801,543 | — | — | ||||||||||||
Short-Term Investments | 17,744,494 | 16,844,745 | 899,749 | — | ||||||||||||
|
|
|
|
|
|
|
| |||||||||
Total | $151,231,781 | $ | 150,332,032 | $ | 899,749 | $ | — | |||||||||
|
|
|
|
|
|
|
| |||||||||
Other Financial Instruments | Total | Level 1 | Level 2 | Level 3 | ||||||||||||
Asset Derivatives | ||||||||||||||||
Futures Contracts | 615,326 | 615,326 | ||||||||||||||
|
|
|
|
|
|
|
| |||||||||
Total Asset Derivatives | $ | 615,326 | $ | 615,326 | $ | — | $ | — | ||||||||
|
|
|
|
|
|
|
| |||||||||
There were no significant transfers between Levels during the period ended December 31, 2014. Transfers between Levels are identified as of the end of the period.
Futures Contracts | Number of Contracts Long/(Short) | Expiration Date | Notional Principal Amount | Value | Unrealized Gain/(Loss) | |||||||||||||||
S&P 400 Index Mini-Futures | 121 | March 2015 | $ | 16,912,734 | $ | 17,528,060 | $ | 615,326 | ||||||||||||
Total Futures Contracts | $ | 615,326 | ||||||||||||||||||
The following table summarizes the fair value and Statement of Assets and Liabilities location, as of December 31, 2014, for Mid Cap Index Portfolio’s investments in financial derivative instruments by primary risk exposure as discussed under item (2) Significant Accounting Policies of the Notes to Financial Statements.
Derivatives by risk category | Statement of Assets and Liabilities Location | Fair Value | ||||
Asset Derivatives | ||||||
Equity Contracts | ||||||
Futures* | Net Assets - Net unrealized appreciation/(depreciation) on Futures contracts | $ | 615,326 | |||
Total Equity Contracts | 615,326 | |||||
|
| |||||
Total Asset Derivatives | $ | 615,326 | ||||
|
| |||||
| * | Includes cumulative appreciation/depreciation of futures contracts as reported in the Schedule of Investments. Only current day’s variation margin is reported within the Statement of Assets and Liabilities. |
The following table summarizes the net realized gains/(losses) and Statement of Operations location, for the period ended December 31, 2014, for Mid Cap Index Portfolio’s investments in financial derivative instruments by primary risk exposure.
Derivatives by risk category | Statement of Operations Location | Realized Gains/(Losses) recognized in Income | ||||
Equity Contracts | ||||||
Futures | Net realized gains/(losses) on Futures contracts | 455,073 | ||||
Total Equity Contracts | 455,073 | |||||
|
| |||||
Total | $ | 455,073 | ||||
|
| |||||
The accompanying Notes to Financial Statements are an integral part of this schedule.
251
Table of Contents
MID CAP INDEX PORTFOLIO
Schedule of Investments as of December 31, 2014
The following table summarizes the change in net unrealized appreciation/(depreciation) and Statement of Operations location, for the period ended December 31, 2014, for Mid Cap Index Portfolio’s investments in financial derivative instruments by primary risk exposure.
Derivatives by risk category | Statement of Operations Location | Change in unrealized appreciation/(depreciation) recognized in Income | ||||
Equity Contracts | ||||||
Futures | Change in net unrealized appreciation/(depreciation) on Futures contracts | 465,928 | ||||
Total Equity Contracts | 465,928 | |||||
|
| |||||
Total | $ | 465,928 | ||||
|
| |||||
The following table presents Mid Cap Index Portfolio’s average volume of derivative activity during the period ended December 31, 2014.
Derivative Risk Category | Futures (Notional)* | Futures (Percentage of Average Net Assets) | ||||||
Equity Contracts | $ | 10,596,125 | 8.0 | % | ||||
| * | Notional amount represents long or short, or both, derivative positions held by the Portfolio. |
Investment in Affiliates
Affiliated issuers, as defined under the Investment Company Act of 1940, include those in which the Portfolio’s holdings of an issuer represent 5% or more of the outstanding voting securities of an issuer, or any affiliated mutual fund.
A summary of transactions for the fiscal year to date, in Mid Cap Index Portfolio, is as follows:
Portfolio | Value December 31, 2013 | Gross Purchases | Gross Sales | Shares Held at December 31, 2014 | Value December 31, 2014 | Income Earned January 1, 2014 - December 31, 2014 | ||||||||||||||||||
Cash Management Trust-Collateral Investment | $ | 8,155,102 | $ | 32,366,837 | $ | 34,720,396 | 5,801,543 | $ | 5,801,543 | $ | 69,325 | |||||||||||||
Cash Management Trust-Short Term Investment | 4,174,053 | 23,712,452 | 11,041,760 | 16,844,745 | 16,844,745 | 5,147 | ||||||||||||||||||
Total Value and Income Earned | 12,329,155 | 22,646,288 | 74,472 | |||||||||||||||||||||
The accompanying Notes to Financial Statements are an integral part of this schedule.
252
Table of Contents
PARTNER WORLDWIDE ALLOCATION PORTFOLIO
Schedule of Investments as of December 31, 2014
| Shares | Common Stock (86.8%) | Value | ||||||
| Australia (2.9%) | |||||||
| 25,542 | Abacus Property Group | $ | 61,702 | |||||
| 1,217,554 | Beach Energy, Ltd. | 1,032,431 | ||||||
| 355,361 | BHP Billiton, Ltd. | 8,401,671 | ||||||
| 31,122 | BT Investment Management, Ltd. | 169,766 | ||||||
| 129,799 | Cabcharge Australia, Ltd. | 480,367 | ||||||
| 302,578 | Challenger, Ltd. | 1,598,380 | ||||||
| 117,499 | Charter Hall Group | 430,647 | ||||||
| 81,078 | Cover-More Group, Ltd. | 124,902 | ||||||
| 1,224,575 | CSR, Ltd. | 3,868,960 | ||||||
| 66,096 | Domino’s Pizza Enterprises, Ltd. | 1,345,783 | ||||||
| 499,628 | Downer EDI, Ltd. | 1,909,329 | ||||||
| 625,320 | Echo Entertainment Group, Ltd. | 1,919,462 | ||||||
| 139,017 | Goodman Fielder, Ltd. | 72,636 | ||||||
| 40,444 | GUD Holdings, Ltd. | 237,853 | ||||||
| 239,387 | iiNet, Ltd. | 1,529,670 | ||||||
| 2,153,575 | Incitec Pivot, Ltd. | 5,570,690 | ||||||
| 82,123 | Independence Group NL | 294,073 | ||||||
| 271,486 | Investa Office Fund | 801,488 | ||||||
| 229,803 | M2 Telecommunications Group, Ltd. | 1,517,300 | ||||||
| 67,941 | Macquarie Group, Ltd. | 3,203,883 | ||||||
| 13,136 | Monadelphous Group, Ltd. | 99,904 | ||||||
| 630,364 | Mount Gibson Iron, Ltd. | 123,671 | ||||||
| 34,239 | Nufarm, Ltd. | 131,665 | ||||||
| 34,883 | OZ Minerals, Ltd. | 97,863 | ||||||
| 30,019 | Premier Investments, Ltd. | 239,883 | ||||||
| 36,285 | Primary Health Care, Ltd. | 138,836 | ||||||
| 94,518 | Ramsay Health Care, Ltd. | 4,381,683 | ||||||
| 71,627 | RCR Tomlinson, Ltd. | 128,562 | ||||||
| 219,320 | Shopping Centres Australasia Property Group | 330,243 | ||||||
| 497,372 | Sigma Pharmaceuticals, Ltd. | 298,572 | ||||||
| 4,861 | Sirtex Medical, Ltd. | 111,969 | ||||||
| 128,214 | Slater & Gordon, Ltd. | 664,940 | ||||||
| 260,420 | Spark Infrastructure Group | 451,087 | ||||||
| 25,652 | Tassal Group, Ltd. | 81,599 | ||||||
| 11,816 | Thorn Group, Ltd. | 29,884 | ||||||
| 22,636 | Village Roadshow, Ltd. | 110,703 | ||||||
| 207,932 | Woolworths, Ltd. | 5,167,029 | ||||||
|
| |||||||
| Total | 47,159,086 | |||||||
|
| |||||||
| Austria (0.8%) | |||||||
| 178,751 | AMS AG | 6,461,846 | ||||||
| 54,085 | CA Immobilien Anlagen AGa | 1,011,510 | ||||||
| 5,576 | Flughafen Wien Aktiengesellschaft | 518,324 | ||||||
| 15,541 | Osterreichische Post AG | 759,364 | ||||||
| 84,690 | Voestalpine AG | 3,346,372 | ||||||
|
| |||||||
| Total | 12,097,416 | |||||||
|
| |||||||
| Belgium (0.8%) | |||||||
| 88,461 | Anheuser-Busch InBev NV | 9,955,548 | ||||||
| 2,511 | Befimmo SA | 182,969 | ||||||
| 61,243 | bpost SA | 1,538,461 | ||||||
| 4,957 | Compagnie Maritime Belge | 91,466 | ||||||
| 23,656 | Exmar NV | 294,080 | ||||||
| 4,595 | Ion Beam Applications SAa | 79,733 | ||||||
| 8,465 | Kinepolis Group NV | 342,734 | ||||||
| 10,669 | Melexis NV | 482,767 | ||||||
|
| |||||||
| Total | 12,967,758 | |||||||
|
| |||||||
| Bermuda (0.9%) | |||||||
| 251,273 | Catlin Group, Ltd. | 2,617,483 | ||||||
| 176,675 | Jardine Matheson Holdings, Ltd. | 10,735,543 | ||||||
| 42,500 | Orient Overseas International, Ltd. | 247,443 | ||||||
| 1,306,000 | Pacific Basin Shipping, Ltd. | 522,444 | ||||||
|
| |||||||
| Total | 14,122,913 | |||||||
|
| |||||||
| Brazil (1.1%) | |||||||
| 401,300 | Ambev SA | 2,468,307 | ||||||
| 185,652 | Banco Bradesco SA ADR | 2,482,168 | ||||||
| 313,300 | Embraer SA | 2,880,540 | ||||||
| 349,800 | Even Construtora e Incorporadora SA | 715,865 | ||||||
| 44,800 | lochpe-Maxion SA | 205,613 | ||||||
| 157,600 | Itau Unibanco Holding SA | 2,051,373 | ||||||
| 37,849 | Lojas Renner SA | 1,088,824 | ||||||
| 47,962 | Multiplan Empreendimentos Imobiliarios SA | 855,962 | ||||||
| 56,900 | Natura Cosmeticos SA | 681,764 | ||||||
| 120,696 | Souza Cruz SA | 877,228 | ||||||
| 89,000 | Ultrapar Participacoes SA ADR | 1,697,230 | ||||||
| 133,490 | Vale SA ADRb | 1,091,948 | ||||||
| 72,900 | WEG SA | 839,192 | ||||||
|
| |||||||
| Total | 17,936,014 | |||||||
|
| |||||||
| Canada (3.5%) | |||||||
| 170,181 | Alimentation Couche-Tard, Inc. | 7,132,134 | ||||||
| 474,600 | Bankers Petroleum, Ltd.a | 1,331,723 | ||||||
| 73,581 | Baytex Energy Corporationb | 1,223,606 | ||||||
| 168,954 | Brookfield Asset Management, Inc. | 8,466,605 | ||||||
| 51,740 | Canadian Imperial Bank of Commerceb | 4,446,309 | ||||||
| 108,146 | Canadian National Railway Company | 7,448,651 | ||||||
| 192,251 | Canadian Natural Resources, Ltd. | 5,943,928 | ||||||
| 22,300 | Canadian Tire Corporation, Ltd. | 2,355,915 | ||||||
| 89,473 | Entertainment One, Ltd. | 447,102 | ||||||
| 61,686 | Magna International, Inc. | 6,684,154 | ||||||
| 52,705 | Metro, Inc. | 4,232,550 | ||||||
| 45,616 | Open Text Corporation | 2,654,586 | ||||||
| 65,874 | Royal Bank of Canadab | 4,549,604 | ||||||
|
| |||||||
| Total | 56,916,867 | |||||||
|
| |||||||
| Chile (0.1%) | |||||||
| 2,184,674 | Aguas Andinas SA | 1,251,415 | ||||||
| 46,315 | Banco Santander Chile SA ADR | 913,332 | ||||||
|
| |||||||
| Total | 2,164,747 | |||||||
|
| |||||||
| China (1.5%) | |||||||
| 1,864,000 | Air China, Ltd. | 1,503,965 | ||||||
| 637,000 | Anhui Conch Cement Company, Ltd.b | 2,358,407 | ||||||
| 1,483,000 | China Construction Bank Corporation | 1,211,289 | ||||||
| 1,111,500 | China Shenhua Energy Company, Ltd. | 3,279,939 | ||||||
| 1,964,000 | CNOOC, Ltd. | 2,655,660 | ||||||
| 2,102,000 | Dongfeng Motor Group Company, Ltd. | 2,940,326 | ||||||
| 1,956,216 | FIH Mobile, Ltd.a | 877,111 | ||||||
| 291,000 | Haitian International Holdings, Ltd. | 609,905 | ||||||
| 3,237,725 | Lenovo Group, Ltd. | 4,227,217 | ||||||
| 4,170,000 | PetroChina Company, Ltd. | 4,629,062 | ||||||
|
| |||||||
| Total | 24,292,881 | |||||||
|
| |||||||
| Colombia (0.1%) | |||||||
| 40,045 | Bancolombia SA ADRb | 1,917,355 | ||||||
|
| |||||||
| Total | 1,917,355 | |||||||
|
| |||||||
| Cyprus (<0.1%) | |||||||
| 68,855 | Globaltrans Investment plc | 345,872 | ||||||
|
| |||||||
| Total | 345,872 | |||||||
|
| |||||||
The accompanying Notes to Financial Statements are an integral part of this schedule.
253
Table of Contents
PARTNER WORLDWIDE ALLOCATION PORTFOLIO
Schedule of Investments as of December 31, 2014
| Shares | Common Stock (86.8%) | Value | ||||||
| Czech Republic (0.3%) | |||||||
| 66,688 | CEZ AS | $ | 1,712,407 | |||||
| 16,449 | Komercni Banka AS | 3,385,224 | ||||||
|
| |||||||
| Total | 5,097,631 | |||||||
|
| |||||||
| Denmark (1.3%) | |||||||
| 1,818 | A P Moller - Maersk AS | 3,615,915 | ||||||
| 7,418 | Aktieselskbet Schouw & Company | 348,494 | ||||||
| 348,425 | Danske Bank AS | 9,419,970 | ||||||
| 47,093 | Novo Nordisk AS | 1,992,024 | ||||||
| 27,814 | Pandora AS | 2,254,524 | ||||||
| 15,057 | Royal Unibrew ASa | 2,639,541 | ||||||
| 2,333 | Topdanmark ASa | 75,721 | ||||||
| 8,120 | Zealand Pharma ASa | 109,508 | ||||||
|
| |||||||
| Total | 20,455,697 | |||||||
|
| |||||||
| Faroe Islands (0.1%) | |||||||
| 38,815 | Bakkafrost PF | 872,094 | ||||||
|
| |||||||
| Total | 872,094 | |||||||
|
| |||||||
| Finland (0.4%) | |||||||
| 67,733 | Orion OYJ | 2,106,535 | ||||||
| 19,156 | Ramirent OYJ | 148,489 | ||||||
| 38,276 | Sponda OYJ | 166,610 | ||||||
| 419,528 | Stora Enso OYJ | 3,750,995 | ||||||
| 6,635 | Tieto OYJ | 171,946 | ||||||
|
| |||||||
| Total | 6,344,575 | |||||||
|
| |||||||
| France (5.9%) | |||||||
| 9,693 | ABC Arbitrage | 54,892 | ||||||
| 63,450 | Air France-KLMa | 608,011 | ||||||
| 11,793 | Assystem | 248,480 | ||||||
| 603,335 | AXA SA | 13,902,707 | ||||||
| 33,402 | Belvedere SAa | 436,499 | ||||||
| 6,441 | Boiron SA | 544,160 | ||||||
| 4,123 | Bourbon SA | 95,790 | ||||||
| 172,573 | Cap Gemini SA | 12,341,964 | ||||||
| 6,200 | Cegid Group | 226,645 | ||||||
| 56,950 | Christian Dior SA | 9,746,342 | ||||||
| 278,137 | Compagnie de Saint-Gobain | 11,782,149 | ||||||
| 4,130 | Euler Hermes Group | 427,667 | ||||||
| 396,125 | GDF Suez | 9,237,278 | ||||||
| 43,775 | Havas SA | 357,452 | ||||||
| 3,224 | Hermes Internationalb | 1,148,013 | ||||||
| 21,178 | Ingenico | 2,230,863 | ||||||
| 26,106 | Ipsen SA | 1,351,288 | ||||||
| 2,602 | Ipsos SA | 74,668 | ||||||
| 45,381 | Mercialys SA | 1,012,329 | ||||||
| 10,181 | Metropole Television SA | 191,908 | ||||||
| 618,472 | Natixis | 4,081,072 | ||||||
| 26,262 | Neopost SA | 1,498,193 | ||||||
| 168,319 | Orange SA | 2,862,561 | ||||||
| 43,226 | Orpea | 2,705,649 | ||||||
| 14,913 | Saft Groupe SA | 452,345 | ||||||
| 1,959 | Societe de la Tour Eiffela | 103,685 | ||||||
| 292,204 | Technicolor SAa | 1,631,099 | ||||||
| 3,959 | Teleperformance SA | 269,490 | ||||||
| 68,958 | Thales SA | 3,731,133 | ||||||
| 147,000 | Total SA | 7,531,126 | ||||||
| 17,972 | Valneva SEa | 91,492 | ||||||
| 4,190 | Vicat SA | 300,825 | ||||||
| 77,689 | Vinci SA | 4,242,026 | ||||||
|
| |||||||
| Total | 95,519,801 | |||||||
|
| |||||||
| Germany (5.1%) | |||||||
| 4,292 | Aareal Bank AG | 171,439 | ||||||
| 5,864 | Alstria Office REIT AGa | 72,811 | ||||||
| 13,998 | Aurelius AG | 529,772 | ||||||
| 34,661 | Bayer AG | 4,724,600 | ||||||
| 613 | Bechtle AG | 48,589 | ||||||
| 3,043 | Biotest AG | 344,228 | ||||||
| 108,575 | Borussia Dortmund GmbH & Company KGaA | 507,921 | ||||||
| 11,207 | Centrotec Sustainable AG | 192,514 | ||||||
| 6,185 | Comdirect Bank AG | 62,201 | ||||||
| 20,525 | Continental AG | 4,329,202 | ||||||
| 15,994 | CTS Eventim AG & Company KGaA | 471,213 | ||||||
| 158,190 | Daimler AG | 13,138,353 | ||||||
| 7,956 | Deutsche Beteiligungs AG | 243,431 | ||||||
| 27,421 | Deutsche EuroShop AG | 1,197,622 | ||||||
| 194,102 | Deutsche Post AG | 6,300,937 | ||||||
| 72,604 | Duerr AG | 6,380,461 | ||||||
| 2,462 | Freenet AG | 70,000 | ||||||
| 80,787 | Fresenius SE & Company KGaA | 4,200,453 | ||||||
| 18,792 | Gerresheimer AG | 1,023,655 | ||||||
| 47,471 | Hochtief AG | 3,349,011 | ||||||
| 6,498 | Homag Group AG | 235,888 | ||||||
| 3,733 | Krones AG | 362,991 | ||||||
| 60,526 | KUKA AGb | 4,281,150 | ||||||
| 17,869 | MorphoSys AGa | 1,664,625 | ||||||
| 1,643 | Nemetschek AG | 165,499 | ||||||
| 3,051 | Nordex SEa | 54,433 | ||||||
| 1,713 | R. Stahl AB | 81,897 | ||||||
| 128,923 | Rhoen-Klinikum AG | 3,613,295 | ||||||
| 8,672 | SAP SE ADRb | 605,553 | ||||||
| 39,989 | Siemens AG | 4,486,931 | ||||||
| 12,179 | Sixt SE | 473,927 | ||||||
| 1,869 | STRATEC Biomedical AG | 103,456 | ||||||
| 14,350 | Symrise AG | 864,520 | ||||||
| 15,132 | Takkt AG | 247,569 | ||||||
| 388,200 | ThyssenKrupp AG | 9,888,969 | ||||||
| 224,739 | TUI AGa | 3,611,376 | ||||||
| 90,271 | United Internet AG | 4,066,259 | ||||||
| 4,109 | Wacker Neuson SE | 83,484 | ||||||
|
| |||||||
| Total | 82,250,235 | |||||||
|
| |||||||
| Hong Kong (3.2%) | |||||||
| 530,800 | AlA Group, Ltd. | 2,927,610 | ||||||
| 859,000 | BOC Hong Kong (Holdings), Ltd. | 2,862,309 | ||||||
| 482,000 | Brightoil Petroleum Holdings, Ltd.a | 120,760 | ||||||
| 167,000 | Cheung Kong Holdings, Ltd. | 2,796,720 | ||||||
| 741,300 | China Mobile, Ltd. | 8,682,659 | ||||||
| 24,000 | Chow Sang Sang Holdings International, Ltd. | 63,003 | ||||||
| 34,400 | Dah Sing Banking Group, Ltd. | 54,992 | ||||||
| 115,200 | Dah Sing Financial Holdings, Ltd. | 669,154 | ||||||
| 147,409 | Dickson Concepts, Ltd. | 72,771 | ||||||
| 205,000 | Emperor Entertainment Hotel, Ltd. | 49,357 | ||||||
| 343,100 | Esprit Holdings, Ltd. | 409,280 | ||||||
| 650,000 | Global Brands Group Holding, Ltd.a | 126,926 | ||||||
| 44,000 | Great Eagle Holdings, Ltd. | 142,773 | ||||||
| 4,796,725 | Guangzhou Automobile Group Company, Ltd. | 4,337,052 | ||||||
| 176,000 | Guotai Junan International Holdings, Ltd. | 132,657 | ||||||
| 365,000 | Hang Lung Group, Ltd. | 1,655,131 | ||||||
| 1,268,000 | HKT Trust and HKT, Ltd. | 1,651,499 | ||||||
| 681,900 | Hutchison Whampoa, Ltd. | 7,795,186 | ||||||
| 64,000 | Luk Fook Holdings International, Ltd. | 240,008 | ||||||
| 3,973,647 | New World Development Company, Ltd. | 4,561,784 | ||||||
The accompanying Notes to Financial Statements are an integral part of this schedule.
254
Table of Contents
PARTNER WORLDWIDE ALLOCATION PORTFOLIO
Schedule of Investments as of December 31, 2014
| Shares | Common Stock (86.8%) | Value | ||||||
| Hong Kong (3.2%) - continued | |||||||
| 416,000 | NewOcean Energy Holdings, Ltd. | $ | 159,722 | |||||
| 3,613,000 | PCCW, Ltd. | 2,460,059 | ||||||
| 433,000 | Samson Holding, Ltd. | 60,368 | ||||||
| 344,000 | Shenzhou International Group Holdings, Ltd. | 1,133,649 | ||||||
| 1,044,000 | Shun Tak Holdings, Ltd. | 481,284 | ||||||
| 973,500 | Sinotruk Hong Kong, Ltd. | 542,737 | ||||||
| 103,000 | SmarTone Telecommunications Holdings, Ltd. | 172,390 | ||||||
| 53,000 | Sun Hung Kai & Company, Ltd. | 40,240 | ||||||
| 250,000 | Sunlight Real Estate Investment Trust | 112,734 | ||||||
| 113,000 | Swire Pacific, Ltd., Class A | 1,466,794 | ||||||
| 340,000 | Swire Pacific, Ltd., Class B | 808,986 | ||||||
| 78,700 | Swire Properties, Ltd. | 231,568 | ||||||
| 80,000 | Texwinca Holdings, Ltd. | 69,071 | ||||||
| 1,144,000 | Truly International Holdings, Ltd. | 457,548 | ||||||
| 690,000 | United Laboratories International Holdingsa | 401,071 | ||||||
| 13,700 | VTech Holdings, Ltd. | 196,455 | ||||||
| 349,000 | Weichai Power Company, Ltd. | 1,462,947 | ||||||
| 410,000 | Wheelock and Company, Ltd. | 1,903,606 | ||||||
|
| |||||||
| Total | 51,512,860 | |||||||
|
| |||||||
| Hungary (0.3%) | |||||||
| 206,625 | OTP Bank Nyrt | 2,980,463 | ||||||
| 82,000 | Richter Gedeon Nyrt | 1,104,292 | ||||||
|
| |||||||
| Total | 4,084,755 | |||||||
|
| |||||||
| India (1.0%) | |||||||
| 7,344 | Grasim Industries, Ltd. | 392,954 | ||||||
| 8,000 | Grasim Industries, Ltd. GDR | 428,400 | ||||||
| 30,500 | Hero Motocorp, Ltd. | 1,496,592 | ||||||
| 122,000 | Hindustan Unilever, Ltd. | 1,466,146 | ||||||
| 150,741 | Housing Development Finance Corporation | 2,703,141 | ||||||
| 125,000 | ICICI Bank, Ltd. | 695,618 | ||||||
| 113,500 | ICICI Bank, Ltd. ADR | 1,310,925 | ||||||
| 46,000 | Infosys, Ltd. | 1,427,273 | ||||||
| 33,008 | Infosys, Ltd. ADRb | 1,038,432 | ||||||
| 299,542 | ITC, Ltd. | 1,744,943 | ||||||
| 72,549 | Reliance Industries, Ltd. GDRc | 2,024,731 | ||||||
| 20,696 | Ultra Tech Cement, Ltd. | 874,075 | ||||||
| 4,570 | Ultra Tech Cement, Ltd. GDR | 193,743 | ||||||
|
| |||||||
| Total | 15,796,973 | |||||||
|
| |||||||
| Indonesia (0.4%) | |||||||
| 5,486,000 | Astra International Tbk PT | 3,271,766 | ||||||
| 959,300 | Bank Mandiri Persero Tbk PT | 834,244 | ||||||
| 1,217,800 | Bank Rakyat Indonesia Persero Tbk PT | 1,144,708 | ||||||
| 781,300 | Indo Tambangraya Megah Tbk PT | 963,655 | ||||||
| 124,000 | Indocement Tunggal Prakarsa Tbk PT | 250,201 | ||||||
| 393,700 | United Tractors Tbk PT | 549,843 | ||||||
|
| |||||||
| Total | 7,014,417 | |||||||
|
| |||||||
| Ireland (0.5%) | |||||||
| 40,701 | Aer Lingus Group plc | 108,646 | ||||||
| 137,746 | Beazley plc | 613,238 | ||||||
| 36,948 | DCC plc | 2,034,105 | ||||||
| 12,711 | Grafton Group plc | 125,755 | ||||||
| 15,780 | Greencore Group plc | 70,093 | ||||||
| 488,314 | Henderson Group plc | 1,614,510 | ||||||
| 119,409 | Smurfit Kappa Group plc | 2,685,326 | ||||||
|
| |||||||
| Total | 7,251,673 | |||||||
|
| |||||||
| Israel (0.6%) | |||||||
| 5,905 | Delek Automotive Systems, Ltd. | 52,472 | ||||||
| 678,983 | Israel Chemicals, Ltd. | 4,885,408 | ||||||
| 54,464 | Plus500, Ltd. | 502,962 | ||||||
| 72,373 | Teva Pharmaceutical Industries, Ltd. ADR | 4,162,171 | ||||||
|
| |||||||
| Total | 9,603,013 | |||||||
|
| |||||||
| Italy (3.1%) | |||||||
| 22,635 | Acea SPA | 244,863 | ||||||
| 8,645 | Amplifon SPA | 51,300 | ||||||
| 53,587 | Ascopiave SPA | 117,708 | ||||||
| 495,560 | Assicurazioni Generali SPA | 10,175,285 | ||||||
| 40,607 | ASTM SPA | 469,209 | ||||||
| 36,252 | Banca IFIS SPA | 596,411 | ||||||
| 423,313 | Banca Popolare di Milano SCRLa | 275,761 | ||||||
| 709,544 | Beni Stabili SPA | 498,409 | ||||||
| 14,469 | Cairo Communication SPA | 84,834 | ||||||
| 87,822 | Cementir Holding SPA | 530,813 | ||||||
| 56,534 | Credito Emiliano SPA | 426,483 | ||||||
| 12,723 | De’Longhi | 229,752 | ||||||
| 863,925 | Enel SPA | 3,850,970 | ||||||
| 537,822 | Eni SPA | 9,420,779 | ||||||
| 82,470 | ERG SPA | 923,585 | ||||||
| 411,043 | Hera SPA | 967,912 | ||||||
| 13,482 | Industria Macchine Automatiche SPA | 589,183 | ||||||
| 6,233 | Interpump Group SPA | 87,458 | ||||||
| 4,893,613 | Intesa Sanpaolo SPA | 14,195,931 | ||||||
| 489,963 | IREN SPA | 535,808 | ||||||
| 307,522 | Recordati SPA | 4,767,634 | ||||||
| 2,455 | Reply SPA | 179,847 | ||||||
| 25,162 | Societa Iniziative Autostradali e Servizi SPA | 242,147 | ||||||
|
| |||||||
| Total | 49,462,082 | |||||||
|
| |||||||
| Japan (16.0%) | |||||||
| 3,000 | Aisan Industry Company, Ltd. | 25,665 | ||||||
| 7,600 | Alpen Company, Ltd. | 106,778 | ||||||
| 87,500 | Alpine Electronics, Inc. | 1,436,510 | ||||||
| 16,800 | AOKI Holdings, Inc. | 170,546 | ||||||
| 111,600 | Aoyama Trading Company, Ltd. | 2,438,452 | ||||||
| 6,100 | Asahi Diamond Industrial Company, Ltd. | 63,776 | ||||||
| 109,400 | Asahi Group Holdings, Ltd. | 3,384,544 | ||||||
| 20,900 | ASKA Pharmaceutical Company, Ltd. | 224,267 | ||||||
| 114,738 | Avex Group Holdings, Inc. | 1,876,484 | ||||||
| 132,700 | Bandai Namco Holdings, Inc. | 2,809,430 | ||||||
| 183,100 | Bridgestone Corporation | 6,350,264 | ||||||
| 122,700 | Brother Industries, Ltd. | 2,224,226 | ||||||
| 3,200 | C. Uyemura & Company, Ltd. | 149,647 | ||||||
| 21,800 | Canon Marketing Japan, Inc. | 369,458 | ||||||
| 18,200 | Capcom Company, Ltd. | 273,400 | ||||||
| 35,000 | Central Glass Company, Ltd. | 126,933 | ||||||
| 32,900 | Century Tokyo Leasing Corporation | 819,704 | ||||||
| 15,200 | Chiyoda Integre Company, Ltd. | 265,014 | ||||||
| 65,000 | Chugoku Marine Paints, Ltd. | 548,524 | ||||||
| 62,700 | CKD Corporation | 596,028 | ||||||
| 390,000 | Clarion Company, Ltd.a | 1,208,503 | ||||||
| 34,000 | Daido Metal Company, Ltd. | 341,254 | ||||||
| 121,000 | Daihen Corporation | 608,187 | ||||||
| 26,589 | Daiichikosho Company, Ltd. | 720,914 | ||||||
| 2,000 | Daikoku Denki Company, Ltd. | 29,695 | ||||||
The accompanying Notes to Financial Statements are an integral part of this schedule.
255
Table of Contents
PARTNER WORLDWIDE ALLOCATION PORTFOLIO
Schedule of Investments as of December 31, 2014
| Shares | Common Stock (86.8%) | Value | ||||||
| Japan (16.0%) - continued | |||||||
| 23,000 | Daio Paper Corporation | $ | 187,771 | |||||
| 9,000 | Daiwa Industries, Ltd. | 56,316 | ||||||
| 1,052,151 | Daiwa Securities Group, Inc. | 8,238,487 | ||||||
| 46,000 | Daiwabo Holdings Company, Ltd. | 79,997 | ||||||
| 26,900 | DCM Holdings Company, Ltd. | 172,007 | ||||||
| 6,000 | Denki Kogyo Company, Ltd. | 26,524 | ||||||
| 106,000 | DIC Corporation | 254,128 | ||||||
| 9,900 | Doshisha Company, Ltd. | 139,788 | ||||||
| 37,800 | Doutor Nichires Holdings Company, Ltd. | 543,501 | ||||||
| 1,800 | Dydo Drinco, Inc. | 74,908 | ||||||
| 32,100 | Eagle Industry Company, Ltd. | 585,622 | ||||||
| 38,000 | Ebara Corporation | 155,708 | ||||||
| 177,300 | EDION Corporation | 1,240,153 | ||||||
| 25,038 | EIZO Corporation | 488,428 | ||||||
| 16,253 | EN-Japan, Inc. | 255,964 | ||||||
| 5,600 | Ezaki Glico Company, Ltd. | 195,762 | ||||||
| 51,975 | Fancl Corporation | 739,412 | ||||||
| 45,100 | Foster Electric Company, Ltd. | 788,522 | ||||||
| 122 | Frontier Real Estate Investment Corporation | 558,988 | ||||||
| 561,000 | Fuji Electric Company, Ltd. | 2,236,642 | ||||||
| 202,800 | Fuji Heavy Industries, Ltd. | 7,176,278 | ||||||
| 67,549 | Fuji Machine Manufacturing Company, Ltd. | 625,698 | ||||||
| 8,900 | Fuji Oil Company, Ltd. | 113,762 | ||||||
| 15,300 | Fuji Soft, Inc. | 311,183 | ||||||
| 99,800 | FUJIFILM Holdings NPV | 3,045,254 | ||||||
| 437,000 | Fujitsu, Ltd. | 2,329,938 | ||||||
| 30,900 | Funai Electric Company, Ltd. | 368,788 | ||||||
| 12,600 | Fuyo General Lease Company, Ltd. | 435,026 | ||||||
| 337 | Global One Real Estate Investment Corporation | 1,279,813 | ||||||
| 37,600 | Gree, Inc. | 226,345 | ||||||
| 20,000 | GS Yuasa Corporation | 85,035 | ||||||
| 25,400 | G-Tekt Corporation | 241,068 | ||||||
| 645 | Hankyu REIT, Inc. | 823,645 | ||||||
| 4,600 | Heiwa Real Estate Company, Ltd. | 69,680 | ||||||
| 283 | Heiwa Real Estate REIT, Inc. | 231,127 | ||||||
| 8,700 | HEIWADO Company, Ltd. | 167,921 | ||||||
| 83,800 | Hitachi Capital Corporation | 1,844,390 | ||||||
| 10,800 | Hitachi Koki Company, Ltd. | 82,489 | ||||||
| 86,300 | Hitachi Transport System, Ltd. | 1,056,524 | ||||||
| 24,500 | IBJ Leasing Company, Ltd. | 486,176 | ||||||
| 308 | Ichigo Real Estate Investment Corporation | 239,572 | ||||||
| 488,000 | Ishihara Sangyo Kaisha, Ltd.a | 422,846 | ||||||
| 107,700 | IT Holdings Corporation | 1,626,790 | ||||||
| 4,100 | IwaiCosmo Holdings, Inc. | 45,889 | ||||||
| 136,000 | Jaccs Company, Ltd. | 689,060 | ||||||
| 57,057 | JAFCO Company, Ltd. | 1,953,752 | ||||||
| 120,200 | Japan Airlines Company, Ltd. | 3,563,817 | ||||||
| 49,000 | Japan Aviation Electronics Industry, Ltd. | 1,070,511 | ||||||
| 11,000 | Japan Digital Laboratory Company, Ltd. | 147,790 | ||||||
| 43 | Japan Logistics Fund, Inc. | 96,712 | ||||||
| 1,300 | Japan Petroleum Exploration Company, Ltd. | 40,842 | ||||||
| 916 | Japan Rental Housing Investments, Inc. | 752,730 | ||||||
| 42,300 | Japan Securities Finance Company, Ltd. | 213,278 | ||||||
| 61,200 | Japan Tobacco, Inc. | 1,684,395 | ||||||
| 47,000 | Japan Vilene Company, Ltd. | 239,444 | ||||||
| 32,000 | J-Oil Mills, Inc. | 103,758 | ||||||
| 176,200 | JTEKT Corporation | 2,965,410 | ||||||
| 532,300 | JVC Kenwood Corporationa | 1,157,742 | ||||||
| 13,700 | Kadokawa Dwango Corporationa | 217,887 | ||||||
| 98,100 | Kao Corporation | 3,868,530 | ||||||
| 88,000 | Kato Works Company, Ltd. | 710,612 | ||||||
| 756,000 | Kawasaki Kisen Kaisha, Ltd. | 2,019,643 | ||||||
| 104,600 | KDDI Corporation | 6,571,396 | ||||||
| 15,600 | Keihin Corporation | 231,545 | ||||||
| 29 | Kenedix Realty Investment Corporation | 164,144 | ||||||
| 34 | Kenedix Residential Investment Corporation | 102,049 | ||||||
| 40,800 | Kissei Pharmaceutical Company, Ltd. | 1,070,278 | ||||||
| 154,800 | KITZ Corporation | 632,257 | ||||||
| 18,400 | KOA Corporation | 172,639 | ||||||
| 1,473,000 | Kobe Steel, Ltd. | 2,537,241 | ||||||
| 55,359 | Koei Tecmo Holdings Company, Ltd. | 813,075 | ||||||
| 51,700 | Kohnan Shoji Company, Ltd. | 580,868 | ||||||
| 4,000 | Kokuyo Company, Ltd. | 29,877 | ||||||
| 9,100 | Konoike Transport Company, Ltd. | 186,280 | ||||||
| 49,000 | Kurabo Industries, Ltd. | 75,743 | ||||||
| 207,000 | Kuroda Electric Company, Ltd. | 2,852,976 | ||||||
| 12,300 | KYORIN Holdings, Inc. | 227,935 | ||||||
| 14,324 | Kyoritsu Maintenance Company, Ltd. | 688,541 | ||||||
| 504,110 | LIXIL Group Corporation | 10,609,373 | ||||||
| 7,600 | MACNICA, Inc. | 212,174 | ||||||
| 73,000 | Maeda Road Construction Company, Ltd. | 1,082,821 | ||||||
| 53,000 | Makino Milling Machine Company, Ltd. | 390,678 | ||||||
| 301,000 | Marubeni Corporation | 1,800,997 | ||||||
| 39,000 | Marudai Food Company, Ltd. | 133,933 | ||||||
| 16,677 | Matsumotokiyoshi Holdings Company, Ltd. | 478,191 | ||||||
| 27,900 | Melco Holdings, Inc. | 415,151 | ||||||
| 225 | MID REIT, Inc. | 565,647 | ||||||
| 26,000 | MIRAIT Holdings Corporation | 294,990 | ||||||
| 59,600 | Mito Securities Company, Ltd. | 211,631 | ||||||
| 338,400 | Mitsubishi UFJ Financial Group, Inc. | 1,859,247 | ||||||
| 416,825 | Mitsui Chemicals, Inc. | 1,180,607 | ||||||
| 1,057,000 | Mitsui Engineering & Shipbuilding Company, Ltd. | 1,857,558 | ||||||
| 25,200 | Mitsui High-tec, Inc. | 174,620 | ||||||
| 48,000 | Mitsui-Soko Holdings Company, Ltd. | 169,973 | ||||||
| 9,100 | Mitsumi Electric Company, Ltd. | 72,005 | ||||||
| 90,000 | Monex Group, Inc. | 214,311 | ||||||
| 156,000 | Morinaga Milk Industry Company, Ltd. | 539,231 | ||||||
| 511,270 | MS and AD Insurance Group Holdings, Inc. | 12,116,188 | ||||||
| 92,000 | Nachi-Fujikoshi Corporation | 564,729 | ||||||
| 36,400 | NEC Networks & System Integration Corporation | 754,397 | ||||||
| 12,200 | Nichii Gakkan Company | 96,702 | ||||||
| 9,600 | Nichi-iko Pharmaceutical Company, Ltd. | 148,902 | ||||||
| 4,000 | Nifty Corporation | 44,113 | ||||||
| 193,000 | NIPPO Corporation | 3,137,189 | ||||||
| 22,000 | Nippon Chemi-Con Corporationa | 62,943 | ||||||
| 52,000 | Nippon Flour Mills Company, Ltd. | 231,147 | ||||||
| 686,800 | Nippon Light Metal Holdings Company, Ltd. | 979,557 | ||||||
| 136,000 | Nippon Meat Packers, Inc. | 2,975,448 | ||||||
| 32,000 | Nippon Road Company, Ltd. | 157,725 | ||||||
| 5,529,955 | Nippon Sheet Glass Companya | 5,195,625 | ||||||
| 41,000 | Nippon Synthetic Chemical Industry Company, Ltd. | 242,806 | ||||||
The accompanying Notes to Financial Statements are an integral part of this schedule.
256
Table of Contents
PARTNER WORLDWIDE ALLOCATION PORTFOLIO
Schedule of Investments as of December 31, 2014
| Shares | Common Stock (86.8%) | Value | ||||||
| Japan (16.0%) - continued | |||||||
| 43,800 | Nippon Telegraph & Telephone Corporation | $ | 2,237,419 | |||||
| 72,000 | Nippon Thompson Company, Ltd. | 350,296 | ||||||
| 5,029,625 | Nippon Yusen Kabushiki Kaisha | 14,206,219 | ||||||
| 18,200 | Nipro Corporation | 156,746 | ||||||
| 1,195,940 | Nissan Motor Company, Ltd. | 10,430,713 | ||||||
| 105,000 | Nisshin Oillio Group, Ltd. | 366,997 | ||||||
| 96,000 | Nissin Electric Company, Ltd. | 511,858 | ||||||
| 266 | Nomura Real Estate Master Fund, Inc. | 344,469 | ||||||
| 71 | Nomura Real Estate Residential Fund, Inc. | 426,927 | ||||||
| 55,900 | North Pacific Bank, Ltd. | 215,805 | ||||||
| 111,359 | NS United Kaiun Kaisha, Ltd. | 315,194 | ||||||
| 355,000 | NTN Corporation | 1,567,751 | ||||||
| 3,900 | Ohsho Food Service Corporation | 141,552 | ||||||
| 4,300 | Okamura Corporation | 30,267 | ||||||
| 2,700 | Okinawa Electric Power Company, Inc. | 85,443 | ||||||
| 65,600 | OMRON Corporation | 2,934,649 | ||||||
| 16,500 | Paltac Corporation | 190,090 | ||||||
| 6,900 | Paramount Bed Holdings Company, Ltd. | 181,875 | ||||||
| 3,100 | Pilot Corporation | 177,122 | ||||||
| 5,100 | Plenus Company, Ltd. | 90,710 | ||||||
| 22,800 | Pola Orbis Holdings, Inc. | 911,272 | ||||||
| 33 | Premier Investment Corporation | 162,520 | ||||||
| 21,012 | Riso Kagaku Corporation | 338,243 | ||||||
| 82,899 | ROHTO Pharmaceutical Company, Ltd. | 1,035,736 | ||||||
| 21,200 | Roland DG Corporation | 700,586 | ||||||
| 68,200 | Round One Corporation | 397,475 | ||||||
| 37,000 | Ryobi, Ltd. | 99,741 | ||||||
| 1,700 | Ryosan Company, Ltd. | 37,015 | ||||||
| 7,000 | Saint Marc Holdings Company, Ltd. | 401,771 | ||||||
| 2,200 | Saizeriya Company, Ltd. | 29,025 | ||||||
| 8,500 | San-A Company, Ltd. | 287,217 | ||||||
| 421,000 | Sankyu, Inc. | 1,708,806 | ||||||
| 29,200 | Sanwa Holdings Corporation | 203,558 | ||||||
| 7,000 | Sanyo Chemical Industries, Ltd. | 50,285 | ||||||
| 87,000 | Sanyo Special Steel Company, Ltd. | �� | 289,885 | |||||
| 254,000 | Sapporo Holdings, Ltd. | 1,073,392 | ||||||
| 95,200 | Seiko Epson Corporation | 3,983,571 | ||||||
| 56,000 | Seino Holdings Company, Ltd. | 564,458 | ||||||
| 938 | Sekisui House SI Investment Corporation | 1,063,466 | ||||||
| 228,000 | SENKO Company, Ltd. | 1,144,646 | ||||||
| 64,000 | SMK Corporation | 255,205 | ||||||
| 72,000 | Sumitomo Bakelite Company, Ltd | 279,822 | ||||||
| 937,890 | Sumitomo Corporation | 9,632,775 | ||||||
| 10,200 | Sumitomo Densetsu Company, Ltd. | 126,092 | ||||||
| 642,000 | Sumitomo Heavy Industries, Ltd. | 3,453,309 | ||||||
| 71,000 | Sumitomo Mitsui Financial Group, Inc. | 2,566,843 | ||||||
| 2,969,190 | Sumitomo Mitsui Trust Holdings, Inc. | 11,372,855 | ||||||
| 47,000 | Sumitomo Osaka Cement Company, Ltd. | 134,234 | ||||||
| 42,000 | Sumitomo Seika Chemicals Company, Ltd. | 279,709 | ||||||
| 18,000 | Taihei Dengyo Kaisha, Ltd. | 137,405 | ||||||
| 20,579 | Taikisha, Ltd. | 447,689 | ||||||
| 36,700 | Tamron Company, Ltd. | 727,662 | ||||||
| 4,500 | TOCALO Company, Ltd. | 77,211 | ||||||
| 41,000 | Toei Company, Ltd. | 234,623 | ||||||
| 6,400 | Toho Holdings Company, Ltd. | 93,188 | ||||||
| 9,500 | Tokai Rika Company, Ltd. | 199,415 | ||||||
| 40,100 | Tokai Tokyo Financial Holdings, Inc. | 273,634 | ||||||
| 117,300 | Tokio Marine Holdings, Inc. | 3,809,634 | ||||||
| 251,000 | Tokuyama Corporation | 506,056 | ||||||
| 11,700 | Tokyo Broadcasting System Holdings, Inc. | 137,320 | ||||||
| 40,700 | Tokyo Seimitsu Company, Ltd. | 819,729 | ||||||
| 397 | Tokyu REIT, Inc. | 541,379 | ||||||
| 176 | Top REIT, Inc. | 789,706 | ||||||
| 4,400 | Torii Pharmaceutical Company, Ltd. | 107,531 | ||||||
| 92,000 | Towa Bank, Ltd. | 77,753 | ||||||
| 16,100 | Towa Pharmaceutical Company, Ltd. | 712,328 | ||||||
| 159,000 | Toyota Motor Corporation | 9,908,466 | ||||||
| 2,000 | TS Tech Company, Ltd. | 46,777 | ||||||
| 17,000 | Tsubakimoto Chain Company | 136,623 | ||||||
| 29,000 | Tsugami Corporation | 154,137 | ||||||
| 3,100 | TV Asahi Holdings Corporation | 48,828 | ||||||
| 6,500 | Valor Company, Ltd. | 115,125 | ||||||
| 5,000 | Wacoal Holdings Corporation | 50,474 | ||||||
| 50,300 | Wakita & Company, Ltd. | 471,682 | ||||||
| 6,500 | Warabeya Nichiyo Company, Ltd. | 109,350 | ||||||
| 62,200 | West Japan Railway Company | 2,940,708 | ||||||
| 7,000 | Zenkoku Hosho Company, Ltd. | 198,642 | ||||||
|
| |||||||
| Total | 256,344,123 | |||||||
|
| |||||||
| Jersey (0.8%) | |||||||
| 50,875 | Petra Diamonds, Ltd.a | 152,739 | ||||||
| 162,266 | Redefine International plc | 137,835 | ||||||
| 609,150 | WPP plc | 12,665,267 | ||||||
|
| |||||||
| Total | 12,955,841 | |||||||
|
| |||||||
| Luxembourg (0.2%) | |||||||
| 47,000 | Tenaris SA ADR | 1,419,870 | ||||||
| 107,941 | Ternium SA ADR | 1,904,079 | ||||||
|
| |||||||
| Total | 3,323,949 | |||||||
|
| |||||||
| Malaysia (0.6%) | |||||||
| 1,920,304 | CIMB Group Holdings Berhad | 3,047,744 | ||||||
| 934,700 | Genting Berhad | 2,367,811 | ||||||
| 1,100,318 | Malayan Banking Berhad | 2,881,537 | ||||||
| 199,400 | Public Bank Berhad | 1,041,725 | ||||||
|
| |||||||
| Total | 9,338,817 | |||||||
|
| |||||||
| Mexico (0.7%) | |||||||
| 4,352,100 | America Movil SAB de CV | 4,837,715 | ||||||
| 172,000 | Consorcio ARA SAB de CVa | 75,661 | ||||||
| 28,500 | Fomento Economico Mexicano SAB de CV ADRa | 2,508,855 | ||||||
| 9,500 | Grupo Aeroportuario del Sureste SAB de CV ADRa | 1,252,480 | ||||||
| 359,094 | Grupo Financiero Banorte SAB de CV ADR | 1,976,340 | ||||||
| 259,000 | Organizacion Soriana SAB de CV | 707,461 | ||||||
|
| |||||||
| Total | 11,358,512 | |||||||
|
| |||||||
| Netherlands (3.0%) | |||||||
| 10,100 | Aalberts Industries NV | 297,860 | ||||||
| 1,987,075 | Aegon NV | 14,934,840 | ||||||
| 25,920 | ASM International NV | 1,097,680 | ||||||
| 69,360 | ASML Holding NV | 7,494,191 | ||||||
| 50,315 | BE Semiconductor Industries NV | 1,119,573 | ||||||
| 76,106 | BinckBank NV | 647,022 | ||||||
| 8,497 | Eurocommercial Properties NV | 361,024 | ||||||
| 81,575 | Heineken NV | 5,792,466 | ||||||
| 186,075 | Koninklijke DSM NV | 11,349,300 | ||||||
| 20,533 | Koninklijke Wessanen NV | 129,999 | ||||||
| 18,565 | Nutreco NV | 996,471 | ||||||
| 164,188 | PostNL NV | 610,226 | ||||||
The accompanying Notes to Financial Statements are an integral part of this schedule.
257
Table of Contents
PARTNER WORLDWIDE ALLOCATION PORTFOLIO
Schedule of Investments as of December 31, 2014
| Shares | Common Stock (86.8%) | Value | ||||||
| Netherlands (3.0%) - continued | |||||||
| 239,496 | TomTom NVa | $ | 1,592,770 | |||||
| 43,598 | Unilever NV | 1,705,459 | ||||||
| 9,092 | Vastned Retail NV | 411,117 | ||||||
| 2,280 | Wereldhave NV | 157,259 | ||||||
|
| |||||||
| Total | 48,697,257 | |||||||
|
| |||||||
| New Zealand (0.1%) | |||||||
| 873,517 | Air New Zealand, Ltd. | 1,677,821 | ||||||
| 26,431 | Sky Network Television, Ltd. | 124,085 | ||||||
| 71,233 | Summerset Group Holdings, Ltd. | 153,485 | ||||||
|
| |||||||
| Total | 1,955,391 | |||||||
|
| |||||||
| Norway (1.0%) | |||||||
| 53,878 | Austevoll Seafood ASA | 333,948 | ||||||
| 35,079 | Borregaard ASA | 259,467 | ||||||
| 120,688 | DnB ASA | 1,780,223 | ||||||
| 120,973 | Kongsberg Automotive ASAa | 92,810 | ||||||
| 16,874 | Leroy Seafood Group ASA | 615,886 | ||||||
| 170,619 | Marine Harvest ASA | 2,342,671 | ||||||
| 533,295 | Norsk Hydro ASA | 3,004,070 | ||||||
| 48,381 | SalMar ASA | 823,614 | ||||||
| 38,192 | SpareBank 1 SMN | 298,423 | ||||||
| 153,656 | Statoil ASA | 2,705,396 | ||||||
| 245,191 | Storebrand ASAa | 957,795 | ||||||
| 64,158 | Yara International ASA | 2,857,110 | ||||||
|
| |||||||
| Total | 16,071,413 | |||||||
|
| |||||||
| Panama (0.1%) | |||||||
| 13,668 | Copa Holdings SAb | 1,416,552 | ||||||
|
| |||||||
| Total | 1,416,552 | |||||||
|
| |||||||
| Philippines (0.2%) | |||||||
| 2,281,000 | Ayala Land, Inc. | 1,700,890 | ||||||
| 601,270 | Bank of the Philippine Islands | 1,257,832 | ||||||
|
| |||||||
| Total | 2,958,722 | |||||||
|
| |||||||
| Poland (0.4%) | |||||||
| 47,499 | Bank Handlowy w Warszawie SA | 1,427,314 | ||||||
| 81,007 | Bank Pekao SA | 4,071,099 | ||||||
| 425,537 | Orange Polska SA | 994,302 | ||||||
|
| |||||||
| Total | 6,492,715 | |||||||
|
| |||||||
| Portugal (0.2%) | |||||||
| 6,184,256 | Banco Espirito Santo SAa,d | 748 | ||||||
| 23,222 | CTT-Correios de Portugal SA | 224,282 | ||||||
| 77,346 | Jeronimo Martins SGPS SA | 775,039 | ||||||
| 117,008 | Portucel SA | 433,901 | ||||||
| 745,977 | Portugal Telecom SGPS SA | 777,965 | ||||||
| 73,277 | Redes Energeticas Nacionais SGPS SA | 212,580 | ||||||
|
| |||||||
| Total | 2,424,515 | |||||||
|
| |||||||
| Russia (0.5%) | |||||||
| 49,500 | Lukoil ADR | 1,958,453 | ||||||
| 15,914 | Magnit OJSC | 719,201 | ||||||
| 5,851 | Magnit PJSCa | 924,751 | ||||||
| 303,278 | Novolipetsk Steel OJSC GDR | 3,481,630 | ||||||
| 119,098 | Phosagro OAO | 1,095,035 | ||||||
|
| |||||||
| Total | 8,179,070 | |||||||
|
| |||||||
| Singapore (0.5%) | |||||||
| 344,000 | DBS Group Holdings, Ltd. | 5,325,578 | ||||||
| 271,880 | Ezra Holdings, Ltd. | 107,610 | ||||||
| 64,000 | Ho Bee Land, Ltd. | 93,489 | ||||||
| 170,000 | Indofood Agri Resources, Ltd. | 92,524 | ||||||
| 128,000 | Mapletree Logistics Trusta | 114,288 | ||||||
| 4,757 | REC Solar ASAa | 64,410 | ||||||
| 44,000 | United Engineers, Ltd. | 96,801 | ||||||
| 167,000 | Wing Tai Holdings, Ltd. | 205,627 | ||||||
| 1,921,000 | Yangzijiang Shipbuilding Holdings, Ltd. | 1,740,838 | ||||||
|
| |||||||
| Total | 7,841,165 | |||||||
|
| |||||||
| South Africa (0.5%) | |||||||
| 214,412 | AngloGold Ashanti, Ltd. ADRb | 1,865,385 | ||||||
| 82,944 | Barclays Africa Group, Ltd. | 1,296,987 | ||||||
| 89,729 | Impala Platinum Holdings, Ltd.a | 586,399 | ||||||
| 80,584 | Massmart Holdings, Ltd. | 987,552 | ||||||
| 38,209 | MTN Group, Ltd. | 726,832 | ||||||
| 146,190 | Reunert, Ltd. | 766,547 | ||||||
| 214,000 | Truworths International, Ltd. | 1,421,123 | ||||||
|
| |||||||
| Total | 7,650,825 | |||||||
|
| |||||||
| South Korea (2.8%) | |||||||
| 5,401 | E-Mart Company, Ltd.a | 999,495 | ||||||
| 16,225 | Hyundai Department Store Company, Ltd.a | 1,804,621 | ||||||
| 23,542 | Hyundai Heavy Industries Company, Ltd.a | 2,443,474 | ||||||
| 16,110 | Hyundai Mobisa | 3,446,683 | ||||||
| 39,415 | Hyundai Motor Companya | 6,020,882 | ||||||
| 187,980 | KB Financial Group, Inc.a | 6,145,827 | ||||||
| 13,800 | LG Chem, Ltd.a | 2,256,611 | ||||||
| 32,500 | POSCO | 8,186,582 | ||||||
| 22,766 | POSCO ADR | 1,452,698 | ||||||
| 4,275 | Samsung Electronics Company, Ltd. | 5,139,595 | ||||||
| 40,081 | Samsung Heavy Industries Company, Ltd. | 722,987 | ||||||
| 24,608 | Samsung Life Insurance Company, Ltd.a | 2,605,714 | ||||||
| 65,515 | Shinhan Financial Group Company, Ltd.a | 2,633,383 | ||||||
| 7,065 | Shinsegae Company, Ltd.a | 1,159,745 | ||||||
|
| |||||||
| Total | 45,018,297 | |||||||
|
| |||||||
| Spain (2.2%) | |||||||
| 10,573 | Acciona SAa | 713,462 | ||||||
| 122,180 | Actividades de Construccion y Servicios SA | 4,258,603 | ||||||
| 1,678,245 | Banco Popular Espanol SA | 8,365,790 | ||||||
| 1,056,775 | Banco Santander SA | 8,869,662 | ||||||
| 138,147 | Gas Natural SDG SA | 3,470,342 | ||||||
| 1,248,971 | Iberdrola SA | 8,419,016 | ||||||
| 8,997 | Let’s GOWEX SAa,d | 1 | ||||||
| 93,066 | Mediaset Espana Comunicacion SAa | 1,170,035 | ||||||
| 28,348 | Papeles y Cartones de Europa SA | 130,481 | ||||||
| 2,947 | Tecnicas Reunidas SA | 128,812 | ||||||
|
| |||||||
| Total | 35,526,204 | |||||||
|
| |||||||
| Sweden (2.2%) | |||||||
| 8,260 | B&B Tools Aktiebolag | 160,604 | ||||||
| 27,345 | Bilia AB | 827,952 | ||||||
| 30,727 | BillerudKorsnas AB | 440,661 | ||||||
| 7,738 | BioGaia AB | 178,175 | ||||||
| 174,753 | Boliden AB | 2,793,392 | ||||||
| 16,645 | Clas Ohlson AB | 287,717 | ||||||
The accompanying Notes to Financial Statements are an integral part of this schedule.
258
Table of Contents
PARTNER WORLDWIDE ALLOCATION PORTFOLIO
Schedule of Investments as of December 31, 2014
| Shares | Common Stock (86.8%) | Value | ||||||
| Sweden (2.2%) - continued | |||||||
| 77,574 | Fabege AB | $ | 995,940 | |||||
| 36,110 | Fastighets AB Baldera | 507,139 | ||||||
| 29,962 | Haldex AB | 388,339 | ||||||
| 4,526 | Hexpol AB | 425,950 | ||||||
| 13,642 | Industrial and Financial Systems | 418,243 | ||||||
| 22,159 | Intrum Justitia AB | 656,296 | ||||||
| 116,942 | Investor AB | 4,251,757 | ||||||
| 64,654 | JM AB | 2,049,439 | ||||||
| 173,045 | Klovern AB, Class Ba | 168,704 | ||||||
| 113,527 | Loomis AB | 3,279,525 | ||||||
| 43,866 | NCC AB | 1,381,087 | ||||||
| 7,211 | Net Entertainment NE ABa | 243,065 | ||||||
| 50,809 | Nobia AB | 453,903 | ||||||
| 25,822 | Nolato AB | 586,383 | ||||||
| 19,346 | Peab AB | 135,816 | ||||||
| 263,664 | Skandinaviska Enskilda Banken AB | 3,348,154 | ||||||
| 22,636 | Swedish Orphan Biovitrum ABa | 230,126 | ||||||
| 14,796 | Tethys Oil ABa | 115,055 | ||||||
| 1,022,900 | Volvo AB | 11,030,437 | ||||||
|
| |||||||
| Total | 35,353,859 | |||||||
|
| |||||||
| Switzerland (7.7%) | |||||||
| 52,079 | Actelion, Ltd. | 5,995,391 | ||||||
| 150,465 | Adecco SA | 10,342,859 | ||||||
| 36,326 | Aryzta AGa | 2,791,637 | ||||||
| 20,345 | Ascom Holding AG | 310,513 | ||||||
| 5,737 | Autoneum Holding AGa | 968,136 | ||||||
| 2,428 | Bossard Holding AGa | 265,438 | ||||||
| 372,004 | Credit Suisse Group AG | 9,345,205 | ||||||
| 1,738 | Flughafen Zuerich AG | 1,162,308 | ||||||
| 453 | Forbo Holding AG | 453,137 | ||||||
| 5,282 | Givaudan SAa | 9,475,155 | ||||||
| 3,127 | Helvetia Holding AG | 1,485,793 | ||||||
| 158,873 | Holcim, Ltd.a | 11,356,902 | ||||||
| 2,149 | Inficon Holding AGa | 666,294 | ||||||
| 3,247 | Komax Holding AGa | 469,731 | ||||||
| 23,507 | Kudelski SA | 284,941 | ||||||
| 822 | Lindt & Spruengli AG | 4,064,355 | ||||||
| 112,129 | Logitech International SA | 1,519,291 | ||||||
| 183,421 | Nestle SA | 13,371,577 | ||||||
| 15,244 | Nobel Biocare Holding AGa | 262,193 | ||||||
| 227,761 | Novartis AG | 21,123,347 | ||||||
| 6,543 | PSP Swiss Property AGa | 563,111 | ||||||
| 94,726 | Roche Holding AG - Genusschein | 25,665,272 | ||||||
| 1,235 | Siegfried Holding AGa | 201,237 | ||||||
| 3,040 | Straumann Holding AG | 763,771 | ||||||
| 4,574 | U-Blox AGa | 626,014 | ||||||
| 513 | Valora Holding AG | 117,738 | ||||||
| 6,445 | Zehnder Group AG | 267,731 | ||||||
|
| |||||||
| Total | 123,919,077 | |||||||
|
| |||||||
| Taiwan (1.1%) | |||||||
| 888,000 | Advanced Semiconductor Engineering, Inc. | 1,054,613 | ||||||
| 148,000 | Asustek Computer, Inc. | 1,614,829 | ||||||
| 392,675 | Chicony Electronics Company, Ltd. | 1,093,451 | ||||||
| 734,000 | Chipbond Technology Corporation | 1,334,457 | ||||||
| 956,000 | Compal Electronics, Inc. | 667,548 | ||||||
| 1,052,000 | CTBC Financial Holding Company, Ltd. | 680,590 | ||||||
| 228,000 | Hon Hai Precision Industry Company, Ltd. | 629,625 | ||||||
| 859,000 | Mega Financial Holding Company, Ltd. | 662,711 | ||||||
| 204,000 | Novatek Microelectronics Corporation | 1,139,972 | ||||||
| 150,000 | Richtek Technology Corporation | 790,446 | ||||||
| 290,300 | Taiwan Mobile Company, Ltd. | 959,950 | ||||||
| 916,951 | Taiwan Semiconductor Manufacturing Company, Ltd. | 4,039,602 | ||||||
| 95,943 | Taiwan Semiconductor Manufacturing Company, Ltd. ADR | 2,147,205 | ||||||
| 855,000 | TECO Electric & Machinery Company, Ltd. | 808,457 | ||||||
|
| |||||||
| Total | 17,623,456 | |||||||
|
| |||||||
| Thailand (1.9%) | |||||||
| 947,225 | Bangkok Bank pcl | 5,627,570 | ||||||
| 229,800 | Bangkok Bank Public Company, Ltd. | 1,349,755 | ||||||
| 185,700 | Kasikornbank pcl | 1,284,346 | ||||||
| 17,052,915 | Krung Thai Bank pcl | 11,699,270 | ||||||
| 380,900 | PTT Exploration & Production pcl | 1,289,874 | ||||||
| 454,960 | PTT pcl | 4,456,866 | ||||||
| 133,600 | Siam Cement pcl | 1,822,935 | ||||||
| 361,500 | Siam Commercial Bank pcl | 1,991,028 | ||||||
| 965,000 | Thai Oil pcl | 1,227,953 | ||||||
|
| |||||||
| Total | 30,749,597 | |||||||
|
| |||||||
| Turkey (0.4%) | |||||||
| 522,982 | Akbank TAS | 1,930,946 | ||||||
| 62,340 | BIM Birlesik Magazalar AS | 1,333,134 | ||||||
| 79,645 | Ford Otomotiv Sanayi AS | 1,107,353 | ||||||
| 72,737 | Turkcell lletisim Hizmetleri ASa | 443,877 | ||||||
| 327,000 | Turkiye Garanti Bankasi AS | 1,313,604 | ||||||
|
| |||||||
| Total | 6,128,914 | |||||||
|
| |||||||
| United Kingdom (9.3%) | |||||||
| 282,041 | Amlin plc | 2,092,132 | ||||||
| 50,629 | AstraZeneca plc | 3,575,971 | ||||||
| 1,449,350 | BAE Systems plc | 10,599,403 | ||||||
| 32,391 | Bank of Georgia Holdings plc | 1,041,961 | ||||||
| 127,574 | Barratt Developments plc | 928,501 | ||||||
| 137,381 | Bellway plc | 4,120,292 | ||||||
| 59,107 | Berendsen plc | 1,010,272 | ||||||
| 55,159 | Berkeley Group Holdings plc | 2,120,835 | ||||||
| 37,000 | BHP Billiton plcb | 791,489 | ||||||
| 58,892 | Big Yellow Group plc | 554,924 | ||||||
| 41,570 | Bodycote plc | 417,287 | ||||||
| 54,234 | British American Tobacco plc | 2,938,998 | ||||||
| 20,518 | Britvic plc | 214,589 | ||||||
| 532,876 | Cable & Wireless Communications plc | 409,600 | ||||||
| 44,463 | Chesnara plc | 235,101 | ||||||
| 20,484 | Concentric AB | 242,873 | ||||||
| 12,218 | CSR plc | 162,094 | ||||||
| 50,544 | Dart Group plc | 229,244 | ||||||
| 41,155 | Diageo plc | 1,178,973 | ||||||
| 65,640 | Dialog Semiconductor plca | 2,291,873 | ||||||
| 60,458 | Diploma plc | 674,705 | ||||||
| 666,504 | Direct Line Insurance Group plc | 3,015,000 | ||||||
| 483,948 | DS Smith plc | 2,413,348 | ||||||
| 183,931 | Elementis plc | 745,559 | ||||||
| 46,868 | Fenner plc | 156,825 | ||||||
| 66,053 | Galliford Try plc | 1,319,979 | ||||||
| 163,166 | GlaxoSmithKline plc | 3,500,504 | ||||||
| 370,925 | Globo plca | 231,250 | ||||||
| 24,798 | Go-Ahead Group plc | 945,262 | ||||||
| 45,743 | Great Portland Estates plc | 521,816 | ||||||
| 23,017 | Greggs plc | 262,478 | ||||||
| 179,956 | Halfords Group plc | 1,313,194 | ||||||
| 389,805 | Hansteen Holdings plc | 653,725 | ||||||
| 156,452 | Hikma Pharmaceuticals plc | 4,800,191 | ||||||
| 68,356 | Hiscox, Ltd. | 766,393 | ||||||
| 581,235 | Home Retail Group plc | 1,873,176 | ||||||
The accompanying Notes to Financial Statements are an integral part of this schedule.
259
Table of Contents
PARTNER WORLDWIDE ALLOCATION PORTFOLIO
Schedule of Investments as of December 31, 2014
| Shares | Common Stock (86.8%) | Value | ||||||
| United Kingdom (9.3%) - continued |
| ||||||
| 28,226 | HomeServe plc | $ | 147,871 | |||||
| 588,795 | Howden Joinery Group plc | 3,673,344 | ||||||
| 175,950 | HSBC Holdings plc ADRb | 8,310,119 | ||||||
| 32,208 | Hunting plc | 265,026 | ||||||
| 211,193 | IG Group Holdings plc | 2,359,993 | ||||||
| 100,007 | Imperial Tobacco Group plc | 4,402,265 | ||||||
| 293,481 | Inchcape plc | 3,297,286 | ||||||
| 181,803 | Intermediate Capital Group plc | 1,298,786 | ||||||
| 79,945 | Interserve plc | 689,945 | ||||||
| 1,515,365 | ITV plc | 5,054,837 | ||||||
| 9,005 | J D Wetherspoon plc | 115,089 | ||||||
| 130,076 | Jazztel plca | 1,965,841 | ||||||
| 7,705 | Keller Group plc | 104,773 | ||||||
| 45,396 | Lancashire Holdings, Ltd. | 396,224 | ||||||
| 126,290 | London Stock Exchange Group plc | 4,345,523 | ||||||
| 140,824 | LondonMetric Property plc | 334,940 | ||||||
| 46,227 | Lookers plc | 92,916 | ||||||
| 1,997,433 | Man Group plc | 4,970,355 | ||||||
| 63,836 | Micro Focus International plc | 1,074,546 | ||||||
| 141,801 | Mondi plc | 2,303,631 | ||||||
| 143,188 | Moneysupermarket.com Group plc | 517,919 | ||||||
| 51,604 | Next plc | 5,472,971 | ||||||
| 41,748 | Northgate plc | 395,793 | ||||||
| 53,663 | Optimal Payments plca | 284,842 | ||||||
| 138,164 | Pace plc | 740,804 | ||||||
| 180,607 | Pennon Group plc | 2,580,279 | ||||||
| 187,697 | Persimmon plc | 4,584,301 | ||||||
| 235,012 | Prudential plc | 5,433,366 | ||||||
| 308,167 | QinetiQ Group plc | 898,389 | ||||||
| 22,467 | Restaurant Group plc | 229,031 | ||||||
| 83,675 | Royal Dutch Shell plc, Class A | 2,792,483 | ||||||
| 32,588 | SABMiller plc | 1,696,984 | ||||||
| 6,452 | Safestore Holdings plc | 23,330 | ||||||
| 6,446 | Savills plc | 68,188 | ||||||
| 62,666 | Shire plc | 4,443,032 | ||||||
| 74,370 | Soco International plca | 347,190 | ||||||
| 229,743 | Speedy Hire plc | 282,882 | ||||||
| 337,217 | Spirit Pub Company plc | 548,188 | ||||||
| 100,183 | Standard Chartered plc | 1,498,330 | ||||||
| 49,386 | Stobart Group, Ltd. | 83,160 | ||||||
| 14,259 | SVG Capital plca | 98,275 | ||||||
| 1,698 | Synergy Health plc | 55,064 | ||||||
| 2,060,345 | Taylor Wimpey plc | 4,395,580 | ||||||
| 72,940 | Trinity Mirror plca | 185,022 | ||||||
| 58,567 | TT Electronics plc | 93,701 | ||||||
| 85,376 | Unilever plc | 3,468,679 | ||||||
| 73,376 | Vedanta Resources plc | 650,869 | ||||||
| 28,372 | Victrex plc | 915,509 | ||||||
| 87,852 | WH Smith plc | 1,837,136 | ||||||
| 15,476 | Workspace Group plc | 182,935 | ||||||
| 44,624 | WS Atkins plc | 945,074 | ||||||
| 15,795 | Xchanging plc | 37,928 | ||||||
|
| |||||||
| Total | 149,340,361 | |||||||
|
| |||||||
| United States (0.5%) | |||||||
| 112,359 | iShares MSCI Emerging Markets Index Fund | 4,414,586 | ||||||
| 66,282 | Southern Copper Corporation | 1,869,152 | ||||||
| 17,700 | Yum! Brands, Inc. | 1,289,445 | ||||||
|
| |||||||
| Total | 7,573,183 | |||||||
|
| |||||||
| Total Common Stock (cost $1,371,629,438) | 1,393,428,530 | |||||||
|
| |||||||
| Principal Amount | Long-Term Fixed Income (10.6%) | |||||||
| Argentina (0.2%) |
| ||||||
Arcos Dorados BV | ||||||||
| 361,000 | 6.625%, 9/27/2023c | 351,975 | ||||||
Argentina Government International Bond | ||||||||
| 140,000 | Zero Coupon, 6/2/2017 | 123,200 | ||||||
| 42,061 | 8.280%, 12/31/2033e | 36,593 | ||||||
| 1,009,467 | 8.280%, 12/31/2033e | 900,950 | ||||||
| 11,162,001 | 0.000%, 12/15/2035f,g | 938,709 | ||||||
| 5,347,000 | 0.000%, 12/15/2035g | 393,005 | ||||||
| 320,000 | 0.000%, 12/15/2035g | 21,920 | ||||||
|
| |||||||
| Total | 2,766,352 | |||||||
|
| |||||||
| Azerbaijan (0.2%) | |||||||
Azerbaijan Government International Bond | ||||||||
| 550,000 | 4.750%, 3/18/2024c | 540,375 | ||||||
| 1,650,000 | 4.750%, 3/18/2024 | 1,621,125 | ||||||
State Oil Company of Azerbaijan Republic | ||||||||
| 400,000 | 5.450%, 2/9/2017 | 411,000 | ||||||
| 460,000 | 4.750%, 3/13/2023 | 443,930 | ||||||
|
| |||||||
| Total | 3,016,430 | |||||||
|
| |||||||
| Belarus (<0.1%) | |||||||
Belarus Government International Bond | ||||||||
| 289,000 | 8.750%, 8/3/2015 | 272,151 | ||||||
|
| |||||||
| Total | 272,151 | |||||||
|
| |||||||
| Belize (<0.1%) | |||||||
Belize Government International Bond | ||||||||
| 116,500 | 5.000%, 2/20/2038*,h | 83,298 | ||||||
|
| |||||||
| Total | 83,298 | |||||||
|
| |||||||
| Brazil (0.6%) | |||||||
Banco do Brasil SA/Cayman | ||||||||
| 600,000 | 9.000%, 6/18/2049i | 558,000 | ||||||
| 840,000 | 6.250%, 10/15/2049i | 613,200 | ||||||
Banco do Estado do Rio Grande do Sul SA | ||||||||
| 200,000 | 7.375%, 2/2/2022 | 203,328 | ||||||
| 680,000 | 7.375%, 2/2/2022c | 691,315 | ||||||
Brazil Government International Bond | ||||||||
| 1,071,000 | 6.000%, 8/15/2050j | 1,010,918 | ||||||
| 370,000 | 7.125%, 1/20/2037 | 468,975 | ||||||
| 360,000 | 5.000%, 1/27/2045 | 352,800 | ||||||
| 1,099,000 | Brazil Letras do Tesouro Nacional Zero Coupon, 1/1/2016j | 365,955 | ||||||
Brazil Loan Trust 1 | ||||||||
| 1,050,000 | 5.477%, 7/24/2023 | 1,068,375 | ||||||
| 1,150,000 | 5.477%, 7/24/2023* | 1,170,124 | ||||||
Brazil Minas SPE via State of Minas Gerais | ||||||||
| 360,000 | 5.333%, 2/15/2028 | 355,500 | ||||||
| 1,480,000 | 5.333%, 2/15/2028* | 1,461,500 | ||||||
| 95,246 | Independencia International, Ltd. | 0 | ||||||
12.000%, 12/30/2016*,d,e | ||||||||
Tupy SA | ||||||||
| 450,000 | 6.625%, 7/17/2024c | 432,000 | ||||||
|
| |||||||
| Total | 8,751,990 | |||||||
|
| |||||||
The accompanying Notes to Financial Statements are an integral part of this schedule.
260
Table of Contents
PARTNER WORLDWIDE ALLOCATION PORTFOLIO
Schedule of Investments as of December 31, 2014
| Principal Amount | Long-Term Fixed Income (10.6%) | Value | ||||||
| Bulgaria (0.1%) | |||||||
Bulgaria Government International Bond | ||||||||
| $ | 1,650,000 | 2.950%, 9/3/2024f | $ | 1,996,588 | ||||
|
| |||||||
| Total | 1,996,588 | |||||||
|
| |||||||
| Canada (<0.1%) | |||||||
PTTEP Canada International Finance, Ltd. | ||||||||
| 540,000 | 6.350%, 6/12/2042 | 636,794 | ||||||
|
| |||||||
| Total | 636,794 | |||||||
|
| |||||||
| Cayman Islands (<0.1%) | |||||||
Sun Hung Kai Properties Capital Market, Ltd. | ||||||||
| 380,000 | 4.500%, 2/14/2022 | 404,361 | ||||||
|
| |||||||
| Total | 404,361 | |||||||
|
| |||||||
| Chile (0.5%) | |||||||
AES Gener SA | ||||||||
| 250,000 | 8.375%, 12/18/2073c | 271,250 | ||||||
| 620,000 | 5.250%, 8/15/2021 | 655,941 | ||||||
| 120,000 | 5.250%, 8/15/2021c | 126,956 | ||||||
Banco del Estado de Chile | ||||||||
| 500,000 | 4.125%, 10/7/2020 | 523,706 | ||||||
| 260,000 | 4.125%, 10/7/2020c | 272,327 | ||||||
Corpbanca SA | ||||||||
| 752,000 | 3.875%, 9/22/2019c | 753,880 | ||||||
E-CL SA | ||||||||
| 320,000 | 5.625%, 1/15/2021c | 345,460 | ||||||
| 200,000 | 4.500%, 1/29/2025c | 200,377 | ||||||
Empresa Electrica Angamos SA | ||||||||
| 1,630,000 | 4.875%, 5/25/2029c | 1,601,476 | ||||||
Empresa Nacional de Telecomunicaciones SA | ||||||||
| 200,000 | 4.875%, 10/30/2024 | 203,225 | ||||||
| 670,000 | 4.875%, 10/30/2024c | 680,805 | ||||||
GNL Quintero SA | ||||||||
| 200,000 | 4.634%, 7/31/2029 | 202,419 | ||||||
| 1,340,000 | 4.634%, 7/31/2029c | 1,356,207 | ||||||
Sociedad Quimica y Minera de Chile SA | ||||||||
| 120,000 | 5.500%, 4/21/2020 | 129,890 | ||||||
| 210,000 | 3.625%, 4/3/2023 | 200,349 | ||||||
| 448,000 | 4.375%, 1/28/2025* | 442,557 | ||||||
|
| |||||||
| Total | 7,966,825 | |||||||
|
| |||||||
| China (0.2%) | |||||||
Biostime International Holdings, Ltd. | ||||||||
| 2,000,000 | Zero Coupon, 2/20/2019k | 222,447 | ||||||
CITIC, Ltd. | ||||||||
| 200,000 | 6.875%, 1/21/2018 | 220,868 | ||||||
| 400,000 | 6.625%, 4/15/2021 | 453,544 | ||||||
| 2,350,000 | 6.800%, 1/17/2023 | 2,706,143 | ||||||
|
| |||||||
| Total | 3,603,002 | |||||||
|
| |||||||
| Colombia (0.3%) | |||||||
Banco de Bogota SA | ||||||||
| 650,000 | 5.000%, 1/15/2017 | 676,000 | ||||||
Bancolombia SA | ||||||||
| 200,000 | 5.950%, 6/3/2021 | 214,500 | ||||||
Colombia Government International Bond | ||||||||
| 400,000 | 7.375%, 1/27/2017 | 443,000 | ||||||
| 277,000 | 7.375%, 3/18/2019 | 325,475 | ||||||
| 291,000 | 4.375%, 7/12/2021 | 307,733 | ||||||
| 60,000 | 8.125%, 5/21/2024 | 79,650 | ||||||
| 130,000 | 7.375%, 9/18/2037 | 175,175 | ||||||
| 700,000 | 6.125%, 1/18/2041 | 838,250 | ||||||
| 1,180,000 | 5.625%, 2/26/2044 | 1,327,500 | ||||||
Ecopetrol SA | ||||||||
| 110,000 | 7.375%, 9/18/2043 | 118,800 | ||||||
Empresas Publicas de Medellin ESP | ||||||||
| 277,000 | 7.625%, 7/29/2019 | 325,475 | ||||||
Pacific Rubiales Energy Corporation | ||||||||
| 150,000 | 5.625%, 1/19/2025c | 115,125 | ||||||
|
| |||||||
| Total | 4,946,683 | |||||||
|
| |||||||
| Costa Rica (0.2%) | |||||||
Banco de Costa Rica | ||||||||
| 200,000 | 5.250%, 8/12/2018 | 201,500 | ||||||
| 410,000 | 5.250%, 8/12/2018c | 413,075 | ||||||
Banco Nacional de Costa Rica | ||||||||
| 410,000 | 4.875%, 11/1/2018c | 405,900 | ||||||
| 890,000 | 6.250%, 11/1/2023c | 884,927 | ||||||
Costa Rica Government International Bond | ||||||||
| 30,000 | 9.995%, 8/1/2020 | 38,025 | ||||||
| 1,220,000 | 4.250%, 1/26/2023 | 1,116,300 | ||||||
| 340,000 | 5.625%, 4/30/2043 | 279,650 | ||||||
| 410,000 | 7.000%, 4/4/2044 | 401,800 | ||||||
|
| |||||||
| Total | 3,741,177 | |||||||
|
| |||||||
| Croatia (0.7%) | |||||||
Croatia Government International Bond | ||||||||
| 720,000 | 6.750%, 11/5/2019 | 788,400 | ||||||
| 2,010,000 | 6.375%, 3/24/2021 | 2,195,925 | ||||||
| 2,160,000 | 3.875%, 5/30/2022f | 2,679,711 | ||||||
| 836,000 | 5.500%, 4/4/2023 | 866,096 | ||||||
| 2,741,000 | 6.000%, 1/26/2024 | 2,953,427 | ||||||
|
| |||||||
| Total | 9,483,559 | |||||||
|
| |||||||
| Dominican Republic (0.6%) | |||||||
Aeropuertos Dominicanos Siglo XXI SA | ||||||||
| 200,000 | 9.750%, 11/13/2019 | 193,000 | ||||||
Dominican Republic Government International Bond | ||||||||
| 8,100,000 | 15.000%, 4/5/2019l | 208,824 | ||||||
| 3,600,000 | 16.000%, 7/10/2020l | 97,972 | ||||||
| 100,000 | 7.500%, 5/6/2021c | 109,643 | ||||||
| 2,408,000 | 7.500%, 5/6/2021 | 2,640,203 | ||||||
| 2,600,000 | 14.500%, 2/10/2023l | 64,266 | ||||||
| 670,000 | 6.600%, 1/28/2024 | 713,550 | ||||||
| 610,000 | 5.875%, 4/18/2024 | 622,200 | ||||||
| 310,000 | 8.625%, 4/20/2027 | 363,475 | ||||||
| 16,900,000 | 18.500%, 2/4/2028c,l | 491,652 | ||||||
| 800,000 | 18.500%, 2/4/2028l | 23,273 | ||||||
| 1,580,000 | 7.450%, 4/30/2044c | 1,727,588 | ||||||
|
| |||||||
| Total | 7,255,646 | |||||||
|
| |||||||
The accompanying Notes to Financial Statements are an integral part of this schedule.
261
Table of Contents
PARTNER WORLDWIDE ALLOCATION PORTFOLIO
Schedule of Investments as of December 31, 2014
| Principal Amount | Long-Term Fixed Income (10.6%) | Value | ||||||
| Ecuador (0.1%) | |||||||
Ecuador Government International Bond | ||||||||
| $ | 255,000 | 7.950%, 6/20/2024 | $ | 218,025 | ||||
EP PetroEcuador | ||||||||
| 1,000,000 | 5.885%, 9/24/2019g | 865,000 | ||||||
|
| |||||||
| Total | 1,083,025 | |||||||
|
| |||||||
| Egypt (0.1%) | |||||||
Egypt Government International Bond | ||||||||
| 800,000 | 5.750%, 4/29/2020 | 836,000 | ||||||
| 100,000 | 6.875%, 4/30/2040 | 102,750 | ||||||
|
| |||||||
| Total | 938,750 | |||||||
|
| |||||||
| El Salvador (<0.1%) | |||||||
El Salvador Government International Bond | ||||||||
| 100,000 | 7.375%, 12/1/2019 | 111,000 | ||||||
| 150,000 | 8.250%, 4/10/2032 | 171,000 | ||||||
| 220,000 | 7.650%, 6/15/2035 | 233,200 | ||||||
|
| |||||||
| Total | 515,200 | |||||||
|
| |||||||
| Ethiopia (<0.1%) | |||||||
Ethiopia Government International Bond | ||||||||
| 210,000 | 6.625%, 12/11/2024c | 204,750 | ||||||
|
| |||||||
| Total | 204,750 | |||||||
|
| |||||||
| Gabon (<0.1%) | |||||||
Gabonese Republic Government International Bond | ||||||||
| 140,000 | 8.200%, 12/12/2017 | 151,228 | ||||||
| 575,200 | 6.375%, 12/12/2024c | 546,440 | ||||||
| 200,000 | 6.375%, 12/12/2024 | 190,000 | ||||||
|
| |||||||
| Total | 887,668 | |||||||
|
| |||||||
| Ghana (0.1%) | |||||||
Ghana Government International Bond | ||||||||
| 620,000 | 8.500%, 10/4/2017 | 618,673 | ||||||
| 400,000 | 8.125%, 1/18/2026 | 370,000 | ||||||
| 770,000 | 8.125%, 1/18/2026* | 712,250 | ||||||
|
| |||||||
| Total | 1,700,923 | |||||||
|
| |||||||
| Guatemala (0.1%) | |||||||
Agromercantil Senior Trust | ||||||||
| 320,000 | 6.250%, 4/10/2019c | 324,000 | ||||||
Guatemala Government International Bond | ||||||||
| 230,000 | 5.750%, 6/6/2022 | 248,918 | ||||||
| 480,000 | 4.875%, 2/13/2028 | 481,267 | ||||||
| 380,000 | 4.875%, 2/13/2028c | 381,003 | ||||||
|
| |||||||
| Total | 1,435,188 | |||||||
|
| |||||||
| Honduras (0.1%) | |||||||
Honduras Government International Bond | ||||||||
| 220,000 | 8.750%, 12/16/2020 | 243,100 | ||||||
| 1,370,000 | 8.750%, 12/16/2020* | 1,513,850 | ||||||
| 470,000 | 7.500%, 3/15/2024* | 489,975 | ||||||
|
| |||||||
| Total | 2,246,925 | |||||||
|
| |||||||
| Hong Kong (0.1%) | |||||||
China Unicom Hong Kong, Ltd. | ||||||||
| 2,770,000 | 4.000%, 4/16/2017m | 444,658 | ||||||
Metropolitan Light International, Ltd. | ||||||||
| 400,000 | 5.250%, 1/17/2018 | 399,441 | ||||||
|
| |||||||
| Total | 844,099 | |||||||
|
| |||||||
| Hungary (<0.1%) | |||||||
MFB Magyar Fejlesztesi Bank Zrt | ||||||||
| 210,000 | 6.250%, 10/21/2020c | 232,050 | ||||||
|
| |||||||
| Total | 232,050 | |||||||
|
| |||||||
| India (<0.1%) | |||||||
Greenko Dutch BV | ||||||||
| 200,000 | 8.000%, 8/1/2019 | 175,494 | ||||||
| 480,000 | 8.000%, 8/1/2019c | 421,186 | ||||||
|
| |||||||
| Total | 596,680 | |||||||
|
| |||||||
| Indonesia (0.5%) | |||||||
Bumi Investment Private, Ltd. | ||||||||
| 190,000 | 10.750%, 10/6/2017e | 42,275 | ||||||
Indonesia Government International Bond | ||||||||
| 200,000 | 3.375%, 4/15/2023 | 189,000 | ||||||
| 320,000 | 3.375%, 4/15/2023c | 302,400 | ||||||
| 945,000 | 8.500%, 10/12/2035 | 1,313,550 | ||||||
| 1,300,000 | 7.750%, 1/17/2038 | 1,701,375 | ||||||
| 550,000 | 5.250%, 1/17/2042 | 554,813 | ||||||
| 200,000 | 4.625%, 4/15/2043 | 185,250 | ||||||
| 520,000 | 6.750%, 1/15/2044 | 643,500 | ||||||
Perusahaan Penerbit SBSN | ||||||||
| 200,000 | 4.000%, 11/21/2018c | 206,250 | ||||||
Perusahaan Penerbit Surat Berharga Syariah Negara Indonesia | ||||||||
| 380,000 | 4.350%, 9/10/2024c | 380,950 | ||||||
PT Pertamina Persero | ||||||||
| 390,000 | 5.625%, 5/20/2043c | 366,600 | ||||||
|
| |||||||
| Total | 5,885,963 | |||||||
|
| |||||||
| Iraq (0.1%) | |||||||
Iraq Government International Bond | ||||||||
| 1,200,000 | 5.800%, 1/15/2028 | 1,002,000 | ||||||
|
| |||||||
| Total | 1,002,000 | |||||||
|
| |||||||
| Ireland (<0.1%) | |||||||
Sibur Securities, Ltd. | ||||||||
| 520,000 | 3.914%, 1/31/2018c | 421,200 | ||||||
|
| |||||||
| Total | 421,200 | |||||||
|
| |||||||
| Israel (<0.1%) | |||||||
Delek and Avner Yam Tethys, Ltd. | ||||||||
| 110,000 | 2.803%, 12/30/2016c | 110,146 | ||||||
| 110,000 | 3.839%, 12/30/2018c | 112,130 | ||||||
The accompanying Notes to Financial Statements are an integral part of this schedule.
262
Table of Contents
PARTNER WORLDWIDE ALLOCATION PORTFOLIO
Schedule of Investments as of December 31, 2014
| Principal Amount | Long-Term Fixed Income (10.6%) | Value | ||||||
| Israel (<0.1%) - continued | |||||||
Israel Electric Corporation, Ltd. | ||||||||
| $ | 230,000 | 5.625%, 6/21/2018c | $ | 243,110 | ||||
|
| |||||||
| Total | 465,386 | |||||||
|
| |||||||
| Italy (<0.1%) | |||||||
Wind Acquisition Finance SA | ||||||||
| 280,000 | 4.000%, 7/15/2020*,f | 332,360 | ||||||
| 360,000 | 7.000%, 4/23/2021f | 425,940 | ||||||
|
| |||||||
| Total | 758,300 | |||||||
|
| |||||||
| Jamaica (<0.1%) | |||||||
Jamaica Government International Bond | ||||||||
| 360,000 | 7.625%, 7/9/2025 | 376,200 | ||||||
|
| |||||||
| Total | 376,200 | |||||||
|
| |||||||
| Kazakhstan (0.2%) | |||||||
Kazakhstan Government International Bond | ||||||||
| 410,000 | 4.875%, 10/14/2044c | 375,150 | ||||||
Kazatomprom Natsionalnaya Atomnaya Kompaniya AO | ||||||||
| 220,000 | 6.250%, 5/20/2015 | 218,383 | ||||||
KazMunayGas National Company JSC | ||||||||
| 430,000 | 11.750%, 1/23/2015 | 431,204 | ||||||
| 330,000 | 9.125%, 7/2/2018 | 361,037 | ||||||
| 830,000 | 6.375%, 4/9/2021c | 839,338 | ||||||
| 340,000 | 4.875%, 5/7/2025c | 303,643 | ||||||
| 514,000 | 5.750%, 4/30/2043 | 431,760 | ||||||
| 1,070,000 | 6.000%, 11/7/2044c | 906,289 | ||||||
|
| |||||||
| Total | 3,866,804 | |||||||
|
| |||||||
| Kenya (<0.1%) | |||||||
Kenya Government International Bond | ||||||||
| 200,000 | 6.875%, 6/24/2024 | 209,500 | ||||||
| 470,000 | 6.875%, 6/24/2024c | 492,325 | ||||||
|
| |||||||
| Total | 701,825 | |||||||
|
| |||||||
| Lithuania (0.3%) | |||||||
Lithuania Government International Bond | ||||||||
| 820,000 | 7.375%, 2/11/2020 | 989,027 | ||||||
| 1,400,000 | 6.125%, 3/9/2021 | 1,628,382 | ||||||
| 1,370,000 | 6.625%, 2/1/2022 | 1,654,275 | ||||||
|
| |||||||
| Total | 4,271,684 | |||||||
|
| |||||||
| Luxembourg (0.2%) | |||||||
Gazprom Neft OAO Via GPN Capital SA | ||||||||
| 1,590,000 | 6.000%, 11/27/2023c | 1,264,050 | ||||||
Millicom International Cellular SA | ||||||||
| 280,000 | 4.750%, 5/22/2020c | 263,900 | ||||||
Telefonica Celular del Paraguay SA | 208,000 | |||||||
| 200,000 | 6.750%, 12/13/2022 | |||||||
Wind Acquisition Finance SA | ||||||||
| 210,000 | 4.750%, 7/15/2020c | 196,350 | ||||||
| 1,140,000 | 7.375%, 4/23/2021c | 1,075,932 | ||||||
|
| |||||||
| Total | 3,008,232 | |||||||
|
| |||||||
| Malaysia (<0.1%) |
| ||||||
Wakala Global Sukuk Berhad | ||||||||
| 420,000 | 4.646%, 7/6/2021 | 462,445 | ||||||
|
| |||||||
| Total | 462,445 | |||||||
|
| |||||||
| Mexico (0.6%) | |||||||
America Movil SAB de CV | ||||||||
| 2,600,000 | 6.000%, 6/9/2019n | 175,610 | ||||||
Cemex SAB de CV | ||||||||
| 180,000 | 4.750%, 1/11/2022c,f | 213,181 | ||||||
Gruma SAB de CV | ||||||||
| 340,000 | 4.875%, 12/1/2024c | 351,900 | ||||||
Grupo Cementos de Chihuahua SAB de CV | ||||||||
| 200,000 | 8.125%, 2/8/2020c | 211,000 | ||||||
Metalsa SA de CV | ||||||||
| 350,000 | 4.900%, 4/24/2023c | 313,250 | ||||||
Mexican Cetes | ||||||||
| 128,860,499 | Zero Coupon, 1/15/2015n | 872,386 | ||||||
| 77,126,000 | Zero Coupon, 2/12/2015n | 521,077 | ||||||
| 7,437,100 | Zero Coupon, 3/5/2015n | 50,167 | ||||||
| 117,787,500 | Zero Coupon, 3/12/2015n | 793,845 | ||||||
| 54,778,000 | Zero Coupon, 3/19/2015n | 368,917 | ||||||
| 37,413,000 | Zero Coupon, 4/1/2015n | 251,699 | ||||||
Mexican Udibonos | ||||||||
| 4,560,574 | 5.000%, 6/16/2016n | 328,347 | ||||||
Mexico Government International Bond | ||||||||
| 20,000 | 6.625%, 3/3/2015 | 20,186 | ||||||
| 818,000 | 6.050%, 1/11/2040 | 1,000,414 | ||||||
| 310,000 | 4.750%, 3/8/2044 | 323,175 | ||||||
| 165,000 | 5.550%, 1/21/2045 | 191,813 | ||||||
| 180,000 | 5.750%, 10/12/2110 | 193,500 | ||||||
Petroleos Mexicanos | ||||||||
| 10,000 | 6.500%, 6/2/2041 | 11,475 | ||||||
| 780,000 | 6.375%, 1/23/2045 | 883,350 | ||||||
SixSigma Networks Mexico SA de CV | ||||||||
| 420,000 | 8.250%, 11/7/2021c | 426,090 | ||||||
Trust F/1401 | ||||||||
| 200,000 | 6.950%, 1/30/2044 | 221,000 | ||||||
| 210,000 | 6.950%, 1/30/2044* | 232,050 | ||||||
|
| |||||||
| Total | 7,954,432 | |||||||
|
| |||||||
| Mozambique (<0.1%) | |||||||
Mozambique EMATUM Finance 2020 BV | ||||||||
| 480,000 | 6.305%, 9/11/2020 | 468,096 | ||||||
|
| |||||||
| Total | 468,096 | |||||||
|
| |||||||
| Netherlands (<0.1%) | |||||||
Kazakhstan Temir Zholy Finance BV | ||||||||
| 390,000 | 6.950%, 7/10/2042* | 377,130 | ||||||
Listrindo Capital BV | ||||||||
| 340,000 | 6.950%, 2/21/2019 | 358,700 | ||||||
|
| |||||||
| Total | 735,830 | |||||||
|
| |||||||
| Nigeria (<0.1%) | |||||||
Nigeria Governmeant International Bond | ||||||||
| 200,000 | 6.750%, 1/28/2021 | 206,000 | ||||||
The accompanying Notes to Financial Statements are an integral part of this schedule.
263
Table of Contents
PARTNER WORLDWIDE ALLOCATION PORTFOLIO
Schedule of Investments as of December 31, 2014
| Principal Amount | Long-Term Fixed Income (10.6%) | Value | ||||||
| Nigeria (<0.1%) - continued |
| ||||||
| $ | 200,000 | 6.375%, 7/12/2023 | $ | 196,500 | ||||
|
| |||||||
Total | 402,500 | |||||||
|
| |||||||
| Pakistan (0.1%) | |||||||
Pakistan Government International Bond |
| |||||||
| 370,000 | 6.875%, 6/1/2017 | 374,625 | ||||||
| 750,000 | 7.250%, 4/15/2019c | 760,875 | ||||||
| 210,000 | 6.750%, 12/3/2019* | 207,900 | ||||||
| 260,000 | 8.250%, 4/15/2024c | 267,150 | ||||||
| 100,000 | 7.875%, 3/31/2036 | 90,100 | ||||||
|
| |||||||
Total | 1,700,650 | |||||||
|
| |||||||
| Panama (0.2%) | |||||||
Panama Government International Bond |
| |||||||
| 300,000 | 4.000%, 9/22/2024 | 308,250 | ||||||
| 286,000 | 8.875%, 9/30/2027 | 414,700 | ||||||
| 1,279,000 | 9.375%, 4/1/2029 | 1,940,883 | ||||||
| 950,000 | 6.700%, 1/26/2036 | 1,227,875 | ||||||
Panama Notas del Tesoro |
| |||||||
| 110,000 | 4.875%, 2/5/2021 | 116,365 | ||||||
|
| |||||||
Total | 4,008,073 | |||||||
|
| |||||||
| Paraguay (0.2%) | |||||||
Banco Continental SAECA |
| |||||||
| 451,000 | 8.875%, 10/15/2017 | 473,550 | ||||||
| 170,000 | 8.875%, 10/15/2017* | 178,500 | ||||||
Banco Regional SAECA |
| |||||||
| 196,000 | 8.125%, 1/24/2019 | 208,838 | ||||||
| 590,000 | 8.125%, 1/24/2019c | 628,645 | ||||||
Paraguay Government International Bond |
| |||||||
| 580,000 | 4.625%, 1/25/2023c | 588,700 | ||||||
| 850,000 | 4.625%, 1/25/2023 | 862,750 | ||||||
| 220,000 | 6.100%, 8/11/2044* | 234,300 | ||||||
|
| |||||||
Total | 3,175,283 | |||||||
|
| |||||||
| Peru (0.3%) | |||||||
Abengoa Transmision Sur SA |
| |||||||
| 200,000 | 6.875%, 4/30/2043 | 221,500 | ||||||
| 590,000 | 6.875%, 4/30/2043* | 653,425 | ||||||
Corporacion Financiera de Desarrollo SA |
| |||||||
| 200,000 | 4.750%, 2/8/2022 | 207,500 | ||||||
| 200,000 | 4.750%, 2/8/2022c | 207,500 | ||||||
Corporacion Lindley SA |
| |||||||
| 70,000 | 6.750%, 11/23/2021c | 74,900 | ||||||
| 640,000 | 6.750%, 11/23/2021 | 684,800 | ||||||
| 100,000 | 4.625%, 4/12/2023c | 97,000 | ||||||
Peru Government International Bond |
| |||||||
| 640,000 | 5.625%, 11/18/2050 | 753,600 | ||||||
| 110,000 | 7.350%, 7/21/2025 | 146,025 | ||||||
| 182,000 | 8.750%, 11/21/2033 | 283,465 | ||||||
| 670,000 | 6.550%, 3/14/2037 | 869,325 | ||||||
|
| |||||||
Total | 4,199,040 | |||||||
|
| |||||||
| Philippines (0.3%) | |||||||
Alliance Global Group, Inc. |
| |||||||
| 160,000 | 6.500%, 8/18/2017 | 171,200 | ||||||
Energy Development Corporation | ||||||||
| 730,000 | 6.500%, 1/20/2021 | 792,050 | ||||||
Philippines Government International Bond | ||||||||
| 1,292,000 | 4.200%, 1/21/2024 | 1,401,820 | ||||||
| 300,000 | 10.625%, 3/16/2025 | 483,000 | ||||||
| 350,000 | 7.750%, 1/14/2031 | 504,000 | ||||||
| 220,000 | 6.375%, 10/23/2034 | 294,800 | ||||||
San Miguel Corporation | ||||||||
| 200,000 | 4.875%, 4/26/2023 | 185,750 | ||||||
|
| |||||||
Total | 3,832,620 | |||||||
|
| |||||||
| Romania (0.1%) | |||||||
Romania Government International Bond | ||||||||
| 220,000 | 4.875%, 11/7/2019f | 307,874 | ||||||
| 930,000 | 3.625%, 4/24/2024f | 1,232,595 | ||||||
|
| |||||||
Total | 1,540,469 | |||||||
|
| |||||||
| Russia (0.6%) | |||||||
AHML Finance, Ltd. | ||||||||
| 10,700,000 | 7.750%, 2/13/2018*,o | 118,889 | ||||||
EDC Finance, Ltd. | ||||||||
| 300,000 | 4.875%, 4/17/2020c | 193,500 | ||||||
Gazprom Neft OAO Via GPN Capital SA | ||||||||
| 1,134,000 | 4.375%, 9/19/2022 | 827,819 | ||||||
| 200,000 | 6.000%, 11/27/2023 | 159,000 | ||||||
Lukoil International Finance BV | ||||||||
| 220,000 | 3.416%, 4/24/2018 | 187,000 | ||||||
| 310,000 | 6.125%, 11/9/2020 | 273,734 | ||||||
Mobile Telesystems OJSC | ||||||||
| 620,000 | 5.000%, 5/30/2023 | 489,800 | ||||||
Phosagro OAO via Phosagro Bond Funding, Ltd. | ||||||||
| 230,000 | 4.204%, 2/13/2018 | 197,800 | ||||||
| 310,000 | 4.204%, 2/13/2018* | 266,600 | ||||||
Russia Government International Bond | ||||||||
| 100,000 | 5.000%, 4/29/2020 | 92,975 | ||||||
| 1,600,000 | 4.500%, 4/4/2022 | 1,414,800 | ||||||
| 9,370,000 | 7.000%, 8/16/2023o | 103,340 | ||||||
| 11,100,000 | 7.050%, 1/19/2028o | 114,654 | ||||||
| 2,272,850 | 7.500%, 3/31/2030 | 2,356,945 | ||||||
| 800,000 | 5.875%, 9/16/2043 | 689,696 | ||||||
Russian Foreign Bond | ||||||||
| 800,000 | 4.875%, 9/16/2023 | 712,800 | ||||||
|
| |||||||
Total | 8,199,352 | |||||||
|
| |||||||
| Serbia (<0.1%) | |||||||
Serbia Government International Bond | ||||||||
| 580,000 | 7.250%, 9/28/2021 | 649,646 | ||||||
|
| |||||||
Total | 649,646 | |||||||
|
| |||||||
| Singapore (<0.1%) | |||||||
Olam International, Ltd. | ||||||||
| 560,000 | 6.750%, 1/29/2018 | 578,592 | ||||||
| 130,000 | 7.500%, 8/12/2020 | 143,841 | ||||||
|
| |||||||
Total | 722,433 | |||||||
|
| |||||||
The accompanying Notes to Financial Statements are an integral part of this schedule.
264
Table of Contents
PARTNER WORLDWIDE ALLOCATION PORTFOLIO
Schedule of Investments as of December 31, 2014
| Principal Amount | Long-Term Fixed Income (10.6%) | Value | ||||||
| South Africa (0.1%) |
| ||||||
South Africa Government International Bond | ||||||||
| $ | 1,400,000 | 5.875%, 5/30/2022 | $ | 1,569,750 | ||||
| 110,000 | 4.665%, 1/17/2024 | 113,850 | ||||||
| 710,000 | 5.375%, 7/24/2044 | 749,938 | ||||||
|
| |||||||
Total | 2,433,538 | |||||||
|
| |||||||
| Sri Lanka (0.1%) | |||||||
Sri Lanka Government International Bond | ||||||||
| 560,000 | 6.000%, 1/14/2019c | 582,400 | ||||||
| 200,000 | 5.125%, 4/11/2019 | 201,500 | ||||||
| 540,000 | 6.250%, 10/4/2020 | 562,275 | ||||||
| 250,000 | 6.250%, 7/27/2021 | 261,875 | ||||||
| 220,000 | 5.875%, 7/25/2022 | 223,575 | ||||||
|
| |||||||
Total | 1,831,625 | |||||||
|
| |||||||
| Supranational (0.1%) | |||||||
Corporacion Andina de Fomento | ||||||||
| 600,000 | 5.750%, 1/12/2017 | 649,547 | ||||||
| 643,000 | 4.375%, 6/15/2022 | 691,133 | ||||||
|
| |||||||
Total | 1,340,680 | |||||||
|
| |||||||
| Turkey (0.3%) | |||||||
Export Credit Bank of Turkey | ||||||||
| 200,000 | 5.875%, 4/24/2019 | 213,260 | ||||||
Turkey Government International Bond | ||||||||
| 330,000 | 7.000%, 3/11/2019 | 376,200 | ||||||
| 1,290,000 | 7.000%, 6/5/2020 | 1,499,944 | ||||||
| 370,000 | 5.625%, 3/30/2021 | 406,538 | ||||||
| 1,010,000 | 5.750%, 3/22/2024 | 1,128,675 | ||||||
| 50,000 | 8.000%, 2/14/2034 | 68,450 | ||||||
| 630,000 | 6.875%, 3/17/2036 | 778,838 | ||||||
| 190,000 | 6.750%, 5/30/2040 | 234,650 | ||||||
| 550,000 | 6.000%, 1/14/2041 | 624,250 | ||||||
| 370,000 | 6.625%, 2/17/2045 | 454,083 | ||||||
|
| |||||||
Total | 5,784,888 | |||||||
|
| |||||||
| Ukraine (0.2%) | |||||||
Financing of Infrastructure Projects State Enterprise | ||||||||
| 430,000 | 9.000%, 12/7/2017 | 258,000 | ||||||
MHP SA | ||||||||
| 200,000 | 8.250%, 4/2/2020 | 136,000 | ||||||
Ukraine Government International Bond | ||||||||
| 1,800,000 | 6.250%, 6/17/2016 | 1,167,300 | ||||||
| 430,000 | 6.580%, 11/21/2016 | 266,600 | ||||||
| 580,000 | 9.250%, 7/24/2017 | 353,800 | ||||||
| 460,000 | 8.375%, 11/3/2017 | 276,000 | ||||||
| 670,000 | 6.750%, 11/14/2017 | 414,596 | ||||||
| 200,000 | 7.400%, 4/20/2018 | 120,000 | ||||||
| 220,000 | 7.950%, 2/23/2021 | 134,200 | ||||||
| 410,000 | 7.800%, 11/28/2022 | 250,100 | ||||||
|
| |||||||
Total | 3,376,596 | |||||||
|
| |||||||
| United Arab Emirates (0.1%) | |||||||
Dolphin Energy, Ltd. | ||||||||
| 434,264 | 5.888%, 6/15/2019 | 472,805 | ||||||
| 200,000 | 5.500%, 12/15/2021 | 225,100 | ||||||
Ruwais Power Company PJSC | ||||||||
| 200,000 | 6.000%, 8/31/2036 | 230,500 | ||||||
| 660,000 | 6.000%, 8/31/2036c | 760,650 | ||||||
|
| |||||||
Total | 1,689,055 | |||||||
|
| |||||||
| United States (0.9%) | |||||||
Comcel Trust | ||||||||
| 200,000 | 6.875%, 2/6/2024 | 209,500 | ||||||
Commonwealth of Puerto Rico G.O. | ||||||||
| 100,000 | 5.750%, 7/1/2028 | 75,607 | ||||||
| 2,325,000 | 8.000%, 7/1/2035 | 2,025,819 | ||||||
HSBC Bank USA NA | ||||||||
| 688,000 | 10.000%, 1/5/2017p | 246,533 | ||||||
| 680,000 | 6.000%, 8/15/2040q | 642,765 | ||||||
Puerto Rico Sales Tax Financing Corporation Rev. | ||||||||
| 175,000 | 5.500%, 8/1/2028 | 138,674 | ||||||
| 75,000 | Zero Coupon, 8/1/2032 | 57,041 | ||||||
| 20,000 | 5.375%, 8/1/2038 | 14,082 | ||||||
| 50,000 | 5.375%, 8/1/2039 | 35,003 | ||||||
| 765,000 | 5.250%, 8/1/2041 | 532,807 | ||||||
| 1,240,000 | 5.500%, 8/1/2042 | 881,293 | ||||||
| 585,000 | 6.000%, 8/1/2042 | 441,072 | ||||||
| 5,000 | 5.000%, 8/1/2043 | 3,332 | ||||||
U.S. Treasury Bonds | ||||||||
| 600,000 | 3.000%, 11/15/2044 | 630,563 | ||||||
U.S. Treasury Notes | ||||||||
| 1,600,000 | 1.750%, 9/30/2019 | 1,609,374 | ||||||
| 4,200,000 | 1.500%, 11/30/2019 | 4,173,421 | ||||||
| 2,700,000 | 2.000%, 10/31/2021 | 2,706,961 | ||||||
| 2,600,000 | 2.125%, 12/31/2021 | 2,625,189 | ||||||
|
| |||||||
Total | 17,049,036 | |||||||
|
| |||||||
| Uruguay (0.2%) | |||||||
Uruguay Government International Bond | ||||||||
| 1,418,852 | 5.100%, 6/18/2050 | 1,440,135 | ||||||
| 1,292,247 | 4.500%, 8/14/2024 | 1,356,859 | ||||||
|
| |||||||
Total | 2,796,994 | |||||||
|
| |||||||
| Venezuela (0.4%) | |||||||
Petroleos de Venezuela SA | ||||||||
| 1,670,000 | 9.000%, 11/17/2021 | 730,625 | ||||||
| 580,000 | 6.000%, 5/16/2024 | 217,500 | ||||||
| 4,056,000 | 6.000%, 11/15/2026 | 1,480,440 | ||||||
Venezuela Government International Bond | ||||||||
| 270,000 | 9.000%, 5/7/2023 | 118,395 | ||||||
| 939,000 | 8.250%, 10/13/2024 | 408,465 | ||||||
| 3,870,000 | 7.650%, 4/21/2025 | 1,640,880 | ||||||
| 610,000 | 9.250%, 9/15/2027 | 281,515 | ||||||
| 905,000 | 9.250%, 5/7/2028 | 397,295 | ||||||
| 580,000 | 9.375%, 1/13/2034 | 251,720 | ||||||
| 90,000 | 7.000%, 3/31/2038 | 36,810 | ||||||
|
| |||||||
Total | 5,563,645 | |||||||
|
| |||||||
| Viet Nam (0.2%) | |||||||
Vietnam Government International Bond | ||||||||
| 2,150,000 | 6.750%, 1/29/2020c | 2,413,483 | ||||||
The accompanying Notes to Financial Statements are an integral part of this schedule.
265
Table of Contents
PARTNER WORLDWIDE ALLOCATION PORTFOLIO
Schedule of Investments as of December 31, 2014
| Principal Amount | Long-Term Fixed Income (10.6%) | Value | ||||||
| Viet Nam (0.2%) - continued |
| ||||||
| $ | 1,492,000 | 4.800%, 11/19/2024* | $ | 1,533,030 | ||||
|
| |||||||
Total | 3,946,513 | |||||||
|
| |||||||
| Vietnam (<0.1%) | |||||||
Debt and Asset Trading Corporation | ||||||||
| 200,000 | 1.000%, 10/10/2025 | 110,000 | ||||||
|
| |||||||
Total | 110,000 | |||||||
|
| |||||||
| Virgin Islands, British (<0.1%) | |||||||
Central American Bottling Corporation | ||||||||
| 108,000 | 6.750%, 2/9/2022 | 114,210 | ||||||
| 210,000 | 6.750%, 2/9/2022c | 222,075 | ||||||
|
| |||||||
Total | 336,285 | |||||||
|
| |||||||
| Zambia (0.1%) | |||||||
Zambia Government International Bond | ||||||||
| 970,000 | 5.375%, 9/20/2022 | 894,825 | ||||||
|
| |||||||
Total | 894,825 | |||||||
|
| |||||||
Total Long-Term Fixed Income (cost $178,648,738) | 171,572,257 | |||||||
|
| |||||||
| Shares | Preferred Stock (0.4%) | |||||||
| Brazil (<0.1%) | |||||||
| 78,532 | Vale SA ADRb | 570,142 | ||||||
|
| |||||||
Total | 570,142 | |||||||
|
| |||||||
| Germany (<0.1%) | |||||||
| 7,106 | Sixt SE | 219,877 | ||||||
|
| |||||||
Total | 219,877 | |||||||
|
| |||||||
| Italy (0.1%) | |||||||
| 164,517 | Unipol Gruppo Finanziario SPA | 805,946 | ||||||
|
| |||||||
Total | 805,946 | |||||||
|
| |||||||
| South Korea (0.3%) | |||||||
| 5,150 | Samsung Electronics Company, Ltd. | 4,843,938 | ||||||
|
| |||||||
Total | 4,843,938 | |||||||
|
| |||||||
Total Preferred Stock (cost $4,894,485) | 6,439,903 | |||||||
|
| |||||||
| Shares | Collateral Held for Securities Loaned (1.6%) | |||||||
| 26,312,891 | Thrivent Cash Management Trust | 26,312,891 | ||||||
|
| |||||||
Total Collateral Held for Securities Loaned (cost $26,312,891) | 26,312,891 | |||||||
|
| |||||||
| Shares or Principal Amount | Short-Term Investments (1.5%)r | |||||||
Federal Home Loan Bank Discount Notes | ||||||||
| 100,000 | 0.106%, 3/6/2015s | 99,981 | ||||||
| 100,000 | 0.110%, 4/1/2015s | 99,973 | ||||||
| 24,293,781 | Thrivent Cash Management Trust 0.060% | 24,293,781 | ||||||
|
| |||||||
Total Short-Term Investments (at amortized cost) | 24,493,735 | |||||||
|
| |||||||
Total Investments (cost $1,605,979,287) 100.9% | $ | 1,622,247,316 | ||||||
|
| |||||||
Other Assets and Liabilities, Net (0.9%) | (14,956,530 | ) | ||||||
|
| |||||||
Total Net Assets 100.0% | $ | 1,607,290,786 | ||||||
|
| |||||||
| a | Non-income producing security. | |
| b | All or a portion of the security is on loan. | |
| c | Denotes securities sold under Rule 144A of the Securities Act of 1933, which exempts them from registration. These securities have been deemed liquid and may be resold to other dealers in the program or to other qualified institutional buyers. As of December 31, 2014, the value of these investments was $32,078,535 or 2.0% of total net assets. | |
| d | Security is valued at fair value. Market quotations or prices were not readily available or were determined to be unreliable. Fair value was determined in good faith pursuant to procedures adopted by the Board. Further information on fair valuation can be found in section (2)(A) of the Notes to Financial Statements. | |
| e | Defaulted security. Interest is not being accrued. | |
| f | Principal amount is displayed in Euros. | |
| g | Denotes variable rate securities. Variable rate securities are securities whose yields vary with a designated market index or market rate. The rate shown is as of December 31, 2014. | |
| h | Denotes step coupon securities. Step coupon securities pay an initial coupon rate for the first period and then different coupon rates for following periods. The rate shown is as of December 31, 2014. | |
| i | Denotes perpetual securities. Perpetual securities pay an indefinite stream of interest, but may be called by the issuer at an earlier date. | |
| j | Principal amount is displayed in Brazilian Real. | |
| k | Principal amount is displayed in Hong Kong Dollar. | |
| l | Principal amount is displayed in Dominican Republic Pesos. | |
| m | Principal amount is displayed in Chinese Yuan. | |
| n | Principal amount is displayed in Mexican Pesos. | |
| o | Principal amount is displayed in Russian Rubles. | |
| p | Principal amount is displayed in Brazilian Real. Security is linked to Brazilian Government Bonds due January 1, 2017. | |
| q | Principal amount is displayed in Brazilian Real. Security is linked to Brazilian Government Bonds due August 15, 2040. | |
| r | The interest rate shown reflects the yield, coupon rate or the discount rate at the date of purchase. | |
| s | At December 31, 2014, $199,954 of investments were held on deposit with the counterparty and pledged as the initial margin deposit for open futures contracts. | |
| * | Denotes restricted securities. Restricted securities are investment securities which have been deemed illiquid and cannot be offered for public sale without first being registered under the Securities Act of 1933. The following table indicates the acquisition date and cost of restricted securities Partner Worldwide Allocation Portfolio owned as of December 31, 2014. |
The accompanying Notes to Financial Statements are an integral part of this schedule.
266
Table of Contents
PARTNER WORLDWIDE ALLOCATION PORTFOLIO
Schedule of Investments as of December 31, 2014
Security | Acquisition Date | Cost | ||||||
Abengoa Transmision Sur SA, 4/30/2043 | 4/8/2014 | $ | 589,970 | |||||
AHML Finance, Ltd., 2/13/2018 | 1/31/2013 | 356,524 | ||||||
Banco Continental SAECA, 10/15/2017 | 10/10/2012 | 170,000 | ||||||
Belize Government International Bond, 8/20/2017 | 3/20/2013 | 111,085 | ||||||
Brazil Loan Trust 1, 7/24/2023 | 7/25/2013 | 1,187,122 | ||||||
Brazil Minas SPE via State of Minas Gerais, 2/15/2028 | 3/22/2013 | 1,483,732 | ||||||
Ghana Government International Bond, 1/18/2026 | 9/11/2014 | 763,540 | ||||||
Honduras Government International Bond, 3/15/2024 | 3/12/2013 | 470,000 | ||||||
Honduras Government International Bond, 12/16/2020 | 12/11/2013 | 1,370,000 | ||||||
Independencia International, Ltd., 12/30/2016 | 3/29/2010 | 100,623 | ||||||
Kazakhstan Temir Zholy Finance BV, 7/10/2042 | 8/1/2012 | 449,968 | ||||||
Pakistan Government International Bond, 12/3/2019 | 11/26/2014 | 210,000 | ||||||
Paraguay Government International Bond, 8/11/2044 | 8/5/2014 | 220,941 | ||||||
Phosagro OAO via Phosagro Bond Funding, Ltd., 2/13/2018 | 2/6/2013 | 310,000 | ||||||
Sociedad Quimica y Minera de Chile SA, 1/28/2025 | 10/23/2014 | 445,357 | ||||||
Trust F/1401, 1/30/2044 | 1/23/2014 | 203,883 | ||||||
Vietnam Government International Bond, 11/19/2024 | 11/7/2014 | 1,502,917 | ||||||
Wind Acquisition Finance SA, 7/15/2020 | 6/24/2014 | 380,926 | ||||||
Definitions:
ADR | - | American Depositary Receipt, which are certificates for an underlying foreign security’s shares held by an issuing U.S. depository bank. | ||
GDR | - | Global Depository Receipts, which are certificates for shares of an underlying foreign security’s shares held by an issuing depository bank from more than one country. | ||
G.O. | - | General Obligation | ||
REIT | - | Real Estate Investment Trust is a company that buys, develops, manages and/or sells real estate assets. | ||
Rev. | - | Revenue |
Unrealized Appreciation (Depreciation)
Gross unrealized appreciation and depreciation of investments, based on cost for federal income tax purposes, were as follows:
Gross unrealized appreciation | $ | 155,494,443 | ||
Gross unrealized depreciation | (144,439,400 | ) | ||
|
| |||
Net unrealized appreciation (depreciation) | $ | 11,055,043 | ||
Cost for federal income tax purposes | $ | 1,611,192,273 |
The accompanying Notes to Financial Statements are an integral part of this schedule.
267
Table of Contents
PARTNER WORLDWIDE ALLOCATION PORTFOLIO
Schedule of Investments as of December 31, 2014
Fair Valuation Measurements
The following table is a summary of the inputs used, as of December 31, 2014, in valuing Partner Worldwide Allocation Portfolio’s assets carried at fair value.
Investments in Securities | Total | Level 1 | Level 2 | Level 3 | ||||||||||||
Common Stock | ||||||||||||||||
Communications Services | 616,267 | — | 616,267 | — | ||||||||||||
Consumer Discretionary | 207,732,925 | 1,289,445 | 206,443,480 | — | ||||||||||||
Consumer Staples | 107,481,368 | 2,508,855 | 104,972,513 | — | ||||||||||||
Energy | 60,183,237 | 3,117,100 | 57,066,137 | — | ||||||||||||
Financials | 348,226,092 | 19,348,485 | 328,876,859 | 748 | ||||||||||||
Health Care | 115,075,476 | 4,162,171 | 110,913,305 | — | ||||||||||||
Industrials | 245,815,377 | 2,669,032 | 243,146,345 | — | ||||||||||||
Information Technology | 103,190,697 | 3,185,637 | 100,005,060 | — | ||||||||||||
Materials | 133,001,752 | 9,472,040 | 123,529,712 | — | ||||||||||||
Telecommunications Services | 38,254,769 | — | 38,254,768 | 1 | ||||||||||||
Utilities | 33,850,570 | — | 33,850,570 | — | ||||||||||||
Long-Term Fixed Income | ||||||||||||||||
Basic Materials | 5,049,751 | — | 5,049,751 | — | ||||||||||||
Capital Goods | 823,622 | — | 823,622 | — | ||||||||||||
Communications Services | 4,706,080 | — | 4,706,080 | — | ||||||||||||
Consumer Cyclical | 665,225 | — | 665,225 | — | ||||||||||||
Consumer Non-Cyclica^ | 2,796,965 | — | 2,796,965 | 0 | ||||||||||||
Energy | 14,732,458 | — | 14,732,458 | — | ||||||||||||
Financials | 12,548,305 | — | 12,548,305 | — | ||||||||||||
Foreign Government | 104,846,873 | — | 103,960,886 | 885,987 | ||||||||||||
Technology | 426,090 | — | 426,090 | — | ||||||||||||
Transportation | 1,926,337 | — | 1,926,337 | — | ||||||||||||
U.S. Government and Agencies | 11,745,508 | — | 11,745,508 | — | ||||||||||||
U.S. Municipal | 4,204,730 | — | 4,204,730 | — | ||||||||||||
Utilities | 7,100,313 | — | 7,100,313 | — | ||||||||||||
Preferred Stock | ||||||||||||||||
Financials | 805,946 | — | 805,946 | — | ||||||||||||
Industrials | 219,877 | — | 219,877 | — | ||||||||||||
Information Technology | 4,843,938 | — | 4,843,938 | — | ||||||||||||
Materials | 570,142 | 570,142 | — | — | ||||||||||||
Collateral Held for Securities Loaned | 26,312,891 | 26,312,891 | — | — | ||||||||||||
Short-Term Investments | 24,493,735 | 24,293,781 | 199,954 | — | ||||||||||||
|
|
|
|
|
|
|
| |||||||||
Total | $ | 1,622,247,316 | $ | 96,929,579 | $ | 1,524,431,001 | $ | 886,736 | ||||||||
|
|
|
|
|
|
|
| |||||||||
Other Financial Instruments | Total | Level 1 | Level 2 | Level 3 | ||||||||||||
Asset Derivatives | ||||||||||||||||
Futures Contracts | 89,459 | 89,459 | — | — | ||||||||||||
Foreign Currency Forward Contracts | 1,392,814 | — | 1,392,814 | — | ||||||||||||
|
|
|
|
|
|
|
| |||||||||
Total Asset Derivatives | $ | 1,482,273 | $ | 89,459 | $ | 1,392,814 | $ | — | ||||||||
|
|
|
|
|
|
|
| |||||||||
Liability Derivatives | ||||||||||||||||
Futures Contracts | 169,758 | 169,758 | — | — | ||||||||||||
Foreign Currency Forward Contracts | 765,483 | — | 765,483 | — | ||||||||||||
|
|
|
|
|
|
|
| |||||||||
Total Liability Derivatives | $ | 935,241 | $ | 169,758 | $ | 765,483 | $ | — | ||||||||
|
|
|
|
|
|
|
| |||||||||
There were no significant transfers between Levels during the period ended December 31, 2014. Transfers between Levels are identified as of the end of the period.
| ^ | Level 3 security in this section is fair valued at <$1. |
The accompanying Notes to Financial Statements are an integral part of this schedule.
268
Table of Contents
PARTNER WORLDWIDE ALLOCATION PORTFOLIO
Schedule of Investments as of December 31, 2014
Futures Contracts | Number of Contracts Long/(Short) | Expiration Date | Notional Principal Amount | Value | Unrealized Gain/(Loss) | |||||||||||||||
2-Yr. U.S. Treasury Bond Futures | 95 | March 2015 | $ | 20,789,896 | $ | 20,766,406 | ($ | 23,490 | ) | |||||||||||
5-Yr. U.S. Treasury Bond Futures | 154 | March 2015 | 18,315,995 | 18,315,172 | (823 | ) | ||||||||||||||
10-Yr. U.S. Treasury Bond Futures | (200 | ) | March 2015 | (25,350,432 | ) | (25,359,376 | ) | (8,944 | ) | |||||||||||
30-Yr. U.S. Treasury Bond Futures | 5 | March 2015 | 714,946 | 722,813 | 7,867 | |||||||||||||||
90 Day Euro$ Futures | 31 | September 2015 | 7,695,880 | 7,699,625 | 3,745 | |||||||||||||||
ASX SPI 200 Index Futures | 3 | March 2015 | 317,488 | 329,601 | 12,113 | |||||||||||||||
CME 3 Month Eurodollar Futures | 62 | June 2015 | 15,429,032 | 15,432,575 | 3,543 | |||||||||||||||
CME 3 Month Eurodollar Futures | (71 | ) | September 2016 | (17,425,095 | ) | (17,454,463 | ) | (29,368 | ) | |||||||||||
Eurex 10 Year Euro BUND Futures | (33 | ) | March 2015 | (6,119,382 | ) | (6,221,367 | ) | (101,985 | ) | |||||||||||
Eurex 5 Year Euro BOBL Futures | 8 | March 2015 | 1,252,615 | 1,261,165 | 8,550 | |||||||||||||||
Eurex EURO STOXX 50 Futures | 43 | March 2015 | 1,616,322 | 1,627,570 | 11,248 | |||||||||||||||
FTSE 100 Index Futures | 8 | March 2015 | 786,851 | 813,279 | 26,428 | |||||||||||||||
Mini MSCI EAFE Index Futures | 20 | March 2015 | 1,763,048 | 1,757,900 | (5,148 | ) | ||||||||||||||
SGX MSCI Singapore Index Futures | 1 | January 2015 | 54,920 | 57,616 | 2,696 | |||||||||||||||
Tokyo Price Index Futures | 10 | March 2015 | 1,174,321 | 1,175,071 | 750 | |||||||||||||||
Ultra Long Term U.S. Treasury Bond Futures | 7 | March 2015 | 1,143,793 | 1,156,312 | 12,519 | |||||||||||||||
Total Futures Contracts | ($ | 80,299 | ) | |||||||||||||||||
The accompanying Notes to Financial Statements are an integral part of this schedule.
269
Table of Contents
PARTNER WORLDWIDE ALLOCATION PORTFOLIO
Schedule of Investments as of December 31, 2014
Foreign Currency Forward Contracts | Counterparty | Contracts to Deliver/Receive | Settlement Date | Value on Settlement Date | Value | Unrealized Gain/(Loss) | ||||||||||||||||
Purchases | ||||||||||||||||||||||
Brazilian Real | SB | 786,071 | 1/9/2015 | $ | 284,000 | $ | 295,017 | $ | 11,017 | |||||||||||||
Brazilian Real | UBS | 1,576,749 | 1/16/2015 - 1/26/2015 | 584,000 | 589,885 | 5,885 | ||||||||||||||||
Brazilian Real | RBC | 7,799,713 | 1/9/2015 - 1/16/2015 | 2,895,000 | 2,922,965 | 27,965 | ||||||||||||||||
Brazilian Real | MSC | 2,339,372 | 1/9/2015 - 1/15/2015 | 860,000 | 877,054 | 17,054 | ||||||||||||||||
Chilean Peso | SB | 293,066,500 | 1/9/2015 | 491,467 | 482,534 | (8,933 | ) | |||||||||||||||
Chinese Yuan | HSBC | 10,596,139 | 3/18/2015 | 1,686,000 | 1,707,953 | 21,953 | ||||||||||||||||
Chinese Yuan | HSBC | 23,098,770 | 3/18/2015 | 3,684,130 | 3,690,891 | 6,761 | ||||||||||||||||
Chinese Yuan | BB | 3,680,860 | 3/18/2015 | 585,714 | 588,155 | 2,441 | ||||||||||||||||
Colombian Peso | CSFB | 206,325,000 | 1/9/2015 | 90,000 | 86,822 | (3,178 | ) | |||||||||||||||
Colombian Peso | BOA | 1,389,535,905 | 1/9/2015 | 597,000 | 584,721 | (12,279 | ) | |||||||||||||||
Euro | BNP | 481,000 | 3/18/2015 | 593,790 | 582,358 | (11,432 | ) | |||||||||||||||
Euro | DB | 148,972 | 3/18/2015 | 182,103 | 180,364 | (1,739 | ) | |||||||||||||||
Euro | CITI | 1,202,500 | 3/18/2015 | 1,490,201 | 1,455,895 | (34,306 | ) | |||||||||||||||
Euro | BB | 457,000 | 3/18/2015 | 561,722 | 552,994 | (8,728 | ) | |||||||||||||||
Euro | JPM | 241,000 | 3/18/2015 | 297,151 | 291,784 | (5,367 | ) | |||||||||||||||
Euro | BOA | 1,282,000 | 3/18/2015 | 1,595,072 | 1,552,147 | (42,925 | ) | |||||||||||||||
Euro | DB | 123,527 | 3/18/2015 | 151,833 | 149,474 | (2,359 | ) | |||||||||||||||
Hungarian Forint | BNP | 153,130,627 | 3/18/2015 | 621,194 | 584,793 | (36,401 | ) | |||||||||||||||
Hungarian Forint | BB | 142,045,940 | 3/18/2015 | 576,789 | 542,461 | (34,328 | ) | |||||||||||||||
Hungarian Forint | DB | 141,745,263 | 3/18/2015 | 571,530 | 541,313 | (30,217 | ) | |||||||||||||||
Indian Rupee | RBS | 83,430,711 | 1/15/2015 - 1/27/2015 | 1,341,805 | 1,316,055 | (25,750 | ) | |||||||||||||||
Indian Rupee | HSBC | 44,602,252 | 1/12/2015 | 716,157 | 704,808 | (11,349 | ) | |||||||||||||||
Indian Rupee | MSC | 37,342,708 | 1/27/2015 | 598,000 | 588,218 | (9,782 | ) | |||||||||||||||
Indonesian Rupiah | JPM | 3,778,905,601 | 1/20/2015 | 288,000 | 304,141 | 16,141 | ||||||||||||||||
Indonesian Rupiah | BOA | 2,989,565,760 | 1/20/2015 | 227,200 | 240,612 | 13,412 | ||||||||||||||||
Japanese Yen | BNP | 33,317,318 | 3/18/2015 | 284,000 | 278,400 | (5,600 | ) | |||||||||||||||
Japanese Yen | BB | 32,993,053 | 3/18/2015 | 281,000 | 275,691 | (5,309 | ) | |||||||||||||||
Japanese Yen | CITI | 34,509,166 | 3/18/2015 | 291,000 | 288,359 | (2,641 | ) | |||||||||||||||
Japanese Yen | JPM | 34,048,786 | 3/18/2015 | 286,000 | 284,261 | (1,739 | ) | |||||||||||||||
Malaysian Ringgit | BNP | 996,494 | 1/20/2015 | 284,000 | 284,623 | 623 | ||||||||||||||||
Malaysian Ringgit | BB | 1,992,097 | 1/20/2015 | 569,000 | 568,992 | (8 | ) | |||||||||||||||
Malaysian Ringgit | HSBC | 996,369 | 1/20/2015 | 284,000 | 284,588 | 588 | ||||||||||||||||
Mexican Peso | UBS | 13,885,640 | 1/20/2015 | 949,089 | 940,152 | (8,937 | ) | |||||||||||||||
Mexican Peso | DB | 22,153,482 | 3/18/2015 | 1,495,500 | 1,494,761 | (739 | ) | |||||||||||||||
Mexican Peso | RBC | 15,809,762 | 3/18/2015 | 1,122,239 | 1,066,731 | (55,508 | ) | |||||||||||||||
Mexican Peso | BNP | 13,885,640 | 1/20/2015 | 936,795 | 940,152 | 3,357 | ||||||||||||||||
Polish Zloty | DB | 4,021,883 | 3/18/2015 | 1,200,359 | 1,133,231 | (67,128 | ) | |||||||||||||||
Russian Ruble | CSFB | 13,768,950 | 1/26/2015 | 299,000 | 223,605 | (75,395 | ) | |||||||||||||||
Russian Ruble | MSC | 54,669,210 | 1/20/2015 | 853,500 | 890,605 | 37,105 | ||||||||||||||||
Russian Ruble | DB | 5,043,188 | 1/26/2015 | 92,748 | 81,900 | (10,848 | ) | |||||||||||||||
South African Rand | CITI | 3,456,323 | 3/18/2015 | 294,000 | 295,299 | 1,299 | ||||||||||||||||
South African Rand | MSC | 3,459,059 | 3/18/2015 | 291,000 | 295,533 | 4,533 | ||||||||||||||||
South African Rand | SB | 2,971,180 | 3/18/2015 | 266,051 | 253,850 | (12,201 | ) | |||||||||||||||
South African Rand | DB | 4,193,787 | 3/18/2015 | 374,539 | 358,306 | (16,233 | ) | |||||||||||||||
South African Rand | UBS | 3,363,952 | 3/18/2015 | 284,000 | 287,407 | 3,407 | ||||||||||||||||
Turkish Lira | ML | 1,890,649 | 3/18/2015 | 828,269 | 797,378 | (30,891 | ) | |||||||||||||||
Turkish Lira | CITI | 1,480,321 | 3/18/2015 | 651,091 | 624,323 | (26,768 | ) | |||||||||||||||
Turkish Lira | SB | 1,374,860 | 3/18/2015 | 605,106 | 579,845 | (25,261 | ) | |||||||||||||||
Turkish Lira | MSC | 1,406,939 | 3/18/2015 | 617,404 | 593,375 | (24,029 | ) | |||||||||||||||
Turkish Lira | RBC | 1,343,826 | 3/18/2015 | 587,593 | 566,757 | (20,836 | ) | |||||||||||||||
Total Purchases | $ | 35,597,141 | $ | 35,101,538 | ($ | 495,603 | ) | |||||||||||||||
Sales | ||||||||||||||||||||||
Brazilian Real | MSC | 2,315,761 | 1/9/2015 - 1/16/2015 | $ | 869,500 | $ | 868,131 | $ | 1,369 | |||||||||||||
Brazilian Real | HSBC | 2,286,000 | 1/13/2015 | 883,666 | 857,046 | 26,620 | ||||||||||||||||
Brazilian Real | CITI | 6,650,909 | 1/15/2015 - 1/23/2015 | 2,595,585 | 2,487,469 | 108,116 | ||||||||||||||||
Brazilian Real | MSC | 766,594 | 1/16/2015 | 286,000 | 288,389 | (2,389 | ) | |||||||||||||||
Brazilian Real | JPM | 1,309,090 | 1/15/2015 | 501,356 | 490,533 | 10,823 | ||||||||||||||||
Brazilian Real | RBC | 2,691,706 | 1/9/2015 - 1/12/2015 | 1,037,457 | 1,009,983 | 27,474 | ||||||||||||||||
Brazilian Real | UBS | 4,875,395 | 1/9/2015 - 1/23/2015 | 1,875,161 | 1,826,966 | 48,195 | ||||||||||||||||
Chilean Peso | CSFB | 111,248,781 | 1/9/2015 | 182,390 | 183,171 | (781 | ) | |||||||||||||||
Chilean Peso | SB | 55,071,990 | 1/9/2015 | 90,000 | 90,676 | (676 | ) | |||||||||||||||
Chinese Yuan | BB | 7,430,174 | 3/18/2015 | 1,196,000 | 1,187,248 | 8,752 | ||||||||||||||||
Chinese Yuan | DB | 10,535,197 | 3/18/2015 | 1,697,689 | 1,683,391 | 14,298 | ||||||||||||||||
Chinese Yuan | SSB | 6,642,845 | 3/18/2015 | 1,069,581 | 1,061,443 | 8,138 | ||||||||||||||||
Chinese Yuan | SB | 7,161,247 | 3/18/2015 | 1,151,733 | 1,144,277 | 7,456 | ||||||||||||||||
The accompanying Notes to Financial Statements are an integral part of this schedule.
270
Table of Contents
PARTNER WORLDWIDE ALLOCATION PORTFOLIO
Schedule of Investments as of December 31, 2014
Foreign Currency Forward Contracts | Counterparty | Contracts to Deliver/Receive | Settlement Date | Value on Settlement Date | Value | Unrealized Gain/(Loss) | ||||||||||||||||
Sales - continued | ||||||||||||||||||||||
Chinese Yuan | HSBC | 25,149,729 | 3/18/2015 | $ | 4,043,191 | $ | 4,018,609 | 24,582 | ||||||||||||||
Chinese Yuan Offshor | UBS | 6,828,245 | 3/18/2015 | 1,099,220 | 1,090,613 | 8,607 | ||||||||||||||||
Colombian Peso | CSFB | 1,013,205,900 | 1/9/2015 | 437,935 | 426,360 | 11,575 | ||||||||||||||||
Colombian Peso | DB | 251,579,000 | 1/9/2015 | 103,428 | 105,865 | (2,437 | ) | |||||||||||||||
Colombian Peso | BOA | 881,379,044 | 1/9/2015 | 397,670 | 370,887 | 26,783 | ||||||||||||||||
Euro | JPM | 8,566,076 | 1/28/2015 - 3/18/2015 | 10,602,490 | 10,367,905 | 234,585 | ||||||||||||||||
Euro | WBC | 456,000 | 3/18/2015 | 562,636 | 551,784 | 10,852 | ||||||||||||||||
Euro | BOA | 241,000 | 3/18/2015 | 298,619 | 291,784 | 6,835 | ||||||||||||||||
Euro | WBC | 3,066,000 | 3/18/2015 | 3,779,581 | 3,712,078 | 67,503 | ||||||||||||||||
Euro | SB | 239,000 | 3/18/2015 | 296,304 | 289,363 | 6,941 | ||||||||||||||||
Euro | DB | 481,000 | 3/18/2015 | 601,359 | 582,358 | 19,001 | ||||||||||||||||
Hong Kong Dollar | RBS | 1,855,000 | 1/8/2015 | 239,259 | 239,217 | 42 | ||||||||||||||||
Hungarian Forint | BOA | 141,936,916 | 3/18/2015 | 559,555 | 542,045 | 17,510 | ||||||||||||||||
Hungarian Forint | DB | 38,844,332 | 3/18/2015 | 151,833 | 148,494 | 3,339 | ||||||||||||||||
Hungarian Forint | DB | 46,854,104 | 3/18/2015 | 182,103 | 178,932 | 3,171 | ||||||||||||||||
Indonesian Rupiah | CITI | 3,665,145,000 | 1/16/2015 | 291,000 | 295,176 | (4,176 | ) | |||||||||||||||
Indonesian Rupiah | BB | 2,899,372,500 | 1/20/2015 | 225,000 | 233,353 | (8,353 | ) | |||||||||||||||
Indonesian Rupiah | BOA | 3,677,472,000 | 1/20/2015 | 288,000 | 295,978 | (7,978 | ) | |||||||||||||||
Indonesian Rupiah | DB | 3,705,955,200 | 1/20/2015 | 288,000 | 298,270 | (10,270 | ) | |||||||||||||||
Japanese Yen | JPM | 34,827,828 | 3/18/2015 | 294,000 | 291,022 | 2,978 | ||||||||||||||||
Japanese Yen | CITI | 66,330,719 | 3/18/2015 | 569,000 | 554,261 | 14,739 | ||||||||||||||||
Japanese Yen | BNP | 34,334,653 | 3/18/2015 | 291,000 | 286,901 | 4,099 | ||||||||||||||||
Malaysian Ringgit | DB | 3,089,574 | 1/9/2015 | 897,000 | 883,097 | 13,903 | ||||||||||||||||
Malaysian Ringgit | HSBC | 1,036,840 | 1/9/2015 | 297,605 | 296,361 | 1,244 | ||||||||||||||||
Malaysian Ringgit | BB | 629,249 | 1/9/2015 | 180,279 | 179,859 | 420 | ||||||||||||||||
Malaysian Ringgit | RBC | 1,002,717 | 1/9/2015 | 287,963 | 286,608 | 1,355 | ||||||||||||||||
Mexican Peso | BOA | 12,737,332 | 1/20/2015 | 881,720 | 862,403 | 19,317 | ||||||||||||||||
Mexican Peso | DB | 27,631,969 | 1/20/2015 | 1,888,711 | 1,870,872 | 17,839 | ||||||||||||||||
Mexican Peso | RBS | 37,956,569 | 1/20/2015 | 2,686,829 | 2,569,917 | 116,912 | ||||||||||||||||
Mexican Peso | JPM | 4,125,502 | 3/18/2015 | 281,000 | 278,360 | 2,640 | ||||||||||||||||
Mexican Peso | SSB | 16,197,823 | 2/12/2015 - 3/18/2015 | 1,155,004 | 1,094,012 | 60,992 | ||||||||||||||||
Philippines Peso | BB | 15,635,276 | 1/13/2015 | 347,335 | 349,334 | (1,999 | ) | |||||||||||||||
Philippines Peso | SB | 10,695,369 | 1/12/2015 | 237,253 | 238,973 | (1,720 | ) | |||||||||||||||
Polish Zloty | BB | 1,942,609 | 3/18/2015 | 561,722 | 548,674 | 13,048 | ||||||||||||||||
Polish Zloty | UBS | 1,988,942 | 3/18/2015 | 589,893 | 560,417 | 29,476 | ||||||||||||||||
Russian Ruble | CITI | 14,340,767 | 1/26/2015 | 269,000 | 232,891 | 36,109 | ||||||||||||||||
Russian Ruble | MSC | 20,832,526 | 1/20/2015 | 328,900 | 342,922 | (14,022 | ) | |||||||||||||||
Russian Ruble | MSC | 42,541,770 | 1/20/2015 - 1/23/2015 | 748,429 | 692,308 | 56,121 | ||||||||||||||||
Singapore Dollar | HSBC | 1,478,009 | 3/18/2015 | 1,124,000 | 1,115,774 | 8,226 | ||||||||||||||||
Singapore Dollar | WBC | 790,813 | 3/18/2015 | 609,339 | 596,500 | 12,839 | ||||||||||||||||
Singapore Dollar | DB | 742,010 | 3/18/2015 | 568,906 | 559,688 | 9,218 | ||||||||||||||||
Singapore Dollar | BB | 742,150 | 3/18/2015 | 571,113 | 559,794 | 11,319 | ||||||||||||||||
South African Rand | DB | 3,723,460 | 3/18/2015 | 330,033 | 318,122 | 11,911 | ||||||||||||||||
South African Rand | SB | 3,381,137 | 3/18/2015 | 297,000 | 288,875 | 8,125 | ||||||||||||||||
South African Rand | JPM | 3,463,258 | 3/18/2015 | 297,000 | 295,891 | 1,109 | ||||||||||||||||
South African Rand | BB | 3,416,251 | 3/18/2015 | 297,000 | 291,875 | 5,125 | ||||||||||||||||
South African Rand | UBS | 3,451,986 | 3/18/2015 | 297,000 | 294,928 | 2,072 | ||||||||||||||||
South Korean Won | SB | 973,610,850 | 1/9/2015 - 1/15/2015 | 879,000 | 885,560 | (6,560 | ) | |||||||||||||||
Turkish Lira | HSBC | 676,745 | 3/18/2015 | 299,000 | 285,416 | 13,584 | ||||||||||||||||
Turkish Lira | MSC | 2,741,577 | 3/18/2015 | 1,187,000 | 1,156,256 | 30,744 | ||||||||||||||||
Turkish Lira | JPM | 1,372,373 | 3/18/2015 | 568,000 | 578,796 | (10,796 | ) | |||||||||||||||
Turkish Lira | RBS | 1,396,426 | 3/18/2015 | 576,000 | 588,940 | (12,940 | ) | |||||||||||||||
Total Sales | $ | 58,576,335 | $ | 57,453,401 | $ | 1,122,934 | ||||||||||||||||
Net Unrealized Gain/(Loss) on Foreign Currency Forward Contracts |
| $ | 627,331 | |||||||||||||||||||
The accompanying Notes to Financial Statements are an integral part of this schedule.
271
Table of Contents
PARTNER WORLDWIDE ALLOCATION PORTFOLIO
Schedule of Investments as of December 31, 2014
Counterparty | ||||||||
BOA | - | Bank of America | ||||||
BB | - | Barclays Bank | ||||||
BNP | - | BNP Paribas | ||||||
CITI | - | Citibank | ||||||
CSFB | - | CS First Boston Corporation | ||||||
DB | - | Deutsche Bank | ||||||
HSBC | - | HSBC Securities, Inc. | ||||||
JPM | - | J.P. Morgan | ||||||
ML | - | Merrill Lynch | ||||||
MSC | - | Morgan Stanley & Company | ||||||
RBC | - | The Royal Bank of Canada | ||||||
RBS | - | The Royal Bank of Scotland | ||||||
SB | - | Standard Bank plc | ||||||
SSB | - | State Street Bank | ||||||
UBS | - | UBS Securities, Ltd. | ||||||
WBC | - | Westpac Banking Corporation | ||||||
The following table summarizes the fair value and Statement of Assets and Liabilities location, as of December 31, 2014, for Partner Worldwide Allocation Portfolio’s investments in financial derivative instruments by primary risk exposure as discussed under item (2) Significant Accounting Policies of the Notes to Financial Statements.
Derivatives by risk category | Statement of Assets and Liabilities Location | Fair Value | ||||
| Asset Derivatives | ||||||
Interest Rate Contracts | ||||||
Futures* | Net Assets - Net unrealized appreciation/(depreciation) on Futures contracts | $ | 36,224 | |||
Total Interest Rate Contracts | 36,224 | |||||
Equity Contracts | ||||||
Futures* | Net Assets - Net unrealized appreciation/(depreciation) on Futures contracts | 53,235 | ||||
Total Equity Contracts | 53,235 | |||||
Foreien Exchange Contracts | ||||||
Forward Contracts | Net Assets - Net unrealized appreciation/(depreciation) on Foreign currency forward contracts | 1,392,814 | ||||
Total Foreign Exchange Contracts | 1,392,814 | |||||
|
| |||||
Total Asset Derivatives | $ | 1,482,273 | ||||
|
| |||||
| Liability Derivatives | ||||||
Interest Rate Contracts | ||||||
Futures* | Net Assets - Net unrealized appreciation/(depreciation) on Futures contracts | 164,610 | ||||
Total Interest Rate Contracts | 164,610 | |||||
Equity Contracts | ||||||
Futures* | Net Assets - Net unrealized appreciation/(depreciation) on Futures contracts | 5,148 | ||||
Total Equity Contracts | 5,148 | |||||
Foreign Exchange Contracts | ||||||
Forward Contracts | Net Assets - Net unrealized appreciation/(depreciation) on Foreign currency forward contracts | 765,483 | ||||
Total Foreign Exchange Contracts | 765,483 | |||||
|
| |||||
Total Liability Derivatives | $ | 935,241 | ||||
|
| |||||
| * | Includes cumulative appreciation/depreciation of futures contracts as reported in the Schedule of Investments. Only current day’s variation margin is reported within the Statement of Assets and Liabilities. |
The following table summarizes the net realized gains/(losses) and Statement of Operations location, for the period ended December 31, 2014, for Partner Worldwide Allocation Portfolio’s investments in financial derivative instruments by primary risk exposure.
Derivatives by risk category | Statement of Operations Location | Realized Gains/(Losses) recognized in Income | ||||
| Equity Contracts | ||||||
Futures | Net realized gains/(losses) on Futures contracts | 49,861 | ||||
| Total Equity Contracts | 49,861 | |||||
Foreign Exchange Contracts | ||||||
Forward Contracts | Net realized gains/(losses) on Foreign currency transactions | 2,324,964 | ||||
Total Foreign Exchange Contracts | 2,324,964 | |||||
The accompanying Notes to Financial Statements are an integral part of this schedule.
272
Table of Contents
PARTNER WORLDWIDE ALLOCATION PORTFOLIO
Schedule of Investments as of December 31, 2014
The following table summarizes the net realized gains/(losses) and Statement of Operations location, for the period ended December 31, 2014, for Partner Worldwide Allocation Portfolio’s investments in financial derivative instruments by primary risk exposure.
Derivatives by risk category | Statement of Operations Location | Realized Gains/(Losses) recognized in Income | ||||
| Interest Rate Contracts | ||||||
Futures | Net realized gains/(losses) on Futures contracts | (794,461 | ) | |||
Total Interest Rate Contracts | (794,461 | ) | ||||
|
| |||||
Total | $ | 1,580,364 | ||||
|
| |||||
The following table summarizes the change in net unrealized appreciation/(depreciation) and Statement of Operations location, for the period ended December 31, 2014, for Partner Worldwide Allocation Portfolio’s investments in financial derivative instruments by primary risk exposure.
Derivatives by risk category | Statement of Operations Location | Change in unrealized appreciation/(depreciation) recognized in Income | ||||
| Interest Rate Contracts | ||||||
Futures | Change in net unrealized appreciation/(depreciation) on Futures contracts | (519,933 | ) | |||
| Total Interest Rate Contracts | (519,933 | ) | ||||
Equity Contracts | ||||||
Futures | Change in net unrealized appreciation/(depreciation) on Futures contracts | (142,747 | ) | |||
Total Equity Contracts | (142,747 | ) | ||||
| Foreign Exchange Contracts | ||||||
Forward Contracts | Change in net unrealized appreciation/(depreciation) on Foreign currency forward contracts | 608,729 | ||||
Total Foreign Exchange Contracts | 608,729 | |||||
|
| |||||
Total | ($ | 53,951 | ) | |||
|
| |||||
The following table presents Partner Worldwide Allocation Portfolio’s average volume of derivative activity during the period ended December 31, 2014.
Derivative Risk Category | Futures (Notional)* | Futures (Percentage of Average Net Assets) | Forwards (Notional)* | Forwards (Percentage of Average Net Assets) | ||||||||||||
Equity Contracts | $ | 3,936,773 | 0.2 | % | N/A | N/A | ||||||||||
Interest Rate Contracts | 100,386,042 | 5.9 | N/A | N/A | ||||||||||||
Foreign Exchange Contracts | N/A | N/A | $ | 141,638,495 | 8.3 | % | ||||||||||
| * | Notional amount represents long or short, or both, derivative positions held by the Portfolio. |
Investment in Affiliates
Affiliated issuers, as defined under the Investment Company Act of 1940, include those in which the Portfolio’s holdings of an issuer represent 5% or more of the outstanding voting securities of an issuer, or any affiliated mutual fund.
A summary of transactions for the fiscal year to date, in Partner Worldwide Allocation Portfolio, is as follows:
Portfolio | Value December 31, 2013 | Gross Purchases | Gross Sales | Shares Held at December 31, 2014 | Value December 31, 2014 | Income Earned January 1, 2014 - December 31, 2014 | ||||||||||||||||||
Cash Management Trust- Collateral Investment | $ | 50,312,730 | $ | 577,835,173 | $ | 601,835,012 | 26,312,891 | $ | 26,312,891 | $ | 765,860 | |||||||||||||
Cash Management Trust-Short Term Investment | 29,071,341 | 388,565,152 | 393,342,712 | 24,293,781 | 24,293,781 | 14,857 | ||||||||||||||||||
Total Value and Income Earned | 79,384,071 | 50,606,672 | 780,717 | |||||||||||||||||||||
The accompanying Notes to Financial Statements are an integral part of this schedule.
273
Table of Contents
Schedule of Investments as of December 31, 2014
| Shares | Common Stock (98.4%) | Value | ||||||
| Consumer Discretionary (12.6%) |
| ||||||
| 21,860 | Comcast Corporation | $ | 1,268,099 | |||||
| 8,800 | Delphi Automotive plc | 639,936 | ||||||
| 3,920 | Dick’s Sporting Goods, Inc. | 194,628 | ||||||
| 10,480 | Home Depot, Inc. | 1,100,085 | ||||||
| 12,450 | Jarden Corporationa | 596,106 | ||||||
| 4,210 | Mohawk Industries, Inc.a | 654,065 | ||||||
| 25,120 | Service Corporation International | 570,224 | ||||||
| 8,520 | Starbucks Corporation | 699,066 | ||||||
| 9,100 | Time Warner, Inc. | 777,322 | ||||||
| 10,200 | TJX Companies, Inc. | 699,516 | ||||||
| 25,020 | Twenty-First Century Fox, Inc. | 960,893 | ||||||
| 7,160 | Wyndham Worldwide Corporation | 614,042 | ||||||
|
| |||||||
| Total | 8,773,982 | |||||||
|
| |||||||
| Consumer Staples (8.6%) | |||||||
| 21,800 | Coca-Cola Company | 920,396 | ||||||
| 4,800 | Constellation Brands, Inc.a | 471,216 | ||||||
| 9,560 | CVS Health Corporation | 920,723 | ||||||
| 3,700 | Energizer Holdings, Inc. | 475,672 | ||||||
| 9,450 | Estee Lauder Companies, Inc. | 720,090 | ||||||
| 8,110 | Kroger Company | 520,743 | ||||||
| 10,270 | Lorillard, Inc. | 646,394 | ||||||
| 15,600 | Mondelez International, Inc. | 566,670 | ||||||
| 14,510 | Natural Grocers by Vitamin Cottage, Inc.a,b | 408,747 | ||||||
| 8,530 | WhiteWave Foods Companya | 298,465 | ||||||
|
| |||||||
| Total | 5,949,116 | |||||||
|
| |||||||
| Energy (7.0%) | |||||||
| 12,160 | Chevron Corporation | 1,364,109 | ||||||
| 2,990 | Dril-Quip, Inc.a | 229,423 | ||||||
| 7,580 | EQT Corporation | 573,806 | ||||||
| 6,320 | FMC Technologies, Inc.a | 296,029 | ||||||
| 4,330 | Hess Corporation | 319,641 | ||||||
| 5,020 | Marathon Petroleum Corporation | 453,105 | ||||||
| 8,950 | Occidental Petroleum Corporation | 721,459 | ||||||
| 10,500 | Schlumberger, Ltd. | 896,805 | ||||||
|
| |||||||
| Total | 4,854,377 | |||||||
|
| |||||||
| Financials (17.6%) | |||||||
| 15,500 | American International Group, Inc. | 868,155 | ||||||
| 78,880 | Bank of America Corporation | 1,411,163 | ||||||
| 7,300 | Boston Properties, Inc. | 939,437 | ||||||
| 12,920 | Capital One Financial Corporation | 1,066,546 | ||||||
| 24,200 | CBRE Group, Inc.a | 828,850 | ||||||
| 25,200 | Citigroup, Inc. | 1,363,572 | ||||||
| 14,370 | East West Bancorp, Inc. | 556,263 | ||||||
| 9,800 | Invesco, Ltd. | 387,296 | ||||||
| 5,560 | J.P. Morgan Chase & Company | 347,945 | ||||||
| 3,920 | M&T Bank Corporation | 492,430 | ||||||
| 4,690 | McGraw-Hill Financial, Inc. | 417,316 | ||||||
| 14,260 | MetLife, Inc. | 771,324 | ||||||
| 13,400 | NASDAQ OMX Group, Inc. | 642,664 | ||||||
| 50,860 | Regions Financial Corporation | 537,082 | ||||||
| 6,170 | Reinsurance Group of America, Inc. | 540,615 | ||||||
| 4,400 | SL Green Realty Corporation | 523,688 | ||||||
| 6,740 | State Street Corporation | 529,090 | ||||||
|
| |||||||
| Total | 12,223,436 | |||||||
|
| |||||||
| Health Care (13.0%) | |||||||
| 6,110 | Air Methods Corporationa,b | 269,023 | ||||||
| 11,290 | BioMarin Pharmaceutical, Inc.a | 1,020,616 | ||||||
| 13,080 | Bristol-Myers Squibb Company | 772,112 | ||||||
| 9,100 | Catamaran Corporationa | 470,925 | ||||||
| 7,590 | Endo International plca | 547,391 | ||||||
| 10,090 | HCA Holdings, Inc.a | 740,505 | ||||||
| 3,500 | McKesson Corporation | 726,530 | ||||||
| 4,630 | Medivation, Inc.a | 461,194 | ||||||
| 6,540 | Salix Pharmaceuticals, Ltd.a | 751,708 | ||||||
| 3,500 | Shire Pharmaceuticals Group plc ADR | 743,890 | ||||||
| 8,163 | Valeant Pharmaceuticals International, Inc.a | 1,168,207 | ||||||
| 6,100 | Vertex Pharmaceuticals, Inc.a | 724,680 | ||||||
| 15,300 | Zoetis, Inc. | 658,359 | ||||||
|
| |||||||
| Total | 9,055,140 | |||||||
|
| |||||||
| Industrials (11.3%) | |||||||
| 13,420 | Alaska Air Group, Inc. | 801,979 | ||||||
| 13,550 | Danaher Corporation | 1,161,371 | ||||||
| 7,020 | FedEx Corporation | 1,219,093 | ||||||
| 4,990 | Genesee & Wyoming, Inc.a | 448,701 | ||||||
| 4,410 | IDEX Corporation | 343,275 | ||||||
| 14,100 | Ingersoll-Rand plc | 893,799 | ||||||
| 7,990 | Manpower, Inc. | 544,678 | ||||||
| 9,090 | Pall Corporation | 919,999 | ||||||
| 15,510 | US Airways Group, Inc. | 831,801 | ||||||
| 6,350 | WABCO Holdings, Inc.a | 665,353 | ||||||
|
| |||||||
| Total | 7,830,049 | |||||||
|
| |||||||
| Information Technology (19.7%) | |||||||
| 15,470 | Adobe Systems, Inc.a | 1,124,669 | ||||||
| 14,050 | Agilent Technologies, Inc. | 575,207 | ||||||
| 14,940 | Apple, Inc. | 1,649,077 | ||||||
| 6,380 | Cavium, Inc.a | 394,412 | ||||||
| 14,320 | Facebook, Inc.a | 1,117,246 | ||||||
| 2,940 | Google, Inc., Class Aa | 1,560,140 | ||||||
| 53,650 | Microsoft Corporation | 2,492,043 | ||||||
| 15,940 | Monolithic Power Systems, Inc. | 792,856 | ||||||
| 7,900 | NXP Semiconductors NV | 603,560 | ||||||
| 31,580 | Oracle Corporation | 1,420,153 | ||||||
| 14,130 | QUALCOMM, Inc. | 1,050,283 | ||||||
| 21,340 | Total System Services, Inc. | 724,706 | ||||||
| 3,800 | Yelp, Inc.a | 207,974 | ||||||
|
| |||||||
| Total | 13,712,326 | |||||||
|
| |||||||
| Materials (3.6%) | |||||||
| 8,440 | Ashland, Inc. | 1,010,774 | ||||||
| 4,230 | Eagle Materials, Inc. | 321,607 | ||||||
| 5,000 | LyondellBasell Industries NV | 396,950 | ||||||
| 13,020 | Rock-Tenn Company | 793,960 | ||||||
|
| |||||||
| Total | 2,523,291 | |||||||
|
| |||||||
| Telecommunications Services (1.8%) | |||||||
| 7,710 | SBA Communications Corporationa | 853,960 | ||||||
| 15,510 | T-Mobile US, Inc.a | 417,839 | ||||||
|
| |||||||
| Total | 1,271,799 | |||||||
|
| |||||||
| Utilities (3.2%) | |||||||
| 17,600 | American Electric Power Company, Inc. | 1,068,672 | ||||||
| 4,540 | Atmos Energy Corporation | 253,059 | ||||||
The accompanying Notes to Financial Statements are an integral part of this schedule.
274
Table of Contents
PARTNER ALL CAP PORTFOLIO
Schedule of Investments as of December 31, 2014
| Shares | Common Stock (98.4%) | Value | ||||||
| Utilities (3.2%) - continued |
| ||||||
| 13,060 | Edison International, Inc. | $ | 855,169 | |||||
|
| |||||||
| Total | 2,176,900 | |||||||
|
| |||||||
Total Common Stock (cost $59,636,358) | 68,370,416 | |||||||
|
| |||||||
Collateral Held for Securities Loaned (0.8%) | ||||||||
| 532,657 | Thrivent Cash Management Trust | 532,657 | ||||||
|
| |||||||
Total Collateral Held for Securities Loaned (cost $532,657) | 532,657 | |||||||
|
| |||||||
| Shares or Principal Amount | Short-Term Investments (1.6%)c | |||||||
| 1,141,464 | Thrivent Cash Management Trust 0.060% | 1,141,464 | ||||||
|
| |||||||
| Total Short-Term Investments (at amortized cost) | 1,141,464 | |||||||
|
| |||||||
| Total Investments (cost $61,310,479) 100.8% | $ | 70,044,537 | ||||||
|
| |||||||
| Other Assets and Liabilities, Net (0.8%) | (546,145 | ) | ||||||
|
| |||||||
| Total Net Assets 100.0% | $ | 69,498,392 | ||||||
|
| |||||||
| a | Non-income producing security. |
| b | All or a portion of the security is on loan. |
| c | The interest rate shown reflects the yield, coupon rate or the discount rate at the date of purchase. |
Definitions:
ADR | - | American Depositary Receipt, which are certificates for an underlying foreign security’s shares held by an issuing U.S. depository bank. |
Unrealized Appreciation (Depreciation)
Gross unrealized appreciation and depreciation of investments, based on cost for federal income tax purposes, were as follows:
Gross unrealized appreciation | $ | 9,488,868 | ||
Gross unrealized depreciation | (769,253 | ) | ||
|
| |||
Net unrealized appreciation (depreciation) | $ | 8,719,615 | ||
Cost for federal income tax purposes | $ | 61,324,922 | ||
The accompanying Notes to Financial Statements are an integral part of this schedule.
275
Table of Contents
PARTNER ALL CAP PORTFOLIO
Schedule of Investments as of December 31, 2014
Fair Valuation Measurements
The following table is a summary of the inputs used, as of December 31, 2014, in valuing Partner All Cap Portfolio’s assets carried at fair value.
Investments in Securities | Total | Level 1 | Level 2 | Level 3 | ||||||||||||
Common Stock | ||||||||||||||||
Consumer Discretionary | 8,773,982 | 8,773,982 | — | — | ||||||||||||
Consumer Staples | 5,949,116 | 5,949,116 | — | — | ||||||||||||
Energy | 4,854,377 | 4,854,377 | — | — | ||||||||||||
Financials | 12,223,436 | 12,223,436 | — | — | ||||||||||||
Health Care | 9,055,140 | 9,055,140 | — | — | ||||||||||||
Industrials | 7,830,049 | 7,830,049 | — | — | ||||||||||||
Information Technology | 13,712,326 | 13,712,326 | — | — | ||||||||||||
Materials | 2,523,291 | 2,523,291 | — | — | ||||||||||||
Telecommunications Services | 1,271,799 | 1,271,799 | — | — | ||||||||||||
Utilities | 2,176,900 | 2,176,900 | — | — | ||||||||||||
Collateral Held for Securities Loaned | 532,657 | 532,657 | — | — | ||||||||||||
Short-Term Investments | 1,141,464 | 1,141,464 | — | — | ||||||||||||
|
|
|
|
|
|
|
| |||||||||
Total | $ | 70,044,537 | $ | 70,044,537 | $ | — | $ | — | ||||||||
|
|
|
|
|
|
|
| |||||||||
There were no significant transfers between Levels during the period ended December 31, 2014. Transfers between Levels are identified as of the end of the period.
Investment in Affiliates
Affiliated issuers, as defined under the Investment Company Act of 1940, include those in which the Portfolio’s holdings of an issuer represent 5% or more of the outstanding voting securities of an issuer, or any affiliated mutual fund.
A summary of transactions for the fiscal year to date, in Partner All Cap Portfolio, is as follows:
Portfolio | Value December 31, 2013 | Gross Purchases | Gross Sales | Shares Held at December 31, 2014 | Value December 31, 2014 | Income Earned January 1, 2014 - December 31, 2014 | ||||||||||||||||||
Cash Management Trust-Collateral Investment | $ | 431,587 | $ | 8,208,870 | $ | 8,107,800 | 532,657 | $ | 532,657 | $ | 6,644 | |||||||||||||
Cash Management Trust-Short Term Investment | 818,729 | 10,223,505 | 9,900,770 | 1,141,464 | 1,141,464 | 481 | ||||||||||||||||||
Total Value and Income Earned | 1,250,316 | 1,674,121 | 7,125 | |||||||||||||||||||||
The accompanying Notes to Financial Statements are an integral part of this schedule.
276
Table of Contents
Schedule of Investments as of December 31, 2014
| Shares | Common Stock (94.5%) | Value | ||||||
| Consumer Discretionary (20.4%) |
| ||||||
| 124,504 | Amazon.com, Inc.a | $ | 38,639,816 | |||||
| 40,100 | AutoZone, Inc.a | 24,826,311 | ||||||
| 641,859 | Comcast Corporation | 37,234,241 | ||||||
| 240,650 | Home Depot, Inc. | 25,261,030 | ||||||
| 233,000 | Kohl’s Corporation | 14,222,320 | ||||||
| 292,300 | Las Vegas Sands Corporation | 17,000,168 | ||||||
| 211,950 | NIKE, Inc. | 20,378,993 | ||||||
| 328,200 | Starbucks Corporation | 26,928,810 | ||||||
|
| |||||||
| Total | 204,491,689 | |||||||
|
| |||||||
| Consumer Staples (1.2%) | |||||||
| 106,650 | Anheuser-Busch InBev NV ADRb | 11,978,928 | ||||||
|
| |||||||
| Total | 11,978,928 | |||||||
|
| |||||||
| Energy (6.8%) | |||||||
| 202,350 | Cameron International Corporationa | 10,107,383 | ||||||
| 234,000 | EOG Resources, Inc. | 21,544,380 | ||||||
| 230,369 | Schlumberger, Ltd. | 19,675,816 | ||||||
| 1,484,001 | Weatherford International, Ltd.a | 16,991,811 | ||||||
|
| |||||||
| Total | 68,319,390 | |||||||
|
| |||||||
| Financials (8.6%) | |||||||
| 313,027 | Citigroup, Inc. | 16,937,891 | ||||||
| 302,839 | J.P. Morgan Chase & Company | 18,951,665 | ||||||
| 145,350 | MasterCard, Inc. | 12,523,356 | ||||||
| 145,700 | Visa, Inc. | 38,202,540 | ||||||
|
| |||||||
| Total | 86,615,452 | |||||||
|
| |||||||
| Health Care (15.9%) | |||||||
| 114,850 | Actavis plca | 29,563,538 | ||||||
| 504,851 | Cerner Corporationa | 32,643,666 | ||||||
| 457,000 | Gilead Sciences, Inc.a | 43,076,820 | ||||||
| 224,700 | Johnson & Johnson | 23,496,879 | ||||||
| 262,400 | Vertex Pharmaceuticals, Inc.a | 31,173,120 | ||||||
|
| |||||||
| Total | 159,954,023 | |||||||
|
| |||||||
| Industrials (10.0%) | |||||||
| 573,950 | Delta Air Lines, Inc. | 28,232,600 | ||||||
| 267,800 | Fluor Corporation | 16,236,714 | ||||||
| 365,100 | Ingersoll-Rand plc | 23,143,689 | ||||||
| 272,700 | Union Pacific Corporation | 32,486,751 | ||||||
|
| |||||||
| Total | 100,099,754 | |||||||
|
| |||||||
| Information Technology (31.6%) | |||||||
| 98,647 | Alibaba Group Holding, Ltd. ADRa | 10,253,369 | ||||||
| 774,407 | Apple, Inc. | 85,479,045 | ||||||
| 800,950 | EMC Corporation | 23,820,253 | ||||||
| 505,250 | Facebook, Inc.a | 39,419,605 | ||||||
| 44,239 | Google, Inc.a | 23,287,410 | ||||||
| 54,639 | Google, Inc., Class Aa | 28,994,732 | ||||||
| 63,500 | Linkedln Corporationa | 14,586,585 | ||||||
| 490,402 | NetApp, Inc. | 20,327,163 | ||||||
| 422,850 | QUALCOMM, Inc. | 31,430,440 | ||||||
| 384,650 | Salesforce.com, Inc.a | 22,813,591 | ||||||
| 211,700 | VMware, Inc.a | 17,469,484 | ||||||
|
| |||||||
| Total | 317,881,677 | |||||||
|
| |||||||
Total Common Stock (cost $729,738,330) | 949,340,913 | |||||||
|
| |||||||
Collateral Held for Securities Loaned (0.1%) | ||||||||
| 1,559,250 | Thrivent Cash Management Trust | 1,559,250 | ||||||
|
| |||||||
Total Collateral Held for Securities Loaned (cost $1,559,250) | 1,559,250 | |||||||
|
| |||||||
| Shares or Principal Amount | Short-Term Investments (5.3%)c | |||||||
Federal Home Loan Bank Discount Notes | ||||||||
| 1,400,000 | 0.053%, 1/16/2015d | 1,399,969 | ||||||
| 800,000 | 0.073%, 2/4/2015d | 799,945 | ||||||
Federal Home Loan Mortgage Corporation Discount Notes | ||||||||
| 100,000 | 0.080%, 3/6/2015d | 99,986 | ||||||
Thrivent Cash Management Trust | ||||||||
| 50,516,790 | 0.060% | 50,516,790 | ||||||
|
| |||||||
| Total Short-Term Investments (at amortized cost) | 52,816,690 | |||||||
|
| |||||||
Total Investments (cost $784,114,270) 99.9% | $ | 1,003,716,853 | ||||||
|
| |||||||
| Other Assets and Liabilities, Net 0.1% | 790,891 | |||||||
|
| |||||||
Total Net Assets 100.0% | $ | 1,004,507,744 | ||||||
|
| |||||||
| a | Non-income producing security. |
| b | All or a portion of the security is on loan. |
| c | The interest rate shown reflects the yield, coupon rate or the discount rate at the date of purchase. |
| d | At December 31, 2014, $2,299,900 of investments were held on deposit with the counterparty and pledged as the initial margin deposit for open futures contracts. |
Definitions:
ADR | - | American Depositary Receipt, which are certificates for an underlying foreign security’s shares held by an issuing U.S. depository bank. |
Unrealized Appreciation (Depreciation)
Gross unrealized appreciation and depreciation of investments, based on cost for federal income tax purposes, were as follows:
Gross unrealized appreciation | $ | 234,558,328 | ||
Gross unrealized depreciation | (14,969,108 | ) | ||
|
| |||
Net unrealized appreciation (depreciation) | $ | 219,589,220 | ||
Cost for federal income tax purposes | $ | 784,127,633 | ||
The accompanying Notes to Financial Statements are an integral part of this schedule.
277
Table of Contents
Schedule of Investments as of December 31, 2014
Fair Valuation Measurements
The following table is a summary of the inputs used, as of December 31, 2014, in valuing Large Cap Growth Portfolio’s assets carried at fair value.
Investments in Securities | Total | Level 1 | Level 2 | Level 3 | ||||||||||||
Common Stock | ||||||||||||||||
Consumer Discretionary | 204,491,689 | 204,491,689 | — | — | ||||||||||||
Consumer Staples | 11,978,928 | 11,978,928 | — | — | ||||||||||||
Energy | 68,319,390 | 68,319,390 | — | — | ||||||||||||
Financials | 86,615,452 | 86,615,452 | — | — | ||||||||||||
Health Care | 159,954,023 | 159,954,023 | — | — | ||||||||||||
Industrials | 100,099,754 | 100,099,754 | — | — | ||||||||||||
Information Technology | 317,881,677 | 317,881,677 | — | — | ||||||||||||
Collateral Held for Securities Loaned | 1,559,250 | 1,559,250 | — | — | ||||||||||||
Short-Term Investments | 52,816,690 | 50,516,790 | 2,299,900 | — | ||||||||||||
|
|
|
|
|
|
|
| |||||||||
Total | $ | 1,003,716,853 | $ | 1,001,416,953 | $ | 2,299,900 | $ | — | ||||||||
|
|
|
|
|
|
|
| |||||||||
Other Financial Instruments | Total | Level 1 | Level 2 | Level 3 | ||||||||||||
Asset Derivatives | ||||||||||||||||
Futures Contracts | 1,362,475 | 1,362,475 | — | — | ||||||||||||
|
|
|
|
|
|
|
| |||||||||
Total Asset Derivatives | $ | 1,362,475 | $ | 1,362,475 | $ | — | $ | — | ||||||||
|
|
|
|
|
|
|
| |||||||||
There were no significant transfers between Levels during the period ended December 31, 2014. Transfers between Levels are identified as of the end of the period.
Futures Contracts | Number of Contracts Long/(Short) | Expiration Date | Notional Principal Amount | Value | Unrealized Gain/(Loss) | |||||||||||||||
Eurex EURO STOXX 50 Futures | 722 | March 2015 | $ | 25,965,558 | $ | 27,328,033 | $ | 1,362,475 | ||||||||||||
Total Futures Contracts | $ | 1,362,475 | ||||||||||||||||||
The following table summarizes the fair value and Statement of Assets and Liabilities location, as of December 31, 2014, for Large Cap Growth Portfolio’s investments in financial derivative instruments by primary risk exposure as discussed under item (2) Significant Accounting Policies of the Notes to Financial Statements.
Derivatives by risk category | Statement of Assets and Liabilities Location | Fair Value | ||||
Asset Derivatives | ||||||
Equity Contracts | ||||||
Futures* | Net Assets - Net unrealized appreciation/(depreciation) on Futures contracts | $ | 1,362,475 | |||
Total Equity Contracts | 1,362,475 | |||||
|
| |||||
Total Asset Derivatives | $ | 1,362,475 | ||||
|
| |||||
| * | Includes cumulative appreciation/depreciation of futures contracts as reported in the Schedule of Investments. Only current day’s variation margin is reported within the Statement of Assets and Liabilities. |
The following table summarizes the net realized gains/(losses) and Statement of Operations location, for the period ended December 31, 2014, for Large Cap Growth Portfolio’s investments in financial derivative instruments by primary risk exposure.
Derivatives by risk category | Statement of Operations Location | Realized Gains/(Losses) recognized in Income | ||||
Equity Contracts | ||||||
Futures | Net realized gains/(losses) on Futures contracts | 270,251 | ||||
Total Equity Contracts | 270,251 | |||||
|
| |||||
Total | $ | 270,251 | ||||
|
| |||||
The accompanying Notes to Financial Statements are an integral part of this schedule.
278
Table of Contents
Schedule of Investments as of December 31, 2014
The following table summarizes the change in net unrealized appreciation/(depreciation) and Statement of Operations location, for the period ended December 31, 2014, for Large Cap Growth Portfolio’s investments in financial derivative instruments by primary risk exposure.
Derivatives by risk category | Statement of Operations Location | Change in unrealized appreciation/(depreciation) recognized in Income | ||||
Equity Contracts | ||||||
Futures | Change in net unrealized appreciation/(depreciation) on Futures contracts | 133,104 | ||||
Total Equity Contracts | 133,104 | |||||
|
| |||||
Total | $ | 133,104 | ||||
|
| |||||
The following table presents Large Cap Growth Portfolio’s average volume of derivative activity during the period ended December 31, 2014.
Derivative Risk Category | Futures (Notional)* | Futures (Percentage of Average Net Assets) | ||||||
Equity Contracts | $ | 29,163,516 | 2.8 | % | ||||
| * | Notional amount represents long or short, or both, derivative positions held by the Portfolio. |
Investment in Affiliates
Affiliated issuers, as defined under the Investment Company Act of 1940, include those in which the Portfolio’s holdings of an issuer represent 5% or more of the outstanding voting securities of an issuer, or any affiliated mutual fund.
A summary of transactions for the fiscal year to date, in Large Cap Growth Portfolio, is as follows:
Portfolio | Value December 31, 2013 | Gross Purchases | Gross Sales | Shares Held at December 31, 2014 | Value December 31, 2014 | Income Earned January 1, 2014 - December 31, 2014 | ||||||||||||||||||
Cash Management Trust-Collateral Investment | $ | 3,392,112 | $ | 214,178,450 | $ | 216,011,312 | 1,559,250 | $ | 1,559,250 | $ | 10,938 | |||||||||||||
Cash Management Trust-Short Term Investment | 43,932,944 | 137,885,405 | 131,301,559 | 50,516,790 | 50,516,790 | 24,949 | ||||||||||||||||||
Total Value and Income Earned | 47,325,056 | 52,076,040 | 35,887 | |||||||||||||||||||||
The accompanying Notes to Financial Statements are an integral part of this schedule.
279
Table of Contents
PARTNER GROWTH STOCK PORTFOLIO
Schedule of Investments as of December 31, 2014
| Shares | Common Stock (98.3%) | Value | ||||||
| Consumer Discretionary (27.6%) |
| ||||||
| 9,280 | Amazon.com, Inc.a | $ | 2,880,048 | |||||
| 1,600 | AutoZone, Inc.a | 990,576 | ||||||
| 12,200 | CarMax, Inc.a | 812,276 | ||||||
| 750 | Chipotle Mexican Grill, Inc.a | 513,382 | ||||||
| 10,200 | Ctrip.com International, Ltd. ADRa | 464,100 | ||||||
| 9,000 | Delphi Automotive plc | 654,480 | ||||||
| 5,900 | Hanesbrands, Inc. | 658,558 | ||||||
| 8,700 | Home Depot, Inc. | 913,239 | ||||||
| 11,900 | Las Vegas Sands Corporation | 692,104 | ||||||
| 18,500 | Lowe’s Companies, Inc. | 1,272,800 | ||||||
| 38,470 | MGM Resorts Internationala | 822,489 | ||||||
| 3,800 | Michael Kors Holdings, Ltd.a | 285,380 | ||||||
| 1,900 | Netflix, Inc.a | 649,059 | ||||||
| 4,900 | NIKE, Inc. | 471,135 | ||||||
| 2,170 | Priceline Group, Inc.a | 2,474,256 | ||||||
| 3,700 | Ross Stores, Inc. | 348,762 | ||||||
| 3,500 | Sherwin-Williams Company | 920,640 | ||||||
| 11,400 | Starbucks Corporation | 935,370 | ||||||
| 4,500 | Starwood Hotels & Resorts Worldwide, Inc. | 364,815 | ||||||
| 3,300 | Tesla Motors, Inc.a,b | 733,953 | ||||||
| 11,600 | Tractor Supply Company | 914,312 | ||||||
| 7,800 | Twenty-First Century Fox, Inc. | 299,559 | ||||||
| 4,600 | Under Armour, Inc.a | 312,340 | ||||||
| 30,000 | Vipshop Holdings, Ltd. ADRa,b | 586,200 | ||||||
| 11,100 | Walt Disney Company | 1,045,509 | ||||||
| 130,000 | Wynn Macau, Ltd. | 362,681 | ||||||
| 7,650 | Wynn Resorts, Ltd. | 1,138,014 | ||||||
|
| |||||||
Total | 22,516,037 | |||||||
|
| |||||||
| Consumer Staples (2.6%) | |||||||
| 3,100 | Costco Wholesale Corporation | �� | 439,425 | |||||
| 9,500 | CVS Health Corporation | 914,945 | ||||||
| 4,200 | Estee Lauder Companies, Inc. | 320,040 | ||||||
| 6,400 | Walgreen Boots Alliance, Inc. | 487,680 | ||||||
|
| |||||||
Total | 2,162,090 | |||||||
|
| |||||||
| Energy (2.2%) | |||||||
| 5,100 | Continental Resources, Inc.a | 195,636 | ||||||
| 1,800 | EOG Resources, Inc. | 165,726 | ||||||
| 6,400 | EQT Corporation | 484,480 | ||||||
| 3,600 | Pioneer Natural Resources Company | 535,860 | ||||||
| 7,525 | Range Resources Corporation | 402,211 | ||||||
|
| |||||||
Total | 1,783,913 | |||||||
|
| |||||||
| Financials (12.1%) | |||||||
| 12,500 | American Tower Corporation | 1,235,625 | ||||||
| 1,100 | BlackRock, Inc. | 393,316 | ||||||
| 16,100 | Crown Castle International Corporation | 1,267,070 | ||||||
| 2,600 | Intercontinental Exchange, Inc. | 570,154 | ||||||
| 1,000 | Invesco, Ltd. | 39,520 | ||||||
| 21,400 | MasterCard, Inc. | 1,843,824 | ||||||
| 21,500 | Morgan Stanley | 834,200 | ||||||
| 6,600 | State Street Corporation | 518,100 | ||||||
| 13,100 | TD Ameritrade Holding Corporation | 468,718 | ||||||
| 10,400 | Visa, Inc. | 2,726,880 | ||||||
|
| |||||||
Total | 9,897,407 | |||||||
|
| |||||||
| Health Care (18.2%) | |||||||
| 3,500 | Actavis plca | 900,935 | ||||||
| 6,000 | Alexion Pharmaceuticals, Inc.a | 1,110,180 | ||||||
| 4,400 | Allergan, Inc. | 935,396 | ||||||
| 5,000 | Biogen Idec, Inc.a | 1,697,250 | ||||||
| 10,200 | Celgene Corporationa | 1,140,972 | ||||||
| 18,600 | Gilead Sciences, Inc.a | 1,753,236 | ||||||
| 3,700 | Humana, Inc. | 531,431 | ||||||
| 5,800 | Incyte Corporationa | 424,038 | ||||||
| 2,100 | Intuitive Surgical, Inc.a | 1,110,774 | ||||||
| 8,600 | McKesson Corporation | 1,785,188 | ||||||
| 3,500 | Pharmacyclics, Inc.a | 427,910 | ||||||
| 1,600 | Regeneron Pharmaceuticals, Inc.a | 656,400 | ||||||
| 6,500 | UnitedHealth Group, Inc. | 657,085 | ||||||
| 8,300 | Valeant Pharmaceuticals International, Inc.a | 1,187,813 | ||||||
| 5,000 | Vertex Pharmaceuticals, Inc.a | 594,000 | ||||||
|
| |||||||
Total | 14,912,608 | |||||||
|
| |||||||
| Industrials (13.5%) | |||||||
| 9,600 | Boeing Company | 1,247,808 | ||||||
| 19,800 | Danaher Corporation | 1,697,058 | ||||||
| 3,300 | FedEx Corporation | 573,078 | ||||||
| 3,900 | Flowserve Corporation | 233,337 | ||||||
| 5,100 | JB Hunt Transport Services, Inc. | 429,675 | ||||||
| 4,700 | Kansas City Southern | 573,541 | ||||||
| 5,900 | Precision Castparts Corporation | 1,421,192 | ||||||
| 5,500 | Roper Industries, Inc. | 859,925 | ||||||
| 10,600 | Tyco International plc | 464,916 | ||||||
| 11,600 | United Continental Holdings, Inc.a | 775,924 | ||||||
| 3,400 | United Technologies Corporation | 391,000 | ||||||
| 33,000 | US Airways Group, Inc. | 1,769,790 | ||||||
| 7,100 | Wabtec Corporation | 616,919 | ||||||
|
| |||||||
Total | 11,054,163 | |||||||
|
| |||||||
| Information Technology (20.6%) | |||||||
| 11,572 | Alibaba Group Holding, Ltd. ADRa | 1,202,794 | ||||||
| 15,000 | Apple, Inc. | 1,655,700 | ||||||
| 4,300 | ASML Holding NVb | 463,669 | ||||||
| 6,500 | Baidu.com, Inc. ADRa | 1,481,805 | ||||||
| 23,200 | Facebook, Inc.a | 1,810,064 | ||||||
| 5,000 | Fiserv, Inc.a | 354,850 | ||||||
| 4,250 | Google, Inc.a | 2,237,200 | ||||||
| 4,100 | Google, Inc., Class Aa | 2,175,706 | ||||||
| 2,900 | Linkedln Corporationa | 666,159 | ||||||
| 4,800 | Mobileye NVa | 194,688 | ||||||
| 390 | NAVER Corporation | 249,769 | ||||||
| 3,900 | NetSuite, Inc.a,b | 425,763 | ||||||
| 1,300 | Palo Alto Networks, Inc.a | 159,341 | ||||||
| 7,400 | Pandora Media, Inc.a | 131,942 | ||||||
| 7,900 | Red Hat, Inc.a | 546,206 | ||||||
| 17,900 | Salesforce.com, Inc.a | 1,061,649 | ||||||
| 5,900 | ServiceNow, Inc.a | 400,315 | ||||||
| 2,600 | Stratasys, Ltd.a | 216,086 | ||||||
| 35,000 | Tencent Holdings, Ltd. | 506,413 | ||||||
| 7,900 | Twitter, Inc.a | 283,373 | ||||||
| 4,700 | VMware, Inc.a | 387,844 | ||||||
| 2,400 | Workday, Inc.a | 195,864 | ||||||
|
| |||||||
Total | 16,807,200 | |||||||
|
| |||||||
| Materials (0.9%) | |||||||
| 3,200 | Ashland, Inc. | 383,232 | ||||||
| 1,100 | Ecolab, Inc. | 114,972 | ||||||
| 2,000 | Martin Marietta Materials, Inc.b | 220,640 | ||||||
|
| |||||||
Total | 718,844 | |||||||
|
| |||||||
The accompanying Notes to Financial Statements are an integral part of this schedule.
280
Table of Contents
PARTNER GROWTH STOCK PORTFOLIO
Schedule of Investments as of December 31, 2014
| Shares | Common Stock (98.3%) | Value | ||||||
| Telecommunications Services (0.6%) |
| ||||||
| 8,100 | Softbank Corporation | $ | 482,139 | |||||
|
| |||||||
Total | 482,139 | |||||||
|
| |||||||
Total Common Stock (cost $46,309,927) | 80,334,401 | |||||||
|
| |||||||
Preferred Stock (0.4%) | ||||||||
| Consumer Discretionary (0.4%) |
| ||||||
| 2,943 | AirBNB, Inc.*,a,c | 119,818 | ||||||
| 7,282 | Dropbox, Inc., ClassA*,a,c | 139,095 | ||||||
| 843 | Flipkart, Ltd. Series G Preference Shares*,a,c | 100,958 | ||||||
|
| |||||||
Total | 359,871 | |||||||
|
| |||||||
| Information Technology (<0.1%) |
| ||||||
| 4,432 | LivingSocial.com, Convertible*,a,c | 1,152 | ||||||
|
| |||||||
Total | 1,152 | |||||||
|
| |||||||
Total Preferred Stock (cost $393,953) | 361,023 | |||||||
|
| |||||||
Collateral Held for Securities Loaned (2.9%) | ||||||||
| 2,334,117 | Thrivent Cash Management Trust | 2,334,117 | ||||||
|
| |||||||
Total Collateral Held for Securities Loaned (cost $2,334,117) | 2,334,117 | |||||||
|
| |||||||
| Shares or Principal Amount | Short-Term Investments (1.5%)d | |||||||
Thrivent Cash Management Trust | ||||||||
| 1,258,543 | 0.060% | 1,258,543 | ||||||
|
| |||||||
Total Short-Term Investments (at amortized cost) | 1,258,543 | |||||||
|
| |||||||
Total Investments (cost $50,296,540) 103.1% | $ | 84,288,084 | ||||||
|
| |||||||
Other Assets and Liabilities, Net (3.1%) | (2,566,098 | ) | ||||||
|
| |||||||
Total Net Assets 100.0% | $ | 81,721,986 | ||||||
|
| |||||||
| a | Non-income producing security. |
| b | All or a portion of the security is on loan. |
| c | Security is valued at fair value. Market quotations or prices were not readily available or were determined to be unreliable. Fair value was determined in good faith pursuant to procedures adopted by the Board. Further information on fair valuation can be found in section (2)(A) of the Notes to Financial Statements. |
| d | The interest rate shown reflects the yield, coupon rate or the discount rate at the date of purchase. |
| * | Denotes restricted securities. Restricted securities are investment securities which have been deemed illiquid and cannot be offered for public sale without first being registered under the Securities Act of 1933. The following table indicates the acquisition date and cost of restricted securities Partner Growth Stock Portfolio owned as of December 31, 2014. |
Security | Acquisition Date | Cost | ||||||
AirBNB, Inc. | 4/16/2014 | $ | 119,818 | |||||
Dropbox, Inc., Class A | 11/7/2014 | 139,095 | ||||||
Flipkart, Ltd. Series G Preference Shares | 12/17/2014 | 100,958 | ||||||
LivingSocial.com, Convertible | 11/18/2011 | 34,082 | ||||||
Definitions:
ADR | - | American Depositary Receipt, which are certificates for an underlying foreign security’s shares held by an issuing U.S. depository bank. |
Unrealized Appreciation (Depreciation)
Gross unrealized appreciation and depreciation of investments, based on cost for federal income tax purposes, were as follows:
Gross unrealized appreciation | $ | 35,019,048 | ||
Gross unrealized depreciation | (1,099,131 | ) | ||
|
| |||
Net unrealized appreciation (depreciation) | $ | 33,919,917 | ||
Cost for federal income tax purposes | $ | 50,368,167 | ||
The accompanying Notes to Financial Statements are an integral part of this schedule.
281
Table of Contents
PARTNER GROWTH STOCK PORTFOLIO
Schedule of Investments as of December 31, 2014
Fair Valuation Measurements
The following table is a summary of the inputs used, as of December 31, 2014, in valuing Partner Growth Stock Portfolio’s assets carried at fair value.
Investments in Securities | Total | Level 1 | Level 2 | Level 3 | ||||||||||||
Common Stock | ||||||||||||||||
Consumer Discretionary | 22,516,037 | 22,153,356 | 362,681 | — | ||||||||||||
Consumer Staples | 2,162,090 | 2,162,090 | — | — | ||||||||||||
Energy | 1,783,913 | 1,783,913 | — | — | ||||||||||||
Financials | 9,897,407 | 9,897,407 | — | — | ||||||||||||
Health Care | 14,912,608 | 14,912,608 | — | — | ||||||||||||
Industrials | 11,054,163 | 11,054,163 | — | — | ||||||||||||
Information Technology | 16,807,200 | 16,051,018 | 756,182 | — | ||||||||||||
Materials | 718,844 | 718,844 | — | — | ||||||||||||
Telecommunications Services | 482,139 | — | 482,139 | — | ||||||||||||
Preferred Stock | ||||||||||||||||
Consumer Discretionary | 359,871 | — | — | 359,871 | ||||||||||||
Information Technology | 1,152 | — | — | 1,152 | ||||||||||||
Collateral Held for Securities Loaned | 2,334,117 | 2,334,117 | — | — | ||||||||||||
Short-Term Investments | 1,258,543 | 1,258,543 | — | — | ||||||||||||
|
|
|
|
|
|
|
| |||||||||
Total | $ | 84,288,084 | $ | 82,326,059 | $ | 1,601,002 | $ | 361,023 | ||||||||
|
|
|
|
|
|
|
| |||||||||
There were no significant transfers between Levels during the period ended December 31, 2014. Transfers between Levels are identified as of the end of the period.
Investment in Affiliates
Affiliated issuers, as defined under the Investment Company Act of 1940, include those in which the Portfolio’s holdings of an issuer represent 5% or more of the outstanding voting securities of an issuer, or any affiliated mutual fund.
A summary of transactions for the fiscal year to date, in Partner Growth Stock Portfolio, is as follows:
Portfolio | Value December 31, 2013 | Gross Purchases | Gross Sales | Shares Held at December 31, 2014 | Value December 31, 2014 | Income Earned January 1, 2014 - December 31, 2014 | ||||||||||||||||||
Cash Management Trust-Collateral Investment | $ | 1,711,975 | $ | 22,329,156 | $ | 21,707,014 | 2,334,117 | $ | 2,334,117 | $ | 2,422 | |||||||||||||
Cash Management Trust-Short Term Investment | 724,634 | 13,458,219 | 12,924,310 | 1,258,543 | 1,258,543 | 390 | ||||||||||||||||||
Total Value and Income Earned | 2,436,609 | 3,592,660 | 2,812 | |||||||||||||||||||||
The accompanying Notes to Financial Statements are an integral part of this schedule.
282
Table of Contents
Schedule of Investments as of December 31, 2014
| Shares | Common Stock (98.2%) | Value | ||||||
| Consumer Discretionary (9.9%) |
| ||||||
| 431,080 | CBS Corporation | $ | 23,855,967 | |||||
| 359,840 | Delphi Automotive plc | 26,167,565 | ||||||
| 654,100 | Lowe’s Companies, Inc. | 45,002,080 | ||||||
| 156,610 | Time Warner Cable, Inc. | 23,814,116 | ||||||
|
| |||||||
Total | 118,839,728 | |||||||
|
| |||||||
| Consumer Staples (6.9%) | |||||||
| 416,070 | CVS Health Corporation | 40,071,702 | ||||||
| 110,500 | Kimberly-Clark Corporation | 12,767,170 | ||||||
| 408,872 | Mondelez International, Inc. | 14,852,275 | ||||||
| 124,109 | Philip Morris International, Inc. | 10,108,678 | ||||||
| 66,500 | Wal-Mart Stores, Inc. | 5,711,020 | ||||||
|
| |||||||
Total | 83,510,845 | |||||||
|
| |||||||
| Energy (10.6%) | |||||||
| 279,400 | Cameron International Corporationa | 13,956,030 | ||||||
| 144,375 | Chevron Corporation | 16,195,987 | ||||||
| 214,138 | EOG Resources, Inc. | 19,715,686 | ||||||
| 205,922 | EQT Corporation | 15,588,295 | ||||||
| 639,751 | Marathon Oil Corporation | 18,098,556 | ||||||
| 221,650 | Schlumberger, Ltd. | 18,931,127 | ||||||
| 499,700 | Total SA ADRb | 25,584,640 | ||||||
|
| |||||||
Total | 128,070,321 | |||||||
|
| |||||||
| Financials (23.3%) | |||||||
| 115,980 | ACE, Ltd. | 13,323,782 | ||||||
| 221,660 | Allstate Corporation | 15,571,615 | ||||||
| 2,074,990 | Bank of America Corporation | 37,121,571 | ||||||
| 379,900 | Blackstone Group, LP | 12,852,017 | ||||||
| 271,200 | Capital One Financial Corporation | 22,387,560 | ||||||
| 856,150 | Citigroup, Inc. | 46,326,277 | ||||||
| 401,600 | Comerica, Inc. | 18,810,944 | ||||||
| 284,432 | Deutsche Bank AG | 8,538,649 | ||||||
| 57,400 | Intercontinental Exchange, Inc. | 12,587,246 | ||||||
| 562,960 | Invesco, Ltd. | 22,248,179 | ||||||
| 594,920 | MetLife, Inc. | 32,179,223 | ||||||
| 763,360 | Morgan Stanley | 29,618,368 | ||||||
| 83,859 | SVB Financial Groupa | 9,733,514 | ||||||
|
| |||||||
Total | 281,298,945 | |||||||
|
| |||||||
| Health Care (14 .9%) | |||||||
| 125,900 | Amgen, Inc. | 20,054,611 | ||||||
| 358,790 | Baxter International, Inc. | 26,295,719 | ||||||
| 234,090 | Covidien plc | 23,942,725 | ||||||
| 172,300 | Express Scripts Holding Companya | 14,588,641 | ||||||
| 134,585 | Johnson & Johnson | 14,073,554 | ||||||
| 751,700 | Merck & Company, Inc. | 42,689,043 | ||||||
| 478,700 | Pfizer, Inc. | 14,911,505 | ||||||
| 225,347 | UnitedHealth Group, Inc. | 22,780,328 | ||||||
|
| |||||||
Total | 179,336,126 | |||||||
|
| |||||||
| Industrials (9.1%) | |||||||
| 98,100 | Boeing Company | 12,751,038 | ||||||
| 751,200 | CSX Corporation | 27,215,976 | ||||||
| 190,000 | Fluor Corporation | 11,519,700 | ||||||
| 203,840 | Honeywell International, Inc. | 20,367,692 | ||||||
| 261,800 | Ingersoll-Rand plc | 16,595,502 | ||||||
| 206,600 | Jacobs Engineering Group, Inc.a | 9,232,954 | ||||||
| 180,440 | Pentair, Ltd. | 11,984,825 | ||||||
|
| |||||||
Total | 109,667,687 | |||||||
|
| |||||||
| Information Technology (15.0%) | |||||||
| 1,833,790 | Cisco Systems, Inc. | 51,006,869 | ||||||
| 598,800 | EMC Corporation | 17,808,312 | ||||||
| 483,660 | Microsoft Corporation | 22,466,007 | ||||||
| 392,380 | NetApp, Inc. | 16,264,151 | ||||||
| 734,800 | Oracle Corporation | 33,043,956 | ||||||
| 421,300 | Teradata Corporationa,b | 18,402,384 | ||||||
| 404,890 | Texas Instruments, Inc. | 21,647,444 | ||||||
|
| |||||||
Total | 180,639,123 | |||||||
|
| |||||||
| Materials (2.9%) | |||||||
| 188,000 | Celanese Corporation | 11,272,480 | ||||||
| 282,980 | Dow Chemical Company | 12,906,718 | ||||||
| 210,540 | Nucor Corporation | 10,326,987 | ||||||
|
| |||||||
Total | 34,506,185 | |||||||
|
| |||||||
| Telecommunications Services (1.8%) | |||||||
| 464,714 | Verizon Communications, Inc. | 21,739,321 | ||||||
|
| |||||||
Total | 21,739,321 | |||||||
|
| |||||||
| Utilities (3.8%) | |||||||
| 297,390 | NiSource, Inc. | 12,615,284 | ||||||
| 615,880 | PG&E Corporation | 32,789,451 | ||||||
|
| |||||||
Total | 45,404,735 | |||||||
|
| |||||||
Total Common Stock (cost $850,746,241) | 1,183,013,016 | |||||||
|
| |||||||
Collateral Held for Securities Loaned (3.1%) | ||||||||
| 37,144,725 | Thrivent Cash Management Trust | 37,144,725 | ||||||
|
| |||||||
Total Collateral Held for Securities Loaned (cost $37,144,725) | 37,144,725 | |||||||
|
| |||||||
| Shares or Principal Amount | Short-Term Investments (1.7%)c | |||||||
| 20,638,983 | Thrivent Cash Management Trust 0.060% | 20,638,983 | ||||||
|
| |||||||
Total Short-Term Investments (at amortized cost) | 20,638,983 | |||||||
|
| |||||||
| Total Investments (cost $908,529,949) 103.0% | $ | 1,240,796,724 | ||||||
|
| |||||||
Other Assets and Liabilities, Net (3.0%) | (35,794,269 | ) | ||||||
|
| |||||||
| Total Net Assets 100.0% | $ | 1,205,002,455 | ||||||
|
| |||||||
| a | Non-income producing security. |
| b | All or a portion of the security is on loan. |
| c | The interest rate shown reflects the yield, coupon rate or the discount rate at the date of purchase. |
Definitions:
ADR | - | American Depositary Receipt, which are certificates for an underlying foreign security’s shares held by an issuing U.S. depository bank. |
The accompanying Notes to Financial Statements are an integral part of this schedule.
283
Table of Contents
LARGE CAP VALUE PORTFOLIO
Schedule of Investments as of December 31, 2014
Unrealized Appreciation (Depreciation)
Gross unrealized appreciation and depreciation of investments, based on cost for federal income tax purposes, were as follows:
Gross unrealized appreciation | $ | 347,852,505 | ||
Gross unrealized depreciation | (15,594,964 | ) | ||
|
| |||
Net unrealized appreciation (depreciation) | $ | 332,257,541 | ||
Cost for federal income tax purposes | $ | 908,539,183 | ||
Fair Valuation Measurements
The following table is a summary of the inputs used, as of December 31, 2014, in valuing Large Cap Value Portfolio’s assets carried at fair value.
Investments in Securities | Total | Level 1 | Level 2 | Level 3 | ||||||||||||
Common Stock | ||||||||||||||||
Consumer Discretionary | 118,839,728 | 118,839,728 | — | — | ||||||||||||
Consumer Staples | 83,510,845 | 83,510,845 | — | — | ||||||||||||
Energy | 128,070,321 | 128,070,321 | — | — | ||||||||||||
Financials | 281,298,945 | 281,298,945 | — | — | ||||||||||||
Health Care | 179,336,126 | 179,336,126 | — | — | ||||||||||||
Industrials | 109,667,687 | 109,667,687 | — | — | ||||||||||||
Information Technology | 180,639,123 | 180,639,123 | — | — | ||||||||||||
Materials | 34,506,185 | 34,506,185 | — | — | ||||||||||||
Telecommunications Services | 21,739,321 | 21,739,321 | — | — | ||||||||||||
Utilities | 45,404,735 | 45,404,735 | — | — | ||||||||||||
Collateral Held for Securities Loaned | 37,144,725 | 37,144,725 | — | — | ||||||||||||
Short-Term Investments | 20,638,983 | 20,638,983 | — | — | ||||||||||||
|
|
|
|
|
|
|
| |||||||||
Total | $ | 1,240,796,724 | $ | 1,240,796,724 | $ | — | $ | — | ||||||||
|
|
|
|
|
|
|
| |||||||||
There were no significant transfers between Levels during the period ended December 31, 2014. Transfers between Levels are identified as of the end of the period.
Investment in Affiliates
Affiliated issuers, as defined under the Investment Company Act of 1940, include those in which the Portfolio’s holdings of an issuer represent 5% or more of the outstanding voting securities of an issuer, or any affiliated mutual fund.
A summary of transactions for the fiscal year to date, in Large Cap Value Portfolio, is as follows:
Portfolio | Value December 31, 2013 | Gross Purchases | Gross Sales | Shares Held at December 31, 2014 | Value December 31, 2014 | Income Earned January 1, 2014 - December 31, 2014 | ||||||||||||||||||
Cash Management Trust-Collateral Investment | $ | 11,313,000 | $ | 313,836,302 | $ | 288,004,577 | 37,144,725 | $ | 37,144,725 | $ | 99,112 | |||||||||||||
Cash Management Trust-Short Term Investment | 26,006,398 | 68,692,840 | 74,060,255 | 20,638,983 | 20,638,983 | 11,445 | ||||||||||||||||||
Total Value and Income Earned | 37,319,398 | 57,783,708 | 110,557 | |||||||||||||||||||||
The accompanying Notes to Financial Statements are an integral part of this schedule.
284
Table of Contents
Schedule of Investments as of December 31, 2014
| Shares | Common Stock (89.5%) | Value | ||||||
| Consumer Discretionary (10.5%) |
| ||||||
| 39,042 | Amazon.com, Inc.a | $ | 12,116,685 | |||||
| 12,000 | Aoyama Trading Company, Ltd. | 262,199 | ||||||
| 25,900 | AutoZone, Inc.a | 16,034,949 | ||||||
| 3,800 | Bayerische Motoren Werke AG | 310,460 | ||||||
| 4,800 | Brembo SPA | 160,881 | ||||||
| 9,300 | Bridgestone Corporation | 322,542 | ||||||
| 7,500 | Chiyoda Company, Ltd. | 147,640 | ||||||
| 251,600 | Comcast Corporation | 14,595,316 | ||||||
| 43,000 | Delphi Automotive plc | 3,126,960 | ||||||
| 97,900 | EDION Corporationb | 684,777 | ||||||
| 49,500 | Hakuhodo Dy Holdings, Inc. | 473,712 | ||||||
| 49,100 | Haseko Corporation | 394,905 | ||||||
| 7,400 | Heiwa Corporation | 147,444 | ||||||
| 26,900 | Informa plc | 196,459 | ||||||
| 30,900 | JM AB | 979,486 | ||||||
| 219,842 | Kongsberg Automotive ASAa | 168,663 | ||||||
| 215,175 | Las Vegas Sands Corporation | 12,514,578 | ||||||
| 240,000 | Li & Fung, Ltd. | 224,691 | ||||||
| 117,000 | Luk Fook Holdings International, Ltd. | 438,765 | ||||||
| 13,200 | Next plc | 1,399,954 | ||||||
| 43,000 | NOK Corporation | 1,094,501 | ||||||
| 46,400 | Persimmon plc | 1,133,271 | ||||||
| 2,500 | Rinnai Corporation | 167,980 | ||||||
| 53,592 | Slater & Gordon, Ltd. | 277,937 | ||||||
| 209,950 | Starbucks Corporation | 17,226,398 | ||||||
| 51,800 | Sumitomo Forestry Company, Ltd. | 506,582 | ||||||
| 11,800 | Sumitomo Rubber Industries, Ltd. | 175,420 | ||||||
| 41,400 | Suzuki Motor Corporation | 1,240,648 | ||||||
| 900 | Valora Holding AG | 206,558 | ||||||
| 29,100 | WH Smith plc | 608,531 | ||||||
| 13,900 | Wolters Kluwer NV | 424,162 | ||||||
| 8,400 | WPP plc | 174,650 | ||||||
|
| |||||||
Total | 87,937,704 | |||||||
|
| |||||||
| Consumer Staples (7.7%) | |||||||
| 112,650 | Anheuser-Busch InBev NVADR | 12,652,848 | ||||||
| 1,741 | Associated British Foods plc | 85,116 | ||||||
| 64,593 | Britvic plc | 675,551 | ||||||
| 98,600 | CVS Health Corporation | 9,496,166 | ||||||
| 38,500 | J Sainsbury plcb | 147,020 | ||||||
| 19,000 | Kesko OYJ | 691,004 | ||||||
| 155,750 | Kimberly-Clark Corporation | 17,995,355 | ||||||
| 6,700 | KOSE Corporation | 261,905 | ||||||
| 9,400 | Nestle SA | 685,269 | ||||||
| 171,375 | Philip Morris International, Inc. | 13,958,494 | ||||||
| 27,789 | Reckitt Benckiser Group plc | 2,250,744 | ||||||
| 24,673 | SalMar ASA | 420,021 | ||||||
| 25,300 | Suedzucker AGb | 363,760 | ||||||
| 47,100 | Tate & Lyle plc | 441,303 | ||||||
| 48,150 | Wal-Mart Stores, Inc. | 4,135,122 | ||||||
|
| |||||||
Total | 64,259,678 | |||||||
|
| |||||||
| Energy (7.1%) | |||||||
| 403,998 | BP plc | 2,564,413 | ||||||
| 213,568 | BW Offshore, Ltd. | 214,215 | ||||||
| 102,500 | Cameron International Corporationa | 5,119,875 | ||||||
| 83,540 | EOG Resources, Inc. | 7,691,528 | ||||||
| 51,400 | ERG SPA | 575,631 | ||||||
| 368,850 | Marathon Oil Corporation | 10,434,766 | ||||||
| 53,500 | Premier Oil plc | 138,375 | ||||||
| 107,398 | Royal Dutch Shell plc | 3,579,494 | ||||||
| 73,337 | Royal Dutch Shell plc, Class B | 2,533,876 | ||||||
| 94,685 | Schlumberger, Ltd. | 8,087,046 | ||||||
| 86,100 | Showa Shell Sekiyu KKb | 848,124 | ||||||
| 12,194 | Statoil ASA | 214,698 | ||||||
| 14,800 | Total SA | 758,236 | ||||||
| 101,250 | Total SA ADRb | 5,184,000 | ||||||
| 805,050 | Weatherford International, Ltd.a | 9,217,822 | ||||||
| 56,000 | Woodside Petroleum, Ltd. | 1,731,930 | ||||||
|
| |||||||
Total | 58,894,029 | |||||||
|
| |||||||
| Financials (17.0%) | |||||||
| 91,880 | ACE, Ltd. | 10,555,174 | ||||||
| 24,900 | Allianz SE | 4,124,104 | ||||||
| 32,014 | Amlin plc | 237,474 | ||||||
| 82,900 | Assicurazioni Generali SPA | 1,702,178 | ||||||
| 13,900 | AXA SA | 320,299 | ||||||
| 165,500 | Banco Santander SA | 1,389,065 | ||||||
| 282,300 | Bank Hapoalim, Ltd. | 1,327,411 | ||||||
| 225,134 | Bank of America Corporation | 4,027,647 | ||||||
| 33,800 | Bank of Queensland, Ltd. | 332,995 | ||||||
| 16,800 | BinckBank NV | 142,827 | ||||||
| 175,200 | Blackstone Group, LP | 5,927,016 | ||||||
| 4,000 | Bolsas y Mercados Espanoles SA | 154,922 | ||||||
| 81,300 | Capital One Financial Corporation | 6,711,315 | ||||||
| 172,000 | Cheung Kong Holdings, Ltd. | 2,880,454 | ||||||
| 293,980 | Citigroup, Inc. | 15,907,258 | ||||||
| 27,300 | CNP Assurances | 483,980 | ||||||
| 127,450 | Comerica, Inc. | 5,969,758 | ||||||
| 32,600 | Commonwealth Bank of Australia | 2,265,008 | ||||||
| 12,000 | Daito Trust Construction Company, Ltd. | 1,361,254 | ||||||
| 34 | Daiwa House REIT Investment Corporation | 169,970 | ||||||
| 44,000 | Daiwa Securities Group, Inc. | 344,526 | ||||||
| 7,350 | Delta Lloyd NV | 161,630 | ||||||
| 4,800 | Deutsche Boerse AG | 341,098 | ||||||
| 151,400 | Direct Line Insurance Group plc | 684,874 | ||||||
| 48,089 | DnB ASA | 709,343 | ||||||
| 87,000 | FlexiGroup, Ltd. | 211,220 | ||||||
| 195,000 | Fukuoka Financial Group, Inc. | 1,005,316 | ||||||
| 9,000 | GAM Holding AGa | 161,802 | ||||||
| 2,800 | Hannover Rueckversicherung SE | 252,592 | ||||||
| 214,000 | Hansteen Holdings plc | 358,890 | ||||||
| 32,900 | IG Group Holdings plc | 367,644 | ||||||
| 49,300 | Intercontinental Exchange, Inc. | 10,810,997 | ||||||
| 145,066 | Intermediate Capital Group plc | 1,036,340 | ||||||
| 255,760 | Invesco, Ltd. | 10,107,635 | ||||||
| 159,600 | Investec plc | 1,337,176 | ||||||
| 21,150 | iShares MSCI EAFE Index Fund | 1,286,766 | ||||||
| 345,249 | J.P. Morgan Chase & Company | 21,605,682 | ||||||
| 43 | Japan Prime Realty Investment Corporation | 149,616 | ||||||
| 101,000 | Link REIT | 632,337 | ||||||
| 343,800 | Man Group plc | 855,502 | ||||||
| 205,600 | Mizuho Financial Group, Inc. | 344,648 | ||||||
| 8,900 | Muenchener Rueckversicherungs-Gesellschaft AG | 1,772,329 | ||||||
| 8,200 | National Australia Bank, Ltd. | 223,616 | ||||||
| 76,700 | Old Mutual plc | 226,048 | ||||||
| 70,190 | Oversea-Chinese Banking Corporation, Ltd. | 552,253 | ||||||
| 66,800 | Phoenix Group Holdings | 860,636 | ||||||
| 85,000 | Resona Holdings, Inc. | 429,378 | ||||||
| 8,600 | Sampo Oyj | 402,605 | ||||||
| 7,300 | SCOR SE | 221,193 | ||||||
| 139,200 | Skandinaviska Enskilda Banken AB | 1,767,640 | ||||||
| 400 | St. Galler Kantonalbank AG | 145,242 | ||||||
| 20,300 | Standard Chartered plc | 303,605 | ||||||
| 306,800 | Stockland | 1,025,290 | ||||||
| 17,000 | Sun Hung Kai Properties, Ltd. | 257,558 | ||||||
The accompanying Notes to Financial Statements are an integral part of this schedule.
285
Table of Contents
LARGE CAP STOCK PORTFOLIO
Schedule of Investments as of December 31, 2014
| Shares | Common Stock (89.5%) | Value | ||||||
| Financials (17.0%) - continued |
| ||||||
| 59,300 | Swedbank AB | $ | 1,471,288 | |||||
| 1,100 | Swiss Life Holding AGa | 259,987 | ||||||
| 27,800 | Swiss Re AG | 2,328,854 | ||||||
| 1,400 | Tryg AS | 156,432 | ||||||
| 91,200 | UNIQA Insurance Group AG | 855,915 | ||||||
| 101,817 | United Overseas Bank, Ltd. | 1,878,936 | ||||||
| 101 | United Urban Investment Corporation | 158,986 | ||||||
| 85,970 | Westpac Banking Corporation | 2,312,231 | ||||||
| 16,400 | Zurich Insurance Group AGa | 5,125,039 | ||||||
|
| |||||||
Total | 141,490,804 | |||||||
|
| |||||||
| Health Care (13.6%) | |||||||
| 28,400 | Actavis plca | 7,310,444 | ||||||
| 7,500 | Actelion, Ltd. | 863,408 | ||||||
| 26,800 | Amgen, Inc. | 4,268,972 | ||||||
| 62,220 | Baxter International, Inc. | 4,560,104 | ||||||
| 117,350 | Cerner Corporationa | 7,587,851 | ||||||
| 3,100 | CSL, Ltd. | 217,762 | ||||||
| 128,359 | Gilead Sciences, Inc.a | 12,099,119 | ||||||
| 86,111 | GlaxoSmithKline plc | 1,847,394 | ||||||
| 13,900 | H. Lundbeck AS | 275,907 | ||||||
| 25,600 | Hikma Pharmaceuticals plc | 785,448 | ||||||
| 22,167 | ICON plca | 1,130,295 | ||||||
| 27,789 | Indivior plca | 64,708 | ||||||
| 191,900 | Johnson & Johnson | 20,066,983 | ||||||
| 10,000 | Kaken Pharmaceutical Company, Ltd. | 193,362 | ||||||
| 32,700 | KYORIN Holdings, Inc. | 605,973 | ||||||
| 381,680 | Merck & Company, Inc. | 21,675,607 | ||||||
| 2,000 | Merck KGaA | 188,217 | ||||||
| 40,200 | Novartis AG | 3,728,288 | ||||||
| 63,200 | Otsuka Holdings Company, Ltd. | 1,894,813 | ||||||
| 397,000 | Pfizer, Inc. | 12,366,550 | ||||||
| 8,000 | Sanofi | 729,366 | ||||||
| 88,000 | Sonic Healthcare, Ltd. | 1,323,921 | ||||||
| 4,700 | Teva Pharmaceutical Industries, Ltd. | 269,427 | ||||||
| 80,050 | Vertex Pharmaceuticals, Inc.a | 9,509,940 | ||||||
|
| |||||||
Total | 113,563,859 | |||||||
|
| |||||||
| Industrials (8.2%) | |||||||
| 172,265 | Air New Zealand, Ltd. | 330,881 | ||||||
| 19,332 | Arcadis NV | 579,819 | ||||||
| 6,100 | Atlas Copco AB | 156,147 | ||||||
| 57,000 | Berendsen plc | 974,258 | ||||||
| 116,100 | Boeing Company | 15,090,678 | ||||||
| 1,400 | Bucher Industries AG | 349,134 | ||||||
| 44,365 | Cardno, Ltd.b | 122,851 | ||||||
| 31,200 | Carillion plc | 161,667 | ||||||
| 63,200 | COMSYS Holdings Corporation | 864,561 | ||||||
| 16,200 | CTT-Correios de Portugal SA | 156,462 | ||||||
| 21,000 | Dai Nippon Printing Company, Ltd. | 189,138 | ||||||
| 293,000 | Delta Air Lines, Inc. | 14,412,670 | ||||||
| 54,842 | Fluor Corporation | 3,325,070 | ||||||
| 7,000 | Go-Ahead Group plc | 266,829 | ||||||
| 18,600 | Hino Motors, Ltd. | 244,838 | ||||||
| 8,900 | Hoshizaki Electric Company, Ltd. | �� | 428,873 | |||||
| 5,000 | Inaba Denki Sangyo Company, Ltd. | 161,436 | ||||||
| 37,500 | Intrum Justitia AB | 1,110,659 | ||||||
| 84,500 | ITOCHU Corporation | 902,046 | ||||||
| 5,629 | Jardine Matheson Holdings, Ltd. | 342,043 | ||||||
| 3,900 | Kanamoto Company, Ltd. | 105,455 | ||||||
| 45,300 | KITZ Corporation | 185,021 | ||||||
| 48,400 | Komatsu, Ltd. | 1,070,024 | ||||||
| 13,200 | Legrand SA | 695,531 | ||||||
| 30,000 | Leighton Holdings, Ltd. | 546,256 | ||||||
| 21,000 | Mitsuboshi Belting, Ltd. | 154,318 | ||||||
| 28,900 | Nitto Kogyo Corporation | 561,743 | ||||||
| 34,300 | Securitas AB | 414,951 | ||||||
| 21,600 | Siemens AG | 2,423,609 | ||||||
| 12,800 | Takasago Thermal Engineering Company, Ltd. | 163,973 | ||||||
| 10,300 | Teleperformance SA | 701,124 | ||||||
| 31,000 | Toppan Printing Company, Ltd. | 201,421 | ||||||
| 176,450 | Union Pacific Corporation | 21,020,488 | ||||||
|
| |||||||
Total | 68,413,974 | |||||||
|
| |||||||
| Information Technology (17.9%) | |||||||
| 66,055 | Alibaba Group Holding, Ltd. ADRa | 6,865,757 | ||||||
| 363,938 | Apple, Inc. | 40,171,476 | ||||||
| 9,100 | Brother Industries, Ltd. | 164,959 | ||||||
| 74,000 | Canon, Inc. | 2,351,998 | ||||||
| 25,650 | Check Point Software Technologies, Ltd.a | 2,015,321 | ||||||
| 187,750 | Cisco Systems, Inc. | 5,222,266 | ||||||
| 13,844 | Dialog Semiconductor plca | 483,374 | ||||||
| 588,250 | EMC Corporation | 17,494,555 | ||||||
| 94,775 | Facebook, Inc.a | 7,394,346 | ||||||
| 67,700 | FUJIFILM Holdings NPV | 2,065,768 | ||||||
| 17,894 | Google, Inc.a | 9,419,402 | ||||||
| 17,894 | Google, Inc., Class Aa | 9,495,630 | ||||||
| 28,000 | Hitachi Kokusai Electric, Inc. | 391,654 | ||||||
| 9,900 | Hitachi Maxell, Ltd. | 155,963 | ||||||
| 29,400 | Hoya Corporation | 994,450 | ||||||
| 17,800 | NEC Networks & System Integration Corporation | 368,909 | ||||||
| 181,350 | NetApp, Inc. | 7,516,957 | ||||||
| 252,000 | Oki Electric Industry Company, Ltd. | 480,376 | ||||||
| 36,100 | Optimal Payments plca | 191,618 | ||||||
| 10,150 | Orbotech, Ltd.a | 150,220 | ||||||
| 4,400 | Otsuka Corporation | 139,517 | ||||||
| 159,362 | Pace plc | 854,463 | ||||||
| 159,581 | QUALCOMM, Inc. | 11,861,656 | ||||||
| 4,400 | Rohm Company, Ltd. | 265,114 | ||||||
| 128,650 | Salesforce.com, Inc.a | 7,630,231 | ||||||
| 21,800 | TE Connectivity, Ltd. | 1,378,850 | ||||||
| 163,700 | Telefonaktiebolaget LM Ericsson | 1,982,097 | ||||||
| 131,050 | Teradata Corporationa | 5,724,264 | ||||||
| 71,105 | VMware, Inc.a | 5,867,585 | ||||||
|
| |||||||
Total | 149,098,776 | |||||||
|
| |||||||
| Materials (2.2%) | |||||||
| 26,000 | Asahi Kasei Corporation | 237,183 | ||||||
| 136,850 | Celanese Corporation | 8,205,526 | ||||||
| 203,345 | Centamin plc | 186,709 | ||||||
| 148,700 | Dow Chemical Company | 6,782,207 | ||||||
| 28,000 | Hitachi Metals, Ltd. | 475,745 | ||||||
| 7,100 | Holmen AB | 241,257 | ||||||
| 46,000 | Kureha Corporation | 192,386 | ||||||
| 7,500 | Novozymes AS | 315,702 | ||||||
| 33,800 | Stora Enso OYJ | 302,205 | ||||||
| 62,000 | Sumitomo Metal Mining Company, Ltd. | 924,724 | ||||||
| 27,000 | Sumitomo Seika Chemicals Company, Ltd. | 179,813 | ||||||
| 45,100 | UPM-Kymmene OYJ | 739,108 | ||||||
|
| |||||||
Total | 18,782,565 | |||||||
|
| |||||||
| Telecommunications Services (1.5%) | |||||||
| 23,100 | Belgacom SA | 838,151 | ||||||
The accompanying Notes to Financial Statements are an integral part of this schedule.
286
Table of Contents
LARGE CAP STOCK PORTFOLIO
Schedule of Investments as of December 31, 2014
| Shares | Common Stock (89.5%) | Value | ||||||
| Telecommunications Services (1.5%) - continued |
| ||||||
| 657,600 | Bezeq Israel Telecommunication Corporation, Ltd. | $ | 1,166,462 | |||||
| 130,412 | BT Group plc | 811,173 | ||||||
| 41,000 | Elisa Oyj | 1,119,099 | ||||||
| 32,000 | Freenet AG | 909,836 | ||||||
| 29,500 | iiNet, Ltd. | 188,503 | ||||||
| 500,938 | KCOM Group plc | 696,999 | ||||||
| 56,000 | M1, Ltd. | 152,202 | ||||||
| 53,400 | Nippon Telegraph & Telephone Corporation | 2,727,812 | ||||||
| 123,900 | Orange SA | 2,107,137 | ||||||
| 189,000 | Singapore Telecommunications, Ltd. | 554,773 | ||||||
| 300 | Swisscom AG | 157,421 | ||||||
| 16,298 | TDC AS | 124,303 | ||||||
| 23,300 | Tele2 AB | 282,343 | ||||||
| 105,700 | Telstra Corporation, Ltd. | 513,155 | ||||||
| 18,400 | Vivendi SAa | 457,987 | ||||||
|
| |||||||
Total | 12,807,356 | |||||||
|
| |||||||
| Utilities (3.8%) | |||||||
| 941,100 | A2A SPA | 953,607 | ||||||
| 25,900 | E.ON SE | 442,676 | ||||||
| 398,500 | Electricidade de Portugal SA | 1,545,245 | ||||||
| 23,600 | Endesa SA | 472,457 | ||||||
| 277,500 | Enel SPA | 1,236,964 | ||||||
| 47,900 | Fortum OYJ | 1,039,986 | ||||||
| 24,900 | Hokuriku Electric Power Company | 317,984 | ||||||
| 121,900 | IREN SPA | 133,306 | ||||||
| 10,900 | National Grid plc | 154,663 | ||||||
| 289,430 | NiSource, Inc. | 12,277,621 | ||||||
| 201,600 | PG&E Corporation | 10,733,184 | ||||||
| 2,800 | Red Electrica Corporacion SAb | 246,825 | ||||||
| 51,900 | Redes Energeticas Nacionais SGPS SA | 150,564 | ||||||
| 4,900 | Severn Trent plc | 152,828 | ||||||
| 131,200 | United Utilities Group plc | 1,863,558 | ||||||
|
| |||||||
Total | 31,721,468 | |||||||
|
| |||||||
Total Common Stock (cost $623,698,815) | 746,970,213 | |||||||
|
| |||||||
Collateral Held for Securities Loaned (0.9%) | ||||||||
| 7,610,288 | Thrivent Cash Management Trust | 7,610,288 | ||||||
|
| |||||||
Total Collateral Held for Securities Loaned (cost $7,610,288) | 7,610,288 | |||||||
|
| |||||||
| Shares or Principal Amount | Short-Term Investments (10.4%)c | |||||||
Federal Home Loan Bank Discount Notes | ||||||||
| 5,900,000 | 0.050%, 1/9/2015d | 5,899,935 | ||||||
| 4,000,000 | 0.080%, 2/6/2015d | 3,999,680 | ||||||
Thrivent Cash Management Trust | ||||||||
| 76,762,661 | 0.060% | 76,762,661 | ||||||
|
| |||||||
Total Short-Term Investments (at amortized cost) | 86,662,276 | |||||||
|
| |||||||
Total Investments (cost $717,971,379) 100.8% | $ | 841,242,777 | ||||||
|
| |||||||
Other Assets and Liabilities, Net (0.8%) | (6,727,733 | ) | ||||||
|
| |||||||
Total Net Assets 100.0% | $ | 834,515,044 | ||||||
|
| |||||||
| a | Non-income producing security. |
| b | All or a portion of the security is on loan. |
| c | The interest rate shown reflects the yield, coupon rate or the discount rate at the date of purchase. |
| d | At December 31, 2014, $9,899,615 of investments were held on deposit with the counterparty and pledged as the initial margin deposit for open futures contracts. |
Definitions:
ADR | - | American Depositary Receipt, which are certificates for an underlying foreign security’s shares held by an issuing U.S. depository bank. | ||
REIT | - | Real Estate Investment Trust is a company that buys, develops, manages and/or sells real estate assets. |
Unrealized Appreciation (Depreciation)
Gross unrealized appreciation and depreciation of investments, based on cost for federal income tax purposes, were as follows:
Gross unrealized appreciation | $ | 137,915,192 | ||
Gross unrealized depreciation | (15,926,228 | ) | ||
|
| |||
Net unrealized appreciation (depreciation) | $ | 121,988,964 | ||
Cost for federal income tax purposes | $ | 719,253,813 | ||
The accompanying Notes to Financial Statements are an integral part of this schedule.
287
Table of Contents
LARGE CAP STOCK PORTFOLIO
Schedule of Investments as of December 31, 2014
Fair Valuation Measurements
The following table is a summary of the inputs used, as of December 31, 2014, in valuing Large Cap Stock Portfolio’s assets carried at fair value.
Investments in Securities | Total | Level 1 | Level 2 | Level 3 | ||||||||||||
Common Stock | ||||||||||||||||
Consumer Discretionary | 87,937,704 | 75,614,886 | 12,322,818 | — | ||||||||||||
Consumer Staples | 64,259,678 | 58,237,985 | 6,021,693 | — | ||||||||||||
Energy | 58,894,029 | 45,735,037 | 13,158,992 | — | ||||||||||||
Financials | 141,490,804 | 92,909,248 | 48,581,556 | — | ||||||||||||
Health Care | 113,563,859 | 100,575,865 | 12,987,994 | — | ||||||||||||
Industrials | 68,413,974 | 53,848,906 | 14,565,068 | — | ||||||||||||
Information Technology | 149,098,776 | 138,208,516 | 10,890,260 | — | ||||||||||||
Materials | 18,782,565 | 14,987,733 | 3,794,832 | — | ||||||||||||
Telecommunications Services | 12,807,356 | — | 12,807,356 | — | ||||||||||||
Utilities | 31,721,468 | 23,010,805 | 8,710,663 | — | ||||||||||||
Collateral Held for Securities Loaned | 7,610,288 | 7,610,288 | — | — | ||||||||||||
Short-Term Investments | 86,662,276 | 76,762,661 | 9,899,615 | — | ||||||||||||
|
|
|
|
|
|
|
| |||||||||
Total | $ | 841,242,777 | $ | 687,501,930 | $ | 153,740,847 | $ | — | ||||||||
|
|
|
|
|
|
|
| |||||||||
Other Financial Instruments | Total | Level 1 | Level 2 | Level 3 | ||||||||||||
Asset Derivatives | ||||||||||||||||
Futures Contracts | 3,901,132 | 3,901,132 | — | — | ||||||||||||
|
|
|
|
|
|
|
| |||||||||
Total Asset Derivatives | $ | 3,901,132 | $ | 3,901,132 | $ | — | $ | — | ||||||||
|
|
|
|
|
|
|
| |||||||||
Liability Derivatives | ||||||||||||||||
Futures Contracts | 1,274,079 | 1,274,079 | — | — | ||||||||||||
|
|
|
|
|
|
|
| |||||||||
Total Liability Derivatives | $ | 1,274,079 | $ | 1,274,079 | $ | — | $ | — | ||||||||
|
|
|
|
|
|
|
| |||||||||
There were no significant transfers between Levels during the period ended December 31, 2014. Transfers between Levels are identified as of the end of the period.
Futures Contracts | Number of Contracts Long/(Short) | Expiration Date | Notional Principal Amount | Value | Unrealized Gain/(Loss) | |||||||||||||||
Eurex EURO STOXX 50 Futures | 1,888 | March 2015 | $ | 67,898,856 | $ | 71,461,672 | $ | 3,562,816 | ||||||||||||
Mini MSCI EAFE Index Futures | 417 | March 2015 | 36,313,899 | 36,652,215 | 338,316 | |||||||||||||||
S&P 500 Index Mini-Futures | (410 | ) | March 2015 | (40,800,121 | ) | (42,074,200 | ) | (1,274,079 | ) | |||||||||||
Total Futures Contracts | $ | 2,627,053 | ||||||||||||||||||
The following table summarizes the fair value and Statement of Assets and Liabilities location, as of December 31, 2014, for Large Cap Stock Portfolio’s investments in financial derivative instruments by primary risk exposure as discussed under item (2) Significant Accounting Policies of the Notes to Financial Statements.
Derivatives by risk category | Statement of Assets and Liabilities Location | Fair Value | ||||
Asset Derivatives | ||||||
Equity Contracts | ||||||
Futures* | Net Assets - Net unrealized appreciation/(depreciation) on Futures contracts | $ | 3,901,132 | |||
Total Equity Contracts | 3,901,132 | |||||
|
| |||||
Total Asset Derivatives | $ | 3,901,132 | ||||
|
| |||||
Liability Derivatives | ||||||
Equity Contracts | ||||||
Futures* | Net Assets - Net unrealized appreciation/(depreciation) on Futures contracts | 1,274,079 | ||||
Total Equity Contracts | 1,274,079 | |||||
|
| |||||
Total Liability Derivatives | $ | 1,274,079 | ||||
|
| |||||
| * | Includes cumulative appreciation/depreciation of futures contracts as reported in the Schedule of Investments. Only current day’s variation margin is reported within the Statement of Assets and Liabilities. |
The accompanying Notes to Financial Statements are an integral part of this schedule.
288
Table of Contents
LARGE CAP STOCK PORTFOLIO
Schedule of Investments as of December 31, 2014
The following table summarizes the net realized gains/(losses) and Statement of Operations location, for the period ended December 31, 2014, for Large Cap Stock Portfolio’s investments in financial derivative instruments by primary risk exposure.
Derivatives by risk category | Statement of Operations Location | Realized Gains/(Losses) recognized in Income | ||||
Equity Contracts | ||||||
Futures | Net realized gains/(losses) on Futures contracts | (3,317,468 | ) | |||
Total Equity Contracts | (3,317,468 | ) | ||||
|
| |||||
Total | ($ | 3,317,468 | ) | |||
|
| |||||
The following table summarizes the change in net unrealized appreciation/(depreciation) and Statement of Operations location, for the period ended December 31, 2014, for Large Cap Stock Portfolio’s investments in financial derivative instruments by primary risk exposure.
Derivatives by risk category | Statement of Operations Location | Change in unrealized appreciation/(depreciation) recognized in Income | ||||
Equity Contracts | ||||||
Futures | Change in net unrealized appreciation/(depreciation) on Futures contracts | 738,428 | ||||
Total Equity Contracts | 738,428 | |||||
|
| |||||
Total | $ | 738,428 | ||||
|
| |||||
The following table presents Large Cap Stock Portfolio’s average volume of derivative activity during the period ended December 31, 2014.
Derivative Risk Category | Futures (Notional)* | Futures (Percentage of Average Net Assets) | ||||||
Equity Contracts | $ | 73,395,677 | 8.8 | % | ||||
| * | Notional amount represents long or short, or both, derivative positions held by the Portfolio. |
Investment in Affiliates
Affiliated issuers, as defined under the Investment Company Act of 1940, include those in which the Portfolio’s holdings of an issuer represent 5% or more of the outstanding voting securities of an issuer, or any affiliated mutual fund.
A summary of transactions for the fiscal year to date, in Large Cap Stock Portfolio, is as follows:
Portfolio | Value December 31, 2013 | Gross Purchases | Gross Sales | Shares Held at December 31, 2014 | Value December 31, 2014 | Income Earned January 1, 2014 - December 31, 2014 | ||||||||||||||||||
Cash Management Trust-Collateral Investment | $ | — | $ | 150,583,235 | $ | 142,972,947 | 7,610,288 | $ | 7,610,288 | $ | 52,970 | |||||||||||||
Cash Management Trust-Short Term Investment | 51,163,767 | 167,000,984 | 141,402,090 | 76,762,661 | 76,762,661 | 24,376 | ||||||||||||||||||
Total Value and Income Earned | 51,163,767 | 84,372,949 | 77,346 | |||||||||||||||||||||
The accompanying Notes to Financial Statements are an integral part of this schedule.
289
Table of Contents
Schedule of Investments as of December 31, 2014
| Shares | Common Stock (96.0%) | Value | ||||||
| Consumer Discretionary (11.8%) | |||||||
| 9,000 | Amazon.com, Inc.a | $ | 2,793,150 | |||||
| 1,800 | AutoNation, Inc.a | 108,738 | ||||||
| 800 | AutoZone, Inc.a | 495,288 | ||||||
| 4,400 | Bed Bath & Beyond, Inc.a | 335,148 | ||||||
| 6,875 | Best Buy Company, Inc. | 267,987 | ||||||
| 5,400 | BorgWarner, Inc. | 296,730 | ||||||
| 5,150 | Cablevision Systems Corporationb | 106,296 | ||||||
| 5,100 | CarMax, Inc.a | 339,558 | ||||||
| 10,650 | Carnival Corporation | 482,764 | ||||||
| 11,322 | CBS Corporation | 626,559 | ||||||
| 700 | Chipotle Mexican Grill, Inc.a | 479,157 | ||||||
| 6,500 | Coach, Inc. | 244,140 | ||||||
| 61,065 | Comcast Corporation | 3,542,381 | ||||||
| 7,850 | D.R. Horton, Inc. | 198,527 | ||||||
| 3,100 | Darden Restaurants, Inc. | 181,753 | ||||||
| 7,050 | Delphi Automotive plc | 512,676 | ||||||
| 11,850 | DIRECTVa | 1,027,395 | ||||||
| 3,550 | Discovery Communications, Inc., Class Aa | 122,298 | ||||||
| 6,450 | Discovery Communications, Inc., Class Ca | 217,494 | ||||||
| 7,200 | Dollar General Corporationa | 509,040 | ||||||
| 4,850 | Dollar Tree, Inc.a | 341,343 | ||||||
| 2,350 | Expedia, Inc. | 200,596 | ||||||
| 2,250 | Family Dollar Stores, Inc. | 178,223 | ||||||
| 91,211 | Ford Motor Company | 1,413,770 | ||||||
| 1,100 | Fossil, Inc.a | 121,814 | ||||||
| 5,350 | Gannett Company, Inc. | 170,825 | ||||||
| 6,362 | Gap, Inc. | 267,904 | ||||||
| 2,850 | Garmin, Ltd. | 150,566 | ||||||
| 31,938 | General Motors Company | 1,114,956 | ||||||
| 3,600 | Genuine Parts Company | 383,652 | ||||||
| 6,500 | Goodyear Tire & Rubber Company | 185,705 | ||||||
| 6,500 | H&R Block, Inc. | 218,920 | ||||||
| 5,100 | Harley-Davidson, Inc. | 336,141 | ||||||
| 1,600 | Harman International Industries, Inc. | 170,736 | ||||||
| 2,700 | Hasbro, Inc. | 148,473 | ||||||
| 31,250 | Home Depot, Inc. | 3,280,312 | ||||||
| 9,967 | Interpublic Group of Companies, Inc. | 207,015 | ||||||
| 15,750 | Johnson Controls, Inc. | 761,355 | ||||||
| 4,800 | Kohl’s Corporation | 292,992 | ||||||
| 3,250 | Leggett & Platt, Inc. | 138,483 | ||||||
| 4,200 | Lennar Corporation | 188,202 | ||||||
| 5,804 | Limited Brands, Inc. | 502,336 | ||||||
| 23,100 | Lowe’s Companies, Inc. | 1,589,280 | ||||||
| 8,218 | Macy’s, Inc. | 540,333 | ||||||
| 5,056 | Marriott International, Inc. | 394,520 | ||||||
| 7,950 | Mattel, Inc. | 246,013 | ||||||
| 23,050 | McDonald’s Corporation | 2,159,785 | ||||||
| 4,900 | Michael Kors Holdings, Ltd.a | 367,990 | ||||||
| 1,450 | Mohawk Industries, Inc.a | 225,272 | ||||||
| 1,400 | Netflix, Inc.a | 478,254 | ||||||
| 6,423 | Newell Rubbermaid, Inc. | 244,652 | ||||||
| 11,775 | News Corporationa | 184,750 | ||||||
| 16,600 | NIKE, Inc. | 1,596,090 | ||||||
| 3,350 | Nordstrom, Inc. | 265,956 | ||||||
| 5,900 | Omnicom Group, Inc. | 457,073 | ||||||
| 2,450 | O’Reilly Automotive, Inc.a | 471,919 | ||||||
| 2,350 | PetSmart, Inc. | 191,043 | ||||||
| 1,200 | Priceline Group, Inc.a | 1,368,252 | ||||||
| 7,892 | Pulte Group, Inc. | 169,362 | ||||||
| 1,950 | PVH Corporation | 249,931 | ||||||
| 1,400 | Ralph Lauren Corporation | 259,224 | ||||||
| 4,950 | Ross Stores, Inc. | 466,587 | ||||||
| 3,950 | Royal Caribbean Cruises, Ltd. | 325,599 | ||||||
| 2,450 | Scripps Networks Interactive, Inc. | 184,412 | ||||||
| 1,950 | Sherwin-Williams Company | 512,928 | ||||||
| 1,400 | Snap-On, Inc. | 191,436 | ||||||
| 15,225 | Staples, Inc. | 275,877 | ||||||
| 17,750 | Starbucks Corporation | 1,456,388 | ||||||
| 4,250 | Starwood Hotels & Resorts Worldwide, Inc. | 344,547 | ||||||
| 15,100 | Target Corporation | 1,146,241 | ||||||
| 2,650 | Tiffany & Company | 283,179 | ||||||
| 6,608 | Time Warner Cable, Inc. | 1,004,812 | ||||||
| 19,900 | Time Warner, Inc. | 1,699,858 | ||||||
| 16,300 | TJX Companies, Inc. | 1,117,854 | ||||||
| 3,250 | Tractor Supply Company | 256,165 | ||||||
| 2,600 | TripAdvisor, Inc.a | 194,116 | ||||||
| 44,000 | Twenty-First Century Fox, Inc. | 1,689,820 | ||||||
| 3,950 | Under Armour, Inc.a | 268,205 | ||||||
| 2,400 | Urban Outfitters, Inc.a | 84,312 | ||||||
| 8,150 | VF Corporation | 610,435 | ||||||
| 8,772 | Viacom, Inc. | 660,093 | ||||||
| 36,997 | Walt Disney Company | 3,484,747 | ||||||
| 1,857 | Whirlpool Corporation | 359,775 | ||||||
| 2,922 | Wyndham Worldwide Corporation | 250,591 | ||||||
| 1,900 | Wynn Resorts, Ltd. | 282,644 | ||||||
| 10,380 | Yum! Brands, Inc. | 756,183 | ||||||
|
| |||||||
Total | 53,027,901 | |||||||
|
| |||||||
| Consumer Staples (9.4%) | |||||||
| 46,850 | Altria Group, Inc. | 2,308,299 | ||||||
| 15,268 | Archer-Daniels-Midland Company | 793,936 | ||||||
| 10,300 | Avon Products, Inc. | 96,717 | ||||||
| 3,737 | Brown-Forman Corporation | 328,258 | ||||||
| 4,200 | Campbell Soup Company | 184,800 | ||||||
| 3,050 | Clorox Company | 317,840 | ||||||
| 93,550 | Coca-Cola Company | 3,949,681 | ||||||
| 5,300 | Coca-Cola Enterprises, Inc. | 234,366 | ||||||
| 20,300 | Colgate-Palmolive Company | 1,404,557 | ||||||
| 10,050 | ConAgra Foods, Inc. | 364,614 | ||||||
| 3,950 | Constellation Brands, Inc.a | 387,772 | ||||||
| 10,350 | Costco Wholesale Corporation | 1,467,112 | ||||||
| 27,194 | CVS Health Corporation | 2,619,054 | ||||||
| 4,600 | Dr Pepper Snapple Group, Inc. | 329,728 | ||||||
| 5,300 | Estee Lauder Companies, Inc. | 403,860 | ||||||
| 14,300 | General Mills, Inc. | 762,619 | ||||||
| 3,500 | Hershey Company | 363,755 | ||||||
| 3,200 | Hormel Foods Corporation | 166,720 | ||||||
| 2,451 | J.M. Smucker Company | 247,502 | ||||||
| 6,000 | Kellogg Company | 392,640 | ||||||
| 2,900 | Keurig Green Mountain, Inc. | 383,946 | ||||||
| 8,842 | Kimberly-Clark Corporation | 1,021,605 | ||||||
| 13,967 | Kraft Foods Group, Inc. | 875,172 | ||||||
| 11,650 | Kroger Company | 748,047 | ||||||
| 8,550 | Lorillard, Inc. | 538,137 | ||||||
| 3,100 | McCormick & Company, Inc. | 230,330 | ||||||
| 4,778 | Mead Johnson Nutrition Company | 480,380 | ||||||
| 3,750 | Molson Coors Brewing Company | 279,450 | ||||||
| 39,852 | Mondelez International, Inc. | 1,447,624 | ||||||
| 3,400 | Monster Beverage Corporationa | 368,390 | ||||||
| 35,530 | PepsiCo, Inc. | 3,359,717 | ||||||
| 36,800 | Philip Morris International, Inc. | 2,997,360 | ||||||
| 64,088 | Procter & Gamble Company | 5,837,776 | ||||||
| 7,300 | Reynolds American, Inc. | 469,171 | ||||||
| 5,450 | Safeway, Inc. | 191,404 | ||||||
| 13,900 | Sysco Corporation | 551,691 | ||||||
| 6,900 | Tyson Foods, Inc. | 276,621 | ||||||
| 20,600 | Walgreen Boots Alliance, Inc. | 1,569,720 | ||||||
| 37,350 | Wal-Mart Stores, Inc. | 3,207,618 | ||||||
The accompanying Notes to Financial Statements are an integral part of this schedule.
290
Table of Contents
LARGE CAP INDEX PORTFOLIO
Schedule of Investments as of December 31, 2014
| Shares | Common Stock (96.0%) | Value | ||||||
| Consumer Staples (9.4%) - continued | |||||||
| 8,500 | Whole Foods Market, Inc. | $ | 428,570 | |||||
|
| |||||||
Total | 42,386,559 | |||||||
|
| |||||||
| Energy (8.1%) | |||||||
| 11,922 | Anadarko Petroleum Corporation | 983,565 | ||||||
| 8,870 | Apache Corporation | 555,883 | ||||||
| 10,283 | Baker Hughes, Inc. | 576,568 | ||||||
| 9,850 | Cabot Oil & Gas Corporation | 291,658 | ||||||
| 4,700 | Cameron International Corporationa | 234,765 | ||||||
| 12,200 | Chesapeake Energy Corporation | 238,754 | ||||||
| 44,796 | Chevron Corporation | 5,025,215 | ||||||
| 2,050 | Cimarex Energy Company | 217,300 | ||||||
| 29,149 | ConocoPhillips | 2,013,030 | ||||||
| 5,450 | Consol Energy, Inc. | 184,265 | ||||||
| 8,350 | Denbury Resources, Inc. | 67,886 | ||||||
| 9,050 | Devon Energy Corporation | 553,950 | ||||||
| 1,600 | Diamond Offshore Drilling, Inc.b | 58,736 | ||||||
| 5,500 | Ensco plc | 164,725 | ||||||
| 12,950 | EOG Resources, Inc. | 1,192,306 | ||||||
| 3,550 | EQT Corporation | 268,735 | ||||||
| 100,090 | Exxon Mobil Corporation | 9,253,320 | ||||||
| 5,550 | FMC Technologies, Inc.a | 259,962 | ||||||
| 20,100 | Halliburton Company | 790,533 | ||||||
| 2,550 | Helmerich & Payne, Inc. | 171,921 | ||||||
| 6,000 | Hess Corporation | 442,920 | ||||||
| 40,250 | Kinder Morgan, Inc. | 1,702,978 | ||||||
| 15,918 | Marathon Oil Corporation | 450,320 | ||||||
| 6,634 | Marathon Petroleum Corporation | 598,785 | ||||||
| 3,950 | Murphy Oil Corporation | 199,554 | ||||||
| 6,800 | Nabors Industries, Ltd. | 88,264 | ||||||
| 10,150 | National Oilwell Varco, Inc. | 665,129 | ||||||
| 3,200 | Newfield Exploration Companya | 86,784 | ||||||
| 5,950 | Noble Corporation | 98,592 | ||||||
| 8,500 | Noble Energy, Inc. | 403,155 | ||||||
| 18,400 | Occidental Petroleum Corporation | 1,483,224 | ||||||
| 4,900 | ONEOK, Inc. | 243,971 | ||||||
| 13,124 | Phillips 66 | 940,991 | ||||||
| 3,500 | Pioneer Natural Resources Company | 520,975 | ||||||
| 3,900 | QEP Resources, Inc. | 78,858 | ||||||
| 4,000 | Range Resources Corporation | 213,800 | ||||||
| 30,444 | Schlumberger, Ltd. | 2,600,222 | ||||||
| 8,350 | Southwestern Energy Companya | 227,872 | ||||||
| 15,854 | Spectra Energy Corporation | 575,500 | ||||||
| 3,000 | Tesoro Corporation | 223,050 | ||||||
| 8,050 | Transocean, Ltd.b | 147,557 | ||||||
| 12,400 | Valero Energy Corporation | 613,800 | ||||||
| 15,900 | Williams Companies, Inc. | 714,546 | ||||||
|
| |||||||
Total | 36,423,924 | |||||||
|
| |||||||
| Financials (17.1%) | |||||||
| 7,900 | ACE, Ltd. | 907,552 | ||||||
| 1,300 | Affiliated Managers Group, Inc.a | 275,912 | ||||||
| 10,700 | Aflac, Inc. | 653,663 | ||||||
| 9,982 | Allstate Corporation | 701,235 | ||||||
| 21,100 | American Express Company | 1,963,144 | ||||||
| 33,167 | American International Group, Inc. | 1,857,684 | ||||||
| 9,400 | American Tower Corporation | 929,190 | ||||||
| 4,400 | Ameriprise Financial, Inc. | 581,900 | ||||||
| 6,775 | Aon plc | 642,473 | ||||||
| 3,436 | Apartment Investment & Management Company | 127,647 | ||||||
| 1,700 | Assurant, Inc. | 116,331 | ||||||
| 3,101 | AvalonBay Communities, Inc. | 506,672 | ||||||
| 249,460 | Bank of America Corporation | 4,462,839 | ||||||
| 26,702 | Bank of New York Mellon Corporation | 1,083,300 | ||||||
| 17,050 | BB&T Corporation | 663,074 | ||||||
| 43,219 | Berkshire Hathaway, Inc.a | 6,489,333 | ||||||
| 3,000 | BlackRock, Inc. | 1,072,680 | ||||||
| 3,600 | Boston Properties, Inc. | 463,284 | ||||||
| 13,223 | Capital One Financial Corporation | 1,091,559 | ||||||
| 6,600 | CBRE Group, Inc.a | 226,050 | ||||||
| 27,275 | Charles Schwab Corporation | 823,432 | ||||||
| 5,600 | Chubb Corporation | 579,432 | ||||||
| 3,438 | Cincinnati Financial Corporation | 178,192 | ||||||
| 71,893 | Citigroup, Inc. | 3,890,130 | ||||||
| 7,450 | CME Group, Inc. | 660,442 | ||||||
| 4,300 | Comerica, Inc. | 201,412 | ||||||
| 7,900 | Crown Castle International Corporation | 621,730 | ||||||
| 10,775 | Discover Financial Services | 705,655 | ||||||
| 6,810 | E*TRADE Financial Corporationa | 165,177 | ||||||
| 8,550 | Equity Residential | 614,232 | ||||||
| 1,500 | Essex Property Trust, Inc. | 309,900 | ||||||
| 19,594 | Fifth Third Bancorp | 399,228 | ||||||
| 9,300 | Franklin Resources, Inc. | 514,941 | ||||||
| 14,850 | General Growth Properties, Inc. | 417,731 | ||||||
| 11,750 | Genworth Financial, Inc.a | 99,875 | ||||||
| 9,650 | Goldman Sachs Group, Inc. | 1,870,460 | ||||||
| 10,250 | Hartford Financial Services Group, Inc. | 427,322 | ||||||
| 10,850 | HCP, Inc. | 477,726 | ||||||
| 7,700 | Health Care REIT, Inc. | 582,659 | ||||||
| 17,941 | Host Hotels & Resorts, Inc. | 426,458 | ||||||
| 11,400 | Hudson City Bancorp, Inc. | 115,368 | ||||||
| 19,271 | Huntington Bancshares, Inc. | 202,731 | ||||||
| 2,700 | Intercontinental Exchange, Inc. | 592,083 | ||||||
| 10,200 | Invesco, Ltd. | 403,104 | ||||||
| 4,432 | Iron Mountain, Inc. | 171,341 | ||||||
| 88,798 | J.P. Morgan Chase & Company | 5,556,979 | ||||||
| 20,600 | KeyCorp | 286,340 | ||||||
| 9,750 | Kimco Realty Corporation | 245,115 | ||||||
| 2,400 | Legg Mason, Inc. | 128,088 | ||||||
| 7,451 | Leucadia National Corporation | 167,051 | ||||||
| 6,194 | Lincoln National Corporation | 357,208 | ||||||
| 7,100 | Loews Corporation | 298,342 | ||||||
| 3,100 | M&T Bank Corporation | 389,422 | ||||||
| 3,300 | Macerich Company | 275,253 | ||||||
| 12,850 | Marsh & McLennan Companies, Inc. | 735,534 | ||||||
| 23,250 | MasterCard, Inc. | 2,003,220 | ||||||
| 6,400 | McGraw-Hill Financial, Inc. | 569,472 | ||||||
| 26,932 | MetLife, Inc. | 1,456,752 | ||||||
| 4,400 | Moody’s Corporation | 421,564 | ||||||
| 36,200 | Morgan Stanley | 1,404,560 | ||||||
| 2,750 | NASDAQ OMX Group, Inc. | 131,890 | ||||||
| 9,750 | Navient Corporation | 210,698 | ||||||
| 5,250 | Northern Trust Corporation | 353,850 | ||||||
| 7,350 | People’s United Financial, Inc. | 111,573 | ||||||
| 4,150 | Plum Creek Timber Company, Inc. | 177,579 | ||||||
| 12,514 | PNC Financial Services Group, Inc. | 1,141,652 | ||||||
| 6,450 | Principal Financial Group, Inc. | 335,013 | ||||||
| 12,700 | Progressive Corporation | 342,773 | ||||||
| 11,846 | Prologis, Inc. | 509,733 | ||||||
| 10,900 | Prudential Financial, Inc. | 986,014 | ||||||
| 3,400 | Public Storage, Inc. | 628,490 | ||||||
| 32,727 | Regions Financial Corporation | 345,597 | ||||||
| 7,344 | Simon Property Group, Inc. | 1,337,416 | ||||||
| 9,900 | State Street Corporation | 777,150 | ||||||
| 12,400 | SunTrust Banks, Inc. | 519,560 | ||||||
| 6,168 | T. Rowe Price Group, Inc. | 529,584 | ||||||
| 3,050 | Torchmark Corporation | 165,218 | ||||||
| 7,881 | Travelers Companies, Inc. | 834,204 | ||||||
The accompanying Notes to Financial Statements are an integral part of this schedule.
291
Table of Contents
LARGE CAP INDEX PORTFOLIO
Schedule of Investments as of December 31, 2014
| Shares | Common Stock (96.0%) | Value | ||||||
| Financials (17.1%) - continued | |||||||
| 42,385 | U.S. Bancorp | $ | 1,905,206 | |||||
| 5,974 | Unum Group | 208,373 | ||||||
| 6,950 | Ventas, Inc. | 498,315 | ||||||
| 11,600 | Visa, Inc. | 3,041,520 | ||||||
| 4,097 | Vornado Realty Trust | 482,258 | ||||||
| 111,840 | Wells Fargo & Company | 6,131,069 | ||||||
| 12,432 | Weyerhaeuser Company | 446,184 | ||||||
| 6,150 | XL Group plc | 211,375 | ||||||
| 4,750 | Zions Bancorporation | 135,423 | ||||||
|
| |||||||
Total | 77,058,900 | |||||||
|
| |||||||
| Health Care (13.6%) |
| ||||||
| 35,650 | Abbott Laboratories | 1,604,963 | ||||||
| 37,800 | AbbVie, Inc. | 2,473,632 | ||||||
| 6,246 | Actavis plca | 1,607,783 | ||||||
| 8,389 | Aetna, Inc. | 745,195 | ||||||
| 4,700 | Alexion Pharmaceuticals, Inc.a | 869,641 | ||||||
| 7,050 | Allergan, Inc. | 1,498,759 | ||||||
| 4,950 | AmerisourceBergen Corporation | 446,292 | ||||||
| 18,090 | Amgen, Inc. | 2,881,556 | ||||||
| 6,400 | Anthem, Inc. | 804,288 | ||||||
| 12,800 | Baxter International, Inc. | 938,112 | ||||||
| 4,500 | Becton, Dickinson and Company | 626,220 | ||||||
| 5,600 | Biogen Idee, Inc.a | 1,900,920 | ||||||
| 31,450 | Boston Scientific Corporationa | 416,712 | ||||||
| 39,248 | Bristol-Myers Squibb Company | 2,316,809 | ||||||
| 1,800 | C.R. Bard, Inc. | 299,916 | ||||||
| 7,875 | Cardinal Health, Inc. | 635,749 | ||||||
| 4,837 | CareFusion Corporationa | 287,028 | ||||||
| 19,050 | Celgene Corporationa | 2,130,933 | ||||||
| 7,200 | Cerner Corporationa | 465,552 | ||||||
| 6,250 | CIGNA Corporation | 643,187 | ||||||
| 10,700 | Covidien plc | 1,094,396 | ||||||
| 4,100 | DaVita Healthcare Partners, Inc.a | 310,534 | ||||||
| 3,350 | DENTSPLY International, Inc. | 178,455 | ||||||
| 2,500 | Edwards Lifesciences Corporationa | 318,450 | ||||||
| 23,200 | Eli Lilly and Company | 1,600,568 | ||||||
| 17,445 | Express Scripts Holding Companya | 1,477,068 | ||||||
| 35,950 | Gilead Sciences, Inc.a | 3,388,647 | ||||||
| 3,980 | Hospira, Inc.a | 243,775 | ||||||
| 3,650 | Humana, Inc. | 524,249 | ||||||
| 850 | Intuitive Surgical, Inc.a | 449,599 | ||||||
| 66,240 | Johnson & Johnson | 6,926,717 | ||||||
| 2,000 | Laboratory Corporation of America Holdingsa | 215,800 | ||||||
| 2,750 | Mallinckrodt, LLCa | 272,333 | ||||||
| 5,492 | McKesson Corporation | 1,140,029 | ||||||
| 23,300 | Medtronic, Inc. | 1,682,260 | ||||||
| 67,633 | Merck & Company, Inc. | 3,840,878 | ||||||
| 8,850 | Mylan, Inc.a | 498,875 | ||||||
| 2,050 | Patterson Companies, Inc. | 98,605 | ||||||
| 2,650 | PerkinElmer, Inc. | 115,885 | ||||||
| 3,300 | Perrigo Company plc | 551,628 | ||||||
| 149,110 | Pfizer, Inc. | 4,644,776 | ||||||
| 3,400 | Quest Diagnostics, Inc. | 228,004 | ||||||
| 1,750 | Regeneron Pharmaceuticals, Inc.a | 717,937 | ||||||
| 6,734 | St. Jude Medical, Inc. | 437,912 | ||||||
| 7,050 | Stryker Corporation | 665,027 | ||||||
| 2,325 | Tenet Healthcare Corporationa | 117,808 | ||||||
| 9,450 | Thermo Fisher Scientific, Inc. | 1,183,991 | ||||||
| 22,850 | UnitedHealth Group, Inc. | 2,309,906 | ||||||
| 2,150 | Universal Health Services, Inc. | 239,209 | ||||||
| 2,400 | Varian Medical Systems, Inc.a | 207,624 | ||||||
| 5,700 | Vertex Pharmaceuticals, Inc.a | 677,160 | ||||||
| 2,000 | Waters Corporationa | 225,440 | ||||||
| 4,000 | Zimmer Holdings, Inc. | 453,680 | ||||||
| 11,850 | Zoetis, Inc. | 509,906 | ||||||
|
| |||||||
Total | 61,140,378 | |||||||
|
| |||||||
| Industrials (10.0%) |
| ||||||
| 15,250 | 3M Company | 2,505,880 | ||||||
| 4,150 | ADT Corporationb | 150,355 | ||||||
| 2,251 | Allegion plc | 124,840 | ||||||
| 5,800 | AMETEK, Inc. | 305,254 | ||||||
| 15,760 | Boeing Company | 2,048,485 | ||||||
| 3,500 | C.H. Robinson Worldwide, Inc. | 262,115 | ||||||
| 14,300 | Caterpillar, Inc. | 1,308,879 | ||||||
| 2,300 | Cintas Corporation | 180,412 | ||||||
| 23,600 | CSX Corporation | 855,028 | ||||||
| 4,050 | Cummins, Inc. | 583,888 | ||||||
| 14,500 | Danaher Corporation | 1,242,795 | ||||||
| 8,450 | Deere & Companyb | 747,571 | ||||||
| 19,900 | Delta Air Lines, Inc. | 978,881 | ||||||
| 3,950 | Dover Corporation | 283,294 | ||||||
| 850 | Dun & Bradstreet Corporation | 102,816 | ||||||
| 11,294 | Eaton Corporation plc | 767,540 | ||||||
| 16,500 | Emerson Electric Company | 1,018,545 | ||||||
| 2,850 | Equifax, Inc. | 230,479 | ||||||
| 4,600 | Expeditors International of Washington, Inc. | 205,206 | ||||||
| 6,450 | Fastenal Company | 306,762 | ||||||
| 6,260 | FedEx Corporation | 1,087,112 | ||||||
| 1,750 | First Solar, Inc.a | 78,041 | ||||||
| 3,250 | Flowserve Corporation | 194,447 | ||||||
| 3,700 | Fluor Corporation | 224,331 | ||||||
| 7,500 | General Dynamics Corporation | 1,032,150 | ||||||
| 238,100 | General Electric Company | 6,016,787 | ||||||
| 18,575 | Honeywell International, Inc. | 1,856,014 | ||||||
| 8,550 | Illinois Tool Works, Inc. | 809,685 | ||||||
| 6,300 | Ingersoll-Rand plc | 399,357 | ||||||
| 3,100 | Jacobs Engineering Group, Inc.a | 138,539 | ||||||
| 2,350 | Joy Global, Inc. | 109,322 | ||||||
| 2,600 | Kansas City Southern | 317,278 | ||||||
| 2,050 | L-3 Communications Holdings, Inc. | 258,730 | ||||||
| 6,350 | Lockheed Martin Corporation | 1,222,819 | ||||||
| 8,400 | Masco Corporation | 211,680 | ||||||
| 7,650 | Nielsen NV | 342,185 | ||||||
| 7,300 | Norfolk Southern Corporation | 800,153 | ||||||
| 4,848 | Northrop Grumman Corporation | 714,547 | ||||||
| 8,387 | PACCAR, Inc. | 570,400 | ||||||
| 2,550 | Pall Corporation | 258,085 | ||||||
| 3,525 | Parker Hannifin Corporation | 454,549 | ||||||
| 4,449 | Pentair, Ltd. | 295,503 | ||||||
| 4,800 | Pitney Bowes, Inc. | 116,976 | ||||||
| 3,400 | Precision Castparts Corporation | 818,992 | ||||||
| 5,100 | Quanta Services, Inc.a | 144,789 | ||||||
| 7,350 | Raytheon Company | 795,050 | ||||||
| 5,970 | Republic Services, Inc. | 240,293 | ||||||
| 3,250 | Robert Half International, Inc. | 189,735 | ||||||
| 3,250 | Rockwell Automation, Inc. | 361,400 | ||||||
| 3,150 | Rockwell Collins, Inc. | 266,112 | ||||||
| 2,350 | Roper Industries, Inc. | 367,423 | ||||||
| 1,250 | Ryder System, Inc. | 116,063 | ||||||
| 16,050 | Southwest Airlines Company | 679,236 | ||||||
| 3,700 | Stanley Black & Decker, Inc. | 355,496 | ||||||
| 2,000 | Stericycle, Inc.a | 262,160 | ||||||
| 6,550 | Textron, Inc. | 275,820 | ||||||
| 9,900 | Tyco International plc | 434,214 | ||||||
| 21,100 | Union Pacific Corporation | 2,513,643 | ||||||
| 16,550 | United Parcel Service, Inc. | 1,839,863 | ||||||
| 2,350 | United Rentals, Inc.a | 239,724 | ||||||
| 20,100 | United Technologies Corporation | 2,311,500 | ||||||
The accompanying Notes to Financial Statements are an integral part of this schedule.
292
Table of Contents
LARGE CAP INDEX PORTFOLIO
Schedule of Investments as of December 31, 2014
| Shares | Common Stock (96.0%) | Value | ||||||
| Industrials (10.0%) - continued | ||||||||
| 1,400 | W.W. Grainger, Inc. | $ | 356,846 | |||||
| 10,099 | Waste Management, Inc. | 518,281 | ||||||
| 4,300 | Xylem, Inc. | 163,701 | ||||||
|
| |||||||
Total | 44,968,056 | |||||||
|
| |||||||
| Information Technology (17.8%) | |||||||
| 14,900 | Accenture plc | 1,330,719 | ||||||
| 11,200 | Adobe Systems, Inc.a | 814,240 | ||||||
| 7,865 | Agilent Technologies, Inc. | 321,993 | ||||||
| 4,200 | Akamai Technologies, Inc.a | 264,432 | ||||||
| 1,500 | Alliance Data Systems Corporationa | 429,075 | ||||||
| 7,250 | Altera Corporation | 267,815 | ||||||
| 7,350 | Amphenol Corporation | 395,504 | ||||||
| 7,400 | Analog Devices, Inc. | 410,848 | ||||||
| 139,150 | Apple, Inc.c | 15,359,377 | ||||||
| 28,750 | Applied Materials, Inc. | 716,450 | ||||||
| 5,400 | Autodesk, Inc.a | 324,324 | ||||||
| 11,400 | Automatic Data Processing, Inc. | 950,418 | ||||||
| 6,000 | Avago Technologies, Ltd. | 603,540 | ||||||
| 12,750 | Broadcom Corporation | 552,457 | ||||||
| 7,562 | CA, Inc. | 230,263 | ||||||
| 120,900 | Cisco Systems, Inc. | 3,362,833 | ||||||
| 3,850 | Citrix Systems, Inc.a | 245,630 | ||||||
| 14,400 | Cognizant Technology Solutions Corporationa | 758,304 | ||||||
| 3,350 | Computer Sciences Corporation | 211,217 | ||||||
| 30,400 | Corning, Inc. | 697,072 | ||||||
| 26,850 | eBay, Inc.a | 1,506,822 | ||||||
| 7,400 | Electronic Arts, Inc.a | 347,911 | ||||||
| 48,136 | EMC Corporation | 1,431,565 | ||||||
| 1,750 | F5 Networks, Inc.a | 228,314 | ||||||
| 49,700 | Facebook, Inc.a | 3,877,594 | ||||||
| 6,750 | Fidelity National Information Services, Inc. | 419,850 | ||||||
| 5,800 | Fiserv, Inc.a | 411,626 | ||||||
| 3,300 | FLIR Systems, Inc. | 106,623 | ||||||
| 2,600 | GameStop Corporationb | 87,880 | ||||||
| 6,750 | Google, Inc.a | 3,553,200 | ||||||
| 6,750 | Google, Inc., Class Aa | 3,581,955 | ||||||
| 2,500 | Harris Corporation | 179,550 | ||||||
| 44,286 | Hewlett-Packard Company | 1,777,197 | ||||||
| 114,500 | Intel Corporation | 4,155,205 | ||||||
| 21,850 | International Business Machines Corporation | 3,505,614 | ||||||
| 6,750 | Intuit, Inc. | 622,282 | ||||||
| 9,150 | Juniper Networks, Inc. | 204,228 | ||||||
| 3,900 | KLA-Tencor Corporation | 274,248 | ||||||
| 3,800 | Lam Research Corporation | 301,492 | ||||||
| 5,650 | Linear Technology Corporation | 257,640 | ||||||
| 4,750 | Microchip Technology, Inc.b | 214,273 | ||||||
| 25,400 | Micron Technology, Inc.a | 889,254 | ||||||
| 195,900 | Microsoft Corporation | 9,099,555 | ||||||
| 5,055 | Motorola Solutions, Inc. | 339,089 | ||||||
| 7,450 | NetApp, Inc. | 308,803 | ||||||
| 12,200 | NVIDIA Corporation | 244,610 | ||||||
| 76,837 | Oracle Corporation | 3,455,360 | ||||||
| 7,700 | Paychex, Inc. | 355,509 | ||||||
| 39,500 | QUALCOMM, Inc. | 2,936,035 | ||||||
| 4,450 | Red Hat, Inc.a | 307,673 | ||||||
| 13,950 | Salesforce.com, Inc.a | 827,375 | ||||||
| 5,250 | SanDisk Corporation | 514,395 | ||||||
| 7,750 | Seagate Technology plc | 515,375 | ||||||
| 16,274 | Symantec Corporation | 417,509 | ||||||
| 9,650 | TE Connectivity, Ltd. | 610,363 | ||||||
| 3,650 | Teradata Corporationa | 159,432 | ||||||
| 25,050 | Texas Instruments, Inc. | 1,339,298 | ||||||
| 3,900 | Total System Services, Inc. | 132,444 | ||||||
| 2,600 | VeriSign, Inc.a,b | 148,200 | ||||||
| 5,200 | Western Digital Corporation | 575,640 | ||||||
| 12,380 | Western Union Companyb | 221,726 | ||||||
| 25,535 | Xerox Corporation | 353,915 | ||||||
| 6,300 | Xilinx, Inc. | 272,727 | ||||||
| 20,950 | Yahoo!, Inc.a | 1,058,184 | ||||||
|
| |||||||
Total | 80,374,051 | |||||||
|
| |||||||
| Materials (2.9%) | |||||||
| 4,550 | Air Products and Chemicals, Inc. | 656,246 | ||||||
| 1,600 | Airgas, Inc. | 184,288 | ||||||
| 27,964 | Alcoa, Inc. | 441,552 | ||||||
| 2,569 | Allegheny Technologies, Inc. | 89,324 | ||||||
| 2,200 | Avery Dennison Corporation | 114,136 | ||||||
| 3,250 | Ball Corporation | 221,552 | ||||||
| 1,200 | CF Industries Holdings, Inc. | 327,048 | ||||||
| 26,293 | Dow Chemical Company | 1,199,224 | ||||||
| 21,511 | E.l. du Pont de Nemours and Company | 1,590,523 | ||||||
| 3,550 | Eastman Chemical Company | 269,303 | ||||||
| 6,350 | Ecolab, Inc. | 663,702 | ||||||
| 3,150 | FMC Corporation | 179,645 | ||||||
| 24,642 | Freeport-McMoRan, Inc. | 575,637 | ||||||
| 1,900 | International Flavors & Fragrances, Inc. | 192,584 | ||||||
| 10,021 | International Paper Company | 536,925 | ||||||
| 9,900 | LyondellBasell Industries NV | 785,961 | ||||||
| 1,450 | Martin Marietta Materials, Inc. | 159,964 | ||||||
| 3,981 | MeadWestvaco Corporation | 176,717 | ||||||
| 11,478 | Monsanto Company | 1,371,277 | ||||||
| 7,500 | Mosaic Company | 342,375 | ||||||
| 11,848 | Newmont Mining Corporation | 223,927 | ||||||
| 7,550 | Nucor Corporation | 370,327 | ||||||
| 3,900 | Owens-Illinois, Inc.a | 105,261 | ||||||
| 3,250 | PPG Industries, Inc. | 751,238 | ||||||
| 6,900 | Praxair, Inc. | 893,964 | ||||||
| 5,002 | Sealed Air Corporation | 212,235 | ||||||
| 2,800 | Sigma-Aldrich Corporation | 384,356 | ||||||
| 3,100 | Vulcan Materials Company | 203,763 | ||||||
|
| |||||||
Total | 13,223,054 | |||||||
|
| |||||||
| Telecommunications Services (2.2%) | |||||||
| 123,039 | AT&T, Inc. | 4,132,880 | ||||||
| 13,525 | CenturyLink, Inc. | 535,319 | ||||||
| 23,728 | Frontier Communications Corporationb | 158,266 | ||||||
| 6,601 | Level 3 Communications, Inc.a | 325,957 | ||||||
| 98,196 | Verizon Communications, Inc. | 4,593,609 | ||||||
| 14,307 | Windstream Corporationb | 117,890 | ||||||
|
| |||||||
Total | 9,863,921 | |||||||
|
| |||||||
| Utilities (3.1%) | |||||||
| 15,600 | AES Corporation | 214,812 | ||||||
| 2,805 | AGL Resources, Inc. | 152,901 | ||||||
| 5,750 | Ameren Corporation | 265,247 | ||||||
| 11,560 | American Electric Power Company, Inc. | 701,923 | ||||||
| 10,173 | CenterPoint Energy, Inc. | 238,353 | ||||||
| 6,500 | CMS Energy Corporation | 225,875 | ||||||
| 6,900 | Consolidated Edison, Inc. | 455,469 | ||||||
| 13,794 | Dominion Resources, Inc. | 1,060,759 | ||||||
| 4,150 | DTE Energy Company | 358,435 | ||||||
| 16,752 | Duke Energy Corporation | 1,399,462 | ||||||
| 7,700 | Edison International, Inc. | 504,196 | ||||||
The accompanying Notes to Financial Statements are an integral part of this schedule.
293
Table of Contents
LARGE CAP INDEX PORTFOLIO
Schedule of Investments as of December 31, 2014
| Shares | Common Stock (96.0%) | Value | ||||||
| Utilities (3.1%) - continued | ||||||||
| 4,250 | Entergy Corporation | $ | 371,790 | |||||
| 20,324 | Exelon Corporation | 753,614 | ||||||
| 9,934 | FirstEnergy Corporation | 387,327 | ||||||
| 1,865 | Integrys Energy Group, Inc. | 145,190 | ||||||
| 10,350 | NextEra Energy, Inc. | 1,100,101 | ||||||
| 7,459 | NiSource, Inc. | 316,411 | ||||||
| 7,500 | Northeast Utilities | 401,400 | ||||||
| 8,000 | NRG Energy, Inc. | 215,600 | ||||||
| 5,950 | Pepco Holdings, Inc. | 160,234 | ||||||
| 11,200 | PG&E Corporation | 596,288 | ||||||
| 2,600 | Pinnacle West Capital Corporation | 177,606 | ||||||
| 15,700 | PPL Corporation | 570,381 | ||||||
| 11,950 | Public Service Enterprise Group, Inc. | 494,849 | ||||||
| 3,350 | SCANA Corporation | 202,340 | ||||||
| 5,475 | Sempra Energy | 609,696 | ||||||
| 21,300 | Southern Company | 1,046,043 | ||||||
| 5,550 | TECO Energy, Inc. | 113,720 | ||||||
| 5,350 | Wisconsin Energy Corporationb | 282,159 | ||||||
| 11,955 | Xcel Energy, Inc. | 429,424 | ||||||
|
| |||||||
Total | 13,951,605 | |||||||
|
| |||||||
Total Common Stock (cost $239,640,497) | 432,418,349 | |||||||
|
| |||||||
Collateral Held for Securities Loaned (0.5%) | ||||||||
| 2,392,432 | Thrivent Cash Management Trust | 2,392,432 | ||||||
|
| |||||||
Total Collateral Held for Securities Loaned (cost $2,392,432) | 2,392,432 | |||||||
|
| |||||||
| Shares or Principal Amount | Short-Term Investments (4.0%)d | |||||||
| 17,782,007 | Thrivent Cash Management Trust 0.060% | 17,782,007 | ||||||
|
| |||||||
Total Short-Term Investments (at amortized cost) | 17,782,007 | |||||||
|
| |||||||
Total Investments (cost $259,814,936) 100.5% | $ | 452,592,788 | ||||||
|
| |||||||
Other Assets and Liabilities, Net (0.5%) | (2,156,312 | ) | ||||||
|
| |||||||
Total Net Assets 100.0% | $ | 450,436,476 | ||||||
|
| |||||||
| a | Non-income producing security. |
| b | All or a portion of the security is on loan. |
| c | At December 31, 2014, $1,545,320 of investments were held on deposit with the counterparty and pledged as the initial margin deposit for open futures contracts. |
| d | The interest rate shown reflects the yield, coupon rate or the discount rate at the date of purchase. |
Definitions:
REIT | - | Real Estate Investment Trust is a company that buys, develops, manages and/or sells real estate assets. |
Unrealized Appreciation (Depreciation)
Gross unrealized appreciation and depreciation of investments, based on cost for federal income tax purposes, were as follows:
Gross unrealized appreciation | $ | 185,907,389 | ||
Gross unrealized depreciation | (8,391,979 | ) | ||
|
| |||
Net unrealized appreciation (depreciation) | $ | 177,515,410 | ||
Cost for federal income tax purposes | $ | 275,077,378 | ||
The accompanying Notes to Financial Statements are an integral part of this schedule.
294
Table of Contents
LARGE CAP INDEX PORTFOLIO
Schedule of Investments as of December 31, 2014
Fair Valuation Measurements
The following table is a summary of the inputs used, as of December 31, 2014, in valuing Large Cap Index Portfolio’s assets carried at fair value.
Investments in Securities | Total | Level 1 | Level 2 | Level 3 | ||||||||||||
Common Stock | ||||||||||||||||
Consumer Discretionary | 53,027,901 | 53,027,901 | — | — | ||||||||||||
Consumer Staples | 42,386,559 | 42,386,559 | — | — | ||||||||||||
Energy | 36,423,924 | 36,423,924 | — | — | ||||||||||||
Financials | 77,058,900 | 77,058,900 | — | — | ||||||||||||
Health Care | 61,140,378 | 61,140,378 | — | — | ||||||||||||
Industrials | 44,968,056 | 44,968,056 | — | — | ||||||||||||
Information Technology | 80,374,051 | 80,374,051 | — | — | ||||||||||||
Materials | 13,223,054 | 13,223,054 | — | — | ||||||||||||
Telecommunications Services | 9,863,921 | 9,863,921 | — | — | ||||||||||||
Utilities | 13,951,605 | 13,951,605 | — | — | ||||||||||||
Collateral Held for Securities Loaned | 2,392,432 | 2,392,432 | — | — | ||||||||||||
Short-Term Investments | 17,782,007 | 17,782,007 | — | — | ||||||||||||
|
|
|
|
|
|
|
| |||||||||
Total | $ | 452,592,788 | $ | 452,592,788 | $ | — | $ | — | ||||||||
|
|
|
|
|
|
|
| |||||||||
Other Financial Instruments | Total | Level 1 | Level 2 | Level 3 | ||||||||||||
Asset Derivatives | ||||||||||||||||
Futures Contracts | 519,846 | 519,846 | — | — | ||||||||||||
|
|
|
|
|
|
|
| |||||||||
Total Asset Derivatives | $ | 519,846 | $ | 519,846 | $ | — | $ | — | ||||||||
|
|
|
|
|
|
|
| |||||||||
There were no significant transfers between Levels during the period ended December 31, 2014. Transfers between Levels are identified as of the end of the period.
Futures Contracts | Number of Contracts Long/(Short) | Expiration Date | Notional Principal Amount | Value | Unrealized Gain/(Loss) | |||||||||||||
S&P 500 Index Mini-Futures | 170 | March 2015 | $ | 16,925,554 | $ | 17,445,400 | $ | 519,846 | ||||||||||
Total Futures Contracts | $ | 519,846 | ||||||||||||||||
The following table summarizes the fair value and Statement of Assets and Liabilities location, as of December 31, 2014, for Large Cap Index Portfolio’s investments in financial derivative instruments by primary risk exposure as discussed under item (2) Significant Accounting Policies of the Notes to Financial Statements.
Derivatives by risk category | Statement of Assets and Liabilities Location | Fair Value | ||||
Asset Derivatives | ||||||
Equity Contracts | ||||||
Futures* | Net Assets - Net unrealized appreciation/(depreciation) on Futures contracts | $ | 519,846 | |||
Total Equity Contracts | 519,846 | |||||
|
| |||||
Total Asset Derivatives | $ | 519,846 | ||||
|
| |||||
| * | Includes cumulative appreciation/depreciation of futures contracts as reported in the Schedule of Investments. Only current day’s variation margin is reported within the Statement of Assets and Liabilities. |
The following table summarizes the net realized gains/(losses) and Statement of Operations location, for the period ended December 31, 2014, for Large Cap Index Portfolio’s investments in financial derivative instruments by primary risk exposure.
Derivatives by risk category | Statement of Operations Location | Realized Gains/(Losses) recognized in Income | ||||
Equity Contracts | ||||||
Futures | Net realized gains/(losses) on Futures contracts | 853,333 | ||||
Total Equity Contracts | 853,333 | |||||
|
| |||||
Total | $ | 853,333 | ||||
|
| |||||
The accompanying Notes to Financial Statements are an integral part of this schedule.
295
Table of Contents
LARGE CAP INDEX PORTFOLIO
Schedule of Investments as of December 31, 2014
The following table summarizes the change in net unrealized appreciation/(depreciation) and Statement of Operations location, for the period ended December 31, 2014, for Large Cap Index Portfolio’s investments in financial derivative instruments by primary risk exposure.
Derivatives by risk category | Statement of Operations Location | Change in unrealized appreciation/(depreciation) recognized in Income | ||||
Equity Contracts | ||||||
Futures | Change in net unrealized appreciation/(depreciation) on Futures contracts | 263,357 | ||||
Total Equity Contracts | 263,357 | |||||
|
| |||||
Total | $ | 263,357 | ||||
|
| |||||
The following table presents Large Cap Index Portfolio’s average volume of derivative activity during the period ended December 31, 2014.
Derivative Risk Category | Futures (Notional)* | Futures (Percentage of Average Net Assets) | ||||||
Equity Contracts | $ | 8,149,548 | 2.0 | % | ||||
| * | Notional amount represents long or short, or both, derivative positions held by the Portfolio. |
Investment in Affiliates
Affiliated issuers, as defined under the Investment Company Act of 1940, include those in which the Portfolio’s holdings of an issuer represent 5% or more of the outstanding voting securities of an issuer, or any affiliated mutual fund.
A summary of transactions for the fiscal year to date, in Large Cap Index Portfolio, is as follows:
Portfolio | Value December 31, 2013 | Gross Purchases | Gross Sales | Shares Held at December 31, 2014 | Value December 31, 2014 | Income Earned January 1, 2014 - December 31, 2014 | ||||||||||||||||||
Cash Management Trust- Collateral Investment | $ | 1,553,927 | $ | 18,513,397 | $ | 17,674,892 | 2,392,432 | $ | 2,392,432 | $ | 11,310 | |||||||||||||
Cash Management Trust-Short Term Investment | 6,939,002 | 26,015,802 | 15,172,797 | 17,782,007 | 17,782,007 | 4,195 | ||||||||||||||||||
Total Value and Income Earned | 8,492,929 | 20,174,439 | 15,505 | |||||||||||||||||||||
The accompanying Notes to Financial Statements are an integral part of this schedule.
296
Table of Contents
Schedule of Investments as of December 31, 2014
| Principal Amount | Bank Loans (5.7%)a | Value | ||||||
| Communications Services (2.9%) |
| ||||||
Birch Communication Inc., Term Loan | ||||||||
| $ | 4,206,715 | 7.750%, 7/17/2020 | $ | 4,122,581 | ||||
Cengage Learning Aquisitions, Term Loan | ||||||||
| 5,379,350 | 7.000%, 3/31/2020 | 5,318,832 | ||||||
Clear Channel Communications, Inc., Term Loan | ||||||||
| 65,243 | 3.819%, 1/29/2016 | 64,493 | ||||||
| 7,733,196 | 6.919%, 1/30/2019 | 7,274,695 | ||||||
| 2,487,127 | 7.669%, 7/30/2019 | 2,365,879 | ||||||
IMG Worldwide, Inc., Term Loan | ||||||||
| 3,250,000 | 8.250%, 5/6/2022 | 3,095,625 | ||||||
McGraw-Hill Global Education, LLC, Term Loan | ||||||||
| 2,228,113 | 5.750%, 3/22/2019 | 2,216,281 | ||||||
|
| |||||||
| Total | 24,458,386 | |||||||
|
| |||||||
| Consumer Cyclical (1.2%) | |||||||
Amaya BV, Term Loan | ||||||||
| 2,695,000 | 8.000%, 8/1/2022 | 2,654,575 | ||||||
Mohegan Tribal Gaming Authority, Term Loan | ||||||||
| 2,682,900 | 5.500%, 11/19/2019 | 2,573,196 | ||||||
Scientific Games International, Inc., Term Loan | ||||||||
| 5,050,000 | 6.000%, 10/1/2021 | 4,970,059 | ||||||
|
| |||||||
| Total | 10,197,830 | |||||||
|
| |||||||
| Consumer Non-Cyclical (0.9%) | |||||||
Albertsons, Inc., Term Loan | ||||||||
| 2,970,093 | 4.750%, 3/21/2019 | 2,947,818 | ||||||
HCA, Inc., Term Loan | ||||||||
| 4,670,427 | 3.005%, 5/1/2018 | 4,624,470 | ||||||
|
| |||||||
| Total | 7,572,288 | |||||||
|
| |||||||
| Technology (0.7%) | |||||||
First Data Corporation, Term Loan | ||||||||
| 6,540,676 | 3.667%, 3/23/2018 | 6,405,807 | ||||||
|
| |||||||
| Total | 6,405,807 | |||||||
|
| |||||||
Total Bank Loans (cost $49,187,132) | 48,634,311 | |||||||
|
| |||||||
Long-Term Fixed Income (88.6%) | ||||||||
| Asset-Backed Securities (0.3%) | |||||||
Renaissance Home Equity Loan Trust | ||||||||
| 2,042,749 | 5.746%, 5/25/2036b | 1,486,269 | ||||||
| 1,800,000 | 6.011%, 5/25/2036b | 1,273,599 | ||||||
|
| |||||||
| Total | 2,759,868 | |||||||
|
| |||||||
| Basic Materials (5.5%) | |||||||
APERAM | ||||||||
| 2,645,000 | 7.750%, 4/1/2018* | 2,697,900 | ||||||
Bluescope Steel, Ltd. | ||||||||
| 1,590,000 | 7.125%, 5/1/2018* | 1,645,650 | ||||||
First Quantum Minerals, Ltd. | ||||||||
| 3,535,000 | 6.750%, 2/15/2020c | 3,199,175 | ||||||
| 3,535,000 | 7.000%, 2/15/2021c | 3,181,500 | ||||||
FMG Resources Pty. Ltd. | ||||||||
| 1,590,000 | 6.000%, 4/1/2017c,d | 1,520,437 | ||||||
| 5,550,000 | 8.250%, 11/1/2019c,d | 5,050,500 | ||||||
Graphic Packaging International, Inc. | ||||||||
| 790,000 | 4.750%, 4/15/2021 | 795,925 | ||||||
Hexion US Finance Corporation/ Hexion Nova Scotia Finance ULC | ||||||||
| 6,410,000 | 8.875%, 2/1/2018 | 5,704,900 | ||||||
INEOS Group Holdings SA | ||||||||
| 3,245,000 | 6.125%, 8/15/2018c,d | 3,107,087 | ||||||
Magnetation, LLC | ||||||||
| 3,720,000 | 11.000%, 5/15/2018*,d | 2,566,800 | ||||||
Midwest Vanadium, Pty. Ltd. | ||||||||
| 3,430,000 | 11.500%, 2/15/2018* | 514,500 | ||||||
Novelis, Inc. | ||||||||
| 3,950,000 | 8.750%, 12/15/2020 | 4,187,000 | ||||||
Rayonier AM Products, Inc. | ||||||||
| 1,190,000 | 5.500%, 6/1/2024c | 977,288 | ||||||
Resolute Forest Products, Inc. | ||||||||
| 3,815,000 | 5.875%, 5/15/2023 | 3,624,250 | ||||||
Ryerson, Inc. | ||||||||
| 2,100,000 | 9.000%, 10/15/2017 | 2,157,750 | ||||||
Sappi Papier Holding GmbH | ||||||||
| 2,645,000 | 8.375%, 6/15/2019c | 2,830,150 | ||||||
Signode Industrial Group Lux SA | ||||||||
| 1,080,000 | 6.375%, 5/1/2022c | 1,053,000 | ||||||
Tembec Industries, Inc. | ||||||||
| 2,660,000 | 9.000%, 12/15/2019c | 2,616,775 | ||||||
|
| |||||||
| Total | 47,430,587 | |||||||
|
| |||||||
| Capital Goods (8.5%) | |||||||
Abengoa Finance SAU | ||||||||
| 3,250,000 | 7.750%, 2/1/2020c | 2,868,125 | ||||||
Abengoa Greenfield SA | ||||||||
| 3,460,000 | 6.500%, 10/1/2019c | 2,958,300 | ||||||
Berry Plastics Corporation | ||||||||
| 2,710,000 | 5.500%, 5/15/2022 | 2,750,650 | ||||||
Brand Energy & Infrastructure Services, Inc. | ||||||||
| 2,170,000 | 8.500%, 12/1/2021c | 1,953,000 | ||||||
Case New Holland, Inc. | ||||||||
| 2,550,000 | 7.875%, 12/1/2017 | 2,805,000 | ||||||
Cemex Finance, LLC | ||||||||
| 2,695,000 | 9.375%, 10/12/2017c | 3,004,925 | ||||||
Cemex SAB de CV | ||||||||
| 2,750,000 | 5.700%, 1/11/2025c | 2,667,500 | ||||||
CNH Capital, LLC | ||||||||
| 2,150,000 | 3.625%, 4/15/2018 | 2,117,750 | ||||||
CTP Transportation Products, LLC | ||||||||
| 3,245,000 | 8.250%, 12/15/2019* | 3,423,475 | ||||||
Graphic Packaging International, Inc. | ||||||||
| 530,000 | 4.875%, 11/15/2022 | 532,650 | ||||||
Huntington Ingalls Industries, Inc. | ||||||||
| 925,000 | 5.000%, 12/15/2021c | 941,188 | ||||||
Manitowoc Company, Inc. | ||||||||
| 4,730,000 | 8.500%, 11/1/2020 | 5,108,400 | ||||||
Milacron, LLC | ||||||||
| 2,640,000 | 7.750%, 2/15/2021c | 2,692,800 | ||||||
Moog, Inc. | ||||||||
| 1,725,000 | 5.250%, 12/1/2022c | 1,746,562 | ||||||
The accompanying Notes to Financial Statements are an integral part of this schedule.
297
Table of Contents
HIGH YIELD PORTFOLIO
Schedule of Investments as of December 31, 2014
Principal Amount | Long-Term Fixed Income (88.6%) | Value | ||||
Capital Goods (8.5%) - continued | ||||||
Nortek, Inc. | ||||||
| $3,640,000 | 8.500%, 4/15/2021 | $ | 3,894,800 | |||
Owens-Illinois, Inc. | ||||||
| 3,470,000 | 7.800%, 5/15/2018 | 3,869,050 | ||||
Reynolds Group Issuer, Inc. | ||||||
| 1,580,000 | 9.000%, 4/15/2019 | 1,635,300 | ||||
| 2,160,000 | 9.875%, 8/15/2019 | 2,289,600 | ||||
| 2,100,000 | 5.750%, 10/15/2020 | 2,152,500 | ||||
| 2,630,000 | 8.250%, 2/15/2021 | 2,695,750 | ||||
RSC Equipment Rental, Inc. | ||||||
| 3,120,000 | 8.250%, 2/1/2021 | 3,400,800 | ||||
Safeway Group Holding, LLC | ||||||
| 3,175,000 | 7.000%, 5/15/2018c | 3,016,250 | ||||
Silgan Holdings, Inc. | ||||||
| 3,970,000 | 5.000%, 4/1/2020 | 4,029,550 | ||||
Tekni-Plex, Inc. | ||||||
| 2,305,000 | 9.750%, 6/1/2019c | 2,500,925 | ||||
United Rentals North America, Inc. | ||||||
| 1,070,000 | 7.375%, 5/15/2020 | 1,155,600 | ||||
| 1,625,000 | 6.125%, 6/15/2023 | 1,706,250 | ||||
UR Financing Escrow Corporation | ||||||
| 4,250,000 | 7.625%, 4/15/2022 | 4,672,875 | ||||
|
| |||||
Total | 72,589,575 | |||||
|
| |||||
Communications Services (16.4%) | ||||||
Altice Financing SA | ||||||
| 1,080,000 | 6.500%, 1/15/2022c | 1,055,700 | ||||
Altice Finco SA | ||||||
| 1,050,000 | 9.875%, 12/15/2020c | 1,122,379 | ||||
| 540,000 | 8.125%, 1/15/2024c | 526,500 | ||||
AMC Networks, Inc. | ||||||
| 4,810,000 | 7.750%, 7/15/2021 | 5,146,700 | ||||
CCO Holdings, LLC | ||||||
| 1,610,000 | 7.000%, 1/15/2019 | 1,670,375 | ||||
| 800,000 | 7.375%, 6/1/2020 | 848,000 | ||||
| 2,165,000 | 5.250%, 3/15/2021 | 2,181,238 | ||||
| 2,165,000 | 5.250%, 9/30/2022 | 2,159,588 | ||||
CenturyLink, Inc. | ||||||
| 1,420,000 | 6.450%, 6/15/2021 | 1,522,950 | ||||
Cequel Communications Escrow 1, LLC | ||||||
| 3,500,000 | 6.375%, 9/15/2020c | 3,622,500 | ||||
Clear Channel Worldwide Holdings, Inc. | ||||||
| 5,000,000 | 6.500%, 11/15/2022 | 5,150,000 | ||||
Columbus International, Inc. | ||||||
| 5,060,000 | 7.375%, 3/30/2021c | 5,262,400 | ||||
Digicel, Ltd. | ||||||
| 4,210,000 | 8.250%, 9/1/2017c | 4,262,625 | ||||
| 1,680,000 | 7.000%, 2/15/2020* | 1,661,520 | ||||
| 3,220,000 | 6.000%, 4/15/2021c | 3,010,700 | ||||
DISH DBS Corporation | ||||||
| 2,645,000 | 5.125%, 5/1/2020 | 2,664,838 | ||||
| 1,330,000 | 5.000%, 3/15/2023 | 1,286,775 | ||||
Eileme 2 AB | ||||||
| 4,260,000 | 11.625%, 1/31/2020* | 4,771,200 | ||||
Equinix, Inc. | ||||||
| 3,185,000 | 5.750%, 1/1/2025 | 3,212,869 | ||||
Frontier Communications Corporation | ||||||
| 3,255,000 | 8.125%, 10/1/2018 | 3,653,737 | ||||
| 500,000 | 6.250%, 9/15/2021 | 502,500 | ||||
| 1,000,000 | 6.875%, 1/15/2025 | 1,000,000 | ||||
Gray Television, Inc. | ||||||
| 2,710,000 | 7.500%, 10/1/2020 | 2,791,300 | ||||
Hughes Satellite Systems Corporation | ||||||
| 4,850,000 | 6.500%, 6/15/2019 | 5,201,625 | ||||
Intelsat Jackson Holdings SA | ||||||
| 7,470,000 | 7.250%, 10/15/2020 | 7,890,187 | ||||
Level 3 Escrow II, Inc. | ||||||
| 3,000,000 | 5.375%, 8/15/2022c | 3,015,000 | ||||
Level 3 Financing, Inc. | ||||||
| 4,230,000 | 8.625%, 7/15/2020 | 4,563,112 | ||||
| 1,620,000 | 6.125%, 1/15/2021 | 1,676,700 | ||||
McGraw-Hill Global Education Holdings, LLC | ||||||
| 5,295,000 | 9.750%, 4/1/2021 | 5,850,975 | ||||
MDC Partners, Inc. | ||||||
| 3,730,000 | 6.750%, 4/1/2020c | 3,841,900 | ||||
Nielsen Finance, LLC | ||||||
| 1,350,000 | 5.000%, 4/15/2022c | 1,356,750 | ||||
Numerciable-SFR | ||||||
| 2,710,000 | 6.250%, 5/15/2024c | 2,730,325 | ||||
Numericable-SFR | ||||||
| 4,590,000 | 6.000%, 5/15/2022c | 4,615,245 | ||||
Sprint Communications, Inc. | ||||||
| 8,180,000 | 9.000%, 11/15/2018c | 9,303,932 | ||||
| 2,870,000 | 7.000%, 3/1/2020c | 3,099,600 | ||||
T-Mobile USA, Inc. | ||||||
| 3,790,000 | 6.542%, 4/28/2020 | 3,913,175 | ||||
| 1,080,000 | 6.125%, 1/15/2022 | 1,096,200 | ||||
| 1,080,000 | 6.500%, 1/15/2024 | 1,107,000 | ||||
Unitymedia Hessen GmbH & Company KG | ||||||
| 5,100,000 | 5.500%, 1/15/2023c | 5,329,500 | ||||
Univision Communications, Inc. | ||||||
| 2,713,000 | 6.750%, 9/15/2022c | 2,902,910 | ||||
UPCB Finance V, Ltd. | ||||||
| 1,600,000 | 7.250%, 11/15/2021c | 1,750,000 | ||||
Verizon Communications, Inc. | ||||||
| 1,560,000 | 5.150%, 9/15/2023 | 1,722,603 | ||||
West Corporation | ||||||
| 3,790,000 | 5.375%, 7/15/2022c | 3,628,925 | ||||
Wind Acquisition Finance SA | ||||||
| 6,040,000 | 4.750%, 7/15/2020c | 5,647,400 | ||||
| 1,025,000 | 7.375%, 4/23/2021c | 967,395 | ||||
|
| |||||
Total | 140,296,853 | |||||
|
| |||||
Consumer Cyclical (11.6%) | ||||||
AMC Entertainment, Inc. | ||||||
| 2,710,000 | 5.875%, 2/15/2022d | 2,750,650 | ||||
Beazer Homes USA, Inc. | ||||||
| 2,710,000 | 5.750%, 6/15/2019 | 2,601,600 | ||||
Brookfield Residential Properties, Inc. | ||||||
| 2,630,000 | 6.500%, 12/15/2020c | 2,748,350 | ||||
| 2,110,000 | 6.125%, 7/1/2022c | 2,194,400 | ||||
Choice Hotels International, Inc. | ||||||
| 6,750,000 | 5.750%, 7/1/2022 | 7,239,375 | ||||
Chrysler Group, LLC | ||||||
| 2,770,000 | 8.000%, 6/15/2019 | 2,911,962 | ||||
The accompanying Notes to Financial Statements are an integral part of this schedule.
298
Table of Contents
HIGH YIELD PORTFOLIO
Schedule of Investments as of December 31, 2014
Principal Amount | Long-Term Fixed Income (88.6%) | Value | ||||
Consumer Cyclical (11.6%) - continued | ||||||
| $2,100,000 | 8.250%, 6/15/2021 | $ | 2,325,750 | |||
Churchill Downs, Inc. | ||||||
| 3,536,000 | 5.375%, 12/15/2021 | 3,536,000 | ||||
Cinemark USA, Inc. | ||||||
| 5,475,000 | 4.875%, 6/1/2023 | 5,173,875 | ||||
CST Brands, Inc. | ||||||
| 2,110,000 | 5.000%, 5/1/2023 | 2,131,100 | ||||
Eldorado Resorts, LLC | ||||||
| 6,015,000 | 8.625%, 6/15/2019* | 6,285,675 | ||||
General Motors Financial Company, Inc. | ||||||
| 1,310,000 | 6.750%, 6/1/2018 | 1,483,575 | ||||
GLP Capital, LP | ||||||
| 815,000 | 5.375%, 11/1/2023 | 843,525 | ||||
Hilton Worldwide Finance, LLC | ||||||
| 3,350,000 | 5.625%, 10/15/2021 | 3,500,750 | ||||
Jaguar Land Rover Automotive plc | ||||||
| 2,490,000 | 4.125%, 12/15/2018c | 2,502,450 | ||||
| 665,000 | 4.250%, 11/15/2019c | 669,988 | ||||
| 1,050,000 | 5.625%, 2/1/2023c | 1,105,125 | ||||
KB Home | ||||||
| 1,070,000 | 7.250%, 6/15/2018 | 1,139,550 | ||||
| 1,087,000 | 4.750%, 5/15/2019 | 1,070,695 | ||||
| 2,000,000 | 8.000%, 3/15/2020 | 2,190,000 | ||||
| 1,580,000 | 7.500%, 9/15/2022 | 1,674,800 | ||||
L Brands, Inc. | ||||||
| 1,570,000 | 6.625%, 4/1/2021 | 1,766,250 | ||||
| 1,860,000 | 5.625%, 2/15/2022 | 1,999,500 | ||||
Lear Corporation | ||||||
| 2,760,000 | 4.750%, 1/15/2023 | 2,753,100 | ||||
LKQ Corporation | ||||||
| 2,910,000 | 4.750%, 5/15/2023 | 2,793,600 | ||||
Mohegan Tribal Gaming Authority | ||||||
| 3,980,000 | 9.750%, 9/1/2021d | 4,059,600 | ||||
Neiman Marcus Group, Ltd., LLC | ||||||
| 3,240,000 | 8.000%, 10/15/2021c | 3,426,300 | ||||
| 2,160,000 | 8.750%, 10/15/2021c,d | 2,289,600 | ||||
New Cotai, LLC | ||||||
| 5,194,992 | 10.625%, 5/1/2019* | 5,480,717 | ||||
Rite Aid Corporation | ||||||
| 3,165,000 | 6.750%, 6/15/2021d | 3,267,862 | ||||
Scientific Games International, Inc. | ||||||
| 4,605,000 | 6.625%, 5/15/2021c,d | 3,211,988 | ||||
Seminole Indian Tribe of Florida | ||||||
| 3,800,000 | 7.804%, 10/1/2020* | 4,028,000 | ||||
Studio City Finance, Ltd. | ||||||
| 5,240,000 | 8.500%, 12/1/2020c,d | 5,502,000 | ||||
Tunica-Biloxi Gaming Authority | ||||||
| 4,770,000 | 9.000%, 11/15/2015* | 3,005,100 | ||||
|
| |||||
Total | 99,662,812 | |||||
|
| |||||
Consumer Non-Cyclical (10.3%) | ||||||
Aviv Healthcare Properties, LP | ||||||
| 3,240,000 | 6.000%, 10/15/2021 | 3,369,600 | ||||
B&G Foods, Inc. | ||||||
| 3,700,000 | 4.625%, 6/1/2021 | 3,611,570 | ||||
Cott Beverages, Inc. | ||||||
| 3,265,000 | 5.375%, 7/1/2022c | 2,995,638 | ||||
Envision Healthcare Corporation | ||||||
| 3,795,000 | 5.125%, 7/1/2022c | 3,766,538 | ||||
Fresenius Medical Care US Finance, Inc. | ||||||
| 2,660,000 | 6.500%, 9/15/2018c | 2,939,300 | ||||
| 2,150,000 | 5.750%, 2/15/2021c | 2,292,437 | ||||
Grifols Worldwide Operations, Ltd. | ||||||
| 2,710,000 | 5.250%, 4/1/2022c | 2,771,517 | ||||
HCA, Inc. | ||||||
| 650,000 | 3.750%, 3/15/2019 | 650,813 | ||||
| 2,645,000 | 6.500%, 2/15/2020 | 2,963,722 | ||||
| 4,810,000 | 5.875%, 3/15/2022 | 5,266,950 | ||||
| 3,360,000 | 4.750%, 5/1/2023 | 3,418,800 | ||||
JBS Finance II, Ltd. | ||||||
| 4,550,000 | 8.250%, 1/29/2018* | 4,652,375 | ||||
JBS USA, LLC | ||||||
| 3,250,000 | 5.875%, 7/15/2024c | 3,193,125 | ||||
Kindred Escrow Corporation II | ||||||
| 3,090,000 | 8.750%, 1/15/2023c,d | 3,325,613 | ||||
MPH Acquisition Holdings, LLC | ||||||
| 3,795,000 | 6.625%, 4/1/2022c | 3,880,388 | ||||
Omnicare, Inc. | ||||||
| 530,000 | 4.750%, 12/1/2022 | 536,625 | ||||
| 2,545,000 | 5.000%, 12/1/2024 | 2,608,625 | ||||
Ortho-Clinical Diagnostics, Inc. | ||||||
| 4,600,000 | 6.625%, 5/15/2022c | 4,134,250 | ||||
Prestige Brands, Inc. | ||||||
| 1,080,000 | 5.375%, 12/15/2021c | 1,061,100 | ||||
Revlon Consumer Products Corporation | ||||||
| 4,760,000 | 5.750%, 2/15/2021 | 4,760,000 | ||||
Spectrum Brands Escrow Corporation | ||||||
| 2,220,000 | 6.375%, 11/15/2020 | 2,314,350 | ||||
| 2,030,000 | 6.625%, 11/15/2022 | 2,146,725 | ||||
Teleflex, Inc. | ||||||
| 1,685,000 | 6.875%, 6/1/2019 | 1,756,612 | ||||
| 2,525,000 | 5.250%, 6/15/2024c | 2,525,000 | ||||
Tenet Healthcare Corporation | ||||||
| 3,250,000 | 6.000%, 10/1/2020 | 3,489,947 | ||||
| 4,335,000 | 8.125%, 4/1/2022 | 4,844,362 | ||||
TreeHouse Foods, Inc. | ||||||
| 2,165,000 | 4.875%, 3/15/2022d | 2,192,062 | ||||
Valeant Pharmaceuticals International | ||||||
| 2,600,000 | 7.250%, 7/15/2022c | 2,772,250 | ||||
Visant Corporation | ||||||
| 2,170,000 | 10.000%, 10/1/2017 | 1,882,475 | ||||
VPII Escrow Corporation | ||||||
| 1,850,000 | 7.500%, 7/15/2021c | 1,998,000 | ||||
|
| |||||
Total | 88,120,769 | |||||
|
| |||||
Energy (11.8%) | ||||||
Antero Resources Corporation | ||||||
| 1,585,000 | 5.125%, 12/1/2022c | 1,493,863 | ||||
Bonanza Creek Energy, Inc. | ||||||
| 5,085,000 | 6.750%, 4/15/2021 | 4,474,800 | ||||
Calumet Specialty Products Partners, LP | ||||||
| 4,060,000 | 6.500%, 4/15/2021c | 3,613,400 | ||||
Chaparral Energy, Inc. | ||||||
| 4,150,000 | 7.625%, 11/15/2022 | 2,718,250 | ||||
The accompanying Notes to Financial Statements are an integral part of this schedule.
299
Table of Contents
HIGH YIELD PORTFOLIO
Schedule of Investments as of December 31, 2014
Principal Amount | Long-Term Fixed Income (88.6%) | Value | ||||
Energy (11.8%) - continued |
| |||||
Chesapeake Energy Corporation | ||||||
| $1,520,000 | 4.875%, 4/15/2022d | $ | 1,478,200 | |||
Concho Resources, Inc. | ||||||
| 4,740,000 | 6.500%, 1/15/2022 | 4,953,300 | ||||
Crestwood Midstream Partners, LP | ||||||
| 2,435,000 | 6.125%, 3/1/2022 | 2,325,425 | ||||
Diamondback Energy, Inc. | ||||||
| 4,555,000 | 7.625%, 10/1/2021 | 4,446,819 | ||||
Energy XXI Gulf Coast, Inc. | ||||||
| 2,170,000 | 7.750%, 6/15/2019 | 1,291,150 | ||||
| 1,360,000 | 6.875%, 3/15/2024c,d | 734,400 | ||||
Exterran Partners, LP | ||||||
| 3,780,000 | 6.000%, 4/1/2021 | 3,288,600 | ||||
Halcon Resources Corporation | ||||||
| 1,585,000 | 8.875%, 5/15/2021d | 1,192,713 | ||||
Hornbeck Offshore Services, Inc. | ||||||
| 1,590,000 | 5.000%, 3/1/2021 | 1,303,800 | ||||
Jones Energy Holdings, LLC | ||||||
| 4,795,000 | 6.750%, 4/1/2022c | 3,644,200 | ||||
Kodiak Oil & Gas Corporation | ||||||
| 3,180,000 | 5.500%, 1/15/2021 | 3,187,950 | ||||
| 1,580,000 | 5.500%, 2/1/2022 | 1,583,950 | ||||
Laredo Petroleum, Inc. | ||||||
| 4,330,000 | 5.625%, 1/15/2022 | 3,788,750 | ||||
Linn Energy, LLC | ||||||
| 1,750,000 | 8.625%, 4/15/2020 | 1,522,500 | ||||
| 2,195,000 | 7.750%, 2/1/2021 | 1,849,287 | ||||
Markwest Energy Partners, LP | ||||||
| 1,729,000 | 6.250%, 6/15/2022 | 1,789,515 | ||||
MEG Energy Corporation | ||||||
| 1,055,000 | 6.500%, 3/15/2021c | 962,687 | ||||
| 3,160,000 | 6.375%, 1/30/2023c | 2,820,300 | ||||
| 1,800,000 | 7.000%, 3/31/2024c | 1,629,000 | ||||
Memorial Production Partners, LP | ||||||
| 3,170,000 | 7.625%, 5/1/2021 | 2,536,000 | ||||
Northern Tier Energy, LLC | ||||||
| 3,020,000 | 7.125%, 11/15/2020 | 3,050,200 | ||||
Oasis Petroleum, Inc. | ||||||
| 2,670,000 | 7.250%, 2/1/2019d | 2,549,850 | ||||
| 1,590,000 | 6.500%, 11/1/2021 | 1,446,900 | ||||
| 2,000,000 | 6.875%, 3/15/2022d | 1,820,000 | ||||
Offshore Group Investment, Ltd. | ||||||
| 4,230,000 | 7.125%, 4/1/2023 | 3,003,300 | ||||
Pacific Drilling V, Ltd. | ||||||
| 3,538,000 | 7.250%, 12/1/2017c | 3,184,200 | ||||
Precision Drilling Corporation | ||||||
| 2,450,000 | 6.625%, 11/15/2020 | 2,205,000 | ||||
| 1,060,000 | 6.500%, 12/15/2021 | 898,350 | ||||
| 1,350,000 | 5.250%, 11/15/2024c | 1,107,000 | ||||
Range Resources Corporation | ||||||
| 1,055,000 | 5.000%, 3/15/2023 | 1,055,000 | ||||
Rice Energy, Inc. | ||||||
| 4,605,000 | 6.250%, 5/1/2022c,d | 4,282,650 | ||||
Rosetta Resources, Inc. | ||||||
| 3,790,000 | 5.875%, 6/1/2024 | 3,373,100 | ||||
Sabine Pass Liquefaction, LLC | ||||||
| 3,250,000 | 5.750%, 5/15/2024 | 3,189,063 | ||||
Samson Investment Company | ||||||
| 5,540,000 | 9.750%, 2/15/2020 | 2,295,637 | ||||
Tesoro Logistics, LP | ||||||
| 2,400,000 | 5.500%, 10/15/2019c | 2,382,000 | ||||
| 2,130,000 | 6.250%, 10/15/2022c | 2,124,675 | ||||
United Refining Company | ||||||
| 3,062,000 | 10.500%, 2/28/2018 | 3,153,860 | ||||
Western Refining, Inc. | ||||||
| 1,060,000 | 6.250%, 4/1/2021 | 1,033,500 | ||||
|
| |||||
Total | 100,783,144 | |||||
|
| |||||
Financials (9.1%) | ||||||
AerCap Ireland Capital, Ltd. | ||||||
| 3,190,000 | 5.000%, 10/1/2021c | 3,301,650 | ||||
Ally Financial, Inc. | ||||||
| 5,590,000 | 7.500%, 9/15/2020 | 6,554,275 | ||||
Aviv Healthcare Properties, LP | ||||||
| 5,270,000 | 7.750%, 2/15/2019 | 5,491,340 | ||||
Banco do Brasil SA/Cayman Islands | ||||||
| 1,750,000 | 6.250%, 12/31/2049c,e | 1,277,500 | ||||
BBVA International Preferred SA Unipersonal | ||||||
| 1,585,000 | 5.919%, 12/29/2049d,e | 1,613,213 | ||||
CIT Group, Inc. | ||||||
| 3,795,000 | 3.875%, 2/19/2019 | 3,785,512 | ||||
Credit Agricole SA | ||||||
| 1,065,000 | 6.625%, 9/29/2049c,e | 1,032,251 | ||||
CyrusOne, LP | ||||||
| 4,540,000 | 6.375%, 11/15/2022 | 4,846,450 | ||||
DDR Corporation | ||||||
| 780,000 | 4.625%, 7/15/2022 | 832,656 | ||||
Denali Borrower, LLC | ||||||
| 6,680,000 | 5.625%, 10/15/2020c,d | 6,950,540 | ||||
Developers Diversified Realty Corporation | ||||||
| 3,190,000 | 7.875%, 9/1/2020 | 3,934,138 | ||||
Drawbridge Special Opportunities Fund, LP | ||||||
| 3,785,000 | 5.000%, 8/1/2021c | 3,780,269 | ||||
HSBC Holdings plc | ||||||
| 1,065,000 | 6.375%, 12/29/2049e | 1,075,650 | ||||
Icahn Enterprises, LP | ||||||
| 5,500,000 | 4.875%, 3/15/2019 | 5,486,250 | ||||
| 8,235,000 | 6.000%, 8/1/2020 | 8,483,697 | ||||
| 3,240,000 | 5.875%, 2/1/2022 | 3,254,175 | ||||
ILFC E-Capital Trust II | ||||||
| 1,895,000 | 6.250%, 12/21/2065c,f | 1,828,675 | ||||
International Lease Finance Corporation | ||||||
| 1,600,000 | 8.875%, 9/1/2017 | 1,804,000 | ||||
Jefferies Finance, LLC | ||||||
| 2,650,000 | 7.375%, 4/1/2020* | 2,464,500 | ||||
Lloyds Banking Group plc | ||||||
| 1,080,000 | 6.657%, 1/29/2049c,e | 1,152,900 | ||||
MPT Operating Partnership, LP | ||||||
| 2,675,000 | 6.875%, 5/1/2021 | 2,862,250 | ||||
| 1,192,000 | 6.375%, 2/15/2022 | 1,266,500 | ||||
Royal Bank of Scotland Group plc | ||||||
| 2,115,000 | 7.640%, 3/29/2049e | 2,220,750 | ||||
RPH Hotel Properties, LP | ||||||
| 790,000 | 5.000%, 4/15/2021 | 786,050 | ||||
The accompanying Notes to Financial Statements are an integral part of this schedule.
300
Table of Contents
HIGH YIELD PORTFOLIO
Schedule of Investments as of December 31, 2014
| Principal Amount | Long-Term Fixed Income (88.6%) | Value | ||||||
| Financials (9.1%) - continued | |||||||
TMX Finance, LLC | ||||||||
| $ | 1,585,000 | 8.500%, 9/15/2018c | $ | 1,331,400 | ||||
|
| |||||||
| Total | 77,416,591 | |||||||
|
| |||||||
| Technology (5.4%) | |||||||
AECOM Technology Corporation | ||||||||
| 2,660,000 | 5.750%, 10/15/2022c | 2,719,850 | ||||||
Alliance Data Systems Corporation | ||||||||
| 4,190,000 | 5.250%, 12/1/2017c | 4,315,700 | ||||||
| 2,700,000 | 5.375%, 8/1/2022c | 2,666,250 | ||||||
Amkor Technology, Inc. | ||||||||
| 3,130,000 | 6.625%, 6/1/2021 | 3,098,700 | ||||||
Anixter, Inc. | ||||||||
| 3,455,000 | 5.125%, 10/1/2021 | 3,455,000 | ||||||
Brocade Communications Systems, Inc. | ||||||||
| 3,790,000 | 4.625%, 1/15/2023 | 3,638,400 | ||||||
First Data Corporation | ||||||||
| 500,000 | 7.375%, 6/15/2019c | 526,250 | ||||||
| 1,850,000 | 12.625%, 1/15/2021 | 2,196,875 | ||||||
| 2,113,000 | 11.750%, 8/15/2021 | 2,424,668 | ||||||
Flextronics International, Ltd. | ||||||||
| 3,000,000 | 4.625%, 2/15/2020 | 3,045,000 | ||||||
Freescale Semiconductor, Inc. | ||||||||
| 1,355,000 | 8.050%, 2/1/2020d | 1,429,525 | ||||||
| 2,400,000 | 10.750%, 8/1/2020 | 2,622,000 | ||||||
Infor US, Inc. | ||||||||
| 3,090,000 | 9.375%, 4/1/2019 | 3,306,300 | ||||||
Micron Technology, Inc. | ||||||||
| 1,625,000 | 5.875%, 2/15/2022c | 1,706,250 | ||||||
NXP BV/NXP Funding, LLC | ||||||||
| 3,715,000 | 5.750%, 3/15/2023c | 3,910,037 | ||||||
Sensata Technologies BV | ||||||||
| 4,870,000 | 4.875%, 10/15/2023c | 4,845,650 | ||||||
|
| |||||||
| Total | 45,906,455 | |||||||
|
| |||||||
| Transportation (4.8%) | |||||||
Algeco Scotsman Global Finance plc | ||||||||
| 3,680,000 | 8.500%, 10/15/2018c | 3,551,200 | ||||||
American Airlines Pass Through Trust | ||||||||
| 3,964,262 | 5.600%, 7/15/2020c | 4,043,547 | ||||||
Avis Budget Car Rental, LLC | ||||||||
| 3,670,000 | 5.125%, 6/1/2022c | 3,706,700 | ||||||
| 3,550,000 | 5.500%, 4/1/2023 | 3,621,000 | ||||||
Continental Airlines, Inc. | ||||||||
| 1,560,000 | 6.125%, 4/29/2018 | 1,618,500 | ||||||
Delta Air Lines Pass Through Trust | ||||||||
| 2,446,056 | 6.875%, 5/7/2019* | 2,690,662 | ||||||
Dynagas LNG Partners, LP | ||||||||
| 2,130,000 | 6.250%, 10/30/2019 | 1,980,900 | ||||||
Eletson Holdings, Inc. | ||||||||
| 2,170,000 | 9.625%, 1/15/2022* | 2,126,600 | ||||||
Hornbeck Offshore Services, Inc. | ||||||||
| 2,115,000 | 5.875%, 4/1/2020 | 1,871,775 | ||||||
Navios Maritime Holdings, Inc. | ||||||||
| 2,220,000 | 8.125%, 2/15/2019 d | 1,953,600 | ||||||
| 1,895,000 | 8.125%, 11/15/2021c | 1,847,625 | ||||||
Navios South American Logistics, Inc. | ||||||||
| 1,900,000 | 7.250%, 5/1/2022c | 1,881,000 | ||||||
Teekay Offshore Partners, LP | ||||||||
| 3,790,000 | 6.000%, 7/30/2019 | 3,486,800 | ||||||
Ultrapetrol Bahamas, Ltd. | ||||||||
| 3,720,000 | 8.875%, 6/15/2021 | 3,924,600 | ||||||
United Airlines Pass Through Trust | ||||||||
| 1,560,000 | 5.375%, 8/15/2021 | 1,583,400 | ||||||
XPO Logistics, Inc. | ||||||||
| 1,330,000 | 7.875%, 9/1/2019c | 1,389,850 | ||||||
|
| |||||||
| Total | 41,277,759 | |||||||
|
| |||||||
| U.S. Government and Agencies (0.1%) | |||||||
U.S. Treasury Notes | ||||||||
| 1,000,000 | 0.250%, 3/31/2015g | 1,000,352 | ||||||
|
| |||||||
| Total | 1,000,352 | |||||||
|
| |||||||
| Utilities (4.8%) | |||||||
Access Midstream Partners, LP | ||||||||
| 2,615,000 | 4.875%, 5/15/2023 | 2,654,225 | ||||||
AES Corporation | ||||||||
| 2,900,000 | 7.375%, 7/1/2021 | 3,277,000 | ||||||
Atlas Pipeline Partners, LP | ||||||||
| 5,119,000 | 4.750%, 11/15/2021 | 4,863,050 | ||||||
Calpine Corporation | ||||||||
| 4,870,000 | 5.375%, 1/15/2023 | 4,918,700 | ||||||
Chesapeake Midstream Partners, LP | ||||||||
| 930,000 | 6.125%, 7/15/2022 | 988,125 | ||||||
Covanta Holding Corporation | ||||||||
| 2,600,000 | 7.250%, 12/1/2020 | 2,762,500 | ||||||
| 1,850,000 | 6.375%, 10/1/2022 | 1,961,000 | ||||||
Dynegy Finance I, Inc. | ||||||||
| 2,660,000 | 7.625%, 11/1/2024c | 2,713,200 | ||||||
Dynegy Finance I, Inc./ Dynegy Finance II, Inc. | ||||||||
| 1,065,000 | 6.750%, 11/1/2019c | 1,083,638 | ||||||
Electricite de France SA | ||||||||
| 2,500,000 | 5.250%, 12/29/2049c,e | 2,562,500 | ||||||
Holly Energy Partners, LP | ||||||||
| 930,000 | 6.500%, 3/1/2020 | 920,700 | ||||||
MarkWest Energy Partners, LP | ||||||||
| 3,590,000 | 4.875%, 12/1/2024d | 3,509,225 | ||||||
Regency Energy Partners, LP | ||||||||
| 4,650,000 | 5.500%, 4/15/2023 | 4,487,250 | ||||||
Targa Resources Partners, LP | ||||||||
| 4,720,000 | 5.250%, 5/1/2023 | 4,554,800 | ||||||
|
| |||||||
| Total | 41,255,913 | |||||||
|
| |||||||
| Total Long-Term Fixed Income (cost $769,030,427) | 758,500,678 | |||||||
|
| |||||||
| Shares | Preferred Stock (1.1%) | Value | ||||||
| Financials (0.9%) | |||||||
| 62,331 | Citigroup, Inc., 6.875%e | 1,656,758 | ||||||
| 48,000 | Discover Financial Services, 6.500%e | 1,216,320 | ||||||
| 86,021 | Goldman Sachs Group, Inc., 5.500%e | 2,098,912 | ||||||
| 20,016 | Morgan Stanley, 6.875%e | 532,626 | ||||||
| 18,720 | PNC Financial Services Group, Inc., 6.125%e | 519,667 | ||||||
The accompanying Notes to Financial Statements are an integral part of this schedule.
301
Table of Contents
HIGH YIELD PORTFOLIO
Schedule of Investments as of December 31, 2014
| Shares | Preferred Stock (1.1%) | Value | ||||||
| Financials (0.9%) - continued | |||||||
| 1,560 | Wells Fargo & Company, Convertible, 7.500%e | $ | 1,881,360 | |||||
|
| |||||||
| Total | 7,905,643 | |||||||
|
| |||||||
| Materials (0.2%) | |||||||
| 43,350 | CHS, Inc., 7.100%e | 1,138,371 | ||||||
|
| |||||||
| Total | 1,138,371 | |||||||
|
| |||||||
| Total Preferred Stock (cost $9,184,908) | 9,044,014 | |||||||
|
| |||||||
Common Stock (<0.1%) | ||||||||
| Consumer Discretionary (<0.1%) | |||||||
| 473 | Lear Corporation | 46,392 | ||||||
| 121,520 | TVMAX Holdings, Inc.h,i | 12 | ||||||
|
| |||||||
| Total | 46,404 | |||||||
|
| |||||||
| Financials (<0.1%) | |||||||
| 10 | New Cotai, LLCh,i | 183,194 | ||||||
|
| |||||||
| Total | 183,194 | |||||||
|
| |||||||
| Total Common Stock (cost $6,604,148) | 229,598 | |||||||
|
| |||||||
Collateral Held for Securities Loaned (6.5%) | ||||||||
| 55,520,434 | Thrivent Cash Management Trust | 55,520,434 | ||||||
|
| |||||||
| Total Collateral Held for Securities Loaned (cost $55,520,434) | 55,520,434 | |||||||
|
| |||||||
| Shares or Principal Amount | Short-Term Investments (3.1%)j | |||||||
Federal National Mortgage Association Discount Notes | ||||||||
| 800,000 | 0.140%, 4/22/2015 | 799,655 | ||||||
| 450,000 | 0.150%, 5/6/2015 | 449,765 | ||||||
Thrivent Cash Management Trust | ||||||||
| 25,362,738 | 0.060% | 25,362,738 | ||||||
|
| |||||||
| Total Short-Term Investments (at amortized cost) | 26,612,158 | |||||||
|
| |||||||
| Total Investments (cost $916,139,207) 105.0% | $ | 898,541,193 | ||||||
|
| |||||||
| Other Assets and Liabilities, Net (5.0%) | (42,744,263 | ) | ||||||
|
| |||||||
| Total Net Assets 100.0% | $ | 855,796,930 | ||||||
|
| |||||||
| a | The stated interest rate represents the weighted average of all contracts within the bank loan facility. |
| b | Denotes step coupon securities. Step coupon securities pay an initial coupon rate for the first period and then different coupon rates for following periods. The rate shown is as of December 31, 2014. |
| c | Denotes securities sold under Rule 144A of the Securities Act of 1933, which exempts them from registration. These securities have been deemed liquid and may be resold to other dealers in the program or to other qualified institutional buyers. As of December 31, 2014, the value of these investments was $268,345,337 or 31.4% of total net assets. |
| d | All or a portion of the security is on loan. |
| e | Denotes perpetual securities. Perpetual securities pay an indefinite stream of interest, but may be called by the issuer at an earlier date. |
| f | Denotes variable rate securities. Variable rate securities are securities whose yields vary with a designated market index or market rate. The rate shown is as of December 31, 2014. |
| g | At December 31, 2014, $1,000,352 of investments were pledged as collateral under the agreement between the counterparty, the custodian and the fund for open swap contracts. |
| h | Security is valued at fair value. Market quotations or prices were not readily available or were determined to be unreliable. Fair value was determined in good faith pursuant to procedures adopted by the Board. Further information on fair valuation can be found in section (2)(A) of the Notes to Financial Statements. |
| i | Non-income producing security. |
| j | The interest rate shown reflects the yield, coupon rate or the discount rate at the date of purchase. |
| * | Denotes restricted securities. Restricted securities are investment securities which have been deemed illiquid and cannot be offered for public sale without first being registered under the Securities Act of 1933. The following table indicates the acquisition date and cost of restricted securities High Yield Portfolio owned as of December 31, 2014. |
Security | Acquisition Date | Cost | ||||||
APERAM, 4/1/2018 | 3/25/2011 | $ | 2,635,553 | |||||
Bluescope Steel, Ltd., 5/1/2018 | 4/11/2013 | 1,590,000 | ||||||
CTP Transportation Products, LLC, 12/15/2019 | 12/13/2013 | 3,369,384 | ||||||
Delta Air Lines Pass Through Trust, 5/7/2019 | 5/3/2013 | 2,584,750 | ||||||
Digicel, Ltd., 2/15/2020 | 2/7/2012 | 1,680,000 | ||||||
Eileme 2 AB, 1/31/2020 | 1/19/2012 | 4,179,060 | ||||||
Eldorado Resorts, LLC, 6/15/2019 | 5/19/2011 | 6,007,062 | ||||||
Eletson Holdings, Inc., 1/15/2022 | 12/12/2013 | 2,139,989 | ||||||
JBS Finance II, Ltd., 1/29/2018 | 7/22/2010 | 4,487,847 | ||||||
Jefferies Finance, LLC, 4/1/2020 | 3/19/2013 | 2,650,000 | ||||||
Magnetation, LLC, 5/15/2018 | 5/15/2013 | 3,814,400 | ||||||
Midwest Vanadium, Pty. Ltd., 2/15/2018 | 2/9/2011 | 3,245,874 | ||||||
New Cotai, LLC, 5/1/2019 | 4/12/2013 | 5,042,020 | ||||||
Seminole Indian Tribe of Florida, 10/1/2020 | 7/8/2010 | 3,570,453 | ||||||
Tunica-Biloxi Gaming Authority, 11/15/2015 | 11/8/2005 | 4,764,756 | ||||||
Unrealized Appreciation (Depreciation)
Gross unrealized appreciation and depreciation of investments, based on cost for federal income tax purposes, were as follows:
Gross unrealized appreciation | $ | 21,654,667 | ||
Gross unrealized depreciation | (39,505,404 | ) | ||
|
| |||
Net unrealized appreciation (depreciation) | $ | (17,850,737 | ) | |
Cost for federal income tax purposes | $ | 916,391,930 | ||
The accompanying Notes to Financial Statements are an integral part of this schedule.
302
Table of Contents
HIGH YIELD PORTFOLIO
Schedule of Investments as of December 31, 2014
Fair Valuation Measurements
The following table is a summary of the inputs used, as of December 31, 2014, in valuing High Yield Portfolio’s assets carried at fair value.
Investments in Securities | Total | Level 1 | Level 2 | Level 3 | ||||||||||||
Bank Loans | ||||||||||||||||
Communications Services | 24,458,386 | — | 20,335,805 | 4,122,581 | ||||||||||||
Consumer Cyclical | 10,197,830 | — | 10,197,830 | — | ||||||||||||
Consumer Non-Cyclical | 7,572,288 | — | 7,572,288 | — | ||||||||||||
Technology | 6,405,807 | — | 6,405,807 | — | ||||||||||||
Long-Term Fixed Income | ||||||||||||||||
Asset-Backed Securities | 2,759,868 | — | 2,759,868 | — | ||||||||||||
Basic Materials | 47,430,587 | — | 47,430,587 | — | ||||||||||||
Capital Goods | 72,589,575 | — | 72,589,575 | — | ||||||||||||
Communications Services | 140,296,853 | — | 140,296,853 | — | ||||||||||||
Consumer Cyclical | 99,662,812 | — | 99,662,812 | — | ||||||||||||
Consumer Non-Cyclical | 88,120,769 | — | 88,120,769 | — | ||||||||||||
Energy | 100,783,144 | — | 100,783,144 | — | ||||||||||||
Financials | 77,416,591 | — | 77,416,591 | — | ||||||||||||
Technology | 45,906,455 | — | 45,906,455 | — | ||||||||||||
Transportation | 41,277,759 | — | 41,277,759 | — | ||||||||||||
U.S. Government and Agencies | 1,000,352 | — | 1,000,352 | — | ||||||||||||
Utilities | 41,255,913 | — | 41,255,913 | — | ||||||||||||
Preferred Stock | ||||||||||||||||
Financials | 7,905,643 | 7,905,643 | — | — | ||||||||||||
Materials | 1,138,371 | 1,138,371 | — | — | ||||||||||||
Common Stock | ||||||||||||||||
Consumer Discretionary | 46,404 | 46,392 | — | 12 | ||||||||||||
Financials | 183,194 | — | — | 183,194 | ||||||||||||
Collateral Held for Securities Loaned | 55,520,434 | 55,520,434 | — | — | ||||||||||||
Short-Term Investments | 26,612,158 | 25,362,738 | 1,249,420 | — | ||||||||||||
|
|
|
|
|
|
|
| |||||||||
Total | $ | 898,541,193 | $ | 89,973,578 | $ | 804,261,828 | $ | 4,305,787 | ||||||||
|
|
|
|
|
|
|
| |||||||||
Other Financial Instruments | Total | Level 1 | Level 2 | Level 3 | ||||||||||||
Asset Derivatives | ||||||||||||||||
Credit Default Swaps | 266,087 | — | 266,087 | — | ||||||||||||
|
|
|
|
|
|
|
| |||||||||
Total Asset Derivatives | $ | 266,087 | $ | — | $ | 266,087 | $ | — | ||||||||
|
|
|
|
|
|
|
| |||||||||
There were no significant transfers between Levels during the period ended December 31, 2014. Transfers between Levels are identified as of the end of the period.
Credit Default Swaps and Counterparty | Buy/Sell Protection1 | Termination Date | Notional Principal Amount2 | Value3 | Unrealized Gain/(Loss) | |||||||||||||
CDX HY 23, 5 Year, at 5.00%; J.P. Morgan Chase and Co. | Sell | 12/20/2019 | ($ | 16,000,000 | ) | $ | 266,087 | $ | 266,087 | |||||||||
Total Credit Default Swaps | $ | 266,087 | $ | 266,087 | ||||||||||||||
| 1 | As the buyer of protection, High Yield Portfolio pays periodic fees in return for payment by the seller which is contingent upon an adverse credit event occurring in the underlying issuer or reference entity. As the seller of protection, High Yield Portfolio collects periodic fees from the buyer and profits if the credit of the underlying issuer or reference entity remains stable or improves while the swap is outstanding, but the seller in a credit default swap contract would be required to pay the amount of credit loss, determined as specified in the agreement, to the buyer in the event of an adverse credit event in the reference entity. |
| 2 | The maximum potential amount of future payments High Yield Portfolio could be required to make as the seller or receive as the buyer of protection. |
| 3 | The values for credit indexes (CDX or LCDX) serve as an indicator of the current status of the payment/performance risk and represent the liability or profit for the credit default swap contract had the contract been closed as of the reporting date. When protection has been sold, the value of the swap will increase when the swap spread declines representing an improvement in the reference entity’s credit worthiness. The value of the swap will decrease when the swap spread increases representing a deterioration in the reference entity’s credit worthiness. When protection has been purchased, the value of the swap will increase when the swap spread increases representing a deterioration in the reference entity’s credit worthiness. The value of the swap will decrease when the swap spread declines representing an improvement in the reference entity’s credit worthiness. |
The accompanying Notes to Financial Statements are an integral part of this schedule.
303
Table of Contents
HIGH YIELD PORTFOLIO
Schedule of Investments as of December 31, 2014
The following table summarizes the fair value and Statement of Assets and Liabilities location, as of December 31, 2014, for High Yield Portfolio’s investments in financial derivative instruments by primary risk exposure as discussed under item (2) Significant Accounting Policies of the Notes to Financial Statements.
Derivatives by risk category | Statement of Assets and Liabilities Location | Fair Value | ||||
Asset Derivatives | ||||||
Credit Contracts | ||||||
Credit Default Swaps | Net Assets - Net unrealized appreciation/(depreciation) on Swap agreements | $ | 266,087 | |||
Total Credit Contracts | 266,087 | |||||
|
| |||||
Total Asset Derivatives | $ | 266,087 | ||||
|
| |||||
The following table summarizes the net realized gains/(losses) and Statement of Operations location, for the period ended December 31, 2014, for High Yield Portfolio’s investments in financial derivative instruments by primary risk exposure.
Derivatives by risk category | Statement of Operations Location | Realized Gains/(Losses) recognized in Income | ||||
Equity Contracts | ||||||
Futures | Net realized gains/(losses) on Futures contracts | (40,886 | ) | |||
Total Equity Contracts | (40,886 | ) | ||||
Credit Contracts | ||||||
Credit Default Swaps | Net realized gains/(losses) on Swap agreements | 27,258 | ||||
Total Credit Contracts | 27,258 | |||||
|
| |||||
Total | ($ | 13,628 | ) | |||
|
| |||||
The following table summarizes the change in net unrealized appreciation/(depreciation) and Statement of Operations location, for the period ended December 31, 2014, for High Yield Portfolio’s investments in financial derivative instruments by primary risk exposure.
Derivatives by risk category | Statement of Operations Location | Change in unrealized appreciation/(depreciation) recognized in Income | ||||
Credit Contracts | ||||||
Credit Default Swaps | Change in net unrealized appreciation/(depreciation) on Swap agreements | 266,087 | ||||
Total Credit Contracts | 266,087 | |||||
|
| |||||
Total | $ | 266,087 | ||||
|
| |||||
The following table presents High Yield Portfolio’s average volume of derivative activity during the period ended December 31, 2014.
Derivative Risk Category | Futures (Notional)* | Futures (Percentage of Average Net Assets) | Swaps (Notional)* | |||||||||
Equity Contracts | $ | 5,738,255 | 0.6 | % | N/A | |||||||
Credit Contracts | N/A | N/A | $ | 42,528 | ||||||||
| * | Notional amount represents long or short, or both, derivative positions held by the Portfolio. |
Investment in Affiliates
Affiliated issuers, as defined under the Investment Company Act of 1940, include those in which the Portfolio’s holdings of an issuer represent 5% or more of the outstanding voting securities of an issuer, or any affiliated mutual fund.
A summary of transactions for the fiscal year to date, in High Yield Portfolio, is as follows:
Portfolio | Value December 31, 2013 | Gross Purchases | Gross Sales | Shares Held at December 31, 2014 | Value December 31, 2014 | Income Earned January 1, 2014 - December 31, 2014 | ||||||||||||||||||
Cash Management Trust- Collateral Investment | $ | 50,419,210 | $ | 275,992,077 | $ | 270,890,853 | 55,520,434 | $ | 55,520,434 | $ | 142,479 | |||||||||||||
Cash Management Trust- ShortTerm Investment | 14,622,201 | 274,263,025 | 263,522,488 | 25,362,738 | 25,362,738 | 14,824 | ||||||||||||||||||
Total Value and Income Earned | 65,041,411 | 80,883,172 | 157,303 | |||||||||||||||||||||
The accompanying Notes to Financial Statements are an integral part of this schedule.
304
Table of Contents
Schedule of Investments as of December 31, 2014
| Principal Amount | Bank Loans (4.1%)a | Value | ||||||
| Basic Materials (0.2%) | |||||||
Fortescue Metals Group, Ltd., Term Loan | ||||||||
| $ | 1,613,081 | 3.750%, 6/30/2019 | $ | 1,461,451 | ||||
Ineos Group Holdings, Ltd., Term Loan | ||||||||
| 1,548,933 | 3.750%, 5/4/2018 | 1,498,422 | ||||||
|
| |||||||
Total | 2,959,873 | |||||||
|
| |||||||
| Capital Goods (0.2%) | |||||||
ADS Waste Holdings, Inc., Term Loan | ||||||||
| 1,554,667 | 3.750%, 10/9/2019 | 1,506,565 | ||||||
Berry Plastics Group, Inc., Term Loan | ||||||||
| 1,572,000 | 3.500%, 2/8/2020 | 1,518,096 | ||||||
|
| |||||||
Total | 3,024,661 | |||||||
|
| |||||||
| Communications Services (1.4%) | |||||||
Charter Communications Operating, LLC, Term Loan | ||||||||
| 945,600 | 3.000%, 1/3/2021 | 925,705 | ||||||
Clear Channel Communications, Inc., Term Loan | ||||||||
| 10,081 | 3.819%, 1/29/2016 | 9,965 | ||||||
| 1,194,893 | 6.919%, 1/30/2019 | 1,124,047 | ||||||
| 384,298 | 7.669%, 7/30/2019 | 365,563 | ||||||
Cumulus Media Holdings, Inc., Term Loan | ||||||||
| 1,377,465 | 4.250%, 12/23/2020 | 1,333,841 | ||||||
Hargray Communications Group, Inc., Term Loan | ||||||||
| 1,543,482 | 5.250%, 6/26/2019 | 1,531,906 | ||||||
Intelsat Jackson Holdings SA, Term Loan | ||||||||
| 1,789,713 | 3.750%, 6/30/2019 | 1,760,630 | ||||||
Level 3 Communications, Inc., Term Loan | ||||||||
| 1,600,000 | 4.000%, 1/15/2020 | 1,586,000 | ||||||
McGraw-Hill Global Education, LLC, Term Loan | ||||||||
| 672,638 | 5.750%, 3/22/2019 | 669,066 | ||||||
NEP/NCP Holdco, Inc., Term Loan | ||||||||
| 1,572,140 | 4.250%, 1/22/2020 | 1,535,462 | ||||||
TNS, Inc., Term Loan | ||||||||
| 1,506,845 | 5.000%, 2/14/2020 | 1,489,894 | ||||||
Univision Communications, Inc., Term Loan | ||||||||
| 1,634,163 | 4.000%, 3/1/2020 | 1,595,761 | ||||||
Virgin Media Investment Holdings, Ltd., Term Loan | ||||||||
| 1,600,000 | 3.500%, 6/7/2020 | 1,568,976 | ||||||
WideOpenWest Finance, LLC, Term Loan | ||||||||
| 1,572,000 | 4.750%, 4/1/2019 | 1,559,235 | ||||||
Yankee Cable Acquisition, LLC, Term Loan | ||||||||
| 1,517,067 | 4.500%, 3/1/2020 | 1,507,585 | ||||||
Zayo Group, LLC, Term Loan | ||||||||
| 1,567,861 | 4.000%, 7/2/2019 | 1,548,890 | ||||||
|
| |||||||
Total | 20,112,526 | |||||||
|
| |||||||
| Consumer Cyclical (0.4%) | |||||||
Burlington Coat Factory Warehouse Corporation, Term Loan | ||||||||
| 1,395,076 | 4.250%, 8/13/2021 | 1,375,029 | ||||||
Chrysler Group, LLC, Term Loan | ||||||||
| 1,551,858 | 3.500%, 5/24/2017 | 1,540,498 | ||||||
MGM Resorts lnternational, Term Loan | ||||||||
| 940,800 | 3.500%, 12/20/2019 | 914,345 | ||||||
ROC Finance, LLC, Term Loan | ||||||||
| 1,580,000 | 5.000%, 6/20/2019 | 1,461,500 | ||||||
|
| |||||||
Total | 5,291,372 | |||||||
|
| |||||||
| Consumer Non-Cyclical (0.5%) | |||||||
Albertsons, Inc., Term Loan | ||||||||
| 1,713,077 | 4.750%, 3/21/2019 | 1,700,228 | ||||||
Biomet, Inc., Term Loan | ||||||||
| 1,533,903 | 3.670%, 7/25/2017 | 1,524,592 | ||||||
CHS/Community Health Systems, Inc., Term Loan | ||||||||
| 432,157 | 3.486%, 1/25/2017 | 429,275 | ||||||
| 1,151,843 | 4.250%, 1/27/2021 | 1,147,765 | ||||||
Roundy’s Supermarkets, Inc., Term Loan | ||||||||
| 1,304,030 | 5.750%, 3/3/2021 | 1,220,351 | ||||||
Visant Corporation, Term Loan | ||||||||
| 1,231,114 | 7.000%, 9/23/2021 | 1,194,181 | ||||||
|
| |||||||
Total | 7,216,392 | |||||||
|
| |||||||
| Energy (0.2%) | |||||||
Arch Coal, Inc., Term Loan | ||||||||
| 1,564,926 | 6.250%, 5/16/2018 | 1,291,722 | ||||||
McJunkin Red Man Corporation, Term Loan | ||||||||
| 632,000 | 5.000%, 11/8/2019 | 579,860 | ||||||
Offshore Group Investment, Ltd., Term Loan | ||||||||
| 786,000 | 5.750%, 3/28/2019 | 585,570 | ||||||
|
| |||||||
Total | 2,457,152 | |||||||
|
| |||||||
| Financials (0.1%) | |||||||
WaveDivision Holdings, LLC, Term Loan | ||||||||
| 1,568,000 | 4.000%, 10/15/2019 | 1,541,861 | ||||||
|
| |||||||
Total | 1,541,861 | |||||||
|
| |||||||
| Technology (0.5%) | |||||||
BMC Software, Inc., Term Loan | ||||||||
| 1,518,892 | 5.000%, 9/10/2020 | 1,474,282 | ||||||
First Data Corporation, Term Loan | ||||||||
| 1,600,000 | 3.667%, 3/23/2018 | 1,567,008 | ||||||
Freescale Semiconductor, Inc., Term Loan | ||||||||
| 1,572,120 | 4.250%, 2/28/2020 | 1,531,842 | ||||||
Infor US, Inc., Term Loan | ||||||||
| 1,103,614 | 3.750%, 6/3/2020 | 1,069,204 | ||||||
SunGard Data Systems, Inc., Term Loan | ||||||||
| 435,845 | 4.000%, 3/8/2020 | 430,942 | ||||||
Syniverse Holdings, Inc., Term Loan | ||||||||
| 614,289 | 4.000%, 4/23/2019 | 595,092 | ||||||
|
| |||||||
Total | 6,668,370 | |||||||
|
| |||||||
The accompanying Notes to Financial Statements are an integral part of this schedule.
305
Table of Contents
INCOME PORTFOLIO
Schedule of Investments as of December 31, 2014
| Principal Amount | Bank Loans (4.1%)a | Value | ||||||
| Transportation (0.3%) | |||||||
American Airlines, Inc., Term Loan | ||||||||
| $ | 1,556,300 | 3.750%, 6/27/2019 | $ | 1,537,500 | ||||
Delta Air Lines, Inc., Term Loan | ||||||||
| 2,386,927 | 3.250%, 4/20/2017b,c | 2,357,091 | ||||||
|
| |||||||
Total | 3,894,591 | |||||||
|
| |||||||
| Utilities (0.3%) | |||||||
Calpine Corporation, Term Loan | ||||||||
| 1,262,124 | 4.000%, 4/1/2018 | 1,246,663 | ||||||
| 1,270,750 | 4.000%, 10/9/2019 | 1,252,489 | ||||||
NGPL PipeCo, LLC, Term Loan | ||||||||
| 1,366,926 | 6.750%, 9/15/2017 | 1,324,210 | ||||||
|
| |||||||
Total | 3,823,362 | |||||||
|
| |||||||
Total Bank Loans (cost $58,585,426) | 56,990,160 | |||||||
|
| |||||||
Long-Term Fixed Income (91.7%) | ||||||||
| Asset-Backed Securities (0.9%) | |||||||
GMAC Mortgage Corporation Loan Trust | ||||||||
| 3,009,242 | 0.350%, 8/25/2035d,e | 2,660,585 | ||||||
| 3,623,587 | 0.350%, 12/25/2036d,e | 3,163,485 | ||||||
IndyMac Seconds Asset-Backed Trust | ||||||||
| 550,951 | 0.510%, 10/25/2036d,e | 332,953 | ||||||
Renaissance Home Equity Loan Trust | ||||||||
| 2,334,570 | 5.746%, 5/25/2036f | 1,698,594 | ||||||
| 2,000,000 | 6.011%, 5/25/2036f | 1,415,110 | ||||||
Vericrest Opportunity Loan Transferee | ||||||||
| 2,052,871 | 3.625%, 10/27/2053g | 2,054,312 | ||||||
|
| |||||||
Total | 11,325,039 | |||||||
|
| |||||||
| Basic Materials (4.9%) | |||||||
Albemarle Corporation | ||||||||
| 3,150,000 | 4.150%, 12/1/2024 | 3,200,419 | ||||||
Alcoa, Inc. | ||||||||
| 1,260,000 | 5.125%, 10/1/2024 | 1,335,310 | ||||||
Anglo American Capital plc | ||||||||
| 1,910,000 | 4.125%, 4/15/2021g | 1,916,418 | ||||||
ArcelorMittal | ||||||||
| 2,750,000 | 5.750%, 8/5/2020h | 2,853,125 | ||||||
Barrick Gold Corporation | ||||||||
| 1,920,000 | 3.850%, 4/1/2022 | 1,847,699 | ||||||
| 1,910,000 | 4.100%, 5/1/2023 | 1,858,808 | ||||||
Dow Chemical Company | ||||||||
| 2,570,000 | 4.250%, 11/15/2020 | 2,747,667 | ||||||
First Quantum Minerals, Ltd. | ||||||||
| 1,084,000 | 6.750%, 2/15/2020g | 981,020 | ||||||
| 1,084,000 | 7.000%, 2/15/2021g | 975,600 | ||||||
Freeport-McMoRan, Inc. | ||||||||
| 4,470,000 | 3.550%, 3/1/2022 | 4,224,646 | ||||||
| 3,175,000 | 3.875%, 3/15/2023 | 2,993,504 | ||||||
| 2,520,000 | 4.550%, 11/14/2024 | 2,446,991 | ||||||
Georgia-Pacific, LLC | ||||||||
| 2,190,000 | 5.400%, 11/1/2020g | 2,464,271 | ||||||
| 3,780,000 | 3.163%, 11/15/2021g | 3,802,589 | ||||||
Glencore Funding, LLC | ||||||||
| 3,180,000 | 4.125%, 5/30/2023g | 3,102,914 | ||||||
International Paper Company | ||||||||
| 3,190,000 | 4.800%, 6/15/2044 | 3,257,641 | ||||||
LYB International Finance BV | ||||||||
| 2,555,000 | 4.000%, 7/15/2023 | 2,613,617 | ||||||
| 1,280,000 | 4.875%, 3/15/2044 | 1,316,819 | ||||||
LyondellBasell Industries NV | ||||||||
| 3,170,000 | 6.000%, 11/15/2021 | 3,648,540 | ||||||
Mosaic Company | ||||||||
| 2,145,000 | 4.250%, 11/15/2023 | 2,263,393 | ||||||
| 1,590,000 | 5.450%, 11/15/2033 | 1,798,937 | ||||||
Rio Tinto Finance USA, Ltd. | ||||||||
| 3,285,000 | 6.500%, 7/15/2018 | 3,760,832 | ||||||
Sappi Papier Holding GmbH | ||||||||
| 1,910,000 | 6.625%, 4/15/2021g | 1,957,750 | ||||||
Vale Overseas, Ltd. | ||||||||
| 1,900,000 | 4.625%, 9/15/2020 | 1,919,845 | ||||||
Vale SA | ||||||||
| 1,930,000 | 5.625%, 9/11/2042 | 1,797,621 | ||||||
Weyerhaeuser Company | ||||||||
| 1,265,000 | 4.625%, 9/15/2023 | 1,362,557 | ||||||
| 2,570,000 | 7.375%, 3/15/2032 | 3,421,567 | ||||||
Xstrata Finance Canada, Ltd. | ||||||||
| 2,560,000 | 4.250%, 10/25/2022g | 2,547,453 | ||||||
Yara International ASA | ||||||||
| 50,000 | 7.875%, 6/11/2019g | 59,572 | ||||||
|
| |||||||
Total | 68,477,125 | |||||||
|
| |||||||
| Capital Goods (2.0%) | |||||||
BAE Systems plc | ||||||||
| 3,880,000 | 4.750%, 10/11/2021g | 4,234,042 | ||||||
CNH Capital, LLC | ||||||||
| 450,000 | 6.250%, 11/1/2016 | 471,375 | ||||||
Huntington Ingalls Industries, Inc. | ||||||||
| 630,000 | 5.000%, 12/15/2021g | 641,025 | ||||||
Hutchison Whampoa Finance Cl, Ltd. | ||||||||
| 2,520,000 | 1.625%, 10/31/2017g | 2,499,235 | ||||||
L-3 Communications Corporation | ||||||||
| 2,560,000 | 3.950%, 5/28/2024 | 2,581,179 | ||||||
Masco Corporation | ||||||||
| 1,625,000 | 5.950%, 3/15/2022 | 1,803,750 | ||||||
Republic Services, Inc. | ||||||||
| 630,000 | 5.500%, 9/15/2019 | 709,745 | ||||||
| 2,200,000 | 5.250%, 11/15/2021 | 2,491,025 | ||||||
| 3,170,000 | 3.550%, 6/1/2022 | 3,254,376 | ||||||
Reynolds Group Issuer, Inc. | ||||||||
| 1,940,000 | 9.875%, 8/15/2019 | 2,056,400 | ||||||
Textron, Inc. | ||||||||
| 2,360,000 | 5.600%, 12/1/2017 | 2,593,418 | ||||||
| 1,280,000 | 4.300%, 3/1/2024 | 1,337,414 | ||||||
| 630,000 | 3.875%, 3/1/2025 | 631,110 | ||||||
United Rentals North America, Inc. | ||||||||
| 1,300,000 | 5.750%, 7/15/2018 | 1,355,250 | ||||||
| 320,000 | 6.125%, 6/15/2023 | 336,000 | ||||||
|
| |||||||
Total | 26,995,344 | |||||||
|
| |||||||
| Collateralized Mortgage Obligations (1.0%) | |||||||
CitiMortgage Alternative Loan Trust | ||||||||
| 2,151,727 | 5.750%, 4/25/2037 | 1,847,589 | ||||||
Countrywide Alternative Loan Trust | ||||||||
| 2,767,008 | 6.000%, 1/25/2037 | 2,553,099 | ||||||
The accompanying Notes to Financial Statements are an integral part of this schedule.
306
Table of Contents
INCOME PORTFOLIO
Schedule of Investments as of December 31, 2014
| Principal Amount | Long-Term Fixed Income (91.7%) | Value | ||||||
| Collateralized Mortgage Obligations (1.0%) - continued | |||||||
Deutsche Alt-A Securities Mortgage Loan Trust | ||||||||
| $ | 2,278,956 | 0.883%, 4/25/2047e | $ | 1,950,725 | ||||
HomeBanc Mortgage Trust | ||||||||
| 2,328,220 | 2.197%, 4/25/2037 | 1,732,461 | ||||||
Wachovia Mortgage Loan Trust, LLC | ||||||||
| 2,413,106 | 2.738%, 5/20/2036 | 2,102,607 | ||||||
WaMu Mortgage Pass Through Certificates | ||||||||
| 622,766 | 0.460%, 10/25/2045e | 570,656 | ||||||
Washington Mutual Alternative Mortgage Pass Through Certificates | ||||||||
| 4,043,580 | 0.863%, 2/25/2047e | 2,837,356 | ||||||
|
| |||||||
Total | 13,594,493 | |||||||
|
| |||||||
| Commercial Mortgage-Backed Securities (0.6%) | |||||||
Bear Stearns Commercial Mortgage Securities, Inc. | ||||||||
| 3,038,407 | 5.331%, 2/11/2044 | 3,246,331 | ||||||
Citigroup/Deutsche Bank Commercial Mortgage | ||||||||
| 1,900,000 | 5.322%, 12/11/2049 | 2,011,648 | ||||||
Credit Suisse First Boston Mortgage Securities | ||||||||
| 3,200,000 | 5.542%, 1/15/2049 | 3,427,945 | ||||||
|
| |||||||
Total | 8,685,924 | |||||||
|
| |||||||
| Communications Services (11.2%) | |||||||
21st Century Fox America, Inc. | ||||||||
| 1,880,000 | 6.150%, 2/15/2041 | 2,392,582 | ||||||
America Movil SAB de CV | ||||||||
| 4,100,000 | 1.241%, 9/12/2016e | 4,129,327 | ||||||
American Tower Corporation | ||||||||
| 3,900,000 | 4.500%, 1/15/2018 | 4,141,749 | ||||||
| 3,500,000 | 3.450%, 9/15/2021 | 3,440,990 | ||||||
| 2,550,000 | 3.500%, 1/31/2023 | 2,463,830 | ||||||
AT&T, Inc. | ||||||||
| 3,190,000 | 4.300%, 12/15/2042 | 3,032,771 | ||||||
British Sky Broadcasting Group plc | ||||||||
| 940,000 | 2.625%, 9/16/2019g | 940,349 | ||||||
| 2,510,000 | 3.750%, 9/16/2024g | 2,525,371 | ||||||
CBS Corporation | ||||||||
| 2,510,000 | 2.300%, 8/15/2019 | 2,480,016 | ||||||
CC Holdings GS V, LLC | ||||||||
| 1,280,000 | 3.849%, 4/15/2023 | 1,271,439 | ||||||
CenturyLink, Inc. | ||||||||
| 1,920,000 | 5.625%, 4/1/2020 | 1,992,000 | ||||||
| 2,700,000 | 5.800%, 3/15/2022 | 2,801,250 | ||||||
Clear Channel Worldwide Holdings, Inc. | ||||||||
| 1,930,000 | 6.500%, 11/15/2022 | 1,987,900 | ||||||
Columbus International, Inc. | ||||||||
| 1,910,000 | 7.375%, 3/30/2021g | 1,986,400 | ||||||
Comcast Corporation | ||||||||
| 2,700,000 | 6.400%, 5/15/2038 | 3,605,053 | ||||||
Cox Communications, Inc. | ||||||||
| 1,900,000 | 9.375%, 1/15/2019g | 2,391,192 | ||||||
| 1,920,000 | 3.250%, 12/15/2022g | 1,885,131 | ||||||
Crown Castle Towers, LLC | ||||||||
| 5,050,000 | 4.174%, 8/15/2017g | 5,284,527 | ||||||
DIRECTV Holdings, LLC | ||||||||
| 2,775,000 | 5.000%, 3/1/2021 | 3,026,135 | ||||||
| 3,310,000 | 3.800%, 3/15/2022 | 3,367,495 | ||||||
| 3,190,000 | 4.450%, 4/1/2024 | 3,337,710 | ||||||
Frontier Communications Corporation | ||||||||
| 1,880,000 | 6.875%, 1/15/2025h | 1,880,000 | ||||||
Hughes Satellite Systems Corporation | ||||||||
| 2,580,000 | 6.500%, 6/15/2019 | 2,767,050 | ||||||
Intelsat Jackson Holdings SA | ||||||||
| 1,260,000 | 7.500%, 4/1/2021 | 1,348,200 | ||||||
NBC Universal Enterprise, Inc. | ||||||||
| 1,920,000 | 1.974%, 4/15/2019g | 1,901,100 | ||||||
NBCUniversal Media, LLC | ||||||||
| 4,510,000 | 4.375%, 4/1/2021 | 4,960,084 | ||||||
News America, Inc. | ||||||||
| 1,900,000 | 7.625%, 11/30/2028 | 2,519,315 | ||||||
| 2,140,000 | 6.400%, 12/15/2035 | 2,793,042 | ||||||
Numericable-SFR | ||||||||
| 1,920,000 | 6.000%, 5/15/2022g | 1,930,560 | ||||||
Omnicom Group, Inc. | ||||||||
| 4,245,000 | 4.450%, 8/15/2020 | 4,566,007 | ||||||
| 940,000 | 3.650%, 11/1/2024 | 940,436 | ||||||
Qwest Corporation | ||||||||
| 3,200,000 | 6.500%, 6/1/2017 | 3,498,496 | ||||||
SES Global Americas Holdings GP | ||||||||
| 3,180,000 | 2.500%, 3/25/2019g | 3,164,021 | ||||||
Sprint Communications, Inc. | ||||||||
| 1,290,000 | 7.000%, 3/1/2020g | 1,393,200 | ||||||
Sprint Corporation | ||||||||
| 1,280,000 | 7.125%, 6/15/2024 | 1,190,400 | ||||||
Telefonica Emisiones SAU | ||||||||
| 4,470,000 | 5.462%, 2/16/2021 | 4,984,014 | ||||||
| 1,600,000 | 4.570%, 4/27/2023 | 1,713,032 | ||||||
Time Warner Cable, Inc. | ||||||||
| 2,500,000 | 8.250%, 4/1/2019 | 3,060,357 | ||||||
| 2,550,000 | 4.125%, 2/15/2021 | 2,728,985 | ||||||
Time Warner Entertainment Company, LP | ||||||||
| 3,000,000 | 8.375%, 3/15/2023 | 4,037,655 | ||||||
Time Warner, Inc. | ||||||||
| 3,190,000 | 2.100%, 6/1/2019 | 3,142,804 | ||||||
| 1,600,000 | 7.700%, 5/1/2032 | 2,260,542 | ||||||
| 1,910,000 | T-Mobile USA, Inc. | |||||||
6.633%, 4/28/2021 | 1,960,138 | |||||||
Univision Communications, Inc. | ||||||||
| 1,920,000 | 6.750%, 9/15/2022g | 2,054,400 | ||||||
UPCB Finance VI, Ltd. | ||||||||
| 2,600,000 | 6.875%, 1/15/2022g | 2,827,500 | ||||||
Verizon Communications, Inc. | ||||||||
| 3,777,000 | 2.625%, 2/21/2020g | 3,733,818 | ||||||
| 2,550,000 | 4.500%, 9/15/2020 | 2,768,680 | ||||||
| 3,830,000 | 3.450%, 3/15/2021 | 3,914,417 | ||||||
| 5,065,000 | 5.150%, 9/15/2023 | 5,592,940 | ||||||
| 5,030,000 | 3.500%, 11/1/2024 | 4,941,970 | ||||||
| 3,820,000 | 6.400%, 9/15/2033 | 4,705,411 | ||||||
| 1,910,000 | 5.050%, 3/15/2034 | 2,037,445 | ||||||
| 5,070,000 | 6.550%, 9/15/2043 | 6,495,425 | ||||||
|
| |||||||
Total | 156,294,661 | |||||||
|
| |||||||
The accompanying Notes to Financial Statements are an integral part of this schedule.
307
Table of Contents
INCOME PORTFOLIO
Schedule of Investments as of December 31, 2014
| Principal Amount | Long-Term Fixed Income (91.7%) | Value | ||||||
| Consumer Cyclical (6.8%) | |||||||
Alibaba Group Holding, Ltd. | ||||||||
| $ | 3,150,000 | 3.125%, 11/28/2021g | $ | 3,112,128 | ||||
| 2,520,000 | 3.600%, 11/28/2024g | 2,499,447 | ||||||
American Honda Finance Corporation | ||||||||
| 4,400,000 | 3.875%, 9/21/2020g | 4,679,915 | ||||||
Chrysler Group, LLC | ||||||||
| 1,900,000 | 8.000%, 6/15/2019 | 1,997,375 | ||||||
CVS Health Corporation | ||||||||
| 3,190,000 | 2.750%, 12/1/2022 | 3,107,003 | ||||||
| 1,890,000 | 3.375%, 8/12/2024 | 1,908,339 | ||||||
Daimler Finance North America, LLC | ||||||||
| 2,260,000 | 3.875%, 9/15/2021g | 2,408,120 | ||||||
Ford Motor Credit Company, LLC | ||||||||
| 2,560,000 | 1.482%, 5/9/2016e | 2,582,277 | ||||||
| 630,000 | 6.625%, 8/15/2017 | 702,297 | ||||||
| 3,830,000 | 2.375%, 3/12/2019 | 3,803,336 | ||||||
| 2,575,000 | 4.250%, 9/20/2022 | 2,732,242 | ||||||
| 2,510,000 | 3.664%, 9/8/2024 | 2,515,015 | ||||||
General Motors Company | ||||||||
| 3,170,000 | 3.500%, 10/2/2018 | 3,233,400 | ||||||
| 3,150,000 | 5.000%, 4/1/2035 | 3,282,584 | ||||||
General Motors Financial Company, Inc. | ||||||||
| 2,410,000 | 4.750%, 8/15/2017 | 2,541,586 | ||||||
| 1,275,000 | 3.500%, 7/10/2019 | 1,301,931 | ||||||
| 1,890,000 | 4.375%, 9/25/2021 | 1,972,688 | ||||||
Hilton Worldwide Finance, LLC | ||||||||
| 1,910,000 | 5.625%, 10/15/2021 | 1,995,950 | ||||||
Hyundai Capital America | ||||||||
| 2,065,000 | 2.875%, 8/9/2018g | 2,106,705 | ||||||
Hyundai Motor Manufacturing Czech SRO | ||||||||
| 2,525,000 | 4.500%, 4/15/2015g | 2,547,942 | ||||||
Jaguar Land Rover Automotive plc | ||||||||
| 1,910,000 | 4.125%, 12/15/2018g | 1,919,550 | ||||||
Johnson Controls, Inc. | ||||||||
| 3,150,000 | 5.250%, 12/1/2041 | 3,553,011 | ||||||
KIA Motors Corporation | ||||||||
| 3,260,000 | 3.625%, 6/14/2016g | 3,361,190 | ||||||
L Brands, Inc. | ||||||||
| 1,900,000 | 5.625%, 2/15/2022 | 2,042,500 | ||||||
Macy’s Retail Holdings, Inc. | ||||||||
| 3,570,000 | 3.875%, 1/15/2022 | 3,710,554 | ||||||
| 3,190,000 | 3.625%, 6/1/2024h | 3,227,543 | ||||||
| 3,150,000 | 4.500%, 12/15/2034 | 3,171,886 | ||||||
Marriott International, Inc. | ||||||||
| 3,250,000 | 3.000%, 3/1/2019 | 3,336,216 | ||||||
QVC, Inc. | ||||||||
| 2,235,000 | 4.375%, 3/15/2023 | 2,242,693 | ||||||
Starwood Hotels & Resorts Worldwide, Inc. | ||||||||
| 1,850,000 | 6.750%, 5/15/2018 | 2,105,781 | ||||||
| 3,210,000 | 3.125%, 2/15/2023 | 3,120,309 | ||||||
Toll Brothers Finance Corporation | ||||||||
| 2,000,000 | 6.750%, 11/1/2019 | 2,240,000 | ||||||
| 960,000 | 4.375%, 4/15/2023 | 940,800 | ||||||
Walgreens Boots Alliance, Inc. | ||||||||
| 3,780,000 | 3.300%, 11/18/2021 | 3,806,297 | ||||||
Wyndham Worldwide Corporation | ||||||||
| 640,000 | 2.500%, 3/1/2018 | 638,906 | ||||||
| 3,220,000 | 4.250%, 3/1/2022 | 3,288,821 | ||||||
|
| |||||||
Total | 93,736,337 | |||||||
|
| |||||||
| Consumer Non-Cyclical (7.9%) | |||||||
AbbVie, Inc. | ||||||||
| 3,190,000 | 2.900%, 11/6/2022 | 3,140,641 | ||||||
| 1,890,000 | 4.400%, 11/6/2042 | 1,949,854 | ||||||
Activis Funding SCS | ||||||||
| 2,555,000 | 3.850%, 6/15/2024 | 2,568,054 | ||||||
Altria Group, Inc. | ||||||||
| 3,175,000 | 4.000%, 1/31/2024 | 3,310,195 | ||||||
| 804,000 | 9.950%, 11/10/2038 | 1,375,365 | ||||||
Boston Scientific Corporation | ||||||||
| 3,190,000 | 6.000%, 1/15/2020 | 3,595,063 | ||||||
BRF SA | ||||||||
| 3,830,000 | 4.750%, 5/22/2024g | 3,719,888 | ||||||
Bunge Limited Finance Corporation | ||||||||
| 2,530,000 | 8.500%, 6/15/2019 | 3,100,616 | ||||||
Celgene Corporation | ||||||||
| 3,770,000 | 3.950%, 10/15/2020 | 3,988,087 | ||||||
ConAgra Foods, Inc. | ||||||||
| 1,895,000 | �� | 2.100%, 3/15/2018 | 1,888,855 | |||||
| 1,505,000 | 3.200%, 1/25/2023 | 1,474,172 | ||||||
CVS Health Corporation | ||||||||
| 1,910,000 | 6.125%, 9/15/2039 | 2,467,903 | ||||||
Edwards Lifesciences Corporation | ||||||||
| 2,375,000 | 2.875%, 10/15/2018 | 2,407,623 | ||||||
Express Scripts Holding Company | ||||||||
| 3,235,000 | 4.750%, 11/15/2021 | 3,569,994 | ||||||
| 1,910,000 | 3.500%, 6/15/2024 | 1,903,300 | ||||||
Forest Laboratories, Inc. | ||||||||
| 2,550,000 | 5.000%, 12/15/2021g | 2,761,206 | ||||||
Fresenius Medical Care US Finance, | ||||||||
Inc. | ||||||||
| 1,290,000 | 6.500%, 9/15/2018g | 1,425,450 | ||||||
HCA, Inc. | ||||||||
| 2,560,000 | 4.750%, 5/1/2023 | 2,604,800 | ||||||
Hospira, Inc. | ||||||||
| 2,540,000 | 5.200%, 8/12/2020 | 2,724,978 | ||||||
JBS USA, LLC | ||||||||
| 1,910,000 | 7.250%, 6/1/2021g | 1,967,300 | ||||||
Kindred Escrow Corporation II | ||||||||
| 1,260,000 | 8.750%, 1/15/2023g,h | 1,356,075 | ||||||
Kroger Company | ||||||||
| 2,520,000 | 2.950%, 11/1/2021 | 2,499,328 | ||||||
Lorillard Tobacco Company | ||||||||
| 3,170,000 | 8.125%, 6/23/2019 | 3,843,077 | ||||||
McKesson Corporation | ||||||||
| 2,550,000 | 4.883%, 3/15/2044 | 2,809,004 | ||||||
Medtronic, Inc. | ||||||||
| 1,575,000 | 2.500%, 3/15/2020g | 1,579,131 | ||||||
| 1,890,000 | 4.625%, 3/15/2045g | 2,048,741 | ||||||
Mondelez International, Inc. | ||||||||
| 5,090,000 | 4.000%, 2/1/2024 | 5,325,499 | ||||||
Pernod Ricard SA | ||||||||
| 5,130,000 | 5.750%, 4/7/2021g | 5,892,713 | ||||||
| 1,910,000 | 4.450%, 1/15/2022g | 2,044,995 | ||||||
Roche Holdings, Inc. | ||||||||
| 2,200,000 | 2.875%, 9/29/2021g | 2,227,487 | ||||||
The accompanying Notes to Financial Statements are an integral part of this schedule.
308
Table of Contents
INCOME PORTFOLIO
Schedule of Investments as of December 31, 2014
| Principal Amount | Long-Term Fixed Income (91.7%) | Value | ||||||
| Consumer Non-Cyclical (7.9%) - continued | |||||||
SABMiller Holdings, Inc. | ||||||||
| $ | 5,040,000 | 3.750%, 1/15/2022g | $ | 5,260,298 | ||||
Spectrum Brands Escrow Corporation | ||||||||
| 1,460,000 | 6.375%, 11/15/2020 | 1,522,050 | ||||||
Tenet Healthcare Corporation | ||||||||
| 1,910,000 | 8.125%, 4/1/2022 | 2,134,425 | ||||||
Thermo Fisher Scientific, Inc. | ||||||||
| 630,000 | 5.300%, 2/1/2044 | 723,552 | ||||||
Tyson Foods, Inc. | ||||||||
| 3,190,000 | 4.500%, 6/15/2022 | 3,453,768 | ||||||
| 910,000 | 3.950%, 8/15/2024 | 940,686 | ||||||
Valeant Pharmaceuticals International | ||||||||
| 2,560,000 | 6.375%, 10/15/2020g | 2,675,200 | ||||||
Watson Pharmaceuticals, Inc. | ||||||||
| 3,180,000 | 3.250%, 10/1/2022 | 3,096,112 | ||||||
Whirlpool Corporation | ||||||||
| 3,245,000 | 3.700%, 3/1/2023 | 3,295,453 | ||||||
| 2,490,000 | 3.700%, 5/1/2025 | 2,520,049 | ||||||
Zoetis, Inc. | ||||||||
| 3,190,000 | 3.250%, 2/1/2023 | 3,146,705 | ||||||
|
| |||||||
Total | 110,337,692 | |||||||
|
| |||||||
| Energy (8.2%) | |||||||
Anadarko Petroleum Corporation | ||||||||
| 2,550,000 | 3.450%, 7/15/2024 | 2,489,409 | ||||||
| 3,190,000 | 6.450%, 9/15/2036 | 3,833,404 | ||||||
Buckeye Partners, LP | ||||||||
| 1,910,000 | 4.150%, 7/1/2023 | 1,861,444 | ||||||
| 3,180,000 | 5.850%, 11/15/2043 | 3,181,679 | ||||||
Calumet Specialty Products Partners, LP | ||||||||
| 1,910,000 | 6.500%, 4/15/2021g | 1,699,900 | ||||||
Canadian Oil Sands, Ltd. | ||||||||
| 2,600,000 | 4.500%, 4/1/2022g,h | 2,420,714 | ||||||
Chaparral Energy, Inc. | ||||||||
| 1,920,000 | 7.625%, 11/15/2022 | 1,257,600 | ||||||
Concho Resources, Inc. | ||||||||
| 1,930,000 | 6.500%, 1/15/2022 | 2,016,850 | ||||||
Continental Resources, Inc. | ||||||||
| 3,830,000 | 3.800%, 6/1/2024h | 3,426,107 | ||||||
El Paso Pipeline Partners Operating Company, LLC | ||||||||
| 3,850,000 | 5.000%, 10/1/2021 | 4,049,161 | ||||||
| 3,800,000 | 4.300%, 5/1/2024 | 3,807,357 | ||||||
Energy Transfer Partners, LP | ||||||||
| 2,980,000 | 6.700%, 7/1/2018 | 3,350,941 | ||||||
Ensco plc | ||||||||
| 2,200,000 | 4.500%, 10/1/2024h | 2,138,349 | ||||||
EQT Midstream Partners, LP | ||||||||
| 3,030,000 | 4.000%, 8/1/2024 | 3,000,503 | ||||||
Halliburton Company | ||||||||
| 3,150,000 | 3.500%, 8/1/2023 | 3,178,649 | ||||||
Hess Corporation | ||||||||
| 2,520,000 | 5.600%, 2/15/2041 | 2,702,262 | ||||||
Kinder Morgan Energy Partners, LP | ||||||||
| 1,600,000 | 3.450%, 2/15/2023 | 1,531,614 | ||||||
Kinder Morgan, Inc. | ||||||||
| 1,260,000 | 3.050%, 12/1/2019 | 1,249,983 | ||||||
| 2,520,000 | 4.300%, 6/1/2025 | 2,521,174 | ||||||
Linn Energy, LLC | ||||||||
| 1,970,000 | 7.750%, 2/1/2021 | 1,659,725 | ||||||
Marathon Oil Corporation | ||||||||
| 2,364,000 | 5.900%, 3/15/2018 | 2,627,574 | ||||||
| 1,920,000 | 2.800%, 11/1/2022 | 1,798,076 | ||||||
Marathon Petroleum Corporation | ||||||||
| 940,000 | 3.625%, 9/15/2024 | 921,203 | ||||||
| 1,920,000 | 6.500%, 3/1/2041 | 2,285,151 | ||||||
Nexen, Inc. | ||||||||
| 1,920,000 | 6.400%, 5/15/2037 | 2,391,452 | ||||||
Noble Holding lnternational, Ltd. | ||||||||
| 2,560,000 | 3.950%, 3/15/2022h | 2,242,701 | ||||||
Offshore Group Investment, Ltd. | ||||||||
| 1,600,000 | 7.500%, 11/1/2019h | 1,192,000 | ||||||
Petroleos Mexicanos | ||||||||
| 1,890,000 | 4.250%, 1/15/2025g | 1,877,715 | ||||||
Pioneer Natural Resources Company | ||||||||
| 3,150,000 | 3.950%, 7/15/2022 | 3,117,864 | ||||||
Plains All American Pipeline, LP | ||||||||
| 3,140,000 | 3.600%, 11/1/2024 | 3,082,588 | ||||||
Regency Energy Partners, LP | ||||||||
| 640,000 | 5.000%, 10/1/2022 | 604,800 | ||||||
Rosetta Resources, Inc. | ||||||||
| 1,920,000 | 5.875%, 6/1/2022 | 1,728,000 | ||||||
Rowan Companies, Inc. | ||||||||
| 2,125,000 | 4.875%, 6/1/2022 | 2,067,797 | ||||||
Sabine Pass Liquefaction, LLC | ||||||||
| 1,910,000 | 5.750%, 5/15/2024 | 1,874,188 | ||||||
Spectra Energy Partners, LP | ||||||||
| 3,200,000 | 4.600%, 6/15/2021 | 3,463,757 | ||||||
Suncor Energy, Inc. | ||||||||
| 1,260,000 | 3.600%, 12/1/2024 | 1,245,074 | ||||||
| 1,940,000 | 6.850%, 6/1/2039 | 2,476,455 | ||||||
Sunoco Logistics Partners Operations, LP | ||||||||
| 3,200,000 | 3.450%, 1/15/2023 | 3,068,726 | ||||||
Tesoro Logistics, LP | ||||||||
| 1,880,000 | 5.500%, 10/15/2019g | 1,865,900 | ||||||
Transocean, Inc. | ||||||||
| 1,920,000 | 7.375%, 4/15/2018 | 1,893,147 | ||||||
| 1,280,000 | 6.375%, 12/15/2021 | 1,180,735 | ||||||
| 2,550,000 | 3.800%, 10/15/2022h | 2,066,329 | ||||||
Weatherford International, Ltd. | ||||||||
| 4,500,000 | 6.000%, 3/15/2018 | 4,803,795 | ||||||
Williams Companies, Inc. | ||||||||
| 2,560,000 | 3.700%, 1/15/2023 | 2,299,100 | ||||||
| 2,550,000 | 4.550%, 6/24/2024 | 2,371,452 | ||||||
Williams Partners, LP | ||||||||
| 2,550,000 | 4.000%, 11/15/2021 | 2,556,240 | ||||||
| 3,810,000 | 4.500%, 11/15/2023 | 3,844,801 | ||||||
| 1,600,000 | 3.900%, 1/15/2025 | 1,537,722 | ||||||
|
| |||||||
Total | 113,861,167 | |||||||
|
| |||||||
| Financials (29.6%) | |||||||
Abbey National Treasury Services plc | ||||||||
| 2,850,000 | 3.050%, 8/23/2018 | 2,950,659 | ||||||
Aegon NV | ||||||||
| 2,600,000 | 2.549%, 7/29/2049e,i | 2,145,000 | ||||||
Air Lease Corporation | ||||||||
| 1,260,000 | 2.125%, 1/15/2018 | 1,237,950 | ||||||
The accompanying Notes to Financial Statements are an integral part of this schedule.
309
Table of Contents
INCOME PORTFOLIO
Schedule of Investments as of December 31, 2014
| Principal Amount | Long-Term Fixed Income (91.7%) | Value | ||||||
| Financials (29.6%) - continued | |||||||
| $ | 1,260,000 | 4.250%, 9/15/2024 | $ | 1,269,450 | ||||
American International Group, Inc. | ||||||||
| 4,445,000 | 3.375%, 8/15/2020 | 4,617,470 | ||||||
| 3,625,000 | 4.125%, 2/15/2024 | 3,858,856 | ||||||
American Tower Trust I | ||||||||
| 3,200,000 | 1.551%, 3/15/2018* | 3,162,112 | ||||||
Ares Capital Corporation | ||||||||
| 3,190,000 | 4.875%, 11/30/2018 | 3,353,931 | ||||||
| 1,570,000 | 3.875%, 1/15/2020 | 1,565,493 | ||||||
Associated Banc-Corporation | ||||||||
| 3,150,000 | 4.250%, 1/15/2025 | 3,158,700 | ||||||
Associates Corporation of North America | ||||||||
| 3,800,000 | 6.950%, 11/1/2018 | 4,438,362 | ||||||
Assured Guaranty US Holdings, Inc. | ||||||||
| 3,200,000 | 5.000%, 7/1/2024h | 3,375,811 | ||||||
AXA SA | ||||||||
| 2,580,000 | 8.600%, 12/15/2030 | 3,505,005 | ||||||
Axis Specialty Finance, LLC | ||||||||
| 2,570,000 | 5.875%, 6/1/2020 | 2,911,245 | ||||||
Banco de Brasil SA | ||||||||
| 3,190,000 | 9.000%, 12/31/2049g,i | 2,966,700 | ||||||
Banco Santander Mexico, SA, Institucion de Banca Multiple, Grupo Financiero Santander Mexico | ||||||||
| 1,445,000 | 4.125%, 11/9/2022g | 1,430,839 | ||||||
Bank of America Corporation | ||||||||
| 3,840,000 | 1.317%, 3/22/2018e | 3,868,055 | ||||||
| 3,880,000 | 7.625%, 6/1/2019 | 4,689,415 | ||||||
| 1,900,000 | 4.100%, 7/24/2023 | 2,000,985 | ||||||
| 3,830,000 | 4.125%, 1/22/2024 | 4,022,094 | ||||||
| 2,830,000 | 4.200%, 8/26/2024 | 2,882,992 | ||||||
| 1,950,000 | 5.875%, 2/7/2042 | 2,440,156 | ||||||
| 1,260,000 | 6.500%, 10/23/2049i | 1,282,554 | ||||||
Barclays Bank plc | ||||||||
| 1,910,000 | 10.179%, 6/12/2021g | 2,564,345 | ||||||
Barclays plc | ||||||||
| 1,890,000 | 4.375%, 9/11/2024 | 1,821,395 | ||||||
BBVA Bancomer SA/Texas | ||||||||
| 3,535,000 | 6.750%, 9/30/2022g | 3,888,500 | ||||||
BPCE SA | ||||||||
| 2,535,000 | 5.700%, 10/22/2023g | 2,721,999 | ||||||
| 3,190,000 | 5.150%, 7/21/2024g | 3,287,202 | ||||||
Caixa Economica Federal | ||||||||
| 3,190,000 | 4.250%, 5/13/2019g | 3,110,250 | ||||||
Camden Property Trust | ||||||||
| 3,140,000 | 3.500%, 9/15/2024 | 3,118,478 | ||||||
Capital One Bank USA NA | ||||||||
| 5,425,000 | 2.250%, 2/13/2019 | 5,385,712 | ||||||
Capital One Financial Corporation | ||||||||
| 960,000 | 2.450%, 4/24/2019 | 957,801 | ||||||
Capital One NA | ||||||||
| 960,000 | 2.950%, 7/23/2021 | 953,993 | ||||||
CIT Group, Inc. | ||||||||
| 3,120,000 | 5.250%, 3/15/2018 | 3,252,600 | ||||||
| 930,000 | 3.875%, 2/19/2019 | 927,675 | ||||||
Citigroup, Inc. | ||||||||
| 4,475,000 | 3.500%, 5/15/2023 | 4,356,368 | ||||||
| 3,805,000 | 5.500%, 9/13/2025 | 4,210,252 | ||||||
| 1,930,000 | 5.950%, 12/29/2049i | 1,901,050 | ||||||
CNA Financial Corporation | ||||||||
| 3,775,000 | 7.350%, 11/15/2019 | 4,505,632 | ||||||
Comerica, Inc. | ||||||||
| 1,910,000 | 3.800%, 7/22/2026 | 1,923,521 | ||||||
Compass Bank | ||||||||
| 1,575,000 | 2.750%, 9/29/2019 | 1,576,610 | ||||||
Cooperatieve Centrale Raiffeisen- Boerenleenbank BA | ||||||||
| 1,910,000 | 5.750%, 12/1/2043 | 2,279,514 | ||||||
| 1,290,000 | 11.000%, 12/29/2049g,i | 1,660,230 | ||||||
Credit Suisse Group AG | ||||||||
| 1,890,000 | 6.500%, 8/8/2023g | 2,074,693 | ||||||
| 1,260,000 | 7.500%, 12/11/2049g,i | 1,310,400 | ||||||
Developers Diversified Realty Corporation | ||||||||
| 1,290,000 | 7.875%, 9/1/2020 | 1,590,921 | ||||||
Discover Bank of Greenwood Delaware | ||||||||
| 2,200,000 | 7.000%, 4/15/2020 | 2,592,795 | ||||||
| 3,505,000 | 4.200%, 8/8/2023 | 3,677,902 | ||||||
| 1,600,000 | 4.250%, 3/13/2026 | 1,658,558 | ||||||
Duke Realty, LP | ||||||||
| 3,220,000 | 3.875%, 10/15/2022 | 3,315,933 | ||||||
| 1,260,000 | 3.750%, 12/1/2024 | 1,274,879 | ||||||
Fairfax Financial Holdings, Ltd. | ||||||||
| 1,915,000 | 5.800%, 5/15/2021g,h | 2,054,075 | ||||||
Fifth Third Bancorp | ||||||||
| 3,825,000 | 4.300%, 1/16/2024 | 4,009,193 | ||||||
GE Capital Trust I | ||||||||
| 4,500,000 | 6.375%, 11/15/2067 | 4,846,738 | ||||||
General Electric Capital Corporation | ||||||||
| 3,225,000 | 3.800%, 6/18/2019g | 3,426,217 | ||||||
| 3,200,000 | 1.241%, 3/15/2023e | 3,245,046 | ||||||
| 1,550,000 | 6.750%, 3/15/2032 | 2,117,117 | ||||||
| 3,200,000 | 7.125%, 12/15/2049i | 3,724,000 | ||||||
Glitnir Banki HF | ||||||||
| 50,000 | Zero Coupon, 1/21/2011* | 14,750 | ||||||
Goldman Sachs Group, Inc. | ||||||||
| 3,250,000 | 6.250%, 9/1/2017 | 3,616,112 | ||||||
| 1,170,000 | 2.900%, 7/19/2018 | 1,200,280 | ||||||
| 2,900,000 | 5.375%, 3/15/2020 | 3,250,021 | ||||||
| 3,275,000 | 5.250%, 7/27/2021 | 3,696,368 | ||||||
| 3,190,000 | 4.000%, 3/3/2024 | 3,311,695 | ||||||
| 4,450,000 | 3.850%, 7/8/2024 | 4,563,911 | ||||||
| 1,260,000 | 6.750%, 10/1/2037 | 1,584,292 | ||||||
Hartford Financial Services Group, Inc. | ||||||||
| 4,480,000 | 5.125%, 4/15/2022 | 5,035,914 | ||||||
HCP, Inc. | ||||||||
| 2,250,000 | 2.625%, 2/1/2020 | 2,226,629 | ||||||
| 2,555,000 | 4.200%, 3/1/2024 | 2,660,223 | ||||||
Health Care REIT, Inc. | ||||||||
| 1,280,000 | 6.125%, 4/15/2020 | 1,471,400 | ||||||
| 3,150,000 | 4.950%, 1/15/2021 | 3,463,671 | ||||||
HSBC Finance Corporation | ||||||||
| 3,210,000 | 6.676%, 1/15/2021 | 3,808,524 | ||||||
HSBC Holdings plc | ||||||||
| 3,200,000 | 4.875%, 1/14/2022 | 3,566,877 | ||||||
| 1,880,000 | 6.375%, 12/29/2049i | 1,898,800 | ||||||
HSBC USA, Inc. | ||||||||
| 1,900,000 | 5.000%, 9/27/2020 | 2,082,172 | ||||||
The accompanying Notes to Financial Statements are an integral part of this schedule.
310
Table of Contents
INCOME PORTFOLIO
Schedule of Investments as of December 31, 2014
| Principal Amount | Long-Term Fixed Income (91.7%) | Value | ||||||
| Financials (29.6%) - continued | |||||||
Huntington Bancshares, Inc. | ||||||||
| $ | 2,850,000 | 7.000%, 12/15/2020 | $ | 3,430,060 | ||||
Icahn Enterprises, LP | ||||||||
| 2,540,000 | 6.000%, 8/1/2020 | 2,616,708 | ||||||
ILFC E-Capital Trust II | ||||||||
| 2,230,000 | 6.250%, 12/21/2065e,g | 2,151,950 | ||||||
ING Bank NV | ||||||||
| 3,165,000 | 5.800%, 9/25/2023g | 3,510,868 | ||||||
International Lease Finance Corporation | ||||||||
| 1,950,000 | 4.875%, 4/1/2015 | 1,964,138 | ||||||
| 1,600,000 | 5.750%, 5/15/2016 | 1,660,000 | ||||||
Intesa Sanpaolo SPA | ||||||||
| 2,550,000 | 5.017%, 6/26/2024g | 2,474,813 | ||||||
J.P. Morgan Chase & Company | ||||||||
| 3,200,000 | 3.375%, 5/1/2023 | 3,165,805 | ||||||
| 2,830,000 | 3.875%, 9/10/2024 | 2,832,408 | ||||||
| 3,150,000 | 5.500%, 10/15/2040 | 3,770,906 | ||||||
| 2,550,000 | 6.750%, 8/29/2049i | 2,690,250 | ||||||
| 2,560,000 | 6.000%, 12/29/2049i | 2,528,000 | ||||||
J.P. Morgan Chase Bank NA | ||||||||
| 2,580,000 | 6.000%, 10/1/2017 | 2,863,501 | ||||||
Kilroy Realty, LP | ||||||||
| 3,190,000 | 4.250%, 8/15/2029 | 3,190,262 | ||||||
Liberty Mutual Group, Inc. | ||||||||
| 3,535,000 | 4.950%, 5/1/2022g | 3,824,407 | ||||||
| 3,190,000 | 4.850%, 8/1/2044g | 3,242,552 | ||||||
Liberty Property, LP | ||||||||
| 1,875,000 | 4.750%, 10/1/2020 | 2,020,601 | ||||||
Lincoln National Corporation | ||||||||
| 4,150,000 | 4.000%, 9/1/2023 | 4,305,538 | ||||||
Lloyds Banking Group plc | ||||||||
| 940,000 | 4.500%, 11/4/2024 | 948,591 | ||||||
| 2,550,000 | 5.920%, 9/29/2049g,i | 2,530,875 | ||||||
Macquarie Bank, Ltd. | ||||||||
| 3,215,000 | 1.650%, 3/24/2017g | 3,226,089 | ||||||
Merrill Lynch & Company, Inc. | ||||||||
| 3,050,000 | 6.875%, 4/25/2018 | 3,503,169 | ||||||
| 3,000,000 | 7.750%, 5/14/2038 | 4,236,912 | ||||||
MetLife Capital Trust IV | ||||||||
| 700,000 | 7.875%, 12/15/2037g | 894,250 | ||||||
MetLife Capital Trust X | ||||||||
| 2,250,000 | 9.250%, 4/8/2038g | 3,217,500 | ||||||
MetLife, Inc. | ||||||||
| 2,250,000 | 3.600%, 4/10/2024 | 2,309,045 | ||||||
Mizuho Bank, Ltd. | ||||||||
| 4,400,000 | 3.600%, 9/25/2024g | 4,470,752 | ||||||
Morgan Stanley | ||||||||
| 3,730,000 | 6.625%, 4/1/2018 | 4,248,601 | ||||||
| 3,195,000 | 2.125%, 4/25/2018 | 3,196,850 | ||||||
| 3,180,000 | 5.625%, 9/23/2019 | 3,589,565 | ||||||
| 3,400,000 | 5.500%, 1/26/2020 | 3,825,439 | ||||||
| 3,205,000 | 4.875%, 11/1/2022 | 3,403,960 | ||||||
| 1,260,000 | 3.700%, 10/23/2024 | 1,277,161 | ||||||
| 2,550,000 | 5.000%, 11/24/2025 | 2,721,143 | ||||||
| 2,510,000 | 4.350%, 9/8/2026 | 2,524,997 | ||||||
National Retail Properties, Inc. | ||||||||
| 3,200,000 | 3.900%, 6/15/2024 | 3,263,581 | ||||||
Navient Corporation | ||||||||
| 2,520,000 | 5.000%, 10/26/2020 | 2,472,750 | ||||||
Nomura Holdings, Inc. | ||||||||
| 3,190,000 | 2.750%, 3/19/2019 | 3,224,940 | ||||||
Nordea Bank AB | ||||||||
| 3,170,000 | 4.875%, 5/13/2021g | 3,434,277 | ||||||
| 1,890,000 | 5.500%, 9/29/2049g,h,i | 1,864,013 | ||||||
Omega Healthcare Investors, Inc. | ||||||||
| 2,960,000 | 5.875%, 3/15/2024 | 3,145,000 | ||||||
ORIX Corporation | ||||||||
| 4,450,000 | 5.000%, 1/12/2016 | 4,600,806 | ||||||
Preferred Term Securities XXIII, Ltd. | ||||||||
| 3,604,473 | 0.441%, 12/22/2036*,e | 2,739,400 | ||||||
ProLogis, LP | ||||||||
| 3,200,000 | 6.875%, 3/15/2020 | 3,758,736 | ||||||
Prudential Financial, Inc. | ||||||||
| 1,915,000 | 3.500%, 5/15/2024 | 1,946,517 | ||||||
| 1,425,000 | 6.200%, 11/15/2040 | 1,814,639 | ||||||
| 1,930,000 | 5.875%, 9/15/2042 | 2,036,150 | ||||||
RBS Capital Trust III | ||||||||
| 2,240,000 | 2.095%, 9/29/2049e,h,i | 2,227,680 | ||||||
Realty Income Corporation | ||||||||
| 3,830,000 | 3.875%, 7/15/2024 | 3,897,718 | ||||||
Regions Bank | ||||||||
| 1,910,000 | 7.500%, 5/15/2018 | 2,217,309 | ||||||
Reinsurance Group of America, Inc. | ||||||||
| 1,930,000 | 6.450%, 11/15/2019 | 2,234,620 | ||||||
| 3,815,000 | 4.700%, 9/15/2023 | 4,099,435 | ||||||
Royal Bank Of Scotland plc | ||||||||
| 2,520,000 | 6.000%, 12/19/2023 | 2,727,643 | ||||||
Santander UK plc | ||||||||
| 960,000 | 5.000%, 11/7/2023g | 1,013,948 | ||||||
Simon Property Group, LP | ||||||||
| 1,250,000 | 10.350%, 4/1/2019 | 1,634,985 | ||||||
| 2,775,000 | 2.750%, 2/1/2023 | 2,717,011 | ||||||
SLM Corporation | ||||||||
| 4,515,000 | 6.000%, 1/25/2017 | 4,729,462 | ||||||
| 1,024,000 | 4.625%, 9/25/2017 | 1,039,360 | ||||||
Societe Generale SA | ||||||||
| 1,920,000 | 7.875%, 12/31/2049g,i | 1,860,000 | ||||||
Sumitomo Mitsui Financial Group, Inc. | ||||||||
| 3,510,000 | 4.436%, 4/2/2024g | 3,634,226 | ||||||
Swiss RE Capital 1, LP | ||||||||
| 4,200,000 | 6.854%, 5/29/2049g,i | 4,399,500 | ||||||
Synchrony Financial | ||||||||
| 1,600,000 | 3.750%, 8/15/2021 | 1,634,382 | ||||||
| 1,260,000 | 4.250%, 8/15/2024 | 1,292,923 | ||||||
UnionBanCal Corporation | ||||||||
| 2,580,000 | 3.500%, 6/18/2022 | 2,657,021 | ||||||
Voya Financial, Inc. | ||||||||
| 1,760,000 | 2.900%, 2/15/2018 | 1,801,805 | ||||||
| 3,215,000 | 5.500%, 7/15/2022 | 3,631,715 | ||||||
Wachovia Capital Trust III | ||||||||
| 120,000 | 5.570%, 3/15/2042e,i | 115,860 | ||||||
WEA Finance, LLC | ||||||||
| 3,770,000 | 2.700%, 9/17/2019g | 3,768,903 | ||||||
Wells Fargo & Company | ||||||||
| 3,035,000 | 3.450%, 2/13/2023 | 3,075,954 | ||||||
| 1,910,000 | 4.100%, 6/3/2026 | 1,952,129 | ||||||
| 3,220,000 | 7.980%, 2/28/2049i | 3,554,075 | ||||||
The accompanying Notes to Financial Statements are an integral part of this schedule.
311
Table of Contents
INCOME PORTFOLIO
Schedule of Investments as of December 31, 2014
| Principal Amount | Long-Term Fixed Income (91.7%) | Value | ||||||
| Financials (29.6%) - continued | |||||||
XLIT, Ltd. | ||||||||
| $ | 3,190,000 | 5.250%, 12/15/2043 | $ | 3,605,456 | ||||
|
| |||||||
Total | 412,098,662 | |||||||
|
| |||||||
| Foreign Government (1.2%) | |||||||
Brazil Government International Bond | ||||||||
| 1,270,000 | 5.000%, 1/27/2045 | 1,244,600 | ||||||
Colombia Government International Bond | ||||||||
| 3,200,000 | 5.625%, 2/26/2044 | 3,600,000 | ||||||
Corporacion Andina de Fomento | ||||||||
| 1,968,000 | 4.375%, 6/15/2022 | 2,115,318 | ||||||
Export-lmport Bank of Korea | ||||||||
| 2,580,000 | 4.375%, 9/15/2021 | 2,827,319 | ||||||
Mexico Government International Bond | ||||||||
| 3,150,000 | 5.125%, 1/15/2020 | 3,472,875 | ||||||
| 3,480,000 | 4.000%, 10/2/2023 | 3,610,500 | ||||||
|
| |||||||
Total | 16,870,612 | |||||||
|
| |||||||
| Mortgage-Backed Securities (3.8%) | |||||||
Federal Home Loan Mortgage Corporation Gold 15-Yr. Pass Through | ||||||||
| 2,412,500 | 3.000%, 1/1/2030c | 2,503,968 | ||||||
Federal Home Loan Mortgage Corporation Gold 30-Yr. Pass Through | ||||||||
| 2,412,500 | 4.000%, 1/1/2045c | 2,571,574 | ||||||
Federal National Mortgage Association Conventional 15-Yr. Pass Through | ||||||||
| 5,700,000 | 3.500%, 1/1/2030c | 6,021,515 | ||||||
Federal National Mortgage Association Conventional 30-Yr. Pass Through | ||||||||
| 15,000,000 | 3.500%, 1/1/2045c | 15,636,330 | ||||||
| 11,937,500 | 4.000%, 1/1/2045c | 12,740,344 | ||||||
| 12,750,000 | 4.500%, 1/1/2045c | 13,839,727 | ||||||
|
| |||||||
Total | 53,313,458 | |||||||
|
| |||||||
| Technology (1.3%) | |||||||
Amkor Technology, Inc. | ||||||||
| 1,910,000 | 6.375%, 10/1/2022 | 1,843,150 | ||||||
Equinix, Inc. | ||||||||
| 1,890,000 | 5.375%, 1/1/2022 | 1,907,766 | ||||||
Fidelity National Information Services, Inc. | ||||||||
| 3,190,000 | 3.875%, 6/5/2024 | 3,222,225 | ||||||
Freescale Semiconductor, Inc. | ||||||||
| 1,910,000 | 5.000%, 5/15/2021g | 1,910,000 | ||||||
Hewlett-Packard Company | ||||||||
| 1,890,000 | 2.750%, 1/14/2019 | 1,892,415 | ||||||
Motorola Solutions, Inc. | ||||||||
| 4,500,000 | 3.750%, 5/15/2022 | 4,565,313 | ||||||
Sensata Technologies BV | ||||||||
| 1,890,000 | 4.875%, 10/15/2023g | 1,880,550 | ||||||
Xerox Corporation | ||||||||
| 1,250,000 | 6.400%, 3/15/2016 | 1,326,078 | ||||||
|
| |||||||
Total | 18,547,497 | |||||||
|
| |||||||
| Transportation (3.1%) | |||||||
American Airlines Pass Through Trust | ||||||||
| 2,392,631 | 5.600%, 7/15/2020g | 2,440,484 | ||||||
| 2,428,732 | 4.000%, 7/15/2025 | 2,477,307 | ||||||
Avis Budget Car Rental, LLC | ||||||||
| 1,920,000 | 5.500%, 4/1/2023h | 1,958,400 | ||||||
British Airways plc | ||||||||
| 4,378,212 | 4.625%, 6/20/2024g | 4,629,959 | ||||||
Canadian Pacific Railway Company | ||||||||
| 2,560,000 | 7.125%, 10/15/2031 | 3,520,794 | ||||||
Continental Airlines, Inc. | ||||||||
| 871,483 | 7.250%, 11/10/2019 | 1,002,746 | ||||||
| 1,339,649 | 4.000%, 10/29/2024 | 1,361,485 | ||||||
CSX Corporation | ||||||||
| 2,225,000 | 3.700%, 11/1/2023 | 2,332,672 | ||||||
| 1,807,000 | 6.220%, 4/30/2040 | 2,353,764 | ||||||
Delta Air Lines, Inc. | ||||||||
| 1,763,504 | 4.950%, 5/23/2019 | 1,886,949 | ||||||
| 1,111,312 | 4.750%, 5/7/2020 | 1,182,214 | ||||||
ERAC USA Finance, LLC | ||||||||
| 3,450,000 | 5.250%, 10/1/2020g | 3,884,155 | ||||||
| 1,915,000 | 4.500%, 8/16/2021g | 2,047,635 | ||||||
Navios South American Logistics, Inc. | ||||||||
| 325,000 | 7.250%, 5/1/2022g | 321,750 | ||||||
Penske Truck Leasing Company, LP | ||||||||
| 1,945,000 | 2.500%, 3/15/2016g | 1,971,767 | ||||||
United Airlines Pass Through Trust | ||||||||
| 1,590,000 | 3.750%, 9/3/2026 | 1,603,992 | ||||||
United Airlines, Inc. | ||||||||
| 2,240,000 | 4.000%, 4/11/2026 | 2,296,000 | ||||||
US Airways Pass Through Trust | ||||||||
| 3,106,817 | 3.950%, 11/15/2025 | 3,172,992 | ||||||
Virgin Australia Holdings, Ltd. | ||||||||
| 2,559,740 | 5.000%, 10/23/2023g | 2,623,733 | ||||||
|
| |||||||
Total | 43,068,798 | |||||||
|
| |||||||
| U.S. Government and Agencies (2.7%) | |||||||
U.S. Treasury Bonds | ||||||||
| 1,500,000 | 4.375%, 5/15/2041 | 1,989,609 | ||||||
| 3,427,000 | 3.125%, 2/15/2042 | 3,689,111 | ||||||
| 3,214,000 | 3.750%, 11/15/2043 | 3,863,578 | ||||||
U.S. Treasury Bonds, TIPS | ||||||||
| 5,841,368 | 0.625%, 1/15/2024 | 5,866,469 | ||||||
U.S. Treasury Notes | ||||||||
| 1,410,000 | 2.875%, 3/31/2018 | 1,483,364 | ||||||
| 4,542,000 | 1.000%, 5/31/2018 | 4,497,997 | ||||||
| 10,023,000 | 1.000%, 6/30/2019 | 9,781,035 | ||||||
| 3,300,000 | 1.750%, 5/15/2023 | 3,213,117 | ||||||
U.S. Treasury Notes, TIPS | ||||||||
| 3,360,825 | 0.625%, 7/15/2021 | 3,403,097 | ||||||
|
| |||||||
Total | 37,787,377 | |||||||
|
| |||||||
The accompanying Notes to Financial Statements are an integral part of this schedule.
312
Table of Contents
INCOME PORTFOLIO
Schedule of Investments as of December 31, 2014
| Principal Amount | Long-Term Fixed Income (91.7%) | Value | ||||||
| U.S. Municipals (0.2%) | |||||||
Denver, CO City & County Airport Rev. | ||||||||
| $ | 2,550,000 | 5.250%, 11/15/2022, Ser. A, AMT | $ | 3,005,201 | ||||
|
| |||||||
Total | 3,005,201 | |||||||
|
| |||||||
| Utilities (6.3%) | |||||||
Access Midstream Partners, LP | ||||||||
| 1,570,000 | 4.875%, 5/15/2023 | 1,593,550 | ||||||
American Electric Power Company, Inc. | ||||||||
| 2,565,000 | 2.950%, 12/15/2022 | 2,516,098 | ||||||
Arizona Public Service Company | ||||||||
| 2,880,000 | 8.750%, 3/1/2019 | 3,622,507 | ||||||
Atlas Pipeline Partners, LP | ||||||||
| 1,280,000 | 4.750%, 11/15/2021 | 1,216,000 | ||||||
Calpine Corporation | ||||||||
| 1,920,000 | 5.375%, 1/15/2023 | 1,939,200 | ||||||
Cleveland Electric Illuminating Company | ||||||||
| 923,000 | 5.700%, 4/1/2017 | 995,421 | ||||||
Commonwealth Edison Company | ||||||||
| 1,500,000 | 6.150%, 9/15/2017 | 1,682,718 | ||||||
DCP Midstream Operating, LP | ||||||||
| 2,560,000 | 3.875%, 3/15/2023 | 2,449,756 | ||||||
| 2,550,000 | 5.600%, 4/1/2044 | 2,607,051 | ||||||
DCP Midstream, LLC | ||||||||
| 1,750,000 | 5.850%, 5/21/2043g | 1,697,500 | ||||||
DPL, Inc. | ||||||||
| 565,000 | 6.500%, 10/15/2016 | 596,075 | ||||||
Dynegy Finance 1, Inc. | ||||||||
| 470,000 | 7.375%, 11/1/2022g | 478,225 | ||||||
EDP Finance BV | ||||||||
| 2,830,000 | 4.125%, 1/15/2020g | 2,845,848 | ||||||
El Paso Pipeline Partners Operating Company, LLC | ||||||||
| 1,280,000 | 4.700%, 11/1/2042 | 1,155,825 | ||||||
Electricite de France SA | ||||||||
| 3,200,000 | 5.250%, 12/29/2049g,i | 3,280,000 | ||||||
Energy Transfer Partners, LP | ||||||||
| 3,380,000 | 4.650%, 6/1/2021 | 3,533,239 | ||||||
Enterprise Products Operating, LLC | ||||||||
| 1,930,000 | 6.650%, 4/15/2018 | 2,204,726 | ||||||
| 1,690,000 | 7.034%, 1/15/2068 | 1,853,719 | ||||||
Exelon Generation Company, LLC | ||||||||
| 1,050,000 | 5.200%, 10/1/2019 | 1,160,271 | ||||||
| 2,500,000 | 4.000%, 10/1/2020 | 2,608,518 | ||||||
FirstEnergy Transmission, LLC | ||||||||
| 3,830,000 | 4.350%, 1/15/2025g | 3,928,971 | ||||||
Great River Energy | ||||||||
| 19,870 | 5.829%, 7/1/2017* | 21,136 | ||||||
ITC Holdings Corporation | ||||||||
| 5,080,000 | 4.050%, 7/1/2023 | 5,293,502 | ||||||
Kinder Morgan Energy Partners, LP | ||||||||
| 2,550,000 | 5.800%, 3/1/2021 | 2,823,814 | ||||||
| 1,935,000 | 5.000%, 8/15/2042 | 1,838,962 | ||||||
MidAmerican Energy Holdings Company | ||||||||
| 4,450,000 | 3.750%, 11/15/2023 | 4,639,508 | ||||||
Nevada Power Company | ||||||||
| 2,800,000 | 6.750%, 7/1/2037 | 3,963,493 | ||||||
NiSource Finance Corporation | ||||||||
| 2,800,000 | 6.400%, 3/15/2018 | 3,188,998 | ||||||
| 3,200,000 | 5.450%, 9/15/2020 | 3,600,998 | ||||||
Ohio Power Company | ||||||||
| 2,400,000 | 6.050%, 5/1/2018 | 2,711,986 | ||||||
ONEOK Partners, LP | ||||||||
| 635,000 | 3.200%, 9/15/2018 | 643,590 | ||||||
Pennsylvania Electric Company | ||||||||
| 3,700,000 | 5.200%, 4/1/2020 | 4,079,257 | ||||||
PPL Capital Funding, Inc. | ||||||||
| 3,205,000 | 3.500%, 12/1/2022 | 3,246,111 | ||||||
| 3,190,000 | 3.950%, 3/15/2024 | 3,321,278 | ||||||
PSEG Power, LLC | ||||||||
| 1,300,000 | 5.320%, 9/15/2016 | 1,388,890 | ||||||
Southern California Edison Company | ||||||||
| 2,585,000 | 6.250%, 8/1/2049i | 2,866,119 | ||||||
|
| |||||||
Total | 87,592,860 | |||||||
|
| |||||||
Total Long-Term Fixed Income (cost $1,232,054,702) | 1,275,592,247 | |||||||
|
| |||||||
| Shares | Preferred Stock (2.0%) | |||||||
| Financials (1.9%) | |||||||
| 79,875 | Allstate Corporation, 5.100% | 2,023,234 | ||||||
| 102,122 | Citigroup, Inc., 7.875% | 2,714,403 | ||||||
| 22,500 | Cobank ACB, 6.250%i | 2,267,579 | ||||||
| 31,925 | Countrywide Capital V, 7.000% | 822,069 | ||||||
| 128,000 | Discover Financial Services, 6.500%i | 3,243,520 | ||||||
| 78,590 | GMAC Capital Trust 1, 8.125% | 2,073,204 | ||||||
| 95,940 | Goldman Sachs Group, Inc., 5.500%i | 2,340,936 | ||||||
| 102,122 | HSBC USA, Inc., 6.500%i | 2,581,644 | ||||||
| 88,200 | Morgan Stanley, 7.125%i | 2,428,146 | ||||||
| 62,918 | RBS Capital Funding Trust V, 5.900%i | 1,528,907 | ||||||
| 63,611 | RBS Capital Funding Trust VII, 6.080%i | 1,551,472 | ||||||
| 101,500 | Wells Fargo & Company, 5.850%i | 2,603,475 | ||||||
|
| |||||||
Total | 26,178,589 | |||||||
|
| |||||||
| Materials (0.1%) | |||||||
| 76,576 | CHS, Inc., 7.100%i | 2,010,886 | ||||||
|
| |||||||
Total | 2,010,886 | |||||||
|
| |||||||
Total Preferred Stock (cost $27,768,928) | 28,189,475 | |||||||
|
| |||||||
Collateral Held for Securities Loaned (1.7%) | ||||||||
| 24,146,820 | Thrivent Cash Management Trust | 24,146,820 | ||||||
|
| |||||||
Total Collateral Held for Securities Loaned (cost $24,146,820) | 24,146,820 | |||||||
|
| |||||||
| Shares or Principal Amount | Short-Term Investments (5.1%)* | |||||||
Federal Home Loan Bank Discount Notes | ||||||||
| 600,000 | 0.090%, 4/24/2015k | 599,830 | ||||||
The accompanying Notes to Financial Statements are an integral part of this schedule.
313
Table of Contents
INCOME PORTFOLIO
Schedule of Investments as of December 31, 2014
| Shares or Principal Amount | Short-Term Investments (5.1%)j | Value | ||||||
Thrivent Cash Management Trust | ||||||||
| 70,366,639 | 0.060% | $ | 70,366,639 | |||||
|
| |||||||
| Total Short-Term Investments (at amortized cost) | 70,966,469 | |||||||
|
| |||||||
| Total Investments (cost $1,413,522,345) 104.6% | $ | 1,455,885,171 | ||||||
|
| |||||||
| Other Assets and Liabilities, Net (4.6%) | (63,622,575 | ) | ||||||
|
| |||||||
| Total Net Assets 100.0% | $ | 1,392,262,596 | ||||||
|
| |||||||
| a | The stated interest rate represents the weighted average of all contracts within the bank loan facility. |
| b | All or a portion of the loan is unfunded. |
| c | Denotes investments purchased on a when-issued or delayed delivery basis. |
| d | All or a portion of the security is insured or guaranteed. |
| e | Denotes variable rate securities. Variable rate securities are securities whose yields vary with a designated market index or market rate. The rate shown is as of December 31, 2014. |
| f | Denotes step coupon securities. Step coupon securities pay an initial coupon rate for the first period and then different coupon rates for following periods. The rate shown is as of December 31, 2014. |
| g | Denotes securities sold under Rule 144A of the Securities Act of 1933, which exempts them from registration. These securities have been deemed liquid and may be resold to other dealers in the program or to other qualified institutional buyers. As of December 31, 2014, the value of these investments was $236,666,430 or 17.0% of total net assets. |
| h | All or a portion of the security is on loan. |
| i | Denotes perpetual securities. Perpetual securities pay an indefinite stream of interest, but may be called by the issuer at an earlier date. |
| j | The interest rate shown reflects the yield, coupon rate or the discount rate at the date of purchase. |
| k | At December 31, 2014, $599,830 of investments were held on deposit with the counterparty and pledged as the initial margin deposit for open futures contracts. |
| * | Denotes restricted securities. Restricted securities are investment securities which have been deemed illiquid and cannot be offered for public sale without first being registered under the Securities Act of 1933. The following table indicates the acquisition date and cost of restricted securities Income Portfolio owned as of December 31, 2014. |
Security | Acquisition Date | Cost | ||||||
American Tower Trust 1, 3/15/2018 | 3/6/2013 | $ | 3,200,744 | |||||
Glitnir Banki HF, 1/21/2015 | 5/1/2008 | 50,000 | ||||||
Great River Energy, 7/1/2017 | 4/13/2009 | 19,870 | ||||||
Preferred Term Securities XXIII, Ltd., 12/22/2036 | 9/14/2006 | 3,604,473 | ||||||
Definitions:
AMT | - | Subject to Alternative Minimum Tax | ||
REIT | - | Real Estate Investment Trust is a company that buys, develops, manages and/or sells real estate assets. | ||
Rev. | - | Revenue | ||
Ser. | - | Series | ||
TIPS | - | Treasury Inflation Protected Security. |
Unrealized Appreciation (Depreciation)
Gross unrealized appreciation and depreciation ofinvestments, based on cost for federal income tax purposes, were as follows:
Gross unrealized appreciation | $ | 57,666,860 | ||
Gross unrealized depreciation | (15,483,778 | ) | ||
|
| |||
Net unrealized appreciation (depreciation) | $ | 42,183,082 | ||
Cost for federal income tax purposes | $ | 1,413,702,089 | ||
The accompanying Notes to Financial Statements are an integral part of this schedule.
314
Table of Contents
INCOME PORTFOLIO
Schedule of Investments as of December 31, 2014
Fair Valuation Measurements
The following table is a summary of the inputs used, as of December 31, 2014, in valuing Income Portfolio’s assets carried at fair value.
Investments in Securities | Total | Level 1 | Level 2 | Level 3 | ||||||||||||
Bank Loans | ||||||||||||||||
Basic Materials | 2,959,873 | — | 2,959,873 | — | ||||||||||||
Capital Goods | 3,024,661 | — | 3,024,661 | — | ||||||||||||
Communications Services | 20,112,526 | — | 20,112,526 | — | ||||||||||||
Consumer Cyclical | 5,291,372 | — | 5,291,372 | — | ||||||||||||
Consumer Non-Cyclical | 7,216,392 | — | 7,216,392 | — | ||||||||||||
Energy | 2,457,152 | — | 2,457,152 | — | ||||||||||||
Financials | 1,541,861 | — | 1,541,861 | — | ||||||||||||
Technology | 6,668,370 | — | 6,668,370 | — | ||||||||||||
Transportation | 3,894,591 | — | 3,894,591 | — | ||||||||||||
Utilities | 3,823,362 | — | 3,823,362 | — | ||||||||||||
Long-Term Fixed Income | ||||||||||||||||
Asset-Backed Securities | 11,325,039 | — | 11,325,039 | — | ||||||||||||
Basic Materials | 68,477,125 | — | 68,477,125 | — | ||||||||||||
Capital Goods | 26,995,344 | — | 26,995,344 | — | ||||||||||||
Collateralized Mortgage Obligations | 13,594,493 | — | 13,594,493 | — | ||||||||||||
Commercial Mortgage-Backed Securities | 8,685,924 | — | 8,685,924 | — | ||||||||||||
Communications Services | 156,294,661 | — | 156,294,661 | — | ||||||||||||
Consumer Cyclical | 93,736,337 | — | 93,736,337 | — | ||||||||||||
Consumer Non-Cyclical | 110,337,692 | — | 110,337,692 | — | ||||||||||||
Energy | 113,861,167 | — | 113,861,167 | — | ||||||||||||
Financials | 412,098,662 | — | 409,359,262 | 2,739,400 | ||||||||||||
Foreign Government | 16,870,612 | — | 16,870,612 | — | ||||||||||||
Mortgage-Backed Securities | 53,313,458 | — | 53,313,458 | — | ||||||||||||
Technology | 18,547,497 | — | 18,547,497 | — | ||||||||||||
Transportation | 43,068,798 | — | 43,068,798 | — | ||||||||||||
U.S. Government and Agencies | 37,787,377 | — | 37,787,377 | — | ||||||||||||
U.S. Municipals | 3,005,201 | — | 3,005,201 | — | ||||||||||||
Utilities | 87,592,860 | — | 87,592,860 | — | ||||||||||||
Preferred Stock | ||||||||||||||||
Financials | 26,178,589 | 23,911,010 | 2,267,579 | — | ||||||||||||
Materials | 2,010,886 | 2,010,886 | — | — | ||||||||||||
Collateral Held for Securities Loaned | 24,146,820 | 24,146,820 | — | — | ||||||||||||
Short-Term Investments | 70,966,469 | 70,366,639 | 599,830 | — | ||||||||||||
|
|
|
|
|
|
|
| |||||||||
Total | $ | 1,455,885,171 | $ | 120,435,355 | $ | 1,332,710,416 | $ | 2,739,400 | ||||||||
|
|
|
|
|
|
|
| |||||||||
Other Financial Instruments | Total | Level 1 | Level 2 | Level 3 | ||||||||||||
Asset Derivatives | ||||||||||||||||
Futures Contracts | 2,393,484 | 2,393,484 | — | — | ||||||||||||
|
|
|
|
|
|
|
| |||||||||
Total Asset Derivatives | $ | 2,393,484 | $ | 2,393,484 | $ | — | $ | — | ||||||||
|
|
|
|
|
|
|
| |||||||||
Liability Derivatives | ||||||||||||||||
Futures Contracts | 902,723 | 902,723 | — | — | ||||||||||||
|
|
|
|
|
|
|
| |||||||||
Total Liability Derivatives | $ | 902,723 | $ | 902,723 | $ | — | $ | — | ||||||||
|
|
|
|
|
|
|
| |||||||||
There were no significant transfers between Levels during the period ended December 31, 2014. Transfers between Levels are identified as of the end of the period.
Futures Contracts | Number of Contracts Long/(Short) | Expiration Date | Notional Principal Amount | Value | Unrealized Gain/(Loss) | |||||||||||||||
5-Yr. U.S. Treasury Bond Futures | (595 | ) | March 2015 | ($ | 70,691,623 | ) | ($ | 70,763,166 | ) | ($ | 71,543 | ) | ||||||||
10-Yr. U.S. Treasury Bond Futures | (1,000 | ) | March 2015 | (125,965,700 | ) | (126,796,880 | ) | (831,180 | ) | |||||||||||
30-Yr. U.S. Treasury Bond Futures | 600 | March 2015 | 84,344,016 | 86,737,500 | 2,393,484 | |||||||||||||||
Total Futures Contracts | $ | 1,490,761 | ||||||||||||||||||
The accompanying Notes to Financial Statements are an integral part of this schedule.
315
Table of Contents
INCOME PORTFOLIO
Schedule of Investments as of December 31, 2014
The following table summarizes the fair value and Statement of Assets and Liabilities location, as of December 31, 2014, for Income Portfolio’s investments in financial derivative instruments by primary risk exposure as discussed under item (2) Significant Accounting Policies of the Notes to Financial Statements.
Derivatives by risk category | Statement of Assets and Liabilities Location | Fair Value | ||||
| Asset Derivatives | ||||||
Interest Rate Contracts | ||||||
Futures* | Net Assets - Net unrealized appreciation/(depreciation) on Futures contracts | $ | 2,393,484 | |||
Total Interest Rate Contracts | 2,393,484 | |||||
|
| |||||
Total Asset Derivatives | $ | 2,393,484 | ||||
|
| |||||
| Liability Derivatives | ||||||
Interest Rate Contracts | ||||||
Futures* | Net Assets - Net unrealized appreciation/(depreciation) on Futures contracts | 902,723 | ||||
Total Interest Rate Contracts | 902,723 | |||||
|
| |||||
Total Liability Derivatives | $ | 902,723 | ||||
|
| |||||
| * | Includes cumulative appreciation/depreciation of futures contracts as reported in the Schedule of Investments. Only current day’s variation margin is reported within the Statement of Assets and Liabilities. |
The following table summarizes the net realized gains/(losses) and Statement of Operations location, for the period ended December 31, 2014, for Income Portfolio’s investments in financial derivative instruments by primary risk exposure.
Derivatives by risk category | Statement of Operations Location | Realized Gains/(Losses) recognized in Income | ||||
Interest Rate Contracts | ||||||
Futures | Net realized gains/(losses) on Futures contracts | 3,916,060 | ||||
Total Interest Rate Contracts | 3,916,060 | |||||
Credit Contracts | ||||||
Credit Default Swaps | Net realized gains/(losses) on Swap agreements | (260,727 | ) | |||
Total Credit Contracts | (260,727 | ) | ||||
|
| |||||
Total | $ | 3,655,333 | ||||
|
| |||||
The following table summarizes the change in net unrealized appreciation/(depreciation) and Statement of Operations location, for the period ended December 31, 2014, for Income Portfolio’s investments in financial derivative instruments by primary risk exposure.
Derivatives by risk category | Statement of Operations Location | Change in unrealized appreciation/(depreciation) recognized in Income | ||||
Interest Rate Contracts | ||||||
Futures | Change in net unrealized appreciation/(depreciation) on Futures contracts | (235,759 | ) | |||
Total Interest Rate Contracts | (235,759 | ) | ||||
|
| |||||
Total | ($ | 235,759 | ) | |||
|
| |||||
The following table presents Income Portfolio’s average volume of derivative activity during the period ended December 31, 2014.
Derivative Risk Category | Futures (Notional)* | Futures (Percentage of Average Net Assets) | Swaps (Notional)* | |||||||||
Interest Rate Contracts | $ | 318,072,344 | 22.2 | % | N/A | |||||||
Credit Contracts | N/A | N/A | $ | 503,345 | ||||||||
| * | Notional amount represents long or short, or both, derivative positions held by the Portfolio. |
The accompanying Notes to Financial Statements are an integral part of this schedule.
316
Table of Contents
INCOME PORTFOLIO
Schedule of Investments as of December 31, 2014
Investment in Affiliates
Affiliated issuers, as defined under the Investment Company Act of 1940, include those in which the Portfolio’s holdings of an issuer represent 5% or more of the outstanding voting securities of an issuer, or any affiliated mutual fund.
A summary of transactions for the fiscal year to date, in Income Portfolio, is as follows:
Portfolio | Value December 31, 2013 | Gross Purchases | Gross Sales | Shares Held at December 31, 2014 | Value December 31, 2014 | Income Earned January 1, 2014 - December 31, 2014 | ||||||||||||||||||
Cash Management Trust- Collateral Investment | $ | 21,063,391 | $ | 188,718,060 | $ | 185,634,631 | 24,146,820 | $ | 24,146,820 | $ | 40,051 | |||||||||||||
Cash Management Trust- ShortTerm Investment | 65,827,337 | 340,760,999 | 336,221,697 | 70,366,639 | 70,366,639 | 38,040 | ||||||||||||||||||
Total Value and Income Earned | 86,890,728 | 94,513,459 | 78,091 | |||||||||||||||||||||
The accompanying Notes to Financial Statements are an integral part of this schedule.
317
Table of Contents
Schedule of Investments as of December 31, 2014
| Principal Amount | Long-Term Fixed Income (101.3%) | Value | ||||||
| Asset-Backed Securities (2.1%) |
| ||||||
Conseco Financial Corporation | ||||||||
| $ | 8,839 | 6.330%, 11/1/2029 | $ | 9,100 | ||||
Countrywide Home Loans, Inc. | ||||||||
| 96,801 | 6.085%, 6/25/2021a,b | 96,402 | ||||||
Credit Based Asset Servicing and Securitization, LLC | ||||||||
| 348,339 | 3.666%, 12/25/2036b | 243,746 | ||||||
First Horizon ABS Trust | ||||||||
| 528,976 | 0.330%, 10/25/2034a,c | 466,927 | ||||||
GMAC Mortgage Corporation Loan Trust | ||||||||
| 752,311 | 0.350%, 8/25/2035a,c | 665,147 | ||||||
| 945,283 | 0.350%, 12/25/2036a,c | 825,257 | ||||||
IndyMac Seconds Asset-Backed Trust | ||||||||
| 367,301 | 0.510%, 10/25/2036a,c | 221,968 | ||||||
Wachovia Asset Securitization, Inc. | ||||||||
| 795,621 | 0.310%, 7/25/2037*,a,c | 697,765 | ||||||
|
| |||||||
Total | 3,226,312 | |||||||
|
| |||||||
| Basic Materials (1.5%) | |||||||
Albemarle Corporation | ||||||||
| 150,000 | 3.000%, 12/1/2019 | 150,023 | ||||||
Dow Chemical Company | ||||||||
| 27,000 | 7.375%, 11/1/2029 | 35,943 | ||||||
Eastman Chemical Company | ||||||||
| 250,000 | 2.700%, 1/15/2020 | 251,419 | ||||||
Freeport-McMoRan, Inc. | ||||||||
| 250,000 | 4.000%, 11/14/2021 | 247,701 | ||||||
Georgia-Pacific, LLC | ||||||||
| 360,000 | 2.539%, 11/15/2019d | 359,875 | ||||||
| 250,000 | 3.734%, 7/15/2023d | 255,689 | ||||||
Mosaic Company | ||||||||
| 400,000 | 4.250%, 11/15/2023 | 422,078 | ||||||
Packaging Corporation of America | ||||||||
| 200,000 | 4.500%, 11/1/2023 | 209,502 | ||||||
Xstrata Finance Canada, Ltd. | ||||||||
| 325,000 | 2.700%, 10/25/2017d | 328,805 | ||||||
|
| |||||||
Total | 2,261,035 | |||||||
|
| |||||||
| Capital Goods (0.8%) | |||||||
Precision Castparts Corporation | ||||||||
| 300,000 | 1.250%, 1/15/2018 | 296,400 | ||||||
Roper Industries, Inc. | ||||||||
| 300,000 | 1.850%, 11/15/2017 | 300,364 | ||||||
Textron, Inc. | �� | |||||||
| 250,000 | 3.875%, 3/1/2025 | 250,440 | ||||||
United Technologies Corporation | ||||||||
| 275,000 | 6.050%, 6/1/2036 | 362,869 | ||||||
|
| |||||||
Total | 1,210,073 | |||||||
|
| |||||||
| Commercial Mortgage-Backed Securities (0.7%) |
| ||||||
Commercial Mortgage Pass-Through Certificates | ||||||||
| 486,374 | 5.306%, 12/10/2046 | 515,229 | ||||||
Morgan Stanley Capital I | ||||||||
| 460,146 | 3.224%, 7/15/2049 | 474,728 | ||||||
|
| |||||||
Total | 989,957 | |||||||
|
| |||||||
| Communications Services (2.0%) | |||||||
America Movil SAB de CV | ||||||||
| $ | 300,000 | 1.241%, 9/12/2016c | 302,146 | |||||
AT&T, Inc. | ||||||||
| 300,000 | 1.400%, 12/1/2017 | 296,990 | ||||||
British Sky Broadcasting Group plc | ||||||||
| 200,000 | 3.125%, 11/26/2022d | 195,894 | ||||||
British Telecommunications plc | ||||||||
| 200,000 | 2.350%, 2/14/2019 | 199,713 | ||||||
CBS Corporation | ||||||||
| 250,000 | 2.300%, 8/15/2019 | 247,013 | ||||||
Cox Communications, Inc. | ||||||||
| 135,000 | 6.450%, 12/1/2036d | 160,959 | ||||||
Crown Castle Towers, LLC | ||||||||
| 500,000 | 4.174%, 8/15/2017d | 523,220 | ||||||
DIRECTV Holdings, LLC | ||||||||
| 250,000 | 1.750%, 1/15/2018 | 248,352 | ||||||
NBC Universal Enterprise, Inc. | ||||||||
| 250,000 | 1.662%, 4/15/2018d | 248,212 | ||||||
Verizon Communications, Inc. | ||||||||
| 250,000 | 3.000%, 11/1/2021 | 246,559 | ||||||
Viacom, Inc. | ||||||||
| 250,000 | 2.500%, 9/1/2018 | 252,210 | ||||||
|
| |||||||
Total | 2,921,268 | |||||||
|
| |||||||
| Consumer Cyclical (2.7%) | |||||||
California Institute of Technology | ||||||||
| 325,000 | 4.700%, 11/1/2111 | 349,499 | ||||||
Daimler Finance North America, LLC | ||||||||
| 27,000 | 8.500%, 1/18/2031 | 41,296 | ||||||
Dartmouth College | ||||||||
| 250,000 | 3.760%, 6/1/2043 | 255,029 | ||||||
Ford Motor Credit Company, LLC | ||||||||
| 350,000 | 3.000%, 6/12/2017 | 359,102 | ||||||
Home Depot, Inc. | ||||||||
| 320,000 | 2.250%, 9/10/2018 | 326,102 | ||||||
Macy’s Retail Holdings, Inc. | ||||||||
| 200,000 | 4.375%, 9/1/2023 | 214,847 | ||||||
Massachusetts Institute of Technology | ||||||||
| 500,000 | 4.678%, 7/1/2114 | 578,266 | ||||||
President and Fellows of Harvard College | ||||||||
| 500,000 | 3.619%, 10/1/2037 | 503,499 | ||||||
Starbucks Corporation | ||||||||
| 200,000 | 3.850%, 10/1/2023 | 213,210 | ||||||
The Board of Trustees of The Leland Stanford Junior University | ||||||||
| 550,000 | 3.563%, 6/1/2044 | 543,676 | ||||||
Wal-MartStores, Inc. | ||||||||
| 327,000 | 7.550%, 2/15/2030 | 481,575 | ||||||
Yale University | ||||||||
| 200,000 | 2.086%, 4/15/2019 | 200,976 | ||||||
|
| |||||||
Total | 4,067,077 | |||||||
|
| |||||||
| Consumer Non-Cyclical (2.7%) | |||||||
Altria Group, Inc. | ||||||||
| 240,000 | 4.000%, 1/31/2024 | 250,219 | ||||||
Bayer U.S. Finance, LLC | ||||||||
| 250,000 | 2.375%, 10/8/2019d | 250,992 | ||||||
The accompanying Notes to Financial Statements are an integral part of this schedule.
318
Table of Contents
BOND INDEX PORTFOLIO
Schedule of Investments as of December 31, 2014
| Principal Amount | Long-Term Fixed Income (101.3%) | Value | ||||||
| Consumer Non-Cyclical (2.7%) - continued |
| ||||||
Cargill, Inc. | ||||||||
| $ | 325,000 | 4.100%, 11/1/2042d | $ | 328,467 | ||||
Church & Dwight Company, Inc. | ||||||||
| 210,000 | 2.450%, 12/15/2019 | 209,889 | ||||||
ConAgra Foods, Inc. | ||||||||
| 200,000 | 1.900%, 1/25/2018 | 198,668 | ||||||
CVS Health Corporation | ||||||||
| 150,000 | 2.250%, 8/12/2019 | 149,374 | ||||||
Dr Pepper Snapple Group, Inc. | ||||||||
| 250,000 | 2.700%, 11/15/2022 | 244,198 | ||||||
Edwards Lifesciences Corporation | ||||||||
| 300,000 | 2.875%, 10/15/2018 | 304,121 | ||||||
Fomento Economico Mexicano SAB de CV | ||||||||
| 200,000 | 2.875%, 5/10/2023 | 186,542 | ||||||
McKesson Corporation | ||||||||
| 275,000 | 2.700%, 12/15/2022 | 263,109 | ||||||
Mondelez International, Inc. | ||||||||
| 250,000 | 2.250%, 2/1/2019 | 248,973 | ||||||
Sanofi | ||||||||
| 250,000 | 1.250%, 4/10/2018 | 247,614 | ||||||
Thermo Fisher Scientific, Inc. | ||||||||
| 300,000 | 1.300%, 2/1/2017 | 298,320 | ||||||
Unilever Capital Corporation | ||||||||
| 300,000 | 2.200%, 3/6/2019 | 303,152 | ||||||
UnitedHealth Group, Inc. | ||||||||
| 160,000 | 2.875%, 12/15/2021 | 161,821 | ||||||
Wyeth, LLC | ||||||||
| 350,000 | 6.000%, 2/15/2036 | 455,315 | ||||||
|
| |||||||
Total | 4,100,774 | |||||||
|
| |||||||
| Energy (1.4%) |
| ||||||
Cameron International Corporation | ||||||||
| 150,000 | 1.400%, 6/15/2017 | 147,737 | ||||||
CNOOC Nexen Finance 2014 ULC | ||||||||
| 250,000 | 1.625%, 4/30/2017 | 248,779 | ||||||
Energy Transfer Partners, LP | ||||||||
| 450,000 | 6.700%, 7/1/2018 | 506,015 | ||||||
Kinder Morgan, Inc. | ||||||||
| 200,000 | 3.050%, 12/1/2019 | 198,410 | ||||||
Marathon Oil Corporation | ||||||||
| 325,000 | 2.800%, 11/1/2022 | 304,362 | ||||||
Petro-Canada | ||||||||
| 300,000 | 6.800%, 5/15/2038 | 378,971 | ||||||
Petroleos Mexicanos | ||||||||
| 300,000 | 2.378%, 4/15/2025 | 296,655 | ||||||
|
| |||||||
Total | 2,080,929 | |||||||
|
| |||||||
| Financials (9.4%) |
| ||||||
American International Group, Inc. | ||||||||
| 200,000 | 2.300%, 7/16/2019 | 200,204 | ||||||
American Tower Trust I | ||||||||
| 225,000 | 1.551%, 3/15/2018* | 222,336 | ||||||
AXA SA | ||||||||
| 27,000 | 8.600%, 12/15/2030 | 36,680 | ||||||
Bank of America Corporation | ||||||||
| 250,000 | 1.700%, 8/25/2017 | 250,057 | ||||||
Bank of England | ||||||||
| 1,000,000 | 0.875%, 3/17/2017d | 998,810 | ||||||
Bank of Tokyo-Mitsubishi UFJ, Ltd. | ||||||||
| 205,000 | 2.850%, 9/8/2021d | 202,186 | ||||||
Barclays Bank plc | ||||||||
| 300,000 | 5.000%, 9/22/2016 | 319,679 | ||||||
BNZ International Funding, Ltd. | ||||||||
| 400,000 | 2.350%, 3/4/2019d | 400,048 | ||||||
Boston Properties, LP | ||||||||
| 300,000 | 3.125%, 9/1/2023 | 292,930 | ||||||
Caixa Economica Federal | ||||||||
| 200,000 | 4.250%, 5/13/2019d | 195,000 | ||||||
Camden Property Trust | ||||||||
| 100,000 | 2.950%, 12/15/2022 | 97,545 | ||||||
Chubb Corporation | ||||||||
| 350,000 | 6.500%, 5/15/2038 | 481,959 | ||||||
Cooperatieve Centrale Raiffeisen-Boerenleen bank BA | ||||||||
| 50,000 | 4.625%, 12/1/2023 | 53,036 | ||||||
DnB Boligkreditt AS | ||||||||
| 200,000 | 1.450%, 3/21/2018d | 199,117 | ||||||
Duke Realty, LP | ||||||||
| 250,000 | 3.875%, 10/15/2022 | 257,448 | ||||||
European Investment Bank | ||||||||
| 455,000 | 2.125%, 10/15/2021 | 456,188 | ||||||
Fifth Third Bancorp | ||||||||
| 200,000 | 2.875%, 10/1/2021 | 199,980 | ||||||
General Electric Capital Corporation | ||||||||
| 475,000 | 5.875%, 1/14/2038 | 601,046 | ||||||
Goldman Sachs Group, Inc. | ||||||||
| 500,000 | 2.375%, 1/22/2018 | 505,049 | ||||||
HSBC Holdings plc | ||||||||
| 300,000 | 6.800%, 6/1/2038 | 397,852 | ||||||
ING Bank NV | ||||||||
| 400,000 | 2.625%, 12/5/2022d | 402,935 | ||||||
J.P. Morgan Chase & Company | ||||||||
| 250,000 | 1.134%, 1/25/2018c | 251,963 | ||||||
Liberty Mutual Group, Inc. | ||||||||
| 150,000 | 4.950%, 5/1/2022d | 162,280 | ||||||
| 200,000 | 4.250%, 6/15/2023d | 206,096 | ||||||
Macquarie Bank, Ltd. | ||||||||
| 200,000 | 5.000%, 2/22/2017d | 213,321 | ||||||
Marsh & McLennan Companies, Inc. | ||||||||
| 400,000 | 2.550%, 10/15/2018 | 406,762 | ||||||
MassMutual Global Funding II | ||||||||
| 350,000 | 2.000%, 4/5/2017d | 354,931 | ||||||
MetLife, Inc. | ||||||||
| 200,000 | 4.368%, 9/15/2023 | 218,078 | ||||||
Morgan Stanley | ||||||||
| 250,000 | 5.000%, 11/24/2025 | 266,779 | ||||||
MUFG Union Bank NA | ||||||||
| 300,000 | 1.500%, 9/26/2016 | 301,220 | ||||||
National Australia Bank, Ltd. | ||||||||
| 325,000 | 2.000%, 6/20/2017d | 329,841 | ||||||
Nordea Bank AB | ||||||||
| 325,000 | 3.125%, 3/20/2017d | 336,692 | ||||||
North American Development Bank | ||||||||
| 400,000 | 2.300%, 10/10/2018 | 405,072 | ||||||
PNC Financial Services Group, Inc. | ||||||||
| 325,000 | 2.854%, 11/9/2022 | 319,609 | ||||||
Preferred Term Securities XXIII, Ltd. | ||||||||
| 772,387 | 0.441%, 12/22/2036*,c | 587,014 | ||||||
The accompanying Notes to Financial Statements are an integral part of this schedule.
319
Table of Contents
BOND INDEX PORTFOLIO
Schedule of Investments as of December 31, 2014
| Principal Amount | Long-Term Fixed Income (101.3%) | Value | ||||||
| Financials (9.4%) - continued |
| ||||||
Prudential Financial, Inc. | ||||||||
| $ | 200,000 | 2.350%, 8/15/2019 | $ | 200,118 | ||||
Realty Income Corporation | ||||||||
| 300,000 | 2.000%, 1/31/2018 | 300,553 | ||||||
Reliance Standard Life Global Funding II | ||||||||
| 240,000 | 2.500%, 4/24/2019d | 241,107 | ||||||
Skandinaviska Enskilda Banken AB | ||||||||
| 300,000 | 1.750%, 3/19/2018d | 298,473 | ||||||
Standard Chartered plc | ||||||||
| 200,000 | 3.950%, 1/11/2023d | 193,008 | ||||||
Sumitomo Mitsui Financial Group, Inc. | ||||||||
| 250,000 | 4.436%, 4/2/2024d | 258,848 | ||||||
Svenska Handelsbanken AB | ||||||||
| 125,000 | 1.625%, 3/21/2018 | 124,806 | ||||||
Swedbank AB | ||||||||
| 300,000 | 1.750%, 3/12/2018d | 299,333 | ||||||
Swedbank Hypotek AB | ||||||||
| 400,000 | 1.375%, 3/28/2018d | 396,100 | ||||||
Synchrony Financial | ||||||||
| 215,000 | 3.000%, 8/15/2019 | 217,353 | ||||||
Ventas Realty, LP | ||||||||
| 175,000 | 4.250%, 3/1/2022 | 183,876 | ||||||
Washington Mutual Bank | ||||||||
| 500,000 | 5.500%, 1/15/2013e,f | 0 | ||||||
Wells Fargo & Company | ||||||||
| 150,000 | 3.450%, 2/13/2023 | 152,024 | ||||||
|
| |||||||
| Total | 13,995,342 | |||||||
|
| |||||||
| Foreign Government (3.3%) |
| ||||||
Chile Government International Bond | ||||||||
| 350,000 | 3.875%, 8/5/2020 | 375,375 | ||||||
Export Development Canada | ||||||||
| 150,000 | 0.750%, 12/15/2017 | 147,976 | ||||||
Hashemite Kingdom of Jordan | ||||||||
| 500,000 | 2.503%, 10/30/2020 | 508,330 | ||||||
Hydro-Quebec | ||||||||
| 27,000 | 8.400%, 1/15/2022 | 36,327 | ||||||
Inter-American Development Bank | ||||||||
| 500,000 | 3.000%, 10/4/2023 | 534,144 | ||||||
| 400,000 | 4.375%, 1/24/2044 | 493,269 | ||||||
Kommunalbanken AS | ||||||||
| 495,000 | 1.500%, 10/22/2019d | 488,440 | ||||||
Kommuninvest I Sverige AB | ||||||||
| 300,000 | 1.000%, 10/24/2017d | 298,323 | ||||||
Mexico Government International Bond | ||||||||
| 100,000 | 3.500%, 1/21/2021 | 102,100 | ||||||
| 250,000 | 3.600%, 1/30/2025 | 249,125 | ||||||
Philippines Government International Bond | ||||||||
| 100,000 | 4.200%, 1/21/2024 | 108,500 | ||||||
Poland Government International Bond | ||||||||
| 250,000 | 4.000%, 1/22/2024 | 265,313 | ||||||
Province of Manitoba | ||||||||
| 600,000 | 1.300%, 4/3/2017 | 603,852 | ||||||
Province of New Brunswick | ||||||||
| 125,000 | 2.750%, 6/15/2018 | 129,764 | ||||||
Province of Quebec | ||||||||
| 400,000 | 7.500%, 7/15/2023 | 541,536 | ||||||
Uruguay Government International Bond | ||||||||
| 125,000 | 5.100%, 6/18/2050 | 126,875 | ||||||
|
| |||||||
| Total | 5,009,249 | |||||||
|
| |||||||
| Mortgage-Backed Securities (30.7%) |
| ||||||
Federal Home Loan Mortgage Corporation Gold 15-Yr. Pass Through | ||||||||
| 579 | 6.500%, 3/1/2016 | 590 | ||||||
| 2,261 | 6.000%, 6/1/2016 | 2,315 | ||||||
| 1,667 | 6.000%, 9/1/2016 | 1,710 | ||||||
| 36,654 | 7.000%, 6/1/2017 | 38,449 | ||||||
| 40,430 | 5.500%, 12/1/2017 | 42,762 | ||||||
| 2,087,500 | 3.000%, 1/1/2030g | 2,166,646 | ||||||
Federal Home Loan Mortgage Corporation Gold 30-Yr. Pass Through | ||||||||
| 6,096 | 8.500%, 11/1/2025 | 6,390 | ||||||
| 681 | 8.000%, 1/1/2026 | 773 | ||||||
| 2,087,500 | 4.000%, 1/1/2045g | 2,225,145 | ||||||
Federal National Mortgage Association Conventional 15-Yr. Pass Through | ||||||||
| 6,250,000 | 3.500%, 1/1/2030g | 6,602,539 | ||||||
Federal National Mortgage Association Conventional 30-Yr. Pass Through | ||||||||
| 1,638 | 10.500%, 8/1/2020 | 1,823 | ||||||
| 1,222 | 8.000%, 12/1/2024 | 1,373 | ||||||
| 328 | 8.500%, 12/1/2025 | 338 | ||||||
| 1,270 | 8.000%, 9/1/2026 | 1,323 | ||||||
| 2,178 | 8.000%, 4/1/2030 | 2,561 | ||||||
| 11,045,000 | 3.500%, 1/1/2045g | 11,513,551 | ||||||
| 11,062,500 | 4.000%, 1/1/2045g | 11,806,496 | ||||||
| 10,500,000 | 4.500%, 1/1/2045g | 11,397,422 | ||||||
Government National Mortgage Association 30-Yr. Pass Through | ||||||||
| 3,548 | 7.500%, 3/15/2023 | 3,562 | ||||||
| 1,951 | 9.000%, 9/15/2024 | 2,244 | ||||||
| 2,150 | 8.000%, 6/15/2025 | 2,225 | ||||||
| 1,175 | 8.000%, 9/15/2026 | 1,333 | ||||||
| 6,897 | 7.500%, 10/15/2027 | 7,102 | ||||||
| 4,304 | 7.000%, 11/15/2027 | 4,351 | ||||||
| 3,681 | 6.500%, 7/15/2028 | 4,299 | ||||||
| 1,993 | 7.000%, 8/15/2028 | 2,118 | ||||||
| 8,108 | 7.500%, 11/15/2028 | 8,200 | ||||||
| 3,711 | 6.500%, 12/15/2028 | 4,235 | ||||||
| 22,350 | 6.500%, 3/15/2029 | 25,504 | ||||||
| 980 | 6.500%, 4/15/2029 | 1,119 | ||||||
| 3,855 | 8.000%, 10/15/2030 | 4,446 | ||||||
| 6,000 | 7.500%, 1/15/2031 | 6,656 | ||||||
| 4,232 | 7.000%, 4/15/2031 | 4,857 | ||||||
| 8,149 | 6.500%, 6/15/2031 | 9,371 | ||||||
| 8,963 | 7.000%, 9/15/2031 | 10,460 | ||||||
| 101,192 | 6.500%, 1/15/2032 | 117,896 | ||||||
| 16,446 | 6.500%, 4/15/2032 | 18,834 | ||||||
|
| |||||||
Total | 46,051,018 | |||||||
|
| |||||||
| Technology (1.1%) |
| ||||||
Amphenol Corporation | ||||||||
| 200,000 | 2.550%, 1/30/2019 | 201,391 | ||||||
The accompanying Notes to Financial Statements are an integral part of this schedule.
320
Table of Contents
BOND INDEX PORTFOLIO
Schedule of Investments as of December 31, 2014
| Principal Amount | Long-Term Fixed Income (101.3%) | Value | ||||||
| Technology (1.1%) - continued |
| ||||||
Apple, Inc. | ||||||||
| $ | 400,000 | 2.400%, 5/3/2023 | $ | 388,799 | ||||
Micron Semiconductor Asia Pte, Ltd. | ||||||||
| 270,000 | 1.258%, 1/15/2019 | 269,563 | ||||||
Motorola Solutions, Inc. | ||||||||
| 250,000 | 3.500%, 3/1/2023 | 246,087 | ||||||
Oracle Corporation | ||||||||
| 325,000 | 1.200%, 10/15/2017 | 323,843 | ||||||
Xilinx, Inc. | ||||||||
| 250,000 | 2.125%, 3/15/2019 | 248,394 | ||||||
|
| |||||||
Total | 1,678,077 | |||||||
|
| |||||||
| Transportation (1.0%) |
| ||||||
American Airlines Pass Through Trust | ||||||||
| 187,658 | 5.600%, 7/15/2020d | 191,411 | ||||||
Continental Airlines, Inc. | ||||||||
| 324,160 | 4.150%, 4/11/2024 | 332,874 | ||||||
Delta Air Lines, Inc. | ||||||||
| 203,481 | 4.950%, 5/23/2019 | 217,725 | ||||||
TTX Company | ||||||||
| 300,000 | 4.125%, 10/1/2023* | 316,952 | ||||||
Union Pacific Corporation | ||||||||
| 437,000 | 4.163%, 7/15/2022 | 480,077 | ||||||
|
| |||||||
Total | 1,539,039 | |||||||
|
| |||||||
| U.S. Government and Agencies (38.2%) |
| ||||||
Federal Farm Credit Bank | ||||||||
| 400,000 | 2.210%, 8/1/2024 | 393,604 | ||||||
Federal Home Loan Mortgage Corporation | ||||||||
| 1,000,000 | 1.250%, 8/1/2019 | 981,536 | ||||||
| 325,000 | 1.250%, 10/2/2019 | 317,971 | ||||||
| 350,000 | 6.750%, 3/15/2031 | 526,200 | ||||||
Federal National Mortgage Association | ||||||||
| 1,000,000 | 1.000%, 9/27/2017 | 997,986 | ||||||
| 2,690,000 | 1.750%, 11/26/2019 | 2,691,614 | ||||||
| 1,300,000 | 2.625%, 9/6/2024 | 1,316,537 | ||||||
| 500,000 | 5.960%, 9/11/2028 | 669,176 | ||||||
| 100,000 | 6.250%, 5/15/2029 | 139,325 | ||||||
Resolution Funding Corporation | ||||||||
| 200,000 | 8.125%, 10/15/2019 | 257,875 | ||||||
Tennessee Valley Authority | ||||||||
| 350,000 | 5.250%, 9/15/2039 | 445,573 | ||||||
U.S. Treasury Bonds | ||||||||
| 2,500,000 | 5.250%, 11/15/2028 | 3,351,758 | ||||||
| 4,425,000 | 3.000%, 5/15/2042 | 4,651,091 | ||||||
U.S. Treasury Notes | ||||||||
| 1,750,000 | 0.625%, 10/15/2016 | 1,750,546 | ||||||
| 17,625,000 | 0.875%, 11/15/2017 | 17,540,999 | ||||||
| 8,925,000 | 1.500%, 10/31/2019 | 8,870,611 | ||||||
| 3,525,000 | 1.875%, 6/30/2020 | 3,548,684 | ||||||
| 2,000,000 | 2.000%, 7/31/2020 | 2,025,000 | ||||||
| 1,000,000 | 2.250%, 7/31/2021 | 1,019,844 | ||||||
| 1,000,000 | 2.125%, 9/30/2021 | 1,011,250 | ||||||
| 1,870,000 | 1.625%, 8/15/2022 | 1,818,867 | ||||||
| 400,000 | 2.250%, 11/15/2024 | 402,688 | ||||||
| 2,200,000 | 3.625%, 2/15/2044 | 2,588,953 | ||||||
|
| |||||||
Total | 57,317,688 | |||||||
|
| |||||||
| Utilities (3.7%) |
| ||||||
American Electric Power Company, Inc. | ||||||||
| 300,000 | 1.650%, 12/15/2017 | 300,077 | ||||||
Berkshire Hathaway Energy Company | ||||||||
| 200,000 | 2.400%, 2/1/2020 d | 199,129 | ||||||
CenterPoint Energy Houston Electric, LLC | ||||||||
| 400,000 | 5.600%, 7/1/2023 | 464,005 | ||||||
Commonwealth Edison Company | ||||||||
| 275,000 | 5.900%, 3/15/2036 | 358,726 | ||||||
Dayton Power and Light Company | ||||||||
| 300,000 | 1.875%, 9/15/2016 | 303,314 | ||||||
Dominion Gas Holdings, LLC | ||||||||
| 210,000 | 2.500%, 12/15/2019 | 210,521 | ||||||
DTE Energy Company | ||||||||
| 100,000 | 2.400%, 12/1/2019 | 100,017 | ||||||
El Paso Pipeline Partners Operating Company, LLC | ||||||||
| 325,000 | 4.700%, 11/1/2042 | 293,471 | ||||||
Kansas City Power & Light Company | ||||||||
| 250,000 | 3.150%, 3/15/2023 | 250,822 | ||||||
National Rural Utilities Cooperative Finance Corporation | ||||||||
| 28,000 | 4.023%, 11/1/2032 | 29,677 | ||||||
NextEra Energy Capital Holdings, Inc. | ||||||||
| 350,000 | 2.400%, 9/15/2019 | 349,668 | ||||||
NiSource Finance Corporation | ||||||||
| 350,000 | 3.850%, 2/15/2023 | 362,646 | ||||||
NSTAR Electric Company | ||||||||
| 325,000 | 2.375%, 10/15/2022 | 313,328 | ||||||
ONEOK Partners, LP | ||||||||
| 275,000 | 6.650%, 10/1/2036 | 316,490 | ||||||
PPL Capital Funding, Inc. | ||||||||
| 325,000 | 3.500%, 12/1/2022 | 329,169 | ||||||
Public Service Company of Colorado | ||||||||
| 350,000 | 3.600%, 9/15/2042 | 338,320 | ||||||
Public Service Electric And Gas Company | ||||||||
| 360,000 | 1.800%, 6/1/2019 | 356,658 | ||||||
Sempra Energy | ||||||||
| 325,000 | 2.300%, 4/1/2017 | 330,975 | ||||||
Southern California Gas Company | ||||||||
| 325,000 | 3.750%, 9/15/2042 | 322,463 | ||||||
|
| |||||||
Total | 5,529,476 | |||||||
|
| |||||||
Total Long-Term Fixed Income (cost $149,182,013) | 151,977,314 | |||||||
|
| |||||||
| Shares or Principal Amount | Short-Term Investments (29.0%)h | |||||||
Thrivent Cash Management Trust | ||||||||
| 43,462,896 | 0.060% | 43,462,896 | ||||||
|
| |||||||
Total Short-Term Investments (at amortized cost) | 43,462,896 | |||||||
|
| |||||||
Total Investments (cost $192,644,909) 130.3% | $ | 195,440,210 | ||||||
|
| |||||||
Other Assets and Liabilities, Net (30.3%) | (45,486,086 | ) | ||||||
|
| |||||||
Total Net Assets 100.0% | $ | 149,954,124 | ||||||
|
| |||||||
The accompanying Notes to Financial Statements are an integral part of this schedule.
321
Table of Contents
BOND INDEX PORTFOLIO
Schedule of Investments as of December 31, 2014
| a | All or a portion of the security is insured or guaranteed. |
| b | Denotes step coupon securities. Step coupon securities pay an initial coupon rate for the first period and then different coupon rates for following periods. The rate shown is as of December 31, 2014. |
| c | Denotes variable rate securities. Variable rate securities are securities whose yields vary with a designated market index or market rate. The rate shown is as of December 31, 2014. |
| d | Denotes securities sold under Rule 144A of the Securities Act of 1933, which exempts them from registration. These securities have been deemed liquid and may be resold to other dealers in the program or to other qualified institutional buyers. As of December 31, 2014, the value of these investments was $9,517,542 or 6.3% of total net assets. |
| e | Defaulted security. Interest is not being accrued. |
| f | Security is valued at fair value. Market quotations or prices were not readily available or were determined to be unreliable. Fair value was determined in good faith pursuant to procedures adopted by the Board. Further information on fair valuation can be found in section (2)(A) of the Notes to Financial Statements. |
| g | Denotes investments purchased on a when-issued or delayed delivery basis. |
| h | The interest rate shown reflects the yield, coupon rate or the discount rate at the date of purchase. |
| * | Denotes restricted securities. Restricted securities are investment securities which have been deemed illiquid and cannot be offered for public sale without first being registered under the Securities Act of 1933. The following table indicates the acquisition date and cost of restricted securities Bond Index Portfolio owned as of December 31, 2014. |
Security | Acquisition Date | Cost | ||||||
American Tower Trust I, 3/15/2018 | 3/6/2013 | $ | 225,000 | |||||
Preferred Term Securities XXIII, Ltd., 12/22/2036 | 9/14/2006 | 772,387 | ||||||
TTX Company, 10/1/2023 | 9/19/2013 | 299,997 | ||||||
Wachovia Asset Securitization, Inc., 7/25/2037 | 3/16/2007 | 795,621 | ||||||
Unrealized Appreciation (Depreciation)
Gross unrealized appreciation and depreciation of investments, based on cost for federal income tax purposes, were as follows:
Gross unrealized appreciation | $ | 4,213,789 | ||
Gross unrealized depreciation | (1,567,339 | ) | ||
|
| |||
Net unrealized appreciation (depreciation) | $ | 2,646,450 | ||
Cost for federal income tax purposes | $ | 192,793,760 | ||
The accompanying Notes to Financial Statements are an integral part of this schedule.
322
Table of Contents
BOND INDEX PORTFOLIO
Schedule of Investments as of December 31, 2014
Fair Valuation Measurements
The following table is a summary of the inputs used, as of December 31, 2014, in valuing Bond Index Portfolio’s assets carried at fair value.
Investments in Securities | Total | Level 1 | Level 2 | Level 3 | ||||||||||||
Long-Term Fixed Income | ||||||||||||||||
Asset-Backed Securities | 3,226,312 | — | 3,226,312 | — | ||||||||||||
Basic Materials | 2,261,035 | — | 2,261,035 | — | ||||||||||||
Capital Goods | 1,210,073 | — | 1,210,073 | — | ||||||||||||
Commercial Mortgage-Backed Securities | 989,957 | — | 989,957 | — | ||||||||||||
Communications Services | 2,921,268 | — | 2,921,268 | — | ||||||||||||
Consumer Cyclical | 4,067,077 | — | 4,067,077 | — | ||||||||||||
Consumer Non-Cyclical | 4,100,774 | — | 4,100,774 | — | ||||||||||||
Energy | 2,080,929 | — | 2,080,929 | — | ||||||||||||
Financials^ | 13,995,342 | — | 13,408,328 | 587,014 | ||||||||||||
Foreign Government | 5,009,249 | — | 5,009,249 | — | ||||||||||||
Mortgage-Backed Securities | 46,051,018 | — | 46,051,018 | — | ||||||||||||
Technology | 1,678,077 | — | 1,678,077 | — | ||||||||||||
Transportation | 1,539,039 | — | 1,539,039 | — | ||||||||||||
U.S. Government and Agencies | 57,317,688 | — | 57,317,688 | — | ||||||||||||
Utilities | 5,529,476 | — | 5,529,476 | — | ||||||||||||
Short-Term Investments | 43,462,896 | 43,462,896 | — | — | ||||||||||||
|
|
|
|
|
|
|
| |||||||||
Total | $ | 195,440,210 | $ | 43,462,896 | $ | 151,390,300 | $ | 587,014 | ||||||||
|
|
|
|
|
|
|
| |||||||||
There were no significant transfers between Levels during the period ended December 31, 2014. Transfers between Levels are identified as of the end of the period.
| ^ | Level 3 security in this section is fair valued at <$1. |
Investment in Affiliates
Affiliated issuers, as defined under the Investment Company Act of 1940, include those in which the Portfolio’s holdings of an issuer represent 5% or more of the outstanding voting securities of an issuer, or any affiliated mutual fund.
A summary of transactions for the fiscal year to date, in Bond Index Portfolio, is as follows:
Portfolio | Value December 31, 2013 | Gross Purchases | Gross Sales | Shares Held at December 31, 2014 | Value December 31, 2014 | Income Earned January 1, 2014 - December 31, 2014 | ||||||||||||||||||
Cash Management Trust-Short Term Investment | $ | 45,080,757 | $ | 50,741,997 | $ | 52,359,858 | 43,462,896 | $ | 43,462,896 | $ | 21,294 | |||||||||||||
Total Value and Income Earned | 45,080,757 | 43,462,896 | 21,294 | |||||||||||||||||||||
The accompanying Notes to Financial Statements are an integral part of this schedule.
323
Table of Contents
LIMITED MATURITY BOND PORTFOLIO
Schedule of Investments as of December 31, 2014
| Principal Amount | Bank Loans (3.3%)a | Value | ||||||
| Basic Materials (0.1%) | |||||||
Fortescue Metals Group, Ltd., Term Loan | ||||||||
| $ | 1,053,964 | 3.750%, 6/30/2019 | $ | 954,891 | ||||
|
| |||||||
Total | 954,891 | |||||||
|
| |||||||
| Capital Goods (0.3%) | |||||||
ADS Waste Holdings, Inc., Term Loan | ||||||||
| 1,206,209 | 3.750%, 10/9/2019 | 1,168,889 | ||||||
Berry Plastics Group, Inc., Term Loan | ||||||||
| 948,113 | 3.500%, 2/8/2020 | 915,602 | ||||||
Silver II Borrower, Term Loan | ||||||||
| 634,781 | 4.000%, 12/13/2019 | 588,563 | ||||||
|
| |||||||
Total | 2,673,054 | |||||||
|
| |||||||
| Communications Services (0.9%) | |||||||
Clear Channel Communications, Inc., Term Loan | ||||||||
| 6,080 | 3.819%, 1/29/2016 | 6,010 | ||||||
| 995,670 | 6.919%, 1/30/2019 | 936,636 | ||||||
| 231,780 | 7.669%, 7/30/2019 | 220,480 | ||||||
Fairpoint Communications, Term Loan | ||||||||
| 270,865 | 7.500%, 2/14/2019 | 267,988 | ||||||
Grande Communications Networks, LLC, Term Loan | ||||||||
| 950,534 | 4.500%, 5/29/2020 | 937,465 | ||||||
Integra Telecom Holdings, Inc., Term Loan | ||||||||
| 1,194,353 | 5.250%, 2/22/2019 | 1,159,275 | ||||||
LTS Buyer, LLC, Term Loan | ||||||||
| 679,650 | 4.000%, 4/13/2020 | 663,937 | ||||||
NEP/NCP Holdco, Inc., Term Loan | ||||||||
| 948,197 | 4.250%, 1/22/2020 | 926,075 | ||||||
NTelos, Inc., Term Loan | ||||||||
| 679,572 | 5.750%, 11/9/2019 | 591,227 | ||||||
Puerto Rico Cable Acquisition Company, Inc., Term Loan | ||||||||
| 1,477,236 | 5.500%, 7/31/2018 | 1,466,157 | ||||||
TNS, Inc., Term Loan | ||||||||
| 1,143,839 | 5.000%, 2/14/2020 | 1,130,971 | ||||||
Univision Communications, Inc., Term Loan | ||||||||
| 1,194,331 | 4.000%, 3/1/2020 | 1,166,265 | ||||||
|
| |||||||
Total | 9,472,486 | |||||||
|
| |||||||
| Consumer Cyclical (0.7%) | |||||||
Burlington Coat Factory Warehouse Corporation, Term Loan | ||||||||
| 657,927 | 4.250%, 8/13/2021 | 648,473 | ||||||
Ceridian HCM Holding, Inc., Term Loan | ||||||||
| 665,943 | 4.500%, 9/15/2020 | 653,876 | ||||||
Chrysler Group, LLC, Term Loan | ||||||||
| 947,812 | 3.500%, 5/24/2017 | 940,874 | ||||||
J.C. Penney Corporation, Inc., Term Loan | ||||||||
| 1,221,400 | 6.000%, 5/22/2018 | 1,195,958 | ||||||
MGM Resorts lnternational, Term Loan | ||||||||
| 1,025,799 | 3.500%, 12/20/2019 | 996,954 | ||||||
ROC Finance, LLC, Term Loan | ||||||||
| 952,937 | 5.000%, 6/20/2019 | 881,467 | ||||||
Scientific Games International, Inc., Term Loan | ||||||||
| 1,227,600 | 6.000%, 10/18/2020 | 1,208,265 | ||||||
Seminole Hard Rock Entertainment, Inc., Term Loan | ||||||||
| 477,725 | 3.500%, 5/14/2020 | 459,810 | ||||||
|
| |||||||
Total | 6,985,677 | |||||||
|
| |||||||
| Consumer Non-Cyclical (0.5%) | |||||||
Albertsons, Inc., Term Loan | ||||||||
| 612,371 | 4.750%, 3/21/2019 | 607,778 | ||||||
Biomet, Inc., Term Loan | ||||||||
| 639,252 | 3.670%, 7/25/2017b,c | 635,372 | ||||||
Del Monte Corporation, Term Loan | ||||||||
| 149,190 | 3.500%, 3/9/2020 | 142,476 | ||||||
JBS USA, LLC, Term Loan | ||||||||
| 606,525 | 3.750%, 5/25/2018 | 597,427 | ||||||
Roundy’s Supermarkets, Inc., Term Loan | ||||||||
| 517,253 | 5.750%, 3/3/2021 | 484,061 | ||||||
Supervalu, Inc., Term Loan | ||||||||
| 1,893,208 | 4.500%, 3/21/2019 | 1,856,404 | ||||||
Visant Corporation, Term Loan | ||||||||
| 471,746 | 7.000%, 9/23/2021 | 457,594 | ||||||
|
| |||||||
Total | 4,781,112 | |||||||
|
| |||||||
| Energy (0.2%) | |||||||
Arch Coal, Inc., Term Loan | ||||||||
| 679,566 | 6.250%, 5/16/2018 | 560,927 | ||||||
Offshore Group Investment, Ltd., Term Loan | ||||||||
| 476,512 | 5.750%, 3/28/2019 | 355,002 | ||||||
Pacific Drilling SA, Term Loan | ||||||||
| 1,196,775 | 4.500%, 6/3/2018 | 983,354 | ||||||
|
| |||||||
Total | 1,899,283 | |||||||
|
| |||||||
| Financials (0.2%) | |||||||
Harland Clarke Holdings Corporation, Term Loan | ||||||||
| 597,371 | 7.000%, 5/22/2018b,c | 597,969 | ||||||
WaveDivision Holdings, LLC, Term Loan | ||||||||
| 945,700 | 4.000%, 10/15/2019 | 929,935 | ||||||
|
| |||||||
Total | 1,527,904 | |||||||
|
| |||||||
| Technology (0.2%) | |||||||
BMC Software, Inc., Term Loan | ||||||||
| 1,313,507 | 5.000%, 9/10/2020 | 1,274,929 | ||||||
First Data Corporation, Term Loan | ||||||||
| 1,240,000 | 3.667%, 3/23/2018 | 1,214,431 | ||||||
|
| |||||||
Total | 2,489,360 | |||||||
|
| |||||||
| Transportation (0.1%) | |||||||
American Airlines, Inc., Term Loan | ||||||||
| 1,354,375 | 3.750%, 6/27/2019 | 1,338,014 | ||||||
|
| |||||||
Total | 1,338,014 | |||||||
|
| |||||||
The accompanying Notes to Financial Statements are an integral part of this schedule.
324
Table of Contents
LIMITED MATURITY BOND PORTFOLIO
Schedule of Investments as of December 31, 2014
| Principal Amount | Bank Loans (3.3%)a | Value | ||||||
| Utilities (0.1%) | |||||||
Calpine Corporation, Term Loan | ||||||||
| $ | 237,600 | 4.000%, 10/31/2020 | $ | 233,606 | ||||
Intergen NV, Term Loan | ||||||||
| 1,196,775 | 5.500%, 6/15/2020 | 1,185,801 | ||||||
|
| |||||||
Total | 1,419,407 | |||||||
|
| |||||||
Total Bank Loans (cost $34,809,256) | 33,541,188 | |||||||
|
| |||||||
Long-Term Fixed Income (94.3%) | ||||||||
| Asset-Backed Securities (15.4%) | |||||||
American Homes 4 Rent | ||||||||
| 3,270,544 | 1.250%, 6/17/2031d,e | 3,227,690 | ||||||
BA Credit Card Trust | ||||||||
| 4,800,000 | 0.541%, 6/15/2021e | 4,796,227 | ||||||
Bayview Opportunity Master Fund Trust IIB.LP | ||||||||
| 4,543,431 | 3.228%, 7/28/2034* | 4,555,453 | ||||||
Capital One Multi-Asset Execution Trust | ||||||||
| 2,750,000 | 1.260%, 1/15/2020 | 2,746,648 | ||||||
Chase Issuance Trust | ||||||||
| 6,500,000 | 1.150%, 1/15/2019 | 6,496,809 | ||||||
Chesapeake Funding, LLC | ||||||||
| 1,640,181 | 0.607%, 5/7/2024d,e | 1,642,625 | ||||||
Citibank Credit Card Issuance Trust | ||||||||
| 5,225,000 | 1.020%, 2/22/2019 | 5,204,910 | ||||||
Countrywide Home Loans, Inc. | ||||||||
| 580,808 | 6.085%, 6/25/2021f,g | 578,410 | ||||||
Credit Based Asset Servicing and Securitization, LLC | ||||||||
| 1,672,027 | 3.666%, 12/25/2036g | 1,169,981 | ||||||
Edlinc Student Loan Funding Trust | ||||||||
| 2,584,113 | 3.160%, 10/1/2025*,e | 2,616,414 | ||||||
Education Loan Asset-Backed Trust I | ||||||||
| 148,638 | 0.620%, 6/25/2022d,e | 148,643 | ||||||
Enterprise Fleet Financing, LLC | ||||||||
| 568,796 | 0.720%, 4/20/2018d | 569,030 | ||||||
First Franklin Mortgage Loan Asset- Backed Certificates | ||||||||
| 215,069 | 5.500%, 3/25/2036*,h | 2 | ||||||
Ford Credit Auto Owner Trust | ||||||||
| 3,575,000 | 2.260%, 11/15/2025d | 3,594,083 | ||||||
GMAC Mortgage Corporation Loan Trust | ||||||||
| 902,773 | 0.350%, 8/25/2035e,f | 798,176 | ||||||
| 1,178,524 | 5.750%, 10/25/2036f | 1,120,648 | ||||||
| 2,205,661 | 0.350%, 12/25/2036e,f | 1,925,600 | ||||||
Golden Credit Card Trust | ||||||||
| 7,200,000 | 0.411%, 2/15/2018d,e | 7,197,538 | ||||||
| 1,000,000 | 0.591%, 9/15/2018d,e | 1,002,244 | ||||||
GoldenTree Loan Opportunities IX, Ltd. | ||||||||
| 3,750,000 | 1.829%, 10/29/2026*,e | 3,720,588 | ||||||
Great America Leasing Receivables | ||||||||
| 2,581,475 | 0.780%, 6/15/2016d | 2,583,561 | ||||||
Master Credit Card Trust | ||||||||
| 10,000,000 | 0.780%, 4/21/2017d | 10,003,200 | ||||||
Mortgage Equity Conversion Asset Trust | ||||||||
| 4,495,697 | 0.750%, 1/25/2042 *,e | 3,821,342 | ||||||
| 4,543,458 | 0.580%, 2/25/2042*,e | 3,634,766 | ||||||
Motor plc | ||||||||
| 3,735,200 | 0.650%, 8/25/2021d,e | 3,738,426 | ||||||
Nationstar Agency Advance Funding Trust | ||||||||
| 4,200,000 | 0.997%, 2/15/2045d | 4,198,530 | ||||||
NextGear Floorplan Master Owner Trust | ||||||||
| 3,000,000 | 1.920%, 10/15/2019d | 2,993,322 | ||||||
Northstar Education Finance, Inc. | ||||||||
| 3,670,197 | 0.870%, 12/26/2031d,e | 3,685,752 | ||||||
OZLM VIII, Ltd. | ||||||||
| 3,760,000 | 1.715%, 10/17/2026*,e | 3,741,966 | ||||||
Penarth Master Issuer plc | ||||||||
| 5,500,000 | 0.552%, 11/18/2017d,e | 5,501,448 | ||||||
Renaissance Home Equity Loan Trust | ||||||||
| 3,531,227 | 5.608%, 5/25/2036g | 2,434,114 | ||||||
| 1,216,368 | 5.285%, 1/25/2037g | 695,106 | ||||||
Selene Non-Performing Loans, LLC | ||||||||
| 1,978,197 | 2.981%, 5/25/2054*,g | 1,960,830 | ||||||
SLM Student Loan Trust | ||||||||
| 1,501,020 | 0.304%, 4/27/2020e | 1,500,716 | ||||||
| 1,273,234 | 1.261%, 12/15/2021d,e | 1,277,221 | ||||||
| 2,138,947 | 0.304%, 4/25/2022e | 2,137,455 | ||||||
| 2,068,388 | 0.761%, 8/15/2022d,e | 2,070,519 | ||||||
| 2,921,906 | 0.911%, 10/16/2023d,e | 2,930,193 | ||||||
| 1,974,015 | 0.570%, 3/25/2025e | 1,973,983 | ||||||
| 5,958,563 | 0.690%, 3/25/2026e | 5,976,766 | ||||||
| 2,700,000 | 1.211%, 5/17/2027d,e | 2,717,620 | ||||||
Vericrest Opportunity Loan Transferee | ||||||||
| 2,385,725 | 3.250%, 11/25/2053d | 2,387,979 | ||||||
| 2,109,992 | 3.625%, 11/25/2053d | 2,117,744 | ||||||
| 4,256,450 | 3.125%, 4/27/2054d | 4,231,678 | ||||||
| 2,941,892 | 3.375%, 10/26/2054d | 2,935,722 | ||||||
Volvo Financial Equipment, LLC | ||||||||
| 5,000,000 | 0.740%, 3/15/2017d | 5,004,245 | ||||||
Wachovia Asset Securitization, Inc. | ||||||||
| 994,526 | 0.310%, 7/25/2037*,e,f | 872,206 | ||||||
World Financial Network Credit Card Master Trust | ||||||||
| 3,000,000 | 0.541%, 12/15/2019e | 3,001,176 | ||||||
| 4,000,000 | 0.910%, 3/16/2020 | 3,994,224 | ||||||
World Omni Auto Receivables Trust | ||||||||
| 4,000,000 | 1.330%, 1/15/2018 | 4,023,260 | ||||||
World Omni Master Owner Trust | ||||||||
| 5,400,000 | 0.505%, 2/15/2018d,e | 5,400,308 | ||||||
|
| |||||||
Total | 156,657,097 | |||||||
|
| |||||||
| Basic Materials (1.2%) | |||||||
Albemarle Corporation | ||||||||
| 1,095,000 | 3.000%, 12/1/2019 | 1,095,165 | ||||||
Eastman Chemical Company | ||||||||
| 2,250,000 | 2.700%, 1/15/2020 | 2,262,769 | ||||||
Freeport-McMoRan, Inc. | ||||||||
| 1,000,000 | 2.375%, 3/15/2018 | 989,005 | ||||||
| 1,500,000 | 4.000%, 11/14/2021 | 1,486,203 | ||||||
Georgia-Pacific, LLC | ||||||||
| 2,555,000 | 2.539%, 11/15/2019d | 2,554,116 | ||||||
Goldcorp, Inc. | ||||||||
| 1,000,000 | 3.625%, 6/9/2021 | 1,001,609 | ||||||
The accompanying Notes to Financial Statements are an integral part of this schedule.
325
Table of Contents
LIMITED MATURITY BOND PORTFOLIO
Schedule of Investments as of December 31, 2014
| Principal Amount | Long-Term Fixed Income (94.3%) | Value | ||||||
| Basic Materials (1.2%) - continued | |||||||
Mosaic Company | ||||||||
| $ | 500,000 | 4.250%, 11/15/2023 | $ | 527,598 | ||||
Xstrata Finance Canada, Ltd. | ||||||||
| 2,825,000 | 2.700%, 10/25/2017d | 2,858,072 | ||||||
|
| |||||||
Total | 12,774,537 | |||||||
|
| |||||||
| Capital Goods (0.5%) | |||||||
Precision Castparts Corporation | ||||||||
| 2,025,000 | 1.250%, 1/15/2018 | 2,000,700 | ||||||
Roper Industries, Inc. | ||||||||
| 2,250,000 | 1.850%, 11/15/2017 | 2,252,734 | ||||||
Textron, Inc. | ||||||||
| 400,000 | 3.875%, 3/1/2025 | 400,704 | ||||||
|
| |||||||
Total | 4,654,138 | |||||||
|
| |||||||
| Collateralized Mortgage Obligations (9.5%) | |||||||
Alm Loan Funding CLO | ||||||||
| 3,760,000 | 1.664%, 10/17/2026*,e | 3,739,961 | ||||||
American Home Mortgage Assets Trust | ||||||||
| 2,764,564 | 1.033%, 11/25/2046e | 1,511,219 | ||||||
Apidos CLO XVIII | ||||||||
| 3,775,000 | 1.646%, 7/22/2026*,e | 3,730,033 | ||||||
Babson CLO, Ltd. 2014-II | ||||||||
| 3,760,000 | 1.656%, 10/17/2026*,e | 3,732,740 | ||||||
BCAP, LLC Trust | ||||||||
| 1,692,328 | 0.350%, 3/25/2037e | 1,406,878 | ||||||
Bear Stearns Adjustable Rate Mortgage Trust | ||||||||
| 1,159,624 | 2.430%, 10/25/2035e | 1,143,271 | ||||||
Birchwood Park CLO, Ltd. | ||||||||
| 3,760,000 | 1.674%, 7/15/2026*,e | 3,741,811 | ||||||
BlueMountain CLO, Ltd. | ||||||||
| 3,760,000 | 1.480%, 10/15/2026*,e | 3,725,575 | ||||||
Carlyle Global Market Strategies CLO, Ltd. | ||||||||
| 3,750,000 | 1.531%, 7/20/2023*,e | 3,719,984 | ||||||
| 3,750,000 | 1.733%, 10/15/2026*,e | 3,742,714 | ||||||
Cent CLO 16, LP | ||||||||
| 3,760,000 | 1.482%, 8/1/2024*,e | 3,727,102 | ||||||
Cent CLO 22, Ltd. | ||||||||
| 3,750,000 | 1.713%, 11/7/2026*,e | 3,714,489 | ||||||
Countrywide Alternative Loan Trust | ||||||||
| 688,611 | 5.500%, 11/25/2035 | 689,734 | ||||||
| 739,264 | 5.500%, 2/25/2036 | 687,431 | ||||||
| 1,317,623 | 6.000%, 1/25/2037 | 1,215,762 | ||||||
Countrywide Home Loans, Inc. | ||||||||
| 1,794,344 | 2.458%, 3/20/2036 | 1,582,360 | ||||||
| 1,634,661 | 2.362%, 9/20/2036 | 1,417,396 | ||||||
Deutsche Alt-A Securities Mortgage Loan Trust | ||||||||
| 3,190,538 | 0.883%, 4/25/2047e | 2,731,014 | ||||||
Dryden 34 Senior Loan Fund CLO | ||||||||
| 3,760,000 | 1.717%, 10/15/2026*,e | 3,740,153 | ||||||
GSR Mortgage Loan Trust | ||||||||
| 1,530,740 | 0.360%, 8/25/2046e | 1,469,994 | ||||||
HarborView Mortgage Loan Trust | ||||||||
| 1,659,993 | 2.125%, 6/19/2034 | 1,638,973 | ||||||
HomeBanc Mortgage Trust | ||||||||
| 1,619,631 | 2.197%, 4/25/2037 | 1,205,190 | ||||||
Impac CMB Trust | ||||||||
| 1,824,057 | 0.690%, 4/25/2035e | 1,668,173 | ||||||
| 557,399 | 0.810%, 8/25/2035e | 497,303 | ||||||
J.P. Morgan Alternative Loan Trust | ||||||||
| 2,587,011 | 2.584%, 3/25/2036 | 2,109,671 | ||||||
J.P. Morgan Mortgage Trust | ||||||||
| 419,700 | 2.537%, 10/25/2036 | 376,735 | ||||||
Madison Park Funding XIV CLO, Ltd. | ||||||||
| 4,150,000 | 1.681%, 7/20/2026*,e | 4,132,798 | ||||||
Master Asset Securitization Trust | ||||||||
| 1,497,050 | 0.670%, 6/25/2036e | 897,544 | ||||||
Neuberger Berman CLO, Ltd. | ||||||||
| 3,000,000 | 1.626%, 8/4/2025*,e | 2,972,283 | ||||||
Octagon Investment Partners XX CLO, Ltd. | ||||||||
| 3,760,000 | 1.675%, 8/12/2026*,e | 3,718,705 | ||||||
Residential Accredit Loans, Inc. | ||||||||
| 1,405,283 | 3.535%, 9/25/2035 | 1,196,491 | ||||||
Sequoia Mortgage Trust | ||||||||
| 3,182,339 | 1.069%, 9/20/2034e | 3,074,760 | ||||||
Structured Adjustable Rate Mortgage Loan Trust | ||||||||
| 35,409 | 5.500%, 12/25/2034 | 34,386 | ||||||
Symphony CLO, Ltd. | ||||||||
| 3,760,000 | 1.331%, 1/9/2023*,e | 3,738,852 | ||||||
Voya CLO 2014-3, Ltd. | ||||||||
| 3,760,000 | 1.649%, 7/25/2026*,e | 3,716,389 | ||||||
Wachovia Mortgage Loan Trust, LLC | ||||||||
| 1,462,489 | 2.738%, 5/20/2036 | 1,274,307 | ||||||
WaMu Mortgage Pass Through Certificates | ||||||||
| 889,666 | 0.460%, 10/25/2045e | 815,223 | ||||||
| 2,738,179 | 0.993%, 10/25/2046e | 2,222,673 | ||||||
| 2,719,684 | 0.933%, 12/25/2046e | 2,180,714 | ||||||
| 2,808,130 | 0.853%, 1/25/2047e | 2,304,767 | ||||||
Washington Mutual Alternative Mortgage Pass Through Certificates | ||||||||
| 2,085,823 | 1.033%, 9/25/2046e | 1,418,251 | ||||||
| 3,459,508 | 0.863%, 2/25/2047e | 2,427,516 | ||||||
Wells Fargo Mortgage Backed Securities Trust | ||||||||
| 960,276 | 2.577%, 3/25/2036 | 929,188 | ||||||
| 1,353,144 | 2.612%, 3/25/2036 | 1,347,542 | ||||||
|
| |||||||
Total | 97,068,055 | |||||||
|
| |||||||
| Commercial Mortgage-Backed Securities (5.2%) | |||||||
Bear Stearns Commercial Mortgage Securities, Inc. | ||||||||
| 189,651 | 5.655%, 6/11/2040 | 191,743 | ||||||
| 1,736,232 | 5.331%, 2/11/2044 | 1,855,046 | ||||||
Citigroup Commercial Mortgage Trust | ||||||||
| 1,250,000 | 5.710%, 12/10/2049 | 1,355,481 | ||||||
Citigroup/Deutsche Bank Commercial Mortgage | ||||||||
| 3,000,000 | 5.322%, 12/11/2049 | 3,176,286 | ||||||
Commercial Mortgage Pass-Through Certificates | ||||||||
| 5,000,000 | 1.208%, 6/8/2030d,e | 4,998,045 | ||||||
| 1,459,122 | 5.306%, 12/10/2046 | 1,545,686 | ||||||
The accompanying Notes to Financial Statements are an integral part of this schedule.
326
Table of Contents
LIMITED MATURITY BOND PORTFOLIO
Schedule of Investments as of December 31, 2014
| Principal Amount | Long-Term Fixed Income (94.3%) | Value | ||||||
| Commercial Mortgage-Backed Securities (5.2%) - continued | |||||||
Credit Suisse Mortgage Capital Certificates | ||||||||
| $3,316,037 | 5.467%, 9/15/2039 | $ | 3,490,198 | |||||
Federal National Mortgage Association | ||||||||
| 2,850,000 | 1.272%, 1/25/2017 | 2,864,951 | ||||||
Government National Mortgage Association | ||||||||
| 667,565 | 2.870%, 3/16/2051 | 673,143 | ||||||
| 802,627 | 2.164%, 3/16/2033 | 803,577 | ||||||
| 467,156 | 3.214%, 1/16/2040 | 469,869 | ||||||
Greenwich Capital Commercial Funding Corporation | ||||||||
| 5,500,000 | 5.224%, 4/10/2037 | 5,559,483 | ||||||
J.P. Morgan Chase Commercial Mortgage Securities Corporation | ||||||||
| 4,500,000 | 1.111%, 12/15/2028d,e | 4,500,648 | ||||||
| 6,500,000 | 5.429%, 12/12/2043 | 6,835,569 | ||||||
LSTAR Commercial Mortgage Trust | ||||||||
| 2,149,478 | 1.519%, 1/20/2041d | 2,149,351 | ||||||
Morgan Stanley Capital, Inc. | ||||||||
| 2,001,592 | 5.592%, 4/12/2049 | 2,015,663 | ||||||
NCUA Guaranteed Notes | ||||||||
| 5,000,000 | 2.900%, 10/29/2020 | 5,134,015 | ||||||
SCG Trust 2013-SRP1 | ||||||||
| 3,150,000 | 1.561%, 11/15/2026d,e | 3,153,827 | ||||||
Wachovia Bank Commercial Mortgage Trust | ||||||||
| 1,944,547 | 5.765%, 7/15/2045 | 2,036,674 | ||||||
|
| |||||||
Total | 52,809,255 | |||||||
|
| |||||||
| Communications Services (2.9%) | |||||||
America Movil SAB de CV | ||||||||
| 3,000,000 | 1.241%, 9/12/2016e | 3,021,459 | ||||||
American Tower Corporation | ||||||||
| 2,200,000 | 3.450%, 9/15/2021 | 2,162,908 | ||||||
AT&T, Inc. | ||||||||
| 2,000,000 | 1.400%, 12/1/2017 | 1,979,932 | ||||||
British Telecommunications plc | ||||||||
| 1,500,000 | 1.625%, 6/28/2016 | 1,510,801 | ||||||
| 722,000 | 2.350%, 2/14/2019 | 720,963 | ||||||
CBS Corporation | ||||||||
| 1,790,000 | 2.300%, 8/15/2019 | 1,768,617 | ||||||
Crown Castle Towers, LLC | ||||||||
| 2,500,000 | 3.214%, 8/15/2015* | 2,529,957 | ||||||
| 1,650,000 | 4.174%, 8/15/2017d | 1,726,628 | ||||||
DIRECTV Holdings, LLC | ||||||||
| 1,125,000 | 1.750%, 1/15/2018 | 1,117,583 | ||||||
Moody’s Corporation | ||||||||
| 1,250,000 | 2.750%, 7/15/2019 | 1,260,291 | ||||||
NBC Universal Enterprise, Inc. | ||||||||
| 2,250,000 | 1.662%, 4/15/2018d | 2,233,908 | ||||||
SES Global Americas Holdings GP | ||||||||
| 1,375,000 | 2.500%, 3/25/2019d | 1,368,091 | ||||||
Verizon Communications, Inc. | ||||||||
| 1,650,000 | 1.771%, 9/15/2016e | 1,679,915 | ||||||
| 1,000,000 | 0.636%, 6/9/2017e | 998,031 | ||||||
| 2,580,000 | 1.013%, 6/17/2019e | 2,593,359 | ||||||
| 1,825,000 | 3.000%, 11/1/2021 | 1,799,877 | ||||||
Viacom, Inc. | ||||||||
| 1,250,000 | 2.500%, 9/1/2018 | 1,261,053 | ||||||
|
| |||||||
Total | 29,733,373 | |||||||
|
| |||||||
| Consumer Cyclical (1.2%) | |||||||
American Honda Finance Corporation | ||||||||
| 2,750,000 | 0.549%, 12/11/2017e | 2,748,276 | ||||||
Ford Motor Credit Company, LLC | ||||||||
| 2,050,000 | 3.984%, 6/15/2016 | 2,122,574 | ||||||
| 1,000,000 | 3.000%, 6/12/2017 | 1,026,007 | ||||||
Home Depot, Inc. | ||||||||
| 2,000,000 | 2.250%, 9/10/2018 | 2,038,136 | ||||||
Hyundai Capital America | ||||||||
| 2,750,000 | 1.875%, 8/9/2016d | 2,769,041 | ||||||
Yale University | ||||||||
| 1,550,000 | 2.086%, 4/15/2019 | 1,557,567 | ||||||
|
| |||||||
Total | 12,261,601 | |||||||
|
| |||||||
| Consumer Non-Cyclical (3.3%) | |||||||
Altria Group, Inc. | ||||||||
| 500,000 | 2.850%, 8/9/2022 | 485,848 | ||||||
Bayer U.S. Finance, LLC | ||||||||
| 1,250,000 | 2.375%, 10/8/2019d | 1,254,960 | ||||||
Becton, Dickinson and Company | ||||||||
| 1,650,000 | 0.691%, 6/15/2016e | 1,650,393 | ||||||
Celgene Corporation | ||||||||
| 2,500,000 | 1.900%, 8/15/2017 | 2,508,810 | ||||||
Church & Dwight Company, Inc. | ||||||||
| 1,440,000 | 2.450%, 12/15/2019 | 1,439,241 | ||||||
ConAgra Foods, Inc. | ||||||||
| 1,400,000 | 1.900%, 1/25/2018 | 1,390,673 | ||||||
CVS Health Corporation | ||||||||
| 1,065,000 | 2.250%, 8/12/2019i | 1,060,552 | ||||||
Edwards Lifesciences Corporation | ||||||||
| 1,500,000 | 2.875%, 10/15/2018 | 1,520,604 | ||||||
Forest Laboratories, Inc. | ||||||||
| 2,750,000 | 4.375%, 2/1/2019d | 2,905,018 | ||||||
Gilead Sciences, Inc. | ||||||||
| 1,000,000 | 2.350%, 2/1/2020 | 1,005,381 | ||||||
Howard Hughes Medical Institute | ||||||||
| 1,500,000 | 3.500%, 9/1/2023 | 1,568,532 | ||||||
Japan Tobacco, Inc. | ||||||||
| 2,500,000 | 2.100%, 7/23/2018d | 2,522,557 | ||||||
Medtronic, Inc. | ||||||||
| 1,650,000 | 1.043%, 3/15/2020d,e | 1,648,259 | ||||||
Mondelez International, Inc. | ||||||||
| 1,858,000 | 0.752%, 2/1/2019e | 1,837,268 | ||||||
| 2,075,000 | 2.250%, 2/1/2019 | 2,066,478 | ||||||
Perrigo Finance plc | ||||||||
| 825,000 | 3.500%, 12/15/2021 | 834,623 | ||||||
SABMiller Holdings, Inc. | ||||||||
| 2,500,000 | 2.450%, 1/15/2017d | 2,550,670 | ||||||
Thermo Fisher Scientific, Inc. | ||||||||
| 1,700,000 | 1.300%, 2/1/2017 | 1,690,482 | ||||||
Unilever Capital Corporation | ||||||||
| 2,600,000 | 2.200%, 3/6/2019 | 2,627,321 | ||||||
The accompanying Notes to Financial Statements are an integral part of this schedule.
327
Table of Contents
LIMITED MATURITY BOND PORTFOLIO
Schedule of Investments as of December 31, 2014
| Principal Amount | Long-Term Fixed Income (94.3%) | Value | ||||||
| Consumer Non-Cyclical (3.3%) - continued |
| ||||||
UnitedHealth Group, Inc. | ||||||||
| $ | 1,080,000 | 2.875%, 12/15/2021 | $ | 1,092,288 | ||||
|
| |||||||
Total | 33,659,958 | |||||||
|
| |||||||
| Energy (2.3%) |
| ||||||
Cameron International Corporation | ||||||||
| 1,575,000 | 1.400%, 6/15/2017 | 1,551,243 | ||||||
Chevron Corporation | ||||||||
| 3,000,000 | 1.718%, 6/24/2018 | 3,015,165 | ||||||
CNOOC Nexen Finance 2014 ULC | ||||||||
| 2,000,000 | 1.625%, 4/30/2017 | 1,990,234 | ||||||
CNPC General Capital, Ltd. | ||||||||
| 1,000,000 | 2.750%, 5/14/2019d | 993,221 | ||||||
DCP Midstream Operating, LP | ||||||||
| 1,650,000 | 2.700%, 4/1/2019 | 1,615,177 | ||||||
Enable Midstream Partners, LP | ||||||||
| 1,250,000 | 2.400%, 5/15/2019d | 1,215,752 | ||||||
Enbridge, Inc. | ||||||||
| 1,700,000 | 0.684%, 6/2/2017e | 1,692,646 | ||||||
EQT Midstream Partners, LP | ||||||||
| 1,000,000 | 4.000%, 8/1/2024 | 990,265 | ||||||
International Petroleum Investment Company, Ltd. | ||||||||
| 2,000,000 | 3.125%, 11/15/2015d | 2,027,680 | ||||||
Kinder Morgan, Inc. | ||||||||
| 2,150,000 | 3.050%, 12/1/2019 | 2,132,907 | ||||||
Petroleos Mexicanos | ||||||||
| 1,500,000 | 2.251%, 7/18/2018e | 1,516,500 | ||||||
| 1,000,000 | 3.500%, 7/18/2018 | 1,012,500 | ||||||
| 2,185,000 | 2.378%, 4/15/2025 | 2,160,635 | ||||||
Weatherford International, Ltd. | ||||||||
| 1,500,000 | 6.000%, 3/15/2018 | 1,601,265 | ||||||
|
| |||||||
Total | 23,515,190 | |||||||
|
| |||||||
| Financials (20.0%) |
| ||||||
American Express Credit Corporation | ||||||||
| 2,580,000 | 0.793%, 3/18/2019e | 2,569,241 | ||||||
American International Group, Inc. | ||||||||
| 1,430,000 | 2.300%, 7/16/2019 | 1,431,456 | ||||||
American Tower Trust 1 | ||||||||
| 1,650,000 | 1.551%, 3/15/2018* | 1,630,464 | ||||||
Ares Capital Corporation | ||||||||
| 1,400,000 | 3.875%, 1/15/2020i | 1,395,981 | ||||||
Australia and New Zealand Banking Group, Ltd. | ||||||||
| 5,000,000 | 2.400%, 11/23/2016d | 5,115,200 | ||||||
Aviation Capital Group Corporation | ||||||||
| 1,350,000 | 3.875%, 9/27/2016d | 1,383,989 | ||||||
Bank of America Corporation | ||||||||
| 1,800,000 | 1.700%, 8/25/2017 | 1,800,409 | ||||||
| 2,000,000 | 1.317%, 3/22/2018e | 2,014,612 | ||||||
| 2,200,000 | 1.105%, 4/1/2019e | 2,203,641 | ||||||
Bank Of America National Association | ||||||||
| 2,000,000 | 5.300%, 3/15/2017 | 2,148,330 | ||||||
Bank of New York Mellon Corporation | ||||||||
| 675,000 | 4.500%, 12/31/2049j | 622,266 | ||||||
Bank of Nova Scotia | ||||||||
| 3,000,000 | 2.150%, 8/3/2016d | 3,055,404 | ||||||
Bank of Tokyo-Mitsubishi UFJ, Ltd. | ||||||||
| 1,445,000 | 2.850%, 9/8/2021d | 1,425,164 | ||||||
BB&T Corporation | ||||||||
| 1,520,000 | 0.950%, 1/15/2020e | 1,519,574 | ||||||
BBVA Banco Continental SA | ||||||||
| 2,000,000 | 2.250%, 7/29/2016d | 1,995,000 | ||||||
Bear Stearns Companies, LLC | ||||||||
| 2,500,000 | 6.400%, 10/2/2017 | 2,799,775 | ||||||
BNZ International Funding, Ltd. | ||||||||
| 3,100,000 | 2.350%, 3/4/2019d | 3,100,369 | ||||||
Caixa Economica Federal | ||||||||
| 1,550,000 | 4.250%, 5/13/2019d | 1,511,250 | ||||||
Citigroup, Inc. | ||||||||
| 1,840,000 | 1.003%, 4/8/2019e | 1,846,902 | ||||||
CNA Financial Corporation | ||||||||
| 3,000,000 | 6.500%, 8/15/2016 | 3,244,905 | ||||||
CoBank ACB | ||||||||
| 1,965,000 | 0.841%, 6/15/2022*,e | 1,861,692 | ||||||
Cooperatieve Centrale Raiffeisen-Boerenleenbank BA | ||||||||
| 800,000 | 4.625%, 12/1/2023 | 848,571 | ||||||
Credit Agricole SA | ||||||||
| 1,650,000 | 1.031%, 4/15/2019d,e | 1,662,649 | ||||||
Credit Suisse AG Guernsey | ||||||||
| 2,000,000 | 2.600%, 5/27/2016d | 2,047,734 | ||||||
Credit Suisse Group AG | ||||||||
| 1,500,000 | 6.500%, 8/8/2023d | 1,646,582 | ||||||
| 990,000 | 7.500%, 12/11/2049d,j | 1,029,600 | ||||||
DnB Boligkreditt AS | ||||||||
| 4,900,000 | 1.450%, 3/21/2018d | 4,878,376 | ||||||
European Investment Bank | ||||||||
| 6,000,000 | 1.750%, 3/15/2017 | 6,114,354 | ||||||
| 3,235,000 | 2.125%, 10/15/2021i | 3,243,443 | ||||||
Fifth Third Bancorp | ||||||||
| 1,440,000 | 2.875%, 10/1/2021 | 1,439,855 | ||||||
General Electric Capital Corporation | ||||||||
| 4,500,000 | 1.241%, 3/15/2023e | 4,563,347 | ||||||
Goldman Sachs Group, Inc. | ||||||||
| 3,550,000 | 2.375%, 1/22/2018 | 3,585,851 | ||||||
| 1,915,000 | 1.332%, 11/15/2018e | 1,933,765 | ||||||
| 1,950,000 | 5.700%, 12/29/2049i,j | 1,972,425 | ||||||
GTP Acquisition Partners 1, LLC | ||||||||
| 2,000,000 | 4.347%, 6/15/2016* | 2,037,030 | ||||||
HSBC USA, Inc. | ||||||||
| 1,905,000 | 0.552%, 6/23/2017e | 1,900,847 | ||||||
ING Capital Funding Trust III | ||||||||
| 1,000,000 | 3.855%, 12/29/2049e,j | 997,500 | ||||||
Inter-American Development Bank | ||||||||
| 3,750,000 | 0.199%, 2/11/2016e | 3,750,563 | ||||||
International Lease Finance Corporation | ||||||||
| 1,100,000 | 8.625%, 9/15/2015 | 1,146,750 | ||||||
Intesa Sanpaolo SPA | ||||||||
| 1,500,000 | 5.017%, 6/26/2024d | 1,455,773 | ||||||
J.P. Morgan Chase & Company | ||||||||
| 4,000,000 | 1.134%, 1/25/2018e,i | 4,031,412 | ||||||
| 1,750,000 | 3.875%, 9/10/2024 | 1,751,489 | ||||||
| 1,450,000 | 7.900%, 4/29/2049j | 1,560,635 | ||||||
J.P. Morgan Chase Bank NA | ||||||||
| 1,800,000 | 5.875%, 6/13/2016 | 1,918,762 | ||||||
The accompanying Notes to Financial Statements are an integral part of this schedule.
328
Table of Contents
LIMITED MATURITY BOND PORTFOLIO
Schedule of Investments as of December 31, 2014
| Principal Amount | Long-Term Fixed Income (94.3%) | Value | ||||||
| Financials (20.0%) - continued |
| ||||||
Japan Bank for International Cooperation | ||||||||
| $ | 4,000,000 | 1.750%, 7/31/2018 | $ | 4,020,160 | ||||
Kilroy Realty, LP | ||||||||
| 750,000 | 3.800%, 1/15/2023 | 758,900 | ||||||
Landwirtschaftliche Rentenbank | ||||||||
| 4,500,000 | 0.441%, 3/15/2016d,e | 4,508,505 | ||||||
Lloyds Banking Group plc | ||||||||
| 800,000 | 4.500%, 11/4/2024 | 807,311 | ||||||
Lloyds TSB Bank plc | ||||||||
| 300,000 | 6.500%, 9/14/2020d | 347,616 | ||||||
Macquarie Bank, Ltd. | ||||||||
| 2,275,000 | 5.000%, 2/22/2017d | 2,426,524 | ||||||
MassMutual Global Funding II | ||||||||
| 3,500,000 | 2.000%, 4/5/2017d | 3,549,311 | ||||||
Metropolitan Life Global Funding I | ||||||||
| 3,250,000 | 3.650%, 6/14/2018d | 3,442,361 | ||||||
Mizuho Financial Group Cayman 3, Ltd. | ||||||||
| 825,000 | 4.600%, 3/27/2024d | 854,842 | ||||||
Morgan Stanley | ||||||||
| 1,750,000 | 5.000%, 11/24/2025 | 1,867,451 | ||||||
| 1,000,000 | 5.450%, 12/29/2049j | 1,001,800 | ||||||
Morgan Stanley Mortgage Loan Trust | ||||||||
| 2,000,000 | 5.750%, 10/18/2016 | 2,147,420 | ||||||
MUFG Union Bank NA | ||||||||
| 1,900,000 | 1.500%, 9/26/2016 | 1,907,725 | ||||||
National Australia Bank, Ltd. | ||||||||
| 3,350,000 | 2.000%, 6/20/2017d | 3,399,898 | ||||||
National Bank of Canada | ||||||||
| 2,750,000 | 2.200%, 10/19/2016d | 2,810,522 | ||||||
NCUA Guaranteed Notes | ||||||||
| 1,922,537 | 0.517%, 12/7/2020e | 1,926,001 | ||||||
Network Rail Infrastructure Finance plc | ||||||||
| 6,000,000 | 0.875%, 5/15/2018d | 5,896,854 | ||||||
Nordea Bank AB | ||||||||
| 2,500,000 | 3.125%, 3/20/2017d | 2,589,937 | ||||||
North American Development Bank | ||||||||
| 2,200,000 | 2.300%, 10/10/2018 | 2,227,894 | ||||||
Prudential Financial, Inc. | ||||||||
| 1,430,000 | 2.350%, 8/15/2019 | 1,430,845 | ||||||
RBS Capital Trust III | ||||||||
| 1,130,000 | 2.095%, 9/29/2049e,i,j | 1,123,785 | ||||||
Realty Income Corporation | ||||||||
| 1,500,000 | 2.000%, 1/31/2018 | 1,502,764 | ||||||
Reliance Standard Life Global Funding II | ||||||||
| 1,740,000 | 2.500%, 4/24/2019d | 1,748,025 | ||||||
Royal Bank of Canada | ||||||||
| 4,000,000 | 1.200%, 9/19/2017 | 3,977,160 | ||||||
Royal Bank of Scotland Group plc | ||||||||
| 2,205,000 | 1.197%, 3/31/2017e | 2,211,813 | ||||||
| 1,650,000 | 5.125%, 5/28/2024 | 1,678,365 | ||||||
Skandinaviska Enskilda Banken AB | ||||||||
| 2,100,000 | 1.750%, 3/19/2018d | 2,089,309 | ||||||
| 2,500,000 | 1.375%, 5/29/2018d | 2,478,483 | ||||||
SLM Corporation | ||||||||
| 700,000 | 4.625%, 9/25/2017 | 710,500 | ||||||
Spare Bank 1 Boligkreditt AS | ||||||||
| 3,000,000 | 1.250%, 5/2/2018d | 2,954,646 | ||||||
Stadshypotek AB | ||||||||
| 2,000,000 | 1.875%, 10/2/2019d | 1,975,466 | ||||||
Standard Chartered plc | ||||||||
| 1,225,000 | 3.950%, 1/11/2023d | 1,182,173 | ||||||
Sumitomo Mitsui Financial Group, Inc. | ||||||||
| 1,800,000 | 4.436%, 4/2/2024d | 1,863,706 | ||||||
Suncorp-Metway, Ltd. | ||||||||
| 2,570,000 | 0.955%, 3/28/2017d,e | 2,573,822 | ||||||
Svensk Exportkredit AB | ||||||||
| 3,500,000 | 0.531%, 1/23/2017e | 3,512,940 | ||||||
Svenska Handelsbanken AB | ||||||||
| 750,000 | 0.733%, 6/17/2019e | 750,619 | ||||||
Swedbank AB | ||||||||
| 1,750,000 | 1.750%, 3/12/2018d | 1,746,108 | ||||||
Synchrony Financial | ||||||||
| 1,520,000 | 3.000%, 8/15/2019 | 1,536,633 | ||||||
Toronto-Dominion Bank | ||||||||
| 1,920,000 | 0.792%, 11/5/2019e | 1,923,600 | ||||||
U.S. Bank National Association | ||||||||
| 4,000,000 | 3.778%, 4/29/2020 | 4,035,904 | ||||||
USAA Capital Corporation | ||||||||
| 2,575,000 | 2.125%, 6/3/2019d | 2,568,393 | ||||||
Voya Financial, Inc. | ||||||||
| 1,500,000 | 2.900%, 2/15/2018 | 1,535,630 | ||||||
| 500,000 | 5.650%, 5/15/2053 | 495,000 | ||||||
Wells Fargo & Company | ||||||||
| 4,500,000 | 2.625%, 12/15/2016 | 4,623,376 | ||||||
| 925,000 | 3.450%, 2/13/2023 | 937,482 | ||||||
| 1,100,000 | 4.100%, 6/3/2026 | 1,124,263 | ||||||
Westpac Banking Corporation | ||||||||
| 2,500,000 | 1.250%, 12/15/2017d | 2,474,885 | ||||||
|
| |||||||
Total | 203,449,664 | |||||||
|
| |||||||
| Foreign Government (3.2%) |
| ||||||
Bahama Government International Bond | ||||||||
| 275,000 | 5.750%, 1/16/2024d | 292,875 | ||||||
Canada Government International Bond | ||||||||
| 8,500,000 | 0.875%, 2/14/2017 | 8,506,970 | ||||||
Eksportfinans ASA | ||||||||
| 2,450,000 | 2.375%, 5/25/2016 | 2,455,733 | ||||||
Hydro Quebec | ||||||||
| 3,000,000 | 2.000%, 6/30/2016 | 3,057,480 | ||||||
Kommunalbanken AS | ||||||||
| 3,500,000 | 1.500%, 10/22/2019d | 3,453,614 | ||||||
Kommuninvest 1 Sverige AB | ||||||||
| 3,500,000 | 1.000%, 10/24/2017d | 3,480,435 | ||||||
Mexico Government International Bond | ||||||||
| 1,250,000 | 5.125%, 1/15/2020 | 1,378,125 | ||||||
| 325,000 | 3.500%, 1/21/2021 | 331,825 | ||||||
Philippines Government International Bond | ||||||||
| 325,000 | 4.200%, 1/21/2024 | 352,625 | ||||||
Poland Government International Bond | ||||||||
| 125,000 | 4.000%, 1/22/2024 | 132,656 | ||||||
Province of Manitoba | ||||||||
| 5,100,000 | 1.300%, 4/3/2017 | 5,132,742 | ||||||
The accompanying Notes to Financial Statements are an integral part of this schedule.
329
Table of Contents
LIMITED MATURITY BOND PORTFOLIO
Schedule of Investments as of December 31, 2014
| Principal Amount | Long-Term Fixed Income (94.3%) | Value | ||||||
| Foreign Government (3.2%) - continued |
| ||||||
Province of Ontario | ||||||||
| $ | 3,500,000 | 0.283%, 8/13/2015e | $ | 3,499,503 | ||||
Slovenia Government International Bond | ||||||||
| 730,000 | 4.125%, 2/18/2019d | 764,690 | ||||||
|
| |||||||
Total | 32,839,273 | |||||||
|
| |||||||
| Mortgage-Backed Securities (6.4%) |
| ||||||
Federal Home Loan Mortgage Corporation Gold 15-Yr. Pass Through | ||||||||
| 7,875,000 | 3.000%, 1/1/2030c | 8,173,574 | ||||||
Federal Home Loan Mortgage Corporation Gold 30-Yr. Pass Through | ||||||||
| 795,737 | 6.500%, 9/1/2037 | 910,315 | ||||||
| 9,875,000 | 4.000%, 1/1/2045c | 10,526,133 | ||||||
Federal National Mortgage Association Conventional 15-Yr. Pass Through | ||||||||
| 4,080,014 | 2.250%, 6/25/2025 | 4,132,018 | ||||||
| 18,850,000 | 3.500%, 1/1/2030c | 19,913,257 | ||||||
Federal National Mortgage Association Conventional 30-Yr. Pass Through | ||||||||
| 1,244,070 | 5.735%, 9/1/2037e | 1,328,797 | ||||||
| 419,216 | 5.196%, 10/1/2037e | 442,439 | ||||||
| 4,543,489 | 2.073%, 1/1/2043e | 4,709,542 | ||||||
| 7,732,325 | 2.058%, 3/1/2043e | 8,020,439 | ||||||
| 7,321,533 | 1.739%, 7/1/2043e | 7,457,268 | ||||||
|
| |||||||
Total | 65,613,782 | |||||||
|
| |||||||
| Technology (0.9%) |
| ||||||
Alibaba Group Holding, Ltd. | ||||||||
| 1,650,000 | 2.500%, 11/28/2019d | 1,627,753 | ||||||
Amphenol Corporation | ||||||||
| 1,409,000 | 2.550%, 1/30/2019 | 1,418,797 | ||||||
Apple, Inc. | ||||||||
| 3,300,000 | 0.532%, 5/6/2019e | 3,301,343 | ||||||
Micron Semiconductor Asia Pte, Ltd. | ||||||||
| 1,237,500 | 1.258%, 1/15/2019 | 1,235,499 | ||||||
Xilinx, Inc. | ||||||||
| 1,750,000 | 2.125%, 3/15/2019i | 1,738,756 | ||||||
|
| |||||||
Total | 9,322,148 | |||||||
|
| |||||||
| Transportation (1.1%) |
| ||||||
American Airlines Pass Through Trust | ||||||||
| 1,454,345 | 5.600%, 7/15/2020d | 1,483,432 | ||||||
| 1,415,952 | 4.950%, 1/15/2023 | 1,511,529 | ||||||
British Airways plc | ||||||||
| 1,465,919 | 4.625%, 6/20/2024d | 1,550,210 | ||||||
Continental Airlines, Inc. | ||||||||
| 3,010,059 | 4.150%, 4/11/2024 | 3,090,969 | ||||||
Delta Air Lines, Inc. | ||||||||
| 821,593 | 4.750%, 5/7/2020 | 874,011 | ||||||
TTX Company | ||||||||
| 800,000 | 4.125%, 10/1/2023* | 845,206 | ||||||
Virgin Australia Holdings, Ltd. | ||||||||
| 1,655,776 | 5.000%, 10/23/2023d | 1,697,170 | ||||||
|
| |||||||
Total | 11,052,527 | |||||||
|
| |||||||
| U.S. Government and Agencies (19.2%) |
| ||||||
Federal Agricultural Mortgage Corporation | ||||||||
| 3,500,000 | 2.000%, 7/27/2016 | 3,571,130 | ||||||
Federal Home Loan Mortgage Corporation | ||||||||
| 500,000 | 1.250%, 8/1/2019 | 490,768 | ||||||
| 4,000,000 | 1.250%, 10/2/2019 | 3,913,484 | ||||||
Federal National Mortgage Association | ||||||||
| 5,000,000 | 1.000%, 9/27/2017 | 4,989,930 | ||||||
| 8,000,000 | 1.750%, 11/26/2019 | 8,004,800 | ||||||
U.S. Treasury Bonds | ||||||||
| 8,000,000 | 5.375%, 2/15/2031 | 11,150,624 | ||||||
| 2,200,000 | 3.000%, 5/15/2042 | 2,312,407 | ||||||
U.S. Treasury Bonds, TIPS | ||||||||
| 21,787,455 | 0.125%, 4/15/2019 | 21,547,444 | ||||||
U.S. Treasury Notes | ||||||||
| 25,250,000 | 0.625%, 10/15/2016 | 25,257,878 | ||||||
| 1,400,000 | 0.875%, 11/15/2017 | 1,393,328 | ||||||
| 41,950,000 | 1.500%, 10/31/2019 | 41,694,357 | ||||||
| 43,605,000 | 1.875%, 6/30/2020 | 43,897,982 | ||||||
| 8,000,000 | 3.625%, 2/15/2044 | 9,414,376 | ||||||
U.S. Treasury Notes, TIPS | ||||||||
| 1,566,510 | 0.125%, 4/15/2018 | 1,560,636 | ||||||
| 922,658 | 1.125%, 1/15/2021 | 958,483 | ||||||
| 8,602,784 | 0.125%, 1/15/2022 | 8,367,549 | ||||||
| 7,021,014 | 0.125%, 1/15/2023 | 6,788,991 | ||||||
|
| |||||||
Total | 195,314,167 | |||||||
|
| |||||||
| Utilities (2.0%) |
| ||||||
Berkshire Hathaway Energy Company | ||||||||
| 1,550,000 | 2.400%, 2/1/2020d | 1,543,251 | ||||||
Dayton Power and Light Company | ||||||||
| 1,200,000 | 1.875%, 9/15/2016 | 1,213,257 | ||||||
Dominion Gas Holdings, LLC | ||||||||
| 1,440,000 | 2.500%, 12/15/2019 | 1,443,573 | ||||||
DTE Energy Company | ||||||||
| 730,000 | 2.400%, 12/1/2019 | 730,120 | ||||||
Electricite de France SA | ||||||||
| 1,500,000 | 5.250%, 12/29/2049d,j | 1,537,500 | ||||||
Enterprise Products Operating, LLC | ||||||||
| 1,650,000 | 7.034%, 1/15/2068 | 1,809,844 | ||||||
National Rural Utilities Cooperative Finance Corporation | ||||||||
| 1,150,000 | 4.750%, 4/30/2043 | 1,139,650 | ||||||
NextEra Energy Capital Holdings, Inc. | ||||||||
| 2,575,000 | 2.400%, 9/15/2019 | 2,572,554 | ||||||
Northeast Utilities | ||||||||
| 1,250,000 | 1.450%, 5/1/2018 | 1,231,019 | ||||||
Pacific Gas & Electric Company | ||||||||
| 250,000 | 5.625%, 11/30/2017 | 277,866 | ||||||
PG&E Corporation | ||||||||
| 1,500,000 | 2.400%, 3/1/2019 | 1,502,271 | ||||||
Public Service Electric And Gas Company | ||||||||
| 2,570,000 | 1.800%, 6/1/2019 | 2,546,140 | ||||||
The accompanying Notes to Financial Statements are an integral part of this schedule.
330
Table of Contents
LIMITED MATURITY BOND PORTFOLIO
Schedule of Investments as of December 31, 2014
| Principal Amount | Long-Term Fixed Income (94.3%) | Value | ||||||
| Utilities (2.0%) - continued | |||||||
Sempra Energy | ||||||||
| $ | 2,425,000 | 2.300%, 4/1/2017 | $ | 2,469,581 | ||||
|
| |||||||
Total | 20,016,626 | |||||||
|
| |||||||
Total Long-Term Fixed Income (cost $965,853,197) | 960,741,391 | |||||||
|
| |||||||
| Shares | Preferred Stock (0.7%) | Value | ||||||
| Financials (0.5%) | |||||||
| 20,000 | Allstate Corporation, 5.100% | 506,600 | ||||||
| 66,000 | Citigroup, Inc., 7.875% | 1,754,280 | ||||||
| 8,125 | Farm Credit Bank of Texas, 6.750%d,j | 840,684 | ||||||
| 66,000 | HSBC Holdings plc, 8.000%j | 1,753,620 | ||||||
|
| |||||||
Total | 4,855,184 | |||||||
|
| |||||||
| Utilities (0.2%) | |||||||
| 24,375 | Southern California Edison Company, 4.510%j | 2,448,927 | ||||||
|
| |||||||
Total | 2,448,927 | |||||||
|
| |||||||
Total Preferred Stock (cost $7,203,319) | 7,304,111 | |||||||
|
| |||||||
| Shares | Collateral Held for Securities Loaned (0.8%) | Value | ||||||
| 8,419,435 | Thrivent Cash Management Trust | 8,419,435 | ||||||
|
| |||||||
Total Collateral Held for Securities Loaned (cost $8,419,435) | 8,419,435 | |||||||
|
| |||||||
| Shares or Principal Amount | Short-Term Investments (4.2%)k | Value | ||||||
Federal Home Loan Bank Discount Notes | ||||||||
| 200,000 | 0.090%, 4/24/2015l | 199,943 | ||||||
| 1,200,000 | 0.135%, 4/29/2015l | 1,199,469 | ||||||
Thrivent Cash Management Trust | ||||||||
| 40,223,834 | 0.060% | 40,223,834 | ||||||
U.S. Treasury Bill | ||||||||
| 700,000 | 0.010%, 1/22/2015 | 699,996 | ||||||
|
| |||||||
Total Short-Term Investments (at amortized cost) | 42,323,242 | |||||||
|
| |||||||
Total Investments (cost $1,058,608,449) 103.3% | $ | 1,052,329,367 | ||||||
|
| |||||||
Other Assets and Liabilities, Net (3.3%) | (33,991,571 | ) | ||||||
|
| |||||||
Total Net Assets 100.0% | $ | 1,018,337,796 | ||||||
|
| |||||||
| a | The stated interest rate represents the weighted average of all contracts within the bank loan facility. |
| b | All or a portion of the loan is unfunded. |
| c | Denotes investments purchased on a when-issued or delayed delivery basis. |
| d | Denotes securities sold under Rule 144A of the Securities Act of 1933, which exempts them from registration. These securities have been deemed liquid and may be resold to other dealers in the program or to other qualified institutional buyers. As of December 31, 2014, the value of these investments was $226,649,255 or 22.3% of total net assets. |
| e | Denotes variable rate securities. Variable rate securities are securities whose yields vary with a designated market index or market rate. The rate shown is as of December 31, 2014. |
| f | All or a portion of the security is insured or guaranteed. |
| g | Denotes step coupon securities. Step coupon securities pay an initial coupon rate for the first period and then different coupon rates for following periods. The rate shown is as of December 31, 2014. |
| h | Defaulted security. Interest is not being accrued. |
| i | All or a portion of the security is on loan. |
| J | Denotes perpetual securities. Perpetual securities pay an indefinite stream of interest, but may be called by the issuer at an earlier date. |
| k | The interest rate shown reflects the yield, coupon rate or the discount rate at the date of purchase. |
| l | At December 31, 2014, $1,399,412 of investments were held on deposit with the counter party and pledged as the initial margin deposit for open futures contracts. |
| * | Denotes restricted securities. Restricted securities are investment securities which have been deemed illiquid and cannot be offered for public sale without first being registered under the Securities Act of 1933. The following table indicates the acquisition date and cost of restricted securities Limited Maturity Bond Portfolio owned as of December 31, 2014. |
Security | Acquisition Date | Cost | ||||||
Alm Loan Funding CLO, 10/17/2026 | 7/31/2014 | $ | 3,758,120 | |||||
American Tower Trust 1, 3/15/2018 | 3/6/2013 | 1,650,000 | ||||||
Apidos CLO XVIII, 7/22/2026 | 6/25/2014 | 3,765,563 | ||||||
Babson CLO, Ltd. 2014-11, 10/17/2026 | 8/15/2014 | 3,758,120 | ||||||
Bayview Opportunity Master Fund Trust IIB, LP, 7/28/2034 | 6/27/2014 | 4,538,888 | ||||||
Birchwood Park CLO, Ltd., 7/15/2026 | 7/31/2014 | 3,760,000 | ||||||
BlueMountain CLO, Ltd., 10/15/2026 | 8/27/2014 | 3,756,202 | ||||||
Carlyle Global Market Strategies CLO, Ltd., 7/20/2023 | 7/3/2014 | 3,750,000 | ||||||
Carlyle Global Market Strategies CLO, Ltd., 10/15/2026 | 9/19/2014 | 3,750,000 | ||||||
Cent CLO 16, LP, 8/1/2024 | 9/5/2014 | 3,760,000 | ||||||
Cent CLO 22, Ltd., 11/7/2026 | 9/19/2014 | 3,750,000 | ||||||
CoBank ACB, 6/15/2022 | 10/18/2013 | 1,856,177 | ||||||
Crown Castle Towers, LLC, 8/15/2015 | 7/29/2010 | 2,500,000 | ||||||
Dryden 34 Senior Loan Fund CLO, 10/15/2026 | 7/21/2014 | 3,760,000 | ||||||
Edlinc Student Loan Funding Trust, 10/1/2025 | 11/29/2012 | 2,605,068 | ||||||
First Franklin Mortgage Loan Asset-Backed Certificates, 3/25/2036 | 4/19/2006 | 214,738 | ||||||
GoldenTree Loan Opportunities IX, Ltd., 10/29/2026 | 10/3/2014 | 3,746,250 | ||||||
GTPAcquisition Partners 1, LLC, 6/15/2016 | 6/29/2011 | 2,000,000 | ||||||
Madison Park Funding XIV CLO, Ltd., 7/20/2026 | 7/3/2014 | 4,145,020 | ||||||
Mortgage Equity Conversion Asset Trust, 1/25/2042 | 1/18/2007 | 4,495,697 | ||||||
Mortgage Equity Conversion Asset Trust, 2/25/2042 | 2/14/2007 | 4,543,458 | ||||||
Neuberger Berman CLO, Ltd., 8/4/2025 | 6/19/2014 | 3,000,000 | ||||||
Octagon Investment Partners XX CLO, Ltd., 8/12/2026 | 7/10/2014 | 3,760,000 | ||||||
The accompanying Notes to Financial Statements are an integral part of this schedule.
331
Table of Contents
LIMITED MATURITY BOND PORTFOLIO
Schedule of Investments as of December 31, 2014
Security | Acquisition Date | Cost | ||||||
OZLM VIII, Ltd., 10/17/2026 | 8/7/2014 | $ | 3,738,568 | |||||
Selene Non-Performing Loans, LLC, 5/25/2054 | 5/23/2014 | 1,978,197 | ||||||
Symphony CLO, Ltd., 1/9/2023 | 9/15/2014 | 3,760,000 | ||||||
TTX Company, 10/1/2023 | 9/19/2013 | 799,992 | ||||||
Voya CLO 2014-3, Ltd., 7/25/2026 | 7/10/2014 | 3,754,360 | ||||||
Wachovia Asset Securitization, Inc., 7/25/2037 | 3/16/2007 | 994,526 | ||||||
Definitions:
CLO | - | Collateralized Loan Obligation | ||
TIPS | - | Treasury Inflation Protected Security. |
Unrealized Appreciation (Depreciation)
Gross unrealized appreciation and depreciation of investments, based on cost for federal income tax purposes, were as follows:
Gross unrealized appreciation | $ | 10,364,333 | ||
Gross unrealized depreciation | (16,643,673 | ) | ||
|
| |||
Net unrealized appreciation (depreciation) | $ | (6,279,340 | ) | |
Cost for federal income tax purposes | $ | 1,058,608,707 | ||
The accompanying Notes to Financial Statements are an integral part of this schedule.
332
Table of Contents
LIMITED MATURITY BOND PORTFOLIO
Schedule of Investments as of December 31, 2014
Fair Valuation Measurements
The following table is a summary of the inputs used, as of December 31, 2014, in valuing Limited Maturity Bond Portfolio’s assets carried at fair value.
Investments in Securities | Total | Level 1 | Level 2 | Level 3 | ||||||||||||
Bank Loans | ||||||||||||||||
Basic Materials | 954,891 | — | 954,891 | — | ||||||||||||
Capital Goods | 2,673,054 | — | 2,673,054 | — | ||||||||||||
Communications Services | 9,472,486 | — | 7,415,102 | 2,057,384 | ||||||||||||
Consumer Cyclical | 6,985,677 | — | 6,985,677 | — | ||||||||||||
Consumer Non-Cyclical | 4,781,112 | — | 4,041,209 | 739,903 | ||||||||||||
Energy | 1,899,283 | — | 1,899,283 | — | ||||||||||||
Financials | 1,527,904 | — | 1,527,904 | — | ||||||||||||
Technology | 2,489,360 | — | 2,489,360 | — | ||||||||||||
Transportation | 1,338,014 | — | 1,338,014 | — | ||||||||||||
Utilities | 1,419,407 | — | 1,419,407 | — | ||||||||||||
Long-Term Fixed Income | ||||||||||||||||
Asset-Backed Securities | 156,657,097 | — | 142,386,045 | 14,271,052 | ||||||||||||
Basic Materials | 12,774,537 | — | 12,774,537 | — | ||||||||||||
Capital Goods | 4,654,138 | — | 4,654,138 | — | ||||||||||||
Collateralized Mortgage Obligations | 97,068,055 | — | 97,068,055 | — | ||||||||||||
Commercial Mortgage-Backed Securities | 52,809,255 | — | 52,809,255 | — | ||||||||||||
Communications Services | 29,733,373 | — | 29,733,373 | — | ||||||||||||
Consumer Cyclical | 12,261,601 | — | 12,261,601 | — | ||||||||||||
Consumer Non-Cyclical | 33,659,958 | — | 33,659,958 | — | ||||||||||||
Energy | 23,515,190 | — | 23,515,190 | — | ||||||||||||
Financials | 203,449,664 | — | 203,449,664 | — | ||||||||||||
Foreign Government | 32,839,273 | — | 32,839,273 | — | ||||||||||||
Mortgage-Backed Securities | 65,613,782 | — | 65,613,782 | — | ||||||||||||
Technology | 9,322,148 | — | 9,322,148 | — | ||||||||||||
Transportation | 11,052,527 | — | 11,052,527 | — | ||||||||||||
U.S. Government and Agencies | 195,314,167 | — | 195,314,167 | — | ||||||||||||
Utilities | 20,016,626 | — | 20,016,626 | — | ||||||||||||
Preferred Stock | ||||||||||||||||
Financials | 4,855,184 | 4,014,500 | 840,684 | — | ||||||||||||
Utilities | 2,448,927 | — | 2,448,927 | — | ||||||||||||
Collateral Held for Securities Loaned | 8,419,435 | 8,419,435 | — | — | ||||||||||||
Short-Term Investments | 42,323,242 | 40,223,834 | 2,099,408 | — | ||||||||||||
|
|
|
|
|
|
|
| |||||||||
Total | $ | 1,052,329,367 | $ | 52,657,769 | $ | 982,603,259 | $ | 17,068,339 | ||||||||
|
|
|
|
|
|
|
| |||||||||
Other Financial Instruments | Total | Level 1 | Level 2 | Level 3 | ||||||||||||
Liability Derivatives Futures Contracts | 421,516 | 421,516 | ||||||||||||||
|
|
|
|
|
|
|
| |||||||||
Total Liability Derivatives | $ | 421,516 | $ | 421,516 | $ | — | $ | — | ||||||||
|
|
|
|
|
|
|
| |||||||||
There were no significant transfers between Levels during the period ended December 31, 2014. Transfers between Levels are identified as of the end of the period.
Futures Contracts | Number of Contracts Long/(Short) | Expiration Date | Notional Principal Amount | Value | Unrealized Gain/(Loss) | |||||||||||||||
5-Yr. U.S. Treasury Bond Futures | (940 | ) | March 2015 | $ | (111,680,883 | ) | $ | (111,793,909 | ) | $ | (113,026 | ) | ||||||||
10-Yr. U.S. Treasury Bond Futures | (275 | ) | March 2015 | (34,640,568 | ) | (34,869,142 | ) | (228,574 | ) | |||||||||||
30-Yr. U.S. Treasury Bond Futures | (75 | ) | March 2015 | (10,762,271 | ) | (10,842,187 | ) | (79,916 | ) | |||||||||||
Total Futures Contracts | $ | (421,516 | ) | |||||||||||||||||
The accompanying Notes to Financial Statements are an integral part of this schedule.
333
Table of Contents
LIMITED MATURITY BOND PORTFOLIO
Schedule of Investments as of December 31, 2014
The following table summarizes the fair value and Statement of Assets and Liabilities location, as of December 31, 2014, for Limited Maturity Bond Portfolio’s investments in financial derivative instruments by primary risk exposure as discussed under item (2) Significant Accounting Policies of the Notes to Financial Statements.
Derivatives by risk category | Statement of Assets and Liabilities Location | Fair Value | ||||
| Liability Derivatives | ||||||
Interest Rate Contracts | ||||||
Futures* | Net Assets - Net unrealized appreciation/(depreciation) on Futures contracts | $ | 421,516 | |||
Total Interest Rate Contracts | 421,516 | |||||
|
| |||||
Total Liability Derivatives | $ | 421,516 | ||||
|
| |||||
| * | Includes cumulative appreciation/depreciation of futures contracts as reported in the Schedule of Investments. Only current day’s variation margin is reported within the Statement of Assets and Liabilities. |
The following table summarizes the net realized gains/(losses) and Statement of Operations location, for the period ended December 31, 2014, for Limited Maturity Bond Portfolio’s investments in financial derivative instruments by primary risk exposure.
Derivatives by risk category | Statement of Operations Location | Realized Gains/(Losses) recognized in Income | ||||
| Equity Contracts | ||||||
Options Written | Net realized gains/(losses) on Written option contracts | 47,600 | ||||
Options Purchased | Net realized gains/(losses) on Investments | (415,656 | ) | |||
| Total Equity Contracts | (368,056 | ) | ||||
Interest Rate Contracts | ||||||
Futures | Net realized gains/(losses) on Futures contracts | (2,568,986 | ) | |||
Total Interest Rate Contracts | (2,568,986 | ) | ||||
| Credit Contracts | ||||||
Credit Default Swaps | Net realized gains/(losses) on Swap agreements | (435,775 | ) | |||
Total Credit Contracts | (435,775 | ) | ||||
|
| |||||
Total | ($ | 3,372,817 | ) | |||
|
| |||||
The following table summarizes the change in net unrealized appreciation/(depreciation) and Statement of Operations location, for the period ended December 31, 2014, for Limited Maturity Bond Portfolio’s investments in financial derivative instruments by primary risk exposure.
Derivatives by risk category | Statement of Operations Location | Change in unrealized appreciation/(depreciation) recognized in Income | ||||
| Interest Rate Contracts | ||||||
Futures | Change in net unrealized appreciation/(depreciation) on Futures contracts | (2,789,651 | ) | |||
| Total Interest Rate Contracts | (2,789,651 | ) | ||||
Credit Contracts | ||||||
Credit Default Swaps | Change in net unrealized appreciation/(depreciation) on Swap agreements | 431,919 | ||||
Total Credit Contracts | 431,919 | |||||
|
| |||||
Total | ($ | 2,357,732 | ) | |||
|
| |||||
The following table presents Limited Maturity Bond Portfolio’s average volume of derivative activity during the period ended December 31, 2014.
Derivative Risk Category | Futures (Notional)* | Futures (Percentage of Average Net Assets) | Swaps (Notional)* | Swaps (Percentage of Average Net Assets) | Options (Contracts) | |||||||||||||||
Equity Contracts | N/A | N/A | N/A | N/A | 112 | |||||||||||||||
Interest Rate Contracts | 156,876,027 | 14.7 | N/A | N/A | N/A | |||||||||||||||
Credit Contracts | N/A | N/A | $ | 1,310,913 | 0.1 | % | N/A | |||||||||||||
| * | Notional amount represents long or short, or both, derivative positions held by the Portfolio. |
The accompanying Notes to Financial Statements are an integral part of this schedule.
334
Table of Contents
LIMITED MATURITY BOND PORTFOLIO
Schedule of Investments as of December 31, 2014
Investment in Affiliates
Affiliated issuers, as defined under the Investment Company Act of 1940, include those in which the Portfolio’s holdings of an issuer represent 5% or more of the outstanding voting securities of an issuer, or any affiliated mutual fund.
A summary of transactions for the fiscal year to date, in Limited Maturity Bond Portfolio, is as follows:
Portfolio | Value December 31, 2013 | Gross Purchases | Gross Sales | Shares Held at December 31, 2014 | Value December 31, 2014 | Income Earned January 1, 2014 - December 31, 2014 | ||||||||||||||||||
Cash Management Trust- Collateral Investment | $ | 4,107,820 | $ | 90,171,694 | $ | 85,860,079 | 8,419,435 | $ | 8,419,435 | $ | 10,794 | |||||||||||||
Cash Management Trust- Short Term Investment | 59,226,574 | 339,727,092 | 358,729,832 | 40,223,834 | 40,223,834 | 30,119 | ||||||||||||||||||
Total Value and Income Earned | 63,334,394 | 48,643,269 | 40,913 | |||||||||||||||||||||
The accompanying Notes to Financial Statements are an integral part of this schedule.
335
Table of Contents
Schedule of Investments as of December 31, 2014
| Principal Amount | Asset Backed Commercial Paper (22.9%)a | Value | ||||||
Chariot Funding, LLC | ||||||||
| $ | 1,028,000 | 0.250%, 6/3/2015b,c | $ | 1,026,908 | ||||
Dealers Capital Access Trust, LLC | ||||||||
| 1,250,000 | 0.340%, 1/14/2015b | 1,249,846 | ||||||
| 675,000 | 0.350%, 1/23/2015b | 674,856 | ||||||
Fairway Finance, LLC | ||||||||
| 1,240,000 | 0.180%, 3/10/2015b,c | 1,239,578 | ||||||
Golden Funding Corporation | ||||||||
| 620,000 | 0.200%, 1/13/2015b,c | 619,959 | ||||||
| 1,220,000 | 0.220%, 1/14/2015b,c | 1,219,903 | ||||||
Kells Funding, LLC | ||||||||
| 1,240,000 | 0.206%, 5/21/2015b,c,d | 1,240,000 | ||||||
| 1,240,000 | 0.232%, 11/4/2015b,c,d | 1,239,874 | ||||||
Liberty Street Funding, LLC | ||||||||
| 5,640,000 | 0.010%, 1/2/2015b,c | 5,639,998 | ||||||
Nieuw Amsterdam Receivables | ||||||||
| 1,230,000 | 0.180%, 2/4/2015b,c | 1,229,791 | ||||||
| 1,250,000 | 0.180%, 2/17/2015b,c | 1,249,706 | ||||||
Old Line Funding, LLC | ||||||||
| 1,240,000 | 0.204%, 4/23/2015b,c,d | 1,240,000 | ||||||
| 1,230,000 | 0.230%, 5/20/2015b,c | 1,228,908 | ||||||
Starbird Funding Corporation | ||||||||
| 6,000,000 | 0.050%, 1/2/2015b,c | 5,999,992 | ||||||
Sydney Capital Corporation | ||||||||
| 1,245,000 | 0.210%, 3/24/2015b,c | 1,244,404 | ||||||
Thunder Bay Funding, LLC | ||||||||
| 1,225,000 | 0.239%, 4/14/2015b,c | 1,224,155 | ||||||
| 1,245,000 | 0.204%, 5/20/2015b,c,d | 1,245,000 | ||||||
|
| |||||||
Total | 28,812,878 | |||||||
|
| |||||||
Certificate of Deposit (7.4%)a | ||||||||
Bank of Montreal Chicago | ||||||||
| 1,320,000 | 0.238%, 4/9/2015d | 1,320,000 | ||||||
Rabobank Nederland NY | ||||||||
| 660,000 | 0.282%, 5/20/2015d | 660,046 | ||||||
| 1,290,000 | 0.262%, 7/17/2015d | 1,290,000 | ||||||
Skandinaviska Enskilda Banken AB | ||||||||
| 1,270,000 | 0.634%, 2/26/2015d | 1,270,766 | ||||||
Svenska Handelsbanken NY | ||||||||
| 1,140,000 | 0.170%, 2/4/2015 | 1,139,989 | ||||||
Toronto-Dominion Bank of New York | ||||||||
| 1,230,000 | 0.252%, 11/18/2015d | 1,230,000 | ||||||
US Bank NA | ||||||||
| 1,250,000 | 0.181%, 6/16/2015d | 1,250,000 | ||||||
Wells Fargo Bank NA | ||||||||
| 1,270,000 | 0.265%, 9/4/2015d | 1,270,000 | ||||||
|
| |||||||
Total | 9,430,801 | |||||||
|
| |||||||
Financial Company Commercial Paper (10.0%)a | ||||||||
AllianceBernstein, LP | ||||||||
| 1,000,000 | 0.300%, 1/5/2015c | 999,967 | ||||||
| 1,240,000 | 0.230%, 2/18/2015c | 1,239,620 | ||||||
BHP Billiton Finance USA, Ltd. | ||||||||
| 1,230,000 | 0.120%, 1/9/2015b,c | 1,229,967 | ||||||
General Electric Capital Corporation | ||||||||
| 1,220,000 | 0.180%, 3/11/2015b | 1,219,579 | ||||||
Skandinaviska Enskilda Banken AB | ||||||||
| 1,240,000 | 0.190%, 3/11/2015c | 1,239,548 | ||||||
| 1,025,000 | 0.200%, 3/17/2015c | 1,024,573 | ||||||
Toronto-Dominion Holdings USA, Inc. | ||||||||
| 1,220,000 | 0.160%, 1/13/2015b,c | 1,219,935 | ||||||
US Bank NA | ||||||||
| 4,500,000 | 0.100%, 1/2/2015 | 4,500,000 | ||||||
|
| |||||||
Total | 12,673,189 | |||||||
|
| |||||||
Government Agency Debt (30.7%)a | ||||||||
Federal Agricultural Mortgage Corporation | ||||||||
| 1,500,000 | 0.390%, 7/1/2015d | 1,501,215 | ||||||
Federal Farm Credit Bank | ||||||||
| 1,140,000 | 0.184%, 4/23/2015d | 1,140,216 | ||||||
| 1,140,000 | 0.158%, 8/3/2015d | 1,140,208 | ||||||
Federal Home Loan Bank | ||||||||
| 1,360,000 | 0.128%, 2/23/2015d | 1,360,000 | ||||||
| 1,980,000 | 0.100%, 3/10/2015 | 1,979,939 | ||||||
| 2,000,000 | 0.114%, 3/11/2015 | 1,999,563 | ||||||
| 1,100,000 | 0.150%, 3/18/2015 | 1,099,652 | ||||||
| 1,100,000 | 0.160%, 3/20/2015 | 1,099,619 | ||||||
| 1,240,000 | 0.135%, 3/27/2015 | 1,239,605 | ||||||
| 620,000 | 0.120%, 3/30/2015 | 619,818 | ||||||
| 1,230,000 | 0.120%, 5/28/2015d | 1,229,980 | ||||||
| 1,250,000 | 0.125%, 6/18/2015d | 1,250,007 | ||||||
| 1,280,000 | 0.129%, 8/26/2015d | 1,280,048 | ||||||
Federal Home Loan Mortgage Corporation | ||||||||
| 1,000,000 | 0.140%, 3/16/2015 | 999,712 | ||||||
| 3,960,000 | 0.160%, 6/26/2015d | 3,960,621 | ||||||
| 650,000 | 0.152%, 7/17/2015d | 650,109 | ||||||
Overseas Private Investment Corporation | ||||||||
| 2,300,000 | 0.110%, 1/7/2015d | 2,300,000 | ||||||
| 1,390,000 | 0.110%, 1/7/2015d | 1,390,000 | ||||||
| 1,300,000 | 0.110%, 1/7/2015d | 1,300,000 | ||||||
| 862,067 | 0.110%, 1/7/2015d | 862,067 | ||||||
| 1,420,000 | 0.110%, 1/7/2015d | 1,420,000 | ||||||
| 1,410,000 | 0.110%, 1/7/2015d | 1,410,000 | ||||||
| 723,786 | 0.420%, 4/15/2015 | 725,958 | ||||||
| 1,980,000 | 0.390%, 5/2/2015 | 1,985,164 | ||||||
| 2,540,000 | 0.430%, 7/12/2015 | 2,545,117 | ||||||
| 800,000 | 0.205%, 9/7/2015 | 801,033 | ||||||
| 900,000 | 0.410%, 9/7/2015 | 901,162 | ||||||
| 800,000 | 0.450%, 12/10/2015 | 800,217 | ||||||
|
| |||||||
Total | 38,991,030 | |||||||
|
| |||||||
| Shares | Investment Company (7.8%) | |||||||
BlackRock Cash Funds | ||||||||
| 6,033,000 | 0.100% | 6,033,000 | ||||||
Dreyfus Institutional Cash Advantage Fund | ||||||||
| 670,000 | 0.060% | 670,000 | ||||||
Duetsche Money Market Series | ||||||||
| 3,150,037 | 0.060% | 3,150,037 | ||||||
|
| |||||||
Total | 9,853,037 | |||||||
|
| |||||||
| Principal Amount | Other Commercial Paper (11.6%)a | |||||||
Caisse des Depots et Consignations | ||||||||
| 1,240,000 | 0.180%, 2/13/2015b,c | 1,239,733 | ||||||
| 1,240,000 | 0.200%, 4/2/2015b,c | 1,239,373 | ||||||
Cargill Global Funding plc | ||||||||
| 2,400,000 | 0.110%, 1/6/2015b,c | 2,399,963 | ||||||
The accompanying Notes to Financial Statements are an integral part of this schedule.
336
Table of Contents
MONEY MARKET PORTFOLIO
Schedule of Investments as of December 31, 2014
| Principal Amount | Other Commercial Paper (11.6%)a | Value | ||||||
Coca-Cola Company | ||||||||
| $ | 1,260,000 | 0.170%, 2/9/2015c | $ | 1,259,768 | ||||
Emerson Electric Company | ||||||||
| 700,000 | 0.150%, 1/21/2015c | 699,942 | ||||||
| 1,250,000 | 0.120%, 1/26/2015c | 1,249,896 | ||||||
Proctor & Gamble Company | ||||||||
| 1,250,000 | 0.110%, 1/28/2015c | 1,249,897 | ||||||
Reckitt Benckiser Treasury Services plc | ||||||||
| 1,000,000 | 0.170%, 2/6/2015b,c | 999,830 | ||||||
| 1,270,000 | 0.240%, 3/24/2015b,c | 1,269,306 | ||||||
Roche Holdings, Inc. | ||||||||
| 630,000 | 0.125%, 1/12/2015b,c | 629,976 | ||||||
Schlumberger Investment SA | ||||||||
| 1,100,000 | 0.140%, 3/18/2015b,c | 1,099,675 | ||||||
Society of New York Hospital Fund | ||||||||
| 1,240,000 | 0.150%, 1/7/2015b | 1,239,969 | ||||||
|
| |||||||
Total | 14,577,328 | |||||||
|
| |||||||
Other Note (9.6%)a | ||||||||
Bank of New York Mellon Corporation | 1,232,284 | |||||||
| 1,230,000 | 0.461%, 10/23/2015d | |||||||
Coca-Cola Company | ||||||||
| 1,250,000 | 0.244%, 9/1/2015d | 1,250,473 | ||||||
General Electric Capital Corporation | ||||||||
| 1,310,000 | 1.000%, 8/11/2015b,d | 1,316,010 | ||||||
| 1,240,000 | 0.839%, 12/11/2015b,d | 1,246,386 | ||||||
John Deere Capital Corporation | ||||||||
| 1,240,000 | 0.300%, 1/12/2015b,d | 1,240,053 | ||||||
Novartis Capital Corporation | ||||||||
| 1,240,000 | 2.900%, 4/24/2015b | 1,250,128 | ||||||
Royal Bank of Canada | ||||||||
| 700,000 | 0.322%, 1/7/2016c,d | 700,000 | ||||||
Total Capital SA | ||||||||
| 1,215,000 | 3.000%, 6/24/2015b | 1,230,348 | ||||||
Wells Fargo Bank NA | ||||||||
| 1,370,000 | 0.331%, 1/15/2016d | 1,370,000 | ||||||
Westpac Banking Corporation | ||||||||
| 1,250,000 | 1.028%, 7/17/2015c,d | 1,255,342 | ||||||
|
| |||||||
Total | 12,091,024 | |||||||
|
| |||||||
Total Investments (at amortized cost) 100.0% | $ | 126,429,287 | ||||||
|
| |||||||
Other Assets and Liabilities, Net (<0.1%) | (14,499 | ) | ||||||
|
| |||||||
Total Net Assets 100.0% | $ | 126,414,788 | ||||||
|
| |||||||
| a | The interest rate shown reflects the yield, coupon rate or the discount rate at the date of purchase. |
| b | Denotes investments that benefit from credit enhancement or liquidity support provided by a third party bank, institution or government. |
| c | Denotes securities sold under Rule 144A of the Securities Act of 1933, which exempts them from registration. These securities have been deemed liquid and may be resold to other dealers in the program or to other qualified institutional buyers. As of December 31, 2014, the value of these investments was $49,134,487 or 38.9% of total net assets. |
| d | Denotes variable rate securities. Variable rate securities are securities whose yields vary with a designated market index or market rate. The rate shown is as of December 31, 2014. |
Cost for federal income tax purposes | $ | 126,429,287 |
The accompanying Notes to Financial Statements are an integral part of this schedule.
337
Table of Contents
MONEY MARKET PORTFOLIO
Schedule of Investments as of December 31, 2014
Fair Valuation Measurements
The following table is a summary of the inputs used, as of December 31, 2014, in valuing Money Market Portfolio’s assets carried at fair value or amortized cost, which approximates fair value.
Investments in Securities | Total | Level 1 | Level 2 | Level 3 | ||||||||||||
Asset Backed Commercial Paper | 28,812,878 | — | 28,812,878 | — | ||||||||||||
Certificate of Deposit | 9,430,801 | — | 9,430,801 | — | ||||||||||||
Financial Company Commercial Paper | 12,673,189 | — | 12,673,189 | — | ||||||||||||
Government Agency Debt | 38,991,030 | — | 38,991,030 | — | ||||||||||||
Investment Company | 9,853,037 | 9,853,037 | — | — | ||||||||||||
Other Commercial Paper | 14,577,328 | — | 14,577,328 | �� | — | |||||||||||
Other Note | 12,091,024 | — | 12,091,024 | — | ||||||||||||
|
|
|
|
|
|
|
| |||||||||
Total | $ | 126,429,287 | $ | 9,853,037 | $ | 116,576,250 | $ | — | ||||||||
|
|
|
|
|
|
|
| |||||||||
There were no significant transfers between Levels during the period ended December 31, 2014. Transfers between Levels are identified as of the end of the period.
The accompanying Notes to Financial Statements are an integral part of this schedule.
338
Table of Contents
THIS PAGE INTENTIONALLY LEFT BLANK
339
Table of Contents
THRIVENT SERIES FUND, INC.
STATEMENTOF ASSETSAND LIABILITIES
As of December 31, 2014 | Aggressive Allocation Portfolio | Moderately Aggressive Allocation Portfolio | Moderate Allocation Portfolio | Moderately Conservative Allocation Portfolio | ||||||||||||
Assets | ||||||||||||||||
Investments at cost | $ | 802,252,298 | $ | 4,422,414,262 | $ | 8,664,971,115 | $ | 3,886,222,772 | ||||||||
Investments in securities at value | 563,491,447 | 2,995,956,240 | 6,328,136,335 | 2,861,808,072 | ||||||||||||
Investments in affiliates at value | 347,384,011 | 1,978,889,007 | 3,019,850,901 | 1,248,866,490 | ||||||||||||
Investments at Value | 910,875,458 | 4,974,845,247 | 9,347,987,236 | 4,110,674,562 | ||||||||||||
Cash | 4,168,485 | 3,048,326 | (a) | 2,843,209 | (b) | 2,443,130 | ||||||||||
Dividends and interest receivable | 501,450 | 4,385,428 | 10,778,525 | 6,883,855 | ||||||||||||
Prepaid expenses | 2,127 | 6,843 | 10,947 | 5,479 | ||||||||||||
Receivable for investments sold | 361,412 | 2,997,037 | 11,062,622 | 7,269,286 | ||||||||||||
Receivable for fund shares sold | 129,987 | 1,818,909 | 557,495 | 2,375,336 | ||||||||||||
Receivable for variation margin | 2,002,774 | 4,867,894 | 6,163,706 | 2,423,086 | ||||||||||||
Total Assets | 918,041,693 | 4,991,969,684 | 9,379,403,740 | 4,132,074,734 | ||||||||||||
Liabilities | ||||||||||||||||
Accrued expenses | 56,806 | 153,499 | 230,043 | 123,764 | ||||||||||||
Payable for investments purchased | 9,875,215 | 167,038,041 | 686,167,122 | 424,040,506 | ||||||||||||
Payable upon return of collateral for securities loaned | 241,100 | 39,076,872 | 67,749,452 | 24,079,812 | ||||||||||||
Payable for fund shares redeemed | 34,849 | 193,103 | 351,875 | 413,036 | ||||||||||||
Payable for variation margin | 2,509,934 | 8,407,982 | 13,039,577 | 2,268,392 | ||||||||||||
Payable to affiliate | 426,570 | 1,963,617 | 3,518,861 | 1,431,915 | ||||||||||||
Mortgage dollar roll deferred revenue | 7,313 | 139,004 | 584,409 | 362,229 | ||||||||||||
Total Liabilities | 13,151,787 | 216,972,118 | 771,641,339 | 452,719,654 | ||||||||||||
Net Assets | ||||||||||||||||
Capital stock (beneficial interest) | 723,090,768 | 3,945,701,373 | 7,461,397,725 | 3,285,127,577 | ||||||||||||
Accumulated undistributed net investment income/(loss) | 10,055,369 | 63,325,415 | 131,718,370 | 69,009,714 | ||||||||||||
Accumulated undistributed net realized gain/(loss) | 60,830,594 | 188,563,993 | 271,545,165 | 85,572,231 | ||||||||||||
Net unrealized appreciation/(depreciation) on: | ||||||||||||||||
Investments | 75,403,737 | 250,069,315 | 307,185,066 | 105,534,147 | ||||||||||||
Affiliated investments | 33,219,423 | 302,361,670 | 375,831,055 | 118,917,643 | ||||||||||||
Futures contracts | 2,287,808 | 24,966,290 | 60,065,160 | 15,186,713 | ||||||||||||
Foreign currency transactions | 2,207 | 9,510 | 19,860 | 7,055 | ||||||||||||
Total Net Assets | $ | 904,889,906 | $ | 4,774,997,566 | $ | 8,607,762,401 | $ | 3,679,355,080 | ||||||||
Shares of beneficial interest outstanding | 58,616,858 | 324,445,807 | 619,044,096 | 285,368,589 | ||||||||||||
Net asset value per share | $ | 15.44 | $ | 14.72 | $ | 13.90 | $ | 12.89 | ||||||||
| (a) | Includes foreign currency holdings of $107,897 (cost $107,453). |
| (b) | Includes foreign currency holdings of $141,087 (cost $140,466). |
The accompanying Notes to Financial Statements are an integral part of this statement.
340
Table of Contents
THRIVENT SERIES FUND, INC.
STATEMENTOF ASSETSAND LIABILITIES –CONTINUED
Growth and Income Plus Portfolio | Balanced Income Plus Portfolio | Diversified Income Plus Portfolio | Opportunity Income Plus Portfolio | Partner Technology Portfolio | Partner Healthcare Portfolio | Natural Resources Portfolio | ||||||||||||||||||||
| $ | 82,485,947 | $ | 306,276,537 | $ | 451,938,947 | $ | 80,466,807 | $ | 41,677,711 | $ | 88,278,496 | $ | 40,037,652 | |||||||||||||
| 75,266,597 | 290,368,028 | 410,383,056 | 69,179,647 | 54,650,543 | 96,496,556 | 30,978,083 | ||||||||||||||||||||
| 8,619,908 | 34,730,169 | 48,792,777 | 10,695,094 | 1,993,717 | 7,778,026 | 2,450,269 | ||||||||||||||||||||
| 83,886,505 | 325,098,197 | 459,175,833 | 79,874,741 | 56,644,260 | 104,274,582 | 33,428,352 | ||||||||||||||||||||
| 2,839 | (c) | 12,798 | 108,395 | (d) | 26,892 | — | — | — | ||||||||||||||||||
| 197,011 | 1,089,640 | 2,261,289 | 379,833 | 20,467 | 100,507 | 52,050 | ||||||||||||||||||||
| 1,146 | 1,421 | 1,549 | 1,119 | 1,116 | 1,136 | 1,098 | ||||||||||||||||||||
| 29,749 | 122,327 | 184,985 | 502,897 | — | — | — | ||||||||||||||||||||
| 8,162 | 51,989 | 4,857 | 198,573 | 77,211 | 285,276 | 3,100 | ||||||||||||||||||||
| 4,125 | 19,313 | 106,563 | 10,750 | — | — | — | ||||||||||||||||||||
| 84,129,537 | 326,395,685 | 461,843,471 | 80,994,805 | 56,743,054 | 104,661,501 | 33,484,600 | ||||||||||||||||||||
| 27,874 | 98,524 | 64,823 | 26,612 | 22,613 | 18,366 | 16,179 | ||||||||||||||||||||
| 2,882,168 | 16,356,547 | 21,921,559 | 9,163,382 | — | 2,434,658 | 145,175 | ||||||||||||||||||||
| — | 6,533,365 | 2,146,445 | — | — | — | 1,983,400 | ||||||||||||||||||||
| 14,476 | 154,827 | 125,760 | 635 | 7,389 | 1,237 | 29,138 | ||||||||||||||||||||
| 41,173 | 46,762 | 69,720 | 3,937 | — | — | — | ||||||||||||||||||||
| 42,075 | 155,771 | 164,414 | 33,963 | 38,887 | 85,655 | 18,472 | ||||||||||||||||||||
| 2,278 | 11,402 | 15,118 | 5,091 | — | — | — | ||||||||||||||||||||
| 3,010,044 | 23,357,198 | 24,507,839 | 9,233,620 | 68,889 | 2,539,916 | 2,192,364 | ||||||||||||||||||||
| 74,839,796 | 268,016,315 | 405,931,881 | 73,601,061 | 38,754,188 | 77,198,484 | 42,188,248 | ||||||||||||||||||||
| 1,697,388 | 6,688,222 | 15,507,791 | 1,795 | (18,797 | ) | (3,559 | ) | 148,701 | ||||||||||||||||||
| 3,058,500 | 9,188,275 | 8,211,990 | (1,341,258 | ) | 2,972,225 | 8,939,465 | (4,435,413 | ) | ||||||||||||||||||
| 1,400,558 | 18,821,660 | 7,236,886 | (592,066 | ) | 14,966,549 | 15,996,086 | (6,609,300 | ) | ||||||||||||||||||
| — | — | — | — | — | — | — | ||||||||||||||||||||
| 124,209 | 324,015 | 448,944 | 91,653 | — | — | — | ||||||||||||||||||||
| (958 | ) | — | (1,860 | ) | — | — | (8,891 | ) | — | |||||||||||||||||
| $ | 81,119,493 | $ | 303,038,487 | $ | 437,335,632 | $ | 71,761,185 | $ | 56,674,165 | $ | 102,121,585 | $ | 31,292,236 | |||||||||||||
| 7,568,910 | 20,382,250 | 55,104,608 | 7,069,967 | 5,297,632 | 5,184,130 | 5,118,162 | ||||||||||||||||||||
| $ | 10.72 | $ | 14.87 | $ | 7.94 | $ | 10.15 | $ | 10.70 | $ | 19.70 | $ | 6.11 | |||||||||||||
| (c) | Includes foreign currency holdings of $341 (cost $339). |
| (d) | Includes foreign currency holdings of $10,533 (cost $10,333). |
The accompanying Notes to Financial Statements are an integral part of this statement.
341
Table of Contents
THRIVENT SERIES FUND, INC.
STATEMENTOF ASSETSAND LIABILITIES –CONTINUED
As of December 31, 2014 | Partner Emerging Markets Equity Portfolio | Real Estate Securities Portfolio | Partner Small Cap Growth Portfolio | Partner Small Cap Value Portfolio | ||||||||||||
Assets | ||||||||||||||||
Investments at cost | $ | 43,217,572 | $ | 127,759,745 | $ | 48,331,883 | $ | 268,510,237 | ||||||||
Investments in securities at value | 47,154,758 | 141,406,776 | 46,633,382 | 374,214,968 | ||||||||||||
Investments in affiliates at value | 2,796,132 | 910,489 | 5,594,787 | 27,313,175 | ||||||||||||
Investments at Value | 49,950,890 | 142,317,265 | 52,228,169 | 401,528,143 | ||||||||||||
Cash | 72,951 | (a) | — | — | — | |||||||||||
Initial margin deposit on open futures contracts | — | — | — | — | ||||||||||||
Dividends and interest receivable | 80,259 | 766,284 | 16,481 | 729,961 | ||||||||||||
Prepaid expenses | 1,130 | 1,220 | 1,493 | 1,556 | ||||||||||||
Receivable for investments sold | — | — | 176,391 | 2,415,366 | ||||||||||||
Receivable for fund shares sold | 22,492 | 36,545 | 344 | 22,608 | ||||||||||||
Unrealized gain on forward contracts | — | — | — | — | ||||||||||||
Receivable for variation margin | — | — | — | — | ||||||||||||
Total Assets | 50,127,722 | 143,121,314 | 52,422,878 | 404,697,634 | ||||||||||||
Liabilities | ||||||||||||||||
Accrued expenses | 31,898 | 53,068 | 45,507 | 56,469 | ||||||||||||
Payable for investments purchased | 65,068 | 395,941 | 528,673 | 3,022,315 | ||||||||||||
Payable upon return of collateral for securities loaned | 1,509,100 | — | 4,013,248 | 12,670,650 | ||||||||||||
Payable for fund shares redeemed | 7,192 | 23,017 | 9,641 | 33,536 | ||||||||||||
Unrealized loss on forward contracts | — | — | — | — | ||||||||||||
Payable for variation margin | — | — | — | — | ||||||||||||
Payable to affiliate | 52,842 | 104,424 | 24,783 | 282,058 | ||||||||||||
Total Liabilities | 1,666,100 | 576,450 | 4,621,852 | 16,065,028 | ||||||||||||
Net Assets | ||||||||||||||||
Capital stock (beneficial interest) | 42,839,538 | 119,583,805 | 19,274,006 | 224,425,995 | ||||||||||||
Accumulated undistributed net investment income/(loss) | 502,190 | 2,167,266 | (39,542 | ) | 3,062,930 | |||||||||||
Accumulated undistributed net realized gain/(loss) | (1,611,993 | ) | 6,236,448 | 24,670,276 | 28,125,775 | |||||||||||
Net unrealized appreciation/(depreciation) on: | ||||||||||||||||
Investments | 6,733,318 | 14,557,520 | 3,896,286 | 133,017,906 | ||||||||||||
Futures contracts | — | — | — | — | ||||||||||||
Foreign currency forward contracts | — | — | — | — | ||||||||||||
Foreign currency transactions | (1,431 | ) | (175 | ) | — | — | ||||||||||
Total Net Assets | $ | 48,461,622 | $ | 142,544,864 | $ | 47,801,026 | $ | 388,632,606 | ||||||||
Shares of beneficial interest outstanding | 4,012,920 | 6,256,380 | 2,748,785 | 13,741,500 | ||||||||||||
Net asset value per share | $ | 12.08 | $ | 22.78 | $ | 17.39 | $ | 28.28 | ||||||||
| (a) | Includes foreign currency holdings of $72,951 (cost $73,351). |
The accompanying Notes to Financial Statements are an integral part of this statement.
342
Table of Contents
THRIVENT SERIES FUND, INC.
STATEMENTOF ASSETSAND LIABILITIES –CONTINUED
Small Cap Stock Portfolio | Small Cap Index Portfolio | Mid Cap Growth Portfolio | Partner Mid Cap Value Portfolio | Mid Cap Stock Portfolio | Mid Cap Index Portfolio | Partner Worldwide Allocation Portfolio | ||||||||||||||||||||
| $ | 286,316,855 | $ | 197,909,134 | $ | 308,045,192 | $ | 339,551,166 | $ | 589,749,356 | $ | 107,056,879 | $ | 1,605,979,287 | |||||||||||||
| 298,340,949 | 252,999,999 | 408,514,653 | 384,207,486 | 713,936,224 | 128,585,493 | 1,571,640,644 | ||||||||||||||||||||
| 38,525,283 | 37,610,821 | 22,064,837 | 20,179,241 | 68,031,929 | 22,646,288 | 50,606,672 | ||||||||||||||||||||
| 336,866,232 | 290,610,820 | 430,579,490 | 404,386,727 | 781,968,153 | 151,231,781 | 1,622,247,316 | ||||||||||||||||||||
| — | — | — | — | — | 83,468 | 6,672,990 | (b) | |||||||||||||||||||
| — | — | — | — | — | — | 433,310 | ||||||||||||||||||||
| 288,271 | 348,708 | 61,107 | 556,397 | 839,778 | 119,154 | 5,044,967 | ||||||||||||||||||||
| 1,513 | 1,394 | 1,592 | 1,528 | 1,970 | 1,220 | 3,295 | ||||||||||||||||||||
| 627,992 | 1,829,840 | — | 407,923 | — | 1,276 | 553,217 | ||||||||||||||||||||
| 11,405 | 110,194 | 17,202 | 34,690 | 37,359 | 123,440 | 8,514 | ||||||||||||||||||||
| — | — | — | — | — | — | 1,392,814 | ||||||||||||||||||||
| — | — | — | — | — | — | 2,148,352 | ||||||||||||||||||||
| 337,795,413 | 292,900,956 | 430,659,391 | 405,387,265 | 782,847,260 | 151,560,339 | 1,638,504,775 | ||||||||||||||||||||
| 68,637 | 69,486 | 113,920 | 48,198 | 85,051 | 29,501 | 361,306 | ||||||||||||||||||||
| 6,742,099 | 369,448 | — | 2,196,243 | — | 370,720 | 294,514 | ||||||||||||||||||||
| 24,447,972 | 23,621,082 | 3,029,925 | — | 29,599,525 | 5,801,543 | 26,312,891 | ||||||||||||||||||||
| 6,822 | 9,331 | 201,398 | 17,875 | 84,232 | 20,680 | 92,419 | ||||||||||||||||||||
| — | — | — | — | — | — | 765,483 | ||||||||||||||||||||
| — | 117,924 | — | — | — | 226,855 | 2,131,917 | ||||||||||||||||||||
| 191,848 | 87,099 | 160,926 | 267,844 | 460,013 | 47,552 | 1,255,459 | ||||||||||||||||||||
| 31,457,378 | 24,274,370 | 3,506,169 | 2,530,160 | 30,228,821 | 6,496,851 | 31,213,989 | ||||||||||||||||||||
| 214,510,409 | 158,504,835 | 266,773,419 | 289,715,941 | 475,025,548 | 95,032,653 | 1,675,501,251 | ||||||||||||||||||||
| 1,323,275 | 2,167,493 | 928,431 | 2,194,546 | 4,100,262 | 1,159,699 | 38,622,010 | ||||||||||||||||||||
| 39,954,962 | 14,529,070 | 36,917,074 | 46,111,057 | 81,273,832 | 4,080,908 | (123,406,565 | ) | |||||||||||||||||||
| 50,549,377 | 92,701,686 | 122,534,298 | 64,835,561 | 192,218,797 | 44,174,902 | 16,268,029 | ||||||||||||||||||||
| — | 723,502 | — | — | — | 615,326 | (80,299 | ) | |||||||||||||||||||
| — | — | — | — | — | — | 627,331 | ||||||||||||||||||||
| 12 | — | — | — | — | — | (240,971 | ) | |||||||||||||||||||
| $ | 306,338,035 | $ | 268,626,586 | $ | 427,153,222 | $ | 402,857,105 | $ | 752,618,439 | $ | 145,063,488 | $ | 1,607,290,786 | |||||||||||||
| 16,675,108 | 15,404,265 | 16,843,306 | 22,212,096 | 39,914,278 | 8,874,841 | 172,814,501 | ||||||||||||||||||||
| $ | 18.37 | $ | 17.44 | $ | 25.36 | $ | 18.14 | $ | 18.86 | $ | 16.35 | $ | 9.30 | |||||||||||||
| (b) | Includes foreign currency holdings of $6,673,006 (cost $6,796,335). |
The accompanying Notes to Financial Statements are an integral part of this statement.
343
Table of Contents
THRIVENT SERIES FUND, INC.
STATEMENTOF ASSETSAND LIABILITIES –CONTINUED
As of December 31, 2014 | Partner All Cap Portfolio | Large Cap Growth Portfolio | Partner Growth Stock Portfolio | Large Cap Value Portfolio | ||||||||||||
Assets | ||||||||||||||||
Investments at cost | $ | 61,310,479 | $ | 784,114,270 | $ | 50,296,540 | $ | 908,529,949 | ||||||||
Investments in securities at value | 68,370,416 | 951,640,813 | 80,695,424 | 1,183,013,016 | ||||||||||||
Investments in affiliates at value | 1,674,121 | 52,076,040 | 3,592,660 | 57,783,708 | ||||||||||||
Investments at Value | 70,044,537 | 1,003,716,853 | 84,288,084 | 1,240,796,724 | ||||||||||||
Cash | — | — | 1,488 | (a) | — | |||||||||||
Dividends and interest receivable | 79,440 | 545,493 | 33,258 | 2,217,822 | ||||||||||||
Prepaid expenses | 1,135 | 2,419 | 1,152 | 2,539 | ||||||||||||
Receivable for investments sold | — | 2,796,497 | 157,050 | — | ||||||||||||
Receivable for fund shares sold | 523 | 17,522 | 5,240 | 13,399 | ||||||||||||
Receivable for variation margin | — | — | — | — | ||||||||||||
Total Assets | 70,125,635 | 1,007,078,784 | 84,486,272 | 1,243,030,484 | ||||||||||||
Liabilities | ||||||||||||||||
Accrued expenses | 22,002 | 293,929 | 27,040 | 140,436 | ||||||||||||
Payable for investments purchased | — | — | 346,364 | — | ||||||||||||
Payable upon return of collateral for securities loaned | 532,657 | 1,559,250 | 2,334,117 | 37,144,725 | ||||||||||||
Payable for fund shares redeemed | 23,399 | 293,449 | 3,643 | 70,039 | ||||||||||||
Payable for variation margin | — | 42,215 | — | — | ||||||||||||
Payable to affiliate | 49,185 | 382,197 | 53,122 | 672,829 | ||||||||||||
Mortgage dollar roll deferred revenue | — | — | — | — | ||||||||||||
Total Liabilities | 627,243 | 2,571,040 | 2,764,286 | 38,028,029 | ||||||||||||
Net Assets | ||||||||||||||||
Capital stock (beneficial interest) | 52,334,279 | 812,767,273 | 38,870,385 | 822,779,770 | ||||||||||||
Accumulated undistributed net investment income/(loss) | 296,891 | 35,506 | (19,923 | ) | 14,985,013 | |||||||||||
Accumulated undistributed net realized gain/(loss) | 8,133,164 | (29,252,429 | ) | 8,880,312 | 34,970,897 | |||||||||||
Net unrealized appreciation/(depreciation) on: | ||||||||||||||||
Investments | 8,734,058 | 219,602,583 | 33,991,544 | 332,266,775 | ||||||||||||
Futures contracts | — | 1,362,475 | — | — | ||||||||||||
Foreign currency transactions | — | (7,664 | ) | (332 | ) | — | ||||||||||
Swap agreements | — | — | — | — | ||||||||||||
Total Net Assets | $ | 69,498,392 | $ | 1,004,507,744 | $ | 81,721,986 | $ | 1,205,002,455 | ||||||||
Shares of beneficial interest outstanding | 4,899,731 | 35,770,992 | 4,366,613 | 71,780,786 | ||||||||||||
Net asset value per share | $ | 14.18 | $ | 28.08 | $ | 18.72 | $ | 16.79 | ||||||||
| (a) | Includes foreign currency holdings of $1,488 (cost $1,528). |
The accompanying Notes to Financial Statements are an integral part of this statement.
344
Table of Contents
THRIVENT SERIES FUND, INC.
STATEMENTOF ASSETSAND LIABILITIES –CONTINUED
| Large Cap Stock Portfolio | Large Cap Index Portfolio | High Yield Portfolio | Income Portfolio | Bond Index Portfolio | Limited Maturity Bond Portfolio | Money Market Portfolio | ||||||||||||||||||||
| $ | 717,971,379 | $ | 259,814,936 | $ | 916,139,207 | $ | 1,413,522,345 | $ | 192,644,909 | $ | 1,058,608,449 | $ | 126,429,287 | |||||||||||||
| 756,869,828 | 432,418,349 | 817,658,021 | 1,361,371,712 | 151,977,314 | 1,003,686,098 | 126,429,287 | ||||||||||||||||||||
| 84,372,949 | 20,174,439 | 80,883,172 | 94,513,459 | 43,462,896 | 48,643,269 | — | ||||||||||||||||||||
| 841,242,777 | 452,592,788 | 898,541,193 | 1,455,885,171 | 195,440,210 | 1,052,329,367 | 126,429,287 | * | |||||||||||||||||||
| 21,774 | (b) | 479 | 96,222 | 1 | — | 18 | 17,411 | |||||||||||||||||||
| 1,370,799 | 580,586 | 13,188,207 | 13,585,688 | 562,283 | 3,470,534 | 23,234 | ||||||||||||||||||||
| 2,123 | 1,569 | 2,277 | 2,920 | 1,245 | 2,450 | 1,224 | ||||||||||||||||||||
| 23 | — | — | 1,159,198 | — | 10,307,626 | — | ||||||||||||||||||||
| 19,431 | 188,685 | 46,921 | 18,702 | 989 | 88,181 | 156,182 | ||||||||||||||||||||
| 498,150 | — | 24,458 | 168,750 | — | — | — | ||||||||||||||||||||
| 843,155,077 | 453,364,107 | 911,899,278 | 1,470,820,430 | 196,004,727 | 1,066,198,176 | 126,627,338 | ||||||||||||||||||||
| 178,553 | 104,140 | 148,370 | 222,221 | 54,233 | 168,637 | 6,554 | ||||||||||||||||||||
| — | — | 12,625 | 53,249,064 | 45,652,756 | 38,591,058 | — | ||||||||||||||||||||
| 7,610,288 | 2,392,432 | 55,520,434 | 24,146,820 | — | 8,419,435 | — | ||||||||||||||||||||
| 35,062 | 83,916 | 97,656 | 66,592 | 254,978 | 28,786 | 199,921 | ||||||||||||||||||||
| 333,486 | 206,865 | — | 311,719 | — | 228,125 | — | ||||||||||||||||||||
| 482,644 | 140,278 | 323,263 | 526,133 | 49,942 | 385,716 | 6,075 | ||||||||||||||||||||
| — | — | — | 35,285 | 38,694 | 38,623 | — | ||||||||||||||||||||
| 8,640,033 | 2,927,631 | 56,102,348 | 78,557,834 | 46,050,603 | 47,860,380 | 212,550 | ||||||||||||||||||||
| 638,954,065 | 265,364,601 | 944,448,135 | 1,323,429,499 | 147,996,966 | 1,030,983,122 | 126,415,547 | ||||||||||||||||||||
| 9,674,625 | 6,739,988 | 313,742 | (113,133 | ) | (602 | ) | 425,277 | — | ||||||||||||||||||
| 59,987,333 | (14,965,811 | ) | (71,633,020 | ) | 25,092,643 | (837,541 | ) | (6,370,005 | ) | (759 | ) | |||||||||||||||
| 123,271,398 | 192,777,852 | (17,598,014 | ) | 42,362,826 | 2,795,301 | (6,279,082 | ) | — | ||||||||||||||||||
| 2,627,053 | 519,846 | — | 1,490,761 | — | (421,516 | ) | — | |||||||||||||||||||
| 570 | — | — | — | — | — | — | ||||||||||||||||||||
| — | — | 266,087 | — | — | — | — | ||||||||||||||||||||
| $ | 834,515,044 | $ | 450,436,476 | $ | 855,796,930 | $ | 1,392,262,596 | $ | 149,954,124 | $ | 1,018,337,796 | $ | 126,414,788 | |||||||||||||
| 67,691,953 | 15,668,265 | 175,607,295 | 132,582,924 | 13,633,325 | 103,753,982 | 126,415,547 | ||||||||||||||||||||
| $ | 12.33 | $ | 28.75 | $ | 4.87 | $ | 10.50 | $ | 11.00 | $ | 9.81 | $ | 1.00 | |||||||||||||
| (b) | Includes foreign currency holdings of $21,774 (cost $21,734). |
| * | Securities held by this Portfolio are valued on the basis of amortized cost, which approximates market value. |
The accompanying Notes to Financial Statements are an integral part of this statement.
345
Table of Contents
THRIVENT SERIES FUND, INC.
For the year ended December 31, 2014 | Aggressive Allocation Portfolio | Moderately Aggressive Allocation Portfolio | Moderate Allocation Portfolio | Moderately Conservative Allocation Portfolio | ||||||||||||
Investment Income | ||||||||||||||||
Dividends | $ | 4,606,553 | $ | 18,237,625 | $ | 26,279,805 | $ | 9,941,183 | ||||||||
Interest | 452,727 | 17,458,508 | 49,171,317 | 30,957,273 | ||||||||||||
Income from mortgage dollar rolls | 443,039 | 5,521,090 | 17,097,628 | 12,773,768 | ||||||||||||
Income from securities loaned | 349 | 369,519 | 540,459 | 189,491 | ||||||||||||
Income from affiliated investments | 4,716,581 | 31,427,543 | 63,053,317 | 27,799,765 | ||||||||||||
Foreign tax withholding | (53,630 | ) | (290,875 | ) | (430,814 | ) | (124,527 | ) | ||||||||
Total Investment Income | 10,165,619 | 72,723,410 | 155,711,712 | 81,536,953 | ||||||||||||
Expenses | ||||||||||||||||
Adviser fees | 3,852,619 | 19,122,347 | 33,323,215 | 14,163,249 | ||||||||||||
Sub-Adviser fees | — | — | — | — | ||||||||||||
Administrative service fees | 237,595 | 921,586 | 1,563,056 | 723,289 | ||||||||||||
Audit and legal fees | 27,036 | 44,753 | 60,050 | 40,242 | ||||||||||||
Custody fees | 68,731 | 201,901 | 269,990 | 123,429 | ||||||||||||
Insurance expenses | 8,266 | 25,994 | 41,654 | 21,611 | ||||||||||||
Directors’ fees | 20,573 | 84,649 | 155,829 | 76,580 | ||||||||||||
Other expenses | 14,940 | 60,128 | 63,758 | 42,674 | ||||||||||||
Total Expenses Before Reimbursement | 4,229,760 | 20,461,358 | 35,477,552 | 15,191,074 | ||||||||||||
Less: | ||||||||||||||||
Reimbursement from adviser | — | — | — | — | ||||||||||||
Total Net Expenses | 4,229,760 | 20,461,358 | 35,477,552 | 15,191,074 | ||||||||||||
Net Investment Income/(Loss) | 5,935,859 | 52,262,052 | 120,234,160 | 66,345,879 | ||||||||||||
Realized and Unrealized Gains/(Losses) | ||||||||||||||||
Net realized gains/(losses) on: | ||||||||||||||||
Investments | 31,326,029 | 107,118,879 | 151,373,145 | 59,320,216 | ||||||||||||
Affiliated investments | 12,431,504 | 16,884,291 | 18,777,780 | (149,997 | ) | |||||||||||
Distributions of realized capital gains from affiliated investments | 14,542,071 | 44,927,633 | 50,112,963 | 12,609,425 | ||||||||||||
Futures contracts | 8,960,841 | 46,703,583 | 88,119,236 | 27,285,345 | ||||||||||||
Foreign currency and forward contract transactions | 110,577 | 473,947 | 811,784 | 271,844 | ||||||||||||
Swap agreements | — | 49,276 | 94,659 | 163,007 | ||||||||||||
Change in net unrealized appreciation/(depreciation) on: | ||||||||||||||||
Investments | (455,943 | ) | 2,227,540 | 204,195 | 3,165,027 | |||||||||||
Affiliated investments | (23,738,037 | ) | (17,896,863 | ) | (17,891,309 | ) | 3,018,168 | |||||||||
Futures contracts | 845,506 | 14,041,973 | 39,165,194 | 7,047,902 | ||||||||||||
Foreign currency transactions | 617 | 1,922 | 8,742 | 3,276 | ||||||||||||
Swap agreements | — | — | — | — | ||||||||||||
Net Realized and Unrealized Gains/(Losses) | 44,023,165 | 214,532,181 | 330,776,389 | 112,734,213 | ||||||||||||
Net Increase/(Decrease) in Net Assets Resulting From Operations | $ | 49,959,024 | $ | 266,794,233 | $ | 451,010,549 | $ | 179,080,092 | ||||||||
The accompanying Notes to Financial Statements are an integral part of this statement.
346
Table of Contents
THRIVENT SERIES FUND, INC.
STATEMENTOF OPERATIONS –CONTINUED
| Growth and Income Plus Portfolio | Balanced Income Plus Portfolio | Diversified Income Plus Portfolio | Opportunity Income Plus Portfolio | Partner Technology Portfolio | Partner Healthcare Portfolio | Natural Resources Portfolio | ||||||||||||||||||||
| $ | 1,599,930 | $ | 3,373,132 | $ | 5,820,060 | $ | 213,277 | $ | 400,543 | $ | 954,992 | $ | 541,129 | |||||||||||||
| 738,723 | 5,031,076 | 11,230,711 | 2,099,715 | 2 | 14 | 26 | ||||||||||||||||||||
| 70,242 | 389,745 | 482,645 | 140,619 | — | — | — | ||||||||||||||||||||
| — | 23,017 | 107,386 | — | — | — | 13,789 | ||||||||||||||||||||
| 4,320 | 11,983 | 20,959 | 3,762 | 565 | 2,172 | 340 | ||||||||||||||||||||
| (84,796 | ) | (58,610 | ) | (194,050 | ) | — | — | (83,802 | ) | (22,932 | ) | |||||||||||||||
| 2,328,419 | 8,770,343 | 17,467,711 | 2,457,373 | 401,110 | 873,376 | 532,352 | ||||||||||||||||||||
| 488,603 | 1,597,354 | 1,615,113 | 291,363 | 153,517 | 223,962 | 274,715 | ||||||||||||||||||||
| — | — | — | — | 230,293 | 475,383 | — | ||||||||||||||||||||
| 93,906 | 133,729 | 154,699 | 90,780 | 89,467 | 93,862 | 86,776 | ||||||||||||||||||||
| 22,926 | 25,536 | 24,469 | 22,831 | 22,862 | 22,818 | 22,443 | ||||||||||||||||||||
| 55,134 | 34,604 | 92,143 | 18,164 | 5,020 | 12,994 | 3,747 | ||||||||||||||||||||
| 4,555 | 5,613 | 6,026 | 4,422 | 4,411 | 4,462 | 4,352 | ||||||||||||||||||||
| 6,598 | 19,021 | 18,841 | 6,881 | 6,910 | 6,531 | 6,531 | ||||||||||||||||||||
| 35,198 | 33,889 | 39,486 | 28,522 | 8,443 | 9,139 | 8,549 | ||||||||||||||||||||
| 706,920 | 1,849,746 | 1,950,777 | 462,963 | 520,923 | 849,151 | 407,113 | ||||||||||||||||||||
| (105,563 | ) | — | — | (19,357 | ) | — | — | (33,500 | ) | |||||||||||||||||
| 601,357 | 1,849,746 | 1,950,777 | 443,606 | 520,923 | 849,151 | 373,613 | ||||||||||||||||||||
| 1,727,062 | 6,920,597 | 15,516,934 | 2,013,767 | (119,813 | ) | 24,225 | 158,739 | |||||||||||||||||||
| 3,131,376 | 10,089,576 | 9,644,959 | 257,088 | 3,658,323 | 9,047,851 | (1,555,500 | ) | |||||||||||||||||||
| — | — | — | — | — | — | — | ||||||||||||||||||||
| — | 3 | 1 | — | — | — | — | ||||||||||||||||||||
| 40,694 | 661,969 | 1,146,945 | 123,983 | — | — | — | ||||||||||||||||||||
| (17,581 | ) | 936 | (41,541 | ) | — | — | (17,547 | ) | — | |||||||||||||||||
| — | — | — | 818 | — | — | — | ||||||||||||||||||||
| (3,170,907 | ) | (814,982 | ) | (10,107,043 | ) | (716,710 | ) | 1,598,968 | 6,289,085 | (5,723,995 | ) | |||||||||||||||
| — | — | — | — | — | — | — | ||||||||||||||||||||
| 69,239 | 215,064 | 170,593 | 91,653 | — | — | — | ||||||||||||||||||||
| (958 | ) | — | (1,860 | ) | — | — | (10,453 | ) | — | |||||||||||||||||
| — | — | — | (2,202 | ) | — | — | — | |||||||||||||||||||
| 51,863 | 10,152,566 | 812,054 | (245,370 | ) | 5,257,291 | 15,308,936 | (7,279,495 | ) | ||||||||||||||||||
| $ | 1,778,925 | $ | 17,073,163 | $ | 16,328,988 | $ | 1,768,397 | $ | 5,137,478 | $ | 15,333,161 | $ | (7,120,756 | ) | ||||||||||||
The accompanying Notes to Financial Statements are an integral part of this statement.
347
Table of Contents
THRIVENT SERIES FUND, INC.
STATEMENTOF OPERATIONS –CONTINUED
For the year ended December 31, 2014 | Partner Emerging Markets Equity Portfolio | Real Estate Securities Portfolio | Partner Small Cap Growth Portfolio | Partner Small Cap Value Portfolio | ||||||||||||
Investment Income | ||||||||||||||||
Dividends | $ | 1,578,963 | $ | 3,430,221 | $ | 1,025,402 | $ | 6,545,916 | ||||||||
Interest | 14 | 1 | 8 | 37 | ||||||||||||
Income from securities loaned | 3,902 | — | 78,263 | 64,016 | ||||||||||||
Income from affiliated investments | 688 | 411 | 3,783 | 4,900 | ||||||||||||
Foreign tax withholding | (153,829 | ) | (286 | ) | (2,335 | ) | (5,028 | ) | ||||||||
Total Investment Income | 1,429,738 | 3,430,347 | 1,105,121 | 6,609,841 | ||||||||||||
Expenses | ||||||||||||||||
Adviser fees | 266,823 | 1,057,715 | 1,841,878 | 755,598 | ||||||||||||
Sub-Adviser fees | 416,548 | — | 832,408 | 2,263,000 | ||||||||||||
Administrative service fees | 90,694 | 104,460 | 129,474 | 149,805 | ||||||||||||
Audit and legal fees | 21,428 | 23,445 | 24,394 | 24,604 | ||||||||||||
Custody fees | 61,662 | 8,391 | 25,798 | 21,853 | ||||||||||||
Insurance expenses | 4,488 | 4,851 | 5,859 | 6,106 | ||||||||||||
Directors’ fees | 6,531 | 8,860 | 17,913 | 19,744 | ||||||||||||
Other expenses | 12,012 | 9,557 | 10,213 | 10,523 | ||||||||||||
Total Expenses Before Reimbursement | 880,186 | 1,217,279 | 2,887,937 | 3,251,233 | ||||||||||||
Less: | ||||||||||||||||
Reimbursement from adviser | (70,897 | ) | — | (301,491 | ) | — | ||||||||||
Total Net Expenses | 809,289 | 1,217,279 | 2,586,446 | 3,251,233 | ||||||||||||
Net Investment Income/(Loss) | 620,449 | 2,213,068 | (1,481,325 | ) | 3,358,608 | |||||||||||
Realized and Unrealized Gains/(Losses) | ||||||||||||||||
Net realized gains/(losses) on: | ||||||||||||||||
Investments | (961,423 | )(a) | 6,262,880 | 25,796,407 | 29,584,348 | |||||||||||
In-kind redemptions | — | — | 47,826,408 | — | ||||||||||||
Distributions of realized capital gains from affiliated investments | — | — | — | — | ||||||||||||
Futures contracts | — | — | — | — | ||||||||||||
Foreign currency and forward contract transactions | (14,155 | ) | — | — | (3,335 | ) | ||||||||||
Change in net unrealized appreciation/(depreciation) on: | ||||||||||||||||
Investments | 529,754 | 26,974,563 | (87,421,150 | ) | (22,136,591 | ) | ||||||||||
Futures contracts | — | — | — | — | ||||||||||||
Foreign currency forward contracts | — | — | — | — | ||||||||||||
Foreign currency transactions | (471 | ) | (155 | ) | — | — | ||||||||||
Net Realized and Unrealized Gains/(Losses) | (446,295 | ) | 33,237,288 | (13,798,335 | ) | 7,444,422 | ||||||||||
Net Increase/(Decrease) in Net Assets Resulting From Operations | $ | 174,154 | $ | 35,450,356 | $ | (15,279,660 | ) | $ | 10,803,030 | |||||||
| (a) | Includes foreign capital gain taxes paid of $28,995. |
The accompanying Notes to Financial Statements are an integral part of this statement.
348
Table of Contents
THRIVENT SERIES FUND, INC.
STATEMENTOF OPERATIONS –CONTINUED
Small Cap Stock | Small Cap Index Portfolio | Mid Cap Growth Portfolio | Partner Mid Cap Value Portfolio | Mid Cap Stock Portfolio | Mid Cap Index Portfolio | Partner Worldwide Allocation Portfolio | ||||||||||||||||||||
| $ 3,486,782 | $ | 3,170,028 | $ | 2,916,775 | $ | 5,192,261 | $ | 9,302,732 | $ | 1,733,641 | $ | 48,399,939 | ||||||||||||||
| 533 | 207 | 60 | 36 | 202 | 394 | 8,792,826 | ||||||||||||||||||||
| 373,549 | 152,888 | 10,898 | — | 206,831 | 69,325 | 765,860 | ||||||||||||||||||||
| 8,120 | 5,855 | 7,679 | 4,099 | 21,297 | 5,147 | 14,857 | ||||||||||||||||||||
| (53,660) | (434 | ) | (19,415 | ) | — | — | — | (4,287,134 | ) | |||||||||||||||||
| 3,815,324 | 3,328,544 | 2,915,997 | 5,196,396 | 9,531,062 | 1,808,507 | 53,686,348 | ||||||||||||||||||||
| 2,218,622 | 895,922 | 1,648,194 | 968,649 | 4,741,008 | 463,702 | 6,554,370 | ||||||||||||||||||||
| — | — | — | 1,756,313 | — | — | 7,573,616 | ||||||||||||||||||||
| 140,299 | 127,561 | 156,229 | 149,374 | 212,090 | 104,510 | 394,574 | ||||||||||||||||||||
| 24,448 | 23,951 | 24,808 | 24,799 | 26,109 | 23,227 | 40,500 | ||||||||||||||||||||
| 18,571 | 19,214 | 16,765 | 37,245 | 24,269 | 11,305 | 796,617 | ||||||||||||||||||||
| 5,951 | 5,480 | 6,251 | 5,993 | 7,684 | 4,803 | 12,932 | ||||||||||||||||||||
| 19,140 | 17,065 | 24,441 | 18,912 | 30,508 | 7,291 | 68,449 | ||||||||||||||||||||
| 9,785 | 13,115 | 10,323 | 9,904 | 11,600 | 11,226 | 98,966 | ||||||||||||||||||||
| 2,436,816 | 1,102,308 | 1,887,011 | 2,971,189 | 5,053,268 | 626,064 | 15,540,024 | ||||||||||||||||||||
| — | — | — | — | — | — | — | ||||||||||||||||||||
| 2,436,816 | 1,102,308 | 1,887,011 | 2,971,189 | 5,053,268 | 626,064 | 15,540,024 | ||||||||||||||||||||
| 1,378,508 | 2,226,236 | 1,028,986 | 2,225,207 | 4,477,794 | 1,182,443 | 38,146,324 | ||||||||||||||||||||
| 41,727,529 | 19,258,914 | 37,280,477 | 46,593,720 | 81,651,037 | 6,519,801 | 69,757,467 | (b) | |||||||||||||||||||
| — | — | — | — | — | — | — | ||||||||||||||||||||
| 2 | — | 1 | 1 | 2 | 1 | 1 | ||||||||||||||||||||
| (585,340) | 237,655 | — | — | — | 455,073 | (744,600 | ) | |||||||||||||||||||
| (1,259) | — | — | — | — | — | 832,779 | ||||||||||||||||||||
| (27,782,525) | (8,381,990 | ) | 56,536 | (928,175 | ) | (5,733,046 | ) | 3,346,467 | (198,441,012 | ) | ||||||||||||||||
| (1,194,990) | 302,301 | — | — | — | 465,928 | (662,680 | ) | |||||||||||||||||||
| — | — | — | — | — | — | 608,729 | ||||||||||||||||||||
| 12 | — | — | — | — | — | (276,557 | ) | |||||||||||||||||||
| 12,163,429 | 11,416,880 | 37,337,014 | 45,665,546 | 75,917,993 | 10,787,270 | (128,925,873 | ) | |||||||||||||||||||
| $ | 13,541,937 | $ | 13,643,116 | $ | 38,366,000 | $ | 47,890,753 | $ | 80,395,787 | $ | 11,969,713 | $ | (90,779,549 | ) | ||||||||||||
| (b) | Includes foreign capital gain taxes paid of $40,634. |
The accompanying Notes to Financial Statements are an integral part of this statement.
349
Table of Contents
THRIVENT SERIES FUND, INC.
STATEMENTOF OPERATIONS –CONTINUED
For the year ended December 31, 2014 | Partner All Cap Portfolio | Large Cap Growth Portfolio | Partner Growth Stock Portfolio | Large Cap Value Portfolio | ||||||||||||
Investment Income | ||||||||||||||||
Dividends | $ | 928,851 | $ | 10,222,230 | $ | 571,317 | $ | 23,000,125 | ||||||||
Interest | 72 | (8,967 | ) | 9 | 102 | |||||||||||
Income from mortgage dollar rolls | — | — | — | — | ||||||||||||
Income from securities loaned | 6,644 | 10,938 | 2,422 | 99,112 | ||||||||||||
Income from affiliated investments | 481 | 24,949 | 390 | 11,445 | ||||||||||||
Foreign tax withholding | — | (106,890 | ) | (1,652 | ) | (272,784 | ) | |||||||||
Total Investment Income | 936,048 | 10,142,260 | 572,486 | 22,838,000 | ||||||||||||
Expenses | ||||||||||||||||
Adviser fees | 229,808 | 4,148,028 | 315,337 | 6,931,242 | ||||||||||||
Sub-Adviser fees | 393,522 | — | 315,539 | — | ||||||||||||
Administrative service fees | 92,139 | 271,846 | 94,589 | 293,713 | ||||||||||||
Audit and legal fees | 23,000 | 28,082 | 23,012 | 28,381 | ||||||||||||
Custody fees | 13,804 | 29,073 | 25,858 | 28,268 | ||||||||||||
Insurance expenses | 4,493 | 9,489 | 4,551 | 9,890 | ||||||||||||
Directors’ fees | 6,874 | 54,798 | 6,969 | 47,765 | ||||||||||||
Other expenses | 9,120 | 13,008 | 9,478 | 13,232 | ||||||||||||
Total Expenses Before Reimbursement | 772,760 | 4,554,324 | 795,333 | 7,352,491 | ||||||||||||
Less: | ||||||||||||||||
Reimbursement from adviser | (149,430 | ) | — | (78,859 | ) | — | ||||||||||
Total Net Expenses | 623,330 | 4,554,324 | 716,474 | 7,352,491 | ||||||||||||
Net Investment Income/(Loss) | 312,718 | 5,587,936 | (143,988 | ) | 15,485,509 | |||||||||||
Realized and Unrealized Gains/(Losses) | ||||||||||||||||
Net realized gains/(losses) on: | ||||||||||||||||
Investments | 8,714,040 | 163,228,672 | 9,097,609 | 61,684,297 | ||||||||||||
Distributions of realized capital gains from affiliated investments | 1 | 1 | — | 1 | ||||||||||||
Written option contracts | — | — | — | — | ||||||||||||
Futures contracts | — | 270,251 | — | — | ||||||||||||
Foreign currency and forward contract transactions | — | 58,018 | (267 | ) | — | |||||||||||
Swap agreements | — | — | — | — | ||||||||||||
Change in net unrealized appreciation/(depreciation) on: | ||||||||||||||||
Investments | (1,331,941 | ) | (59,754,621 | ) | (2,457,745 | ) | 23,223,019 | |||||||||
Futures contracts | — | 133,104 | — | — | ||||||||||||
Foreign currency transactions | — | (10,716 | ) | (399 | ) | — | ||||||||||
Swap agreements | — | — | — | — | ||||||||||||
Net Realized and Unrealized Gains/(Losses) | 7,382,100 | 103,924,709 | 6,639,198 | 84,907,317 | ||||||||||||
Net Increase/(Decrease) in Net Assets Resulting From Operations | $ | 7,694,818 | $ | 109,512,645 | $ | 6,495,210 | $ | 100,392,826 | ||||||||
The accompanying Notes to Financial Statements are an integral part of this statement.
350
Table of Contents
THRIVENT SERIES FUND, INC.
STATEMENTOF OPERATIONS –CONTINUED
| Large Cap Stock Portfolio | Large Cap Index Portfolio | High Yield Portfolio | Income Portfolio | Bond Index Portfolio | Limited Maturity Bond Portfolio | Money Market Portfolio | ||||||||||||||||||||
| $16,044,625 | $ | 8,415,630 | $ | 488,197 | $ | 1,724,540 | $ | — | $ | 430,756 | $ | 7,524 | ||||||||||||||
| (8,152) | (101 | ) | 57,390,609 | 57,109,370 | 2,512,299 | 21,626,328 | 227,740 | |||||||||||||||||||
| — | — | — | 1,457,505 | 1,483,059 | 1,215,474 | — | ||||||||||||||||||||
| 52,970 | 11,310 | 142,479 | 40,051 | — | 10,794 | — | ||||||||||||||||||||
| 24,376 | 4,195 | 14,824 | 38,040 | 21,294 | 30,119 | — | ||||||||||||||||||||
| (488,810) | (405 | ) | — | — | — | — | — | |||||||||||||||||||
| 15,625,009 | 8,430,629 | 58,036,109 | 60,369,506 | 4,016,652 | 23,313,471 | 235,264 | ||||||||||||||||||||
| 5,132,054 | 1,363,463 | 3,682,199 | 5,740,302 | 522,901 | 4,259,238 | 520,888 | ||||||||||||||||||||
| — | — | — | — | — | — | — | ||||||||||||||||||||
| 233,703 | 156,372 | 250,302 | 345,489 | 107,639 | 276,990 | 104,091 | ||||||||||||||||||||
| 27,187 | 27,514 | 27,352 | 29,909 | 23,375 | 28,178 | 22,900 | ||||||||||||||||||||
| 118,494 | 18,695 | 24,379 | 42,559 | 13,901 | 35,650 | 18,880 | ||||||||||||||||||||
| 8,325 | 6,163 | 9,082 | 11,885 | 4,992 | 9,967 | 4,876 | ||||||||||||||||||||
| 38,464 | 23,726 | 41,333 | 59,407 | 8,736 | 45,961 | 5,804 | ||||||||||||||||||||
| 26,032 | 12,863 | 30,232 | 36,362 | 20,411 | 37,708 | 12,607 | ||||||||||||||||||||
| 5,584,259 | 1,608,796 | 4,064,879 | 6,265,913 | 701,955 | 4,693,692 | 690,046 | ||||||||||||||||||||
| — | — | — | — | — | — | (454,782 | ) | |||||||||||||||||||
| 5,584,259 | 1,608,796 | 4,064,879 | 6,265,913 | 701,955 | 4,693,692 | 235,264 | ||||||||||||||||||||
| 10,040,750 | 6,821,833 | 53,971,230 | 54,103,593 | 3,314,697 | 18,619,779 | — | ||||||||||||||||||||
| 72,486,115 | 1,811,497 | 13,207,559 | 22,311,423 | 1,450,013 | 1,818,261 | (759 | ) | |||||||||||||||||||
| 3 | 1 | 1 | 2 | 1 | 2 | — | ||||||||||||||||||||
| — | — | — | — | — | 47,600 | — | ||||||||||||||||||||
| (3,317,468) | 853,333 | (40,886 | ) | 3,916,060 | — | (2,568,986 | ) | — | ||||||||||||||||||
| (57,689) | — | — | — | — | — | — | ||||||||||||||||||||
| — | — | 27,258 | (260,727 | ) | — | (435,775 | ) | — | ||||||||||||||||||
| (37,233,966) | 42,223,166 | (47,937,220 | ) | 13,153,657 | 4,703,041 | 2,814,358 | — | |||||||||||||||||||
| 738,428 | 263,357 | — | (235,759 | ) | — | (2,789,651 | ) | — | ||||||||||||||||||
| (337) | — | — | — | — | — | — | ||||||||||||||||||||
| — | — | 266,087 | — | — | 431,919 | — | ||||||||||||||||||||
| 32,615,086 | 45,151,354 | (34,477,201 | ) | 38,884,656 | 6,153,055 | (682,272 | ) | (759 | ) | |||||||||||||||||
| $ | 42,655,836 | $ | 51,973,187 | $ | 19,494,029 | $ | 92,988,249 | $ | 9,467,752 | $ | 17,937,507 | $ | (759 | ) | ||||||||||||
The accompanying Notes to Financial Statements are an integral part of this statement.
351
Table of Contents
THRIVENT SERIES FUND, INC.
STATEMENTOF CHANGESIN NET ASSETS
| Aggressive Allocation Portfolio | Moderately Aggressive Allocation Portfolio | |||||||||||||||
For the periods ended | 12/31/2014 | 12/31/2013 | 12/31/2014 | 12/31/2013 | ||||||||||||
Operations | ||||||||||||||||
Net investment income/(loss) | $ | 5,935,859 | $ | 3,651,851 | $ | 52,262,052 | $ | 39,069,588 | ||||||||
Net realized gains/(losses) | 67,371,022 | 20,077,762 | 216,157,609 | 105,536,723 | ||||||||||||
Change in net unrealized appreciation/(depreciation) | (23,347,857 | ) | 141,921,865 | (1,625,428 | ) | 546,205,354 | ||||||||||
Net Change in Net Assets Resulting From Operations | 49,959,024 | 165,651,478 | 266,794,233 | 690,811,665 | ||||||||||||
Distributions to Shareholders | ||||||||||||||||
From net investment income | (3,726,768 | ) | (8,582,861 | ) | (38,731,043 | ) | (52,915,278 | ) | ||||||||
From net realized gains | (23,798,379 | ) | (8,753,472 | ) | (121,445,375 | ) | (77,567,611 | ) | ||||||||
Total Distributions to Shareholders | (27,525,147 | ) | (17,336,333 | ) | (160,176,418 | ) | (130,482,889 | ) | ||||||||
Capital Stock Transactions | ||||||||||||||||
Sold | 97,332,428 | 71,795,448 | 385,542,249 | 567,241,188 | ||||||||||||
Distributions reinvested | 27,525,147 | 17,336,333 | 160,176,418 | 130,482,889 | ||||||||||||
Redeemed | (41,801,258 | ) | (46,235,687 | ) | (101,884,966 | ) | (89,497,182 | ) | ||||||||
In-kind redemptions | — | — | — | — | ||||||||||||
Total Capital Stock Transactions | 83,056,317 | 42,896,094 | 443,833,701 | 608,226,895 | ||||||||||||
Net Increase/(Decrease) in Net Assets | 105,490,194 | 191,211,239 | 550,451,516 | 1,168,555,671 | ||||||||||||
Net Assets, Beginning of Period | 799,399,712 | 608,188,473 | 4,224,546,050 | 3,055,990,379 | ||||||||||||
Net Assets, End of Period | $ | 904,889,906 | $ | 799,399,712 | $ | 4,774,997,566 | $ | 4,224,546,050 | ||||||||
Accumulated Undistributed Net Investment Income/(Loss) | $ | 10,055,369 | $ | 3,758,799 | $ | 63,325,415 | $ | 38,714,975 | ||||||||
Capital Stock Share Transactions | ||||||||||||||||
Sold | 6,398,050 | 5,238,963 | 26,564,398 | 42,282,717 | ||||||||||||
Distributions reinvested | 1,798,324 | 1,308,788 | 10,963,929 | 10,033,441 | ||||||||||||
Redeemed | (2,744,367 | ) | (3,456,690 | ) | (6,997,792 | ) | (6,725,965 | ) | ||||||||
In-kind redemptions | — | — | — | — | ||||||||||||
|
|
|
|
|
|
|
| |||||||||
Total Capital Stock Share Transactions | 5,452,007 | 3,091,061 | 30,530,535 | 45,590,193 | ||||||||||||
|
|
|
|
|
|
|
| |||||||||
The accompanying Notes to Financial Statements are an integral part of this statement.
352
Table of Contents
THRIVENT SERIES FUND, INC.
STATEMENTOF CHANGESIN NET ASSETS –CONTINUED
| Moderate Allocation Portfolio | Moderately Conservative Allocation Portfolio | Growth and Income Plus Portfolio | Balanced Income Plus Portfolio | |||||||||||||||||||||||||||
| 12/31/2014 | 12/31/2013 | 12/31/2014 | 12/31/2013 | 12/31/2014 | 12/31/2013 | 12/31/2014 | 12/31/2013 | |||||||||||||||||||||||
| $ | 120,234,160 | $ | 91,072,245 | $ | 66,345,879 | $ | 54,615,787 | $ | 1,727,062 | $ | 1,927,133 | $ | 6,920,597 | $ | 4,635,807 | |||||||||||||||
| 309,289,567 | 180,613,587 | 99,499,840 | 61,088,904 | 3,154,489 | 17,743,134 | 10,752,484 | 56,220,823 | |||||||||||||||||||||||
| 21,486,822 | 604,446,205 | 13,234,373 | 158,181,005 | (3,102,626) | (338,775) | (599,918) | (18,617,990) | |||||||||||||||||||||||
| 451,010,549 | 876,132,037 | 179,080,092 | 273,885,696 | 1,778,925 | 19,331,492 | 17,073,163 | 42,238,640 | |||||||||||||||||||||||
| (90,042,092) | (94,191,290) | (53,606,712) | (48,161,738) | (1,923,162) | (2,504,677) | (4,580,942) | (4,682,407) | |||||||||||||||||||||||
| (208,433,582) | (125,697,258) | (73,822,403) | (62,314,304) | (5,890,712) | — | (51,313,269) | (8,188,843) | |||||||||||||||||||||||
| (298,475,674) | (219,888,548) | (127,429,115) | (110,476,042) | (7,813,874) | (2,504,677) | (55,894,211) | (12,871,250) | |||||||||||||||||||||||
| 1,118,066,502 | 1,088,059,591 | 277,291,740 | 276,455,867 | 21,627,230 | 26,381,957 | 43,001,414 | 23,654,926 | |||||||||||||||||||||||
| 298,475,674 | 219,888,548 | 127,429,115 | 110,476,042 | 7,813,874 | 2,504,677 | 55,894,211 | 12,871,250 | |||||||||||||||||||||||
| (142,438,450) | (121,004,094) | (129,995,621) | (117,686,160) | (7,738,160) | (8,480,857) | (32,053,287) | (30,210,315) | |||||||||||||||||||||||
| — | — | — | — | — | (73,842,028) | — | — | |||||||||||||||||||||||
| 1,274,103,726 | 1,186,944,045 | 274,725,234 | 269,245,749 | 21,702,944 | (53,436,251) | 66,842,338 | 6,315,861 | |||||||||||||||||||||||
| 1,426,638,601 | 1,843,187,534 | 326,376,211 | 432,655,403 | 15,667,995 | (36,609,436) | 28,021,290 | 35,683,251 | |||||||||||||||||||||||
| 7,181,123,800 | 5,337,936,266 | 3,352,978,869 | 2,920,323,466 | 65,451,498 | 102,060,934 | 275,017,197 | 239,333,946 | |||||||||||||||||||||||
| $ | 8,607,762,401 | $ | 7,181,123,800 | $ | 3,679,355,080 | $ | 3,352,978,869 | $ | 81,119,493 | $ | 65,451,498 | $ | 303,038,487 | $ | 275,017,197 | |||||||||||||||
| $ | 131,718,370 | $ | 90,046,748 | $ | 69,009,714 | $ | 53,555,301 | $ | 1,697,388 | $ | 1,914,126 | $ | 6,688,222 | $ | 4,535,096 | |||||||||||||||
| 81,002,815 | 84,058,196 | 21,625,434 | 22,386,150 | 1,937,939 | 2,411,891 | 2,687,304 | 1,437,170 | |||||||||||||||||||||||
| 21,694,542 | 17,351,357 | 9,975,741 | 9,098,369 | 723,420 | 229,593 | 3,813,482 | 795,037 | |||||||||||||||||||||||
| (10,334,775) | (9,333,911) | (10,126,964) | (9,505,090) | (707,032) | (775,097) | (2,036,381) | (1,831,808) | |||||||||||||||||||||||
| — | — | — | — | — | (6,647,883) | — | — | |||||||||||||||||||||||
|
|
|
|
|
|
|
|
|
|
|
|
|
|
|
| |||||||||||||||
| 92,362,582 | 92,075,642 | 21,474,211 | 21,979,429 | 1,954,327 | (4,781,496) | 4,464,405 | 400,399 | |||||||||||||||||||||||
|
|
|
|
|
|
|
|
|
|
|
|
|
|
|
| |||||||||||||||
The accompanying Notes to Financial Statements are an integral part of this statement.
353
Table of Contents
THRIVENT SERIES FUND, INC.
STATEMENTOF CHANGESIN NET ASSETS –CONTINUED
| Diversified Income Plus Portfolio | Opportunity Income Plus Portfolio | |||||||||||||||
For the periods ended | 12/31/2014 | 12/31/2013 | 12/31/2014 | 12/31/2013 | ||||||||||||
Operations | ||||||||||||||||
Net investment income/(loss) | $ | 15,516,934 | $ | 11,858,151 | $ | 2,013,767 | $ | 1,012,530 | ||||||||
Net realized gains/(losses) | 10,750,364 | 9,396,899 | 381,889 | (1,724,664 | ) | |||||||||||
Change in net unrealized appreciation/(depreciation) | (9,938,310 | ) | 9,521,894 | (627,259 | ) | 288,119 | ||||||||||
Net Change in Net Assets Resulting From Operations | 16,328,988 | 30,776,944 | 1,768,397 | (424,015 | ) | |||||||||||
Distributions to Shareholders | ||||||||||||||||
From net investment income | (11,945,610 | ) | (7,460,218 | ) | (2,013,133 | ) | (1,012,847 | ) | ||||||||
From net realized gains | — | — | — | (301,210 | ) | |||||||||||
Total Distributions to Shareholders | (11,945,610 | ) | (7,460,218 | ) | (2,013,133 | ) | (1,314,057 | ) | ||||||||
Capital Stock Transactions | ||||||||||||||||
Sold | 78,367,852 | 117,802,735 | 34,935,161 | 17,096,427 | ||||||||||||
Distributions reinvested | 11,945,610 | 7,460,218 | 2,013,133 | 1,314,057 | ||||||||||||
Redeemed | (20,073,456 | ) | (15,574,126 | ) | (11,483,556 | ) | (7,403,776 | ) | ||||||||
Total Capital Stock Transactions | 70,240,006 | 109,688,827 | 25,464,738 | 11,006,708 | ||||||||||||
Net Increase/(Decrease) in Net Assets | 74,623,384 | 133,005,553 | 25,220,002 | 9,268,636 | ||||||||||||
Net Assets, Beginning of Period | 362,712,248 | 229,706,695 | 46,541,183 | 37,272,547 | ||||||||||||
Net Assets, End of Period | $ | 437,335,632 | $ | 362,712,248 | $ | 71,761,185 | $ | 46,541,183 | ||||||||
Accumulated Undistributed Net Investment Income/(Loss) | $ | 15,507,791 | $ | 11,868,879 | $ | 1,795 | $ | 753 | ||||||||
Capital Stock Share Transactions | ||||||||||||||||
Sold | 9,878,425 | 15,537,955 | 3,408,417 | 1,671,877 | ||||||||||||
Distributions reinvested | 1,506,284 | 986,514 | 196,344 | 127,594 | ||||||||||||
Redeemed | (2,539,841 | ) | (2,050,214 | ) | (1,119,921 | ) | (716,030 | ) | ||||||||
|
|
|
|
|
|
|
| |||||||||
Total Capital Stock Share Transactions | 8,844,868 | 14,474,255 | 2,484,840 | 1,083,441 | ||||||||||||
|
|
|
|
|
|
|
| |||||||||
The accompanying Notes to Financial Statements are an integral part of this statement.
354
Table of Contents
THRIVENT SERIES FUND, INC.
STATEMENTOF CHANGESIN NET ASSETS –CONTINUED
| Partner Technology Portfolio | Partner Healthcare Portfolio | Natural Resources Portfolio | Partner Emerging Markets Equity Portfolio | |||||||||||||||||||||||||||
| 12/31/2014 | 12/31/2013 | 12/31/2014 | 12/31/2013 | 12/31/2014 | 12/31/2013 | 12/31/2014 | 12/31/2013 | |||||||||||||||||||||||
| $(119,813 | ) | $ | (84,746 | ) | $ | 24,225 | $ | (38,222 | ) | $ | 158,739 | $ | 167,934 | $ | 620,449 | $ | 641,319 | |||||||||||||
| 3,658,323 | 4,503,669 | 9,030,304 | 4,219,641 | (1,555,500 | ) | (438,132 | ) | (975,578 | ) | (430,928 | ) | |||||||||||||||||||
| 1,598,968 | 6,213,839 | 6,278,632 | 5,839,702 | (5,723,995 | ) | 3,320,003 | 529,283 | (4,978,975 | ) | |||||||||||||||||||||
| 5,137,478 | 10,632,762 | 15,333,161 | 10,021,121 | (7,120,756 | ) | 3,049,805 | 174,154 | (4,768,584 | ) | |||||||||||||||||||||
| — | — | — | (127,607 | ) | (164,907 | ) | (226,334 | ) | (625,090 | ) | (626,603 | ) | ||||||||||||||||||
| — | — | (4,267,782 | ) | (1,382,286 | ) | — | — | — | — | |||||||||||||||||||||
| — | — | (4,267,782 | ) | (1,509,893 | ) | (164,907 | ) | (226,334 | ) | (625,090 | ) | (626,603 | ) | |||||||||||||||||
| 8,707,334 | 6,827,308 | 37,891,021 | 21,399,137 | 7,531,628 | 4,866,233 | 12,120,351 | 21,174,506 | |||||||||||||||||||||||
| — | — | 4,267,782 | 1,509,893 | 164,907 | 226,334 | 625,090 | 626,603 | |||||||||||||||||||||||
| (5,225,441 | ) | (4,902,962 | ) | (4,801,440 | ) | (2,944,132 | ) | (4,070,906 | ) | (4,538,478 | ) | (23,701,729 | ) | (11,204,248 | ) | |||||||||||||||
| 3,481,893 | 1,924,346 | 37,357,363 | 19,964,898 | 3,625,629 | 554,089 | (10,956,288 | ) | 10,596,861 | ||||||||||||||||||||||
| 8,619,371 | 12,557,108 | 48,422,742 | 28,476,126 | (3,660,034 | ) | 3,377,560 | (11,407,224 | ) | 5,201,674 | |||||||||||||||||||||
| 48,054,794 | 35,497,686 | 53,698,843 | 25,222,717 | 34,952,270 | 31,574,710 | 59,868,846 | 54,667,172 | |||||||||||||||||||||||
| $56,674,165 | $ | 48,054,794 | $ | 102,121,585 | $ | 53,698,843 | $ | 31,292,236 | $ | 34,952,270 | $ | 48,461,622 | $ | 59,868,846 | ||||||||||||||||
| $(18,797 | ) | $ | (16,529 | ) | $ | (3,559 | ) | $ | (10,237 | ) | $ | 148,701 | $ | 159,631 | $ | 502,190 | $ | 549,677 | ||||||||||||
| 859,524 | 836,201 | 2,022,167 | 1,394,927 | 998,357 | 672,269 | 948,289 | 1,596,634 | |||||||||||||||||||||||
| — | — | 234,644 | 100,929 | 19,823 | 31,637 | 46,995 | 50,371 | |||||||||||||||||||||||
| (523,338 | ) | (602,916 | ) | (261,666 | ) | (191,019 | ) | (546,081 | ) | (624,700 | ) | (1,782,215 | ) | (864,595 | ) | |||||||||||||||
|
|
|
|
|
|
|
|
|
|
|
|
|
|
|
| |||||||||||||||
| 336,186 | 233,285 | 1,995,145 | 1,304,837 | 472,099 | 79,206 | (786,931 | ) | 782,410 | ||||||||||||||||||||||
|
|
|
|
|
|
|
|
|
|
|
|
|
|
|
| |||||||||||||||
The accompanying Notes to Financial Statements are an integral part of this statement.
355
Table of Contents
THRIVENT SERIES FUND, INC.
STATEMENTOF CHANGESIN NET ASSETS –CONTINUED
| Real Estate Securities Portfolio | Partner Small Cap Growth Portfolio | |||||||||||||||
For the periods ended | 12/31/2014 | 12/31/2013 | 12/31/2014 | 12/31/2013 | ||||||||||||
Operations | ||||||||||||||||
Net investment income/(loss) | $ | 2,213,068 | $ | 1,999,451 | $ | (1,481,325) | $ | (1,449,545) | ||||||||
Net realized gains/(losses) | 6,262,880 | 3,729,450 | 73,622,815 | 40,580,228 | ||||||||||||
Change in net unrealized appreciation/(depreciation) | 26,974,408 | (3,152,293) | (87,421,150) | 63,097,078 | ||||||||||||
Net Change in Net Assets Resulting From Operations | 35,450,356 | 2,576,608 | (15,279,660) | 102,227,761 | ||||||||||||
Distributions to Shareholders | ||||||||||||||||
From net investment income | (2,006,084) | (1,880,889) | — | — | ||||||||||||
From net realized gains | (2,407,859) | — | (38,837,387) | (6,075,672) | ||||||||||||
Total Distributions to Shareholders | (4,413,943) | (1,880,889) | (38,837,387) | (6,075,672) | ||||||||||||
Capital Stock Transactions | ||||||||||||||||
Sold | 19,573,670 | 19,037,347 | 5,081,763 | 6,878,294 | ||||||||||||
Distributions reinvested | 4,413,943 | 1,880,889 | 38,837,387 | 6,075,672 | ||||||||||||
Redeemed | (32,545,004) | (23,990,372) | (7,558,351) | (21,700,165) | ||||||||||||
In-kind redemptions | — | — | (278,767,780) | — | ||||||||||||
Total Capital Stock Transactions | (8,557,391) | (3,072,136) | (242,406,981) | (8,746,199) | ||||||||||||
Net Increase/(Decrease) in Net Assets | 22,479,022 | (2,376,417) | (296,524,028) | 87,405,890 | ||||||||||||
Net Assets, Beginning of Period | 120,065,842 | 122,442,259 | 344,325,054 | 256,919,164 | ||||||||||||
Net Assets, End of Period | $ | 142,544,864 | $ | 120,065,842 | $ | 47,801,026 | $ | 344,325,054 | ||||||||
Accumulated Undistributed Net Investment Income/(Loss) | $ | 2,167,266 | $ | 1,959,695 | $ | (39,542) | $ | (112,650) | ||||||||
Capital Stock Share Transactions | ||||||||||||||||
Sold | 950,655 | 1,004,072 | 287,441 | 402,076 | ||||||||||||
Distributions reinvested | 217,660 | 99,130 | 2,345,324 | 379,533 | ||||||||||||
Redeemed | (1,588,870) | (1,287,432) | (431,301) | (1,397,890) | ||||||||||||
In-kind redemptions | — | — | (17,355,030) | — | ||||||||||||
|
|
|
|
|
|
|
| |||||||||
Total Capital Stock Share Transactions | (420,555) | (184,230) | (15,153,566) | (616,281) | ||||||||||||
|
|
|
|
|
|
|
| |||||||||
The accompanying Notes to Financial Statements are an integral part of this statement.
356
Table of Contents
THRIVENT SERIES FUND, INC.
STATEMENTOF CHANGESIN NET ASSETS –CONTINUED
| Partner Small Cap Value Portfolio | Small Cap Stock Portfolio | Small Cap Index Portfolio | Mid Cap Growth Portfolio | |||||||||||||||||||||||||||
| 12/31/2014 | 12/31/2013 | 12/31/2014 | 12/31/2013 | 12/31/2014 | 12/31/2013 | 12/31/2014 | 12/31/2013 | |||||||||||||||||||||||
| $3,358,608 | $ | 1,877,079 | $ | 1,378,508 | $ | 766,894 | $ | 2,226,236 | $ | 1,914,039 | $ | 1,028,986 | $ | 868,487 | ||||||||||||||||
| 29,581,013 | 9,854,389 | 41,140,932 | 30,901,008 | 19,496,569 | 17,444,322 | 37,280,478 | 37,331,666 | |||||||||||||||||||||||
| (22,136,591) | 91,972,307 | (28,977,503 | ) | 63,194,648 | (8,079,689 | ) | 58,011,540 | 56,536 | 65,343,840 | |||||||||||||||||||||
| 10,803,030 | 103,703,775 | 13,541,937 | 94,862,550 | 13,643,116 | 77,369,901 | 38,366,000 | 103,543,993 | |||||||||||||||||||||||
| (830,710) | (6,212,011 | ) | (760,245 | ) | (1,110,363 | ) | (1,923,687 | ) | (2,774,672 | ) | (878,668 | ) | (1,307,135 | ) | ||||||||||||||||
| (9,885,913) | (1,618,481 | ) | (3,810,915 | ) | — | (17,451,260 | ) | (9,403,427 | ) | (37,294,754 | ) | (216,636 | ) | |||||||||||||||||
| (10,716,623) | (7,830,492 | ) | (4,571,160 | ) | (1,110,363 | ) | (19,374,947 | ) | (12,178,099 | ) | (38,173,422 | ) | (1,523,771 | ) | ||||||||||||||||
| 6,442,106 | 13,620,695 | 6,694,325 | 8,906,708 | 19,450,966 | 15,094,607 | 11,623,294 | 10,907,279 | |||||||||||||||||||||||
| 10,716,623 | 7,830,492 | 4,571,160 | 1,110,363 | 19,374,947 | 12,178,099 | 38,173,422 | 1,523,771 | |||||||||||||||||||||||
| (13,288,687) | (15,228,121 | ) | (68,471,873 | ) | (18,675,324 | ) | (27,229,344 | ) | (23,380,516 | ) | (47,155,406 | ) | (51,638,208 | ) | ||||||||||||||||
| — | — | — | — | — | — | — | — | |||||||||||||||||||||||
| 3,870,042 | 6,223,066 | (57,206,388 | ) | (8,658,253 | ) | 11,596,569 | 3,892,190 | 2,641,310 | (39,207,158 | ) | ||||||||||||||||||||
| 3,956,449 | 102,096,349 | (48,235,611 | ) | 85,093,934 | 5,864,738 | 69,083,992 | 2,833,888 | 62,813,064 | ||||||||||||||||||||||
| 384,676,157 | 282,579,808 | 354,573,646 | 269,479,712 | 262,761,848 | 193,677,856 | 424,319,334 | 361,506,270 | |||||||||||||||||||||||
| $388,632,606 | $ | 384,676,157 | $ | 306,338,035 | $ | 354,573,646 | $ | 268,626,586 | $ | 262,761,848 | $ | 427,153,222 | $ | 424,319,334 | ||||||||||||||||
| $3,062,930 | $ | (168,608 | ) | $ | 1,323,275 | $ | 703,090 | $ | 2,167,493 | $ | 1,863,885 | $ | 928,431 | $ | 783,613 | |||||||||||||||
| 233,340 | 565,151 | 380,860 | 579,630 | 1,139,106 | 964,708 | 475,776 | 486,854 | |||||||||||||||||||||||
| 384,844 | 324,118 | 257,462 | 72,690 | 1,146,358 | 810,987 | 1,623,075 | 70,344 | |||||||||||||||||||||||
| (484,226) | (626,924 | ) | (3,920,354 | ) | (1,233,674 | ) | (1,589,636 | ) | (1,502,424 | ) | (1,925,665 | ) | (2,339,125 | ) | ||||||||||||||||
| — | — | — | — | — | — | — | — | |||||||||||||||||||||||
|
|
|
|
|
|
|
|
|
|
|
|
|
|
|
| |||||||||||||||
| 133,958 | 262,345 | (3,282,032 | ) | (581,354 | ) | 695,828 | 273,271 | 173,186 | (1,781,927 | ) | ||||||||||||||||||||
|
|
|
|
|
|
|
|
|
|
|
|
|
|
|
| |||||||||||||||
The accompanying Notes to Financial Statements are an integral part of this statement.
357
Table of Contents
THRIVENT SERIES FUND, INC.
STATEMENTOF CHANGESIN NET ASSETS –CONTINUED
| Partner Mid Cap Value Portfolio | Mid Cap Stock Portfolio | |||||||||||||||
For the periods ended | 12/31/2014 | 12/31/2013 | 12/31/2014 | 12/31/2013 | ||||||||||||
Operations | ||||||||||||||||
Net investment income/(loss) | $ | 2,225,207 | $ | 2,373,852 | $ | 4,477,794 | $ | 2,224,350 | ||||||||
Net realized gains/(losses) | 46,593,721 | 49,541,187 | 81,651,039 | 56,136,087 | ||||||||||||
Change in net unrealized appreciation/(depreciation) | (928,175 | ) | 34,483,092 | (5,733,046 | ) | 119,829,423 | ||||||||||
Net Change in Net Assets Resulting From Operations | 47,890,753 | 86,398,131 | 80,395,787 | 178,189,860 | ||||||||||||
Distributions to Shareholders | ||||||||||||||||
From net investment income | (2,382,909 | ) | (3,042,438 | ) | (2,238,163 | ) | (2,176,782 | ) | ||||||||
From net realized gains | (49,092,042 | ) | (13,305,805 | ) | (31,748,560 | ) | — | |||||||||
Total Distributions to Shareholders | (51,474,951 | ) | (16,348,243 | ) | (33,986,723 | ) | (2,176,782 | ) | ||||||||
Capital Stock Transactions | ||||||||||||||||
Sold | 6,139,367 | 11,505,045 | 12,414,918 | 6,010,562 | ||||||||||||
Distributions reinvested | 51,474,951 | 16,348,243 | 33,986,723 | 2,176,782 | ||||||||||||
Redeemed | (4,118,963 | ) | (6,416,261 | ) | (15,614,364 | ) | (15,505,487 | ) | ||||||||
Total Capital Stock Transactions | 53,495,355 | 21,437,027 | 30,787,277 | (7,318,143 | ) | |||||||||||
Net Increase/(Decrease) in Net Assets | 49,911,157 | 91,486,915 | 77,196,341 | 168,694,935 | ||||||||||||
Net Assets, Beginning of Period | 352,945,948 | 261,459,033 | 675,422,098 | 506,727,163 | ||||||||||||
Net Assets, End of Period | $ | 402,857,105 | $ | 352,945,948 | $ | 752,618,439 | $ | 675,422,098 | ||||||||
Accumulated Undistributed Net Investment Income/(Loss) | $ | 2,194,546 | $ | 2,338,230 | $ | 4,100,262 | $ | 1,932,768 | ||||||||
Capital Stock Share Transactions | ||||||||||||||||
Sold | 338,700 | 698,248 | 681,375 | 392,094 | ||||||||||||
Distributions reinvested | 2,975,792 | 994,806 | 1,849,557 | 144,603 | ||||||||||||
Redeemed | (231,539 | ) | (388,569 | ) | (855,258 | ) | (1,023,275 | ) | ||||||||
|
|
|
|
|
|
|
| |||||||||
Total Capital Stock Share Transactions | 3,082,953 | 1,304,485 | 1,675,674 | (486,578 | ) | |||||||||||
|
|
|
|
|
|
|
| |||||||||
The accompanying Notes to Financial Statements are an integral part of this statement.
358
Table of Contents
THRIVENT SERIES FUND, INC.
STATEMENTOF CHANGESIN NET ASSETS –CONTINUED
| Mid Cap Index Portfolio | Partner Worldwide Allocation Portfolio | Partner All Cap Portfolio | Large Cap Growth Portfolio | |||||||||||||||||||||||||||
| 12/31/2014 | 12/31/2013 | 12/31/2014 | 12/31/2013 | 12/31/2014 | 12/31/2013 | 12/31/2014 | 12/31/2013 | |||||||||||||||||||||||
| $ | 1,182,443 | $ | 997,123 | $ | 38,146,324 | $ | 31,098,950 | $ | 312,718 | $ | 395,155 | $ | 5,587,936 | $ | 6,199,197 | |||||||||||||||
| 6,974,875 | 5,697,265 | 69,845,647 | 73,417,195 | 8,714,041 | 9,321,198 | 163,556,942 | 92,037,523 | |||||||||||||||||||||||
| 3,812,395 | 22,432,414 | (198,771,520) | 136,848,064 | (1,331,941) | 6,528,169 | (59,632,233) | 195,315,087 | |||||||||||||||||||||||
| 11,969,713 | 29,126,802 | (90,779,549) | 241,364,209 | 7,694,818 | 16,244,522 | 109,512,645 | 293,551,807 | |||||||||||||||||||||||
| (1,001,203) | (926,864) | (34,636,379) | (416,617) | (396,564) | (428,025) | (6,205,697) | (5,999,580) | |||||||||||||||||||||||
| (6,112,967) | (3,159,150) | — | — | — | — | — | — | |||||||||||||||||||||||
| (7,114,170) | (4,086,014) | (34,636,379) | (416,617) | (396,564) | (428,025) | (6,205,697) | (5,999,580) | |||||||||||||||||||||||
| 20,796,010 | 19,220,321 | 22,264,244 | 19,622,603 | 5,673,145 | 3,795,626 | 27,123,582 | 33,770,524 | |||||||||||||||||||||||
| 7,114,170 | 4,086,014 | 34,636,379 | 416,617 | 396,564 | 428,025 | 6,205,697 | 5,999,580 | |||||||||||||||||||||||
| (10,694,946) | (10,466,874) | (30,182,494) | (75,334,755) | (7,677,955) | (7,701,099) | (194,100,261) | (125,260,503) | |||||||||||||||||||||||
| 17,215,234 | 12,839,461 | 26,718,129 | (55,295,535) | (1,608,246) | (3,477,448) | (160,770,982) | (85,490,399) | |||||||||||||||||||||||
| 22,070,777 | 37,880,249 | (98,697,799) | 185,652,057 | 5,690,008 | 12,339,049 | (57,464,034) | 202,061,828 | |||||||||||||||||||||||
| 122,992,711 | 85,112,462 | 1,705,988,585 | 1,520,336,528 | 63,808,384 | 51,469,335 | 1,061,971,778 | 859,909,950 | |||||||||||||||||||||||
| $ | 145,063,488 | $ | 122,992,711 | $ | 1,607,290,786 | $ | 1,705,988,585 | $ | 69,498,392 | $ | 63,808,384 | $ | 1,004,507,744 | $ | 1,061,971,778 | |||||||||||||||
| $ | 1,159,699 | $ | 978,459 | $ | 38,622,010 | $ | 32,581,677 | $ | 296,891 | $ | 382,935 | $ | 35,506 | $ | 578,625 | |||||||||||||||
| 1,310,042 | 1,350,292 | 2,250,484 | 2,116,956 | 431,176 | 343,947 | 1,017,440 | 1,524,721 | |||||||||||||||||||||||
| 447,533 | 293,994 | 3,380,214 | 46,389 | 29,955 | 38,956 | 222,358 | 240,562 | |||||||||||||||||||||||
| (674,553) | (736,355) | (3,045,127) | (8,330,270) | (581,464) | (702,140) | (7,186,682) | (5,770,940) | |||||||||||||||||||||||
|
|
|
|
|
|
|
|
|
|
|
|
|
|
|
| |||||||||||||||
| 1,083,022 | 907,931 | 2,585,571 | (6,166,925) | (120,333) | (319,237) | (5,946,884) | (4,005,657) | |||||||||||||||||||||||
|
|
|
|
|
|
|
|
|
|
|
|
|
|
|
| |||||||||||||||
The accompanying Notes to Financial Statements are an integral part of this statement.
359
Table of Contents
THRIVENT SERIES FUND, INC.
STATEMENTOF CHANGESIN NET ASSETS –CONTINUED
| Partner Growth Stock Portfolio | Large Cap Value Portfolio | |||||||||||||||
For the periods ended | 12/31/2014 | 12/31/2013 | 12/31/2014 | 12/31/2013 | ||||||||||||
Operations | ||||||||||||||||
Net investment income/(loss) | $ | (143,988) | $ | (156,897) | $ | 15,485,509 | $ | 14,173,723 | ||||||||
Net realized gains/(losses) | 9,097,342 | 6,963,318 | 61,684,298 | 52,222,956 | ||||||||||||
Change in net unrealized appreciation/(depreciation) | (2,458,144) | 14,998,010 | 23,223,019 | 204,156,400 | ||||||||||||
Net Change in Net Assets Resulting From Operations | 6,495,210 | 21,804,431 | 100,392,826 | 270,553,079 | ||||||||||||
Distributions to Shareholders | ||||||||||||||||
From net investment income | — | (18,555) | (14,210,465) | (14,880,600) | ||||||||||||
From net realized gains | (6,496,774) | — | — | — | ||||||||||||
Total Distributions to Shareholders | (6,496,774) | (18,555) | (14,210,465) | (14,880,600) | ||||||||||||
Capital Stock Transactions | ||||||||||||||||
Sold | 9,628,170 | 5,772,927 | 13,682,320 | 21,155,090 | ||||||||||||
Issued in connection with merger | — | — | — | — | ||||||||||||
Distributions reinvested | 6,496,774 | 18,555 | 14,210,465 | 14,880,600 | ||||||||||||
Redeemed | (10,635,385) | (9,323,745) | (28,234,730) | (25,189,006) | ||||||||||||
Total Capital Stock Transactions | 5,489,559 | (3,532,263) | (341,945) | 10,846,684 | ||||||||||||
Net Increase/(Decrease) in Net Assets | 5,487,995 | 18,253,613 | 85,840,416 | 266,519,163 | ||||||||||||
Net Assets, Beginning of Period | 76,233,991 | 57,980,378 | 1,119,162,039 | 852,642,876 | ||||||||||||
Net Assets, End of Period | $ | 81,721,986 | $ | 76,233,991 | $ | 1,205,002,455 | $ | 1,119,162,039 | ||||||||
Accumulated Undistributed Net Investment Income/(Loss) | $ | (19,923) | $ | (17,607) | $ | 14,985,013 | $ | 14,061,142 | ||||||||
Capital Stock Share Transactions | ||||||||||||||||
Sold | 519,716 | 366,880 | 851,800 | 1,506,230 | ||||||||||||
Issued in connection with merger | — | — | — | — | ||||||||||||
Distributions reinvested | 371,456 | 1,209 | 869,333 | 1,059,653 | ||||||||||||
Redeemed | (581,551) | (593,980) | (1,755,314) | (1,810,189) | ||||||||||||
|
|
|
|
|
|
|
| |||||||||
Total Capital Stock Share Transactions | 309,621 | (225,891) | (34,181) | 755,694 | ||||||||||||
|
|
|
|
|
|
|
| |||||||||
The accompanying Notes to Financial Statements are an integral part of this statement.
360
Table of Contents
THRIVENT SERIES FUND, INC.
STATEMENTOF CHANGESIN NET ASSETS –CONTINUED
| Large Cap Stock Portfolio | Large Cap Index Portfolio | High Yield Portfolio | Income Portfolio | |||||||||||||||||||||||||||
| 12/31/2014 | 12/31/2013 | 12/31/2014 | 12/31/2013 | 12/31/2014 | 12/31/2013 | 12/31/2014 | 12/31/2013 | |||||||||||||||||||||||
| $ | 10,040,750 | $ | 7,249,881 | $ | 6,821,833 | $ | 5,921,597 | $ | 53,971,230 | $ | 57,959,063 | $ | 54,103,593 | $ | 56,447,660 | |||||||||||||||
| 69,110,961 | 63,213,680 | 2,664,831 | 4,166,717 | 13,193,932 | 16,338,100 | 25,966,758 | 22,402,779 | |||||||||||||||||||||||
| (36,495,875) | 113,722,579 | 42,486,523 | 85,018,738 | (47,671,133) | (13,294,522) | 12,917,898 | (80,301,383) | |||||||||||||||||||||||
| 42,655,836 | 184,186,140 | 51,973,187 | 95,107,052 | 19,494,029 | 61,002,641 | 92,988,249 | (1,450,944) | |||||||||||||||||||||||
| (7,274,387) | (8,140,375) | (5,820,275) | (5,733,630) | (54,199,192) | (57,720,706) | (53,952,988) | (56,092,101) | |||||||||||||||||||||||
| — | — | (927,955) | (3,429,327) | — | — | (17,510,205) | (3,278,491) | |||||||||||||||||||||||
| (7,274,387) | (8,140,375) | (6,748,230) | (9,162,957) | (54,199,192) | (57,720,706) | (71,463,193) | (59,370,592) | |||||||||||||||||||||||
| 9,307,227 | 6,604,862 | 40,918,587 | 28,709,669 | 27,735,059 | 41,888,839 | 16,327,597 | 25,072,319 | |||||||||||||||||||||||
| — | 31,485,903 | — | — | — | — | — | — | |||||||||||||||||||||||
| 7,274,387 | 8,140,375 | 6,748,230 | 9,162,957 | 54,199,192 | 57,720,706 | 71,463,193 | 59,370,592 | |||||||||||||||||||||||
| (29,323,725) | (32,934,081) | (35,085,339) | (35,155,121) | (113,316,667) | (85,904,394) | (134,662,331) | (181,912,585) | |||||||||||||||||||||||
| (12,742,111) | 13,297,059 | 12,581,478 | 2,717,505 | (31,382,416) | 13,705,151 | (46,871,541) | (97,469,674) | |||||||||||||||||||||||
| 22,639,338 | 189,342,824 | 57,806,435 | 88,661,600 | (66,087,579) | 16,987,086 | (25,346,485) | (158,291,210) | |||||||||||||||||||||||
| 811,875,706 | 622,532,882 | 392,630,041 | 303,968,441 | 921,884,509 | 904,897,423 | 1,417,609,081 | 1,575,900,291 | |||||||||||||||||||||||
| $ | 834,515,044 | $ | 811,875,706 | $ | 450,436,476 | $ | 392,630,041 | $ | 855,796,930 | $ | 921,884,509 | $ | 1,392,262,596 | $ | 1,417,609,081 | |||||||||||||||
| $ | 9,674,625 | $ | 7,106,693 | $ | 6,739,988 | $ | 5,841,728 | $ | 313,742 | $ | 514,131 | $ | (113,133) | $ | (117,618) | |||||||||||||||
| 763,018 | 628,688 | 1,510,271 | 1,237,822 | 5,446,151 | 8,267,882 | 1,547,161 | 2,371,793 | |||||||||||||||||||||||
| — | 2,953,760 | — | — | — | — | — | — | |||||||||||||||||||||||
| 583,594 | 782,300 | 249,150 | 400,945 | 10,675,532 | 11,421,526 | 6,770,456 | 5,650,047 | |||||||||||||||||||||||
| (2,403,756) | (3,141,637) | (1,307,336) | (1,539,086) | (22,365,303) | (17,037,868) | (12,771,102) | (17,264,108) | |||||||||||||||||||||||
|
|
|
|
|
|
|
|
|
|
|
|
|
|
|
| |||||||||||||||
| (1,057,144) | 1,223,111 | 452,085 | 99,681 | (6,243,620) | 2,651,540 | (4,453,485) | (9,242,268) | |||||||||||||||||||||||
|
|
|
|
|
|
|
|
|
|
|
|
|
|
|
| |||||||||||||||
The accompanying Notes to Financial Statements are an integral part of this statement.
361
Table of Contents
THRIVENT SERIES FUND, INC.
STATEMENTOF CHANGESIN NET ASSETS –CONTINUED
| Bond Index Portfolio | Limited Maturity Bond Portfolio | |||||||||||||||
For the periods ended | 12/31/2014 | 12/31/2013 | 12/31/2014 | 12/31/2013 | ||||||||||||
Operations | ||||||||||||||||
Net investment income/(loss) | $ | 3,314,697 | $ | 3,328,936 | $ | 18,619,779 | $ | 17,777,172 | ||||||||
Net realized gains/(losses) | 1,450,014 | (2,176,457 | ) | (1,138,898 | ) | 8,286,041 | ||||||||||
Change in net unrealized appreciation/(depreciation) | 4,703,041 | (5,573,292 | ) | 456,626 | (20,804,818 | ) | ||||||||||
Net Change in Net Assets Resulting From Operations | 9,467,752 | (4,420,813 | ) | 17,937,507 | 5,258,395 | |||||||||||
Distributions to Shareholders | ||||||||||||||||
From net investment income | (3,314,697 | ) | (3,328,936 | ) | (18,195,371 | ) | (17,218,976 | ) | ||||||||
From net realized gains | — | (5,464,327 | ) | — | — | |||||||||||
Total Distributions to Shareholders | (3,314,697 | ) | (8,793,263 | ) | (18,195,371 | ) | (17,218,976 | ) | ||||||||
Capital Stock Transactions | ||||||||||||||||
Sold | 11,545,085 | 13,325,069 | 32,112,602 | 41,686,633 | ||||||||||||
Distributions reinvested | 3,314,697 | 8,793,263 | 18,195,371 | 17,218,976 | ||||||||||||
Redeemed | (23,075,491 | ) | (42,349,648 | ) | (114,240,511 | ) | (164,430,498 | ) | ||||||||
Total Capital Stock Transactions | (8,215,709 | ) | (20,231,316 | ) | (63,932,538 | ) | (105,524,889 | ) | ||||||||
Net Increase/(Decrease) in Net Assets | (2,062,654 | ) | (33,445,392 | ) | (64,190,402 | ) | (117,485,470 | ) | ||||||||
Net Assets, Beginning of Period | 152,016,778 | 185,462,170 | 1,082,528,198 | 1,200,013,668 | ||||||||||||
Net Assets, End of Period | $ | 149,954,124 | $ | 152,016,778 | $ | 1,018,337,796 | $ | 1,082,528,198 | ||||||||
Accumulated Undistributed Net Investment Income/(Loss) | $ | (602 | ) | $ | (602 | ) | $ | 425,277 | $ | 431,630 | ||||||
Capital Stock Share Transactions | ||||||||||||||||
Sold | 1,063,905 | 1,195,866 | 3,257,533 | 4,221,041 | ||||||||||||
Distributions reinvested | 306,504 | 810,078 | 1,845,982 | 1,745,050 | ||||||||||||
Redeemed | (2,136,588 | ) | (3,887,287 | ) | (11,596,039 | ) | (16,634,618 | ) | ||||||||
|
|
|
|
|
|
|
| |||||||||
Total Capital Stock Share Transactions | (766,179 | ) | (1,881,343 | ) | (6,492,524 | ) | (10,668,527 | ) | ||||||||
|
|
|
|
|
|
|
| |||||||||
The accompanying Notes to Financial Statements are an integral part of this statement.
362
Table of Contents
THRIVENT SERIES FUND, INC.
STATEMENTOF CHANGESIN NET ASSETS –CONTINUED
| Money Market Portfolio | ||||||
| 12/31/2014 | 12/31/2013 | |||||
| $ | — | $ | (4,026 | ) | ||
| (759 | ) | 4,026 | ||||
| — | — | |||||
| (759 | ) | — | ||||
| — | — | |||||
| — | — | |||||
| — | — | |||||
| 65,254,801 | 89,452,873 | |||||
| — | — | |||||
| (85,420,968 | ) | (91,133,483 | ) | |||
| (20,166,167 | ) | (1,680,610 | ) | |||
| (20,166,926 | ) | (1,680,610 | ) | |||
| 146,581,714 | 148,262,324 | |||||
| $ | 126,414,788 | $ | 146,581,714 | |||
| $ | — | $ | — | |||
| 65,254,800 | 89,452,873 | |||||
| — | — | |||||
| (85,420,967 | ) | (91,133,483 | ) | |||
|
|
|
| |||
| (20,166,167 | ) | (1,680,610 | ) | |||
|
|
|
| |||
The accompanying Notes to Financial Statements are an integral part of this statement.
363
Table of Contents
THRIVENT SERIES FUND, INC.
NOTESTO FINANCIAL STATEMENTS
December 31, 2014
(1) ORGANIZATION
Thrivent Series Fund, Inc. (the “Fund”), a corporation organized under the laws of Minnesota, is registered under the Investment Company Act of 1940 (the “1940 Act”). The Fund is divided into thirty-three separate series (each, a “Portfolio”), each with its own investment objective and policies. The Fund consists of four asset allocation Portfolios, four income plus Portfolios, twenty equity Portfolios, four fixed-income Portfolios, and one money market Portfolio. The assets of each Portfolio are segregated, and each has a separate class of capital stock.
Shares in the Fund are currently sold, without sales charges, only to retirement plans sponsored by Thrivent Financial for Lutherans (“Thrivent Financial” or the “Adviser”) or separate accounts of Thrivent Financial or Thrivent Life Insurance Company (“Thrivent Life”), which are used to fund benefits of variable life insurance and variable annuity contracts issued by Thrivent Financial and Thrivent Life.
The Portfolios are each investment companies that follow the accounting and reporting guidance of the Financial Accounting Standards Board (FASB) Accounting Standard Codification Topic 946 - Financial Services - Investment Companies.
Under the Fund’s organizational documents, its officers and directors are indemnified against certain liabilities arising out of the performance of their duties to the Fund. In addition, in the normal course of business, the Fund enters into contracts with service providers and others that provide general damage clauses. The Fund’s maximum exposure under these contracts is unknown, as this would involve future claims that may be made against the Fund. However, based on experience, the Fund expects the risk of loss to be remote.
(A) Portfolio Mergers – At a meeting held on August 2, 2013, shareholders of Thrivent Partner All Cap Value Portfolio, Thrivent Partner All Cap Growth Portfolio, and Thrivent Partner Socially Responsible Stock Portfolio (the “Target Portfolios”) approved the merger of the Target Portfolios into Thrivent Large Cap Stock Portfolio (the “Acquiring Portfolio”).
Target Portfolios | Acquiring Portfolios | |||
| Partner All Cap Value | > | Large Cap Stock | ||
| Partner All Cap Growth | > | Large Cap Stock | ||
| Partner Socially Responsible Stock | > | Large Cap Stock |
The mergers occurred at the close of business on August 16, 2013. Acquisition of the assets and liabilities of the Target Portfolios by the Acquiring Portfolio were followed by the distribution of the Acquiring Portfolio shares to the Target Portfolios’ shareholders. The shares issued of the Acquiring Portfolio are disclosed in the Statement of Changes in Net Assets.
The mergers were accomplished by tax free exchanges as detailed below:
Portfolio | Description | Net Assets as of August 16, 2013 | ||||
Large Cap Stock | Acquiring Portfolio | $ | 710,028,233 | |||
Partner All Cap Value | Target Portfolio | $ | 6,754,374 | |||
Partner All Cap Growth | Target Portfolio | $ | 13,237,069 | |||
Partner Socially Responsible Stock | Target Portfolio | $ | 11,494,460 | |||
|
| |||||
Large Cap Stock | After Acquisition | $ | 741,514,136 | |||
|
| |||||
As of August 16, 2013, the net assets of the Target Portfolios were comprised of the following:
Target Portfolio | Unrealized Appreciation | Undistributed Net Investment (Loss) | Accumulated Net Realized (Losses) | Capital Stock | ||||||||||||
Partner All Cap Value | $ | 495,239 | $ | (11,204 | ) | $ | (24,651 | ) | $ | 6,294,990 | ||||||
Partner All Cap Growth | $ | 2,820,455 | $ | (9,152 | ) | $ | (5,699 | ) | $ | 10,431,465 | ||||||
Partner Socially Responsible Stock | $ | 2,159,274 | $ | (9,094 | ) | $ | (644 | ) | $ | 9,344,924 | ||||||
The Target Portfolios’ capital loss carryovers are carried over to the Acquiring Portfolio. The amounts, if any, and applicable limitations are disclosed in Note (4) Tax Information.
364
Table of Contents
THRIVENT SERIES FUND, INC.
December 31, 2014
Assuming the mergers had been completed on January 1, 2013 the Acquiring Portfolio’s pro-forma results of operations for the year ended December 31, 2013 would be the following:
Acquiring Portfolio | Net Change in Unrealized Appreciation/ (Depreciation) | Net Investment Income | Net Gains/(Losses) on Investments | Net Increase in Net Assets from Operations | ||||||||||||
Large Cap Stock | $ | 116,147,892 | $ | 7,385,559 | $ | 64,446,500 | $ | 187,979,951 | ||||||||
The financial statements reflect the operations of the Portfolios for the period prior to the merger and the combined Portfolios for the period subsequent to the mergers. Because the combined investment portfolios have been managed as a single integrated portfolio since the mergers were completed, it is not practicable to separate the amounts of revenue and earnings of Thrivent Partner All Cap Value Portfolio, Thrivent Partner All Cap Growth Portfolio, and Thrivent Partner Socially Responsible Stock Portfolio that have been included in the combined Portfolio’s Statement of Operations since the mergers were completed.
(2) SIGNIFICANT ACCOUNTING POLICIES
(A) Valuation of Investments – Securities traded on U.S. or foreign securities exchanges or included in a national market system are valued at the official closing price at the close of each business day unless otherwise stated below. Over-the-counter securities and listed securities for which no price is readily available are valued at the current bid price considered best to represent the value at that time. Swap agreements are valued at the latest bid quotation of the contract as furnished by an independent pricing service. Security prices are based on quotes that are obtained from an independent pricing service approved by the Board of Directors (the “Board”). The pricing service, in determining values of fixed-income securities, takes into consideration such factors as current quotations by broker/dealers, coupon, maturity, quality, type of issue, trading characteristics, and other yield and risk factors it deems relevant in determining valuations. Securities which cannot be valued by the approved pricing service are valued using valuations obtained from dealers that make markets in the securities. Exchange-listed options and futures contracts are valued at the last quoted sales price. Forward foreign currency exchange contracts are marked-to-market based upon foreign currency exchange rates provided by the pricing service. Investments in open-ended mutual funds are valued at their net asset value at the close of each business day. Short-term securities are valued at amortized cost (which approximates market value) to the extent it is not materially different than market value.
Securities held by Money Market Portfolio are valued on the basis of amortized cost (which approximates market value), whereby a portfolio security is valued at its cost initially and thereafter valued to reflect a constant amortization to maturity of any discount or premium. Money Market Portfolio and the Adviser follow procedures necessary to maintain a constant net asset value of $1.00 per share.
The Board has delegated responsibility for daily valuation of the Portfolios’ securities to the Adviser. The Adviser has formed a Valuation Committee (“Committee”) that is responsible for overseeing the Portfolios’ valuation policies in accordance with Valuation Policies and Procedures. The Committee meets on a monthly and on an as-needed basis to review price challenges, price overrides, stale prices, shadow prices, manual prices, money market pricing, international fair valuation, and other securities requiring fair valuation.
The Committee monitors for significant events occurring prior to the close of trading on the New York Stock Exchange that could have a material impact on the value of any securities that are held by the Portfolios. Examples of such events include trading halts, national news/events, and issuer-specific developments. If the Committee decides that such events warrant using fair value estimates, the Committee will take such events into consideration in determining the fair value of such securities. If market quotations or prices are not readily available or determined to be unreliable, the securities will be valued at fair value as determined in good faith pursuant to procedures adopted by the Board.
Financial Accounting Standards Board (FASB) guidelines require increased fair value disclosure intended to improve the consistency and comparability of fair value measurements used in financial reporting. The guidelines define fair value, establish a framework for measuring fair value in U.S. Generally Accepted Accounting Principles (“GAAP”) and expand disclosures about fair value requirements. The various inputs used to determine the fair value of the Portfolios’ investments are summarized in three broad levels: Level 1 includes quoted prices in active markets for identical securities, typically included in this level are U.S. equity securities, futures, options and registered investment company funds; Level 2 includes other significant observable inputs such as quoted prices for similar securities, interest rates, prepayment speeds and credit risk, typically included in this level are fixed income securities, international securities, swaps and forward contracts; and Level 3 includes significant unobservable inputs such as the Adviser’s own assumptions and broker evaluations in determining the fair value of investments. Of the Level 3 securities, those for which market values were not readily available or were deemed unreliable were fair valued as determined in good faith under procedures established by the Board. The valuation levels are not necessarily an indication
365
Table of Contents
THRIVENT SERIES FUND, INC.
NOTESTO FINANCIAL STATEMENTS
December 31, 2014
of the risk associated with investing in these securities or other investments.
Valuation of International Securities – Because many foreign markets close before the U.S. markets, events may occur between the close of the foreign market and the close of the U.S. markets that could have a material impact on the valuation of foreign securities. The Portfolios, under the supervision of the Board, evaluate the impacts of these events and may adjust the valuation of foreign securities to reflect the fair value as of the close of the U.S. markets. The Board has authorized the Adviser to make fair valuation determinations pursuant to policies approved by the Board.
(B) Foreign Currency Translation – The accounting records of each Portfolio are maintained in U.S. dollars. Securities and other assets and liabilities that are denominated in foreign currencies are translated into U.S. dollars at the daily closing rates of exchange.
Foreign currency amounts related to the purchase or sale of securities and income and expenses are translated at the exchange rate on the transaction date. Net realized and unrealized currency gains and losses are recorded from closed currency contracts, disposition of foreign currencies, exchange gains or losses between the trade date and settlement dates on securities transactions, and other translation gains or losses on dividends, interest income and foreign withholding taxes. The Portfolios do not separately report the effect of changes in foreign exchange rates from changes in prices on securities held. Such changes are included in net realized and unrealized gain or loss from investments in the Statement of Operations.
For federal income tax purposes, the Portfolios treat the effect of changes in foreign exchange rates arising from actual foreign currency transactions and the changes in foreign exchange rates between the trade date and settlement date as ordinary income.
(C) Foreign Denominated Investments – Foreign denominated assets and currency contracts may involve more risks than domestic transactions including currency risk, political and economic risk, regulatory risk, and market risk. Certain Portfolios may also invest in securities of companies located in emerging markets. Future economic or political developments could adversely affect the liquidity or value, or both, of such securities.
(D) Federal Income Taxes – No provision has been made for income taxes because each Portfolio’s policy is to qualify as a regulated investment company under the Internal Revenue Code and distribute substantially all investment company taxable income and net capital gain on a timely basis. It is also the intention of each Portfolio to distribute an amount sufficient to avoid imposition of any federal excise tax. The Portfolios, accordingly, anticipate paying no federal taxes and no federal tax provision was recorded. Each Portfolio is treated as a separate taxable entity for federal income tax purposes. Certain Portfolios may utilize earnings and profits distributed to shareholders on the redemption of shares as part of the dividends paid deduction.
GAAP requires management of the Portfolios (i.e., the Adviser) to make additional tax disclosures with respect to the tax effects of certain income tax positions, whether those positions were taken on previously filed tax returns or are expected to be taken on future returns. These positions must meet a “more likely than not” standard that, based on the technical merits of the position, would have a greater than 50 percent likelihood of being sustained upon examination. In evaluating whether a tax position has met the more-likely-than-not recognition threshold, the Adviser must presume that the position will be examined by the appropriate taxing authority that has full knowledge of all relevant information.
The Adviser analyzed all open tax years, as defined by the statute of limitations, for all major jurisdictions. Open tax years are those that are open for examination by taxing authorities. Major jurisdictions for the Portfolios include U.S. Federal, Minnesota, and Wisconsin, as well as certain foreign countries. As of December 31, 2014, open U.S. Federal, Minnesota, and Wisconsin tax years include the tax years ended December 31, 2011 through 2014. Additionally, as of December 31, 2014, the tax year ended December 31, 2010 is open for Wisconsin. The Portfolios have no examinations in progress and none are expected at this time.
As of December 31, 2014, the Adviser has reviewed all open tax years and major jurisdictions and concluded that there is no effect to the Portfolios’ tax liability, financial position or results of operations. There is no tax liability resulting from unrecognized tax benefits related to uncertain income tax positions taken or expected to be taken in future tax returns. The Portfolios are also not aware of any tax positions for which it is reasonably possible that the total amounts of unrecognized tax benefits will significantly change in the next 12 months.
Foreign Income Taxes – Certain Portfolios are subject to foreign income taxes imposed by certain countries in which they invest. Withholding taxes on foreign dividends have been provided for in accordance with the applicable country’s tax rules and rates. These amounts are shown as foreign dividend tax withholding in the Statement of Operations. The Portfolios pay tax on foreign capital gains, where applicable.
(E) Expenses and Income – Estimated expenses are accrued daily. The Portfolios are charged for those expenses that are directly attributable to them. Expenses that are not directly attributable to a Portfolio are allocated among all appropriate Portfolios in proportion to their respective net assets, number of shareholder accounts or other reasonable basis.
366
Table of Contents
THRIVENT SERIES FUND, INC.
NOTESTO FINANCIAL STATEMENTS
December 31, 2014
Interest income is recorded daily on all debt securities, as is accretion of market discount and original issue discount and amortization of premium. Paydown gains and losses on mortgage- and asset-backed securities are recorded as components of interest income. Dividend income is recorded on the ex-dividend date.
For certain securities, including real estate investment trusts, the Fund records distributions received in excess of income as a reduction of cost of investments and/or realized gain. Such amounts are based on estimates if actual amounts are not available. Actual amounts of income, realized gain and return of capital may differ from the estimated amounts. The Fund adjusts the estimated amounts of the components of distributions as adjustments to investment income, unrealized appreciation/depreciation and realized gain/ loss on investments as necessary, once the issuers provide information about the actual composition of the distributions.
(F) Distributions to Shareholders – Dividends and capital gain distributions are recorded on the ex-dividend date. With the exception of Money Market Portfolio, net realized gains from securities transactions, if any, are paid at least annually after the close of the fiscal year. Any Portfolio subject to excise tax would require an additional distribution prior to the close of the fiscal year.
Dividends are declared and reinvested daily for High Yield Portfolio, Income Portfolio, Bond Index Portfolio, Limited Maturity Bond Portfolio, and Opportunity Income Plus Portfolio; declared daily and reinvested monthly for Money Market Portfolio; and declared and reinvested at least annually for all other Portfolios.
(G) Derivative Financial Instruments – Each of the Portfolios, except Thrivent Money Market Portfolio, may invest in derivatives. Derivatives, a category that includes options, futures, swaps and hybrid instruments, are financial instruments whose value derives from another security, an index or a currency. Each Portfolio may use derivatives for hedging (attempting to offset a potential loss in one position by establishing an interest in an opposite position). This includes the use of currency-based derivatives for hedging its positions in foreign securities. Each Portfolio may also use derivatives for replication of a certain asset class or speculation (investing for potential income or capital gain). These contracts may be transacted on an exchange or over-the-counter (OTC).
A derivative may incur a mark to market loss if the value of the derivative decreases due to an unfavorable change in the market rates or values of the underlying derivative. Losses can also occur if the counterparty does not perform under the derivative. A Portfolio’s risk of loss from the counterparty credit risk on OTC derivatives is generally limited to the aggregate unrealized gain netted against any collateral held by such Portfolio. With exchange traded futures and centrally cleared swaps, there is minimal counterparty credit risk to the Portfolios because the exchange’s clearinghouse, as counterparty to such derivatives, guarantees against a possible default. The clearing house stands between the buyer and the seller of the derivative; thus, the credit risk is limited to the failure of the clearinghouse. However, credit risk still exists in exchange traded futures and centrally cleared swaps with respect to initial and variation margin that is held in a broker’s customer accounts. While brokers are required to segregate customer margin from their own assets, in the event that a broker becomes insolvent or goes into bankruptcy and at that time there is a shortfall in the aggregate amount of margin held by the broker for all its clients, U.S. bankruptcy laws will typically allocate that shortfall on a pro-rata basis across all the broker’s customers, potentially resulting in losses in the Portfolios. Using derivatives to hedge can guard against potential risks, but it also adds to the Portfolios’ expenses and can eliminate some opportunities for gains. In addition, a derivative used for hedging or replication may not accurately track the value of the underlying asset. Another risk with derivatives is that some types can amplify a gain or loss, potentially earning or losing substantially more money than the actual cost of the derivative.
In order to define their contractual rights and to secure rights that will help the Portfolios mitigate their counterparty risk, the Portfolios may enter into an International Swaps and Derivatives Association, Inc. Master Agreement (“ISDA Master Agreement”) or similar agreement with its derivative contract counterparties. An ISDA Master Agreement is a bilateral agreement between a Portfolio and a counterparty that governs OTC derivatives and foreign exchange contracts and typically includes, among other things, collateral posting terms and netting provisions in the event of a default and/ or termination event. Under an ISDA Master Agreement, each Portfolio may, under certain circumstances, offset with the counterparty certain derivative’s payables and/or receivables with collateral held and/or posted and create one single net payment. The provisions of the ISDA Master Agreement typically permit a single net payment in the event of a default (close-out netting) including the bankruptcy or insolvency of the counterparty. Note, however, that bankruptcy and insolvency laws of a particular jurisdiction may impose restrictions on or prohibitions against the right of offset in bankruptcy, insolvency or other events.
Collateral and margin requirements vary by type of derivative. Margin requirements are established by the broker or clearing house for exchange traded and centrally cleared derivatives (futures, options, and centrally cleared swaps). Brokers can ask for margining in excess of the minimum in certain situations. Collateral terms are contract specific for OTC derivatives (foreign currency exchange contracts, options, swaps). For derivatives traded under an ISDA Master Agreement, the collateral requirements are typically calculated by netting the mark to market amount for each transaction
367
Table of Contents
THRIVENT SERIES FUND, INC.
NOTESTO FINANCIAL STATEMENTS
December 31, 2014
under such agreement and comparing that amount to the value of any collateral currently pledged by the Portfolio and the counterparty. For financial reporting purposes, non-cash collateral that has been pledged to cover obligations of the Portfolio has been noted in the Schedule of Investments. To the extent amounts due to the Portfolio from its counterparties are not fully collateralized, contractually or otherwise, the Portfolio bears the risk of loss from counterparty nonperformance. The Portfolios attempt to mitigate counterparty risk by only entering into agreements with counterparties that they believe have the financial resources to honor their obligations and by monitoring the financial stability of those counterparties.
Options – All Portfolios, with the exception of Money Market Portfolio, may buy put and call options and write put and covered call options. The Portfolios intend to use such derivative instruments as hedges to facilitate buying or selling securities or to provide protection against adverse movements in security prices or interest rates. The Portfolios may also enter into options contracts to protect against adverse foreign exchange rate fluctuations. Option contracts are valued daily and unrealized appreciation or depreciation is recorded. A Portfolio will realize a gain or loss upon expiration or closing of the option transaction. When an option is exercised, the proceeds upon sale for a written call option or the cost of a security for purchased put and call options is adjusted by the amount of premium received or paid.
Buying put options tends to decrease a Portfolio’s exposure to the underlying security while buying call options tends to increase a Portfolio’s exposure to the underlying security. The risk associated with purchasing put and call options is limited to the premium paid. There is no significant counterparty risk on exchange-traded options as the exchange guarantees the contract against default. Writing put options tends to increase a Portfolio’s exposure to the underlying security while writing call options tends to decrease a Portfolio’s exposure to the underlying security. The writer of an option has no control over whether the underlying security may be bought or sold, and therefore bears the market risk of an unfavorable change in the price of the underlying security. The counterparty risk for purchased options arises when the Portfolio has purchased an option, exercises that option, and the counterparty doesn’t buy from the Portfolio or sell to the Portfolio the underlying asset as required. In the case where the Portfolio has written an option, the Portfolio doesn’t have counterparty risk. Counterparty risk on purchased over-the-counter options is partially mitigated by the Portfolio’s collateral posting requirements. As the option increases in value to the Portfolio, the Portfolio receives collateral from the counterparty. Risks of loss may exceed amounts recognized on the Statement of Assets and Liabilities.
Futures Contracts – All Portfolios, with the exception of Money Market Portfolio, may use futures contracts to manage the exposure to interest rate and market or currency fluctuations. Gains or losses on futures contracts can offset changes in the yield of securities. When a futures contract is opened, cash or other investments equal to the required “initial margin deposit” are held on deposit with and pledged to the broker. Additional securities held by the Portfolios may be earmarked to cover open futures contracts. The futures contract’s daily change in value (“variation margin”) is either paid to or received from the broker, and is recorded as an unrealized gain or loss. When the contract is closed, realized gain or loss is recorded equal to the difference between the value of the contract when opened and the value of the contract when closed. Futures contracts involve, to varying degrees, risk of loss in excess of the variation margin disclosed in the Statement of Assets and Liabilities. Exchange-traded futures have no significant counterparty risk as the exchange guarantees the contracts against default.
Foreign Currency Forward Contracts – In connection with purchases and sales of securities denominated in foreign currencies all Portfolios, except Money Market Portfolio, may enter into foreign currency forward contracts. Additionally, the Portfolios may enter into such contracts to hedge certain other foreign-currency-denominated investments. These contracts are recorded at value and the related realized and unrealized foreign exchange gains and losses are included in the Statement of Operations. In the event that counterparties fail to settle these forward contracts, the Portfolios could be exposed to foreign currency fluctuations. Foreign currency contracts are valued daily and unrealized appreciation or depreciation is recorded daily as the difference between the contract exchange rate and the closing forward rate applied to the face amount of the contract. A realized gain or loss is recorded at the time a forward contract is closed. These contracts are over-the-counter and the Portfolio is exposed to counterparty risk equal to the discounted net amount of payments to the Portfolio. This risk is partially mitigated by the Portfolio’s collateral posting requirements.
Swap Agreements – All Portfolios, with the exception of Money Market Portfolio, may enter into swap transactions, which involve swapping one or more investment characteristics of a security or a basket of securities with another party. Such transactions include market risk, risk of default by the other party to the transaction, risk of imperfect correlation and manager risk and may involve commissions or other costs. Swap transactions generally do not involve delivery of securities, other underlying assets or principal. Accordingly, the risk of loss with respect to swap transactions is generally limited to the net amount of payments that the Portfolio is contractually obligated to make, or in the case of the counterparty defaulting, the net amount of payments that the Portfolio is contractually entitled to receive. Risks of loss may exceed amounts recognized on the Statement of Assets and Liabilities. If there is a default by the counterparty, the Portfolio may have contractual remedies pursuant to the agreements related to the transaction. The contracts are
368
Table of Contents
THRIVENT SERIES FUND, INC.
NOTESTO FINANCIAL STATEMENTS
December 31, 2014
valued daily and unrealized appreciation or depreciation is recorded. Swap agreements are valued at fair value of the contract as provided by an independent pricing service. The pricing service takes into account such factors as swap curves, default probabilities, recent trades, recovery rates and other factors it deems relevant in determining valuations. Daily fluctuations in the value of the centrally cleared credit default contracts are recorded in variation margin in the Statement of Assets and Liabilities and recorded as unrealized gain or loss. The Portfolio accrues for the periodic payment and amortizes upfront payments, if any, on swap agreements on a daily basis with the net amount recorded as realized gains or losses in the Statement of Operations. Receipts and payments received or made as a result of a credit event or termination of the contract are also recognized as realized gains or losses in the Statement of Operations. Collateral, in the form of cash or securities, may be required to be held with the Portfolio’s custodian, or a third party, in connection with these agreements. Certain swap agreements are over-the-counter and the Portfolio is exposed to counterparty risk, which is the discounted net amount of payments owed to the Portfolio. This risk is partially mitigated by the Portfolio’s collateral posting requirements. As the swap increases in value to the Portfolio, the Portfolio receives collateral from the counterparty. Certain interest rate and credit default index swaps must be cleared through a clearinghouse or central counterparty.
Credit Default Swaps – A credit default swap is a swap agreement between two parties to exchange the credit risk of a particular issuer, basket of securities or reference entity. In a credit default swap transaction, a buyer pays periodic fees in return for payment by the seller which is contingent upon an adverse credit event occurring in the underlying issuer or reference entity. The seller collects periodic fees from the buyer and profits if the credit of the underlying issuer or reference entity remains stable or improves while the swap is outstanding, but the seller in a credit default swap contract would be required to pay the amount of credit loss, determined as specified in the agreement, to the buyer in the event of an adverse credit event in the reference entity. A buyer of a credit default swap is said to buy protection whereas a seller of a credit default swap is said to sell protection. The Portfolios may be either the protection buyer or the protection seller.
Certain Portfolios enter into credit default derivative contracts directly through credit default swaps (CDS) or through credit default swap indices (CDX Indices). CDX Indices are static pools of equally weighted credit default swaps referencing corporate bonds and/or loans designed to provide diversified credit exposure to these asset classes. Portfolios sell default protection and assume long-risk positions in individual credits or indices. Index positions are entered into to gain exposure to the corporate bond and/or loan markets in a cost-efficient and diversified structure. In the event that a position defaults, by going into bankruptcy and failing to pay interest or principal on borrowed money, within any given CDX Index held, the maximum potential amount of future payments required would be equal to the pro-rata share of that position within the index based on the notional amount of the index. In the event of a default under a CDS contract, the maximum potential amount of future payments would be the notional amount. For CDS, the default events could be bankruptcy and failing to pay interest or principal on borrowed money or a restructuring. A restructuring is a change in the underlying obligations which would include reduction in interest or principal, maturity extension and subordination to other obligations.
For financial reporting purposes, the Portfolios do not offset derivative assets and derivative liabilities that are subject to netting arrangements in the Statement of Assets and Liabilities.
The amounts presented in the tables below are offset first by financial instruments that have the right of offset under master netting or similar arrangements, then any remaining amount is reduced by cash and non-cash collateral pledged. The actual amounts of collateral may be greater than amounts presented in the tables.
Gross Amounts Not Offset in the Statement of Assets and Liabilities | ||||||||||||||
Portfolio | Gross Amounts of Recognized Assets | Gross Amounts Offset | Net Amounts of Recognized Assets | Financial Instruments | Cash Collateral Received | Non-Cash Collateral Received | Net Amount | |||||||
Aggressive Allocation | ||||||||||||||
Futures Contracts | 2,002,774 | — | 2,002,774 | 2,002,774 | — | — | — | |||||||
Moderately Aggressive Allocation | ||||||||||||||
Futures Contracts | 4,867,894 | — | 4,867,894 | 4,867,894 | — | — | — | |||||||
Moderate Allocation | ||||||||||||||
Futures Contracts | 6,163,706 | — | 6,163,706 | 6,163,706 | — | — | — | |||||||
Moderately Conservative Allocation | ||||||||||||||
Futures Contracts | 2,423,086 | — | 2,423,086 | 2,268,392 | — | — | 154,694(*) | |||||||
369
Table of Contents
THRIVENT SERIES FUND, INC.
NOTESTO FINANCIAL STATEMENTS
December 31, 2014
Gross Amounts Not Offset in the Statement of Assets and Liabilities | ||||||||||||||
Portfolio | Gross Amounts of Recognized Assets | Gross Amounts Offset | Net Amounts of Recognized Assets | Financial Instruments | Cash Collateral Received | Non-Cash Collateral Received | Net Amount | |||||||
Growth and Income Plus | ||||||||||||||
Futures Contracts | 4,125 | — | 4,125 | 4,125 | — | — | — | |||||||
Balanced Income Plus | ||||||||||||||
Futures Contracts | 19,313 | — | 19,313 | 19,313 | — | — | — | |||||||
Diversified Income Plus | ||||||||||||||
Futures Contracts | 106,563 | — | 106,563 | 69,720 | — | — | 36,843(*) | |||||||
Opportunity Income Plus | ||||||||||||||
Futures Contracts | 10,750 | — | 10,750 | 3,937 | — | — | 6,813(*) | |||||||
Partner Worldwide Allocation | ||||||||||||||
Futures Contracts | 2,148,352 | — | 2,148,352 | 2,131,917 | — | — | 16,435(*) | |||||||
Exchange Contracts | 1,392,814 | — | 1,392,814 | 513,185 | — | — | 879,629(†) | |||||||
Large Cap Stock | ||||||||||||||
Futures Contracts | 498,150 | — | 498,150 | 333,486 | — | — | 164,664(*) | |||||||
High Yield | ||||||||||||||
Swap Credit Contracts | 24,458 | — | 24,458 | — | — | — | 24,458(‡) | |||||||
Income | ||||||||||||||
Futures Contracts | 168,750 | — | 168,750 | 168,750 | — | — | — | |||||||
| (*) | Net futures amount represents the net amount receivable from the counterparty in the event of a default. |
| (†) | Net exchange contract amount represents the net amount receivable from the counterparty in the event of a default. |
| (‡) | Net swap credit contracts amount represents the net amount receivable from the counterparty in the event of a default. |
370
Table of Contents
THRIVENT SERIES FUND, INC.
NOTESTO FINANCIAL STATEMENTS
December 31, 2014
The following table presents the gross and net information about liabilities subject to master netting arrangements, as presented in our Statement of Assets and Liabilities:
Gross Amounts Not Offset in the Statement of Assets and Liabilities | ||||||||||||||||||||||||||||
Portfolio | Gross Amounts of Recognized Liabilities | Gross Amounts Offset | Net Amounts of Recognized Liabilities | Financial Instruments | Cash Collateral Pledged | Non-Cash Collateral Pledged** | Net Amount | |||||||||||||||||||||
Aggressive Allocation | ||||||||||||||||||||||||||||
Futures Contracts | 2,509,934 | — | 2,509,934 | 2,002,774 | — | 507,160 | — | |||||||||||||||||||||
Securities Lending | 241,100 | — | 241,100 | 235,085 | — | — | 6,015^ | |||||||||||||||||||||
Moderately Aggressive Allocation | ||||||||||||||||||||||||||||
Futures Contracts | 8,407,982 | — | 8,407,982 | 4,867,894 | — | 3,540,088 | — | |||||||||||||||||||||
Securities Lending | 39,076,872 | — | 39,076,872 | 38,081,034 | — | — | 995,838^ | |||||||||||||||||||||
Moderate Allocation | ||||||||||||||||||||||||||||
Futures Contracts | 13,039,577 | — | 13,039,577 | 6,163,706 | — | 6,875,871 | — | |||||||||||||||||||||
Securities Lending | 67,749,452 | — | 67,749,452 | 65,863,115 | — | — | 1,886,337^ | |||||||||||||||||||||
Moderately Conservative Allocation | ||||||||||||||||||||||||||||
Futures Contracts | 2,268,392 | — | 2,268,392 | 2,268,392 | — | — | — | |||||||||||||||||||||
Securities Lending | 24,079,812 | — | 24,079,812 | 23,547,725 | — | — | 532,087^ | |||||||||||||||||||||
Growth and Income Plus | ||||||||||||||||||||||||||||
Futures Contracts | 41,173 | — | 41,173 | 4,125 | — | 37,048 | — | |||||||||||||||||||||
Balanced Income Plus | ||||||||||||||||||||||||||||
Futures Contracts | 46,762 | — | 46,762 | 19,313 | — | 27,449 | — | |||||||||||||||||||||
Securities Lending | 6,533,365 | — | 6,533,365 | 6,467,718 | — | — | 65,647^ | |||||||||||||||||||||
Diversified Income Plus | ||||||||||||||||||||||||||||
Futures Contracts | 69,720 | — | 69,720 | 69,720 | — | — | — | |||||||||||||||||||||
Securities Lending | 2,146,445 | — | 2,146,445 | 2,100,961 | — | — | 45,484^ | |||||||||||||||||||||
Opportunity Income Plus | ||||||||||||||||||||||||||||
Futures Contracts | 3,937 | — | 3,937 | 3,937 | — | — | — | |||||||||||||||||||||
Natural Resources | ||||||||||||||||||||||||||||
Securities Lending | 1,983,400 | — | 1,983,400 | 1,925,120 | — | — | 58,280^ | |||||||||||||||||||||
Partner Emerging Markets Equity | ||||||||||||||||||||||||||||
Securities Lending | 1,509,100 | — | 1,509,100 | 1,443,356 | — | — | 65,744^ | |||||||||||||||||||||
Partner Small Cap Growth | ||||||||||||||||||||||||||||
Securities Lending | 4,013,248 | — | 4,013,248 | 3,937,328 | — | — | 75,920^ | |||||||||||||||||||||
Partner Small Cap Value | ||||||||||||||||||||||||||||
Securities Lending | 12,670,650 | — | 12,670,650 | 12,241,842 | — | — | 428,808^ | |||||||||||||||||||||
Small Cap Stock | ||||||||||||||||||||||||||||
Securities Lending | 24,447,972 | — | 24,447,972 | 23,756,768 | — | — | 691,204^ | |||||||||||||||||||||
Small Cap Index | ||||||||||||||||||||||||||||
Futures Contracts | 117,924 | — | 117,924 | — | — | 117,924 | — | |||||||||||||||||||||
Securities Lending | 23,621,082 | — | 23,621,082 | 22,827,976 | — | — | 793,106^ | |||||||||||||||||||||
Mid Cap Growth | ||||||||||||||||||||||||||||
Securities Lending | 3,029,925 | — | 3,029,925 | 2,926,382 | — | — | 103,543^ | |||||||||||||||||||||
Mid Cap Stock | ||||||||||||||||||||||||||||
Securities Lending | 29,599,525 | — | 29,599,525 | 28,742,558 | — | — | 856,967^ | |||||||||||||||||||||
Mid Cap Index | ||||||||||||||||||||||||||||
Futures Contracts | 226,855 | — | 226,855 | — | — | 226,855 | — | |||||||||||||||||||||
Securities Lending | 5,801,543 | — | 5,801,543 | 5,625,978 | — | — | 175,565^ | |||||||||||||||||||||
Partner Worldwide Allocation | ||||||||||||||||||||||||||||
Futures Contracts | 2,131,917 | — | 2,131,917 | 2,131,917 | — | — | ||||||||||||||||||||||
Exchange Contracts | 765,483 | — | 765,483 | 513,185 | — | — | 252,298 | # | ||||||||||||||||||||
Securities Lending | 26,312,891 | — | 26,312,891 | 26,312,891 | — | — | — | |||||||||||||||||||||
Partner All Cap | ||||||||||||||||||||||||||||
Securities Lending | 532,657 | — | 532,657 | 532,567 | — | — | 90^ | |||||||||||||||||||||
371
Table of Contents
THRIVENT SERIES FUND, INC.
NOTESTO FINANCIAL STATEMENTS
December 31, 2014
Gross Amounts Not Offset in the Statement of Assets and Liabilities | ||||||||||||||
Portfolio | Gross Amounts of Recognized Liabilities | Gross Amounts Offset | Net Amounts of Recognized Liabilities | Financial Instruments | Cash Collateral Pledged | Non-Cash Collateral Pledged** | Net Amount | |||||||
Large Cap Growth | ||||||||||||||
Futures Contracts | 42,215 | — | 42,215 | — | — | 42,215 | — | |||||||
Securities Lending | 1,559,250 | — | 1,559,250 | 1,516,320 | — | — | 42,930^ | |||||||
Partner Growth Stock | ||||||||||||||
Securities Lending | 2,334,117 | — | 2,334,117 | 2,276,605 | — | — | 57,512^ | |||||||
Large Cap Value | ||||||||||||||
Securities Lending | 37,144,725 | — | 37,144,725 | 35,792,688 | — | — | 1,352,037^ | |||||||
Large Cap Stock | ||||||||||||||
Futures Contracts | 333,486 | — | 333,486 | 333,486 | — | — | — | |||||||
Securities Lending | 7,610,288 | — | 7,610,288 | 7,309,678 | — | — | 300,610^ | |||||||
Large Cap Index | ||||||||||||||
Futures Contracts | 206,865 | — | 206,865 | — | — | 206,865 | — | |||||||
Securities Lending | 2,392,432 | — | 2,392,432 | 2,310,307 | — | — | 82,125^ | |||||||
High Yield | ||||||||||||||
Securities Lending | 55,520,434 | — | 55,520,434 | 53,619,904 | — | — | 1,900,530^ | |||||||
Income | ||||||||||||||
Futures Contracts | 311,719 | �� | 311,719 | 168,750 | — | 142,969 | — | |||||||
Securities Lending | 24,146,820 | — | 24,146,820 | 23,374,462 | — | — | 772,358^ | |||||||
Limited Maturity Bond | ||||||||||||||
Futures Contracts | 228,125 | — | 228,125 | — | — | 228,125 | — | |||||||
Securities Lending | 8,419,435 | — | 8,419,435 | 8,206,640 | — | — | 212,795^ | |||||||
| ** | Excess of collateral pledged to the counterparty may not be shown for financial reporting purposes. |
| ^ | Net securities lending amounts represent the net amount payable from the counterparty in the event of a default. |
| # | Net exchange contract amounts represent the net amount payable from the counterparty in the event of a default. |
(H) Mortgage Dollar Roll Transactions — Certain Portfolios enter into dollar roll transactions on securities issued or to be issued by the Government National Mortgage Association, Federal National Mortgage Association and Federal Home Loan Mortgage Corporation, in which the Portfolios sell mortgage securities and simultaneously agree to repurchase similar (same type and coupon) securities at a later date at an agreed upon price. The Portfolios must maintain liquid securities having a value at least equal to the repurchase price (including accrued interest) for such dollar rolls. In addition, the Portfolios are required to post or receive margin-depending on market movements-on their mortgage dollar rolls. The value of the securities that the Portfolios are required to purchase may decline below the agreed upon repurchase price of those securities.
During the period between the sale and repurchase, the Portfolios forgo principal and interest paid on the mortgage securities sold. The Portfolios are compensated from negotiated fees paid by brokers offered as an inducement to the Portfolios to “roll over” their purchase commitments, thus enhancing the yield. Mortgage dollar rolls may be renewed with a new purchase and repurchase price and a cash settlement made on settlement date without physical delivery of the securities subject to the contract. The fees received are recognized over the roll period and are included in Income from mortgage dollar rolls in the Statement of Operations.
(I) Securities Lending — The Fund has entered into a Securities Lending Agreement (the “Agreement”) with Deutsche Bank AG (“Deutsche”). The Agreement authorizes Deutsche to lend securities to authorized borrowers on behalf of the Portfolios. Pursuant to the Agreement, all loaned securities are initially collateralized by cash equal to at least 102% of the value of the loaned securities. All cash collateral received is invested in Thrivent Cash Management Trust. The Portfolios receive dividends and interest that would have been earned on the securities loaned while simultaneously seeking to earn income on the investment of cash collateral. Amounts earned on investments in Thrivent Cash Management Trust, net of rebates, fees paid to Deutsche for services provided and any other securities lending expenses, are included in Income from securities loaned in the Statement of Operations. By investing any cash collateral it receives in these transactions, a Portfolio could realize additional gains or losses. If the borrower fails to return the securities or the invested collateral has declined in value, the Portfolio could lose money.
As of December 31, 2014, the value of securities on loan is as follows:
372
Table of Contents
THRIVENT SERIES FUND, INC.
NOTESTO FINANCIAL STATEMENTS
December 31, 2014
Fund | Securities on Loan | |||
Aggressive Allocation | $ | 235,085 | ||
Moderately Aggressive Allocation | 38,081,034 | |||
Moderate Allocation | 65,863,115 | |||
Moderately Conservative Allocation | 23,547,725 | |||
Balanced Income Plus | 6,467,718 | |||
Diversified Income Plus | 2,100,961 | |||
Natural Resources | 1,925,120 | |||
Partner Emerging Markets Equity | 1,443,356 | |||
Partner Small Cap Growth | 3,937,328 | |||
Partner Small Cap Value | 12,241,842 | |||
Small Cap Stock | 23,756,768 | |||
Small Cap Index | 22,827,976 | |||
Mid Cap Growth | 2,926,382 | |||
Mid Cap Stock | 28,742,558 | |||
Mid Cap Index | 5,625,978 | |||
Partner Worldwide Allocation | 26,420,054 | |||
Partner All Cap | 532,567 | |||
Large Cap Growth | 1,516,320 | |||
Partner Growth Stock | 2,276,605 | |||
Large Cap Value | 35,792,688 | |||
Large Cap Stock | 7,309,678 | |||
Large Cap Index | 2,310,307 | |||
High Yield | 53,619,904 | |||
Income | 23,374,462 | |||
Limited Maturity Bond | 8,206,640 | |||
(J) When Issued and Delayed Delivery Transactions – Each Portfolio may purchase or sell securities on a when-issued or delayed delivery basis. These transactions involve a commitment by a Portfolio to purchase or sell securities for a predetermined price or yield, with payment and delivery taking place beyond the customary settlement period. When delayed delivery purchases are outstanding, a Portfolio will designate liquid assets in an amount sufficient to meet the purchase price. When purchasing a security on a delayed delivery basis, a Portfolio assumes the rights and risks of ownership of the security, including the risk of price and yield fluctuations, and takes such fluctuations into account when determining its net asset value. A Portfolio may dispose of a delayed delivery transaction after it is entered into, and may sell when-issued securities before they are delivered, which may result in a capital gain or loss. When a Portfolio has sold a security on a delayed delivery basis, a Portfolio does not participate in future gains and losses with respect to the security.
(K) Treasury Inflation Protected Securities – Certain Portfolios may invest in treasury inflation protected securities (TIPS). These securities are fixed income securities whose principal value is periodically adjusted to the rate of inflation. The interest rate is generally fixed at issuance. Interest is paid based on the principal value, which is adjusted for inflation.
Any increase in the principal amount will be included as taxable interest in the Statement of Operations and received upon maturity or sale of the security.
(L) Repurchase Agreements – Each Portfolio may engage in repurchase agreement transactions in pursuit of its investment objective. A repurchase agreement consists of a purchase and a simultaneous agreement to resell an investment for later delivery at an agreed upon price and rate of interest. The Portfolio uses a third-party custodian to maintain the collateral. If the original seller of a security subject to a repurchase agreement fails to repurchase the security at the agreed upon time, the Portfolio could incur a loss due to a drop in the value of the security during the time it takes the Portfolio to either sell the security or take action to enforce the original seller’s agreement to repurchase the security. Also, if a defaulting original seller filed for bankruptcy or became insolvent, disposition of such security might be delayed by pending legal action. The Portfolio may only enter into repurchase agreements with banks and other recognized financial institutions such as broker/dealers that are found by the Adviser or subadviser to be creditworthy. During the year ended December 31, 2014, no Portfolios engaged in this type of investment.
(M) Equity-Linked Structured Securities – Certain Portfolios may invest in equity-linked structured notes. Equity-linked structured notes are debt securities which combine the characteristics of common stock and the sale of an option. The return component is based upon the performance of a single equity security, a basket of equity securities, or an equity index and the sale of an option. There is no guaranteed return of principal with these securities. The appreciation potential of these securities may be limited by a maximum payment or call right and can be influenced by many unpredictable factors. In addition to the performance of the equity, the nature and credit of the issuer may also impact return.
(N) Stripped Securities – Certain Portfolios may invest in Interest Only and Principal Only stripped mortgage or asset backed securities. These securities represent a participation in securities that are structured in classes with rights to receive different portions of the interest and principal. Interest only securities receive all the interest and principal only securities receive all the principal. If the underlying pool of mortgages or assets experience greater than anticipated prepayments of principal, the Portfolio may not fully recoup its initial investment in an interest only security. Principal only securities increase in value if prepayments are greater than anticipated and decline if prepayments are slower than anticipated. The market value of these securities is highly sensitive to changes in interest rates.
(O) Credit Risk – The Portfolios may be susceptible to credit risk to the extent the issuer or counterparty defaults on its payment obligation. The Portfolios’ policy is to monitor
373
Table of Contents
THRIVENT SERIES FUND, INC.
NOTESTO FINANCIAL STATEMENTS
December 31, 2014
the creditworthiness of the issuers. Interest receivable on defaulted securities is monitored for the ability to collect payments in default and adjusted accordingly.
(P) Accounting Estimates – The preparation of financial statements in conformity with GAAP requires management to make estimates and assumptions that affect the reported amounts of assets and liabilities and disclosure of contingent assets and liabilities at the date of the financial statements and the reported amounts of income and expenses during the reporting period. Actual results could differ from those estimates.
(Q) Loan Commitments – Certain Portfolios may enter into loan commitments, which generally have interest rates which are reset daily, monthly, quarterly or semi-annually by reference to a base lending rate, plus a premium. These base rates are primarily the London-Interbank Offered Rate (“LIBOR”), and secondarily the prime rate offered by one or more major United States banks (the “Prime Rate”) and the certificate of deposit (“CD”) rate or other base lending rates used by commercial lenders. Loan commitments often require prepayments from excess cash flows or allow the borrower to repay at its election. The rate at which the borrower repays cannot be predicted with accuracy. Therefore, the remaining maturity may be considerably less than the stated maturity shown in the Schedule of Investments.
All or a portion of these loan commitments may be unfunded. The Portfolio is obligated to fund these commitments at the borrower’s discretion. Therefore, the Portfolio must have funds sufficient to cover its contractual obligation. These unfunded loan commitments, which are marked-to-market daily, are presented in the Schedule of Investments.
(R) Loss Contingencies – Thrivent High Yield Portfolio and Thrivent Income Portfolio are defendants in an adversary action filed on July 31, 2009 by the Official Committee of Unsecured Creditors of Motors Liquidation Company, formerly known as General Motors Corporation (GM), against prior and current holders of term loan debt of GM. The suit seeks to determine whether GM’s term loan facility was secured at the time it entered bankruptcy. Thrivent High Yield Portfolio at one time held term loans in an original principal amount of at least $4,627,531 and, if the plaintiffs are successful, it is reasonably possible that the Portfolio will be required to make payments in some amount. This loss contingency has not been accrued as a liability because the amount of potential damages and the likelihood of loss cannot be reasonably estimated. Thrivent Income Portfolio is named as a defendant in this action, but we do not expect that the Portfolio’s assets will be subject to a loss contingency.
Thrivent Balanced Income Plus Portfolio (formerly known as Thrivent Balanced Portfolio) and Thrivent Large Cap Index Portfolio are defendants in two separate adversary actions: One was filed in federal court on November 1, 2010 by the Official Committee of Unsecured Creditors of Tribune Company (“Tribune”) and the other was filed in the state of Minnesota on June 2, 2011 by the successor trustees of certain series of debt securities issued by Tribune. These actions have since been consolidated and moved to the United States District Court of the Southern District of New York as consolidated multi-district litigation. The actions seek to determine whether stock repurchases of Tribune stock in connection with a leveraged buyout of Tribune in 2007 (the “LBO Transaction”) were fraudulent transactions that can be voided requiring repurchase payments to be returned to the Tribune bankruptcy estate. Thrivent Balanced Income Plus Portfolio and Thrivent Large Cap Index Portfolio tendered Tribune stock in the LBO Transaction in exchange for $115,600 and $219,300 respectively. If the plaintiffs are successful, it is reasonably possible that these Portfolios would be required to return payments in some amount. Management does not believe it is possible at this time to predict with any reasonable certainty the amount or probability of any potential loss.
Thrivent Mid Cap Index Portfolio is a potential defendant in an adversary action filed on October 22, 2010 by the trustee of the LB Creditor Trust. The suit seeks to determine whether certain pre-bankruptcy distributions in December 2007 by Lyondell Chemical Company (“Lyondell”) to its shareholders were fraudulent transactions that can be voided and repaid to Lyondell’s creditors. Thrivent Mid Cap Index Portfolio owned shares of Lyondell stock before the merger. On December 21, 2007, Thrivent Mid Cap Index Portfolio tendered its shares of Lyondell for $1,542,720. Management does not believe it is possible at this time to predict with any reasonable certainty the amount or probability of any potential loss.
Thrivent Opportunity Income Plus Portfolio (formerly known as Mortgage Securities Portfolio) was obligated to pay $133,203 to Lehman Brothers as of October 14, 2008. Because of the collapse of Lehman Brothers, the securities and obligations remain involved in litigation and bankruptcy proceedings. At the conclusion of legal proceedings, it is reasonably possible that Thrivent Opportunity Income Plus Portfolio could be required to pay all or a portion of the $133,203. However, it is also reasonably possible that the Portfolio would be able to offset some of this liability because of amounts owed to the Portfolio by Lehman Brothers at the time of its bankruptcy. Management does not believe it is possible at this time to predict with any reasonable certainty the amount or probability of any potential loss.
(S) Litigation – Awards from class action litigation are recorded as realized gains on payment date.
(T) In-kind Redemptions – During the year ended December 31, 2013, the Thrivent Asset Allocation Portfolios, as the shareholders of underlying series of Thrivent Series Fund, Inc. (the “underlying portfolios”), redeemed their shares in-kind (“in-kind
374
Table of Contents
THRIVENT SERIES FUND, INC.
NOTESTO FINANCIAL STATEMENTS
December 31, 2014
redemption”) of Thrivent Growth and Income Plus Portfolio. The underlying portfolio distributed portfolio securities and cash as payment for the redemption of these portfolio shares. For financial reporting purposes, the underlying portfolio recognizes gain on these transactions to the extent the value of the distributed securities on the date of redemption exceeds the cost of those securities; they recognize a loss if the cost exceeds the value. Gains or losses on in-kind redemptions are not recognized for tax purposes. The realized gains or losses below are included in the Statement of Operations of the underlying portfolio as net realized gains/losses on in-kind redemptions. The in-kind amounts and shares redeemed are included in the Capital Stock Transactions of the Statement of Changes in Net Assets of the underlying portfolio. These in-kind transactions were conducted at market value. The transactions were as follows:
| Underlying Portfolio | Underlying Shares Redeemed | Date | In-kind Amount | Realized Gain/(Loss) | ||||||||||||||||
Aggressive Allocation Portfolio | Growth and Income Plus | 550,683 | 8/6/2013 | $ | 6,116,764 | $ | 792,628 | |||||||||||||
Moderately Aggressive Allocation Portfolio | Growth and Income Plus | 2,306,527 | 8/6/2013 | $ | 25,619,981 | $ | 3,136,192 | |||||||||||||
Moderate Allocation Portfolio | Growth and Income Plus | 3,039,607 | 8/6/2013 | $ | 33,762,739 | $ | 4,188,389 | |||||||||||||
Moderately Conservative Allocation Portfolio | Growth and Income Plus | 751,066 | 8/6/2013 | $ | 8,342,544 | $ | 1,050,476 | |||||||||||||
During the year ended December 31, 2014, the Thrivent Asset Allocation Portfolios, as the shareholders of underlying series of Thrivent Series Fund, Inc. (the “underlying portfolios”), redeemed their shares in-kind (“in-kind redemption”) of Thrivent Partner Small Cap Growth Portfolio. The underlying portfolio distributed portfolio securities and cash as payment for the redemption of these portfolio shares. For financial reporting purposes, the underlying portfolio recognizes gain on these transactions to the extent the value of the distributed securities on the date of redemption exceeds the cost of those securities; they recognize a loss if the cost exceeds the value. Gains or losses on in-kind redemptions are not recognized for tax purposes. The realized gains or losses below are included in the Statement of Operations of the underlying portfolio as net realized gains/losses on in-kind redemptions. The in-kind amounts and shares redeemed are included in the Capital Stock Transactions of the Statement of Changes in Net Assets of the underlying portfolio. These in-kind transactions were conducted at market value. The transactions were as follows:
| Underlying Portfolio | Underlying Shares Redeemed | Date | In-Kind Amount | Realized Gain/(Loss) | ||||||||||||||
Aggressive Allocation Portfolio | Partner Small Cap Growth Portfolio | 4,044,547 | 10/6/2014 | $ | 64,802,142 | $ | 12,593,308 | |||||||||||
Moderately Aggressive Allocation Portfolio | Partner Small Cap Growth Portfolio | 5,844,908 | 10/6/2014 | $ | 93,647,695 | $ | 19,424,365 | |||||||||||
Moderate Allocation Portfolio | Partner Small Cap Growth Portfolio | 6,587,309 | 10/6/2014 | $ | 105,542,526 | $ | 14,201,526 | |||||||||||
During the year ended December 31, 2014, Thrivent Defined Benefit Trust, as the shareholder of underlying series of Thrivent Series Fund, Inc. (the “underlying portfolios”), redeemed their shares in-kind (“in-kind redemption”) of Thrivent Partner Small Cap Growth Portfolio. The underlying portfolio distributed portfolio securities and cash as payment for the redemption of these portfolio shares. For financial reporting purposes, the underlying portfolio recognizes gain on these transactions to the extent the value of the distributed securities on the date of redemption exceeds the cost of those securities; they recognize a loss if the cost exceeds the value. Gains or losses on in-kind redemptions are not recognized for tax purposes. The realized gains or losses below are included in the Statement of Operations of the underlying portfolio as net realized gains/losses on in-kind redemptions. The in-kind amounts and shares redeemed are included in the Capital Stock Transactions of the Statement of Changes in Net Assets of the underlying portfolio. These in-kind transactions were conducted at market value. The transactions were as follows:
| Underlying Portfolio | Underlying Shares Redeemed | Date | In-Kind Amount | Realized Gain/(Loss) | ||||||||||||||
Defined Benefit Trust | Partner Small Cap Growth Portfolio | 878,266 | 11/6/2014 | $ | 14,775,417 | $ | 1,607,209 | |||||||||||
375
Table of Contents
THRIVENT SERIES FUND, INC.
NOTESTO FINANCIAL STATEMENTS
December 31, 2014
(U) Other – For financial statement purposes, investment security transactions are accounted for on the trade date. Realized gains and losses from investment transactions are determined on a specific cost identification basis, which is the same basis used for federal income tax purposes.
(3) FEES AND COMPENSATION PAID TO AFFILIATES
(A) Investment Advisory Fees – The Fund has entered into an Investment Advisory Agreement with Thrivent Financial, the Adviser. Under the Investment Advisory Agreement, each of the Portfolios pays a fee for investment advisory services. The fees are accrued daily and paid monthly.
The four Asset Allocation Portfolios – Aggressive Allocation Portfolio, Moderately Aggressive Allocation Portfolio, Moderate Allocation Portfolio and Moderately Conservative Allocation Portfolio – pay investment advisory fees for asset allocation services. In addition, for investments (other than underlying Thrivent Portfolios) held directly by the Asset Allocation Portfolios, each Asset Allocation Portfolio will pay an additional advisory fee. The annual rates of fees as a percentage of average daily net assets under the Investment Advisory Agreement are as follows:
Portfolio (M – Millions) | $0 to $500M | $500 to $2,000M | Over $2,000M | |||||||||
Aggressive Allocation | 0.150 | % | 0.125 | % | 0.100 | % | ||||||
Aggressive Allocation – Direct Holdings | 0.600 | % | 0.600 | % | 0.600 | % | ||||||
Moderately Aggressive Allocation | 0.150 | % | 0.125 | % | 0.100 | % | ||||||
Moderately Aggressive Allocation – Direct Holdings | 0.550 | % | 0.550 | % | 0.550 | % | ||||||
Moderate Allocation | 0.150 | % | 0.125 | % | 0.100 | % | ||||||
Moderate Allocation – Direct Holdings | 0.500 | % | 0.500 | % | 0.500 | % | ||||||
Moderately Conservative Allocation | 0.150 | % | 0.125 | % | 0.100 | % | ||||||
Moderately Conservative Allocation – Direct Holdings | 0.450 | % | 0.450 | % | 0.450 | % | ||||||
For all other Portfolios, the annual rates of fees as a percent of average daily net assets under the Investment Advisory Agreement were as follows:
Portfolio (M – Millions) | $0 to $50M | $50 to $200M | $200 to $250M | $250 to $500M | $500 to $750M | $750 to $1,000M | $1,000 to $1,500M | $1,500 to $2,000M | $2,000 to $2,500M | $2,500 to $5,000M | Over $5,000M | |||||||||||||||||||||||||||||||||
Growth and Income Plus | 0.650 | % | 0.650 | % | 0.650 | % | 0.600 | % | 0.600 | % | 0.600 | % | 0.600 | % | 0.600 | % | 0.600 | % | 0.600 | % | 0.600 | % | ||||||||||||||||||||||
Balanced Income Plus | 0.550 | % | 0.550 | % | 0.550 | % | 0.550 | % | 0.500 | % | 0.500 | % | 0.475 | % | 0.475 | % | 0.475 | % | 0.450 | % | 0.425 | % | ||||||||||||||||||||||
Diversified Income Plus | 0.400 | % | 0.400 | % | 0.400 | % | 0.400 | % | 0.400 | % | 0.400 | % | 0.400 | % | 0.400 | % | 0.400 | % | 0.400 | % | 0.400 | % | ||||||||||||||||||||||
Opportunity Income Plus | 0.500 | % | 0.500 | % | 0.500 | % | 0.500 | % | 0.500 | % | 0.500 | % | 0.500 | % | 0.500 | % | 0.500 | % | 0.500 | % | 0.500 | % | ||||||||||||||||||||||
Partner Technology | 0.750 | % | 0.750 | % | 0.750 | % | 0.750 | % | 0.750 | % | 0.750 | % | 0.750 | % | 0.750 | % | 0.750 | % | 0.750 | % | 0.750 | % | ||||||||||||||||||||||
Partner Healthcare | 0.950 | % | 0.900 | % | 0.900 | % | 0.900 | % | 0.900 | % | 0.900 | % | 0.900 | % | 0.900 | % | 0.900 | % | 0.900 | % | 0.900 | % | ||||||||||||||||||||||
Natural Resources | 0.750 | % | 0.725 | % | 0.725 | % | 0.725 | % | 0.725 | % | 0.725 | % | 0.725 | % | 0.725 | % | 0.725 | % | 0.725 | % | 0.725 | % | ||||||||||||||||||||||
Partner Emerging Markets Equity | 1.200 | % | 1.070 | % | 1.070 | % | 1.070 | % | 1.070 | % | 1.070 | % | 1.070 | % | 1.070 | % | 1.070 | % | 1.070 | % | 1.070 | % | ||||||||||||||||||||||
Real Estate Securities | 0.800 | % | 0.800 | % | 0.800 | % | 0.800 | % | 0.750 | % | 0.750 | % | 0.750 | % | 0.750 | % | 0.750 | % | 0.750 | % | 0.750 | % | ||||||||||||||||||||||
Partner Small Cap Growth | 1.000 | % | 1.000 | % | 1.000 | % | 1.000 | % | 0.900 | % | 0.900 | % | 0.900 | % | 0.900 | % | 0.900 | % | 0.900 | % | 0.900 | % | ||||||||||||||||||||||
Partner Small Cap Value | 0.800 | % | 0.800 | % | 0.800 | % | 0.800 | % | 0.800 | % | 0.800 | % | 0.800 | % | 0.800 | % | 0.800 | % | 0.800 | % | 0.800 | % | ||||||||||||||||||||||
Small Cap Stock | 0.700 | % | 0.700 | % | 0.650 | % | 0.650 | % | 0.650 | % | 0.650 | % | 0.600 | % | 0.600 | % | 0.600 | % | 0.550 | % | 0.525 | % | ||||||||||||||||||||||
Small Cap Index | 0.350 | % | 0.350 | % | 0.350 | % | 0.300 | % | 0.250 | % | 0.250 | % | 0.200 | % | 0.150 | % | 0.100 | % | 0.100 | % | 0.100 | % | ||||||||||||||||||||||
Mid Cap Growth | 0.400 | % | 0.400 | % | 0.400 | % | 0.400 | % | 0.400 | % | 0.400 | % | 0.400 | % | 0.400 | % | 0.400 | % | 0.400 | % | 0.400 | % | ||||||||||||||||||||||
Partner Mid Cap Value | 0.750 | % | 0.750 | % | 0.700 | % | 0.700 | % | 0.700 | % | 0.700 | % | 0.700 | % | 0.700 | % | 0.700 | % | 0.700 | % | 0.700 | % | ||||||||||||||||||||||
Mid Cap Stock | 0.700 | % | 0.700 | % | 0.650 | % | 0.650 | % | 0.650 | % | 0.650 | % | 0.600 | % | 0.600 | % | 0.600 | % | 0.550 | % | 0.525 | % | ||||||||||||||||||||||
Mid Cap Index | 0.350 | % | 0.350 | % | 0.350 | % | 0.300 | % | 0.250 | % | 0.250 | % | 0.200 | % | 0.150 | % | 0.100 | % | 0.100 | % | 0.100 | % | ||||||||||||||||||||||
Partner Worldwide Allocation | 0.900 | % | 0.900 | % | 0.900 | % | 0.850 | % | 0.850 | % | 0.850 | % | 0.800 | % | 0.750 | % | 0.750 | % | 0.750 | % | 0.750 | % | ||||||||||||||||||||||
376
Table of Contents
THRIVENT SERIES FUND, INC.
NOTESTO FINANCIAL STATEMENTS
December 31, 2014
Portfolio (M – Millions) | $0 to $50M | $50 to $200M | $200 to $250M | $250 to $500M | $500 to $750M | $750 to $1,000M | $1,000 to $1,500M | $1,500 to $2,000M | $2,000 to $2,500M | $2,500 to $5,000M | Over $5,000M | |||||||||||||||||||||||||||||||||
Partner All Cap | 0.950 | % | 0.950 | % | 0.950 | % | 0.950 | % | 0.900 | % | 0.900 | % | 0.900 | % | 0.900 | % | 0.900 | % | 0.900 | % | 0.900 | % | ||||||||||||||||||||||
Large Cap Growth | 0.400 | % | 0.400 | % | 0.400 | % | 0.400 | % | 0.400 | % | 0.400 | % | 0.400 | % | 0.400 | % | 0.400 | % | 0.400 | % | 0.400 | % | ||||||||||||||||||||||
Partner Growth Stock | 0.800 | % | 0.800 | % | 0.800 | % | 0.800 | % | 0.700 | % | 0.700 | % | 0.700 | % | 0.700 | % | 0.700 | % | 0.700 | % | 0.700 | % | ||||||||||||||||||||||
Large Cap Value | 0.600 | % | 0.600 | % | 0.600 | % | 0.600 | % | 0.600 | % | 0.600 | % | 0.600 | % | 0.600 | % | 0.600 | % | 0.600 | % | 0.600 | % | ||||||||||||||||||||||
Large Cap Stock | 0.650 | % | 0.650 | % | 0.650 | % | 0.650 | % | 0.575 | % | 0.550 | % | 0.475 | % | 0.475 | % | 0.475 | % | 0.450 | % | 0.425 | % | ||||||||||||||||||||||
Large Cap Index | 0.350 | % | 0.350 | % | 0.350 | % | 0.300 | % | 0.250 | % | 0.250 | % | 0.200 | % | 0.150 | % | 0.100 | % | 0.100 | % | 0.100 | % | ||||||||||||||||||||||
High Yield | 0.400 | % | 0.400 | % | 0.400 | % | 0.400 | % | 0.400 | % | 0.400 | % | 0.400 | % | 0.400 | % | 0.400 | % | 0.400 | % | 0.400 | % | ||||||||||||||||||||||
Income | 0.400 | % | 0.400 | % | 0.400 | % | 0.400 | % | 0.400 | % | 0.400 | % | 0.400 | % | 0.400 | % | 0.400 | % | 0.400 | % | 0.400 | % | ||||||||||||||||||||||
Bond Index | 0.350 | % | 0.350 | % | 0.350 | % | 0.300 | % | 0.250 | % | 0.250 | % | 0.200 | % | 0.150 | % | 0.100 | % | 0.100 | % | 0.100 | % | ||||||||||||||||||||||
Limited Maturity Bond | 0.400 | % | 0.400 | % | 0.400 | % | 0.400 | % | 0.400 | % | 0.400 | % | 0.400 | % | 0.400 | % | 0.400 | % | 0.400 | % | 0.400 | % | ||||||||||||||||||||||
Money Market | 0.400 | % | 0.400 | % | 0.400 | % | 0.400 | % | 0.400 | % | 0.400 | % | 0.400 | % | 0.400 | % | 0.400 | % | 0.400 | % | 0.400 | % | ||||||||||||||||||||||
(B) Sub-Adviser Fees – The following subadvisory fees are charged as part of the total investment advisory fees stated in the table above. The subadvisory fees are borne directly by the Adviser and do not increase the overall fees paid by the Portfolio.
Partner Technology Portfolio
The Adviser has entered into a subadvisory agreement with Goldman Sachs Asset Management, LP (“GSAM”) for the performance of subadvisory services. The fee payable is equal to 0.45% of average daily net assets.
Partner Healthcare Portfolio
The Adviser has entered into a subadvisory agreement with Sectoral Asset Management, Inc. for the performance of subadvisory services. The fee payable is equal to 0.65% of the first $50 million of average daily net assets, 0.60% of the next $50 million, 0.40% of the next $150 million and 0.35% of average daily net assets over $250 million.
Partner Emerging Markets Equity Portfolio
The Adviser has entered into a subadvisory agreement with Aberdeen Asset Managers Limited (“Aberdeen”) for the performance of subadvisory services. The fee payable is equal to 0.85% of the first $50 million of average daily net assets, 0.72% of the next $50 million and 0.68% of average daily net assets over $100 million. Thrivent Partner Worldwide Allocation Portfolio and Thrivent Partner Worldwide Allocation Fund are included in determining breakpoints for the assets managed by Aberdeen.
Partner Small Cap Growth Portfolio
The Adviser had entered into a subadvisory agreement with Turner Investments, L.P. (“Turner”) for the performance of subadvisory services. For assets that are invested in companies that have market capitalizations that fall within the bottom half of the Russell 2000® Growth Index (the “microcap portion”), the fee payable is equal to 0.80% of the average daily net assets in that microcap portion. For all other assets, the fee payable is equal to 0.65% of the average daily net assets when the entire portfolio assets (including the microcap portion) are no greater than $100 million, 0.60% of the average daily net assets when the entire portfolio assets are greater than $100 million but no greater than $350 million, and 0.575% of the average daily net assets when the entire portfolio assets are greater than $350 million. Thrivent Partner Small Cap Growth Fund (including the microcap portion of that Fund) is included in determining breakpoints for the assets managed by Turner. This agreement was terminated on May 27, 2014.
Partner Small Cap Value Portfolio
The Adviser has entered into a subadvisory agreement with T. Rowe Price Associates, Inc. for the performance of subadvisory services. The fee payable is equal to 0.60% of average daily net assets.
Partner Mid Cap Value Portfolio
The Adviser has entered into a subadvisory agreement with GSAM for the performance of subadvisory services. The fee payable is equal to 0.50% of average daily net assets for the first $200 million and 0.45% for assets over $200 million. Thrivent Partner Mid Cap Value Fund is included in determining breakpoints for the assets managed by GSAM.
Partner Worldwide Allocation Portfolio
The Adviser has entered into subadvisory agreements with Mercator Asset Management, LP (“Mercator”), Principal Global Investors, LLC (“Principal”), Aberdeen Asset Managers Limited (“Aberdeen”), DuPont Capital and Goldman Sachs Asset Management, LP (“GSAM”) for the performance of subadvisory services.
The fee payable for Mercator is equal to 0.75% of the first $25 million of average daily net assets managed by Mercator, 0.60% of the next $25 million, 0.55% of the next $25 million, 0.50% of the next $225 million, 0.40% of the next $200 million and 0.20% of average daily net assets over $500 million. Thrivent Partner Worldwide Allocation Fund is included in determining breakpoints for the assets managed by Mercator.
The fee payable for Principal is equal to 0.35% of the first $500 million of average daily net assets managed by Principal, 0.30% of the next $500 million and 0.25% of average daily net assets over $1 billion. Thrivent Partner Worldwide Allocation
377
Table of Contents
THRIVENT SERIES FUND, INC.
NOTESTO FINANCIAL STATEMENTS
December 31, 2014
Fund is included in determining breakpoints for the assets managed by Principal.
The fee payable for Aberdeen is equal to 0.85% of the first $50 million of average daily net assets managed by Aberdeen, 0.72% of the next $50 million and 0.68% of average daily net assets over $100 million. Thrivent Partner Emerging Markets Equity Portfolio and Partner Worldwide Allocation Fund are included in determining breakpoints for the assets managed by Aberdeen.
The fee payable for GSAM for managing the emerging markets debt portion is equal to 0.50% of the first $200 million of average daily net assets, 0.45% of the next $200 million and 0.40% of average daily net assets over $400 million. The fee payable for GSAM for managing the international small- and mid-cap equities portion is equal to 0.58% of the first $250 million of average daily net assets; and 0.54% of average daily net assets in excess of $250 million. Thrivent Partner Worldwide Allocation Fund is included in determining breakpoints for the assets managed by GSAM.
The fee payable for DuPont Capital is equal to 0.72% of the first $50 million of average daily net assets managed by DuPont Capital and 0.68% of average daily net assets over $50 million. Thrivent Partner Worldwide Allocation Fund and Thrivent Partner Emerging Markets Equity Fund is included in determining breakpoints for the assets managed by DuPont Capital.
Partner All Cap Portfolio
The Adviser has entered into a subadvisory agreement with Pyramis Global Advisors, LLC (“Pyramis Advisors”) for the performance of subadvisory services. Pyramis Advisors is a wholly owned subsidiary of Fidelity Management & Research Corporation. The fee payable is equal to 0.60% of average daily net assets for the first $100 million, 0.55% for the next $400 million, 0.50% for the next $250 million and 0.45% for assets over $750 million.
Partner Growth Stock Portfolio
The Adviser has entered into a subadvisory agreement with T. Rowe Price Associates, Inc. for the performance of subadvisory services. The fee payable is equal to 0.40% of average daily net assets for the first $500 million and 0.35% for assets over $500 million.
(C) Expense Reimbursements – As of December 31, 2014, the following voluntary expense reimbursements, as a percentage of net assets, were in effect:
Portfolio | Expense Reimbursement | Expiration Date | ||||||
Partner Growth Stock | 0.10 | % | N/A | |||||
Money Market1 | 0.10 | % | N/A | |||||
| 1 | Thrivent Asset Management has voluntarily agreed to reimburse certain portfolio level expenses to the extent necessary in order to maintain a minimum annualized net yield of 0.00%. |
As of December 31, 2014, contractual expense reimbursements to limit expenses to the following percentages were in effect:
Portfolio | Expense Limit | Expiration Date | ||||||
Growth and Income Plus1 | 0.80 | % | 4/30/2015 | |||||
Opportunity Income Plus2 | 0.75 | % | 4/30/2015 | |||||
Partner Healthcare | 1.25 | % | 4/30/2015 | |||||
Natural Resources | 1.02 | % | 4/30/2015 | |||||
Partner Emerging Markets Equity | 1.40 | % | 4/30/2015 | |||||
Partner All Cap | 0.95 | % | 4/30/2015 | |||||
Large Cap Index | 0.40 | % | 4/30/2015 | |||||
| 1 | Prior voluntary expense limit of 0.80% became a contractual expense cap effective May 1, 2014. |
| 2 | Prior contractual expense cap of 0.79% expired on April 30, 2014. |
For the period ended December 31, 2014, the following voluntary expense reimbursements to limit expenses to the following percentages were in effect:
Portfolio | Expense Limit | Expiration Date | ||||||
Partner Small Cap Growth1 | 0.95 | % | N/A | |||||
| 1 | The following voluntary expense cap replaced the voluntary expense reimbursement of 0.10% and became effective October 6, 2014. |
Thrivent does not recoup amounts previously reimbursed or waived in prior fiscal years.
Each equity, hybrid and fixed income Portfolio may invest cash in High Yield Fund, Money Market Portfolio and Thrivent Cash Management Trust, subject to certain limitations. During the year ended December 31, 2014, none of the Portfolios invested in High Yield Fund or Money Market Portfolio. During the year ended December 31, 2014, all Portfolios, except Money Market Portfolio, invested in Thrivent Cash Management Trust. These related-party transactions are subject to the same terms as non-related party transactions except that, to avoid duplicate investment advisory fees, Thrivent Financial reimburses an amount equal to the advisory fee which is charged to the Portfolio for its investment in High Yield Fund or Money Market Portfolio.
(D) Other Expenses – The Fund has entered into an accounting and administrative services agreement with the Adviser to provide certain accounting and administrative personnel and services to the Portfolios. For the year ended December 31, 2014, the Adviser received aggregate fees for accounting and administrative personnel and services of $8,174,689 from the Fund.
Each Director who is not affiliated with the Adviser receives an annual fee from the Fund for services as a Director and is
378
Table of Contents
THRIVENT SERIES FUND, INC.
NOTESTO FINANCIAL STATEMENTS
December 31, 2014
eligible to participate in a deferred compensation plan with respect to these fees. Participants in the plan may designate their deferred Director’s fees as if invested in any one of the portfolios of Thrivent Mutual Funds. The value of each Director’s deferred compensation account will increase or decrease as if it were invested in shares of the selected portfolios of Thrivent Mutual Funds. Their fees as well as the change in value are included in Director’s fees in the Statement of Operations. The deferred fees remain in the appropriate fund until distribution in accordance with the plan. The deferred fee liability, included in accrued expenses in the Statement of Assets and Liabilities, is unsecured.
Those Directors not participating in the above plan received $412,737 in fees from the Fund for the year ended December 31, 2014. In addition, the Fund reimbursed independent Directors for reasonable expenses incurred in relation to attendance at the meetings and industry conferences.
Certain officers and non-independent directors of the Fund are officers and directors of Thrivent Financial and Thrivent Life; however, they receive no compensation from the Fund.
(E) Indirect Expenses – Some Portfolios invest in other mutual funds. Fees and expenses of those underlying funds are not included in the Portfolios’ expense ratios. The Portfolios indirectly bear their proportionate share of the annualized weighted average expense ratio of the underlying funds in which they invest.
(4) TAX INFORMATION
Distributions are based on amounts calculated in accordance with applicable federal income tax regulations, which may differ from GAAP. To the extent that these differences are permanent in nature, such amounts are reclassified within the capital accounts based on their federal tax-basis treatment; temporary differences do not require reclassifications.
On the Statement of Assets and Liabilities, as a result of permanent book-to-tax differences, reclassification adjustments were made as follows [Increase/(Decrease)]:
Portfolio | Accumulated Undistributed Net Investment Income/(Loss) | Accumulated Undistributed Net Realized Gain/(Loss) | Capital Stock | |||||||||
Aggressive Allocation | $ | 4,087,479 | $ | (4,087,479 | ) | $ | — | |||||
Moderately Aggressive Allocation | 11,079,431 | (11,079,431 | ) | — | ||||||||
Moderate Allocation | 11,479,554 | (11,479,554 | ) | — | ||||||||
Moderately Conservative Allocation | 2,715,246 | (2,715,246 | ) | — | ||||||||
Growth and Income Plus | (20,638 | ) | 20,638 | — | ||||||||
Balanced Income Plus | (186,529 | ) | 186,529 | — | ||||||||
Diversified Income Plus | 67,588 | (67,588 | ) | — | ||||||||
Portfolio | Accumulated Undistributed Net Investment Income/(Loss) | Accumulated Undistributed Net Realized Gain/(Loss) | Capital Stock | |||||||||
Opportunity Income Plus | 408 | (408 | ) | — | ||||||||
Partner Technology | 117,545 | — | (117,545 | ) | ||||||||
Partner Healthcare | (17,547 | ) | 17,547 | — | ||||||||
Natural Resources | (4,762 | ) | 4,762 | — | ||||||||
Partner Emerging Markets Equity | (42,846 | ) | 42,846 | — | ||||||||
Real Estate Securities | 587 | (587 | ) | — | ||||||||
Partner Small Cap Growth | 1,554,433 | (48,676,824 | ) | 47,122,391 | ||||||||
Partner Small Cap Value | 703,640 | (703,640 | ) | — | ||||||||
Small Cap Stock | 1,922 | (1,922 | ) | — | ||||||||
Small Cap Index | 1,059 | (1,059 | ) | — | ||||||||
Mid Cap Growth | (5,500 | ) | 5,500 | — | ||||||||
Partner Mid Cap Value | 14,018 | (14,018 | ) | — | ||||||||
Mid Cap Stock | (72,137 | ) | 72,137 | — | ||||||||
Partner Worldwide Allocation | 2,530,388 | (2,530,388 | ) | — | ||||||||
Partner All Cap | (2,198 | ) | 2,198 | — | ||||||||
Large Cap Growth | 74,642 | (74,642 | ) | — | ||||||||
Partner Growth Stock | 141,672 | (141,672 | ) | — | ||||||||
Large Cap Value | (351,173 | ) | 351,173 | — | ||||||||
Large Cap Stock | (198,431 | ) | 198,437 | (6 | ) | |||||||
Large Cap Index | (103,298 | ) | 103,298 | — | ||||||||
High Yield | 27,573 | (27,573 | ) | — | ||||||||
Income | (146,120 | ) | 146,120 | — | ||||||||
Limited Maturity Bond | (430,761 | ) | 430,761 | — | ||||||||
At December 31, 2014, the components of distributable earnings on a tax basis were as follows:
Portfolio | Undistributed Ordinary Income# | Undistributed Long-Term Capital Gain | ||||||
Aggressive Allocation | $ | 20,914,938 | $ | 53,377,152 | ||||
Moderately Aggressive Allocation | 118,438,587 | 165,826,172 | ||||||
Moderate Allocation | 233,888,446 | 237,387,186 | ||||||
Moderately Conservative Allocation | 107,649,881 | 66,610,377 | ||||||
Growth and Income Plus | 3,312,402 | 1,658,511 | ||||||
Balanced Income Plus | 12,213,196 | 5,155,664 | ||||||
Diversified Income Plus | 18,149,403 | 6,561,531 | ||||||
Opportunity Income Plus | 20,100 | — | ||||||
Partner Technology | — | 2,996,372 | ||||||
Partner Healthcare | 4,928,752 | 4,103,739 | ||||||
Natural Resources | 161,287 | — | ||||||
Partner Emerging Markets Equity | 580,153 | — | ||||||
Real Estate Securities | 2,558,204 | 5,973,723 | ||||||
Partner Small Cap Growth | 1,228,540 | 23,500,401 | ||||||
Partner Small Cap Value | 3,772,252 | 28,358,918 | ||||||
Small Cap Stock | 9,696,716 | 31,665,284 | ||||||
Small Cap Index | 2,884,002 | 18,732,618 | ||||||
Mid Cap Growth | 1,662,474 | 36,746,223 | ||||||
379
Table of Contents
THRIVENT SERIES FUND, INC.
NOTESTO FINANCIAL STATEMENTS
December 31, 2014
Portfolio | Undistributed Ordinary Income# | Undistributed Long-Term Capital Gain | ||||||
Partner Mid Cap Value | 17,934,984 | 31,464,438 | ||||||
Mid Cap Stock | 16,228,149 | 69,552,203 | ||||||
Mid Cap Index | 1,774,475 | 6,866,868 | ||||||
Partner Worldwide Allocation | 41,277,663 | — | ||||||
Partner All Cap | 3,533,874 | 4,928,803 | ||||||
Large Cap Growth | 324,353 | — | ||||||
Partner Growth Stock | 410,740 | 8,541,198 | ||||||
Large Cap Value | 15,119,276 | 34,980,129 | ||||||
Large Cap Stock | 10,789,194 | 62,929,892 | ||||||
Large Cap Index | 7,364,740 | 1,695,275 | ||||||
High Yield | 651,227 | — | ||||||
Income | 4,215,258 | 27,096,209 | ||||||
Bond Index | 55,732 | — | ||||||
Limited Maturity Bond | 606,102 | — | ||||||
| # | Undistributed ordinary income includes income derived from short-term capital gains, if any. |
At December 31, 2014, the following Portfolios had accumulated net realized capital loss carryovers expiring as follows:
Portfolio | Capital Loss Carryover | Expiration Year | ||||||
Opportunity Income Plus | $ | 1,229,322 | Unlimited | |||||
|
| |||||||
Natural Resources | $ | 4,388,087 | Unlimited | |||||
|
| |||||||
Partner Emerging Markets Equity | $ | 1,506,849 | Unlimited | |||||
|
| |||||||
Partner Worldwide Allocation | $ | 120,081,661 | 2016 | |||||
|
| |||||||
Large Cap Growth | $ | 27,862,025 | 2017 | |||||
|
| |||||||
High Yield | $ | 24,542,293 | 2016 | |||||
| 46,838,004 | 2017 | |||||||
|
| |||||||
| $ | 71,380,297 | |||||||
|
| |||||||
Bond Index | $ | 688,692 | Unlimited | |||||
Limited Maturity Bond | 5,004,107 | 2017 | ||||||
| 703,883 | Unlimited | |||||||
|
| |||||||
| $ | 5,707,990 | |||||||
|
| |||||||
Money Market | $ | 759 | Unlimited | |||||
|
| |||||||
To the extent that these Portfolios realize future net capital gains, taxable distributions will be reduced by any unused capital loss carryovers as permitted by the Internal Revenue Code. Unlimited capital loss carryovers will be utilized before capital loss carryovers with expiration dates.
During the fiscal year 2014, capital loss carryovers utilized by the Portfolios were as follows:
Portfolio | Capital Loss Carryover | |||
Diversified Income Plus | 2,247,582 | |||
Opportunity Income Plus | 493,399 | |||
Partner Technology | 657,215 | |||
Partner Worldwide Allocation | 68,971,766 | |||
Partner All Cap | 563,845 | |||
Large Cap Growth | 163,627,583 | |||
Large Cap Value | 26,684,113 | |||
Large Cap Stock | 5,002,652 | |||
High Yield | 13,174,066 | |||
Bond Index | 1,439,349 | |||
380
Table of Contents
THRIVENT SERIES FUND, INC.
NOTESTO FINANCIAL STATEMENTS
December 31, 2014
The tax character of distributions paid during the years ended December 31, 2014 and 2013 was as follows:
| Ordinary Incomea | Long-term Capital Gain | Return of Capital | ||||||||||||||||||||||
Portfolio | 12/31/2014 | 12/31/2013 | 12/31/2014 | 12/31/2013 | 12/31/2014 | 12/31/2013 | ||||||||||||||||||
Aggressive Allocation | $ | 11,094,169 | $ | 11,627,216 | $ | 16,430,978 | $ | 5,709,117 | $ | — | $ | — | ||||||||||||
Moderately Aggressive Allocation | 87,033,784 | 94,028,514 | 73,142,634 | 36,454,375 | — | — | ||||||||||||||||||
Moderate Allocation | 167,287,487 | 166,852,796 | 131,188,187 | 53,035,752 | — | — | ||||||||||||||||||
Moderately Conservative Allocation | 70,435,909 | 82,026,029 | 56,993,206 | 28,450,013 | — | — | ||||||||||||||||||
Growth and Income Plus | 5,240,749 | 2,504,677 | 2,573,125 | — | — | — | ||||||||||||||||||
Balanced Income Plus | 5,039,798 | 6,424,903 | 50,854,413 | 6,446,347 | — | — | ||||||||||||||||||
Diversified Income Plus | 11,945,610 | 7,460,218 | — | — | — | — | ||||||||||||||||||
Opportunity Income Plus | 2,013,133 | 1,314,057 | — | — | — | — | ||||||||||||||||||
Partner Healthcare | 567,852 | 505,666 | 3,699,930 | 1,004,227 | — | — | ||||||||||||||||||
Natural Resources | 164,907 | 226,334 | — | — | — | — | ||||||||||||||||||
Partner Emerging Markets Equity | 625,090 | 626,603 | — | — | — | — | ||||||||||||||||||
Real Estate Securities | 2,006,084 | 1,880,889 | 2,407,859 | — | — | — | ||||||||||||||||||
Partner Small Cap Growth | 12,119,742 | — | 26,717,645 | 6,075,672 | — | — | ||||||||||||||||||
Partner Small Cap Value | 1,287,248 | 6,212,011 | 9,429,375 | 1,618,481 | — | — | ||||||||||||||||||
Small Cap Stock | 760,245 | 1,110,363 | 3,810,915 | — | — | — | ||||||||||||||||||
Small Cap Index | 3,285,051 | 3,167,163 | 16,089,896 | 9,010,936 | — | — | ||||||||||||||||||
Mid Cap Growth | 3,404,424 | 1,307,135 | 34,768,998 | 216,636 | — | — | ||||||||||||||||||
Partner Mid Cap Value | 23,506,820 | 3,991,956 | 27,968,131 | 12,356,287 | — | — | ||||||||||||||||||
Mid Cap Stock | 2,238,163 | 2,176,782 | 31,748,560 | — | — | — | ||||||||||||||||||
Mid Cap Index | 1,514,929 | 1,130,073 | 5,599,241 | 2,955,941 | — | — | ||||||||||||||||||
Partner Worldwide Allocation | 34,636,379 | 416,617 | — | — | — | — | ||||||||||||||||||
Partner All Cap | 396,564 | 428,025 | — | — | — | — | ||||||||||||||||||
Large Cap Growth | 6,205,697 | 5,999,580 | — | — | — | — | ||||||||||||||||||
Partner Growth Stock | 186,646 | 18,555 | 6,310,128 | — | — | — | ||||||||||||||||||
Large Cap Value | 14,210,465 | 14,880,600 | — | — | — | — | ||||||||||||||||||
Large Cap Stock | 7,274,387 | 8,140,375 | — | — | — | — | ||||||||||||||||||
Large Cap Index | 6,355,717 | 5,733,630 | 392,513 | 3,429,327 | — | — | ||||||||||||||||||
High Yield | 54,199,192 | 57,720,706 | — | — | — | — | ||||||||||||||||||
Income | 53,952,988 | 56,092,101 | 17,510,205 | 3,278,491 | — | — | ||||||||||||||||||
Bond Index | 3,314,697 | 6,585,111 | — | 2,208,152 | — | — | ||||||||||||||||||
Limited Maturity Bond | 18,195,371 | 17,218,976 | — | — | — | — | ||||||||||||||||||
| a | Ordinary income includes income derived from Short-term Capital Gains, if any. |
(5) SECURITY TRANSACTIONS
(A) Purchases and Sales of Investment Securities — For the year ended December 31, 2014, the cost of purchases and the proceeds from sales of investment securities, other than U.S. Government and short-term securities, were as follows:
| In thousands | ||||||||
Portfolio | Purchases | Sales | ||||||
Aggressive Allocation | $ | 281,857 | $ | 331,537 | ||||
Moderately Aggressive Allocation | 1,256,509 | 1,237,617 | ||||||
Moderate Allocation | 2,194,782 | 2,055,063 | ||||||
Moderately Conservative Allocation | 888,734 | 903,165 | ||||||
Growth and Income Plus | 106,754 | 94,379 | ||||||
Balanced Income Plus | 171,918 | 162,000 | ||||||
Diversified Income Plus | 375,991 | 316,219 | ||||||
Opportunity Income Plus | 41,197 | 21,690 | ||||||
Partner Technology | 17,978 | 15,705 | ||||||
Partner Healthcare | 73,849 | 44,711 | ||||||
Natural Resources | 27,190 | 21,836 | ||||||
Partner Emerging Markets Equity | 7,717 | 18,258 | ||||||
Real Estate Securities | 27,154 | 36,554 | ||||||
Partner Small Cap Growth | 230,074 | 235,849 | ||||||
Partner Small Cap Value | 67,941 | 76,463 | ||||||
Small Cap Stock | 172,004 | 215,286 | ||||||
Small Cap Index | 30,512 | 42,319 | ||||||
Mid Cap Growth | 158,688 | 199,850 | ||||||
Partner Mid Cap Value | 330,969 | 340,655 | ||||||
Mid Cap Stock | 251,115 | 260,878 | ||||||
Mid Cap Index | 15,749 | 16,278 | ||||||
Partner Worldwide Allocation | 1,304,941 | 1,286,383 | ||||||
381
Table of Contents
THRIVENT SERIES FUND, INC.
NOTESTO FINANCIAL STATEMENTS
December 31, 2014
| In thousands | ||||||||
Portfolio | Purchases | Sales | ||||||
Partner Growth Stock | 29,518 | 30,957 | ||||||
Large Cap Value | 232,556 | 226,029 | ||||||
Large Cap Stock | 494,003 | 538,515 | ||||||
Large Cap Index | 13,894 | 10,801 | ||||||
High Yield | 369,582 | 413,550 | ||||||
Income | 623,021 | 665,547 | ||||||
Bond Index | 13,931 | 17,365 | ||||||
Limited Maturity Bond | 350,792 | 426,700 | ||||||
Purchases and Sales of U.S. Government Securities were:
| In thousands | ||||||||
Portfolio | Purchases | Sales | ||||||
Aggressive Allocation | $ | 173,874 | $ | 185,611 | ||||
Moderately Aggressive Allocation | 2,319,635 | 2,404,121 | ||||||
Moderate Allocation | 7,640,690 | 7,342,658 | ||||||
Moderately Conservative Allocation | 5,201,143 | 5,067,302 | ||||||
Growth and Income Plus | 27,534 | 26,626 | ||||||
Balanced Income Plus | 150,954 | 150,052 | ||||||
Diversified Income Plus | 208,007 | 197,409 | ||||||
Opportunity Income Plus | 62,101 | 57,656 | ||||||
Partner Worldwide Allocation | 18,861 | 9,658 | ||||||
Income | 593,911 | 612,525 | ||||||
Bond Index | 605,141 | 612,419 | ||||||
Limited Maturity Bond | 718,331 | 713,019 | ||||||
(B) Investments in Restricted Securities – Certain Portfolios may own restricted securities that have been deemed illiquid and were purchased in private placement transactions without registration under the Securities Act of 1933. Unless such securities subsequently become registered, they generally may be resold only in privately negotiated transactions with a limited number of purchasers. As of December 31, 2014, the following Portfolios held restricted securities:
Portfolio | Number of Securities | Percent of Portfolio’s Net Assets | ||||||
Moderately Aggressive Allocation | 25 | 0.25 | % | |||||
Moderate Allocation | 25 | 0.49 | % | |||||
Moderately Conservative Allocation | 25 | 0.72 | % | |||||
Growth and Income Plus | 2 | 0.15 | % | |||||
Balanced Income Plus | 5 | 0.71 | % | |||||
Diversified Income Plus | 3 | 0.64 | % | |||||
Opportunity Income Plus | 4 | 0.90 | % | |||||
Partner Worldwide Allocation | 18 | 0.62 | % | |||||
Partner Growth Stock | 4 | 0.44 | % | |||||
High Yield | 15 | 5.61 | % | |||||
Income | 4 | 0.43 | % | |||||
Bond Index | 4 | 1.22 | % | |||||
Limited Maturity Bond | 29 | 8.78 | % | |||||
The Portfolios have no right to require registration of unregistered securities.
(C) Investments in High-Yielding Securities – High Yield Portfolio invests primarily in high-yielding fixed income securities. Each of the other Portfolios, except Money Market Portfolio, may also invest in high-yielding securities. These securities will typically be in lower rated categories or will be non-rated and generally will involve more risk than securities in higher rated categories. Lower rated or unrated securities are more likely to react to developments affecting market risk and credit risk than are more highly rated securities, which react primarily to movements in the general level of interest rates.
(D) Investments in Options and Futures Contracts – The movement in the price of the security underlying an option or futures contract may not correlate perfectly with the movement in the prices of the portfolio securities being hedged. A lack of correlation could render the Portfolio’s hedging strategy unsuccessful and could result in a loss to the Portfolio. In the event that a liquid secondary market would not exist, the Portfolio could be prevented from entering into a closing transaction which could result in additional losses to the Portfolio.
(E) Written Option Contracts – The number of contracts and premium amounts associated with covered call option contracts written during the year ended December 31, 2014, were as follows:
| Number of Contracts | Premium Amount | |||||||
Limited Maturity Bond | ||||||||
Balance at December 31, 2013 | — | $ | — | |||||
Opened | 400 | 61,300 | ||||||
Closed | (400 | ) | (61,300 | ) | ||||
Expired | — | — | ||||||
Exercised | — | — | ||||||
|
|
|
| |||||
Balance at December 31, 2014 | — | $ | — | |||||
|
|
|
| |||||
(6) SECURITY TRANSACTIONS WITH AFFILIATED FUNDS
The Portfolios are permitted to purchase or sell securities from or to certain other Portfolios under specified conditions outlined in procedures adopted by the Board. The procedures have been designed to ensure that any purchase or sale of securities by the Portfolio from or to another portfolio or fund that is or could be considered an affiliate by virtue of having a common investment adviser (or affiliated investment advisers), common Directors and/ or common officers complies with Rule 17a-7 of the 1940 Act. Further, as defined under the procedures, each transaction is executed at the current market price.
(7) SHARES OF BENEFICIAL INTEREST
The shares of each Portfolio have equal rights and privileges with all shares of that Portfolio. Shares in the Portfolio are
382
Table of Contents
THRIVENT SERIES FUND, INC.
NOTESTO FINANCIAL STATEMENTS
December 31, 2014
currently sold only to separate accounts of Thrivent Financial, Thrivent Life and retirement plans sponsored by Thrivent Financial.
As of December 31, 2014, authorized capital stock consists of ten billion shares as follows:
Portfolio | Shares Authorized | Par Value | ||||||
Aggressive Allocation | 350,000,000 | $ | 0.01 | |||||
Moderately Aggressive Allocation | 700,000,000 | 0.01 | ||||||
Moderate Allocation | 1,200,000,000 | 0.01 | ||||||
Moderately Conservative Allocation | 800,000,000 | 0.01 | ||||||
Growth and Income Plus | 200,000,000 | 0.01 | ||||||
Balanced Income Plus | 200,000,000 | 0.01 | ||||||
Diversified Income Plus | 250,000,000 | 0.01 | ||||||
Opportunity Income Plus | 50,000,000 | 0.01 | ||||||
Partner Technology | 100,000,000 | 0.01 | ||||||
Partner Healthcare | 50,000,000 | 0.01 | ||||||
Natural Resources | 200,000,000 | 0.01 | ||||||
Partner Emerging Markets Equity | 100,000,000 | 0.01 | ||||||
Real Estate Securities | 100,000,000 | 0.01 | ||||||
Partner Small Cap Growth | 50,000,000 | 0.01 | ||||||
Partner Small Cap Value | 150,000,000 | 0.01 | ||||||
Small Cap Stock | 200,000,000 | 0.01 | ||||||
Small Cap Index | 200,000,000 | 0.01 | ||||||
Mid Cap Growth | 200,000,000 | 0.01 | ||||||
Partner Mid Cap Value | 50,000,000 | 0.01 | ||||||
Mid Cap Stock | 200,000,000 | 0.01 | ||||||
Mid Cap Index | 200,000,000 | 0.01 | ||||||
Partner Worldwide Allocation | 700,000,000 | 0.01 | ||||||
Partner All Cap | 100,000,000 | 0.01 | ||||||
Large Cap Growth | 300,000,000 | 0.01 | ||||||
Partner Growth Stock | 50,000,000 | 0.01 | ||||||
Large Cap Value | 200,000,000 | 0.01 | ||||||
Large Cap Stock | 400,000,000 | 0.01 | ||||||
Large Cap Index | 200,000,000 | 0.01 | ||||||
High Yield | 350,000,000 | 0.01 | ||||||
Income | 300,000,000 | 0.01 | ||||||
Bond Index | 200,000,000 | 0.01 | ||||||
Limited Maturity Bond | 450,000,000 | 0.01 | ||||||
Money Market | 1,200,000,000 | 0.01 | ||||||
(8) MONEY MARKET FUND REGULATORY REFORM
On July 23, 2014, the Securities and Exchange Commission adopted amendments to Rule 2a-7, which governs money market funds. The majority of the amendments, except for certain disclosure enhancements, will not take effect until 2016. The amendments are being made to address potential systemic risks associated with money markets and to improve transparency for money market fund investors. At this time, management is evaluating the impact of the amendments, including potential effects on the structure, operations and return potential of Thrivent Money Market Portfolio.
(9) SUBSEQUENT EVENTS
Management of the Portfolios has evaluated the impact of subsequent events and, except as already included in the Notes to Financial Statements, has determined that no additional items require disclosure.
383
Table of Contents
THRIVENT SERIES FUND, INC.
| FOR A SHARE OUTSTANDING THROUGHOUT EACH PERIOD* | ||||||||||||||||||||||||
| Income From Investment Operations | Less Distributions From | |||||||||||||||||||||||
| Net Asset Value, Beginning of Period | Net Investment Income/(Loss) | Net Realized and Unrealized Gain/(Loss) on Investments(a) | Total from Investment Operations | Net Investment Income | Net Realized Gain on Investments | |||||||||||||||||||
AGGRESSIVE ALLOCATION PORTFOLIO | ||||||||||||||||||||||||
Year Ended 12/31/2014 | $ | 15.04 | $ | 0.10 | $ | 0.80 | $ | 0.90 | $ | (0.07 | ) | $ | (0.43 | ) | ||||||||||
Year Ended 12/31/2013 | 12.15 | 0.07 | 3.17 | 3.24 | (0.17 | ) | (0.18 | ) | ||||||||||||||||
Year Ended 12/31/2012 | 11.40 | 0.17 | 1.18 | 1.35 | (0.08 | ) | (0.52 | ) | ||||||||||||||||
Year Ended 12/31/2011 | 12.22 | 0.06 | (0.52 | ) | (0.46 | ) | (0.16 | ) | (0.20 | ) | ||||||||||||||
Year Ended 12/31/2010 | 10.66 | 0.10 | 1.72 | 1.82 | (0.16 | ) | (0.10 | ) | ||||||||||||||||
MODERATELY AGGRESSIVE ALLOCATION PORTFOLIO | ||||||||||||||||||||||||
Year Ended 12/31/2014 | 14.37 | 0.16 | 0.71 | 0.87 | (0.13 | ) | (0.39 | ) | ||||||||||||||||
Year Ended 12/31/2013 | 12.31 | 0.12 | 2.44 | 2.56 | (0.20 | ) | (0.30 | ) | ||||||||||||||||
Year Ended 12/31/2012 | 11.19 | 0.21 | 1.21 | 1.42 | (0.14 | ) | (0.16 | ) | ||||||||||||||||
Year Ended 12/31/2011 | 11.89 | 0.12 | (0.45 | ) | (0.33 | ) | (0.23 | ) | (0.14 | ) | ||||||||||||||
Year Ended 12/31/2010 | 10.72 | 0.17 | 1.42 | 1.59 | (0.25 | ) | (0.17 | ) | ||||||||||||||||
MODERATE ALLOCATION PORTFOLIO | ||||||||||||||||||||||||
Year Ended 12/31/2014 | 13.63 | 0.18 | 0.62 | 0.80 | (0.16 | ) | (0.37 | ) | ||||||||||||||||
Year Ended 12/31/2013 | 12.28 | 0.16 | 1.66 | 1.82 | (0.20 | ) | (0.27 | ) | ||||||||||||||||
Year Ended 12/31/2012 | 11.25 | 0.20 | 1.10 | 1.30 | (0.19 | ) | (0.08 | ) | ||||||||||||||||
Year Ended 12/31/2011 | 11.79 | 0.17 | (0.28 | ) | (0.11 | ) | (0.26 | ) | (0.17 | ) | ||||||||||||||
Year Ended 12/31/2010 | 10.82 | 0.22 | 1.21 | 1.43 | (0.29 | ) | (0.17 | ) | ||||||||||||||||
MODERATELY CONSERVATIVE ALLOCATION PORTFOLIO | ||||||||||||||||||||||||
Year Ended 12/31/2014 | 12.71 | 0.23 | 0.43 | 0.66 | (0.20 | ) | (0.28 | ) | ||||||||||||||||
Year Ended 12/31/2013 | 12.07 | 0.20 | 0.87 | 1.07 | (0.19 | ) | (0.24 | ) | ||||||||||||||||
Year Ended 12/31/2012 | 11.28 | 0.18 | 0.89 | 1.07 | (0.19 | ) | (0.09 | ) | ||||||||||||||||
Year Ended 12/31/2011 | 11.66 | 0.18 | (0.16 | ) | 0.02 | (0.25 | ) | (0.15 | ) | |||||||||||||||
Year Ended 12/31/2010 | 10.91 | 0.23 | 0.97 | 1.20 | (0.28 | ) | (0.17 | ) | ||||||||||||||||
GROWTH AND INCOME PLUS PORTFOLIO | ||||||||||||||||||||||||
Year Ended 12/31/2014 | 11.66 | 0.18 | 0.09 | 0.27 | (0.30 | ) | (0.91 | ) | ||||||||||||||||
Year Ended 12/31/2013 | 9.82 | 0.33 | 1.74 | 2.07 | (0.23 | ) | — | |||||||||||||||||
Year Ended 12/31/2012 | 8.81 | 0.24 | 0.91 | 1.15 | (0.14 | ) | — | |||||||||||||||||
Year Ended 12/31/2011 | 9.06 | 0.15 | (0.37 | ) | (0.22 | ) | (0.03 | ) | — | |||||||||||||||
Year Ended 12/31/2010 | 7.91 | 0.15 | 1.13 | 1.28 | (0.13 | ) | — | |||||||||||||||||
BALANCED INCOME PLUS PORTFOLIO | ||||||||||||||||||||||||
Year Ended 12/31/2014 | 17.28 | 0.33 | 0.67 | 1.00 | (0.28 | ) | (3.13 | ) | ||||||||||||||||
Year Ended 12/31/2013 | 15.42 | 0.30 | 2.42 | 2.72 | (0.31 | ) | (0.55 | ) | ||||||||||||||||
Year Ended 12/31/2012 | 14.48 | 0.33 | 1.42 | 1.75 | (0.34 | ) | (0.47 | ) | ||||||||||||||||
Year Ended 12/31/2011 | 14.72 | 0.34 | 0.26 | 0.60 | (0.34 | ) | (0.50 | ) | ||||||||||||||||
Year Ended 12/31/2010 | 13.44 | 0.34 | 1.39 | 1.73 | (0.36 | ) | (0.09 | ) | ||||||||||||||||
DIVERSIFIED INCOME PLUS PORTFOLIO | ||||||||||||||||||||||||
Year Ended 12/31/2014 | 7.84 | 0.26 | 0.08 | 0.34 | (0.24 | ) | — | |||||||||||||||||
Year Ended 12/31/2013 | 7.23 | 0.21 | 0.59 | 0.80 | (0.19 | ) | — | |||||||||||||||||
Year Ended 12/31/2012 | 6.56 | 0.19 | 0.74 | 0.93 | (0.26 | ) | — | |||||||||||||||||
Year Ended 12/31/2011 | 6.75 | 0.29 | (0.13 | ) | 0.16 | (0.35 | ) | — | ||||||||||||||||
Year Ended 12/31/2010 | 6.14 | 0.38 | 0.55 | 0.93 | (0.32 | ) | — | |||||||||||||||||
| (a) | The amount shown may not correlate with the change in aggregate gains and losses of portfolio securities due to the timing of sales and redemptions of portfolio shares. |
| * | All per share amounts have been rounded to the nearest cent. |
The accompanying Notes to Financial Statements are an integral part of this statement.
384
Table of Contents
THRIVENT SERIES FUND, INC.
FINANCIAL HIGHLIGHTS –CONTINUED
| ||||||||||||||||||||||||||||||||||
| RATIOS / SUPPLEMENTAL DATA | ||||||||||||||||||||||||||||||||||
| Ratios to Average Net Assets | ||||||||||||||||||||||||||||||||||
| Ratio to Average Net | Before Expenses Waived, | |||||||||||||||||||||||||||||||||
| Net Asset | Net Assets, End | Assets** | Credited or Paid Indirectly** | Portfolio Turnover | ||||||||||||||||||||||||||||||
| Total | Value, End of | Total | of Period | Net Investment | Net Investment | |||||||||||||||||||||||||||||
Distributions | Period | Return(b) | (in millions) | Expenses | Income/(Loss) | Expenses | Income/(Loss) | Rate | ||||||||||||||||||||||||||
| $ | (0.50 | ) | $ | 15.44 | 6.02 | % | $ | 904.9 | 0.50 | % | 0.70 | % | 0.50 | % | 0.70 | % | 58 | % | ||||||||||||||||
| (0.35 | ) | 15.04 | 27.05 | % | 799.4 | 0.46 | % | 0.53 | % | 0.47 | % | 0.52 | % | 43 | % | |||||||||||||||||||
| (0.60 | ) | 12.15 | 12.25 | % | 608.2 | 0.49 | % | 1.45 | % | 0.49 | % | 1.45 | % | 69 | % | |||||||||||||||||||
| (0.36 | ) | 11.40 | (3.93 | )% | 560.6 | 0.42 | % | 0.49 | % | 0.43 | % | 0.47 | % | 74 | % | |||||||||||||||||||
| (0.26 | ) | 12.22 | 17.53 | % | 587.1 | 0.34 | % | 0.95 | % | 0.39 | % | 0.90 | % | 68 | % | |||||||||||||||||||
| (0.52 | ) | 14.72 | 6.05 | % | 4,775.0 | 0.45 | % | 1.15 | % | 0.45 | % | 1.15 | % | 88 | % | |||||||||||||||||||
| (0.50 | ) | 14.37 | 21.30 | % | 4,224.5 | 0.38 | % | 1.09 | % | 0.40 | % | 1.07 | % | 60 | % | |||||||||||||||||||
| (0.30 | ) | 12.31 | 12.87 | % | 3,056.0 | 0.40 | % | 1.83 | % | 0.40 | % | 1.83 | % | 93 | % | |||||||||||||||||||
| (0.37 | ) | 11.19 | (2.86 | )% | 2,659.6 | 0.33 | % | 1.22 | % | 0.33 | % | 1.22 | % | 64 | % | |||||||||||||||||||
| (0.42 | ) | 11.89 | 15.43 | % | 2,505.6 | 0.28 | % | 1.83 | % | 0.28 | % | 1.83 | % | 39 | % | |||||||||||||||||||
| (0.53 | ) | 13.90 | 5.88 | % | 8,607.8 | 0.44 | % | 1.50 | % | 0.44 | % | 1.50 | % | 134 | % | |||||||||||||||||||
| (0.47 | ) | 13.63 | 15.12 | % | 7,181.1 | 0.36 | % | 1.46 | % | 0.38 | % | 1.44 | % | 99 | % | |||||||||||||||||||
| (0.27 | ) | 12.28 | 11.72 | % | 5,337.9 | 0.38 | % | 1.98 | % | 0.38 | % | 1.98 | % | 121 | % | |||||||||||||||||||
| (0.43 | ) | 11.25 | (1.02 | )% | 4,133.6 | 0.29 | % | 1.86 | % | 0.29 | % | 1.86 | % | 53 | % | |||||||||||||||||||
| (0.46 | ) | 11.79 | 13.68 | % | 3,569.4 | 0.26 | % | 2.51 | % | 0.26 | % | 2.51 | % | 30 | % | |||||||||||||||||||
| (0.48 | ) | 12.89 | 5.32 | % | 3,679.4 | 0.44 | % | 1.91 | % | 0.44 | % | 1.91 | % | 182 | % | |||||||||||||||||||
| (0.43 | ) | 12.71 | 9.02 | % | 3,353.0 | 0.37 | % | 1.72 | % | 0.40 | % | 1.68 | % | 198 | % | |||||||||||||||||||
| (0.28 | ) | 12.07 | 9.59 | % | 2,920.3 | 0.41 | % | 1.95 | % | 0.41 | % | 1.95 | % | 190 | % | |||||||||||||||||||
| (0.40 | ) | 11.28 | 0.20 | % | 2,055.3 | 0.31 | % | 2.14 | % | 0.31 | % | 2.14 | % | 46 | % | |||||||||||||||||||
| (0.45 | ) | 11.66 | 11.41 | % | 1,591.3 | 0.28 | % | 2.81 | % | 0.28 | % | 2.81 | % | 30 | % | |||||||||||||||||||
| (1.21 | ) | 10.72 | 2.21 | % | 81.1 | 0.80 | % | 2.30 | % | 0.94 | % | 2.16 | % | 176 | % | |||||||||||||||||||
| (0.23 | ) | 11.66 | 21.24 | % | 65.5 | 0.79 | % | 2.10 | % | 0.85 | % | 2.04 | % | 153 | % | |||||||||||||||||||
| (0.14 | ) | 9.82 | 13.17 | % | 102.1 | 0.81 | % | 2.56 | % | 0.81 | % | 2.56 | % | 160 | % | |||||||||||||||||||
| (0.03 | ) | 8.81 | (2.46 | )% | 88.1 | 0.83 | % | 1.78 | % | 0.83 | % | 1.78 | % | 195 | % | |||||||||||||||||||
| (0.13 | ) | 9.06 | 16.23 | % | 76.3 | 0.85 | % | 2.06 | % | 0.89 | % | 2.02 | % | 362 | % | |||||||||||||||||||
| (3.41 | ) | 14.87 | 6.07 | % | 303.0 | 0.64 | % | 2.38 | % | 0.64 | % | 2.38 | % | 111 | % | |||||||||||||||||||
| (0.86 | ) | 17.28 | 17.95 | % | 275.0 | 0.53 | % | 1.81 | % | 0.53 | % | 1.81 | % | 216 | % | |||||||||||||||||||
| (0.81 | ) | 15.42 | 12.42 | % | 239.3 | 0.45 | % | 1.93 | % | 0.45 | % | 1.93 | % | 142 | % | |||||||||||||||||||
| (0.84 | ) | 14.48 | 4.18 | % | 240.5 | 0.44 | % | 2.06 | % | 0.44 | % | 2.06 | % | 143 | % | |||||||||||||||||||
| (0.45 | ) | 14.72 | 13.30 | % | 270.6 | 0.44 | % | 2.13 | % | 0.44 | % | 2.13 | % | 136 | % | |||||||||||||||||||
| (0.24 | ) | 7.94 | 4.27 | % | 437.3 | 0.48 | % | 3.84 | % | 0.48 | % | 3.84 | % | 136 | % | |||||||||||||||||||
| (0.19 | ) | 7.84 | 11.17 | % | 362.7 | 0.49 | % | 3.88 | % | 0.49 | % | 3.88 | % | 150 | % | |||||||||||||||||||
| (0.26 | ) | 7.23 | 14.48 | % | 229.7 | 0.52 | % | 4.58 | % | 0.52 | % | 4.58 | % | 155 | % | |||||||||||||||||||
| (0.35 | ) | 6.56 | 2.32 | % | 118.4 | 0.55 | % | 4.98 | % | 0.55 | % | 4.98 | % | 127 | % | |||||||||||||||||||
| (0.32 | ) | 6.75 | 15.85 | % | 106.0 | 0.57 | % | 6.28 | % | 0.57 | % | 6.28 | % | 116 | % | |||||||||||||||||||
| (b) | Total investment return assumes dividend reinvestment and does not reflect any deduction for applicable sales charges. Not annualized for periods less than one year. Total return shown does not reflect charges and expenses imposed on contract holders by the variable accounts. Those charges and expenses reduce the return received by contract holders as compared to the return presented. |
| ** | Computed on an annualized basis for periods less than one year |
The accompanying Notes to Financial Statements are an integral part of this statement.
385
Table of Contents
THRIVENT SERIES FUND, INC.
FINANCIAL HIGHLIGHTS –CONTINUED
| FOR A SHARE OUTSTANDING THROUGHOUT EACH PERIOD* | ||||||||||||||||||||||||
| Income From Investment Operations | Less Distributions From | |||||||||||||||||||||||
| Net Asset Value, Beginning of Period | Net Investment Income/ (Loss) | Net Realized and Unrealized Gain/(Loss) on Investments(a) | Total from Investment Operations | Net Investment Income | Net Realized Gain on Investments | |||||||||||||||||||
OPPORTUNITY INCOME PLUS PORTFOLIO | ||||||||||||||||||||||||
Year Ended 12/31/2014 | $ | 10.15 | $ | 0.35 | $ | — | $ | 0.35 | $ | (0.35 | ) | $ | — | |||||||||||
Year Ended 12/31/2013 | 10.64 | 0.26 | (0.40 | ) | (0.14 | ) | (0.26 | ) | (0.09 | ) | ||||||||||||||
Year Ended 12/31/2012 | 10.45 | 0.16 | 0.44 | 0.60 | (0.16 | ) | (0.25 | ) | ||||||||||||||||
Year Ended 12/31/2011 | 10.32 | 0.30 | 0.17 | 0.47 | (0.30 | ) | (0.04 | ) | ||||||||||||||||
Year Ended 12/31/2010 | 9.62 | 0.35 | 0.80 | 1.15 | (0.35 | ) | (0.10 | ) | ||||||||||||||||
PARTNER TECHNOLOGY PORTFOLIO | ||||||||||||||||||||||||
Year Ended 12/31/2014 | 9.69 | (0.02 | ) | 1.03 | 1.01 | — | — | |||||||||||||||||
Year Ended 12/31/2013 | 7.51 | (0.02 | ) | 2.20 | 2.18 | — | — | |||||||||||||||||
Year Ended 12/31/2012 | 6.20 | (0.03 | ) | 1.34 | 1.31 | — | — | |||||||||||||||||
Year Ended 12/31/2011 | 7.11 | (0.01 | ) | (0.90 | ) | (0.91 | ) | — | — | |||||||||||||||
Year Ended 12/31/2010 | 5.69 | (0.04 | ) | 1.46 | 1.42 | — | — | |||||||||||||||||
PARTNER HEALTHCARE PORTFOLIO | ||||||||||||||||||||||||
Year Ended 12/31/2014 | 16.84 | 0.01 | 3.98 | 3.99 | — | (1.13 | ) | |||||||||||||||||
Year Ended 12/31/2013 | 13.39 | (0.02 | ) | 4.10 | 4.08 | (0.05 | ) | (0.58 | ) | |||||||||||||||
Year Ended 12/31/2012 | 11.26 | 0.03 | 2.29 | 2.32 | (0.04 | ) | (0.15 | ) | ||||||||||||||||
Year Ended 12/31/2011 | 12.08 | 0.03 | (0.46 | ) | (0.43 | ) | — | (0.39 | ) | |||||||||||||||
Year Ended 12/31/2010 | 11.08 | (0.02 | ) | 1.22 | 1.20 | (0.02 | ) | (0.18 | ) | |||||||||||||||
NATURAL RESOURCES PORTFOLIO | ||||||||||||||||||||||||
Year Ended 12/31/2014 | 7.52 | 0.03 | (1.41 | ) | (1.38 | ) | (0.03 | ) | — | |||||||||||||||
Year Ended 12/31/2013 | 6.91 | 0.04 | 0.62 | 0.66 | (0.05 | ) | — | |||||||||||||||||
Year Ended 12/31/2012 | 8.33 | 0.05 | (0.43 | ) | (0.38 | ) | (0.02 | ) | (1.02 | ) | ||||||||||||||
Year Ended 12/31/2011 | 9.56 | 0.02 | (1.24 | ) | (1.22 | ) | (0.01 | ) | — | |||||||||||||||
Year Ended 12/31/2010 | 8.23 | — | 1.34 | 1.34 | (0.01 | ) | — | |||||||||||||||||
PARTNER EMERGING MARKETS EQUITY PORTFOLIO | ||||||||||||||||||||||||
Year Ended 12/31/2014 | 12.47 | 0.14 | (0.41 | ) | (0.27 | ) | (0.12 | ) | — | |||||||||||||||
Year Ended 12/31/2013 | 13.61 | 0.12 | (1.13 | ) | (1.01 | ) | (0.13 | ) | — | |||||||||||||||
Year Ended 12/31/2012 | 10.92 | 0.14 | 2.68 | 2.82 | (0.07 | ) | (0.06 | ) | ||||||||||||||||
Year Ended 12/31/2011 | 12.38 | 0.15 | (1.48 | ) | (1.33 | ) | (0.13 | ) | — | |||||||||||||||
Year Ended 12/31/2010 | 9.72 | 0.06 | 2.60 | 2.66 | — | — | ||||||||||||||||||
REAL ESTATE SECURITIES PORTFOLIO | ||||||||||||||||||||||||
Year Ended 12/31/2014 | 17.98 | 0.35 | 5.11 | 5.46 | (0.30 | ) | (0.36 | ) | ||||||||||||||||
Year Ended 12/31/2013 | 17.85 | 0.29 | 0.11 | 0.40 | (0.27 | ) | — | |||||||||||||||||
Year Ended 12/31/2012 | 15.77 | 0.30 | 2.43 | 2.73 | (0.65 | ) | — | |||||||||||||||||
Year Ended 12/31/2011 (c) | 14.49 | 0.22 | 1.06 | 1.28 | — | — | ||||||||||||||||||
Year Ended 12/31/2010 | 11.67 | 0.22 | 2.99 | 3.21 | (0.39 | ) | — | |||||||||||||||||
PARTNER SMALL CAP GROWTH PORTFOLIO | ||||||||||||||||||||||||
Year Ended 12/31/2014 | 19.23 | (0.57 | ) | 0.91 | 0.34 | — | (2.18 | ) | ||||||||||||||||
Year Ended 12/31/2013 | 13.87 | (0.08 | ) | 5.79 | 5.71 | — | (0.35 | ) | ||||||||||||||||
Year Ended 12/31/2012 | 12.42 | (0.01 | ) | 1.46 | 1.45 | — | — | |||||||||||||||||
Year Ended 12/31/2011 | 12.92 | (0.08 | ) | (0.42 | ) | (0.50 | ) | — | — | |||||||||||||||
Year Ended 12/31/2010 | 10.03 | (0.07 | ) | 2.96 | 2.89 | — | — | |||||||||||||||||
| (a) | The amount shown may not correlate with the change in aggregate gains and losses of portfolio securities due to the timing of sales and redemptions of portfolio shares. |
| (c) | Per share amounts have been calculated using the average shares outstanding method. |
| * | All per share amounts have been rounded to the nearest cent. |
The accompanying Notes to Financial Statements are an integral part of this statement.
386
Table of Contents
THRIVENT SERIES FUND, INC.
FINANCIAL HIGHLIGHTS –CONTINUED
| RATIOS/SUPPLEMENTAL DATA | ||||||||||||||||||||||||||||||||||
| Net Asset | Net Assets, End | Ratio to Average Net Assets** | Ratio to Average Net Assets Before Expenses Waived, Credited or Paid Indirectly** | |||||||||||||||||||||||||||||||
Total Distributions | Value, End of Period | Total Return(b) | of Period (in millions) | Expenses | Net Investment Income/(Loss) | Expenses | Net Investment Income/(Loss) | Portfolio Turnover Rate | ||||||||||||||||||||||||||
|
|
|
| ||||||||||||||||||||||||||||||||
| $ | (0.35) | $ | 10.15 | 3.48 | % | $ | 71.8 | 0.76 | % | 3.46 | % | 0.79 | % | 3.42 | % | 140 | % | |||||||||||||||||
| (0.35) | 10.15 | (1.39 | )% | 46.5 | 0.79 | % | 2.58 | % | 0.88 | % | 2.49 | % | 755 | % | ||||||||||||||||||||
| (0.41) | 10.64 | 5.99 | % | 37.3 | 0.83 | % | 1.54 | % | 0.88 | % | 1.49 | % | 936 | % | ||||||||||||||||||||
| (0.34) | 10.45 | 4.53 | % | 32.4 | 0.90 | % | 2.89 | % | 0.90 | % | 2.89 | % | 854 | % | ||||||||||||||||||||
| (0.45) | 10.32 | 12.09 | % | 33.5 | 0.89 | % | 3.43 | % | 0.89 | % | 3.43 | % | 676 | % | ||||||||||||||||||||
|
|
|
| ||||||||||||||||||||||||||||||||
| — | 10.70 | 10.45 | % | 56.7 | 1.02 | % | (0.23 | )% | 1.02 | % | (0.23 | )% | 31 | % | ||||||||||||||||||||
| — | 9.69 | 29.01 | % | 48.1 | 1.08 | % | (0.21 | )% | 1.08 | % | (0.21 | )% | 48 | % | ||||||||||||||||||||
| — | 7.51 | 21.09 | % | 35.5 | 1.13 | % | (0.39 | )% | 1.13 | % | (0.39 | )% | 45 | % | ||||||||||||||||||||
| — | 6.20 | (12.83 | )% | 29.6 | 1.13 | % | (0.21 | )% | 1.13 | % | (0.21 | )% | 56 | % | ||||||||||||||||||||
| — | 7.11 | 25.00 | % | 36.3 | 1.15 | % | (0.57 | )% | 1.15 | % | (0.57 | )% | 54 | % | ||||||||||||||||||||
|
|
|
| ||||||||||||||||||||||||||||||||
| (1.13) | 19.70 | 24.23 | % | 102.1 | 1.13 | % | 0.03 | % | 1.13 | % | 0.03 | % | 63 | % | ||||||||||||||||||||
| (0.63) | 16.84 | 31.09 | % | 53.7 | 1.25 | % | (0.10 | )% | 1.31 | % | (0.16 | )% | 61 | % | ||||||||||||||||||||
| (0.19) | 13.39 | 20.68 | % | 25.2 | 1.25 | % | 0.26 | % | 1.54 | % | (0.04 | )% | 40 | % | ||||||||||||||||||||
| (0.39) | 11.26 | (3.79 | )% | 18.0 | 1.30 | % | 0.24 | % | 1.64 | % | (0.11 | )% | 66 | % | ||||||||||||||||||||
| (0.20) | 12.08 | 11.13 | % | 17.9 | 1.39 | % | (0.15 | )% | 1.71 | % | (0.47 | )% | 45 | % | ||||||||||||||||||||
|
|
|
| ||||||||||||||||||||||||||||||||
| (0.03) | 6.11 | (18.39 | )% | 31.3 | 1.02 | % | 0.43 | % | 1.11 | % | 0.34 | % | 61 | % | ||||||||||||||||||||
| (0.05) | 7.52 | 9.55 | % | 35.0 | 1.02 | % | 0.50 | % | 1.13 | % | 0.39 | % | 37 | % | ||||||||||||||||||||
| (1.04) | 6.91 | (3.15 | )% | 31.6 | 1.06 | % | 0.70 | % | 1.14 | % | 0.62 | % | 28 | % | ||||||||||||||||||||
| (0.01) | 8.33 | (12.84 | )% | 31.6 | 1.12 | % | 0.17 | % | 1.12 | % | 0.17 | % | 118 | % | ||||||||||||||||||||
| (0.01) | 9.56 | 16.33 | % | 28.7 | 1.20 | % | (0.06 | )% | 1.28 | % | (0.15 | )% | 2 | % | ||||||||||||||||||||
|
|
|
| ||||||||||||||||||||||||||||||||
| (0.12) | 12.08 | (2.29 | )% | 48.5 | 1.40 | % | 1.07 | % | 1.52 | % | 0.95 | % | 14 | % | ||||||||||||||||||||
| (0.13) | 12.47 | (7.34 | )% | 59.9 | 1.40 | % | 1.07 | % | 1.54 | % | 0.92 | % | 5 | % | ||||||||||||||||||||
| (0.13) | 13.61 | 25.98 | % | 54.7 | 1.40 | % | 1.27 | % | 1.62 | % | 1.05 | % | 4 | % | ||||||||||||||||||||
| (0.13) | 10.92 | (10.83 | )% | 38.9 | 1.43 | % | 1.27 | % | 1.66 | % | 1.04 | % | 6 | % | ||||||||||||||||||||
| — | 12.38 | 27.33 | % | 40.9 | 1.50 | % | 0.74 | % | 1.88 | % | 0.36 | % | 4 | % | ||||||||||||||||||||
|
|
|
| ||||||||||||||||||||||||||||||||
| (0.66) | 22.78 | 30.82 | % | 142.5 | 0.92 | % | 1.67 | % | 0.92 | % | 1.67 | % | 21 | % | ||||||||||||||||||||
| (0.27) | 17.98 | 2.18 | % | 120.1 | 0.92 | % | 1.53 | % | 0.92 | % | 1.53 | % | 22 | % | ||||||||||||||||||||
| (0.65) | 17.85 | 17.54 | % | 122.4 | 0.93 | % | 1.62 | % | 0.93 | % | 1.62 | % | 32 | % | ||||||||||||||||||||
| — | 15.77 | 8.83 | % | 108.0 | 0.87 | % | 1.47 | % | 0.87 | % | 1.47 | % | 16 | % | ||||||||||||||||||||
| (0.39) | 14.49 | 27.56 | % | 329.5 | 0.87 | % | 1.62 | % | 0.87 | % | 1.62 | % | 15 | % | ||||||||||||||||||||
|
|
|
| ||||||||||||||||||||||||||||||||
| (2.18) | 17.39 | 2.31 | % | 47.8 | 0.97 | % | (0.55 | )% | 1.08 | % | (0.67 | )% | 88 | % | ||||||||||||||||||||
| (0.35) | 19.23 | 41.64 | % | 344.3 | 0.98 | % | (0.49 | )% | 1.08 | % | (0.59 | )% | 85 | % | ||||||||||||||||||||
| — | 13.87 | 11.69 | % | 256.9 | 0.99 | % | (0.12 | )% | 1.09 | % | (0.22 | )% | 93 | % | ||||||||||||||||||||
| — | 12.42 | (3.85 | )% | 197.5 | 1.00 | % | (0.63 | )% | 1.10 | % | (0.73 | )% | 101 | % | ||||||||||||||||||||
| — | 12.92 | 28.86 | % | 208.5 | 1.01 | % | (0.62 | )% | 1.11 | % | (0.72 | )% | 100 | % | ||||||||||||||||||||
| (b) | Total investment return assumes dividend reinvestment and does not reflect any deduction for applicable sales charges. Not annualized for periods less than one year. Total return shown does not reflect charges and expenses imposed on contract holders by the variable accounts. Those charges and expenses reduce the return received by contract holders as compared to the return presented. |
| ** | Computed on an annualized basis for periods less than one year |
The accompanying Notes to Financial Statements are an integral part of this statement.
387
Table of Contents
THRIVENT SERIES FUND, INC.
FINANCIAL HIGHLIGHTS –CONTINUED
| FOR A SHARE OUTSTANDING THROUGHOUT EACH PERIOD* | ||||||||||||||||||||||||
| Income From Investment Operations | Less Distributions From | |||||||||||||||||||||||
| Net Asset Value, Beginning of Period | Net Investment Income/(Loss) | Net Realized and Unrealized Gain/(Loss) on Investments(a) | Total from Investment Operations | Net Investment Income | Net Realized Gain on Investments | |||||||||||||||||||
PARTNER SMALL CAP VALUE PORTFOLIO | ||||||||||||||||||||||||
Year Ended 12/31/2014 | $ | 28.27 | $ | 0.25 | $ | 0.55 | $ | 0.80 | $ | (0.06 | ) | $ | (0.73 | ) | ||||||||||
Year Ended 12/31/2013 | 21.17 | 0.14 | 7.55 | 7.69 | (0.47 | ) | (0.12 | ) | ||||||||||||||||
Year Ended 12/31/2012 | 18.64 | 0.38 | 2.28 | 2.66 | (0.13 | ) | — | |||||||||||||||||
Year Ended 12/31/2011 | 19.06 | 0.10 | (0.48 | ) | (0.38 | ) | (0.04 | ) | — | |||||||||||||||
Year Ended 12/31/2010 | 15.58 | 0.13 | 3.52 | 3.65 | (0.17 | ) | — | |||||||||||||||||
SMALL CAP STOCK PORTFOLIO | ||||||||||||||||||||||||
Year Ended 12/31/2014 | 17.77 | 0.08 | 0.75 | 0.83 | (0.04 | ) | (0.19 | ) | ||||||||||||||||
Year Ended 12/31/2013 | 13.12 | 0.04 | 4.67 | 4.71 | (0.06 | ) | — | |||||||||||||||||
Year Ended 12/31/2012 | 11.99 | 0.06 | 1.07 | 1.13 | — | — | ||||||||||||||||||
Year Ended 12/31/2011 | 12.66 | (0.01 | ) | (0.66 | ) | (0.67 | ) | — | — | |||||||||||||||
Year Ended 12/31/2010 | 10.13 | (0.01 | ) | 2.54 | 2.53 | — | — | |||||||||||||||||
SMALL CAP INDEX PORTFOLIO | ||||||||||||||||||||||||
Year Ended 12/31/2014 | 17.86 | 0.15 | 0.77 | 0.92 | (0.13 | ) | (1.21 | ) | ||||||||||||||||
Year Ended 12/31/2013 | 13.42 | 0.14 | 5.17 | 5.31 | (0.20 | ) | (0.67 | ) | ||||||||||||||||
Year Ended 12/31/2012 | 12.77 | 0.20 | 1.68 | 1.88 | (0.09 | ) | (1.14 | ) | ||||||||||||||||
Year Ended 12/31/2011 | 13.19 | 0.10 | (0.02 | ) | 0.08 | (0.11 | ) | (0.39 | ) | |||||||||||||||
Year Ended 12/31/2010 | 10.57 | 0.11 | 2.60 | 2.71 | (0.09 | ) | — | |||||||||||||||||
MID CAP GROWTH PORTFOLIO | ||||||||||||||||||||||||
Year Ended 12/31/2014 | 25.45 | 0.06 | 2.23 | 2.29 | (0.06 | ) | (2.32 | ) | ||||||||||||||||
Year Ended 12/31/2013 | 19.59 | 0.06 | 5.89 | 5.95 | (0.08 | ) | (0.01 | ) | ||||||||||||||||
Year Ended 12/31/2012 | 17.50 | 0.07 | 2.06 | 2.13 | (0.04 | ) | — | |||||||||||||||||
Year Ended 12/31/2011 | 18.56 | 0.04 | (1.04 | ) | (1.00 | ) | (0.06 | ) | — | |||||||||||||||
Year Ended 12/31/2010 | 14.42 | 0.06 | 4.12 | 4.18 | (0.04 | ) | — | |||||||||||||||||
PARTNER MID CAP VALUE PORTFOLIO | ||||||||||||||||||||||||
Year Ended 12/31/2014 | 18.45 | 0.10 | 2.27 | 2.37 | (0.12 | ) | (2.56 | ) | ||||||||||||||||
Year Ended 12/31/2013 | 14.67 | 0.12 | 4.57 | 4.69 | (0.17 | ) | (0.74 | ) | ||||||||||||||||
Year Ended 12/31/2012 | 12.51 | 0.17 | 2.10 | 2.27 | (0.11 | ) | — | |||||||||||||||||
Year Ended 12/31/2011 | 13.38 | 0.11 | (0.95 | ) | (0.84 | ) | (0.03 | ) | — | |||||||||||||||
Year Ended 12/31/2010 | 10.82 | 0.08 | 2.58 | 2.66 | (0.10 | ) | — | |||||||||||||||||
MID CAP STOCK PORTFOLIO | ||||||||||||||||||||||||
Year Ended 12/31/2014 | 17.66 | 0.11 | 1.98 | 2.09 | (0.06 | ) | (0.83 | ) | ||||||||||||||||
Year Ended 12/31/2013 | 13.09 | 0.06 | 4.57 | 4.63 | (0.06 | ) | — | |||||||||||||||||
Year Ended 12/31/2012 | 11.48 | 0.06 | 1.58 | 1.64 | (0.03 | ) | — | |||||||||||||||||
Year Ended 12/31/2011 | 12.25 | 0.03 | (0.79 | ) | (0.76 | ) | (0.01 | ) | — | |||||||||||||||
Year Ended 12/31/2010 | 9.80 | 0.05 | 2.45 | 2.50 | (0.05 | ) | — | |||||||||||||||||
MID CAP INDEX PORTFOLIO | ||||||||||||||||||||||||
Year Ended 12/31/2014 | 15.78 | 0.13 | 1.32 | 1.45 | (0.12 | ) | (0.76 | ) | ||||||||||||||||
Year Ended 12/31/2013 | 12.36 | 0.12 | 3.87 | 3.99 | (0.13 | ) | (0.44 | ) | ||||||||||||||||
Year Ended 12/31/2012 | 11.79 | 0.14 | 1.74 | 1.88 | (0.10 | ) | (1.21 | ) | ||||||||||||||||
Year Ended 12/31/2011 | 12.91 | 0.10 | (0.33 | ) | (0.23 | ) | (0.11 | ) | (0.78 | ) | ||||||||||||||
Year Ended 12/31/2010 | 10.37 | 0.11 | 2.55 | 2.66 | (0.12 | ) | — | |||||||||||||||||
| (a) | The amount shown may not correlate with the change in aggregate gains and losses of portfolio securities due to the timing of sales and redemptions of portfolio shares. |
| * | All per share amounts have been rounded to the nearest cent. |
The accompanying Notes to Financial Statements are an integral part of this statement.
388
Table of Contents
THRIVENT SERIES FUND, INC.
FINANCIAL HIGHLIGHTS –CONTINUED
| RATIOS / SUPPLEMENTAL DATA | ||||||||||||||||||||||||||||||||||
| Net Asset | Net Assets, End | Ratio to Average Net Assets** | Ratio to Average Net Assets Before Expenses Waived, Credited or Paid Indirectly** | |||||||||||||||||||||||||||||||
Total | Value, End of Period | Total Return(b) | of Period (in millions) | Expenses | Net Investment Income/(Loss) | Expenses | Net Investment Income/(Loss) | Portfolio Turnover Rate | ||||||||||||||||||||||||||
|
|
|
| ||||||||||||||||||||||||||||||||
| $ | (0.79) | $ | 28.28 | 2.89 | % | $ | 388.6 | 0.86 | % | 0.89 | % | 0.86 | % | 0.89 | % | 19 | % | |||||||||||||||||
| (0.59) | 28.27 | 36.76 | % | 384.7 | 0.86 | % | 0.56 | % | 0.86 | % | 0.56 | % | 11 | % | ||||||||||||||||||||
| (0.13) | 21.17 | 14.37 | % | 282.6 | 0.88 | % | 1.90 | % | 0.88 | % | 1.90 | % | 18 | % | ||||||||||||||||||||
| (0.04) | 18.64 | (1.99 | )% | 250.4 | 0.88 | % | 0.52 | % | 0.88 | % | 0.52 | % | 10 | % | ||||||||||||||||||||
| (0.17) | 19.06 | 23.46 | % | 266.9 | 0.88 | % | 0.75 | % | 0.88 | % | 0.75 | % | 19 | % | ||||||||||||||||||||
|
|
|
| ||||||||||||||||||||||||||||||||
| (0.23) | 18.37 | 4.76 | % | 306.3 | 0.75 | % | 0.42 | % | 0.75 | % | 0.42 | % | 56 | % | ||||||||||||||||||||
| (0.06) | 17.77 | 35.90 | % | 354.6 | 0.75 | % | 0.25 | % | 0.75 | % | 0.25 | % | 62 | % | ||||||||||||||||||||
| — | 13.12 | 9.42 | % | 269.5 | 0.76 | % | 0.49 | % | 0.76 | % | 0.49 | % | 96 | % | ||||||||||||||||||||
| — | 11.99 | (5.31 | )% | 263.8 | 0.76 | % | (0.10 | )% | 0.76 | % | (0.10 | )% | 88 | % | ||||||||||||||||||||
| — | 12.66 | 25.09 | % | 303.2 | 0.77 | % | (0.11 | )% | 0.77 | % | (0.11 | )% | 208 | % | ||||||||||||||||||||
|
|
|
| ||||||||||||||||||||||||||||||||
| (1.34) | 17.44 | 5.36 | % | 268.6 | 0.43 | % | 0.87 | % | 0.43 | % | 0.87 | % | 12 | % | ||||||||||||||||||||
| (0.87) | 17.86 | 40.83 | % | 262.8 | 0.44 | % | 0.84 | % | 0.44 | % | 0.84 | % | 12 | % | ||||||||||||||||||||
| (1.23) | 13.42 | 15.95 | % | 193.7 | 0.46 | % | 1.44 | % | 0.46 | % | 1.44 | % | 9 | % | ||||||||||||||||||||
| (0.50) | 12.77 | 0.53 | % | 189.0 | 0.45 | % | 0.63 | % | 0.45 | % | 0.63 | % | 13 | % | ||||||||||||||||||||
| (0.09) | 13.19 | 25.88 | % | 220.1 | 0.46 | % | 0.86 | % | 0.46 | % | 0.86 | % | 11 | % | ||||||||||||||||||||
|
|
|
| ||||||||||||||||||||||||||||||||
| (2.38) | 25.36 | 9.71 | % | 427.2 | 0.46 | % | 0.25 | % | 0.46 | % | 0.25 | % | 40 | % | ||||||||||||||||||||
| (0.09) | 25.45 | 30.45 | % | 424.3 | 0.46 | % | 0.22 | % | 0.46 | % | 0.22 | % | 38 | % | ||||||||||||||||||||
| (0.04) | 19.59 | 12.22 | % | 361.5 | 0.46 | % | 0.39 | % | 0.46 | % | 0.39 | % | 39 | % | ||||||||||||||||||||
| (0.06) | 17.50 | (5.43 | )% | 348.8 | 0.46 | % | 0.21 | % | 0.46 | % | 0.21 | % | 67 | % | ||||||||||||||||||||
| (0.04) | 18.56 | 29.11 | % | 419.9 | 0.46 | % | 0.34 | % | 0.46 | % | 0.34 | % | 48 | % | ||||||||||||||||||||
|
|
|
| ||||||||||||||||||||||||||||||||
| (2.68) | 18.14 | 13.52 | % | 402.9 | 0.79 | % | 0.59 | % | 0.79 | % | 0.59 | % | 90 | % | ||||||||||||||||||||
| (0.91) | 18.45 | 32.74 | % | 352.9 | 0.79 | % | 0.76 | % | 0.81 | % | 0.75 | % | 108 | % | ||||||||||||||||||||
| (0.11) | 14.67 | 18.27 | % | 261.5 | 0.84 | % | 1.26 | % | 0.84 | % | 1.26 | % | 80 | % | ||||||||||||||||||||
| (0.03) | 12.51 | (6.33 | )% | 215.8 | 0.84 | % | 0.84 | % | 0.84 | % | 0.84 | % | 76 | % | ||||||||||||||||||||
| (0.10) | 13.38 | 24.73 | % | 232.2 | 0.85 | % | 0.72 | % | 0.85 | % | 0.72 | % | 91 | % | ||||||||||||||||||||
|
|
|
| ||||||||||||||||||||||||||||||||
| (0.89) | 18.86 | 11.93 | % | 752.6 | 0.71 | % | 0.63 | % | 0.71 | % | 0.63 | % | 37 | % | ||||||||||||||||||||
| (0.06) | 17.66 | 35.50 | % | 675.4 | 0.72 | % | 0.38 | % | 0.72 | % | 0.38 | % | 39 | % | ||||||||||||||||||||
| (0.03) | 13.09 | 14.29 | % | 506.7 | 0.73 | % | 0.51 | % | 0.73 | % | 0.51 | % | 47 | % | ||||||||||||||||||||
| (0.01) | 11.48 | (6.29 | )% | 457.0 | 0.72 | % | 0.24 | % | 0.72 | % | 0.24 | % | 35 | % | ||||||||||||||||||||
| (0.05) | 12.25 | 25.60 | % | 511.5 | 0.73 | % | 0.45 | % | 0.73 | % | 0.45 | % | 78 | % | ||||||||||||||||||||
|
|
|
| ||||||||||||||||||||||||||||||||
| (0.88) | 16.35 | 9.28 | % | 145.1 | 0.47 | % | 0.89 | % | 0.47 | % | 0.89 | % | 13 | % | ||||||||||||||||||||
| (0.57) | 15.78 | 32.92 | % | 123.0 | 0.50 | % | 0.95 | % | 0.50 | % | 0.95 | % | 12 | % | ||||||||||||||||||||
| (1.31) | 12.36 | 17.38 | % | 85.1 | 0.53 | % | 1.11 | % | 0.53 | % | 1.11 | % | 8 | % | ||||||||||||||||||||
| (0.89) | 11.79 | (2.23 | )% | 78.1 | 0.53 | % | 0.72 | % | 0.53 | % | 0.72 | % | 16 | % | ||||||||||||||||||||
| (0.12) | 12.91 | 25.91 | % | 94.2 | 0.54 | % | 0.81 | % | 0.54 | % | 0.81 | % | 13 | % | ||||||||||||||||||||
| (b) | Total investment return assumes dividend reinvestment and does not reflect any deduction for applicable sales charges. Not annualized for periods less than one year. Total return shown does not reflect charges and expenses imposed on contract holders by the variable accounts. Those charges and expenses reduce the return received by contract holders as compared to the return presented. |
| ** | Computed on an annualized basis for periods less than one year |
The accompanying Notes to Financial Statements are an integral part of this statement.
389
Table of Contents
THRIVENT SERIES FUND, INC.
FINANCIAL HIGHLIGHTS –CONTINUED
| FOR A SHARE OUTSTANDING THROUGHOUT EACH PERIOD* | ||||||||||||||||||||||||
| Income From Investment Operations | Less Distributions From | |||||||||||||||||||||||
| Net Asset Value, Beginning of Period | Net Investment Income/(Loss) | Net Realized and Unrealized Gain/(Loss) on Investments(a) | Total from Investment Operations | Net Investment Income | Net Realized Gain on Investments | |||||||||||||||||||
PARTNER WORLDWIDE ALLOCATION PORTFOLIO | ||||||||||||||||||||||||
Year Ended 12/31/2014 | $ | 10.02 | $ | 0.22 | $ | (0.74 | ) | $ | (0.52 | ) | $ | (0.20 | ) | $ | — | |||||||||
Year Ended 12/31/2013 | 8.62 | 0.18 | 1.22 | 1.40 | — | — | ||||||||||||||||||
Year Ended 12/31/2012 | 7.39 | 0.12 | 1.26 | 1.38 | (0.12 | ) | (0.03 | ) | ||||||||||||||||
Year Ended 12/31/2011 | 8.77 | 0.19 | (1.26 | ) | (1.07 | ) | (0.17 | ) | (0.14 | ) | ||||||||||||||
Year Ended 12/31/2010 | 7.84 | 0.11 | 0.93 | 1.04 | (0.11 | ) | — | |||||||||||||||||
PARTNER ALL CAP PORTFOLIO | ||||||||||||||||||||||||
Year Ended 12/31/2014 | 12.71 | 0.06 | 1.49 | 1.55 | (0.08 | ) | — | |||||||||||||||||
Year Ended 12/31/2013 | 9.64 | 0.08 | 3.07 | 3.15 | (0.08 | ) | — | |||||||||||||||||
Year Ended 12/31/2012 | 8.44 | 0.08 | 1.16 | 1.24 | (0.04 | ) | — | |||||||||||||||||
Year Ended 12/31/2011 | 8.93 | 0.06 | (0.49 | ) | (0.43 | ) | (0.06 | ) | — | |||||||||||||||
Year Ended 12/31/2010 | 7.73 | 0.04 | 1.22 | 1.26 | (0.06 | ) | — | |||||||||||||||||
LARGE CAP GROWTH PORTFOLIO | ||||||||||||||||||||||||
Year Ended 12/31/2014 | 25.46 | 0.16 | 2.63 | 2.79 | (0.17 | ) | — | |||||||||||||||||
Year Ended 12/31/2013 | 18.81 | 0.15 | 6.64 | 6.79 | (0.14 | ) | — | |||||||||||||||||
Year Ended 12/31/2012 | 15.96 | 0.22 | 2.85 | 3.07 | (0.22 | ) | — | |||||||||||||||||
Year Ended 12/31/2011 | 16.98 | 0.10 | (1.02 | ) | (0.92 | ) | (0.10 | ) | — | |||||||||||||||
Year Ended 12/31/2010 | 15.40 | 0.09 | 1.58 | 1.67 | (0.09 | ) | — | |||||||||||||||||
PARTNER GROWTH STOCK PORTFOLIO | ||||||||||||||||||||||||
Year Ended 12/31/2014 | 18.79 | (0.03 | ) | 1.53 | 1.50 | — | (1.57 | ) | ||||||||||||||||
Year Ended 12/31/2013 | 13.54 | (0.04 | ) | 5.29 | 5.25 | — | — | |||||||||||||||||
Year Ended 12/31/2012 | 11.41 | — | 2.13 | 2.13 | — | — | ||||||||||||||||||
Year Ended 12/31/2011 | 11.58 | (0.03 | ) | (0.14 | ) | (0.17 | ) | — | — | |||||||||||||||
Year Ended 12/31/2010 | 9.93 | (0.02 | ) | 1.67 | 1.65 | — | — | |||||||||||||||||
LARGE CAP VALUE PORTFOLIO | ||||||||||||||||||||||||
Year Ended 12/31/2014 | 15.58 | 0.22 | 1.19 | 1.41 | (0.20 | ) | — | |||||||||||||||||
Year Ended 12/31/2013 | 12.00 | 0.20 | 3.59 | 3.79 | (0.21 | ) | — | |||||||||||||||||
Year Ended 12/31/2012 | 10.39 | 0.21 | 1.59 | 1.80 | (0.19 | ) | — | |||||||||||||||||
Year Ended 12/31/2011 | 10.73 | 0.18 | (0.52 | ) | (0.34 | ) | — | — | ||||||||||||||||
Year Ended 12/31/2010 | 9.65 | 0.14 | 1.08 | 1.22 | (0.14 | )�� | — | |||||||||||||||||
LARGE CAP STOCK PORTFOLIO | ||||||||||||||||||||||||
Year Ended 12/31/2014 | 11.81 | 0.15 | 0.48 | 0.63 | (0.11 | ) | — | |||||||||||||||||
Year Ended 12/31/2013 | 9.22 | 0.11 | 2.60 | 2.71 | (0.12 | ) | — | |||||||||||||||||
Year Ended 12/31/2012 | 8.11 | 0.12 | 1.08 | 1.20 | (0.09 | ) | — | |||||||||||||||||
Year Ended 12/31/2011 | 8.50 | 0.09 | (0.48 | ) | (0.39 | ) | — | — | ||||||||||||||||
Year Ended 12/31/2010 | 7.72 | 0.06 | 0.78 | 0.84 | (0.06 | ) | — | |||||||||||||||||
LARGE CAP INDEX PORTFOLIO | ||||||||||||||||||||||||
Year Ended 12/31/2014 | 25.80 | 0.44 | 2.96 | 3.40 | (0.39 | ) | (0.06 | ) | ||||||||||||||||
Year Ended 12/31/2013 | 20.11 | 0.40 | 5.91 | 6.31 | (0.39 | ) | (0.23 | ) | ||||||||||||||||
Year Ended 12/31/2012 | 17.71 | 0.40 | 2.33 | 2.73 | (0.33 | ) | — | |||||||||||||||||
Year Ended 12/31/2011 | 17.71 | 0.34 | (0.04 | ) | 0.30 | (0.30 | ) | — | ||||||||||||||||
Year Ended 12/31/2010 | 15.76 | 0.30 | 1.95 | 2.25 | (0.30 | ) | — | |||||||||||||||||
| (a) | The amount shown may not correlate with the change in aggregate gains and losses of portfolio securities due to the timing of sales and redemptions of portfolio shares. |
| * | All per share amounts have been rounded to the nearest cent. |
The accompanying Notes to Financial Statements are an integral part of this statement.
390
Table of Contents
THRIVENT SERIES FUND, INC.
FINANCIAL HIGHLIGHTS –CONTINUED
| RATIOS / SUPPLEMENTAL DATA | ||||||||||||||||||||||||||||||||||
| Ratio to Average Net Assets | ||||||||||||||||||||||||||||||||||
| Ratio to Average Net | Before Expenses Waived, | |||||||||||||||||||||||||||||||||
| Net Asset | Net Assets, End | Assets** | Credited or Paid Indirectly** | |||||||||||||||||||||||||||||||
| Total | Value, End of | Total | of Period | Net Investment | Net Investment | Portfolio | ||||||||||||||||||||||||||||
Distributions | Period | Return(b) | (in millions) | Expenses | Income/(Loss) | Expenses | Income/(Loss) | Turnover Rate | ||||||||||||||||||||||||||
| $ | (0.20) | $ | 9.30 | (5.35 | )% | $ | 1,607.3 | 0.91 | % | 2.24 | % | 0.91 | % | 2.24 | % | 78 | % | |||||||||||||||||
| — | 10.02 | 16.31 | % | 1,706.0 | 0.91 | % | 1.97 | % | 0.91 | % | 1.97 | % | 80 | % | ||||||||||||||||||||
| (0.15) | 8.62 | 18.67 | % | 1,520.3 | 0.95 | % | 2.10 | % | 0.95 | % | 2.10 | % | 93 | % | ||||||||||||||||||||
| (0.31) | 7.39 | (12.13 | )% | 495.6 | 0.99 | % | 2.25 | % | 0.99 | % | 2.25 | % | 64 | % | ||||||||||||||||||||
| (0.11) | 8.77 | 13.43 | % | 522.6 | 1.00 | % | 1.73 | % | 1.05 | % | 1.68 | % | 84 | % | ||||||||||||||||||||
| (0.08) | 14.18 | 12.26 | % | 69.5 | 0.95 | % | 0.48 | % | 1.18 | % | 0.25 | % | 105 | % | ||||||||||||||||||||
| (0.08) | 12.71 | 32.85 | % | 63.8 | 0.98 | % | 0.69 | % | 1.23 | % | 0.45 | % | 133 | % | ||||||||||||||||||||
| (0.04) | 9.64 | 14.74 | % | 51.5 | 1.04 | % | 0.81 | % | 1.24 | % | 0.61 | % | 116 | % | ||||||||||||||||||||
| (0.06) | 8.44 | (4.83 | )% | 51.4 | 1.03 | % | 0.56 | % | 1.23 | % | 0.36 | % | 124 | % | ||||||||||||||||||||
| (0.06) | 8.93 | 16.34 | % | 62.4 | 1.02 | % | 0.47 | % | 1.22 | % | 0.27 | % | 180 | % | ||||||||||||||||||||
| (0.17) | 28.08 | 10.99 | % | 1,004.5 | 0.44 | % | 0.54 | % | 0.44 | % | 0.54 | % | 43 | % | ||||||||||||||||||||
| (0.14) | 25.46 | 36.14 | % | 1,062.0 | 0.44 | % | 0.66 | % | 0.44 | % | 0.66 | % | 62 | % | ||||||||||||||||||||
| (0.22) | 18.81 | 19.18 | % | 859.9 | 0.45 | % | 1.16 | % | 0.45 | % | 1.16 | % | 87 | % | ||||||||||||||||||||
| (0.10) | 15.96 | (5.42 | )% | 805.3 | 0.44 | % | 0.55 | % | 0.44 | % | 0.55 | % | 216 | % | ||||||||||||||||||||
| (0.09) | 16.98 | 10.90 | % | 983.3 | 0.45 | % | 0.56 | % | 0.45 | % | 0.56 | % | 231 | % | ||||||||||||||||||||
| (1.57) | 18.72 | 8.51 | % | 81.7 | 0.91 | % | (0.18 | )% | 1.01 | % | (0.28 | )% | 38 | % | ||||||||||||||||||||
| — | 18.79 | 38.84 | % | 76.2 | 0.94 | % | (0.24 | )% | 1.04 | % | (0.34 | )% | 34 | % | ||||||||||||||||||||
| — | 13.54 | 18.66 | % | 58.0 | 0.96 | % | 0.02 | % | 1.06 | % | (0.08 | )% | 32 | % | ||||||||||||||||||||
| — | 11.41 | (1.49 | )% | 51.1 | 0.96 | % | (0.20 | )% | 1.06 | % | (0.30 | )% | 26 | % | ||||||||||||||||||||
| — | 11.58 | 16.62 | % | 61.4 | 0.95 | % | (0.19 | )% | 1.05 | % | (0.29 | )% | 36 | % | ||||||||||||||||||||
| (0.20) | 16.79 | 9.03 | % | 1,205.0 | 0.64 | % | 1.34 | % | 0.64 | % | 1.34 | % | 20 | % | ||||||||||||||||||||
| (0.21) | 15.58 | 31.82 | % | 1,119.2 | 0.64 | % | 1.42 | % | 0.64 | % | 1.42 | % | 32 | % | ||||||||||||||||||||
| (0.19) | 12.00 | 17.57 | % | 852.6 | 0.64 | % | 1.84 | % | 0.64 | % | 1.84 | % | 90 | % | ||||||||||||||||||||
| — | 10.39 | (3.08 | )% | 752.1 | 0.64 | % | 1.70 | % | 0.64 | % | 1.70 | % | 73 | % | ||||||||||||||||||||
| (0.14) | 10.73 | 12.61 | % | 811.3 | 0.65 | % | 1.39 | % | 0.65 | % | 1.39 | % | 109 | % | ||||||||||||||||||||
| (0.11) | 12.33 | 5.29 | % | 834.5 | 0.67 | % | 1.21 | % | 0.67 | % | 1.21 | % | 64 | % | ||||||||||||||||||||
| (0.12) | 11.81 | 29.60 | % | 811.9 | 0.67 | % | 1.02 | % | 0.67 | % | 1.02 | % | 73 | % | ||||||||||||||||||||
| (0.09) | 9.22 | 14.90 | % | 622.5 | 0.69 | % | 1.35 | % | 0.69 | % | 1.35 | % | 121 | % | ||||||||||||||||||||
| — | 8.11 | (4.58 | )% | 565.8 | 0.69 | % | 1.00 | % | 0.69 | % | 1.00 | % | 139 | % | ||||||||||||||||||||
| (0.06) | 8.50 | 10.82 | % | 628.3 | 0.69 | % | 0.74 | % | 0.69 | % | 0.74 | % | 181 | % | ||||||||||||||||||||
| (0.45) | 28.75 | 13.25 | % | 450.4 | 0.39 | % | 1.65 | % | 0.39 | % | 1.65 | % | 3 | % | ||||||||||||||||||||
| (0.62) | 25.80 | 31.81 | % | 392.6 | 0.40 | % | 1.71 | % | 0.40 | % | 1.71 | % | 4 | % | ||||||||||||||||||||
| (0.33) | 20.11 | 15.54 | % | 304.0 | 0.42 | % | 1.89 | % | 0.42 | % | 1.89 | % | 4 | % | ||||||||||||||||||||
| (0.30) | 17.71 | 1.71 | % | 291.3 | 0.42 | % | 1.67 | % | 0.42 | % | 1.67 | % | 4 | % | ||||||||||||||||||||
| (0.30) | 17.71 | 14.63 | % | 331.5 | 0.42 | % | 1.64 | % | 0.42 | % | 1.64 | % | 6 | % | ||||||||||||||||||||
| (b) | Total investment return assumes dividend reinvestment and does not reflect any deduction for applicable sales charges. Not annualized for periods less than one year. Total return shown does not reflect charges and expenses imposed on contract holders by the variable accounts. Those charges and expenses reduce the return received by contract holders as compared to the return presented. |
| ** | Computed on an annualized basis for periods less than one year |
The accompanying Notes to Financial Statements are an integral part of this statement.
391
Table of Contents
THRIVENT SERIES FUND, INC.
FINANCIAL HIGHLIGHTS –CONTINUED
| FOR A SHARE OUTSTANDING THROUGHOUT EACH PERIOD* | ||||||||||||||||||||||||
| Income From Investment Operations | Less Distributions From | |||||||||||||||||||||||
| Net Asset Value, Beginning of Period | Net Investment Income/(Loss) | Net Realized and Unrealized Gain/(Loss) on Investments(a) | Total from Investment Operations | Net Investment Income | Net Realized Gain on Investments | |||||||||||||||||||
HIGH YIELD PORTFOLIO | ||||||||||||||||||||||||
Year Ended 12/31/2014 | $ | 5.07 | $ | 0.30 | $ | (0.20 | ) | $ | 0.10 | $ | (0.30 | ) | $ | — | ||||||||||
Year Ended 12/31/2013 | 5.05 | 0.32 | 0.02 | 0.34 | (0.32 | ) | — | |||||||||||||||||
Year Ended 12/31/2012 | 4.66 | 0.35 | 0.39 | 0.74 | (0.35 | ) | — | |||||||||||||||||
Year Ended 12/31/2011 | 4.81 | 0.37 | (0.15 | ) | 0.22 | (0.37 | ) | — | ||||||||||||||||
Year Ended 12/31/2010 | 4.56 | 0.38 | 0.25 | 0.63 | (0.38 | ) | — | |||||||||||||||||
INCOME PORTFOLIO | ||||||||||||||||||||||||
Year Ended 12/31/2014 | 10.34 | 0.40 | 0.29 | 0.69 | (0.40 | ) | (0.13 | ) | ||||||||||||||||
Year Ended 12/31/2013 | 10.77 | 0.40 | (0.41 | ) | (0.01 | ) | (0.40 | ) | (0.02 | ) | ||||||||||||||
Year Ended 12/31/2012 | 10.09 | 0.40 | 0.68 | 1.08 | (0.40 | ) | — | |||||||||||||||||
Year Ended 12/31/2011 | 9.96 | 0.46 | 0.12 | 0.58 | (0.45 | ) | — | |||||||||||||||||
Year Ended 12/31/2010 | 9.39 | 0.49 | 0.57 | 1.06 | (0.49 | ) | — | |||||||||||||||||
BOND INDEX PORTFOLIO | ||||||||||||||||||||||||
Year Ended 12/31/2014 | 10.56 | 0.24 | 0.44 | 0.68 | (0.24 | ) | — | |||||||||||||||||
Year Ended 12/31/2013 | 11.39 | 0.21 | (0.48 | ) | (0.27 | ) | (0.21 | ) | (0.35 | ) | ||||||||||||||
Year Ended 12/31/2012 | 11.21 | 0.23 | 0.32 | 0.55 | (0.23 | ) | (0.14 | ) | ||||||||||||||||
Year Ended 12/31/2011 | 10.73 | 0.31 | 0.55 | 0.86 | (0.31 | ) | (0.07 | ) | ||||||||||||||||
Year Ended 12/31/2010 | 10.13 | 0.33 | 0.60 | 0.93 | (0.33 | ) | — | |||||||||||||||||
LIMITED MATURITY BOND PORTFOLIO | ||||||||||||||||||||||||
Year Ended 12/31/2014 | 9.82 | 0.17 | (0.01 | ) | 0.16 | (0.17 | ) | — | ||||||||||||||||
Year Ended 12/31/2013 | 9.92 | 0.15 | (0.10 | ) | 0.05 | (0.15 | ) | — | ||||||||||||||||
Year Ended 12/31/2012 | 9.67 | 0.17 | 0.24 | 0.41 | (0.16 | ) | — | |||||||||||||||||
Year Ended 12/31/2011 | 9.80 | 0.23 | (0.14 | ) | 0.09 | (0.22 | ) | — | ||||||||||||||||
Year Ended 12/31/2010 | 9.62 | 0.32 | 0.18 | 0.50 | (0.32 | ) | — | |||||||||||||||||
MONEY MARKET PORTFOLIO | ||||||||||||||||||||||||
Year Ended 12/31/2014 | 1.00 | — | — | — | — | — | ||||||||||||||||||
Year Ended 12/31/2013 | 1.00 | — | — | — | — | — | ||||||||||||||||||
Year Ended 12/31/2012 | 1.00 | — | — | — | — | — | ||||||||||||||||||
Year Ended 12/31/2011 | 1.00 | — | — | — | — | — | ||||||||||||||||||
Year Ended 12/31/2010 | 1.00 | — | — | — | — | — | ||||||||||||||||||
| (a) | The amount shown may not correlate with the change in aggregate gains and losses of portfolio securities due to the timing of sales and redemptions of portfolio shares. |
| * | All per share amounts have been rounded to the nearest cent. |
The accompanying Notes to Financial Statements are an integral part of this statement.
392
Table of Contents
THRIVENT SERIES FUND, INC.
FINANCIAL HIGHLIGHTS –CONTINUED
| RATIOS / SUPPLEMENTAL DATA | ||||||||||||||||||||||||||||||||||
| Ratio to Average Net Assets | ||||||||||||||||||||||||||||||||||
| Ratio to Average Net | Before Expenses Waived, | |||||||||||||||||||||||||||||||||
| Net Asset | Net Assets, End | Assets** | Credited or Paid Indirectly** | |||||||||||||||||||||||||||||||
| Total | Value, End of | Total | of Period | Net Investment | Net Investment | Portfolio | ||||||||||||||||||||||||||||
Distributions | Period | Return(b) | (in millions) | Expenses | Income/(Loss) | Expenses | Income/(Loss) | Turnover Rate | ||||||||||||||||||||||||||
| $ | (0.30 | ) | $ | 4.87 | 1.96 | % | $ | 855.8 | 0.44 | % | 5.86 | % | 0.44 | % | 5.86 | % | 42 | % | ||||||||||||||||
| (0.32 | ) | 5.07 | 6.91 | % | 921.9 | 0.44 | % | 6.31 | % | 0.44 | % | 6.31 | % | 53 | % | |||||||||||||||||||
| (0.35 | ) | 5.05 | 16.28 | % | 904.9 | 0.44 | % | 7.11 | % | 0.44 | % | 7.11 | % | 57 | % | |||||||||||||||||||
| (0.37 | ) | 4.66 | 4.71 | % | 778.5 | 0.45 | % | 7.81 | % | 0.45 | % | 7.81 | % | 58 | % | |||||||||||||||||||
| (0.38 | ) | 4.81 | 14.58 | % | 783.0 | 0.45 | % | 8.20 | % | 0.45 | % | 8.20 | % | 82 | % | |||||||||||||||||||
| (0.53 | ) | 10.50 | 6.68 | % | 1,392.3 | 0.44 | % | 3.77 | % | 0.44 | % | 3.77 | % | 87 | % | |||||||||||||||||||
| (0.42 | ) | 10.34 | (0.07 | )% | 1,417.6 | 0.44 | % | 3.78 | % | 0.44 | % | 3.78 | % | 115 | % | |||||||||||||||||||
| (0.40 | ) | 10.77 | 10.98 | % | 1,575.9 | 0.44 | % | 3.84 | % | 0.44 | % | 3.84 | % | 132 | % | |||||||||||||||||||
| (0.45 | ) | 10.09 | 5.96 | % | 1,463.1 | 0.44 | % | 4.53 | % | 0.44 | % | 4.53 | % | 142 | % | |||||||||||||||||||
| (0.49 | ) | 9.96 | 11.55 | % | 1,322.2 | 0.44 | % | 5.06 | % | 0.44 | % | 5.05 | % | 146 | % | |||||||||||||||||||
| (0.24 | ) | 11.00 | 6.52 | % | 150.0 | 0.47 | % | 2.22 | % | 0.47 | % | 2.22 | % | 407 | % | |||||||||||||||||||
| (0.56 | ) | 10.56 | (2.47 | )% | 152.0 | 0.46 | % | 1.94 | % | 0.46 | % | 1.94 | % | 384 | % | |||||||||||||||||||
| (0.37 | ) | 11.39 | 4.94 | % | 185.5 | 0.46 | % | 2.00 | % | 0.46 | % | 2.00 | % | 401 | % | |||||||||||||||||||
| (0.38 | ) | 11.21 | 8.23 | % | 164.5 | 0.46 | % | 2.83 | % | 0.46 | % | 2.83 | % | 415 | % | |||||||||||||||||||
| (0.33 | ) | 10.73 | 9.24 | % | 161.4 | 0.46 | % | 3.12 | % | 0.46 | % | 3.12 | % | 387 | % | |||||||||||||||||||
| (0.17 | ) | 9.81 | 1.68 | % | 1,018.3 | 0.44 | % | 1.75 | % | 0.44 | % | 1.75 | % | 102 | % | |||||||||||||||||||
| (0.15 | ) | 9.82 | 0.45 | % | 1,082.5 | 0.44 | % | 1.56 | % | 0.44 | % | 1.56 | % | 114 | % | |||||||||||||||||||
| (0.16 | ) | 9.92 | 4.32 | % | 1,200.0 | 0.43 | % | 1.72 | % | 0.44 | % | 1.71 | % | 107 | % | |||||||||||||||||||
| (0.22 | ) | 9.67 | 0.90 | % | 1,497.8 | 0.43 | % | 2.31 | % | 0.44 | % | 2.30 | % | 91 | % | |||||||||||||||||||
| (0.32 | ) | 9.80 | 5.25 | % | 1,318.7 | 0.43 | % | 3.27 | % | 0.44 | % | 3.27 | % | 102 | % | |||||||||||||||||||
| — | 1.00 | 0.00 | % | 126.4 | 0.18 | % | 0.00 | % | 0.53 | % | (0.35 | )% | N/A | |||||||||||||||||||||
| — | 1.00 | 0.00 | % | 146.6 | 0.22 | % | 0.00 | % | 0.52 | % | (0.30 | )% | N/A | |||||||||||||||||||||
| — | 1.00 | 0.00 | % | 148.3 | 0.29 | % | 0.00 | % | 0.51 | % | (0.23 | )% | N/A | |||||||||||||||||||||
| — | 1.00 | 0.00 | % | 170.5 | 0.30 | % | 0.00 | % | 0.51 | % | (0.21 | )% | N/A | |||||||||||||||||||||
| — | 1.00 | 0.00 | % | 171.8 | 0.31 | % | (0.01 | )% | 0.50 | % | (0.19 | )% | N/A | |||||||||||||||||||||
| (b) | Total investment return assumes dividend reinvestment and does not reflect any deduction for applicable sales charges. Not annualized for periods less than one year. Total return shown does not reflect charges and expenses imposed on contract holders by the variable accounts. Those charges and expenses reduce the return received by contract holders as compared to the return presented. |
| ** | Computed on an annualized basis for periods less than one year |
The accompanying Notes to Financial Statements are an integral part of this statement.
393
Table of Contents
(unaudited)
Proxy Voting
The policies and procedures that the Fund uses to determine how to vote proxies relating to portfolio securities are attached to the Fund’s Statement of Additional Information. You may request a free copy of the Statement of Additional Information by calling 1-800-847-4836. You also may review the Statement of Additional Information or the report of how the Fund voted proxies relating to portfolio securities during the most recent 12-month period ended June 30 at Thrivent.com or www.sec.gov.
Quarterly Schedule of Portfolio Holdings
The Fund files its Schedule of Portfolio Holdings on Form N-Q with the SEC for the first and third quarters of each fiscal year. You may request a free copy of the Fund’s Forms N-Q by calling 1-800-847-4836. The Fund’s most recent Form N-Q Schedule of Investments also is available at Thrivent.com or www.sec.gov. You also may review and copy the Forms N-Q for the Fund at the SEC’s Public Reference Room in Washington, DC. You may get information about the operation of the Public Reference Room by calling 1-800-SEC-0330.
Board Approval of Investment Advisory Agreement and Subadvisory Agreements
Both the Investment Company Act of 1940 (the “Investment Company Act”) and the terms of the Advisory and Subadvisory Agreements of the Thrivent Series Fund, Inc. (the “Fund”) require that these agreements be approved annually by the Board of Directors (the “Board”), including a majority of the Directors who are not “interested persons” of the Fund, as defined in the Investment Company Act (the “Independent Directors”). The nine-member Board consists of eight Independent Directors, including the Chairman.
At its meeting on October 28-29, 2014, the Board voted unanimously to renew the existing Advisory Agreement between the Fund and Thrivent Financial for Lutherans (the “Adviser”) for each series (each, a “Portfolio”) of the Fund. The Board also unanimously approved the Subadvisory Agreements for each of the Portfolios for which there is an investment subadviser (each a “Subadviser”). The Adviser and Subadvisers are referred to, collectively, as the “Advisory Organizations.” In connection with its evaluation of the agreements with the Advisory Organizations, the Board reviewed a broad range of information requested for this purpose and considered a variety of factors, including the following:
| 1. | The nature, extent, and quality of the services provided by the Advisory Organizations; |
| 2. | The performance of each Portfolio; |
| 3. | The advisory fee and net operating expense ratio of each Portfolio compared to a peer group; |
| 4. | The cost of services provided and profit realized by the Adviser; |
| 5. | The extent to which economies of scale may be realized as the Portfolios grow; |
| 6. | Whether fee levels reflect these economies of scale for the benefit of the Portfolios’ shareholders; |
| 7. | Other benefits realized by the Adviser and its affiliates from their relationship with the Fund; and |
| 8. | Any other factors that the Board deemed relevant to its consideration. |
In connection with the renewal process, the Contracts Committee of the Board (consisting of all of the Independent Directors) met on six occasions from February 25 to October 28, 2014 to consider information relevant to the renewal process. The Independent Directors also retained the services of Management Practice, Inc. (“MPI”) as an independent consultant to assist in the compilation, organization, and evaluation of relevant information. This information included Portfolio-by-Portfolio statistical comparisons of the advisory fees, other fees, net operating expenses and performance of each of the Portfolios in comparison to a peer group of comparable funds; portfolio turnover percentages; information with respect to services provided to the Portfolios and fees charged, including effective advisory fees that take into account breakpoints and fee waivers by the Adviser; asset and flow trends for the Portfolios; the cost of services and profit realized by the Adviser and its affiliates that provide services to the Portfolios; and information regarding the types of services furnished to the Portfolios. The Board received information from the investment management staff of the Adviser regarding the personnel providing services to the Portfolios, as well as changes in staff and systems and compliance enhancements. The Board also received periodic reports
394
Table of Contents
ADDITIONAL INFORMATION
(unaudited)
from the Adviser’s investment management staff with respect to the performance of the Portfolios. In addition to its review of the information presented to the Board during the contract renewal process, the Board also considered information obtained from management throughout the course of the year.
The Independent Directors were represented by independent counsel throughout the review process and during executive sessions without management present to consider reapproval of the agreements. Each Independent Director relied on his or her own business judgment in determining the weight to be given to each factor considered in evaluating the materials that were presented. The Contracts Committee’s and Board’s review and conclusions were based on a comprehensive consideration of all information presented to them and were not the result of any single controlling factor. In addition, each Director may have weighed individual factors differently. The key factors considered and the conclusions reached are described below.
Nature, Extent and Quality of Services
At each of the Board’s regular quarterly meetings, management presented information describing the services furnished to the Portfolios by the Adviser and, as appropriate, the Subadvisers. During these meetings, management reported on the investment management, portfolio trading and compliance services provided to the Portfolios under the Advisory and Subadvisory Agreements. During the renewal process, the Board considered the specific services provided under the Advisory Agreement. The Board also considered information relating to the investment experience and qualifications of the Adviser’s portfolio managers and those of the Subadvisers.
The Board received reports at each of its quarterly meetings from the Adviser’s Head of Equity Investments and Head of Fixed Income Funds, as supplemented by the Adviser’s Chief Investment Officer, who was also present at all of the meetings. At each quarterly meeting, the Head of Equity Investments and Head of Fixed Income Funds presented information about each of the Portfolios. These reports and presentations gave the Board the opportunity to evaluate the portfolio managers’ abilities and the quality of services they provide to the Portfolios. The Adviser also reviewed with the Board the services provided by the Subadvisers. Information was also presented to the Board describing the portfolio compliance functions performed by the Adviser. The Independent Directors also met in-person with and received quarterly reports from the Fund’s Chief Compliance Officer.
The Board considered the depth and quality of the Adviser’s oversight of the Subadvisers to the Fund. In addition, the Board noted the broad functions that the Adviser performed in support of the subadvised Portfolios, including, among other things, management of portfolio cash, subadviser expense management and payment and performance monitoring. The Board noted that investment management staff of the Adviser and the Fund’s Chief Compliance Officer conduct in-person oversight visits of each Subadviser, report the results of the visit to the Board and then follow through with additional inquiry on any questions or concerns that arise during the visit. The Board also noted that, as part of its oversight practice, the Adviser requires the Subadvisers to respond to a variety of compliance checklists and certifications to ensure their ongoing compliance with a subadvised Portfolio’s investment parameters. The Board noted that the Adviser requires the Subadvisers to complete an annual questionnaire addressing a range of compliance topics. In addition, the Board noted that the Adviser has dedicated personnel responsible for daily monitoring of the Subadvisers’ activities pertaining to the subadvised Portfolios.
The Board considered the adequacy of the Advisory Organizations’ resources used to provide services to the Fund pursuant to the Advisory and Subadvisory Agreements. The Adviser reviewed with the Board the Adviser’s process for overseeing the portfolio management teams of the Portfolios, and explained similarities and differences for how it oversees the Adviser’s teams and the teams of the Subadvisers. In addition, the Adviser explained how its investments in technology and personnel have benefitted the Portfolios and discussed continued investments in these resources. The Adviser also discussed how it has continued to strengthen its compliance program. The Adviser reviewed with the Board its process for selecting and overseeing the Subadvisers, including the results of on-site compliance due diligence visits. The Board viewed these actions as a positive factor in reapproving the existing Advisory Agreement, as they demonstrated the Adviser’s commitment to provide the Portfolios with quality service and competitive investment performance. The Board concluded that, within the context of its full deliberations, the nature, extent and quality of the investment advisory services provided to the Portfolios by the Adviser and Subadvisers supported renewal of the Advisory Agreement and Subadvisory Agreements.
395
Table of Contents
ADDITIONAL INFORMATION
(unaudited)
Performance of the Portfolios
In connection with each of its regular quarterly meetings, the Board received information on the performance of each Portfolio, including net performance, relative performance rankings within each Portfolio’s Lipper peer group, Morningstar ratings, and performance as compared to benchmark index returns. At each quarterly Board meeting, the Head of Equity Investments and Head of Fixed Income Funds reviewed with the Board the economic and market environment, risk management, and style consistency in connection with management of the Portfolios. The Board considered investment performance for each Portfolio, to the extent applicable, over the one-, two-, three-, five-, and ten-year periods. When evaluating investment performance, the Board considered longer-term performance and the trend of performance, and focused particularly upon the three-year performance record. Although the Board conducted its review on a Portfolio-by-Portfolio basis, it noted that, for the three-year period ended June 30, 2014, the average ranking of the Portfolios against their Lipper categories was 43% (on a scale of 1-99%, with 1% being the best).
The Board noted that certain Portfolios did not fit well within a Lipper peer group because of differences between the principal investment strategies of these Portfolios and funds included in their respective Lipper peer group. In such cases, the Adviser provided additional information regarding these Portfolios’ performance compared to a customized benchmark that the Adviser believed better represented the investment strategies of such Portfolios. The Board received from the Adviser additional information about certain Portfolios which had faced performance challenges, and how the Adviser was addressing such challenges. The Board concluded that the performance of each individual Portfolio was either satisfactory or that the Adviser had taken appropriate actions in an effort to improve performance.
Advisory Fees and Fund Expenses
The Board reviewed information prepared by MPI comparing each Portfolio’s advisory fee with the advisory fee of its peer group. The Board considered both the contractual and effective advisory fees for each of the Portfolios. The Board noted that the majority of the Portfolios’ advisory fees were at or below the medians of their peer groups, with many in the lower (i.e., less expensive) quartiles. Although the Board conducted its review on a Portfolio-by-Portfolio basis, it noted that the average ranking of the Portfolios was 40% (on a scale of 1-99%, with 1% being the lowest fee). The Board viewed favorably the Adviser’s proposal to continue or extend fee waivers for certain Portfolios and considered the effect of the waivers in lowering the Portfolios’ expenses. The Board also viewed favorably that the Adviser would reduce the advisory fee for three Portfolios effective January 1, 2015.
On the basis of its review, the Board concluded that the advisory fees charged to the Portfolios for investment management services were reasonable.
The Board also reviewed information prepared by MPI comparing each Portfolio’s overall expense ratio with the expense ratio of its peer group. Although the Board conducted its review on a Portfolio-by-Portfolio basis, it noted that approximately 91% of the Portfolios had net operating expenses at or below the median of their peer groups (i.e., in the two least expensive quartiles), with an average ranking of 26% (on a scale of 1-99%, with 1% being the lowest expenses).
Cost of Services and Profitability
The Board considered the Adviser’s estimates of its profitability, which included allocations by the Adviser of its costs in providing advisory services to the Portfolios. The internal audit department (i.e., Business Risk Management) of the Adviser conducted a review of such allocations and a department representative reported to the Board his views regarding the reasonableness and consistency of these allocations. The Board considered the profitability of the Adviser both overall and on a Portfolio-by-Portfolio basis. The Board also considered the expense reimbursements and waivers in effect. Based on its review of the data prepared by MPI and expense and profit information provided by the Adviser, the Board concluded that the profits earned by the Adviser from the Advisory Agreement were not excessive in light of the nature, extent and quality of services provided to the Portfolios.
With respect to fees paid to Subadvisers under the Subadvisory Agreements, the Board did not consider profitability information with respect to the Subadvisers, which are not affiliated with the Adviser. The Board considered that those contracts had been negotiated on an arm’s-length basis between the Adviser and each Subadviser, and that each Subadviser’s
396
Table of Contents
ADDITIONAL INFORMATION
(unaudited)
separate profitability from its relationship with the Portfolios was not a material factor in determining whether to renew the Subadvisory Agreement.
Economies of Scale and Breakpoints
The Board considered information regarding the extent to which economies of scale may be realized as a Portfolio’s assets increase and whether the fee levels reflect these economies of scale for the benefit of shareholders. The Adviser explained its general goal with respect to the employment of fee waivers, expense reimbursements and breakpoints. The Board considered information provided by the Adviser related to advisory fee rates, breakpoints in the advisory fee rates and fee waivers provided by the Adviser. The Board also considered management’s view that it is difficult to generalize as to whether, or to what extent, economies in the advisory function may be realized as a Portfolio’s assets increase. The Board noted that expected economies of scale, where they exist, may be shared through the use of fee breakpoints, fee waivers by the Adviser, and/or a lower overall fee rate. The Board viewed favorably that the Adviser would be implementing additional breakpoints for certain Portfolios effective January 1, 2015.
Other Benefits to the Adviser and its Affiliates
The Board considered information regarding potential “fall-out” or ancillary benefits that the Adviser and its affiliates may receive as a result of their relationship with the Fund, both tangible and intangible, such as their ability to leverage investment professionals who manage other portfolios, reputational benefits in the investment advisory community and the engagement of affiliates as service providers to the Portfolios. The Board noted that such benefits were difficult to quantify but were consistent with benefits received by other mutual fund advisers.
The Board also considered other potential benefits to the Adviser and its affiliates derived from its relationship with the Fund, including, among other things, research received by the Adviser generated from commission dollars spent on the Portfolios’ portfolio trading. The Board reviewed with the Adviser these arrangements and the reasonableness of the costs relative to the services performed. The Board considered the Adviser’s brokerage reports and representations that it evaluates any soft-dollar arrangements for compliance with applicable requirements, particularly with respect to the safe harbor contained in Section 28(e) of the Securities Exchange Act of 1934, and for compliance with the Adviser’s duty to seek best execution.
Based on the factors discussed above, the Contracts Committee unanimously recommended approval of the Advisory Agreement and the Subadvisory Agreements, and the Board, including all of the Independent Directors voting separately, approved each of the agreements.
397
Table of Contents
BOARDOF DIRECTORSAND OFFICERS
The following table provides information about the Directors and Officers of the Fund. Each Director oversees each of the 33 series of the Fund and also serves as:
| • | Trustee of Thrivent Mutual Funds, a registered investment company consisting of 26 funds that offer Class A and Institutional Class shares. |
| • | Trustee of Thrivent Cash Management Trust, a registered investment company consisting of one portfolio that serves as a cash collateral fund for a securities lending program sponsored by Thrivent Financial. |
The 33 series of the Fund, the 26 funds of Thrivent Mutual Funds and Thrivent Cash Management Trust are referred to herein as the “Fund Complex.” The Statement of Additional Information includes additional information about the Directors and is available, without charge, by calling 1-800-847-4836.
Interested Directors (1)(2)(3)(4)
Name (Year of Birth) Year Elected | Principal Occupation(s) and Directorships of Public Companies and Other Investment Companies During the Past Five Years | |
Russell W. Swansen (1957) 2008 | Senior Vice President and Chief Investment Officer, Thrivent Financial since 2003. | |
Independent Directors (2)(3)(4)(5) | ||
Name (Year of Birth) Year Elected | Principal Occupation(s) and Directorships of Public Companies and Other Investment Companies During the Past Five Years | |
Janice B. Case (1952) 2011 | Independent Trustee of North American Electric Reliability Corporation (self-regulatory organization) since 2008. | |
Richard L. Gady (1943) 1987 | Retired. | |
Richard A. Hauser (1943) 2004 | Vice President and Assistant General Counsel, The Boeing Company since 2007. | |
Marc S. Joseph (1960) 2011 (1960) | Managing Director of Granite Ridge LLP (consulting and advisory firm) since 2009; Managing Director of Triangle Crest (private investing and consulting firm) since 2004. | |
Paul R. Laubscher (1956) 2009 | Portfolio Manager for U.S. private real estate portfolios of IBM Retirement Funds. | |
James A. Nussle (1960) 2011 | President and Chief Executive Officer of Credit Union National Association since September 2014; President and Chief Operating Officer of Growth Energy (trade association) since 2010; Advisory Board member of AVISTA Capital Partners (private equity firm) since 2010; Contributor on CNBC (media) since 2010; CEO of The Nussle Group LLC (consulting firm) since 2009. | |
Douglas D. Sims (1946) 2006 | Currently, Director of Keystone Science School. Previously, Director of the Center for Corporate Excellence. | |
Constance L. Souders (1950) 2007 | Retired. | |
398
Table of Contents
Executive Officers (4)
Name (Year of Birth) | Principal Occupation(s) During the Past Five Years | |
| Russell W. Swansen (1957) President | Senior Vice President and Chief Investment Officer, Thrivent Financial since 2003. | |
David S. Royal (1971) Secretary and Chief Legal Officer | Vice President, Deputy General Counsel since 2006; Interim Investment Company and Investment Adviser Chief Compliance Officer from May 2010 until December 2010. | |
Gerard V. Vaillancourt (1967) Treasurer and Principal Accounting Officer | Vice President, Mutual Fund Accounting since 2006. | |
Ted S. Dryden (1965) Chief Compliance Officer | Investment Company and Investment Adviser Chief Compliance Officer, Thrivent Financial since December 2010; Chief Compliance Officer, OptumHealth Financial Services from 2009 to 2010; Vice President, Asset Management Compliance, Ameriprise Financial from 2006 to 2009. | |
Janice M. Guimond (1965) Vice President | Vice President, Investment Operations, Thrivent Financial since 2004. | |
Kathleen M. Koelling (1977) Anti-Money Laundering Officer (6) | Privacy and Anti-Money Laundering Officer, Thrivent Financial since 2011; Senior Counsel, Thrivent Financial since 2002. | |
Mark D. Anema (1961) Vice President | Vice President, New Product Management and Development, Thrivent Financial since 2007. | |
Karen L. Larson (1965) Assistant Vice President | Vice President, Member and Field Support Services, Thrivent Financial since 2010; Vice President, Thrivent Brokerage Managed Accounts from 2009 to 2010. | |
Michael W. Kremenak (1978) Assistant Secretary | Senior Counsel, Thrivent Financial since January 2013; Vice President and Assistant General Counsel at Nuveen Investments 2011 until 2013; Attorney at FAF Advisors 2009 to 2010; Associate at Skadden, Arps, Slate, Meagher & Flom 2005 to 2009. | |
James M. Odland (1955) Assistant Secretary | Vice President and Managing Counsel, Thrivent Financial since 2005. | |
Todd J. Kelly (1969) Assistant Treasurer (6) | Director, Fund Accounting Operations, Thrivent Financial since 2002. | |
Sarah L. Bergstrom (1977) Assistant Treasurer | Director, Fund Accounting Administration, Thrivent Financial since 2007. | |
| (1) | “Interested Director” of the Fund as defined in the Investment Company Act of 1940 by virtue of positions with Thrivent Financial. Mr. Swanson is considered an interested trustee because of his principal occupation with Thrivent Financial. |
| (2) | Each Director generally serves an indefinite term until her or his successor is duly elected and qualified. Directors serve at the discretion of the board until their successors are duly appointed and qualified. |
| (3) | Each Director oversees 60 portfolios. |
| (4) | The address for each Director and Officer unless otherwise noted is 625 Fourth Avenue South, Minneapolis, MN 55415 |
| (5) | The Directors other than Mr. Swansen are not “interested directors” of the Fund and are referred to as “independent Directors.” |
| (6) | The address for this Officer is 4321 North Ballard Road, Appleton, Wl 54913 |
399
Table of Contents
Thrivent Series Fund, Inc.
dated April 30, 2014
with respect to
Thrivent Partner Worldwide Allocation Portfolio
Effective immediately, DuPont Capital Management Corporation (“DuPont”) is no longer a subadviser to Thrivent Partner Worldwide Allocation Portfolio. As a result, all references in the prospectus to DuPont are hereby deleted.
The date of this Supplement is February 26, 2015.
Please include this Supplement with your Prospectus.
Thrivent Variable Life Account I
Thrivent Variable Insurance Account A
TLIC Variable Insurance Account A
Thrivent Variable Annuity Account I
Thrivent Variable Annuity Account II
Thrivent Variable Annuity Account A
Thrivent Variable Annuity Account B
TLIC Variable Annuity Account A
Supplement to Prospectuses dated April 30, 2014
Effective immediately, the prospectuses for Contracts offered above will be amended to reflect the removal of DuPont Capital Management Corporation (“DuPont”) as a subadviser to the Thrivent Partner Worldwide Allocation Portfolio. As a result, all references in the prospectus to DuPont are hereby deleted.
The date of this Supplement is February 26, 2015.
Please include this Supplement with your Prospectus.
400
Table of Contents
Table of Contents
Table of Contents
| Item 2. | Code of Ethics |
As of the end of the period covered by this report, registrant has adopted a code of ethics (as defined in Item 2 of Form N-CSR) applicable to registrant’s Principal Executive Officer, Principal Financial Officer, and Principal Accounting Officer. No waivers were granted to such code of ethics during the period covered by this report. A copy of this code of ethics is filed as an exhibit to this Form N-CSR.
| Item 3. | Audit Committee Financial Expert |
Registrant’s Board of Directors has determined that Constance L. Souders, an independent director, is the Audit Committee Financial Expert.
| Item 4. | Principal Accountant Fees and Services |
| (a) | Audit Fees |
The aggregate fees billed by registrant’s independent public accounts, PricewaterhouseCoopers LLP (“PwC”), for each of the last two complete fiscal years and the fiscal period covered by this report for professional services rendered in connection with the audit of registrant’s annual financial statements or services that are normally provided by the accountant in connection with statutory and regulatory filings or engagements were $524,100 for the year ended December 31, 2013 and $527,340 for the year ended December 31, 2014.
Table of Contents
| (b) | Audit-Related Fees |
The aggregate fees PwC billed to registrant for each of the last two fiscal years for assurance and other services which are reasonably related to the performance of registrant’s audit and are not reported under Item 4(a) were $15,968 for the fiscal year ended December 31, 2013 and $0 for the year ended December 31, 2014. The aggregate fees PwC billed to registrant’s investment adviser and any entity controlling, controlled by, or under common control with registrant’s investment adviser for assurance and other services directly related to the operations and financial reporting of registrant were $0 for the year ended December 31, 2013 and $0 for the year ended December 31, 2014.
| (c) | Tax Fees |
The aggregate tax fees PwC billed to registrant for each of the last two fiscal years for tax compliance, tax advice, and tax planning services were $175,974 for the year ended December 31, 2013 and $115,181 for the year ended December 31, 2014. The aggregate tax fees PwC billed to registrant’s investment adviser and any entity controlling, controlled by, or under common control with registrant’s investment adviser for services directly related to the operations and financial reporting of registrant were $0 for the year ended December 31, 2013 and $0 for the year ended December 31, 2014.
| (d) | All Other Fees |
The aggregate fees PwC billed to registrant for each of the last two fiscal years for products and services provided other than the services reported in paragraphs (a) through (c) of this item were $0 for the year ended December 31, 2013 and $0 for the year ended December 31, 2014. The aggregate fees PwC billed to registrant’s investment adviser and any entity controlling, controlled by, or under common control with registrant’s investment adviser for products and services provided other than the services reported in paragraphs (a) through (c) of this item were $6,450 for the year ended December 31, 2013 and $3,600 for the year ended December 31, 2014. These payments were for access to a PwC-sponsored online library that provides interpretive guidance regarding U.S. and foreign accounting standards. These figures are also reported in response to item 4(g) below.
| (e) | Registrant’s audit committee charter, adopted in February 2010, provides that the audit committee (comprised of the independent Directors of registrant) is responsible for pre-approval of all auditing services performed for the registrant. The audit committee also is responsible for pre-approval (subject to the de minimis exceptions for non-audit services described in Section 10A(i)(1)(B) of the Securities Exchange Act of 1934) of all non-auditing services performed for the registrant or an affiliate of registrant. In addition, registrant’s audit committee charter permits a designated member of the audit committee to pre-approve, between meetings, one or more audit or non-audit service projects, subject to an expense limit and notification to the audit committee at the next committee meeting. Registrant’s audit committee pre-approved all fees described above that PwC billed to registrant. |
| (f) | Less than 50% of the hours billed by PwC for auditing services to registrant for the fiscal year ended December 31, 2014, were for work performed by persons other than full-time permanent employees of PwC. |
| (g) | The aggregate non-audit fees billed by PwC to registrant and to registrant’s investment adviser and any entity controlling, controlled by, or under common control with registrant’s investment adviser for the fiscal years ending December 31, 2013 and December 31, 2014 were $6,450 and $3,600, respectively. These figures are also reported in response to item 4(d) above. |
Table of Contents
| (h) | Registrant’s audit committee has considered the non-audit services provided to the registrant and registrant’s investment adviser and any entity controlling, controlled by, or under common control with registrant’s investment adviser as described above and determined that these services do not compromise PwC’s independence. |
| Item 5. | Audit Committee of Listed Registrants |
Not applicable.
| Item 6. | Schedule of Investments |
| (a) | Registrant’s Schedule of Investments is included in the report to shareholders filed under Item 1. |
| (b) | Not applicable to this filing. |
| Item 7. | Disclosure of Proxy Voting Policies and Procedures for Closed-End Management Investment Companies |
Not applicable.
| Item 8. | Purchases of Equity Securities by Closed-End Management Investment Company and Affiliated Purchasers. |
Not applicable.
| Item 9. | Submission of Matters to a Vote of Security Holders |
There have been no material changes to the procedures by which shareholders may recommend nominees to registrant’s board of directors.
| Item 10. | Controls and Procedures |
(a)(i) Registrant’s President and Treasurer have concluded that registrant’s disclosure controls and procedures (as defined in Rule 30a-3(c) under the Investment Company Act) are effective, based on their evaluation of these controls and procedures as of a date within 90 days of the filing date of this report.
(a)(ii) Registrant’s President and Treasurer are aware of no change in registrant’s internal control over financial reporting (as defined in Rule 30a-3(d) under the Investment Company Act) that occurred during registrant’s most recent fiscal quarter that has materially affected, or is reasonably likely to materially affect, registrant’s internal control over financial reporting.
| Item 11. | Exhibits |
| (a) | The code of ethics pursuant to Item 2 is attached hereto. |
| (b) | Certifications pursuant to Rules 30a-2(a) and 30a-2(b) under the Investment Company Act of 1940 are attached hereto. |
Table of Contents
SIGNATURES
Pursuant to the requirements of the Securities Exchange Act of 1934 and the Investment Company Act of 1940, the registrant has duly caused this report to be signed on its behalf by the undersigned, thereunto duly authorized.
| Date: February 26, 2015 | THRIVENT SERIES FUND, INC. | |||
| By: | /s/ David S. Royal | |||
| David S. Royal | ||||
| President | ||||
Pursuant to the requirements of the Securities Exchange Act of 1934 and the Investment Company Act of 1940, this report has been signed below by the following persons on behalf of the registrant and in the capacities and on the dates indicated.
| Date: February 26, 2015 | By: | /s/ David S. Royal | ||
| David S. Royal | ||||
| President | ||||
| Date: February 26, 2015 | By: | /s/ Gerard V. Vaillancourt | ||
| Gerard V. Vaillancourt | ||||
| Treasurer | ||||