Table of Contents
UNITED STATES
SECURITIES AND EXCHANGE COMMISSION
Washington, D.C. 20549
FORM N-CSR
CERTIFIED SHAREHOLDER REPORT OF REGISTERED
MANAGEMENT INVESTMENT COMPANIES
Investment Company Act file number: 811-4603
Thrivent Series Fund, Inc.
(Exact name of registrant as specified in charter)
625 Fourth Avenue South
Minneapolis, Minnesota 55415
(Address of principal executive offices) (Zip code)
Michael W. Kremenak, Secretary and Chief Legal Officer
625 Fourth Avenue South
Minneapolis, Minnesota 55415
(Name and address of agent for service)
Registrant’s telephone number, including area code: (612) 844-4198
Date of fiscal year end: December 31
Date of reporting period: December 31, 2016
Table of Contents
| Item 1. | Report to Stockholders |
Table of Contents

Table of Contents
| 2 | ||||
| 3 | ||||
Portfolio Perspectives | ||||
| 4 | ||||
| 6 | ||||
| 8 | ||||
| 10 | ||||
| 12 | ||||
| 14 | ||||
| 16 | ||||
| 18 | ||||
| 20 | ||||
| 22 | ||||
| 24 | ||||
| 26 | ||||
| 28 | ||||
| 30 | ||||
| 32 | ||||
| 34 | ||||
| 36 | ||||
| 38 | ||||
| 40 | ||||
| 42 | ||||
| 44 | ||||
| 46 | ||||
| 48 | ||||
| 50 | ||||
| 52 | ||||
| 54 | ||||
| 56 | ||||
| 58 | ||||
| 61 | ||||
Summary Schedules of Investments/Schedules of Investments | ||||
| 62 | ||||
| 67 | ||||
| 74 | ||||
| 81 | ||||
| 88 | ||||
| 94 | ||||
| 100 | ||||
| 107 | ||||
| 113 | ||||
| 115 | ||||
| 118 | ||||
| 121 | ||||
| 124 | ||||
| 128 | ||||
| 131 | ||||
| 135 | ||||
| 146 | ||||
| 149 | ||||
| 152 | ||||
| 155 | ||||
| 157 | ||||
| 161 | ||||
| 165 | ||||
| 170 | ||||
| 176 | ||||
| 182 | ||||
| 189 | ||||
| 192 | ||||
| 198 | ||||
| 204 | ||||
| 214 | ||||
| 232 | ||||
| 240 | ||||
| 244 | ||||
Table of Contents
In the past, my letters have often focused on the performance and rankings of our Portfolios, but this time I thought it would be a good opportunity to give a more personal perspective of the work we do here at Thrivent Financial in managing the assets you have entrusted to us. That is not to say that I do not continue to be proud of the performance of our Portfolios. Our investment team of more than 100 investment professionals continues to work tirelessly to help you be wise with money and achieve your investment goals. I encourage you to take the time to read this annual report, including the discussion of the performance of each of the Portfolios by the individual portfolio managers.
Mentioning the hard work of our investment team brings to mind a phrase from “The Thrivent Way,” which is Thrivent’s statement of our mission and who we are as an organization. Every person in our organization is aligned around the principles embodied in The Thrivent Way, which permeates the work we do every day. You can find the full text of The Thrivent Way on Thrivent’s website at Thrivent.com/about-us/what-makes-us-different. The last line of The Thrivent Way states that we will “live balanced and generous lives.” I’ll admit that the first time I read a draft of that statement, I thought to myself, “Do people really want an investment manager who leads a balanced life? Or would they rather have a manager who lives a painfully unbalanced life in single-minded pursuit of investment returns?”
I am happy to say that in my experience, our investment professionals do as well as anyone in our organization at living The Thrivent Way, including leading balanced and generous lives. And I think that you, our members, may be better off because of it. At Thrivent, we don’t seek to make a quick buck by doing a lot of short-term trading. We are investors, not traders. If there’s one characteristic that defines our investment approach, I would say it is that we take a long-term view of the markets and of our performance. As an organization that’s been around for more than 100 years, the concept of taking a long-term approach is ingrained in our DNA.
A second characteristic of our investment approach is that we are disciplined. We won’t stray from the investment objectives of the products you invest in. You can count on us to manage your money the way we said we would. People who live balanced and generous lives are, in my opinion, better suited to take such a long-term, disciplined view and less likely to sacrifice long-term results or style consistency for short-term gains. And I believe that our approach has contributed to our investment results.
But living balanced and generous lives doesn’t mean we don’t work hard. Quite the opposite. I’ve worked with numerous money management firms over the course of my career and have never met investment professionals who were more diligent and dedicated than our team at Thrivent. That reminds me of a personal anecdote, if you’ll indulge me. Last summer I was driving home from work one day and the famous Harry Chapin song Cat’s in the Cradle came on. I heard a verse that made me think of my two boys:
My son turned 10 just the other day.
He said, “Thanks for the ball, Dad, come on let’s play.
Can you teach me to throw?” I said, “Not today,
I got a lot to do. “He said, “That’s OK.’”
Admittedly, I started to tear up a little thinking about how my boys would be grown before I knew it. And I naturally had a feeling come over me, wondering if I, too, sometimes prioritized work over family too often. But then it occurred to me—I had left work a little early that day to coach my son’s baseball practice. And he was, in fact, 10 years old. But this little story made me think about how living The Thrivent Way has helped me lead a balanced life for the benefit of my wife and children.
Living a balanced life also doesn’t mean never staying late at the office, never coming in early, or never working over the weekend. I honestly believe that the best work I’ve done for Thrivent in my nearly 11 years here has been done outside normal working hours, often at my home. It’s the new ideas you may not have the time to consider during the workday that you may wish to ponder on your own time. Or the transaction that just needs some extra effort to get across the finish line. And I believe it’s good for children to see a parent working hard, going to work early, or staying late into the evening from time to time. Being a good steward of God’s gifts means not only being wise with money, but working hard and doing our best to make the most of all of the talents that God has given us as individuals.
In many communications you receive from Thrivent, we will mention that our mission is to help people be wise with money and live generously. It’s not just a motto or a slogan; it’s a description of who we are. I had the privilege of observing some focus groups a couple months ago in which we asked folks about their investment needs, concerns and preferences. In one of the sessions, we asked a group of people who were unfamiliar with Thrivent whether they would be interested in working with an organization that had our investment capabilities and had a mission such as ours. One participant said, “I would love to, but I don’t believe such an organization could exist.” Well, here we are. And the more than 100 investment professionals at Thrivent Financial are working hard every day to help you meet your financial goals—and to do our best to see that all of us are able to be wise with money and live balanced and generous lives. That’s The Thrivent Way.
Sincerely,

David S. Royal
President
Thrivent Series Fund, Inc.
2
Table of Contents
During a historic year that culminated in the election of a new president, the stock market experienced strong performance, spurred by falling unemployment and a rebound in oil prices after a rocky start to the year.
Although the economy was still hampered by softness in the labor market and productivity growth, the Federal Reserve finally demonstrated enough confidence in it to raise interest rates in December by 0.25%, to the 0.50% to 0.75% range. It was the first Fed rate hike since December 2015.
Economic Review
Gross domestic product (GDP), which is the broadest measure of economic output, grew at a seasonally adjusted annual rate of 1.4% in the second quarter and 3.5% in the third quarter, according to the U.S. Commerce Department, although we believe the 3.5% third quarter rate is somewhat misleading. Net trade added 0.8%, but that was driven by a surge in soybean exports due to a drought in South America. In addition, an inventory build-up added 0.6%. Neither development is considered to be sustainable.
Unemployment reached a nine-year low of 4.6% in November, and closed the year at 4.7%, according to the U.S. Department of Labor. The economy has experienced 75 consecutive months of job growth through December, with a total of 2.2 million new nonfarm jobs added in 2016. However, the Labor Force Participation Rate for those in their prime working years (ages 25 to 54) remains at a low level of about 81.5%, which is about 1.5% below the pre-recession level.
After a summer swoon, retail sales were solid to close out the final months of 2016. Year-over-year, retail and food services sales were up 3.8% through November, according to the U.S. Commerce Department.
The other big economic story for 2016 was the improving oil market. After dropping to a low of $26.21 per barrel (West Texas Intermediate crude) on February 11, oil prices rebounded through the remainder of the year. Oil closed the year at $53.72 per barrel—a 45% increase for the year.
Market Review
The S&P 500 Index finished 2016 with a gain of 9.54% for the year, as it moved up from 2,043.94 to 2,238.83. The real annual return for the S&P, including dividends and distributions, was 11.96%. The Nasdaq also had a solid year, finishing 2016 at 5,383.12 after ending 2015 at 5,007.41—an increase of 7.50%.
Leading sectors of the S&P 500 for 2016 included energy, telecommunications and financials, which all gained more than 20% for the year, followed by industrials, materials, utilities, and information technology, all with double-digit gains. The only loser for 2016 was health care, which was down 2.7% for the year after a 4% drop in December. (S&P sector indexes reflect the composite performance of the stocks that comprise each of the 11 industrial sector groupings of the S&P 500 Index.)
International stocks remained sluggish as the tepid economy brought on by the Great Recession still lingered. For the year, the MSCI EAFE Index, which tracks developed markets in Europe, Australasia and the Far East, dropped 1.88%.
In the fixed-income market, higher risk assets continued their multi-year run of exceptional relative performance, with the lowest quality sector of the market, CCC-rated bonds, up nearly 30% on a total return basis. Longer-maturity U.S. Treasury bond prices soared more than 20% early in the year, only to give up those price gains near the end of the year. Interest rates in the U.S. market were among the lowest in history, with market rates on 10-year U.S. Treasuries sinking to a historical low of 1.32% in July. But rates rebounded in the second half, closing the year at 2.45%.
Our Outlook
While a strengthening U.S. dollar will make U.S. exporters less competitive abroad, we believe the U.S. stock market remains the best relative investment opportunity in the world for 2017. Asia continues to be relatively unattractive entering 2017; Europe, including the U.K., retains significant potential, even though it may be less resilient to political and international trade challenges.
In the fixed-income market, we expect interest rates to continue rising modestly. As in 2016, we expect the market will be bumpy in 2017. Thus, we recommend caution in terms of duration, with a preference for shorter-term maturities.
We continue to have modest expectations for the economy in 2017. The consensus estimate for real GDP growth in 2017 is 2.3%, according to Blue Chip Economic Indicators (based on a monthly survey of more than 50 leading economists). Our expectation for growth is slightly lower than the consensus. Although we are not projecting a recession in the near term, we believe the risk of recession in the next 12 months remains elevated.
As always, thank you for the trust you have placed in our entire team of professionals at Thrivent Financial.
Sincerely,

Russell W. Swansen
Chief Investment Officer
Thrivent Series Fund, Inc.
3
Table of Contents
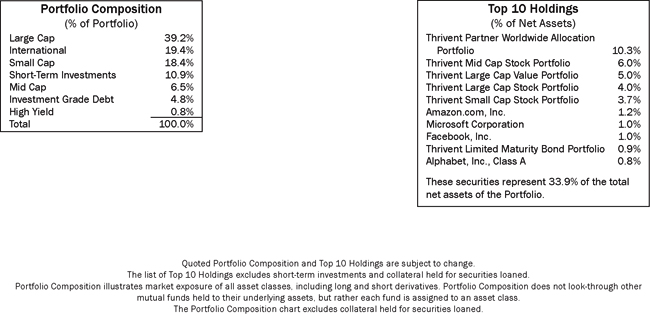
THRIVENT AGGRESSIVE ALLOCATION PORTFOLIO
Russell W. Swansen, David C. Francis, CFA, Mark L. Simenstad, CFA, Darren M. Bagwell, CFA, Stephen D. Lowe, CFA, Portfolio Co-Managers*
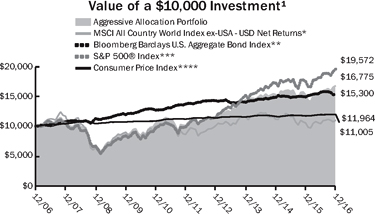
Thrivent Aggressive Allocation Portfolio seeks long-term capital growth.
The Portfolio invests in other Thrivent Portfolios and in directly-held equity and debt instruments. The Portfolio is subject to its own operating expenses and risks, as well as the operating expenses and risks of the other portfolios in which it invests. The value of the Portfolio is influenced by factors impacting the overall market, certain asset classes, certain investment styles, and specific issuers. The Portfolio may incur losses due to incorrect assessments of investments by its investment adviser. Foreign investments involve additional risks, including currency fluctuations, liquidity, political, economic and market instability, and different legal and accounting standards. Bond prices generally fall as interest rates rise. Credit risk is the risk that an issuer of a debt security may not pay its debt, and high yield securities are subject to increased credit risk as well as liquidity risk. The use of derivatives (such as futures and swaps) involves additional risks and transaction costs, which could leave the Portfolio in a worse position than if it had not used these instruments.
* Effective April 29, 2016, Darren M. Bagwell, CFA, and Stephen D. Lowe, CFA, were added as Portfolio Co-Managers
How did the Portfolio perform during the 12-month period ended December 31, 2016?
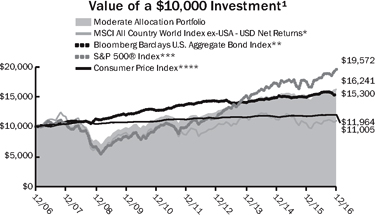
Thrivent Aggressive Allocation Portfolio earned a return of 10.11%, compared with the median return of its peer group, the Lipper Mixed-Asset Target Allocation Aggressive Growth category, of 7.96%. The Portfolio’s market benchmarks, the S&P 500 Index, the Bloomberg Barclays U.S. Aggregate Bond Index, and the MSCI All Country World Index ex-USA-USD Net Returns, earned returns of 11.96%, 2.65% and 4.50%, respectively.
What factors affected the Portfolio’s performance?
The primary factors impacting performance were the Portfolio’s equity and fixed-income allocations and security selection within the equity and bond portfolios. We positioned the Portfolio with a moderate underweighting to equity securities for much of the period, which modestly detracted from results given the late surge in equity prices. The Portfolio was also modestly overweighted in international securities versus our strategic targets within equities, which further limited returns. That being said, both of these shortfalls were more than offset by the strong performance of the Portfolio’s mid-and small-cap managers across all style allocations of value, core and growth. In large cap, our value allocation performed in line with its respective peers while our growth manager—following three prior strong years—fell behind the benchmark for the period.
Over the period, the Treasury yield curve flattened significantly, meaning that yields on shorter-term Treasuries rose while yields on Treasuries of five years and longer fell substantially. Rates on short-term securities rose because the Federal Reserve delivered a rate hike in December 2015, and the market began to price in another increase in late 2016, which eventually took place in December. Rates on longer-term securities declined due to concerns about slow economic growth and low inflation, along with increased foreign demand for higher-yielding U.S. securities from Europe and Japan, where yields dove into negative territory.
The fixed-income portion of the Portfolio outperformed in part because it was positioned with a long duration. This duration stance made the fixed-income portfolio more sensitive to interest rate changes, which helped as long-term rates declined. The Portfolio also benefited from the flattening in the Treasury yield curve. Additionally, the Portfolio was overweighted in Treasury Inflation Protected Securities (TIPS), which performed well on a relative basis as inflation expectations rose. TIPS are Treasury securities indexed to inflation to help provide investors with protection against higher inflation.
Derivatives—in the form of futures contracts traded on major exchanges—are used in both the equity and fixed-income segments of the Portfolio. The use of equity futures allowed us to tactically adjust our exposure to a segment while minimizing transaction costs. Fixed-income futures were used to adjust the Portfolio’s duration, or sensitivity to interest rate changes. Cash positions held in the Portfolio largely reflect—in conjunction with the stated futures holdings—the full notional or market values of the futures positions we own. They do not reflect a tactical allocation to cash.
What is your outlook?
Equity valuations are quite full, particularly with the late-year surge in equity prices, and fixed-income markets are generally being distorted by the actions of central bankers targeting low interest rates in hopes of stimulating economic growth and mitigating deflationary pressures. Central bank actions are appearing increasingly ineffective, while calls for fiscal stimulus and regulatory relief are becoming more prevalent as necessary policy actions to achieve the dual goals of accelerating economic growth and modest inflation. We continue to believe equity markets are already discounting success in achieving these goals, with the recently added assumption that the new administration’s policies will be more business friendly. Markets are not prepared for incremental ineffective policy actions; therefore, we remain modestly defensive. We anticipate the actions will ultimately be effective, but are mindful of the risks.
4
Table of Contents
Average Annual Total Returns1
As of December 31, 2016
1-Year | 5-Year | 10-Year | ||
10.11% | 10.62% | 5.30% |
Past performance is not an indication of future results. Total investment return and principal value will fluctuate and units, when redeemed, may be worth more or less than their original cost. Current performance may be higher or lower than the performance data quoted. Call 800-THRIVENT (847-4836) or visit thrivent.com for performance results current to the most recent month-end. The prospectus contains more complete information on the investment objectives, risks, charges and expenses of the investment company, which investors should read and consider carefully before investing. To obtain a prospectus, contact a registered representative or visit thrivent.com.
| 1 | Average annual total returns for the Portfolio represent past performance and reflect changes in share prices, the reinvestment of all dividends and capital gains, and the effects of compounding. Periods of less than one year are not annualized. At various times, the Portfolio’s adviser may have waived its management fee and/or reimbursed Portfolio expenses. If this were the case, the Portfolio’s return would have been lower. The returns shown do not reflect any charges or expenses imposed on contract holders by the variable accounts. Those charges and expenses reduce the returns received by contract holders as compared to the returns presented. Unless otherwise noted, the index results shown do not reflect deductions for fees, expenses, or taxes. Index results shown reflect reinvestment of dividends. It is not possible to invest directly in an index. |
| * | The MSCI All Country World Index ex-USA—USD Net Returns is an unmanaged market capitalization-weighted index that is to represent the per formance of developed and emerging stock markets throughout the world. The performance of the Index reflects dividends reinvested after the deduction of withholding taxes. |
| ** | The Bloomberg Barclays U.S. Aggregate Bond Index is an index that measures the performance of U.S. investment grade bonds. |
| *** | The S&P 500® Index is an index that represents the average performance of a group of 500 widely held, publicly traded stocks. “S&P 500” is a trademark of The McGraw-Hill Companies, Inc. and has been licensed for use by Thrivent Financial. The product is not sponsored, endorsed or promoted by Standard & Poor’s, and Standard & Poor’s makes no representation regarding the advisability of investing in the product. |
| **** | The Consumer Price Index is an inflationary indicator that measures the change in the cost of a fixed basket of products and services, including housing, electricity, food and transportation. |
5
Table of Contents
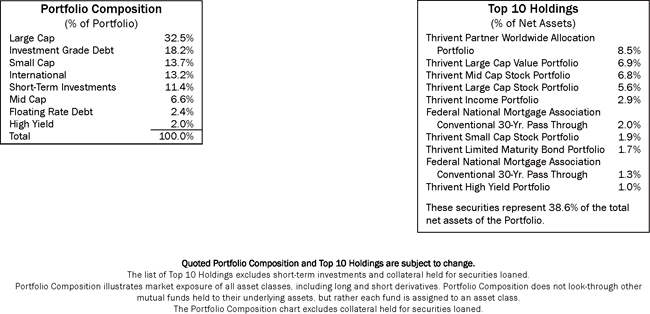
THRIVENT MODERATELY AGGRESSIVE ALLOCATION PORTFOLIO
Russell W. Swansen, David C. Francis, CFA, Mark L. Simenstad, CFA, Darren M. Bagwell, CFA, Stephen D. Lowe, CFA, Portfolio Co-Managers*
Thrivent Moderately Aggressive Allocation Portfolio seeks long-term capital growth.
The Portfolio invests in other Thrivent Portfolios and in directly-held equity and debt instruments. The Portfolio is subject to its own operating expenses and risks, as well as the operating expenses and risks of the other portfolios in which it invests. The value of the Portfolio is influenced by factors impacting the overall market, certain asset classes, certain investment styles, and specific issuers. The Portfolio may incur losses due to incorrect assessments of investments by its investment adviser. Foreign investments involve additional risks, including currency fluctuations, liquidity, political, economic and market instability, and different legal and accounting standards. Bond prices generally fall as interest rates rise. Credit risk is the risk that an issuer of a debt security may not pay its debt, and high yield securities are subject to increased credit risk as well as liquidity risk. The use of derivatives (such as futures and swaps) involves additional risks and transaction costs, which could leave the Portfolio in a worse position than if it had not used these instruments.
| * | Effective April 29, 2016, Darren M. Bagwell, CFA, and Stephen D. Lowe, CFA, were added as Portfolio Co-Managers |
How did the Portfolio perform during the 12-month period ended December 31, 2016?
Thrivent Moderately Aggressive Allocation Portfolio earned a return of 10.23%, compared with the median return of its peer group, the Lipper Mixed-Asset Target Allocation Growth category, of 7.15%. The Portfolio’s market benchmarks, the S&P 500 Index, the Bloomberg Barclays U.S. Aggregate Bond Index, and the MSCI All Country World Index ex-USA-USD Net Returns, earned returns of 11.96%, 2.65% and 4.50%, respectively.
What factors affected the Portfolio’s performance?
The primary factors impacting performance were the Portfolio’s equity and fixed-income allocations and security selection within the equity and bond portfolios. We positioned the Portfolio with a moderate underweighting to equity securities for much of the period, which modestly detracted from results given the late surge in equity prices. The Portfolio was also modestly overweighted in international securities versus our strategic targets within equities, which further limited returns. That being said, both of these shortfalls were more than offset by the strong performance of the Portfolio’s mid-and small-cap managers across all style allocations of value, core and growth. In large cap, our value allocation performed in line with its respective peers while our growth manager—following three prior strong years—fell behind the benchmark for the period.
Over the period, the Treasury yield curve flattened significantly, meaning that yields on shorter-term Treasuries rose while yields on Treasuries of five years and longer fell substantially. Rates on short-term securities rose because the Federal Reserve delivered a rate hike in December 2015, and the market began to price in another increase in late 2016, which eventually took place in December. Rates on longer-term securities declined due to concerns about slow economic growth and low inflation, along with increased foreign demand for higher-yielding U.S. securities from Europe and Japan, where yields dove into negative territory.
The fixed-income portion of the Portfolio outperformed in part because it was positioned with a long duration. This duration stance made the fixed-income portfolio more sensitive to interest rate changes, which helped as long-term rates declined. The Portfolio also benefited from the flattening in the Treasury yield curve. Additionally, the Portfolio was overweighted in corporate credit and underweighted in U.S. Treasury securities, which boosted results since corporate bonds significantly outperformed Treasuries. Within credit, our high-yield exposure underperformed relative to the benchmark’s high-yield holdings due to our higher-quality bias because the riskier segments of the sector posted stronger returns. This was offset by strong performance from the Portfolio’s investment-grade corporate bonds and leveraged loans.
Derivatives—in the form of futures contracts traded on major exchanges—are used in both the equity and fixed-income segments of the Portfolio. The use of equity futures allowed us to tactically adjust our exposure to a segment while minimizing transaction costs. Fixed-income futures were used to adjust the Portfolio’s duration, or sensitivity to interest rate changes. Cash positions held in the Portfolio largely reflect—in conjunction with the stated futures holdings—the full notional or market values of the futures positions we own. They do not reflect a tactical allocation to cash.
What is your outlook?
Equity valuations are quite full, particularly with the late-year surge in equity prices, and fixed-income markets are generally being distorted by the actions of central bankers targeting low interest rates in hopes of stimulating economic growth and mitigating deflationary pressures. Central bank actions are appearing increasingly ineffective, while calls for fiscal stimulus and regulatory relief are becoming more prevalent as necessary policy actions to achieve the dual goals of accelerating economic growth and modest inflation. We continue to believe equity markets are already discounting success in achieving these goals, with the recently added assumption that the new administration’s policies will be more business friendly. Markets are not prepared for incremental ineffective policy actions; therefore, we remain modestly defensive. We anticipate the actions will ultimately be effective, but are mindful of the risks.
6
Table of Contents
Average Annual Total Returns1
As of December 31, 2016
1-Year | 5-Year | 10-Year | ||
| 10.23% | 9.68% | 5.19% |

Past performance is not an indication of future results. Total investment return and principal value will fluctuate and units, when redeemed, may be worth more or less than their original cost. Current performance may be higher or lower than the performance data quoted. Call 800-THRIVENT (847-4836) or visit thrivent.com for performance results current to the most recent month-end. The prospectus contains more complete information on the investment objectives, risks, charges and expenses of the investment company, which investors should read and consider carefully before investing. To obtain a prospectus, contact a registered representative or visit thrivent.com.
| 1 | Average annual total returns for the Portfolio represent past performance and reflect changes in share prices, the reinvestment of all dividends and capital gains, and the effects of compounding. Periods of less than one year are not annualized. At various times, the Portfolio’s adviser may have waived its management fee and/or reimbursed Portfolio expenses. If this were the case, the Portfolio’s return would have been lower. The returns shown do not reflect any charges or expenses imposed on contract holders by the variable accounts. Those charges and expenses reduce the returns received by contract holders as compared to the returns presented. Unless otherwise noted, the index results shown do not reflect deductions for fees, expenses, or taxes. Index results shown reflect reinvestment of dividends. It is not possible to invest directly in an index. |
| * | The MSCI All Country World Index ex-USA—USD Net Returns is an unmanaged market capitalization-weighted index that is to represent the performance of developed and emerging stock markets throughout the world. The performance of the Index reflects dividends reinvested after the deduction of withholding taxes. |
| ** | The Bloomberg Barclays U.S. Aggregate Bond Index is an index that measures the performance of U.S. investment grade bonds. |
| *** | The S&P 500® Index is an index that represents the average performance of a group of 500 widely held, publicly traded stocks. It is not possible to invest directly in the Index. The performance of the Index does not reflect deductions for fees, expenses or taxes. “S&P 500” is a trademark of The McGraw-Hill Companies, Inc. and has been licensed for use by Thrivent Financial. The product is not sponsored, endorsed or promoted by Standard & Poor’s, and Standard & Poor’s makes no representation regarding the advisability of investing in the product. |
| **** | The Consumer Price Index is an inflationary indicator that measures the change in the cost of a fixed basket of products and services, including housing, electricity, food and transportation. |
7
Table of Contents
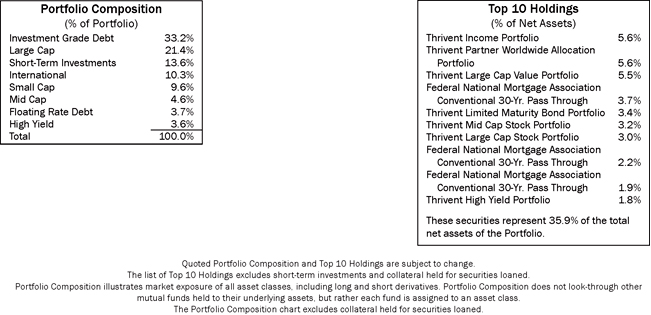
THRIVENT MODERATE ALLOCATION PORTFOLIO
Russell W. Swansen, David C. Francis, CFA, Mark L. Simenstad, CFA, Darren M. Bagwell, CFA, Stephen D. Lowe, CFA, Portfolio Co-Managers*
Thrivent Moderate Allocation Portfolio seeks long-term capital growth while providing reasonable stability of principal.
The Portfolio invests in other Thrivent Portfolios and in directly-held equity and debt instruments. The Portfolio is subject to its own operating expenses and risks, as well as the operating expenses and risks of the other portfolios in which it invests. The value of the Portfolio is influenced by factors impacting the overall market, certain asset classes, certain investment styles, and specific issuers. The Portfolio may incur losses due to incorrect assessments of investments by its investment adviser. Foreign investments involve additional risks, including currency fluctuations, liquidity, political, economic and market instability, and different legal and accounting standards. Bond prices generally fall as interest rates rise. Credit risk is the risk that an issuer of a debt security may not pay its debt, and high yield securities are subject to increased credit risk as well as liquidity risk. The use of derivatives (such as futures and swaps) involves additional risks and transaction costs, which could leave the Portfolio in a worse position than if it had not used these instruments.
| * | Effective April 29, 2016, Darren M. Bagwell, CFA, and Stephen D. Lowe, CFA, were added as Portfolio Co-Managers |
How did the Portfolio perform during the 12-month period ended December 31, 2016?
Thrivent Moderate Allocation Portfolio earned a return of 8.89%, compared with the median return of its peer group, the Lipper Mixed-Asset Target Allocation Moderate category, of 6.15%. The Portfolio’s market benchmarks, the S&P 500 Index, the Bloomberg Barclays U.S. Aggregate Bond Index, and the MSCI All Country World Index ex-USA-USD Net Returns, earned returns of 11.96%, 2.65%, and 4.50%, respectively.
What factors affected the Portfolio’s performance?
The primary factors impacting performance were the Portfolio’s equity and fixed-income allocations and security selection within the equity and bond portfolios. We positioned the Portfolio with a moderate underweighting to equity securities for much of the period, which modestly detracted from results given the late surge in equity prices. The Portfolio was also modestly overweighted in international securities versus our strategic targets within equities, which further limited returns. That being said, both of these shortfalls were more than offset by the strong performance of the Portfolio’s mid- and small-cap managers across all style allocations of value, core and growth. In large cap, our value allocation performed in line with its respective peers while our growth manager—following three prior strong years—fell behind the benchmark for the period.
Over the period, the Treasury yield curve flattened significantly, meaning that yields on shorter-term Treasuries rose while yields on Treasuries of five years and longer fell substantially. Rates on short-term securities rose because the Federal Reserve delivered a rate hike in December 2015, and the market began to price in another increase in late 2016, which eventually took place in December. Rates on longer-term securities declined due to concerns about slow economic growth and low inflation, along with increased foreign demand for higher-yielding U.S. securities from Europe and Japan, where yields dove into negative territory.
The fixed-income portion of the Portfolio outperformed in part because it was positioned with a long duration. This duration stance made the fixed-income portfolio more sensitive to interest rate changes, which helped as long-term rates declined. The Portfolio also benefited from the flattening in the Treasury yield curve. Additionally, the Portfolio was overweighted in corporate credit and underweighted in U.S. Treasury securities, which boosted results since corporate bonds significantly outperformed Treasuries. Within credit, our high-yield exposure underperformed relative to the benchmark’s high-yield holdings due to our higher-quality bias because the riskier segments of the sector posted stronger returns. This was offset by strong performance from the Portfolio’s investment-grade corporate bonds and leveraged loans.
Derivatives—in the form of futures contracts traded on major exchanges—are used in both the equity and fixed-income segments of the Portfolio. The use of equity futures allowed us to tactically adjust our exposure to a segment while minimizing transaction costs. Fixed-income futures were used to adjust the Portfolio’s duration, or sensitivity to interest rate changes. Cash positions held in the Portfolio largely reflect—in conjunction with the stated futures holdings—the full notional or market values of the futures positions we own. They do not reflect a tactical allocation to cash.
What is your outlook?
Equity valuations are quite full, particularly with the late-year surge in equity prices, and fixed-income markets are generally being distorted by the actions of central bankers targeting low interest rates in hopes of stimulating economic growth and mitigating deflationary pressures. Central bank actions are appearing increasingly ineffective, while calls for fiscal stimulus and regulatory relief are becoming more prevalent as necessary policy actions to achieve the dual goals of accelerating economic growth and modest inflation. We continue to believe equity markets are already discounting success in achieving these goals, with the recently added assumption that the new administration’s policies will be more business friendly. Markets are not prepared for incremental ineffective policy actions; therefore, we remain modestly defensive. We anticipate the actions will ultimately be effective, but are mindful of the risks.
8
Table of Contents
Average Annual Total Returns1
As of December 31, 2016
1-Year | 5-Year | 10-Year | ||
| 8.89% | 8.06% | 4.96% |
Past performance is not an indication of future results. Total investment return and principal value will fluctuate and units, when redeemed, may be worth more or less than their original cost. Current performance may be higher or lower than the performance data quoted. Call 800-THRIVENT (847-4836) or visit thrivent.com for performance results current to the most recent month-end. The prospectus contains more complete information on the investment objectives, risks, charges and expenses of the investment company, which investors should read and consider carefully before investing. To obtain a prospectus, contact a registered representative or visit thrivent.com.
| 1 | Average annual total returns for the Portfolio represent past performance and reflect changes in share prices, the reinvestment of all dividends and capital gains, and the effects of compounding. Periods of less than one year are not annualized. At various times, the Portfolio’s adviser may have waived its management fee and/or reimbursed Portfolio expenses. If this were the case, the Portfolio’s return would have been lower. The returns shown do not reflect any charges or expenses imposed on contract holders by the variable accounts. Those charges and expenses reduce the returns received by contract holders as compared to the returns presented. Unless otherwise noted, the index results shown do not reflect deductions for fees, expenses, or taxes. Index results shown reflect reinvestment of dividends. It is not possible to invest directly in an index. |
| * | The MSCI All Country World Index ex-USA—USD Net Returns is an unmanaged market capitalization-weighted index that is to represent the performance of developed and emerging stock markets throughout the world. The performance of the Index reflects dividends reinvested after the deduction of withholding taxes. |
| ** | The Bloomberg Barclays U.S. Aggregate Bond Index is an index that measures the performance of U.S. investment grade bonds. |
| *** | The S&P 500® Index is an index that represents the average performance of a group of 500 widely held, publicly traded stocks. It is not possible to invest directly in the Index. The performance of the Index does not reflect deductions for fees, expenses or taxes. “S&P 500” is a trademark of The McGraw-Hill Companies, Inc. and has been licensed for use by Thrivent Financial. The product is not sponsored, endorsed or promoted by Standard & Poor’s, and Standard & Poor’s makes no representation regarding the advisability of investing in the product. |
| **** | The Consumer Price Index is an inflationary indicator that measures the change in the cost of a fixed basket of products and services, including housing, electricity, food and transportation. |
9
Table of Contents
THRIVENT MODERATELY CONSERVATIVE ALLOCATION PORTFOLIO
Russell W. Swansen, David C. Francis, CFA, Mark L. Simenstad, CFA, Darren M. Bagwell, CFA, Stephen D. Lowe, CFA, Portfolio Co-Managers*
Thrivent Moderately Conservative Allocation Portfolio seeks long-term capital growth while providing reasonable stability of principal. The Portfolio invests in other Thrivent Portfolios and in directly-held equity and debt instruments. The Portfolio is subject to its own operating expenses and risks, as well as the operating expenses and risks of the other portfolios in which it invests. The value of the Portfolio is influenced by factors impacting the overall market, certain asset classes, certain investment styles, and specific issuers. The Portfolio may incur losses due to incorrect assessments of investments by its investment adviser. Foreign investments involve additional risks, including currency fluctuations, liquidity, political, economic and market instability, and different legal and accounting standards. Bond prices generally fall as interest rates rise. Credit risk is the risk that an issuer of a debt security may not pay its debt, and high yield securities are subject to increased credit risk as well as liquidity risk. The use of derivatives (such as futures and swaps) involves additional risks and transaction costs, which could leave the Portfolio in a worse position than if it had not used these instruments.
| * | Effective April 29, 2016, Darren M. Bagwell, CFA, and Stephen D. Lowe, CFA, were added as Portfolio Co-Managers |
How did the Portfolio perform during the 12-month period ended December 31, 2016?
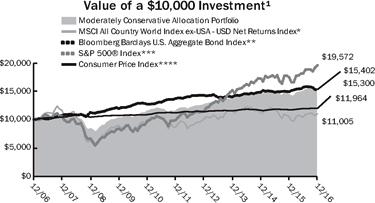
Thrivent Moderately Conservative Allocation Portfolio earned a return of 7.24%, compared with the median return of its peer group, the Lipper Mixed-Asset Target Allocation Conservative category, of 4.92%. The Portfolio’s market benchmarks, the S&P 500 Index, the Bloomberg Barclays U.S. Aggregate Bond Index, and the MSCI All Country World Index ex-USA-USD Net Returns, earned returns of 11.96%, 2.65%, and 4.50%, respectively.
What factors affected the Portfolio’s performance?
The primary factors impacting performance were the Portfolio’s equity and fixed-income allocations and security selection within the equity and bond portfolios. We positioned the Portfolio with a moderate underweighting to equity securities for much of the period, which modestly detracted from results given the late surge in equity prices. The Portfolio was also modestly overweighted in international securities versus our strategic targets within equities, which further limited returns. That being said, both of these shortfalls were more than offset by the strong performance of the Portfolio’s mid- and small- cap managers across all style allocations of value, core and growth. In large cap, our value allocation performed in line with its respective peers, while our growth manager—following three prior strong years—fell behind the benchmark for the period.
Over the period, the Treasury yield curve flattened significantly, meaning that yields on shorter-term Treasuries rose while yields on Treasuries of five years and longer fell substantially. Rates on short-term securities rose because the Federal Reserve delivered a rate hike in December 2015, and the market began to price in another increase in late 2016, which eventually took place in December. Rates on longer-term securities declined due to concerns about slow economic growth and low inflation, along with increased foreign demand for higher-yielding U.S. securities from Europe and Japan, where yields dove into negative territory.
The fixed-income portion of the Portfolio outperformed in part because it was positioned with a long duration. This duration stance made the fixed-income portfolio more sensitive to interest rate changes, which helped as long-term rates declined. The Portfolio also benefited from the flattening in the Treasury yield curve. Additionally, the Portfolio was overweighted in corporate credit and underweighted in U.S. Treasury securities, which boosted results since corporate bonds significantly outperformed Treasuries. Within credit, our high-yield exposure underperformed relative to the benchmark’s high-yield holdings due to our higher-quality bias because the riskier segments of the sector posted stronger returns. This was offset by strong performance from the Portfolio’s investment-grade corporate bonds and leveraged loans.
Derivatives—in the form of futures contracts traded on major exchanges—are used in both the equity and fixed-income segments of the Portfolio. The use of equity futures allowed us to tactically adjust our exposure to a segment while minimizing transaction costs. Fixed-income futures were used to adjust the Portfolio’s duration, or sensitivity to interest rate changes. Cash positions held in the Portfolio largely reflect—in conjunction with the stated futures holdings—the full notional or market values of the futures positions we own. They do not reflect a tactical allocation to cash.
What is your outlook?
Equity valuations are quite full, particularly with the late-year surge in equity prices, and fixed-income markets are generally being distorted by the actions of central bankers targeting low interest rates in hopes of stimulating economic growth and mitigating deflationary pressures. Central bank actions are appearing increasingly ineffective, while calls for fiscal stimulus and regulatory relief are becoming more prevalent as necessary policy actions to achieve the dual goals of accelerating economic growth and modest inflation. We continue to believe equity markets are already discounting success in achieving these goals, with the recently added assumption that the new administration’s policies will be more business friendly. Markets are not prepared for incremental ineffective policy actions; therefore, we remain modestly defensive. We anticipate the actions will ultimately be effective, but are mindful of the risks.
10
Table of Contents
Average Annual Total Returns1
As of December 31, 2016
1-Year | 5-Year | 10-Year | ||
7.24% | 6.07% | 4.41% |
Past performance is not an indication of future results. Total investment return and principal value will fluctuate and units, when redeemed, may be worth more or less than their original cost. Current performance may be higher or lower than the performance data quoted. Call 800-THRIVENT (847-4836) or visit thrivent.com for performance results current to the most recent month-end. The prospectus contains more complete information on the investment objectives, risks, charges and expenses of the investment company, which investors should read and consider carefully before investing. To obtain a prospectus, contact a registered representative or visit thrivent.com.
| 1 | Average annual total returns for the Portfolio represent past performance and reflect changes in share prices, the reinvestment of all dividends and capital gains, and the effects of compounding. Periods of less than one year are not annualized. At various times, the Portfolio’s adviser may have waived its management fee and/or reimbursed Portfolio expenses. If this were the case, the Portfolio’s return would have been lower. The returns shown do not reflect any charges or expenses imposed on contract holders by the variable accounts. Those charges and expenses reduce the returns received by contract holders as compared to the returns presented. Unless otherwise noted, the index results shown do not reflect deductions for fees, expenses, or taxes. Index results shown reflect reinvestment of dividends. It is not possible to invest directly in an index. |
| * | The MSCI All Country World Index ex-USA—USD Net Returns is an unmanaged market capitalization-weighted index that is to represent the performance of developed and emerging stock markets throughout the world. The performance of the Index reflects dividends reinvested after the deduction of withholding taxes. |
| ** | The Bloomberg Barclays U.S. Aggregate Bond Index is an index that measures the performance of U.S. investment grade bonds. |
| *** | The S&P 500® Index is an index that represents the average performance of a group of 500 widely held, publicly traded stocks. It is not possible to invest directly in the Index. The performance of the Index does not reflect deductions for fees, expenses or taxes. “S&P 500” is a trademark of The McGraw-Hill Companies, Inc. and has been licensed for use by Thrivent Financial. The product is not sponsored, endorsed or promoted by Standard & Poor’s, and Standard & Poor’s makes no representation regarding the advisability of investing in the product. |
| **** | The Consumer Price Index is an inflationary indicator that measures the change in the cost of a fixed basket of products and services, including housing, electricity, food and transportation. |
11
Table of Contents
THRIVENT GROWTHAND INCOME PLUS PORTFOLIO
Stephen D. Lowe, CFA, Mark L. Simenstad, CFA, John T. Groton, CFA, Noah J. Monsen, CFA, and Reginald L. Pfeifer, CFA, Portfolio Co-Managers
Thrivent Growth and Income Plus Portfolio seeks income plus long-term capital growth.
The Portfolio invests in debt securities and equity securities. The value of the Portfolio is influenced by factors impacting the overall market, certain asset classes, certain investment styles, and specific issuers. The Portfolio may incur losses due to incorrect assessments of investments by its investment adviser. Bond prices generally fall as interest rates rise. Credit risk is the risk that an issuer of a debt security may not pay its debt, and high yield securities are subject to increased credit risk as well as liquidity risk. Leveraged loans, REITs, preferred securities, sovereign debt, and mortgage-related and other asset-backed securities are subject to additional risks. Foreign investments involve additional risks, including currency fluctuations, liquidity, political, economic and market instability, and different legal and accounting standards; these risks are magnified for investments in emerging markets. An ETF is subject to additional fees and expenses, tracking error, and the risks of the underlying investments that it holds. The use of derivatives (such as futures and swaps) involves additional risks and transaction costs, which could leave the Portfolio in a worse position than if it had not used these instruments.
How did the Portfolio perform during the 12-month period ended December 31, 2016?
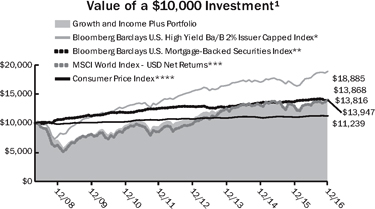
Thrivent Growth and Income Plus Portfolio earned a return of 6.63%, compared with the median return of its peer group, the Lipper Mixed-Asset Target Allocation Growth category, of 7.15%. The Portfolio’s market benchmarks, the MSCI World Index-USD Net Returns, the Bloomberg Barclays U.S. Mortgage-Backed Securities Index, and the Bloomberg Barclays U.S. High Yield Ba/B 2% Issuer Capped Index, returned 7.51%, 1.67% and 14.09%, respectively. The Portfolio’s fourth market benchmark, the U.S. High Yield Loan Index, was decommissioned by Bloomberg Barclays effective September 30, 2016.
What factors affected the Portfolio’s performance?
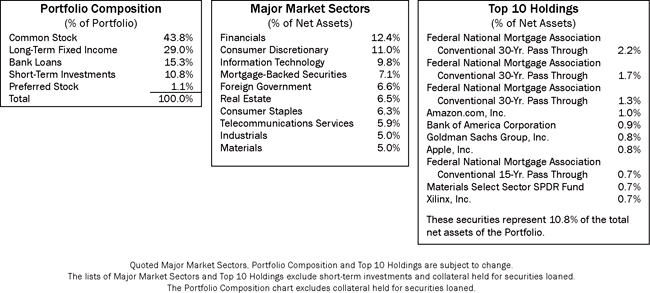
Stock and bond markets turned in solid results in 2016 as the economy accelerated, oil prices rebounded, unemployment fell to a nine-year low, and interest rates and inflation both remained modest. Those conditions proved especially fertile for small-company stocks and high-yield bonds, both of which typically do best when economic conditions are favorable. The Portfolio raised its allocation to equities to 66% by year-end from 62.7% at the start the year, with all the increase allocated to domestic equities. The remainder of the Portfolio was invested in fixed-income securities.
Within the equity sleeve, small-cap and mid-cap stocks substantially outperformed large-cap stocks. All three groups posted positive results but lagged benchmark returns. Energy stocks were among the top performers. Real estate investment trusts (REITs), telecommunication services shares and utilities stocks delivered strong absolute and relative performances, while health care and consumer discretionary stocks detracted from returns. International stock holdings posted a modestly negative return, with losses concentrated in the U.K. following its vote to exit the European Union.
In the fixed-income sleeve, alternative investments—a group that included closed-end funds, exchange-traded funds and preferred shares—turned in the best returns, earning about 26% before expenses. Securitized assets—mostly mortgage-backed securities—were the weakest performers but still earned about 4.5% before expenses.
The Portfolio underperformed its peer group largely by virtue of having a larger allocation to international equities, which dramatically underperformed domestic equities and the fixed-income market. Derivatives, in the form of futures contracts traded on major exchanges, were used in both the equity and fixed-income segments of the Portfolio. Equity futures were used to tactically adjust exposure to various market segments while minimizing transaction costs. Fixed-income futures were used to adjust duration, or sensitivity to interest rates, within the Portfolio’s fixed-income sleeve. The Portfolio had a cash position in excess of 5% of assets at various times due to large inflows that took some time to put to work. Cash levels were below 5% at year-end.
What is your outlook?
We anticipate the U.S. economy will continue to grow at a modest pace in 2017, with interest rates and inflation likely to rise modestly. To minimize the impact of rising rates on our fixed-income portfolio, we may shorten its duration. We are cautious on the outlook for fixed-income and do not anticipate returns matching those from 2016. In the equity markets, concerns about high valuations and the sustainability of corporate profit growth are being compounded by the political uncertainty associated with a new administration in Washington. Still, the administration’s pledges to invest in infrastructure, reduce or improve regulations, and simplify and overhaul the tax code could eventually benefit the economy. That could boost demand for energy, material, industrial and financial stocks.
The outlook for international equities is mixed, weighed down by what we expect will be flat-to-negative economic growth in Japan, slow growth in Europe, and slowing growth in China—all exacerbated by a strong U.S. dollar.
12
Table of Contents
Average Annual Total Returns1
As of December 31, 2016
1-Year | 5-Year | From Inception 4/30/2008 | ||
6.63% | 8.19% | 3.80% |
Past performance is not an indication of future results. Total investment return and principal value will fluctuate and units, when redeemed, may be worth more or less than their original cost. Current performance may be higher or lower than the performance data quoted. Call 800-THRIVENT (847-4836) or visit thrivent.com for performance results current to the most recent month-end. The prospectus contains more complete information on the investment objectives, risks, charges and expenses of the investment company, which investors should read and consider carefully before investing. To obtain a prospectus, contact a registered representative or visit thrivent.com.
| 1 | Average annual total returns for the Portfolio represent past performance and reflect changes in share prices, the reinvestment of all dividends and capital gains, and the effects of compounding. Periods of less than one year are not annualized. At various times, the Portfolio’s adviser may have waived its management fee and/or reimbursed Portfolio expenses. If this were the case, the Portfolio’s return would have been lower. The returns shown do not reflect any charges or expenses imposed on contract holders by the variable accounts. Those charges and expenses reduce the returns received by contract holders as compared to the returns presented. Unless otherwise noted, the index results shown do not reflect deductions for fees, expenses, or taxes. Index results shown reflect reinvestment of dividends. It is not possible to invest directly in an index. |
| * | The Bloomberg Barclays U.S. High Yield Ba/B 2% Issuer Capped Index covers the USD denominated, non-investment grade, Ba or B rated, fixed-rate, taxable corporate bond market. The index limits issuer exposures to a maximum 2%, redistributing excess market value index-wide on a pro-rata basis. |
| ** | The Bloomberg Barclays U.S. Mortgage-Backed Securities Index (MBS) is formed by grouping the universe of over 600,000 individual fixed-rate U.S. government agency MBS pools into approximately 3,500 generic types of securities. |
| *** | The MSCI World Index—USD Net Returns is an index that represents large and mid-cap stock performance across developed market countries throughout the world. The performance of the Index reflects dividends reinvested after the deduction of withholding taxes. |
| **** | The Consumer Price Index is an inflationary indicator that measures the change in the cost of a fixed basket of products and services, including housing, electricity, food and transportation. |
13
Table of Contents
THRIVENT BALANCED INCOME PLUS PORTFOLIO
John T. Groton, CFA, Stephen D. Lowe, CFA, Mark L. Simenstad, CFA, Noah J. Monsen, CFA, and Reginald L. Pfeifer, CFA, Portfolio Co-Managers
Thrivent Balanced Income Plus Portfolio seeks long-term total return through a balance between income and the potential for long-term capital growth.
The Portfolio invests in debt securities and equity securities. The value of the Portfolio is influenced by factors impacting the overall market, certain asset classes, certain investment styles, and specific issuers. The Portfolio may incur losses due to incorrect assessments of investments by its investment adviser. Bond prices generally fall as interest rates rise. Credit risk is the risk that an issuer of a debt security may not pay its debt, and high yield securities are subject to increased credit risk as well as liquidity risk. Leveraged loans, REITs, preferred securities, sovereign debt, and mortgage-related and other asset-backed securities are subject to additional risks. Foreign investments involve additional risks, including currency fluctuations, liquidity, political, economic and market instability, and different legal and accounting standards; these risks are magnified for investments in emerging markets. An ETF is subject to additional fees and expenses, tracking error, and the risks of the underlying investments that it holds. The use of derivatives (such as futures and swaps) involves additional risks and transaction costs, which could leave the Portfolio in a worse position than if it had not used these instruments.
How did the Portfolio perform during the 12-month period ended December 31, 2016?
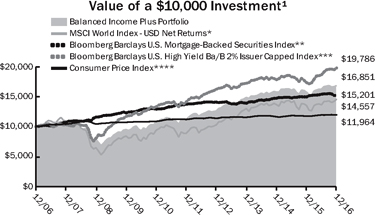
Thrivent Balanced Income Plus Portfolio earned a return of 7.06%, compared with the median return of its peer group, the Lipper Mixed-Asset Target Allocation Moderate category, of 6.15%. The Portfolio’s market benchmarks, the MSCI World Index-USD Net Returns, the Bloomberg Barclays U.S. Mortgage-Backed Securities Index, and the Bloomberg Barclays U.S. High Yield Ba/B 2% Issuer Capped Index, returned 7.51%, 1.67% and 14.09%, respectively. The Portfolio’s fourth market benchmark, the U.S. High Yield Loan Index, was decommissioned by Bloomberg Barclays effective September 30, 2016.
What factors affected the Portfolio’s performance?
Stock and bond markets turned in solid results in 2016 as the economy accelerated, oil prices rebounded, unemployment fell to a nine-year low, and interest rates and inflation both remained modest. Those conditions proved especially fertile for small-company stocks and high-yield bonds, which typically do best when economic conditions are favorable.
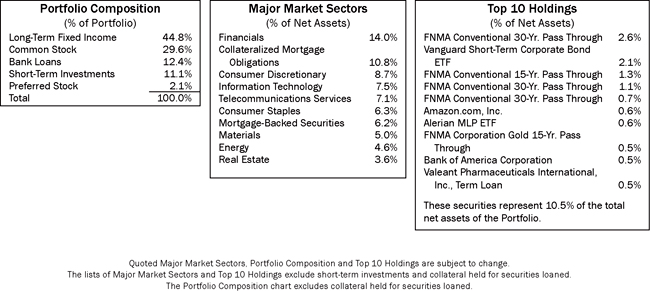
Throughout the course of the year, the Portfolio allocated about 46% of its holdings to equities and the remainder to fixed-income securities. Alternative investments, including closed-end funds, exchange-traded funds and preferred shares, turned in the best returns within the fixed-income sleeve, earning about 26% before expenses. High-yield bonds and leveraged loans earned about 11.2% and 10.4%, respectively. Securitized assets—mostly mortgage-backed securities—were the weakest fixed-income performers, but still earned about 4.5%.
Within the equity sleeve, small-cap and mid-cap stocks substantially outperformed large-cap stocks. All three groups posted positive results but lagged benchmark returns. Energy stocks were among the equity sleeve’s top performers. Real estate investment trusts, telecommunication services shares and utilities stocks delivered strong absolute and relative performances, while health care and consumer discretionary stocks detracted from returns. International stock holdings posted a modestly negative return, with losses concentrated in the U.K. following its vote to exit the European Union.
The Portfolio outperformed its peer group largely due to the strong performance of its fixed-income sleeve, which was overweighted toward “spread” products, including corporate bonds and alternatives, that delivered significantly higher returns than Treasuries.
Derivatives, in the form of futures contracts traded on major exchanges, were used in both the equity and fixed-income segments of the Portfolio. Equity futures were used to tactically adjust exposure to various market segments while minimizing transaction costs. Fixed-income futures were used to adjust duration, or sensitivity to interest rates, within the Portfolio’s fixed-income sleeve.
What is your outlook?
We anticipate the U.S. economy will continue to grow at a modest pace in 2017, with interest rates and inflation likely rising modestly. To minimize the impact of rising rates on our fixed-income portfolio, we may shorten its duration. Overall, we are cautious on the outlook for fixed-income, and do not anticipate returns matching those from 2016.
In the equity markets, concerns about high valuations and the sustainability of corporate profit growth are being compounded by the political uncertainty associated with a new administration taking office in Washington. Still, administration pledges to invest in infrastructure, reduce or improve regulations, and simplify and overhaul the tax code could eventually benefit the economy. That could boost demand for energy, material, industrial and financial stocks. The outlook for international equities is mixed, weighed down by what we expect will be flat-to-negative economic growth in Japan, slow growth in Europe, and slowing growth in China—all exacerbated by a strong U.S. dollar.
14
Table of Contents
Average Annual Total Returns1
As of December 31, 2016
1-Year | 5-Year | 10-Year | ||
| 7.06% | 8.49% | 5.35% |
Past performance is not an indication of future results. Total investment return and principal value will fluctuate and units, when redeemed, may be worth more or less than their original cost. Current performance may be higher or lower than the performance data quoted. Call 800-THRIVENT (847-4836) or visit thrivent.com for performance results current to the most recent month-end. The prospectus contains more complete information on the investment objectives, risks, charges and expenses of the investment company, which investors should read and consider carefully before investing. To obtain a prospectus, contact a registered representative or visit thrivent.com.
| 1 | Average annual total returns for the Portfolio represent past performance and reflect changes in share prices, the reinvestment of all dividends and capital gains, and the effects of compounding. Periods of less than one year are not annualized. At various times, the Portfolio’s adviser may have waived its management fee and/or reimbursed Portfolio expenses. If this were the case, the Portfolio’s return would have been lower. The returns shown do not reflect any charges or expenses imposed on contract holders by the variable accounts. Those charges and expenses reduce the returns received by contract holders as compared to the returns presented. Unless otherwise noted, the index results shown do not reflect deductions for fees, expenses, or taxes. Index results shown reflect reinvestment of dividends. It is not possible to invest directly in an index. |
| * | The MSCI World Index—USD Net Returns is an index that represents large and mid-cap stock performance across developed market countries throughout the world. The performance of the Index reflects dividends reinvested after the deduction of withholding taxes. |
| ** | The Bloomberg Barclays U.S. Mortgage-Backed Securities Index (MBS) is formed by grouping the universe of over 600,000 individual fixed-rate U.S. government agency MBS pools into approximately 3,500 generic types of securities. |
| *** | The Bloomberg Barclays U.S. High Yield Ba/B 2% Issuer Capped Index covers the USD denominated, non-investment grade, Ba or B rated, fixed-rate, taxable corporate bond market. The index limits issuer exposures to a maximum 2%, redistributing excess market value index-wide on a pro-rata basis. |
| **** | The Consumer Price Index is an inflationary indicator that measures the change in the cost of a fixed basket of products and services, including housing, electricity, food and transportation. |
15
Table of Contents
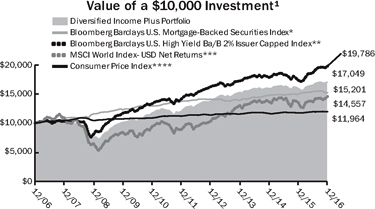
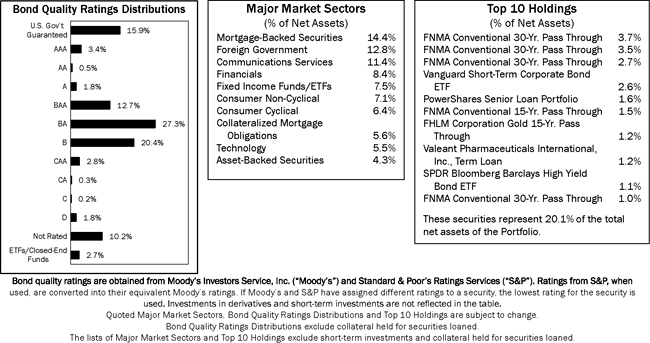
THRIVENT DIVERSIFIED INCOME PLUS PORTFOLIO
Mark L. Simenstad, CFA, Stephen D. Lowe, CFA, John T. Groton, CFA, Noah J. Monsen, CFA, and Reginald L. Pfeifer, CFA, Portfolio Co-Managers
Thrivent Diversified Income Plus Portfolio seeks to maximize income while maintaining prospects for capital appreciation.
The Portfolio invests in debt securities and equity securities. The value of the Portfolio is influenced by factors impacting the overall market, certain asset classes, certain investment styles, and specific issuers. The Portfolio may incur losses due to incorrect assessments of investments by its investment adviser. Bond prices generally fall as interest rates rise. Credit risk is the risk that an issuer of a debt security may not pay its debt, and high yield securities are subject to increased credit risk as well as liquidity risk. Leveraged loans, REITs, preferred securities, sovereign debt, and mortgage-related and other asset-backed securities are subject to additional risks. Foreign investments involve additional risks, including currency fluctuations, liquidity, political, economic and market instability, and different legal and accounting standards; these risks are magnified for investments in emerging markets. An ETF is subject to additional fees and expenses, tracking error, and the risks of the underlying investments that it holds. The use of derivatives (such as futures and swaps) involves additional risks and transaction costs, which could leave the Portfolio in a worse position than if it had not used these instruments.
How did the Portfolio perform during the 12-month period ended December 31, 2016?
Thrivent Diversified Income Plus Portfolio earned a return of 7.08%, compared with the median return of its peer group, the Lipper Mixed-Asset Target Allocation Conservative category, of 4.92%. The Portfolio’s market benchmarks, the MSCI World Index-USD Net Returns, the Bloomberg Barclays U.S. Mortgage-Backed Securities Index, and the Bloomberg Barclays U.S. High Yield Ba/B 2% Issuer Capped Index, returned 7.51%, 1.67% and 14.09%, respectively. The Portfolio’s fourth market benchmark, the U.S. High Yield Loan Index, was decommissioned by Bloomberg Barclays effective September 30, 2016.
What factors affected the Portfolio’s performance?
Stock and bond markets posted solid returns as the economy accelerated, oil prices rebounded, unemployment fell to a nine-year low, and interest rates and inflation remained modest. Those conditions proved especially fertile for small-company stocks and high-yield bonds, both of which tend to do best when economic conditions are improving.
The Portfolio allocated about 27% of its holdings to equities and the remainder to fixed-income securities. Alternative investments, including closed-end funds, exchange-traded funds and preferred shares, turned in the best returns within the fixed-income sleeve, earning about 14% before expenses. High-yield bonds and leveraged loans earned about 11.8% and 10.5%, respectively. Investment-grade corporate bonds were the Portfolio’s weakest performers, earning about 3%.
Within the equity sleeve, small-cap and mid-cap stocks substantially outperformed large-cap stocks. All three groups posted positive returns but lagged their respective indexes. Energy stocks were among the top performers. Yield-sensitive real estate investment trusts (REITs), telecommunication services and utilities stocks delivered strong absolute and relative performances, while health care and consumer discretionary stocks detracted from returns. International stocks posted a modestly negative return, with the biggest losses concentrated in the U.K. following that country’s vote to exit the European Union.
The Portfolio outperformed its peer group largely due to the strong performance of its fixed-income sleeve. Fixed-income holdings included an overweighted allocation to “spread” products, including corporate bonds and alternatives, which significantly outperformed Treasuries. Derivatives, in the form of futures contracts traded on major exchanges, were used in both the equity and fixed-income segments of the Portfolio. Equity futures were used to tactically adjust exposure to various market segments while minimizing transaction costs. Fixed-income futures were used to adjust duration, or sensitivity to interest rates, within the Portfolio’s fixed-income sleeve.
What is your outlook?
We anticipate the U.S. economy will continue to grow at a modest pace in 2017, with interest rates and inflation likely rising modestly as well. To minimize the negative impact of rising rates on the Portfolio’s fixed-income sleeve, we may shorten its overall duration. Overall, we are cautious on the outlook for fixed-income, and consider it unlikely to deliver gains in 2017 on the order of those we saw in 2016.
In the equity markets, concerns about high valuations and the sustainability of corporate profits are compounded by the political uncertainty associated with a new administration in Washington. Still, the administration’s pledges to invest in infrastructure, reduce or improve regulations, and simplify and overhaul the tax code could eventually benefit the economy. That could boost demand for energy, material, industrial and financial stocks. The outlook for international equities is mixed, owing largely to what we believe will be flat-to-negative economic growth in Japan, slow growth in Europe, and slowing growth in China—all exacerbated by a strong U.S. dollar.
16
Table of Contents
Average Annual Total Returns1
As of December 31, 2016
1-Year | 5-Year | 10-Year | ||
| 7.08% | 7.29% | 5.47% |
Past performance is not an indication of future results. Total investment return and principal value will fluctuate and units, when redeemed, may be worth more or less than their original cost. Current performance may be higher or lower than the performance data quoted. Call 800-THRIVENT (847-4836) or visit thrivent.com for performance results current to the most recent month-end. The prospectus contains more complete information on the investment objectives, risks, charges and expenses of the investment company, which investors should read and consider carefully before investing. To obtain a prospectus, contact a registered representative or visit thrivent.com.
| 1 | Average annual total returns for the Portfolio represent past performance and reflect changes in share prices, the reinvestment of all dividends and capital gains, and the effects of compounding. Periods of less than one year are not annualized. At various times, the Portfolio’s adviser may have waived its management fee and/or reimbursed Portfolio expenses. If this were the case, the Portfolio’s return would have been lower. The returns shown do not reflect any charges or expenses imposed on contract holders by the variable accounts. Those charges and expenses reduce the returns received by contract holders as compared to the returns presented. Unless otherwise noted, the index results shown do not reflect deductions for fees, expenses, or taxes. Index results shown reflect reinvestment of dividends. It is not possible to invest directly in an index. |
| * | The Bloomberg Barclays U.S. Mortgage-Backed Securities Index (MBS) is formed by grouping the universe of over 600,000 individual fixed-rate U.S. government agency MBS pools into approximately 3,500 generic types of securities. |
| ** | The Bloomberg Barclays U.S. High Yield Ba/B 2% Issuer Capped Index covers the USD denominated, non-investment grade, Ba or B rated, fixed-rate, taxable corporate bond market. The index limits issuer exposures to a maximum 2%, redistributing excess market value index-wide on a pro-rata basis. |
| *** | The MSCI World Index—USD Net Returns is an index that represents large and mid-cap stock performance across developed market countries throughout the world. The performance of the Index reflects dividends reinvested after the deduction of withholding taxes. |
| **** | The Consumer Price Index is an inflationary indicator that measures the change in the cost of a fixed basket of products and services, including housing, electricity, food and transportation. |
17
Table of Contents
THRIVENT OPPORTUNITY INCOME PLUS PORTFOLIO
Gregory R. Anderson, CFA, Michael G. Landreville, CFA and CPA (inactive) and Conrad E. Smith, CFA, Paul J. Ocenasek, CFA, and Kent L. White, CFA, Portfolio Co-Managers
Thrivent Opportunity Income Plus Portfolio seeks a combination of current income and long-term capital appreciation.
The Portfolio primarily invests in a broad range of debt securities. The value of the Portfolio is influenced by factors impacting the overall market, certain asset classes, certain investment styles, and specific issuers. The Portfolio may incur losses due to incorrect assessments of investments by its investment adviser. Bond prices generally fall as interest rates rise. Credit risk is the risk that an issuer of a debt security may not pay its debt, and high yield securities are subject to increased credit risk as well as liquidity risk. Leveraged loans, sovereign debt, and mortgage-related and other asset-backed securities are subject to additional risks. Foreign investments involve additional risks, including currency fluctuations, liquidity, political, economic and market instability, and different legal and accounting standards; these risks are magnified for investments in emerging markets. An ETF is subject to additional fees and expenses, tracking error, and the risks of the underlying investments that it holds. The use of derivatives (such as futures and swaps) involves additional risks and transaction costs, which could leave the Portfolio in a worse position than if it had not used these instruments.
How did the Portfolio perform during the 12-month period ended December 31, 2016?
Thrivent Opportunity Income Plus Portfolio generated a return of 6.38%, compared with the median return of its peer group, the Lipper General Bond category, of 6.04%. The Portfolio’s market benchmarks, the Bloomberg Barclays U.S. Mortgage-Backed Securities Index and the Bloomberg Barclays U.S. High Yield Ba/B 2% Issuer Capped Index, posted returns of 1.67% and 14.09%, respectively. The Portfolio’s third market benchmark, the U.S. High Yield Loan Index, was decommissioned by Bloomberg Barclays effective September 30, 2016.
What factors affected the Portfolio’s performance?
Bond prices marched higher in the first half of 2016—particularly in the U.S. Treasury sector—as weak economic growth convinced investors the Federal Reserve would likely hold off on plans to raise interest rates. At the same time, a rebound in oil prices pushed prices up for high-yield bonds, particularly those issued by energy companies. Market conditions began to shift over the summer, though, as the pace of economic growth accelerated, renewing the chances of an interest-rate hike and further improving the outlook for both high-yield and investment-grade corporate bonds.
During the second half of the year, Treasuries—which are highly rate-sensitive—gave back their first-half gains, while corporate bonds continued to do well. The Fed finally announced a quarter-percentage-point increase in its target for the federal funds rate in December, pushing it to a range of 0.50% to 0.75%. This mirrored a similar increase the Fed had implemented the previous December, which was the central bank’s first interest-rate hike in nine years.
Alternative investments, a group that includes closed-end funds, exchange-traded funds and preferred shares, turned in the Portfolio’s best returns, earning about 26% before expenses. High-yield bonds and leveraged loans earned about 11.2% and 10.4%, respectively. Securitized assets—mostly mortgage-backed securities—were the Portfolio’s weakest performers, but still earned about 4.5% before expenses.
The Portfolio outperformed its peer group largely because of its substantially higher allocation to leveraged loans (nearly a third of the Portfolio’s holdings), a generally heavier weighting in corporate bonds, and its allocation to alternatives.
The Portfolio used derivatives, in the form of fixed-income futures traded on major exchanges, to adjust the Portfolio’s duration, or sensitivity to interest rates. Interest-rate positioning—via cash and futures positions—proved modestly positive for Portfolio returns. The Portfolio also had a cash position in excess of 5% of assets at various times due to large inflows that took some time to put to work. Cash levels were below 5% at year-end.
What is your outlook?
We anticipate continued modest economic growth in 2017, with interest rates and inflation likely rising modestly as well. Corporate bonds, including high-yield bonds, appeared fairly priced at the start of the year. Valuations and prospects for nonagency mortgage-backed securities, floating-rate leveraged loans and preferred shares looked more favorable.
Many investors entered the new year optimistic that the policies of the incoming Donald Trump administration would be favorable for the economy, although details of those policies in many cases remained sketchy. That being said, the administration’s pledges to invest in infrastructure, reduce or improve regulations, and simplify and overhaul the tax code could eventually benefit the economy. We are cautious about the outlook for the fixed-income market given our expectation that interest rates should rise somewhat in 2017 and the fact that the yield spread between corporate and high-yield bonds is fairly tight after compressing considerably in 2016. Against this backdrop, it is unlikely the market will be able to deliver gains in 2017 on the magnitude of those we saw in 2016.
18
Table of Contents
Average Annual Total Returns1
As of December 31, 2016
1-Year | 5-Year | 10-Year | ||
| 6.38% | 2.84% | 4.28% |
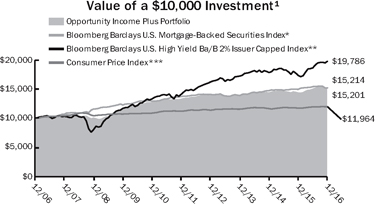
Past performance is not an indication of future results. Total investment return and principal value will fluctuate and units, when redeemed, may be worth more or less than their original cost. Current performance may be higher or lower than the performance data quoted. Call 800-THRIVENT (847-4836) or visit thrivent.com for performance results current to the most recent month-end. The prospectus contains more complete information on the investment objectives, risks, charges and expenses of the investment company, which investors should read and consider carefully before investing. To obtain a prospectus, contact a registered representative or visit thrivent.com.
| 1 | Average annual total returns for the Portfolio represent past performance and reflect changes in share prices, the reinvestment of all dividends and capital gains, and the effects of compounding. Periods of less than one year are not annualized. At various times, the Portfolio’s adviser may have waived its management fee and/or reimbursed Portfolio expenses. If this were the case, the Portfolio’s return would have been lower. The returns shown do not reflect any charges or expenses imposed on contract holders by the variable accounts. Those charges and expenses reduce the returns received by contract holders as compared to the returns presented. Unless otherwise noted, the index results shown do not reflect deductions for fees, expenses, or taxes. Index results shown reflect reinvestment of dividends. It is not possible to invest directly in an index. |
| * | The Bloomberg Barclays U.S. Mortgage-Backed Securities Index (MBS) is formed by grouping the universe of over 600,000 individual fixed-rate U.S. government agency MBS pools into approximately 3,500 generic types of securities. |
| ** | The Bloomberg Barclays U.S. High Yield Ba/B 2% Issuer Capped Index covers the USD denominated, non-investment grade, Ba or B rated, fixed-rate, taxable corporate bond market. The Index limits issuer exposures to a maximum 2%, redistributing excess market value index-wide on a pro-rata basis. |
| *** | The Consumer Price Index is an inflationary indicator that measures the change in the cost of a fixed basket of products and services, including housing, electricity, food and transportation. |
19
Table of Contents

How did the Portfolio perform during the 12-month period ended December 31, 2016?
Thrivent Partner Healthcare Portfolio earned a return of -16.01%, compared with the median return of its peer group, the Lipper Health/Biotechnology category, of -10.51%. The Portfolio’s market benchmark, the Morgan Stanley Capital International (MSCI) World Healthcare Index-USD Net Returns, earned a return of -6.81%.
What factors affected the Portfolio’s performance?
The key driver of the Portfolio’s underperformance for the year was its overweighted position in the biotechnology sector. After biotech stocks experienced a steep sell off in January and February 2016, we made a strategic decision to meaningfully overweight the sector, given the industry’s solid fundamentals and attractively low valuations. However, following this move, U.S. election concerns and a cyclical rally in the broader equity market served as significant headwinds to a biotech recovery. During 2016, the large-cap focused MSCI Biotechnology Index returned -12%, while the all-cap Nasdaq Biotechnology Index returned -21%.
In terms of individual holdings, the key detractors from the Portfolio’s performance included Ophthotech, which suffered a clinical setback with its eye drug Fovista, and Amicus Therapeutics and PTC Therapeutics, which experienced U.S. regulatory setbacks with their drugs, Migalastat and Translarna, respectively. Pharmaceutical stocks also modestly detracted largely because of the Portfolio’s lack of exposure to Johnson & Johnson.
On the other hand, the Portfolio benefited from an overweighted position in Merck and no exposure to Bristol-Myers Squibb, which reported negative clinical data with its immuno-oncology drug Opdivo for lung cancer to the benefit of competitor Merck. Medical technology stocks made a small positive contribution, including positions in product rollout stories such as NxStage Medical, Align Technology and Abiomed. The Portfolio also benefited from a position in St. Jude Medical after Abbott Laboratories announced its acquisition in April. While providers and services negatively impacted results, including positions in free-standing emergency room company Adeptus Health and behavioral health hospital Acadia Healthcare, telemedicine company Teladoc made a positive contribution. Returns also were aided by a position in cash because the position did not decline in value over the period.
What is your outlook?
Stocks in the health care sector are inexpensive based on a variety of measures. In the past 20 years, the health care sector’s valuation has fallen to a discount to the broad market on two occasions, and both times led to a period of health care outperformance. Our focus is on innovation and volume-driven growth. We believe we can best capitalize on innovation, both in terms of pricing inelasticity and health care system benefits, through mid- and small-cap biotechs and medtechs with revolutionary projects. The initial public offering (IPO) window of the past few years has dramatically increased this investment universe, while the sell off over the past 18 months has led to attractive valuations in many cases.
We are also interested in large-cap pharma and biotech stocks that are successfully executing on pipelines and topline growth, driven by volume, not pricing. Emerging markets continue to be an important theme for the global health care investor given the volume-driven benefits that result from health care’s position as a superior good. In contrast, we are cautious about large-cap medtechs, where valuations may be stretched and the likelihood of stagnation is significant. With limited exceptions, we fail to see how generics and specialty pharmas will turn around, despite the corrections in this segment.
20
Table of Contents
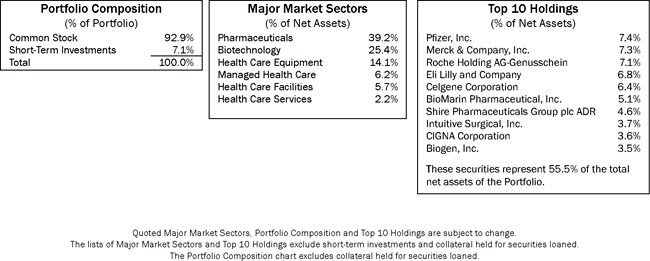
Average Annual Total Returns1
As of December 31, 2016
1-Year | 5-Year | From Inception | ||
| -16.01% | 11.52% | 8.60% |
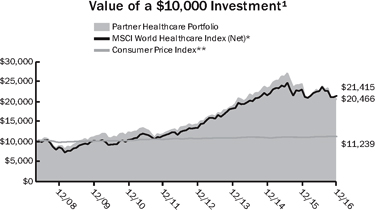
Past performance is not an indication of future results. Total investment return and principal value will fluctuate and units, when redeemed, may be worth more or less than their original cost. Current performance may be higher or lower than the performance data quoted. Call 800-THRIVENT (847-4836) or visit thrivent.com for performance results current to the most recent month-end. The prospectus contains more complete information on the investment objectives, risks, charges and expenses of the investment company, which investors should read and consider carefully before investing. To obtain a prospectus, contact a registered representative or visit thrivent.com.
| 1 | Average annual total returns for the Portfolio represent past performance and reflect changes in share prices, the reinvestment of all dividends and capital gains, and the effects of compounding. Periods of less than one year are not annualized. At various times, the Portfolio’s adviser may have waived its management fee and/or reimbursed Portfolio expenses. If this were the case, the Portfolio’s return would have been lower. The returns shown do not reflect any charges or expenses imposed on contract holders by the variable accounts. Those charges and expenses reduce the returns received by contract holders as compared to the returns presented. Unless otherwise noted, the index results shown do not reflect deductions for fees, expenses, or taxes. Index results shown reflect reinvestment of dividends. It is not possible to invest directly in an index. |
| * | The MSCI World Healthcare Index (Net) is a capitalization-weighted index of selected health care stocks from around the world. The index includes reinvestment of dividends, gross of foreign withholding taxes. The performance of the Index reflects dividends reinvested after the deduction of withholding taxes. |
| ** | The Consumer Price Index is an inflationary indicator that measures the change in the cost of a fixed basket of products and services, including housing, electricity, food and transportation. |
21
Table of Contents
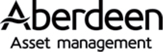
How did the Portfolio perform during the 12-month period ended December 31, 2016?
Thrivent Partner Emerging Markets Equity Portfolio earned a return of 11.58%, compared with the median return of its peer group, the Lipper Emerging Markets category, of 9.06%. The Portfolio’s market benchmark, the MSCI Emerging Markets Index-USD Net Returns, earned a return of 11.19%.
What factors affected the Portfolio’s performance?
The Portfolio’s outperformance was largely driven by positive stock selection. In Asia, the Portfolio’s underweighting to China contributed the most to performance, benefiting from the yuan weakness. The market also lagged the region based on concerns about high leverage in the banking sector and continued capital outflows, compelling the regulator to impose stricter rules on foreign currency purchases. Elsewhere, the Portfolio benefited from its underweighting to South Korea because its currency weakened following the vote to impeach the president. Indonesia’s Astra International added to relative performance, driven by robust car sales and new regulation to improve affordability. Against this, the Portfolio’s overweighting to the Philippines detracted, where market weakness reflected a persistent and deteriorating current account deficit as well as erosion of support for the peso. An underweighting to Taiwan, which outperformed the broader market, also hurt relative performance. Elsewhere, our large exposure to India detracted after the market sold off based on concerns about the impact of demonetization on the economy.
Latin America added to performance largely due to our overweighting to Brazil, where both the market and currency rallied. Sentiment was helped by the prospect of economic reform following the end of a lengthy impeachment process. Our holdings there, such as lender Banco Bradesco, shopping mall operator Multiplan and retailer Lojas Renner, contributed to relative outperformance. We also benefited from holding Argentinian steel pipe manufacturer Tenaris and Brazilian iron ore producer Vale, which rallied on improving sentiment toward commodity demand. Conversely, our overweighting to Mexico detracted after the stock market and the peso weakened because of negative sentiment regarding President-elect Donald Trump’s protectionist stance. This was further compounded by declines in Coca-Cola bottling franchise Femsa and lender Banorte due to concerns about their exposure to the domestic economy.
In Europe, the Middle East and Africa, Russia was the top-performing market, thanks to rising energy prices and a potential thawing of its relationship with the U.S. under the new administration. Lukoil in particular benefited from this. However, our overweighting to Turkey detracted after the lira continued to sell off due to political uncertainty and a credit-rating downgrade. Stock selection was also negative with BIM and Garanti underperforming the broader market.
The Portfolio was overweighted in the financial sector and stock selection was poor. The overweighted position was not a factor because the group performed well. However, our stock selections performed poorly relative to the group and were a meaningful detractor from performance.
What is your outlook?
Emerging markets posted decent gains in 2016 and outperformed developed markets, but the year ahead may prove to be difficult. With Donald Trump set to take office in January, his protectionist stance will be among the biggest concerns. His proposed tax cuts and fiscal stimulus could boost borrowing, forcing up interest rates. That would be positive for the dollar, but negative for emerging markets. That being said, most developing economies are in a better position to weather uncertainty than even a few years ago. Balance sheets are more robust, while they have also built up substantial reserves to counter currency weakness. Inflation is largely under control, giving central banks room to cut interest rates to support growth. Meanwhile, a recovery in oil prices should be a boon to commodity exporters. While uncertainties lie ahead, we are confident that our prudent approach will help us navigate these headwinds over the long run.
22
Table of Contents
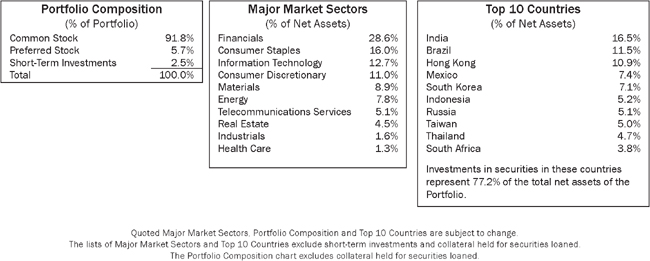
Average Annual Total Returns1
As of December 31, 2016
1-Year | 5-Year | From Inception | ||
| 11.58% | 1.92% | 2.42% |
Past performance is not an indication of future results. Total investment return and principal value will fluctuate and units, when redeemed, may be worth more or less than their original cost. Current performance may be higher or lower than the performance data quoted. Call 800-THRIVENT (847-4836) or visit thrivent.com for performance results current to the most recent month-end. The prospectus contains more complete information on the investment objectives, risks, charges and expenses of the investment company, which investors should read and consider carefully before investing. To obtain a prospectus, contact a registered representative or visit thrivent.com.
| 1 | Average annual total returns for the Portfolio represent past performance and reflect changes in share prices, the reinvestment of all dividends and capital gains, and the effects of compounding. Periods of less than one year are not annualized. At various times, the Portfolio’s adviser may have waived its management fee and/or reimbursed Portfolio expenses. If this were the case, the Portfolio’s return would have been lower. The returns shown do not reflect any charges or expenses imposed on contract holders by the variable accounts. Those charges and expenses reduce the returns received by contract holders as compared to the returns presented. Unless otherwise noted, the index results shown do not reflect deductions for fees, expenses, or taxes. Index results shown reflect reinvestment of dividends. It is not possible to invest directly in an index. |
| * | The MSCI Emerging Markets Index-USD Net Returns is a modified capitalization-weighted index of selected emerging economies from around the world. The performance of the Index reflects dividends reinvested after the deduction of withholding taxes. |
| ** | The Consumer Price Index is an inflationary indicator that measures the change in the cost of a fixed basket of products and services, including housing, electricity, food and transportation. |
23
Table of Contents
THRIVENT REAL ESTATE SECURITIES PORTFOLIO
Reginald L. Pfeifer, CFA, Portfolio Manager
Thrivent Real Estate Securities Portfolio seeks to provide long-term capital appreciation and high current income.
The Portfolio focuses on income-producing equity securities of U.S. real estate companies. Declines in real estate values, changes in interest rates or economic downturns can have a significant negative effect on companies in the real estate industry. REITs are subject to numerous risks and can be affected by interest rates, the values of the properties they own, and the credit quality of mortgage loans they hold. The value of the Portfolio is influenced by factors impacting the overall market, certain asset classes, certain investment styles, and specific issuers. The Portfolio may incur losses due to incorrect assessments of investments by its investment adviser.
How did the Portfolio perform during the 12-month period ended December 31, 2016?
Thrivent Real Estate Securities Portfolio earned a return of 7.50%, compared with the median return of its peer group, the Lipper U.S. Real Estate category, of 6.06%. The Portfolio’s market benchmark, the FTSE NAREIT All Equity REITs Index, earned a return of 8.63%.
What factors affected the Portfolio’s performance?
Real estate investment trust (REIT) stock performance was positive in 2016, supported by a modestly growing U.S. economy and continued low, though modestly rising interest rates. New construction occurred in certain property sectors including lodging, apartment and self-storage properties. However, this new supply was largely needed to meet strong demand in these property sectors, causing occupancy rates to remain generally stable. Rent growth accelerated in the industrial property sector due to strong demand, remained steady in retail properties, and decelerated (while still remaining positive) in the lodging, apartment and self-storage sectors. REITs performed well in this environment with steady earnings growth and stable dividend yields. During the second half of the year, REIT stock prices declined as a result of rising interest rates and the expectation that this trend will continue in 2017.
The Portfolio’s best-performing REIT property sectors were industrial, data centers and lodging. Property sectors that underperformed this year included self-storage and malls. The largest individual stock contributors to return included Digital Realty Trust (data centers), Prologis (industrial), Duke Realty Corporation (industrial) and Alexandria Real Estate Equities (office).
What is your outlook?
On August 31, 2016, the U.S. equity REIT sector was broken out from financials to become the 11th industry sector under the widely used Global Industry Classification Standard (GICS). As a result, REITs may begin to receive more attention from the generalist investment community, including portfolio managers who have historically avoided REITs. Fund flows to this sector were negative in 2016, and the outlook is cautious due to the expectation that interest rates will continue to rise. However, with the second half correction in 2016, REIT stocks enter 2017 at more attractive values. Multiple property sectors, including apartments, class-A malls and shopping centers, now trade at significant discounts to the underlying value of their existing assets. Fundamentals for commercial real estate are in equilibrium for most property types, with certain exceptions. Industrial properties are exhibiting strong demand due to the growth in eCommerce, and data centers show similar strength as a result of the growth in cloud storage and outsourcing of data storage. Sectors that are currently experiencing a moderation in rent growth due to new construction include lodging, apartments, self-storage and senior housing properties.
In 2017, we expect REIT earnings (funds-from-operations) growth will be 4% to 5%. Combined with their average dividend yield of 4%, we believe REIT stocks could generate an upper single-digit total return before expenses if valuations remain near current levels. Our strategy is to overweight best-in-class REITs that have high-quality real estate portfolios and experienced management teams. We continually search for attractive value in all REIT property sectors and adjust positions throughout the year in an attempt to maximize Portfolio performance and manage risk.
24
Table of Contents
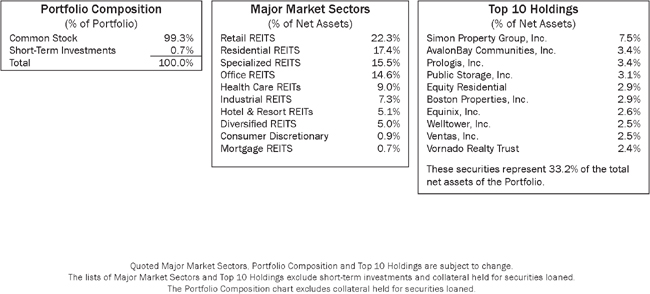
Average Annual Total Returns1
As of December 31, 2016
1-Year | 5-Year | 10-Year | ||
| 7.50% | 11.64% | 4.96% |
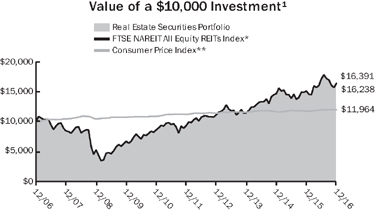
Past performance is not an indication of future results. Total investment return and principal value will fluctuate and units, when redeemed, may be worth more or less than their original cost. Current performance may be higher or lower than the performance data quoted. Call 800-THRIVENT (847-4836) or visit thrivent.com for performance results current to the most recent month-end. The prospectus contains more complete information on the investment objectives, risks, charges and expenses of the investment company, which investors should read and consider carefully before investing. To obtain a prospectus, contact a registered representative or visit thrivent.com.
| 1 | Average annual total returns for the Portfolio represent past performance and reflect changes in share prices, the reinvestment of all dividends and capital gains, and the effects of compounding. Periods of less than one year are not annualized. At various times, the Portfolio’s adviser may have waived its management fee and/or reimbursed Portfolio expenses. If this were the case, the Portfolio’s return would have been lower. The returns shown do not reflect any charges or expenses imposed on contract holders by the variable accounts. Those charges and expenses reduce the returns received by contract holders as compared to the returns presented. Unless otherwise noted, the index results shown do not reflect deductions for fees, expenses, or taxes. Index results shown reflect reinvestment of dividends. It is not possible to invest directly in an index. |
| * | The FTSE NAREIT All Equity REITs Index is an unmanaged capitalization-weighted index of all equity real estate investment trusts. |
| ** | The Consumer Price Index is an inflationary indicator that measures the change in the cost of a fixed basket of products and services, including housing, electricity, food and transportation. |
25
Table of Contents
THRIVENT SMALL CAP STOCK PORTFOLIO
Matthew D. Finn, CFA, Portfolio Manager and James M. Tinucci, CFA, Associate Portfolio Manager
Thrivent Small Cap Stock Portfolio seeks long-term capital growth.
The Portfolio primarily invests in securities of small companies. Smaller, less seasoned companies often have greater price volatility, lower trading volume, and less liquidity than larger, more established companies. The value of the Portfolio is influenced by factors impacting the overall market, certain asset classes, certain investment styles, and specific issuers. The Portfolio may incur losses due to incorrect assessments of investments by its investment adviser.
How did the Portfolio perform during the 12-month period ended December 31, 2016?
Thrivent Small Cap Stock Portfolio earned a return of 25.94%, compared with the median return of its peer group, the Lipper Small Cap Core category, of 20.97%. The Portfolio’s market benchmark, the Russell 2000® Index, earned a return of 21.31%.
What factors affected the Portfolio’s performance?
The Portfolio provided strong results relative to its benchmark and Lipper peer group driven by sector allocations and favorable stock selection. In terms of sector allocations, the Portfolio benefited from having its largest underweighting in the consumer discretionary sector, which was one of the worst-performing sectors during the year, and its largest overweighting in financial services, which was one of the best performers. Stock selection was strongest in the energy, health care and industrials sectors.
In energy, the Portfolio’s positions in three exploration and production companies focused in the Permian Basin—WPX Energy, Parsley Energy and Callon Petroleum—appreciated substantially during the period. After the price of oil declined to a point where the high-cost producers were losing money (as it did earlier in 2016), the seeds of recovery were planted for these companies. As demand for oil continued to grow and production declined, the market eventually rebalanced and oil prices started to recover. We sold Parsley Energy and Callon Petroleum during the period because their valuations discounted a lot of improvement. We reinvested the proceeds in other areas related to energy that we believe offer greater opportunity.
In health care, positions in Align Technology and Heska drove performance. Align Technology, the maker of the Invisaline system for treating the misalignment of teeth, has been a multi-year holding in the Portfolio. The company has a strong competitive position due to its patents and market share. While we sold some shares due to valuation concerns, we still hold a position due to the long-term secular growth opportunity for its business. Heska, the maker of diagnostic equipment for veterinarians, is a newer position in the Portfolio. The company is an insurgent in the market and is taking share from incumbents with its innovative new products. Heska’s business model is attractive because the company sells equipment that requires consumables, which the company locks in with long-term contracts.
In the industrial sector, many positions contributed to the strong stock selection, led by Waste Connections and Clarcor. Our position in Waste Connections resulted from its acquisition of Portfolio holding Progressive Waste Solutions in June. We reduced the position due to valuation, but continue to hold shares in the Portfolio. Our long-term holding in Clarcor, the producer of aftermarket filtration products primarily for engines, is being acquired by Parker Hannifin.
What is your outlook?
Investor sentiment about the economy fluctuates much more rapidly and with greater amplitude than actual changes in activity, which often results in sharp movements in stock prices. Our focus remains on finding solid companies that are attractively priced with long runways ahead of them for growth in sales, income and free cash flow. Short-term price changes are an opportunity for investors who are focused on the long term.
Since the election, we have reduced the Portfolio’s overweighted positions in the industrial and energy sectors. The Portfolio remains underweighted in the consumer discretionary, utilities and real estate investment trust (REIT) sectors.
While the U.S. economy is later in its cycle, many overseas trading partners are not. In addition, a number of industries are still depressed and have multi-year potential for improvement, such as agriculture, commodities and some areas of financial services. We will continue to look for opportunities in industries and companies that can grow regardless of the economic environment.
26
Table of Contents
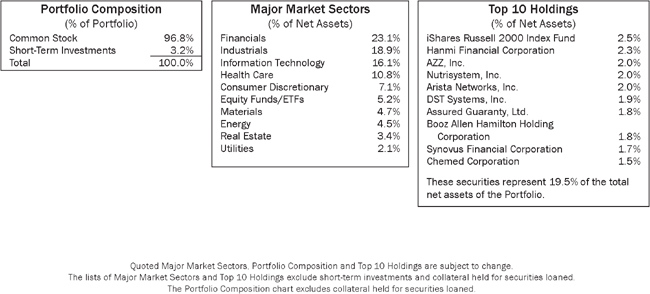
Average Annual Total Returns1
As of December 31, 2016
1-Year | 5-Year | 10-Year | ||
| 25.94% | 13.68% | 6.03% |
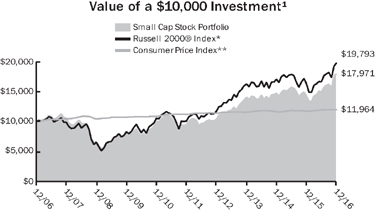
Past performance is not an indication of future results. Total investment return and principal value will fluctuate and units, when redeemed, may be worth more or less than their original cost. Current performance may be higher or lower than the performance data quoted. Call 800-THRIVENT (847-4836) or visit thrivent.com for performance results current to the most recent month-end. The prospectus contains more complete information on the investment objectives, risks, charges and expenses of the investment company, which investors should read and consider carefully before investing. To obtain a prospectus, contact a registered representative or visit thrivent.com.
| 1 | Average annual total returns for the Portfolio represent past performance and reflect changes in share prices, the reinvestment of all dividends and capital gains, and the effects of compounding. Periods of less than one year are not annualized. At various times, the Portfolio’s adviser may have waived its management fee and/or reimbursed Portfolio expenses. If this were the case, the Portfolio’s return would have been lower. The returns shown do not reflect any charges or expenses imposed on contract holders by the variable accounts. Those charges and expenses reduce the returns received by contract holders as compared to the returns presented. Unless otherwise noted, the index results shown do not reflect deductions for fees, expenses, or taxes. Index results shown reflect reinvestment of dividends. It is not possible to invest directly in an index. |
| * | The Russell 2000® Index measures the performance of small cap stocks. |
| ** | The Consumer Price Index is an inflationary indicator that measures the change in the cost of a fixed basket of products and services, including housing, electricity, food and transportation. |
27
Table of Contents
THRIVENT SMALL CAP INDEX PORTFOLIO
Kevin R. Brimmer, FSA, Portfolio Manager
Thrivent Small Cap Index Portfolio seeks capital growth that tracks the performance of the S&P SmallCap 600 Index.
The Portfolio primarily invests in small company common stocks. Smaller, less seasoned companies often have greater price volatility, lower trading volume, and less liquidity than larger, more established companies. The value of the Portfolio is influenced by factors impacting the overall market, certain asset classes, certain investment styles, and specific issuers.
How did the Portfolio perform during the 12-month period ended December 31, 2016?
Thrivent Small Cap Index Portfolio earned a return of 26.12%, compared with the median return of its peer group, the Lipper Small Cap Core category, of 20.97%. The Portfolio’s market benchmark, the S&P SmallCap 600 Index, earned a return of 26.56%.
What factors affected the Portfolio’s performance?
The Portfolio’s holdings are aligned with those of the S&P SmallCap 600 Index. As typically occurs in an index portfolio, the difference in performance between the benchmark index and the Portfolio itself can largely be attributed to expenses and minor differences in portfolio composition. Because the Portfolio invests in futures for cash management purposes, small differences in performance also can be attributed to differences in the futures and the cash markets.
All of the sectors in the S&P SmallCap 600 Index posted positive returns for the year. Materials, financials and information technology were the best-performing sectors in the market over the past 12 months. Telecommunication services, consumer discretionary and health care delivered the lowest positive returns during the year. Small-cap stocks outperformed large- and mid-cap stocks over the reporting period, since large-cap stocks tend to underperform during low-volatility, “risk-on” market periods.
What is your outlook?
Small-cap stocks outperformed both mid- and large-cap stocks during the past year. Returns over the 12-month period were akin to a roller coaster ride: a steep drop in the first quarter, strong returns in the second quarter, flat returns in the third quarter, and strong returns again in the fourth quarter. Worldwide, central banks continue to provide stimulus to the global economy, and profit margins remain strong. Market multiples still have the potential to expand, even with slightly higher interest rates. Although this environment may increase the risks for stocks, it would also tend to favor large-cap over mid- and small-cap companies. Risk levels will likely fluctuate in a range-bound manner. While opportunities for small- and mid-sized companies do exist, we believe larger companies should outperform as this cycle matures.
The financial markets appear to be resolving some of the uncertainty and ambiguity that has surrounded the fixed-income markets, so we expect to see modest increases in interest rates. The new Trump administration is likely to makes changes in taxes and infrastructure spending, which may be tempered by slower global growth. The prices of risk assets have adjusted significantly, reflecting the increased uncertainty.
28
Table of Contents
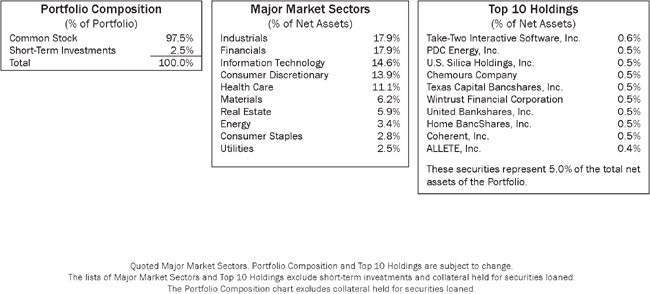
Average Annual Total Returns1
As of December 31, 2016
1-Year | 5-Year | 10-Year | ||
| 26.12% | 16.22% | 8.71% |
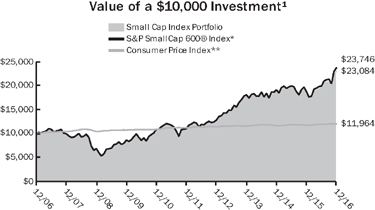
Past performance is not an indication of future results. Total investment return and principal value will fluctuate and units, when redeemed, may be worth more or less than their original cost. Current performance may be higher or lower than the performance data quoted. Call 800-THRIVENT (847-4836) or visit thrivent.com for performance results current to the most recent month-end. The prospectus contains more complete information on the investment objectives, risks, charges and expenses of the investment company, which investors should read and consider carefully before investing. To obtain a prospectus, contact a registered representative or visit thrivent.com.
| 1 | Average annual total returns for the Portfolio represent past performance and reflect changes in share prices, the reinvestment of all dividends and capital gains, and the effects of compounding. Periods of less than one year are not annualized. At various times, the Portfolio’s adviser may have waived its management fee and/or reimbursed Portfolio expenses. If this were the case, the Portfolio’s return would have been lower. The returns shown do not reflect any charges or expenses imposed on contract holders by the variable accounts. Those charges and expenses reduce the returns received by contract holders as compared to the returns presented. Unless otherwise noted, the index results shown do not reflect deductions for fees, expenses, or taxes. Index results shown reflect reinvestment of dividends. It is not possible to invest directly in an index. |
| * | The S&P SmallCap 600® Index is an index that represents the average performance of a group of 600 small capitalization stocks. The product is not sponsored, endorsed or promoted by Standard & Poor’s, and Standard & Poor’s makes no representation regarding the advisability of investing in the product. |
| ** | The Consumer Price Index is an inflationary indicator that measures the change in the cost of a fixed basket of products and services, including housing, electricity, food and transportation. |
29
Table of Contents
THRIVENT MID CAP STOCK PORTFOLIO
Brian J. Flanagan, CFA, Portfolio Manager
Thrivent Mid Cap Stock Portfolio seeks long-term capital growth.
The Portfolio primarily invests in securities of mid-sized companies, which often have greater price volatility, lower trading volume, and less liquidity than larger, more established companies. The value of the Portfolio is influenced by factors impacting the overall market, certain asset classes, certain investment styles, and specific issuers. The Portfolio may incur losses due to incorrect assessments of investments by its investment adviser.
How did the Portfolio perform during the 12-month period ended December 31, 2016?
Thrivent Mid Cap Stock Portfolio earned a return of 28.71%, compared with the median return of its peer group, the Lipper Mid Cap Core category, of 17.20%. The Portfolio’s market benchmark, the Russell Midcap® Index, earned a return of 13.80%.
What factors affected the Portfolio’s performance?
The Portfolio produced exceptional absolute and relative returns during the reporting period, which was led by stock selection in the information technology, financial and energy sectors. Within information technology, NVIDIA and Applied Materials significantly outperformed their peers. NVIDIA benefited from expanding addressable end-markets (including gaming, automotive and artificial intelligence), new product introductions, excellent execution and shareholder-friendly capital management. Applied materials was also the beneficiary of growing end markets in semiconductor equipment and organic light-emitting diode displays, while expanding its market share by introducing new products in each area.
The Portfolio’s financial sector returns were buoyed by strong regional bank performance and an investment in Nasdaq. Solid results from Zions Bancorporation, First Republic Bank and KeyCorp were propelled by low valuations, solid loan growth and the prospect of rising interest rates. Nasdaq’s valuation increased based on the continued business model diversification away from a reliance on unpredictable trading revenues and toward more stable, recurring revenues.
The Portfolio’s significant outperformance in the energy sector resulted from rising oil prices and our focus on the lowest-cost exploration and production companies with the best acreage, such as Continental Resources, Parsley Energy and WPX Energy. We positioned the Portfolio with an underweighting in utilities, which detracted from relative performance because declining interest rates for much of the period continued to drive strong returns in the sector.
Finally, the year-end cash position in the Portfolio is higher than usual because some investments rallied significantly into the end of the year and exceeded our fundamental valuation targets. These positions were recently sold or reduced, and the cash balance will decline as the cash is reinvested in other opportunities as they arise.
What is your outlook?
We believe equity markets remain in a somewhat precarious position because low gross domestic product growth, the contentious presidential election, continued terrorism fears and the potential for an increase in the federal funds rate are creating a difficult investing environment. In contrast, markets could be supported by low unemployment and rising wages, the potential for improving investor confidence from the current low levels, and continued worldwide monetary stimulus with the possibility of increasing fiscal stimulus.
Given this mixed backdrop, we are currently deploying a barbell approach across the Portfolio’s holdings. At one end, we are focusing on companies that can improve returns through superior growth and margin potential. At the other end, we are looking for struggling companies that offer attractive return opportunities based on normalized earnings and cash flow. On the growth side, we continue to find opportunities within health care equipment as worldwide health care utilization continues to increase. At the other end of the spectrum, we are focused on the airline and regional bank industries. Airlines have suffered from too much capacity and declining fares; however, valuations now reflect this negative backdrop, while at the same time capacity growth is slowing and fares are starting to increase. Many of the characteristics that benefited regional banks over the past year remain in place including attractive valuations, decent loan growth and the potential for rising interest rates.
The Portfolio remains underweighted in those industries that will suffer under a rising interest rate environment. Many midcap sectors have seen their returns become highly correlated with U.S. Treasury bond rates, including utilities, consumer staples and real estate. As interest rates declined earlier in the period, valuations in these sectors increased significantly. In light of these extended valuations, the prospect for rising rates on the horizon and the high correlation to U.S. Treasuries, we believe the risk/reward potential in these sectors tilts toward risk versus reward.
30
Table of Contents
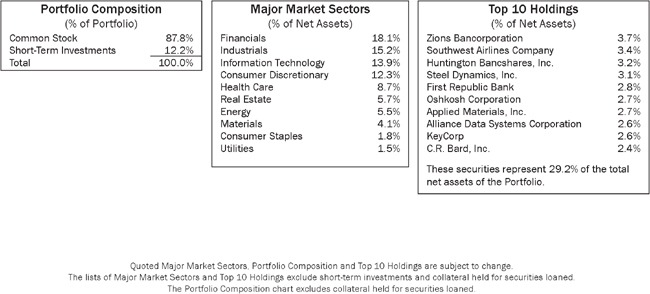
Average Annual Total Returns1
As of December 31, 2016
| 1-Year | 5-Year | 10-Year | ||
| 28.71% | 17.40% | 8.62% |
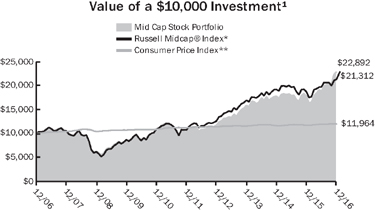
Past performance is not an indication of future results. Total investment return and principal value will fluctuate and units, when redeemed, may be worth more or less than their original cost. Current performance may be higher or lower than the performance data quoted. Call 800-THRIVENT (847-4836) or visit thrivent.com for performance results current to the most recent month-end. The prospectus contains more complete information on the investment objectives, risks, charges and expenses of the investment company, which investors should read and consider carefully before investing. To obtain a prospectus, contact a registered representative or visit thrivent.com.
| 1 | Average annual total returns for the Portfolio represent past performance and reflect changes in share prices, the reinvestment of all dividends and capital gains, and the effects of compounding. Periods of less than one year are not annualized. At various times, the Portfolio’s adviser may have waived its management fee and/or reimbursed Portfolio expenses. If this were the case, the Portfolio’s return would have been lower. The returns shown do not reflect any charges or expenses imposed on contract holders by the variable accounts. Those charges and expenses reduce the returns received by contract holders as compared to the returns presented. Unless otherwise noted, the index results shown do not reflect deductions for fees, expenses, or taxes. Index results shown reflect reinvestment of dividends. It is not possible to invest directly in an index. |
| * | The Russell Midcap® Index is an index that measures the performance of the smallest 800 securities in the Russell 1000® Index, as ranked by total market capitalization. |
| ** | The Consumer Price Index is an inflationary indicator that measures the change in the cost of a fixed basket of products and services, including housing, electricity, food and transportation. |
31
Table of Contents
THRIVENT MID CAP INDEX PORTFOLIO
Kevin R. Brimmer, FSA, Portfolio Manager
Thrivent Mid Cap Index Portfolio seeks total returns that track the performance of the S&P MidCap 400 Index.
The Portfolio primarily invests in mid-sized company stocks, which often have greater price volatility, lower trading volume, and less liquidity than stocks of larger, more established companies. The value of the Portfolio is influenced by factors impacting the overall market, certain asset classes, certain investment styles, and specific issuers.
How did the Portfolio perform during the 12-month period ended December 31, 2016?
Thrivent Mid Cap Index Portfolio earned a return of 20.43%, compared with the median return of its peer group, the Lipper Mid Cap Core category, of 17.20%. The Portfolio’s market benchmark, the S&P MidCap 400 Index, earned a return of 20.74%.
What factors affected the Portfolio’s performance?
The Portfolio’s holdings are aligned with those of the S&P MidCap 400 Index. As typically occurs in an index portfolio, the difference in performance between the benchmark index and the Portfolio itself can largely be attributed to expenses and minor differences in portfolio composition. Because the Portfolio invests in futures for cash management purposes, small differences in performance also can be attributed to differences in the futures and the cash markets.
All of the sectors in the S&P MidCap 400 Index posted positive returns for the year. Materials, industrials and utilities were the best-performing sectors in the market over the past 12 months. Consumer discretionary, health care and energy delivered the lowest positive returns during the year. Mid-cap stocks underperformed small-cap stocks over the reporting period, but outperformed large-cap stocks since these stocks tend to underperform during low-volatility, “risk-on” market periods.
What is your outlook?
Mid-cap stocks outperformed large-cap stocks, but underperformed small-cap stocks during the past year. Returns over the 12-month period were akin to a roller coaster ride: a steep drop in the first quarter, strong returns in the second quarter, flat returns in the third quarter, and strong returns again in the fourth quarter. Worldwide, central banks continue to provide stimulus to the global economy, and profit margins remain strong. Market multiples still have the potential to expand, even with slightly higher interest rates. Although this environment may increase the risks for stocks, it would also tend to favor large-cap over mid- and small-cap companies. Risk levels will likely fluctuate in a range-bound manner. While opportunities for small- and mid-sized companies do exist, we believe larger companies should outperform as this cycle matures.
The financial markets appear to be resolving some of the uncertainty and ambiguity that has surrounded the fixed-income markets, so we expect to see modest increases in interest rates. The new Trump administration is likely to make changes in taxes and infrastructure spending, which may be tempered by slower global growth. The prices of risk assets have adjusted significantly, reflecting the increased uncertainty.
32
Table of Contents
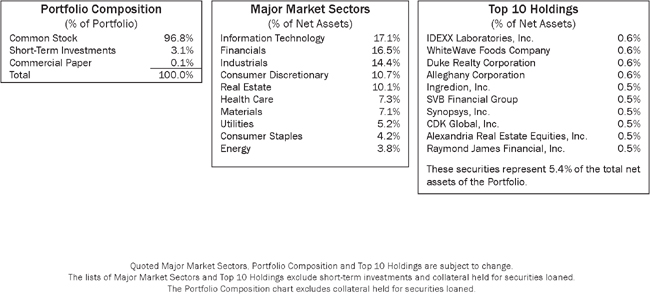
Average Annual Total Returns1
As of December 31, 2016
1-Year | 5-Year | 10-Year | ||
| 20.43% | 14.86% | 8.72% |
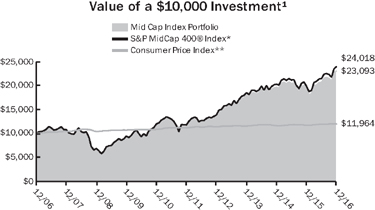
Past performance is not an indication of future results. Total investment return and principal value will fluctuate and units, when redeemed, may be worth more or less than their original cost. Current performance may be higher or lower than the performance data quoted. Call 800-THRIVENT (847-4836) or visit thrivent.com for performance results current to the most recent month-end. The prospectus contains more complete information on the investment objectives, risks, charges and expenses of the investment company, which investors should read and consider carefully before investing. To obtain a prospectus, contact a registered representative or visit thrivent.com.
| 1 | Average annual total returns for the Portfolio represent past performance and reflect changes in share prices, the reinvestment of all dividends and capital gains, and the effects of compounding. Periods of less than one year are not annualized. At various times, the Portfolio’s adviser may have waived its management fee and/or reimbursed Portfolio expenses. If this were the case, the Portfolio’s return would have been lower. The returns shown do not reflect any charges or expenses imposed on contract holders by the variable accounts. Those charges and expenses reduce the returns received by contract holders as compared to the returns presented. Unless otherwise noted, the index results shown do not reflect deductions for fees, expenses, or taxes. Index results shown reflect reinvestment of dividends. It is not possible to invest directly in an index. |
| * | The S&P MidCap 400® Index is an index that represents the average performance of a group of 400 medium capitalization stocks. The product is not sponsored, endorsed or promoted by Standard & Poor’s, and Standard & Poor’s makes no representation regarding the advisability of investing in the product. |
| ** | The Consumer Price Index is an inflationary indicator that measures the change in the cost of a fixed basket of products and services, including housing, electricity, food and transportation. |
33
Table of Contents

How did the Portfolio perform during the 12-month period ended December 31, 2016?
Thrivent Partner Worldwide Allocation Portfolio earned a return of 3.35%, compared with the median return of its peer group, the Lipper International Multi-Cap Core category, of 0.74%. The Portfolio’s market benchmark, the MSCI All Country World Index ex-USA-USD Net Returns, earned a return of 4.50%.
What factors affected the Portfolio’s performance?
The Portfolio has allocations to managers in the following international asset categories: large-cap value, large-cap growth, small-cap EAFE (Europe, Australasia and Far East), emerging-market equity and emerging-market debt. We experienced favorable returns from each manager in his or her respective asset classes with the exception of large-cap value. In that segment, the Portfolio underwent a manager change early in the period, which eventually led to an improvement in returns relative to the large-cap value benchmark. The large-cap value allocation had lagged badly in the first half of the year, but experienced a sharp rebound in the second half.
Emerging-market debt and equity returns were quite strong over the period versus the developed world benchmarks, outpacing all other asset categories represented within the Portfolio as well as the benchmark index. Our managers outperformed relative to other emerging-market debt and equity managers. Small-cap EAFE returns were modestly ahead of large-cap EAFE, and our manager performed in line with its benchmark. Large-cap growth experienced the poorest absolute returns during the period, but our manager modestly outperformed its benchmark. In total, the returns of the large-cap value, emerging-market debt and emerging-market equity segments outperformed the Portfolio’s benchmark, while small-cap EAFE and large-cap growth lagged the benchmark index, limiting our advance.
The Portfolio holds positions in various derivatives contracts—more specifically, futures contracts traded on various public exchanges. At year-end, it held 17 different futures contracts across five different portfolio strategies representing, in total, less than 5% of portfolio assets. These positions are taken to assist in cash management, portfolio positioning and duration management. They are complimentary to the strategies mentioned above, while at the same time the performance impact on efficient portfolio management and positioning was positive relative to alternatives.
What is your outlook?
We remain cautiously optimistic that policies to stimulate growth and mitigate deflationary risks will ultimately prove successful. That being said, the risks are not insignificant in an environment where equity valuations are quite full and yields on fixed-income securities are being substantially distorted by the actions of central bankers. We are particularly concerned about how policymakers will ultimately unwind their aggressive interventions and how that will cascade into risk assets. An additional concern is the amount of debt that has been issued in emerging markets over the last cycle. China has been particularly aggressive in expanding the debt burden in both the public and private sector.
Growth is slowing in many markets, and debt service obligations remain elevated. We believe a moderate approach to risk management is appropriate at this point in the cycle.
34
Table of Contents
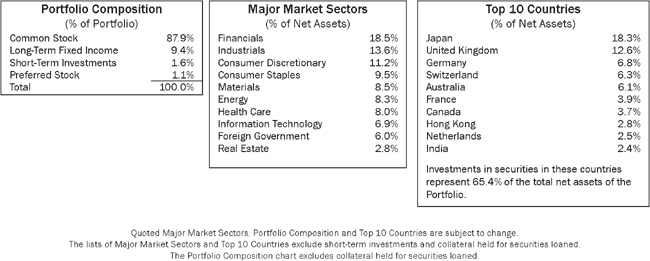
Average Annual Total Returns1
As of December 31, 2016
1-Year | 5-Year | From Inception | ||
| 3.35% | 6.01% | 0.79% |
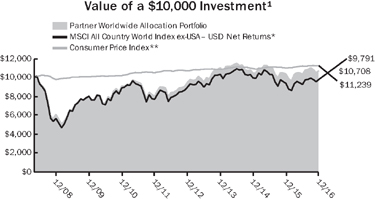
Past performance is not an indication of future results. Total investment return and principal value will fluctuate and units, when redeemed, may be worth more or less than their original cost. Current performance may be higher or lower than the performance data quoted. Call 800-THRIVENT (847-4836) or visit thrivent.com for performance results current to the most recent month-end. The prospectus contains more complete information on the investment objectives, risks, charges and expenses of the investment company, which investors should read and consider carefully before investing. To obtain a prospectus, contact a registered representative or visit thrivent.com.
| 1 | Average annual total returns for the Portfolio represent past performance and reflect changes in share prices, the reinvestment of all dividends and capital gains, and the effects of compounding. Periods of less than one year are not annualized. At various times, the Portfolio’s adviser may have waived its management fee and/or reimbursed Portfolio expenses. If this were the case, the Portfolio’s return would have been lower. The returns shown do not reflect any charges or expenses imposed on contract holders by the variable accounts. Those charges and expenses reduce the returns received by contract holders as compared to the returns presented. Unless otherwise noted, the index results shown do not reflect deductions for fees, expenses, or taxes. Index results shown reflect reinvestment of dividends. It is not possible to invest directly in an index. |
| * | The MSCI All Country World Index ex-USA—USD Net Returns is an unmanaged market capitalization-weighted index that is designed to represent the performance of developed and emerging stock markets throughout the world. The performance of the Index reflects dividends reinvested after the deduction of withholding taxes. |
| ** | The Consumer Price Index is an inflationary indicator that measures the change in the cost of a fixed basket of products and services, including housing, electricity, food and transportation. |
35
Table of Contents
| THRIVENT PARTNER ALL CAP PORTFOLIO |

Subadvised by FIAM LLC*, an affiliate of Fidelity Investments
Thrivent Partner All Cap Portfolio seeks long-term growth of capital.
The Portfolio primarily invests in common stocks. The value of the Portfolio is influenced by factors impacting the overall market, certain asset classes, certain investment styles, and specific issuers. The Portfolio may incur losses due to incorrect assessments of investments by its investment advisers. Small and medium-sized companies often have greater price volatility and less liquidity than larger companies. Large cap companies may be unable to respond quickly to new competitive challenges and may not be able to attain a high growth rate.
* Prior to January 4, 2016, FIAM LLC was known as Pyramis Global Advisors, LLC.
How did the Portfolio perform during the 12-month period ended December 31, 2016?
Thrivent Partner All Cap Portfolio earned a return of 5.77%, compared with the median return of its peer group, the Lipper Multi-Cap Core category, of 10.93%. The Portfolio’s market benchmark, the Russell 3000® Index, earned a return of 12.74%.
What factors affected the Portfolio’s performance?
Stock selection in the information technology and health care sectors detracted the most from the Portfolio’s relative performance. In technology, overweightings in cloud-computing company Salesforce.com and aviation communications service provider Gogo detracted. Shares in Salesforce.com fell after the company reported quarterly results that topped analysts’ revenue and earnings forecasts, but posted weaker-than-expected billings growth with deceleration in its Marketing Cloud segment. Additionally, the company issued quarterly revenue guidance that was below market expectations, moving shares lower. Speculation surrounding interest in purchasing social networking service Twitter also put pressure on the stock price, raising concerns about the company’s capital deployment strategy. Shares of Gogo dropped sharply after American Airlines, the company’s second-largest customer, filed a lawsuit to terminate its contract with the company in order to switch to another provider for in-flight connectivity service for its existing aircraft. In addition, American Airlines chose one of Gogo’s rivals to provide in-flight Wi-Fi for its newest fleet scheduled for service starting in September 2017.
In health care, our overweightings in specialty pharmaceutical and generics company Endo International and biotechnology company Alexion Pharmaceuticals were among the largest detractors from relative performance. Endo International was the leading detractor after the emergence of large purchasing consortiums led to deep price declines in the company’s Qualitest generics business and steep cuts to its earnings outlook. Alexion shares declined after a late-stage clinical trial of Soliris, a drug being studied to treat the neuromuscular disease refractory myasthenia gravis, failed to meet its primary goal, although several secondary trial goals were met.
What is your outlook?
U.S. equity markets, as measured by the S&P 500, rose solidly in light of rather muted volatility. The biggest headlines of the year came on the political front, with the Republican Party’s sweep of the White House and Congress during the November elections signaling a changing political landscape and also serving as a catalyst for U.S. equity markets. On the economic front, the Federal Reserve raised interest rates in December for the second year in a row, signaling its belief that the economy has strengthened enough to withstand a gradual normalization of interest rates. While the U.S. economy appears to be expanding at a healthy pace with solid underlying fundamentals, potential uncertainty on the political and global economic fronts bears monitoring as we move forward in 2017, offering opportunities for active equity management to uncover stronger active excess returns.
Against this backdrop, our global sector leaders continue to focus on uncovering attractive investment ideas by applying bottom-up, fundamental research to their respective sectors. We remain consistent in our investment process that is designed to deliver a sector-neutral, cohesive portfolio capturing the best ideas from the team.
36
Table of Contents
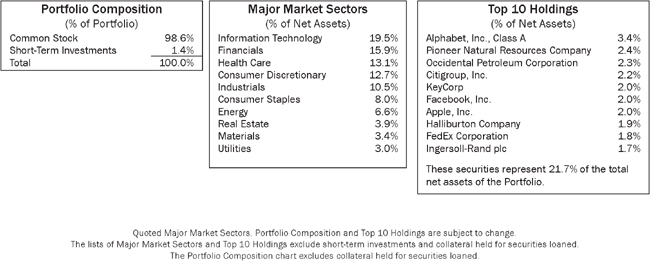
Average Annual Total Returns1
As of December 31, 2016
1-Year | 5-Year | 10-Year | ||
| 5.77% | 13.08% | 6.10% |
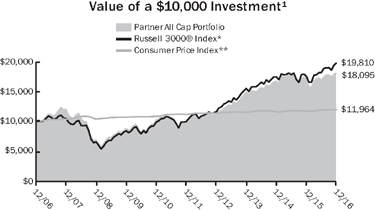
Past performance is not an indication of future results. Total investment return and principal value will fluctuate and units, when redeemed, may be worth more or less than their original cost. Current performance may be higher or lower than the performance data quoted. Call 800-THRIVENT (847-4836) or visit thrivent.com for performance results current to the most recent month-end. The prospectus contains more complete information on the investment objectives, risks, charges and expenses of the investment company, which investors should read and consider carefully before investing. To obtain a prospectus, contact a registered representative or visit thrivent.com.
| 1 | Average annual total returns for the Portfolio represent past performance and reflect changes in share prices, the reinvestment of all dividends and capital gains, and the effects of compounding. Periods of less than one year are not annualized. At various times, the Portfolio’s adviser may have waived its management fee and/or reimbursed Portfolio expenses. If this were the case, the Portfolio’s return would have been lower. The returns shown do not reflect any charges or expenses imposed on contract holders by the variable accounts. Those charges and expenses reduce the returns received by contract holders as compared to the returns presented. Unless otherwise noted, the index results shown do not reflect deductions for fees, expenses, or taxes. Index results shown reflect reinvestment of dividends. It is not possible to invest directly in an index. |
| * | The Russell 3000® Index is an index comprised of the 3,000 largest U.S. companies based on market capitalization. |
| ** | The Consumer Price Index is an inflationary indicator that measures the change in the cost of a fixed basket of products and services, including housing, electricity, food and transportation. |
37
Table of Contents
THRIVENT LARGE CAP GROWTH PORTFOLIO
Darren M. Bagwell, CFA, Portfolio Manager
Thrivent Large Cap Growth Portfolio seeks to achieve long-term growth of capital.
The Portfolio primarily invests in securities of large companies, which may be unable to respond quickly to new competitive challenges and may not be able to attain a high growth rate. The value of the Portfolio is influenced by factors impacting the overall market, certain asset classes, certain investment styles, and specific issuers. The Portfolio may incur losses due to incorrect assessments of investments by its investment adviser. Foreign investments involve additional risks, including currency fluctuations, liquidity, political, economic and market instability, and different legal and accounting standards.
How did the Portfolio perform during the 12-month period ended December 31, 2016?
Thrivent Large Cap Growth Portfolio earned a return of -1.48%, compared with the median return for its peer group, the Lipper Large Cap Growth category, of 2.13%. The Portfolio’s market benchmark, the Russell 1000® Growth Index, earned a return of 7.08%.
What factors affected the Portfolio’s performance?
The Portfolio’s disappointing underperformance can be tied primarily to three factors: our emphasis on, and poor selection within, the specialty pharmaceutical and biotechnology areas of health care; our larger-than-normal cash balances over the course of the year; and our emphasis on transportation stocks within industrials, where we underestimated the immediate earnings and sentiment impacts of an increase in energy prices. We remain confident in the multi-year positions behind our holdings. The concentrated nature of the Portfolio magnifies short-term performance swings. We believe, however, there is a long-term performance benefit to the focus and persistence of our holdings.
In health care, our positions in specialty pharmaceutical maker Allergan and biotechnology firm Vertex Pharmaceuticals were notable underperformers. We believe Allergan is run by one of the best management teams in the industry with a proven track record of value creation. However, the U.S. Treasury’s unprecedented move to block its merger with Pfizer using grandfathered policy changes, combined with election-driven drug pricing rhetoric, created a toxic atmosphere for the company. Allergan’s shares traded down well below its peers despite superior management and growth prospects. We continue to own Allergan because we expect its value recognition has only been delayed. Vertex Pharmaceuticals is in the process of developing novel and expanded therapies for cystic fibrosis and other genetic diseases. Despite the company’s inevitable hiccups in achieving approvals and entering new international markets, we continue to believe its first-mover status will result in significant earnings growth in the future. Therefore, we remain holders of this stock.
Entering 2016, we believed that transportation-related stocks such as Delta Air Lines and Union Pacific Railroad were the best- managed options for us in a sector where the impact of rising oil prices was overestimated, pricing was stable and volume declines were manageable. Unfortunately, while oil prices stayed contained below $50 per barrel, airline industry pricing was much less disciplined than we expected. Also, crude-by-rail volumes in the low-growth environment of 2016 were worse than anticipated because we underestimated the duration and impact of the economy’s weakness. Although Delta and Union Pacific benefited from the market’s post-election cyclical rebound, we have since sold both positions to focus on companies we believe hold more promising secular prospects.
Finally, we kept the Portfolio’s cash balances higher as a reflection of valuation concerns in light of our predictions for slower earnings growth in the face of economic weakness. Unfortunately, while earnings did indeed stagnate, stocks revalued higher as a result of historically low interest rates, which pushed multiples to near-record levels.
The Portfolio’s positive contributors were concentrated in the information technology sector. Our exposures are focused on the powerful secular trends of online retailing, cloud infrastructure and services, and financial payment technologies. We have a meaningful overweighting in information technology relative to our peers given our positive secular outlook for the sector. This strategic emphasis is expected to continue and to also be a large influence on future performance.
What is your outlook?
Our 2017 outlook calls for economic growth and earnings to be generally below consensus. We believe gross domestic product (GDP) will stay near a 2% real annualized rate of growth, constrained by low productivity, slow work force growth, and sluggish international trade. As a result, margins are likely to disappoint. We believe equities will move higher, although in volatile fashion, as investors quickly focus on improved 2018 results due to favorable tax and regulatory changes under the new U.S. administration. Inflation, interest rates and the dollar should move higher, but will provide as many benefits as headwinds.
38
Table of Contents
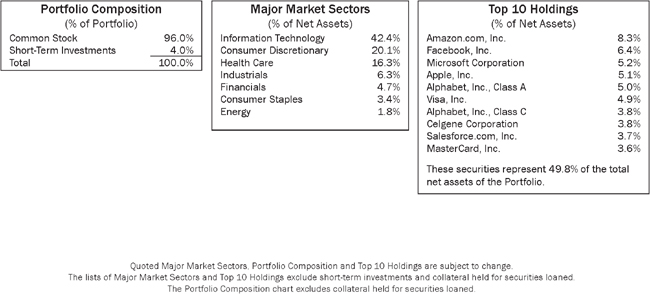
Average Annual Total Returns1
As of December 31, 2016
1-Year | 5-Year | 10-Year | ||
| -1.48% | 14.38% | 7.00% |
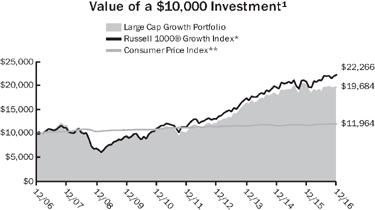
Past performance is not an indication of future results. Total investment return and principal value will fluctuate and units, when redeemed, may be worth more or less than their original cost. Current performance may be higher or lower than the performance data quoted. Call 800-THRIVENT (847-4836) or visit thrivent.com for performance results current to the most recent month-end. The prospectus contains more complete information on the investment objectives, risks, charges and expenses of the investment company, which investors should read and consider carefully before investing. To obtain a prospectus, contact a registered representative or visit thrivent.com.
| 1 | Average annual total returns for the Portfolio represent past performance and reflect changes in share prices, the reinvestment of all dividends and capital gains, and the effects of compounding. Periods of less than one year are not annualized. At various times, the Portfolio’s adviser may have waived its management fee and/or reimbursed Portfolio expenses. If this were the case, the Portfolio’s return would have been lower. The returns shown do not reflect any charges or expenses imposed on contract holders by the variable accounts. Those charges and expenses reduce the returns received by contract holders as compared to the returns presented. Unless otherwise noted, the index results shown do not reflect deductions for fees, expenses, or taxes. Index results shown reflect reinvestment of dividends. It is not possible to invest directly in an index. |
| * | The Russell 1000® Growth Index measures the performance of large cap growth stocks. |
| ** | The Consumer Price Index is an inflationary indicator that measures the change in the cost of a fixed basket of products and services, including housing, electricity, food and transportation. |
39
Table of Contents
 | THRIVENT PARTNER GROWTH STOCK PORTFOLIO |
Subadvised by T. Rowe Price Associates, Inc.
Thrivent Partner Growth Stock Portfolio seeks long-term growth of capital and, secondarily, to increase dividend income.
The Portfolio primarily invests in common stocks. The value of the Portfolio is influenced by factors impacting the overall market, certain asset classes, certain investment styles, and specific issuers. The Portfolio may incur losses due to incorrect assessments of investments by its investment advisers. Foreign investments involve additional risks, including currency fluctuations, liquidity, political, economic and market instability, and different legal and accounting standards.
How did the Portfolio perform during the 12-month period ended December 31, 2016?
Thrivent Partner Growth Stock Portfolio earned a return of 1.35%, compared with the median return of its peer group, the Lipper Large Cap Growth category, of 2.13%. The Portfolio’s market benchmark, the S&P 500/Citigroup Growth Index, earned a return of 6.89%.
What factors affected the Portfolio’s performance?
Stock selection was the primary reason for relative underperformance, but sector weightings were also negative. Health care and information technology were the largest relative detractors. Financials and real estate investment trusts (REITs) were the leading outperformers. Consumer discretionary was overweighted and the group underperformed, which detracted from performance. That being said, our stock selection in the sector achieved better results, mitigating some of that underperformance.
Health care was the largest detractor due mostly to stock selection. Shares of Allergan declined early in the year when its proposed merger with Pfizer was called off after the U.S. Treasury Department issued a notice aimed at curbing the benefits of tax inversions. While we maintained a constructive view, we subsequently trimmed our position and continued to monitor competitive pressures on Restasis, its dry-eye therapy, as well as sales growth of Namenda, its Alzheimer’s disease treatment.
Information technology detracted as a result of stock selection. Our sector allocation was similar to the Portfolio benchmark, resulting in a limited effect on performance. Our exposure to Salesforce.com, for example, detracted from relative returns in the latter half of 2016 largely in response to a lack of clarity surrounding the company’s acquisition strategy. Sentiment weighed on the stock based on its failed bid for LinkedIn, rumors of the CEO’s interest in acquiring Twitter, and a leaked presentation highlighting numerous potential acquisition targets.
The financial sector was the leading outperformer, driven by stock selection. Morgan Stanley was a strong positive contributor to the Portfolio’s performance. Real estate outperformed due to the Portfolio’s underweighting in the second-weakest performer in the benchmark. Our exposure in this sector focused on REITs involved in the development and expansion of wireless towers and infrastructure such as American Tower.
What is your outlook?
Valuations for large-cap growth stocks appear relatively attractive versus their value counterparts and compared with small- and mid-cap stocks, which recorded strong fourth-quarter and 12-month gains. We are not concerned that interest rates are rising, because moderately rising rates are a sign that the economy is growing. If President Trump’s agenda is pursued successfully, multinational companies should benefit from improving global growth. We believe large-cap growth stocks would benefit from a rollback in corporate tax rates and an increase in infrastructure spending in 2017.
40
Table of Contents
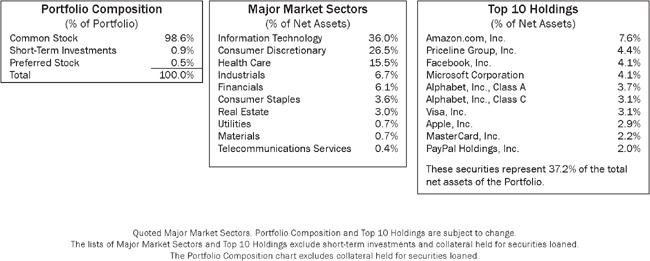
Average Annual Total Returns1
As of December 31, 2016
1-Year | 5-Year | 10-Year | ||
| 1.35% | 14.90% | 7.62% |
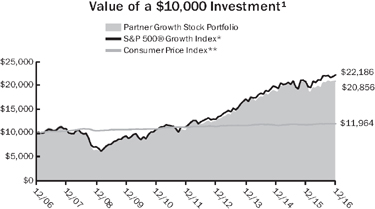
Past performance is not an indication of future results. Total investment return and principal value will fluctuate and units, when redeemed, may be worth more or less than their original cost. Current performance may be higher or lower than the performance data quoted. Call 800-THRIVENT (847-4836) or visit thrivent.com for performance results current to the most recent month-end. The prospectus contains more complete information on the investment objectives, risks, charges and expenses of the investment company, which investors should read and consider carefully before investing. To obtain a prospectus, contact a registered representative or visit thrivent.com.
| 1 | Average annual total returns for the Portfolio represent past performance and reflect changes in share prices, the reinvestment of all dividends and capital gains, and the effects of compounding. Periods of less than one year are not annualized. At various times, the Portfolio’s adviser may have waived its management fee and/or reimbursed Portfolio expenses. If this were the case, the Portfolio’s return would have been lower. The returns shown do not reflect any charges or expenses imposed on contract holders by the variable accounts. Those charges and expenses reduce the returns received by contract holders as compared to the returns presented. Unless otherwise noted, the index results shown do not reflect deductions for fees, expenses, or taxes. Index results shown reflect reinvestment of dividends. It is not possible to invest directly in an index. |
| * | The S&P 500® Growth Index is a capitalization-weighted index comprised of the highest price-to-book ratio securities in the S&P 500® Index. The S&P 500® Growth Index is designed so that approximately one-half of the S&P 500® Index market capitalization is characterized as “value” and the other half as “growth.” The product is not sponsored, endorsed or promoted by Standard & Poor’s, and Standard & Poor’s makes no representation regarding the advisability of investing in the product. |
| ** | The Consumer Price Index is an inflationary indicator that measures the change in the cost of a fixed basket of products and services, including housing, electricity, food and transportation. |
41
Table of Contents
THRIVENT LARGE CAP VALUE PORTFOLIO
Kurt J. Lauber, CFA, Portfolio Manager
Thrivent Large Cap Value Portfolio seeks to achieve long-term growth of capital.
The Portfolio primarily invests in securities of large companies, which may be unable to respond quickly to new competitive challenges and may not be able to attain a high growth rate. The value of the Portfolio is influenced by factors impacting the overall market, certain asset classes, certain investment styles, and specific issuers. The Portfolio may incur losses due to incorrect assessments of investments by its investment adviser. Foreign investments involve additional risks, including currency fluctuations, liquidity, political, economic and market instability, and different legal and accounting standards.
How did the Portfolio perform during the 12-month period ended December 31, 2016?
Thrivent Large Cap Value Portfolio earned a return of 17.44%, compared with the median return of its peer group, the Lipper Large Cap Value category, of 15.35%. The Portfolio’s market benchmark, the Russell 1000® Value Index, earned a return of 17.34%.
What factors affected the Portfolio’s performance?
Stock selection, especially in energy, materials, health care and financials, led to the Portfolio’s outperformance versus its peers. Stock selection only lagged in two sectors: consumer staples and technology. Sector allocations were slightly positive overall due to a large overweighting in technology and a similar-sized underweighting in consumer staples.
In energy, the Portfolio benefited from increased weightings in Marathon Oil and Devon Energy, which both issued equity at the depths of oil-price fears in February. Chevron was the Portfolio’s best-performing integrated energy company. Years of expensive projects that dragged down Chevron’s operations and free cash flow are now at a point of inflecting positively, just in time for the recovery in energy prices. Our addition of Baker Hughes and its subsequent merger deal with General Electric benefited performance, but was more than offset by Weatherford International’s poor operating execution. In materials, the addition of Albemarle benefited performance due to a bottoming in bromine fundamentals and the increased demand from electric vehicles for lithium.
In health care, Merck made strong gains after its new cancer product showed better results than a treatment under development at Bristol-Myers Squibb, the perceived leader in next-generation lung cancer drugs. UnitedHealth Group showed superior operating performance, while shares of other health maintenance organizations fell after their potential mergers ran into regulatory roadblocks.
In financials, the Portfolio added value through stock selection since the sector weighting was roughly in line with the benchmark. Regional banks were one of the strongest areas of outperformance, especially the holdings of Comerica, Zion and Fifth Third. Asset managers Invesco and Blackstone were hurt by market volatility caused by Brexit. Invesco was also hurt by fee pressures and the increased regulatory risk resulting from the Department of Labor’s new fiduciary rules.
The consumer staples sector was responsible for the majority of the Portfolio’s underperformance versus the benchmark, primarily due to our position in CVS Health. Investors worried that pharmaceutical pricing pressures and new regulatory scrutiny on generics would have a negative impact on the business models of prescription benefit managers.
What is your outlook?
As the world faces one of the slowest economic recoveries in history, external macro shocks such as Brexit and the ongoing deceleration of China’s economy continue to knock the market off its recovery path. The U.S. election was viewed as a positive shock because investors believe an increase in fiscal stimulus through lower taxes and less regulation will lead to improved growth. While valuations might look unattractive on a price-to-earnings basis, they appear fair based on the more important price-to-free-cash-flow. As a result, we did not change allocations materially.
At the beginning of the year, fears of a global economic recession provided an opportunity to add Fifth Third Bancorp, Synchrony Financial and Goldman Sachs. We believe Fifth Third will benefit from better underwriting this cycle and an opportunity to reduce costs by closing branches, which was not appreciated by investors. Synchrony has the opportunity to grow its credit card business faster due to increased private label programs with merchant partners like Amazon.
The Portfolio will remain overweighted in technology and underweighted in staples, which have similar growth and returns, but technology has more favorable valuations. Cisco Systems, Microsoft and Oracle still trade at a discount to the market due to fears of technology obsolescence, but have shown further evidence of their ability to transition to cloud computing. We added Apple because the low customer replacement rate for iPhones sets up greater demand for the company’s next new product release. We sold Intel after a rebound in personal computer sales and high expectations for data center growth.
42
Table of Contents
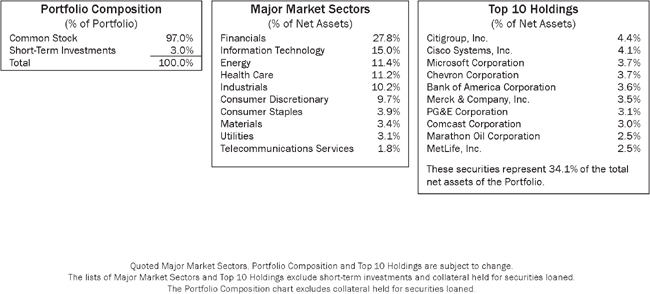
Average Annual Total Returns1
As of December 31, 2016
| 1-Year | 5-Year | 10-Year | ||
| 17.44% | 13.84% | 5.69% |
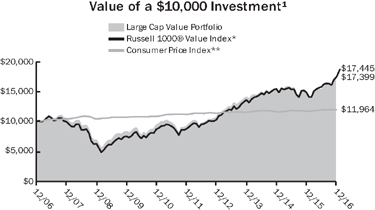
Past performance is not an indication of future results. Total investment return and principal value will fluctuate and units, when redeemed, may be worth more or less than their original cost. Current performance may be higher or lower than the performance data quoted. Call 800-THRIVENT (847-4836) or visit thrivent.com for performance results current to the most recent month-end. The prospectus contains more complete information on the investment objectives, risks, charges and expenses of the investment company, which investors should read and consider carefully before investing. To obtain a prospectus, contact a registered representative or visit thrivent.com.
| 1 | Average annual total returns for the Portfolio represent past performance and reflect changes in share prices, the reinvestment of all dividends and capital gains, and the effects of compounding. Periods of less than one year are not annualized. At various times, the Portfolio’s adviser may have waived its management fee and/or reimbursed Portfolio expenses. If this were the case, the Portfolio’s return would have been lower. The returns shown do not reflect any charges or expenses imposed on contract holders by the variable accounts. Those charges and expenses reduce the returns received by contract holders as compared to the returns presented. Unless otherwise noted, the index results shown do not reflect deductions for fees, expenses, or taxes. Index results shown reflect reinvestment of dividends. It is not possible to invest directly in an index. |
| * | The Russell 1000® Value Index measures the performance of large cap value stocks. |
| ** | The Consumer Price Index is an inflationary indicator that measures the change in the cost of a fixed basket of products and services, including housing, electricity, food and transportation. |
43
Table of Contents
THRIVENT LARGE CAP STOCK PORTFOLIO
Darren M. Bagwell, CFA and Kurt J. Lauber, CFA, Portfolio Co-Managers
Thrivent Large Cap Stock Portfolio seeks long-term capital growth.
The Portfolio primarily invests in securities of large companies, which may be unable to respond quickly to new competitive challenges and may not be able to attain a high growth rate. The value of the Portfolio is influenced by factors impacting the overall market, certain asset classes, certain investment styles, and specific issuers. The Portfolio may incur losses due to incorrect assessments of investments by its investment adviser. Foreign investments involve additional risks, including currency fluctuations, liquidity, political, economic and market instability, and different legal and accounting standards.
How did the Portfolio perform during the 12-month period ended December 31, 2016?
Thrivent Large Cap Stock Portfolio earned a return of 5.42%, compared with the median return of its peer group, the Lipper Global Large Cap Core category, of 7.06%. The Portfolio’s market benchmark, the MSCI World Large Cap Index-USD Net Returns, earned a return of 7.51%.
What factors affected the Portfolio’s performance?
The Portfolio’s shortfall versus its benchmark and Lipper peers was mainly the result of stock selection in the portfolio and an overweighting in international securities. Poor stock selection in the information technology, health care, consumer staples and industrials sectors were all factors in the Portfolio’s underperformance. In industrials, our positions in Boeing and Delta Air Lines performed below the overall market as well as other stocks within this group. Additionally, weakness in Salesforce. com and Alphabet (formerly Google) as well as a lack of exposure to the strong performance of semiconductor stocks limited our returns in information technology. Biotechnology shares in health care experienced intense selling pressure following quite strong results in the prior fiscal year. Our underweighting to the sector was a positive for relative returns. We also benefited from favorable returns to our holding in pharmaceutical company Merck.
In energy, the Portfolio was overweighted to the group and the sector performed well. Our stock selection was good but below the average for the group, offsetting part of that contribution. We experienced favorable returns from our positions in Chevron, BP, Royal Dutch Petroleum, EOG Resources and Columbia Pipeline. In the consumer discretionary sector, we realized solid returns from our position in Amazon.com, but experienced weakness in Berkeley Group. The Portfolio’s holdings in the chemical industry performed well. We also saw much better returns than the group in the financial sector with particular strength among our bank holdings.
Internationally, our Portfolio outperformed the international benchmarks; however, overseas stocks generally did not keep pace with the better returns experienced in the U.S. In financials, our holdings in the banking and diversified financials space performed well versus their peers. In consumer staples, we also saw favorable results from our holdings in food and staples retailing, tobacco and food products. Also, our positions in real estate investment trusts (REITs) performed quite well, while we also held a modest overweighting in the group, which added value.
We have derivatives exposure in the Portfolio in the form of futures contracts that provide efficient exposure to some of our tactical investment positions, particularly our international allocations; since international markets underperformed U.S. markets, it had a limiting effect on returns. There is a cash position in the account as well, but its role is to support the futures positions. The explicit cash position is approximately 2% and is held for liquidity purposes.
What is your outlook?
Valuations both domestically and internationally are quite rich, anticipating a continuation of the economic recovery—tepid as it may have been and continues to be. The U.S. recovery has led the rest of the world by 18 to 24 months, while serious fundamental issues have impaired the recoveries in the developed world outside the U.S. Central bankers have taken aggressive actions to stimulate or accelerate growth. While these actions have had some moderate impact, it appears that additional monetary actions will likely prove insufficient to achieve the goal of faster growth and moderately higher inflation. After the results of the U.S. election, investors began to discount a sharp improvement in fiscal, tax and regulatory policies.
We see a greater opportunity to improve revenues and margins outside the U.S. because domestic companies are already operating at cyclically high levels of profitability, and momentum seems to be moderating. The Portfolio remains overweighted in international versus domestic stocks; however, we are monitoring economic conditions quite closely since sustained or accelerating economic growth will be a necessary condition to validate current valuation levels.
44
Table of Contents
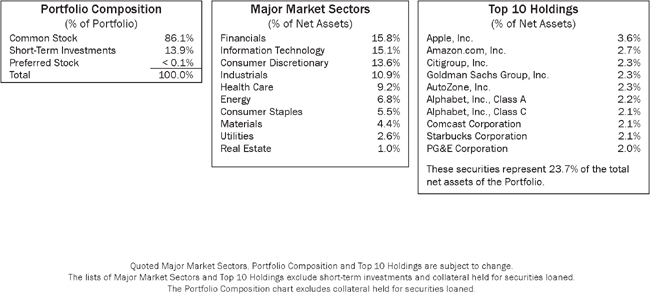
Average Annual Total Returns1
As of December 31, 2016
1-Year | 5-Year | 10-Year | ||
| 5.42% | 11.23% | 4.42% |
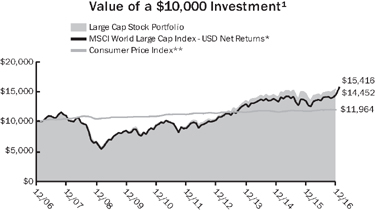
Past performance is not an indication of future results. Total investment return and principal value will fluctuate and units, when redeemed, may be worth more or less than their original cost. Current performance may be higher or lower than the performance data quoted. Call 800-THRIVENT (847-4836) or visit thrivent.com for performance results current to the most recent month-end. The prospectus contains more complete information on the investment objectives, risks, charges and expenses of the investment company, which investors should read and consider carefully before investing. To obtain a prospectus, contact a registered representative or visit thrivent.com.
| 1 | Average annual total returns for the Portfolio represent past performance and reflect changes in share prices, the reinvestment of all dividends and capital gains, and the effects of compounding. Periods of less than one year are not annualized. At various times, the Portfolio’s adviser may have waived its management fee and/or reimbursed Portfolio expenses. If this were the case, the Portfolio’s return would have been lower. The returns shown do not reflect any charges or expenses imposed on contract holders by the variable accounts. Those charges and expenses reduce the returns received by contract holders as compared to the returns presented. Unless otherwise noted, the index results shown do not reflect deductions for fees, expenses, or taxes. Index results shown reflect reinvestment of dividends. It is not possible to invest directly in an index. |
| * | The MSCI World Large Cap Index—USD Net Returns is an index that represents large cap stocks in 23 developed market countries. The performance of the Index reflects dividends reinvested after the deduction of withholding taxes. |
| ** | The Consumer Price Index is an inflationary indicator that measures the change in the cost of a fixed basket of products and services, including housing, electricity, food and transportation. |
45
Table of Contents
THRIVENT LARGE CAP INDEX PORTFOLIO
Kevin R. Brimmer, FSA, Portfolio Manager
Thrivent Large Cap Index Portfolio seeks total returns that track the performance of the S&P 500 Index.
The Portfolio primarily invests in large company common stocks. Large companies may be unable to respond quickly to new competitive challenges and may not be able to attain a high growth rate. The value of the Portfolio is influenced by factors impacting the overall market, certain asset classes, certain investment styles, and specific issuers.
How did the Portfolio perform during the 12-month period ended December 31, 2016?
Thrivent Large Cap Index Portfolio earned a return of 11.68%, compared with the median return of its peer group, the Lipper S&P 500 Index Objective category, of 11.57%. The Portfolio’s market benchmark, the S&P 500 Index, earned a return of 11.96%.
What factors affected the Portfolio’s performance?
The Portfolio’s holdings are aligned with those of the S&P 500 Index. As typically occurs in an index portfolio, the difference in performance between the benchmark index and the Portfolio itself can largely be attributed to expenses and minor differences in portfolio composition. Because the Portfolio invests in futures for cash management purposes, small differences in performance also can be attributed to differences in the futures and the cash markets.
All but one of the sectors in the S&P 500 Index posted positive returns for the year. Energy, telecommunication services and financials were the best-performing sectors in the market over the past 12 months. Consumer staples and real estate delivered the lowest positive returns during the year, while the health care sector posted negative returns. Large-cap stocks underperformed small-cap and mid-cap stocks over the reporting period, since large-cap stocks tend to underperform during low-volatility, “risk-on” market periods.
What is your outlook?
Large-cap stocks underperformed both mid- and small-cap stocks during the past year. Returns over the 12-month period were akin to a roller coaster ride: a steep drop in the first quarter, strong returns in the second quarter, flat returns in the third quarter and strong returns again in the fourth quarter. Worldwide, central banks continue to provide stimulus to the global economy, and profit margins remain strong. Market multiples still have the potential to expand, even with slightly higher interest rates. Although this environment may increase the risks for stocks, it would also tend to favor large-cap over mid- and small-cap companies. Risk levels will likely fluctuate in a range-bound manner. While opportunities for small- and mid-sized companies do exist, we believe large-cap companies should outperform as this cycle matures.
The financial markets appear to be resolving some of the uncertainty and ambiguity that has surrounded the fixed-income markets, so we expect to see modest increases in interest rates. The new Trump administration is likely to make changes in taxes and infrastructure spending, which may be tempered by slower global growth. The prices of risk assets have adjusted significantly, reflecting the increased uncertainty.
46
Table of Contents
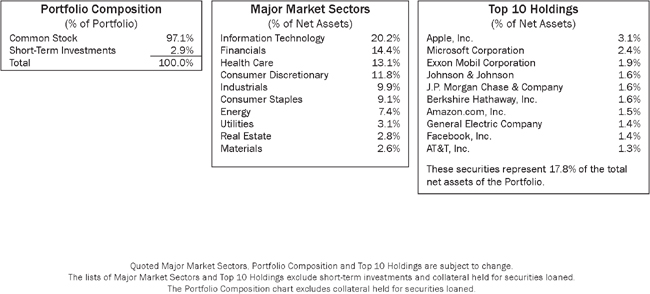
Average Annual Total Returns1
As of December 31, 2016
| 1-Year | 5-Year | 10-Year | ||
| 11.68% | 14.24% | 6.59% |
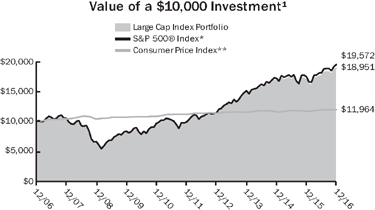
Past performance is not an indication of future results. Total investment return and principal value will fluctuate and units, when redeemed, may be worth more or less than their original cost. Current performance may be higher or lower than the performance data quoted. Call 800-THRIVENT (847-4836) or visit thrivent.com for performance results current to the most recent month-end. The prospectus contains more complete information on the investment objectives, risks, charges and expenses of the investment company, which investors should read and consider carefully before investing. To obtain a prospectus, contact a registered representative or visit thrivent.com.
| 1 | Average annual total returns for the Portfolio represent past performance and reflect changes in share prices, the reinvestment of all dividends and capital gains, and the effects of compounding. Periods of less than one year are not annualized. At various times, the Portfolio’s adviser may have waived its management fee and/or reimbursed Portfolio expenses. If this were the case, the Portfolio’s return would have been lower. The returns shown do not reflect any charges or expenses imposed on contract holders by the variable accounts. Those charges and expenses reduce the returns received by contract holders as compared to the returns presented. Unless otherwise noted, the index results shown do not reflect deductions for fees, expenses, or taxes. Index results shown reflect reinvestment of dividends. It is not possible to invest directly in an index. |
| * | The S&P 500® Index is an index that represents the average performance of a group of 500 widely held, publicly traded stocks. “S&P 500” is a trademark of The McGraw-Hill Companies, Inc. and has been licensed for use by Thrivent Financial. The product is not sponsored, endorsed or promoted by Standard & Poor’s and Standard & Poor’s makes no representation regarding the advisability of investing in the product. |
| ** | The Consumer Price Index is an inflationary indicator that measures the change in the cost of a fixed basket of products and services, including housing, electricity, food and transportation. |
47
Table of Contents
Paul J. Ocenasek, CFA, Portfolio Manager
Thrivent High Yield Portfolio seeks to achieve a higher level of income. The Portfolio will also consider growth of capital as a secondary objective.
The Portfolio primarily invests in high-yield, high-risk bonds, notes, debentures and other debt obligations, or preferred stocks. Credit risk is the risk that an issuer of a debt security may not pay its debt, and high yield securities are subject to increased credit risk as well as liquidity risk. Bond prices generally fall as interest rates rise. Leveraged loans are subject to numerous risks, including liquidity, credit, declines in the value of collateral underlying them, and detrimental legal actions against them. The value of the Portfolio is influenced by factors impacting the overall market, certain asset classes, certain investment styles, and specific issuers. The Portfolio may incur losses due to incorrect assessments of investments by its investment adviser. Foreign investments involve additional risks, including currency fluctuations, liquidity, political, economic and market instability, and different legal and accounting standards. Dealer inventories of bonds are at or near historic lows in relation to market size, which has the potential to decrease liquidity and increase price volatility in the fixed income markets.
How did the Portfolio perform during the 12-month period ended December 31, 2016?
Thrivent High Yield Portfolio earned a return of 12.78%, compared with the median return of its peer group, the Lipper U.S. High Current Yield category, of 13.82%. The Portfolio’s market benchmark, the Bloomberg Barclays U.S. Corporate High Yield Bond Index, earned a return of 17.13%.
What factors affected the Portfolio’s performance?
For a second straight year, trading in the high-yield bond market was heavily influenced by developments in the oil market. Energy bonds constitute about 15% of the high-yield market, and the sharp downturn in crude oil prices from June 2014 through the end of 2015, to about $30 a barrel, weighed heavily on those bonds during 2015. In the first half of 2016, oil prices rebounded to just under $50 a barrel after the Organization of Petroleum Exporting Countries (OPEC) agreed to production cuts. Oil prices then spurted above $50 a barrel at year-end on expectations that Donald Trump’s election to the presidency will usher in a new wave of infrastructure spending and economic growth. These developments were viewed as making high-yield bonds—especially energy bonds—less risky and, hence, more attractive and helped drive dramatic increases in their prices. Within the Bloomberg Barclays U.S. Corporate High Yield Bond Index, for example, bonds issued by oil and gas services companies generated a total return of 39.5% for the year.
The Portfolio underperformed its Lipper peer group and benchmark index largely because the Portfolio was invested more conservatively than either its peer or its benchmark. The Portfolio generally owns securities with higher credit ratings, on average, than its peer group or benchmark. In 2016, higher-quality high-yield bonds significantly underperformed those at the lower end of the credit-quality spectrum, where many energy-related bonds are clustered. Within the Bloomberg Barclays index, for example, CCC-rated bonds generated a total return of about 31.5%, while B-rated bonds earned 15.8%.
The Portfolio benefited from strong security selection in the shipping and paper industries, where its returns significantly outpaced those of the index. The Portfolio earned double-digit returns in the oil services, oil and gas exploration, and metals and mining sectors. However, owing to its bias toward higher-credit-quality securities and underweighted positions, it underperformed its benchmark in those areas. The Portfolio held about 7% of its assets in cash during the first quarter of the year, and then took that position below 5% as the outlook for the high-yield sector began to improve.
What is your outlook?
After eight years of economic recovery, the U.S. is late in the credit cycle. This would argue against investing aggressively in risk products, including high-yield debt, where valuations appear to be relatively rich after their strong gains in 2016. Several factors prevent us from being bearish on the high-yield sector, however, including improving global economic growth, improving business and consumer confidence, a more stable oil market, and continued accommodative monetary policy in Europe and Japan. These factors suggest there is no imminent threat of recession in the U.S. In addition, yields on high-yield debt remain attractive relative to most alternatives, which should support continued demand for the asset class in 2017. Strategically, we may shift some of the Portfolio’s assets out of BB-rated bonds—the highest credit quality sector in the high-yield market—into B-rated securities, which should suffer less if, as expected, the Federal Reserve raises short-term interest rates.
48
Table of Contents
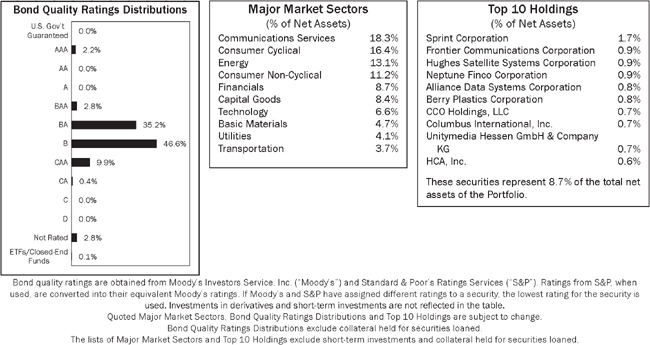
Average Annual Total Returns1
As of December 31, 2016
| 1-Year | 5-Year | 10-Year | ||
| 12.78% | 6.82% | 6.86% |
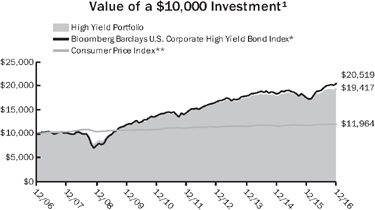
Past performance is not an indication of future results. Total investment return and principal value will fluctuate and units, when redeemed, may be worth more or less than their original cost. Current performance may be higher or lower than the performance data quoted. Call 800-THRIVENT (847-4836) or visit thrivent.com for performance results current to the most recent month-end. The prospectus contains more complete information on the investment objectives, risks, charges and expenses of the investment company, which investors should read and consider carefully before investing. To obtain a prospectus, contact a registered representative or visit thrivent.com.
| 1 | Average annual total returns for the Portfolio represent past performance and reflect changes in share prices, the reinvestment of all dividends and capital gains, and the effects of compounding. Periods of less than one year are not annualized. At various times, the Portfolio’s adviser may have waived its management fee and/or reimbursed Portfolio expenses. If this were the case, the Portfolio’s return would have been lower. The returns shown do not reflect any charges or expenses imposed on contract holders by the variable accounts. Those charges and expenses reduce the returns received by contract holders as compared to the returns presented. Unless otherwise noted, the index results shown do not reflect deductions for fees, expenses, or taxes. Index results shown reflect reinvestment of dividends. It is not possible to invest directly in an index. |
| * | The Bloomberg Barclays U.S. Corporate High Yield Bond Index is an index which measures the performance of fixed-rate non-investment grade bonds. |
| ** | The Consumer Price Index is an inflationary indicator that measures the change in the cost of a fixed basket of products and services, including housing, electricity, food and transportation. |
49
Table of Contents
Stephen D. Lowe, CFA, Portfolio Manager
Thrivent Income Portfolio seeks a high level of income over the longer term while providing reasonable safety of capital.
The Portfolio primarily invests in investment-grade corporate bonds, government bonds, asset-backed securities and mortgage-backed securities. The value of the Portfolio is influenced by factors impacting the overall market, certain asset classes, certain investment styles, and specific issuers. The Portfolio may incur losses due to incorrect assessments of investments by its investment adviser. Bond prices generally fall as interest rates rise. Credit risk is the risk that an issuer of a debt security may not pay its debt, and high yield securities are subject to increased credit risk as well as liquidity risk. The value of mortgage-related and other asset-backed securities will be influenced by the factors affecting the housing market and the assets underlying such securities. Foreign investments involve additional risks, including currency fluctuations, liquidity, political, economic and market instability, and different legal and accounting standards. The prices of futures contracts can be highly volatile and the loss from investing in them can exceed the initial investment. Dealer inventories of bonds are at or near historic lows in relation to market size, which has the potential to decrease liquidity and increase price volatility in the fixed income markets.
How did the Portfolio perform during the 12-month period ended December 31, 2016?
Thrivent Income Portfolio generated a return of 6.09%, compared with the median return of its peer group, the Lipper Corporate Debt Funds BBB-Rated category, of 4.26%. The Portfolio’s market benchmark, the Bloomberg Barclays U.S. Aggregate Bond Index, earned a return of 2.65%.
What factors affected the Portfolio’s performance?
The Portfolio invests in a broad cross section of the fixed-income markets, which were characterized by two very different investment climates during the first and second halves of the year. During the first part of the year, sluggish U.S. economic growth convinced investors that the Federal Reserve was unlikely to follow through with its plans for a series of interest-rate hikes. In response, investors flocked to interest-sensitive U.S. Treasury bonds, driving their prices up and their yields down. By early July, the 30-year Treasury bonds were up more than 20% on a price basis alone, and the 10-year Treasury bonds were up more than 9%.
Prices for oil and many other commodities had been improving during the first half, however, and during the second half of the year the economy picked up steam, too, making the prospect of a Fed rate hike begin to appear more likely. Some investors began selling Treasuries and searching instead for yield in corporate bonds, including high-yield bonds, which proceeded to rack up sharp gains. High-yield bonds carry below-investment-grade credit ratings but are considered less risky when the economy is improving. In December, the Fed raised its target for short-term interest rates by a quarter of a percentage point, and by year-end the price gains notched by Treasuries had evaporated.
The Portfolio outperformed its benchmark index and peer group largely due to a higher allocation to corporate bonds and a smaller allocation to Treasuries. The Portfolio’s high-yield bonds were among its best performers, earning a return before expenses of about 11%, although the Portfolio’s bias toward holding higher-credit-quality high-yield bonds moderated the benefit. (Lower-quality high-yield bonds, including many issued by energy and commodity companies, performed even better.) Also, the Portfolio’s benchmark index contains no high-yield bonds.
The Portfolio also benefited from returns of about 11% on its leveraged loans, before expenses, and about 15.5% on its non- U.S. sovereign bonds, although the latter represented less than 1% of the Portfolio’s holdings. Its weakest performers were Treasuries, which earned about 0.7% before expenses, and securitized assets, which earned about 3.3%. The latter figure was low relative to the Portfolio’s total return, but above what securitized assets in the benchmark index earned.
The Portfolio allocated about 29% of its assets to financial-sector securities, which earned more than 5% before expenses and contributed to the Portfolio outperforming its benchmark. There was no material difference in the performance of that sector relative to the Portfolio’s Lipper peer group. The Portfolio also used derivatives, in the form of fixed-income futures traded on major exchanges, to adjust the Portfolio’s duration, or sensitivity to interest rates. Interest-rate positioning, via cash and futures positions, proved modestly positive for Portfolio returns.
What is your outlook?
Political and economic uncertainty is heightened around the globe, particularly with a new administration in Washington, making forecasts difficult. Assuming no dramatic developments, we anticipate moderate economic growth in 2017, which ultimately should lead to an uptick in inflation and higher interest rates. Low interest rates throughout much of the rest of the world should help to dampen rate increases in the U.S., however. If so, the Portfolio should be able to generate positive returns, albeit not on the scale we saw in 2016.
50
Table of Contents
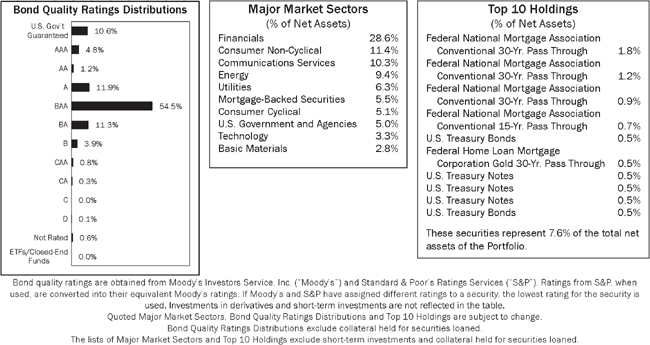
Average Annual Total Returns1
As of December 31, 2016
1-Year | 5-Year | 10-Year | ||
| 6.09% | 4.51% | 5.15% |
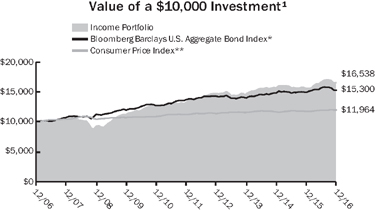
Past performance is not an indication of future results. Total investment return and principal value will fluctuate and units, when redeemed, may be worth more or less than their original cost. Current performance may be higher or lower than the performance data quoted. Call 800-THRIVENT (847-4836) or visit thrivent.com for performance results current to the most recent month-end. The prospectus contains more complete information on the investment objectives, risks, charges and expenses of the investment company, which investors should read and consider carefully before investing. To obtain a prospectus, contact a registered representative or visit thrivent.com.
| 1 | Average annual total returns for the Portfolio represent past performance and reflect changes in share prices, the reinvestment of all dividends and capital gains, and the effects of compounding. Periods of less than one year are not annualized. At various times, the Portfolio’s adviser may have waived its management fee and/or reimbursed Portfolio expenses. If this were the case, the Portfolio’s return would have been lower. The returns shown do not reflect any charges or expenses imposed on contract holders by the variable accounts. Those charges and expenses reduce the returns received by contract holders as compared to the returns presented. Unless otherwise noted, the index results shown do not reflect deductions for fees, expenses, or taxes. Index results shown reflect reinvestment of dividends. It is not possible to invest directly in an index. |
| * | The Bloomberg Barclays U.S. Aggregate Bond Index is an index that measures the performance of U.S. investment grade bonds. |
| ** | The Consumer Price Index is an inflationary indicator that measures the change in the cost of a fixed basket of products and services, including housing, electricity, food and transportation. |
51
Table of Contents
Michael G. Landreville, CFA and CPA (inactive), Portfolio Manager
Thrivent Bond Index Portfolio strives for investment results similar to the total return of the Bloomberg Barclays U.S. Aggregate Bond Index.
The Portfolio primarily invests in investment-grade bonds and other debt securities. The value of the Portfolio is influenced by factors impacting the overall market, the debt market in particular, and specific issuers. The Portfolio may incur losses due to incorrect assessments of investments by its investment adviser. Bond prices generally fall as interest rates rise. Credit risk is the risk that an issuer of a debt security may not pay its debt. The value of mortgage-related and other asset-backed securities will be influenced by the factors affecting the housing market and the assets underlying such securities. Collateralized debt obligations are subject to additional risks. Dealer inventories of bonds are at or near historic lows in relation to market size, which has the potential to decrease liquidity and increase price volatility in the fixed income markets.
How did the Portfolio perform during the 12-month period ended December 31, 2016?
Thrivent Bond Index Portfolio generated a return of 1.49%, compared with 2.65% for the Portfolio’s market benchmark, the Bloomberg Barclays U.S. Aggregate Bond Index.
What factors affected the Portfolio’s performance?
The Portfolio seeks to replicate the Bloomberg Barclays index in terms of its overall duration and how it allocates assets to each of four sectors of the fixed-income markets: U.S. Treasury securities; other government-related bonds; securitized assets; and corporate bonds. The Portfolio’s returns can differ from those of the index, though, not only because the index incurs no trading or operating expenses but also by virtue of security selection. The Portfolio cannot invest in every security in the index, and within different sectors of the bond market, the Portfolio’s managers are able to choose securities that may underperform or outperform those in the index. In addition, it may take some time for the Portfolio to invest cash inflows, a factor that weighed on Portfolio returns in 2016.
Bond prices mostly rose during the first half of the year after economic growth slowed, dimming prospects that the Federal Reserve would follow through on its plans to raise short-term interest rates. That drove the yield on the 10-year U.S. Treasury bond to a record low close of 1.37% on July 5. (Bond yields fall when bond prices go up.) As the year wore on, signs of stronger economic growth, along with rebounding oil prices, revived expectations of a Fed rate hike. During the second half of the year, Treasuries gave back their earlier gains while taxable bonds fared better—especially those in the lower-quality investment-grade corporate sector—as the brightening economic outlook created optimism about issuers’ prospects. In December, the Fed raised its target for short-term interest rates by a quarter of a percentage point, to between 0.5% and 0.75%.
The Portfolio allocated about 44% of its assets to U.S. government and agency securities, which performed in line with that sector’s performance in the benchmark index. The Portfolio allocated about 27% of its assets to mortgage-backed securities, which earned about 2.4% before expenses, versus about 1.7% within the index.
The Portfolio underperformed its benchmark index for three principal reasons. In the corporate sector, it maintained a higher allocation to higher-credit-quality bonds than the index, and a smaller allocation to lower-credit-quality bonds. While the rebound in oil prices and economic growth sparked renewed confidence in corporate bonds, it was those at the lower end of the credit-quality scale that benefited the most. The Portfolio also was negatively impacted by holding some cash over the course of the year and by an overweighting in U.S. Treasuries.
The Portfolio benefited from strong security selection in the securitized sector, where it outperformed the index, although that benefit was offset in part by the Portfolio’s slightly smaller allocation to that asset class.
What is your outlook?
We anticipate that the economy will continue to grow at a moderate pace in 2017 and that the Fed will gradually raise short-term rates over the course of the year, perhaps by another three-quarters of a percentage point. Under this scenario, the Portfolio would likely generate modestly positive returns, about in line with its yield. At year-end 2016, that yield was about 2.5% before expenses, although that figure can fluctuate as market conditions change. To minimize the buildup of cash in the Portfolio going forward, the Portfolio from time to time may invest cash inflows into exchange-traded funds to gain quick exposure to the fixed-income market, and then later reallocate those cash inflows to individual securities.
52
Table of Contents
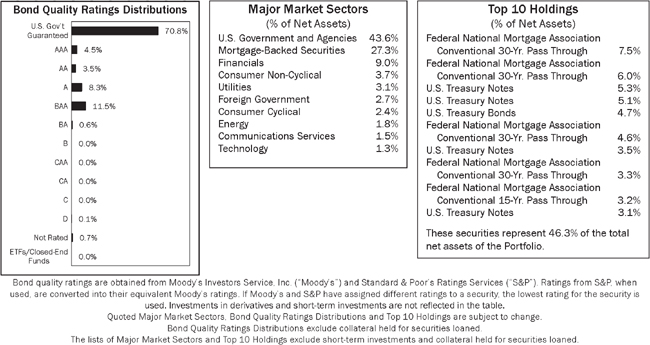
Average Annual Total Returns1
As of December 31, 2016
1-Year | 5-Year | 10-Year | ||
| 1.49% | 2.21% | 4.13% |
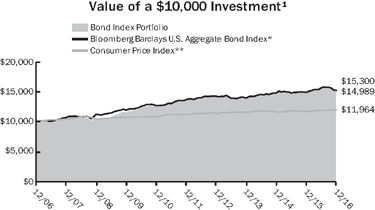
Past performance is not an indication of future results. Total investment return and principal value will fluctuate and units, when redeemed, may be worth more or less than their original cost. Current performance may be higher or lower than the performance data quoted. Call 800-THRIVENT (847-4836) or visit thrivent.com for performance results current to the most recent month-end. The prospectus contains more complete information on the investment objectives, risks, charges and expenses of the investment company, which investors should read and consider carefully before investing. To obtain a prospectus, contact a registered representative or visit thrivent.com.
| 1 | Average annual total returns for the Portfolio represent past performance and reflect changes in share prices, the reinvestment of all dividends and capital gains, and the effects of compounding. Periods of less than one year are not annualized. At various times, the Portfolio’s adviser may have waived its management fee and/or reimbursed Portfolio expenses. If this were the case, the Portfolio’s return would have been lower. The returns shown do not reflect any charges or expenses imposed on contract holders by the variable accounts. Those charges and expenses reduce the returns received by contract holders as compared to the returns presented. Unless otherwise noted, the index results shown do not reflect deductions for fees, expenses, or taxes. Index results shown reflect reinvestment of dividends. It is not possible to invest directly in an index. |
| * | The Bloomberg Barclays U.S. Aggregate Bond Index is an index that measures the performance of U.S. investment grade bonds. |
| ** | The Consumer Price Index is an inflationary indicator that measures the change in the cost of a fixed basket of products and services, including housing, electricity, food and transportation. |
53
Table of Contents
THRIVENT LIMITED MATURITY BOND PORTFOLIO
Michael G. Landreville, CFA and CPA (inactive) and Gregory R. Anderson, CFA, Portfolio Co-Managers
Thrivent Limited Maturity Bond Portfolio seeks a high level of current income consistent with stability of principal.
The Portfolio primarily invests in investment-grade debt securities. The value of the Portfolio is influenced by factors impacting the overall market, debt securities in particular, and specific issuers. The Portfolio may incur losses due to incorrect assessments of investments by its investment adviser. Bond prices generally fall as interest rates rise. Credit risk is the risk that an issuer of a debt security may not pay its debt. The value of mortgage-related and other asset-backed securities will be influenced by the factors affecting the housing market and the assets underlying such securities. Foreign investments involve additional risks, including currency fluctuations, liquidity, political, economic and market instability, and different legal and accounting standards. The prices of futures contracts can be highly volatile and the loss from investing in them can exceed the initial investment. Collateralized debt obligations are subject to additional risks. Dealer inventories of bonds are at or near historic lows in relation to market size, which has the potential to decrease liquidity and increase price volatility in the fixed income markets.
How did the Portfolio perform during the 12-month period ended December 31, 2016?
Thrivent Limited Maturity Bond Portfolio earned a return of 2.84%, compared with the median return of its peer group, the Lipper Short-Intermediate Investment Grade Debt category, of 2.04%. The Portfolio’s market benchmark, the Bloomberg Barclays 1-3 Year Government/Credit Bond Index, earned a return of 1.28%.
What factors affected the Portfolio’s performance?
The Portfolio had about 81% of its assets allocated to corporate bonds, leveraged loans and securitized assets in 2016 and 19% to U.S. Treasuries and other government-related bonds. During the first half of the year, tepid economic growth dampened expectations that the Federal Reserve would follow through with its plans to boost short-term interest rates. Against that backdrop, Treasury bonds, which are highly rate-sensitive, significantly outperformed most taxable bonds. That dynamic reversed in the second half of the year as economic conditions improved, with Treasuries giving up their earlier gains and taxable bonds spiking higher. High-yield bonds, including many energy and metals and mining bonds, did particularly well as commodity prices rebounded throughout the year. In December, the Fed finally boosted its target for short-term interest rates by a quarter of a percentage point, to a range of 0.50% to 0.75%. It was only the second such increase since 2006, the first having been made one year earlier.
The Portfolio took advantage of the shifts in market sentiment by overweighting longer-duration securities at the start of the year and adopting a more neutral weighting mid-year. Longer-duration securities react more strongly to interest-rate changes than shorter-duration securities, which made them especially valuable during the first six months of the year.
The Portfolio outperformed its market benchmark in part because of the decision to emphasize longer-duration securities during the first half of the year. It also benefited from strong security selection, and slightly overweighted positions in leveraged loans, nonagency residential mortgage-backed securities and investment-grade corporate bonds. An overweighted position in Treasury Inflation Protected Securities, or TIPS, also helped returns, while a small allocation to cash was a drag on returns.
Leveraged loans were the Portfolio’s top performers for the year, earning more than 11.5% before expenses, followed by nonagency mortgage-backed securities, which earned nearly 7%, and high-yield bonds, which earned about 6%. Cash was the poorest performer, earning just under 0.5%, followed by Treasuries, other government-related debt, and agency mortgage-backed securities, all of which earned about 2.4%.
The Portfolio used derivatives, in the form of fixed-income futures traded on major exchanges, to adjust the Portfolio’s duration, or sensitivity to interest rates. Interest-rate positioning, via cash and futures positions, proved modestly positive for Portfolio returns.
What is your outlook?
We anticipate continued modest economic growth in 2017, which would allow the Fed to follow through on expectations it will raise short-term interest rates several more times. While rising rates are a negative for bonds, the impact would be moderated for the Portfolio to some degree due to its shorter-duration profile and its allocation to floating-rate bonds, which have coupons that adjust higher as short-term rates rise. Assuming economic growth and Fed policy play out as expected, it would not be unreasonable to expect the Portfolio to generate returns in 2017 about equal to the average yield on its fixed-income holdings. That yield was just under 2% at the start of the year, but can fluctuate as market conditions change.
54
Table of Contents
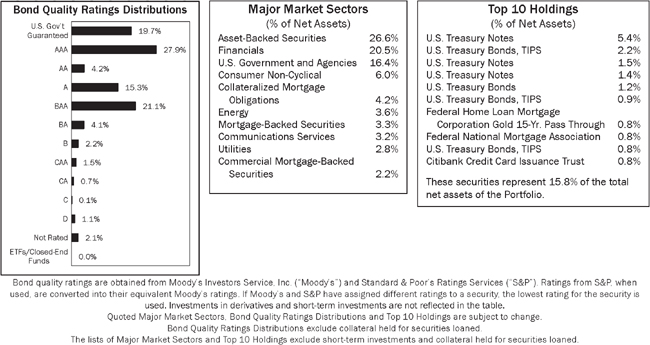
Average Annual Total Returns1
As of December 31, 2016
1-Year | 5-Year | 10-Year | ||
| 2.84% | 1.99% | 2.66% |
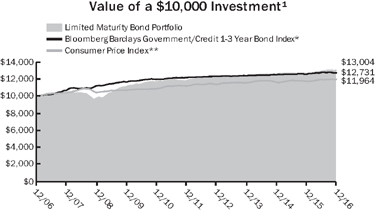
Past performance is not an indication of future results. Total investment return and principal value will fluctuate and units, when redeemed, may be worth more or less than their original cost. Current performance may be higher or lower than the performance data quoted. Call 800-THRIVENT (847-4836) or visit thrivent.com for performance results current to the most recent month-end. The prospectus contains more complete information on the investment objectives, risks, charges and expenses of the investment company, which investors should read and consider carefully before investing. To obtain a prospectus, contact a registered representative or visit thrivent.com.
| 1 | Average annual total returns for the Portfolio represent past performance and reflect changes in share prices, the reinvestment of all dividends and capital gains, and the effects of compounding. Periods of less than one year are not annualized. At various times, the Portfolio’s adviser may have waived its management fee and/or reimbursed Portfolio expenses. If this were the case, the Portfolio’s return would have been lower. The returns shown do not reflect any charges or expenses imposed on contract holders by the variable accounts. Those charges and expenses reduce the returns received by contract holders as compared to the returns presented. Unless otherwise noted, the index results shown do not reflect deductions for fees, expenses, or taxes. Index results shown reflect reinvestment of dividends. It is not possible to invest directly in an index. |
| * | The Bloomberg Barclays Government/Credit 1-3 Year Bond Index is an index that measures the performance of government and corporate fixed-rate debt securities with maturities of 1-3 years. |
| ** | The Consumer Price Index is an inflationary indicator that measures the change in the cost of a fixed basket of products and services, including housing, electricity, food and transportation. |
55
Table of Contents
THRIVENT MONEY MARKET PORTFOLIO
William D. Stouten, Portfolio Manager
Thrivent Money Market Portfolio seeks to achieve the maximum current income that is consistent with stability of capital and maintenance of liquidity.
The Portfolio invests in high quality, short-term money market instruments. Although the Portfolio seeks to preserve the value of your investment at $1.00 per share, it is possible to lose money by investing in the Portfolio. Credit risk is the risk that an issuer of a debt security may not pay its debt. Low or declining short-term interest rates can negatively impact the Portfolio. The financial services industry is particularly vulnerable to certain factors, such as the availability and cost of borrowing and raising additional capital, changes in interest rates, the rate of corporate and consumer debt defaults, and price competition. The Portfolio could experience a loss when selling portfolio securities to meet redemption requests.
How did the Portfolio perform during the 12-month period ended December 31, 2016?
Thrivent Money Market Portfolio produced a 0.00% return during the period, just under the 0.01% median net return reported by its peer group, the Lipper Money Market category.
What factors affected the Portfolio’s performance?
The Portfolio generated negligible returns for a seventh consecutive year as the Federal Reserve kept short-term interest rates low to support the economy.
Heading into 2016, the Fed had anticipated raising rates several times over the course of the year amid indications the U.S. economy had stabilized enough to support a more normalized interest-rate environment. When the economy posted only tepid growth in the fourth quarter of 2015 and the first quarter of 2016, though, and showed signs of continued weakness in the labor market, the Fed opted to hold interest rates where they were. It was only after improvement in labor market conditions in the third quarter of 2016 that the Fed finally took action in December, raisings its target for the federal funds rate—the rate at which banks borrow from each other overnight—by a quarter of a percentage point to between 0.50% and 0.75%. It had made a similar quarter-point increase—its first since 2006—in December 2015.
Despite these moves, yields on short-term securities remained just above their historic lows for much of 2016. In that environment, it remained difficult for money market funds to generate positive returns after accounting for trading and operating expenses. As it has done for the past several years, the Portfolio’s investment adviser continued to waive fees on the Portfolio to ensure that investors would not experience a negative return.
Early in 2016, Thrivent Money Market Portfolio completed its transition from a prime fund to a government fund, meaning it now invests only in securities backed by the U.S. government. This change allows Portfolio contract owners to avoid becoming subject to the risks of liquidity fees, redemption gates and floating net asset values—risks that owners of prime money market funds are now subject to under Securities and Exchange Commission (SEC) rules that took effect in 2016.
In higher interest-rate environments, the Portfolio can expect to have a lower net yield as a government money market fund than it would have had as a prime fund. However, Portfolio contract owners will benefit from enhanced levels of security knowing that all of the Portfolio’s holdings are backed by the full faith and credit of the federal government.
What is your outlook?
As 2016 drew to a close, Federal Reserve officials were indicating that they expect to implement additional rate hikes in 2017, pushing their target for the federal funds rate to 1.4% by year-end 2017. The actual rate was 0.55% at year-end 2016. A federal funds rate of 0.75% or higher would allow the Portfolio to begin delivering a positive return to investors. Regardless of the interest-rate environment, we will, as always, continue to invest in a manner designed to meet the Portfolio’s primary objectives of safety and liquidity.
An investment in the Thrivent Money Market Fund is not insured
or guaranteed by the FDIC or any other government agency.
Although the Fund seeks to preserve the value of your investment at $1.00 per share,
it is possible to lose money by investing in the Portfolio.
56
Table of Contents
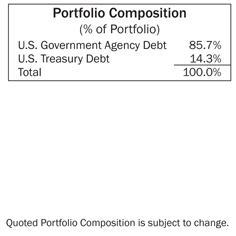
Average Annual Total Returns1
As of December 31, 2016
1-Year | 5-Year | 10-Year | ||
| 0.00% | 0.00% | 0.84% |
Money Market Portfolio Yields *
As of December 31, 2016
| Portfolio | ||||
7-Day Yield | 0.00 | % | ||
7-Day Yield Gross of Waivers** | 0.11 | % | ||
7-Day Effective Yield | 0.00 | % | ||
7-Day Effective Yield Gross of Waivers** | 0.11 | % | ||
Past performance is not an indication of future results. Total investment return and principal value will fluctuate and units, when redeemed, may be worth more or less than their original cost. Current performance may be higher or lower than the performance data quoted. Call 800-THRIVENT (847-4836) or visit thrivent.com for performance results current to the most recent month-end. The prospectus contains more complete information on the investment objectives, risks, charges and expenses of the investment company, which investors should read and consider carefully before investing. To obtain a prospectus, contact a registered representative or visit thrivent.com.
| 1 | Average annual total returns for the Portfolio represent past performance and reflect changes in share prices, the reinvestment of all dividends and capital gains, and the effects of compounding. Periods of less than one year are not annualized. At various times, the Portfolio’s adviser may have waived its management fee and/or reimbursed Portfolio expenses. If this were the case, the Portfolio’s return would have been lower. The returns shown do not reflect any charges or expenses imposed on contract holders by the variable accounts. Those charges and expenses reduce the returns received by contract holders as compared to the returns presented. |
| * | Seven-day yields of Thrivent Money Market Portfolio refer to the income generated by an investment in the Portfolio over a specified seven-day period. Effective yields reflect the reinvestment of income. A yield gross of waivers represents what the yield would have been if the Adviser were not waiving, reimbursing, or recouping certain expenses associated with the Portfolio. The Adviser may recoup certain expenses associated with the Portfolio only during the Portfolio’s fiscal year. Yields are subject to daily fluctuation and should not be considered an indication of future results. |
| ** | During the year ended December 31, 2016, the Portfolio’s yield became positive and therefore, the Adviser recouped previously reimbursed amounts from the current fiscal year. The current 7-day yield gross of waivers and 7-day effective yield gross of waivers reflect the yield before the reimbursed amounts were recouped |
57
Table of Contents
(unaudited)
As a shareholder of the Thrivent Series Fund, Inc., you incur ongoing costs, including management fees and other Portfolio expenses. This Example is intended to help you understand your ongoing costs (in dollars) of investing in a Portfolio and to compare these costs with the ongoing costs of investing in other mutual funds. The Example is based on an investment of $1,000 invested at the beginning of the period and held for the entire period from July 1, 2016 through December 31, 2016. Shares in a Portfolio are currently sold, without sales charges, only to separate accounts of Thrivent Financial for Lutherans and Thrivent Life Insurance Company, which are used to fund benefits of variable life insurance and variable annuity contracts issued by Thrivent Financial for Lutherans and Thrivent Life Insurance Company, and retirement plans sponsored by Thrivent Financial for Lutherans. Expenses associated with these variable contracts and retirement plans are not included in these examples and had these costs been included, your costs would have been higher.
Actual Expenses
In the table below, the first section, labeled “Actual,” provides information about actual account values and actual expenses. You may use the information in this line, together with the amount you invested, to estimate the expenses that you paid over the period. Simply divide your account value by $1,000 (for example, an $8,600 account value divided by $1,000 = 8.6), then multiply the result by the number in the first line under the heading entitled “Expenses Paid During Period” to estimate the expenses you paid.
Hypothetical Example for Comparison Purposes
In the table below, the second section, labeled “Hypothetical,” provides information about hypothetical account values and hypothetical expenses based on the Portfolio’s actual expense ratio and an assumed rate of return of 5% per year before expenses, which is not the Portfolio’s actual return. The hypothetical account values and expenses may not be used to estimate the actual ending account balance or expenses you paid for the period. You may use this information to compare the ongoing costs of investing in the Portfolio and other funds. To do so, compare this 5% hypothetical example with the 5% hypothetical examples that appear in the shareholder reports of the other funds.
| Beginning Account Value 7/1/2016 | Ending Account Value 12/31/2016 | Expenses Paid During Period 7/1/2016 -12/31/2016* | Annualized Expense Ratio | |||||||||||||
Thrivent Aggressive Allocation Portfolio |
| |||||||||||||||
Actual | $ | 1,000 | $ | 1,093 | $ | 3.02 | 0.57 | % | ||||||||
Hypothetical** | $ | 1,000 | $ | 1,022 | $ | 2.92 | 0.57 | % | ||||||||
Thrivent Moderately Aggressive Allocation Portfolio |
| |||||||||||||||
Actual | $ | 1,000 | $ | 1,082 | $ | 2.43 | 0.46 | % | ||||||||
Hypothetical** | $ | 1,000 | $ | 1,023 | $ | 2.36 | 0.46 | % | ||||||||
Thrivent Moderate Allocation Portfolio |
| |||||||||||||||
Actual | $ | 1,000 | $ | 1,057 | $ | 2.35 | 0.45 | % | ||||||||
Hypothetical** | $ | 1,000 | $ | 1,023 | $ | 2.31 | 0.45 | % | ||||||||
Thrivent Moderately Conservative Allocation Portfolio |
| |||||||||||||||
Actual | $ | 1,000 | $ | 1,031 | $ | 2.37 | 0.46 | % | ||||||||
Hypothetical** | $ | 1,000 | $ | 1,023 | $ | 2.36 | 0.46 | % | ||||||||
Thrivent Growth and Income Plus Portfolio |
| |||||||||||||||
Actual | $ | 1,000 | $ | 1,040 | $ | 4.09 | 0.80 | % | ||||||||
Hypothetical** | $ | 1,000 | $ | 1,021 | $ | 4.05 | 0.80 | % | ||||||||
Thrivent Balanced Income Plus Portfolio |
| |||||||||||||||
Actual | $ | 1,000 | $ | 1,036 | $ | 3.38 | 0.66 | % | ||||||||
Hypothetical** | $ | 1,000 | $ | 1,022 | $ | 3.35 | 0.66 | % | ||||||||
Thrivent Diversified Income Plus Portfolio |
| |||||||||||||||
Actual | $ | 1,000 | $ | 1,034 | $ | 2.45 | 0.48 | % | ||||||||
Hypothetical** | $ | 1,000 | $ | 1,023 | $ | 2.43 | 0.48 | % | ||||||||
Thrivent Opportunity Income Plus Portfolio |
| |||||||||||||||
Actual | $ | 1,000 | $ | 1,017 | $ | 3.40 | 0.67 | % | ||||||||
Hypothetical** | $ | 1,000 | $ | 1,022 | $ | 3.41 | 0.67 | % | ||||||||
Thrivent Partner Healthcare Portfolio |
| |||||||||||||||
Actual | $ | 1,000 | $ | 912 | $ | 4.40 | 0.92 | % | ||||||||
Hypothetical** | $ | 1,000 | $ | 1,021 | $ | 4.65 | 0.92 | % | ||||||||
58
Table of Contents
| Beginning Account Value 7/1/2016 | Ending Account Value 12/31/2016 | Expenses Paid During Period 7/1/2016 -12/31/2016* | Annualized Expense Ratio | |||||||||||||
Thrivent Partner Emerging Markets Equity Portfolio |
| |||||||||||||||
Actual | $ | 1,000 | $ | 993 | $ | 6.48 | 1.29 | % | ||||||||
Hypothetical** | $ | 1,000 | $ | 1,019 | $ | 6.56 | 1.29 | % | ||||||||
Thrivent Real Estate Securities Portfolio |
| |||||||||||||||
Actual | $ | 1,000 | $ | 960 | $ | 4.41 | 0.89 | % | ||||||||
Hypothetical** | $ | 1,000 | $ | 1,021 | $ | 4.54 | 0.89 | % | ||||||||
Thrivent Small Cap Stock Portfolio |
| |||||||||||||||
Actual | $ | 1,000 | $ | 1,202 | $ | 4.03 | 0.73 | % | ||||||||
Hypothetical** | $ | 1,000 | $ | 1,021 | $ | 3.70 | 0.73 | % | ||||||||
Thrivent Small Cap Index Portfolio |
| |||||||||||||||
Actual | $ | 1,000 | $ | 1,190 | $ | 1.49 | 0.27 | % | ||||||||
Hypothetical** | $ | 1,000 | $ | 1,024 | $ | 1.37 | 0.27 | % | ||||||||
Thrivent Mid Cap Stock Portfolio |
| |||||||||||||||
Actual | $ | 1,000 | $ | 1,214 | $ | 3.77 | 0.68 | % | ||||||||
Hypothetical** | $ | 1,000 | $ | 1,022 | $ | 3.44 | 0.68 | % | ||||||||
Thrivent Mid Cap Index Portfolio |
| |||||||||||||||
Actual | $ | 1,000 | $ | 1,117 | $ | 1.56 | 0.29 | % | ||||||||
Hypothetical** | $ | 1,000 | $ | 1,024 | $ | 1.49 | 0.29 | % | ||||||||
Thrivent Partner Worldwide Allocation Portfolio |
| |||||||||||||||
Actual | $ | 1,000 | $ | 1,037 | $ | 4.67 | 0.91 | % | ||||||||
Hypothetical** | $ | 1,000 | $ | 1,021 | $ | 4.63 | 0.91 | % | ||||||||
Thrivent Partner All Cap Portfolio |
| |||||||||||||||
Actual | $ | 1,000 | $ | 1,073 | $ | 4.41 | 0.85 | % | ||||||||
Hypothetical** | $ | 1,000 | $ | 1,021 | $ | 4.30 | 0.85 | % | ||||||||
Thrivent Large Cap Growth Portfolio |
| |||||||||||||||
Actual | $ | 1,000 | $ | 1,058 | $ | 2.27 | 0.44 | % | ||||||||
Hypothetical** | $ | 1,000 | $ | 1,023 | $ | 2.23 | 0.44 | % | ||||||||
Thrivent Partner Growth Stock Portfolio |
| |||||||||||||||
Actual | $ | 1,000 | $ | 1,080 | $ | 4.16 | 0.80 | % | ||||||||
Hypothetical** | $ | 1,000 | $ | 1,021 | $ | 4.04 | 0.80 | % | ||||||||
Thrivent Large Cap Value Portfolio |
| |||||||||||||||
Actual | $ | 1,000 | $ | 1,139 | $ | 3.41 | 0.63 | % | ||||||||
Hypothetical** | $ | 1,000 | $ | 1,022 | $ | 3.22 | 0.63 | % | ||||||||
Thrivent Large Cap Stock Portfolio |
| |||||||||||||||
Actual | $ | 1,000 | $ | 1,082 | $ | 3.47 | 0.66 | % | ||||||||
Hypothetical** | $ | 1,000 | $ | 1,022 | $ | 3.37 | 0.66 | % | ||||||||
Thrivent Large Cap Index Portfolio |
| |||||||||||||||
Actual | $ | 1,000 | $ | 1,077 | $ | 1.31 | 0.25 | % | ||||||||
Hypothetical** | $ | 1,000 | $ | 1,024 | $ | 1.28 | 0.25 | % | ||||||||
Thrivent High Yield Portfolio |
| |||||||||||||||
Actual | $ | 1,000 | $ | 1,058 | $ | 2.30 | 0.45 | % | ||||||||
Hypothetical** | $ | 1,000 | $ | 1,023 | $ | 2.26 | 0.45 | % | ||||||||
Thrivent Income Portfolio |
| |||||||||||||||
Actual | $ | 1,000 | $ | 992 | $ | 2.18 | 0.44 | % | ||||||||
Hypothetical** | $ | 1,000 | $ | 1,023 | $ | 2.22 | 0.44 | % | ||||||||
Thrivent Bond Index Portfolio |
| |||||||||||||||
Actual | $ | 1,000 | $ | 967 | $ | 2.22 | 0.45 | % | ||||||||
Hypothetical** | $ | 1,000 | $ | 1,023 | $ | 2.28 | 0.45 | % | ||||||||
Thrivent Limited Maturity Bond Portfolio |
| |||||||||||||||
Actual | $ | 1,000 | $ | 1,008 | $ | 2.24 | 0.44 | % | ||||||||
Hypothetical** | $ | 1,000 | $ | 1,023 | $ | 2.26 | 0.44 | % | ||||||||
59
Table of Contents
| Beginning Account Value 7/1/2016 | Ending Account Value 12/31/2016 | Expenses Paid During Period 7/1/2016 -12/31/2016* | Annualized Expense Ratio | |||||||||||||
Thrivent Money Market Portfolio |
| |||||||||||||||
Actual | $ | 1,000 | $ | 1,000 | $ | 2.31 | 0.46 | % | ||||||||
Hypothetical** | $ | 1,000 | $ | 1,023 | $ | 2.33 | 0.46 | % | ||||||||
60
Table of Contents
 | Report of Independent Registered Public Accounting Firm |
To the Board of Directors and Shareholders of the Thrivent Series Fund, Inc.:
In our opinion, the accompanying statements of assets and liabilities, including the schedules of investments of Thrivent Partner Healthcare Portfolio, Thrivent Partner Emerging Markets Equity Portfolio, Thrivent Real Estate Securities Portfolio, Thrivent Small Cap Stock Portfolio, Thrivent Mid Cap Stock Portfolio, Thrivent Partner All Cap Portfolio, Thrivent Large Cap Growth Portfolio, Thrivent Partner Growth Stock Portfolio, Thrivent Large Cap Value Portfolio, Thrivent Bond Index Portfolio, and Thrivent Money Market Portfolio, and the summary schedules of investments of Thrivent Aggressive Allocation Portfolio, Thrivent Moderately Aggressive Allocation Portfolio, Thrivent Moderate Allocation Portfolio, Thrivent Moderately Conservative Allocation Portfolio, Thrivent Growth and Income Plus Portfolio, Thrivent Balanced Income Plus Portfolio, Thrivent Diversified Income Plus Portfolio, Thrivent Opportunity Income Plus Portfolio, Thrivent Small Cap Index Portfolio, Thrivent Mid Cap Index Portfolio, Thrivent Partner Worldwide Allocation Portfolio, Thrivent Large Cap Stock Portfolio, Thrivent Large Cap Index Portfolio, Thrivent High Yield Portfolio, Thrivent Income Portfolio, and Thrivent Limited Maturity Bond Portfolio (collectively constituting Thrivent Series Fund, Inc.) (hereafter collectively referred to as the “Funds”), and the related statements of operations and of changes in net assets and the financial highlights present fairly, in all material respects, the financial position of the Funds as of December 31, 2016, the results of each of their operations for the year then ended, the changes in each of their net assets for each of the two years in the period then ended and their financial highlights for each of the five years in the period then ended, in conformity with accounting principles generally accepted in the United States of America. These financial statements and financial highlights (hereafter referred to as “financial statements”) are the responsibility of the Funds’ management. Our responsibility is to express an opinion on these financial statements based on our audits. We conducted our audits of these financial statements in accordance with the standards of the Public Company Accounting Oversight Board (United States). Those standards require that we plan and perform the audit to obtain reasonable assurance about whether the financial statements are free of material misstatement. An audit includes examining, on a test basis, evidence supporting the amounts and disclosures in the financial statements, assessing the accounting principles used and significant estimates made by management, and evaluating the overall financial statement presentation. We believe that our audits, which included confirmation of securities as of December 31, 2016 by correspondence with the custodian, agent banks, transfer agent and brokers provide a reasonable basis for our opinion.

February 20, 2017
PricewaterhouseCoopers LLP, 45 South Seventh Street, Suite 3400, Minneapolis, MN 55402
T: (612) 596 6000, F: (612) 373 7160, www.pwc.com/us
61
Table of Contents
AGGRESSIVE ALLOCATION PORTFOLIO
Summary Schedule of Investments as of December 31, 2016
| % of Net | ||||||||||||
| Shares | Common Stock (53.8%) | Value | Assets | |||||||||
Consumer Discretionary (7.9%) | ||||||||||||
| 17,326 | Amazon.com, Inc.a | $ | 12,992,248 | 1.2 | % | |||||||
| 4,520 | AutoZone, Inc.a | 3,569,851 | 0.3 | % | ||||||||
| 74,278 | Comcast Corporation | 5,128,896 | 0.5 | % | ||||||||
| 37,500 | Home Depot, Inc. | 5,028,000 | 0.5 | % | ||||||||
| 84,880 | Nutrisystem, Inc. | 2,941,092 | 0.3 | % | ||||||||
| 38,800 | Walt Disney Company | 4,043,736 | 0.4 | % | ||||||||
Other Securities^ | 50,239,084 | 4.7 | % | |||||||||
|
| |||||||||||
Total | 83,942,907 | |||||||||||
|
| |||||||||||
Consumer Staples (1.6%) | ||||||||||||
| 44,970 | Walgreens Boots Alliance, Inc. | 3,721,717 | 0.4 | % | ||||||||
Other Securities^ | 13,496,609 | 1.2 | % | |||||||||
|
| |||||||||||
Total | 17,218,326 | |||||||||||
|
| |||||||||||
Energy (5.1%) | ||||||||||||
| 33,250 | Chevron Corporation | 3,913,525 | 0.4 | % | ||||||||
| 44,321 | EQT Corporation | 2,898,593 | 0.3 | % | ||||||||
| 63,520 | Halliburton Company | 3,435,797 | 0.3 | % | ||||||||
| 17,360 | Pioneer Natural Resources Company | 3,126,015 | 0.3 | % | ||||||||
| 33,738 | Schlumberger, Ltd. | 2,832,305 | 0.3 | % | ||||||||
| 75,130 | Suncor Energy, Inc. ADR | 2,456,000 | 0.2 | % | ||||||||
| 46,560 | Valero Energy Corporation | 3,180,979 | 0.3 | % | ||||||||
| 250,200 | WPX Energy, Inc.a | 3,645,414 | 0.4 | % | ||||||||
Other Securities^ | 28,833,607 | 2.6 | % | |||||||||
|
| |||||||||||
Total | 54,322,235 | |||||||||||
|
| |||||||||||
Financials (6.8%) | ||||||||||||
| 189,680 | Bank of America Corporation | 4,191,928 | 0.4 | % | ||||||||
| 32,448 | First Republic Bank | 2,989,759 | 0.3 | % | ||||||||
| 17,470 | Goldman Sachs Group, Inc. | 4,183,192 | 0.4 | % | ||||||||
| 227,670 | SLM Corporationa | 2,508,923 | 0.2 | % | ||||||||
Other Securities^ | 58,331,488 | 5.5 | % | |||||||||
|
| |||||||||||
Total | 72,205,290 | |||||||||||
|
| |||||||||||
Health Care (7.3%) | ||||||||||||
| 38,971 | Alexion Pharmaceuticals, Inc.a | 4,768,102 | 0.4 | % | ||||||||
| 23,954 | Allergan plca | 5,030,580 | 0.5 | % | ||||||||
| 51,180 | Celgene Corporationa | 5,924,085 | 0.6 | % | ||||||||
| 83,378 | Gilead Sciences, Inc. | 5,970,699 | 0.6 | % | ||||||||
| 47,064 | Medtronic plc | 3,352,369 | 0.3 | % | ||||||||
| 40,583 | NuVasive, Inc.a | 2,733,671 | 0.3 | % | ||||||||
| 34,284 | Vertex Pharmaceuticals, Inc.a | 2,525,702 | 0.2 | % | ||||||||
Other Securities^ | 46,918,490 | 4.4 | % | |||||||||
|
| |||||||||||
Total | 77,223,698 | |||||||||||
|
| |||||||||||
Industrials (6.6%) | ||||||||||||
| 11,740 | Acuity Brands, Inc. | 2,710,296 | 0.3 | % | ||||||||
| 25,270 | Cummins, Inc. | 3,453,651 | 0.3 | % | ||||||||
| 63,851 | Southwest Airlines Company | 3,182,334 | 0.3 | % | ||||||||
| 49,874 | Union Pacific Corporation | 5,170,936 | 0.5 | % | ||||||||
Other Securities^ | 55,473,579 | 5.2 | % | |||||||||
|
| |||||||||||
Total | 69,990,796 | |||||||||||
|
| |||||||||||
Information Technology (14.2%) | ||||||||||||
| 10,943 | Alphabet, Inc., Class Aa | 8,671,780 | 0.8 | % | ||||||||
| 7,997 | Alphabet, Inc., Class Ca | 6,172,245 | 0.6 | % | ||||||||
| 74,744 | Apple, Inc. | 8,656,850 | 0.8 | % | ||||||||
| 30,282 | Arista Networks, Inc.a | 2,930,389 | 0.3 | % | ||||||||
| 27,410 | DST Systems, Inc. | 2,936,982 | 0.3 | % | ||||||||
| 88,100 | Facebook, Inc.a | 10,135,905 | 1.0 | % | ||||||||
| 68,210 | MasterCard, Inc. | 7,042,683 | 0.7 | % | ||||||||
| 163,800 | Microsoft Corporation | 10,178,532 | 1.0 | % | ||||||||
| 136,424 | PayPal Holdings, Inc.a | 5,384,655 | 0.5 | % | ||||||||
| 96,050 | Salesforce.com, Inc.a | 6,575,583 | 0.6 | % | ||||||||
| 98,850 | Visa, Inc. | 7,712,277 | 0.7 | % | ||||||||
Other Securities^ | 74,838,303 | 6.9 | % | |||||||||
|
| |||||||||||
Total | 151,236,184 | |||||||||||
|
| |||||||||||
Materials (2.1%) | ||||||||||||
Other Securities^ | 21,983,136 | 2.1 | % | |||||||||
|
| |||||||||||
Total | 21,983,136 | |||||||||||
|
| |||||||||||
Real Estate (1.0%) | ||||||||||||
Other Securities^ | 11,224,653 | 1.0 | % | |||||||||
|
| |||||||||||
Total | 11,224,653 | |||||||||||
|
| |||||||||||
Telecommunications Services (0.3%) | ||||||||||||
Other Securities^ | 2,994,881 | 0.3 | % | |||||||||
|
| |||||||||||
Total | 2,994,881 | |||||||||||
|
| |||||||||||
Utilities (0.9%) | ||||||||||||
Other Securities^ | 9,194,172 | 0.9 | % | |||||||||
|
| |||||||||||
Total | 9,194,172 | |||||||||||
|
| |||||||||||
Total Common Stock (cost $467,036,687) | 571,536,278 | |||||||||||
|
| |||||||||||
Registered Investment Companies (32.3%) | ||||||||||||
Affiliated Equity Holdings (29.0%) | ||||||||||||
| 3,495,736 | Thrivent Large Cap Stock Portfolio | 42,283,026 | 4.0 | % | ||||||||
| 3,170,544 | Thrivent Large Cap Value Portfolio | 53,389,419 | 5.0 | % | ||||||||
| 3,352,705 | Thrivent Mid Cap Stock Portfolio | 63,971,952 | 6.0 | % | ||||||||
| 12,044,477 | Thrivent Partner Worldwide Allocation Portfolio | 109,497,545 | 10.3 | % | ||||||||
| 2,105,112 | Thrivent Small Cap Stock Portfolio | 38,931,305 | 3.7 | % | ||||||||
|
| |||||||||||
Total | 308,073,247 | |||||||||||
|
| |||||||||||
Affiliated Fixed Income Holdings (2.1%) | ||||||||||||
| 1,768,459 | Thrivent High Yield Portfolio | 8,435,903 | 0.8 | % | ||||||||
| 468,133 | Thrivent Income Portfolio | 4,713,587 | 0.4 | % | ||||||||
| 938,887 | Thrivent Limited Maturity Bond Portfolio | 9,207,570 | 0.9 | % | ||||||||
|
| |||||||||||
Total | 22,357,060 | |||||||||||
|
| |||||||||||
Equity Funds/ETFs (1.2%) | ||||||||||||
| 28,305 | iShares Russell 2000 Growth Index Fund | 4,357,272 | 0.4 | % | ||||||||
| 20,956 | SPDR S&P 500 ETF Trust | 4,684,295 | 0.4 | % | ||||||||
Other Securities^ | 4,299,155 | 0.4 | % | |||||||||
|
| |||||||||||
Total | 13,340,722 | |||||||||||
|
| |||||||||||
Total Registered Investment Companies (cost $321,617,561) | 343,771,029 | |||||||||||
|
| |||||||||||
| Principal | ||||||||||||
| Amount | Long-Term Fixed Income (3.6%) | |||||||||||
Collateralized Mortgage Obligations (<0.1%) | ||||||||||||
Other Securities^ | 225,828 | <0.1 | % | |||||||||
|
| |||||||||||
Total | 225,828 | |||||||||||
|
| |||||||||||
The accompanying Notes to Financial Statements are an integral part of this schedule.
62
Table of Contents
AGGRESSIVE ALLOCATION PORTFOLIO
Summary Schedule of Investments as of December 31, 2016
| Principal Amount | Long-Term Fixed Income (3.6%) | Value | % of Net Assets | |||||||||
Mortgage-Backed Securities (1.7%) | ||||||||||||
Federal National Mortgage Association Conventional 15-Yr. Pass Through | ||||||||||||
| $900,000 | 2.500%, 1/1/2032b | $ | 900,990 | 0.1 | % | |||||||
Federal National Mortgage Association Conventional 30-Yr. Pass Through | ||||||||||||
| 7,475,000 | 3.500%, 1/1/2047b | 7,656,642 | 0.7 | % | ||||||||
| 3,975,000 | 4.000%, 1/1/2047b | 4,176,930 | 0.4 | % | ||||||||
| 3,425,000 | 3.000% - 4.500%, 1/1/2047b | 3,529,935 | 0.3 | % | ||||||||
Other Securities^ | 1,816,063 | 0.2 | % | |||||||||
|
| |||||||||||
Total | 18,080,560 | |||||||||||
|
| |||||||||||
U.S. Government and Agencies (1.9%) | ||||||||||||
Tennessee Valley Authority | ||||||||||||
| 165,000 | 5.250%, 9/15/2039 | 206,870 | <0.1 | % | ||||||||
U.S. Treasury Bonds | ||||||||||||
| 2,028,000 | 2.500% - 3.625%, 2/15/2044 - 5/15/2046 | 2,166,671 | 0.2 | % | ||||||||
U.S. Treasury Bonds, TIPS | ||||||||||||
| 1,322,477 | 0.625%, 1/15/2026 | 1,333,881 | 0.1 | % | ||||||||
U.S. Treasury Notes | ||||||||||||
| 2,520,000 | 0.750%, 2/15/2019 | 2,494,253 | 0.2 | % | ||||||||
| 3,425,000 | 1.125%, 8/31/2021 | 3,306,084 | 0.3 | % | ||||||||
| 5,100,000 | 1.625%, 10/31/2023 | 4,900,493 | 0.5 | % | ||||||||
| 5,847,000 | 0.875% - 2.250%, 3/31/2018 - 11/15/2026c | 5,784,330 | 0.6 | % | ||||||||
|
| |||||||||||
Total | 20,192,582 | |||||||||||
|
| |||||||||||
Total Long-Term Fixed Income (cost $38,618,657) | 38,498,970 | |||||||||||
|
| |||||||||||
| Shares | Preferred Stock (<0.1%) | |||||||||||
Consumer Staples (<0.1%) | ||||||||||||
Other Securities^ | 10,476 | <0.1 | % | |||||||||
|
| |||||||||||
Total | 10,476 | |||||||||||
|
| |||||||||||
Total Preferred Stock (cost $10,840) | 10,476 | |||||||||||
|
| |||||||||||
Collateral Held for Securities Loaned (0.1%) | ||||||||||||
| 1,164,525 | Thrivent Cash Management Trust | 1,164,525 | 0.1 | % | ||||||||
|
| |||||||||||
Total Collateral Held for Securities Loaned (cost $1,164,525) | 1,164,525 | |||||||||||
|
| |||||||||||
| Shares or Principal Amount | Short-Term Investments (11.8%)d | |||||||||||
Federal Home Loan Bank Discount Notes | ||||||||||||
| 3,000,000 | 0.340%, 1/4/2017e | 2,999,967 | 0.3 | % | ||||||||
| 5,200,000 | 0.344%, 1/6/2017e | 5,199,834 | 0.5 | % | ||||||||
Thrivent Core Short-Term Reserve Fund | ||||||||||||
| 11,605,862 | 0.910% | 116,058,618 | 10.9 | % | ||||||||
Other Securities^ | 1,099,688 | 0.1 | % | |||||||||
|
| |||||||||||
Total Short-Term Investments (cost $125,357,942) | 125,358,107 | |||||||||||
|
| |||||||||||
Total Investments (cost $953,806,212) 101.6% | $ | 1,080,339,385 | ||||||||||
|
| |||||||||||
Other Assets and Liabilities, Net (1.6%) | (16,911,396 | ) | ||||||||||
|
| |||||||||||
Total Net Assets 100.0% | $ | 1,063,427,989 | ||||||||||
|
| |||||||||||
| ^ | The Summary Schedule of Investments shows the 50 largest holdings in unaffiliated issuers, any holding or issuer that exceeds 1% of net assets and all affiliated holdings as of the report date. The remaining securities held are grouped by category as “Other securities”. |
| a | Non-income producing security. |
| b | Denotes investments purchased on a when-issued or delayed delivery basis. |
| c | All or a portion of the security is on loan. |
| d | The interest rate shown reflects the yield, coupon rate or the discount rate at the date of purchase. |
| e | All or a portion of the security is held on deposit with the counterparty and pledged as the initial margin deposit for open futures contracts. |
The following table presents the total amount of securities loaned with continuous maturity, by type, offset by the gross payable upon return of collateral for securities loaned by Thrivent Aggressive Allocation Portfolio as of December 31, 2016:
Securities Lending Transactions | ||||
Taxable Debt Security | $ | 1,140,212 | ||
|
| |||
Total lending | $ | 1,140,212 | ||
Gross amount payable upon return of collateral for securities loaned | $ | 1,164,525 | ||
|
| |||
Net amounts due to counterparty | $ | 24,313 | ||
|
|
Definitions:
| ADR | - | American Depositary Receipt, which are certificates for an underlying foreign security’s shares held by an issuing U.S. depository bank. | ||
| ETF | - | Exchange Traded Fund. | ||
| TIPS | - | Treasury Inflation Protected Security. |
Unrealized Appreciation (Depreciation)
Gross unrealized appreciation and depreciation of investments, based on cost for federal income tax purposes, were as follows:
Gross unrealized appreciation | $ | 159,834,507 | ||
Gross unrealized depreciation | (36,544,914 | ) | ||
|
| |||
Net unrealized appreciation (depreciation) | $ | 123,289,593 | ||
Cost for federal income tax purposes | $ | 957,049,792 | ||
The accompanying Notes to Financial Statements are an integral part of this schedule.
63
Table of Contents
AGGRESSIVE ALLOCATION PORTFOLIO
Summary Schedule of Investments as of December 31, 2016
Fair Valuation Measurements
The following table is a summary of the inputs used, as of December 31, 2016, in valuing Aggressive Allocation Portfolio’s assets carried at fair value.
Investments in Securities | Total | Level 1 | Level 2 | Level 3 | ||||||||||||
Common Stock | ||||||||||||||||
Consumer Discretionary | 83,942,907 | 82,720,090 | 1,222,817 | — | ||||||||||||
Consumer Staples | 17,218,326 | 16,517,712 | 700,614 | — | ||||||||||||
Energy | 54,322,235 | 53,435,230 | 886,971 | 34 | ||||||||||||
Financials | 72,205,290 | 70,170,070 | 2,035,220 | — | ||||||||||||
Health Care | 77,223,698 | 76,471,281 | 752,417 | — | ||||||||||||
Industrials | 69,990,796 | 68,473,631 | 1,517,165 | — | ||||||||||||
Information Technology | 151,236,184 | 150,938,851 | 297,333 | — | ||||||||||||
Materials | 21,983,136 | 21,056,736 | 926,399 | 1 | ||||||||||||
Real Estate | 11,224,653 | 10,867,070 | 357,583 | — | ||||||||||||
Telecommunications Services | 2,994,881 | 2,656,373 | 338,508 | — | ||||||||||||
Utilities | 9,194,172 | 8,995,712 | 198,460 | — | ||||||||||||
Registered Investment Companies | ||||||||||||||||
Affiliated Equity Holdings | 308,073,247 | 308,073,247 | — | — | ||||||||||||
Equity Funds/ETFs | 13,340,722 | 13,340,722 | — | — | ||||||||||||
Affiliated Fixed Income Holdings | 22,357,060 | 22,357,060 | — | — | ||||||||||||
Long-Term Fixed Income | ||||||||||||||||
Collateralized Mortgage Obligations | 225,828 | — | 225,828 | — | ||||||||||||
Mortgage-Backed Securities | 18,080,560 | — | 18,080,560 | — | ||||||||||||
U.S. Government and Agencies | 20,192,582 | — | 20,192,582 | — | ||||||||||||
Preferred Stock | ||||||||||||||||
Consumer Staples | 10,476 | — | 10,476 | — | ||||||||||||
Short-Term Investments | 9,299,489 | — | 9,299,489 | — | ||||||||||||
|
|
|
|
|
|
|
| |||||||||
Subtotal Investments in Securities | $ | 963,116,242 | $ | 906,073,785 | $ | 57,042,422 | $ | 35 | ||||||||
|
|
|
|
|
|
|
| |||||||||
Other Investments * | Total | |||||||||||||||
Short-Term Investments | 116,058,618 | |||||||||||||||
Collateral Held for Securities Loaned | 1,164,525 | |||||||||||||||
|
| |||||||||||||||
Subtotal Other Investments | $ | 117,223,143 | ||||||||||||||
|
| |||||||||||||||
Total Investments at Value | $ | 1,080,339,385 | ||||||||||||||
|
| |||||||||||||||
| * | Certain investments are measured at fair value using a net asset value per share that is not publicly available (practical expedient). According to disclosure requirements of Accounting Standards Codification (ASC) 820, Fair Value Measurement, securities valued using the practical expedient are not classified in the fair value hierarchy. The fair value amounts presented in this table are intended to permit reconciliation of the fair value hierarchy to the amounts presented in the Statement of Assets and Liabilities. |
Other Financial Instruments | Total | Level 1 | Level 2 | Level 3 | ||||||||||||
Asset Derivatives | ||||||||||||||||
Futures Contracts | 2,565,469 | 2,565,469 | — | — | ||||||||||||
|
|
|
|
|
|
|
| |||||||||
Total Asset Derivatives | $ | 2,565,469 | $ | 2,565,469 | $ | — | $ | — | ||||||||
|
|
|
|
|
|
|
| |||||||||
Liability Derivatives | ||||||||||||||||
Futures Contracts | 1,192,739 | 1,192,739 | — | — | ||||||||||||
|
|
|
|
|
|
|
| |||||||||
Total Liability Derivatives | $ | 1,192,739 | $ | 1,192,739 | $ | — | $ | — | ||||||||
|
|
|
|
|
|
|
| |||||||||
There were no significant transfers between Levels during the period ended December 31, 2016. Transfers between Levels are identified as of the end of the period.
The following table presents Aggressive Allocation Portfolio’s futures contracts held as of December 31, 2016. Investments and/or cash totaling $9,299,489 were pledged as the initial margin deposit for these contracts.
Futures Contracts | Number of Contracts Long/(Short) | Expiration Date | Notional Principal Amount | Value | Unrealized Gain/(Loss) | |||||||||||||||
CBOT 10-Yr. U.S. Treasury Note | (14 | ) | March 2017 | ($ | 1,750,174 | ) | ($ | 1,739,938 | ) | $ | 10,236 | |||||||||
CBOT 2-Yr. U.S. Treasury Note | (11 | ) | March 2017 | (2,384,216 | ) | (2,383,562 | ) | 654 | ||||||||||||
CBOT 5-Yr. U.S. Treasury Note | 33 | March 2017 | 3,893,845 | 3,882,914 | (10,931 | ) | ||||||||||||||
CBOT U.S. Long Bond | 10 | March 2017 | 1,518,306 | 1,506,563 | (11,743 | ) | ||||||||||||||
CME E-mini S&P Mid-Cap 400 Index | (760 | ) | March 2017 | (128,646,179 | ) | (126,091,600 | ) | 2,554,579 | ||||||||||||
CME S&P 500 Index | 155 | March 2017 | 87,351,821 | 86,652,750 | (699,071 | ) | ||||||||||||||
CME Ultra Long Term U.S. Treasury Bond | 8 | March 2017 | 1,291,714 | 1,282,000 | (9,714 | ) | ||||||||||||||
ICE mini MSCI EAFE Index | 1,234 | March 2017 | 103,827,634 | 103,384,520 | (443,114 | ) | ||||||||||||||
NYBOT NYF mini Russell 2000 Index | 12 | March 2017 | 832,306 | 814,140 | (18,166 | ) | ||||||||||||||
Total Futures Contracts | $ | 1,372,730 | ||||||||||||||||||
The accompanying Notes to Financial Statements are an integral part of this schedule.
64
Table of Contents
AGGRESSIVE ALLOCATION PORTFOLIO
Summary Schedule of Investments as of December 31, 2016
The following table summarizes the fair value and Statement of Assets and Liabilities location, as of December 31, 2016, for Aggressive Allocation Portfolio’s investments in financial derivative instruments by primary risk exposure as discussed under item (2) Significant Accounting Policies of the Notes to Financial Statements.
Derivatives by risk category | Statement of Assets and Liabilities Location | Fair Value | ||||
| Asset Derivatives | ||||||
Interest Rate Contracts | ||||||
Futures* | Net Assets - Net unrealized appreciation/(depreciation) on Futures contracts | $ | 10,890 | |||
Total Interest Rate Contracts | 10,890 | |||||
Equity Contracts | ||||||
Futures* | Net Assets - Net unrealized appreciation/(depreciation) on Futures contracts | 2,554,579 | ||||
Total Equity Contracts | 2,554,579 | |||||
|
| |||||
Total Asset Derivatives | $ | 2,565,469 | ||||
|
| |||||
Liability Derivatives | ||||||
Interest Rate Contracts | ||||||
Futures* | Net Assets - Net unrealized appreciation/(depreciation) on Futures contracts | 32,388 | ||||
Total Interest Rate Contracts | 32,388 | |||||
Equity Contracts | ||||||
Futures* | Net Assets - Net unrealized appreciation/(depreciation) on Futures contracts | 1,160,351 | ||||
Total Equity Contracts | 1,160,351 | |||||
|
| |||||
Total Liability Derivatives | $ | 1,192,739 | ||||
|
| |||||
| * | Includes cumulative appreciation/depreciation of futures contracts as reported in the Schedule of Investments. Only current day’s variation margin is reported within the Statement of Assets and Liabilities. |
The following table summarizes the net realized gains/(losses) and Statement of Operations location, for the period ended December 31, 2016, for Aggressive Allocation Portfolio’s investments in financial derivative instruments by primary risk exposure.
Derivatives by risk category | Statement of Operations Location | Realized Gains/(Losses) recognized in Income | ||||
Equity Contracts | ||||||
Futures | Net realized gains/(losses) on Futures contracts | (12,625,347) | ||||
Total Equity Contracts | (12,625,347) | |||||
Interest Rate Contracts | ||||||
Futures | Net realized gains/(losses) on Futures contracts | 26,822 | ||||
Total Interest Rate Contracts | 26,822 | |||||
|
| |||||
Total | ($ | 12,598,525) | ||||
|
| |||||
The following table summarizes the change in net unrealized appreciation/(depreciation) and Statement of Operations location, for the period ended December 31, 2016, for Aggressive Allocation Portfolio’s investments in financial derivative instruments by primary risk exposure.
Derivatives by risk category | Statement of Operations Location | Change in unrealized appreciation/(depreciation) recognized in Income | ||||
Interest Rate Contracts | ||||||
Futures | Change in net unrealized appreciation/(depreciation) on Futures contracts | (26,344) | ||||
Total Interest Rate Contracts | (26,344) | |||||
Equity Contracts | ||||||
Futures | Change in net unrealized appreciation/(depreciation) on Futures contracts | (1,219,199) | ||||
Total Equity Contracts | (1,219,199) | |||||
|
| |||||
Total | ($ | 1,245,543) | ||||
|
| |||||
The following table presents Aggressive Allocation Portfolio’s average volume of derivative activity during the period ended December 31, 2016.
Derivative Risk Category | Futures (Notional)* | Futures (Percentage of Average Net Assets) | ||||||
Equity Contracts | $ | 312,398,735 | 31.5 | % | ||||
Interest Rate Contracts | 9,266,989 | 0.9 | ||||||
| * | Notional amount represents long or short, or both, derivative positions held by the Portfolio. |
The accompanying Notes to Financial Statements are an integral part of this schedule.
65
Table of Contents
AGGRESSIVE ALLOCATION PORTFOLIO
Summary Schedule of Investments as of December 31, 2016
Investment in Affiliates
Affiliated issuers, as defined under the Investment Company Act of 1940, include those in which the Portfolio’s holdings of an issuer represent 5% or more of the outstanding voting securities of an issuer, any affiliated mutual fund, or a company which is under common ownership or control with the Portfolio. The Portfolio owns shares of Thrivent Cash Management Trust for the purpose of securities lending and Thrivent Core Short-Term Reserve Fund primarily to serve as a cash sweep vehicle for the Portfolio. Thrivent Cash Management Trust and Thrivent Core Short-Term Reserve Fund are established for the sole use of affiliated portfolios.
A summary of transactions for the fiscal year to date, in Aggressive Allocation Portfolio, is as follows:
Portfolio | Value December 31, 2015 | Gross Purchases | Gross Sales | Shares Held at December 31, 2016 | Value December 31, 2016 | Income Earned January 1, 2016 - December 31, 2016 | ||||||||||||||||||
Opportunity Income Plus | $ | 4,541,113 | $ | 43,510 | $ | 4,650,239 | — | $ | — | $ | 43,542 | |||||||||||||
Small Cap Stock | 30,912,419 | 1,689,734 | — | 2,105,112 | 38,931,305 | 108,358 | ||||||||||||||||||
Mid Cap Stock | 49,700,986 | 5,786,431 | — | 3,352,705 | 63,971,952 | 204,535 | ||||||||||||||||||
Partner Worldwide Allocation | 105,949,793 | 2,361,195 | — | 12,044,477 | 109,497,545 | 2,361,195 | ||||||||||||||||||
Large Cap Value | 45,459,708 | 3,450,043 | — | 3,170,544 | 53,389,419 | 645,965 | ||||||||||||||||||
Large Cap Stock | 40,107,608 | 502,461 | — | 3,495,736 | 42,283,026 | 502,461 | ||||||||||||||||||
High Yield | 7,480,973 | 452,829 | — | 1,768,459 | 8,435,903 | 452,856 | ||||||||||||||||||
Income | 4,443,283 | 163,875 | — | 468,133 | 4,713,587 | 160,356 | ||||||||||||||||||
Limited Maturity Bond | 8,953,804 | 176,334 | — | 938,887 | 9,207,570 | 176,299 | ||||||||||||||||||
Cash Management Trust-Collateral Investment | — | 3,938,900 | 2,774,375 | 1,164,525 | 1,164,525 | 742 | ||||||||||||||||||
Cash Management Trust-Short Term Investment | 31,326,929 | 113,015,313 | 144,342,242 | — | — | 64,715 | ||||||||||||||||||
Core Short-Term Reserve Fund | — | 206,545,589 | 90,486,971 | 11,605,862 | 116,058,618 | 427,166 | ||||||||||||||||||
Total Value and Income Earned | $ | 328,876,616 | $ | 447,653,450 | $ | 5,148,190 | ||||||||||||||||||
The accompanying Notes to Financial Statements are an integral part of this schedule.
66
Table of Contents
MODERATELY AGGRESSIVE ALLOCATION PORTFOLIO
Summary Schedule of Investments as of December 31, 2016
| Principal Amount | Bank Loans (1.0%) | Value | % of Net Assets | |||||||||
Basic Materials (0.1%) | ||||||||||||
Other Securities^ | $ | 3,605,136 | 0.1 | % | ||||||||
|
| |||||||||||
Total | 3,605,136 | |||||||||||
|
| |||||||||||
Capital Goods (0.1%) | ||||||||||||
Other Securities^ | 1,848,232 | 0.1 | % | |||||||||
|
| |||||||||||
Total | 1,848,232 | |||||||||||
|
| |||||||||||
Communications Services (0.3%) | ||||||||||||
Other Securities^ | 17,128,567 | 0.3 | % | |||||||||
|
| |||||||||||
Total | 17,128,567 | |||||||||||
|
| |||||||||||
Consumer Cyclical (0.1%) | ||||||||||||
Other Securities^ | 6,813,419 | 0.1 | % | |||||||||
|
| |||||||||||
Total | 6,813,419 | |||||||||||
|
| |||||||||||
Consumer Non-Cyclical (0.1%) | ||||||||||||
Other Securities^ | 6,038,693 | 0.1 | % | |||||||||
|
| |||||||||||
Total | 6,038,693 | |||||||||||
|
| |||||||||||
Energy (0.1%) | ||||||||||||
Other Securities^ | 3,612,201 | 0.1 | % | |||||||||
|
| |||||||||||
Total | 3,612,201 | |||||||||||
|
| |||||||||||
Financials (0.1%) | ||||||||||||
Other Securities^ | 3,927,240 | 0.1 | % | |||||||||
|
| |||||||||||
Total | 3,927,240 | |||||||||||
|
| |||||||||||
Technology (0.1%) | ||||||||||||
Other Securities^ | 7,019,985 | 0.1 | % | |||||||||
|
| |||||||||||
Total | 7,019,985 | |||||||||||
|
| |||||||||||
Transportation (<0.1%) | ||||||||||||
Other Securities^ | 1,125,966 | <0.1 | % | |||||||||
|
| |||||||||||
Total | 1,125,966 | |||||||||||
|
| |||||||||||
Utilities (<0.1%) | ||||||||||||
Other Securities^ | 675,613 | <0.1 | % | |||||||||
|
| |||||||||||
Total | 675,613 | |||||||||||
|
| |||||||||||
Total Bank Loans (cost $51,839,036) | 51,795,052 | |||||||||||
|
| |||||||||||
| Shares | Common Stock (39.3%) | Value | % of Net Assets | |||||||||
Consumer Discretionary (5.4%) | ||||||||||||
| 55,432 | Amazon.com, Inc.a | 41,566,794 | 0.8 | % | ||||||||
| 14,300 | AutoZone, Inc.a | 11,293,997 | 0.2 | % | ||||||||
| 309,006 | Comcast Corporation | 21,336,864 | 0.4 | % | ||||||||
| 119,550 | Home Depot, Inc. | 16,029,264 | 0.3 | % | ||||||||
| 124,060 | Walt Disney Company | 12,929,533 | 0.3 | % | ||||||||
Other Securities^ | 183,830,235 | 3.4 | % | |||||||||
|
| |||||||||||
Total | 286,986,687 | |||||||||||
|
| |||||||||||
Consumer Staples (1.2%) | ||||||||||||
| 144,410 | CVS Health Corporation | 11,395,393 | 0.2 | % | ||||||||
| 145,930 | Walgreens Boots Alliance, Inc. | 12,077,167 | 0.2 | % | ||||||||
Other Securities^ | 42,741,277 | 0.8 | % | |||||||||
|
| |||||||||||
Total | 66,213,837 | |||||||||||
|
| |||||||||||
Energy (3.8%) | ||||||||||||
| 157,810 | Chevron Corporation | 18,574,237 | 0.4 | % | ||||||||
| 165,751 | EQT Corporation | 10,840,115 | 0.2 | % | ||||||||
| 221,580 | Halliburton Company | 11,985,262 | 0.2 | % | ||||||||
| 64,740 | Pioneer Natural Resources Company | 11,657,732 | 0.2 | % | ||||||||
| 746,350 | WPX Energy, Inc.a | 10,874,320 | 0.2 | % | ||||||||
Other Securities^ | 140,642,149 | 2.6 | % | |||||||||
|
| |||||||||||
Total | 204,573,815 | |||||||||||
|
| |||||||||||
Financials (5.8%) | ||||||||||||
| 859,750 | Bank of America Corporation | 19,000,475 | 0.4 | % | ||||||||
| 225,500 | Citigroup, Inc. | 13,401,465 | 0.3 | % | ||||||||
| 68,550 | Goldman Sachs Group, Inc. | 16,414,297 | 0.3 | % | ||||||||
| 251,743 | Zions Bancorporation | 10,835,019 | 0.2 | % | ||||||||
Other Securities^ | 249,583,039 | 4.6 | % | |||||||||
|
| |||||||||||
Total | 309,234,295 | |||||||||||
|
| |||||||||||
Health Care (4.9%) | ||||||||||||
| 124,740 | Alexion Pharmaceuticals, Inc.a | 15,261,939 | 0.3 | % | ||||||||
| 76,626 | Allergan plca | 16,092,226 | 0.3 | % | ||||||||
| 163,870 | Celgene Corporationa | 18,967,953 | 0.4 | % | ||||||||
| 272,315 | Gilead Sciences, Inc. | 19,500,477 | 0.4 | % | ||||||||
| 183,458 | Medtronic plc | 13,067,713 | 0.3 | % | ||||||||
Other Securities^ | 177,550,013 | 3.2 | % | |||||||||
|
| |||||||||||
Total | 260,440,321 | |||||||||||
|
| |||||||||||
Industrials (4.8%) | ||||||||||||
| 80,780 | Cummins, Inc. | 11,040,203 | 0.2 | % | ||||||||
| 167,948 | Union Pacific Corporation | 17,412,849 | 0.3 | % | ||||||||
Other Securities^ | 227,772,810 | 4.3 | % | |||||||||
|
| |||||||||||
Total | 256,225,862 | |||||||||||
|
| |||||||||||
Information Technology (9.5%) | ||||||||||||
| 35,763 | Alphabet, Inc., Class Aa | 28,340,389 | 0.5 | % | ||||||||
| 28,497 | Alphabet, Inc., Class Ca | 21,994,555 | 0.4 | % | ||||||||
| 265,266 | Apple, Inc. | 30,723,108 | 0.6 | % | ||||||||
| 475,970 | Cisco Systems, Inc. | 14,383,813 | 0.3 | % | ||||||||
| 281,220 | Facebook, Inc.a | 32,354,361 | 0.6 | % | ||||||||
| 226,370 | MasterCard, Inc. | 23,372,703 | 0.4 | % | ||||||||
| 629,180 | Microsoft Corporation | 39,097,245 | 0.7 | % | ||||||||
| 426,078 | PayPal Holdings, Inc.a | 16,817,299 | 0.3 | % | ||||||||
| 313,910 | Salesforce.com, Inc.a | 21,490,279 | 0.4 | % | ||||||||
| 316,470 | Visa, Inc. | 24,690,989 | 0.5 | % | ||||||||
Other Securities^ | 251,159,627 | 4.8 | % | |||||||||
|
| |||||||||||
Total | 504,424,368 | |||||||||||
|
| |||||||||||
Materials (1.7%) | ||||||||||||
Other Securities^ | 91,534,975 | 1.7 | % | |||||||||
|
| |||||||||||
Total | 91,534,975 | |||||||||||
|
| |||||||||||
Real Estate (1.0%) | ||||||||||||
Other Securities^ | 52,454,383 | 1.0 | % | |||||||||
|
| |||||||||||
Total | 52,454,383 | |||||||||||
|
| |||||||||||
Telecommunications Services (0.3%) | ||||||||||||
Other Securities^ | 13,600,164 | 0.3 | % | |||||||||
|
| |||||||||||
Total | 13,600,164 | |||||||||||
|
| |||||||||||
Utilities (0.9%) | ||||||||||||
Other Securities^ | 46,995,111 | 0.9 | % | |||||||||
|
| |||||||||||
Total | 46,995,111 | |||||||||||
|
| |||||||||||
Total Common Stock (cost $1,705,302,509) | 2,092,683,818 | |||||||||||
|
| |||||||||||
The accompanying Notes to Financial Statements are an integral part of this schedule.
67
Table of Contents
MODERATELY AGGRESSIVE ALLOCATION PORTFOLIO
Summary Schedule of Investments as of December 31, 2016
| Shares | Registered Investment Companies (36.8%) | Value | % of Net Assets | |||||||||
Affiliated Equity Holdings (29.7%) | ||||||||||||
| 24,752,802 | Thrivent Large Cap Stock Portfolio | $ | 299,399,986 | 5.6 | % | |||||||
| 21,779,551 | Thrivent Large Cap Value Portfolio | 366,750,218 | 6.9 | % | ||||||||
| 18,902,196 | Thrivent Mid Cap Stock Portfolio | 360,667,132 | 6.8 | % | ||||||||
| 50,069,595 | Thrivent Partner Worldwide Allocation Portfolio | 455,187,694 | 8.5 | % | ||||||||
| 5,579,836 | Thrivent Small Cap Stock Portfolio | 103,191,812 | 1.9 | % | ||||||||
|
| |||||||||||
Total | 1,585,196,842 | |||||||||||
|
| |||||||||||
Affiliated Fixed Income Holdings (5.6%) | ||||||||||||
| 10,873,034 | Thrivent High Yield Portfolio | 51,866,545 | 1.0 | % | ||||||||
| 15,219,349 | Thrivent Income Portfolio | 153,242,099 | 2.9 | % | ||||||||
| 9,490,688 | Thrivent Limited Maturity Bond Portfolio | 93,074,230 | 1.7 | % | ||||||||
|
| |||||||||||
Total | 298,182,874 | |||||||||||
|
| |||||||||||
Equity Funds/ETFs (0.8%) | ||||||||||||
| 97,919 | SPDR S&P 500 ETF Trust | 21,887,834 | 0.4 | % | ||||||||
Other Securities^ | 19,614,659 | 0.4 | % | |||||||||
|
| |||||||||||
Total | 41,502,493 | |||||||||||
|
| |||||||||||
Fixed Income Funds/ETFs (0.7%) | ||||||||||||
| 113,650 | iShares iBoxx $ Investment Grade Corporate Bond ETF | 13,317,507 | 0.2 | % | ||||||||
| 179,500 | Vanguard Short-Term Corporate Bond ETF | 14,246,915 | 0.3 | % | ||||||||
Other Securities^ | 9,442,225 | 0.2 | % | |||||||||
|
| |||||||||||
Total | 37,006,647 | |||||||||||
|
| |||||||||||
Total Registered Investment Companies (cost $1,720,669,889) | 1,961,888,856 | |||||||||||
|
| |||||||||||
| Principal Amount | Long-Term Fixed Income (15.8%) | |||||||||||
| �� | Asset-Backed Securities (1.0%) | |||||||||||
U.S. Small Business Administration | ||||||||||||
| $ | 485,447 | 3.191%, 3/10/2024, Series 2014-10A, Class 1 | 502,098 | <0.1 | % | |||||||
Other Securities^ | 55,210,446 | 1.0 | % | |||||||||
|
| |||||||||||
Total | 55,712,544 | |||||||||||
|
| |||||||||||
Basic Materials (0.1%) | ||||||||||||
Other Securities^ | 4,956,708 | 0.1 | % | |||||||||
|
| |||||||||||
Total | 4,956,708 | |||||||||||
|
| |||||||||||
Capital Goods (0.2%) | ||||||||||||
Other Securities^ | 12,378,082 | 0.2 | % | |||||||||
|
| |||||||||||
Total | 12,378,082 | |||||||||||
|
| |||||||||||
Collateralized Mortgage Obligations (0.4%) | ||||||||||||
Federal National Mortgage Association | ||||||||||||
| 2,491,831 | 3.500%, 1/25/2033, Series 2012-150, Class YIb | 335,957 | <0.1 | % | ||||||||
Other Securities^ | 19,794,369 | 0.4 | % | |||||||||
|
| |||||||||||
Total | 20,130,326 | |||||||||||
|
| |||||||||||
Commercial Mortgage-Backed Securities (0.3%) | ||||||||||||
Federal National Mortgage Association | ||||||||||||
| 23,957 | 1.272%, 1/25/2017 | 23,936 | <0.1 | % | ||||||||
Other Securities^ | 12,842,195 | 0.3 | % | |||||||||
|
| |||||||||||
Total | 12,866,131 | |||||||||||
|
| |||||||||||
Communications Services (0.6%) | ||||||||||||
Other Securities^ | 30,229,799 | 0.6 | % | |||||||||
|
| |||||||||||
Total | 30,229,799 | |||||||||||
|
| |||||||||||
Consumer Cyclical (0.4%) | ||||||||||||
Other Securities^ | 18,818,457 | 0.4 | % | |||||||||
|
| |||||||||||
Total | 18,818,457 | |||||||||||
|
| |||||||||||
Consumer Non-Cyclical (0.6%) | ||||||||||||
Other Securities^ | 29,859,289 | 0.6 | % | |||||||||
|
| |||||||||||
Total | 29,859,289 | |||||||||||
|
| |||||||||||
Energy (0.4%) | ||||||||||||
Other Securities^ | 23,665,341 | 0.4 | % | |||||||||
|
| |||||||||||
Total | 23,665,341 | |||||||||||
|
| |||||||||||
Financials (1.2%) | ||||||||||||
Other Securities^ | 64,265,998 | 1.2 | % | |||||||||
|
| |||||||||||
Total | 64,265,998 | |||||||||||
|
| |||||||||||
Foreign Government (<0.1%) | ||||||||||||
Other Securities^ | 2,790,320 | <0.1 | % | |||||||||
|
| |||||||||||
Total | 2,790,320 | |||||||||||
|
| |||||||||||
Mortgage-Backed Securities (5.8%) | ||||||||||||
Federal Home Loan Mortgage Corporation Gold 15-Yr. Pass Through | ||||||||||||
| 18,800,000 | 3.000%, 1/1/2032c | 19,283,160 | 0.4 | % | ||||||||
Federal Home Loan Mortgage Corporation Gold 30-Yr. Pass Through | ||||||||||||
| 12,300,000 | 4.000%, 1/1/2047c | 12,912,540 | 0.2 | % | ||||||||
Federal National Mortgage Association Conventional 15-Yr. Pass Through | ||||||||||||
| 24,525,000 | 2.500%, 1/1/2032c | 24,551,977 | 0.5 | % | ||||||||
Federal National Mortgage Association Conventional 30-Yr. Pass Through | ||||||||||||
| 50,200,000 | 3.000%, 1/1/2047c | 49,833,540 | 0.9 | % | ||||||||
| 105,575,000 | 3.500%, 1/1/2047c | 108,140,473 | 2.0 | % | ||||||||
| 65,000,000 | 4.000%, 1/1/2047c | 68,302,000 | 1.3 | % | ||||||||
| 24,139,000 | 4.500%, 1/1/2047c | 25,954,253 | 0.5 | % | ||||||||
| 2,445,528 | 1.740% - 2.088%, 7/1/2043 - 8/1/2043d | 2,514,974 | <0.1 | % | ||||||||
|
| |||||||||||
Total | 311,492,917 | |||||||||||
|
| |||||||||||
Technology (0.2%) | ||||||||||||
Other Securities^ | 13,245,097 | 0.2 | % | |||||||||
|
| |||||||||||
Total | 13,245,097 | |||||||||||
|
| |||||||||||
Transportation (0.1%) | ||||||||||||
Other Securities^ | 4,431,730 | 0.1 | % | |||||||||
|
| |||||||||||
Total | 4,431,730 | |||||||||||
|
| |||||||||||
The accompanying Notes to Financial Statements are an integral part of this schedule.
68
Table of Contents
MODERATELY AGGRESSIVE ALLOCATION PORTFOLIO
Summary Schedule of Investments as of December 31, 2016
| Principal Amount | Long-Term Fixed Income (15.8%) | Value | % of Net Assets | |||||||||
U.S. Government and Agencies (4.1%) | ||||||||||||
Federal National Mortgage Association | ||||||||||||
| $ | 405,000 | 6.250%, 5/15/2029 | $ | 535,933 | <0.1 | % | ||||||
Tennessee Valley Authority | ||||||||||||
| 390,000 | 5.250%, 9/15/2039 | 488,965 | <0.1 | % | ||||||||
U.S. Treasury Bonds | ||||||||||||
| 14,300,000 | 3.625%, 2/15/2044 | 15,816,644 | 0.3 | % | ||||||||
| 31,259,000 | 2.500% - 6.500%, 11/15/2026 - 11/15/2046 | 32,871,782 | 0.7 | % | ||||||||
U.S. Treasury Bonds, TIPS | ||||||||||||
| 36,887,972 | 0.125%, 1/15/2023 | 36,611,386 | 0.7 | % | ||||||||
| 30,096,525 | 0.625%, 1/15/2026 | 30,356,047 | 0.6 | % | ||||||||
| 2,511,732 | 0.125% - 2.375%, 4/15/2019 - 2/15/2042 | 2,533,175 | <0.1 | % | ||||||||
U.S. Treasury Notes | ||||||||||||
| 23,030,000 | 1.125%, 8/31/2021 | 22,230,398 | 0.4 | % | ||||||||
| 24,900,000 | 1.625%, 10/31/2023 | 23,925,937 | 0.5 | % | ||||||||
| 16,686,000 | 2.000%, 11/15/2026e | 16,028,405 | 0.3 | % | ||||||||
| 35,268,000 | 0.750% - 2.250%, 1/31/2017 - 11/15/2024e,f | 34,926,448 | 0.6 | % | ||||||||
|
| |||||||||||
Total | 216,325,120 | |||||||||||
|
| |||||||||||
Utilities (0.4%) | ||||||||||||
Other Securities^ | 20,650,604 | 0.4 | % | |||||||||
|
| |||||||||||
Total | 20,650,604 | |||||||||||
|
| |||||||||||
Total Long-Term Fixed Income (cost $840,545,662) | 841,818,463 | |||||||||||
|
| |||||||||||
| Shares | Preferred Stock (<0.1%) | |||||||||||
Consumer Staples (<0.1%) | ||||||||||||
Other Securities^ | 35,593 | <0.1 | % | |||||||||
|
| |||||||||||
Total | 35,593 | |||||||||||
|
| |||||||||||
Energy (<0.1%) | ||||||||||||
Other Securities^ | 49,631 | <0.1 | % | |||||||||
|
| |||||||||||
Total | 49,631 | |||||||||||
|
| |||||||||||
Total Preferred Stock (cost $40,059) | 85,224 | |||||||||||
|
| |||||||||||
Collateral Held for Securities Loaned (1.1%) | ||||||||||||
| 56,510,060 | Thrivent Cash Management Trust | 56,510,060 | 1.1 | % | ||||||||
|
| |||||||||||
Total Collateral Held for Securities Loaned (cost $56,510,060) | 56,510,060 | |||||||||||
|
| |||||||||||
| Shares or Principal Amount | Short-Term Investments (12.7%)g | |||||||||||
Federal Home Loan Bank Discount Notes | ||||||||||||
| 13,000,000 | 0.343%, 1/4/2017h | 12,999,857 | 0.2 | % | ||||||||
Federal National Mortgage Association Discount Notes | ||||||||||||
| 3,600,000 | 0.345%, 1/11/2017h | 3,599,698 | 0.1 | % | ||||||||
U.S. Treasury Bills | ||||||||||||
| 3,100,000 | 0.412% - 0.480%, 1/26/2017 - 2/9/2017f | 3,098,822 | <0.1 | % | ||||||||
U.S. Treasury Note | ||||||||||||
| 300,000 | 0.500%, 1/31/2017f | 300,034 | <0.1 | % | ||||||||
Thrivent Core Short-Term Reserve Fund | ||||||||||||
| 64,077,688 | 0.910% | 640,776,883 | 12.0 | % | ||||||||
Other Securities^ | 16,995,533 | 0.4 | % | |||||||||
|
| |||||||||||
Total Short-Term Investments (cost $677,769,871) | 677,770,827 | |||||||||||
|
| |||||||||||
Total Investments (cost $5,052,677,086) 106.7% | $ | 5,682,552,300 | ||||||||||
|
| |||||||||||
Other Assets and Liabilities, Net (6.7%) | (356,863,084 | ) | ||||||||||
|
| |||||||||||
Total Net Assets 100.0% | $ | 5,325,689,216 | ||||||||||
|
| |||||||||||
| ^ | The Summary Schedule of Investments shows the 50 largest holdings in unaffiliated issuers, any holding or issuer that exceeds 1% of net assets and all affiliated holdings as of the report date. The remaining securities held are grouped by category as “Other securities”. |
| a | Non-income producing security. |
| b | Denotes interest only security. Interest only securities represent the right to receive monthly interest payments on an underlying pool of mortgages or assets. The principal shown is the outstanding par amount of the pool as of the end of the period. The actual effective yield of the security is different than the stated coupon rate. |
| c | Denotes investments purchased on a when-issued or delayed delivery basis. |
| d | Denotes variable rate securities. Variable rate securities are securities whose yields vary with a designated market index or market rate. The rate shown is as of December 31, 2016. |
| e | All or a portion of the security is on loan. |
| f | At December 31, 2016, $1,038,717 of investments were segregated to cover exposure to a counterparty for margin on open mortgage-backed security transactions. |
| g | The interest rate shown reflects the yield, coupon rate or the discount rate at the date of purchase. |
| h | All or a portion of the security is held on deposit with the counterparty and pledged as the initial margin deposit for open futures contracts. |
Moderately Aggressive Allocation Portfolio held restricted securities as of December 31, 2016. Restricted securities are investment securities which cannot be offered for public sale without first being registered under the Securities Act of 1933. As of December 31, 2016, the value of these investments was $33,835,986 or 0.6% of total net assets.
The following table presents the total amount of securities loaned with continuous maturity, by type, offset by the gross payable upon return of collateral for securities loaned by Thrivent Moderately Aggressive Allocation Portfolio as of December 31, 2016:
Securities Lending Transactions | ||||
Taxable Debt Security | $ | 18,843,443 | ||
Common Stock | 36,303,769 | |||
|
| |||
Total lending | $ | 55,147,212 | ||
Gross amount payable upon return of collateral for securities loaned | $ | 56,510,060 | ||
|
| |||
Net amounts due to counterparty | $ | 1,362,848 | ||
|
|
Definitions:
| ETF | - | Exchange Traded Fund. | ||
| TIPS | - | Treasury Inflation Protected Security. |
The accompanying Notes to Financial Statements are an integral part of this schedule.
69
Table of Contents
MODERATELY AGGRESSIVE ALLOCATION PORTFOLIO
Summary Schedule of Investments as of December 31, 2016
Unrealized Appreciation (Depreciation)
Gross unrealized appreciation and depreciation of investments, based on cost for federal income tax purposes, were as follows:
Gross unrealized appreciation | $ | 713,361,434 | ||
Gross unrealized depreciation | (95,570,042 | ) | ||
|
| |||
Net unrealized appreciation (depreciation) | $ | 617,791,392 | ||
Cost for federal income tax purposes | $ | 5,064,760,908 | ||
The accompanying Notes to Financial Statements are an integral part of this schedule.
70
Table of Contents
MODERATELY AGGRESSIVE ALLOCATION PORTFOLIO
Summary Schedule of Investments as of December 31, 2016
Fair Valuation Measurements
The following table is a summary of the inputs used, as of December 31, 2016, in valuing Moderately Aggressive Allocation Portfolio’s assets carried at fair value.
Investments in Securities | Total | Level 1 | Level 2 | Level 3 | ||||||||||||
Bank Loans | ||||||||||||||||
Basic Materials | 3,605,136 | — | 3,605,136 | — | ||||||||||||
Capital Goods | 1,848,232 | — | 805,357 | 1,042,875 | ||||||||||||
Communications Services | 17,128,567 | — | 16,214,075 | 914,492 | ||||||||||||
Consumer Cyclical | 6,813,419 | — | 6,408,419 | 405,000 | ||||||||||||
Consumer Non-Cyclical | 6,038,693 | — | 6,038,693 | — | ||||||||||||
Energy | 3,612,201 | — | 1,572,407 | 2,039,794 | ||||||||||||
Financials | 3,927,240 | — | 3,927,240 | — | ||||||||||||
Technology | 7,019,985 | — | 6,119,972 | 900,013 | ||||||||||||
Transportation | 1,125,966 | — | 1,125,966 | — | ||||||||||||
Utilities | 675,613 | — | 675,613 | — | ||||||||||||
Common Stock | ||||||||||||||||
Consumer Discretionary | 286,986,687 | 282,821,085 | 4,165,602 | — | ||||||||||||
Consumer Staples | 66,213,837 | 63,831,430 | 2,382,407 | — | ||||||||||||
Energy | 204,573,815 | 201,568,223 | 3,005,477 | 115 | ||||||||||||
Financials | 309,234,295 | 302,345,986 | 6,888,309 | — | ||||||||||||
Health Care | 260,440,321 | 257,890,511 | 2,549,810 | — | ||||||||||||
Industrials | 256,225,862 | 251,032,162 | 5,193,700 | — | ||||||||||||
Information Technology | 504,424,368 | 503,395,171 | 1,029,197 | — | ||||||||||||
Materials | 91,534,975 | 88,395,279 | 3,139,690 | 6 | ||||||||||||
Real Estate | 52,454,383 | 51,202,998 | 1,251,385 | — | ||||||||||||
Telecommunications Services | 13,600,164 | 12,454,397 | 1,145,767 | — | ||||||||||||
Utilities | 46,995,111 | 46,307,147 | 687,964 | — | ||||||||||||
Registered Investment Companies | ||||||||||||||||
Affiliated Equity Holdings | 1,585,196,842 | 1,585,196,842 | — | — | ||||||||||||
Affiliated Fixed Income Holdings | 298,182,874 | 298,182,874 | — | — | ||||||||||||
Equity Funds/ETFs | 41,502,493 | 41,502,493 | — | — | ||||||||||||
Fixed Income Funds/ETFs | 37,006,647 | 37,006,647 | — | — | ||||||||||||
Long-Term Fixed Income | ||||||||||||||||
Asset-Backed Securities | 55,712,544 | — | 53,562,544 | 2,150,000 | ||||||||||||
Basic Materials | 4,956,708 | — | 4,956,708 | — | ||||||||||||
Capital Goods | 12,378,082 | — | 12,378,082 | — | ||||||||||||
Collateralized Mortgage Obligations | 20,130,326 | — | 20,130,326 | — | ||||||||||||
Commercial Mortgage-Backed Securities | 12,866,131 | — | 12,866,131 | — | ||||||||||||
Communications Services | 30,229,799 | — | 30,229,799 | — | ||||||||||||
Consumer Cyclical | 18,818,457 | — | 18,818,457 | — | ||||||||||||
Consumer Non-Cyclical | 29,859,289 | — | 29,859,289 | — | ||||||||||||
Energy | 23,665,341 | — | 23,665,341 | — | ||||||||||||
Financials | 64,265,998 | — | 64,265,998 | — | ||||||||||||
Foreign Government | 2,790,320 | — | 2,790,320 | — | ||||||||||||
Mortgage-Backed Securities | 311,492,917 | — | 311,492,917 | — | ||||||||||||
Technology | 13,245,097 | — | 13,245,097 | — | ||||||||||||
Transportation | 4,431,730 | — | 4,431,730 | — | ||||||||||||
U.S. Government and Agencies | 216,325,120 | — | 216,325,120 | — | ||||||||||||
Utilities | 20,650,604 | — | 20,650,604 | — | ||||||||||||
Preferred Stock | ||||||||||||||||
Consumer Staples | 35,593 | — | 35,593 | — | ||||||||||||
Energy | 49,631 | — | — | 49,631 | ||||||||||||
Short-Term Investments | 36,993,944 | — | 36,993,944 | — | ||||||||||||
|
|
|
|
|
|
|
| |||||||||
Subtotal Investments in Securities | $ | 4,985,265,357 | $ | 4,023,133,245 | $ | 954,630,186 | $ | 7,501,926 | ||||||||
|
|
|
|
|
|
|
| |||||||||
Other Investments * | Total | |||||||||||||||
Short-Term Investments | 640,776,883 | |||||||||||||||
Collateral Held for Securities Loaned | 56,510,060 | |||||||||||||||
|
| |||||||||||||||
Subtotal Other Investments | $ | 697,286,943 | ||||||||||||||
|
| |||||||||||||||
Total Investments at Value | $ | 5,682,552,300 | ||||||||||||||
|
| |||||||||||||||
| * | Certain investments are measured at fair value using a net asset value per share that is not publicly available (practical expedient). According to disclosure requirements of Accounting Standards Codification (ASC) 820, Fair Value Measurement, securities valued using the practical expedient are not classified in the fair value hierarchy. The fair value amounts presented in this table are intended to permit reconciliation of the fair value hierarchy to the amounts presented in the Statement of Assets and Liabilities. |
The accompanying Notes to Financial Statements are an integral part of this schedule.
71
Table of Contents
MODERATELY AGGRESSIVE ALLOCATION PORTFOLIO
Summary Schedule of Investments as of December 31, 2016
Other Financial Instruments | Total | Level 1 | Level 2 | Level 3 | ||||||||||||
Asset Derivatives | ||||||||||||||||
Futures Contracts | 8,651,779 | 8,651,779 | — | — | ||||||||||||
|
|
|
|
|
|
|
| |||||||||
Total Asset Derivatives | $ | 8,651,779 | $ | 8,651,779 | $ | — | $ | — | ||||||||
|
|
|
|
|
|
|
| |||||||||
Liability Derivatives | ||||||||||||||||
Futures Contracts | 5,510,337 | 5,510,337 | — | — | ||||||||||||
|
|
|
|
|
|
|
| |||||||||
Total Liability Derivatives | $ | 5,510,337 | $ | 5,510,337 | $ | — | $ | — | ||||||||
|
|
|
|
|
|
|
| |||||||||
There were no significant transfers between Levels during the period ended December 31, 2016. Transfers between Levels are identified as of the end of the period.
The following table presents Moderately Aggressive Allocation Portfolio’s futures contracts held as of December 31, 2016. Investments and/or cash totaling $33,595,088 were pledged as the initial margin deposit for these contracts.
Futures Contracts | Number of Contracts Long/(Short) | Expiration Date | Notional Principal Amount | Value | Unrealized Gain/(Loss) | |||||||||||||||
CBOT 10-Yr. U.S. Treasury Note | (313 | ) | March 2017 | ($ | 39,128,891 | ) | ($ | 38,900,032 | ) | $ | 228,859 | |||||||||
CBOT 2-Yr. U.S. Treasury Note | 36 | March 2017 | 7,803,672 | 7,800,750 | (2,922 | ) | ||||||||||||||
CBOT 5-Yr. U.S. Treasury Note | 876 | March 2017 | 103,363,874 | 103,073,716 | (290,158 | ) | ||||||||||||||
CBOT U.S. Long Bond | 290 | March 2017 | 44,003,965 | 43,690,312 | (313,653 | ) | ||||||||||||||
CME E-mini S&P Mid-Cap 400 Index | (2,497 | ) | March 2017 | (422,670,272 | ) | (414,277,270 | ) | 8,393,002 | ||||||||||||
CME S&P 500 Index | 428 | March 2017 | 241,167,975 | 239,273,400 | (1,894,575 | ) | ||||||||||||||
CME Ultra Long Term U.S. Treasury Bond | (13 | ) | March 2017 | (2,113,168 | ) | (2,083,250 | ) | 29,918 | ||||||||||||
ICE mini MSCI EAFE Index | 3,505 | March 2017 | 294,920,035 | 293,648,900 | (1,271,135 | ) | ||||||||||||||
NYBOT NYF mini Russell 2000 Index | 1,148 | March 2017 | 79,623,954 | 77,886,060 | (1,737,894 | ) | ||||||||||||||
Total Futures Contracts | $ | 3,141,442 | ||||||||||||||||||
The following table summarizes the fair value and Statement of Assets and Liabilities location, as of December 31, 2016, for Moderately Aggressive Allocation Portfolio’s investments in financial derivative instruments by primary risk exposure as discussed under item (2) Significant Accounting Policies of the Notes to Financial Statements.
Derivatives by risk category | Statement of Assets and Liabilities Location | Fair Value | ||||
Asset Derivatives | ||||||
Interest Rate Contracts | ||||||
Futures* | Net Assets - Net unrealized appreciation/(depreciation) on Futures contracts | $ | 258,777 | |||
Total Interest Rate Contracts | 258,777 | |||||
Equity Contracts | ||||||
Futures* | Net Assets - Net unrealized appreciation/(depreciation) on Futures contracts | 8,393,002 | ||||
Total Equity Contracts | 8,393,002 | |||||
|
| |||||
Total Asset Derivatives | $ | 8,651,779 | ||||
|
| |||||
Liability Derivatives | ||||||
Interest Rate Contracts | ||||||
Futures* | Net Assets - Net unrealized appreciation/(depreciation) on Futures contracts | 606,733 | ||||
Total Interest Rate Contracts | 606,733 | |||||
Equity Contracts | ||||||
Futures* | Net Assets - Net unrealized appreciation/(depreciation) on Futures contracts | 4,903,604 | ||||
Total Equity Contracts | 4,903,604 | |||||
|
| |||||
Total Liability Derivatives | $ | 5,510,337 | ||||
|
| |||||
| * | Includes cumulative appreciation/depreciation of futures contracts as reported in the Schedule of Investments. Only current day’s variation margin is reported within the Statement of Assets and Liabilities. |
The following table summarizes the net realized gains/(losses) and Statement of Operations location, for the period ended December 31, 2016, for Moderately Aggressive Allocation Portfolio’s investments in financial derivative instruments by primary risk exposure.
Derivatives by risk category | Statement of Operations Location | Realized Gains/(Losses) recognized in Income | ||||
Equity Contracts | ||||||
Futures | Net realized gains/(losses) on Futures contracts | (42,011,014 | ) | |||
Total Equity Contracts | (42,011,014 | ) | ||||
Interest Rate Contracts | ||||||
Futures | Net realized gains/(losses) on Futures contracts | 3,728,499 | ||||
Total Interest Rate Contracts | 3,728,499 | |||||
|
| |||||
Total | ($ | 38,282,515 | ) | |||
|
| |||||
The accompanying Notes to Financial Statements are an integral part of this schedule.
72
Table of Contents
MODERATELY AGGRESSIVE ALLOCATION PORTFOLIO
Summary Schedule of Investments as of December 31, 2016
The following table summarizes the change in net unrealized appreciation/(depreciation) and Statement of Operations location, for the period ended December 31, 2016, for Moderately Aggressive Allocation Portfolio’s investments in financial derivative instruments by primary risk exposure.
Derivatives by risk category | Statement of Operations Location | Change in unrealized appreciation/(depreciation) recognized in Income | ||||
Interest Rate Contracts | ||||||
Futures | Change in net unrealized appreciation/(depreciation) on Futures contracts | (281,665) | ||||
Total Interest Rate Contracts | (281,665) | |||||
Fquity Contracts | ||||||
Futures | Change in net unrealized appreciation/(depreciation) on Futures contracts | (5,948,456) | ||||
Total Equity Contracts | (5,948,456) | |||||
|
| |||||
Total | ($6,230,121) | |||||
|
| |||||
The following table presents Moderately Aggressive Allocation Portfolio’s average volume of derivative activity during the period ended December 31, 2016.
Derivative Risk Category | Futures (Notional)* | Futures (Percentage of Average Net Assets) | ||||||
Equity Contracts | $ | 987,949,999 | 19.8 | % | ||||
Interest Rate Contracts | 165,966,345 | 3.3 | ||||||
| * | Notional amount represents long or short, or both, derivative positions held by the Portfolio. |
Investment in Affiliates
Affiliated issuers, as defined under the Investment Company Act of 1940, include those in which the Portfolio’s holdings of an issuer represent 5% or more of the outstanding voting securities of an issuer, any affiliated mutual fund, or a company which is under common ownership or control with the Portfolio. The Portfolio owns shares of Thrivent Cash Management Trust for the purpose of securities lending and Thrivent Core Short-Term Reserve Fund primarily to serve as a cash sweep vehicle for the Portfolio. Thrivent Cash Management Trust and Thrivent Core Short-Term Reserve Fund are established for the sole use of affiliated portfolios.
A summary of transactions for the fiscal year to date, in Moderately Aggressive Allocation Portfolio, is as follows:
Portfolio | Value December 31, 2015 | Gross Purchases | Gross Sales | Shares Held at December 31, 2016 | Value December 31, 2016 | Income Earned January 1, 2016 - December 31, 2016 | ||||||||||||||||||
Small Cap Stock | $ | 81,936,849 | $ | 4,478,831 | $ | — | 5,579,836 | $ | 103,191,812 | $ | 287,214 | |||||||||||||
Mid Cap Stock | 280,208,930 | 32,623,289 | — | 18,902,196 | 360,667,132 | 1,153,148 | ||||||||||||||||||
Partner Worldwide Allocation | 440,439,482 | 9,815,624 | — | 50,069,595 | 455,187,694 | 9,815,624 | ||||||||||||||||||
Large Cap Value | 312,278,320 | 23,699,525 | — | 21,779,551 | 366,750,218 | 4,437,355 | ||||||||||||||||||
Large Cap Stock | 283,996,164 | 3,557,857 | — | 24,752,802 | 299,399,986 | 3,557,857 | ||||||||||||||||||
High Yield | 45,995,339 | 2,784,132 | — | 10,873,034 | 51,866,545 | 2,784,297 | ||||||||||||||||||
Income | 144,454,320 | 5,327,686 | — | 15,219,349 | 153,242,099 | 5,213,292 | ||||||||||||||||||
Limited Maturity Bond | 90,509,050 | 1,782,461 | — | 9,490,688 | 93,074,230 | 1,782,116 | ||||||||||||||||||
Cash Management Trust-Collateral Investment | 80,456,520 | 678,433,276 | 702,379,736 | 56,510,060 | 56,510,060 | 638,267 | ||||||||||||||||||
Cash Management Trust-Short Term Investment | 108,913,011 | 536,100,515 | 645,013,526 | — | — | 281,952 | ||||||||||||||||||
Core Short-Term Reserve Fund | — | 1,182,306,648 | 541,529,765 | 64,077,688 | 640,776,883 | 2,332,730 | ||||||||||||||||||
Total Value and Income Earned | $ | 1,869,187,985 | $ | 2,580,666,659 | $ | 32,283,852 | ||||||||||||||||||
The accompanying Notes to Financial Statements are an integral part of this schedule.
73
Table of Contents
Summary Schedule of Investments as of December 31, 2016
| Principal Amount | Bank Loans (1.8%) | Value | % of Net Assets | |||||||||
Basic Materials (0.1%) | ||||||||||||
Other Securities^ | $ | 8,236,590 | 0.1 | % | ||||||||
|
| |||||||||||
Total | 8,236,590 | |||||||||||
|
| |||||||||||
Capital Goods (0.1%) | ||||||||||||
Other Securities^ | 5,994,274 | 0.1 | % | |||||||||
|
| |||||||||||
Total | 5,994,274 | |||||||||||
|
| |||||||||||
Communications Services (0.5%) | ||||||||||||
Other Securities^ | 46,407,732 | 0.5 | % | |||||||||
|
| |||||||||||
Total | 46,407,732 | |||||||||||
|
| |||||||||||
Consumer Cyclical (0.3%) | ||||||||||||
Other Securities^ | 28,751,319 | 0.3 | % | |||||||||
|
| |||||||||||
Total | 28,751,319 | |||||||||||
|
| |||||||||||
Consumer Non-Cyclical (0.2%) | ||||||||||||
Other Securities^ | 18,797,613 | 0.2 | % | |||||||||
|
| |||||||||||
Total | 18,797,613 | |||||||||||
|
| |||||||||||
Energy (0.2%) | ||||||||||||
Other Securities^ | 14,571,813 | 0.2 | % | |||||||||
|
| |||||||||||
Total | 14,571,813 | |||||||||||
|
| |||||||||||
Financials (0.1%) | ||||||||||||
Other Securities^ | 12,774,554 | 0.1 | % | |||||||||
|
| |||||||||||
Total | 12,774,554 | |||||||||||
|
| |||||||||||
Technology (0.2%) | ||||||||||||
Other Securities^ | 14,918,186 | 0.2 | % | |||||||||
|
| |||||||||||
Total | 14,918,186 | |||||||||||
|
| |||||||||||
Transportation (<0.1%) | ||||||||||||
Other Securities^ | 4,903,769 | <0.1 | % | |||||||||
|
| |||||||||||
Total | 4,903,769 | |||||||||||
|
| |||||||||||
Utilities (0.1%) | ||||||||||||
Other Securities^ | 6,999,898 | 0.1 | % | |||||||||
|
| |||||||||||
Total | 6,999,898 | |||||||||||
|
| |||||||||||
Total Bank Loans (cost $163,218,799) | 162,355,748 | |||||||||||
|
| |||||||||||
| Shares | Common Stock (33.0%) | |||||||||||
Consumer Discretionary (4.4%) | ||||||||||||
| 73,982 | Amazon.com, Inc.a | 55,476,882 | 0.6 | % | ||||||||
| 512,664 | Comcast Corporation | 35,399,449 | 0.4 | % | ||||||||
| 159,590 | Home Depot, Inc. | 21,397,827 | 0.3 | % | ||||||||
Other Securities^ | 300,597,732 | 3.1 | % | |||||||||
|
| |||||||||||
Total | 412,871,890 | |||||||||||
|
| |||||||||||
Consumer Staples (1.1%) | ||||||||||||
| 257,680 | CVS Health Corporation | 20,333,529 | 0.2 | % | ||||||||
Other Securities^ | 83,496,795 | 0.9 | % | |||||||||
|
| |||||||||||
Total | 103,830,324 | |||||||||||
|
| |||||||||||
Energy (3.2%) | ||||||||||||
| 261,050 | Chevron Corporation | 30,725,585 | 0.3 | % | ||||||||
Other Securities^ | 262,297,369 | 2.9 | % | |||||||||
|
| |||||||||||
Total | 293,022,954 | |||||||||||
|
| |||||||||||
Financials (5.3%) | ||||||||||||
| 1,492,740 | Bank of America Corporation | 32,989,554 | 0.4 | % | ||||||||
| 467,490 | Citigroup, Inc. | 27,782,931 | 0.3 | % | ||||||||
| 108,640 | Goldman Sachs Group, Inc. | 26,013,848 | 0.3 | % | ||||||||
| 498,726 | Zions Bancorporation | 21,465,167 | 0.2 | % | ||||||||
Other Securities^ | 383,637,625 | 4.1 | % | |||||||||
|
| |||||||||||
Total | 491,889,125 | |||||||||||
|
| |||||||||||
Health Care (4.0%) | ||||||||||||
| 166,651 | Alexion Pharmaceuticals, Inc.a | 20,389,750 | 0.2 | % | ||||||||
| 102,388 | Allergan plca | 21,502,504 | 0.2 | % | ||||||||
| 218,890 | Celgene Corporationa | 25,336,518 | 0.3 | % | ||||||||
| 368,651 | Gilead Sciences, Inc. | 26,399,098 | 0.3 | % | ||||||||
| 288,024 | Medtronic plc | 20,515,950 | 0.2 | % | ||||||||
| 335,340 | Merck & Company, Inc. | 19,741,466 | 0.2 | % | ||||||||
Other Securities^ | 237,392,047 | 2.6 | % | |||||||||
|
| |||||||||||
Total | 371,277,333 | |||||||||||
|
| |||||||||||
Industrials (4.0%) | ||||||||||||
| 231,029 | Union Pacific Corporation | 23,953,087 | 0.3 | % | ||||||||
Other Securities^ | 347,379,508 | 3.7 | % | |||||||||
|
| |||||||||||
Total | 371,332,595 | |||||||||||
|
| |||||||||||
Information Technology (7.5%) | ||||||||||||
| 48,224 | Alphabet, Inc., Class Aa | 38,215,109 | 0.4 | % | ||||||||
| 41,469 | Alphabet, Inc., Class Ca | 32,006,604 | 0.3 | % | ||||||||
| 389,449 | Apple, Inc. | 45,105,983 | 0.5 | % | ||||||||
| 947,610 | Cisco Systems, Inc. | 28,636,774 | 0.3 | % | ||||||||
| 375,630 | Facebook, Inc.a | 43,216,232 | 0.5 | % | ||||||||
| 308,820 | MasterCard, Inc. | 31,885,665 | 0.3 | % | ||||||||
| 976,550 | Microsoft Corporation | 60,682,817 | 0.7 | % | ||||||||
| 472,580 | Oracle Corporation | 18,170,701 | 0.2 | % | ||||||||
| 593,614 | PayPal Holdings, Inc.a | 23,429,945 | 0.2 | % | ||||||||
| 424,790 | Salesforce.com, Inc.a | 29,081,123 | 0.3 | % | ||||||||
| 423,060 | Visa, Inc. | 33,007,141 | 0.4 | % | ||||||||
Other Securities^ | 315,565,766 | 3.4 | % | |||||||||
|
| |||||||||||
Total | 699,003,860 | |||||||||||
|
| |||||||||||
Materials (1.5%) | ||||||||||||
Other Securities^ | 135,723,904 | 1.5 | % | |||||||||
|
| |||||||||||
Total | 135,723,904 | |||||||||||
|
| |||||||||||
Real Estate (0.9%) | ||||||||||||
Other Securities^ | 81,476,296 | 0.9 | % | |||||||||
|
| |||||||||||
Total | 81,476,296 | |||||||||||
|
| |||||||||||
Telecommunications Services (0.3%) | ||||||||||||
Other Securities^ | 24,438,987 | 0.3 | % | |||||||||
|
| |||||||||||
Total | 24,438,987 | |||||||||||
|
| |||||||||||
Utilities (0.8%) | ||||||||||||
Other Securities^ | 73,806,447 | 0.8 | % | |||||||||
|
| |||||||||||
Total | 73,806,447 | |||||||||||
|
| |||||||||||
Total Common Stock (cost $2,525,310,992) | 3,058,673,715 | |||||||||||
|
| |||||||||||
Registered Investment Companies (30.2%) | ||||||||||||
Affiliated Equity Holdings (18.2%) | ||||||||||||
| 22,936,793 | Thrivent Large Cap Stock Portfolio | 277,434,277 | 3.0 | % | ||||||||
| 30,302,240 | Thrivent Large Cap Value Portfolio | 510,265,482 | 5.5 | % | ||||||||
| 15,614,280 | Thrivent Mid Cap Stock Portfolio | 297,931,385 | 3.2 | % | ||||||||
| 57,080,403 | Thrivent Partner Worldwide Allocation Portfolio | 518,923,651 | 5.6 | % | ||||||||
The accompanying Notes to Financial Statements are an integral part of this schedule.
74
Table of Contents
MODERATE ALLOCATION PORTFOLIO
Summary Schedule of Investments as of December 31, 2016
| Shares | Registered Investment Companies (30.2%) | Value | % of Net Assets | |||||||||
Affiliated Equity Holdings (18.2%) - continued | ||||||||||||
| 4,432,127 | Thrivent Small Cap Stock Portfolio | $ | 81,966,430 | 0.9 | % | |||||||
|
| |||||||||||
Total | 1,686,521,225 | |||||||||||
|
| |||||||||||
Affiliated Fixed Income Holdings (10.8%) | ||||||||||||
| 35,466,032 | Thrivent High Yield Portfolio | 169,180,064 | 1.8 | % | ||||||||
| 51,812,632 | Thrivent Income Portfolio | 521,696,215 | 5.6 | % | ||||||||
| 31,725,097 | Thrivent Limited Maturity Bond Portfolio | 311,124,857 | 3.4 | % | ||||||||
|
| |||||||||||
Total | 1,002,001,136 | |||||||||||
|
| |||||||||||
Equity Funds/ETFs (0.5%) | ||||||||||||
| 118,993 | SPDR S&P 500 ETF Trust | 26,598,505 | 0.3 | % | ||||||||
Other Securities^ | 18,956,027 | 0.2 | % | |||||||||
|
| |||||||||||
Total | 45,554,532 | |||||||||||
|
| |||||||||||
Fixed Income Funds/ETFs (0.7%) | ||||||||||||
| 195,050 | iShares iBoxx $ Investment Grade Corporate Bond ETF | 22,855,959 | 0.3 | % | ||||||||
| 291,700 | Vanguard Short-Term Corporate Bond ETF | 23,152,229 | 0.3 | % | ||||||||
Other Securities^ | 19,107,411 | 0.1 | % | |||||||||
|
| |||||||||||
Total | 65,115,599 | |||||||||||
|
| |||||||||||
Total Registered Investment Companies (cost $2,514,142,373) | 2,799,192,492 | |||||||||||
|
| |||||||||||
| Principal Amount | Long-Term Fixed Income (29.7%) | |||||||||||
Asset-Backed Securities (2.1%) | ||||||||||||
U.S. Small Business Administration | ||||||||||||
| $ | 851,662 | 3.191%, 3/10/2024, Series 2014-10A, Class 1 | 880,874 | <0.1 | % | |||||||
Other Securities^ | 186,929,396 | 2.1 | % | |||||||||
|
| |||||||||||
Total | 187,810,270 | |||||||||||
|
| |||||||||||
Basic Materials (0.2%) | ||||||||||||
Other Securities^ | 14,592,708 | 0.2 | % | |||||||||
|
| |||||||||||
Total | 14,592,708 | |||||||||||
|
| |||||||||||
Capital Goods (0.4%) | ||||||||||||
Other Securities^ | 41,612,959 | 0.4 | % | |||||||||
|
| |||||||||||
Total | 41,612,959 | |||||||||||
|
| |||||||||||
Collateralized Mortgage Obligations (0.6%) | ||||||||||||
Federal Home Loan Mortgage Corporation | ||||||||||||
| 12,010,460 | 3.000% - 4.000%, 7/15/2031 - 2/15/2033, Series-4170, Class IGb | 1,403,729 | <0.1 | % | ||||||||
Federal National Mortgage Association | ||||||||||||
| 8,466,220 | 3.500%, 1/25/2033, Series 2012-150, Class YIb | 1,141,443 | <0.1 | % | ||||||||
Other Securities^ | 48,824,948 | 0.6 | % | |||||||||
|
| |||||||||||
Total | 51,370,120 | |||||||||||
|
| |||||||||||
Commercial Mortgage-Backed Securities (0.5%) | ||||||||||||
Federal National Mortgage Association | ||||||||||||
| 54,448 | 1.272%, 1/25/2017 | 54,400 | <0.1 | % | ||||||||
Other Securities^ | 50,586,015 | 0.5 | % | |||||||||
|
| |||||||||||
Total | 50,640,415 | |||||||||||
|
| |||||||||||
Communications Services (1.1%) | ||||||||||||
Other Securities^ | 101,631,682 | 1.1 | % | |||||||||
|
| |||||||||||
Total | 101,631,682 | |||||||||||
|
| |||||||||||
Consumer Cyclical (0.7%) | ||||||||||||
Other Securities^ | 61,271,991 | 0.7 | % | |||||||||
|
| |||||||||||
Total | 61,271,991 | |||||||||||
|
| |||||||||||
Consumer Non-Cyclical (1.1%) | ||||||||||||
Other Securities^ | 104,563,098 | 1.1 | % | |||||||||
|
| |||||||||||
Total | 104,563,098 | |||||||||||
|
| |||||||||||
Energy (0.8%) | ||||||||||||
Other Securities^ | 79,164,035 | 0.8 | % | |||||||||
|
| |||||||||||
Total | 79,164,035 | |||||||||||
|
| |||||||||||
Financials (2.4%) | ||||||||||||
Other Securities^ | 220,806,081 | 2.4 | % | |||||||||
|
| |||||||||||
Total | 220,806,081 | |||||||||||
|
| |||||||||||
Foreign Government (0.1%) | ||||||||||||
Other Securities^ | 9,354,366 | 0.1 | % | |||||||||
|
| |||||||||||
Total | 9,354,366 | |||||||||||
|
| |||||||||||
Mortgage-Backed Securities (10.8%) | ||||||||||||
Federal Home Loan Mortgage Corporation Gold 15-Yr. Pass Through | ||||||||||||
| 65,995,000 | 3.000%, 1/1/2032c | 67,691,071 | 0.7 | % | ||||||||
Federal Home Loan Mortgage Corporation Gold 30-Yr. Pass Through | ||||||||||||
| 48,845,000 | 4.000%, 1/1/2047c | 51,277,481 | 0.6 | % | ||||||||
Federal National Mortgage Association Conventional 15-Yr. Pass Through | ||||||||||||
| 59,375,000 | 2.500%, 1/1/2032c | 59,440,312 | 0.6 | % | ||||||||
Federal National Mortgage Association Conventional 30-Yr. Pass Through | ||||||||||||
| 182,200,000 | 3.000%, 1/1/2047c | 180,869,940 | 1.9 | % | ||||||||
| 336,550,000 | 3.500%, 1/1/2047c | 344,728,165 | 3.7 | % | ||||||||
| 192,432,500 | 4.000%, 1/1/2047c | 202,208,071 | 2.2 | % | ||||||||
| 71,494,000 | 4.500%, 1/1/2047c | 76,870,349 | 0.8 | % | ||||||||
| 18,386,786 | 1.740% - 2.088%, 7/1/2043 - 8/1/2043d | 18,922,433 | 0.3 | % | ||||||||
|
| |||||||||||
Total | 1,002,007,822 | |||||||||||
|
| |||||||||||
Technology (0.5%) | ||||||||||||
Other Securities^ | 51,480,250 | 0.5 | % | |||||||||
|
| |||||||||||
Total | 51,480,250 | |||||||||||
|
| |||||||||||
Transportation (0.2%) | ||||||||||||
Other Securities^ | 16,333,717 | 0.2 | % | |||||||||
|
| |||||||||||
Total | 16,333,717 | |||||||||||
|
| |||||||||||
U.S. Government and Agencies (7.4%) | ||||||||||||
Federal National Mortgage Association | ||||||||||||
| 540,000 | 6.250%, 5/15/2029 | 714,577 | <0.1 | % | ||||||||
The accompanying Notes to Financial Statements are an integral part of this schedule.
75
Table of Contents
MODERATE ALLOCATION PORTFOLIO
Summary Schedule of Investments as of December 31, 2016
| Principal Amount | Long-Term Fixed Income (29.7%) | Value | % of Net Assets | |||||||||
U.S. Government and Agencies (7.4%) - continued | ||||||||||||
Tennessee Valley Authority | ||||||||||||
| $ | 520,000 | 5.250%, 9/15/2039 | $ | 651,953 | <0.1 | % | ||||||
U.S. Treasury Bonds | ||||||||||||
| 35,920,000 | 3.625%, 2/15/2044 | 39,729,639 | 0.4 | % | ||||||||
| 25,136,000 | 2.500%, 5/15/2046 | 22,282,335 | 0.2 | % | ||||||||
| 13,725,000 | 2.875% - 5.250%, 11/15/2028 - 11/15/2046 | 15,484,631 | 0.2 | % | ||||||||
U.S. Treasury Bonds, TIPS | ||||||||||||
| 35,505,655 | 0.125%, 1/15/2023 | 35,239,434 | 0.4 | % | ||||||||
| 31,708,929 | 0.625%, 1/15/2026 | 31,982,355 | 0.4 | % | ||||||||
| 5,681,754 | 0.125% - 2.375%, 4/15/2019 - 2/15/2042 | 5,725,026 | 0.1 | % | ||||||||
U.S. Treasury Notes | ||||||||||||
| 25,100,000 | 0.875%, 3/31/2018 | 25,065,538 | 0.3 | % | ||||||||
| 65,050,000 | 1.000%, 11/30/2018e | 64,828,245 | 0.7 | % | ||||||||
| 112,320,000 | 1.500%, 10/31/2019 | 112,539,249 | 1.2 | % | ||||||||
| 76,185,000 | 1.375%, 9/30/2020 | 75,265,752 | 0.8 | % | ||||||||
| 38,359,000 | 1.125%, 8/31/2021 | 37,027,176 | 0.4 | % | ||||||||
| 50,800,000 | 1.625%, 10/31/2023 | 48,812,755 | 0.5 | % | ||||||||
| 68,135,000 | 2.250%, 11/15/2024 | 67,626,985 | 0.7 | % | ||||||||
| 55,654,000 | 2.000%, 11/15/2026e | 53,460,676 | 0.6 | % | ||||||||
| 48,025,000 | 0.750% - 2.125%, 1/31/2017 - 9/30/2023f | 47,348,475 | 0.5 | % | ||||||||
|
| |||||||||||
Total | 683,784,801 | |||||||||||
|
| |||||||||||
Utilities (0.8%) | ||||||||||||
Other Securities^ | 70,159,034 | 0.8 | % | |||||||||
|
| |||||||||||
Total | 70,159,034 | |||||||||||
|
| |||||||||||
Total Long-Term Fixed Income (cost $2,743,821,405) | 2,746,583,349 | |||||||||||
|
| |||||||||||
| Shares | Preferred Stock (<0.1%) | |||||||||||
Consumer Staples (<0.1%) | ||||||||||||
Other Securities^ | 94,994 | <0.1 | % | |||||||||
|
| |||||||||||
Total | 94,994 | |||||||||||
|
| |||||||||||
Energy (<0.1%) | ||||||||||||
Other Securities^ | 642,265 | <0.1 | % | |||||||||
|
| |||||||||||
Total | 642,265 | |||||||||||
|
| |||||||||||
Total Preferred Stock (cost $194,605) | 737,259 | |||||||||||
|
| |||||||||||
Collateral Held for Securities Loaned (2.0%) | ||||||||||||
| 186,669,340 | Thrivent Cash Management Trust | 186,669,340 | 2.0 | % | ||||||||
|
| |||||||||||
Total Collateral Held for Securities Loaned (cost $186,669,340) | 186,669,340 | |||||||||||
|
| |||||||||||
| Shares or Principal Amount | Short-Term Investments (15.8%)g | |||||||||||
Federal Home Loan Bank Discount Notes | ||||||||||||
| 18,000,000 | 0.340%, 1/4/2017h | 17,999,802 | 0.2 | % | ||||||||
Federal National Mortgage Association Discount Notes | ||||||||||||
| 12,000,000 | 0.345%, 1/11/2017h | 11,998,992 | 0.1 | % | ||||||||
U.S. Treasury Bills | ||||||||||||
| 10,600,000 | 0.411% - 0.473%, 1/26/2017 - 2/9/2017f | 10,595,941 | 0.1 | % | ||||||||
U.S. Treasury Note | ||||||||||||
| 1,900,000 | 0.500%, 1/31/2017 | 1,900,216 | <0.1 | % | ||||||||
Thrivent Core Short-Term Reserve Fund | ||||||||||||
| 138,900,615 | 0.910% | 1,389,006,154 | 15.0 | % | ||||||||
Other Securities^ | 31,987,280 | 0.4 | % | |||||||||
|
| |||||||||||
Total Short-Term Investments (cost $1,463,486,512) | 1,463,488,385 | |||||||||||
|
| |||||||||||
Total Investments (cost $9,596,844,026) 112.5% | $ | 10,417,700,288 | ||||||||||
|
| |||||||||||
Other Assets and Liabilities, Net (12.5%) | (1,156,303,810 | ) | ||||||||||
|
| |||||||||||
Total Net Assets 100.0% | $ | 9,261,396,478 | ||||||||||
|
| |||||||||||
| ^ | The Summary Schedule of Investments shows the 50 largest holdings in unaffiliated issuers, any holding or issuer that exceeds 1% of net assets and all affiliated holdings as of the report date. The remaining securities held are grouped by category as “Other securities”. |
| a | Non-income producing security. |
| b | Denotes interest only security. Interest only securities represent the right to receive monthly interest payments on an underlying pool of mortgages or assets. The principal shown is the outstanding par amount of the pool as of the end of the period. The actual effective yield of the security is different than the stated coupon rate. |
| c | Denotes investments purchased on a when-issued or delayed delivery basis. |
| d | Denotes variable rate securities. Variable rate securities are securities whose yields vary with a designated market index or market rate. The rate shown is as of December 31, 2016. |
| e | All or a portion of the security is on loan. |
| f | At December 31, 2016, $2,547,481 of investments were segregated to cover exposure to a counterparty for margin on open mortgage-backed security transactions. |
| g | The interest rate shown reflects the yield, coupon rate or the discount rate at the date of purchase. |
| h | All or a portion of the security is held on deposit with the counterparty and pledged as the initial margin deposit for open futures contracts. |
Moderate Allocation Portfolio held restricted securities as of December 31, 2016. Restricted securities are investment securities which cannot be offered for public sale without first being registered under the Securities Act of 1933. As of December 31, 2016, the value of these investments was $111,487,739 or 1.2% of total net assets.
The accompanying Notes to Financial Statements are an integral part of this schedule.
76
Table of Contents
MODERATE ALLOCATION PORTFOLIO
Summary Schedule of Investments as of December 31, 2016
The following table presents the total amount of securities loaned with continuous maturity, by type, offset by the gross payable upon return of collateral for securities loaned by Thrivent Moderate Allocation Portfolio as of December 31, 2016:
Securities Lending Transactions | ||||
Taxable Debt Security | $ | 135,038,038 | ||
Common Stock | 47,486,754 | |||
|
| |||
Total lending | $ | 182,524,792 | ||
Gross amount payable upon return of collateral for securities loaned | $ | 186,669,340 | ||
|
| |||
Net amounts due to counterparty | $ | 4,144,548 | ||
|
| |||
Definitions:
| ETF | - | Exchange Traded Fund. | ||
| TIPS | - | Treasury Inflation Protected Security. |
Unrealized Appreciation (Depreciation)
Gross unrealized appreciation and depreciation of investments, based on cost for federal income tax purposes, were as follows:
Gross unrealized appreciation | $ | 930,164,437 | ||
Gross unrealized depreciation | (127,338,400 | ) | ||
|
| |||
Net unrealized appreciation (depreciation) | $ | 802,826,037 | ||
Cost for federal income tax purposes | $ | 9,614,874,251 | ||
The accompanying Notes to Financial Statements are an integral part of this schedule.
77
Table of Contents
MODERATE ALLOCATION PORTFOLIO
Summary Schedule of Investments as of December 31, 2016
Fair Valuation Measurements
The following table is a summary of the inputs used, as of December 31, 2016, in valuing Moderate Allocation Portfolio’s assets
carried at fair value.
Investments in Securities | Total | Level 1 | Level 2 | Level 3 | ||||||||||||
Bank Loans | ||||||||||||||||
Basic Materials | 8,236,590 | — | 8,236,590 | — | ||||||||||||
Capital Goods | 5,994,274 | — | 2,703,649 | 3,290,625 | ||||||||||||
Communications Services | 46,407,732 | — | 43,312,194 | 3,095,538 | ||||||||||||
Consumer Cyclical | 28,751,319 | — | 27,252,819 | 1,498,500 | ||||||||||||
Consumer Non-Cyclical | 18,797,613 | — | 18,797,613 | — | ||||||||||||
Energy | 14,571,813 | — | 10,556,759 | 4,015,054 | ||||||||||||
Financials | 12,774,554 | — | 12,774,554 | — | ||||||||||||
Technology | 14,918,186 | — | 12,986,699 | 1,931,487 | ||||||||||||
Transportation | 4,903,769 | — | 4,903,769 | — | ||||||||||||
Utilities | 6,999,898 | — | 3,988,648 | 3,011,250 | ||||||||||||
Common Stock | ||||||||||||||||
Consumer Discretionary | 412,871,890 | 401,776,217 | 11,095,673 | — | ||||||||||||
Consumer Staples | 103,830,324 | 97,506,115 | 6,324,209 | — | ||||||||||||
Energy | 293,022,954 | 285,017,806 | 8,004,847 | 301 | ||||||||||||
Financials | 491,889,125 | 473,548,138 | 18,340,987 | — | ||||||||||||
Health Care | 371,277,333 | 364,511,489 | 6,765,844 | — | ||||||||||||
Industrials | 371,332,595 | 357,406,444 | 13,926,151 | — | ||||||||||||
Information Technology | 699,003,860 | 696,225,425 | 2,778,435 | — | ||||||||||||
Materials | 135,723,904 | 127,311,980 | 8,411,915 | 9 | ||||||||||||
Real Estate | 81,476,296 | 78,122,578 | 3,353,718 | — | ||||||||||||
Telecommunications Services | 24,438,987 | 21,403,702 | 3,035,285 | — | ||||||||||||
Utilities | 73,806,447 | 71,976,185 | 1,830,262 | — | ||||||||||||
Registered Investment Companies | ||||||||||||||||
Affiliated Fixed Income Holdings | 1,002,001,136 | 1,002,001,136 | — | — | ||||||||||||
Affiliated Equity Holdings | 1,686,521,225 | 1,686,521,225 | — | — | ||||||||||||
Fixed Income Funds/ETFs | 65,115,599 | 65,115,599 | — | — | ||||||||||||
Equity Funds/ETFs | 45,554,532 | 45,554,532 | — | — | ||||||||||||
Long-Term Fixed Income | ||||||||||||||||
Asset-Backed Securities | 187,810,270 | — | 180,310,270 | 7,500,000 | ||||||||||||
Basic Materials | 14,592,708 | — | 14,592,708 | — | ||||||||||||
Capital Goods | 41,612,959 | — | 41,612,959 | — | ||||||||||||
Collateralized Mortgage Obligations | 51,370,120 | — | 51,370,120 | — | ||||||||||||
Commercial Mortgage-Backed Securities | 50,640,415 | — | 50,640,415 | — | ||||||||||||
Communications Services | 101,631,682 | — | 101,631,682 | — | ||||||||||||
Consumer Cyclical | 61,271,991 | — | 61,271,991 | — | ||||||||||||
Consumer Non-Cyclical | 104,563,098 | — | 104,563,098 | — | ||||||||||||
Energy | 79,164,035 | — | 79,164,035 | — | ||||||||||||
Financials | 220,806,081 | — | 220,806,081 | — | ||||||||||||
Foreign Government | 9,354,366 | — | 9,354,366 | — | ||||||||||||
Mortgage-Backed Securities | 1,002,007,822 | — | 1,002,007,822 | — | ||||||||||||
Technology | 51,480,250 | — | 51,480,250 | — | ||||||||||||
Transportation | 16,333,717 | — | 16,333,717 | — | ||||||||||||
U.S. Government and Agencies | 683,784,801 | — | 683,784,801 | — | ||||||||||||
Utilities | 70,159,034 | — | 70,159,034 | — | ||||||||||||
Preferred Stock | ||||||||||||||||
Consumer Staples | 94,994 | — | 94,994 | — | ||||||||||||
Energy | 642,265 | — | — | 642,265 | ||||||||||||
Short-Term Investments | 74,482,231 | — | 74,482,231 | — | ||||||||||||
|
|
|
|
|
|
|
| |||||||||
Subtotal Investments in Securities | $ | 8,842,024,794 | $ | 5,773,998,571 | $ | 3,043,041,194 | $ | 24,985,029 | ||||||||
|
|
|
|
|
|
|
| |||||||||
Other Investments * | Total | |||||||||||||||
Short-Term Investments | 1,389,006,154 | |||||||||||||||
Collateral Held for Securities Loaned | 186,669,340 | |||||||||||||||
|
| |||||||||||||||
Subtotal Other Investments | $ | 1,575,675,494 | ||||||||||||||
|
| |||||||||||||||
Total Investments at Value | $ | 10,417,700,288 | ||||||||||||||
|
| |||||||||||||||
| * | Certain investments are measured at fair value using a net asset value per share that is not publicly available (practical expedient). According to disclosure requirements of Accounting Standards Codification (ASC) 820, Fair Value Measurement, securities valued using the practical expedient are not classified in the fair value hierarchy. The fair value amounts presented in this table are intended to permit reconciliation of the fair value hierarchy to the amounts presented in the Statement of Assets and Liabilities. |
The accompanying Notes to Financial Statements are an integral part of this schedule.
78
Table of Contents
MODERATE ALLOCATION PORTFOLIO
Summary Schedule of Investments as of December 31, 2016
Other Financial Instruments | Total | Level 1 | Level 2 | Level 3 | ||||||||||||
Asset Derivatives | ||||||||||||||||
Futures Contracts | 9,316,711 | 9,316,711 | — | — | ||||||||||||
|
|
|
|
|
|
|
| |||||||||
Total Asset Derivatives | $ | 9,316,711 | $ | 9,316,711 | $ | — | $ | — | ||||||||
|
|
|
|
|
|
|
| |||||||||
Liability Derivatives | ||||||||||||||||
Futures Contracts | 8,259,044 | 8,259,044 | — | — | ||||||||||||
|
|
|
|
|
|
|
| |||||||||
Total Liability Derivatives | $ | 8,259,044 | $ | 8,259,044 | $ | — | $ | — | ||||||||
|
|
|
|
|
|
|
| |||||||||
There were no significant transfers between Levels during the period ended December 31, 2016. Transfers between Levels are identified as of the end of the period.
The following table presents Moderate Allocation Portfolio’s futures contracts held as of December 31, 2016. Investments and/or cash totaling $61,986,074 were pledged as the initial margin deposit for these contracts.
Futures Contracts | Number of Contracts Long/(Short) | Expiration Date | Notional Principal Amount | Value | Unrealized Gain/(Loss) | |||||||||||||||
CBOT 10-Yr. U.S. Treasury Note | 392 | March 2017 | $ | 49,001,254 | $ | 48,718,249 | ($ | 283,005 | ) | |||||||||||
CBOT 2-Yr. U.S. Treasury Note | (512 | ) | March 2017 | (110,974,438 | ) | (110,944,000 | ) | 30,438 | ||||||||||||
CBOT 5-Yr. U.S. Treasury Note | 2,473 | March 2017 | 291,802,352 | 290,983,220 | (819,132 | ) | ||||||||||||||
CBOT U.S. Long Bond | 847 | March 2017 | 128,540,837 | 127,605,844 | (934,993 | ) | ||||||||||||||
CME E-mini S&P Mid-Cap 400 Index | (2,595 | ) | March 2017 | (439,258,979 | ) | (430,536,450 | ) | 8,722,529 | ||||||||||||
CME S&P 500 Index | (122 | ) | March 2017 | (68,767,844 | ) | (68,204,100 | ) | 563,744 | ||||||||||||
CME Ultra Long Term U.S. Treasury Bond | 222 | March 2017 | 35,845,061 | 35,575,500 | (269,561 | ) | ||||||||||||||
ICE mini MSCI EAFE Index | 6,067 | March 2017 | 510,509,443 | 508,293,260 | (2,216,183 | ) | ||||||||||||||
NYBOT NYF mini Russell 2000 Index | 2,468 | March 2017 | 171,177,629 | 167,441,459 | (3,736,170 | ) | ||||||||||||||
Total Futures Contracts | $ | 1,057,667 | ||||||||||||||||||
The following table summarizes the fair value and Statement of Assets and Liabilities location, as of December 31, 2016, for Moderate Allocation Portfolio’s investments in financial derivative instruments by primary risk exposure as discussed under item (2) Significant Accounting Policies of the Notes to Financial Statements.
Derivatives by risk category | Statement of Assets and Liabilities Location | Fair Value | ||||
Asset Derivatives | ||||||
Interest Rate Contracts | ||||||
Futures* | Net Assets - Net unrealized appreciation/(depreciation) on Futures contracts | $ | 30,438 | |||
Total Interest Rate Contracts | 30,438 | |||||
Equity Contracts | ||||||
Futures* | Net Assets - Net unrealized appreciation/(depreciation) on Futures contracts | 9,286,273 | ||||
Total Equity Contracts | 9,286,273 | |||||
|
| |||||
Total Asset Derivatives | $ | 9,316,711 | ||||
|
| |||||
Liability Derivatives | ||||||
Interest Rate Contracts | ||||||
Futures* | Net Assets - Net unrealized appreciation/(depreciation) on Futures contracts | 2,306,691 | ||||
Total Interest Rate Contracts | 2,306,691 | |||||
Fquity Contracts | ||||||
Futures* | Net Assets - Net unrealized appreciation/(depreciation) on Futures contracts | 5,952,353 | ||||
Total Equity Contracts | 5,952,353 | |||||
|
| |||||
Total Liability Derivatives | $ | 8,259,044 | ||||
|
| |||||
| * | Includes cumulative appreciation/depreciation of futures contracts as reported in the Schedule of Investments. Only current day’s variation margin is reported within the Statement of Assets and Liabilities. |
The following table summarizes the net realized gains/(losses) and Statement of Operations location, for the period ended December 31, 2016, for Moderate Allocation Portfolio’s investments in financial derivative instruments by primary risk exposure.
Derivatives by risk category | Statement of Operations Location | Realized Gains/(Losses) recognized in Income | ||||
Fquity Contracts | ||||||
Futures | Net realized gains/(losses) on Futures contracts | (40,173,797 | ) | |||
Total Equity Contracts | (40,173,797 | ) | ||||
Interest Rate Contracts | ||||||
Futures | Net realized gains/(losses) on Futures contracts | 15,097,014 | ||||
Total Interest Rate Contracts | 15,097,014 | |||||
|
| |||||
Total | ($ | 25,076,783 | ) | |||
|
| |||||
The accompanying Notes to Financial Statements are an integral part of this schedule.
79
Table of Contents
MODERATE ALLOCATION PORTFOLIO
Summary Schedule of Investments as of December 31, 2016
The following table summarizes the change in net unrealized appreciation/(depreciation) and Statement of Operations location, for the period ended December 31, 2016, for Moderate Allocation Portfolio’s investments in financial derivative instruments by primary risk exposure.
Derivatives by risk category | Statement of Operations Location | Change in unrealized appreciation/ (depreciation) recognized in Income | ||||
Interest Rate Contracts | ||||||
Futures | Change in net unrealized appreciation/(depreciation) on Futures contracts | (2,362,911 | ) | |||
Total Interest Rate Contracts | (2,362,911 | ) | ||||
Fquity Contracts | ||||||
Futures | Change in net unrealized appreciation/(depreciation) on Futures contracts | (9,615,752 | ) | |||
Total Equity Contracts | (9,615,752 | ) | ||||
|
| |||||
Total | ($ | 11,978,663 | ) | |||
|
| |||||
The following table presents Moderate Allocation Portfolio’s average volume of derivative activity during the period ended December 31, 2016.
Derivative Risk Category | Futures (Notional)* | Futures (Percentage of Average Net Assets) | ||||||
Equity Contracts | $ | 1,131,104,028 | 12.8 | % | ||||
Interest Rate Contracts | 638,909,405 | 7.2 | ||||||
| * | Notional amount represents long or short, or both, derivative positions held by the Portfolio. |
Investment in Affiliates
Affiliated issuers, as defined under the Investment Company Act of 1940, include those in which the Portfolio’s holdings of an issuer represent 5% or more of the outstanding voting securities of an issuer, any affiliated mutual fund, or a company which is under common ownership or control with the Portfolio. The Portfolio owns shares of Thrivent Cash Management Trust for the purpose of securities lending and Thrivent Core Short-Term Reserve Fund primarily to serve as a cash sweep vehicle for the Portfolio. Thrivent Cash Management Trust and Thrivent Core Short-Term Reserve Fund are established for the sole use of affiliated portfolios.
A summary of transactions for the fiscal year to date, in Moderate Allocation Portfolio, is as follows:
Portfolio | Value December 31, 2015 | Gross Purchases | Gross Sales | Shares Held at December 31, 2016 | Value December 31, 2016 | Income Earned January 1, 2016 - December 31, 2016 | ||||||||||||||||||
Small Cap Stock | $ | 65,083,371 | $ | 3,557,587 | $ | — | 4,432,127 | $ | 81,966,430 | $ | 228,138 | |||||||||||||
Mid Cap Stock | 231,468,373 | 26,948,676 | — | 15,614,280 | 297,931,385 | 952,565 | ||||||||||||||||||
Partner Worldwide Allocation | 502,110,376 | 11,190,020 | — | 57,080,403 | 518,923,651 | 11,190,020 | ||||||||||||||||||
Large Cap Value | 434,477,853 | 32,973,531 | — | 30,302,240 | 510,265,482 | 6,173,763 | ||||||||||||||||||
Large Cap Stock | 263,160,569 | 3,296,832 | — | 22,936,793 | 277,434,277 | 3,296,832 | ||||||||||||||||||
High Yield | 150,029,163 | 9,081,376 | — | 35,466,032 | 169,180,064 | 9,081,915 | ||||||||||||||||||
Income | 491,779,169 | 18,137,533 | — | 51,812,632 | 521,696,215 | 17,748,091 | ||||||||||||||||||
Limited Maturity Bond | 302,550,074 | 5,958,340 | — | 31,725,097 | 311,124,857 | 5,957,186 | ||||||||||||||||||
Cash Management Trust-Collateral Investment | 182,839,267 | 1,225,600,515 | 1,221,770,442 | 186,669,340 | 186,669,340 | 1,075,543 | ||||||||||||||||||
Cash Management Trust-Short Term Investment | 213,007,058 | 1,146,526,774 | 1,359,533,832 | — | — | 520,264 | ||||||||||||||||||
Core Short-Term Reserve Fund | — | 2,442,180,913 | 1,053,174,759 | 138,900,615 | 1,389,006,154 | 5,405,407 | ||||||||||||||||||
Total Value and Income Earned | $ | 2,836,505,273 | $ | 4,264,197,855 | $ | 61,629,724 | ||||||||||||||||||
The accompanying Notes to Financial Statements are an integral part of this schedule.
80
Table of Contents
MODERATELY CONSERVATIVE ALLOCATION PORTFOLIO
Summary Schedule of Investments as of December 31, 2016
| Principal Amount | Bank Loans (2.6%) | Value | % of Net Assets | |||||||||
Basic Materials (0.2%) | ||||||||||||
| Other Securities^ | $ | 7,372,646 | 0.2 | % | ||||||||
|
| |||||||||||
| Total | 7,372,646 | |||||||||||
|
| |||||||||||
Capital Goods (0.1%) | ||||||||||||
| Other Securities^ | 6,770,950 | 0.1 | % | |||||||||
|
| |||||||||||
| Total | 6,770,950 | |||||||||||
|
| |||||||||||
Communications Services (0.8%) | ||||||||||||
| Other Securities^ | 36,524,627 | 0.8 | % | |||||||||
|
| |||||||||||
| Total | 36,524,627 | |||||||||||
|
| |||||||||||
Consumer Cyclical (0.4%) | ||||||||||||
| Other Securities^ | 18,681,797 | 0.4 | % | |||||||||
|
| |||||||||||
| Total | 18,681,797 | |||||||||||
|
| |||||||||||
Consumer Non-Cyclical (0.4%) | ||||||||||||
| Other Securities^ | 19,366,869 | 0.4 | % | |||||||||
|
| |||||||||||
| Total | 19,366,869 | |||||||||||
|
| |||||||||||
Energy (0.1%) | ||||||||||||
| Other Securities^ | 5,925,179 | 0.1 | % | |||||||||
|
| |||||||||||
| Total | 5,925,179 | |||||||||||
|
| |||||||||||
Financials (0.2%) | ||||||||||||
| Other Securities^ | 8,566,205 | 0.2 | % | |||||||||
|
| |||||||||||
| Total | 8,566,205 | |||||||||||
|
| |||||||||||
Technology (0.3%) | ||||||||||||
| Other Securities^ | 13,380,086 | 0.3 | % | |||||||||
|
| |||||||||||
| Total | 13,380,086 | |||||||||||
|
| |||||||||||
Transportation (<0.1%) | ||||||||||||
| Other Securities^ | 2,674,740 | <0.1 | % | |||||||||
|
| |||||||||||
| Total | 2,674,740 | |||||||||||
|
| |||||||||||
Utilities (0.1%) | ||||||||||||
| Other Securities^ | 3,605,937 | 0.1 | % | |||||||||
|
| |||||||||||
| Total | 3,605,937 | |||||||||||
|
| |||||||||||
Total Bank Loans (cost $122,905,456) | 122,869,036 | |||||||||||
|
| |||||||||||
Long-Term Fixed Income (42.2%) | ||||||||||||
Asset-Backed Securities (2.7%) | ||||||||||||
| U.S. Small Business Administration | ||||||||||||
| $ | 366,215 | 3.191%, 3/10/2024, Series 2014-10A, Class 1 | 378,776 | <0.1 | % | |||||||
| Other Securities^ | 125,983,089 | 2.7 | % | |||||||||
|
| |||||||||||
| Total | 126,361,865 | |||||||||||
|
| |||||||||||
Basic Materials (0.3%) | ||||||||||||
| Other Securities^ | 11,425,399 | 0.3 | % | |||||||||
|
| |||||||||||
| Total | 11,425,399 | |||||||||||
|
| |||||||||||
Capital Goods (0.6%) | ||||||||||||
| Other Securities^ | 29,893,671 | 0.6 | % | |||||||||
|
| |||||||||||
| Total | 29,893,671 | |||||||||||
|
| |||||||||||
Collateralized Mortgage Obligations (0.8%) | ||||||||||||
| Federal Home Loan Mortgage Corporation | ||||||||||||
| 16,809,366 | 3.000% - 4.000%, | |||||||||||
4/15/2028 - 2/15/2033, Series-4193, Class AIa | 1,815,950 | <0.1 | % | |||||||||
Federal National Mortgage Association | ||||||||||||
| 9,497,435 | 3.500%, 1/25/2033, Series 2012-150, Class YIa | 1,280,475 | <0.1 | % | ||||||||
| Other Securities^ | 32,835,036 | 0.8 | % | |||||||||
|
| |||||||||||
| Total | 35,931,461 | |||||||||||
|
| |||||||||||
Commercial Mortgage-Backed Securities (0.7%) | ||||||||||||
Federal National Mortgage Association |
| |||||||||||
| 74,049 | 1.272%, 1/25/2017 | 73,985 | <0.1 | % | ||||||||
| Other Securities^ | 35,796,167 | 0.7 | % | |||||||||
|
| |||||||||||
| Total | 35,870,152 | |||||||||||
|
| |||||||||||
Communications Services (1.5%) | ||||||||||||
| Other Securities^ | 71,622,777 | 1.5 | % | |||||||||
|
| |||||||||||
| Total | 71,622,777 | |||||||||||
|
| |||||||||||
Consumer Cyclical (1.0%) | ||||||||||||
| Other Securities^ | 46,307,126 | 1.0 | % | |||||||||
|
| |||||||||||
| Total | 46,307,126 | |||||||||||
|
| |||||||||||
Consumer Non-Cyclical (1.6%) | ||||||||||||
| Other Securities^ | 74,116,189 | 1.6 | % | |||||||||
|
| |||||||||||
| Total | 74,116,189 | |||||||||||
|
| |||||||||||
Energy (1.2%) | ||||||||||||
| Other Securities^ | 57,158,799 | 1.2 | % | |||||||||
|
| |||||||||||
| Total | 57,158,799 | |||||||||||
|
| |||||||||||
Financials (3.3%) | ||||||||||||
| Other Securities^ | 156,214,417 | 3.3 | % | |||||||||
|
| |||||||||||
| Total | 156,214,417 | |||||||||||
|
| |||||||||||
Foreign Government (0.1%) | ||||||||||||
| Other Securities^ | 6,655,941 | 0.1 | % | |||||||||
|
| |||||||||||
| Total | 6,655,941 | |||||||||||
|
| |||||||||||
Mortgage-Backed Securities (15.5%) | ||||||||||||
Federal Home Loan Mortgage Corporation Gold 15-Yr. Pass Through |
| |||||||||||
| 49,100,000 | 3.000%, 1/1/2032b | 50,361,870 | 1.1 | % | ||||||||
Federal Home Loan Mortgage Corporation Gold 30-Yr. Pass Through |
| |||||||||||
| 33,600,000 | 4.000%, 1/1/2047b | 35,273,280 | 0.8 | % | ||||||||
Federal National Mortgage Association Conventional 15-Yr. Pass Through |
| |||||||||||
| 57,325,000 | 2.500%, 1/1/2032b | 57,388,057 | 1.2 | % | ||||||||
Federal National Mortgage Association Conventional 30-Yr. Pass Through |
| |||||||||||
| 139,550,000 | 3.000%, 1/1/2047b | 138,531,285 | 2.9 | % | ||||||||
| 247,700,000 | 3.500%, 1/1/2047b | 253,719,110 | 5.4 | % | ||||||||
| 125,250,000 | 4.000%, 1/1/2047b | 131,612,700 | 2.8 | % | ||||||||
| 51,396,000 | 4.500%, 1/1/2047b | 55,260,979 | 1.2 | % | ||||||||
The accompanying Notes to Financial Statements are an integral part of this schedule.
81
Table of Contents
MODERATELY CONSERVATIVE ALLOCATION PORTFOLIO
Summary Schedule of Investments as of December 31, 2016
| Principal Amount | Long-Term Fixed Income (42.2%) | Value | % of Net Assets | |||||||||
Mortgage-Backed Securities (15.5%) - continued | ||||||||||||
| $4,820,637 | 1.740%, 7/1/2043c | $ | 4,954,236 | 0.1 | % | |||||||
|
| |||||||||||
| Total | 727,101,517 | |||||||||||
|
| |||||||||||
Technology (0.8%) | ||||||||||||
| Other Securities^ | 35,708,785 | 0.8 | % | |||||||||
|
| |||||||||||
| Total | 35,708,785 | |||||||||||
|
| |||||||||||
Transportation (0.3%) | ||||||||||||
| Other Securities^ | 12,343,930 | 0.3 | % | |||||||||
|
| |||||||||||
| Total | 12,343,930 | |||||||||||
|
| |||||||||||
U.S. Government and Agencies (10.7%) | ||||||||||||
| Federal National Mortgage Association | ||||||||||||
| 205,000 | 6.250%, 5/15/2029 | 271,275 | <0.1 | % | ||||||||
| Tennessee Valley Authority | ||||||||||||
| 200,000 | 5.250%, 9/15/2039 | 250,751 | <0.1 | % | ||||||||
| U.S. Treasury Bonds | ||||||||||||
| 26,928,000 | 2.500%, 5/15/2046 | 23,870,891 | 0.5 | % | ||||||||
| 6,045,000 | 2.875% - 4.375%, 5/15/2040 - 11/15/2046 | 6,179,535 | 0.1 | % | ||||||||
| U.S. Treasury Bonds, TIPS | ||||||||||||
| 28,453,601 | 0.625%, 1/15/2026 | 28,698,957 | 0.6 | % | ||||||||
| 10,037,835 | 0.125% - 2.375%, 4/15/2019 - 2/15/2042 | 9,998,963 | 0.2 | % | ||||||||
| U.S. Treasury Notes | ||||||||||||
| 23,000,000 | 0.875%, 3/31/2018 | 22,968,421 | 0.5 | % | ||||||||
| 21,220,000 | 1.000%, 11/30/2018d | 21,147,661 | 0.5 | % | ||||||||
| 22,400,000 | 0.750%, 2/15/2019 | 22,171,139 | 0.5 | % | ||||||||
| 15,500,000 | 1.000%, 10/15/2019 | 15,327,097 | 0.3 | % | ||||||||
| 41,710,000 | 1.500%, 10/31/2019 | 41,791,418 | 0.9 | % | ||||||||
| 79,080,000 | 1.375%, 9/30/2020 | 78,125,821 | 1.7 | % | ||||||||
| 10,250,000 | 1.375%, 5/31/2021 | 10,037,066 | 0.2 | % | ||||||||
| 59,409,000 | 1.125%, 8/31/2021 | 57,346,320 | 1.2 | % | ||||||||
| 41,325,000 | 2.125%, 6/30/2022 | 41,425,709 | 0.9 | % | ||||||||
| 10,765,000 | 1.625%, 8/15/2022 | 10,486,822 | 0.2 | % | ||||||||
| 26,500,000 | 1.625%, 10/31/2023 | 25,463,346 | 0.5 | % | ||||||||
| 47,630,000 | 2.250%, 11/15/2024 | 47,274,871 | 1.0 | % | ||||||||
| 39,702,000 | 2.000%, 11/15/2026d | 38,137,344 | 0.8 | % | ||||||||
| 3,220,000 | 0.875% - 1.375%, 1/31/2017 - 9/30/2023e | 3,160,154 | 0.1 | % | ||||||||
|
| |||||||||||
| Total | 504,133,561 | |||||||||||
|
| |||||||||||
Utilities (1.1%) | ||||||||||||
| Other Securities^ | 50,880,399 | 1.1 | % | |||||||||
|
| |||||||||||
| Total | 50,880,399 | |||||||||||
|
| |||||||||||
Total Long-Term Fixed Income (cost $1,986,566,985) | 1,981,725,989 | |||||||||||
|
| |||||||||||
| Shares | Registered Investment Companies (25.9%) | |||||||||||
Affiliated Equity Holdings (9.5%) | ||||||||||||
| 2,586,561 | Thrivent Large Cap Stock Portfolio | 31,286,010 | 0.7 | % | ||||||||
| 8,818,308 | Thrivent Large Cap Value Portfolio | 148,493,256 | 3.1 | % | ||||||||
| 3,932,207 | Thrivent Mid Cap Stock Portfolio | 75,029,259 | 1.6 | % | ||||||||
| 16,955,184 | Thrivent Partner Worldwide Allocation Portfolio | 154,141,277 | 3.3 | % | ||||||||
| 1,989,819 | Thrivent Small Cap Stock Portfolio | 36,799,107 | 0.8 | % | ||||||||
|
| |||||||||||
| Total | 445,748,909 | |||||||||||
|
| |||||||||||
Affiliated Fixed Income Holdings (14.9%) | ||||||||||||
| 24,579,035 | Thrivent High Yield Portfolio | 117,246,915 | 2.5 | % | ||||||||
| 35,397,259 | Thrivent Income Portfolio | 356,411,464 | 7.6 | % | ||||||||
| 23,148,257 | Thrivent Limited Maturity Bond Portfolio | 227,012,639 | 4.8 | % | ||||||||
|
| |||||||||||
| Total | �� | 700,671,018 | ||||||||||
|
| |||||||||||
Equity Funds/ETFs (0.3%) | ||||||||||||
| 42,086 | SPDR S&P 500 ETF Trust | 9,407,483 | 0.2 | % | ||||||||
| Other Securities^ | 3,718,887 | 0.1 | % | |||||||||
|
| |||||||||||
| Total | 13,126,370 | |||||||||||
|
| |||||||||||
Fixed Income Funds/ETFs (1.2%) | ||||||||||||
| 276,900 | iShares iBoxx $ Investment Grade Corporate Bond ETF | 32,447,142 | 0.7 | % | ||||||||
| 216,000 | Vanguard Short-Term Corporate Bond ETF | 17,143,920 | 0.4 | % | ||||||||
| Other Securities^ | 8,228,794 | 0.1 | % | |||||||||
|
| |||||||||||
| Total | 57,819,856 | |||||||||||
|
| |||||||||||
Total Registered Investment Companies (cost $1,131,940,166) | 1,217,366,153 | |||||||||||
|
| |||||||||||
Common Stock (22.2%) | ||||||||||||
Consumer Discretionary (2.9%) | ||||||||||||
| 29,216 | Amazon.com, Inc.f | 21,908,202 | 0.5 | % | ||||||||
| 263,583 | Comcast Corporation | 18,200,406 | 0.4 | % | ||||||||
| Other Securities^ | 96,116,717 | 2.0 | % | |||||||||
|
| |||||||||||
| Total | 136,225,325 | |||||||||||
|
| |||||||||||
Consumer Staples (0.8%) | ||||||||||||
| 143,150 | CVS Health Corporation | 11,295,967 | 0.3 | % | ||||||||
| Other Securities^ | 26,825,562 | 0.5 | % | |||||||||
|
| |||||||||||
| Total | 38,121,529 | |||||||||||
|
| |||||||||||
Energy (2.2%) | ||||||||||||
| 133,970 | Chevron Corporation | 15,768,269 | 0.3 | % | ||||||||
| Other Securities^ | 88,548,278 | 1.9 | % | |||||||||
|
| |||||||||||
| Total | 104,316,547 | |||||||||||
|
| |||||||||||
Financials (3.7%) | ||||||||||||
| 809,270 | Bank of America Corporation | 17,884,867 | 0.4 | % | ||||||||
| 287,530 | Citigroup, Inc. | 17,087,908 | 0.4 | % | ||||||||
| 53,580 | Goldman Sachs Group, Inc. | 12,829,731 | 0.3 | % | ||||||||
| Other Securities^ | 126,711,596 | 2.6 | % | |||||||||
|
| |||||||||||
| Total | 174,514,102 | |||||||||||
|
| |||||||||||
Health Care (2.8%) | ||||||||||||
| 86,270 | Celgene Corporationf | 9,985,753 | 0.2 | % | ||||||||
| 146,955 | Gilead Sciences, Inc. | 10,523,448 | 0.2 | % | ||||||||
| 140,449 | Medtronic plc | 10,004,182 | 0.2 | % | ||||||||
| 213,860 | Merck & Company, Inc. | 12,589,938 | 0.3 | % | ||||||||
| 277,770 | Pfizer, Inc. | 9,021,970 | 0.2 | % | ||||||||
| Other Securities^ | 79,726,429 | 1.7 | % | |||||||||
|
| |||||||||||
| Total | 131,851,720 | |||||||||||
|
| |||||||||||
Industrials (2.4%) | ||||||||||||
| 92,962 | Union Pacific Corporation | 9,638,300 | 0.2 | % | ||||||||
| Other Securities^ | 105,282,813 | 2.2 | % | |||||||||
|
| |||||||||||
| Total | 114,921,113 | |||||||||||
|
| |||||||||||
Information Technology (5.3%) | ||||||||||||
| 19,129 | Alphabet, Inc., Class Af | 15,158,776 | 0.3 | % | ||||||||
The accompanying Notes to Financial Statements are an integral part of this schedule.
82
Table of Contents
MODERATELY CONSERVATIVE ALLOCATION PORTFOLIO
Summary Schedule of Investments as of December 31, 2016
| Shares | Common Stock (22.2%) | Value | % of Net Assets | |||||||||
Information Technology (5.3%) - continued | ||||||||||||
| 18,541 | Alphabet, Inc., Class Cf | $ | 14,310,315 | 0.3 | % | |||||||
| 175,274 | Apple, Inc. | 20,300,235 | 0.4 | % | ||||||||
| 564,820 | Cisco Systems, Inc. | 17,068,860 | 0.4 | % | ||||||||
| 148,240 | Facebook, Inc.f | 17,055,012 | 0.4 | % | ||||||||
| 123,240 | MasterCard, Inc. | 12,724,530 | 0.3 | % | ||||||||
| 468,180 | Microsoft Corporation | 29,092,705 | 0.6 | % | ||||||||
| 264,790 | Oracle Corporation | 10,181,175 | 0.2 | % | ||||||||
| 218,570 | PayPal Holdings, Inc.f | 8,626,958 | 0.2 | % | ||||||||
| 169,040 | Salesforce.com, Inc.f | 11,572,478 | 0.3 | % | ||||||||
| 167,110 | Visa, Inc. | 13,037,922 | 0.3 | % | ||||||||
| Other Securities^ | 77,578,192 | 1.6 | % | |||||||||
|
| |||||||||||
| Total | 246,707,158 | |||||||||||
|
| |||||||||||
Materials (0.9%) | ||||||||||||
| Other Securities^ | 40,873,491 | 0.9 | % | |||||||||
|
| |||||||||||
| Total | 40,873,491 | |||||||||||
|
| |||||||||||
Real Estate (0.4%) | ||||||||||||
| Other Securities^ | 17,558,125 | 0.4 | % | |||||||||
|
| |||||||||||
| Total | 17,558,125 | |||||||||||
|
| |||||||||||
Telecommunications Services (0.2%) | ||||||||||||
| Other Securities^ | 9,588,513 | 0.2 | % | |||||||||
|
| |||||||||||
| Total | 9,588,513 | |||||||||||
|
| |||||||||||
Utilities (0.6%) | ||||||||||||
| 168,280 | PG&E Corporation | 10,226,376 | 0.2 | % | ||||||||
| Other Securities^ | 16,280,854 | 0.4 | % | |||||||||
|
| |||||||||||
| Total | 26,507,230 | |||||||||||
|
| |||||||||||
Total Common Stock (cost $869,615,257) | 1,041,184,853 | |||||||||||
|
| |||||||||||
Preferred Stock (<0.1%) | ||||||||||||
Energy (<0.1%) | ||||||||||||
| Other Securities^ | 291,490 | <0.1 | % | |||||||||
|
| |||||||||||
| Total | 291,490 | |||||||||||
|
| |||||||||||
Total Preferred Stock (cost $43,842) | 291,490 | |||||||||||
|
| |||||||||||
Collateral Held for Securities Loaned (1.7%) | ||||||||||||
| 78,436,450 | Thrivent Cash Management Trust | 78,436,450 | 1.7 | % | ||||||||
|
| |||||||||||
Total Collateral Held for Securities Loaned (cost $78,436,450) | 78,436,450 | |||||||||||
|
| |||||||||||
| Shares or Principal Amount | Short-Term Investments (22.3%)g | |||||||||||
| Federal National Mortgage Association Discount Notes | ||||||||||||
| 3,000,000 | 0.345%, 1/11/2017h | 2,999,748 | 0.1 | % | ||||||||
| U.S. Treasury Bills | ||||||||||||
| 8,600,000 | 0.411% - 0.473%, 1/26/2017 - 2/9/2017e | 8,596,725 | 0.2 | % | ||||||||
| U.S. Treasury Note | ||||||||||||
| 1,300,000 | 0.500%, 1/31/2017e | 1,300,148 | <0.1 | % | ||||||||
Thrivent Core Short-Term Reserve Fund | ||||||||||||
| 101,280,818 | 0.910% | 1,012,808,183 | 21.6 | % | ||||||||
| Other Securities^ | 22,695,158 | 0.4 | % | |||||||||
|
| |||||||||||
| Total Short-Term Investments (cost $1,048,399,091) | 1,048,399,962 | |||||||||||
|
| |||||||||||
| Total Investments (cost $5,237,907,247) 116.9% | $ | 5,490,273,933 | ||||||||||
|
| |||||||||||
| Other Assets and Liabilities, Net (16.9%) | (795,205,330 | ) | ||||||||||
|
| |||||||||||
| Total Net Assets 100.0% | $ | 4,695,068,603 | ||||||||||
|
| |||||||||||
| ^ | The Summary Schedule of Investments shows the 50 largest holdings in unaffiliated issuers, any holding or issuer that exceeds 1% of net assets and all affiliated holdings as of the report date. The remaining securities held are grouped by category as “Other securities”. |
| a | Denotes interest only security. Interest only securities represent the right to receive monthly interest payments on an underlying pool of mortgages or assets. The principal shown is the outstanding par amount of the pool as of the end of the period. The actual effective yield of the security is different than the stated coupon rate. |
| b | Denotes investments purchased on a when-issued or delayed delivery basis. |
| c | Denotes variable rate securities. Variable rate securities are securities whose yields vary with a designated market index or market rate. The rate shown is as of December 31, 2016. |
| d | All or a portion of the security is on loan. |
| e | At December 31, 2016, $1,900,449 of investments were segregated to cover exposure to a counterparty for margin on open mortgage-backed security transactions. |
| f | Non-income producing security. |
| g | The interest rate shown reflects the yield, coupon rate or the discount rate at the date of purchase. |
| h | All or a portion of the security is held on deposit with the counterparty and pledged as the initial margin deposit for open futures contracts. |
Moderately Conservative Allocation Portfolio held restricted securities as of December 31, 2016. Restricted securities are investment securities which cannot be offered for public sale without first being registered under the Securities Act of 1933. As of December 31, 2016, the value of these investments was $71,326,291 or 1.5% of total net assets.
The following table presents the total amount of securities loaned with continuous maturity, by type, offset by the gross payable upon return of collateral for securities loaned by Thrivent Moderately Conservative Allocation Portfolio as of December 31, 2016:
Securities Lending Transactions | ||||
Taxable Debt Security | $ | 71,885,439 | ||
Common Stock | 4,986,435 | |||
|
| |||
Total lending | $ | 76,871,874 | ||
Gross amount payable upon return of collateral for securities loaned | $ | 78,436,450 | ||
|
| |||
Net amounts due to counterparty | $ | 1,564,576 | ||
|
|
Definitions:
| ETF | - | Exchange Traded Fund. | ||
| TIPS | - | Treasury Inflation Protected Security. |
The accompanying Notes to Financial Statements are an integral part of this schedule.
83
Table of Contents
MODERATELY CONSERVATIVE ALLOCATION PORTFOLIO
Summary Schedule of Investments as of December 31, 2016
Unrealized Appreciation (Depreciation)
Gross unrealized appreciation and depreciation of investments, based on cost for federal income tax purposes, were as follows:
Gross unrealized appreciation | $ | 289,670,987 | ||
Gross unrealized depreciation | (43,379,144 | ) | ||
|
| |||
Net unrealized appreciation (depreciation) | $ | 246,291,843 | ||
Cost for federal income tax purposes | $ | 5,243,982,090 | ||
The accompanying Notes to Financial Statements are an integral part of this schedule.
84
Table of Contents
MODERATELY CONSERVATIVE ALLOCATION PORTFOLIO
Summary Schedule of Investments as of December 31, 2016
Fair Valuation Measurements
The following table is a summary of the inputs used, as of December 31, 2016, in valuing Moderately Conservative Allocation Portfolio’s assets carried at fair value.
Investments in Securities | Total | Level 1 | Level 2 | Level 3 | ||||||||||||
Bank Loans | ||||||||||||||||
Basic Materials | 7,372,646 | — | 7,372,646 | — | ||||||||||||
Capital Goods | 6,770,950 | — | 3,708,138 | 3,062,812 | ||||||||||||
Communications Services | 36,524,627 | — | 34,599,723 | 1,924,904 | ||||||||||||
Consumer Cyclical | 18,681,797 | — | 17,719,922 | 961,875 | ||||||||||||
Consumer Non-Cyclical | 19,366,869 | — | 19,366,869 | — | ||||||||||||
Energy | 5,925,179 | — | 3,947,134 | 1,978,045 | ||||||||||||
Financials | 8,566,205 | — | 8,566,205 | — | ||||||||||||
Technology | 13,380,086 | — | 11,964,336 | 1,415,750 | ||||||||||||
Transportation | 2,674,740 | — | 2,674,740 | — | ||||||||||||
Utilities | 3,605,937 | — | 1,498,062 | 2,107,875 | ||||||||||||
Long-Term Fixed Income | ||||||||||||||||
Asset-Backed Securities | 126,361,865 | — | 121,511,865 | 4,850,000 | ||||||||||||
Basic Materials | 11,425,399 | — | 11,425,399 | — | ||||||||||||
Capital Goods | 29,893,671 | — | 29,893,671 | — | ||||||||||||
Collateralized Mortgage Obligations | 35,931,461 | — | 35,931,461 | — | ||||||||||||
Commercial Mortgage-Backed Securities | 35,870,152 | — | 35,870,152 | — | ||||||||||||
Communications Services | 71,622,777 | — | 71,622,777 | — | ||||||||||||
Consumer Cyclical | 46,307,126 | — | 46,307,126 | — | ||||||||||||
Consumer Non-Cyclical | 74,116,189 | — | 74,116,189 | — | ||||||||||||
Energy | 57,158,799 | — | 57,158,799 | — | ||||||||||||
Financials | 156,214,417 | — | 156,214,417 | — | ||||||||||||
Foreign Government | 6,655,941 | — | 6,655,941 | — | ||||||||||||
Mortgage-Backed Securities | 727,101,517 | — | 727,101,517 | — | ||||||||||||
Technology | 35,708,785 | — | 35,708,785 | — | ||||||||||||
Transportation | 12,343,930 | — | 12,343,930 | — | ||||||||||||
U.S. Government and Agencies | 504,133,561 | — | 504,133,561 | — | ||||||||||||
Utilities | 50,880,399 | — | 50,880,399 | — | ||||||||||||
Registered Investment Companies | ||||||||||||||||
Affiliated Fixed Income Holdings | 700,671,018 | 700,671,018 | — | — | ||||||||||||
Affiliated Equity Holdings | 445,748,909 | 445,748,909 | — | — | ||||||||||||
Fixed Income Funds/ETFs | 57,819,856 | 57,819,856 | — | — | ||||||||||||
Equity Funds/ETFs | 13,126,370 | 13,126,370 | — | — | ||||||||||||
Common Stock | ||||||||||||||||
Consumer Discretionary | 136,225,325 | 136,225,325 | — | — | ||||||||||||
Consumer Staples | 38,121,529 | 38,121,529 | — | — | ||||||||||||
Energy | 104,316,547 | 104,316,547 | — | — | ||||||||||||
Financials | 174,514,102 | 174,514,102 | — | — | ||||||||||||
Health Care | 131,851,720 | 131,851,720 | — | — | ||||||||||||
Industrials | 114,921,113 | 114,921,113 | — | — | ||||||||||||
Information Technology | 246,707,158 | 246,707,158 | — | — | ||||||||||||
Materials | 40,873,491 | 40,873,489 | — | 2 | ||||||||||||
Real Estate | 17,558,125 | 17,558,125 | — | — | ||||||||||||
Telecommunications Services | 9,588,513 | 9,588,513 | — | — | ||||||||||||
Utilities | 26,507,230 | 26,507,230 | — | — | ||||||||||||
Preferred Stock | ||||||||||||||||
Energy | 291,490 | — | — | 291,490 | ||||||||||||
Short-Term Investments | 35,591,779 | — | 35,591,779 | — | ||||||||||||
|
|
|
|
|
|
|
| |||||||||
Subtotal Investments in Securities | $ | 4,399,029,300 | $ | 2,258,551,004 | $ | 2,123,885,543 | $ | 16,592,753 | ||||||||
|
|
|
|
|
|
|
| |||||||||
Other Investments* | Total | |||||||||||||||
Short-Term Investments | 1,012,808,183 | |||||||||||||||
Collateral Held for Securities Loaned | 78,436,450 | |||||||||||||||
|
| |||||||||||||||
Subtotal Other Investments | $ | 1,091,244,633 | ||||||||||||||
|
| |||||||||||||||
Total Investments at Value | $ | 5,490,273,933 | ||||||||||||||
|
| |||||||||||||||
| * | Certain investments are measured at fair value using a net asset value per share that is not publicly available (practical expedient). According to disclosure requirements of Accounting Standards Codification (ASC) 820, Fair Value Measurement, securities valued using the practical expedient are not classified in the fair value hierarchy. The fair value amounts presented in this table are intended to permit reconciliation of the fair value hierarchy to the amounts presented in the Statement of Assets and Liabilities. |
The accompanying Notes to Financial Statements are an integral part of this schedule.
85
Table of Contents
MODERATELY CONSERVATIVE ALLOCATION PORTFOLIO
Summary Schedule of Investments as of December 31, 2016
Other Financial Instruments | Total | Level 1 | Level 2 | Level 3 | ||||||||||||
Asset Derivatives | ||||||||||||||||
Futures Contracts | 2,375,533 | 2,375,533 | — | — | ||||||||||||
|
|
|
|
|
|
|
| |||||||||
Total Asset Derivatives | $ | 2,375,533 | $ | 2,375,533 | $ | — | $ | — | ||||||||
|
|
|
|
|
|
|
| |||||||||
Liability Derivatives | ||||||||||||||||
Futures Contracts | 4,121,796 | 4,121,796 | — | — | ||||||||||||
|
|
|
|
|
|
|
| |||||||||
Total Liability Derivatives | $ | 4,121,796 | $ | 4,121,796 | $ | — | $ | — | ||||||||
|
|
|
|
|
|
|
| |||||||||
There were no significant transfers between Levels during the period ended December 31, 2016. Transfers between Levels are identified as of the end of the period.
The following table presents Moderately Conservative Allocation Portfolio’s futures contracts held as of December 31, 2016. Investments and/or cash totaling $25,694,905 were pledged as the initial margin deposit for these contracts.
Futures Contracts | Number of Contracts Long/(Short) | Expiration Date | Notional Principal Amount | Value | Unrealized Gain/(Loss) | |||||||||||||||
CBOT 10-Yr. U.S. Treasury Note | 124 | March 2017 | $ | 15,432,585 | $ | 15,410,875 | ($ | 21,710 | ) | |||||||||||
CBOT 2-Yr. U.S. Treasury Note | (47 | ) | March 2017 | (10,187,107 | ) | (10,184,313 | ) | 2,794 | ||||||||||||
CBOT 5-Yr. U.S. Treasury Note | 984 | March 2017 | 116,107,365 | 115,781,435 | (325,930 | ) | ||||||||||||||
CBOT U.S. Long Bond | 1,035 | March 2017 | 157,165,323 | 155,929,219 | (1,236,104 | ) | ||||||||||||||
CME E-mini S&P Mid-Cap 400 Index | (486 | ) | March 2017 | (82,265,662 | ) | (80,632,259 | ) | 1,633,403 | ||||||||||||
CME S&P 500 Index | (160 | ) | March 2017 | (90,187,336 | ) | (89,448,000 | ) | 739,336 | ||||||||||||
ICE mini MSCI EAFE Index | 2,091 | March 2017 | 175,950,833 | 175,183,980 | (766,853 | ) | ||||||||||||||
NYBOT NYF mini Russell 2000 Index | 1,170 | March 2017 | 81,149,849 | 79,378,650 | (1,771,199 | ) | ||||||||||||||
Total Futures Contracts | ($ | 1,746,263 | ) | |||||||||||||||||
The following table summarizes the fair value and Statement of Assets and Liabilities location, as of December 31, 2016, for Moderately Conservative Allocation Portfolio’s investments in financial derivative instruments by primary risk exposure as discussed under item (2) Significant Accounting Policies of the Notes to Financial Statements.
Derivatives by risk category | Statement of Assets and Liabilities Location | Fair Value | ||||
Asset Derivatives | ||||||
Interest Rate Contracts | ||||||
Futures* | Net Assets - Net unrealized appreciation/(depreciation) on Futures contracts | $ | 2,794 | |||
Total Interest Rate Contracts | 2,794 | |||||
Equity Contracts | ||||||
Futures* | Net Assets - Net unrealized appreciation/(depreciation) on Futures contracts | 2,372,739 | ||||
Total Equity Contracts | 2,372,739 | |||||
|
| |||||
Total Asset Derivatives | $ | 2,375,533 | ||||
|
| |||||
Liability Derivatives | ||||||
Interest Rate Contracts | ||||||
Futures* | Net Assets - Net unrealized appreciation/(depreciation) on Futures contracts | 1,583,744 | ||||
Total Interest Rate Contracts | 1,583,744 | |||||
Equity Contracts | ||||||
Futures* | Net Assets - Net unrealized appreciation/(depreciation) on Futures contracts | 2,538,052 | ||||
Total Equity Contracts | 2,538,052 | |||||
|
| |||||
Total Liability Derivatives | $ | 4,121,796 | ||||
|
| |||||
| * | Includes cumulative appreciation/depreciation of futures contracts as reported in the Schedule of Investments. Only current day’s variation margin is reported within the Statement of Assets and Liabilities. |
The following table summarizes the net realized gains/(losses) and Statement of Operations location, for the period ended December 31, 2016, for Moderately Conservative Allocation Portfolio’s investments in financial derivative instruments by primary risk exposure.
Derivatives by risk category | Statement of Operations Location | Realized Gains/(Losses) recognized in Income | ||||
Equity Contracts | ||||||
Futures | Net realized gains/(losses) on Futures contracts | 4,478,326 | ||||
Total Equity Contracts | 4,478,326 | |||||
Interest Rate Contracts | ||||||
Futures | Net realized gains/(losses) on Futures contracts | 11,573,890 | ||||
Total Interest Rate Contracts | 11,573,890 | |||||
|
| |||||
Total | $ | 16,052,216 | ||||
|
| |||||
The accompanying Notes to Financial Statements are an integral part of this schedule.
86
Table of Contents
MODERATELY CONSERVATIVE ALLOCATION PORTFOLIO
Summary Schedule of Investments as of December 31, 2016
The following table summarizes the change in net unrealized appreciation/(depreciation) and Statement of Operations location, for the period ended December 31, 2016, for Moderately Conservative Allocation Portfolio’s investments in financial derivative instruments by primary risk exposure.
Derivatives by risk category | Statement of Operations Location | Change in unrealized appreciation/(depreciation) recognized in Income | ||||
Interest Rate Contracts | ||||||
Futures | Change in net unrealized appreciation/(depreciation) on Futures contracts | (1,694,523 | ) | |||
Total Interest Rate Contracts | (1,694,523 | ) | ||||
Equity Contracts | ||||||
Futures | Change in net unrealized appreciation/(depreciation) on Futures contracts | (4,189,028 | ) | |||
Total Equity Contracts | (4,189,028 | ) | ||||
|
| |||||
Total | ($ | 5,883,551 | ) | |||
|
| |||||
The following table presents Moderately Conservative Allocation Portfolio’s average volume of derivative activity during the period ended December 31, 2016.
Derivative Risk Category | Futures (Notional)* | Futures (Percentage of Average Net Assets) | ||||||
Equity Contracts | $ | 368,277,435 | 8.4 | % | ||||
Interest Rate Contracts | 335,564,397 | 7.6 | ||||||
| * | Notional amount represents long or short, or both, derivative positions held by the Portfolio. |
Investment in Affiliates
Affiliated issuers, as defined under the Investment Company Act of 1940, include those in which the Portfolio’s holdings of an issuer represent 5% or more of the outstanding voting securities of an issuer, any affiliated mutual fund, or a company which is under common ownership or control with the Portfolio. The Portfolio owns shares of Thrivent Cash Management Trust for the purpose of securities lending and Thrivent Core Short-Term Reserve Fund primarily to serve as a cash sweep vehicle for the Portfolio. Thrivent Cash Management Trust and Thrivent Core Short-Term Reserve Fund are established for the sole use of affiliated portfolios.
A summary of transactions for the fiscal year to date, in Moderately Conservative Allocation Portfolio, is as follows:
Portfolio | Value December 31, 2015 | Gross Purchases | Gross Sales | Shares Held at December 31, 2016 | Value December 31, 2016 | Income Earned January 1, 2016 - December 31, 2016 | ||||||||||||||||||
Small Cap Stock | $ | 29,219,401 | $ | 1,597,191 | $ | — | 1,989,819 | $ | 36,799,107 | $ | 102,423 | |||||||||||||
Mid Cap Stock | 58,291,611 | 6,786,593 | — | 3,932,207 | 75,029,259 | 239,888 | ||||||||||||||||||
Partner Worldwide Allocation | 149,147,055 | 3,323,888 | — | 16,955,184 | 154,141,277 | 3,323,888 | ||||||||||||||||||
Large Cap Value | 126,438,164 | 9,595,685 | — | 8,818,308 | 148,493,256 | 1,796,638 | ||||||||||||||||||
Large Cap Stock | 29,676,377 | 371,781 | — | 2,586,561 | 31,286,010 | 371,781 | ||||||||||||||||||
High Yield | 103,974,761 | 6,293,669 | — | 24,579,035 | 117,246,915 | 6,294,043 | ||||||||||||||||||
Income | 335,972,791 | 12,391,166 | — | 35,397,259 | 356,411,464 | 12,125,108 | ||||||||||||||||||
Limited Maturity Bond | 220,756,038 | 4,347,510 | — | 23,148,257 | 227,012,639 | 4,346,668 | ||||||||||||||||||
Cash Management Trust- Collateral Investment | 68,616,520 | 679,526,647 | 669,706,717 | 78,436,450 | 78,436,450 | 335,794 | ||||||||||||||||||
Cash Management Trust-Short Term Investment | 118,807,605 | 797,878,522 | 916,686,127 | — | — | 360,007 | ||||||||||||||||||
Core Short-Term Reserve Fund | — | 1,579,808,120 | 566,999,937 | 101,280,818 | 1,012,808,183 | 4,091,908 | ||||||||||||||||||
Total Value and Income Earned | $ | 1,240,900,323 | $ | 2,237,664,560 | $ | 33,388,146 | ||||||||||||||||||
The accompanying Notes to Financial Statements are an integral part of this schedule.
87
Table of Contents
GROWTHAND INCOME PLUS PORTFOLIO
Summary Schedule of Investments as of December 31, 2016
| Principal Amount | Bank Loans (11.6%) | Value | % of Net Assets | |||||||||
Basic Materials (0.7%) | ||||||||||||
| Other Securities^ | $ | 620,113 | 0.7 | % | ||||||||
|
| |||||||||||
| Total | 620,113 | |||||||||||
|
| |||||||||||
Capital Goods (0.6%) | ||||||||||||
| Other Securities^ | 559,495 | 0.6 | % | |||||||||
|
| |||||||||||
| Total | 559,495 | |||||||||||
|
| |||||||||||
Communications Services (3.1%) | ||||||||||||
| Other Securities^ | 2,670,819 | 3.1 | % | |||||||||
|
| |||||||||||
| Total | 2,670,819 | |||||||||||
|
| |||||||||||
Consumer Cyclical (2.0%) | ||||||||||||
| Other Securities^ | 1,766,663 | 2.0 | % | |||||||||
|
| |||||||||||
| Total | 1,766,663 | |||||||||||
|
| |||||||||||
Consumer Non-Cyclical (1.9%) | ||||||||||||
| Valeant Pharmaceuticals International, Inc., Term Loan | ||||||||||||
| $390,133 | 5.500%, 4/1/2022a,b,c | 390,207 | 0.4 | % | ||||||||
| Other Securities^ | 1,285,898 | 1.5 | % | |||||||||
|
| |||||||||||
| Total | 1,676,105 | |||||||||||
|
| |||||||||||
Energy (0.5%) | ||||||||||||
| Other Securities^ | 445,355 | 0.5 | % | |||||||||
|
| |||||||||||
| Total | 445,355 | |||||||||||
|
| |||||||||||
Financials (0.8%) | ||||||||||||
| Other Securities^ | 716,542 | 0.8 | % | |||||||||
|
| |||||||||||
| Total | 716,542 | |||||||||||
|
| |||||||||||
Technology (1.5%) | ||||||||||||
| Other Securities^ | 1,276,065 | 1.5 | % | |||||||||
|
| |||||||||||
| Total | 1,276,065 | |||||||||||
|
| |||||||||||
Transportation (0.3%) | ||||||||||||
| Other Securities^ | 240,227 | 0.3 | % | |||||||||
|
| |||||||||||
| Total | 240,227 | |||||||||||
|
| |||||||||||
Utilities (0.2%) | ||||||||||||
| Other Securities^ | 204,757 | 0.2 | % | |||||||||
|
| |||||||||||
| Total | 204,757 | |||||||||||
|
| |||||||||||
Total Bank Loans (cost $10,127,448) | 10,176,141 | |||||||||||
|
| |||||||||||
| Shares | Common Stock (62.3%) | |||||||||||
Consumer Discretionary (10.1%) | ||||||||||||
| 1,720 | Amazon.com, Inc.d | 1,289,776 | 1.5 | % | ||||||||
| 990 | AutoZone, Inc.d | 781,892 | 0.9 | % | ||||||||
| 12,476 | Comcast Corporation | 861,468 | 1.0 | % | ||||||||
| 11,800 | Honda Motor Company, Ltd. | 344,505 | 0.4 | % | ||||||||
| 14,630 | NIKE, Inc. | 743,643 | 0.9 | % | ||||||||
| 8,320 | Walt Disney Company | 867,110 | 1.0 | % | ||||||||
| Other Securities^ | 3,975,105 | 4.4 | % | |||||||||
|
| |||||||||||
| Total | 8,863,499 | |||||||||||
|
| |||||||||||
Consumer Staples (2.9%) | ||||||||||||
| 5,920 | Philip Morris International, Inc. | 541,621 | 0.6 | % | ||||||||
| 4,550 | Walgreens Boots Alliance, Inc. | 376,558 | 0.4 | % | ||||||||
| Other Securities^ | 1,612,242 | 1.9 | % | |||||||||
|
| |||||||||||
| Total | 2,530,421 | |||||||||||
|
| |||||||||||
Energy (4.1%) | ||||||||||||
| 100,450 | BP plc | 629,165 | 0.7 | % | ||||||||
| 3,280 | Concho Resources, Inc.d | 434,928 | 0.5 | % | ||||||||
| 7,770 | Devon Energy Corporation | 354,856 | 0.4 | % | ||||||||
| 8,220 | Halliburton Company | 444,620 | 0.5 | % | ||||||||
| 2,620 | Pioneer Natural Resources Company | 471,783 | 0.5 | % | ||||||||
| Other Securities^ | 1,273,432 | 1.5 | % | |||||||||
|
| |||||||||||
| Total | 3,608,784 | |||||||||||
|
| |||||||||||
Financials (9.2%) | ||||||||||||
| 48,360 | Bank of America Corporation | 1,068,756 | 1.2 | % | ||||||||
| 4,140 | Goldman Sachs Group, Inc. | 991,323 | 1.1 | % | ||||||||
| 16,640 | Synchrony Financial | 603,533 | 0.7 | % | ||||||||
| Other Securities^ | 5,391,201 | 6.2 | % | |||||||||
|
| |||||||||||
| Total | 8,054,813 | |||||||||||
|
| |||||||||||
Health Care (6.1%) | ||||||||||||
| 2,100 | Allergan plcd | 441,021 | 0.5 | % | ||||||||
| 9,410 | Bristol-Myers Squibb Company | 549,920 | 0.6 | % | ||||||||
| 5,940 | Celgene Corporationd | 687,555 | 0.8 | % | ||||||||
| 9,310 | Medtronic plc | 663,151 | 0.8 | % | ||||||||
| 13,170 | Merck & Company, Inc. | 775,318 | 0.9 | % | ||||||||
| 6,919 | Novartis AG | 503,174 | 0.6 | % | ||||||||
| Other Securities^ | 1,736,844 | 1.9 | % | |||||||||
|
| |||||||||||
| Total | 5,356,983 | |||||||||||
|
| |||||||||||
Industrials (7.1%) | ||||||||||||
| 2,310 | Acuity Brands, Inc. | 533,287 | 0.6 | % | ||||||||
| 4,814 | Illinois Tool Works, Inc. | 589,523 | 0.7 | % | ||||||||
| 9,860 | Jacobs Engineering Group, Inc.d | 562,020 | 0.6 | % | ||||||||
| 6,840 | Union Pacific Corporation | 709,171 | 0.8 | % | ||||||||
| Other Securities^ | 3,799,266 | 4.4 | % | |||||||||
|
| |||||||||||
| Total | 6,193,267 | |||||||||||
|
| |||||||||||
Information Technology (9.4%) | ||||||||||||
| 800 | Alphabet, Inc., Class Ad | 633,960 | 0.7 | % | ||||||||
| 441 | Alphabet, Inc., Class Cd | 340,373 | 0.4 | % | ||||||||
| 8,260 | Apple, Inc. | 956,673 | 1.1 | % | ||||||||
| 5,400 | Facebook, Inc.d | 621,270 | 0.7 | % | ||||||||
| 9,620 | Microsoft Corporation | 597,787 | 0.7 | % | ||||||||
| 3,140 | Palo Alto Networks, Inc.d | 392,657 | 0.5 | % | ||||||||
| 13,570 | PayPal Holdings, Inc.d | 535,608 | 0.6 | % | ||||||||
| 4,860 | Salesforce.com, Inc.d | 332,716 | 0.4 | % | ||||||||
| 5,750 | Vantiv, Inc.d | 342,815 | 0.4 | % | ||||||||
| 9,770 | Visa, Inc. | 762,255 | 0.9 | % | ||||||||
| 13,360 | Xilinx, Inc. | 806,543 | 0.9 | % | ||||||||
| Other Securities^ | 1,896,238 | 2.1 | % | |||||||||
|
| |||||||||||
| Total | 8,218,895 | |||||||||||
|
| |||||||||||
Materials (2.6%) | ||||||||||||
| 19,716 | BHP Billiton, Ltd. | 353,210 | 0.4 | % | ||||||||
| Other Securities^ | 1,895,161 | 2.2 | % | |||||||||
|
| |||||||||||
| Total | 2,248,371 | |||||||||||
|
| |||||||||||
Real Estate (8.9%) | ||||||||||||
| 3,141 | Alexandria Real Estate Equities, Inc. | 349,059 | 0.4 | % | ||||||||
| 13,460 | Duke Realty Corporation | 357,498 | 0.4 | % | ||||||||
| 3,150 | Simon Property Group, Inc. | 559,661 | 0.7 | % | ||||||||
| Other Securities^ | 6,547,736 | 7.4 | % | |||||||||
|
| |||||||||||
| Total | 7,813,954 | |||||||||||
|
| |||||||||||
The accompanying Notes to Financial Statements are an integral part of this schedule.
88
Table of Contents
GROWTHAND INCOME PLUS PORTFOLIO
Summary Schedule of Investments as of December 31, 2016
| Shares | Common Stock (62.3%) | Value | % of Net Assets | |||||||||
Telecommunications Services (0.9%) | ||||||||||||
| Other Securities^ | $ | 813,632 | 0.9 | % | ||||||||
|
| |||||||||||
| Total | 813,632 | |||||||||||
|
| |||||||||||
Utilities (1.0%) | ||||||||||||
| Other Securities^ | 820,949 | 1.0 | % | |||||||||
|
| |||||||||||
| Total | 820,949 | |||||||||||
|
| |||||||||||
Total Common Stock (cost $51,595,097) | 54,523,568 | |||||||||||
|
| |||||||||||
| Principal Amount | Long-Term Fixed Income (16.8%) | |||||||||||
Asset-Backed Securities (0.1%) | ||||||||||||
| Other Securities^ | 106,476 | 0.1 | % | |||||||||
|
| |||||||||||
| Total | 106,476 | |||||||||||
|
| |||||||||||
Basic Materials (0.4%) | ||||||||||||
| Other Securities^ | 341,932 | 0.4 | % | |||||||||
|
| |||||||||||
| Total | 341,932 | |||||||||||
|
| |||||||||||
Capital Goods (0.3%) | ||||||||||||
| Other Securities^ | 306,233 | 0.3 | % | |||||||||
|
| |||||||||||
| Total | 306,233 | |||||||||||
|
| |||||||||||
Collateralized Mortgage Obligations (1.9%) | ||||||||||||
Alternative Loan Trust | ||||||||||||
| 134,182 | 5.500%, 10/25/2035, Series 2005-47CB, Class A7 | 114,412 | 0.1 | % | ||||||||
CHL Mortgage Pass-Through Trust | ||||||||||||
| 70,078 | 2.919%, 1/25/2036, Series 2005-31, Class 4A2 | 62,432 | 0.1 | % | ||||||||
| Other Securities^ | 1,430,491 | 1.7 | % | |||||||||
|
| |||||||||||
| Total | 1,607,335 | |||||||||||
|
| |||||||||||
Communications Services (0.7%) | ||||||||||||
| Other Securities^ | 653,363 | 0.7 | % | |||||||||
|
| |||||||||||
| Total | 653,363 | |||||||||||
|
| |||||||||||
Consumer Cyclical (0.8%) | ||||||||||||
| Other Securities^ | 717,414 | 0.8 | % | |||||||||
|
| |||||||||||
| Total | 717,414 | |||||||||||
|
| |||||||||||
Consumer Non-Cyclical (0.8%) | ||||||||||||
| Other Securities^ | 689,066 | 0.8 | % | |||||||||
|
| |||||||||||
| Total | 689,066 | |||||||||||
|
| |||||||||||
Energy (0.7%) | ||||||||||||
| Other Securities^ | 611,459 | 0.7 | % | |||||||||
|
| |||||||||||
| Total | 611,459 | |||||||||||
|
| |||||||||||
Financials (1.8%) | ||||||||||||
Bank of America Corporation | ||||||||||||
| 111,000 | 1.700% - 8.000%, 5/2/2017 - 4/19/2021e,f | 112,891 | 0.2 | % | ||||||||
Goldman Sachs Group, Inc. | ||||||||||||
| 55,000 | 2.000% - 7.500%, 1/31/2019 - 11/29/2023e | 56,749 | <0.1 | % | ||||||||
Goldman Sachs Group, Inc., Convertible | ||||||||||||
| 375,000 | 0.500%, 9/24/2022 | 414,202 | 0.5 | % | ||||||||
| Other Securities^ | 1,025,377 | 1.1 | % | |||||||||
|
| |||||||||||
| Total | 1,609,219 | |||||||||||
|
| |||||||||||
Foreign Government (3.7%) | ||||||||||||
| Other Securities^ | 3,209,757 | 3.7 | % | |||||||||
|
| |||||||||||
| Total | 3,209,757 | |||||||||||
|
| |||||||||||
Mortgage-Backed Securities (3.8%) | ||||||||||||
| Federal Home Loan Mortgage Corporation Gold 15-Yr. Pass Through | ||||||||||||
| 350,000 | 3.000%, 1/1/2032c | 358,995 | 0.4 | % | ||||||||
| Federal National Mortgage Association Conventional 30-Yr. Pass Through | ||||||||||||
| 1,275,000 | 3.500%, 1/1/2047c | 1,305,983 | 1.5 | % | ||||||||
| 650,000 | 4.000%, 1/1/2047c | 683,020 | 0.8 | % | ||||||||
| 425,000 | 4.500%, 1/1/2047c | 456,960 | 0.5 | % | ||||||||
| 250,000 | 3.000%, 1/1/2047c | 248,175 | 0.3 | % | ||||||||
| Other Securities^ | 262,450 | 0.3 | % | |||||||||
|
| |||||||||||
| Total | 3,315,583 | |||||||||||
|
| |||||||||||
Technology (0.7%) | ||||||||||||
| Apple, Inc. | ||||||||||||
| 10,000 | 1.202%, 5/6/2020e | 9,992 | <0.1 | % | ||||||||
| Other Securities^ | 565,270 | 0.7 | % | |||||||||
|
| |||||||||||
| Total | 575,262 | |||||||||||
|
| |||||||||||
Transportation (0.1%) | ||||||||||||
| Other Securities^ | 110,263 | 0.1 | % | |||||||||
|
| |||||||||||
| Total | 110,263 | |||||||||||
|
| |||||||||||
U.S. Government and Agencies (0.5%) | ||||||||||||
| Other Securities^ | 420,815 | 0.5 | % | |||||||||
|
| |||||||||||
| Total | 420,815 | |||||||||||
|
| |||||||||||
Utilities (0.5%) | ||||||||||||
| Other Securities^ | 424,462 | 0.5 | % | |||||||||
|
| |||||||||||
| Total | 424,462 | |||||||||||
|
| |||||||||||
Total Long-Term Fixed Income (cost $14,667,997) | 14,698,639 | |||||||||||
|
| |||||||||||
| Shares | Registered Investment Companies (3.6%) | |||||||||||
Equity Funds/ETFs (1.9%) | ||||||||||||
| 18,250 | Materials Select Sector SPDR Fund | 907,025 | 1.1 | % | ||||||||
| 12,090 | Utilities Select Sector SPDR Fund | 587,211 | 0.7 | % | ||||||||
| Other Securities^ | 183,043 | 0.1 | % | |||||||||
|
| |||||||||||
| Total | 1,677,279 | |||||||||||
|
| |||||||||||
Fixed Income Funds/ETFs (1.7%) | ||||||||||||
| 16,673 | iShares S&P U.S. Preferred Stock Index Fund | 620,402 | 0.7 | % | ||||||||
| Other Securities^ | 884,280 | 1.0 | % | |||||||||
|
| |||||||||||
| Total | 1,504,682 | |||||||||||
|
| |||||||||||
| Total Registered Investment Companies (cost $3,232,020) | 3,181,961 | |||||||||||
|
| |||||||||||
The accompanying Notes to Financial Statements are an integral part of this schedule.
89
Table of Contents
GROWTHAND INCOME PLUS PORTFOLIO
Summary Schedule of Investments as of December 31, 2016
| Shares | Preferred Stock (0.3%) | Value | % of Net Assets | |||||||||
Consumer Staples (<0.1%) | ||||||||||||
| Other Securities^ | $ | 17,737 | <0.1 | % | ||||||||
|
| |||||||||||
| Total | 17,737 | |||||||||||
|
| |||||||||||
Energy (<0.1%) | ||||||||||||
| Other Securities^ | 9,017 | <0.1 | % | |||||||||
|
| |||||||||||
| Total | 9,017 | |||||||||||
|
| |||||||||||
Health Care (0.1%) | ||||||||||||
| Other Securities^ | 64,706 | 0.1 | % | |||||||||
|
| |||||||||||
| Total | 64,706 | |||||||||||
|
| |||||||||||
Real Estate (0.2%) | ||||||||||||
| Other Securities^ | 156,750 | 0.2 | % | |||||||||
|
| |||||||||||
| Total | 156,750 | |||||||||||
|
| |||||||||||
| Total Preferred Stock (cost $248,881) | 248,210 | |||||||||||
|
| |||||||||||
| Shares or Principal Amount | Short-Term Investments (9.4%)g | |||||||||||
| Thrivent Core Short-Term Reserve Fund | ||||||||||||
| 785,439 | 0.910% | 7,854,389 | 9.0 | % | ||||||||
| Other Securities^ | 399,894 | 0.4 | % | |||||||||
|
| |||||||||||
| Total Short-Term Investments (cost $8,254,280) | 8,254,283 | |||||||||||
|
| |||||||||||
| Total Investments (cost $88,125,723) 104.0% | $ | 91,082,802 | ||||||||||
|
| |||||||||||
| Other Assets and Liabilities, Net (4.0%) | (3,522,955 | ) | ||||||||||
|
| |||||||||||
| Total Net Assets 100.0% | $ | 87,559,847 | ||||||||||
|
| |||||||||||
| ^ | The Summary Schedule of Investments shows the 50 largest holdings in unaffiliated issuers, any holding or issuer that exceeds 1% of net assets and all affiliated holdings as of the report date. The remaining securities held are grouped by category as “Other securities”. |
| a | All or a portion of the loan is unfunded. |
| b | The stated interest rate represents the weighted average of all contracts within the bank loan facility. |
| c | Denotes investments purchased on a when-issued or delayed delivery basis. |
| d | Non-income producing security. |
| e | Denotes variable rate securities. Variable rate securities are securities whose yields vary with a designated market index or market rate. The rate shown is as of December 31, 2016. |
| f | Denotes perpetual securities. Perpetual securities pay an indefinite stream of interest and have no contractual maturity date. Date shown, if applicable, is next call date. |
| g | The interest rate shown reflects the yield, coupon rate or the discount rate at the date of purchase. |
Growth and Income Plus Portfolio held restricted securities as of December 31, 2016. Restricted securities are investment securities which cannot be offered for public sale without first being registered under the Securities Act of 1933. As of December 31, 2016, the value of these investments was $164,664 or 0.2% of total net assets.
Definitions:
ETF | - | Exchange Traded Fund. |
Unrealized Appreciation (Depreciation)
Gross unrealized appreciation and depreciation of investments, based on cost for federal income tax purposes, were as follows:
Gross unrealized appreciation | $ | 5,128,038 | ||
Gross unrealized depreciation | (2,446,228 | ) | ||
|
| |||
Net unrealized appreciation (depreciation) | $ | 2,681,810 | ||
Cost for federal income tax purposes | $ | 88,400,992 |
The accompanying Notes to Financial Statements are an integral part of this schedule.
90
Table of Contents
GROWTHAND INCOME PLUS PORTFOLIO
Summary Schedule of Investments as of December 31, 2016
Fair Valuation Measurements
The following table is a summary of the inputs used, as of December 31, 2016, in valuing Growth and Income Plus Portfolio’s assets carried at fair value.
Investments in Securities | Total | Level 1 | Level 2 | Level 3 | ||||||||||||
Bank Loans | ||||||||||||||||
Basic Materials | 620,113 | — | 620,113 | — | ||||||||||||
Capital Goods | 559,495 | — | 291,182 | 268,313 | ||||||||||||
Communications Services | 2,670,819 | — | 2,438,968 | 231,851 | ||||||||||||
Consumer Cyclical | 1,766,663 | — | 1,705,913 | 60,750 | ||||||||||||
Consumer Non-Cyclical | 1,676,105 | — | 1,676,105 | — | ||||||||||||
Energy | 445,355 | — | 331,184 | 114,171 | ||||||||||||
Financials | 716,542 | — | 716,542 | — | ||||||||||||
Technology | 1,276,065 | — | 1,276,065 | — | ||||||||||||
Transportation | 240,227 | — | 240,227 | — | ||||||||||||
Utilities | 204,757 | — | 119,438 | 85,319 | ||||||||||||
Common Stock | ||||||||||||||||
Consumer Discretionary | 8,863,499 | 6,776,922 | 2,086,577 | — | ||||||||||||
Consumer Staples | 2,530,421 | 1,335,474 | 1,194,947 | — | ||||||||||||
Energy | 3,608,784 | 2,105,399 | 1,503,328 | 57 | ||||||||||||
Financials | 8,054,813 | 4,600,651 | 3,454,162 | — | ||||||||||||
Health Care | 5,356,983 | 4,077,225 | 1,279,758 | — | ||||||||||||
Industrials | 6,193,267 | 3,615,334 | 2,577,933 | — | ||||||||||||
Information Technology | 8,218,895 | 7,698,822 | 520,073 | — | ||||||||||||
Materials | 2,248,371 | 678,849 | 1,569,522 | — | ||||||||||||
Real Estate | 7,813,954 | 7,200,767 | 613,187 | — | ||||||||||||
Telecommunications Services | 813,632 | 241,193 | 572,439 | — | ||||||||||||
Utilities | 820,949 | 481,722 | 339,227 | — | ||||||||||||
Long-Term Fixed Income | ||||||||||||||||
Asset-Backed Securities | 106,476 | — | 106,476 | — | ||||||||||||
Basic Materials | 341,932 | — | 341,932 | — | ||||||||||||
Capital Goods | 306,233 | — | 306,233 | — | ||||||||||||
Collateralized Mortgage Obligations | 1,607,335 | — | 1,607,335 | — | ||||||||||||
Communications Services | 653,363 | — | 653,363 | — | ||||||||||||
Consumer Cyclical | 717,414 | — | 717,414 | — | ||||||||||||
Consumer Non-Cyclical | 689,066 | — | 689,066 | — | ||||||||||||
Energy | 611,459 | — | 611,459 | — | ||||||||||||
Financials | 1,609,219 | — | 1,195,017 | 414,202 | ||||||||||||
Foreign Government | 3,209,757 | — | 3,209,757 | — | ||||||||||||
Mortgage-Backed Securities | 3,315,583 | — | 3,315,583 | — | ||||||||||||
Technology | 575,262 | — | 575,262 | — | ||||||||||||
Transportation | 110,263 | — | 110,263 | — | ||||||||||||
U.S. Government and Agencies | 420,815 | — | 420,815 | — | ||||||||||||
Utilities | 424,462 | — | 424,462 | — | ||||||||||||
Registered Investment Companies | ||||||||||||||||
Equity Funds/ETFs | 1,677,279 | 1,677,279 | — | — | ||||||||||||
Fixed Income Funds/ETFs | 1,504,682 | 1,504,682 | — | — | ||||||||||||
Preferred Stock | ||||||||||||||||
Consumer Staples | 17,737 | — | 17,737 | — | ||||||||||||
Energy | 9,017 | — | — | 9,017 | ||||||||||||
Health Care | 64,706 | 64,706 | — | — | ||||||||||||
Real Estate | 156,750 | 156,750 | — | — | ||||||||||||
Short-Term Investments | 399,894 | — | 399,894 | — | ||||||||||||
|
|
|
|
|
|
|
| |||||||||
Subtotal Investments in Securities | $ | 83,228,413 | $ | 42,215,775 | $ | 39,828,958 | $ | 1,183,680 | ||||||||
|
|
|
|
|
|
|
| |||||||||
Other Investments * | Total | |||||||||||||||
Short-Term Investments | 7,854,389 | |||||||||||||||
|
| |||||||||||||||
Subtotal Other Investments | $ | 7,854,389 | ||||||||||||||
|
| |||||||||||||||
Total Investments at Value | $ | 91,082,802 | ||||||||||||||
|
| |||||||||||||||
| * | Certain investments are measured at fair value using a net asset value per share that is not publicly available (practical expedient). According to disclosure requirements of Accounting Standards Codification (ASC) 820, Fair Value Measurement, securities valued using the practical expedient are not classified in the fair value hierarchy. The fair value amounts presented in this table are intended to permit reconciliation of the fair value hierarchy to the amounts presented in the Statement of Assets and Liabilities. |
The accompanying Notes to Financial Statements are an integral part of this schedule.
91
Table of Contents
GROWTHAND INCOME PLUS PORTFOLIO
Summary Schedule of Investments as of December 31, 2016
Other Financial Instruments | Total | Level 1 | Level 2 | Level 3 | ||||||||||||
Asset Derivatives | ||||||||||||||||
Futures Contracts | 20,449 | 20,449 | — | — | ||||||||||||
|
|
|
|
|
|
|
| |||||||||
Total Asset Derivatives | $ | 20,449 | $ | 20,449 | $ | — | $ | — | ||||||||
|
|
|
|
|
|
|
| |||||||||
Liability Derivatives | ||||||||||||||||
Futures Contracts | 21,764 | 21,764 | — | — | ||||||||||||
|
|
|
|
|
|
|
| |||||||||
Total Liability Derivatives | $ | 21,764 | $ | 21,764 | $ | — | $ | — | ||||||||
|
|
|
|
|
|
|
| |||||||||
There were no significant transfers between Levels during the period ended December 31, 2016. Transfers between Levels are identified as of the end of the period.
The following table presents Growth and Income Plus Portfolio’s futures contracts held as of December 31, 2016. Investments and/or cash totaling $399,894 were pledged as the initial margin deposit for these contracts.
Futures Contracts | Number of Contracts Long/(Short) | Expiration Date | Notional Principal Amount | Value | Unrealized Gain/(Loss) | |||||||||||||||
CBOT 10-Yr. U.S. Treasury Note | 6 | March 2017 | $ | 747,832 | $ | 745,688 | ($ | 2,144 | ) | |||||||||||
CBOT 2-Yr. U.S. Treasury Note | (13 | ) | March 2017 | (2,817,710 | ) | (2,816,937 | ) | 773 | ||||||||||||
CBOT 5-Yr. U.S. Treasury Note | 6 | March 2017 | 707,081 | 705,984 | (1,097 | ) | ||||||||||||||
CBOT U.S. Long Bond | 2 | March 2017 | 304,046 | 301,313 | (2,733 | ) | ||||||||||||||
CME E-mini S&P 500 Index | 12 | March 2017 | 1,356,295 | 1,341,719 | (14,576 | ) | ||||||||||||||
CME S&P 500 Index | (5 | ) | March 2017 | (2,813,104 | ) | (2,795,250 | ) | 17,854 | ||||||||||||
CME Ultra Long Term U.S. Treasury Bond | 1 | March 2017 | 161,464 | 160,250 | (1,214 | ) | ||||||||||||||
Ultra 10-Yr. U.S. Treasury Note | (2 | ) | March 2017 | (269,947 | ) | (268,125 | ) | 1,822 | ||||||||||||
Total Futures Contracts | ($ | 1,315 | ) | |||||||||||||||||
The following table summarizes the fair value and Statement of Assets and Liabilities location, as of December 31, 2016, for Growth and Income Plus Portfolio’s investments in financial derivative instruments by primary risk exposure as discussed under item (2) Significant Accounting Policies of the Notes to Financial Statements.
Derivatives by risk category | Statement of Assets and Liabilities Location | Fair Value | ||||
Asset Derivatives | ||||||
Interest Rate Contracts | ||||||
Futures* | Net Assets - Net unrealized appreciation/(depreciation) on Futures contracts | $ | 2,595 | |||
Total Interest Rate Contracts | 2,595 | |||||
Equity Contracts | ||||||
Futures* | Net Assets - Net unrealized appreciation/(depreciation) on Futures contracts | 17,854 | ||||
Total Equity Contracts | 17,854 | |||||
|
| |||||
Total Asset Derivatives | $ | 20,449 | ||||
|
| |||||
Liability Derivatives | ||||||
Interest Rate Contracts | ||||||
Futures* | Net Assets - Net unrealized appreciation/(depreciation) on Futures contracts | 7,188 | ||||
Total Interest Rate Contracts | 7,188 | |||||
Fquity Contracts | ||||||
Futures* | Net Assets - Net unrealized appreciation/(depreciation) on Futures contracts | 14,576 | ||||
Total Equity Contracts | 14,576 | |||||
|
| |||||
Total Liability Derivatives | $ | 21,764 | ||||
|
| |||||
| * | Includes cumulative appreciation/depreciation of futures contracts as reported in the Schedule of Investments. Only current day’s variation margin is reported within the Statement of Assets and Liabilities. |
The following table summarizes the net realized gains/(losses) and Statement of Operations location, for the period ended December 31, 2016, for Growth and Income Plus Portfolio’s investments in financial derivative instruments by primary risk exposure.
Derivatives by risk category | Statement of Operations Location | Realized Gains/(Losses) recognized in Income | ||||
Equity Contracts | ||||||
Futures | Net realized gains/(losses) on Futures contracts | (48,961 | ) | |||
Total Equity Contracts | (48,961 | ) | ||||
Interest Rate Contracts | ||||||
Futures | Net realized gains/(losses) on Futures contracts | 72,248 | ||||
Total Interest Rate Contracts | 72,248 | |||||
Credit Contracts | ||||||
Credit Default Swaps | Net realized gains/(losses) on Swap agreements | 83 | ||||
Total Credit Contracts | 83 | |||||
|
| |||||
Total | $ | 23,370 | ||||
|
| |||||
The accompanying Notes to Financial Statements are an integral part of this schedule.
92
Table of Contents
GROWTHAND INCOME PLUS PORTFOLIO
Summary Schedule of Investments as of December 31, 2016
The following table summarizes the change in net unrealized appreciation/(depreciation) and Statement of Operations location, for the period ended December 31, 2016, for Growth and Income Plus Portfolio’s investments in financial derivative instruments by primary risk exposure.
Derivatives by risk category | Statement of Operations Location | Change in unrealized appreciation/(depreciation) recognized in Income | ||||
Interest Rate Contracts | ||||||
Futures | Change in net unrealized appreciation/(depreciation) on Futures contracts | (10,672 | ) | |||
Total Interest Rate Contracts | (10,672 | ) | ||||
Equity Contracts | ||||||
Futures | Change in net unrealized appreciation/(depreciation) on Futures contracts | 4,581 | ||||
Total Equity Contracts | 4,581 | |||||
Credit Contracts | ||||||
Credit Default Swaps | Change in net unrealized appreciation/(depreciation) on Swap agreements | (1,172 | ) | |||
Total Credit Contracts | (1,172 | ) | ||||
|
| |||||
Total | ($ | 7,263 | ) | |||
|
| |||||
The following table presents Growth and Income Plus Portfolio’s average volume of derivative activity during the period ended December 31, 2016.
Derivative Risk Category | Futures (Notional)* | Futures (Percentage of Average Net Assets) | Swaps (Notional)* | Swaps (Percentage of Average Net Assets) | ||||||||||||
Equity Contracts | $ | 1,885,558 | 2.3 | % | N/A | N/A | ||||||||||
Interest Rate | ||||||||||||||||
Contracts | 4,099,079 | 5.1 | N/A | N/A | ||||||||||||
Credit Contracts | N/A | N/A | $ | 245 | <0.1 | % | ||||||||||
| * | Notional amount represents long or short, or both, derivative positions held by the Portfolio. |
Investment in Affiliates
Affiliated issuers, as defined under the Investment Company Act of 1940, include those in which the Portfolio’s holdings of an issuer represent 5% or more of the outstanding voting securities of an issuer, any affiliated mutual fund, or a company which is under common ownership or control with the Portfolio. The Portfolio owns shares of Thrivent Cash Management Trust for the purpose of securities lending and Thrivent Core Short-Term Reserve Fund primarily to serve as a cash sweep vehicle for the Portfolio. Thrivent Cash Management Trust and Thrivent Core Short-Term Reserve Fund are established for the sole use of affiliated portfolios.
A summary of transactions for the fiscal year to date, in Growth and Income Plus Portfolio, is as follows:
Portfolio | Value December 31, 2015 | Gross Purchases | Gross Sales | Shares Held at December 31, 2016 | Value December 31, 2016 | Income Earned January 1, 2016 - December 31, 2016 | ||||||||||||||||||
Cash Management Trust- Short Term Investment | $ | 6,429,870 | $ | 8,908,384 | $ | 15,338,254 | — | $ | — | $ | 5,462 | |||||||||||||
Core Short-Term Reserve Fund | — | 38,714,711 | 30,860,322 | 785,439 | 7,854,389 | 30,393 | ||||||||||||||||||
Total Value and Income Earned | $ | 6,429,870 | $ | 7,854,389 | $ | 35,855 | ||||||||||||||||||
The accompanying Notes to Financial Statements are an integral part of this schedule.
93
Table of Contents
BALANCED INCOME PLUS PORTFOLIO
Summary Schedule of Investments as of December 31, 2016
| Principal Amount | Bank Loans (16.5%) | Value | % of Net Assets | |||||||||
Basic Materials (1.0%) | ||||||||||||
| Ineos US Finance, LLC, Term Loan | ||||||||||||
| $1,221,705 | 3.750%, 12/15/2020a | $ | 1,226,799 | 0.3 | % | |||||||
| Other Securities^ | 2,341,306 | 0.7 | % | |||||||||
|
| |||||||||||
| Total | 3,568,105 | |||||||||||
|
| |||||||||||
Capital Goods (1.0%) | ||||||||||||
| Cortes NP Acquisition Corporation, Term Loan | ||||||||||||
| 1,510,000 | 6.000%, 11/30/2023a | 1,528,875 | 0.4 | % | ||||||||
| Other Securities^ | 1,874,831 | 0.6 | % | |||||||||
|
| |||||||||||
| Total | 3,403,706 | |||||||||||
|
| |||||||||||
Communications Services (3.8%) | ||||||||||||
| NEP/NCP Holdco, Inc., Term Loan | ||||||||||||
| 1,195,809 | 4.250%, 1/22/2020a | 1,198,798 | 0.3 | % | ||||||||
| Other Securities^ | 12,447,023 | 3.5 | % | |||||||||
|
| |||||||||||
| Total | 13,645,821 | |||||||||||
|
| |||||||||||
Consumer Cyclical (2.7%) | ||||||||||||
| Scientific Games International, Inc., Term Loan | ||||||||||||
| 1,277,306 | 6.000%, 10/1/2021a | 1,292,480 | 0.4 | % | ||||||||
| Other Securities^ | 8,432,307 | 2.3 | % | |||||||||
|
| |||||||||||
| Total | 9,724,787 | |||||||||||
|
| |||||||||||
Consumer Non-Cyclical (3.1%) | ||||||||||||
| Valeant Pharmaceuticals International, Inc., Term Loan | ||||||||||||
| 2,292,790 | 5.500%, 4/1/2022a,b,c | 2,293,226 | 0.6 | % | ||||||||
| Other Securities^ | 8,631,350 | 2.5 | % | |||||||||
|
| |||||||||||
| Total | 10,924,576 | |||||||||||
|
| |||||||||||
Energy (0.8%) | ||||||||||||
| Other Securities^ | 2,784,418 | 0.8 | % | |||||||||
|
| |||||||||||
| Total | 2,784,418 | |||||||||||
|
| |||||||||||
Financials (1.1%) | ||||||||||||
| Other Securities^ | 4,007,892 | 1.1 | % | |||||||||
|
| |||||||||||
| Total | 4,007,892 | |||||||||||
|
| |||||||||||
Technology (2.3%) | ||||||||||||
| First Data Corporation, Term Loan | ||||||||||||
| 1,358,613 | 3.756%, 3/24/2021a | 1,373,897 | 0.4 | % | ||||||||
| ON Semiconductor Corporation, Term Loan | ||||||||||||
| 1,356,600 | 4.020%, 3/31/2023a | 1,373,069 | 0.4 | % | ||||||||
| Western Digital Corporation, Term Loan | ||||||||||||
| 1,164,150 | 4.520%, 4/29/2023a | 1,181,973 | 0.3 | % | ||||||||
| Other Securities^ | 4,194,014 | 1.2 | % | |||||||||
|
| |||||||||||
| Total | 8,122,953 | |||||||||||
|
| |||||||||||
Transportation (0.3%) | ||||||||||||
| Other Securities^ | 1,086,306 | 0.3 | % | |||||||||
|
| |||||||||||
| Total | 1,086,306 | |||||||||||
|
| |||||||||||
Utilities (0.4%) | ||||||||||||
| Other Securities^ | 1,213,710 | 0.4 | % | |||||||||
|
| |||||||||||
| Total | 1,213,710 | |||||||||||
|
| |||||||||||
Total Bank Loans (cost $58,233,310) | 58,482,274 | |||||||||||
|
| |||||||||||
| Shares | Common Stock (44.2%) | |||||||||||
Consumer Discretionary (7.1%) | ||||||||||||
| 4,850 | Amazon.com, Inc.d | 3,636,869 | 1.0 | % | ||||||||
| 2,770 | AutoZone, Inc.d | 2,187,718 | 0.6 | % | ||||||||
| 34,945 | Comcast Corporation | 2,412,952 | 0.7 | % | ||||||||
| 41,020 | NIKE, Inc. | 2,085,047 | 0.6 | % | ||||||||
| 23,340 | Walt Disney Company | 2,432,495 | 0.7 | % | ||||||||
| Other Securities^ | 12,446,759 | 3.5 | % | |||||||||
|
| |||||||||||
| Total | 25,201,840 | |||||||||||
|
| |||||||||||
Consumer Staples (2.0%) | ||||||||||||
| 16,600 | Philip Morris International, Inc. | 1,518,734 | 0.4 | % | ||||||||
| Other Securities^ | 5,739,664 | 1.6 | % | |||||||||
|
| |||||||||||
| Total | 7,258,398 | |||||||||||
|
| |||||||||||
Energy (3.0%) | ||||||||||||
| 297,021 | BP plc | 1,860,381 | 0.5 | % | ||||||||
| 9,190 | Concho Resources, Inc.d | 1,218,594 | 0.4 | % | ||||||||
| 23,050 | Halliburton Company | 1,246,775 | 0.4 | % | ||||||||
| 7,360 | Pioneer Natural Resources | |||||||||||
| Company | 1,325,315 | 0.4 | % | |||||||||
| Other Securities^ | 4,927,464 | 1.3 | % | |||||||||
|
| |||||||||||
| Total | 10,578,529 | |||||||||||
|
| |||||||||||
Financials (6.6%) | ||||||||||||
| 137,750 | Bank of America Corporation | 3,044,275 | 0.9 | % | ||||||||
| 11,640 | Goldman Sachs Group, Inc. | 2,787,198 | 0.8 | % | ||||||||
| 46,650 | Synchrony Financial | 1,691,995 | 0.5 | % | ||||||||
| Other Securities^ | 15,958,751 | 4.4 | % | |||||||||
|
| |||||||||||
| Total | 23,482,219 | |||||||||||
|
| |||||||||||
Health Care (4.3%) | ||||||||||||
| 5,850 | Allergan plcd | 1,228,559 | 0.3 | % | ||||||||
| 26,380 | Bristol-Myers Squibb Company | 1,541,647 | 0.4 | % | ||||||||
| 16,650 | Celgene Corporationd | 1,927,238 | 0.5 | % | ||||||||
| 26,100 | Medtronic plc | 1,859,103 | 0.5 | % | ||||||||
| 36,940 | Merck & Company, Inc. | 2,174,658 | 0.6 | % | ||||||||
| 20,409 | Novartis AG | 1,484,214 | 0.4 | % | ||||||||
| Other Securities^ | 5,205,167 | 1.6 | % | |||||||||
|
| |||||||||||
| Total | 15,420,586 | |||||||||||
|
| |||||||||||
Industrials (5.0%) | ||||||||||||
| 6,470 | Acuity Brands, Inc. | 1,493,664 | 0.4 | % | ||||||||
| 13,470 | Illinois Tool Works, Inc. | 1,649,536 | 0.5 | % | ||||||||
| 27,630 | Jacobs Engineering Group, Inc.d | 1,574,910 | 0.5 | % | ||||||||
| 19,180 | Union Pacific Corporation | 1,988,582 | 0.6 | % | ||||||||
| Other Securities^ | 11,028,579 | 3.0 | % | |||||||||
|
| |||||||||||
| Total | 17,735,271 | |||||||||||
|
| |||||||||||
Information Technology (6.6%) | ||||||||||||
| 2,260 | Alphabet, Inc., Class Ad | 1,790,937 | 0.5 | % | ||||||||
| 23,100 | Apple, Inc. | 2,675,442 | 0.8 | % | ||||||||
| 15,130 | Facebook, Inc.d | 1,740,706 | 0.5 | % | ||||||||
| 26,960 | Microsoft Corporation | 1,675,294 | 0.5 | % | ||||||||
| 38,030 | PayPal Holdings, Inc.d | 1,501,044 | 0.4 | % | ||||||||
| 27,380 | Visa, Inc. | 2,136,188 | 0.6 | % | ||||||||
The accompanying Notes to Financial Statements are an integral part of this schedule.
94
Table of Contents
BALANCED INCOME PLUS PORTFOLIO
Summary Schedule of Investments as of December 31, 2016
| Shares | Common Stock (44.2%) | Value | % of Net Assets | |||||||||
Information Technology (6.6%) - continued | ||||||||||||
| 40,540 | Xilinx, Inc. | $ | 2,447,400 | 0.7 | % | |||||||
| Other Securities^ | 9,618,000 | 2.6 | % | |||||||||
|
| |||||||||||
| Total | 23,585,011 | |||||||||||
|
| |||||||||||
Materials (1.9%) | ||||||||||||
| Other Securities^ | 6,641,527 | 1.9 | % | |||||||||
|
| |||||||||||
| Total | 6,641,527 | |||||||||||
|
| |||||||||||
Real Estate (6.3%) | ||||||||||||
| 8,938 | Simon Property Group, Inc. | 1,588,014 | 0.5 | % | ||||||||
| Other Securities^ | 20,717,829 | 5.8 | % | |||||||||
|
| |||||||||||
| Total | 22,305,843 | |||||||||||
|
| |||||||||||
Telecommunications Services (0.7%) | ||||||||||||
| Other Securities^ | 2,353,145 | 0.7 | % | |||||||||
|
| |||||||||||
| Total | 2,353,145 | |||||||||||
|
| |||||||||||
Utilities (0.7%) | ||||||||||||
| Other Securities^ | 2,360,715 | 0.7 | % | |||||||||
|
| |||||||||||
| Total | 2,360,715 | |||||||||||
|
| |||||||||||
Total Common Stock (cost $143,470,872) | 156,923,084 | |||||||||||
|
| |||||||||||
| Principal Amount | Long-Term Fixed Income (31.1%) | |||||||||||
Asset-Backed Securities (2.0%) | ||||||||||||
| Other Securities^ | 7,093,220 | 2.0 | % | |||||||||
|
| |||||||||||
| Total | 7,093,220 | |||||||||||
|
| |||||||||||
Basic Materials (0.5%) | ||||||||||||
| Other Securities^ | 1,909,412 | 0.5 | % | |||||||||
|
| |||||||||||
| Total | 1,909,412 | |||||||||||
|
| |||||||||||
Capital Goods (0.6%) | ||||||||||||
| Other Securities^ | 1,988,691 | 0.6 | % | |||||||||
|
| |||||||||||
| Total | 1,988,691 | |||||||||||
|
| |||||||||||
Collateralized Mortgage Obligations (3.2%) | ||||||||||||
Alternative Loan Trust | ||||||||||||
| 59,677 | 5.500%, 5/25/2035, Series 2005-J3, Class 2A13 | 59,507 | <0.1 | % | ||||||||
Banc of America Mortgage Securities, Inc. | ||||||||||||
| 147,313 | 3.242%, 9/25/2035, Series 2005-H, Class 2A1 | 141,243 | <0.1 | % | ||||||||
Countrywide Home Loan Mortgage Pass Through Trust | ||||||||||||
| 308,013 | 3.155%, 11/25/2035, Series 2005-22, Class 2A1 | 252,560 | 0.1 | % | ||||||||
| Other Securities^ | 11,213,743 | 3.1 | % | |||||||||
|
| |||||||||||
| Total | 11,667,053 | |||||||||||
|
| |||||||||||
Communications Services (1.4%) | ||||||||||||
| Other Securities^ | 5,160,729 | 1.4 | % | |||||||||
|
| |||||||||||
| Total | 5,160,729 | |||||||||||
|
| |||||||||||
Consumer Cyclical (1.2%) | ||||||||||||
| Other Securities^ | 4,258,798 | 1.2 | % | |||||||||
|
| |||||||||||
| Total | 4,258,798 | |||||||||||
|
| |||||||||||
Consumer Non-Cyclical (1.1%) | ||||||||||||
| Other Securities^ | 3,871,815 | 1.1 | % | |||||||||
|
| |||||||||||
| Total | 3,871,815 | |||||||||||
|
| |||||||||||
Energy (1.1%) | ||||||||||||
| Other Securities^ | 3,929,279 | 1.1 | % | |||||||||
|
| |||||||||||
| Total | 3,929,279 | |||||||||||
|
| |||||||||||
Financials (3.9%) | ||||||||||||
Bank of America Corporation |
| |||||||||||
| 803,000 | 1.700% - 8.000%, 5/2/2017 - 3/10/2026e,f | 821,775 | 0.3 | % | ||||||||
Goldman Sachs Group, Inc. |
| |||||||||||
| 740,000 | 2.042% - 7.500%, 1/31/2019 - 11/10/2026e,f | 733,831 | 0.1 | % | ||||||||
Goldman Sachs Group, Inc., Convertible |
| |||||||||||
| 1,600,000 | 0.500%, 9/24/2022 | 1,767,264 | 0.5 | % | ||||||||
| Other Securities^ | 10,374,866 | 3.0 | % | |||||||||
|
| |||||||||||
| Total | 13,697,736 | |||||||||||
|
| |||||||||||
Foreign Government (6.6%) | ||||||||||||
Turkey Government International Bond |
| |||||||||||
| 3,813,000 | 4.250% - 7.500%, 11/7/2019 - 2/17/2045g | 3,740,304 | 1.0 | % | ||||||||
| Other Securities^ | 19,673,165 | 5.6 | % | |||||||||
|
| |||||||||||
| Total | 23,413,469 | |||||||||||
|
| |||||||||||
Mortgage-Backed Securities (7.1%) | ||||||||||||
Federal Home Loan Mortgage Corporation Gold 15-Yr. Pass Through |
| |||||||||||
| 1,180,000 | 3.000%, 1/1/2032c | 1,210,326 | 0.4 | % | ||||||||
Federal Home Loan Mortgage Corporation Gold 30-Yr. Pass Through |
| |||||||||||
| 1,180,000 | 4.000%, 1/1/2047c | 1,238,764 | 0.4 | % | ||||||||
Federal National Mortgage Association Conventional 15-Yr. Pass Through |
| |||||||||||
| 2,600,000 | 2.500%, 1/1/2032c | 2,602,860 | 0.7 | % | ||||||||
Federal National Mortgage Association Conventional 30-Yr. Pass Through |
| |||||||||||
| 6,000,000 | 3.000%, 1/1/2047c | 5,956,200 | 1.7 | % | ||||||||
| 7,675,000 | 3.500%, 1/1/2047c | 7,861,502 | 2.2 | % | ||||||||
| 4,475,000 | 4.000%, 1/1/2047c | 4,702,330 | 1.3 | % | ||||||||
| 1,300,000 | 4.500%, 1/1/2047c | 1,397,760 | 0.4 | % | ||||||||
| 24,929 | 8.000% - 10.500%, 8/1/2020 - 4/1/2030 | 27,738 | <0.1 | % | ||||||||
| Other Securities^ | 138,927 | <0.1 | % | |||||||||
|
| |||||||||||
| Total | 25,136,407 | |||||||||||
|
| |||||||||||
Technology (0.9%) | ||||||||||||
| Other Securities^ | 3,207,291 | 0.9 | % | |||||||||
|
| |||||||||||
| Total | 3,207,291 | |||||||||||
|
| |||||||||||
Transportation (0.3%) | ||||||||||||
| Other Securities^ | 990,979 | 0.3 | % | |||||||||
|
| |||||||||||
| Total | 990,979 | |||||||||||
|
| |||||||||||
The accompanying Notes to Financial Statements are an integral part of this schedule.
95
Table of Contents
BALANCED INCOME PLUS PORTFOLIO
Summary Schedule of Investments as of December 31, 2016
| Principal Amount | Long-Term Fixed Income (31.1%) Value | Value | % of Net Assets | |||||||||
U.S. Government and Agencies (0.6%) | ||||||||||||
U.S. Treasury Notes |
| |||||||||||
| $1,450,000 | 1.625%, 2/15/2026 | $ | 1,352,764 | 0.4 | % | |||||||
| Other Securities^ | 774,656 | 0.2 | % | |||||||||
|
| |||||||||||
| Total | 2,127,420 | |||||||||||
|
| |||||||||||
Utilities (0.6%) | ||||||||||||
| Other Securities^ | 2,240,471 | 0.6 | % | |||||||||
|
| |||||||||||
| Total | 2,240,471 | |||||||||||
|
| |||||||||||
Total Long-Term Fixed Income (cost $111,081,501) | 110,692,770 | |||||||||||
|
| |||||||||||
| Shares | Registered Investment Companies (2.9%) | |||||||||||
Equity Funds/ETFs (1.6%) | ||||||||||||
| 51,140 | Materials Select Sector SPDR Fund | 2,541,658 | 0.7 | % | ||||||||
| 33,910 | Utilities Select Sector SPDR Fundg | 1,647,009 | 0.5 | % | ||||||||
Other Securities^ | 1,445,905 | 0.4 | % | |||||||||
|
| |||||||||||
| Total | 5,634,572 | |||||||||||
|
| |||||||||||
Fixed Income Funds/ETFs (1.3%) | ||||||||||||
| Other Securities^ | 4,583,093 | 1.3 | % | |||||||||
|
| |||||||||||
| Total | 4,583,093 | |||||||||||
|
| |||||||||||
Total Registered Investment Companies (cost $10,119,179) | 10,217,665 | |||||||||||
|
| |||||||||||
| Shares | Preferred Stock (1.2%) | |||||||||||
Consumer Staples (0.1%) | ||||||||||||
| Other Securities^ | 555,968 | 0.1 | % | |||||||||
|
| |||||||||||
| Total | 555,968 | |||||||||||
|
| |||||||||||
Energy (<0.1%) | ||||||||||||
Other Securities^ | 74,473 | <0.1 | % | |||||||||
|
| |||||||||||
| Total | 74,473 | |||||||||||
|
| |||||||||||
Financials (0.8%) | ||||||||||||
| 8,620 | Countrywide Capital V, 7.000% | 219,465 | <0.1 | % | ||||||||
| 13,000 | Goldman Sachs Group, Inc., |
| ||||||||||
5.500%e | 329,940 | 0.1 | % | |||||||||
Other Securities^ | 2,285,495 | 0.7 | % | |||||||||
|
| |||||||||||
| Total | 2,834,900 | |||||||||||
|
| |||||||||||
Health Care (0.1%) | ||||||||||||
Other Securities^ | 277,969 | 0.1 | % | |||||||||
|
| |||||||||||
| Total | 277,969 | |||||||||||
|
| |||||||||||
Real Estate (0.2%) | ||||||||||||
Other Securities^ | 564,300 | 0.2 | % | |||||||||
|
| |||||||||||
| Total | 564,300 | |||||||||||
|
| |||||||||||
Total Preferred Stock (cost $4,175,580) | 4,307,610 | |||||||||||
|
| |||||||||||
| Shares | Collateral Held for Securities Loaned (1.8%) | |||||||||||
| 6,483,360 | Thrivent Cash Management Trust | 6,483,360 | 1.8 | % | ||||||||
|
| |||||||||||
Total Collateral Held for Securities Loaned (cost $6,483,360) | 6,483,360 | |||||||||||
|
| |||||||||||
| Shares or Principal Amount | Short-Term Investments (11.6%)h | |||||||||||
Thrivent Core Short-Term Reserve Fund | ||||||||||||
| 4,023,664 | 0.910% | 40,236,638 | 11.3 | % | ||||||||
Other Securities^ | 999,829 | 0.3 | % | |||||||||
|
| |||||||||||
Total Short-Term Investments (cost $41,236,457) | 41,236,467 | |||||||||||
|
| |||||||||||
Total Investments (cost $374,800,259) 109.3% | $ | 388,343,230 | ||||||||||
|
| |||||||||||
Other Assets and Liabilities, Net (9.3%) | (32,969,244 | ) | ||||||||||
|
| |||||||||||
Total Net Assets 100.0% | $ | 355,373,986 | ||||||||||
|
| |||||||||||
| ^ | The Summary Schedule of Investments shows the 50 largest holdings in unaffiliated issuers, any holding or issuer that exceeds 1% of net assets and all affiliated holdings as of the report date. The remaining securities held are grouped by category as “Other securities”. |
| a | The stated interest rate represents the weighted average of all contracts within the bank loan facility. |
| b | All or a portion of the loan is unfunded. |
| c | Denotes investments purchased on a when-issued or delayed delivery basis. |
| d | Non-income producing security. |
| e | Denotes perpetual securities. Perpetual securities pay an indefinite stream of interest and have no contractual maturity date. Date shown, if applicable, is next call date. |
| f | Denotes variable rate securities. Variable rate securities are securities whose yields vary with a designated market index or market rate. The rate shown is as of December 31, 2016. |
| g | All or a portion of the security is on loan. |
| h | The interest rate shown reflects the yield, coupon rate or the discount rate at the date of purchase. |
Balanced Income Plus Portfolio held restricted securities as of December 31, 2016. Restricted securities are investment securities which cannot be offered for public sale without first being registered under the Securities Act of 1933. As of December 31, 2016, the value of these investments was $3,880,260 or 1.1% of total net assets.
The following table presents the total amount of securities loaned with continuous maturity, by type, offset by the gross payable upon return of collateral for securities loaned by Thrivent Balanced Income Plus Portfolio as of December 31, 2016:
| Securities Lending Transactions | ||||
Common Stock | $ | 4,144,491 | ||
Taxable Debt Security | 2,127,966 | |||
|
| |||
Total lending | $ | 6,272,457 | ||
Gross amount payable upon return of collateral for securities loaned | $ | 6,483,360 | ||
|
| |||
Net amounts due to counterparty | $ | 210,903 | ||
|
| |||
Definitions:
ETF - Exchange Traded Fund.
Unrealized Appreciation (Depreciation)
Gross unrealized appreciation and depreciation of investments, based on cost for federal income tax purposes, were as follows:
Gross unrealized appreciation | $ | 21,650,141 | ||
Gross unrealized depreciation | (8,773,225 | ) | ||
|
| |||
Net unrealized appreciation (depreciation) | $ | 12,876,916 | ||
Cost for federal income tax purposes | $ | 375,466,314 |
The accompanying Notes to Financial Statements are an integral part of this schedule.
96
Table of Contents
BALANCED INCOME PLUS PORTFOLIO
Summary Schedule of Investments as of December 31, 2016
Fair Valuation Measurements
The following table is a summary of the inputs used, as of December 31, 2016, in valuing Balanced Income Plus Portfolio’s assets carried at fair value.
Investments in Securities | Total | Level 1 | Level 2 | Level 3 | ||||||||||||
Bank Loans | ||||||||||||||||
Basic Materials | 3,568,105 | — | 3,568,105 | — | ||||||||||||
Capital Goods | 3,403,706 | — | 1,874,831 | 1,528,875 | ||||||||||||
Communications Services | 13,645,821 | — | 12,383,336 | 1,262,485 | ||||||||||||
Consumer Cyclical | 9,724,787 | — | 9,370,412 | 354,375 | ||||||||||||
Consumer Non-Cyclical | 10,924,576 | — | 10,924,576 | — | ||||||||||||
Energy | 2,784,418 | — | 2,077,004 | 707,414 | ||||||||||||
Financials | 4,007,892 | — | 4,007,892 | — | ||||||||||||
Technology | 8,122,953 | — | 7,490,922 | 632,031 | ||||||||||||
Transportation | 1,086,306 | — | 1,086,306 | — | ||||||||||||
Utilities | 1,213,710 | — | 696,779 | 516,931 | ||||||||||||
Common Stock | ||||||||||||||||
Consumer Discretionary | 25,201,840 | 19,130,426 | 6,071,414 | — | ||||||||||||
Consumer Staples | 7,258,398 | 3,770,430 | 3,487,968 | — | ||||||||||||
Energy | 10,578,529 | 6,159,094 | 4,419,272 | 163 | ||||||||||||
Financials | 23,482,219 | 13,436,233 | 10,045,986 | — | ||||||||||||
Health Care | 15,420,586 | 11,703,598 | 3,716,988 | — | ||||||||||||
Industrials | 17,735,271 | 10,201,305 | 7,533,966 | — | ||||||||||||
Information Technology | 23,585,011 | 22,075,760 | 1,509,251 | — | ||||||||||||
Materials | 6,641,527 | 2,037,411 | 4,604,116 | — | ||||||||||||
Real Estate | 22,305,843 | 20,512,296 | 1,793,547 | — | ||||||||||||
Telecommunications Services | 2,353,145 | 691,374 | 1,661,771 | — | ||||||||||||
Utilities | 2,360,715 | 1,381,660 | 979,055 | — | ||||||||||||
Long-Term Fixed Income | ||||||||||||||||
Asset-Backed Securities | 7,093,220 | — | 7,093,220 | — | ||||||||||||
Basic Materials | 1,909,412 | — | 1,909,412 | — | ||||||||||||
Capital Goods | 1,988,691 | — | 1,988,691 | — | ||||||||||||
Collateralized Mortgage Obligations | 11,667,053 | — | 11,667,053 | — | ||||||||||||
Communications Services | 5,160,729 | — | 5,160,729 | — | ||||||||||||
Consumer Cyclical | 4,258,798 | — | 4,258,798 | — | ||||||||||||
Consumer Non-Cyclical | 3,871,815 | — | 3,871,815 | — | ||||||||||||
Energy | 3,929,279 | — | 3,929,279 | — | ||||||||||||
Financials | 13,697,736 | — | 11,930,472 | 1,767,264 | ||||||||||||
Foreign Government | 23,413,469 | — | 23,413,469 | — | ||||||||||||
Mortgage-Backed Securities | 25,136,407 | — | 25,136,407 | — | ||||||||||||
Technology | 3,207,291 | — | 3,207,291 | — | ||||||||||||
Transportation | 990,979 | — | 990,979 | — | ||||||||||||
U.S. Government and Agencies | 2,127,420 | — | 2,127,420 | — | ||||||||||||
Utilities | 2,240,471 | — | 2,240,471 | — | ||||||||||||
Registered Investment Companies | ||||||||||||||||
Equity Funds/ETFs | 5,634,572 | 5,634,572 | — | — | ||||||||||||
Fixed Income Funds/ETFs | 4,583,093 | 4,583,093 | — | — | ||||||||||||
Preferred Stock | ||||||||||||||||
Consumer Staples | 555,968 | 505,257 | 50,711 | — | ||||||||||||
Energy | 74,473 | — | — | 74,473 | ||||||||||||
Financials | 2,834,900 | 2,582,905 | 251,995 | — | ||||||||||||
Health Care | 277,969 | 277,969 | — | — | ||||||||||||
Real Estate | 564,300 | 564,300 | — | — | ||||||||||||
Short-Term Investments | 999,829 | — | 999,829 | — | ||||||||||||
|
|
|
|
|
|
|
| |||||||||
Subtotal Investments in Securities | $ | 341,623,232 | $ | 125,247,683 | $ | 209,531,538 | $ | 6,844,011 | ||||||||
|
|
|
|
|
|
|
| |||||||||
Other Investments* | Total | |||||||||||||||
Short-Term Investments | 40,236,638 | |||||||||||||||
Collateral Held for Securities Loaned | 6,483,360 | |||||||||||||||
|
| |||||||||||||||
Subtotal Other Investments | $ | 46,719,998 | ||||||||||||||
|
| |||||||||||||||
Total Investments at Value | $ | 388,343,230 | ||||||||||||||
|
| |||||||||||||||
| * | Certain investments are measured at fair value using a net asset value per share that is not publicly available (practical expedient). According to disclosure requirements of Accounting Standards Codification (ASC) 820, Fair Value Measurement, securities valued using the practical expedient are not classified in the fair value hierarchy. The fair value amounts presented in this table are intended to permit reconciliation of the fair value hierarchy to the amounts presented in the Statement of Assets and Liabilities. |
The accompanying Notes to Financial Statements are an integral part of this schedule.
97
Table of Contents
BALANCED INCOME PLUS PORTFOLIO
Summary Schedule of Investments as of December 31, 2016
Other Financial Instruments | Total | Level 1 | Level 2 | Level 3 | ||||||||||||
Asset Derivatives | ||||||||||||||||
Futures Contracts | 85,866 | 85,866 | — | — | ||||||||||||
|
|
|
|
|
|
|
| |||||||||
Total Asset Derivatives | $ | 85,866 | $ | 85,866 | $ | — | $ | — | ||||||||
|
|
|
|
|
|
|
| |||||||||
Liability Derivatives | ||||||||||||||||
Futures Contracts | 55,425 | 55,425 | — | — | ||||||||||||
|
|
|
|
|
|
|
| |||||||||
Total Liability Derivatives | $ | 55,425 | $ | 55,425 | $ | — | $ | — | ||||||||
|
|
|
|
|
|
|
| |||||||||
There were no significant transfers between Levels during the period ended December 31, 2016. Transfers between Levels are identified as of the end of the period.
The following table presents Balanced Income Plus Portfolio’s futures contracts held as of December 31, 2016. Investments and/or cash totaling $799,876 were pledged as the initial margin deposit for these contracts.
Futures Contracts | Number of Contracts Long/(Short) | Expiration Date | Notional Principal Amount | Value | Unrealized Gain/(Loss) | |||||||||||||||
CBOT 10-Yr. U.S. Treasury Note | (19 | ) | March 2017 | ($ | 2,375,236 | ) | ($ | 2,361,344 | ) | $ | 13,892 | |||||||||
CBOT 2-Yr. U.S. Treasury Note | (76 | ) | March 2017 | (16,472,768 | ) | (16,468,250 | ) | 4,518 | ||||||||||||
CBOT 5-Yr. U.S. Treasury Note | 69 | March 2017 | 8,131,433 | 8,118,821 | (12,612 | ) | ||||||||||||||
CBOT U.S. Long Bond | (2 | ) | March 2017 | (304,494 | ) | (301,313 | ) | 3,181 | ||||||||||||
CME E-mini S&P 500 Index | 29 | March 2017 | 3,273,161 | 3,242,490 | (30,671 | ) | ||||||||||||||
CME S&P 500 Index | (18 | ) | March 2017 | (10,127,175 | ) | (10,062,900 | ) | 64,275 | ||||||||||||
CME Ultra Long Term U.S. Treasury Bond | 10 | March 2017 | 1,614,642 | 1,602,500 | (12,142 | ) | ||||||||||||||
Total Futures Contracts | $ | 30,441 | ||||||||||||||||||
The following table summarizes the fair value and Statement of Assets and Liabilities location, as of December 31, 2016, for Balanced Income Plus Portfolio’s investments in financial derivative instruments by primary risk exposure as discussed under item (2) Significant Accounting Policies of the Notes to Financial Statements.
Derivatives by risk category | Statement of Assets and Liabilities Location | Fair Value | ||||
Asset Derivatives | ||||||
Interest Rate Contracts | ||||||
Futures* | Net Assets - Net unrealized appreciation/(depreciation) on Futures contracts | $ | 21,591 | |||
Total Interest Rate Contracts | 21,591 | |||||
Equity Contracts | ||||||
Futures* | Net Assets - Net unrealized appreciation/(depreciation) on Futures contracts | 64,275 | ||||
Total Equity Contracts | 64,275 | |||||
|
| |||||
Total Asset Derivatives | $ | 85,866 | ||||
|
| |||||
Liability Derivatives | ||||||
Interest Rate Contracts | ||||||
Futures* | Net Assets - Net unrealized appreciation/(depreciation) on Futures contracts | 24,754 | ||||
Total Interest Rate Contracts | 24,754 | |||||
Equity Contracts | ||||||
Futures* | Net Assets - Net unrealized appreciation/(depreciation) on Futures contracts | 30,671 | ||||
Total Equity Contracts | 30,671 | |||||
|
| |||||
Total Liability Derivatives | $ | 55,425 | ||||
|
| |||||
| * | Includes cumulative appreciation/depreciation of futures contracts as reported in the Schedule of Investments. Only current day’s variation margin is reported within the Statement of Assets and Liabilities. |
The following table summarizes the net realized gains/(losses) and Statement of Operations location, for the period ended December 31, 2016, for Balanced Income Plus Portfolio’s investments in financial derivative instruments by primary risk exposure.
Derivatives by risk category | Statement of Operations Location | Realized Gains/(Losses) recognized in Income | ||||
Equity Contracts | ||||||
Futures | Net realized gains/(losses) on Futures contracts | (391,765 | ) | |||
Total Equity Contracts | (391,765 | ) | ||||
Interest Rate Contracts | ||||||
Futures | Net realized gains/(losses) on Futures contracts | 531,160 | ||||
Total Interest Rate Contracts | 531,160 | |||||
Credit Contracts | ||||||
Credit Default Swaps | Net realized gains/(losses) on Swap agreements | 1,247 | ||||
Total Credit Contracts | 1,247 | |||||
|
| |||||
Total | $ | 140,642 | ||||
|
| |||||
The accompanying Notes to Financial Statements are an integral part of this schedule.
98
Table of Contents
BALANCED INCOME PLUS PORTFOLIO
Summary Schedule of Investments as of December 31, 2016
The following table summarizes the change in net unrealized appreciation/(depreciation) and Statement of Operations location, for the period ended December 31, 2016, for Balanced Income Plus Portfolio’s investments in financial derivative instruments by primary risk exposure.
Derivatives by risk category | Statement of Operations Location | Change in unrealized appreciation/(depreciation) recognized in Income | ||||
Interest Rate Contracts | ||||||
Futures | Change in net unrealized appreciation/(depreciation) on Futures contracts | (43,133 | ) | |||
Total Interest Rate Contracts | (43,133 | ) | ||||
Equity Contracts | ||||||
Futures | Change in net unrealized appreciation/(depreciation) on Futures contracts | 36,632 | ||||
Total Equity Contracts | 36,632 | |||||
Credit Contracts | ||||||
Credit Default Swaps | Change in net unrealized appreciation/(depreciation) on Swap agreements | (17,586 | ) | |||
Total Credit Contracts | (17,586 | ) | ||||
|
| |||||
Total | ($ | 24,087 | ) | |||
|
| |||||
The following table presents Balanced Income Plus Portfolio’s average volume of derivative activity during the period ended December 31, 2016.
| Futures | Swaps | |||||||||||||||
| (Percentage | (Percentage | |||||||||||||||
Derivative Risk Category | Futures (Notional)* | of Average Net Assets) | Swaps (Notional)* | of Average Net Assets) | ||||||||||||
Equity Contracts | $ | 6,706,798 | 2.0 | % | N/A | N/A | ||||||||||
Interest Rate Contracts | 29,420,421 | 9.0 | N/A | N/A | ||||||||||||
Credit Contracts | N/A | N/A | $ | 3,669 | <0.1 | % | ||||||||||
| * | Notional amount represents long or short, or both, derivative positions held by the Portfolio. |
Investment in Affiliates
Affiliated issuers, as defined under the Investment Company Act of 1940, include those in which the Portfolio’s holdings of an issuer represent 5% or more of the outstanding voting securities of an issuer, any affiliated mutual fund, or a company which is under common ownership or control with the Portfolio. The Portfolio owns shares of Thrivent Cash Management Trust for the purpose of securities lending and Thrivent Core Short-Term Reserve Fund primarily to serve as a cash sweep vehicle for the Portfolio. Thrivent Cash Management Trust and Thrivent Core Short-Term Reserve Fund are established for the sole use of affiliated portfolios.
A summary of transactions for the fiscal year to date, in Balanced Income Plus Portfolio, is as follows:
Portfolio | Value December 31, 2015 | Gross Purchases | Gross Sales | Shares Held at December 31, 2016 | Value December 31, 2016 | Income Earned January 1, 2016 - December 31, 2016 | ||||||||||||||||||
Cash Management Trust- Collateral Investment | $ | 9,667,927 | $ | 105,613,796 | $ | 108,798,363 | 6,483,360 | $ | 6,483,360 | $ | 44,067 | |||||||||||||
Cash Management Trust- Short Term Investment | 27,808,704 | 30,675,252 | 58,483,956 | — | — | 23,316 | ||||||||||||||||||
Core Short-Term Reserve Fund | — | 157,304,701 | 117,068,063 | 4,023,664 | 40,236,638 | 151,552 | ||||||||||||||||||
Total Value and Income Earned | $ | 37,476,631 | $ | 46,719,998 | $ | 218,935 | ||||||||||||||||||
The accompanying Notes to Financial Statements are an integral part of this schedule.
99
Table of Contents
DIVERSIFIED INCOME PLUS PORTFOLIO
Summary Schedule of Investments as of December 31, 2016
| Principal Amount | Bank Loans (13.2%) | Value | % of Net Assets | |||||||||
Basic Materials (0.8%) | ||||||||||||
Ineos US Finance, LLC, Term Loan | ||||||||||||
| $1,523,470 | 3.750%, 12/15/2020a | $ | 1,529,823 | 0.3 | % | |||||||
Other Securities^ | 2,928,663 | 0.5 | % | |||||||||
|
| |||||||||||
Total | 4,458,486 | |||||||||||
|
| |||||||||||
Capital Goods (0.7%) | ||||||||||||
Cortes NP Acquisition Corporation, Term Loan | ||||||||||||
| 1,885,000 | 6.000%, 11/30/2023a | 1,908,563 | 0.3 | % | ||||||||
Other Securities^ | 2,093,262 | 0.4 | % | |||||||||
|
| |||||||||||
Total | 4,001,825 | |||||||||||
|
| |||||||||||
Communications Services (3.4%) | ||||||||||||
NEP/NCP Holdco, Inc., Term Loan | ||||||||||||
| 1,496,545 | 4.250%, 1/22/2020a | 1,500,286 | 0.3 | % | ||||||||
Other Securities^ | 17,572,577 | 3.1 | % | |||||||||
|
| |||||||||||
Total | 19,072,863 | |||||||||||
|
| |||||||||||
Consumer Cyclical (2.0%) | ||||||||||||
Scientific Games International, Inc., Term Loan | ||||||||||||
| 1,683,342 | 6.000%, 10/1/2021a | 1,703,340 | 0.3 | % | ||||||||
Other Securities^ | 9,345,146 | 1.7 | % | |||||||||
|
| |||||||||||
Total | 11,048,486 | |||||||||||
|
| |||||||||||
Consumer Non-Cyclical (2.4%) | ||||||||||||
MultiPlan, Inc., Term Loan | ||||||||||||
| 1,438,329 | 5.000%, 6/7/2023a | 1,462,219 | 0.3 | % | ||||||||
Valeant Pharmaceuticals International, Inc., Term Loan | ||||||||||||
| 2,876,882 | 5.500%, 4/1/2022a,b,c | 2,877,429 | 0.5 | % | ||||||||
Other Securities^ | 8,984,094 | 1.6 | % | |||||||||
|
| |||||||||||
Total | 13,323,742 | |||||||||||
|
| |||||||||||
Energy (0.5%) | ||||||||||||
Other Securities^ | 2,992,874 | 0.5 | % | |||||||||
|
| |||||||||||
Total | 2,992,874 | |||||||||||
|
| |||||||||||
Financials (0.9%) | ||||||||||||
Other Securities^ | 5,251,336 | 0.9 | % | |||||||||
|
| |||||||||||
Total | 5,251,336 | |||||||||||
|
| |||||||||||
Technology (1.9%) | ||||||||||||
First Data Corporation, Term Loan | ||||||||||||
| 1,798,310 | 3.756%, 3/24/2021a | 1,818,541 | 0.3 | % | ||||||||
ON Semiconductor Corporation, Term Loan | ||||||||||||
| 1,695,750 | 4.020%, 3/31/2023a | 1,716,336 | 0.3 | % | ||||||||
Western Digital Corporation, Term Loan | ||||||||||||
| 1,432,800 | 4.520%, 4/29/2023a | 1,454,736 | 0.3 | % | ||||||||
Other Securities^ | 5,775,368 | 1.0 | % | |||||||||
|
| |||||||||||
Total | 10,764,981 | |||||||||||
|
| |||||||||||
Transportation (0.3%) | ||||||||||||
Other Securities^ | 1,633,790 | 0.3 | % | |||||||||
|
| |||||||||||
Total | 1,633,790 | |||||||||||
|
| |||||||||||
Utilities (0.3%) | ||||||||||||
Other Securities^ | 1,500,423 | 0.3 | % | |||||||||
|
| |||||||||||
Total | 1,500,423 | |||||||||||
|
| |||||||||||
| Total Bank Loans (cost $73,615,259) | 74,048,806 | |||||||||||
|
| |||||||||||
Long-Term Fixed Income (47.7%) | ||||||||||||
Asset-Backed Securities (3.6%) | ||||||||||||
Other Securities^ | 20,255,435 | 3.6 | % | |||||||||
|
| |||||||||||
Total | 20,255,435 | |||||||||||
|
| |||||||||||
Basic Materials (0.8%) | ||||||||||||
Other Securities^ | 4,694,203 | 0.8 | % | |||||||||
|
| |||||||||||
Total | 4,694,203 | |||||||||||
|
| |||||||||||
Capital Goods (1.6%) | ||||||||||||
Other Securities^ | 9,050,246 | 1.6 | % | |||||||||
|
| |||||||||||
Total | 9,050,246 | |||||||||||
|
| |||||||||||
Collateralized Mortgage Obligations (10.8%) | ||||||||||||
Alternative Loan Trust | ||||||||||||
| 321,793 | 5.500%, 5/25/2035, Series 2005-J3, Class 2A13 | 320,874 | 0.1 | % | ||||||||
Countrywide Alternative Loan Trust | ||||||||||||
| 1,747,316 | 1.156% - 6.000%, 2/25/2035 - 4/25/2036, Series 2005-43, Class 4A1d | 1,494,395 | 0.3 | % | ||||||||
Countrywide Home Loan Mortgage Pass Through Trust | ||||||||||||
| 1,268,074 | 3.147% - 3.155%, 11/25/2035 - 2/20/2036, Series 2005- HY10, Class 5A1 | 1,040,430 | 0.2 | % | ||||||||
Federal National Mortgage Association | ||||||||||||
| 6,993,423 | 2.500% - 3.500%, 2/25/2028 - 1/25/2033, Series 2012-150, Class YIe | 748,327 | 0.1 | % | ||||||||
Other Securities^ | 57,059,251 | 10.1 | % | |||||||||
|
| |||||||||||
Total | 60,663,277 | |||||||||||
|
| |||||||||||
Commercial Mortgage-Backed Securities (0.3%) | ||||||||||||
Other Securities^ | 1,659,168 | 0.3 | % | |||||||||
|
| |||||||||||
Total | 1,659,168 | |||||||||||
|
| |||||||||||
Communications Services (3.3%) | ||||||||||||
Other Securities^ | 18,507,813 | 3.3 | % | |||||||||
|
| |||||||||||
Total | 18,507,813 | |||||||||||
|
| |||||||||||
Consumer Cyclical (2.5%) | ||||||||||||
Other Securities^ | 14,213,709 | 2.5 | % | |||||||||
|
| |||||||||||
Total | 14,213,709 | |||||||||||
|
| |||||||||||
Consumer Non-Cyclical (2.4%) | ||||||||||||
Other Securities^ | 13,581,463 | 2.4 | % | |||||||||
|
| |||||||||||
Total | 13,581,463 | |||||||||||
|
| |||||||||||
The accompanying Notes to Financial Statements are an integral part of this schedule.
100
Table of Contents
DIVERSIFIED INCOME PLUS PORTFOLIO
Summary Schedule of Investments as of December 31, 2016
| Principal Amount | Long-Term Fixed Income (47.7%) | Value | % of Net Assets | |||||||||
Energy (2.3%) | ||||||||||||
Other Securities^ | $ | 13,170,762 | 2.3 | % | ||||||||
|
| |||||||||||
Total | 13,170,762 | |||||||||||
|
| |||||||||||
Financials (6.7%) | ||||||||||||
Bank of America Corporation | ||||||||||||
| 930,000 | 2.061% - 8.000%, 5/2/2017 - 10/21/2022d,f | 957,761 | 0.1 | % | ||||||||
Goldman Sachs Group, Inc. | ||||||||||||
| 1,270,000 | 2.000% - 7.500%, 1/31/2019 - 11/10/2026d,f | 1,288,988 | 0.2 | % | ||||||||
Goldman Sachs Group, Inc., Convertible | ||||||||||||
| 2,450,000 | 0.500%, 9/24/2022 | 2,706,123 | 0.5 | % | ||||||||
Other Securities^ | 32,658,564 | 5.9 | % | |||||||||
|
| |||||||||||
Total | 37,611,436 | |||||||||||
|
| |||||||||||
Foreign Government (3.5%) | ||||||||||||
Other Securities^ | 19,443,993 | 3.5 | % | |||||||||
|
| |||||||||||
Total | 19,443,993 | |||||||||||
|
| |||||||||||
Mortgage-Backed Securities (6.2%) | ||||||||||||
Federal Home Loan Mortgage Corporation Gold 15-Yr. Pass Through | ||||||||||||
| 2,950,000 | 3.000%, 1/1/2032c | 3,025,815 | 0.5 | % | ||||||||
Federal National Mortgage Association Conventional 15-Yr. Pass Through | ||||||||||||
| 7,500,000 | 2.500%, 1/1/2032c | 7,508,250 | 1.3 | % | ||||||||
Federal National Mortgage Association Conventional 30-Yr. Pass Through | ||||||||||||
| 14,800,000 | 3.000%, 1/1/2047c | 14,691,960 | 2.6 | % | ||||||||
| 5,800,000 | 3.500%, 1/1/2047c | 5,940,940 | 1.1 | % | ||||||||
| 3,850,000 | 4.000%, 1/1/2047c | 4,045,580 | 0.7 | % | ||||||||
|
| |||||||||||
Total | 35,212,545 | |||||||||||
|
| |||||||||||
Technology (1.6%) | ||||||||||||
Other Securities^ | 9,000,789 | 1.6 | % | |||||||||
|
| |||||||||||
Total | 9,000,789 | |||||||||||
|
| |||||||||||
Transportation (0.4%) | ||||||||||||
Other Securities^ | 2,387,690 | 0.4 | % | |||||||||
|
| |||||||||||
Total | 2,387,690 | |||||||||||
|
| |||||||||||
U.S. Government and Agencies (0.5%) | ||||||||||||
Other Securities^ | 2,593,129 | 0.5 | % | |||||||||
|
| |||||||||||
Total | 2,593,129 | |||||||||||
|
| |||||||||||
Utilities (1.2%) | ||||||||||||
Other Securities^ | 6,645,935 | 1.2 | % | |||||||||
|
| |||||||||||
Total | 6,645,935 | |||||||||||
|
| |||||||||||
Total Long-Term Fixed Income (cost $265,712,999) | 268,691,593 | |||||||||||
|
| |||||||||||
| Shares | Common Stock (26.8%) | |||||||||||
| Consumer Discretionary (4.2%) | ||||||||||||
| 4,540 | Amazon.com, Inc.g | 3,404,410 | 0.6 | % | ||||||||
| 2,600 | AutoZone, Inc.g | 2,053,454 | 0.4 | % | ||||||||
| 32,744 | Comcast Corporation | 2,260,973 | 0.4 | % | ||||||||
| 38,430 | NIKE, Inc. | 1,953,397 | 0.4 | % | ||||||||
| 21,870 | Walt Disney Company | 2,279,291 | 0.4 | % | ||||||||
Other Securities^ | 11,475,751 | 2.0 | % | |||||||||
|
| |||||||||||
Total | 23,427,276 | |||||||||||
|
| |||||||||||
| Consumer Staples (1.2%) | ||||||||||||
| 15,550 | Philip Morris International, Inc. | 1,422,669 | 0.3 | % | ||||||||
Other Securities^ | 5,493,238 | 0.9 | % | |||||||||
|
| |||||||||||
Total | 6,915,907 | |||||||||||
|
| |||||||||||
| Energy (1.8%) | ||||||||||||
| 279,508 | BP plc | 1,750,689 | 0.3 | % | ||||||||
Other Securities^ | 8,182,482 | 1.5 | % | |||||||||
|
| |||||||||||
Total | 9,933,171 | |||||||||||
|
| |||||||||||
| Financials (4.7%) | ||||||||||||
| 115,400 | Ares Capital Corporation | 1,902,946 | 0.3 | % | ||||||||
| 132,410 | Bank of America Corporation | 2,926,261 | 0.5 | % | ||||||||
| 10,900 | Goldman Sachs Group, Inc. | 2,610,005 | 0.5 | % | ||||||||
| 120,000 | Golub Capital BDC, Inc. | 2,206,800 | 0.4 | % | ||||||||
| 43,710 | Synchrony Financial | 1,585,362 | 0.3 | % | ||||||||
Other Securities^ | 15,328,783 | 2.7 | % | |||||||||
|
| |||||||||||
Total | 26,560,157 | |||||||||||
|
| |||||||||||
| Health Care (2.6%) | ||||||||||||
| 24,720 | Bristol-Myers Squibb Company | 1,444,637 | 0.3 | % | ||||||||
| 15,610 | Celgene Corporationg | 1,806,857 | 0.3 | % | ||||||||
| 24,460 | Medtronic plc | 1,742,286 | 0.3 | % | ||||||||
| 34,610 | Merck & Company, Inc. | 2,037,491 | 0.4 | % | ||||||||
| 19,155 | Novartis AG | 1,393,019 | 0.2 | % | ||||||||
Other Securities^ | 6,234,826 | 1.1 | % | |||||||||
|
| |||||||||||
Total | 14,659,116 | |||||||||||
|
| |||||||||||
| Industrials (2.9%) | ||||||||||||
| 6,060 | Acuity Brands, Inc. | 1,399,012 | 0.3 | % | ||||||||
| 12,626 | Illinois Tool Works, Inc. | 1,546,180 | 0.3 | % | ||||||||
| 25,890 | Jacobs Engineering Group, Inc.g | 1,475,730 | 0.3 | % | ||||||||
| 17,970 | Union Pacific Corporation | 1,863,130 | 0.4 | % | ||||||||
Other Securities^ | 10,253,548 | 1.6 | % | |||||||||
|
| |||||||||||
Total | 16,537,600 | |||||||||||
|
| |||||||||||
| Information Technology (4.0%) | ||||||||||||
| 2,120 | Alphabet, Inc., Class Ag | 1,679,994 | 0.3 | % | ||||||||
| 21,650 | Apple, Inc. | 2,507,503 | 0.4 | % | ||||||||
| 14,180 | Facebook, Inc.g | 1,631,409 | 0.3 | % | ||||||||
| 25,270 | Microsoft Corporation | 1,570,278 | 0.3 | % | ||||||||
| 35,640 | PayPal Holdings, Inc.g | 1,406,711 | 0.2 | % | ||||||||
| 25,660 | Visa, Inc. | 2,001,993 | 0.4 | % | ||||||||
| 44,410 | Xilinx, Inc. | 2,681,032 | 0.5 | % | ||||||||
Other Securities^ | 9,232,554 | 1.6 | % | |||||||||
|
| |||||||||||
Total | 22,711,474 | |||||||||||
|
| |||||||||||
| Materials (1.1%) | ||||||||||||
Other Securities^ | 6,162,122 | 1.1 | % | |||||||||
|
| |||||||||||
Total | 6,162,122 | |||||||||||
|
| |||||||||||
| Real Estate (3.5%) | ||||||||||||
| 7,950 | Simon Property Group, Inc. | 1,412,477 | 0.3 | % | ||||||||
Other Securities^ | 18,425,036 | 3.2 | % | |||||||||
|
| |||||||||||
Total | 19,837,513 | |||||||||||
|
| |||||||||||
| Telecommunications Services (0.4%) | ||||||||||||
Other Securities^ | 2,187,605 | 0.4 | % | |||||||||
|
| |||||||||||
Total | 2,187,605 | |||||||||||
|
| |||||||||||
The accompanying Notes to Financial Statements are an integral part of this schedule.
101
Table of Contents
DIVERSIFIED INCOME PLUS PORTFOLIO
Summary Schedule of Investments as of December 31, 2016
| Shares | Common Stock (26.8%) | Value | % of Net Assets | |||||||||
Utilities (0.4%) | ||||||||||||
Other Securities^ | $ | 2,172,065 | 0.4 | % | ||||||||
|
| |||||||||||
Total | 2,172,065 | |||||||||||
|
| |||||||||||
Total Common Stock (cost $142,230,585) | 151,104,006 | |||||||||||
|
| |||||||||||
Registered Investment Companies (4.7%) | ||||||||||||
Equity Funds/ETFs (1.8%) | ||||||||||||
| 256,500 | Alerian MLP ETF | 3,231,900 | 0.6 | % | ||||||||
| 47,910 | Materials Select Sector SPDR Fund | 2,381,127 | 0.4 | % | ||||||||
| 31,780 | Utilities Select Sector SPDR Fund | 1,543,554 | 0.3 | % | ||||||||
| 25,000 | Vanguard High Dividend Yield ETF | 1,894,250 | 0.3 | % | ||||||||
Other Securities^ | 969,287 | 0.2 | % | |||||||||
|
| |||||||||||
Total | 10,020,118 | |||||||||||
|
| |||||||||||
Fixed Income Funds/ETFs (2.9%) | ||||||||||||
| 75,300 | iShares S&P U.S. Preferred Stock Index Fund | 2,801,913 | 0.5 | % | ||||||||
| 144,565 | Vanguard Short-Term Corporate Bond ETF | 11,474,124 | 2.1 | % | ||||||||
Other Securities^ | 1,982,349 | 0.3 | % | |||||||||
|
| |||||||||||
Total | 16,258,386 | |||||||||||
|
| |||||||||||
Total Registered Investment Companies (cost $26,786,285) | 26,278,504 | |||||||||||
|
| |||||||||||
Preferred Stock (2.3%) | ||||||||||||
Consumer Staples (0.3%) | ||||||||||||
Other Securities^ | 1,700,800 | 0.3 | % | |||||||||
|
| |||||||||||
| Total | 1,700,800 | |||||||||||
|
| |||||||||||
Energy (<0.1%) | ||||||||||||
Other Securities^ | 60,985 | <0.1 | % | |||||||||
|
| |||||||||||
| Total | 60,985 | |||||||||||
|
| |||||||||||
Financials (1.7%) | ||||||||||||
| 30,800 | Goldman Sachs Group, Inc., | |||||||||||
5.500%f | 781,704 | 0.1 | % | |||||||||
Other Securities^ | 8,668,913 | 1.6 | % | |||||||||
|
| |||||||||||
| Total | 9,450,617 | |||||||||||
|
| |||||||||||
Health Care (0.2%) | ||||||||||||
Other Securities^ | 777,863 | 0.2 | % | |||||||||
|
| |||||||||||
| Total | 777,863 | |||||||||||
|
| |||||||||||
Real Estate (0.1%) | ||||||||||||
Other Securities^ | 721,050 | 0.1 | % | |||||||||
|
| |||||||||||
| Total | 721,050 | |||||||||||
|
| |||||||||||
| Total Preferred Stock (cost $12,570,149) | 12,711,315 | |||||||||||
|
| |||||||||||
Collateral Held for Securities Loaned (<0.1%) | ||||||||||||
| 172,250 | Thrivent Cash Management Trust | 172,250 | <0.1 | % | ||||||||
Total Collateral Held for Securities Loaned (cost $172,250) | 172,250 | |||||||||||
|
| |||||||||||
| Shares or Principal Amount | Short-Term Investments (11.8%)h | |||||||||||
| Thrivent Core Short-Term Reserve Fund | ||||||||||||
| 6,498,975 | 0.910% | 64,989,751 | 11.5 | % | ||||||||
| Other Securities^ | 1,399,732 | 0.3 | % | |||||||||
|
| |||||||||||
Total Short-Term Investments (cost $66,389,437) | 66,389,483 | |||||||||||
|
| |||||||||||
Total Investments (cost $587,476,964) 106.5% | $ | 599,395,957 | ||||||||||
|
| |||||||||||
Other Assets and Liabilities, Net (6.5%) | (36,604,159 | ) | ||||||||||
|
| |||||||||||
Total Net Assets 100.0% | $ | 562,791,798 | ||||||||||
|
| |||||||||||
| ^ | The Summary Schedule of Investments shows the 50 largest holdings in unaffiliated issuers, any holding or issuer that exceeds 1% of net assets and all affiliated holdings as of the report date. The remaining securities held are grouped by category as “Other securities”. |
| a | The stated interest rate represents the weighted average of all contracts within the bank loan facility. |
| b | All or a portion of the loan is unfunded. |
| c | Denotes investments purchased on a when-issued or delayed delivery basis. |
| d | Denotes variable rate securities. Variable rate securities are securities whose yields vary with a designated market index or market rate. The rate shown is as of December 31, 2016. |
| e | Denotes interest only security. Interest only securities represent the right to receive monthly interest payments on an underlying pool of mortgages or assets. The principal shown is the outstanding par amount of the pool as of the end of the period. The actual effective yield of the security is different than the stated coupon rate. |
| f | Denotes perpetual securities. Perpetual securities pay an indefinite stream of interest and have no contractual maturity date. Date shown, if applicable, is next call date. |
| g | Non-income producing security. |
| h | The interest rate shown reflects the yield, coupon rate or the discount rate at the date of purchase. |
Diversified Income Plus Portfolio held restricted securities as of December 31, 2016. Restricted securities are investment securities which cannot be offered for public sale without first being registered under the Securities Act of 1933. As of December 31, 2016, the value of these investments was $14,471,160 or 2.6% of total net assets.
The following table presents the total amount of securities loaned with continuous maturity, by type, offset by the gross payable upon return of collateral for securities loaned by Thrivent Diversified Income Plus Portfolio as of December 31, 2016:
Securities Lending Transactions | ||||
Common Stock | $ | 162,954 | ||
|
| |||
Total lending | $ | 162,954 | ||
Gross amount payable upon return of collateral for securities loaned | $ | 172,250 | ||
|
| |||
Net amounts due to counterparty | $ | 9,296 |
Definitions:
| ETF | - | Exchange Traded Fund. |
The accompanying Notes to Financial Statements are an integral part of this schedule.
102
Table of Contents
DIVERSIFIED INCOME PLUS PORTFOLIO
Summary Schedule of Investments as of December 31, 2016
Unrealized Appreciation (Depreciation)
Gross unrealized appreciation and depreciation of investments, based on cost for federal income tax purposes, were as follows:
Gross unrealized appreciation | $ | 23,156,578 | ||
Gross unrealized depreciation | (12,215,511 | ) | ||
|
| |||
Net unrealized appreciation (depreciation) | $ | 10,941,067 | ||
Cost for federal income tax purposes | $ | 588,454,890 |
The accompanying Notes to Financial Statements are an integral part of this schedule.
103
Table of Contents
DIVERSIFIED INCOME PLUS PORTFOLIO
Summary Schedule of Investments as of December 31, 2016
Fair Valuation Measurements
The following table is a summary of the inputs used, as of December 31, 2016, in valuing Diversified Income Plus Portfolio’s assets carried at fair value.
Investments in Securities | Total | Level 1 | Level 2 | Level 3 | ||||||||||||
Bank Loans | ||||||||||||||||
Basic Materials | 4,458,486 | — | 4,458,486 | — | ||||||||||||
Capital Goods | 4,001,825 | — | 2,093,262 | 1,908,563 | ||||||||||||
Communications Services | 19,072,863 | — | 17,254,998 | 1,817,865 | ||||||||||||
Consumer Cyclical | 11,048,486 | — | 10,643,486 | 405,000 | ||||||||||||
Consumer Non-Cyclical | 13,323,742 | — | 13,323,742 | — | ||||||||||||
Energy | 2,992,874 | — | 2,133,929 | 858,945 | ||||||||||||
Financials | 5,251,336 | — | 5,251,336 | — | ||||||||||||
Technology | 10,764,981 | — | 9,890,250 | 874,731 | ||||||||||||
Transportation | 1,633,790 | — | 1,633,790 | — | ||||||||||||
Utilities | 1,500,423 | — | 847,985 | 652,438 | ||||||||||||
Long-Term Fixed Income | ||||||||||||||||
Asset-Backed Securities | 20,255,435 | — | 20,255,435 | — | ||||||||||||
Basic Materials | 4,694,203 | — | 4,694,203 | — | ||||||||||||
Capital Goods | 9,050,246 | — | 9,050,246 | — | ||||||||||||
Collateralized Mortgage Obligations | 60,663,277 | — | 60,663,277 | — | ||||||||||||
Commercial Mortgage-Backed Securities | 1,659,168 | — | 1,659,168 | — | ||||||||||||
Communications Services | 18,507,813 | — | 18,507,813 | — | ||||||||||||
Consumer Cyclical | 14,213,709 | — | 14,213,709 | — | ||||||||||||
Consumer Non-Cyclical | 13,581,463 | — | 13,581,463 | — | ||||||||||||
Energy | 13,170,762 | — | 13,170,762 | — | ||||||||||||
Financials | 37,611,436 | — | 34,905,313 | 2,706,123 | ||||||||||||
Foreign Government | 19,443,993 | — | 19,443,993 | — | ||||||||||||
Mortgage-Backed Securities | 35,212,545 | — | 35,212,545 | — | ||||||||||||
Technology | 9,000,789 | — | 9,000,789 | — | ||||||||||||
Transportation | 2,387,690 | — | 2,387,690 | — | ||||||||||||
U.S. Government and Agencies | 2,593,129 | — | 2,593,129 | — | ||||||||||||
Utilities | 6,645,935 | — | 6,645,935 | — | ||||||||||||
Common Stock | ||||||||||||||||
Consumer Discretionary | 23,427,276 | 17,745,496 | 5,681,780 | — | ||||||||||||
Consumer Staples | 6,915,907 | 3,635,095 | 3,280,812 | — | ||||||||||||
Energy | 9,933,171 | 5,774,244 | 4,158,774 | 153 | ||||||||||||
Financials | 26,560,157 | 17,113,799 | 9,446,358 | — | ||||||||||||
Health Care | 14,659,116 | 11,171,976 | 3,487,140 | — | ||||||||||||
Industrials | 16,537,600 | 9,446,317 | 7,091,283 | — | ||||||||||||
Information Technology | 22,711,474 | 21,299,706 | 1,411,768 | — | ||||||||||||
Materials | 6,162,122 | 1,831,791 | 4,330,331 | — | ||||||||||||
Real Estate | 19,837,513 | 18,123,071 | 1,714,442 | — | ||||||||||||
Telecommunications Services | 2,187,605 | 622,040 | 1,565,565 | — | ||||||||||||
Utilities | 2,172,065 | 1,243,637 | 928,428 | — | ||||||||||||
Registered Investment Companies | ||||||||||||||||
Fixed Income Funds/ETFs | 16,258,386 | 16,258,386 | — | — | ||||||||||||
Equity Funds/ETFs | 10,020,118 | 10,020,118 | — | — | ||||||||||||
Preferred Stock | ||||||||||||||||
Consumer Staples | 1,700,800 | 1,653,184 | 47,616 | — | ||||||||||||
Energy | 60,985 | — | — | 60,985 | ||||||||||||
Financials | 9,450,617 | 8,573,452 | 877,165 | — | ||||||||||||
Health Care | 777,863 | 777,863 | — | — | ||||||||||||
Real Estate | 721,050 | 721,050 | — | — | ||||||||||||
Short-Term Investments | 1,399,732 | — | 1,399,732 | — | ||||||||||||
|
|
|
|
|
|
|
| |||||||||
Subtotal Investments in Securities | $ | 534,233,956 | $ | 146,011,225 | $ | 378,937,928 | $ | 9,284,803 | ||||||||
|
|
|
|
|
|
|
| |||||||||
Other Investments * | Total | |||||||||||||||
Short-Term Investments | 64,989,751 | |||||||||||||||
Collateral Held for Securities Loaned | 172,250 | |||||||||||||||
|
| |||||||||||||||
Subtotal Other Investments | $ | 65,162,001 | ||||||||||||||
|
| |||||||||||||||
Total Investments at Value | $ | 599,395,957 | ||||||||||||||
|
| |||||||||||||||
| * | Certain investments are measured at fair value using a net asset value per share that is not publicly available (practical expedient). According to disclosure requirements of Accounting Standards Codification (ASC) 820, Fair Value Measurement, securities valued using the practical expedient are not classified in the fair value hierarchy. The fair value amounts presented in this table are intended to permit reconciliation of the fair value hierarchy to the amounts presented in the Statement of Assets and Liabilities. |
The accompanying Notes to Financial Statements are an integral part of this schedule.
104
Table of Contents
DIVERSIFIED INCOME PLUS PORTFOLIO
Summary Schedule of Investments as of December 31, 2016
Other Financial Instruments | Total | Level 1 | Level 2 | Level 3 | ||||||||||||
Asset Derivatives | ||||||||||||||||
Futures Contracts | 144,380 | 144,380 | — | — | ||||||||||||
|
|
|
|
|
|
|
| |||||||||
Total Asset Derivatives | $ | 144,380 | $ | 144,380 | $ | — | $ | — | ||||||||
|
|
|
|
|
|
|
| |||||||||
Liability Derivatives | ||||||||||||||||
Futures Contracts | 90,412 | 90,412 | — | — | ||||||||||||
|
|
|
|
|
|
|
| |||||||||
Total Liability Derivatives | $ | 90,412 | $ | 90,412 | $ | — | $ | — | ||||||||
|
|
|
|
|
|
|
| |||||||||
There were no significant transfers between Levels during the period ended December 31, 2016. Transfers between Levels are identified as of the end of the period.
The following table presents Diversified Income Plus Portfolio’s futures contracts held as of December 31, 2016. Investments and/or cash totaling $1,399,732 were pledged as the initial margin deposit for these contracts.
Futures Contracts | Number of Contracts Long/(Short) | Expiration Date | Notional Principal Amount | Value | Unrealized Gain/(Loss) | |||||||||||||||
CBOT 10-Yr. U.S. Treasury Note | 10 | March 2017 | $ | 1,250,032 | $ | 1,242,812 | ($ | 7,220 | ) | |||||||||||
CBOT 2-Yr. U.S. Treasury Note | (26 | ) | March 2017 | (5,635,421 | ) | (5,633,875 | ) | 1,546 | ||||||||||||
CBOT 5-Yr. U.S. Treasury Note | 176 | March 2017 | 20,741,046 | 20,708,875 | (32,171 | ) | ||||||||||||||
CBOT U.S. Long Bond | 8 | March 2017 | 1,220,026 | 1,205,250 | (14,776 | ) | ||||||||||||||
CME E-mini S&P 500 Index | 33 | March 2017 | 3,724,761 | 3,689,730 | (35,031 | ) | ||||||||||||||
CME S&P 500 Index | (40 | ) | March 2017 | (22,504,834 | ) | (22,362,000 | ) | 142,834 | ||||||||||||
CME Ultra Long Term U.S. Treasury Bond | 1 | March 2017 | 161,464 | 160,250 | (1,214 | ) | ||||||||||||||
Total Futures Contracts | $ | 53,968 | ||||||||||||||||||
The following table summarizes the fair value and Statement of Assets and Liabilities location, as of December 31, 2016, for Diversified Income Plus Portfolio’s investments in financial derivative instruments by primary risk exposure as discussed under item (2) Significant Accounting Policies of the Notes to Financial Statements.
Derivatives by risk category | Statement of Assets and Liabilities Location | Fair Value | ||||
Asset Derivatives | ||||||
Interest Rate Contracts | ||||||
Futures* | Net Assets - Net unrealized appreciation/(depreciation) on Futures contracts | $ | 1,546 | |||
Total Interest Rate Contracts | 1,546 | |||||
Equity Contracts | ||||||
Futures* | Net Assets - Net unrealized appreciation/(depreciation) on Futures contracts | 142,834 | ||||
Total Equity Contracts | 142,834 | |||||
|
| |||||
Total Asset Derivatives | $ | 144,380 | ||||
|
| |||||
Liability Derivatives | ||||||
Interest Rate Contracts | ||||||
Futures* | Net Assets - Net unrealized appreciation/(depreciation) on Futures contracts | 55,381 | ||||
Total Interest Rate Contracts | 55,381 | |||||
Equity Contracts | ||||||
Futures* | Net Assets - Net unrealized appreciation/(depreciation) on Futures contracts | 35,031 | ||||
Total Equity Contracts | 35,031 | |||||
|
| |||||
Total Liability Derivatives | $ | 90,412 | ||||
|
| |||||
| * | Includes cumulative appreciation/depreciation of futures contracts as reported in the Schedule of Investments. Only current day’s variation margin is reported within the Statement of Assets and Liabilities. |
The following table summarizes the net realized gains/(losses) and Statement of Operations location, for the period ended December 31, 2016, for Diversified Income Plus Portfolio’s investments in financial derivative instruments by primary risk exposure.
Derivatives by risk category | Statement of Operations Location | Realized Gains/(Losses) recognized in Income | ||||
Equity Contracts | ||||||
Futures | Net realized gains/(losses) on Futures contracts | (1,905,796 | ) | |||
Total Equity Contracts | (1,905,796 | ) | ||||
Interest Rate Contracts | ||||||
Futures | Net realized gains/(losses) on Futures contracts | 878,491 | ||||
Total Interest Rate Contracts | 878,491 | |||||
|
| |||||
Total | ($ | 1,027,305 | ) | |||
|
| |||||
The accompanying Notes to Financial Statements are an integral part of this schedule.
105
Table of Contents
DIVERSIFIED INCOME PLUS PORTFOLIO
Summary Schedule of Investments as of December 31, 2016
The following table summarizes the change in net unrealized appreciation/(depreciation) and Statement of Operations location, for the period ended December 31, 2016, for Diversified Income Plus Portfolio’s investments in financial derivative instruments by primary risk exposure.
Derivatives by risk category | Statement of Operations Location | Change in unrealized appreciation/(depreciation) recognized in Income | ||||
Interest Rate Contracts | ||||||
Futures | Change in net unrealized appreciation/(depreciation) on Futures contracts | (67,638 | ) | |||
Total Interest Rate Contracts | (67,638 | ) | ||||
Equity Contracts | ||||||
Futures | Change in net unrealized appreciation/(depreciation) on Futures contracts | 506,543 | ||||
Total Equity Contracts | 506,543 | |||||
|
| |||||
Total | $ | 438,905 | ||||
|
| |||||
The following table presents Diversified Income Plus Portfolio’s average volume of derivative activity during the period ended December 31, 2016.
Derivative Risk Category | Futures (Notional)* | Futures (Percentage of Average Net Assets) | ||||||
Equity Contracts | $ | 22,382,114 | 4.4 | % | ||||
Interest Rate Contracts | 47,219,053 | 9.2 | ||||||
| * | Notional amount represents long or short, or both, derivative positions held by the Portfolio. |
Investment in Affiliates
Affiliated issuers, as defined under the Investment Company Act of 1940, include those in which the Portfolio’s holdings of an issuer represent 5% or more of the outstanding voting securities of an issuer, any affiliated mutual fund, or a company which is under common ownership or control with the Portfolio. The Portfolio owns shares of Thrivent Cash Management Trust for the purpose of securities lending and Thrivent Core Short-Term Reserve Fund primarily to serve as a cash sweep vehicle for the Portfolio. Thrivent Cash Management Trust and Thrivent Core Short-Term Reserve Fund are established for the sole use of affiliated portfolios.
A summary of transactions for the fiscal year to date, in Diversified Income Plus Portfolio, is as follows:
Portfolio | Value December 31, 2015 | Gross Purchases | Gross Sales | Shares Held at December 31, 2016 | Value December 31, 2016 | Income Earned January 1, 2016 - December 31, 2016 | ||||||||||||||||||
Cash Management Trust- | $ | 341,050 | $ | 11,091,050 | $ | 11,259,850 | 172,250 | $ | 172,250 | $ | 13,877 | |||||||||||||
Cash Management Trust- | 40,972,462 | 82,682,703 | 123,655,165 | — | — | 36,909 | ||||||||||||||||||
Core Short-Term Reserve Fund | — | 269,534,773 | 204,545,022 | 6,498,975 | 64,989,751 | 241,983 | ||||||||||||||||||
Total Value and Income Earned | $ | 41,313,512 | $ | 65,162,001 | $ | 292,769 | ||||||||||||||||||
The accompanying Notes to Financial Statements are an integral part of this schedule.
106
Table of Contents
OPPORTUNITY INCOME PLUS PORTFOLIO
Summary Schedule of Investments as of December 31, 2016
| Principal Amount | Bank Loans (29.6%) | Value | % of Net Assets | |||||||||
Basic Materials (1.6%) | ||||||||||||
Ineos US Finance, LLC, Term Loan | ||||||||||||
| $732,474 | 3.750%, 12/15/2020a | $ | 735,528 | 0.5 | % | |||||||
Tronox Pigments BV, Term Loan | ||||||||||||
| 682,922 | 4.500%, 3/19/2020a | 685,196 | 0.5 | % | ||||||||
Other Securities^ | 821,452 | 0.6 | % | |||||||||
|
| |||||||||||
Total | 2,242,176 | |||||||||||
|
| |||||||||||
Capital Goods (1.5%) | ||||||||||||
Advanced Disposal Services, Inc., Term Loan | ||||||||||||
| 585,650 | 3.500%, 11/10/2023a | 590,411 | 0.4 | % | ||||||||
Cortes NP Acquisition Corporation, Term Loan | ||||||||||||
| 1,025,000 | 6.000%, 11/30/2023a | 1,037,812 | 0.7 | % | ||||||||
Other Securities^ | 562,690 | 0.4 | % | |||||||||
|
| |||||||||||
Total | 2,190,913 | |||||||||||
|
| |||||||||||
Communications Services (8.7%) | ||||||||||||
Charter Communications Operating, LLC, Term Loan | ||||||||||||
| 475,000 | 0.000%, 1/15/2024a,b,c | 477,461 | 0.3 | % | ||||||||
Hargray Communications Group, Inc., Term Loan | ||||||||||||
| 515,760 | 4.750%, 6/26/2019a | 521,346 | 0.4 | % | ||||||||
LTS Buyer, LLC, Term Loan | ||||||||||||
| 669,166 | 4.248%, 4/13/2020a | 672,305 | 0.5 | % | ||||||||
NEP/NCP Holdco, Inc., Term Loan | ||||||||||||
| 746,173 | 4.250%, 1/22/2020a | 748,039 | 0.5 | % | ||||||||
Nexstar Broadcasting, Inc., Term Loan | ||||||||||||
| 510,000 | 0.000%, 9/26/2023a,b,c | 513,983 | 0.4 | % | ||||||||
SBA Senior Finance II, LLC, Term Loan | ||||||||||||
| 731,250 | 3.270%, 3/24/2021a | 734,453 | 0.5 | % | ||||||||
Virgin Media Bristol, LLC, Term Loan | ||||||||||||
| 550,000 | 3.486%, 1/31/2025a | 552,134 | 0.4 | % | ||||||||
WideOpenWest Finance, LLC, Term Loan | ||||||||||||
| 922,688 | 4.500%, 8/18/2023a | 931,748 | 0.7 | % | ||||||||
XO Communications, LLC, Term Loan | ||||||||||||
| 680,750 | 4.250%, 3/20/2021a | 682,452 | 0.5 | % | ||||||||
Other Securities^ | 6,356,741 | 4.5 | % | |||||||||
|
| |||||||||||
Total | 12,190,662 | |||||||||||
|
| |||||||||||
Consumer Cyclical (4.2%) | ||||||||||||
Amaya BV, Term Loan | ||||||||||||
| 624,177 | 5.000%, 8/1/2021a | 626,087 | 0.4 | % | ||||||||
Cengage Learning Acquisitions, Term Loan | ||||||||||||
| 572,125 | 5.250%, 6/7/2023a | 555,768 | 0.4 | % | ||||||||
Four Seasons Holdings, Inc., Term Loan | ||||||||||||
| 535,000 | 3.750%, 11/30/2023a | 540,573 | 0.4 | % | ||||||||
IMG Worldwide, Inc., Term Loan | ||||||||||||
| 618,671 | 5.250%, 5/6/2021a | 624,474 | 0.4 | % | ||||||||
Scientific Games International, Inc., Term Loan | ||||||||||||
| 643,747 | 6.000%, 10/1/2021a | 651,395 | 0.5 | % | ||||||||
Other Securities^ | 2,903,587 | 2.1 | % | |||||||||
|
| |||||||||||
Total | 5,901,884 | |||||||||||
|
| |||||||||||
Consumer Non-Cyclical (5.0%) | ||||||||||||
Albertson’s, LLC, Term Loan | ||||||||||||
| 612,370 | 0.000%, 6/22/2023a,b,c | 619,767 | 0.4 | % | ||||||||
CHS/Community Health Systems, Inc., Term Loan | ||||||||||||
| 723,281 | 4.000%, 1/27/2021a | 699,174 | 0.5 | % | ||||||||
MultiPlan, Inc., Term Loan | ||||||||||||
| 510,375 | 5.000%, 6/7/2023a | 518,852 | 0.4 | % | ||||||||
Valeant Pharmaceuticals International, Inc., Term Loan | ||||||||||||
| 1,665,728 | 5.500%, 4/1/2022a,b,c | 1,666,044 | 1.2 | % | ||||||||
Other Securities^ | 3,539,904 | 2.5 | % | |||||||||
|
| |||||||||||
Total | 7,043,741 | |||||||||||
|
| |||||||||||
Energy (0.9%) | ||||||||||||
Other Securities^ | 1,220,272 | 0.9 | % | |||||||||
|
| |||||||||||
Total | 1,220,272 | |||||||||||
|
| |||||||||||
Financials (1.8%) | ||||||||||||
Sable International Finance, Ltd., Term Loan | ||||||||||||
| 630,000 | 5.748%, 1/3/2023a,b,c | 637,484 | 0.4 | % | ||||||||
TransUnion, LLC, Term Loan | ||||||||||||
| 525,540 | 3.520%, 4/9/2021a | 529,765 | 0.4 | % | ||||||||
Other Securities^ | 1,387,812 | 1.0 | % | |||||||||
|
| |||||||||||
Total | 2,555,061 | |||||||||||
|
| |||||||||||
Technology (4.3%) | ||||||||||||
Avago Technoligies Cayman Finance, Ltd., Term Loan | ||||||||||||
| 572,074 | 3.704%, 2/1/2023a | 579,940 | 0.4 | % | ||||||||
First Data Corporation, Term Loan | ||||||||||||
| 1,027,606 | 3.756%, 3/24/2021a | 1,039,166 | 0.7 | % | ||||||||
| 361,954 | 3.756%, 7/8/2022a | 365,650 | 0.3 | % | ||||||||
ON Semiconductor Corporation, Term Loan | ||||||||||||
| 947,625 | 4.020%, 3/31/2023a | 959,129 | 0.7 | % | ||||||||
Rackspace Hosting, LLC, Term Loan | ||||||||||||
| 650,000 | 4.500%, 12/20/2023a,b,c | 657,852 | 0.5 | % | ||||||||
Western Digital Corporation, Term Loan | ||||||||||||
| 721,375 | 4.520%, 4/29/2023a | 732,419 | 0.5 | % | ||||||||
Xerox Business Services, LLC, Term Loan | ||||||||||||
| 550,000 | 6.250%, 12/7/2023a,b,c | 556,187 | 0.4 | % | ||||||||
Other Securities^ | 1,164,571 | 0.8 | % | |||||||||
|
| |||||||||||
Total | 6,054,914 | |||||||||||
|
| |||||||||||
Transportation (0.7%) | ||||||||||||
XPO Logistics, Inc., Term Loan | ||||||||||||
| 539,310 | 4.250%, 11/1/2021a | 545,884 | 0.4 | % | ||||||||
Other Securities^ | 406,034 | 0.3 | % | |||||||||
|
| |||||||||||
Total | 951,918 | |||||||||||
|
| |||||||||||
Utilities (0.9%) | ||||||||||||
Calpine Corporation, Term Loan | ||||||||||||
| 775,000 | 0.000%, 1/15/2024a,b,c | 777,906 | 0.6 | % | ||||||||
The accompanying Notes to Financial Statements are an integral part of this schedule.
107
Table of Contents
OPPORTUNITY INCOME PLUS PORTFOLIO
Summary Schedule of Investments as of December 31, 2016
| Principal Amount | Bank Loans (29.6%) | Value | % of Net Assets | |||||||||
Utilities (0.9%) - continued | ||||||||||||
Other Securities^ | $ | 471,051 | 0.3 | % | ||||||||
|
| |||||||||||
Total | 1,248,957 | |||||||||||
|
| |||||||||||
Total Bank Loans (cost $41,333,842) | 41,600,498 | |||||||||||
|
| |||||||||||
Long-Term Fixed Income (57.7%) | ||||||||||||
Asset-Backed Securities (4.3%) | ||||||||||||
Other Securities^ | 5,978,388 | 4.3 | % | |||||||||
|
| |||||||||||
Total | 5,978,388 | |||||||||||
|
| |||||||||||
Basic Materials (0.7%) | ||||||||||||
Other Securities^ | 974,430 | 0.7 | % | |||||||||
|
| |||||||||||
Total | 974,430 | |||||||||||
|
| |||||||||||
Capital Goods (1.3%) | ||||||||||||
Other Securities^ | 1,831,191 | 1.3 | % | |||||||||
|
| |||||||||||
Total | 1,831,191 | |||||||||||
|
| |||||||||||
Collateralized Mortgage Obligations (5.6%) | ||||||||||||
Other Securities^ | 7,884,342 | 5.6 | % | |||||||||
|
| |||||||||||
Total | 7,884,342 | |||||||||||
|
| |||||||||||
Commercial Mortgage-Backed Securities (<0.1%) | ||||||||||||
Other Securities^ | 62,446 | <0.1 | % | |||||||||
|
| |||||||||||
Total | 62,446 | |||||||||||
|
| |||||||||||
Communications Services (2.7%) | ||||||||||||
Other Securities^ | 3,824,243 | 2.7 | % | |||||||||
|
| |||||||||||
Total | 3,824,243 | |||||||||||
|
| |||||||||||
Consumer Cyclical (2.2%) | ||||||||||||
Other Securities^ | 3,180,813 | 2.2 | % | |||||||||
|
| |||||||||||
Total | 3,180,813 | |||||||||||
|
| |||||||||||
Consumer Non-Cyclical (2.1%) | ||||||||||||
Valeant Pharmaceuticals International | ||||||||||||
| 64,810 | 7.250%, 7/15/2022d | 52,982 | <0.1 | % | ||||||||
Other Securities^ | 2,858,729 | 2.1 | % | |||||||||
|
| |||||||||||
Total | 2,911,711 | |||||||||||
|
| |||||||||||
Energy (2.1%) | ||||||||||||
Petrobras Global Finance BV | ||||||||||||
| 138,000 | 8.375%, 5/23/2021 | 148,695 | 0.1 | % | ||||||||
Petroleos Mexicanos | ||||||||||||
| 208,000 | 4.607% - 6.500%, 3/11/2022 - 3/13/2027d,e | 214,542 | 0.1 | % | ||||||||
Other Securities^ | 2,659,304 | 1.9 | % | |||||||||
|
| |||||||||||
Total | 3,022,541 | |||||||||||
|
| |||||||||||
Financials (5.2%) | ||||||||||||
Other Securities^ | 7,272,720 | 5.2 | % | |||||||||
|
| |||||||||||
Total | 7,272,720 | |||||||||||
|
| |||||||||||
Foreign Government (12.8%) | ||||||||||||
Brazil Government International Bond | ||||||||||||
| 1,956,000 | 2.625% -7.125%, 1/22/2021 - 2/21/2047 | 1,861,451 | 1.4 | % | ||||||||
Indonesia Government International Bond | ||||||||||||
| $350,000 | 8.500%, 10/12/2035d | 474,807 | 0.3 | % | ||||||||
| 480,000 | 5.125%, 1/15/2045d | 478,923 | 0.3 | % | ||||||||
| 1,334,000 | 3.375% - 5.875%, 5/5/2021 - 1/8/2026d | 1,384,562 | 1.1 | % | ||||||||
Mexico Government International Bond | ||||||||||||
| 2,465,000 | 3.600% - 6.750%, 3/15/2022 - 10/12/2110 | 2,389,052 | 1.6 | % | ||||||||
Russia Government International Bond | ||||||||||||
| 880,000 | 5.000%, 4/29/2020d | 933,812 | 0.7 | % | ||||||||
| 507,000 | 5.625%, 4/4/2042d | 545,214 | 0.4 | % | ||||||||
| 774,450 | 3.500% - 7.500%, 1/16/2019 - 3/31/2030d | 846,706 | 0.6 | % | ||||||||
Turkey Government International Bond | ||||||||||||
| 3,021,000 | 4.250% - 7.500%, 11/7/2019 - 2/17/2045 | 2,964,800 | 2.0 | % | ||||||||
Other Securities^ | 6,141,224 | 4.4 | % | |||||||||
|
| |||||||||||
Total | 18,020,551 | |||||||||||
|
| |||||||||||
Mortgage-Backed Securities (14.4%) | ||||||||||||
Federal Home Loan Mortgage Corporation Gold 15-Yr. Pass Through | ||||||||||||
| 1,650,000 | 3.000%, 1/1/2032c | 1,692,405 | 1.2 | % | ||||||||
Federal Home Loan Mortgage Corporation Gold 20-Yr. Pass Through | ||||||||||||
| 28,360 | 5.500%, 9/1/2024 | 31,430 | <0.1 | % | ||||||||
Federal Home Loan Mortgage Corporation Gold 30-Yr. Pass Through | ||||||||||||
| 750,000 | 4.000%, 1/1/2047c | 787,350 | 0.6 | % | ||||||||
Federal National Mortgage Association Conventional 15-Yr. Pass Through | ||||||||||||
| 2,100,000 | 2.500%, 1/1/2032c | 2,102,310 | 1.5 | % | ||||||||
Federal National Mortgage Association Conventional 20-Yr. Pass Through | ||||||||||||
| 211,303 | 6.000%, 8/1/2024 | 239,046 | 0.2 | % | ||||||||
Federal National Mortgage Association Conventional 30-Yr. Pass Through | ||||||||||||
| 5,000,000 | 3.000%, 1/1/2047c | 4,963,500 | 3.5 | % | ||||||||
| 5,100,000 | 3.500%, 1/1/2047c | 5,223,930 | 3.7 | % | ||||||||
| 3,600,000 | 4.000%, 1/1/2047c | 3,782,880 | 2.7 | % | ||||||||
| 1,325,000 | 4.500%, 1/1/2047c | 1,424,640 | 1.0 | % | ||||||||
|
| |||||||||||
Total | 20,247,491 | |||||||||||
|
| |||||||||||
Technology (1.2%) | ||||||||||||
First Data Corporation | ||||||||||||
| 110,000 | 5.375%, 8/15/2023d | 114,125 | 0.1 | % | ||||||||
Other Securities^ | 1,522,903 | 1.1 | % | |||||||||
|
| |||||||||||
Total | 1,637,028 | |||||||||||
|
| |||||||||||
Transportation (0.4%) | ||||||||||||
Other Securities^ | 528,936 | 0.4 | % | |||||||||
|
| |||||||||||
Total | 528,936 | |||||||||||
|
| |||||||||||
The accompanying Notes to Financial Statements are an integral part of this schedule.
108
Table of Contents
OPPORTUNITY INCOME PLUS PORTFOLIO
Summary Schedule of Investments as of December 31, 2016
| Principal Amount | Long-Term Fixed Income (57.7%) | Value | % of Net Assets | |||||||||
U.S. Government and Agencies (1.5%) | ||||||||||||
U.S. Treasury Notes | ||||||||||||
| $925,000 | 1.125%, 8/31/2021 | $ | 892,884 | 0.6 | % | |||||||
| 1,070,000 | 2.125%, 6/30/2022 | 1,072,608 | 0.8 | % | ||||||||
| 100,000 | 1.625%, 2/15/2026 | 93,294 | 0.1 | % | ||||||||
|
| |||||||||||
Total | 2,058,786 | |||||||||||
|
| |||||||||||
Utilities (1.2%) | ||||||||||||
Other Securities^ | 1,681,376 | 1.2 | % | |||||||||
|
| |||||||||||
Total | 1,681,376 | |||||||||||
|
| |||||||||||
Total Long-Term Fixed Income | 81,116,993 | |||||||||||
|
| |||||||||||
| Shares | Registered Investment Companies (7.7%) | |||||||||||
Equity Funds/ETFs (0.2%) | ||||||||||||
Other Securities^ | 205,390 | 0.2 | % | |||||||||
|
| |||||||||||
Total | 205,390 | |||||||||||
|
| |||||||||||
Fixed Income Funds/ETFs (7.5%) | ||||||||||||
| 12,472 | iShares J.P. Morgan USD Emerging Markets Bond ETF | 1,374,664 | 1.0 | % | ||||||||
| 13,400 | iShares S&P U.S. Preferred Stock Index Fund | 498,614 | 0.3 | % | ||||||||
| 95,700 | PowerShares Senior Loan Portfolio | 2,235,552 | 1.6 | % | ||||||||
| 43,440 | SPDR Bloomberg Barclays High Yield Bond ETF | 1,583,388 | 1.1 | % | ||||||||
| 45,320 | Vanguard Short-Term Corporate Bond ETF | 3,597,048 | 2.6 | % | ||||||||
Other Securities^ | 1,172,387 | 0.9 | % | |||||||||
|
| |||||||||||
Total | 10,461,653 | |||||||||||
|
| |||||||||||
Total Registered Investment Companies (cost $10,949,723) | 10,667,043 | |||||||||||
|
| |||||||||||
Preferred Stock (1.3%) | ||||||||||||
Consumer Staples (<0.1%) | ||||||||||||
Other Securities^ | 60,443 | <0.1 | % | |||||||||
|
| |||||||||||
Total | 60,443 | |||||||||||
|
| |||||||||||
Energy (0.1%) | ||||||||||||
Other Securities^ | 66,091 | 0.1 | % | |||||||||
|
| |||||||||||
Total | 66,091 | |||||||||||
|
| |||||||||||
Financials (1.2%) | ||||||||||||
Other Securities^ | 1,677,505 | 1.2 | % | |||||||||
|
| |||||||||||
Total | 1,677,505 | |||||||||||
|
| |||||||||||
Total Preferred Stock (cost $1,714,094) | 1,804,039 | |||||||||||
|
| |||||||||||
Common Stock (0.5%) | ||||||||||||
Energy (0.3%) | ||||||||||||
Other Securities^ | 349,504 | 0.3 | % | |||||||||
|
| |||||||||||
Total | 349,504 | |||||||||||
|
| |||||||||||
Financials (0.2%) | ||||||||||||
Other Securities^ | 324,265 | 0.2 | % | |||||||||
|
| |||||||||||
Total | 324,265 | |||||||||||
|
| |||||||||||
Materials (<0.1%) | ||||||||||||
Other Securities^ | 55,614 | <0.1 | % | |||||||||
|
| |||||||||||
Total | 55,614 | |||||||||||
|
| |||||||||||
Total Common Stock (cost $678,171) | 729,383 | |||||||||||
|
| |||||||||||
| Shares or Principal Amount | Short-Term Investments (19.2%)f | |||||||||||
Thrivent Core Short-Term Reserve Fund | ||||||||||||
| 2,664,922 | 0.910% | 26,649,222 | 19.0 | % | ||||||||
Other Securities^ | 299,948 | 0.2 | % | |||||||||
|
| |||||||||||
Total Short-Term Investments (cost $26,949,167) | 26,949,170 | |||||||||||
|
| |||||||||||
Total Investments (cost $163,213,783) 116.0% | $ | 162,867,126 | ||||||||||
|
| |||||||||||
Other Assets and Liabilities, Net (16.0%) | (22,507,712 | ) | ||||||||||
|
| |||||||||||
Total Net Assets 100.0% | $ | 140,359,414 | ||||||||||
|
| |||||||||||
| ^ | The Summary Schedule of Investments shows the 50 largest holdings in unaffiliated issuers, any holding or issuer that exceeds 1% of net assets and all affiliated holdings as of the report date. The remaining securities held are grouped by category as “Other securities”. |
| a | The stated interest rate represents the weighted average of all contracts within the bank loan facility. |
| b | All or a portion of the loan is unfunded. |
| c | Denotes investments purchased on a when-issued or delayed delivery basis. |
| d | Denotes securities sold under Rule 144A of the Securities Act of 1933, which exempts them from registration. These securities may be resold to other dealers in the program or to other qualified institutional buyers. As of December 31, 2016, the value of these investments was $16,940,677 or 12.1% of total net assets. |
| e | Denotes variable rate securities. Variable rate securities are securities whose yields vary with a designated market index or market rate. The rate shown is as of December 31, 2016. |
| f | The interest rate shown reflects the yield, coupon rate or the discount rate at the date of purchase. |
Opportunity Income Plus Portfolio held restricted securities as of December 31, 2016. Restricted securities are investment securities which cannot be offered for public sale without first being registered under the Securities Act of 1933. As of December 31, 2016, the value of these investments was $3,044,389 or 2.2% of total net assets.
Definitions:
| ETF | - | Exchange Traded Fund. |
Unrealized Appreciation (Depreciation)
Gross unrealized appreciation and depreciation of investments, based on cost for federal income tax purposes, were as follows:
Gross unrealized appreciation | $ | 1,822,056 | ||
Gross unrealized depreciation | (2,143,338 | ) | ||
|
| |||
Net unrealized appreciation (depreciation) | $ | (321,282 | ) | |
Cost for federal income tax purposes | $ | 163,188,408 | ||
The accompanying Notes to Financial Statements are an integral part of this schedule.
109
Table of Contents
OPPORTUNITY INCOME PLUS PORTFOLIO
Summary Schedule of Investments as of December 31, 2016
Fair Valuation Measurements
The following table is a summary of the inputs used, as of December 31, 2016, in valuing Opportunity Income Plus Portfolio’s assets carried at fair value.
Investments in Securities | Total | Level 1 | Level 2 | Level 3 | ||||||||||||
Bank Loans | ||||||||||||||||
Basic Materials | 2,242,176 | — | 2,242,176 | — | ||||||||||||
Capital Goods | 2,190,913 | — | 1,153,101 | 1,037,812 | ||||||||||||
Communications Services | 12,190,662 | — | 11,053,522 | 1,137,140 | ||||||||||||
Consumer Cyclical | 5,901,884 | — | 5,674,071 | 227,813 | ||||||||||||
Consumer Non-Cyclical | 7,043,741 | — | 7,043,741 | — | ||||||||||||
Energy | 1,220,272 | — | 931,525 | 288,747 | ||||||||||||
Financials | 2,555,061 | — | 2,555,061 | — | ||||||||||||
Technology | 6,054,914 | — | 5,498,727 | 556,187 | ||||||||||||
Transportation | 951,918 | — | 951,918 | — | ||||||||||||
Utilities | 1,248,957 | — | 471,051 | 777,906 | ||||||||||||
Long-Term Fixed Income | ||||||||||||||||
Asset-Backed Securities | 5,978,388 | — | 5,978,388 | — | ||||||||||||
Basic Materials | 974,430 | — | 974,430 | — | ||||||||||||
Capital Goods | 1,831,191 | — | 1,831,191 | — | ||||||||||||
Collateralized Mortgage Obligations | 7,884,342 | — | 7,884,342 | — | ||||||||||||
Commercial Mortgage-Backed Securities | 62,446 | — | 62,446 | — | ||||||||||||
Communications Services | 3,824,243 | — | 3,824,243 | — | ||||||||||||
Consumer Cyclical | 3,180,813 | — | 3,180,813 | — | ||||||||||||
Consumer Non-Cyclical | 2,911,711 | — | 2,911,711 | — | ||||||||||||
Energy | 3,022,541 | — | 3,022,541 | — | ||||||||||||
Financials | 7,272,720 | — | 7,272,720 | — | ||||||||||||
Foreign Government | 18,020,551 | — | 18,020,551 | — | ||||||||||||
Mortgage-Backed Securities | 20,247,491 | — | 20,247,491 | — | ||||||||||||
Technology | 1,637,028 | — | 1,637,028 | — | ||||||||||||
Transportation | 528,936 | — | 528,936 | — | ||||||||||||
U.S. Government and Agencies | 2,058,786 | — | 2,058,786 | — | ||||||||||||
Utilities | 1,681,376 | — | 1,681,376 | — | ||||||||||||
Registered Investment Companies | ||||||||||||||||
Fixed Income Funds/ETFs | 10,461,653 | 10,461,653 | — | — | ||||||||||||
Equity Funds/ETFs | 205,390 | 205,390 | — | — | ||||||||||||
Preferred Stock | ||||||||||||||||
Consumer Staples | 60,443 | 60,443 | — | — | ||||||||||||
Energy | 66,091 | — | — | 66,091 | ||||||||||||
Financials | 1,677,505 | 1,530,973 | 146,532 | — | ||||||||||||
Common Stock | ||||||||||||||||
Energy | 349,504 | 349,504 | — | — | ||||||||||||
Financials | 324,265 | 324,265 | — | — | ||||||||||||
Materials | 55,614 | 55,614 | — | — | ||||||||||||
Short-Term Investments | 299,948 | — | 299,948 | — | ||||||||||||
|
|
|
|
|
|
|
| |||||||||
Subtotal Investments in Securities | $ | 136,217,904 | $ | 12,987,842 | $ | 119,138,366 | $ | 4,091,696 | ||||||||
|
|
|
|
|
|
|
| |||||||||
Other Investments * | Total | |||||||||||||||
Short-Term Investments | 26,649,222 | |||||||||||||||
|
| |||||||||||||||
Subtotal Other Investments | $ | 26,649,222 | ||||||||||||||
|
| |||||||||||||||
Total Investments at Value | $ | 162,867,126 | ||||||||||||||
|
| |||||||||||||||
| * | Certain investments are measured at fair value using a net asset value per share that is not publicly available (practical expedient). According to disclosure requirements of Accounting Standards Codification (ASC) 820, Fair Value Measurement, securities valued using the practical expedient are not classified in the fair value hierarchy. The fair value amounts presented in this table are intended to permit reconciliation of the fair value hierarchy to the amounts presented in the Statement of Assets and Liabilities. |
Other Financial Instruments | Total | Level 1 | Level 2 | Level 3 | ||||||||||||
Asset Derivatives | ||||||||||||||||
Futures Contracts | 46,986 | 46,986 | — | — | ||||||||||||
|
|
|
|
|
|
|
| |||||||||
Total Asset Derivatives | $ | 46,986 | $ | 46,986 | $ | — | $ | — | ||||||||
|
|
|
|
|
|
|
| |||||||||
Liability Derivatives | ||||||||||||||||
Futures Contracts | 14,884 | 14,884 | — | — | ||||||||||||
|
|
|
|
|
|
|
| |||||||||
Total Liability Derivatives | $ | 14,884 | $ | 14,884 | $ | — | $ | — | ||||||||
|
|
|
|
|
|
|
| |||||||||
There were no significant transfers between Levels during the period ended December 31, 2016. Transfers between Levels are identified as of the end of the period.
The accompanying Notes to Financial Statements are an integral part of this schedule.
110
Table of Contents
OPPORTUNITY INCOME PLUS PORTFOLIO
Summary Schedule of Investments as of December 31, 2016
The following table presents Opportunity Income Plus Portfolio’s futures contracts held as of December 31, 2016. Investments and/or cash totaling $299,948 were pledged as the initial margin deposit for these contracts.
Futures Contracts | Number of Contracts Long/(Short) | Expiration Date | Notional Principal Amount | Value | Unrealized Gain/(Loss) | |||||||||||||||
CBOT 10-Yr. U.S. Treasury Note | (11 | ) | March 2017 | ($ | 1,375,137 | ) | ($ | 1,367,094 | ) | $ | 8,043 | |||||||||
CBOT 2-Yr. U.S. Treasury Note | (33 | ) | March 2017 | (7,152,649 | ) | (7,150,687 | ) | 1,962 | ||||||||||||
CBOT 5-Yr. U.S. Treasury Note | 15 | March 2017 | 1,767,703 | 1,764,961 | (2,742 | ) | ||||||||||||||
CBOT U.S. Long Bond | (3 | ) | March 2017 | (456,740 | ) | (451,969 | ) | 4,771 | ||||||||||||
CME S&P 500 Index | (8 | ) | March 2017 | (4,500,967 | ) | (4,472,400 | ) | 28,567 | ||||||||||||
CME Ultra Long Term U.S. Treasury Bond | 10 | March 2017 | 1,614,642 | 1,602,500 | (12,142 | ) | ||||||||||||||
Ultra 10-Yr. U.S. Treasury Note | (4 | ) | March 2017 | (539,893 | ) | (536,250 | ) | 3,643 | ||||||||||||
Total Futures Contracts | $ | 32,102 | ||||||||||||||||||
The following table summarizes the fair value and Statement of Assets and Liabilities location, as of December 31, 2016, for Opportunity Income Plus Portfolio’s investments in financial derivative instruments by primary risk exposure as discussed under item (2) Significant Accounting Policies of the Notes to Financial Statements.
Derivatives by risk category | Statement of Assets and Liabilities Location | Fair Value | ||||
Asset Derivatives | ||||||
Interest Rate Contracts | ||||||
Futures* | Net Assets - Net unrealized appreciation/(depreciation) on Futures contracts | $ | 18,419 | |||
Total Interest Rate Contracts | 18,419 | |||||
Equity Contracts | ||||||
Futures* | Net Assets - Net unrealized appreciation/(depreciation) on Futures contracts | 28,567 | ||||
Total Equity Contracts | 28,567 | |||||
|
| |||||
Total Asset Derivatives | $ | 46,986 | ||||
|
| |||||
Liability Derivatives | ||||||
Interest Rate Contracts | ||||||
Futures* | Net Assets - Net unrealized appreciation/(depreciation) on Futures contracts | 14,884 | ||||
Total Interest Rate Contracts | 14,884 | |||||
|
| |||||
Total Liability Derivatives | $ | 14,884 | ||||
|
| |||||
| * | Includes cumulative appreciation/depreciation of futures contracts as reported in the Schedule of Investments. Only current day’s variation margin is reported within the Statement of Assets and Liabilities. |
The following table summarizes the net realized gains/(losses) and Statement of Operations location, for the period ended December 31, 2016, for Opportunity Income Plus Portfolio’s investments in financial derivative instruments by primary risk exposure.
Derivatives by risk category | Statement of Operations Location | Realized Gains/(Losses) recognized in Income | ||||
Equity Contracts | ||||||
Futures | Net realized gains/(losses) on Futures contracts | (233,733 | ) | |||
Total Equity Contracts | (233,733 | ) | ||||
Interest Rate Contracts | ||||||
Futures | Net realized gains/(losses) on Futures contracts | 385,900 | ||||
Total Interest Rate Contracts | 385,900 | |||||
Credit Contracts | ||||||
Credit Default Swaps | Net realized gains/(losses) on Swap agreements | (10,495 | ) | |||
Total Credit Contracts | (10,495 | ) | ||||
|
| |||||
Total | $ | 141,672 | ||||
|
| |||||
The accompanying Notes to Financial Statements are an integral part of this schedule.
111
Table of Contents
OPPORTUNITY INCOME PLUS PORTFOLIO
Summary Schedule of Investments as of December 31, 2016
The following table summarizes the change in net unrealized appreciation/(depreciation) and Statement of Operations location, for the period ended December 31, 2016, for Opportunity Income Plus Portfolio’s investments in financial derivative instruments by primary risk exposure.
Derivatives by risk category | Statement of Operations Location | Change in unrealized appreciation/(depreciation) recognized in Income | ||||
Interest Rate Contracts | ||||||
Futures | Change in net unrealized appreciation/(depreciation) on Futures contracts | (16,633 | ) | |||
Total Interest Rate Contracts | (16,633 | ) | ||||
Equity Contracts | ||||||
Futures | Change in net unrealized appreciation/(depreciation) on Futures contracts | 28,567 | ||||
Total Equity Contracts | 28,567 | |||||
Credit Contracts | ||||||
Credit Default Swaps | Change in net unrealized appreciation/(depreciation) on Swap agreements | 9,568 | ||||
Total Credit Contracts | 9,568 | |||||
|
| |||||
Total | $ | 21,502 | ||||
|
| |||||
The following table presents Opportunity Income Plus Portfolio’s average volume of derivative activity during the period ended December 31, 2016.
Derivative Risk Category | Futures (Notional)* | Futures (Percentage of Average Net Assets) | Swaps (Notional)* | Swaps (Percentage of Average Net Assets) | ||||||||||||
Equity Contracts | $ | 1,732,382 | 1.5 | % | N/A | N/A | ||||||||||
Interest Rate Contracts | 15,867,116 | 13.6 | N/A | N/A | ||||||||||||
Credit Contracts | N/A | N/A | $ | 986 | <0.1 | % | ||||||||||
| * | Notional amount represents long or short, or both, derivative positions held by the Portfolio. |
Investment in Affiliates
Affiliated issuers, as defined under the Investment Company Act of 1940, include those in which the Portfolio’s holdings of an issuer represent 5% or more of the outstanding voting securities of an issuer, any affiliated mutual fund, or a company which is under common ownership or control with the Portfolio. The Portfolio owns shares of Thrivent Cash Management Trust for the purpose of securities lending and Thrivent Core Short-Term Reserve Fund primarily to serve as a cash sweep vehicle for the Portfolio. Thrivent Cash Management Trust and Thrivent Core Short-Term Reserve Fund are established for the sole use of affiliated portfolios.
A summary of transactions for the fiscal year to date, in Opportunity Income Plus Portfolio, is as follows:
Portfolio | Value December 31, 2015 | Gross Purchases | Gross Sales | Shares Held at December 31, 2016 | Value December 31, 2016 | Income Earned January 1, 2016 - December 31, 2016 | ||||||||||||||||||
Cash Management Trust-Collateral Investment | $ | — | $ | 515,100 | $ | 515,100 | — | $ | — | $ | 414 | |||||||||||||
Cash Management Trust-Short Term Investment | 19,671,931 | 25,619,463 | 45,291,394 | — | — | 18,046 | ||||||||||||||||||
Core Short-Term Reserve Fund | — | 118,720,874 | 92,071,652 | 2,664,922 | 26,649,222 | 111,976 | ||||||||||||||||||
Total Value and Income Earned | $ | 19,671,931 | $ | 26,649,222 | $ | 130,436 | ||||||||||||||||||
The accompanying Notes to Financial Statements are an integral part of this schedule.
112
Table of Contents
Schedule of Investments as of December 31, 2016
| Shares | Common Stock (92.8%) | Value | ||||||
Biotechnology (25.4%) | ||||||||
| 67,905 | Alder Biopharmaceuticals, Inc.a | $ | 1,412,424 | |||||
| 687,254 | Amicus Therapeutics, Inc.a | 3,415,652 | ||||||
| 20,301 | Biogen, Inc.a | 5,756,958 | ||||||
| 101,368 | BioMarin Pharmaceutical, Inc.a | 8,397,325 | ||||||
| 91,000 | Celgene Corporationa | 10,533,250 | ||||||
| 103,769 | Global Blood Therapeutics, Inc.a | 1,499,462 | ||||||
| 17,300 | Incyte Corporationa | 1,734,671 | ||||||
| 37,402 | Kite Pharma, Inc.a | 1,677,106 | ||||||
| 81,290 | Neurocrine Biosciences, Inc.a | 3,145,923 | ||||||
| 174,626 | Portola Pharmaceuticals, Inc.a | 3,918,607 | ||||||
|
| |||||||
Total | 41,491,378 | |||||||
|
| |||||||
Health Care Equipment (14.1%) | ||||||||
| 35,685 | ABIOMED, Inc.a | 4,020,986 | ||||||
| 346,692 | Accuray, Inc.a | 1,594,783 | ||||||
| 78,200 | Dexcom, Inc.a | 4,668,540 | ||||||
| 9,475 | Intuitive Surgical, Inc.a | 6,008,761 | ||||||
| 62,000 | NuVasive, Inc.a | 4,176,320 | ||||||
| 98,947 | NxStage Medical, Inc.a | 2,593,401 | ||||||
|
| |||||||
Total | 23,062,791 | |||||||
|
| |||||||
Health Care Facilities (5.7%) | ||||||||
| 135,800 | Acadia Healthcare Company, Inc.a | 4,494,980 | ||||||
| 165,097 | ACADIA Pharmaceuticals, Inc.a | 4,761,397 | ||||||
|
| |||||||
Total | 9,256,377 | |||||||
|
| |||||||
Health Care Services (2.2%) | ||||||||
| 222,687 | Teladoc, Inc.a | 3,674,336 | ||||||
|
| |||||||
Total | 3,674,336 | |||||||
|
| |||||||
Managed Health Care (6.2%) | ||||||||
| 34,600 | Aetna, Inc. | 4,290,746 | ||||||
| 43,600 | CIGNA Corporation | 5,815,804 | ||||||
|
| |||||||
Total | 10,106,550 | |||||||
|
| |||||||
Pharmaceuticals (39.2%) | ||||||||
| 88,883 | Aspen Pharmacare Holdings, Ltd. | 1,831,058 | ||||||
| 279,293 | Collegium Pharmaceutical, Inc.a | 4,348,592 | ||||||
| 151,000 | Eli Lilly and Company | 11,106,050 | ||||||
| 203,300 | Merck & Company, Inc. | 11,968,271 | ||||||
| 88,298 | Neuroderm, Ltd.a | 1,960,216 | ||||||
| 370,299 | Pfizer, Inc. | 12,027,311 | ||||||
| 50,783 | Roche Holding AG-Genusschein | 11,576,115 | ||||||
| 31,944 | Sawai Pharmaceutical Company, Ltd. | 1,712,333 | ||||||
| 43,889 | Shire Pharmaceuticals Group plc ADR | 7,477,808 | ||||||
|
| |||||||
Total | 64,007,754 | |||||||
|
| |||||||
Total Common Stock (cost $153,572,765) | 151,599,186 | |||||||
|
| |||||||
| Shares or Principal Amount | Short-Term Investments (7.1%)b | |||||||
Federal Home Loan Bank Discount Notes | ||||||||
| 2,000,000 | 0.350%, 1/3/2017 | 2,000,000 | ||||||
| 1,460,000 | 0.500%, 1/6/2017 | 1,459,953 | ||||||
Thrivent Core Short-Term Reserve Fund | ||||||||
| 821,080 | 0.910% | 8,210,797 | ||||||
|
| |||||||
Total Short-Term Investments (cost $11,670,657) | 11,670,750 | |||||||
|
| |||||||
Total Investments (cost $165,243,422) 99.9% | $ | 163,269,936 | ||||||
|
| |||||||
Other Assets and Liabilities, Net 0.1% | 150,928 | |||||||
|
| |||||||
Total Net Assets 100.0% | $ | 163,420,864 | ||||||
|
| |||||||
| a | Non-income producing security. |
| b | The interest rate shown reflects the yield, coupon rate or the discount rate at the date of purchase. |
Definitions:
| ADR | - | American Depositary Receipt, which are certificates for an underlying foreign security’s shares held by an issuing U.S. depository bank. |
Unrealized Appreciation (Depreciation)
Gross unrealized appreciation and depreciation of investments, based on cost for federal income tax purposes, were as follows:
Gross unrealized appreciation | $ | 6,324,724 | ||
Gross unrealized depreciation | (10,592,230 | ) | ||
|
| |||
Net unrealized appreciation (depreciation) | $ | (4,267,506 | ) | |
Cost for federal income tax purposes | $ | 167,537,442 |
The accompanying Notes to Financial Statements are an integral part of this schedule.
113
Table of Contents
PARTNER HEALTHCARE PORTFOLIO
Schedule of Investments as of December 31, 2016
Fair Valuation Measurements
The following table is a summary of the inputs used, as of December 31, 2016, in valuing Partner Healthcare Portfolio’s assets carried at fair value.
Investments in Securities | Total | Level 1 | Level 2 | Level 3 | ||||||||||||
Common Stock | ||||||||||||||||
Biotechnology | 41,491,378 | 41,491,378 | — | — | ||||||||||||
Health Care Equipment | 23,062,791 | 23,062,791 | — | — | ||||||||||||
Health Care Facilities | 9,256,377 | 9,256,377 | — | — | ||||||||||||
Health Care Services | 3,674,336 | 3,674,336 | — | — | ||||||||||||
Managed Health Care | 10,106,550 | 10,106,550 | — | — | ||||||||||||
Pharmaceuticals | 64,007,754 | 48,888,248 | 15,119,506 | — | ||||||||||||
Short-Term Investments | 3,459,953 | — | 3,459,953 | — | ||||||||||||
|
|
|
|
|
|
|
| |||||||||
Subtotal Investments in Securities | $ | 155,059,139 | $ | 136,479,680 | $ | 18,579,459 | $ | — | ||||||||
|
|
|
|
|
|
|
| |||||||||
Other Investments * | Total | |||||||||||||||
Short-Term Investments | 8,210,797 | |||||||||||||||
|
| |||||||||||||||
Subtotal Other Investments | $ | 8,210,797 | ||||||||||||||
|
| |||||||||||||||
Total Investments at Value | $ | 163,269,936 | ||||||||||||||
|
| |||||||||||||||
| * | Certain investments are measured at fair value using a net asset value per share that is not publicly available (practical expedient). According to disclosure requirements of Accounting Standards Codification (ASC) 820, Fair Value Measurement, securities valued using the practical expedient are not classified in the fair value hierarchy. The fair value amounts presented in this table are intended to permit reconciliation of the fair value hierarchy to the amounts presented in the Statement of Assets and Liabilities. |
The following table is a reconciliation of assets in which significant unobservable inputs (Level 3) were used in determining fair value for Partner Healthcare Portfolio as discussed in the Notes to Financial Statements.
Investments in Securities | Value January 1, 2016 | Realized Gain/(Loss) | Change in Unrealized Appreciation/ (Depreciation) | Purchases | Sales | Transfers Into Level 3 | Transfers Out of Level 3 | Value December 31, 2016 | ||||||||||||||||||||||||
Common Stock Pharmaceuticals | $ | 1,702,124 | — | — | — | — | — | $ | (1,702,124 | ) | — | |||||||||||||||||||||
|
|
|
|
|
|
|
|
|
|
|
|
|
|
|
| |||||||||||||||||
Total | $ | 1,702,124 | $ | — | $ | — | $ | — | $ | — | $ | — | $ | (1,702,124 | ) | $ | — | |||||||||||||||
|
|
|
|
|
|
|
|
|
|
|
|
|
|
|
| |||||||||||||||||
The significant unobservable inputs used in the fair value measurement of the reporting entity’s transfer out of Level Three Common Stock Pharmaceuticals Securities are recent market activity based on comparable trades. A significant increase or decrease in the inputs in isolation would result in a significantly lower or higher fair value measurement.
Investment in Affiliates
Affiliated issuers, as defined under the Investment Company Act of 1940, include those in which the Portfolio’s holdings of an issuer represent 5% or more of the outstanding voting securities of an issuer, any affiliated mutual fund, or a company which is under common ownership or control with the Portfolio. The Portfolio owns shares of Thrivent Cash Management Trust for the purpose of securities lending and Thrivent Core Short-Term Reserve Fund primarily to serve as a cash sweep vehicle for the Portfolio. Thrivent Cash Management Trust and Thrivent Core Short-Term Reserve Fund are established for the sole use of affiliated portfolios.
A summary of transactions for the fiscal year to date, in Partner Healthcare Portfolio, is as follows:
Portfolio | Value December 31, 2015 | Gross Purchases | Gross Sales | Shares Held at December 31, 2016 | Value December 31, 2016 | Income Earned January 1, 2016 - December 31, 2016 | ||||||||||||||||||
Cash Management Trust-Short Term Investment | $ | 12,518,371 | $ | 32,171,599 | $ | 44,689,970 | — | $ | — | $ | 4,460 | |||||||||||||
Core Short-Term Reserve Fund | — | 48,096,099 | 39,885,302 | 821,080 | 8,210,797 | 34,888 | ||||||||||||||||||
Total Value and Income Earned | $ | 12,518,371 | $ | 8,210,797 | $ | 39,348 | ||||||||||||||||||
The accompanying Notes to Financial Statements are an integral part of this schedule.
114
Table of Contents
PARTNER EMERGING MARKETS EQUITY PORTFOLIO
Schedule of Investments as of December 31, 2016
| Shares | Common Stock (91.8%) | Value | ||||||
Brazil (10.6%) | ||||||||
| 116,000 | Ambev SA | $ | 583,439 | |||||
| 166,467 | Banco Bradesco SA ADR | 1,449,928 | ||||||
| 45,900 | BRF SA | 679,255 | ||||||
| 120,105 | Lojas Renner SA | 853,020 | ||||||
| 38,756 | Multiplan Empreendimentos Imobiliarios SA | 704,749 | ||||||
| 62,600 | Ultrapar Participacoes SA | 1,314,342 | ||||||
| 52,660 | Vale SA ADR | 401,269 | ||||||
|
| |||||||
Total | 5,986,002 | |||||||
|
| |||||||
Chile (2.0%) | ||||||||
| 31,770 | Banco Santander Chile SA ADR | 694,810 | ||||||
| 51,862 | S.A.C.I. Falabella | 410,338 | ||||||
|
| |||||||
Total | 1,105,148 | |||||||
|
| |||||||
China (1.2%) | ||||||||
| 890,000 | PetroChina Company, Ltd. | 660,985 | ||||||
|
| |||||||
Total | 660,985 | |||||||
|
| |||||||
Hong Kong (10.9%) | ||||||||
| 324,000 | AIA Group, Ltd. | 1,814,996 | ||||||
| 162,000 | China Mobile, Ltd. | 1,707,995 | ||||||
| 236,000 | Hang Lung Group, Ltd. | 818,896 | ||||||
| 132,000 | Hang Lung Properties, Ltd. | 278,342 | ||||||
| 21,640 | Hong Kong Exchanges and Clearing, Ltd. | 508,938 | ||||||
| 71,000 | Swire Pacific, Ltd., Class A | 675,620 | ||||||
| 100,000 | Swire Pacific, Ltd., Class B | 171,610 | ||||||
| 59,500 | Swire Properties, Ltd. | 163,797 | ||||||
|
| |||||||
Total | 6,140,194 | |||||||
|
| |||||||
Hungary (1.3%) | ||||||||
| 34,710 | Richter Gedeon Nyrt | 733,157 | ||||||
|
| |||||||
Total | 733,157 | |||||||
|
| |||||||
India (16.5%) | ||||||||
| 59,005 | Grasim Industries, Ltd. | 748,725 | ||||||
| 31,750 | Grasim Industries, Ltd. GDR | 402,907 | ||||||
| 18,800 | Hero Motocorp, Ltd. | 841,661 | ||||||
| 67,000 | Hindustan Unilever, Ltd. | 814,481 | ||||||
| 116,639 | Housing Development Finance Corporation | 2,163,177 | ||||||
| 263,000 | ICICI Bank, Ltd. | 984,695 | ||||||
| 54,818 | Infosys, Ltd. | 813,638 | ||||||
| 413,339 | ITC, Ltd. | 1,468,191 | ||||||
| 15,936 | Tata Consultancy Services, Ltd. | 554,349 | ||||||
| 10,947 | Ultra Tech Cement, Ltd. | 522,943 | ||||||
|
| |||||||
Total | 9,314,767 | |||||||
|
| |||||||
Indonesia (5.2%) | ||||||||
| 3,710,000 | Astra International Tbk PT | 2,268,559 | ||||||
| 568,900 | Indocement Tunggal Prakarsa Tbk PT | 648,063 | ||||||
|
| |||||||
Total | 2,916,622 | |||||||
|
| |||||||
Luxembourg (1.7%) | ||||||||
| 26,965 | Tenaris SA ADRa | 962,920 | ||||||
|
| |||||||
Total | 962,920 | |||||||
|
| |||||||
Malaysia (1.2%) | ||||||||
| 156,452 | CIMB Group Holdings Berhad | 156,886 | ||||||
| 120,000 | Public Bank Berhad | 527,508 | ||||||
|
| |||||||
Total | 684,394 | |||||||
|
| |||||||
Mexico (7.4%) | ||||||||
| 19,800 | Fomento Economico Mexicano SAB de CV ADR | 1,508,958 | ||||||
| 6,300 | Grupo Aeroportuario del Sureste SAB de CV ADR | 906,507 | ||||||
| 320,477 | Grupo Financiero Banorte SAB de CV ADR | 1,578,449 | ||||||
| 97,300 | Organizacion Soriana SAB de CVb | 211,126 | ||||||
|
| |||||||
Total | 4,205,040 | |||||||
|
| |||||||
Philippines (3.7%) | ||||||||
| 45,710 | Ayala Corporation | 671,090 | ||||||
| 917,900 | Ayala Land, Inc. | 589,749 | ||||||
| 474,862 | Bank of the Philippine Islands | 848,232 | ||||||
|
| |||||||
Total | 2,109,071 | |||||||
|
| |||||||
Poland (1.2%) | ||||||||
| 23,319 | Bank Pekao SA | 700,191 | ||||||
|
| |||||||
Total | 700,191 | |||||||
|
| |||||||
Portugal (1.2%) | ||||||||
| 45,229 | Jeronimo Martins SGPS SA | 701,488 | ||||||
|
| |||||||
Total | 701,488 | |||||||
|
| |||||||
Russia (5.1%) | ||||||||
| 26,386 | Lukoil ADR | 1,478,028 | ||||||
| 7,919 | Magnit PJSC | 1,419,688 | ||||||
|
| |||||||
Total | 2,897,716 | |||||||
|
| |||||||
South Africa (3.8%) | ||||||||
| 63,421 | Massmart Holdings, Ltd. | 582,594 | ||||||
| 68,564 | MTN Group, Ltd. | 627,957 | ||||||
| 164,808 | Truworths International, Ltd. | 956,057 | ||||||
|
| |||||||
Total | 2,166,608 | |||||||
|
| |||||||
South Korea (2.3%) | ||||||||
| 1,263 | Amorepacific Corporation | 214,671 | ||||||
| 2,434 | Amorepacific Group | 267,512 | ||||||
| 1,290 | NAVER Corporation | 826,087 | ||||||
|
| |||||||
Total | 1,308,270 | |||||||
|
| |||||||
Taiwan (5.0%) | ||||||||
| 175,400 | Taiwan Mobile Company, Ltd. | 564,669 | ||||||
| 403,499 | Taiwan Semiconductor Manufacturing Company, Ltd. | 2,260,101 | ||||||
|
| |||||||
Total | 2,824,770 | |||||||
|
| |||||||
Thailand (4.7%) | ||||||||
| 98,500 | Siam Cement pcl | 1,367,113 | ||||||
| 297,800 | Siam Commercial Bank pcl | 1,262,920 | ||||||
|
| |||||||
Total | 2,630,033 | |||||||
|
| |||||||
Turkey (3.8%) | ||||||||
| 331,433 | Akbank TAS | 733,679 | ||||||
| 55,836 | BIM Birlesik Magazalar AS | 774,842 | ||||||
| 292,190 | Turkiye Garanti Bankasi AS | 630,144 | ||||||
|
| |||||||
Total | 2,138,665 | |||||||
|
| |||||||
United Kingdom (1.7%) | ||||||||
| 26,386 | BHP Billiton plc | 415,252 | ||||||
| 66,791 | Standard Chartered plcb | 544,679 | ||||||
|
| |||||||
Total | 959,931 | |||||||
|
| |||||||
United States (1.3%) | ||||||||
| 27,000 | Yum China Holding, Inc.b | 705,240 | ||||||
|
| |||||||
Total | 705,240 | |||||||
|
| |||||||
Total Common Stock (cost $49,853,731) | 51,851,212 | |||||||
|
| |||||||
Preferred Stock (5.7%) | ||||||||
Brazil (0.9%) | ||||||||
| 71,605 | Vale SA ADR | 493,358 | ||||||
|
| |||||||
Total | 493,358 | |||||||
|
| |||||||
The accompanying Notes to Financial Statements are an integral part of this schedule.
115
Table of Contents
PARTNER EMERGING MARKETS EQUITY PORTFOLIO
Schedule of Investments as of December 31, 2016
| Shares | Preferred Stock (5.7%) | Value | ||||||
South Korea (4.8%) | ||||||||
| 2,297 | Samsung Electronics Company, Ltd. | $ | 2,719,731 | |||||
|
| |||||||
Total | 2,719,731 | |||||||
|
| |||||||
Total Preferred Stock (cost $2,146,754) | 3,213,089 | |||||||
|
| |||||||
Collateral Held for Securities Loaned (1.7%) | ||||||||
| 981,850 | Thrivent Cash Management Trust | 981,850 | ||||||
|
| |||||||
Total Collateral Held for Securities Loaned (cost $981,850) | 981,850 | |||||||
|
| |||||||
| Shares or Principal Amount | Short-Term Investments (2.5%)c | |||||||
Thrivent Core Short-Term Reserve Fund | ||||||||
| 139,818 | 0.910% | 1,398,177 | ||||||
|
| |||||||
Total Short-Term Investments (cost $1,398,177) | 1,398,177 | |||||||
|
| |||||||
Total Investments (cost $54,380,512) 101.7% | $ | 57,444,328 | ||||||
|
| |||||||
Other Assets and Liabilities, Net (1.7%) | (970,639 | ) | ||||||
|
| |||||||
Total Net Assets 100.0% | $ | 56,473,689 | ||||||
|
| |||||||
| a | All or a portion of the security is on loan. |
| b | Non-income producing security. |
| c | The interest rate shown reflects the yield, coupon rate or the discount rate at the date of purchase. |
The following table presents the total amount of securities loaned with continuous maturity, by type, offset by the gross payable upon return of collateral for securities loaned by Thrivent Partner Emerging Markets Equity Portfolio as of December 31, 2016:
Securities Lending Transactions | ||||
Common Stock | $ | 960,599 | ||
|
| |||
Total lending | $ | 960,599 | ||
Gross amount payable upon return of collateral for securities loaned | $ | 981,850 | ||
|
| |||
Net amounts due to counterparty | $ | 21,251 | ||
|
| |||
Definitions:
| ADR | - | American Depositary Receipt, which are certificates for an underlying foreign security’s shares held by an issuing U.S. depository bank. | ||
| GDR | - | Global Depository Receipts, which are certificates for shares of an underlying foreign security’s shares held by an issuing depository bank from more than one country. |
Unrealized Appreciation (Depreciation)
Gross unrealized appreciation and depreciation of investments, based on cost for federal income tax purposes, were as follows:
Gross unrealized appreciation | $ | 9,171,861 | ||
Gross unrealized depreciation | (6,275,167 | ) | ||
|
| |||
Net unrealized appreciation (depreciation) | $ | 2,896,694 | ||
Cost for federal income tax purposes | $ | 54,547,634 |
The accompanying Notes to Financial Statements are an integral part of this schedule.
116
Table of Contents
PARTNER EMERGING MARKETS EQUITY PORTFOLIO
Schedule of Investments as of December 31, 2016
Fair Valuation Measurements
The following table is a summary of the inputs used, as of December 31, 2016, in valuing Partner Emerging Markets Equity Portfolio’s assets carried at fair value.
Investments in Securities | Total | Level 1 | Level 2 | Level 3 | ||||||||||||
Common Stock | ||||||||||||||||
Consumer Discretionary | 6,246,001 | 705,240 | 5,540,761 | — | ||||||||||||
Consumer Staples | 9,015,119 | 1,508,958 | 7,506,161 | — | ||||||||||||
Energy | 4,416,275 | 962,920 | 3,453,355 | — | ||||||||||||
Financials | 16,138,868 | 2,144,738 | 13,994,130 | — | ||||||||||||
Health Care | 733,157 | — | 733,157 | — | ||||||||||||
Industrials | 906,507 | 906,507 | — | — | ||||||||||||
Information Technology | 4,454,175 | — | 4,454,175 | — | ||||||||||||
Materials | 4,506,272 | 401,269 | 4,105,003 | — | ||||||||||||
Real Estate | 2,534,217 | — | 2,534,217 | — | ||||||||||||
Telecommunications Services | 2,900,621 | — | 2,900,621 | — | ||||||||||||
Preferred Stock | ||||||||||||||||
Information Technology | 2,719,731 | — | 2,719,731 | — | ||||||||||||
Materials | 493,358 | 493,358 | — | — | ||||||||||||
|
|
|
|
|
|
|
| |||||||||
Subtotal Investments in Securities | $ | 55,064,301 | $ | 7,122,990 | $ | 47,941,311 | $ | — | ||||||||
|
|
|
|
|
|
|
| |||||||||
Other Investments * | Total | |||||||||||||||
Short-Term Investments | 1,398,177 | |||||||||||||||
Collateral Held for Securities Loaned | 981,850 | |||||||||||||||
|
| |||||||||||||||
Subtotal Other Investments | $ | 2,380,027 | ||||||||||||||
|
| |||||||||||||||
Total Investments at Value | $ | 57,444,328 | ||||||||||||||
|
| |||||||||||||||
| * | Certain investments are measured at fair value using a net asset value per share that is not publicly available (practical expedient). According to disclosure requirements of Accounting Standards Codification (ASC) 820, Fair Value Measurement, securities valued using the practical expedient are not classified in the fair value hierarchy. The fair value amounts presented in this table are intended to permit reconciliation of the fair value hierarchy to the amounts presented in the Statement of Assets and Liabilities. |
There were no significant transfers between Levels during the period ended December 31, 2016. Transfers between Levels are identified as of the end of the period.
Investment in Affiliates
Affiliated issuers, as defined under the Investment Company Act of 1940, include those in which the Portfolio’s holdings of an issuer represent 5% or more of the outstanding voting securities of an issuer, any affiliated mutual fund, or a company which is under common ownership or control with the Portfolio. The Portfolio owns shares of Thrivent Cash Management Trust for the purpose of securities lending and Thrivent Core Short-Term Reserve Fund primarily to serve as a cash sweep vehicle for the Portfolio. Thrivent Cash Management Trust and Thrivent Core Short-Term Reserve Fund are established for the sole use of affiliated portfolios.
A summary of transactions for the fiscal year to date, in Partner Emerging Markets Equity Portfolio, is as follows:
Portfolio | Value December 31, 2015 | Gross Purchases | Gross Sales | Shares Held at December 31, 2016 | Value December 31, 2016 | Income Earned January 1, 2016 - December 31, 2016 | ||||||||||||||||||
Cash Management Trust- Collateral Investment | $ | 212,275 | $ | 13,237,057 | $ | 12,467,482 | 981,850 | $ | 981,850 | $ | 7,998 | |||||||||||||
Cash Management Trust- Short Term Investment | 965,123 | 2,338,068 | 3,303,191 | — | — | 987 | ||||||||||||||||||
Core Short-Term Reserve Fund | — | 9,988,932 | 8,590,755 | 139,818 | 1,398,177 | 7,297 | ||||||||||||||||||
Total Value and Income Earned | $ | 1,177,398 | $ | 2,380,027 | $ | 16,282 | ||||||||||||||||||
The accompanying Notes to Financial Statements are an integral part of this schedule.
117
Table of Contents
REAL ESTATE SECURITIES PORTFOLIO
Schedule of Investments as of December 31, 2016
| Shares | Common Stock (98.2%) | Value | ||||||
Consumer Discretionary (0.9%) | ||||||||
| 46,900 | Hilton Worldwide Holdings, Inc. | $ | 1,275,680 | |||||
| 6,500 | iShares Dow Jones US Home Construction Index Fund | 178,620 | ||||||
| 5,800 | MGM Resorts Internationala | 167,214 | ||||||
|
| |||||||
Total | 1,621,514 | |||||||
|
| |||||||
Diversified REITS (5.0%) | ||||||||
| 11,292 | American Assets Trust, Inc. | 486,459 | ||||||
| 5,000 | Armada Hoffler Properties, Inc. | 72,850 | ||||||
| 4,428 | Brookfield Asset Management, Inc. | 146,168 | ||||||
| 29,919 | Empire State Realty Trust, Inc. | 604,065 | ||||||
| 16,376 | First Potomac Realty Trust | 179,645 | ||||||
| 32,493 | Forest City Realty Trust, Inc. | 677,154 | ||||||
| 48,603 | Gramercy Property Trust | 446,176 | ||||||
| 35,414 | Lexington Realty Trust | 382,471 | ||||||
| 34,943 | Liberty Property Trust | 1,380,248 | ||||||
| 15,600 | NorthStar Realty Finance Corporation | 236,340 | ||||||
| 4,970 | PS Business Parks, Inc. | 579,104 | ||||||
| 106,060 | Spirit Realty Captial, Inc. | 1,151,812 | ||||||
| 54,396 | Store Capital Corporation | 1,344,125 | ||||||
| 69,734 | VEREIT, Inc. | 589,950 | ||||||
| 9,515 | Washington Real Estate Investment Trust | 311,045 | ||||||
| 4,000 | Whitestone REIT | 57,520 | ||||||
| 10,500 | Winthrop Realty Trust Liquidation Escrowb | 78,120 | ||||||
| 3,450 | WP Carey, Inc. | 203,861 | ||||||
|
| |||||||
Total | 8,927,113 | |||||||
|
| |||||||
Health Care REITs (9.0%) | ||||||||
| 8,930 | Care Capital Properties, Inc. | 223,250 | ||||||
| 49,142 | HCP, Inc. | 1,460,500 | ||||||
| 36,562 | Healthcare Realty Trust, Inc. | 1,108,560 | ||||||
| 38,419 | Healthcare Trust of America, Inc. | 1,118,377 | ||||||
| 7,022 | LTC Properties, Inc. | 329,894 | ||||||
| 32,564 | Medical Properties Trust, Inc. | 400,537 | ||||||
| 8,220 | National Health Investors, Inc. | 609,677 | ||||||
| 14,371 | Omega Healthcare Investors, Inc. | 449,237 | ||||||
| 44,520 | Physicians Realty Trust | 844,099 | ||||||
| 14,431 | Sabra Health Care REIT, Inc. | 352,405 | ||||||
| 22,822 | Senior Housing Property Trust | 432,021 | ||||||
| 71,220 | Ventas, Inc. | 4,452,674 | ||||||
| 67,177 | Welltower, Inc. | 4,496,157 | ||||||
|
| |||||||
Total | 16,277,388 | |||||||
|
| |||||||
Hotel & Resort REITs (5.1%) | ||||||||
| 7,800 | Apple Hospitality REIT, Inc. | 155,844 | ||||||
| 6,000 | Ashford Hospitality Prime, Inc. | 81,900 | ||||||
| 9,928 | Ashford Hospitality Trust, Inc. | 77,041 | �� | |||||
| 24,156 | Chatham Lodging Trust | 496,406 | ||||||
| 21,883 | Chesapeake Lodging Trust | 565,894 | ||||||
| 40,395 | DiamondRock Hospitality Company | 465,754 | ||||||
| 24,593 | FelCor Lodging Trust, Inc. | 196,990 | ||||||
| 8,786 | Hersha Hospitality Trust | 188,899 | ||||||
| 17,449 | Hospitality Properties Trust | 553,831 | ||||||
| 123,129 | Host Hotels & Resorts, Inc. | 2,319,750 | ||||||
| 20,705 | LaSalle Hotel Properties | 630,881 | ||||||
| 17,600 | MGM Growth Properties, LLC | 445,456 | ||||||
| 27,974 | Pebblebrook Hotel Trust | 832,227 | ||||||
| 26,691 | RLJ Lodging Trust | 653,663 | ||||||
| 29,215 | Summit Hotel Properties, Inc. | 468,317 | ||||||
| 71,031 | Sunstone Hotel Investors, Inc. | 1,083,223 | ||||||
|
| |||||||
Total | 9,216,076 | |||||||
|
| |||||||
Industrial REITS (7.3%) | ||||||||
| 19,016 | DCT Industrial Trust, Inc. | 910,486 | ||||||
| 102,920 | Duke Realty Corporation | 2,733,555 | ||||||
| 6,524 | EastGroup Properties, Inc. | 481,732 | ||||||
| 48,496 | First Industrial Realty Trust, Inc. | 1,360,313 | ||||||
| 5,450 | Monmouth Real Estate Investment Corporation | 83,058 | ||||||
| 115,282 | Prologis, Inc. | 6,085,737 | ||||||
| 26,578 | Rexford Industrial Realty, Inc. | 616,344 | ||||||
| 21,700 | STAG Industrial, Inc. | 517,979 | ||||||
| 9,608 | Terreno Realty Corporation | 273,732 | ||||||
|
| |||||||
Total | 13,062,936 | |||||||
|
| |||||||
Information Technology (0.2%) | ||||||||
| 9,450 | InterXion Holding NVa | 331,412 | ||||||
|
| |||||||
Total | 331,412 | |||||||
|
| |||||||
Mortgage REITS (0.7%) | ||||||||
| 13,367 | Apollo Commercial Real Estate Finance, Inc. | 222,160 | ||||||
| 10,250 | Blackstone Mortgage Trust, Inc. | 308,217 | ||||||
| 21,250 | Colony Capital, Inc. | 430,313 | ||||||
| 15,000 | Starwood Property Trust, Inc. | 329,250 | ||||||
|
| |||||||
Total | 1,289,940 | |||||||
|
| |||||||
Office REITS (14.6%) | ||||||||
| 25,712 | Alexandria Real Estate Equities, Inc. | 2,857,375 | ||||||
| 41,098 | Boston Properties, Inc. | 5,169,306 | ||||||
| 41,430 | Brandywine Realty Trust | 684,009 | ||||||
| 17,297 | City Office REIT, Inc. | 227,802 | ||||||
| 19,857 | Corporate Office Properties Trust | 619,936 | ||||||
| 100,732 | Cousins Properties, Inc. | 857,229 | ||||||
| 33,557 | Douglas Emmett, Inc. | 1,226,844 | ||||||
| 17,500 | Equity Commonwealtha | 529,200 | ||||||
| 37,800 | Franklin Street Properties Corporation | 489,888 | ||||||
| 25,312 | Highwoods Properties, Inc. | 1,291,165 | ||||||
| 41,259 | Hudson Pacific Properties, Inc. | 1,434,988 | ||||||
| 23,563 | Kilroy Realty Corporation | 1,725,283 | ||||||
| 29,405 | Mack-Cali Realty Corporation | 853,333 | ||||||
| 33,300 | Paramount Group, Inc. | 532,467 | ||||||
| 12,591 | Parkway, Inc.a | 280,150 | ||||||
| 16,963 | Piedmont Office Realty Trust, Inc. | 354,696 | ||||||
| 27,877 | SL Green Realty Corporation | 2,998,171 | ||||||
| 40,650 | Vornado Realty Trust | 4,242,641 | ||||||
|
| |||||||
Total | 26,374,483 | |||||||
|
| |||||||
Real Estate Services (0.2%) | ||||||||
| 6,619 | CBRE Group, Inc.a | 208,432 | ||||||
| 800 | Jones Lang LaSalle, Inc. | 80,832 | ||||||
| 3,000 | Kennedy-Wilson Holdings, Inc. | 61,500 | ||||||
|
| |||||||
Total | 350,764 | |||||||
|
| |||||||
Residential REITS (17.4%) | ||||||||
| 37,353 | American Campus Communities, Inc. | 1,859,059 | ||||||
| 65,800 | American Homes 4 Rent | 1,380,484 | ||||||
| 36,734 | Apartment Investment & Management Company | 1,669,560 | ||||||
| 35,054 | AvalonBay Communities, Inc. | 6,209,816 | ||||||
| 12,139 | Bluerock Residential Growth REIT, Inc. | 166,547 | ||||||
| 20,931 | Camden Property Trust | 1,759,669 | ||||||
| 15,800 | Colony Starwood Homes | 455,198 | ||||||
| 13,638 | Education Realty Trust, Inc. | 576,887 | ||||||
| 20,628 | Equity Lifestyle Properties, Inc. | 1,487,279 | ||||||
| 80,458 | Equity Residential | 5,178,277 | ||||||
| 17,185 | Essex Property Trust, Inc. | 3,995,512 | ||||||
| 15,000 | Independence Realty Trust, Inc. | 133,800 | ||||||
| 20,505 | Mid-America Apartment Communities, Inc. | 2,007,850 | ||||||
| 39,739 | Monogram Residential Trust, Inc. | 429,976 | ||||||
| 26,078 | Sun Communities, Inc. | 1,997,836 | ||||||
The accompanying Notes to Financial Statements are an integral part of this schedule.
118
Table of Contents
REAL ESTATE SECURITIES PORTFOLIO
Schedule of Investments as of December 31, 2016
| Shares | Common Stock (98.2%) | Value | ||||||
Residential REITS (17.4%) - continued | ||||||||
| 53,794 | UDR, Inc. | $ | 1,962,405 | |||||
|
| |||||||
Total | 31,270,155 | |||||||
|
| |||||||
Retail REITS (22.3%) | ||||||||
| 35,413 | Acadia Realty Trust | 1,157,297 | ||||||
| 11,309 | Agree Realty Corporation | 520,779 | ||||||
| 79,091 | Brixmor Property Group, Inc. | 1,931,402 | ||||||
| 19,239 | CBL & Associates Properties, Inc. | 221,249 | ||||||
| 11,320 | Cedar Realty Trust, Inc. | 73,920 | ||||||
| 83,206 | DDR Corporation | 1,270,556 | ||||||
| 39,224 | Equity One, Inc. | 1,203,785 | ||||||
| 15,795 | Federal Realty Investment Trust | 2,244,628 | ||||||
| 152,205 | General Growth Properties, Inc. | 3,802,081 | ||||||
| 65,987 | Kimco Realty Corporation | 1,660,233 | ||||||
| 18,436 | Kite Realty Group Trust | 432,877 | ||||||
| 21,791 | Macerich Company | 1,543,674 | ||||||
| 23,286 | National Retail Properties, Inc. | 1,029,241 | ||||||
| 12,026 | �� | Pennsylvania Real Estate Investment Trust | 228,013 | |||||
| 31,548 | Ramco-Gershenson Properties Trust | 523,066 | ||||||
| 10,750 | Realty Income Corporation | 617,910 | ||||||
| 35,892 | Regency Centers Corporation | 2,474,753 | ||||||
| 38,822 | Retail Opportunity Investments Corporation | 820,309 | ||||||
| 53,400 | Retail Properties of America, Inc. | 818,622 | ||||||
| 1,138 | Saul Centers, Inc. | 75,802 | ||||||
| 76,311 | Simon Property Group, Inc. | 13,558,175 | ||||||
| 21,363 | Tanger Factory Outlet Centers, Inc. | 764,368 | ||||||
| 15,447 | Taubman Centers, Inc. | 1,141,997 | ||||||
| 19,271 | Urban Edge Properties | 530,145 | ||||||
| 14,000 | Urstadt Biddle Properties, Inc. | 337,540 | ||||||
| 33,771 | Washington Prime Group, Inc. | 351,556 | ||||||
| 23,142 | Weingarten Realty Investors | 828,252 | ||||||
|
| |||||||
Total | 40,162,230 | |||||||
|
| |||||||
Specialized REITS (15.5%) | ||||||||
| 20,457 | American Tower Corporation | 2,161,896 | ||||||
| 7,750 | Communications Sales & Leasing, Inc. | 196,927 | ||||||
| 9,396 | CoreSite Realty Corporation | 745,761 | ||||||
| 16,142 | Crown Castle International Corporation | 1,400,641 | ||||||
| 58,672 | CubeSmart | 1,570,649 | ||||||
| 31,700 | CyrusOne, Inc. | 1,417,941 | ||||||
| 29,068 | Digital Realty Trust, Inc. | 2,856,222 | ||||||
| 16,050 | DuPont Fabros Technology, Inc. | 705,076 | ||||||
| 6,532 | EPR Properties | 468,802 | ||||||
| 12,992 | Equinix, Inc. | 4,643,471 | ||||||
| 28,870 | Extra Space Storage, Inc. | 2,229,919 | ||||||
| 14,450 | Gaming and Leisure Properties, Inc. | 442,459 | ||||||
| 4,500 | GEO Group, Inc. | 161,685 | ||||||
| 4,957 | Iron Mountain, Inc. | 161,003 | ||||||
| 9,258 | Life Storage, Inc. | 789,337 | ||||||
| 33,265 | National Storage Affiliates Trust | 734,159 | ||||||
| 5,182 | Outfront Media, Inc. | 128,876 | ||||||
| 24,583 | Public Storage, Inc. | 5,494,300 | ||||||
| 11,700 | QTS Realty Trust, Inc. | 580,905 | ||||||
| 34,930 | Weyerhaeuser Company | 1,051,044 | ||||||
|
| |||||||
Total | 27,941,073 | |||||||
|
| |||||||
Total Common Stock (cost $153,303,188) | 176,825,084 | |||||||
|
| |||||||
Registered Investment Companies (0.1%) | ||||||||
Equity Funds/ETFs (<0.1%) | ||||||||
| 14,400 | Cohen & Steers Quality Income Realty Fund, Inc. | 175,824 | ||||||
|
| |||||||
Total | 175,824 | |||||||
|
| |||||||
Total Registered Investment Companies (cost $156,744) | 175,824 | |||||||
|
| |||||||
| Shares or Principal Amount | Short-Term Investments (0.7%)c | |||||||
Thrivent Core Short-Term Reserve Fund | ||||||||
| 116,262 | 0.910% | 1,162,622 | ||||||
|
| |||||||
Total Short-Term Investments (cost $1,162,622) | 1,162,622 | |||||||
|
| |||||||
Total Investments (cost $154,622,554) 99.0% | $ | 178,163,530 | ||||||
|
| |||||||
Other Assets and Liabilities, Net 1.0% | 1,864,557 | |||||||
|
| |||||||
Total Net Assets 100.0% | $ | 180,028,087 | ||||||
|
| |||||||
| a | Non-income producing security. |
| b | Security is valued at fair value. Market quotations or prices were not readily available or were determined to be unreliable. Fair value was determined in good faith pursuant to procedures adopted by the Board. Further information on fair valuation can be found in the Notes to Financial Statements. |
| c | The interest rate shown reflects the yield, coupon rate or the discount rate at the date of purchase. |
Definitions:
| REIT | - | Real Estate Investment Trust is a company that buys, develops, manages and/or sells real estate assets. |
Unrealized Appreciation (Depreciation)
Gross unrealized appreciation and depreciation of investments, based on cost for federal income tax purposes, were as follows:
Gross unrealized appreciation | $ | 33,544,468 | ||
Gross unrealized depreciation | (10,413,666 | ) | ||
|
| |||
Net unrealized appreciation (depreciation) | $ | 23,130,802 | ||
Cost for federal income tax purposes | $ | 155,032,728 | ||
The accompanying Notes to Financial Statements are an integral part of this schedule.
119
Table of Contents
REAL ESTATE SECURITIES PORTFOLIO
Schedule of Investments as of December 31, 2016
Fair Valuation Measurements
The following table is a summary of the inputs used, as of December 31, 2016, in valuing Real Estate Securities Portfolio’s assets carried at fair value.
Investments in Securities | Total | Level 1 | Level 2 | Level 3 | ||||||||||||
Common Stock | ||||||||||||||||
Consumer Discretionary | 1,621,514 | 1,621,514 | — | — | ||||||||||||
Diversified REITS | 8,927,113 | 8,848,993 | — | 78,120 | ||||||||||||
Health Care REITs | 16,277,388 | 16,277,388 | — | — | ||||||||||||
Hotel & Resort REITs | 9,216,076 | 9,216,076 | — | — | ||||||||||||
Industrial REITS | 13,062,936 | 13,062,936 | — | — | ||||||||||||
Information Technology | 331,412 | 331,412 | — | — | ||||||||||||
Mortgage REITS | 1,289,940 | 1,289,940 | — | — | ||||||||||||
Office REITS | 26,374,483 | 26,374,483 | — | — | ||||||||||||
Real Estate Services | 350,764 | 350,764 | — | — | ||||||||||||
Residential REITS | 31,270,155 | 31,270,155 | — | — | ||||||||||||
Retail REITS | 40,162,230 | 40,162,230 | — | — | ||||||||||||
Specialized REITS | 27,941,073 | 27,941,073 | — | — | ||||||||||||
Registered Investment Companies | ||||||||||||||||
Equity Funds/ETFs | 175,824 | 175,824 | — | — | ||||||||||||
|
|
|
|
|
|
|
| |||||||||
Subtotal Investments in Securities | $ | 177,000,908 | $ | 176,922,788 | $ | — | $ | 78,120 | ||||||||
|
|
|
|
|
|
|
| |||||||||
Other Investments * | Total | |||||||||||||||
Short-Term Investments | 1,162,622 | |||||||||||||||
|
| |||||||||||||||
Subtotal Other Investments | $ | 1,162,622 | ||||||||||||||
|
| |||||||||||||||
Total Investments at Value | $ | 178,163,530 | ||||||||||||||
|
| |||||||||||||||
| * | Certain investments are measured at fair value using a net asset value per share that is not publicly available (practical expedient). According to disclosure requirements of Accounting Standards Codification (ASC) 820, Fair Value Measurement, securities valued using the practical expedient are not classified in the fair value hierarchy. The fair value amounts presented in this table are intended to permit reconciliation of the fair value hierarchy to the amounts presented in the Statement of Assets and Liabilities. |
There were no significant transfers between Levels during the period ended December 31, 2016. Transfers between Levels are identified as of the end of the period.
Investment in Affiliates
Affiliated issuers, as defined under the Investment Company Act of 1940, include those in which the Portfolio’s holdings of an issuer represent 5% or more of the outstanding voting securities of an issuer, any affiliated mutual fund, or a company which is under common ownership or control with the Portfolio. The Portfolio owns shares of Thrivent Cash Management Trust for the purpose of securities lending and Thrivent Core Short-Term Reserve Fund primarily to serve as a cash sweep vehicle for the Portfolio. Thrivent Cash Management Trust and Thrivent Core Short-Term Reserve Fund are established for the sole use of affiliated portfolios.
A summary of transactions for the fiscal year to date, in Real Estate Securities Portfolio, is as follows:
Portfolio | Value December 31, 2015 | Gross Purchases | Gross Sales | Shares Held at December 31, 2016 | Value December 31, 2016 | Income Earned January 1, 2016 - December 31, 2016 | ||||||||||||||||||
Cash Management Trust- Short Term Investment | $ | 1,707,534 | $ | 5,800,848 | $ | 7,508,382 | — | $ | — | $ | 749 | |||||||||||||
Core Short-Term Reserve Fund | — | 20,709,164 | 19,546,542 | 116,262 | 1,162,622 | 7,600 | ||||||||||||||||||
Total Value and Income Earned | $ | 1,707,534 | $ | 1,162,622 | $ | 8,349 | ||||||||||||||||||
The accompanying Notes to Financial Statements are an integral part of this schedule.
120
Table of Contents
Schedule of Investments as of December 31, 2016
| Shares | Common Stock (91.5%) | Value | ||||||
Consumer Discretionary (7.1%) | ||||||||
| 77,788 | Aaron’s, Inc. | $ | 2,488,438 | |||||
| 56,223 | Cedar Fair, LP | 3,609,517 | ||||||
| 115,479 | Core-Mark Holding Company, Inc. | 4,973,681 | ||||||
| 55,480 | G-III Apparel Group, Ltd.a | 1,639,989 | ||||||
| 182,820 | Houghton Mifflin Harcourt Companya | 1,983,597 | ||||||
| 287,450 | Nutrisystem, Inc. | 9,960,142 | ||||||
| 46,110 | Oxford Industries, Inc. | 2,772,594 | ||||||
| 38,070 | Papa John’s International, Inc. | 3,258,031 | ||||||
| 140,770 | Pinnacle Entertainment, Inc.a | 2,041,165 | ||||||
| 27,630 | Ruth’s Hospitality Group, Inc. | 505,629 | ||||||
| 377,692 | Tuesday Morning Corporationa | 2,039,537 | ||||||
| 35,060 | Zoe’s Kitchen, Inc.a,b | 841,089 | ||||||
|
| |||||||
Total | 36,113,409 | |||||||
|
| |||||||
Consumer Staples (0.8%) | ||||||||
| 61,152 | AdvancePierre Foods Holdings, Inc. | 1,821,107 | ||||||
| 45,430 | WhiteWave Foods Companya | 2,525,908 | ||||||
|
| |||||||
Total | 4,347,015 | |||||||
|
| |||||||
Energy (4.5%) | ||||||||
| 52,150 | Oil States International, Inc.a | 2,033,850 | ||||||
| 92,550 | Parsley Energy, Inc.a | 3,261,462 | ||||||
| 273,840 | Rowan Companies plca | 5,172,838 | ||||||
| 118,540 | RPC, Inc.b | 2,348,277 | ||||||
| 61,330 | U.S. Silica Holdings, Inc. | 3,476,184 | ||||||
| 443,600 | WPX Energy, Inc.a | 6,463,252 | ||||||
|
| |||||||
Total | 22,755,863 | |||||||
|
| |||||||
Financials (23.1%) | ||||||||
| 86,100 | Allied World Assurance Company Holdings AG | 4,624,431 | ||||||
| 127,718 | Ameris Bancorp | 5,568,505 | ||||||
| 78,570 | Argo Group International Holdings, Ltd. | 5,177,763 | ||||||
| 236,972 | Assured Guaranty, Ltd. | 8,950,432 | ||||||
| 210,240 | BancorpSouth, Inc. | 6,527,952 | ||||||
| 112,902 | Chemical Financial Corporation | 6,115,901 | ||||||
| 251,768 | CoBiz Financial, Inc. | 4,252,362 | ||||||
| 333,269 | Hanmi Financial Corporation | 11,631,088 | ||||||
| 11,159 | Hanover Insurance Group, Inc. | 1,015,581 | ||||||
| 210,711 | Hope Bancorp, Inc. | 4,612,464 | ||||||
| 124,225 | Horace Mann Educators Corporation | 5,316,830 | ||||||
| 154,097 | Houlihan Lokey, Inc. | 4,795,499 | ||||||
| 40,388 | Infinity Property & Casualty Corporation | 3,550,105 | ||||||
| 488,342 | Janus Capital Group, Inc. | 6,480,298 | ||||||
| 26,510 | Meta Financial Group, Inc. | 2,727,879 | ||||||
| 152,550 | National Bank Holdings Corporation | 4,864,819 | ||||||
| 70,670 | Primerica, Inc. | 4,886,831 | ||||||
| 111,620 | Renasant Corporation | 4,712,596 | ||||||
| 38,236 | State Auto Financial Corporation | 1,025,107 | ||||||
| 143,425 | Stifel Financial Corporationa | 7,164,079 | ||||||
| 214,730 | Synovus Financial Corporation | 8,821,108 | ||||||
| 132,090 | United Community Banks, Inc. | 3,912,506 | ||||||
|
| |||||||
Total | 116,734,136 | |||||||
|
| |||||||
Health Care (10.8%) | ||||||||
| 101,530 | Akorn, Inc.a | 2,216,400 | ||||||
| 27,310 | Align Technology, Inc.a | 2,625,310 | ||||||
| 46,860 | Analogic Corporation | 3,887,037 | ||||||
| 243,050 | Catalent, Inc.a | 6,552,628 | ||||||
| 46,850 | Chemed Corporation | 7,515,208 | ||||||
| 44,090 | Heska Corporationa | 3,156,844 | ||||||
| 49,920 | Neurocrine Biosciences, Inc.a | 1,931,904 | ||||||
| 103,483 | NuVasive, Inc.a | 6,970,615 | ||||||
| 171,180 | Omnicell, Inc.a | 5,803,002 | ||||||
| 97,650 | PerkinElmer, Inc. | 5,092,448 | ||||||
| 37,450 | Teleflex, Inc. | 6,035,068 | ||||||
| 35,164 | West Pharmaceutical Services, Inc. | 2,982,962 | ||||||
|
| |||||||
Total | 54,769,426 | |||||||
|
| |||||||
Industrials (18.9%) | ||||||||
| 56,990 | AGCO Corporation | 3,297,441 | ||||||
| 157,460 | AZZ, Inc. | 10,061,694 | ||||||
| 155,140 | BWX Technologies, Inc. | 6,159,058 | ||||||
| 10,538 | CLARCOR, Inc. | 869,069 | ||||||
| 58,160 | Curtiss-Wright Corporation | 5,720,618 | ||||||
| 67,240 | Encore Wire Corporation | 2,914,854 | ||||||
| 75,606 | Granite Construction, Inc. | 4,158,330 | ||||||
| 49,370 | ICF International, Inc.a | 2,725,224 | ||||||
| 82,230 | Kirby Corporationa | 5,468,295 | ||||||
| 44,520 | Lindsay Corporationb | 3,321,637 | ||||||
| 150,930 | MRC Global, Inc.a | 3,057,842 | ||||||
| 91,185 | MSA Safety, Inc. | 6,321,856 | ||||||
| 57,540 | Orbital ATK, Inc. | 5,047,984 | ||||||
| 94,510 | Oshkosh Corporation | 6,106,291 | ||||||
| 28,070 | Proto Labs, Inc.a,b | 1,441,395 | ||||||
| 243,710 | Raven Industries, Inc. | 6,141,492 | ||||||
| 108,290 | Saia, Inc.a | 4,781,003 | ||||||
| 64,423 | Team, Inc.a | 2,528,603 | ||||||
| 60,112 | Tennant Company | 4,279,974 | ||||||
| 209,890 | TransUniona | 6,491,898 | ||||||
| 59,704 | Waste Connections, Inc. | 4,692,137 | ||||||
|
| |||||||
Total | 95,586,695 | |||||||
|
| |||||||
Information Technology (16.1%) | ||||||||
| 102,305 | Arista Networks, Inc.a | 9,900,055 | ||||||
| 90,560 | Belden, Inc. | 6,771,171 | ||||||
| 247,170 | Booz Allen Hamilton Holding Corporation | 8,915,422 | ||||||
| 56,160 | Criteo SA ADRa,b | 2,307,053 | ||||||
| 127,650 | Dolby Laboratories, Inc. | 5,768,503 | ||||||
| 88,620 | DST Systems, Inc. | 9,495,633 | ||||||
| 52,230 | Envestnet, Inc.a | 1,841,108 | ||||||
| 23,750 | Finisar Corporationa | 718,913 | ||||||
| 76,080 | Guidewire Software, Inc.a | 3,753,026 | ||||||
| 201,680 | Integrated Device Technology, Inc.a | 4,751,581 | ||||||
| 46,270 | M/A-COM Technology Solutions Holdings, Inc.a,b | 2,141,376 | ||||||
| 90,750 | Microsemi Corporationa | 4,897,777 | ||||||
| 233,900 | National Instruments Corporation | 7,208,798 | ||||||
| 184,595 | Pegasystems, Inc. | 6,645,420 | ||||||
| 23,458 | Q2 Holdings, Inc.a | 676,763 | ||||||
| 218,987 | Virtusa Corporationa | 5,500,953 | ||||||
|
| |||||||
Total | 81,293,552 | |||||||
|
| |||||||
Materials (4.7%) | ||||||||
| 62,810 | Balchem Corporation | 5,271,015 | ||||||
| 78,464 | Chemtura Corporationa | 2,605,005 | ||||||
| 59,590 | Materion Corporation | 2,359,764 | ||||||
| 67,800 | Methanex Corporation | 2,969,640 | ||||||
| 53,418 | Scotts Miracle-Gro Company | 5,104,090 | ||||||
| 72,440 | Sensient Technologies Corporation | 5,692,335 | ||||||
|
| |||||||
Total | 24,001,849 | |||||||
|
| |||||||
Real Estate (3.4%) | ||||||||
| 87,070 | American Assets Trust, Inc. | 3,750,976 | ||||||
| 221,435 | Cousins Properties, Inc. | 1,884,412 | ||||||
| 22,700 | Mid-America Apartment Communities, Inc. | 2,222,784 | ||||||
| 42,921 | Pebblebrook Hotel Trust | 1,276,900 | ||||||
| 118,310 | Physicians Realty Trust | 2,243,157 | ||||||
| 197,720 | Terreno Realty Corporation | 5,633,043 | ||||||
|
| |||||||
Total | 17,011,272 | |||||||
|
| |||||||
Utilities (2.1%) | ||||||||
| 89,990 | MDU Resources Group, Inc. | 2,589,012 | ||||||
The accompanying Notes to Financial Statements are an integral part of this schedule.
121
Table of Contents
SMALL CAP STOCK PORTFOLIO
Schedule of Investments as of December 31, 2016
| Shares | Common Stock (91.5%) | Value | ||||||
Utilities (2.1 %) - continued | ||||||||
| 115,030 | PNM Resources, Inc. | $ | 3,945,529 | |||||
| 54,320 | Southwest Gas Holdings, Inc. | 4,161,999 | ||||||
|
| |||||||
Total | 10,696,540 | |||||||
|
| |||||||
Total Common Stock (cost $362,865,598) | 463,309,757 | |||||||
|
| |||||||
Registered Investment Companies (5.2%) | ||||||||
Equity Funds/ETFs (5.2%) | ||||||||
| 15,510 | iShares Russell 2000 Growth Index Fund | 2,387,609 | ||||||
| 93,250 | iShares Russell 2000 Index Fund | 12,574,763 | ||||||
| 41,960 | iShares Russell 2000 Value Index Fund | 4,990,722 | ||||||
| 73,370 | Materials Select Sector SPDR Fund | 3,646,489 | ||||||
| 46,910 | SPDR S&P Biotech ElF | 2,776,603 | ||||||
|
| |||||||
Total | 26,376,186 | |||||||
|
| |||||||
Total Registered Investment Companies (cost $23,002,460) | 26,376,186 | |||||||
|
| |||||||
Collateral Held for Securities Loaned (2.3%) | ||||||||
| 11,513,109 | Thrivent Cash Management Trust | 11,513,109 | ||||||
|
| |||||||
Total Collateral Held for Securities Loaned (cost $11,513,109) | 11,513,109 | |||||||
|
| |||||||
| Shares or Principal Amount | Short-Term Investments (3.2%)C | |||||||
Federal Home Loan Bank Discount Notes | ||||||||
| 1,700,000 | 0.490%,1/26/2017 | 1,699,587 | ||||||
| 1,000,000 | 0.460%,2/2/2017 | 999,583 | ||||||
| 400,000 | 0.510%,2/7/2017 | 399,805 | ||||||
| 200,000 | 0.515%, 2/16/2017 | 199,878 | ||||||
Thrivent Core Short-Term Reserve Fund | ||||||||
| 1,295,047 | 0.910% | 12,950,473 | ||||||
|
| |||||||
Total Short-Term Investments (cost $16,249,144) | 16,249,326 | |||||||
|
| |||||||
Total Investments (cost $413,630,311) 102,2% | $ | 517,448,378 | ||||||
|
| |||||||
Other Assets and Liabilities, Net (2,2%) | (11,335,039 | ) | ||||||
|
| |||||||
Total Net Assets 100.0% | $ | 506,113,339 | ||||||
|
| |||||||
| a | Non-income producing security. |
| b | All or a portion of the security is on loan |
| c | The interest rate shown reflects the yield, coupon rate or the discount rate at the date of purchase. |
The following table presents the total amount of securities loaned with continuous maturity, by type, offset by the gross payable upon return of collateral for securities loaned by Thrivent Small Cap Stock Portfolio as of December 31, 2016:
Securities Lending Transactions | ||||
Common Stock | $ | 11,185,125 | ||
|
| |||
Total lending | $ | 11,185,125 | ||
Gross amount payable upon return of collateral for securities loaned | $ | 11,513,109 | ||
|
| |||
Net amounts due to counterparty | $ | 327,984 | ||
|
| |||
Definitions:
| ADR | - | American Depositary Receipt, which are certificates for an underlying foreign security’s shares held by an issuing U.S. depository bank. | ||
| ETF | - | Exchange Traded Fund. |
Unrealized Appreciation (Depreciation)
Gross unrealized appreciation and depreciation of investments, based on cost for federal income tax purposes, were as follows:
Gross unrealized appreciation | $ | 112,999,178 | ||
Gross unrealized depreciation | (10,040,116 | ) | ||
|
| |||
Net unrealized appreciation (depreciation) | $ | 102,959,062 | ||
Cost for federal income tax purposes | $ | 414,489,316 |
The accompanying Notes to Financial Statements are an integral part of this schedule.
122
Table of Contents
SMALL CAP STOCK PORTFOLIO
Schedule of Investments as of December 31, 2016
Fair Valuation Measurements
The following table is a summary of the inputs used, as of December 31, 2016, in valuing Small Cap Stock Portfolio’s assets carried at fair value.
Investments in Securities | Total | Level 1 | Level 2 | Level 3 | ||||||||||||
Common Stock | ||||||||||||||||
Consumer Discretionary | 36,113,409 | 36,113,409 | — | — | ||||||||||||
Consumer Staples | 4,347,015 | 4,347,015 | — | — | ||||||||||||
Energy^ | 22,755,863 | 22,755,863 | — | — | ||||||||||||
Financials | 116,734,136 | 116,734,136 | — | — | ||||||||||||
Health Care | 54,769,426 | 54,769,426 | — | — | ||||||||||||
Industrials | 95,586,695 | 95,586,695 | — | — | ||||||||||||
Information Technology | 81,293,552 | 81,293,552 | — | — | ||||||||||||
Materials | 24,001,849 | 24,001,849 | — | — | ||||||||||||
Real Estate | 17,011,272 | 17,011,272 | — | — | ||||||||||||
Utilities | 10,696,540 | 10,696,540 | — | — | ||||||||||||
Registered Investment Companies | ||||||||||||||||
Equity Funds/ETFs | 26,376,186 | 26,376,186 | — | — | ||||||||||||
Short-Term Investments | 3,298,853 | — | 3,298,853 | — | ||||||||||||
|
|
|
|
|
|
|
| |||||||||
Subtotal Investments in Securities | $ | 492,984,796 | $ | 489,685,943 | $ | 3,298,853 | $ | — | ||||||||
|
|
|
|
|
|
|
| |||||||||
Other Investments * | Total | |||||||||||||||
Short-Term Investments | 12,950,473 | |||||||||||||||
Collateral Held for Securities Loaned | 11,513,109 | |||||||||||||||
|
| |||||||||||||||
Subtotal Other Investments | $ | 24,463,582 | ||||||||||||||
|
| |||||||||||||||
Total Investments at Value | $ | 517,448,378 | ||||||||||||||
|
| |||||||||||||||
| * | Certain investments are measured at fair value using a net asset value per share that is not publicly available (practical expedient). According to disclosure requirements of Accounting Standards Codification (ASC) 820, Fair Value Measurement, securities valued using the practical expedient are not classified in the fair value hierarchy. The fair value amounts presented in this table are intended to permit reconciliation of the fair value hierarchy to the amounts presented in the Statement of Assets and Liabilities. |
There were no significant transfers between Levels during the period ended December 31, 2016. Transfers between Levels are identified as of the end of the period.
Investment in Affiliates
Affiliated issuers, as defined under the Investment Company Act of 1940, include those in which the Portfolio’s holdings of an issuer represent 5% or more of the outstanding voting securities of an issuer, any affiliated mutual fund, or a company which is under common ownership or control with the Portfolio. The Portfolio owns shares of Thrivent Cash Management Trust for the purpose of securities lending and Thrivent Core Short-Term Reserve Fund primarily to serve as a cash sweep vehicle for the Portfolio. Thrivent Cash Management Trust and Thrivent Core Short-Term Reserve Fund are established for the sole use of affiliated portfolios.
A summary of transactions for the fiscal year to date, in Small Cap Stock Portfolio, is as follows:
Portfolio | Value December 31, 2015 | Gross Purchases | Gross Sales | Shares Held at December 31, 2016 | Value December 31, 2016 | Income Earned January 1, 2016 - December 31, 2016 | ||||||||||||||||||
Cash Management Trust- Collateral Investment | $ | 40,959,020 | $ | 276,204,107 | $ | 305,650,018 | 11,513,109 | $ | 11,513,109 | $ | 183,692 | |||||||||||||
Cash Management Trust- Short Term Investment | 12,996,171 | 43,066,106 | 56,062,277 | — | — | 9,227 | ||||||||||||||||||
Core Short-Term Reserve Fund | — | 94,499,466 | 81,548,993 | 1,295,047 | 12,950,473 | 43,949 | ||||||||||||||||||
Total Value and Income Earned | $ | 53,955,191 | $ | 24,463,582 | $ | 236,868 | ||||||||||||||||||
The accompanying Notes to Financial Statements are an integral part of this schedule.
123
Table of Contents
Summary Schedule of Investments as of December 31, 2016
| Shares | Common Stock (97.3%) | Value | % of Net Assets | |||||||||
Consumer Discretionary (13.9%) | ||||||||||||
| 13,250 | Drew Industries, Inc. | $ | 1,427,688 | 0.4 | % | |||||||
Other Securities^ | 54,509,568 | 13.5 | % | |||||||||
|
| |||||||||||
Total | 55,937,256 | |||||||||||
|
| |||||||||||
Consumer Staples (2.8%) | ||||||||||||
| 35,860 | B&G Foods, Inc. | 1,570,668 | 0.4 | % | ||||||||
Other Securities^ | 9,622,965 | 2.4 | % | |||||||||
|
| |||||||||||
Total | 11,193,633 | |||||||||||
|
| |||||||||||
Energy (3.4%) | ||||||||||||
| 30,010 | PDC Energy, Inc.a | 2,178,126 | 0.5 | % | ||||||||
| 38,410 | U.S. Silica Holdings, Inc. | 2,177,079 | 0.5 | % | ||||||||
Other Securities^ | 9,354,627 | 2.4 | % | |||||||||
|
| |||||||||||
Total | 13,709,832 | |||||||||||
|
| |||||||||||
Financials (17.9%) | ||||||||||||
| 31,480 | Columbia Banking System, Inc. | 1,406,526 | 0.4 | % | ||||||||
| 24,050 | Community Bank System, Inc. | 1,486,049 | 0.4 | % | ||||||||
| 20,900 | Evercore Partners, Inc. | 1,435,830 | 0.4 | % | ||||||||
| 35,750 | First Financial Bankshares, Inc.b | 1,615,900 | 0.4 | % | ||||||||
| 41,540 | Glacier Bancorp, Inc. | 1,504,994 | 0.4 | % | ||||||||
| 31,510 | Great Western Bancorp, Inc. | 1,373,521 | 0.3 | % | ||||||||
| 67,300 | Home BancShares, Inc. | 1,868,921 | 0.5 | % | ||||||||
| 68,804 | Hope Bancorp, Inc. | 1,506,120 | 0.4 | % | ||||||||
| 73,090 | Old National Bancorp | 1,326,583 | 0.3 | % | ||||||||
| 23,570 | Pinnacle Financial Partners, Inc. | 1,633,401 | 0.4 | % | ||||||||
| 28,540 | ProAssurance Corporation | 1,603,948 | 0.4 | % | ||||||||
| 31,430 | Selective Insurance Group, Inc. | 1,353,061 | 0.3 | % | ||||||||
| 70,839 | Sterling Bancorp | 1,657,633 | 0.4 | % | ||||||||
| 26,620 | Texas Capital Bancshares, Inc.a | 2,087,008 | 0.5 | % | ||||||||
| 43,680 | United Bankshares, Inc.b | 2,020,200 | 0.5 | % | ||||||||
| 27,880 | Wintrust Financial Corporation | 2,023,252 | 0.5 | % | ||||||||
Other Securities^ | 45,964,259 | 11.4 | % | |||||||||
|
| |||||||||||
Total | 71,867,206 | |||||||||||
|
| |||||||||||
Health Care (11.1%) | ||||||||||||
| 19,615 | Cantel Medical Corporation | 1,544,681 | 0.4 | % | ||||||||
| 8,730 | Chemed Corporation | 1,400,379 | 0.3 | % | ||||||||
| 16,080 | Integra LifeSciences Holdings Corporationa | 1,379,503 | 0.3 | % | ||||||||
| 23,760 | Masimo Corporationa | 1,601,424 | 0.4 | % | ||||||||
| 29,480 | Medidata Solutions, Inc.a | 1,464,272 | 0.4 | % | ||||||||
| 20,315 | Neogen Corporationa | 1,340,790 | 0.3 | % | ||||||||
Other Securities^ | 35,960,995 | 9.0 | % | |||||||||
|
| |||||||||||
Total | 44,692,044 | |||||||||||
|
| |||||||||||
Industrials (17.9%) | ||||||||||||
| 28,580 | Hawaiian Holdings, Inc.a | 1,629,060 | 0.4 | % | ||||||||
| 39,247 | Healthcare Services Group, Inc. | 1,537,305 | 0.4 | % | ||||||||
| 15,700 | John Bean Technologies Corporation | 1,349,415 | 0.3 | % | ||||||||
| 17,410 | Matthews International Corporation | 1,337,959 | 0.3 | % | ||||||||
| 19,820 | WageWorks, Inc.a | 1,436,950 | 0.4 | % | ||||||||
Other Securities^ | 64,665,093 | 16.1 | % | |||||||||
|
| |||||||||||
Total | 71,955,782 | |||||||||||
|
| |||||||||||
Information Technology (14.6%) | ||||||||||||
| 25,770 | Blackbaud, Inc. | 1,649,280 | 0.4 | % | ||||||||
| 13,170 | CACI International, Inc.a | 1,637,031 | 0.4 | % | ||||||||
| 24,420 | Cardtronics, Inc.a | 1,332,599 | 0.3 | % | ||||||||
| 13,400 | Coherent, Inc.a | 1,840,959 | 0.5 | % | ||||||||
| 13,920 | LogMeIn, Inc.b | 1,343,976 | 0.3 | % | ||||||||
| 28,640 | MKS Instruments, Inc. | 1,701,216 | 0.4 | % | ||||||||
| 39,600 | Sanmina Corporationa | 1,451,340 | 0.4 | % | ||||||||
| 46,720 | Take-Two Interactive Software, Inc.a | 2,302,829 | 0.6 | % | ||||||||
| 64,520 | TiVo Corpa | 1,348,468 | 0.3 | % | ||||||||
Other Securities^ | 44,155,915 | 11.0 | % | |||||||||
|
| |||||||||||
Total | 58,763,613 | |||||||||||
|
| |||||||||||
Materials (6.2%) | ||||||||||||
| 166,540 | AK Steel Holding Corporationa | 1,700,373 | 0.4 | % | ||||||||
| 17,130 | Balchem Corporation | 1,437,550 | 0.4 | % | ||||||||
| 97,180 | Chemours Company | 2,146,706 | 0.5 | % | ||||||||
Other Securities^ | 19,586,206 | 4.9 | % | |||||||||
|
| |||||||||||
Total | 24,870,835 | |||||||||||
|
| |||||||||||
Real Estate (5.9%) | ||||||||||||
| 43,588 | Acadia Realty Trust | 1,424,456 | 0.4 | % | ||||||||
| 18,240 | CoreSite Realty Corporation | 1,447,709 | 0.4 | % | ||||||||
| 40,476 | GEO Group, Inc. | 1,454,303 | 0.4 | % | ||||||||
Other Securities^ | 19,386,692 | 4.7 | % | |||||||||
|
| |||||||||||
Total | 23,713,160 | |||||||||||
|
| |||||||||||
Telecommunications Services (1.1%) | ||||||||||||
Other Securities^ | 4,144,072 | 1.1 | % | |||||||||
|
| |||||||||||
Total | 4,144,072 | |||||||||||
|
| |||||||||||
Utilities (2.5%) | ||||||||||||
| 26,653 | ALLETE, Inc. | 1,710,856 | 0.4 | % | ||||||||
| 35,020 | Avista Corporation | 1,400,450 | 0.4 | % | ||||||||
| 42,620 | South Jersey Industries, Inc. | 1,435,868 | 0.4 | % | ||||||||
| 24,610 | Spire, Inc. | 1,588,575 | 0.4 | % | ||||||||
Other Securities^ | 3,723,530 | 0.9 | % | |||||||||
|
| |||||||||||
Total | 9,859,279 | |||||||||||
|
| |||||||||||
Total Common Stock (cost $280,269,302) | 390,706,712 | |||||||||||
|
| |||||||||||
Collateral Held for Securities Loaned (5.8%) | ||||||||||||
| 23,458,379 | Thrivent Cash Management Trust | 23,458,379 | 5.8 | % | ||||||||
|
| |||||||||||
Total Collateral Held for Securities Loaned (cost $23,458,379) | 23,458,379 | |||||||||||
|
| |||||||||||
| Shares or Principal Amount | Short-Term Investments (2.5%)c | |||||||||||
Thrivent Core Short-Term Reserve Fund | ||||||||||||
| 930,431 | 0.910% | 9,304,310 | 2.3 | % | ||||||||
Other Securities^ | 799,884 | 0.2 | % | |||||||||
|
| |||||||||||
Total Short-Term Investments (cost $10,104,196) | 10,104,194 | |||||||||||
|
| |||||||||||
Total Investments (cost $313,831,877) 105.6% | $ | 424,269,285 | ||||||||||
|
| |||||||||||
Other Assets and Liabilities, Net (5.6%) | (22,537,350 | ) | ||||||||||
|
| |||||||||||
Total Net Assets 100.0% | $ | 401,731,935 | ||||||||||
|
| |||||||||||
The accompanying Notes to Financial Statements are an integral part of this schedule.
124
Table of Contents
SMALL CAP INDEX PORTFOLIO
Summary Schedule of Investments as of December 31, 2016
| ^ | The Summary Schedule of Investments shows the 50 largest holdings in unaffiliated issuers, any holding or issuer that exceeds 1% of net assets and all affiliated holdings as of the report date. The remaining securities held are grouped by category as “Other securities”. |
| a | Non-income producing security. |
| b | All or a portion of the security is on loan. |
| c | The interest rate shown reflects the yield, coupon rate or the discount rate at the date of purchase. |
The following table presents the total amount of securities loaned with continuous maturity, by type, offset by the gross payable upon return of collateral for securities loaned by Thrivent Small Cap Index Portfolio as of December 31, 2016:
Securities Lending Transactions | ||||
Common Stock | $ | 22,811,867 | ||
|
| |||
Total lending | $ | 22,811,867 | ||
Gross amount payable upon return of collateral for securities loaned | $ | 23,458,379 | ||
|
| |||
Net amounts due to counterparty | $ | 646,512 | ||
|
| |||
Unrealized Appreciation (Depreciation)
Gross unrealized appreciation and depreciation of investments, based on cost for federal income tax purposes, were as follows:
Gross unrealized appreciation | $ | 121,412,154 | ||
Gross unrealized depreciation | (14,842,096 | ) | ||
|
| |||
Net unrealized appreciation (depreciation) | $ | 106,570,058 | ||
Cost for federal income tax purposes | $ | 317 699,227 |
The accompanying Notes to Financial Statements are an integral part of this schedule.
125
Table of Contents
SMALL CAP INDEX PORTFOLIO
Summary Schedule of Investments as of December 31, 2016
Fair Valuation Measurements
The following table is a summary of the inputs used, as of December 31, 2016, in valuing Small Cap Index Portfolio’s assets carried at fair value.
Investments in Securities | Total | Level 1 | Level 2 | Level 3 | ||||||||||||
Common Stock | ||||||||||||||||
Consumer Discretionary | 55,937,256 | 55,937,256 | – | – | ||||||||||||
Consumer Staples | 11,193,633 | 11,193,633 | – | – | ||||||||||||
Energy | 13,709,832 | 13,709,832 | – | – | ||||||||||||
Financials | 71,867,206 | 71,867,206 | – | – | ||||||||||||
Health Care | 44,692,044 | 44,692,044 | – | – | ||||||||||||
Industrials | 71,955,782 | 71,955,782 | – | – | ||||||||||||
Information Technology | 58,763,613 | 58,763,613 | – | – | ||||||||||||
Materials | 24,870,835 | 24,870,835 | – | – | ||||||||||||
Real Estate | 23,713,160 | 23,713,160 | – | – | ||||||||||||
Telecommunications Services | 4,144,072 | 4,144,072 | – | – | ||||||||||||
Utilities | 9,859,279 | 9,859,279 | – | – | ||||||||||||
Short-Term Investments | 799,884 | – | 799,884 | – | ||||||||||||
|
|
|
|
|
|
|
| |||||||||
Subtotal Investments in Securities | $ | 391,506,596 | $ | 390,706,712 | $ | 799,884 | $ | – | ||||||||
|
|
|
|
|
|
|
| |||||||||
Other Investments * | Total | |||||||||||||||
Short-Term Investments | 9,304,310 | |||||||||||||||
Collateral Held for Securities Loaned | 23,458,379 | |||||||||||||||
|
| |||||||||||||||
Subtotal Other Investments | $ | 32,762,689 | ||||||||||||||
|
| |||||||||||||||
Total Investments at Value | $ | 424,269,285 | ||||||||||||||
|
| |||||||||||||||
| * | Certain investments are measured at fair value using a net asset value per share that is not publicly available (practical expedient). According to disclosure requirements of Accounting Standards Codification (ASC) 820, Fair Value Measurement, securities valued using the practical expedient are not classified in the fair value hierarchy. The fair value amounts presented in this table are intended to permit reconciliation of the fair value hierarchy to the amounts presented in the Statement of Assets and Liabilities. |
Other Financial Instruments | Total | Level 1 | Level 2 | Level 3 | ||||||||||||
Liability Derivatives | ||||||||||||||||
| Futures Contracts | 155,073 | 155,073 | — | — | ||||||||||||
|
|
|
|
|
|
|
| |||||||||
Total Liability Derivatives | $ | 155,073 | $ | 155,073 | $ | — | $ | — | ||||||||
|
|
|
|
|
|
|
| |||||||||
There were no significant transfers between Levels during the period ended December 31, 2016. Transfers between Levels are identified as of the end of the period.
The following table presents Small Cap Index Portfolio’s futures contracts held as of December 31, 2016. Investments and/or cash totaling $799,884 were pledged as the initial margin deposit for these contracts.
| Number of | Notional | |||||||||||||||||||
| Contracts | Expiration | Principal | Unrealized | |||||||||||||||||
Futures Contracts | Long/(Short) | Date | Amount | Value | Gain/(Loss) | |||||||||||||||
NYBOT NYF mini Russell 2000 Index | 147 | March 2017 | $ | 10,128,288 | $ | 9,973,215 | ($ | 155,073 | ) | |||||||||||
Total Futures Contracts | ($ | 155,073 | ) | |||||||||||||||||
The following table summarizes the fair value and Statement of Assets and Liabilities location, as of December 31, 2016, for Small Cap Index Portfolio’s investments in financial derivative instruments by primary risk exposure as discussed under item (2) Significant Accounting Policies of the Notes to Financial Statements.
Derivatives by risk category | Statement of Assets and Liabilities Location | Fair Value | ||||
Liability Derivatives | ||||||
Equity Contracts | ||||||
Futures* | Net Assets - Net unrealized appreciation/(depreciation) on Futures contracts | $ | 155,073 | |||
Total Equity Contracts | 155,073 | |||||
|
| |||||
Total Liability Derivatives | $ | 155,073 | ||||
|
| |||||
| * | Includes cumulative appreciation/depreciation of futures contracts as reported in the Schedule of Investments. Only current day’s variation margin is reported within the Statement of Assets and Liabilities. |
The accompanying Notes to Financial Statements are an integral part of this schedule.
126
Table of Contents
SMALL CAP INDEX PORTFOLIO
Summary Schedule of Investments as of December 31, 2016
The following table summarizes the net realized gains/(losses) and Statement of Operations location, for the period ended December 31, 2016, for Small Cap Index Portfolio’s investments in financial derivative instruments by primary risk exposure.
Derivatives by risk category | Statement of Operations Location | Realized Gains/(Losses) recognized in Income | ||||
Equity Contracts | ||||||
Futures | Net realized gains/(losses) on Futures contracts | 2,731,830 | ||||
Total Equity Contracts | 2,731,830 | |||||
|
| |||||
Total | $ | 2,731,830 | ||||
|
| |||||
The following table summarizes the change in net unrealized appreciation/(depreciation) and Statement of Operations location, for the period ended December 31, 2016, for Small Cap Index Portfolio’s investments in financial derivative instruments by primary risk exposure.
Derivatives by risk category | Statement of Operations Location | Change in unrealized appreciation/(depreciation) recognized in Income | ||||
Equity Contracts | ||||||
Futures | Change in net unrealized appreciation/(depreciation) on Futures contracts | (125,093 | ) | |||
Total Equity Contracts | (125,093 | ) | ||||
|
| |||||
Total | ($ | 125,093 | ) | |||
|
| |||||
The following table presents Small Cap Index Portfolio’s average volume of derivative activity during the period ended December 31, 2016.
| Futures | ||||||||
| (Percentage | ||||||||
| Derivative Risk | Futures | of Average | ||||||
Category | (Notional)* | Net Assets) | ||||||
Equity Contracts | $ | 11,126,585 | 3.5 | % | ||||
| * | Notional amount represents long or short, or both, derivative positions held by the Portfolio. |
Investment in Affiliates
Affiliated issuers, as defined under the Investment Company Act of 1940, include those in which the Portfolio’s holdings of an issuer represent 5% or more of the outstanding voting securities of an issuer, any affiliated mutual fund, or a company which is under common ownership or control with the Portfolio. The Portfolio owns shares of Thrivent Cash Management Trust for the purpose of securities lending and Thrivent Core Short-Term Reserve Fund primarily to serve as a cash sweep vehicle for the Portfolio. Thrivent Cash Management Trust and Thrivent Core Short-Term Reserve Fund are established for the sole use of affiliated portfolios.
A summary of transactions for the fiscal year to date, in Small Cap Index Portfolio, is as follows:
Portfolio | Value December 31, 2015 | Gross Purchases | Gross Sales | Shares Held at December 31, 2016 | Value December 31, 2016 | Income Earned January 1, 2016 - December 31, 2016 | ||||||||||||||||||
Cash Management Trust- Collateral Investment | $ | 15,229,214 | $ | 98,889,310 | $ | 90,660,145 | 23,458,379 | $ | 23,458,379 | $ | 259,023 | |||||||||||||
Cash Management Trust- Short Term Investment | 10,370,336 | 24,105,517 | 34,475,853 | — | — | 9,157 | ||||||||||||||||||
Core Short-Term Reserve Fund | — | 66,097,996 | 56,793,686 | 930,431 | 9,304,310 | 49,884 | ||||||||||||||||||
Total Value and Income Earned | $ | 25,599,550 | $ | 32,762,689 | $ | 318,064 | ||||||||||||||||||
The accompanying Notes to Financial Statements are an integral part of this schedule.
127
Table of Contents
Schedule of Investments as of December 31, 2016
| Shares | Common Stock (86.8%) | Value | ||||||
Consumer Discretionary (12.3%) | ||||||||
| 167,650 | American Axle & Manufacturing Holdings, Inc.a | $ | 3,235,645 | |||||
| 537,050 | Aramark | 19,183,426 | ||||||
| 299,650 | Cheesecake Factory, Inc. | 17,943,042 | ||||||
| 482,300 | DISH Network Corporationa | 27,939,639 | ||||||
| 211,200 | Dollar Tree, Inc.a | 16,300,416 | ||||||
| 269,119 | Scripps Networks Interactive, Inc. | 19,207,023 | ||||||
| 300,300 | Tempur Sealy International, Inc.a,b | 20,504,484 | ||||||
| 995,291 | Time, Inc. | 17,765,944 | ||||||
| 569,986 | Toll Brothers, Inc.a | 17,669,566 | ||||||
| 132,950 | Whirlpool Corporation | 24,166,322 | ||||||
|
| |||||||
Total | 183,915,507 | |||||||
|
| |||||||
Consumer Staples (1.8%) | ||||||||
| 215,900 | Ingredion, Inc. | 26,978,864 | ||||||
|
| |||||||
Total | 26,978,864 | |||||||
|
| |||||||
Energy (5.5%) | ||||||||
| 94,725 | Cimarex Energy Company | 12,873,128 | ||||||
| 299,600 | Continental Resources, Inc.a | 15,441,384 | ||||||
| 118,100 | Oil States International, Inc.a | 4,605,900 | ||||||
| 515,831 | Parsley Energy, Inc.a | 18,177,884 | ||||||
| 491,675 | Patterson-UTI Energy, Inc. | 13,235,891 | ||||||
| 420,650 | RPC, Inc.b | 8,333,076 | ||||||
| 598,775 | WPX Energy, Inc.a | 8,724,152 | ||||||
|
| |||||||
Total | 81,391,415 | |||||||
|
| |||||||
Financials (18.1%) | ||||||||
| 845,800 | Assured Guaranty, Ltd. | 31,945,866 | ||||||
| 449,396 | First Republic Bank | 41,407,347 | ||||||
| 3,619,575 | Huntington Bancshares, Inc. | 47,850,782 | ||||||
| 2,125,000 | KeyCorp | 38,823,750 | ||||||
| 130,050 | M&T Bank Corporation | 20,343,722 | ||||||
| 500,322 | Raymond James Financial, Inc. | 34,657,305 | ||||||
| 1,283,125 | Zions Bancorporation | 55,225,700 | ||||||
|
| |||||||
Total | 270,254,472 | |||||||
|
| |||||||
Health Care (8.7%) | ||||||||
| 161,432 | C.R. Bard, Inc. | 36,267,313 | ||||||
| 210,825 | Edwards Lifesciences Corporationa | 19,754,302 | ||||||
| 810,850 | Hologic, Inc.a | 32,531,302 | ||||||
| 248,553 | Universal Health Services, Inc. | 26,441,068 | ||||||
| 106,950 | Waters Corporationa | 14,373,011 | ||||||
|
| |||||||
Total | 129,366,996 | |||||||
|
| |||||||
Industrials (15.2%) | ||||||||
| 386,050 | AGCO Corporation | 22,336,853 | ||||||
| 150,340 | Equifax, Inc. | 17,774,698 | ||||||
| 182,800 | Huntington Ingalls Industries, Inc. | 33,669,932 | ||||||
| 245,050 | Masco Corporation | 7,748,481 | ||||||
| 627,834 | Oshkosh Corporation | 40,564,355 | ||||||
| 1,026,712 | Southwest Airlines Company | 51,171,326 | ||||||
| 377,150 | United Continental Holdings, Inc.a | 27,486,692 | ||||||
| 246,800 | WABCO Holdings, Inc.a | 26,197,820 | ||||||
|
| |||||||
Total | 226,950,157 | |||||||
|
| |||||||
Information Technology (13.9%) | ||||||||
| 309,875 | Akamai Technologies, Inc.a | 20,662,465 | ||||||
| 172,850 | Alliance Data Systems Corporation | 39,496,225 | ||||||
| 1,241,883 | Applied Materials, Inc. | 40,075,564 | ||||||
| 137,601 | NVIDIA Corporation | 14,687,531 | ||||||
| 410,175 | Paycom Software, Inc.a,b | 18,658,861 | ||||||
| 428,804 | PayPal Holdings, Inc.a | 16,924,894 | ||||||
| 429,400 | Red Hat, Inc.a | 29,929,180 | ||||||
| 1,091,672 | Teradyne, Inc. | 27,728,469 | ||||||
|
| |||||||
Total | 208,163,189 | |||||||
|
| |||||||
Materials (4.1%) | ||||||||
| 874,000 | Owens-Illinois, Inc.a | 15,216,340 | ||||||
| 1,304,763 | Steel Dynamics, Inc. | 46,423,468 | ||||||
|
| |||||||
Total | 61,639,808 | |||||||
|
| |||||||
Real Estate (5.7%) | ||||||||
| 191,100 | Camden Property Trust | 16,065,777 | ||||||
| 174,850 | Digital Realty Trust, Inc. | 17,180,761 | ||||||
| 618,250 | Duke Realty Corporation | 16,420,720 | ||||||
| 580,800 | General Growth Properties, Inc. | 14,508,384 | ||||||
| 1,075,948 | Host Hotels & Resorts, Inc. | 20,270,860 | ||||||
|
| |||||||
Total | 84,446,502 | |||||||
|
| |||||||
Utilities (1.5%) | ||||||||
| 505,700 | Public Service Enterprise Group, Inc. | 22,190,116 | ||||||
|
| |||||||
Total | 22,190,116 | |||||||
|
| |||||||
Total Common Stock (cost $917,198,224) | 1,295,297,026 | |||||||
|
| |||||||
Collateral Held for Securities Loaned (2.0%) | ||||||||
| 30,153,421 | Thrivent Cash Management Trust | 30,153,421 | ||||||
|
| |||||||
Total Collateral Held for Securities Loaned (cost $30,153,421) | 30,153,421 | |||||||
|
| |||||||
| Shares or Principal Amount | Short-Term Investments (12.1%)c | |||||||
Federal Home Loan Bank Discount Notes | ||||||||
| 3,000,000 | 0.350%, 1/3/2017 | 3,000,000 | ||||||
| 8,354,000 | 0.420%, 1/11/2017 | 8,353,298 | ||||||
| 14,000,000 | 0.370%, 1/13/2017 | 13,998,516 | ||||||
| 5,600,000 | 0.425%, 1/20/2017 | 5,598,998 | ||||||
| 5,000,000 | 0.470%, 1/24/2017 | 4,998,890 | ||||||
| 2,500,000 | 0.458%, 1/25/2017 | 2,499,420 | ||||||
| 8,600,000 | 0.490%, 1/26/2017 | 8,597,910 | ||||||
| 13,450,000 | 0.458%, 1/27/2017 | 13,446,597 | ||||||
| 7,800,000 | 0.389%, 2/1/2017 | 7,796,857 | ||||||
| 4,200,000 | 0.505%, 2/6/2017 | 4,198,018 | ||||||
| 4,900,000 | 0.460%, 2/8/2017 | 4,897,550 | ||||||
| 4,700,000 | 0.470%, 2/9/2017 | 4,697,584 | ||||||
| 10,000,000 | 0.515%, 2/15/2017 | 9,994,030 | ||||||
| 5,000,000 | 0.515%, 2/16/2017 | 4,996,945 | ||||||
| 8,030,000 | 0.530%, 2/22/2017 | 8,024,427 | ||||||
| 600,000 | 0.545%, 3/17/2017 | 599,367 | ||||||
Thrivent Core Short-Term Reserve Fund | ||||||||
| 7,489,621 | 0.910% | 74,896,213 | ||||||
|
| |||||||
Total Short-Term Investments (cost $180,590,497) | 180,594,620 | |||||||
|
| |||||||
Total Investments (cost $1,127,942,142) 100.9% | $ | 1,506,045,067 | ||||||
|
| |||||||
Other Assets and Liabilities, Net (0.9%) | (14,104,525 | ) | ||||||
|
| |||||||
Total Net Assets 100.0% | $ | 1,491,940,542 | ||||||
|
| |||||||
| a | Non-income producing security. |
| b | All or a portion of the security is on loan. |
| c | The interest rate shown reflects the yield, coupon rate or the discount rate at the date of purchase. |
The accompanying Notes to Financial Statements are an integral part of this schedule.
128
Table of Contents
MID CAP STOCK PORTFOLIO
Schedule of Investments as of December 31, 2016
The following table presents the total amount of securities loaned with continuous maturity, by type, offset by the gross payable upon return of collateral for securities loaned by Thrivent Mid Cap Stock Portfolio as of December 31, 2016:
Securities Lending Transactions | ||||
Common Stock | $ | 29,492,475 | ||
|
| |||
Total lending | $ | 29,492,475 | ||
Gross amount payable upon return of collateral for securities loaned | $ | 30,153,421 | ||
|
| |||
Net amounts due to counterparty | $ | 660,946 | ||
|
| |||
Unrealized Appreciation (Depreciation)
Gross unrealized appreciation and depreciation of investments, based on cost for federal income tax purposes, were as follows:
Gross unrealized appreciation | $ | 387,696,211 | ||
Gross unrealized depreciation | (9,944,149 | ) | ||
|
| |||
Net unrealized appreciation (depreciation) | $ | 377,752,062 | ||
Cost for federal income tax purposes | $ | 1,128,293,005 |
Fair Valuation Measurements
The following table is a summary of the inputs used, as of December 31, 2016, in valuing Mid Cap Stock Portfolio’s assets carried at fair value.
Investments in Securities | Total | Level 1 | Level 2 | Level 3 | ||||||||||||
Common Stock | ||||||||||||||||
Consumer Discretionary | 183,915,507 | 183,915,507 | — | — | ||||||||||||
Consumer Staples | 26,978,864 | 26,978,864 | — | — | ||||||||||||
Energy | 81,391,415 | 81,391,415 | — | — | ||||||||||||
Financials | 270,254,472 | 270,254,472 | — | — | ||||||||||||
Health Care | 129,366,996 | 129,366,996 | — | — | ||||||||||||
Industrials | 226,950,157 | 226,950,157 | — | — | ||||||||||||
Information Technology | 208,163,189 | 208,163,189 | — | — | ||||||||||||
Materials | 61,639,808 | 61,639,808 | — | — | ||||||||||||
Real Estate | 84,446,502 | 84,446,502 | — | — | ||||||||||||
Utilities | 22,190,116 | 22,190,116 | — | — | ||||||||||||
Short-Term Investments | 105,698,407 | — | 105,698,407 | — | ||||||||||||
|
|
|
|
|
|
|
| |||||||||
Subtotal Investments in Securities | $ | 1,400,995,433 | $ | 1,295,297,026 | $ | 105,698,407 | $ | — | ||||||||
|
|
|
|
|
|
|
| |||||||||
Other Investments* | Total | |||||||||||||||
Short-Term Investments | 74,896,213 | |||||||||||||||
Collateral Held for Securities Loaned | 30,153,421 | |||||||||||||||
|
| |||||||||||||||
Subtotal Other Investments | $ | 105,049,634 | ||||||||||||||
|
| |||||||||||||||
Total Investments at Value | $ | 1,506,045,067 | ||||||||||||||
|
| |||||||||||||||
| * | Certain investments are measured at fair value using a net asset value per share that is not publicly available (practical expedient). According to disclosure requirements of Accounting Standards Codification (ASC) 820, Fair Value Measurement, securities valued using the practical expedient are not classified in the fair value hierarchy. The fair value amounts presented in this table are intended to permit reconciliation of the fair value hierarchy to the amounts presented in the Statement of Assets and Liabilities. |
There were no significant transfers between Levels during the period ended December 31, 2016. Transfers between Levels are identified as of the end of the period.
The accompanying Notes to Financial Statements are an integral part of this schedule.
129
Table of Contents
MID CAP STOCK PORTFOLIO
Schedule of Investments as of December 31, 2016
Investment in Affiliates
Affiliated issuers, as defined under the Investment Company Act of 1940, include those in which the Portfolio’s holdings of an issuer represent 5% or more of the outstanding voting securities of an issuer, any affiliated mutual fund, or a company which is under common ownership or control with the Portfolio. The Portfolio owns shares of Thrivent Cash Management Trust for the purpose of securities lending and Thrivent Core Short-Term Reserve Fund primarily to serve as a cash sweep vehicle for the Portfolio. Thrivent Cash Management Trust and Thrivent Core Short-Term Reserve Fund are established for the sole use of affiliated portfolios.
A summary of transactions for the fiscal year to date, in Mid Cap Stock Portfolio, is as follows:
Portfolio | Value December 31, 2015 | Gross Purchases | Gross Sales | Shares Held at December 31, 2016 | Value December 31, 2016 | Income Earned January 1, 2016 - December 31, 2016 | ||||||||||||||||||
Cash Management Trust- Collateral Investment | $ | 57,473,443 | $ | 316,535,118 | $ | 343,855,140 | 30,153,421 | $ | 30,153,421 | $ | 121,736 | |||||||||||||
Cash Management Trust- Short Term Investment | 50,569,195 | 76,915,662 | 127,484,857 | — | — | 48,058 | ||||||||||||||||||
Core Short-Term Reserve Fund | — | 145,377,201 | 70,480,988 | 7,489,621 | 74,896,213 | 277,567 | ||||||||||||||||||
Total Value and Income Earned | $ | 108,042,638 | $ | 105,049,634 | $ | 447,361 | ||||||||||||||||||
The accompanying Notes to Financial Statements are an integral part of this schedule.
130
Table of Contents
Summary Schedule of Investments as of December 31, 2016
| Shares | Common Stock (96.6%) | Value | % of Net Assets | |||||||||
Consumer Discretionary (10.7%) | ||||||||||||
| 8,190 | Domino’s Pizza, Inc. | $ | 1,304,176 | 0.5 | % | |||||||
Other Securities^ | 29,564,083 | 10.2 | % | |||||||||
|
| |||||||||||
Total | 30,868,259 | |||||||||||
|
| |||||||||||
Consumer Staples (4.2%) | ||||||||||||
| 12,360 | Ingredion, Inc. | 1,544,506 | 0.5 | % | ||||||||
| 30,330 | WhiteWave Foods Companya | 1,686,348 | 0.6 | % | ||||||||
Other Securities^ | 8,756,114 | 3.1 | % | |||||||||
|
| |||||||||||
Total | 11,986,968 | |||||||||||
|
| |||||||||||
Energy (3.8%) | ||||||||||||
Other Securities^ | 10,998,391 | 3.8 | % | |||||||||
|
| |||||||||||
Total | 10,998,391 | |||||||||||
|
| |||||||||||
Financials (16.5%) | ||||||||||||
| 2,620 | Alleghany Corporationa | 1,593,274 | 0.6 | % | ||||||||
| 24,690 | East West Bancorp, Inc. | 1,254,993 | 0.4 | % | ||||||||
| 6,920 | Everest Re Group, Ltd. | 1,497,488 | 0.5 | % | ||||||||
| 16,150 | MSCI, Inc. | 1,272,297 | 0.4 | % | ||||||||
| 83,541 | New York Community Bancorp, Inc. | 1,329,137 | 0.5 | % | ||||||||
| 20,590 | PacWest Bancorp | 1,120,920 | 0.4 | % | ||||||||
| 21,685 | Raymond James Financial, Inc. | 1,502,120 | 0.5 | % | ||||||||
| 11,040 | Reinsurance Group of America, Inc. | 1,389,163 | 0.5 | % | ||||||||
| 23,130 | SEI Investments Company | 1,141,697 | 0.4 | % | ||||||||
| 9,270 | Signature Banka | 1,392,354 | 0.5 | % | ||||||||
| 8,880 | SVB Financial Groupa | 1,524,341 | 0.5 | % | ||||||||
Other Securities^ | 32,559,290 | 11.3 | % | |||||||||
|
| |||||||||||
Total | 47,577,074 | |||||||||||
|
| |||||||||||
Health Care (7.3%) | ||||||||||||
| 12,720 | Align Technology, Inc.a | 1,222,774 | 0.4 | % | ||||||||
| 15,290 | IDEXX Laboratories, Inc.a | 1,793,058 | 0.6 | % | ||||||||
| 24,040 | ResMed, Inc. | 1,491,682 | 0.5 | % | ||||||||
| 7,510 | Teleflex, Inc. | 1,210,236 | 0.4 | % | ||||||||
Other Securities^ | 15,226,719 | 5.4 | % | |||||||||
|
| |||||||||||
Total | 20,944,469 | |||||||||||
|
| |||||||||||
Industrials (14.4%) | ||||||||||||
| 25,290 | A.O. Smith Corporation | 1,197,482 | 0.4 | % | ||||||||
| 10,970 | Carlisle Companies, Inc. | 1,209,881 | 0.4 | % | ||||||||
| 7,951 | Huntington Ingalls Industries, Inc. | 1,464,495 | 0.5 | % | ||||||||
| 13,070 | IDEX Corporation | 1,177,084 | 0.4 | % | ||||||||
| 55,595 | JetBlue Airways Corporationa | 1,246,440 | 0.4 | % | ||||||||
| 15,220 | Wabtec Corporation | 1,263,564 | 0.4 | % | ||||||||
Other Securities^ | 33,816,945 | 11.9 | % | |||||||||
|
| |||||||||||
Total | 41,375,891 | |||||||||||
|
| |||||||||||
Information Technology (17.1%) | ||||||||||||
| 128,970 | Advanced Micro Devices, Inc.a | 1,462,520 | 0.5 | % | ||||||||
| 14,790 | ANSYS, Inc.a | 1,367,927 | 0.5 | % | ||||||||
| 20,320 | Broadridge Financial Solutions, Inc. | 1,347,216 | 0.5 | % | ||||||||
| 48,870 | Cadence Design Systems, Inc.a | 1,232,501 | 0.4 | % | ||||||||
| 25,480 | CDK Global, Inc. | 1,520,901 | 0.5 | % | ||||||||
| 23,710 | Computer Sciences Corporation | 1,408,848 | 0.5 | % | ||||||||
| 14,080 | Gartner, Inc.a | 1,423,066 | 0.5 | % | ||||||||
| 13,380 | Jack Henry & Associates, Inc. | 1,187,876 | 0.4 | % | ||||||||
| 24,395 | Leidos Holdings, Inc. | 1,247,560 | 0.4 | % | ||||||||
| 25,870 | Synopsys, Inc.a | 1,522,708 | 0.5 | % | ||||||||
| 42,840 | Trimble, Inc.a | 1,291,626 | 0.4 | % | ||||||||
Other Securities^ | 34,253,330 | 12.0 | % | |||||||||
|
| |||||||||||
Total | 49,266,079 | |||||||||||
|
| |||||||||||
Materials (7.1%) | ||||||||||||
| 10,650 | Ashland Global Holdings, Inc. | 1,163,938 | 0.4 | % | ||||||||
| 15,930 | Packaging Corporation of America | 1,351,183 | 0.5 | % | ||||||||
| 22,880 | RPM International, Inc. | 1,231,630 | 0.4 | % | ||||||||
| 41,610 | Steel Dynamics, Inc. | 1,480,484 | 0.5 | % | ||||||||
| 12,560 | Valspar Corporation | 1,301,342 | 0.5 | % | ||||||||
Other Securities^ | 13,862,162 | 4.8 | % | |||||||||
|
| |||||||||||
Total | 20,390,739 | |||||||||||
|
| |||||||||||
Real Estate (10.1%) | ||||||||||||
| 13,620 | Alexandria Real Estate Equities, Inc. | 1,513,591 | 0.5 | % | ||||||||
| 22,710 | American Campus Communities, Inc. | 1,130,277 | 0.4 | % | ||||||||
| 14,960 | Camden Property Trust | 1,257,687 | 0.4 | % | ||||||||
| 60,680 | Duke Realty Corporation | 1,611,661 | 0.6 | % | ||||||||
| 15,840 | Kilroy Realty Corporation | 1,159,805 | 0.4 | % | ||||||||
| 17,960 | Regency Centers Corporation | 1,238,342 | 0.4 | % | ||||||||
Other Securities^ | 21,211,705 | 7.4 | % | |||||||||
|
| |||||||||||
Total | 29,123,068 | |||||||||||
|
| |||||||||||
Telecommunications Services (0.2%) | ||||||||||||
Other Securities^ | 459,177 | 0.2 | % | |||||||||
|
| |||||||||||
Total | 459,177 | |||||||||||
|
| |||||||||||
Utilities (5.2%) | ||||||||||||
| 17,850 | Atmos Energy Corporation | 1,323,577 | 0.5 | % | ||||||||
| 34,250 | OGE Energy Corporation | 1,145,662 | 0.4 | % | ||||||||
| 29,770 | UGI Corporation | 1,371,802 | 0.5 | % | ||||||||
| 24,340 | Westar Energy, Inc. | 1,371,559 | 0.5 | % | ||||||||
Other Securities^ | 9,651,933 | 3.3 | % | |||||||||
|
| |||||||||||
Total | 14,864,533 | |||||||||||
|
| |||||||||||
Total Common Stock (cost $221,145,241) | 277,854,648 | |||||||||||
|
| |||||||||||
Collateral Held for Securities Loaned (2.1%) | ||||||||||||
| 6,191,137 | Thrivent Cash Management Trust | 6,191,137 | 2.1 | % | ||||||||
|
| |||||||||||
Total Collateral Held for Securities Loaned (cost $6,191,137) | 6,191,137 | |||||||||||
|
| |||||||||||
| Shares or Principal Amount | Short-Term Investments (3.2%)b | |||||||||||
Thrivent Core Short-Term Reserve Fund | ||||||||||||
| 830,705 | 0.910% | 8,307,047 | 2.9 | % | ||||||||
Other Securities^ | 799,660 | 0.3 | % | |||||||||
|
| |||||||||||
Total Short-Term Investments (cost $9,106,711) | 9,106,707 | |||||||||||
|
| |||||||||||
Total Investments (cost $236,443,089) 101.9% | $ | 293,152,492 | ||||||||||
|
| |||||||||||
Other Assets and Liabilities, Net (1.9%) | (5,480,334 | ) | ||||||||||
|
| |||||||||||
Total Net Assets 100.0% | $ | 287,672,158 | ||||||||||
|
| |||||||||||
The accompanying Notes to Financial Statements are an integral part of this schedule.
131
Table of Contents
MID CAP INDEX PORTFOLIO
Summary Schedule of Investments as of December 31, 2016
| ^ | The Summary Schedule of Investments shows the 50 largest holdings in unaffiliated issuers, any holding or issuer that exceeds 1% of net assets and all affiliated holdings as of the report date. The remaining securities held are grouped by category as “Other securities”. |
| a | Non-income producing security. |
| b | The interest rate shown reflects the yield, coupon rate or the discount rate at the date of purchase. |
The following table presents the total amount of securities loaned with continuous maturity, by type, offset by the gross payable upon return of collateral for securities loaned by Thrivent Mid Cap Index Portfolio as of December 31, 2016:
Securities Lending Transactions | ||||
Common Stock | $ | 5,996,089 | ||
|
| |||
Total lending | $ | 5,996,089 | ||
Gross amount payable upon return of collateral for securities loaned | $ | 6,191,137 | ||
|
| |||
Net amounts due to counterparty | $ | 195,048 | ||
|
| |||
Unrealized Appreciation (Depreciation)
Gross unrealized appreciation and depreciation of investments, based on cost for federal income tax purposes, were as follows:
Gross unrealized appreciation | $ | 62,708,852 | ||
Gross unrealized depreciation | (7,850,149 | ) | ||
|
| |||
Net unrealized appreciation (depreciation) | $ | 54,858,703 | ||
Cost for federal income tax purposes | $ | 238,293,789 |
The accompanying Notes to Financial Statements are an integral part of this schedule.
132
Table of Contents
MID CAP INDEX PORTFOLIO
Summary Schedule of Investments as of December 31, 2016
Fair Valuation Measurements
The following table is a summary of the inputs used, as of December 31, 2016, in valuing Mid Cap Index Portfolio’s assets carried at fair value.
Investments in Securities | Total | Level 1 | Level 2 | Level 3 | ||||||||||||
Common Stock | ||||||||||||||||
Consumer Discretionary | 30,868,259 | 30,868,259 | — | — | ||||||||||||
Consumer Staples | 11,986,968 | 11,986,968 | — | — | ||||||||||||
Energy | 10,998,391 | 10,998,391 | — | — | ||||||||||||
Financials | 47,577,074 | 47,577,074 | — | — | ||||||||||||
Health Care | 20,944,469 | 20,944,469 | — | — | ||||||||||||
Industrials | 41,375,891 | 41,375,891 | — | — | ||||||||||||
Information Technology | 49,266,079 | 49,266,079 | — | — | ||||||||||||
Materials | 20,390,739 | 20,390,739 | — | — | ||||||||||||
Real Estate | 29,123,068 | 29,123,068 | — | — | ||||||||||||
Telecommunications Services | 459,177 | 459,177 | — | — | ||||||||||||
Utilities | 14,864,533 | 14,864,533 | — | — | ||||||||||||
Short-Term Investments | 799,660 | — | 799,660 | — | ||||||||||||
|
|
|
|
|
|
|
| |||||||||
Subtotal Investments in Securities | $ | 278,654,308 | $ | 277,854,648 | $ | 799,660 | $ | — | ||||||||
|
|
|
|
|
|
|
| |||||||||
Other Investments * | Total | |||||||||||||||
Short-Term Investments | 8,307,047 | |||||||||||||||
Collateral Held for Securities Loaned | 6,191,137 | |||||||||||||||
|
| |||||||||||||||
Subtotal Other Investments | $ | 14,498,184 | ||||||||||||||
|
| |||||||||||||||
Total Investments at Value | $ | 293,152,492 | ||||||||||||||
|
| |||||||||||||||
| * | Certain investments are measured at fair value using a net asset value per share that is not publicly available (practical expedient). According to disclosure requirements of Accounting Standards Codification (ASC) 820, Fair Value Measurement, securities valued using the practical expedient are not classified in the fair value hierarchy. The fair value amounts presented in this table are intended to permit reconciliation of the fair value hierarchy to the amounts presented in the Statement of Assets and Liabilities. |
Other Financial Instruments | Total | Level 1 | Level 2 | Level 3 | ||||||||||||
Liability Derivatives | ||||||||||||||||
| Futures Contracts | 114,127 | 114,127 | — | — | ||||||||||||
|
|
|
|
|
|
|
| |||||||||
Total Liability Derivatives | $ | 114,127 | $ | 114,127 | $ | — | $ | — | ||||||||
|
|
|
|
|
|
|
| |||||||||
There were no significant transfers between Levels during the period ended December 31, 2016. Transfers between Levels are identified as of the end of the period.
The following table presents Mid Cap Index Portfolio’s futures contracts held as of December 31, 2016. Investments and/or cash totaling $599,758 were pledged as the initial margin deposit for these contracts.
Futures Contracts | Number of Contracts Long/(Short) | Expiration Date | Notional Principal Amount | Value | Unrealized Gain/(Loss) | |||||||||||||||
CME E-mini S&P Mid-Cap 400 Index | 54 | March 2017 | $ | 9,073,267 | $ | 8,959,140 | ($ | 114,127 | ) | |||||||||||
Total Futures Contracts | ($ | 114,127 | ) | |||||||||||||||||
The following table summarizes the fair value and Statement of Assets and Liabilities location, as of December 31, 2016, for Mid Cap Index Portfolio’s investments in financial derivative instruments by primary risk exposure as discussed under item (2) Significant Accounting Policies of the Notes to Financial Statements.
Derivatives by risk category | Statement of Assets and Liabilities Location | Fair Value | ||||
Liability Derivatives | ||||||
Equity Contracts | ||||||
Futures* | Net Assets - Net unrealized appreciation/(depreciation) on Futures contracts | $ | 114,127 | |||
Total Equity Contracts | 114,127 | |||||
|
| |||||
Total Liability Derivatives | $ | 114,127 | ||||
|
| |||||
| * | Includes cumulative appreciation/depreciation of futures contracts as reported in the Schedule of Investments. Only current day’s variation margin is reported within the Statement of Assets and Liabilities. |
The accompanying Notes to Financial Statements are an integral part of this schedule.
133
Table of Contents
MID CAP INDEX PORTFOLIO
Summary Schedule of Investments as of December 31, 2016
The following table summarizes the net realized gains/(losses) and Statement of Operations location, for the period ended December 31, 2016, for Mid Cap Index Portfolio’s investments in financial derivative instruments by primary risk exposure.
Derivatives by risk category | Statement of Operations Location | Realized Gains/(Losses) recognized in Income | ||||
Equity Contracts | ||||||
Futures | Net realized gains/(losses) on Futures contracts | 805,027 | ||||
Total Equity Contracts | 805,027 | |||||
|
| |||||
Total | $ | 805,027 | ||||
|
| |||||
The following table summarizes the change in net unrealized appreciation/(depreciation) and Statement of Operations location, for the period ended December 31, 2016, for Mid Cap Index Portfolio’s investments in financial derivative instruments by primary risk exposure.
Derivatives by risk category | Statement of Operations Location | Change in unrealized appreciation/(depreciation) recognized in Income | ||||
Equity Contracts | ||||||
Futures | Change in net unrealized appreciation/(depreciation) on Futures contracts | (76,091 | ) | |||
Total Equity Contracts | (76,091 | ) | ||||
|
| |||||
Total | ($ | 76,091 | ) | |||
|
| |||||
The following table presents Mid Cap Index Portfolio’s average volume of derivative activity during the period ended December 31, 2016.
Derivative Risk Category | Futures (Notional)* | Futures (Percentage of Average Net Assets) | ||||||
Equity Contracts | $ | 8,010,191 | 3.6 | % | ||||
| * | Notional amount represents long or short, or both, derivative positions held by the Portfolio. |
Investment in Affiliates
Affiliated issuers, as defined under the Investment Company Act of 1940, include those in which the Portfolio’s holdings of an issuer represent 5% or more of the outstanding voting securities of an issuer, any affiliated mutual fund, or a company which is under common ownership or control with the Portfolio. The Portfolio owns shares of Thrivent Cash Management Trust for the purpose of securities lending and Thrivent Core Short-Term Reserve Fund primarily to serve as a cash sweep vehicle for the Portfolio. Thrivent Cash Management Trust and Thrivent Core Short-Term Reserve Fund are established for the sole use of affiliated portfolios.
A summary of transactions for the fiscal year to date, in Mid Cap Index Portfolio, is as follows:
Portfolio | Value December 31, 2015 | Gross Purchases | Gross Sales | Shares Held at December 31, 2016 | Value December 31, 2016 | Income Earned January 1, 2016 - December 31, 2016 | ||||||||||||||||||
Cash Management Trust- Collateral Investment | $ | 5,872,212 | $ | 60,614,553 | $ | 60,295,628 | 6,191,137 | $ | 6,191,137 | $ | 57,041 | |||||||||||||
Cash Management Trust- Short Term Investment | 9,442,638 | 23,557,238 | 32,999,876 | — | — | 6,222 | ||||||||||||||||||
Core Short-Term Reserve Fund | — | 61,738,184 | 53,431,137 | 830,705 | 8,307,047 | 39,019 | ||||||||||||||||||
Total Value and Income Earned | $ | 15,314,850 | $ | 14,498,184 | $ | 102,282 | ||||||||||||||||||
The accompanying Notes to Financial Statements are an integral part of this schedule.
134
Table of Contents
PARTNER WORLDWIDE ALLOCATION PORTFOLIO
Summary Schedule of Investments as of December 31, 2016
| Shares | Common Stock (87.4%) | Value | % of Net Assets | |||||||||
Australia (6.1%) | ||||||||||||
| 633,572 | Australia & New Zealand Banking Group, Ltd. | $ | 13,869,665 | 0.8 | % | |||||||
| 611,961 | Westpac Banking Corporation | 14,365,145 | 0.9 | % | ||||||||
Other Securities^ | 73,494,256 | 4.4 | % | |||||||||
|
| |||||||||||
Total | 101,729,066 | |||||||||||
|
| |||||||||||
Austria (0.8%) | ||||||||||||
| 187,830 | OMV AG | 6,621,720 | 0.4 | % | ||||||||
Other Securities^ | 6,081,163 | 0.4 | % | |||||||||
|
| |||||||||||
Total | 12,702,883 | |||||||||||
|
| |||||||||||
Belgium (0.9%) | ||||||||||||
Other Securities^ | 15,374,612 | 0.9 | % | |||||||||
|
| |||||||||||
Total | 15,374,612 | |||||||||||
|
| |||||||||||
Bermuda (0.1%) | ||||||||||||
Other Securities^ | 929,711 | 0.1 | % | |||||||||
|
| |||||||||||
Total | 929,711 | |||||||||||
|
| |||||||||||
Brazil (1.5%) | ||||||||||||
| 712,300 | Banco Bradesco SA ADR | 6,204,133 | 0.4 | % | ||||||||
Other Securities^ | 18,509,626 | 1.1 | % | |||||||||
|
| |||||||||||
Total | 24,713,759 | |||||||||||
|
| |||||||||||
Canada (3.7%) | ||||||||||||
| 92,746 | Canadian National Railway Company | 6,241,782 | 0.4 | % | ||||||||
Other Securities^ | 54,485,576 | 3.3 | % | |||||||||
|
| |||||||||||
Total | 60,727,358 | |||||||||||
|
| |||||||||||
Cayman Islands (0.2%) | ||||||||||||
Other Securities^ | 3,323,483 | 0.2 | % | |||||||||
|
| |||||||||||
Total | 3,323,483 | |||||||||||
|
| |||||||||||
Chile (0.3%) | ||||||||||||
Other Securities^ | 4,789,124 | 0.3 | % | |||||||||
|
| |||||||||||
Total | 4,789,124 | |||||||||||
|
| |||||||||||
China (0.1%) | ||||||||||||
Other Securities^ | 1,914,628 | 0.1 | % | |||||||||
|
| |||||||||||
Total | 1,914,628 | |||||||||||
|
| |||||||||||
Denmark (1.4%) | ||||||||||||
| 203,986 | Novo Nordisk AS | 7,317,424 | 0.4 | % | ||||||||
Other Securities^ | 15,159,868 | 1.0 | % | |||||||||
Total | 22,477,292 | |||||||||||
Faroe Islands (0.1%) | ||||||||||||
Other Securities^ | 1,399,950 | 0.1 | % | |||||||||
Total | 1,399,950 | |||||||||||
Finland (0.8%) | ||||||||||||
| 257,688 | UPM-Kymmene Oyj | 6,301,927 | 0.4 | % | ||||||||
Other Securities^ | 7,714,330 | 0.4 | % | |||||||||
|
| |||||||||||
Total | 14,016,257 | |||||||||||
|
| |||||||||||
France (3.9%) | ||||||||||||
| 329,108 | AXA SA | 8,296,446 | 0.5 | % | ||||||||
| 108,140 | Sanofi | 8,744,790 | 0.5 | % | ||||||||
| 298,258 | Total SA | 15,298,330 | 0.9 | % | ||||||||
Other Securities^ | 32,815,008 | 2.0 | % | |||||||||
|
| |||||||||||
Total | 65,154,574 | |||||||||||
|
| |||||||||||
Germany (6.6%) | ||||||||||||
| 62,736 | Allianz SE | 10,353,851 | 0.6 | % | ||||||||
| 197,508 | Evonik Industries AG | 5,887,500 | 0.4 | % | ||||||||
| 83,599 | Fresenius SE & Company KGaA | 6,521,649 | 0.4 | % | ||||||||
| 107,068 | SAP SE | 9,261,953 | 0.6 | % | ||||||||
| 160,193 | Siemens AG | 19,614,090 | 1.2 | % | ||||||||
Other Securities^ | 57,885,073 | 3.4 | % | |||||||||
|
| |||||||||||
Total | 109,524,116 | |||||||||||
|
| |||||||||||
Hong Kong (2.8%) | ||||||||||||
| 1,403,800 | AIA Group, Ltd. | 7,863,864 | 0.5 | % | ||||||||
| 661,300 | China Mobile, Ltd. | 6,972,202 | 0.4 | % | ||||||||
Other Securities^ | 31,156,123 | 1.9 | % | |||||||||
|
| |||||||||||
Total | 45,992,189 | |||||||||||
|
| |||||||||||
Hungary (0.2%) | ||||||||||||
Other Securities^ | 3,083,866 | 0.2 | % | |||||||||
|
| |||||||||||
Total | 3,083,866 | |||||||||||
|
| |||||||||||
India (2.3%) | ||||||||||||
| 464,741 | Housing Development Finance Corporation | 8,619,046 | 0.5 | % | ||||||||
| 1,742,313 | ITC, Ltd. | 6,188,742 | 0.4 | % | ||||||||
Other Securities^ | 24,379,985 | 1.4 | % | |||||||||
Total | 39,187,773 | |||||||||||
Indonesia (0.7%) | ||||||||||||
| 14,912,100 | Astra International Tbk PT | 9,118,322 | 0.5 | % | ||||||||
Other Securities^ | 2,660,373 | 0.2 | % | |||||||||
|
| |||||||||||
Total | 11,778,695 | |||||||||||
|
| |||||||||||
Ireland (0.4%) | ||||||||||||
Other Securities^ | 6,775,988 | 0.4 | % | |||||||||
|
| |||||||||||
Total | 6,775,988 | |||||||||||
|
| |||||||||||
Israel (0.2%) | ||||||||||||
Other Securities^ | 3,764,051 | 0.2 | % | |||||||||
|
| |||||||||||
Total | 3,764,051 | |||||||||||
|
| |||||||||||
Italy (1.9%) | ||||||||||||
Other Securities^ | 31,317,158 | 1.9 | % | |||||||||
|
| |||||||||||
Total | 31,317,158 | |||||||||||
|
| |||||||||||
Japan (18.3%) | ||||||||||||
| 256,800 | Bridgestone Corporation | 9,239,866 | 0.6 | % | ||||||||
| 193,400 | Fuji Heavy Industries, Ltd. | 7,879,968 | 0.5 | % | ||||||||
| 526,500 | Honda Motor Company, Ltd. | 15,371,333 | 0.9 | % | ||||||||
| 310,900 | Mitsubishi Corporation | 6,603,098 | 0.4 | % | ||||||||
| 4,546,400 | Mizuho Financial Group, Inc. | 8,158,673 | 0.5 | % | ||||||||
| 1,568,000 | Osaka Gas Company, Ltd. | 6,016,513 | 0.4 | % | ||||||||
| 146,800 | Toyota Motor Corporation | 8,606,651 | 0.5 | % | ||||||||
Other Securities^ | 240,941,536 | 14.5 | % | |||||||||
|
| |||||||||||
Total | 302,817,638 | |||||||||||
|
| |||||||||||
Jersey (0.3%) | ||||||||||||
Other Securities^ | 5,666,515 | 0.3 | % | |||||||||
|
| |||||||||||
Total | 5,666,515 | |||||||||||
|
| |||||||||||
Luxembourg (0.7%) | ||||||||||||
Other Securities^ | 12,057,587 | 0.7 | % | |||||||||
|
| |||||||||||
Total | 12,057,587 | |||||||||||
|
| |||||||||||
Malaysia (0.2%) | ||||||||||||
Other Securities^ | 3,494,717 | 0.2 | % | |||||||||
|
| |||||||||||
Total | 3,494,717 | |||||||||||
|
| |||||||||||
Mexico (1.0%) | ||||||||||||
| 83,000 | Fomento Economico Mexicano SAB de CV ADR | 6,325,430 | 0.4 | % | ||||||||
| 1,272,594 | Grupo Financiero Banorte SAB de CV ADR | 6,267,923 | 0.4 | % | ||||||||
Other Securities^ | 4,087,293 | 0.2 | % | |||||||||
|
| |||||||||||
Total | 16,680,646 | |||||||||||
|
| |||||||||||
Netherlands (2.3%) | ||||||||||||
| 181,237 | Unilever NV | 7,445,031 | 0.5 | % | ||||||||
The accompanying Notes to Financial Statements are an integral part of this schedule.
135
Table of Contents
PARTNER WORLDWIDE ALLOCATION PORTFOLIO
Summary Schedule of Investments as of December 31, 2016
| Shares | Common Stock (87.4%) | Value | % of Net Assets | |||||||||
Netherlands (2.3%) - continued | ||||||||||||
Other Securities^ | $ | 29,413,884 | 1.8 | % | ||||||||
|
| |||||||||||
Total | 36,858,915 | |||||||||||
|
| |||||||||||
New Zealand (<0.1%) | ||||||||||||
Other Securities^ | 532,370 | <0.1 | % | |||||||||
|
| |||||||||||
Total | 532,370 | |||||||||||
|
| |||||||||||
Norway (1.4%) | ||||||||||||
| 1,346,647 | Norsk Hydro ASA | 6,427,186 | 0.4 | % | ||||||||
Other Securities^ | 17,189,139 | 1.0 | % | |||||||||
|
| |||||||||||
Total | 23,616,325 | |||||||||||
|
| |||||||||||
Philippines (0.5%) | ||||||||||||
Other Securities^ | 8,829,333 | 0.5 | % | |||||||||
|
| |||||||||||
Total | 8,829,333 | |||||||||||
|
| |||||||||||
Poland (0.2%) | ||||||||||||
Other Securities^ | 3,163,248 | 0.2 | % | |||||||||
|
| |||||||||||
Total | 3,163,248 | |||||||||||
|
| |||||||||||
Portugal (0.9%) | ||||||||||||
| 421,119 | Galp Energia SGPS SA | 6,278,164 | 0.4 | % | ||||||||
Other Securities^ | 8,855,114 | 0.5 | % | |||||||||
|
| |||||||||||
Total | 15,133,278 | |||||||||||
|
| |||||||||||
Russia (0.8%) | ||||||||||||
| 112,500 | Lukoil ADR | 6,301,755 | 0.4 | % | ||||||||
| 34,097 | Magnit PJSC | 6,112,780 | 0.4 | % | ||||||||
|
| |||||||||||
Total | 12,414,535 | |||||||||||
|
| |||||||||||
Singapore (0.7%) | ||||||||||||
Other Securities^ | 12,359,944 | 0.7 | % | |||||||||
|
| |||||||||||
Total | 12,359,944 | |||||||||||
|
| |||||||||||
South Africa (0.6%) | ||||||||||||
Other Securities^ | 9,407,815 | 0.6 | % | |||||||||
|
| |||||||||||
Total | 9,407,815 | |||||||||||
|
| |||||||||||
South Korea (0.4%) | ||||||||||||
Other Securities^ | 5,799,734 | 0.4 | % | |||||||||
|
| |||||||||||
Total | 5,799,734 | |||||||||||
|
| |||||||||||
Spain (1.0%) | ||||||||||||
Other Securities^ | 17,009,283 | 1.0 | % | |||||||||
|
| |||||||||||
Total | 17,009,283 | |||||||||||
|
| |||||||||||
Sweden (2.0%) | ||||||||||||
| 902,613 | Nordea Bank AB | 10,001,516 | 0.6 | % | ||||||||
Other Securities^ | 22,252,051 | 1.4 | % | |||||||||
|
| |||||||||||
Total | 32,253,567 | |||||||||||
|
| |||||||||||
Switzerland (6.3%) | ||||||||||||
| 519,819 | ABB, Ltd. | 10,937,888 | 0.7 | % | ||||||||
| 267,828 | Nestle SA | 19,186,552 | 1.2 | % | ||||||||
| 184,549 | Novartis AG | 13,421,049 | 0.8 | % | ||||||||
| 60,720 | Roche Holding AG-Genusschein | 13,841,280 | 0.8 | % | ||||||||
Other Securities^ | 47,254,038 | 2.8 | % | |||||||||
|
| |||||||||||
Total | 104,640,807 | |||||||||||
|
| |||||||||||
Taiwan (0.7%) | ||||||||||||
| 1,693,951 | Taiwan Semiconductor Manufacturing Company, Ltd. | 9,488,253 | 0.6 | % | ||||||||
Other Securities^ | 2,132,155 | 0.1 | % | |||||||||
|
| |||||||||||
Total | 11,620,408 | |||||||||||
|
| |||||||||||
Thailand (0.7%) | ||||||||||||
| 427,750 | Siam Cement pcl | 5,936,881 | 0.4 | % | ||||||||
Other Securities^ | 5,570,333 | 0.3 | % | |||||||||
|
| |||||||||||
Total | 11,507,214 | |||||||||||
|
| |||||||||||
Turkey (0.6%) | ||||||||||||
Other Securities^ | 9,325,968 | 0.6 | % | |||||||||
|
| |||||||||||
Total | 9,325,968 | |||||||||||
|
| |||||||||||
United Kingdom (12.6%) | ||||||||||||
| 1,883,899 | BP plc | 11,799,738 | 0.7 | % | ||||||||
| 174,504 | British American Tobacco plc | 9,890,148 | 0.6 | % | ||||||||
| 231,032 | Diageo plc | 5,995,283 | 0.4 | % | ||||||||
| 679,528 | GlaxoSmithKline plc | 13,052,796 | 0.8 | % | ||||||||
| 3,830,829 | HSBC Holdings plc | 30,909,670 | 1.9 | % | ||||||||
| 67,755 | Reckitt Benckiser Group plc | 5,739,424 | 0.3 | % | ||||||||
| 83,575 | Royal Dutch Shell plc | 2,279,565 | 0.2 | % | ||||||||
| 81,841 | Royal Dutch Shell plc, Class A | 2,259,115 | 0.1 | % | ||||||||
| 645,855 | Royal Dutch Shell plc, Class B | 18,556,756 | 1.1 | % | ||||||||
| 349,653 | Smiths Group plc | 6,086,488 | 0.4 | % | ||||||||
Other Securities^ | 101,307,470 | 6.1 | % | |||||||||
|
| |||||||||||
Total | 207,876,453 | |||||||||||
|
| |||||||||||
United States (0.2%) | ||||||||||||
Other Securities^ | 2,967,232 | 0.2 | % | |||||||||
|
| |||||||||||
Total | 2,967,232 | |||||||||||
|
| |||||||||||
Total Common Stock (cost $1,413,991,147) | 1,446,710,065 | |||||||||||
|
| |||||||||||
| Principal Amount | Long-Term Fixed Income (9.4%) | |||||||||||
Angola (0.1%) | ||||||||||||
Other Securities^ | 878,405 | 0.1 | % | |||||||||
|
| |||||||||||
Total | 878,405 | |||||||||||
|
| |||||||||||
Argentina (0.5%) | ||||||||||||
Other Securities^ | 7,892,362 | 0.5 | % | |||||||||
|
| |||||||||||
Total | 7,892,362 | |||||||||||
|
| |||||||||||
Armenia (<0.1%) | ||||||||||||
Other Securities^ | 477,754 | <0.1 | % | |||||||||
|
| |||||||||||
Total | 477,754 | |||||||||||
|
| |||||||||||
Azerbaijan (0.1%) | ||||||||||||
Other Securities^ | 1,475,540 | 0.1 | % | |||||||||
|
| |||||||||||
Total | 1,475,540 | |||||||||||
|
| |||||||||||
Belize (<0.1%) | ||||||||||||
Other Securities^ | 47,765 | <0.1 | % | |||||||||
|
| |||||||||||
Total | 47,765 | |||||||||||
|
| |||||||||||
Bermuda (0.1%) | ||||||||||||
Other Securities^ | 1,598,476 | 0.1 | % | |||||||||
|
| |||||||||||
Total | 1,598,476 | |||||||||||
|
| |||||||||||
Brazil (0.4%) | ||||||||||||
Other Securities^ | 6,869,990 | 0.4 | % | |||||||||
|
| |||||||||||
Total | 6,869,990 | |||||||||||
|
| |||||||||||
Bulgaria (0.2%) | ||||||||||||
Other Securities^ | 2,905,954 | 0.2 | % | |||||||||
|
| |||||||||||
Total | 2,905,954 | |||||||||||
|
| |||||||||||
Cameroon (<0.1%) | ||||||||||||
Other Securities^ | 215,012 | <0.1 | % | |||||||||
|
| |||||||||||
Total | 215,012 | |||||||||||
|
| |||||||||||
Cayman Islands (0.1%) | ||||||||||||
Other Securities^ | 1,215,984 | 0.1 | % | |||||||||
|
| |||||||||||
Total | 1,215,984 | |||||||||||
|
| |||||||||||
Chile (0.2%) | ||||||||||||
Other Securities^ | 3,562,225 | 0.2 | % | |||||||||
|
| |||||||||||
Total | 3,562,225 | |||||||||||
|
| |||||||||||
The accompanying Notes to Financial Statements are an integral part of this schedule.
136
Table of Contents
PARTNER WORLDWIDE ALLOCATION PORTFOLIO
Summary Schedule of Investments as of December 31, 2016
| Principal Amount | Long-Term Fixed Income (9.4%) | Value | % of Net Assets | |||||||
Colombia (0.3%) | ||||||||||
Other Securities^ | $ | 4,374,095 | 0.3 | % | ||||||
|
| |||||||||
Total | 4,374,095 | |||||||||
|
| |||||||||
Costa Rica (0.2%) | ||||||||||
Other Securities^ | 3,426,312 | 0.2 | % | |||||||
|
| |||||||||
Total | 3,426,312 | |||||||||
|
| |||||||||
Croatia (<0.1%) | ||||||||||
Other Securities^ | 209,162 | <0.1 | % | |||||||
|
| |||||||||
Total | 209,162 | |||||||||
|
| |||||||||
Dominican Republic (0.4%) | ||||||||||
Other Securities^ | 7,488,577 | 0.4 | % | |||||||
|
| |||||||||
Total | 7,488,577 | |||||||||
|
| |||||||||
Ecuador (0.2%) | ||||||||||
Other Securities^ | 2,719,084 | 0.2 | % | |||||||
|
| |||||||||
Total | 2,719,084 | |||||||||
|
| |||||||||
El Salvador (0.2%) | ||||||||||
Other Securities^ | 2,155,480 | 0.2 | % | |||||||
|
| |||||||||
Total | 2,155,480 | |||||||||
|
| |||||||||
Gabon (<0.1%) | ||||||||||
Other Securities^ | 297,254 | <0.1 | % | |||||||
|
| |||||||||
Total | 297,254 | |||||||||
|
| |||||||||
Ghana (<0.1%) | ||||||||||
Other Securities^ | 460,929 | <0.1 | % | |||||||
|
| |||||||||
Total | 460,929 | |||||||||
|
| |||||||||
Guatemala (0.2%) | ||||||||||
Other Securities^ | 3,294,351 | 0.2 | % | |||||||
|
| |||||||||
Total | 3,294,351 | |||||||||
|
| |||||||||
Honduras (0.1%) | ||||||||||
Other Securities^ | 1,876,079 | 0.1 | % | |||||||
|
| |||||||||
Total | 1,876,079 | |||||||||
|
| |||||||||
Hong Kong (<0.1%) | ||||||||||
Other Securities^ | 400,469 | <0.1 | % | |||||||
|
| |||||||||
Total | 400,469 | |||||||||
|
| |||||||||
Hungary (0.3%) | ||||||||||
Other Securities^ | 4,996,317 | 0.3 | % | |||||||
|
| |||||||||
Total | 4,996,317 | |||||||||
|
| |||||||||
India (0.1%) | ||||||||||
Other Securities^ | 717,740 | 0.1 | % | |||||||
|
| |||||||||
Total | 717,740 | |||||||||
|
| |||||||||
Indonesia (0.7%) | ||||||||||
Other Securities^ | 11,540,648 | 0.7 | % | |||||||
|
| |||||||||
Total | 11,540,648 | |||||||||
|
| |||||||||
Israel (<0.1%) | ||||||||||
Other Securities^ | 111,788 | <0.1 | % | |||||||
|
| |||||||||
Total | 111,788 | |||||||||
|
| |||||||||
Japan (<0.1%) | ||||||||||
Other Securities^ | 538,875 | <0.1 | % | |||||||
|
| |||||||||
Total | 538,875 | |||||||||
|
| |||||||||
Kazakhstan (0.1%) | ||||||||||
Other Securities^ | 1,303,920 | 0.1 | % | |||||||
|
| |||||||||
Total | 1,303,920 | |||||||||
|
| |||||||||
Kenya (<0.1%) | ||||||||||
Other Securities^ | 603,448 | <0.1 | % | |||||||
|
| |||||||||
Total | 603,448 | |||||||||
|
| |||||||||
Latvia (<0.1%) | ||||||||||
Other Securities^ | 382,715 | <0.1 | % | |||||||
|
| |||||||||
Total | 382,715 | |||||||||
|
| |||||||||
Luxembourg (0.3%) | ||||||||||
Other Securities^ | 5,671,687 | 0.3 | % | |||||||
|
| |||||||||
Total | 5,671,687 | |||||||||
|
| |||||||||
Macedonia, The Former Yugoslav Republic Of (0.1%) | ||||||||||
Other Securities^ | 1,491,140 | 0.1 | % | |||||||
|
| |||||||||
Total | 1,491,140 | |||||||||
|
| |||||||||
Mauritius (0.1%) | ||||||||||
Other Securities^ | 789,126 | 0.1 | % | |||||||
|
| |||||||||
Total | 789,126 | |||||||||
|
| |||||||||
Mexico (0.8%) | ||||||||||
Other Securities^ | 11,959,783 | 0.8 | % | |||||||
|
| |||||||||
Total | 11,959,783 | |||||||||
|
| |||||||||
Mongolia (0.1%) | ||||||||||
Other Securities^ | 701,627 | 0.1 | % | |||||||
|
| |||||||||
Total | 701,627 | |||||||||
|
| |||||||||
Montenegro (<0.1%) | ||||||||||
Other Securities^ | 208,432 | <0.1 | % | |||||||
|
| |||||||||
Total | 208,432 | |||||||||
|
| |||||||||
Mozambique (<0.1%) | ||||||||||
Other Securities^ | 118,500 | <0.1 | % | |||||||
|
| |||||||||
Total | 118,500 | |||||||||
|
| |||||||||
Netherlands (0.2%) | ||||||||||
Other Securities^ | 3,345,778 | 0.2 | % | |||||||
|
| |||||||||
Total | 3,345,778 | |||||||||
|
| |||||||||
Nigeria (<0.1%) | ||||||||||
Other Securities^ | 585,172 | <0.1 | % | |||||||
|
| |||||||||
Total | 585,172 | |||||||||
|
| |||||||||
Pakistan (0.1%) | ||||||||||
Other Securities^ | 1,844,359 | 0.1 | % | |||||||
|
| |||||||||
Total | 1,844,359 | |||||||||
|
| |||||||||
Panama (<0.1%) | ||||||||||
Other Securities^ | 116,490 | <0.1 | % | |||||||
|
| |||||||||
Total | 116,490 | |||||||||
|
| |||||||||
Paraguay (0.2%) | ||||||||||
Other Securities^ | 2,850,382 | 0.2 | % | |||||||
|
| |||||||||
Total | 2,850,382 | |||||||||
|
| |||||||||
Peru (0.1%) | ||||||||||
Other Securities^ | 2,269,290 | 0.1 | % | |||||||
|
| |||||||||
Total | 2,269,290 | |||||||||
|
| |||||||||
Philippines (<0.1%) | ||||||||||
Other Securities^ | 1,025,466 | <0.1 | % | |||||||
|
| |||||||||
Total | 1,025,466 | |||||||||
|
| |||||||||
Poland (0.2%) | ||||||||||
Other Securities^ | 3,339,851 | 0.2 | % | |||||||
|
| |||||||||
Total | 3,339,851 | |||||||||
|
| |||||||||
Romania (0.1%) | ||||||||||
Other Securities^ | 2,153,812 | 0.1 | % | |||||||
|
| |||||||||
Total | 2,153,812 | |||||||||
|
| |||||||||
Russia (0.3%) | ||||||||||
Other Securities^ | 5,271,923 | 0.3 | % | |||||||
|
| |||||||||
Total | 5,271,923 | |||||||||
|
| |||||||||
The accompanying Notes to Financial Statements are an integral part of this schedule.
137
Table of Contents
PARTNER WORLDWIDE ALLOCATION PORTFOLIO
Summary Schedule of Investments as of December 31, 2016
| Principal Amount | Long-Term Fixed Income (9.4%) | Value | % of Net Assets | |||||||||
South Africa (0.3%) | ||||||||||||
Other Securities^ | $ | 3,391,099 | 0.3 | % | ||||||||
|
| |||||||||||
Total | 3,391,099 | |||||||||||
|
| |||||||||||
South Korea (0.1%) | ||||||||||||
Other Securities^ | 1,100,721 | 0.1 | % | |||||||||
|
| |||||||||||
Total | 1,100,721 | |||||||||||
|
| |||||||||||
| Sri Lanka (0.2%) | ||||||||||||
Other Securities^ | 3,015,223 | 0.2 | % | |||||||||
|
| |||||||||||
Total | 3,015,223 | |||||||||||
|
| |||||||||||
Suriname (<0.1%) | ||||||||||||
Other Securities^ | 613,305 | <0.1 | % | |||||||||
|
| |||||||||||
Total | 613,305 | |||||||||||
|
| |||||||||||
Turkey (0.6%) | ||||||||||||
Other Securities^ | 9,634,689 | 0.6 | % | |||||||||
|
| |||||||||||
Total | 9,634,689 | |||||||||||
|
| |||||||||||
Ukraine (<0.1%) | ||||||||||||
Other Securities^ | 454,528 | <0.1 | % | |||||||||
|
| |||||||||||
Total | 454,528 | |||||||||||
|
| |||||||||||
United Arab Emirates (0.1%) | ||||||||||||
Other Securities^ | 2,341,763 | 0.1 | % | |||||||||
|
| |||||||||||
Total | 2,341,763 | |||||||||||
|
| |||||||||||
United States (0.5%) | ||||||||||||
Other Securities^ | 8,013,018 | 0.5 | % | |||||||||
|
| |||||||||||
Total | 8,013,018 | |||||||||||
|
| |||||||||||
Venezuela (0.3%) | ||||||||||||
Other Securities^ | 4,638,095 | 0.3 | % | |||||||||
|
| |||||||||||
Total | 4,638,095 | |||||||||||
|
| |||||||||||
Vietnam (<0.1%) | ||||||||||||
Other Securities^ | 600,118 | <0.1 | % | |||||||||
|
| |||||||||||
Total | 600,118 | |||||||||||
|
| |||||||||||
Virgin Islands, British (<0.1%) | ||||||||||||
Other Securities^ | 324,360 | <0.1 | % | |||||||||
|
| |||||||||||
Total | 324,360 | |||||||||||
|
| |||||||||||
Zambia (0.2%) | ||||||||||||
|
| |||||||||||
Other Securities^ | 3,694,947 | 0.2 | % | |||||||||
|
| |||||||||||
Total | 3,694,947 | |||||||||||
|
| |||||||||||
Total Long-Term Fixed Income (cost $160,096,053) | 155,601,394 | |||||||||||
|
| |||||||||||
| Shares | Preferred Stock (1.1%) | |||||||||||
Brazil (0.2%) | ||||||||||||
Other Securities^ | 3,324,645 | 0.2 | % | |||||||||
|
| |||||||||||
Total | 3,324,645 | |||||||||||
|
| |||||||||||
Germany (0.2%) | ||||||||||||
Other Securities^ | 2,413,799 | 0.2 | % | |||||||||
|
| |||||||||||
Total | 2,413,799 | |||||||||||
|
| |||||||||||
South Korea (0.7%) | ||||||||||||
| 10,250 | Samsung Electronics Company, Ltd. | 12,136,369 | 0.7 | % | ||||||||
|
| |||||||||||
Total | 12,136,369 | |||||||||||
|
| |||||||||||
Total Preferred Stock (cost $15,839,913) | 17,874,813 | |||||||||||
|
| |||||||||||
Equity Funds/ETFs (<0.1%) | ||||||||||||
Other Securities^ | 662,741 | <0.1 | % | |||||||||
|
| |||||||||||
Total | 662,741 | |||||||||||
|
| |||||||||||
Total Registered Investment Companies (cost $661,937) | 662,741 | |||||||||||
|
| |||||||||||
Collateral Held for Securities Loaned (1.0%) | ||||||||||||
| 16,401,014 | Thrivent Cash Management Trust | 16,401,014 | 1.0 | % | ||||||||
|
| |||||||||||
Total Collateral Held for Securities Loaned (cost $16,401,014) | 16,401,014 | |||||||||||
|
| |||||||||||
| Shares or Principal Amount | Short-Term Investments (1.6%)a | |||||||||||
Thrivent Core Short-Term Reserve Fund | ||||||||||||
| 2,583,165 | 0.910% | 25,831,644 | 1.6 | % | ||||||||
Other Securities^ | 399,880 | <0.1 | % | |||||||||
|
| |||||||||||
Total Short-Term Investments (cost $26,231,510) | 26,231,524 | |||||||||||
|
| |||||||||||
Total Investments (cost $1,633,221,574) 100.5% | $ | 1,663,481,551 | ||||||||||
|
| |||||||||||
Other Assets and Liabilities, Net (0.5%) | (8,744,917 | ) | ||||||||||
|
| |||||||||||
Total Net Assets 100.0% | $ | 1,654,736,634 | ||||||||||
|
| |||||||||||
| ^ | The Summary Schedule of Investments shows the 50 largest holdings in unaffiliated issuers, any holding or issuer that exceeds 1% of net assets and all affiliated holdings as of the report date. The remaining securities held are grouped by category as “Other securities”. |
| a | The interest rate shown reflects the yield, coupon rate or the discount rate at the date of purchase. |
Partner Worldwide Allocation Portfolio held restricted securities as of December 31, 2016. Restricted securities are investment securities which cannot be offered for public sale without first being registered under the Securities Act of 1933. As of December 31, 2016, the value of these investments was $5,613,264 or 0.3% of total net assets.
The following table presents the total amount of securities loaned with continuous maturity, by type, offset by the gross payable upon return of collateral for securities loaned by Thrivent Partner Worldwide Allocation Portfolio as of December 31, 2016:
Securities Lending Transactions | ||||
Common Stock | $ | 15,613,935 | ||
|
| |||
Total lending | $ | 15,613,935 | ||
Gross amount payable upon return of collateral for securities loaned | $ | 16,401,014 | ||
|
| |||
Net amounts due to counterparty | $ | 787,079 | ||
|
| |||
Definitions:
| ADR | - | American Depositary Receipt, which are certificates for an underlying foreign security’s shares held by an issuing U.S. depository bank. |
The accompanying Notes to Financial Statements are an integral part of this schedule.
138
Table of Contents
PARTNER WORLDWIDE ALLOCATION PORTFOLIO
Summary Schedule of Investments as of December 31, 2016
Unrealized Appreciation (Depreciation)
Gross unrealized appreciation and depreciation of investments, based on cost for federal income tax purposes, were as follows:
Gross unrealized appreciation | $ | 113,344,782 | ||
Gross unrealized depreciation | (86,781,297 | ) | ||
|
| |||
Net unrealized appreciation (depreciation) | $ | 26,563,485 | ||
Cost for federal income tax purposes | $ | 1,636,918,066 |
The accompanying Notes to Financial Statements are an integral part of this schedule.
139
Table of Contents
PARTNER WORLDWIDE ALLOCATION PORTFOLIO
Summary Schedule of Investments as of December 31, 2016
Fair Valuation Measurements
The following table is a summary of the inputs used, as of December 31, 2016, in valuing Partner Worldwide Allocation Portfolio’s assets carried at fair value.
Investments in Securities | Total | Level 1 | Level 2 | Level 3 | ||||||||||||
Common Stock | ||||||||||||||||
Consumer Discretionary | 183,647,681 | 2,967,232 | 180,680,449 | — | ||||||||||||
Consumer Staples | 153,917,302 | 6,325,430 | 147,591,872 | — | ||||||||||||
Energy | 118,049,403 | 9,743,250 | 108,298,548 | 7,605 | ||||||||||||
Financials | 295,779,630 | 9,250,952 | 286,527,944 | 734 | ||||||||||||
Health Care | 131,732,581 | 2,757,900 | 128,974,681 | — | ||||||||||||
Industrials | 225,001,575 | 3,525,305 | 221,476,270 | — | ||||||||||||
Information Technology | 99,251,737 | 1,297,780 | 97,953,957 | — | ||||||||||||
Materials | 133,937,282 | 1,669,784 | 132,267,498 | — | ||||||||||||
Real Estate | 46,324,571 | — | 46,324,571 | — | ||||||||||||
Telecommunications Services | 36,813,342 | — | 36,813,342 | — | ||||||||||||
Utilities | 22,254,961 | — | 22,254,961 | — | ||||||||||||
Long-Term Fixed Income | ||||||||||||||||
Basic Materials | 2,119,349 | — | 2,119,349 | — | ||||||||||||
Capital Goods | 1,487,816 | — | 1,487,816 | — | ||||||||||||
Communications Services | 6,160,749 | — | 6,160,749 | — | ||||||||||||
Consumer Cyclical | 442,125 | — | 442,125 | — | ||||||||||||
Consumer Non-Cyclical^ | 2,418,570 | — | 2,418,570 | 0 | ||||||||||||
Energy | 20,581,080 | — | 20,581,080 | — | ||||||||||||
Financials | 9,948,112 | — | 9,948,112 | — | ||||||||||||
Foreign Government | 99,285,779 | — | 99,285,779 | — | ||||||||||||
Technology | 1,023,822 | — | 1,023,822 | — | ||||||||||||
Transportation | 1,531,350 | — | 1,531,350 | — | ||||||||||||
U.S. Government and Agencies | 5,629,201 | — | 5,629,201 | — | ||||||||||||
U.S. Municipal | 1,674,194 | — | 1,674,194 | — | ||||||||||||
Utilities | 3,299,247 | — | 3,299,247 | — | ||||||||||||
Preferred Stock | ||||||||||||||||
Consumer Discretionary | 1,918,830 | — | 1,918,830 | — | ||||||||||||
Consumer Staples | 494,969 | — | 494,969 | — | ||||||||||||
Information Technology | 12,136,369 | — | 12,136,369 | — | ||||||||||||
Materials | 3,324,645 | 3,324,645 | — | — | ||||||||||||
Registered Investment Companies | ||||||||||||||||
Equity Funds/ETFs | 662,741 | 662,741 | — | — | ||||||||||||
Short-Term Investments | 399,880 | — | 399,880 | — | ||||||||||||
|
|
|
|
|
|
|
| |||||||||
Subtotal Investments in Securities | $ | 1,621,248,893 | $ | 41,525,019 | $ | 1,579,715,535 | $ | 8,339 | ||||||||
|
|
|
|
|
|
|
| |||||||||
Other Investments * | Total | |||||||||||||||
Short-Term Investments | 25,831,644 | |||||||||||||||
Collateral Held for Securities Loaned | 16,401,014 | |||||||||||||||
|
| |||||||||||||||
Subtotal Other Investments | $ | 42,232,658 | ||||||||||||||
|
| |||||||||||||||
Total Investments at Value | $ | 1,663,481,551 | ||||||||||||||
|
| |||||||||||||||
* Certain investments are measured at fair value using a net asset value per share that is not publicly available (practical expedient). According to disclosure requirements of Accounting Standards Codification (ASC) 820, Fair Value Measurement, securities valued using the practical expedient are not classified in the fair value hierarchy. The fair value amounts presented in this table are intended to permit reconciliation of the fair value hierarchy to the amounts presented in the Statement of Assets and Liabilities.
|
| |||||||||||||||
Other Financial Instruments | Total | Level 1 | Level 2 | Level 3 | ||||||||||||
Asset Derivatives | ||||||||||||||||
Futures Contracts | 125,635 | 125,635 | — | — | ||||||||||||
Foreign Currency Forward Contracts | 779,380 | — | 779,380 | — | ||||||||||||
|
|
|
|
|
|
|
| |||||||||
Total Asset Derivatives | $ | 905,015 | $ | 125,635 | $ | 779,380 | $ | — | ||||||||
|
|
|
|
|
|
|
| |||||||||
Liability Derivatives | ||||||||||||||||
Futures Contracts | 160,792 | 160,792 | — | — | ||||||||||||
Foreign Currency Forward Contracts | 820,700 | — | 820,700 | — | ||||||||||||
|
|
|
|
|
|
|
| |||||||||
Total Liability Derivatives | $ | 981,492 | $ | 160,792 | $ | 820,700 | $ | — | ||||||||
|
|
|
|
|
|
|
| |||||||||
There were no significant transfers between Levels during the period ended December 31, 2016. Transfers between Levels are identified as of the end of the period.
| ^ | Level 3 security in this section is fair valued at <$1. |
The accompanying Notes to Financial Statements are an integral part of this schedule.
140
Table of Contents
PARTNER WORLDWIDE ALLOCATION PORTFOLIO
Summary Schedule of Investments as of December 31, 2016
The following table presents Partner Worldwide Allocation Portfolio’s futures contracts held as of December 31, 2016. Investments and/or cash totaling $1,343,784 were pledged as the initial margin deposit for these contracts.
Futures Contracts | Number of Contracts Long/(Short) | Expiration Date | Notional Principal Amount | Value | Unrealized Gain/(Loss) | |||||||||||||||
CBOT 10-Yr. U.S. Treasury Note | 110 | March 2017 | $ | 13,672,563 | $ | 13,670,938 | ($ | 1,625 | ) | |||||||||||
CBOT 2-Yr. U.S. Treasury Note | 57 | March 2017 | 12,341,053 | 12,351,188 | 10,135 | |||||||||||||||
CBOT 30 Day Federal Funds | (33 | ) | May 2017 | (13,654,303 | ) | (13,653,468 | ) | 835 | ||||||||||||
CBOT 5-Yr. U.S. Treasury Note | (50 | ) | March 2017 | (5,863,493 | ) | (5,883,203 | ) | (19,710 | ) | |||||||||||
CBOT U.S. Long Bond | 12 | March 2017 | 1,806,736 | 1,807,875 | 1,139 | |||||||||||||||
CME Ultra Long Term U.S. Treasury Bond | 44 | March 2017 | 7,070,854 | 7,051,000 | (19,854 | ) | ||||||||||||||
Eurex 2-Yr. Euro SCHATZ | (10 | ) | March 2017 | (1,180,924 | ) | (1,182,130 | ) | (1,206 | ) | |||||||||||
Eurex 30-Yr. Euro BUXL | (4 | ) | March 2017 | (724,551 | ) | (729,615 | ) | (5,064 | ) | |||||||||||
Eurex 5-Yr. Euro BOBL | (20 | ) | March 2017 | (2,793,462 | ) | (2,813,322 | ) | (19,860 | ) | |||||||||||
Eurex Euro STOXX 50 Index | 60 | March 2017 | 2,031,013 | 2,066,570 | 35,557 | |||||||||||||||
Euro-Bund Futures | (33 | ) | March 2017 | (5,616,306 | ) | (5,701,826 | ) | (85,520 | ) | |||||||||||
FTSE 100 Index | 12 | March 2017 | 1,014,917 | 1,043,725 | 28,808 | |||||||||||||||
HKG Hang Seng Index | 1 | January 2017 | 138,794 | 141,608 | 2,814 | |||||||||||||||
ICE mini MSCI EAFE Index | 94 | March 2017 | 7,883,173 | 7,875,320 | (7,853 | ) | ||||||||||||||
SFE S&P ASX Share Price Index 200 | 5 | March 2017 | 497,733 | 507,953 | 10,220 | |||||||||||||||
SGX MSCI Singapore Index | 5 | January 2017 | 110,517 | 110,417 | (100 | ) | ||||||||||||||
TSE Tokyo Price Index | 10 | March 2017 | 1,262,697 | 1,298,824 | 36,127 | |||||||||||||||
Total Futures Contracts | ($ | 35,157 | ) | |||||||||||||||||
The accompanying Notes to Financial Statements are an integral part of this schedule.
141
Table of Contents
PARTNER WORLDWIDE ALLOCATION PORTFOLIO
Summary Schedule of Investments as of December 31, 2016
The following table presents Partner Worldwide Allocation Portfolio’s foreign currency forward contracts held as of December 31, 2016.
Foreign Currency Forward Contracts | Counterparty | Contracts to Deliver/ Receive | Settlement Date | Value on Settlement Date | Value | Unrealized Gain/(Loss) | ||||||||||||||||||
Purchases | ||||||||||||||||||||||||
Argentina Peso | DB | 4,351,404 | 1/18/2017 | $ | 267,861 | $ | 269,940 | $ | 2,079 | |||||||||||||||
Argentina Peso | RBS | 251,057 | 1/6/2017 | 15,569 | 15,739 | 170 | ||||||||||||||||||
Argentina Peso | BNP | 5,025,079 | 1/6/2017 - 1/17/2017 | 308,803 | 314,328 | 5,525 | ||||||||||||||||||
Brazilian Real | BOA | 4,878,704 | 1/4/2017 | 1,475,446 | 1,498,119 | 22,673 | ||||||||||||||||||
Brazilian Real | BNP | 1,417,737 | 1/4/2017 | 412,971 | 435,090 | 22,119 | ||||||||||||||||||
Brazilian Real | HSBC | 1,655,482 | 1/4/2017 | 483,298 | 508,051 | 24,753 | ||||||||||||||||||
Brazilian Real | RBC | 1,804,432 | 1/4/2017 | 553,660 | 554,408 | 748 | ||||||||||||||||||
Brazilian Real | MSC | 5,147,743 | 1/4/2017 - 2/2/2017 | 1,547,825 | 1,578,649 | 30,824 | ||||||||||||||||||
Chilean Peso | DB | 149,244,770 | 1/19/2017 | 222,753 | 222,625 | (128 | ) | |||||||||||||||||
Chilean Peso | RBS | 81,680,927 | 1/19/2017 | 121,424 | 121,841 | 417 | ||||||||||||||||||
Chinese Yuan | HSBC | 4,287,943 | 1/20/2017 - 4/5/2017 | 607,167 | 616,806 | 9,639 | ||||||||||||||||||
Chinese Yuan | SB | 1,839,139 | 1/23/2017 | 262,809 | 264,381 | 1,572 | ||||||||||||||||||
Chinese Yuan Offshore | BNP | 3,810,636 | 3/15/2017 | 540,625 | 536,067 | (4,558 | ) | |||||||||||||||||
Chinese Yuan Offshore | JPM | 3,804,000 | 3/15/2017 | 536,892 | 535,134 | (1,758 | ) | |||||||||||||||||
Chinese Yuan Offshore | HSBC | 1,905,890 | 3/15/2017 | 270,000 | 268,114 | (1,886 | ) | |||||||||||||||||
Chinese Yuan Offshore | SB | 1,899,099 | 3/15/2017 | 270,000 | 267,159 | (2,841 | ) | |||||||||||||||||
Colombian Peso | CSFB | 322,754,944 | 1/17/2017 | 108,111 | 107,160 | (951 | ) | |||||||||||||||||
Colombian Peso | BOA | 1,123,278,302 | 1/26/2017 | 373,182 | 372,297 | (885 | ) | |||||||||||||||||
Czech Republic Koruna | BOA | 6,604,588 | 6/21/2017 | 273,052 | 260,922 | (12,130 | ) | |||||||||||||||||
Czech Republic Koruna | CITI | 29,101,290 | 6/21/2017 - 11/21/2017 | 1,169,136 | 1,150,148 | (18,988 | ) | |||||||||||||||||
Czech Republic Koruna | UBS | 6,627,240 | 6/21/2017 | 274,670 | 261,816 | (12,854 | ) | |||||||||||||||||
Czech Republic Koruna | SSB | 24,625,818 | 6/21/2017 - 9/20/2017 | 1,017,901 | 973,398 | (44,503 | ) | |||||||||||||||||
Czech Republic Koruna | MSC | 19,375,889 | 9/21/2017 - 11/22/2017 | 768,464 | 766,041 | (2,423 | ) | |||||||||||||||||
Euro | JPM | 261,000 | 3/15/2017 | 270,748 | 275,724 | 4,976 | ||||||||||||||||||
Euro | UBS | 261,000 | 3/16/2017 | 270,748 | 275,740 | 4,992 | ||||||||||||||||||
Euro | MSC | 140,000 | 3/15/2017 | 146,223 | 147,898 | 1,675 | ||||||||||||||||||
Euro | BNP | 277,790 | 3/16/2017 | 292,504 | 292,806 | 302 | ||||||||||||||||||
Euro | SSB | 50,813 | 6/21/2017 | 57,050 | 53,952 | (3,098 | ) | |||||||||||||||||
Euro | CITI | 591,899 | 6/21/2017 | 627,087 | 628,463 | 1,376 | ||||||||||||||||||
Hungarian Forint | UBS | 156,609,136 | 3/16/2017 | 528,754 | 534,713 | 5,959 | ||||||||||||||||||
Indian Rupee | DB | 4,411,620 | 2/3/2017 | 64,592 | 65,001 | 409 | ||||||||||||||||||
Indian Rupee | UBS | 34,698,525 | 1/9/2017 - 1/30/2017 | 510,296 | 509,943 | (353 | ) | |||||||||||||||||
Indian Rupee | CITI | 65,894,168 | 1/30/2017 | 966,615 | 968,035 | 1,420 | ||||||||||||||||||
Indonesian Rupiah | UBS | 7,810,703,676 | 1/12/2017 - 1/17/2017 | 584,457 | 578,695 | (5,762 | ) | |||||||||||||||||
Indonesian Rupiah | CITI | 11,219,401,020 | 1/12/2017 - 1/17/2017 | 849,969 | 831,269 | (18,700 | ) | |||||||||||||||||
Indonesian Rupiah | BNP | 4,793,102,506 | 1/9/2017 | 363,389 | 355,313 | (8,076 | ) | |||||||||||||||||
Indonesian Rupiah | JPM | 3,052,126,560 | 1/17/2017 | 228,000 | 225,998 | (2,002 | ) | |||||||||||||||||
Malaysian Ringgit | UBS | 921,808 | 1/19/2017 | 207,428 | 205,404 | (2,024 | ) | |||||||||||||||||
Malaysian Ringgit | JPM | 1,393,624 | 1/12/2017 - 1/19/2017 | 309,655 | 310,577 | 922 | ||||||||||||||||||
Mexican Peso | RBS | 22,309,546 | 3/15/2017 | 1,088,828 | 1,066,264 | (22,564 | ) | |||||||||||||||||
Mexican Peso | CITI | 39,721,935 | 3/15/2017 | 1,935,900 | 1,898,474 | (37,426 | ) | |||||||||||||||||
Mexican Peso | BOA | 25,888,087 | 3/15/2017 | 1,264,375 | 1,237,298 | (27,077 | ) | |||||||||||||||||
New Taiwan Dollar | HSBC | 23,723,512 | 1/13/2017 | 740,000 | 736,608 | (3,392 | ) | |||||||||||||||||
New Taiwan Dollar | CITI | 5,802,120 | 1/20/2017 | 180,000 | 180,222 | 222 | ||||||||||||||||||
New Taiwan Dollar | SB | 8,697,200 | 1/19/2017 | 272,000 | 270,133 | (1,867 | ) | |||||||||||||||||
New Taiwan Dollar | MSC | 8,629,200 | 1/20/2017 | 270,000 | 268,035 | (1,965 | ) | |||||||||||||||||
New Taiwan Dollar | WBC | 3,567,740 | 1/20/2017 | 112,423 | 110,819 | (1,604 | ) | |||||||||||||||||
New Taiwan Dollar | UBS | 8,669,538 | 1/20/2017 | 270,000 | 269,288 | (712 | ) | |||||||||||||||||
Philippines Peso | UBS | 25,452,462 | 1/19/2017 | 510,121 | 511,912 | 1,791 | ||||||||||||||||||
Polish Zloty | MSC | 1,138,881 | 3/15/2017 | 274,181 | 271,988 | (2,193 | ) | |||||||||||||||||
Polish Zloty | BNP | 15,339,180 | 3/15/2017 | 3,639,448 | 3,663,307 | 23,859 | ||||||||||||||||||
Russian Ruble | CITI | 67,149,736 | 1/26/2017 | 1,082,000 | 1,091,419 | 9,419 | ||||||||||||||||||
Russian Ruble | MSC | 17,236,399 | 1/26/2017 | 268,000 | 280,152 | 12,152 | ||||||||||||||||||
Russian Ruble | BOA | 53,636,475 | 1/26/2017 | 824,289 | 871,781 | 47,492 | ||||||||||||||||||
Russian Ruble | CSFB | 16,624,793 | 1/26/2017 | 271,000 | 270,211 | (789 | ) | |||||||||||||||||
Russian Ruble | UBS | 19,200,166 | 1/26/2017 | 294,617 | 312,070 | 17,453 | ||||||||||||||||||
South African Rand | JPM | 1,539,054 | 3/15/2017 | 108,000 | 110,602 | 2,602 | ||||||||||||||||||
South African Rand | DB | 2,327,999 | 3/15/2017 | 163,000 | 167,299 | 4,299 | ||||||||||||||||||
South African Rand | CITI | 1,511,034 | 3/15/2017 | 109,000 | 108,589 | (411 | ) | |||||||||||||||||
South African Rand | BNP | 5,129,247 | 3/15/2017 | 370,743 | 368,607 | (2,136 | ) | |||||||||||||||||
South Korean Won | HSBC | 155,566,190 | 1/20/2017 | 130,000 | 128,830 | (1,170 | ) | |||||||||||||||||
South Korean Won | BNP | 327,482,506 | 1/19/2017 | 276,861 | 271,197 | (5,664 | ) | |||||||||||||||||
The accompanying Notes to Financial Statements are an integral part of this schedule.
142
Table of Contents
PARTNER WORLDWIDE ALLOCATION PORTFOLIO
Summary Schedule of Investments as of December 31, 2016
Foreign Currency Forward Contracts | Counterparty | Contracts to Deliver/ Receive | Settlement Date | Value on Settlement Date | Value | Unrealized Gain/(Loss) | ||||||||||||||||||
Purchases | ||||||||||||||||||||||||
South Korean Won | UBS | 656,222,730 | 1/19/2017 | $ | 555,633 | $ | 543,435 | ($ | 12,198 | ) | ||||||||||||||
South Korean Won | SB | 326,862,400 | 1/31/2017 | 272,000 | 270,718 | (1,282 | ) | |||||||||||||||||
South Korean Won | JPM | 933,398,521 | 1/19/2017 - 1/20/2017 | 777,000 | 772,975 | (4,025 | ) | |||||||||||||||||
Turkish Lira | MSC | 2,504,082 | 3/15/2017 | 702,000 | 699,412 | (2,588 | ) | |||||||||||||||||
Total Purchases | $ | 34,920,553 | $ | 34,909,409 | ($ | 11,144 | ) | |||||||||||||||||
Sales | ||||||||||||||||||||||||
Argentina Peso | BNP | 2,375,409 | 4/3/2017 | $ | 140,974 | $ | 140,373 | $ | 601 | |||||||||||||||
Argentina Peso | DB | 1,744,305 | 1/31/2017 | 109,000 | 107,002 | 1,998 | ||||||||||||||||||
Argentina Peso | BOA | 4,652,401 | 1/18/2017 | 290,775 | 288,613 | 2,162 | ||||||||||||||||||
Brazilian Real | BOA | 6,638,001 | 1/4/2017 - 2/2/2017 | 1,991,632 | 2,033,488 | (41,856 | ) | |||||||||||||||||
Brazilian Real | BNP | 1,417,737 | 1/4/2017 | 435,009 | 435,597 | (588 | ) | |||||||||||||||||
Brazilian Real | MSC | 11,007,727 | 1/4/2017 - 2/2/2017 | 3,206,539 | 3,375,117 | (168,578 | ) | |||||||||||||||||
Brazilian Real | HSBC | 1,655,482 | 1/4/2017 | 507,957 | 508,643 | (686 | ) | |||||||||||||||||
Brazilian Real | RBC | 1,804,432 | 1/4/2017 | 542,000 | 553,762 | (11,762 | ) | |||||||||||||||||
Chilean Peso | DB | 521,677,580 | 1/19/2017 | 767,083 | 778,174 | (11,091 | ) | |||||||||||||||||
Chilean Peso | CSFB | 78,440,040 | 1/19/2017 | 119,000 | 117,007 | 1,993 | ||||||||||||||||||
Chinese Yuan Offshore | JPM | 1,893,464 | 3/15/2017 | 270,000 | 266,366 | 3,634 | ||||||||||||||||||
Chinese Yuan Offshore | SB | 5,616,797 | 1/23/2017 - 3/15/2017 | 802,399 | 792,965 | 9,434 | ||||||||||||||||||
Chinese Yuan Offshore | HSBC | 9,818,585 | 1/20/2017 - 4/5/2017 | 1,398,507 | 1,391,205 | 7,302 | ||||||||||||||||||
Czech Republic Koruna | CITI | 15,927,990 | 6/21/2017 | 627,087 | 629,253 | (2,166 | ) | |||||||||||||||||
Czech Republic Koruna | SSB | 1,358,333 | 6/21/2017 | 57,050 | 53,662 | 3,388 | ||||||||||||||||||
Euro | JPM | 10,712,353 | 2/9/2017 | 11,137,740 | 11,297,770 | (160,030 | ) | |||||||||||||||||
Euro | WBC | 3,483,873 | 3/15/2017 | 3,655,471 | 3,680,410 | (24,939 | ) | |||||||||||||||||
Euro | BOA | 245,000 | 6/21/2017 | 273,052 | 260,135 | 12,917 | ||||||||||||||||||
Euro | MSC | 979,400 | 3/15/2017 - 11/22/2017 | 1,042,646 | 1,038,845 | 3,801 | ||||||||||||||||||
Euro | CITI | 1,084,174 | 6/21/2017 - 11/21/2017 | 1,169,136 | 1,151,402 | 17,734 | ||||||||||||||||||
Euro | UBS | 746,312 | 3/16/2017 - 6/21/2017 | 803,424 | 789,764 | 13,660 | ||||||||||||||||||
Euro | SSB | 920,351 | 6/21/2017 - 9/20/2017 | 1,017,901 | 977,490 | 40,411 | ||||||||||||||||||
Hungarian Forint | MSC | 237,003,829 | 3/16/2017 | 802,342 | 809,206 | (6,864 | ) | |||||||||||||||||
Hungarian Forint | UBS | 82,152,621 | 3/16/2017 | 270,748 | 280,495 | (9,747 | ) | |||||||||||||||||
Hungarian Forint | BNP | 86,224,998 | 3/16/2017 | 292,504 | 293,825 | (1,321 | ) | |||||||||||||||||
Indian Rupee | UBS | 37,901,891 | 1/30/2017 | 555,665 | 556,808 | (1,143 | ) | |||||||||||||||||
Indian Rupee | CITI | 36,934,150 | 1/30/2017 | 541,556 | 542,591 | (1,035 | ) | |||||||||||||||||
Indonesian Rupiah | CITI | 3,613,410,000 | 1/12/2017 | 270,000 | 267,750 | 2,250 | ||||||||||||||||||
Indonesian Rupiah | HSBC | 7,460,653,050 | 1/12/2017 | 563,281 | 552,827 | 10,454 | ||||||||||||||||||
Indonesian Rupiah | MSC | 3,681,520,000 | 1/27/2017 | 272,000 | 272,215 | (215 | ) | |||||||||||||||||
Israel Shekel | CITI | 1,020,166 | 3/15/2017 | 267,764 | 265,555 | 2,209 | ||||||||||||||||||
Malaysian Ringgit | MSC | 2,408,928 | 1/12/2017 | 545,004 | 536,854 | 8,150 | ||||||||||||||||||
Mexican Peso | RBS | 27,018,554 | 3/15/2017 | 1,305,819 | 1,291,328 | 14,491 | ||||||||||||||||||
Mexican Peso | BOA | 44,161,380 | 1/20/2017 | 2,134,452 | 2,124,308 | 10,144 | ||||||||||||||||||
New Taiwan Dollar | CITI | 77,880,658 | 1/20/2017 | 2,446,769 | 2,419,081 | 27,688 | ||||||||||||||||||
New Taiwan Dollar | MSC | 45,187,628 | 1/13/2017 | 1,437,677 | 1,403,062 | 34,615 | ||||||||||||||||||
New Taiwan Dollar | UBS | 59,111,701 | 1/13/2017 - 6/20/2017 | 1,854,815 | 1,848,054 | 6,761 | ||||||||||||||||||
New Taiwan Dollar | HSBC | 17,106,212 | 1/13/2017 | 538,000 | 531,143 | 6,857 | ||||||||||||||||||
New Taiwan Dollar | BOA | 26,157,408 | 1/13/2017 - 1/20/2017 | 823,040 | 812,382 | 10,658 | ||||||||||||||||||
Philippines Peso | JPM | 13,569,814 | 1/19/2017 | 270,000 | 272,922 | (2,922 | ) | |||||||||||||||||
Philippines Peso | UBS | 13,934,733 | 1/19/2017 | 278,723 | 280,262 | (1,539 | ) | |||||||||||||||||
Polish Zloty | MSC | 621,264 | 3/15/2017 | 146,223 | 148,370 | (2,147 | ) | |||||||||||||||||
Polish Zloty | JPM | 1,168,418 | 3/15/2017 | 270,748 | 279,042 | (8,294 | ) | |||||||||||||||||
Polish Zloty | BNP | 14,425,891 | 1/26/2017 | 3,441,537 | 3,447,342 | (5,805 | ) | |||||||||||||||||
Russian Ruble | CSFB | 33,332,920 | 1/26/2017 | 543,000 | 541,777 | 1,223 | ||||||||||||||||||
Russian Ruble | MSC | 119,185,996 | 1/26/2017 | 1,895,000 | 1,937,190 | (42,190 | ) | |||||||||||||||||
Singapore Dollar | WBC | 1,475,572 | 3/15/2017 | 1,036,613 | 1,019,044 | 17,569 | ||||||||||||||||||
Singapore Dollar | SB | 782,029 | 3/15/2017 | 543,000 | 540,076 | 2,924 | ||||||||||||||||||
South African Rand | MSC | 3,198,260 | 3/15/2017 | 230,000 | 232,876 | (2,876 | ) | |||||||||||||||||
South African Rand | CITI | 1,543,920 | 3/15/2017 | 109,000 | 110,952 | (1,952 | ) | |||||||||||||||||
South Korean Won | JPM | 413,241,696 | 1/31/2017 | 344,000 | 342,144 | 1,856 | ||||||||||||||||||
South Korean Won | UBS | 2,172,694,597 | 1/13/2017 - 1/19/2017 | 1,846,246 | 1,799,238 | 47,008 | ||||||||||||||||||
South Korean Won | SB | 312,836,936 | 1/13/2017 | 268,000 | 259,051 | 8,949 | ||||||||||||||||||
South Korean Won | BNP | 2,191,028,375 | 1/13/2017 - 2/9/2017 | 1,882,288 | 1,814,496 | 67,792 | ||||||||||||||||||
South Korean Won | RBS | 316,877,837 | 1/19/2017 | 271,000 | 262,415 | 8,585 | ||||||||||||||||||
South Korean Won | CITI | 1,127,733,751 | 1/19/2017 | 963,422 | 933,906 | 29,516 | ||||||||||||||||||
South Korean Won | SSB | 617,467,240 | 1/13/2017 - 1/19/2017 | 528,477 | 511,323 | 17,154 | ||||||||||||||||||
The accompanying Notes to Financial Statements are an integral part of this schedule.
143
Table of Contents
PARTNER WORLDWIDE ALLOCATION PORTFOLIO
Summary Schedule of Investments as of December 31, 2016
Foreign Currency Forward Contracts | Counterparty | Contracts to Deliver/Receive | Settlement Date | Value on Settlement Date | Value | Unrealized Gain/(Loss) | ||||||||||||||||||
Sales | ||||||||||||||||||||||||
South Korean Won | HSBC | 315,006,300 | 1/13/2017 | $ | 270,000 | $ | 260,848 | $ | 9,152 | |||||||||||||||
South Korean Won | MSC | 283,306,970 | 1/19/2017 | 240,040 | 234,614 | 5,426 | ||||||||||||||||||
Turkish Lira | BNP | 3,769,881 | 3/15/2017 | 1,062,088 | 1,052,961 | 9,127 | ||||||||||||||||||
Turkish Lira | RBS | 973,916 | 3/15/2017 | 272,000 | 272,023 | (23 | ) | |||||||||||||||||
Total Sales | $ | 61,997,223 | $ | 62,027,399 | ($ | 30,176 | ) | |||||||||||||||||
Net Unrealized Gain/(Loss) on Foreign Currency Forward Contracts |
| ($ | 41,320 | ) | ||||||||||||||||||||
Counterparty | ||||||
BOA | - | Bank of America | ||||
BNP | - | BNP Paribas | ||||
CITI | - | Citibank | ||||
CSFB | - | CS First Boston Corporation | ||||
DB | - | Deutsche Bank | ||||
HSBC | - | HSBC Securities, Inc. | ||||
JPM | - | J.P. Morgan | ||||
MSC | - | Morgan Stanley & Company | ||||
RBC | - | The Royal Bank of Canada | ||||
RBS | - | The Royal Bank of Scotland | ||||
SB | - | Standard Bank plc | ||||
SSB | - | State Street Bank | ||||
UBS | - | UBS Securities, Ltd. | ||||
WBC | - | Westpac Banking Corporation | ||||
The following table summarizes the fair value and Statement of Assets and Liabilities location, as of December 31, 2016, for Partner Worldwide Allocation Portfolio’s investments in financial derivative instruments by primary risk exposure as discussed under item (2) Significant Accounting Policies of the Notes to Financial Statements.
Derivatives by risk category | Statement of Assets and Liabilities Location | Fair Value | ||||
Asset Derivatives | ||||||
Interest Rate Contracts | ||||||
Futures* | Net Assets - Net unrealized appreciation/(depreciation) on Futures contracts | $ | 12,109 | |||
Total Interest Rate Contracts | 12,109 | |||||
Equity Contracts | ||||||
Futures* | Net Assets - Net unrealized appreciation/(depreciation) on Futures contracts | 113,526 | ||||
Total Equity Contracts | 113,526 | |||||
Foreign Exchange Contracts | ||||||
Forward Contracts | Net Assets - Net unrealized appreciation/(depreciation) on Foreign currency forward contracts | 779,380 | ||||
Total Foreign Exchange Contracts | 779,380 | |||||
|
| |||||
Total Asset Derivatives | $ | 905,015 | ||||
|
| |||||
Liability Derivatives | ||||||
Interest Rate Contracts | ||||||
Futures* | Net Assets - Net unrealized appreciation/(depreciation) on Futures contracts | 152,839 | ||||
Total Interest Rate Contracts | 152,839 | |||||
Equity Contracts | ||||||
Futures* | Net Assets - Net unrealized appreciation/(depreciation) on Futures contracts | 7,953 | ||||
Total Equity Contracts | 7,953 | |||||
Foreign Exchange Contracts | ||||||
Forward Contracts | Net Assets - Net unrealized appreciation/(depreciation) on Foreign currency forward contracts | 820,700 | ||||
Total Foreign Exchange Contracts | 820,700 | |||||
|
| |||||
Total Liability Derivatives | $ | 981,492 | ||||
|
| |||||
| * | Includes cumulative appreciation/depreciation of futures contracts as reported in the Schedule of Investments. Only current day’s variation margin is reported within the Statement of Assets and Liabilities. |
The accompanying Notes to Financial Statements are an integral part of this schedule.
144
Table of Contents
PARTNER WORLDWIDE ALLOCATION PORTFOLIO
Summary Schedule of Investments as of December 31, 2016
The following table summarizes the net realized gains/(losses) and Statement of Operations location, for the period ended December 31, 2016, for Partner Worldwide Allocation Portfolio’s investments in financial derivative instruments by primary risk exposure.
Derivatives by risk category | Statement of Operations Location | Realized Gains/(Losses) recognized in Income | ||||
Equity Contracts | ||||||
Futures | Net realized gains/(losses) on Futures contracts | (68,988 | ) | |||
Total Equity Contracts | (68,988 | ) | ||||
Foreign Exchange Contracts | ||||||
Forward Contracts | Net realized gains/(losses) on Foreign currency transactions | 300,304 | ||||
Total Foreign Exchange Contracts | 300,304 | |||||
Interest Rate Contracts | ||||||
Futures | Net realized gains/(losses) on Futures contracts | (527,145 | ) | |||
Total Interest Rate Contracts | (527,145 | ) | ||||
|
| |||||
Total | ($ | 295,829 | ) | |||
|
| |||||
The following table summarizes the change in net unrealized appreciation/(depreciation) and Statement of Operations location, for the period ended December 31, 2016, for Partner Worldwide Allocation Portfolio’s investments in financial derivative instruments by primary risk exposure.
Derivatives by risk category | Statement of Operations Location | Change in unrealized appreciation/(depreciation) recognized in Income | ||||
Interest Rate Contracts | ||||||
Futures | Change in net unrealized appreciation/(depreciation) on Futures contracts | 132,567 | ||||
Total Interest Rate Contracts | 132,567 | |||||
Equity Contracts | ||||||
Futures | Change in net unrealized appreciation/(depreciation) on Futures contracts | 50,171 | ||||
Total Equity Contracts | 50,171 | |||||
Foreign Exchange Contracts | ||||||
Forward Contracts | Change in net unrealized appreciation/(depreciation) on Foreign currency forward contracts | (60,501 | ) | |||
Total Foreign Exchange Contracts | (60,501 | ) | ||||
|
| |||||
Total | $ | 122,237 | ||||
|
| |||||
The following table presents Partner Worldwide Allocation Portfolio’s average volume of derivative activity during the period ended December 31, 2016.
Derivative Risk Category | Futures (Notional)* | Futures (Percentage of Average Net Assets) | Forwards (Notional)* | Forwards (Percentage of Average Net Assets) | ||||||||||||
Equity Contracts Interest Rate | $ | 10,427,028 | 0.6 | % | N/A | N/A | ||||||||||
Contracts | 69,762,826 | 4.3 | N/A | N/A | ||||||||||||
Foreign Exchange Contracts | N/A | N/A | $ | 134,124,540 | 8.3 | % | ||||||||||
| * | Notional amount represents long or short, or both, derivative positions held by the Portfolio. |
Investment in Affiliates
Affiliated issuers, as defined under the Investment Company Act of 1940, include those in which the Portfolio’s holdings of an issuer represent 5% or more of the outstanding voting securities of an issuer, any affiliated mutual fund, or a company which is under common ownership or control with the Portfolio. The Portfolio owns shares of Thrivent Cash Management Trust for the purpose of securities lending and Thrivent Core Short-Term Reserve Fund primarily to serve as a cash sweep vehicle for the Portfolio. Thrivent Cash Management Trust and Thrivent Core Short-Term Reserve Fund are established for the sole use of affiliated portfolios.
A summary of transactions for the fiscal year to date, in Partner Worldwide Allocation Portfolio, is as follows:
Portfolio | Value December 31, 2015 | Gross Purchases | Gross Sales | Shares Held at December 31, 2016 | Value December 31, 2016 | Income Earned January 1, 2016 - December 31, 2016 | ||||||||||||||||||
Cash Management Trust-Collateral Investment | $ | 18,465,884 | $ | 367,848,751 | $ | 369,913,621 | 16,401,014 | $ | 16,401,014 | $ | 420,844 | |||||||||||||
Cash Management Trust-Short Term Investment | 17,322,047 | 222,829,835 | 240,151,882 | — | — | 28,127 | ||||||||||||||||||
Core Short-Term Reserve Fund | — | 288,222,866 | 262,391,222 | 2,583,165 | 25,831,644 | 109,897 | ||||||||||||||||||
Total Value and Income Earned | $ | 35,787,931 | $ | 42,232,658 | $ | 558,868 | ||||||||||||||||||
The accompanying Notes to Financial Statements are an integral part of this schedule.
145
Table of Contents
Schedule of Investments as of December 31, 2016
| Shares | Common Stock (98.7%) | Value | ||||||
Consumer Discretionary (12.7%) | ||||||||
| 1,900 | Amazon.com, Inc.a | $ | 1,424,753 | |||||
| 22,500 | Comcast Corporation | 1,553,625 | ||||||
| 10,400 | Delphi Automotive plc | 700,440 | ||||||
| 11,280 | Home Depot, Inc. | 1,512,423 | ||||||
| 27,690 | Interpublic Group of Companies, Inc. | 648,223 | ||||||
| 3,300 | Mohawk Industries, Inc.a | 658,944 | ||||||
| 33,579 | Newell Brands, Inc. | 1,499,302 | ||||||
| 16,700 | NIKE, Inc. | 848,861 | ||||||
| 7,600 | Royal Caribbean Cruises, Ltd. | 623,504 | ||||||
| 23,520 | Service Corporation International | 667,968 | ||||||
| 6,700 | Signet Jewelers, Ltd. | 631,542 | ||||||
| 12,200 | Walt Disney Company | 1,271,484 | ||||||
|
| |||||||
Total | 12,041,069 | |||||||
|
| |||||||
Consumer Staples (8.0%) | ||||||||
| 6,600 | Constellation Brands, Inc. | 1,011,846 | ||||||
| 42,400 | Coty, Inc. | 776,344 | ||||||
| 14,300 | CVS Health Corporation | 1,128,413 | ||||||
| 29,100 | Kroger Company | 1,004,241 | ||||||
| 9,800 | Molson Coors Brewing Company | 953,638 | ||||||
| 19,900 | Monster Beverage Corporationa | 882,366 | ||||||
| 11,200 | Philip Morris International, Inc. | 1,024,688 | ||||||
| 21,800 | Snyder’s-Lance, Inc. | 835,812 | ||||||
|
| |||||||
Total | 7,617,348 | |||||||
|
| |||||||
Energy (6.6%) | ||||||||
| 33,200 | Halliburton Company | 1,795,788 | ||||||
| 30,550 | Occidental Petroleum Corporation | 2,176,076 | ||||||
| 12,600 | Pioneer Natural Resources Company | 2,268,882 | ||||||
|
| |||||||
Total | 6,240,746 | |||||||
|
| |||||||
Financials (15.9%) | ||||||||
| 39,100 | Boston Private Financial Holdings, Inc. | 647,105 | ||||||
| 17,120 | Capital One Financial Corporation | 1,493,549 | ||||||
| 34,600 | Citigroup, Inc. | 2,056,278 | ||||||
| 12,100 | CME Group, Inc. | 1,395,735 | ||||||
| 16,900 | Discover Financial Services | 1,218,321 | ||||||
| 5,300 | Goldman Sachs Group, Inc. | 1,269,085 | ||||||
| 10,500 | Hartford Financial Services Group, Inc. | 500,325 | ||||||
| 24,200 | Invesco, Ltd. | 734,228 | ||||||
| 106,300 | KeyCorp | 1,942,101 | ||||||
| 11,300 | Marsh & McLennan Companies, Inc. | 763,767 | ||||||
| 79,960 | Regions Financial Corporation | 1,148,225 | ||||||
| 8,670 | Reinsurance Group of America, Inc. | 1,090,946 | ||||||
| 15,400 | Wells Fargo & Company | 848,694 | ||||||
|
| |||||||
Total | 15,108,359 | |||||||
|
| |||||||
Health Care (13.1%) | ||||||||
| 8,000 | Alexion Pharmaceuticals, Inc.a | 978,800 | ||||||
| 64,600 | ARIAD Pharmaceuticals, Inc.a,b | 803,624 | ||||||
| 3,200 | Biogen, Inc.a | 907,456 | ||||||
| 15,390 | BioMarin Pharmaceutical, Inc.a | 1,274,907 | ||||||
| 15,300 | Bristol-Myers Squibb Company | 894,132 | ||||||
| 4,300 | C.R. Bard, Inc. | 966,038 | ||||||
| 20,750 | Danaher Corporation | 1,615,180 | ||||||
| 5,644 | Envision Healthcare Corporationa | 357,209 | ||||||
| 6,200 | Humana, Inc. | 1,264,986 | ||||||
| 14,300 | Merck & Company, Inc. | 841,841 | ||||||
| 7,400 | Shire Pharmaceuticals Group plc ADR | 1,260,812 | ||||||
| 35,554 | Wright Medical Group NVa | 817,031 | ||||||
| 4,300 | Zimmer Biomet Holdings, Inc. | 443,760 | ||||||
|
| |||||||
Total | 12,425,776 | |||||||
|
| |||||||
Industrials (10.5%) | ||||||||
| 7,720 | Alaska Air Group, Inc. | 684,996 | ||||||
| 9,220 | FedEx Corporation | 1,716,764 | ||||||
| 22,625 | Fortive Corporation | 1,213,379 | ||||||
| 10,500 | Fortune Brands Home and Security, Inc. | 561,330 | ||||||
| 8,390 | Genesee & Wyoming, Inc.a | 582,350 | ||||||
| 12,610 | IDEX Corporation | 1,135,656 | ||||||
| 22,100 | Ingersoll-Rand plc | 1,658,384 | ||||||
| 5,800 | Lockheed Martin Corporation | 1,449,652 | ||||||
| 9,150 | WABCO Holdings, Inc.a | 971,272 | ||||||
|
| |||||||
Total | 9,973,783 | |||||||
|
| |||||||
Information Technology (19.5%) | ||||||||
| 14,470 | Adobe Systems, Inc.a | 1,489,687 | ||||||
| 4,040 | Alphabet, Inc., Class Aa | 3,201,498 | ||||||
| 16,040 | Apple, Inc. | 1,857,753 | ||||||
| 8,300 | Broadcom, Ltd. | 1,467,191 | ||||||
| 12,980 | Cavium, Inc.a | 810,471 | ||||||
| 16,720 | Facebook, Inc.a | 1,923,636 | ||||||
| 41,900 | Gogo, Inc.a,b | 386,318 | ||||||
| 3,900 | Imperva, Inc.a | 149,760 | ||||||
| 5,200 | Luxoft Holding, Inc.a | 292,240 | ||||||
| 14,940 | Monolithic Power Systems, Inc. | 1,224,034 | ||||||
| 9,300 | NXP Semiconductors NVa | 911,493 | ||||||
| 16,480 | Oracle Corporation | 633,656 | ||||||
| 18,300 | Paycom Software, Inc.a | 832,467 | ||||||
| 24,200 | PayPal Holdings, Inc.a | 955,174 | ||||||
| 11,000 | QUALCOMM, Inc. | 717,200 | ||||||
| 17,300 | Salesforce.com, Inc.a | 1,184,358 | ||||||
| 3,400 | Tyler Technologies, Inc.a | 485,418 | ||||||
|
| |||||||
Total | 18,522,354 | |||||||
|
| |||||||
Materials (3.4%) | ||||||||
| 5,800 | Albemarle Corporation | 499,264 | ||||||
| 14,130 | Eagle Materials, Inc. | 1,392,229 | ||||||
| 3,800 | Ecolab, Inc. | 445,436 | ||||||
| 10,300 | LyondellBasell Industries NV | 883,534 | ||||||
|
| |||||||
Total | �� | 3,220,463 | ||||||
|
| |||||||
Real Estate (3.9%) | ||||||||
| 12,600 | American Tower Corporation | 1,331,568 | ||||||
| 9,700 | Boston Properties, Inc. | 1,220,066 | ||||||
| 15,100 | Extra Space Storage, Inc. | 1,166,324 | ||||||
|
| |||||||
Total | 3,717,958 | |||||||
|
| |||||||
Telecommunications Services (2.1%) | ||||||||
| 10,510 | SBA Communications Corporationa | 1,085,263 | ||||||
| 16,410 | T-Mobile US, Inc.a | 943,739 | ||||||
|
| |||||||
Total | 2,029,002 | |||||||
|
| |||||||
Utilities (3.0%) | ||||||||
| 13,000 | American Electric Power Company, Inc. | 818,480 | ||||||
| 11,340 | Atmos Energy Corporation | 840,861 | ||||||
| 19,200 | PG&E Corporation | 1,166,784 | ||||||
|
| |||||||
Total | 2,826,125 | |||||||
|
| |||||||
Total Common Stock (cost $82,523,634) | 93,722,983 | |||||||
|
| |||||||
Collateral Held for Securities Loaned (1.3%) | ||||||||
| 1,232,175 | Thrivent Cash Management Trust | 1,232,175 | ||||||
|
| |||||||
Total Collateral Held for Securities Loaned (cost $1,232,175) | 1,232,175 | |||||||
|
| |||||||
The accompanying Notes to Financial Statements are an integral part of this schedule.
146
Table of Contents
PARTNER ALL CAP PORTFOLIO
Schedule of Investments as of December 31, 2016
| Shares or Principal Amount | Short-Term Investments (1.4%)c | Value | ||||||
Thrivent Core Short-Term Reserve Fund | ||||||||
| 133,882 | 0.910% | $ | 1,338,819 | |||||
|
| |||||||
Total Short-Term Investments (cost $1,338,819) | 1,338,819 | |||||||
|
| |||||||
Total Investments (cost $85,094,628) 101.4% | $ | 96,293,977 | ||||||
|
| |||||||
Other Assets and Liabilities, Net (1.4%) | (1,372,054 | ) | ||||||
|
| |||||||
Total Net Assets 100.0% | $ | 94,921,923 | ||||||
|
| |||||||
| a | Non-income producing security. |
| b | All or a portion of the security is on loan. |
| c | The interest rate shown reflects the yield, coupon rate or the discount rate at the date of purchase. |
The following table presents the total amount of securities loaned with continuous maturity, by type, offset by the gross payable upon return of collateral for securities loaned by Thrivent Partner All Cap Portfolio as of December 31, 2016:
Securities Lending Transactions | ||||
Common Stock | $ | 1,189,942 | ||
|
| |||
Total lending | $ | 1,189,942 | ||
Gross amount payable upon return of collateral for securities loaned | $ | 1,232,175 | ||
|
| |||
Net amounts due to counterparty | $ | 42,233 | ||
|
| |||
Definitions:
| ADR | - | American Depositary Receipt, which are certificates for an underlying foreign security’s shares held by an issuing U.S. depository bank. |
Unrealized Appreciation (Depreciation)
Gross unrealized appreciation and depreciation of investments, based on cost for federal income tax purposes, were as follows:
Gross unrealized appreciation | $ | 13,990,846 | ||
Gross unrealized depreciation | (2,865,660 | ) | ||
|
| |||
Net unrealized appreciation (depreciation) | $ | 11,125,186 | ||
Cost for federal income tax purposes | $ | 85,168,791 |
The accompanying Notes to Financial Statements are an integral part of this schedule.
147
Table of Contents
PARTNER ALL CAP PORTFOLIO
Schedule of Investments as of December 31, 2016
Fair Valuation Measurements
The following table is a summary of the inputs used, as of December 31, 2016, in valuing Partner All Cap Portfolio’s assets carried at fair value.
Investments in Securities | Total | Level 1 | Level 2 | Level 3 | ||||||||||||
Common Stock | ||||||||||||||||
Consumer Discretionary | 12,041,069 | 12,041,069 | — | — | ||||||||||||
Consumer Staples | 7,617,348 | 7,617,348 | — | — | ||||||||||||
Energy | 6,240,746 | 6,240,746 | — | — | ||||||||||||
Financials | 15,108,359 | 15,108,359 | — | — | ||||||||||||
Health Care | 12,425,776 | 12,425,776 | — | — | ||||||||||||
Industrials | 9,973,783 | 9,973,783 | — | — | ||||||||||||
Information Technology | 18,522,354 | 18,522,354 | — | — | ||||||||||||
Materials | 3,220,463 | 3,220,463 | — | — | ||||||||||||
Real Estate | 3,717,958 | 3,717,958 | — | — | ||||||||||||
Telecommunications Services | 2,029,002 | 2,029,002 | — | — | ||||||||||||
Utilities | 2,826,125 | 2,826,125 | — | — | ||||||||||||
|
|
|
|
|
|
|
| |||||||||
Subtotal Investments in Securities | $ | 93,722,983 | $ | 93,722,983 | $ | — | $ | — | ||||||||
|
|
|
|
|
|
|
| |||||||||
Other Investments * | Total | |||||||||||||||
Short-Term Investments | 1,338,819 | |||||||||||||||
Collateral Held for Securities Loaned | 1,232,175 | |||||||||||||||
|
| |||||||||||||||
Subtotal Other Investments | $ | 2,570,994 | ||||||||||||||
|
| |||||||||||||||
Total Investments at Value | $96,293,977 | |||||||||||||||
|
| |||||||||||||||
| * | Certain investments are measured at fair value using a net asset value per share that is not publicly available (practical expedient). According to disclosure requirements of Accounting Standards Codification (ASC) 820, Fair Value Measurement, securities valued using the practical expedient are not classified in the fair value hierarchy. The fair value amounts presented in this table are intended to permit reconciliation of the fair value hierarchy to the amounts presented in the Statement of Assets and Liabilities. |
There were no significant transfers between Levels during the period ended December 31, 2016. Transfers between Levels are identified as of the end of the period.
Investment in Affiliates
Affiliated issuers, as defined under the Investment Company Act of 1940, include those in which the Portfolio’s holdings of an issuer represent 5% or more of the outstanding voting securities of an issuer, any affiliated mutual fund, or a company which is under common ownership or control with the Portfolio. The Portfolio owns shares of Thrivent Cash Management Trust for the purpose of securities lending and Thrivent Core Short-Term Reserve Fund primarily to serve as a cash sweep vehicle for the Portfolio. Thrivent Cash Management Trust and Thrivent Core Short-Term Reserve Fund are established for the sole use of affiliated portfolios.
A summary of transactions for the fiscal year to date, in Partner All Cap Portfolio, is as follows:
Portfolio | Value December 31, 2015 | Gross Purchases | Gross Sales | Shares Held at December 31, 2016 | Value December 31, 2016 | Income Earned January 1, 2016 - December 31, 2016 | ||||||||||||||||||
Cash Management Trust- Collateral Investment | $ | 786,450 | $ | 22,856,618 | $ | 22,410,893 | 1,232,175 | $ | 1,232,175 | $ | 42,153 | |||||||||||||
Cash Management Trust- Short Term Investment | 1,773,740 | 5,953,819 | 7,727,559 | — | — | 1,495 | ||||||||||||||||||
Core Short-Term Reserve Fund | — | 11,712,344 | 10,373,525 | 133,882 | 1,338,819 | 6,380 | ||||||||||||||||||
Total Value and Income Earned | $ | 2,560,190 | $ | 2,570,994 | $ | 50,028 | ||||||||||||||||||
The accompanying Notes to Financial Statements are an integral part of this schedule.
148
Table of Contents
Schedule of Investments as of December 31, 2016
| Shares | Common Stock (95.0%) | Value | ||||||
Consumer Discretionary (20.1%) | ||||||||
| 110,481 | Amazon.com, Inc.a | $ | 82,846,387 | |||||
| 28,340 | AutoZone, Inc.a | 22,382,649 | ||||||
| 373,109 | Comcast Corporation | 25,763,176 | ||||||
| 236,060 | Home Depot, Inc. | 31,650,925 | ||||||
| 232,090 | Starbucks Corporation | 12,885,637 | ||||||
| 245,240 | Walt Disney Company | 25,558,913 | ||||||
|
| |||||||
Total | 201,087,687 | |||||||
|
| |||||||
Consumer Staples (3.4%) | ||||||||
| 162,540 | CVS Health Corporation | 12,826,031 | ||||||
| 259,950 | Walgreens Boots Alliance, Inc. | 21,513,462 | ||||||
|
| |||||||
Total | 34,339,493 | |||||||
|
| |||||||
Energy (1.8%) | ||||||||
| 111,090 | EQT Corporation | 7,265,286 | ||||||
| 59,560 | Pioneer Natural Resources Company | 10,724,969 | ||||||
|
| |||||||
Total | 17,990,255 | |||||||
|
| |||||||
Financials (4.7%) | ||||||||
| 1,030,100 | Bank of America Corporation | 22,765,210 | ||||||
| 102,940 | Goldman Sachs Group, Inc. | 24,648,983 | ||||||
|
| |||||||
Total | 47,414,193 | |||||||
|
| |||||||
Health Care (16.3%) | ||||||||
| 245,368 | Alexion Pharmaceuticals, Inc.a | 30,020,775 | ||||||
| 153,006 | Allergan plca | 32,132,790 | ||||||
| 325,580 | Celgene Corporationa | 37,685,885 | ||||||
| 467,292 | Gilead Sciences, Inc. | 33,462,780 | ||||||
| 242,100 | Medtronic plc | 17,244,783 | ||||||
| 173,679 | Vertex Pharmaceuticals, Inc.a | 12,794,932 | ||||||
|
| |||||||
Total | 163,341,945 | |||||||
|
| |||||||
Industrials (6.3%) | ||||||||
| 74,330 | Acuity Brands, Inc. | 17,159,824 | ||||||
| 161,380 | Cummins, Inc. | 22,055,805 | ||||||
| 229,036 | Union Pacific Corporation | 23,746,452 | ||||||
|
| |||||||
Total | 62,962,081 | |||||||
|
| |||||||
Information Technology (42.4%) | ||||||||
| 63,583 | Alphabet, Inc., Class Aa | 50,386,348 | ||||||
| 49,682 | Alphabet, Inc., Class Ca | 38,345,561 | ||||||
| 440,760 | Apple, Inc. | 51,048,823 | ||||||
| 557,402 | Facebook, Inc.a | 64,129,100 | ||||||
| 346,710 | MasterCard, Inc. | 35,797,808 | ||||||
| 843,610 | Microsoft Corporation | 52,421,926 | ||||||
| 93,730 | NVIDIA Corporation | 10,004,740 | ||||||
| 48,220 | Palo Alto Networks, Inc.a | 6,029,911 | ||||||
| 795,900 | PayPal Holdings, Inc.a | 31,414,173 | ||||||
| 535,189 | Salesforce.com, Inc.a | 36,639,039 | ||||||
| 629,460 | Visa, Inc. | 49,110,469 | ||||||
|
| |||||||
Total | 425,327,898 | |||||||
|
| |||||||
Total Common Stock (cost $751,347,279) | 952,463,552 | |||||||
|
| |||||||
| Shares or Principal Amount | Short-Term Investments (3.9%)b | |||||||
Thrivent Core Short-Term Reserve Fund | ||||||||
| 3,935,461 | 0.910% | 39,354,611 | ||||||
|
| |||||||
Total Short-Term Investments (cost $39,354,611) | 39,354,611 | |||||||
|
| |||||||
Total Investments (cost $790,701,890) 98.9% | $ | 991,818,163 | ||||||
|
| |||||||
Other Assets and Liabilities, Net 1.1% | 11,232,131 | |||||||
|
| |||||||
Total Net Assets 100.0% | $ | 1,003,050,294 | ||||||
|
| |||||||
| a | Non-income producing security. |
| b | The interest rate shown reflects the yield, coupon rate or the discount rate at the date of purchase. |
Unrealized Appreciation (Depreciation)
Gross unrealized appreciation and depreciation of investments, based on cost for federal income tax purposes, were as follows:
Gross unrealized appreciation | $ | 228,340,192 | ||
Gross unrealized depreciation | (29,236,620 | ) | ||
|
| |||
Net unrealized appreciation (depreciation) | $ | 199,103,572 | ||
Cost for federal income tax purposes | $ | 792,714,591 |
The accompanying Notes to Financial Statements are an integral part of this schedule.
149
Table of Contents
LARGE CAP GROWTH PORTFOLIO
Schedule of Investments as of December 31, 2016
Fair Valuation Measurements
The following table is a summary of the inputs used, as of December 31, 2016, in valuing Large Cap Growth Portfolio’s assets carried at fair value.
Investments in Securities | Total | Level 1 | Level 2 | Level 3 | ||||||||||||
Common Stock | ||||||||||||||||
Consumer Discretionary | 201,087,687 | 201,087,687 | — | — | ||||||||||||
Consumer Staples | 34,339,493 | 34,339,493 | — | — | ||||||||||||
Energy | 17,990,255 | 17,990,255 | — | — | ||||||||||||
Financials | 47,414,193 | 47,414,193 | — | — | ||||||||||||
Health Care | 163,341,945 | 163,341,945 | — | — | ||||||||||||
Industrials | 62,962,081 | 62,962,081 | — | — | ||||||||||||
Information Technology | 425,327,898 | 425,327,898 | — | — | ||||||||||||
|
|
|
|
|
|
|
| |||||||||
Subtotal Investments in Securities | $ | 952,463,552 | $ | 952,463,552 | $ | — | $ | — | ||||||||
|
|
|
|
|
|
|
| |||||||||
Other Investments * | Total | |||||||||||||||
Short-Term Investments | 39,354,611 | |||||||||||||||
|
| |||||||||||||||
Subtotal Other Investments | $ | 39,354,611 | ||||||||||||||
|
| |||||||||||||||
Total Investments at Value | $ | 991,818,163 | ||||||||||||||
|
| |||||||||||||||
| * | Certain investments are measured at fair value using a net asset value per share that is not publicly available (practical expedient). According to disclosure requirements of Accounting Standards Codification (ASC) 820, Fair Value Measurement, securities valued using the practical expedient are not classified in the fair value hierarchy. The fair value amounts presented in this table are intended to permit reconciliation of the fair value hierarchy to the amounts presented in the Statement of Assets and Liabilities. |
There were no significant transfers between Levels during the period ended December 31, 2016. Transfers between Levels are identified as of the end of the period.
The following table summarizes the net realized gains/(losses) and Statement of Operations location, for the period ended December 31, 2016, for Large Cap Growth Portfolio’s investments in financial derivative instruments by primary risk exposure.
Derivatives by risk category | Statement of Operations Location | Realized Gains/(Losses) recognized in Income | ||||
Equity Contracts | ||||||
Futures | Net realized gains/(losses) on Futures contracts | (4,188,582 | ) | |||
Total Equity Contracts | (4,188,582 | ) | ||||
|
| |||||
Total | ($ | 4,188,582 | ) | |||
|
| |||||
The following table summarizes the change in net unrealized appreciation/(depreciation) and Statement of Operations location, for the period ended December 31, 2016, for Large Cap Growth Portfolio’s investments in financial derivative instruments by primary risk exposure.
Derivatives by risk category | Statement of Operations Location | Change in unrealized appreciation/(depreciation) recognized in Income | ||||
Equity Contracts | ||||||
Futures | Change in net unrealized appreciation/(depreciation) on Futures contracts | (1,039,585 | ) | |||
Total Equity Contracts | (1,039,585 | ) | ||||
|
| |||||
Total | ($ | 1,039,585 | ) | |||
|
| |||||
The following table presents Large Cap Growth Portfolio’s average volume of derivative activity during the period ended December 31, 2016.
Derivative Risk Category | Futures (Notional)* | Futures (Percentage of Average Net Assets) | ||||||
Equity Contracts | $ | 4,928,502 | 0.5 | % | ||||
| * | Notional amount represents long or short, or both, derivative positions held by the Portfolio. |
The accompanying Notes to Financial Statements are an integral part of this schedule.
150
Table of Contents
LARGE CAP GROWTH PORTFOLIO
Schedule of Investments as of December 31, 2016
Investment in Affliates
Affiliated issuers, as defined under the Investment Company Act of 1940, include those in which the Portfolio’s holdings of an issuer represent 5% or more of the outstanding voting securities of an issuer, any affiliated mutual fund, or a company which is under common ownership or control with the Portfolio. The Portfolio owns shares of Thrivent Cash Management Trust for the purpose of securities lending and Thrivent Core Short-Term Reserve Fund primarily to serve as a cash sweep vehicle for the Portfolio. Thrivent Cash Management Trust and Thrivent Core Short-Term Reserve Fund are established for the sole use of affiliated portfolios.
A summary of transactions for the fiscal year to date, in Large Cap Growth Portfolio, is as follows:
Portfolio | Value December 31, 2015 | Gross Purchases | Gross Sales | Shares Held at December 31, 2016 | Value December 31, 2016 | Income Earned January 1, 2016 - December 31, 2016 | ||||||||||||||||||
Cash Management Trust-Collateral Investment | $ | 10,560,850 | $ | 158,591,975 | $ | 169,152,825 | — | $ | — | $ | 5,520 | |||||||||||||
Cash Management Trust-Short Term Investment | 74,078,772 | 120,244,987 | 194,323,759 | — | — | 64,923 | ||||||||||||||||||
Core Short-Term Reserve Fund | — | 223,723,364 | 184,368,753 | 3,935,461 | 39,354,611 | 145,084 | ||||||||||||||||||
Total Value and Income Earned | $ | 84,639,622 | $ | 39,354,611 | $ | 215,527 | ||||||||||||||||||
The accompanying Notes to Financial Statements are an integral part of this schedule.
151
Table of Contents
PARTNER GROWTH STOCK PORTFOLIO
Schedule of Investments as of December 31, 2016
| Shares | Common Stock (98.7%) | Value | ||||||
Consumer Discretionary (26.0%) | ||||||||
| 12,360 | Amazon.com, Inc.a | $ | 9,268,393 | |||||
| 1,862 | AutoZone, Inc.a | 1,470,589 | ||||||
| 13,900 | Ctrip.com International, Ltd. ADRa | 556,000 | ||||||
| 13,600 | Delphi Automotive plc | 915,960 | ||||||
| 6,100 | Dollar General Corporation | 451,827 | ||||||
| 16,930 | Ferrari NV | 984,310 | ||||||
| 166 | Flipkart, Ltd.a,b | 15,463 | ||||||
| 21,300 | Hilton Worldwide Holdings, Inc. | 579,360 | ||||||
| 6,700 | Home Depot, Inc. | 898,336 | ||||||
| 14,100 | Las Vegas Sands Corporation | 753,081 | ||||||
| 15,700 | Lowe’s Companies, Inc. | 1,116,584 | ||||||
| 13,200 | Marriott International, Inc. | 1,091,376 | ||||||
| 40,470 | MGM Resorts Internationala | 1,166,750 | ||||||
| 4,131 | Netfix,Inc.a | 511,418 | ||||||
| 2,900 | O’Reilly Automotive, Inc.a | 807,389 | ||||||
| 3,610 | Priceline Group, Inc.a | 5,292,477 | ||||||
| 13,900 | Ross Stores, Inc. | 911,840 | ||||||
| 5,735 | Signet Jewelers, Ltd. | 540,581 | ||||||
| 18,400 | Starbucks Corporation | 1,021,568 | ||||||
| 7,837 | Tesla Motors, Inc.a,c | 1,674,689 | ||||||
| 13,077 | Tractor Supply Company | 991,367 | ||||||
| 7,900 | Yum! Brands, Inc. | 500,307 | ||||||
|
| |||||||
Total | 31,519,665 | |||||||
|
| |||||||
Consumer Staples (3.6%) | ||||||||
| 1,000 | Costco Wholesale Corporation | 160,110 | ||||||
| 23,800 | Mondelez International, Inc. | 1,055,054 | ||||||
| 19,200 | Philip Morris International, Inc. | 1,756,608 | ||||||
| 17,099 | Walgreens Boots Alliance, Inc. | 1,415,113 | ||||||
|
| |||||||
Total | 4,386,885 | |||||||
|
| |||||||
Financials (6.1%) | ||||||||
| 23,100 | Charles Schwab Corporation | 911,757 | ||||||
| 2,719 | First Republic Bank | 250,529 | ||||||
| 24,900 | Intercontinental Exchange, Inc. | 1,404,858 | ||||||
| 10,500 | J.P. Morgan Chase & Company | 906,045 | ||||||
| 47,600 | Morgan Stanley | 2,011,100 | ||||||
| 12,800 | State Street Corporation | 994,816 | ||||||
| 22,389 | TD Ameritrade Holding Corporation | 976,160 | ||||||
|
| |||||||
Total | 7,455,265 | |||||||
|
| |||||||
Health Care (15.5%) | ||||||||
| 9,919 | Aetna, Inc. | 1,230,055 | ||||||
| 14,062 | Alexion Pharmaceuticals, Inc.a | 1,720,486 | ||||||
| 2,467 | Allergan plca | 518,095 | ||||||
| 3,700 | Anthem, Inc. | 531,949 | ||||||
| 5,465 | Biogen, Inc.a | 1,549,765 | ||||||
| 15,700 | Bristol-Myers Squibb Company | 917,508 | ||||||
| 6,600 | Celgene Corporationa | 763,950 | ||||||
| 4,342 | Centene Corporationa | 245,366 | ||||||
| 5,300 | CIGNA Corporation | 706,967 | ||||||
| 21,800 | Danaher Corporation | 1,696,912 | ||||||
| 5,797 | Humana, Inc. | 1,182,762 | ||||||
| 5,462 | Illumina, Inc.a | 699,354 | ||||||
| 2,980 | Intuitive Surgical, Inc.a | 1,889,827 | ||||||
| 11,700 | Stryker Corporation | 1,401,777 | ||||||
| 11,800 | UnitedHealth Group, Inc. | 1,888,472 | ||||||
| 12,166 | Vertex Pharmaceuticals, Inc.a | 896,269 | ||||||
| 18,500 | Zoetis, Inc. | 990,305 | ||||||
|
| |||||||
Total | 18,829,819 | |||||||
|
| |||||||
Industrials (6.7%) | ||||||||
| 37,472 | American Airlines Group, Inc. | 1,749,568 | ||||||
| 11,300 | Boeing Company | 1,759,184 | ||||||
| 5,600 | Delta Air Lines, Inc. | 275,464 | ||||||
| 1,512 | Equifax, Inc. | 178,764 | ||||||
| 3,700 | FedEx Corporation | 688,940 | ||||||
| 12,150 | Fortive Corporation | 651,604 | ||||||
| 7,700 | Honeywell International, Inc. | 892,045 | ||||||
| 11,481 | IHS Markit, Ltd.a | 406,542 | ||||||
| 2,200 | Illinois Tool Works, Inc. | 269,412 | ||||||
| 5,200 | Roper Industries, Inc. | 952,016 | ||||||
| 2,952 | Wabtec Corporation | 245,075 | ||||||
|
| |||||||
Total | 8,068,614 | |||||||
|
| |||||||
Information Technology (36.0%) | ||||||||
| 16,300 | Alibaba Group Holding, Ltd. ADRa | 1,431,303 | ||||||
| 5,605 | Alphabet, Inc., Class Aa | 4,441,682 | ||||||
| 4,895 | Alphabet, Inc., Class Ca | 3,778,059 | ||||||
| 30,500 | Apple, Inc. | 3,532,510 | ||||||
| 9,380 | ASML Holding NV GDRc | 1,052,436 | ||||||
| 43,553 | Facebook, Inc.a | 5,010,773 | ||||||
| 4,100 | Fidelity National Information Services, Inc. | 310,124 | ||||||
| 9,573 | Fiserv, Inc.a | 1,017,418 | ||||||
| 26,400 | MasterCard, Inc. | 2,725,800 | ||||||
| 3,400 | Mercadolibre, Inc. | 530,876 | ||||||
| 79,500 | Microsoft Corporation | 4,940,130 | ||||||
| 7,400 | NVIDIA Corporation | 789,876 | ||||||
| 16,576 | NXP Semiconductors NVa | 1,624,614 | ||||||
| 2,200 | Palo Alto Networks, Inc.a | 275,110 | ||||||
| 60,400 | PayPal Holdings, Inc.a | 2,383,988 | ||||||
| 29,800 | Salesforce.com, Inc.a | 2,040,108 | ||||||
| 15,482 | ServiceNow, Inc.a | 1,150,932 | ||||||
| 63,700 | Tencent Holdings, Ltd.a | 1,544,541 | ||||||
| 9,772 | VeriSign, Inc.a,c | 743,356 | ||||||
| 47,500 | Visa, Inc. | 3,705,950 | ||||||
| 9,600 | Workday, Inc.a | 634,464 | ||||||
|
| |||||||
Total | 43,664,050 | |||||||
|
| |||||||
Materials (0.7%) | ||||||||
| 3,100 | Ashland Global Holdings, Inc. | 338,799 | ||||||
| 2,195 | Martin Marietta Materials, Inc. | 486,259 | ||||||
|
| |||||||
Total | 825,058 | |||||||
|
| |||||||
Real Estate (3.0%) | ||||||||
| 17,300 | American Tower Corporation | 1,828,264 | ||||||
| 10,800 | Crown Castle International Corporation | 937,116 | ||||||
| 2,320 | Equinix, Inc. | 829,191 | ||||||
|
| |||||||
Total | 3,594,571 | |||||||
|
| |||||||
Telecommunications Services (0.4%) | ||||||||
| 9,100 | T-Mobile US, Inc.a | 523,341 | ||||||
|
| |||||||
Total | 523,341 | |||||||
|
| |||||||
Utilities (0.7%) | ||||||||
| 7,200 | NextEra Energy, Inc. | 860,112 | ||||||
|
| |||||||
Total | 860,112 | |||||||
|
| |||||||
Total Common Stock (cost $80,663,250) | 119,727,380 | |||||||
|
| |||||||
Preferred Stock (0.5%) | ||||||||
Consumer Discretionary (0.5%) | ||||||||
| 2,943 | Airbnb, Inc., Convertiblea,b | 309,015 | ||||||
| 7,282 | Dropbox, Inc., Class Aa,b | 69,907 | ||||||
| 58 | Flipkart, Ltd. Series A Preference Sharesa,b | 5,403 | ||||||
| 100 | Flipkart, Ltd. Series C Preference Sharesa,b | 9,315 | ||||||
| 187 | Flipkart, Ltd. Series E Preference Sharesa,b | 17,419 | ||||||
| 843 | Flipkart, Ltd. Series G Preference Sharesa,b | 78,525 | ||||||
The accompanying Notes to Financial Statements are an integral part of this schedule.
152
Table of Contents
PARTNER GROWTH STOCK PORTFOLIO
Schedule of Investments as of December 31, 2016
| Shares | Preferred Stock (0.5%) | Value | ||||||
Consumer Discretionary (0.5%) - continued | ||||||||
| 760 | Flipkart, Ltd. Series H Preference Sharesa,b | $ | 70,794 | |||||
|
| |||||||
Total | 560,378 | |||||||
|
| |||||||
Total Preferred Stock (cost $507,303) | 560,378 | |||||||
|
| |||||||
Collateral Held for Securities Loaned (2.9%) | ||||||||
| 3,546,303 | Thrivent Cash Management Trust | 3,546,303 | ||||||
|
| |||||||
Total Collateral Held for Securities Loaned (cost $3,546,303) | 3,546,303 | |||||||
|
| |||||||
| Shares or Principal Amount | Short-Term Investments (0.9%)d | |||||||
Thrivent Core Short-Term Reserve Fund | ||||||||
| 116,370 | 0.910% | 1,163,701 | ||||||
|
| |||||||
Total Short-Term Investments (cost $1,163,701) | 1,163,701 | |||||||
|
| |||||||
Total Investments (cost $85,880,557) 103.0% | $ | 124,997,762 | ||||||
|
| |||||||
Other Assets and Liabilities, Net (3.0%) | (3,649,330 | ) | ||||||
|
| |||||||
Total Net Assets 100.0% | $ | 121,348,432 | ||||||
|
| |||||||
| a | Non-income producing security. |
| b | Security is valued at fair value. Market quotations or prices were not readily available or were determined to be unreliable. Fair value was determined in good faith pursuant to procedures adopted by the Board. Further information on fair valuation can be found in the Notes to Financial Statements. |
| c | All or a portion of the security is on loan. |
| d | The interest rate shown reflects the yield, coupon rate or the discount rate at the date of purchase. |
The following table presents the total amount of securities loaned with continuous maturity, by type, offset by the gross payable upon return of collateral for securities loaned by Thrivent Partner Growth Stock Portfolio as of December 31, 2016:
Securities Lending Transactions | ||||
Common Stock | $ | 3,478,468 | ||
|
| |||
Total lending | $ | 3,478,468 | ||
Gross amount payable upon return of collateral for securities loaned | $ | 3,546,303 | ||
|
| |||
Net amounts due to counterparty | $ | 67,835 | ||
|
| |||
Definitions:
| ADR | - | American Depositary Receipt, which are certificates for an underlying foreign security’s shares held by an issuing U.S. depository bank. | ||
| GDR | - | Global Depository Receipts, which are certificates for shares of an underlying foreign security’s shares held by an issuing depository bank from more than one country. |
Unrealized Appreciation (Depreciation)
Gross unrealized appreciation and depreciation of investments, based on cost for federal income tax purposes, were as follows:
Gross unrealized appreciation | $ | 39,667,772 | ||
Gross unrealized depreciation | (1,090,063 | ) | ||
|
| |||
Net unrealized appreciation (depreciation) | $ | 38,577,709 | ||
Cost for federal income tax purposes | $ | 86,420,053 |
The accompanying Notes to Financial Statements are an integral part of this schedule.
153
Table of Contents
PARTNER GROWTH STOCK PORTFOLIO
Schedule of Investments as of December 31, 2016
Fair Valuation Measurements
The following table is a summary of the inputs used, as of December 31, 2016, in valuing Partner Growth Stock Portfolio’s assets carried at fair value.
Investments in Securities | Total | Level 1 | Level 2 | Level 3 | ||||||||||||
Common Stock | ||||||||||||||||
Consumer Discretionary | 31,519,665 | 31,504,202 | — | 15,463 | ||||||||||||
Consumer Staples | 4,386,885 | 4,386,885 | — | — | ||||||||||||
Financials | 7,455,265 | 7,455,265 | — | — | ||||||||||||
Health Care | 18,829,819 | 18,829,819 | — | — | ||||||||||||
Industrials | 8,068,614 | 8,068,614 | — | — | ||||||||||||
Information Technology | 43,664,050 | 42,119,509 | 1,544,541 | — | ||||||||||||
Materials | 825,058 | 825,058 | — | — | ||||||||||||
Real Estate | 3,594,571 | 3,594,571 | — | — | ||||||||||||
Telecommunications Services | 523,341 | 523,341 | — | — | ||||||||||||
Utilities | 860,112 | 860,112 | — | — | ||||||||||||
Preferred Stock | ||||||||||||||||
Consumer Discretionary | 560,378 | — | — | 560,378 | ||||||||||||
|
|
|
|
|
|
|
| |||||||||
Subtotal Investments in Securities | $ | 120,287,758 | $ | 118,167,376 | $ | 1,544,541 | $ | 575,841 | ||||||||
|
|
|
|
|
|
|
| |||||||||
Other Investments* | Total | |||||||||||||||
Short-Term Investments | 1,163,701 | |||||||||||||||
Collateral Held for Securities Loaned | 3,546,303 | |||||||||||||||
Subtotal Other Investments | $ | 4,710,004 | ||||||||||||||
|
| |||||||||||||||
Total Investments at Value | $ | 124,997,762 | ||||||||||||||
|
| |||||||||||||||
| * | Certain investments are measured at fair value using a net asset value per share that is not publicly available (practical expedient). According to disclosure requirements of Accounting Standards Codification (ASC) 820, Fair Value Measurement, securities valued using the practical expedient are not classified in the fair value hierarchy. The fair value amounts presented in this table are intended to permit reconciliation of the fair value hierarchy to the amounts presented in the Statement of Assets and Liabilities. |
There were no significant transfers between Levels during the period ended December 31, 2016. Transfers between Levels are identified as of the end of the period.
Investment in Affliates
Affiliated issuers, as defined under the Investment Company Act of 1940, include those in which the Portfolio’s holdings of an issuer represent 5% or more of the outstanding voting securities of an issuer, any affiliated mutual fund, or a company which is under common ownership or control with the Portfolio. The Portfolio owns shares of Thrivent Cash Management Trust for the purpose of securities lending and Thrivent Core Short-Term Reserve Fund primarily to serve as a cash sweep vehicle for the Portfolio. Thrivent Cash Management Trust and Thrivent Core Short-Term Reserve Fund are established for the sole use of affiliated portfolios. A summary of transactions for the fiscal year to date, in Partner Growth Stock Portfolio, is as follows:
Portfolio | Value December 31, 2015 | Gross Purchases | Gross Sales | Shares Held at December 31, 2016 | Value December 31, 2016 | Income Earned January 1, 2016 - December 31, 2016 | ||||||||||||||||||
Cash Management Trust-Collateral Investment | $ | 3,501,278 | $ | 34,312,577 | $ | 34,267,552 | 3,546,303 | $ | 3,546,303 | $ | 70,761 | |||||||||||||
Cash Management Trust-Short Term Investment | 2,630,798 | 6,608,018 | 9,238,816 | — | — | 1,365 | ||||||||||||||||||
Core Short-Term Reserve Fund | — | 17,107,829 | 15,944,128 | 116,370 | 1,163,701 | 6,101 | ||||||||||||||||||
Total Value and Income Earned | $ | 6,132,076 | $ | 4,710,004 | $ | 78,227 | ||||||||||||||||||
The accompanying Notes to Financial Statements are an integral part of this schedule.
154
Table of Contents
Schedule of Investments as of December 31, 2016
| Shares | Common Stock (97.5%) | Value | ||||||
Consumer Discretionary (9.7%) | ||||||||
| 590,550 | Comcast Corporation | $ | 40,777,478 | |||||
| 168,840 | Delphi Automotive plc | 11,371,374 | ||||||
| 543,348 | Harley-Davidson, Inc. | 31,698,922 | ||||||
| 427,700 | Lowe’s Companies, Inc. | 30,418,024 | ||||||
| 240,966 | Scripps Networks Interactive, Inc. | 17,197,743 | ||||||
|
| |||||||
Total | 131,463,541 | |||||||
|
| |||||||
Consumer Staples (3.9%) | ||||||||
| 409,170 | CVS Health Corporation | 32,287,605 | ||||||
| 86,800 | Kimberly-Clark Corporation | 9,905,616 | ||||||
| 149,421 | Wal-Mart Stores, Inc. | 10,327,979 | ||||||
|
| |||||||
Total | 52,521,200 | |||||||
|
| |||||||
Energy (11.4%) | ||||||||
| 273,230 | Baker Hughes, Inc. | 17,751,753 | ||||||
| 421,025 | Chevron Corporation | 49,554,643 | ||||||
| 387,500 | Devon Energy Corporation | 17,697,125 | ||||||
| 188,119 | EQT Corporation | 12,302,983 | ||||||
| 1,944,301 | Marathon Oil Corporation | 33,655,850 | ||||||
| 75,600 | Pioneer Natural Resources Company | 13,613,292 | ||||||
| 1,921,450 | Weatherford International plca | 9,588,035 | ||||||
|
| |||||||
Total | 154,163,681 | |||||||
|
| |||||||
Financials (27.8%) | ||||||||
| 201,150 | American International Group, Inc. | 13,137,106 | ||||||
| 2,178,690 | Bank of America Corporation | 48,149,049 | ||||||
| 625,200 | Blackstone Group, LP | 16,899,156 | ||||||
| 163,600 | Capital One Financial Corporation | 14,272,464 | ||||||
| 112,730 | Chubb, Ltd. | 14,893,888 | ||||||
| 998,600 | Citigroup, Inc. | 59,346,798 | ||||||
| 335,450 | Comerica, Inc. | 22,847,500 | ||||||
| 1,098,430 | Fifth Third Bancorp | 29,624,657 | ||||||
| 110,100 | Goldman Sachs Group, Inc. | 26,363,445 | ||||||
| 220,450 | Intercontinental Exchange, Inc. | 12,437,789 | ||||||
| 554,710 | Invesco, Ltd. | 16,829,901 | ||||||
| 621,070 | MetLife, Inc. | 33,469,462 | ||||||
| 440,310 | Morgan Stanley | 18,603,098 | ||||||
| 827,650 | Synchrony Financial | 30,018,866 | ||||||
| 410,200 | Zions Bancorporation | 17,655,008 | ||||||
|
| |||||||
Total | 374,548,187 | |||||||
|
| |||||||
Health Care (11.2%) | ||||||||
| 72,397 | Amgen, Inc. | 10,585,165 | ||||||
| 289,650 | Express Scripts Holding Companya | 19,925,024 | ||||||
| 263,640 | Medtronic plc | 18,779,077 | ||||||
| 795,100 | Merck & Company, Inc. | 46,807,537 | ||||||
| 813,750 | Pfizer, Inc. | 26,430,600 | ||||||
| 331,800 | Roche Holding AG ADR | 9,466,254 | ||||||
| 118,197 | UnitedHealth Group, Inc. | 18,916,248 | ||||||
|
| |||||||
Total | 150,909,905 | |||||||
|
| |||||||
Industrials (10.2%) | ||||||||
| 90,150 | Boeing Company | 14,034,552 | ||||||
| 474,400 | CSX Corporation | 17,045,192 | ||||||
| 404,500 | Delta Air Lines, Inc. | 19,897,355 | ||||||
| 176,603 | Honeywell International, Inc. | 20,459,458 | ||||||
| 187,200 | Ingersoll-Rand plc | 14,047,488 | ||||||
| 147,900 | Norfolk Southern Corporation | 15,983,553 | ||||||
| 67,350 | Rockwell Automation, Inc. | 9,051,840 | ||||||
| 231,850 | United Parcel Service, Inc. | 26,579,284 | ||||||
|
| |||||||
Total | 137,098,722 | |||||||
|
| |||||||
Information Technology (15.0%) | ||||||||
| 22,400 | Alphabet, Inc., Class Ca | 17,288,768 | ||||||
| 215,300 | Apple, Inc. | 24,936,046 | ||||||
| 1,818,340 | Cisco Systems, Inc. | 54,950,235 | ||||||
| 801,610 | Microsoft Corporation | 49,812,045 | ||||||
| 757,500 | Oracle Corporation | 29,125,875 | ||||||
| 362,240 | Texas Instruments, Inc. | 26,432,653 | ||||||
|
| |||||||
Total | 202,545,622 | |||||||
|
| |||||||
Materials (3.4%) | ||||||||
| 277,180 | Dow Chemical Company | 15,860,240 | ||||||
| 215,021 | Eastman Chemical Company | 16,171,729 | ||||||
| 451,700 | Mosaic Company | 13,248,361 | ||||||
|
| |||||||
Total | 45,280,330 | |||||||
|
| |||||||
Telecommunications Services (1.8%) | ||||||||
| 459,414 | Verizon Communications, Inc. | 24,523,519 | ||||||
Total | 24,523,519 | |||||||
|
| |||||||
Utilities (3.1%) | ||||||||
| 684,930 | PG&E Corporation | 41,623,196 | ||||||
|
| |||||||
Total | 41,623,196 | |||||||
|
| |||||||
Total Common Stock (cost $971,989,464) | 1,314,677,903 | |||||||
|
| |||||||
| Shares or Principal Amount | Short-Term Investments (3.0%)b | |||||||
Thrivent Core Short-Term Reserve Fund | ||||||||
| 4,076,364 | 0.910% | 40,763,640 | ||||||
|
| |||||||
Total Short-Term Investments (cost $40,763,640) | 40,763,640 | |||||||
|
| |||||||
Total Investments (cost $1,012,753,104) 100.5% | $ | 1,355,441,543 | ||||||
|
| |||||||
Other Assets and Liabilities, Net (0.5%) | (6,639,110 | ) | ||||||
|
| |||||||
Total Net Assets 100.0% | $ | 1,348,802,433 | ||||||
|
| |||||||
| a | Non-income producing security. |
| b | The interest rate shown reflects the yield, coupon rate or the discount rate at the date of purchase. |
Definitions:
| ADR | - | American Depositary Receipt, which are certificates for an underlying foreign security’s shares held by an issuing U.S. depository bank. |
Unrealized Appreciation (Depreciation)
Gross unrealized appreciation and depreciation of investments, based on cost for federal income tax purposes, were as follows:
Gross unrealized appreciation | $ | 362,702,222 | ||
Gross unrealized depreciation | (20,233,276 | ) | ||
|
| |||
Net unrealized appreciation (depreciation) | $ | 342,468,946 | ||
Cost for federal income tax purposes | $ | 1,012,972,597 |
The accompanying Notes to Financial Statements are an integral part of this schedule.
155
Table of Contents
LARGE CAP VALUE PORTFOLIO
Schedule of Investments as of December 31, 2016
Fair Valuation Measurements
The following table is a summary of the inputs used, as of December 31, 2016, in valuing Large Cap Value Portfolio’s assets carried at fair value.
Investments in Securities | Total | Level 1 | Level 2 | Level 3 | ||||||||||||
Common Stock | ||||||||||||||||
Consumer Discretionary | 131,463,541 | 131,463,541 | — | — | ||||||||||||
Consumer Staples | 52,521,200 | 52,521,200 | — | — | ||||||||||||
Energy | 154,163,681 | 154,163,681 | — | — | ||||||||||||
Financials | 374,548,187 | 374,548,187 | — | — | ||||||||||||
Health Care | 150,909,905 | 150,909,905 | — | — | ||||||||||||
Industrials | 137,098,722 | 137,098,722 | — | — | ||||||||||||
Information Technology | 202,545,622 | 202,545,622 | — | — | ||||||||||||
Materials | 45,280,330 | 45,280,330 | — | — | ||||||||||||
Telecommunications Services | 24,523,519 | 24,523,519 | — | — | ||||||||||||
Utilities | 41,623,196 | 41,623,196 | — | — | ||||||||||||
|
|
|
|
|
|
|
| |||||||||
Subtotal Investments in Securities | $ | 1,314,677,903 | $ | 1,314,677,903 | $ | — | $ | — | ||||||||
|
|
|
|
|
|
|
| |||||||||
Other Investments* | Total | |||||||||||||||
Short-Term Investments | 40,763,640 | |||||||||||||||
|
| |||||||||||||||
Subtotal Other Investments | $ | 40,763,640 | ||||||||||||||
|
| |||||||||||||||
Total Investments at Value | $ | 1,355,441,543 | ||||||||||||||
|
| |||||||||||||||
| * | Certain investments are measured at fair value using a net asset value per share that is not publicly available (practical expedient). According to disclosure requirements of Accounting Standards Codification (ASC) 820, Fair Value Measurement, securities valued using the practical expedient are not classified in the fair value hierarchy. The fair value amounts presented in this table are intended to permit reconciliation of the fair value hierarchy to the amounts presented in the Statement of Assets and Liabilities. |
There were no significant transfers between Levels during the period ended December 31, 2016. Transfers between Levels are identified as of the end of the period.
Investment in Affiliates
Affiliated issuers, as defined under the Investment Company Act of 1940, include those in which the Portfolio’s holdings of an issuer represent 5% or more of the outstanding voting securities of an issuer, any affiliated mutual fund, or a company which is under common ownership or control with the Portfolio. The Portfolio owns shares of Thrivent Cash Management Trust for the purpose of securities lending and Thrivent Core Short-Term Reserve Fund primarily to serve as a cash sweep vehicle for the Portfolio. Thrivent Cash Management Trust and Thrivent Core Short-Term Reserve Fund are established for the sole use of affiliated portfolios. A summary of transactions for the fiscal year to date, in Large Cap Value Portfolio, is as follows:
Portfolio | Value December 31, 2015 | Gross Purchases | Gross Sales | Shares Held at December 31, 2016 | Value December 31, 2016 | Income Earned January 1, 2016 - December 31, 2016 | ||||||||||||||||||
Cash Management Trust-Collateral Investment | $ | 13,026,675 | $ | 352,821,001 | $ | 365,847,676 | — | $ | — | $ | 55,627 | |||||||||||||
Cash Management Trust-Short Term Investment | 19,152,858 | 28,107,108 | 47,259,966 | — | — | 20,621 | ||||||||||||||||||
Core Short-Term Reserve Fund | — | 80,950,233 | 40,186,593 | 4,076,364 | 40,763,640 | 154,119 | ||||||||||||||||||
Total Value and Income Earned | $ | 32,179,533 | $ | 40,763,640 | $ | 230,367 | ||||||||||||||||||
The accompanying Notes to Financial Statements are an integral part of this schedule.
156
Table of Contents
Summary Schedule of Investments as of December 31, 2016
| Shares | Common Stock (85.9%) | Value | % of Net Assets | |||||||||
Consumer Discretionary (13.6%) | ||||||||||||
| 32,112 | Amazon.com, Inc.a | $ | 24,079,825 | 2.7 | % | |||||||
| 26,120 | AutoZone, Inc.a | 20,629,315 | 2.3 | % | ||||||||
| 275,160 | Comcast Corporation | 18,999,798 | 2.1 | % | ||||||||
| 181,100 | Honda Motor Company, Ltd. | 5,287,272 | 0.5 | % | ||||||||
| 335,000 | Starbucks Corporation | 18,599,200 | 2.1 | % | ||||||||
| 82,820 | Walt Disney Company | 8,631,500 | 1.0 | % | ||||||||
Other Securities^ | 26,979,484 | 2.9 | % | |||||||||
|
| |||||||||||
| Total | 123,206,394 | |||||||||||
|
| |||||||||||
Consumer Staples (5.5%) | ||||||||||||
| 172,580 | CVS Health Corporation | 13,618,288 | 1.5 | % | ||||||||
| 162,810 | Walgreens Boots Alliance, Inc. | 13,474,156 | 1.5 | % | ||||||||
Other Securities^ | 22,382,312 | 2.5 | % | |||||||||
|
| |||||||||||
| Total | 49,474,756 | |||||||||||
|
| |||||||||||
Energy (6.8%) | ||||||||||||
| 154,040 | Baker Hughes, Inc. | 10,007,979 | 1.1 | % | ||||||||
| 1,530,567 | BP plc | 9,586,655 | 1.1 | % | ||||||||
| 100,739 | Chevron Corporation | 11,856,980 | 1.3 | % | ||||||||
| 34,910 | Pioneer Natural Resources Company | 6,286,244 | 0.7 | % | ||||||||
| 1,223,990 | Weatherford International plca | 6,107,710 | 0.7 | % | ||||||||
Other Securities^ | 17,384,249 | 1.9 | % | |||||||||
|
| |||||||||||
| Total | 61,229,817 | |||||||||||
|
| |||||||||||
Financials (15.8%) | ||||||||||||
| 580,344 | Bank of America Corporation | 12,825,602 | 1.4 | % | ||||||||
| 238,260 | Blackstone Group, LP | 6,440,168 | 0.7 | % | ||||||||
| 52,260 | Chubb, Ltd. | 6,904,591 | 0.8 | % | ||||||||
| 356,230 | Citigroup, Inc. | 21,170,749 | 2.3 | % | ||||||||
| 86,290 | Goldman Sachs Group, Inc. | 20,662,141 | 2.3 | % | ||||||||
| 182,490 | Intercontinental Exchange, Inc. | 10,296,086 | 1.1 | % | ||||||||
| 242,390 | Invesco, Ltd. | 7,354,113 | 0.8 | % | ||||||||
Other Securities^ | 57,577,722 | 6.4 | % | |||||||||
|
| |||||||||||
| Total | 143,231,172 | |||||||||||
|
| |||||||||||
Health Care (9.2%) | ||||||||||||
| 34,010 | Allergan plca | 7,142,440 | 0.8 | % | ||||||||
| 63,330 | Celgene Corporationa | 7,330,447 | 0.8 | % | ||||||||
| 95,029 | Gilead Sciences, Inc. | 6,805,027 | 0.7 | % | ||||||||
| 256,160 | Merck & Company, Inc. | 15,080,139 | 1.7 | % | ||||||||
| 105,393 | Novartis AG | 7,664,548 | 0.8 | % | ||||||||
| 489,790 | Pfizer, Inc. | 15,908,379 | 1.8 | % | ||||||||
Other Securities^ | 23,516,134 | 2.6 | % | |||||||||
|
| |||||||||||
| Total | 83,447,114 | |||||||||||
|
| |||||||||||
Industrials (10.9%) | ||||||||||||
| 77,050 | Boeing Company | 11,995,144 | 1.3 | % | ||||||||
| 45,530 | Cummins, Inc. | 6,222,585 | 0.7 | % | ||||||||
| 229,810 | Delta Air Lines, Inc. | 11,304,354 | 1.3 | % | ||||||||
| 132,010 | Norfolk Southern Corporation | 14,266,321 | 1.6 | % | ||||||||
| 70,830 | Union Pacific Corporation | 7,343,654 | 0.8 | % | ||||||||
Other Securities^ | 47,398,845 | 5.2 | % | |||||||||
|
| |||||||||||
| Total | 98,530,903 | |||||||||||
|
| |||||||||||
Information Technology (15.1%) | ||||||||||||
| 24,634 | Alphabet, Inc., Class Aa | 19,521,213 | 2.2 | % | ||||||||
| 24,660 | Alphabet, Inc., Class Ca | 19,033,081 | 2.1 | % | ||||||||
| 283,598 | Apple, Inc. | 32,846,320 | 3.6 | % | ||||||||
| 207,180 | Cisco Systems, Inc. | 6,260,980 | 0.7 | % | ||||||||
| 129,395 | Facebook, Inc.a | 14,886,895 | 1.7 | % | ||||||||
| 218,900 | Microsoft Corporation | 13,602,446 | 1.5 | % | ||||||||
| 111,960 | Salesforce.com, Inc.a | 7,664,782 | 0.9 | % | ||||||||
| 84,420 | Visa, Inc. | 6,586,448 | 0.7 | % | ||||||||
Other Securities^ | 16,253,997 | 1.7 | % | |||||||||
|
| |||||||||||
| Total | 136,656,162 | |||||||||||
|
| |||||||||||
Materials (4.4%) | ||||||||||||
| 300,412 | BHP Billiton, Ltd. | 5,381,841 | 0.6 | % | ||||||||
| 149,760 | Dow Chemical Company | 8,569,267 | 1.0 | % | ||||||||
| 98,200 | Eastman Chemical Company | 7,385,622 | 0.8 | % | ||||||||
Other Securities^ | 18,788,264 | 2.0 | % | |||||||||
|
| |||||||||||
| Total | 40,124,994 | |||||||||||
|
| |||||||||||
Real Estate (1.0%) | ||||||||||||
Other Securities^ | 9,595,748 | 1.0 | % | |||||||||
|
| |||||||||||
| Total | 9,595,748 | |||||||||||
|
| |||||||||||
Telecommunications Services (1.0%) | ||||||||||||
Other Securities^ | 8,744,708 | 1.0 | % | |||||||||
|
| |||||||||||
| Total | 8,744,708 | |||||||||||
|
| |||||||||||
Utilities (2.6%) | ||||||||||||
| 300,170 | PG&E Corporation | 18,241,331 | 2.0 | % | ||||||||
Other Securities^ | 5,180,358 | 0.6 | % | |||||||||
|
| |||||||||||
| Total | 23,421,689 | |||||||||||
|
| |||||||||||
Total Common Stock (cost $625,365,122) | 777,663,457 | |||||||||||
|
| |||||||||||
Registered Investment Companies (0.1%) | ||||||||||||
Equity Funds/ETFs (<0.1%) | ||||||||||||
| Other Securities^ | 751,067 | 0.1 | % | |||||||||
|
| |||||||||||
| Total | 751,067 | |||||||||||
|
| |||||||||||
Total Registered Investment Companies (cost $750,423) | 751,067 | |||||||||||
|
| |||||||||||
Preferred Stock (<0.1%) | ||||||||||||
Consumer Staples (<0.1%) | ||||||||||||
| Other Securities^ | 272,007 | <0.1 | % | |||||||||
|
| |||||||||||
| Total | 272,007 | |||||||||||
|
| |||||||||||
Total Preferred Stock (cost $281,579) | 272,007 | |||||||||||
|
| |||||||||||
Collateral Held for Securities Loaned (0.1%) | ||||||||||||
| 1,213,950 | Thrivent Cash Management Trust | 1,213,950 | 0.1 | % | ||||||||
Total Collateral Held for Securities Loaned (cost $1,213,950) | 1,213,950 | |||||||||||
|
| |||||||||||
| Shares or Principal Amount | Short-Term Investments (13.9%)b | |||||||||||
| Federal Home Loan Bank Discount Notes | ||||||||||||
| 6,560,000 | 0.369%, 1/11/2017 | 6,559,449 | 0.7 | % | ||||||||
| 10,100,000 | 0.370%, 1/13/2017 | 10,098,929 | 1.1 | % | ||||||||
| 17,300,000 | 0.443%, 1/25/2017c | 17,295,986 | 1.9 | % | ||||||||
| 6,000,000 | 0.450%, 1/27/2017c | 5,998,482 | 0.7 | % | ||||||||
| 5,200,000 | 0.385%, 2/1/2017c | 5,197,904 | 0.6 | % | ||||||||
| 5,900,000 | 0.473%, 2/3/2017 | 5,897,457 | 0.7 | % | ||||||||
| 10,000,000 | 0.470%, 2/9/2017 | 9,994,860 | 1.1 | % | ||||||||
The accompanying Notes to Financial Statements are an integral part of this schedule.
157
Table of Contents
LARGE CAP STOCK PORTFOLIO
Summary Schedule of Investments as of December 31, 2016
| Shares or Principal Amount | Short-Term Investments (13.9%)b | Value | % of Net Assets | |||||||||
| Federal Home Loan Bank Discount Notes | ||||||||||||
| 19,034,000 | 0.359% - 0.515%, 1/6/2017 - 2/16/2017c | $ | 19,029,339 | 2.1 | % | |||||||
| 4,542,764 | Thrivent Core Short-Term Reserve Fund 0.910% | 45,427,642 | 5.0 | % | ||||||||
Total Short-Term Investments (cost $125,498,170) | 125,500,048 | |||||||||||
|
| |||||||||||
Total Investments (cost $753,109,244) 100.0% | $ | 905,400,529 | ||||||||||
|
| |||||||||||
Other Assets and Liabilities, Net <0.1% | 24,622 | |||||||||||
|
| |||||||||||
Total Net Assets 100.0% | $ | 905,425,151 | ||||||||||
|
| |||||||||||
| ^ | The Summary Schedule of Investments shows the 50 largest holdings in unaffiliated issuers, any holding or issuer that exceeds 1% of net assets and all affiliated holdings as of the report date. The remaining securities held are grouped by category as “Other securities”. |
| a | Non-income producing security. |
| b | The interest rate shown reflects the yield, coupon rate or the discount rate at the date of purchase. |
| c | All or a portion of the security is held on deposit with the counterparty and pledged as the initial margin deposit for open futures contracts. |
The following table presents the total amount of securities loaned with continuous maturity, by type, offset by the gross payable upon return of collateral for securities loaned by Thrivent Large Cap Stock Portfolio as of December 31, 2016:
Securities Lending Transactions | ||||
Common Stock | $ | 1,147,877 | ||
|
| |||
Total lending | $ | 1,147,877 | ||
Gross amount payable upon return of collateral for securities loaned | $ | 1,213,950 | ||
|
| |||
Net amounts due to counterparty | $ | 66,073 | ||
|
| |||
Unrealized Appreciation (Depreciation)
Gross unrealized appreciation and depreciation of investments, based on cost for federal income tax purposes, were as follows:
Gross unrealized appreciation | $ | 161,420,245 | ||
Gross unrealized depreciation | (13,843,391 | ) | ||
|
| |||
Net unrealized appreciation (depreciation) | $ | 147,576,854 | ||
Cost for federal income tax purposes | $ | 757,823,675 |
The accompanying Notes to Financial Statements are an integral part of this schedule.
158
Table of Contents
LARGE CAP STOCK PORTFOLIO
Summary Schedule of Investments as of December 31, 2016
Fair Valuation Measurements
The following table is a summary of the inputs used, as of December 31, 2016, in valuing Large Cap Stock Portfolio’s assets carried at fair value.
Investments in Securities | Total | Level 1 | Level 2 | Level 3 | ||||||||||||
Common Stock | ||||||||||||||||
Consumer Discretionary | 123,206,394 | 91,386,689 | 31,819,705 | — | ||||||||||||
Consumer Staples | 49,474,756 | 31,336,567 | 18,138,189 | — | ||||||||||||
Energy | 61,229,817 | 38,348,375 | 22,880,579 | 863 | ||||||||||||
Financials | 143,231,172 | 90,540,107 | 52,691,065 | — | ||||||||||||
Health Care | 83,447,114 | 63,953,833 | 19,493,281 | — | ||||||||||||
Industrials | 98,530,903 | 58,680,849 | 39,850,054 | — | ||||||||||||
Information Technology | 136,656,162 | 128,674,184 | 7,981,978 | — | ||||||||||||
Materials | 40,124,994 | 16,120,123 | 24,004,871 | — | ||||||||||||
Real Estate | 9,595,748 | — | 9,595,748 | — | ||||||||||||
Telecommunications Services | 8,744,708 | — | 8,744,708 | — | ||||||||||||
Utilities | 23,421,689 | 18,241,331 | 5,180,358 | — | ||||||||||||
Registered Investment Companies | ||||||||||||||||
Equity Funds/ETFs | 751,067 | 751,067 | — | — | ||||||||||||
Preferred Stock | ||||||||||||||||
Consumer Staples | 272,007 | — | 272,007 | — | ||||||||||||
Short-Term Investments | 80,072,406 | — | 80,072,406 | — | ||||||||||||
|
|
|
|
|
|
|
| |||||||||
Subtotal Investments in Securities | $ | 858,758,937 | $ | 538,033,125 | $ | 320,724,949 | $ | 863 | ||||||||
|
|
|
|
|
|
|
| |||||||||
Other Investments* | Total | |||||||||||||||
Short-Term Investments | 45,427,642 | |||||||||||||||
Collateral Held for Securities Loaned | 1,213,950 | |||||||||||||||
|
| |||||||||||||||
Subtotal Other Investments | $ | 46,641,592 | ||||||||||||||
|
| |||||||||||||||
Total Investments at Value | $ | 905,400,529 | ||||||||||||||
|
| |||||||||||||||
* Certain investments are measured at fair value using a net asset value per share that is not publicly available (practical expedient). According to disclosure requirements of Accounting Standards Codification (ASC) 820, Fair Value Measurement, securities valued using the practical expedient are not classified in the fair value hierarchy. The fair value amounts presented in this table are intended to permit reconciliation of the fair value hierarchy to the amounts presented in the Statement of Assets and Liabilities.
|
| |||||||||||||||
Other Financial Instruments | Total | Level 1 | Level 2 | Level 3 | ||||||||||||
Asset Derivatives | ||||||||||||||||
Futures Contracts | 1,227,442 | 1,227,442 | — | — | ||||||||||||
|
|
|
|
|
|
|
| |||||||||
Total Asset Derivatives | $ | 1,227,442 | $ | 1,227,442 | $ | — | $ | — | ||||||||
|
|
|
|
|
|
|
| |||||||||
Liability Derivatives | ||||||||||||||||
Futures Contracts | 192,588 | 192,588 | — | — | ||||||||||||
|
|
|
|
|
|
|
| |||||||||
Total Liability Derivatives | $ | 192,588 | $ | 192,588 | $ | — | $ | — | ||||||||
|
|
|
|
|
|
|
| |||||||||
There were no significant transfers between Levels during the period ended December 31, 2016. Transfers between Levels are identified as of the end of the period.
The following table presents Large Cap Stock Portfolio’s futures contracts held as of December 31, 2016. Investments and/or cash totaling $9,297,664 were pledged as the initial margin deposit for these contracts.
Futures Contracts | Number of Contracts Long/(Short) | Expiration Date | Notional Principal Amount | Value | Unrealized Gain/(Loss) | |||||||||||||||
Eurex Euro STOXX 50 Index | 1,273 | March 2017 | $ | 43,006,890 | $ | 43,845,723 | $ | 838,833 | ||||||||||||
Eurex Stoxx Europe 600 Index | 321 | March 2017 | 5,981,205 | 6,058,580 | 77,375 | |||||||||||||||
FTSE 100 Index | 142 | March 2017 | 12,039,521 | 12,350,755 | 311,234 | |||||||||||||||
ICE mini MSCI EAFE Index | 511 | March 2017 | 43,004,168 | 42,811,580 | (192,588 | ) | ||||||||||||||
|
| |||||||||||||||||||
Total Futures Contracts | $ | 1,034,854 | ||||||||||||||||||
|
| |||||||||||||||||||
The accompanying Notes to Financial Statements are an integral part of this schedule.
159
Table of Contents
LARGE CAP STOCK PORTFOLIO
Summary Schedule of Investments as of December 31, 2016
The following table summarizes the fair value and Statement of Assets and Liabilities location, as of December 31, 2016, for Large Cap Stock Portfolio’s investments in fnancial derivative instruments by primary risk exposure as discussed under item (2) Significant Accounting Policies of the Notes to Financial Statements.
Derivatives by risk category | Statement of Assets and Liabilities Location | Fair Value | ||||
| Asset Derivatives | ||||||
Equity Contracts | ||||||
Futures* | Net Assets - Net unrealized appreciation/(depreciation) on Futures contracts | $ | 1,227,442 | |||
Total Equity Contracts | 1,227,442 | |||||
|
| |||||
Total Asset Derivatives | $ | 1,227,442 | ||||
|
| |||||
Liability Derivatives | ||||||
Equity Contracts | ||||||
Futures* | Net Assets - Net unrealized appreciation/(depreciation) on Futures contracts | 192,588 | ||||
Total Equity Contracts | 192,588 | |||||
|
| |||||
Total Liability Derivatives | $ | 192,588 | ||||
|
| |||||
| * | Includes cumulative appreciation/depreciation of futures contracts as reported in the Schedule of Investments. Only current day’s variation margin is reported within the Statement of Assets and Liabilities. |
The following table summarizes the net realized gains/(losses) and Statement of Operations location, for the period ended December 31, 2016, for Large Cap Stock Portfolio’s investments in financial derivative instruments by primary risk exposure.
Derivatives by risk category | Statement of Operations Location | Realized Gains/(Losses) recognized in Income | ||||
Equity Contracts | ||||||
Futures | Net realized gains/(losses) on Futures contracts | 918,544 | ||||
Total Equity Contracts | 918,544 | |||||
|
| |||||
Total | $ | 918,544 | ||||
|
| |||||
The following table summarizes the change in net unrealized appreciation/(depreciation) and Statement of Operations location, for the period ended December 31, 2016, for Large Cap Stock Portfolio’s investments in financial derivative instruments by primary risk exposure.
Derivatives by risk category | Statement of Operations Location | Change in unrealized appreciation/(depreciation) recognized in Income | ||||
Equity Contracts | ||||||
Futures | Change in net unrealized appreciation/(depreciation) on Futures contracts | (2,345,523) | ||||
Total Equity Contracts | (2,345,523) | |||||
|
| |||||
Total | ($ | 2,345,523) | ||||
|
| |||||
The following table presents Large Cap Stock Portfolio’s average volume of derivative activity during the period ended December 31, 2016.
Derivative Risk Category | Futures (Notional)* | Futures (Percentage of Average Net Assets) | ||||||
Equity Contracts | $ | 108,636,592 | 12.6 | % | ||||
| * | Notional amount represents long or short, or both, derivative positions held by the Portfolio. |
Investment in Affliates
Affiliated issuers, as defined under the Investment Company Act of 1940, include those in which the Portfolio’s holdings of an issuer represent 5% or more of the outstanding voting securities of an issuer, any affiliated mutual fund, or a company which is under common ownership or control with the Portfolio. The Portfolio owns shares of Thrivent Cash Management Trust for the purpose of securities lending and Thrivent Core Short-Term Reserve Fund primarily to serve as a cash sweep vehicle for the Portfolio. Thrivent Cash Management Trust and Thrivent Core Short-Term Reserve Fund are established for the sole use of affiliated portfolios.
A summary of transactions for the fiscal year to date, in Large Cap Stock Portfolio, is as follows:
Portfolio | Value December 31, 2015 | Gross Purchases | Gross Sales | Shares Held at December 31, 2016 | Value December 31, 2016 | Income Earned January 1, 2016 - December 31, 2016 | ||||||||||||||||||
Cash Management Trust- | ||||||||||||||||||||||||
Collateral Investment | $ | 4,545,524 | $ | 101,504,164 | $ | 104,835,738 | 1,213,950 | $ | 1,213,950 | $ | 108,785 | |||||||||||||
Cash Management Trust- | ||||||||||||||||||||||||
Short Term Investment | 129,184,785 | 111,721,796 | 240,906,581 | – | – | 96,694 | ||||||||||||||||||
Core Short-Term Reserve Fund | – | 158,627,157 | 113,199,515 | 4,542,764 | 45,427,642 | 192,880 | ||||||||||||||||||
Total Value and Income Earned | $ | 133,730,309 | $ | 46,641,592 | $ | 398,359 | ||||||||||||||||||
The accompanying Notes to Financial Statements are an integral part of this schedule.
160
Table of Contents
Summary Schedule of Investments as of December 31, 2016
| Shares | Common Stock (97.0%) | Value | % of Net Assets | |||||||||
Consumer Discretionary (11.8%) | ||||||||||||
| 13,650 | Amazon.com, Inc.a | $ | 10,235,725 | 1.5 | % | |||||||
| 82,835 | Comcast Corporation | 5,719,757 | 0.8 | % | ||||||||
| 42,240 | Home Depot, Inc. | 5,663,539 | 0.8 | % | ||||||||
| 29,000 | McDonald’s Corporation | 3,529,880 | 0.5 | % | ||||||||
| 49,967 | Walt Disney Company | 5,207,561 | 0.8 | % | ||||||||
Other Securities^ | 51,213,228 | 7.4 | % | |||||||||
|
| |||||||||||
Total | 81,569,690 | |||||||||||
|
| |||||||||||
Consumer Staples (9.1%) | ||||||||||||
| 67,440 | Altria Group, Inc. | 4,560,293 | 0.7 | % | ||||||||
| 135,380 | Coca-Cola Company | 5,612,855 | 0.8 | % | ||||||||
| 37,154 | CVS Health Corporation | 2,931,822 | 0.4 | % | ||||||||
| 50,150 | PepsiCo, Inc. | 5,247,194 | 0.8 | % | ||||||||
| 54,220 | Philip Morris International, Inc. | 4,960,588 | 0.7 | % | ||||||||
| 93,238 | Procter & Gamble Company | 7,839,451 | 1.1 | % | ||||||||
| 52,340 | Wal-Mart Stores, Inc. | 3,617,741 | 0.5 | % | ||||||||
Other Securities^ | 28,102,342 | 4.1 | % | |||||||||
|
| |||||||||||
Total | 62,872,286 | |||||||||||
|
| |||||||||||
Energy (7.4%) | ||||||||||||
| 65,956 | Chevron Corporation | 7,763,021 | 1.1 | % | ||||||||
| 144,900 | Exxon Mobil Corporation | 13,078,674 | 1.9 | % | ||||||||
| 48,549 | Schlumberger, Ltd. | 4,075,688 | 0.6 | % | ||||||||
Other Securities^ | 25,933,764 | 3.8 | % | |||||||||
|
| |||||||||||
Total | 50,851,147 | |||||||||||
|
| |||||||||||
Financials (14.4%) | ||||||||||||
| 355,040 | Bank of America Corporation | 7,846,384 | 1.1 | % | ||||||||
| 66,049 | Berkshire Hathaway, Inc.a | 10,764,666 | 1.6 | % | ||||||||
| 100,173 | Citigroup, Inc. | 5,953,281 | 0.9 | % | ||||||||
| 12,940 | Goldman Sachs Group, Inc. | 3,098,483 | 0.4 | % | ||||||||
| 125,058 | J.P. Morgan Chase & Company | 10,791,255 | 1.6 | % | ||||||||
| 158,060 | Wells Fargo & Company | 8,710,687 | 1.3 | % | ||||||||
Other Securities^ | 52,504,022 | 7.5 | % | |||||||||
|
| |||||||||||
Total | 99,668,778 | |||||||||||
|
| |||||||||||
Health Care (13.1%) | ||||||||||||
| 56,300 | AbbVie, Inc. | 3,525,506 | 0.5 | % | ||||||||
| 25,970 | Amgen, Inc. | 3,797,074 | 0.5 | % | ||||||||
| 57,168 | Bristol-Myers Squibb Company | 3,340,898 | 0.5 | % | ||||||||
| 26,900 | Celgene Corporationa | 3,113,675 | 0.4 | % | ||||||||
| 45,770 | Gilead Sciences, Inc. | 3,277,590 | 0.5 | % | ||||||||
| 94,490 | Johnson & Johnson | 10,886,193 | 1.6 | % | ||||||||
| 47,899 | Medtronic plc | 3,411,846 | 0.5 | % | ||||||||
| 97,123 | Merck & Company, Inc. | 5,717,631 | 0.8 | % | ||||||||
| 211,320 | Pfizer, Inc. | 6,863,674 | 1.0 | % | ||||||||
| 33,460 | UnitedHealth Group, Inc. | 5,354,938 | 0.8 | % | ||||||||
Other Securities^ | 41,583,415 | 6.0 | % | |||||||||
|
| |||||||||||
Total | 90,872,440 | |||||||||||
|
| |||||||||||
Industrials (9.9%) | ||||||||||||
| 20,960 | 3M Company | 3,742,827 | 0.5 | % | ||||||||
| 19,780 | Boeing Company | 3,079,350 | 0.4 | % | ||||||||
| 307,567 | General Electric Company | 9,719,117 | 1.4 | % | ||||||||
| 26,345 | Honeywell International, Inc. | 3,052,068 | 0.4 | % | ||||||||
| 28,680 | Union Pacific Corporation | 2,973,542 | 0.4 | % | ||||||||
Other Securities^ | 45,922,299 | 6.8 | % | |||||||||
|
| |||||||||||
Total | 68,489,203 | |||||||||||
|
| |||||||||||
Information Technology (20.2%) | ||||||||||||
| 10,300 | Alphabet, Inc., Class Aa | 8,162,235 | 1.2 | % | ||||||||
| 10,309 | Alphabet, Inc., Class Ca | 7,956,692 | 1.1 | % | ||||||||
| 184,890 | Apple, Inc. | 21,413,960 | 3.1 | % | ||||||||
| 175,130 | Cisco Systems, Inc. | 5,292,429 | 0.8 | % | ||||||||
| 81,920 | Facebook, Inc.a | 9,424,896 | 1.4 | % | ||||||||
| 164,020 | Intel Corporation | 5,949,005 | 0.9 | % | ||||||||
| 30,230 | International Business Machines Corporation | 5,017,878 | 0.7 | % | ||||||||
| 33,010 | MasterCard, Inc. | 3,408,283 | 0.5 | % | ||||||||
| 268,310 | Microsoft Corporation | 16,672,783 | 2.4 | % | ||||||||
| 105,177 | Oracle Corporation | 4,044,056 | 0.6 | % | ||||||||
| 51,090 | QUALCOMM, Inc. | 3,331,068 | 0.5 | % | ||||||||
| 65,060 | Visa, Inc. | 5,075,981 | 0.7 | % | ||||||||
Other Securities^ | 43,601,724 | 6.3 | % | |||||||||
|
| |||||||||||
Total | 139,350,990 | |||||||||||
|
| |||||||||||
Materials (2.6%) | ||||||||||||
Other Securities^ | 18,330,654 | 2.6 | % | |||||||||
|
| |||||||||||
Total | 18,330,654 | |||||||||||
|
| |||||||||||
Real Estate (2.8%) | ||||||||||||
Other Securities^ | 19,258,297 | 2.8 | % | |||||||||
|
| |||||||||||
Total | 19,258,297 | |||||||||||
|
| |||||||||||
Telecommunications Services (2.6%) | ||||||||||||
| 213,566 | AT&T, Inc. | 9,082,962 | 1.3 | % | ||||||||
| 141,336 | Verizon Communications, Inc. | 7,544,516 | 1.1 | % | ||||||||
Other Securities^ | 1,162,310 | 0.2 | % | |||||||||
|
| |||||||||||
Total | 17,789,788 | |||||||||||
|
| |||||||||||
Utilities (3.1%) | ||||||||||||
Other Securities^ | 21,316,588 | 3.1 | % | |||||||||
|
| |||||||||||
Total | 21,316,588 | |||||||||||
|
| |||||||||||
Total Common Stock (cost $434,891,692) | 670,369,861 | |||||||||||
|
| |||||||||||
Collateral Held for Securities Loaned (0.1%) | ||||||||||||
| 848,560 | Thrivent Cash Management Trust | 848,560 | 0.1 | % | ||||||||
|
| |||||||||||
Total Collateral Held for Securities Loaned (cost $848,560) | 848,560 | |||||||||||
|
| |||||||||||
| Shares or Principal Amount | Short-Term Investments (2.9%)b | |||||||||||
Thrivent Core Short-Term Reserve Fund | ||||||||||||
| 1,854,264 | 0.910% | 18,542,637 | 2.7 | % | ||||||||
Other Securities^ | 1,199,598 | 0.2 | % | |||||||||
|
| |||||||||||
Total Short-Term Investments (cost $19,742,210) | 19,742,235 | |||||||||||
|
| |||||||||||
Total Investments (cost $455,482,462) 100.0% | $ | 690,960,656 | ||||||||||
|
| |||||||||||
Other Assets and Liabilities, Net <0.1% | 336,374 | |||||||||||
|
| |||||||||||
Total Net Assets 100.0% | $ | 691,297,030 | ||||||||||
|
| |||||||||||
| ^ | The Summary Schedule of Investments shows the 50 largest holdings in unaffiliated issuers, any holding or issuer that exceeds 1% of net assets and all affiliated holdings as of the report date. The remaining securities held are grouped by category as “Other securities”. |
| a | Non-income producing security. |
| b | The interest rate shown reflects the yield, coupon rate or the discount rate at the date of purchase. |
The accompanying Notes to Financial Statements are an integral part of this schedule.
161
Table of Contents
LARGE CAP INDEX PORTFOLIO
Summary Schedule of Investments as of December 31, 2016
The following table presents the total amount of securities loaned with continuous maturity, by type, offset by the gross payable upon return of collateral for securities loaned by Thrivent Large Cap Index Portfolio as of December 31, 2016:
Securities Lending Transactions | ||||
Common Stock | $ | 824,413 | ||
|
| |||
Total lending | $ | 824,413 | ||
Gross amount payable upon return of collateral for securities loaned | $ | 848,560 | ||
|
| |||
Net amounts due to counterparty | $ | 24,147 | ||
|
| |||
Unrealized Appreciation (Depreciation)
Gross unrealized appreciation and depreciation of investments, based on cost for federal income tax purposes, were as follows:
Gross unrealized appreciation | $ | 229,437,748 | ||
Gross unrealized depreciation | (9,567,499 | ) | ||
|
| |||
Net unrealized appreciation (depreciation) | $ | 219,870,249 | ||
Cost for federal income tax purposes | $ | 471,090,407 |
The accompanying Notes to Financial Statements are an integral part of this schedule.
162
Table of Contents
LARGE CAP INDEX PORTFOLIO
Summary Schedule of Investments as of December 31, 2016
Fair Valuation Measurements
The following table is a summary of the inputs used, as of December 31, 2016, in valuing Large Cap Index Portfolio’s assets carried at fair value.
Investments in Securities | Total | Level 1 | Level 2 | Level 3 | ||||||||||||
Common Stock | ||||||||||||||||
Consumer Discretionary | 81,569,690 | 81,569,690 | — | — | ||||||||||||
Consumer Staples | 62,872,286 | 62,867,069 | — | 5,217 | ||||||||||||
Energy | 50,851,147 | 50,851,147 | — | — | ||||||||||||
Financials | 99,668,778 | 99,668,778 | — | — | ||||||||||||
Health Care | 90,872,440 | 90,872,440 | — | — | ||||||||||||
Industrials | 68,489,203 | 68,489,203 | — | — | ||||||||||||
Information Technology | 139,350,990 | 139,350,990 | — | — | ||||||||||||
Materials | 18,330,654 | 18,330,654 | — | — | ||||||||||||
Real Estate | 19,258,297 | 19,258,297 | — | — | ||||||||||||
Telecommunications Services | 17,789,788 | 17,789,788 | — | — | ||||||||||||
Utilities | 21,316,588 | 21,316,588 | — | — | ||||||||||||
Short-Term Investments | 1,199,598 | — | 1,199,598 | — | ||||||||||||
|
|
|
|
|
|
|
| |||||||||
Subtotal Investments in Securities | $ | 671,569,459 | $ | 670,364,644 | $ | 1,199,598 | $ | 5,217 | ||||||||
|
|
|
|
|
|
|
| |||||||||
Other Investments* | Total | |||||||||||||||
Short-Term Investments | 18,542,637 | |||||||||||||||
Collateral Held for Securities Loaned | 848,560 | |||||||||||||||
|
| |||||||||||||||
Subtotal Other Investments | $19,391,197 | |||||||||||||||
|
| |||||||||||||||
Total Investments at Value | $690,960,656 | |||||||||||||||
|
| |||||||||||||||
| * | Certain investments are measured at fair value using a net asset value per share that is not publicly available (practical expedient). According to disclosure requirements of Accounting Standards Codification (ASC) 820, Fair Value Measurement, securities valued using the practical expedient are not classified in the fair value hierarchy. The fair value amounts presented in this table are intended to permit reconciliation of the fair value hierarchy to the amounts presented in the Statement of Assets and Liabilities. |
Other Financial Instruments | Total | Level 1 | Level 2 | Level 3 | ||||||||||||
Liability Derivatives | ||||||||||||||||
Futures Contracts | 183,750 | 183,750 | — | — | ||||||||||||
|
|
|
|
|
|
|
| |||||||||
Total Liability Derivatives | $ | 183,750 | $ | 183,750 | $ | — | $ | — | ||||||||
|
|
|
|
|
|
|
| |||||||||
There were no significant transfers between Levels during the period ended December 31, 2016. Transfers between Levels are identified as of the end of the period.
The following table presents Large Cap Index Portfolio’s futures contracts held as of December 31, 2016. Investments and/or cash totaling $1,199,598 were pledged as the initial margin deposit for these contracts.
| Number of | Notional | |||||||||||||||||||
Futures Contracts | Contracts Long/(Short) | Expiration Date | Principal Amount | Value | Unrealized Gain/(Loss) | |||||||||||||||
CME E-mini S&P 500 Index | 174 | March 2017 | $ | 19,638,690 | $ | 19,454,940 | ($ | 183,750 | ) | |||||||||||
Total Futures Contracts | ($ | 183,750 | ) | |||||||||||||||||
The following table summarizes the fair value and Statement of Assets and Liabilities location, as of December 31, 2016, for Large Cap Index Portfolio’s investments in financial derivative instruments by primary risk exposure as discussed under item (2) Significant Accounting Policies of the Notes to Financial Statements.
Derivatives by risk category | Statement of Assets and Liabilities Location | Fair Value | ||||
Liability Derivatives | ||||||
Equity Contracts | ||||||
Futures* | Net Assets - Net unrealized appreciation/(depreciation) on Futures contracts | $ | 183,750 | |||
Total Equity Contracts | 183,750 | |||||
|
| |||||
Total Liability Derivatives | $ | 183,750 | ||||
|
| |||||
| * | Includes cumulative appreciation/depreciation of futures contracts as reported in the Schedule of Investments. Only current day’s variation margin is reported within the Statement of Assets and Liabilities. |
The accompanying Notes to Financial Statements are an integral part of this schedule.
163
Table of Contents
LARGE CAP INDEX PORTFOLIO
Summary Schedule of Investments as of December 31, 2016
The following table summarizes the net realized gains/(losses) and Statement of Operations location, for the period ended December 31, 2016, for Large Cap Index Portfolio’s investments in financial derivative instruments by primary risk exposure.
Derivatives by risk category | Statement of Operations Location | Realized Gains/(Losses) recognized in Income | ||||
Equity Contracts | ||||||
Futures | Net realized gains/(losses) on Futures contracts | 2,552,767 | ||||
Total Equity Contracts | 2,552,767 | |||||
|
| |||||
Total | $ | 2,552,767 | ||||
|
| |||||
The following table summarizes the change in net unrealized appreciation/(depreciation) and Statement of Operations location, for the period ended December 31, 2016, for Large Cap Index Portfolio’s investments in financial derivative instruments by primary risk exposure.
Derivatives by risk category | Statement of Operations Location | Change in unrealized appreciation/(depreciation) recognized in Income | ||||
Equity Contracts | ||||||
Futures | Change in net unrealized appreciation/(depreciation) on Futures contracts | (146,364 | ) | |||
Total Equity Contracts | (146,364 | ) | ||||
|
| |||||
Total | ($ | 146,364 | ) | |||
|
| |||||
The following table presents Large Cap Index Portfolio’s average volume of derivative activity during the period ended December 31, 2016.
| Futures | ||||||||
| (Percentage | ||||||||
Derivative Risk Category | Futures (Notional)* | of Average Net Assets) | ||||||
Equity Contracts | $ | 20,346,146 | 3.5 | % | ||||
| * | Notional amount represents long or short, or both, derivative positions held by the Portfolio. |
Investment in Affiliates
Affiliated issuers, as defined under the Investment Company Act of 1940, include those in which the Portfolio’s holdings of an issuer represent 5% or more of the outstanding voting securities of an issuer, any affiliated mutual fund, or a company which is under common ownership or control with the Portfolio. The Portfolio owns shares of Thrivent Cash Management Trust for the purpose of securities lending and Thrivent Core Short-Term Reserve Fund primarily to serve as a cash sweep vehicle for the Portfolio. Thrivent Cash Management Trust and Thrivent Core Short-Term Reserve Fund are established for the sole use of affiliated portfolios.
A summary of transactions for the fiscal year to date, in Large Cap Index Portfolio, is as follows:
Portfolio | Value December 31, 2015 | Gross Purchases | Gross Sales | Shares Held at December 31, 2016 | Value December 31, 2016 | Income Earned January 1, 2016 - December 31, 2016 | ||||||||||||||||||
Cash Management | $ | 1,894,887 | $ | 39,154,945 | $ | 40,201,272 | 848,560 | $ | 848,560 | $ | 28,989 | |||||||||||||
Cash Management | 16,796,121 | 24,089,679 | 40,885,800 | — | — | 15,487 | ||||||||||||||||||
Core Short-Term | — | 112,874,970 | 94,332,333 | 1,854,264 | 18,542,637 | 92,595 | ||||||||||||||||||
Total Value and | $ | 18,691,008 | $ | 19,391,197 | $ | 137,071 | ||||||||||||||||||
The accompanying Notes to Financial Statements are an integral part of this schedule.
164
Table of Contents
Summary Schedule of Investments as of December 31, 2016
| Principal Amount | Bank Loans (2.2%) | Value | % of Net Assets | |||||||||
Basic Materials (0.3%) | ||||||||||||
Other Securities^ | $ | 2,355,363 | 0.3 | % | ||||||||
|
| |||||||||||
Total | 2,355,363 | |||||||||||
|
| |||||||||||
Capital Goods (0.3%) | ||||||||||||
Other Securities^ | 2,328,750 | 0.3 | % | |||||||||
|
| |||||||||||
Total | 2,328,750 | |||||||||||
|
| |||||||||||
Consumer Cyclical (1.5%) | ||||||||||||
Scientific Games International, Inc., Term Loan | ||||||||||||
| $4,949,000 | 6.000%, 10/1/2021a | 5,007,794 | 0.7 | % | ||||||||
Other Securities^ | 6,609,843 | 0.8 | % | |||||||||
|
| |||||||||||
Total | 11,617,637 | |||||||||||
|
| |||||||||||
Energy (0.1%) | ||||||||||||
Other Securities^ | 1,141,434 | 0.1 | % | |||||||||
|
| |||||||||||
Total | 1,141,434 | |||||||||||
|
| |||||||||||
Total Bank Loans (cost $16,833,125) | 17,443,184 | |||||||||||
|
| |||||||||||
Long-Term Fixed Income (92.1%) | ||||||||||||
Asset-Backed Securities (0.1%) | ||||||||||||
Other Securities^ | 1,124,199 | 0.1 | % | |||||||||
|
| |||||||||||
Total | 1,124,199 | |||||||||||
|
| |||||||||||
Basic Materials (4.4%) | ||||||||||||
Other Securities^ | 34,765,233 | 4.4 | % | |||||||||
|
| |||||||||||
Total | 34,765,233 | |||||||||||
|
| |||||||||||
Capital Goods (8.1%) | ||||||||||||
AECOM | ||||||||||||
| 4,240,000 | 5.750%, 10/15/2022 | 4,481,680 | 0.6 | % | ||||||||
Ardagh Packaging Finance plc | ||||||||||||
| 4,190,000 | 7.250%, 5/15/2024b | 4,415,212 | 0.6 | % | ||||||||
Berry Plastics Corporation | ||||||||||||
| 6,370,000 | 5.125%, 7/15/2023 | 6,481,475 | 0.8 | % | ||||||||
Bombardier, Inc. | ||||||||||||
| 4,195,000 | 7.500%, 3/15/2025b | 4,144,744 | 0.5 | % | ||||||||
Building Materials Corporation of America | ||||||||||||
| 3,990,000 | 6.000%, 10/15/2025b | 4,199,475 | 0.5 | % | ||||||||
Other Securities^ | 40,026,820 | 5.1 | % | |||||||||
|
| |||||||||||
Total | 63,749,406 | |||||||||||
|
| |||||||||||
Communications Services (18.3%) | ||||||||||||
Altice Financing SA | ||||||||||||
| 4,985,000 | 6.625% - 7.500%, 2/15/2023 - 5/15/2026b | 5,161,400 | 0.6 | % | ||||||||
Altice Finco SA | ||||||||||||
| 1,590,000 | 8.125% - 9.875%, 12/15/2020 - 1/15/2024b,c | 1,666,650 | 0.2 | % | ||||||||
Altice US Finance I Corporation | ||||||||||||
| 2,900,000 | 5.500%, 5/15/2026b | 2,958,000 | 0.4 | % | ||||||||
CCO Holdings, LLC | ||||||||||||
| 5,500,000 | 5.875%, 4/1/2024b | 5,871,250 | 0.7 | % | ||||||||
| 4,330,000 | 5.250% - 5.250%, 3/15/2021 - 9/30/2022 | 4,470,725 | 0.6 | % | ||||||||
Columbus International, Inc. | ||||||||||||
| 5,060,000 | 7.375%, 3/30/2021b | 5,384,548 | 0.7 | % | ||||||||
CSC Holdings, LLC | ||||||||||||
| 820,000 | 5.500%, 4/15/2027b | 830,250 | 0.1 | % | ||||||||
Frontier Communications Corporation | ||||||||||||
| 6,963,000 | 10.500%, 9/15/2022 | 7,320,202 | 0.9 | % | ||||||||
Hughes Satellite Systems Corporation | ||||||||||||
| 6,810,000 | 6.625%, 8/1/2026b | 6,844,050 | 0.9 | % | ||||||||
Neptune Finco Corporation | ||||||||||||
| 5,630,000 | 10.875%, 10/15/2025b | 6,699,700 | 0.9 | % | ||||||||
SFR Group SA | ||||||||||||
| 8,920,000 | 6.000% - 7.375%, 5/15/2022 - 5/1/2026b | 9,083,462 | 1.1 | % | ||||||||
Sprint Communications, Inc. | ||||||||||||
| 5,130,000 | 6.000%, 11/15/2022 | 5,168,475 | 0.7 | % | ||||||||
| 2,870,000 | 7.000%, 3/1/2020b | 3,113,950 | 0.4 | % | ||||||||
Sprint Corporation | ||||||||||||
| 12,615,000 | 7.625%, 2/15/2025c | 13,261,519 | 1.7 | % | ||||||||
T-Mobile USA, Inc. | ||||||||||||
| 7,240,000 | 6.000% - 6.542%, 4/28/2020 - 4/15/2024 | 7,539,138 | 1.0 | % | ||||||||
Unitymedia Hessen GmbH & Company KG | ||||||||||||
| 5,100,000 | 5.500%, 1/15/2023b | 5,310,375 | 0.7 | % | ||||||||
WMG Acquisition Corporation | ||||||||||||
| 4,039,000 | 6.750%, 4/15/2022b | 4,251,047 | 0.5 | % | ||||||||
Zayo Group, LLC | ||||||||||||
| 3,925,000 | 6.375%, 5/15/2025 | 4,101,625 | 0.5 | % | ||||||||
Other Securities^ | 45,594,237 | 5.7 | % | |||||||||
|
| |||||||||||
Total | 144,630,603 | |||||||||||
|
| |||||||||||
Consumer Cyclical (14.9%) | ||||||||||||
Argos Merger Sub, Inc. | ||||||||||||
| 4,730,000 | 7.125%, 3/15/2023b,c | 4,824,600 | 0.6 | % | ||||||||
Brookfield Residential Properties, Inc. | ||||||||||||
| 3,960,000 | 6.125%, 7/1/2022b | 3,979,800 | 0.5 | % | ||||||||
Cinemark USA, Inc. | ||||||||||||
| 4,475,000 | 4.875%, 6/1/2023 | 4,530,938 | 0.6 | % | ||||||||
Dana Financing Luxembourg SARL | ||||||||||||
| 3,925,000 | 6.500%, 6/1/2026b,c | 4,101,625 | 0.5 | % | ||||||||
Live Nation Entertainment, Inc. | ||||||||||||
| 3,918,000 | 5.375%, 6/15/2022b | 4,055,130 | 0.5 | % | ||||||||
LKQ Corporation | ||||||||||||
| 4,005,000 | 4.750%, 5/15/2023 | 3,984,975 | �� | 0.5 | % | |||||||
ServiceMaster Company, LLC | ||||||||||||
| 4,210,000 | 5.125%, 11/15/2024b | 4,273,150 | 0.5 | % | ||||||||
Other Securities^ | 88,566,646 | 11.2 | % | |||||||||
|
| |||||||||||
Total | 118,316,864 | |||||||||||
|
| |||||||||||
Consumer Non-Cyclical (11.0%) | ||||||||||||
Energizer Holdings, Inc. | ||||||||||||
| 4,240,000 | 5.500%, 6/15/2025b | 4,250,600 | 0.5 | % | ||||||||
Grifols Worldwide Operations, Ltd. | ||||||||||||
| 4,395,000 | 5.250%, 4/1/2022 | 4,548,825 | 0.6 | % | ||||||||
HCA, Inc. | ||||||||||||
| 4,810,000 | 5.875%, 3/15/2022 | 5,182,775 | 0.6 | % | ||||||||
| 11,745,000 | 4.750% - 6.500%, 2/15/2020 - 2/15/2026 | 12,152,024 | 1.6 | % | ||||||||
JBS USA, LLC | ||||||||||||
| 4,705,000 | 5.750%, 6/15/2025b | 4,763,813 | 0.6 | % | ||||||||
| 3,250,000 | 5.875%, 7/15/2024b | 3,355,625 | 0.4 | % | ||||||||
MPH Acquisition Holdings, LLC | ||||||||||||
| 4,190,000 | 7.125%, 6/1/2024b | 4,410,394 | 0.6 | % | ||||||||
The accompanying Notes to Financial Statements are an integral part of this schedule.
165
Table of Contents
HIGH YIELD PORTFOLIO
Summary Schedule of Investments as of December 31, 2016
| Principal Amount | Long-Term Fixed Income (92.1%) | Value | % of Net Assets | |||||||||
Consumer Non-Cyclical (11.0%) - continued | ||||||||||||
Revlon Consumer Products Corporation | ||||||||||||
| $4,760,000 | 5.750%, 2/15/2021 | $ | 4,783,800 | 0.6 | % | |||||||
TreeHouse Foods, Inc. | ||||||||||||
| 4,155,000 | 4.875%, 3/15/2022 | 4,258,875 | 0.5 | % | ||||||||
Other Securities^ | 39,688,812 | 5.0 | % | |||||||||
|
| |||||||||||
Total | 87,395,543 | |||||||||||
|
| |||||||||||
Energy (12.9%) | ||||||||||||
Cheniere Corpus Christi Holdings, LLC | ||||||||||||
| 4,950,000 | 5.875% - 7.000%, 6/30/2024 - 3/31/2025b | 5,187,352 | 0.7 | % | ||||||||
Concho Resources, Inc. | ||||||||||||
| 4,740,000 | 6.500%, 1/15/2022 | 4,904,478 | 0.6 | % | ||||||||
| 3,425,000 | 4.375%, 1/15/2025 | 3,418,184 | 0.4 | % | ||||||||
MPLX, LP | ||||||||||||
| 4,740,000 | 4.875%, 12/1/2024 | 4,875,081 | 0.6 | % | ||||||||
Range Resources Corporation | ||||||||||||
| 4,180,000 | 5.000%, 3/15/2023b | 4,138,200 | 0.5 | % | ||||||||
Rice Energy, Inc. | ||||||||||||
| 4,605,000 | 6.250%, 5/1/2022 | 4,731,638 | 0.6 | % | ||||||||
Rowan Companies, Inc. | ||||||||||||
| 5,240,000 | 4.875%, 6/1/2022 | 4,951,800 | 0.6 | % | ||||||||
6Sabine Pass Liquefaction,LLC | ||||||||||||
| 7,350,000 | 5.625% - 5.875%, 2/1/2021 - 6/30/2026b | 7,884,150 | 1.1 | % | ||||||||
Tesoro Logistics, LP | ||||||||||||
| 4,530,000 | 5.500% - 6.250%, 10/15/2019 - 10/15/2022 | 4,795,800 | 0.6 | % | ||||||||
Other Securities^ | 57,241,810 | 7.2 | % | |||||||||
|
| |||||||||||
Total | 102,128,493 | |||||||||||
|
| |||||||||||
Financials (7.7%) | ||||||||||||
Ally Financial, Inc. | ||||||||||||
| 4,670,000 | 4.125%, 3/30/2020 | 4,763,400 | 0.6 | % | ||||||||
Centene Escrow Corporation | ||||||||||||
| 4,440,000 | 6.125%, 2/15/2024 | 4,678,650 | 0.6 | % | ||||||||
Quicken Loans, Inc. | ||||||||||||
| 4,255,000 | 5.750%, 5/1/2025b | 4,137,987 | 0.5 | % | ||||||||
VEREIT Operating Partnership, LP | ||||||||||||
| 3,955,000 | 4.875%, 6/1/2026 | 4,005,822 | 0.5 | % | ||||||||
Other Securities^ | 43,456,160 | 5.5 | % | |||||||||
|
| |||||||||||
Total | 61,042,019 | |||||||||||
|
| |||||||||||
Foreign Government (0.3%) | ||||||||||||
Other Securities^ | 2,205,000 | 0.3 | % | |||||||||
|
| |||||||||||
Total | 2,205,000 | |||||||||||
|
| |||||||||||
Technology (6.6%) | ||||||||||||
Alliance Data Systems Corporation | ||||||||||||
| 6,880,000 | 5.375%, 8/1/2022b | 6,639,200 | 0.8 | % | ||||||||
CommScope Technologies Finance, LLC | ||||||||||||
| 4,775,000 | 6.000%, 6/15/2025b | 5,061,500 | 0.6 | % | ||||||||
Micron Technology, Inc. | ||||||||||||
| 4,730,000 | 5.250%, 8/1/2023b | 4,747,737 | 0.6 | % | ||||||||
Sensata Technologies BV | ||||||||||||
| 4,870,000 | 4.875%, 10/15/2023b | 4,979,575 | 0.6 | % | ||||||||
Other Securities^ | $ | 30,718,793 | 4.0 | % | ||||||||
|
| |||||||||||
Total | 52,146,805 | |||||||||||
|
| |||||||||||
Transportation (3.7%) | ||||||||||||
XPO Logistics, Inc. | ||||||||||||
| 4,710,000 | 6.500%, 6/15/2022b,c | 4,945,500 | 0.6 | % | ||||||||
Other Securities^ | 24,141,455 | 3.1 | % | |||||||||
|
| |||||||||||
Total | 29,086,955 | |||||||||||
|
| |||||||||||
Utilities (4.1%) | ||||||||||||
Dynegy, Inc. | ||||||||||||
| 4,720,000 | 7.625%, 11/1/2024c | 4,354,200 | 0.5 | % | ||||||||
Energy Transfer Equity,LP | ||||||||||||
| 4,245,000 | 5.500%, 6/1/2027 | 4,138,875 | 0.5 | % | ||||||||
Regency Energy Partners, LP | ||||||||||||
| 4,650,000 | 5.500%, 4/15/2023 | 4,801,125 | 0.6 | % | ||||||||
Tesoro Corporation | ||||||||||||
| 4,745,000 | 4.750%, 12/15/2023b | 4,768,725 | 0.6 | % | ||||||||
Tesoro Logistics, LP | ||||||||||||
| 2,000,000 | 5.250%, 1/15/2025 | 2,042,500 | 0.3 | % | ||||||||
Other Securities^ | 12,205,527 | 1.6 | % | |||||||||
|
| |||||||||||
Total | 32,310,952 | |||||||||||
|
| |||||||||||
Total Long-Term Fixed Income (cost $731,484,964) | 728,902,072 | |||||||||||
|
| |||||||||||
| Shares | Preferred Stock (1.2%) | |||||||||||
Consumer Staples (0.2%) | ||||||||||||
Other Securities^ | 1,149,209 | 0.2 | % | |||||||||
|
| |||||||||||
Total | 1,149,209 | |||||||||||
|
| |||||||||||
Financials (1.0%) | ||||||||||||
Other Securities^ | 8,029,107 | 1.0 | % | |||||||||
|
| |||||||||||
Total | 8,029,107 | |||||||||||
|
| |||||||||||
Total Preferred Stock (cost $9,184,908) | 9,178,316 | |||||||||||
|
| |||||||||||
Registered Investment Companies (0.8%) | ||||||||||||
Equity Funds/ETFs (0.8%) | ||||||||||||
| 54,500 | Energy Select Sector SPDR Fund | 4,104,940 | 0.5 | % | ||||||||
Other Securities^ | 2,412,715 | 0.3 | % | |||||||||
Total | 6,517,655 | |||||||||||
|
| |||||||||||
Total Registered Investment Companies (cost $5,352,250) | 6,517,655 | |||||||||||
|
| |||||||||||
Common Stock (0.1%) | ||||||||||||
Consumer Discretionary (<0.1%) | ||||||||||||
Other Securities^ | 12 | <0.1 | % | |||||||||
|
| |||||||||||
Total | 12 | |||||||||||
|
| |||||||||||
Energy (0.1%) | ||||||||||||
Other Securities^ | 738,411 | 0.1 | % | |||||||||
|
| |||||||||||
Total | 738,411 | |||||||||||
|
| |||||||||||
Financials (<0.1%) | ||||||||||||
Other Securities^ | 0 | <0.1 | % | |||||||||
|
| |||||||||||
Total | 0 | |||||||||||
|
| |||||||||||
Total Common Stock (cost $7,237,186) | 738,423 | |||||||||||
|
| |||||||||||
The accompanying Notes to Financial Statements are an integral part of this schedule.
166
Table of Contents
HIGH YIELD PORTFOLIO
Summary Schedule of Investments as of December 31, 2016
| Shares | Collateral Held for Securities Loaned (9.5%) | Value | % of Net Assets | |||||||||
| 74,873,939 | Thrivent Cash Management Trust | $ | 74,873,939 | 9.5 | % | |||||||
|
| |||||||||||
Total Collateral Held for Securities Loaned (cost $74,873,939) | 74,873,939 | |||||||||||
|
| |||||||||||
| Shares or Principal Amount | Short-Term Investments (2.1%)d | |||||||||||
Federal Home Loan Bank Discount Notes | ||||||||||||
| 4,000,000 | 0.405%, 1/13/2017 | 3,999,576 | 0.5 | % | ||||||||
Thrivent Core Short-Term Reserve Fund | ||||||||||||
| 1,167,991 | 0.910% | 11,679,914 | 1.4 | % | ||||||||
Other Securities^ | 1,399,675 | 0.2 | % | |||||||||
|
| |||||||||||
Total Short-Term Investments (cost $17,079,033) | 17,079,165 | |||||||||||
|
| |||||||||||
Total Investments (cost $862,045,405) 108.0% | $ | 854,732,754 | ||||||||||
|
| |||||||||||
Other Assets and Liabilities, Net (8.0%) | (63,636,979 | ) | ||||||||||
|
| |||||||||||
Total Net Assets 100.0% | $ | 791,095,775 | ||||||||||
|
| |||||||||||
| ^ | The Summary Schedule of Investments shows the 50 largest holdings in unaffiliated issuers, any holding or issuer that exceeds 1% of net assets and all affiliated holdings as of the report date. The remaining securities held are grouped by category as “Other securities”. |
| a | The stated interest rate represents the weighted average of all contracts within the bank loan facility. |
| b | Denotes securities sold under Rule 144A of the Securities Act of 1933, which exempts them from registration. These securities may be resold to other dealers in the program or to other qualified institutional buyers. As of December 31, 2016, the value of these investments was $352,863,449 or 44.6% of total net assets. |
| c | All or a portion of the security is on loan. |
| d | The interest rate shown reflects the yield, coupon rate or the discount rate at the date of purchase. |
High Yield Portfolio held restricted securities as of December 31, 2016. Restricted securities are investment securities which cannot be offered for public sale without first being registered under the Securities Act of 1933. As of December 31, 2016, the value of these investments was $15,043,783 or 1.9% of total net assets.
The following table presents the total amount of securities loaned with continuous maturity, by type, offset by the gross payable upon return of collateral for securities loaned by Thrivent High Yield Portfolio as of December 31, 2016:
Securities Lending Transactions | ||||
Taxable Debt Security | $ | 69,702,713 | ||
Common Stock | 2,410,644 | |||
|
| |||
Total lending | $ | 72,113,357 | ||
Gross amount payable upon return of collateral for securities loaned | $ | 74,873,939 | ||
|
| |||
Net amounts due to counterparty | $ | 2,760,582 | ||
|
|
The accompanying Notes to Financial Statements are an integral part of this schedule.
167
Table of Contents
HIGH YIELD PORTFOLIO
Summary Schedule of Investments as of December 31, 2016
Unrealized Appreciation (Depreciation)
Gross unrealized appreciation and depreciation of investments, based on cost for federal income tax purposes, were as follows:
Gross unrealized appreciation | $ | 26,208,899 | ||
Gross unrealized depreciation | (33,554,658 | ) | ||
|
| |||
Net unrealized appreciation (depreciation) | $ | (7,345,759 | ) | |
Cost for federal income tax purposes | $ | 862,078,513 | ||
Fair Valuation Measurements
The following table is a summary of the inputs used, as of December 31, 2016, in valuing High Yield Portfolio’s assets carried at fair value.
Investments in Securities | Total | Level 1 | Level 2 | Level 3 | ||||||||||||
Bank Loans | ||||||||||||||||
Basic Materials | 2,355,363 | — | 2,355,363 | — | ||||||||||||
Capital Goods | 2,328,750 | — | — | 2,328,750 | ||||||||||||
Consumer Cyclical | 11,617,637 | — | 8,327,012 | 3,290,625 | ||||||||||||
Energy | 1,141,434 | — | 1,141,434 | — | ||||||||||||
Long-Term Fixed Income | ||||||||||||||||
Asset-Backed Securities | 1,124,199 | — | 1,124,199 | — | ||||||||||||
Basic Materials | 34,765,233 | — | 34,765,233 | — | ||||||||||||
Capital Goods | 63,749,406 | — | 63,749,406 | — | ||||||||||||
Communications Services | 144,630,603 | — | 144,630,603 | — | ||||||||||||
Consumer Cyclical | 118,316,864 | — | 118,316,864 | — | ||||||||||||
Consumer Non-Cyclical | 87,395,543 | — | 87,395,543 | — | ||||||||||||
Energy | 102,128,493 | — | 102,128,493 | — | ||||||||||||
Financials | 61,042,019 | — | 61,042,019 | — | ||||||||||||
Foreign Government | 2,205,000 | — | 2,205,000 | — | ||||||||||||
Technology | 52,146,805 | — | 52,146,805 | — | ||||||||||||
Transportation | 29,086,955 | — | 29,086,955 | — | ||||||||||||
Utilities | 32,310,952 | — | 32,310,952 | — | ||||||||||||
Preferred Stock | ||||||||||||||||
Consumer Staples | 1,149,209 | 1,149,209 | — | — | ||||||||||||
Financials | 8,029,107 | 8,029,107 | — | — | ||||||||||||
Registered Investment Companies | ||||||||||||||||
Equity Funds/ETFs | 6,517,655 | 6,517,655 | — | — | ||||||||||||
Common Stock | ||||||||||||||||
Consumer Discretionary | 12 | — | — | 12 | ||||||||||||
Energy | 738,411 | 738,411 | — | — | ||||||||||||
Financials^ | — | — | — | 0 | ||||||||||||
Short-Term Investments | 5,399,251 | — | 5,399,251 | — | ||||||||||||
|
|
|
|
|
|
|
| |||||||||
Subtotal Investments in Securities | $ | 768,178,901 | $ | 16,434,382 | $ | 746,125,132 | $ | 5,619,387 | ||||||||
|
|
|
|
|
|
|
| |||||||||
Other Investments* | Total | |||||||||||||||
Short-Term Investments | 11,679,914 | |||||||||||||||
Collateral Held for Securities Loaned | 74,873,939 | |||||||||||||||
|
| |||||||||||||||
Subtotal Other Investments | $ | 86,553,853 | ||||||||||||||
|
| |||||||||||||||
Total Investments at Value | $ | 854,732,754 | ||||||||||||||
|
| |||||||||||||||
| * | Certain investments are measured at fair value using a net asset value per share that is not publicly available (practical expedient). According to disclosure requirements of Accounting Standards Codification (ASC) 820, Fair Value Measurement, securities valued using the practical expedient are not classified in the fair value hierarchy. The fair value amounts presented in this table are intended to permit reconciliation of the fair value hierarchy to the amounts presented in the Statement of Assets and Liabilities. |
There were no significant transfers between Levels during the period ended December 31, 2016. Transfers between Levels are identified as of the end of the period.
| ^ | Level 3 security in this section is fair valued at <$1. |
The accompanying Notes to Financial Statements are an integral part of this schedule.
168
Table of Contents
HIGH YIELD PORTFOLIO
Summary Schedule of Investments as of December 31, 2016
The following table summarizes the net realized gains/(losses) and Statement of Operations location, for the period ended December 31, 2016, for High Yield Portfolio’s investments in financial derivative instruments by primary risk exposure.
Derivatives by risk category | Statement of Operations Location | Realized Gains/(Losses) recognized in Income | ||||
Credit Contracts | ||||||
Credit Default Swaps | Net realized gains/(losses) on Swap agreements | 225,055 | ||||
Total Credit Contracts | 225,055 | |||||
|
| |||||
Total | $ | 225,055 | ||||
|
| |||||
The following table presents High Yield Portfolio’s average volume of derivative activity during the period ended December 31, 2016.
Derivative Risk Category | Swaps (Notional)* | Swaps (Percentage of Average Net Assets) | ||||||
Credit Contracts | $ | 96,307 | <0.1 | % | ||||
| * | Notional amount represents long or short, or both, derivative positions held by the Portfolio. |
Investment in Affiliates
Affiliated issuers, as defined under the Investment Company Act of 1940, include those in which the Portfolio’s holdings of an issuer represent 5% or more of the outstanding voting securities of an issuer, any affiliated mutual fund, or a company which is under common ownership or control with the Portfolio. The Portfolio owns shares of Thrivent Cash Management Trust for the purpose of securities lending and Thrivent Core Short-Term Reserve Fund primarily to serve as a cash sweep vehicle for the Portfolio. Thrivent Cash Management Trust and Thrivent Core Short-Term Reserve Fund are established for the sole use of affiliated portfolios.
A summary of transactions for the fiscal year to date, in High Yield Portfolio, is as follows:
Portfolio | Value December 31, 2015 | Gross Purchases | Gross Sales | Shares Held at December 31, 2016 | Value December 31, 2016 | Income Earned January 1, 2016 - December 31, 2016 | ||||||||||||||||||
Cash Management Trust-Collateral Investment | $ | 42,864,685 | $ | 265,111,640 | $ | 233,102,386 | 74,873,939 | $ | 74,873,939 | $ | 395,547 | |||||||||||||
Cash Management Trust-Short Term Investment | 46,291,200 | 50,786,544 | 97,077,744 | — | — | 42,714 | ||||||||||||||||||
Core Short-Term Reserve Fund | — | 153,482,539 | 141,802,625 | 1,167,991 | 11,679,914 | 113,585 | ||||||||||||||||||
Total Value and Income Earned | $ | 89,155,885 | $ | 86,553,853 | $ | 551,846 | ||||||||||||||||||
The accompanying Notes to Financial Statements are an integral part of this schedule.
169
Table of Contents
Summary Schedule of Investments as of December 31, 2016
| Principal Amount | Bank Loans (2.9%) | Value | % of Net Assets | |||||||||
Basic Materials (0.2%) | ||||||||||||
Other Securities^ | $ | 3,173,210 | 0.2 | % | ||||||||
|
| |||||||||||
Total | 3,173,210 | |||||||||||
|
| |||||||||||
Capital Goods (0.2%) | ||||||||||||
Other Securities^ | 3,364,837 | 0.2 | % | |||||||||
|
| |||||||||||
Total | 3,364,837 | |||||||||||
|
| |||||||||||
Communications Services (0.9%) | ||||||||||||
Other Securities^ | 13,313,930 | 0.9 | % | |||||||||
|
| |||||||||||
Total | 13,313,930 | |||||||||||
|
| |||||||||||
Consumer Cyclical (0.4%) | ||||||||||||
Other Securities^ | 5,522,576 | 0.4 | % | |||||||||
|
| |||||||||||
Total | 5,522,576 | |||||||||||
|
| |||||||||||
Consumer Non-Cyclical (0.4%) | ||||||||||||
Other Securities^ | 6,478,073 | 0.4 | % | |||||||||
|
| |||||||||||
Total | 6,478,073 | |||||||||||
|
| |||||||||||
Energy (0.1%) | ||||||||||||
Other Securities^ | 908,793 | 0.1 | % | |||||||||
|
| |||||||||||
Total | 908,793 | |||||||||||
|
| |||||||||||
Financials (0.2%) | ||||||||||||
Other Securities^ | 2,240,221 | 0.2 | % | |||||||||
|
| |||||||||||
Total | 2,240,221 | |||||||||||
|
| |||||||||||
Technology (0.4%) | ||||||||||||
Other Securities^ | 5,160,230 | 0.4 | % | |||||||||
|
| |||||||||||
Total | 5,160,230 | |||||||||||
|
| |||||||||||
Transportation (0.1%) | ||||||||||||
Other Securities^ | 1,132,866 | 0.1 | % | |||||||||
|
| |||||||||||
Total | 1,132,866 | |||||||||||
|
| |||||||||||
Total Bank Loans (cost $40,837,467) | 41,294,736 | |||||||||||
|
| |||||||||||
Long-Term Fixed Income (91.2%) | ||||||||||||
Asset-Backed Securities (1.7%) | ||||||||||||
Other Securities^ | 24,652,016 | 1.7 | % | |||||||||
|
| |||||||||||
Total | 24,652,016 | |||||||||||
|
| |||||||||||
Basic Materials (2.6%) | ||||||||||||
Other Securities^ | 36,988,927 | 2.6 | % | |||||||||
|
| |||||||||||
Total | 36,988,927 | |||||||||||
|
| |||||||||||
Capital Goods (2.2%) | ||||||||||||
Other Securities^ | 31,493,899 | 2.2 | % | |||||||||
|
| |||||||||||
Total | 31,493,899 | |||||||||||
|
| |||||||||||
Collateralized Mortgage Obligations (0.6%) | ||||||||||||
Other Securities^ | 8,700,821 | 0.6 | % | |||||||||
|
| |||||||||||
Total | 8,700,821 | |||||||||||
|
| |||||||||||
Commercial Mortgage-Backed Securities (<0.1%) | ||||||||||||
Other Securities^ | 777,532 | <0.1 | % | |||||||||
|
| |||||||||||
Total | 777,532 | |||||||||||
|
| |||||||||||
Communications Services (9.4%) | ||||||||||||
AT&T, Inc. | ||||||||||||
| $20,230,000 | 1.928% - 4.750%, 6/30/2020 - 5/15/2046a | $ | 19,914,813 | 1.4 | % | |||||||
Charter Communications Operating, LLC | ||||||||||||
| 4,370,000 | 4.464%, 7/23/2022 | 4,562,123 | 0.3 | % | ||||||||
Crown Castle International Corporation | ||||||||||||
| 4,160,000 | 5.250%, 1/15/2023 | 4,477,200 | 0.3 | % | ||||||||
Omnicom Group, Inc. | ||||||||||||
| 4,245,000 | 4.450%, 8/15/2020 | 4,512,223 | 0.3 | % | ||||||||
Time Warner Cable, Inc. | ||||||||||||
| 3,800,000 | 4.125%, 2/15/2021 | 3,925,609 | 0.3 | % | ||||||||
Time Warner Entertainment Company, LP | ||||||||||||
| 3,620,000 | 8.375%, 3/15/2023 | 4,548,288 | 0.3 | % | ||||||||
Verizon Communications, Inc. | ||||||||||||
| 3,830,000 | 3.450%, 3/15/2021 | 3,950,810 | 0.3 | % | ||||||||
| 5,300,000 | 3.500%, 11/1/2024 | 5,276,452 | 0.4 | % | ||||||||
| 5,457,000 | 4.522%, 9/15/2048 | 5,222,120 | 0.4 | % | ||||||||
| 13,601,000 | 2.625% - 4.862%, | |||||||||||
2/21/2020 - 8/21/2046 | 13,292,074 | 1.0 | % | |||||||||
Other Securities^ | 64,346,094 | 4.4 | % | |||||||||
|
| |||||||||||
Total | 134,027,806 | |||||||||||
|
| |||||||||||
Consumer Cyclical (4.7%) | ||||||||||||
General Motors Company | ||||||||||||
| 3,150,000 | 5.000%, 4/1/2035 | 3,067,149 | 0.2 | % | ||||||||
General Motors Financial Company, Inc. | ||||||||||||
| 11,980,000 | 3.450% - 4.200%, | |||||||||||
3/1/2021 - 1/15/2025 | 11,884,424 | 0.9 | % | |||||||||
Other Securities^ | 51,869,142 | 3.6 | % | |||||||||
|
| |||||||||||
Total | 66,820,715 | |||||||||||
|
| |||||||||||
Consumer Non-Cyclical (10.8%) | ||||||||||||
AbbVie, Inc. | ||||||||||||
| 4,460,000 | 3.200%, 5/14/2026 | 4,237,187 | 0.3 | % | ||||||||
Anheuser-Busch InBev Finance, Inc. | ||||||||||||
| 4,470,000 | 3.650%, 2/1/2026 | 4,530,922 | 0.3 | % | ||||||||
| 8,980,000 | 3.300% - 4.900%, | |||||||||||
2/1/2023 - 2/1/2046 | 9,424,229 | 0.6 | % | |||||||||
Anheuser-Busch InBev Worldwide, Inc. | ||||||||||||
| 4,320,000 | 3.750%, 1/15/2022 | 4,504,702 | 0.3 | % | ||||||||
Boston Scientific Corporation | ||||||||||||
| 4,360,000 | 3.375%, 5/15/2022 | 4,427,004 | 0.3 | % | ||||||||
Express Scripts Holding Company | ||||||||||||
| 3,810,000 | 4.500%, 2/25/2026 | 3,917,065 | 0.3 | % | ||||||||
Kraft Foods Group, Inc. | ||||||||||||
| 4,390,000 | 3.500%, 6/6/2022 | 4,461,877 | 0.3 | % | ||||||||
Other Securities^ | 119,201,166 | 8.4 | % | |||||||||
|
| |||||||||||
Total | 154,704,152 | |||||||||||
|
| |||||||||||
Energy (9.3%) | ||||||||||||
El Paso Pipeline Partners Operating Company, LLC | ||||||||||||
| 3,850,000 | 5.000%, 10/1/2021 | 4,095,749 | 0.3 | % | ||||||||
MPLX, LP | ||||||||||||
| 4,470,000 | 4.875%, 6/1/2025 | 4,590,194 | 0.3 | % | ||||||||
The accompanying Notes to Financial Statements are an integral part of this schedule.
170
Table of Contents
INCOME PORTFOLIO
Summary Schedule of Investments as of December 31, 2016
| Principal Amount | Long-Term Fixed Income (91.2%) | Value | % of Net Assets | |||||||||
| Energy (9.3%) - continued | ||||||||||||
Other Securities^ | $ | 123,377,677 | 8.7 | % | ||||||||
|
| |||||||||||
Total | 132,063,620 | |||||||||||
|
| |||||||||||
Financials (27.2%) | ||||||||||||
Bank of America Corporation | ||||||||||||
| $ | 3,830,000 | 4.125%, 1/22/2024 | 3,975,896 | 0.3 | % | |||||||
| 27,130,000 | 2.066% - 7.625%, 3/22/2018 - 4/21/2045a,b | 28,273,188 | 2.1 | % | ||||||||
Berkshire Hathaway, Inc. | ||||||||||||
| 2,860,000 | 2.750%, 3/15/2023 | 2,846,321 | 0.2 | % | ||||||||
Citigroup, Inc. | ||||||||||||
| 4,370,000 | 4.400%, 6/10/2025 | 4,465,008 | 0.3 | % | ||||||||
| 13,465,000 | 2.021% - 5.500%, 12/8/2021 - 9/29/2027a | 13,879,861 | 1.0 | % | ||||||||
CoreStates Capital III | ||||||||||||
| 2,440,000 | 1.476%, 2/15/2027a,c | 2,189,900 | 0.2 | % | ||||||||
Credit Suisse Group Funding, Ltd. | ||||||||||||
| 4,400,000 | 3.750%, 3/26/2025 | 4,327,585 | 0.3 | % | ||||||||
Goldman Sachs Group, Inc. | ||||||||||||
| 4,450,000 | 3.850%, 7/8/2024 | 4,537,296 | 0.3 | % | ||||||||
| 3,760,000 | 5.150%, 5/22/2045 | 3,946,804 | 0.3 | % | ||||||||
| 18,535,000 | 2.350% - 5.375%, 3/15/2020 - 11/16/2026b | 18,980,436 | 1.4 | % | ||||||||
J.P. Morgan Chase & Company | ||||||||||||
| 17,460,000 | 2.112% - 7.900%, 4/30/2018 - 10/15/2040a,b,d | 18,303,264 | 1.3 | % | ||||||||
Lincoln National Corporation | ||||||||||||
| 4,150,000 | 4.000%, 9/1/2023 | 4,321,652 | 0.3 | % | ||||||||
Morgan Stanley | ||||||||||||
| 24,685,000 | 2.282% - 5.500%, 1/26/2020 - 1/27/2045a | 25,362,149 | 1.8 | % | ||||||||
Realty Income Corporation | ||||||||||||
| 3,830,000 | 3.875%, 7/15/2024 | 3,906,340 | 0.3 | % | ||||||||
Wells Fargo & Company | ||||||||||||
| 10,820,000 | 3.000% - 5.875%, 6/15/2025 - 10/23/2026b | 10,722,494 | 0.7 | % | ||||||||
Other Securities^ | 238,701,247 | 16.4 | % | |||||||||
|
| |||||||||||
Total | 388,739,441 | |||||||||||
|
| |||||||||||
| Foreign Government (0.7%) | ||||||||||||
Other Securities^ | 10,115,034 | 0.7 | % | |||||||||
|
| |||||||||||
Total | 10,115,034 | |||||||||||
|
| |||||||||||
| Mortgage-Backed Securities (5.5%) | ||||||||||||
Federal Home Loan Mortgage Corporation Gold 15-Yr. Pass Through | ||||||||||||
| 4,172,500 | 3.000%, 1/1/2032e | 4,279,733 | 0.3 | % | ||||||||
Federal Home Loan Mortgage Corporation Gold 30-Yr. Pass Through | ||||||||||||
| 6,802,500 | 4.000%, 1/1/2047e | 7,141,265 | 0.5 | % | ||||||||
Federal National Mortgage Association Conventional 15-Yr. Pass Through | ||||||||||||
| 9,500,000 | 2.500%, 1/1/2032e | 9,510,450 | 0.7 | % | ||||||||
Federal National Mortgage Association Conventional 30-Yr. Pass Through | ||||||||||||
| 17,200,000 | 3.000%, 1/1/2047e | 17,074,440 | 1.2 | % | ||||||||
| 25,150,000 | 3.500%, 1/1/2047e | 25,761,145 | 1.8 | % | ||||||||
| 11,777,500 | 4.000%, 1/1/2047e | 12,375,797 | 0.9 | % | ||||||||
| 2,025,000 | 4.500%, 1/1/2047e | 2,177,280 | 0.1 | % | ||||||||
|
| |||||||||||
Total | 78,320,110 | |||||||||||
|
| |||||||||||
| Technology (2.9%) | ||||||||||||
Apple, Inc. | ||||||||||||
| 4,450,000 | 3.250%, 2/23/2026 | 4,445,986 | 0.3 | % | ||||||||
Other Securities^ | 36,937,063 | 2.6 | % | |||||||||
|
| |||||||||||
Total | 41,383,049 | |||||||||||
|
| |||||||||||
| Transportation (2.1%) | ||||||||||||
British Airways plc | ||||||||||||
| 3,983,708 | 4.625%, 6/20/2024c | 4,237,670 | 0.3 | % | ||||||||
Burlington Northern Santa Fe, LLC | ||||||||||||
| 2,500,000 | 4.700%, 9/1/2045 | 2,730,820 | 0.2 | % | ||||||||
Other Securities^ | 22,343,730 | 1.6 | % | |||||||||
|
| |||||||||||
Total | 29,312,220 | |||||||||||
|
| |||||||||||
| U.S. Government and Agencies (5.0%) | ||||||||||||
U.S. Treasury Bonds | ||||||||||||
| 4,500,000 | 4.375%, 5/15/2041 | 5,557,523 | 0.4 | % | ||||||||
| 5,307,000 | 3.125%, 2/15/2042 | 5,374,245 | 0.4 | % | ||||||||
| 7,550,000 | 2.500%, 2/15/2045 | 6,709,255 | 0.5 | % | ||||||||
| 7,940,000 | 3.000%, 11/15/2045 | 7,813,111 | 0.5 | % | ||||||||
| 3,500,000 | 1.500%, 8/15/2026 | 3,213,840 | 0.2 | % | ||||||||
U.S. Treasury Bonds, TIPS | ||||||||||||
| 3,600,931 | 0.750% - 1.000%, 2/15/2045 - 2/15/2046 | 3,511,035 | 0.2 | % | ||||||||
U.S. Treasury Notes | ||||||||||||
| 7,000,000 | 1.375%, 10/31/2020 | 6,908,797 | 0.5 | % | ||||||||
| 5,730,000 | 1.125%, 2/28/2021 | 5,570,523 | 0.4 | % | ||||||||
| 7,000,000 | 1.875%, 10/31/2022 | 6,899,284 | 0.5 | % | ||||||||
| 7,130,000 | 2.125%, 12/31/2022 | 7,118,014 | 0.5 | % | ||||||||
| 4,840,000 | 1.625%, 5/31/2023 | 4,670,116 | 0.3 | % | ||||||||
| 6,050,000 | 1.875% - 2.875%, 3/31/2018 - 8/31/2022 | 6,033,746 | 0.4 | % | ||||||||
U.S. Treasury Notes, TIPS | ||||||||||||
| 2,581,453 | 0.125%, 7/15/2026 | 2,495,971 | 0.2 | % | ||||||||
|
| |||||||||||
Total | 71,875,460 | |||||||||||
|
| |||||||||||
| U.S. Municipals (0.2%) | ||||||||||||
Other Securities^ | 2,880,531 | 0.2 | % | |||||||||
|
| |||||||||||
Total | 2,880,531 | |||||||||||
|
| |||||||||||
| Utilities (6.3%) | ||||||||||||
FirstEnergy Transmission, LLC | ||||||||||||
| 3,830,000 | 4.350%, 1/15/2025c | 3,957,987 | 0.3 | % | ||||||||
ITC Holdings Corporation | ||||||||||||
| 5,080,000 | 4.050%, 7/1/2023 | 5,206,299 | 0.4 | % | ||||||||
MidAmerican Energy Holdings Company | ||||||||||||
| 4,450,000 | 3.750%, 11/15/2023 | 4,648,417 | 0.3 | % | ||||||||
Nevada Power Company | ||||||||||||
| 2,800,000 | 6.750%, 7/1/2037 | 3,673,110 | 0.3 | % | ||||||||
Pennsylvania Electric Company | ||||||||||||
| 3,700,000 | 5.200%, 4/1/2020 | 3,959,770 | 0.3 | % | ||||||||
Other Securities^ | 68,324,076 | 4.7 | % | |||||||||
|
| |||||||||||
Total | 89,769,659 | |||||||||||
|
| |||||||||||
Total Long-Term Fixed Income (cost $1,294,800,201) | 1,302,624,992 | |||||||||||
|
| |||||||||||
The accompanying Notes to Financial Statements are an integral part of this schedule.
171
Table of Contents
INCOME PORTFOLIO
Summary Schedule of Investments as of December 31, 2016
| Shares | Preferred Stock (1.4%) | Value | % of Net Assets | |||||||||
| Consumer Staples (0.2%) | ||||||||||||
Other Securities^ | $ | 2,030,030 | 0.2 | % | ||||||||
|
| |||||||||||
Total | 2,030,030 | |||||||||||
|
| |||||||||||
| Financials (1.2%) | ||||||||||||
| 102,122 | Citigroup, Inc., 7.257%a | 2,636,790 | 0.2 | % | ||||||||
| 31,925 | Countrywide Capital V, 7.000% | 812,810 | <0.1 | % | ||||||||
| 95,940 | Goldman Sachs Group, Inc., 5.500%b | 2,434,957 | 0.2 | % | ||||||||
| 88,200 | Morgan Stanley, 7.125%b | 2,481,066 | 0.2 | % | ||||||||
| 101,500 | Wells Fargo & Company, 5.850%b | 2,561,860 | 0.2 | % | ||||||||
Other Securities^ | 6,601,868 | 0.4 | % | |||||||||
|
| |||||||||||
Total | 17,529,351 | |||||||||||
|
| |||||||||||
Total Preferred Stock (cost $19,317,283) | 19,559,381 | |||||||||||
|
| |||||||||||
Common Stock (<0.1%) | ||||||||||||
| Energy (<0.1%) | ||||||||||||
Other Securities^ | 512,537 | <0.1 | % | |||||||||
|
| |||||||||||
Total | 512,537 | |||||||||||
|
| |||||||||||
Total Common Stock (cost $435,960) | 512,537 | |||||||||||
|
| |||||||||||
Collateral Held for Securities Loaned (0.6%) | ||||||||||||
| 7,919,140 | Thrivent Cash Management Trust | 7,919,140 | 0.6 | % | ||||||||
|
| |||||||||||
Total Collateral Held for Securities Loaned (cost $7,919,140) | 7,919,140 | |||||||||||
|
| |||||||||||
| Shares or Principal Amount | Short-Term Investments (9.2%)f | |||||||||||
Federal Home Loan Bank Discount Notes | ||||||||||||
| 10,650,000 | 0.383%, 1/6/2017 | 10,649,659 | 0.7 | % | ||||||||
| 6,600,000 | 0.365%, 1/13/2017 | 6,599,300 | 0.5 | % | ||||||||
| 6,700,000 | 0.310%, 1/17/2017 | 6,699,008 | 0.5 | % | ||||||||
| 6,100,000 | 0.433%, 1/27/2017 | 6,098,457 | 0.4 | % | ||||||||
| 8,400,000 | 0.430%, 2/1/2017g | 8,396,615 | 0.6 | % | ||||||||
| 4,000,000 | 0.530%, 2/22/2017 | 3,997,224 | 0.3 | % | ||||||||
Federal Home Loan Bank Discount Notes | ||||||||||||
| 11,950,000 | 0.310% - 0.515%, 1/3/2017 - 2/16/2017g | 11,945,493 | 0.8 | % | ||||||||
U.S. Treasury Bills | ||||||||||||
| 900,000 | 0.495%, 2/9/2017h | 899,586 | 0.1 | % | ||||||||
Thrivent Core Short-Term Reserve Fund | ||||||||||||
| 7,527,561 | 0.910% | 75,275,609 | 5.3 | % | ||||||||
|
| |||||||||||
Total Short-Term Investments (cost $130,559,967) | 130,560,951 | |||||||||||
|
| |||||||||||
Total Investments (cost $1,493,870,018) 105.3% | $ | 1,502,471,737 | ||||||||||
|
| |||||||||||
Other Assets and Liabilities, Net (5.3%) | (75,062,474 | ) | ||||||||||
|
| |||||||||||
Total Net Assets 100.0% | $ | 1,427,409,263 | ||||||||||
|
| |||||||||||
| ^ | The Summary Schedule of Investments shows the 50 largest holdings in unaffiliated issuers, any holding or issuer that exceeds 1% of net assets and all affiliated holdings as of the report date. The remaining securities held are grouped by category as “Other securities”. |
| a | Denotes variable rate securities. Variable rate securities are securities whose yields vary with a designated market index or market rate. The rate shown is as of December 31, 2016. |
| b | Denotes perpetual securities. Perpetual securities pay an indefinite stream of interest and have no contractual maturity date. Date shown, if applicable, is next call date. |
| c | Denotes securities sold under Rule 144A of the Securities Act of 1933, which exempts them from registration. These securities may be resold to other dealers in the program or to other qualified institutional buyers. As of December 31, 2016, the value of these investments was $189,611,378 or 13.3% of total net assets. |
| d | All or a portion of the security is on loan. |
| e | Denotes investments purchased on a when-issued or delayed delivery basis. |
| f | The interest rate shown reflects the yield, coupon rate or the discount rate at the date of purchase. |
| g | All or a portion of the security is held on deposit with the counterparty and pledged as the initial margin deposit for open futures contracts. |
| h | At December 31, 2016, $649,701 of investments were segregated to cover exposure to a counterparty for margin on open mortgage-backed security transactions. |
Income Portfolio held restricted securities as of December 31, 2016. Restricted securities are investment securities which cannot be offered for public sale without first being registered under the Securities Act of 1933. As of December 31, 2016, the value of these investments was $11,426,307 or 0.8% of total net assets.
The following table presents the total amount of securities loaned with continuous maturity, by type, offset by the gross payable upon return of collateral for securities loaned by Thrivent Income Portfolio as of December 31, 2016:
Securities Lending Transactions | ||||
Taxable Debt Security | $ | 7,275,055 | ||
Common Stock | 374,640 | |||
|
| |||
Total lending | $ | 7,649,695 | ||
Gross amount payable upon return of collateral for securities loaned | $ | 7,919,140 | ||
|
| |||
Net amounts due to counterparty | $ | 269,445 | ||
|
| |||
Definitions:
TIPS | - | Treasury Inflation Protected Security. |
Unrealized Appreciation (Depreciation)
Gross unrealized appreciation and depreciation of investments, based on cost for federal income tax purposes, were as follows:
Gross unrealized appreciation | $ | 30,047,140 | ||
Gross unrealized depreciation | (21,322,857 | ) | ||
|
| |||
Net unrealized appreciation (depreciation) | $ | 8,724,283 | ||
Cost for federal income tax purposes | $ | 1,493,747,454 | ||
The accompanying Notes to Financial Statements are an integral part of this schedule.
172
Table of Contents
INCOME PORTFOLIO
Summary Schedule of Investments as of December 31, 2016
Fair Valuation Measurements
The following table is a summary of the inputs used, as of December 31, 2016, in valuing Income Portfolio’s assets carried at fair value.
Investments in Securities | Total | Level 1 | Level 2 | Level 3 | ||||||||||||
Bank Loans | ||||||||||||||||
Basic Materials | 3,173,210 | — | 3,173,210 | — | ||||||||||||
Capital Goods | 3,364,837 | — | 2,630,775 | 734,062 | ||||||||||||
Communications Services | 13,313,930 | — | 12,988,930 | 325,000 | ||||||||||||
Consumer Cyclical | 5,522,576 | — | 5,522,576 | — | ||||||||||||
Consumer Non-Cyclical | 6,478,073 | — | 6,478,073 | — | ||||||||||||
Energy | 908,793 | — | 482,155 | 426,638 | ||||||||||||
Financials | 2,240,221 | — | 2,240,221 | — | ||||||||||||
Technology | 5,160,230 | — | 4,872,024 | 288,206 | ||||||||||||
Transportation | 1,132,866 | — | 1,132,866 | — | ||||||||||||
Long-Term Fixed Income | ||||||||||||||||
Asset-Backed Securities | 24,652,016 | — | 21,452,016 | 3,200,000 | ||||||||||||
Basic Materials | 36,988,927 | — | 36,988,927 | — | ||||||||||||
Capital Goods | 31,493,899 | — | 31,493,899 | — | ||||||||||||
Collateralized Mortgage Obligations | 8,700,821 | — | 8,700,821 | — | ||||||||||||
Commercial Mortgage-Backed Securities | 777,532 | — | 777,532 | — | ||||||||||||
Communications Services | 134,027,806 | — | 134,027,806 | — | ||||||||||||
Consumer Cyclical | 66,820,715 | — | 66,820,715 | — | ||||||||||||
Consumer Non-Cyclical | 154,704,152 | — | 154,704,152 | — | ||||||||||||
Energy | 132,063,620 | — | 132,063,620 | — | ||||||||||||
Financials | 388,739,441 | — | 388,739,441 | — | ||||||||||||
Foreign Government | 10,115,034 | — | 10,115,034 | — | ||||||||||||
Mortgage-Backed Securities | 78,320,110 | — | 78,320,110 | — | ||||||||||||
Technology | 41,383,049 | — | 41,383,049 | — | ||||||||||||
Transportation | 29,312,220 | — | 29,312,220 | — | ||||||||||||
U.S. Government and Agencies | 71,875,460 | — | 71,875,460 | — | ||||||||||||
U.S. Municipals | 2,880,531 | — | 2,880,531 | — | ||||||||||||
Utilities | 89,769,659 | — | 89,769,659 | — | ||||||||||||
Preferred Stock | ||||||||||||||||
Consumer Staples | 2,030,030 | 2,030,030 | — | — | ||||||||||||
Financials | 17,529,351 | 15,247,709 | 2,281,642 | — | ||||||||||||
Common Stock | ||||||||||||||||
Energy | 512,537 | 512,537 | — | — | ||||||||||||
Short-Term Investments | 55,285,342 | — | 55,285,342 | — | ||||||||||||
|
|
|
|
|
|
|
| |||||||||
Subtotal Investments in Securities | $ | 1,419,276,988 | $ | 17,790,276 | $ | 1,396,512,806 | $ | 4,973,906 | ||||||||
|
|
|
|
|
|
|
| |||||||||
Other Investments * | Total | |||||||||||||||
Short-Term Investments | 75,275,609 | |||||||||||||||
Collateral Held for Securities Loaned | 7,919,140 | |||||||||||||||
|
| |||||||||||||||
Subtotal Other Investments | $ | 83,194,749 | ||||||||||||||
|
| |||||||||||||||
Total Investments at Value | $ | 1,502,471,737 | ||||||||||||||
|
| |||||||||||||||
| * | Certain investments are measured at fair value using a net asset value per share that is not publicly available (practical expedient). According to disclosure requirements of Accounting Standards Codification (ASC) 820, Fair Value Measurement, securities valued using the practical expedient are not classified in the fair value hierarchy. The fair value amounts presented in this table are intended to permit reconciliation of the fair value hierarchy to the amounts presented in the Statement of Assets and Liabilities. |
Other Financial Instruments | Total | Level 1 | Level 2 | Level 3 | ||||||||||||
Asset Derivatives | ||||||||||||||||
Futures Contracts | 719,625 | 719,625 | — | — | ||||||||||||
|
|
|
|
|
|
|
| |||||||||
Total Asset Derivatives | $ | 719,625 | $ | 719,625 | $ | — | $ | — | ||||||||
|
|
|
|
|
|
|
| |||||||||
Liability Derivatives | ||||||||||||||||
Futures Contracts | 448,346 | 448,346 | — | — | ||||||||||||
|
|
|
|
|
|
|
| |||||||||
Total Liability Derivatives | $ | 448,346 | $ | 448,346 | $ | — | $ | — | ||||||||
|
|
|
|
|
|
|
| |||||||||
There were no significant transfers between Levels during the period ended December 31, 2016. Transfers between Levels are identified as of the end of the period.
The accompanying Notes to Financial Statements are an integral part of this schedule.
173
Table of Contents
INCOME PORTFOLIO
Summary Schedule of Investments as of December 31, 2016
The following table presents Income Portfolio’s futures contracts held as of December 31, 2016. Investments and/or cash totaling $1,099,444 were pledged as the initial margin deposit for these contracts.
Futures Contracts | Number of Contracts Long/(Short) | Expiration Date | Notional Principal Amount | Value | Unrealized Gain/(Loss) | |||||||||||||||
CBOT 10-Yr. U.S. Treasury Note | (902 | ) | March 2017 | ($ | 112,761,212 | ) | ($ | 112,101,688 | ) | $ | 659,524 | |||||||||
CBOT 5-Yr. U.S. Treasury Note | (437 | ) | March 2017 | (51,479,295 | ) | (51,419,194 | ) | 60,101 | ||||||||||||
CBOT U.S. Long Bond | 506 | March 2017 | 76,680,409 | 76,232,063 | (448,346 | ) | ||||||||||||||
Total Futures Contracts | $ | 271,279 | ||||||||||||||||||
The following table summarizes the fair value and Statement of Assets and Liabilities location, as of December 31, 2016, for Income Portfolio’s investments in financial derivative instruments by primary risk exposure as discussed under item (2) Significant Accounting Policies of the Notes to Financial Statements.
Derivatives by risk category | Statement of Assets and Liabilities Location | Fair Value | ||||
| Asset Derivatives | ||||||
Interest Rate Contracts | ||||||
Futures* | Net Assets - Net unrealized appreciation/(depreciation) on Futures contracts | $ | 719,625 | |||
Total Interest Rate Contracts | 719,625 | |||||
Total Asset Derivatives | $ | 719,625 | ||||
| Liability Derivatives | ||||||
Interest Rate Contracts | ||||||
Futures* | Net Assets - Net unrealized appreciation/(depreciation) on Futures contracts | 448,346 | ||||
Total Interest Rate Contracts | 448,346 | |||||
|
| |||||
Total Liability Derivatives | $ | 448,346 | ||||
|
| |||||
| * | Includes cumulative appreciation/depreciation of futures contracts as reported in the Schedule of Investments. Only current day’s variation margin is reported within the Statement of Assets and Liabilities. |
The following table summarizes the net realized gains/(losses) and Statement of Operations location, for the period ended December 31, 2016, for Income Portfolio’s investments in financial derivative instruments by primary risk exposure.
Derivatives by risk category | Statement of Operations Location | Realized Gains/(Losses) recognized in Income | ||||
Interest Rate Contracts | ||||||
Futures | Net realized gains/(losses) on Futures contracts | 542,421 | ||||
Total Interest Rate Contracts | 542,421 | |||||
Credit Contracts | ||||||
Credit Default Swaps | Net realized gains/(losses) on Swap agreements | (431,845 | ) | |||
Total Credit Contracts | (431,845 | ) | ||||
|
| |||||
Total | $ | 110,576 | ||||
|
| |||||
The following table summarizes the change in net unrealized appreciation/(depreciation) and Statement of Operations location, for the period ended December 31, 2016, for Income Portfolio’s investments in financial derivative instruments by primary risk exposure.
Derivatives by risk category | Statement of Operations Location | Change in unrealized appreciation/(depreciation) recognized in Income | ||||
Interest Rate Contracts | ||||||
Futures | Change in net unrealized appreciation/(depreciation) on Futures contracts | (431,859 | ) | |||
Total Interest Rate Contracts | (431,859 | ) | ||||
|
| |||||
Total | ($ | 431,859 | ) | |||
|
| |||||
The following table presents Income Portfolio’s average volume of derivative activity during the period ended December 31, 2016.
Derivative Risk Category | Futures (Notional)* | Futures (Percentage of Average Net Assets) | Swaps (Notional)* | Swaps (Percentage of Average Net Assets) | ||||||||||||
Interest Rate Contracts | $ | 256,134,315 | 18.2 | % | N/A | N/A | ||||||||||
Credit Contracts | N/A | N/A | $ | 26,777 | <0.1 | % | ||||||||||
| * | Notional amount represents long or short, or both, derivative positions held by the Portfolio. |
The accompanying Notes to Financial Statements are an integral part of this schedule.
174
Table of Contents
INCOME PORTFOLIO
Summary Schedule of Investments as of December 31, 2016
Investment in Affiliates
Affiliated issuers, as defined under the Investment Company Act of 1940, include those in which the Portfolio’s holdings of an issuer represent 5% or more of the outstanding voting securities of an issuer, any affiliated mutual fund, or a company which is under common ownership or control with the Portfolio. The Portfolio owns shares of Thrivent Cash Management Trust for the purpose of securities lending and Thrivent Core Short-Term Reserve Fund primarily to serve as a cash sweep vehicle for the Portfolio. Thrivent Cash Management Trust and Thrivent Core Short-Term Reserve Fund are established for the sole use of affiliated portfolios.
A summary of transactions for the fiscal year to date, in Income Portfolio, is as follows:
Portfolio | Value December 31, 2015 | Gross Purchases | Gross Sales | Shares Held at December 31, 2016 | Value December 31, 2016 | Income Earned January 1, 2016 - December 31, 2016 | ||||||||||||||||||
Cash Management Trust- Collateral Investment | $ | 28,613,386 | $ | 190,354,594 | $ | 211,048,840 | 7,919,140 | $ | 7,919,140 | $ | 174,954 | |||||||||||||
Cash Management Trust- Short Term Investment | 94,638,205 | 91,569,484 | 186,207,689 | — | — | 70,771 | ||||||||||||||||||
Core Short-Term Reserve Fund | — | 252,428,169 | 177,152,560 | 7,527,561 | 75,275,609 | 323,397 | ||||||||||||||||||
Total Value and Income Earned | $ | 123,251,591 | $ | 83,194,749 | $ | 569,122 | ||||||||||||||||||
The accompanying Notes to Financial Statements are an integral part of this schedule.
175
Table of Contents
Schedule of Investments as of December 31, 2016
| Principal Amount | Long-Term Fixed Income (100.3%) | Value | ||||||
Asset-Backed Securities (1.2%) | ||||||||
Conseco Financial Corporation | ||||||||
| $ | 2,281 | 6.330%, 11/1/2029, Series 1998-1, Class A6 | $ | 2,300 | ||||
Credit Based Asset Servicing and Securitization, LLC | ||||||||
| 324,144 | 3.503%, 12/25/2036, Series 2006-CB2, Class AF2a | 238,718 | ||||||
First Horizon ABS Trust | ||||||||
| 173,791 | 0.916%, 10/25/2034, Series 2006-HE1, Class Ab,c | 169,499 | ||||||
GMAC Mortgage Corporation Loan Trust | ||||||||
| 298,622 | 1.084%, 8/25/2035, Series 2005-HE1, Class A2b,c | 282,477 | ||||||
| 561,579 | 0.772%, 12/25/2036, Series 2006-HE4, Class A1b,c | 521,055 | ||||||
IndyMac Seconds Asset-Backed Trust | ||||||||
| 299,522 | 1.096%, 10/25/2036, Series 2006-2B, Class Ab,c | 189,141 | ||||||
Preferred Term Securities XXIII, Ltd. | ||||||||
| 479,872 | 1.163%, 12/22/2036*,c | 386,187 | ||||||
Wachovia Asset Securitization, Inc. | ||||||||
| 594,646 | 0.896%, 7/25/2037, Series 2007-HE1, Class A*,b,c | 507,541 | ||||||
|
| |||||||
Total | 2,296,918 | |||||||
|
| |||||||
| Basic Materials (0.5%) | ||||||||
Albemarle Corporation | ||||||||
| 150,000 | 3.000%, 12/1/2019 | 153,331 | ||||||
Dow Chemical Company | ||||||||
| 27,000 | 7.375%, 11/1/2029 | 35,420 | ||||||
Georgia-Pacific, LLC | ||||||||
| 360,000 | 2.539%, 11/15/2019d | 362,982 | ||||||
| 250,000 | 3.734%, 7/15/2023d | 257,321 | ||||||
Glencore Funding, LLC | ||||||||
| 175,000 | 1.940%, 4/16/2018c,d | 173,023 | ||||||
|
| |||||||
Total | 982,077 | |||||||
|
| |||||||
| Capital Goods (0.6%) | ||||||||
L3 Technologies, Inc. | ||||||||
| 250,000 | 3.850%, 12/15/2026 | 248,132 | ||||||
Lockheed Martin Corporation | ||||||||
| 290,000 | 2.500%, 11/23/2020 | 292,224 | ||||||
Roper Technologies, Inc. | ||||||||
| 116,000 | 1.850%, 11/15/2017 | 116,352 | ||||||
| 123,000 | 6.250%, 9/1/2019 | 135,233 | ||||||
| 100,000 | 2.800%, 12/15/2021 | 99,851 | ||||||
Textron, Inc. | ||||||||
| 250,000 | 3.875%, 3/1/2025 | 251,064 | ||||||
|
| |||||||
Total | 1,142,856 | |||||||
|
| |||||||
| Commercial Mortgage-Backed Securities (0.8%) | ||||||||
UBS Commercial Mortgage Trust | ||||||||
| 741,066 | 3.400%, 5/10/2045 | 771,262 | ||||||
WFRBS Commercial Mortgage Trust | ||||||||
| 826,000 | 2.870%, 11/15/2045 | 837,862 | ||||||
|
| |||||||
Total | 1,609,124 | |||||||
|
| |||||||
| Communications Services (1.5%) | ||||||||
American Tower Corporation | ||||||||
| 100,000 | 2.800%, 6/1/2020 | 99,995 | ||||||
American Tower Trust I | ||||||||
| 225,000 | 1.551%, 3/15/2018* | 224,796 | ||||||
AT&T, Inc. | ||||||||
| 250,000 | 1.750%, 1/15/2018 | 250,135 | ||||||
| 400,000 | 2.800%, 2/17/2021 | 396,495 | ||||||
British Sky Broadcasting Group plc | ||||||||
| 200,000 | 3.125%, 11/26/2022d | 198,149 | ||||||
Charter Communications Operating, LLC | ||||||||
| 211,000 | 3.579%, 7/23/2020 | 215,120 | ||||||
| 211,000 | 4.464%, 7/23/2022 | 220,276 | ||||||
Crown Castle International Corporation | ||||||||
| 250,000 | 2.250%, 9/1/2021 | 241,636 | ||||||
NBC Universal Enterprise, Inc. | ||||||||
| 250,000 | 1.662%, 4/15/2018d | 250,256 | ||||||
Time Warner, Inc. | ||||||||
| 250,000 | 3.800%, 2/15/2027 | 247,805 | ||||||
Verizon Communications, Inc. | ||||||||
| 250,000 | 3.000%, 11/1/2021 | 251,663 | ||||||
| 250,000 | 4.125%, 8/15/2046 | 225,798 | ||||||
|
| |||||||
Total | 2,822,124 | |||||||
|
| |||||||
Consumer Cyclical (2.4%) | ||||||||
BMW US Capital, LLC | ||||||||
| 200,000 | 1.500%, 4/11/2019d | 198,024 | ||||||
Board of Trustees of The Leland Stanford Junior University | ||||||||
| 550,000 | 3.563%, 6/1/2044 | 540,915 | ||||||
California Institute of Technology | ||||||||
| 325,000 | 4.700%, 11/1/2111 | 306,482 | ||||||
CVS Health Corporation | ||||||||
| 150,000 | 2.250%, 8/12/2019 | 150,758 | ||||||
Daimler Finance North America, LLC | ||||||||
| 250,000 | 1.591%, 8/3/2017c,d | 250,654 | ||||||
| 27,000 | 8.500%, 1/18/2031 | 40,597 | ||||||
Dartmouth College | ||||||||
| 250,000 | 3.760%, 6/1/2043 | 233,263 | ||||||
Home Depot, Inc. | ||||||||
| 300,000 | 4.400%, 4/1/2021 | 325,019 | ||||||
Macy’s Retail Holdings, Inc. | ||||||||
| 200,000 | 4.375%, 9/1/2023 | 205,436 | ||||||
Massachusetts Institute of Technology | ||||||||
| 500,000 | 4.678%, 7/1/2114 | 501,994 | ||||||
Newell Rubbermaid, Inc. | ||||||||
| 100,000 | 3.150%, 4/1/2021 | 101,685 | ||||||
NIKE, Inc. | ||||||||
| 250,000 | 2.375%, 11/1/2026 | 235,501 | ||||||
President and Fellows of Harvard College | ||||||||
| 500,000 | 3.619%, 10/1/2037 | 495,419 | ||||||
Starbucks Corporation | ||||||||
| 200,000 | 3.850%, 10/1/2023 | 213,170 | ||||||
Walgreens Boots Alliance, Inc. | ||||||||
| 150,000 | 1.750%, 5/30/2018 | 150,127 | ||||||
| 150,000 | 2.600%, 6/1/2021 | 148,926 | ||||||
Wal-Mart Stores, Inc. | ||||||||
| 327,000 | 7.550%, 2/15/2030 | 471,405 | ||||||
Yale University | ||||||||
| 200,000 | 2.086%, 4/15/2019 | 201,687 | ||||||
|
| |||||||
Total | 4,771,062 | |||||||
|
| |||||||
Consumer Non-Cyclical (3.7%) | ||||||||
Abbott Laboratories | ||||||||
| 250,000 | 3.400%, 11/30/2023 | 248,768 | ||||||
| 250,000 | 4.750%, 11/30/2036 | 253,756 | ||||||
Actavis Funding SCS | ||||||||
| 350,000 | 2.208%, 3/12/2020c | 356,701 | ||||||
Altria Group, Inc. | ||||||||
| 240,000 | 4.000%, 1/31/2024 | 253,303 | ||||||
The accompanying Notes to Financial Statements are an integral part of this schedule.
176
Table of Contents
BOND INDEX PORTFOLIO
Schedule of Investments as of December 31, 2016
| Principal Amount | Long-Term Fixed Income (100.3%) | Value | ||||||
Consumer Non-Cyclical (3.7%) - continued | ||||||||
Anheuser-Busch InBev Finance, Inc. | ||||||||
| $ | 250,000 | 3.650%, 2/1/2026 | $ | 253,407 | ||||
| 250,000 | 4.700%, 2/1/2036 | 262,881 | ||||||
BAT International Finance plc | ||||||||
| 350,000 | 1.473%, 6/15/2018c,d | 350,067 | ||||||
Bayer U.S. Finance, LLC | ||||||||
| 250,000 | 2.375%, 10/8/2019d | 250,324 | ||||||
Boston Scientific Corporation | ||||||||
| 300,000 | 6.000%, 1/15/2020 | 329,453 | ||||||
Bunge Limited Finance Corporation | ||||||||
| 225,000 | 3.500%, 11/24/2020 | 228,834 | ||||||
Cargill, Inc. | ||||||||
| 325,000 | 4.100%, 11/1/2042d | 310,764 | ||||||
Celgene Corporation | ||||||||
| 195,000 | 3.550%, 8/15/2022 | 199,773 | ||||||
Church & Dwight Company, Inc. | ||||||||
| 210,000 | 2.450%, 12/15/2019 | 210,939 | ||||||
Dr Pepper Snapple Group, Inc. | ||||||||
| 250,000 | 2.700%, 11/15/2022 | 246,371 | ||||||
EMD Finance, LLC | ||||||||
| 300,000 | 1.343%, 3/17/2017c,d | 300,069 | ||||||
Fomento Economico Mexicano SAB de CV | ||||||||
| 200,000 | 2.875%, 5/10/2023e | 190,481 | ||||||
Gilead Sciences, Inc. | ||||||||
| 200,000 | 2.550%, 9/1/2020 | 202,154 | ||||||
| 200,000 | 3.250%, 9/1/2022 | 203,927 | ||||||
Imperial Tobacco Finance plc | ||||||||
| 250,000 | 3.750%, 7/21/2022d | 256,377 | ||||||
Laboratory Corporation of America Holdings | ||||||||
| 255,000 | 2.625%, 2/1/2020 | 254,617 | ||||||
McKesson Corporation | ||||||||
| 275,000 | 2.700%, 12/15/2022 | 268,667 | ||||||
Mead Johnson Nutrition Company | ||||||||
| 200,000 | 3.000%, 11/15/2020 | 202,348 | ||||||
Mylan NV | ||||||||
| 195,000 | 3.150%, 6/15/2021d | 191,202 | ||||||
Reynolds American, Inc. | ||||||||
| 81,000 | 3.250%, 6/12/2020 | 82,950 | ||||||
Sanofi | ||||||||
| 250,000 | 1.250%, 4/10/2018 | 249,485 | ||||||
Shire Acquisitions Investments Ireland Designated Activity Company | ||||||||
| 250,000 | 1.900%, 9/23/2019 | 246,715 | ||||||
Teva Pharmaceutical Finance Netherlands III BV | ||||||||
| 250,000 | 2.800%, 7/21/2023 | 236,380 | ||||||
Unilever Capital Corporation | ||||||||
| 300,000 | 2.200%, 3/6/2019 | 302,921 | ||||||
| 350,000 | 2.100%, 7/30/2020 | 348,572 | ||||||
|
| |||||||
Total | 7,292,206 | |||||||
|
| |||||||
Energy (1.8%) | ||||||||
Anadarko Petroleum Corporation | ||||||||
| 100,000 | 4.850%, 3/15/2021 | 107,138 | ||||||
BP Capital Markets plc | ||||||||
| 250,000 | 1.676%, 5/3/2019 | 248,169 | ||||||
Cameron International Corporation | ||||||||
| 150,000 | 1.400%, 6/15/2017 | 149,939 | ||||||
El Paso Pipeline Partners Operating Company, LLC | ||||||||
| 325,000 | 4.700%, 11/1/2042 | 302,258 | ||||||
Enbridge, Inc. | ||||||||
| 250,000 | 5.500%, 12/1/2046 | 268,201 | ||||||
Encana Corporation | ||||||||
| 215,000 | 3.900%, 11/15/2021 | 216,544 | ||||||
EOG Resources, Inc. | ||||||||
| 200,000 | 2.625%, 3/15/2023 | 193,683 | ||||||
Exxon Mobil Corporation | ||||||||
| 250,000 | 1.708%, 3/1/2019 | 250,482 | ||||||
| 250,000 | 1.316%, 3/6/2022c | 248,233 | ||||||
Marathon Petroleum Corporation | ||||||||
| 250,000 | 3.400%, 12/15/2020 | 255,484 | ||||||
Petro-Canada | ||||||||
| 150,000 | 6.800%, 5/15/2038 | 194,215 | ||||||
Petroleos Mexicanos | ||||||||
| 255,000 | 2.378%, 4/15/2025 | 254,891 | ||||||
Schlumberger Holdings Corporation | ||||||||
| 250,000 | 3.000%, 12/21/2020d | 255,089 | ||||||
Sunoco Logistics Partners Operations, LP | ||||||||
| 300,000 | 4.400%, 4/1/2021 | 315,673 | ||||||
Transcontinental Gas Pipe Line Company, LLC | ||||||||
| 125,000 | 7.850%, 2/1/2026d | 157,429 | ||||||
|
| |||||||
Total | 3,417,428 | |||||||
|
| |||||||
Financials (9.0%) | ||||||||
ABN AMRO Bank NV | ||||||||
| 300,000 | 2.450%, 6/4/2020d | 298,337 | ||||||
ACE INA Holdings, Inc. | ||||||||
| 350,000 | 2.875%, 11/3/2022 | 352,471 | ||||||
Aetna, Inc. | ||||||||
| 250,000 | 1.900%, 6/7/2019 | 249,362 | ||||||
Aetna, Inc. | ||||||||
| 250,000 | 2.400%, 3/16/2020 | 250,740 | ||||||
Allstate Corporation | ||||||||
| 500,000 | 4.200%, 12/15/2046 | 509,196 | ||||||
American International Group, Inc. | ||||||||
| 200,000 | 3.300%, 3/1/2021 | 204,690 | ||||||
AXA SA | ||||||||
| 27,000 | 8.600%, 12/15/2030 | 37,125 | ||||||
Bank Nederlandse Gemeenten NV | ||||||||
| 500,000 | 1.750%, 3/24/2020d,e | 496,854 | ||||||
Bank of America Corporation | ||||||||
| 250,000 | 1.700%, 8/25/2017 | 250,326 | ||||||
Bank of England | ||||||||
| 1,000,000 | 0.875%, 3/17/2017d,e | 999,911 | ||||||
Bank of Montreal | ||||||||
| 250,000 | 1.500%, 7/18/2019 | 246,617 | ||||||
Bank of Tokyo-Mitsubishi UFJ, Ltd. | ||||||||
| 205,000 | 2.850%, 9/8/2021d | 204,844 | ||||||
Barclays plc | ||||||||
| 250,000 | 3.200%, 8/10/2021 | 247,098 | ||||||
Boston Properties, LP | ||||||||
| 300,000 | 3.125%, 9/1/2023 | 293,851 | ||||||
Chubb Corporation | ||||||||
| 350,000 | 6.500%, 5/15/2038 | 468,373 | ||||||
Citigroup, Inc. | ||||||||
| 250,000 | 2.900%, 12/8/2021 | 249,082 | ||||||
CNA Financial Corporation | ||||||||
| 250,000 | 5.750%, 8/15/2021 | 279,030 | ||||||
Discover Bank | ||||||||
| 288,000 | 8.700%, 11/18/2019 | 326,846 | ||||||
Duke Realty, LP | ||||||||
| 250,000 | 3.875%, 10/15/2022 | 259,755 | ||||||
European Investment Bank | ||||||||
| 500,000 | 1.250%, 5/15/2018 | 499,048 | ||||||
Fifth Third Bancorp | ||||||||
| 200,000 | 2.875%, 10/1/2021 | 202,192 | ||||||
The accompanying Notes to Financial Statements are an integral part of this schedule.
177
Table of Contents
BOND INDEX PORTFOLIO
Schedule of Investments as of December 31, 2016
| Principal Amount | Long-Term Fixed Income (100.3%) | Value | ||||||
Financials (9.0%) - continued | ||||||||
HCP, Inc. | ||||||||
| $ | 250,000 | 4.000%, 12/1/2022 | $ | 257,072 | ||||
Hospitality Properties Trust | ||||||||
| 150,000 | 4.250%, 2/15/2021 | 155,065 | ||||||
HSBC Holdings plc | ||||||||
| 300,000 | 6.800%, 6/1/2038 | 379,328 | ||||||
Huntington Bancshares, Inc. | ||||||||
| 200,000 | 3.150%, 3/14/2021 | 202,653 | ||||||
ING Bank NV | ||||||||
| 400,000 | 2.625%, 12/5/2022d | 396,552 | ||||||
J.P. Morgan Chase & Company | ||||||||
| 250,000 | 1.782%, 1/25/2018c | 251,634 | ||||||
| 250,000 | 2.250%, 1/23/2020 | 249,255 | ||||||
| 250,000 | 2.700%, 5/18/2023 | 244,325 | ||||||
Liberty Mutual Group, Inc. | ||||||||
| 150,000 | 4.950%, 5/1/2022d | 163,503 | ||||||
| 200,000 | 4.250%, 6/15/2023d | 209,180 | ||||||
Lincoln National Corporation | ||||||||
| 250,000 | 6.250%, 2/15/2020 | 275,936 | ||||||
Lloyds Bank plc | ||||||||
| 365,000 | 1.490%, 3/16/2018c | 365,495 | ||||||
Marsh & McLennan Companies, Inc. | ||||||||
| 400,000 | 2.550%, 10/15/2018 | 403,687 | ||||||
MassMutual Global Funding II | ||||||||
| 350,000 | 2.000%, 4/5/2017d | 350,860 | ||||||
MetLife, Inc. | ||||||||
| 200,000 | 4.368%, 9/15/2023 | 214,979 | ||||||
Morgan Stanley | ||||||||
| 250,000 | 5.000%, 11/24/2025 | 266,721 | ||||||
National Australia Bank, Ltd. | ||||||||
| 325,000 | 2.000%, 6/20/2017d | 326,053 | ||||||
New York Life Global Funding | ||||||||
| 350,000 | 1.550%, 11/2/2018d | 348,930 | ||||||
Nordea Bank AB | ||||||||
| 325,000 | 3.125%, 3/20/2017d | 326,473 | ||||||
North American Development Bank | ||||||||
| 400,000 | 2.300%, 10/10/2018 | 404,614 | ||||||
PNC Financial Services Group, Inc. | ||||||||
| 325,000 | 2.854%, 11/9/2022 | 321,638 | ||||||
Prudential Financial, Inc. | ||||||||
| 200,000 | 2.350%, 8/15/2019 | 201,839 | ||||||
Realty Income Corporation | ||||||||
| 300,000 | 2.000%, 1/31/2018 | 300,815 | ||||||
Regions Financial Corporation | ||||||||
| 200,000 | 3.200%, 2/8/2021 | 202,668 | ||||||
Reliance Standard Life Global Funding II | ||||||||
| 240,000 | 2.500%, 4/24/2019d | 241,493 | ||||||
Santander UK plc | ||||||||
| 175,000 | 3.125%, 1/8/2021 | 174,591 | ||||||
Simon Property Group, LP | ||||||||
| 250,000 | 2.500%, 9/1/2020 | 251,700 | ||||||
| 250,000 | 2.500%, 7/15/2021 | 250,019 | ||||||
Standard Chartered plc | ||||||||
| 200,000 | 3.950%, 1/11/2023d,e | 195,257 | ||||||
Sumitomo Mitsui Financial Group, Inc. | ||||||||
| 250,000 | 4.436%, 4/2/2024d | 260,629 | ||||||
Svensk Exportkredit AB | ||||||||
| 500,000 | 1.750%, 8/28/2020 | 496,422 | ||||||
Svenska Handelsbanken AB | ||||||||
| 125,000 | 1.625%, 3/21/2018 | 124,835 | ||||||
Swedbank AB | ||||||||
| 300,000 | 1.750%, 3/12/2018d | 299,901 | ||||||
Synchrony Financial | ||||||||
| 215,000 | 3.750%, 8/15/2021 | 220,788 | ||||||
Toronto-Dominion Bank | ||||||||
| 250,000 | 1.889%, 12/14/2020c | 252,939 | ||||||
UBS AG | ||||||||
| 250,000 | 1.697%, 3/26/2018c | 250,831 | ||||||
UnitedHealth Group, Inc. | ||||||||
| 165,000 | 3.350%, 7/15/2022 | 169,818 | ||||||
Wells Fargo & Company | ||||||||
| 250,000 | 2.100%, 7/26/2021 | 243,039 | ||||||
| 150,000 | 3.450%, 2/13/2023 | 150,390 | ||||||
| 250,000 | 3.000%, 10/23/2026 | 237,694 | ||||||
|
| |||||||
Total | 17,565,369 | |||||||
|
| |||||||
Foreign Government (2.7%) | ||||||||
Chile Government International Bond | ||||||||
| 350,000 | 3.875%, 8/5/2020 | 368,323 | ||||||
Export Development Canada | ||||||||
| 150,000 | 0.750%, 12/15/2017 | 149,304 | ||||||
Export-Import Bank of Korea | ||||||||
| 200,000 | 2.250%, 1/21/2020 | 198,819 | ||||||
Hashemite Kingdom of Jordan | ||||||||
| 500,000 | 2.503%, 10/30/2020 | 512,535 | ||||||
Inter-American Development Bank | ||||||||
| 500,000 | 3.000%, 10/4/2023 | 517,633 | ||||||
| 400,000 | 4.375%, 1/24/2044 | 459,666 | ||||||
Kommunalbanken AS | ||||||||
| 495,000 | 1.500%, 10/22/2019d | 490,523 | ||||||
Kommuninvest I Sverige AB | ||||||||
| 300,000 | 1.000%, 10/24/2017d | 299,302 | ||||||
Mexico Government International Bond | ||||||||
| 250,000 | 3.600%, 1/30/2025 | 241,000 | ||||||
Poland Government International Bond | ||||||||
| 250,000 | 4.000%, 1/22/2024 | 255,690 | ||||||
Province of Manitoba | ||||||||
| 600,000 | 1.300%, 4/3/2017 | 600,263 | ||||||
Province of New Brunswick | ||||||||
| 125,000 | 2.750%, 6/15/2018 | 127,156 | ||||||
Province of Quebec | ||||||||
| 400,000 | 7.500%, 7/15/2023 | 503,608 | ||||||
Sweden Government International Bond | ||||||||
| 500,000 | 1.625%, 3/24/2020d | 497,468 | ||||||
|
| |||||||
Total | 5,221,290 | |||||||
|
| |||||||
Mortgage-Backed Securities (27.3%) | ||||||||
Federal Home Loan Mortgage Corporation Gold 15-Yr. Pass Through | ||||||||
| 3,366 | 7.000%, 6/1/2017 | 3,388 | ||||||
| 6,068 | 5.500%, 12/1/2017 | 6,140 | ||||||
| 2,087,500 | 3.000%, 1/1/2032f | 2,141,149 | ||||||
Federal Home Loan Mortgage Corporation Gold 30-Yr. Pass Through | ||||||||
| 1,695 | 8.500%, 11/1/2025 | 1,695 | ||||||
| 303 | 8.000%, 1/1/2026 | 334 | ||||||
| 2,987,500 | 4.000%, 1/1/2047f | 3,136,277 | ||||||
Federal National Mortgage Association Conventional 15-Yr. Pass Through | ||||||||
| 6,150,000 | 2.500%, 1/1/2032f | 6,156,765 | ||||||
The accompanying Notes to Financial Statements are an integral part of this schedule.
178
Table of Contents
BOND INDEX PORTFOLIO
Schedule of Investments as of December 31, 2016
| Principal Amount | Long-Term Fixed Income (100.3%) | Value | ||||||
Mortgage-Backed Securities (27.3%) - continued | ||||||||
Federal National Mortgage Association Conventional 30-Yr. Pass Through | ||||||||
| $ | 925 | 10.500%, 8/1/2020 | $ | 957 | ||||
| 863 | 8.000%, 12/1/2024 | 946 | ||||||
| 132 | 8.500%, 12/1/2025 | 132 | ||||||
| 1,104 | 8.000%, 9/1/2026 | 1,134 | ||||||
| 1,561 | 8.000%, 4/1/2030 | 1,839 | ||||||
| 6,500,000 | 3.000%, 1/1/2047f | 6,452,550 | ||||||
| 14,245,000 | 3.500%, 1/1/2047f | 14,591,153 | ||||||
| 11,062,500 | 4.000%, 1/1/2047f | 11,624,475 | ||||||
| 8,400,000 | 4.500%, 1/1/2047f | 9,031,680 | ||||||
Government National Mortgage Association 30-Yr. Pass Through | ||||||||
| 2,510 | 7.500%, 3/15/2023 | 2,518 | ||||||
| 1,623 | 9.000%, 9/15/2024 | 1,819 | ||||||
| 1,850 | 8.000%, 6/15/2025 | 1,903 | ||||||
| 558 | 8.000%, 9/15/2026 | 576 | ||||||
| 6,228 | 7.500%, 10/15/2027 | 6,370 | ||||||
| 7,406 | 7.500%, 11/15/2028 | 7,449 | ||||||
| 1,429 | 8.000%, 10/15/2030 | 1,479 | ||||||
| 2,772 | 7.500%, 1/15/2031 | 3,110 | ||||||
|
| |||||||
Total | 53,175,838 | |||||||
|
| |||||||
Technology (1.3%) | ||||||||
Amphenol Corporation | ||||||||
| 200,000 | 2.550%, 1/30/2019 | 202,331 | ||||||
Apple, Inc. | ||||||||
| 400,000 | 2.400%, 5/3/2023 | 389,052 | ||||||
Automatic Data Processing, Inc. | ||||||||
| 150,000 | 2.250%, 9/15/2020 | 150,664 | ||||||
Cisco Systems, Inc. | ||||||||
| 350,000 | 1.431%, 3/1/2019c | 351,997 | ||||||
Diamond 1 Finance Corporation | ||||||||
| 150,000 | 3.480%, 6/1/2019d | 153,082 | ||||||
Intel Corporation | ||||||||
| 250,000 | 1.700%, 5/19/2021 | 243,931 | ||||||
| 140,000 | 3.100%, 7/29/2022 | 143,809 | ||||||
Microsoft Corporation | ||||||||
| 250,000 | 3.450%, 8/8/2036 | 237,179 | ||||||
Motorola Solutions, Inc. | ||||||||
| 250,000 | 3.500%, 3/1/2023 | 246,153 | ||||||
Oracle Corporation | ||||||||
| 250,000 | 2.500%, 5/15/2022 | 247,999 | ||||||
Texas Instruments, Inc. | ||||||||
| 200,000 | 1.750%, 5/1/2020 | 197,676 | ||||||
|
| |||||||
Total | 2,563,873 | |||||||
|
| |||||||
Transportation (0.8%) | ||||||||
American Airlines Pass Through Trust | ||||||||
| 157,718 | 5.600%, 7/15/2020d | 163,632 | ||||||
Continental Airlines, Inc. | ||||||||
| 289,707 | 4.150%, 4/11/2024 | 297,674 | ||||||
Delta Air Lines, Inc. | ||||||||
| 134,031 | 4.950%, 5/23/2019 | 140,465 | ||||||
ERAC USA Finance, LLC | ||||||||
| 250,000 | 2.600%, 12/1/2021d | 245,788 | ||||||
J.B. Hunt Transport Services, Inc. | ||||||||
| 220,000 | 3.300%, 8/15/2022 | 220,640 | ||||||
TTX Company | ||||||||
| 250,000 | 2.250%, 2/1/2019d | 249,801 | ||||||
| 300,000 | 4.125%, 10/1/2023* | 304,943 | ||||||
|
| |||||||
Total | 1,622,943 | |||||||
|
| |||||||
U.S. Government and Agencies (43.6%) | ||||||||
Federal Farm Credit Bank | ||||||||
| 400,000 | 2.210%, 8/1/2024 | 386,660 | ||||||
Federal Home Loan Bank | ||||||||
| 1,650,000 | 1.375%, 11/15/2019 | 1,642,603 | ||||||
Federal Home Loan Mortgage Corporation | ||||||||
| 350,000 | 6.750%, 3/15/2031 | 493,220 | ||||||
Federal National Mortgage Association | ||||||||
| 1,500,000 | 1.250%, 8/17/2021 | 1,449,445 | ||||||
| 1,300,000 | 1.875%, 9/24/2026 | 1,192,664 | ||||||
| 500,000 | 5.960%, 9/11/2028 | 638,004 | ||||||
| 100,000 | 6.250%, 5/15/2029 | 132,329 | ||||||
Resolution Funding Corporation | ||||||||
| 200,000 | 8.125%, 10/15/2019 | 235,406 | ||||||
Tennessee Valley Authority | ||||||||
| 350,000 | 5.250%, 9/15/2039 | 438,815 | ||||||
U.S. Treasury Bonds | ||||||||
| 1,500,000 | 1.500%, 8/15/2026 | 1,377,360 | ||||||
| 500,000 | 5.500%, 8/15/2028 | 646,305 | ||||||
| 2,500,000 | 5.250%, 11/15/2028 | 3,177,420 | ||||||
| 4,425,000 | 3.000%, 5/15/2042 | 4,378,976 | ||||||
| 8,200,000 | 3.625%, 2/15/2044 | 9,069,684 | ||||||
| 2,750,000 | 2.500%, 5/15/2046 | 2,437,795 | ||||||
U.S. Treasury Notes | ||||||||
| 400,000 | 0.875%, 1/31/2017g | 400,159 | ||||||
| 9,875,000 | 1.000%, 11/30/2018e | 9,841,336 | ||||||
| 3,500,000 | 1.250%, 12/15/2018 | 3,503,073 | ||||||
| 6,000,000 | 1.000%, 3/15/2019 | 5,966,466 | ||||||
| 3,500,000 | 0.875%, 9/15/2019 | 3,452,715 | ||||||
| 150,000 | 1.500%, 10/31/2019 | 150,293 | ||||||
| 1,000,000 | 2.000%, 7/31/2020 | 1,012,231 | ||||||
| 7,000,000 | 1.250%, 3/31/2021 | 6,832,399 | ||||||
| 1,000,000 | 2.250%, 7/31/2021 | 1,014,722 | ||||||
| 3,130,000 | 1.125%, 8/31/2021 | 3,021,326 | ||||||
| 1,000,000 | 2.125%, 9/30/2021 | 1,007,898 | ||||||
| 1,750,000 | 2.125%, 6/30/2022 | 1,754,265 | ||||||
| 2,825,000 | 1.625%, 8/15/2022 | 2,751,999 | ||||||
| 500,000 | 1.375%, 6/30/2023 | 474,385 | ||||||
| 2,600,000 | 1.375%, 9/30/2023 | 2,459,132 | ||||||
| 10,400,000 | 2.250%, 11/15/2024 | 10,322,458 | ||||||
| 3,530,000 | 1.625%, 2/15/2026 | 3,293,282 | ||||||
|
| |||||||
Total | 84,954,825 | |||||||
|
| |||||||
Utilities (3.1%) | ||||||||
Ameren Corporation | ||||||||
| 225,000 | 2.700%, 11/15/2020 | 226,035 | ||||||
American Electric Power Company, Inc. | ||||||||
| 300,000 | 1.650%, 12/15/2017 | 300,082 | ||||||
Berkshire Hathaway Energy Company | ||||||||
| 200,000 | 2.400%, 2/1/2020 | 200,422 | ||||||
CenterPoint Energy Houston Electric, LLC | ||||||||
| 400,000 | 5.600%, 7/1/2023 | 449,796 | ||||||
Commonwealth Edison Company | ||||||||
| 275,000 | 5.900%, 3/15/2036 | 337,317 | ||||||
DTE Energy Company | ||||||||
| 100,000 | 2.400%, 12/1/2019 | 100,445 | ||||||
Energy Transfer Partners, LP | ||||||||
| 250,000 | 4.150%, 10/1/2020 | 258,702 | ||||||
Eversource Energy | ||||||||
| 230,000 | 1.600%, 1/15/2018 | 229,453 | ||||||
Exelon Generation Company, LLC | ||||||||
| 200,000 | 2.950%, 1/15/2020 | 202,277 | ||||||
Kansas City Power & Light Company | ||||||||
| 250,000 | 3.150%, 3/15/2023 | 247,879 | ||||||
The accompanying Notes to Financial Statements are an integral part of this schedule.
179
Table of Contents
BOND INDEX PORTFOLIO
Schedule of Investments as of December 31, 2016
| Principal Amount | Long-Term Fixed Income (100.3%) | Value | ||||||
Utilities (3.1%) - continued | ||||||||
National Rural Utilities Cooperative Finance Corporation | ||||||||
| $ | 28,000 | 4.023%, 11/1/2032 | $ | 28,461 | ||||
NextEra Energy Capital Holdings, Inc. | ||||||||
| 200,000 | 2.300%, 4/1/2019 | 201,444 | ||||||
NiSource Finance Corporation | ||||||||
| 350,000 | 3.850%, 2/15/2023 | 361,250 | ||||||
NSTAR Electric Company | ||||||||
| 325,000 | 2.375%, 10/15/2022 | 318,808 | ||||||
PPL Capital Funding, Inc. | ||||||||
| 325,000 | 3.500%, 12/1/2022 | 332,011 | ||||||
Public Service Company of Colorado | ||||||||
| 350,000 | 3.600%, 9/15/2042 | 328,520 | ||||||
Public Service Electric And Gas Company | ||||||||
| 360,000 | 1.800%, 6/1/2019 | 359,506 | ||||||
Sempra Energy | ||||||||
| 325,000 | 2.300%, 4/1/2017 | 325,631 | ||||||
| 265,000 | 2.400%, 3/15/2020 | 264,465 | ||||||
Southern California Edison Company | ||||||||
| 155,000 | 2.400%, 2/1/2022 | 154,399 | ||||||
Southern California Gas Company | ||||||||
| 325,000 | 3.750%, 9/15/2042 | 316,819 | ||||||
Southern Company | ||||||||
| 250,000 | 1.850%, 7/1/2019 | 249,119 | ||||||
Xcel Energy, Inc. | ||||||||
| 250,000 | 1.200%, 6/1/2017 | 249,758 | ||||||
|
| |||||||
Total | 6,042,599 | |||||||
|
| |||||||
Total Long-Term Fixed Income (cost $196,142,551) | 195,480,532 | |||||||
|
| |||||||
| Shares | Collateral Held for Securities Loaned (5.6%) | |||||||
| 11,000,368 | Thrivent Cash Management Trust | 11,000,368 | ||||||
|
| |||||||
Total Collateral Held for Securities Loaned (cost $11,000,368) | 11,000,368 | |||||||
|
| |||||||
| Shares or Principal Amount | Short-Term Investments (27.5%)h | |||||||
Federal Home Loan Bank Discount Notes | ||||||||
| 870,000 | 0.390%, 1/11/2017 | 869,927 | ||||||
| 9,800,000 | 0.386%, 1/13/2017 | 9,798,961 | ||||||
| 6,000,000 | 0.440%, 1/17/2017 | 5,999,112 | ||||||
| 9,700,000 | 0.434%, 1/25/2017 | 9,697,750 | ||||||
| 675,000 | 0.490%, 1/26/2017 | 674,836 | ||||||
| 8,300,000 | 0.425%, 1/27/2017 | 8,297,900 | ||||||
| 4,700,000 | 0.400%, 2/1/2017 | 4,698,106 | ||||||
| 600,000 | 0.460%, 2/8/2017 | 599,700 | ||||||
Thrivent Core Short-Term Reserve Fund | ||||||||
| 1,239,435 | 0.910% | 12,394,352 | ||||||
U.S. Treasury Bills | ||||||||
| 500,000 | 0.495%, 2/9/2017g | 499,770 | ||||||
|
| |||||||
Total Short-Term Investments (cost $53,529,062) | 53,530,414 | |||||||
|
| |||||||
Total Investments (cost $260,671,981) 133.4% | $ | 260,011,314 | ||||||
|
| |||||||
Other Assets and Liabilities, Net(33.4%) | (65,079,286 | ) | ||||||
|
| |||||||
Total Net Assets 100.0% | $ | 194,932,028 | ||||||
|
| |||||||
| a | Denotes step coupon securities. Step coupon securities pay an initial coupon rate for the first period and then different coupon rates for following periods. The rate shown is as of December 31, 2016. |
| b | All or a portion of the security is insured or guaranteed. |
| c | Denotes variable rate securities. Variable rate securities are securities whose yields vary with a designated market index or market rate. The rate shown is as of December 31, 2016. |
| d | Denotes securities sold under Rule 144A of the Securities Act of 1933, which exempts them from registration. These securities may be resold to other dealers in the program or to other qualified institutional buyers. As of December 31, 2016, the value of these investments was $10,980,103 or 5.6% of total net assets. |
| e | All or a portion of the security is on loan. |
| f | Denotes investments purchased on a when-issued or delayed delivery basis. |
| g | At December 31, 2016, $599,964 of investments were segregated to cover exposure to a counterparty for margin on open mortgage-backed security transactions. |
| h | The interest rate shown reflects the yield, coupon rate or the discount rate at the date of purchase. |
| * | Denotes restricted securities. Restricted securities are investment securities which cannot be offered for public sale without first being registered under the Securities Act of 1933. The value of all restricted securities held in Bond Index Portfolio as of December 31, 2016 was $1,423,467 or 0.7% of total net assets. The following table indicates the acquisition date and cost of restricted securities shown in the schedule as of December 31, 2016 |
Security | Acquisition Date | Cost | ||||||
American Tower Trust I, 3/15/2018 | 3/6/2013 | $ | 225,000 | |||||
Preferred Term Securities XXIII, Ltd., 12/22/2036 | 9/14/2006 | 479,872 | ||||||
TTX Company, 10/1/2023 | 9/19/2013 | 299,997 | ||||||
Wachovia Asset Securitization, Inc., 7/25/2037 | 3/16/2007 | 594,646 | ||||||
The following table presents the total amount of securities loaned with continuous maturity, by type, offset by the gross payable upon return of collateral for securities loaned by Thrivent Bond Index Portfolio as of December 31, 2016:
Securities Lending Transactions | ||||
Taxable Debt Security | $ | 10,769,134 | ||
|
| |||
Total lending | $ | 10,769,134 | ||
Gross amount payable upon return of collateral for securities loaned | $ | 11,000,368 | ||
|
| |||
Net amounts due to counterparty | $ | 231,234 | ||
|
| |||
Unrealized Appreciation (Depreciation)
Gross unrealized appreciation and depreciation of investments, based on cost for federal income tax purposes, were as follows:
Gross unrealized appreciation | $ | 2,366,689 | ||
Gross unrealized depreciation | (3,175,843 | ) | ||
|
| |||
Net unrealized appreciation (depreciation) | $ | (809,154 | ) | |
Cost for federal income tax purposes | $ | 260,820,468 |
The accompanying Notes to Financial Statements are an integral part of this schedule.
180
Table of Contents
BOND INDEX PORTFOLIO
Schedule of Investments as of December 31, 2016
Fair Valuation Measurements
The following table is a summary of the inputs used, as of December 31, 2016, in valuing Bond Index Portfolio’s assets carried at fair value.
Investments in Securities | Total | Level 1 | Level 2 | Level 3 | ||||||||||||
Long-Term Fixed Income | ||||||||||||||||
Asset-Backed Securities | 2,296,918 | — | 2,296,918 | — | ||||||||||||
Basic Materials | 982,077 | — | 982,077 | — | ||||||||||||
Capital Goods | 1,142,856 | — | 1,142,856 | — | ||||||||||||
Commercial Mortgage-Backed Securities | 1,609,124 | — | 1,609,124 | — | ||||||||||||
Communications Services | 2,822,124 | — | 2,822,124 | — | ||||||||||||
Consumer Cyclical | 4,771,062 | — | 4,771,062 | — | ||||||||||||
Consumer Non-Cyclical | 7,292,206 | — | 7,292,206 | — | ||||||||||||
Energy | 3,417,428 | — | 3,417,428 | — | ||||||||||||
Financials | 17,565,369 | — | 17,565,369 | — | ||||||||||||
Foreign Government | 5,221,290 | — | 5,221,290 | — | ||||||||||||
Mortgage-Backed Securities | 53,175,838 | — | 53,175,838 | — | ||||||||||||
Technology | 2,563,873 | — | 2,563,873 | — | ||||||||||||
Transportation | 1,622,943 | — | 1,622,943 | — | ||||||||||||
U.S. Government and Agencies | 84,954,825 | — | 84,954,825 | — | ||||||||||||
Utilities | 6,042,599 | — | 6,042,599 | — | ||||||||||||
Short-Term Investments | 41,136,062 | — | 41,136,062 | — | ||||||||||||
|
|
|
|
|
|
|
| |||||||||
Subtotal Investments in Securities | $ | 236,616,594 | $ | — | $ | 236,616,594 | $ | — | ||||||||
|
|
|
|
|
|
|
| |||||||||
Other Investments * | Total | |||||||||||||||
Short-Term Investments | 12,394,352 | |||||||||||||||
Collateral Held for Securities Loaned | 11,000,368 | |||||||||||||||
|
| |||||||||||||||
Subtotal Other Investments | $ | 23,394,720 | ||||||||||||||
|
| |||||||||||||||
Total Investments at Value | $ | 260,011,314 | ||||||||||||||
|
| |||||||||||||||
| * | Certain investments are measured at fair value using a net asset value per share that is not publicly available (practical expedient). According to disclosure requirements of Accounting Standards Codification (ASC) 820, Fair Value Measurement, securities valued using the practical expedient are not classified in the fair value hierarchy. The fair value amounts presented in this table are intended to permit reconciliation of the fair value hierarchy to the amounts presented in the Statement of Assets and Liabilities. |
There were no significant transfers between Levels during the period ended December 31, 2016. Transfers between Levels are identified as of the end of the period.
Investment in Affiliates
Affiliated issuers, as defined under the Investment Company Act of 1940, include those in which the Portfolio’s holdings of an issuer represent 5% or more of the outstanding voting securities of an issuer, any affiliated mutual fund, or a company which is under common ownership or control with the Portfolio. The Portfolio owns shares of Thrivent Cash Management Trust for the purpose of securities lending and Thrivent Core Short-Term Reserve Fund primarily to serve as a cash sweep vehicle for the Portfolio. Thrivent Cash Management Trust and Thrivent Core Short-Term Reserve Fund are established for the sole use of affiliated portfolios.
A summary of transactions for the fiscal year to date, in Bond Index Portfolio, is as follows:
Portfolio | Value December 31, 2015 | Gross Purchases | Gross Sales | Shares Held at December 31, 2016 | Value December 31, 2016 | Income Earned January 1, 2016 - December 31, 2016 | ||||||||||||||||||
Cash Management Trust-Collateral Investment | $ | 815,750 | $ | 19,911,586 | $ | 9,726,968 | 11,000,368 | $ | 11,000,368 | $ | 11,600 | |||||||||||||
Cash Management Trust-Short Term Investment | 45,346,506 | 19,643,481 | 64,989,987 | — | — | 38,182 | ||||||||||||||||||
Core Short-Term Reserve Fund | — | 50,107,971 | 37,713,619 | 1,239,435 | 12,394,352 | 53,681 | ||||||||||||||||||
Total Value and Income Earned | $ | 46,162,256 | $ | 23,394,720 | $ | 103,463 | ||||||||||||||||||
The accompanying Notes to Financial Statements are an integral part of this schedule.
181
Table of Contents
LIMITED MATURITY BOND PORTFOLIO
Summary Schedule of Investments as of December 31, 2016
| Principal Amount | Bank Loans (1.7%) | Value | % of Net Assets | |||||||||
Basic Materials (<0.1%) | ||||||||||||
Other Securities^ | $ | 329,753 | <0.1 | % | ||||||||
|
| |||||||||||
Total | 329,753 | |||||||||||
|
| |||||||||||
Capital Goods (0.3%) | ||||||||||||
Other Securities^ | 2,453,266 | 0.3 | % | |||||||||
|
| |||||||||||
Total | 2,453,266 | |||||||||||
|
| |||||||||||
Communications Services (0.6%) | ||||||||||||
Other Securities^ | 5,516,228 | 0.6 | % | |||||||||
|
| |||||||||||
Total | 5,516,228 | |||||||||||
|
| |||||||||||
Consumer Cyclical (0.4%) | ||||||||||||
Other Securities^ | 3,669,837 | 0.4 | % | |||||||||
|
| |||||||||||
Total | 3,669,837 | |||||||||||
|
| |||||||||||
Consumer Non-Cyclical (0.1%) | ||||||||||||
Other Securities^ | 607,028 | 0.1 | % | |||||||||
|
| |||||||||||
Total | 607,028 | |||||||||||
|
| |||||||||||
Energy (0.1%) | ||||||||||||
Other Securities^ | 411,539 | 0.1 | % | |||||||||
|
| |||||||||||
Total | 411,539 | |||||||||||
|
| |||||||||||
Financials (0.1%) | ||||||||||||
Other Securities^ | 1,284,809 | 0.1 | % | |||||||||
|
| |||||||||||
Total | 1,284,809 | |||||||||||
|
| |||||||||||
Technology (0.1%) | ||||||||||||
Other Securities^ | 509,591 | 0.1 | % | |||||||||
|
| |||||||||||
Total | 509,591 | |||||||||||
|
| |||||||||||
Utilities (<0.1%) | ||||||||||||
Other Securities^ | 244,255 | <0.1 | % | |||||||||
|
| |||||||||||
Total | 244,255 | |||||||||||
|
| |||||||||||
Total Bank Loans (cost $15,753,174) | 15,026,306 | |||||||||||
|
| |||||||||||
Long-Term Fixed Income (94.9%) | ||||||||||||
Asset-Backed Securities (26.6%) | ||||||||||||
Alm Loan Funding CLO | ||||||||||||
| $ | 3,760,000 | 2.310%, 10/17/2026, Series 2014-11A, Class A1*,a | 3,766,565 | 0.4 | % | |||||||
Americredit Automobile Receivables Trust | ||||||||||||
| 5,000,000 | 1.340%, 4/8/2020, Series 2016-4, Class A2A | 4,997,425 | 0.6 | % | ||||||||
Apidos CLO XVIII | ||||||||||||
| 3,775,000 | 2.294%, 7/22/2026, Series 2014-18A, Class A1*,a | 3,780,821 | 0.4 | % | ||||||||
BA Credit Card Trust | ||||||||||||
| 4,800,000 | 1.084%, 6/15/2021, Series 2014-A1, Class Aa | 4,812,070 | 0.6 | % | ||||||||
Babson CLO, Ltd. | ||||||||||||
| 3,760,000 | 2.270%, 10/17/2026, Series 2014-IIA, Class A*,a | 3,766,012 | 0.4 | % | ||||||||
Birchwood Park CLO, Ltd. | ||||||||||||
| 3,760,000 | 2.320%, 7/15/2026, Series 2014-1A, Class A*,a | 3,766,907 | 0.4 | % | ||||||||
BlueMountain CLO, Ltd. | ||||||||||||
| 3,760,000 | 2.360%, 10/15/2026, Series 2014-3A, Class A1*,a | 3,766,024 | 0.4 | % | ||||||||
Capital One Multi-Asset Execution Trust | ||||||||||||
| 6,750,000 | 1.260%, 1/15/2020, Series 2014-A2, Class A2 | 6,753,735 | 0.8 | % | ||||||||
Carlyle Global Market Strategies CLO, Ltd. | ||||||||||||
| 3,750,000 | 2.380%, 10/15/2026, Series 2014-4A, Class A1*,a | 3,755,876 | 0.4 | % | ||||||||
CarMax Auto Owner Trust | ||||||||||||
| 6,300,000 | 1.210%, 11/15/2019, Series 2016-4, Class A2 | 6,287,108 | 0.7 | % | ||||||||
Cent CLO 16, LP | ||||||||||||
| 3,653,108 | 2.136%, 8/1/2024, Series 2012-16A, Class A1AR*,a | 3,653,805 | 0.4 | % | ||||||||
Cent CLO 22, Ltd. | ||||||||||||
| 3,750,000 | 2.291%, 11/7/2026, Series 2014-22A, Class A1R*,a | 3,741,210 | 0.4 | % | ||||||||
Chase Issuance Trust | ||||||||||||
| 3,700,000 | 1.590%, 2/18/2020, Series 2015-A2, Class A2 | 3,710,238 | 0.4 | % | ||||||||
| 8,050,000 | 1.100% - 1.620%, 1/15/2020 - 5/17/2021, Series 2016-A6, Class A6a | 8,059,104 | 0.9 | % | ||||||||
Chesapeake Funding II, LLC | ||||||||||||
| 4,000,000 | 1.880%, 6/15/2028, Series 2016-2A, Class A1b | 3,989,144 | 0.4 | % | ||||||||
Chrysler Capital Auto Receivables Trust | ||||||||||||
| 5,000,000 | 1.360%, 1/15/2020, Series 2016-BA, Class A2b | 4,992,980 | 0.6 | % | ||||||||
Citibank Credit Card Issuance Trust | ||||||||||||
| 6,975,000 | 1.020%, 2/22/2019, Series 2014-A2, Class A2 | 6,974,720 | 0.8 | % | ||||||||
Dryden 34 Senior Loan Fund CLO | ||||||||||||
| 3,760,000 | 2.310%, 10/15/2026, Series 2014-34A, Class A*,a | 3,766,512 | 0.4 | % | ||||||||
Ford Credit Auto Owner Trust | ||||||||||||
| 5,500,000 | 1.040%, 9/15/2019, Series 2016-C, Class A2A | 5,487,902 | 0.6 | % | ||||||||
| 3,575,000 | 2.260%, 11/15/2025, Series 2014-1, Class Ab | 3,604,291 | 0.4 | % | ||||||||
Madison Park Funding XIV CLO, Ltd. | ||||||||||||
| 4,150,000 | 2.331%, 7/20/2026, Series 2014-14A, Class A2*,a | 4,157,009 | 0.5 | % | ||||||||
Master Credit Card Trust | ||||||||||||
| 4,500,000 | 1.494%, 9/23/2019, Series 2016-1A, Class Aa,b | 4,517,654 | 0.5 | % | ||||||||
Octagon Investment Partners XX CLO, Ltd. | ||||||||||||
| 3,760,000 | 2.342%, 8/12/2026, Series 2014-1A, Class A*,a | 3,766,569 | 0.4 | % | ||||||||
The accompanying Notes to Financial Statements are an integral part of this schedule.
182
Table of Contents
LIMITED MATURITY BOND PORTFOLIO
Summary Schedule of Investments as of December 31, 2016
| Principal Amount | Long-Term Fixed Income (94.9%) | Value | % of Net Assets | |||||||||
Asset-Backed Securities (26.6%) - continued | ||||||||||||
OZLM VIII, Ltd. | ||||||||||||
| $ | 3,760,000 | 2.320%, 10/17/2026, Series 2014-8A, Class A1A*,a | $ | 3,766,715 | 0.4 | % | ||||||
Prestige Auto Receivables Trust | ||||||||||||
| 5,500,000 | 1.460%, 7/15/2020, Series 2016-2A, Class A2b | 5,494,396 | 0.6 | % | ||||||||
SLM Student Loan Trust | ||||||||||||
| 4,627,063 | 1.156%, 3/25/2025, Series 2010-1, Class Aa | 4,506,251 | 0.5 | % | ||||||||
SoFi Professional Loan Program, LLC | ||||||||||||
| 8,793,675 | 1.380% - 2.510%, 3/25/2030 - 7/25/2039, Series 2016-E, Class A1b | 8,780,782 | 1.0 | % | ||||||||
Springleaf Funding Trust | ||||||||||||
| 3,650,000 | 2.900%, 11/15/2029, Series 2016-AA, Class Ab | 3,640,495 | 0.4 | % | ||||||||
Synchrony Credit Card Master Note Trust | ||||||||||||
| 6,250,000 | 1.360%, 8/17/2020, Series 2012-6, Class A | 6,253,312 | 0.7 | % | ||||||||
Toyota Auto Receivables Owner Trust | ||||||||||||
| 5,500,000 | 1.060%, 5/15/2019, Series 2016-D, Class A2A | 5,489,185 | 0.6 | % | ||||||||
Verizon Owner Trust | ||||||||||||
| 4,000,000 | 1.420%, 1/20/2021, Series 2016-1A, Class Ab | 3,971,169 | 0.5 | % | ||||||||
Voya CLO 3, Ltd. | ||||||||||||
| 3,760,000 | 2.302%, 7/25/2026, Series 2014-3A, Class A1*,a | 3,766,050 | 0.4 | % | ||||||||
Other Securities^ | 84,365,651 | 9.7 | % | |||||||||
|
| |||||||||||
Total | 235,907,687 | |||||||||||
|
| |||||||||||
Basic Materials (0.5%) | ||||||||||||
Other Securities^ | 4,684,179 | 0.5 | % | |||||||||
|
| |||||||||||
Total | 4,684,179 | |||||||||||
|
| |||||||||||
Capital Goods (0.5%) | ||||||||||||
Other Securities^ | 4,501,390 | 0.5 | % | |||||||||
|
| |||||||||||
Total | 4,501,390 | |||||||||||
|
| |||||||||||
Collateralized Mortgage Obligations (4.2%) | ||||||||||||
Countrywide Alternative Loan Trust | ||||||||||||
| 970,243 | 5.500% - 5.500%, 11/25/2035 - 2/25/2036, Series 2005- 85CB, Class 2A2 | 914,023 | 0.2 | % | ||||||||
Countrywide Home Loans, Inc. | ||||||||||||
| 1,367,201 | 2.981%, 3/20/2036, Series 2006-HYB1, Class 1A1 | 1,156,789 | 0.1 | % | ||||||||
Wells Fargo Commercial Mortgage Trust | ||||||||||||
| 3,575,000 | 2.632%, 5/15/2048 | 3,623,783 | 0.4 | % | ||||||||
Other Securities^ | 30,945,536 | 3.5 | % | |||||||||
|
| |||||||||||
Total | 36,640,131 | |||||||||||
|
| |||||||||||
Commercial Mortgage-Backed Securities (2.2%) | ||||||||||||
Commercial Mortgage Pass-Through Certificate | ||||||||||||
| 5,000,000 | 1.699%, 6/8/2030a,b | 5,012,554 | 0.6 | % | ||||||||
Federal National Mortgage Association | ||||||||||||
| 124,141 | 1.272%, 1/25/2017 | 124,033 | <0.1 | % | ||||||||
Other Securities^ | 14,014,521 | 1.6 | % | |||||||||
|
| |||||||||||
Total | 19,151,108 | |||||||||||
|
| |||||||||||
Communications Services (2.6%) | ||||||||||||
Other Securities^ | 22,906,647 | 2.6 | % | |||||||||
|
| |||||||||||
Total | 22,906,647 | |||||||||||
|
| |||||||||||
Consumer Cyclical (1.6%) | ||||||||||||
Other Securities^ | 14,109,875 | 1.6 | % | |||||||||
|
| |||||||||||
Total | 14,109,875 | |||||||||||
|
| |||||||||||
Consumer Non-Cyclical (5.9%) | ||||||||||||
Unilever Capital Corporation | ||||||||||||
| 3,650,000 | 2.100%, 7/30/2020 | 3,635,112 | 0.4 | % | ||||||||
Other Securities^ | 48,536,247 | 5.5 | % | |||||||||
|
| |||||||||||
Total | 52,171,359 | |||||||||||
|
| |||||||||||
Energy (3.5%) | ||||||||||||
Other Securities^ | 30,395,836 | 3.5 | % | |||||||||
|
| |||||||||||
Total | 30,395,836 | |||||||||||
|
| |||||||||||
Financials (20.1%) | ||||||||||||
Bank of America Corporation | ||||||||||||
| 9,385,000 | 1.700% - 6.100%, 8/25/2017 - 12/29/2049a,c | 9,437,739 | 1.1 | % | ||||||||
Bank of America NA | ||||||||||||
| 2,000,000 | 5.300%, 3/15/2017 | 2,015,486 | 0.2 | % | ||||||||
Bear Stearns Companies, LLC | ||||||||||||
| 2,500,000 | 6.400%, 10/2/2017 | 2,589,733 | 0.3 | % | ||||||||
DRB Prime Student Loan Trust | ||||||||||||
| 3,685,025 | 2.492%, 10/27/2031, Series 2015-B, Class A1*,a | 3,750,579 | 0.4 | % | ||||||||
J.P. Morgan Chase & Company | ||||||||||||
| 4,000,000 | 1.782%, 1/25/2018a | 4,026,140 | 0.5 | % | ||||||||
| 4,950,000 | 2.250% - 7.900%, 1/23/2020 - 4/29/2049c | 5,014,841 | 0.6 | % | ||||||||
J.P. Morgan Chase Bank NA | ||||||||||||
| 1,350,000 | 1.588%, 9/23/2019a | 1,351,015 | 0.2 | % | ||||||||
Japan Bank for International Cooperation | ||||||||||||
| 4,000,000 | 1.750%, 7/31/2018 | 4,000,984 | 0.5 | % | ||||||||
Wells Fargo & Company | ||||||||||||
| 6,880,000 | 1.567% - 5.875%, 1/30/2020 - 12/31/2049a,c | 6,968,912 | 0.7 | % | ||||||||
Other Securities^ | 138,270,688 | 15.6 | % | |||||||||
|
| |||||||||||
Total | 177,426,117 | |||||||||||
|
| |||||||||||
Foreign Government (0.8%) | ||||||||||||
Other Securities^ | 7,219,240 | 0.8 | % | |||||||||
|
| |||||||||||
Total | 7,219,240 | |||||||||||
|
| |||||||||||
The accompanying Notes to Financial Statements are an integral part of this schedule.
183
Table of Contents
LIMITED MATURITY BOND PORTFOLIO
Summary Schedule of Investments as of December 31, 2016
| Principal Amount | Long-Term Fixed Income (94.9%) | Value | % of Net Assets | |||||||||
Mortgage-Backed Securities (3.3%) | ||||||||||||
Federal Home Loan Mortgage Corporation Gold 15-Yr. Pass Through | ||||||||||||
| $ | 7,150,000 | 3.000%, 1/1/2032d | $ | 7,333,755 | 0.8 | % | ||||||
Federal Home Loan Mortgage Corporation Gold 30-Yr. Pass Through | ||||||||||||
| 6,000,000 | 4.000%, 1/1/2047d | 6,298,800 | 0.7 | % | ||||||||
| 444,913 | 6.500%, 9/1/2037 | 504,177 | 0.1 | % | ||||||||
Federal National Mortgage Association Connecticut Avenue Securities | ||||||||||||
| 4,222,895 | 2.056%, 4/25/2029, Series 2016-C07, Class 2M1a | 4,227,096 | 0.5 | % | ||||||||
Federal National Mortgage Association Conventional 15- Yr. Pass Through | ||||||||||||
| 2,015,864 | 2.250%, 6/25/2025, Series 2010-58, Class PT | 2,040,824 | 0.2 | % | ||||||||
Federal National Mortgage Association Conventional 30- Yr. Pass Through | ||||||||||||
| 4,935,414 | 1.740%, 7/1/2043a | 5,072,194 | 0.6 | % | ||||||||
| 3,456,797 | 2.046% - 5.464%, 9/1/2037 - 1/1/2043a | 3,590,069 | 0.4 | % | ||||||||
|
| |||||||||||
Total | 29,066,915 | |||||||||||
|
| |||||||||||
Technology (2.1%) | ||||||||||||
Other Securities^ | 18,624,176 | 2.1 | % | |||||||||
|
| |||||||||||
Total | 18,624,176 | |||||||||||
|
| |||||||||||
Transportation (1.9%) | ||||||||||||
Other Securities^ | 16,673,868 | 1.9 | % | |||||||||
|
| |||||||||||
Total | 16,673,868 | |||||||||||
|
| |||||||||||
U.S. Government and Agencies (16.4%) | ||||||||||||
Federal National Mortgage Association | ||||||||||||
| 7,500,000 | 1.250%, 8/17/2021 | 7,247,227 | 0.8 | % | ||||||||
U.S. Treasury Bonds | ||||||||||||
| 8,000,000 | 5.500%, 8/15/2028 | 10,340,888 | 1.2 | % | ||||||||
| 4,300,000 | 2.500% - 3.625%, 5/15/2042 - 5/15/2046 | 4,117,916 | 0.5 | % | ||||||||
U.S. Treasury Bonds, TIPS | ||||||||||||
| 19,600,020 | 0.125%, 4/15/2019 | 19,843,825 | 2.2 | % | ||||||||
| 7,147,208 | 0.125%, 1/15/2023 | 7,093,618 | 0.8 | % | ||||||||
| 7,756,836 | 0.625%, 1/15/2026 | 7,823,723 | 0.9 | % | ||||||||
| 6,120,900 | 1.000%, 2/15/2046 | 6,144,490 | 0.7 | % | ||||||||
U.S. Treasury Notes | ||||||||||||
| 5,000,000 | 1.250%, 12/15/2018 | 5,004,390 | 0.6 | % | ||||||||
| 12,350,000 | 1.500%, 10/31/2019 | 12,374,107 | 1.4 | % | ||||||||
| 48,990,000 | 1.125%, 8/31/2021 | 47,289,067 | 5.4 | % | ||||||||
| 13,150,000 | 2.125%, 6/30/2022 | 13,182,047 | 1.5 | % | ||||||||
| 3,065,000 | 0.875% - 2.000%, 1/31/2017 - 11/15/2026e | 2,990,955 | 0.3 | % | ||||||||
Other Securities^ | 995,517 | 0.1 | % | |||||||||
|
| |||||||||||
Total | 144,447,770 | |||||||||||
|
| |||||||||||
Utilities (2.7%) | ||||||||||||
Other Securities^ | 24,031,803 | 2.7 | % | |||||||||
|
| |||||||||||
Total | 24,031,803 | |||||||||||
|
| |||||||||||
Total Long-Term Fixed Income (cost $847,058,382) | 837,958,101 | |||||||||||
|
| |||||||||||
| Shares | Preferred Stock (0.4%) | |||||||||||
Financials (0.3%) | ||||||||||||
Other Securities^ | 2,549,120 | 0.3 | % | |||||||||
|
| |||||||||||
Total | 2,549,120 | |||||||||||
|
| |||||||||||
Utilities (0.1%) | ||||||||||||
Other Securities^ | 888,480 | 0.1 | % | |||||||||
|
| |||||||||||
Total | 888,480 | |||||||||||
|
| |||||||||||
Total Preferred Stock (cost $3,534,100) | 3,437,600 | |||||||||||
|
| |||||||||||
Common Stock (<0.1%) | ||||||||||||
Energy (<0.1%) | ||||||||||||
Other Securities^ | 245,931 | <0.1 | % | |||||||||
|
| |||||||||||
Total | 245,931 | |||||||||||
|
| |||||||||||
Total Common Stock (cost $209,137) | 245,931 | |||||||||||
|
| |||||||||||
Collateral Held for Securities Loaned (0.4%) | ||||||||||||
| 3,886,725 | Thrivent Cash Management Trust | 3,886,725 | 0.4 | % | ||||||||
|
| |||||||||||
Total Collateral Held for Securities Loaned (cost $3,886,725) | 3,886,725 | |||||||||||
|
| |||||||||||
| Shares or Principal Amount | Short-Term Investments (4.3%)f | |||||||||||
Thrivent Core Short-Term Reserve Fund | ||||||||||||
| 3,694,371 | 0.910% | 36,943,713 | 4.2 | % | ||||||||
Other Securities^ | 1,299,789 | 0.1 | % | |||||||||
|
| |||||||||||
Total Short-Term Investments (cost $38,243,449) | 38,243,502 | |||||||||||
|
| |||||||||||
Total Investments (cost $908,684,967) 101.7% | $ | 898,798,165 | ||||||||||
|
| |||||||||||
Other Assets and Liabilities, Net (1.7%) | (14,711,729 | ) | ||||||||||
|
| |||||||||||
Total Net Assets 100.0% | $ | 884,086,436 | ||||||||||
|
| |||||||||||
| ^ | The Summary Schedule of Investments shows the 50 largest holdings in unaffiliated issuers, any holding or issuer that exceeds 1% of net assets and all affiliated holdings as of the report date. The remaining securities held are grouped by category as “Other securities”. |
| a | Denotes variable rate securities. Variable rate securities are securities whose yields vary with a designated market index or market rate. The rate shown is as of December 31, 2016. |
| b | Denotes securities sold under Rule 144A of the Securities Act of 1933, which exempts them from registration. These securities may be resold to other dealers in the program or to other qualified institutional buyers. As of December 31, 2016, the value of these investments was $169,330,931 or 19.2% of total net assets. |
The accompanying Notes to Financial Statements are an integral part of this schedule.
184
Table of Contents
LIMITED MATURITY BOND PORTFOLIO
Summary Schedule of Investments as of December 31, 2016
| c | Denotes perpetual securities. Perpetual securities pay an indefinite stream of interest and have no contractual maturity date. Date shown, if applicable, is next call date. |
| d | Denotes investments purchased on a when-issued or delayed delivery basis. |
| e | At December 31, 2016, $40,016 of investments were segregated to cover exposure to a counterparty for margin on open mortgage-backed security transactions. |
| f | The interest rate shown reflects the yield, coupon rate or the discount rate at the date of purchase. |
| * | Denotes restricted securities. Restricted securities are investment securities which cannot be offered for public sale without first being registered under the Securities Act of 1933. The value of all restricted securities held in Limited Maturity Bond Portfolio as of December 31, 2016 was $88,880,192 or 10.1% of total net assets. The following table indicates the acquisition date and cost of restricted securities shown in the schedule as of December 31, 2016. |
Security | Acquisition Date | Cost | ||||||
Alm Loan Funding CLO, 10/17/2026 | 7/31/2014 | $ | 3,758,120 | |||||
Apidos CLO XVIII, 7/22/2026 | 6/25/2014 | 3,765,562 | ||||||
Babson CLO, Ltd., 10/17/2026 | 8/15/2014 | 3,758,120 | ||||||
Birchwood Park CLO, Ltd., 7/15/2026 | 7/31/2014 | 3,760,000 | ||||||
BlueMountain CLO, Ltd., 10/15/2026 | 8/27/2014 | 3,756,202 | ||||||
Carlyle Global Market Strategies CLO, Ltd., 10/15/2026 | 9/19/2014 | 3,750,000 | ||||||
Cent CLO 16, LP, 8/1/2024 | 9/5/2014 | 3,653,108 | ||||||
Cent CLO 22, Ltd., 11/7/2026 | 11/1/2016 | 3,750,000 | ||||||
DRB Prime Student Loan Trust, 10/27/2031 | 9/23/2015 | 3,713,157 | ||||||
Dryden 34 Senior Loan Fund CLO, 10/15/2026 | 7/21/2014 | 3,760,000 | ||||||
Madison Park Funding XIV CLO, Ltd., 7/20/2026 | 7/3/2014 | 4,145,020 | ||||||
Octagon Investment Partners XX CLO, Ltd., 8/12/2026 | 7/10/2014 | 3,760,000 | ||||||
OZLM VIII, Ltd., 10/17/2026 | 8/7/2014 | 3,738,568 | ||||||
Voya CLO 3, Ltd., 7/25/2026 | 7/10/2014 | 3,754,360 | ||||||
The following table presents the total amount of securities loaned with continuous maturity, by type, offset by the gross payable upon return of collateral for securities loaned by Thrivent Limited Maturity Bond Portfolio as of December 31, 2016:
Securities Lending Transactions | ||||
Taxable Debt Security | $ | 3,756,401 | ||
|
| |||
Total lending | $ | 3,756,401 | ||
Gross amount payable upon return of collateral for securities loaned | $ | 3,886,725 | ||
|
| |||
Net amounts due to counterparty | $ | 130,324 | ||
|
| |||
Definitions:
CLO | - | Collateralized Loan Obligation | ||
TIPS | - | Treasury Inflation Protected Security. |
Unrealized Appreciation (Depreciation)
Gross unrealized appreciation and depreciation of investments, based on cost for federal income tax purposes, were as follows:
Gross unrealized appreciation | $ | 5,089,577 | ||
Gross unrealized depreciation | (14,817,163 | ) | ||
|
| |||
Net unrealized appreciation (depreciation) | $ | (9,727,586 | ) | |
Cost for federal income tax purposes | $ | 908,525,751 |
The accompanying Notes to Financial Statements are an integral part of this schedule.
185
Table of Contents
LIMITED MATURITY BOND PORTFOLIO
Summary Schedule of Investments as of December 31, 2016
Fair Valuation Measurements
The following table is a summary of the inputs used, as of December 31, 2016, in valuing Limited Maturity Bond Portfolio’s assets carried at fair value.
Investments in Securities | Total | Level 1 | Level 2 | Level 3 | ||||||||||||
Bank Loans | ||||||||||||||||
Basic Materials | 329,753 | — | 329,753 | — | ||||||||||||
Capital Goods | 2,453,266 | — | 2,453,266 | — | ||||||||||||
Communications Services | 5,516,228 | — | 5,516,228 | — | ||||||||||||
Consumer Cyclical | 3,669,837 | — | 3,669,837 | — | ||||||||||||
Consumer Non-Cyclical | 607,028 | — | 607,028 | — | ||||||||||||
Energy | 411,539 | — | 411,539 | — | ||||||||||||
Financials | 1,284,809 | — | 1,284,809 | — | ||||||||||||
Technology | 509,591 | — | 509,591 | — | ||||||||||||
Utilities | 244,255 | — | 244,255 | — | ||||||||||||
Long-Term Fixed Income | ||||||||||||||||
Asset-Backed Securities | 235,907,687 | — | 228,842,922 | 7,064,765 | ||||||||||||
Basic Materials | 4,684,179 | — | 4,684,179 | — | ||||||||||||
Capital Goods | 4,501,390 | — | 4,501,390 | — | ||||||||||||
Collateralized Mortgage Obligations | 36,640,131 | — | 36,640,131 | — | ||||||||||||
Commercial Mortgage-Backed Securities | 19,151,108 | — | 19,151,108 | — | ||||||||||||
Communications Services | 22,906,647 | — | 22,906,647 | — | ||||||||||||
Consumer Cyclical | 14,109,875 | — | 14,109,875 | — | ||||||||||||
Consumer Non-Cyclical | 52,171,359 | — | 52,171,359 | — | ||||||||||||
Energy | 30,395,836 | — | 30,395,836 | — | ||||||||||||
Financials | 177,426,117 | — | 177,426,117 | — | ||||||||||||
Foreign Government | 7,219,240 | — | 7,219,240 | — | ||||||||||||
Mortgage-Backed Securities | 29,066,915 | — | 29,066,915 | — | ||||||||||||
Technology | 18,624,176 | — | 18,624,176 | — | ||||||||||||
Transportation | 16,673,868 | — | 16,673,868 | — | ||||||||||||
U.S. Government and Agencies | 144,447,770 | — | 144,447,770 | — | ||||||||||||
Utilities | 24,031,803 | — | 24,031,803 | — | ||||||||||||
Preferred Stock | ||||||||||||||||
Financials | 2,549,120 | 1,704,120 | 845,000 | — | ||||||||||||
Utilities | 888,480 | 888,480 | — | — | ||||||||||||
Common Stock | ||||||||||||||||
Energy | 245,931 | 245,931 | — | — | ||||||||||||
Short-Term Investments | 1,299,789 | — | 1,299,789 | — | ||||||||||||
|
|
|
|
|
|
|
| |||||||||
Subtotal Investments in Securities | $ | 857,967,727 | $ | 2,838,531 | $ | 848,064,431 | $ | 7,064,765 | ||||||||
|
|
|
|
|
|
|
| |||||||||
Other Investments* | Total | |||||||||||||||
Short-Term Investments | 36,943,713 | |||||||||||||||
Collateral Held for Securities Loaned | 3,886,725 | |||||||||||||||
|
| |||||||||||||||
Subtotal Other Investments | $ | 40,830,438 | ||||||||||||||
|
| |||||||||||||||
Total Investments at Value | $ | 898,798,165 | ||||||||||||||
|
| |||||||||||||||
| * | Certain investments are measured at fair value using a net asset value per share that is not publicly available (practical expedient). According to disclosure requirements of Accounting Standards Codification (ASC) 820, Fair Value Measurement, securities valued using the practical expedient are not classified in the fair value hierarchy. The fair value amounts presented in this table are intended to permit reconciliation of the fair value hierarchy to the amounts presented in the Statement of Assets and Liabilities. |
Other Financial Instruments | Total | Level 1 | Level 2 | Level 3 | ||||||||||||
Asset Derivatives | ||||||||||||||||
Futures Contracts | 541,571 | 541,571 | — | — | ||||||||||||
|
|
|
|
|
|
|
| |||||||||
Total Asset Derivatives | $ | 541,571 | $ | 541,571 | $ | — | $ | — | ||||||||
|
|
|
|
|
|
|
| |||||||||
Liability Derivatives | ||||||||||||||||
Futures Contracts | 59,430 | 59,430 | — | — | ||||||||||||
|
|
|
|
|
|
|
| |||||||||
Total Liability Derivatives | $ | 59,430 | $ | 59,430 | $ | — | $ | — | ||||||||
|
|
|
|
|
|
|
| |||||||||
There were no significant transfers between Levels during the period ended December 31, 2016. Transfers between Levels are identified as of the end of the period.
The accompanying Notes to Financial Statements are an integral part of this schedule.
186
Table of Contents
LIMITED MATURITY BOND PORTFOLIO
Summary Schedule of Investments as of December 31, 2016
The following table presents Limited Maturity Bond Portfolio’s futures contracts held as of December 31, 2016. Investments and/or cash totaling $1,299,789 were pledged as the initial margin deposit for these contracts.
Futures Contracts | Number of Contracts Long/(Short) | Expiration Date | Notional Principal Amount | Value | Unrealized Gain/(Loss) | |||||||||||||||
CBOT 10-Yr. U.S. Treasury Note | (417 | ) | March 2017 | ($ | 52,130,183 | ) | ($ | 51,825,281 | ) | $ | 304,902 | |||||||||
CBOT 2-Yr. U.S. Treasury Note | 728 | March 2017 | 157,807,599 | 157,748,500 | (59,099 | ) | ||||||||||||||
CBOT 5-Yr. U.S. Treasury Note | (618 | ) | March 2017 | (72,801,383 | ) | (72,716,390 | ) | 84,993 | ||||||||||||
CBOT U.S. Long Bond | (78 | ) | March 2017 | (11,875,247 | ) | (11,751,188 | ) | 124,059 | ||||||||||||
CME Ultra Long Term U.S. Treasury Bond | (12 | ) | March 2017 | (1,950,617 | ) | (1,923,000 | ) | 27,617 | ||||||||||||
Ultra 10-Yr. U.S. Treasury Note | 1 | March 2017 | 134,394 | 134,063 | (331 | ) | ||||||||||||||
Total Futures Contracts | $ | 482,141 | ||||||||||||||||||
The following table summarizes the fair value and Statement of Assets and Liabilities location, as of December 31, 2016, for Limited Maturity Bond Portfolio’s investments in financial derivative instruments by primary risk exposure as discussed under item (2) Significant Accounting Policies of the Notes to Financial Statements.
Derivatives by risk category | Statement of Assets and Liabilities Location | Fair Value | ||||
| Asset Derivatives | ||||||
Interest Rate Contracts | ||||||
Futures* | Net Assets - Net unrealized appreciation/(depreciation) on Futures contracts | $ | 541,571 | |||
Total Interest Rate Contracts | 541,571 | |||||
|
| |||||
Total Asset Derivatives | $ | 541,571 | ||||
|
| |||||
Liability Derivatives | ||||||
Interest Rate Contracts | ||||||
Futures* | Net Assets - Net unrealized appreciation/(depreciation) on Futures contracts | 59,430 | ||||
Total Interest Rate Contracts | 59,430 | |||||
|
| |||||
Total Liability Derivatives | $ | 59,430 | ||||
|
| |||||
| * | Includes cumulative appreciation/depreciation of futures contracts as reported in the Schedule of Investments. Only current day’s variation margin is reported within the Statement of Assets and Liabilities. |
The following table summarizes the net realized gains/(losses) and Statement of Operations location, for the period ended December 31, 2016, for Limited Maturity Bond Portfolio’s investments in financial derivative instruments by primary risk exposure.
Derivatives by risk category | Statement of Operations Location | Realized Gains/(Losses) recognized in Income | ||||
Interest Rate Contracts | ||||||
Futures | Net realized gains/(losses) on Futures contracts | (772,751) | ||||
Total Interest Rate Contracts | (772,751) | |||||
|
| |||||
Total | ($ | 772,751) | ||||
|
| |||||
The following table summarizes the change in net unrealized appreciation/(depreciation) and Statement of Operations location, for the period ended December 31, 2016, for Limited Maturity Bond Portfolio’s investments in financial derivative instruments by primary risk exposure.
Derivatives by risk category | Statement of Operations Location | Change in unrealized appreciation/(depreciation) recognized in Income | ||||
Interest Rate Contracts | ||||||
Futures | Change in net unrealized appreciation/(depreciation) on Futures contracts | 339,915 | ||||
Total Interest Rate Contracts | 339,915 | |||||
|
| |||||
Total | $ | 339,915 | ||||
|
| |||||
The following table presents Limited Maturity Bond Portfolio’s average volume of derivative activity during the period ended December 31, 2016.
Derivative Risk Category | Futures (Notional)* | Futures (Percentage of Average Net Assets) | ||||||
Interest Rate Contracts | $ | 287,529,656 | 33.8 | % | ||||
| * | Notional amount represents long or short, or both, derivative positions held by the Portfolio. |
The accompanying Notes to Financial Statements are an integral part of this schedule.
187
Table of Contents
LIMITED MATURITY BOND PORTFOLIO
Summary Schedule of Investments as of December 31, 2016
Investment in Affiliates
Affiliated issuers, as defined under the Investment Company Act of 1940, include those in which the Portfolio’s holdings of an issuer represent 5% or more of the outstanding voting securities of an issuer, any affiliated mutual fund, or a company which is under common ownership or control with the Portfolio. The Portfolio owns shares of Thrivent Cash Management Trust for the purpose of securities lending and Thrivent Core Short-Term Reserve Fund primarily to serve as a cash sweep vehicle for the Portfolio. Thrivent Cash Management Trust and Thrivent Core Short-Term Reserve Fund are established for the sole use of affiliated portfolios.
A summary of transactions for the fiscal year to date, in Limited Maturity Bond Portfolio, is as follows:,
Portfolio | Value December 31, 2015 | Gross Purchases | Gross Sales | Shares Held at December 31, 2016 | Value December 31, 2016 | Income Earned January 1, 2016 - December 31, 2016 | ||||||||||||||||||
Cash Management Trust-Collateral Investment | $ | 11,023,000 | $ | 94,841,624 | $ | 101,977,899 | 3,886,725 | $ | 3,886,725 | $ | 35,513 | |||||||||||||
Cash Management Trust-Short Term Investment | 44,769,481 | 56,586,057 | 101,355,538 | — | — | 31,520 | ||||||||||||||||||
Core Short-Term Reserve Fund | — | 166,353,993 | 129,410,280 | 3,694,371 | 36,943,713 | 165,085 | ||||||||||||||||||
Total Value and Income Earned | $ | 55,792,481 | $ | 40,830,438 | $ | 232,118 | ||||||||||||||||||
The accompanying Notes to Financial Statements are an integral part of this schedule.
188
Table of Contents
Schedule of Investments as of December 31, 2016
| Principal Amount | U.S. Government Agency Debt (85.3%)a | Value | ||||||
Federal Agricultural Mortgage Corporation | ||||||||
| $ | 1,470,000 | 0.882%, 1/25/2017b | $ | 1,470,000 | ||||
| 1,510,000 | 0.762%, 3/7/2017b | 1,510,000 | ||||||
Federal Farm Credit Bank | ||||||||
| 1,200,000 | 0.500%, 1/13/2017 | 1,200,016 | ||||||
| 200,000 | 0.450%, 2/1/2017 | 199,923 | ||||||
| 780,000 | 0.705%, 3/13/2017b | 779,891 | ||||||
| 130,000 | 0.786%, 4/17/2017b | 129,989 | ||||||
| 1,300,000 | 0.724%, 8/10/2017b | 1,299,605 | ||||||
| 2,960,000 | 0.760%, 3/14/2018b | 2,959,640 | ||||||
Federal Home Loan Bank | ||||||||
| 5,735,000 | 0.309%, 1/3/2017 | 5,734,902 | ||||||
| 3,250,000 | 0.362%, 1/4/2017 | 3,249,902 | ||||||
| 4,645,000 | 0.374%, 1/5/2017 | 4,644,807 | ||||||
| 6,545,000 | 0.375%, 1/6/2017 | 6,544,660 | ||||||
| 2,450,000 | 0.333%, 1/9/2017 | 2,449,819 | ||||||
| 4,880,000 | 0.395%, 1/10/2017 | 4,879,519 | ||||||
| 7,795,000 | 0.396%, 1/11/2017 | 7,794,142 | ||||||
| 1,830,000 | 0.423%, 1/12/2017 | 1,829,763 | ||||||
| 3,050,000 | 0.342%, 1/13/2017 | 3,049,653 | ||||||
| 4,210,000 | 0.444%, 1/17/2017 | 4,209,168 | ||||||
| 8,200,000 | 0.433%, 1/18/2017 | 8,198,322 | ||||||
| 1,880,000 | 0.500%, 1/19/2017 | 1,879,530 | ||||||
| 1,470,000 | 0.818%, 1/19/2017b | 1,469,992 | ||||||
| 4,940,000 | 0.368%, 1/20/2017 | 4,939,041 | ||||||
| 1,640,000 | 0.475%, 1/23/2017 | 1,639,524 | ||||||
| 450,000 | 0.500%, 1/24/2017 | 449,856 | ||||||
| 5,070,000 | 0.361%, 1/25/2017 | 5,068,778 | ||||||
| 1,000,000 | 0.490%, 1/26/2017 | 999,660 | ||||||
| 1,280,000 | 0.846%, 1/26/2017b | 1,280,000 | ||||||
| 2,840,000 | 0.413%, 1/27/2017 | 2,839,152 | ||||||
| 475,000 | 0.500%, 1/30/2017 | 474,809 | ||||||
| 1,880,000 | 0.500%, 1/31/2017 | 1,879,217 | ||||||
| 4,870,000 | 0.435%, 2/1/2017 | 4,868,175 | ||||||
| 1,535,000 | 0.460%, 2/2/2017 | 1,534,372 | ||||||
| 4,740,000 | 0.490%, 2/3/2017 | 4,737,872 | ||||||
| 1,050,000 | 0.520%, 2/6/2017 | 1,049,454 | ||||||
| 1,590,000 | 0.510%, 2/7/2017 | 1,589,167 | ||||||
| 3,800,000 | 0.490%, 2/8/2017 | 3,798,035 | ||||||
| 3,500,000 | 0.527%, 2/9/2017 | 3,498,000 | ||||||
| 450,000 | 0.520%, 2/10/2017 | 449,740 | ||||||
| 1,190,000 | 0.520%, 2/13/2017 | 1,189,261 | ||||||
| 3,075,000 | 0.517%, 2/15/2017 | 3,073,013 | ||||||
| 1,920,000 | 0.530%, 2/22/2017 | 1,918,530 | ||||||
| 3,000,000 | 0.520%, 2/27/2017 | 2,997,530 | ||||||
| 500,000 | 0.525%, 3/6/2017 | 499,533 | ||||||
| 1,900,000 | 0.545%, 3/17/2017 | 1,897,843 | ||||||
| 500,000 | 0.540%, 3/22/2017 | 499,400 | ||||||
| 500,000 | 0.545%, 3/24/2017 | 499,379 | ||||||
| 1,300,000 | 0.923%, 3/30/2017b | 1,300,000 | ||||||
| 1,300,000 | 0.766%, 5/16/2017b | 1,299,863 | ||||||
| 1,300,000 | 0.895%, 8/23/2017b | 1,299,958 | ||||||
| 1,825,000 | 0.675%, 9/5/2017b | 1,825,776 | ||||||
| 800,000 | 0.699%, 11/2/2017b | 800,000 | ||||||
Federal Home Loan Mortgage Corporation | ||||||||
| 1,220,000 | 0.480%, 1/20/2017 | 1,219,691 | ||||||
| 895,000 | 0.334%, 1/23/2017 | 894,817 | ||||||
| 1,450,000 | 0.700%, 1/27/2017 | 1,450,229 | ||||||
| 400,000 | 0.510%, 2/7/2017 | 399,790 | ||||||
| 1,950,000 | 0.875%, 2/22/2017 | 1,950,738 | ||||||
| 1,250,000 | 0.874%, 7/21/2017b | 1,249,929 | ||||||
Federal National Mortgage Association | ||||||||
| 1,630,000 | 0.846%, 1/11/2018b | 1,630,000 | ||||||
Overseas Private Investment Corporation | ||||||||
| 2,500,000 | 0.700%, 1/4/2017b | 2,500,000 | ||||||
| 1,984,210 | 0.700%, 1/4/2017b | 1,984,210 | ||||||
| 1,575,000 | 0.700%, 1/6/2017b | 1,575,000 | ||||||
| 600,000 | 0.700%, 1/6/2017b | 600,000 | ||||||
| 835,000 | 0.700%, 1/6/2017b | 835,000 | ||||||
| 3,450,000 | 0.700%, 1/6/2017b | 3,450,000 | ||||||
| 2,850,000 | 0.700%, 1/6/2017b | 2,850,000 | ||||||
| 2,289,474 | 0.700%, 1/6/2017b | 2,289,474 | ||||||
| 1,410,000 | 0.700%, 1/6/2017b | 1,410,000 | ||||||
| 1,900,000 | 0.700%, 1/6/2017b | 1,900,000 | ||||||
| 810,866 | 0.700%, 1/6/2017b | 810,866 | ||||||
| 1,940,463 | 0.750%, 1/6/2017b | 1,940,463 | ||||||
| 2,600,000 | 1.010%, 3/17/2017 | 2,620,637 | ||||||
| 1,530,000 | 0.760%, 3/30/2017 | 1,537,792 | ||||||
| 2,920,000 | 0.970%, 11/8/2017 | 2,924,173 | ||||||
|
| |||||||
Total | 163,700,990 | |||||||
|
| |||||||
U.S. Treasury Debt (14.3%)a | ||||||||
U.S. Treasury Bills | ||||||||
| 4,280,000 | 0.423%, 1/19/2017 | 4,279,094 | ||||||
| 1,900,000 | 0.585%, 4/27/2017 | 1,896,418 | ||||||
U.S. Treasury Notes | ||||||||
| 1,420,000 | 0.500%, 1/31/2017 | 1,420,129 | ||||||
| 5,050,000 | 0.640%, 1/31/2017b | 5,050,256 | ||||||
| 3,060,000 | 0.633%, 7/31/2017b | 3,059,675 | ||||||
| 2,380,000 | 0.828%, 1/31/2018b | 2,383,419 | ||||||
| 4,360,000 | 0.746%, 4/30/2018b | 4,364,387 | ||||||
| 4,950,000 | 0.730%, 7/31/2018b | 4,950,928 | ||||||
|
| |||||||
Total | 27,404,306 | |||||||
|
| |||||||
Total Investments (at amortized cost) 99.6% | $ | 191,105,296 | ||||||
|
| |||||||
Other Assets and Liabilities, Net 0.4% | 819,603 | |||||||
|
| |||||||
Total Net Assets 100.0% | $ | 191,924,899 | ||||||
|
| |||||||
| a | The interest rate shown reflects the yield, coupon rate or the discount rate at the date of purchase. |
| b | Denotes variable rate securities. Variable rate securities are securities whose yields vary with a designated market index or market rate. The rate shown is as of December 31, 2016. |
Cost for federal income tax purposes | $ | 191,105,296 |
The accompanying Notes to Financial Statements are an integral part of this schedule.
189
Table of Contents
MONEY MARKET PORTFOLIO
Schedule of Investments as of December 31, 2016
Fair Valuation Measurements
The following table is a summary of the inputs used, as of December 31, 2016, in valuing Money Market Portfolio’s assets carried at fair value or amortized cost, which approximates fair value.
Investments in Securities | Total | Level 1 | Level 2 | Level 3 | ||||||||||||
U.S. Government Agency Debt | 163,700,990 | — | 163,700,990 | — | ||||||||||||
U.S. Treasury Debt | 27,404,306 | — | 27,404,306 | — | ||||||||||||
|
|
|
|
|
|
|
| |||||||||
Total | $ | 191,105,296 | $ | — | $ | 191,105,296 | $ | — | ||||||||
|
|
|
|
|
|
|
| |||||||||
There were no significant transfers between Levels during the period ended December 31, 2016. Transfers between Levels are identified as of the end of the period.
The accompanying Notes to Financial Statements are an integral part of this schedule.
190
Table of Contents
(This page intentionally left blank)
191
Table of Contents
THRIVENT SERIES FUND, INC.
STATEMENTOF ASSETSAND LIABILITIES
As of December 31, 2016 | Aggressive Allocation Portfolio | Moderately Aggressive Allocation Portfolio | Moderate Allocation Portfolio | Moderately Conservative Allocation Portfolio | ||||||||||||
Assets | ||||||||||||||||
Investments at cost | $ | 953,806,212 | $ | 5,052,677,086 | $ | 9,596,844,026 | $ | 5,237,907,247 | ||||||||
Investments in securities at value | 632,685,935 | 3,101,885,641 | 6,153,502,433 | 3,252,609,373 | ||||||||||||
Investments in affiliates at value | 447,653,450 | 2,580,666,659 | 4,264,197,855 | 2,237,664,560 | ||||||||||||
Investments at Value | 1,080,339,385 | 5,682,552,300 | 10,417,700,288 | 5,490,273,933 | ||||||||||||
Cash | 15,513 | (a) | 206,858 | (b) | 292,887 | (c) | 55,183 | (d) | ||||||||
Dividends and interest receivable | 625,580 | 6,347,898 | 17,089,479 | 11,158,359 | ||||||||||||
Prepaid expenses | 2,342 | 6,899 | 11,302 | 6,121 | ||||||||||||
Receivable for investments sold | 3,007,859 | 9,319,662 | 15,466,533 | 4,124,610 | ||||||||||||
Receivable for fund shares sold | 344,505 | 1,990,656 | 1,212,018 | 882,654 | ||||||||||||
Receivable for expense reimbursements | 190,514 | 1,017,648 | 1,315,712 | 498,354 | ||||||||||||
Receivable for variation margin | 872,074 | 3,015,222 | 5,060,538 | 2,225,765 | ||||||||||||
Total Assets | 1,085,397,772 | 5,704,457,143 | 10,458,148,757 | 5,509,224,979 | ||||||||||||
Liabilities | ||||||||||||||||
Accrued expenses | 60,604 | 96,321 | 129,470 | 80,162 | ||||||||||||
Payable for investments purchased | 19,507,874 | 317,157,918 | 1,003,041,258 | 732,312,993 | ||||||||||||
Payable upon return of collateral for securities loaned | 1,164,525 | 56,510,060 | 186,669,340 | 78,436,450 | ||||||||||||
Payable for fund shares redeemed | 126,568 | 163,857 | 408,722 | 36,090 | ||||||||||||
Payable for variation margin | 353,795 | 1,399,668 | 735,380 | 336,388 | ||||||||||||
Payable for investment advisory fees | 664,491 | 2,973,883 | 4,665,230 | 2,231,145 | ||||||||||||
Payable for administrative fees | 22,902 | 87,741 | 147,737 | 77,954 | ||||||||||||
Payable for director fees | 532 | 1,876 | 3,359 | 1,718 | ||||||||||||
Payable for director deferred compensation | 59,208 | 185,977 | 319,784 | 169,951 | ||||||||||||
Commitments and contingent liabilities^ | — | — | — | — | ||||||||||||
Mortgage dollar roll deferred revenue | 9,284 | 190,626 | 631,999 | 473,525 | ||||||||||||
Total Liabilities | 21,969,783 | 378,767,927 | 1,196,752,279 | 814,156,376 | ||||||||||||
Net Assets | ||||||||||||||||
Capital stock (beneficial interest) | 925,825,361 | 4,599,827,182 | 8,251,532,227 | 4,317,125,001 | ||||||||||||
Accumulated undistributed net investment income/(loss) | 8,928,983 | 70,799,623 | 159,386,237 | 88,718,811 | ||||||||||||
Accumulated undistributed net realized gain/(loss) | 769,700 | 22,046,229 | 28,567,167 | 38,604,368 | ||||||||||||
Net unrealized appreciation/(depreciation) on: | ||||||||||||||||
Investments | 106,876,274 | 397,859,937 | 546,276,959 | 170,242,460 | ||||||||||||
Affiliated investments | 19,656,899 | 232,015,277 | 274,579,303 | 82,124,226 | ||||||||||||
Futures contracts | 1,372,730 | 3,141,442 | 1,057,667 | (1,746,263 | ) | |||||||||||
Foreign currency transactions | (1,958 | ) | (474 | ) | (3,082 | ) | — | |||||||||
Total Net Assets | $ | 1,063,427,989 | $ | 5,325,689,216 | $ | 9,261,396,478 | $ | 4,695,068,603 | ||||||||
Shares of beneficial interest outstanding | 72,913,434 | 371,981,530 | 679,168,528 | 367,373,405 | ||||||||||||
Net asset value per share | $ | 14.58 | $ | 14.32 | $ | 13.64 | $ | 12.78 | ||||||||
| (a) | Includes foreign currency holdings of $1,512 (cost $1,506). |
| (b) | Includes foreign currency holdings of $135,247 (cost $133,983). |
| (c) | Includes foreign currency holdings of $179,851 (cost $178,691). |
| (d) | Includes foreign currency holdings of $4 (cost $4). |
| (e) | Includes foreign currency holdings of $12,652 (cost $12,617). |
| (f) | Includes foreign currency holdings of $33,259 (cost $33,171). |
| (g) | Includes foreign currency holdings of $39,304 (cost $39,318). |
| (h) | Includes foreign currency holdings of $27,222 (cost $27,626). |
| ^ | Commitments and contingent liability accrual. Additional information can be found in the accompanying Notes to Financial Statements. |
The accompanying Notes to Financial Statements are an integral part of this statement.
192
Table of Contents
THRIVENT SERIES FUND, INC.
STATEMENTOF ASSETSAND LIABILITIES –CONTINUED
| Growth and Income Plus Portfolio | Balanced Income Plus Portfolio | Diversified Income Plus Portfolio | Opportunity Income Plus Portfolio | Partner Healthcare Portfolio | Partner Emerging Markets Equity Portfolio | Real Estate Securities Portfolio | ||||||||||||||||||||
| $ | 88,125,723 | $ | 374,800,259 | $ | 587,476,964 | $ | 163,213,783 | $ | 165,243,422 | $ | 54,380,512 | $ | 154,622,554 | |||||||||||||
| 83,228,413 | 341,623,232 | 534,233,956 | 136,217,904 | 155,059,139 | 55,064,301 | 177,000,908 | ||||||||||||||||||||
| 7,854,389 | 46,719,998 | 65,162,001 | 26,649,222 | 8,210,797 | 2,380,027 | 1,162,622 | ||||||||||||||||||||
| 91,082,802 | 388,343,230 | 599,395,957 | 162,867,126 | 163,269,936 | 57,444,328 | 178,163,530 | ||||||||||||||||||||
| 12,681 | (e) | 33,450 | (f) | 39,304 | (g) | 85 | 174,416 | 27,222 | (h) | — | ||||||||||||||||
| 284,058 | 1,448,696 | 2,781,026 | 811,963 | 316,500 | 109,232 | 880,061 | ||||||||||||||||||||
| 1,309 | 1,581 | 1,785 | 1,339 | 1,417 | 1,273 | 1,408 | ||||||||||||||||||||
| 142,227 | 674,838 | 1,090,197 | 835,040 | — | 5,066 | 1,643,850 | ||||||||||||||||||||
| 8,106 | 54,791 | 209,146 | 56,982 | 6,181 | 7,184 | 5,912 | ||||||||||||||||||||
| 15,445 | — | — | — | 8,478 | 19,754 | — | ||||||||||||||||||||
| 16,641 | 61,238 | 128,281 | 29,948 | — | — | — | ||||||||||||||||||||
| 91,563,269 | 390,617,824 | 603,645,696 | 164,602,483 | 163,776,928 | 57,614,059 | 180,694,761 | ||||||||||||||||||||
| 42,766 | 49,001 | 53,265 | 26,915 | 16,633 | 46,394 | 15,455 | ||||||||||||||||||||
| 3,872,060 | 28,389,220 | 40,291,993 | 24,097,144 | — | 25,801 | 352,020 | ||||||||||||||||||||
| — | 6,483,360 | 172,250 | — | — | 981,850 | — | ||||||||||||||||||||
| 4,334 | 9,942 | 32,142 | 2,565 | 184,629 | 3,899 | 117,519 | ||||||||||||||||||||
| 7,309 | 25,686 | 16,310 | 10,406 | — | — | — | ||||||||||||||||||||
| 47,187 | 164,568 | 188,759 | 59,492 | 126,742 | 56,065 | 119,499 | ||||||||||||||||||||
| 7,974 | 12,053 | 15,161 | 8,809 | 9,216 | 7,517 | 9,355 | ||||||||||||||||||||
| 150 | 343 | 454 | 150 | 150 | 150 | 150 | ||||||||||||||||||||
| 19,638 | 93,525 | 57,685 | 23,879 | 18,694 | 18,694 | 52,676 | ||||||||||||||||||||
| — | — | — | — | — | — | — | ||||||||||||||||||||
| 2,004 | 16,140 | 25,879 | 13,709 | — | — | — | ||||||||||||||||||||
| 4,003,422 | 35,243,838 | 40,853,898 | 24,243,069 | 356,064 | 1,140,370 | 666,674 | ||||||||||||||||||||
| 84,988,365 | 336,069,577 | 540,166,819 | 142,920,219 | 191,676,231 | 53,776,911 | 153,754,195 | ||||||||||||||||||||
| 1,697,121 | 9,245,351 | 18,664,203 | 37,640 | 195,587 | 426,203 | 2,951,342 | ||||||||||||||||||||
| (2,080,087 | ) | (3,511,161 | ) | (8,008,551 | ) | (2,283,890 | ) | (26,469,421 | ) | (793,013 | ) | (218,104 | ) | |||||||||||||
| 2,957,079 | 13,542,971 | 11,918,993 | (346,657 | ) | (1,973,486 | ) | 3,063,816 | 23,540,976 | ||||||||||||||||||
| — | — | — | — | — | — | — | ||||||||||||||||||||
| (1,315 | ) | 30,441 | 53,968 | 32,102 | — | — | — | |||||||||||||||||||
| (1,316 | ) | (3,193 | ) | (3,634 | ) | — | (8,047 | ) | (228 | ) | (322 | ) | ||||||||||||||
| $ | 87,559,847 | $ | 355,373,986 | $ | 562,791,798 | $ | 140,359,414 | $ | 163,420,864 | $ | 56,473,689 | $ | 180,028,087 | |||||||||||||
| 8,581,117 | 25,221,436 | 72,521,547 | 13,915,706 | 10,885,500 | 4,958,667 | 7,746,017 | ||||||||||||||||||||
| $ | 10.20 | $ | 14.09 | $ | 7.76 | $ | 10.09 | $ | 15.01 | $ | 11.39 | $ | 23.24 | |||||||||||||
The accompanying Notes to Financial Statements are an integral part of this statement.
193
Table of Contents
THRIVENT SERIES FUND, INC.
STATEMENTOF ASSETSAND LIABILITIES –CONTINUED
As of December 31, 2016 | Small Cap Stock Portfolio | Small Cap Index Portfolio | Mid Cap Stock Portfolio | Mid Cap Index Portfolio | ||||||||||||
Assets |
| |||||||||||||||
Investments at cost | $ | 413,630,311 | $ | 313,831,877 | $ | 1,127,942,142 | $ | 236,443,089 | ||||||||
Investments in securities at value | 492,984,796 | 391,506,596 | 1,400,995,433 | 278,654,308 | ||||||||||||
Investments in affiliates at value | 24,463,582 | 32,762,689 | 105,049,634 | 14,498,184 | ||||||||||||
Investments at Value | 517,448,378 | 424,269,285 | 1,506,045,067 | 293,152,492 | ||||||||||||
Cash | — | 33,605 | 62,929 | — | ||||||||||||
Initial margin deposit on open futures contracts | — | — | — | — | ||||||||||||
Initial margin deposit on open currency contracts | — | — | — | — | ||||||||||||
Dividends and interest receivable | 256,706 | 514,691 | 1,705,374 | 343,567 | ||||||||||||
Prepaid expenses | 1,694 | 1,559 | 2,600 | 1,446 | ||||||||||||
Receivable for investments sold | 3,073,653 | — | 16,634,468 | — | ||||||||||||
Receivable for fund shares sold | 48,310 | 599,554 | 288,632 | 562,606 | ||||||||||||
Unrealized gain on forward contracts | — | — | — | — | ||||||||||||
Receivable for expense reimbursements | — | — | — | — | ||||||||||||
Receivable for variation margin | — | — | — | — | ||||||||||||
Total Assets | 520,828,741 | 425,418,694 | 1,524,739,070 | 294,060,111 | ||||||||||||
Liabilities |
| |||||||||||||||
Accrued expenses | 20,114 | 22,724 | 21,481 | 24,135 | ||||||||||||
Payable for investments purchased | 2,682,123 | — | 1,475,795 | — | ||||||||||||
Payable upon return of collateral for securities loaned | 11,513,109 | 23,458,379 | 30,153,421 | 6,191,137 | ||||||||||||
Payable for fund shares redeemed | 27,094 | 9,043 | 45,875 | 44,077 | ||||||||||||
Unrealized loss on forward contracts | — | — | — | — | ||||||||||||
Payable for variation margin | — | 42,648 | — | 38,065 | ||||||||||||
Payable for investment advisory fees | 286,849 | 67,340 | 809,646 | 47,977 | ||||||||||||
Payable for administrative fees | 14,376 | 12,727 | 29,432 | 10,985 | ||||||||||||
Payable for director fees | 425 | 358 | 945 | 298 | ||||||||||||
Payable for director deferred compensation | 171,312 | 73,540 | 261,933 | 31,279 | ||||||||||||
Commitments and contingent liabilities^ | — | — | — | — | ||||||||||||
Total Liabilities | 14,715,402 | 23,686,759 | 32,798,528 | 6,387,953 | ||||||||||||
Net Assets |
| |||||||||||||||
Capital stock (beneficial interest) | 370,724,238 | 266,115,277 | 991,424,028 | 221,552,591 | ||||||||||||
Accumulated undistributed net investment income/(loss) | 1,828,779 | 3,723,538 | 5,425,315 | 3,003,256 | ||||||||||||
Accumulated undistributed net realized gain/(loss) | 29,742,255 | 21,610,785 | 116,988,274 | 6,521,035 | ||||||||||||
Net unrealized appreciation/(depreciation) on: |
| |||||||||||||||
Investments | 103,818,067 | 110,437,408 | 378,102,925 | 56,709,403 | ||||||||||||
Futures contracts | — | (155,073 | ) | — | (114,127 | ) | ||||||||||
Foreign currency forward contracts | — | — | — | — | ||||||||||||
Foreign currency transactions | — | — | — | — | ||||||||||||
Total Net Assets | $ | 506,113,339 | $ | 401,731,935 | $ | 1,491,940,542 | $ | 287,672,158 | ||||||||
Shares of beneficial interest outstanding | 27,367,367 | 22,093,469 | 78,192,426 | 16,855,456 | ||||||||||||
Net asset value per share | $ | 18.49 | $ | 18.18 | $ | 19.08 | $ | 17.07 | ||||||||
| (a) | Includes foreign currency holdings of $5,433,126 (cost $5,475,311). (b) Includes foreign currency holdings of $176,673 (cost $175,841). |
| ^ | Commitments and contingent liability accrual. Additional information can be found in the accompanying Notes to Financial Statements. |
The accompanying Notes to Financial Statements are an integral part of this statement.
194
Table of Contents
THRIVENT SERIES FUND, INC.
STATEMENTOF ASSETSAND LIABILITIES –CONTINUED
| Partner Worldwide Allocation Portfolio | Partner All Cap Portfolio | Large Cap Growth Portfolio | Partner Growth Stock Portfolio | Large Cap Value Portfolio | Large Cap Stock Portfolio | Large Cap Index Portfolio | ||||||||||||||||||||
| $ | 1,633,221,574 | $ | 85,094,628 | $ | 790,701,890 | $ | 85,880,557 | $ | 1,012,753,104 | $ | 753,109,244 | $ | 455,482,462 | |||||||||||||
| 1,621,248,893 | 93,722,983 | 952,463,552 | 120,287,758 | 1,314,677,903 | 858,758,937 | 671,569,459 | ||||||||||||||||||||
| 42,232,658 | 2,570,994 | 39,354,611 | 4,710,004 | 40,763,640 | 46,641,592 | 19,391,197 | ||||||||||||||||||||
| 1,663,481,551 | 96,293,977 | 991,818,163 | 124,997,762 | 1,355,441,543 | 905,400,529 | 690,960,656 | ||||||||||||||||||||
| 5,344,218 | (a) | 8,840 | — | — | 74,460 | 209,280 | (b) | 4,174 | ||||||||||||||||||
| 943,904 | — | — | — | — | — | — | ||||||||||||||||||||
| 1,260,000 | — | — | — | — | — | — | ||||||||||||||||||||
| 6,467,804 | 142,809 | 351,647 | 54,953 | 1,801,300 | 1,417,827 | 864,095 | ||||||||||||||||||||
| 3,072 | 1,318 | 2,433 | 1,344 | 2,553 | 2,211 | 1,845 | ||||||||||||||||||||
| 22,725 | 139,510 | 12,066,451 | 935,797 | — | — | — | ||||||||||||||||||||
| 72,270 | 39 | 20,662 | 6 | 11,220 | 144,907 | 715,840 | ||||||||||||||||||||
| 779,380 | — | — | — | — | — | — | ||||||||||||||||||||
| — | 22,253 | — | 15,716 | — | — | — | ||||||||||||||||||||
| 2,156,316 | — | — | — | — | 387,458 | — | ||||||||||||||||||||
| 1,680,531,240 | 96,608,746 | 1,004,259,356 | 126,005,578 | 1,357,331,076 | 907,562,212 | 692,546,610 | ||||||||||||||||||||
| 244,416 | 15,909 | 19,990 | 20,786 | 20,417 | 47,093 | 23,114 | ||||||||||||||||||||
| 4,889,607 | 292,138 | — | 959,745 | 7,597,217 | — | — | ||||||||||||||||||||
| 16,401,014 | 1,232,175 | — | 3,546,303 | — | 1,213,950 | 848,560 | ||||||||||||||||||||
| 15,375 | 37,954 | 500,020 | 13,317 | 24,603 | 109,123 | 54,801 | ||||||||||||||||||||
| 820,700 | — | — | — | — | — | — | ||||||||||||||||||||
| 1,983,035 | — | — | — | — | 90,423 | 79,010 | ||||||||||||||||||||
| 1,161,559 | 76,583 | 343,214 | 82,981 | 690,064 | 470,383 | 115,918 | ||||||||||||||||||||
| 31,749 | 8,118 | 22,112 | 8,534 | 27,369 | 20,502 | 17,099 | ||||||||||||||||||||
| 1,194 | 150 | 778 | 158 | 895 | 671 | 531 | ||||||||||||||||||||
| 245,957 | 23,796 | 322,948 | 25,322 | 168,078 | 184,916 | 110,547 | ||||||||||||||||||||
| — | — | — | — | — | — | — | ||||||||||||||||||||
| 25,794,606 | 1,686,823 | 1,209,062 | 4,657,146 | 8,528,643 | 2,137,061 | 1,249,580 | ||||||||||||||||||||
| 1,639,713,152 | 83,949,007 | 803,665,147 | 81,087,525 | 946,592,020 | 739,049,082 | 457,502,911 | ||||||||||||||||||||
| 37,690,465 | 508,573 | 36,559 | 115,741 | 20,123,837 | 12,242,087 | 11,321,398 | ||||||||||||||||||||
| (52,653,105 | ) | (735,006 | ) | (1,767,685 | ) | 1,027,961 | 39,398,137 | 822,123 | (12,821,723 | ) | ||||||||||||||||
| 30,259,977 | 11,199,349 | 201,116,273 | 39,117,205 | 342,688,439 | 152,291,285 | 235,478,194 | ||||||||||||||||||||
| (35,157 | ) | — | — | — | — | 1,034,854 | (183,750 | ) | ||||||||||||||||||
| (41,320 | ) | — | — | — | — | — | — | |||||||||||||||||||
| (197,378 | ) | — | — | — | — | (14,280 | ) | — | ||||||||||||||||||
| $ | 1,654,736,634 | $ | 94,921,923 | $ | 1,003,050,294 | $ | 121,348,432 | $ | 1,348,802,433 | $ | 905,425,151 | $ | 691,297,030 | |||||||||||||
| 182,017,715 | 7,306,680 | 36,281,851 | 6,736,187 | 80,100,485 | 74,857,438 | 22,273,192 | ||||||||||||||||||||
| $ | 9.09 | $ | 12.99 | $ | 27.65 | $ | 18.01 | $ | 16.84 | $ | 12.10 | $ | 31.04 | |||||||||||||
The accompanying Notes to Financial Statements are an integral part of this statement.
195
Table of Contents
THRIVENT SERIES FUND, INC.
STATEMENTOF ASSETSAND LIABILITIES –CONTINUED
As of December 31, 2016 | High Yield Portfolio | Income Portfolio | Bond Index Portfolio | Limited Maturity Bond Portfolio | ||||||||||||
Assets |
| |||||||||||||||
Investments at cost | $ | 862,045,405 | $ | 1,493,870,018 | $ | 260,671,981 | $ | 908,684,967 | ||||||||
Investments in securities at value | 768,178,901 | 1,419,276,988 | 236,616,594 | 857,967,727 | ||||||||||||
Investments in affiliates at value | 86,553,853 | 83,194,749 | 23,394,720 | 40,830,438 | ||||||||||||
Investments at Value | 854,732,754 | 1,502,471,737 | 260,011,314 | 898,798,165 | ||||||||||||
Cash | — | 5,797 | 72,721 | — | ||||||||||||
Dividends and interest receivable | 11,647,469 | 12,872,393 | 845,665 | 3,726,806 | ||||||||||||
Prepaid expenses | 2,053 | 2,808 | 1,415 | 2,183 | ||||||||||||
Receivable for investments sold | 8,262 | — | — | 687 | ||||||||||||
Receivable for fund shares sold | 99,018 | 164,251 | 25,053 | 44,676 | ||||||||||||
Receivable for variation margin | — | 379,500 | — | 46,078 | ||||||||||||
Total Assets | 866,489,556 | 1,515,896,486 | 260,956,168 | 902,618,595 | ||||||||||||
Liabilities | ||||||||||||||||
Accrued expenses | 22,323 | 28,609 | 17,421 | 25,215 | ||||||||||||
Cash overdraft | 1 | — | — | 1 | ||||||||||||
Payable for investments purchased | — | 79,329,389 | 54,730,287 | 13,643,672 | ||||||||||||
Payable upon return of collateral for securities loaned | 74,873,939 | 7,919,140 | 11,000,368 | 3,886,725 | ||||||||||||
Payable for fund shares redeemed | 49,053 | 17,709 | 124,599 | 146,217 | ||||||||||||
Payable for variation margin | — | 381,757 | — | 314,858 | ||||||||||||
Payable for investment advisory fees | 266,089 | 480,749 | 57,702 | 298,867 | ||||||||||||
Payable for administrative fees | 18,641 | 28,300 | 9,634 | 20,116 | ||||||||||||
Payable for director fees | 612 | 1,013 | 150 | 661 | ||||||||||||
Payable for director deferred compensation | 163,123 | 247,711 | 51,034 | 186,859 | ||||||||||||
Commitments and contingent liabilities^ | — | — | — | — | ||||||||||||
Mortgage dollar roll deferred revenue | — | 52,846 | 32,945 | 8,968 | ||||||||||||
Total Liabilities | 75,393,781 | 88,487,223 | 66,024,140 | 18,532,159 | ||||||||||||
Net Assets | ||||||||||||||||
Capital stock (beneficial interest) | 873,691,696 | 1,417,364,207 | 196,509,508 | 897,907,731 | ||||||||||||
Accumulated undistributed net investment income/(loss) | (147,170 | ) | 185,566 | 16,847 | 387,555 | |||||||||||
Accumulated undistributed net realized gain/(loss) | (75,136,100 | ) | 986,492 | (933,660 | ) | (4,804,189 | ) | |||||||||
Net unrealized appreciation/(depreciation) on: | ||||||||||||||||
Investments | (7,312,651 | ) | 8,601,719 | (660,667 | ) | (9,886,802 | ) | |||||||||
Futures contracts | — | 271,279 | — | 482,141 | ||||||||||||
Total Net Assets | $ | 791,095,775 | $ | 1,427,409,263 | $ | 194,932,028 | $ | 884,086,436 | ||||||||
Shares of beneficial interest outstanding | 165,819,082 | 141,750,945 | 17,967,906 | 90,145,274 | ||||||||||||
Net asset value per share | $ | 4.77 | $ | 10.07 | $ | 10.85 | $ | 9.81 | ||||||||
| ^ | Commitments and contingent liability accrual. Additional information can be found in the accompanying Notes to Financial Statements. |
The accompanying Notes to Financial Statements are an integral part of this statement.
196
Table of Contents
THRIVENT SERIES FUND, INC.
STATEMENTOF ASSETSAND LIABILITIES –CONTINUED
As of December 31, 2016 | Money Market Portfolio | |||
Assets | ||||
Investments at cost | $ | 191,105,296 | ||
Investments in securities at value | 191,105,296 | |||
Investments at Value | 191,105,296 | * | ||
Cash | 4,803 | |||
Dividends and interest receivable | 72,145 | |||
Prepaid expenses | 1,396 | |||
Receivable for fund shares sold | 839,211 | |||
Total Assets | 192,022,851 | |||
Liabilities | ||||
Accrued expenses | 16,513 | |||
Payable for fund shares redeemed | 4,946 | |||
Payable for investment advisory fees | 56,087 | |||
Payable for administrative fees | 9,551 | |||
Payable for director fees | 150 | |||
Payable for expense reimbursements | 10,705 | |||
Commitments and contingent liabilities^ | — | |||
Total Liabilities | 97,952 | |||
Net Assets | ||||
Capital stock (beneficial interest) | 191,927,743 | |||
Accumulated undistributed net realized gain/(loss) | (2,844 | ) | ||
Total Net Assets | $ | 191,924,899 | ||
Shares of beneficial interest outstanding | 191,925,875 | |||
Net asset value per share | $ | 1.00 | ||
| * | Securities held by this Portfolio are valued on the basis of amortized cost, which approximates market value. |
| ^ | Commitments and contingent liability accrual. Additional information can be found in the accompanying Notes to Financial Statements. |
The accompanying Notes to Financial Statements are an integral part of this statement.
197
Table of Contents
STATEMENTOF OPERATIONS
For the year ended December 31, 2016 | Aggressive Allocation Portfolio | Moderately Aggressive Allocation Portfolio | Moderate Allocation Portfolio | Moderately Conservative Allocation Portfolio | ||||||||||||
Investment Income | ||||||||||||||||
Dividends | $ | 8,869,883 | $ | 37,279,861 | $ | 57,720,001 | $ | 19,358,370 | ||||||||
Interest | 392,082 | 20,933,168 | 68,088,091 | 47,568,838 | ||||||||||||
Income from mortgage dollar rolls | 207,062 | 3,883,886 | 12,974,504 | 9,418,183 | ||||||||||||
Income from securities loaned, net | 742 | 638,267 | �� | 1,075,543 | 335,794 | |||||||||||
Income from affiliated investments | 5,147,448 | 31,645,585 | 60,554,181 | 33,052,352 | ||||||||||||
Foreign tax withholding | (70,436 | ) | (243,465 | ) | (451,623 | ) | (43,927 | ) | ||||||||
Total Investment Income | 14,546,781 | 94,137,302 | 199,960,697 | 109,689,610 | ||||||||||||
Expenses | ||||||||||||||||
Adviser fees | 7,305,864 | 33,079,151 | 52,764,833 | 24,775,783 | ||||||||||||
Sub-Adviser fees | — | — | — | — | ||||||||||||
Administrative service fees | 258,283 | 979,349 | 1,673,073 | 870,389 | ||||||||||||
Audit and legal fees | 35,718 | 54,903 | 73,256 | 51,160 | ||||||||||||
Custody fees | 138,583 | 216,930 | 298,870 | 180,859 | ||||||||||||
Insurance expenses | 9,367 | 27,650 | 45,378 | 24,067 | ||||||||||||
Directors’ fees | 29,695 | 108,591 | 198,793 | 100,727 | ||||||||||||
Other expenses | 41,087 | 94,957 | 117,564 | 76,576 | ||||||||||||
Total Expenses Before Reimbursement | 7,818,597 | 34,561,531 | 55,171,767 | 26,079,561 | ||||||||||||
Less: | ||||||||||||||||
Reimbursement from adviser | (2,080,767 | ) | (11,100,339 | ) | (14,561,747 | ) | (5,595,019 | ) | ||||||||
Total Net Expenses | 5,737,830 | 23,461,192 | 40,610,020 | 20,484,542 | ||||||||||||
Net Investment Income/(Loss) | 8,808,951 | 70,676,110 | 159,350,677 | 89,205,068 | ||||||||||||
Realized and Unrealized Gains/(Losses) | ||||||||||||||||
Net realized gains/(losses) on: | ||||||||||||||||
Investments | 9,867,449 | 32,043,889 | 31,523,966 | 18,654,728 | ||||||||||||
Affiliated investments | (67,926 | ) | — | — | — | |||||||||||
Distributions of realized capital gains from affiliated investments | 9,970,813 | 55,036,774 | 56,508,871 | 16,102,332 | ||||||||||||
Futures contracts | (12,598,525 | ) | (38,282,515 | ) | (25,076,783 | ) | 16,052,216 | |||||||||
Foreign currency and forward contract transactions | 215,442 | 883,775 | 1,169,066 | 354,028 | ||||||||||||
Swap agreements | — | — | — | — | ||||||||||||
Change in net unrealized appreciation/(depreciation) on: | ||||||||||||||||
Investments | 61,238,912 | 264,148,453 | 413,464,371 | 123,614,785 | ||||||||||||
Affiliated investments | 22,972,375 | 119,491,858 | 136,719,520 | 48,236,246 | ||||||||||||
Futures contracts | (1,245,543 | ) | (6,230,121 | ) | (11,978,663 | ) | (5,883,551 | ) | ||||||||
Foreign currency transactions | (2,899 | ) | (4,408 | ) | (7,253 | ) | (1,873 | ) | ||||||||
Swap agreements | — | — | — | — | ||||||||||||
Net Realized and Unrealized Gains/(Losses) | 90,350,098 | 427,087,705 | 602,323,095 | 217,128,911 | ||||||||||||
Net Increase/(Decrease) in Net Assets Resulting | ||||||||||||||||
From Operations | $ | 99,159,049 | $ | 497,763,815 | $ | 761,673,772 | $ | 306,333,979 | ||||||||
| (a) | Includes foreign capital gain taxes paid of $1. |
The accompanying Notes to Financial Statements are an integral part of this statement.
198
Table of Contents
THRIVENT SERIES FUND, INC.
STATEMENTOF OPERATIONS –CONTINUED
| Growth and Income Plus Portfolio | Balanced Income Plus Portfolio | Diversified Income Plus Portfolio | Opportunity Income Plus Portfolio | Partner Healthcare Portfolio | Partner Emerging Markets Equity Portfolio | Real Estate Securities Portfolio | ||||||||||||||||||||
| $ | 1,344,880 | $ | 4,810,826 | $ | 5,327,656 | $ | 554,490 | $ | 1,994,781 | $ | 1,282,864 | $ | 4,522,126 | |||||||||||||
| 1,009,198 | 6,369,992 | 15,253,412 | 3,886,180 | 10,574 | 2,446 | 5,216 | ||||||||||||||||||||
| 46,945 | 286,694 | 279,244 | 217,960 | — | — | — | ||||||||||||||||||||
| — | 44,067 | 13,877 | 414 | — | 7,998 | — | ||||||||||||||||||||
| 35,855 | 174,868 | 278,892 | 130,022 | 39,348 | 8,284 | 8,349 | ||||||||||||||||||||
| (55,496 | ) | (157,215 | ) | (145,831 | ) | — | (118,990 | ) | (125,888 | ) | (630 | ) | ||||||||||||||
| 2,381,382 | 11,529,232 | 21,007,250 | 4,789,066 | 1,925,713 | 1,175,704 | 4,535,061 | ||||||||||||||||||||
| 525,231 | 1,799,800 | 2,053,787 | 582,303 | 661,499 | 247,761 | 1,356,871 | ||||||||||||||||||||
| — | — | — | — | 944,921 | 358,534 | — | ||||||||||||||||||||
| 94,545 | 138,902 | 172,420 | 100,963 | 112,430 | 89,151 | 110,529 | ||||||||||||||||||||
| 31,135 | 33,379 | 34,189 | 32,336 | 29,984 | 40,906 | 30,043 | ||||||||||||||||||||
| 86,274 | 106,960 | 109,260 | 30,179 | 12,343 | 78,907 | 7,966 | ||||||||||||||||||||
| 5,265 | 6,348 | 7,125 | 5,352 | 5,647 | 5,121 | 5,648 | ||||||||||||||||||||
| 8,528 | 20,656 | 24,812 | 8,658 | 8,483 | 8,483 | 9,674 | ||||||||||||||||||||
| 54,655 | 61,788 | 70,157 | 42,273 | 13,582 | 15,443 | 13,908 | ||||||||||||||||||||
| 805,633 | 2,167,833 | 2,471,750 | 802,064 | 1,788,889 | 844,306 | 1,534,639 | ||||||||||||||||||||
| (158,755 | ) | — | — | — | (121,046 | ) | (168,864 | ) | — | |||||||||||||||||
| 646,878 | 2,167,833 | 2,471,750 | 802,064 | 1,667,843 | 675,442 | 1,534,639 | ||||||||||||||||||||
| 1,734,504 | 9,361,399 | 18,535,500 | 3,987,002 | 257,870 | 500,262 | 3,000,422 | ||||||||||||||||||||
| (1,803,308 | ) | (2,451,828 | ) | (6,190,735 | ) | (646,147 | ) | (25,825,404 | ) | 538,026 | (a) | 9,801 | ||||||||||||||
| — | — | — | — | — | — | — | ||||||||||||||||||||
| — | 67 | 8 | — | — | 13 | — | ||||||||||||||||||||
| 23,287 | 139,395 | (1,027,305 | ) | 152,167 | — | — | — | |||||||||||||||||||
| (9,617 | ) | (23,540 | ) | (25,069 | ) | — | (47,225 | ) | 6,377 | — | ||||||||||||||||
| 83 | 1,247 | — | (10,495 | ) | — | — | — | |||||||||||||||||||
| 5,218,992 | 15,165,726 | 23,388,479 | 3,072,537 | (5,249,994 | ) | 3,925,436 | 8,247,409 | |||||||||||||||||||
| — | — | — | — | — | — | — | ||||||||||||||||||||
| (6,091 | ) | (6,501 | ) | 438,905 | 11,934 | — | — | — | ||||||||||||||||||
| 599 | (1,278 | ) | 271 | — | 2,779 | 693 | (32 | ) | ||||||||||||||||||
| (1,172 | ) | (17,586 | ) | — | 9,568 | — | — | — | ||||||||||||||||||
| 3,422,773 | 12,805,702 | 16,584,554 | 2,589,564 | (31,119,844 | ) | 4,470,545 | 8,257,178 | |||||||||||||||||||
| $ | 5,157,277 | $ | 22,167,101 | $ | 35,120,054 | $ | 6,576,566 | $ | (30,861,974 | ) | $ | 4,970,807 | $ | 11,257,600 | ||||||||||||
The accompanying Notes to Financial Statements are an integral part of this statement.
199
Table of Contents
THRIVENT SERIES FUND, INC.
STATEMENTOF OPERATIONS –CONTINUED
For the year ended December 31, 2016 | Small Cap Stock Portfolio | Small Cap Index Portfolio | Mid Cap Stock Portfolio | Mid Cap Index Portfolio | ||||||||||||
Investment Income | ||||||||||||||||
Dividends | $ | 5,337,133 | $ | 4,348,785 | $ | 13,654,430 | $ | 3,582,066 | ||||||||
Interest | 42,874 | 10,574 | 218,983 | 8,675 | ||||||||||||
Income from securities loaned, net | 183,692 | 259,023 | 121,736 | 57,041 | ||||||||||||
Income from affiliated investments | 53,176 | 59,041 | 325,625 | 45,241 | ||||||||||||
Foreign tax withholding | (27,314 | ) | (524 | ) | — | — | ||||||||||
Total Investment Income | 5,589,561 | 4,676,899 | 14,320,774 | 3,693,023 | ||||||||||||
Expenses | ||||||||||||||||
Adviser fees | 2,908,308 | 634,339 | 8,187,682 | 439,884 | ||||||||||||
Sub-Adviser fees | — | — | — | — | ||||||||||||
Administrative service fees | 157,768 | 137,090 | 307,631 | 119,590 | ||||||||||||
Audit and legal fees | 31,065 | 32,105 | 34,864 | 31,627 | ||||||||||||
Custody fees | 21,306 | 37,078 | 29,576 | 37,055 | ||||||||||||
Insurance expenses | 7,247 | 6,242 | 11,019 | 5,766 | ||||||||||||
Directors’ fees | 27,511 | 20,110 | 55,632 | 12,494 | ||||||||||||
Other expenses | 18,958 | 19,217 | 27,955 | 16,664 | ||||||||||||
Total Expenses Before Reimbursement | 3,172,163 | 886,181 | 8,654,359 | 663,080 | ||||||||||||
Less: | ||||||||||||||||
Reimbursement from adviser | — | — | — | — | ||||||||||||
Total Net Expenses | 3,172,163 | 886,181 | 8,654,359 | 663,080 | ||||||||||||
Net Investment Income/(Loss) | 2,417,398 | 3,790,718 | 5,666,415 | 3,029,943 | ||||||||||||
Realized and Unrealized Gains/(Losses) | ||||||||||||||||
Net realized gains/(losses) on: | ||||||||||||||||
Investments | 33,252,584 | 23,399,658 | 131,925,669 | 9,365,375 | ||||||||||||
Distributions of realized capital gains from affiliated investments | 228 | 267 | 402 | 66 | ||||||||||||
Futures contracts | — | 2,731,830 | — | 805,027 | ||||||||||||
Foreign currency and forward contract transactions | — | — | — | — | ||||||||||||
Change in net unrealized appreciation/(depreciation) on: | ||||||||||||||||
Investments | 68,760,261 | 49,395,416 | 196,840,008 | 30,252,816 | ||||||||||||
Futures contracts | — | (125,093 | ) | — | (76,091 | ) | ||||||||||
Foreign currency forward contracts | — | — | — | — | ||||||||||||
Foreign currency transactions | — | — | — | — | ||||||||||||
Net Realized and Unrealized Gains/(Losses) | 102,013,073 | 75,402,078 | 328,766,079 | 40,347,193 | ||||||||||||
Net Increase/(Decrease) in Net Assets Resulting From Operations | $ | 104,430,471 | $ | 79,192,796 | $ | 334,432,494 | $ | 43,377,136 | ||||||||
The accompanying Notes to Financial Statements are an integral part of this statement.
200
Table of Contents
THRIVENT SERIES FUND, INC.
STATEMENTOF OPERATIONS –CONTINUED
| Partner Worldwide Allocation Portfolio | Partner All Cap Portfolio | Large Cap Growth Portfolio | Partner Growth Stock Portfolio | Large Cap Value Portfolio | Large Cap Stock Portfolio | Large Cap Index Portfolio | ||||||||||||||||||||
| $ | 46,364,162 | $ | 1,230,611 | $ | 9,741,586 | $ | 959,481 | $ | 27,700,199 | $ | 18,142,434 | $ | 12,746,651 | |||||||||||||
| 10,425,810 | 14,961 | 207,713 | 32,274 | 11,466 | 201,692 | 13,666 | ||||||||||||||||||||
| 420,844 | 42,153 | 5,520 | 70,761 | 55,627 | 108,785 | 28,989 | ||||||||||||||||||||
| 138,024 | 7,875 | 210,007 | 7,466 | 174,740 | 289,574 | 108,082 | ||||||||||||||||||||
| (3,850,053 | ) | (1,795 | ) | — | (1,703 | ) | (50,367 | ) | (812,015 | ) | — | |||||||||||||||
| 53,498,787 | 1,293,805 | 10,164,826 | 1,068,279 | 27,891,665 | 17,930,470 | 12,897,388 | ||||||||||||||||||||
| 7,485,520 | 309,075 | 4,107,329 | 456,209 | 7,170,289 | 5,300,667 | 1,162,816 | ||||||||||||||||||||
| 5,983,111 | 530,716 | — | 457,046 | — | — | — | ||||||||||||||||||||
| 370,280 | 95,912 | 264,830 | 100,548 | 295,109 | 235,067 | 184,654 | ||||||||||||||||||||
| 55,049 | 29,895 | 34,444 | 29,586 | 34,652 | 35,039 | 33,715 | ||||||||||||||||||||
| 771,887 | 10,742 | 22,988 | 29,112 | 32,203 | 102,969 | 34,341 | ||||||||||||||||||||
| 12,391 | 5,282 | 9,730 | 5,377 | 10,291 | 8,997 | 7,323 | ||||||||||||||||||||
| 68,603 | 8,655 | 52,620 | 8,707 | 51,331 | 39,825 | 29,610 | ||||||||||||||||||||
| 104,118 | 13,521 | 24,572 | 13,615 | 26,204 | 40,911 | 21,593 | ||||||||||||||||||||
| 14,850,959 | 1,003,798 | 4,516,513 | 1,100,200 | 7,620,079 | 5,763,475 | 1,474,052 | ||||||||||||||||||||
| — | (238,907 | ) | — | (169,761 | ) | — | — | — | ||||||||||||||||||
| 14,850,959 | 764,891 | 4,516,513 | 930,439 | 7,620,079 | 5,763,475 | 1,474,052 | ||||||||||||||||||||
| 38,647,828 | 528,914 | 5,648,313 | 137,840 | 20,271,586 | 12,166,995 | 11,423,336 | ||||||||||||||||||||
| (27,138,072 | ) | (678,101 | ) | 3,538,287 | 1,466,317 | 39,653,657 | 19,676,832 | 2,126,832 | ||||||||||||||||||
| 449 | 5 | — | 32 | — | 60 | 7 | ||||||||||||||||||||
| (596,133 | ) | — | (4,188,582 | ) | — | — | 918,544 | 2,552,767 | ||||||||||||||||||
| (471,041 | ) | — | 4,010 | (140 | ) | — | 175,900 | — | ||||||||||||||||||
| 43,064,605 | 5,420,396 | (22,137,200 | ) | 889,008 | 139,629,657 | 15,836,439 | 51,275,614 | |||||||||||||||||||
| 182,738 | — | (1,039,585 | ) | — | — | (2,345,523 | ) | (146,364 | ) | |||||||||||||||||
| (60,501 | ) | — | — | — | — | — | — | |||||||||||||||||||
| 31,912 | — | 4,773 | 190 | — | (2,983 | ) | — | |||||||||||||||||||
| 15,013,957 | 4,742,300 | (23,818,297 | ) | 2,355,407 | 179,283,314 | 34,259,269 | 55,808,856 | |||||||||||||||||||
| $ | 53,661,785 | $ | 5,271,214 | $ | (18,169,984 | ) | $ | 2,493,247 | $ | 199,554,900 | $ | 46,426,264 | $ | 67,232,192 | ||||||||||||
The accompanying Notes to Financial Statements are an integral part of this statement.
201
Table of Contents
THRIVENT SERIES FUND, INC.
STATEMENTOF OPERATIONS –CONTINUED
For the year ended December 31, 2016 | High Yield Portfolio | Income Portfolio | Bond Index Portfolio | Limited Maturity Bond Portfolio | ||||||||||||
Investment Income | ||||||||||||||||
Dividends | $ | 654,757 | $ | 1,314,552 | $ | — | $ | 220,188 | ||||||||
Interest | 44,398,120 | 51,628,060 | 3,048,607 | 19,605,035 | ||||||||||||
Income from mortgage dollar rolls | — | 1,026,470 | 755,853 | 222,949 | ||||||||||||
Income from securities loaned, net | 395,547 | 174,954 | 11,600 | 35,513 | ||||||||||||
Income from affiliated investments | 156,299 | 394,168 | 91,863 | 196,605 | ||||||||||||
Total Investment Income | 45,604,723 | 54,538,204 | 3,907,923 | 20,280,290 | ||||||||||||
Expenses | ||||||||||||||||
Adviser fees | 2,989,494 | 5,621,870 | 638,251 | 3,404,752 | ||||||||||||
Administrative service fees | 214,527 | 332,984 | 112,825 | 233,214 | ||||||||||||
Audit and legal fees | 35,332 | 38,374 | 29,817 | 35,880 | ||||||||||||
Custody fees | 18,350 | 39,350 | 12,862 | 29,477 | ||||||||||||
Insurance expenses | 8,402 | 11,299 | 5,665 | 8,965 | ||||||||||||
Directors’ fees | 36,557 | 59,462 | 9,617 | 40,602 | ||||||||||||
Other expenses | 40,409 | 50,306 | 23,184 | 43,082 | ||||||||||||
Total Expenses Before Reimbursement | 3,343,071 | 6,153,645 | 832,221 | 3,795,972 | ||||||||||||
Total Net Expenses | 3,343,071 | 6,153,645 | 832,221 | 3,795,972 | ||||||||||||
Net Investment Income/(Loss) | 42,261,652 | 48,384,559 | 3,075,702 | 16,484,318 | ||||||||||||
Realized and Unrealized Gains/(Losses) | ||||||||||||||||
Net realized gains/(losses) on: | ||||||||||||||||
Investments | (16,120,349 | ) | 3,399,443 | (785,152 | ) | 1,087,266 | ||||||||||
Distributions of realized capital gains from affiliated investments | 825 | 229 | 12 | 56 | ||||||||||||
Futures contracts | — | 542,421 | — | (772,751 | ) | |||||||||||
Swap agreements | 225,055 | (431,845 | ) | — | — | |||||||||||
Change in net unrealized appreciation/(depreciation) on: | ||||||||||||||||
Investments | 63,124,768 | 29,194,319 | (858,199 | ) | 6,393,006 | |||||||||||
Futures contracts | — | (431,859 | ) | — | 339,915 | |||||||||||
Net Realized and Unrealized Gains/(Losses) | 47,230,299 | 32,272,708 | (1,643,339 | ) | 7,047,492 | |||||||||||
Net Increase/(Decrease) in Net Assets Resulting From Operations | $ | 89,491,951 | $ | 80,657,267 | $ | 1,432,363 | $ | 23,531,810 | ||||||||
The accompanying Notes to Financial Statements are an integral part of this statement.
202
Table of Contents
THRIVENT SERIES FUND, INC.
STATEMENTOF OPERATIONS –CONTINUED
For the year ended December 31, 2016 | Money Market Portfolio | |||
Investment Income | ||||
Interest | $ | 740,926 | ||
Total Investment Income | 740,926 | |||
Expenses | ||||
Adviser fees | 587,646 | |||
Administrative service fees | 109,899 | |||
Audit and legal fees | 29,217 | |||
Custody fees | 12,576 | |||
Insurance expenses | 5,572 | |||
Directors’ fees | 7,776 | |||
Other expenses | 16,472 | |||
Total Expenses Before Reimbursement | 769,158 | |||
Less: | ||||
Reimbursement from adviser | (28,232 | ) | ||
Total Net Expenses | 740,926 | |||
Net Investment Income/(Loss) | — | |||
Realized and Unrealized Gains/(Losses) | ||||
Net realized gains/(losses) on: | ||||
Investments | (2,844 | ) | ||
Net Realized and Unrealized Gains/(Losses) | (2,844 | ) | ||
Net Increase/(Decrease) in Net Assets Resulting From Operations | $ | (2,844 | ) | |
The accompanying Notes to Financial Statements are an integral part of this statement.
203
Table of Contents
STATEMENTOF CHANGESIN NET ASSETS
| Aggressive Allocation Portfolio | Moderately Aggressive Allocation Portfolio | |||||||||||||||
For the periods ended | 12/31/2016 | 12/31/2015 | 12/31/2016 | 12/31/2015 | ||||||||||||
Operations | ||||||||||||||||
Net investment income/(loss) | $ | 8,808,951 | $ | 6,951,429 | $ | 70,676,110 | $ | 59,950,102 | ||||||||
Net realized gains/(losses) | 7,387,253 | 53,544,165 | 49,681,923 | 221,944,080 | ||||||||||||
Change in net unrealized appreciation/(depreciation) | 82,962,845 | (65,972,075 | ) | 377,405,782 | (321,796,385 | ) | ||||||||||
Net Change in Net Assets Resulting From Operations | 99,159,049 | (5,476,481 | ) | 497,763,815 | (39,902,203 | ) | ||||||||||
Distributions to Shareholders | ||||||||||||||||
From net investment income | (9,699,089 | ) | (10,016,955 | ) | (71,972,085 | ) | (63,263,996 | ) | ||||||||
From net realized gains | (53,887,684 | ) | (64,276,808 | ) | (205,042,436 | ) | (221,020,955 | ) | ||||||||
Total Distributions to Shareholders | (63,586,773 | ) | (74,293,763 | ) | (277,014,521 | ) | (284,284,951 | ) | ||||||||
Capital Stock Transactions | ||||||||||||||||
Sold | 53,379,686 | 97,207,283 | 117,943,428 | 243,080,600 | ||||||||||||
Distributions reinvested | 63,586,773 | 74,293,763 | 277,014,521 | 284,284,951 | ||||||||||||
Redeemed | (56,669,269 | ) | (29,062,185 | ) | (188,096,646 | ) | (80,097,344 | ) | ||||||||
Total Capital Stock Transactions | 60,297,190 | 142,438,861 | 206,861,303 | 447,268,207 | ||||||||||||
Net Increase/(Decrease) in Net Assets | 95,869,466 | 62,668,617 | 427,610,597 | 123,081,053 | ||||||||||||
Net Assets, Beginning of Period | 967,558,523 | 904,889,906 | 4,898,078,619 | 4,774,997,566 | ||||||||||||
Net Assets, End of Period | $ | 1,063,427,989 | $ | 967,558,523 | $ | 5,325,689,216 | $ | 4,898,078,619 | ||||||||
Accumulated Undistributed Net Investment Income/(Loss) | $ | 8,928,983 | $ | 9,765,509 | $ | 70,799,623 | $ | 71,853,420 | ||||||||
Capital Stock Share Transactions | ||||||||||||||||
Sold | 3,855,769 | 6,446,047 | 8,584,715 | 16,716,940 | ||||||||||||
Distributions reinvested | 4,904,949 | 5,050,527 | 21,432,624 | 20,023,028 | ||||||||||||
Redeemed | (4,037,160 | ) | (1,923,556 | ) | (13,686,052 | ) | (5,535,532 | ) | ||||||||
|
|
|
|
|
|
|
| |||||||||
Total Capital Stock Share Transactions | 4,723,558 | 9,573,018 | 16,331,287 | 31,204,436 | ||||||||||||
|
|
|
|
|
|
|
| |||||||||
The accompanying Notes to Financial Statements are an integral part of this statement.
204
Table of Contents
THRIVENT SERIES FUND, INC.
STATEMENTOF CHANGESIN NET ASSETS –CONTINUED
Moderate Allocation Portfolio | Moderately Conservative Allocation Portfolio | Growth and Income Plus Portfolio | Balanced Income Plus Portfolio | |||||||||||||||||||||||||
12/31/2016 | 12/31/2015 | 12/31/2016 | 12/31/2015 | 12/31/2016 | 12/31/2015 | 12/31/2016 | 12/31/2015 | |||||||||||||||||||||
| $159,350,677 | $ | 137,851,838 | $ | 89,205,068 | $ | 69,925,732 | $ | 1,734,504 | $ | 1,811,467 | $ | 9,361,399 | $ | 8,749,921 | ||||||||||||||
| 64,125,120 | 270,719,455 | 51,163,304 | 60,786,937 | (1,789,555 | ) | 1,294,358 | (2,334,659 | ) | 11,262,969 | |||||||||||||||||||
| 538,197,975 | (459,388,269 | ) | 165,965,607 | (154,990,742 | ) | 5,212,328 | (3,781,689 | ) | 15,140,361 | (20,715,817 | ) | |||||||||||||||||
| 761,673,772 | (50,816,976 | ) | 306,333,979 | (24,278,073 | ) | 5,157,277 | (675,864 | ) | 22,167,101 | (702,927 | ) | |||||||||||||||||
| (149,917,958) | (131,649,087 | ) | (74,694,401 | ) | (69,007,378 | ) | (1,812,791 | ) | (1,713,253 | ) | (8,280,417 | ) | (6,723,615 | ) | ||||||||||||||
| (226,127,215) | (339,666,242 | ) | (49,387,817 | ) | (105,251,002 | ) | (1,403,976 | ) | (3,260,084 | ) | (11,442,058 | ) | (10,737,920 | ) | ||||||||||||||
| (376,045,173) | (471,315,329 | ) | (124,082,218 | ) | (174,258,380 | ) | (3,216,767 | ) | (4,973,337 | ) | (19,722,475 | ) | (17,461,535 | ) | ||||||||||||||
| ||||||||||||||||||||||||||||
| 109,443,688 | 248,462,245 | 351,516,759 | 496,567,865 | 12,525,190 | 8,840,886 | 46,346,621 | 34,411,525 | |||||||||||||||||||||
| 376,045,173 | 471,315,329 | 124,082,218 | 174,258,380 | 3,216,767 | 4,973,337 | 19,722,475 | 17,461,535 | |||||||||||||||||||||
| (266,975,796) | (148,152,856 | ) | (62,889,975 | ) | (51,537,032 | ) | (8,901,681 | ) | (10,505,454 | ) | (26,216,280 | ) | (23,670,541 | ) | ||||||||||||||
| 218,513,065 | 571,624,718 | 412,709,002 | 619,289,213 | 6,840,276 | 3,308,769 | 39,852,816 | 28,202,519 | |||||||||||||||||||||
| ||||||||||||||||||||||||||||
| 604,141,664 | 49,492,413 | 594,960,763 | 420,752,760 | 8,780,786 | (2,340,432 | ) | 42,297,442 | 10,038,057 | ||||||||||||||||||||
| 8,657,254,814 | 8,607,762,401 | 4,100,107,840 | 3,679,355,080 | 78,779,061 | 81,119,493 | 313,076,544 | 303,038,487 | |||||||||||||||||||||
| $9,261,396,478 | $ | 8,657,254,814 | $ | 4,695,068,603 | $ | 4,100,107,840 | $ | 87,559,847 | $ | 78,779,061 | $ | 355,373,986 | $ | 313,076,544 | ||||||||||||||
| $159,386,237 | $ | 149,830,112 | $ | 88,718,811 | $ | 74,352,002 | $ | 1,697,121 | $ | 1,781,865 | $ | 9,245,351 | $ | 8,403,985 | ||||||||||||||
| ||||||||||||||||||||||||||||
| 8,291,033 | 18,055,739 | 28,042,093 | 38,938,072 | 1,239,808 | 840,320 | 3,303,376 | 2,336,044 | |||||||||||||||||||||
| 29,672,472 | 35,190,381 | 10,125,441 | 13,980,711 | 334,770 | 486,571 | 1,473,817 | 1,220,233 | |||||||||||||||||||||
| (20,205,143) | (10,880,050 | ) | (5,028,395 | ) | (4,053,106 | ) | (893,012 | ) | (996,250 | ) | (1,877,855 | ) | (1,616,429 | ) | ||||||||||||||
|
|
|
|
|
|
|
|
|
|
|
|
|
|
| ||||||||||||||
| 17,758,362 | 42,366,070 | 33,139,139 | 48,865,677 | 681,566 | 330,641 | 2,899,338 | 1,939,848 | |||||||||||||||||||||
|
|
|
|
|
|
|
|
|
|
|
|
|
|
| ||||||||||||||
The accompanying Notes to Financial Statements are an integral part of this statement.
205
Table of Contents
THRIVENT SERIES FUND, INC.
STATEMENTOF CHANGESIN NET ASSETS –CONTINUED
| Diversified Income Plus Portfolio | Opportunity Income Plus Portfolio | |||||||||||||||
For the periods ended | 12/31/2016 | 12/31/2015 | 12/31/2016 | 12/31/2015 | ||||||||||||
Operations | ||||||||||||||||
Net investment income/(loss) | $ | 18,535,500 | $ | 17,005,900 | $ | 3,987,002 | $ | 3,006,317 | ||||||||
Net realized gains/(losses) | (7,243,101 | ) | 2,102,185 | (504,475 | ) | (488,440 | ) | |||||||||
Change in net unrealized appreciation/(depreciation) | 23,827,655 | (19,542,298 | ) | 3,094,039 | (2,908,181 | ) | ||||||||||
Net Change in Net Assets Resulting From Operations | 35,120,054 | (434,213 | ) | 6,576,566 | (390,304 | ) | ||||||||||
Distributions to Shareholders | ||||||||||||||||
From net investment income | (17,529,531 | ) | (15,370,120 | ) | (3,939,453 | ) | (2,967,738 | ) | ||||||||
From net realized gains | (1,400,147 | ) | (9,166,017 | ) | — | — | ||||||||||
Total Distributions to Shareholders | (18,929,678 | ) | (24,536,137 | ) | (3,939,453 | ) | (2,967,738 | ) | ||||||||
Capital Stock Transactions | ||||||||||||||||
Sold | 65,711,402 | 60,503,894 | 48,746,545 | 35,378,258 | ||||||||||||
Issued in connection with merger | — | — | — | — | ||||||||||||
Distributions reinvested | 18,929,678 | 24,536,137 | 3,939,453 | 2,967,738 | ||||||||||||
Redeemed | (17,612,443 | ) | (17,832,528 | ) | (14,628,664 | ) | (7,084,172 | ) | ||||||||
Total Capital Stock Transactions | 67,028,637 | 67,207,503 | 38,057,334 | 31,261,824 | ||||||||||||
Net Increase/(Decrease) in Net Assets | 83,219,013 | 42,237,153 | 40,694,447 | 27,903,782 | ||||||||||||
Net Assets, Beginning of Period | 479,572,785 | 437,335,632 | 99,664,967 | 71,761,185 | ||||||||||||
Net Assets, End of Period | $ | 562,791,798 | $ | 479,572,785 | $ | 140,359,414 | $ | 99,664,967 | ||||||||
Accumulated Undistributed Net Investment Income/(Loss) | $ | 18,664,203 | $ | 17,565,006 | $ | 37,640 | $ | 39,603 | ||||||||
Capital Stock Share Transactions | ||||||||||||||||
Sold | 8,581,927 | 7,685,123 | 4,825,048 | 3,497,874 | ||||||||||||
Issued in connection with merger | — | — | — | — | ||||||||||||
Distributions reinvested | 2,550,516 | 3,202,649 | 392,526 | 294,285 | ||||||||||||
Redeemed | (2,313,107 | ) | (2,290,169 | ) | (1,463,262 | ) | (700,732 | ) | ||||||||
|
|
|
|
|
|
|
| |||||||||
Total Capital Stock Share Transactions | 8,819,336 | 8,597,603 | 3,754,312 | 3,091,427 | ||||||||||||
|
|
|
|
|
|
|
| |||||||||
The accompanying Notes to Financial Statements are an integral part of this statement.
206
Table of Contents
THRIVENT SERIES FUND, INC.
STATEMENTOF CHANGESIN NET ASSETS –CONTINUED
| Partner Healthcare Portfolio | Partner Emerging Markets Equity Portfolio | Real Estate Securities Portfolio | Small Cap Stock Portfolio | |||||||||||||||||||||||||||
| 12/31/2016 | 12/31/2015 | 12/31/2016 | 12/31/2015 | 12/31/2016 | 12/31/2015 | 12/31/2016 | 12/31/2015 | |||||||||||||||||||||||
| $ | 257,870 | $ | 7,666,795 | $ | 500,262 | $ | 522,930 | $ | 3,000,422 | $ | 2,657,093 | $ | 2,417,398 | $ | 1,658,505 | |||||||||||||||
| (25,872,629 | ) | 6,297,295 | 544,416 | 266,410 | 9,801 | 302,504 | 33,252,812 | 16,713,717 | ||||||||||||||||||||||
| (5,247,215 | ) | (12,721,513 | ) | 3,926,129 | (7,594,428 | ) | 8,247,377 | 735,932 | 68,760,261 | (32,780,045 | ) | |||||||||||||||||||
| (30,861,974 | ) | 1,242,577 | 4,970,807 | (6,805,088 | ) | 11,257,600 | 3,695,529 | 104,430,471 | (14,407,823 | ) | ||||||||||||||||||||
| (7,625,521 | ) | (9,026 | ) | (510,872 | ) | (580,153 | ) | (2,477,260 | ) | (2,187,603 | ) | (1,427,353 | ) | (1,376,310 | ) | |||||||||||||||
| (6,901,059 | ) | (9,023,465 | ) | — | — | (660,933 | ) | (6,314,500 | ) | (20,830,835 | ) | (39,985,690 | ) | |||||||||||||||||
| (14,526,580 | ) | (9,032,491 | ) | (510,872 | ) | (580,153 | ) | (3,138,193 | ) | (8,502,103 | ) | (22,258,188 | ) | (41,362,000 | ) | |||||||||||||||
| 20,963,705 | 92,802,357 | 11,839,342 | 7,350,729 | 24,335,056 | 21,146,056 | 8,684,051 | 6,004,931 | |||||||||||||||||||||||
| — | — | — | — | — | — | — | 129,919,332 | |||||||||||||||||||||||
| 14,526,580 | 9,032,491 | 510,872 | 580,153 | 3,138,193 | 8,502,103 | 22,258,188 | 41,362,000 | |||||||||||||||||||||||
| (18,915,747 | ) | (3,931,639 | ) | (3,801,159 | ) | (5,542,564 | ) | (11,102,876 | ) | (11,848,142 | ) | (20,769,745 | ) | (14,085,913 | ) | |||||||||||||||
| 16,574,538 | 97,903,209 | 8,549,055 | 2,388,318 | 16,370,373 | 17,800,017 | 10,172,494 | 163,200,350 | |||||||||||||||||||||||
| (28,814,016 | ) | 90,113,295 | 13,008,990 | (4,996,923 | ) | 24,489,780 | 12,993,443 | 92,344,777 | 107,430,527 | |||||||||||||||||||||
| 192,234,880 | 102,121,585 | 43,464,699 | 48,461,622 | 155,538,307 | 142,544,864 | 413,768,562 | 306,338,035 | |||||||||||||||||||||||
| $ | 163,420,864 | $ | 192,234,880 | $ | 56,473,689 | $ | 43,464,699 | $ | 180,028,087 | $ | 155,538,307 | $ | 506,113,339 | $ | 413,768,562 | |||||||||||||||
| $ | 195,587 | $ | 7,610,463 | $ | 426,203 | $ | 430,436 | $ | 2,951,342 | $ | 2,605,351 | $ | 1,828,779 | $ | 1,283,325 | |||||||||||||||
| 1,229,575 | 4,458,973 | 1,038,037 | 623,165 | 1,040,150 | 925,981 | 521,560 | 346,038 | |||||||||||||||||||||||
| — | — | — | — | — | — | — | 8,046,136 | |||||||||||||||||||||||
| 906,670 | 434,112 | 46,143 | 48,589 | 132,685 | 422,209 | 1,503,525 | 2,420,926 | |||||||||||||||||||||||
| (1,132,464 | ) | (195,496 | ) | (340,356 | ) | (469,831 | ) | (491,936 | ) | (539,452 | ) | (1,307,173 | ) | (838,753 | ) | |||||||||||||||
|
|
|
|
|
|
|
|
|
|
|
|
|
|
|
| |||||||||||||||
| 1,003,781 | 4,697,589 | 743,824 | 201,923 | 680,899 | 808,738 | 717,912 | 9,974,347 | |||||||||||||||||||||||
|
|
|
|
|
|
|
|
|
|
|
|
|
|
|
| |||||||||||||||
The accompanying Notes to Financial Statements are an integral part of this statement.
207
Table of Contents
THRIVENT SERIES FUND, INC.
STATEMENTOF CHANGESIN NET ASSETS –CONTINUED
| Small Cap Index Portfolio | Mid Cap Stock Portfolio | |||||||||||||||
For the periods ended | 12/31/2016 | 12/31/2015 | 12/31/2016 | 12/31/2015 | ||||||||||||
Operations | ||||||||||||||||
Net investment income/(loss) | $ | 3,790,718 | $ | 3,156,160 | $ | 5,666,415 | $ | 4,852,527 | ||||||||
Net realized gains/(losses) | 26,131,755 | 22,865,934 | 131,926,071 | 117,649,621 | ||||||||||||
Change in net unrealized appreciation/(depreciation) | 49,270,323 | (32,413,176 | ) | 196,840,008 | (104,979,812 | ) | ||||||||||
Net Change in Net Assets Resulting From Operations | 79,192,796 | (6,391,082 | ) | 334,432,494 | 17,522,336 | |||||||||||
Distributions to Shareholders | ||||||||||||||||
From net investment income | (3,140,256 | ) | (2,182,237 | ) | (4,831,544 | ) | (4,486,191 | ) | ||||||||
From net realized gains | (22,598,303 | ) | (19,386,011 | ) | (131,855,876 | ) | (81,601,370 | ) | ||||||||
Total Distributions to Shareholders | (25,738,559 | ) | (21,568,248 | ) | (136,687,420 | ) | (86,087,561 | ) | ||||||||
Capital Stock Transactions | ||||||||||||||||
Sold | 60,369,176 | 35,257,316 | 17,646,659 | 10,660,395 | ||||||||||||
Issued in connection with merger | — | — | — | 445,589,040 | ||||||||||||
Distributions reinvested | 25,738,559 | 21,568,248 | 136,687,420 | 86,087,561 | ||||||||||||
Redeemed | (17,697,606 | ) | (17,625,251 | ) | (54,718,867 | ) | (31,809,954 | ) | ||||||||
Total Capital Stock Transactions | 68,410,129 | 39,200,313 | 99,615,212 | 510,527,042 | ||||||||||||
Net Increase/(Decrease) in Net Assets | 121,864,366 | 11,240,983 | 297,360,286 | 441,961,817 | ||||||||||||
Net Assets, Beginning of Period | 279,867,569 | 268,626,586 | 1,194,580,256 | 752,618,439 | ||||||||||||
Net Assets, End of Period | $ | 401,731,935 | $ | 279,867,569 | $ | 1,491,940,542 | $ | 1,194,580,256 | ||||||||
Accumulated Undistributed Net Investment Income/(Loss) | $ | 3,723,538 | $ | 3,093,435 | $ | 5,425,315 | $ | 4,149,933 | ||||||||
Capital Stock Share Transactions | ||||||||||||||||
Sold | 3,692,564 | 2,092,201 | 1,010,543 | 601,576 | ||||||||||||
Issued in connection with merger | — | — | — | 27,661,254 | ||||||||||||
Distributions reinvested | 1,755,053 | 1,288,595 | 9,015,785 | 5,111,268 | ||||||||||||
Redeemed | (1,097,646 | ) | (1,041,563 | ) | (3,243,947 | ) | (1,878,331 | ) | ||||||||
|
|
|
|
|
|
|
| |||||||||
Total Capital Stock Share Transactions | 4,349,971 | 2,339,233 | 6,782,381 | 31,495,767 | ||||||||||||
|
|
|
|
|
|
|
| |||||||||
The accompanying Notes to Financial Statements are an integral part of this statement.
208
Table of Contents
THRIVENT SERIES FUND, INC.
STATEMENTOF CHANGESIN NET ASSETS –CONTINUED
| Mid Cap Index Portfolio | Partner Worldwide Allocation Portfolio | Partner All Cap Portfolio | Large Cap Growth Portfolio | |||||||||||||||||||||||||||
| 12/31/2016 | 12/31/2015 | 12/31/2016 | 12/31/2015 | 12/31/2016 | 12/31/2015 | 12/31/2016 | 12/31/2015 | |||||||||||||||||||||||
| $ | 3,029,943 | $ | 1,922,514 | $ | 38,647,828 | $ | 34,134,390 | $ | 528,914 | $ | 282,439 | $ | 5,648,313 | $ | 4,375,599 | |||||||||||||||
| 10,170,468 | 10,955,840 | (28,204,797 | ) | (17,767,952 | ) | (678,096 | ) | 3,983,649 | (646,285 | ) | 113,543,834 | |||||||||||||||||||
| 30,176,725 | (18,371,677 | ) | 43,218,754 | (29,806,722 | ) | 5,420,396 | (2,955,105 | ) | (23,172,012 | ) | (10,047,363 | ) | ||||||||||||||||||
| 43,377,136 | (5,493,323 | ) | 53,661,785 | (13,440,284 | ) | 5,271,214 | 1,310,983 | (18,169,984 | ) | 107,872,070 | ||||||||||||||||||||
| (1,921,723 | ) | (1,183,197 | ) | (35,720,547 | ) | (41,262,492 | ) | (240,353 | ) | (263,625 | ) | (5,522,479 | ) | (4,480,734 | ) | |||||||||||||||
| (11,233,356 | ) | (7,456,805 | ) | — | — | (4,074,564 | ) | (8,194,852 | ) | (85,392,249 | ) | — | ||||||||||||||||||
| (13,155,079 | ) | (8,640,002 | ) | (35,720,547 | ) | (41,262,492 | ) | (4,314,917 | ) | (8,458,477 | ) | (90,914,728 | ) | (4,480,734 | ) | |||||||||||||||
| 69,403,024 | 45,971,973 | 18,483,768 | 30,446,483 | 11,037,988 | 19,782,668 | 17,102,897 | 26,854,540 | |||||||||||||||||||||||
| — | — | — | — | — | — | — | 61,211,950 | |||||||||||||||||||||||
| 13,155,079 | 8,640,002 | 35,720,547 | 41,262,492 | 4,314,917 | 8,458,477 | 90,914,728 | 4,480,734 | |||||||||||||||||||||||
| (5,278,292 | ) | (5,371,848 | ) | (22,969,541 | ) | (18,736,363 | ) | (7,602,381 | ) | (4,376,941 | ) | (105,532,973 | ) | (90,795,950 | ) | |||||||||||||||
| 77,279,811 | 49,240,127 | 31,234,774 | 52,972,612 | 7,750,524 | 23,864,204 | 2,484,652 | 1,751,274 | |||||||||||||||||||||||
| 107,501,868 | 35,106,802 | 49,176,012 | (1,730,164 | ) | 8,706,821 | 16,716,710 | (106,600,060 | ) | 105,142,610 | |||||||||||||||||||||
| 180,170,290 | 145,063,488 | 1,605,560,622 | 1,607,290,786 | 86,215,102 | 69,498,392 | 1,109,650,354 | 1,004,507,744 | |||||||||||||||||||||||
| $ | 287,672,158 | $ | 180,170,290 | $ | 1,654,736,634 | $ | 1,605,560,622 | $ | 94,921,923 | $ | 86,215,102 | $ | 1,003,050,294 | $ | 1,109,650,354 | |||||||||||||||
| $ | 3,003,256 | $ | 1,897,754 | $ | 37,690,465 | $ | 33,094,109 | $ | 508,573 | $ | 255,055 | $ | 36,559 | $ | (98,849 | ) | ||||||||||||||
| 4,383,386 | 2,837,565 | 2,065,052 | 3,182,107 | 883,585 | 1,444,191 | 600,671 | 893,765 | |||||||||||||||||||||||
| — | — | — | — | — | — | — | 2,142,856 | |||||||||||||||||||||||
| 893,433 | 536,230 | 4,194,226 | 4,320,951 | 368,655 | 636,871 | 3,505,276 | 145,529 | |||||||||||||||||||||||
| (337,826 | ) | (332,173 | ) | (2,561,643 | ) | (1,997,479 | ) | (607,926 | ) | (318,427 | ) | (3,737,485 | ) | (3,039,753 | ) | |||||||||||||||
|
|
|
|
|
|
|
|
|
|
|
|
|
|
|
| |||||||||||||||
| 4,938,993 | 3,041,622 | 3,697,635 | 5,505,579 | 644,314 | 1,762,635 | 368,462 | 142,397 | |||||||||||||||||||||||
|
|
|
|
|
|
|
|
|
|
|
|
|
|
|
| |||||||||||||||
The accompanying Notes to Financial Statements are an integral part of this statement.
209
Table of Contents
THRIVENT SERIES FUND, INC.
STATEMENTOF CHANGESIN NET ASSETS –CONTINUED
| Partner Growth Stock Portfolio | Large Cap Value Portfolio | |||||||||||||||
For the periods ended | 12/31/2016 | 12/31/2015 | 12/31/2016 | 12/31/2015 | ||||||||||||
Operations | ||||||||||||||||
Net investment income/(loss) | $ | 137,840 | $ | (134,892 | ) | $ | 20,271,586 | $ | 17,208,708 | |||||||
Net realized gains/(losses) | 1,466,209 | 4,853,817 | 39,653,657 | 69,943,107 | ||||||||||||
Change in net unrealized appreciation/(depreciation) | 889,198 | 4,236,795 | 139,629,657 | (129,207,993 | ) | |||||||||||
Net Change in Net Assets Resulting From Operations | 2,493,247 | 8,955,720 | 199,554,900 | (42,056,178 | ) | |||||||||||
Distributions to Shareholders | ||||||||||||||||
From net investment income | — | — | (16,286,358 | ) | (15,306,586 | ) | ||||||||||
From net realized gains | (5,258,920 | ) | (8,951,938 | ) | (70,697,664 | ) | (35,220,436 | ) | ||||||||
Total Distributions to Shareholders | (5,258,920 | ) | (8,951,938 | ) | (86,984,022 | ) | (50,527,022 | ) | ||||||||
Capital Stock Transactions | ||||||||||||||||
Sold | 21,765,516 | 24,791,006 | 18,947,215 | 7,314,689 | ||||||||||||
Issued in connection with merger | — | — | — | — | ||||||||||||
Distributions reinvested | 5,258,920 | 8,951,938 | 86,984,022 | 50,527,022 | ||||||||||||
Redeemed | (12,983,981 | ) | (5,395,062 | ) | (16,717,880 | ) | (23,242,768 | ) | ||||||||
Total Capital Stock Transactions | 14,040,455 | 28,347,882 | 89,213,357 | 34,598,943 | ||||||||||||
Net Increase/(Decrease) in Net Assets | 11,274,782 | 28,351,664 | 201,784,235 | (57,984,257 | ) | |||||||||||
Net Assets, Beginning of Period | 110,073,650 | 81,721,986 | 1,147,018,198 | 1,205,002,455 | ||||||||||||
Net Assets, End of Period | $ | 121,348,432 | $ | 110,073,650 | $ | 1,348,802,433 | $ | 1,147,018,198 | ||||||||
Accumulated Undistributed Net Investment Income/(Loss) | $ | 115,741 | $ | (21,959 | ) | $ | 20,123,837 | $ | 15,909,295 | |||||||
Capital Stock Share Transactions | ||||||||||||||||
Sold | 1,251,720 | 1,312,766 | 1,188,892 | 447,454 | ||||||||||||
Issued in connection with merger | — | — | — | — | ||||||||||||
Distributions reinvested | 323,099 | 499,634 | 6,075,364 | 3,109,413 | ||||||||||||
Redeemed | (735,520 | ) | (282,125 | ) | (1,081,694 | ) | (1,419,730 | ) | ||||||||
|
|
|
|
|
|
|
| |||||||||
Total Capital Stock Share Transactions | 839,299 | 1,530,275 | 6,182,562 | 2,137,137 | ||||||||||||
|
|
|
|
|
|
|
| |||||||||
The accompanying Notes to Financial Statements are an integral part of this statement.
210
Table of Contents
THRIVENT SERIES FUND, INC.
STATEMENTOF CHANGESIN NET ASSETS –CONTINUED
| Large Cap Stock Portfolio | Large Cap Index Portfolio | High Yield Portfolio | Income Portfolio | |||||||||||||||||||||||||||
| 12/31/2016 | 12/31/2015 | 12/31/2016 | 12/31/2015 | 12/31/2016 | 12/31/2015 | 12/31/2016 | 12/31/2015 | |||||||||||||||||||||||
| $ | 12,166,995 | $ | 11,036,561 | $ | 11,423,336 | $ | 11,078,421 | $ | 42,261,652 | $ | 48,070,494 | $ | 48,384,559 | $ | 50,985,951 | |||||||||||||||
| 20,771,336 | (11,510,381 | ) | 4,679,606 | 3,152,666 | (15,894,469 | ) | (12,320,952 | ) | 3,510,248 | 4,006,898 | ||||||||||||||||||||
| 13,487,933 | 27,701,492 | 51,129,250 | (9,132,504 | ) | 63,124,768 | (53,105,492 | ) | 28,762,460 | (63,743,049 | ) | ||||||||||||||||||||
| 46,426,264 | 27,227,672 | 67,232,192 | 5,098,583 | 89,491,951 | (17,355,950 | ) | 80,657,267 | (8,750,200 | ) | |||||||||||||||||||||
| (10,892,157 | ) | (10,019,263 | ) | (10,883,022 | ) | (6,663,271 | ) | (42,506,756 | ) | (48,028,166 | ) | (48,254,930 | ) | (50,670,151 | ) | |||||||||||||||
| — | (63,898,912 | ) | (3,760,238 | ) | (2,302,000 | ) | — | — | (1,034,971 | ) | (30,735,056 | ) | ||||||||||||||||||
| (10,892,157 | ) | (73,918,175 | ) | (14,643,260 | ) | (8,965,271 | ) | (42,506,756 | ) | (48,028,166 | ) | (49,289,901 | ) | (81,405,207 | ) | |||||||||||||||
| 6,567,049 | 11,194,752 | 127,865,686 | 89,820,844 | 26,319,016 | 26,632,909 | 44,403,247 | 122,259,487 | |||||||||||||||||||||||
| — | 30,415,790 | — | — | — | — | — | — | |||||||||||||||||||||||
| 10,892,157 | 73,918,175 | 14,643,260 | 8,965,271 | 42,506,756 | 48,028,166 | 49,289,901 | 81,405,207 | |||||||||||||||||||||||
| (26,483,492 | ) | (24,437,928 | ) | (24,979,907 | ) | (24,176,844 | ) | (36,848,704 | ) | (152,940,377 | ) | (33,671,684 | ) | (169,751,450 | ) | |||||||||||||||
| (9,024,286 | ) | 91,090,789 | 117,529,039 | 74,609,271 | 31,977,068 | (78,279,302 | ) | 60,021,464 | 33,913,244 | |||||||||||||||||||||
| 26,509,821 | 44,400,286 | 170,117,971 | 70,742,583 | 78,962,263 | (143,663,418 | ) | 91,388,830 | (56,242,163 | ) | |||||||||||||||||||||
| 878,915,330 | 834,515,044 | 521,179,059 | 450,436,476 | 712,133,512 | 855,796,930 | 1,336,020,433 | 1,392,262,596 | |||||||||||||||||||||||
| $ | 905,425,151 | $ | 878,915,330 | $ | 691,297,030 | $ | 521,179,059 | $ | 791,095,775 | $ | 712,133,512 | $ | 1,427,409,263 | $ | 1,336,020,433 | |||||||||||||||
| $ | 12,242,087 | $ | 10,417,603 | $ | 11,321,398 | $ | 10,979,600 | $ | (147,170 | ) | $ | 68,605 | $ | 185,566 | $ | 316,882 | ||||||||||||||
| 572,866 | 901,555 | 4,344,678 | 3,120,135 | 5,610,450 | 5,599,070 | 4,320,096 | 12,173,633 | |||||||||||||||||||||||
| — | 2,717,491 | — | — | — | — | — | — | |||||||||||||||||||||||
| 1,002,426 | 6,278,512 | 523,643 | 314,996 | 9,182,735 | 9,962,929 | 4,856,942 | 7,986,614 | |||||||||||||||||||||||
| (2,309,504 | ) | (1,997,861 | ) | (857,549 | ) | (840,976 | ) | (8,008,229 | ) | (32,135,168 | ) | (3,330,645 | ) | (16,838,619 | ) | |||||||||||||||
|
|
|
|
|
|
|
|
|
|
|
|
|
|
|
| |||||||||||||||
| (734,212 | ) | 7,899,697 | 4,010,772 | 2,594,155 | 6,784,956 | (16,573,169 | ) | 5,846,393 | 3,321,628 | |||||||||||||||||||||
|
|
|
|
|
|
|
|
|
|
|
|
|
|
|
| |||||||||||||||
The accompanying Notes to Financial Statements are an integral part of this statement.
211
Table of Contents
THRIVENT SERIES FUND, INC.
STATEMENTOF CHANGESIN NET ASSETS –CONTINUED
| Bond Index Portfolio | Limited Maturity Bond Portfolio | |||||||||||||||
For the periods ended | 12/31/2016 | 12/31/2015 | 12/31/2016 | 12/31/2015 | ||||||||||||
Operations | ||||||||||||||||
Net investment income/(loss) | $ | 3,075,702 | $ | 2,744,084 | $ | 16,484,318 | $ | 16,319,881 | ||||||||
Net realized gains/(losses) | (785,140 | ) | 1,041,644 | 314,571 | 1,198,638 | |||||||||||
Change in net unrealized appreciation/(depreciation) | (858,199 | ) | (2,597,769 | ) | 6,732,921 | (9,436,984 | ) | |||||||||
Net Change in Net Assets Resulting From Operations | 1,432,363 | 1,187,959 | 23,531,810 | 8,081,535 | ||||||||||||
Distributions to Shareholders | ||||||||||||||||
From net investment income | (3,058,253 | ) | (2,744,084 | ) | (16,476,116 | ) | (16,313,198 | ) | ||||||||
From net realized gains | (352,623 | ) | — | — | — | |||||||||||
Total Distributions to Shareholders | (3,410,876 | ) | (2,744,084 | ) | (16,476,116 | ) | (16,313,198 | ) | ||||||||
Capital Stock Transactions | ||||||||||||||||
Sold | 51,987,425 | 20,209,678 | 61,547,128 | 112,264,971 | ||||||||||||
Distributions reinvested | 3,410,876 | 2,744,084 | 16,476,116 | 16,313,198 | ||||||||||||
Redeemed | (15,781,293 | ) | (14,058,228 | ) | (24,889,095 | ) | (314,787,709 | ) | ||||||||
Total Capital Stock Transactions | 39,617,008 | 8,895,534 | 53,134,149 | (186,209,540 | ) | |||||||||||
Net Increase/(Decrease) in Net Assets | 37,638,495 | 7,339,409 | 60,189,843 | (194,441,203 | ) | |||||||||||
Net Assets, Beginning of Period | 157,293,533 | 149,954,124 | 823,896,593 | 1,018,337,796 | ||||||||||||
Net Assets, End of Period | $ | 194,932,028 | $ | 157,293,533 | $ | 884,086,436 | $ | 823,896,593 | ||||||||
Accumulated Undistributed Net Investment Income/(Loss) | $ | 16,847 | $ | (602 | ) | $ | 387,555 | $ | 406,288 | |||||||
Capital Stock Share Transactions | ||||||||||||||||
Sold | 4,651,143 | 1,837,590 | 6,270,691 | 11,475,409 | ||||||||||||
Distributions reinvested | 305,984 | 249,362 | 1,682,484 | 1,661,359 | ||||||||||||
Redeemed | (1,431,118 | ) | (1,278,380 | ) | (2,543,844 | ) | (32,154,807 | ) | ||||||||
|
|
|
|
|
|
|
| |||||||||
Total Capital Stock Share Transactions | 3,526,009 | 808,572 | 5,409,331 | (19,018,039 | ) | |||||||||||
|
|
|
|
|
|
|
| |||||||||
The accompanying Notes to Financial Statements are an integral part of this statement.
212
Table of Contents
THRIVENT SERIES FUND, INC.
STATEMENTOF CHANGESIN NET ASSETS –CONTINUED
| Money Market Portfolio | ||||||
| 12/31/2016 | 12/31/2015 | |||||
| $ | — | $ | (952 | ) | ||
| (2,844 | ) | 3,579 | ||||
| — | — | |||||
| (2,844 | ) | 2,627 | ||||
| — | — | |||||
| — | — | |||||
| — | — | |||||
| 99,009,053 | 88,468,253 | |||||
| — | — | |||||
| (53,961,769 | ) | (68,005,209 | ) | |||
| 45,047,284 | 20,463,044 | |||||
| 45,044,440 | 20,465,671 | |||||
| 146,880,459 | 126,414,788 | |||||
| $ | 191,924,899 | $ | 146,880,459 | |||
| $ | — | $ | — | |||
| 99,009,053 | 88,468,253 | |||||
| — | — | |||||
| (53,961,769) | (68,005,209 | ) | ||||
|
|
|
| |||
| 45,047,284 | 20,463,044 | |||||
|
|
|
| |||
The accompanying Notes to Financial Statements are an integral part of this statement.
213
Table of Contents
THRIVENT SERIES FUND, INC.
December 31, 2016
(1) ORGANIZATION
Thrivent Series Fund, Inc. (the “Fund”), a corporation organized under the laws of Minnesota, is registered under the Investment Company Act of 1940 (the “1940 Act”). The Fund is divided into twenty-seven separate series (each, a “Portfolio”), each with its own investment objective and policies. The Fund consists of four asset allocation Portfolios, four income plus Portfolios, fourteen equity Portfolios, four fixed-income Portfolios, and one money market Portfolio. The assets of each Portfolio are segregated, and each has a separate class of capital stock.
Shares in the Fund are currently sold, without sales charges, only to retirement plans sponsored by Thrivent Financial for Lutherans (“Thrivent Financial” or the “Adviser”) or separate accounts of Thrivent Financial or Thrivent Life Insurance Company (“Thrivent Life”), which are used to fund benefits of variable life insurance and variable annuity contracts issued by Thrivent Financial and Thrivent Life.
Each of the Portfolios is an investment company that follows the accounting and reporting guidance of the Financial Accounting Standards Board (FASB) Accounting Standard Codification Topic 946 - Financial Services - Investment Companies.
Under the Fund’s organizational documents, its officers and directors are indemnified against certain liabilities arising out of the performance of their duties to the Fund. In addition, in the normal course of business, the Fund enters into contracts with service providers and others that provide general damage clauses. The Fund’s maximum exposure under these contracts is unknown, as this would involve future claims that may be made against the Fund. However, based on experience, the Fund expects the risk of loss to be remote.
(A) Mergers – At a meeting held on August 14, 2015, contractholders of Thrivent Partner Small Cap Growth Portfolio, Thrivent Partner Small Cap Value Portfolio, Thrivent Mid Cap Growth Portfolio, Thrivent Partner Mid Cap Value Portfolio, Thrivent Natural Resources Portfolio, and Thrivent Partner Technology Portfolio (the “Target Portfolios”) approved the merger of the Target Portfolios into the Portfolios shown below (the “Acquiring Portfolios”).
Target Portfolios | Acquiring Portfolios | |||
| Partner Small Cap Growth | > | Small Cap Stock | ||
| Partner Small Cap Value | > | Small Cap Stock | ||
| Mid Cap Growth | > | Mid Cap Stock | ||
| Partner Mid Cap Value | > | Mid Cap Stock | ||
| Natural Resources | > | Large Cap Stock | ||
| Partner Technology | > | Large Cap Growth |
The mergers occurred at the close of business on August 21, 2015. Acquisition of the assets and liabilities of the Target Portfolios by the Acquiring Portfolios were followed by the distribution of the Acquiring Portfolios’ shares to the Target Portfolios’ contractholders. The shares issued of the Acquiring Portfolios are disclosed in the Statement of Changes in Net Assets.
The mergers were accomplished by tax free exchanges as detailed below:
Portfolio | Description | Net Assets as of August 21, 2015 | ||||
Small Cap Stock | Acquiring Portfolio | $ | 307,383,234 | |||
Partner Small Cap Growth | Target Portfolio | $ | 48,776,411 | |||
Partner Small Cap Value | Target Portfolio | $ | 81,142,921 | |||
Small Cap Stock | After Acquisition | $ | 437,302,566 | |||
Mid Cap Stock | Acquiring Portfolio | $ | 725,136,640 | |||
Mid Cap Growth | Target Portfolio | $ | 411,465,006 | |||
Partner Mid Cap Value | Target Portfolio | $ | 34,124,034 | |||
Mid Cap Stock | After Acquisition | $ | 1,170,725,680 | |||
Large Cap Stock | Acquiring Portfolio | $ | 822,157,367 | |||
Natural Resources | Target Portfolio | $ | 30,415,790 | |||
Large Cap Stock | After Acquisition | $ | 852,573,157 | |||
Large Cap Growth | Acquiring Portfolio | $ | 983,293,490 | |||
Partner Technology | Target Portfolio | $ | 61,211,950 | |||
Large Cap Growth | After Acquisition | $ | 1,044,505,440 | |||
214
Table of Contents
THRIVENT SERIES FUND, INC.
NOTESTO FINANCIAL STATEMENTS
December 31, 2016
As of August 21, 2015, the net assets of the Target Portfolios were comprised of the following:
Target Portfolio | Unrealized Appreciation/ (Depreciation) | Undistributed Net Investment Income | Accumulated Net Realized Gains/ (Losses) | Capital Stock | ||||||||||||
Partner Small Cap Growth | $ | 5,116,383 | $ | (155,592 | ) | $ | 17,762,180 | $ | 26,053,440 | |||||||
Partner Small Cap Value | $ | 12,172,079 | $ | (465,732 | ) | $ | 106,081,143 | $ | (36,644,569 | ) | ||||||
Mid Cap Growth | $ | 98,121,712 | $ | 43,055 | $ | (204,124 | ) | $ | 313,504,363 | |||||||
Partner Mid Cap Value | $ | (4,097,780 | ) | $ | 1,374,245 | $ | 53,479,724 | $ | (16,632,155 | ) | ||||||
Natural Resources | $ | (13,776,587 | ) | $ | (11,187 | ) | $ | (4,240,765 | ) | $ | 48,444,329 | |||||
Partner Technology | $ | 13,378,254 | $ | (163,802 | ) | $ | 114,262 | $ | 47,883,236 | |||||||
The Target Portfolios’ capital loss carryovers are carried over to the Acquiring Portfolios. The amounts, if any, and applicable limitations are disclosed in Note (4) Tax Information.
Assuming the mergers had been completed on January 1, 2015 the Acquiring Portfolios’ pro-forma results of operations for the year ended December 31, 2015 would be the following:
Acquiring Portfolio | Net Change in Unrealized Appreciation/ (Depreciation) | Net Investment Income | Net Gains/(Losses) on Investments | Net Increase in Net Assets from Operations | ||||||||||||
Small Cap Stock | $ | (152,472,171 | ) | $ | 3,806,264 | $ | 132,587,125 | $ | (16,078,782 | ) | ||||||
Mid Cap Stock | $ | (198,911,176 | ) | $ | 5,856,004 | $ | 202,884,388 | $ | 9,829,216 | |||||||
Large Cap Stock | $ | 20,534,205 | $ | 11,163,071 | $ | (11,315,733 | ) | $ | 20,381,543 | |||||||
Large Cap Growth | $ | (11,635,658 | ) | $ | 4,348,728 | $ | 115,283,367 | $ | 107,996,437 | |||||||
The financial statements reflect the operations of the Acquiring Portfolios for the period prior to the merger and the combined Portfolios for the period subsequent to the mergers. Because the combined investment portfolios have been managed as a single integrated portfolio since the mergers were completed, it is not practicable to separate the amounts of revenue and earnings of Thrivent Partner Small Cap Growth Portfolio, Thrivent Partner Small Cap Value Portfolio, Thrivent Mid Cap Growth Portfolio, Thrivent Partner Mid Cap Value Portfolio, Thrivent Natural Resources Portfolio, and Thrivent Partner Technology Portfolio that have been included in the Acquiring Portfolios’ Statement of Operations since the mergers were completed.
(2) SIGNIFICANT ACCOUNTING POLICIES
(A) Valuation of Investments – Securities traded on U.S. or foreign securities exchanges or included in a national market system are valued at the official closing price at the close of each business day unless otherwise stated below. Over-the-counter securities and listed securities for which no price is readily available are valued at the current bid price considered best to represent the value at that time. Security prices are based on quotes that are obtained from an independent pricing service approved by the Board of Directors (the “Board”). The pricing service, in determining values of fixed-income securities, takes into consideration such factors as current quotations by broker/dealers, coupon, maturity, quality, type of issue, trading characteristics, and other yield and risk factors it deems relevant in determining valuations. Securities which cannot be valued by the approved pricing service are valued using valuations from dealers that make markets in the securities. Exchange-listed options and futures contracts are valued at the last quoted sales price. Swap agreements are valued at the clearing house end of day prices as furnished by an independent pricing service. Forward foreign currency exchange contracts are marked-to-market based upon foreign currency exchange rates provided by the pricing service. Investments in open-ended mutual funds are valued at their net asset value at the close of each business day.
Securities held by the Money Market Portfolio are valued on the basis of amortized cost (which approximates market value), whereby a portfolio security is valued at its cost initially and thereafter valued to reflect a constant amortization to maturity of any discount or premium. The Money Market Portfolio and the Adviser follow procedures designed to help maintain a constant net asset value of $1.00 per share.
The Board has delegated responsibility for daily valuation of the Portfolios’ securities to the Adviser. The Adviser has formed a Valuation Committee (“Committee”) that is responsible for overseeing the Portfolios’ valuation policies in accordance with Valuation Policies and Procedures. The Committee meets on a monthly and on an as-needed basis to review price challenges, price overrides, stale prices, shadow prices, manual prices, money market pricing, international fair valuation, and other securities requiring fair valuation.
215
Table of Contents
THRIVENT SERIES FUND, INC.
NOTESTO FINANCIAL STATEMENTS
December 31, 2016
The Committee monitors for significant events occurring prior to the close of trading on the New York Stock Exchange that could have a material impact on the value of any securities that are held by the Portfolios. Examples of such events include trading halts, national news/events, and issuer-specific developments. If the Committee decides that such events warrant using fair value estimates, the Committee will take such events into consideration in determining the fair value of such securities. If market quotations or prices are not readily available or determined to be unreliable, the securities will be valued at fair value as determined in good faith pursuant to procedures adopted by the Board.
In accordance with U.S. Generally Accepted Accounting Principles (“GAAP”), the various inputs used to determine the fair value of the Portfolios’ investments are summarized in three broad levels. Level 1 includes quoted prices in active markets for identical securities, typically included in this level are U.S. equity securities, futures, options and registered investment company funds. Level 2 includes other significant observable inputs such as quoted prices for similar securities, interest rates, prepayment speeds and credit risk, typically included in this level are fixed income securities, international securities, swaps and forward contracts. Level 3 includes significant unobservable inputs such as the Adviser’s own assumptions and broker evaluations in determining the fair value of investments. Of the Level 3 securities, those for which market values were not readily available or were deemed unreliable were fair valued as determined in good faith under procedures established by the Board. The valuation levels are not necessarily an indication of the risk associated with investing in these securities or other investments. Investments measured using net asset value per share as a practical expedient for fair value and that are not publicly available-for-sale are not categorized within the fair value hierarchy.
Valuation of International Securities – Because many foreign markets close before the U.S. markets, events may occur between the close of the foreign market and the close of the U.S. markets that could have a material impact on the valuation of foreign securities. The Portfolios, under the supervision of the Board, evaluate the impacts of these events and may adjust the valuation of foreign securities to reflect the fair value as of the close of the U.S. markets. The Board has authorized the Adviser to make fair valuation determinations pursuant to policies approved by the Board.
(B) Foreign Currency Translation – The accounting records of each Portfolio are maintained in U.S. dollars. Securities and other assets and liabilities that are denominated in foreign currencies are translated into U.S. dollars at the daily closing rates of exchange.
Foreign currency amounts related to the purchase or sale of securities and income and expenses are translated at the exchange rate on the transaction date. Net realized and unrealized currency gains and losses are recorded from closed currency contracts, disposition of foreign currencies, exchange gains or losses between the trade date and settlement date on securities transactions, and other translation gains or losses on dividends, interest income and foreign withholding taxes. The Portfolios do not separately report the effect of changes in foreign exchange rates from changes in prices on securities held. Such changes are included in net realized and unrealized gain or loss from investments in the Statement of Operations.
For federal income tax purposes, the Portfolios treat the effect of changes in foreign exchange rates arising from actual foreign currency transactions and the changes in foreign exchange rates between the trade date and settlement date as ordinary income.
(C) Foreign Denominated Investments – Foreign denominated assets and currency contracts may involve more risks than domestic transactions including currency risk, political and economic risk, regulatory risk, and market risk. Certain Portfolios may also invest in securities of companies located in emerging markets. Future economic or political developments could adversely affect the liquidity or value, or both, of such securities.
(D) Federal Income Taxes – No provision has been made for income taxes because each Portfolio’s policy is to qualify as a regulated investment company under the Internal Revenue Code and distribute substantially all investment company taxable income and net capital gain on a timely basis. It is also the intention of each Portfolio to distribute an amount sufficient to avoid imposition of any federal excise tax. The Portfolios, accordingly, anticipate paying no federal taxes and no federal tax provision was recorded. Each Portfolio is treated as a separate taxable entity for federal income tax purposes. Certain Portfolios may utilize earnings and profits distributed to shareholders on the redemption of shares as part of the dividends paid deduction.
GAAP requires management of the Portfolios (i.e., the Adviser) to make additional tax disclosures with respect to the tax effects of certain income tax positions, whether those positions were taken on previously filed tax returns or are expected to be taken on future returns. These positions must meet a “more likely than not” standard that, based on the technical merits of the position, would have a greater than 50 percent likelihood of being sustained upon examination. In evaluating whether a tax position has met the more-likely-than-not recognition threshold, the Adviser must presume that the position will be examined by the appropriate taxing authority that has full knowledge of all relevant information.
The Adviser analyzed all open tax years, as defined by the statute of limitations, for all major jurisdictions. Open tax years are those that are open for examination by taxing authorities. Major jurisdictions for the Portfolios include U.S. Federal, Minnesota, and Wisconsin, as well as certain foreign countries. As of December 31, 2016, open U.S. Federal, Minnesota, and Wisconsin tax years include the tax years ended December 31, 2013 through 2016. Additionally, as of December 31, 2016, the tax year ended December 31, 2012 is open for Wisconsin. The Portfolios have no examinations in progress and none are expected at this time.
216
Table of Contents
THRIVENT SERIES FUND, INC.
NOTESTO FINANCIAL STATEMENTS
December 31, 2016
As of December 31, 2016, the Adviser has reviewed all open tax years and major jurisdictions and concluded that there is no effect to the Portfolios’ tax liability, financial position or results of operations. There is no tax liability resulting from unrecognized tax benefits related to uncertain income tax positions taken or expected to be taken in future tax returns. The Portfolios are also not aware of any tax positions for which it is reasonably possible that the total amounts of unrecognized tax benefits will significantly change in the next 12 months.
Foreign Income Taxes – Portfolios are subject to foreign income taxes imposed by certain countries in which they invest. Withholding taxes on foreign dividends have been provided for in accordance with the applicable country’s tax rules and rates. These amounts are shown as foreign dividend tax withholding in the Statement of Operations. The Portfolios pay tax on foreign capital gains, where applicable.
(E) Expenses and Income – Estimated expenses are accrued daily. The Portfolios are charged for those expenses that are directly attributable to them. Expenses that are not directly attributable to a Portfolio are allocated among all appropriate Portfolios in proportion to their respective net assets, number of shareholder accounts or other reasonable basis.
Interest income is recorded daily on all debt securities, as is accretion of market discount and original issue discount and amortization of premium. Paydown gains and losses on mortgage- and asset-backed securities are recorded as components of interest income. Dividend income and capital gain distributions are recorded on the ex-dividend date. However, in certain foreign markets where declaration of the dividend follows the ex-dividend date, the dividend will be recorded as soon as the Portfolio is informed of the declaration date.
For certain securities, including real estate investment trusts, the Fund records distributions received in excess of income as a reduction of cost of investments and/or realized gain. Such amounts are based on estimates if actual amounts are not available. Actual amounts of income, realized gain and return of capital may differ from the estimated amounts. The Fund adjusts the estimated amounts of the components of distributions as adjustments to investment income, unrealized appreciation/depreciation and realized gain/ loss on investments as necessary, once the issuers provide information about the actual composition of the distributions.
(F) Distributions to Shareholders – Dividends and capital gain distributions are recorded on the ex-dividend date. With the exception of the Money Market Portfolio, net realized gains from securities transactions, if any, are paid at least annually after the close of the fiscal year. Any Portfolio subject to excise tax would require an additional distribution prior to the close of the fiscal year.
Dividends are declared and reinvested daily for High Yield Portfolio, Income Portfolio, Bond Index Portfolio, Limited Maturity Bond Portfolio, and Opportunity Income Plus Portfolio; declared daily and reinvested monthly for the Money Market Portfolio; and declared and reinvested at least annually for all other Portfolios.
(G) Derivative Financial Instruments – Each of the Portfolios, with the exception of the Money Market Portfolio, may invest in derivatives. Derivatives, a category that includes options, futures, swaps, foreign currency forward contracts and hybrid instruments, are financial instruments whose value is derived from another security, an index or a currency. Each applicable Portfolio may use derivatives for hedging (attempting to offset a potential loss in one position by establishing an interest in an opposite position). This includes the use of currency-based derivatives to manage the risk of its positions in foreign securities. Each applicable Portfolio may also use derivatives for replication of a certain asset class or speculation (investing for potential income or capital gain). These contracts may be transacted on an exchange or over-the-counter (OTC).
A derivative may incur a mark to market loss if the value of the derivative decreases due to an unfavorable change in the market rates or values of the underlying derivative. Losses can also occur if the counterparty does not perform under the derivative. A Portfolio’s risk of loss from the counterparty credit risk on OTC derivatives is generally limited to the aggregate unrealized gain netted against any collateral held by such Portfolio. With exchange traded futures and centrally cleared swaps, there is minimal counterparty credit risk to the Portfolios because the exchange’s clearinghouse, as counterparty to such derivatives, guarantees against a possible default. The clearinghouse stands between the buyer and the seller of the derivative; thus, the credit risk is limited to the failure of the clearinghouse. However, credit risk still exists in exchange traded futures and centrally cleared swaps with respect to initial and variation margin that is held in a broker’s customer accounts. While brokers are required to segregate customer margin from their own assets, in the event that a broker becomes insolvent or goes into bankruptcy and at that time there is a shortfall in the aggregate amount of margin held by the broker for all its clients, U.S. bankruptcy laws will typically allocate that shortfall on a pro-rata basis across all the broker’s customers, potentially resulting in losses to the Portfolios. Using derivatives to hedge can guard against potential risks, but it also adds to the Portfolios’ expenses and can eliminate some opportunities for gains. In addition, a derivative used for mitigating exposure or replication may not accurately track the value of the underlying asset. Another risk with derivatives is that some types can amplify a gain or loss, potentially earning or losing substantially more money than the actual cost of the derivative.
217
Table of Contents
THRIVENT SERIES FUND, INC.
NOTESTO FINANCIAL STATEMENTS
December 31, 2016
In order to define their contractual rights and to secure rights that will help the Portfolios mitigate their counterparty risk, the Portfolios may enter into an International Swaps and Derivatives Association, Inc. Master Agreement (“ISDA Master Agreement”) or similar agreement with its derivative contract counterparties. An ISDA Master Agreement is a bilateral agreement between a Portfolio and a counterparty that governs OTC derivatives and foreign exchange contracts and typically includes, among other things, collateral posting terms and netting provisions in the event of a default and/ or termination event. Under an ISDA Master Agreement, each Portfolio may, under certain circumstances, offset with the counterparty certain derivatives’ payables and/or receivables with collateral held and/or posted and create one single net payment. The provisions of the ISDA Master Agreement typically permit a single net payment in the event of a default (close-out netting) including the bankruptcy or insolvency of the counterparty. Note, however, that bankruptcy and insolvency laws of a particular jurisdiction may impose restrictions on or prohibitions against the right of offset in bankruptcy, insolvency or other events.
Collateral and margin requirements vary by type of derivative. Margin requirements are established by the broker or clearinghouse for exchange traded and centrally cleared derivatives (futures, options, and centrally cleared swaps). Brokers can ask for margining in excess of the minimum in certain situations. Collateral terms are contract specific for OTC derivatives (foreign currency exchange contracts, options, and swaps). For derivatives traded under an ISDA Master Agreement, the collateral requirements are typically calculated by netting the mark to market amount for each transaction under such agreement and comparing that amount to the value of any collateral currently pledged by the Portfolio and the counterparty. For financial reporting purposes, non-cash collateral that has been pledged to cover obligations of the Portfolio has been noted in the Schedule of Investments. To the extent amounts due to the Portfolio from its counterparties are not fully collateralized, contractually or otherwise, the Portfolio bears the risk of loss from counterparty nonperformance. The Portfolios attempt to mitigate counterparty risk by only entering into agreements with counterparties that they believe have the financial resources to honor their obligations and by monitoring the financial stability of those counterparties.
Options – All Portfolios, with the exception of the Money Market Portfolio, may buy put and call options and write put and covered call options. The Portfolios intend to use such derivative instruments as hedges to facilitate buying or selling securities or to provide protection against adverse movements in security prices or interest rates. The Portfolios may also enter into options contracts to protect against adverse foreign exchange rate fluctuations. Option contracts are valued daily and unrealized appreciation or depreciation is recorded. A Portfolio will realize a gain or loss upon expiration or closing of the option transaction. When an option is exercised, the proceeds upon sale for a written call option or the cost of a security for purchased put and call options is adjusted by the amount of premium received or paid.
Buying put options tends to decrease a Portfolio’s exposure to the underlying security while buying call options tends to increase a Portfolio’s exposure to the underlying security. The risk associated with purchasing put and call options is limited to the premium paid. There is no significant counterparty risk on exchange-traded options as the exchange guarantees the contract against default. Writing put options tends to increase a Portfolio’s exposure to the underlying security while writing call options tends to decrease a Portfolio’s exposure to the underlying security. The writer of an option has no control over whether the underlying security may be bought or sold, and therefore bears the market risk of an unfavorable change in the price of the underlying security. The counterparty risk for purchased options arises when the Portfolio has purchased an option, exercises that option, and the counterparty doesn’t buy from the Portfolio or sell to the Portfolio the underlying asset as required. In the case where the Portfolio has written an option, the Portfolio doesn’t have counterparty risk. Counterparty risk on purchased over-the-counter options is partially mitigated by the Portfolio’s collateral posting requirements. As the option increases in value to the Portfolio, the Portfolio receives collateral from the counterparty. Risks of loss may exceed amounts recognized on the Statement of Assets and Liabilities.
Futures Contracts – All Portfolios, with the exception of the Money Market Portfolio, may use futures contracts to manage the exposure to interest rate and market or currency fluctuations. Gains or losses on futures contracts can offset changes in the yield of securities. When a futures contract is opened, cash or other investments equal to the required “initial margin deposit” are held on deposit with and pledged to the broker. Additional securities held by the Portfolios may be earmarked to cover open futures contracts. The futures contract’s daily change in value (“variation margin”) is either paid to or received from the broker, and is recorded as an unrealized gain or loss. When the contract is closed, realized gain or loss is recorded equal to the difference between the value of the contract when opened and the value of the contract when closed. Futures contracts involve, to varying degrees, risk of loss in excess of the variation margin disclosed in the Statement of Assets and Liabilities. Exchange-traded futures have no significant counterparty risk as the exchange guarantees the contracts against default.
218
Table of Contents
THRIVENT SERIES FUND, INC.
NOTESTO FINANCIAL STATEMENTS
December 31, 2016
During the year ended December 31, 2016, Aggressive Allocation Portfolio, Moderately Aggressive Allocation Portfolio, Moderate Allocation Portfolio, Moderately Conservative Allocation Portfolio, Growth and Income Plus Porfolio, Balanced Income Plus Portfolio, Diversified Income Plus Portfolio, Opportunity Income Plus Portfolio, Partner Worldwide Allocation Portfolio, Income Portfolio and Limited Maturity Bond Portfolio used treasury futures to manage the duration and yield curve exposure of the Portfolio versus the benchmark.
During the year ended December 31, 2016, Aggressive Allocation Portfolio, Moderately Aggressive Allocation Portfolio, Moderate Allocation Portfolio, Moderately Conservative Allocation Portfolio, Growth and Income Plus Portfolio, Balanced Income Plus Portfolio, Diversified Income Plus Portfolio, Opportunity Income Plus Portfolio, Small Cap Index Portfolio, Mid Cap Index Portfolio, Partner Worldwide Allocation Portfolio, Large Cap Growth Portfolio, Large Cap Stock Portfolio and Large Cap Index Portfolio used equity futures to manage exposure to the equities market.
Foreign Currency Forward Contracts – In connection with purchases and sales of securities denominated in foreign currencies all Portfolios, with the exception of the Money Market Portfolio, may enter into foreign currency forward contracts. Additionally, the Portfolios may enter into such contracts to mitigate currency and counterparty exposure to other foreign-currency-denominated investments. These contracts are recorded at value and the related realized and change in unrealized foreign exchange gains and losses are included in the Statement of Operations. In the event that counterparties fail to settle these forward contracts, the Portfolios could be exposed to foreign currency fluctuations. Foreign currency contracts are valued daily and unrealized appreciation or depreciation is recorded daily as the difference between the contract exchange rate and the closing forward rate applied to the face amount of the contract. A realized gain or loss is recorded at the time a forward contract is closed. These contracts are over-the-counter and the Portfolio is exposed to counterparty risk equal to the discounted net amount of payments to the Portfolio.
During the year ended December 31, 2016, Partner Worldwide Allocation Portfolio used foreign currency forward contracts in order to gain active currency exposure and to hedge unwanted currency exposure.
Swap Agreements – All Portfolios, with the exception of the Money Market Portfolio, may enter into swap transactions, which involve swapping one or more investment characteristics of a security or a basket of securities with another party. Such transactions include market risk, risk of default by the other party to the transaction, risk of imperfect correlation and manager risk and may involve commissions or other costs. Swap transactions generally do not involve delivery of securities, other underlying assets or principal. Accordingly, the risk of loss with respect to swap transactions is generally limited to the net amount of payments that the Portfolio is contractually obligated to make, or in the case of the counterparty defaulting, the net amount of payments that the Portfolio is contractually entitled to receive. Risks of loss may exceed amounts recognized on the Statement of Assets and Liabilities. If there is a default by the counterparty, the Portfolio may have contractual remedies pursuant to the agreements related to the transaction. The contracts are valued daily and unrealized appreciation or depreciation is recorded. Swap agreements are valued at the clearinghouse end of day prices as furnished by an independent pricing service. The pricing service takes into account such factors as swap curves, default probabilities, recent trades, recovery rates and other factors it deems relevant in determining valuations. Daily fluctuations in the value of the centrally cleared credit default contracts are recorded in variation margin in the Statement of Assets and Liabilities and recorded as unrealized gain or loss. The Portfolio accrues for the periodic payment and amortizes upfront payments, if any, on swap agreements on a daily basis with the net amount recorded as realized gains or losses in the Statement of Operations. Receipts and payments received or made as a result of a credit event or termination of the contract are also recognized as realized gains or losses in the Statement of Operations. Collateral, in the form of cash or securities, may be required to be held with the Portfolio’s custodian, or a third party, in connection with these agreements. Certain swap agreements are over-the-counter and the Portfolio is exposed to counterparty risk, which is the discounted net amount of payments owed to the Portfolio. This risk is partially mitigated by the Portfolio’s collateral posting requirements. As the swap increases in value to the Portfolio, the Portfolio receives collateral from the counterparty. Certain interest rate and credit default index swaps must be cleared through a clearinghouse or central counterparty.
Credit Default Swaps – A credit default swap is a swap agreement between two parties to exchange the credit risk of a particular issuer, basket of securities or reference entity. In a credit default swap transaction, a buyer pays periodic fees in return for payment by the seller which is contingent upon an adverse credit event occurring in the underlying issuer or reference entity. The seller collects periodic fees from the buyer and profits if the credit of the underlying issuer or reference entity remains stable or improves while the swap is outstanding, but the seller in a credit default swap contract would be required to pay the amount of credit loss, determined as specified in the agreement, to the buyer in the event of an adverse credit event in the reference entity. A buyer of a credit default swap is said to buy protection whereas a seller of a credit default swap is said to sell protection. The Portfolios may be either the protection buyer or the protection seller.
219
Table of Contents
THRIVENT SERIES FUND, INC.
NOTESTO FINANCIAL STATEMENTS
December 31, 2016
Certain Portfolios enter into credit default derivative contracts directly through credit default swaps (CDS) or through credit default swap indices (CDX Indices). CDX Indices are static pools of equally weighted credit default swaps referencing corporate bonds and/or loans designed to provide diversified credit exposure to these asset classes. Portfolios sell default protection and assume long-risk positions in individual credits or indices. Index positions are entered into to gain exposure to the corporate bond and/or loan markets in a cost-efficient and diversified structure. In the event that a position defaults, by going into bankruptcy and failing to pay interest or principal on borrowed money, within any given CDX Index held, the maximum potential amount of future payments required would be equal to the pro-rata share of that position within the index based on the notional amount of the index. In the event of a default under a CDS contract, the maximum potential amount of future payments would be the notional amount. For CDS, the default events could be bankruptcy and failing to pay interest or principal on borrowed money or a restructuring. A restructuring is a change in the underlying obligations which would include reduction in interest or principal, maturity extension and subordination to other obligations.
During the year ended December 31, 2016, Growth and Income Plus Portfolio, Balanced Income Plus Portfolio, Opportunity Income Plus Portfolio, High Yield Portfolio and Income Portfolio used CDX indexes (comprised of credit default swaps) to help manage credit risk exposures within the portfolio.
For financial reporting purposes, the Portfolios do not offset derivative assets and derivative liabilities that are subject to netting arrangements in the Statement of Assets and Liabilities.
The amounts presented in the tables below are offset first by financial instruments that have the right to offset under master netting or similar arrangements, then any remaining amount is reduced by cash and non-cash collateral received/pledged. The actual amounts of collateral may be greater than the amounts presented in the tables.
The following table presents the gross and net information about assets subject to master netting arrangements, as presented in the Statement of Assets and Liabilities:
Gross Amounts Not Offset in the Statement of Assets and Liabilities | ||||||||||||||
Portfolio | Gross Amounts of Recognized Assets | Gross Amounts Offset | Net Amounts of Recognized Assets | Financial Instruments | Cash Collateral Received | Non-Cash Collateral Received | Net Amount | |||||||
Aggressive Allocation | ||||||||||||||
Futures Contracts | 872,074 | — | 872,074 | 353,795 | — | — | 518,279(*) | |||||||
Moderately Aggressive Allocation | ||||||||||||||
Futures Contracts | 3,015,222 | — | 3,015,222 | 1,399,668 | — | — | 1,615,554(*) | |||||||
Moderate Allocation | ||||||||||||||
Futures Contracts | 5,060,538 | — | 5,060,538 | 735,380 | — | — | 4,325,158(*) | |||||||
Moderately Conservative Allocation | ||||||||||||||
Futures Contracts | 2,225,765 | — | 2,225,765 | 336,388 | — | — | 1,889,377(*) | |||||||
Growth and Income Plus | ||||||||||||||
Futures Contracts | 16,641 | — | 16,641 | 7,309 | — | — | 9,332(*) | |||||||
Balanced Income Plus | ||||||||||||||
Futures Contracts | 61,238 | — | 61,238 | 25,686 | — | — | 35,552(*) | |||||||
Diversified Income Plus | ||||||||||||||
Futures Contracts | 128,281 | — | 128,281 | 16,310 | — | — | 111,971(*) | |||||||
Opportunity Income Plus | ||||||||||||||
Futures Contracts | 29,948 | — | 29,948 | 10,406 | — | — | 19,542(*) | |||||||
Partner Worldwide Allocation | ||||||||||||||
Futures Contracts | 2,156,316 | — | 2,156,316 | 1,983,035 | — | — | 173,281(*) | |||||||
Exchange Contracts | 779,380 | — | 779,380 | 497,840 | — | — | 281,540(†) | |||||||
Large Cap Stock | ||||||||||||||
Futures Contracts | 387,458 | — | 387,458 | 90,423 | — | — | 297,035(*) | |||||||
Income | ||||||||||||||
Futures Contracts | 379,500 | — | 379,500 | 379,500 | — | — | — | |||||||
Limited Maturity Bond | ||||||||||||||
Futures Contracts | 46,078 | — | 46,078 | 46,078 | — | — | — | |||||||
| (*) | Net futures amount represents the net amount receivable from the counterparty in the event of a default. |
| (†) | Net exchange contract amount represents the net amount receivable from the counterparty in the event of a default. |
220
Table of Contents
THRIVENT SERIES FUND, INC.
NOTESTO FINANCIAL STATEMENTS
December 31, 2016
The following table presents the gross and net information about liabilities subject to master netting arrangements, as presented in the Statement of Assets and Liabilities:
Gross Amounts Not Offset in the Statement of Assets and Liabilities | ||||||||||||||||||||||||||||
Portfolio | Gross Amounts of Recognized Liabilities | Gross Amounts Offset | Net Amounts of Recognized Liabilities | Financial Instruments | Cash Collateral Pledged | Non-Cash Collateral Pledged** | Net Amount | |||||||||||||||||||||
Aggressive Allocation | ||||||||||||||||||||||||||||
Futures Contracts | 353,795 | — | 353,795 | 353,795 | — | — | — | |||||||||||||||||||||
Securities Lending | 1,164,525 | — | 1,164,525 | 1,140,212 | — | — | 24,313 | ^ | ||||||||||||||||||||
Moderately Aggressive Allocation | ||||||||||||||||||||||||||||
Futures Contracts | 1,399,668 | — | 1,399,668 | 1,399,668 | — | — | — | |||||||||||||||||||||
Securities Lending | 56,510,060 | — | 56,510,060 | 55,147,212 | — | — | 1,362,848 | ^ | ||||||||||||||||||||
Moderate Allocation | ||||||||||||||||||||||||||||
Futures Contracts | 735,380 | — | 735,380 | 735,380 | — | — | — | |||||||||||||||||||||
Securities Lending | 186,669,340 | — | 186,669,340 | 182,524,792 | — | — | 4,144,548 | ^ | ||||||||||||||||||||
Moderately Conservative Allocation | ||||||||||||||||||||||||||||
Futures Contracts | 336,388 | — | 336,388 | 336,388 | — | — | — | |||||||||||||||||||||
Securities Lending | 78,436,450 | — | 78,436,450 | 76,871,874 | — | — | 1,564,576 | ^ | ||||||||||||||||||||
Growth and Income Plus | ||||||||||||||||||||||||||||
Futures Contracts | 7,309 | — | 7,309 | 7,309 | — | — | — | |||||||||||||||||||||
Balanced Income Plus | ||||||||||||||||||||||||||||
Futures Contracts | 25,686 | — | 25,686 | 25,686 | — | — | — | |||||||||||||||||||||
Securities Lending | 6,483,360 | — | 6,483,360 | 6,272,457 | — | — | 210,903 | ^ | ||||||||||||||||||||
Diversified Income Plus | ||||||||||||||||||||||||||||
Futures Contracts | 16,310 | — | 16,310 | 16,310 | — | — | — | |||||||||||||||||||||
Securities Lending | 172,250 | — | 172,250 | 162,954 | — | — | 9,296 | ^ | ||||||||||||||||||||
Opportunity Income Plus | ||||||||||||||||||||||||||||
Futures Contracts | 10,406 | — | 10,406 | 10,406 | — | — | — | |||||||||||||||||||||
Partner Emerging Markets Equity | ||||||||||||||||||||||||||||
Securities Lending | 981,850 | — | 981,850 | 960,599 | — | — | 21,251 | ^ | ||||||||||||||||||||
Small Cap Stock | ||||||||||||||||||||||||||||
Securities Lending | 11,513,109 | — | 11,513,109 | 11,185,125 | — | — | 327,984 | ^ | ||||||||||||||||||||
Small Cap Index | ||||||||||||||||||||||||||||
Futures Contracts | 42,648 | — | 42,648 | — | — | 42,648 | — | |||||||||||||||||||||
Securities Lending | 23,458,379 | — | 23,458,379 | 22,811,867 | — | — | 646,512 | ^ | ||||||||||||||||||||
Mid Cap Stock | ||||||||||||||||||||||||||||
Securities Lending | 30,153,421 | — | 30,153,421 | 29,492,475 | — | — | 660,946 | ^ | ||||||||||||||||||||
Mid Cap Index | ||||||||||||||||||||||||||||
Futures Contracts | 38,065 | — | 38,065 | — | — | 38,065 | — | |||||||||||||||||||||
Securities Lending | 6,191,137 | — | 6,191,137 | 5,996,089 | — | — | 195,048 | ^ | ||||||||||||||||||||
Partner Worldwide Allocation | ||||||||||||||||||||||||||||
Futures Contracts | 1,983,035 | — | 1,983,035 | 1,983,035 | — | — | — | |||||||||||||||||||||
Exchange Contracts | 820,700 | — | 820,700 | 497,840 | 322,860 | — | — | |||||||||||||||||||||
Securities Lending | 16,401,014 | — | 16,401,014 | 15,613,935 | — | — | 787,079 | ^ | ||||||||||||||||||||
Partner All Cap | ||||||||||||||||||||||||||||
Securities Lending | 1,232,175 | — | 1,232,175 | 1,189,942 | — | — | 42,233 | ^ | ||||||||||||||||||||
Partner Growth Stock | ||||||||||||||||||||||||||||
Securities Lending | 3,546,303 | — | 3,546,303 | 3,478,468 | — | — | 67,835 | ^ | ||||||||||||||||||||
Large Cap Stock | ||||||||||||||||||||||||||||
Futures Contracts | 90,423 | — | 90,423 | 90,423 | — | — | — | |||||||||||||||||||||
Securities Lending | 1,213,950 | — | 1,213,950 | 1,147,877 | — | — | 66,073 | ^ | ||||||||||||||||||||
Large Cap Index | ||||||||||||||||||||||||||||
Futures Contracts | 79,010 | — | 79,010 | — | — | 79,010 | — | |||||||||||||||||||||
Securities Lending | 848,560 | — | 848,560 | 824,413 | — | — | 24,147 | ^ | ||||||||||||||||||||
High Yield | ||||||||||||||||||||||||||||
Securities Lending | 74,873,939 | — | 74,873,939 | 72,113,357 | — | — | 2,760,582 | ^ | ||||||||||||||||||||
221
Table of Contents
THRIVENT SERIES FUND, INC.
NOTESTO FINANCIAL STATEMENTS
December 31, 2016
The following table presents the gross and net information about liabilities subject to master netting arrangements, as presented in the Statement of Assets and Liabilities:
| Gross Amounts Not Offset in the Statement of Assets and Liabilities | ||||||||||||||||||||||||||||
Portfolio | Gross Amounts of Recognized Liabilities | Gross Amounts Offset | Net Amounts of Recognized Liabilities | Financial Instruments | Cash Collateral Pledged | Non-Cash Collateral Pledged** | Net Amount | |||||||||||||||||||||
Income | ||||||||||||||||||||||||||||
Futures Contracts | 381,757 | — | 381,757 | 379,500 | — | 2,257 | — | |||||||||||||||||||||
Securities Lending | 7,919,140 | — | 7,919,140 | 7,649,695 | — | — | 269,445 | ^ | ||||||||||||||||||||
Bond Index | ||||||||||||||||||||||||||||
Securities Lending | 11,000,368 | — | 11,000,368 | 10,769,134 | — | — | 231,234 | ^ | ||||||||||||||||||||
Limited Maturity Bond | ||||||||||||||||||||||||||||
Futures Contracts | 314,858 | — | 314,858 | 46,078 | — | 268,780 | — | |||||||||||||||||||||
Securities Lending | 3,886,725 | — | 3,886,725 | 3,756,401 | — | — | 130,324 | ^ | ||||||||||||||||||||
| ** | Excess of collateral pledged to the counterparty may not be shown for financial reporting purposes. |
| ^ | Net securities lending amounts represent the net amount payable to the counterparty in the event of a default. |
(H) Mortgage Dollar Roll Transactions – Certain Portfolios enter into dollar roll transactions on securities issued or to be issued by the Government National Mortgage Association, Federal National Mortgage Association and Federal Home Loan Mortgage Corporation, in which the Portfolios sell mortgage securities and simultaneously agree to repurchase similar (same type and coupon) securities at a later date at an agreed upon price. The Portfolios must maintain liquid securities having a value at least equal to the repurchase price (including accrued interest) for such dollar rolls. In addition, the Portfolios are required to segregate collateral with the fund custodian - depending on market movements - on their mortgage dollar rolls. Securities segregated for collateral are footnoted within each Schedule of Investments. The value of the securities that the Portfolios are required to purchase may decline below the agreed upon repurchase price of those securities.
During the period between the sale and repurchase, the Portfolios forgo principal and interest paid on the mortgage securities sold. The Portfolios are compensated from negotiated fees paid by brokers offered as an inducement to the Portfolios to “roll over” their purchase commitments, thus enhancing the yield. Mortgage dollar rolls may be renewed with a new purchase and repurchase price and a cash settlement made on settlement date without physical delivery of the securities subject to the contract. The fees received are recognized over the roll period and are included in Income from mortgage dollar rolls in the Statement of Operations.
(I) Securities Lending – The Fund has entered into a Securities Lending Agreement (the “Agreement”) with Deutsche Bank AG (“Deutsche”). The Agreement authorizes Deutsche to lend securities to authorized borrowers on behalf of the Portfolios. Pursuant to the Agreement, all loaned securities are initially collateralized by cash equal to at least 102% of the value of the loaned securities. Daily market fluctuations could cause the value of loaned securities to be more or less than the value of collateral received. Any additional collateral is adjusted and settled on the next business day. The Fund has the ability to recall the loans at any time and could do so in order to vote proxies or sell the loaned securities. All cash collateral received is invested in Thrivent Cash Management Trust. The Portfolios receive income and corporate action proceeds from Duetsche that would have been earned on the securities loaned while simultaneously seeking to earn income on the investment of cash collateral. Amounts earned on investments in Thrivent Cash Management Trust, net of rebates, fees paid to Deutsche for services provided and any other securities lending expenses, are included in Income from securities loaned on the Statement of Operations. By investing any cash collateral it receives in these transactions, a Portfolio could realize additional gains or losses. If the borrower fails to return the securities or the invested collateral has declined in value, the Portfolio could lose money. Generally, in the event of borrower default, the Portfolio has the right to use the collateral to offset any losses incurred. However, in the event the Portfolio is delayed or prevented from exercising its right to dispose of the collateral, there may be a potential loss. Some of these losses may be indemnified by the lending agent.
As of December 31, 2016, the value of securities on loan is as follows:
Portfolio | Securities on Loan | |||
Aggressive Allocation | $ | 1,140,212 | ||
Moderately Aggressive Allocation | 55,147,212 | |||
Moderate Allocation | 182,524,792 | |||
Moderately Conservative Allocation | 76,871,874 | |||
Balanced Income Plus | 6,272,457 | |||
222
Table of Contents
THRIVENT SERIES FUND, INC.
NOTESTO FINANCIAL STATEMENTS
December 31, 2016
Portfolio | Securities on Loan | |||
Diversified Income Plus | 162,954 | |||
Partner Emerging Markets Equity | 960,599 | |||
Small Cap Stock | 11,185,125 | |||
Small Cap Index | 22,811,867 | |||
Mid Cap Stock | 29,492,475 | |||
Mid Cap Index | 5,996,089 | |||
Partner Worldwide Allocation | 15,613,935 | |||
Partner All Cap | 1,189,942 | |||
Partner Growth Stock | 3,478,468 | |||
Large Cap Stock | 1,147,877 | |||
Large Cap Index | 824,413 | |||
High Yield | 72,113,357 | |||
Income | 7,649,695 | |||
Bond Index | 10,769,134 | |||
Limited Maturity Bond | 3,756,401 | |||
(J) When-Issued and Delayed Delivery Transactions – Each Portfolio may purchase or sell securities on a when-issued or delayed delivery basis. These transactions involve a commitment by a Portfolio to purchase or sell securities for a predetermined price or yield, with payment and delivery taking place beyond the customary settlement period. When delayed delivery purchases are outstanding, a Portfolio will designate liquid assets in an amount sufficient to meet the purchase price. When purchasing a security on a delayed delivery basis, a Portfolio assumes the rights and risks of ownership of the security, including the risk of price and yield fluctuations, and takes such fluctuations into account when determining its net asset value. A Portfolio may dispose of a delayed delivery transaction after it is entered into, and may sell when-issued securities before they are delivered, which may result in a capital gain or loss. When a Portfolio has sold a security on a delayed delivery basis, a Portfolio does not participate in future gains and losses with respect to the security.
(K) Treasury Inflation Protected Securities – Certain Portfolios may invest in treasury inflation protected securities (TIPS). These securities are fixed income securities whose principal value is periodically adjusted to the rate of inflation. The coupon interest rate is generally fixed at issuance. Interest is paid based on the principal value, which is adjusted for inflation. Any increase in the principal amount will be included as taxable interest in the Statement of Operations and received in cash upon maturity or sale of the security.
(L) Repurchase Agreements – Each Portfolio may engage in repurchase agreement transactions in pursuit of its investment objective. A repurchase agreement consists of a purchase and a simultaneous agreement to resell an investment for later delivery at an agreed upon price and rate of interest. The Portfolio uses a third-party custodian to maintain the collateral. If the original seller of a security subject to a repurchase agreement fails to repurchase the security at the agreed upon time, the Portfolio could incur a loss due to a drop in the value of the security during the time it takes the Portfolio to either sell the security or take action to enforce the original seller’s agreement to repurchase the security. Also, if a defaulting original seller filed for bankruptcy or became insolvent, disposition of such security might be delayed by pending legal action. The Portfolio may only enter into repurchase agreements with banks and other recognized financial institutions such as broker/dealers that are found by the Adviser or subadviser to be creditworthy. During the year ended December 31, 2016, none of the Portfolios engaged in this type of investment.
(M) Equity-Linked Structured Securities – Certain Portfolios may invest in equity-linked structured notes. Equity-linked structured notes are debt securities which combine the characteristics of common stock and the sale of an option. The return component is based upon the performance of a single equity security, a basket of equity securities, or an equity index and the sale of an option. There is no guaranteed return of principal with these securities. The appreciation potential of these securities may be limited by a maximum payment or call right and can be influenced by many unpredictable factors. In addition to the performance of the equity, the nature and credit of the issuer may also impact return. During the year ended December 31, 2016, none of the Portfolios engaged in these types of transactions.
(N) Stripped Securities – Certain Portfolios may invest in Interest Only and Principal Only stripped mortgage or asset backed securities. These securities represent a participation in securities that are structured in classes with rights to receive different portions of the interest and principal. Interest only securities receive all the interest and principal only securities receive all the principal. If the underlying pool of mortgages or assets experience greater than anticipated prepayments of principal, the Portfolio may not fully recoup its initial investment in an interest only security. Principal only securities increase in value if prepayments are greater than anticipated and decline if prepayments are slower than anticipated. The market value of these securities is highly sensitive to changes in interest rates. As interest rates increase, the price of the principal only security decreases. Similarly, as interest rates decrease, the price of the principal only security increases. The principal only security represents the payment with the longest maturity, therefore making it the most sensitive to interest rate changes.
(O) Credit Risk – The Portfolios may be susceptible to credit risk to the extent an issuer or counterparty defaults on its payment obligation. The Portfolios’ policy is to monitor the creditworthiness of issuers and counterparties. Interest receivable on defaulted securities is monitored for ability to collect payments in default and is adjusted accordingly.
(P) Accounting Estimates – The preparation of financial statements in conformity with GAAP requires management to make estimates and assumptions that affect the reported amounts of assets and liabilities and disclosure of contingent assets and liabilities at the date of the financial statements and the reported amounts of income and expenses during the reporting period. Actual results could differ from those estimates.
223
Table of Contents
THRIVENT SERIES FUND, INC.
NOTESTO FINANCIAL STATEMENTS
December 31, 2016
(Q) Loan Commitments – Certain Portfolios may enter into loan commitments, which generally have interest rates which are reset daily, monthly, quarterly or semi-annually by reference to a base lending rate, plus a premium. These base rates are primarily the London-Interbank Offered Rate (“LIBOR”), and secondarily the prime rate offered by one or more major United States banks (the “Prime Rate”) and the certificate of deposit (“CD”) rate or other base lending rates used by commercial lenders. Loan commitments often require prepayments from excess cash flows or allow the borrower to repay at its election. The rate at which the borrower repays cannot be predicted with accuracy. Therefore, the remaining maturity may be considerably less than the stated maturity shown in the Schedule of Investments.
All or a portion of these loan commitments may be unfunded. The Portfolio is obligated to fund these commitments at the borrower’s discretion. Therefore, the Portfolio must have funds sufficient to cover its contractual obligation. These unfunded loan commitments, which are marked-to-market daily, are presented in the Schedule of Investments.
(R) Loss Contingencies – Thrivent High Yield Portfolio and Thrivent Income Portfolio are defendants in an adversary action filed on July 31, 2009 by the Official Committee of Unsecured Creditors of Motors Liquidation Company, formerly known as General Motors Corporation (GM), against prior and current holders of term loan debt of GM. The suit seeks to determine whether GM’s term loan facility was secured at the time it entered bankruptcy. Thrivent High Yield Portfolio at one time held term loans in an original principal amount of at least $4,627,531 and, if the plaintiffs are successful, it is reasonably possible that the Portfolio will be required to make payments in some amount. This loss contingency has not been accrued as a liability because the amount of potential damages and the likelihood of loss cannot be reasonably estimated. Thrivent Income Portfolio is named as a defendant in this action, but management does not expect that the Portfolio’s assets will be subject to a loss contingency.
Thrivent Balanced Income Plus Portfolio (formerly known as Thrivent Balanced Portfolio) and Thrivent Large Cap Index Portfolio are defendants in two separate adversary actions: One was filed in federal court on November 1, 2010 by the Official Committee of Unsecured Creditors of Tribune Company (“Tribune”) and the other was filed in the state of Minnesota on June 2, 2011 by the successor trustees of certain series of debt securities issued by Tribune. These actions were consolidated and moved to the United States District Court of the Southern District of New York as consolidated multi-district litigation. The actions seek to determine whether stock repurchases of Tribune stock in connection with a leveraged buyout of Tribune in 2007 (the “LBO Transaction”) were fraudulent transactions that can be voided requiring repurchase payments to be returned to the Tribune bankruptcy estate. Thrivent Balanced Income Plus Portfolio and Thrivent Large Cap Index Portfolio tendered Tribune stock in the LBO Transaction in exchange for $115,600 and $219,300 respectively. The district court has dismissed the claims, but the dismissals are on appeal. If the plaintiffs are successful with their claims, it is reasonably possible that these Portfolios would be required to return payments in some amount. Management does not believe it is possible at this time to predict with any reasonable certainty the amount or probability of any potential loss.
Thrivent Mid Cap Index Portfolio is a potential defendant in an adversary action filed on October 22, 2010 by the trustee of the LB Creditor Trust. The suit seeks to determine whether certain pre-bankruptcy distributions in December 2007 by Lyondell Chemical Company (“Lyondell”) to its shareholders were fraudulent transactions that can be voided and repaid to Lyondell’s creditors. Thrivent Mid Cap Index Portfolio owned shares of Lyondell stock before the merger and on December 21, 2007 tendered its shares of Lyondell for $1,542,720. On July 27, 2016, the Southern District of New York reversed a bankruptcy court’s dismissal of the intentional fraudulent transfer count in a related adversary proceeding. The action against the Portfolio remains pending, and Management does not believe it is possible at this time to predict with any reasonable certainty the amount or probability of any potential loss.
Thrivent Opportunity Income Plus Portfolio (formerly known as Mortgage Securities Portfolio) was obligated to pay $133,203 to Lehman Brothers as of October 14, 2008. Because of the collapse of Lehman Brothers, the securities and obligations remain involved in litigation and bankruptcy proceedings. At the conclusion of legal proceedings, it is reasonably possible that Thrivent Opportunity Income Plus Portfolio could be required to pay all or a portion of the $133,203. However, it is also reasonably possible that the Portfolio would be able to offset some of this liability because of amounts owed to the Portfolio by Lehman Brothers at the time of its bankruptcy. Management does not believe it is possible at this time to predict with any reasonable certainty the amount or probability of any potential loss.
(S) Litigation – Awards from class action litigation are recorded as realized gains on payment date.
(T) Bank Loans (Leveraged Loans) – Certain Portfolios may invest in bank loans, which are senior secured loans that are made by banks or other lending institutions to companies that are typically rated below investment grade. A portfolio may invest in multiple series or tranches of a bank loan, with varying terms and different associated risks. Transactions in bank loan securities may settle on a delayed basis, which may result in the proceeds of the sale to not be readily available for a portfolio to make additional investments. Interest
224
Table of Contents
THRIVENT SERIES FUND, INC.
NOTESTO FINANCIAL STATEMENTS
December 31, 2016
rates of bank loan securities typically reset periodically, as the rates are tied a reference index, such as the London Interbank Offered Rate (“LIBOR”), plus a premium. Income is recorded daily on bank loan securities. On an ongoing basis, a portfolio may receive a commitment fee based on the undrawn portion of the underlying line of credit of the bank loan. This commitment fee is accrued as income over the term of the bank loan. A portfolio may receive consent and amendment fees for accepting an amendment to the current terms of a bank loan. Consent and amendment fees are accrued as income when the changes to the bank loan are immaterial and to capital when the changes are material.
(U) Recent Accounting Pronouncements –
Fair Value Measurement (Topic 820), Disclosure for Investments in Certain Entities That Calculate Net Asset Value per Share (or Its Equivalent).
In May 2015, the Financial Accounting Standards Board (FASB) issued Accounting Standards Update (ASU No. 2015-07, Fair Value Measurement (Topic 820), Disclosure for Investments in Certain Entities That Calculate Net Asset Value per Share (or Its Equivalent). ASU No. 2015-07 changes the disclosure requirements for investments for which fair value is measured using the net asset value per share practical expedient. The disclosure requirements are effective for annual periods beginning after December 15, 2015 and interim periods within those fiscal years. Management has evaluated the impact of this guidance and has determined there to be no impact to financial statement amounts. However, footnote disclosures related to investments valued using the net asset value per share practical expedient were increased within the Schedule of Investments Fair Valuation Measurement tables to meet the requirement of this guidance.
Investment Company Reporting Modernization.
In October 2016, the Securities and Exchange Commission (SEC) adopted new rules and forms to modernize the reporting and disclosure of information by registered investment companies. The SEC also adopted amendments to Regulation S-X, which describe the specific format and content of financial reports, to require standardized and enhanced disclosures about derivatives in investment company financial statements and other amendments. These amendments are effective August 1, 2017. At this time, management is evaluating the implications of this guidance and the impact it will have on the financial statements and footnote disclosures.
(V) Other – For financial statement purposes, investment security transactions are accounted for on the trade date. Realized gains and losses from investment transactions are determined on a specific cost identification basis, which is the same basis used for federal income tax purposes.
(3) FEES AND COMPENSATION PAID TO AFFILIATES
(A) Investment Advisory Fees – The Fund has entered into an Investment Advisory Agreement with Thrivent Financial, the Adviser. Under the Investment Advisory Agreement, each of the Portfolios pays a fee for investment advisory services. The fees are accrued daily and paid monthly. The annual rates of fees as a percent of average daily net assets under the Investment Advisory Agreement were as follows:
Portfolio (M – Millions) | $0 to $500M | Over $500 to $2,000M | Over $2,000 to $5,000M | Over $5,000 to $10,000M | Over $10,000M | |||||||||||||||
Aggressive Allocation | 0.750 | % | 0.725 | % | 0.700 | % | 0.675 | % | 0.650 | % | ||||||||||
Moderately Aggressive Allocation | 0.700 | % | 0.675 | % | 0.650 | % | 0.625 | % | 0.600 | % | ||||||||||
Moderate Allocation | 0.650 | % | 0.625 | % | 0.600 | % | 0.575 | % | 0.550 | % | ||||||||||
Moderately Conservative Allocation | 0.600 | % | 0.575 | % | 0.550 | % | 0.525 | % | 0.500 | % | ||||||||||
Portfolio (M – Millions) | $0 to $50M | Over $50 to $100M | Over $100 to $250M | Over $250M | ||||||||||||
Partner Healthcare | 0.950 | % | 0.900 | % | 0.850 | % | 0.800 | % | ||||||||
Portfolio (M – Millions) | $0 to $50M | Over $50 to $200M | Over $200 to $250M | Over $250 to $500M | Over $500 to $750M | Over $750 to $1,000M | Over $1,000 to $1,500M | Over $1,500 to $2,000M | Over $2,000 to $2,500 | Over $2,500M to $5,000M | Over $5,000M | |||||||||||||||||||||||||||||||||
Growth and Income Plus | 0.650 | % | 0.650 | % | 0.650 | % | 0.600 | % | 0.600 | % | 0.600 | % | 0.600 | % | 0.600 | % | 0.600 | % | 0.600 | % | 0.600 | % | ||||||||||||||||||||||
Balanced Income Plus | 0.550 | % | 0.550 | % | 0.550 | % | 0.550 | % | 0.500 | % | 0.500 | % | 0.475 | % | 0.475 | % | 0.475 | % | 0.450 | % | 0.425 | % | ||||||||||||||||||||||
Diversified Income Plus | 0.400 | % | 0.400 | % | 0.400 | % | 0.400 | % | 0.400 | % | 0.400 | % | 0.400 | % | 0.400 | % | 0.400 | % | 0.400 | % | 0.400 | % | ||||||||||||||||||||||
Opportunity Income Plus | 0.500 | % | 0.500 | % | 0.500 | % | 0.500 | % | 0.500 | % | 0.500 | % | 0.500 | % | 0.500 | % | 0.500 | % | 0.500 | % | 0.500 | % | ||||||||||||||||||||||
Partner Emerging Markets Equity | 1.200 | % | 1.070 | % | 1.070 | % | 1.070 | % | 1.070 | % | 1.070 | % | 1.070 | % | 1.070 | % | 1.070 | % | 1.070 | % | 1.070 | % | ||||||||||||||||||||||
225
Table of Contents
THRIVENT SERIES FUND, INC.
NOTESTO FINANCIAL STATEMENTS
December 31, 2016
Portfolio (M – Millions) | $0 to $50M | Over $50 to $200M | Over $200 to $250M | Over $250 to $500M | Over $500 to $750M | Over $750 to $1,000M | Over $1,000 to $1,500M | Over $1,500 to $2,000M | Over $2,000 to $2,500 | Over $2,500M to $5,000M | Over $5,000M | |||||||||||||||||||||||||||||||||
Real Estate Securities | 0.800 | % | 0.800 | % | 0.800 | % | 0.800 | % | 0.750 | % | 0.750 | % | 0.750 | % | 0.750 | % | 0.750 | % | 0.750 | % | 0.750 | % | ||||||||||||||||||||||
Small Cap Stock | 0.700 | % | 0.700 | % | 0.650 | % | 0.650 | % | 0.650 | % | 0.650 | % | 0.600 | % | 0.600 | % | 0.600 | % | 0.550 | % | 0.525 | % | ||||||||||||||||||||||
Small Cap Index | 0.200 | % | 0.200 | % | 0.200 | % | 0.200 | % | 0.200 | % | 0.200 | % | 0.200 | % | 0.150 | % | 0.100 | % | 0.100 | % | 0.100 | % | ||||||||||||||||||||||
Mid Cap Stock | 0.700 | % | 0.700 | % | 0.650 | % | 0.650 | % | 0.650 | % | 0.650 | % | 0.600 | % | 0.600 | % | 0.600 | % | 0.550 | % | 0.525 | % | ||||||||||||||||||||||
Mid Cap Index | 0.200 | % | 0.200 | % | 0.200 | % | 0.200 | % | 0.200 | % | 0.200 | % | 0.200 | % | 0.150 | % | 0.100 | % | 0.100 | % | 0.100 | % | ||||||||||||||||||||||
Partner Worldwide Allocation | 0.900 | % | 0.900 | % | 0.900 | % | 0.850 | % | 0.850 | % | 0.850 | % | 0.800 | % | 0.750 | % | 0.750 | % | 0.750 | % | 0.750 | % | ||||||||||||||||||||||
Partner All Cap* | 0.950 | % | 0.950 | % | 0.950 | % | 0.950 | % | 0.900 | % | 0.900 | % | 0.900 | % | 0.900 | % | 0.900 | % | 0.900 | % | 0.900 | % | ||||||||||||||||||||||
Large Cap Growth | 0.400 | % | 0.400 | % | 0.400 | % | 0.400 | % | 0.400 | % | 0.400 | % | 0.400 | % | 0.400 | % | 0.400 | % | 0.400 | % | 0.400 | % | ||||||||||||||||||||||
Partner Growth Stock* | 0.800 | % | 0.800 | % | 0.800 | % | 0.800 | % | 0.700 | % | 0.700 | % | 0.700 | % | 0.700 | % | 0.700 | % | 0.700 | % | 0.700 | % | ||||||||||||||||||||||
Large Cap Value | 0.600 | % | 0.600 | % | 0.600 | % | 0.600 | % | 0.600 | % | 0.600 | % | 0.600 | % | 0.600 | % | 0.600 | % | 0.600 | % | 0.600 | % | ||||||||||||||||||||||
Large Cap Stock | 0.650 | % | 0.650 | % | 0.650 | % | 0.650 | % | 0.575 | % | 0.550 | % | 0.475 | % | 0.475 | % | 0.475 | % | 0.450 | % | 0.425 | % | ||||||||||||||||||||||
Large Cap Index | 0.200 | % | 0.200 | % | 0.200 | % | 0.200 | % | 0.200 | % | 0.200 | % | 0.200 | % | 0.150 | % | 0.100 | % | 0.100 | % | 0.100 | % | ||||||||||||||||||||||
High Yield | 0.400 | % | 0.400 | % | 0.400 | % | 0.400 | % | 0.400 | % | 0.400 | % | 0.400 | % | 0.400 | % | 0.400 | % | 0.400 | % | 0.400 | % | ||||||||||||||||||||||
Income | 0.400 | % | 0.400 | % | 0.400 | % | 0.400 | % | 0.400 | % | 0.400 | % | 0.400 | % | 0.400 | % | 0.400 | % | 0.400 | % | 0.400 | % | ||||||||||||||||||||||
Bond Index | 0.350 | % | 0.350 | % | 0.350 | % | 0.300 | % | 0.250 | % | 0.250 | % | 0.200 | % | 0.150 | % | 0.100 | % | 0.100 | % | 0.100 | % | ||||||||||||||||||||||
Limited Maturity Bond | 0.400 | % | 0.400 | % | 0.400 | % | 0.400 | % | 0.400 | % | 0.400 | % | 0.400 | % | 0.400 | % | 0.400 | % | 0.400 | % | 0.400 | % | ||||||||||||||||||||||
Money Market | 0.350 | % | 0.350 | % | 0.350 | % | 0.350 | % | 0.350 | % | 0.350 | % | 0.350 | % | 0.350 | % | 0.350 | % | 0.350 | % | 0.350 | % | ||||||||||||||||||||||
| * | Effective January 1, 2017, the fees payable for investment advisory services are 0.650% for the first $500 million and 0.600% for assets over $500 million. |
(B) Sub-Adviser Fees – The following subadvisory fees are charged as part of the total investment advisory fees stated in the table above. The subadvisory fees are borne directly by the Adviser and do not increase the overall fees paid by the Portfolio. The amounts listed as subadviser fees in the Statement of Operations is the portion of the investment advisory fee that is paid to the subadviser. The amount listed as adviser fees in the Statement of Operations is the portion of the investment advisory fee that is retained by the investment adviser.
Partner Healthcare Portfolio
The Adviser has entered into a subadvisory agreement with Sectoral Asset Management, Inc. for the performance of subadvisory services. The fee payable is equal to 0.65% of the first $50 million of average daily net assets, 0.60% of the next $50 million, 0.40% of the next $150 million and 0.35% of average daily net assets over $250 million.
Partner Emerging Markets Equity Portfolio
The Adviser has entered into a subadvisory agreement with Aberdeen Asset Managers Limited (“Aberdeen”) for the performance of subadvisory services. The fee payable is equal to 0.85% of the first $50 million of average daily net assets, 0.72% of the next $50 million and 0.68% of average daily net assets over $100 million. Thrivent Partner Worldwide Allocation Portfolio, Thrivent Partner Emerging Markets Equity Fund and Thrivent Partner Worldwide Allocation Fund are included in determining breakpoints for the assets managed by Aberdeen. Thrivent Partner Emerging Markets Equity Fund and Thrivent Partner Worldwide Allocation Fund are presented under a separate shareholder report.
Partner Worldwide Allocation Portfolio
The Adviser has entered into subadvisory agreements with Principal Global Investors, LLC (“Principal”), Aberdeen Asset Managers Limited (“Aberdeen”), and Goldman Sachs Asset Mangement, LP (“GSAM”) for the performance of subadvisory services.
The fee payable for Principal is equal to 0.35% of the first $500 million of average daily net assets managed by Principal, 0.30% of the next $500 million and 0.25% of average daily net assets over $1 billion. Thrivent Partner Worldwide Allocation Fund (presented under a separate shareholder report) is included in determining breakpoints for the assets managed by Principal.
The fee payable for Aberdeen is equal to 0.85% of the first $50 million of average daily net assets managed by Aberdeen, 0.72% of the next $50 million and 0.68% of average daily net assets over $100 million. Thrivent Partner Emerging Markets Equity Portfolio, Partner Emerging Markets Equity Fund and Partner Worldwide Allocation Fund are included in determining breakpoints for the assets managed by Aberdeen. Partner Emerging Markets Equity Fund and Partner Worldwide Allocation Fund are presented under a separate shareholder report.
The fee payable for GSAM for managing the emerging markets debt portion is equal to 0.50% of the first $200 million of average daily net assets, 0.45% of the next $200 million and 0.40% of average daily net assets over $400 million. The fee payable for GSAM for managing the international small- and mid-cap equities portion is equal to 0.58% of the first $250 million of average daily net assets; and 0.54% of average daily net assets in excess of $250 million. Thrivent Partner Worldwide Allocation Fund (presented under a separate shareholder report) is included in determining breakpoints for the assets managed by GSAM.
226
Table of Contents
THRIVENT SERIES FUND, INC.
NOTESTO FINANCIAL STATEMENTS
December 31, 2016
Effective February 22, 2016, the Adviser terminated the subadvisory agreements with Mercator Asset Management, LP (“Mercator”). For the period January 1, 2016 until termination, the fee payable for Mercator was equal to 0.70% of the first $25 million of average daily net assets managed by Mercator, 0.60% of the next $25 million, 0.50% of the next $250 million, 0.40% of the next $200 million and 0.20% of average daily net assets over $500 million. Thrivent Partner Worldwide Allocation Fund (presented under a separate shareholder report) was included in determining breakpoints for the assets managed by Mercator.
Partner All Cap Portfolio
The Adviser has entered into a subadvisory agreement with FIAM, LLC (“FIAM”) for the performance of subadvisory services. FIAM is a wholly owned subsidiary of Fidelity Management & Research Corporation. The fee payable is equal to 0.60% of average daily net assets for the first $100 million, 0.55% for the next $400 million, 0.50% for the next $250 million and 0.45% for assets over $750 million.
Partner Growth Stock Portfolio
The Adviser has entered into a subadvisory agreement with T. Rowe Price Associates, Inc. for the performance of subadvisory services. The fee payable is equal to 0.40% of average daily net assets for the first $500 million and 0.35% for assets over $500 million.
| (C) | Expense Reimbursements – For the period ended December 31, 2016, voluntarily expense reimbursements, as a percentage of net assets, were in effect: |
Portfolio | Expense Reimbursement | Expiration Date | ||||||
Partner Healthcare | 0.07 | % | N/A | |||||
Money Market* | 0.01 | % | N/A | |||||
| * | Thrivent Financial has voluntarily agreed to reimburse certain portfolio level expenses to the extent necessary in order to maintain a minimum annualized net yield of 0.00%. |
For the period ended December 31, 2016, contractual expense reimbursements to limit expenses to the following percentages were in effect:
Portfolio | Expense Limit | Expiration Date | ||||||
Growth and Income Plus | 0.80 | % | 4/30/2017 | |||||
Partner Healthcare1 | 0.95 | % | 4/30/2017 | |||||
Partner Emerging Markets Equity2 | 1.30 | % | 4/30/2017 | |||||
Partner All Cap3 | 0.85 | % | 4/30/2017 | |||||
Partner Growth Stock4 | 0.80 | % | 4/30/2017 | |||||
| 1 | Prior contractual expense cap of 1.10% expired on April 30, 2016. |
| 2 | Prior contractual expense cap of 1.40% expired on April 30, 2016. |
| 3 | Prior contractual expense cap of 0.90% expired on April 30, 2016. |
| 4 | Prior contractual expense cap of 0.85% expired on April 30, 2016. |
The four Asset Allocation Portfolios paid one fee for investment advisory services. The Adviser has contractually agreed, for as long as the current fee structure is in place, to waive an amount equal to any investment advisory fees indirectly incurred by the Asset Allocation Portfolios as a result of their investment in any other mutual fund for which the Adviser or an affiliate serves as investment adviser, other than Thrivent Cash Management Trust. This contractual provision may be terminated upon the mutual agreement between the Independent Directors of the Portfolio and the Adviser. For the period ended December 31, 2016, the following expense reimbursements, as a percentage of net assets, were in effect:
Portfolio | Expense Reimbursement | Expiration Date | ||||||
Aggressive Allocation | 0.21 | % | N/A | |||||
Moderately Aggressive Allocation | 0.22 | % | N/A | |||||
Moderate Allocation | 0.16 | % | N/A | |||||
Moderately Conservative Allocation | 0.12 | % | N/A | |||||
Expense reimbursements are accrued daily and paid by Thrivent Financial monthly. Thrivent does not recoup amounts previously reimbursed or waived in prior fiscal years.
(D) Other Expenses – The Fund has entered into an accounting and administrative services agreement with the Adviser to provide certain accounting and administrative personnel and services to the Portfolios. The Portfolios pay an annual fixed fee per portfolio plus a certain percentage of net assets to Thrivent Financial. These fees are accrued daily and paid monthly. For the year ended December 31, 2016, the Adviser received aggregate fees for accounting and administrative personnel and services of $7,871,963 from the Fund.
Each Director who is not affiliated with the Adviser receives an annual fee from the Fund for services as a Director and is eligible to participate in a deferred compensation plan with respect to fees received from the Portfolios. Participants in the plan may designate their deferred Director’s fees as if invested in any one of the portfolios of the Fund. The value of each Director’s deferred compensation account will increase or decrease as if it were invested in shares of the selected portfolios of the Fund. Their fees as well as the change in value are included in Director’s fees in the Statement of Operations. The deferred fees remain in the appropriate fund until distribution in accordance with the plan. The Payable for director deferred compensation, located in the Statement of Assets and Liabilities, is unsecured.
Those Directors not participating in the above plan received $540,805 in fees from the Fund for the year ended December 31, 2016. In addition, the Fund reimbursed independent Directors for reasonable expenses incurred in relation to attendance at the meetings and industry conferences.
227
Table of Contents
THRIVENT SERIES FUND, INC.
NOTESTO FINANCIAL STATEMENTS
December 31, 2016
Certain officers and non-independent directors of the Fund are officers and directors of Thrivent Financial and Thrivent Life; however, they receive no compensation from the Fund.
(E) Indirect Expenses – Some Portfolios invest in other open-ended funds. Fees and expenses of those underlying funds are not included in those Portfolios’ expense ratios. The Portfolios indirectly bear their proportionate share of the annualized weighted average expense ratio of the underlying funds in which they invest. The contractual provision may be terminated upon the mutual agreement between the Independent Directors of the Fund and the Adviser.
(4) TAX INFORMATION
Distributions are based on amounts calculated in accordance with applicable federal income tax regulations, which may differ from GAAP. To the extent that these differences are permanent in nature, such amounts are reclassified within the capital accounts based on their federal tax-basis treatment; temporary differences do not require reclassifications.
On the Statement of Assets and Liabilities, as a result of permanent book-to-tax differences, reclassification adjustments were made as follows [Increase/(Decrease)]:
Portfolio | Accumulated Undistributed Net Investment Income/(Loss) | Accumulated Undistributed Net Realized Gain/(Loss) | Capital Stock | |||||||||
Aggressive Allocation | $ | 53,612 | $ | (52,155 | ) | $ | (1,457 | ) | ||||
Moderately Aggressive Allocation | 242,178 | (238,482 | ) | (3,696 | ) | |||||||
Moderate Allocation | 123,406 | (120,135 | ) | (3,271 | ) | |||||||
Moderately Conservative Allocation | (143,858 | ) | 144,643 | (785 | ) | |||||||
Growth and Income Plus | (6,457 | ) | 6,933 | (476 | ) | |||||||
Balanced Income Plus | (239,616 | ) | 241,680 | (2,064 | ) | |||||||
Diversified Income Plus | 93,228 | (92,026 | ) | (1,202 | ) | |||||||
Opportunity Income Plus | (49,512 | ) | 49,512 | — | ||||||||
Partner Healthcare | (47,225 | ) | 47,225 | — | ||||||||
Partner Emerging Markets Equity | 6,377 | (6,377 | ) | — | ||||||||
Real Estate Securities | (177,171 | ) | 177,171 | — | ||||||||
Small Cap Stock | (444,591 | ) | 454,828 | (10,237 | ) | |||||||
Small Cap Index | (20,359 | ) | 20,359 | — | ||||||||
Mid Cap Stock | 440,511 | (440,511 | ) | — | ||||||||
Mid Cap Index | (2,718 | ) | 2,718 | — | ||||||||
Partner Worldwide Allocation | 1,669,075 | 118,326,410 | (119,995,485 | ) | ||||||||
Partner All Cap | (35,043 | ) | 35,043 | — | ||||||||
Large Cap Growth | 9,574 | (9,574 | ) | — | ||||||||
Partner Growth Stock | (140 | ) | 36,757 | (36,617 | ) | |||||||
Large Cap Value | 229,314 | (229,296 | ) | (18 | ) | |||||||
Large Cap Stock | 549,646 | (549,639 | ) | (7 | ) | |||||||
Large Cap Index | (198,516 | ) | 198,516 | — | ||||||||
High Yield | 29,329 | 24,424,876 | (24,454,205 | ) | ||||||||
Income | (260,945 | ) | 260,945 | — | ||||||||
Limited Maturity Bond | (26,935 | ) | 26,935 | — | ||||||||
At December 31, 2016, the components of distributable earnings on a tax basis were as follows:
Portfolio | Undistributed Ordinary Income# | Undistributed Long- Term Capital Gain | ||||||
Aggressive Allocation | $ | 10,155,073 | $ | 4,412,939 | ||||
Moderately Aggressive Allocation | 80,836,958 | 30,115,350 | ||||||
Moderate Allocation | 167,015,092 | 45,859,320 | ||||||
Moderately Conservative Allocation | 104,817,134 | 29,404,003 | ||||||
Growth and Income Plus | 1,768,165 | — | ||||||
Balanced Income Plus | 9,469,074 | — | ||||||
Diversified Income Plus | 18,897,195 | — | ||||||
Opportunity Income Plus | 54,004 | — | ||||||
Partner Healthcare | 494,439 | — | ||||||
Partner Emerging Markets Equity | 507,471 | — | ||||||
Real Estate Securities | 3,093,846 | 102,327 | ||||||
Small Cap Stock | 6,442,665 | 28,108,980 | ||||||
Small Cap Index | 6,340,623 | 22,939,681 | ||||||
Mid Cap Stock | 27,363,056 | 104,409,415 | ||||||
Mid Cap Index | 3,794,965 | 10,122,296 | ||||||
Partner Worldwide Allocation | 39,560,062 | — | ||||||
Partner All Cap | 532,369 | — | ||||||
Large Cap Growth | 359,507 | 245,016 | ||||||
Partner Growth Stock | 141,063 | 1,567,456 | ||||||
Large Cap Value | 20,291,913 | 39,617,628 | ||||||
Large Cap Stock | 12,920,508 | 6,077,664 | ||||||
Large Cap Index | 12,378,014 | 3,934,410 | ||||||
High Yield | 535,229 | — | ||||||
Income | 3,588,320 | — | ||||||
Bond Index | 67,881 | — | ||||||
Limited Maturity Bond | 415,198 | — | ||||||
| # | Undistributed ordinary income may include income derived from short-term capital gains. |
228
Table of Contents
THRIVENT SERIES FUND, INC.
NOTESTO FINANCIAL STATEMENTS
December 31, 2016
At December 31, 2016, the following Portfolios had accumulated net realized capital loss carryovers expiring as follows:
Portfolio | Capital Loss Carryover | Expiration Year | ||||||
Thrivent Growth and Income Plus | $ | 1,817,291 | Unlimited | |||||
|
| |||||||
Balanced Income Plus | 2,611,044 | Unlimited | ||||||
|
| |||||||
Diversified Income Plus | 6,563,478 | Unlimited | ||||||
|
| |||||||
Opportunity Income Plus | 2,193,301 | Unlimited | ||||||
|
| |||||||
Partner Healthcare | 24,455,561 | Unlimited | ||||||
|
| |||||||
Partner Emerging Markets | 691,268 | Unlimited | ||||||
|
| |||||||
Partner Worldwide Allocation | 50,597,027 | Unlimited | ||||||
|
| |||||||
Partner All Cap | 660,843 | Unlimited | ||||||
|
| |||||||
High Yield | 46,838,004 | 2017 | ||||||
| 28,031,031 | Unlimited | |||||||
|
| |||||||
| 74,869,035 | ||||||||
|
| |||||||
Bond Index | 785,175 | Unlimited | ||||||
|
| |||||||
Limited Maturity Bond | 4,353,022 | 2017 | ||||||
|
| |||||||
Money Market | 2,844 | Unlimited | ||||||
|
| |||||||
To the extent that these Portfolios realize future net capital gains, taxable distributions will be reduced by any unused capital loss carryovers as permitted by the Internal Revenue Code. Unlimited capital loss carryovers will be utilized before capital loss carryovers with expiration dates.
In addition to the capital loss carryovers noted above, $119,995,485 and $24,454,205 in Partner Worldwide Allocation Portfolio and High Yield Portfolio respectively, expired during the fiscal year 2016.
During the fiscal year 2016, capital loss carryovers utilized by the Portfolios were as follows:
Portfolio | Capital Loss Carryover | |||
Partner Emerging Markets Equity | $ | 534,640 | ||
Large Cap Stock | 15,169,108 | |||
Limited Maturity Bond | 291,821 | |||
The tax character of distributions paid during the years ended December 31, 2016 and 2015 was as follows:
| Ordinary Incomea | Long-Term Capital Gain | |||||||||||||||
Portfolio | 12/31/16 | 12/31/15 | 12/31/16 | 12/31/15 | ||||||||||||
Aggressive Allocation | $ | 11,455,287 | $ | 20,847,112 | $ | 52,131,486 | $ | 53,446,651 | ||||||||
Moderately Aggressive Allocation | 71,972,085 | 118,236,201 | 205,042,436 | 166,048,750 | ||||||||||||
Moderate Allocation | 149,917,958 | 233,639,585 | 226,127,215 | 237,675,744 | ||||||||||||
Moderately Conservative Allocation | 74,694,401 | 107,521,545 | 49,387,817 | 66,736,835 | ||||||||||||
Growth and Income Plus | 1,812,791 | 3,314,826 | 1,403,976 | 1,658,511 | ||||||||||||
Balanced Income Plus | 8,280,417 | 12,159,888 | 11,442,058 | 5,301,647 | ||||||||||||
Diversified Income Plus | 17,529,531 | 17,973,443 | 1,400,147 | 6,562,694 | ||||||||||||
Opportunity Income Plus | 3,939,453 | 2,967,738 | — | — | ||||||||||||
Partner Healthcare | 9,575,755 | 4,928,752 | 4,950,825 | 4,103,739 | ||||||||||||
Partner Emerging Markets Equity | 510,872 | 580,153 | — | — | ||||||||||||
Real Estate Securities | 2,477,260 | 2,532,458 | 660,933 | 5,969,645 | ||||||||||||
Small Cap Stock | 1,427,353 | 9,695,095 | 20,830,835 | 31,666,905 | ||||||||||||
Small Cap Index | 3,163,365 | 2,834,335 | 22,575,194 | 18,733,913 | ||||||||||||
Mid Cap Stock | 4,831,544 | 16,535,329 | 131,855,876 | 69,552,232 | ||||||||||||
Mid Cap Index | 2,027,771 | 1,772,997 | 11,127,308 | 6,867,005 | ||||||||||||
Partner Worldwide Allocation | 35,720,547 | 41,262,492 | — | — | ||||||||||||
Partner All Cap | 1,893,730 | 3,491,549 | 2,421,187 | 4,966,928 | ||||||||||||
Large Cap Growth | 5,522,479 | 4,480,734 | 85,392,249 | — | ||||||||||||
Partner Growth Stock | — | 410,740 | 5,258,920 | 8,541,198 | ||||||||||||
Large Cap Value | 16,286,358 | 15,306,586 | 70,697,664 | 35,220,436 | ||||||||||||
Large Cap Stock | 10,892,157 | 10,870,927 | — | 63,047,248 | ||||||||||||
Large Cap Index | 11,009,369 | 7,189,484 | 3,633,891 | 1,775,787 | ||||||||||||
High Yield | 42,506,756 | 48,028,166 | — | — | ||||||||||||
Income | 48,254,930 | 54,155,618 | 1,034,971 | 27,249,589 | ||||||||||||
Bond Index | 3,058,253 | 2,744,084 | 352,623 | — | ||||||||||||
Limited Maturity Bond | 16,476,116 | 16,313,198 | — | — | ||||||||||||
| (a) | Ordinary income includes income derived from short-term capital gains, if any. |
229
Table of Contents
THRIVENT SERIES FUND, INC.
NOTESTO FINANCIAL STATEMENTS
December 31, 2016
(5) SECURITY TRANSACTIONS
(A) Purchases and Sales of Investment Securities – For the year ended December 31, 2016, the cost of purchases and the proceeds from sales of investment securities, other than U.S. Government and short-term securities, were as follows:
| In thousands | ||||||||
Portfolio | Purchases | Sales | ||||||
Aggressive Allocation | $ | 397,882 | $ | 429,915 | ||||
Moderately Aggressive Allocation | 1,812,004 | 1,954,797 | ||||||
Moderate Allocation | 2,933,147 | 3,190,042 | ||||||
Moderately Conservative Allocation | 1,276,234 | 1,160,703 | ||||||
Growth and Income Plus | 68,254 | 64,188 | ||||||
Balanced Income Plus | 237,960 | 221,908 | ||||||
Diversified Income Plus | 340,268 | 299,710 | ||||||
Opportunity Income Plus | 86,313 | 53,454 | ||||||
Partner Healthcare | 180,811 | 171,513 | ||||||
Partner Emerging Markets Equity | 11,779 | 3,673 | ||||||
Real Estate Securities | 46,989 | 28,207 | ||||||
Small Cap Stock | 239,450 | 251,466 | ||||||
Small Cap Index | 114,088 | 64,443 | ||||||
Mid Cap Stock | 267,829 | 439,384 | ||||||
Mid Cap Index | 108,705 | 39,783 | ||||||
Partner Worldwide Allocation | 1,794,823 | 1,752,238 | ||||||
Partner All Cap | 60,929 | 56,347 | ||||||
Large Cap Growth | 653,741 | 712,666 | ||||||
Partner Growth Stock | 59,211 | 48,918 | ||||||
Large Cap Value | 263,956 | 255,534 | ||||||
Large Cap Stock | 518,857 | 486,242 | ||||||
Large Cap Index | 131,082 | 15,393 | ||||||
High Yield | 335,441 | 271,824 | ||||||
Income | 617,702 | 594,861 | ||||||
Bond Index | 14,128 | 8,600 | ||||||
Limited Maturity Bond | 254,615 | 188,681 | ||||||
Purchases and Sales of U.S. Government Securities were:
| In thousands | ||||||||
Portfolio | Purchases | Sales | ||||||
Aggressive Allocation | $ | 180,959 | $ | 165,885 | ||||
Moderately Aggressive Allocation | 3,190,471 | 3,071,396 | ||||||
Moderate Allocation | 10,409,455 | 10,115,210 | ||||||
Moderately Conservative Allocation | 7,649,129 | 7,365,476 | ||||||
Growth and Income Plus | 37,154 | 36,544 | ||||||
Balanced Income Plus | 231,560 | 222,808 | ||||||
Diversified Income Plus | 228,027 | 200,622 | ||||||
Opportunity Income Plus | 177,491 | 168,656 | ||||||
Partner Worldwide Allocation | 43,719 | 49,876 | ||||||
Income | 904,853 | 875,719 | ||||||
Bond Index | 660,748 | 626,240 | ||||||
Limited Maturity Bond | 294,675 | 300,853 | ||||||
(B) Investments in Restricted Securities – Certain Portfolios may own restricted securities which were purchased in private placement transactions without registration under the Securities Act of 1933. Unless such securities subsequently become registered, they generally may be resold only in privately negotiated transactions with a limited number of purchasers. As of December 31, 2016, the following Portfolios held restricted securities:
Portfolio | Number of Securities | Percent of Portfolio’s Net Assets | ||||||
Moderately Aggressive Allocation | 46 | 0.64 | % | |||||
Moderate Allocation | 48 | 1.20 | % | |||||
Moderately Conservative Allocation | 47 | 1.52 | % | |||||
Growth and Income Plus | 4 | 0.19 | % | |||||
Balanced Income Plus | 16 | 1.09 | % | |||||
Diversified Income Plus | 19 | 2.57 | % | |||||
Opportunity Income Plus | 19 | 2.17 | % | |||||
Partner Worldwide Allocation | 14 | 0.34 | % | |||||
High Yield | 10 | 1.90 | % | |||||
Income | 6 | 0.80 | % | |||||
Bond Index | 4 | 0.73 | % | |||||
Limited Maturity Bond | 30 | 10.05 | % | |||||
The Portfolios have no right to require registration of unregistered securities.
(C) Investments in High-Yielding Securities – High Yield Portfolio invests primarily in high-yielding fixed income securities. Each of the other Portfolios, except the Money Market Portfolio, may also invest in high-yielding securities. These securities will typically be in the lower rating categories or will be non-rated and generally will involve more risk than securities in the higher rating categories. Lower rated or unrated securities (e.g., junk bonds) are more likely to react to developments affecting market risk and credit risk than are more highly rated securities, which react primarily to movements in the general level of interest rates.
(D) Investments in Options and Futures Contracts – The movement in the price of the security underlying an option or futures contract may not correlate perfectly with the movement in the prices of the portfolio securities being hedged. A lack of correlation could render the Portfolio’s hedging strategy unsuccessful and could result in a loss to the Portfolio. In the event that a liquid secondary market would not exist, the Portfolio could be prevented from entering into a closing transaction, which could result in additional losses to the Portfolio.
(E) Written Option Contracts – During the year ended December 31, 2016, none of the Portfolios engaged in these types of investments.
(6) SECURITY TRANSACTIONS WITH AFFILIATED FUNDS
The Portfolios are permitted to purchase or sell securities from or to certain other Portfolios or affiliated Funds under specified conditions outlined in procedures adopted by the Board. The procedures have been designed to ensure that any purchase or sale of securities by a Portfolio from or to another Portfolio or Fund that is or could be considered an affiliate by virtue of having a common investment adviser (or affiliated investment advisers), common directors and/ or common officers complies with Rule 17a-7 of the 1940 Act. Further, as defined under the procedures, each transaction is executed at the current market price.
230
Table of Contents
THRIVENT SERIES FUND, INC.
NOTESTO FINANCIAL STATEMENTS
December 31, 2016
During the period ended December 31, 2016, the following Portfolios engaged in purchase transactions that complied with Rule 17a-7 of the 1940 Act.
Portfolio | Purchase Amount | |||
Moderately Conservative | $ | 91,060,275 | ||
Opportunity Income Plus | 1,282,231 | |||
Mid Cap Index | 13,342,731 | |||
Large Cap Index | 5,204,456 | |||
During the period ended December 31, 2016, the following Portfolios engaged in sale transactions that complied with Rule 17a-7 of the 1940 Act.
Portfolio | Sales Proceeds | Realized Gain/(Loss) | ||||||
Diversified Income Plus | $ | 2,992,366 | $ | (43,597 | ) | |||
Small Cap Index | 12,555,564 | 3,234,123 | ||||||
Mid cap Index | 6,942,247 | 1,802,467 | ||||||
(7) SHARES OF BENEFICIAL INTEREST
The shares of each Portfolio have equal rights and privileges with all shares of that Portfolio. Shares in the Portfolio are currently sold only to separate accounts of Thrivent Financial, Thrivent Life and retirement plans sponsored by Thrivent Financial.
As of December 31, 2016, authorized capital stock consists of ten billion shares as follows:
Portfolio | Shares Authorized | Par Value | ||||||
Aggressive Allocation | 350,000,000 | $ | 0.01 | |||||
Moderately Aggressive Allocation | 700,000,000 | 0.01 | ||||||
Moderate Allocation | 1,200,000,000 | 0.01 | ||||||
Moderately Conservative Allocation | 800,000,000 | 0.01 | ||||||
Growth and Income Plus | 200,000,000 | 0.01 | ||||||
Balanced Income Plus | 200,000,000 | 0.01 | ||||||
Diversified Income Plus | 250,000,000 | 0.01 | ||||||
Opportunity Income Plus | 50,000,000 | 0.01 | ||||||
Partner Healthcare | 50,000,000 | 0.01 | ||||||
Partner Emerging Markets Equity | 100,000,000 | 0.01 | ||||||
Real Estate Securities | 100,000,000 | 0.01 | ||||||
Small Cap Stock | 200,000,000 | 0.01 | ||||||
Small Cap Index | 200,000,000 | 0.01 | ||||||
Mid Cap Stock | 200,000,000 | 0.01 | ||||||
Mid Cap Index | 200,000,000 | 0.01 | ||||||
Partner Worldwide Allocation | 700,000,000 | 0.01 | ||||||
Partner All Cap | 100,000,000 | 0.01 | ||||||
Large Cap Growth | 300,000,000 | 0.01 | ||||||
Partner Growth Stock | 50,000,000 | 0.01 | ||||||
Large Cap Value | 200,000,000 | 0.01 | ||||||
Large Cap Stock | 400,000,000 | 0.01 | ||||||
Large Cap Index | 200,000,000 | 0.01 | ||||||
High Yield | 350,000,000 | 0.01 | ||||||
Income | 300,000,000 | 0.01 | ||||||
Bond Index | 200,000,000 | 0.01 | ||||||
Limited Maturity Bond | 450,000,000 | 0.01 | ||||||
Money Market | 1,200,000,000 | 0.01 | ||||||
(8) MONEY MARKET FUND REGULATORY REFORM
On July 23, 2014, the Securities and Exchange Commission adopted amendments to Rule 2a-7 under the Investment Company Act of 1940 - which is the primary rule governing the operation of money market portfolios. In connection with the amendments to Rule 2a-7, the Board of Directors of Thrivent Money Market Portfolio (the “Portfolio”) approved changes to the Portfolio’s principal investment strategies to allow the Portfolio to qualify and begin operating as a “government money market portfolio,” effective February 1, 2016. As such, the Portfolio invests at least 99.5% of its total assets in government securities, cash, and repurchase agreements collateralized fully by government securities or cash.
(9) SUBSEQUENT EVENTS
Management of the Portfolios has evaluated the impact of subsequent events through February 20, 2017, and, except as already included in the Notes to Financial Statements, has determined that no additional items require disclosure.
(10) MARKET RISK
Over time, securities markets generally tend to move in cycles with periods when security prices rise and periods when security prices decline. The value of a Portfolio’s investments may move with these cycles and, in some instances, increase or decrease more than the applicable market(s) as measured by the Portfolio’s benchmark index(es). The securities markets may also decline because of factors that affect a particular industry. As of December 31, 2016, the following Portfolios had portfolio concentration greater than 25% in certain market sectors.
Portfolio | Sector | % Total Net Assets | ||||
Partner Emerging Markets Equity | Financials | 28.6 | % | |||
Large Cap Growth | Information Technology | 42.4 | % | |||
Partner Growth Stock | Consumer Discretionary | 26.5 | % | |||
Partner Growth Stock | Information Technology | 36.0 | % | |||
Large Cap Value | Financials | 27.8 | % | |||
Income | Financials | 28.6 | % | |||
Bond Index | Mortgage-Backed | 27.3 | % | |||
Bond Index | U.S. Govt. & Agencies | 43.8 | % | |||
231
Table of Contents
THRIVENT SERIES FUND, INC.
| FOR A SHARE OUTSTANDING THROUGHOUT EACH PERIOD * | ||||||||||||||||||||||||
| Income From Investment Operations | Less Distributions From | |||||||||||||||||||||||
| Net Asset Value, Beginning of Period | Net Investment Income/ (Loss) | Net Realized and Unrealized Gain/(Loss) on Investments(a) | Total from Investment Operations | Net Investment Income | Net Realized Gain on Investments | |||||||||||||||||||
AGGRESSIVE ALLOCATION PORTFOLIO |
| |||||||||||||||||||||||
Year Ended 12/31/2016 | $ | 14.19 | $ | 0.12 | $ | 1.19 | $ | 1.31 | $ | (0.14 | ) | $ | (0.78 | ) | ||||||||||
Year Ended 12/31/2015 | 15.44 | 0.10 | (0.13 | ) | (0.03 | ) | (0.16 | ) | (1.06 | ) | ||||||||||||||
Year Ended 12/31/2014 | 15.04 | 0.10 | 0.80 | 0.90 | (0.07 | ) | (0.43 | ) | ||||||||||||||||
Year Ended 12/31/2013 | 12.15 | 0.07 | 3.17 | 3.24 | (0.17 | ) | (0.18 | ) | ||||||||||||||||
Year Ended 12/31/2012 | 11.40 | 0.17 | 1.18 | 1.35 | (0.08 | ) | (0.52 | ) | ||||||||||||||||
MODERATELY AGGRESSIVE ALLOCATION PORTFOLIO |
| |||||||||||||||||||||||
Year Ended 12/31/2016 | 13.77 | 0.19 | 1.14 | 1.33 | (0.20 | ) | (0.58 | ) | ||||||||||||||||
Year Ended 12/31/2015 | 14.72 | 0.17 | (0.26 | ) | (0.09 | ) | (0.19 | ) | (0.67 | ) | ||||||||||||||
Year Ended 12/31/2014 | 14.37 | 0.16 | 0.71 | 0.87 | (0.13 | ) | (0.39 | ) | ||||||||||||||||
Year Ended 12/31/2013 | 12.31 | 0.12 | 2.44 | 2.56 | (0.20 | ) | (0.30 | ) | ||||||||||||||||
Year Ended 12/31/2012 | 11.19 | 0.21 | 1.21 | 1.42 | (0.14 | ) | (0.16 | ) | ||||||||||||||||
MODERATE ALLOCATION PORTFOLIO |
| |||||||||||||||||||||||
Year Ended 12/31/2016 | 13.09 | 0.24 | 0.88 | 1.12 | (0.23 | ) | (0.34 | ) | ||||||||||||||||
Year Ended 12/31/2015 | 13.90 | 0.21 | (0.26 | ) | (0.05 | ) | (0.21 | ) | (0.55 | ) | ||||||||||||||
Year Ended 12/31/2014 | 13.63 | 0.18 | 0.62 | 0.80 | (0.16 | ) | (0.37 | ) | ||||||||||||||||
Year Ended 12/31/2013 | 12.28 | 0.16 | 1.66 | 1.82 | (0.20 | ) | (0.27 | ) | ||||||||||||||||
Year Ended 12/31/2012 | 11.25 | 0.20 | 1.10 | 1.30 | (0.19 | ) | (0.08 | ) | ||||||||||||||||
MODERATELY CONSERVATIVE ALLOCATION PORTFOLIO |
| |||||||||||||||||||||||
Year Ended 12/31/2016 | 12.27 | 0.24 | 0.63 | 0.87 | (0.22 | ) | (0.14 | ) | ||||||||||||||||
Year Ended 12/31/2015 | 12.89 | 0.20 | (0.24 | ) | (0.04 | ) | (0.23 | ) | (0.35 | ) | ||||||||||||||
Year Ended 12/31/2014 | 12.71 | 0.23 | 0.43 | 0.66 | (0.20 | ) | (0.28 | ) | ||||||||||||||||
Year Ended 12/31/2013 | 12.07 | 0.20 | 0.87 | 1.07 | (0.19 | ) | (0.24 | ) | ||||||||||||||||
Year Ended 12/31/2012 | 11.28 | 0.18 | 0.89 | 1.07 | (0.19 | ) | (0.09 | ) | ||||||||||||||||
GROWTH AND INCOME PLUS PORTFOLIO |
| |||||||||||||||||||||||
Year Ended 12/31/2016 | 9.97 | 0.20 | 0.44 | 0.64 | (0.23 | ) | (0.18 | ) | ||||||||||||||||
Year Ended 12/31/2015 | 10.72 | 0.24 | (0.32 | ) | (0.08 | ) | (0.23 | ) | (0.44 | ) | ||||||||||||||
Year Ended 12/31/2014 | 11.66 | 0.18 | 0.09 | 0.27 | (0.30 | ) | (0.91 | ) | ||||||||||||||||
Year Ended 12/31/2013 | 9.82 | 0.33 | 1.74 | 2.07 | (0.23 | ) | — | |||||||||||||||||
Year Ended 12/31/2012 | 8.81 | 0.24 | 0.91 | 1.15 | (0.14 | ) | — | |||||||||||||||||
BALANCED INCOME PLUS PORTFOLIO |
| |||||||||||||||||||||||
Year Ended 12/31/2016 | 14.03 | 0.37 | 0.57 | 0.94 | (0.37 | ) | (0.51 | ) | ||||||||||||||||
Year Ended 12/31/2015 | 14.87 | 0.38 | (0.38 | ) | 0.00 | (0.32 | ) | (0.52 | ) | |||||||||||||||
Year Ended 12/31/2014 | 17.28 | 0.33 | 0.67 | 1.00 | (0.28 | ) | (3.13 | ) | ||||||||||||||||
Year Ended 12/31/2013 | 15.42 | 0.30 | 2.42 | 2.72 | (0.31 | ) | (0.55 | ) | ||||||||||||||||
Year Ended 12/31/2012 | 14.48 | 0.33 | 1.42 | 1.75 | (0.34 | ) | (0.47 | ) | ||||||||||||||||
DIVERSIFIED INCOME PLUS PORTFOLIO |
| |||||||||||||||||||||||
Year Ended 12/31/2016 | 7.53 | 0.25 | 0.27 | 0.52 | (0.27 | ) | (0.02 | ) | ||||||||||||||||
Year Ended 12/31/2015 | 7.94 | 0.25 | (0.24 | ) | 0.01 | (0.26 | ) | (0.16 | ) | |||||||||||||||
Year Ended 12/31/2014 | 7.84 | 0.26 | 0.08 | 0.34 | (0.24 | ) | — | |||||||||||||||||
Year Ended 12/31/2013 | 7.23 | 0.21 | 0.59 | 0.80 | (0.19 | ) | — | |||||||||||||||||
Year Ended 12/31/2012 | 6.56 | 0.19 | 0.74 | 0.93 | (0.26 | ) | — | |||||||||||||||||
| (a) | The amount shown may not correlate with the change in aggregate gains and losses of portfolio securities due to the timing of sales and redemptions of portfolio shares. |
| (b) | Total investment return assumes dividend reinvestment and does not reflect any deduction for applicable sales charges. Not annualized for periods less than one year. Total return shown does not reflect charges and expenses imposed on contract holders by the variable accounts. Those charges and expenses reduce the return received by contract holders as compared to the return presented. |
| * | All per share amounts have been rounded to the nearest cent. |
| ** | Computed on an annualized basis for periods less than one year |
The accompanying Notes to Financial Statements are an integral part of this statement.
232
Table of Contents
THRIVENT SERIES FUND, INC.
FINANCIAL HIGHLIGHTS –CONTINUED
| RATIOS/SUPPLEMENTAL DATA | ||||||||||||||||||||||||||||||||||
| Ratio to Average Net Assets | ||||||||||||||||||||||||||||||||||
| Ratio to Average Net | Before Expenses Waived, | |||||||||||||||||||||||||||||||||
| Net Asset | Net Assets, End | Assets** | Credited or Paid Indirectly** | Portfolio Turnover | ||||||||||||||||||||||||||||||
| Total | Value, End of | Total | of Period | Net Investment | Net Investment | |||||||||||||||||||||||||||||
Distributions | Period | Return(b) | (in millions) | Expenses | Income/(Loss) | Expenses | Income/(Loss) | Rate | ||||||||||||||||||||||||||
| $(0.92) | $ | 14.58 | 10.11 | % | $ | 1,063.4 | 0.58 | % | 0.89 | % | 0.79 | % | 0.68 | % | 65 | % | ||||||||||||||||||
| (1.22) | 14.19 | (0.45 | )% | 967.6 | 0.57 | % | 0.73 | % | 0.64 | % | 0.65 | % | 60 | % | ||||||||||||||||||||
| (0.50) | 15.44 | 6.02 | % | 904.9 | 0.50 | % | 0.70 | % | 0.50 | % | 0.70 | % | 58 | % | ||||||||||||||||||||
| (0.35) | 15.04 | 27.05 | % | 799.4 | 0.46 | % | 0.53 | % | 0.47 | % | 0.52 | % | 43 | % | ||||||||||||||||||||
| (0.60) | 12.15 | 12.25 | % | 608.2 | 0.49 | % | 1.45 | % | 0.49 | % | 1.45 | % | 69 | % | ||||||||||||||||||||
| (0.78) | 14.32 | 10.23 | % | 5,325.7 | 0.47 | % | 1.41 | % | 0.69 | % | 1.19 | % | 106 | % | ||||||||||||||||||||
| (0.86) | 13.77 | (0.75 | )% | 4,898.1 | 0.47 | % | 1.21 | % | 0.55 | % | 1.14 | % | 91 | % | ||||||||||||||||||||
| (0.52) | 14.72 | 6.05 | % | 4,775.0 | 0.45 | % | 1.15 | % | 0.45 | % | 1.15 | % | 88 | % | ||||||||||||||||||||
| (0.50) | 14.37 | 21.30 | % | 4,224.5 | 0.38 | % | 1.09 | % | 0.40 | % | 1.07 | % | 60 | % | ||||||||||||||||||||
| (0.30) | 12.31 | 12.87 | % | 3,056.0 | 0.40 | % | 1.83 | % | 0.40 | % | 1.83 | % | 93 | % | ||||||||||||||||||||
| (0.57) | 13.64 | 8.89 | % | 9,261.4 | 0.46 | % | 1.80 | % | 0.62 | % | 1.64 | % | 159 | % | ||||||||||||||||||||
| (0.76) | 13.09 | (0.56 | )% | 8,657.3 | 0.46 | % | 1.57 | % | 0.51 | % | 1.51 | % | 153 | % | ||||||||||||||||||||
| (0.53) | 13.90 | 5.88 | % | 8,607.8 | 0.44 | % | 1.50 | % | 0.44 | % | 1.50 | % | 134 | % | ||||||||||||||||||||
| (0.47) | 13.63 | 15.12 | % | 7,181.1 | 0.36 | % | 1.46 | % | 0.38 | % | 1.44 | % | 99 | % | ||||||||||||||||||||
| (0.27) | 12.28 | 11.72 | % | 5,337.9 | 0.38 | % | 1.98 | % | 0.38 | % | 1.98 | % | 121 | % | ||||||||||||||||||||
| (0.36) | 12.78 | 7.24 | % | 4,695.1 | 0.47 | % | 2.03 | % | 0.59 | % | 1.90 | % | 211 | % | ||||||||||||||||||||
| (0.58) | 12.27 | (0.46 | )% | 4,100.1 | 0.46 | % | 1.77 | % | 0.50 | % | 1.73 | % | 198 | % | ||||||||||||||||||||
| (0.48) | 12.89 | 5.32 | % | 3,679.4 | 0.44 | % | 1.91 | % | 0.44 | % | 1.91 | % | 182 | % | ||||||||||||||||||||
| (0.43) | 12.71 | 9.02 | % | 3,353.0 | 0.37 | % | 1.72 | % | 0.40 | % | 1.68 | % | 198 | % | ||||||||||||||||||||
| (0.28) | 12.07 | 9.59 | % | 2,920.3 | 0.41 | % | 1.95 | % | 0.41 | % | 1.95 | % | 190 | % | ||||||||||||||||||||
| (0.41) | 10.20 | 6.63 | % | 87.6 | 0.80 | % | 2.15 | % | 1.00 | % | 1.95 | % | 129 | % | ||||||||||||||||||||
| (0.67) | 9.97 | (0.81 | )% | 78.8 | 0.80 | % | 2.24 | % | 0.99 | % | 2.06 | % | 191 | % | ||||||||||||||||||||
| (1.21) | 10.72 | 2.21 | % | 81.1 | 0.80 | % | 2.30 | % | 0.94 | % | 2.16 | % | 176 | % | ||||||||||||||||||||
| (0.23) | 11.66 | 21.24 | % | 65.5 | 0.79 | % | 2.10 | % | 0.85 | % | 2.04 | % | 153 | % | ||||||||||||||||||||
| (0.14) | 9.82 | 13.17 | % | 102.1 | 0.81 | % | 2.56 | % | 0.81 | % | 2.56 | % | 160 | % | ||||||||||||||||||||
| (0.88) | 14.09 | 7.06 | % | 355.4 | 0.66 | % | 2.86 | % | 0.66 | % | 2.86 | % | 140 | % | ||||||||||||||||||||
| (0.84) | 14.03 | (0.14 | )% | 313.1 | 0.66 | % | 2.77 | % | 0.66 | % | 2.77 | % | 147 | % | ||||||||||||||||||||
| (3.41) | 14.87 | 6.07 | % | 303.0 | 0.64 | % | 2.38 | % | 0.64 | % | 2.38 | % | 111 | % | ||||||||||||||||||||
| (0.86) | 17.28 | 17.95 | % | 275.0 | 0.53 | % | 1.81 | % | 0.53 | % | 1.81 | % | 216 | % | ||||||||||||||||||||
| (0.81) | 15.42 | 12.42 | % | 239.3 | 0.45 | % | 1.93 | % | 0.45 | % | 1.93 | % | 142 | % | ||||||||||||||||||||
| (0.29) | 7.76 | 7.08 | % | 562.8 | 0.48 | % | 3.61 | % | 0.48 | % | 3.61 | % | 103 | % | ||||||||||||||||||||
| (0.42) | 7.53 | 0.08 | % | 479.6 | 0.49 | % | 3.65 | % | 0.49 | % | 3.65 | % | 113 | % | ||||||||||||||||||||
| (0.24) | 7.94 | 4.27 | % | 437.3 | 0.48 | % | 3.84 | % | 0.48 | % | 3.84 | % | �� | 136 | % | |||||||||||||||||||
| (0.19) | 7.84 | 11.17 | % | 362.7 | 0.49 | % | 3.88 | % | 0.49 | % | 3.88 | % | 150 | % | ||||||||||||||||||||
| (0.26) | 7.23 | 14.48 | % | 229.7 | 0.52 | % | 4.58 | % | 0.52 | % | 4.58 | % | 155 | % | ||||||||||||||||||||
The accompanying Notes to Financial Statements are an integral part of this statement.
233
Table of Contents
THRIVENT SERIES FUND, INC.
FINANCIAL HIGHLIGHTS –CONTINUED
| FOR A SHARE OUTSTANDING THROUGHOUT EACH PERIOD * | ||||||||||||||||||||||||
| Income From Investment Operations | Less Distributions From | |||||||||||||||||||||||
| Net Asset Value, Beginning of Period | Net Investment Income/ (Loss) | Net Realized and Unrealized Gain/(Loss) on Investments(a) | Total from Investment Operations | Net Investment Income | Net Realized Gain on Investments | |||||||||||||||||||
OPPORTUNITY INCOME PLUS PORTFOLIO |
| |||||||||||||||||||||||
Year Ended 12/31/2016 | $ | 9.81 | $ | 0.34 | $ | 0.28 | $ | 0.62 | $ | (0.34 | ) | $ | — | |||||||||||
Year Ended 12/31/2015 | 10.15 | 0.35 | (0.35 | ) | 0.00 | (0.34 | ) | — | ||||||||||||||||
Year Ended 12/31/2014 | 10.15 | 0.35 | 0.00 | 0.35 | (0.35 | ) | — | |||||||||||||||||
Year Ended 12/31/2013 | 10.64 | 0.26 | (0.40 | ) | (0.14 | ) | (0.26 | ) | (0.09 | ) | ||||||||||||||
Year Ended 12/31/2012 | 10.45 | 0.16 | 0.44 | 0.60 | (0.16 | ) | (0.25 | ) | ||||||||||||||||
PARTNER HEALTHCARE PORTFOLIO |
| |||||||||||||||||||||||
Year Ended 12/31/2016 | 19.45 | 0.00 | (3.02 | ) | (3.02 | ) | (0.75 | ) | (0.67 | ) | ||||||||||||||
Year Ended 12/31/2015 | 19.70 | 0.78 | *** | 0.20 | 0.98 | 0.00 | (1.23 | ) | ||||||||||||||||
Year Ended 12/31/2014 | 16.84 | 0.01 | 3.98 | 3.99 | — | (1.13 | ) | |||||||||||||||||
Year Ended 12/31/2013 | 13.39 | (0.02 | ) | 4.10 | 4.08 | (0.05 | ) | (0.58 | ) | |||||||||||||||
Year Ended 12/31/2012 | 11.26 | 0.03 | 2.29 | 2.32 | (0.04 | ) | (0.15 | ) | ||||||||||||||||
PARTNER EMERGING MARKETS EQUITY PORTFOLIO |
| |||||||||||||||||||||||
Year Ended 12/31/2016 | 10.31 | 0.10 | 1.09 | 1.19 | (0.11 | ) | — | |||||||||||||||||
Year Ended 12/31/2015 | 12.08 | 0.12 | (1.75 | ) | (1.63 | ) | (0.14 | ) | — | |||||||||||||||
Year Ended 12/31/2014 | 12.47 | 0.14 | (0.41 | ) | (0.27 | ) | (0.12 | ) | — | |||||||||||||||
Year Ended 12/31/2013 | 13.61 | 0.12 | (1.13 | ) | (1.01 | ) | (0.13 | ) | — | |||||||||||||||
Year Ended 12/31/2012 | 10.92 | 0.14 | 2.68 | 2.82 | (0.07 | ) | (0.06 | ) | ||||||||||||||||
REAL ESTATE SECURITIES PORTFOLIO |
| |||||||||||||||||||||||
Year Ended 12/31/2016 | 22.01 | 0.38 | 1.28 | 1.66 | (0.34 | ) | (0.09 | ) | ||||||||||||||||
Year Ended 12/31/2015 | 22.78 | 0.35 | 0.16 | 0.51 | (0.33 | ) | (0.95 | ) | ||||||||||||||||
Year Ended 12/31/2014 | 17.98 | 0.35 | 5.11 | 5.46 | (0.30 | ) | (0.36 | ) | ||||||||||||||||
Year Ended 12/31/2013 | 17.85 | 0.29 | 0.11 | 0.40 | (0.27 | ) | — | |||||||||||||||||
Year Ended 12/31/2012 | 15.77 | 0.30 | 2.43 | 2.73 | (0.65 | ) | — | |||||||||||||||||
SMALL CAP STOCK PORTFOLIO |
| |||||||||||||||||||||||
Year Ended 12/31/2016 | 15.53 | 0.09 | 3.72 | 3.81 | (0.06 | ) | (0.79 | ) | ||||||||||||||||
Year Ended 12/31/2015 | 18.37 | 0.04 | (0.38 | ) | (0.34 | ) | (0.08 | ) | (2.42 | ) | ||||||||||||||
Year Ended 12/31/2014 | 17.77 | 0.08 | 0.75 | 0.83 | (0.04 | ) | (0.19 | ) | ||||||||||||||||
Year Ended 12/31/2013 | 13.12 | 0.04 | 4.67 | 4.71 | (0.06 | ) | — | |||||||||||||||||
Year Ended 12/31/2012 | 11.99 | 0.06 | 1.07 | 1.13 | — | — | ||||||||||||||||||
SMALL CAP INDEX PORTFOLIO |
| |||||||||||||||||||||||
Year Ended 12/31/2016 | 15.77 | 0.16 | 3.63 | 3.79 | (0.17 | ) | (1.21 | ) | ||||||||||||||||
Year Ended 12/31/2015 | 17.44 | 0.17 | (0.47 | ) | (0.30 | ) | (0.14 | ) | (1.23 | ) | ||||||||||||||
Year Ended 12/31/2014 | 17.86 | 0.15 | 0.77 | 0.92 | (0.13 | ) | (1.21 | ) | ||||||||||||||||
Year Ended 12/31/2013 | 13.42 | 0.14 | 5.17 | 5.31 | (0.20 | ) | (0.67 | ) | ||||||||||||||||
Year Ended 12/31/2012 | 12.77 | 0.20 | 1.68 | 1.88 | (0.09 | ) | (1.14 | ) | ||||||||||||||||
MID CAP STOCK PORTFOLIO | ||||||||||||||||||||||||
Year Ended 12/31/2016 | 16.73 | 0.07 | 4.23 | 4.30 | (0.07 | ) | (1.88 | ) | ||||||||||||||||
Year Ended 12/31/2015 | 18.86 | 0.09 | (0.06 | ) | 0.03 | (0.11 | ) | (2.05 | ) | |||||||||||||||
Year Ended 12/31/2014 | 17.66 | 0.11 | 1.98 | 2.09 | (0.06 | ) | (0.83 | ) | ||||||||||||||||
Year Ended 12/31/2013 | 13.09 | 0.06 | 4.57 | 4.63 | (0.06 | ) | — | |||||||||||||||||
Year Ended 12/31/2012 | 11.48 | 0.06 | 1.58 | 1.64 | (0.03 | ) | — | |||||||||||||||||
| (a) | The amount shown may not correlate with the change in aggregate gains and losses of portfolio securities due to the timing of sales and redemptions of portfolio shares. |
| (b) | Total investment return assumes dividend reinvestment and does not reflect any deduction for applicable sales charges. Not annualized for periods less than one year. Total return shown does not reflect charges and expenses imposed on contract holders by the variable accounts. Those charges and expenses reduce the return received by contract holders as compared to the return presented. |
| * | All per share amounts have been rounded to the nearest cent. |
| ** | Computed on an annualized basis for periods less than one year. |
| *** | Net investment income per share reflects special dividends. The effect of these dividends amounted to $0.76 per share. |
The accompanying Notes to Financial Statements are an integral part of this statement.
234
Table of Contents
THRIVENT SERIES FUND, INC.
FINANCIAL HIGHLIGHTS –CONTINUED
| RATIOS/SUPPLEMENTAL DATA | ||||||||||||||||||||||||||||||||||
| Ratio to Average Net Assets | ||||||||||||||||||||||||||||||||||
| Ratio to Average Net | Before Expenses Waived, | |||||||||||||||||||||||||||||||||
| Net Asset | Net Assets, End | Assets** | Credited or Paid Indirectly** | Portfolio | ||||||||||||||||||||||||||||||
| Total | Value, End of | Total | of Period | Net Investment | Net Investment | Turnover | ||||||||||||||||||||||||||||
Distributions | of Period | Return(b) | (in millions) | Expenses | Income/(Loss) | Expenses | Income/(Loss) | Rate | ||||||||||||||||||||||||||
| $ | (0.34) | $ | 10.09 | 6.38 | % | $ | 140.4 | 0.69 | % | 3.42 | % | 0.69 | % | 3.42 | % | 202 | % | |||||||||||||||||
| (0.34) | 9.81 | (0.03 | )% | 99.7 | 0.73 | % | 3.44 | % | 0.73 | % | 3.44 | % | 184 | % | ||||||||||||||||||||
| (0.35) | 10.15 | 3.48 | % | 71.8 | 0.76 | % | 3.46 | % | 0.79 | % | 3.42 | % | 140 | % | ||||||||||||||||||||
| (0.35) | 10.15 | (1.39 | )% | 46.5 | 0.79 | % | 2.58 | % | 0.88 | % | 2.49 | % | 755 | % | ||||||||||||||||||||
| (0.41) | 10.64 | 5.99 | % | 37.3 | 0.83 | % | 1.54 | % | 0.88 | % | 1.49 | % | 936 | % | ||||||||||||||||||||
| (1.42) | 15.01 | (16.01 | )% | 163.4 | 0.93 | % | 0.14 | % | 0.99 | % | 0.08 | % | 101 | % | ||||||||||||||||||||
| (1.23) | 19.45 | 4.61 | % | 192.2 | 0.96 | % | 4.90 | % | 1.03 | % | 4.83 | % | 73 | % | ||||||||||||||||||||
| (1.13) | 19.70 | 24.23 | % | 102.1 | 1.13 | % | 0.03 | % | 1.13 | % | 0.03 | % | 63 | % | ||||||||||||||||||||
| (0.63) | 16.84 | 31.09 | % | 53.7 | 1.25 | % | (0.10 | )% | 1.31 | % | (0.16 | )% | 61 | % | ||||||||||||||||||||
| (0.19) | 13.39 | 20.68 | % | 25.2 | 1.25 | % | 0.26 | % | 1.54 | % | (0.04 | )% | 40 | % | ||||||||||||||||||||
| (0.11) | 11.39 | 11.58 | % | 56.5 | 1.33 | % | 0.98 | % | 1.66 | % | 0.65 | % | 7 | % | ||||||||||||||||||||
| (0.14) | 10.31 | (13.59 | )% | 43.5 | 1.40 | % | 1.09 | % | 1.70 | % | 0.79 | % | 4 | % | ||||||||||||||||||||
| (0.12) | 12.08 | (2.29 | )% | 48.5 | 1.40 | % | 1.07 | % | 1.52 | % | 0.95 | % | 14 | % | ||||||||||||||||||||
| (0.13) | 12.47 | (7.34 | )% | 59.9 | 1.40 | % | 1.07 | % | 1.54 | % | 0.92 | % | 5 | % | ||||||||||||||||||||
| (0.13) | 13.61 | 25.98 | % | 54.7 | 1.40 | % | 1.27 | % | 1.62 | % | 1.05 | % | 4 | % | ||||||||||||||||||||
| (0.43) | 23.24 | 7.50 | % | 180.0 | 0.90 | % | 1.77 | % | 0.90 | % | 1.77 | % | 17 | % | ||||||||||||||||||||
| (1.28) | 22.01 | 2.75 | % | 155.5 | 0.92 | % | 1.77 | % | 0.92 | % | 1.77 | % | 12 | % | ||||||||||||||||||||
| (0.66) | 22.78 | 30.82 | % | 142.5 | 0.92 | % | 1.67 | % | 0.92 | % | 1.67 | % | 21 | % | ||||||||||||||||||||
| (0.27) | 17.98 | 2.18 | % | 120.1 | 0.92 | % | 1.53 | % | 0.92 | % | 1.53 | % | 22 | % | ||||||||||||||||||||
| (0.65) | 17.85 | 17.54 | % | 122.4 | 0.93 | % | 1.62 | % | 0.93 | % | 1.62 | % | 32 | % | ||||||||||||||||||||
| (0.85) | 18.49 | 25.94 | % | 506.1 | 0.73 | % | 0.56 | % | 0.73 | % | 0.56 | % | 57 | % | ||||||||||||||||||||
| (2.50) | 15.53 | (3.13 | )% | 413.8 | 0.75 | % | 0.47 | % | 0.75 | % | 0.47 | % | 90 | % | ||||||||||||||||||||
| (0.23) | 18.37 | 4.76 | % | 306.3 | 0.75 | % | 0.42 | % | 0.75 | % | 0.42 | % | 56 | % | ||||||||||||||||||||
| (0.06) | 17.77 | 35.90 | % | 354.6 | 0.75 | % | 0.25 | % | 0.75 | % | 0.25 | % | 62 | % | ||||||||||||||||||||
| — | 13.12 | 9.42 | % | 269.5 | 0.76 | % | 0.49 | % | 0.76 | % | 0.49 | % | 96 | % | ||||||||||||||||||||
| (1.38) | 18.18 | 26.12 | % | 401.7 | 0.28 | % | 1.20 | % | 0.28 | % | 1.20 | % | 21 | % | ||||||||||||||||||||
| (1.37) | 15.77 | (2.17 | )% | 279.9 | 0.29 | % | 1.13 | % | 0.29 | % | 1.13 | % | 20 | % | ||||||||||||||||||||
| (1.34) | 17.44 | 5.36 | % | 268.6 | 0.43 | % | 0.87 | % | 0.43 | % | 0.87 | % | 12 | % | ||||||||||||||||||||
| (0.87) | 17.86 | 40.83 | % | 262.8 | 0.44 | % | 0.84 | % | 0.44 | % | 0.84 | % | 12 | % | ||||||||||||||||||||
| (1.23) | 13.42 | 15.95 | % | 193.7 | 0.46 | % | 1.44 | % | 0.46 | % | 1.44 | % | 9 | % | ||||||||||||||||||||
| (1.95) | 19.08 | 28.71 | % | 1,491.9 | 0.68 | % | 0.45 | % | 0.68 | % | 0.45 | % | 23 | % | ||||||||||||||||||||
| (2.16) | 16.73 | 0.08 | % | 1,194.6 | 0.69 | % | 0.53 | % | 0.70 | % | 0.52 | % | 77 | % | ||||||||||||||||||||
| (0.89) | 18.86 | 11.93 | % | 752.6 | 0.71 | % | 0.63 | % | 0.71 | % | 0.63 | % | 37 | % | ||||||||||||||||||||
| (0.06) | 17.66 | 35.50 | % | 675.4 | 0.72 | % | 0.38 | % | 0.72 | % | 0.38 | % | 39 | % | ||||||||||||||||||||
| (0.03) | 13.09 | 14.29 | % | 506.7 | 0.73 | % | 0.51 | % | 0.73 | % | 0.51 | % | 47 | % | ||||||||||||||||||||
The accompanying Notes to Financial Statements are an integral part of this statement.
235
Table of Contents
THRIVENT SERIES FUND, INC.
FINANCIAL HIGHLIGHTS –CONTINUED
| FOR A SHARE OUTSTANDING THROUGHOUT EACH PERIOD * | ||||||||||||||||||||||||
| Income From Investment Operations | Less Distributions From | |||||||||||||||||||||||
| Net Asset Value, Beginning of Period | Net Investment Income/ (Loss) | Net Realized and Unrealized Gain/(Loss) on Investments(a) | Total from Investment Operations | Net Investment Income | Net Realized Gain on Investments | |||||||||||||||||||
MID CAP INDEX PORTFOLIO | ||||||||||||||||||||||||
Year Ended 12/31/2016 | $ | 15.12 | $ | 0.16 | $ | 2.77 | $ | 2.93 | $ | (0.14 | ) | $ | (0.84 | ) | ||||||||||
Year Ended 12/31/2015 | 16.35 | 0.15 | (0.51 | ) | (0.36 | ) | (0.12 | ) | (0.75 | ) | ||||||||||||||
Year Ended 12/31/2014 | 15.78 | 0.13 | 1.32 | 1.45 | (0.12 | ) | (0.76 | ) | ||||||||||||||||
Year Ended 12/31/2013 | 12.36 | 0.12 | 3.87 | 3.99 | (0.13 | ) | (0.44 | ) | ||||||||||||||||
Year Ended 12/31/2012 | 11.79 | 0.14 | 1.74 | 1.88 | (0.10 | ) | (1.21 | ) | ||||||||||||||||
PARTNER WORLDWIDE ALLOCATION PORTFOLIO |
| |||||||||||||||||||||||
Year Ended 12/31/2016 | 9.00 | 0.21 | 0.08 | 0.29 | (0.20 | ) | — | |||||||||||||||||
Year Ended 12/31/2015 | 9.30 | 0.19 | (0.25 | ) | (0.06 | ) | (0.24 | ) | — | |||||||||||||||
Year Ended 12/31/2014 | 10.02 | 0.22 | (0.74 | ) | (0.52 | ) | (0.20 | ) | — | |||||||||||||||
Year Ended 12/31/2013 | 8.62 | 0.18 | 1.22 | 1.40 | 0.00 | — | ||||||||||||||||||
Year Ended 12/31/2012 | 7.39 | 0.12 | 1.26 | 1.38 | (0.12 | ) | (0.03 | ) | ||||||||||||||||
PARTNER ALL CAP PORTFOLIO | ||||||||||||||||||||||||
Year Ended 12/31/2016 | 12.94 | 0.07 | 0.61 | 0.68 | (0.04 | ) | (0.59 | ) | ||||||||||||||||
Year Ended 12/31/2015 | 14.18 | 0.04 | 0.33 | 0.37 | (0.05 | ) | (1.56 | ) | ||||||||||||||||
Year Ended 12/31/2014 | 12.71 | 0.06 | 1.49 | 1.55 | (0.08 | ) | — | |||||||||||||||||
Year Ended 12/31/2013 | 9.64 | 0.08 | 3.07 | 3.15 | (0.08 | ) | — | |||||||||||||||||
Year Ended 12/31/2012 | 8.44 | 0.08 | 1.16 | 1.24 | (0.04 | ) | — | |||||||||||||||||
LARGE CAP GROWTH PORTFOLIO |
| |||||||||||||||||||||||
Year Ended 12/31/2016 | 30.90 | 0.16 | (0.80 | ) | (0.64 | ) | (0.15 | ) | (2.46 | ) | ||||||||||||||
Year Ended 12/31/2015 | 28.08 | 0.12 | 2.83 | 2.95 | (0.13 | ) | — | |||||||||||||||||
Year Ended 12/31/2014 | 25.46 | 0.16 | 2.63 | 2.79 | (0.17 | ) | — | |||||||||||||||||
Year Ended 12/31/2013 | 18.81 | 0.15 | 6.64 | 6.79 | (0.14 | ) | — | |||||||||||||||||
Year Ended 12/31/2012 | 15.96 | 0.22 | 2.85 | 3.07 | (0.22 | ) | — | |||||||||||||||||
PARTNER GROWTH STOCK PORTFOLIO |
| |||||||||||||||||||||||
Year Ended 12/31/2016 | 18.67 | 0.02 | 0.14 | 0.16 | — | (0.82 | ) | |||||||||||||||||
Year Ended 12/31/2015 | 18.72 | (0.02 | ) | 1.93 | 1.91 | — | (1.96 | ) | ||||||||||||||||
Year Ended 12/31/2014 | 18.79 | (0.03 | ) | 1.53 | 1.50 | — | (1.57 | ) | ||||||||||||||||
Year Ended 12/31/2013 | 13.54 | (0.04 | ) | 5.29 | 5.25 | 0.00 | — | |||||||||||||||||
Year Ended 12/31/2012 | 11.41 | 0.00 | 2.13 | 2.13 | — | — | ||||||||||||||||||
LARGE CAP VALUE PORTFOLIO | ||||||||||||||||||||||||
Year Ended 12/31/2016 | 15.52 | 0.25 | 2.25 | 2.50 | (0.22 | ) | (0.96 | ) | ||||||||||||||||
Year Ended 12/31/2015 | 16.79 | 0.23 | (0.79 | ) | (0.56 | ) | (0.22 | ) | (0.49 | ) | ||||||||||||||
Year Ended 12/31/2014 | 15.58 | 0.22 | 1.19 | 1.41 | (0.20 | ) | — | |||||||||||||||||
Year Ended 12/31/2013 | 12.00 | 0.20 | 3.59 | 3.79 | (0.21 | ) | — | |||||||||||||||||
Year Ended 12/31/2012 | 10.39 | 0.21 | 1.59 | 1.80 | (0.19 | ) | — | |||||||||||||||||
LARGE CAP STOCK PORTFOLIO | ||||||||||||||||||||||||
Year Ended 12/31/2016 | 11.63 | 0.16 | 0.46 | 0.62 | (0.15 | ) | — | |||||||||||||||||
Year Ended 12/31/2015 | 12.33 | 0.15 | 0.25 | 0.40 | (0.15 | ) | (0.95 | ) | ||||||||||||||||
Year Ended 12/31/2014 | 11.81 | 0.15 | 0.48 | 0.63 | (0.11 | ) | — | |||||||||||||||||
Year Ended 12/31/2013 | 9.22 | 0.11 | 2.60 | 2.71 | (0.12 | ) | — | |||||||||||||||||
Year Ended 12/31/2012 | 8.11 | 0.12 | 1.08 | 1.20 | (0.09 | ) | — | |||||||||||||||||
| (a) | The amount shown may not correlate with the change in aggregate gains and losses of portfolio securities due to the timing of sales and redemptions of portfolio shares. |
| (b) | Total investment return assumes dividend reinvestment and does not reflect any deduction for applicable sales charges. Not annualized for periods less than one year. Total return shown does not reflect charges and expenses imposed on contract holders by the variable accounts. Those charges and expenses reduce the return received by contract holders as compared to the return presented. |
| * | All per share amounts have been rounded to the nearest cent. |
| ** | Computed on an annualized basis for periods less than one year |
The accompanying Notes to Financial Statements are an integral part of this statement.
236
Table of Contents
THRIVENT SERIES FUND, INC.
FINANCIAL HIGHLIGHTS –CONTINUED
RATIOS/SUPPLEMENTAL DATA | ||||||||||||||||||||||||||||||||||
| Net Asset | Net Assets, End | Ratio to Average Net Assets** | Ratio to Average Net Assets Before Expenses Waived, Credited or Paid Indirectly** | Portfolio | ||||||||||||||||||||||||||||||
Total Distributions | Value, End of Period | Total Return(b) | of Period (in millions) | Expenses | Net Investment Income/(Loss) | Expenses | Net Investment Income/(Loss) | Turnover Rate | ||||||||||||||||||||||||||
| $ | (0.98 | ) | $ | 17.07 | 20.43 | % | $ | 287.7 | 0.30 | % | 1.38 | % | 0.30 | % | 1.38 | % | 19 | % | ||||||||||||||||
| (0.87 | ) | 15.12 | (2.52 | )% | 180.2 | 0.32 | % | 1.15 | % | 0.32 | % | 1.15 | % | 19 | % | |||||||||||||||||||
| (0.88 | ) | 16.35 | 9.28 | % | 145.1 | 0.47 | % | 0.89 | % | 0.47 | % | 0.89 | % | 13 | % | |||||||||||||||||||
| (0.57 | ) | 15.78 | 32.92 | % | 123.0 | 0.50 | % | 0.95 | % | 0.50 | % | 0.95 | % | 12 | % | |||||||||||||||||||
| (1.31 | ) | 12.36 | 17.38 | % | 85.1 | 0.53 | % | 1.11 | % | 0.53 | % | 1.11 | % | 8 | % | |||||||||||||||||||
| (0.20 | ) | 9.09 | 3.35 | % | 1,654.7 | 0.92 | % | 2.40 | % | 0.92 | % | 2.40 | % | 114 | % | |||||||||||||||||||
| (0.24 | ) | 9.00 | (0.78 | )% | 1,605.6 | 0.92 | % | 2.06 | % | 0.92 | % | 2.06 | % | 76 | % | |||||||||||||||||||
| (0.20 | ) | 9.30 | (5.35 | )% | 1,607.3 | 0.91 | % | 2.24 | % | 0.91 | % | 2.24 | % | 78 | % | |||||||||||||||||||
| 0.00 | 10.02 | 16.31 | % | 1,706.0 | 0.91 | % | 1.97 | % | 0.91 | % | 1.97 | % | 80 | % | ||||||||||||||||||||
| (0.15 | ) | 8.62 | 18.67 | % | 1,520.3 | 0.95 | % | 2.10 | % | 0.95 | % | 2.10 | % | 93 | % | |||||||||||||||||||
| (0.63 | ) | 12.99 | 5.77 | % | 94.9 | 0.87 | % | 0.60 | % | 1.14 | % | 0.33 | % | 64 | % | |||||||||||||||||||
| (1.61 | ) | 12.94 | 2.26 | % | 86.2 | 0.92 | % | 0.36 | % | 1.16 | % | 0.12 | % | 72 | % | |||||||||||||||||||
| (0.08 | ) | 14.18 | 12.26 | % | 69.5 | 0.95 | % | 0.48 | % | 1.18 | % | 0.25 | % | 105 | % | |||||||||||||||||||
| (0.08 | ) | 12.71 | 32.85 | % | 63.8 | 0.98 | % | 0.69 | % | 1.23 | % | 0.45 | % | 133 | % | |||||||||||||||||||
| (0.04 | ) | 9.64 | 14.74 | % | 51.5 | 1.04 | % | 0.81 | % | 1.24 | % | 0.61 | % | 116 | % | |||||||||||||||||||
| (2.61 | ) | 27.65 | (1.48 | )% | 1,003.1 | 0.44 | % | 0.55 | % | 0.44 | % | 0.55 | % | 68 | % | |||||||||||||||||||
| (0.13 | ) | 30.90 | 10.48 | % | 1,109.7 | 0.44 | % | 0.41 | % | 0.44 | % | 0.41 | % | 68 | % | |||||||||||||||||||
| (0.17 | ) | 28.08 | 10.99 | % | 1,004.5 | 0.44 | % | 0.54 | % | 0.44 | % | 0.54 | % | 43 | % | |||||||||||||||||||
| (0.14 | ) | 25.46 | 36.14 | % | 1,062.0 | 0.44 | % | 0.66 | % | 0.44 | % | 0.66 | % | 62 | % | |||||||||||||||||||
| (0.22 | ) | 18.81 | 19.18 | % | 859.9 | 0.45 | % | 1.16 | % | 0.45 | % | 1.16 | % | 87 | % | |||||||||||||||||||
| (0.82 | ) | 18.01 | 1.35 | % | 121.3 | 0.82 | % | 0.12 | % | 0.96 | % | (0.03 | )% | 43 | % | |||||||||||||||||||
| (1.96 | ) | 18.67 | 10.65 | % | 110.1 | 0.86 | % | (0.14 | )% | 1.00 | % | (0.28 | )% | 35 | % | |||||||||||||||||||
| (1.57 | ) | 18.72 | 8.51 | % | 81.7 | 0.91 | % | (0.18 | )% | 1.01 | % | (0.28 | )% | 38 | % | |||||||||||||||||||
| 0.00 | 18.79 | 38.84 | % | 76.2 | 0.94 | % | (0.24 | )% | 1.04 | % | (0.34 | )% | 34 | % | ||||||||||||||||||||
| — | 13.54 | 18.66 | % | 58.0 | 0.96 | % | 0.02 | % | 1.06 | % | (0.08 | )% | 32 | % | ||||||||||||||||||||
| (1.18 | ) | 16.84 | 17.44 | % | 1,348.8 | 0.64 | % | 1.70 | % | 0.64 | % | 1.70 | % | 22 | % | |||||||||||||||||||
| (0.71 | ) | 15.52 | (3.53 | )% | 1,147.0 | 0.64 | % | 1.44 | % | 0.64 | % | 1.44 | % | 34 | % | |||||||||||||||||||
| (0.20 | ) | 16.79 | 9.03 | % | 1,205.0 | 0.64 | % | 1.34 | % | 0.64 | % | 1.34 | % | 20 | % | |||||||||||||||||||
| (0.21 | ) | 15.58 | 31.82 | % | 1,119.2 | 0.64 | % | 1.42 | % | 0.64 | % | 1.42 | % | 32 | % | |||||||||||||||||||
| (0.19 | ) | 12.00 | 17.57 | % | 852.6 | 0.64 | % | 1.84 | % | 0.64 | % | 1.84 | % | 90 | % | |||||||||||||||||||
| (0.15 | ) | 12.10 | 5.42 | % | 905.4 | 0.67 | % | 1.41 | % | 0.67 | % | 1.41 | % | 66 | % | |||||||||||||||||||
| (1.10 | ) | 11.63 | 3.11 | % | 878.9 | 0.67 | % | 1.26 | % | 0.67 | % | 1.26 | % | 57 | % | |||||||||||||||||||
| (0.11 | ) | 12.33 | 5.29 | % | 834.5 | 0.67 | % | 1.21 | % | 0.67 | % | 1.21 | % | 64 | % | |||||||||||||||||||
| (0.12 | ) | 11.81 | 29.60 | % | 811.9 | 0.67 | % | 1.02 | % | 0.67 | % | 1.02 | % | 73 | % | |||||||||||||||||||
| (0.09 | ) | 9.22 | 14.90 | % | 622.5 | 0.69 | % | 1.35 | % | 0.69 | % | 1.35 | % | 121 | % | |||||||||||||||||||
The accompanying Notes to Financial Statements are an integral part of this statement.
237
Table of Contents
THRIVENT SERIES FUND, INC.
FINANCIAL HIGHLIGHTS –CONTINUED
| FOR A SHARE OUTSTANDING THROUGHOUT EACH PERIOD * | ||||||||||||||||||||||||
| Income From Investment Operations | Less Distributions From | |||||||||||||||||||||||
| Net Asset Value, Beginning of Period | Net Investment Income/(Loss) | Net Realized and Unrealized Gain/(Loss) on Investments(a) | Total from Investment Operations | Net Investment Income | Net Realized Gain on Investments | |||||||||||||||||||
LARGE CAP INDEX PORTFOLIO | ||||||||||||||||||||||||
Year Ended 12/31/2016 | $ | 28.54 | $ | 0.47 | $ | 2.78 | $ | 3.25 | $ | (0.56 | ) | $ | (0.19 | ) | ||||||||||
Year Ended 12/31/2015 | 28.75 | 0.57 | *** | (0.25 | ) | 0.32 | (0.39 | ) | (0.14 | ) | ||||||||||||||
Year Ended 12/31/2014 | 25.80 | 0.44 | 2.96 | 3.40 | (0.39 | ) | (0.06 | ) | ||||||||||||||||
Year Ended 12/31/2013 | 20.11 | 0.40 | 5.91 | 6.31 | (0.39 | ) | (0.23 | ) | ||||||||||||||||
Year Ended 12/31/2012 | 17.71 | 0.40 | 2.33 | 2.73 | (0.33 | ) | — | |||||||||||||||||
HIGH YIELD PORTFOLIO | ||||||||||||||||||||||||
Year Ended 12/31/2016 | 4.48 | 0.26 | 0.29 | 0.55 | (0.26 | ) | — | |||||||||||||||||
Year Ended 12/31/2015 | 4.87 | 0.28 | (0.39 | ) | (0.11 | ) | (0.28 | ) | — | |||||||||||||||
Year Ended 12/31/2014 | 5.07 | 0.30 | (0.20 | ) | 0.10 | (0.30 | ) | — | ||||||||||||||||
Year Ended 12/31/2013 | 5.05 | 0.32 | 0.02 | 0.34 | (0.32 | ) | — | |||||||||||||||||
Year Ended 12/31/2012 | 4.66 | 0.35 | 0.39 | 0.74 | (0.35 | ) | — | |||||||||||||||||
INCOME PORTFOLIO | ||||||||||||||||||||||||
Year Ended 12/31/2016 | 9.83 | 0.35 | 0.25 | 0.60 | (0.35 | ) | (0.01 | ) | ||||||||||||||||
Year Ended 12/31/2015 | 10.50 | 0.38 | (0.44 | ) | (0.06 | ) | (0.38 | ) | (0.23 | ) | ||||||||||||||
Year Ended 12/31/2014 | 10.34 | 0.40 | 0.29 | 0.69 | (0.40 | ) | (0.13 | ) | ||||||||||||||||
Year Ended 12/31/2013 | 10.77 | 0.40 | (0.41 | ) | (0.01 | ) | (0.40 | ) | (0.02 | ) | ||||||||||||||
Year Ended 12/31/2012 | 10.09 | 0.40 | 0.68 | 1.08 | (0.40 | ) | — | |||||||||||||||||
BOND INDEX PORTFOLIO | ||||||||||||||||||||||||
Year Ended 12/31/2016 | 10.89 | 0.19 | (0.02 | ) | 0.17 | (0.19 | ) | (0.02 | ) | |||||||||||||||
Year Ended 12/31/2015 | 11.00 | 0.20 | (0.11 | ) | 0.09 | (0.20 | ) | — | ||||||||||||||||
Year Ended 12/31/2014 | 10.56 | 0.24 | 0.44 | 0.68 | (0.24 | ) | — | |||||||||||||||||
Year Ended 12/31/2013 | 11.39 | 0.21 | (0.48 | ) | (0.27 | ) | (0.21 | ) | (0.35 | ) | ||||||||||||||
Year Ended 12/31/2012 | 11.21 | 0.23 | 0.32 | 0.55 | (0.23 | ) | (0.14 | ) | ||||||||||||||||
LIMITED MATURITY BOND PORTFOLIO | ||||||||||||||||||||||||
Year Ended 12/31/2016 | 9.72 | 0.19 | 0.09 | 0.28 | (0.19 | ) | — | |||||||||||||||||
Year Ended 12/31/2015 | 9.81 | 0.17 | (0.10 | ) | 0.07 | (0.16 | ) | — | ||||||||||||||||
Year Ended 12/31/2014 | 9.82 | 0.17 | (0.01 | ) | 0.16 | (0.17 | ) | — | ||||||||||||||||
Year Ended 12/31/2013 | 9.92 | 0.15 | (0.10 | ) | 0.05 | (0.15 | ) | — | ||||||||||||||||
Year Ended 12/31/2012 | 9.67 | 0.17 | 0.24 | 0.41 | (0.16 | ) | — | |||||||||||||||||
MONEY MARKET PORTFOLIO | ||||||||||||||||||||||||
Year Ended 12/31/2016 | 1.00 | 0.00 | 0.00 | 0.00 | — | — | ||||||||||||||||||
Year Ended 12/31/2015 | 1.00 | 0.00 | 0.00 | 0.00 | — | — | ||||||||||||||||||
Year Ended 12/31/2014 | 1.00 | 0.00 | 0.00 | 0.00 | — | — | ||||||||||||||||||
Year Ended 12/31/2013 | 1.00 | 0.00 | 0.00 | 0.00 | — | — | ||||||||||||||||||
Year Ended 12/31/2012 | 1.00 | 0.00 | 0.00 | 0.00 | — | — | ||||||||||||||||||
| (a) | The amount shown may not correlate with the change in aggregate gains and losses of portfolio securities due to the timing of sales and redemptions of portfolio shares. |
| (b) | Total investment return assumes dividend reinvestment and does not reflect any deduction for applicable sales charges. Not annualized for periods less than one year. Total return shown does not reflect charges and expenses imposed on contract holders by the variable accounts. Those charges and expenses reduce the return received by contract holders as compared to the return presented. |
| * | All per share amounts have been rounded to the nearest cent. |
| ** | Computed on an annualized basis for periods less than one year. |
| *** | Net investment income per share reflects special dividends. The effect of these dividends amounted to $0.07 per share. |
The accompanying Notes to Financial Statements are an integral part of this statement.
238
Table of Contents
THRIVENT SERIES FUND, INC.
FINANCIAL HIGHLIGHTS –CONTINUED
| RATIOS/SUPPLEMENTAL DATA | ||||||||||||||||||||||||||||||||||
| Net Asset | Net Assets, End | Ratio to Average Net Assets** | Ratio to Average Net Assets Before Expenses Waived, Credited or Paid Indirectly** | Portfolio | ||||||||||||||||||||||||||||||
Total Distributions | Value, End of Period | Total Return(b) | of Period (in millions) | Expenses | Net Investment Income/(Loss) | Expenses | Net Investment Income/(Loss) | Turnover Rate | ||||||||||||||||||||||||||
| $ | (0.75 | ) | $ | 31.04 | 11.68 | % | $ | 691.3 | 0.25 | % | 1.96 | % | 0.25 | % | 1.96 | % | 3 | % | ||||||||||||||||
| (0.53 | ) | 28.54 | 1.12 | % | 521.2 | 0.26 | % | 2.26 | % | 0.26 | % | 2.26 | % | 3 | % | |||||||||||||||||||
| (0.45 | ) | 28.75 | 13.25 | % | 450.4 | 0.39 | % | 1.65 | % | 0.39 | % | 1.65 | % | 3 | % | |||||||||||||||||||
| (0.62 | ) | 25.80 | 31.81 | % | 392.6 | 0.40 | % | 1.71 | % | 0.40 | % | 1.71 | % | 4 | % | |||||||||||||||||||
| (0.33 | ) | 20.11 | 15.54 | % | 304.0 | 0.42 | % | 1.89 | % | 0.42 | % | 1.89 | % | 4 | % | |||||||||||||||||||
| (0.26 | ) | 4.77 | 12.78 | % | 791.1 | 0.45 | % | 5.65 | % | 0.45 | % | 5.65 | % | 38 | % | |||||||||||||||||||
| (0.28 | ) | 4.48 | (2.69 | )% | 712.1 | 0.45 | % | 5.73 | % | 0.45 | % | 5.73 | % | 38 | % | |||||||||||||||||||
| (0.30 | ) | 4.87 | 1.96 | % | 855.8 | 0.44 | % | 5.86 | % | 0.44 | % | 5.86 | % | 42 | % | |||||||||||||||||||
| (0.32 | ) | 5.07 | 6.91 | % | 921.9 | 0.44 | % | 6.31 | % | 0.44 | % | 6.31 | % | 53 | % | |||||||||||||||||||
| (0.35 | ) | 5.05 | 16.28 | % | 904.9 | 0.44 | % | 7.11 | % | 0.44 | % | 7.11 | % | 57 | % | |||||||||||||||||||
| (0.36 | ) | 10.07 | 6.09 | % | 1,427.4 | 0.44 | % | 3.44 | % | 0.44 | % | 3.44 | % | 109 | % | |||||||||||||||||||
| (0.61 | ) | 9.83 | (0.68 | )% | 1,336.0 | 0.44 | % | 3.69 | % | 0.44 | % | 3.69 | % | 92 | % | |||||||||||||||||||
| (0.53 | ) | 10.50 | 6.68 | % | 1,392.3 | 0.44 | % | 3.77 | % | 0.44 | % | 3.77 | % | 87 | % | |||||||||||||||||||
| (0.42 | ) | 10.34 | (0.07 | )% | 1,417.6 | 0.44 | % | 3.78 | % | 0.44 | % | 3.78 | % | 115 | % | |||||||||||||||||||
| (0.40 | ) | 10.77 | 10.98 | % | 1,575.9 | 0.44 | % | 3.84 | % | 0.44 | % | 3.84 | % | 132 | % | |||||||||||||||||||
| (0.21 | ) | 10.85 | 1.49 | % | 194.9 | 0.46 | % | 1.69 | % | 0.46 | % | 1.69 | % | 349 | % | |||||||||||||||||||
| (0.20 | ) | 10.89 | 0.80 | % | 157.3 | 0.47 | % | 1.78 | % | 0.47 | % | 1.78 | % | 372 | % | |||||||||||||||||||
| (0.24 | ) | 11.00 | 6.52 | % | 150.0 | 0.47 | % | 2.22 | % | 0.47 | % | 2.22 | % | 407 | % | |||||||||||||||||||
| (0.56 | ) | 10.56 | (2.47 | )% | 152.0 | 0.46 | % | 1.94 | % | 0.46 | % | 1.94 | % | 384 | % | |||||||||||||||||||
| (0.37 | ) | 11.39 | 4.94 | % | 185.5 | 0.46 | % | 2.00 | % | 0.46 | % | 2.00 | % | 401 | % | |||||||||||||||||||
| (0.19 | ) | 9.81 | 2.84 | % | 884.1 | 0.45 | % | 1.94 | % | 0.45 | % | 1.94 | % | 59 | % | |||||||||||||||||||
| (0.16 | ) | 9.72 | 0.73 | % | 823.9 | 0.44 | % | 1.67 | % | 0.44 | % | 1.67 | % | 73 | % | |||||||||||||||||||
| (0.17 | ) | 9.81 | 1.68 | % | 1,018.3 | 0.44 | % | 1.75 | % | 0.44 | % | 1.75 | % | 102 | % | |||||||||||||||||||
| (0.15 | ) | 9.82 | 0.45 | % | 1,082.5 | 0.44 | % | 1.56 | % | 0.44 | % | 1.56 | % | 114 | % | |||||||||||||||||||
| (0.16 | ) | 9.92 | 4.32 | % | 1,200.0 | 0.43 | % | 1.72 | % | 0.44 | % | 1.71 | % | 107 | % | |||||||||||||||||||
| — | 1.00 | 0.00 | % | 191.9 | 0.45 | % | 0.00 | % | 0.46 | % | (0.02 | )% | N/A | |||||||||||||||||||||
| — | 1.00 | 0.00 | % | 146.9 | 0.21 | % | 0.00 | % | 0.55 | % | (0.33 | )% | N/A | |||||||||||||||||||||
| — | 1.00 | 0.00 | % | 126.4 | 0.18 | % | 0.00 | % | 0.53 | % | (0.35 | )% | N/A | |||||||||||||||||||||
| — | 1.00 | 0.00 | % | 146.6 | 0.22 | % | 0.00 | % | 0.52 | % | (0.30 | )% | N/A | |||||||||||||||||||||
| — | 1.00 | 0.00 | % | 148.3 | 0.29 | % | 0.00 | % | 0.51 | % | (0.23 | )% | N/A | |||||||||||||||||||||
The accompanying Notes to Financial Statements are an integral part of this statement.
239
Table of Contents
(unaudited)
Proxy Voting
The policies and procedures that the Fund uses to determine how to vote proxies relating to portfolio securities are attached to the Fund’s Statement of Additional Information. You may request a free copy of the Statement of Additional Information by calling 800-THRIVENT (847-4836). You also may review the Statement of Additional Information or the report of how the Fund voted proxies relating to portfolio securities during the most recent 12-month period ended June 30 at thrivent.com or sec.gov.
Quarterly Schedule of Investments
The Fund files its Schedule of Investments on Form N-Q with the SEC for the first and third quarters of each fiscal year. You may request a free copy of the Fund’s Forms N-Q by calling 800-THRIVENT (847-4836). The Fund’s most recent Form N-Q Schedule of Investments also is available at Thrivent.com or sec.gov. You also may review and copy the Forms N-Q for the Fund at the SEC’s Public Reference Room in Washington, DC. You may get information about the operation of the Public Reference Room by calling 1-800-SEC-0330.
Summary Schedule of Investments
The summary schedule of investments is designed to streamline the report and help investors better focus on a portfolio’s principal holdings. A complete listing of holdings for a portfolio in which the summary is included in the shareholder report is available free of charge by calling 800-THRIVENT (847-4836). It is also available at Thrivent.com or sec.gov where it is part of form N-CSR.
Board Approval of Investment Advisory Agreement and Subadvisory Agreements
Both the Investment Company Act of 1940 (the “Investment Company Act”) and the terms of the Advisory and Subadvisory Agreements of the Thrivent Series Fund, Inc. (the “Fund”) require that these agreements be approved annually by the Board of Directors (the “Board”), including a majority of the Directors who are not “interested persons” of the Fund, as defined in the Investment Company Act (the “Independent Directors”). The ten-member Board includes eight Independent Directors, including the Chairman.
At its meeting on November 15-16, 2016, the Board voted unanimously to renew the existing Advisory Agreement, as amended, between the Fund and Thrivent Financial for Lutherans (the “Adviser”) for each series of the Fund (each, a “Portfolio”). The Board also unanimously approved the Subadvisory Agreements for each of the Portfolios for which there is an investment subadviser (each a “Subadviser”). The Adviser and Subadvisers are referred to, collectively, as the “Advisory Organizations.” In connection with its evaluation of the agreements with the Advisory Organizations, the Board reviewed a broad range of information requested for this purpose and considered a variety of factors, including the following:
| 1. | The nature, extent, and quality of the services provided by the Advisory Organizations; |
| 2. | The performance of each Portfolio; |
| 3. | The advisory fee and net operating expense ratio of each Portfolio compared to a peer group; |
| 4. | The cost of services provided and profit realized by the Adviser; |
| 5. | The extent to which economies of scale may be realized as the Portfolios grow; |
| 6. | Whether fee levels reflect these economies of scale for the benefit of the Portfolios’ shareholders; |
| 7. | Other benefits realized by the Adviser and its affiliates from their relationship with the Fund; and |
| 8. | Any other factors that the Board deemed relevant to its consideration. |
In connection with the renewal process, the Contracts Committee of the Board (consisting of all of the Independent Directors) met on five occasions from May 24 to November 16, 2016 to consider information relevant to the renewal process. The Independent Directors also retained the services of Management Practice Inc. (“MPI”) as an independent consultant to assist
240
Table of Contents
ADDITIONAL INFORMATION
(unaudited)
in the compilation, organization, and evaluation of relevant information. This information included Portfolio-by-Portfolio statistical comparisons of the advisory fees, other fees, net operating expenses and performance of each of the Portfolios in comparison to a peer group of comparable funds; portfolio turnover percentages; brokerage costs; information with respect to services provided to the Portfolios and fees charged, including effective advisory fees that take into account breakpoints and fee waivers by the Adviser; asset and flow trends for the Portfolios; the cost of services and profit realized by the Adviser and its affiliates that provide services to the Portfolios; and information regarding the types of services furnished to the Portfolios. The Contracts Committee also received from the Adviser a summary document containing information about each Portfolio including its inception date, investment strategy, and the names of Lipper peer groups, custom or other benchmarks, and portfolio managers. The summary document also included information regarding historical changes in certain of the Portfolios’ information.
The Board received information from the Adviser regarding the personnel providing services to the Portfolios, including investment management, compliance and administrative personnel. The Board also received monthly reports from the Adviser’s investment management staff with respect to the performance of the Portfolios. In addition to its review of the information presented to the Board during the contract renewal process, the Board also considered information obtained from management throughout the course of the year. The Board also reviewed information from MPI, including Portfolio-by-Portfolio analyses and independent assessment of information relating to the Portfolios and the agreements.
The Independent Directors were represented by independent counsel throughout the review process and during executive sessions without management present to consider reapproval of the agreements. As noted above, the Independent Trustees were assisted throughout the process by an independent consultant, MPI. Each Independent Director relied on his or her own business judgment in determining the weight to be given to each factor considered in evaluating the materials that were presented to them. The Contracts Committee’s and Board’s review and conclusions were based on a comprehensive consideration of all information presented to them and were not the result of any single controlling factor. In addition, each Director may have weighed individual factors differently. The key factors considered and the conclusions reached are described below.
Nature, Extent and Quality of Services
At each of the Board’s regular quarterly meetings, management presented information describing the services furnished to the Portfolios by the Adviser, transfer agent, administrator and, as appropriate, the Subadvisers. During these meetings, management reported on the investment management, portfolio trading and compliance services provided to the Portfolios. During the renewal process, the Board considered the specific services provided under the Advisory Agreement. The Board also considered information relating to the investment experience and qualifications of the Adviser’s portfolio managers and those of the Subadvisers overseeing investments for the Fund.
The Board received reports at each of its quarterly meetings from the Adviser’s Head of Equity Investments and Head of Fixed Income Funds, as supplemented by the Adviser’s Chief Investment Officer, who was also present at all of the meetings. At each quarterly meeting, the Head of Equity Investments and Head of Fixed Income Funds presented information about each of the Portfolios. The Adviser noted that the Head of Equity Investments and Head of Fixed Income Funds monitor the Portfolios’ risk profiles and that the Adviser had implemented a process to monitor market and relative risks in comparison to the Portfolios’ Lipper peer groups and market benchmarks. On a schedule agreed to by the Adviser and the Independent Directors, the Board received presentations from certain Subadvisers regarding their portfolio management services to certain Portfolios. These reports and presentations gave the Board the opportunity to evaluate the portfolio managers’ abilities and the quality of services they provide to the Portfolios. The Adviser also reviewed with the Board the services provided by the Subadvisers and its oversight of the Subadvisers. The Adviser and the Fund’s Chief Compliance Officer presented information to the Board describing the portfolio compliance functions performed by the Adviser. The Independent Directors also met in-person, including in executive session, with and received quarterly reports from the Fund’s Chief Compliance Officer.
The Board considered the depth and quality of the Adviser’s oversight of the Subadvisers. In addition, the Board noted the broad functions that the Adviser performed in support of the subadvised Portfolios, including, among other things, management of portfolio cash, subadviser expense management and payment, performance and compliance monitoring. The Board noted that investment management staff of the Adviser and the Fund’s Chief Compliance Officer conduct in-person oversight visits of each Subadviser, report the results of the visit to the Board and then follow through with additional inquiry on any questions or concerns that arise during the visit. The Board also noted that, as part of its oversight practice, the
241
Table of Contents
ADDITIONAL INFORMATION
(unaudited)
Adviser requires the Subadvisers to respond to a variety of compliance checklists and certifications to ensure their ongoing compliance with a subadvised Portfolio’s policies. The Board noted that the Adviser requires the Subadvisers to complete an annual questionnaire addressing a range of compliance topics. In addition, the Board noted that the Adviser has dedicated personnel responsible for daily monitoring of the Subadvisers’ activities pertaining to the subadvised Portfolios.
The Board considered the adequacy of the Advisory Organizations’ resources used to provide services to the Fund pursuant to the Advisory and Subadvisory Agreements. The Adviser reviewed with the Board the Adviser’s process for overseeing the portfolio management teams of the Portfolios, and explained similarities and differences for how it oversees the Adviser’s teams and the teams of the Subadvisers. In addition, the Adviser noted that its investments in technology and personnel have benefitted the Portfolios and discussed continued investments in these resources. The Adviser also discussed how it has continued to strengthen its compliance program. The Board viewed these actions as a positive factor in reapproving the existing Advisory Agreement, as they demonstrated the Adviser’s commitment to provide the Portfolios with quality service and competitive investment performance. The Board concluded that, within the context of its full deliberations, the nature, extent and quality of the investment advisory services provided to the Portfolios by the Adviser and Subadvisers supported renewal of the Advisory Agreement and Subadvisory Agreements.
Performance of the Portfolios
In connection with each of its regular quarterly meetings, the Board received information on the performance of each Portfolio, including net performance, relative performance rankings within each Portfolio’s Lipper peer group, Morningstar ratings, and performance as compared to benchmark index returns. At each quarterly Board meeting, the Head of Equity Investments and Head of Fixed Income Funds reviewed with the Board the economic and market environment, risk management, and style consistency in connection with management of the Portfolios. The Board considered investment performance for each Portfolio, to the extent applicable, over the one-, two-, three-, five-, and ten-year periods. When evaluating investment performance, the Board considered longer-term performance and the trend of performance, and focused particularly upon the three-year performance record. Although the Board conducted its review on a Portfolio-by-Portfolio basis, it noted that, for the period ended June 30, 2016, the three-year average ranking of the Portfolios against their Lipper categories was 32% (on a scale of 1-99%, with 1% being the best).
The Board noted that certain Portfolios did not fit well within a Lipper peer group because of differences between the principal investment strategies of these Portfolios and funds included in their respective Lipper peer group. In such cases, the Adviser provided additional information regarding these Portfolios’ performance compared to a customized benchmark that the Adviser believed better represented the investment strategies of such Portfolios. The Board concluded that the performance of each individual Portfolio was either satisfactory or that the Adviser had taken appropriate actions in an effort to improve performance.
Advisory Fees and Fund Expenses
The Board reviewed information prepared by MPI comparing each Portfolio’s advisory fee with the advisory fee of its peer group. The Board considered both the contractual and effective advisory fees for each of the Portfolios. The Board noted that the majority of the Portfolios’ advisory fees were below the medians of their peer groups. Although the Board conducted its review on a Portfolio-by-Portfolio basis, it noted that the average ranking of the Portfolios’ advisory fees was 38% (on a scale of 1-99%, with 1% being the lowest fee). The Board viewed favorably the Adviser’s proposal to provide certain fee waivers and expense limitations for certain Portfolios and considered the effect of the waivers and limitations in lowering the Portfolios’ expenses. On the basis of its review, the Board concluded that the advisory fees charged to the Portfolios for investment management services were reasonable.
The Board also reviewed information prepared by MPI comparing each Portfolio’s overall expense ratio with the expense ratio of its peer group. The Board conducted its review on a Portfolio-by-Portfolio basis and noted that all but two Portfolios (each of which is discussed below) had better total net expense ratios than their peer group medians. The Board further noted that the Portfolios had an average ranking of 27% (on a scale of 1-99%, with 1% being the lowest expenses). With respect to the Thrivent Money Market Portfolio, the Board noted that the Adviser, like many investment advisers in the industry, continued to waive fees in order to maintain a zero yield. With respect to Thrivent Partner Emerging Markets Equity Portfolio, the Board noted the relatively small average asset size of the Portfolio, that the Portfolio’s net expense ratio was higher than its peer group median by one basis point and that the Portfolio was subject to a expense cap, which the Adviser lowered.
242
Table of Contents
ADDITIONAL INFORMATION
(unaudited)
Cost of Services and Profitability
The Board considered the Adviser’s estimates of its profitability, which included allocations by the Adviser of its costs in providing advisory services to the Portfolios. The internal audit department (i.e., Business Risk Management) of the Adviser conducted a review of such allocations and a department representative reported to the Board his views regarding the reasonableness and consistency of these allocations. The Board considered the profitability of the Adviser both overall and on a Portfolio-by-Portfolio basis. The Board also considered the expense reimbursements and waivers in effect. The Board received a comprehensive presentation that discussed, among other things, profitability benchmarks and trends based on a sample of asset managers, as well as the Adviser’s view of its profitability. Based on its review of the data prepared by MPI and expense and profit information provided by the Adviser, the Board concluded that the profits earned by the Adviser from the Advisory Agreement were not excessive in light of the nature, extent and quality of services provided to the Portfolios.
With respect to fees paid to Subadvisers under the Subadvisory Agreements, the Board did not consider profitability information with respect to the Subadvisers, which are not affiliated with the Adviser. The Board considered that those contracts had been negotiated on an arm’s-length basis between the Adviser and each Subadviser, and that each Subadviser’s separate profitability from its relationship with the Portfolios was not a material factor in determining whether to renew the Subadvisory Agreements.
Economies of Scale and Breakpoints
The Board considered information regarding the extent to which economies of scale may be realized as a Portfolio’s assets increase and whether the fee levels reflect these economies of scale for the benefit of shareholders. The Adviser explained its general goal with respect to the employment of fee waivers, expense reimbursements and breakpoints. The Board considered information provided by the Adviser related to advisory fee rates, breakpoints in the advisory fee rates and fee waivers provided by the Adviser. The Board also considered management’s view that it is difficult to generalize as to whether, or to what extent, economies in the advisory function may be realized as a Portfolio’s assets increase. The Board noted that expected economies of scale, where they exist, may be shared through the use of fee breakpoints, fee waivers and expense limitations by the Adviser, and/or a lower overall fee rate.
Other Benefits to the Adviser and its Affiliates
The Board considered information regarding potential “fall-out” or ancillary benefits that the Adviser and its affiliates may receive as a result of their relationship with the Fund, both tangible and intangible, such as their ability to leverage investment professionals who manage other portfolios, an enhanced reputation as an investment adviser which may help in attracting other clients and investment personnel, and the engagement of affiliates as service providers to the Portfolios. The Board noted that such benefits were difficult to quantify but were consistent with benefits received by other mutual fund advisers. The Board also considered the research received by the Adviser generated from commission dollars spent on the Portfolios’ portfolio trading.
Based on the factors discussed above, the Contracts Committee unanimously recommended approval of the Advisory Agreement and the Subadvisory Agreements, and the Board, including all of the Independent Directors voting separately, approved each of the agreements.
243
Table of Contents
The following table provides information about the Directors and Officers of the Fund. The Board is responsible for the management and supervision of the Funds’ business affairs and for exercising all powers except for those reserved to the shareholders. Each Director oversees each of the 27 series of the Fund and also serves as:
| • | Trustee of Thrivent Mutual Funds, a registered investment company consisting of 21 funds that offer Class A and Class S shares. |
| • | Trustee of Thrivent Cash Management Trust, a registered investment company consisting of one portfolio that serves as a cash collateral fund for a securities lending program sponsored by Thrivent Financial. |
| • | Trustee of Thrivent Core Funds, a registered investment company that only offers its shares to the Fund and Thrivent Mutual Funds. |
The Fund, Thrivent Mutual Funds, Thrivent Cash Management Trust, and Thrivent Core Funds are collectively referred to as the “Fund Complex.” The Statement of Additional Information includes additional information about the Directors and is available, without charge, by calling 1-800-847-4836.
Interested Directors (1)(2)(3)(4)
Name (Year of Birth) Year Elected | Principal Occupation(s) and Directorships of Public Companies and Other Investment Companies During the Past Five Years | |
Russell W. Swansen (1957) 2009 | Senior Vice President, Chief Investment Officer, Thrivent Financial since 2003. Director of Twin Bridge Capital Partners; Invenshure, LLC; Children’s Cancer Research Fund; and Intellectual Takeout. | |
David S. Royal (1971) 2015 | President, Thrivent Mutual Funds, Thrivent Financial since 2015; Vice President and Deputy General Counsel from 2006 to 2015. Director of Fairview Hospital Foundation. | |
Independent Directors (2)(3)(4)(5) | ||
Name (Year of Birth) Year Elected | Principal Occupation(s) and Directorships of Public Companies and Other Investment Companies During the Past Five Years | |
Janice B. Case (1952) 2011 | Retired. Independent Trustee of North American Electric Reliability Corporation (the electric reliability organization (“ERD”) for North America) since 2008. | |
Robert J. Chersi (1961) 2017 | Founder of Chersi Services LLC (consulting firm) since 2012; Executive Director of Center for Global Governance, Reporting & Regulation and Adjunct Professor of Finance and Economics at Pace University since 2013; Helpful Executive in Research (counseling) in the Department of Accounting & Information Systems at Rutgers University since 2013; Chief Financial Officer of Fidelity Investments Financial Services from 2008 to 2012. Director and Chairman of the Audit Committee of Old Mutual Asset Management PLC since 2016; Advisory Board member of the Pace University Lubin School of Business; Trustee of Fidelity Investments Financial Services’ Political Action Committee. | |
Richard A. Hauser (1943) 2004 | Retired. Vice President and Assistant General Counsel, The Boeing Company from 2007-2016. | |
Marc S. Joseph (1960) 2011 | Managing Director of Granite Ridge LLP (consulting and advisory firm) since 2009; Managing Director of Triangle Crest (private investing and consulting firm) since 2004. | |
Paul R. Laubscher (1956) 2009 | Portfolio Manager for U.S. private real estate portfolios of IBM Retirement Funds. | |
James A. Nussle (1960) 2011 | President and Chief Executive Officer of Credit Union National Association since September 2014; President and Chief Operating Officer of Growth Energy (trade association) from 2010 through August 2014; Advisory Board member of AVISTA Capital Partners (private equity firm) since 2010; CEO of The Nussle Group LLC (consulting firm) since 2009. Advisory Board member of AVISTA Capital Partners and Director of Portfolio Recovery Associates (PRAA). | |
244
Table of Contents
BOARDOF DIRECTORSAND OFFICERS
Independent Directors (2)(3)(4)(5)
Name (Year of Birth) Year Elected | Principal Occupation(s) and Directorships of Public Companies and Other Investment Companies During the Past | |
Verne O. Sedlacek (1954) 2017 | Chief Executive Officer of E&F Advisors LLC (consulting) since 2015; PChief resident & Chief Executive Officer of the Commonfund from 2003 to 2015. Director of Association of Governing Boards of Universities and Collleges since 2007; Trustee of Valparaiso University since 2015; Trustee of Museum of American Finance since 2015; Chairman of the Board of Directors of AGB Institutional Strategies since 2016. | |
Constance L. Souders (1950) 2007 | Retired. | |
Executive Officers (4)
Name (Year of Birth) Position Held With Thrivent | Principal Occupation(S) During the Past Five Years | |
| David S. Royal (1971) President | Vice President, Thrivent Mutual Funds, Thrivent Financial since 2015; Vice President and Deputy General Counsel from 2006 to 2015. | |
| Russell W. Swansen (1957) Chief Investment Officer | Senior Vice President and Chief Investment Officer, Thrivent Financial since 2003. | |
Gerard V. Vaillancourt (1967) Treasurer and Principal Accounting Officer | Vice President, Mutual Fund Accounting, Thrivent Financial since 2006. | |
| Michael W. Kremenak (1978) Secretary and Chief Legal Officer | Vice President, Thrivent Financial since 2015; Senior Counsel, Thrivent Financial from 2013 to 2015; Vice President and Assistant General Counsel at Nuveen Investments from 2011 to 2013. | |
Ted S. Dryden (1965) Chief Compliance Officer | Investment Company and Investment Adviser Chief Compliance Officer, Thrivent Financial since December 2010. | |
| Janice M. Guimond (1964) Vice President | Vice President, Investment Operations, Thrivent Financial since 2004. | |
Kathleen M. Koelling(1977) Privacy and Identity Theft and Anti-Money Laundering Officer (6) | Privacy and Identity Theft and Anti-Money Laundering Officer, Thrivent Financial since 2011; Senior Counsel, Thrivent Financial since 2002. | |
Mark D. Anema (1961) Vice President | Vice President, New Product Management and Development, Thrivent Financial since 2007. | |
KathrynA. Stelter (1962) Vice President | Director, Mutual Fund Operations, Thrivent Financial since 2014; Director, Mutual Fund Operations at Hartford Funds from 2006 to 2014. | |
| James M. Odland (1955) Assistant Secretary | Vice President, Managing Counsel, Thrivent Financial since 2005. | |
Jill M. Forte (1974) Assistant Secretary | Counsel, Thrivent Financial since 2015; Associate Counsel, Ameriprise Financial, Inc. from 2013 to 2015; Manager - Legal Affairs, Ameriprise Financial, Inc. from 2010 to 2013. | |
Troy A. Beaver (1967) Vice President | Vice President, Mutual Fund Distribution & Sales, Thrivent Financial since 2015; Vice President, Marketing, American Century Investments from 2006 to 2015. | |
| Sarah L. Bergstrom (1977) Assistant Treasurer | Director, Fund Accounting Administration, Thrivent Financial since 2007. | |
| (1) | “Interested Director” of the Fund as defined in the Investment Company Act of 1940 by virtue of positions with Thrivent Financial. Mr. Swansen and Mr. Royal are each considered an interested director because of his principal occupation with Thrivent Financial. |
| (2) | Each Director generally serves an indefinite term until her or his successor is duly elected and qualified. Directors serve at the discretion of the board until their successors are duly appointed and qualified. |
| (3) | Each Director oversees 50 portfolios. |
| (4) | The address for each Director and Officer unless otherwise noted is 625 Fourth Avenue South, Minneapolis, MN 55415. |
| (5) | The Directors, other than Mr. Swansen or Mr. Royal, are not “interested directors” of the Fund and are referred to as “Independent Directors.” |
| (6) | The address for this Officer is 4321 North Ballard Road, Appleton, Wl 54913. |
245
Table of Contents
(This page intentionally left blank)
Table of Contents
(This page intentionally left blank)
Table of Contents
(This page intentionally left blank)
Table of Contents

REGISTER ON THRIVENT.COM To access your accounts, member benefits and more It only takes five steps. Step 1: Visit Thrivent.com and click “Register.” Step 2: Enter your member ID and birth date. Step 3: Enter your email address. Step 4: Create a user ID, password and security questions. Your password should be something that only you would know and one that is not easily guessed by others. Step 5: Log in to Thrivent.com using your new user ID and password. A selection of popular links will appear, ready for you to explore. That’s it! Now you’re ready to enjoy all the features and benefits of Thrivent.com, anytime and from anywhere. REGISTER TODAY so you can log in tomorrow! This page is not part of the annual report.
Table of Contents
4321 N. Ballard Road, Appleton, WI 54919-0001 We’re listening to you! In response to concerns regarding multiple mailings, we send one copy of a shareholder report and one copy of a prospectus for for Thrivent Series Fund, Inc. to each household. This process is known as householding. This consolidation helps reduce printing and postage costs, thereby saving money. If you wish to receive an additional copy of this report, call us toll-free at 800-847-4836. If you wish to revoke householding in the future, you may write to us at 4321 N. Ballard Road, Appleton, WI 54919-0001, or by calling us at 800-847-4836. We will begin to mail separate regulatory mailings within 30 days of receiving your request. It’s your choice—email, U.S. mail or some of each? Paperless delivery of documents provides faster access to important information. An email is sent to you when new documents are available. Paperless delivery options: Prospectuses Annual and annual reports Most billing and contribution notices Most contract and account statements Most life insurance statements Confirmation activity statements Tax Forms (life, health and annuity contract tax forms) Annual privacy notice Thrivent magazine Go to Thrivent.com/gopaperless to learn more. 23572AR R2-17
Table of Contents
| Item 2. | Code of Ethics |
As of the end of the period covered by this report, registrant has adopted a code of ethics (as defined in Item 2 of Form N-CSR) applicable to registrant’s Principal Executive Officer, Principal Financial Officer, and Principal Accounting Officer. No waivers were granted to such code of ethics during the period covered by this report. A copy of this code of ethics is filed as an exhibit to this Form N-CSR.
| Item 3. | Audit Committee Financial Expert |
Registrant’s Board of Directors has determined that Constance L. Souders, an independent director, is the Audit Committee Financial Expert.
| Item 4. | Principal Accountant Fees and Services |
| (a) | Audit Fees |
The aggregate fees billed by registrant’s independent public accounts, PricewaterhouseCoopers LLP (“PwC”), for each of the last two complete fiscal years and the fiscal period covered by this report for professional services rendered in connection with the audit of registrant’s annual financial statements or services that are normally provided by the accountant in connection with statutory and regulatory filings or engagements were $491,872 for the year ended December 31, 2015 and $180,763 for the year ended December 31, 2016.
| (b) | Audit-Related Fees |
The aggregate fees PwC billed to registrant for each of the last two fiscal years for assurance and other services which are reasonably related to the performance of registrant’s audit and are not reported under Item 4(a) were $0 for the fiscal year ended December 31, 2015 and $0 for the year ended December 31, 2016. The aggregate fees PwC billed to registrant’s investment adviser and any entity controlling, controlled by, or under common control with registrant’s investment adviser for assurance and other services directly related to the operations and financial reporting of registrant were $0 for the year ended December 31, 2015 and $0 for the year ended December 31, 2016.
| (c) | Tax Fees |
The aggregate tax fees PwC billed to registrant for each of the last two fiscal years for tax compliance, tax advice, and tax planning services were $129,548 for the year ended December 31, 2015 and $100,289 for the year ended December 31, 2016. The aggregate tax fees PwC billed to registrant’s investment adviser and any entity controlling, controlled by, or under common control with registrant’s investment adviser for services directly related to the operations and financial reporting of registrant were $0 for the year ended December 31, 2015 and $0 for the year ended December 31, 2016.
| (d) | All Other Fees |
The aggregate fees PwC billed to registrant for each of the last two fiscal years for products and services provided other than the services reported in paragraphs (a) through (c) of this item were $0 for the year ended December 31, 2015 and $0 for the year ended December 31, 2016. The aggregate fees PwC billed to registrant’s investment adviser and any entity controlling, controlled by, or under common control with registrant’s investment adviser for products and services provided other than the services reported in paragraphs (a) through (c) of this item were $147,014 for the year ended December 31, 2015 and $0 for the year ended December 31, 2016. The 2015 payments were for access to a PwC-sponsored online library that provides interpretive guidance regarding U.S. and foreign accounting standards, fees related to the merger of certain series of Thrivent Mutual Funds and certain series of Thrivent Series Fund, Inc., and other tax related work. These figures are also reported in response to item 4(g) below.
Table of Contents
| (e) | Registrant’s audit committee charter, adopted in February 2010, provides that the audit committee (comprised of the independent Directors of registrant) is responsible for pre-approval of all auditing services performed for the registrant. The audit committee also is responsible for pre-approval (subject to the de minimis exceptions for non-audit services described in Section 10A(i)(1)(B) of the Securities Exchange Act of 1934) of all non-auditing services performed for the registrant or an affiliate of registrant. In addition, registrant’s audit committee charter permits a designated member of the audit committee to pre-approve, between meetings, one or more audit or non-audit service projects, subject to an expense limit and notification to the audit committee at the next committee meeting. Registrant’s audit committee pre-approved all fees described above that PwC billed to registrant. |
| (f) | Less than 50% of the hours billed by PwC for auditing services to registrant for the fiscal year ended December 31, 2016, were for work performed by persons other than full-time permanent employees of PwC. |
| (g) | The aggregate non-audit fees billed by PwC to registrant and to registrant’s investment adviser and any entity controlling, controlled by, or under common control with registrant’s investment adviser for the fiscal years ending December 31, 2015 and December 31, 2016 were $147,014 and $0, respectively. These figures are also reported in response to item 4(d) above. |
| (h) | Registrant’s audit committee has considered the non-audit services provided to the registrant and registrant’s investment adviser and any entity controlling, controlled by, or under common control with registrant’s investment adviser as described above and determined that these services do not compromise PwC’s independence. |
| Item 5. | Audit Committee of Listed Registrants |
Not applicable.
| Item 6. | Schedule of Investments |
| (a) | The summary schedule of investments for these portfolios: Aggressive Allocation Portfolio, Moderately Aggressive Allocation Portfolio, Moderate Allocation Portfolio, Moderately Conservative Allocation Portfolio, Growth and Income Plus Portfolio, Balance Income Plus Portfolio, Diversified Income Plus Portfolio, Opportunity Income Plus Portfolio, Small cap Index Portfolio, Mid Cap Index Portfolio Partner Worldwide Allocation Portfolio, Large Cap Stock Portfolio, Large Cap Index Portfolio, High Yield Portfolio, Income Portfolio and limited Maturity Bond Portfolio, are included as part of the report to shareholders filed under Item 1 of this Form. The schedule of investments for said portfolios are filed under this Item. |
Table of Contents

Report of Independent Registered Public Accounting Firm
To the Board of Directors and Shareholders of Thrivent Aggressive Allocation Portfolio, Thrivent Moderately Aggressive Allocation Portfolio, Thrivent Moderate Allocation Portfolio, Thrivent Moderately Conservative Allocation Portfolio, Thrivent Growth and Income Plus Portfolio, Thrivent Balanced Income Plus Portfolio, Thrivent Diversified Income Plus Portfolio, Thrivent Opportunity Income Plus Portfolio, Thrivent Small Cap Index Portfolio, Thrivent Mid Cap Index Portfolio, Thrivent Partner Worldwide Allocation Portfolio, Thrivent Large Cap Stock Portfolio, Thrivent Large Cap Index Portfolio, Thrivent High Yield Portfolio, Thrivent Income Portfolio, and Thrivent Limited Maturity Bond Portfolio:
In our opinion, the accompanying statements of assets and liabilities, including the summary schedules of investments, and the related statements of operations and of changes in net assets and the financial highlights (included in Item 1 of this Form N-CSR) and the schedule of investments (included in Item 6 of this Form N-CSR) present fairly, in all material respects, the financial position of Thrivent Aggressive Allocation Portfolio, Thrivent Moderately Aggressive Allocation Portfolio, Thrivent Moderate Allocation Portfolio, Thrivent Moderately Conservative Allocation Portfolio, Thrivent Growth and Income Plus Portfolio, Thrivent Balanced Income Plus Portfolio, Thrivent Diversified Income Plus Portfolio, Thrivent Opportunity Income Plus Portfolio, Thrivent Small Cap Index Portfolio, Thrivent Mid Cap Index Portfolio, Thrivent Partner Worldwide Allocation Portfolio, Thrivent Large Cap Stock Portfolio, Thrivent Large Cap Index Portfolio, Thrivent High Yield Portfolio, Thrivent Income Portfolio, and Thrivent Limited Maturity Bond Portfolio (constituting part of Thrivent Series Fund, Inc.) (hereafter referred to as the “Funds”) as of December 31, 2016, the results of each of their operations for the year then ended, the changes in each of their net assets for each of the two years in the period then ended and their financial highlights for each of the five years in the period then ended, in conformity with accounting principles generally accepted in the United States of America. These financial statements, financial highlights and schedules of investments (hereafter referred to as “financial statements”) are the responsibility of the Funds’ management. Our responsibility is to express an opinion on these financial statements based on our audits. We conducted our audits of these financial statements in accordance with the standards of the Public Company Accounting Oversight Board (United States). Those standards require that we plan and perform the audit to obtain reasonable assurance about whether the financial statements are free of material misstatement. An audit includes examining, on a test basis, evidence supporting the amounts and disclosures in the financial statements, assessing the accounting principles used and significant estimates made by management, and evaluating the overall financial statement presentation. We believe that our audits, which included confirmation of securities as of December 31, 2016 by correspondence with the custodian, agent banks, transfer agent and brokers provide a reasonable basis for our opinion.
February 20, 2017
PricewaterhouseCoopers LLP, 45 South Seventh Street, Suite 3400, Minneapolis, MN 55402
T: (612) 596 6000, F: (612) 373 7160, www.pwc.com/us
Table of Contents
AGGRESSIVE ALLOCATION PORTFOLIO
Schedule of Investments as of December 31, 2016
| Shares | Common Stock (53.8%) | Value | ||||||
| Consumer Discretionary (7.9%) | ||||||||
| 16,435 | Aaron’s, Inc. | $ | 525,756 | |||||
| 2,340 | Abercrombie & Fitch Company | 28,080 | ||||||
| 17,326 | Amazon.com, Inc.a | 12,992,248 | ||||||
| 4,550 | American Axle & Manufacturing Holdings, Inc.a | 87,815 | ||||||
| 2,111 | American Public Education, Inc.a | 51,825 | ||||||
| 39,430 | Aramark | 1,408,440 | ||||||
| 1,150 | Armstrong Flooring, Inc.a | 22,896 | ||||||
| 1,360 | Ascent Capital Group, Inc.a | 22,114 | ||||||
| 4,520 | AutoZone, Inc.a | 3,569,851 | ||||||
| 9,310 | Barnes & Noble, Inc. | 103,806 | ||||||
| 2,730 | Beazer Homes USA, Inc.a | 36,309 | ||||||
| 890 | Bed Bath & Beyond, Inc. | 36,170 | ||||||
| 1,891 | Berkeley Group Holdings plc | 65,370 | ||||||
| 1,430 | Big 5 Sporting Goods Corporation | 24,811 | ||||||
| 5,350 | Bloomin’ Brands, Inc. | 96,461 | ||||||
| 19,380 | BorgWarner, Inc. | 764,347 | ||||||
| 2,130 | Boyd Gaming Corporationa | 42,962 | ||||||
| 300 | Brembo SPA | 18,149 | ||||||
| 2,600 | Bridgestone Corporation | 93,550 | ||||||
| 31,497 | Brunswick Corporation | 1,717,846 | ||||||
| 1,710 | Bunzl plc | 44,394 | ||||||
| 21,176 | Burlington Stores, Inc.a | 1,794,666 | ||||||
| 7,020 | Caleres, Inc. | 230,396 | ||||||
| 4,720 | Callaway Golf Company | 51,731 | ||||||
| 400 | Canon Marketing Japan, Inc. | 6,716 | ||||||
| 9,090 | Carter’s, Inc. | 785,285 | ||||||
| 6,505 | Cedar Fair, LP | 417,621 | ||||||
| 8,250 | Cheesecake Factory, Inc. | 494,010 | ||||||
| 900 | Chipotle Mexican Grill, Inc.a | 339,588 | ||||||
| 800 | Chuy’s Holdings, Inc.a | 25,960 | ||||||
| 4,290 | Cinemark Holdings, Inc. | 164,564 | ||||||
| 1,340 | ClubCorp Holdings, Inc. | 19,229 | ||||||
| 940 | Columbia Sportswear Company | 54,802 | ||||||
| 74,278 | Comcast Corporation | 5,128,896 | ||||||
| 34,681 | Core-Mark Holding Company, Inc. | 1,493,711 | ||||||
| 3,292 | CSS Industries, Inc. | 89,114 | ||||||
| 3,893 | Culp, Inc. | 144,625 | ||||||
| 1,270 | D.R. Horton, Inc. | 34,709 | ||||||
| 15,970 | Dana, Inc. | 303,111 | ||||||
| 810 | Deckers Outdoor Corporationa | 44,866 | ||||||
| 15,549 | Delphi Automotive plc | 1,047,225 | ||||||
| 2,700 | Denso Corporation | 116,793 | ||||||
| 2,740 | DeVry Education Group, Inc. | 85,488 | ||||||
| 2,380 | Discovery Communications, Inc., Class Aa | 65,236 | ||||||
| 1,880 | Discovery Communications, Inc., Class Ca | 50,346 | ||||||
| 13,300 | DISH Network Corporationa | 770,469 | ||||||
| 3,630 | Dollar General Corporation | 268,874 | ||||||
| 24,666 | Dollar Tree, Inc.a | 1,903,722 | ||||||
| 2,360 | Domino’s Pizza, Inc. | 375,806 | ||||||
| 8,680 | DSW, Inc. | 196,602 | ||||||
| 43,957 | Duluth Holdings, Inc.a | 1,116,508 | ||||||
| 4,030 | Etsy, Inc.a | 47,473 | ||||||
| 2,700 | Eutelsat Communications | 52,212 | ||||||
| 6,568 | Expedia, Inc. | 744,023 | ||||||
| 5,065 | Finish Line, Inc. | 95,273 | ||||||
| 2,800 | Fuji Heavy Industries, Ltd. | 114,084 | ||||||
| 9,370 | Gentex Corporation | 184,495 | ||||||
| 17,986 | G-III Apparel Group, Ltd.a | 531,666 | ||||||
| 14,170 | GNC Holdings, Inc. | 156,437 | ||||||
| 700 | Hakuhodo Dy Holdings, Inc. | 8,619 | ||||||
| 6,720 | Harley-Davidson, Inc. | 392,045 | ||||||
| 4,492 | Haverty Furniture Companies, Inc. | 106,460 | ||||||
| 37,500 | Home Depot, Inc. | 5,028,000 | ||||||
| 6,900 | Honda Motor Company, Ltd. | 201,448 | ||||||
| 20,890 | Houghton Mifflin Harcourt Companya | 226,657 | ||||||
| 500 | HSN, Inc. | 17,150 | ||||||
| 1,110 | Hyatt Hotels Corporationa | 61,339 | ||||||
| 1,850 | ILG, Inc. | 33,615 | ||||||
| 3,800 | Inchcape plc | 32,840 | ||||||
| 1,010 | International Speedway Corporation | 37,168 | ||||||
| 477 | Intertek Group plc | 20,443 | ||||||
| 350 | Jack in the Box, Inc. | 39,074 | ||||||
| 660 | John Wiley and Sons, Inc. | 35,970 | ||||||
| 30,437 | Kate Spade & Companya | 568,259 | ||||||
| 6,326 | L Brands, Inc. | 416,504 | ||||||
| 6,205 | La-Z-Boy, Inc. | 192,665 | ||||||
| 25,050 | Liberty Interactive Corporationa | 500,499 | ||||||
| 229 | Linamar Corporation | 9,839 | ||||||
| 10,377 | Lithia Motors, Inc. | 1,004,805 | ||||||
| 820 | Live Nation Entertainment, Inc.a | 21,812 | ||||||
| 16,640 | LKQ Corporationa | 510,016 | ||||||
| 6,470 | Lowe’s Companies, Inc. | 460,146 | ||||||
| 260 | LVMH Moet Hennessy Louis Vuitton SE | 49,575 | ||||||
| 940 | M/I Homes, Inc.a | 23,669 | ||||||
| 790 | Meredith Corporation | 46,728 | ||||||
| 360 | Mohawk Industries, Inc.a | 71,885 | ||||||
| 430 | Monro Muffler Brake, Inc. | 24,596 | ||||||
| 550 | Murphy USA, Inc.a | 33,809 | ||||||
| 24,690 | Nautilus, Inc.a | 456,765 | ||||||
| 2,545 | New Media Investment Group, Inc. | 40,695 | ||||||
| 36,940 | Newell Brands, Inc. | 1,649,371 | ||||||
| 10,830 | News Corporation, Class A | 124,112 | ||||||
| 3,540 | News Corporation, Class B | 41,772 | ||||||
| 200 | Nifco, Inc. | 10,538 | ||||||
| 300 | Nokian Renkaat Oyj | 11,153 | ||||||
| 21,482 | Nord Anglia Education, Inc.a | 500,531 | ||||||
| 9,750 | Norwegian Cruise Line Holdings, Ltd.a | 414,667 | ||||||
| 84,880 | Nutrisystem, Inc. | 2,941,092 | ||||||
| 2,524 | O’Reilly Automotive, Inc.a | 702,707 | ||||||
| 22,150 | Oxford Industries, Inc. | 1,331,879 | ||||||
| 1,200 | Panasonic Corporation | 12,171 | ||||||
| 14,600 | Papa John’s International, Inc. | 1,249,468 | ||||||
| 28,184 | Papa Murphy’s Holdings, Inc.a | 118,936 | ||||||
| 3,042 | Persimmon plc | 66,370 | ||||||
| 44,920 | Pinnacle Entertainment, Inc.a | 651,340 | ||||||
| 428 | Publicis Groupe SA | 29,491 | ||||||
| 11,949 | PVH Corporation | 1,078,278 | ||||||
| 4,029 | Ralph Lauren Corporation | 363,899 | ||||||
| 350 | Restaurant Brands International, Inc. | 16,681 | ||||||
| 6,927 | Restoration Hardware Holdings, Inc.a | 212,659 | ||||||
| 1,930 | Retailmenot, Inc.a | 17,949 | ||||||
| 30,086 | Ross Stores, Inc. | 1,973,642 | ||||||
| 142 | RTL Group SA | 10,403 | ||||||
| 6,550 | Ruth’s Hospitality Group, Inc. | 119,865 | ||||||
| 4,430 | Sally Beauty Holdings, Inc.a | 117,041 | ||||||
| 10,295 | Scripps Networks Interactive, Inc. | 734,754 | ||||||
| 500 | Sekisui Chemical Company, Ltd. | 7,959 | ||||||
| 1,830 | Select Comfort Corporationa | 41,395 | ||||||
| 5,320 | Signet Jewelers, Ltd. | 501,463 | ||||||
| 3,052 | Sportsman’s Warehouse Holdings, Inc.a | 28,658 | ||||||
| 410 | Standard Motor Products, Inc. | 21,820 | ||||||
| 42,400 | Starbucks Corporation | 2,354,048 | ||||||
| 5,644 | Stein Mart, Inc. | 30,929 | ||||||
| 1,820 | Steven Madden, Ltd.a | 65,065 | ||||||
| 2,700 | Sumitomo Forestry Company, Ltd. | 35,660 | ||||||
| 2,000 | Sumitomo Rubber Industries, Ltd. | 31,645 | ||||||
The accompanying Notes to Financial Statements are an integral part of this schedule.
1
Table of Contents
AGGRESSIVE ALLOCATION PORTFOLIO
Schedule of Investments as of December 31, 2016
| Shares | Common Stock (53.8%) | Value | ||||||
| Consumer Discretionary (7.9%) - continued | ||||||||
| 100 | Swatch Group AG | $ | 6,103 | |||||
| 850 | Target Corporation | 61,395 | ||||||
| 13,900 | Tegna, Inc. | 297,321 | ||||||
| 8,050 | Tempur Sealy International, Inc.a | 549,654 | ||||||
| 7,703 | Tenneco, Inc.a | 481,206 | ||||||
| 27,081 | Time, Inc. | 483,396 | ||||||
| 14,830 | TJX Companies, Inc. | 1,114,178 | ||||||
| 37,426 | Toll Brothers, Inc.a | 1,160,206 | ||||||
| 10,577 | Tower International, Inc. | 299,858 | ||||||
| 43,886 | Tuesday Morning Corporationa | 236,984 | ||||||
| 4,600 | Tupperware Brands Corporation | 242,052 | ||||||
| 1,699 | Ulta Salon Cosmetics & Fragrance, Inc.a | 433,143 | ||||||
| 5,300 | Under Armour, Inc., Class Aa | 153,965 | ||||||
| 5,333 | Under Armour, Inc., Class Ca | 134,232 | ||||||
| 7,035 | Vail Resorts, Inc. | 1,134,816 | ||||||
| 47 | Valora Holding AG | 13,350 | ||||||
| 4,180 | Vera Bradley, Inc.a | 48,990 | ||||||
| 7,789 | VF Corporation | 415,543 | ||||||
| 1,520 | Visteon Corporation | 122,117 | ||||||
| 1,660 | Vitamin Shoppe, Inc.a | 39,425 | ||||||
| 38,800 | Walt Disney Company | 4,043,736 | ||||||
| 3,625 | Whirlpool Corporation | 658,916 | ||||||
| 370 | Whitbread plc | 17,212 | ||||||
| 33,570 | Wingstop, Inc. | 993,336 | ||||||
| 2,186 | Wolters Kluwer NV | 79,066 | ||||||
| 2,500 | Wolverine World Wide, Inc. | 54,875 | ||||||
| 1,788 | WPP plc | 39,789 | ||||||
| 1,400 | Wyndham Worldwide Corporation | 106,918 | ||||||
| 1,000 | Yokohama Rubber Company, Ltd. | 17,875 | ||||||
| 6,850 | Yum! Brands, Inc. | 433,811 | ||||||
| 19,900 | Zoe’s Kitchen, Inc.a | 477,401 | ||||||
|
| |||||||
Total | 83,942,907 | |||||||
|
| |||||||
| Consumer Staples (1.6%) | ||||||||
| 23,706 | AdvancePierre Foods Holdings, Inc. | 705,965 | ||||||
| 1,500 | Axfood AB | 23,555 | ||||||
| 4,010 | Brown-Forman Corporation | 180,129 | ||||||
| 1,887 | Casey’s General Stores, Inc. | 224,327 | ||||||
| 6,199 | Coca-Cola Amatil, Ltd. | 45,209 | ||||||
| 33,660 | Coca-Cola Company | 1,395,544 | ||||||
| 2,586 | Coca-Cola HBC AG | 56,311 | ||||||
| 30,250 | CVS Health Corporation | 2,387,027 | ||||||
| 2,270 | Dr Pepper Snapple Group, Inc. | 205,821 | ||||||
| 3,416 | e.l.f. Beauty, Inc.a | 98,859 | ||||||
| 500 | Ebro Foods SA | 10,464 | ||||||
| 7,850 | Estee Lauder Companies, Inc. | 600,446 | ||||||
| 4,510 | Flowers Foods, Inc. | 90,065 | ||||||
| 20,176 | Hain Celestial Group, Inc.a | 787,469 | ||||||
| 285 | Henkel AG & Company KGaA | 29,661 | ||||||
| 3,895 | Imperial Brands plc | 169,747 | ||||||
| 5,950 | Ingredion, Inc. | 743,512 | ||||||
| 647 | J & J Snack Foods Corporation | 86,329 | ||||||
| 600 | Jeronimo Martins SGPS SA | 9,306 | ||||||
| 204 | Kesko Oyj | 10,181 | ||||||
| 1,300 | Kewpie Corporation | 31,530 | ||||||
| 1,160 | Kimberly-Clark Corporation | 132,379 | ||||||
| 700 | Kirin Holdings Company, Ltd. | 11,362 | ||||||
| 9,156 | Koninklijke Ahold Delhaize NV | 192,853 | ||||||
| 330 | Lancaster Colony Corporation | 46,659 | ||||||
| 1 | Lindt & Spruengli AG | 5,174 | ||||||
| 1,420 | Mondelez International, Inc. | 62,949 | ||||||
| 23,767 | Monster Beverage Corporationa | 1,053,829 | ||||||
| 775 | Nestle SA | 55,519 | ||||||
| 4,230 | PepsiCo, Inc. | 442,585 | ||||||
| 18,240 | Pinnacle Foods, Inc. | 974,928 | ||||||
| 6,020 | Procter & Gamble Company | 506,162 | ||||||
| 7,402 | SpartanNash Company | 292,675 | ||||||
| 600 | Suedzucker AG | 14,302 | ||||||
| 3,150 | Sysco Corporation | 174,416 | ||||||
| 2,509 | Tate & Lyle plc | 21,835 | ||||||
| 9,126 | United Natural Foods, Inc.a | 435,493 | ||||||
| 44,970 | Walgreens Boots Alliance, Inc. | 3,721,717 | ||||||
| 1,804 | Wal-Mart Stores, Inc. | 124,692 | ||||||
| 17,710 | WhiteWave Foods Companya | 984,676 | ||||||
| 1,920 | Whole Foods Market, Inc. | 59,059 | ||||||
| 4,790 | William Morrison Supermarkets plc | 13,605 | ||||||
|
| |||||||
Total | 17,218,326 | |||||||
|
| |||||||
| Energy (5.1%) | ||||||||
| 2,310 | Anadarko Petroleum Corporation | 161,076 | ||||||
| 22,720 | Archrock, Inc. | 299,904 | ||||||
| 5,706 | Atwood Oceanics, Inc. | 74,920 | ||||||
| 3,273 | Baker Hughes, Inc. | 212,647 | ||||||
| 59,076 | BP plc | 370,021 | ||||||
| 5,677 | Bristow Group, Inc. | 116,265 | ||||||
| 29,067 | Callon Petroleum Companya | 446,760 | ||||||
| 46,550 | Canadian Natural Resources, Ltd. | 1,484,014 | ||||||
| 33,250 | Chevron Corporation | 3,913,525 | ||||||
| 7,850 | Cimarex Energy Company | 1,066,815 | ||||||
| 14,360 | Clean Energy Fuels Corporationa | 41,070 | ||||||
| 17,147 | Concho Resources, Inc.a | 2,273,692 | ||||||
| 25,960 | ConocoPhillips | 1,301,634 | ||||||
| 8,275 | Continental Resources, Inc.a | 426,494 | ||||||
| 1,279 | Crescent Point Energy Corporation | 17,385 | ||||||
| 9,380 | Delek US Holdings, Inc. | 225,777 | ||||||
| 5,810 | Devon Energy Corporation | 265,343 | ||||||
| 5,190 | Diamond Offshore Drilling, Inc.a | 91,863 | ||||||
| 37,920 | Ensco plc | 368,582 | ||||||
| 23,830 | EOG Resources, Inc. | 2,409,213 | ||||||
| 8,880 | EP Energy Corporationa | 58,164 | ||||||
| 44,321 | EQT Corporation | 2,898,593 | ||||||
| 23,940 | Exxon Mobil Corporation | 2,160,824 | ||||||
| 5,800 | Frank’s International NV | 71,398 | ||||||
| 1,700 | Galp Energia SGPS SA | 25,344 | ||||||
| 4,890 | Green Plains, Inc. | 136,187 | ||||||
| 1,370 | Gulfport Energy Corporationa | 29,647 | ||||||
| 63,520 | Halliburton Company | 3,435,797 | ||||||
| 6,450 | Helix Energy Solutions Group, Inc.a | 56,889 | ||||||
| 8,679 | HollyFrontier Corporation | 284,324 | ||||||
| 6,990 | Hornbeck Offshore Services, Inc.a | 50,468 | ||||||
| 1,746 | John Wood Group plc | 18,854 | ||||||
| 3,030 | Kinder Morgan, Inc. | 62,751 | ||||||
| 23,878 | Marathon Oil Corporation | 413,328 | ||||||
| 1,930 | Murphy Oil Corporation | 60,081 | ||||||
| 60,880 | Nabors Industries, Ltd. | 998,432 | ||||||
| 1,635 | Noble Energy, Inc. | 62,228 | ||||||
| 7,221 | Oasis Petroleum, Inc.a | 109,326 | ||||||
| 2,040 | Oceaneering International, Inc. | 57,548 | ||||||
| 22,885 | Oil States International, Inc.a | 892,515 | ||||||
| 2,336 | OMV AG | 82,353 | ||||||
| 48,430 | Parsley Energy, Inc.a | 1,706,673 | ||||||
| 37,975 | Patterson-UTI Energy, Inc. | 1,022,287 | ||||||
| 3,100 | PBF Energy, Inc. | 86,428 | ||||||
| 2,483 | Petrofac, Ltd. | 26,572 | ||||||
| 1,670 | Phillips 66 | 144,305 | ||||||
| 12,254 | Pioneer Energy Services Corporationa | 83,940 | ||||||
| 17,360 | Pioneer Natural Resources Company | 3,126,015 | ||||||
| 18,190 | Range Resources Corporation | 625,008 | ||||||
| 86,660 | Rowan Companies plca | 1,637,007 | ||||||
| 2,013 | Royal Dutch Shell plc | 54,906 | ||||||
| 27,193 | Royal Dutch Shell plc ADR | 1,478,755 | ||||||
| 501 | Royal Dutch Shell plc, Class A | 13,829 | ||||||
| 4,676 | Royal Dutch Shell plc, Class B | 134,351 | ||||||
The accompanying Notes to Financial Statements are an integral part of this schedule.
2
Table of Contents
AGGRESSIVE ALLOCATION PORTFOLIO
Schedule of Investments as of December 31, 2016
| Shares | Common Stock (53.8%) | Value | ||||||
| Energy (5.1%) - continued | ||||||||
| 25,240 | RPC, Inc. | $ | 500,004 | |||||
| 33,738 | Schlumberger, Ltd. | 2,832,305 | ||||||
| 1,560 | SemGroup Corporation | 65,130 | ||||||
| 870 | SM Energy Company | 29,998 | ||||||
| 1,921 | Statoil ASA | 35,062 | ||||||
| 75,130 | Suncor Energy, Inc. ADR | 2,456,000 | ||||||
| 1,710 | Superior Energy Services, Inc. | 28,865 | ||||||
| 186 | Tecnicas Reunidas SA | 7,607 | ||||||
| 4,280 | Teekay Corporation | 34,368 | ||||||
| 9,830 | Teekay Tankers, Ltd. | 22,216 | ||||||
| 5,667 | Tesco Corporationa | 46,753 | ||||||
| 5,100 | Tesoro Corporation | 445,995 | ||||||
| 16,740 | TETRA Technologies, Inc.a | 84,035 | ||||||
| 1,963 | Total SA | 100,687 | ||||||
| 1,963 | Total SA Rightsa,b | 34 | ||||||
| 40,036 | U.S. Silica Holdings, Inc. | 2,269,240 | ||||||
| 46,560 | Valero Energy Corporation | 3,180,979 | ||||||
| 173,430 | Weatherford International plca | 865,416 | ||||||
| 250,200 | WPX Energy, Inc.a | 3,645,414 | ||||||
|
| |||||||
Total | 54,322,235 | |||||||
|
| |||||||
| Financials (6.8%) | ||||||||
| 12,437 | Aberdeen Asset Management plc | 39,323 | ||||||
| 12,055 | Affiliated Managers Group, Inc.a | 1,751,592 | ||||||
| 10,000 | Allied World Assurance Company Holdings AG | 537,100 | ||||||
| 1,120 | American Financial Group, Inc. | 98,694 | ||||||
| 2,470 | American International Group, Inc. | 161,316 | ||||||
| 29,041 | Ameris Bancorp | 1,266,188 | ||||||
| 2,480 | AMERISAFE, Inc. | 154,628 | ||||||
| 9,132 | Argo Group International Holdings, Ltd. | 601,799 | ||||||
| 10,985 | Aspen Insurance Holdings, Ltd. | 604,175 | ||||||
| 1,670 | Associated Banc-Corp | 41,249 | ||||||
| 50,880 | Assured Guaranty, Ltd. | 1,921,738 | ||||||
| 2,594 | ASX, Ltd. | 92,930 | ||||||
| 4,310 | Australia & New Zealand Banking Group, Ltd. | 94,351 | ||||||
| 27,770 | BancorpSouth, Inc. | 862,259 | ||||||
| 189,680 | Bank of America Corporation | 4,191,928 | ||||||
| 5,246 | Bank of East Asia, Ltd. | 20,027 | ||||||
| 229 | Bank of Montreal | 16,471 | ||||||
| 8,930 | Bank of New York Mellon Corporation | 423,103 | ||||||
| 3,300 | Bank of Nova Scotia | 183,747 | ||||||
| 20,552 | Bank of the Ozarks, Inc. | 1,080,830 | ||||||
| 2,110 | BankFinancial Corporation | 31,270 | ||||||
| 440 | Banner Corporation | 24,556 | ||||||
| 17,640 | BB&T Corporation | 829,433 | ||||||
| 9,830 | Beneficial Bancorp, Inc. | 180,872 | ||||||
| 410 | BlackRock, Inc. | 156,021 | ||||||
| 7,630 | Blackstone Group, LP | 206,239 | ||||||
| 18,100 | Boston Private Financial Holdings, Inc. | 299,555 | ||||||
| 8,630 | Brookline Bancorp, Inc. | 141,532 | ||||||
| 466 | Canadian Imperial Bank of Commerce | 38,026 | ||||||
| 1,950 | Capital One Financial Corporation | 170,118 | ||||||
| 3,230 | Cathay General Bancorp | 122,837 | ||||||
| 8,450 | Central Pacific Financial Corporation | 265,499 | ||||||
| 4,520 | Charles Schwab Corporation | 178,404 | ||||||
| 13,113 | Chemical Financial Corporation | 710,331 | ||||||
| 2,000 | Chiba Bank, Ltd. | 12,260 | ||||||
| 1,390 | Chubb, Ltd. | 183,647 | ||||||
| 1,042 | CI Financial Corporation | 22,405 | ||||||
| 30,770 | Citigroup, Inc. | 1,828,661 | ||||||
| 3,020 | Citizens Financial Group, Inc. | 107,603 | ||||||
| 2,540 | Clifton Bancorp, Inc. | 42,977 | ||||||
| 3,966 | CNP Assurances | 73,408 | ||||||
| 39,086 | CoBiz Financial, Inc. | 660,163 | ||||||
| 4,371 | Columbia Banking System, Inc. | 195,296 | ||||||
| 11,300 | Comerica, Inc. | 769,643 | ||||||
| 1,648 | Danske Bank AS | 49,858 | ||||||
| 10,876 | Direct Line Insurance Group plc | 49,499 | ||||||
| 39,150 | E*TRADE Financial Corporationa | 1,356,548 | ||||||
| 14,678 | East West Bancorp, Inc. | 746,083 | ||||||
| 15,120 | Eaton Vance Corporation | 633,226 | ||||||
| 4,967 | Employers Holdings, Inc. | 196,693 | ||||||
| 2,810 | Enova International, Inc.a | 35,266 | ||||||
| 1,211 | Erste Group Bank AG | 35,406 | ||||||
| 21,619 | Essent Group, Ltd.a | 699,807 | ||||||
| 6,783 | Evercore Partners, Inc. | 465,992 | ||||||
| 2,710 | F.N.B. Corporation | 43,441 | ||||||
| 1,310 | Federated Investors, Inc. | 37,047 | ||||||
| 18,157 | Fifth Third Bancorp | 489,694 | ||||||
| 2,020 | First American Financial Corporation | 73,993 | ||||||
| 13,010 | First Commonwealth Financial Corporation | 184,482 | ||||||
| 3,090 | First Financial Bancorp | 87,911 | ||||||
| 1,340 | First Financial Corporation | 70,752 | ||||||
| 1,070 | First Merchants Corporation | 40,286 | ||||||
| 23,630 | First Midwest Bancorp, Inc. | 596,185 | ||||||
| 32,448 | First Republic Bank | 2,989,759 | ||||||
| 13,453 | FlexiGroup, Ltd. | 21,894 | ||||||
| 2,990 | Franklin Resources, Inc. | 118,344 | ||||||
| 16,000 | Fukuoka Financial Group, Inc. | 70,960 | ||||||
| 1,424 | Genworth MI Canada, Inc. | 35,699 | ||||||
| 3,771 | Glacier Bancorp, Inc. | 136,623 | ||||||
| 17,470 | Goldman Sachs Group, Inc. | 4,183,192 | ||||||
| 15,370 | Great Western Bancorp, Inc. | 669,978 | ||||||
| 8,625 | Green Bancorp, Inc.a | 131,100 | ||||||
| 1,030 | Greenhill & Company, Inc. | 28,531 | ||||||
| 1,500 | Hang Seng Bank, Ltd. | 27,817 | ||||||
| 55,206 | Hanmi Financial Corporation | 1,926,689 | ||||||
| 834 | Hannover Rueckversicherung SE | 90,095 | ||||||
| 10,419 | Hanover Insurance Group, Inc. | 948,233 | ||||||
| 3,360 | Hartford Financial Services Group, Inc. | 160,104 | ||||||
| 12,800 | Henderson Group plc | 36,943 | ||||||
| 820 | Hilltop Holdings, Inc. | 24,436 | ||||||
| 8,644 | Home BancShares, Inc. | 240,044 | ||||||
| 810 | HomeStreet, Inc.a | 25,596 | ||||||
| 1,160 | Hometrust Bancshares, Inc.a | 30,044 | ||||||
| 31,131 | Hope Bancorp, Inc. | 681,458 | ||||||
| 14,425 | Horace Mann Educators Corporation | 617,390 | ||||||
| 17,884 | Houlihan Lokey, Inc. | 556,550 | ||||||
| 15,528 | HSBC Holdings plc | 125,290 | ||||||
| 100,400 | Huntington Bancshares, Inc. | 1,327,288 | ||||||
| 4,668 | Infinity Property & Casualty Corporation | 410,317 | ||||||
| 520 | Intact Financial Corporation | 37,219 | ||||||
| 30,785 | Intercontinental Exchange, Inc. | 1,736,890 | ||||||
| 6,830 | Invesco, Ltd. | 207,222 | ||||||
| 56,464 | Janus Capital Group, Inc. | 749,277 | ||||||
| 96,070 | KeyCorp | 1,755,199 | ||||||
| 23,017 | Kinsale Capital Group, Inc. | 782,808 | ||||||
| 1,060 | Lazard, Ltd. | 43,555 | ||||||
| 770 | Legg Mason, Inc. | 23,031 | ||||||
| 674 | Lincoln National Corporation | 44,666 | ||||||
| 3,600 | M&T Bank Corporation | 563,148 | ||||||
| 1,170 | Macquarie Group, Ltd. | 73,291 | ||||||
| 24,734 | Mapfre SA | 75,342 | ||||||
| 110 | Markel Corporationa | 99,495 | ||||||
| 8,880 | Meta Financial Group, Inc. | 913,752 | ||||||
The accompanying Notes to Financial Statements are an integral part of this schedule.
3
Table of Contents
AGGRESSIVE ALLOCATION PORTFOLIO
Schedule of Investments as of December 31, 2016
| Shares | Common Stock (53.8%) | Value | ||||||
| Financials (6.8%) - continued | ||||||||
| 7,540 | MetLife, Inc. | $ | 406,331 | |||||
| 31,800 | Mizuho Financial Group, Inc. | 57,066 | ||||||
| 13,830 | Morgan Stanley | 584,317 | ||||||
| 600 | MS and AD Insurance Group Holdings, Inc. | 18,581 | ||||||
| 23,410 | National Bank Holdings Corporation | 746,545 | ||||||
| 3,653 | National Bank of Canada | 148,362 | ||||||
| 640 | Navigators Group, Inc. | 75,360 | ||||||
| 2,790 | NMI Holdings, Inc.a | 29,714 | ||||||
| 3,597 | Nordea Bank AB | 39,857 | ||||||
| 16,989 | PacWest Bancorp | 924,881 | ||||||
| 1,148 | Power Corporation of Canada | 25,694 | ||||||
| 8,210 | Primerica, Inc. | 567,722 | ||||||
| 660 | Principal Financial Group, Inc. | 38,188 | ||||||
| 8,420 | Provident Financial Services, Inc. | 238,286 | ||||||
| 26,198 | Raymond James Financial, Inc. | 1,814,735 | ||||||
| 12,961 | Renasant Corporation | 547,213 | ||||||
| 5,600 | Resona Holdings, Inc. | 28,700 | ||||||
| 393 | Safety Insurance Group, Inc. | 28,964 | ||||||
| 4,661 | Sandy Spring Bancorp, Inc. | 186,393 | ||||||
| 337 | Schroders plc | 12,377 | ||||||
| 450 | SEI Investments Company | 22,212 | ||||||
| 1,340 | Selective Insurance Group, Inc. | 57,687 | ||||||
| 2,600 | Seven Bank, Ltd. | 7,434 | ||||||
| 227,670 | SLM Corporationa | 2,508,923 | ||||||
| 4,412 | State Auto Financial Corporation | 118,286 | ||||||
| 5,210 | Stewart Information Services Corporation | 240,077 | ||||||
| 42,628 | Stifel Financial Corporationa | 2,129,269 | ||||||
| 13,569 | SVB Financial Groupa | 2,329,255 | ||||||
| 1,456 | Swiss Re AG | 137,756 | ||||||
| 10,060 | Synchrony Financial | 364,876 | ||||||
| 25,520 | Synovus Financial Corporation | 1,048,362 | ||||||
| 2,600 | T&D Holdings, Inc. | 34,313 | ||||||
| 21,230 | TCF Financial Corporation | 415,896 | ||||||
| 33,069 | TD Ameritrade Holding Corporation | 1,441,808 | ||||||
| 1,150 | Territorial Bancorp, Inc. | 37,766 | ||||||
| 168 | TMX Group, Ltd. | 8,949 | ||||||
| 2,740 | TriCo Bancshares | 93,653 | ||||||
| 22,320 | TrustCo Bank Corporation | 195,300 | ||||||
| 1,050 | Trustmark Corporation | 37,432 | ||||||
| 15,210 | Umpqua Holdings Corporation | 285,644 | ||||||
| 1,480 | Union Bankshares Corporation | 52,895 | ||||||
| 16,160 | United Community Banks, Inc. | 478,659 | ||||||
| 7,970 | United Financial Bancorp, Inc. | 144,735 | ||||||
| 780 | United Fire Group, Inc. | 38,353 | ||||||
| 3,908 | United Overseas Bank, Ltd. | 54,903 | ||||||
| 1,980 | Unum Group | 86,981 | ||||||
| 1,300 | Virtu Financial, Inc. | 20,735 | ||||||
| 2,340 | Voya Financial, Inc. | 91,775 | ||||||
| 9,968 | Western Alliance Bancorpa | 485,541 | ||||||
| 4,761 | Westpac Banking Corporation | 111,760 | ||||||
| 1,079 | Wintrust Financial Corporation | 78,303 | ||||||
| 3,100 | WisdomTree Investments, Inc. | 34,534 | ||||||
| 1,545 | WSFS Financial Corporation | 71,611 | ||||||
| 55,471 | Zions Bancorporation | 2,387,472 | ||||||
| 99 | Zurich Insurance Group AGa | 27,207 | ||||||
|
| |||||||
Total | 72,205,290 | |||||||
|
| |||||||
| Health Care (7.3%) | ||||||||
| 7,080 | Abbott Laboratories | 271,943 | ||||||
| 11,240 | ABIOMED, Inc.a | 1,266,523 | ||||||
| 28,355 | Acadia Healthcare Company, Inc.a | 938,551 | ||||||
| 580 | Acceleron Pharma, Inc.a | 14,802 | ||||||
| 860 | Aceto Corporation | 18,894 | ||||||
| 3,270 | Advaxis, Inc.a | 23,413 | ||||||
| 13,580 | Aerie Pharmaceuticals, Inc.a | 514,003 | ||||||
| 5,190 | Aetna, Inc. | 643,612 | ||||||
| 40,124 | Akorn, Inc.a | 875,907 | ||||||
| 38,971 | Alexion Pharmaceuticals, Inc.a | 4,768,102 | ||||||
| 9,628 | Align Technology, Inc.a | 925,540 | ||||||
| 23,954 | Allergan plca | 5,030,580 | ||||||
| 902 | Amgen, Inc. | 131,881 | ||||||
| 6,451 | Analogic Corporation | 535,110 | ||||||
| 1,290 | AngioDynamics, Inc.a | 21,762 | ||||||
| 10,744 | Asterias Biotherapeutics, Inc.a | 49,422 | ||||||
| 864 | AstraZeneca plc | 47,181 | ||||||
| 276 | Atrion Corporation | 139,987 | ||||||
| 2,050 | Biogen, Inc.a | 581,339 | ||||||
| 10,462 | BioMarin Pharmaceutical, Inc.a | 866,672 | ||||||
| 1,960 | Bristol-Myers Squibb Company | 114,542 | ||||||
| 4,408 | C.R. Bard, Inc. | 990,301 | ||||||
| 1,360 | CAE, Inc. | 19,023 | ||||||
| 3,320 | Cardinal Health, Inc. | 238,940 | ||||||
| 36,091 | Cardiovascular Systems, Inc.a | 873,763 | ||||||
| 63,730 | Catalent, Inc.a | 1,718,161 | ||||||
| 51,180 | Celgene Corporationa | 5,924,085 | ||||||
| 1,550 | Centene Corporationa | 87,591 | ||||||
| 4,150 | Charles River Laboratories International, Inc.a | 316,189 | ||||||
| 5,430 | Chemed Corporation | 871,026 | ||||||
| 7,110 | Coherus Biosciences, Inc.a | 200,146 | ||||||
| 1,790 | CONMED Corporation | 79,064 | ||||||
| 5,800 | Cooper Companies, Inc. | 1,014,594 | ||||||
| 1,500 | Cross Country Healthcare, Inc.a | 23,415 | ||||||
| 15,110 | Dentsply Sirona, Inc. | 872,300 | ||||||
| 8,950 | Dexcom, Inc.a | 534,315 | ||||||
| 8,120 | Diplomat Pharmacy, Inc.a | 102,312 | ||||||
| 17,320 | Edwards Lifesciences Corporationa | 1,622,884 | ||||||
| 700 | Emergent Biosolutions, Inc.a | 22,988 | ||||||
| 5,460 | Ensign Group, Inc. | 121,267 | ||||||
| 8,621 | Envision Healthcare Corporationa | 545,623 | ||||||
| 923 | Essilor International SA | 104,141 | ||||||
| 3,480 | Express Scripts Holding Companya | 239,389 | ||||||
| 37,030 | GenMark Diagnostics, Inc.a | 453,247 | ||||||
| 83,378 | Gilead Sciences, Inc. | 5,970,699 | ||||||
| 2,029 | GlaxoSmithKline plc | 38,974 | ||||||
| 1,330 | Global Blood Therapeutics, Inc.a | 19,219 | ||||||
| 2,340 | HCA Holdings, Inc.a | 173,207 | ||||||
| 11,733 | HealthEquity, Inc.a | 475,421 | ||||||
| 2,300 | Healthways, Inc.a | 52,325 | ||||||
| 5,120 | Heska Corporationa | 366,592 | ||||||
| 962 | Hikma Pharmaceuticals plc | 22,422 | ||||||
| 7,470 | Hill-Rom Holdings, Inc. | 419,366 | ||||||
| 39,660 | Hologic, Inc.a | 1,591,159 | ||||||
| 1,580 | ICU Medical, Inc.a | 232,813 | ||||||
| 19,089 | Inogen, Inc.a | 1,282,208 | ||||||
| 37,326 | Intersect ENT, Inc.a | 451,645 | ||||||
| 6,140 | Intra-Cellular Therapies, Inc.a | 92,653 | ||||||
| 21,228 | Ironwood Pharmaceuticals, Inc.a | 324,576 | ||||||
| 18,670 | Johnson & Johnson | 2,150,971 | ||||||
| 10,090 | Kindred Healthcare, Inc. | 79,207 | ||||||
| 200 | Lonza Group AG | 34,566 | ||||||
| 4,860 | Magellan Health Services, Inc.a | 365,715 | ||||||
| 47,064 | Medtronic plc | 3,352,369 | ||||||
| 17,760 | Merck & Company, Inc. | 1,045,531 | ||||||
| 656 | Merck KGaA | 68,304 | ||||||
| 2,568 | Mettler-Toledo International, Inc.a | 1,074,862 | ||||||
| 21,105 | Mylan NVa | 805,156 | ||||||
| 2,128 | National Healthcare Corporation | 161,281 | ||||||
| 15,582 | Neurocrine Biosciences, Inc.a | 603,023 | ||||||
| 23,935 | Nevro Corporationa | 1,739,117 | ||||||
| 4,069 | Novartis AG | 295,912 | ||||||
The accompanying Notes to Financial Statements are an integral part of this schedule.
4
Table of Contents
AGGRESSIVE ALLOCATION PORTFOLIO
Schedule of Investments as of December 31, 2016
| Shares | Common Stock (53.8%) | Value | ||||||
Health Care (7.3%) - continued | ||||||||
| 2,000 | Novo Nordisk AS | $ | 71,744 | |||||
| 40,583 | NuVasive, Inc.a | 2,733,671 | ||||||
| 19,890 | Omnicell, Inc.a | 674,271 | ||||||
| 19,280 | OraSure Technologies, Inc.a | 169,278 | ||||||
| 2,740 | Orthofix International NVa | 99,133 | ||||||
| 11,340 | PerkinElmer, Inc. | 591,381 | ||||||
| 9,130 | Perrigo Company plc | 759,890 | ||||||
| 44,930 | Pfizer, Inc. | 1,459,326 | ||||||
| 2,870 | PharMerica Corporationa | 72,181 | ||||||
| 4,000 | Prothena Corporation plca | 196,760 | ||||||
| 4,090 | Roche Holding AG ADR | 116,688 | ||||||
| 220 | Roche Holding AG-Genusschein | 50,150 | ||||||
| 17,950 | Surgical Care Affiliates, Inc.a | 830,547 | ||||||
| 14,967 | Teleflex, Inc. | 2,411,932 | ||||||
| 3,763 | Triple-S Management Corporationa | 77,894 | ||||||
| 6,273 | UnitedHealth Group, Inc. | 1,003,931 | ||||||
| 16,514 | Universal Health Services, Inc. | 1,756,759 | ||||||
| 2,030 | VCA Antech, Inc.a | 139,360 | ||||||
| 30,450 | Veeva Systems, Inc.a | 1,239,315 | ||||||
| 34,284 | Vertex Pharmaceuticals, Inc.a | 2,525,702 | ||||||
| 4,160 | Waters Corporationa | 559,062 | ||||||
| 4,080 | West Pharmaceutical Services, Inc. | 346,106 | ||||||
| 25,720 | Wright Medical Group NVa | 591,046 | ||||||
| 3,570 | Ziopharm Oncology, Inc.a | 19,099 | ||||||
| 12,790 | Zoetis, Inc. | 684,649 | ||||||
|
| |||||||
Total | 77,223,698 | |||||||
|
| |||||||
Industrials (6.6%) | ||||||||
| 7 | A P Moller - Maersk AS | 11,158 | ||||||
| 2,222 | ABB, Ltd. | 46,755 | ||||||
| 4,575 | ABM Industries, Inc. | 186,843 | ||||||
| 11,740 | Acuity Brands, Inc. | 2,710,296 | ||||||
| 1,410 | Adecco SA | 92,040 | ||||||
| 5,324 | Aegion Corporationa | 126,179 | ||||||
| 1,130 | Aerovironment, Inc.a | 30,318 | ||||||
| 17,115 | AGCO Corporation | 990,274 | ||||||
| 7,500 | Air New Zealand, Ltd. | 11,422 | ||||||
| 8,840 | Ardmore Shipping Corporation | 65,416 | ||||||
| 5,000 | Asahi Glass Company, Ltd. | 33,923 | ||||||
| 1,711 | Astec Industries, Inc. | 115,424 | ||||||
| 300 | Atlas Copco Aktiebolag | 9,101 | ||||||
| 25,855 | AZZ, Inc. | 1,652,134 | ||||||
| 17,516 | B/E Aerospace, Inc. | 1,054,288 | ||||||
| 7,480 | Barnes Group, Inc. | 354,702 | ||||||
| 629 | Berendsen plc | 6,744 | ||||||
| 2,000 | Boeing Company | 311,360 | ||||||
| 35,180 | BWX Technologies, Inc. | 1,396,646 | ||||||
| 7,900 | Carlisle Companies, Inc. | 871,291 | ||||||
| 2,100 | CEB, Inc. | 127,260 | ||||||
| 2,329 | CIRCOR International, Inc. | 151,106 | ||||||
| 4,005 | CLARCOR, Inc. | 330,292 | ||||||
| 2,270 | Colfax Corporationa | 81,561 | ||||||
| 5,052 | Comfort Systems USA, Inc. | 168,232 | ||||||
| 6,070 | Copart, Inc.a | 336,339 | ||||||
| 1,250 | Crane Company | 90,150 | ||||||
| 5,978 | CSX Corporation | 214,790 | ||||||
| 25,270 | Cummins, Inc. | 3,453,651 | ||||||
| 6,750 | Curtiss-Wright Corporation | 663,930 | ||||||
| 1,000 | Dai Nippon Printing Company, Ltd. | 9,867 | ||||||
| 16,930 | Delta Air Lines, Inc. | 832,787 | ||||||
| 490 | Deluxe Corporation | 35,089 | ||||||
| 1,063 | Deutsche Post AG | 34,861 | ||||||
| 8,440 | Donaldson Company, Inc. | 355,155 | ||||||
| 600 | DSV AS | 26,646 | ||||||
| 7,977 | El Al Israel Airlines, Ltd. | 5,275 | ||||||
| 2,910 | EMCOR Group, Inc. | 205,912 | ||||||
| 7,800 | Encore Wire Corporation | 338,130 | ||||||
| 6,020 | EnerSys | 470,162 | ||||||
| 380 | EnPro Industries, Inc. | 25,597 | ||||||
| 4,095 | Equifax, Inc. | 484,152 | ||||||
| 1,799 | ESCO Technologies, Inc. | 101,913 | ||||||
| 8,991 | Federal Signal Corporation | 140,350 | ||||||
| 70 | Flughafen Zuerich AG | 12,971 | ||||||
| 1,440 | Fortive Corporation | 77,227 | ||||||
| 10,327 | Fortune Brands Home and Security, Inc. | 552,081 | ||||||
| 2,807 | Franklin Electric Company, Inc. | 109,192 | ||||||
| 400 | Fraport AG Frankfurt Airport Services Worldwide | 23,603 | ||||||
| 1,100 | Fuji Machine Manufacturing Company, Ltd. | 12,559 | ||||||
| 2,010 | GasLog, Ltd. | 32,361 | ||||||
| 4,840 | Gener8 Maritime, Inc.a | 21,683 | ||||||
| 4,491 | Gibraltar Industries, Inc.a | 187,050 | ||||||
| 18,295 | Granite Construction, Inc. | 1,006,225 | ||||||
| 11,920 | Harsco Corporation | 162,112 | ||||||
| 17,970 | Healthcare Services Group, Inc. | 703,885 | ||||||
| 12,869 | Heico Corporation | 992,843 | ||||||
| 3,570 | Herman Miller, Inc. | 122,094 | ||||||
| 5,390 | Hexcel Corporation | 277,262 | ||||||
| 500 | Hitachi Transport System, Ltd. | 10,130 | ||||||
| 172 | Hochtief AG | 24,014 | ||||||
| 4,421 | Honeywell International, Inc. | 512,173 | ||||||
| 963 | Hub Group, Inc.a | 42,131 | ||||||
| 3,360 | Hubbell, Inc. | 392,112 | ||||||
| 5,000 | Huntington Ingalls Industries, Inc. | 920,950 | ||||||
| 5,730 | ICF International, Inc.a | 316,296 | ||||||
| 800 | Inaba Denki Sangyo Company, Ltd. | 27,504 | ||||||
| 13,710 | Ingersoll-Rand plc | 1,028,798 | ||||||
| 1,730 | Insperity, Inc. | 122,743 | ||||||
| 1,150 | Insteel Industries, Inc. | 40,986 | ||||||
| 1,030 | Interface, Inc. | 19,106 | ||||||
| 11,100 | ITOCHU Corporation | 146,972 | ||||||
| 3,180 | ITT Corporation | 122,653 | ||||||
| 590 | Jacobs Engineering Group, Inc.a | 33,630 | ||||||
| 500 | Jardine Matheson Holdings, Ltd. | 27,625 | ||||||
| 7,974 | JB Hunt Transport Services, Inc. | 774,036 | ||||||
| 9,729 | Johnson Controls International plc | 400,738 | ||||||
| 2,690 | Kansas City Southern | 228,247 | ||||||
| 3,570 | KBR, Inc. | 59,583 | ||||||
| 20,210 | Kennametal, Inc. | 631,765 | ||||||
| 5,061 | Kforce, Inc. | 116,909 | ||||||
| 16,310 | Kirby Corporationa | 1,084,615 | ||||||
| 3,000 | KITZ Corporation | 16,379 | ||||||
| 1,300 | Komatsu, Ltd. | 29,445 | ||||||
| 2,632 | KONE Oyj | 117,608 | ||||||
| 620 | Koninklijke Boskalis Westminster NV | 21,509 | ||||||
| 10,020 | Korn/Ferry International | 294,889 | ||||||
| 9,230 | Lincoln Electric Holdings, Inc. | 707,664 | ||||||
| 5,140 | Lindsay Corporation | 383,495 | ||||||
| 1,480 | Manpower, Inc. | 131,528 | ||||||
| 1,700 | Marubeni Corporation | 9,615 | ||||||
| 6,750 | Masco Corporation | 213,435 | ||||||
| 15,330 | Masonite International Corporationa | 1,008,714 | ||||||
| 4,345 | Meggitt plc | 24,537 | ||||||
| 5,700 | Meritor, Inc.a | 70,794 | ||||||
| 10,573 | Middleby Corporationa | 1,361,908 | ||||||
| 1,200 | MIRAIT Holdings Corporation | 10,815 | ||||||
| 900 | Mitsubishi Corporation | 19,115 | ||||||
| 4,300 | Mitsubishi Electric Corporation | 59,809 | ||||||
| 3,000 | Mitsubishi Heavy Industries, Ltd. | 13,638 | ||||||
| 1,000 | Mitsuboshi Belting, Ltd. | 8,503 | ||||||
| 600 | Mitsui & Company, Ltd. | 8,221 | ||||||
The accompanying Notes to Financial Statements are an integral part of this schedule.
5
Table of Contents
AGGRESSIVE ALLOCATION PORTFOLIO
Schedule of Investments as of December 31, 2016
| Shares | Common Stock (53.8%) | Value | ||||||
Industrials (6.6%) - continued | ||||||||
| 5,120 | Moog, Inc.a | $ | 336,282 | |||||
| 17,500 | MRC Global, Inc.a | 354,550 | ||||||
| 19,392 | MSA Safety, Inc. | 1,344,447 | ||||||
| 1,020 | Mueller Industries, Inc. | 40,759 | ||||||
| 5,330 | MYR Group, Inc.a | 200,834 | ||||||
| 1,652 | National Express Group plc | 7,199 | ||||||
| 7,039 | Navigant Consulting, Inc.a | 184,281 | ||||||
| 3,610 | NCI Building Systems, Inc.a | 56,497 | ||||||
| 10,033 | Nielsen Holdings plc | 420,884 | ||||||
| 2,100 | Nitto Kogyo Corporation | 28,592 | ||||||
| 499 | Nordson Corporation | 55,913 | ||||||
| 1,730 | Norfolk Southern Corporation | 186,961 | ||||||
| 6,820 | Old Dominion Freight Line, Inc.a | 585,088 | ||||||
| 20,537 | On Assignment, Inc.a | 906,914 | ||||||
| 14,990 | Orbital ATK, Inc. | 1,315,073 | ||||||
| 28,205 | Oshkosh Corporation | 1,822,325 | ||||||
| 43,315 | PGT Innovations, Inc.a | 495,957 | ||||||
| 711 | Philips Lighting NVa,c | 17,513 | ||||||
| 17,950 | Proto Labs, Inc.a | 921,732 | ||||||
| 1,550 | Quanex Building Products Corporation | 31,465 | ||||||
| 544 | Randstad Holding NV | 29,467 | ||||||
| 28,320 | Raven Industries, Inc. | 713,664 | ||||||
| 8,740 | Raytheon Company | 1,241,080 | ||||||
| 430 | RBC Bearings, Inc.a | 39,908 | ||||||
| 1,220 | Regal-Beloit Corporation | 84,485 | ||||||
| 1,016 | RELX NV | 17,089 | ||||||
| 5,470 | Resources Connection, Inc. | 105,298 | ||||||
| 1,670 | Rexnord Corporationa | 32,715 | ||||||
| 62 | Rieter Holding AG | 10,783 | ||||||
| 800 | Rockwell Automation, Inc. | 107,520 | ||||||
| 12,260 | Rockwell Collins, Inc. | 1,137,238 | ||||||
| 2,620 | Rolls-Royce Holdings plca | 21,520 | ||||||
| 5,668 | Roper Industries, Inc. | 1,037,697 | ||||||
| 915 | Ryder System, Inc. | 68,113 | ||||||
| 32,930 | Saia, Inc.a | 1,453,860 | ||||||
| 1,100 | Sanwa Holdings Corporation | 10,462 | ||||||
| 168 | Schindler Holding AG, Participation Certificate | 29,587 | ||||||
| 231 | Schneider Electric SE | 16,047 | ||||||
| 1,182 | Siemens AG | 144,725 | ||||||
| 589 | Skanska AB | 13,868 | ||||||
| 2,048 | SKF AB | 37,552 | ||||||
| 1,700 | Smiths Group plc | 29,592 | ||||||
| 6,200 | Sojitz Corporation | 15,011 | ||||||
| 63,851 | Southwest Airlines Company | 3,182,334 | ||||||
| 3,440 | SPX FLOW, Inc.a | 110,286 | ||||||
| 430 | Standex International Corporation | 37,776 | ||||||
| 550 | Stanley Black & Decker, Inc. | 63,080 | ||||||
| 1,230 | Stericycle, Inc.a | 94,759 | ||||||
| 239 | Sulzer, Ltd. | 24,603 | ||||||
| 7,479 | Team, Inc.a | 293,551 | ||||||
| 6,955 | Tennant Company | 495,196 | ||||||
| 930 | Tetra Tech, Inc. | 40,130 | ||||||
| 3,191 | Textron, Inc. | 154,955 | ||||||
| 31,260 | TransUniona | 966,872 | ||||||
| 1,180 | TrueBlue, Inc.a | 29,087 | ||||||
| 49,874 | Union Pacific Corporation | 5,170,936 | ||||||
| 24,110 | United Continental Holdings, Inc.a | 1,757,137 | ||||||
| 2,730 | United Parcel Service, Inc. | 312,967 | ||||||
| 10,882 | United Rentals, Inc.a | 1,148,922 | ||||||
| 1,873 | Universal Forest Products, Inc. | 191,383 | ||||||
| 3,635 | Universal Truckload Services, Inc. | 59,432 | ||||||
| 1,538 | Vinci SA | 104,622 | ||||||
| 12,530 | WABCO Holdings, Inc.a | 1,330,059 | ||||||
| 14,706 | WageWorks, Inc.a | 1,066,185 | ||||||
| 26,984 | Waste Connections, Inc. | 2,120,673 | ||||||
| 3,002 | Watsco, Inc. | 444,656 | ||||||
| 351 | Wolseley plc | 21,427 | ||||||
| 456 | WSP Global, Inc. | 15,178 | ||||||
| 7,150 | Xylem, Inc. | 354,068 | ||||||
| 2,410 | YRC Worldwide, Inc.a | 32,005 | ||||||
| 400 | Yuasa Trading Company, Ltd. | 9,964 | ||||||
|
| |||||||
Total | 69,990,796 | |||||||
|
| |||||||
Information Technology (14.2%) | ||||||||
| 37,989 | Agilent Technologies, Inc. | 1,730,779 | ||||||
| 29,105 | Akamai Technologies, Inc.a | 1,940,721 | ||||||
| 10,320 | Alliance Data Systems Corporation | 2,358,120 | ||||||
| 10,943 | Alphabet, Inc., Class Aa | 8,671,780 | ||||||
| 7,997 | Alphabet, Inc., Class Ca | 6,172,245 | ||||||
| 14,792 | Ambarella, Inc.a | 800,691 | ||||||
| 8,160 | Amkor Technology, Inc.a | 86,088 | ||||||
| 28,685 | Amphenol Corporation | 1,927,632 | ||||||
| 19,580 | Analog Devices, Inc. | 1,421,900 | ||||||
| 74,744 | Apple, Inc. | 8,656,850 | ||||||
| 33,834 | Applied Materials, Inc. | 1,091,823 | ||||||
| 17,120 | Apptio, Inc.a | 317,234 | ||||||
| 30,282 | Arista Networks, Inc.a | 2,930,389 | ||||||
| 21,480 | ARRIS International plca | 647,192 | ||||||
| 8,783 | Aspen Technology, Inc.a | 480,254 | ||||||
| 3,490 | AVX Corporation | 54,549 | ||||||
| 2,620 | Bankrate, Inc.a | 28,951 | ||||||
| 10,510 | Belden, Inc. | 785,833 | ||||||
| 8,990 | Blackhawk Network Holdings, Inc.a | 338,698 | ||||||
| 55,960 | Booz Allen Hamilton Holding Corporation | 2,018,477 | ||||||
| 10,814 | Brooks Automation, Inc. | 184,595 | ||||||
| 2,910 | CA, Inc. | 92,451 | ||||||
| 2,436 | Cabot Microelectronics Corporation | 153,882 | ||||||
| 1,030 | CACI International, Inc.a | 128,029 | ||||||
| 1,190 | Cadence Design Systems, Inc.a | 30,012 | ||||||
| 1,100 | Canon, Inc. | 30,978 | ||||||
| 661 | Capital Power Corporation | 11,436 | ||||||
| 1,210 | Carbonite, Inc.a | 19,844 | ||||||
| 17,149 | Cavium, Inc.a | 1,070,784 | ||||||
| 2,510 | CDK Global, Inc. | 149,822 | ||||||
| 40,100 | Ciena Corporationa | 978,841 | ||||||
| 390 | Cirrus Logic, Inc.a | 22,051 | ||||||
| 73,040 | Cisco Systems, Inc. | 2,207,269 | ||||||
| 8,980 | Cognex Corporation | 571,308 | ||||||
| 1,790 | Coherent, Inc.a | 245,919 | ||||||
| 18,960 | CommVault Systems, Inc.a | 974,544 | ||||||
| 1,620 | Comtech Telecommunications Corporation | 19,197 | ||||||
| 5,620 | Convergys Corporation | 138,027 | ||||||
| 12,970 | CoreLogic, Inc.a | 477,685 | ||||||
| 40,546 | Criteo SA ADRa | 1,665,630 | ||||||
| 1,780 | CTS Corporation | 39,872 | ||||||
| 37,540 | Dolby Laboratories, Inc. | 1,696,433 | ||||||
| 27,410 | DST Systems, Inc. | 2,936,982 | ||||||
| 300 | DTS Corporation | 6,382 | ||||||
| 13,950 | eBay, Inc.a | 414,176 | ||||||
| 3,610 | Entegris, Inc.a | 64,619 | ||||||
| 20,160 | Envestnet, Inc.a | 710,640 | ||||||
| 3,770 | EVERTEC, Inc. | 66,918 | ||||||
| 4,310 | ExlService Holdings, Inc.a | 217,396 | ||||||
| 4,492 | F5 Networks, Inc.a | 650,082 | ||||||
| 4,597 | Fabrineta | 185,259 | ||||||
| 88,100 | Facebook, Inc.a | 10,135,905 | ||||||
| 31,490 | Finisar Corporationa | 953,202 | ||||||
| 41,170 | FLIR Systems, Inc. | 1,489,942 | ||||||
| 850 | Forrester Research, Inc. | 36,507 | ||||||
The accompanying Notes to Financial Statements are an integral part of this schedule.
6
Table of Contents
AGGRESSIVE ALLOCATION PORTFOLIO
Schedule of Investments as of December 31, 2016
| Shares | Common Stock (53.8%) | Value | ||||||
Information Technology (14.2%) - continued | ||||||||
| 29,592 | Fortinet, Inc.a | $ | 891,311 | |||||
| 2,400 | FUJIFILM Holdings NPV | 90,878 | ||||||
| 41,752 | Guidewire Software, Inc.a | 2,059,626 | ||||||
| 4,857 | IAC/InterActiveCorporationa | 314,685 | ||||||
| 1,850 | Insight Enterprises, Inc.a | 74,814 | ||||||
| 67,920 | Integrated Device Technology, Inc.a | 1,600,195 | ||||||
| 21,320 | Intel Corporation | 773,276 | ||||||
| 9,579 | Ixiaa | 154,222 | ||||||
| 730 | Keysight Technologies, Inc.a | 26,696 | ||||||
| 1,300 | Konica Minolta Holdings, Inc. | 12,884 | ||||||
| 13,940 | Lam Research Corporation | 1,473,876 | ||||||
| 5,600 | Liberty Tripadvisor Holdings, Inc.a | 84,280 | ||||||
| 1,076 | Littelfuse, Inc. | 163,305 | ||||||
| 18,170 | M/A-COM Technology Solutions Holdings, Inc.a | 840,908 | ||||||
| 9,074 | Manhattan Associates, Inc.a | 481,194 | ||||||
| 68,210 | MasterCard, Inc. | 7,042,683 | ||||||
| 22,070 | Maxim Integrated Products, Inc. | 851,240 | ||||||
| 850 | MAXIMUS, Inc. | 47,422 | ||||||
| 4,680 | Methode Electronics, Inc. | 193,518 | ||||||
| 10,500 | Microsemi Corporationa | 566,685 | ||||||
| 163,800 | Microsoft Corporation | 10,178,532 | ||||||
| 19,760 | Mobileye NVa | 753,251 | ||||||
| 27,449 | Monolithic Power Systems, Inc. | 2,248,897 | ||||||
| 2,780 | Monotype Imaging Holdings, Inc. | 55,183 | ||||||
| 27,130 | National Instruments Corporation | 836,147 | ||||||
| 1,100 | NEC Networks & System Integration Corporation | 19,832 | ||||||
| 2,230 | NetApp, Inc. | 78,652 | ||||||
| 33,850 | New Relic, Inc.a | 956,263 | ||||||
| 356 | Nice, Ltd. | 24,426 | ||||||
| 10,251 | Nice, Ltd. ADR | 704,859 | ||||||
| 800 | Nichicon Corporation | 6,966 | ||||||
| 200 | NTT Data Corporation | 9,662 | ||||||
| 18,554 | NVIDIA Corporation | 1,980,454 | ||||||
| 8,820 | NXP Semiconductors NVa | 864,448 | ||||||
| 62,994 | Oclaro, Inc.a | 563,796 | ||||||
| 10,370 | ON Semiconductor Corporationa | 132,321 | ||||||
| 44,650 | Oracle Corporation | 1,716,792 | ||||||
| 1,170 | OSI Systems, Inc.a | 89,060 | ||||||
| 13,960 | Palo Alto Networks, Inc.a | 1,745,698 | ||||||
| 62,980 | Pandora Media, Inc.a | 821,259 | ||||||
| 11,225 | Paycom Software, Inc.a | 510,625 | ||||||
| 16,590 | Paylocity Holding Corporationa | 497,866 | ||||||
| 136,424 | PayPal Holdings, Inc.a | 5,384,655 | ||||||
| 21,446 | Pegasystems, Inc. | 772,056 | ||||||
| 4,633 | Progress Software Corporation | 147,932 | ||||||
| 33,706 | Proofpoint, Inc.a | 2,381,329 | ||||||
| 4,690 | PTC, Inc.a | 217,006 | ||||||
| 36,216 | Q2 Holdings, Inc.a | 1,044,832 | ||||||
| 640 | Qorvo, Inc.a | 33,747 | ||||||
| 13,150 | QUALCOMM, Inc. | 857,380 | ||||||
| 680 | Qualys, Inc.a | 21,522 | ||||||
| 4,640 | RealPage, Inc.a | 139,200 | ||||||
| 11,850 | Red Hat, Inc.a | 825,945 | ||||||
| 100 | Rohm Company, Ltd. | 5,737 | ||||||
| 4,683 | Rudolph Technologies, Inc.a | 109,348 | ||||||
| 400 | Ryosan Company, Ltd. | 12,059 | ||||||
| 96,050 | Salesforce.com, Inc.a | 6,575,583 | ||||||
| 137 | SAP SE | 11,851 | ||||||
| 810 | ScanSource, Inc.a | 32,684 | ||||||
| 590 | Seagate Technology plc | 22,520 | ||||||
| 15,531 | ServiceNow, Inc.a | 1,154,575 | ||||||
| 5,250 | ShoreTel, Inc.a | 37,537 | ||||||
| 570 | Silicon Laboratories, Inc.a | 37,050 | ||||||
| 325 | Software AG | 11,779 | ||||||
| 22,200 | SS&C Technologies Holdings, Inc. | 634,920 | ||||||
| 14,532 | Synopsys, Inc.a | 855,354 | ||||||
| 2,431 | Telefonaktiebolaget LM Ericsson | 14,248 | ||||||
| 51,311 | Teradyne, Inc. | 1,303,299 | ||||||
| 910 | Tessera Technologies, Inc. | 40,222 | ||||||
| 4,530 | Texas Instruments, Inc. | 330,554 | ||||||
| 300 | Tokyo Electron, Ltd. | 28,215 | ||||||
| 1,670 | Total System Services, Inc. | 81,880 | ||||||
| 4,690 | Trimble, Inc.a | 141,404 | ||||||
| 10,142 | Tyler Technologies, Inc.a | 1,447,973 | ||||||
| 6,448 | Ultimate Software Group, Inc.a | 1,175,793 | ||||||
| 610 | Verint Systems, Inc.a | 21,503 | ||||||
| 58,304 | Virtusa Corporationa | 1,464,596 | ||||||
| 98,850 | Visa, Inc. | 7,712,277 | ||||||
| 560 | Western Digital Corporation | 38,052 | ||||||
| 67,510 | Xerox Corporation | 589,362 | ||||||
| 28,900 | Xilinx, Inc. | 1,744,693 | ||||||
|
| |||||||
Total | 151,236,184 | |||||||
|
| |||||||
Materials (2.1%) | ||||||||
| 500 | Adeka Corporation | 6,783 | ||||||
| 4,790 | Agnico Eagle Mines, Ltd. | 201,180 | ||||||
| 4,000 | Air Products and Chemicals, Inc. | 575,280 | ||||||
| 2,576 | American Vanguard Corporation | 49,330 | ||||||
| 983 | APERAM | 44,860 | ||||||
| 3,510 | Ashland Global Holdings, Inc. | 383,608 | ||||||
| 2,920 | Avery Dennison Corporation | 205,042 | ||||||
| 11,570 | Axalta Coating Systems, Ltd.a | 314,704 | ||||||
| 7,298 | Balchem Corporation | 612,448 | ||||||
| 4,040 | Ball Corporation | 303,283 | ||||||
| 26,670 | Barrick Gold Corporation | 426,187 | ||||||
| 784 | BHP Billiton plc | 12,484 | ||||||
| 11,619 | BHP Billiton, Ltd. | 208,153 | ||||||
| 8,094 | BlueScope Steel, Ltd. | 53,793 | ||||||
| 4,010 | Boise Cascade Companya | 90,225 | ||||||
| 3,790 | Cabot Corporation | 191,547 | ||||||
| 1,890 | Carpenter Technology Corporation | 68,361 | ||||||
| 11,617 | Celanese Corporation | 914,723 | ||||||
| 23,509 | Chemtura Corporationa | 780,499 | ||||||
| 2,110 | Continental Building Products, Inc.a | 48,741 | ||||||
| 288 | Croda International plc | 11,327 | ||||||
| 10,130 | Crown Holdings, Inc.a | 532,534 | ||||||
| 4,700 | Daicel Corporation | 51,672 | ||||||
| 3,420 | Dow Chemical Company | 195,692 | ||||||
| 970 | Eagle Materials, Inc. | 95,574 | ||||||
| 8,300 | Eastman Chemical Company | 624,243 | ||||||
| 8,270 | Ecolab, Inc. | 969,409 | ||||||
| 18,530 | Eldorado Gold Corporationa | 59,667 | ||||||
| 3,050 | Evonik Industries AG | 90,917 | ||||||
| 4,170 | Ferro Corporationa | 59,756 | ||||||
| 8,150 | Ferroglobe plc | 88,265 | ||||||
| 8,150 | Ferroglobe Representation & Warranty Insurance Trusta,b | 1 | ||||||
| 26,495 | FMC Corporation | 1,498,557 | ||||||
| 8 | Givaudan SA | 14,641 | ||||||
| 18,170 | Goldcorp, Inc. | 247,112 | ||||||
| 67,300 | Graphic Packaging Holding Company | 839,904 | ||||||
| 4,130 | Huntsman Corporation | 78,800 | ||||||
| 1,215 | Ingevity Corporationa | 66,655 | ||||||
| 430 | Innophos Holdings, Inc. | 22,472 | ||||||
| 1,497 | Innospec, Inc. | 102,545 | ||||||
| 710 | International Flavors & Fragrances, Inc. | 83,659 | ||||||
| 15,060 | International Paper Company | 799,084 | ||||||
| 800 | JSR Corporation | 12,592 | ||||||
| 1,990 | Kadant, Inc. | 121,788 | ||||||
The accompanying Notes to Financial Statements are an integral part of this schedule.
7
Table of Contents
AGGRESSIVE ALLOCATION PORTFOLIO
Schedule of Investments as of December 31, 2016
| Shares | Common Stock (53.8%) | Value | ||||||
Materials (2.1%) - continued | ||||||||
| 6,030 | KapStone Paper and Packaging Corporation | $ | 132,962 | |||||
| 34,020 | Kinross Gold Corporationa | 105,802 | ||||||
| 910 | Koppers Holdings, Inc.a | 36,673 | ||||||
| 3,100 | Kuraray Company, Ltd. | 46,486 | ||||||
| 700 | Kyoei Steel, Ltd. | 13,309 | ||||||
| 183 | LafargeHolcim, Ltd. | 9,606 | ||||||
| 1,240 | Martin Marietta Materials, Inc. | 274,697 | ||||||
| 7,600 | Materion Corporation | 300,960 | ||||||
| 7,870 | Methanex Corporation | 344,706 | ||||||
| 1,194 | Minerals Technologies, Inc. | 92,237 | ||||||
| 3,700 | Mitsubishi Chemical Holdings Corporation | 23,923 | ||||||
| 600 | Mitsubishi Gas Chemical Company, Inc. | 10,224 | ||||||
| 400 | Mitsubishi Materials Corporation | 12,235 | ||||||
| 5,510 | Mosaic Company | 161,608 | ||||||
| 7,088 | Myers Industries, Inc. | 101,358 | ||||||
| 430 | Neenah Paper, Inc. | 36,636 | ||||||
| 18,390 | Newmont Mining Corporation | 626,547 | ||||||
| 200 | Nippon Shokubai Company, Ltd. | 12,455 | ||||||
| 13,492 | Norsk Hydro ASA | 64,394 | ||||||
| 7,880 | Nucor Corporation | 469,018 | ||||||
| 1,421 | Nufarm, Ltd. | 9,363 | ||||||
| 3,390 | OMNOVA Solutions, Inc.a | 33,900 | ||||||
| 3,760 | Orora, Ltd. | 8,086 | ||||||
| 29,770 | Owens-Illinois, Inc.a | 518,296 | ||||||
| 12,487 | Packaging Corporation of America | 1,059,147 | ||||||
| 1,980 | PolyOne Corporation | 63,439 | ||||||
| 330 | Quaker Chemical Corporation | 42,220 | ||||||
| 2,430 | Rayonier Advanced Materials, Inc. | 37,568 | ||||||
| 2,080 | Reliance Steel & Aluminum Company | 165,443 | ||||||
| 348 | Rio Tinto, Ltd. | 14,909 | ||||||
| 1,720 | Royal Gold, Inc. | 108,962 | ||||||
| 2,700 | Schnitzer Steel Industries, Inc. | 69,390 | ||||||
| 530 | Schweitzer-Mauduit International, Inc. | 24,131 | ||||||
| 6,177 | Scotts Miracle-Gro Company | 590,212 | ||||||
| 5,320 | Sealed Air Corporation | 241,209 | ||||||
| 9,230 | Sensient Technologies Corporation | 725,293 | ||||||
| 460 | Silgan Holdings, Inc. | 23,543 | ||||||
| 8,120 | Silver Wheaton Corporation | 156,878 | ||||||
| 5,290 | Sonoco Products Company | 278,783 | ||||||
| 40,652 | Steel Dynamics, Inc. | 1,446,398 | ||||||
| 300 | Sumitomo Seika Chemicals Company, Ltd. | 11,749 | ||||||
| 3,150 | SunCoke Energy, Inc.a | 35,721 | ||||||
| 14,180 | Teck Resources, Ltd. | 284,025 | ||||||
| 1,400 | Toagosei Company, Ltd. | 13,742 | ||||||
| 1,000 | Tosoh Corporation | 7,054 | ||||||
| 2,099 | UPM-Kymmene Oyj | 51,332 | ||||||
| 2,610 | Vulcan Materials Company | 326,642 | ||||||
| 8,194 | Westrock Company | 416,009 | ||||||
| 26,850 | Yamana Gold, Inc. | 75,449 | ||||||
| 400 | Yamato Kogyo Company, Ltd. | 11,156 | ||||||
| 2,388 | Yara International ASA | 93,942 | ||||||
| 200 | Yodogawa Steel Works, Ltd. | 5,212 | ||||||
|
| |||||||
Total | 21,983,136 | |||||||
|
| |||||||
Real Estate (1.0%) | ||||||||
| 9,940 | American Assets Trust, Inc. | 428,215 | ||||||
| 4,740 | American Campus Communities, Inc. | 235,910 | ||||||
| 3,300 | Bluerock Residential Growth REIT, Inc. | 45,276 | ||||||
| 31,337 | Brixmor Property Group, Inc. | 765,250 | ||||||
| 5,250 | Camden Property Trust | 441,367 | ||||||
| 7,400 | CapitaLand Retail China Trusta | 7,001 | ||||||
| 6,790 | CBL & Associates Properties, Inc. | 78,085 | ||||||
| 18,023 | Cedar Realty Trust, Inc. | 117,690 | ||||||
| 8,450 | Chatham Lodging Trust | 173,647 | ||||||
| 1,650 | City Office REIT, Inc. | 21,730 | ||||||
| 7,100 | Columbia Property Trust, Inc. | 153,360 | ||||||
| 5,590 | CoreCivic, Inc. | 136,731 | ||||||
| 24,060 | Corporate Office Properties Trust | 751,153 | ||||||
| 25,303 | Cousins Properties, Inc. | 215,328 | ||||||
| 6,230 | CyrusOne, Inc. | 278,668 | ||||||
| 100 | Daito Trust Construction Company, Ltd. | 15,034 | ||||||
| 49,290 | DDR Corporation | 752,658 | ||||||
| 10,579 | DEXUS Property Group | 73,389 | ||||||
| 4,800 | Digital Realty Trust, Inc. | 471,648 | ||||||
| 16,850 | Duke Realty Corporation | 447,536 | ||||||
| 2,530 | Equity Lifestyle Properties, Inc. | 182,413 | ||||||
| 790 | First Industrial Realty Trust, Inc. | 22,159 | ||||||
| 5,848 | First Potomac Realty Trust | 64,153 | ||||||
| 4,210 | Franklin Street Properties Corporation | 54,562 | ||||||
| 15,800 | General Growth Properties, Inc. | 394,684 | ||||||
| 3,167 | H&R Real Estate Investment Trust | 52,766 | ||||||
| 900 | Hamborner REIT AG | 8,562 | ||||||
| 7,970 | HFF, Inc. | 241,092 | ||||||
| 2,450 | Hospitality Properties Trust | 77,763 | ||||||
| 29,748 | Host Hotels & Resorts, Inc. | 560,452 | ||||||
| 1,280 | Hudson Pacific Properties, Inc. | 44,518 | ||||||
| 12,000 | Hysan Development Company, Ltd. | 49,488 | ||||||
| 3,880 | InfraREIT, Inc. | 69,491 | ||||||
| 6,050 | Kite Realty Group Trust | 142,054 | ||||||
| 5,910 | LaSalle Hotel Properties | 180,078 | ||||||
| 8,300 | Liberty Property Trust | 327,850 | ||||||
| 1,610 | Life Storage, Inc. | 137,269 | ||||||
| 1,500 | Link REIT | 9,725 | ||||||
| 3,080 | Mid-America Apartment Communities, Inc. | 301,594 | ||||||
| 49,394 | New World Development Company, Ltd. | 52,042 | ||||||
| 16,583 | Pebblebrook Hotel Trust | 493,344 | ||||||
| 13,740 | Physicians Realty Trust | 260,510 | ||||||
| 547 | Potlatch Corporation | 22,783 | ||||||
| 2,680 | RE/MAX Holdings, Inc. | 150,080 | ||||||
| 5,700 | Realogy Holdings Corporation | 146,661 | ||||||
| 21,830 | Retail Properties of America, Inc. | 334,654 | ||||||
| 3,370 | Silver Bay Realty Trust Corporation REIT | 57,762 | ||||||
| 1,980 | Spirit Realty Captial, Inc. | 21,503 | ||||||
| 19,498 | Stockland | 64,415 | ||||||
| 2,670 | Store Capital Corporation | 65,976 | ||||||
| 540 | Sun Communities, Inc. | 41,369 | ||||||
| 22,593 | Terreno Realty Corporation | 643,675 | ||||||
| 4,350 | Urstadt Biddle Properties, Inc. | 104,878 | ||||||
| 3,130 | Welltower, Inc. | 209,491 | ||||||
| 1,000 | Wharf Holdings, Ltd. | 6,624 | ||||||
| 1,000 | Wheelock and Company, Ltd. | 5,612 | ||||||
| 11,800 | Wing Tai Holdings, Ltd. | 12,925 | ||||||
|
| |||||||
Total | 11,224,653 | |||||||
|
| |||||||
Telecommunications Services (0.3%) | ||||||||
| 9,960 | AT&T, Inc. | 423,599 | ||||||
| 920 | ATN International, Inc. | 73,720 | ||||||
| 1,864 | Cincinnati Bell, Inc.a | 41,660 | ||||||
| 1,741 | Elisa Oyj | 56,516 | ||||||
| 1,528 | Freenet AG | 42,944 | ||||||
| 8,460 | General Communication, Inc.a | 164,547 | ||||||
| 26,380 | KCOM Group plc | 30,804 | ||||||
| 6,676 | Koninklijke (Royal) KPN NV | 19,742 | ||||||
The accompanying Notes to Financial Statements are an integral part of this schedule.
8
Table of Contents
AGGRESSIVE ALLOCATION PORTFOLIO
Schedule of Investments as of December 31, 2016
| Shares | Common Stock (53.8%) | Value | ||||||
Telecommunications Services (0.3%) - continued | ||||||||
| 10,905 | Level 3 Communications, Inc.a | $ | 614,606 | |||||
| 1,600 | Nippon Telegraph & Telephone Corporation | 67,352 | ||||||
| 1,700 | NTT DOCOMO, Inc. | 38,667 | ||||||
| 30,494 | PCCW, Ltd. | 16,485 | ||||||
| 717 | Proximus SA | 20,612 | ||||||
| 7,624 | SBA Communications Corporationa | 787,254 | ||||||
| 2,800 | Telefonica Deutschland Holding AG | 11,968 | ||||||
| 1,742 | Telenor ASA | 26,002 | ||||||
| 7,708 | Verizon Communications, Inc. | 411,453 | ||||||
| 391 | Vivendi SA | 7,416 | ||||||
| 20,370 | Vonage Holdings Corporationa | 139,534 | ||||||
|
| |||||||
Total | 2,994,881 | |||||||
|
| |||||||
Utilities (0.9%) | ||||||||
| 1,010 | Alliant Energy Corporation | 38,269 | ||||||
| 1,410 | American Electric Power Company, Inc. | 88,774 | ||||||
| 5,720 | American States Water Company | 260,603 | ||||||
| 1,940 | Artesian Resources Corporation | 61,964 | ||||||
| 590 | ATCO, Ltd. | 19,625 | ||||||
| 9,450 | Avista Corporation | 377,905 | ||||||
| 13,770 | Calpine Corporationa | 157,391 | ||||||
| 9,600 | Centrica plc | 27,649 | ||||||
| 780 | Consolidated Edison, Inc. | 57,470 | ||||||
| 1,640 | Consolidated Water Company, Ltd. | 17,794 | ||||||
| 9,230 | DTE Energy Company | 909,247 | ||||||
| 2,740 | Dynegy, Inc.a | 23,180 | ||||||
| 2,530 | Edison International, Inc. | 182,135 | ||||||
| 13,400 | Electricidade de Portugal SA | 40,784 | ||||||
| 19,450 | Eversource Energy | 1,074,223 | ||||||
| 2,970 | Exelon Corporation | 105,405 | ||||||
| 39,560 | Great Plains Energy, Inc. | 1,081,966 | ||||||
| 2,080 | Hawaiian Electric Industries, Inc. | 68,786 | ||||||
| 12,510 | MDU Resources Group, Inc. | 359,913 | ||||||
| 830 | Middlesex Water Company | 35,640 | ||||||
| 1,640 | National Fuel Gas Company | 92,890 | ||||||
| 5,510 | NiSource, Inc. | 121,991 | ||||||
| 1,050 | NorthWestern Corporation | 59,713 | ||||||
| 16,000 | Osaka Gas Company, Ltd. | 61,393 | ||||||
| 8,480 | PG&E Corporation | 515,330 | ||||||
| 13,350 | PNM Resources, Inc. | 457,905 | ||||||
| 5,770 | Portland General Electric Company | 250,014 | ||||||
| 13,950 | Public Service Enterprise Group, Inc. | 612,126 | ||||||
| 8,531 | Redes Energeticas Nacionais SGPS SA | 24,205 | ||||||
| 2,350 | Renewable Energy Group, Inc.a | 22,795 | ||||||
| 12,060 | Southern Company | 593,231 | ||||||
| 6,300 | Southwest Gas Holdings, Inc. | 482,706 | ||||||
| 320 | Spire, Inc. | 20,656 | ||||||
| 1,000 | Toho Gas Company, Ltd. | 8,122 | ||||||
| 1,505 | United Utilities Group plc | 16,682 | ||||||
| 16,600 | Vectren Corporation | 865,690 | ||||||
|
| |||||||
Total | 9,194,172 | |||||||
|
| |||||||
Total Common Stock (cost $467,036,687) | 571,536,278 | |||||||
|
| |||||||
Registered Investment Companies (32.3%) | ||||||||
Affiliated Equity Holdings (29.0%) | ||||||||
| 3,495,736 | Thrivent Large Cap Stock Portfolio | 42,283,026 | ||||||
| 3,170,544 | Thrivent Large Cap Value Portfolio | 53,389,419 | ||||||
| 3,352,705 | Thrivent Mid Cap Stock Portfolio | 63,971,952 | ||||||
| 12,044,477 | Thrivent Partner Worldwide Allocation Portfolio | 109,497,545 | ||||||
| 2,105,112 | Thrivent Small Cap Stock Portfolio | 38,931,305 | ||||||
|
| |||||||
Total | 308,073,247 | |||||||
|
| |||||||
Affiliated Fixed Income Holdings (2.1%) | ||||||||
| 1,768,459 | Thrivent High Yield Portfolio | 8,435,903 | ||||||
| 468,133 | Thrivent Income Portfolio | 4,713,587 | ||||||
| 938,887 | Thrivent Limited Maturity Bond Portfolio | 9,207,570 | ||||||
|
| |||||||
Total | 22,357,060 | |||||||
|
| |||||||
Equity Funds/ETFs (1.2%) | ||||||||
| 1,310 | iShares MSCI EAFE Index Fund | 75,626 | ||||||
| 28,305 | iShares Russell 2000 Growth Index Fund | 4,357,272 | ||||||
| 12,288 | iShares Russell 2000 Index Fund | 1,657,037 | ||||||
| 4,860 | iShares Russell 2000 Value Index Fund | 578,048 | ||||||
| 8,520 | Materials Select Sector SPDR Fund | 423,444 | ||||||
| 20,956 | SPDR S&P 500 ETF Trust | 4,684,295 | ||||||
| 24,860 | SPDR S&P Biotech ETF | 1,471,464 | ||||||
| 310 | SPDR S&P MidCap 400 ETF Trust | 93,536 | ||||||
|
| |||||||
Total | 13,340,722 | |||||||
|
| |||||||
Total Registered Investment Companies (cost $321,617,561) | 343,771,029 | |||||||
|
| |||||||
| Principal Amount | Long-Term Fixed Income (3.6%) | |||||||
Collateralized Mortgage Obligations (<0.1%) | ||||||||
MASTR Alternative Loans Trust | ||||||||
| $ | 27,389 | 1.206%, 12/25/2035, Series 2005-6, Class 2A1d | 12,443 | |||||
Residential Asset Securitization Trust | ||||||||
| 45,326 | 1.136%, 8/25/2037, Series 2007-A8, Class 2A3d | 11,819 | ||||||
Sequoia Mortgage Trust | ||||||||
| 112,279 | 3.280%, 9/20/2046, Series 2007-1, Class 4A1 | 91,057 | ||||||
WaMu Mortgage Pass Through Certificates | ||||||||
| 50,571 | 2.837%, 9/25/2036, Series 2006-AR10, Class 1A2 | 46,528 | ||||||
| 73,397 | 2.850%, 10/25/2036, Series 2006-AR12, Class 1A1 | 63,981 | ||||||
|
| |||||||
Total | 225,828 | |||||||
|
| |||||||
Mortgage-Backed Securities (1.7%) | ||||||||
Federal Home Loan Mortgage Corporation Gold 15-Yr. Pass Through | ||||||||
| 875,000 | 3.000%, 1/1/2032e | 897,488 | ||||||
Federal Home Loan Mortgage Corporation Gold 30-Yr. Pass Through | ||||||||
| 875,000 | 4.000%, 1/1/2047e | 918,575 | ||||||
Federal National Mortgage Association Conventional 15-Yr. Pass Through | ||||||||
| 900,000 | 2.500%, 1/1/2032e | 900,990 | ||||||
Federal National Mortgage Association Conventional 30-Yr. Pass Through | ||||||||
| 1,850,000 | 3.000%, 1/1/2047e | 1,836,495 | ||||||
| 7,475,000 | 3.500%, 1/1/2047e | 7,656,642 | ||||||
| 3,975,000 | 4.000%, 1/1/2047e | 4,176,930 | ||||||
| 1,575,000 | 4.500%, 1/1/2047e | 1,693,440 | ||||||
|
| |||||||
Total | 18,080,560 | |||||||
|
| |||||||
The accompanying Notes to Financial Statements are an integral part of this schedule.
9
Table of Contents
AGGRESSIVE ALLOCATION PORTFOLIO
Schedule of Investments as of December 31, 2016
| Principal Amount | Long-Term Fixed Income (3.6%) | Value | ||||||
U.S. Government and Agencies (1.9%) | ||||||||
Tennessee Valley Authority | ||||||||
| $ | 165,000 | 5.250%, 9/15/2039 | $ | 206,870 | ||||
U.S. Treasury Bonds | ||||||||
| 1,680,000 | 3.625%, 2/15/2044 | 1,858,179 | ||||||
| 348,000 | 2.500%, 5/15/2046 | 308,492 | ||||||
U.S. Treasury Bonds, TIPS | ||||||||
| 1,322,477 | 0.625%, 1/15/2026 | 1,333,881 | ||||||
U.S. Treasury Notes | ||||||||
| 225,000 | 0.875%, 3/31/2018 | 224,691 | ||||||
| 400,000 | 1.000%, 11/30/2018f | 398,636 | ||||||
| 2,520,000 | 0.750%, 2/15/2019 | 2,494,253 | ||||||
| 360,000 | 1.000%, 10/15/2019 | 355,984 | ||||||
| 825,000 | 1.500%, 10/31/2019 | 826,610 | ||||||
| 665,000 | 1.375%, 9/30/2020 | 656,976 | ||||||
| 3,425,000 | 1.125%, 8/31/2021 | 3,306,084 | ||||||
| 250,000 | 2.125%, 9/30/2021 | 251,975 | ||||||
| 250,000 | 1.625%, 8/15/2022 | 243,540 | ||||||
| 5,100,000 | 1.625%, 10/31/2023 | 4,900,493 | ||||||
| 2,100,000 | 2.250%, 11/15/2024 | 2,084,342 | ||||||
| 772,000 | 2.000%, 11/15/2026f | 741,576 | ||||||
|
| |||||||
Total | 20,192,582 | |||||||
|
| |||||||
Total Long-Term Fixed Income (cost $38,618,657) | 38,498,970 | |||||||
|
| |||||||
| Shares | Preferred Stock (<0.1%) | |||||||
Consumer Staples (<0.1%) | ||||||||
| 88 | Henkel AG & Company KGaA, 1.470% | 10,476 | ||||||
|
| |||||||
Total | 10,476 | |||||||
|
| |||||||
Total Preferred Stock (cost $10,840) | 10,476 | |||||||
|
| |||||||
Collateral Held for Securities Loaned (0.1%) | ||||||||
| 1,164,525 | Thrivent Cash Management Trust | 1,164,525 | ||||||
|
| |||||||
Total Collateral Held for Securities Loaned (cost $1,164,525) | 1,164,525 | |||||||
|
| |||||||
| Shares or Principal Amount | Short-Term Investments (11.8%)g | |||||||
Federal Home Loan Bank Discount Notes | ||||||||
| 3,000,000 | 0.340%, 1/4/2017h | 2,999,967 | ||||||
| 5,200,000 | 0.344%, 1/6/2017h | 5,199,834 | ||||||
| 500,000 | 0.500%, 1/19/2017h | 499,915 | ||||||
| 100,000 | 0.425%, 1/20/2017h | 99,982 | ||||||
| 100,000 | 0.365%, 1/27/2017h | 99,975 | ||||||
| 300,000 | 0.400%, 2/1/2017h | 299,879 | ||||||
| 100,000 | 0.500%, 2/17/2017h | 99,937 | ||||||
Thrivent Core Short-Term Reserve Fund | ||||||||
| 11,605,862 | 0.910% | 116,058,618 | ||||||
|
| |||||||
Total Short-Term Investments (cost $125,357,942) | 125,358,107 | |||||||
|
| |||||||
Total Investments (cost $953,806,212) 101.6% | $ | 1,080,339,385 | ||||||
|
| |||||||
Other Assets and Liabilities, Net (1.6%) | (16,911,396 | ) | ||||||
|
| |||||||
Total Net Assets 100.0% | $ | 1,063,427,989 | ||||||
|
| |||||||
| a | Non-income producing security. |
| b | Security is valued at fair value. Market quotations or prices were not readily available or were determined to be unreliable. Fair value was determined in good faith pursuant to procedures adopted by the Board. Further information on fair valuation can be found in the Notes to Financial Statements. |
| c | Denotes securities sold under Rule 144A of the Securities Act of 1933, which exempts them from registration. These securities may be resold to other dealers in the program or to other qualified institutional buyers. As of December 31, 2016, the value of these investments was $17,513 or 0.0% of total net assets. |
| d | Denotes variable rate securities. Variable rate securities are securities whose yields vary with a designated market index or market rate. The rate shown is as of December 31, 2016. |
| e | Denotes investments purchased on a when-issued or delayed delivery basis. |
| f | All or a portion of the security is on loan. |
| g | The interest rate shown reflects the yield, coupon rate or the discount rate at the date of purchase. |
| h | All or a portion of the security is held on deposit with the counterparty and pledged as the initial margin deposit for open futures contracts. |
The following table presents the total amount of securities loaned with continuous maturity, by type, offset by the gross payable upon return of collateral for securities loaned by Thrivent Aggressive Allocation Portfolio as of December 31, 2016:
Securities Lending Transactions | ||||
Taxable Debt Security | $ | 1,140,212 | ||
|
| |||
Total lending | $ | 1,140,212 | ||
Gross amount payable upon return of collateral for securities loaned | $ | 1,164,525 | ||
|
| |||
Net amounts due to counterparty | $ | 24,313 | ||
|
| |||
Definitions:
ADR | - | American Depositary Receipt, which are certificates for an underlying foreign security’s shares held by an issuing U.S. depository bank. | ||
ETF | - | Exchange Traded Fund. | ||
REIT | - | Real Estate Investment Trust is a company that buys, develops, manages and/or sells real estate assets. | ||
TIPS | - | Treasury Inflation Protected Security. |
The accompanying Notes to Financial Statements are an integral part of this schedule.
10
Table of Contents
MODERATELY AGGRESSIVE ALLOCATION PORTFOLIO
Schedule of Investments as of December 31, 2016
| Principal Amount | Bank Loans (1.0%)a | Value | ||||||
| Basic Materials (0.1%) | ||||||||
Arch Coal, Inc., Term Loan | ||||||||
| $ 441,038 | 10.000%, 10/5/2021 | $ | 446,737 | |||||
Axalta Coating Systems US Holdings, Inc.,Term Loan | ||||||||
| 577,696 | 3.498%, 2/1/2023 | 583,115 | ||||||
Fortescue Metals Group, Ltd., Term Loan | ||||||||
| 445,645 | 3.750%, 6/30/2019 | 446,536 | ||||||
Ineos US Finance, LLC, Term Loan | ||||||||
| 1,334,299 | 3.750%, 12/15/2020 | 1,339,863 | ||||||
Tronox Pigments BV, Term Loan | ||||||||
| 786,267 | 4.500%, 3/19/2020 | 788,885 | ||||||
|
| |||||||
Total | 3,605,136 | |||||||
|
| |||||||
| Capital Goods (0.1%) | ||||||||
Accudyne Industries, LLC, Term Loan | ||||||||
| 438,294 | 4.000%, 12/13/2019 | 413,719 | ||||||
Advanced Disposal Services, Inc., Term Loan | ||||||||
| 388,480 | 3.500%, 11/10/2023 | 391,638 | ||||||
Cortes NP Acquisition Corporation, Term Loan | ||||||||
| 1,030,000 | 6.000%, 11/30/2023 | 1,042,875 | ||||||
|
| |||||||
Total | 1,848,232 | |||||||
|
| |||||||
| Communications Services (0.3%) | ||||||||
Altice US Finance I Corporation, Term Loan | ||||||||
| 563,854 | 3.882%, 1/15/2025 | 569,492 | ||||||
Beasley Broadcast Group, Inc., Term Loan | ||||||||
| 345,000 | 7.000%, 11/1/2023 | 345,000 | ||||||
FairPoint Communications, Inc., Term Loan | ||||||||
| 798,021 | 7.500%, 2/14/2019 | 804,757 | ||||||
Grande Communications Networks, LLC, Term Loan | ||||||||
| 718,952 | 4.500%, 5/29/2020 | 723,266 | ||||||
Hargray Communications Group, Inc., Term Loan | ||||||||
| 786,638 | 4.750%, 6/26/2019 | 795,157 | ||||||
Integra Telecom Holdings, Inc., Term Loan | ||||||||
| 499,540 | 5.250%, 8/14/2020 | 500,414 | ||||||
| 220,520 | 9.750%, 2/12/2021 | 220,107 | ||||||
Intelsat Jackson Holdings SA, Term Loan | ||||||||
| 267,851 | 3.750%, 6/30/2019 | 258,615 | ||||||
Level 3 Communications, Inc., Term Loan | ||||||||
| 1,555,000 | 4.000%, 1/15/2020 | 1,575,215 | ||||||
Liberty Cablevision of Puerto Rico, LLC, Term Loan | ||||||||
| 2,765,000 | 4.500%, 1/7/2022 | 2,742,548 | ||||||
LTS Buyer, LLC, Term Loan | ||||||||
| 765,514 | 4.248%, 4/13/2020 | 769,104 | ||||||
NEP Broadcasting, LLC, Term Loan | ||||||||
| 68,571 | 10.000%, 7/22/2020 | 68,828 | ||||||
NEP/NCP Holdco, Inc., Term Loan | ||||||||
| 1,029,234 | 4.250%, 1/22/2020 | 1,031,807 | ||||||
SBA Senior Finance II, LLC, Term Loan | ||||||||
| 531,900 | 3.270%, 6/10/2022 | 533,597 | ||||||
Syniverse Holdings, Inc., Term Loan | ||||||||
| 684,177 | 4.000%, 4/23/2019 | 595,918 | ||||||
TNS, Inc., Term Loan | ||||||||
| 391,848 | 5.000%, 2/14/2020 | 395,155 | ||||||
Univision Communications, Inc., Term Loan | ||||||||
| 973,894 | 4.000%, 3/1/2020 | 978,764 | ||||||
Virgin Media Bristol, LLC, Term Loan | ||||||||
| 1,385,000 | 3.486%, 1/31/2025 | 1,390,374 | ||||||
WideOpenWest Finance, LLC, Term Loan | ||||||||
| 748,125 | 4.500%, 8/18/2023 | 755,472 | ||||||
XO Communications, LLC, Term Loan | ||||||||
| 291,750 | 4.250%, 3/20/2021 | 292,479 | ||||||
Yankee Cable Acquisition, LLC, Term Loan | ||||||||
| 619,269 | 4.250%, 3/1/2020 | 619,529 | ||||||
Zayo Group, LLC, Term Loan | ||||||||
| 1,151,294 | 3.750%, 5/6/2021 | 1,162,969 | ||||||
|
| |||||||
Total | 17,128,567 | |||||||
|
| |||||||
| Consumer Cyclical (0.1%) | ||||||||
Amaya BV, Term Loan | ||||||||
| 1,359,073 | 5.000%, 8/1/2021 | 1,363,232 | ||||||
Burlington Coat Factory Warehouse Corporation, Term Loan | ||||||||
| 728,516 | 3.510%, 8/13/2021 | 732,807 | ||||||
Cengage Learning Acquisitions, Term Loan | ||||||||
| 467,650 | 5.250%, 6/7/2023 | 454,280 | ||||||
Ceridian HCM Holding, Inc., Term Loan | ||||||||
| 339,664 | 4.500%, 9/15/2020 | 336,974 | ||||||
Four Seasons Holdings, Inc., Term Loan | ||||||||
| 495,000 | 3.750%, 11/30/2023 | 500,156 | ||||||
Golden Nugget, Inc., Term Loan | ||||||||
| 334,069 | 4.500%, 11/21/2019 | 337,409 | ||||||
Golden Nugget, Inc., Term Loan Delayed Draw | ||||||||
| 139,698 | 4.500%, 11/21/2019 | 141,095 | ||||||
IMG Worldwide, Inc., Term Loan | ||||||||
| 571,258 | 5.250%, 5/6/2021 | 576,617 | ||||||
| 400,000 | 8.250%, 5/6/2022 | 405,000 | ||||||
Mohegan Tribal Gaming Authority, Term Loan | ||||||||
| 623,438 | 5.500%, 10/13/2023 | 627,727 | ||||||
Scientific Games International, Inc., Term Loan | ||||||||
| 403,559 | 6.000%, 10/18/2020 | 408,688 | ||||||
| 918,522 | 6.000%, 10/1/2021 | 929,434 | ||||||
|
| |||||||
Total | 6,813,419 | |||||||
|
| |||||||
| Consumer Non-Cyclical (0.1%) | ||||||||
Albertson’s, LLC, Term Loan | ||||||||
| 444,250 | 0.000%, 12/21/2022b,c | 449,803 | ||||||
| 805,750 | 0.000%, 6/22/2023b,c | 815,483 | ||||||
Endo Luxembourg Finance I Company SARL, Term Loan | ||||||||
| 579,150 | 3.813%, 9/26/2022 | 581,635 | ||||||
Mallinckrodt International Finance SA, Term Loan | ||||||||
| 272,215 | 3.748%, 3/19/2021 | 272,798 | ||||||
McGraw-Hill Global Education Holdings, LLC, Term Loan | ||||||||
| 800,975 | 5.000%, 5/4/2022 | 801,103 | ||||||
The accompanying Notes to Financial Statements are an integral part of this schedule.
11
Table of Contents
MODERATELY AGGRESSIVE ALLOCATION PORTFOLIO
Schedule of Investments as of December 31, 2016
| Principal Amount | Bank Loans (1.0%)a | Value | ||||||
| Consumer Non-Cyclical (0.1%) - continued | ||||||||
Ortho-Clinical Diagnostics, Inc., Term Loan | ||||||||
| $1,020,279 | 4.750%, 6/30/2021 | $ | 1,010,443 | |||||
PetSmart, Inc., Term Loan | ||||||||
| 294,253 | 4.000%, 3/11/2022 | 294,989 | ||||||
Valeant Pharmaceuticals International, Inc., Term Loan | ||||||||
| 1,812,095 | 5.500%, 4/1/2022b,c | 1,812,439 | ||||||
|
| |||||||
Total | 6,038,693 | |||||||
|
| |||||||
| Energy (0.1%) | ||||||||
Calpine Corporation, Term Loan | ||||||||
| 1,043,057 | 0.000%, 1/15/2024b,c | 1,046,969 | ||||||
Energy Solutions, LLC, Term Loan | ||||||||
| 400,446 | 6.750%, 5/29/2020 | 402,948 | ||||||
Expro Holdings UK 2, Ltd., Term Loan | ||||||||
| 439,875 | 5.750%, 9/2/2021 | 370,960 | ||||||
Houston Fuel Oil Terminal, LLC, Term Loan | ||||||||
| 829,576 | 4.250%, 8/19/2021 | 823,354 | ||||||
McJunkin Red Man Corporation, Term Loan | ||||||||
| 326,378 | 5.000%, 11/8/2019 | 327,602 | ||||||
Pacific Drilling SA, Term Loan | ||||||||
| 477,675 | 4.500%, 6/3/2018 | 167,664 | ||||||
Targa Resources Partners, LP, Term Loan | ||||||||
| 168,628 | 5.750%, 2/27/2022 | 169,471 | ||||||
Western Refining, Inc., Term Loan | ||||||||
| 301,725 | 5.500%, 6/23/2023 | 303,233 | ||||||
|
| |||||||
Total | 3,612,201 | |||||||
|
| |||||||
| Financials (0.1%) | ||||||||
DJO Finance, LLC, Term Loan | ||||||||
| 543,125 | 4.250%, 6/7/2020 | 520,553 | ||||||
Harland Clarke Holdings Corporation, Term Loan | ||||||||
| 693,750 | 6.993%, 8/4/2019 | 692,591 | ||||||
| 118,750 | 7.000%, 12/31/2019 | 119,195 | ||||||
MoneyGram International, Inc., Term Loan | ||||||||
| 836,078 | 4.250%, 3/27/2020 | 824,933 | ||||||
Sable International Finance, Ltd., Term Loan | ||||||||
| 795,000 | 5.748%, 1/3/2023b,c | 804,445 | ||||||
WaveDivision Holdings, LLC, Term Loan | ||||||||
| 960,480 | 4.000%, 10/15/2019 | 965,523 | ||||||
|
| |||||||
Total | 3,927,240 | |||||||
|
| |||||||
| Technology (0.1%) | ||||||||
Avago Technoligies Cayman Finance, Ltd., Term Loan | ||||||||
| 992,717 | 3.704%, 2/1/2023 | 1,006,366 | ||||||
First Data Corporation, Term Loan | ||||||||
| 602,730 | 3.756%, 3/24/2021 | 609,511 | ||||||
| 780,386 | 3.756%, 7/8/2022 | 788,353 | ||||||
NXP BV, Term Loan | ||||||||
| 364,087 | 3.270%, 12/7/2020 | 365,726 | ||||||
ON Semiconductor Corporation, Term Loan | ||||||||
| 1,087,275 | 4.020%, 3/31/2023 | 1,100,475 | ||||||
Rackspace Hosting, LLC, Term Loan | ||||||||
| 905,000 | 4.500%, 12/20/2023b,c | 915,932 | ||||||
SS&C European Holdings SARL, Term Loan | ||||||||
| 248,912 | 4.001%, 7/8/2022 | 252,181 | ||||||
| 25,401 | 4.002%, 7/8/2022 | 25,734 | ||||||
Western Digital Corporation, Term Loan | ||||||||
| 1,039,775 | 4.520%, 4/29/2023 | 1,055,694 | ||||||
Xerox Business Services, LLC, Term Loan | ||||||||
| 890,000 | 6.250%, 12/7/2023b,c | 900,013 | ||||||
|
| |||||||
Total | 7,019,985 | |||||||
|
| |||||||
| Transportation (<0.1%) | ||||||||
OSG Bulk Ships, Inc., Term Loan | ||||||||
| 589,232 | 5.250%, 8/5/2019 | 573,765 | ||||||
XPO Logistics, Inc., Term Loan | ||||||||
| 545,550 | 4.250%, 11/1/2021 | 552,201 | ||||||
|
| |||||||
Total | 1,125,966 | |||||||
|
| |||||||
| Utilities (<0.1%) | ||||||||
Intergen NV, Term Loan | ||||||||
| 423,236 | 5.500%, 6/12/2020 | 409,832 | ||||||
Talen Energy Supply, LLC, Term Loan | ||||||||
| 262,500 | 6.000%, 12/6/2023 | 265,781 | ||||||
|
| |||||||
Total | 675,613 | |||||||
|
| |||||||
Total Bank Loans (cost $51,839,036) | 51,795,052 | |||||||
|
| |||||||
| Shares | Common Stock (39.3%) | |||||||
| Consumer Discretionary (5.4%) | ||||||||
| 78,934 | Aaron’s, Inc. | 2,525,099 | ||||||
| 21,680 | Abercrombie & Fitch Company | 260,160 | ||||||
| 55,432 | Amazon.com, Inc.d | 41,566,794 | ||||||
| 10,350 | American Axle & Manufacturing Holdings, Inc.d | 199,755 | ||||||
| 19,506 | American Public Education, Inc.d | 478,872 | ||||||
| 176,050 | Aramark | 6,288,506 | ||||||
| 10,650 | Armstrong Flooring, Inc.d | 212,042 | ||||||
| 12,650 | Ascent Capital Group, Inc.d | 205,689 | ||||||
| 14,300 | AutoZone, Inc.d | 11,293,997 | ||||||
| 60,350 | Barnes & Noble, Inc. | 672,903 | ||||||
| 25,270 | Beazer Homes USA, Inc.d | 336,091 | ||||||
| 4,260 | Bed Bath & Beyond, Inc. | 173,126 | ||||||
| 6,342 | Berkeley Group Holdings plc | 219,237 | ||||||
| 13,220 | Big 5 Sporting Goods Corporation | 229,367 | ||||||
| 25,800 | Bloomin’ Brands, Inc. | 465,174 | ||||||
| 64,000 | BorgWarner, Inc. | 2,524,160 | ||||||
| 19,710 | Boyd Gaming Corporationd | 397,551 | ||||||
| 1,000 | Brembo SPA | 60,495 | ||||||
| 9,000 | Bridgestone Corporation | 323,827 | ||||||
| 101,539 | Brunswick Corporation | 5,537,937 | ||||||
| 5,836 | Bunzl plc | 151,511 | ||||||
| 45,371 | Burlington Stores, Inc.d | 3,845,192 | ||||||
| 31,520 | Caleres, Inc. | 1,034,486 | ||||||
| 43,540 | Callaway Golf Company | 477,198 | ||||||
| 1,400 | Canon Marketing Japan, Inc. | 23,508 | ||||||
| 52,100 | Carter’s, Inc. | 4,500,919 | ||||||
| 20,636 | Cedar Fair, LP | 1,324,831 | ||||||
| 19,600 | Cheesecake Factory, Inc. | 1,173,648 | ||||||
| 2,710 | Chipotle Mexican Grill, Inc.d | 1,022,537 | ||||||
| 7,390 | Chuy’s Holdings, Inc.d | 239,805 | ||||||
| 23,070 | Cinemark Holdings, Inc. | 884,965 | ||||||
| 12,450 | ClubCorp Holdings, Inc. | 178,658 | ||||||
| 6,180 | Columbia Sportswear Company | 360,294 | ||||||
| 309,006 | Comcast Corporation | 21,336,864 | ||||||
| 87,993 | Core-Mark Holding Company, Inc. | 3,789,859 | ||||||
| 30,482 | CSS Industries, Inc. | 825,148 | ||||||
| 35,944 | Culp, Inc. | 1,335,320 | ||||||
| 6,170 | D.R. Horton, Inc. | 168,626 | ||||||
The accompanying Notes to Financial Statements are an integral part of this schedule.
12
Table of Contents
MODERATELY AGGRESSIVE ALLOCATION PORTFOLIO
Schedule of Investments as of December 31, 2016
| Shares | Common Stock (39.3%) | Value | ||||||
Consumer Discretionary (5.4%) - continued | ||||||||
| 76,980 | Dana, Inc. | $ | 1,461,080 | |||||
| 5,330 | Deckers Outdoor Corporationd | 295,229 | ||||||
| 84,659 | Delphi Automotive plc | 5,701,784 | ||||||
| 9,200 | Denso Corporation | 397,960 | ||||||
| 13,170 | DeVry Education Group, Inc. | 410,904 | ||||||
| 11,493 | Discovery Communications, Inc., Class Ad | 315,023 | ||||||
| 9,090 | Discovery Communications, Inc., Class Cd | 243,430 | ||||||
| 31,500 | DISH Network Corporationd | 1,824,795 | ||||||
| 14,310 | Dollar General Corporation | 1,059,942 | ||||||
| 69,745 | Dollar Tree, Inc.d | 5,382,919 | ||||||
| 7,080 | Domino’s Pizza, Inc. | 1,127,419 | ||||||
| 51,720 | DSW, Inc. | 1,171,458 | ||||||
| 94,192 | Duluth Holdings, Inc.d,e | 2,392,477 | ||||||
| 25,990 | Etsy, Inc.d | 306,162 | ||||||
| 9,300 | Eutelsat Communications | 179,841 | ||||||
| 19,720 | Expedia, Inc. | 2,233,882 | ||||||
| 31,180 | Finish Line, Inc. | 586,496 | ||||||
| 9,500 | Fuji Heavy Industries, Ltd. | 387,072 | ||||||
| 45,210 | Gentex Corporation | 890,185 | ||||||
| 45,208 | G-III Apparel Group, Ltd.d | 1,336,348 | ||||||
| 100,790 | GNC Holdings, Inc. | 1,112,722 | ||||||
| 2,300 | Hakuhodo Dy Holdings, Inc. | 28,320 | ||||||
| 84,228 | Harley-Davidson, Inc. | 4,913,862 | ||||||
| 41,420 | Haverty Furniture Companies, Inc. | 981,654 | ||||||
| 119,550 | Home Depot, Inc. | 16,029,264 | ||||||
| 23,600 | Honda Motor Company, Ltd. | 689,009 | ||||||
| 66,270 | Houghton Mifflin Harcourt Companyd | 719,029 | ||||||
| 4,630 | HSN, Inc. | 158,809 | ||||||
| 7,260 | Hyatt Hotels Corporationd | 401,188 | ||||||
| 8,940 | ILG, Inc. | 162,440 | ||||||
| 12,900 | Inchcape plc | 111,482 | ||||||
| 4,890 | International Speedway Corporation | 179,952 | ||||||
| 1,612 | Intertek Group plc | 69,088 | ||||||
| 1,670 | Jack in the Box, Inc. | 186,439 | ||||||
| 3,160 | John Wiley and Sons, Inc. | 172,220 | ||||||
| 65,367 | Kate Spade & Companyd | 1,220,402 | ||||||
| 18,969 | L Brands, Inc. | 1,248,919 | ||||||
| 29,925 | La-Z-Boy, Inc. | 929,171 | ||||||
| 106,390 | Liberty Interactive Corporationd | 2,125,672 | ||||||
| 775 | Linamar Corporation | 33,300 | ||||||
| 22,214 | Lithia Motors, Inc. | 2,150,982 | ||||||
| 7,630 | Live Nation Entertainment, Inc.d | 202,958 | ||||||
| 63,360 | LKQ Corporationd | 1,941,984 | ||||||
| 70,180 | Lowe’s Companies, Inc. | 4,991,202 | ||||||
| 882 | LVMH Moet Hennessy Louis Vuitton SE | 168,173 | ||||||
| 8,710 | M/I Homes, Inc.d | 219,318 | ||||||
| 3,810 | Meredith Corporation | 225,362 | ||||||
| 1,770 | Mohawk Industries, Inc.d | 353,434 | ||||||
| 4,030 | Monro Muffler Brake, Inc. | 230,516 | ||||||
| 2,670 | Murphy USA, Inc.d | 164,125 | ||||||
| 53,050 | Nautilus, Inc.d | 981,425 | ||||||
| 23,587 | New Media Investment Group, Inc. | 377,156 | ||||||
| 110,810 | Newell Brands, Inc. | 4,947,667 | ||||||
| 52,320 | News Corporation, Class A | 599,587 | ||||||
| 17,090 | News Corporation, Class B | 201,662 | ||||||
| 800 | Nifco, Inc. | 42,151 | ||||||
| 781 | Nokian Renkaat Oyj | 29,036 | ||||||
| 45,974 | Nord Anglia Education, Inc.d,e | 1,071,194 | ||||||
| 29,280 | Norwegian Cruise Line Holdings, Ltd.d | 1,245,278 | ||||||
| 216,261 | Nutrisystem, Inc. | 7,493,444 | ||||||
| 7,527 | O’Reilly Automotive, Inc.d | 2,095,592 | ||||||
| 62,245 | Oxford Industries, Inc. | 3,742,792 | ||||||
| 4,300 | Panasonic Corporation | 43,611 | ||||||
| 35,810 | Papa John’s International, Inc. | 3,064,620 | ||||||
| 60,361 | Papa Murphy’s Holdings, Inc.d,e | 254,723 | ||||||
| 10,294 | Persimmon plc | 224,592 | ||||||
| 112,940 | Pinnacle Entertainment, Inc.d | 1,637,630 | ||||||
| 1,449 | Publicis Groupe SA | 99,843 | ||||||
| 38,624 | PVH Corporation | 3,485,430 | ||||||
| 12,152 | Ralph Lauren Corporation | 1,097,569 | ||||||
| 1,220 | Restaurant Brands International, Inc. | 58,145 | ||||||
| 14,810 | Restoration Hardware Holdings, Inc.d,e | 454,667 | ||||||
| 17,860 | Retailmenot, Inc.d | 166,098 | ||||||
| 90,184 | Ross Stores, Inc. | 5,916,070 | ||||||
| 500 | RTL Group SA | 36,632 | ||||||
| 41,150 | Ruth’s Hospitality Group, Inc. | 753,045 | ||||||
| 21,420 | Sally Beauty Holdings, Inc.d | 565,916 | ||||||
| 54,795 | Scripps Networks Interactive, Inc. | 3,910,719 | ||||||
| 1,700 | Sekisui Chemical Company, Ltd. | 27,062 | ||||||
| 8,830 | Select Comfort Corporationd | 199,735 | ||||||
| 15,990 | Signet Jewelers, Ltd.e | 1,507,217 | ||||||
| 28,157 | Sportsman’s Warehouse Holdings, Inc.d | 264,394 | ||||||
| 3,820 | Standard Motor Products, Inc. | 203,300 | ||||||
| 137,420 | Starbucks Corporation | 7,629,558 | ||||||
| 52,184 | Stein Mart, Inc. | 285,968 | ||||||
| 11,440 | Steven Madden, Ltd.d | 408,980 | ||||||
| 9,000 | Sumitomo Forestry Company, Ltd. | 118,866 | ||||||
| 6,700 | Sumitomo Rubber Industries, Ltd. | 106,010 | ||||||
| 400 | Swatch Group AG | 24,411 | ||||||
| 3,240 | Target Corporation | 234,025 | ||||||
| 84,520 | Tegna, Inc. | 1,807,883 | ||||||
| 19,100 | Tempur Sealy International, Inc.d,e | 1,304,148 | ||||||
| 16,499 | Tenneco, Inc.d | 1,030,693 | ||||||
| 60,750 | Time, Inc. | 1,084,387 | ||||||
| 56,470 | TJX Companies, Inc. | 4,242,591 | ||||||
| 102,347 | Toll Brothers, Inc.d | 3,172,757 | ||||||
| 75,808 | Tower International, Inc. | 2,149,157 | ||||||
| 139,228 | Tuesday Morning Corporationd | 751,831 | ||||||
| 29,250 | Tupperware Brands Corporation | 1,539,135 | ||||||
| 5,142 | Ulta Salon Cosmetics & Fragrance, Inc.d | 1,310,901 | ||||||
| 15,962 | Under Armour, Inc., Class Ad,e | 463,696 | ||||||
| 16,064 | Under Armour, Inc., Class Cd | 404,331 | ||||||
| 14,910 | Vail Resorts, Inc. | 2,405,132 | ||||||
| 161 | Valora Holding AG | 45,732 | ||||||
| 38,650 | Vera Bradley, Inc.d | 452,978 | ||||||
| 23,386 | VF Corporation | 1,247,643 | ||||||
| 7,380 | Visteon Corporation | 592,909 | ||||||
| 8,030 | Vitamin Shoppe, Inc.d | 190,713 | ||||||
| 124,060 | Walt Disney Company | 12,929,533 | ||||||
| 8,175 | Whirlpool Corporation | 1,485,970 | ||||||
| 1,300 | Whitbread plc | 60,474 | ||||||
| 71,900 | Wingstop, Inc.e | 2,127,521 | ||||||
| 7,393 | Wolters Kluwer NV | 267,399 | ||||||
| 16,360 | Wolverine World Wide, Inc. | 359,102 | ||||||
| 6,200 | WPP plc | 137,972 | ||||||
| 6,770 | Wyndham Worldwide Corporation | 517,025 | ||||||
| 3,300 | Yokohama Rubber Company, Ltd. | 58,988 | ||||||
| 26,060 | Yum! Brands, Inc. | 1,650,380 | ||||||
| 46,700 | Zoe’s Kitchen, Inc.d,e | 1,120,333 | ||||||
|
| |||||||
Total | 286,986,687 | |||||||
|
| |||||||
Consumer Staples (1.2%) | ||||||||
| 57,988 | AdvancePierre Foods Holdings, Inc. | 1,726,883 | ||||||
| 5,000 | Axfood AB | 78,515 | ||||||
| 15,270 | Brown-Forman Corporation | 685,928 | ||||||
| 4,104 | Casey’s General Stores, Inc. | 487,884 | ||||||
The accompanying Notes to Financial Statements are an integral part of this schedule.
13
Table of Contents
MODERATELY AGGRESSIVE ALLOCATION PORTFOLIO
Schedule of Investments as of December 31, 2016
| Shares | Common Stock (39.3%) | Value | ||||||
Consumer Staples (1.2%) - continued | ||||||||
| 20,972 | Coca-Cola Amatil, Ltd. | $ | 152,948 | |||||
| 128,160 | Coca-Cola Company | 5,313,514 | ||||||
| 8,900 | Coca-Cola HBC AG | 193,801 | ||||||
| 144,410 | CVS Health Corporation | 11,395,393 | ||||||
| 9,600 | Dr Pepper Snapple Group, Inc. | 870,432 | ||||||
| 7,304 | e.l.f. Beauty, Inc.d,e | 211,378 | ||||||
| 1,800 | Ebro Foods SA | 37,671 | ||||||
| 29,870 | Estee Lauder Companies, Inc. | 2,284,756 | ||||||
| 28,350 | Flowers Foods, Inc. | 566,150 | ||||||
| 60,636 | Hain Celestial Group, Inc.d | 2,366,623 | ||||||
| 963 | Henkel AG & Company KGaA | 100,223 | ||||||
| 13,175 | Imperial Brands plc | 574,177 | ||||||
| 14,100 | Ingredion, Inc. | 1,761,936 | ||||||
| 4,068 | J & J Snack Foods Corporation | 542,793 | ||||||
| 1,800 | Jeronimo Martins SGPS SA | 27,917 | ||||||
| 700 | Kesko Oyj | 34,934 | ||||||
| 4,500 | Kewpie Corporation | 109,142 | ||||||
| 13,630 | Kimberly-Clark Corporation | 1,555,456 | ||||||
| 2,300 | Kirin Holdings Company, Ltd. | 37,332 | ||||||
| 30,973 | Koninklijke Ahold Delhaize NV | 652,386 | ||||||
| 1,560 | Lancaster Colony Corporation | 220,568 | ||||||
| 5 | Lindt & Spruengli AG | 25,872 | ||||||
| 5,400 | Mondelez International, Inc. | 239,382 | ||||||
| 71,384 | Monster Beverage Corporationd | 3,165,167 | ||||||
| 2,584 | Nestle SA | 185,112 | ||||||
| 16,140 | PepsiCo, Inc. | 1,688,728 | ||||||
| 116,210 | Pinnacle Foods, Inc. | 6,211,425 | ||||||
| 22,930 | Procter & Gamble Company | 1,927,954 | ||||||
| 57,859 | SpartanNash Company | 2,287,745 | ||||||
| 2,200 | Suedzucker AG | 52,441 | ||||||
| 12,020 | Sysco Corporation | 665,547 | ||||||
| 8,491 | Tate & Lyle plc | 73,895 | ||||||
| 27,364 | United Natural Foods, Inc.d | 1,305,810 | ||||||
| 145,930 | Walgreens Boots Alliance, Inc. | 12,077,167 | ||||||
| 22,824 | Wal-Mart Stores, Inc. | 1,577,595 | ||||||
| 43,330 | WhiteWave Foods Companyd | 2,409,148 | ||||||
| 9,300 | Whole Foods Market, Inc. | 286,068 | ||||||
| 16,210 | William Morrison Supermarkets plc | 46,041 | ||||||
|
| |||||||
Total | 66,213,837 | |||||||
|
| |||||||
Energy (3.8%) | ||||||||
| 8,810 | Anadarko Petroleum Corporation | 614,321 | ||||||
| 7,956 | Arch Coal, Inc.d,e | 620,966 | ||||||
| 164,385 | Archrock, Inc. | 2,169,882 | ||||||
| 52,654 | Atwood Oceanics, Inc.e | 691,347 | ||||||
| 41,656 | Baker Hughes, Inc. | 2,706,390 | ||||||
| 199,889 | BP plc | 1,251,998 | ||||||
| 38,918 | Bristow Group, Inc. | 797,041 | ||||||
| 62,218 | Callon Petroleum Companyd | 956,291 | ||||||
| 152,870 | Canadian Natural Resources, Ltd. | 4,873,496 | ||||||
| 157,810 | Chevron Corporation | 18,574,237 | ||||||
| 24,225 | Cimarex Energy Company | 3,292,178 | ||||||
| 132,790 | Clean Energy Fuels Corporationd | 379,779 | ||||||
| 54,274 | Concho Resources, Inc.d | 7,196,732 | ||||||
| 98,860 | ConocoPhillips | 4,956,840 | ||||||
| 19,800 | Continental Resources, Inc.d | 1,020,492 | ||||||
| 2,631 | Contura Energy, Inc.d | 186,801 | ||||||
| 4,326 | Crescent Point Energy Corporation | 58,801 | ||||||
| 59,940 | Delek US Holdings, Inc. | 1,442,756 | ||||||
| 64,840 | Devon Energy Corporation | 2,961,243 | ||||||
| 24,990 | Diamond Offshore Drilling, Inc.d,e | 442,323 | ||||||
| 205,932 | Ensco plc | 2,001,659 | ||||||
| 79,210 | EOG Resources, Inc. | 8,008,131 | ||||||
| 42,830 | EP Energy Corporationd,e | 280,537 | ||||||
| 165,751 | EQT Corporation | 10,840,115 | ||||||
| 91,150 | Exxon Mobil Corporation | 8,227,199 | ||||||
| 36,120 | Frank’s International NV | 444,637 | ||||||
| 5,800 | Galp Energia SGPS SA | 86,468 | ||||||
| 32,710 | Green Plains, Inc. | 910,974 | ||||||
| 6,590 | Gulfport Energy Corporationd | 142,608 | ||||||
| 221,580 | Halliburton Company | 11,985,262 | ||||||
| 41,440 | Helix Energy Solutions Group, Inc.d | 365,501 | ||||||
| 33,344 | HollyFrontier Corporation | 1,092,349 | ||||||
| 64,650 | Hornbeck Offshore Services, Inc.d,e | 466,773 | ||||||
| 5,907 | John Wood Group plc | 63,787 | ||||||
| 11,550 | Kinder Morgan, Inc. | 239,201 | ||||||
| 300,278 | Marathon Oil Corporation | 5,197,812 | ||||||
| 9,360 | Murphy Oil Corporation | 291,377 | ||||||
| 358,290 | Nabors Industries, Ltd. | 5,875,956 | ||||||
| 7,880 | Noble Energy, Inc. | 299,913 | ||||||
| 66,645 | Oasis Petroleum, Inc.d | 1,009,005 | ||||||
| 9,820 | Oceaneering International, Inc. | 277,022 | ||||||
| 61,025 | Oil States International, Inc.d | 2,379,975 | ||||||
| 7,905 | OMV AG | 278,681 | ||||||
| 117,973 | Parsley Energy, Inc.d | 4,157,369 | ||||||
| 105,460 | Patterson-UTI Energy, Inc. | 2,838,983 | ||||||
| 22,130 | PBF Energy, Inc. | 616,984 | ||||||
| 8,402 | Petrofac, Ltd. | 89,915 | ||||||
| 6,360 | Phillips 66 | 549,568 | ||||||
| 113,280 | Pioneer Energy Services Corporationd | 775,968 | ||||||
| 64,740 | Pioneer Natural Resources Company | 11,657,732 | ||||||
| 59,780 | Range Resources Corporation | 2,054,041 | ||||||
| 248,260 | Rowan Companies plcd | 4,689,631 | ||||||
| 6,786 | Royal Dutch Shell plc | 185,093 | ||||||
| 89,838 | Royal Dutch Shell plc ADR | 4,885,390 | ||||||
| 1,704 | Royal Dutch Shell plc, Class A | 47,037 | ||||||
| 15,821 | Royal Dutch Shell plc, Class B | 454,570 | ||||||
| 71,085 | RPC, Inc.e | 1,408,194 | ||||||
| 110,810 | Schlumberger, Ltd. | 9,302,499 | ||||||
| 14,380 | SemGroup Corporation | 600,365 | ||||||
| 8,040 | SM Energy Company | 277,219 | ||||||
| 6,522 | Statoil ASA | 119,037 | ||||||
| 246,870 | Suncor Energy, Inc. ADR | 8,070,180 | ||||||
| 8,220 | Superior Energy Services, Inc. | 138,754 | ||||||
| 630 | Tecnicas Reunidas SA | 25,765 | ||||||
| 38,770 | Teekay Corporation | 311,323 | ||||||
| 90,801 | Teekay Tankers, Ltd. | 205,210 | ||||||
| 52,394 | Tesco Corporationd | 432,251 | ||||||
| 22,240 | Tesoro Corporation | 1,944,888 | ||||||
| 154,690 | TETRA Technologies, Inc.d | 776,544 | ||||||
| 6,713 | Total SA | 344,325 | ||||||
| 6,713 | Total SA Rightsd,f | 115 | ||||||
| 107,588 | U.S. Silica Holdings, Inc. | 6,098,088 | ||||||
| 154,920 | Valero Energy Corporation | 10,584,134 | ||||||
| 1,690 | Vantage Drilling Internationald | 170,690 | ||||||
| 787,330 | Weatherford International plcd | 3,928,777 | ||||||
| 746,350 | WPX Energy, Inc.d | 10,874,320 | ||||||
|
| |||||||
Total | 204,573,815 | |||||||
|
| |||||||
Financials (5.8%) | ||||||||
| 42,080 | Aberdeen Asset Management plc | 133,049 | ||||||
| 37,308 | Affiliated Managers Group, Inc.d | 5,420,852 | ||||||
| 31,730 | Allied World Assurance Company Holdings AG | 1,704,218 | ||||||
| 10,360 | American Financial Group, Inc. | 912,923 | ||||||
| 31,310 | American International Group, Inc. | 2,044,856 | ||||||
| 77,677 | Ameris Bancorp | 3,386,717 | ||||||
| 10,600 | AMERISAFE, Inc. | 660,910 | ||||||
| 28,969 | Argo Group International Holdings, Ltd. | 1,909,057 | ||||||
| 63,910 | Aspen Insurance Holdings, Ltd. | 3,515,050 | ||||||
| 15,440 | Associated Banc-Corp | 381,368 | ||||||
| 142,600 | Assured Guaranty, Ltd. | 5,386,002 | ||||||
| 8,780 | ASX, Ltd. | 314,545 | ||||||
The accompanying Notes to Financial Statements are an integral part of this schedule.
14
Table of Contents
MODERATELY AGGRESSIVE ALLOCATION PORTFOLIO
Schedule of Investments as of December 31, 2016
| Shares | Common Stock (39.3%) | Value | ||||||
Financials (5.8%) - continued | ||||||||
| 14,585 | Australia & New Zealand Banking Group, Ltd. | $ | 319,283 | |||||
| 93,690 | BancorpSouth, Inc. | 2,909,075 | ||||||
| 859,750 | Bank of America Corporation | 19,000,475 | ||||||
| 17,353 | Bank of East Asia, Ltd. | 66,247 | ||||||
| 773 | Bank of Montreal | 55,598 | ||||||
| 34,170 | Bank of New York Mellon Corporation | 1,618,975 | ||||||
| 11,164 | Bank of Nova Scotia | 621,622 | ||||||
| 46,202 | Bank of the Ozarks, Inc. | 2,429,763 | ||||||
| 19,520 | BankFinancial Corporation | 289,286 | ||||||
| 4,120 | Banner Corporation | 229,937 | ||||||
| 67,160 | BB&T Corporation | 3,157,863 | ||||||
| 56,580 | Beneficial Bancorp, Inc. | 1,041,072 | ||||||
| 1,570 | BlackRock, Inc. | 597,448 | ||||||
| 97,090 | Blackstone Group, LP | 2,624,343 | ||||||
| 139,480 | Boston Private Financial Holdings, Inc. | 2,308,394 | ||||||
| 79,800 | Brookline Bancorp, Inc. | 1,308,720 | ||||||
| 1,577 | Canadian Imperial Bank of Commerce | 128,683 | ||||||
| 24,550 | Capital One Financial Corporation | 2,141,742 | ||||||
| 23,640 | Cathay General Bancorp | 899,029 | ||||||
| 46,000 | Central Pacific Financial Corporation | 1,445,320 | ||||||
| 17,200 | Charles Schwab Corporation | 678,884 | ||||||
| 41,614 | Chemical Financial Corporation | 2,254,230 | ||||||
| 7,000 | Chiba Bank, Ltd. | 42,911 | ||||||
| 17,530 | Chubb, Ltd. | 2,316,064 | ||||||
| 3,526 | CI Financial Corporation | 75,817 | ||||||
| 225,500 | Citigroup, Inc. | 13,401,465 | ||||||
| 14,620 | Citizens Financial Group, Inc. | 520,911 | ||||||
| 23,500 | Clifton Bancorp, Inc. | 397,620 | ||||||
| 13,422 | CNP Assurances | 248,433 | ||||||
| 183,582 | CoBiz Financial, Inc. | 3,100,700 | ||||||
| 40,332 | Columbia Banking System, Inc. | 1,802,034 | ||||||
| 85,420 | Comerica, Inc. | 5,817,956 | ||||||
| 5,576 | Danske Bank AS | 168,695 | ||||||
| 37,189 | Direct Line Insurance Group plc | 169,254 | ||||||
| 231,730 | E*TRADE Financial Corporationd | 8,029,444 | ||||||
| 97,463 | East West Bancorp, Inc. | 4,954,044 | ||||||
| 89,290 | Eaton Vance Corporation | 3,739,465 | ||||||
| 45,874 | Employers Holdings, Inc. | 1,816,610 | ||||||
| 25,990 | Enova International, Inc.d | 326,175 | ||||||
| 4,200 | Erste Group Bank AG | 122,797 | ||||||
| 46,302 | Essent Group, Ltd.d | 1,498,796 | ||||||
| 14,517 | Evercore Partners, Inc. | 997,318 | ||||||
| 24,990 | F.N.B. Corporation | 400,590 | ||||||
| 6,320 | Federated Investors, Inc. | 178,730 | ||||||
| 186,814 | Fifth Third Bancorp | 5,038,374 | ||||||
| 14,440 | First American Financial Corporation | 528,937 | ||||||
| 120,270 | First Commonwealth Financial Corporation | 1,705,429 | ||||||
| 28,580 | First Financial Bancorp | 813,101 | ||||||
| 12,440 | First Financial Corporation | 656,832 | ||||||
| 9,950 | First Merchants Corporation | 374,617 | ||||||
| 150,970 | First Midwest Bancorp, Inc. | 3,808,973 | ||||||
| 89,431 | First Republic Bank | 8,240,172 | ||||||
| 46,001 | FlexiGroup, Ltd. | 74,864 | ||||||
| 11,420 | Franklin Resources, Inc. | 452,004 | ||||||
| 53,000 | Fukuoka Financial Group, Inc. | 235,054 | ||||||
| 4,871 | Genworth MI Canada, Inc.e | 122,115 | ||||||
| 34,769 | Glacier Bancorp, Inc. | 1,259,681 | ||||||
| 68,550 | Goldman Sachs Group, Inc. | 16,414,297 | ||||||
| 82,520 | Great Western Bancorp, Inc. | 3,597,047 | ||||||
| 78,197 | Green Bancorp, Inc.d | 1,188,594 | ||||||
| 9,460 | Greenhill & Company, Inc. | 262,042 | ||||||
| 5,000 | Hang Seng Bank, Ltd. | 92,723 | ||||||
| 165,393 | Hanmi Financial Corporation | 5,772,216 | ||||||
| 2,814 | Hannover Rueckversicherung SE | 303,990 | ||||||
| 53,556 | Hanover Insurance Group, Inc. | 4,874,132 | ||||||
| 16,210 | Hartford Financial Services Group, Inc. | 772,406 | ||||||
| 43,400 | Henderson Group plc | 125,261 | ||||||
| 7,630 | Hilltop Holdings, Inc. | 227,374 | ||||||
| 79,828 | Home BancShares, Inc. | 2,216,824 | ||||||
| 7,490 | HomeStreet, Inc.d | 236,684 | ||||||
| 10,770 | Hometrust Bancshares, Inc.d | 278,943 | ||||||
| 139,131 | Hope Bancorp, Inc. | 3,045,578 | ||||||
| 45,759 | Horace Mann Educators Corporation | 1,958,485 | ||||||
| 56,754 | Houlihan Lokey, Inc. | 1,766,184 | ||||||
| 52,534 | HSBC Holdings plc | 423,879 | ||||||
| 237,050 | Huntington Bancshares, Inc. | 3,133,801 | ||||||
| 14,815 | Infinity Property & Casualty Corporation | 1,302,238 | ||||||
| 1,761 | Intact Financial Corporation | 126,043 | ||||||
| 118,475 | Intercontinental Exchange, Inc. | 6,684,359 | ||||||
| 85,290 | Invesco, Ltd. | 2,587,699 | ||||||
| 179,120 | Janus Capital Group, Inc. | 2,376,922 | ||||||
| 293,220 | KeyCorp | 5,357,129 | ||||||
| 49,266 | Kinsale Capital Group, Inc. | 1,675,537 | ||||||
| 9,840 | Lazard, Ltd. | 404,326 | ||||||
| 7,190 | Legg Mason, Inc. | 215,053 | ||||||
| 3,259 | Lincoln National Corporation | 215,974 | ||||||
| 8,050 | M&T Bank Corporation | 1,259,261 | ||||||
| 3,988 | Macquarie Group, Ltd. | 249,817 | ||||||
| 83,678 | Mapfre SA | 254,892 | ||||||
| 450 | Markel Corporationd | 407,025 | ||||||
| 22,220 | Meta Financial Group, Inc. | 2,286,438 | ||||||
| 94,640 | MetLife, Inc. | 5,100,150 | ||||||
| 107,400 | Mizuho Financial Group, Inc. | 192,733 | ||||||
| 100,440 | Morgan Stanley | 4,243,590 | ||||||
| 2,100 | MS and AD Insurance Group Holdings, Inc. | 65,032 | ||||||
| 77,140 | National Bank Holdings Corporation | 2,459,995 | ||||||
| 12,359 | National Bank of Canada | 501,945 | ||||||
| 3,110 | Navigators Group, Inc. | 366,202 | ||||||
| 25,790 | NMI Holdings, Inc.d | 274,663 | ||||||
| 12,171 | Nordea Bank AB | 134,862 | ||||||
| 36,395 | PacWest Bancorp | 1,981,344 | ||||||
| 3,886 | Power Corporation of Canada | 86,973 | ||||||
| 26,050 | Primerica, Inc. | 1,801,358 | ||||||
| 3,140 | Principal Financial Group, Inc. | 181,680 | ||||||
| 51,700 | Provident Financial Services, Inc. | 1,463,110 | ||||||
| 98,073 | Raymond James Financial, Inc. | 6,793,517 | ||||||
| 41,145 | Renasant Corporation | 1,737,142 | ||||||
| 18,900 | Resona Holdings, Inc. | 96,863 | ||||||
| 3,567 | Safety Insurance Group, Inc. | 262,888 | ||||||
| 43,043 | Sandy Spring Bancorp, Inc. | 1,721,290 | ||||||
| 1,026 | Schroders plc | 37,683 | ||||||
| 4,200 | SEI Investments Company | 207,312 | ||||||
| 8,830 | Selective Insurance Group, Inc. | 380,131 | ||||||
| 9,000 | Seven Bank, Ltd. | 25,734 | ||||||
| 580,890 | SLM Corporationd | 6,401,408 | ||||||
| 14,020 | State Auto Financial Corporation | 375,876 | ||||||
| 29,440 | Stewart Information Services Corporation | 1,356,595 | ||||||
| 108,729 | Stifel Financial Corporationd | 5,431,014 | ||||||
| 49,589 | SVB Financial Groupd | 8,512,448 | ||||||
| 4,944 | Swiss Re AG | 467,766 | ||||||
| 126,370 | Synchrony Financial | 4,583,440 | ||||||
| 84,780 | Synovus Financial Corporation | 3,482,762 | ||||||
| 9,000 | T&D Holdings, Inc. | 118,777 | ||||||
| 158,600 | TCF Financial Corporation | 3,106,974 | ||||||
The accompanying Notes to Financial Statements are an integral part of this schedule.
15
Table of Contents
MODERATELY AGGRESSIVE ALLOCATION PORTFOLIO
Schedule of Investments as of December 31, 2016
| Shares | Common Stock (39.3%) | Value | ||||||
Financials (5.8%) - continued | ||||||||
| 106,874 | TD Ameritrade Holding Corporation | $ | 4,659,706 | |||||
| 10,710 | Territorial Bancorp, Inc. | 351,716 | ||||||
| 571 | TMX Group, Ltd. | 30,416 | ||||||
| 25,395 | TriCo Bancshares | 868,001 | ||||||
| 136,010 | TrustCo Bank Corporation | 1,190,087 | ||||||
| 9,780 | Trustmark Corporation | 348,657 | ||||||
| 89,070 | Umpqua Holdings Corporation | 1,672,735 | ||||||
| 7,130 | Union Bankshares Corporation | 254,826 | ||||||
| 56,490 | United Community Banks, Inc. | 1,673,234 | ||||||
| 73,700 | United Financial Bancorp, Inc. | 1,338,392 | ||||||
| 3,780 | United Fire Group, Inc. | 185,863 | ||||||
| 13,079 | United Overseas Bank, Ltd. | 183,746 | ||||||
| 9,570 | Unum Group | 420,410 | ||||||
| 11,960 | Virtu Financial, Inc. | 190,762 | ||||||
| 11,300 | Voya Financial, Inc. | 443,186 | ||||||
| 21,356 | Western Alliance Bancorpd | 1,040,251 | ||||||
| 16,109 | Westpac Banking Corporation | 378,142 | ||||||
| 9,880 | Wintrust Financial Corporation | 716,992 | ||||||
| 28,570 | WisdomTree Investments, Inc.e | 318,270 | ||||||
| 14,323 | WSFS Financial Corporation | 663,871 | ||||||
| 251,743 | Zions Bancorporation | 10,835,019 | ||||||
| 335 | Zurich Insurance Group AGd | 92,065 | ||||||
|
| |||||||
Total | 309,234,295 | |||||||
|
| |||||||
Health Care (4.9%) | ||||||||
| 26,970 | Abbott Laboratories | 1,035,918 | ||||||
| 24,094 | ABIOMED, Inc.d | 2,714,912 | ||||||
| 60,788 | Acadia Healthcare Company, Inc.d,e | 2,012,083 | ||||||
| 5,360 | Acceleron Pharma, Inc.d | 136,787 | ||||||
| 7,890 | Aceto Corporation | 173,343 | ||||||
| 30,250 | Advaxis, Inc.d,e | 216,590 | ||||||
| 29,110 | Aerie Pharmaceuticals, Inc.d | 1,101,814 | ||||||
| 19,750 | Aetna, Inc. | 2,449,197 | ||||||
| 100,608 | Akorn, Inc.d | 2,196,273 | ||||||
| 124,740 | Alexion Pharmaceuticals, Inc.d | 15,261,939 | ||||||
| 23,892 | Align Technology, Inc.d | 2,296,738 | ||||||
| 76,626 | Allergan plcd | 16,092,226 | ||||||
| 11,104 | Amgen, Inc. | 1,623,516 | ||||||
| 27,290 | Analogic Corporation | 2,263,705 | ||||||
| 11,930 | AngioDynamics, Inc.d | 201,259 | ||||||
| 99,313 | Asterias Biotherapeutics, Inc.d,e | 456,840 | ||||||
| 2,924 | AstraZeneca plc | 159,674 | ||||||
| 2,584 | Atrion Corporation | 1,310,605 | ||||||
| 7,820 | Biogen, Inc.d | 2,217,596 | ||||||
| 31,494 | BioMarin Pharmaceutical, Inc.d | 2,608,963 | ||||||
| 7,460 | Bristol-Myers Squibb Company | 435,962 | ||||||
| 10,487 | C.R. Bard, Inc. | 2,356,009 | ||||||
| 4,601 | CAE, Inc. | 64,355 | ||||||
| 12,620 | Cardinal Health, Inc. | 908,261 | ||||||
| 77,432 | Cardiovascular Systems, Inc.d | 1,874,629 | ||||||
| 165,590 | Catalent, Inc.d | 4,464,306 | ||||||
| 163,870 | Celgene Corporationd | 18,967,953 | ||||||
| 5,880 | Centene Corporationd | 332,279 | ||||||
| 24,420 | Charles River Laboratories International, Inc.d | 1,860,560 | ||||||
| 17,230 | Chemed Corporation | 2,763,864 | ||||||
| 15,250 | Coherus Biosciences, Inc.d | 429,288 | ||||||
| 12,380 | CONMED Corporation | 546,825 | ||||||
| 32,430 | Cooper Companies, Inc. | 5,672,980 | ||||||
| 13,870 | Cross Country Healthcare, Inc.d | 216,511 | ||||||
| 63,480 | Dentsply Sirona, Inc. | 3,664,700 | ||||||
| 26,930 | Dexcom, Inc.d | 1,607,721 | ||||||
| 52,320 | Diplomat Pharmacy, Inc.d | 659,232 | ||||||
| 60,095 | Edwards Lifesciences Corporationd | 5,630,901 | ||||||
| 6,540 | Emergent Biosolutions, Inc.d | 214,774 | ||||||
| 32,370 | Ensign Group, Inc. | 718,938 | ||||||
| 25,920 | Envision Healthcare Corporationd | 1,640,477 | ||||||
| 3,122 | Essilor International SA | 352,251 | ||||||
| 44,260 | Express Scripts Holding Companyd | 3,044,645 | ||||||
| 79,430 | GenMark Diagnostics, Inc.d | 972,223 | ||||||
| 272,315 | Gilead Sciences, Inc. | 19,500,477 | ||||||
| 6,867 | GlaxoSmithKline plc | 131,906 | ||||||
| 12,370 | Global Blood Therapeutics, Inc.d | 178,747 | ||||||
| 8,890 | HCA Holdings, Inc.d | 658,038 | ||||||
| 25,137 | HealthEquity, Inc.d | 1,018,551 | ||||||
| 21,170 | Healthways, Inc.d | 481,618 | ||||||
| 16,250 | Heska Corporationd | 1,163,500 | ||||||
| 3,253 | Hikma Pharmaceuticals plc | 75,820 | ||||||
| 37,040 | Hill-Rom Holdings, Inc. | 2,079,426 | ||||||
| 109,000 | Hologic, Inc.d | 4,373,080 | ||||||
| 7,770 | ICU Medical, Inc.d | 1,144,909 | ||||||
| 40,869 | Inogen, Inc.d | 2,745,171 | ||||||
| 80,257 | Intersect ENT, Inc.d | 971,110 | ||||||
| 13,170 | Intra-Cellular Therapies, Inc.d | 198,735 | ||||||
| 45,526 | Ironwood Pharmaceuticals, Inc.d | 696,093 | ||||||
| 71,090 | Johnson & Johnson | 8,190,279 | ||||||
| 48,700 | Kindred Healthcare, Inc. | 382,295 | ||||||
| 700 | Lonza Group AG | 120,980 | ||||||
| 22,360 | Magellan Health Services, Inc.d | 1,682,590 | ||||||
| 183,458 | Medtronic plc | 13,067,713 | ||||||
| 154,100 | Merck & Company, Inc. | 9,071,867 | ||||||
| 2,221 | Merck KGaA | 231,253 | ||||||
| 7,738 | Mettler-Toledo International, Inc.d | 3,238,817 | ||||||
| 63,280 | Mylan NVd | 2,414,132 | ||||||
| 19,634 | National Healthcare Corporation | 1,488,061 | ||||||
| 39,904 | Neurocrine Biosciences, Inc.d | 1,544,285 | ||||||
| 51,324 | Nevro Corporationd | 3,729,202 | ||||||
| 13,765 | Novartis AG | 1,001,039 | ||||||
| 6,696 | Novo Nordisk AS | 240,200 | ||||||
| 99,700 | NuVasive, Inc.d | 6,715,792 | ||||||
| 63,100 | Omnicell, Inc.d | 2,139,090 | ||||||
| 97,710 | OraSure Technologies, Inc.d | 857,894 | ||||||
| 11,370 | Orthofix International NVd | 411,367 | ||||||
| 35,990 | PerkinElmer, Inc. | 1,876,878 | ||||||
| 27,410 | Perrigo Company plc | 2,281,334 | ||||||
| 257,950 | Pfizer, Inc. | 8,378,216 | ||||||
| 17,430 | PharMerica Corporationd | 438,364 | ||||||
| 8,600 | Prothena Corporation plcd | 423,034 | ||||||
| 51,730 | Roche Holding AG ADR | 1,475,857 | ||||||
| 756 | Roche Holding AG-Genusschein | 172,332 | ||||||
| 38,490 | Surgical Care Affiliates, Inc.d | 1,780,932 | ||||||
| 39,645 | Teleflex, Inc. | 6,388,792 | ||||||
| 34,753 | Triple-S Management Corporationd | 719,387 | ||||||
| 36,326 | UnitedHealth Group, Inc. | 5,813,613 | ||||||
| 45,277 | Universal Health Services, Inc. | 4,816,567 | ||||||
| 9,780 | VCA Antech, Inc.d | 671,397 | ||||||
| 65,190 | Veeva Systems, Inc.d | 2,653,233 | ||||||
| 108,147 | Vertex Pharmaceuticals, Inc.d | 7,967,189 | ||||||
| 11,910 | Waters Corporationd | 1,600,585 | ||||||
| 12,960 | West Pharmaceutical Services, Inc. | 1,099,397 | ||||||
| 77,250 | Wright Medical Group NVd | 1,775,205 | ||||||
| 33,020 | Ziopharm Oncology, Inc.d,e | 176,657 | ||||||
| 38,440 | Zoetis, Inc. | 2,057,693 | ||||||
|
| |||||||
Total | 260,440,321 | |||||||
|
| |||||||
Industrials (4.8%) | ||||||||
| 25 | A P Moller - Maersk AS | 39,849 | ||||||
| 7,518 | ABB, Ltd. | 158,192 | ||||||
| 22,080 | ABM Industries, Inc. | 901,747 | ||||||
| 37,620 | Acuity Brands, Inc. | 8,684,953 | ||||||
| 4,772 | Adecco SA | 311,501 | ||||||
| 49,166 | Aegion Corporationd | 1,165,234 | ||||||
| 5,410 | Aerovironment, Inc.d | 145,150 | ||||||
| 44,695 | AGCO Corporation | 2,586,053 | ||||||
The accompanying Notes to Financial Statements are an integral part of this schedule.
16
Table of Contents
MODERATELY AGGRESSIVE ALLOCATION PORTFOLIO
Schedule of Investments as of December 31, 2016
| Shares | Common Stock (39.3%) | Value | ||||||
Industrials (4.8%) - continued | ||||||||
| 25,313 | Air New Zealand, Ltd. | $ | 38,550 | |||||
| 81,710 | Ardmore Shipping Corporatione | 604,654 | ||||||
| 16,000 | Asahi Glass Company, Ltd. | 108,554 | ||||||
| 15,758 | Astec Industries, Inc. | 1,063,035 | ||||||
| 1,100 | Atlas Copco Aktiebolag | 33,370 | ||||||
| 74,240 | AZZ, Inc. | 4,743,936 | ||||||
| 52,586 | B/E Aerospace, Inc. | 3,165,151 | ||||||
| 44,760 | Barnes Group, Inc. | 2,122,519 | ||||||
| 2,129 | Berendsen plc | 22,826 | ||||||
| 17,200 | Boeing Company | 2,677,696 | ||||||
| 154,900 | BWX Technologies, Inc. | 6,149,530 | ||||||
| 40,710 | Carlisle Companies, Inc. | 4,489,906 | ||||||
| 10,120 | CEB, Inc. | 613,272 | ||||||
| 21,522 | CIRCOR International, Inc. | 1,396,347 | ||||||
| 9,836 | CLARCOR, Inc. | 811,175 | ||||||
| 10,980 | Colfax Corporationd | 394,511 | ||||||
| 46,638 | Comfort Systems USA, Inc. | 1,553,045 | ||||||
| 27,790 | Copart, Inc.d | 1,539,844 | ||||||
| 7,540 | Crane Company | 543,785 | ||||||
| 74,860 | CSX Corporation | 2,689,720 | ||||||
| 80,780 | Cummins, Inc. | 11,040,203 | ||||||
| 21,440 | Curtiss-Wright Corporation | 2,108,838 | ||||||
| 5,000 | Dai Nippon Printing Company, Ltd. | 49,333 | ||||||
| 108,420 | Delta Air Lines, Inc. | 5,333,180 | ||||||
| 2,380 | Deluxe Corporation | 170,432 | ||||||
| 3,600 | Deutsche Post AG | 118,063 | ||||||
| 38,680 | Donaldson Company, Inc. | 1,627,654 | ||||||
| 2,100 | DSV AS | 93,262 | ||||||
| 26,995 | El Al Israel Airlines, Ltd. | 17,851 | ||||||
| 14,030 | EMCOR Group, Inc. | 992,763 | ||||||
| 24,740 | Encore Wire Corporation | 1,072,479 | ||||||
| 31,160 | EnerSys | 2,433,596 | ||||||
| 3,540 | EnPro Industries, Inc. | 238,454 | ||||||
| 9,195 | Equifax, Inc. | 1,087,125 | ||||||
| 16,550 | ESCO Technologies, Inc. | 937,558 | ||||||
| 46,008 | Federal Signal Corporation | 718,185 | ||||||
| 235 | Flughafen Zuerich AG | 43,547 | ||||||
| 5,480 | Fortive Corporation | 293,892 | ||||||
| 30,780 | Fortune Brands Home and Security, Inc. | 1,645,499 | ||||||
| 25,866 | Franklin Electric Company, Inc. | 1,006,187 | ||||||
| 1,400 | Fraport AG Frankfurt Airport Services Worldwide | 82,611 | ||||||
| 3,800 | Fuji Machine Manufacturing Company, Ltd. | 43,385 | ||||||
| 18,520 | GasLog, Ltd.e | 298,172 | ||||||
| 44,800 | Gener8 Maritime, Inc.d | 200,704 | ||||||
| 41,454 | Gibraltar Industries, Inc.d | 1,726,559 | ||||||
| 48,758 | Granite Construction, Inc. | 2,681,690 | ||||||
| 110,170 | Harsco Corporation | 1,498,312 | ||||||
| 38,521 | Healthcare Services Group, Inc. | 1,508,868 | ||||||
| 32,535 | Heico Corporation | 2,510,075 | ||||||
| 15,290 | Herman Miller, Inc. | 522,918 | ||||||
| 28,040 | Hexcel Corporation | 1,442,378 | ||||||
| 1,600 | Hitachi Transport System, Ltd. | 32,415 | ||||||
| 600 | Hochtief AG | 83,768 | ||||||
| 35,694 | Honeywell International, Inc. | 4,135,150 | ||||||
| 8,844 | Hub Group, Inc.d | 386,925 | ||||||
| 18,820 | Hubbell, Inc. | 2,196,294 | ||||||
| 11,900 | Huntington Ingalls Industries, Inc. | 2,191,861 | ||||||
| 18,180 | ICF International, Inc.d | 1,003,536 | ||||||
| 2,700 | Inaba Denki Sangyo Company, Ltd. | 92,825 | ||||||
| 78,180 | Ingersoll-Rand plc | 5,866,627 | ||||||
| 8,340 | Insperity, Inc. | 591,723 | ||||||
| 5,590 | Insteel Industries, Inc. | 199,228 | ||||||
| 9,580 | Interface, Inc. | 177,709 | ||||||
| 37,700 | ITOCHU Corporation | 499,177 | ||||||
| 15,390 | ITT Corporation | 593,592 | ||||||
| 2,820 | Jacobs Engineering Group, Inc.d | 160,740 | ||||||
| 1,800 | Jardine Matheson Holdings, Ltd. | 99,450 | ||||||
| 23,963 | JB Hunt Transport Services, Inc. | 2,326,088 | ||||||
| 40,837 | Johnson Controls International plc | 1,682,076 | ||||||
| 13,010 | Kansas City Southern | 1,103,898 | ||||||
| 23,490 | KBR, Inc. | 392,048 | ||||||
| 118,960 | Kennametal, Inc. | 3,718,690 | ||||||
| 46,814 | Kforce, Inc. | 1,081,403 | ||||||
| 44,930 | Kirby Corporationd | 2,987,845 | ||||||
| 10,000 | KITZ Corporation | 54,597 | ||||||
| 4,400 | Komatsu, Ltd. | 99,661 | ||||||
| 8,795 | KONE Oyj | 392,993 | ||||||
| 2,101 | Koninklijke Boskalis Westminster NV | 72,888 | ||||||
| 55,670 | Korn/Ferry International | 1,638,368 | ||||||
| 45,870 | Lincoln Electric Holdings, Inc. | 3,516,853 | ||||||
| 16,330 | Lindsay Corporatione | 1,218,381 | ||||||
| 7,120 | Manpower, Inc. | 632,754 | ||||||
| 5,900 | Marubeni Corporation | 33,371 | ||||||
| 15,150 | Masco Corporation | 479,043 | ||||||
| 36,930 | Masonite International Corporationd | 2,429,994 | ||||||
| 14,754 | Meggitt plc | 83,319 | ||||||
| 39,700 | Meritor, Inc.d | 493,074 | ||||||
| 22,658 | Middleby Corporationd | 2,918,577 | ||||||
| 3,900 | MIRAIT Holdings Corporation | 35,148 | ||||||
| 3,000 | Mitsubishi Corporation | 63,716 | ||||||
| 14,500 | Mitsubishi Electric Corporation | 201,683 | ||||||
| 10,000 | Mitsubishi Heavy Industries, Ltd. | 45,460 | ||||||
| 4,000 | Mitsuboshi Belting, Ltd. | 34,013 | ||||||
| 2,000 | Mitsui & Company, Ltd. | 27,405 | ||||||
| 29,150 | Moog, Inc.d | 1,914,572 | ||||||
| 55,540 | MRC Global, Inc.d | 1,125,240 | ||||||
| 52,413 | MSA Safety, Inc. | 3,633,793 | ||||||
| 4,920 | Mueller Industries, Inc. | 196,603 | ||||||
| 27,620 | MYR Group, Inc.d | 1,040,722 | ||||||
| 5,590 | National Express Group plc | 24,360 | ||||||
| 64,957 | Navigant Consulting, Inc.d | 1,700,574 | ||||||
| 23,560 | NCI Building Systems, Inc.d | 368,714 | ||||||
| 30,134 | Nielsen Holdings plc | 1,264,121 | ||||||
| 1,000 | NIPPO Corporation | 18,630 | ||||||
| 7,000 | Nitto Kogyo Corporation | 95,306 | ||||||
| 4,576 | Nordson Corporation | 512,741 | ||||||
| 22,770 | Norfolk Southern Corporation | 2,460,754 | ||||||
| 2,000 | Okuma Corporation | 19,029 | ||||||
| 20,507 | Old Dominion Freight Line, Inc.d | 1,759,296 | ||||||
| 46,566 | On Assignment, Inc.d | 2,056,355 | ||||||
| 38,960 | Orbital ATK, Inc. | 3,417,961 | ||||||
| 73,606 | Oshkosh Corporation | 4,755,684 | ||||||
| 92,902 | PGT Innovations, Inc.d | 1,063,728 | ||||||
| 2,407 | Philips Lighting NVd,g | 59,289 | ||||||
| 41,886 | Proto Labs, Inc.d | 2,150,846 | ||||||
| 14,330 | Quanex Building Products Corporation | 290,899 | ||||||
| 1,841 | Randstad Holding NV | 99,723 | ||||||
| 89,840 | Raven Industries, Inc. | 2,263,968 | ||||||
| 33,270 | Raytheon Company | 4,724,340 | ||||||
| 2,110 | RBC Bearings, Inc.d | 195,829 | ||||||
| 7,520 | Regal-Beloit Corporation | 520,760 | ||||||
| 3,439 | RELX NV | 57,844 | ||||||
| 20,840 | Resources Connection, Inc. | 401,170 | ||||||
| 8,020 | Rexnord Corporationd | 157,112 | ||||||
| 208 | Rieter Holding AG | 36,175 | ||||||
| 10,290 | Rockwell Automation, Inc. | 1,382,976 | ||||||
| 36,860 | Rockwell Collins, Inc. | 3,419,134 | ||||||
| 8,867 | Rolls-Royce Holdings plcd | 72,830 | ||||||
The accompanying Notes to Financial Statements are an integral part of this schedule.
17
Table of Contents
MODERATELY AGGRESSIVE ALLOCATION PORTFOLIO
Schedule of Investments as of December 31, 2016
| Shares | Common Stock (39.3%) | Value | ||||||
Industrials (4.8%) - continued | ||||||||
| 18,092 | Roper Industries, Inc. | $ | 3,312,283 | |||||
| 4,400 | Ryder System, Inc. | 327,536 | ||||||
| 83,453 | Saia, Inc.d | 3,684,450 | ||||||
| 3,600 | Sanwa Holdings Corporation | 34,240 | ||||||
| 568 | Schindler Holding AG, Participation Certificate | 100,032 | ||||||
| 783 | Schneider Electric SE | 54,394 | ||||||
| 3,999 | Siemens AG | 489,639 | ||||||
| 1,993 | Skanska AB | 46,924 | ||||||
| 6,931 | SKF AB | 127,088 | ||||||
| 5,900 | Smiths Group plc | 102,703 | ||||||
| 21,200 | Sojitz Corporation | 51,329 | ||||||
| 173,521 | Southwest Airlines Company | 8,648,287 | ||||||
| 31,800 | SPX FLOW, Inc.d | 1,019,508 | ||||||
| 2,090 | Standex International Corporation | 183,606 | ||||||
| 2,670 | Stanley Black & Decker, Inc. | 306,222 | ||||||
| 5,950 | Stericycle, Inc.d | 458,388 | ||||||
| 811 | Sulzer, Ltd. | 83,487 | ||||||
| 23,741 | Team, Inc.d | 931,834 | ||||||
| 22,063 | Tennant Company | 1,570,886 | ||||||
| 4,470 | Tetra Tech, Inc. | 192,880 | ||||||
| 15,339 | Textron, Inc. | 744,862 | ||||||
| 117,550 | TransUniond | 3,635,822 | ||||||
| 10,910 | TrueBlue, Inc.d | 268,931 | ||||||
| 167,948 | Union Pacific Corporation | 17,412,849 | ||||||
| 64,650 | United Continental Holdings, Inc.d | 4,711,692 | ||||||
| 35,720 | United Parcel Service, Inc. | 4,094,941 | ||||||
| 32,699 | United Rentals, Inc.d | 3,452,360 | ||||||
| 14,666 | Universal Forest Products, Inc. | 1,498,572 | ||||||
| 33,649 | Universal Truckload Services, Inc. | 550,161 | ||||||
| 5,203 | Vinci SA | 353,933 | ||||||
| 42,310 | WABCO Holdings, Inc.d | 4,491,207 | ||||||
| 31,433 | WageWorks, Inc.d | 2,278,893 | ||||||
| 82,113 | Waste Connections, Inc. | 6,453,261 | ||||||
| 6,339 | Watsco, Inc. | 938,933 | ||||||
| 1,190 | Wolseley plc | 72,645 | ||||||
| 1,545 | WSP Global, Inc. | 51,425 | ||||||
| 30,900 | Xylem, Inc. | 1,530,168 | ||||||
| 22,310 | YRC Worldwide, Inc.d | 296,277 | ||||||
| 1,200 | Yuasa Trading Company, Ltd. | 29,892 | ||||||
|
| |||||||
Total | 256,225,862 | |||||||
|
| |||||||
Information Technology (9.5%) | ||||||||
| 131,580 | Agilent Technologies, Inc. | 5,994,785 | ||||||
| 82,005 | Akamai Technologies, Inc.d | 5,468,093 | ||||||
| 28,040 | Alliance Data Systems Corporation | 6,407,140 | ||||||
| 35,763 | Alphabet, Inc., Class Ad | 28,340,389 | ||||||
| 28,497 | Alphabet, Inc., Class Cd | 21,994,555 | ||||||
| 31,773 | Ambarella, Inc.d,e | 1,719,872 | ||||||
| 39,370 | Amkor Technology, Inc.d | 415,354 | ||||||
| 95,824 | Amphenol Corporation | 6,439,373 | ||||||
| 81,760 | Analog Devices, Inc. | 5,937,411 | ||||||
| 265,266 | Apple, Inc. | 30,723,108 | ||||||
| 80,002 | Applied Materials, Inc. | 2,581,665 | ||||||
| 36,870 | Apptio, Inc.d | 683,201 | ||||||
| 77,158 | Arista Networks, Inc.d | 7,466,580 | ||||||
| 115,310 | ARRIS International plcd | 3,474,290 | ||||||
| 18,810 | Aspen Technology, Inc.d | 1,028,531 | ||||||
| 16,860 | AVX Corporation | 263,522 | ||||||
| 24,240 | Bankrate, Inc.d | 267,852 | ||||||
| 33,340 | Belden, Inc. | 2,492,832 | ||||||
| 50,900 | Blackhawk Network Holdings, Inc.d | 1,917,658 | ||||||
| 172,880 | Booz Allen Hamilton Holding Corporation | 6,235,782 | ||||||
| 99,978 | Brooks Automation, Inc. | 1,706,624 | ||||||
| 14,040 | CA, Inc. | 446,051 | ||||||
| 22,502 | Cabot Microelectronics Corporation | 1,421,451 | ||||||
| 4,940 | CACI International, Inc.d | 614,042 | ||||||
| 11,080 | Cadence Design Systems, Inc.d | 279,438 | ||||||
| 3,800 | Canon, Inc. | 107,016 | ||||||
| 2,239 | Capital Power Corporation | 38,738 | ||||||
| 11,210 | Carbonite, Inc.d | 183,844 | ||||||
| 36,711 | Cavium, Inc.d | 2,292,235 | ||||||
| 9,550 | CDK Global, Inc. | 570,040 | ||||||
| 120,261 | Ciena Corporationd | 2,935,571 | ||||||
| 3,660 | Cirrus Logic, Inc.d | 206,936 | ||||||
| 475,970 | Cisco Systems, Inc. | 14,383,813 | ||||||
| 21,345 | Cognex Corporation | 1,357,969 | ||||||
| 8,660 | Coherent, Inc.d | 1,189,754 | ||||||
| 74,540 | CommVault Systems, Inc.d | 3,831,356 | ||||||
| 15,050 | Comtech Telecommunications Corporation | 178,342 | ||||||
| 27,090 | Convergys Corporation | 665,330 | ||||||
| 61,810 | CoreLogic, Inc.d | 2,276,462 | ||||||
| 102,169 | Criteo SA ADRd,e | 4,197,103 | ||||||
| 8,640 | CTS Corporation | 193,536 | ||||||
| 98,690 | Dolby Laboratories, Inc. | 4,459,801 | ||||||
| 70,632 | DST Systems, Inc. | 7,568,219 | ||||||
| 1,100 | DTS Corporation | 23,399 | ||||||
| 53,160 | eBay, Inc.d | 1,578,320 | ||||||
| 17,420 | Entegris, Inc.d | 311,818 | ||||||
| 49,530 | Envestnet, Inc.d | 1,745,933 | ||||||
| 18,190 | EVERTEC, Inc. | 322,873 | ||||||
| 20,910 | ExlService Holdings, Inc.d | 1,054,700 | ||||||
| 13,500 | F5 Networks, Inc.d | 1,953,720 | ||||||
| 38,802 | Fabrinetd | 1,563,721 | ||||||
| 281,220 | Facebook, Inc.d | 32,354,361 | ||||||
| 70,230 | Finisar Corporationd | 2,125,862 | ||||||
| 143,530 | FLIR Systems, Inc. | 5,194,351 | ||||||
| 4,120 | Forrester Research, Inc. | 176,954 | ||||||
| 88,751 | Fortinet, Inc.d | 2,673,180 | ||||||
| 8,200 | FUJIFILM Holdings NPV | 310,500 | ||||||
| 105,277 | Guidewire Software, Inc.d | 5,193,314 | ||||||
| 16,680 | IAC/InterActiveCorporationd | 1,080,697 | ||||||
| 12,120 | Insight Enterprises, Inc.d | 490,133 | ||||||
| 196,300 | Integrated Device Technology, Inc.d | 4,624,828 | ||||||
| 81,190 | Intel Corporation | 2,944,761 | ||||||
| 88,573 | Ixiad | 1,426,025 | ||||||
| 6,730 | Keysight Technologies, Inc.d | 246,116 | ||||||
| 4,400 | Konica Minolta Holdings, Inc. | 43,607 | ||||||
| 41,870 | Lam Research Corporation | 4,426,915 | ||||||
| 35,610 | Liberty Tripadvisor Holdings, Inc.d | 535,931 | ||||||
| 9,945 | Littelfuse, Inc. | 1,509,353 | ||||||
| 44,470 | M/A-COM Technology Solutions Holdings, Inc.d,e | 2,058,072 | ||||||
| 20,794 | Manhattan Associates, Inc.d | 1,102,706 | ||||||
| 226,370 | MasterCard, Inc. | 23,372,703 | ||||||
| 88,716 | Maxim Integrated Products, Inc. | 3,421,776 | ||||||
| 7,800 | MAXIMUS, Inc. | 435,162 | ||||||
| 36,808 | Methode Electronics, Inc. | 1,522,011 | ||||||
| 33,310 | Microsemi Corporationd | 1,797,741 | ||||||
| 629,180 | Microsoft Corporation | 39,097,245 | ||||||
| 42,260 | Mobileye NVd | 1,610,951 | ||||||
| 79,221 | Monolithic Power Systems, Inc. | 6,490,577 | ||||||
| 18,160 | Monotype Imaging Holdings, Inc. | 360,476 | ||||||
| 86,070 | National Instruments Corporation | 2,652,677 | ||||||
| 3,700 | NEC Networks & System Integration Corporation | 66,708 | ||||||
| 10,780 | NetApp, Inc. | 380,211 | ||||||
| 72,510 | New Relic, Inc.d,e | 2,048,408 | ||||||
| 1,200 | Nice, Ltd. | 82,335 | ||||||
| 30,776 | Nice, Ltd. ADR | 2,116,158 | ||||||
| 2,800 | Nichicon Corporation | 24,380 | ||||||
The accompanying Notes to Financial Statements are an integral part of this schedule.
18
Table of Contents
MODERATELY AGGRESSIVE ALLOCATION PORTFOLIO
Schedule of Investments as of December 31, 2016
| Shares | Common Stock (39.3%) | Value | ||||||
Information Technology (9.5%) - continued | ||||||||
| 800 | NTT Data Corporation | $ | 38,649 | |||||
| 55,706 | NVIDIA Corporation | 5,946,058 | ||||||
| 26,446 | NXP Semiconductors NVd | 2,591,972 | ||||||
| 134,875 | Oclaro, Inc.d | 1,207,131 | ||||||
| 69,000 | ON Semiconductor Corporationd | 880,440 | ||||||
| 252,470 | Oracle Corporation | 9,707,471 | ||||||
| 7,970 | OSI Systems, Inc.d | 606,676 | ||||||
| 43,520 | Palo Alto Networks, Inc.d | 5,442,176 | ||||||
| 188,850 | Pandora Media, Inc.d,e | 2,462,604 | ||||||
| 25,300 | Paycom Software, Inc.d | 1,150,897 | ||||||
| 35,520 | Paylocity Holding Corporationd,e | 1,065,955 | ||||||
| 426,078 | PayPal Holdings, Inc.d | 16,817,299 | ||||||
| 68,045 | Pegasystems, Inc. | 2,449,620 | ||||||
| 42,844 | Progress Software Corporation | 1,368,009 | ||||||
| 72,165 | Proofpoint, Inc.d | 5,098,457 | ||||||
| 22,610 | PTC, Inc.d | 1,046,165 | ||||||
| 80,419 | Q2 Holdings, Inc.d | 2,320,088 | ||||||
| 3,130 | Qorvo, Inc.d | 165,045 | ||||||
| 50,080 | QUALCOMM, Inc. | 3,265,216 | ||||||
| 6,360 | Qualys, Inc.d | 201,294 | ||||||
| 22,390 | RealPage, Inc.d | 671,700 | ||||||
| 28,100 | Red Hat, Inc.d | 1,958,570 | ||||||
| 400 | Rohm Company, Ltd. | 22,949 | ||||||
| 36,883 | Rudolph Technologies, Inc.d | 861,218 | ||||||
| 1,300 | Ryosan Company, Ltd. | 39,193 | ||||||
| 313,910 | Salesforce.com, Inc.d | 21,490,279 | ||||||
| 465 | SAP SE | 40,225 | ||||||
| 7,480 | ScanSource, Inc.d | 301,818 | ||||||
| 2,010 | Seagate Technology plc | 76,722 | ||||||
| 46,608 | ServiceNow, Inc.d | 3,464,839 | ||||||
| 48,540 | ShoreTel, Inc.d | 347,061 | ||||||
| 2,750 | Silicon Laboratories, Inc.d | 178,750 | ||||||
| 1,099 | Software AG | 39,832 | ||||||
| 47,700 | SS&C Technologies Holdings, Inc. | 1,364,220 | ||||||
| 43,604 | Synopsys, Inc.d | 2,566,531 | ||||||
| 8,226 | Telefonaktiebolaget LM Ericsson | 48,212 | ||||||
| 186,464 | Teradyne, Inc. | 4,736,186 | ||||||
| 4,370 | Tessera Technologies, Inc. | 193,154 | ||||||
| 56,570 | Texas Instruments, Inc. | 4,127,913 | ||||||
| 1,100 | Tokyo Electron, Ltd. | 103,454 | ||||||
| 8,060 | Total System Services, Inc. | 395,182 | ||||||
| 22,570 | Trimble, Inc.d | 680,486 | ||||||
| 21,730 | Tyler Technologies, Inc.d | 3,102,392 | ||||||
| 13,887 | Ultimate Software Group, Inc.d | 2,532,294 | ||||||
| 5,710 | Verint Systems, Inc.d | 201,277 | ||||||
| 151,095 | Virtusa Corporationd | 3,795,506 | ||||||
| 316,470 | Visa, Inc. | 24,690,989 | ||||||
| 2,700 | Western Digital Corporation | 183,465 | ||||||
| 287,400 | Xerox Corporation | 2,509,002 | ||||||
| 105,390 | Xilinx, Inc. | 6,362,394 | ||||||
|
| |||||||
Total | 504,424,368 | |||||||
|
| |||||||
Materials (1.7%) | ||||||||
| 1,800 | Adeka Corporation | 24,419 | ||||||
| 15,730 | Agnico Eagle Mines, Ltd. | 660,660 | ||||||
| 15,230 | Air Products and Chemicals, Inc. | 2,190,379 | ||||||
| 23,763 | American Vanguard Corporation | 455,061 | ||||||
| 3,362 | APERAM | 153,429 | ||||||
| 20,500 | Ashland Global Holdings, Inc. | 2,240,445 | ||||||
| 9,450 | Avery Dennison Corporation | 663,579 | ||||||
| 71,790 | Axalta Coating Systems, Ltd.d | 1,952,688 | ||||||
| 23,149 | Balchem Corporation | 1,942,664 | ||||||
| 13,150 | Ball Corporation | 987,170 | ||||||
| 87,650 | Barrick Gold Corporation | 1,400,647 | ||||||
| 2,655 | BHP Billiton plc | 42,276 | ||||||
| 39,312 | BHP Billiton, Ltd. | 704,269 | ||||||
| 27,386 | BlueScope Steel, Ltd. | 182,010 | ||||||
| 29,010 | Boise Cascade Companyd | 652,725 | ||||||
| 18,290 | Cabot Corporation | 924,377 | ||||||
| 13,550 | Carpenter Technology Corporation | 490,104 | ||||||
| 42,807 | Celanese Corporation | 3,370,623 | ||||||
| 59,689 | Chemtura Corporationd | 1,981,675 | ||||||
| 19,530 | Continental Building Products, Inc.d | 451,143 | ||||||
| 972 | Croda International plc | 38,229 | ||||||
| 40,020 | Crown Holdings, Inc.d | 2,103,851 | ||||||
| 15,700 | Daicel Corporation | 172,607 | ||||||
| 43,260 | Dow Chemical Company | 2,475,337 | ||||||
| 3,200 | Eagle Materials, Inc. | 315,296 | ||||||
| 58,439 | Eastman Chemical Company | 4,395,197 | ||||||
| 31,480 | Ecolab, Inc. | 3,690,086 | ||||||
| 60,880 | Eldorado Gold Corporationd | 196,034 | ||||||
| 10,026 | Evonik Industries AG | 298,864 | ||||||
| 27,280 | Ferro Corporationd | 390,922 | ||||||
| 57,670 | Ferroglobe plc | 624,566 | ||||||
| 57,670 | Ferroglobe Representation & Warranty Insurance Trustd,f | 6 | ||||||
| 79,523 | FMC Corporation | 4,497,821 | ||||||
| 25 | Givaudan SA | 45,754 | ||||||
| 59,690 | Goldcorp, Inc. | 811,784 | ||||||
| 416,720 | Graphic Packaging Holding Company | 5,200,666 | ||||||
| 19,940 | Huntsman Corporation | 380,455 | ||||||
| 3,995 | Ingevity Corporationd | 219,166 | ||||||
| 3,920 | Innophos Holdings, Inc. | 204,859 | ||||||
| 13,753 | Innospec, Inc. | 942,080 | ||||||
| 3,440 | International Flavors & Fragrances, Inc. | 405,335 | ||||||
| 53,840 | International Paper Company | 2,856,750 | ||||||
| 3,000 | JSR Corporation | 47,221 | ||||||
| 8,430 | Kadant, Inc. | 515,916 | ||||||
| 44,990 | KapStone Paper and Packaging Corporation | 992,030 | ||||||
| 112,020 | Kinross Gold Corporationd | 348,382 | ||||||
| 8,350 | Koppers Holdings, Inc.d | 336,505 | ||||||
| 10,500 | Kuraray Company, Ltd. | 157,453 | ||||||
| 2,400 | Kyoei Steel, Ltd. | 45,630 | ||||||
| 622 | LafargeHolcim, Ltd. | 32,650 | ||||||
| 4,080 | Martin Marietta Materials, Inc. | 903,842 | ||||||
| 28,320 | Materion Corporation | 1,121,472 | ||||||
| 24,990 | Methanex Corporation | 1,094,562 | ||||||
| 11,040 | Minerals Technologies, Inc. | 852,840 | ||||||
| 12,800 | Mitsubishi Chemical Holdings Corporation | 82,760 | ||||||
| 2,600 | Mitsubishi Gas Chemical Company, Inc. | 44,303 | ||||||
| 1,400 | Mitsubishi Materials Corporation | 42,822 | ||||||
| 69,340 | Mosaic Company | 2,033,742 | ||||||
| 65,565 | Myers Industries, Inc. | 937,579 | ||||||
| 2,110 | Neenah Paper, Inc. | 179,772 | ||||||
| 71,100 | Newmont Mining Corporation | 2,422,377 | ||||||
| 500 | Nippon Shokubai Company, Ltd. | 31,139 | ||||||
| 45,669 | Norsk Hydro ASA | 217,966 | ||||||
| 35,340 | Nucor Corporation | 2,103,437 | ||||||
| 4,809 | Nufarm, Ltd. | 31,687 | ||||||
| 31,350 | OMNOVA Solutions, Inc.d | 313,500 | ||||||
| 12,705 | Orora, Ltd. | 27,322 | ||||||
| 76,040 | Owens-Illinois, Inc.d | 1,323,856 | ||||||
| 57,220 | Packaging Corporation of America | 4,853,400 | ||||||
| 9,550 | PolyOne Corporation | 305,982 | ||||||
| 1,590 | Quaker Chemical Corporation | 203,425 | ||||||
| 22,490 | Rayonier Advanced Materials, Inc.e | 347,695 | ||||||
| 10,020 | Reliance Steel & Aluminum Company | 796,991 | ||||||
| 1,179 | Rio Tinto, Ltd. | 50,510 | ||||||
| 5,670 | Royal Gold, Inc. | 359,195 | ||||||
The accompanying Notes to Financial Statements are an integral part of this schedule.
19
Table of Contents
MODERATELY AGGRESSIVE ALLOCATION PORTFOLIO
Schedule of Investments as of December 31, 2016
| Shares | Common Stock (39.3%) | Value | ||||||
Materials (1.7%) - continued | ||||||||
| 24,990 | Schnitzer Steel Industries, Inc. | $ | 642,243 | |||||
| 4,950 | Schweitzer-Mauduit International, Inc. | 225,374 | ||||||
| 19,594 | Scotts Miracle-Gro Company | 1,872,207 | ||||||
| 17,410 | Sealed Air Corporation | 789,369 | ||||||
| 31,960 | Sensient Technologies Corporation | 2,511,417 | ||||||
| 4,250 | Silgan Holdings, Inc. | 217,515 | ||||||
| 26,690 | Silver Wheaton Corporation | 515,651 | ||||||
| 25,500 | Sonoco Products Company | 1,343,850 | ||||||
| 107,112 | Steel Dynamics, Inc. | 3,811,045 | ||||||
| 1,000 | Sumitomo Seika Chemicals Company, Ltd. | 39,163 | ||||||
| 15,210 | SunCoke Energy, Inc.d | 172,481 | ||||||
| 46,600 | Teck Resources, Ltd. | 933,398 | ||||||
| 4,700 | Toagosei Company, Ltd. | 46,132 | ||||||
| 5,000 | Tosoh Corporation | 35,270 | ||||||
| 6,998 | UPM-Kymmene Oyj | 171,141 | ||||||
| 26,111 | Verso Corporationd | 185,388 | ||||||
| 8,580 | Vulcan Materials Company | 1,073,787 | ||||||
| 28,225 | Westrock Company | 1,432,983 | ||||||
| 88,230 | Yamana Gold, Inc. | 247,926 | ||||||
| 1,200 | Yamato Kogyo Company, Ltd. | 33,467 | ||||||
| 8,077 | Yara International ASA | 317,742 | ||||||
| 900 | Yodogawa Steel Works, Ltd. | 23,455 | ||||||
|
| |||||||
Total | 91,534,975 | |||||||
|
| |||||||
Real Estate (1.0%) | ||||||||
| 31,560 | American Assets Trust, Inc. | 1,359,605 | ||||||
| 22,850 | American Campus Communities, Inc. | 1,137,245 | ||||||
| 30,520 | Bluerock Residential Growth REIT, Inc.e | 418,734 | ||||||
| 186,459 | Brixmor Property Group, Inc. | 4,553,329 | ||||||
| 12,500 | Camden Property Trust | 1,050,875 | ||||||
| 25,100 | CapitaLand Retail China Trustd | 23,745 | ||||||
| 62,660 | CBL & Associates Properties, Inc. | 720,590 | ||||||
| 166,466 | Cedar Realty Trust, Inc. | 1,087,023 | ||||||
| 65,490 | Chatham Lodging Trust | 1,345,820 | ||||||
| 15,290 | City Office REIT, Inc. | 201,369 | ||||||
| 41,200 | Columbia Property Trust, Inc. | 889,920 | ||||||
| 31,500 | CoreCivic, Inc. | 770,490 | ||||||
| 145,600 | Corporate Office Properties Trust | 4,545,632 | ||||||
| 80,266 | Cousins Properties, Inc. | 683,064 | ||||||
| 13,346 | CyrusOne, Inc. | 596,967 | ||||||
| 300 | Daito Trust Construction Company, Ltd. | 45,101 | ||||||
| 308,490 | DDR Corporation | 4,710,642 | ||||||
| 35,294 | DEXUS Property Group | 244,842 | ||||||
| 10,700 | Digital Realty Trust, Inc. | 1,051,382 | ||||||
| 37,750 | Duke Realty Corporation | 1,002,640 | ||||||
| 15,830 | Equity Lifestyle Properties, Inc. | 1,141,343 | ||||||
| 7,240 | First Industrial Realty Trust, Inc. | 203,082 | ||||||
| 54,038 | First Potomac Realty Trust | 592,797 | ||||||
| 38,860 | Franklin Street Properties Corporation | 503,626 | ||||||
| 35,400 | General Growth Properties, Inc. | 884,292 | ||||||
| 10,712 | H&R Real Estate Investment Trust | 178,474 | ||||||
| 3,099 | Hamborner REIT AG | 29,480 | ||||||
| 51,100 | HFF, Inc. | 1,545,775 | ||||||
| 22,710 | Hospitality Properties Trust | 720,815 | ||||||
| 70,345 | Host Hotels & Resorts, Inc. | 1,325,300 | ||||||
| 6,180 | Hudson Pacific Properties, Inc. | 214,940 | ||||||
| 41,000 | Hysan Development Company, Ltd. | 169,086 | ||||||
| 35,910 | InfraREIT, Inc. | 643,148 | ||||||
| 32,630 | Kite Realty Group Trust | 766,152 | ||||||
| 39,050 | LaSalle Hotel Properties | 1,189,854 | ||||||
| 42,580 | Liberty Property Trust | 1,681,910 | ||||||
| 12,670 | Life Storage, Inc. | 1,080,244 | ||||||
| 4,000 | Link REIT | 25,932 | ||||||
| 10,530 | Mid-America Apartment Communities, Inc. | 1,031,098 | ||||||
| 167,100 | New World Development Company, Ltd. | 176,058 | ||||||
| 40,571 | Pebblebrook Hotel Trust | 1,206,987 | ||||||
| 43,610 | Physicians Realty Trust | 826,846 | ||||||
| 5,055 | Potlatch Corporation | 210,541 | ||||||
| 24,680 | RE/MAX Holdings, Inc. | 1,382,080 | ||||||
| 30,920 | Realogy Holdings Corporation | 795,572 | ||||||
| 115,400 | Retail Properties of America, Inc. | 1,769,082 | ||||||
| 31,100 | Silver Bay Realty Trust Corporation REIT | 533,054 | ||||||
| 18,320 | Spirit Realty Captial, Inc. | 198,955 | ||||||
| 65,723 | Stockland | 217,128 | ||||||
| 17,180 | Store Capital Corporation | 424,518 | ||||||
| 5,060 | Sun Communities, Inc. | 387,647 | ||||||
| 3,000 | Sun Hung Kai Properties, Ltd. | 37,777 | ||||||
| 71,671 | Terreno Realty Corporation | 2,041,907 | ||||||
| 31,610 | Urstadt Biddle Properties, Inc. | 762,117 | ||||||
| 15,150 | Welltower, Inc. | 1,013,989 | ||||||
| 4,000 | Wharf Holdings, Ltd. | 26,496 | ||||||
| 6,000 | Wheelock and Company, Ltd. | 33,673 | ||||||
| 39,800 | Wing Tai Holdings, Ltd. | 43,593 | ||||||
|
| |||||||
Total | 52,454,383 | |||||||
|
| |||||||
Telecommunications Services (0.3%) | ||||||||
| 37,930 | AT&T, Inc. | 1,613,163 | ||||||
| 6,330 | ATN International, Inc. | 507,223 | ||||||
| 17,234 | Cincinnati Bell, Inc.d | 385,180 | ||||||
| 5,888 | Elisa Oyj | 191,134 | ||||||
| 5,400 | Freenet AG | 151,765 | ||||||
| 49,670 | General Communication, Inc.d | 966,082 | ||||||
| 89,270 | KCOM Group plc | 104,241 | ||||||
| 22,584 | Koninklijke (Royal) KPN NV | 66,784 | ||||||
| 32,797 | Level 3 Communications, Inc.d | 1,848,439 | ||||||
| 5,200 | Nippon Telegraph & Telephone Corporation | 218,895 | ||||||
| 5,900 | NTT DOCOMO, Inc. | 134,197 | ||||||
| 104,697 | PCCW, Ltd. | 56,597 | ||||||
| 2,424 | Proximus SA | 69,683 | ||||||
| 22,896 | SBA Communications Corporationd | 2,364,241 | ||||||
| 9,200 | Telefonica Deutschland Holding AG | 39,325 | ||||||
| 5,899 | Telenor ASA | 88,053 | ||||||
| 79,409 | Verizon Communications, Inc. | 4,238,852 | ||||||
| 1,323 | Vivendi SA | 25,093 | ||||||
| 77,550 | Vonage Holdings Corporationd | 531,217 | ||||||
|
| |||||||
Total | 13,600,164 | |||||||
|
| |||||||
Utilities (0.9%) | ||||||||
| 4,860 | Alliant Energy Corporation | 184,145 | ||||||
| 5,390 | American Electric Power Company, Inc. | 339,354 | ||||||
| 41,600 | American States Water Company | 1,895,296 | ||||||
| 17,960 | Artesian Resources Corporation | 573,642 | ||||||
| 1,999 | ATCO, Ltd. | 66,492 | ||||||
| 64,520 | Avista Corporation | 2,580,155 | ||||||
| 73,760 | Calpine Corporationd | 843,077 | ||||||
| 32,600 | Centrica plc | 93,890 | ||||||
| 3,760 | Consolidated Edison, Inc. | 277,037 | ||||||
| 15,200 | Consolidated Water Company, Ltd. | 164,920 | ||||||
| 39,640 | DTE Energy Company | 3,904,936 | ||||||
| 25,340 | Dynegy, Inc.d | 214,376 | ||||||
| 9,640 | Edison International, Inc. | 693,984 | ||||||
| 45,100 | Electricidade de Portugal SA | 137,265 | ||||||
| 81,310 | Eversource Energy | 4,490,751 | ||||||
| 11,280 | Exelon Corporation | 400,327 | ||||||
The accompanying Notes to Financial Statements are an integral part of this schedule.
20
Table of Contents
MODERATELY AGGRESSIVE ALLOCATION PORTFOLIO
Schedule of Investments as of December 31, 2016
| Shares | Common Stock (39.3%) | Value | ||||||
| Utilities (0.9%) - continued | ||||||||
| 218,000 | Great Plains Energy, Inc. | $ | 5,962,300 | |||||
| 13,140 | Hawaiian Electric Industries, Inc. | 434,540 | ||||||
| 43,080 | MDU Resources Group, Inc. | 1,239,412 | ||||||
| 7,670 | Middlesex Water Company | 329,350 | ||||||
| 7,920 | National Fuel Gas Company | 448,589 | ||||||
| 26,600 | NiSource, Inc. | 588,924 | ||||||
| 6,620 | NorthWestern Corporation | 376,479 | ||||||
| 54,000 | Osaka Gas Company, Ltd. | 207,201 | ||||||
| 106,790 | PG&E Corporation | 6,489,628 | ||||||
| 42,360 | PNM Resources, Inc. | 1,452,948 | ||||||
| 46,140 | Portland General Electric Company | 1,999,246 | ||||||
| 33,050 | Public Service Enterprise Group, Inc. | 1,450,234 | ||||||
| 28,868 | Redes Energeticas Nacionais SGPS SA | 81,906 | ||||||
| 21,740 | Renewable Energy Group, Inc.d | 210,878 | ||||||
| 46,120 | Southern Company | 2,268,643 | ||||||
| 20,000 | Southwest Gas Holdings, Inc. | 1,532,400 | ||||||
| 3,030 | Spire, Inc. | 195,587 | ||||||
| 4,000 | Toho Gas Company, Ltd. | 32,487 | ||||||
| 6,200 | United Utilities Group plc | 68,723 | ||||||
| 91,390 | Vectren Corporation | 4,765,989 | ||||||
|
| |||||||
Total | 46,995,111 | |||||||
|
| |||||||
Total Common Stock (cost $1,705,302,509) | 2,092,683,818 | |||||||
|
| |||||||
Registered Investment Companies (36.8%) | ||||||||
| Affiliated Equity Holdings (29.7%) | �� | |||||||
| 24,752,802 | Thrivent Large Cap Stock Portfolio | 299,399,986 | ||||||
| 21,779,551 | Thrivent Large Cap Value Portfolio | 366,750,218 | ||||||
| 18,902,196 | Thrivent Mid Cap Stock Portfolio | 360,667,132 | ||||||
| 50,069,595 | Thrivent Partner Worldwide | |||||||
Allocation Portfolio | 455,187,694 | |||||||
| 5,579,836 | Thrivent Small Cap Stock Portfolio | 103,191,812 | ||||||
|
| |||||||
Total | 1,585,196,842 | |||||||
|
| |||||||
Affiliated Fixed Income Holdings (5.6%) | ||||||||
| 10,873,034 | Thrivent High Yield Portfolio | 51,866,545 | ||||||
| 15,219,349 | Thrivent Income Portfolio | 153,242,099 | ||||||
| 9,490,688 | Thrivent Limited Maturity Bond Portfolio | 93,074,230 | ||||||
|
| |||||||
Total | 298,182,874 | |||||||
|
| |||||||
Equity Funds/ETFs (0.8%) | ||||||||
| 870 | iShares MSCI EAFE Index Fund | 50,225 | ||||||
| 40,931 | iShares Russell 2000 Growth Index Funde | 6,300,918 | ||||||
| 45,453 | iShares Russell 2000 Index Fund | 6,129,337 | ||||||
| 15,440 | iShares Russell 2000 Value Index Fund | 1,836,434 | ||||||
| 27,040 | Materials Select Sector SPDR Fund | 1,343,888 | ||||||
| 97,919 | SPDR S&P 500 ETF Trust | 21,887,834 | ||||||
| 59,000 | SPDR S&P Biotech ETF | 3,492,210 | ||||||
| 1,530 | SPDR S&P MidCap 400 ETF Truste | 461,647 | ||||||
|
| |||||||
Total | 41,502,493 | |||||||
|
| |||||||
Fixed Income Funds/ETFs (0.7%) | ||||||||
| 35,000 | iShares Barclays 1-3 Year Credit Bond Fund | 3,672,900 | ||||||
| 113,650 | iShares iBoxx $ Investment Grade Corporate Bond ETF | 13,317,507 | ||||||
| 5,611 | iShares J.P. Morgan USD Emerging Markets Bond ETFe | 618,445 | ||||||
| 220,500 | PowerShares Senior Loan Portfolio | 5,150,880 | ||||||
| 179,500 | Vanguard Short-Term Corporate Bond ETF | 14,246,915 | ||||||
|
| |||||||
Total | 37,006,647 | |||||||
|
| |||||||
Total Registered Investment Companies (cost $1,720,669,889) | 1,961,888,856 | |||||||
|
| |||||||
| Principal Amount | Long-Term Fixed Income (15.8%) | |||||||
| Asset-Backed Securities (1.0%) | ||||||||
Access Group, Inc. | ||||||||
| 320,417 | 1.256%, 2/25/2036, Series 2013-1, Class Ag,h | 316,469 | ||||||
Alm Loan Funding CLO | ||||||||
| 385,000 | 2.310%, 10/17/2026, Series 2014-11A, Class A1*,h | 385,672 | ||||||
AMSR Trust | ||||||||
2.136%, 11/17/2033, Series | ||||||||
| 1,075,000 | 2016-SFR1, Class Ag,h | 1,075,049 | ||||||
Apidos CLO XVIII | ||||||||
2.294%, 7/22/2026, Series | ||||||||
| 375,000 | 2014-18A, Class A1*,h | 375,578 | ||||||
Ares CLO, Ltd. | ||||||||
| 1,275,000 | 2.164%, 10/12/2023, Series 2012-2A, Class AR*,h | 1,275,171 | ||||||
| 750,000 | 2.386%, 11/15/2025, Series 2014-32A, Class A1*,h | 751,285 | ||||||
BA Credit Card Trust | ||||||||
| 650,000 | 1.084%, 6/15/2021, Series 2014-A1, Class Ah | 651,634 | ||||||
Babson CLO, Ltd. | ||||||||
| 385,000 | 2.270%, 10/17/2026, Series 2014-IIA, Class A*,h | 385,616 | ||||||
Betony CLO, Ltd. | ||||||||
| 350,000 | 2.256%, 4/15/2027, Series 2015-1A, Class AR*,h | 348,074 | ||||||
Birchwood Park CLO, Ltd. | ||||||||
| 385,000 | 2.320%, 7/15/2026, Series 2014-1A, Class A*,h | 385,707 | ||||||
BlueMountain CLO, Ltd. | ||||||||
| 385,000 | 2.360%, 10/15/2026, Series 2014-3A, Class A1*,h | 385,617 | ||||||
Capital One Multi-Asset Execution Trust | ||||||||
| 800,000 | 1.084%, 1/18/2022, Series 2014-A3, Class A3h | 800,325 | ||||||
Carlyle Global Market Strategies CLO, Ltd. | ||||||||
| 333,824 | 2.181%, 7/20/2023, Series 2012-2A, Class A1R*,h | 333,867 | ||||||
| 400,000 | 2.380%, 10/15/2026, Series 2014-4A, Class A1*,h | 400,627 | ||||||
Cent CLO 16, LP | ||||||||
| 374,055 | 2.136%, 8/1/2024, Series 2012-16A, Class A1AR*,h | 374,126 | ||||||
Cent CLO 22, Ltd. | ||||||||
| 400,000 | 2.291%, 11/7/2026, Series 2014-22A, Class A1R*,h | 399,062 | ||||||
Chase Issuance Trust | ||||||||
| 500,000 | 1.590%, 2/18/2020, Series 2015-A2, Class A2 | 501,383 | ||||||
| 375,000 | 1.620%, 7/15/2020, Series 2015-A7, Class A7 | 375,703 | ||||||
| 250,000 | 1.114%, 5/17/2021, Series 2016-A1, Class Ah | 250,781 | ||||||
The accompanying Notes to Financial Statements are an integral part of this schedule.
21
Table of Contents
MODERATELY AGGRESSIVE ALLOCATION PORTFOLIO
Schedule of Investments as of December 31, 2016
| Principal Amount | Long-Term Fixed Income (15.8%) | Value | ||||||
Asset-Backed Securities (1.0%) - continued | ||||||||
Chesapeake Funding II, LLC | ||||||||
| $ | 800,000 | 1.880%, 6/15/2028, Series 2016-2A, Class A1g | $ | 797,829 | ||||
Chesapeake Funding, LLC | ||||||||
| 93,034 | 1.102%, 1/7/2025, Series 2013-1A, Class Ag,h | 93,000 | ||||||
Commonbond Student Loan Trust | ||||||||
| 970,112 | 2.730%, 10/25/2040, Series 2016-B, Class A1g | 953,280 | ||||||
DRB Prime Student Loan Trust | ||||||||
| 1,607,018 | 3.200%, 1/25/2040, Series 2015-D, Class A2* | 1,595,635 | ||||||
Dryden 34 Senior Loan Fund CLO | ||||||||
| 385,000 | 2.310%, 10/15/2026, Series 2014-34A, Class A*,h | 385,667 | ||||||
Earnest Student Loan Program, LLC | ||||||||
| 2,511,349 | 3.020%, 5/25/2034, Series 2016-B, Class A2g | 2,491,362 | ||||||
Edlinc Student Loan Funding Trust | ||||||||
| 243,273 | 3.410%, 10/1/2025, Series 2012-A, Class AT*,h | 245,975 | ||||||
Enterprise Fleet Financing, LLC | ||||||||
| 44,487 | 0.870%, 9/20/2019, Series 2014-1, Class A2g | 44,454 | ||||||
FirstEnergy Ohio PIRB Special Purpose Trust | ||||||||
| 41,060 | 0.679%, 1/15/2019, Series 2013-1, Class A1 | 41,019 | ||||||
Ford Credit Auto Owner Trust | ||||||||
| 485,000 | 2.260%, 11/15/2025, Series 2014-1, Class Ag | 488,974 | ||||||
Galaxy XX CLO, Ltd. | ||||||||
| 1,200,000 | 2.331%, 7/20/2027, Series 2015-20A, Class A*,h | 1,198,595 | ||||||
GoldenTree Loan Opportunities IX, Ltd. | ||||||||
| 400,000 | 2.238%, 10/29/2026, Series 2014-9A, Class AR*,h | 399,724 | ||||||
Golub Capital Partners CLO 22B, Ltd. | ||||||||
| 725,000 | 2.391%, 2/20/2027, Series 2015-22A, Class A1*,h | 724,961 | ||||||
Golub Capital Partners CLO 23M, Ltd. | ||||||||
| 350,000 | 2.366%, 5/5/2027, Series 2015-23A, Class A1*,h | 350,031 | ||||||
Limerock CLO III, LLC | ||||||||
| 1,150,000 | 2.411%, 10/20/2026, Series 2014-3A, Class A1*,h | 1,134,024 | ||||||
Madison Park Funding XIV CLO, Ltd. | ||||||||
| 425,000 | 2.331%, 7/20/2026, Series 2014-14A, Class A2*,h | 425,718 | ||||||
Madison Park Funding, Ltd. | ||||||||
| 965,957 | 2.196%, 8/15/2022, Series 2012-9A, Class AR*,h | 966,134 | ||||||
Magnetite XII, Ltd. | ||||||||
| 1,200,000 | 2.256%, 4/15/2027, Series 2015-12A, Class AR*,h | 1,199,093 | ||||||
Marlette Funding Trust | ||||||||
| 515,134 | 3.060%, 1/17/2023, Series 2016-1A, Class A* | 515,007 | ||||||
Morgan Stanley Bank of America Merrill Lynch Trust | ||||||||
| 1,425,000 | 3.176%, 8/15/2045 | 1,464,416 | ||||||
| 1,425,000 | 3.246%, 12/15/2047 | 1,435,136 | ||||||
Morgan Stanley Capital, Inc. | ||||||||
| 912,980 | 0.906%, 2/25/2037, Series 2007-NC2, Class A2FPh | 545,540 | ||||||
Mountain View CLO, Ltd. | ||||||||
| 1,200,000 | 2.340%, 7/15/2027, Series 2015-9A, Class A1A*,h | 1,196,748 | ||||||
Murray Hill Marketplace Trust | ||||||||
| 1,118,295 | 4.190%, 11/25/2022, Series 2016-LC1, Class A* | 1,123,656 | ||||||
NCF Dealer Floorplan Master Trust | ||||||||
| 1,500,000 | 3.812%, 3/21/2022, Series 2016-1A, Class A*,h | 1,489,209 | ||||||
Neuberger Berman CLO, Ltd. | ||||||||
| 300,000 | 2.346%, 8/4/2025, Series 2014-17A, Class A*,h | 300,008 | ||||||
NZCG Funding CLO, Ltd. | ||||||||
| 1,200,000 | 2.436%, 4/27/2027, Series 2015-2A, Class A1*,h | 1,199,030 | ||||||
Octagon Investment Partners XX CLO, Ltd. | ||||||||
| 385,000 | 2.342%, 8/12/2026, Series 2014-1A, Class A*,h | 385,673 | ||||||
OHA Loan Funding, Ltd. | ||||||||
| 1,150,000 | 2.411%, 10/20/2026, Series 2014-1A, Class A1*,h | 1,156,656 | ||||||
OneMain Financial Issuance Trust | ||||||||
| 750,000 | 4.100%, 3/20/2028, Series 2016-2A, Class Ag | 764,485 | ||||||
OZLM VIII, Ltd. | ||||||||
| 385,000 | 2.320%, 10/17/2026, Series 2014-8A, Class A1A*,h | 385,688 | ||||||
Race Point IX CLO, Ltd. | ||||||||
| 900,000 | 2.390%, 4/15/2027, Series 2015-9A, Class A1*,h | 902,928 | ||||||
Renaissance Home Equity Loan Trust | ||||||||
| 1,162,581 | 5.746%, 5/25/2036, Series 2006-1, Class AF6i | 762,849 | ||||||
| 1,432,175 | 6.011%, 5/25/2036, Series 2006-1, Class AF4i | 978,021 | ||||||
| 1,185,155 | 5.580%, 11/25/2036, Series 2006-3, Class AF2i | 659,777 | ||||||
Shackleton, Ltd. | ||||||||
| 1,200,000 | 2.340%, 4/15/2027, Series 2015-7A, Class AR*,h | 1,200,000 | ||||||
SLM Student Loan Trust | ||||||||
| 195,916 | 1.304%, 7/15/2022, Series 2014-A, Class A1g,h | 196,076 | ||||||
| 255,593 | 1.304%, 8/15/2022, Series 2013-A, Class A1g,h | 255,747 | ||||||
| 7,491 | 1.282%, 4/25/2023, Series 2004-10, Class A5Ag,h | 7,490 | ||||||
| 692,039 | 1.276%, 3/25/2026, Series 2011-1, Class A1h | 690,979 | ||||||
| 450,000 | 1.754%, 5/17/2027, Series 2013-A, Class A2Bg,h | 453,308 | ||||||
Sofi Consumer Loan Program, LLC | ||||||||
| 585,561 | 3.260%, 8/25/2025, Series 2016-1, Class Ag | 586,116 | ||||||
SoFi Consumer Loan Program, LLC | ||||||||
| 821,142 | 3.050%, 12/26/2025, Series 2016-3, Class Ag | 818,128 | ||||||
SoFi Professional Loan Program, LLC | ||||||||
| 606,345 | 2.420%, 3/25/2030, Series 2015-A, Class A2g | 604,272 | ||||||
The accompanying Notes to Financial Statements are an integral part of this schedule.
22
Table of Contents
MODERATELY AGGRESSIVE ALLOCATION PORTFOLIO
Schedule of Investments as of December 31, 2016
| Principal Amount | Long-Term Fixed Income (15.8%) | Value | ||||||
Asset-Backed Securities (1.0%) - continued | ||||||||
Sunset Mortgage Loan Company, LLC | ||||||||
| $ | 1,339,712 | 3.844%, 7/16/2047, Series 2016-NPL1, Class A*,i | $ | 1,344,271 | ||||
Symphony CLO VIII, Ltd. | ||||||||
| 352,425 | 1.976%, 1/9/2023, Series 2012-8A, Class AR*,h | 352,472 | ||||||
Symphony CLO XV, Ltd. | ||||||||
| 1,150,000 | 2.330%, 10/17/2026, Series 2014-15A, Class A*,h | 1,152,121 | ||||||
U.S. Small Business Administration | ||||||||
| 485,447 | 3.191%, 3/10/2024, Series 2014-10A, Class 1 | 502,098 | ||||||
Vericrest Opportunity Loan Transferee | ||||||||
| 818,924 | 3.375%, 10/25/2058, Series 2015-NPL3, Class A1*,i | 817,777 | ||||||
| 975,370 | 4.250%, 3/26/2046, Series 2016-NPL3, Class A1g,i | 982,900 | ||||||
| 937,294 | 3.500%, 9/25/2046, Series 2016-NP10, Class A1g,i | 934,730 | ||||||
| 1,731,328 | 3.500%, 10/25/2046, Series 2016-NP11, Class A1g,i | 1,727,295 | ||||||
| 196,736 | 3.500%, 2/25/2055, Series 2015-NPL4, Class A1*,i | 196,887 | ||||||
Vericrest Opportunity Loan Trust | ||||||||
| 2,751,260 | 3.625%, 11/26/2046, Series 2016-NP12, Class A1g,i | 2,743,123 | ||||||
| 950,000 | 3.875%, 12/26/2046, Series 2016-NP13, Class A1g,i | 950,000 | ||||||
Volvo Financial Equipment, LLC | ||||||||
| 239,242 | 0.820%, 4/16/2018, Series 2014-1A, Class A3g | 239,087 | ||||||
Voya CLO 3, Ltd. | ||||||||
| 385,000 | 2.302%, 7/25/2026, Series 2014-3A, Class A1*,h | 385,619 | ||||||
|
| |||||||
Total | 55,712,544 | |||||||
|
| |||||||
Basic Materials (0.1%) | ||||||||
Albemarle Corporation | ||||||||
| 105,000 | 3.000%, 12/1/2019 | 107,331 | ||||||
Alcoa Nederland Holding BV | ||||||||
| 395,000 | 6.750%, 9/30/2024g | 428,575 | ||||||
Anglo American plc | ||||||||
| 772,000 | 3.625%, 5/14/2020g | 780,646 | ||||||
ArcelorMittal SA | ||||||||
| 670,000 | 6.500%, 3/1/2021 | 733,650 | ||||||
First Quantum Minerals, Ltd. | ||||||||
| 355,000 | 6.750%, 2/15/2020g | 354,113 | ||||||
| 355,000 | 7.000%, 2/15/2021g | 353,083 | ||||||
Georgia-Pacific, LLC | ||||||||
| 245,000 | 2.539%, 11/15/2019g | 247,030 | ||||||
Glencore Funding, LLC | ||||||||
| 180,000 | 1.940%, 4/16/2018g,h | 177,966 | ||||||
Kinross Gold Corporation | ||||||||
| 448,000 | 5.950%, 3/15/2024 | 453,600 | ||||||
Novelis Corporation | ||||||||
| 275,000 | 5.875%, 9/30/2026g | 277,750 | ||||||
Steel Dynamics, Inc. | ||||||||
| 615,000 | 5.000%, 12/15/2026g | 612,694 | ||||||
Westlake Chemical Corporation | ||||||||
| 448,000 | 3.600%, 8/15/2026g | 430,270 | ||||||
|
| |||||||
Total | 4,956,708 | |||||||
|
| |||||||
Capital Goods (0.2%) | ||||||||
AECOM | ||||||||
| 920,000 | 5.875%, 10/15/2024 | 982,201 | ||||||
Building Materials Corporation of America | ||||||||
| 660,000 | 6.000%, 10/15/2025g | 694,650 | ||||||
Cemex Finance, LLC | ||||||||
| 900,000 | 9.375%, 10/12/2022g | 981,000 | ||||||
CNH Industrial Capital, LLC | ||||||||
| 370,000 | 4.375%, 11/6/2020 | 379,712 | ||||||
CNH Industrial NV | ||||||||
| 450,000 | 4.500%, 8/15/2023 | 444,375 | ||||||
Crown Americas Capital Corporation IV | ||||||||
| 670,000 | 4.500%, 1/15/2023 | 683,400 | ||||||
General Electric Company | ||||||||
| 607,000 | 5.000%, 1/21/2021j | 629,884 | ||||||
Huntington Ingalls Industries, Inc. | ||||||||
| 850,000 | 5.000%, 12/15/2021g | 884,000 | ||||||
L3 Technologies, Inc. | ||||||||
| 455,000 | 3.950%, 5/28/2024 | 462,238 | ||||||
Lockheed Martin Corporation | ||||||||
| 389,000 | 2.500%, 11/23/2020 | 391,984 | ||||||
| 448,000 | 4.500%, 5/15/2036 | 475,546 | ||||||
Northrop Grumman Corporation | ||||||||
| 350,000 | 3.850%, 4/15/2045 | 331,326 | ||||||
Owens-Brockway Glass Container, Inc. | ||||||||
| 960,000 | 5.000%, 1/15/2022g | 981,600 | ||||||
Pentair Finance SA | ||||||||
| 295,000 | 2.900%, 9/15/2018 | 298,355 | ||||||
Republic Services, Inc. | ||||||||
| 335,000 | 2.900%, 7/1/2026 | 320,668 | ||||||
Reynolds Group Issuer, Inc. | ||||||||
| 670,000 | 5.125%, 7/15/2023g | 680,887 | ||||||
Roper Industries, Inc. | ||||||||
| 601,000 | 2.050%, 10/1/2018 | 602,930 | ||||||
Roper Technologies, Inc. | ||||||||
| 336,000 | 2.800%, 12/15/2021 | 335,498 | ||||||
Standard Industries, Inc. | ||||||||
| 415,000 | 5.500%, 2/15/2023g | 429,566 | ||||||
Textron, Inc. | ||||||||
| 150,000 | 5.600%, 12/1/2017 | 155,298 | ||||||
| 400,000 | 7.250%, 10/1/2019 | 449,364 | ||||||
United Rentals North America, Inc. | ||||||||
| 680,000 | 5.500%, 7/15/2025 | 693,600 | ||||||
Waste Management, Inc. | ||||||||
| 90,000 | 3.125%, 3/1/2025 | 90,000 | ||||||
|
| |||||||
Total | 12,378,082 | |||||||
|
| |||||||
Collateralized Mortgage Obligations (0.4%) | ||||||||
Angel Oak Mortgage Trust I, LLC | ||||||||
| 504,761 | 3.500%, 7/25/2046, Series 2016-1, Class A1* | 501,661 | ||||||
BCAP, LLC Trust | ||||||||
| 1,003,074 | 0.936%, 3/25/2037, Series 2007-AA1, Class 2A1h | 930,858 | ||||||
Citigroup Mortgage Loan Trust, Inc. | ||||||||
| 353,815 | 5.500%, 11/25/2035, Series 2005-9, Class 21A2 | 341,869 | ||||||
CitiMortgage Alternative Loan Trust | ||||||||
| 1,174,942 | 5.750%, 4/25/2037, Series 2007-A4, Class 1A5 | 1,006,663 | ||||||
COLT Mortgage Loan Trust | ||||||||
| 925,000 | 2.800%, 12/26/2046, Series 2016-3, Class A1* | 925,736 | ||||||
The accompanying Notes to Financial Statements are an integral part of this schedule.
23
Table of Contents
MODERATELY AGGRESSIVE ALLOCATION PORTFOLIO
Schedule of Investments as of December 31, 2016
| Principal Amount | Long-Term Fixed Income (15.8%) | Value | ||||||
Collateralized Mortgage Obligations (0.4%) - continued | ||||||||
Countrywide Alternative Loan Trust | ||||||||
| $ | 466,647 | 3.036%, 10/25/2035, Series 2005-43, Class 4A1 | $ | 378,299 | ||||
| 344,391 | 6.500%, 8/25/2036, Series 2006-23CB, Class 2A3 | 232,281 | ||||||
| 222,637 | 6.000%, 1/25/2037, Series 2006-39CB, Class 1A16 | 212,583 | ||||||
| 1,097,648 | 5.500%, 5/25/2037, Series 2007-8CB, Class A1 | 939,372 | ||||||
| 1,032,751 | 7.000%, 10/25/2037, Series 2007-24, Class A10 | 552,892 | ||||||
Countrywide Home Loans, Inc. | ||||||||
| 427,200 | 5.750%, 4/25/2037, Series 2007-3, Class A27 | 360,485 | ||||||
Deutsche Alt-A Securities Mortgage Loan Trust | ||||||||
| 318,432 | 6.000%, 10/25/2021, Series 2006-AR5, Class 23A | 283,276 | ||||||
Federal Home Loan Mortgage Corporation | ||||||||
| 2,326,801 | 4.000%, 7/15/2031, Series-4104, Class KIk | 268,316 | ||||||
| 1,263,421 | 3.000%, 2/15/2033, Series-4170, Class IGk | 151,255 | ||||||
Federal National Mortgage Association | ||||||||
| 2,491,831 | 3.500%, 1/25/2033, Series 2012-150, Class YIk | 335,957 | ||||||
J.P. Morgan Mortgage Trust | ||||||||
| 745,575 | 3.110%, 10/25/2036, Series 2006-A6, Class 1A2 | 676,020 | ||||||
| 1,108,803 | 1.136%, 1/25/2037, Series 2006-S4, Class A8h | 586,914 | ||||||
| 1,315,078 | 6.250%, 8/25/2037, Series 2007-S3, Class 1A10 | 974,385 | ||||||
MASTR Alternative Loans Trust | ||||||||
| 295,417 | 6.500%, 7/25/2034, Series 2004-6, Class 6A1 | 296,263 | ||||||
| 671,027 | 1.206%, 12/25/2035, Series 2005-6, Class 2A1h | 304,860 | ||||||
Merrill Lynch Alternative Note Asset Trust | ||||||||
| 287,242 | 6.000%, 3/25/2037, Series 2007-F1, Class 2A1 | 223,849 | ||||||
Pretium Mortgage Credit Partners, LLC | ||||||||
| 1,953,083 | 4.375%, 11/27/2030, Series 2015-NPL4, Class A1*,i | 1,968,897 | ||||||
Residential Asset Securitization Trust | ||||||||
| 1,133,160 | 1.136%, 8/25/2037, Series 2007-A8, Class 2A3h | 295,480 | ||||||
Sequoia Mortgage Trust | ||||||||
| 673,672 | 3.280%, 9/20/2046, Series 2007-1, Class 4A1 | 546,341 | ||||||
TBW Mortgage-Backed Trust | ||||||||
| 3,121,569 | 5.965%, 7/25/2037, Series 2007-2, Class A1A | 2,094,629 | ||||||
WaMu Mortgage Pass Through Certificates | ||||||||
| 183,895 | 2.837%, 9/25/2036, Series 2006-AR10, Class 1A2 | 169,194 | ||||||
| 359,644 | 2.850%, 10/25/2036, Series 2006-AR12, Class 1A1 | 313,506 | ||||||
| 2,583,058 | 2.617%, 11/25/2036, Series 2006-AR14, Class 1A1 | 2,290,228 | ||||||
| 1,553,138 | 1.527%, 9/25/2046, Series 2006-AR11, Class 1Ah | 1,276,411 | ||||||
Washington Mutual Mortgage Pass Through Certificates Trust | ||||||||
| 929,836 | 7.000%, 2/25/2036, Series 2006-1, Class 2CB1 | 691,846 | ||||||
|
| |||||||
Total | 20,130,326 | |||||||
|
| |||||||
Commercial Mortgage-Backed Securities (0.3%) | ||||||||
Citigroup Commercial Mortgage Trust | ||||||||
| 481,114 | 1.102%, 11/10/2046 | 479,966 | ||||||
Commercial Mortgage Pass-Through Certificates | ||||||||
| 780,000 | 1.699%, 6/8/2030g,h | 781,959 | ||||||
Federal National Mortgage Association | ||||||||
| 23,957 | 1.272%, 1/25/2017 | 23,936 | ||||||
Greenwich Capital Commercial Funding Corporation | ||||||||
| 1,750,000 | 5.867%, 12/10/2049 | 1,788,431 | ||||||
GS Mortgage Securities Trust | ||||||||
| 2,450,000 | 3.666%, 9/10/2047 | 2,540,271 | ||||||
J.P. Morgan Chase Commercial Mortgage Securities Corporation | ||||||||
| 1,300,000 | 5.713%, 2/12/2049 | 1,312,560 | ||||||
JPMBB Commercial Mortgage Securities Trust | ||||||||
| 1,175,000 | 3.231%, 1/15/2048 | 1,186,611 | ||||||
Morgan Stanley Capital, Inc. | ||||||||
| 900,000 | 5.406%, 3/15/2044 | 899,214 | ||||||
SCG Trust | ||||||||
| 425,000 | 2.104%, 11/15/2026g,h | 425,000 | ||||||
UBS Commercial Mortgage Trust | ||||||||
| 2,124,388 | 3.400%, 5/10/2045 | 2,210,951 | ||||||
WFRBS Commercial Mortgage Trust | ||||||||
| 1,200,000 | 2.870%, 11/15/2045 | 1,217,232 | ||||||
|
| |||||||
Total | 12,866,131 | |||||||
|
| |||||||
Communications Services (0.6%) | ||||||||
21st Century Fox America, Inc. | ||||||||
| 460,000 | 6.900%, 3/1/2019 | 505,121 | ||||||
Altice Financing SA | ||||||||
| 770,000 | 6.625%, 2/15/2023g | 791,175 | ||||||
AMC Networks, Inc. | ||||||||
| 690,000 | 5.000%, 4/1/2024 | 691,725 | ||||||
America Movil SAB de CV | ||||||||
| 288,000 | 5.000%, 10/16/2019 | 308,502 | ||||||
American Tower Corporation | ||||||||
| 50,000 | 2.800%, 6/1/2020 | 49,998 | ||||||
| 560,000 | 3.300%, 2/15/2021 | 565,924 | ||||||
AT&T, Inc. | ||||||||
| 212,000 | 5.875%, 10/1/2019 | 231,593 | ||||||
| 165,000 | 1.928%, 6/30/2020h | 165,895 | ||||||
| 349,000 | 3.875%, 8/15/2021 | 359,999 | ||||||
| 275,000 | 3.000%, 6/30/2022 | 269,653 | ||||||
| 336,000 | 6.350%, 3/15/2040 | 382,218 | ||||||
| 355,000 | 5.550%, 8/15/2041 | 368,985 | ||||||
| 450,000 | 5.150%, 3/15/2042 | 447,499 | ||||||
| 275,000 | 4.750%, 5/15/2046 | 260,044 | ||||||
British Sky Broadcasting Group plc | ||||||||
| 320,000 | 2.625%, 9/16/2019g | 321,156 | ||||||
CCO Holdings, LLC | ||||||||
| 900,000 | 5.875%, 4/1/2024g | 960,750 | ||||||
The accompanying Notes to Financial Statements are an integral part of this schedule.
24
Table of Contents
MODERATELY AGGRESSIVE ALLOCATION PORTFOLIO
Schedule of Investments as of December 31, 2016
| Principal Amount | Long-Term Fixed Income (15.8%) | Value | ||||||
Communications Services (0.6%) - continued | ||||||||
CenturyLink, Inc. | ||||||||
| $ | 775,000 | 6.450%, 6/15/2021 | $ | 815,687 | ||||
Charter Communications Operating, LLC | ||||||||
| 452,000 | 6.834%, 10/23/2055 | 528,901 | ||||||
| 288,000 | 3.579%, 7/23/2020 | 293,624 | ||||||
| 448,000 | 4.908%, 7/23/2025 | 471,573 | ||||||
Clear Channel Worldwide Holdings, Inc. | ||||||||
| 760,000 | 6.500%, 11/15/2022 | 777,100 | ||||||
Columbus International, Inc. | ||||||||
| 895,000 | 7.375%, 3/30/2021g | 952,405 | ||||||
Comcast Corporation | ||||||||
| 360,000 | 2.750%, 3/1/2023 | 357,040 | ||||||
| 960,000 | 4.400%, 8/15/2035 | 1,002,729 | ||||||
| 140,000 | 4.650%, 7/15/2042 | 145,484 | ||||||
| 677,000 | 4.750%, 3/1/2044 | 724,694 | ||||||
Cox Communications, Inc. | ||||||||
| 184,000 | 9.375%, 1/15/2019g | 207,799 | ||||||
Crown Castle International Corporation | ||||||||
| 521,000 | 3.400%, 2/15/2021 | 528,262 | ||||||
| 931,000 | 5.250%, 1/15/2023 | 1,001,989 | ||||||
| 200,000 | 3.700%, 6/15/2026 | 196,024 | ||||||
CSC Holdings, LLC | ||||||||
| 100,000 | 5.500%, 4/15/2027g | 101,250 | ||||||
Digicel, Ltd. | ||||||||
| 1,295,000 | 6.000%, 4/15/2021* | 1,170,952 | ||||||
FairPoint Communications, Inc. | ||||||||
| 685,000 | 8.750%, 8/15/2019g | 714,969 | ||||||
Frontier Communications Corporation | ||||||||
| 1,090,000 | 8.875%, 9/15/2020 | 1,160,850 | ||||||
Level 3 Communications, Inc. | ||||||||
| 920,000 | 5.375%, 1/15/2024 | 929,200 | ||||||
Level 3 Financing, Inc. | ||||||||
| 335,000 | 5.375%, 5/1/2025 | 341,700 | ||||||
Neptune Finco Corporation | ||||||||
| 225,000 | 10.875%, 10/15/2025g | 267,750 | ||||||
Omnicom Group, Inc. | ||||||||
| 224,000 | 3.600%, 4/15/2026 | 221,370 | ||||||
S&P Global, Inc. | ||||||||
| 448,000 | 3.300%, 8/14/2020 | 456,451 | ||||||
SES Global Americas Holdings GP | ||||||||
| 365,000 | 2.500%, 3/25/2019g | 362,752 | ||||||
SFR Group SA | ||||||||
| 1,165,000 | 6.000%, 5/15/2022g | 1,195,581 | ||||||
Sprint Communications, Inc. | ||||||||
| 615,000 | 6.000%, 11/15/2022 | 619,612 | ||||||
Sprint Corporation | ||||||||
| 640,000 | 7.625%, 2/15/2025 | 672,800 | ||||||
Telefonica Emisiones SAU | ||||||||
| 244,000 | 3.192%, 4/27/2018 | 247,474 | ||||||
Time Warner Entertainment Company, LP | ||||||||
| 459,000 | 8.375%, 3/15/2023 | 576,703 | ||||||
Time Warner, Inc. | ||||||||
| 224,000 | 3.600%, 7/15/2025 | 222,450 | ||||||
| 265,000 | 6.250%, 3/29/2041 | 310,438 | ||||||
T-Mobile USA, Inc. | ||||||||
| 1,040,000 | 6.125%, 1/15/2022 | 1,097,200 | ||||||
Verizon Communications, Inc. | ||||||||
| 350,000 | 1.763%, 6/17/2019h | 353,182 | ||||||
| 1,025,000 | 3.000%, 11/1/2021 | 1,031,819 | ||||||
| 1,008,000 | 5.150%, 9/15/2023 | 1,113,428 | ||||||
| 78,000 | 5.050%, 3/15/2034 | 82,020 | ||||||
| 319,000 | 4.272%, 1/15/2036 | 304,840 | ||||||
| 748,000 | 4.522%, 9/15/2048 | 715,805 | ||||||
Viacom, Inc. | ||||||||
| 560,000 | 4.375%, 3/15/2043 | 445,291 | ||||||
| 336,000 | 5.850%, 9/1/2043 | 328,738 | ||||||
Vodafone Group plc | ||||||||
| 448,000 | 6.150%, 2/27/2037 | 501,626 | ||||||
|
| |||||||
Total | 30,229,799 | |||||||
|
| |||||||
Consumer Cyclical (0.4%) | ||||||||
Argos Merger Sub, Inc. | ||||||||
| 1,080,000 | 7.125%, 3/15/2023e,g | 1,101,600 | ||||||
Automatic Data Processing, Inc. | ||||||||
| 100,000 | 3.375%, 9/15/2025 | 102,405 | ||||||
Cinemark USA, Inc. | ||||||||
| 1,130,000 | 4.875%, 6/1/2023 | 1,144,125 | ||||||
CVS Health Corporation | ||||||||
| 110,000 | 2.250%, 8/12/2019 | 110,556 | ||||||
| 870,000 | 4.875%, 7/20/2035 | 934,211 | ||||||
| 360,000 | 5.125%, 7/20/2045 | 400,429 | ||||||
Daimler Finance North America, LLC | ||||||||
| 448,000 | 1.618%, 10/30/2019g,h | 449,077 | ||||||
Delphi Automotive plc | ||||||||
| 560,000 | 3.150%, 11/19/2020 | 568,533 | ||||||
eBay, Inc. | ||||||||
| 225,000 | 2.500%, 3/9/2018 | 226,947 | ||||||
Ford Motor Credit Company, LLC | ||||||||
| 336,000 | 5.000%, 5/15/2018 | 349,102 | ||||||
| 550,000 | 2.551%, 10/5/2018 | 552,989 | ||||||
| 450,000 | 2.943%, 1/8/2019 | 454,978 | ||||||
| 224,000 | 2.459%, 3/27/2020 | 220,978 | ||||||
| 168,000 | 3.200%, 1/15/2021 | 168,110 | ||||||
General Motors Company | ||||||||
| 220,000 | 6.600%, 4/1/2036 | 251,111 | ||||||
| 429,000 | 6.250%, 10/2/2043 | 473,452 | ||||||
General Motors Financial Company, Inc. | ||||||||
| 332,000 | 3.700%, 11/24/2020 | 337,472 | ||||||
| 224,000 | 4.200%, 3/1/2021 | 230,297 | ||||||
| 385,000 | 4.300%, 7/13/2025 | 381,425 | ||||||
Home Depot, Inc. | ||||||||
| 184,000 | 2.625%, 6/1/2022 | 184,691 | ||||||
| 280,000 | 3.000%, 4/1/2026 | 279,054 | ||||||
| 336,000 | 4.250%, 4/1/2046 | 352,017 | ||||||
Hyundai Capital America | ||||||||
| 176,000 | 2.400%, 10/30/2018g | 176,700 | ||||||
| 336,000 | 3.000%, 10/30/2020g | 335,771 | ||||||
Jaguar Land Rover Automotive plc | ||||||||
| 630,000 | 5.625%, 2/1/2023g | 656,775 | ||||||
KB Home | ||||||||
| 503,000 | 4.750%, 5/15/2019 | 513,060 | ||||||
L Brands, Inc. | ||||||||
| 630,000 | 5.625%, 2/15/2022 | 672,525 | ||||||
Lear Corporation | ||||||||
| 560,000 | 5.250%, 1/15/2025 | 588,700 | ||||||
Lennar Corporation | ||||||||
| 235,000 | 4.125%, 12/1/2018 | 240,288 | ||||||
| 660,000 | 4.875%, 12/15/2023 | 653,400 | ||||||
Live Nation Entertainment, Inc. | ||||||||
| 200,000 | 5.375%, 6/15/2022g | 207,000 | ||||||
| 380,000 | 4.875%, 11/1/2024g | 380,950 | ||||||
McDonald’s Corporation | ||||||||
| 335,000 | 2.750%, 12/9/2020 | 339,951 | ||||||
MGM Resorts International | ||||||||
| 915,000 | 6.000%, 3/15/2023 | 988,200 | ||||||
The accompanying Notes to Financial Statements are an integral part of this schedule.
25
Table of Contents
MODERATELY AGGRESSIVE ALLOCATION PORTFOLIO
Schedule of Investments as of December 31, 2016
| Principal Amount | Long-Term Fixed Income (15.8%) | Value | ||||||
Consumer Cyclical (0.4%) - continued | ||||||||
Newell Rubbermaid, Inc. | ||||||||
| $ | 224,000 | 2.600%, 3/29/2019 | $ | 226,404 | ||||
| 336,000 | 5.500%, 4/1/2046 | 385,004 | ||||||
Prime Security Services Borrower, LLC | ||||||||
| 835,000 | 9.250%, 5/15/2023g | 909,106 | ||||||
Rite Aid Corporation | ||||||||
| 880,000 | 6.125%, 4/1/2023g | 946,000 | ||||||
Toll Brothers Finance Corporation | ||||||||
| 100,000 | 8.910%, 10/15/2017 | 105,125 | ||||||
| 186,000 | 4.000%, 12/31/2018 | 190,883 | ||||||
West Corporation | ||||||||
| 1,065,000 | 5.375%, 7/15/2022g | 1,029,056 | ||||||
|
| |||||||
Total | 18,818,457 | |||||||
|
| |||||||
Consumer Non-Cyclical (0.6%) | ||||||||
Abbott Laboratories | ||||||||
| 224,000 | 2.350%, 11/22/2019 | 224,153 | ||||||
| 280,000 | 3.400%, 11/30/2023 | 278,620 | ||||||
| 260,000 | 4.750%, 11/30/2036 | 263,907 | ||||||
| 210,000 | 4.900%, 11/30/2046 | 215,111 | ||||||
AbbVie, Inc. | ||||||||
| 315,000 | 2.500%, 5/14/2020 | 314,902 | ||||||
| 540,000 | 3.600%, 5/14/2025 | 534,165 | ||||||
| 560,000 | 4.450%, 5/14/2046 | 535,152 | ||||||
Actavis Funding SCS | ||||||||
| 675,000 | 4.550%, 3/15/2035 | 667,094 | ||||||
| 336,000 | 4.850%, 6/15/2044 | 332,522 | ||||||
Altria Group, Inc. | ||||||||
| 224,000 | 2.850%, 8/9/2022 | 224,028 | ||||||
| 280,000 | 2.625%, 9/16/2026 | 264,746 | ||||||
Amgen, Inc. | ||||||||
| 224,000 | 2.700%, 5/1/2022 | 221,567 | ||||||
| 300,000 | 3.125%, 5/1/2025 | 291,567 | ||||||
Anheuser-Busch InBev Finance, Inc. | ||||||||
| 240,000 | 2.146%, 2/1/2021h | 244,221 | ||||||
| 809,000 | 3.650%, 2/1/2026 | 820,026 | ||||||
| 896,000 | 4.700%, 2/1/2036 | 942,166 | ||||||
| 560,000 | 4.900%, 2/1/2046 | 601,290 | ||||||
Anheuser-Busch InBev Worldwide, Inc. | ||||||||
| 184,000 | 3.750%, 1/15/2022 | 191,867 | ||||||
BAT International Finance plc | ||||||||
| 220,000 | 1.473%, 6/15/2018g,h | 220,042 | ||||||
Baxter International, Inc. | ||||||||
| 280,000 | 2.600%, 8/15/2026 | 258,095 | ||||||
Bayer U.S. Finance, LLC | ||||||||
| 336,000 | 3.375%, 10/8/2024g | 333,904 | ||||||
Biogen, Inc. | ||||||||
| 210,000 | 3.625%, 9/15/2022 | 215,321 | ||||||
Boston Scientific Corporation | ||||||||
| 200,000 | 6.000%, 1/15/2020 | 219,635 | ||||||
| 325,000 | 3.850%, 5/15/2025 | 325,218 | ||||||
| 336,000 | 7.375%, 1/15/2040 | 417,260 | ||||||
BRF SA | ||||||||
| 475,000 | 4.750%, 5/22/2024g | 461,463 | ||||||
Bunge Limited Finance Corporation | ||||||||
| 282,000 | 8.500%, 6/15/2019 | 322,945 | ||||||
| 305,000 | 3.500%, 11/24/2020 | 310,197 | ||||||
Cardinal Health, Inc. | ||||||||
| 138,000 | 4.900%, 9/15/2045 | 145,334 | ||||||
Celgene Corporation | ||||||||
| 495,000 | 2.875%, 8/15/2020 | 500,304 | ||||||
| 120,000 | 3.550%, 8/15/2022 | 122,937 | ||||||
| 280,000 | 5.000%, 8/15/2045 | 290,573 | ||||||
Church & Dwight Company, Inc. | ||||||||
| 140,000 | 2.450%, 12/15/2019 | 140,626 | ||||||
Conagra Brands, Inc. | ||||||||
| 168,000 | 7.125%, 10/1/2026 | 202,614 | ||||||
EMD Finance, LLC | ||||||||
| 235,000 | 1.343%, 3/17/2017g,h | 235,054 | ||||||
| 280,000 | 2.950%, 3/19/2022g | 278,527 | ||||||
Energizer Holdings, Inc. | ||||||||
| 820,000 | 5.500%, 6/15/2025g | 822,050 | ||||||
Envision Healthcare Corporation | ||||||||
| 970,000 | 5.125%, 7/1/2022g | 966,363 | ||||||
Express Scripts Holding Company | ||||||||
| 224,000 | 3.000%, 7/15/2023 | 216,591 | ||||||
| 525,000 | 4.500%, 2/25/2026 | 539,753 | ||||||
| 90,000 | 3.400%, 3/1/2027 | 84,192 | ||||||
Gilead Sciences, Inc. | ||||||||
| 120,000 | 2.550%, 9/1/2020 | 121,292 | ||||||
| 560,000 | 2.950%, 3/1/2027 | 535,105 | ||||||
Grifols Worldwide Operations, Ltd. | ||||||||
| 790,000 | 5.250%, 4/1/2022 | 817,650 | ||||||
H. J. Heinz Company | ||||||||
| 350,000 | 3.500%, 7/15/2022 | 354,917 | ||||||
HCA, Inc. | ||||||||
| 585,000 | 5.250%, 6/15/2026 | 604,744 | ||||||
| 300,000 | 4.500%, 2/15/2027 | 294,750 | ||||||
Imperial Tobacco Finance plc | ||||||||
| 450,000 | 2.950%, 7/21/2020g | 452,429 | ||||||
JBS USA, LLC | ||||||||
| 670,000 | 5.750%, 6/15/2025g | 678,375 | ||||||
Kraft Foods Group, Inc. | ||||||||
| 448,000 | 5.000%, 6/4/2042 | 457,902 | ||||||
Laboratory Corporation of America Holdings | ||||||||
| 165,000 | 2.625%, 2/1/2020 | 164,752 | ||||||
McKesson Corporation | ||||||||
| 225,000 | 4.883%, 3/15/2044 | 228,460 | ||||||
Mead Johnson Nutrition Company | ||||||||
| 200,000 | 3.000%, 11/15/2020 | 202,348 | ||||||
Medtronic plc | ||||||||
| 1,085,000 | 4.375%, 3/15/2035 | 1,146,050 | ||||||
Merck & Company, Inc. | ||||||||
| 175,000 | 1.257%, 2/10/2020h | 175,911 | ||||||
| 88,000 | 3.700%, 2/10/2045 | 83,734 | ||||||
Mondelez International, Inc. | ||||||||
| 247,000 | 1.406%, 2/1/2019h | 246,986 | ||||||
Mylan NV | ||||||||
| 450,000 | 3.000%, 12/15/2018g | 453,161 | ||||||
| 120,000 | 3.150%, 6/15/2021g | 117,663 | ||||||
| 672,000 | 5.250%, 6/15/2046g | 618,681 | ||||||
PepsiCo, Inc. | ||||||||
| 450,000 | 2.850%, 2/24/2026 | 442,917 | ||||||
Pernod Ricard SA | ||||||||
| 400,000 | 3.250%, 6/8/2026g | 383,250 | ||||||
Perrigo Finance Unlimited Company | ||||||||
| 675,000 | 3.500%, 3/15/2021 | 681,484 | ||||||
Reynolds American, Inc. | ||||||||
| 235,000 | 2.300%, 8/21/2017 | 236,149 | ||||||
| 672,000 | 5.700%, 8/15/2035 | 770,539 | ||||||
Roche Holdings, Inc. | ||||||||
| 336,000 | 4.000%, 11/28/2044g | 334,209 | ||||||
Shire Acquisitions Investments Ireland Designated Activity Company | ||||||||
| 336,000 | 2.400%, 9/23/2021 | 324,265 | ||||||
| 336,000 | 3.200%, 9/23/2026 | 313,548 | ||||||
The accompanying Notes to Financial Statements are an integral part of this schedule.
26
Table of Contents
MODERATELY AGGRESSIVE ALLOCATION PORTFOLIO
Schedule of Investments as of December 31, 2016
| Principal Amount | Long-Term Fixed Income (15.8%) | Value | ||||||
Consumer Non-Cyclical (0.6%) - continued | ||||||||
Tenet Healthcare Corporation | ||||||||
| $ | 805,000 | 8.125%, 4/1/2022 | $ | 759,518 | ||||
Teva Pharmaceutical Finance Netherlands III BV | ||||||||
| 458,000 | 2.200%, 7/21/2021 | 437,762 | ||||||
| 280,000 | 2.800%, 7/21/2023 | 264,745 | ||||||
| 205,000 | 4.100%, 10/1/2046 | 175,308 | ||||||
Thermo Fisher Scientific, Inc. | ||||||||
| 168,000 | 3.000%, 4/15/2023 | 164,942 | ||||||
TreeHouse Foods, Inc. | ||||||||
| 450,000 | 4.875%, 3/15/2022 | 461,250 | ||||||
VRX Escrow Corporation | ||||||||
| 1,495,000 | 6.125%, 4/15/2025g | 1,123,119 | ||||||
Zoetis, Inc. | ||||||||
| 448,000 | 4.700%, 2/1/2043 | 435,272 | ||||||
|
| |||||||
Total | 29,859,289 | |||||||
|
| |||||||
Energy (0.4%) | ||||||||
Anadarko Petroleum Corporation | ||||||||
| 320,000 | 4.850%, 3/15/2021 | 342,842 | ||||||
Antero Resources Corporation | ||||||||
| 240,000 | 5.125%, 12/1/2022 | 242,400 | ||||||
| 500,000 | 5.625%, 6/1/2023 | 511,875 | ||||||
Apache Corporation | ||||||||
| 450,000 | 4.750%, 4/15/2043 | 462,653 | ||||||
Boardwalk Pipelines, LP | ||||||||
| 220,000 | 5.950%, 6/1/2026 | 238,662 | ||||||
BP Capital Markets plc | ||||||||
| 452,000 | 3.062%, 3/17/2022 | 456,731 | ||||||
| 665,000 | 3.535%, 11/4/2024 | 674,103 | ||||||
| 120,000 | 3.119%, 5/4/2026 | 117,029 | ||||||
Buckeye Partners, LP | ||||||||
| 288,000 | 2.650%, 11/15/2018 | 289,839 | ||||||
| 70,000 | 3.950%, 12/1/2026 | 68,189 | ||||||
Canadian Natural Resources, Ltd. | ||||||||
| 585,000 | 3.450%, 11/15/2021 | 597,463 | ||||||
| 225,000 | 6.250%, 3/15/2038 | 255,584 | ||||||
Cheniere Corpus Christi Holdings, LLC | ||||||||
| 685,000 | 5.875%, 3/31/2025g | 698,912 | ||||||
CNOOC Nexen Finance | ||||||||
| 345,000 | 1.625%, 4/30/2017 | 344,676 | ||||||
CNPC General Capital, Ltd. | ||||||||
| 192,000 | 2.750%, 4/19/2017g | 192,485 | ||||||
Columbia Pipeline Group, Inc. | ||||||||
| 450,000 | 2.450%, 6/1/2018 | 452,131 | ||||||
Concho Resources, Inc. | ||||||||
| 625,000 | 6.500%, 1/15/2022 | 646,688 | ||||||
| 629,634 | 5.500%, 10/1/2022 | 652,458 | ||||||
| 305,000 | 4.375%, 1/15/2025 | 304,393 | ||||||
Contura Energy, Inc. | ||||||||
| 90,000 | 10.000%, 8/1/2021* | 96,075 | ||||||
Crestwood Midstream Partners, LP | ||||||||
| 400,000 | 6.125%, 3/1/2022 | 410,000 | ||||||
Devon Energy Corporation | ||||||||
| 340,000 | 3.250%, 5/15/2022e | 337,490 | ||||||
Ecopetrol SA | ||||||||
| 220,000 | 5.875%, 9/18/2023 | 232,870 | ||||||
Enbridge Energy Partners, LP | ||||||||
| 224,000 | 4.375%, 10/15/2020 | 233,680 | ||||||
Enbridge, Inc. | ||||||||
| 245,000 | 1.384%, 6/2/2017e,h | 245,023 | ||||||
| 224,000 | 4.250%, 12/1/2026 | 229,021 | ||||||
Encana Corporation | ||||||||
| 121,000 | 3.900%, 11/15/2021 | 121,869 | ||||||
| 448,000 | 6.500%, 2/1/2038 | 484,181 | ||||||
Energy Transfer Partners, LP | ||||||||
| 448,000 | 4.650%, 6/1/2021 | 464,749 | ||||||
| 265,000 | 4.900%, 3/15/2035 | 247,291 | ||||||
EnLink Midstream Partners, LP | ||||||||
| 225,000 | 4.150%, 6/1/2025 | 218,120 | ||||||
| 168,000 | 4.850%, 7/15/2026 | 169,238 | ||||||
Enterprise Products Operating, LLC | ||||||||
| 172,000 | 5.100%, 2/15/2045 | 181,061 | ||||||
EQT Corporation | ||||||||
| 162,000 | 5.150%, 3/1/2018 | 166,983 | ||||||
| 118,000 | 8.125%, 6/1/2019 | 132,713 | ||||||
| 250,000 | 4.875%, 11/15/2021 | 266,798 | ||||||
Exxon Mobil Corporation | ||||||||
| 180,000 | 4.114%, 3/1/2046 | 183,983 | ||||||
Magellan Midstream Partners, LP | ||||||||
| 315,000 | 5.000%, 3/1/2026 | 344,962 | ||||||
Marathon Oil Corporation | ||||||||
| 336,000 | 2.700%, 6/1/2020 | 336,258 | ||||||
Marathon Petroleum Corporation | ||||||||
| 165,000 | 3.400%, 12/15/2020 | 168,619 | ||||||
| 176,000 | 4.750%, 9/15/2044 | 155,745 | ||||||
MEG Energy Corporation | ||||||||
| 630,000 | 6.500%, 3/15/2021g | 582,750 | ||||||
MPLX, LP | ||||||||
| 448,000 | 4.875%, 6/1/2025 | 460,046 | ||||||
Newfield Exploration Company | ||||||||
| 850,000 | 5.625%, 7/1/2024 | 886,125 | ||||||
Noble Energy, Inc. | ||||||||
| 202,000 | 5.625%, 5/1/2021 | 210,570 | ||||||
Northern Tier Energy, LLC | ||||||||
| 975,000 | 7.125%, 11/15/2020 | 1,012,781 | ||||||
Occidental Petroleum Corporation | ||||||||
| 448,000 | 4.100%, 2/15/2047 | 435,449 | ||||||
Petrobras Global Finance BV | ||||||||
| 140,000 | 8.375%, 5/23/2021 | 150,850 | ||||||
| 336,000 | 8.750%, 5/23/2026 | 362,460 | ||||||
Petrobras International Finance Company | ||||||||
| 224,000 | 5.750%, 1/20/2020 | 226,800 | ||||||
Petroleos Mexicanos | ||||||||
| 168,000 | 5.375%, 3/13/2022g | 172,029 | ||||||
| 178,500 | 2.378%, 4/15/2025 | 178,423 | ||||||
| 295,000 | 6.750%, 9/21/2047g | 278,716 | ||||||
Phillips 66 Partners, LP | ||||||||
| 280,000 | 3.550%, 10/1/2026 | 270,574 | ||||||
Pioneer Natural Resources Company | ||||||||
| 225,000 | 4.450%, 1/15/2026 | 238,085 | ||||||
Regency Energy Partners, LP | ||||||||
| 670,000 | 5.000%, 10/1/2022 | 709,270 | ||||||
Rice Energy, Inc. | ||||||||
| 750,000 | 6.250%, 5/1/2022 | 770,625 | ||||||
Rowan Companies, Inc. | ||||||||
| 95,000 | 7.375%, 6/15/2025 | 96,900 | ||||||
Sabine Pass Liquefaction, LLC | ||||||||
| 670,000 | 5.625%, 3/1/2025 | 716,900 | ||||||
Schlumberger Holdings Corporation | ||||||||
| 165,000 | 3.000%, 12/21/2020g | 168,359 | ||||||
| 280,000 | 4.000%, 12/21/2025g | 293,043 | ||||||
Shell International Finance BV | ||||||||
| 165,000 | 1.352%, 5/11/2020h | 165,106 | ||||||
Suncor Energy, Inc. | ||||||||
| 270,000 | 3.600%, 12/1/2024 | 276,342 | ||||||
Sunoco Logistics Partners Operations, LP | ||||||||
| 760,000 | 4.400%, 4/1/2021 | 799,706 | ||||||
The accompanying Notes to Financial Statements are an integral part of this schedule.
27
Table of Contents
MODERATELY AGGRESSIVE ALLOCATION PORTFOLIO
Schedule of Investments as of December 31, 2016
| Principal Amount | Long-Term Fixed Income (15.8%) | Value | ||||||
Energy (0.4%) - continued | ||||||||
Valero Energy Corporation | ||||||||
| $ | 560,000 | 3.400%, 9/15/2026 | $ | 535,690 | ||||
Weatherford International, Ltd. | ||||||||
| 680,000 | 8.250%, 6/15/2023e | 691,900 | ||||||
|
| |||||||
Total | 23,665,341 | |||||||
|
| |||||||
Financials (1.2%) | ||||||||
ABN AMRO Bank NV | ||||||||
| 450,000 | 4.750%, 7/28/2025g | 455,292 | ||||||
ACE INA Holdings, Inc. | ||||||||
| 335,000 | 4.350%, 11/3/2045 | 353,136 | ||||||
AerCap Ireland Capital, Ltd. | ||||||||
| 220,000 | 3.750%, 5/15/2019 | 224,125 | ||||||
| 224,000 | 4.625%, 10/30/2020 | 232,960 | ||||||
| 925,000 | 5.000%, 10/1/2021 | 972,406 | ||||||
| 224,000 | 4.625%, 7/1/2022 | 230,720 | ||||||
Aetna, Inc. | ||||||||
| 350,000 | 2.400%, 6/15/2021 | 348,103 | ||||||
| 480,000 | 2.800%, 6/15/2023 | 472,273 | ||||||
| 225,000 | 3.200%, 6/15/2026 | 222,257 | ||||||
| 345,000 | 4.250%, 6/15/2036 | 345,358 | ||||||
Air Lease Corporation | ||||||||
| 220,000 | 2.125%, 1/15/2018 | 220,376 | ||||||
| 90,000 | 2.625%, 9/4/2018 | 90,611 | ||||||
Ally Financial, Inc. | ||||||||
| 440,000 | 3.750%, 11/18/2019 | 441,883 | ||||||
| 475,000 | 4.125%, 3/30/2020 | 484,500 | ||||||
American Express Credit Corporation | ||||||||
| 350,000 | 1.543%, 3/18/2019h | 350,668 | ||||||
American International Group, Inc. | ||||||||
| 150,000 | 3.300%, 3/1/2021 | 153,518 | ||||||
| 336,000 | 4.125%, 2/15/2024 | 349,209 | ||||||
| 150,000 | 3.900%, 4/1/2026 | 152,427 | ||||||
Aon plc | ||||||||
| 168,000 | 3.875%, 12/15/2025 | 171,010 | ||||||
Avalonbay Communities, Inc. | ||||||||
| 500,000 | 3.500%, 11/15/2025 | 500,285 | ||||||
Banco Santander Chile | ||||||||
| 435,000 | 1.776%, 4/11/2017g,h | 434,478 | ||||||
Bank of America Corporation | ||||||||
| 448,000 | 8.000%, 1/30/2018j | 460,320 | ||||||
| 370,000 | 2.066%, 3/22/2018h | 372,490 | ||||||
| 295,000 | 1.716%, 4/1/2019h | 296,388 | ||||||
| 350,000 | 2.625%, 10/19/2020 | 349,931 | ||||||
| 595,000 | 3.300%, 1/11/2023 | 596,396 | ||||||
| 448,000 | 4.000%, 4/1/2024 | 461,511 | ||||||
| 450,000 | 4.000%, 1/22/2025 | 450,004 | ||||||
| 336,000 | 3.500%, 4/19/2026 | 331,047 | ||||||
| 561,000 | 5.875%, 2/7/2042 | 676,859 | ||||||
Bank of New York Mellon Corporation | ||||||||
| 560,000 | 2.500%, 4/15/2021 | 560,145 | ||||||
Bank of Tokyo-Mitsubishi UFJ, Ltd. | ||||||||
| 145,000 | 2.850%, 9/8/2021g | 144,890 | ||||||
Barclays Bank plc | ||||||||
| 112,000 | 10.179%, 6/12/2021g | 138,962 | ||||||
Barclays plc | ||||||||
| 264,000 | 2.750%, 11/8/2019 | 263,303 | ||||||
| 448,000 | 3.650%, 3/16/2025 | 433,136 | ||||||
BB&T Corporation | ||||||||
| 150,000 | 1.595%, 1/15/2020h | 150,515 | ||||||
Berkshire Hathaway, Inc. | ||||||||
| 280,000 | 2.750%, 3/15/2023 | 278,661 | ||||||
BPCE SA | ||||||||
| 258,000 | 5.700%, 10/22/2023g | 271,231 | ||||||
Caisse Centrale Desjardins du Quebec | ||||||||
| 210,000 | 1.552%, 1/29/2018g,h | 209,786 | ||||||
Capital One Financial Corporation | ||||||||
| 235,000 | 2.450%, 4/24/2019 | 236,398 | ||||||
Centene Escrow Corporation | ||||||||
| 900,000 | 5.625%, 2/15/2021 | 946,260 | ||||||
Cigna Corporation | ||||||||
| 215,000 | 5.375%, 2/15/2042 | 239,092 | ||||||
CIT Group, Inc. | ||||||||
| 905,000 | 5.000%, 8/15/2022 | 943,462 | ||||||
Citigroup, Inc. | ||||||||
| 245,000 | 1.642%, 4/8/2019h | 245,298 | ||||||
| 450,000 | 2.700%, 3/30/2021 | 448,588 | ||||||
| 244,000 | 4.050%, 7/30/2022 | 252,268 | ||||||
| 685,000 | 4.400%, 6/10/2025 | 699,893 | ||||||
| 448,000 | 3.200%, 10/21/2026 | 427,739 | ||||||
| 336,000 | 4.125%, 7/25/2028 | 331,358 | ||||||
| 177,000 | 4.650%, 7/30/2045e | 186,195 | ||||||
Citizens Bank NA | ||||||||
| 625,000 | 2.300%, 12/3/2018 | 628,079 | ||||||
CoBank ACB | ||||||||
| 120,000 | 1.563%, 6/15/2022h | 114,776 | ||||||
Compass Bank | ||||||||
| 30,000 | 2.750%, 9/29/2019 | 29,823 | ||||||
Cooperatieve Centrale Raiffeisen-Boerenleenbank BA | ||||||||
| 228,000 | 3.950%, 11/9/2022 | 234,287 | ||||||
Credit Agricole SA | ||||||||
| 290,000 | 1.680%, 4/15/2019g,h | 291,259 | ||||||
Credit Suisse AG | ||||||||
| 231,000 | 5.400%, 1/14/2020 | 247,516 | ||||||
Credit Suisse Group Funding, Ltd. | ||||||||
| 672,000 | 2.750%, 3/26/2020 | 665,730 | ||||||
| 448,000 | 3.750%, 3/26/2025 | 440,627 | ||||||
Deutsche Bank AG | ||||||||
| 675,000 | 3.375%, 5/12/2021 | 667,601 | ||||||
Digital Realty Trust LP | ||||||||
| 280,000 | 3.400%, 10/1/2020 | 284,611 | ||||||
Discover Bank | ||||||||
| 510,000 | 8.700%, 11/18/2019 | 578,789 | ||||||
Discover Financial Services | ||||||||
| 188,000 | 6.450%, 6/12/2017 | 191,850 | ||||||
DRB Prime Student Loan Trust | ||||||||
| 631,719 | 2.492%, 10/27/2031, Series 2015-B, Class A1*,h | 642,957 | ||||||
Duke Realty, LP | ||||||||
| 88,000 | 3.875%, 2/15/2021 | 91,639 | ||||||
| 264,000 | 4.375%, 6/15/2022 | 281,067 | ||||||
ERP Operating, LP | ||||||||
| 90,000 | 3.375%, 6/1/2025 | 89,236 | ||||||
European Investment Bank | ||||||||
| 445,000 | 1.875%, 3/15/2019 | 447,868 | ||||||
Fifth Third Bancorp | ||||||||
| 286,000 | 5.450%, 1/15/2017 | 286,393 | ||||||
| 148,000 | 2.875%, 7/27/2020 | 149,628 | ||||||
| 145,000 | 2.875%, 10/1/2021 | 146,589 | ||||||
GE Capital International Funding Company | ||||||||
| 919,000 | 4.418%, 11/15/2035 | 961,487 | ||||||
Genworth Financial, Inc. | ||||||||
| 168,000 | 7.700%, 6/15/2020 | 162,490 | ||||||
Goldman Sachs Group, Inc. | ||||||||
| 390,000 | 2.087%, 4/30/2018h | 393,397 | ||||||
| 205,000 | 2.006%, 11/15/2018h | 206,949 | ||||||
The accompanying Notes to Financial Statements are an integral part of this schedule.
28
Table of Contents
MODERATELY AGGRESSIVE ALLOCATION PORTFOLIO
Schedule of Investments as of December 31, 2016
| Principal Amount | Long-Term Fixed Income (15.8%) | Value | ||||||
Financials (1.2%) - continued | ||||||||
| $ | 909,000 | 5.375%, 3/15/2020 | $ | 985,630 | ||||
| 210,000 | 2.042%, 4/23/2020h | 212,007 | ||||||
| 896,000 | 5.250%, 7/27/2021 | 981,150 | ||||||
| 560,000 | 2.350%, 11/15/2021 | 543,544 | ||||||
| 224,000 | 3.500%, 1/23/2025 | 220,740 | ||||||
| 390,000 | 4.750%, 10/21/2045 | 410,392 | ||||||
Hartford Financial Services Group, Inc. | ||||||||
| 544,000 | 5.125%, 4/15/2022 | 602,795 | ||||||
HBOS plc | ||||||||
| 558,000 | 6.750%, 5/21/2018g | 588,270 | ||||||
HCP, Inc. | ||||||||
| 705,000 | 4.000%, 12/1/2022 | 724,944 | ||||||
| 176,000 | 3.400%, 2/1/2025 | 168,187 | ||||||
HSBC Bank plc | ||||||||
| 495,000 | 1.546%, 5/15/2018g,h | 495,167 | ||||||
HSBC Holdings plc | ||||||||
| 450,000 | 3.400%, 3/8/2021 | 457,217 | ||||||
| 450,000 | 6.875%, 6/1/2021j | 474,750 | ||||||
| 350,000 | 2.650%, 1/5/2022 | 342,137 | ||||||
| 350,000 | 3.600%, 5/25/2023 | 351,646 | ||||||
| 425,000 | 3.900%, 5/25/2026 | 427,292 | ||||||
Huntington Bancshares, Inc. | ||||||||
| 66,000 | 2.600%, 8/2/2018 | 66,632 | ||||||
Huntington National Bank | ||||||||
| 250,000 | 2.200%, 11/6/2018 | 250,660 | ||||||
Icahn Enterprises, LP | ||||||||
| 475,000 | 6.000%, 8/1/2020 | 485,094 | ||||||
ING Capital Funding Trust III | ||||||||
| 265,000 | 4.438%, 3/31/2017h,j | 263,675 | ||||||
Intesa Sanpaolo SPA | ||||||||
| 450,000 | 5.250%, 1/12/2024 | 472,922 | ||||||
J.P. Morgan Chase & Company | ||||||||
| 582,000 | 7.900%, 4/30/2018j | 602,661 | ||||||
| 326,000 | 6.300%, 4/23/2019 | 356,095 | ||||||
| 165,000 | 2.250%, 1/23/2020 | 164,508 | ||||||
| 265,000 | 2.295%, 8/15/2021 | 259,849 | ||||||
| 560,000 | 4.500%, 1/24/2022 | 603,336 | ||||||
| 336,000 | 3.200%, 1/25/2023 | 339,400 | ||||||
| 575,000 | 2.700%, 5/18/2023 | 561,947 | ||||||
| 245,000 | 2.112%, 10/24/2023h | 249,892 | ||||||
| 352,000 | 3.625%, 5/13/2024 | 357,630 | ||||||
| 690,000 | 3.125%, 1/23/2025 | 673,646 | ||||||
| 360,000 | 3.300%, 4/1/2026 | 353,210 | ||||||
KeyBank NA | ||||||||
| 365,000 | 2.350%, 3/8/2019 | 366,959 | ||||||
KeyCorp | ||||||||
| 300,000 | 2.900%, 9/15/2020 | 303,329 | ||||||
Kookmin Bank | ||||||||
| 375,000 | 1.625%, 8/1/2019g | 369,371 | ||||||
Liberty Mutual Group, Inc. | ||||||||
| 445,000 | 4.950%, 5/1/2022g | 485,058 | ||||||
Liberty Property, LP | ||||||||
| 618,000 | 3.750%, 4/1/2025 | 620,451 | ||||||
Lincoln National Corporation | ||||||||
| 220,000 | 8.750%, 7/1/2019 | 253,025 | ||||||
| 336,000 | 7.000%, 6/15/2040 | 423,546 | ||||||
Lloyds Bank plc | ||||||||
| 235,000 | 1.490%, 3/16/2018h | 235,319 | ||||||
Merrill Lynch & Company, Inc. | ||||||||
| 675,000 | 6.400%, 8/28/2017 | 695,677 | ||||||
MetLife, Inc. | ||||||||
| 355,000 | 4.050%, 3/1/2045 | 339,733 | ||||||
Mitsubishi UFJ Financial Group, Inc. | ||||||||
| 370,000 | 2.190%, 9/13/2021 | 359,471 | ||||||
Mizuho Bank, Ltd. | ||||||||
| 282,000 | 1.850%, 3/21/2018g | 281,472 | ||||||
Morgan Stanley | ||||||||
| 1,018,000 | 6.625%, 4/1/2018 | 1,076,421 | ||||||
| 260,000 | 2.162%, 4/25/2018h | 262,721 | ||||||
| 210,000 | 2.026%, 1/27/2020h | 211,858 | ||||||
| 224,000 | 5.550%, 7/15/2020e,j | 226,520 | ||||||
| 280,000 | 2.500%, 4/21/2021 | 276,716 | ||||||
| 560,000 | 2.625%, 11/17/2021 | 552,722 | ||||||
| 155,000 | 4.875%, 11/1/2022 | 165,939 | ||||||
| 275,000 | 4.000%, 7/23/2025 | 281,508 | ||||||
| 540,000 | 4.350%, 9/8/2026 | 550,224 | ||||||
MPT Operating Partnership, LP | ||||||||
| 725,000 | 6.375%, 3/1/2024 | 758,531 | ||||||
Nasdaq, Inc. | ||||||||
| 295,000 | 3.850%, 6/30/2026 | 292,632 | ||||||
National City Corporation | ||||||||
| 288,000 | 6.875%, 5/15/2019 | 316,873 | ||||||
Prudential Financial, Inc. | ||||||||
| 145,000 | 2.350%, 8/15/2019 | 146,333 | ||||||
Quicken Loans, Inc. | ||||||||
| 980,000 | 5.750%, 5/1/2025g | 953,050 | ||||||
Realty Income Corporation | ||||||||
| 58,000 | 2.000%, 1/31/2018 | 58,157 | ||||||
Regions Bank | ||||||||
| 250,000 | 7.500%, 5/15/2018 | 267,794 | ||||||
Regions Financial Corporation | ||||||||
| 250,000 | 2.250%, 9/14/2018 | 250,777 | ||||||
| 336,000 | 3.200%, 2/8/2021 | 340,482 | ||||||
Reinsurance Group of America, Inc. | ||||||||
| 105,000 | 5.625%, 3/15/2017 | 105,853 | ||||||
| 252,000 | 5.000%, 6/1/2021 | 272,093 | ||||||
Reliance Standard Life Global Funding II | ||||||||
| 230,000 | 2.500%, 4/24/2019g | 231,431 | ||||||
Royal Bank of Scotland Group plc | ||||||||
| 250,000 | 8.625%, 8/15/2021j | 255,000 | ||||||
| 300,000 | 3.875%, 9/12/2023 | 287,756 | ||||||
Santander Holdings USA, Inc. | ||||||||
| 295,000 | 3.450%, 8/27/2018 | 299,416 | ||||||
Santander UK Group Holdings plc | ||||||||
| 380,000 | 2.875%, 10/16/2020 | 376,577 | ||||||
Santander UK plc | ||||||||
| 132,000 | 3.050%, 8/23/2018 | 134,061 | ||||||
Simon Property Group, LP | ||||||||
| 150,000 | 2.500%, 9/1/2020 | 151,020 | ||||||
| 400,000 | 2.750%, 2/1/2023 | 394,022 | ||||||
| 448,000 | 4.250%, 11/30/2046 | 439,438 | ||||||
Skandinaviska Enskilda Banken AB | ||||||||
| 365,000 | 2.375%, 3/25/2019g | 365,937 | ||||||
Standard Chartered plc | ||||||||
| 375,000 | 2.100%, 8/19/2019g | 370,548 | ||||||
State Street Corporation | ||||||||
| 233,000 | 1.809%, 8/18/2020h | 236,116 | ||||||
Sumitomo Mitsui Banking Corporation | ||||||||
| 250,000 | 1.460%, 1/16/2018h | 250,313 | ||||||
Sumitomo Mitsui Financial Group, Inc. | ||||||||
| 336,000 | 3.010%, 10/19/2026 | 321,047 | ||||||
Svenska Handelsbanken AB | ||||||||
| 330,000 | 1.483%, 6/17/2019h | 330,241 | ||||||
Synchrony Financial | ||||||||
| 140,000 | 2.111%, 2/3/2020h | 138,416 | ||||||
| 155,000 | 3.750%, 8/15/2021 | 159,173 | ||||||
The accompanying Notes to Financial Statements are an integral part of this schedule.
29
Table of Contents
MODERATELY AGGRESSIVE ALLOCATION PORTFOLIO
Schedule of Investments as of December 31, 2016
| Principal Amount | Long-Term Fixed Income (15.8%) | Value | ||||||
Financials (1.2%) - continued | ||||||||
| $ | 625,000 | 4.250%, 8/15/2024 | $ | 635,488 | ||||
Toronto-Dominion Bank | ||||||||
| 165,000 | 1.889%, 12/14/2020h | 166,940 | ||||||
UBS Group Funding Jersey, Ltd. | ||||||||
| 560,000 | 2.950%, 9/24/2020g | 559,828 | ||||||
| 336,000 | 4.125%, 9/24/2025g | 342,018 | ||||||
UnitedHealth Group, Inc. | ||||||||
| 100,000 | 3.350%, 7/15/2022 | 102,920 | ||||||
| 1,010,000 | 4.625%, 7/15/2035 | 1,099,209 | ||||||
USB Realty Corporation | ||||||||
| 140,000 | 2.027%, 1/15/2022g,h,j | 123,200 | ||||||
Voya Financial, Inc. | ||||||||
| 344,000 | 2.900%, 2/15/2018 | 348,219 | ||||||
Wells Fargo & Company | ||||||||
| 210,000 | 1.567%, 1/30/2020h | 209,897 | ||||||
| 450,000 | 2.550%, 12/7/2020 | 450,157 | ||||||
| 448,000 | 3.450%, 2/13/2023 | 449,163 | ||||||
| 350,000 | 3.000%, 2/19/2025 | 335,787 | ||||||
| 450,000 | 3.000%, 4/22/2026 | 428,799 | ||||||
| 450,000 | 3.000%, 10/23/2026 | 427,849 | ||||||
| 430,000 | 4.900%, 11/17/2045 | 440,811 | ||||||
Welltower, Inc. | ||||||||
| 58,000 | 2.250%, 3/15/2018 | 58,240 | ||||||
| 185,000 | 3.750%, 3/15/2023 | 188,537 | ||||||
| 165,000 | 4.000%, 6/1/2025 | 168,415 | ||||||
|
| |||||||
Total | 64,265,998 | |||||||
|
| |||||||
Foreign Government (<0.1%) | ||||||||
Argentina Government International Bond | ||||||||
| 335,000 | 7.500%, 4/22/2026g | 351,750 | ||||||
Brazil Government International Bond | ||||||||
| 590,000 | 7.125%, 1/20/2037 | 615,075 | ||||||
Export-Import Bank of Korea | ||||||||
| 205,000 | 2.250%, 1/21/2020 | 203,790 | ||||||
Indonesia Government International Bond | ||||||||
| 735,000 | 5.250%, 1/8/2047g | 732,885 | ||||||
Kommunalbanken AS | ||||||||
| 335,000 | 1.500%, 10/22/2019g | 331,970 | ||||||
Mexico Government International Bond | ||||||||
| 300,000 | 4.125%, 1/21/2026 | 297,600 | ||||||
| 300,000 | 4.350%, 1/15/2047 | 257,250 | ||||||
|
| |||||||
Total | 2,790,320 | |||||||
|
| |||||||
Mortgage-Backed Securities (5.8%) | ||||||||
Federal Home Loan Mortgage Corporation Gold 15-Yr. Pass Through | ||||||||
| 18,800,000 | 3.000%, 1/1/2032c | 19,283,160 | ||||||
Federal Home Loan Mortgage Corporation Gold 30-Yr. Pass Through | ||||||||
| 12,300,000 | 4.000%, 1/1/2047c | 12,912,540 | ||||||
Federal National Mortgage Association Conventional 15-Yr. Pass Through | ||||||||
| 24,525,000 | 2.500%, 1/1/2032c | 24,551,977 | ||||||
Federal National Mortgage Association Conventional 30-Yr. Pass Through | ||||||||
| 1,692,962 | 1.740%, 7/1/2043h | 1,739,880 | ||||||
| 371,442 | 2.043%, 7/1/2043h | 382,521 | ||||||
| 381,124 | 2.088%, 8/1/2043h | 392,573 | ||||||
| 50,200,000 | 3.000%, 1/1/2047c | 49,833,540 | ||||||
| 105,575,000 | 3.500%, 1/1/2047c | 108,140,473 | ||||||
| 65,000,000 | 4.000%, 1/1/2047c | 68,302,000 | ||||||
| 24,139,000 | 4.500%, 1/1/2047c | 25,954,253 | ||||||
|
| |||||||
Total | 311,492,917 | |||||||
|
| |||||||
Technology (0.2%) | ||||||||
Amphenol Corporation | ||||||||
| 188,000 | 2.550%, 1/30/2019 | 190,191 | ||||||
Apple, Inc. | ||||||||
| 165,000 | 1.202%, 5/6/2020h | 164,864 | ||||||
| 784,000 | 3.200%, 5/13/2025 | 786,207 | ||||||
| 336,000 | 4.650%, 2/23/2046 | 362,098 | ||||||
Avnet, Inc. | ||||||||
| 335,000 | 3.750%, 12/1/2021 | 336,754 | ||||||
Cisco Systems, Inc. | ||||||||
| 220,000 | 1.431%, 3/1/2019h | 221,256 | ||||||
CommScope Technologies Finance, LLC | ||||||||
| 650,000 | 6.000%, 6/15/2025g | 689,000 | ||||||
Diamond 1 Finance Corporation | ||||||||
| 280,000 | 3.480%, 6/1/2019g | 285,753 | ||||||
| 220,000 | 5.450%, 6/15/2023g | 233,124 | ||||||
| 168,000 | 6.020%, 6/15/2026g | 181,758 | ||||||
| 336,000 | 8.100%, 7/15/2036g | 399,183 | ||||||
| 224,000 | 8.350%, 7/15/2046g | 275,385 | ||||||
Equinix, Inc. | ||||||||
| 700,000 | 5.750%, 1/1/2025 | 731,500 | ||||||
Fidelity National Information Services, Inc. | ||||||||
| 400,000 | 2.850%, 10/15/2018 | 406,880 | ||||||
| 338,000 | 3.625%, 10/15/2020 | 349,662 | ||||||
First Data Corporation | ||||||||
| 450,000 | 5.375%, 8/15/2023g | 466,875 | ||||||
Hewlett Packard Enterprise Company | ||||||||
| 280,000 | 2.450%, 10/5/2017 | 281,542 | ||||||
| 140,000 | 2.850%, 10/5/2018 | 141,327 | ||||||
| 140,000 | 4.400%, 10/15/2022 | 145,637 | ||||||
Intel Corporation | ||||||||
| 85,000 | 3.100%, 7/29/2022 | 87,312 | ||||||
| 180,000 | 3.700%, 7/29/2025 | 189,608 | ||||||
| 504,000 | 4.100%, 5/19/2046 | 498,505 | ||||||
International Business Machines Corporation | ||||||||
| 448,000 | 4.700%, 2/19/2046 | 487,484 | ||||||
Iron Mountain, Inc. | ||||||||
| 825,000 | 6.000%, 8/15/2023 | 876,563 | ||||||
Microsoft Corporation | ||||||||
| 700,000 | 4.750%, 11/3/2055 | 759,650 | ||||||
| 700,000 | 4.200%, 11/3/2035 | 735,438 | ||||||
| 390,000 | 3.700%, 8/8/2046 | 366,375 | ||||||
NXP BV | ||||||||
| 650,000 | 3.875%, 9/1/2022g | 658,125 | ||||||
Oracle Corporation | ||||||||
| 150,000 | 2.500%, 5/15/2022 | 148,800 | ||||||
| 448,000 | 2.400%, 9/15/2023 | 433,512 | ||||||
| 460,000 | 2.950%, 5/15/2025 | 450,325 | ||||||
Qualcomm, Inc. | ||||||||
| 336,000 | 3.000%, 5/20/2022 | 340,104 | ||||||
Sensata Technologies UK Financing Company plc | ||||||||
| 540,000 | 6.250%, 2/15/2026g | 564,300 | ||||||
|
| |||||||
Total | 13,245,097 | |||||||
|
| |||||||
The accompanying Notes to Financial Statements are an integral part of this schedule.
30
Table of Contents
MODERATELY AGGRESSIVE ALLOCATION PORTFOLIO
Schedule of Investments as of December 31, 2016
| Principal Amount | Long-Term Fixed Income (15.8%) | Value | ||||||
Transportation (0.1%) | ||||||||
Air Canada Pass Through Trust | ||||||||
| $ 130,427 | 3.875%, 3/15/2023g | $ | 125,862 | |||||
American Airlines Pass Through Trust | ||||||||
| 274,122 | 3.375%, 5/1/2027 | 270,010 | ||||||
Avis Budget Car Rental, LLC | ||||||||
| 665,000 | 5.125%, 6/1/2022g | 651,700 | ||||||
| 500,000 | 6.375%, 4/1/2024e,g | 499,375 | ||||||
Burlington Northern Santa Fe, LLC | ||||||||
| 350,000 | 5.050%, 3/1/2041 | 396,473 | ||||||
| 480,000 | 3.900%, 8/1/2046 | 468,279 | ||||||
Continental Airlines, Inc. | ||||||||
| 136,576 | 4.150%, 4/11/2024 | 140,332 | ||||||
CSX Corporation | ||||||||
| 448,000 | 4.250%, 11/1/2066 | 407,852 | ||||||
| 115,000 | 3.700%, 11/1/2023 | 119,221 | ||||||
Delta Air Lines, Inc. | ||||||||
| 62,548 | 4.950%, 5/23/2019 | 65,550 | ||||||
ERAC USA Finance, LLC | ||||||||
| 67,000 | 2.800%, 11/1/2018g | 67,827 | ||||||
J.B. Hunt Transport Services, Inc. | ||||||||
| 135,000 | 3.300%, 8/15/2022 | 135,393 | ||||||
Southwest Airlines Company | ||||||||
| 285,000 | 2.750%, 11/6/2019 | 289,894 | ||||||
Virgin Australia Holdings, Ltd. | ||||||||
| 66,471 | 5.000%, 10/23/2023g | 69,462 | ||||||
XPO Logistics, Inc. | ||||||||
| 690,000 | 6.500%, 6/15/2022e,g | 724,500 | ||||||
|
| |||||||
Total | 4,431,730 | |||||||
|
| |||||||
U.S. Government and Agencies (4.1%) | ||||||||
Federal National Mortgage Association | ||||||||
| 405,000 | 6.250%, 5/15/2029 | 535,933 | ||||||
Tennessee Valley Authority | ||||||||
| 390,000 | 5.250%, 9/15/2039 | 488,965 | ||||||
U.S. Treasury Bonds | ||||||||
| 4,150,000 | 6.500%, 11/15/2026 | 5,612,240 | ||||||
| 2,900,000 | 5.250%, 11/15/2028 | 3,685,807 | ||||||
| 2,050,000 | 4.375%, 5/15/2040 | 2,528,193 | ||||||
| 10,625,000 | 3.000%, 5/15/2042 | 10,514,489 | ||||||
| 14,300,000 | 3.625%, 2/15/2044 | 15,816,644 | ||||||
| 7,534,000 | 2.500%, 5/15/2046 | 6,678,673 | ||||||
| 4,000,000 | 2.875%, 11/15/2046 | 3,852,380 | ||||||
U.S. Treasury Bonds, TIPS | ||||||||
| 1,753,686 | 0.125%, 4/15/2019 | 1,775,500 | ||||||
| 36,887,972 | 0.125%, 1/15/2023 | 36,611,386 | ||||||
| 102,588 | 2.375%, 1/15/2025 | 117,776 | ||||||
| 30,096,525 | 0.625%, 1/15/2026 | 30,356,047 | ||||||
| 67,101 | 2.125%, 2/15/2040 | 83,081 | ||||||
| 588,357 | 0.750%, 2/15/2042 | 556,818 | ||||||
U.S. Treasury Notes | ||||||||
| 700,000 | 0.875%, 1/31/2017l | 700,279 | ||||||
| 385,000 | 1.000%, 11/30/2018e | 383,688 | ||||||
| 3,650,000 | 0.750%, 2/15/2019 | 3,612,708 | ||||||
| 3,900,000 | 1.000%, 10/15/2019 | 3,856,495 | ||||||
| 8,415,000 | 1.500%, 10/31/2019 | 8,431,426 | ||||||
| 4,070,000 | 1.375%, 9/30/2020 | 4,020,891 | ||||||
| 1,500,000 | 1.375%, 5/31/2021 | 1,468,839 | ||||||
| 23,030,000 | 1.125%, 8/31/2021 | 22,230,398 | ||||||
| 2,000,000 | 2.125%, 6/30/2022 | 2,004,874 | ||||||
| 1,015,000 | 1.625%, 8/15/2022 | 988,771 | ||||||
| 2,198,000 | 1.375%, 9/30/2023 | 2,078,912 | ||||||
| 24,900,000 | 1.625%, 10/31/2023 | 23,925,937 | ||||||
| 7,435,000 | 2.250%, 11/15/2024 | 7,379,565 | ||||||
| 16,686,000 | 2.000%, 11/15/2026e | 16,028,405 | ||||||
|
| |||||||
Total | 216,325,120 | |||||||
|
| |||||||
Utilities (0.4%) | ||||||||
American Electric Power Company, Inc. | ||||||||
| 718,000 | 2.950%, 12/15/2022 | 721,749 | ||||||
Arizona Public Service Company | ||||||||
| 180,000 | 2.200%, 1/15/2020 | 180,102 | ||||||
Berkshire Hathaway Energy Company | ||||||||
| 132,000 | 2.400%, 2/1/2020 | 132,278 | ||||||
Calpine Corporation | ||||||||
| 670,000 | 5.375%, 1/15/2023 | 654,925 | ||||||
Chesapeake Midstream Partners, LP | ||||||||
| 560,000 | 6.125%, 7/15/2022 | 577,594 | ||||||
CMS Energy Corporation | ||||||||
| 336,000 | 2.950%, 2/15/2027 | 318,393 | ||||||
Commonwealth Edison Company | ||||||||
| 355,000 | 3.700%, 3/1/2045 | 333,165 | ||||||
| 280,000 | 4.350%, 11/15/2045 | 291,751 | ||||||
Consolidated Edison Company of New York, Inc. | ||||||||
| 168,000 | 4.500%, 12/1/2045 | 177,779 | ||||||
Consolidated Edison, Inc. | ||||||||
| 224,000 | 2.000%, 5/15/2021 | 218,727 | ||||||
Dominion Resources, Inc. | ||||||||
| 475,000 | 2.962%, 7/1/2019 | 480,689 | ||||||
DTE Electric Company | ||||||||
| 265,000 | 3.700%, 3/15/2045 | 252,830 | ||||||
| 360,000 | 3.700%, 6/1/2046 | 345,561 | ||||||
DTE Energy Company | ||||||||
| 70,000 | 2.400%, 12/1/2019 | 70,311 | ||||||
Duke Energy Corporation | ||||||||
| 468,000 | 2.100%, 6/15/2018 | 469,922 | ||||||
| 448,000 | 3.750%, 9/1/2046 | 402,438 | ||||||
Duke Energy Indiana, LLC | ||||||||
| 450,000 | 3.750%, 5/15/2046 | 422,350 | ||||||
Dynegy, Inc. | ||||||||
| 665,000 | 7.375%, 11/1/2022 | 635,075 | ||||||
Edison International | ||||||||
| 450,000 | 2.950%, 3/15/2023 | 444,710 | ||||||
Emera U.S. Finance, LP | ||||||||
| 335,000 | 2.150%, 6/15/2019g | 334,305 | ||||||
| 335,000 | 4.750%, 6/15/2046g | 337,171 | ||||||
Enel Finance International NV | ||||||||
| 84,000 | 6.250%, 9/15/2017g | 86,573 | ||||||
Energy Transfer Equity, LP | ||||||||
| 670,000 | 5.500%, 6/1/2027 | 653,250 | ||||||
Eversource Energy | ||||||||
| 150,000 | 1.600%, 1/15/2018 | 149,643 | ||||||
Exelon Corporation | ||||||||
| 240,000 | 5.100%, 6/15/2045 | 254,639 | ||||||
| 336,000 | 4.450%, 4/15/2046 | 328,261 | ||||||
Exelon Generation Company, LLC | ||||||||
| 300,000 | 5.200%, 10/1/2019 | 321,381 | ||||||
| 135,000 | 2.950%, 1/15/2020 | 136,537 | ||||||
ITC Holdings Corporation | ||||||||
| 67,000 | 4.050%, 7/1/2023 | 68,666 | ||||||
| 224,000 | 5.300%, 7/1/2043 | 244,587 | ||||||
Kinder Morgan Energy Partners, LP | ||||||||
| 340,000 | 3.500%, 3/1/2021 | 344,908 | ||||||
MidAmerican Energy Holdings Company | ||||||||
| 672,000 | 6.500%, 9/15/2037 | 873,369 | ||||||
Monongahela Power Company | ||||||||
| 275,000 | 5.400%, 12/15/2043g | 320,830 | ||||||
The accompanying Notes to Financial Statements are an integral part of this schedule.
31
Table of Contents
MODERATELY AGGRESSIVE ALLOCATION PORTFOLIO
Schedule of Investments as of December 31, 2016
| Principal Amount | Long-Term Fixed Income (15.8%) | Value | ||||||
Utilities (0.4%) - continued | ||||||||
National Rural Utilities Cooperative Finance Corporation | ||||||||
| $ 400,000 | 2.300%, 11/1/2020 | $ | 397,300 | |||||
NextEra Energy Capital Holdings, Inc. | ||||||||
| 280,000 | 2.300%, 4/1/2019 | 282,022 | ||||||
NiSource Finance Corporation | ||||||||
| 615,000 | 5.650%, 2/1/2045 | 715,739 | ||||||
Northern States Power Company | ||||||||
| 410,000 | 4.125%, 5/15/2044 | 416,018 | ||||||
NRG Energy, Inc. | ||||||||
| 630,000 | 6.625%, 3/15/2023 | 631,575 | ||||||
Oncor Electric Delivery Company, LLC | ||||||||
| 258,000 | 3.750%, 4/1/2045 | 246,836 | ||||||
Pacific Gas & Electric Company | ||||||||
| 336,000 | 4.250%, 3/15/2046 | 340,751 | ||||||
PG&E Corporation | ||||||||
| 140,000 | 2.400%, 3/1/2019 | 140,501 | ||||||
PPL Capital Funding, Inc. | ||||||||
| 144,000 | 3.500%, 12/1/2022 | 147,106 | ||||||
| 515,000 | 5.000%, 3/15/2044 | 543,605 | ||||||
Regency Energy Partners, LP | ||||||||
| 448,000 | 5.875%, 3/1/2022 | 492,374 | ||||||
Sempra Energy | ||||||||
| 365,000 | 6.150%, 6/15/2018 | 386,635 | ||||||
| 170,000 | 2.400%, 3/15/2020 | 169,657 | ||||||
Southern California Edison Company | ||||||||
| 100,000 | 2.400%, 2/1/2022 | 99,612 | ||||||
Southern Company | ||||||||
| 450,000 | 1.850%, 7/1/2019 | 448,413 | ||||||
| 450,000 | 4.400%, 7/1/2046 | 444,200 | ||||||
Southwestern Electric Power Company | ||||||||
| 180,000 | 3.900%, 4/1/2045 | 167,315 | ||||||
Tesoro Corporation | ||||||||
| 910,000 | 4.750%, 12/15/2023g | 914,550 | ||||||
Tesoro Logistics, LP | ||||||||
| 755,000 | 5.250%, 1/15/2025 | 771,044 | ||||||
TransAlta Corporation | ||||||||
| 336,000 | 1.900%, 6/3/2017 | 334,320 | ||||||
Williams Partners, LP | ||||||||
| 450,000 | 5.100%, 9/15/2045 | 426,926 | ||||||
Xcel Energy, Inc. | ||||||||
| 550,000 | 3.350%, 12/1/2026 | 549,636 | ||||||
|
| |||||||
Total | 20,650,604 | |||||||
|
| |||||||
Total Long-Term Fixed Income (cost $840,545,662) | 841,818,463 | |||||||
|
| |||||||
| Shares | Preferred Stock (<0.1%) | |||||||
Consumer Staples (<0.1%) | ||||||||
| 299 | Henkel AG & Company KGaA, 1.470% | 35,593 | ||||||
|
| |||||||
Total | 35,593 | |||||||
|
| |||||||
Energy (<0.1%) | ||||||||
| 1,954 | Alpha Natural Resources, Inc., 0.000%d | 39,080 | ||||||
| 1,954 | ANR Holdings, Inc., 0.000%d | 10,551 | ||||||
|
| |||||||
Total | 49,631 | |||||||
|
| |||||||
Total Preferred Stock (cost $40,059) | 85,224 | |||||||
|
| |||||||
Collateral Held for Securities Loaned (1.1%) | ||||||||
| 56,510,060 | Thrivent Cash Management Trust | 56,510,060 | ||||||
|
| |||||||
Total Collateral Held for Securities Loaned (cost $56,510,060) | 56,510,060 | |||||||
|
| |||||||
| Shares or Principal Amount | Short-Term Investments (12.7%)m | |||||||
Federal Home Loan Bank Discount Notes | ||||||||
| 13,000,000 | 0.343%, 1/4/2017n | 12,999,857 | ||||||
| 2,600,000 | 0.344%, 1/6/2017n | 2,599,917 | ||||||
| 300,000 | 0.440%, 1/18/2017n | 299,953 | ||||||
| 800,000 | 0.500%, 1/19/2017n | 799,865 | ||||||
| 2,500,000 | 0.383%, 1/20/2017n | 2,499,552 | ||||||
| 5,000,000 | 0.455%, 1/25/2017n | 4,998,840 | ||||||
| 300,000 | 0.365%, 1/27/2017n | 299,924 | ||||||
| 3,900,000 | 0.454%, 2/1/2017n | 3,898,428 | ||||||
| 400,000 | 0.515%, 2/9/2017n | 399,794 | ||||||
| 100,000 | 0.490%, 2/10/2017n | 99,947 | ||||||
| 1,100,000 | 0.500%, 2/17/2017n | 1,099,313 | ||||||
Federal National Mortgage Association Discount Notes | ||||||||
| 3,600,000 | 0.345%, 1/11/2017n | 3,599,698 | ||||||
Thrivent Core Short-Term Reserve Fund | ||||||||
| 64,077,688 | 0.910% | 640,776,883 | ||||||
U.S. Treasury Bills | ||||||||
| 1,300,000 | 0.412%, 1/26/2017l | 1,299,650 | ||||||
| 1,800,000 | 0.480%, 2/9/2017l | 1,799,172 | ||||||
U.S. Treasury Notes | ||||||||
| 300,000 | 0.500%, 1/31/2017l | 300,034 | ||||||
|
| |||||||
Total Short-Term Investments (cost $677,769,871) | 677,770,827 | |||||||
|
| |||||||
Total Investments (cost $5,052,677,086) 106.7% | $ | 5,682,552,300 | ||||||
|
| |||||||
Other Assets and Liabilities, Net (6.7%) | (356,863,084 | ) | ||||||
|
| |||||||
Total Net Assets 100.0% | $ | 5,325,689,216 | ||||||
|
| |||||||
| a | The stated interest rate represents the weighted average of all contracts within the bank loan facility. |
| b | All or a portion of the loan is unfunded. |
| c | Denotes investments purchased on a when-issued or delayed delivery basis. |
| d | Non-income producing security. |
| e | All or a portion of the security is on loan. |
| f | Security is valued at fair value. Market quotations or prices were not readily available or were determined to be unreliable. Fair value was determined in good faith pursuant to procedures adopted by the Board. Further information on fair valuation can be found in the Notes to Financial Statements. |
| g | Denotes securities sold under Rule 144A of the Securities Act of 1933, which exempts them from registration. These securities may be resold to other dealers in the program or to other qualified institutional buyers. As of December 31, 2016, the value of these investments was $65,448,969 or 1.2% of total net assets. |
| h | Denotes variable rate securities. Variable rate securities are securities whose yields vary with a designated market index or market rate. The rate shown is as of December 31, 2016. |
| i | Denotes step coupon securities. Step coupon securities pay an initial coupon rate for the first period and then different coupon rates for following periods. The rate shown is as of December 31, 2016. |
| j | Denotes perpetual securities. Perpetual securities pay an indefinite stream of interest and have no contractual maturity date. Date shown, if applicable, is next call date. |
The accompanying Notes to Financial Statements are an integral part of this schedule.
32
Table of Contents
MODERATELY AGGRESSIVE ALLOCATION PORTFOLIO
Schedule of Investments as of December 31, 2016
| k | Denotes interest only security. Interest only securities represent the right to receive monthly interest payments on an underlying pool of mortgages or assets. The principal shown is the outstanding par amount of the pool as of the end of the period. The actual effective yield of the security is different than the stated coupon rate. |
| l | At December 31, 2016, $1,038,717 of investments were segregated to cover exposure to a counterparty for margin on open mortgage-backed security transactions. |
| m | The interest rate shown reflects the yield, coupon rate or the discount rate at the date of purchase. |
| n | All or a portion of the security is held on deposit with the counterparty and pledged as the initial margin deposit for open futures contracts. |
| * | Denotes restricted securities. Restricted securities are investment securities which cannot be offered for public sale without first being registered under the Securities Act of 1933. The value of all restricted securities held in Moderately Aggressive Allocation Portfolio as of December 31, 2016 was $33,835,987 or 0.6% of total net assets. The following table indicates the acquisition date and cost of restricted securities shown in the schedule as of December 31, 2016. |
Security | Acquisition Date | Cost | ||||||
Alm Loan Funding CLO, 10/17/2026 | 7/31/2014 | $ | 384,807 | |||||
Angel Oak Mortgage Trust I, LLC, 7/25/2046 | 8/15/2016 | 503,870 | ||||||
Apidos CLO XVIII, 7/22/2026 | 6/25/2014 | 374,062 | ||||||
Ares CLO, Ltd., 10/12/2023 | 5/15/2015 | 1,275,000 | ||||||
Ares CLO, Ltd., 11/15/2025 | 11/26/2014 | 750,000 | ||||||
Babson CLO, Ltd., 10/17/2026 | 8/15/2014 | 384,808 | ||||||
Betony CLO, Ltd., 4/15/2027 | 11/17/2016 | 350,000 | ||||||
Birchwood Park CLO, Ltd., 7/15/2026 | 7/31/2014 | 385,000 | ||||||
BlueMountain CLO, Ltd., 10/15/2026 | 8/27/2014 | 384,611 | ||||||
Carlyle Global Market Strategies CLO, Ltd., 10/15/2026 | 9/19/2014 | 400,000 | ||||||
Carlyle Global Market Strategies CLO, Ltd., 7/20/2023 | 7/3/2014 | 333,824 | ||||||
Cent CLO 16, LP, 8/1/2024 | 9/5/2014 | 374,055 | ||||||
Cent CLO 22, Ltd., 11/7/2026 | 11/1/2016 | 400,000 | ||||||
COLT Mortgage Loan Trust, 12/26/2046 | 12/14/2016 | 925,779 | ||||||
Contura Energy, Inc., 8/1/2021 | 3/28/2016 | 72,577 | ||||||
Digicel, Ltd., 4/15/2021 | 8/18/2014 | 1,244,296 | ||||||
DRB Prime Student Loan Trust, 10/27/2031 | 9/30/2016 | 641,846 | ||||||
DRB Prime Student Loan Trust, 1/25/2040 | 12/4/2015 | 1,596,936 | ||||||
Dryden 34 Senior Loan Fund CLO, 10/15/2026 | 7/21/2014 | 385,000 | ||||||
Edlinc Student Loan Funding Trust, 10/1/2025 | 2/28/2013 | 244,843 | ||||||
Galaxy XX CLO, Ltd., 7/20/2027 | 5/20/2015 | 1,200,000 | ||||||
GoldenTree Loan Opportunities IX, Ltd., 10/29/2026 | 10/7/2016 | 400,000 | ||||||
Golub Capital Partners CLO 22B, Ltd., 2/20/2027 | 2/6/2015 | 721,303 | ||||||
Golub Capital Partners CLO 23M, Ltd., 5/5/2027 | 5/18/2015 | 349,125 | ||||||
Limerock CLO III, LLC, 10/20/2026 | 10/16/2014 | 1,150,000 | ||||||
Madison Park Funding XIV CLO, Ltd., 7/20/2026 | 7/3/2014 | 424,490 | ||||||
Madison Park Funding, Ltd., 8/15/2022 | 5/8/2015 | 965,957 | ||||||
Magnetite XII, Ltd., 4/15/2027 | 11/17/2016 | 1,200,000 | ||||||
Marlette Funding Trust, 1/17/2023 | 7/20/2016 | 514,979 | ||||||
Mountain View CLO, Ltd., 7/15/2027 | 5/13/2015 | 1,196,892 | ||||||
Murray Hill Marketplace Trust, 11/25/2022 | 10/6/2016 | 1,118,266 | ||||||
NCF Dealer Floorplan Master Trust, 3/21/2022 | 4/8/2016 | 1,472,107 | ||||||
Neuberger Berman CLO, Ltd., 8/4/2025 | 6/19/2014 | 300,000 | ||||||
NZCG Funding CLO, Ltd., 4/27/2027 | 3/27/2015 | 1,200,000 | ||||||
Octagon Investment Partners XX CLO, Ltd., 8/12/2026 | 7/10/2014 | 385,000 | ||||||
OHA Loan Funding, Ltd., 10/20/2026 | 11/6/2014 | 1,147,125 | ||||||
OZLM VIII, Ltd., 10/17/2026 | 8/7/2014 | 382,805 | ||||||
Pretium Mortgage Credit Partners, LLC, 11/27/2030 | 11/6/2015 | 1,951,233 | ||||||
Race Point IX CLO, Ltd., 4/15/2027 | 2/13/2015 | 900,000 | ||||||
Shackleton, Ltd., 4/15/2027 | 12/16/2016 | 1,200,000 | ||||||
Sunset Mortgage Loan Company, LLC, 7/16/2047 | 7/27/2016 | 1,339,712 | ||||||
Symphony CLO VIII, Ltd., 1/9/2023 | 9/15/2014 | 352,425 | ||||||
Symphony CLO XV, Ltd., 10/17/2026 | 10/17/2014 | 1,141,375 | ||||||
Vericrest Opportunity Loan Transferee, 2/25/2055 | 2/25/2015 | 196,529 | ||||||
Vericrest Opportunity Loan Transferee, 10/25/2058 | 1/13/2016 | 807,664 | ||||||
Voya CLO 3, Ltd., 7/25/2026 | 7/10/2014 | 384,422 | ||||||
The following table presents the total amount of securities loaned with continuous maturity, by type, offset by the gross payable upon return of collateral for securities loaned by Thrivent Moderately Aggressive Allocation Portfolio as of December 31, 2016:
Securities Lending Transactions
Taxable Debt Security | $ | 18,843,443 | ||
Common Stock | 36,303,769 | |||
|
| |||
Total lending | $ | 55,147,212 | ||
Gross amount payable upon return of collateral for securities loaned | $ | 56,510,060 | ||
|
| |||
Net amounts due to counterparty | $ | 1,362,848 | ||
|
|
Definitions:
ADR | - | American Depositary Receipt, which are certificates for an underlying foreign security’s shares held by an issuing U.S. depository bank. | ||
CLO | - | Collateralized Loan Obligation | ||
ETF | - | Exchange Traded Fund. | ||
REIT | - | Real Estate Investment Trust is a company that buys, develops, manages and/or sells real estate assets. | ||
TIPS | - | Treasury Inflation Protected Security. |
The accompanying Notes to Financial Statements are an integral part of this schedule.
33
Table of Contents
MODERATE ALLOCATION PORTFOLIO
Schedule of Investments as of December 31, 2016
| Principal Amount | Bank Loans (1.8%)a | Value | ||||||
Basic Materials (0.1%) | ||||||||
Arch Coal, Inc., Term Loan | ||||||||
| $ | 589,825 | 10.000%, 10/5/2021 | $ | 597,446 | ||||
Fortescue Metals Group, Ltd., Term Loan | ||||||||
| 877,455 | 3.750%, 6/30/2019 | 879,210 | ||||||
Ineos US Finance, LLC, Term Loan | ||||||||
| 3,764,823 | 3.750%, 12/15/2020 | 3,780,521 | ||||||
Tronox Pigments BV, Term Loan | ||||||||
| 2,969,524 | 4.500%, 3/19/2020 | 2,979,413 | ||||||
|
| |||||||
Total | 8,236,590 | |||||||
|
| |||||||
Capital Goods (0.1%) | ||||||||
Accudyne Industries, LLC, Term Loan | ||||||||
| 1,529,557 | 4.000%, 12/13/2019 | 1,443,795 | ||||||
Advanced Disposal Services, Inc., Term Loan | ||||||||
| 1,249,694 | 3.500%, 11/10/2023 | 1,259,854 | ||||||
Cortes NP Acquisition Corporation, Term Loan | ||||||||
| 3,250,000 | 6.000%, 11/30/2023 | 3,290,625 | ||||||
|
| |||||||
Total | 5,994,274 | |||||||
|
| |||||||
Communications Services (0.5%) | ||||||||
Altice US Finance I Corporation, Term Loan | ||||||||
| 1,975,780 | 3.882%, 1/15/2025 | 1,995,538 | ||||||
Beasley Broadcast Group, Inc., Term Loan | ||||||||
| 1,100,000 | 7.000%, 11/1/2023 | 1,100,000 | ||||||
FairPoint Communications, Inc., Term Loan | ||||||||
| 2,867,508 | 7.500%, 2/14/2019 | 2,891,710 | ||||||
Grande Communications Networks, LLC, Term Loan | ||||||||
| 2,518,745 | 4.500%, 5/29/2020 | 2,533,857 | ||||||
Hargray Communications Group, Inc., Term Loan | ||||||||
| 2,833,174 | 4.750%, 6/26/2019 | 2,863,857 | ||||||
Integra Telecom Holdings, Inc., Term Loan | ||||||||
| 1,842,324 | 5.250%, 8/14/2020 | 1,845,549 | ||||||
| 890,900 | 9.750%, 2/12/2021 | 889,234 | ||||||
Intelsat Jackson Holdings SA, Term Loan | ||||||||
| 919,236 | 3.750%, 6/30/2019 | 887,541 | ||||||
Liberty Cablevision of Puerto Rico, LLC, Term Loan | ||||||||
| 4,380,000 | 4.500%, 1/7/2022 | 4,344,434 | ||||||
| 1,000,000 | 7.750%, 7/7/2023 | 965,000 | ||||||
LTS Buyer, LLC, Term Loan | ||||||||
| 2,945,718 | 4.248%, 4/13/2020 | 2,959,533 | ||||||
NEP Broadcasting, LLC, Term Loan | ||||||||
| 242,857 | 10.000%, 7/22/2020 | 243,768 | ||||||
NEP/NCP Holdco, Inc., Term Loan | ||||||||
| 3,842,987 | 4.250%, 1/22/2020 | 3,852,595 | ||||||
Syniverse Holdings, Inc., Term Loan | ||||||||
| 2,434,006 | 4.000%, 4/23/2019 | 2,120,019 | ||||||
TNS, Inc., Term Loan | ||||||||
| 2,517,534 | 5.000%, 2/14/2020 | 2,538,782 | ||||||
Univision Communications, Inc., Term Loan | ||||||||
| 3,438,853 | 4.000%, 3/1/2020 | 3,456,047 | ||||||
Virgin Media Bristol, LLC, Term Loan | ||||||||
| 2,025,000 | 3.486%, 1/31/2025 | 2,032,857 | ||||||
WideOpenWest Finance, LLC, Term Loan | ||||||||
| 2,418,938 | 4.500%, 8/18/2023 | 2,442,691 | ||||||
Yankee Cable Acquisition, LLC, Term Loan | ||||||||
| 2,234,143 | 4.250%, 3/1/2020 | 2,235,082 | ||||||
Zayo Group, LLC, Term Loan | ||||||||
| 4,167,381 | 3.750%, 5/6/2021 | 4,209,638 | ||||||
|
| |||||||
Total | 46,407,732 | |||||||
|
| |||||||
Consumer Cyclical (0.3%) | ||||||||
Amaya BV, Term Loan | ||||||||
| 5,139,228 | 5.000%, 8/1/2021 | 5,154,954 | ||||||
Burlington Coat Factory Warehouse Corporation, Term Loan | ||||||||
| 1,754,092 | 3.510%, 8/13/2021 | 1,764,423 | ||||||
Cengage Learning Acquisitions, Term Loan | ||||||||
| 1,631,800 | 5.250%, 6/7/2023 | 1,585,147 | ||||||
Ceridian HCM Holding, Inc., Term Loan | ||||||||
| 1,631,036 | 4.500%, 9/15/2020 | 1,618,118 | ||||||
Four Seasons Holdings, Inc., Term Loan | ||||||||
| 1,505,000 | 3.750%, 11/30/2023 | 1,520,678 | ||||||
Golden Nugget, Inc., Term Loan | ||||||||
| 1,102,710 | 4.500%, 11/21/2019 | 1,113,737 | ||||||
Golden Nugget, Inc., Term Loan Delayed Draw | ||||||||
| 472,590 | 4.500%, 11/21/2019 | 477,316 | ||||||
IMG Worldwide, Inc., Term Loan | ||||||||
| 2,876,354 | 5.250%, 5/6/2021 | 2,903,335 | ||||||
| 1,480,000 | 8.250%, 5/6/2022 | 1,498,500 | ||||||
Mohegan Tribal Gaming Authority, Term Loan | ||||||||
| 1,970,063 | 5.500%, 10/13/2023 | 1,983,616 | ||||||
Scientific Games International, Inc., Term Loan | ||||||||
| 4,469,050 | 6.000%, 10/18/2020 | 4,525,852 | ||||||
| 4,551,570 | 6.000%, 10/1/2021 | 4,605,643 | ||||||
|
| |||||||
Total | 28,751,319 | |||||||
|
| |||||||
Consumer Non-Cyclical (0.2%) | ||||||||
Albertson’s, LLC, Term Loan | ||||||||
| 1,146,165 | 0.000%, 12/21/2022b,c | 1,160,492 | ||||||
| 2,078,835 | 0.000%, 6/22/2023b,c | 2,103,947 | ||||||
JBS USA, LLC, Term Loan | ||||||||
| 915,750 | 4.000%, 10/30/2022 | 923,378 | ||||||
McGraw-Hill Global Education Holdings, LLC, Term Loan | ||||||||
| 2,810,875 | 5.000%, 5/4/2022 | 2,811,325 | ||||||
Ortho-Clinical Diagnostics, Inc., Term Loan | ||||||||
| 4,062,352 | 4.750%, 6/30/2021 | 4,023,191 | ||||||
PetSmart, Inc., Term Loan | ||||||||
| 947,595 | 4.000%, 3/11/2022 | 949,964 | ||||||
Sterigenics-Nordion Holdings, LLC, Term Loan | ||||||||
| 903,562 | 4.250%, 5/16/2022 | 906,391 | ||||||
Valeant Pharmaceuticals International, Inc., Term Loan | ||||||||
| 5,917,801 | 5.500%, 4/1/2022 | 5,918,925 | ||||||
|
| |||||||
Total | 18,797,613 | |||||||
|
| |||||||
Energy (0.2%) | ||||||||
Energy Solutions, LLC, Term Loan | ||||||||
| 2,066,894 | 6.750%, 5/29/2020 | 2,079,812 | ||||||
The accompanying Notes to Financial Statements are an integral part of this schedule.
34
Table of Contents
MODERATE ALLOCATION PORTFOLIO
Schedule of Investments as of December 31, 2016
| Principal Amount | Bank Loans (1.8%)a | Value | ||||||
Energy (0.2%) - continued | ||||||||
Expro Holdings UK 2, Ltd., Term Loan | ||||||||
| $2,526,652 | 5.750%, 9/2/2021 | $ | 2,130,801 | |||||
Fieldwood Energy, LLC, Term Loan | ||||||||
| 2,052,773 | 3.875%, 10/1/2018 | 1,929,607 | ||||||
Houston Fuel Oil Terminal, LLC, Term Loan | ||||||||
| 3,002,657 | 4.250%, 8/19/2021 | 2,980,138 | ||||||
McJunkin Red Man Corporation, Term Loan | ||||||||
| 1,139,691 | 5.000%, 11/8/2019 | 1,143,965 | ||||||
MEG Energy Corporation, Term Loan | ||||||||
| 1,438,647 | 3.750%, 3/31/2020 | 1,395,488 | ||||||
Pacific Drilling SA, Term Loan | ||||||||
| 2,340,125 | 4.500%, 6/3/2018 | 821,384 | ||||||
Targa Resources Partners, LP, Term Loan | ||||||||
| 1,029,768 | 5.750%, 2/27/2022 | 1,034,916 | ||||||
Western Refining, Inc., Term Loan | ||||||||
| 1,050,450 | 5.500%, 6/23/2023 | 1,055,702 | ||||||
|
| |||||||
Total | 14,571,813 | |||||||
|
| |||||||
Financials (0.1%) | ||||||||
DJO Finance, LLC, Term Loan | ||||||||
| 1,436,813 | 4.250%, 6/7/2020 | 1,377,098 | ||||||
Harland Clarke Holdings Corporation, Term Loan | ||||||||
| 1,297,362 | 7.000%, 5/22/2018 | 1,297,765 | ||||||
| 1,306,250 | 7.000%, 12/31/2019 | 1,311,148 | ||||||
MoneyGram International, Inc., Term Loan | ||||||||
| 2,983,997 | 4.250%, 3/27/2020 | 2,944,221 | ||||||
Sable International Finance, Ltd., Term Loan | ||||||||
| 2,285,000 | 5.748%, 1/3/2023b,c | 2,312,146 | ||||||
WaveDivision Holdings, LLC, Term Loan | ||||||||
| 3,513,729 | 4.000%, 10/15/2019 | 3,532,176 | ||||||
|
| |||||||
Total | 12,774,554 | |||||||
|
| |||||||
Technology (0.2%) | ||||||||
Avago Technoligies Cayman Finance, Ltd., Term Loan | ||||||||
| 2,355,599 | 3.704%, 2/1/2023 | 2,387,988 | ||||||
First Data Corporation, Term Loan | ||||||||
| 2,460,325 | 3.756%, 3/24/2021 | 2,488,004 | ||||||
| 1,890,628 | 3.756%, 7/8/2022 | 1,909,932 | ||||||
Micron Technologies, Inc., Term Loan | ||||||||
| 721,375 | 4.520%, 4/26/2022 | 731,654 | ||||||
Rackspace Hosting, LLC, Term Loan | ||||||||
| 2,035,000 | 4.500%, 12/20/2023b,c | 2,059,583 | ||||||
Western Digital Corporation, Term Loan | ||||||||
| 3,358,125 | 4.520%, 4/29/2023 | 3,409,538 | ||||||
Xerox Business Services, LLC, Term Loan | ||||||||
| 1,910,000 | 6.250%, 12/7/2023b,c | 1,931,487 | ||||||
|
| |||||||
Total | 14,918,186 | |||||||
|
| |||||||
Transportation (<0.1%) | ||||||||
OSG Bulk Ships, Inc., Term Loan | ||||||||
| 3,154,327 | 5.250%, 8/5/2019 | 3,071,526 | ||||||
XPO Logistics, Inc., Term Loan | ||||||||
| 1,810,177 | 4.250%, 11/1/2021 | 1,832,243 | ||||||
|
| |||||||
Total | 4,903,769 | |||||||
|
| |||||||
Utilities (0.1%) | ||||||||
Calpine Corporation, Term Loan | ||||||||
| 3,000,000 | 0.000%, 1/15/2024b,c | 3,011,250 | ||||||
Intergen NV, Term Loan | ||||||||
| 1,142,826 | 5.500%, 6/12/2020 | 1,106,632 | ||||||
Talen Energy Supply, LLC, Term Loan | ||||||||
| 846,435 | 6.000%, 12/6/2023 | 857,016 | ||||||
Vistra Operations Company, LLC, Term Loan | ||||||||
| 2,000,000 | 0.000%, 8/4/2023b,c | 2,025,000 | ||||||
|
| |||||||
Total | 6,999,898 | |||||||
|
| |||||||
Total Bank Loans (cost $163,218,799) | 162,355,748 | |||||||
|
| |||||||
| Shares | Common Stock (33.0%) | |||||||
Consumer Discretionary (4.4%) | ||||||||
| 96,611 | Aaron’s, Inc. | 3,090,586 | ||||||
| 38,010 | Abercrombie & Fitch Company | 456,120 | ||||||
| 73,982 | Amazon.com, Inc.d | 55,476,882 | ||||||
| 24,000 | American Axle & Manufacturing Holdings, Inc.d | 463,200 | ||||||
| 34,204 | American Public Education, Inc.d | 839,708 | ||||||
| 295,180 | Aramark | 10,543,830 | ||||||
| 18,670 | Armstrong Flooring, Inc.d | 371,720 | ||||||
| 22,180 | Ascent Capital Group, Inc.d | 360,647 | ||||||
| 19,110 | AutoZone, Inc.d | 15,092,887 | ||||||
| 90,870 | Barnes & Noble, Inc. | 1,013,200 | ||||||
| 44,300 | Beazer Homes USA, Inc.d | 589,190 | ||||||
| 5,210 | Bed Bath & Beyond, Inc. | 211,734 | ||||||
| 16,918 | Berkeley Group Holdings plc | 584,839 | ||||||
| 23,190 | Big 5 Sporting Goods Corporation | 402,346 | ||||||
| 31,490 | Bloomin’ Brands, Inc. | 567,765 | ||||||
| 84,750 | BorgWarner, Inc. | 3,342,540 | ||||||
| 34,550 | Boyd Gaming Corporationd | 696,873 | ||||||
| 2,600 | Brembo SPA | 157,288 | ||||||
| 24,100 | Bridgestone Corporation | 867,137 | ||||||
| 127,055 | Brunswick Corporation | 6,929,580 | ||||||
| 15,698 | Bunzl plc | 407,543 | ||||||
| 46,656 | Burlington Stores, Inc.d | 3,954,096 | ||||||
| 40,530 | Caleres, Inc. | 1,330,195 | ||||||
| 76,320 | Callaway Golf Company | 836,467 | ||||||
| 3,900 | Canon Marketing Japan, Inc. | 65,486 | ||||||
| 81,240 | Carter’s, Inc. | 7,018,324 | ||||||
| 16,153 | Cedar Fair, LP | 1,037,023 | ||||||
| 43,360 | Cheesecake Factory, Inc. | 2,596,397 | ||||||
| 3,670 | Chipotle Mexican Grill, Inc.d | 1,384,764 | ||||||
| 12,940 | Chuy’s Holdings, Inc.d | 419,903 | ||||||
| 30,850 | Cinemark Holdings, Inc. | 1,183,406 | ||||||
| 21,840 | ClubCorp Holdings, Inc. | 313,404 | ||||||
| 9,350 | Columbia Sportswear Company | 545,105 | ||||||
| 512,664 | Comcast Corporation | 35,399,449 | ||||||
| 80,014 | Core-Mark Holding Company, Inc. | 3,446,203 | ||||||
| 53,440 | CSS Industries, Inc. | 1,446,621 | ||||||
| 63,013 | Culp, Inc. | 2,340,933 | ||||||
| 7,530 | D.R. Horton, Inc. | 205,795 | ||||||
| 93,980 | Dana, Inc. | 1,783,740 | ||||||
| 8,050 | Deckers Outdoor Corporationd | 445,889 | ||||||
| 138,838 | Delphi Automotive plc | 9,350,739 | ||||||
| 24,500 | Denso Corporation | 1,059,784 | ||||||
| 16,080 | DeVry Education Group, Inc. | 501,696 | ||||||
| 14,032 | Discovery Communications, Inc., Class Ad | 384,617 | ||||||
| 11,100 | Discovery Communications, Inc., Class Cd | 297,258 | ||||||
| 69,790 | DISH Network Corporationd | 4,042,935 | ||||||
| 20,350 | Dollar General Corporation | 1,507,324 | ||||||
The accompanying Notes to Financial Statements are an integral part of this schedule.
35
Table of Contents
MODERATE ALLOCATION PORTFOLIO
Schedule of Investments as of December 31, 2016
| Shares | Common Stock (33.0%) | Value | ||||||
Consumer Discretionary (4.4%) - continued | ||||||||
| 107,263 | Dollar Tree, Inc.d | $ | 8,278,558 | |||||
| 9,630 | Domino’s Pizza, Inc. | 1,533,481 | ||||||
| 74,070 | DSW, Inc. | 1,677,685 | ||||||
| 96,836 | Duluth Holdings, Inc.d,e | 2,459,634 | ||||||
| 39,040 | Etsy, Inc.d | 459,891 | ||||||
| 24,800 | Eutelsat Communications | 479,575 | ||||||
| 26,747 | Expedia, Inc. | 3,029,900 | ||||||
| 45,620 | Finish Line, Inc. | 858,112 | ||||||
| 25,200 | Fuji Heavy Industries, Ltd. | 1,026,759 | ||||||
| 55,190 | Gentex Corporation | 1,086,691 | ||||||
| 41,515 | G-III Apparel Group, Ltd.d | 1,227,183 | ||||||
| 159,120 | GNC Holdings, Inc.e | 1,756,685 | ||||||
| 6,100 | Hakuhodo Dy Holdings, Inc. | 75,110 | ||||||
| 197,758 | Harley-Davidson, Inc. | 11,537,202 | ||||||
| 72,601 | Haverty Furniture Companies, Inc. | 1,720,644 | ||||||
| 159,590 | Home Depot, Inc. | 21,397,827 | ||||||
| 63,000 | Honda Motor Company, Ltd. | 1,839,305 | ||||||
| 51,870 | Houghton Mifflin Harcourt Companyd | 562,790 | ||||||
| 8,120 | HSN, Inc. | 278,516 | ||||||
| 11,000 | Hyatt Hotels Corporationd | 607,860 | ||||||
| 10,910 | ILG, Inc. | 198,235 | ||||||
| 34,500 | Inchcape plc | 298,149 | ||||||
| 5,970 | International Speedway Corporation | 219,696 | ||||||
| 4,301 | Intertek Group plc | 184,334 | ||||||
| 2,040 | Jack in the Box, Inc. | 227,746 | ||||||
| 3,860 | John Wiley and Sons, Inc. | 210,370 | ||||||
| 67,289 | Kate Spade & Companyd | 1,256,286 | ||||||
| 25,728 | L Brands, Inc. | 1,693,932 | ||||||
| 36,540 | La-Z-Boy, Inc. | 1,134,567 | ||||||
| 142,950 | Liberty Interactive Corporationd | 2,856,141 | ||||||
| 2,062 | Linamar Corporation | 88,598 | ||||||
| 22,880 | Lithia Motors, Inc. | 2,215,470 | ||||||
| 13,380 | Live Nation Entertainment, Inc.d | 355,908 | ||||||
| 92,580 | LKQ Corporationd | 2,837,577 | ||||||
| 160,760 | Lowe’s Companies, Inc. | 11,433,251 | ||||||
| 2,355 | LVMH Moet Hennessy Louis Vuitton SE | 449,033 | ||||||
| 15,270 | M/I Homes, Inc.d | 384,499 | ||||||
| 4,650 | Meredith Corporation | 275,047 | ||||||
| 2,160 | Mohawk Industries, Inc.d | 431,309 | ||||||
| 7,070 | Monro Muffler Brake, Inc. | 404,404 | ||||||
| 3,260 | Murphy USA, Inc.d | 200,392 | ||||||
| 54,510 | Nautilus, Inc.d | 1,008,435 | ||||||
| 41,362 | New Media Investment Group, Inc. | 661,378 | ||||||
| 150,380 | Newell Brands, Inc. | 6,714,467 | ||||||
| 63,880 | News Corporation, Class A | 732,065 | ||||||
| 20,860 | News Corporation, Class B | 246,148 | ||||||
| 1,900 | Nifco, Inc. | 100,110 | ||||||
| 2,081 | Nokian Renkaat Oyj | 77,367 | ||||||
| 47,272 | Nord Anglia Education, Inc.d,e | 1,101,438 | ||||||
| 39,740 | Norwegian Cruise Line Holdings, Ltd.d | 1,690,142 | ||||||
| 196,367 | Nutrisystem, Inc. | 6,804,117 | ||||||
| 10,251 | O’Reilly Automotive, Inc.d | 2,853,981 | ||||||
| 67,061 | Oxford Industries, Inc. | 4,032,378 | ||||||
| 11,600 | Panasonic Corporation | 117,649 | ||||||
| 33,370 | Papa John’s International, Inc. | 2,855,805 | ||||||
| 62,113 | Papa Murphy’s Holdings, Inc.d,e | 262,117 | ||||||
| 27,460 | Persimmon plc | 599,116 | ||||||
| 103,480 | Pinnacle Entertainment, Inc.d | 1,500,460 | ||||||
| 3,866 | Publicis Groupe SA | 266,386 | ||||||
| 51,438 | PVH Corporation | 4,641,765 | ||||||
| 16,502 | Ralph Lauren Corporation | 1,490,461 | ||||||
| 3,280 | Restaurant Brands International, Inc. | 156,325 | ||||||
| 15,225 | Restoration Hardware Holdings, Inc.d,e | 467,408 | ||||||
| 31,320 | Retailmenot, Inc.d | 291,276 | ||||||
| 122,328 | Ross Stores, Inc. | 8,024,717 | ||||||
| 1,300 | RTL Group SA | 95,242 | ||||||
| 62,290 | Ruth’s Hospitality Group, Inc. | 1,139,907 | ||||||
| 26,160 | Sally Beauty Holdings, Inc.d | 691,147 | ||||||
| 126,354 | Scripps Networks Interactive, Inc. | 9,017,885 | ||||||
| 4,700 | Sekisui Chemical Company, Ltd. | 74,817 | ||||||
| 10,780 | Select Comfort Corporationd | 243,844 | ||||||
| 21,740 | Signet Jewelers, Ltd.e | 2,049,212 | ||||||
| 49,363 | Sportsman’s Warehouse Holdings, Inc.d | 463,519 | ||||||
| 6,700 | Standard Motor Products, Inc. | 356,574 | ||||||
| 185,830 | Starbucks Corporation | 10,317,282 | ||||||
| 91,484 | Stein Mart, Inc. | 501,332 | ||||||
| 16,870 | Steven Madden, Ltd.d | 603,102 | ||||||
| 23,800 | Sumitomo Forestry Company, Ltd. | 314,334 | ||||||
| 18,100 | Sumitomo Rubber Industries, Ltd. | 286,385 | ||||||
| 1,200 | Swatch Group AG | 73,234 | ||||||
| 4,730 | Target Corporation | 341,648 | ||||||
| 128,720 | Tegna, Inc. | 2,753,321 | ||||||
| 42,400 | Tempur Sealy International, Inc.d,e | 2,895,072 | ||||||
| 16,945 | Tenneco, Inc.d | 1,058,554 | ||||||
| 141,833 | Time, Inc. | 2,531,719 | ||||||
| 82,500 | TJX Companies, Inc. | 6,198,225 | ||||||
| 170,804 | Toll Brothers, Inc.d | 5,294,924 | ||||||
| 120,093 | Tower International, Inc. | 3,404,637 | ||||||
| 108,977 | Tuesday Morning Corporationd | 588,476 | ||||||
| 43,530 | Tupperware Brands Corporation | 2,290,549 | ||||||
| 6,962 | Ulta Salon Cosmetics & Fragrance, Inc.d | 1,774,892 | ||||||
| 21,693 | Under Armour, Inc., Class Ad,e | 630,182 | ||||||
| 21,842 | Under Armour, Inc., Class Cd | 549,763 | ||||||
| 15,409 | Vail Resorts, Inc. | 2,485,626 | ||||||
| 453 | Valora Holding AG | 128,675 | ||||||
| 67,760 | Vera Bradley, Inc.d | 794,147 | ||||||
| 31,762 | VF Corporation | 1,694,503 | ||||||
| 9,010 | Visteon Corporation | 723,863 | ||||||
| 9,800 | Vitamin Shoppe, Inc.d | 232,750 | ||||||
| 165,730 | Walt Disney Company | 17,272,381 | ||||||
| 19,050 | Whirlpool Corporation | 3,462,718 | ||||||
| 3,400 | Whitbread plc | 158,163 | ||||||
| 73,920 | Wingstop, Inc.e | 2,187,293 | ||||||
| 19,720 | Wolters Kluwer NV | 713,258 | ||||||
| 24,740 | Wolverine World Wide, Inc. | 543,043 | ||||||
| 16,000 | WPP plc | 356,057 | ||||||
| 8,270 | Wyndham Worldwide Corporation | 631,580 | ||||||
| 8,500 | Yokohama Rubber Company, Ltd. | 151,940 | ||||||
| 38,070 | Yum! Brands, Inc. | 2,410,973 | ||||||
| 44,940 | Zoe’s Kitchen, Inc.d,e | 1,078,111 | ||||||
|
| |||||||
Total | 412,871,890 | |||||||
|
| |||||||
Consumer Staples (1.1%) | ||||||||
| 54,164 | AdvancePierre Foods Holdings, Inc. | 1,613,004 | ||||||
| 13,200 | Axfood AB | 207,280 | ||||||
| 22,310 | Brown-Forman Corporation | 1,002,165 | ||||||
| 4,234 | Casey’s General Stores, Inc. | 503,338 | ||||||
| 55,944 | Coca-Cola Amatil, Ltd. | 407,999 | ||||||
| 187,260 | Coca-Cola Company | 7,763,799 | ||||||
| 23,041 | Coca-Cola HBC AG | 501,727 | ||||||
| 257,680 | CVS Health Corporation | 20,333,529 | ||||||
| 12,970 | Dr Pepper Snapple Group, Inc. | 1,175,990 | ||||||
| 7,509 | e.l.f. Beauty, Inc.d,e | 217,310 | ||||||
| 4,800 | Ebro Foods SA | 100,456 | ||||||
| 43,640 | Estee Lauder Companies, Inc. | 3,338,024 | ||||||
| 41,990 | Flowers Foods, Inc.e | 838,540 | ||||||
| 82,290 | Hain Celestial Group, Inc.d | 3,211,779 | ||||||
| 2,569 | Henkel AG & Company KGaA | 267,365 | ||||||
The accompanying Notes to Financial Statements are an integral part of this schedule.
36
Table of Contents
MODERATE ALLOCATION PORTFOLIO
Schedule of Investments as of December 31, 2016
| Shares | Common Stock (33.0%) | Value | ||||||
Consumer Staples (1.1%) - continued | ||||||||
| 35,143 | Imperial Brands plc | $ | 1,531,560 | |||||
| 31,220 | Ingredion, Inc. | 3,901,251 | ||||||
| 5,995 | J & J Snack Foods Corporation | 799,913 | ||||||
| 4,600 | Jeronimo Martins SGPS SA | 71,344 | ||||||
| 1,900 | Kesko Oyj | 94,821 | ||||||
| 10,600 | Kewpie Corporation | 257,090 | ||||||
| 31,930 | Kimberly-Clark Corporation | 3,643,851 | ||||||
| 6,300 | Kirin Holdings Company, Ltd. | 102,257 | ||||||
| 82,621 | Koninklijke Ahold Delhaize NV | 1,740,252 | ||||||
| 1,900 | Lancaster Colony Corporation | 268,641 | ||||||
| 15 | Lindt & Spruengli AG | 77,617 | ||||||
| 7,890 | Mondelez International, Inc. | 349,764 | ||||||
| 96,840 | Monster Beverage Corporationd | 4,293,886 | ||||||
| 7,100 | Nestle SA | 508,627 | ||||||
| 23,590 | PepsiCo, Inc. | 2,468,222 | ||||||
| 184,820 | Pinnacle Foods, Inc. | 9,878,629 | ||||||
| 33,500 | Procter & Gamble Company | 2,816,680 | ||||||
| 95,303 | SpartanNash Company | 3,768,281 | ||||||
| 5,700 | Suedzucker AG | 135,869 | ||||||
| 17,570 | Sysco Corporation | 972,851 | ||||||
| 22,650 | Tate & Lyle plc | 197,116 | ||||||
| 37,108 | United Natural Foods, Inc.d | 1,770,794 | ||||||
| 196,620 | Walgreens Boots Alliance, Inc. | 16,272,271 | ||||||
| 53,601 | Wal-Mart Stores, Inc. | 3,704,901 | ||||||
| 40,460 | WhiteWave Foods Companyd | 2,249,576 | ||||||
| 11,350 | Whole Foods Market, Inc. | 349,126 | ||||||
| 43,245 | William Morrison Supermarkets plc | 122,829 | ||||||
|
| |||||||
Total | 103,830,324 | |||||||
|
| |||||||
Energy (3.2%) | ||||||||
| 12,870 | Anadarko Petroleum Corporation | 897,425 | ||||||
| 10,640 | Arch Coal, Inc.d,e | 830,452 | ||||||
| 261,592 | Archrock, Inc. | 3,453,014 | ||||||
| 92,309 | Atwood Oceanics, Inc.e | 1,212,017 | ||||||
| 97,820 | Baker Hughes, Inc. | 6,355,365 | ||||||
| 533,262 | BP plc | 3,340,069 | ||||||
| 60,289 | Bristow Group, Inc. | 1,234,719 | ||||||
| 63,983 | Callon Petroleum Companyd | 983,419 | ||||||
| 178,450 | Canadian Natural Resources, Ltd. | 5,688,986 | ||||||
| 261,050 | Chevron Corporation | 30,725,585 | ||||||
| 34,920 | Cimarex Energy Company | 4,745,628 | ||||||
| 232,790 | Clean Energy Fuels Corporationd | 665,779 | ||||||
| 67,652 | Concho Resources, Inc.d | 8,970,655 | ||||||
| 144,450 | ConocoPhillips | 7,242,723 | ||||||
| 43,450 | Continental Resources, Inc.d | 2,239,413 | ||||||
| 34,039 | Contura Energy, Inc.d,e | 2,416,769 | ||||||
| 11,540 | Crescent Point Energy Corporation | 156,858 | ||||||
| 89,510 | Delek US Holdings, Inc. | 2,154,506 | ||||||
| 146,170 | Devon Energy Corporation | 6,675,584 | ||||||
| 30,510 | Diamond Offshore Drilling, Inc.d,e | 540,027 | ||||||
| 276,867 | Ensco plc | 2,691,147 | ||||||
| 94,470 | EOG Resources, Inc. | 9,550,917 | ||||||
| 52,290 | EP Energy Corporationd,e | 342,500 | ||||||
| 237,551 | EQT Corporation | 15,535,835 | ||||||
| 133,180 | Exxon Mobil Corporation | 12,020,827 | ||||||
| 53,130 | Frank’s International NV | 654,030 | ||||||
| 15,500 | Galp Energia SGPS SA | 231,078 | ||||||
| 54,700 | Green Plains, Inc. | 1,523,395 | ||||||
| 8,050 | Gulfport Energy Corporationd | 174,202 | ||||||
| 287,800 | Halliburton Company | 15,567,102 | ||||||
| 62,070 | Helix Energy Solutions Group, Inc.d | 547,457 | ||||||
| 49,497 | HollyFrontier Corporation | 1,621,522 | ||||||
| 113,330 | Hornbeck Offshore Services, Inc.d,e | 818,243 | ||||||
| 15,757 | John Wood Group plc | 170,152 | ||||||
| 16,880 | Kinder Morgan, Inc. | 349,585 | ||||||
| 704,671 | Marathon Oil Corporation | 12,197,855 | ||||||
| 11,430 | Murphy Oil Corporation | 355,816 | ||||||
| 527,930 | Nabors Industries, Ltd. | 8,658,052 | ||||||
| 9,620 | Noble Energy, Inc. | 366,137 | ||||||
| 116,840 | Oasis Petroleum, Inc.d | 1,768,958 | ||||||
| 11,980 | Oceaneering International, Inc. | 337,956 | ||||||
| 69,415 | Oil States International, Inc.d | 2,707,185 | ||||||
| 21,088 | OMV AG | 743,432 | ||||||
| 152,868 | Parsley Energy, Inc.d | 5,387,068 | ||||||
| 169,545 | Patterson-UTI Energy, Inc. | 4,564,151 | ||||||
| 34,960 | PBF Energy, Inc.e | 974,685 | ||||||
| 22,415 | Petrofac, Ltd. | 239,878 | ||||||
| 9,290 | Phillips 66 | 802,749 | ||||||
| 198,592 | Pioneer Energy Services Corporationd | 1,360,355 | ||||||
| 94,360 | Pioneer Natural Resources Company | 16,991,405 | ||||||
| 69,830 | Range Resources Corporation | 2,399,359 | ||||||
| 242,110 | Rowan Companies plcd | 4,573,458 | ||||||
| 18,135 | Royal Dutch Shell plc | 494,645 | ||||||
| 105,121 | Royal Dutch Shell plc ADR | 5,716,480 | ||||||
| 4,549 | Royal Dutch Shell plc, Class A | 125,569 | ||||||
| 42,207 | Royal Dutch Shell plc, Class B | 1,212,695 | ||||||
| 94,405 | RPC, Inc.e | 1,870,163 | ||||||
| 129,345 | Schlumberger, Ltd. | 10,858,513 | ||||||
| 25,200 | SemGroup Corporation | 1,052,100 | ||||||
| 14,087 | SM Energy Company | 485,720 | ||||||
| 17,407 | Statoil ASA | 317,707 | ||||||
| 288,190 | Suncor Energy, Inc. ADR | 9,420,931 | ||||||
| 10,030 | Superior Energy Services, Inc. | 169,306 | ||||||
| 1,682 | Tecnicas Reunidas SA | 68,789 | ||||||
| 67,970 | Teekay Corporation | 545,799 | ||||||
| 159,172 | Teekay Tankers, Ltd. | 359,729 | ||||||
| 91,845 | Tesco Corporationd | 757,721 | ||||||
| 29,310 | Tesoro Corporation | 2,563,160 | ||||||
| 271,180 | TETRA Technologies, Inc.d | 1,361,324 | ||||||
| 17,624 | Total SA | 903,975 | ||||||
| 17,624 | Total SA Rightsd,f | 301 | ||||||
| 110,824 | U.S. Silica Holdings, Inc. | 6,281,504 | ||||||
| 185,140 | Valero Energy Corporation | 12,648,765 | ||||||
| 5,693 | Vantage Drilling Internationald | 574,993 | ||||||
| 1,266,710 | Weatherford International plcd | 6,320,883 | ||||||
| 834,365 | WPX Energy, Inc.d | 12,156,698 | ||||||
|
| |||||||
Total | 293,022,954 | |||||||
|
| |||||||
Financials (5.3%) | ||||||||
| 112,257 | Aberdeen Asset Management plc | 354,935 | ||||||
| 50,251 | Affiliated Managers Group, Inc.d | 7,301,470 | ||||||
| 24,840 | Allied World Assurance Company Holdings AG | 1,334,156 | ||||||
| 18,170 | American Financial Group, Inc. | 1,601,140 | ||||||
| 73,430 | American International Group, Inc. | 4,795,713 | ||||||
| 68,350 | Ameris Bancorp | 2,980,060 | ||||||
| 14,220 | AMERISAFE, Inc. | 886,617 | ||||||
| 22,676 | Argo Group International Holdings, Ltd. | 1,494,348 | ||||||
| 92,560 | Aspen Insurance Holdings, Ltd. | 5,090,800 | ||||||
| 27,070 | Associated Banc-Corp | 668,629 | ||||||
| 190,750 | Assured Guaranty, Ltd. | 7,204,628 | ||||||
| 23,422 | ASX, Ltd. | 839,097 | ||||||
| 38,910 | Australia & New Zealand Banking Group, Ltd. | 851,787 | ||||||
| 80,500 | BancorpSouth, Inc. | 2,499,525 | ||||||
| 1,492,740 | Bank of America Corporation | 32,989,554 | ||||||
| 46,007 | Bank of East Asia, Ltd.e | 175,637 | ||||||
| 2,063 | Bank of Montreal | 148,381 | ||||||
| 49,900 | Bank of New York Mellon Corporation | 2,364,262 | ||||||
| 29,779 | Bank of Nova Scotia | 1,658,122 | ||||||
| 47,585 | Bank of the Ozarks, Inc. | 2,502,495 | ||||||
| 34,220 | BankFinancial Corporation | 507,140 | ||||||
| 7,220 | Banner Corporation | 402,948 | ||||||
The accompanying Notes to Financial Statements are an integral part of this schedule.
37
Table of Contents
MODERATE ALLOCATION PORTFOLIO
Schedule of Investments as of December 31, 2016
| Shares | Common Stock (33.0%) | Value | ||||||
Financials (5.3%) - continued | ||||||||
| 98,130 | BB&T Corporation | $ | 4,614,073 | |||||
| 88,080 | Beneficial Bancorp, Inc. | 1,620,672 | ||||||
| 2,300 | BlackRock, Inc. | 875,242 | ||||||
| 228,030 | Blackstone Group, LP | 6,163,651 | ||||||
| 228,350 | Boston Private Financial Holdings, Inc. | 3,779,192 | ||||||
| 139,910 | Brookline Bancorp, Inc. | 2,294,524 | ||||||
| 4,207 | Canadian Imperial Bank of Commerce | 343,290 | ||||||
| 57,780 | Capital One Financial Corporation | 5,040,727 | ||||||
| 37,870 | Cathay General Bancorp | 1,440,196 | ||||||
| 67,300 | Central Pacific Financial Corporation | 2,114,566 | ||||||
| 25,140 | Charles Schwab Corporation | 992,276 | ||||||
| 32,573 | Chemical Financial Corporation | 1,764,479 | ||||||
| 15,000 | Chiba Bank, Ltd. | 91,952 | ||||||
| 41,310 | Chubb, Ltd. | 5,457,877 | ||||||
| 9,404 | CI Financial Corporation | 202,207 | ||||||
| 467,490 | Citigroup, Inc. | 27,782,931 | ||||||
| 17,850 | Citizens Financial Group, Inc. | 635,996 | ||||||
| 41,200 | Clifton Bancorp, Inc. | 697,104 | ||||||
| 35,808 | CNP Assurances | 662,784 | ||||||
| 231,762 | CoBiz Financial, Inc. | 3,914,460 | ||||||
| 70,693 | Columbia Banking System, Inc. | 3,158,563 | ||||||
| 165,070 | Comerica, Inc. | 11,242,918 | ||||||
| 14,875 | Danske Bank AS | 450,025 | ||||||
| 99,789 | Direct Line Insurance Group plc | 454,158 | ||||||
| 363,780 | E*TRADE Financial Corporationd | 12,604,977 | ||||||
| 152,665 | East West Bancorp, Inc. | 7,759,962 | ||||||
| 135,440 | Eaton Vance Corporation | 5,672,227 | ||||||
| 80,408 | Employers Holdings, Inc. | 3,184,157 | ||||||
| 45,570 | Enova International, Inc.d | 571,904 | ||||||
| 11,000 | Erste Group Bank AG | 321,610 | ||||||
| 47,617 | Essent Group, Ltd.d | 1,541,362 | ||||||
| 14,922 | Evercore Partners, Inc. | 1,025,141 | ||||||
| 43,810 | F.N.B. Corporation | 702,274 | ||||||
| 7,720 | Federated Investors, Inc. | 218,322 | ||||||
| 422,011 | Fifth Third Bancorp | 11,381,637 | ||||||
| 22,820 | First American Financial Corporation | 835,897 | ||||||
| 210,850 | First Commonwealth Financial Corporation | 2,989,853 | ||||||
| 50,110 | First Financial Bancorp | 1,425,630 | ||||||
| 21,810 | First Financial Corporation | 1,151,568 | ||||||
| 17,450 | First Merchants Corporation | 656,993 | ||||||
| 236,510 | First Midwest Bancorp, Inc. | 5,967,147 | ||||||
| 146,535 | First Republic Bank | 13,501,735 | ||||||
| 123,434 | FlexiGroup, Ltd. | 200,881 | ||||||
| 16,680 | Franklin Resources, Inc. | 660,194 | ||||||
| 140,000 | Fukuoka Financial Group, Inc. | 620,898 | ||||||
| 13,071 | Genworth MI Canada, Inc.e | 327,688 | ||||||
| 60,948 | Glacier Bancorp, Inc. | 2,208,146 | ||||||
| 108,640 | Goldman Sachs Group, Inc. | 26,013,848 | ||||||
| 123,830 | Great Western Bancorp, Inc. | 5,397,750 | ||||||
| 137,090 | Green Bancorp, Inc.d | 2,083,768 | ||||||
| 16,570 | Greenhill & Company, Inc. | 458,989 | ||||||
| 13,300 | Hang Seng Bank, Ltd. | 246,643 | ||||||
| 145,651 | Hanmi Financial Corporation | 5,083,220 | ||||||
| 7,506 | Hannover Rueckversicherung SE | 810,856 | ||||||
| 74,075 | Hanover Insurance Group, Inc. | 6,741,566 | ||||||
| 19,790 | Hartford Financial Services Group, Inc. | 942,993 | ||||||
| 113,800 | Henderson Group plc | 328,450 | ||||||
| 13,380 | Hilltop Holdings, Inc. | 398,724 | ||||||
| 139,936 | Home BancShares, Inc. | 3,886,023 | ||||||
| 13,130 | HomeStreet, Inc.d | 414,908 | ||||||
| 18,890 | Hometrust Bancshares, Inc.d | 489,251 | ||||||
| 168,535 | Hope Bancorp, Inc. | 3,689,231 | ||||||
| 35,818 | Horace Mann Educators Corporation | 1,533,010 | ||||||
| 44,426 | Houlihan Lokey, Inc. | 1,382,537 | ||||||
| 140,137 | HSBC Holdings plc | 1,130,718 | ||||||
| 524,590 | Huntington Bancshares, Inc. | 6,935,080 | ||||||
| 11,593 | Infinity Property & Casualty Corporation | 1,019,025 | ||||||
| 4,682 | Intact Financial Corporation | 335,114 | ||||||
| 194,095 | Intercontinental Exchange, Inc. | 10,950,840 | ||||||
| 200,790 | Invesco, Ltd. | 6,091,969 | ||||||
| 140,208 | Janus Capital Group, Inc. | 1,860,560 | ||||||
| 518,800 | KeyCorp | 9,478,476 | ||||||
| 50,640 | Kinsale Capital Group, Inc. | 1,722,266 | ||||||
| 17,250 | Lazard, Ltd. | 708,803 | ||||||
| 12,610 | Legg Mason, Inc. | 377,165 | ||||||
| 3,970 | Lincoln National Corporation | 263,092 | ||||||
| 18,660 | M&T Bank Corporation | 2,918,984 | ||||||
| 10,636 | Macquarie Group, Ltd. | 666,262 | ||||||
| 223,218 | Mapfre SA | 679,946 | ||||||
| 620 | Markel Corporationd | 560,790 | ||||||
| 20,440 | Meta Financial Group, Inc. | 2,103,276 | ||||||
| 222,070 | MetLife, Inc. | 11,967,352 | ||||||
| 294,000 | Mizuho Financial Group, Inc. | 527,593 | ||||||
| 208,020 | Morgan Stanley | 8,788,845 | ||||||
| 5,600 | MS and AD Insurance Group Holdings, Inc. | 173,418 | ||||||
| 73,810 | National Bank Holdings Corporation | 2,353,801 | ||||||
| 32,966 | National Bank of Canada | 1,338,872 | ||||||
| 3,800 | Navigators Group, Inc. | 447,450 | ||||||
| 45,220 | NMI Holdings, Inc.d | 481,593 | ||||||
| 32,470 | Nordea Bank AB | 359,788 | ||||||
| 37,423 | PacWest Bancorp | 2,037,308 | ||||||
| 10,367 | Power Corporation of Canada | 232,025 | ||||||
| 20,390 | Primerica, Inc. | 1,409,969 | ||||||
| 3,840 | Principal Financial Group, Inc. | 222,182 | ||||||
| 75,510 | Provident Financial Services, Inc. | 2,136,933 | ||||||
| 161,897 | Raymond James Financial, Inc. | 11,214,605 | ||||||
| 32,204 | Renasant Corporation | 1,359,653 | ||||||
| 50,600 | Resona Holdings, Inc. | 259,326 | ||||||
| 6,247 | Safety Insurance Group, Inc. | 460,404 | ||||||
| 75,453 | Sandy Spring Bancorp, Inc. | 3,017,365 | ||||||
| 2,630 | Schroders plc | 96,595 | ||||||
| 7,370 | SEI Investments Company | 363,783 | ||||||
| 13,370 | Selective Insurance Group, Inc. | 575,579 | ||||||
| 24,100 | Seven Bank, Ltd. | 68,911 | ||||||
| 704,030 | SLM Corporationd | 7,758,411 | ||||||
| 10,971 | State Auto Financial Corporation | 294,133 | ||||||
| 43,380 | Stewart Information Services Corporation | 1,998,950 | ||||||
| 98,833 | Stifel Financial Corporationd | 4,936,708 | ||||||
| 71,747 | SVB Financial Groupd | 12,316,090 | ||||||
| 13,189 | Swiss Re AG | 1,247,850 | ||||||
| 296,490 | Synchrony Financial | 10,753,692 | ||||||
| 71,970 | Synovus Financial Corporation | 2,956,528 | ||||||
| 23,900 | T&D Holdings, Inc. | 315,418 | ||||||
| 256,210 | TCF Financial Corporation | 5,019,154 | ||||||
| 147,044 | TD Ameritrade Holding Corporation | 6,411,118 | ||||||
| 18,780 | Territorial Bancorp, Inc. | 616,735 | ||||||
| 1,400 | TMX Group, Ltd. | 74,575 | ||||||
| 44,520 | TriCo Bancshares | 1,521,694 | ||||||
| 215,620 | TrustCo Bank Corporation | 1,886,675 | ||||||
| 17,150 | Trustmark Corporation | 611,398 | ||||||
| 134,520 | Umpqua Holdings Corporation | 2,526,286 | ||||||
| 8,710 | Union Bankshares Corporation | 311,295 | ||||||
| 51,900 | United Community Banks, Inc. | 1,537,278 | ||||||
| 129,200 | United Financial Bancorp, Inc. | 2,346,272 | ||||||
| 4,620 | United Fire Group, Inc. | 227,165 | ||||||
The accompanying Notes to Financial Statements are an integral part of this schedule.
38
Table of Contents
MODERATE ALLOCATION PORTFOLIO
Schedule of Investments as of December 31, 2016
| Shares | Common Stock (33.0%) | Value | ||||||
Financials (5.3%) - continued | ||||||||
| 34,890 | United Overseas Bank, Ltd. | $ | 490,166 | |||||
| 11,680 | Unum Group | 513,102 | ||||||
| 20,970 | Virtu Financial, Inc. | 334,472 | ||||||
| 13,800 | Voya Financial, Inc. | 541,236 | ||||||
| 21,990 | Western Alliance Bancorpd | 1,071,133 | ||||||
| 42,974 | Westpac Banking Corporation | 1,008,770 | ||||||
| 17,319 | Wintrust Financial Corporation | 1,256,840 | ||||||
| 50,070 | WisdomTree Investments, Inc.e | 557,780 | ||||||
| 25,109 | WSFS Financial Corporation | 1,163,802 | ||||||
| 498,726 | Zions Bancorporation | 21,465,167 | ||||||
| 896 | Zurich Insurance Group AGd | 246,239 | ||||||
|
| |||||||
Total | 491,889,125 | |||||||
|
| |||||||
Health Care (4.0%) | ||||||||
| 39,410 | Abbott Laboratories | 1,513,738 | ||||||
| 24,746 | ABIOMED, Inc.d | 2,788,379 | ||||||
| 62,512 | Acadia Healthcare Company, Inc.d,e | 2,069,147 | ||||||
| 9,400 | Acceleron Pharma, Inc.d | 239,888 | ||||||
| 13,830 | Aceto Corporation | 303,845 | ||||||
| 53,040 | Advaxis, Inc.d,e | 379,766 | ||||||
| 29,940 | Aerie Pharmaceuticals, Inc.d | 1,133,229 | ||||||
| 28,860 | Aetna, Inc. | 3,578,929 | ||||||
| 94,560 | Akorn, Inc.d | 2,064,245 | ||||||
| 166,651 | Alexion Pharmaceuticals, Inc.d | 20,389,750 | ||||||
| 22,101 | Align Technology, Inc.d | 2,124,569 | ||||||
| 102,388 | Allergan plcd | 21,502,504 | ||||||
| 26,011 | Amgen, Inc. | 3,803,068 | ||||||
| 31,085 | Analogic Corporation | 2,578,501 | ||||||
| 20,920 | AngioDynamics, Inc.d | 352,920 | ||||||
| 174,100 | Asterias Biotherapeutics, Inc.d,e | 800,860 | ||||||
| 7,800 | AstraZeneca plc | 425,943 | ||||||
| 4,539 | Atrion Corporation | 2,302,181 | ||||||
| 11,420 | Biogen, Inc.d | 3,238,484 | ||||||
| 42,726 | BioMarin Pharmaceutical, Inc.d | 3,539,422 | ||||||
| 10,900 | Bristol-Myers Squibb Company | 636,996 | ||||||
| 23,291 | C.R. Bard, Inc. | 5,232,556 | ||||||
| 12,275 | CAE, Inc. | 171,694 | ||||||
| 18,440 | Cardinal Health, Inc. | 1,327,127 | ||||||
| 79,625 | Cardiovascular Systems, Inc.d | 1,927,721 | ||||||
| 148,290 | Catalent, Inc.d | 3,997,898 | ||||||
| 218,890 | Celgene Corporationd | 25,336,518 | ||||||
| 8,590 | Centene Corporationd | 485,421 | ||||||
| 39,930 | Charles River Laboratories International, Inc.d | 3,042,267 | ||||||
| 13,490 | Chemed Corporation | 2,163,931 | ||||||
| 15,680 | Coherus Biosciences, Inc.d | 441,392 | ||||||
| 19,240 | CONMED Corporation | 849,831 | ||||||
| 50,760 | Cooper Companies, Inc. | 8,879,447 | ||||||
| 24,310 | Cross Country Healthcare, Inc.d | 379,479 | ||||||
| 89,510 | Dentsply Sirona, Inc. | 5,167,412 | ||||||
| 36,550 | Dexcom, Inc.d | 2,182,035 | ||||||
| 87,060 | Diplomat Pharmacy, Inc.d | 1,096,956 | ||||||
| 95,465 | Edwards Lifesciences Corporationd | 8,945,071 | ||||||
| 11,480 | Emergent Biosolutions, Inc.d | 377,003 | ||||||
| 46,226 | Ensign Group, Inc. | 1,026,679 | ||||||
| 35,180 | Envision Healthcare Corporationd | 2,226,542 | ||||||
| 8,326 | Essilor International SA | 939,411 | ||||||
| 103,950 | Express Scripts Holding Companyd | 7,150,721 | ||||||
| 81,710 | GenMark Diagnostics, Inc.d | 1,000,130 | ||||||
| 368,651 | Gilead Sciences, Inc. | 26,399,098 | ||||||
| 18,321 | GlaxoSmithKline plc | 351,921 | ||||||
| 21,690 | Global Blood Therapeutics, Inc.d,e | 313,421 | ||||||
| 12,990 | HCA Holdings, Inc.d | 961,520 | ||||||
| 25,849 | HealthEquity, Inc.d | 1,047,401 | ||||||
| 37,110 | Healthways, Inc.d | 844,253 | ||||||
| 12,720 | Heska Corporationd | 910,752 | ||||||
| 8,678 | Hikma Pharmaceuticals plc | �� | 202,265 | |||||
| 58,380 | Hill-Rom Holdings, Inc. | 3,277,453 | ||||||
| 195,760 | Hologic, Inc.d | 7,853,891 | ||||||
| 11,680 | ICU Medical, Inc.d | 1,721,048 | ||||||
| 42,020 | Inogen, Inc.d | 2,822,483 | ||||||
| 82,539 | Intersect ENT, Inc.d | 998,722 | ||||||
| 13,540 | Intra-Cellular Therapies, Inc.d | 204,319 | ||||||
| 46,766 | Ironwood Pharmaceuticals, Inc.d | 715,052 | ||||||
| 103,860 | Johnson & Johnson | 11,965,711 | ||||||
| 59,450 | Kindred Healthcare, Inc. | 466,683 | ||||||
| 1,796 | Lonza Group AG | 310,401 | ||||||
| 32,830 | Magellan Health Services, Inc.d | 2,470,457 | ||||||
| 288,024 | Medtronic plc | 20,515,950 | ||||||
| 335,340 | Merck & Company, Inc. | 19,741,466 | ||||||
| 5,700 | Merck KGaA | 593,491 | ||||||
| 10,523 | Mettler-Toledo International, Inc.d | 4,404,507 | ||||||
| 85,862 | Mylan NVd | 3,275,635 | ||||||
| 34,418 | National Healthcare Corporation | 2,608,540 | ||||||
| 36,526 | Neurocrine Biosciences, Inc.d | 1,413,556 | ||||||
| 52,765 | Nevro Corporationd | 3,833,905 | ||||||
| 36,717 | Novartis AG | 2,670,189 | ||||||
| 17,862 | Novo Nordisk AS | 640,749 | ||||||
| 93,222 | NuVasive, Inc.d | 6,279,434 | ||||||
| 49,390 | Omnicell, Inc.d | 1,674,321 | ||||||
| 154,840 | OraSure Technologies, Inc.d | 1,359,495 | ||||||
| 15,500 | Orthofix International NVd | 560,790 | ||||||
| 28,170 | PerkinElmer, Inc. | 1,469,066 | ||||||
| 37,198 | Perrigo Company plc | 3,095,990 | ||||||
| 487,280 | Pfizer, Inc. | 15,826,854 | ||||||
| 25,250 | PharMerica Corporationd | 635,038 | ||||||
| 8,800 | Prothena Corporation plcd | 432,872 | ||||||
| 121,560 | Roche Holding AG ADR | 3,468,107 | ||||||
| 2,017 | Roche Holding AG-Genusschein | 459,780 | ||||||
| 39,610 | Surgical Care Affiliates, Inc.d | 1,832,755 | ||||||
| 41,014 | Teleflex, Inc. | 6,609,406 | ||||||
| 60,912 | Triple-S Management Corporationd | 1,260,878 | ||||||
| 69,126 | UnitedHealth Group, Inc. | 11,062,925 | ||||||
| 75,347 | Universal Health Services, Inc. | 8,015,414 | ||||||
| 11,940 | VCA Antech, Inc.d | 819,681 | ||||||
| 67,060 | Veeva Systems, Inc.d | 2,729,342 | ||||||
| 144,939 | Vertex Pharmaceuticals, Inc.d | 10,677,656 | ||||||
| 22,230 | Waters Corporationd | 2,987,490 | ||||||
| 10,140 | West Pharmaceutical Services, Inc. | 860,176 | ||||||
| 104,830 | Wright Medical Group NVd | 2,408,993 | ||||||
| 57,900 | Ziopharm Oncology, Inc.d,e | 309,765 | ||||||
| 52,170 | Zoetis, Inc. | 2,792,660 | ||||||
|
| |||||||
Total | 371,277,333 | |||||||
|
| |||||||
Industrials (4.0%) | ||||||||
| 66 | A P Moller - Maersk AS | 105,202 | ||||||
| 20,058 | ABB, Ltd. | 422,055 | ||||||
| 26,950 | ABM Industries, Inc. | 1,100,638 | ||||||
| 50,270 | Acuity Brands, Inc. | 11,605,332 | ||||||
| 12,730 | Adecco SA | 830,974 | ||||||
| 86,177 | Aegion Corporationd | 2,042,395 | ||||||
| 6,610 | Aerovironment, Inc.d | 177,346 | ||||||
| 71,655 | AGCO Corporation | 4,145,958 | ||||||
| 67,339 | Air New Zealand, Ltd. | 102,552 | ||||||
| 143,240 | Ardmore Shipping Corporatione | 1,059,976 | ||||||
| 43,000 | Asahi Glass Company, Ltd. | 291,740 | ||||||
| 27,622 | Astec Industries, Inc. | 1,863,380 | ||||||
| 3,000 | Atlas Copco Aktiebolag | 91,010 | ||||||
| 62,084 | AZZ, Inc. | 3,967,168 | ||||||
| 71,373 | B/E Aerospace, Inc. | 4,295,941 | ||||||
| 69,140 | Barnes Group, Inc. | 3,278,619 | ||||||
| 5,681 | Berendsen plc | 60,909 | ||||||
| 37,320 | Boeing Company | 5,809,978 | ||||||
| 194,340 | BWX Technologies, Inc. | 7,715,298 | ||||||
The accompanying Notes to Financial Statements are an integral part of this schedule.
39
Table of Contents
MODERATE ALLOCATION PORTFOLIO
Schedule of Investments as of December 31, 2016
| Shares | Common Stock (33.0%) | Value | ||||||
Industrials (4.0%) - continued | ||||||||
| 59,850 | Carlisle Companies, Inc. | $ | 6,600,856 | |||||
| 12,350 | CEB, Inc. | 748,410 | ||||||
| 37,733 | CIRCOR International, Inc. | 2,448,117 | ||||||
| 9,162 | CLARCOR, Inc. | 755,590 | ||||||
| 13,400 | Colfax Corporationd | 481,462 | ||||||
| 81,744 | Comfort Systems USA, Inc. | 2,722,075 | ||||||
| 35,260 | Copart, Inc.d | 1,953,757 | ||||||
| 10,800 | Crane Company | 778,896 | ||||||
| 175,680 | CSX Corporation | 6,312,182 | ||||||
| 107,900 | Cummins, Inc. | 14,746,693 | ||||||
| 16,780 | Curtiss-Wright Corporation | 1,650,481 | ||||||
| 13,000 | Dai Nippon Printing Company, Ltd. | 128,266 | ||||||
| 213,570 | Delta Air Lines, Inc. | 10,505,508 | ||||||
| 2,910 | Deluxe Corporation | 208,385 | ||||||
| 9,500 | Deutsche Post AG | 311,554 | ||||||
| 49,080 | Donaldson Company, Inc. | 2,065,286 | ||||||
| 5,700 | DSV AS | 253,138 | ||||||
| 72,016 | El Al Israel Airlines, Ltd. | 47,623 | ||||||
| 17,120 | EMCOR Group, Inc. | 1,211,411 | ||||||
| 19,370 | Encore Wire Corporation | 839,690 | ||||||
| 45,190 | EnerSys | 3,529,339 | ||||||
| 6,200 | EnPro Industries, Inc. | 417,632 | ||||||
| 21,440 | Equifax, Inc. | 2,534,851 | ||||||
| 28,999 | ESCO Technologies, Inc. | 1,642,793 | ||||||
| 73,134 | Federal Signal Corporation | 1,141,622 | ||||||
| 626 | Flughafen Zuerich AG | 116,002 | ||||||
| 8,000 | Fortive Corporation | 429,040 | ||||||
| 41,749 | Fortune Brands Home and Security, Inc. | 2,231,902 | ||||||
| 45,344 | Franklin Electric Company, Inc. | 1,763,882 | ||||||
| 3,900 | Fraport AG Frankfurt Airport Services Worldwide | 230,132 | ||||||
| 10,300 | Fuji Machine Manufacturing Company, Ltd. | 117,597 | ||||||
| 32,460 | GasLog, Ltd.e | 522,606 | ||||||
| 78,550 | Gener8 Maritime, Inc.d | 351,904 | ||||||
| 72,668 | Gibraltar Industries, Inc.d | 3,026,622 | ||||||
| 43,317 | Granite Construction, Inc. | 2,382,435 | ||||||
| 193,140 | Harsco Corporation | 2,626,704 | ||||||
| 39,602 | Healthcare Services Group, Inc. | 1,551,210 | ||||||
| 34,684 | Heico Corporation | 2,675,871 | ||||||
| 20,450 | Herman Miller, Inc. | 699,390 | ||||||
| 36,520 | Hexcel Corporation | 1,878,589 | ||||||
| 4,500 | Hitachi Transport System, Ltd. | 91,167 | ||||||
| 1,600 | Hochtief AG | 223,382 | ||||||
| 76,183 | Honeywell International, Inc. | 8,825,801 | ||||||
| 15,509 | Hub Group, Inc.d | 678,519 | ||||||
| 27,240 | Hubbell, Inc. | 3,178,908 | ||||||
| 26,430 | Huntington Ingalls Industries, Inc. | 4,868,142 | ||||||
| 14,230 | ICF International, Inc.d | 785,496 | ||||||
| 7,200 | Inaba Denki Sangyo Company, Ltd. | 247,534 | ||||||
| 132,730 | Ingersoll-Rand plc | 9,960,059 | ||||||
| 10,180 | Insperity, Inc. | 722,271 | ||||||
| 6,830 | Insteel Industries, Inc. | 243,421 | ||||||
| 16,790 | Interface, Inc. | 311,454 | ||||||
| 100,400 | ITOCHU Corporation | 1,329,373 | ||||||
| 18,800 | ITT Corporation | 725,116 | ||||||
| 3,440 | Jacobs Engineering Group, Inc.d | 196,080 | ||||||
| 4,800 | Jardine Matheson Holdings, Ltd. | 265,200 | ||||||
| 32,524 | JB Hunt Transport Services, Inc. | 3,157,105 | ||||||
| 55,338 | Johnson Controls International plc | 2,279,372 | ||||||
| 15,880 | Kansas City Southern | 1,347,418 | ||||||
| 35,590 | KBR, Inc. | 593,997 | ||||||
| 182,240 | Kennametal, Inc. | 5,696,822 | ||||||
| 82,083 | Kforce, Inc. | 1,896,117 | ||||||
| 38,770 | Kirby Corporationd | 2,578,205 | ||||||
| 26,900 | KITZ Corporation | 146,865 | ||||||
| 11,800 | Komatsu, Ltd. | 267,272 | ||||||
| 23,461 | KONE Oyj | 1,048,325 | ||||||
| 5,604 | Koninklijke Boskalis Westminster NV | 194,415 | ||||||
| 81,880 | Korn/Ferry International | 2,409,728 | ||||||
| 65,970 | Lincoln Electric Holdings, Inc. | 5,057,920 | ||||||
| 12,780 | Lindsay Corporatione | 953,516 | ||||||
| 8,700 | Manpower, Inc. | 773,169 | ||||||
| 15,800 | Marubeni Corporation | 89,366 | ||||||
| 35,150 | Masco Corporation | 1,111,443 | ||||||
| 40,920 | Masonite International Corporationd | 2,692,536 | ||||||
| 39,413 | Meggitt plc | 222,574 | ||||||
| 62,130 | Meritor, Inc.d | 771,655 | ||||||
| 23,298 | Middleby Corporationd | 3,001,015 | ||||||
| 10,600 | MIRAIT Holdings Corporatione | 95,530 | ||||||
| 8,200 | Mitsubishi Corporation | 174,157 | ||||||
| 38,800 | Mitsubishi Electric Corporation | 539,676 | ||||||
| 27,000 | Mitsubishi Heavy Industries, Ltd. | 122,743 | ||||||
| 12,000 | Mitsuboshi Belting, Ltd. | 102,039 | ||||||
| 5,500 | Mitsui & Company, Ltd. | 75,363 | ||||||
| 43,160 | Moog, Inc.d | 2,834,749 | ||||||
| 43,470 | MRC Global, Inc.d | 880,702 | ||||||
| 45,678 | MSA Safety, Inc. | 3,166,856 | ||||||
| 6,010 | Mueller Industries, Inc. | 240,160 | ||||||
| 40,670 | MYR Group, Inc.d | 1,532,446 | ||||||
| 14,912 | National Express Group plc | 64,983 | ||||||
| 113,869 | Navigant Consulting, Inc.d | 2,981,090 | ||||||
| 35,610 | NCI Building Systems, Inc.d | 557,296 | ||||||
| 40,902 | Nielsen Holdings plc | 1,715,839 | ||||||
| 4,000 | NIPPO Corporation | 74,522 | ||||||
| 18,900 | Nitto Kogyo Corporation | 257,325 | ||||||
| 8,027 | Nordson Corporation | 899,425 | ||||||
| 53,210 | Norfolk Southern Corporation | 5,750,405 | ||||||
| 6,000 | Okuma Corporation | 57,087 | ||||||
| 27,830 | Old Dominion Freight Line, Inc.d | 2,387,536 | ||||||
| 48,698 | On Assignment, Inc.d | 2,150,504 | ||||||
| 34,800 | Orbital ATK, Inc. | 3,053,004 | ||||||
| 117,258 | Oshkosh Corporation | 7,576,039 | ||||||
| 95,526 | PGT Innovations, Inc.d | 1,093,773 | ||||||
| 6,421 | Philips Lighting NVd,g | 158,163 | ||||||
| 40,474 | Proto Labs, Inc.d,e | 2,078,340 | ||||||
| 25,130 | Quanex Building Products Corporation | 510,139 | ||||||
| 4,912 | Randstad Holding NV | 266,072 | ||||||
| 70,320 | Raven Industries, Inc. | 1,772,064 | ||||||
| 48,610 | Raytheon Company | 6,902,620 | ||||||
| 2,580 | RBC Bearings, Inc.d | 239,450 | ||||||
| 10,930 | Regal-Beloit Corporation | 756,902 | ||||||
| 9,000 | RELX NV | 151,379 | ||||||
| 30,450 | Resources Connection, Inc. | 586,162 | ||||||
| 9,790 | Rexnord Corporationd | 191,786 | ||||||
| 553 | Rieter Holding AG | 96,176 | ||||||
| 24,310 | Rockwell Automation, Inc. | 3,267,264 | ||||||
| 50,010 | Rockwell Collins, Inc. | 4,638,928 | ||||||
| 23,656 | Rolls-Royce Holdings plcd | 194,300 | ||||||
| 24,716 | Roper Industries, Inc. | 4,525,005 | ||||||
| 5,370 | Ryder System, Inc. | 399,743 | ||||||
| 76,038 | Saia, Inc.d | 3,357,078 | ||||||
| 9,600 | Sanwa Holdings Corporation | 91,305 | ||||||
| 1,515 | Schindler Holding AG, Participation Certificate | 266,812 | ||||||
| 2,021 | Schneider Electric SE | 140,396 | ||||||
| 10,668 | Siemens AG | 1,306,194 | ||||||
| 5,317 | Skanska AB | 125,186 | ||||||
| 18,489 | SKF AB | 339,017 | ||||||
| 15,700 | Smiths Group plc | 273,293 | ||||||
The accompanying Notes to Financial Statements are an integral part of this schedule.
40
Table of Contents
MODERATE ALLOCATION PORTFOLIO
Schedule of Investments as of December 31, 2016
| Shares | Common Stock (33.0%) | Value | ||||||
Industrials (4.0%) - continued | ||||||||
| 56,700 | Sojitz Corporation | $ | 137,280 | |||||
| 292,900 | Southwest Airlines Company | 14,598,136 | ||||||
| 55,750 | SPX FLOW, Inc.d | 1,787,345 | ||||||
| 2,560 | Standex International Corporation | 224,896 | ||||||
| 3,260 | Stanley Black & Decker, Inc. | 373,889 | ||||||
| 7,270 | Stericycle, Inc.d | 560,081 | ||||||
| 2,165 | Sulzer, Ltd. | 222,872 | ||||||
| 18,584 | Team, Inc.d | 729,422 | ||||||
| 17,270 | Tennant Company | 1,229,624 | ||||||
| 5,460 | Tetra Tech, Inc. | 235,599 | ||||||
| 18,723 | Textron, Inc. | 909,189 | ||||||
| 126,220 | TransUniond | 3,903,985 | ||||||
| 19,130 | TrueBlue, Inc.d | 471,554 | ||||||
| 231,029 | Union Pacific Corporation | 23,953,087 | ||||||
| 110,280 | United Continental Holdings, Inc.d | 8,037,206 | ||||||
| 83,970 | United Parcel Service, Inc. | 9,626,321 | ||||||
| 44,394 | United Rentals, Inc.d | 4,687,119 | ||||||
| 24,125 | Universal Forest Products, Inc. | 2,465,092 | ||||||
| 58,983 | Universal Truckload Services, Inc. | 964,372 | ||||||
| 13,878 | Vinci SA | 944,049 | ||||||
| 72,140 | WABCO Holdings, Inc.d | 7,657,661 | ||||||
| 32,374 | WageWorks, Inc.d | 2,347,115 | ||||||
| 98,775 | Waste Connections, Inc. | 7,762,727 | ||||||
| 6,585 | Watsco, Inc. | 975,370 | ||||||
| 3,146 | Wolseley plc | 192,052 | ||||||
| 4,109 | WSP Global, Inc. | 136,768 | ||||||
| 40,980 | Xylem, Inc. | 2,029,330 | ||||||
| 39,120 | YRC Worldwide, Inc.d | 519,514 | ||||||
| 3,500 | Yuasa Trading Company, Ltd. | 87,185 | ||||||
|
| |||||||
Total | 371,332,595 | |||||||
|
| |||||||
Information Technology (7.5%) | ||||||||
| 178,280 | Agilent Technologies, Inc. | 8,122,437 | ||||||
| 128,355 | Akamai Technologies, Inc.d | 8,558,711 | ||||||
| 47,740 | Alliance Data Systems Corporation | 10,908,590 | ||||||
| 48,224 | Alphabet, Inc., Class Ad | 38,215,109 | ||||||
| 41,469 | Alphabet, Inc., Class Cd | 32,006,604 | ||||||
| 32,722 | Ambarella, Inc.d,e | 1,771,242 | ||||||
| 48,070 | Amkor Technology, Inc.d | 507,139 | ||||||
| 126,447 | Amphenol Corporation | 8,497,238 | ||||||
| 111,280 | Analog Devices, Inc. | 8,081,154 | ||||||
| 389,449 | Apple, Inc. | 45,105,983 | ||||||
| 177,061 | Applied Materials, Inc. | 5,713,758 | ||||||
| 37,910 | Apptio, Inc.d | 702,472 | ||||||
| 70,066 | Arista Networks, Inc.d | 6,780,287 | ||||||
| 170,280 | ARRIS International plcd | 5,130,536 | ||||||
| 19,346 | Aspen Technology, Inc.d | 1,057,839 | ||||||
| 20,590 | AVX Corporation | 321,822 | ||||||
| 42,490 | Bankrate, Inc.d | 469,515 | ||||||
| 26,100 | Belden, Inc. | 1,951,497 | ||||||
| 74,570 | Blackhawk Network Holdings, Inc.d | 2,809,425 | ||||||
| 182,300 | Booz Allen Hamilton Holding Corporation | 6,575,561 | ||||||
| 175,275 | Brooks Automation, Inc. | 2,991,944 | ||||||
| 17,140 | CA, Inc. | 544,538 | ||||||
| 39,442 | Cabot Microelectronics Corporation | 2,491,551 | ||||||
| 6,030 | CACI International, Inc.d | 749,529 | ||||||
| 19,430 | Cadence Design Systems, Inc.d | 490,025 | ||||||
| 10,000 | Canon, Inc. | 281,622 | ||||||
| 5,500 | Capital Power Corporation | 95,159 | ||||||
| 19,660 | Carbonite, Inc.d | 322,424 | ||||||
| 37,748 | Cavium, Inc.d | 2,356,985 | ||||||
| 13,950 | CDK Global, Inc. | 832,676 | ||||||
| 163,177 | Ciena Corporationd | 3,983,151 | ||||||
| 6,420 | Cirrus Logic, Inc.d | 362,987 | ||||||
| 947,610 | Cisco Systems, Inc. | 28,636,774 | ||||||
| 22,679 | Cognex Corporation | 1,442,838 | ||||||
| 10,580 | Coherent, Inc.d | 1,453,533 | ||||||
| 104,660 | CommVault Systems, Inc.d | 5,379,524 | ||||||
| 26,390 | Comtech Telecommunications Corporation | 312,722 | ||||||
| 33,070 | Convergys Corporation | 812,199 | ||||||
| 87,600 | CoreLogic, Inc.d | 3,226,308 | ||||||
| 109,675 | Criteo SA ADRd,e | 4,505,449 | ||||||
| 10,540 | CTS Corporation | 236,096 | ||||||
| 92,900 | Dolby Laboratories, Inc. | 4,198,151 | ||||||
| 65,806 | DST Systems, Inc. | 7,051,113 | ||||||
| 3,000 | DTS Corporation | 63,815 | ||||||
| 77,650 | eBay, Inc.d | 2,305,428 | ||||||
| 21,260 | Entegris, Inc.d | 380,554 | ||||||
| 46,320 | Envestnet, Inc.d | 1,632,780 | ||||||
| 22,210 | EVERTEC, Inc. | 394,228 | ||||||
| 29,290 | ExlService Holdings, Inc.d | 1,477,388 | ||||||
| 18,320 | F5 Networks, Inc.d | 2,651,270 | ||||||
| 65,827 | Fabrinetd | 2,652,828 | ||||||
| 375,630 | Facebook, Inc.d | 43,216,232 | ||||||
| 70,060 | Finisar Corporationd | 2,120,716 | ||||||
| 196,530 | FLIR Systems, Inc. | 7,112,421 | ||||||
| 5,030 | Forrester Research, Inc. | 216,039 | ||||||
| 120,419 | Fortinet, Inc.d | 3,627,020 | ||||||
| 22,100 | FUJIFILM Holdings NPV | 836,834 | ||||||
| 103,618 | Guidewire Software, Inc.d | 5,111,476 | ||||||
| 23,831 | IAC/InterActiveCorporationd | 1,544,010 | ||||||
| 18,330 | Insight Enterprises, Inc.d | 741,265 | ||||||
| 209,700 | Integrated Device Technology, Inc.d | 4,940,532 | ||||||
| 118,630 | Intel Corporation | 4,302,710 | ||||||
| 155,275 | Ixiad | 2,499,928 | ||||||
| 11,790 | Keysight Technologies, Inc.d | 431,160 | ||||||
| 11,700 | Konica Minolta Holdings, Inc. | 115,955 | ||||||
| 56,830 | Lam Research Corporation | 6,008,636 | ||||||
| 52,980 | Liberty Tripadvisor Holdings, Inc.d | 797,349 | ||||||
| 17,434 | Littelfuse, Inc. | 2,645,958 | ||||||
| 41,590 | M/A-COM Technology Solutions Holdings, Inc.d | 1,924,785 | ||||||
| 21,348 | Manhattan Associates, Inc.d | 1,132,084 | ||||||
| 308,820 | MasterCard, Inc. | 31,885,665 | ||||||
| 117,500 | Maxim Integrated Products, Inc. | 4,531,975 | ||||||
| 13,670 | MAXIMUS, Inc. | 762,649 | ||||||
| 60,737 | Methode Electronics, Inc. | 2,511,475 | ||||||
| 26,080 | Microsemi Corporationd | 1,407,538 | ||||||
| 976,550 | Microsoft Corporation | 60,682,817 | ||||||
| 43,450 | Mobileye NVd | 1,656,314 | ||||||
| 97,276 | Monolithic Power Systems, Inc. | 7,969,823 | ||||||
| 27,460 | Monotype Imaging Holdings, Inc. | 545,081 | ||||||
| 67,370 | National Instruments Corporation | 2,076,343 | ||||||
| 9,800 | NEC Networks & System Integration Corporation | 176,687 | ||||||
| 13,160 | NetApp, Inc. | 464,153 | ||||||
| 74,570 | New Relic, Inc.d,e | 2,106,603 | ||||||
| 3,300 | Nice, Ltd. | 226,421 | ||||||
| 41,766 | Nice, Ltd. ADR | 2,871,830 | ||||||
| 7,500 | Nichicon Corporation | 65,303 | ||||||
| 2,300 | NTT Data Corporation | 111,117 | ||||||
| 82,769 | NVIDIA Corporation | 8,834,763 | ||||||
| 35,885 | NXP Semiconductors NVd | 3,517,089 | ||||||
| 138,691 | Oclaro, Inc.d | 1,241,284 | ||||||
| 105,340 | ON Semiconductor Corporationd | 1,344,138 | ||||||
| 472,580 | Oracle Corporation | 18,170,701 | ||||||
| 12,300 | OSI Systems, Inc.d | 936,276 | ||||||
| 58,560 | Palo Alto Networks, Inc.d | 7,322,928 | ||||||
| 256,210 | Pandora Media, Inc.d,e | 3,340,978 | ||||||
| 58,775 | Paycom Software, Inc.d | 2,673,675 | ||||||
| 36,520 | Paylocity Holding Corporationd,e | 1,095,965 | ||||||
The accompanying Notes to Financial Statements are an integral part of this schedule.
41
Table of Contents
MODERATE ALLOCATION PORTFOLIO
Schedule of Investments as of December 31, 2016
| Shares | Common Stock (33.0%) | Value | ||||||
| Information Technology (7.5%) - continued | ||||||||
| 593,614 | PayPal Holdings, Inc.d | $ | 23,429,945 | |||||
| 53,255 | Pegasystems, Inc. | 1,917,180 | ||||||
| 75,117 | Progress Software Corporation | 2,398,486 | ||||||
| 74,209 | Proofpoint, Inc.d | 5,242,866 | ||||||
| 27,600 | PTC, Inc.d | 1,277,052 | ||||||
| 80,531 | Q2 Holdings, Inc.d | 2,323,319 | ||||||
| 3,820 | Qorvo, Inc.d | 201,429 | ||||||
| 73,190 | QUALCOMM, Inc. | 4,771,988 | ||||||
| 11,160 | Qualys, Inc.d | 353,214 | ||||||
| 27,330 | RealPage, Inc.d | 819,900 | ||||||
| 62,160 | Red Hat, Inc.d | 4,332,552 | ||||||
| 1,100 | Rohm Company, Ltd. | 63,110 | ||||||
| 60,922 | Rudolph Technologies, Inc.d | 1,422,529 | ||||||
| 3,600 | Ryosan Company, Ltd. | 108,534 | ||||||
| 424,790 | Salesforce.com, Inc.d | 29,081,123 | ||||||
| 1,242 | SAP SE | 107,440 | ||||||
| 13,110 | ScanSource, Inc.d | 528,989 | ||||||
| 5,360 | Seagate Technology plc | 204,591 | ||||||
| 63,235 | ServiceNow, Inc.d | 4,700,890 | ||||||
| 85,100 | ShoreTel, Inc.d | 608,465 | ||||||
| 3,360 | Silicon Laboratories, Inc.d | 218,400 | ||||||
| 2,932 | Software AG | 106,266 | ||||||
| 49,000 | SS&C Technologies Holdings, Inc. | 1,401,400 | ||||||
| 59,148 | Synopsys, Inc.d | 3,481,451 | ||||||
| 21,945 | Telefonaktiebolaget LM Ericsson | 128,619 | ||||||
| 319,257 | Teradyne, Inc. | 8,109,128 | ||||||
| 5,340 | Tessera Technologies, Inc. | 236,028 | ||||||
| 132,790 | Texas Instruments, Inc. | 9,689,686 | ||||||
| 3,100 | Tokyo Electron, Ltd. | 291,553 | ||||||
| 9,840 | Total System Services, Inc. | 482,455 | ||||||
| 27,560 | Trimble, Inc.d | 830,934 | ||||||
| 22,346 | Tyler Technologies, Inc.d | 3,190,338 | ||||||
| 14,302 | Ultimate Software Group, Inc.d | 2,607,970 | ||||||
| 10,010 | Verint Systems, Inc.d | 352,853 | ||||||
| 135,516 | Virtusa Corporationd | 3,404,162 | ||||||
| 423,060 | Visa, Inc. | 33,007,141 | ||||||
| 3,300 | Western Digital Corporation | 224,235 | ||||||
| 385,450 | Xerox Corporation | 3,364,979 | ||||||
| 141,220 | Xilinx, Inc. | 8,525,451 | ||||||
|
| |||||||
Total | 699,003,860 | |||||||
|
| |||||||
| Materials (1.5%) | ||||||||
| 4,900 | Adeka Corporation | 66,474 | ||||||
| 18,360 | Agnico Eagle Mines, Ltd. | 771,120 | ||||||
| 22,250 | Air Products and Chemicals, Inc. | 3,199,995 | ||||||
| 41,654 | American Vanguard Corporation | 797,674 | ||||||
| 9,021 | APERAM | 411,683 | ||||||
| 31,270 | Ashland Global Holdings, Inc. | 3,417,498 | ||||||
| 11,040 | Avery Dennison Corporation | 775,229 | ||||||
| 118,690 | Axalta Coating Systems, Ltd.d | 3,228,368 | ||||||
| 18,124 | Balchem Corporation | 1,520,966 | ||||||
| 15,350 | Ball Corporation | 1,152,324 | ||||||
| 102,310 | Barrick Gold Corporation | 1,634,914 | ||||||
| 7,000 | BHP Billiton plc | 111,462 | ||||||
| 104,874 | BHP Billiton, Ltd. | 1,878,804 | ||||||
| 73,058 | BlueScope Steel, Ltd. | 485,549 | ||||||
| 46,120 | Boise Cascade Companyd | 1,037,700 | ||||||
| 22,330 | Cabot Corporation | 1,128,558 | ||||||
| 21,470 | Carpenter Technology Corporation | 776,570 | ||||||
| 55,867 | Celanese Corporation | 4,398,968 | ||||||
| 54,243 | Chemtura Corporationd | 1,800,868 | ||||||
| 34,240 | Continental Building Products, Inc.d | 790,944 | ||||||
| 2,593 | Croda International plc | 101,982 | ||||||
| 49,800 | Crown Holdings, Inc.d | 2,617,986 | ||||||
| 41,700 | Daicel Corporation | 458,452 | ||||||
| 101,670 | Dow Chemical Company | 5,817,557 | ||||||
| 3,730 | Eagle Materials, Inc. | 367,517 | ||||||
| 110,164 | Eastman Chemical Company | 8,285,434 | ||||||
| 45,990 | Ecolab, Inc. | 5,390,948 | ||||||
| 71,060 | Eldorado Gold Corporationd | 228,813 | ||||||
| 26,905 | Evonik Industries AG | 802,009 | ||||||
| 41,220 | Ferro Corporationd | 590,683 | ||||||
| 90,800 | Ferroglobe plc | 983,364 | ||||||
| 90,800 | Ferroglobe Representation & Warranty Insurance Trustd,f | 9 | ||||||
| 107,916 | FMC Corporation | 6,103,729 | ||||||
| 67 | Givaudan SA | 122,622 | ||||||
| 69,680 | Goldcorp, Inc. | 947,648 | ||||||
| 658,590 | Graphic Packaging Holding Company | 8,219,203 | ||||||
| 24,340 | Huntsman Corporation | 464,407 | ||||||
| 4,666 | Ingevity Corporationd | 255,977 | ||||||
| 6,860 | Innophos Holdings, Inc. | 358,504 | ||||||
| 24,098 | Innospec, Inc. | 1,650,713 | ||||||
| 4,200 | International Flavors & Fragrances, Inc. | 494,886 | ||||||
| 63,570 | International Paper Company | 3,373,024 | ||||||
| 8,000 | JSR Corporation | 125,923 | ||||||
| 11,310 | Kadant, Inc. | 692,172 | ||||||
| 72,650 | KapStone Paper and Packaging Corporation | 1,601,932 | ||||||
| 141,210 | Kinross Gold Corporationd | 439,163 | ||||||
| 14,630 | Koppers Holdings, Inc.d | 589,589 | ||||||
| 28,100 | Kuraray Company, Ltd. | 421,375 | ||||||
| 6,600 | Kyoei Steel, Ltd. | 125,482 | ||||||
| 1,659 | LafargeHolcim, Ltd. | 87,084 | ||||||
| 4,760 | Martin Marietta Materials, Inc. | 1,054,483 | ||||||
| 28,380 | Materion Corporation | 1,123,848 | ||||||
| 19,560 | Methanex Corporation | 856,728 | ||||||
| 19,365 | Minerals Technologies, Inc. | 1,495,946 | ||||||
| 34,200 | Mitsubishi Chemical Holdings Corporation | 221,126 | ||||||
| 6,000 | Mitsubishi Gas Chemical Company, Inc. | 102,237 | ||||||
| 3,700 | Mitsubishi Materials Corporation | 113,173 | ||||||
| 162,870 | Mosaic Company | 4,776,977 | ||||||
| 114,947 | Myers Industries, Inc. | 1,643,742 | ||||||
| 2,570 | Neenah Paper, Inc. | 218,964 | ||||||
| 84,840 | Newmont Mining Corporation | 2,890,499 | ||||||
| 1,100 | Nippon Shokubai Company, Ltd. | 68,505 | ||||||
| 121,768 | Norsk Hydro ASA | 581,166 | ||||||
| 45,540 | Nucor Corporation | 2,710,541 | ||||||
| 12,830 | Nufarm, Ltd. | 84,538 | ||||||
| 54,970 | OMNOVA Solutions, Inc.d | 549,700 | ||||||
| 33,949 | Orora, Ltd. | 73,008 | ||||||
| 147,600 | Owens-Illinois, Inc.d | 2,569,716 | ||||||
| 80,714 | Packaging Corporation of America | 6,846,161 | ||||||
| 11,660 | PolyOne Corporation | 373,586 | ||||||
| 1,950 | Quaker Chemical Corporation | 249,483 | ||||||
| 39,440 | Rayonier Advanced Materials, Inc.e | 609,742 | ||||||
| 12,230 | Reliance Steel & Aluminum Company | 972,774 | ||||||
| 3,146 | Rio Tinto, Ltd. | 134,778 | ||||||
| 6,620 | Royal Gold, Inc. | 419,377 | ||||||
| 43,810 | Schnitzer Steel Industries, Inc. | 1,125,917 | ||||||
| 8,680 | Schweitzer-Mauduit International, Inc. | 395,200 | ||||||
| 15,337 | Scotts Miracle-Gro Company | 1,465,450 | ||||||
| 20,320 | Sealed Air Corporation | 921,309 | ||||||
| 28,750 | Sensient Technologies Corporation | 2,259,175 | ||||||
| 7,450 | Silgan Holdings, Inc. | 381,291 | ||||||
| 31,140 | Silver Wheaton Corporation | 601,625 | ||||||
| 31,130 | Sonoco Products Company | 1,640,551 | ||||||
| 215,493 | Steel Dynamics, Inc. | 7,667,241 | ||||||
The accompanying Notes to Financial Statements are an integral part of this schedule.
42
Table of Contents
MODERATE ALLOCATION PORTFOLIO
Schedule of Investments as of December 31, 2016
| Shares | Common Stock (33.0%) | Value | ||||||
Materials (1.5%) - continued | ||||||||
| 3,000 | Sumitomo Seika Chemicals Company, Ltd. | $ | 117,490 | |||||
| 18,570 | SunCoke Energy, Inc.d | 210,584 | ||||||
| 54,400 | Teck Resources, Ltd. | 1,089,632 | ||||||
| 12,700 | Toagosei Company, Ltd. | 124,655 | ||||||
| 15,000 | Tosoh Corporation | 105,810 | ||||||
| 18,694 | UPM-Kymmene Oyj | 457,174 | ||||||
| 149,207 | Verso Corporationd | 1,059,370 | ||||||
| 10,020 | Vulcan Materials Company | 1,254,003 | ||||||
| 33,169 | Westrock Company | 1,683,990 | ||||||
| 103,000 | Yamana Gold, Inc. | 289,430 | ||||||
| 3,800 | Yamato Kogyo Company, Ltd. | 105,980 | ||||||
| 21,816 | Yara International ASA | 858,221 | ||||||
| 2,500 | Yodogawa Steel Works, Ltd. | 65,153 | ||||||
|
| |||||||
Total | 135,723,904 | |||||||
|
| |||||||
Real Estate (0.9%) | ||||||||
| 24,700 | American Assets Trust, Inc. | 1,064,076 | ||||||
| 27,890 | American Campus Communities, Inc. | 1,388,085 | ||||||
| 53,500 | Bluerock Residential Growth REIT, Inc.e | 734,020 | ||||||
| 288,566 | Brixmor Property Group, Inc. | 7,046,782 | ||||||
| 27,630 | Camden Property Trust | 2,322,854 | ||||||
| 67,000 | CapitaLand Retail China Trustd | 63,384 | ||||||
| 109,850 | CBL & Associates Properties, Inc. | 1,263,275 | ||||||
| 291,831 | Cedar Realty Trust, Inc. | 1,905,656 | ||||||
| 107,490 | Chatham Lodging Trust | 2,208,920 | ||||||
| 26,800 | City Office REIT, Inc. | 352,956 | ||||||
| 63,480 | Columbia Property Trust, Inc. | 1,371,168 | ||||||
| 43,490 | CoreCivic, Inc. | 1,063,765 | ||||||
| 223,000 | Corporate Office Properties Trust | 6,962,060 | ||||||
| 62,833 | Cousins Properties, Inc. | 534,709 | ||||||
| 13,720 | CyrusOne, Inc. | 613,696 | ||||||
| 900 | Daito Trust Construction Company, Ltd. | 135,304 | ||||||
| 487,160 | DDR Corporation | 7,438,933 | ||||||
| 94,153 | DEXUS Property Group | 653,160 | ||||||
| 24,970 | Digital Realty Trust, Inc. | 2,453,552 | ||||||
| 88,090 | Duke Realty Corporation | 2,339,670 | ||||||
| 26,210 | Equity Lifestyle Properties, Inc. | 1,889,741 | ||||||
| 12,700 | First Industrial Realty Trust, Inc. | 356,235 | ||||||
| 94,719 | First Potomac Realty Trust | 1,039,067 | ||||||
| 68,110 | Franklin Street Properties Corporation | 882,706 | ||||||
| 82,750 | General Growth Properties, Inc. | 2,067,095 | ||||||
| 28,574 | H&R Real Estate Investment Trust | 476,074 | ||||||
| 8,533 | Hamborner REIT AG | 81,173 | ||||||
| 76,470 | HFF, Inc. | 2,313,217 | ||||||
| 39,810 | Hospitality Properties Trust | 1,263,569 | ||||||
| 155,736 | Host Hotels & Resorts, Inc. | 2,934,066 | ||||||
| 7,550 | Hudson Pacific Properties, Inc. | 262,589 | ||||||
| 108,000 | Hysan Development Company, Ltd. | 445,397 | ||||||
| 62,960 | InfraREIT, Inc. | 1,127,614 | ||||||
| 52,430 | Kite Realty Group Trust | 1,231,056 | ||||||
| 59,400 | LaSalle Hotel Properties | 1,809,918 | ||||||
| 54,810 | Liberty Property Trust | 2,164,995 | ||||||
| 20,930 | Life Storage, Inc. | 1,784,492 | ||||||
| 10,500 | Link REIT | 68,072 | ||||||
| 9,200 | Mid-America Apartment Communities, Inc. | 900,864 | ||||||
| 437,289 | New World Development Company, Ltd. | 460,731 | ||||||
| 37,826 | Pebblebrook Hotel Trust | 1,125,323 | ||||||
| 34,130 | Physicians Realty Trust | 647,105 | ||||||
| 8,845 | Potlatch Corporation | 368,394 | ||||||
| 43,270 | RE/MAX Holdings, Inc. | 2,423,120 | ||||||
| 46,520 | Realogy Holdings Corporation | 1,196,960 | ||||||
| 170,980 | Retail Properties of America, Inc. | 2,621,123 | ||||||
| 54,520 | Silver Bay Realty Trust Corporation REIT | 934,473 | ||||||
| 32,130 | Spirit Realty Captial, Inc. | 348,932 | ||||||
| 175,130 | Stockland | 578,575 | ||||||
| 25,750 | Store Capital Corporation | 636,283 | ||||||
| 8,880 | Sun Communities, Inc. | 680,297 | ||||||
| 8,000 | Sun Hung Kai Properties, Ltd. | 100,740 | ||||||
| 56,096 | Terreno Realty Corporation | 1,598,175 | ||||||
| 50,330 | Urstadt Biddle Properties, Inc. | 1,213,456 | ||||||
| 18,490 | Welltower, Inc. | 1,237,536 | ||||||
| 12,000 | Wharf Holdings, Ltd. | 79,488 | ||||||
| 17,000 | Wheelock and Company, Ltd. | 95,408 | ||||||
| 106,100 | Wing Tai Holdings, Ltd. | 116,212 | ||||||
|
| |||||||
Total | 81,476,296 | |||||||
|
| |||||||
Telecommunications Services (0.3%) | ||||||||
| 55,410 | AT&T, Inc. | 2,356,587 | ||||||
| 9,770 | ATN International, Inc. | 782,870 | ||||||
| 30,214 | Cincinnati Bell, Inc.d | 675,283 | ||||||
| 15,707 | Elisa Oyj | 509,874 | ||||||
| 14,000 | Freenet AG | 393,466 | ||||||
| 77,670 | General Communication, Inc.d | 1,510,681 | ||||||
| 234,235 | KCOM Group plc | 273,518 | ||||||
| 60,242 | Koninklijke (Royal) KPN NV | 178,144 | ||||||
| 44,507 | Level 3 Communications, Inc.d | 2,508,415 | ||||||
| 13,700 | Nippon Telegraph & Telephone Corporation | 576,704 | ||||||
| 15,800 | NTT DOCOMO, Inc. | 359,375 | ||||||
| 280,547 | PCCW, Ltd. | 151,659 | ||||||
| 6,466 | Proximus SA | 185,878 | ||||||
| 31,082 | SBA Communications Corporationd | 3,209,527 | ||||||
| 24,500 | Telefonica Deutschland Holding AG | 104,723 | ||||||
| 15,743 | Telenor ASA | 234,991 | ||||||
| 179,546 | Verizon Communications, Inc. | 9,584,165 | ||||||
| 3,530 | Vivendi SA | 66,953 | ||||||
| 113,310 | Vonage Holdings Corporationd | 776,174 | ||||||
|
| |||||||
Total | 24,438,987 | |||||||
|
| |||||||
Utilities (0.8%) | ||||||||
| 5,930 | Alliant Energy Corporation | 224,688 | ||||||
| 7,880 | American Electric Power Company, Inc. | 496,125 | ||||||
| 66,350 | American States Water Company | 3,022,906 | ||||||
| 31,490 | Artesian Resources Corporation | 1,005,791 | ||||||
| 5,000 | ATCO, Ltd. | 166,313 | ||||||
| 103,130 | Avista Corporation | 4,124,169 | ||||||
| 108,620 | Calpine Corporationd | 1,241,527 | ||||||
| 87,100 | Centrica plc | 250,853 | ||||||
| 4,590 | Consolidated Edison, Inc. | 338,191 | ||||||
| 26,650 | Consolidated Water Company, Ltd. | 289,153 | ||||||
| 52,830 | DTE Energy Company | 5,204,283 | ||||||
| 44,430 | Dynegy, Inc.d | 375,878 | ||||||
| 14,080 | Edison International, Inc. | 1,013,619 | ||||||
| 120,100 | Electricidade de Portugal SA | 365,531 | ||||||
| 110,540 | Eversource Energy | 6,105,124 | ||||||
| 16,480 | Exelon Corporation | 584,875 | ||||||
| 324,430 | Great Plains Energy, Inc. | 8,873,161 | ||||||
| 19,490 | Hawaiian Electric Industries, Inc. | 644,534 | ||||||
| 38,050 | MDU Resources Group, Inc. | 1,094,698 | ||||||
| 13,450 | Middlesex Water Company | 577,543 | ||||||
| 9,670 | National Fuel Gas Company | 547,709 | ||||||
| 32,480 | NiSource, Inc. | 719,107 | ||||||
| 9,850 | NorthWestern Corporation | 560,169 | ||||||
| 143,000 | Osaka Gas Company, Ltd. | 548,700 | ||||||
| 250,730 | PG&E Corporation | 15,236,862 | ||||||
| 33,160 | PNM Resources, Inc. | 1,137,388 | ||||||
The accompanying Notes to Financial Statements are an integral part of this schedule.
43
Table of Contents
MODERATE ALLOCATION PORTFOLIO
Schedule of Investments as of December 31, 2016
| Shares | Common Stock (33.0%) | Value | ||||||
Utilities (0.8%) - continued | ||||||||
| 76,680 | Portland General Electric Company | $ | 3,322,544 | |||||
| 73,160 | Public Service Enterprise Group, Inc. | 3,210,261 | ||||||
| 77,015 | Redes Energeticas Nacionais SGPS SA | 218,511 | ||||||
| 38,100 | Renewable Energy Group, Inc.d | 369,570 | ||||||
| 67,400 | Southern Company | 3,315,406 | ||||||
| 15,660 | Southwest Gas Holdings, Inc. | 1,199,869 | ||||||
| 5,310 | Spire, Inc. | 342,761 | ||||||
| 12,000 | Toho Gas Company, Ltd. | 97,462 | ||||||
| 16,500 | United Utilities Group plc | 182,892 | ||||||
| 130,360 | Vectren Corporation | 6,798,274 | ||||||
|
| |||||||
Total | 73,806,447 | |||||||
|
| |||||||
Total Common Stock (cost $2,525,310,992) | 3,058,673,715 | |||||||
|
| |||||||
Registered Investment Companies (30.2%) | ||||||||
Affiliated Equity Holdings (18.2%) | ||||||||
| 22,936,793 | Thrivent Large Cap Stock Portfolio | 277,434,277 | ||||||
| 30,302,240 | Thrivent Large Cap Value Portfolio | 510,265,482 | ||||||
| 15,614,280 | Thrivent Mid Cap Stock Portfolio | 297,931,385 | ||||||
| 57,080,403 | Thrivent Partner Worldwide Allocation Portfolio | 518,923,651 | ||||||
| 4,432,127 | Thrivent Small Cap Stock Portfolio | 81,966,430 | ||||||
|
| |||||||
Total | 1,686,521,225 | |||||||
|
| |||||||
Affiliated Fixed Income Holdings (10.8%) | ||||||||
| 35,466,032 | Thrivent High Yield Portfolio | 169,180,064 | ||||||
| 51,812,632 | Thrivent Income Portfolio | 521,696,215 | ||||||
| 31,725,097 | Thrivent Limited Maturity Bond Portfolio | 311,124,857 | ||||||
|
| |||||||
Total | 1,002,001,136 | |||||||
|
| |||||||
Equity Funds/ETFs (0.5%) | ||||||||
| 2,190 | iShares MSCI EAFE Index Fund | 126,429 | ||||||
| 40,421 | iShares Russell 2000 Growth Index Funde | 6,222,409 | ||||||
| 46,089 | iShares Russell 2000 Index Fund | 6,215,102 | ||||||
| 12,080 | iShares Russell 2000 Value Index Fund | 1,436,795 | ||||||
| 21,170 | Materials Select Sector SPDR Fund | 1,052,149 | ||||||
| 118,993 | SPDR S&P 500 ETF Trust | 26,598,505 | ||||||
| 56,410 | SPDR S&P Biotech ETFe | 3,338,908 | ||||||
| 1,870 | SPDR S&P MidCap 400 ETF Truste | 564,235 | ||||||
|
| |||||||
Total | 45,554,532 | |||||||
|
| |||||||
Fixed Income Funds/ETFs (0.7%) | ||||||||
| 123,000 | iShares Barclays 1-3 Year Credit Bond Fund | 12,907,620 | ||||||
| 195,050 | iShares iBoxx $ Investment Grade Corporate Bond ETF | 22,855,959 | ||||||
| 16,998 | iShares J.P. Morgan USD Emerging Markets Bond ETFe | 1,873,519 | ||||||
| 185,200 | PowerShares Senior Loan Portfolio | 4,326,272 | ||||||
| 291,700 | Vanguard Short-Term Corporate Bond ETF | 23,152,229 | ||||||
|
| |||||||
Total | 65,115,599 | |||||||
|
| |||||||
Total Registered Investment Companies (cost $2,514,142,373) | 2,799,192,492 | |||||||
|
| |||||||
| Principal Amount | Long-Term Fixed Income (29.7%) | |||||||
Asset-Backed Securities (2.1%) | ||||||||
Access Group, Inc. | ||||||||
1.256%, 2/25/2036, Series | ||||||||
| 690,129 | 2013-1, Class Ag,h | 681,626 | ||||||
Alm Loan Funding CLO | ||||||||
2.310%, 10/17/2026, Series | ||||||||
| 1,400,000 | 2014-11A, Class A1*,h | 1,402,444 | ||||||
AMSR Trust | ||||||||
2.136%, 11/17/2033, Series | ||||||||
| 3,625,000 | 2016-SFR1, Class Ag,h | 3,625,165 | ||||||
Apidos CLO XVIII | ||||||||
2.294%, 7/22/2026, Series | ||||||||
| 1,400,000 | 2014-18A, Class A1*,h | 1,402,159 | ||||||
Ares CLO, Ltd. | ||||||||
2.164%, 10/12/2023, Series | ||||||||
| 4,400,000 | 2012-2A, Class AR*,h | 4,400,590 | ||||||
2.386%, 11/15/2025, Series | ||||||||
| 2,750,000 | 2014-32A, Class A1*,h | 2,754,711 | ||||||
BA Credit Card Trust | ||||||||
1.084%, 6/15/2021, Series | ||||||||
| 1,750,000 | 2014-A1, Class Ah | 1,754,400 | ||||||
Babson CLO, Ltd. | ||||||||
2.270%, 10/17/2026, Series | ||||||||
| 1,400,000 | 2014-IIA, Class A*,h | 1,402,239 | ||||||
Bayview Opportunity Master Fund Trust | ||||||||
3.228%, 7/28/2034, Series | ||||||||
| 959,192 | 2014-18NP, Class A*,i | 960,567 | ||||||
3.721%, 7/28/2035, Series | ||||||||
| 1,343,940 | 2015-NPLA, Class Ag,i | 1,343,632 | ||||||
Betony CLO, Ltd. | ||||||||
2.256%, 4/15/2027, Series | ||||||||
| 1,260,000 | 2015-1A, Class AR*,h | 1,253,068 | ||||||
Birchwood Park CLO, Ltd. | ||||||||
2.320%, 7/15/2026, Series | ||||||||
| 1,400,000 | 2014-1A, Class A*,h | 1,402,572 | ||||||
BlueMountain CLO, Ltd. | ||||||||
2.360%, 10/15/2026, Series | ||||||||
| 1,400,000 | 2014-3A, Class A1*,h | 1,402,243 | ||||||
CAM Mortgage, LLC | ||||||||
3.500%, 7/15/2064, Series | ||||||||
| 27,438 | 2015-1, Class A*,i | 27,436 | ||||||
Capital One Multi-Asset Execution Trust | ||||||||
1.084%, 1/18/2022, Series | ||||||||
| 2,250,000 | 2014-A3, Class A3h | 2,250,913 | ||||||
Carlyle Global Market Strategies CLO, Ltd. | ||||||||
2.181%, 7/20/2023, Series | ||||||||
| 1,213,907 | 2012-2A, Class A1R*,h | 1,214,064 | ||||||
2.380%, 10/15/2026, Series | ||||||||
| 1,400,000 | 2014-4A, Class A1*,h | 1,402,194 | ||||||
Cent CLO 16, LP | ||||||||
2.136%, 8/1/2024, Series | ||||||||
| 1,360,200 | 2012-16A, Class A1AR*,h | 1,360,459 | ||||||
Cent CLO 22, Ltd. | ||||||||
2.291%, 11/7/2026, Series | ||||||||
| 1,400,000 | 2014-22A, Class A1R*,h | 1,396,718 | ||||||
Chase Issuance Trust | ||||||||
1.590%, 2/18/2020, Series | ||||||||
| 1,375,000 | 2015-A2, Class A2 | 1,378,804 | ||||||
1.620%, 7/15/2020, Series | ||||||||
| 2,525,000 | 2015-A7, Class A7 | 2,529,731 | ||||||
1.114%, 5/17/2021, Series | ||||||||
| 2,500,000 | 2016-A1, Class Ah | 2,507,811 | ||||||
Chesapeake Funding II, LLC | ||||||||
1.880%, 6/15/2028, Series | ||||||||
| 1,000,000 | 2016-2A, Class A1g | 997,286 | ||||||
The accompanying Notes to Financial Statements are an integral part of this schedule.
44
Table of Contents
MODERATE ALLOCATION PORTFOLIO
Schedule of Investments as of December 31, 2016
| Principal Amount | Long-Term Fixed Income (29.7%) | Value | ||||||
Asset-Backed Securities (2.1%) - continued | ||||||||
Chesapeake Funding, LLC | ||||||||
1.102%, 1/7/2025, Series | ||||||||
| $ 558,206 | 2013-1A, Class Ag,h | $ | 558,002 | |||||
Commonbond Student Loan Trust | ||||||||
3.320%, 5/25/2040, Series | ||||||||
| 5,297,560 | 2016-A, Class A1g | 5,277,788 | ||||||
DRB Prime Student Loan Trust | ||||||||
3.170%, 7/25/2031, Series | ||||||||
| 1,032,695 | 2015-B, Class A2* | 1,034,315 | ||||||
3.200%, 1/25/2040, Series | ||||||||
| 3,406,878 | 2015-D, Class A2* | 3,382,746 | ||||||
2.890%, 6/25/2040, Series | ||||||||
| 998,044 | 2016-B, Class A2g | 990,243 | ||||||
Dryden 34 Senior Loan Fund CLO | ||||||||
2.310%, 10/15/2026, Series | ||||||||
| 1,400,000 | 2014-34A, Class A*,h | 1,402,425 | ||||||
Earnest Student Loan Program, LLC | ||||||||
2.680%, 7/25/2035, Series | ||||||||
| 5,077,711 | 2016-C, Class A2g | 4,979,673 | ||||||
2.720%, 1/25/2041, Series | ||||||||
| 3,460,210 | 2016-D, Class A2g | 3,407,354 | ||||||
Edlinc Student Loan Funding Trust | ||||||||
3.410%, 10/1/2025, Series | ||||||||
| 67,477 | 2012-A, Class AT*,h | 68,227 | ||||||
Enterprise Fleet Financing, LLC | ||||||||
0.870%, 9/20/2019, Series | ||||||||
| 66,730 | 2014-1, Class A2g | 66,681 | ||||||
FirstEnergy Ohio PIRB Special Purpose Trust | ||||||||
0.679%, 1/15/2019, Series | ||||||||
| 88,438 | 2013-1, Class A1 | 88,348 | ||||||
Ford Credit Auto Owner Trust | ||||||||
2.260%, 11/15/2025, Series | ||||||||
| 1,350,000 | 2014-1, Class Ag | 1,361,061 | ||||||
Ford Credit Floorplan Master Owner Trust | ||||||||
1.200%, 2/15/2019, Series | ||||||||
| 1,000,000 | 2014-1, Class A1 | 1,000,046 | ||||||
Galaxy XX CLO, Ltd. | ||||||||
2.331%, 7/20/2027, Series | ||||||||
| 4,500,000 | 2015-20A, Class A*,h | 4,494,730 | ||||||
GoldenTree Loan Opportunities IX, Ltd. | ||||||||
2.238%, 10/29/2026, Series | ||||||||
| 1,325,000 | 2014-9A, Class AR*,h | 1,324,085 | ||||||
Golub Capital Partners CLO 22B, Ltd. | ||||||||
2.391%, 2/20/2027, Series | ||||||||
| 2,700,000 | 2015-22A, Class A1*,h | 2,699,854 | ||||||
Golub Capital Partners CLO 23M, Ltd. | ||||||||
2.366%, 5/5/2027, Series | ||||||||
| 1,350,000 | 2015-23A, Class A1*,h | 1,350,119 | ||||||
Lehman XS Trust | ||||||||
5.440%, 8/25/2035, Series | ||||||||
| 5,473,007 | 2005-2, Class 2A3Bi | 4,794,608 | ||||||
Limerock CLO III, LLC | ||||||||
2.411%, 10/20/2026, Series | ||||||||
| 4,500,000 | 2014-3A, Class A1*,h | 4,437,485 | ||||||
Madison Park Funding XIV CLO, Ltd. | ||||||||
2.331%, 7/20/2026, Series | ||||||||
| 1,525,000 | 2014-14A, Class A2*,h | 1,527,576 | ||||||
Madison Park Funding, Ltd. | ||||||||
2.196%, 8/15/2022, Series | ||||||||
| 3,732,106 | 2012-9A, Class AR*,h | 3,732,789 | ||||||
Magnetite XII, Ltd. | ||||||||
2.256%, 4/15/2027, Series | ||||||||
| 4,425,000 | 2015-12A, Class AR*,h | 4,421,657 | ||||||
Marlette Funding Trust | ||||||||
3.060%, 1/17/2023, Series | ||||||||
| 1,692,584 | 2016-1A, Class A* | 1,692,170 | ||||||
Morgan Stanley Bank of America Merrill Lynch Trust | ||||||||
| 5,400,000 | 3.176%, 8/15/2045 | 5,549,366 | ||||||
| 5,400,000 | 3.246%, 12/15/2047 | 5,438,411 | ||||||
Morgan Stanley Capital, Inc. | ||||||||
0.906%, 2/25/2037, Series | ||||||||
| 2,654,230 | 2007-NC2, Class A2FPh | 1,586,003 | ||||||
Mountain View CLO, Ltd. | ||||||||
2.340%, 7/15/2027, Series | ||||||||
| 4,525,000 | 2015-9A, Class A1A*,h | 4,512,736 | ||||||
Murray Hill Marketplace Trust | ||||||||
4.190%, 11/25/2022, Series | ||||||||
| 3,792,848 | 2016-LC1, Class A* | 3,811,032 | ||||||
Neuberger Berman CLO, Ltd. | ||||||||
2.346%, 8/4/2025, Series | ||||||||
| 1,100,000 | 2014-17A, Class A*,h | 1,100,029 | ||||||
NZCG Funding CLO, Ltd. | ||||||||
2.436%, 4/27/2027, Series | ||||||||
| 4,500,000 | 2015-2A, Class A1*,h | 4,496,363 | ||||||
Octagon Investment Partners XX CLO, Ltd. | ||||||||
2.342%, 8/12/2026, Series | ||||||||
| 1,400,000 | 2014-1A, Class A*,h | 1,402,446 | ||||||
OHA Loan Funding, Ltd. | ||||||||
2.411%, 10/20/2026, Series | ||||||||
| 4,500,000 | 2014-1A, Class A1*,h | 4,526,046 | ||||||
OneMain Financial Issuance Trust | ||||||||
4.100%, 3/20/2028, Series | ||||||||
| 2,600,000 | 2016-2A, Class Ag | 2,650,215 | ||||||
OZLM VIII, Ltd. | ||||||||
2.320%, 10/17/2026, Series | ||||||||
| 1,400,000 | 2014-8A, Class A1A*,h | 1,402,500 | ||||||
Race Point IX CLO, Ltd. | ||||||||
2.390%, 4/15/2027, Series | ||||||||
| 3,260,000 | 2015-9A, Class A1*,h | 3,270,605 | ||||||
Renaissance Home Equity Loan Trust | ||||||||
6.011%, 5/25/2036, Series | ||||||||
| 1,909,567 | 2006-1, Class AF4i | 1,304,027 | ||||||
5.580%, 11/25/2036, Series | ||||||||
| 3,555,466 | 2006-3, Class AF2i | 1,979,331 | ||||||
Shackleton, Ltd. | ||||||||
2.340%, 4/15/2027, Series | ||||||||
| 4,500,000 | 2015-7A, Class AR*,h | 4,500,000 | ||||||
SLM Student Loan Trust | ||||||||
1.304%, 7/15/2022, Series | ||||||||
| 685,705 | 2014-A, Class A1g,h | 686,266 | ||||||
1.304%, 8/15/2022, Series | ||||||||
| 99,615 | 2013-A, Class A1g,h | 99,676 | ||||||
1.282%, 4/25/2023, Series | ||||||||
| 18,728 | 2004-10, Class A5Ag,h | 18,725 | ||||||
1.156%, 3/25/2025, Series | ||||||||
| 2,256,021 | 2010-1, Class Ah | 2,197,116 | ||||||
1.754%, 5/17/2027, Series | ||||||||
| 125,000 | 2013-A, Class A2Bg,h | 125,919 | ||||||
Sofi Consumer Loan Program, LLC | ||||||||
3.260%, 8/25/2025, Series | ||||||||
| 1,756,682 | 2016-1, Class Ag | 1,758,349 | ||||||
The accompanying Notes to Financial Statements are an integral part of this schedule.
45
Table of Contents
MODERATE ALLOCATION PORTFOLIO
Schedule of Investments as of December 31, 2016
| Principal Amount | Long-Term Fixed Income (29.7%) | Value | ||||||
Asset-Backed Securities (2.1%) - continued | ||||||||
SoFi Professional Loan Program, LLC | ||||||||
2.420%, 3/25/2030, Series | ||||||||
| $2,054,149 | 2015-A, Class A2g | $ | 2,047,125 | |||||
Sunset Mortgage Loan Company, LLC | ||||||||
4.459%, 9/18/2045, Series | ||||||||
| 1,854,067 | 2015-NPL1, Class A*,i | 1,846,177 | ||||||
3.844%, 7/16/2047, Series | ||||||||
| 4,516,126 | 2016-NPL1, Class A*,i | 4,531,494 | ||||||
Symphony CLO VIII, Ltd. | ||||||||
1.976%, 1/9/2023, Series | ||||||||
| 1,281,546 | 2012-8A, Class AR*,h | 1,281,718 | ||||||
Symphony CLO XV, Ltd. | ||||||||
2.330%, 10/17/2026, Series | ||||||||
| 4,500,000 | 2014-15A, Class A*,h | 4,508,298 | ||||||
U.S. Small Business Administration | ||||||||
3.191%, 3/10/2024, Series | ||||||||
| 851,662 | 2014-10A, Class 1 | 880,874 | ||||||
Vericrest Opportunity Loan Transferee | ||||||||
3.375%, 10/25/2058, Series | ||||||||
| 4,185,611 | 2015-NPL3, Class A1*,i | 4,179,747 | ||||||
3.500%, 6/26/2045, Series | ||||||||
| 2,945,265 | 2015-NPL8, Class A1g,i | 2,950,825 | ||||||
3.500%, 6/26/2045, Series | ||||||||
| 2,197,990 | 2015-NPL9, Class A1g | 2,193,510 | ||||||
3.625%, 7/25/2045, Series | ||||||||
| 1,890,426 | 2015-NP10, Class A1g,i | 1,892,728 | ||||||
4.250%, 3/26/2046, Series | ||||||||
| 3,284,409 | 2016-NPL3, Class A1g,i | 3,309,766 | ||||||
3.500%, 9/25/2046, Series | ||||||||
| 3,181,868 | 2016-NP10, Class A1g,i | 3,173,162 | ||||||
3.500%, 2/25/2055, Series | ||||||||
| 773,830 | 2015-NPL4, Class A1*,i | 774,423 | ||||||
Vericrest Opportunity Loan Trust | ||||||||
3.625%, 11/26/2046, Series | ||||||||
| 4,013,891 | 2016-NP12, Class A1g,i | 4,002,021 | ||||||
3.875%, 12/26/2046, Series | ||||||||
| 3,000,000 | 2016-NP13, Class A1g,i | 3,000,000 | ||||||
Volvo Financial Equipment, LLC | ||||||||
0.820%, 4/16/2018, Series | ||||||||
| 478,485 | 2014-1A, Class A3g | 478,174 | ||||||
Voya CLO 3, Ltd. | ||||||||
2.302%, 7/25/2026, Series | ||||||||
| 1,400,000 | 2014-3A, Class A1*,h | 1,402,253 | ||||||
|
| |||||||
Total | 187,810,270 | |||||||
|
| |||||||
Basic Materials (0.2%) | ||||||||
Albemarle Corporation | ||||||||
| 395,000 | 3.000%, 12/1/2019 | 403,771 | ||||||
Alcoa Nederland Holding BV | ||||||||
| 1,305,000 | 6.750%, 9/30/2024g | 1,415,925 | ||||||
Anglo American plc | ||||||||
| 2,433,000 | 3.625%, 5/14/2020g | 2,460,250 | ||||||
ArcelorMittal SA | ||||||||
| 1,425,000 | 6.500%, 3/1/2021 | 1,560,375 | ||||||
First Quantum Minerals, Ltd. | ||||||||
| 621,000 | 6.750%, 2/15/2020g | 619,447 | ||||||
| 621,000 | 7.000%, 2/15/2021g | 617,647 | ||||||
Georgia-Pacific, LLC | ||||||||
| 920,000 | 2.539%, 11/15/2019g | 927,621 | ||||||
Glencore Funding, LLC | ||||||||
| 680,000 | 1.940%, 4/16/2018g,h | 672,316 | ||||||
Kinross Gold Corporation | ||||||||
| 1,520,000 | 5.950%, 3/15/2024 | 1,539,000 | ||||||
Novelis Corporation | ||||||||
| 905,000 | 5.875%, 9/30/2026g | 914,050 | ||||||
Steel Dynamics, Inc. | ||||||||
| 2,010,000 | 5.000%, 12/15/2026g | 2,002,462 | ||||||
Westlake Chemical Corporation | ||||||||
| 1,520,000 | 3.600%, 8/15/2026g | 1,459,844 | ||||||
|
| |||||||
Total | 14,592,708 | |||||||
|
| |||||||
Capital Goods (0.4%) | ||||||||
AECOM | ||||||||
| 3,030,000 | 5.875%, 10/15/2024 | 3,234,858 | ||||||
Building Materials Corporation of America | ||||||||
| 2,355,000 | 6.000%, 10/15/2025g | 2,478,637 | ||||||
Cemex Finance, LLC | ||||||||
| 2,970,000 | 9.375%, 10/12/2022g | 3,237,300 | ||||||
CNH Industrial Capital, LLC | ||||||||
| 1,155,000 | 4.375%, 11/6/2020 | 1,185,319 | ||||||
CNH Industrial NV | ||||||||
| 1,500,000 | 4.500%, 8/15/2023 | 1,481,250 | ||||||
Crown Americas Capital Corporation IV | ||||||||
| 1,470,000 | 4.500%, 1/15/2023 | 1,499,400 | ||||||
General Electric Company | ||||||||
| 2,095,000 | 5.000%, 1/21/2021j | 2,173,981 | ||||||
Huntington Ingalls Industries, Inc. | ||||||||
| 2,975,000 | 5.000%, 11/15/2025g | 3,090,281 | ||||||
L3 Technologies, Inc. | ||||||||
| 1,550,000 | 3.950%, 5/28/2024 | 1,574,656 | ||||||
Lockheed Martin Corporation | ||||||||
| 1,332,000 | 2.500%, 11/23/2020 | 1,342,218 | ||||||
| 1,544,000 | 4.500%, 5/15/2036 | 1,638,934 | ||||||
Northrop Grumman Corporation | ||||||||
| 1,310,000 | 3.850%, 4/15/2045 | 1,240,105 | ||||||
Owens-Brockway Glass Container, Inc. | ||||||||
| 1,460,000 | 5.000%, 1/15/2022g | 1,492,850 | ||||||
| 1,500,000 | 5.875%, 8/15/2023g | 1,563,750 | ||||||
Pentair Finance SA | ||||||||
| 1,500,000 | 2.900%, 9/15/2018 | 1,517,061 | ||||||
Republic Services, Inc. | ||||||||
| 1,100,000 | 2.900%, 7/1/2026 | 1,052,939 | ||||||
Reynolds Group Issuer, Inc. | ||||||||
| 2,935,000 | 5.125%, 7/15/2023g | 2,982,694 | ||||||
Roper Industries, Inc. | ||||||||
| 2,070,000 | 2.050%, 10/1/2018 | 2,076,649 | ||||||
Roper Technologies, Inc. | ||||||||
| 1,140,000 | 2.800%, 12/15/2021 | 1,138,298 | ||||||
Standard Industries, Inc. | ||||||||
| 800,000 | 5.500%, 2/15/2023g | 828,080 | ||||||
Textron, Inc. | ||||||||
| 785,000 | 5.600%, 12/1/2017 | 812,724 | ||||||
| 1,225,000 | 7.250%, 10/1/2019 | 1,376,176 | ||||||
United Rentals North America, Inc. | ||||||||
| 2,240,000 | 5.500%, 7/15/2025 | 2,284,800 | ||||||
Waste Management, Inc. | ||||||||
| 310,000 | 3.125%, 3/1/2025 | 309,999 | ||||||
|
| |||||||
Total | 41,612,959 | |||||||
|
| |||||||
Collateralized Mortgage Obligations (0.6%) | ||||||||
Alternative Loan Trust | ||||||||
6.000%, 6/25/2036, Series | ||||||||
| 1,189,376 | 2006-24CB, Class A9 | 1,036,508 | ||||||
Angel Oak Mortgage Trust I, LLC | ||||||||
3.500%, 7/25/2046, Series | ||||||||
| 1,682,536 | 2016-1, Class A1* | 1,672,203 | ||||||
The accompanying Notes to Financial Statements are an integral part of this schedule.
46
Table of Contents
MODERATE ALLOCATION PORTFOLIO
Schedule of Investments as of December 31, 2016
| Principal Amount | Long-Term Fixed Income (29.7%) | Value | ||||||
Collateralized Mortgage Obligations (0.6%) - continued | ||||||||
BCAP, LLC Trust | ||||||||
0.936%, 3/25/2037, Series | ||||||||
| $2,925,632 | 2007-AA1, Class 2A1h | $ | 2,715,003 | |||||
Citigroup Mortgage Loan Trust, Inc. | ||||||||
5.500%, 11/25/2035, Series | ||||||||
| 825,569 | 2005-9, Class 21A2 | 797,693 | ||||||
CitiMortgage Alternative Loan Trust | ||||||||
5.750%, 4/25/2037, Series | ||||||||
| 2,685,582 | 2007-A4, Class 1A5 | 2,300,944 | ||||||
COLT Mortgage Loan Trust | ||||||||
2.800%, 12/26/2046, Series | ||||||||
| 3,025,000 | 2016-3, Class A1* | 3,027,408 | ||||||
Countrywide Alternative Loan Trust | ||||||||
3.036%, 10/25/2035, Series | ||||||||
| 1,765,143 | 2005-43, Class 4A1 | 1,430,958 | ||||||
6.000%, 4/25/2036, Series | ||||||||
| 1,134,326 | 2006-4CB, Class 1A1 | 910,792 | ||||||
6.000%, 1/25/2037, Series | ||||||||
| 519,486 | 2006-39CB, Class 1A16 | 496,027 | ||||||
5.500%, 5/25/2037, Series | ||||||||
| 3,183,486 | 2007-8CB, Class A1 | 2,724,441 | ||||||
7.000%, 10/25/2037, Series | ||||||||
| 2,991,939 | 2007-24, Class A10 | 1,601,762 | ||||||
Countrywide Home Loans, Inc. | ||||||||
5.750%, 4/25/2037, Series | ||||||||
| 961,201 | 2007-3, Class A27 | 811,091 | ||||||
Deutsche Alt-A Securities Mortgage Loan Trust | ||||||||
6.000%, 10/25/2021, Series | ||||||||
| 732,192 | 2006-AR5, Class 23A | 651,355 | ||||||
Federal Home Loan Mortgage Corporation | ||||||||
4.000%, 7/15/2031, | ||||||||
| 7,754,725 | Series-4104, Class KIk | 894,238 | ||||||
3.000%, 2/15/2033, | ||||||||
| 4,255,735 | Series-4170, Class IGk | 509,491 | ||||||
Federal National Mortgage Association | ||||||||
3.500%, 1/25/2033, Series | ||||||||
| 8,466,220 | 2012-150, Class YIk | 1,141,443 | ||||||
First Horizon Alternative Mortgage Securities Trust | ||||||||
6.000%, 8/25/2036, Series | ||||||||
| 2,350,234 | 2006-FA4, Class 1A4h | 1,944,710 | ||||||
IndyMac INDX Mortgage Loan Trust | ||||||||
1.396%, 7/25/2045, Series | ||||||||
| 3,285,368 | 2005-16IP, Class A1h | 2,748,257 | ||||||
J.P. Morgan Alternative Loan Trust | ||||||||
6.500%, 3/25/2036, Series | ||||||||
| 1,597,389 | 2006-S1, Class 1A19 | 1,394,222 | ||||||
J.P. Morgan Mortgage Trust | ||||||||
3.263%, 6/25/2036, Series | ||||||||
| 546,343 | 2006-A4, Class 1A2 | 471,835 | ||||||
3.110%, 10/25/2036, Series | ||||||||
| 251,036 | 2006-A6, Class 1A2 | 227,616 | ||||||
1.136%, 1/25/2037, Series | ||||||||
| 3,069,007 | 2006-S4, Class A8h | 1,624,493 | ||||||
6.250%, 8/25/2037, Series | ||||||||
| 3,529,946 | 2007-S3, Class 1A10 | 2,615,456 | ||||||
MASTR Alternative Loans Trust | ||||||||
6.500%, 7/25/2034, Series | ||||||||
| 686,129 | 2004-6, Class 6A1 | 688,096 | ||||||
1.206%, 12/25/2035, Series | ||||||||
| 1,999,388 | 2005-6, Class 2A1h | 908,359 | ||||||
Merrill Lynch Alternative Note Asset Trust | ||||||||
6.000%, 3/25/2037, Series | ||||||||
| 670,232 | 2007-F1, Class 2A1 | 522,314 | ||||||
Residential Asset Securitization Trust | ||||||||
1.136%, 8/25/2037, Series | ||||||||
| 3,422,142 | 2007-A8, Class 2A3h | 892,350 | ||||||
Sequoia Mortgage Trust | ||||||||
3.280%, 9/20/2046, Series | ||||||||
| 2,694,687 | 2007-1, Class 4A1 | 2,185,364 | ||||||
WaMu Mortgage Pass Through Certificates | ||||||||
2.837%, 9/25/2036, Series | ||||||||
| 257,452 | 2006-AR10, Class 1A2 | 236,872 | ||||||
2.850%, 10/25/2036, Series | ||||||||
| 895,441 | 2006-AR12, Class 1A1 | 780,565 | ||||||
2.617%, 11/25/2036, Series | ||||||||
| 2,583,057 | 2006-AR14, Class 1A1 | 2,290,228 | ||||||
2.137%, 1/25/2037, Series | ||||||||
| 2,992,120 | 2006-AR18, Class 1A1 | 2,544,056 | ||||||
1.527%, 9/25/2046, Series | ||||||||
| 5,212,388 | 2006-AR11, Class 1Ah | 4,283,682 | ||||||
Washington Mutual Mortgage Pass Through Certificates Trust | ||||||||
7.000%, 2/25/2036, Series | ||||||||
| 3,078,129 | 2006-1, Class 2CB1 | 2,290,288 | ||||||
|
| |||||||
Total | 51,370,120 | |||||||
|
| |||||||
Commercial Mortgage-Backed Securities (0.5%) | ||||||||
Commercial Mortgage Pass-Through Certificates | ||||||||
| 1,680,000 | 1.699%, 6/8/2030g,h | 1,684,218 | ||||||
Federal National Mortgage Association | ||||||||
| 54,448 | 1.272%, 1/25/2017 | 54,400 | ||||||
Greenwich Capital Commercial Funding Corporation | ||||||||
| 4,650,000 | 5.867%, 12/10/2049 | 4,752,117 | ||||||
GS Mortgage Securities Trust | ||||||||
| 36,341 | 2.999%, 8/10/2044 | 36,324 | ||||||
| 6,600,000 | 3.666%, 9/10/2047 | 6,843,180 | ||||||
J.P. Morgan Chase Commercial Mortgage Securities Corporation | ||||||||
| 2,750,000 | 3.507%, 5/15/2045 | 2,873,873 | ||||||
| 3,650,000 | 5.713%, 2/12/2049 | 3,685,263 | ||||||
JPMBB Commercial Mortgage Securities Trust | ||||||||
| 4,500,000 | 3.231%, 1/15/2048 | 4,544,468 | ||||||
Morgan Stanley Capital, Inc. | ||||||||
| 6,580,000 | 5.406%, 3/15/2044 | 6,574,253 | ||||||
SCG Trust | ||||||||
| 1,150,000 | 2.104%, 11/15/2026g,h | 1,150,001 | ||||||
UBS Commercial Mortgage Trust | ||||||||
| 8,052,914 | 3.400%, 5/10/2045 | 8,381,046 | ||||||
Wells Fargo Commercial Mortgage Trust | ||||||||
| 4,000,000 | 3.617%, 9/15/2057 | 4,113,570 | ||||||
| 3,750,000 | 3.839%, 9/15/2058 | 3,918,982 | ||||||
WFRBS Commercial Mortgage Trust | ||||||||
| 2,000,000 | 2.870%, 11/15/2045 | 2,028,720 | ||||||
|
| |||||||
Total | 50,640,415 | |||||||
|
| |||||||
Communications Services (1.1%) | ||||||||
21st Century Fox America, Inc. | ||||||||
| 1,620,000 | 6.900%, 3/1/2019 | 1,778,906 | ||||||
The accompanying Notes to Financial Statements are an integral part of this schedule.
47
Table of Contents
MODERATE ALLOCATION PORTFOLIO
Schedule of Investments as of December 31, 2016
| Principal Amount | Long-Term Fixed Income (29.7%) | Value | ||||||
Communications Services (1.1%) - continued | ||||||||
Altice Financing SA | ||||||||
| $2,400,000 | 6.625%, 2/15/2023g | $ | 2,466,000 | |||||
AMC Networks, Inc. | ||||||||
| 2,295,000 | 5.000%, 4/1/2024 | 2,300,737 | ||||||
America Movil SAB de CV | ||||||||
| 1,039,000 | 5.000%, 10/16/2019 | 1,112,964 | ||||||
American Tower Corporation | ||||||||
| 180,000 | 2.800%, 6/1/2020 | 179,992 | ||||||
| 1,930,000 | 3.300%, 2/15/2021 | 1,950,417 | ||||||
AT&T, Inc. | ||||||||
| 707,000 | 5.875%, 10/1/2019 | 772,342 | ||||||
| 615,000 | 1.928%, 6/30/2020h | 618,336 | ||||||
| 1,212,000 | 3.875%, 8/15/2021 | 1,250,197 | ||||||
| 1,015,000 | 3.000%, 6/30/2022 | 995,266 | ||||||
| 1,140,000 | 6.350%, 3/15/2040 | 1,296,810 | ||||||
| 1,300,000 | 5.550%, 8/15/2041 | 1,351,214 | ||||||
| 1,527,000 | 5.150%, 3/15/2042 | 1,518,513 | ||||||
| 772,000 | 4.750%, 5/15/2046 | 730,014 | ||||||
British Sky Broadcasting Group plc | ||||||||
| 1,130,000 | 2.625%, 9/16/2019g | 1,134,080 | ||||||
CCO Holdings, LLC | ||||||||
| 3,100,000 | 5.875%, 4/1/2024g | 3,309,250 | ||||||
CCOH Safari, LLC | ||||||||
| 1,300,000 | 5.750%, 2/15/2026g | 1,345,500 | ||||||
CenturyLink, Inc. | ||||||||
| 2,315,000 | 6.450%, 6/15/2021 | 2,436,538 | ||||||
Charter Communications Operating, LLC | ||||||||
| 1,530,000 | 6.834%, 10/23/2055 | 1,790,305 | ||||||
| 920,000 | 3.579%, 7/23/2020 | 937,965 | ||||||
| 1,560,000 | 4.908%, 7/23/2025 | 1,642,086 | ||||||
Clear Channel Worldwide Holdings, Inc. | ||||||||
| 2,920,000 | 6.500%, 11/15/2022 | 2,985,700 | ||||||
Columbus International, Inc. | ||||||||
| 2,945,000 | 7.375%, 3/30/2021g | 3,133,892 | ||||||
Comcast Corporation | ||||||||
| 1,225,000 | 2.750%, 3/1/2023 | 1,214,928 | ||||||
| 3,265,000 | 4.400%, 8/15/2035 | 3,410,322 | ||||||
| 539,000 | 4.650%, 7/15/2042 | 560,114 | ||||||
| 2,253,000 | 4.750%, 3/1/2044 | 2,411,722 | ||||||
Cox Communications, Inc. | ||||||||
| 648,000 | 9.375%, 1/15/2019g | 731,814 | ||||||
Crown Castle International Corporation | ||||||||
| 1,774,000 | 3.400%, 2/15/2021 | 1,798,728 | ||||||
| 2,423,000 | 5.250%, 1/15/2023 | 2,607,754 | ||||||
| 700,000 | 3.700%, 6/15/2026 | 686,083 | ||||||
CSC Holdings, LLC | ||||||||
| 330,000 | 5.500%, 4/15/2027g | 334,125 | ||||||
Digicel, Ltd. | ||||||||
| 3,875,000 | 6.000%, 4/15/2021* | 3,503,814 | ||||||
FairPoint Communications, Inc. | ||||||||
| 2,260,000 | 8.750%, 8/15/2019g | 2,358,875 | ||||||
Frontier Communications Corporation | ||||||||
| 3,250,000 | 8.875%, 9/15/2020 | 3,461,250 | ||||||
Level 3 Communications, Inc. | ||||||||
| 3,020,000 | 5.375%, 1/15/2024 | 3,050,200 | ||||||
Level 3 Financing, Inc. | ||||||||
| 995,000 | 5.375%, 5/1/2025 | 1,014,900 | ||||||
Neptune Finco Corporation | ||||||||
| 1,895,000 | 10.875%, 10/15/2025g | 2,255,050 | ||||||
Omnicom Group, Inc. | ||||||||
| 750,000 | 3.600%, 4/15/2026 | 741,194 | ||||||
S&P Global, Inc. | ||||||||
| 1,544,000 | 3.300%, 8/14/2020 | 1,573,128 | ||||||
SES Global Americas Holdings GP | ||||||||
| 1,035,000 | 2.500%, 3/25/2019g | 1,028,624 | ||||||
SFR Group SA | ||||||||
| 3,480,000 | 6.000%, 5/15/2022g | 3,571,350 | ||||||
Sprint Communications, Inc. | ||||||||
| 2,025,000 | 6.000%, 11/15/2022 | 2,040,188 | ||||||
Sprint Corporation | ||||||||
| 1,400,000 | 7.625%, 2/15/2025e | 1,471,750 | ||||||
Telefonica Emisiones SAU | ||||||||
| 1,110,000 | 3.192%, 4/27/2018 | 1,125,804 | ||||||
Time Warner Entertainment Company, LP | ||||||||
| 1,691,000 | 8.375%, 3/15/2023 | 2,124,628 | ||||||
Time Warner, Inc. | ||||||||
| 760,000 | 3.600%, 7/15/2025 | 754,740 | ||||||
| 975,000 | 6.250%, 3/29/2041 | 1,142,177 | ||||||
T-Mobile USA, Inc. | ||||||||
| 3,570,000 | 6.125%, 1/15/2022 | 3,766,350 | ||||||
Verizon Communications, Inc. | ||||||||
| 945,000 | 1.763%, 6/17/2019h | 953,592 | ||||||
| 2,485,000 | 3.000%, 11/1/2021 | 2,501,533 | ||||||
| 3,489,000 | 5.150%, 9/15/2023 | 3,853,918 | ||||||
| 650,000 | 5.050%, 3/15/2034 | 683,500 | ||||||
| 1,165,000 | 4.272%, 1/15/2036 | 1,113,286 | ||||||
| 2,530,000 | 4.522%, 9/15/2048 | 2,421,104 | ||||||
Viacom, Inc. | ||||||||
| 1,900,000 | 4.375%, 3/15/2043 | 1,510,808 | ||||||
| 1,140,000 | 5.850%, 9/1/2043 | 1,115,361 | ||||||
Vodafone Group plc | ||||||||
| 1,520,000 | 6.150%, 2/27/2037 | 1,701,944 | ||||||
|
| |||||||
Total | 101,631,682 | |||||||
|
| |||||||
Consumer Cyclical (0.7%) | ||||||||
Argos Merger Sub, Inc. | ||||||||
| 2,730,000 | 7.125%, 3/15/2023e,g | 2,784,600 | ||||||
Automatic Data Processing, Inc. | ||||||||
| 500,000 | 3.375%, 9/15/2025 | 512,023 | ||||||
Cinemark USA, Inc. | ||||||||
| 3,525,000 | 4.875%, 6/1/2023 | 3,569,063 | ||||||
CVS Health Corporation | ||||||||
| 400,000 | 2.250%, 8/12/2019 | 402,021 | ||||||
| 2,900,000 | 4.875%, 7/20/2035 | 3,114,037 | ||||||
| 1,225,000 | 5.125%, 7/20/2045 | 1,362,571 | ||||||
Daimler Finance North America, LLC | ||||||||
| 1,520,000 | 1.618%, 10/30/2019g,h | 1,523,654 | ||||||
Delphi Automotive plc | ||||||||
| 1,930,000 | 3.150%, 11/19/2020 | 1,959,409 | ||||||
eBay, Inc. | ||||||||
| 760,000 | 2.500%, 3/9/2018 | 766,575 | ||||||
Ford Motor Credit Company, LLC | ||||||||
| 1,140,000 | 5.000%, 5/15/2018 | 1,184,454 | ||||||
| 1,470,000 | 2.551%, 10/5/2018 | 1,477,989 | ||||||
| 1,525,000 | 2.943%, 1/8/2019 | 1,541,870 | ||||||
| 760,000 | 2.459%, 3/27/2020 | 749,748 | ||||||
| 570,000 | 3.200%, 1/15/2021 | 570,373 | ||||||
General Motors Company | ||||||||
| 750,000 | 6.600%, 4/1/2036 | 856,061 | ||||||
| 1,401,000 | 6.250%, 10/2/2043 | 1,546,167 | ||||||
General Motors Financial Company, Inc. | ||||||||
| 1,156,000 | 3.700%, 11/24/2020 | 1,175,053 | ||||||
| 772,000 | 4.200%, 3/1/2021 | 793,703 | ||||||
| 1,630,000 | 4.300%, 7/13/2025 | 1,614,862 | ||||||
The accompanying Notes to Financial Statements are an integral part of this schedule.
48
Table of Contents
MODERATE ALLOCATION PORTFOLIO
Schedule of Investments as of December 31, 2016
| Principal Amount | Long-Term Fixed Income (29.7%) | Value | ||||||
Consumer Cyclical (0.7%) - continued | ||||||||
Home Depot, Inc. | ||||||||
| $ | 676,000 | 2.625%, 6/1/2022 | $ | 678,540 | ||||
| 965,000 | 3.000%, 4/1/2026 | 961,739 | ||||||
| 1,140,000 | 4.250%, 4/1/2046 | 1,194,345 | ||||||
Hyundai Capital America | ||||||||
| 639,000 | 2.400%, 10/30/2018g | 641,541 | ||||||
| 1,158,000 | 3.000%, 10/30/2020g | 1,157,210 | ||||||
Jaguar Land Rover Automotive plc | ||||||||
| 1,270,000 | 4.125%, 12/15/2018g | 1,304,925 | ||||||
| 1,100,000 | 5.625%, 2/1/2023g | 1,146,750 | ||||||
KB Home | ||||||||
| 1,815,000 | 4.750%, 5/15/2019 | 1,851,300 | ||||||
L Brands, Inc. | ||||||||
| 2,100,000 | 5.625%, 2/15/2022 | 2,241,750 | ||||||
Lear Corporation | ||||||||
| 1,875,000 | 5.250%, 1/15/2025 | 1,971,094 | ||||||
Lennar Corporation | ||||||||
| 1,100,000 | 4.125%, 12/1/2018 | 1,124,750 | ||||||
| 1,445,000 | 4.875%, 12/15/2023 | 1,430,550 | ||||||
Live Nation Entertainment, Inc. | ||||||||
| 2,150,000 | 5.375%, 6/15/2022g | 2,225,250 | ||||||
McDonald’s Corporation | ||||||||
| 1,100,000 | 2.750%, 12/9/2020 | 1,116,258 | ||||||
MGM Resorts International | ||||||||
| 3,140,000 | 6.000%, 3/15/2023 | 3,391,200 | ||||||
Newell Rubbermaid, Inc. | ||||||||
| 772,000 | 2.600%, 3/29/2019 | 780,285 | ||||||
| 1,093,000 | 5.500%, 4/1/2046 | 1,252,409 | ||||||
Prime Security Services Borrower, LLC | ||||||||
| 1,370,000 | 9.250%, 5/15/2023g | 1,491,588 | ||||||
Rite Aid Corporation | ||||||||
| 2,955,000 | 6.125%, 4/1/2023g | 3,176,625 | ||||||
Toll Brothers Finance Corporation | ||||||||
| 620,000 | 8.910%, 10/15/2017 | 651,775 | ||||||
| 609,000 | 4.000%, 12/31/2018 | 624,986 | ||||||
West Corporation | ||||||||
| 3,470,000 | 5.375%, 7/15/2022g | 3,352,888 | ||||||
|
| |||||||
Total | 61,271,991 | |||||||
|
| |||||||
Consumer Non-Cyclical (1.1%) | ||||||||
Abbott Laboratories | ||||||||
| 760,000 | 2.350%, 11/22/2019 | 760,520 | ||||||
| 950,000 | 3.400%, 11/30/2023 | 945,319 | ||||||
| 900,000 | 4.750%, 11/30/2036 | 913,523 | ||||||
| 723,000 | 4.900%, 11/30/2046 | 740,598 | ||||||
AbbVie, Inc. | ||||||||
| 1,150,000 | 2.500%, 5/14/2020 | 1,149,644 | ||||||
| 1,910,000 | 3.600%, 5/14/2025 | 1,889,362 | ||||||
| 1,930,000 | 4.450%, 5/14/2046 | 1,844,362 | ||||||
Actavis Funding SCS | ||||||||
| 2,350,000 | 4.550%, 3/15/2035 | 2,322,477 | ||||||
| 1,140,000 | 4.850%, 6/15/2044 | 1,128,201 | ||||||
Altria Group, Inc. | ||||||||
| 760,000 | 2.850%, 8/9/2022 | 760,094 | ||||||
| 940,000 | 2.625%, 9/16/2026 | 888,791 | ||||||
Amgen, Inc. | ||||||||
| 772,000 | 2.700%, 5/1/2022 | 763,615 | ||||||
| 875,000 | 3.125%, 5/1/2025 | 850,404 | ||||||
Anheuser-Busch InBev Finance, Inc. | ||||||||
| 815,000 | 2.146%, 2/1/2021h | 829,334 | ||||||
| 2,828,000 | 3.650%, 2/1/2026 | 2,866,543 | ||||||
| 3,040,000 | 4.700%, 2/1/2036 | 3,196,633 | ||||||
| 1,930,000 | 4.900%, 2/1/2046 | 2,072,305 | ||||||
Anheuser-Busch InBev Worldwide, Inc. | ||||||||
| 676,000 | 3.750%, 1/15/2022 | 704,902 | ||||||
BAT International Finance plc | ||||||||
| 825,000 | 1.473%, 6/15/2018g,h | 825,158 | ||||||
Baxter International, Inc. | ||||||||
| 950,000 | 2.600%, 8/15/2026 | 875,678 | ||||||
Bayer U.S. Finance, LLC | ||||||||
| 1,140,000 | 3.375%, 10/8/2024g | 1,132,888 | ||||||
Biogen, Inc. | ||||||||
| 1,100,000 | 3.625%, 9/15/2022 | 1,127,874 | ||||||
Boston Scientific Corporation | ||||||||
| 740,000 | 6.000%, 1/15/2020 | 812,650 | ||||||
| 1,025,000 | 3.850%, 5/15/2025 | 1,025,687 | ||||||
| 1,140,000 | 7.375%, 1/15/2040 | 1,415,703 | ||||||
BRF SA | ||||||||
| 1,500,000 | 4.750%, 5/22/2024g | 1,457,250 | ||||||
Bunge Limited Finance Corporation | ||||||||
| 960,000 | 8.500%, 6/15/2019 | 1,099,387 | ||||||
| 1,230,000 | 3.500%, 11/24/2020 | 1,250,957 | ||||||
Cardinal Health, Inc. | ||||||||
| 507,000 | 4.900%, 9/15/2045 | 533,943 | ||||||
Celgene Corporation | ||||||||
| 1,685,000 | 2.875%, 8/15/2020 | 1,703,056 | ||||||
| 445,000 | 3.550%, 8/15/2022 | 455,893 | ||||||
| 950,000 | 5.000%, 8/15/2045 | 985,873 | ||||||
Church & Dwight Company, Inc. | ||||||||
| 530,000 | 2.450%, 12/15/2019 | 532,369 | ||||||
Conagra Brands, Inc. | ||||||||
| 579,000 | 7.125%, 10/1/2026 | 698,296 | ||||||
Cott Beverages, Inc. | ||||||||
| 1,470,000 | 5.375%, 7/1/2022 | 1,495,725 | ||||||
EMD Finance, LLC | ||||||||
| 880,000 | 1.343%, 3/17/2017g,h | 880,202 | ||||||
| 1,520,000 | 2.950%, 3/19/2022g | 1,512,003 | ||||||
Energizer Holdings, Inc. | ||||||||
| 2,749,000 | 5.500%, 6/15/2025g | 2,755,873 | ||||||
Envision Healthcare Corporation | ||||||||
| 3,165,000 | 5.125%, 7/1/2022g | 3,153,131 | ||||||
Express Scripts Holding Company | ||||||||
| 760,000 | 3.000%, 7/15/2023 | 734,861 | ||||||
| 1,820,000 | 4.500%, 2/25/2026 | 1,871,144 | ||||||
| 305,000 | 3.400%, 3/1/2027 | 285,318 | ||||||
Gilead Sciences, Inc. | ||||||||
| 435,000 | 2.550%, 9/1/2020 | 439,685 | ||||||
| 1,900,000 | 2.950%, 3/1/2027 | 1,815,536 | ||||||
Grifols Worldwide Operations, Ltd. | ||||||||
| 3,000,000 | 5.250%, 4/1/2022 | 3,105,000 | ||||||
H. J. Heinz Company | ||||||||
| 1,250,000 | 3.500%, 7/15/2022 | 1,267,561 | ||||||
HCA, Inc. | ||||||||
| 1,430,000 | 5.250%, 6/15/2026 | 1,478,262 | ||||||
| 1,505,000 | 4.500%, 2/15/2027 | 1,478,662 | ||||||
Imperial Tobacco Finance plc | ||||||||
| 1,765,000 | 2.950%, 7/21/2020g | 1,774,526 | ||||||
JBS USA, LLC | ||||||||
| 2,220,000 | 5.750%, 6/15/2025g | 2,247,750 | ||||||
Kraft Foods Group, Inc. | ||||||||
| 1,544,000 | 5.000%, 6/4/2042 | 1,578,127 | ||||||
Laboratory Corporation of America Holdings | ||||||||
| 620,000 | 2.625%, 2/1/2020 | 619,068 | ||||||
McKesson Corporation | ||||||||
| 825,000 | 4.883%, 3/15/2044 | 837,687 | ||||||
The accompanying Notes to Financial Statements are an integral part of this schedule.
49
Table of Contents
MODERATE ALLOCATION PORTFOLIO
Schedule of Investments as of December 31, 2016
| Principal Amount | Long-Term Fixed Income (29.7%) | Value | ||||||
Consumer Non-Cyclical (1.1%) - continued | ||||||||
Mead Johnson Nutrition Company | ||||||||
| $ | 735,000 | 3.000%, 11/15/2020 | $ | 743,630 | ||||
Medtronic plc | ||||||||
| 3,855,000 | 4.375%, 3/15/2035 | 4,071,909 | ||||||
Merck & Company, Inc. | ||||||||
| 660,000 | 1.257%, 2/10/2020h | 663,434 | ||||||
| 330,000 | 3.700%, 2/10/2045 | 314,002 | ||||||
Mondelez International, Inc. | ||||||||
| 672,000 | 1.406%, 2/1/2019h | 671,962 | ||||||
Mylan NV | ||||||||
| 1,550,000 | 3.000%, 12/15/2018g | 1,560,887 | ||||||
| 450,000 | 3.150%, 6/15/2021g | 441,236 | ||||||
| 2,280,000 | 5.250%, 6/15/2046g | 2,099,096 | ||||||
PepsiCo, Inc. | ||||||||
| 1,545,000 | 2.850%, 2/24/2026 | 1,520,683 | ||||||
Pernod Ricard SA | ||||||||
| 1,200,000 | 3.250%, 6/8/2026g | 1,149,751 | ||||||
Perrigo Finance Unlimited Company | ||||||||
| 2,315,000 | 3.500%, 3/15/2021 | 2,337,238 | ||||||
Reynolds American, Inc. | ||||||||
| 800,000 | 2.300%, 8/21/2017 | 803,913 | ||||||
| 2,338,000 | 5.700%, 8/15/2035 | 2,680,833 | ||||||
Roche Holdings, Inc. | ||||||||
| 1,158,000 | 4.000%, 11/28/2044g | 1,151,828 | ||||||
Shire Acquisitions Investments Ireland Designated Activity Company | ||||||||
| 1,140,000 | 2.400%, 9/23/2021 | 1,100,186 | ||||||
| 1,140,000 | 3.200%, 9/23/2026 | 1,063,824 | ||||||
Tenet Healthcare Corporation | ||||||||
| 3,090,000 | 8.125%, 4/1/2022 | 2,915,415 | ||||||
Teva Pharmaceutical Finance Netherlands III BV | ||||||||
| 1,555,000 | 2.200%, 7/21/2021 | 1,486,288 | ||||||
| 950,000 | 2.800%, 7/21/2023 | 898,242 | ||||||
| 700,000 | 4.100%, 10/1/2046 | 598,612 | ||||||
Thermo Fisher Scientific, Inc. | ||||||||
| 579,000 | 3.000%, 4/15/2023 | 568,460 | ||||||
TreeHouse Foods, Inc. | ||||||||
| 970,000 | 4.875%, 3/15/2022 | 994,250 | ||||||
VRX Escrow Corporation | ||||||||
| 4,500,000 | 6.125%, 4/15/2025g | 3,380,625 | ||||||
Zoetis, Inc. | ||||||||
| 1,500,000 | 4.700%, 2/1/2043 | 1,457,384 | ||||||
|
| |||||||
Total | 104,563,098 | |||||||
|
| |||||||
Energy (0.8%) | ||||||||
Anadarko Petroleum Corporation | ||||||||
| 1,085,000 | 4.850%, 3/15/2021 | 1,162,448 | ||||||
Antero Resources Corporation | ||||||||
| 960,000 | 5.125%, 12/1/2022 | 969,600 | ||||||
| 1,500,000 | 5.625%, 6/1/2023 | 1,535,625 | ||||||
Apache Corporation | ||||||||
| 1,500,000 | 4.750%, 4/15/2043 | 1,542,177 | ||||||
Boardwalk Pipelines, LP | ||||||||
| 765,000 | 5.950%, 6/1/2026 | 829,892 | ||||||
BP Capital Markets plc | ||||||||
| 1,590,000 | 3.062%, 3/17/2022 | 1,606,643 | ||||||
| 2,285,000 | 3.535%, 11/4/2024 | 2,316,277 | ||||||
| 415,000 | 3.119%, 5/4/2026 | 404,725 | ||||||
Buckeye Partners, LP | ||||||||
| 1,182,000 | 2.650%, 11/15/2018 | 1,189,546 | ||||||
| 240,000 | 3.950%, 12/1/2026 | 233,792 | ||||||
Canadian Natural Resources, Ltd. | ||||||||
| 1,600,000 | 3.450%, 11/15/2021 | 1,634,086 | ||||||
| 750,000 | 6.250%, 3/15/2038 | 851,947 | ||||||
Cheniere Corpus Christi Holdings, LLC | ||||||||
| 2,245,000 | 5.875%, 3/31/2025g | 2,290,596 | ||||||
CNOOC Nexen Finance | ||||||||
| 651,000 | 1.625%, 4/30/2017 | 650,388 | ||||||
CNPC General Capital, Ltd. | ||||||||
| 543,000 | 2.750%, 4/19/2017g | 544,372 | ||||||
Columbia Pipeline Group, Inc. | ||||||||
| 1,480,000 | 2.450%, 6/1/2018 | 1,487,008 | ||||||
Concho Resources, Inc. | ||||||||
| 2,907,000 | 6.500%, 1/15/2022 | 3,007,873 | ||||||
| 1,101,432 | 5.500%, 10/1/2022 | 1,141,359 | ||||||
| 995,000 | 4.375%, 1/15/2025 | 993,020 | ||||||
Contura Energy, Inc. | ||||||||
| 1,167,000 | 10.000%, 8/1/2021*,e | 1,245,772 | ||||||
Crestwood Midstream Partners, LP | ||||||||
| 775,000 | 6.125%, 3/1/2022 | 794,375 | ||||||
Devon Energy Corporation | ||||||||
| 1,150,000 | 3.250%, 5/15/2022e | 1,141,511 | ||||||
Ecopetrol SA | ||||||||
| 640,000 | 5.875%, 9/18/2023 | 677,440 | ||||||
Enbridge Energy Partners, LP | ||||||||
| 760,000 | 4.375%, 10/15/2020 | 792,841 | ||||||
Enbridge, Inc. | ||||||||
| 700,000 | 1.384%, 6/2/2017h | 700,065 | ||||||
| 760,000 | 4.250%, 12/1/2026 | 777,037 | ||||||
Encana Corporation | ||||||||
| 413,000 | 3.900%, 11/15/2021 | 415,965 | ||||||
| 1,520,000 | 6.500%, 2/1/2038 | 1,642,755 | ||||||
Energy Transfer Partners, LP | ||||||||
| 1,520,000 | 4.650%, 6/1/2021 | 1,576,828 | ||||||
| 970,000 | 4.900%, 3/15/2035 | 905,179 | ||||||
EnLink Midstream Partners, LP | ||||||||
| 775,000 | 4.150%, 6/1/2025 | 751,304 | ||||||
| 569,000 | 4.850%, 7/15/2026 | 573,192 | ||||||
Enterprise Products Operating, LLC | ||||||||
| 942,000 | 5.100%, 2/15/2045 | 991,623 | ||||||
EQT Corporation | ||||||||
| 659,000 | 5.150%, 3/1/2018 | 679,272 | ||||||
| 770,000 | 8.125%, 6/1/2019 | 866,008 | ||||||
| 425,000 | 4.875%, 11/15/2021 | 453,556 | ||||||
Exxon Mobil Corporation | ||||||||
| 625,000 | 4.114%, 3/1/2046 | 638,831 | ||||||
Magellan Midstream Partners, LP | ||||||||
| 1,070,000 | 5.000%, 3/1/2026 | 1,171,775 | ||||||
Marathon Oil Corporation | ||||||||
| 1,140,000 | 2.700%, 6/1/2020 | 1,140,876 | ||||||
Marathon Petroleum Corporation | ||||||||
| 560,000 | 3.400%, 12/15/2020 | 572,284 | ||||||
| 600,000 | 4.750%, 9/15/2044 | 530,947 | ||||||
MEG Energy Corporation | ||||||||
| 1,100,000 | 6.500%, 3/15/2021g | 1,017,500 | ||||||
MPLX, LP | ||||||||
| 1,500,000 | 4.875%, 6/1/2025 | 1,540,333 | ||||||
Newfield Exploration Company | ||||||||
| 2,780,000 | 5.625%, 7/1/2024 | 2,898,150 | ||||||
Noble Energy, Inc. | ||||||||
| 970,000 | 5.625%, 5/1/2021 | 1,011,152 | ||||||
Northern Tier Energy, LLC | ||||||||
| 3,225,000 | 7.125%, 11/15/2020 | 3,349,969 | ||||||
Occidental Petroleum Corporation | ||||||||
| 1,520,000 | 4.100%, 2/15/2047 | 1,477,417 | ||||||
Petrobras Global Finance BV | ||||||||
| 474,000 | 8.375%, 5/23/2021 | 510,735 | ||||||
| 1,140,000 | 8.750%, 5/23/2026 | 1,229,775 | ||||||
The accompanying Notes to Financial Statements are an integral part of this schedule.
50
Table of Contents
MODERATE ALLOCATION PORTFOLIO
Schedule of Investments as of December 31, 2016
| Principal Amount | Long-Term Fixed Income (29.7%) | Value | ||||||
Energy (0.8%) - continued | ||||||||
Petrobras International Finance Company | ||||||||
| $ | 760,000 | 5.750%, 1/20/2020 | $ | 769,500 | ||||
Petroleos Mexicanos | ||||||||
| 570,000 | 5.375%, 3/13/2022g | 583,669 | ||||||
| 680,000 | 2.378%, 4/15/2025 | 679,708 | ||||||
| 1,000,000 | 6.750%, 9/21/2047g | 944,800 | ||||||
Phillips 66 Partners, LP | ||||||||
| 950,000 | 3.550%, 10/1/2026 | 918,019 | ||||||
Pioneer Natural Resources Company | ||||||||
| 750,000 | 4.450%, 1/15/2026 | 793,617 | ||||||
Regency Energy Partners, LP | ||||||||
| 1,470,000 | 5.000%, 10/1/2022 | 1,556,160 | ||||||
Rice Energy, Inc. | ||||||||
| 2,440,000 | 6.250%, 5/1/2022 | 2,507,100 | ||||||
Rowan Companies, Inc. | ||||||||
| 310,000 | 7.375%, 6/15/2025 | 316,200 | ||||||
Sabine Pass Liquefaction, LLC | ||||||||
| 1,430,000 | 5.625%, 3/1/2025 | 1,530,100 | ||||||
Schlumberger Holdings Corporation | ||||||||
| 560,000 | 3.000%, 12/21/2020g | 571,399 | ||||||
| 950,000 | 4.000%, 12/21/2025g | 994,254 | ||||||
Shell International Finance BV | ||||||||
| 615,000 | 1.352%, 5/11/2020h | 615,397 | ||||||
Suncor Energy, Inc. | ||||||||
| 990,000 | 3.600%, 12/1/2024 | 1,013,253 | ||||||
Sunoco Logistics Partners Operations, LP | ||||||||
| 2,660,000 | 4.400%, 4/1/2021 | 2,798,972 | ||||||
Valero Energy Corporation | ||||||||
| 1,900,000 | 3.400%, 9/15/2026 | 1,817,521 | ||||||
Weatherford International, Ltd. | ||||||||
| 2,630,000 | 8.250%, 6/15/2023e | 2,676,025 | ||||||
WPX Energy, Inc. | ||||||||
| 1,500,000 | 7.500%, 8/1/2020e | 1,612,500 | ||||||
|
| |||||||
Total | 79,164,035 | |||||||
|
| |||||||
Financials (2.4%) | ||||||||
ABN AMRO Bank NV | ||||||||
| 1,550,000 | 4.750%, 7/28/2025g | 1,568,226 | ||||||
ACE INA Holdings, Inc. | ||||||||
| 1,115,000 | 4.350%, 11/3/2045 | 1,175,362 | ||||||
AerCap Ireland Capital, Ltd. | ||||||||
| 760,000 | 3.750%, 5/15/2019 | 774,250 | ||||||
| 760,000 | 4.625%, 10/30/2020 | 790,400 | ||||||
| 3,165,000 | 5.000%, 10/1/2021 | 3,327,206 | ||||||
| 760,000 | 4.625%, 7/1/2022 | 782,800 | ||||||
Aetna, Inc. | ||||||||
| 1,150,000 | 2.400%, 6/15/2021 | 1,143,766 | ||||||
| 1,500,000 | 2.800%, 6/15/2023 | 1,475,854 | ||||||
| 765,000 | 3.200%, 6/15/2026 | 755,675 | ||||||
| 1,100,000 | 4.250%, 6/15/2036 | 1,101,141 | ||||||
Air Lease Corporation | ||||||||
| 800,000 | 2.125%, 1/15/2018 | 801,366 | ||||||
| 339,000 | 2.625%, 9/4/2018 | 341,303 | ||||||
Ally Financial, Inc. | ||||||||
| 960,000 | 3.750%, 11/18/2019 | 964,109 | ||||||
| 2,025,000 | 4.125%, 3/30/2020 | 2,065,500 | ||||||
American Express Credit Corporation | ||||||||
| 945,000 | 1.543%, 3/18/2019h | 946,803 | ||||||
American International Group, Inc. | ||||||||
| 530,000 | 3.300%, 3/1/2021 | 542,429 | ||||||
| 1,154,000 | 4.125%, 2/15/2024 | 1,199,365 | ||||||
| 525,000 | 3.900%, 4/1/2026 | 533,494 | ||||||
Aon plc | ||||||||
| 577,000 | 3.875%, 12/15/2025 | 587,339 | ||||||
Avalonbay Communities, Inc. | ||||||||
| 1,650,000 | 3.500%, 11/15/2025 | 1,650,940 | ||||||
Banco Santander Chile | ||||||||
| 1,200,000 | 1.776%, 4/11/2017g,h | 1,198,560 | ||||||
Bank of America Corporation | ||||||||
| 1,544,000 | 8.000%, 1/30/2018j | 1,586,460 | ||||||
| 1,325,000 | 2.066%, 3/22/2018h | 1,333,919 | ||||||
| 840,000 | 1.716%, 4/1/2019h | 843,952 | ||||||
| 1,300,000 | 2.625%, 10/19/2020 | 1,299,744 | ||||||
| 1,280,000 | 3.300%, 1/11/2023 | 1,283,004 | ||||||
| 1,520,000 | 4.000%, 4/1/2024 | 1,565,842 | ||||||
| 1,540,000 | 4.000%, 1/22/2025 | 1,540,014 | ||||||
| 1,150,000 | 3.500%, 4/19/2026 | 1,133,047 | ||||||
| 1,908,000 | 5.875%, 2/7/2042 | 2,302,046 | ||||||
Bank of New York Mellon Corporation | ||||||||
| 1,930,000 | 2.500%, 4/15/2021 | 1,930,500 | ||||||
Bank of Tokyo-Mitsubishi UFJ, Ltd. | ||||||||
| 530,000 | 2.850%, 9/8/2021g | 529,597 | ||||||
Barclays Bank plc | ||||||||
| 386,000 | 10.179%, 6/12/2021g | 478,922 | ||||||
Barclays plc | ||||||||
| 990,000 | 2.750%, 11/8/2019 | 987,386 | ||||||
| 1,544,000 | 3.650%, 3/16/2025 | 1,492,773 | ||||||
BB&T Corporation | ||||||||
| 560,000 | 1.595%, 1/15/2020h | 561,923 | ||||||
Berkshire Hathaway, Inc. | ||||||||
| 965,000 | 2.750%, 3/15/2023 | 960,384 | ||||||
BPCE SA | ||||||||
| 960,000 | 5.700%, 10/22/2023g | 1,009,232 | ||||||
Caisse Centrale Desjardins du Quebec | ||||||||
| 780,000 | 1.552%, 1/29/2018g,h | 779,205 | ||||||
Capital One Financial Corporation | ||||||||
| 820,000 | 2.450%, 4/24/2019 | 824,877 | ||||||
Centene Escrow Corporation | ||||||||
| 3,100,000 | 5.625%, 2/15/2021 | 3,259,340 | ||||||
Cigna Corporation | ||||||||
| 980,000 | 5.375%, 2/15/2042 | 1,089,817 | ||||||
CIT Group, Inc. | ||||||||
| 2,970,000 | 5.000%, 8/15/2022 | 3,096,225 | ||||||
Citigroup, Inc. | ||||||||
| 700,000 | 1.642%, 4/8/2019h | 700,851 | ||||||
| 1,555,000 | 2.700%, 3/30/2021 | 1,550,122 | ||||||
| 850,000 | 4.050%, 7/30/2022 | 878,801 | ||||||
| 2,515,000 | 4.400%, 6/10/2025 | 2,569,679 | ||||||
| 1,520,000 | 3.200%, 10/21/2026 | 1,451,258 | ||||||
| 1,140,000 | 4.125%, 7/25/2028 | 1,124,250 | ||||||
| 598,000 | 4.650%, 7/30/2045e | 629,065 | ||||||
Citizens Bank NA | ||||||||
| 1,865,000 | 2.300%, 12/3/2018 | 1,874,189 | ||||||
CoBank ACB | ||||||||
| 495,000 | 1.563%, 6/15/2022h | 473,451 | ||||||
Compass Bank | ||||||||
| 920,000 | 2.750%, 9/29/2019 | 914,566 | ||||||
Cooperatieve Centrale Raiffeisen- Boerenleenbank BA | ||||||||
| 795,000 | 3.950%, 11/9/2022 | 816,922 | ||||||
Credit Agricole SA | ||||||||
| 820,000 | 1.680%, 4/15/2019g,h | 823,561 | ||||||
Credit Suisse AG | ||||||||
| 772,000 | 5.400%, 1/14/2020 | 827,196 | ||||||
Credit Suisse Group Funding, Ltd. | ||||||||
| 2,316,000 | 2.750%, 3/26/2020 | 2,294,392 | ||||||
| 1,544,000 | 3.750%, 3/26/2025 | 1,518,589 | ||||||
The accompanying Notes to Financial Statements are an integral part of this schedule.
51
Table of Contents
MODERATE ALLOCATION PORTFOLIO
Schedule of Investments as of December 31, 2016
| Principal Amount | Long-Term Fixed Income (29.7%) | Value | ||||||
Financials (2.4%) - continued | ||||||||
Deutsche Bank AG | ||||||||
| $ | 2,300,000 | 3.375%, 5/12/2021 | $ | 2,274,790 | ||||
Digital Realty Trust LP | ||||||||
| 1,500,000 | 3.400%, 10/1/2020 | 1,524,703 | ||||||
Discover Bank | ||||||||
| 1,750,000 | 8.700%, 11/18/2019 | 1,986,042 | ||||||
Discover Financial Services | ||||||||
| 640,000 | 6.450%, 6/12/2017 | 653,107 | ||||||
DRB Prime Student Loan Trust | ||||||||
2.492%, 10/27/2031, Series | ||||||||
| 1,123,055 | 2015-B, Class A1*,h | 1,143,034 | ||||||
Duke Realty, LP | ||||||||
| 330,000 | 3.875%, 2/15/2021 | 343,647 | ||||||
| 990,000 | 4.375%, 6/15/2022 | 1,054,001 | ||||||
ERP Operating, LP | ||||||||
| 337,000 | 3.375%, 6/1/2025 | 334,140 | ||||||
European Investment Bank | ||||||||
| 1,215,000 | 1.875%, 3/15/2019 | 1,222,829 | ||||||
Fifth Third Bancorp | ||||||||
| 991,000 | 5.450%, 1/15/2017 | 992,361 | ||||||
| 740,000 | 2.875%, 7/27/2020 | 748,140 | ||||||
| 530,000 | 2.875%, 10/1/2021 | 535,808 | ||||||
GE Capital International Funding Company | ||||||||
| 3,052,000 | 4.418%, 11/15/2035 | 3,193,100 | ||||||
Genworth Financial, Inc. | ||||||||
| 570,000 | 7.700%, 6/15/2020 | 551,304 | ||||||
Goldman Sachs Group, Inc. | ||||||||
| 840,000 | 2.087%, 4/30/2018h | 847,316 | ||||||
| 620,000 | 2.006%, 11/15/2018h | 625,894 | ||||||
| 3,145,000 | 5.375%, 3/15/2020 | 3,410,127 | ||||||
| 780,000 | 2.042%, 4/23/2020h | 787,454 | ||||||
| 3,088,000 | 5.250%, 7/27/2021 | 3,381,465 | ||||||
| 1,900,000 | 2.350%, 11/15/2021 | 1,844,167 | ||||||
| 772,000 | 3.500%, 1/23/2025 | 760,765 | ||||||
| 1,260,000 | 4.750%, 10/21/2045 | 1,325,880 | ||||||
Hartford Financial Services Group, Inc. | ||||||||
| 1,960,000 | 5.125%, 4/15/2022 | 2,171,835 | ||||||
HBOS plc | ||||||||
| 1,932,000 | 6.750%, 5/21/2018g | 2,036,807 | ||||||
HCP, Inc. | ||||||||
| 2,430,000 | 4.000%, 12/1/2022 | 2,498,742 | ||||||
| 660,000 | 3.400%, 2/1/2025 | 630,701 | ||||||
HSBC Bank plc | ||||||||
| 1,765,000 | 1.546%, 5/15/2018g,h | 1,765,597 | ||||||
HSBC Holdings plc | ||||||||
| 1,550,000 | 3.400%, 3/8/2021 | 1,574,857 | ||||||
| 1,475,000 | 6.875%, 6/1/2021e,j | 1,556,125 | ||||||
| 1,225,000 | 2.650%, 1/5/2022 | 1,197,479 | ||||||
| 1,170,000 | 3.600%, 5/25/2023 | 1,175,503 | ||||||
| 1,460,000 | 3.900%, 5/25/2026 | 1,467,875 | ||||||
Huntington Bancshares, Inc. | ||||||||
| 304,000 | 2.600%, 8/2/2018 | 306,912 | ||||||
Huntington National Bank | ||||||||
| 1,030,000 | 2.200%, 11/6/2018 | 1,032,721 | ||||||
Icahn Enterprises, LP | ||||||||
| 1,565,000 | 6.000%, 8/1/2020 | 1,598,256 | ||||||
ING Capital Funding Trust III | ||||||||
| 1,015,000 | 4.438%, 3/31/2017h,j | 1,009,925 | ||||||
Intesa Sanpaolo SPA | ||||||||
| 1,605,000 | 5.250%, 1/12/2024 | 1,686,755 | ||||||
J.P. Morgan Chase & Company | ||||||||
| 2,335,000 | 7.900%, 4/30/2018j | 2,417,892 | ||||||
| 1,215,000 | 6.300%, 4/23/2019 | 1,327,164 | ||||||
| 625,000 | 2.250%, 1/23/2020 | 623,137 | ||||||
| 900,000 | 2.295%, 8/15/2021 | 882,507 | ||||||
| 1,930,000 | 4.500%, 1/24/2022 | 2,079,353 | ||||||
| 1,158,000 | 3.200%, 1/25/2023 | 1,169,718 | ||||||
| 1,950,000 | 2.700%, 5/18/2023 | 1,905,733 | ||||||
| 825,000 | 2.112%, 10/24/2023h | 841,474 | ||||||
| 1,320,000 | 3.625%, 5/13/2024 | 1,341,112 | ||||||
| 2,585,000 | 3.125%, 1/23/2025 | 2,523,730 | ||||||
| 1,250,000 | 3.300%, 4/1/2026 | 1,226,425 | ||||||
KeyBank NA | ||||||||
| 1,225,000 | 2.350%, 3/8/2019 | 1,231,575 | ||||||
KeyCorp | ||||||||
| 1,600,000 | 2.900%, 9/15/2020 | 1,617,757 | ||||||
Kookmin Bank | ||||||||
| 1,225,000 | 1.625%, 8/1/2019g | 1,206,613 | ||||||
Liberty Mutual Group, Inc. | ||||||||
| 1,502,000 | 4.950%, 5/1/2022g | 1,637,206 | ||||||
Liberty Property, LP | ||||||||
| 2,210,000 | 3.750%, 4/1/2025 | 2,218,765 | ||||||
Lincoln National Corporation | ||||||||
| 750,000 | 8.750%, 7/1/2019 | 862,586 | ||||||
| 1,158,000 | 7.000%, 6/15/2040 | 1,459,723 | ||||||
Lloyds Bank plc | ||||||||
| 885,000 | 1.490%, 3/16/2018h | 886,201 | ||||||
Merrill Lynch & Company, Inc. | ||||||||
| 2,295,000 | 6.400%, 8/28/2017 | 2,365,300 | ||||||
MetLife, Inc. | ||||||||
| 1,300,000 | 4.050%, 3/1/2045 | 1,244,092 | ||||||
Mitsubishi UFJ Financial Group, Inc. | ||||||||
| 1,200,000 | 2.190%, 9/13/2021 | 1,165,852 | ||||||
Mizuho Bank, Ltd. | ||||||||
| 960,000 | 1.850%, 3/21/2018g | 958,202 | ||||||
Morgan Stanley | ||||||||
| 2,625,000 | 6.625%, 4/1/2018 | 2,775,643 | ||||||
| 560,000 | 2.162%, 4/25/2018h | 565,860 | ||||||
| 780,000 | 2.026%, 1/27/2020h | 786,901 | ||||||
| 760,000 | 5.550%, 7/15/2020j | 768,550 | ||||||
| 945,000 | 2.500%, 4/21/2021 | 933,918 | ||||||
| 1,900,000 | 2.625%, 11/17/2021 | 1,875,308 | ||||||
| 670,000 | 4.875%, 11/1/2022 | 717,285 | ||||||
| 1,530,000 | 4.000%, 7/23/2025 | 1,566,211 | ||||||
| 1,925,000 | 4.350%, 9/8/2026 | 1,961,446 | ||||||
MPT Operating Partnership, LP | ||||||||
| 2,200,000 | 6.375%, 3/1/2024 | 2,301,750 | ||||||
Nasdaq, Inc. | ||||||||
| 900,000 | 3.850%, 6/30/2026 | 892,777 | ||||||
National City Corporation | ||||||||
| 975,000 | 6.875%, 5/15/2019 | 1,072,747 | ||||||
Prudential Financial, Inc. | ||||||||
| 530,000 | 2.350%, 8/15/2019 | 534,872 | ||||||
Quicken Loans, Inc. | ||||||||
| 3,265,000 | 5.750%, 5/1/2025g | 3,175,212 | ||||||
Realty Income Corporation | ||||||||
| 302,000 | 2.000%, 1/31/2018 | 302,820 | ||||||
Regions Bank | ||||||||
| 344,000 | 7.500%, 5/15/2018 | 368,484 | ||||||
Regions Financial Corporation | ||||||||
| 1,400,000 | 2.250%, 9/14/2018 | 1,404,353 | ||||||
| 1,158,000 | 3.200%, 2/8/2021 | 1,173,445 | ||||||
Reinsurance Group of America, Inc. | ||||||||
| 500,000 | 5.625%, 3/15/2017 | 504,060 | ||||||
| 990,000 | 5.000%, 6/1/2021 | 1,068,938 | ||||||
Reliance Standard Life Global Funding II | ||||||||
| 660,000 | 2.500%, 4/24/2019g | 664,107 | ||||||
The accompanying Notes to Financial Statements are an integral part of this schedule.
52
Table of Contents
MODERATE ALLOCATION PORTFOLIO
Schedule of Investments as of December 31, 2016
| Principal Amount | Long-Term Fixed Income (29.7%) | Value | ||||||
| Financials (2.4%) - continued | ||||||||
Royal Bank of Scotland Group plc | ||||||||
| $ | 850,000 | 8.625%, 8/15/2021j | $ | 867,000 | ||||
| 1,000,000 | 3.875%, 9/12/2023 | 959,186 | ||||||
Santander Holdings USA, Inc. | ||||||||
| 1,030,000 | 3.450%, 8/27/2018 | 1,045,417 | ||||||
Santander UK Group Holdings plc | ||||||||
| 1,351,000 | 2.875%, 10/16/2020 | 1,338,829 | ||||||
Santander UK plc | ||||||||
| 608,000 | 3.050%, 8/23/2018 | 617,491 | ||||||
Simon Property Group, LP | ||||||||
| 570,000 | 2.500%, 9/1/2020 | 573,877 | ||||||
| 1,400,000 | 2.750%, 2/1/2023 | 1,379,076 | ||||||
| 1,520,000 | 4.250%, 11/30/2046 | 1,490,950 | ||||||
Skandinaviska Enskilda Banken AB | ||||||||
| 1,025,000 | 2.375%, 3/25/2019g | 1,027,631 | ||||||
Standard Chartered plc | ||||||||
| 1,200,000 | 2.100%, 8/19/2019g | 1,185,752 | ||||||
State Street Corporation | ||||||||
| 873,000 | 1.809%, 8/18/2020h | 884,676 | ||||||
Sumitomo Mitsui Banking Corporation | ||||||||
| 930,000 | 1.460%, 1/16/2018h | 931,166 | ||||||
Sumitomo Mitsui Financial Group, Inc. | ||||||||
| 1,140,000 | 3.010%, 10/19/2026 | 1,089,265 | ||||||
Svenska Handelsbanken AB | ||||||||
| 1,190,000 | 1.483%, 6/17/2019h | 1,190,870 | ||||||
Synchrony Financial | ||||||||
| 520,000 | 2.111%, 2/3/2020h | 514,116 | ||||||
| 560,000 | 3.750%, 8/15/2021 | 575,075 | ||||||
| 2,125,000 | 4.250%, 8/15/2024 | 2,160,660 | ||||||
Toronto-Dominion Bank | ||||||||
| 560,000 | 1.889%, 12/14/2020h | 566,583 | ||||||
UBS Group Funding Jersey, Ltd. | ||||||||
| 1,930,000 | 2.950%, 9/24/2020g | 1,929,406 | ||||||
| 1,158,000 | 4.125%, 9/24/2025g | 1,178,742 | ||||||
UnitedHealth Group, Inc. | ||||||||
| 375,000 | 3.350%, 7/15/2022 | 385,949 | ||||||
| 3,450,000 | 4.625%, 7/15/2035 | 3,754,725 | ||||||
USB Realty Corporation | ||||||||
| 535,000 | 2.027%, 1/15/2022g,h,j | 470,800 | ||||||
Voya Financial, Inc. | ||||||||
| 1,185,000 | 2.900%, 2/15/2018 | 1,199,534 | ||||||
Wells Fargo & Company | ||||||||
| 780,000 | 1.567%, 1/30/2020h | 779,617 | ||||||
| 1,550,000 | 2.550%, 12/7/2020 | 1,550,541 | ||||||
| 1,520,000 | 3.450%, 2/13/2023 | 1,523,947 | ||||||
| 1,320,000 | 3.000%, 2/19/2025 | 1,266,396 | ||||||
| 1,875,000 | 3.000%, 4/22/2026 | 1,786,661 | ||||||
| 1,475,000 | 3.000%, 10/23/2026 | 1,402,393 | ||||||
| 1,500,000 | 4.900%, 11/17/2045 | 1,537,711 | ||||||
Welltower, Inc. | ||||||||
| 300,000 | 2.250%, 3/15/2018 | 301,243 | ||||||
| 655,000 | 3.750%, 3/15/2023 | 667,522 | ||||||
| 740,000 | 4.000%, 6/1/2025 | 755,317 | ||||||
|
| |||||||
Total | 220,806,081 | |||||||
|
| |||||||
| Foreign Government (0.1%) | ||||||||
Argentina Government International Bond | ||||||||
| 1,110,000 | 7.500%, 4/22/2026g | 1,165,500 | ||||||
Brazil Government International Bond | ||||||||
| 1,900,000 | 7.125%, 1/20/2037 | 1,980,750 | ||||||
Export-Import Bank of Korea | ||||||||
| 765,000 | 2.250%, 1/21/2020 | 760,483 | ||||||
Indonesia Government International Bond | ||||||||
| 2,300,000 | 5.250%, 1/8/2047g | 2,293,381 | ||||||
Kommunalbanken AS | ||||||||
| 1,270,000 | 1.500%, 10/22/2019g | 1,258,514 | ||||||
Mexico Government International Bond | ||||||||
| 1,025,000 | 4.125%, 1/21/2026 | 1,016,800 | ||||||
| 1,025,000 | 4.350%, 1/15/2047 | 878,938 | ||||||
|
| |||||||
Total | 9,354,366 | |||||||
|
| |||||||
| Mortgage-Backed Securities (10.8%) | ||||||||
Federal Home Loan Mortgage Corporation Gold 15-Yr. Pass Through | ||||||||
| 65,995,000 | 3.000%, 1/1/2032c | 67,691,071 | ||||||
Federal Home Loan Mortgage Corporation Gold 30-Yr. Pass Through | ||||||||
| 48,845,000 | 4.000%, 1/1/2047c | 51,277,481 | ||||||
Federal National Mortgage Association Conventional 15-Yr. Pass Through | ||||||||
| 59,375,000 | 2.500%, 1/1/2032c | 59,440,312 | ||||||
Federal National Mortgage Association Conventional 30-Yr. Pass Through | ||||||||
| 6,644,372 | 1.740%, 7/1/2043h | 6,828,513 | ||||||
| 5,785,705 | 2.043%, 7/1/2043h | 5,958,268 | ||||||
| 5,956,709 | 2.088%, 8/1/2043h | 6,135,652 | ||||||
| 182,200,000 | 3.000%, 1/1/2047c | 180,869,940 | ||||||
| 336,550,000 | 3.500%, 1/1/2047c | 344,728,165 | ||||||
| 192,432,500 | 4.000%, 1/1/2047c | 202,208,071 | ||||||
| 71,494,000 | 4.500%, 1/1/2047c | 76,870,349 | ||||||
|
| |||||||
Total | 1,002,007,822 | |||||||
|
| |||||||
| Technology (0.5%) | ||||||||
Amphenol Corporation | ||||||||
| 511,000 | 2.550%, 1/30/2019 | 516,956 | ||||||
Apple, Inc. | ||||||||
| 615,000 | 1.202%, 5/6/2020h | 614,494 | ||||||
| 2,676,000 | 3.200%, 5/13/2025 | 2,683,533 | ||||||
| 1,154,000 | 4.650%, 2/23/2046 | 1,243,635 | ||||||
Avnet, Inc. | ||||||||
| 1,100,000 | 3.750%, 12/1/2021 | 1,105,761 | ||||||
Cisco Systems, Inc. | ||||||||
| 825,000 | 1.431%, 3/1/2019h | 829,708 | ||||||
CommScope Technologies Finance, LLC | ||||||||
| 2,125,000 | 6.000%, 6/15/2025g | 2,252,500 | ||||||
Diamond 1 Finance Corporation | ||||||||
| 950,000 | 3.480%, 6/1/2019g | 969,521 | ||||||
| 755,000 | 5.450%, 6/15/2023g | 800,040 | ||||||
| 579,000 | 6.020%, 6/15/2026g | 626,414 | ||||||
| 1,140,000 | 8.100%, 7/15/2036g | 1,354,371 | ||||||
| 760,000 | 8.350%, 7/15/2046g | 934,341 | ||||||
Equinix, Inc. | ||||||||
| 2,695,000 | 5.750%, 1/1/2025 | 2,816,275 | ||||||
Fidelity National Information Services, Inc. | ||||||||
| 1,560,000 | 2.850%, 10/15/2018 | 1,586,832 | ||||||
| 1,159,000 | 3.625%, 10/15/2020 | 1,198,990 | ||||||
First Data Corporation | ||||||||
| 1,570,000 | 5.375%, 8/15/2023g | 1,628,875 | ||||||
Hewlett Packard Enterprise Company | ||||||||
| 1,520,000 | 2.450%, 10/5/2017 | 1,528,371 | ||||||
The accompanying Notes to Financial Statements are an integral part of this schedule.
53
Table of Contents
MODERATE ALLOCATION PORTFOLIO
Schedule of Investments as of December 31, 2016
| Principal Amount | Long-Term Fixed Income (29.7%) | Value | ||||||
| Technology (0.5%) - continued | ||||||||
| $ | 760,000 | 2.850%, 10/5/2018 | $ | 767,206 | ||||
| 760,000 | 4.400%, 10/15/2022 | 790,599 | ||||||
Intel Corporation | ||||||||
| 320,000 | 3.100%, 7/29/2022 | 328,706 | ||||||
| 925,000 | 3.700%, 7/29/2025 | 974,373 | ||||||
| 1,737,000 | 4.100%, 5/19/2046 | 1,718,061 | ||||||
International Business Machines Corporation | ||||||||
| 1,544,000 | 4.700%, 2/19/2046e | 1,680,080 | ||||||
Iron Mountain, Inc. | ||||||||
| 2,740,000 | 6.000%, 8/15/2023 | 2,911,250 | ||||||
Micron Technology, Inc. | ||||||||
| 4,415,000 | 7.500%, 9/15/2023g | 4,889,613 | ||||||
Microsoft Corporation | ||||||||
| 2,400,000 | 4.750%, 11/3/2055 | 2,604,514 | ||||||
| 2,400,000 | 4.200%, 11/3/2035 | 2,521,500 | ||||||
| 1,325,000 | 3.700%, 8/8/2046 | 1,244,735 | ||||||
NXP BV | ||||||||
| 1,830,000 | 3.875%, 9/1/2022g | 1,852,875 | ||||||
Oracle Corporation | ||||||||
| 565,000 | 2.500%, 5/15/2022 | 560,478 | ||||||
| 1,544,000 | 2.400%, 9/15/2023 | 1,494,069 | ||||||
| 1,690,000 | 2.950%, 5/15/2025 | 1,654,454 | ||||||
Qualcomm, Inc. | ||||||||
| 1,158,000 | 3.000%, 5/20/2022 | 1,172,145 | ||||||
Sensata Technologies UK Financing Company plc | ||||||||
| 1,555,000 | 6.250%, 2/15/2026g | 1,624,975 | ||||||
|
| |||||||
Total | 51,480,250 | |||||||
|
| |||||||
| Transportation (0.2%) | ||||||||
Air Canada Pass Through Trust | ||||||||
| 493,761 | 3.875%, 3/15/2023g | 476,479 | ||||||
American Airlines Pass Through Trust | ||||||||
| 1,463,532 | 3.375%, 5/1/2027 | 1,441,579 | ||||||
Avis Budget Car Rental, LLC | ||||||||
| 2,275,000 | 5.125%, 6/1/2022e,g | 2,229,500 | ||||||
| 1,625,000 | 6.375%, 4/1/2024e,g | 1,622,969 | ||||||
Burlington Northern Santa Fe, LLC | ||||||||
| 1,320,000 | 5.050%, 3/1/2041 | 1,495,268 | ||||||
| 1,640,000 | 3.900%, 8/1/2046 | 1,599,953 | ||||||
Continental Airlines, Inc. | ||||||||
| 666,326 | 4.150%, 4/11/2024 | 684,650 | ||||||
CSX Corporation | ||||||||
| 1,520,000 | 4.250%, 11/1/2066 | 1,383,782 | ||||||
| 532,000 | 3.700%, 11/1/2023 | 551,529 | ||||||
Delta Air Lines, Inc. | ||||||||
| 268,063 | 4.950%, 5/23/2019 | 280,929 | ||||||
ERAC USA Finance, LLC | ||||||||
| 294,000 | 2.800%, 11/1/2018g | 297,628 | ||||||
J.B. Hunt Transport Services, Inc. | ||||||||
| 510,000 | 3.300%, 8/15/2022 | 511,485 | ||||||
Southwest Airlines Company | ||||||||
| 1,075,000 | 2.750%, 11/6/2019 | 1,093,461 | ||||||
Virgin Australia Holdings, Ltd. | ||||||||
| 268,904 | 5.000%, 10/23/2023g | 281,005 | ||||||
XPO Logistics, Inc. | ||||||||
| 2,270,000 | 6.500%, 6/15/2022e,g | 2,383,500 | ||||||
|
| |||||||
Total | 16,333,717 | |||||||
|
| |||||||
| U.S. Government and Agencies (7.4%) | ||||||||
Federal National Mortgage Association | ||||||||
| 540,000 | 6.250%, 5/15/2029 | 714,577 | ||||||
Tennessee Valley Authority | ||||||||
| 520,000 | 5.250%, 9/15/2039 | 651,953 | ||||||
U.S. Treasury Bonds | ||||||||
| 4,750,000 | 5.250%, 11/15/2028 | 6,037,098 | ||||||
| 2,975,000 | 4.375%, 5/15/2040 | 3,668,963 | ||||||
| 35,920,000 | 3.625%, 2/15/2044 | 39,729,639 | ||||||
| 25,136,000 | 2.500%, 5/15/2046 | 22,282,335 | ||||||
| 6,000,000 | 2.875%, 11/15/2046 | 5,778,570 | ||||||
U.S. Treasury Bonds, TIPS | ||||||||
| 4,435,794 | 0.125%, 4/15/2019 | 4,490,971 | ||||||
| 35,505,655 | 0.125%, 1/15/2023 | 35,239,434 | ||||||
| 134,647 | 2.375%, 1/15/2025 | 154,581 | ||||||
| 31,708,929 | 0.625%, 1/15/2026 | 31,982,355 | ||||||
| 95,060 | 2.125%, 2/15/2040 | 117,698 | ||||||
| 1,016,253 | 0.750%, 2/15/2042 | 961,776 | ||||||
U.S. Treasury Notes | ||||||||
| 2,800,000 | 0.875%, 1/31/2017l | 2,801,114 | ||||||
| 25,100,000 | 0.875%, 3/31/2018 | 25,065,538 | ||||||
| 65,050,000 | 1.000%, 11/30/2018e | 64,828,245 | ||||||
| 14,000,000 | 0.750%, 2/15/2019 | 13,856,962 | ||||||
| 13,600,000 | 1.000%, 10/15/2019 | 13,448,292 | ||||||
| 112,320,000 | 1.500%, 10/31/2019 | 112,539,249 | ||||||
| 76,185,000 | 1.375%, 9/30/2020 | 75,265,752 | ||||||
| 5,000,000 | 1.375%, 5/31/2021 | 4,896,130 | ||||||
| 38,359,000 | 1.125%, 8/31/2021 | 37,027,176 | ||||||
| 1,000,000 | 2.125%, 9/30/2021 | 1,007,898 | ||||||
| 2,000,000 | 2.125%, 6/30/2022 | 2,004,874 | ||||||
| 8,105,000 | 1.625%, 8/15/2022 | 7,895,559 | ||||||
| 1,520,000 | 1.375%, 9/30/2023 | 1,437,646 | ||||||
| 50,800,000 | 1.625%, 10/31/2023 | 48,812,755 | ||||||
| 68,135,000 | 2.250%, 11/15/2024 | 67,626,985 | ||||||
| 55,654,000 | 2.000%, 11/15/2026e | 53,460,676 | ||||||
|
| |||||||
Total | 683,784,801 | |||||||
|
| |||||||
| Utilities (0.8%) | ||||||||
American Electric Power Company, Inc. | ||||||||
| 2,552,000 | 2.950%, 12/15/2022 | 2,565,324 | ||||||
Arizona Public Service Company | ||||||||
| 675,000 | 2.200%, 1/15/2020 | 675,381 | ||||||
Berkshire Hathaway Energy Company | ||||||||
| 495,000 | 2.400%, 2/1/2020 | 496,043 | ||||||
Calpine Corporation | ||||||||
| 1,470,000 | 5.375%, 1/15/2023 | 1,436,925 | ||||||
Chesapeake Midstream Partners, LP | ||||||||
| 1,930,000 | 6.125%, 7/15/2022 | 1,990,635 | ||||||
CMS Energy Corporation | ||||||||
| 1,140,000 | 2.950%, 2/15/2027 | 1,080,263 | ||||||
Commonwealth Edison Company | ||||||||
| 1,300,000 | 3.700%, 3/1/2045 | 1,220,042 | ||||||
| 965,000 | 4.350%, 11/15/2045 | 1,005,498 | ||||||
Consolidated Edison Company of New York, Inc. | ||||||||
| 579,000 | 4.500%, 12/1/2045 | 612,704 | ||||||
Consolidated Edison, Inc. | ||||||||
| 772,000 | 2.000%, 5/15/2021 | 753,826 | ||||||
Dominion Resources, Inc. | ||||||||
| 1,495,000 | 2.962%, 7/1/2019 | 1,512,904 | ||||||
DTE Electric Company | ||||||||
| 965,000 | 3.700%, 3/15/2045 | 920,683 | ||||||
| 1,225,000 | 3.700%, 6/1/2046 | 1,175,869 | ||||||
DTE Energy Company | ||||||||
| 265,000 | 2.400%, 12/1/2019 | 266,178 | ||||||
Duke Energy Corporation | ||||||||
| 1,073,000 | 2.100%, 6/15/2018 | 1,077,406 | ||||||
| 1,520,000 | 3.750%, 9/1/2046 | 1,365,413 | ||||||
Duke Energy Indiana, LLC | ||||||||
| 1,550,000 | 3.750%, 5/15/2046 | 1,454,760 | ||||||
The accompanying Notes to Financial Statements are an integral part of this schedule.
54
Table of Contents
MODERATEALLOCATION PORTFOLIO
Schedule of Investments as of December 31, 2016
| Principal Amount | Long-Term Fixed Income (29.7%) | Value | ||||||
Utilities (0.8%) - continued | ||||||||
Dynegy, Inc. | ||||||||
| $ | 2,665,000 | 7.375%, 11/1/2022 | $ | 2,545,075 | ||||
Edison International | ||||||||
| 1,520,000 | 2.950%, 3/15/2023 | 1,502,132 | ||||||
Emera U.S. Finance, LP | ||||||||
| 1,175,000 | 2.150%, 6/15/2019g | 1,172,562 | ||||||
| 1,160,000 | 4.750%, 6/15/2046g | 1,167,519 | ||||||
Enel Finance International NV | ||||||||
| 474,000 | 6.250%, 9/15/2017g | 488,516 | ||||||
Energy Transfer Equity, LP | ||||||||
| 1,470,000 | 5.500%, 6/1/2027 | 1,433,250 | ||||||
Eversource Energy | ||||||||
| 565,000 | 1.600%, 1/15/2018 | 563,657 | ||||||
Exelon Corporation | ||||||||
| 825,000 | 5.100%, 6/15/2045 | 875,322 | ||||||
| 1,158,000 | 4.450%, 4/15/2046 | 1,131,329 | ||||||
Exelon Generation Company, LLC | ||||||||
| 1,077,000 | 5.200%, 10/1/2019 | 1,153,759 | ||||||
| 505,000 | 2.950%, 1/15/2020 | 510,750 | ||||||
ITC Holdings Corporation | ||||||||
| 294,000 | 4.050%, 7/1/2023 | 301,309 | ||||||
| 760,000 | 5.300%, 7/1/2043 | 829,847 | ||||||
Kinder Morgan Energy Partners, LP | ||||||||
| 1,150,000 | 3.500%, 3/1/2021 | 1,166,601 | ||||||
MidAmerican Energy Holdings Company | ||||||||
| 2,316,000 | �� | 6.500%, 9/15/2037 | 3,010,003 | |||||
Monongahela Power Company | ||||||||
| 990,000 | 5.400%, 12/15/2043g | 1,154,987 | ||||||
National Rural Utilities Cooperative Finance Corporation | ||||||||
| 1,500,000 | 2.300%, 11/1/2020 | 1,489,875 | ||||||
NextEra Energy Capital Holdings, Inc. | ||||||||
| 965,000 | 2.300%, 4/1/2019 | 971,969 | ||||||
NiSource Finance Corporation | ||||||||
| 2,200,000 | 5.650%, 2/1/2045 | 2,560,367 | ||||||
Northern States Power Company | ||||||||
| 1,670,000 | 4.125%, 5/15/2044 | 1,694,511 | ||||||
NRG Energy, Inc. | ||||||||
| 1,100,000 | 6.625%, 3/15/2023 | 1,102,750 | ||||||
Oncor Electric Delivery Company, LLC | ||||||||
| 960,000 | 3.750%, 4/1/2045 | 918,461 | ||||||
Pacific Gas & Electric Company | ||||||||
| 1,158,000 | 4.250%, 3/15/2046 | 1,174,374 | ||||||
PG&E Corporation | ||||||||
| 485,000 | 2.400%, 3/1/2019 | 486,735 | ||||||
PPL Capital Funding, Inc. | ||||||||
| 508,000 | 3.500%, 12/1/2022 | 518,959 | ||||||
| 1,900,000 | 5.000%, 3/15/2044 | 2,005,534 | ||||||
Regency Energy Partners, LP | ||||||||
| 1,520,000 | 5.875%, 3/1/2022 | 1,670,556 | ||||||
Sempra Energy | ||||||||
| 1,640,000 | 6.150%, 6/15/2018 | 1,737,208 | ||||||
| 630,000 | 2.400%, 3/15/2020 | 628,727 | ||||||
Southern California Edison Company | ||||||||
| 375,000 | 2.400%, 2/1/2022 | 373,545 | ||||||
Southern Company | ||||||||
| 1,550,000 | 1.850%, 7/1/2019 | 1,544,535 | ||||||
| 1,550,000 | 4.400%, 7/1/2046 | 1,530,021 | ||||||
Southwestern Electric Power Company | ||||||||
| 620,000 | 3.900%, 4/1/2045 | 576,309 | ||||||
Targa Resources Partners, LP | ||||||||
| 975,000 | 5.250%, 5/1/2023 | 984,750 | ||||||
Tesoro Corporation | ||||||||
| 2,920,000 | 4.750%, 12/15/2023g | 2,934,600 | ||||||
Tesoro Logistics, LP | ||||||||
| 2,460,000 | 5.250%, 1/15/2025 | 2,512,275 | ||||||
TransAlta Corporation | ||||||||
| 1,213,000 | 1.900%, 6/3/2017 | 1,206,935 | ||||||
Williams Partners, LP | ||||||||
| 1,550,000 | 5.100%, 9/15/2045 | 1,470,524 | ||||||
Xcel Energy, Inc. | ||||||||
| 1,450,000 | 3.350%, 12/1/2026 | 1,449,042 | ||||||
|
| |||||||
Total | 70,159,034 | |||||||
|
| |||||||
Total Long-Term Fixed Income (cost $2,743,821,405) | 2,746,583,349 | |||||||
|
| |||||||
| Shares | Preferred Stock (<0.1%) | |||||||
Consumer Staples (<0.1%) | ||||||||
| 798 | Henkel AG & Company KGaA, 1.470% | 94,994 | ||||||
|
| |||||||
Total | 94,994 | |||||||
|
| |||||||
Energy (<0.1%) | ||||||||
| 25,286 | Alpha Natural Resources, Inc., 0.000%d | 505,720 | ||||||
| 25,286 | ANR Holdings, Inc., 0.000%d | 136,545 | ||||||
|
| |||||||
Total | 642,265 | |||||||
|
| |||||||
Total Preferred Stock (cost $194,605) | 737,259 | |||||||
|
| |||||||
Collateral Held for Securities Loaned (2.0%) | ||||||||
| 186,669,340 | Thrivent Cash Management Trust | 186,669,340 | ||||||
|
| |||||||
Total Collateral Held for Securities Loaned (cost $186,669,340) | 186,669,340 | |||||||
|
| |||||||
| Shares or Principal Amount | Short-Term Investments (15.8%)m | |||||||
Federal Home Loan Bank Discount Notes | ||||||||
| 18,000,000 | 0.340%, 1/4/2017n | 17,999,802 | ||||||
| 100,000 | 0.500%, 1/6/2017n | 99,997 | ||||||
| 1,500,000 | 0.440%, 1/18/2017n | 1,499,763 | ||||||
| 1,300,000 | 0.500%, 1/19/2017n | 1,299,780 | ||||||
| 9,600,000 | 0.385%, 1/20/2017n | 9,598,282 | ||||||
| 9,100,000 | 0.459%, 2/1/2017n | 9,096,333 | ||||||
| 800,000 | 0.515%, 2/9/2017n | 799,589 | ||||||
| 200,000 | 0.490%, 2/10/2017n | 199,894 | ||||||
| 2,400,000 | 0.500%, 2/17/2017n | 2,398,500 | ||||||
| 7,000,000 | 0.530%, 2/22/2017n | 6,995,142 | ||||||
Federal National Mortgage Association Discount Notes | ||||||||
| 12,000,000 | 0.345%, 1/11/2017n | 11,998,992 | ||||||
Thrivent Core Short-Term Reserve Fund | ||||||||
| 138,900,615 | 0.910% | 1,389,006,154 | ||||||
U.S. Treasury Bills | ||||||||
| 3,600,000 | 0.412%, 1/26/2017l | 3,599,031 | ||||||
| 1,200,000 | 0.411%, 2/2/2017l | 1,199,578 | ||||||
| 5,800,000 | 0.473%, 2/9/2017l | 5,797,332 | ||||||
The accompanying Notes to Financial Statements are an integral part of this schedule.
55
Table of Contents
MODERATE ALLOCATION PORTFOLIO
Schedule of Investments as of December 31, 2016
| Shares or Principal Amount | Short-Term Investments (15.8%)m | Value | ||||||
U.S. Treasury Notes | ||||||||
| 1,900,000 | 0.500%, 1/31/2017 | $ | 1,900,216 | |||||
|
| |||||||
Total Short-Term Investments (cost $1,463,486,512) | 1,463,488,385 | |||||||
|
| |||||||
Total Investments (cost $9,596,844,026) 112.5% | $ | 10,417,700,288 | ||||||
|
| |||||||
Other Assets and Liabilities, Net (12.5%) | (1,156,303,810 | ) | ||||||
|
| |||||||
Total Net Assets 100.0% | $ | 9,261,396,478 | ||||||
|
| |||||||
| a | The stated interest rate represents the weighted average of all contracts within the bank loan facility. |
| b | All or a portion of the loan is unfunded. |
| c | Denotes investments purchased on a when-issued or delayed delivery basis. |
| d | Non-income producing security. |
| e | All or a portion of the security is on loan. |
| f | Security is valued at fair value. Market quotations or prices were not readily available or were determined to be unreliable. Fair value was determined in good faith pursuant to procedures adopted by the Board. Further information on fair valuation can be found in the Notes to Financial Statements. |
| g | Denotes securities sold under Rule 144A of the Securities Act of 1933, which exempts them from registration. These securities may be resold to other dealers in the program or to other qualified institutional buyers. As of December 31, 2016, the value of these investments was $213,856,456 or 2.3% of total net assets. |
| h | Denotes variable rate securities. Variable rate securities are securities whose yields vary with a designated market index or market rate. The rate shown is as of December 31, 2016. |
| i | Denotes step coupon securities. Step coupon securities pay an initial coupon rate for the first period and then different coupon rates for following periods. The rate shown is as of December 31, 2016. |
| j | Denotes perpetual securities. Perpetual securities pay an indefinite stream of interest and have no contractual maturity date. Date shown, if applicable, is next call date. |
| k | Denotes interest only security. Interest only securities represent the right to receive monthly interest payments on an underlying pool of mortgages or assets. The principal shown is the outstanding par amount of the pool as of the end of the period. The actual effective yield of the security is different than the stated coupon rate. |
| l | At December 31, 2016, $2,547,481 of investments were segregated to cover exposure to a counterparty for margin on open mortgage-backed security transactions. |
| m | The interest rate shown reflects the yield, coupon rate or the discount rate at the date of purchase. |
| n | All or a portion of the security is held on deposit with the counterparty and pledged as the initial margin deposit for open futures contracts. |
| * | Denotes restricted securities. Restricted securities are investment securities which cannot be offered for public sale without first being registered under the Securities Act of 1933. The value of all restricted securities held in Moderate Allocation Portfolio as of December 31, 2016 was $111,487,740 or 1.2% of total net assets. The following table indicates the acquisition date and cost of restricted securities shown in the schedule as of December 31, 2016. |
Security | Acquisition Date | Cost | ||||||
Alm Loan Funding CLO, 10/17/2026 | 7/31/2014 | $ | 1,399,300 | |||||
Angel Oak Mortgage Trust I, LLC, 7/25/2046 | 8/15/2016 | 1,679,566 | ||||||
Apidos CLO XVIII, 7/22/2026 | 6/25/2014 | 1,396,500 | ||||||
Ares CLO, Ltd., 11/15/2025 | 11/26/2014 | 2,750,000 | ||||||
Ares CLO, Ltd., 10/12/2023 | 5/15/2015 | 4,400,000 | ||||||
Babson CLO, Ltd., 10/17/2026 | 8/15/2014 | 1,399,300 | ||||||
Bayview Opportunity Master Fund Trust, 7/28/2034 | 3/19/2015 | 956,794 | ||||||
Betony CLO, Ltd., 4/15/2027 | 11/17/2016 | 1,260,000 | ||||||
Birchwood Park CLO, Ltd., 7/15/2026 | 7/31/2014 | 1,400,000 | ||||||
BlueMountain CLO, Ltd., 10/15/2026 | 8/27/2014 | 1,398,586 | ||||||
CAM Mortgage, LLC, 7/15/2064 | 6/24/2015 | 27,438 | ||||||
Carlyle Global Market Strategies CLO, Ltd., 10/15/2026 | 9/19/2014 | 1,400,000 | ||||||
Carlyle Global Market Strategies CLO, Ltd., 7/20/2023 | 7/3/2014 | 1,213,907 | ||||||
Cent CLO 16, LP, 8/1/2024 | 9/5/2014 | 1,360,200 | ||||||
Cent CLO 22, Ltd., 11/7/2026 | 11/1/2016 | 1,400,000 | ||||||
COLT Mortgage Loan Trust, 12/26/2046 | 12/14/2016 | 3,027,549 | ||||||
Contura Energy, Inc., 8/1/2021 | 5/20/2013 | 1,842,381 | ||||||
Digicel, Ltd., 4/15/2021 | 8/18/2014 | 3,659,303 | ||||||
DRB Prime Student Loan Trust, 1/25/2040 | 6/23/2016 | 3,449,489 | ||||||
DRB Prime Student Loan Trust, 7/25/2031 | 9/23/2015 | 1,032,530 | ||||||
DRB Prime Student Loan Trust, 10/27/2031 | 9/30/2016 | 1,141,060 | ||||||
Dryden 34 Senior Loan Fund CLO, 10/15/2026 | 7/21/2014 | 1,400,000 | ||||||
Edlinc Student Loan Funding Trust, 10/1/2025 | 2/28/2013 | 67,913 | ||||||
Galaxy XX CLO, Ltd., 7/20/2027 | 5/20/2015 | 4,500,000 | ||||||
GoldenTree Loan Opportunities IX, Ltd., 10/29/2026 | 10/7/2016 | 1,325,000 | ||||||
Golub Capital Partners CLO 22B, Ltd., 2/20/2027 | 2/6/2015 | 2,686,230 | ||||||
Golub Capital Partners CLO 23M, Ltd., 5/5/2027 | 5/18/2015 | 1,346,625 | ||||||
Limerock CLO III, LLC, 10/20/2026 | 10/16/2014 | 4,500,000 | ||||||
Madison Park Funding XIV CLO, Ltd., 7/20/2026 | 7/3/2014 | 1,523,170 | ||||||
Madison Park Funding, Ltd., 8/15/2022 | 5/8/2015 | 3,732,106 | ||||||
Magnetite XII, Ltd., 4/15/2027 | 11/17/2016 | 4,425,000 | ||||||
Marlette Funding Trust, 1/17/2023 | 7/20/2016 | 1,692,076 | ||||||
Mountain View CLO, Ltd., 7/15/2027 | 5/13/2015 | 4,513,280 | ||||||
Murray Hill Marketplace Trust, 11/25/2022 | 10/6/2016 | 3,792,749 | ||||||
Neuberger Berman CLO, Ltd., 8/4/2025 | 6/19/2014 | 1,100,000 | ||||||
NZCG Funding CLO, Ltd., 4/27/2027 | 3/27/2015 | 4,500,000 | ||||||
Octagon Investment Partners XX CLO, Ltd., 8/12/2026 | 7/10/2014 | 1,400,000 | ||||||
OHA Loan Funding, Ltd., 10/20/2026 | 11/6/2014 | 4,488,750 | ||||||
OZLM VIII, Ltd., 10/17/2026 | 8/7/2014 | 1,392,020 | ||||||
Race Point IX CLO, Ltd., 4/15/2027 | 2/13/2015 | 3,260,000 | ||||||
Shackleton, Ltd., 4/15/2027 | 12/16/2016 | 4,500,000 | ||||||
The accompanying Notes to Financial Statements are an integral part of this schedule.
56
Table of Contents
MODERATE ALLOCATION PORTFOLIO
Schedule of Investments as of December 31, 2016
Security | Acquisition Date | Cost | ||||||
Sunset Mortgage Loan Company, LLC, 7/16/2047 | 7/27/2016 | $ | 4,516,126 | |||||
Sunset Mortgage Loan Company, LLC, 9/18/2045 | 10/2/2015 | 1,854,067 | ||||||
Symphony CLO VIII, Ltd., 1/9/2023 | 9/15/2014 | 1,281,546 | ||||||
Symphony CLO XV, Ltd., 10/17/2026 | 10/17/2014 | 4,466,250 | ||||||
Vericrest Opportunity Loan Transferee, 10/25/2058 | 2/6/2015 | 4,145,352 | ||||||
Vericrest Opportunity Loan Transferee, 2/25/2055 | 2/25/2015 | 773,014 | ||||||
Voya CLO 3, Ltd., 7/25/2026 | 7/10/2014 | 1,397,900 | ||||||
The following table presents the total amount of securities loaned with continuous maturity, by type, offset by the gross payable upon return of collateral for securities loaned by Thrivent Moderate Allocation Portfolio as of December 31, 2016:
Securities Lending Transactions | ||||
Taxable Debt Security | $ | 135,038,038 | ||
Common Stock | 47,486,754 | |||
|
| |||
Total lending | $ | 182,524,792 | ||
Gross amount payable upon return of collateral for securities loaned | $ | 186,669,340 | ||
|
| |||
Net amounts due to counterparty | $ | 4,144,548 | ||
|
| |||
Definitions:
| ADR | - | American Depositary Receipt, which are certificates for an underlying foreign security’s shares held by an issuing U.S. depository bank. | ||
| CLO | - | Collateralized Loan Obligation | ||
| ETF | - | Exchange Traded Fund. | ||
| REIT | - | Real Estate Investment Trust is a company that buys, develops, manages and/or sells real estate assets. | ||
| TIPS | - | Treasury Inflation Protected Security. |
The accompanying Notes to Financial Statements are an integral part of this schedule.
57
Table of Contents
MODERATELY CONSERVATIVE ALLOCATION PORTFOLIO
Schedule of Investments as of December 31, 2016
| Principal Amount | Bank Loans (2.6%)a | Value | ||||||
Basic Materials (0.2%) | ||||||||
Arch Coal, Inc., Term Loan | ||||||||
| $ | 452,109 | 10.000%, 10/5/2021 | $ | 457,950 | ||||
Axalta Coating Systems US Holdings, Inc.,Term Loan | ||||||||
| 1,084,859 | 3.498%, 2/1/2023 | 1,095,034 | ||||||
Chemours Company, Term Loan | ||||||||
| 1,028,179 | 3.770%, 5/12/2022 | 1,021,116 | ||||||
Fortescue Metals Group, Ltd., Term Loan | ||||||||
| 586,946 | 3.750%, 6/30/2019 | 588,120 | ||||||
Ineos US Finance, LLC, Term Loan | ||||||||
| 2,243,140 | 3.750%, 12/15/2020 | 2,252,494 | ||||||
Tronox Pigments BV, Term Loan | ||||||||
| 1,951,434 | 4.500%, 3/19/2020 | 1,957,932 | ||||||
|
| |||||||
Total | 7,372,646 | |||||||
|
| |||||||
Capital Goods (0.1%) | ||||||||
Accudyne Industries, LLC, Term Loan | ||||||||
| 1,145,978 | 4.000%, 12/13/2019 | 1,081,723 | ||||||
Advanced Disposal Services, Inc., Term Loan | ||||||||
| 964,858 | 3.500%, 11/10/2023 | 972,703 | ||||||
Berry Plastics Group, Inc., Term Loan | ||||||||
| 1,642,510 | 3.500%, 2/8/2020 | 1,653,712 | ||||||
Cortes NP Acquisition Corporation, Term Loan | ||||||||
| 3,025,000 | 6.000%, 11/30/2023 | 3,062,812 | ||||||
|
| |||||||
Total | 6,770,950 | |||||||
|
| |||||||
Communications Services (0.8%) | ||||||||
Altice US Finance I Corporation, Term Loan | ||||||||
| 1,054,360 | 3.882%, 1/15/2025 | 1,064,904 | ||||||
Atlantic Broadband Penn, LLC, Term Loan | ||||||||
| 879,939 | 3.250%, 11/30/2019 | 882,139 | ||||||
Beasley Broadcast Group, Inc., Term Loan | ||||||||
| 860,000 | 7.000%, 11/1/2023 | 860,000 | ||||||
Charter Communications Operating, LLC, Term Loan | ||||||||
| 443,900 | 3.020%, 7/1/2020 | 445,751 | ||||||
Grande Communications Networks, LLC, Term Loan | ||||||||
| 1,312,449 | 4.500%, 5/29/2020 | 1,320,324 | ||||||
Hargray Communications Group, Inc., Term Loan | ||||||||
| 1,940,371 | 4.750%, 6/26/2019 | 1,961,385 | ||||||
Integra Telecom Holdings, Inc., Term Loan | ||||||||
| 1,247,201 | 5.250%, 8/14/2020 | 1,249,384 | ||||||
| 405,757 | 9.750%, 2/12/2021 | 404,998 | ||||||
Intelsat Jackson Holdings SA, Term Loan | ||||||||
| 650,968 | 3.750%, 6/30/2019 | 628,523 | ||||||
Level 3 Communications, Inc., Term Loan | ||||||||
| 2,540,000 | 4.000%, 1/15/2020 | 2,573,020 | ||||||
Level 3 Financing, Inc., Term Loan | ||||||||
| 840,000 | 3.500%, 5/31/2022 | 849,450 | ||||||
Liberty Cablevision of Puerto Rico, | ||||||||
LLC, Term Loan | ||||||||
| 2,585,000 | 4.500%, 1/7/2022 | 2,564,010 | ||||||
LTS Buyer, LLC, Term Loan | ||||||||
| 1,981,553 | 4.248%, 4/13/2020 | 1,990,846 | ||||||
NEP Broadcasting, LLC, Term Loan | ||||||||
| 134,286 | 10.000%, 7/22/2020 | 134,789 | ||||||
NEP/NCP Holdco, Inc., Term Loan | ||||||||
| 2,485,366 | 4.250%, 1/22/2020 | 2,491,579 | ||||||
SBA Senior Finance II, LLC, Term Loan | ||||||||
| 1,812,400 | 3.270%, 6/10/2022 | 1,818,182 | ||||||
Syniverse Holdings, Inc., Term Loan | ||||||||
| 1,508,440 | 4.000%, 4/23/2019 | 1,313,851 | ||||||
TNS, Inc., Term Loan | ||||||||
| 737,595 | 5.000%, 2/14/2020 | 743,821 | ||||||
Univision Communications, Inc., Term Loan | ||||||||
| 1,881,555 | 4.000%, 3/1/2020 | 1,890,963 | ||||||
Virgin Media Bristol, LLC, Term Loan | ||||||||
| 1,475,000 | 3.486%, 1/31/2025 | 1,480,723 | ||||||
WideOpenWest Finance, LLC, Term Loan | ||||||||
| 3,815,438 | 4.500%, 8/18/2023 | 3,852,905 | ||||||
XO Communications, LLC, Term Loan | ||||||||
| 2,059,602 | 4.250%, 3/20/2021 | 2,064,751 | ||||||
Yankee Cable Acquisition, LLC, Term Loan | ||||||||
| 1,528,049 | 4.250%, 3/1/2020 | 1,528,691 | ||||||
Zayo Group, LLC, Term Loan | ||||||||
| 2,385,450 | 3.750%, 5/6/2021 | 2,409,638 | ||||||
|
| |||||||
Total | 36,524,627 | |||||||
|
| |||||||
Consumer Cyclical (0.4%) | ||||||||
Amaya BV, Term Loan | ||||||||
| 2,869,369 | 5.000%, 8/1/2021 | 2,878,150 | ||||||
Burlington Coat Factory Warehouse Corporation, Term Loan | ||||||||
| 1,094,626 | 3.510%, 8/13/2021 | 1,101,073 | ||||||
Cengage Learning Acquisitions, Term Loan | ||||||||
| 1,144,250 | 5.250%, 6/7/2023 | 1,111,536 | ||||||
Ceridian HCM Holding, Inc., Term Loan | ||||||||
| 566,107 | 4.500%, 9/15/2020 | 561,623 | ||||||
Charter Communications Operating, LLC, Term Loan | ||||||||
| 2,171,250 | 3.020%, 1/3/2021 | 2,179,696 | ||||||
Four Seasons Holdings, Inc., Term Loan | ||||||||
| 1,130,000 | 3.750%, 11/30/2023 | 1,141,771 | ||||||
Golden Nugget, Inc., Term Loan | ||||||||
| 551,355 | 4.500%, 11/21/2019 | 556,869 | ||||||
Golden Nugget, Inc., Term Loan Delayed Draw | ||||||||
| 236,295 | 4.500%, 11/21/2019 | 238,658 | ||||||
IMG Worldwide, Inc., Term Loan | ||||||||
| 2,048,218 | 5.250%, 5/6/2021 | 2,067,431 | ||||||
| 950,000 | 8.250%, 5/6/2022 | 961,875 | ||||||
Mohegan Tribal Gaming Authority, Term Loan | ||||||||
| 1,521,187 | 5.500%, 10/13/2023 | 1,531,653 | ||||||
Scientific Games International, Inc., Term Loan | ||||||||
| 3,017,454 | 6.000%, 10/18/2020 | 3,055,806 | ||||||
| 648,421 | 6.000%, 10/1/2021 | 656,124 | ||||||
Seminole Indian Tribe of Florida, Term Loan | ||||||||
| 637,938 | 3.248%, 4/29/2020 | 639,532 | ||||||
|
| |||||||
Total | 18,681,797 | |||||||
|
| |||||||
The accompanying Notes to Financial Statements are an integral part of this schedule.
58
Table of Contents
MODERATELY CONSERVATIVE ALLOCATION PORTFOLIO
Schedule of Investments as of December 31, 2016
| Principal Amount | Bank Loans (2.6%)a | Value | ||||||
Consumer Non-Cyclical (0.4%) | ||||||||
Albertson’s, LLC, Term Loan | ||||||||
| $ | 844,075 | 0.000%, 12/21/2022b,c | $ | 854,626 | ||||
| 1,530,925 | 0.000%, 6/22/2023b,c | 1,549,419 | ||||||
CHS/Community Health Systems, Inc., Term Loan | ||||||||
| 313,821 | 3.750%, 12/31/2019 | 303,819 | ||||||
| 2,023,987 | 4.000%, 1/27/2021 | 1,956,528 | ||||||
Endo Luxembourg Finance I Company SARL, Term Loan | ||||||||
| 1,638,450 | 3.813%, 9/26/2022 | 1,645,479 | ||||||
JBS USA, LLC, Term Loan | ||||||||
| 1,508,730 | 3.750%, 5/25/2018 | 1,509,982 | ||||||
McGraw-Hill Global Education Holdings, LLC, Term Loan | ||||||||
| 1,766,125 | 5.000%, 5/4/2022 | 1,766,408 | ||||||
Ortho-Clinical Diagnostics, Inc., Term Loan | ||||||||
| 2,319,374 | 4.750%, 6/30/2021 | 2,297,015 | ||||||
PetSmart, Inc., Term Loan | ||||||||
| 723,165 | 4.000%, 3/11/2022 | 724,972 | ||||||
Sterigenics-Nordion Holdings, LLC, Term Loan | ||||||||
| 1,071,437 | 4.250%, 5/16/2022 | 1,074,791 | ||||||
Valeant Pharmaceuticals International, Inc., Term Loan | ||||||||
| 5,682,750 | 5.500%, 4/1/2022b,c | 5,683,830 | ||||||
|
| |||||||
Total | 19,366,869 | |||||||
|
| |||||||
Energy (0.1%) | ||||||||
Energy Solutions, LLC, Term Loan | ||||||||
| 437,250 | 6.750%, 5/29/2020 | 439,983 | ||||||
Expro Holdings UK 2, Ltd., Term Loan | ||||||||
| 733,125 | 5.750%, 9/2/2021 | 618,266 | ||||||
Fieldwood Energy, LLC, Term Loan | ||||||||
| 879,760 | 3.875%, 10/1/2018 | 826,975 | ||||||
Houston Fuel Oil Terminal, LLC, Term Loan | ||||||||
| 1,832,862 | 4.250%, 8/19/2021 | 1,819,115 | ||||||
McJunkin Red Man Corporation, Term Loan | ||||||||
| 887,533 | 5.000%, 11/8/2019 | 890,861 | ||||||
Pacific Drilling SA, Term Loan | ||||||||
| 1,235,200 | 4.500%, 6/3/2018 | 433,555 | ||||||
Targa Resources Partners, LP, Term Loan | ||||||||
| 158,139 | 5.750%, 2/27/2022 | 158,930 | ||||||
Western Refining, Inc., Term Loan | ||||||||
| 733,825 | 5.500%, 6/23/2023 | 737,494 | ||||||
|
| |||||||
Total | 5,925,179 | |||||||
|
| |||||||
Financials (0.2%) | ||||||||
DJO Finance, LLC, Term Loan | ||||||||
| 938,125 | 4.250%, 6/7/2020 | 899,137 | ||||||
Harland Clarke Holdings Corporation, Term Loan | ||||||||
| 871,266 | 7.000%, 5/22/2018 | 871,536 | ||||||
| 959,500 | 7.000%, 12/31/2019 | 963,098 | ||||||
MoneyGram International, Inc., Term Loan | ||||||||
| 1,733,477 | 4.250%, 3/27/2020 | 1,710,370 | ||||||
Sable International Finance, Ltd., Term Loan | ||||||||
| 1,675,000 | 5.748%, 1/3/2023b,c | 1,694,899 | ||||||
WaveDivision Holdings, LLC, Term Loan | ||||||||
| 2,414,489 | 4.000%, 10/15/2019 | 2,427,165 | ||||||
|
| |||||||
Total | 8,566,205 | |||||||
|
| |||||||
Technology (0.3%) | ||||||||
Avago Technoligies Cayman Finance, Ltd., Term Loan | ||||||||
| 1,130,687 | 3.704%, 2/1/2023 | 1,146,234 | ||||||
Dell International, LLC, Term Loan | ||||||||
| 575,000 | 4.020%, 9/7/2023 | 584,470 | ||||||
First Data Corporation, Term Loan | ||||||||
| 1,694,561 | 3.756%, 3/24/2021 | 1,713,625 | ||||||
| 1,675,044 | 3.756%, 7/8/2022 | 1,692,146 | ||||||
NXP BV, Term Loan | ||||||||
| 914,210 | 3.270%, 12/7/2020 | 918,324 | ||||||
Rackspace Hosting, LLC, Term Loan | ||||||||
| 1,480,000 | 4.500%, 12/20/2023b,c | 1,497,878 | ||||||
RP Crown Parent, LLC, Term Loan | ||||||||
| 1,225,000 | 4.500%, 10/12/2023 | 1,236,944 | ||||||
SS&C European Holdings SARL, Term Loan | ||||||||
| 554,245 | 4.001%, 7/8/2022 | 561,522 | ||||||
| 56,559 | 4.002%, 7/8/2022 | 57,302 | ||||||
Western Digital Corporation, Term Loan | ||||||||
| 2,517,350 | 4.520%, 4/29/2023 | 2,555,891 | ||||||
Xerox Business Services, LLC, Term Loan | ||||||||
| 1,400,000 | 6.250%, 12/7/2023b,c | 1,415,750 | ||||||
|
| |||||||
Total | 13,380,086 | |||||||
|
| |||||||
Transportation (<0.1%) | ||||||||
OSG Bulk Ships, Inc., Term Loan | ||||||||
| 949,195 | 5.250%, 8/5/2019 | 924,279 | ||||||
XPO Logistics, Inc., Term Loan | ||||||||
| 1,729,380 | 4.250%, 11/1/2021 | 1,750,461 | ||||||
|
| |||||||
Total | 2,674,740 | |||||||
|
| |||||||
Utilities (0.1%) | ||||||||
Calpine Corporation, Term Loan | ||||||||
| 2,100,000 | 0.000%, 1/15/2024b,c | 2,107,875 | ||||||
Intergen NV, Term Loan | ||||||||
| 863,675 | 5.500%, 6/12/2020 | 836,322 | ||||||
Talen Energy Supply, LLC, Term Loan | ||||||||
| 653,570 | 6.000%, 12/6/2023 | 661,740 | ||||||
|
| |||||||
Total | 3,605,937 | |||||||
|
| |||||||
Total Bank Loans (cost $122,905,456) | 122,869,036 | |||||||
|
| |||||||
Long-Term Fixed Income (42.2%) | ||||||||
Asset-Backed Securities (2.7%) | ||||||||
Access Group, Inc. | ||||||||
1.256%, 2/25/2036, Series | ||||||||
| 961,252 | 2013-1, Class Ad,e | 949,408 | ||||||
Alm Loan Funding CLO | ||||||||
2.310%, 10/17/2026, Series | ||||||||
| 825,000 | 2014-11A, Class A1*,e | 826,441 | ||||||
AMSR Trust | ||||||||
2.136%, 11/17/2033, Series | ||||||||
| 2,700,000 | 2016-SFR1, Class Ad,e | 2,700,123 | ||||||
Apidos CLO XVIII | ||||||||
2.294%, 7/22/2026, Series | ||||||||
| 825,000 | 2014-18A, Class A1*,e | 826,272 | ||||||
The accompanying Notes to Financial Statements are an integral part of this schedule.
59
Table of Contents
MODERATELY CONSERVATIVE ALLOCATION PORTFOLIO
Schedule of Investments as of December 31, 2016
| Principal Amount | Long-Term Fixed Income (42.2%) | Value | ||||||
Asset-Backed Securities (2.7%) - continued | ||||||||
Ares CLO, Ltd. | ||||||||
2.164%, 10/12/2023, Series | ||||||||
| $ | 2,800,000 | 2012-2A, Class AR*,e | $ | 2,800,375 | ||||
2.386%, 11/15/2025, Series | ||||||||
| 1,500,000 | 2014-32A, Class A1*,e | 1,502,570 | ||||||
BA Credit Card Trust | ||||||||
1.084%, 6/15/2021, Series | ||||||||
| 1,100,000 | 2014-A1, Class Ae | 1,102,766 | ||||||
Babson CLO, Ltd. | ||||||||
2.270%, 10/17/2026, Series | ||||||||
| 825,000 | 2014-IIA, Class A*,e | 826,319 | ||||||
Bayview Opportunity Master Fund Trust | ||||||||
3.721%, 7/28/2035, Series | ||||||||
| 812,615 | 2015-NPLA, Class Ad,f | 812,429 | ||||||
Betony CLO, Ltd. | ||||||||
2.256%, 4/15/2027, Series | ||||||||
| 750,000 | 2015-1A, Class AR*,e | 745,874 | ||||||
Birchwood Park CLO, Ltd. | ||||||||
2.320%, 7/15/2026, Series | ||||||||
| 825,000 | 2014-1A, Class A*,e | 826,516 | ||||||
BlueMountain CLO, Ltd. | ||||||||
2.360%, 10/15/2026, Series | ||||||||
| 825,000 | 2014-3A, Class A1*,e | 826,322 | ||||||
CAM Mortgage, LLC | ||||||||
3.500%, 7/15/2064, Series | ||||||||
| 16,463 | 2015-1, Class A*,f | 16,462 | ||||||
Capital One Multi-Asset Execution Trust | ||||||||
1.084%, 1/18/2022, Series | ||||||||
| 1,350,000 | 2014-A3, Class A3e | 1,350,548 | ||||||
Carlyle Global Market Strategies CLO, Ltd. | ||||||||
2.181%, 7/20/2023, Series | ||||||||
| 715,338 | 2012-2A, Class A1R*,e | 715,430 | ||||||
2.380%, 10/15/2026, Series | ||||||||
| 825,000 | 2014-4A, Class A1*,e | 826,293 | ||||||
Cent CLO 16, LP | ||||||||
2.136%, 8/1/2024, Series | ||||||||
| 801,546 | 2012-16A, Class A1AR*,e | 801,699 | ||||||
Cent CLO 22, Ltd. | ||||||||
2.291%, 11/7/2026, Series | ||||||||
| 825,000 | 2014-22A, Class A1R*,e | 823,066 | ||||||
Chase Issuance Trust | ||||||||
1.590%, 2/18/2020, Series | ||||||||
| 850,000 | 2015-A2, Class A2 | 852,352 | ||||||
1.620%, 7/15/2020, Series | ||||||||
| 1,625,000 | 2015-A7, Class A7 | 1,628,045 | ||||||
1.114%, 5/17/2021, Series | ||||||||
| 1,500,000 | 2016-A1, Class Ae | 1,504,687 | ||||||
Chesapeake Funding II, LLC | ||||||||
1.880%, 6/15/2028, Series | ||||||||
| 1,000,000 | 2016-2A, Class A1d | 997,286 | ||||||
Chesapeake Funding, LLC | ||||||||
1.102%, 1/7/2025, Series | ||||||||
| 427,958 | 2013-1A, Class Ad,e | 427,801 | ||||||
Commonbond Student Loan Trust | ||||||||
3.320%, 5/25/2040, Series | ||||||||
| 3,531,707 | 2016-A, Class A1d | 3,518,525 | ||||||
DRB Prime Student Loan Trust | ||||||||
3.170%, 7/25/2031, Series | ||||||||
| 688,464 | 2015-B, Class A2* | 689,543 | ||||||
3.200%, 1/25/2040, Series | ||||||||
| 3,214,036 | 2015-D, Class A2* | 3,191,270 | ||||||
Dryden 34 Senior Loan Fund CLO | ||||||||
2.310%, 10/15/2026, Series | ||||||||
| 825,000 | 2014-34A, Class A*,e | 826,429 | ||||||
Earnest Student Loan Program, LLC | ||||||||
3.020%, 5/25/2034, Series | ||||||||
| 2,343,925 | 2016-B, Class A2d | 2,325,272 | ||||||
2.680%, 7/25/2035, Series | ||||||||
| 1,838,085 | 2016-C, Class A2d | 1,802,597 | ||||||
2.720%, 1/25/2041, Series | ||||||||
| 2,471,579 | 2016-D, Class A2d | 2,433,824 | ||||||
Edlinc Student Loan Funding Trust | ||||||||
3.410%, 10/1/2025, Series | ||||||||
| 734,079 | 2012-A, Class AT*,e | 742,233 | ||||||
FirstEnergy Ohio PIRB Special Purpose Trust | ||||||||
0.679%, 1/15/2019, Series | ||||||||
| 123,181 | 2013-1, Class A1 | 123,056 | ||||||
Ford Credit Auto Owner Trust | ||||||||
2.260%, 11/15/2025, Series | ||||||||
| 810,000 | 2014-1, Class Ad | 816,637 | ||||||
Galaxy XX CLO, Ltd. | ||||||||
2.331%, 7/20/2027, Series | ||||||||
| 2,650,000 | 2015-20A, Class A*,e | 2,646,897 | ||||||
GoldenTree Loan Opportunities IX, Ltd. | ||||||||
2.238%, 10/29/2026, Series | ||||||||
| 825,000 | 2014-9A, Class AR*,e | 824,430 | ||||||
Golub Capital Partners CLO 22B, Ltd. | ||||||||
2.391%, 2/20/2027, Series | ||||||||
| 1,575,000 | 2015-22A, Class A1*,e | 1,574,915 | ||||||
Golub Capital Partners CLO 23M, Ltd. | ||||||||
2.366%, 5/5/2027, Series | ||||||||
| 800,000 | 2015-23A, Class A1*,e | 800,070 | ||||||
Lehman XS Trust | ||||||||
5.440%, 8/25/2035, Series | ||||||||
| 3,238,196 | 2005-2, Class 2A3Bf | 2,836,810 | ||||||
Limerock CLO III, LLC | ||||||||
2.411%, 10/20/2026, Series | ||||||||
| 2,500,000 | 2014-3A, Class A1*,e | 2,465,270 | ||||||
Madison Park Funding XIV CLO, Ltd. | ||||||||
2.331%, 7/20/2026, Series | ||||||||
| 900,000 | 2014-14A, Class A2*,e | 901,520 | ||||||
Madison Park Funding, Ltd. | ||||||||
2.196%, 8/15/2022, Series | ||||||||
| 2,612,474 | 2012-9A, Class AR*,e | 2,612,952 | ||||||
Magnetite XII, Ltd. | ||||||||
2.256%, 4/15/2027, Series | ||||||||
| 2,600,000 | 2015-12A, Class AR*,e | 2,598,036 | ||||||
Marlette Funding Trust | ||||||||
3.060%, 1/17/2023, Series | ||||||||
| 1,177,450 | 2016-1A, Class A* | 1,177,162 | ||||||
Morgan Stanley Bank of America Merrill Lynch Trust | ||||||||
| 3,400,000 | 3.176%, 8/15/2045 | 3,494,045 | ||||||
| 3,400,000 | 3.246%, 12/15/2047 | 3,424,185 | ||||||
Morgan Stanley Capital, Inc. | ||||||||
0.906%, 2/25/2037, Series | ||||||||
| 1,760,074 | 2007-NC2, Class A2FPe | 1,051,711 | ||||||
Mountain View CLO, Ltd. | ||||||||
2.340%, 7/15/2027, Series | ||||||||
| 2,625,000 | 2015-9A, Class A1A*,e | 2,617,886 | ||||||
Murray Hill Marketplace Trust | ||||||||
4.190%, 11/25/2022, Series | ||||||||
| 2,806,367 | 2016-LC1, Class A* | 2,819,822 | ||||||
The accompanying Notes to Financial Statements are an integral part of this schedule.
60
Table of Contents
MODERATELY CONSERVATIVE ALLOCATION PORTFOLIO
Schedule of Investments as of December 31, 2016
| Principal Amount | Long-Term Fixed Income (42.2%) | Value | ||||||
Asset-Backed Securities (2.7%) - continued | ||||||||
Neuberger Berman CLO, Ltd. | ||||||||
2.346%, 8/4/2025, Series | ||||||||
| $ | 700,000 | 2014-17A, Class A*,e | $ | 700,018 | ||||
NZCG Funding CLO, Ltd. | ||||||||
2.436%, 4/27/2027, Series | ||||||||
| 2,650,000 | 2015-2A, Class A1*,e | 2,647,858 | ||||||
Octagon Investment Partners XX CLO, Ltd. | ||||||||
2.342%, 8/12/2026, Series | ||||||||
| 825,000 | 2014-1A, Class A*,e | 826,441 | ||||||
OHA Loan Funding, Ltd. | ||||||||
2.411%, 10/20/2026, Series | ||||||||
| 2,500,000 | 2014-1A, Class A1*,e | 2,514,470 | ||||||
OneMain Financial Issuance Trust | ||||||||
4.100%, 3/20/2028, Series | ||||||||
| 1,750,000 | 2016-2A, Class Ad | 1,783,799 | ||||||
OZLM VIII, Ltd. | ||||||||
2.320%, 10/17/2026, Series | ||||||||
| 825,000 | 2014-8A, Class A1A*,e | 826,474 | ||||||
Race Point IX CLO, Ltd. | ||||||||
2.390%, 4/15/2027, Series | ||||||||
| 1,925,000 | 2015-9A, Class A1*,e | 1,931,262 | ||||||
Renaissance Home Equity Loan Trust | ||||||||
6.011%, 5/25/2036, Series | ||||||||
| 2,005,045 | 2006-1, Class AF4f | 1,369,229 | ||||||
5.580%, 11/25/2036, Series | ||||||||
| 2,370,311 | 2006-3, Class AF2f | 1,319,554 | ||||||
Shackleton, Ltd. | ||||||||
2.340%, 4/15/2027, Series | ||||||||
| 2,650,000 | 2015-7A, Class AR*,e | 2,650,000 | ||||||
SLM Student Loan Trust | ||||||||
1.304%, 8/15/2022, Series | ||||||||
| 596,382 | 2013-A, Class A1d,e | 596,742 | ||||||
1.282%, 4/25/2023, Series | ||||||||
| 12,485 | 2004-10, Class A5Ad,e | 12,483 | ||||||
1.156%, 3/25/2025, Series | ||||||||
| 1,903,815 | 2010-1, Class Ae | 1,854,106 | ||||||
1.754%, 5/17/2027, Series | ||||||||
| 1,350,000 | 2013-A, Class A2Bd,e | 1,359,923 | ||||||
Sofi Consumer Loan Program, LLC | ||||||||
3.260%, 8/25/2025, Series | ||||||||
| 1,254,773 | 2016-1, Class Ad | 1,255,963 | ||||||
SoFi Professional Loan Program, LLC | ||||||||
2.420%, 3/25/2030, Series | ||||||||
| 1,385,931 | 2015-A, Class A2d | 1,381,193 | ||||||
Sunset Mortgage Loan Company, LLC | ||||||||
4.459%, 9/18/2045, Series | ||||||||
| 1,059,467 | 2015-NPL1, Class A*,f | 1,054,958 | ||||||
3.844%, 7/16/2047, Series | ||||||||
| 3,284,455 | 2016-NPL1, Class A*,f | 3,295,632 | ||||||
Symphony CLO VIII, Ltd. | ||||||||
1.976%, 1/9/2023, Series | ||||||||
| 755,197 | 2012-8A, Class AR*,e | 755,298 | ||||||
Symphony CLO XV, Ltd. | ||||||||
2.330%, 10/17/2026, Series | ||||||||
| 2,500,000 | 2014-15A, Class A*,e | 2,504,610 | ||||||
U.S. Small Business Administration | ||||||||
3.191%, 3/10/2024, Series | ||||||||
| 366,215 | 2014-10A, Class 1 | 378,776 | ||||||
Vericrest Opportunity Loan Transferee | ||||||||
3.375%, 10/25/2058, Series | ||||||||
| 2,843,486 | 2015-NPL3, Class A1*,f | 2,839,502 | ||||||
3.500%, 6/26/2045, Series | ||||||||
| 1,318,794 | 2015-NPL9, Class A1d | 1,316,106 | ||||||
3.500%, 6/26/2045, Series | ||||||||
| 1,900,171 | 2015-NPL8, Class A1d,f | 1,903,758 | ||||||
3.625%, 7/25/2045, Series | ||||||||
| 1,155,261 | 2015-NP10, Class A1d,f | 1,156,667 | ||||||
4.250%, 3/26/2046, Series | ||||||||
| 2,289,134 | 2016-NPL3, Class A1d,f | 2,306,806 | ||||||
3.500%, 9/25/2046, Series | ||||||||
| 2,367,902 | 2016-NP10, Class A1d,f | 2,361,423 | ||||||
3.500%, 2/25/2055, Series | ||||||||
| 472,167 | 2015-NPL4, Class A1*,f | 472,529 | ||||||
Vericrest Opportunity Loan Trust | ||||||||
3.625%, 11/26/2046, Series | ||||||||
| 6,976,408 | 2016-NP12, Class A1d,f | 6,955,777 | ||||||
3.875%, 12/26/2046, Series | ||||||||
| 2,200,000 | 2016-NP13, Class A1d,f | 2,200,000 | ||||||
Voya CLO 3, Ltd. | ||||||||
2.302%, 7/25/2026, Series | ||||||||
| 825,000 | 2014-3A, Class A1*,e | 826,327 | ||||||
|
| |||||||
Total | 126,361,865 | |||||||
|
| |||||||
Basic Materials (0.3%) | ||||||||
Albemarle Corporation | ||||||||
| 230,000 | 3.000%, 12/1/2019 | 235,107 | ||||||
Alcoa Nederland Holding BV | ||||||||
| 960,000 | 6.750%, 9/30/2024d | 1,041,600 | ||||||
Anglo American plc | ||||||||
| 1,777,000 | 3.625%, 5/14/2020d | 1,796,902 | ||||||
ArcelorMittal SA | ||||||||
| 1,300,000 | 6.500%, 3/1/2021g | 1,423,500 | ||||||
First Quantum Minerals, Ltd. | ||||||||
| 847,000 | 6.750%, 2/15/2020d | 844,883 | ||||||
| 847,000 | 7.000%, 2/15/2021d | 842,426 | ||||||
Georgia-Pacific, LLC | ||||||||
| 535,000 | 2.539%, 11/15/2019d | 539,432 | ||||||
Glencore Funding, LLC | ||||||||
| 395,000 | 1.940%, 4/16/2018d,e | 390,537 | ||||||
Kinross Gold Corporation | ||||||||
| 1,120,000 | 5.950%, 3/15/2024 | 1,134,000 | ||||||
Novelis Corporation | ||||||||
| 670,000 | 5.875%, 9/30/2026d | 676,700 | ||||||
Steel Dynamics, Inc. | ||||||||
| 1,430,000 | 5.000%, 12/15/2026d | 1,424,637 | ||||||
Westlake Chemical Corporation | ||||||||
| 1,120,000 | 3.600%, 8/15/2026d | 1,075,675 | ||||||
|
| |||||||
Total | 11,425,399 | |||||||
|
| |||||||
Capital Goods (0.6%) | ||||||||
AECOM | ||||||||
| 2,080,000 | 5.875%, 10/15/2024 | 2,220,629 | ||||||
Building Materials Corporation of America | ||||||||
| 1,575,000 | 6.000%, 10/15/2025d | 1,657,688 | ||||||
Cemex Finance, LLC | ||||||||
| 2,030,000 | 9.375%, 10/12/2022d | 2,212,700 | ||||||
CNH Industrial Capital, LLC | ||||||||
| 800,000 | 4.375%, 11/6/2020 | 821,000 | ||||||
CNH Industrial NV | ||||||||
| 1,100,000 | 4.500%, 8/15/2023 | 1,086,250 | ||||||
Crown Americas Capital Corporation IV | ||||||||
| 1,450,000 | 4.500%, 1/15/2023 | 1,479,000 | ||||||
General Electric Company | ||||||||
| 1,422,000 | 5.000%, 1/21/2021h | 1,475,609 | ||||||
The accompanying Notes to Financial Statements are an integral part of this schedule.
61
Table of Contents
MODERATELY CONSERVATIVE ALLOCATION PORTFOLIO
Schedule of Investments as of December 31, 2016
| Principal Amount | Long-Term Fixed Income (42.2%) | Value | ||||||
Capital Goods (0.6%) - continued | ||||||||
Huntington Ingalls Industries, Inc. | ||||||||
| $ | 2,025,000 | 5.000%, 11/15/2025d | $ | 2,103,469 | ||||
L3 Technologies, Inc. | ||||||||
| 1,056,000 | 3.950%, 5/28/2024 | 1,072,798 | ||||||
Lockheed Martin Corporation | ||||||||
| 892,000 | 2.500%, 11/23/2020 | 898,843 | ||||||
| 1,024,000 | 4.500%, 5/15/2036 | 1,086,962 | ||||||
Northrop Grumman Corporation | ||||||||
| 1,010,000 | 3.850%, 4/15/2045 | 956,111 | ||||||
Owens-Brockway Glass Container, Inc. | ||||||||
| 2,205,000 | 5.000%, 1/15/2022d | 2,254,613 | ||||||
Pentair Finance SA | ||||||||
| 1,100,000 | 2.900%, 9/15/2018 | 1,112,511 | ||||||
Republic Services, Inc. | ||||||||
| 850,000 | 2.900%, 7/1/2026 | 813,634 | ||||||
Reynolds Group Issuer, Inc. | ||||||||
| 2,170,000 | 5.125%, 7/15/2023d | 2,205,262 | ||||||
Roper Industries, Inc. | ||||||||
| 1,316,000 | 2.050%, 10/1/2018 | 1,320,227 | ||||||
Roper Technologies, Inc. | ||||||||
| 840,000 | 2.800%, 12/15/2021 | 838,746 | ||||||
Standard Industries, Inc. | ||||||||
| 675,000 | 5.500%, 2/15/2023d | 698,692 | ||||||
Textron, Inc. | ||||||||
| 680,000 | 5.600%, 12/1/2017 | 704,016 | ||||||
| 825,000 | 7.250%, 10/1/2019 | 926,812 | ||||||
United Rentals North America, Inc. | ||||||||
| 1,655,000 | 5.500%, 7/15/2025 | 1,688,100 | ||||||
Waste Management, Inc. | ||||||||
| 260,000 | 3.125%, 3/1/2025 | 259,999 | ||||||
|
| |||||||
Total | 29,893,671 | |||||||
|
| |||||||
Collateralized Mortgage Obligations (0.8%) | ||||||||
Alternative Loan Trust | ||||||||
6.000%, 6/25/2036, Series | ||||||||
| 1,418,905 | 2006-24CB, Class A9 | 1,236,536 | ||||||
Angel Oak Mortgage Trust I, LLC | ||||||||
3.500%, 7/25/2046, Series | ||||||||
| 1,261,902 | 2016-1, Class A1* | 1,254,152 | ||||||
BCAP, LLC Trust | ||||||||
0.936%, 3/25/2037, Series | ||||||||
| 1,972,712 | 2007-AA1, Class 2A1e | 1,830,688 | ||||||
Citigroup Mortgage Loan Trust, Inc. | ||||||||
5.500%, 11/25/2035, Series | ||||||||
| 448,166 | 2005-9, Class 21A2 | 433,033 | ||||||
CitiMortgage Alternative Loan Trust | ||||||||
5.750%, 4/25/2037, Series | ||||||||
| 1,477,070 | 2007-A4, Class 1A5 | 1,265,519 | ||||||
COLT Mortgage Loan Trust | ||||||||
2.800%, 12/26/2046, Series | ||||||||
| 2,200,000 | 2016-3, Class A1* | 2,201,751 | ||||||
Countrywide Alternative Loan Trust | ||||||||
3.036%, 10/25/2035, Series | ||||||||
| 1,856,444 | 2005-43, Class 4A1 | 1,504,974 | ||||||
6.500%, 8/25/2036, Series | ||||||||
| 918,375 | 2006-23CB, Class 2A3 | 619,415 | ||||||
6.000%, 1/25/2037, Series | ||||||||
| 282,007 | 2006-39CB, Class 1A16 | 269,272 | ||||||
5.500%, 5/25/2037, Series | ||||||||
| 2,959,988 | 2007-8CB, Class A1 | 2,533,170 | ||||||
7.000%, 10/25/2037, Series | ||||||||
| 1,944,001 | 2007-24, Class A10 | 1,040,739 | ||||||
Countrywide Home Loans, Inc. | ||||||||
5.750%, 4/25/2037, Series | ||||||||
| 534,001 | 2007-3, Class A27 | 450,606 | ||||||
Deutsche Alt-A Securities Mortgage Loan Trust | ||||||||
6.000%, 10/25/2021, Series | ||||||||
| 401,988 | 2006-AR5, Class 23A | 357,607 | ||||||
Federal Home Loan Mortgage Corporation | ||||||||
3.000%, 4/15/2028, | ||||||||
| 6,553,802 | Series-4193, Class AIi | 612,214 | ||||||
4.000%, 7/15/2031, | ||||||||
| 5,460,860 | Series-4104, Class KIi | 629,720 | ||||||
3.000%, 2/15/2033, | ||||||||
| 4,794,704 | Series-4170, Class IGi | 574,016 | ||||||
Federal National Mortgage Association | ||||||||
3.500%, 1/25/2033, Series | ||||||||
| 9,497,435 | 2012-150, Class YIi | 1,280,475 | ||||||
Greenpoint Mortgage Funding Trust | ||||||||
0.792%, 10/25/2045, Series | ||||||||
| 1,135,229 | 2005-AR4, Class G41Be | 887,523 | ||||||
IndyMac INDX Mortgage Loan Trust | ||||||||
1.396%, 7/25/2045, Series | ||||||||
| 2,031,818 | 2005-16IP, Class A1e | 1,699,645 | ||||||
J.P. Morgan Mortgage Trust | ||||||||
3.110%, 10/25/2036, Series | ||||||||
| 136,276 | 2006-A6, Class 1A2 | 123,563 | ||||||
1.136%, 1/25/2037, Series | ||||||||
| 2,257,205 | 2006-S4, Class A8e | 1,194,788 | ||||||
6.250%, 8/25/2037, Series | ||||||||
| 2,526,334 | 2007-S3, Class 1A10 | 1,871,846 | ||||||
MASTR Alternative Loans Trust | ||||||||
6.500%, 7/25/2034, Series | ||||||||
| 390,713 | 2004-6, Class 6A1 | 391,832 | ||||||
1.206%, 12/25/2035, Series | ||||||||
| 1,643,332 | 2005-6, Class 2A1e | 746,597 | ||||||
Merrill Lynch Alternative Note Asset Trust | ||||||||
6.000%, 3/25/2037, Series | ||||||||
| 363,840 | 2007-F1, Class 2A1 | 283,542 | ||||||
Residential Accredit Loans, Inc. Trust | ||||||||
5.750%, 9/25/2035, Series | ||||||||
| 603,537 | 2005-QS13, Class 2A3 | 538,927 | ||||||
Residential Asset Securitization Trust | ||||||||
1.136%, 8/25/2037, Series | ||||||||
| 2,810,236 | 2007-A8, Class 2A3e | 732,790 | ||||||
Sequoia Mortgage Trust | ||||||||
3.280%, 9/20/2046, Series | ||||||||
| 2,357,851 | 2007-1, Class 4A1 | 1,912,193 | ||||||
WaMu Mortgage Pass Through Certificates | ||||||||
2.837%, 9/25/2036, Series | ||||||||
| 353,997 | 2006-AR10, Class 1A2 | 325,699 | ||||||
2.850%, 10/25/2036, Series | ||||||||
| 332,732 | 2006-AR12, Class 1A1 | 290,046 | ||||||
2.617%, 11/25/2036, Series | ||||||||
| 1,124,597 | 2006-AR14, Class 1A1 | 997,106 | ||||||
2.137%, 1/25/2037, Series | ||||||||
| 1,713,238 | 2006-AR18, Class 1A1 | 1,456,684 | ||||||
1.527%, 9/25/2046, Series | ||||||||
| 3,388,666 | 2006-AR11, Class 1Ae | 2,784,898 | ||||||
Washington Mutual Mortgage Pass Through Certificates Trust | ||||||||
7.000%, 2/25/2036, Series | ||||||||
| 2,150,245 | 2006-1, Class 2CB1 | 1,599,895 | ||||||
|
| |||||||
Total | 35,931,461 | |||||||
|
| |||||||
The accompanying Notes to Financial Statements are an integral part of this schedule.
62
Table of Contents
MODERATELY CONSERVATIVE ALLOCATION PORTFOLIO
Schedule of Investments as of December 31, 2016
| Principal Amount | Long-Term Fixed Income (42.2%) | Value | ||||||
Commercial Mortgage-Backed Securities (0.7%) | ||||||||
Citigroup Commercial Mortgage Trust | ||||||||
| $ | 1,255,078 | 1.102%, 11/10/2046 | $ | 1,252,085 | ||||
Commercial Mortgage Pass-Through Certificates | ||||||||
| 2,340,000 | 1.699%, 6/8/2030d,e | 2,345,875 | ||||||
Federal National Mortgage Association | ||||||||
| 74,049 | 1.272%, 1/25/2017 | 73,985 | ||||||
Greenwich Capital Commercial Funding Corporation | ||||||||
| 3,100,000 | 5.867%, 12/10/2049 | 3,168,078 | ||||||
GS Mortgage Securities Trust | ||||||||
| 4,000,000 | 3.666%, 9/10/2047 | 4,147,382 | ||||||
J.P. Morgan Chase Commercial Mortgage Securities Corporation | ||||||||
| 1,750,000 | 3.507%, 5/15/2045 | 1,828,828 | ||||||
| 2,300,000 | 5.713%, 2/12/2049 | 2,322,221 | ||||||
JPMBB Commercial Mortgage Securities Trust | ||||||||
| 2,850,000 | 3.231%, 1/15/2048 | 2,878,163 | ||||||
Morgan Stanley Capital, Inc. | ||||||||
| 4,150,000 | 5.406%, 3/15/2044 | 4,146,375 | ||||||
SCG Trust | ||||||||
| 700,000 | 2.104%, 11/15/2026d,e | 700,001 | ||||||
UBS Commercial Mortgage Trust | ||||||||
| 5,039,247 | 3.400%, 5/10/2045 | 5,244,581 | ||||||
Wells Fargo Commercial Mortgage Trust | ||||||||
| 2,500,000 | 3.617%, 9/15/2057 | 2,570,981 | ||||||
| 2,250,000 | 3.839%, 9/15/2058 | 2,351,389 | ||||||
WFRBS Commercial Mortgage Trust | ||||||||
| 2,800,000 | 2.870%, 11/15/2045 | 2,840,208 | ||||||
|
| |||||||
Total | 35,870,152 | |||||||
|
| |||||||
Communications Services (1.5%) | ||||||||
21st Century Fox America, Inc. | ||||||||
| 1,140,000 | 6.900%, 3/1/2019 | 1,251,823 | ||||||
Altice Financing SA | ||||||||
| 1,675,000 | 6.625%, 2/15/2023d | 1,721,062 | ||||||
AMC Networks, Inc. | ||||||||
| 1,675,000 | 5.000%, 4/1/2024 | 1,679,187 | ||||||
America Movil SAB de CV | ||||||||
| 829,000 | 5.000%, 10/16/2019 | 888,015 | ||||||
American Tower Corporation | ||||||||
| 105,000 | 2.800%, 6/1/2020 | 104,995 | ||||||
| 1,280,000 | 3.300%, 2/15/2021 | 1,293,541 | ||||||
AT&T, Inc. | ||||||||
| 600,000 | 5.875%, 10/1/2019 | 655,453 | ||||||
| 360,000 | 1.928%, 6/30/2020e | 361,953 | ||||||
| 963,000 | 3.875%, 8/15/2021 | 993,350 | ||||||
| 805,000 | 3.000%, 6/30/2022 | 789,349 | ||||||
| 840,000 | 6.350%, 3/15/2040 | 955,545 | ||||||
| 950,000 | 5.550%, 8/15/2041 | 987,425 | ||||||
| 1,000,000 | 5.150%, 3/15/2042 | 994,442 | ||||||
| 546,000 | 4.750%, 5/15/2046 | 516,305 | ||||||
British Sky Broadcasting Group plc | ||||||||
| 880,000 | 2.625%, 9/16/2019d | 883,178 | ||||||
CCO Holdings, LLC | ||||||||
| 2,100,000 | 5.875%, 4/1/2024d | 2,241,750 | ||||||
CenturyLink, Inc. | ||||||||
| 1,630,000 | 6.450%, 6/15/2021 | 1,715,575 | ||||||
Charter Communications Operating, LLC | ||||||||
| 1,010,000 | 6.834%, 10/23/2055 | 1,181,835 | ||||||
| 630,000 | 3.579%, 7/23/2020 | 642,302 | ||||||
| 1,070,000 | 4.908%, 7/23/2025 | 1,126,302 | ||||||
Clear Channel Worldwide Holdings, Inc. | ||||||||
| 2,160,000 | 6.500%, 11/15/2022 | 2,208,600 | ||||||
Columbus International, Inc. | ||||||||
| 2,015,000 | 7.375%, 3/30/2021d | 2,144,242 | ||||||
Comcast Corporation | ||||||||
| 875,000 | 2.750%, 3/1/2023 | 867,806 | ||||||
| 2,190,000 | 4.400%, 8/15/2035 | 2,287,475 | ||||||
| 418,000 | 4.650%, 7/15/2042 | 434,374 | ||||||
| 1,552,000 | 4.750%, 3/1/2044 | 1,661,337 | ||||||
Cox Communications, Inc. | ||||||||
| 476,000 | 9.375%, 1/15/2019d | 537,567 | ||||||
Crown Castle International Corporation | ||||||||
| 1,183,000 | 3.400%, 2/15/2021 | 1,199,490 | ||||||
| 2,062,000 | 5.250%, 1/15/2023 | 2,219,228 | ||||||
| 500,000 | 3.700%, 6/15/2026 | 490,059 | ||||||
CSC Holdings, LLC | ||||||||
| 245,000 | 5.500%, 4/15/2027d | 248,062 | ||||||
Digicel, Ltd. | ||||||||
| 2,725,000 | 6.000%, 4/15/2021* | 2,463,972 | ||||||
FairPoint Communications, Inc. | ||||||||
| 1,565,000 | 8.750%, 8/15/2019d | 1,633,469 | ||||||
Frontier Communications Corporation | ||||||||
| 2,270,000 | 8.875%, 9/15/2020 | 2,417,550 | ||||||
Level 3 Communications, Inc. | ||||||||
| 2,080,000 | 5.375%, 1/15/2024 | 2,100,800 | ||||||
Level 3 Financing, Inc. | ||||||||
| 700,000 | 5.375%, 5/1/2025 | 714,000 | ||||||
Neptune Finco Corporation | ||||||||
| 1,330,000 | 10.875%, 10/15/2025d | 1,582,700 | ||||||
Omnicom Group, Inc. | ||||||||
| 530,000 | 3.600%, 4/15/2026 | 523,777 | ||||||
S&P Global, Inc. | ||||||||
| 1,024,000 | 3.300%, 8/14/2020 | 1,043,318 | ||||||
SES Global Americas Holdings GP | ||||||||
| 620,000 | 2.500%, 3/25/2019d | 616,181 | ||||||
SFR Group SA | ||||||||
| 2,455,000 | 6.000%, 5/15/2022d | 2,519,444 | ||||||
Sprint Communications, Inc. | ||||||||
| 1,485,000 | 6.000%, 11/15/2022 | 1,496,138 | ||||||
Sprint Corporation | ||||||||
| 1,405,000 | 7.625%, 2/15/2025g | 1,477,006 | ||||||
Telefonica Emisiones SAU | ||||||||
| 858,000 | 3.192%, 4/27/2018 | 870,216 | ||||||
Time Warner Entertainment Company, LP | ||||||||
| 1,341,000 | 8.375%, 3/15/2023 | 1,684,877 | ||||||
Time Warner, Inc. | ||||||||
| 560,000 | 3.600%, 7/15/2025 | 556,124 | ||||||
| 780,000 | 6.250%, 3/29/2041 | 913,742 | ||||||
T-Mobile USA, Inc. | ||||||||
| 2,520,000 | 6.125%, 1/15/2022 | 2,658,600 | ||||||
Verizon Communications, Inc. | ||||||||
| 590,000 | 1.763%, 6/17/2019e | 595,364 | ||||||
| 1,655,000 | 3.000%, 11/1/2021 | 1,666,011 | ||||||
| 2,304,000 | 5.150%, 9/15/2023 | 2,544,978 | ||||||
| 508,000 | 5.050%, 3/15/2034 | 534,181 | ||||||
| 859,000 | 4.272%, 1/15/2036 | 820,869 | ||||||
| 1,796,000 | 4.522%, 9/15/2048 | 1,718,697 | ||||||
Viacom, Inc. | ||||||||
| 1,400,000 | 4.375%, 3/15/2043 | 1,113,227 | ||||||
| 840,000 | 5.850%, 9/1/2043 | 821,845 | ||||||
The accompanying Notes to Financial Statements are an integral part of this schedule.
63
Table of Contents
MODERATELY CONSERVATIVE ALLOCATION PORTFOLIO
Schedule of Investments as of December 31, 2016
| Principal Amount | Long-Term Fixed Income (42.2%) | Value | ||||||
Communications Services (1.5%) - continued | ||||||||
Vodafone Group plc | ||||||||
| $ | 1,120,000 | 6.150%, 2/27/2037 | $ | 1,254,064 | ||||
|
| |||||||
Total | 71,622,777 | |||||||
|
| |||||||
Consumer Cyclical (1.0%) | ||||||||
Argos Merger Sub, Inc. | ||||||||
| 1,975,000 | 7.125%, 3/15/2023d,g | 2,014,500 | ||||||
Automatic Data Processing, Inc. | ||||||||
| 375,000 | 3.375%, 9/15/2025 | 384,017 | ||||||
Cinemark USA, Inc. | ||||||||
| 2,695,000 | 4.875%, 6/1/2023 | 2,728,688 | ||||||
CVS Health Corporation | ||||||||
| 235,000 | 2.250%, 8/12/2019 | 236,187 | ||||||
| 1,900,000 | 4.875%, 7/20/2035 | 2,040,231 | ||||||
| 1,150,000 | 5.125%, 7/20/2045 | 1,279,148 | ||||||
Daimler Finance North America, LLC | ||||||||
| 1,120,000 | 1.618%, 10/30/2019d,e | 1,122,693 | ||||||
Delphi Automotive plc | ||||||||
| 1,280,000 | 3.150%, 11/19/2020 | 1,299,505 | ||||||
eBay, Inc. | ||||||||
| 520,000 | 2.500%, 3/9/2018 | 524,499 | ||||||
Ford Motor Credit Company, LLC | ||||||||
| 840,000 | 5.000%, 5/15/2018 | 872,756 | ||||||
| 950,000 | 2.551%, 10/5/2018 | 955,163 | ||||||
| 1,000,000 | 2.943%, 1/8/2019 | 1,011,062 | ||||||
| 100,000 | 8.125%, 1/15/2020 | 115,251 | ||||||
| 560,000 | 2.459%, 3/27/2020 | 552,446 | ||||||
| 420,000 | 3.200%, 1/15/2021 | 420,275 | ||||||
General Motors Company | ||||||||
| 500,000 | 6.600%, 4/1/2036 | 570,707 | ||||||
| 992,000 | 6.250%, 10/2/2043 | 1,094,788 | ||||||
General Motors Financial Company, Inc. | ||||||||
| 770,000 | 3.700%, 11/24/2020 | 782,691 | ||||||
| 512,000 | 4.200%, 3/1/2021 | 526,393 | ||||||
| 1,240,000 | 4.300%, 7/13/2025 | 1,228,484 | ||||||
Home Depot, Inc. | ||||||||
| 536,000 | 2.625%, 6/1/2022 | 538,014 | ||||||
| 640,000 | 3.000%, 4/1/2026 | 637,837 | ||||||
| 840,000 | 4.250%, 4/1/2046 | 880,044 | ||||||
Hyundai Capital America | ||||||||
| 418,000 | 2.400%, 10/30/2018d | 419,662 | ||||||
| 768,000 | 3.000%, 10/30/2020d | 767,476 | ||||||
Jaguar Land Rover Automotive plc | ||||||||
| 1,500,000 | 5.625%, 2/1/2023d,g | 1,563,750 | ||||||
KB Home | ||||||||
| 1,141,000 | 4.750%, 5/15/2019 | 1,163,820 | ||||||
L Brands, Inc. | ||||||||
| 1,500,000 | 5.625%, 2/15/2022 | 1,601,250 | ||||||
Lear Corporation | ||||||||
| 1,400,000 | 5.250%, 1/15/2025 | 1,471,750 | ||||||
Lennar Corporation | ||||||||
| 695,000 | 4.125%, 12/1/2018 | 710,638 | ||||||
| 1,485,000 | 4.875%, 12/15/2023 | 1,470,150 | ||||||
Live Nation Entertainment, Inc. | ||||||||
| 3,170,000 | 5.375%, 6/15/2022d | 3,280,950 | ||||||
McDonald’s Corporation | ||||||||
| 730,000 | 2.750%, 12/9/2020 | 740,789 | ||||||
MGM Resorts International | ||||||||
| 2,115,000 | 6.000%, 3/15/2023 | 2,284,200 | ||||||
Newell Rubbermaid, Inc. | ||||||||
| 528,000 | 2.600%, 3/29/2019 | 533,667 | ||||||
| 748,000 | 5.500%, 4/1/2046 | 857,092 | ||||||
Prime Security Services Borrower, LLC | ||||||||
| 1,930,000 | 9.250%, 5/15/2023d | 2,101,288 | ||||||
Rite Aid Corporation | ||||||||
| 1,985,000 | 6.125%, 4/1/2023d | 2,133,875 | ||||||
Toll Brothers Finance Corporation | ||||||||
| 580,000 | 8.910%, 10/15/2017 | 609,725 | ||||||
| 432,000 | 4.000%, 12/31/2018 | 443,340 | ||||||
West Corporation | ||||||||
| 2,420,000 | 5.375%, 7/15/2022d | 2,338,325 | ||||||
|
| |||||||
Total | 46,307,126 | |||||||
|
| |||||||
Consumer Non-Cyclical (1.6%) | ||||||||
Abbott Laboratories | ||||||||
| 560,000 | 2.350%, 11/22/2019 | 560,383 | ||||||
| 700,000 | 3.400%, 11/30/2023 | 696,551 | ||||||
| 700,000 | 4.750%, 11/30/2036 | 710,518 | ||||||
| 560,000 | 4.900%, 11/30/2046 | 573,630 | ||||||
AbbVie, Inc. | ||||||||
| 920,000 | 2.500%, 5/14/2020 | 919,715 | ||||||
| 1,320,000 | 3.600%, 5/14/2025 | 1,305,737 | ||||||
| 1,395,000 | 4.450%, 5/14/2046 | 1,333,101 | ||||||
Actavis Funding SCS | ||||||||
| 1,620,000 | 4.550%, 3/15/2035 | 1,601,027 | ||||||
| 840,000 | 4.850%, 6/15/2044 | 831,306 | ||||||
Altria Group, Inc. | ||||||||
| 560,000 | 2.850%, 8/9/2022 | 560,069 | ||||||
| 700,000 | 2.625%, 9/16/2026 | 661,865 | ||||||
Amgen, Inc. | ||||||||
| 512,000 | 2.700%, 5/1/2022 | 506,439 | ||||||
| 475,000 | 3.125%, 5/1/2025 | 461,648 | ||||||
Anheuser-Busch InBev Finance, Inc. | ||||||||
| 550,000 | 2.146%, 2/1/2021e | 559,673 | ||||||
| 2,839,000 | 3.650%, 2/1/2026 | 2,877,693 | ||||||
| 2,240,000 | 4.700%, 2/1/2036 | 2,355,414 | ||||||
| 1,320,000 | 4.900%, 2/1/2046 | 1,417,328 | ||||||
Anheuser-Busch InBev Worldwide, Inc. | ||||||||
| 536,000 | 3.750%, 1/15/2022 | 558,917 | ||||||
BAT International Finance plc | ||||||||
| 480,000 | 1.473%, 6/15/2018d,e | 480,092 | ||||||
Baxter International, Inc. | ||||||||
| 700,000 | 2.600%, 8/15/2026 | 645,236 | ||||||
Bayer U.S. Finance, LLC | ||||||||
| 840,000 | 3.375%, 10/8/2024d | 834,759 | ||||||
Biogen, Inc. | ||||||||
| 810,000 | 3.625%, 9/15/2022 | 830,525 | ||||||
Boston Scientific Corporation | ||||||||
| 435,000 | 6.000%, 1/15/2020 | 477,706 | ||||||
| 525,000 | 3.850%, 5/15/2025 | 525,352 | ||||||
| 840,000 | 7.375%, 1/15/2040 | 1,043,150 | ||||||
BRF SA | ||||||||
| 1,090,000 | 4.750%, 5/22/2024d | 1,058,935 | ||||||
Bunge Limited Finance Corporation | ||||||||
| 762,000 | 8.500%, 6/15/2019 | 872,639 | ||||||
| 590,000 | 3.500%, 11/24/2020 | 600,052 | ||||||
Cardinal Health, Inc. | ||||||||
| 402,000 | 4.900%, 9/15/2045 | 423,363 | ||||||
Celgene Corporation | ||||||||
| 1,185,000 | 2.875%, 8/15/2020 | 1,197,698 | ||||||
| 260,000 | 3.550%, 8/15/2022 | 266,364 | ||||||
| 700,000 | 5.000%, 8/15/2045 | 726,433 | ||||||
Church & Dwight Company, Inc. | ||||||||
| 310,000 | 2.450%, 12/15/2019 | 311,386 | ||||||
Conagra Brands, Inc. | ||||||||
| 396,000 | 7.125%, 10/1/2026 | 477,591 | ||||||
EMD Finance, LLC | ||||||||
| 515,000 | 1.343%, 3/17/2017d,e | 515,118 | ||||||
| 1,128,000 | 2.950%, 3/19/2022d | 1,122,066 | ||||||
The accompanying Notes to Financial Statements are an integral part of this schedule.
64
Table of Contents
MODERATELY CONSERVATIVE ALLOCATION PORTFOLIO
Schedule of Investments as of December 31, 2016
| Principal Amount | Long-Term Fixed Income (42.2%) | Value | ||||||
Consumer Non-Cyclical (1.6%) - continued | ||||||||
Energizer Holdings, Inc. | ||||||||
| $ | 1,900,000 | 5.500%, 6/15/2025d | $ | 1,904,750 | ||||
Envision Healthcare Corporation | ||||||||
| 2,205,000 | 5.125%, 7/1/2022d | 2,196,731 | ||||||
Express Scripts Holding Company | ||||||||
| 560,000 | 3.000%, 7/15/2023 | 541,477 | ||||||
| 1,240,000 | 4.500%, 2/25/2026 | 1,274,845 | ||||||
| 223,000 | 3.400%, 3/1/2027 | 208,609 | ||||||
Gilead Sciences, Inc. | ||||||||
| 260,000 | 2.550%, 9/1/2020 | 262,800 | ||||||
| 1,400,000 | 2.950%, 3/1/2027 | 1,337,763 | ||||||
Grifols Worldwide Operations, Ltd. | ||||||||
| 2,235,000 | 5.250%, 4/1/2022 | 2,313,225 | ||||||
H. J. Heinz Company | ||||||||
| 1,000,000 | 3.500%, 7/15/2022 | 1,014,049 | ||||||
HCA, Inc. | ||||||||
| 1,070,000 | 5.250%, 6/15/2026 | 1,106,113 | ||||||
| 1,105,000 | 4.500%, 2/15/2027 | 1,085,662 | ||||||
Imperial Tobacco Finance plc | ||||||||
| 1,250,000 | 2.950%, 7/21/2020d | 1,256,746 | ||||||
JBS USA, LLC | ||||||||
| 1,450,000 | 5.750%, 6/15/2025d | 1,468,125 | ||||||
Kraft Foods Group, Inc. | ||||||||
| 1,056,000 | 5.000%, 6/4/2042 | 1,079,341 | ||||||
Laboratory Corporation of America Holdings | ||||||||
| 360,000 | 2.625%, 2/1/2020 | 359,459 | ||||||
McKesson Corporation | ||||||||
| 650,000 | 4.883%, 3/15/2044 | 659,996 | ||||||
Mead Johnson Nutrition Company | ||||||||
| 512,000 | 3.000%, 11/15/2020 | 518,012 | ||||||
Medtronic plc | ||||||||
| 2,570,000 | 4.375%, 3/15/2035 | 2,714,606 | ||||||
Merck & Company, Inc. | ||||||||
| 385,000 | 1.257%, 2/10/2020e | 387,003 | ||||||
| 260,000 | 3.700%, 2/10/2045 | 247,396 | ||||||
Mondelez International, Inc. | ||||||||
| 418,000 | 1.406%, 2/1/2019e | 417,977 | ||||||
Mylan NV | ||||||||
| 1,020,000 | 3.000%, 12/15/2018d | 1,027,164 | ||||||
| 260,000 | 3.150%, 6/15/2021d | 254,937 | ||||||
| 1,680,000 | 5.250%, 6/15/2046d | 1,546,702 | ||||||
PepsiCo, Inc. | ||||||||
| 1,032,000 | 2.850%, 2/24/2026 | 1,015,757 | ||||||
Pernod Ricard SA | ||||||||
| 850,000 | 3.250%, 6/8/2026d | 814,407 | ||||||
Perrigo Finance Unlimited Company | ||||||||
| 1,605,000 | 3.500%, 3/15/2021 | 1,620,418 | ||||||
Reynolds American, Inc. | ||||||||
| 604,000 | 2.300%, 8/21/2017 | 606,954 | ||||||
| 1,563,000 | 5.700%, 8/15/2035 | 1,792,191 | ||||||
Roche Holdings, Inc. | ||||||||
| 768,000 | 4.000%, 11/28/2044d | 763,907 | ||||||
Shire Acquisitions Investments Ireland Designated Activity Company | ||||||||
| 840,000 | 2.400%, 9/23/2021 | 810,663 | ||||||
| 840,000 | 3.200%, 9/23/2026 | 783,870 | ||||||
Teleflex, Inc. | ||||||||
| 560,000 | 4.875%, 6/1/2026 | 554,400 | ||||||
Tenet Healthcare Corporation | ||||||||
| 2,285,000 | 8.125%, 4/1/2022 | 2,155,898 | ||||||
Teva Pharmaceutical Finance Netherlands III BV | ||||||||
| 1,150,000 | 2.200%, 7/21/2021 | 1,099,184 | ||||||
| 700,000 | 2.800%, 7/21/2023 | 661,863 | ||||||
| 520,000 | 4.100%, 10/1/2046 | 444,683 | ||||||
Thermo Fisher Scientific, Inc. | ||||||||
| 396,000 | 3.000%, 4/15/2023 | 388,791 | ||||||
TreeHouse Foods, Inc. | ||||||||
| 970,000 | 4.875%, 3/15/2022 | 994,250 | ||||||
VRX Escrow Corporation | ||||||||
| 3,245,000 | 6.125%, 4/15/2025d | 2,437,806 | ||||||
Zoetis, Inc. | ||||||||
| 1,120,000 | 4.700%, 2/1/2043 | 1,088,180 | ||||||
|
| |||||||
Total | 74,116,189 | |||||||
|
| |||||||
Energy (1.2%) | ||||||||
Anadarko Petroleum Corporation | ||||||||
| 755,000 | 4.850%, 3/15/2021 | 808,893 | ||||||
Antero Resources Corporation | ||||||||
| 1,775,000 | 5.125%, 12/1/2022 | 1,792,750 | ||||||
Apache Corporation | ||||||||
| 1,125,000 | 4.750%, 4/15/2043 | 1,156,633 | ||||||
Boardwalk Pipelines, LP | ||||||||
| 525,000 | 5.950%, 6/1/2026 | 569,534 | ||||||
BP Capital Markets plc | ||||||||
| 1,003,000 | 3.062%, 3/17/2022 | 1,013,498 | ||||||
| 1,560,000 | 3.535%, 11/4/2024 | 1,581,353 | ||||||
| 285,000 | 3.119%, 5/4/2026 | 277,943 | ||||||
Buckeye Partners, LP | ||||||||
| 846,000 | 2.650%, 11/15/2018 | 851,401 | ||||||
| 184,000 | 3.950%, 12/1/2026 | 179,240 | ||||||
Canadian Natural Resources, Ltd. | ||||||||
| 1,005,000 | 3.450%, 11/15/2021 | 1,026,410 | ||||||
| 560,000 | 6.250%, 3/15/2038 | 636,120 | ||||||
Cheniere Corpus Christi Holdings, LLC | ||||||||
| 1,635,000 | 5.875%, 3/31/2025d | 1,668,207 | ||||||
CNOOC Nexen Finance | ||||||||
| 762,000 | 1.625%, 4/30/2017 | 761,284 | ||||||
CNPC General Capital, Ltd. | ||||||||
| 446,000 | 2.750%, 4/19/2017d | 447,127 | ||||||
Columbia Pipeline Group, Inc. | ||||||||
| 995,000 | 2.450%, 6/1/2018 | 999,711 | ||||||
Concho Resources, Inc. | ||||||||
| 1,310,000 | 6.500%, 1/15/2022 | 1,355,457 | ||||||
| 1,412,019 | 5.500%, 10/1/2022 | 1,463,205 | ||||||
| 715,000 | 4.375%, 1/15/2025 | 713,577 | ||||||
Contura Energy, Inc. | ||||||||
| 530,000 | 10.000%, 8/1/2021*,g | 565,775 | ||||||
Crestwood Midstream Partners, LP | ||||||||
| 850,000 | 6.125%, 3/1/2022 | 871,250 | ||||||
Devon Energy Corporation | ||||||||
| 765,000 | 3.250%, 5/15/2022g | 759,353 | ||||||
Ecopetrol SA | ||||||||
| 460,000 | 5.875%, 9/18/2023 | 486,910 | ||||||
Enbridge Energy Partners, LP | ||||||||
| 560,000 | 4.375%, 10/15/2020 | 584,199 | ||||||
Enbridge, Inc. | ||||||||
| 400,000 | 1.384%, 6/2/2017e | 400,037 | ||||||
| 560,000 | 4.250%, 12/1/2026 | 572,554 | ||||||
Encana Corporation | ||||||||
| 278,000 | 3.900%, 11/15/2021 | 279,996 | ||||||
| 1,120,000 | 6.500%, 2/1/2038 | 1,210,451 | ||||||
Energy Transfer Partners, LP | ||||||||
| 1,120,000 | 4.650%, 6/1/2021 | 1,161,873 | ||||||
| 765,000 | 4.900%, 3/15/2035 | 713,878 | ||||||
EnLink Midstream Partners, LP | ||||||||
| 575,000 | 4.150%, 6/1/2025 | 557,419 | ||||||
| 420,000 | 4.850%, 7/15/2026 | 423,095 | ||||||
The accompanying Notes to Financial Statements are an integral part of this schedule.
65
Table of Contents
MODERATELY CONSERVATIVE ALLOCATION PORTFOLIO
Schedule of Investments as of December 31, 2016
| Principal Amount | Long-Term Fixed Income (42.2%) | Value | ||||||
Energy (1.2%) - continued | ||||||||
Enterprise Products Operating, LLC | ||||||||
| $ | 758,000 | 5.100%, 2/15/2045 | $ | 797,930 | ||||
EQT Corporation | ||||||||
| 500,000 | 5.150%, 3/1/2018 | 515,381 | ||||||
| 754,000 | 8.125%, 6/1/2019 | 848,013 | ||||||
Exxon Mobil Corporation | ||||||||
| 420,000 | 4.114%, 3/1/2046 | 429,294 | ||||||
Magellan Midstream Partners, LP | ||||||||
| 750,000 | 5.000%, 3/1/2026 | 821,338 | ||||||
Marathon Oil Corporation | ||||||||
| 840,000 | 2.700%, 6/1/2020 | 840,645 | ||||||
Marathon Petroleum Corporation | ||||||||
| 375,000 | 3.400%, 12/15/2020 | 383,226 | ||||||
| 470,000 | 4.750%, 9/15/2044 | 415,909 | ||||||
MEG Energy Corporation | ||||||||
| 1,500,000 | 6.500%, 3/15/2021d | 1,387,500 | ||||||
MPLX, LP | ||||||||
| 1,120,000 | 4.875%, 6/1/2025 | 1,150,116 | ||||||
Newfield Exploration Company | ||||||||
| 1,960,000 | 5.625%, 7/1/2024 | 2,043,300 | ||||||
Noble Energy, Inc. | ||||||||
| 724,000 | 5.625%, 5/1/2021 | 754,716 | ||||||
Northern Tier Energy, LLC | ||||||||
| 2,360,000 | 7.125%, 11/15/2020 | 2,451,450 | ||||||
Occidental Petroleum Corporation | ||||||||
| 1,120,000 | 4.100%, 2/15/2047 | 1,088,623 | ||||||
Petrobras Global Finance BV | ||||||||
| 340,000 | 8.375%, 5/23/2021 | 366,350 | ||||||
| 840,000 | 8.750%, 5/23/2026 | 906,150 | ||||||
Petrobras International Finance Company | ||||||||
| 560,000 | 5.750%, 1/20/2020 | 567,000 | ||||||
Petroleos Mexicanos | ||||||||
| 420,000 | 5.375%, 3/13/2022d | 430,072 | ||||||
| 391,000 | 2.378%, 4/15/2025 | 390,832 | ||||||
| 790,000 | 6.750%, 9/21/2047d | 746,392 | ||||||
Phillips 66 Partners, LP | ||||||||
| 700,000 | 3.550%, 10/1/2026 | 676,435 | ||||||
Pioneer Natural Resources Company | ||||||||
| 500,000 | 4.450%, 1/15/2026 | 529,078 | ||||||
Regency Energy Partners, LP | ||||||||
| 1,450,000 | 5.000%, 10/1/2022 | 1,534,987 | ||||||
Rice Energy, Inc. | ||||||||
| 1,790,000 | 6.250%, 5/1/2022 | 1,839,225 | ||||||
Rowan Companies, Inc. | ||||||||
| 220,000 | 7.375%, 6/15/2025 | 224,400 | ||||||
Sabine Pass Liquefaction, LLC | ||||||||
| 1,440,000 | 5.625%, 3/1/2025 | 1,540,800 | ||||||
Schlumberger Holdings Corporation | ||||||||
| 375,000 | 3.000%, 12/21/2020d | 382,633 | ||||||
| 700,000 | 4.000%, 12/21/2025d | 732,608 | ||||||
Shell International Finance BV | ||||||||
| 360,000 | 1.352%, 5/11/2020e | 360,232 | ||||||
Suncor Energy, Inc. | ||||||||
| 780,000 | 3.600%, 12/1/2024 | 798,321 | ||||||
Sunoco Logistics Partners Operations, LP | ||||||||
| 1,730,000 | 4.400%, 4/1/2021 | 1,820,384 | ||||||
Valero Energy Corporation | ||||||||
| 1,400,000 | 3.400%, 9/15/2026 | 1,339,226 | ||||||
Weatherford International, Ltd. | ||||||||
| 2,120,000 | 8.250%, 6/15/2023g | 2,157,100 | ||||||
|
| |||||||
Total | 57,158,799 | |||||||
|
| |||||||
Financials (3.3%) | ||||||||
ABN AMRO Bank NV | ||||||||
| 1,050,000 | 4.750%, 7/28/2025d | 1,062,347 | ||||||
ACE INA Holdings, Inc. | ||||||||
| 737,000 | 4.350%, 11/3/2045 | 776,898 | ||||||
AerCap Ireland Capital, Ltd. | ||||||||
| 550,000 | 3.750%, 5/15/2019 | 560,312 | ||||||
| 560,000 | 4.625%, 10/30/2020 | 582,400 | ||||||
| 2,080,000 | 5.000%, 10/1/2021 | 2,186,600 | ||||||
| 560,000 | 4.625%, 7/1/2022 | 576,800 | ||||||
Aetna, Inc. | ||||||||
| 805,000 | 2.400%, 6/15/2021 | 800,636 | ||||||
| 1,100,000 | 2.800%, 6/15/2023 | 1,082,293 | ||||||
| 535,000 | 3.200%, 6/15/2026 | 528,478 | ||||||
| 800,000 | 4.250%, 6/15/2036 | 800,830 | ||||||
Air Lease Corporation | ||||||||
| 625,000 | 2.125%, 1/15/2018 | 626,067 | ||||||
| 198,000 | 2.625%, 9/4/2018 | 199,345 | ||||||
Ally Financial, Inc. | ||||||||
| 960,000 | 3.750%, 11/18/2019 | 964,109 | ||||||
| 1,050,000 | 4.125%, 3/30/2020 | 1,071,000 | ||||||
American Express Credit Corporation | ||||||||
| 590,000 | 1.543%, 3/18/2019e | 591,126 | ||||||
American International Group, Inc. | ||||||||
| 320,000 | 3.300%, 3/1/2021 | 327,504 | ||||||
| 768,000 | 4.125%, 2/15/2024 | 798,191 | ||||||
| 360,000 | 3.900%, 4/1/2026 | 365,825 | ||||||
Aon plc | ||||||||
| 384,000 | 3.875%, 12/15/2025 | 390,880 | ||||||
Avalonbay Communities, Inc. | ||||||||
| 1,125,000 | 3.500%, 11/15/2025 | 1,125,641 | ||||||
Banco Santander Chile | ||||||||
| 710,000 | 1.776%, 4/11/2017d,e | 709,148 | ||||||
Bank of America Corporation | ||||||||
| 1,056,000 | 8.000%, 1/30/2018h | 1,085,040 | ||||||
| 800,000 | 2.066%, 3/22/2018e | 805,385 | ||||||
| 500,000 | 1.716%, 4/1/2019e | 502,352 | ||||||
| 800,000 | 2.625%, 10/19/2020 | 799,842 | ||||||
| 1,065,000 | 3.300%, 1/11/2023 | 1,067,500 | ||||||
| 1,056,000 | 4.000%, 4/1/2024 | 1,087,848 | ||||||
| 1,055,000 | 4.000%, 1/22/2025 | 1,055,009 | ||||||
| 795,000 | 3.500%, 4/19/2026 | 783,280 | ||||||
| 1,322,000 | 5.875%, 2/7/2042 | 1,595,023 | ||||||
Bank of New York Mellon Corporation | ||||||||
| 1,280,000 | 2.500%, 4/15/2021 | 1,280,331 | ||||||
Bank of Tokyo-Mitsubishi UFJ, Ltd. | ||||||||
| 315,000 | 2.850%, 9/8/2021d | 314,760 | ||||||
Barclays Bank plc | ||||||||
| 264,000 | 10.179%, 6/12/2021d | 327,553 | ||||||
Barclays plc | ||||||||
| 780,000 | 2.750%, 11/8/2019 | 777,941 | ||||||
| 1,039,000 | 3.650%, 3/16/2025 | 1,004,528 | ||||||
BB&T Corporation | ||||||||
| 325,000 | 1.595%, 1/15/2020e | 326,116 | ||||||
Berkshire Hathaway, Inc. | ||||||||
| 640,000 | 2.750%, 3/15/2023 | 636,939 | ||||||
BPCE SA | ||||||||
| 762,000 | 5.700%, 10/22/2023d | 801,078 | ||||||
Caisse Centrale Desjardins du Quebec | ||||||||
| 455,000 | 1.552%, 1/29/2018d,e | 454,536 | ||||||
Capital One Financial Corporation | ||||||||
| 635,000 | 2.450%, 4/24/2019 | 638,776 | ||||||
Centene Escrow Corporation | ||||||||
| 2,100,000 | 5.625%, 2/15/2021 | 2,207,940 | ||||||
The accompanying Notes to Financial Statements are an integral part of this schedule.
66
Table of Contents
MODERATELY CONSERVATIVE ALLOCATION PORTFOLIO
Schedule of Investments as of December 31, 2016
| Principal Amount | Long-Term Fixed Income (42.2%) | Value | ||||||
Financials (3.3%) - continued | ||||||||
Cigna Corporation | ||||||||
| $ | 775,000 | 5.375%, 2/15/2042 | $ | 861,845 | ||||
CIT Group, Inc. | ||||||||
| 2,075,000 | 5.000%, 8/15/2022 | 2,163,187 | ||||||
Citigroup, Inc. | ||||||||
| 415,000 | 1.642%, 4/8/2019e | 415,505 | ||||||
| 1,075,000 | 2.700%, 3/30/2021 | 1,071,628 | ||||||
| 690,000 | 4.050%, 7/30/2022 | 713,380 | ||||||
| 1,990,000 | 4.400%, 6/10/2025 | 2,033,265 | ||||||
| 1,120,000 | 3.200%, 10/21/2026 | 1,069,348 | ||||||
| 840,000 | 4.125%, 7/25/2028 | 828,395 | ||||||
| 441,000 | 4.650%, 7/30/2045g | 463,909 | ||||||
Citizens Bank NA | ||||||||
| 1,220,000 | 2.300%, 12/3/2018 | 1,226,011 | ||||||
CoBank ACB | ||||||||
| 395,000 | 1.563%, 6/15/2022e | 377,804 | ||||||
Compass Bank | ||||||||
| 750,000 | 2.750%, 9/29/2019 | 745,570 | ||||||
Cooperatieve Centrale Raiffeisen- Boerenleenbank BA | ||||||||
| 650,000 | 3.950%, 11/9/2022 | 667,924 | ||||||
Credit Agricole SA | ||||||||
| 485,000 | 1.680%, 4/15/2019d,e | 487,106 | ||||||
Credit Suisse AG | ||||||||
| 512,000 | 5.400%, 1/14/2020 | 548,606 | ||||||
Credit Suisse Group Funding, Ltd. | ||||||||
| 1,536,000 | 2.750%, 3/26/2020 | 1,521,669 | ||||||
| 1,024,000 | 3.750%, 3/26/2025 | 1,007,147 | ||||||
Deutsche Bank AG | ||||||||
| 1,630,000 | 3.375%, 5/12/2021 | 1,612,134 | ||||||
Digital Realty Trust LP | ||||||||
| 1,125,000 | 3.400%, 10/1/2020 | 1,143,528 | ||||||
Discover Bank | ||||||||
| 1,135,000 | 8.700%, 11/18/2019 | 1,288,090 | ||||||
Discover Financial Services | ||||||||
| 526,000 | 6.450%, 6/12/2017 | 536,772 | ||||||
DRB Prime Student Loan Trust | ||||||||
2.492%, 10/27/2031, Series | ||||||||
| 2,105,728 | 2015-B, Class A1*,e | 2,143,188 | ||||||
Duke Realty, LP | ||||||||
| 260,000 | 3.875%, 2/15/2021 | 270,753 | ||||||
| 780,000 | 4.375%, 6/15/2022 | 830,425 | ||||||
ERP Operating, LP | ||||||||
| 267,000 | 3.375%, 6/1/2025 | 264,734 | ||||||
European Investment Bank | ||||||||
| 755,000 | 1.875%, 3/15/2019 | 759,865 | ||||||
Fifth Third Bancorp | ||||||||
| 755,000 | 5.450%, 1/15/2017 | 756,037 | ||||||
| 548,000 | 2.875%, 7/27/2020 | 554,028 | ||||||
| 310,000 | 2.875%, 10/1/2021 | 313,397 | ||||||
GE Capital International Funding Company | ||||||||
| 2,052,000 | 4.418%, 11/15/2035 | 2,146,868 | ||||||
Genworth Financial, Inc. | ||||||||
| 420,000 | 7.700%, 6/15/2020 | 406,224 | ||||||
Goldman Sachs Group, Inc. | ||||||||
| 1,170,000 | 2.087%, 4/30/2018e | 1,180,191 | ||||||
| 430,000 | 2.006%, 11/15/2018e | 434,088 | ||||||
| 2,150,000 | 5.375%, 3/15/2020 | 2,331,247 | ||||||
| 460,000 | 2.042%, 4/23/2020e | 464,396 | ||||||
| 2,048,000 | 5.250%, 7/27/2021 | 2,242,630 | ||||||
| 1,400,000 | 2.350%, 11/15/2021 | 1,358,860 | ||||||
| 512,000 | 3.500%, 1/23/2025 | 504,549 | ||||||
| 800,000 | 4.750%, 10/21/2045 | 841,829 | ||||||
Hartford Financial Services Group, Inc. | ||||||||
| 1,250,000 | 5.125%, 4/15/2022 | 1,385,099 | ||||||
HBOS plc | ||||||||
| 1,384,000 | 6.750%, 5/21/2018d | 1,459,079 | ||||||
HCP, Inc. | ||||||||
| 1,630,000 | 4.000%, 12/1/2022 | 1,676,111 | ||||||
| 520,000 | 3.400%, 2/1/2025 | 496,916 | ||||||
HSBC Bank plc | ||||||||
| 1,065,000 | 1.546%, 5/15/2018d,e | 1,065,360 | ||||||
HSBC Holdings plc | ||||||||
| 1,080,000 | 3.400%, 3/8/2021 | 1,097,320 | ||||||
| 1,075,000 | 6.875%, 6/1/2021g,h | 1,134,125 | ||||||
| 925,000 | 2.650%, 1/5/2022 | 904,219 | ||||||
| 850,000 | 3.600%, 5/25/2023 | 853,997 | ||||||
| 1,040,000 | 3.900%, 5/25/2026 | 1,045,610 | ||||||
Huntington Bancshares, Inc. | ||||||||
| 282,000 | 2.600%, 8/2/2018 | 284,701 | ||||||
Huntington National Bank | ||||||||
| 720,000 | 2.200%, 11/6/2018 | 721,902 | ||||||
Icahn Enterprises, LP | ||||||||
| 1,145,000 | 6.000%, 8/1/2020 | 1,169,331 | ||||||
ING Capital Funding Trust III | ||||||||
| 825,000 | 4.438%, 3/31/2017e,h | 820,875 | ||||||
Intesa Sanpaolo SPA | ||||||||
| 1,000,000 | 5.250%, 1/12/2024 | 1,050,938 | ||||||
J.P. Morgan Chase & Company | ||||||||
| 1,605,000 | 7.900%, 4/30/2018h | 1,661,977 | ||||||
| 980,000 | 6.300%, 4/23/2019 | 1,070,470 | ||||||
| 365,000 | 2.250%, 1/23/2020 | 363,912 | ||||||
| 670,000 | 2.295%, 8/15/2021 | 656,977 | ||||||
| 1,220,000 | 4.500%, 1/24/2022 | 1,314,410 | ||||||
| 768,000 | 3.200%, 1/25/2023 | 775,771 | ||||||
| 1,400,000 | 2.700%, 5/18/2023 | 1,368,219 | ||||||
| 565,000 | 2.112%, 10/24/2023e | 576,282 | ||||||
| 1,040,000 | 3.625%, 5/13/2024 | 1,056,634 | ||||||
| 2,040,000 | 3.125%, 1/23/2025 | 1,991,648 | ||||||
| 855,000 | 3.300%, 4/1/2026 | 838,875 | ||||||
KeyBank NA | ||||||||
| 860,000 | 2.350%, 3/8/2019 | 864,616 | ||||||
KeyCorp | ||||||||
| 1,080,000 | 2.900%, 9/15/2020 | 1,091,986 | ||||||
Kookmin Bank | ||||||||
| 900,000 | 1.625%, 8/1/2019d | 886,491 | ||||||
Liberty Mutual Group, Inc. | ||||||||
| 1,027,000 | 4.950%, 5/1/2022d | 1,119,447 | ||||||
Liberty Property, LP | ||||||||
| 1,417,000 | 3.750%, 4/1/2025 | 1,422,620 | ||||||
Lincoln National Corporation | ||||||||
| 575,000 | 8.750%, 7/1/2019 | 661,316 | ||||||
| 792,000 | 7.000%, 6/15/2040 | 998,360 | ||||||
Lloyds Bank plc | ||||||||
| 515,000 | 1.490%, 3/16/2018e | 515,699 | ||||||
Merrill Lynch & Company, Inc. | ||||||||
| 1,555,000 | 6.400%, 8/28/2017 | 1,602,633 | ||||||
MetLife, Inc. | ||||||||
| 1,025,000 | 4.050%, 3/1/2045 | 980,919 | ||||||
Mitsubishi UFJ Financial Group, Inc. | ||||||||
| 930,000 | 2.190%, 9/13/2021 | 903,535 | ||||||
Mizuho Bank, Ltd. | ||||||||
| 762,000 | 1.850%, 3/21/2018d | 760,573 | ||||||
Morgan Stanley | ||||||||
| 1,455,000 | 6.625%, 4/1/2018 | 1,538,499 | ||||||
| 780,000 | 2.162%, 4/25/2018e | 788,163 | ||||||
| 460,000 | 2.026%, 1/27/2020e | 464,070 | ||||||
The accompanying Notes to Financial Statements are an integral part of this schedule.
67
Table of Contents
MODERATELY CONSERVATIVE ALLOCATION PORTFOLIO
Schedule of Investments as of December 31, 2016
| Principal Amount | Long-Term Fixed Income (42.2%) | Value | ||||||
Financials (3.3%) - continued | ||||||||
| $ | 560,000 | 5.550%, 7/15/2020h | $ | 566,300 | ||||
| 675,000 | 2.500%, 4/21/2021 | 667,084 | ||||||
| 1,400,000 | 2.625%, 11/17/2021 | 1,381,806 | ||||||
| 660,000 | 4.875%, 11/1/2022 | 706,579 | ||||||
| 975,000 | 4.000%, 7/23/2025 | 998,075 | ||||||
| 1,350,000 | 4.350%, 9/8/2026 | 1,375,559 | ||||||
MPT Operating Partnership, LP | ||||||||
| 1,535,000 | 6.375%, 3/1/2024 | 1,605,994 | ||||||
Nasdaq, Inc. | ||||||||
| 655,000 | 3.850%, 6/30/2026 | 649,743 | ||||||
National City Corporation | ||||||||
| 776,000 | 6.875%, 5/15/2019 | 853,796 | ||||||
Prudential Financial, Inc. | ||||||||
| 315,000 | 2.350%, 8/15/2019 | 317,896 | ||||||
Quicken Loans, Inc. | ||||||||
| 2,210,000 | 5.750%, 5/1/2025d | 2,149,225 | ||||||
Realty Income Corporation | ||||||||
| 265,000 | 2.000%, 1/31/2018 | 265,719 | ||||||
Regions Bank | ||||||||
| 261,000 | 7.500%, 5/15/2018 | 279,577 | ||||||
Regions Financial Corporation | ||||||||
| 1,000,000 | 2.250%, 9/14/2018 | 1,003,109 | ||||||
| 768,000 | 3.200%, 2/8/2021 | 778,244 | ||||||
Reinsurance Group of America, Inc. | ||||||||
| 400,000 | 5.625%, 3/15/2017 | 403,248 | ||||||
| 579,000 | 5.000%, 6/1/2021 | 625,167 | ||||||
Reliance Standard Life Global Funding II | ||||||||
| 395,000 | 2.500%, 4/24/2019d | 397,458 | ||||||
Royal Bank of Scotland Group plc | ||||||||
| 650,000 | 8.625%, 8/15/2021h | 663,000 | ||||||
| 800,000 | 3.875%, 9/12/2023 | 767,349 | ||||||
Santander Holdings USA, Inc. | ||||||||
| 725,000 | 3.450%, 8/27/2018 | 735,852 | ||||||
Santander UK Group Holdings plc | ||||||||
| 896,000 | 2.875%, 10/16/2020 | 887,928 | ||||||
Santander UK plc | ||||||||
| 456,000 | 3.050%, 8/23/2018 | 463,118 | ||||||
Simon Property Group, LP | ||||||||
| 330,000 | 2.500%, 9/1/2020 | 332,244 | ||||||
| 1,115,000 | 2.750%, 2/1/2023 | 1,098,335 | ||||||
| 1,120,000 | 4.250%, 11/30/2046 | 1,098,595 | ||||||
Skandinaviska Enskilda Banken AB | ||||||||
| 615,000 | 2.375%, 3/25/2019d | 616,579 | ||||||
Standard Chartered plc | ||||||||
| 925,000 | 2.100%, 8/19/2019d | 914,017 | ||||||
State Street Corporation | ||||||||
| 510,000 | 1.809%, 8/18/2020e | 516,821 | ||||||
Sumitomo Mitsui Banking Corporation | ||||||||
| 545,000 | 1.460%, 1/16/2018e | 545,683 | ||||||
Sumitomo Mitsui Financial Group, Inc. | ||||||||
| 840,000 | 3.010%, 10/19/2026 | 802,617 | ||||||
Svenska Handelsbanken AB | ||||||||
| 715,000 | 1.483%, 6/17/2019e | 715,523 | ||||||
Synchrony Financial | ||||||||
| 305,000 | 2.111%, 2/3/2020e | 301,549 | ||||||
| 330,000 | 3.750%, 8/15/2021 | 338,884 | ||||||
| 1,475,000 | 4.250%, 8/15/2024 | 1,499,752 | ||||||
Toronto-Dominion Bank | ||||||||
| 375,000 | 1.889%, 12/14/2020e | 379,408 | ||||||
UBS Group Funding Jersey, Ltd. | ||||||||
| 1,280,000 | 2.950%, 9/24/2020d | 1,279,606 | ||||||
| 768,000 | 4.125%, 9/24/2025d | 781,756 | ||||||
UnitedHealth Group, Inc. | ||||||||
| 220,000 | 3.350%, 7/15/2022 | 226,423 | ||||||
| 2,470,000 | 4.625%, 7/15/2035 | 2,688,165 | ||||||
USB Realty Corporation | ||||||||
| 310,000 | 2.027%, 1/15/2022d,e,h | 272,800 | ||||||
Voya Financial, Inc. | ||||||||
| 948,000 | 2.900%, 2/15/2018 | 959,627 | ||||||
Wells Fargo & Company | ||||||||
| 455,000 | 1.567%, 1/30/2020e | 454,777 | ||||||
| 1,020,000 | 2.550%, 12/7/2020 | 1,020,356 | ||||||
| 1,120,000 | 3.450%, 2/13/2023 | 1,122,909 | ||||||
| 1,040,000 | 3.000%, 2/19/2025 | 997,767 | ||||||
| 1,600,000 | 3.000%, 4/22/2026 | 1,524,618 | ||||||
| 1,140,000 | 3.000%, 10/23/2026 | 1,083,883 | ||||||
| 1,020,000 | 4.900%, 11/17/2045 | 1,045,644 | ||||||
Welltower, Inc. | ||||||||
| 268,000 | 2.250%, 3/15/2018 | 269,111 | ||||||
| 520,000 | 3.750%, 3/15/2023 | 529,941 | ||||||
| 540,000 | 4.000%, 6/1/2025 | 551,177 | ||||||
|
| |||||||
Total | 156,214,417 | |||||||
|
| |||||||
Foreign Government (0.1%) | ||||||||
Argentina Government International Bond | ||||||||
| 820,000 | 7.500%, 4/22/2026d | 861,000 | ||||||
Brazil Government International Bond | ||||||||
| 1,430,000 | 7.125%, 1/20/2037 | 1,490,775 | ||||||
Export-Import Bank of Korea | ||||||||
| 450,000 | 2.250%, 1/21/2020 | 447,343 | ||||||
Indonesia Government International Bond | ||||||||
| 1,700,000 | 5.250%, 1/8/2047d | 1,695,107 | ||||||
Kommunalbanken AS | ||||||||
| 735,000 | 1.500%, 10/22/2019d | 728,353 | ||||||
Mexico Government International Bond | ||||||||
| 775,000 | 4.125%, 1/21/2026 | 768,800 | ||||||
| 775,000 | 4.350%, 1/15/2047 | 664,563 | ||||||
|
| |||||||
Total | 6,655,941 | |||||||
|
| |||||||
Mortgage-Backed Securities (15.5%) | ||||||||
Federal Home Loan Mortgage Corporation Gold 15-Yr. Pass Through | ||||||||
| 49,100,000 | 3.000%, 1/1/2032c | 50,361,870 | ||||||
Federal Home Loan Mortgage Corporation Gold 30-Yr. Pass Through | ||||||||
| 33,600,000 | 4.000%, 1/1/2047c | 35,273,280 | ||||||
Federal National Mortgage Association Conventional 15-Yr. Pass Through | ||||||||
| 57,325,000 | 2.500%, 1/1/2032c | 57,388,057 | ||||||
Federal National Mortgage Association Conventional 30-Yr. Pass Through | ||||||||
| 4,820,637 | 1.740%, 7/1/2043e | 4,954,236 | ||||||
| 139,550,000 | 3.000%, 1/1/2047c | 138,531,285 | ||||||
| 247,700,000 | 3.500%, 1/1/2047c | 253,719,110 | ||||||
| 125,250,000 | 4.000%, 1/1/2047c | 131,612,700 | ||||||
| 51,396,000 | 4.500%, 1/1/2047c | 55,260,979 | ||||||
|
| |||||||
Total | 727,101,517 | |||||||
|
| |||||||
Technology (0.8%) | ||||||||
Amphenol Corporation | ||||||||
| 318,000 | 2.550%, 1/30/2019 | 321,706 | ||||||
The accompanying Notes to Financial Statements are an integral part of this schedule.
68
Table of Contents
MODERATELY CONSERVATIVE ALLOCATION PORTFOLIO
Schedule of Investments as of December 31, 2016
| Principal Amount | Long-Term Fixed Income (42.2%) | Value | ||||||
Technology (0.8%) - continued | ||||||||
Apple, Inc. | ||||||||
| $ | 360,000 | 1.202%, 5/6/2020e | $ | 359,704 | ||||
| 1,792,000 | 3.200%, 5/13/2025 | 1,797,044 | ||||||
| 768,000 | 4.650%, 2/23/2046 | 827,653 | ||||||
Avnet, Inc. | ||||||||
| 820,000 | 3.750%, 12/1/2021 | 824,294 | ||||||
Cisco Systems, Inc. | ||||||||
| 480,000 | 1.431%, 3/1/2019e | 482,739 | ||||||
CommScope Technologies Finance, LLC | ||||||||
| 1,480,000 | 6.000%, 6/15/2025d | 1,568,800 | ||||||
Diamond 1 Finance Corporation | ||||||||
| 680,000 | 3.480%, 6/1/2019d | 693,973 | ||||||
| 550,000 | 5.450%, 6/15/2023d | 582,811 | ||||||
| 396,000 | 6.020%, 6/15/2026d | 428,428 | ||||||
| 840,000 | 8.100%, 7/15/2036d | 997,958 | ||||||
| 560,000 | 8.350%, 7/15/2046d | 688,462 | ||||||
Equinix, Inc. | ||||||||
| 1,870,000 | 5.750%, 1/1/2025 | 1,954,150 | ||||||
Fidelity National Information Services, Inc. | ||||||||
| 1,070,000 | 2.850%, 10/15/2018 | 1,088,404 | ||||||
| 769,000 | 3.625%, 10/15/2020 | 795,534 | ||||||
First Data Corporation | ||||||||
| 970,000 | 5.375%, 8/15/2023d | 1,006,375 | ||||||
Hewlett Packard Enterprise Company | ||||||||
| 1,130,000 | 2.450%, 10/5/2017 | 1,136,223 | ||||||
| 565,000 | 2.850%, 10/5/2018 | 570,357 | ||||||
| 565,000 | 4.400%, 10/15/2022 | 587,748 | ||||||
Intel Corporation | ||||||||
| 185,000 | 3.100%, 7/29/2022 | 190,033 | ||||||
| 685,000 | 3.700%, 7/29/2025 | 721,563 | ||||||
| 1,188,000 | 4.100%, 5/19/2046 | 1,175,047 | ||||||
International Business Machines Corporation | ||||||||
| 1,056,000 | 4.700%, 2/19/2046g | 1,149,071 | ||||||
Iron Mountain, Inc. | ||||||||
| 1,885,000 | 6.000%, 8/15/2023 | 2,002,813 | ||||||
Micron Technology, Inc. | ||||||||
| 3,085,000 | 7.500%, 9/15/2023d | 3,416,638 | ||||||
Microsoft Corporation | ||||||||
| 1,575,000 | 4.750%, 11/3/2055 | 1,709,212 | ||||||
| 1,575,000 | 4.200%, 11/3/2035 | 1,654,734 | ||||||
| 975,000 | 3.700%, 8/8/2046 | 915,937 | ||||||
NXP BV | ||||||||
| 1,390,000 | 3.875%, 9/1/2022d | 1,407,375 | ||||||
Oracle Corporation | ||||||||
| 330,000 | 2.500%, 5/15/2022 | 327,359 | ||||||
| 1,056,000 | 2.400%, 9/15/2023 | 1,021,850 | ||||||
| 1,340,000 | 2.950%, 5/15/2025 | 1,311,816 | ||||||
Qualcomm, Inc. | ||||||||
| 792,000 | 3.000%, 5/20/2022 | 801,674 | ||||||
Sensata Technologies UK Financing Company plc | ||||||||
| 1,140,000 | 6.250%, 2/15/2026d | 1,191,300 | ||||||
|
| |||||||
Total | 35,708,785 | |||||||
|
| |||||||
Transportation (0.3%) | ||||||||
Air Canada Pass Through Trust | ||||||||
| 288,804 | 3.875%, 3/15/2023d | 278,696 | ||||||
American Airlines Pass Through Trust | ||||||||
| 1,170,826 | 3.375%, 5/1/2027 | 1,153,263 | ||||||
Avis Budget Car Rental, LLC | ||||||||
| 1,665,000 | 5.125%, 6/1/2022d,g | 1,631,700 | ||||||
| 1,195,000 | 6.375%, 4/1/2024d,g | 1,193,506 | ||||||
Burlington Northern Santa Fe, LLC | ||||||||
| 1,040,000 | 5.050%, 3/1/2041 | 1,178,090 | ||||||
| 1,175,000 | 3.900%, 8/1/2046 | 1,146,308 | ||||||
Continental Airlines, Inc. | ||||||||
| 604,246 | 4.150%, 4/11/2024 | 620,863 | ||||||
CSX Corporation | ||||||||
| 1,150,000 | 4.250%, 11/1/2066 | 1,046,941 | ||||||
| 494,000 | 3.700%, 11/1/2023 | 512,134 | ||||||
Delta Air Lines, Inc. | ||||||||
| 254,659 | 4.950%, 5/23/2019 | 266,883 | ||||||
ERAC USA Finance, LLC | ||||||||
| 284,000 | 2.800%, 11/1/2018d | 287,504 | ||||||
J.B. Hunt Transport Services, Inc. | ||||||||
| 295,000 | 3.300%, 8/15/2022 | 295,859 | ||||||
Southwest Airlines Company | ||||||||
| 845,000 | 2.750%, 11/6/2019 | 859,511 | ||||||
Virgin Australia Holdings, Ltd. | ||||||||
| 214,519 | 5.000%, 10/23/2023d | 224,172 | ||||||
XPO Logistics, Inc. | ||||||||
| 1,570,000 | 6.500%, 6/15/2022d,g | 1,648,500 | ||||||
|
| |||||||
Total | 12,343,930 | |||||||
|
| |||||||
U.S. Government and Agencies (10.7%) | ||||||||
Federal National Mortgage Association | ||||||||
| 205,000 | 6.250%, 5/15/2029 | 271,275 | ||||||
Tennessee Valley Authority | ||||||||
| 200,000 | 5.250%, 9/15/2039 | 250,751 | ||||||
U.S. Treasury Bonds | ||||||||
| 1,075,000 | 4.375%, 5/15/2040 | 1,325,760 | ||||||
| 470,000 | 3.625%, 2/15/2044 | 519,848 | ||||||
| 26,928,000 | 2.500%, 5/15/2046 | 23,870,891 | ||||||
| 4,500,000 | 2.875%, 11/15/2046 | 4,333,927 | ||||||
U.S. Treasury Bonds, TIPS | ||||||||
| 2,063,160 | 0.125%, 4/15/2019 | 2,088,824 | ||||||
| 7,435,191 | 0.125%, 1/15/2023 | 7,379,442 | ||||||
| 51,294 | 2.375%, 1/15/2025 | 58,888 | ||||||
| 28,453,601 | 0.625%, 1/15/2026 | 28,698,957 | ||||||
| 33,550 | 2.125%, 2/15/2040 | 41,541 | ||||||
| 454,640 | 0.750%, 2/15/2042 | 430,268 | ||||||
U.S. Treasury Notes | ||||||||
| 2,100,000 | 0.875%, 1/31/2017j | 2,100,836 | ||||||
| 23,000,000 | 0.875%, 3/31/2018 | 22,968,421 | ||||||
| 21,220,000 | 1.000%, 11/30/2018g | 21,147,661 | ||||||
| 22,400,000 | 0.750%, 2/15/2019 | 22,171,139 | ||||||
| 15,500,000 | 1.000%, 10/15/2019 | 15,327,097 | ||||||
| 41,710,000 | 1.500%, 10/31/2019 | 41,791,418 | ||||||
| 79,080,000 | 1.375%, 9/30/2020 | 78,125,821 | ||||||
| 10,250,000 | 1.375%, 5/31/2021 | 10,037,066 | ||||||
| 59,409,000 | 1.125%, 8/31/2021 | 57,346,320 | ||||||
| 41,325,000 | 2.125%, 6/30/2022 | 41,425,709 | ||||||
| 10,765,000 | 1.625%, 8/15/2022 | 10,486,822 | ||||||
| 1,120,000 | 1.375%, 9/30/2023 | 1,059,318 | ||||||
| 26,500,000 | 1.625%, 10/31/2023 | 25,463,346 | ||||||
| 47,630,000 | 2.250%, 11/15/2024 | 47,274,871 | ||||||
| 39,702,000 | 2.000%, 11/15/2026g | 38,137,344 | ||||||
|
| |||||||
Total | 504,133,561 | |||||||
|
| |||||||
Utilities (1.1%) | ||||||||
American Electric Power Company, Inc. | ||||||||
| 1,722,000 | 2.950%, 12/15/2022 | 1,730,991 | ||||||
Arizona Public Service Company | ||||||||
| 395,000 | 2.200%, 1/15/2020 | 395,223 | ||||||
Berkshire Hathaway Energy Company | ||||||||
| 390,000 | 2.400%, 2/1/2020 | 390,822 | ||||||
The accompanying Notes to Financial Statements are an integral part of this schedule.
69
Table of Contents
MODERATELY CONSERVATIVE ALLOCATION PORTFOLIO
Schedule of Investments as of December 31, 2016
| Principal Amount | Long-Term Fixed Income (42.2%) | Value | ||||||
Utilities (1.1%) - continued | ||||||||
Calpine Corporation | ||||||||
| $ | 1,450,000 | 5.375%, 1/15/2023 | $ | 1,417,375 | ||||
Chesapeake Midstream Partners, LP | ||||||||
| 1,320,000 | 6.125%, 7/15/2022 | 1,361,470 | ||||||
CMS Energy Corporation | ||||||||
| 840,000 | 2.950%, 2/15/2027 | 795,983 | ||||||
Commonwealth Edison Company | ||||||||
| 1,025,000 | 3.700%, 3/1/2045 | 961,956 | ||||||
| 640,000 | 4.350%, 11/15/2045 | 666,859 | ||||||
Consolidated Edison Company of New York, Inc. | ||||||||
| 384,000 | 4.500%, 12/1/2045 | 406,353 | ||||||
Consolidated Edison, Inc. | ||||||||
| 528,000 | 2.000%, 5/15/2021 | 515,570 | ||||||
Dominion Resources, Inc. | ||||||||
| 1,070,000 | 2.962%, 7/1/2019 | 1,082,814 | ||||||
DTE Electric Company | ||||||||
| 760,000 | 3.700%, 3/15/2045 | 725,098 | ||||||
| 890,000 | 3.700%, 6/1/2046 | 854,305 | ||||||
DTE Energy Company | ||||||||
| 155,000 | 2.400%, 12/1/2019 | 155,689 | ||||||
Duke Energy Corporation | ||||||||
| 900,000 | 2.100%, 6/15/2018 | 903,695 | ||||||
| 1,120,000 | 3.750%, 9/1/2046 | 1,006,094 | ||||||
Duke Energy Indiana, LLC | ||||||||
| 1,085,000 | 3.750%, 5/15/2046 | 1,018,332 | ||||||
Dynegy, Inc. | ||||||||
| 1,720,000 | 7.375%, 11/1/2022 | 1,642,600 | ||||||
Edison International | ||||||||
| 1,050,000 | 2.950%, 3/15/2023 | 1,037,657 | ||||||
Emera U.S. Finance, LP | ||||||||
| 800,000 | 2.150%, 6/15/2019d | 798,340 | ||||||
| 820,000 | 4.750%, 6/15/2046d | 825,315 | ||||||
Enel Finance International NV | ||||||||
| 450,000 | 6.250%, 9/15/2017d | 463,781 | ||||||
Energy Transfer Equity, LP | ||||||||
| 1,450,000 | 5.500%, 6/1/2027 | 1,413,750 | ||||||
Eversource Energy | ||||||||
| 330,000 | 1.600%, 1/15/2018 | 329,216 | ||||||
Exelon Corporation | ||||||||
| 580,000 | 5.100%, 6/15/2045 | 615,378 | ||||||
| 792,000 | 4.450%, 4/15/2046 | 773,759 | ||||||
Exelon Generation Company, LLC | ||||||||
| 770,000 | 5.200%, 10/1/2019 | 824,879 | ||||||
| 295,000 | 2.950%, 1/15/2020 | 298,359 | ||||||
ITC Holdings Corporation | ||||||||
| 284,000 | 4.050%, 7/1/2023 | 291,061 | ||||||
| 560,000 | 5.300%, 7/1/2043 | 611,466 | ||||||
Kinder Morgan Energy Partners, LP | ||||||||
| 765,000 | 3.500%, 3/1/2021 | 776,044 | ||||||
MidAmerican Energy Holdings Company | ||||||||
| 1,586,000 | 6.500%, 9/15/2037 | 2,061,254 | ||||||
Monongahela Power Company | ||||||||
| 780,000 | 5.400%, 12/15/2043d | 909,990 | ||||||
National Rural Utilities Cooperative Finance Corporation | ||||||||
| 1,025,000 | 2.300%, 11/1/2020 | 1,018,081 | ||||||
NextEra Energy Capital Holdings, Inc. | ||||||||
| 660,000 | 2.300%, 4/1/2019 | 664,766 | ||||||
NiSource Finance Corporation | ||||||||
| 1,475,000 | 5.650%, 2/1/2045 | 1,716,609 | ||||||
Northern States Power Company | ||||||||
| 1,240,000 | 4.125%, 5/15/2044 | 1,258,199 | ||||||
NRG Energy, Inc. | ||||||||
| 1,500,000 | 6.625%, 3/15/2023 | 1,503,750 | ||||||
Oncor Electric Delivery Company, LLC | ||||||||
| 760,000 | 3.750%, 4/1/2045 | 727,115 | ||||||
Pacific Gas & Electric Company | ||||||||
| 768,000 | 4.250%, 3/15/2046 | 778,860 | ||||||
PG&E Corporation | ||||||||
| 375,000 | 2.400%, 3/1/2019 | 376,341 | ||||||
PPL Capital Funding, Inc. | ||||||||
| 372,000 | 3.500%, 12/1/2022 | 380,025 | ||||||
| 1,275,000 | 5.000%, 3/15/2044 | 1,345,819 | ||||||
Regency Energy Partners, LP | ||||||||
| 1,120,000 | 5.875%, 3/1/2022 | 1,230,936 | ||||||
Sempra Energy | ||||||||
| 1,285,000 | 6.150%, 6/15/2018 | 1,361,166 | ||||||
| 370,000 | 2.400%, 3/15/2020 | 369,253 | ||||||
Southern California Edison Company | ||||||||
| 220,000 | 2.400%, 2/1/2022 | 219,146 | ||||||
Southern Company | ||||||||
| 1,080,000 | 1.850%, 7/1/2019 | 1,076,192 | ||||||
| 1,100,000 | 4.400%, 7/1/2046 | 1,085,821 | ||||||
Southwestern Electric Power Company | ||||||||
| 460,000 | 3.900%, 4/1/2045 | 427,584 | ||||||
Targa Resources Partners, LP | ||||||||
| 525,000 | 5.250%, 5/1/2023 | 530,250 | ||||||
Tesoro Corporation | ||||||||
| 2,075,000 | 4.750%, 12/15/2023d | 2,085,375 | ||||||
Tesoro Logistics, LP | ||||||||
| 1,755,000 | 5.250%, 1/15/2025 | 1,792,294 | ||||||
TransAlta Corporation | ||||||||
| 825,000 | 1.900%, 6/3/2017 | 820,875 | ||||||
Williams Partners, LP | ||||||||
| 1,050,000 | 5.100%, 9/15/2045 | 996,161 | ||||||
Xcel Energy, Inc. | ||||||||
| 1,055,000 | 3.350%, 12/1/2026 | 1,054,303 | ||||||
|
| |||||||
Total | 50,880,399 | |||||||
|
| |||||||
Total Long-Term Fixed Income (cost $1,986,566,985) | 1,981,725,989 | |||||||
|
| |||||||
| Shares | Registered Investment Companies (25.9%) | |||||||
Affiliated Equity Holdings (9.5%) | ||||||||
| 2,586,561 | Thrivent Large Cap Stock Portfolio | 31,286,010 | ||||||
| 8,818,308 | Thrivent Large Cap Value Portfolio | 148,493,256 | ||||||
| 3,932,207 | Thrivent Mid Cap Stock Portfolio | 75,029,259 | ||||||
| 16,955,184 | Thrivent Partner Worldwide Allocation Portfolio | 154,141,277 | ||||||
| 1,989,819 | Thrivent Small Cap Stock Portfolio | 36,799,107 | ||||||
|
| |||||||
Total | 445,748,909 | |||||||
|
| |||||||
Affiliated Fixed Income Holdings (14.9%) | ||||||||
| 24,579,035 | Thrivent High Yield Portfolio | 117,246,915 | ||||||
| 35,397,259 | Thrivent Income Portfolio | 356,411,464 | ||||||
| 23,148,257 | Thrivent Limited Maturity Bond Portfolio | 227,012,639 | ||||||
|
| |||||||
Total | 700,671,018 | |||||||
|
| |||||||
Equity Funds/ETFs (0.3%) | ||||||||
| 5,380 | iShares Russell 2000 Growth Index Fund | 828,197 | ||||||
| 11,099 | iShares Russell 2000 Index Fund | 1,496,700 | ||||||
| 3,350 | iShares Russell 2000 Value Index Fund | 398,449 | ||||||
| 5,870 | Materials Select Sector SPDR Fund | 291,739 | ||||||
| 42,086 | SPDR S&P 500 ETF Trust | 9,407,483 | ||||||
The accompanying Notes to Financial Statements are an integral part of this schedule.
70
Table of Contents
MODERATELY CONSERVATIVE ALLOCATION PORTFOLIO
Schedule of Investments as of December 31, 2016
| Shares | Registered Investment Companies (25.9%) | Value | ||||||
Equity Funds/ETFs (0.3%) - continued | ||||||||
| 8,730 | SPDR S&P Biotech ETF | $ | 516,729 | |||||
| 620 | SPDR S&P MidCap 400 ETF Trust | 187,073 | ||||||
|
| |||||||
Total | 13,126,370 | |||||||
|
| |||||||
| Fixed Income Funds/ETFs (1.2%) | ||||||||
| 72,000 | iShares Barclays 1-3 Year Credit Bond Fund | 7,555,680 | ||||||
| 276,900 | iShares iBoxx $ Investment Grade Corporate Bond ETF | 32,447,142 | ||||||
| 6,107 | iShares J.P. Morgan USD Emerging Markets Bond ETFg | 673,114 | ||||||
| 216,000 | Vanguard Short-Term Corporate Bond ETF | 17,143,920 | ||||||
|
| |||||||
Total | 57,819,856 | |||||||
|
| |||||||
Total Registered Investment Companies (cost $1,131,940,166) | 1,217,366,153 | |||||||
|
| |||||||
Common Stock (22.2%) | ||||||||
Consumer Discretionary (2.9%) | ||||||||
| 24,092 | Aaron’s, Inc. | 770,703 | ||||||
| 6,830 | Abercrombie & Fitch Company | 81,960 | ||||||
| 29,216 | Amazon.com, Inc.k | 21,908,202 | ||||||
| 3,500 | American Axle & Manufacturing Holdings, Inc.k | 67,550 | ||||||
| 6,115 | American Public Education, Inc.k | 150,123 | ||||||
| 69,350 | Aramark | 2,477,182 | ||||||
| 3,350 | Armstrong Flooring, Inc.k | 66,698 | ||||||
| 3,980 | Ascent Capital Group, Inc.k | 64,715 | ||||||
| 7,560 | AutoZone, Inc.k | 5,970,812 | ||||||
| 21,190 | Barnes & Noble, Inc. | 236,269 | ||||||
| 7,960 | Beazer Homes USA, Inc.k | 105,868 | ||||||
| 1,680 | Bed Bath & Beyond, Inc. | 68,275 | ||||||
| 4,160 | Big 5 Sporting Goods Corporation | 72,176 | ||||||
| 10,120 | Bloomin’ Brands, Inc. | 182,464 | ||||||
| 21,100 | BorgWarner, Inc. | 832,184 | ||||||
| 6,210 | Boyd Gaming Corporationk | 125,256 | ||||||
| 26,420 | Brunswick Corporation | 1,440,947 | ||||||
| 5,470 | Burlington Stores, Inc.k | 463,582 | ||||||
| 14,220 | Caleres, Inc. | 466,700 | ||||||
| 13,730 | Callaway Golf Company | 150,481 | ||||||
| 21,750 | Carter’s, Inc. | 1,878,983 | ||||||
| 4,483 | Cedar Fair, LP | 287,809 | ||||||
| 6,350 | Cheesecake Factory, Inc. | 380,238 | ||||||
| 830 | Chipotle Mexican Grill, Inc.k | 313,176 | ||||||
| 2,330 | Chuy’s Holdings, Inc.k | 75,608 | ||||||
| 8,670 | Cinemark Holdings, Inc. | 332,581 | ||||||
| 3,920 | ClubCorp Holdings, Inc. | 56,252 | ||||||
| 2,160 | Columbia Sportswear Company | 125,928 | ||||||
| 263,583 | Comcast Corporation | 18,200,406 | ||||||
| 14,734 | Core-Mark Holding Company, Inc. | 634,593 | ||||||
| 9,559 | CSS Industries, Inc. | 258,762 | ||||||
| 11,338 | Culp, Inc. | 421,207 | ||||||
| 2,420 | D.R. Horton, Inc. | 66,139 | ||||||
| 30,200 | Dana, Inc. | 573,196 | ||||||
| 1,860 | Deckers Outdoor Corporationk | 103,025 | ||||||
| 69,719 | Delphi Automotive plc | 4,695,575 | ||||||
| 5,170 | DeVry Education Group, Inc. | 161,304 | ||||||
| 4,515 | Discovery Communications, Inc., Class Ak | 123,756 | ||||||
| 3,560 | Discovery Communications, Inc., Class Ck | 95,337 | ||||||
| 10,250 | DISH Network Corporationk | 593,783 | ||||||
| 8,220 | Dollar General Corporation | 608,855 | ||||||
| 22,030 | Dollar Tree, Inc.k | 1,700,275 | ||||||
| 2,180 | Domino’s Pizza, Inc. | 347,143 | ||||||
| 18,710 | DSW, Inc. | 423,782 | ||||||
| 11,303 | Duluth Holdings, Inc.g,k | 287,096 | ||||||
| 9,140 | Etsy, Inc.k | 107,669 | ||||||
| 6,108 | Expedia, Inc. | 691,914 | ||||||
| 11,150 | Finish Line, Inc. | 209,732 | ||||||
| 17,740 | Gentex Corporation | 349,301 | ||||||
| 7,563 | G-III Apparel Group, Ltd.k | 223,562 | ||||||
| 34,310 | GNC Holdings, Inc. | 378,782 | ||||||
| 132,864 | Harley-Davidson, Inc. | 7,751,286 | ||||||
| 13,058 | Haverty Furniture Companies, Inc. | 309,475 | ||||||
| 63,110 | Home Depot, Inc. | 8,461,789 | ||||||
| 14,390 | Houghton Mifflin Harcourt Companyk | 156,131 | ||||||
| 1,460 | HSN, Inc. | 50,078 | ||||||
| 2,530 | Hyatt Hotels Corporationk | 139,808 | ||||||
| 3,500 | ILG, Inc. | 63,595 | ||||||
| 1,920 | International Speedway Corporation | 70,656 | ||||||
| 660 | Jack in the Box, Inc. | 73,682 | ||||||
| 1,240 | John Wiley and Sons, Inc. | 67,580 | ||||||
| 7,810 | Kate Spade & Companyk | 145,813 | ||||||
| 5,890 | L Brands, Inc. | 387,798 | ||||||
| 11,740 | La-Z-Boy, Inc. | 364,527 | ||||||
| 53,540 | Liberty Interactive Corporationk | 1,069,729 | ||||||
| 2,680 | Lithia Motors, Inc. | 259,504 | ||||||
| 2,400 | Live Nation Entertainment, Inc.k | 63,840 | ||||||
| 38,630 | LKQ Corporationk | 1,184,010 | ||||||
| 106,480 | Lowe’s Companies, Inc. | 7,572,858 | ||||||
| 2,740 | M/I Homes, Inc.k | 68,993 | ||||||
| 1,500 | Meredith Corporation | 88,725 | ||||||
| 690 | Mohawk Industries, Inc.k | 137,779 | ||||||
| 1,270 | Monro Muffler Brake, Inc. | 72,644 | ||||||
| 1,040 | Murphy USA, Inc.k | 63,929 | ||||||
| 6,380 | Nautilus, Inc.k | 118,030 | ||||||
| 7,400 | New Media Investment Group, Inc. | 118,326 | ||||||
| 34,340 | Newell Brands, Inc. | 1,533,281 | ||||||
| 20,520 | News Corporation, Class A | 235,159 | ||||||
| 6,700 | News Corporation, Class B | 79,060 | ||||||
| 5,558 | Nord Anglia Education, Inc.g,k | 129,501 | ||||||
| 9,060 | Norwegian Cruise Line Holdings, Ltd.k | 385,322 | ||||||
| 36,331 | Nutrisystem, Inc. | 1,258,869 | ||||||
| 2,350 | O’Reilly Automotive, Inc.k | 654,264 | ||||||
| 13,420 | Oxford Industries, Inc. | 806,945 | ||||||
| 5,680 | Papa John’s International, Inc. | 486,094 | ||||||
| 7,303 | Papa Murphy’s Holdings, Inc.g,k | 30,819 | ||||||
| 18,530 | Pinnacle Entertainment, Inc.k | 268,685 | ||||||
| 12,550 | PVH Corporation | 1,132,512 | ||||||
| 3,720 | Ralph Lauren Corporation | 335,990 | ||||||
| 1,700 | Restoration Hardware Holdings, Inc.g,k | 52,190 | ||||||
| 5,630 | Retailmenot, Inc.k | 52,359 | ||||||
| 28,000 | Ross Stores, Inc. | 1,836,800 | ||||||
| 11,970 | Ruth’s Hospitality Group, Inc. | 219,051 | ||||||
| 8,400 | Sally Beauty Holdings, Inc.k | 221,928 | ||||||
| 63,764 | Scripps Networks Interactive, Inc. | 4,550,837 | ||||||
| 3,460 | Select Comfort Corporationk | 78,265 | ||||||
| 4,910 | Signet Jewelers, Ltd. | 462,817 | ||||||
| 8,882 | Sportsman’s Warehouse Holdings, Inc.k | 83,402 | ||||||
| 1,200 | Standard Motor Products, Inc. | 63,864 | ||||||
| 73,910 | Starbucks Corporation | 4,103,483 | ||||||
| 16,444 | Stein Mart, Inc. | 90,113 | ||||||
| 4,070 | Steven Madden, Ltd.k | 145,503 | ||||||
| 1,970 | Target Corporation | 142,293 | ||||||
| 32,330 | Tegna, Inc. | 691,539 | ||||||
| 6,200 | Tempur Sealy International, Inc.g,k | 423,336 | ||||||
| 2,075 | Tenneco, Inc.k | 129,625 | ||||||
| 20,850 | Time, Inc. | 372,172 | ||||||
The accompanying Notes to Financial Statements are an integral part of this schedule.
71
Table of Contents
MODERATELY CONSERVATIVE ALLOCATION PORTFOLIO
Schedule of Investments as of December 31, 2016
| Shares | Common Stock (22.2%) | Value | ||||||
Consumer Discretionary (2.9%) - continued | ||||||||
| 34,410 | TJX Companies, Inc. | $ | 2,585,223 | |||||
| 32,330 | Toll Brothers, Inc.k | 1,002,230 | ||||||
| 25,758 | Tower International, Inc. | 730,239 | ||||||
| 30,242 | Tuesday Morning Corporationk | 163,307 | ||||||
| 10,340 | Tupperware Brands Corporation | 544,091 | ||||||
| 1,550 | Ulta Salon Cosmetics & Fragrance, Inc.k | 395,157 | ||||||
| 4,950 | Under Armour, Inc., Class Ag,k | 143,797 | ||||||
| 4,981 | Under Armour, Inc., Class Ck | 125,372 | ||||||
| 1,900 | Vail Resorts, Inc. | 306,489 | ||||||
| 12,180 | Vera Bradley, Inc.k | 142,750 | ||||||
| 7,230 | VF Corporation | 385,721 | ||||||
| 2,890 | Visteon Corporation | 232,183 | ||||||
| 3,150 | Vitamin Shoppe, Inc.k | 74,812 | ||||||
| 65,310 | Walt Disney Company | 6,806,608 | ||||||
| 2,775 | Whirlpool Corporation | 504,412 | ||||||
| 8,690 | Wingstop, Inc. | 257,137 | ||||||
| 5,720 | Wolverine World Wide, Inc. | 125,554 | ||||||
| 2,650 | Wyndham Worldwide Corporation | 202,380 | ||||||
| 15,890 | Yum! Brands, Inc. | 1,006,314 | ||||||
| 6,960 | Zoe’s Kitchen, Inc.g,k | 166,970 | ||||||
|
| |||||||
Total | 136,225,325 | |||||||
|
| |||||||
Consumer Staples (0.8%) | ||||||||
| 9,204 | AdvancePierre Foods Holdings, Inc. | 274,095 | ||||||
| 9,310 | Brown-Forman Corporation | 418,205 | ||||||
| 578 | Casey’s General Stores, Inc. | 68,713 | ||||||
| 78,140 | Coca-Cola Company | 3,239,684 | ||||||
| 143,150 | CVS Health Corporation | 11,295,967 | ||||||
| 4,890 | Dr Pepper Snapple Group, Inc. | 443,376 | ||||||
| 884 | e.l.f. Beauty, Inc.g,k | 25,583 | ||||||
| 18,200 | Estee Lauder Companies, Inc. | 1,392,118 | ||||||
| 10,060 | Flowers Foods, Inc. | 200,898 | ||||||
| 18,760 | Hain Celestial Group, Inc.k | 732,203 | ||||||
| 4,600 | Ingredion, Inc. | 574,816 | ||||||
| 1,439 | J & J Snack Foods Corporation | 192,006 | ||||||
| 21,510 | Kimberly-Clark Corporation | 2,454,721 | ||||||
| 620 | Lancaster Colony Corporation | 87,662 | ||||||
| 3,290 | Mondelez International, Inc. | 145,846 | ||||||
| 22,120 | Monster Beverage Corporationk | 980,801 | ||||||
| 9,830 | PepsiCo, Inc. | 1,028,513 | ||||||
| 44,750 | Pinnacle Foods, Inc. | 2,391,887 | ||||||
| 13,980 | Procter & Gamble Company | 1,175,438 | ||||||
| 19,121 | SpartanNash Company | 756,044 | ||||||
| 7,330 | Sysco Corporation | 405,862 | ||||||
| 8,480 | United Natural Foods, Inc.k | 404,666 | ||||||
| 77,960 | Walgreens Boots Alliance, Inc. | 6,451,970 | ||||||
| 35,990 | Wal-Mart Stores, Inc. | 2,487,629 | ||||||
| 6,850 | WhiteWave Foods Companyk | 380,860 | ||||||
| 3,640 | Whole Foods Market, Inc. | 111,966 | ||||||
|
| |||||||
Total | 38,121,529 | |||||||
|
| |||||||
Energy (2.2%) | ||||||||
| 5,370 | Anadarko Petroleum Corporation | 374,450 | ||||||
| 8,156 | Arch Coal, Inc.g,k | 636,576 | ||||||
| 55,672 | Archrock, Inc. | 734,870 | ||||||
| 16,609 | Atwood Oceanics, Inc. | 218,076 | ||||||
| 65,894 | Baker Hughes, Inc. | 4,281,133 | ||||||
| 13,406 | Bristow Group, Inc. | 274,555 | ||||||
| 7,525 | Callon Petroleum Companyk | 115,659 | ||||||
| 51,680 | Canadian Natural Resources, Ltd. | 1,647,558 | ||||||
| 133,970 | Chevron Corporation | 15,768,269 | ||||||
| 8,200 | Cimarex Energy Company | 1,114,380 | ||||||
| 41,860 | Clean Energy Fuels Corporationk | 119,720 | ||||||
| 17,690 | Concho Resources, Inc.k | 2,345,694 | ||||||
| 60,250 | ConocoPhillips | 3,020,935 | ||||||
| 6,350 | Continental Resources, Inc.k | 327,279 | ||||||
| 15,449 | Contura Energy, Inc.k | 1,096,879 | ||||||
| 21,150 | Delek US Holdings, Inc. | 509,080 | ||||||
| 95,880 | Devon Energy Corporation | 4,378,840 | ||||||
| 9,810 | Diamond Offshore Drilling, Inc.k | 173,637 | ||||||
| 77,094 | Ensco plc | 749,354 | ||||||
| 28,620 | EOG Resources, Inc. | 2,893,482 | ||||||
| 16,800 | EP Energy Corporationk | 110,040 | ||||||
| 103,175 | EQT Corporation | 6,747,645 | ||||||
| 55,550 | Exxon Mobil Corporation | 5,013,943 | ||||||
| 12,870 | Frank’s International NV | 158,430 | ||||||
| 12,880 | Green Plains, Inc. | 358,708 | ||||||
| 2,590 | Gulfport Energy Corporationk | 56,048 | ||||||
| 100,390 | Halliburton Company | 5,430,095 | ||||||
| 14,590 | Helix Energy Solutions Group, Inc.k | 128,684 | ||||||
| 10,380 | HollyFrontier Corporation | 340,049 | ||||||
| 20,380 | Hornbeck Offshore Services, Inc.g,k | 147,144 | ||||||
| 7,040 | Kinder Morgan, Inc. | 145,798 | ||||||
| 473,603 | Marathon Oil Corporation | 8,198,068 | ||||||
| 3,670 | Murphy Oil Corporation | 114,247 | ||||||
| 136,270 | Nabors Industries, Ltd. | 2,234,828 | ||||||
| 3,100 | Noble Energy, Inc. | 117,986 | ||||||
| 21,019 | Oasis Petroleum, Inc.k | 318,228 | ||||||
| 3,850 | Oceaneering International, Inc. | 108,609 | ||||||
| 13,345 | Oil States International, Inc.k | 520,455 | ||||||
| 24,378 | Parsley Energy, Inc.k | 859,081 | ||||||
| 33,245 | Patterson-UTI Energy, Inc. | 894,955 | ||||||
| 7,520 | PBF Energy, Inc. | 209,658 | ||||||
| 3,880 | Phillips 66 | 335,271 | ||||||
| 35,707 | Pioneer Energy Services Corporationk | 244,593 | ||||||
| 41,790 | Pioneer Natural Resources Company | 7,525,125 | ||||||
| 20,200 | Range Resources Corporation | 694,072 | ||||||
| 57,350 | Rowan Companies plck | 1,083,342 | ||||||
| 30,464 | Royal Dutch Shell plc ADR | 1,656,632 | ||||||
| 18,320 | RPC, Inc.g | 362,919 | ||||||
| 37,458 | Schlumberger, Ltd. | 3,144,599 | ||||||
| 4,540 | SemGroup Corporation | 189,545 | ||||||
| 2,533 | SM Energy Company | 87,338 | ||||||
| 83,450 | Suncor Energy, Inc. ADR | 2,727,981 | ||||||
| 3,230 | Superior Energy Services, Inc. | 54,522 | ||||||
| 12,220 | Teekay Corporation | 98,127 | ||||||
| 28,631 | Teekay Tankers, Ltd. | 64,706 | ||||||
| 16,430 | Tesco Corporationk | 135,547 | ||||||
| 10,670 | Tesoro Corporation | 933,092 | ||||||
| 48,770 | TETRA Technologies, Inc.k | 244,825 | ||||||
| 24,280 | U.S. Silica Holdings, Inc. | 1,376,190 | ||||||
| 56,270 | Valero Energy Corporation | 3,844,366 | ||||||
| 3,112 | Vantage Drilling Internationalk | 314,312 | ||||||
| 631,490 | Weatherford International plck | 3,151,135 | ||||||
| 209,690 | WPX Energy, Inc.k | 3,055,183 | ||||||
|
| |||||||
Total | 104,316,547 | |||||||
|
| |||||||
Financials (3.7%) | ||||||||
| 11,770 | Affiliated Managers Group, Inc.k | 1,710,181 | ||||||
| 6,890 | Allied World Assurance Company Holdings AG | 370,062 | ||||||
| 3,260 | American Financial Group, Inc. | 287,271 | ||||||
| 49,360 | American International Group, Inc. | 3,223,702 | ||||||
| 13,925 | Ameris Bancorp | 607,130 | ||||||
| 5,310 | AMERISAFE, Inc. | 331,079 | ||||||
| 6,294 | Argo Group International Holdings, Ltd. | 414,775 | ||||||
| 24,100 | Aspen Insurance Holdings, Ltd. | 1,325,500 | ||||||
| 4,860 | Associated Banc-Corp | 120,042 | ||||||
| 36,970 | Assured Guaranty, Ltd. | 1,396,357 | ||||||
| 23,210 | BancorpSouth, Inc. | 720,671 | ||||||
| 809,270 | Bank of America Corporation | 17,884,867 | ||||||
| 20,800 | Bank of New York Mellon Corporation | 985,504 | ||||||
The accompanying Notes to Financial Statements are an integral part of this schedule.
72
Table of Contents
MODERATELY CONSERVATIVE ALLOCATION PORTFOLIO
Schedule of Investments as of December 31, 2016
| Shares | Common Stock (22.2%) | Value | ||||||
Financials (3.7%) - continued | ||||||||
| 5,650 | Bank of the Ozarks, Inc. | $ | 297,134 | |||||
| 6,120 | BankFinancial Corporation | 90,698 | ||||||
| 1,290 | Banner Corporation | 71,995 | ||||||
| 40,930 | BB&T Corporation | 1,924,529 | ||||||
| 23,590 | Beneficial Bancorp, Inc. | 434,056 | ||||||
| 950 | BlackRock, Inc. | 361,513 | ||||||
| 152,980 | Blackstone Group, LP | 4,135,049 | ||||||
| 46,310 | Boston Private Financial Holdings, Inc. | 766,431 | ||||||
| 25,150 | Brookline Bancorp, Inc. | 412,460 | ||||||
| 39,480 | Capital One Financial Corporation | 3,444,235 | ||||||
| 7,970 | Cathay General Bancorp | 303,099 | ||||||
| 18,950 | Central Pacific Financial Corporation | 595,409 | ||||||
| 10,490 | Charles Schwab Corporation | 414,040 | ||||||
| 9,034 | Chemical Financial Corporation | 489,372 | ||||||
| 27,800 | Chubb, Ltd. | 3,672,936 | ||||||
| 287,530 | Citigroup, Inc. | 17,087,908 | ||||||
| 5,730 | Citizens Financial Group, Inc. | 204,160 | ||||||
| 7,340 | Clifton Bancorp, Inc. | 124,193 | ||||||
| 48,765 | CoBiz Financial, Inc. | 823,641 | ||||||
| 12,719 | Columbia Banking System, Inc. | 568,285 | ||||||
| 97,010 | Comerica, Inc. | 6,607,351 | ||||||
| 94,740 | E*TRADE Financial Corporationk | 3,282,741 | ||||||
| 35,228 | East West Bancorp, Inc. | 1,790,639 | ||||||
| 35,080 | Eaton Vance Corporation | 1,469,150 | ||||||
| 14,459 | Employers Holdings, Inc. | 572,576 | ||||||
| 8,190 | Enova International, Inc.k | 102,785 | ||||||
| 5,600 | Essent Group, Ltd.k | 181,272 | ||||||
| 1,760 | Evercore Partners, Inc. | 120,912 | ||||||
| 7,880 | F.N.B. Corporation | 126,316 | ||||||
| 2,480 | Federated Investors, Inc. | 70,134 | ||||||
| 276,123 | Fifth Third Bancorp | 7,447,037 | ||||||
| 4,910 | First American Financial Corporation | 179,853 | ||||||
| 37,910 | First Commonwealth Financial Corporation | 537,564 | ||||||
| 9,010 | First Financial Bancorp | 256,335 | ||||||
| 3,920 | First Financial Corporation | 206,976 | ||||||
| 3,130 | First Merchants Corporation | 117,844 | ||||||
| 56,860 | First Midwest Bancorp, Inc. | 1,434,578 | ||||||
| 28,200 | First Republic Bank | 2,598,348 | ||||||
| 6,950 | Franklin Resources, Inc. | 275,081 | ||||||
| 10,965 | Glacier Bancorp, Inc. | 397,262 | ||||||
| 53,580 | Goldman Sachs Group, Inc. | 12,829,731 | ||||||
| 35,450 | Great Western Bancorp, Inc. | 1,545,265 | ||||||
| 25,130 | Green Bancorp, Inc.k | 381,976 | ||||||
| 2,980 | Greenhill & Company, Inc. | 82,546 | ||||||
| 33,286 | Hanmi Financial Corporation | 1,161,681 | ||||||
| 20,839 | Hanover Insurance Group, Inc. | 1,896,557 | ||||||
| 6,360 | Hartford Financial Services Group, Inc. | 303,054 | ||||||
| 2,400 | Hilltop Holdings, Inc. | 71,520 | ||||||
| 25,176 | Home BancShares, Inc. | 699,138 | ||||||
| 2,360 | HomeStreet, Inc.k | 74,576 | ||||||
| 3,380 | Hometrust Bancshares, Inc.k | 87,542 | ||||||
| 36,238 | Hope Bancorp, Inc. | 793,250 | ||||||
| 9,941 | Horace Mann Educators Corporation | 425,475 | ||||||
| 12,331 | Houlihan Lokey, Inc. | 383,741 | ||||||
| 77,350 | Huntington Bancshares, Inc. | 1,022,567 | ||||||
| 3,209 | Infinity Property & Casualty Corporation | 282,071 | ||||||
| 79,280 | Intercontinental Exchange, Inc. | 4,472,978 | ||||||
| 136,570 | Invesco, Ltd. | 4,143,534 | ||||||
| 38,912 | Janus Capital Group, Inc. | 516,362 | ||||||
| 126,400 | KeyCorp | 2,309,328 | ||||||
| 5,948 | Kinsale Capital Group, Inc. | 202,291 | ||||||
| 3,100 | Lazard, Ltd. | 127,379 | ||||||
| 2,260 | Legg Mason, Inc. | 67,597 | ||||||
| 1,278 | Lincoln National Corporation | 84,693 | ||||||
| 2,750 | M&T Bank Corporation | 430,183 | ||||||
| 230 | Markel Corporationk | 208,035 | ||||||
| 3,590 | Meta Financial Group, Inc. | 369,411 | ||||||
| 149,300 | MetLife, Inc. | 8,045,777 | ||||||
| 128,590 | Morgan Stanley | 5,432,928 | ||||||
| 16,950 | National Bank Holdings Corporation | 540,535 | ||||||
| 1,220 | Navigators Group, Inc. | 143,655 | ||||||
| 8,130 | NMI Holdings, Inc.k | 86,584 | ||||||
| 4,400 | PacWest Bancorp | 239,536 | ||||||
| 5,650 | Primerica, Inc. | 390,697 | ||||||
| 1,240 | Principal Financial Group, Inc. | 71,746 | ||||||
| 18,490 | Provident Financial Services, Inc. | 523,267 | ||||||
| 36,433 | Raymond James Financial, Inc. | 2,523,714 | ||||||
| 8,931 | Renasant Corporation | 377,067 | ||||||
| 1,126 | Safety Insurance Group, Inc. | 82,986 | ||||||
| 13,575 | Sandy Spring Bancorp, Inc. | 542,864 | ||||||
| 1,330 | SEI Investments Company | 65,649 | ||||||
| 3,080 | Selective Insurance Group, Inc. | 132,594 | ||||||
| 131,810 | SLM Corporationk | 1,452,546 | ||||||
| 3,045 | State Auto Financial Corporation | 81,636 | ||||||
| 11,700 | Stewart Information Services Corporation | 539,136 | ||||||
| 18,161 | Stifel Financial Corporationk | 907,142 | ||||||
| 14,075 | SVB Financial Groupk | 2,416,115 | ||||||
| 198,800 | Synchrony Financial | 7,210,476 | ||||||
| 18,980 | Synovus Financial Corporation | 779,698 | ||||||
| 53,170 | TCF Financial Corporation | 1,041,600 | ||||||
| 41,540 | TD Ameritrade Holding Corporation | 1,811,144 | ||||||
| 3,360 | Territorial Bancorp, Inc. | 110,342 | ||||||
| 8,000 | TriCo Bancshares | 273,440 | ||||||
| 54,680 | TrustCo Bank Corporation | 478,450 | ||||||
| 3,080 | Trustmark Corporation | 109,802 | ||||||
| 35,140 | Umpqua Holdings Corporation | 659,929 | ||||||
| 2,790 | Union Bankshares Corporation | 99,715 | ||||||
| 13,040 | United Community Banks, Inc. | 386,245 | ||||||
| 23,230 | United Financial Bancorp, Inc. | 421,857 | ||||||
| 1,480 | United Fire Group, Inc. | 72,772 | ||||||
| 3,750 | Unum Group | 164,738 | ||||||
| 3,780 | Virtu Financial, Inc. | 60,291 | ||||||
| 4,440 | Voya Financial, Inc. | 174,137 | ||||||
| 2,590 | Western Alliance Bancorpk | 126,159 | ||||||
| 3,118 | Wintrust Financial Corporation | 226,273 | ||||||
| 9,010 | WisdomTree Investments, Inc.g | 100,371 | ||||||
| 4,496 | WSFS Financial Corporation | 208,390 | ||||||
| 163,954 | Zions Bancorporation | 7,056,580 | ||||||
|
| |||||||
Total | 174,514,102 | |||||||
|
| |||||||
Health Care (2.8%) | ||||||||
| 16,430 | Abbott Laboratories | 631,076 | ||||||
| 2,840 | ABIOMED, Inc.k | 320,011 | ||||||
| 7,352 | Acadia Healthcare Company, Inc.k | 243,351 | ||||||
| 1,690 | Acceleron Pharma, Inc.k | 43,129 | ||||||
| 2,490 | Aceto Corporation | 54,705 | ||||||
| 9,530 | Advaxis, Inc.g,k | 68,235 | ||||||
| 3,510 | Aerie Pharmaceuticals, Inc.k | 132,853 | ||||||
| 12,040 | Aetna, Inc. | 1,493,080 | ||||||
| 15,790 | Akorn, Inc.k | 344,696 | ||||||
| 65,650 | Alexion Pharmaceuticals, Inc.k | 8,032,278 | ||||||
| 3,860 | Align Technology, Inc.k | 371,062 | ||||||
| 40,250 | Allergan plck | 8,452,903 | ||||||
| 17,481 | Amgen, Inc. | 2,555,897 | ||||||
| 6,917 | Analogic Corporation | 573,765 | ||||||
| 3,760 | AngioDynamics, Inc.k | 63,431 | ||||||
| 31,298 | Asterias Biotherapeutics, Inc.g,k | 143,971 | ||||||
| 822 | Atrion Corporation | 416,918 | ||||||
The accompanying Notes to Financial Statements are an integral part of this schedule.
73
Table of Contents
MODERATELY CONSERVATIVE ALLOCATION PORTFOLIO
Schedule of Investments as of December 31, 2016
| Shares | Common Stock (22.2%) | Value | ||||||
Health Care (2.8%) - continued | ||||||||
| 4,760 | Biogen, Inc.k | $ | 1,349,841 | |||||
| 9,740 | BioMarin Pharmaceutical, Inc.k | 806,862 | ||||||
| 4,550 | Bristol-Myers Squibb Company | 265,902 | ||||||
| 3,422 | C.R. Bard, Inc. | 768,787 | ||||||
| 7,700 | Cardinal Health, Inc. | 554,169 | ||||||
| 9,350 | Cardiovascular Systems, Inc.k | 226,363 | ||||||
| 28,620 | Catalent, Inc.k | 771,595 | ||||||
| 86,270 | Celgene Corporationk | 9,985,753 | ||||||
| 3,590 | Centene Corporationk | 202,871 | ||||||
| 10,590 | Charles River Laboratories International, Inc.k | 806,852 | ||||||
| 3,740 | Chemed Corporation | 599,933 | ||||||
| 1,840 | Coherus Biosciences, Inc.k | 51,796 | ||||||
| 4,260 | CONMED Corporation | 188,164 | ||||||
| 14,010 | Cooper Companies, Inc. | 2,450,769 | ||||||
| 4,370 | Cross Country Healthcare, Inc.k | 68,216 | ||||||
| 33,700 | Dentsply Sirona, Inc. | 1,945,501 | ||||||
| 8,330 | Dexcom, Inc.k | 497,301 | ||||||
| 21,190 | Diplomat Pharmacy, Inc.k | 266,994 | ||||||
| 29,925 | Edwards Lifesciences Corporationk | 2,803,973 | ||||||
| 2,060 | Emergent Biosolutions, Inc.k | 67,650 | ||||||
| 11,738 | Ensign Group, Inc. | 260,701 | ||||||
| 8,020 | Envision Healthcare Corporationk | 507,586 | ||||||
| 69,810 | Express Scripts Holding Companyk | 4,802,230 | ||||||
| 9,550 | GenMark Diagnostics, Inc.k | 116,892 | ||||||
| 146,955 | Gilead Sciences, Inc. | 10,523,448 | ||||||
| 3,900 | Global Blood Therapeutics, Inc.k | 56,355 | ||||||
| 5,420 | HCA Holdings, Inc.k | 401,188 | ||||||
| 3,044 | HealthEquity, Inc.k | 123,343 | ||||||
| 6,680 | Healthways, Inc.k | 151,970 | ||||||
| 3,530 | Heska Corporationk | 252,748 | ||||||
| 18,270 | Hill-Rom Holdings, Inc. | 1,025,678 | ||||||
| 34,610 | Hologic, Inc.k | 1,388,553 | ||||||
| 3,680 | ICU Medical, Inc.k | 542,248 | ||||||
| 4,945 | Inogen, Inc.k | 332,156 | ||||||
| 9,630 | Intersect ENT, Inc.k | 116,523 | ||||||
| 1,590 | Intra-Cellular Therapies, Inc.k | 23,993 | ||||||
| 5,600 | Ironwood Pharmaceuticals, Inc.k | 85,624 | ||||||
| 43,320 | Johnson & Johnson | 4,990,897 | ||||||
| 19,110 | Kindred Healthcare, Inc. | 150,014 | ||||||
| 11,150 | Magellan Health Services, Inc.k | 839,038 | ||||||
| 140,449 | Medtronic plc | 10,004,182 | ||||||
| 213,860 | Merck & Company, Inc. | 12,589,938 | ||||||
| 2,380 | Mettler-Toledo International, Inc.k | 996,173 | ||||||
| 19,630 | Mylan NVk | 748,885 | ||||||
| 6,193 | National Healthcare Corporation | 469,367 | ||||||
| 6,590 | Neurocrine Biosciences, Inc.k | 255,033 | ||||||
| 6,156 | Nevro Corporationk | 447,295 | ||||||
| 15,585 | NuVasive, Inc.k | 1,049,806 | ||||||
| 13,700 | Omnicell, Inc.k | 464,430 | ||||||
| 47,390 | OraSure Technologies, Inc.k | 416,084 | ||||||
| 5,930 | Orthofix International NVk | 214,547 | ||||||
| 7,820 | PerkinElmer, Inc. | 407,813 | ||||||
| 8,470 | Perrigo Company plc | 704,958 | ||||||
| 277,770 | Pfizer, Inc. | 9,021,970 | ||||||
| 6,260 | PharMerica Corporationk | 157,439 | ||||||
| 1,000 | Prothena Corporation plck | 49,190 | ||||||
| 81,560 | Roche Holding AG ADR | 2,326,907 | ||||||
| 4,650 | Surgical Care Affiliates, Inc.k | 215,155 | ||||||
| 8,300 | Teleflex, Inc. | 1,337,545 | ||||||
| 10,960 | Triple-S Management Corporationk | 226,872 | ||||||
| 39,698 | UnitedHealth Group, Inc. | 6,353,268 | ||||||
| 14,230 | Universal Health Services, Inc. | 1,513,787 | ||||||
| 3,840 | VCA Antech, Inc.k | 263,616 | ||||||
| 7,950 | Veeva Systems, Inc.k | 323,565 | ||||||
| 52,451 | Vertex Pharmaceuticals, Inc.k | 3,864,065 | ||||||
| 4,740 | Waters Corporationk | 637,009 | ||||||
| 2,810 | West Pharmaceutical Services, Inc. | 238,372 | ||||||
| 23,930 | Wright Medical Group NVk | 549,911 | ||||||
| 10,410 | Ziopharm Oncology, Inc.g,k | 55,693 | ||||||
| 11,900 | Zoetis, Inc. | 637,007 | ||||||
|
| |||||||
Total | 131,851,720 | |||||||
|
| |||||||
Industrials (2.4%) | ||||||||
| 8,660 | ABM Industries, Inc. | 353,674 | ||||||
| 19,750 | Acuity Brands, Inc. | 4,559,485 | ||||||
| 15,504 | Aegion Corporationk | 367,445 | ||||||
| 2,130 | Aerovironment, Inc.k | 57,148 | ||||||
| 12,640 | AGCO Corporation | 731,350 | ||||||
| 25,760 | Ardmore Shipping Corporation | 190,624 | ||||||
| 4,973 | Astec Industries, Inc. | 335,479 | ||||||
| 14,549 | AZZ, Inc. | 929,681 | ||||||
| 16,280 | B/E Aerospace, Inc. | 979,893 | ||||||
| 17,710 | Barnes Group, Inc. | 839,808 | ||||||
| 23,870 | Boeing Company | 3,716,082 | ||||||
| 52,790 | BWX Technologies, Inc. | 2,095,763 | ||||||
| 17,890 | Carlisle Companies, Inc. | 1,973,088 | ||||||
| 3,970 | CEB, Inc. | 240,582 | ||||||
| 6,782 | CIRCOR International, Inc. | 440,016 | ||||||
| 1,565 | CLARCOR, Inc. | 129,066 | ||||||
| 4,300 | Colfax Corporationk | 154,499 | ||||||
| 14,705 | Comfort Systems USA, Inc. | 489,676 | ||||||
| 12,110 | Copart, Inc.k | 671,015 | ||||||
| 2,720 | Crane Company | 196,166 | ||||||
| 118,080 | CSX Corporation | 4,242,614 | ||||||
| 42,560 | Cummins, Inc. | 5,816,675 | ||||||
| 4,650 | Curtiss-Wright Corporation | 457,374 | ||||||
| 125,540 | Delta Air Lines, Inc. | 6,175,313 | ||||||
| 930 | Deluxe Corporation | 66,597 | ||||||
| 16,850 | Donaldson Company, Inc. | 709,048 | ||||||
| 5,510 | EMCOR Group, Inc. | 389,888 | ||||||
| 5,370 | Encore Wire Corporation | 232,789 | ||||||
| 13,440 | EnerSys | 1,049,664 | ||||||
| 1,110 | EnPro Industries, Inc. | 74,770 | ||||||
| 3,155 | Equifax, Inc. | 373,016 | ||||||
| 5,218 | ESCO Technologies, Inc. | 295,600 | ||||||
| 22,126 | Federal Signal Corporation | 345,387 | ||||||
| 3,340 | Fortive Corporation | 179,124 | ||||||
| 9,580 | Fortune Brands Home and Security, Inc. | 512,147 | ||||||
| 8,155 | Franklin Electric Company, Inc. | 317,229 | ||||||
| 5,840 | GasLog, Ltd. | 94,024 | ||||||
| 14,120 | Gener8 Maritime, Inc.k | 63,258 | ||||||
| 13,068 | Gibraltar Industries, Inc.k | 544,282 | ||||||
| 8,432 | Granite Construction, Inc. | 463,760 | ||||||
| 34,730 | Harsco Corporation | 472,328 | ||||||
| 4,670 | Healthcare Services Group, Inc. | 182,924 | ||||||
| 5,626 | Heico Corporation | 434,046 | ||||||
| 7,600 | Herman Miller, Inc. | 259,920 | ||||||
| 10,670 | Hexcel Corporation | 548,865 | ||||||
| 47,994 | Honeywell International, Inc. | 5,560,105 | ||||||
| 2,790 | Hub Group, Inc.k | 122,063 | ||||||
| 7,390 | Hubbell, Inc. | 862,413 | ||||||
| 3,850 | Huntington Ingalls Industries, Inc. | 709,131 | ||||||
| 3,950 | ICF International, Inc.k | 218,040 | ||||||
| 69,120 | Ingersoll-Rand plc | 5,186,765 | ||||||
| 3,270 | Insperity, Inc. | 232,007 | ||||||
| 2,190 | Insteel Industries, Inc. | 78,052 | ||||||
| 3,020 | Interface, Inc. | 56,021 | ||||||
| 6,040 | ITT Corporation | 232,963 | ||||||
| 1,110 | Jacobs Engineering Group, Inc.k | 63,270 | ||||||
| 7,410 | JB Hunt Transport Services, Inc. | 719,289 | ||||||
| 20,975 | Johnson Controls International plc | 863,960 | ||||||
The accompanying Notes to Financial Statements are an integral part of this schedule.
74
Table of Contents
MODERATELY CONSERVATIVE ALLOCATION PORTFOLIO
Schedule of Investments as of December 31, 2016
| Shares | Common Stock (22.2%) | Value | ||||||
Industrials (2.4%) - continued | ||||||||
| 5,100 | Kansas City Southern | $ | 432,735 | |||||
| 8,210 | KBR, Inc. | 137,025 | ||||||
| 47,430 | Kennametal, Inc. | 1,482,662 | ||||||
| 14,758 | Kforce, Inc. | 340,910 | ||||||
| 8,310 | Kirby Corporationk | 552,615 | ||||||
| 22,540 | Korn/Ferry International | 663,352 | ||||||
| 20,529 | Lincoln Electric Holdings, Inc. | 1,573,958 | ||||||
| 3,540 | Lindsay Corporationg | 264,119 | ||||||
| 2,800 | Manpower, Inc. | 248,836 | ||||||
| 5,200 | Masco Corporation | 164,424 | ||||||
| 5,840 | Masonite International Corporationk | 384,272 | ||||||
| 13,600 | Meritor, Inc.k | 168,912 | ||||||
| 2,740 | Middleby Corporationk | 352,939 | ||||||
| 11,600 | Moog, Inc.k | 761,888 | ||||||
| 12,060 | MRC Global, Inc.k | 244,336 | ||||||
| 9,545 | MSA Safety, Inc. | 661,755 | ||||||
| 1,930 | Mueller Industries, Inc. | 77,123 | ||||||
| 12,110 | MYR Group, Inc.k | 456,305 | ||||||
| 20,488 | Navigant Consulting, Inc.k | 536,376 | ||||||
| 8,250 | NCI Building Systems, Inc.k | 129,113 | ||||||
| 9,340 | Nielsen Holdings plc | 391,813 | ||||||
| 1,442 | Nordson Corporation | 161,576 | ||||||
| 35,735 | Norfolk Southern Corporation | 3,861,881 | ||||||
| 6,350 | Old Dominion Freight Line, Inc.k | 544,766 | ||||||
| 6,690 | On Assignment, Inc.k | 295,430 | ||||||
| 6,650 | Orbital ATK, Inc. | 583,405 | ||||||
| 20,827 | Oshkosh Corporation | 1,345,632 | ||||||
| 11,210 | PGT Innovations, Inc.k | 128,354 | ||||||
| 6,130 | Proto Labs, Inc.k | 314,775 | ||||||
| 4,510 | Quanex Building Products Corporation | 91,553 | ||||||
| 19,510 | Raven Industries, Inc. | 491,652 | ||||||
| 20,280 | Raytheon Company | 2,879,760 | ||||||
| 830 | RBC Bearings, Inc.k | 77,032 | ||||||
| 2,690 | Regal-Beloit Corporation | 186,283 | ||||||
| 12,700 | Resources Connection, Inc. | 244,475 | ||||||
| 3,150 | Rexnord Corporationk | 61,709 | ||||||
| 16,330 | Rockwell Automation, Inc. | 2,194,752 | ||||||
| 11,380 | Rockwell Collins, Inc. | 1,055,609 | ||||||
| 6,530 | Roper Industries, Inc. | 1,195,512 | ||||||
| 1,730 | Ryder System, Inc. | 128,781 | ||||||
| 13,910 | Saia, Inc.k | 614,126 | ||||||
| 54,820 | Southwest Airlines Company | 2,732,229 | ||||||
| 10,020 | SPX FLOW, Inc.k | 321,241 | ||||||
| 820 | Standex International Corporation | 72,037 | ||||||
| 1,040 | Stanley Black & Decker, Inc. | 119,278 | ||||||
| 2,330 | Stericycle, Inc.k | 179,503 | ||||||
| 5,151 | Team, Inc.k | 202,177 | ||||||
| 4,793 | Tennant Company | 341,262 | ||||||
| 1,760 | Tetra Tech, Inc. | 75,944 | ||||||
| 6,019 | Textron, Inc. | 292,283 | ||||||
| 34,280 | TransUnionk | 1,060,280 | ||||||
| 3,440 | TrueBlue, Inc.k | 84,796 | ||||||
| 92,962 | Union Pacific Corporation | 9,638,300 | ||||||
| 20,790 | United Continental Holdings, Inc.k | 1,515,175 | ||||||
| 56,400 | United Parcel Service, Inc. | 6,465,696 | ||||||
| 10,110 | United Rentals, Inc.k | 1,067,414 | ||||||
| 4,849 | Universal Forest Products, Inc. | 495,471 | ||||||
| 10,553 | Universal Truckload Services, Inc. | 172,542 | ||||||
| 17,580 | WABCO Holdings, Inc.k | 1,866,117 | ||||||
| 3,870 | WageWorks, Inc.k | 280,575 | ||||||
| 23,443 | Waste Connections, Inc. | 1,842,385 | ||||||
| 800 | Watsco, Inc. | 118,496 | ||||||
| 15,080 | Xylem, Inc. | 746,762 | ||||||
| 7,030 | YRC Worldwide, Inc.k | 93,358 | ||||||
|
| |||||||
Total | 114,921,113 | |||||||
|
| |||||||
Information Technology (5.3%) | ||||||||
| 53,150 | Agilent Technologies, Inc. | 2,421,514 | ||||||
| 25,695 | Akamai Technologies, Inc.k | 1,713,343 | ||||||
| 8,810 | Alliance Data Systems Corporation | 2,013,085 | ||||||
| 19,129 | Alphabet, Inc., Class Ak | 15,158,776 | ||||||
| 18,541 | Alphabet, Inc., Class Ck | 14,310,315 | ||||||
| 3,870 | Ambarella, Inc.g,k | 209,483 | ||||||
| 15,450 | Amkor Technology, Inc.k | 162,998 | ||||||
| 31,890 | Amphenol Corporation | 2,143,008 | ||||||
| 42,440 | Analog Devices, Inc. | 3,081,993 | ||||||
| 175,274 | Apple, Inc. | 20,300,235 | ||||||
| 26,055 | Applied Materials, Inc. | 840,795 | ||||||
| 4,370 | Apptio, Inc.k | 80,976 | ||||||
| 12,891 | Arista Networks, Inc.k | 1,247,462 | ||||||
| 48,700 | ARRIS International plck | 1,467,331 | ||||||
| 2,280 | Aspen Technology, Inc.k | 124,670 | ||||||
| 6,620 | AVX Corporation | 103,471 | ||||||
| 7,640 | Bankrate, Inc.k | 84,422 | ||||||
| 7,240 | Belden, Inc. | 541,335 | ||||||
| 20,040 | Blackhawk Network Holdings, Inc.k | 755,007 | ||||||
| 45,120 | Booz Allen Hamilton Holding Corporation | 1,627,478 | ||||||
| 31,507 | Brooks Automation, Inc. | 537,824 | ||||||
| 5,510 | CA, Inc. | 175,053 | ||||||
| 7,092 | Cabot Microelectronics Corporation | 448,002 | ||||||
| 1,940 | CACI International, Inc.k | 241,142 | ||||||
| 3,490 | Cadence Design Systems, Inc.k | 88,018 | ||||||
| 3,530 | Carbonite, Inc.k | 57,892 | ||||||
| 4,440 | Cavium, Inc.k | 277,234 | ||||||
| 5,820 | CDK Global, Inc. | 347,396 | ||||||
| 37,260 | Ciena Corporationk | 909,517 | ||||||
| 1,150 | Cirrus Logic, Inc.k | 65,021 | ||||||
| 564,820 | Cisco Systems, Inc. | 17,068,860 | ||||||
| 3,620 | Cognex Corporation | 230,304 | ||||||
| 3,400 | Coherent, Inc.k | 467,109 | ||||||
| 29,080 | CommVault Systems, Inc.k | 1,494,712 | ||||||
| 4,740 | Comtech Telecommunications Corporation | 56,169 | ||||||
| 10,630 | Convergys Corporation | 261,073 | ||||||
| 28,570 | CoreLogic, Inc.k | 1,052,233 | ||||||
| 19,791 | Criteo SA ADRg,k | 813,014 | ||||||
| 3,380 | CTS Corporation | 75,712 | ||||||
| 17,180 | Dolby Laboratories, Inc. | 776,364 | ||||||
| 11,990 | DST Systems, Inc. | 1,284,728 | ||||||
| 32,400 | eBay, Inc.k | 961,956 | ||||||
| 6,840 | Entegris, Inc.k | 122,436 | ||||||
| 7,810 | Envestnet, Inc.k | 275,303 | ||||||
| 7,130 | EVERTEC, Inc. | 126,557 | ||||||
| 9,380 | ExlService Holdings, Inc.k | 473,127 | ||||||
| 4,160 | F5 Networks, Inc.k | 602,035 | ||||||
| 12,543 | Fabrinetk | 505,483 | ||||||
| 148,240 | Facebook, Inc.k | 17,055,012 | ||||||
| 9,350 | Finisar Corporationk | 283,025 | ||||||
| 46,830 | FLIR Systems, Inc. | 1,694,778 | ||||||
| 1,610 | Forrester Research, Inc. | 69,150 | ||||||
| 27,520 | Fortinet, Inc.k | 828,902 | ||||||
| 18,563 | Guidewire Software, Inc.k | 915,713 | ||||||
| 5,150 | IAC/InterActiveCorporationk | 333,668 | ||||||
| 4,240 | Insight Enterprises, Inc.k | 171,466 | ||||||
| 44,990 | Integrated Device Technology, Inc.k | 1,059,964 | ||||||
| 49,480 | Intel Corporation | 1,794,640 | ||||||
| 27,915 | Ixiak | 449,431 | ||||||
| 2,120 | Keysight Technologies, Inc.k | 77,528 | ||||||
| 12,940 | Lam Research Corporation | 1,368,146 | ||||||
| 12,590 | Liberty Tripadvisor Holdings, Inc.k | 189,479 | ||||||
| 3,131 | Littelfuse, Inc. | 475,192 | ||||||
The accompanying Notes to Financial Statements are an integral part of this schedule.
75
Table of Contents
MODERATELY CONSERVATIVE ALLOCATION PORTFOLIO
Schedule of Investments as of December 31, 2016
| Shares | Common Stock (22.2%) | Value | ||||||
Information Technology (5.3%) - continued | ||||||||
| 7,040 | M/A-COM Technology Solutions Holdings, Inc.k | $ | 325,811 | |||||
| 2,500 | Manhattan Associates, Inc.k | 132,575 | ||||||
| 123,240 | MasterCard, Inc. | 12,724,530 | ||||||
| 39,645 | Maxim Integrated Products, Inc. | 1,529,108 | ||||||
| 2,460 | MAXIMUS, Inc. | 137,243 | ||||||
| 12,153 | Methode Electronics, Inc. | 502,527 | ||||||
| 7,240 | Microsemi Corporationk | 390,743 | ||||||
| 468,180 | Microsoft Corporation | 29,092,705 | ||||||
| 5,050 | Mobileye NVk | 192,506 | ||||||
| 18,510 | Monolithic Power Systems, Inc. | 1,516,524 | ||||||
| 6,360 | Monotype Imaging Holdings, Inc. | 126,246 | ||||||
| 18,690 | National Instruments Corporation | 576,026 | ||||||
| 4,230 | NetApp, Inc. | 149,192 | ||||||
| 8,750 | New Relic, Inc.k | 247,187 | ||||||
| 9,540 | Nice, Ltd. ADR | 655,970 | ||||||
| 27,711 | NVIDIA Corporation | 2,957,872 | ||||||
| 8,180 | NXP Semiconductors NVk | 801,722 | ||||||
| 16,299 | Oclaro, Inc.k | 145,876 | ||||||
| 24,010 | ON Semiconductor Corporationk | 306,368 | ||||||
| 264,790 | Oracle Corporation | 10,181,175 | ||||||
| 2,750 | OSI Systems, Inc.k | 209,330 | ||||||
| 18,670 | Palo Alto Networks, Inc.k | 2,334,683 | ||||||
| 58,570 | Pandora Media, Inc.g,k | 763,753 | ||||||
| 8,600 | Paycom Software, Inc.k | 391,214 | ||||||
| 4,300 | Paylocity Holding Corporationk | 129,043 | ||||||
| 218,570 | PayPal Holdings, Inc.k | 8,626,958 | ||||||
| 14,777 | Pegasystems, Inc. | 531,972 | ||||||
| 13,500 | Progress Software Corporation | 431,055 | ||||||
| 8,710 | Proofpoint, Inc.k | 615,361 | ||||||
| 8,870 | PTC, Inc.k | 410,415 | ||||||
| 10,473 | Q2 Holdings, Inc.k | 302,146 | ||||||
| 1,220 | Qorvo, Inc.k | 64,331 | ||||||
| 30,520 | QUALCOMM, Inc. | 1,989,904 | ||||||
| 2,000 | Qualys, Inc.k | 63,300 | ||||||
| 8,790 | RealPage, Inc.k | 263,700 | ||||||
| 9,150 | Red Hat, Inc.k | 637,755 | ||||||
| 12,166 | Rudolph Technologies, Inc.k | 284,076 | ||||||
| 169,040 | Salesforce.com, Inc.k | 11,572,478 | ||||||
| 2,360 | ScanSource, Inc.k | 95,226 | ||||||
| 14,440 | ServiceNow, Inc.k | 1,073,470 | ||||||
| 15,300 | ShoreTel, Inc.k | 109,395 | ||||||
| 1,070 | Silicon Laboratories, Inc.k | 69,550 | ||||||
| 5,700 | SS&C Technologies Holdings, Inc. | 163,020 | ||||||
| 13,510 | Synopsys, Inc.k | 795,199 | ||||||
| 68,123 | Teradyne, Inc. | 1,730,324 | ||||||
| 1,720 | Tessera Technologies, Inc. | 76,024 | ||||||
| 89,480 | Texas Instruments, Inc. | 6,529,356 | ||||||
| 3,160 | Total System Services, Inc. | 154,935 | ||||||
| 8,860 | Trimble, Inc.k | 267,129 | ||||||
| 2,610 | Tyler Technologies, Inc.k | 372,630 | ||||||
| 1,600 | Ultimate Software Group, Inc.k | 291,760 | ||||||
| 1,800 | Verint Systems, Inc.k | 63,450 | ||||||
| 26,032 | Virtusa Corporationk | 653,924 | ||||||
| 167,110 | Visa, Inc. | 13,037,922 | ||||||
| 1,060 | Western Digital Corporation | 72,027 | ||||||
| 143,990 | Xerox Corporation | 1,257,033 | ||||||
| 43,620 | Xilinx, Inc. | 2,633,339 | ||||||
|
| |||||||
Total | 246,707,158 | |||||||
|
| |||||||
Materials (0.9%) | ||||||||
| 5,310 | Agnico Eagle Mines, Ltd. | 223,020 | ||||||
| 9,280 | Air Products and Chemicals, Inc. | 1,334,650 | ||||||
| 7,460 | American Vanguard Corporation | 142,859 | ||||||
| 8,230 | Ashland Global Holdings, Inc. | 899,457 | ||||||
| 3,190 | Avery Dennison Corporation | 224,002 | ||||||
| 29,860 | Axalta Coating Systems, Ltd.k | 812,192 | ||||||
| 5,026 | Balchem Corporation | 421,782 | ||||||
| 4,440 | Ball Corporation | 333,311 | ||||||
| 29,630 | Barrick Gold Corporation | 473,487 | ||||||
| 9,820 | Boise Cascade Companyk | 220,950 | ||||||
| 7,180 | Cabot Corporation | 362,877 | ||||||
| 4,600 | Carpenter Technology Corporation | 166,382 | ||||||
| 15,750 | Celanese Corporation | 1,240,155 | ||||||
| 10,077 | Chemtura Corporationk | 334,556 | ||||||
| 6,150 | Continental Building Products, Inc.k | 142,065 | ||||||
| 16,470 | Crown Holdings, Inc.k | 865,828 | ||||||
| 68,250 | Dow Chemical Company | 3,905,265 | ||||||
| 1,080 | Eagle Materials, Inc. | 106,412 | ||||||
| 63,426 | Eastman Chemical Company | 4,770,269 | ||||||
| 19,180 | Ecolab, Inc. | 2,248,280 | ||||||
| 20,580 | Eldorado Gold Corporationk | 66,268 | ||||||
| 9,550 | Ferro Corporationk | 136,852 | ||||||
| 19,660 | Ferroglobe plc | 212,918 | ||||||
| 19,660 | Ferroglobe Representation & Warranty Insurance Trustk,l | 2 | ||||||
| 24,640 | FMC Corporation | 1,393,638 | ||||||
| 20,180 | Goldcorp, Inc. | 274,448 | ||||||
| 164,030 | Graphic Packaging Holding Company | 2,047,094 | ||||||
| 7,820 | Huntsman Corporation | 149,206 | ||||||
| 1,347 | Ingevity Corporationk | 73,896 | ||||||
| 1,240 | Innophos Holdings, Inc. | 64,802 | ||||||
| 4,338 | Innospec, Inc. | 297,153 | ||||||
| 1,350 | International Flavors & Fragrances, Inc. | 159,071 | ||||||
| 18,920 | International Paper Company | 1,003,895 | ||||||
| 4,220 | Kadant, Inc. | 258,264 | ||||||
| 15,090 | KapStone Paper and Packaging Corporation | 332,735 | ||||||
| 35,510 | Kinross Gold Corporationk | 110,436 | ||||||
| 2,620 | Koppers Holdings, Inc.k | 105,586 | ||||||
| 1,380 | Martin Marietta Materials, Inc. | 305,711 | ||||||
| 6,770 | Materion Corporation | 268,092 | ||||||
| 5,430 | Methanex Corporation | 237,834 | ||||||
| 3,476 | Minerals Technologies, Inc. | 268,521 | ||||||
| 109,380 | Mosaic Company | 3,208,115 | ||||||
| 20,664 | Myers Industries, Inc. | 295,495 | ||||||
| 820 | Neenah Paper, Inc. | 69,864 | ||||||
| 25,890 | Newmont Mining Corporation | 882,072 | ||||||
| 16,030 | Nucor Corporation | 954,106 | ||||||
| 9,880 | OMNOVA Solutions, Inc.k | 98,800 | ||||||
| 24,940 | Owens-Illinois, Inc.k | 434,205 | ||||||
| 24,953 | Packaging Corporation of America | 2,116,514 | ||||||
| 3,740 | PolyOne Corporation | 119,830 | ||||||
| 620 | Quaker Chemical Corporation | 79,323 | ||||||
| 7,090 | Rayonier Advanced Materials, Inc. | 109,611 | ||||||
| 3,930 | Reliance Steel & Aluminum Company | 312,592 | ||||||
| 1,910 | Royal Gold, Inc. | 120,999 | ||||||
| 7,870 | Schnitzer Steel Industries, Inc. | 202,259 | ||||||
| 1,560 | Schweitzer-Mauduit International, Inc. | 71,027 | ||||||
| 4,257 | Scotts Miracle-Gro Company | 406,756 | ||||||
| 5,880 | Sealed Air Corporation | 266,599 | ||||||
| 7,650 | Sensient Technologies Corporation | 601,137 | ||||||
| 1,340 | Silgan Holdings, Inc. | 68,581 | ||||||
| 9,020 | Silver Wheaton Corporation | 174,266 | ||||||
| 10,010 | Sonoco Products Company | 527,527 | ||||||
| 36,401 | Steel Dynamics, Inc. | 1,295,148 | ||||||
| 5,960 | SunCoke Energy, Inc.k | 67,586 | ||||||
| 15,750 | Teck Resources, Ltd. | 315,473 | ||||||
| 19,583 | Verso Corporationk | 139,039 | ||||||
| 2,900 | Vulcan Materials Company | 362,935 | ||||||
| 9,762 | Westrock Company | 495,617 | ||||||
The accompanying Notes to Financial Statements are an integral part of this schedule.
76
Table of Contents
MODERATELY CONSERVATIVE ALLOCATION PORTFOLIO
Schedule of Investments as of December 31, 2016
| Shares | Common Stock (22.2%) | Value | ||||||
Materials (0.9%) - continued | ||||||||
| 29,820 | Yamana Gold, Inc. | $ | 83,794 | |||||
|
| |||||||
Total | 40,873,491 | |||||||
|
| |||||||
Real Estate (0.4%) | ||||||||
| 6,850 | American Assets Trust, Inc. | 295,098 | ||||||
| 8,970 | American Campus Communities, Inc. | 446,437 | ||||||
| 9,620 | Bluerock Residential Growth REIT, Inc.g | 131,986 | ||||||
| 74,489 | Brixmor Property Group, Inc. | 1,819,021 | ||||||
| 4,000 | Camden Property Trust | 336,280 | ||||||
| 19,760 | CBL & Associates Properties, Inc. | 227,240 | ||||||
| 52,477 | Cedar Realty Trust, Inc. | 342,675 | ||||||
| 21,710 | Chatham Lodging Trust | 446,141 | ||||||
| 4,820 | City Office REIT, Inc. | 63,479 | ||||||
| 16,830 | Columbia Property Trust, Inc. | 363,528 | ||||||
| 11,620 | CoreCivic, Inc. | 284,225 | ||||||
| 56,380 | Corporate Office Properties Trust | 1,760,184 | ||||||
| 17,429 | Cousins Properties, Inc. | 148,321 | ||||||
| 1,610 | CyrusOne, Inc. | 72,015 | ||||||
| 119,970 | DDR Corporation | 1,831,942 | ||||||
| 3,700 | Digital Realty Trust, Inc. | 363,562 | ||||||
| 12,950 | Duke Realty Corporation | 343,952 | ||||||
| 6,530 | Equity Lifestyle Properties, Inc. | 470,813 | ||||||
| 2,290 | First Industrial Realty Trust, Inc. | 64,235 | ||||||
| 17,042 | First Potomac Realty Trust | 186,951 | ||||||
| 12,250 | Franklin Street Properties Corporation | 158,760 | ||||||
| 12,150 | General Growth Properties, Inc. | 303,507 | ||||||
| 18,010 | HFF, Inc. | 544,803 | ||||||
| 7,160 | Hospitality Properties Trust | 227,258 | ||||||
| 22,898 | Host Hotels & Resorts, Inc. | 431,398 | ||||||
| 2,430 | Hudson Pacific Properties, Inc. | 84,516 | ||||||
| 11,320 | InfraREIT, Inc. | 202,741 | ||||||
| 15,090 | Kite Realty Group Trust | 354,313 | ||||||
| 13,620 | LaSalle Hotel Properties | 415,002 | ||||||
| 16,300 | Liberty Property Trust | 643,850 | ||||||
| 4,180 | Life Storage, Inc. | 356,387 | ||||||
| 2,660 | Mid-America Apartment Communities, Inc. | 260,467 | ||||||
| 6,433 | Pebblebrook Hotel Trust | 191,382 | ||||||
| 9,470 | Physicians Realty Trust | 179,551 | ||||||
| 1,596 | Potlatch Corporation | 66,473 | ||||||
| 7,790 | RE/MAX Holdings, Inc. | 436,240 | ||||||
| 13,210 | Realogy Holdings Corporation | 339,893 | ||||||
| 49,770 | Retail Properties of America, Inc. | 762,974 | ||||||
| 9,810 | Silver Bay Realty Trust Corporation REIT | 168,144 | ||||||
| 5,770 | Spirit Realty Captial, Inc. | 62,662 | ||||||
| 6,040 | Store Capital Corporation | 149,248 | ||||||
| 1,590 | Sun Communities, Inc. | 121,810 | ||||||
| 15,562 | Terreno Realty Corporation | 443,361 | ||||||
| 10,690 | Urstadt Biddle Properties, Inc. | 257,736 | ||||||
| 5,940 | Welltower, Inc. | 397,564 | ||||||
|
| |||||||
Total | 17,558,125 | |||||||
|
| |||||||
Telecommunications Services (0.2%) | ||||||||
| 23,110 | AT&T, Inc. | 982,868 | ||||||
| 2,180 | ATN International, Inc. | 174,684 | ||||||
| 5,432 | Cincinnati Bell, Inc.k | 121,405 | ||||||
| 20,400 | General Communication, Inc.k | 396,780 | ||||||
| 10,140 | Level 3 Communications, Inc.k | 571,490 | ||||||
| 7,090 | SBA Communications Corporationk | 732,113 | ||||||
| 117,749 | Verizon Communications, Inc. | 6,285,442 | ||||||
| 47,260 | Vonage Holdings Corporationk | 323,731 | ||||||
|
| |||||||
Total | 9,588,513 | |||||||
|
| |||||||
Utilities (0.6%) | ||||||||
| 1,910 | Alliant Energy Corporation | 72,370 | ||||||
| 3,280 | American Electric Power Company, Inc. | 206,509 | ||||||
| 14,060 | American States Water Company | 640,574 | ||||||
| 5,630 | Artesian Resources Corporation | 179,822 | ||||||
| 23,310 | Avista Corporation | 932,167 | ||||||
| 31,140 | Calpine Corporationk | 355,930 | ||||||
| 1,470 | Consolidated Edison, Inc. | 108,310 | ||||||
| 4,790 | Consolidated Water Company, Ltd. | 51,971 | ||||||
| 19,550 | DTE Energy Company | 1,925,871 | ||||||
| 7,990 | Dynegy, Inc.k | 67,595 | ||||||
| 5,870 | Edison International, Inc. | 422,581 | ||||||
| 42,080 | Eversource Energy | 2,324,078 | ||||||
| 6,880 | Exelon Corporation | 244,171 | ||||||
| 90,260 | Great Plains Energy, Inc. | 2,468,611 | ||||||
| 4,650 | Hawaiian Electric Industries, Inc. | 153,776 | ||||||
| 11,090 | MDU Resources Group, Inc. | 319,059 | ||||||
| 2,400 | Middlesex Water Company | 103,056 | ||||||
| 3,110 | National Fuel Gas Company | 176,150 | ||||||
| 10,440 | NiSource, Inc. | 231,142 | ||||||
| 2,340 | NorthWestern Corporation | 133,076 | ||||||
| 168,280 | PG&E Corporation | 10,226,376 | ||||||
| 9,200 | PNM Resources, Inc. | 315,560 | ||||||
| 15,150 | Portland General Electric Company | 656,449 | ||||||
| 10,750 | Public Service Enterprise Group, Inc. | 471,710 | ||||||
| 6,820 | Renewable Energy Group, Inc.k | 66,154 | ||||||
| 28,050 | Southern Company | 1,379,780 | ||||||
| 4,340 | Southwest Gas Holdings, Inc. | 332,531 | ||||||
| 950 | Spire, Inc. | 61,322 | ||||||
| 36,060 | Vectren Corporation | 1,880,529 | ||||||
|
| |||||||
Total | 26,507,230 | |||||||
|
| |||||||
Total Common Stock (cost $869,615,257) | 1,041,184,853 | |||||||
|
| |||||||
Preferred Stock (<0.1%) | ||||||||
Energy (<0.1%) | ||||||||
| 11,476 | Alpha Natural Resources, Inc., 0.000%k | 229,520 | ||||||
| 11,476 | ANR Holdings, Inc., 0.000%k | 61,970 | ||||||
|
| |||||||
Total | 291,490 | |||||||
|
| |||||||
Total Preferred Stock (cost $43,842) | 291,490 | |||||||
|
| |||||||
Collateral Held for Securities Loaned (1.7%) | ||||||||
| 78,436,450 | Thrivent Cash Management Trust | 78,436,450 | ||||||
|
| |||||||
Total Collateral Held for Securities Loaned (cost $78,436,450) | 78,436,450 | |||||||
|
| |||||||
| Shares or Principal Amount | Short-Term Investments (22.3%)m | |||||||
Federal Home Loan Bank Discount Notes | ||||||||
| 200,000 | 0.310%, 1/6/2017n | 199,994 | ||||||
| 7,200,000 | 0.440%, 1/11/2017n | 7,199,395 | ||||||
| 100,000 | 0.400%, 1/13/2017n | 99,989 | ||||||
| 1,400,000 | 0.440%, 1/18/2017n | 1,399,779 | ||||||
| 700,000 | 0.500%, 1/19/2017n | 699,882 | ||||||
| 4,800,000 | 0.381%, 1/20/2017n | 4,799,141 | ||||||
| 100,000 | 0.455%, 1/25/2017n | 99,977 | ||||||
| 4,200,000 | 0.365%, 1/27/2017n | 4,198,937 | ||||||
| 2,200,000 | 0.388%, 2/1/2017n | 2,199,113 | ||||||
| 500,000 | 0.515%, 2/9/2017n | 499,743 | ||||||
| 200,000 | 0.490%, 2/10/2017n | 199,895 | ||||||
| 1,100,000 | 0.500%, 2/17/2017n | 1,099,313 | ||||||
The accompanying Notes to Financial Statements are an integral part of this schedule.
77
Table of Contents
MODERATELY CONSERVATIVE ALLOCATION PORTFOLIO
Schedule of Investments as of December 31, 2016
| Shares or Principal Amount | Short-Term Investments (22.3%)m | Value | ||||||
Federal National Mortgage Association Discount Notes | ||||||||
| 3,000,000 | 0.345%, 1/11/2017n | $ | 2,999,748 | |||||
Thrivent Core Short-Term Reserve Fund | ||||||||
| 101,280,818 | 0.910% | 1,012,808,183 | ||||||
U.S. Treasury Bills | ||||||||
| 3,000,000 | 0.412%, 1/26/2017 | 2,999,193 | ||||||
| 1,000,000 | 0.411%, 2/2/2017j | 999,648 | ||||||
| 4,600,000 | 0.473%, 2/9/2017j | 4,597,884 | ||||||
U.S. Treasury Notes | ||||||||
| 1,300,000 | 0.500%, 1/31/2017j | 1,300,148 | ||||||
|
| |||||||
Total Short-Term Investments (cost $1,048,399,091) | 1,048,399,962 | |||||||
|
| |||||||
Total Investments (cost $5,237,907,247) 116.9% | $ | 5,490,273,933 | ||||||
|
| |||||||
Other Assets and Liabilities, Net (16.9%) | (795,205,330 | ) | ||||||
|
| |||||||
Total Net Assets 100.0% | $ | 4,695,068,603 | ||||||
|
| |||||||
| a | The stated interest rate represents the weighted average of all contracts within the bank loan facility. |
| b | All or a portion of the loan is unfunded. |
| c | Denotes investments purchased on a when-issued or delayed delivery basis. |
| d | Denotes securities sold under Rule 144A of the Securities Act of 1933, which exempts them from registration. These securities may be resold to other dealers in the program or to other qualified institutional buyers. As of December 31, 2016, the value of these investments was $159,004,970 or 3.4% of total net assets. |
| e | Denotes variable rate securities. Variable rate securities are securities whose yields vary with a designated market index or market rate. The rate shown is as of December 31, 2016. |
| f | Denotes step coupon securities. Step coupon securities pay an initial coupon rate for the first period and then different coupon rates for following periods. The rate shown is as of December 31, 2016. |
| g | All or a portion of the security is on loan. |
| h | Denotes perpetual securities. Perpetual securities pay an indefinite stream of interest and have no contractual maturity date. Date shown, if applicable, is next call date. |
| i | Denotes interest only security. Interest only securities represent the right to receive monthly interest payments on an underlying pool of mortgages or assets. The principal shown is the outstanding par amount of the pool as of the end of the period. The actual effective yield of the security is different than the stated coupon rate. |
| j | At December 31, 2016, $1,900,449 of investments were segregated to cover exposure to a counterparty for margin on open mortgage-backed security transactions. |
| k | Non-income producing security. |
| l | Security is valued at fair value. Market quotations or prices were not readily available or were determined to be unreliable. Fair value was determined in good faith pursuant to procedures adopted by the Board. Further information on fair valuation can be found in the Notes to Financial Statements. |
| m | The interest rate shown reflects the yield, coupon rate or the discount rate at the date of purchase. |
| n | All or a portion of the security is held on deposit with the counterparty and pledged as the initial margin deposit for open futures contracts. |
| * | Denotes restricted securities. Restricted securities are investment securities which cannot be offered for public sale without first being registered under the Securities Act of 1933. The value of all restricted securities held in Moderately Conservative Allocation Portfolio as of December 31, 2016 was $71,326,291 or 1.5% of total net assets. The following table indicates the acquisition date and cost of restricted securities shown in the schedule as of December 31, 2016. |
Security | Acquisition Date | Cost | ||||||
Alm Loan Funding CLO, 10/17/2026 | 7/31/2014 | $ | 824,587 | |||||
Angel Oak Mortgage Trust I, LLC, 7/25/2046 | 8/15/2016 | 1,259,675 | ||||||
Apidos CLO XVIII, 7/22/2026 | 6/25/2014 | 822,938 | ||||||
Ares CLO, Ltd., 10/12/2023 | 5/15/2015 | 2,800,000 | ||||||
Ares CLO, Ltd., 11/15/2025 | 11/26/2014 | 1,500,000 | ||||||
Babson CLO, Ltd., 10/17/2026 | 8/15/2014 | 824,587 | ||||||
Betony CLO, Ltd., 4/15/2027 | 11/17/2016 | 750,000 | ||||||
Birchwood Park CLO, Ltd., 7/15/2026 | 7/31/2014 | 825,000 | ||||||
BlueMountain CLO, Ltd., 10/15/2026 | 8/27/2014 | 824,167 | ||||||
CAM Mortgage, LLC, 7/15/2064 | 6/24/2015 | 16,463 | ||||||
Carlyle Global Market Strategies CLO, Ltd., 10/15/2026 | 9/19/2014 | 825,000 | ||||||
The accompanying Notes to Financial Statements are an integral part of this schedule.
78
Table of Contents
MODERATELY CONSERVATIVE ALLOCATION PORTFOLIO
Schedule of Investments as of December 31, 2016
Security | Acquisition Date | Cost | ||||||
Carlyle Global Market Strategies CLO, Ltd., 7/20/2023 | 7/3/2014 | $ | 715,338 | |||||
Cent CLO 16, LP, 8/1/2024 | 9/5/2014 | 801,546 | ||||||
Cent CLO 22, Ltd., 11/7/2026 | 11/1/2016 | 825,000 | ||||||
COLT Mortgage Loan Trust, 12/26/2046 | 12/14/2016 | 2,201,854 | ||||||
Contura Energy, Inc., 8/1/2021 | 5/20/2013 | 836,729 | ||||||
Digicel, Ltd., 4/15/2021 | 8/18/2014 | 2,516,866 | ||||||
DRB Prime Student Loan Trust, 10/27/2031 | 9/30/2016 | 2,139,487 | ||||||
DRB Prime Student Loan Trust, 1/25/2040 | 12/4/2015 | 3,223,948 | ||||||
DRB Prime Student Loan Trust, 7/25/2031 | 9/23/2015 | 688,353 | ||||||
Dryden 34 Senior Loan Fund CLO, 10/15/2026 | 7/21/2014 | 825,000 | ||||||
Edlinc Student Loan Funding Trust, 10/1/2025 | 2/28/2013 | 738,818 | ||||||
Galaxy XX CLO, Ltd., 7/20/2027 | 5/20/2015 | 2,650,000 | ||||||
GoldenTree Loan Opportunities IX, Ltd., 10/29/2026 | 10/7/2016 | 825,000 | ||||||
Golub Capital Partners CLO 22B, Ltd., 2/20/2027 | 2/6/2015 | 1,566,968 | ||||||
Golub Capital Partners CLO 23M, Ltd., 5/5/2027 | 5/18/2015 | 798,000 | ||||||
Limerock CLO III, LLC, 10/20/2026 | 10/16/2014 | 2,500,000 | ||||||
Madison Park Funding XIV CLO, Ltd., 7/20/2026 | 7/3/2014 | 898,920 | ||||||
Madison Park Funding, Ltd., 8/15/2022 | 5/8/2015 | 2,612,474 | ||||||
Magnetite XII, Ltd., 4/15/2027 | 11/17/2016 | 2,600,000 | ||||||
Marlette Funding Trust, 1/17/2023 | 7/20/2016 | 1,177,096 | ||||||
Mountain View CLO, Ltd., 7/15/2027 | 5/13/2015 | 2,618,201 | ||||||
Murray Hill Marketplace Trust, 11/25/2022 | 10/6/2016 | 2,806,294 | ||||||
Neuberger Berman CLO, Ltd., 8/4/2025 | 6/19/2014 | 700,000 | ||||||
NZCG Funding CLO, Ltd., 4/27/2027 | 3/27/2015 | 2,650,000 | ||||||
Octagon Investment Partners XX CLO, Ltd., 8/12/2026 | 7/10/2014 | 825,000 | ||||||
OHA Loan Funding, Ltd., 10/20/2026 | 11/6/2014 | 2,493,750 | ||||||
OZLM VIII, Ltd., 10/17/2026 | 8/7/2014 | 820,298 | ||||||
Race Point IX CLO, Ltd., 4/15/2027 | 2/13/2015 | 1,925,000 | ||||||
Shackleton, Ltd., 4/15/2027 | 12/16/2016 | 2,650,000 | ||||||
Sunset Mortgage Loan Company, LLC, 7/16/2047 | 7/27/2016 | 3,284,455 | ||||||
Sunset Mortgage Loan Company, LLC, 9/18/2045 | 10/2/2015 | 1,059,467 | ||||||
Symphony CLO VIII, Ltd., 1/9/2023 | 9/15/2014 | 755,197 | ||||||
Symphony CLO XV, Ltd., 10/17/2026 | 10/17/2014 | 2,481,250 | ||||||
Vericrest Opportunity Loan Transferee, 10/25/2058 | 2/6/2015 | 2,815,916 | ||||||
Vericrest Opportunity Loan Transferee, 2/25/2055 | 2/25/2015 | 471,669 | ||||||
Voya CLO 3, Ltd., 7/25/2026 | 7/10/2014 | 823,762 | ||||||
The following table presents the total amount of securities loaned with continuous maturity, by type, offset by the gross payable upon return of collateral for securities loaned by Thrivent Moderately Conservative Allocation Portfolio as of December 31, 2016:
Securities Lending Transactions
Taxable Debt Security | $ | 71,885,439 | ||
Common Stock | 4,986,435 | |||
|
| |||
Total lending | $ | 76,871,874 | ||
Gross amount payable upon return of collateral for securities loaned | $ | 78,436,450 | ||
|
| |||
Net amounts due to counterparty | $ | 1,564,576 | ||
|
|
Definitions:
ADR | - | American Depositary Receipt, which are certificates for an underlying foreign security’s shares held by an issuing U.S. depository bank. | ||
CLO | - | Collateralized Loan Obligation | ||
ETF | - | Exchange Traded Fund. | ||
REIT | - | Real Estate Investment Trust is a company that buys, develops, manages and/or sells real estate assets. | ||
TIPS | - | Treasury Inflation Protected Security. |
The accompanying Notes to Financial Statements are an integral part of this schedule.
79
Table of Contents
GROWTHAND INCOME PLUS PORTFOLIO
Schedule of Investments as of December 31, 2016
| Principal Amount | Bank Loans (11.6%)a | Value | ||||||
Basic Materials (0.7%) | ||||||||
Arch Coal, Inc., Term Loan | ||||||||
| $26,616 | 10.000%, 10/5/2021 | $ | 26,960 | |||||
Chemours Company, Term Loan | ||||||||
| 90,862 | 3.770%, 5/12/2022 | 90,238 | ||||||
Fortescue Metals Group, Ltd., Term Loan | ||||||||
| 126,502 | 3.750%, 6/30/2019 | 126,755 | ||||||
Ineos US Finance, LLC, Term Loan | ||||||||
| 208,215 | 3.750%, 12/15/2020 | 209,083 | ||||||
Tronox Pigments BV, Term Loan | ||||||||
| 166,522 | 4.500%, 3/19/2020 | 167,077 | ||||||
|
| |||||||
Total | 620,113 | |||||||
|
| |||||||
Capital Goods (0.6%) | ||||||||
Accudyne Industries, LLC, Term Loan | ||||||||
| 67,089 | 4.000%, 12/13/2019 | 63,327 | ||||||
Advanced Disposal Services, Inc., Term Loan | ||||||||
| 84,541 | 3.500%, 11/10/2023 | 85,228 | ||||||
Berry Plastics Group, Inc., Term Loan | ||||||||
| 76,472 | 3.500%, 2/8/2020 | 76,994 | ||||||
Cortes NP Acquisition Corporation, Term Loan | ||||||||
| 265,000 | 6.000%, 11/30/2023 | 268,313 | ||||||
Reynolds Group, Inc., Term Loan | ||||||||
| 64,838 | 4.250%, 2/5/2023 | 65,633 | ||||||
|
| |||||||
Total | 559,495 | |||||||
|
| |||||||
Communications Services (3.1%) | ||||||||
Atlantic Broadband Penn, LLC, Term Loan | ||||||||
| 47,049 | 3.250%, 11/30/2019 | 47,166 | ||||||
Beasley Broadcast Group, Inc., Term Loan | ||||||||
| 75,000 | 7.000%, 11/1/2023 | 75,000 | ||||||
Birch Communication Inc., Term Loan | ||||||||
| 101,318 | 8.250%, 7/17/2020 | 89,160 | ||||||
Block Communications, Inc., Term Loan | ||||||||
| 108,889 | 4.248%, 11/7/2021 | 109,841 | ||||||
CBS Radio, Inc., Term Loan | ||||||||
| 45,283 | 4.500%, 10/17/2023 | 45,679 | ||||||
Charter Communications Operating, LLC, Term Loan | ||||||||
| 25,343 | 3.020%, 7/1/2020 | 25,449 | ||||||
Cincinnati Bell, Inc., Term Loan | ||||||||
| 54,186 | 4.000%, 9/10/2020 | 54,312 | ||||||
CommScope, Inc., Term Loan | ||||||||
| 88,875 | 3.270%, 12/29/2022 | 89,630 | ||||||
CSC Holdings, LLC, Term Loan | ||||||||
| 24,671 | 3.876%, 10/11/2024 | 24,913 | ||||||
FairPoint Communications, Inc., Term Loan | ||||||||
| 165,644 | 7.500%, 2/14/2019 | 167,042 | ||||||
Grande Communications Networks, LLC, Term Loan | ||||||||
| 104,224 | 4.500%, 5/29/2020 | 104,849 | ||||||
Gray Television, Inc., Term Loan | ||||||||
| 66,773 | 3.938%, 6/13/2021 | 67,691 | ||||||
Hargray Communications Group, Inc., Term Loan | ||||||||
| 133,509 | 4.750%, 6/26/2019 | 134,954 | ||||||
Integra Telecom Holdings, Inc., Term Loan | ||||||||
| 69,601 | 5.250%, 8/14/2020 | 69,723 | ||||||
Intelsat Jackson Holdings SA, Term Loan | ||||||||
| $42,173 | 3.750%, 6/30/2019 | 40,719 | ||||||
Level 3 Communications, Inc., Term Loan | ||||||||
| 79,000 | 4.000%, 8/1/2019 | 80,047 | ||||||
Liberty Cablevision of Puerto Rico, LLC, Term Loan | ||||||||
| 145,000 | 4.500%, 1/7/2022 | 143,823 | ||||||
LTS Buyer, LLC, Term Loan | ||||||||
| 157,770 | 4.248%, 4/13/2020 | 158,510 | ||||||
NEP/NCP Holdco, Inc., Term Loan | ||||||||
| 208,973 | 4.250%, 1/22/2020 | 209,496 | ||||||
Nexstar Broadcasting, Inc., Term Loan | ||||||||
| 130,000 | 0.000%, 9/26/2023b,c | 131,015 | ||||||
Numericable US, LLC, Term Loan | ||||||||
| 114,463 | 5.137%, 1/15/2024 | 115,812 | ||||||
SBA Senior Finance II, LLC, Term Loan | ||||||||
| 97,500 | 3.270%, 3/24/2021 | 97,927 | ||||||
TNS, Inc., Term Loan | ||||||||
| 44,721 | 5.000%, 2/14/2020 | 45,098 | ||||||
Univision Communications, Inc., Term Loan | ||||||||
| 104,144 | 4.000%, 3/1/2020 | 104,665 | ||||||
WideOpenWest Finance, LLC, Term Loan | ||||||||
| 149,625 | 4.500%, 8/18/2023 | 151,094 | ||||||
XO Communications, LLC, Term Loan | ||||||||
| 97,274 | 4.250%, 3/20/2021 | 97,518 | ||||||
Yankee Cable Acquisition, LLC, Term Loan | ||||||||
| 87,553 | 4.250%, 3/1/2020 | 87,590 | ||||||
Zayo Group, LLC, Term Loan | ||||||||
| 101,071 | 3.750%, 5/6/2021 | 102,096 | ||||||
|
| |||||||
Total | 2,670,819 | |||||||
|
| |||||||
Consumer Cyclical (2.0%) | ||||||||
Amaya BV, Term Loan | ||||||||
| 184,536 | 5.000%, 8/1/2021 | 185,101 | ||||||
Burlington Coat Factory Warehouse Corporation, Term Loan | ||||||||
| 86,035 | 3.510%, 8/13/2021 | 86,542 | ||||||
Cengage Learning Acquisitions, Term Loan | ||||||||
| 164,175 | 5.250%, 6/7/2023 | 159,481 | ||||||
Ceridian HCM Holding, Inc., Term Loan | ||||||||
| 50,908 | 4.500%, 9/15/2020 | 50,505 | ||||||
Charter Communications Operating, LLC, Term Loan | ||||||||
| 52,110 | 3.020%, 1/3/2021 | 52,313 | ||||||
Dollar Tree, Inc., Term Loan | ||||||||
| 34,205 | 3.250%, 7/6/2022 | 34,483 | ||||||
Four Seasons Holdings, Inc., Term Loan | ||||||||
| 100,000 | 3.750%, 11/30/2023 | 101,042 | ||||||
Golden Nugget, Inc., Term Loan | ||||||||
| 73,916 | 4.500%, 11/21/2019 | 74,655 | ||||||
Golden Nugget, Inc., Term Loan Delayed Draw | ||||||||
| 31,678 | 4.500%, 11/21/2019 | 31,995 | ||||||
IMG Worldwide, Inc., Term Loan | ||||||||
| 127,190 | 5.250%, 5/6/2021 | 128,383 | ||||||
| 60,000 | 8.250%, 5/6/2022 | 60,750 | ||||||
The accompanying Notes to Financial Statements are an integral part of this schedule.
80
Table of Contents
GROWTHAND INCOME PLUS PORTFOLIO
Schedule of Investments as of December 31, 2016
| Principal Amount | Bank Loans (11.6%)a | Value | ||||||
| Consumer Cyclical (2.0%) - continued | ||||||||
KAR Auction Services, Inc., Term Loan | ||||||||
| $109,175 | 4.500%, 3/9/2023 | $ | 110,540 | |||||
Michaels Stores, Inc., Term Loan | ||||||||
| 72,119 | 3.750%, 1/30/2023 | 72,908 | ||||||
Mohegan Tribal Gaming Authority, Term Loan | ||||||||
| 149,625 | 5.500%, 10/13/2023 | 150,654 | ||||||
Scientific Games International, Inc., Term Loan | ||||||||
| 104,760 | 6.000%, 10/18/2020 | 106,091 | ||||||
| 237,864 | 6.000%, 10/1/2021 | 240,690 | ||||||
Seminole Hard Rock Entertainment, Inc., Term Loan | ||||||||
| 48,737 | 3.520%, 5/14/2020 | 48,981 | ||||||
Seminole Indian Tribe of Florida, Term Loan | ||||||||
| 71,371 | 3.248%, 4/29/2020 | 71,549 | ||||||
|
| |||||||
Total | 1,766,663 | |||||||
|
| |||||||
Consumer Non-Cyclical (1.9%) | ||||||||
Air Medical Group Holdings, Inc., Term Loan | ||||||||
| 201,487 | 5.000%, 4/28/2022 | 204,385 | ||||||
CHS/Community Health Systems, Inc., Term Loan | ||||||||
| 46,233 | 3.750%, 12/31/2019 | 44,759 | ||||||
| 157,396 | 4.000%, 1/27/2021 | 152,150 | ||||||
Endo Luxembourg Finance I Company SARL, Term Loan | ||||||||
| 99,000 | 3.813%, 9/26/2022 | 99,425 | ||||||
JBS USA, LLC, Term Loan | ||||||||
| 71,201 | 3.750%, 5/25/2018 | 71,260 | ||||||
| 9,748 | 3.750%, 9/18/2020 | 9,827 | ||||||
| 24,750 | 4.000%, 10/30/2022 | 24,956 | ||||||
Libbey Glass, Inc., Term Loan | ||||||||
| 69,716 | 3.750%, 4/9/2021 | 70,370 | ||||||
LTF Merger Sub, Inc., Term Loan | ||||||||
| 73,875 | 4.250%, 6/10/2022 | 74,279 | ||||||
Mallinckrodt International Finance SA, Term Loan | ||||||||
| 44,544 | 3.748%, 3/19/2021 | 44,639 | ||||||
McGraw-Hill Global Education Holdings, LLC, Term Loan | ||||||||
| 134,325 | 5.000%, 5/4/2022 | 134,346 | ||||||
MultiPlan, Inc., Term Loan | ||||||||
| 88,156 | 5.000%, 6/7/2023 | 89,620 | ||||||
Ortho-Clinical Diagnostics, Inc., Term Loan | ||||||||
| 136,722 | 4.750%, 6/30/2021 | 135,404 | ||||||
PetSmart, Inc., Term Loan | ||||||||
| 59,848 | 4.000%, 3/11/2022 | 59,998 | ||||||
Revlon Consumer Products Corporation, Term Loan | ||||||||
| 69,825 | 4.307%, 9/7/2023 | 70,480 | ||||||
Valeant Pharmaceuticals International, Inc., Term Loan | ||||||||
| 390,133 | 5.500%, 4/1/2022b,c | 390,207 | ||||||
|
| |||||||
Total | 1,676,105 | |||||||
|
| |||||||
Energy (0.5%) | ||||||||
Energy Solutions, LLC, Term Loan | ||||||||
| 62,020 | 6.750%, 5/29/2020 | 62,407 | ||||||
Exgen Renewables I, LLC, Term Loan | ||||||||
| 46,766 | 5.250%, 2/8/2021 | 47,058 | ||||||
Houston Fuel Oil Terminal, LLC, Term Loan | ||||||||
| 69,467 | 4.250%, 8/19/2021 | 68,946 | ||||||
McJunkin Red Man Corporation, Term Loan | ||||||||
| 60,577 | 5.000%, 11/8/2019 | 60,805 | ||||||
MEG Energy Corporation, Term Loan | ||||||||
| 73,454 | 3.750%, 3/31/2020 | 71,251 | ||||||
Pacific Drilling SA, Term Loan | ||||||||
| 78,165 | 4.500%, 6/3/2018 | 27,436 | ||||||
Targa Resources Partners, LP, Term Loan | ||||||||
| 45,000 | 5.750%, 2/27/2022 | 45,225 | ||||||
Western Refining, Inc., Term Loan | ||||||||
| 39,592 | 5.250%, 11/12/2020 | 39,765 | ||||||
| 22,350 | 5.500%, 6/23/2023 | 22,462 | ||||||
|
| |||||||
Total | 445,355 | |||||||
|
| |||||||
Financials (0.8%) | ||||||||
Delos Finance Sarl, Term Loan | ||||||||
| 100,000 | 3.748%, 3/6/2021 | 100,643 | ||||||
DJO Finance, LLC, Term Loan | ||||||||
| 39,500 | 4.250%, 6/7/2020 | 37,858 | ||||||
Harland Clarke Holdings Corporation, Term Loan | ||||||||
| 47,200 | 7.000%, 5/22/2018 | 47,215 | ||||||
| 85,500 | 7.000%, 12/31/2019 | 85,821 | ||||||
MoneyGram International, Inc., Term Loan | ||||||||
| 116,851 | 4.250%, 3/27/2020 | 115,293 | ||||||
Sable International Finance, Ltd., Term Loan | ||||||||
| 130,000 |
| 5.748%, 1/3/2023b,c | 131,544 | ||||
TransUnion, LLC, Term Loan | ||||||||
| 87,526 | 3.520%, 4/9/2021 | 88,230 | ||||||
WaveDivision Holdings, LLC, Term Loan | ||||||||
| 109,364 | 4.000%, 10/15/2019 | 109,938 | ||||||
|
| |||||||
Total | 716,542 | |||||||
|
| |||||||
Technology (1.5%) | ||||||||
Avago Technoligies Cayman Finance, Ltd., Term Loan | ||||||||
| 168,257 | 3.704%, 2/1/2023 | 170,570 | ||||||
First Data Corporation, Term Loan | ||||||||
| 172,914 | 3.756%, 3/24/2021 | 174,860 | ||||||
| 116,648 | 3.756%, 7/8/2022 | 117,839 | ||||||
Micron Technologies, Inc., Term Loan | ||||||||
| 74,638 | 4.520%, 4/26/2022 | 75,701 | ||||||
NXP BV, Term Loan | ||||||||
| 79,800 | 3.270%, 12/7/2020 | 80,159 | ||||||
ON Semiconductor Corporation, Term Loan | ||||||||
| 234,413 | 4.020%, 3/31/2023 | 237,258 | ||||||
Rackspace Hosting, LLC, Term Loan | ||||||||
| 70,000 | 4.500%, 12/20/2023 | 70,846 | ||||||
RP Crown Parent, LLC, Term Loan | ||||||||
| 105,000 | 4.500%, 10/12/2023 | 106,024 | ||||||
SS&C European Holdings SARL, Term Loan | ||||||||
| 36,507 | 4.001%, 7/8/2022 | 36,986 | ||||||
| 3,726 | 4.002%, 7/8/2022 | 3,775 | ||||||
Western Digital Corporation, Term Loan | ||||||||
| 199,000 | 4.520%, 4/29/2023 | 202,047 | ||||||
|
| |||||||
Total | 1,276,065 | |||||||
|
| |||||||
The accompanying Notes to Financial Statements are an integral part of this schedule.
81
Table of Contents
GROWTHAND INCOME PLUS PORTFOLIO
Schedule of Investments as of December 31, 2016
| Principal Amount | Bank Loans (11.6%)a | Value | ||||||
Transportation (0.3%) | ||||||||
OSG Bulk Ships, Inc., Term Loan | ||||||||
| $83,055 | 5.250%, 8/5/2019 | $ | 80,875 | |||||
XPO Logistics, Inc., Term Loan | ||||||||
| 157,433 | 4.250%, 11/1/2021 | 159,352 | ||||||
|
| |||||||
Total | 240,227 | |||||||
|
| |||||||
Utilities (0.2%) | ||||||||
Calpine Corporation, Term Loan | ||||||||
| 85,000 | 0.000%, 1/15/2024b,c | 85,319 | ||||||
Intergen NV, Term Loan | ||||||||
| 64,528 | 5.500%, 6/12/2020 | 62,485 | ||||||
Talen Energy Supply, LLC, Term Loan | ||||||||
| 56,250 | 6.000%, 12/6/2023 | 56,953 | ||||||
|
| |||||||
Total | 204,757 | |||||||
|
| |||||||
Total Bank Loans (cost $10,127,448) | 10,176,141 | |||||||
|
| |||||||
| Shares | Common Stock (62.3%) | |||||||
Consumer Discretionary (10.1%) | ||||||||
| 1,720 | Amazon.com, Inc.d | 1,289,776 | ||||||
| 11,810 | American Axle & Manufacturing Holdings, Inc.d | 227,933 | ||||||
| 3,580 | Aramark | 127,878 | ||||||
| 990 | AutoZone, Inc.d | 781,892 | ||||||
| 3,235 | Berkeley Group Holdings plc | 111,831 | ||||||
| 500 | Brembo SPA | 30,248 | ||||||
| 4,500 | Bridgestone Corporation | 161,913 | ||||||
| 2,916 | Bunzl plc | 75,704 | ||||||
| 2,660 | Burlington Stores, Inc.d | 225,435 | ||||||
| 700 | Canon Marketing Japan, Inc. | 11,754 | ||||||
| 2,265 | Cedar Fair, LP | 145,413 | ||||||
| 12,476 | Comcast Corporation | 861,468 | ||||||
| 4,600 | Denso Corporation | 198,980 | ||||||
| 4,600 | Eutelsat Communications | 88,953 | ||||||
| 7,930 | Ford Motor Company | 96,191 | ||||||
| 4,800 | Fuji Heavy Industries, Ltd. | 195,573 | ||||||
| 3,300 | General Motors Company | 114,972 | ||||||
| 1,200 | Hakuhodo Dy Holdings, Inc. | 14,776 | ||||||
| 11,800 | Honda Motor Company, Ltd. | 344,505 | ||||||
| 6,300 | Inchcape plc | 54,445 | ||||||
| 811 | Intertek Group plc | 34,758 | ||||||
| 380 | Linamar Corporation | 16,327 | ||||||
| 442 | LVMH Moet Hennessy Louis Vuitton SE | 84,277 | ||||||
| 3,480 | Newell Brands, Inc. | 155,382 | ||||||
| 400 | Nifco, Inc. | 21,076 | ||||||
| 14,630 | NIKE, Inc. | 743,643 | ||||||
| 393 | Nokian Renkaat Oyj | 14,611 | ||||||
| 2,100 | Panasonic Corporation | 21,298 | ||||||
| 5,159 | Persimmon plc | 112,558 | ||||||
| 726 | Publicis Groupe SA | 50,025 | ||||||
| 600 | Restaurant Brands International, Inc. | 28,596 | ||||||
| 2,702 | Restoration Hardware Holdings, Inc.d | 82,951 | ||||||
| 243 | RTL Group SA | 17,803 | ||||||
| 900 | Sekisui Chemical Company, Ltd. | 14,327 | ||||||
| 5,490 | Starbucks Corporation | 304,805 | ||||||
| 4,900 | Sumitomo Forestry Company, Ltd. | 64,716 | ||||||
| 3,400 | Sumitomo Rubber Industries, Ltd. | 53,796 | ||||||
| 200 | Swatch Group AG | 12,206 | ||||||
| 14,150 | Time, Inc. | 252,577 | ||||||
| 6,540 | Toll Brothers, Inc.d | 202,740 | ||||||
| 2,770 | Tractor Supply Company | 209,994 | ||||||
| 79 | Valora Holding AG | 22,440 | ||||||
| 8,320 | Walt Disney Company | 867,110 | ||||||
| 320 | Whirlpool Corporation | 58,166 | ||||||
| 600 | Whitbread plc | 27,911 | ||||||
| 3,716 | Wolters Kluwer NV | 134,405 | ||||||
| 3,000 | WPP plc | 66,761 | ||||||
| 1,600 | Yokohama Rubber Company, Ltd. | 28,600 | ||||||
|
| |||||||
Total | 8,863,499 | |||||||
|
| |||||||
Consumer Staples (2.9%) | ||||||||
| 4,970 | AdvancePierre Foods Holdings, Inc. | 148,007 | ||||||
| 2,400 | Axfood AB | 37,687 | ||||||
| 10,541 | Coca-Cola Amatil, Ltd. | 76,875 | ||||||
| 4,400 | Coca-Cola HBC AG | 95,812 | ||||||
| 900 | Ebro Foods SA | 18,835 | ||||||
| 485 | Henkel AG & Company KGaA | 50,476 | ||||||
| 6,753 | Imperial Brands plc | 294,301 | ||||||
| 800 | Jeronimo Martins SGPS SA | 12,408 | ||||||
| 400 | Kesko Oyj | 19,962 | ||||||
| 2,000 | Kewpie Corporation | 48,508 | ||||||
| 1,200 | Kirin Holdings Company, Ltd. | 19,478 | ||||||
| 15,568 | Koninklijke Ahold Delhaize NV | 327,910 | ||||||
| 3 | Lindt & Spruengli AG | 15,523 | ||||||
| 1,300 | Nestle SA | 93,129 | ||||||
| 5,920 | Philip Morris International, Inc. | 541,621 | ||||||
| 1,000 | Suedzucker AG | 23,837 | ||||||
| 4,267 | Tate & Lyle plc | 37,134 | ||||||
| 200 | Universal Corporation | 12,750 | ||||||
| 4,550 | Walgreens Boots Alliance, Inc. | 376,558 | ||||||
| 8,340 | Whole Foods Market, Inc. | 256,538 | ||||||
| 8,123 | William Morrison Supermarkets plc | 23,072 | ||||||
|
| |||||||
Total | 2,530,421 | |||||||
|
| |||||||
Energy (4.1%) | ||||||||
| 481 | Arch Coal, Inc.d | 37,542 | ||||||
| 100,450 | BP plc | 629,165 | ||||||
| 3,280 | Concho Resources, Inc.d | 434,928 | ||||||
| 478 | Contura Energy, Inc.d | 33,938 | ||||||
| 2,175 | Crescent Point Energy Corporation | 29,564 | ||||||
| 7,770 | Devon Energy Corporation | 354,856 | ||||||
| 2,900 | Galp Energia SGPS SA | 43,234 | ||||||
| 8,220 | Halliburton Company | 444,620 | ||||||
| 2,969 | John Wood Group plc | 32,061 | ||||||
| 3,870 | OMV AG | 136,432 | ||||||
| 4,223 | Petrofac, Ltd. | 45,193 | ||||||
| 2,620 | Pioneer Natural Resources Company | 471,783 | ||||||
| 3,950 | Range Resources Corporation | 135,722 | ||||||
| 3,386 | Royal Dutch Shell plc | 92,355 | ||||||
| 851 | Royal Dutch Shell plc, Class A | 23,491 | ||||||
| 7,935 | Royal Dutch Shell plc, Class B | 227,989 | ||||||
| 3,305 | Statoil ASA | 60,322 | ||||||
| 316 | Tecnicas Reunidas SA | 12,924 | ||||||
| 3,326 | Total SA | 170,598 | ||||||
| 3,326 | Total SA Rightsd,e | 57 | ||||||
| 170 | Vantage Drilling Internationald | 17,170 | ||||||
| 12,000 | WPX Energy, Inc.d | 174,840 | ||||||
|
| |||||||
Total | 3,608,784 | |||||||
|
| |||||||
Financials (9.2%) | ||||||||
| 21,104 | Aberdeen Asset Management plc | 66,727 | ||||||
| 1,300 | Affiliated Managers Group, Inc.d | 188,890 | ||||||
| 8,600 | Apollo Investment Corporation | 50,396 | ||||||
| 3,950 | Ares Capital Corporation | 65,135 | ||||||
| 4,400 | ASX, Ltd. | 157,631 | ||||||
| 7,315 | Australia & New Zealand Banking Group, Ltd. | 160,134 | ||||||
| 48,360 | Bank of America Corporation | 1,068,756 | ||||||
| 8,878 | Bank of East Asia, Ltd. | 33,893 | ||||||
| 388 | Bank of Montreal | 27,907 | ||||||
| 5,719 | Bank of Nova Scotia | 318,439 | ||||||
| 4,530 | Bank of the Ozarks, Inc. | 238,233 | ||||||
The accompanying Notes to Financial Statements are an integral part of this schedule.
82
Table of Contents
GROWTHAND INCOME PLUS PORTFOLIO
Schedule of Investments as of December 31, 2016
| Shares | Common Stock (62.3%) | Value | ||||||
Financials (9.2%) - continued | ||||||||
| 790 | Canadian Imperial Bank of Commerce | $ | 64,464 | |||||
| 3,000 | Chiba Bank, Ltd. | 18,390 | ||||||
| 1,772 | CI Financial Corporation | 38,102 | ||||||
| 6,726 | CNP Assurances | 124,494 | ||||||
| 2,796 | Danske Bank AS | 84,590 | ||||||
| 18,428 | Direct Line Insurance Group plc | 83,869 | ||||||
| 11,390 | Encore Capital Group, Inc.d | 326,323 | ||||||
| 2,100 | Erste Group Bank AG | 61,398 | ||||||
| 22,794 | FlexiGroup, Ltd. | 37,096 | ||||||
| 26,000 | Fukuoka Financial Group, Inc. | 115,310 | ||||||
| 2,413 | Genworth MI Canada, Inc. | 60,493 | ||||||
| 4,140 | Goldman Sachs Group, Inc. | 991,323 | ||||||
| 2,500 | Hang Seng Bank, Ltd. | 46,361 | ||||||
| 1,413 | Hannover Rueckversicherung SE | 152,643 | ||||||
| 21,700 | Henderson Group plc | 62,631 | ||||||
| 26,405 | HSBC Holdings plc | 213,053 | ||||||
| 863 | Intact Financial Corporation | 61,769 | ||||||
| 2,530 | Intercontinental Exchange, Inc. | 142,743 | ||||||
| 17,350 | KeyCorp | 316,984 | ||||||
| 1,957 | Macquarie Group, Ltd. | 122,591 | ||||||
| 42,060 | Mapfre SA | 128,119 | ||||||
| 54,600 | Mizuho Financial Group, Inc. | 97,982 | ||||||
| 1,000 | MS and AD Insurance Group Holdings, Inc. | 30,968 | ||||||
| 6,212 | National Bank of Canada | 252,292 | ||||||
| 6,104 | Nordea Bank AB | 67,636 | ||||||
| 1,965 | Power Corporation of Canada | 43,979 | ||||||
| 2,460 | Raymond James Financial, Inc. | 170,404 | ||||||
| 9,500 | Resona Holdings, Inc. | 48,688 | ||||||
| 557 | Schroders plc | 20,458 | ||||||
| 4,500 | Seven Bank, Ltd. | 12,867 | ||||||
| 2,467 | Swiss Re AG | 233,410 | ||||||
| 16,640 | Synchrony Financial | 603,533 | ||||||
| 4,600 | T&D Holdings, Inc. | 60,708 | ||||||
| 288 | TMX Group, Ltd. | 15,341 | ||||||
| 6,683 | United Overseas Bank, Ltd. | 93,889 | ||||||
| 8,080 | Westpac Banking Corporation | 189,670 | ||||||
| 5,920 | XL Group, Ltd. | 220,579 | ||||||
| 5,050 | Zions Bancorporation | 217,352 | ||||||
| 168 | Zurich Insurance Group AGd | 46,170 | ||||||
|
| |||||||
Total | 8,054,813 | |||||||
|
| |||||||
Health Care (6.1%) | ||||||||
| 3,480 | Acadia Healthcare Company, Inc.d | 115,188 | ||||||
| 5,550 | Akorn, Inc.d | 121,157 | ||||||
| 2,100 | Allergan plcd | 441,021 | ||||||
| 1,466 | AstraZeneca plc | 80,055 | ||||||
| 9,410 | Bristol-Myers Squibb Company | 549,920 | ||||||
| 2,313 | CAE, Inc. | 32,353 | ||||||
| 5,940 | Celgene Corporationd | 687,555 | ||||||
| 1,569 | Essilor International SA | 177,028 | ||||||
| 3,441 | GlaxoSmithKline plc | 66,097 | ||||||
| 1,645 | Hikma Pharmaceuticals plc | 38,341 | ||||||
| 4,460 | Hologic, Inc.d | 178,935 | ||||||
| 333 | Lonza Group AG | 57,552 | ||||||
| 9,310 | Medtronic plc | 663,151 | ||||||
| 13,170 | Merck & Company, Inc. | 775,318 | ||||||
| 1,113 | Merck KGaA | 115,887 | ||||||
| 6,919 | Novartis AG | 503,174 | ||||||
| 3,400 | Novo Nordisk AS | 121,965 | ||||||
| 383 | Roche Holding AG-Genusschein | 87,306 | ||||||
| 940 | Teleflex, Inc. | 151,481 | ||||||
| 3,280 | Vertex Pharmaceuticals, Inc.d | 241,638 | ||||||
| 1,130 | Waters Corporationd | 151,861 | ||||||
|
| |||||||
Total | 5,356,983 | |||||||
|
| |||||||
Industrials (7.1%) | ||||||||
| 12 | A P Moller - Maersk AS | 19,128 | ||||||
| 3,768 | ABB, Ltd. | 79,285 | ||||||
| 2,310 | Acuity Brands, Inc. | 533,287 | ||||||
| 2,398 | Adecco SA | 156,534 | ||||||
| 12,300 | Air New Zealand, Ltd. | 18,732 | ||||||
| 8,000 | Asahi Glass Company, Ltd. | 54,277 | ||||||
| 500 | Atlas Copco Aktiebolag | 15,168 | ||||||
| 1,076 | Berendsen plc | 11,536 | ||||||
| 2,000 | Dai Nippon Printing Company, Ltd. | 19,733 | ||||||
| 3,910 | Delta Air Lines, Inc. | 192,333 | ||||||
| 1,820 | Deutsche Post AG | 59,687 | ||||||
| 1,000 | DSV AS | 44,410 | ||||||
| 13,528 | El Al Israel Airlines, Ltd. | 8,946 | ||||||
| 1,470 | Equifax, Inc. | 173,798 | ||||||
| 118 | Flughafen Zuerich AG | 21,866 | ||||||
| 700 | Fraport AG Frankfurt Airport Services Worldwide | 41,306 | ||||||
| 1,900 | Fuji Machine Manufacturing Company, Ltd. | 21,693 | ||||||
| 800 | Hitachi Transport System, Ltd. | 16,208 | ||||||
| 291 | Hochtief AG | 40,628 | ||||||
| 4,814 | Illinois Tool Works, Inc. | 589,523 | ||||||
| 1,300 | Inaba Denki Sangyo Company, Ltd. | 44,694 | ||||||
| 18,800 | ITOCHU Corporation | 248,926 | ||||||
| 9,860 | Jacobs Engineering Group, Inc.d | 562,020 | ||||||
| 900 | Jardine Matheson Holdings, Ltd. | 49,725 | ||||||
| 4,900 | KITZ Corporation | 26,752 | ||||||
| 2,200 | Komatsu, Ltd. | 49,830 | ||||||
| 4,411 | KONE Oyj | 197,100 | ||||||
| 1,049 | Koninklijke Boskalis Westminster NV | 36,392 | ||||||
| 2,900 | Marubeni Corporation | 16,403 | ||||||
| 3,420 | Masonite International Corporationd | 225,036 | ||||||
| 7,175 | Meggitt plc | 40,519 | ||||||
| 1,630 | Middleby Corporationd | 209,960 | ||||||
| 1,900 | MIRAIT Holdings Corporation | 17,123 | ||||||
| 1,500 | Mitsubishi Corporation | 31,858 | ||||||
| 7,300 | Mitsubishi Electric Corporation | 101,537 | ||||||
| 5,000 | Mitsubishi Heavy Industries, Ltd. | 22,730 | ||||||
| 2,000 | Mitsuboshi Belting, Ltd. | 17,007 | ||||||
| 1,000 | Mitsui & Company, Ltd. | 13,702 | ||||||
| 2,809 | National Express Group plc | 12,241 | ||||||
| 3,400 | Nitto Kogyo Corporation | 46,291 | ||||||
| 1,000 | Okuma Corporation | 9,515 | ||||||
| 3,300 | Oshkosh Corporation | 213,213 | ||||||
| 1,206 | Philips Lighting NVd,f | 29,706 | ||||||
| 925 | Randstad Holding NV | 50,105 | ||||||
| 1,738 | RELX NV | 29,233 | ||||||
| 105 | Rieter Holding AG | 18,261 | ||||||
| 4,444 | Rolls-Royce Holdings plcd | 36,501 | ||||||
| 1,800 | Sanwa Holdings Corporation | 17,120 | ||||||
| 286 | Schindler Holding AG, Participation Certificate | 50,368 | ||||||
| 396 | Schneider Electric SE | 27,510 | ||||||
| 2,006 | Siemens AG | 245,615 | ||||||
| 998 | Skanska AB | 23,497 | ||||||
| 3,483 | SKF AB | 63,865 | ||||||
| 3,000 | Smiths Group plc | 52,222 | ||||||
| 10,600 | Sojitz Corporation | 25,664 | ||||||
| 408 | Sulzer, Ltd. | 42,001 | ||||||
| 6,840 | Union Pacific Corporation | 709,171 | ||||||
| 2,615 | Vinci SA | 177,885 | ||||||
| 1,950 | WABCO Holdings, Inc.d | 206,993 | ||||||
| 601 | Wolseley plc | 36,689 | ||||||
| 759 | WSP Global, Inc. | 25,263 | ||||||
| 600 | Yuasa Trading Company, Ltd. | 14,946 | ||||||
|
| |||||||
Total | 6,193,267 | |||||||
|
| |||||||
The accompanying Notes to Financial Statements are an integral part of this schedule.
83
Table of Contents
GROWTHAND INCOME PLUS PORTFOLIO
Schedule of Investments as of December 31, 2016
| Shares | Common Stock (62.3%) | Value | ||||||
Information Technology (9.4%) | ||||||||
| 960 | Alliance Data Systems Corporation | $ | 219,360 | |||||
| 800 | Alphabet, Inc., Class Ad | 633,960 | ||||||
| 441 | Alphabet, Inc., Class Cd | 340,373 | ||||||
| 8,260 | Apple, Inc. | 956,673 | ||||||
| 1,900 | Canon, Inc. | 53,508 | ||||||
| 1,132 | Capital Power Corporation | 19,585 | ||||||
| 500 | DTS Corporation | 10,636 | ||||||
| 5,400 | Facebook, Inc.d | 621,270 | ||||||
| 6,770 | Finisar Corporationd | 204,928 | ||||||
| 4,200 | FUJIFILM Holdings NPV | 159,036 | ||||||
| 7,260 | Juniper Networks, Inc. | 205,168 | ||||||
| 2,200 | Konica Minolta Holdings, Inc. | 21,804 | ||||||
| 9,620 | Microsoft Corporation | 597,787 | ||||||
| 1,800 | NEC Networks & System Integration Corporation | 32,453 | ||||||
| 600 | Nice, Ltd. | 41,167 | ||||||
| 1,400 | Nichicon Corporation | 12,190 | ||||||
| 400 | NTT Data Corporation | 19,325 | ||||||
| 65 | NVIDIA Corporation | 6,938 | ||||||
| 3,140 | Palo Alto Networks, Inc.d | 392,657 | ||||||
| 21,310 | Pandora Media, Inc.d | 277,882 | ||||||
| 13,570 | PayPal Holdings, Inc.d | 535,608 | ||||||
| 3,490 | Plantronics, Inc. | 191,112 | ||||||
| 14,350 | Pure Storage, Inc.d | 162,298 | ||||||
| 200 | Rohm Company, Ltd. | 11,475 | ||||||
| 600 | Ryosan Company, Ltd. | 18,089 | ||||||
| 4,860 | Salesforce.com, Inc.d | 332,716 | ||||||
| 233 | SAP SE | 20,156 | ||||||
| 1,010 | Seagate Technology plc | 38,552 | ||||||
| 553 | Software AG | 20,043 | ||||||
| 4,125 | Telefonaktiebolaget LM Ericsson | 24,176 | ||||||
| 600 | Tokyo Electron, Ltd. | 56,430 | ||||||
| 4,290 | Twitter, Inc.d | 69,927 | ||||||
| 5,750 | Vantiv, Inc.d | 342,815 | ||||||
| 9,770 | Visa, Inc. | 762,255 | ||||||
| 13,360 | Xilinx, Inc. | 806,543 | ||||||
|
| |||||||
Total | 8,218,895 | |||||||
|
| |||||||
Materials (2.6%) | ||||||||
| 900 | Adeka Corporation | 12,210 | ||||||
| 1,666 | APERAM | 76,030 | ||||||
| 580 | Ashland Global Holdings, Inc. | 63,388 | ||||||
| 1,342 | BHP Billiton plc | 21,369 | ||||||
| 19,716 | BHP Billiton, Ltd. | 353,210 | ||||||
| 13,725 | BlueScope Steel, Ltd. | 91,217 | ||||||
| 600 | Croda International plc | 23,598 | ||||||
| 1,460 | Crown Holdings, Inc.d | 76,752 | ||||||
| 7,800 | Daicel Corporation | 85,754 | ||||||
| 1,831 | Domtar Corporation | 71,464 | ||||||
| 760 | Eagle Materials, Inc. | 74,883 | ||||||
| 5,172 | Evonik Industries AG | 154,172 | ||||||
| 1,170 | FMC Corporation | 66,175 | ||||||
| 13 | Givaudan SA | 23,792 | ||||||
| 1,500 | JSR Corporation | 23,611 | ||||||
| 3,510 | Kinross Gold Corporationd | 10,916 | ||||||
| 5,200 | Kuraray Company, Ltd. | 77,977 | ||||||
| 1,200 | Kyoei Steel, Ltd. | 22,815 | ||||||
| 312 | LafargeHolcim, Ltd. | 16,378 | ||||||
| 6,400 | Mitsubishi Chemical Holdings Corporation | 41,380 | ||||||
| 1,300 | Mitsubishi Gas Chemical Company, Inc. | 22,151 | ||||||
| 700 | Mitsubishi Materials Corporation | 21,411 | ||||||
| 200 | Nippon Shokubai Company, Ltd. | 12,455 | ||||||
| 22,628 | Norsk Hydro ASA | 107,997 | ||||||
| 2,412 | Nufarm, Ltd. | 15,893 | ||||||
| 6,302 | Orora, Ltd. | 13,552 | ||||||
| 1,210 | Packaging Corporation of America | 102,632 | ||||||
| 820 | PPG Industries, Inc. | 77,703 | ||||||
| 591 | Rio Tinto, Ltd. | 25,319 | ||||||
| 3,290 | Steel Dynamics, Inc. | 117,058 | ||||||
| 500 | Sumitomo Seika Chemicals Company, Ltd. | 19,582 | ||||||
| 2,300 | Toagosei Company, Ltd. | 22,575 | ||||||
| 2,000 | Tosoh Corporation | 14,108 | ||||||
| 3,453 | UPM-Kymmene Oyj | 84,445 | ||||||
| 2,518 | Verso Corporationd | 17,878 | ||||||
| 600 | Yamato Kogyo Company, Ltd. | 16,734 | ||||||
| 4,051 | Yara International ASA | 159,363 | ||||||
| 400 | Yodogawa Steel Works, Ltd. | 10,424 | ||||||
|
| |||||||
Total | 2,248,371 | |||||||
|
| |||||||
Real Estate (8.9%) | ||||||||
| 650 | Acadia Realty Trust | 21,242 | ||||||
| 300 | Agree Realty Corporation | 13,815 | ||||||
| 3,141 | Alexandria Real Estate Equities, Inc. | 349,059 | ||||||
| 900 | American Campus Communities, Inc. | 44,793 | ||||||
| 1,400 | American Homes 4 Rent | 29,372 | ||||||
| 1,400 | Apartment Investment & Management Company | 63,630 | ||||||
| 1,200 | Apple Hospitality REIT, Inc. | 23,976 | ||||||
| 900 | AvalonBay Communities, Inc. | 159,435 | ||||||
| 400 | Bluerock Residential Growth REIT, Inc. | 5,488 | ||||||
| 1,731 | Boston Properties, Inc. | 217,725 | ||||||
| 1,200 | Brandywine Realty Trust | 19,812 | ||||||
| 11,634 | Brixmor Property Group, Inc. | 284,102 | ||||||
| 3,560 | Camden Property Trust | 299,289 | ||||||
| 12,600 | CapitaLand Retail China Trustd | 11,920 | ||||||
| 650 | Care Capital Properties, Inc. | 16,250 | ||||||
| 356 | Chesapeake Lodging Trust | 9,206 | ||||||
| 700 | CoreCivic, Inc. | 17,122 | ||||||
| 250 | CoreSite Realty Corporation | 19,842 | ||||||
| 700 | Corporate Office Properties Trust | 21,854 | ||||||
| 2,456 | Cousins Properties, Inc. | 20,901 | ||||||
| 2,070 | Crown Castle International Corporation | 179,614 | ||||||
| 1,600 | CubeSmart | 42,832 | ||||||
| 750 | CyrusOne, Inc. | 33,547 | ||||||
| 100 | Daito Trust Construction Company, Ltd. | 15,034 | ||||||
| 700 | DCT Industrial Trust, Inc. | 33,516 | ||||||
| 2,200 | DDR Corporation | 33,594 | ||||||
| 17,701 | DEXUS Property Group | 122,796 | ||||||
| 772 | DiamondRock Hospitality Company | 8,901 | ||||||
| 1,118 | Digital Realty Trust, Inc. | 109,855 | ||||||
| 700 | Douglas Emmett, Inc. | 25,592 | ||||||
| 13,460 | Duke Realty Corporation | 357,498 | ||||||
| 350 | DuPont Fabros Technology, Inc. | 15,376 | ||||||
| 121 | EastGroup Properties, Inc. | 8,935 | ||||||
| 400 | Education Realty Trust, Inc. | 16,920 | ||||||
| 456 | EPR Properties | 32,727 | ||||||
| 810 | Equinix, Inc. | 289,502 | ||||||
| 800 | Equity Commonwealthd | 24,192 | ||||||
| 700 | Equity Lifestyle Properties, Inc. | 50,470 | ||||||
| 600 | Equity One, Inc. | 18,414 | ||||||
| 3,690 | Equity Residential | 237,488 | ||||||
| 500 | Essex Property Trust, Inc. | 116,250 | ||||||
| 950 | Extra Space Storage, Inc. | 73,378 | ||||||
| 400 | Federal Realty Investment Trust | 56,844 | ||||||
| 700 | First Industrial Realty Trust, Inc. | 19,635 | ||||||
| 1,477 | Forest City Realty Trust, Inc. | 30,781 | ||||||
| 1,200 | Gaming and Leisure Properties, Inc. | 36,744 | ||||||
| 4,239 | General Growth Properties, Inc. | 105,890 | ||||||
The accompanying Notes to Financial Statements are an integral part of this schedule.
84
Table of Contents
GROWTHAND INCOME PLUS PORTFOLIO
Schedule of Investments as of December 31, 2016
| Shares | Common Stock (62.3%) | Value | ||||||
| Real Estate (8.9%) - continued | ||||||||
| 500 | GEO Group, Inc. | $ | 17,965 | |||||
| 1,800 | Gramercy Property Trust | 16,524 | ||||||
| 5,385 | H&R Real Estate Investment Trust | 89,720 | ||||||
| 1,500 | Hamborner REIT AG | 14,269 | ||||||
| 3,150 | HCP, Inc. | 93,618 | ||||||
| 900 | Healthcare Realty Trust, Inc. | 27,288 | ||||||
| 1,250 | Healthcare Trust of America, Inc. | 36,387 | ||||||
| 1,000 | Highwoods Properties, Inc. | 51,010 | ||||||
| 1,200 | Hospitality Properties Trust | 38,088 | ||||||
| 5,271 | Host Hotels & Resorts, Inc. | 99,306 | ||||||
| 800 | Hudson Pacific Properties, Inc. | 27,824 | ||||||
| 21,000 | Hysan Development Company, Ltd. | 86,605 | ||||||
| 1,600 | Iron Mountain, Inc. | 51,968 | ||||||
| 600 | Kilroy Realty Corporation | 43,932 | ||||||
| 3,500 | Kimco Realty Corporation | 88,060 | ||||||
| 467 | Lamar Advertising Company | 31,401 | ||||||
| 700 | LaSalle Hotel Properties | 21,329 | ||||||
| 1,000 | Liberty Property Trust | 39,500 | ||||||
| 313 | Life Storage, Inc. | 26,686 | ||||||
| 2,000 | Link REIT | 12,966 | ||||||
| 1,075 | Macerich Company | 76,153 | ||||||
| 600 | Mack-Cali Realty Corporation | 17,412 | ||||||
| 2,300 | Medical Properties Trust, Inc. | 28,290 | ||||||
| 734 | Mid-America Apartment Communities, Inc. | 71,873 | ||||||
| 500 | National Health Investors, Inc. | 37,085 | ||||||
| 1,600 | National Retail Properties, Inc. | 70,720 | ||||||
| 713 | National Storage Affiliates Trust | 15,736 | ||||||
| 82,930 | New World Development Company, Ltd. | 87,376 | ||||||
| 1,150 | NorthStar Realty Finance Corporation | 17,423 | ||||||
| 1,000 | Omega Healthcare Investors, Inc. | 31,260 | ||||||
| 800 | Outfront Media, Inc. | 19,896 | ||||||
| 307 | Parkway, Inc.d | 6,831 | ||||||
| 400 | Pebblebrook Hotel Trust | 11,900 | ||||||
| 1,550 | Physicians Realty Trust | 29,388 | ||||||
| 300 | Piedmont Office Realty Trust, Inc. | 6,273 | ||||||
| 5,585 | Prologis, Inc. | 294,832 | ||||||
| 1,448 | Public Storage, Inc. | 323,628 | ||||||
| 338 | QTS Realty Trust, Inc. | 16,782 | ||||||
| 630 | Quality Care Properties, Inc.d | 9,765 | ||||||
| 1,300 | Realty Income Corporation | 74,724 | ||||||
| 1,000 | Regency Centers Corporation | 68,950 | ||||||
| 650 | Retail Opportunity Investments Corporation | 13,734 | ||||||
| 1,200 | Retail Properties of America, Inc. | 18,396 | ||||||
| 1,095 | RLJ Lodging Trust | 26,817 | ||||||
| 1,123 | Senior Housing Property Trust | 21,258 | ||||||
| 3,150 | Simon Property Group, Inc. | 559,661 | ||||||
| 700 | SL Green Realty Corporation | 75,285 | ||||||
| 5,300 | Spirit Realty Captial, Inc. | 57,558 | ||||||
| 32,931 | Stockland | 108,794 | ||||||
| 1,296 | Store Capital Corporation | 32,024 | ||||||
| 1,135 | Summit Hotel Properties, Inc. | 18,194 | ||||||
| 500 | Sun Communities, Inc. | 38,305 | ||||||
| 1,000 | Sun Hung Kai Properties, Ltd. | 12,592 | ||||||
| 1,421 | Sunstone Hotel Investors, Inc. | 21,670 | ||||||
| 733 | Tanger Factory Outlet Centers, Inc. | 26,227 | ||||||
| 450 | Taubman Centers, Inc. | 33,269 | ||||||
| 2,000 | UDR, Inc. | 72,960 | ||||||
| 600 | Urban Edge Properties | 16,506 | ||||||
| 200 | Urstadt Biddle Properties, Inc. | 4,822 | ||||||
| 2,400 | Ventas, Inc. | 150,048 | ||||||
| 5,042 | VEREIT, Inc. | 42,655 | ||||||
| 2,060 | Vornado Realty Trust | 215,002 | ||||||
| 800 | Washington Prime Group, Inc. | 8,328 | ||||||
| 800 | Weingarten Realty Investors | 28,632 | ||||||
| 2,399 | Welltower, Inc. | 160,565 | ||||||
| 2,000 | Wharf Holdings, Ltd. | 13,248 | ||||||
| 3,000 | Wheelock and Company, Ltd. | 16,837 | ||||||
| 19,200 | Wing Tai Holdings, Ltd. | 21,030 | ||||||
| 400 | WP Carey, Inc. | 23,636 | ||||||
|
| |||||||
Total | 7,813,954 | |||||||
|
| |||||||
Telecommunications Services (0.9%) | ||||||||
| 2,960 | Elisa Oyj | 96,086 | ||||||
| 2,600 | Freenet AG | 73,072 | ||||||
| 46,042 | KCOM Group plc | 53,764 | ||||||
| 11,352 | Koninklijke (Royal) KPN NV | 33,569 | ||||||
| 2,600 | Nippon Telegraph & Telephone Corporation | 109,448 | ||||||
| 2,900 | NTT DOCOMO, Inc. | 65,961 | ||||||
| 52,856 | PCCW, Ltd. | 28,573 | ||||||
| 1,216 | Proximus SA | 34,956 | ||||||
| 4,600 | Telefonica Deutschland Holding AG | 19,662 | ||||||
| 2,997 | Telenor ASA | 44,735 | ||||||
| 665 | Vivendi SA | 12,613 | ||||||
| 7,340 | Zayo Group Holdings, Inc.d | 241,193 | ||||||
|
| |||||||
Total | 813,632 | |||||||
|
| |||||||
Utilities (1.0%) | ||||||||
| 1,010 | ATCO, Ltd. | 33,595 | ||||||
| 16,500 | Centrica plc | 47,521 | ||||||
| 22,500 | Electricidade de Portugal SA | 68,480 | ||||||
| 10,371 | MDU Resources Group, Inc. | 298,373 | ||||||
| 3,224 | NorthWestern Corporation | 183,349 | ||||||
| 27,000 | Osaka Gas Company, Ltd. | 103,601 | ||||||
| 14,595 | Redes Energeticas Nacionais SGPS SA | 41,410 | ||||||
| 2,000 | Toho Gas Company, Ltd. | 16,244 | ||||||
| 2,560 | United Utilities Group plc | 28,376 | ||||||
|
| |||||||
Total | 820,949 | |||||||
|
| |||||||
Total Common Stock (cost $51,595,097) | 54,523,568 | |||||||
|
| |||||||
| Principal Amount | Long-Term Fixed Income (16.8%) | |||||||
| Asset-Backed Securities (0.1%) | ||||||||
Marlette Funding Trust | ||||||||
3.060%, 1/17/2023, Series | ||||||||
| 73,591 | 2016-1A, Class A* | 73,573 | ||||||
Vericrest Opportunity Loan Transferee | ||||||||
3.500%, 6/26/2045, Series | ||||||||
| 32,970 | 2015-NPL9, Class A1f | 32,903 | ||||||
|
| |||||||
Total | 106,476 | |||||||
|
| |||||||
Basic Materials (0.4%) | ||||||||
Albemarle Corporation | ||||||||
| 14,000 | 3.000%, 12/1/2019 | 14,311 | ||||||
Alcoa Nederland Holding BV | ||||||||
| 15,000 | 6.750%, 9/30/2024f | 16,275 | ||||||
ArcelorMittal SA | ||||||||
| 50,000 | 6.500%, 3/1/2021 | 54,750 | ||||||
Dow Chemical Company | ||||||||
| 10,000 | 8.550%, 5/15/2019 | 11,457 | ||||||
First Quantum Minerals, Ltd. | ||||||||
| 55,000 | 7.000%, 2/15/2021f | 54,703 | ||||||
Glencore Funding, LLC | ||||||||
| 10,000 | 1.940%, 4/16/2018f,g | 9,887 | ||||||
LyondellBasell Industries NV | ||||||||
| 10,000 | 5.000%, 4/15/2019 | 10,557 | ||||||
The accompanying Notes to Financial Statements are an integral part of this schedule.
85
Table of Contents
GROWTHAND INCOME PLUS PORTFOLIO
Schedule of Investments as of December 31, 2016
| Principal Amount | Long-Term Fixed Income (16.8%) | Value | ||||||
| Basic Materials (0.4%) - continued | ||||||||
Newmont Mining Corporation, Convertible | ||||||||
| $30,000 | 1.625%, 7/15/2017 | $ | 30,581 | |||||
NOVA Chemicals Corporation | ||||||||
| 40,122 | 5.250%, 8/1/2023f | 40,523 | ||||||
Royal Gold, Inc., Convertible | ||||||||
| 20,000 | 2.875%, 6/15/2019 | 21,125 | ||||||
RPM International, Inc., Convertible | ||||||||
| 40,000 | 2.250%, 12/15/2020 | 47,875 | ||||||
Steel Dynamics, Inc. | ||||||||
| 30,000 | 5.000%, 12/15/2026f | 29,888 | ||||||
|
| |||||||
Total | 341,932 | |||||||
|
| |||||||
Capital Goods (0.3%) | ||||||||
AECOM | ||||||||
| 50,000 | 5.875%, 10/15/2024 | 53,381 | ||||||
Building Materials Corporation of America | ||||||||
| 50,000 | 6.000%, 10/15/2025f | 52,625 | ||||||
Cemex SAB de CV | ||||||||
| 55,000 | 5.700%, 1/11/2025f | 55,412 | ||||||
Crown Americas Capital Corporation IV | ||||||||
| 50,000 | 4.500%, 1/15/2023 | 51,000 | ||||||
General Electric Company | ||||||||
| 16,000 | 5.000%, 1/21/2021h | 16,603 | ||||||
Lockheed Martin Corporation | ||||||||
| 10,000 | 2.500%, 11/23/2020 | 10,077 | ||||||
Roper Industries, Inc. | ||||||||
| 11,000 | 2.050%, 10/1/2018 | 11,035 | ||||||
United Rentals North America, Inc. | ||||||||
| 55,000 | 5.500%, 7/15/2025 | 56,100 | ||||||
|
| |||||||
Total | 306,233 | |||||||
|
| |||||||
Collateralized Mortgage Obligations (1.9%) | ||||||||
Alternative Loan Trust | ||||||||
5.500%, 10/25/2035, Series | ||||||||
| 134,182 | 2005-47CB, Class A7 | 114,412 | ||||||
Angel Oak Mortgage Trust | ||||||||
4.500%, 11/25/2045, Series | ||||||||
| 22,568 | 2015-1, Class A*,i | 22,699 | ||||||
Banc of America Alternative Loan Trust | ||||||||
6.000%, 11/25/2035, Series | ||||||||
| 47,256 | 2005-10, Class 3CB1 | 41,690 | ||||||
CHL Mortgage Pass-Through Trust | ||||||||
2.919%, 1/25/2036, Series | ||||||||
| 70,078 | 2005-31, Class 4A2 | 62,432 | ||||||
Citigroup Mortgage Loan Trust, Inc. | ||||||||
3.037%, 3/25/2037, Series | ||||||||
| 21,802 | 2007-AR4, Class 2A1A | 18,557 | ||||||
CitiMortgage Alternative Loan Trust | ||||||||
5.750%, 4/25/2037, Series | ||||||||
| 75,532 | 2007-A4, Class 1A5 | 64,714 | ||||||
Countrywide Alternative Loan Trust | ||||||||
6.500%, 8/25/2036, Series | ||||||||
| 68,878 | 2006-23CB, Class 2A3 | 46,456 | ||||||
6.000%, 4/25/2037, Series | ||||||||
| 209,908 | 2007-7T2, Class A9 | 140,905 | ||||||
Credit Suisse First Boston Mortgage Securities Corporation | ||||||||
5.250%, 10/25/2035, Series | ||||||||
| 46,261 | 2005-9, Class 1A3 | 44,706 | ||||||
Deutsche Alt-A Securities, Inc., Mortgage Loan Trust | ||||||||
5.500%, 11/25/2035, Series | ||||||||
| 48,529 | 2005-5, Class 1A4 | 48,733 | ||||||
J.P. Morgan Alternative Loan Trust | ||||||||
6.500%, 3/25/2036, Series | ||||||||
| 119,126 | 2006-S1, Class 1A19 | 103,975 | ||||||
J.P. Morgan Mortgage Trust | ||||||||
2.834%, 6/25/2035, Series | ||||||||
| 74,172 | 2005-A3, Class 3A4 | 73,666 | ||||||
3.077%, 6/25/2035, Series | ||||||||
| 66,838 | 2005-A3, Class 4A1 | 67,084 | ||||||
3.247%, 8/25/2035, Series | ||||||||
| 50,150 | 2005-A5, Class 1A2 | 49,728 | ||||||
3.186%, 1/25/2037, Series | ||||||||
| 70,004 | 2006-A7, Class 2A2 | 62,682 | ||||||
MortgageIT Trust | ||||||||
1.016%, 12/25/2035, Series | ||||||||
| 58,030 | 2005-5, Class A1g | 53,557 | ||||||
New York Mortgage Trust | ||||||||
3.112%, 5/25/2036, Series | ||||||||
| 59,547 | 2006-1, Class 2A3 | 53,583 | ||||||
Residential Accredit Loans, Inc. Trust | ||||||||
5.750%, 9/25/2035, Series | ||||||||
| 58,664 | 2005-QS13, Class 2A3 | 52,384 | ||||||
Residential Funding Mortgage Security I Trust | ||||||||
6.000%, 7/25/2037, Series | ||||||||
| 66,368 | 2007-S7, Class A20 | 61,152 | ||||||
Structured Adjustable Rate Mortgage Loan Trust | ||||||||
3.364%, 9/25/2035, Series | ||||||||
| 77,430 | 2005-18, Class 1A1 | 63,415 | ||||||
Structured Asset Mortgage Investments, Inc. | ||||||||
1.066%, 12/25/2035, Series | ||||||||
| 122,379 | 2005-AR4, Class A1g | 89,394 | ||||||
WaMu Mortgage Pass Through Certificates | ||||||||
2.850%, 10/25/2036, Series | ||||||||
| 58,717 | 2006-AR12, Class 1A1 | 51,185 | ||||||
1.307%, 1/25/2047, Series | ||||||||
| 109,742 | 2006-AR19, Class 1Ag | 85,591 | ||||||
Wells Fargo Mortgage Backed Securities Trust | ||||||||
3.003%, 3/25/2036, Series | ||||||||
| 49,089 | 2006-AR2, Class 2A1 | 48,971 | ||||||
3.037%, 7/25/2036, Series | ||||||||
| 47,890 | 2006-AR10, Class 2A1 | 46,857 | ||||||
6.000%, 7/25/2037, Series | ||||||||
| 39,283 | 2007-8, Class 1A16 | 38,807 | ||||||
|
| |||||||
Total | 1,607,335 | |||||||
|
| |||||||
Communications Services (0.7%) | ||||||||
America Movil SAB de CV | ||||||||
| 10,000 | 5.000%, 10/16/2019 | 10,712 | ||||||
American Tower Corporation | ||||||||
| 10,000 | 2.800%, 6/1/2020 | 10,000 | ||||||
AT&T, Inc. | ||||||||
| 10,000 | 5.875%, 10/1/2019 | 10,924 | ||||||
| 10,000 | 1.928%, 6/30/2020g | 10,054 | ||||||
| 15,000 | 2.800%, 2/17/2021 | 14,869 | ||||||
British Sky Broadcasting Group plc | ||||||||
| 14,000 | 2.625%, 9/16/2019f | 14,051 | ||||||
The accompanying Notes to Financial Statements are an integral part of this schedule.
86
Table of Contents
GROWTHAND INCOME PLUS PORTFOLIO
Schedule of Investments as of December 31, 2016
| Principal Amount | Long-Term Fixed Income (16.8%) | Value | ||||||
| Communications Services (0.7%) - continued | ||||||||
CCOH Safari, LLC | ||||||||
| $30,000 | 5.750%, 2/15/2026f | $ | 31,050 | |||||
CenturyLink, Inc. | ||||||||
| 35,000 | 6.450%, 6/15/2021 | 36,837 | ||||||
Charter Communications Operating, LLC | ||||||||
| 10,000 | 3.579%, 7/23/2020 | 10,195 | ||||||
| 5,000 | 4.464%, 7/23/2022 | 5,220 | ||||||
Clear Channel Worldwide Holdings, Inc. | ||||||||
| 40,000 | 6.500%, 11/15/2022 | 40,900 | ||||||
Columbus International, Inc. | ||||||||
| 50,000 | 7.375%, 3/30/2021f | 53,207 | ||||||
Crown Castle International Corporation | ||||||||
| 5,000 | 3.400%, 2/15/2021 | 5,070 | ||||||
| 5,000 | 2.250%, 9/1/2021 | 4,833 | ||||||
CSC Holdings, LLC | ||||||||
| 5,000 | 5.500%, 4/15/2027f | 5,062 | ||||||
Digicel, Ltd. | ||||||||
| 56,748 | 6.000%, 4/15/2021* | 51,312 | ||||||
Frontier Communications Corporation | ||||||||
| 50,000 | 8.875%, 9/15/2020 | 53,250 | ||||||
Hughes Satellite Systems Corporation | ||||||||
| 30,000 | 6.500%, 6/15/2019 | 32,625 | ||||||
Neptune Finco Corporation | ||||||||
| 30,000 | 10.875%, 10/15/2025f | 35,700 | ||||||
SFR Group SA | ||||||||
| 50,000 | 6.000%, 5/15/2022f | 51,312 | ||||||
Sprint Corporation | ||||||||
| 55,000 | 7.625%, 2/15/2025 | 57,819 | ||||||
Telefonica Emisiones SAU | ||||||||
| 12,000 | 3.192%, 4/27/2018 | 12,171 | ||||||
T-Mobile USA, Inc. | ||||||||
| 40,000 | 6.633%, 4/28/2021 | 41,750 | ||||||
Verizon Communications, Inc. | ||||||||
| 37,000 | 2.625%, 2/21/2020 | 37,331 | ||||||
| 16,000 | 4.500%, 9/15/2020 | 17,109 | ||||||
|
| |||||||
Total | 653,363 | |||||||
|
| |||||||
Consumer Cyclical (0.8%) | ||||||||
Allison Transmission, Inc. | ||||||||
| 45,000 | 5.000%, 10/1/2024f | 45,450 | ||||||
BMW US Capital, LLC | ||||||||
| 15,000 | 1.500%, 4/11/2019f | 14,852 | ||||||
Brookfield Residential Properties, Inc. | ||||||||
| 60,000 | 6.125%, 7/1/2022f | 60,300 | ||||||
Cinemark USA, Inc. | ||||||||
| 31,000 | 4.875%, 6/1/2023 | 31,387 | ||||||
Daimler Finance North America, LLC | ||||||||
| 9,000 | 1.875%, 1/11/2018f | 9,011 | ||||||
eBay, Inc. | ||||||||
| 10,000 | 2.500%, 3/9/2018 | 10,087 | ||||||
ERAC USA Finance, LLC | ||||||||
| 16,000 | 2.350%, 10/15/2019f | 15,978 | ||||||
Ford Motor Credit Company, LLC | ||||||||
| 16,000 | 5.000%, 5/15/2018 | 16,624 | ||||||
| 14,000 | 2.597%, 11/4/2019 | 13,972 | ||||||
General Motors Financial Company, Inc. | ||||||||
| 5,000 | 3.150%, 1/15/2020 | 5,028 | ||||||
| 21,000 | 4.375%, 9/25/2021 | 21,764 | ||||||
Home Depot, Inc. | ||||||||
| 10,000 | 1.333%, 9/15/2017g | 10,017 | ||||||
| 10,000 | 2.625%, 6/1/2022 | 10,038 | ||||||
KB Home | ||||||||
| 29,000 | 4.750%, 5/15/2019 | 29,580 | ||||||
L Brands, Inc. | ||||||||
| 33,000 | 6.625%, 4/1/2021 | 37,043 | ||||||
Lennar Corporation | ||||||||
| 50,000 | 4.750%, 11/15/2022 | 51,250 | ||||||
Macy’s Retail Holdings, Inc. | ||||||||
| 14,000 | 7.450%, 7/15/2017 | 14,441 | ||||||
MGM Resorts International | ||||||||
| 55,000 | 6.000%, 3/15/2023 | 59,400 | ||||||
Newell Rubbermaid, Inc. | ||||||||
| 10,000 | 3.150%, 4/1/2021 | 10,169 | ||||||
PulteGroup, Inc. | ||||||||
| 30,000 | 4.250%, 3/1/2021 | 30,675 | ||||||
Ralph Lauren Corporation | ||||||||
| 10,000 | 2.625%, 8/18/2020 | 10,094 | ||||||
Royal Caribbean Cruises, Ltd. | ||||||||
| 51,748 | 5.250%, 11/15/2022 | 55,306 | ||||||
Toll Brothers Finance Corporation | ||||||||
| 20,000 | 4.000%, 12/31/2018 | 20,525 | ||||||
Visa, Inc. | ||||||||
| 10,000 | 2.200%, 12/14/2020 | 10,006 | ||||||
Walgreens Boots Alliance, Inc. | ||||||||
| 10,000 | 1.750%, 5/30/2018 | 10,008 | ||||||
| 10,000 | 2.600%, 6/1/2021 | 9,928 | ||||||
West Corporation | ||||||||
| 50,000 | 5.375%, 7/15/2022f | 48,312 | ||||||
Yum! Brands, Inc. | ||||||||
| 55,000 | 5.000%, 6/1/2024f | 56,169 | ||||||
|
| |||||||
Total | 717,414 | |||||||
|
| |||||||
Consumer Non-Cyclical (0.8%) | ||||||||
Actavis Funding SCS | ||||||||
| 7,000 | 2.208%, 3/12/2020g | 7,134 | ||||||
Anheuser-Busch InBev Finance, Inc. | ||||||||
| 15,000 | 2.146%, 2/1/2021g | 15,264 | ||||||
| 10,000 | 2.650%, 2/1/2021 | 10,046 | ||||||
Anheuser-Busch InBev Worldwide, Inc. | ||||||||
| 12,000 | 6.500%, 7/15/2018 | 12,850 | ||||||
B&G Foods, Inc. | ||||||||
| 40,000 | 4.625%, 6/1/2021 | 40,800 | ||||||
BAT International Finance plc | ||||||||
| 10,000 | 1.473%, 6/15/2018f,g | 10,002 | ||||||
Boston Scientific Corporation | ||||||||
| 5,000 | 6.000%, 1/15/2020 | 5,491 | ||||||
Bunge Limited Finance Corporation | ||||||||
| 10,000 | 3.500%, 11/24/2020 | 10,170 | ||||||
Celgene Corporation | ||||||||
| 10,000 | 3.550%, 8/15/2022 | 10,245 | ||||||
Cott Beverages, Inc. | ||||||||
| 55,000 | 5.375%, 7/1/2022 | 55,963 | ||||||
CVS Health Corporation | ||||||||
| 10,000 | 2.250%, 12/5/2018 | 10,086 | ||||||
EMD Finance, LLC | ||||||||
| 6,000 | 1.343%, 3/17/2017f,g | 6,001 | ||||||
Envision Healthcare Corporation | ||||||||
| 50,000 | 5.125%, 7/1/2022f | 49,813 | ||||||
Forest Laboratories, Inc. | ||||||||
| 15,000 | 4.375%, 2/1/2019f | 15,582 | ||||||
Gilead Sciences, Inc. | ||||||||
| 10,000 | 3.250%, 9/1/2022 | 10,196 | ||||||
The accompanying Notes to Financial Statements are an integral part of this schedule.
87
Table of Contents
GROWTHAND INCOME PLUS PORTFOLIO
Schedule of Investments as of December 31, 2016
| Principal Amount | Long-Term Fixed Income (16.8%) | Value | ||||||
| Consumer Non-Cyclical (0.8%) - continued | ||||||||
Grifols Worldwide Operations, Ltd. | ||||||||
| $40,000 | 5.250%, 4/1/2022 | $ | 41,400 | |||||
HCA, Inc. | ||||||||
| 26,748 | 4.750%, 5/1/2023 | 27,383 | ||||||
Iconix Brand Group, Inc., Convertible | ||||||||
| 35,000 | 1.500%, 3/15/2018 | 32,900 | ||||||
JBS USA, LLC | ||||||||
| 55,000 | 5.750%, 6/15/2025f | 55,688 | ||||||
Laboratory Corporation of America Holdings | ||||||||
| 5,000 | 2.625%, 2/1/2020 | 4,993 | ||||||
Mead Johnson Nutrition Company | ||||||||
| 10,000 | 3.000%, 11/15/2020 | 10,117 | ||||||
Merck & Company, Inc. | ||||||||
| 5,000 | 1.257%, 2/10/2020g | 5,026 | ||||||
Mylan NV | ||||||||
| 10,000 | 3.150%, 6/15/2021f | 9,805 | ||||||
Perrigo Finance plc | ||||||||
| 5,000 | 3.500%, 12/15/2021 | 5,035 | ||||||
Pinnacle Foods, Inc. | ||||||||
| 50,000 | 5.875%, 1/15/2024 | 53,000 | ||||||
Revlon Consumer Products Corporation | ||||||||
| 26,748 | 5.750%, 2/15/2021 | 26,882 | ||||||
Reynolds American, Inc. | ||||||||
| 6,000 | 3.250%, 6/12/2020 | 6,144 | ||||||
Tenet Healthcare Corporation | ||||||||
| 50,000 | 8.125%, 4/1/2022 | 47,175 | ||||||
Teva Pharmaceutical Finance Netherlands III BV | ||||||||
| 10,000 | 1.700%, 7/19/2019 | 9,821 | ||||||
TreeHouse Foods, Inc. | ||||||||
| 40,000 | 4.875%, 3/15/2022 | 41,000 | ||||||
Valeant Pharmaceuticals International | ||||||||
| 26,748 | 7.250%, 7/15/2022f | 21,866 | ||||||
VPII Escrow Corporation | ||||||||
| 25,000 | 7.500%, 7/15/2021f | 21,188 | ||||||
|
| |||||||
Total | 689,066 | |||||||
|
| |||||||
Energy (0.7%) | ||||||||
Anadarko Petroleum Corporation | ||||||||
| 10,000 | 8.700%, 3/15/2019 | 11,361 | ||||||
Antero Resources Corporation | ||||||||
| 35,000 | 5.125%, 12/1/2022 | 35,350 | ||||||
BP Capital Markets plc | ||||||||
| 15,000 | 1.676%, 5/3/2019 | 14,890 | ||||||
Buckeye Partners, LP | ||||||||
| 17,000 | 2.650%, 11/15/2018 | 17,109 | ||||||
Chevron Corporation | ||||||||
| 10,000 | 1.421%, 11/16/2018g | 10,040 | ||||||
CNPC General Capital, Ltd. | ||||||||
| 3,000 | 2.750%, 4/19/2017f | 3,008 | ||||||
Concho Resources, Inc. | ||||||||
| 51,748 | 6.500%, 1/15/2022 | 53,544 | ||||||
| 15,000 | 4.375%, 1/15/2025 | 14,970 | ||||||
Contura Energy, Inc. | ||||||||
| 16,000 | 10.000%, 8/1/2021* | 17,080 | ||||||
Crestwood Midstream Partners, LP | ||||||||
| 40,000 | 6.250%, 4/1/2023 | 40,800 | ||||||
Ecopetrol SA | ||||||||
| 7,000 | 5.875%, 9/18/2023 | 7,410 | ||||||
Enbridge, Inc. | ||||||||
| 8,000 | 1.384%, 6/2/2017g | 8,001 | ||||||
EQT Corporation | ||||||||
| 10,000 | 8.125%, 6/1/2019 | 11,247 | ||||||
Exxon Mobil Corporation | ||||||||
| 10,000 | 1.708%, 3/1/2019 | 10,019 | ||||||
Marathon Petroleum Corporation | ||||||||
| 10,000 | 3.400%, 12/15/2020 | 10,219 | ||||||
MEG Energy Corporation | ||||||||
| 33,000 | 6.375%, 1/30/2023f | 29,370 | ||||||
MPLX, LP | ||||||||
| 55,000 | 4.875%, 12/1/2024 | 56,567 | ||||||
Northern Tier Energy, LLC | ||||||||
| 30,000 | 7.125%, 11/15/2020 | 31,162 | ||||||
Petrobras Global Finance BV | ||||||||
| 22,000 | 8.375%, 5/23/2021 | 23,705 | ||||||
Petroleos Mexicanos | ||||||||
| 27,000 | 6.500%, 3/13/2027f | 27,850 | ||||||
Regency Energy Partners, LP | ||||||||
| 50,000 | 5.000%, 10/1/2022 | 52,931 | ||||||
Rowan Companies, Inc. | ||||||||
| 5,000 | 7.375%, 6/15/2025 | 5,100 | ||||||
Sabine Pass Liquefaction, LLC | ||||||||
| 55,000 | 5.625%, 3/1/2025 | 58,850 | ||||||
Schlumberger Holdings Corporation | ||||||||
| 10,000 | 3.000%, 12/21/2020f | 10,204 | ||||||
Shell International Finance BV | ||||||||
| 10,000 | 1.352%, 5/11/2020g | 10,006 | ||||||
Sunoco Logistics Partners Operations, LP | ||||||||
| 10,000 | 4.400%, 4/1/2021 | 10,522 | ||||||
Transcontinental Gas Pipe Line Company, LLC | ||||||||
| 10,000 | 7.850%, 2/1/2026f | 12,594 | ||||||
Whiting Petroleum Corporation, Convertible | ||||||||
| 20,000 | 1.250%, 4/1/2020 | 17,550 | ||||||
|
| |||||||
Total | 611,459 | |||||||
|
| |||||||
Financials (1.8%) | ||||||||
Abbey National Treasury Services plc | ||||||||
| 14,000 | 1.407%, 9/29/2017g | 13,975 | ||||||
ACE INA Holdings, Inc. | ||||||||
| 10,000 | 2.875%, 11/3/2022 | 10,071 | ||||||
AerCap Ireland Capital, Ltd. | ||||||||
| 25,000 | 3.950%, 2/1/2022 | 25,219 | ||||||
Air Lease Corporation | ||||||||
| 14,000 | 2.125%, 1/15/2018 | 14,024 | ||||||
| 5,000 | 2.625%, 9/4/2018 | 5,034 | ||||||
Ally Financial, Inc. | ||||||||
| 40,000 | 4.750%, 9/10/2018 | 41,200 | ||||||
American Express Credit Corporation | ||||||||
| 10,000 | 2.009%, 9/14/2020g | 10,167 | ||||||
AMG Capital Trust II, Convertible | ||||||||
| 700 | 5.150%, 10/15/2037 | 38,216 | ||||||
Bank of America Corporation | ||||||||
| 18,000 | 5.700%, 5/2/2017 | 18,245 | ||||||
| 16,000 | 1.700%, 8/25/2017 | 16,021 | ||||||
| 11,000 | 8.000%, 1/30/2018h | 11,303 | ||||||
| 31,000 | 2.066%, 3/22/2018g | 31,209 | ||||||
| 25,000 | 5.650%, 5/1/2018 | 26,190 | ||||||
| 10,000 | 2.625%, 4/19/2021 | 9,923 | ||||||
Bank of Montreal | ||||||||
| 8,000 | 1.500%, 7/18/2019 | 7,892 | ||||||
BB&T Corporation | ||||||||
| 16,000 | 2.050%, 6/19/2018 | 16,080 | ||||||
Bear Stearns Companies, LLC | ||||||||
| 20,000 | 6.400%, 10/2/2017 | 20,718 | ||||||
The accompanying Notes to Financial Statements are an integral part of this schedule.
88
Table of Contents
GROWTHAND INCOME PLUS PORTFOLIO
Schedule of Investments as of December 31, 2016
| Principal Amount | Long-Term Fixed Income (16.8%) | Value | ||||||
| Financials (1.8%) - continued | ||||||||
Blackstone Mortgage Trust, Inc., Convertible | ||||||||
| $40,000 | 5.250%, 12/1/2018 | $ | 44,600 | |||||
BNP Paribas SA | ||||||||
| 12,000 | 2.375%, 9/14/2017 | 12,080 | ||||||
Caisse Centrale Desjardins du Quebec | ||||||||
| 7,000 | 1.552%, 1/29/2018f,g | 6,993 | ||||||
Citigroup, Inc. | ||||||||
| 21,000 | 1.850%, 11/24/2017 | 21,038 | ||||||
| 5,000 | 2.361%, 9/1/2023g | 5,099 | ||||||
CNA Financial Corporation | ||||||||
| 10,000 | 5.750%, 8/15/2021 | 11,161 | ||||||
Credit Agricole SA | ||||||||
| 8,000 | 1.923%, 6/10/2020f,g | 8,027 | ||||||
CyrusOne, LP | ||||||||
| 26,000 | 6.375%, 11/15/2022 | 27,365 | ||||||
Discover Bank | ||||||||
| 4,000 | 8.700%, 11/18/2019 | 4,540 | ||||||
Discover Financial Services | ||||||||
| 8,000 | 6.450%, 6/12/2017 | 8,164 | ||||||
Fifth Third Bancorp | ||||||||
| 20,000 | 5.450%, 1/15/2017 | 20,027 | ||||||
Goldman Sachs Group, Inc. | ||||||||
| 8,000 | 2.625%, 1/31/2019 | 8,083 | ||||||
| 12,000 | 7.500%, 2/15/2019 | 13,298 | ||||||
| 10,000 | 2.000%, 4/25/2019 | 9,956 | ||||||
| 5,000 | 2.042%, 4/23/2020g | 5,048 | ||||||
| 10,000 | 2.241%, 11/15/2021g | 10,054 | ||||||
| 10,000 | 2.537%, 11/29/2023g | 10,310 | ||||||
Goldman Sachs Group, Inc., Convertible | ||||||||
| 375,000 | 0.500%, 9/24/2022 | 414,202 | ||||||
Guardian Life Global Funding | ||||||||
| 10,000 | 2.000%, 4/26/2021f | 9,744 | ||||||
Hartford Financial Services Group, Inc. | ||||||||
| 17,000 | 6.000%, 1/15/2019 | 18,287 | ||||||
HCP, Inc. | ||||||||
| 10,000 | 3.750%, 2/1/2019 | 10,278 | ||||||
Health Care REIT, Inc. | ||||||||
| 10,000 | 4.700%, 9/15/2017 | 10,214 | ||||||
Hospitality Properties Trust | ||||||||
| 10,000 | 4.250%, 2/15/2021 | 10,338 | ||||||
Huntington Bancshares, Inc. | ||||||||
| 10,000 | 3.150%, 3/14/2021 | 10,133 | ||||||
Hutchison Whampoa Finance CI, Ltd. | ||||||||
| 15,000 | 1.625%, 10/31/2017f | 14,965 | ||||||
Icahn Enterprises, LP | ||||||||
| 25,000 | 6.000%, 8/1/2020 | 25,531 | ||||||
ING Capital Funding Trust III | ||||||||
| 10,000 | 4.438%, 3/31/2017g,h | 9,950 | ||||||
Intesa Sanpaolo SPA | ||||||||
| 4,000 | 3.875%, 1/16/2018 | 4,053 | ||||||
| 15,000 | 3.875%, 1/15/2019 | 15,264 | ||||||
J.P. Morgan Chase & Company | ||||||||
| 9,000 | 7.900%, 4/30/2018h | 9,320 | ||||||
| 8,000 | 6.300%, 4/23/2019 | 8,739 | ||||||
| 5,000 | 2.250%, 1/23/2020 | 4,985 | ||||||
| 15,000 | 2.700%, 5/18/2023 | 14,659 | ||||||
| 14,000 | 2.112%, 10/24/2023g | 14,280 | ||||||
KeyCorp | ||||||||
| 12,000 | 2.300%, 12/13/2018 | 12,069 | ||||||
Liberty Mutual Group, Inc. | ||||||||
| 4,000 | 5.000%, 6/1/2021f | 4,348 | ||||||
Lincoln National Corporation | ||||||||
| 8,000 | 6.250%, 2/15/2020 | 8,830 | ||||||
Lloyds Bank plc | ||||||||
| 7,000 | 1.490%, 3/16/2018g | 7,010 | ||||||
Macquarie Bank, Ltd. | ||||||||
| 10,000 | 2.060%, 1/15/2019f,g | 10,079 | ||||||
MetLife, Inc. | ||||||||
| 14,000 | 1.903%, 12/15/2017 | 14,036 | ||||||
Mizuho Corporate Bank, Ltd. | ||||||||
| 14,000 | 1.550%, 10/17/2017f | 13,987 | ||||||
Morgan Stanley | ||||||||
| 16,000 | 6.625%, 4/1/2018 | 16,918 | ||||||
| 10,000 | 2.026%, 1/27/2020g | 10,088 | ||||||
| 10,000 | 2.500%, 4/21/2021 | 9,883 | ||||||
| 10,000 | 4.875%, 11/1/2022 | 10,706 | ||||||
| 10,000 | 2.282%, 10/24/2023g | 10,111 | ||||||
MPT Operating Partnership, LP | ||||||||
| 40,000 | 5.500%, 5/1/2024 | 40,400 | ||||||
Murray Street Investment Trust I | ||||||||
| 24,000 | 4.647%, 3/9/2017 | 24,125 | ||||||
National City Corporation | ||||||||
| 8,000 | 6.875%, 5/15/2019 | 8,802 | ||||||
New York Life Global Funding | ||||||||
| 10,000 | 1.550%, 11/2/2018f | 9,969 | ||||||
Nomura Holdings, Inc. | ||||||||
| 8,000 | 2.750%, 3/19/2019 | 8,073 | ||||||
Quicken Loans, Inc. | ||||||||
| 55,000 | 5.750%, 5/1/2025f | 53,487 | ||||||
Realty Income Corporation | ||||||||
| 12,000 | 2.000%, 1/31/2018 | 12,033 | ||||||
Regions Bank | ||||||||
| 7,000 | 7.500%, 5/15/2018 | 7,498 | ||||||
Regions Financial Corporation | ||||||||
| 10,000 | 3.200%, 2/8/2021 | 10,133 | ||||||
Reinsurance Group of America, Inc. | ||||||||
| 16,000 | 5.625%, 3/15/2017 | 16,130 | ||||||
Simon Property Group, LP | ||||||||
| 10,000 | 2.500%, 9/1/2020 | 10,068 | ||||||
| 15,000 | 2.500%, 7/15/2021 | 15,001 | ||||||
State Street Corporation | ||||||||
| 10,000 | 1.809%, 8/18/2020g | 10,134 | ||||||
SunTrust Banks, Inc. | ||||||||
| 10,000 | 2.900%, 3/3/2021 | 10,133 | ||||||
Synchrony Financial | ||||||||
| 22,000 | 1.875%, 8/15/2017 | 22,017 | ||||||
| 5,000 | 2.111%, 2/3/2020g | 4,943 | ||||||
Toronto-Dominion Bank | ||||||||
| 10,000 | 1.722%, 1/22/2019g | 10,082 | ||||||
| 10,000 | 1.889%, 12/14/2020g | 10,118 | ||||||
UnitedHealth Group, Inc. | ||||||||
| 10,000 | 3.350%, 7/15/2022 | 10,292 | ||||||
USB Realty Corporation | ||||||||
| 5,000 | 2.027%, 1/15/2022f,g,h | 4,400 | ||||||
Voya Financial, Inc. | ||||||||
| 12,000 | 2.900%, 2/15/2018 | 12,147 | ||||||
Wells Fargo & Company | ||||||||
| 7,000 | 1.567%, 1/30/2020g | 6,997 | ||||||
| 8,000 | 2.100%, 7/26/2021 | 7,777 | ||||||
| 10,000 | 2.117%, 10/31/2023g | 10,123 | ||||||
|
| |||||||
Total | 1,609,219 | |||||||
|
| |||||||
Foreign Government (3.7%) | ||||||||
Argentina Government International Bond | ||||||||
| 55,000 | 7.500%, 4/22/2026f | 57,750 | ||||||
The accompanying Notes to Financial Statements are an integral part of this schedule.
89
Table of Contents
GROWTHAND INCOME PLUS PORTFOLIO
Schedule of Investments as of December 31, 2016
| Principal Amount | Long-Term Fixed Income (16.8%) | Value | ||||||
Foreign Government (3.7%) - continued | ||||||||
Brazil Government International Bond | ||||||||
| $73,000 | 4.875%, 1/22/2021 | $ | 75,190 | |||||
| 100,000 | 2.625%, 1/5/2023 | 89,000 | ||||||
| 39,000 | 6.000%, 4/7/2026 | 40,365 | ||||||
| 45,000 | 7.125%, 1/20/2037 | 46,913 | ||||||
| 54,000 | 5.000%, 1/27/2045 | 43,805 | ||||||
Colombia Government International Bond | ||||||||
| 45,000 | 4.375%, 7/12/2021 | 47,138 | ||||||
| 57,000 | 2.625%, 3/15/2023 | 53,723 | ||||||
| 40,000 | 4.000%, 2/26/2024 | 40,400 | ||||||
| 29,000 | 5.625%, 2/26/2044 | 29,870 | ||||||
| 54,000 | 5.000%, 6/15/2045 | 51,232 | ||||||
Croatia Government International Bond | ||||||||
| 9,000 | 6.750%, 11/5/2019f | 9,765 | ||||||
| 55,000 | 6.625%, 7/14/2020f | 59,821 | ||||||
| 28,000 | 6.000%, 1/26/2024f | 30,345 | ||||||
Hungary Government International Bond | ||||||||
| 18,000 | 6.375%, 3/29/2021 | 20,156 | ||||||
| 70,000 | 5.750%, 11/22/2023 | 77,613 | ||||||
| 72,000 | 5.375%, 3/25/2024 | 78,480 | ||||||
Indonesia Government International Bond | ||||||||
| 60,000 | 4.875%, 5/5/2021f | 63,517 | ||||||
| 45,000 | 3.375%, 4/15/2023f | 43,897 | ||||||
| 66,000 | 5.875%, 1/15/2024f | 72,818 | ||||||
| 60,000 | 4.125%, 1/15/2025f | 59,450 | ||||||
| 13,000 | 4.750%, 1/8/2026f | 13,420 | ||||||
| 45,000 | 8.500%, 10/12/2035f | 61,047 | ||||||
| 90,000 | 5.125%, 1/15/2045f | 89,798 | ||||||
Mexico Government International Bond | ||||||||
| 10,000 | 5.750%, 10/12/2110 | 9,225 | ||||||
| 28,000 | 3.625%, 3/15/2022 | 28,056 | ||||||
| 68,000 | 4.000%, 10/2/2023 | 68,156 | ||||||
| 70,000 | 3.600%, 1/30/2025 | 67,480 | ||||||
| 53,000 | 4.125%, 1/21/2026 | 52,576 | ||||||
| 18,000 | 6.750%, 9/27/2034 | 21,330 | ||||||
| 26,000 | 6.050%, 1/11/2040 | 28,119 | ||||||
| 60,000 | 4.750%, 3/8/2044 | 54,540 | ||||||
| 44,000 | 5.550%, 1/21/2045 | 44,990 | ||||||
| 31,000 | 4.600%, 1/23/2046 | 27,822 | ||||||
| 26,000 | 4.350%, 1/15/2047 | 22,295 | ||||||
Panama Government International Bond | ||||||||
| 27,000 | 4.000%, 9/22/2024 | 27,472 | ||||||
| 40,000 | 3.750%, 3/16/2025 | 39,700 | ||||||
| 40,000 | 6.700%, 1/26/2036 | 48,540 | ||||||
Peru Government International Bond | ||||||||
| 21,000 | 5.625%, 11/18/2050 | 23,783 | ||||||
| 41,000 | 4.125%, 8/25/2027 | 42,589 | ||||||
| 45,000 | 8.750%, 11/21/2033 | 65,700 | ||||||
Philippines Government International Bond | ||||||||
| 72,000 | 4.000%, 1/15/2021 | 76,578 | ||||||
| 40,000 | 7.750%, 1/14/2031 | 56,229 | ||||||
| 50,000 | 6.375%, 10/23/2034 | 65,036 | ||||||
| 20,000 | 5.000%, 1/13/2037 | 22,568 | ||||||
| 40,000 | 3.950%, 1/20/2040 | 39,380 | ||||||
Romania Government International Bond | ||||||||
| 42,000 | 4.375%, 8/22/2023f | 43,218 | ||||||
| 20,000 | 4.875%, 1/22/2024f | 21,154 | ||||||
| 10,000 | 6.125%, 1/22/2044f | 11,672 | ||||||
Russia Government International Bond | ||||||||
| 44,000 | 3.500%, 1/16/2019f | 44,717 | ||||||
| 200,000 | 5.000%, 4/29/2020f | 212,230 | ||||||
| 54,000 | 4.875%, 9/16/2023f | 56,885 | ||||||
| 58,850 | 7.500%, 3/31/2030f | 70,855 | ||||||
| 66,000 | 5.625%, 4/4/2042f | 70,975 | ||||||
South Africa Government International Bond | ||||||||
| 50,000 | 5.500%, 3/9/2020 | 52,940 | ||||||
Turkey Government International Bond | ||||||||
| 18,000 | 7.500%, 11/7/2019 | 19,575 | ||||||
| 63,000 | 7.000%, 6/5/2020 | 67,644 | ||||||
| 85,000 | 5.125%, 3/25/2022 | 84,354 | ||||||
| 44,000 | 6.250%, 9/26/2022 | 45,696 | ||||||
| 58,000 | 5.750%, 3/22/2024 | 58,168 | ||||||
| 67,000 | 4.250%, 4/14/2026 | 59,556 | ||||||
| 54,000 | 6.875%, 3/17/2036 | 55,545 | ||||||
| 36,000 | 4.875%, 4/16/2043 | 28,998 | ||||||
| 18,000 | 6.625%, 2/17/2045 | 17,898 | ||||||
|
| |||||||
Total | 3,209,757 | |||||||
|
| |||||||
| Mortgage-Backed Securities (3.8%) | ||||||||
Federal Home Loan Mortgage Corporation Gold 15-Yr. Pass Through | ||||||||
| 350,000 | 3.000%, 1/1/2032c | 358,995 | ||||||
Federal Home Loan Mortgage Corporation Gold 30-Yr. Pass Through | ||||||||
| 250,000 | 4.000%, 1/1/2047c | 262,450 | ||||||
Federal National Mortgage Association Conventional 30-Yr. Pass Through | ||||||||
| 250,000 | 3.000%, 1/1/2047c | 248,175 | ||||||
| 1,275,000 | 3.500%, 1/1/2047c | 1,305,983 | ||||||
| 650,000 | 4.000%, 1/1/2047c | 683,020 | ||||||
| 425,000 | 4.500%, 1/1/2047c | 456,960 | ||||||
|
| |||||||
Total | 3,315,583 | |||||||
|
| |||||||
| Technology (0.7%) | ||||||||
Alliance Data Systems Corporation | ||||||||
| 30,000 | 5.375%, 8/1/2022f | 28,950 | ||||||
Apple, Inc. | ||||||||
| 10,000 | 1.202%, 5/6/2020g | 9,992 | ||||||
Automatic Data Processing, Inc. | ||||||||
| 10,000 | 2.250%, 9/15/2020 | 10,044 | ||||||
Cisco Systems, Inc. | ||||||||
| 10,000 | 1.431%, 3/1/2019g | 10,057 | ||||||
Diamond 1 Finance Corporation | ||||||||
| 10,000 | 3.480%, 6/1/2019f | 10,205 | ||||||
Equinix, Inc. | ||||||||
| 40,000 | 5.750%, 1/1/2025 | 41,800 | ||||||
Fidelity National Information Services, Inc. | ||||||||
| 15,000 | 1.450%, 6/5/2017 | 15,006 | ||||||
| 10,000 | 3.625%, 10/15/2020 | 10,345 | ||||||
First Data Corporation | ||||||||
| 40,000 | 5.375%, 8/15/2023f | 41,500 | ||||||
Hewlett Packard Enterprise Company | �� | |||||||
| 10,000 | 3.600%, 10/15/2020 | 10,166 | ||||||
Intel Corporation | ||||||||
| 15,000 | 1.700%, 5/19/2021 | 14,636 | ||||||
The accompanying Notes to Financial Statements are an integral part of this schedule.
90
Table of Contents
GROWTHAND INCOME PLUS PORTFOLIO
Schedule of Investments as of December 31, 2016
| Principal Amount | Long-Term Fixed Income (16.8%) | Value | ||||||
Technology (0.7%) - continued | ||||||||
| $10,000 | 3.100%, 7/29/2022 | $ | 10,272 | |||||
Intel Corporation, Convertible | ||||||||
| 30,000 | 2.950%, 12/15/2035 | 40,519 | ||||||
Iron Mountain, Inc. | ||||||||
| 21,748 | 6.000%, 8/15/2023 | 23,107 | ||||||
Micron Technology, Inc., Convertible | ||||||||
| 30,000 | 2.375%, 5/1/2032 | 69,712 | ||||||
| 38,000 | 3.000%, 11/15/2043 | 37,739 | ||||||
NXP BV | ||||||||
| 35,000 | 3.875%, 9/1/2022f | 35,437 | ||||||
NXP Semiconductors NV, Convertible | ||||||||
| 60,000 | 1.000%, 12/1/2019 | 68,250 | ||||||
Oracle Corporation | ||||||||
| 10,000 | 2.500%, 5/15/2022 | 9,920 | ||||||
Sensata Technologies BV | ||||||||
| 50,000 | 4.875%, 10/15/2023f | 51,125 | ||||||
Texas Instruments, Inc. | ||||||||
| 10,000 | 1.750%, 5/1/2020 | 9,884 | ||||||
Tyco Electronics Group SA | ||||||||
| 16,000 | 6.550%, 10/1/2017 | 16,596 | ||||||
|
| |||||||
Total | 575,262 | |||||||
|
| |||||||
Transportation (0.1%) | ||||||||
Air Canada Pass Through Trust | ||||||||
| 4,658 | 3.875%, 3/15/2023f | 4,495 | ||||||
American Airlines Pass Through Trust | ||||||||
| 6,393 | 4.950%, 1/15/2023 | 6,817 | ||||||
Avis Budget Car Rental, LLC | ||||||||
| 50,000 | 5.125%, 6/1/2022f | 49,000 | ||||||
Delta Air Lines, Inc. | ||||||||
| 6,701 | 4.950%, 5/23/2019 | 7,023 | ||||||
ERAC USA Finance, LLC | ||||||||
| 10,000 | 2.600%, 12/1/2021f | 9,832 | ||||||
J.B. Hunt Transport Services, Inc. | ||||||||
| 10,000 | 3.300%, 8/15/2022 | 10,029 | ||||||
Korea Expressway Corporation | ||||||||
| 13,000 | 1.625%, 4/28/2017f | 12,992 | ||||||
United Airlines Pass Through Trust | ||||||||
| 10,000 | 3.700%, 12/1/2022 | 10,075 | ||||||
|
| |||||||
Total | 110,263 | |||||||
|
| |||||||
U.S. Government and Agencies (0.5%) | ||||||||
U.S. Treasury Notes | ||||||||
| 115,000 | 1.125%, 8/31/2021 | 111,007 | ||||||
| 95,000 | 2.125%, 6/30/2022 | 95,232 | ||||||
| 230,000 | 1.625%, 2/15/2026 | 214,576 | ||||||
|
| |||||||
Total | 420,815 | |||||||
|
| |||||||
Utilities (0.5%) | ||||||||
AES Corporation | ||||||||
| 26,000 | 7.375%, 7/1/2021 | 28,961 | ||||||
Ameren Corporation | ||||||||
| 10,000 | 2.700%, 11/15/2020 | 10,046 | ||||||
Arizona Public Service Company | ||||||||
| 5,000 | 2.200%, 1/15/2020 | 5,003 | ||||||
Berkshire Hathaway Energy Company | ||||||||
| 14,000 | 2.400%, 2/1/2020 | 14,029 | ||||||
Calpine Corporation | ||||||||
| 50,000 | 5.375%, 1/15/2023 | 48,875 | ||||||
DTE Energy Company | ||||||||
| 14,000 | 2.400%, 12/1/2019 | 14,062 | ||||||
Dynegy, Inc. | ||||||||
| 55,000 | 7.375%, 11/1/2022 | 52,525 | ||||||
El Paso Corporation | ||||||||
| 7,000 | 7.000%, 6/15/2017 | 7,162 | ||||||
Emera U.S. Finance, LP | ||||||||
| 5,000 | 2.150%, 6/15/2019f | 4,990 | ||||||
Energy Transfer Equity, LP | ||||||||
| 55,000 | 5.500%, 6/1/2027 | 53,625 | ||||||
Eversource Energy | ||||||||
| 5,000 | 1.600%, 1/15/2018 | 4,988 | ||||||
Exelon Generation Company, LLC | ||||||||
| 8,000 | 5.200%, 10/1/2019 | 8,570 | ||||||
| 5,000 | 2.950%, 1/15/2020 | 5,057 | ||||||
Fortis, Inc. | ||||||||
| 5,000 | 2.100%, 10/4/2021f | 4,828 | ||||||
NextEra Energy Capital Holdings, Inc. | ||||||||
| 10,000 | 2.300%, 4/1/2019 | 10,072 | ||||||
NiSource Finance Corporation | ||||||||
| 7,000 | 6.400%, 3/15/2018 | 7,371 | ||||||
NRG Energy, Inc. | ||||||||
| 26,748 | 6.625%, 3/15/2023 | 26,815 | ||||||
Pacific Gas & Electric Company | ||||||||
| 10,000 | 5.625%, 11/30/2017 | 10,370 | ||||||
PG&E Corporation | ||||||||
| 8,000 | 2.400%, 3/1/2019 | 8,029 | ||||||
PPL Capital Funding, Inc. | ||||||||
| 5,000 | 3.500%, 12/1/2022 | 5,108 | ||||||
PSEG Power, LLC | ||||||||
| 9,000 | 3.000%, 6/15/2021 | 9,020 | ||||||
Sempra Energy | ||||||||
| 14,000 | 6.150%, 6/15/2018 | 14,830 | ||||||
| 5,000 | 2.400%, 3/15/2020 | 4,990 | ||||||
Southern California Edison Company | ||||||||
| 5,000 | 2.400%, 2/1/2022 | 4,981 | ||||||
Southern Company | ||||||||
| 10,000 | 1.850%, 7/1/2019 | 9,965 | ||||||
Tesoro Corporation | ||||||||
| 40,000 | 4.750%, 12/15/2023f | 40,200 | ||||||
Xcel Energy, Inc. | ||||||||
| 10,000 | 1.200%, 6/1/2017 | 9,990 | ||||||
|
| |||||||
Total | 424,462 | |||||||
|
| |||||||
Total Long-Term Fixed Income (cost $14,667,997) | 14,698,639 | |||||||
|
| |||||||
| Shares | Registered Investment Companies (3.6%) | |||||||
Equity Funds/ETFs (1.9%) | ||||||||
| 2,075 | AllianzGI NFJ Dividend Interest & Premium Strategy Fund | 26,166 | ||||||
| 2,300 | BlackRock Resources & Commodities Strategy Trust | 19,021 | ||||||
| 1,025 | Guggenheim Multi-Asset Income ETF | 20,664 | ||||||
| 2,030 | iShares MSCI EAFE Index Fund | 117,192 | ||||||
| 18,250 | Materials Select Sector SPDR Fund | 907,025 | ||||||
| 12,090 | Utilities Select Sector SPDR Fund | 587,211 | ||||||
|
| |||||||
Total | 1,677,279 | |||||||
|
| |||||||
Fixed Income Funds/ETFs (1.7%) | ||||||||
| 12,047 | Aberdeen Asia-Pacific Income Fund, Inc. | 55,778 | ||||||
| 3,250 | Doubleline Income Solutions Fund | 61,717 | ||||||
| 1,895 | First Trust High Income Long/Short Fund | 30,472 | ||||||
| 500 | iShares J.P. Morgan USD Emerging Markets Bond ETF | 55,110 | ||||||
| 16,673 | iShares S&P U.S. Preferred Stock Index Fund | 620,402 | ||||||
| 11,462 | MFS Intermediate Income Trust | 50,891 | ||||||
| 4,377 | Pimco Dynamic Credit And Mortgage Income Fund | 88,503 | ||||||
| 18,944 | PowerShares Preferred Portfolio | 269,573 | ||||||
| 9,283 | Templeton Global Income Fund | 60,154 | ||||||
The accompanying Notes to Financial Statements are an integral part of this schedule.
91
Table of Contents
GROWTHAND INCOME PLUS PORTFOLIO
Schedule of Investments as of December 31, 2016
| Shares | Registered Investment Companies (3.6%) | Value | ||||||
Fixed Income Funds/ETFs (1.7%) - continued | ||||||||
| 1,465 | Vanguard Short-Term Corporate Bond ETF | $ | 116,277 | |||||
| 4,234 | Western Asset Emerging Markets Debt Fund, Inc. | 62,282 | ||||||
| 6,718 | Western Asset High Income Opportunity Fund, Inc. | 33,523 | ||||||
|
| |||||||
Total | 1,504,682 | |||||||
|
| |||||||
Total Registered Investment Companies (cost $3,232,020) | 3,181,961 | |||||||
|
| |||||||
Preferred Stock (0.3%) | ||||||||
Consumer Staples (<0.1%) | ||||||||
| 149 | Henkel AG & Company KGaA, 1.470% | 17,737 | ||||||
|
| |||||||
Total | 17,737 | |||||||
|
| |||||||
Energy (<0.1%) | ||||||||
| 355 | Alpha Natural Resources, Inc., 0.000%d | 7,100 | ||||||
| 355 | ANR Holdings, Inc., 0.000%d | 1,917 | ||||||
|
| |||||||
Total | 9,017 | |||||||
|
| |||||||
Health Care (0.1%) | ||||||||
| 85 | Allergan plc, Convertible, 5.500% | 64,706 | ||||||
|
| |||||||
Total | 64,706 | |||||||
|
| |||||||
Real Estate (0.2%) | ||||||||
| 1,500 | American Tower Corporation, Convertible, 5.500% | 156,750 | ||||||
|
| |||||||
Total | 156,750 | |||||||
|
| |||||||
Total Preferred Stock (cost $248,881) | 248,210 | |||||||
|
| |||||||
| Shares or Principal Amount | Short-Term Investments (9.4%)j | |||||||
Federal Home Loan Bank Discount Notes | ||||||||
| 100,000 | 0.500%, 1/19/2017k | 99,983 | ||||||
| 100,000 | 0.355%, 1/25/2017k | 99,977 | ||||||
| 100,000 | 0.365%, 1/27/2017k | 99,975 | ||||||
| 100,000 | 0.400%, 2/1/2017k | 99,959 | ||||||
Thrivent Core Short-Term Reserve Fund | ||||||||
| 785,439 | 0.910% | 7,854,389 | ||||||
|
| |||||||
Total Short-Term Investments (cost $8,254,280) | 8,254,283 | |||||||
|
| |||||||
Total Investments (cost $88,125,723) 104.0% | $ | 91,082,802 | ||||||
|
| |||||||
Other Assets and Liabilities, Net (4.0%) | (3,522,955 | ) | ||||||
|
| |||||||
Total Net Assets 100.0% | $ | 87,559,847 | ||||||
|
| |||||||
| a | The stated interest rate represents the weighted average of all contracts within the bank loan facility. |
| b | All or a portion of the loan is unfunded. |
| c | Denotes investments purchased on a when-issued or delayed delivery basis. |
| d | Non-income producing security. |
| e | Security is valued at fair value. Market quotations or prices were not readily available or were determined to be unreliable. Fair value was determined in good faith pursuant to procedures adopted by the Board. Further information on fair valuation can be found in the Notes to Financial Statements. |
| f | Denotes securities sold under Rule 144A of the Securities Act of 1933, which exempts them from registration. These securities may be resold to other dealers in the program or to other qualified institutional buyers. As of December 31, 2016, the value of these investments was $2,558,234 or 2.9% of total net assets. |
| g | Denotes variable rate securities. Variable rate securities are securities whose yields vary with a designated market index or market rate. The rate shown is as of December 31, 2016. |
| h | Denotes perpetual securities. Perpetual securities pay an indefinite stream of interest and have no contractual maturity date. Date shown, if applicable, is next call date. |
| i | Denotes step coupon securities. Step coupon securities pay an initial coupon rate for the first period and then different coupon rates for following periods. The rate shown is as of December 31, 2016. |
| j | The interest rate shown reflects the yield, coupon rate or the discount rate at the date of purchase. |
| k | All or a portion of the security is held on deposit with the counterparty and pledged as the initial margin deposit for open futures contracts. |
| * | Denotes restricted securities. Restricted securities are investment securities which cannot be offered for public sale without first being registered under the Securities Act of 1933. The value of all restricted securities held in Growth and Income Plus Portfolio as of December 31, 2016 was $164,664 or 0.2% of total net assets. The following table indicates the acquisition date and cost of restricted securities shown in the schedule as of December 31, 2016. |
Security | Acquisition Date | Cost | ||||||
Angel Oak Mortgage Trust, 11/25/2045 | 3/4/2016 | $ | 22,342 | |||||
Contura Energy, Inc., 8/1/2021 | 2/12/2014 | 25,661 | ||||||
Digicel, Ltd., 4/15/2021 | 8/19/2013 | 57,083 | ||||||
Marlette Funding Trust, 1/17/2023 | 7/20/2016 | 73,569 | ||||||
Definitions:
ETF | - | Exchange Traded Fund. | ||
REIT | - | Real Estate Investment Trust is a company that buys, develops, manages and/or sells real estate assets. |
The accompanying Notes to Financial Statements are an integral part of this schedule.
92
Table of Contents
BALANCED INCOME PLUS PORTFOLIO
Schedule of Investments as of December 31, 2016
| Principal Amount | Bank Loans (16.5%)a | Value | ||||||
Basic Materials (1.0%) | ||||||||
Arch Coal, Inc., Term Loan | ||||||||
| $105,201 | 10.000%, 10/5/2021 | $ | 106,561 | |||||
Chemours Company, Term Loan | ||||||||
| 535,610 | 3.770%, 5/12/2022 | 531,930 | ||||||
Fortescue Metals Group, Ltd., Term Loan | ||||||||
| 731,576 | 3.750%, 6/30/2019 | 733,040 | ||||||
Ineos US Finance, LLC, Term Loan | ||||||||
| 1,221,705 | 3.750%, 12/15/2020 | 1,226,799 | ||||||
Tronox Pigments BV, Term Loan | ||||||||
| 966,556 | 4.500%, 3/19/2020 | 969,775 | ||||||
|
| |||||||
Total | 3,568,105 | |||||||
|
| |||||||
Capital Goods (1.0%) | ||||||||
Accudyne Industries, LLC, Term Loan | ||||||||
| 411,858 | 4.000%, 12/13/2019 | 388,765 | ||||||
Advanced Disposal Services, Inc., Term Loan | ||||||||
| 477,492 | 3.500%, 11/10/2023 | 481,375 | ||||||
Berry Plastics Group, Inc., Term Loan | ||||||||
| 636,842 | 3.500%, 2/8/2020 | 641,185 | ||||||
Cortes NP Acquisition Corporation, Term Loan | ||||||||
| 1,510,000 | 6.000%, 11/30/2023 | 1,528,875 | ||||||
Reynolds Group, Inc., Term Loan | ||||||||
| 359,100 | 4.250%, 2/5/2023 | 363,506 | ||||||
|
| |||||||
Total | 3,403,706 | |||||||
|
| |||||||
Communications Services (3.8%) | ||||||||
Atlantic Broadband Penn, LLC, Term Loan | ||||||||
| 42,344 | 3.250%, 11/30/2019 | 42,450 | ||||||
Beasley Broadcast Group, Inc., Term Loan | ||||||||
| 425,000 | 7.000%, 11/1/2023 | 425,000 | ||||||
Birch Communication Inc., Term Loan | ||||||||
| 515,802 | 8.250%, 7/17/2020 | 453,905 | ||||||
Block Communications, Inc., Term Loan | ||||||||
| 668,180 | 4.248%, 11/7/2021 | 674,027 | ||||||
Cincinnati Bell, Inc., Term Loan | ||||||||
| 336,268 | 4.000%, 9/10/2020 | 337,049 | ||||||
CSC Holdings, LLC, Term Loan | ||||||||
| 213,816 | 3.876%, 10/11/2024 | 215,909 | ||||||
FairPoint Communications, Inc., Term Loan | ||||||||
| 678,983 | 7.500%, 2/14/2019 | 684,713 | ||||||
Grande Communications Networks, LLC, Term Loan | ||||||||
| 617,623 | 4.500%, 5/29/2020 | 621,329 | ||||||
Gray Television, Inc., Term Loan | ||||||||
| 378,377 | 3.938%, 6/13/2021 | 383,580 | ||||||
Hargray Communications Group, Inc., Term Loan | ||||||||
| 756,668 | 4.750%, 6/26/2019 | 764,863 | ||||||
Integra Telecom Holdings, Inc., Term Loan | ||||||||
| 433,994 | 5.250%, 8/14/2020 | 434,754 | ||||||
Intelsat Jackson Holdings SA, Term Loan | ||||||||
| 264,628 | 3.750%, 6/30/2019 | 255,504 | ||||||
Level 3 Communications, Inc., Term Loan | ||||||||
| 610,000 | 4.000%, 8/1/2019 | 618,083 | ||||||
Liberty Cablevision of Puerto Rico, LLC, Term Loan | ||||||||
| 745,000 | 4.500%, 1/7/2022 | 738,951 | ||||||
LTS Buyer, LLC, Term Loan | ||||||||
| 909,893 | 4.248%, 4/13/2020 | 914,160 | ||||||
NEP/NCP Holdco, Inc., Term Loan | ||||||||
| 1,195,809 | 4.250%, 1/22/2020 | 1,198,798 | ||||||
Nexstar Broadcasting, Inc., Term Loan | ||||||||
| 265,000 | 0.000%, 9/26/2023b,c | 267,070 | ||||||
Numericable US, LLC, Term Loan | ||||||||
| 423,511 | 5.137%, 1/15/2024 | 428,504 | ||||||
SBA Senior Finance II, LLC, Term Loan | ||||||||
| 682,500 | 3.270%, 3/24/2021 | 685,489 | ||||||
TNS, Inc., Term Loan | ||||||||
| 389,330 | 5.000%, 2/14/2020 | 392,615 | ||||||
Univision Communications, Inc., Term Loan | ||||||||
| 573,758 | 4.000%, 3/1/2020 | 576,627 | ||||||
WideOpenWest Finance, LLC, Term Loan | ||||||||
| 847,875 | 4.500%, 8/18/2023 | 856,201 | ||||||
XO Communications, LLC, Term Loan | ||||||||
| 534,875 | 4.250%, 3/20/2021 | 536,212 | ||||||
Yankee Cable Acquisition, LLC, Term Loan | ||||||||
| 549,114 | 4.250%, 3/1/2020 | 549,345 | ||||||
Zayo Group, LLC, Term Loan | ||||||||
| 584,754 | 3.750%, 5/6/2021 | 590,683 | ||||||
|
| |||||||
Total | 13,645,821 | |||||||
|
| |||||||
Consumer Cyclical (2.7%) | ||||||||
Amaya BV, Term Loan | ||||||||
| 1,096,500 | 5.000%, 8/1/2021 | 1,099,855 | ||||||
Burlington Coat Factory Warehouse Corporation, Term Loan | ||||||||
| 542,772 | 3.510%, 8/13/2021 | 545,969 | ||||||
Cengage Learning Acquisitions, Term Loan | ||||||||
| 950,225 | 5.250%, 6/7/2023 | 923,058 | ||||||
Ceridian HCM Holding, Inc., Term Loan | ||||||||
| 301,676 | 4.500%, 9/15/2020 | 299,287 | ||||||
Charter Communications Operating, LLC, Term Loan | ||||||||
| 723,750 | 3.020%, 1/3/2021 | 726,565 | ||||||
Dollar Tree, Inc., Term Loan | ||||||||
| 210,000 | 3.250%, 7/6/2022 | 211,707 | ||||||
Four Seasons Holdings, Inc., Term Loan | ||||||||
| 565,000 | 3.750%, 11/30/2023 | 570,886 | ||||||
Golden Nugget, Inc., Term Loan | ||||||||
| 314,995 | 4.500%, 11/21/2019 | 318,145 | ||||||
Golden Nugget, Inc., Term Loan Delayed Draw | ||||||||
| 132,219 | 4.500%, 11/21/2019 | 133,541 | ||||||
IMG Worldwide, Inc., Term Loan | ||||||||
| 745,902 | 5.250%, 5/6/2021 | 752,899 | ||||||
| 350,000 | 8.250%, 5/6/2022 | 354,375 | ||||||
Michaels Stores, Inc., Term Loan | ||||||||
| 617,648 | 3.750%, 1/30/2023 | 624,405 | ||||||
Mohegan Tribal Gaming Authority, Term Loan | ||||||||
| 773,062 | 5.500%, 10/13/2023 | 778,381 | ||||||
The accompanying Notes to Financial Statements are an integral part of this schedule.
93
Table of Contents
BALANCED INCOME PLUS PORTFOLIO
Schedule of Investments as of December 31, 2016
| Principal Amount | Bank Loans (16.5%)a | Value | ||||||
Consumer Cyclical (2.7%) - continued | ||||||||
Scientific Games International, Inc., Term Loan | ||||||||
| $591,700 | 6.000%, 10/18/2020 | $ | 599,221 | |||||
| 1,277,306 | 6.000%, 10/1/2021 | 1,292,480 | ||||||
Seminole Hard Rock Entertainment, Inc., Term Loan | ||||||||
| 43,864 | 3.520%, 5/14/2020 | 44,083 | ||||||
Seminole Indian Tribe of Florida, Term Loan | ||||||||
| 448,808 | 3.248%, 4/29/2020 | 449,930 | ||||||
|
| |||||||
Total | 9,724,787 | |||||||
|
| |||||||
Consumer Non-Cyclical (3.1%) | ||||||||
Air Medical Group Holdings, Inc., Term Loan | ||||||||
| 537,300 | 5.000%, 4/28/2022 | 545,026 | ||||||
Albertson’s, LLC, Term Loan | ||||||||
| 408,710 | 0.000%, 12/21/2022b,c | 413,819 | ||||||
| 741,290 | 0.000%, 6/22/2023b,c | 750,245 | ||||||
CHS/Community Health Systems, Inc., Term Loan | ||||||||
| 181,051 | 3.750%, 12/31/2019 | 175,280 | ||||||
| 984,083 | 4.000%, 1/27/2021 | 951,284 | ||||||
Endo Luxembourg Finance I Company SARL, Term Loan | ||||||||
| 480,150 | 3.813%, 9/26/2022 | 482,210 | ||||||
JBS USA, LLC, Term Loan | ||||||||
| 659,266 | 3.750%, 5/25/2018 | 659,813 | ||||||
| 138,600 | 4.000%, 10/30/2022 | 139,754 | ||||||
Libbey Glass, Inc., Term Loan | ||||||||
| 320,693 | 3.750%, 4/9/2021 | 323,701 | ||||||
LTF Merger Sub, Inc., Term Loan | ||||||||
| 615,625 | 4.250%, 6/10/2022 | 618,992 | ||||||
Mallinckrodt International Finance SA, Term Loan | ||||||||
| 272,215 | 3.748%, 3/19/2021 | 272,798 | ||||||
McGraw-Hill Global Education Holdings, LLC, Term Loan | ||||||||
| 800,975 | 5.000%, 5/4/2022 | 801,103 | ||||||
MultiPlan, Inc., Term Loan | ||||||||
| 881,556 | 5.000%, 6/7/2023 | 896,199 | ||||||
Ortho-Clinical Diagnostics, Inc., Term Loan | ||||||||
| 845,578 | 4.750%, 6/30/2021 | 837,427 | ||||||
PetSmart, Inc., Term Loan | ||||||||
| 364,076 | 4.000%, 3/11/2022 | 364,986 | ||||||
Sterigenics-Nordion Holdings, LLC, Term Loan | ||||||||
| 397,469 | 4.250%, 5/16/2022 | 398,713 | ||||||
Valeant Pharmaceuticals International, Inc., Term Loan | ||||||||
| 2,292,790 | 5.500%, 4/1/2022b,c | 2,293,226 | ||||||
|
| |||||||
Total | 10,924,576 | |||||||
|
| |||||||
Energy (0.8%) | ||||||||
Energy Solutions, LLC, Term Loan | ||||||||
| 388,857 | 6.750%, 5/29/2020 | 391,287 | ||||||
Exgen Renewables I, LLC, Term Loan | ||||||||
| 354,640 | 5.250%, 2/8/2021 | 356,856 | ||||||
Houston Fuel Oil Terminal, LLC, Term Loan | ||||||||
| 401,916 | 4.250%, 8/19/2021 | 398,902 | ||||||
McJunkin Red Man Corporation, Term Loan | ||||||||
| 279,001 | 5.000%, 11/8/2019 | 280,047 | ||||||
MEG Energy Corporation, Term Loan | ||||||||
| 500,152 | 3.750%, 3/31/2020 | 485,148 | ||||||
Pacific Drilling SA, Term Loan | ||||||||
| 574,175 | 4.500%, 6/3/2018 | 201,535 | ||||||
Targa Resources Partners, LP, Term Loan | ||||||||
| 306,977 | 5.750%, 2/27/2022 | 308,512 | ||||||
Western Refining, Inc., Term Loan | ||||||||
| 237,551 | 5.250%, 11/12/2020 | 238,591 | ||||||
| 122,925 | 5.500%, 6/23/2023 | 123,540 | ||||||
|
| |||||||
Total | 2,784,418 | |||||||
|
| |||||||
Financials (1.1%) | ||||||||
DJO Finance, LLC, Term Loan | ||||||||
| 320,937 | 4.250%, 6/7/2020 | 307,599 | ||||||
Harland Clarke Holdings Corporation, Term Loan | ||||||||
| 288,536 | 7.000%, 5/22/2018 | 288,626 | ||||||
| 513,000 | 7.000%, 12/31/2019 | 514,924 | ||||||
MoneyGram International, Inc., Term Loan | ||||||||
| 662,153 | 4.250%, 3/27/2020 | 653,326 | ||||||
Sable International Finance, Ltd., Term Loan | ||||||||
| 820,000 | 5.748%, 1/3/2023b,c | 829,742 | ||||||
TransUnion, LLC, Term Loan | ||||||||
| 680,758 | 3.520%, 4/9/2021 | 686,231 | ||||||
WaveDivision Holdings, LLC, Term Loan | ||||||||
| 723,645 | 4.000%, 10/15/2019 | 727,444 | ||||||
|
| |||||||
Total | 4,007,892 | |||||||
|
| |||||||
Technology (2.3%) | ||||||||
Avago Technoligies Cayman Finance, Ltd., Term Loan | ||||||||
| 989,351 | 3.704%, 2/1/2023 | 1,002,955 | ||||||
First Data Corporation, Term Loan | ||||||||
| 1,358,613 | 3.756%, 3/24/2021 | 1,373,897 | ||||||
| 495,557 | 3.756%, 7/8/2022 | 500,616 | ||||||
Micron Technologies, Inc., Term Loan | ||||||||
| 298,500 | 4.520%, 4/26/2022 | 302,754 | ||||||
NXP BV, Term Loan | ||||||||
| 448,875 | 3.270%, 12/7/2020 | 450,895 | ||||||
ON Semiconductor Corporation, Term Loan | ||||||||
| 1,356,600 | 4.020%, 3/31/2023 | 1,373,069 | ||||||
Rackspace Hosting, LLC, Term Loan | ||||||||
| 400,000 | 4.500%, 12/20/2023 | 404,832 | ||||||
RP Crown Parent, LLC, Term Loan | ||||||||
| 605,000 | 4.500%, 10/12/2023 | 610,899 | ||||||
SS&C European Holdings SARL, Term Loan | ||||||||
| 258,869 | 4.001%, 7/8/2022 | 262,268 | ||||||
| 26,417 | 4.002%, 7/8/2022 | 26,764 | ||||||
Western Digital Corporation, Term Loan | ||||||||
| 1,164,150 | 4.520%, 4/29/2023 | 1,181,973 | ||||||
Xerox Business Services, LLC, Term Loan | ||||||||
| 625,000 | 6.250%, 12/7/2023 | 632,031 | ||||||
|
| |||||||
Total | 8,122,953 | |||||||
|
| |||||||
Transportation (0.3%) | ||||||||
OSG Bulk Ships, Inc., Term Loan | ||||||||
| 213,569 | 5.250%, 8/5/2019 | 207,963 | ||||||
The accompanying Notes to Financial Statements are an integral part of this schedule.
94
Table of Contents
BALANCED INCOME PLUS PORTFOLIO
Schedule of Investments as of December 31, 2016
| Principal Amount | Bank Loans (16.5%)a | Value | ||||||
Transportation (0.3%) - continued | ||||||||
XPO Logistics, Inc., Term Loan | ||||||||
| $867,765 | 4.250%, 11/1/2021 | $ | 878,343 | |||||
|
| |||||||
Total | 1,086,306 | |||||||
|
| |||||||
Utilities (0.4%) | ||||||||
Calpine Corporation, Term Loan | ||||||||
| 515,000 | 0.000%, 1/15/2024b,c | 516,931 | ||||||
Intergen NV, Term Loan | ||||||||
| 380,679 | 5.500%, 6/12/2020 | 368,623 | ||||||
Talen Energy Supply, LLC, Term Loan | ||||||||
| 324,105 | 6.000%, 12/6/2023 | 328,156 | ||||||
|
| |||||||
Total | 1,213,710 | |||||||
|
| |||||||
Total Bank Loans (cost $58,233,310) | 58,482,274 | |||||||
|
| |||||||
| Shares | Common Stock (44.2%) | |||||||
Consumer Discretionary (7.1%) | ||||||||
| 4,850 | Amazon.com, Inc.d | 3,636,869 | ||||||
| 33,870 | American Axle & Manufacturing Holdings, Inc.d | 653,691 | ||||||
| 10,280 | Aramark | 367,202 | ||||||
| 2,770 | AutoZone, Inc.d | 2,187,718 | ||||||
| 9,119 | Berkeley Group Holdings plc | 315,235 | ||||||
| 1,300 | Brembo SPA | 78,644 | ||||||
| 13,400 | Bridgestone Corporation | 482,143 | ||||||
| 8,345 | Bunzl plc | 216,649 | ||||||
| 7,620 | Burlington Stores, Inc.d | 645,795 | ||||||
| 2,000 | Canon Marketing Japan, Inc. | 33,582 | ||||||
| 6,490 | Cedar Fair, LP | 416,658 | ||||||
| 34,945 | Comcast Corporation | 2,412,952 | ||||||
| 13,300 | Denso Corporation | 575,311 | ||||||
| 13,100 | Eutelsat Communications | 253,324 | ||||||
| 22,190 | Ford Motor Company | 269,165 | ||||||
| 13,700 | Fuji Heavy Industries, Ltd. | 558,198 | ||||||
| 9,230 | General Motors Company | 321,573 | ||||||
| 3,300 | Hakuhodo Dy Holdings, Inc. | 40,634 | ||||||
| 35,100 | Honda Motor Company, Ltd. | 1,024,756 | ||||||
| 18,100 | Inchcape plc | 156,420 | ||||||
| 2,800 | Intertek Group plc | 120,003 | ||||||
| 1,045 | Linamar Corporation | 44,901 | ||||||
| 1,259 | LVMH Moet Hennessy Louis Vuitton SE | 240,056 | ||||||
| 9,980 | Newell Brands, Inc. | 445,607 | ||||||
| 1,200 | Nifco, Inc. | 63,227 | ||||||
| 41,020 | NIKE, Inc. | 2,085,047 | ||||||
| 1,160 | Nokian Renkaat Oyj | 43,126 | ||||||
| 6,200 | Panasonic Corporation | 62,881 | ||||||
| 14,681 | Persimmon plc | 320,307 | ||||||
| 2,067 | Publicis Groupe SA | 142,426 | ||||||
| 1,730 | Restaurant Brands International, Inc. | 82,452 | ||||||
| 7,765 | Restoration Hardware Holdings, Inc.d,e | 238,386 | ||||||
| 700 | RTL Group SA | 51,284 | ||||||
| 2,500 | Sekisui Chemical Company, Ltd. | 39,796 | ||||||
| 15,410 | Starbucks Corporation | 855,563 | ||||||
| 13,800 | Sumitomo Forestry Company, Ltd. | 182,261 | ||||||
| 10,100 | Sumitomo Rubber Industries, Ltd. | 159,806 | ||||||
| 700 | Swatch Group AG | 42,720 | ||||||
| 40,610 | Time, Inc. | 724,889 | ||||||
| 18,770 | Toll Brothers, Inc.d | 581,870 | ||||||
| 7,960 | Tractor Supply Company | 603,448 | ||||||
| 247 | Valora Holding AG | 70,161 | ||||||
| 23,340 | Walt Disney Company | 2,432,495 | ||||||
| 930 | Whirlpool Corporation | 169,046 | ||||||
| 1,800 | Whitbread plc | 83,733 | ||||||
| 10,992 | Wolters Kluwer NV | 397,573 | ||||||
| 8,700 | WPP plc | 193,606 | ||||||
| 4,400 | Yokohama Rubber Company, Ltd. | 78,651 | ||||||
|
| |||||||
Total | 25,201,840 | |||||||
|
| |||||||
Consumer Staples (2.0%) | ||||||||
| 14,240 | AdvancePierre Foods Holdings, Inc. | 424,067 | ||||||
| 6,800 | Axfood AB | 106,780 | ||||||
| 31,183 | Coca-Cola Amatil, Ltd. | 227,417 | ||||||
| 12,500 | Coca-Cola HBC AG | 272,192 | ||||||
| 2,600 | Ebro Foods SA | 54,413 | ||||||
| 1,432 | Henkel AG & Company KGaA | 149,034 | ||||||
| 19,745 | Imperial Brands plc | 860,503 | ||||||
| 2,200 | Jeronimo Martins SGPS SA | 34,121 | ||||||
| 1,000 | Kesko Oyj | 49,906 | ||||||
| 6,500 | Kewpie Corporation | 157,650 | ||||||
| 3,400 | Kirin Holdings Company, Ltd. | 55,186 | ||||||
| 46,054 | Koninklijke Ahold Delhaize NV | 970,039 | ||||||
| 7 | Lindt & Spruengli AG | 36,221 | ||||||
| 3,800 | Nestle SA | 272,223 | ||||||
| 16,600 | Philip Morris International, Inc. | 1,518,734 | ||||||
| 2,800 | Suedzucker AG | 66,743 | ||||||
| 12,625 | Tate & Lyle plc | 109,872 | ||||||
| 800 | Universal Corporation | 51,000 | ||||||
| 12,770 | Walgreens Boots Alliance, Inc. | 1,056,845 | ||||||
| 23,400 | Whole Foods Market, Inc. | 719,784 | ||||||
| 23,120 | William Morrison Supermarkets plc | 65,668 | ||||||
|
| |||||||
Total | 7,258,398 | |||||||
|
| |||||||
Energy (3.0%) | ||||||||
| 1,898 | Arch Coal, Inc.d | 148,139 | ||||||
| 297,021 | BP plc | 1,860,381 | ||||||
| 9,190 | Concho Resources, Inc.d | 1,218,594 | ||||||
| 3,947 | Contura Energy, Inc.d | 280,237 | ||||||
| 6,432 | Crescent Point Energy Corporation | 87,427 | ||||||
| 21,790 | Devon Energy Corporation | 995,149 | ||||||
| 8,300 | Galp Energia SGPS SA | 123,739 | ||||||
| 23,050 | Halliburton Company | 1,246,775 | ||||||
| 8,783 | John Wood Group plc | 94,843 | ||||||
| 11,754 | OMV AG | 414,373 | ||||||
| 12,494 | Petrofac, Ltd. | 133,707 | ||||||
| 7,360 | Pioneer Natural Resources Company | 1,325,315 | ||||||
| 11,340 | Range Resources Corporation | 389,642 | ||||||
| 9,625 | Royal Dutch Shell plc | 262,528 | ||||||
| 2,516 | Royal Dutch Shell plc, Class A | 69,451 | ||||||
| 23,488 | Royal Dutch Shell plc, Class B | 674,859 | ||||||
| 9,323 | Statoil ASA | 170,161 | ||||||
| 937 | Tecnicas Reunidas SA | 38,321 | ||||||
| 9,543 | Total SA | 489,482 | ||||||
| 9,543 | Total SA Rightsd,f | 163 | ||||||
| 535 | Vantage Drilling Internationald | 54,035 | ||||||
| 34,400 | WPX Energy, Inc.d | 501,208 | ||||||
|
| |||||||
Total | 10,578,529 | |||||||
|
| |||||||
Financials (6.6%) | ||||||||
| 62,469 | Aberdeen Asset Management plc | 197,515 | ||||||
| 3,750 | Affiliated Managers Group, Inc.d | 544,875 | ||||||
| 51,650 | Apollo Investment Corporation | 302,669 | ||||||
| 23,800 | Ares Capital Corporation | 392,462 | ||||||
| 12,797 | ASX, Ltd. | 458,454 | ||||||
| 21,653 | Australia & New Zealand Banking Group, Ltd. | 474,011 | ||||||
| 137,750 | Bank of America Corporation | 3,044,275 | ||||||
| 24,618 | Bank of East Asia, Ltd. | 93,982 | ||||||
| 1,145 | Bank of Montreal | 82,354 | ||||||
| 16,423 | Bank of Nova Scotia | 914,448 | ||||||
| 12,980 | Bank of the Ozarks, Inc. | 682,618 | ||||||
| 2,249 | Canadian Imperial Bank of Commerce | 183,518 | ||||||
The accompanying Notes to Financial Statements are an integral part of this schedule.
95
Table of Contents
BALANCED INCOME PLUS PORTFOLIO
Schedule of Investments as of December 31, 2016
| Shares | Common Stock (44.2%) | Value | ||||||
Financials (6.6%) - continued | ||||||||
| 10,000 | Chiba Bank, Ltd. | $ | 61,301 | |||||
| 5,954 | CI Financial Corporation | 128,024 | ||||||
| 19,144 | CNP Assurances | 354,344 | ||||||
| 8,277 | Danske Bank AS | 250,410 | ||||||
| 52,863 | Direct Line Insurance Group plc | 240,589 | ||||||
| 32,650 | Encore Capital Group, Inc.d,e | 935,422 | ||||||
| 5,900 | Erste Group Bank AG | 172,500 | ||||||
| 65,388 | FlexiGroup, Ltd. | 106,415 | ||||||
| 75,000 | Fukuoka Financial Group, Inc. | 332,624 | ||||||
| 6,924 | Genworth MI Canada, Inc. | 173,583 | ||||||
| 11,640 | Goldman Sachs Group, Inc. | 2,787,198 | ||||||
| 7,400 | Hang Seng Bank, Ltd. | 137,230 | ||||||
| 4,095 | Hannover Rueckversicherung SE | 442,374 | ||||||
| 61,300 | Henderson Group plc | 176,924 | ||||||
| 78,112 | HSBC Holdings plc | 630,259 | ||||||
| 2,472 | Intact Financial Corporation | 176,933 | ||||||
| 7,110 | Intercontinental Exchange, Inc. | 401,146 | ||||||
| 49,760 | KeyCorp | 909,115 | ||||||
| 5,727 | Macquarie Group, Ltd. | 358,752 | ||||||
| 124,422 | Mapfre SA | 379,003 | ||||||
| 155,800 | Mizuho Financial Group, Inc. | 279,589 | ||||||
| 3,000 | MS and AD Insurance Group Holdings, Inc. | 92,903 | ||||||
| 18,550 | National Bank of Canada | 753,384 | ||||||
| 18,069 | Nordea Bank AB | 200,216 | ||||||
| 5,538 | Power Corporation of Canada | 123,947 | ||||||
| 7,070 | Raymond James Financial, Inc. | 489,739 | ||||||
| 28,200 | Resona Holdings, Inc. | 144,526 | ||||||
| 1,464 | Schroders plc | 53,770 | ||||||
| 12,800 | Seven Bank, Ltd. | 36,600 | ||||||
| 7,200 | Swiss Re AG | 681,213 | ||||||
| 46,650 | Synchrony Financial | 1,691,995 | ||||||
| 12,800 | T&D Holdings, Inc. | 168,927 | ||||||
| 814 | TMX Group, Ltd. | 43,360 | ||||||
| 18,615 | United Overseas Bank, Ltd. | 261,520 | ||||||
| 23,381 | Westpac Banking Corporation | 548,845 | ||||||
| 16,960 | XL Group, Ltd. | 631,930 | ||||||
| 14,470 | Zions Bancorporation | 622,789 | ||||||
| 479 | Zurich Insurance Group AGd | 131,639 | ||||||
|
| |||||||
Total | 23,482,219 | |||||||
|
| |||||||
| Health Care (4.3%) | ||||||||
| 9,960 | Acadia Healthcare Company, Inc.d | 329,676 | ||||||
| 15,910 | Akorn, Inc.d | 347,315 | ||||||
| 5,850 | Allergan plcd | 1,228,559 | ||||||
| 1,150 | Anthem, Inc. | 165,335 | ||||||
| 4,170 | AstraZeneca plc | 227,716 | ||||||
| 26,380 | Bristol-Myers Squibb Company | 1,541,647 | ||||||
| 6,842 | CAE, Inc. | 95,701 | ||||||
| 16,650 | Celgene Corporationd | 1,927,238 | ||||||
| 4,641 | Essilor International SA | 523,638 | ||||||
| 9,795 | GlaxoSmithKline plc | 188,148 | ||||||
| 4,636 | Hikma Pharmaceuticals plc | 108,055 | ||||||
| 12,790 | Hologic, Inc.d | 513,135 | ||||||
| 600 | Laboratory Corporation of America Holdingsd | 77,028 | ||||||
| 982 | Lonza Group AG | 169,718 | ||||||
| 26,100 | Medtronic plc | 1,859,103 | ||||||
| 36,940 | Merck & Company, Inc. | 2,174,658 | ||||||
| 3,167 | Merck KGaA | 329,752 | ||||||
| 20,409 | Novartis AG | 1,484,214 | ||||||
| 9,700 | Novo Nordisk AS | 347,960 | ||||||
| 1,062 | Roche Holding AG-Genusschein | 242,086 | ||||||
| 2,670 | Teleflex, Inc. | 430,270 | ||||||
| 9,170 | Vertex Pharmaceuticals, Inc.d | 675,554 | ||||||
| 3,230 | Waters Corporationd | 434,080 | ||||||
|
| |||||||
Total | 15,420,586 | |||||||
|
| |||||||
| Industrials (5.0%) | ||||||||
| 37 | A P Moller - Maersk AS | 58,977 | ||||||
| 10,724 | ABB, Ltd. | 225,651 | ||||||
| 6,470 | Acuity Brands, Inc. | 1,493,664 | ||||||
| 7,095 | Adecco SA | 463,139 | ||||||
| 34,400 | Air New Zealand, Ltd. | 52,388 | ||||||
| 22,000 | Asahi Glass Company, Ltd. | 149,262 | ||||||
| 1,400 | Atlas Copco Aktiebolag | 42,471 | ||||||
| 3,035 | Berendsen plc | 32,540 | ||||||
| 7,000 | Dai Nippon Printing Company, Ltd. | 69,067 | ||||||
| 10,960 | Delta Air Lines, Inc. | 539,122 | ||||||
| 5,131 | Deutsche Post AG | 168,272 | ||||||
| 3,000 | DSV AS | 133,231 | ||||||
| 38,503 | El Al Israel Airlines, Ltd. | 25,461 | ||||||
| 4,260 | Equifax, Inc. | 503,660 | ||||||
| 349 | Flughafen Zuerich AG | 64,672 | ||||||
| 2,000 | Fraport AG Frankfurt Airport Services Worldwide | 118,016 | ||||||
| 5,700 | Fuji Machine Manufacturing Company, Ltd. | 65,078 | ||||||
| 2,300 | Hitachi Transport System, Ltd. | 46,597 | ||||||
| 883 | Hochtief AG | 123,279 | ||||||
| 13,470 | Illinois Tool Works, Inc. | 1,649,536 | ||||||
| 3,800 | Inaba Denki Sangyo Company, Ltd. | 130,643 | ||||||
| 54,700 | ITOCHU Corporation | 724,270 | ||||||
| 27,630 | Jacobs Engineering Group, Inc.d | 1,574,910 | ||||||
| 2,500 | Jardine Matheson Holdings, Ltd. | 138,125 | ||||||
| 13,300 | KITZ Corporation | 72,614 | ||||||
| 6,400 | Komatsu, Ltd. | 144,961 | ||||||
| 12,800 | KONE Oyj | 571,952 | ||||||
| 3,032 | Koninklijke Boskalis Westminster NV | 105,187 | ||||||
| 8,800 | Marubeni Corporation | 49,773 | ||||||
| 9,820 | Masonite International Corporationd | 646,156 | ||||||
| 20,818 | Meggitt plc | 117,564 | ||||||
| 4,660 | Middleby Corporationd | 600,255 | ||||||
| 5,200 | MIRAIT Holdings Corporation | 46,864 | ||||||
| 4,500 | Mitsubishi Corporation | 95,574 | ||||||
| 21,600 | Mitsubishi Electric Corporation | 300,438 | ||||||
| 15,000 | Mitsubishi Heavy Industries, Ltd. | 68,191 | ||||||
| 6,000 | Mitsuboshi Belting, Ltd. | 51,020 | ||||||
| 3,100 | Mitsui & Company, Ltd. | 42,477 | ||||||
| 8,312 | National Express Group plc | 36,221 | ||||||
| 2,000 | NIPPO Corporation | 37,261 | ||||||
| 9,900 | Nitto Kogyo Corporation | 134,790 | ||||||
| 3,000 | Okuma Corporation | 28,543 | ||||||
| 9,440 | Oshkosh Corporation | 609,918 | ||||||
| 3,433 | Philips Lighting NVd,g | 84,562 | ||||||
| 2,738 | Randstad Holding NV | 148,311 | ||||||
| 4,901 | RELX NV | 82,435 | ||||||
| 262 | Rieter Holding AG | 45,566 | ||||||
| 12,647 | Rolls-Royce Holdings plcd | 103,877 | ||||||
| 4,900 | Sanwa Holdings Corporation | 46,604 | ||||||
| 845 | Schindler Holding AG, Participation Certificate | 148,816 | ||||||
| 1,116 | Schneider Electric SE | 77,527 | ||||||
| 5,810 | Siemens AG | 711,379 | ||||||
| 2,842 | Skanska AB | 66,913 | ||||||
| 10,306 | SKF AB | 188,973 | ||||||
| 8,920 | Smiths Group plc | 155,272 | ||||||
| 30,300 | Sojitz Corporation | 73,361 | ||||||
| 1,207 | Sulzer, Ltd. | 124,252 | ||||||
| 19,180 | Union Pacific Corporation | 1,988,582 | ||||||
| 7,736 | Vinci SA | 526,240 | ||||||
| 5,610 | WABCO Holdings, Inc.d | 595,502 | ||||||
The accompanying Notes to Financial Statements are an integral part of this schedule.
96
Table of Contents
BALANCED INCOME PLUS PORTFOLIO
Schedule of Investments as of December 31, 2016
| Shares | Common Stock (44.2%) | Value | ||||||
| Industrials (5.0%) - continued | ||||||||
| 1,697 | Wolseley plc | $ | 103,596 | |||||
| 2,084 | WSP Global, Inc. | 69,366 | ||||||
| 1,700 | Yuasa Trading Company, Ltd. | 42,347 | ||||||
|
| |||||||
Total | 17,735,271 | |||||||
|
| |||||||
| Information Technology (6.6%) | ||||||||
| 855 | Advanced Micro Devices, Inc.d | 9,696 | ||||||
| 2,780 | Alliance Data Systems Corporation | 635,230 | ||||||
| 2,260 | Alphabet, Inc., Class Ad | 1,790,937 | ||||||
| 1,185 | Alphabet, Inc., Class Cd | 914,607 | ||||||
| 23,100 | Apple, Inc. | 2,675,442 | ||||||
| 5,600 | Canon, Inc. | 157,708 | ||||||
| 3,192 | Capital Power Corporation | 55,227 | ||||||
| 1,600 | DTS Corporation | 34,035 | ||||||
| 15,130 | Facebook, Inc.d | 1,740,706 | ||||||
| 19,370 | Finisar Corporationd | 586,330 | ||||||
| 11,900 | FUJIFILM Holdings NPV | 450,603 | ||||||
| 20,790 | Juniper Networks, Inc. | 587,525 | ||||||
| 6,500 | Konica Minolta Holdings, Inc. | 64,419 | ||||||
| 26,960 | Microsoft Corporation | 1,675,294 | ||||||
| 5,000 | NEC Networks & System Integration Corporation | 90,146 | ||||||
| 1,745 | Nice, Ltd. | 119,729 | ||||||
| 4,200 | Nichicon Corporation | 36,570 | ||||||
| 1,200 | NTT Data Corporation | 57,974 | ||||||
| 2,405 | NVIDIA Corporation | 256,710 | ||||||
| 8,780 | Palo Alto Networks, Inc.d | 1,097,939 | ||||||
| 61,090 | Pandora Media, Inc.d,e | 796,614 | ||||||
| 38,030 | PayPal Holdings, Inc.d | 1,501,044 | ||||||
| 10,010 | Plantronics, Inc. | 548,148 | ||||||
| 41,140 | Pure Storage, Inc.d,e | 465,293 | ||||||
| 600 | Rohm Company, Ltd. | 34,424 | ||||||
| 2,000 | Ryosan Company, Ltd. | 60,297 | ||||||
| 13,650 | Salesforce.com, Inc.d | 934,479 | ||||||
| 664 | SAP SE | 57,439 | ||||||
| 2,980 | Seagate Technology plc | 113,747 | ||||||
| 1,634 | Software AG | 59,222 | ||||||
| 12,212 | Telefonaktiebolaget LM Ericsson | 71,574 | ||||||
| 1,700 | Tokyo Electron, Ltd. | 159,884 | ||||||
| 12,280 | Twitter, Inc.d | 200,164 | ||||||
| 16,140 | Vantiv, Inc.d | 962,267 | ||||||
| 27,380 | Visa, Inc. | 2,136,188 | ||||||
| 40,540 | Xilinx, Inc. | 2,447,400 | ||||||
|
| |||||||
Total | 23,585,011 | |||||||
|
| |||||||
| Materials (1.9%) | ||||||||
| 2,600 | Adeka Corporation | 35,272 | ||||||
| 4,779 | APERAM | 218,095 | ||||||
| 1,620 | Ashland Global Holdings, Inc. | 177,050 | ||||||
| 3,785 | BHP Billiton plc | 60,269 | ||||||
| 58,361 | BHP Billiton, Ltd. | 1,045,530 | ||||||
| 39,060 | BlueScope Steel, Ltd. | 259,596 | ||||||
| 1,900 | Croda International plc | 74,727 | ||||||
| 4,180 | Crown Holdings, Inc.d | 219,742 | ||||||
| 22,300 | Daicel Corporation | 245,167 | ||||||
| 5,260 | Domtar Corporation | 205,298 | ||||||
| 2,170 | Eagle Materials, Inc. | 213,810 | ||||||
| 14,984 | Evonik Industries AG | 446,657 | ||||||
| 3,370 | FMC Corporation | 190,607 | ||||||
| 38 | Givaudan SA | 69,546 | ||||||
| 4,400 | JSR Corporation | 69,257 | ||||||
| 9,920 | Kinross Gold Corporationd | 30,851 | ||||||
| 15,600 | Kuraray Company, Ltd. | 233,931 | ||||||
| 3,700 | Kyoei Steel, Ltd. | 70,346 | ||||||
| 924 | LafargeHolcim, Ltd. | 48,503 | ||||||
| 18,300 | Mitsubishi Chemical Holdings Corporation | 118,322 | ||||||
| 3,000 | Mitsubishi Gas Chemical Company, Inc. | 51,118 | ||||||
| 2,100 | Mitsubishi Materials Corporation | 64,233 | ||||||
| 600 | Nippon Shokubai Company, Ltd. | 37,366 | ||||||
| 64,452 | Norsk Hydro ASA | 307,612 | ||||||
| 7,139 | Nufarm, Ltd. | 47,040 | ||||||
| 17,381 | Orora, Ltd. | 37,378 | ||||||
| 3,450 | Packaging Corporation of America | 292,629 | ||||||
| 2,380 | PPG Industries, Inc. | 225,529 | ||||||
| 1,751 | Rio Tinto, Ltd. | 75,015 | ||||||
| 9,450 | Steel Dynamics, Inc. | 336,231 | ||||||
| 1,600 | Sumitomo Seika Chemicals Company, Ltd. | 62,661 | ||||||
| 6,800 | Toagosei Company, Ltd. | 66,744 | ||||||
| 7,000 | Tosoh Corporation | 49,378 | ||||||
| 9,997 | UPM-Kymmene Oyj | 244,483 | ||||||
| 20,516 | Verso Corporationd | 145,664 | ||||||
| 1,700 | Yamato Kogyo Company, Ltd. | 47,412 | ||||||
| 12,318 | Yara International ASA | 484,578 | ||||||
| 1,300 | Yodogawa Steel Works, Ltd. | 33,880 | ||||||
|
| |||||||
Total | 6,641,527 | |||||||
|
| |||||||
| Real Estate (6.3%) | ||||||||
| 2,000 | Acadia Realty Trust | 65,360 | ||||||
| 950 | Agree Realty Corporation | 43,747 | ||||||
| 9,030 | Alexandria Real Estate Equities, Inc. | 1,003,504 | ||||||
| 2,650 | American Campus Communities, Inc. | 131,890 | ||||||
| 4,200 | American Homes 4 Rent | 88,116 | ||||||
| 3,950 | Apartment Investment & Management Company | 179,527 | ||||||
| 3,500 | Apple Hospitality REIT, Inc. | 69,930 | ||||||
| 2,700 | AvalonBay Communities, Inc. | 478,305 | ||||||
| 1,200 | Bluerock Residential Growth REIT, Inc. | 16,464 | ||||||
| 4,887 | Boston Properties, Inc. | 614,687 | ||||||
| 3,400 | Brandywine Realty Trust | 56,134 | ||||||
| 32,988 | Brixmor Property Group, Inc. | 805,567 | ||||||
| 10,210 | Camden Property Trust | 858,355 | ||||||
| 35,800 | CapitaLand Retail China Trustd | 33,868 | ||||||
| 1,800 | Care Capital Properties, Inc. | 45,000 | ||||||
| 1,024 | Chesapeake Lodging Trust | 26,481 | ||||||
| 2,100 | CoreCivic, Inc. | 51,366 | ||||||
| 650 | CoreSite Realty Corporation | 51,591 | ||||||
| 2,000 | Corporate Office Properties Trust | 62,440 | ||||||
| 7,042 | Cousins Properties, Inc. | 59,927 | ||||||
| 5,790 | Crown Castle International Corporation | 502,398 | ||||||
| 4,600 | CubeSmart | 123,142 | ||||||
| 2,100 | CyrusOne, Inc. | 93,933 | ||||||
| 400 | Daito Trust Construction Company, Ltd. | 60,135 | ||||||
| 2,000 | DCT Industrial Trust, Inc. | 95,760 | ||||||
| 6,300 | DDR Corporation | 96,201 | ||||||
| 51,200 | DEXUS Property Group | 355,185 | ||||||
| 2,214 | DiamondRock Hospitality Company | 25,527 | ||||||
| 3,168 | Digital Realty Trust, Inc. | 311,288 | ||||||
| 2,000 | Douglas Emmett, Inc. | 73,120 | ||||||
| 38,490 | Duke Realty Corporation | 1,022,294 | ||||||
| 1,150 | DuPont Fabros Technology, Inc. | 50,520 | ||||||
| 364 | EastGroup Properties, Inc. | 26,878 | ||||||
| 1,200 | Education Realty Trust, Inc. | 50,760 | ||||||
| 1,319 | EPR Properties | 94,665 | ||||||
| 2,042 | Equinix, Inc. | 729,831 | ||||||
| 2,400 | Equity Commonwealthd | 72,576 | ||||||
| 2,000 | Equity Lifestyle Properties, Inc. | 144,200 | ||||||
| 1,700 | Equity One, Inc. | 52,173 | ||||||
| 10,460 | Equity Residential | 673,206 | ||||||
The accompanying Notes to Financial Statements are an integral part of this schedule.
97
Table of Contents
BALANCED INCOME PLUS PORTFOLIO
Schedule of Investments as of December 31, 2016
| Shares | Common Stock (44.2%) | Value | ||||||
| Real Estate (6.3%) - continued | ||||||||
| 1,425 | Essex Property Trust, Inc. | $ | 331,312 | |||||
| 2,800 | Extra Space Storage, Inc. | 216,272 | ||||||
| 1,100 | Federal Realty Investment Trust | 156,321 | ||||||
| 2,000 | First Industrial Realty Trust, Inc. | 56,100 | ||||||
| 4,240 | Forest City Realty Trust, Inc. | 88,362 | ||||||
| 3,550 | Gaming and Leisure Properties, Inc. | 108,701 | ||||||
| 12,086 | General Growth Properties, Inc. | 301,908 | ||||||
| 1,400 | GEO Group, Inc. | 50,302 | ||||||
| 5,200 | Gramercy Property Trust | 47,736 | ||||||
| 15,928 | H&R Real Estate Investment Trust | 265,378 | ||||||
| 4,300 | Hamborner REIT AG | 40,905 | ||||||
| 9,000 | HCP, Inc. | 267,480 | ||||||
| 2,600 | Healthcare Realty Trust, Inc. | 78,832 | ||||||
| 3,650 | Healthcare Trust of America, Inc. | 106,251 | ||||||
| 2,900 | Highwoods Properties, Inc. | 147,929 | ||||||
| 3,600 | Hospitality Properties Trust | 114,264 | ||||||
| 14,796 | Host Hotels & Resorts, Inc. | 278,757 | ||||||
| 2,200 | Hudson Pacific Properties, Inc. | 76,516 | ||||||
| 61,000 | Hysan Development Company, Ltd. | 251,567 | ||||||
| 4,400 | Iron Mountain, Inc. | 142,912 | ||||||
| 1,700 | Kilroy Realty Corporation | 124,474 | ||||||
| 10,000 | Kimco Realty Corporation | 251,600 | ||||||
| 1,403 | Lamar Advertising Company | 94,338 | ||||||
| 2,400 | LaSalle Hotel Properties | 73,128 | ||||||
| 2,900 | Liberty Property Trust | 114,550 | ||||||
| 915 | Life Storage, Inc. | 78,013 | ||||||
| 6,000 | Link REIT | 38,898 | ||||||
| 3,150 | Macerich Company | 223,146 | ||||||
| 1,700 | Mack-Cali Realty Corporation | 49,334 | ||||||
| 6,400 | Medical Properties Trust, Inc. | 78,720 | ||||||
| 2,102 | Mid-America Apartment Communities, Inc. | 205,828 | ||||||
| 1,500 | National Health Investors, Inc. | 111,255 | ||||||
| 4,600 | National Retail Properties, Inc. | 203,320 | ||||||
| 2,026 | National Storage Affiliates Trust | 44,714 | ||||||
| 235,066 | New World Development Company, Ltd. | 247,667 | ||||||
| 3,500 | NorthStar Realty Finance Corporation | 53,025 | ||||||
| 3,050 | Omega Healthcare Investors, Inc. | 95,343 | ||||||
| 2,400 | Outfront Media, Inc. | 59,688 | ||||||
| 880 | Parkway, Inc.d | 19,580 | ||||||
| 1,200 | Pebblebrook Hotel Trust | 35,700 | ||||||
| 4,500 | Physicians Realty Trust | 85,320 | ||||||
| 900 | Piedmont Office Realty Trust, Inc. | 18,819 | ||||||
| 15,763 | Prologis, Inc. | 832,129 | ||||||
| 4,080 | Public Storage, Inc. | 911,880 | ||||||
| 919 | QTS Realty Trust, Inc. | 45,628 | ||||||
| 1,800 | Quality Care Properties, Inc.d | 27,900 | ||||||
| 3,710 | Realty Income Corporation | 213,251 | ||||||
| 3,000 | Regency Centers Corporation | 206,850 | ||||||
| 2,050 | Retail Opportunity Investments Corporation | 43,317 | ||||||
| 3,500 | Retail Properties of America, Inc. | 53,655 | ||||||
| 3,092 | RLJ Lodging Trust | 75,723 | ||||||
| 3,171 | Senior Housing Property Trust | 60,027 | ||||||
| 8,938 | Simon Property Group, Inc. | 1,588,014 | ||||||
| 2,000 | SL Green Realty Corporation | 215,100 | ||||||
| 14,900 | Spirit Realty Captial, Inc. | 161,814 | ||||||
| 92,857 | Stockland | 306,771 | ||||||
| 3,760 | Store Capital Corporation | 92,910 | ||||||
| 3,352 | Summit Hotel Properties, Inc. | 53,733 | ||||||
| 1,400 | Sun Communities, Inc. | 107,254 | ||||||
| 4,000 | Sun Hung Kai Properties, Ltd. | 50,370 | ||||||
| 4,162 | Sunstone Hotel Investors, Inc. | 63,470 | ||||||
| 1,932 | Tanger Factory Outlet Centers, Inc. | 69,127 | ||||||
| 1,250 | Taubman Centers, Inc. | 92,412 | ||||||
| 5,600 | UDR, Inc. | 204,288 | ||||||
| 1,700 | Urban Edge Properties | 46,767 | ||||||
| 600 | Urstadt Biddle Properties, Inc. | 14,466 | ||||||
| 6,800 | Ventas, Inc. | 425,136 | ||||||
| 14,319 | VEREIT, Inc. | 121,139 | ||||||
| 5,850 | Vornado Realty Trust | 610,564 | ||||||
| 2,600 | Washington Prime Group, Inc. | 27,066 | ||||||
| 2,300 | Weingarten Realty Investors | 82,317 | ||||||
| 6,854 | Welltower, Inc. | 458,738 | ||||||
| 6,000 | Wharf Holdings, Ltd. | 39,744 | ||||||
| 8,000 | Wheelock and Company, Ltd. | 44,898 | ||||||
| 53,100 | Wing Tai Holdings, Ltd. | 58,161 | ||||||
| 1,200 | WP Carey, Inc. | 70,908 | ||||||
|
| |||||||
Total | 22,305,843 | |||||||
|
| |||||||
| Telecommunications Services (0.7%) | ||||||||
| 8,755 | Elisa Oyj | 284,201 | ||||||
| 7,500 | Freenet AG | 210,785 | ||||||
| 126,585 | KCOM Group plc | 147,814 | ||||||
| 33,579 | Koninklijke (Royal) KPN NV | 99,298 | ||||||
| 7,700 | Nippon Telegraph & Telephone Corporation | 324,133 | ||||||
| 8,400 | NTT DOCOMO, Inc. | 191,060 | ||||||
| 149,422 | PCCW, Ltd. | 80,775 | ||||||
| 3,700 | Proximus SA | 106,364 | ||||||
| 12,600 | Telefonica Deutschland Holding AG | 53,858 | ||||||
| 8,453 | Telenor ASA | 126,175 | ||||||
| 1,967 | Vivendi SA | 37,308 | ||||||
| 21,040 | Zayo Group Holdings, Inc.d | 691,374 | ||||||
|
| |||||||
Total | 2,353,145 | |||||||
|
| |||||||
Utilities (0.7%) | �� | |||||||
| 2,850 | ATCO, Ltd. | 94,798 | ||||||
| 46,500 | Centrica plc | 133,923 | ||||||
| 63,700 | Electricidade de Portugal SA | 193,875 | ||||||
| 29,720 | MDU Resources Group, Inc. | 855,044 | ||||||
| 9,260 | NorthWestern Corporation | 526,616 | ||||||
| 77,000 | Osaka Gas Company, Ltd. | 295,454 | ||||||
| 43,300 | Redes Energeticas Nacionais SGPS SA | 122,853 | ||||||
| 5,000 | Toho Gas Company, Ltd. | 40,609 | ||||||
| 8,800 | United Utilities Group plc | 97,543 | ||||||
|
| |||||||
Total | 2,360,715 | |||||||
|
| |||||||
Total Common Stock (cost $143,470,872) | 156,923,084 | |||||||
|
| |||||||
| Principal Amount | Long-Term Fixed Income (31.1%) | |||||||
| Asset-Backed Securities (2.0%) | ||||||||
Asset Backed Securities Corporation Home Equity Loan Trust | ||||||||
| 338,641 | 0.896%, 7/25/2036, Series 2006-HE5, Class A4h | 312,093 | ||||||
Bayview Opportunity Master Fund Trust | ||||||||
| 58,975 | 3.623%, 4/28/2030, Series 2015-3, Class A1g | 59,102 | ||||||
| 169,269 | 3.228%, 7/28/2034, Series 2014-18NP, Class A*,i | 169,512 | ||||||
| 312,544 | 3.721%, 7/28/2035, Series 2015-NPLA, Class Ag,i | 312,473 | ||||||
Credit Based Asset Servicing and Securitization, LLC | ||||||||
| 259,315 | 3.503%, 12/25/2036, Series 2006-CB2, Class AF2i | 190,975 | ||||||
The accompanying Notes to Financial Statements are an integral part of this schedule.
98
Table of Contents
BALANCED INCOME PLUS PORTFOLIO
Schedule of Investments as of December 31, 2016
| Principal Amount | Long-Term Fixed Income (31.1%) | Value | ||||||
Asset-Backed Securities (2.0%) - continued | ||||||||
Credit-Based Asset Servicing & Securitization, LLC | ||||||||
| $600,000 | 1.176%, 12/25/2035, Series 2005-CB8, Class M1h | $ | 345,966 | |||||
Earnest Student Loan Program, LLC | ||||||||
| 344,641 | 2.680%, 7/25/2035, Series 2016-C, Class A2g | 337,987 | ||||||
First Horizon ABS Trust | ||||||||
| 139,033 | 0.916%, 10/25/2034, Series 2006-HE1, Class Ah,j | 135,599 | ||||||
GMAC Mortgage Corporation Loan Trust | ||||||||
| 298,622 | 1.084%, 8/25/2035, Series 2005-HE1, Class A2h,j | 282,476 | ||||||
| 280,790 | 0.772%, 12/25/2036, Series 2006-HE4, Class A1h,j | 260,527 | ||||||
IndyMac Seconds Asset-Backed Trust | ||||||||
| 224,641 | 1.096%, 10/25/2036, Series 2006-2B, Class Ah,j | 141,856 | ||||||
J.P. Morgan Mortgage Acquisition Trust | ||||||||
| 182,568 | 4.480%, 3/25/2047, Series 2007-HE1, Class AF4i | 135,333 | ||||||
Lehman XS Trust | ||||||||
| 182,434 | 5.440%, 8/25/2035, Series 2005-2, Class 2A3Bi | 159,820 | ||||||
Marlette Funding Trust | ||||||||
| 331,159 | 3.060%, 1/17/2023, Series 2016-1A, Class A* | 331,077 | ||||||
Merrill Lynch Mortgage Investors Trust | ||||||||
| 348,527 | 2.830%, 6/25/2035, Series 2005-A5, Class M1 | 233,241 | ||||||
Murray Hill Marketplace Trust | ||||||||
| 136,066 | 4.190%, 11/25/2022, Series 2016-LC1, Class A* | 136,719 | ||||||
NRZ Advance Receivables Trust Advance Receivables Backed | ||||||||
| 451,000 | 2.751%, 6/15/2049, Series 2016-T1, Class AT1* | 449,309 | ||||||
Preferred Term Securities XXIII, Ltd. | ||||||||
| 479,872 | 1.163%, 12/22/2036*,h | 386,187 | ||||||
Preston Ridge Partners Mortgage Trust, LLC | ||||||||
| 266,665 | 4.000%, 9/27/2021, Series 2016-1A, Class A1*,i | 265,632 | ||||||
Pretium Mortgage Credit Partners I, LLC | ||||||||
| 240,742 | 4.000%, 7/27/2031, Series 2016-NPL4, Class A*,i | 240,644 | ||||||
SoFi Consumer Loan Program, LLC | ||||||||
| 410,571 | 3.050%, 12/26/2025, Series 2016-3, Class Ag | 409,064 | ||||||
Sunset Mortgage Loan Company, LLC | ||||||||
| 105,947 | 4.459%, 9/18/2045, Series 2015-NPL1, Class A*,i | 105,496 | ||||||
| 151,258 | 3.844%, 7/16/2047, Series 2016-NPL1, Class A*,i | 151,773 | ||||||
US Residential Opportunity Fund Trust | ||||||||
| 332,543 | 3.475%, 7/27/2036, Series 2016-1III, Class A*,i | 331,133 | ||||||
Vericrest Opportunity Loan Transferee | ||||||||
| 90,992 | 3.375%, 10/25/2058, Series 2015-NPL3, Class A1*,i | 90,864 | ||||||
| 98,910 | 3.500%, 6/26/2045, Series 2015-NPL9, Class A1g | 98,708 | ||||||
| 296,799 | 3.500%, 10/25/2046, Series 2016-NP11, Class A1g,i | 296,108 | ||||||
Vericrest Opportunity Loan Trust | ||||||||
| 343,907 | 3.625%, 11/26/2046, Series 2016-NP12, Class A1g,i | 342,890 | ||||||
Wachovia Asset Securitization, Inc. | ||||||||
| 445,984 | 0.896%, 7/25/2037, Series 2007-HE1, Class A*,h,j | 380,656 | ||||||
|
| |||||||
Total | 7,093,220 | |||||||
|
| |||||||
| Basic Materials (0.5%) | ||||||||
Albemarle Corporation | ||||||||
| 96,000 | 3.000%, 12/1/2019 | 98,132 | ||||||
Alcoa Nederland Holding BV | ||||||||
| 90,000 | 6.750%, 9/30/2024g | 97,650 | ||||||
ArcelorMittal SA | ||||||||
| 190,000 | 6.500%, 3/1/2021 | 208,050 | ||||||
Dow Chemical Company | ||||||||
| 86,000 | 8.550%, 5/15/2019 | 98,525 | ||||||
Glencore Funding, LLC | ||||||||
| 65,000 | 1.940%, 4/16/2018g,h | 64,265 | ||||||
INEOS Group Holdings SA | ||||||||
| 380,000 | 5.625%, 8/1/2024e,g | 377,150 | ||||||
LyondellBasell Industries NV | ||||||||
| 80,000 | 5.000%, 4/15/2019 | 84,458 | ||||||
Newmont Mining Corporation, Convertible | ||||||||
| 200,000 | 1.625%, 7/15/2017 | 203,875 | ||||||
NOVA Chemicals Corporation | ||||||||
| 341,904 | 5.250%, 8/1/2023g | 345,323 | ||||||
Royal Gold, Inc., Convertible | ||||||||
| 150,000 | 2.875%, 6/15/2019 | 158,437 | ||||||
RPM International, Inc., Convertible | ||||||||
| 145,000 | 2.250%, 12/15/2020 | 173,547 | ||||||
|
| |||||||
Total | 1,909,412 | |||||||
|
| |||||||
| Capital Goods (0.6%) | ||||||||
Building Materials Corporation of America | ||||||||
| 280,000 | 6.000%, 10/15/2025g | 294,700 | ||||||
Cemex SAB de CV | ||||||||
| 300,000 | 5.700%, 1/11/2025g | 302,250 | ||||||
CNH Industrial Capital, LLC | ||||||||
| 305,000 | 4.375%, 11/6/2020 | 313,006 | ||||||
Crown Americas Capital Corporation IV | ||||||||
| 190,000 | 4.500%, 1/15/2023 | 193,800 | ||||||
General Electric Company | ||||||||
| 103,000 | 5.000%, 1/21/2021k | 106,883 | ||||||
Lockheed Martin Corporation | ||||||||
| 65,000 | 2.500%, 11/23/2020 | 65,499 | ||||||
Reynolds Group Issuer, Inc. | ||||||||
| 340,000 | 5.125%, 7/15/2023g | 345,525 | ||||||
Roper Industries, Inc. | ||||||||
| 71,000 | 2.050%, 10/1/2018 | 71,228 | ||||||
United Rentals North America, Inc. | ||||||||
| 290,000 | 5.500%, 7/15/2025 | 295,800 | ||||||
|
| |||||||
Total | 1,988,691 | |||||||
|
| |||||||
The accompanying Notes to Financial Statements are an integral part of this schedule.
99
Table of Contents
BALANCED INCOME PLUS PORTFOLIO
Schedule of Investments as of December 31, 2016
| Principal Amount | Long-Term Fixed Income (31.1%) | Value | ||||||
| Collateralized Mortgage Obligations (3.2%) | ||||||||
Alternative Loan Trust | ||||||||
| $59,677 | 5.500%, 5/25/2035, Series 2005-J3, Class 2A13 | $ | 59,507 | |||||
Angel Oak Mortgage Trust | ||||||||
| 169,261 | 4.500%, 11/25/2045, Series 2015-1, Class A*,i | 170,242 | ||||||
Banc of America Alternative Loan Trust | ||||||||
| 442,551 | 6.000%, 11/25/2035, Series 2005-10, Class 3CB1 | 390,430 | ||||||
Banc of America Mortgage Securities, Inc. | ||||||||
| 147,313 | 3.242%, 9/25/2035, Series 2005-H, Class 2A1 | 141,243 | ||||||
Bayview Opportunity Master Fund Trust | ||||||||
| 301,839 | 3.475%, 7/28/2031, Series 2016-RPL3, Class A1g | 300,031 | ||||||
Bear Stearns ALT-A Trust | ||||||||
| 176,053 | 3.108%, 10/25/2033, Series 2003-3, Class 5A | 172,150 | ||||||
COLT Mortgage Loan Trust | ||||||||
| 292,143 | 2.750%, 9/25/2046, Series 2016-2, Class A1* | 293,675 | ||||||
Countrywide Alternative Loan Trust | ||||||||
| 413,269 | 6.500%, 8/25/2036, Series 2006-23CB, Class 2A3 | 278,737 | ||||||
Countrywide Home Loan Mortgage Pass Through Trust | ||||||||
| 308,013 | 3.155%, 11/25/2035, Series 2005-22, Class 2A1 | 252,560 | ||||||
Credit Suisse First Boston Mortgage Securities Corporation | ||||||||
| 277,564 | 5.250%, 10/25/2035, Series 2005-9, Class 1A3 | 268,234 | ||||||
Deutsche Alt-A Securities, Inc., Mortgage Loan Trust | ||||||||
| 308,985 | 2.356%, 8/25/2035, Series 2005-AR1, Class 2A3 | 238,712 | ||||||
| 485,292 | 5.500%, 11/25/2035, Series 2005-5, Class 1A4 | 487,329 | ||||||
| 331,976 | 1.337%, 4/25/2047, Series 2007-OA2, Class A1h | 281,194 | ||||||
GMAC Mortgage Corporation Loan Trust | ||||||||
| 233,585 | 3.384%, 5/25/2035, Series 2005-AR2, Class 4A | 215,525 | ||||||
HarborView Mortgage Loan Trust | ||||||||
| 245,201 | 3.108%, 7/19/2035, Series 2005-4, Class 3A1 | 214,724 | ||||||
| 154,942 | 3.341%, 12/19/2035, Series 2005-14, Class 3A1A | 134,670 | ||||||
IndyMac INDA Mortgage Loan Trust | ||||||||
| 225,610 | 3.141%, 8/25/2036, Series 2006-AR1, Class A1 | 214,172 | ||||||
IndyMac INDX Mortgage Loan Trust | ||||||||
| 413,097 | 0.966%, 4/25/2046, Series 2006-AR2, Class 1A1Bh | 338,987 | ||||||
J.P. Morgan Alternative Loan Trust | ||||||||
| 541,264 | 6.500%, 3/25/2036, Series 2006-S1, Class 1A19 | 472,422 | ||||||
J.P. Morgan Mortgage Trust | ||||||||
| 401,203 | 3.247%, 8/25/2035, Series 2005-A5, Class 1A2 | 397,820 | ||||||
| 420,025 | 3.186%, 1/25/2037, Series 2006-A7, Class 2A2 | 376,095 | ||||||
Merrill Lynch Mortgage Investors Trust | ||||||||
| 413,702 | 6.250%, 8/25/2036, Series 2006-AF1, Class AF2A | 329,286 | ||||||
MortgageIT Trust | ||||||||
| 580,296 | 1.016%, 12/25/2035, Series 2005-5, Class A1h | 535,566 | ||||||
| 656,140 | 0.956%, 4/25/2036, Series 2006-1, Class 1A2h | 485,541 | ||||||
New York Mortgage Trust | ||||||||
| 158,791 | 3.112%, 5/25/2036, Series 2006-1, Class 2A3 | 142,889 | ||||||
Residential Accredit Loans, Inc. Trust | ||||||||
| 313,839 | 5.750%, 9/25/2035, Series 2005-QS13, Class 2A3 | 280,242 | ||||||
Residential Funding Mortgage Security I Trust | ||||||||
| 530,947 | 6.000%, 7/25/2037, Series 2007-S7, Class A20 | 489,212 | ||||||
Structured Adjustable Rate Mortgage Loan Trust | ||||||||
| 326,761 | 2.949%, 1/25/2035, Series 2004-19, Class 2A2 | 266,005 | ||||||
| 211,149 | 3.142%, 7/25/2035, Series 2005-15, Class 4A1 | 180,154 | ||||||
| 339,420 | 3.364%, 9/25/2035, Series 2005-18, Class 1A1 | 277,984 | ||||||
Structured Asset Mortgage Investments, Inc. | ||||||||
| 795,465 | 1.066%, 12/25/2035, Series 2005-AR4, Class A1h | 581,064 | ||||||
Vericrest Opportunity Loan Transferee | ||||||||
| 380,912 | 3.500%, 7/25/2046, Series 2016-NPL8, Class A1g,i | 379,585 | ||||||
WaMu Mortgage Pass Through Certificates | ||||||||
| 88,561 | 5.000%, 11/25/2018, Series 2003-S12, Class 3A | 89,745 | ||||||
| 155,840 | 2.137%, 1/25/2037, Series 2006-AR18, Class 1A1 | 132,503 | ||||||
| 276,237 | 1.307%, 1/25/2047, Series 2006-AR19, Class 1Ah | 215,445 | ||||||
Washington Mutual Mortgage Pass Through Certificates Trust | ||||||||
| 409,420 | 1.317%, 2/25/2047, Series 2007-OA3, Class 2Ah | 305,181 | ||||||
Wells Fargo Mortgage Backed Securities Trust | ||||||||
| 130,903 | 3.003%, 3/25/2036, Series 2006-AR2, Class 2A1 | 130,589 | ||||||
| 458,521 | 3.037%, 7/25/2036, Series 2006-AR10, Class 2A1 | 448,630 | ||||||
| 237,515 | 3.073%, 10/25/2036, Series 2006-AR14, Class 2A3 | 221,022 | ||||||
| 261,884 | 6.000%, 7/25/2037, Series 2007-8, Class 1A16 | 258,714 | ||||||
| 222,467 | 6.000%, 7/25/2037, Series 2007-10, Class 1A1 | 219,237 | ||||||
|
| |||||||
Total | 11,667,053 | |||||||
|
| |||||||
The accompanying Notes to Financial Statements are an integral part of this schedule.
100
Table of Contents
BALANCED INCOME PLUS PORTFOLIO
Schedule of Investments as of December 31, 2016
| Principal Amount | Long-Term Fixed Income (31.1%) | Value | ||||||
| Communications Services (1.4%) | ||||||||
Altice US Finance I Corporation | ||||||||
| $200,000 | 5.500%, 5/15/2026g | $ | 204,000 | |||||
AMC Networks, Inc. | ||||||||
| 300,000 | 5.000%, 4/1/2024 | 300,750 | ||||||
America Movil SAB de CV | ||||||||
| 71,000 | 5.000%, 10/16/2019 | 76,054 | ||||||
American Tower Corporation | ||||||||
| 65,000 | 2.800%, 6/1/2020 | 64,997 | ||||||
AT&T, Inc. | ||||||||
| 86,000 | 5.875%, 10/1/2019 | 93,948 | ||||||
| 65,000 | 1.928%, 6/30/2020h | 65,353 | ||||||
| 60,000 | 2.800%, 2/17/2021 | 59,474 | ||||||
British Sky Broadcasting Group plc | ||||||||
| 102,000 | 2.625%, 9/16/2019g | 102,368 | ||||||
CCOH Safari, LLC | ||||||||
| 305,000 | 5.750%, 2/15/2026g | 315,675 | ||||||
CenturyLink, Inc. | ||||||||
| 230,000 | 6.450%, 6/15/2021 | 242,075 | ||||||
Charter Communications Operating, LLC | ||||||||
| 72,000 | 3.579%, 7/23/2020 | 73,406 | ||||||
| 32,000 | 4.464%, 7/23/2022 | 33,407 | ||||||
Clear Channel Worldwide Holdings, Inc. | ||||||||
| 290,000 | 6.500%, 11/15/2022 | 296,525 | ||||||
Columbus International, Inc. | ||||||||
| 205,000 | 7.375%, 3/30/2021g | 218,149 | ||||||
Crown Castle International Corporation | ||||||||
| 35,000 | 3.400%, 2/15/2021 | 35,488 | ||||||
| 35,000 | 2.250%, 9/1/2021 | 33,829 | ||||||
CSC Holdings, LLC | ||||||||
| 20,000 | 5.500%, 4/15/2027g | 20,250 | ||||||
Digicel, Ltd. | ||||||||
| 257,936 | 6.000%, 4/15/2021* | 233,228 | ||||||
DISH Network Corporation, Convertible | ||||||||
| 460,000 | 3.375%, 8/15/2026g | 523,537 | ||||||
Frontier Communications Corporation | ||||||||
| 275,000 | 8.875%, 9/15/2020 | 292,875 | ||||||
Liberty Interactive, LLC, Convertible | ||||||||
| 220,000 | 1.750%, 9/30/2046g | 236,500 | ||||||
Neptune Finco Corporation | ||||||||
| 100,000 | 10.875%, 10/15/2025g | 119,000 | ||||||
Nexstar Escrow Corporation | ||||||||
| 335,000 | 5.625%, 8/1/2024g | 332,487 | ||||||
Sprint Corporation | ||||||||
| 290,000 | 7.625%, 2/15/2025e | 304,863 | ||||||
Telefonica Emisiones SAU | ||||||||
| 78,000 | 3.192%, 4/27/2018 | 79,111 | ||||||
T-Mobile USA, Inc. | ||||||||
| 250,000 | 6.633%, 4/28/2021 | 260,938 | ||||||
Verizon Communications, Inc. | ||||||||
| 237,000 | 2.625%, 2/21/2020 | 239,121 | ||||||
| 106,000 | 4.500%, 9/15/2020 | 113,349 | ||||||
Zillow Group, Inc., Convertible | ||||||||
| 185,000 | 2.000%, 12/1/2021g | 189,972 | ||||||
|
| |||||||
Total | 5,160,729 | |||||||
|
| |||||||
Consumer Cyclical (1.2%) | ||||||||
Allison Transmission, Inc. | ||||||||
| 305,000 | 5.000%, 10/1/2024g | 308,050 | ||||||
BMW US Capital, LLC | ||||||||
| 80,000 | 1.500%, 4/11/2019g | 79,210 | ||||||
Brookfield Residential Properties, Inc. | ||||||||
| 200,000 | 6.125%, 7/1/2022g | 201,000 | ||||||
Cinemark USA, Inc. | ||||||||
| 263,000 | 4.875%, 6/1/2023 | 266,287 | ||||||
Daimler Finance North America, LLC | ||||||||
| 55,000 | 1.875%, 1/11/2018g | 55,069 | ||||||
eBay, Inc. | ||||||||
| 55,000 | 2.500%, 3/9/2018 | 55,476 | ||||||
ERAC USA Finance, LLC | ||||||||
| 106,000 | 2.350%, 10/15/2019g | 105,855 | ||||||
Ford Motor Credit Company, LLC | ||||||||
| 130,000 | 5.000%, 5/15/2018 | 135,069 | ||||||
| 87,000 | 2.597%, 11/4/2019 | 86,829 | ||||||
General Motors Financial Company, Inc. | ||||||||
| 40,000 | 3.150%, 1/15/2020 | 40,227 | ||||||
| 150,000 | 4.375%, 9/25/2021 | 155,456 | ||||||
Home Depot, Inc. | ||||||||
| 65,000 | 1.333%, 9/15/2017h | 65,110 | ||||||
| 65,000 | 2.625%, 6/1/2022 | 65,244 | ||||||
Jaguar Land Rover Automotive plc | ||||||||
| 273,000 | 5.625%, 2/1/2023g | 284,602 | ||||||
KB Home | ||||||||
| 189,000 | 4.750%, 5/15/2019 | 192,780 | ||||||
L Brands, Inc. | ||||||||
| 273,000 | 6.625%, 4/1/2021 | 306,443 | ||||||
Lennar Corporation | ||||||||
| 225,000 | 4.500%, 11/15/2019 | 233,719 | ||||||
Live Nation Entertainment, Inc. | ||||||||
| 335,000 | 5.375%, 6/15/2022g | 346,725 | ||||||
Macy’s Retail Holdings, Inc. | ||||||||
| 66,000 | 7.450%, 7/15/2017 | 68,081 | ||||||
MGM Resorts International | ||||||||
| 300,000 | 6.000%, 3/15/2023 | 324,000 | ||||||
Newell Rubbermaid, Inc. | ||||||||
| 55,000 | 3.150%, 4/1/2021 | 55,927 | ||||||
Ralph Lauren Corporation | ||||||||
| 60,000 | 2.625%, 8/18/2020 | 60,562 | ||||||
Toll Brothers Finance Corporation | ||||||||
| 76,000 | 4.000%, 12/31/2018 | 77,995 | ||||||
Visa, Inc. | ||||||||
| 65,000 | 2.200%, 12/14/2020 | 65,036 | ||||||
Walgreens Boots Alliance, Inc. | ||||||||
| 55,000 | 1.750%, 5/30/2018 | 55,047 | ||||||
| 55,000 | 2.600%, 6/1/2021 | 54,606 | ||||||
West Corporation | ||||||||
| 210,000 | 5.375%, 7/15/2022g | 202,912 | ||||||
Yum! Brands, Inc. | ||||||||
| 305,000 | 5.000%, 6/1/2024g | 311,481 | ||||||
|
| |||||||
Total | 4,258,798 | |||||||
|
| |||||||
Consumer Non-Cyclical (1.1%) | ||||||||
Abbott Laboratories | ||||||||
| 90,000 | 2.350%, 11/22/2019 | 90,062 | ||||||
Actavis Funding SCS | ||||||||
| 40,000 | 2.208%, 3/12/2020h | 40,766 | ||||||
Anheuser-Busch InBev Finance, Inc. | ||||||||
| 90,000 | 2.146%, 2/1/2021h | 91,583 | ||||||
| 65,000 | 2.650%, 2/1/2021 | 65,298 | ||||||
Anheuser-Busch InBev Worldwide, Inc. | ||||||||
| 78,000 | 6.500%, 7/15/2018 | 83,528 | ||||||
BAT International Finance plc | ||||||||
| 65,000 | 1.473%, 6/15/2018g,h | 65,012 | ||||||
The accompanying Notes to Financial Statements are an integral part of this schedule.
101
Table of Contents
BALANCED INCOME PLUS PORTFOLIO
Schedule of Investments as of December 31, 2016
| Principal Amount | Long-Term Fixed Income (31.1%) | Value | ||||||
Consumer Non-Cyclical (1.1%) - continued | ||||||||
Baxter International, Inc. | ||||||||
| $ 40,000 | 1.700%, 8/15/2021 | $ | 38,445 | |||||
Boston Scientific Corporation | ||||||||
| 40,000 | 6.000%, 1/15/2020 | 43,927 | ||||||
Bunge Limited Finance Corporation | ||||||||
| 65,000 | 3.500%, 11/24/2020 | 66,107 | ||||||
Celgene Corporation | ||||||||
| 65,000 | 3.550%, 8/15/2022 | 66,591 | ||||||
Cott Beverages, Inc. | ||||||||
| 200,000 | 5.375%, 7/1/2022 | 203,500 | ||||||
CVS Health Corporation | ||||||||
| 86,000 | 2.250%, 12/5/2018 | 86,737 | ||||||
EMD Finance, LLC | ||||||||
| 39,000 | 1.343%, 3/17/2017g,h | 39,009 | ||||||
Envision Healthcare Corporation | ||||||||
| 295,000 | 5.125%, 7/1/2022g | 293,894 | ||||||
Express Scripts Holding Company | ||||||||
| 55,000 | 3.000%, 7/15/2023 | 53,181 | ||||||
Forest Laboratories, Inc. | ||||||||
| 109,000 | 4.375%, 2/1/2019g | 113,226 | ||||||
Gilead Sciences, Inc. | ||||||||
| 65,000 | 3.250%, 9/1/2022 | 66,276 | ||||||
Grifols Worldwide Operations, Ltd. | ||||||||
| 200,000 | 5.250%, 4/1/2022 | 207,000 | ||||||
HCA, Inc. | ||||||||
| 227,936 | 4.750%, 5/1/2023 | 233,349 | ||||||
| 115,000 | 4.500%, 2/15/2027 | 112,988 | ||||||
Iconix Brand Group, Inc., Convertible | ||||||||
| 240,000 | 1.500%, 3/15/2018 | 225,600 | ||||||
Intercept Pharmaceuticals, Inc., Convertible | ||||||||
| 75,000 | 3.250%, 7/1/2023 | 66,844 | ||||||
JBS USA, LLC | ||||||||
| 290,000 | 5.750%, 6/15/2025g | 293,625 | ||||||
Laboratory Corporation of America Holdings | ||||||||
| 35,000 | 2.625%, 2/1/2020 | 34,947 | ||||||
Mead Johnson Nutrition Company | ||||||||
| 65,000 | 3.000%, 11/15/2020 | 65,763 | ||||||
Merck & Company, Inc. | ||||||||
| 40,000 | 1.257%, 2/10/2020h | 40,208 | ||||||
Mylan NV | ||||||||
| 65,000 | 3.150%, 6/15/2021g | 63,734 | ||||||
Perrigo Finance plc | ||||||||
| 40,000 | 3.500%, 12/15/2021 | 40,283 | ||||||
Pinnacle Foods, Inc. | ||||||||
| 200,000 | 5.875%, 1/15/2024 | 212,000 | ||||||
Revlon Consumer Products Corporation | ||||||||
| 227,936 | 5.750%, 2/15/2021 | 229,076 | ||||||
Reynolds American, Inc. | ||||||||
| 35,000 | 3.250%, 6/12/2020 | 35,843 | ||||||
Teva Pharmaceutical Finance Netherlands III BV | ||||||||
| 65,000 | 1.700%, 7/19/2019 | 63,836 | ||||||
TreeHouse Foods, Inc. | ||||||||
| 200,000 | 4.875%, 3/15/2022 | 205,000 | ||||||
Valeant Pharmaceuticals International | ||||||||
| 227,936 | 7.250%, 7/15/2022g | 186,338 | ||||||
WM Wrigley Jr. Company | ||||||||
| 48,000 | 2.000%, 10/20/2017g | 48,239 | ||||||
|
| |||||||
Total | 3,871,815 | |||||||
|
| |||||||
Energy (1.1%) | ||||||||
Anadarko Petroleum Corporation | ||||||||
| 60,000 | 8.700%, 3/15/2019 | 68,163 | ||||||
Antero Resources Corporation | ||||||||
| 200,000 | 5.125%, 12/1/2022 | 202,000 | ||||||
BP Capital Markets plc | ||||||||
| 60,000 | 1.676%, 5/3/2019 | 59,561 | ||||||
Buckeye Partners, LP | ||||||||
| 100,000 | 2.650%, 11/15/2018 | 100,638 | ||||||
Chesapeake Energy Corporation, Convertible | ||||||||
| 240,000 | 5.500%, 9/15/2026g | 259,800 | ||||||
Chevron Corporation | ||||||||
| 65,000 | 1.421%, 11/16/2018h | 65,261 | ||||||
Concho Resources, Inc. | ||||||||
| 277,936 | 6.500%, 1/15/2022 | 287,580 | ||||||
| 75,000 | 4.375%, 1/15/2025 | 74,851 | ||||||
Contura Energy, Inc. | ||||||||
| 135,000 | 10.000%, 8/1/2021* | 144,113 | ||||||
Crestwood Midstream Partners, LP | ||||||||
| 200,000 | 6.250%, 4/1/2023 | 204,000 | ||||||
Ecopetrol SA | ||||||||
| 40,000 | 5.875%, 9/18/2023 | 42,340 | ||||||
Enbridge, Inc. | ||||||||
| 54,000 | 1.384%, 6/2/2017e,h | 54,005 | ||||||
Encana Corporation | ||||||||
| 22,000 | 3.900%, 11/15/2021 | 22,158 | ||||||
EOG Resources, Inc. | ||||||||
| 65,000 | 2.625%, 3/15/2023 | 62,947 | ||||||
EQT Corporation | ||||||||
| 88,000 | 8.125%, 6/1/2019 | 98,972 | ||||||
Exxon Mobil Corporation | ||||||||
| 80,000 | 1.708%, 3/1/2019 | 80,154 | ||||||
Marathon Petroleum Corporation | ||||||||
| 65,000 | 3.400%, 12/15/2020 | 66,426 | ||||||
MEG Energy Corporation | ||||||||
| 273,000 | 6.375%, 1/30/2023g | 242,970 | ||||||
Northern Tier Energy, LLC | ||||||||
| 215,000 | 7.125%, 11/15/2020 | 223,331 | ||||||
Petrobras Global Finance BV | ||||||||
| 170,000 | 8.375%, 5/23/2021 | 183,175 | ||||||
Petroleos Mexicanos | ||||||||
| 45,000 | 4.607%, 3/11/2022g,h | 46,406 | ||||||
| 204,000 | 6.500%, 3/13/2027g | 210,426 | ||||||
Sabine Pass Liquefaction, LLC | ||||||||
| 300,000 | 5.625%, 3/1/2025 | 321,000 | ||||||
Schlumberger Holdings Corporation | ||||||||
| 65,000 | 3.000%, 12/21/2020g | 66,323 | ||||||
Shell International Finance BV | ||||||||
| 65,000 | 1.352%, 5/11/2020h | 65,042 | ||||||
Sunoco Logistics Partners Operations, LP | ||||||||
| 65,000 | 4.400%, 4/1/2021 | 68,396 | ||||||
TransCanada Trust | ||||||||
| 255,000 | 5.875%, 8/15/2076 | 265,200 | ||||||
Transcontinental Gas Pipe Line Company, LLC | ||||||||
| 60,000 | 7.850%, 2/1/2026g | 75,566 | ||||||
Weatherford International, Ltd. | ||||||||
| 100,000 | 8.250%, 6/15/2023e | 101,750 | ||||||
Whiting Petroleum Corporation, Convertible | ||||||||
| 190,000 | 1.250%, 4/1/2020 | 166,725 | ||||||
|
| |||||||
Total | 3,929,279 | |||||||
|
| |||||||
The accompanying Notes to Financial Statements are an integral part of this schedule.
102
Table of Contents
BALANCED INCOME PLUS PORTFOLIO
Schedule of Investments as of December 31, 2016
| Principal Amount | Long-Term Fixed Income (31.1%) | Value | ||||||
Financials (3.9%) | ||||||||
Abbey National Treasury Services plc | ||||||||
| $ | 100,000 | 1.407%, 9/29/2017h | $ | 99,825 | ||||
ACE INA Holdings, Inc. | ||||||||
| 65,000 | 2.875%, 11/3/2022 | 65,459 | ||||||
Aetna, Inc. | ||||||||
| 65,000 | 1.900%, 6/7/2019 | 64,834 | ||||||
Air Lease Corporation | ||||||||
| 100,000 | 2.125%, 1/15/2018 | 100,171 | ||||||
| 32,000 | 2.625%, 9/4/2018 | 32,217 | ||||||
Ally Financial, Inc. | ||||||||
| 325,000 | 4.750%, 9/10/2018 | 334,750 | ||||||
American Express Credit Corporation | ||||||||
| 65,000 | 2.009%, 9/14/2020h | 66,083 | ||||||
AMG Capital Trust II, Convertible | ||||||||
| 3,650 | 5.150%, 10/15/2037 | 199,267 | ||||||
Australia and New Zealand Banking Group, Ltd. | ||||||||
| 200,000 | 6.750%, 6/15/2026g,k | 211,142 | ||||||
BAC Capital Trust XIV | ||||||||
| 340,000 | 4.000%, 1/19/2017h,k | 266,900 | ||||||
Bank of America Corporation | ||||||||
| 120,000 | 5.700%, 5/2/2017 | 121,634 | ||||||
| 102,000 | 1.700%, 8/25/2017 | 102,133 | ||||||
| 77,000 | 8.000%, 1/30/2018k | 79,117 | ||||||
| 209,000 | 2.066%, 3/22/2018h | 210,407 | ||||||
| 80,000 | 5.650%, 5/1/2018 | 83,809 | ||||||
| 215,000 | 6.300%, 3/10/2026k | 224,675 | ||||||
Bank of Montreal | ||||||||
| 55,000 | 1.500%, 7/18/2019 | 54,256 | ||||||
BB&T Corporation | ||||||||
| 130,000 | 2.050%, 6/19/2018 | 130,653 | ||||||
Bear Stearns Companies, LLC | ||||||||
| 122,000 | 6.400%, 10/2/2017 | 126,379 | ||||||
Blackstone Mortgage Trust, Inc., Convertible | ||||||||
| 290,000 | 5.250%, 12/1/2018 | 323,350 | ||||||
BNP Paribas SA | ||||||||
| 84,000 | 2.375%, 9/14/2017 | 84,561 | ||||||
| 300,000 | 7.625%, 3/30/2021g,k | 316,530 | ||||||
Caisse Centrale Desjardins du Quebec | ||||||||
| 45,000 | 1.552%, 1/29/2018g,h | 44,954 | ||||||
Centene Escrow Corporation | ||||||||
| 215,000 | 5.625%, 2/15/2021 | 226,051 | ||||||
Central Fidelity Capital Trust I | ||||||||
| 310,000 | 1.880%, 4/15/2027h | 279,775 | ||||||
Citigroup, Inc. | ||||||||
| 144,000 | 1.850%, 11/24/2017 | 144,263 | ||||||
| 40,000 | 2.361%, 9/1/2023h | 40,795 | ||||||
CNA Financial Corporation | ||||||||
| 75,000 | 5.750%, 8/15/2021 | 83,709 | ||||||
Credit Agricole SA | ||||||||
| 45,000 | 1.923%, 6/10/2020g,h | 45,154 | ||||||
Credit Suisse Group AG | ||||||||
| 255,000 | 7.500%, 12/11/2023g,k | 266,794 | ||||||
Discover Bank | ||||||||
| 28,000 | 8.700%, 11/18/2019 | 31,777 | ||||||
Discover Financial Services | ||||||||
| 47,000 | 6.450%, 6/12/2017 | 47,963 | ||||||
Fifth Third Bancorp | ||||||||
| 167,000 | 5.450%, 1/15/2017 | 167,229 | ||||||
Goldman Sachs Group, Inc. | ||||||||
| 52,000 | 2.625%, 1/31/2019 | 52,540 | ||||||
| 78,000 | 7.500%, 2/15/2019 | 86,439 | ||||||
| 45,000 | 2.042%, 4/23/2020h | 45,430 | ||||||
| 65,000 | 2.241%, 11/15/2021h | 65,351 | ||||||
| 65,000 | 2.537%, 11/29/2023h | 67,015 | ||||||
| 435,000 | 5.300%, 11/10/2026k | 417,056 | ||||||
Goldman Sachs Group, Inc., Convertible | ||||||||
| 1,600,000 | 0.500%, 9/24/2022 | 1,767,264 | ||||||
Hartford Financial Services Group, Inc. | ||||||||
| 120,000 | 6.000%, 1/15/2019 | 129,085 | ||||||
HCP, Inc. | ||||||||
| 88,000 | 3.750%, 2/1/2019 | 90,444 | ||||||
Health Care REIT, Inc. | ||||||||
| 88,000 | 4.700%, 9/15/2017 | 89,887 | ||||||
Hospitality Properties Trust | ||||||||
| 60,000 | 4.250%, 2/15/2021 | 62,026 | ||||||
Huntington Bancshares, Inc. | ||||||||
| 80,000 | 3.150%, 3/14/2021 | 81,061 | ||||||
Hutchison Whampoa Finance CI, Ltd. | ||||||||
| 99,000 | 1.625%, 10/31/2017g | 98,770 | ||||||
Icahn Enterprises, LP | ||||||||
| 120,000 | 6.000%, 8/1/2020 | 122,550 | ||||||
ILFC E-Capital Trust II | ||||||||
| 370,000 | 4.920%, 12/21/2065g,h | 325,600 | ||||||
ING Capital Funding Trust III | ||||||||
| 68,000 | 4.438%, 3/31/2017h,k | 67,660 | ||||||
International Lease Finance Corporation | ||||||||
| 250,000 | 5.875%, 8/15/2022 | 271,250 | ||||||
Intesa Sanpaolo SPA | ||||||||
| 30,000 | 3.875%, 1/16/2018 | 30,395 | ||||||
| 132,000 | 3.875%, 1/15/2019 | 134,319 | ||||||
J.P. Morgan Chase & Company | ||||||||
| 54,000 | 7.900%, 4/30/2018k | 55,917 | ||||||
| 52,000 | 6.300%, 4/23/2019 | 56,800 | ||||||
| 25,000 | 2.250%, 1/23/2020 | 24,926 | ||||||
| 90,000 | 2.700%, 5/18/2023 | 87,957 | ||||||
| 89,000 | 2.112%, 10/24/2023h | 90,777 | ||||||
KeyCorp | ||||||||
| 68,000 | 2.300%, 12/13/2018 | 68,392 | ||||||
| 105,000 | 5.000%, 9/15/2026k | 96,862 | ||||||
Liberty Mutual Group, Inc. | ||||||||
| 35,000 | 5.000%, 6/1/2021g | 38,047 | ||||||
Lincoln National Corporation | ||||||||
| 55,000 | 6.250%, 2/15/2020 | 60,706 | ||||||
Lloyds Bank plc | ||||||||
| 40,000 | 1.490%, 3/16/2018h | 40,054 | ||||||
Macquarie Bank, Ltd. | ||||||||
| 60,000 | 2.060%, 1/15/2019g,h | 60,472 | ||||||
MetLife, Inc. | ||||||||
| 100,000 | 1.903%, 12/15/2017 | 100,257 | ||||||
MGIC Investment Corporation, Convertible | ||||||||
| 120,000 | 9.000%, 4/1/2063g | 149,550 | ||||||
| 35,000 | 2.000%, 4/1/2020 | 51,887 | ||||||
Mizuho Corporate Bank, Ltd. | ||||||||
| 59,000 | 1.550%, 10/17/2017g | 58,945 | ||||||
Morgan Stanley | ||||||||
| 106,000 | 6.625%, 4/1/2018 | 112,083 | ||||||
| 45,000 | 2.026%, 1/27/2020h | 45,398 | ||||||
| 75,000 | 4.875%, 11/1/2022 | 80,293 | ||||||
| 70,000 | 2.282%, 10/24/2023h | 70,778 | ||||||
MPT Operating Partnership, LP | ||||||||
| 200,000 | 5.500%, 5/1/2024 | 202,000 | ||||||
Murray Street Investment Trust I | ||||||||
| 173,000 | 4.647%, 3/9/2017 | 173,901 | ||||||
The accompanying Notes to Financial Statements are an integral part of this schedule.
103
Table of Contents
BALANCED INCOME PLUS PORTFOLIO
Schedule of Investments as of December 31, 2016
| Principal Amount | Long-Term Fixed Income (31.1%) | Value | ||||||
Financials (3.9%) - continued | ||||||||
National City Corporation | ||||||||
| $ | 56,000 | 6.875%, 5/15/2019 | $ | 61,614 | ||||
New York Life Global Funding | ||||||||
| 65,000 | 1.550%, 11/2/2018g | 64,801 | ||||||
Nomura Holdings, Inc. | ||||||||
| 56,000 | 2.750%, 3/19/2019 | 56,509 | ||||||
Quicken Loans, Inc. | ||||||||
| 295,000 | 5.750%, 5/1/2025g | 286,888 | ||||||
Realty Income Corporation | ||||||||
| 95,000 | 2.000%, 1/31/2018 | 95,258 | ||||||
Regions Bank | ||||||||
| 43,000 | 7.500%, 5/15/2018 | 46,061 | ||||||
Regions Financial Corporation | ||||||||
| 55,000 | 3.200%, 2/8/2021 | 55,734 | ||||||
Reinsurance Group of America, Inc. | ||||||||
| 104,000 | 5.625%, 3/15/2017 | 104,844 | ||||||
Royal Bank of Scotland Group plc | ||||||||
| 350,000 | 7.640%, 9/30/2017e,k | 324,625 | ||||||
| 320,000 | 7.648%, 9/30/2031k | 365,600 | ||||||
Simon Property Group, LP | ||||||||
| 65,000 | 2.500%, 9/1/2020 | 65,442 | ||||||
| 90,000 | 2.500%, 7/15/2021 | 90,007 | ||||||
Standard Chartered plc | ||||||||
| 400,000 | 6.409%, 1/30/2027g,k | 306,000 | ||||||
State Street Capital Trust IV | ||||||||
| 306,000 | 1.963%, 6/15/2037h | 270,428 | ||||||
State Street Corporation | ||||||||
| 65,000 | 1.809%, 8/18/2020h | 65,869 | ||||||
Sumitomo Mitsui Banking Corporation | ||||||||
| 55,000 | 1.460%, 1/16/2018h | 55,069 | ||||||
SunTrust Banks, Inc. | ||||||||
| 55,000 | 2.900%, 3/3/2021 | 55,731 | ||||||
Synchrony Financial | ||||||||
| 159,000 | 1.875%, 8/15/2017 | 159,124 | ||||||
| 30,000 | 2.111%, 2/3/2020h | 29,661 | ||||||
Toronto-Dominion Bank | ||||||||
| 60,000 | 1.722%, 1/22/2019h | 60,492 | ||||||
| 65,000 | 1.889%, 12/14/2020h | 65,764 | ||||||
UnitedHealth Group, Inc. | ||||||||
| 65,000 | 3.350%, 7/15/2022 | 66,898 | ||||||
USB Realty Corporation | ||||||||
| 340,000 | 2.027%, 1/15/2022g,h,k | 299,200 | ||||||
Voya Financial, Inc. | ||||||||
| 84,000 | 2.900%, 2/15/2018 | 85,030 | ||||||
Wells Fargo & Company | ||||||||
| 45,000 | 1.567%, 1/30/2020h | 44,978 | ||||||
| 50,000 | 2.100%, 7/26/2021 | 48,608 | ||||||
| 60,000 | 2.117%, 10/31/2023h | 60,741 | ||||||
|
| |||||||
Total | 13,697,736 | |||||||
|
| |||||||
Foreign Government (6.6%) | ||||||||
Brazil Government International Bond | ||||||||
| 491,000 | 4.875%, 1/22/2021 | 505,730 | ||||||
| 700,000 | 2.625%, 1/5/2023 | 623,000 | ||||||
| 274,000 | 6.000%, 4/7/2026 | 283,590 | ||||||
| 320,000 | 7.125%, 1/20/2037 | 333,600 | ||||||
| 384,000 | 5.000%, 1/27/2045 | 311,501 | ||||||
| 270,000 | 5.625%, 2/21/2047 | 236,925 | ||||||
Colombia Government International Bond | ||||||||
| 320,000 | 4.375%, 7/12/2021 | 335,200 | ||||||
| 435,000 | 2.625%, 3/15/2023 | 409,988 | ||||||
| 350,000 | 4.000%, 2/26/2024 | 353,500 | ||||||
| 205,000 | 5.625%, 2/26/2044 | 211,150 | ||||||
| 384,000 | 5.000%, 6/15/2045 | 364,320 | ||||||
Croatia Government International Bond | ||||||||
| 64,000 | 6.750%, 11/5/2019g | 69,440 | ||||||
| 384,000 | 6.625%, 7/14/2020g | 417,661 | ||||||
| 205,000 | 6.000%, 1/26/2024e,g | 222,169 | ||||||
Export-Import Bank of Korea | ||||||||
| 45,000 | 2.250%, 1/21/2020 | 44,734 | ||||||
Hungary Government International Bond | ||||||||
| 128,000 | 6.375%, 3/29/2021 | 143,329 | ||||||
| 562,000 | 5.750%, 11/22/2023 | 623,118 | ||||||
| 564,000 | 5.375%, 3/25/2024 | 614,760 | ||||||
Indonesia Government International Bond | ||||||||
| 435,000 | 4.875%, 5/5/2021g | 460,496 | ||||||
| 320,000 | 3.375%, 4/15/2023g | 312,153 | ||||||
| 432,000 | 5.875%, 1/15/2024g | 476,627 | ||||||
| 264,000 | 4.125%, 1/15/2025g | 261,581 | ||||||
| 280,000 | 4.750%, 1/8/2026g | 289,040 | ||||||
| 420,000 | 8.500%, 10/12/2035g | 569,769 | ||||||
| 640,000 | 5.125%, 1/15/2045g | 638,564 | ||||||
Mexico Government International Bond | ||||||||
| 64,000 | 5.750%, 10/12/2110 | 59,040 | ||||||
| 192,000 | 3.625%, 3/15/2022 | 192,384 | ||||||
| 446,000 | 4.000%, 10/2/2023 | 447,026 | ||||||
| 490,000 | 3.600%, 1/30/2025 | 472,360 | ||||||
| 420,000 | 4.125%, 1/21/2026 | 416,640 | ||||||
| 128,000 | 6.750%, 9/27/2034 | 151,680 | ||||||
| 178,000 | 6.050%, 1/11/2040 | 192,507 | ||||||
| 478,000 | 4.750%, 3/8/2044 | 434,502 | ||||||
| 288,000 | 5.550%, 1/21/2045 | 294,480 | ||||||
| 238,000 | 4.600%, 1/23/2046 | 213,605 | ||||||
| 200,000 | 4.350%, 1/15/2047 | 171,500 | ||||||
Panama Government International Bond | ||||||||
| 192,000 | 4.000%, 9/22/2024 | 195,360 | ||||||
| 280,000 | 3.750%, 3/16/2025 | 277,900 | ||||||
| 272,000 | 6.700%, 1/26/2036 | 330,072 | ||||||
Peru Government International Bond | ||||||||
| 138,000 | 5.625%, 11/18/2050 | 156,285 | ||||||
| 306,000 | 4.125%, 8/25/2027e | 317,858 | ||||||
| 330,000 | 8.750%, 11/21/2033 | 481,800 | ||||||
Philippines Government International Bond | ||||||||
| 528,000 | 4.000%, 1/15/2021 | 561,575 | ||||||
| 315,000 | 7.750%, 1/14/2031 | 442,806 | ||||||
| 165,000 | 6.375%, 10/23/2034 | 214,618 | ||||||
| 140,000 | 5.000%, 1/13/2037 | 157,979 | ||||||
| 280,000 | 3.950%, 1/20/2040 | 275,663 | ||||||
Romania Government International Bond | ||||||||
| 276,000 | 4.375%, 8/22/2023g | 284,004 | ||||||
| 130,000 | 4.875%, 1/22/2024g | 137,498 | ||||||
| 66,000 | 6.125%, 1/22/2044g | 77,039 | ||||||
Russia Government International Bond | ||||||||
| 288,000 | 3.500%, 1/16/2019g | 292,694 | ||||||
| 1,100,000 | 5.000%, 4/29/2020g | 1,167,265 | ||||||
| 408,000 | 4.875%, 9/16/2023g | 429,795 | ||||||
| 385,200 | 7.500%, 3/31/2030g | 463,781 | ||||||
| 507,000 | 5.625%, 4/4/2042g | 545,214 | ||||||
The accompanying Notes to Financial Statements are an integral part of this schedule.
104
Table of Contents
BALANCED INCOME PLUS PORTFOLIO
Schedule of Investments as of December 31, 2016
| Principal Amount | Long-Term Fixed Income (31.1%) | Value | ||||||
Foreign Government (6.6%) - continued | ||||||||
South Africa Government International Bond | ||||||||
| $ | 65,000 | 5.500%, 3/9/2020 | $ | 68,822 | ||||
| 295,000 | 5.875%, 5/30/2022 | 321,190 | ||||||
| 341,000 | 4.300%, 10/12/2028 | 316,278 | ||||||
Turkey Government International Bond | ||||||||
| 128,000 | 7.500%, 11/7/2019 | 139,200 | ||||||
| 476,000 | 7.000%, 6/5/2020 | 511,092 | ||||||
| 565,000 | 5.125%, 3/25/2022 | 560,706 | ||||||
| 288,000 | 6.250%, 9/26/2022 | 299,102 | ||||||
| 414,000 | 5.750%, 3/22/2024 | 415,196 | ||||||
| 563,000 | 4.250%, 4/14/2026 | 500,448 | ||||||
| 290,000 | 4.875%, 10/9/2026 | 268,307 | ||||||
| 387,000 | 6.875%, 3/17/2036 | 398,076 | ||||||
| 264,000 | 4.875%, 4/16/2043 | 212,652 | ||||||
| 438,000 | 6.625%, 2/17/2045e | 435,525 | ||||||
|
| |||||||
Total | 23,413,469 | |||||||
|
| |||||||
Mortgage-Backed Securities (7.1%) | ||||||||
Federal Home Loan Mortgage Corporation Gold 15-Yr. Pass Through | ||||||||
| 12,136 | 5.500%, 12/1/2017 | 12,280 | ||||||
| 1,180,000 | 3.000%, 1/1/2032c | 1,210,326 | ||||||
Federal Home Loan Mortgage Corporation Gold 30-Yr. Pass Through | ||||||||
| 10,990 | 9.000%, 11/1/2024 | 12,255 | ||||||
| 524 | 9.000%, 4/1/2025 | 595 | ||||||
| 248 | 8.500%, 9/1/2025 | 249 | ||||||
| 3,845 | 8.000%, 6/1/2027 | 4,572 | ||||||
| 725 | 8.500%, 7/1/2027 | 764 | ||||||
| 3,038 | 8.000%, 10/1/2027 | 3,463 | ||||||
| 1,609 | 8.000%, 8/1/2030 | 1,974 | ||||||
| 1,180,000 | 4.000%, 1/1/2047c | 1,238,764 | ||||||
Federal National Mortgage Association Conventional 15-Yr. Pass Through | ||||||||
| 2,600,000 | 2.500%, 1/1/2032c | 2,602,860 | ||||||
Federal National Mortgage Association Conventional 30-Yr. Pass Through | ||||||||
| 925 | 10.500%, 8/1/2020 | 957 | ||||||
| 3,523 | 9.500%, 4/1/2025 | 3,539 | ||||||
| 607 | 8.500%, 11/1/2025 | 675 | ||||||
| 1,129 | 8.500%, 5/1/2026 | 1,171 | ||||||
| 268 | 8.000%, 8/1/2026 | 269 | ||||||
| 734 | 8.000%, 11/1/2026 | 843 | ||||||
| 9,957 | 8.000%, 9/1/2027 | 11,312 | ||||||
| 3,059 | 8.000%, 12/1/2027 | 3,091 | ||||||
| 4,727 | 8.500%, 4/1/2030 | 5,881 | ||||||
| 6,000,000 | 3.000%, 1/1/2047c | 5,956,200 | ||||||
| 7,675,000 | 3.500%, 1/1/2047c | 7,861,502 | ||||||
| 4,475,000 | 4.000%, 1/1/2047c | 4,702,330 | ||||||
| 1,300,000 | 4.500%, 1/1/2047c | 1,397,760 | ||||||
Government National Mortgage Association 30-Yr. Pass Through | ||||||||
| 1,428 | 9.500%, 1/15/2025 | 1,498 | ||||||
| 605 | 6.000%, 5/15/2026 | 686 | ||||||
| 4,830 | 8.500%, 6/15/2026 | 4,907 | ||||||
| 1,445 | 8.500%, 7/15/2026 | 1,611 | ||||||
| 5,573 | 8.000%, 9/15/2026 | 6,258 | ||||||
| 2,322 | 7.500%, 10/15/2026 | 2,525 | ||||||
| 9 | 8.500%, 11/15/2026 | 9 | ||||||
| 974 | 9.000%, 12/15/2026 | 1,158 | ||||||
| 9,225 | 7.500%, 4/15/2027 | 10,201 | ||||||
| 1,923 | 8.000%, 6/20/2027 | 2,308 | ||||||
| 86 | 8.000%, 8/15/2027 | 87 | ||||||
| 7,032 | 7.500%, 7/15/2028 | 7,081 | ||||||
| 23,223 | 6.000%, 12/15/2028 | 26,487 | ||||||
| 25,357 | 6.000%, 6/15/2029 | 29,023 | ||||||
| 8,818 | 8.000%, 5/15/2030 | 8,936 | ||||||
|
| |||||||
Total | 25,136,407 | |||||||
|
| |||||||
Technology (0.9%) | ||||||||
Alliance Data Systems Corporation | ||||||||
| 195,000 | 5.375%, 8/1/2022g | 188,175 | ||||||
Apple, Inc. | ||||||||
| 65,000 | 1.202%, 5/6/2020h | 64,947 | ||||||
Automatic Data Processing, Inc. | ||||||||
| 65,000 | 2.250%, 9/15/2020 | 65,288 | ||||||
Cisco Systems, Inc. | ||||||||
| 60,000 | 1.511%, 2/21/2018h | 60,345 | ||||||
| 65,000 | 1.431%, 3/1/2019h | 65,371 | ||||||
Diamond 1 Finance Corporation | ||||||||
| 55,000 | 3.480%, 6/1/2019g | 56,130 | ||||||
Equinix, Inc. | ||||||||
| 200,000 | 5.750%, 1/1/2025 | 209,000 | ||||||
Fidelity National Information Services, Inc. | ||||||||
| 109,000 | 1.450%, 6/5/2017 | 109,041 | ||||||
| 65,000 | 3.625%, 10/15/2020 | 67,243 | ||||||
First Data Corporation | ||||||||
| 200,000 | 5.375%, 8/15/2023g | 207,500 | ||||||
Hewlett Packard Enterprise Company | ||||||||
| 64,000 | 3.600%, 10/15/2020 | 65,060 | ||||||
Intel Corporation | ||||||||
| 90,000 | 1.700%, 5/19/2021 | 87,815 | ||||||
| 65,000 | 3.100%, 7/29/2022 | 66,768 | ||||||
Intel Corporation, Convertible | ||||||||
| 220,000 | 2.950%, 12/15/2035 | 297,137 | ||||||
Iron Mountain, Inc. | ||||||||
| 122,936 | 6.000%, 8/15/2023 | 130,620 | ||||||
Micron Technology, Inc., Convertible | ||||||||
| 110,000 | 2.375%, 5/1/2032 | 255,612 | ||||||
| 195,000 | 3.000%, 11/15/2043 | 193,659 | ||||||
NXP BV | ||||||||
| 235,000 | 3.875%, 9/1/2022g | 237,937 | ||||||
NXP Semiconductors NV, Convertible | ||||||||
| 202,000 | 1.000%, 12/1/2019 | 229,775 | ||||||
Oracle Corporation | ||||||||
| 65,000 | 2.500%, 5/15/2022 | 64,480 | ||||||
Sensata Technologies BV | ||||||||
| 280,000 | 4.875%, 10/15/2023g | 286,300 | ||||||
Texas Instruments, Inc. | ||||||||
| 65,000 | 1.750%, 5/1/2020 | 64,245 | ||||||
Tyco Electronics Group SA | ||||||||
| 130,000 | 6.550%, 10/1/2017 | 134,843 | ||||||
|
| |||||||
Total | 3,207,291 | |||||||
|
| |||||||
Transportation (0.3%) | ||||||||
Air Canada Pass Through Trust | ||||||||
| 23,291 | 3.875%, 3/15/2023g | 22,475 | ||||||
American Airlines Pass Through Trust | ||||||||
| 44,750 | 4.950%, 1/15/2023 | 47,715 | ||||||
Avis Budget Car Rental, LLC | ||||||||
| 195,000 | 5.125%, 6/1/2022g | 191,100 | ||||||
Delta Air Lines, Inc. | ||||||||
| 58,974 | 4.950%, 5/23/2019 | 61,805 | ||||||
ERAC USA Finance, LLC | ||||||||
| 60,000 | 2.600%, 12/1/2021g | 58,989 | ||||||
The accompanying Notes to Financial Statements are an integral part of this schedule.
105
Table of Contents
BALANCED INCOME PLUS PORTFOLIO
Schedule of Investments as of December 31, 2016
| Principal Amount | Long-Term Fixed Income (31.1%) | Value | ||||||
Transportation (0.3%) - continued | ||||||||
J.B. Hunt Transport Services, Inc. | ||||||||
| $ | 65,000 | 3.300%, 8/15/2022 | $ | 65,189 | ||||
Korea Expressway Corporation | ||||||||
| 93,000 | 1.625%, 4/28/2017g | 92,944 | ||||||
Trinity Industries, Inc., Convertible | ||||||||
| 137,000 | 3.875%, 6/1/2036 | 175,274 | ||||||
United Airlines Pass Through Trust | ||||||||
| 65,000 | 3.700%, 12/1/2022 | 65,488 | ||||||
XPO Logistics, Inc. | ||||||||
| 200,000 | 6.500%, 6/15/2022g | 210,000 | ||||||
|
| |||||||
Total | 990,979 | |||||||
|
| |||||||
U.S. Government and Agencies (0.6%) | ||||||||
U.S. Treasury Notes | ||||||||
| 195,000 | 1.125%, 8/31/2021 | 188,230 | ||||||
| 585,000 | 2.125%, 6/30/2022 | 586,426 | ||||||
| 1,450,000 | 1.625%, 2/15/2026 | 1,352,764 | ||||||
|
| |||||||
Total | 2,127,420 | |||||||
|
| |||||||
Utilities (0.6%) | ||||||||
Ameren Corporation | ||||||||
| 65,000 | 2.700%, 11/15/2020 | 65,299 | ||||||
Arizona Public Service Company | ||||||||
| 40,000 | 2.200%, 1/15/2020 | 40,023 | ||||||
Berkshire Hathaway Energy Company | ||||||||
| 96,000 | 2.400%, 2/1/2020 | 96,202 | ||||||
Calpine Corporation | ||||||||
| 210,000 | 5.375%, 1/15/2023 | 205,275 | ||||||
DTE Energy Company | ||||||||
| 96,000 | 2.400%, 12/1/2019 | 96,427 | ||||||
Dynegy, Inc. | ||||||||
| 160,000 | 7.375%, 11/1/2022 | 152,800 | ||||||
El Paso Corporation | ||||||||
| 50,000 | 7.000%, 6/15/2017 | 51,159 | ||||||
Emera U.S. Finance, LP | ||||||||
| 25,000 | 2.150%, 6/15/2019g | 24,948 | ||||||
Energy Transfer Equity, LP | ||||||||
| 290,000 | 5.500%, 6/1/2027 | 282,750 | ||||||
Energy Transfer Partners, LP | ||||||||
| 65,000 | 4.150%, 10/1/2020 | 67,263 | ||||||
Eversource Energy | ||||||||
| 30,000 | 1.600%, 1/15/2018 | 29,929 | ||||||
Exelon Generation Company, LLC | ||||||||
| 52,000 | 5.200%, 10/1/2019 | 55,706 | ||||||
| 30,000 | 2.950%, 1/15/2020 | 30,342 | ||||||
Fortis, Inc. | ||||||||
| 60,000 | 2.100%, 10/4/2021g | 57,935 | ||||||
NextEra Energy Capital Holdings, Inc. | ||||||||
| 55,000 | 2.300%, 4/1/2019 | 55,397 | ||||||
NiSource Finance Corporation | ||||||||
| 41,000 | 6.400%, 3/15/2018 | 43,174 | ||||||
NRG Energy, Inc. | ||||||||
| 227,936 | 6.625%, 3/15/2023 | 228,506 | ||||||
Pacific Gas & Electric Company | ||||||||
| 65,000 | 5.625%, 11/30/2017 | 67,407 | ||||||
PG&E Corporation | ||||||||
| 57,000 | 2.400%, 3/1/2019 | 57,204 | ||||||
PPL Capital Funding, Inc. | ||||||||
| 60,000 | 3.500%, 12/1/2022 | 61,294 | ||||||
PSEG Power, LLC | ||||||||
| 55,000 | 3.000%, 6/15/2021 | 55,121 | ||||||
Sempra Energy | ||||||||
| 100,000 | 6.150%, 6/15/2018 | 105,927 | ||||||
| 25,000 | 2.400%, 3/15/2020 | 24,950 | ||||||
Southern California Edison Company | ||||||||
| 20,000 | 2.400%, 2/1/2022 | 19,922 | ||||||
Southern Company | ||||||||
| 50,000 | 1.850%, 7/1/2019 | 49,824 | ||||||
Tesoro Corporation | ||||||||
| 150,000 | 4.750%, 12/15/2023g | 150,750 | ||||||
Xcel Energy, Inc. | ||||||||
| 65,000 | 1.200%, 6/1/2017 | 64,937 | ||||||
|
| |||||||
Total | 2,240,471 | |||||||
|
| |||||||
Total Long-Term Fixed Income (cost $111,081,501) | 110,692,770 | |||||||
|
| |||||||
| Shares | Registered Investment Companies (2.9%) | |||||||
Equity Funds/ETFs (1.6%) | ||||||||
| 13,850 | AllianzGI NFJ Dividend Interest & | |||||||
Premium Strategy Fund | 174,648 | |||||||
| 15,400 | BlackRock Resources & | |||||||
Commodities Strategy Trust | 127,358 | |||||||
| 6,800 | Guggenheim Multi-Asset Income ETF | 137,088 | ||||||
| 17,440 | iShares MSCI EAFE Index Fund | 1,006,811 | ||||||
| 51,140 | Materials Select Sector SPDR Fund | 2,541,658 | ||||||
| 33,910 | Utilities Select Sector SPDR Funde | 1,647,009 | ||||||
|
| |||||||
Total | 5,634,572 | |||||||
|
| |||||||
Fixed Income Funds/ETFs (1.3%) | ||||||||
| 82,771 | Aberdeen Asia-Pacific Income Fund, Inc. | 383,230 | ||||||
| 21,125 | Doubleline Income Solutions Fund | 401,164 | ||||||
| 13,042 | First Trust High Income Long/Short Fund | 209,715 | ||||||
| 697 | iShares J.P. Morgan USD Emerging Markets Bond ETFe | 76,823 | ||||||
| 18,800 | iShares S&P U.S. Preferred Stock Index Fund | 699,548 | ||||||
| 79,271 | MFS Intermediate Income Trust | 351,963 | ||||||
| 25,714 | Pimco Dynamic Credit And Mortgage Income Fund | 519,937 | ||||||
| 63,832 | Templeton Global Income Fund | 413,631 | ||||||
| 10,950 | Vanguard Short-Term Corporate Bond ETF | 869,102 | ||||||
| 29,063 | Western Asset Emerging Markets Debt Fund, Inc. | 427,517 | ||||||
| 46,185 | Western Asset High Income Opportunity Fund, Inc. | 230,463 | ||||||
|
| |||||||
Total | 4,583,093 | |||||||
|
| |||||||
Total Registered Investment Companies (cost $10,119,179) | 10,217,665 | |||||||
|
| |||||||
Preferred Stock (1.2%) | ||||||||
Consumer Staples (0.1%) | ||||||||
| 1,625 | Bunge, Ltd., Convertible, 4.875%k | 165,929 | ||||||
| 12,800 | CHS, Inc., 7.100%k | 339,328 | ||||||
| 426 | Henkel AG & Company KGaA, 1.470% | 50,711 | ||||||
|
| |||||||
Total | 555,968 | |||||||
|
| |||||||
Energy (<0.1%) | ||||||||
| 2,932 | Alpha Natural Resources, Inc., 0.000%d | 58,640 | ||||||
| 2,932 | ANR Holdings, Inc., 0.000%d | 15,833 | ||||||
|
| |||||||
Total | 74,473 | |||||||
|
| |||||||
Financials (0.8%) | ||||||||
| 3,174 | Agribank FCB, 6.875%k | 337,436 | ||||||
| 13,915 | Citigroup, Inc., 6.875%k | 380,575 | ||||||
| 2,485 | Cobank ACB, 6.250%k | 251,995 | ||||||
| 8,620 | Countrywide Capital V, 7.000% | 219,465 | ||||||
The accompanying Notes to Financial Statements are an integral part of this schedule.
106
Table of Contents
BALANCED INCOME PLUS PORTFOLIO
Schedule of Investments as of December 31, 2016
| Shares | Preferred Stock (1.2%) | Value | ||||||
Financials (0.8%) - continued | ||||||||
| 13,000 | GMAC Capital Trust I, 6.602%h | $ | 330,200 | |||||
| 13,000 | Goldman Sachs Group, Inc., 5.500%k | 329,940 | ||||||
| 12,800 | Morgan Stanley, 7.125%k | 360,064 | ||||||
| 8,640 | U.S. Bancorp, 6.500%k | 244,425 | ||||||
| 320 | Wells Fargo & Company, Convertible, 7.500%k | 380,800 | ||||||
|
| |||||||
Total | 2,834,900 | |||||||
|
| |||||||
Health Care (0.1%) | ||||||||
| 255 | Allergan plc, Convertible, 5.500% | 194,119 | ||||||
| 130 | Teva Pharmaceutical Industries, Ltd., Convertible, 7.000% | 83,850 | ||||||
|
| |||||||
Total | 277,969 | |||||||
|
| |||||||
Real Estate (0.2%) | ||||||||
| 5,400 | American Tower Corporation, Convertible, 5.500% | 564,300 | ||||||
|
| |||||||
Total | 564,300 | |||||||
|
| |||||||
Total Preferred Stock (cost $4,175,580) | 4,307,610 | |||||||
|
| |||||||
Collateral Held for Securities Loaned (1.8%) | ||||||||
| 6,483,360 | Thrivent Cash Management Trust | 6,483,360 | ||||||
|
| |||||||
Total Collateral Held for Securities Loaned (cost $6,483,360) | 6,483,360 | |||||||
|
| |||||||
| Shares or Principal Amount | Short-Term Investments (11.6%)l | |||||||
Federal Home Loan Bank Discount Notes | ||||||||
| 300,000 | 0.344%, 1/6/2017m | 299,990 | ||||||
| 100,000 | 0.340%, 1/20/2017m | 99,982 | ||||||
| 400,000 | 0.360%, 1/25/2017m | 399,907 | ||||||
| 200,000 | 0.365%, 1/27/2017m | 199,950 | ||||||
| 4,023,664 | Thrivent Core Short-Term Reserve Fund 0.910% | 40,236,638 | ||||||
|
| |||||||
Total Short-Term Investments (cost $41,236,457) | 41,236,467 | |||||||
|
| |||||||
Total Investments (cost $374,800,259) 109.3% | $ | 388,343,230 | ||||||
|
| |||||||
Other Assets and Liabilities, Net (9.3%) | (32,969,244 | ) | ||||||
|
| |||||||
Total Net Assets 100.0% | $ | 355,373,986 | ||||||
|
| |||||||
| a | The stated interest rate represents the weighted average of all contracts within the bank loan facility. |
| b | All or a portion of the loan is unfunded. |
| c | Denotes investments purchased on a when-issued or delayed delivery basis. |
| d | Non-income producing security. |
| e | All or a portion of the security is on loan. |
| f | Security is valued at fair value. Market quotations or prices were not readily available or were determined to be unreliable. Fair value was determined in good faith pursuant to procedures adopted by the Board. Further information on fair valuation can be found in the Notes to Financial Statements. |
| g | Denotes securities sold under Rule 144A of the Securities Act of 1933, which exempts them from registration. These securities may be resold to other dealers in the program or to other qualified institutional buyers. As of December 31, 2016, the value of these investments was $22,081,603 or 6.2% of total net assets. |
| h | Denotes variable rate securities. Variable rate securities are securities whose yields vary with a designated market index or market rate. The rate shown is as of December 31, 2016. |
| i | Denotes step coupon securities. Step coupon securities pay an initial coupon rate for the first period and then different coupon rates for following periods. The rate shown is as of December 31, 2016. |
| j | All or a portion of the security is insured or guaranteed. |
| k | Denotes perpetual securities. Perpetual securities pay an indefinite stream of interest and have no contractual maturity date. Date shown, if applicable, is next call date. |
| l | The interest rate shown reflects the yield, coupon rate or the discount rate at the date of purchase. |
| m | All or a portion of the security is held on deposit with the counterparty and pledged as the initial margin deposit for open futures contracts. |
| * | Denotes restricted securities. Restricted securities are investment securities which cannot be offered for public sale without first being registered under the Securities Act of 1933. The value of all restricted securities held in Balanced Income Plus Portfolio as of December 31, 2016 was $3,880,260 or 1.1% of total net assets. The following table indicates the acquisition date and cost of restricted securities shown in the schedule as of December 31, 2016. |
Security | Acquisition Date | Cost | ||||||
Angel Oak Mortgage Trust, 11/25/2045 | 12/10/2015 | $ | 168,905 | |||||
Bayview Opportunity Master Fund Trust, 7/28/2034 | 11/12/2014 | 168,846 | ||||||
COLT Mortgage Loan Trust, 9/25/2046 | 9/9/2016 | 293,825 | ||||||
Contura Energy, Inc., 8/1/2021 | 2/12/2014 | 213,060 | ||||||
Digicel, Ltd., 4/15/2021 | 8/19/2013 | 254,538 | ||||||
Marlette Funding Trust, 1/17/2023 | 7/20/2016 | 331,059 | ||||||
Murray Hill Marketplace Trust, 11/25/2022 | 10/6/2016 | 136,063 | ||||||
NRZ Advance Receivables Trust Advance Receivables Backed, 6/15/2049 | 6/23/2016 | 450,999 | ||||||
Preferred Term Securities XXIII, Ltd., 12/22/2036 | 9/14/2006 | 479,872 | ||||||
Preston Ridge Partners Mortgage Trust, LLC, 9/27/2021 | 9/23/2016 | 266,665 | ||||||
Pretium Mortgage Credit Partners I, LLC, 7/27/2031 | 6/17/2016 | 240,742 | ||||||
Sunset Mortgage Loan Company, LLC, 7/16/2047 | 7/27/2016 | 151,258 | ||||||
Sunset Mortgage Loan Company, LLC, 9/18/2045 | 10/2/2015 | 105,947 | ||||||
The accompanying Notes to Financial Statements are an integral part of this schedule.
107
Table of Contents
BALANCED INCOME PLUS PORTFOLIO
Schedule of Investments as of December 31, 2016
Security | Acquisition Date | Cost | ||||||
US Residential Opportunity Fund Trust, 7/27/2036 | 7/20/2016 | $ | 332,543 | |||||
Vericrest Opportunity Loan Transferee, 10/25/2058 | 1/13/2016 | 89,740 | ||||||
Wachovia Asset Securitization, Inc., 7/25/2037 | 3/16/2007 | 445,984 | ||||||
The following table presents the total amount of securities loaned with continuous maturity, by type, offset by the gross payable upon return of collateral for securities loaned by Thrivent Balanced Income Plus Portfolio as of December 31, 2016:
Securities Lending Transactions
Common Stock | $ | 4,144,491 | ||
Taxable Debt Security | 2,127,966 | |||
|
| |||
Total lending | $ | 6,272,457 | ||
Gross amount payable upon return of collateral for securities loaned | $ | 6,483,360 | ||
|
| |||
Net amounts due to counterparty | $ | 210,903 | ||
|
|
Definitions:
ETF | - | Exchange Traded Fund. | ||
REIT | - | Real Estate Investment Trust is a company that buys, develops, manages and/or sells real estate assets. |
The accompanying Notes to Financial Statements are an integral part of this schedule.
108
Table of Contents
DIVERSIFIED INCOME PLUS PORTFOLIO
Schedule of Investments as of December 31, 2016
| Principal Amount | Bank Loans (13.2%)a | Value | ||||||
Basic Materials (0.8%) | ||||||||
Arch Coal, Inc., Term Loan | ||||||||
| $135,124 | 10.000%, 10/5/2021 | $ | 136,870 | |||||
Chemours Company, Term Loan | ||||||||
| 655,166 | 3.770%, 5/12/2022 | 650,665 | ||||||
Fortescue Metals Group, Ltd., Term Loan | ||||||||
| 915,411 | 3.750%, 6/30/2019 | 917,242 | ||||||
Ineos US Finance, LLC, Term Loan | ||||||||
| 1,523,470 | 3.750%, 12/15/2020 | 1,529,823 | ||||||
Tronox Pigments BV, Term Loan | ||||||||
| 1,219,824 | 4.500%, 3/19/2020 | 1,223,886 | ||||||
|
| |||||||
Total | 4,458,486 | |||||||
|
| |||||||
Capital Goods (0.7%) | ||||||||
Accudyne Industries, LLC, Term Loan | ||||||||
| 479,383 | 4.000%, 12/13/2019 | 452,504 | ||||||
Advanced Disposal Services, Inc., Term Loan | ||||||||
| 600,058 | 3.500%, 11/10/2023 | 604,936 | ||||||
Berry Plastics Group, Inc., Term Loan | ||||||||
| 577,500 | 3.500%, 2/8/2020 | 581,439 | ||||||
Cortes NP Acquisition Corporation, Term Loan | ||||||||
| 1,885,000 | 6.000%, 11/30/2023 | 1,908,563 | ||||||
Reynolds Group, Inc., Term Loan | ||||||||
| 448,875 | 4.250%, 2/5/2023 | 454,383 | ||||||
|
| |||||||
Total | 4,001,825 | |||||||
|
| |||||||
Communications Services (3.4%) | ||||||||
Altice US Finance I Corporation, Term Loan | ||||||||
| 275,000 | 3.882%, 1/15/2025 | 277,750 | ||||||
Atlantic Broadband Penn, LLC, Term Loan | ||||||||
| 103,508 | 3.250%, 11/30/2019 | 103,766 | ||||||
Beasley Broadcast Group, Inc., Term Loan | ||||||||
| 535,000 | 7.000%, 11/1/2023 | 535,000 | ||||||
Birch Communication Inc., Term Loan | ||||||||
| 644,752 | 8.250%, 7/17/2020 | 567,382 | ||||||
Block Communications, Inc., Term Loan | ||||||||
| 810,787 | 4.248%, 11/7/2021 | 817,882 | ||||||
CBS Radio, Inc., Term Loan | ||||||||
| 344,151 | 4.500%, 10/17/2023 | 347,162 | ||||||
Charter Communications Operating, LLC, Term Loan | ||||||||
| 58,485 | 3.020%, 7/1/2020 | 58,729 | ||||||
Cincinnati Bell, Inc., Term Loan | ||||||||
| 402,775 | 4.000%, 9/10/2020 | 403,709 | ||||||
CommScope, Inc., Term Loan | ||||||||
| 869,000 | 3.270%, 12/29/2022 | 876,387 | ||||||
CSC Holdings, LLC, Term Loan | ||||||||
| 575,658 | 3.876%, 10/11/2024 | 581,294 | ||||||
FairPoint Communications, Inc., Term Loan | ||||||||
| 893,825 | 7.500%, 2/14/2019 | 901,369 | ||||||
Grande Communications Networks, LLC, Term Loan | ||||||||
| 772,029 | 4.500%, 5/29/2020 | 776,661 | ||||||
Gray Television, Inc., Term Loan | ||||||||
| 431,796 | 3.938%, 6/13/2021 | 437,733 | ||||||
Hargray Communications Group, Inc., Term Loan | ||||||||
| 954,607 | 4.750%, 6/26/2019 | 964,946 | ||||||
Integra Telecom Holdings, Inc., Term Loan | ||||||||
| 526,432 | 5.250%, 8/14/2020 | 527,353 | ||||||
Intelsat Jackson Holdings SA, Term Loan | ||||||||
| 331,029 | 3.750%, 6/30/2019 | 319,615 | ||||||
Level 3 Communications, Inc., Term Loan | ||||||||
| 800,000 | 4.000%, 1/15/2020 | 810,400 | ||||||
Liberty Cablevision of Puerto Rico, LLC, Term Loan | ||||||||
| 725,000 | 4.500%, 1/7/2022 | 719,113 | ||||||
LTS Buyer, LLC, Term Loan | ||||||||
| 1,155,931 | 4.248%, 4/13/2020 | 1,161,352 | ||||||
NEP/NCP Holdco, Inc., Term Loan | ||||||||
| 1,496,545 | 4.250%, 1/22/2020 | 1,500,286 | ||||||
Nexstar Broadcasting, Inc., Term Loan | ||||||||
| 330,000 | 0.000%, 9/26/2023b,c | 332,577 | ||||||
Numericable US, LLC, Term Loan | ||||||||
| 453,411 | 5.137%, 1/15/2024 | 458,757 | ||||||
SBA Senior Finance II, LLC, Term Loan | ||||||||
| 463,125 | 3.270%, 3/24/2021 | 465,153 | ||||||
| 88,650 | 3.270%, 6/10/2022 | 88,933 | ||||||
TNS, Inc., Term Loan | ||||||||
| 361,566 | 5.000%, 2/14/2020 | 364,618 | ||||||
Univision Communications, Inc., Term Loan | ||||||||
| 875,323 | 4.000%, 3/1/2020 | 879,700 | ||||||
Virgin Media Bristol, LLC, Term Loan | ||||||||
| 905,000 | 3.486%, 1/31/2025 | 908,511 | ||||||
WideOpenWest Finance, LLC, Term Loan | ||||||||
| 1,047,375 | 4.500%, 8/18/2023 | 1,057,660 | ||||||
XO Communications, LLC, Term Loan | ||||||||
| 632,125 | 4.250%, 3/20/2021 | 633,705 | ||||||
Yankee Cable Acquisition, LLC, Term Loan | ||||||||
| 530,072 | 4.250%, 3/1/2020 | 530,295 | ||||||
Zayo Group, LLC, Term Loan | ||||||||
| 658,389 | 3.750%, 5/6/2021 | 665,065 | ||||||
|
| |||||||
Total | 19,072,863 | |||||||
|
| |||||||
Consumer Cyclical (2.0%) | ||||||||
Amaya BV, Term Loan | ||||||||
| 1,315,044 | 5.000%, 8/1/2021 | 1,319,068 | ||||||
Burlington Coat Factory Warehouse Corporation, Term Loan | ||||||||
| 506,238 | 3.510%, 8/13/2021 | 509,219 | ||||||
Cengage Learning Acquisitions, Term Loan | ||||||||
| 1,184,050 | 5.250%, 6/7/2023 | 1,150,198 | ||||||
Ceridian HCM Holding, Inc., Term Loan | ||||||||
| 282,821 | 4.500%, 9/15/2020 | 280,581 | ||||||
Charter Communications Operating, LLC, Term Loan | ||||||||
| 579,000 | 3.020%, 1/3/2021 | 581,252 | ||||||
Dollar Tree, Inc., Term Loan | ||||||||
| 208,068 | 3.250%, 7/6/2022 | 209,760 | ||||||
Four Seasons Holdings, Inc., Term Loan | ||||||||
| 710,000 | 3.750%, 11/30/2023 | 717,396 | ||||||
Golden Nugget, Inc., Term Loan | ||||||||
| 140,175 | 4.500%, 11/21/2019 | 141,577 | ||||||
The accompanying Notes to Financial Statements are an integral part of this schedule.
109
Table of Contents
DIVERSIFIED INCOME PLUS PORTFOLIO
Schedule of Investments as of December 31, 2016
| Principal Amount | Bank Loans (13.2%)a | Value | ||||||
Consumer Cyclical (2.0%) - continued | ||||||||
Golden Nugget, Inc., Term Loan Delayed Draw | ||||||||
| $ | 60,075 | 4.500%, 11/21/2019 | $ | 60,676 | ||||
IMG Worldwide, Inc., Term Loan | ||||||||
| 1,055,103 | 5.250%, 5/6/2021 | 1,065,000 | ||||||
| 400,000 | 8.250%, 5/6/2022 | 405,000 | ||||||
Michaels Stores, Inc., Term Loan | ||||||||
| 552,915 | 3.750%, 1/30/2023 | 558,964 | ||||||
Mohegan Tribal Gaming Authority, Term Loan | ||||||||
| 997,500 | 5.500%, 10/13/2023 | 1,004,363 | ||||||
Scientific Games International, Inc., Term Loan | ||||||||
| 582,000 | 6.000%, 10/18/2020 | 589,397 | ||||||
| 1,683,342 | 6.000%, 10/1/2021 | 1,703,340 | ||||||
Seminole Hard Rock Entertainment, Inc., Term Loan | ||||||||
| 307,551 | 3.520%, 5/14/2020 | 309,089 | ||||||
Seminole Indian Tribe of Florida, Term Loan | ||||||||
| 442,500 | 3.248%, 4/29/2020 | 443,606 | ||||||
|
| |||||||
Total | 11,048,486 | |||||||
|
| |||||||
Consumer Non-Cyclical (2.4%) | ||||||||
Air Medical Group Holdings, Inc., Term Loan | ||||||||
| 686,550 | 5.000%, 4/28/2022 | 696,423 | ||||||
Albertson’s, LLC, Term Loan | ||||||||
| 533,100 | 0.000%, 12/21/2022b,c | 539,764 | ||||||
| 966,900 | 0.000%, 6/22/2023b,c | 978,580 | ||||||
CHS/Community Health Systems, Inc., Term Loan | ||||||||
| 150,127 | 3.750%, 12/31/2019 | 145,342 | ||||||
| 1,312,933 | 4.000%, 1/27/2021 | 1,269,173 | ||||||
Endo Luxembourg Finance I Company SARL, Term Loan | ||||||||
| 594,000 | 3.813%, 9/26/2022 | 596,548 | ||||||
Hanesbrands, Inc., Term Loan | ||||||||
| 382,350 | 3.270%, 4/29/2022 | 384,858 | ||||||
JBS USA, LLC, Term Loan | ||||||||
| 143,550 | 4.000%, 10/30/2022 | 144,746 | ||||||
Libbey Glass, Inc., Term Loan | ||||||||
| 285,835 | 3.750%, 4/9/2021 | 288,517 | ||||||
LTF Merger Sub, Inc., Term Loan | ||||||||
| 743,675 | 4.250%, 6/10/2022 | 747,743 | ||||||
Mallinckrodt International Finance SA, Term Loan | ||||||||
| 331,608 | 3.748%, 3/19/2021 | 332,317 | ||||||
McGraw-Hill Global Education Holdings, LLC, Term Loan | ||||||||
| 995,000 | 5.000%, 5/4/2022 | 995,159 | ||||||
MultiPlan, Inc., Term Loan | ||||||||
| 1,438,329 | 5.000%, 6/7/2023 | 1,462,219 | ||||||
Ortho-Clinical Diagnostics, Inc., Term Loan | ||||||||
| 993,565 | 4.750%, 6/30/2021 | 983,987 | ||||||
PetSmart, Inc., Term Loan | ||||||||
| 453,848 | 4.000%, 3/11/2022 | 454,983 | ||||||
Sterigenics-Nordion Holdings, LLC, Term Loan | ||||||||
| 424,625 | 4.250%, 5/16/2022 | 425,954 | ||||||
Valeant Pharmaceuticals International, Inc., Term Loan | ||||||||
| 2,876,882 | 5.500%, 4/1/2022b,c | 2,877,429 | ||||||
|
| |||||||
Total | 13,323,742 | |||||||
|
| |||||||
Energy (0.5%) | ||||||||
Energy Solutions, LLC, Term Loan | ||||||||
| 336,104 | 6.750%, 5/29/2020 | 338,205 | ||||||
Exgen Renewables I, LLC, Term Loan | ||||||||
| 342,948 | 5.250%, 2/8/2021 | 345,092 | ||||||
Houston Fuel Oil Terminal, LLC, Term Loan | ||||||||
| 496,193 | 4.250%, 8/19/2021 | 492,471 | ||||||
McJunkin Red Man Corporation, Term Loan | ||||||||
| 236,887 | 5.000%, 11/8/2019 | 237,776 | ||||||
MEG Energy Corporation, Term Loan | ||||||||
| 579,014 | 3.750%, 3/31/2020 | 561,643 | ||||||
Pacific Drilling SA, Term Loan | ||||||||
| 579,000 | 4.500%, 6/3/2018 | 203,229 | ||||||
Targa Resources Partners, LP, Term Loan | ||||||||
| 364,651 | 5.750%, 2/27/2022 | 366,474 | ||||||
Western Refining, Inc., Term Loan | ||||||||
| 296,939 | 5.250%, 11/12/2020 | 298,239 | ||||||
| 149,000 | 5.500%, 6/23/2023 | 149,745 | ||||||
|
| |||||||
Total | 2,992,874 | |||||||
|
| |||||||
Financials (0.9%) | ||||||||
Delos Finance Sarl, Term Loan | ||||||||
| 630,000 | 3.748%, 3/6/2021 | 634,051 | ||||||
DJO Finance, LLC, Term Loan | ||||||||
| 296,250 | 4.250%, 6/7/2020 | 283,938 | ||||||
Harland Clarke Holdings Corporation, Term Loan | ||||||||
| 290,961 | 7.000%, 5/22/2018 | 291,051 | ||||||
| 707,750 | 7.000%, 12/31/2019 | 710,404 | ||||||
MoneyGram International, Inc., Term Loan | ||||||||
| 830,679 | 4.250%, 3/27/2020 | 819,606 | ||||||
Sable International Finance, Ltd., Term Loan | ||||||||
| 1,035,000 | 5.748%, 1/3/2023b,c | 1,047,296 | ||||||
TransUnion, LLC, Term Loan | ||||||||
| 632,132 | 3.520%, 4/9/2021 | 637,214 | ||||||
WaveDivision Holdings, LLC, Term Loan | ||||||||
| 823,453 | 4.000%, 10/15/2019 | 827,776 | ||||||
|
| |||||||
Total | 5,251,336 | |||||||
|
| |||||||
Technology (1.9%) | ||||||||
Avago Technoligies Cayman Finance, Ltd., Term Loan | ||||||||
| 1,235,007 | 3.704%, 2/1/2023 | 1,251,988 | ||||||
First Data Corporation, Term Loan | ||||||||
| 1,798,310 | 3.756%, 3/24/2021 | 1,818,541 | ||||||
| 526,227 | 3.756%, 7/8/2022 | 531,600 | ||||||
Micron Technologies, Inc., Term Loan | ||||||||
| 532,724 | 4.520%, 4/26/2022 | 540,315 | ||||||
NXP BV, Term Loan | ||||||||
| 566,469 | 3.270%, 12/7/2020 | 569,018 | ||||||
ON Semiconductor Corporation, Term Loan | ||||||||
| 1,695,750 | 4.020%, 3/31/2023 | 1,716,336 | ||||||
Rackspace Hosting, LLC, Term Loan | ||||||||
| 885,000 | 4.500%, 12/20/2023b,c | 895,691 | ||||||
RP Crown Parent, LLC, Term Loan | ||||||||
| 760,000 | 4.500%, 10/12/2023 | 767,410 | ||||||
SS&C European Holdings SARL, Term Loan | ||||||||
| 308,651 | 4.001%, 7/8/2022 | 312,704 | ||||||
| 31,497 | 4.002%, 7/8/2022 | 31,911 | ||||||
The accompanying Notes to Financial Statements are an integral part of this schedule.
110
Table of Contents
DIVERSIFIED INCOME PLUS PORTFOLIO
Schedule of Investments as of December 31, 2016
| Principal Amount | Bank Loans (13.2%)a | Value | ||||||
Technology (1.9%) - continued | ||||||||
Western Digital Corporation, Term Loan | ||||||||
| $1,432,800 | 4.520%, 4/29/2023 | $ | 1,454,736 | |||||
Xerox Business Services, LLC, Term Loan | ||||||||
| 865,000 | 6.250%, 12/7/2023b,c | 874,731 | ||||||
|
| |||||||
Total | 10,764,981 | |||||||
|
| |||||||
Transportation (0.3%) | ||||||||
OSG Bulk Ships, Inc., Term Loan | ||||||||
| 557,652 | 5.250%, 8/5/2019 | 543,014 | ||||||
XPO Logistics, Inc., Term Loan | ||||||||
| 1,077,640 | 4.250%, 11/1/2021 | 1,090,776 | ||||||
|
| |||||||
Total | 1,633,790 | |||||||
|
| |||||||
Utilities (0.3%) | ||||||||
Calpine Corporation, Term Loan | ||||||||
| 650,000 | 0.000%, 1/15/2024b,c | 652,438 | ||||||
Intergen NV, Term Loan | ||||||||
| 450,002 | 5.500%, 6/12/2020 | 435,751 | ||||||
Talen Energy Supply, LLC, Term Loan | ||||||||
| 407,145 | 6.000%, 12/6/2023 | 412,234 | ||||||
|
| |||||||
Total | 1,500,423 | |||||||
|
| |||||||
Total Bank Loans (cost $73,615,259) | 74,048,806 | |||||||
|
| |||||||
Long-Term Fixed Income (47.7%) | ||||||||
| Asset-Backed Securities (3.6%) | ||||||||
Asset Backed Securities Corporation Home Equity Loan Trust | ||||||||
0.896%, 7/25/2036, Series | ||||||||
| 564,402 | 2006-HE5, Class A4d | 520,155 | ||||||
0.916%, 11/25/2036, Series | ||||||||
| 576,127 | 2006-HE6, Class A4d | 528,409 | ||||||
Bayview Opportunity Master Fund Trust | ||||||||
3.623%, 4/28/2030, Series | ||||||||
| 262,113 | 2015-3, Class A1e | 262,675 | ||||||
3.228%, 7/28/2034, Series | ||||||||
| 376,154 | 2014-18NP, Class A*,f | 376,693 | ||||||
3.721%, 7/28/2035, Series | ||||||||
| 812,615 | 2015-NPLA, Class Ae,f | 812,429 | ||||||
Citi Held For Asset Issuance | ||||||||
4.480%, 8/15/2022, Series | ||||||||
| 1,092,065 | 2016-MF1, Class A* | 1,105,132 | ||||||
Credit-Based Asset Servicing & Securitization, LLC | ||||||||
1.176%, 12/25/2035, Series | ||||||||
| 1,495,500 | 2005-CB8, Class M1d | 862,321 | ||||||
GSAA Home Equity Trust | ||||||||
1.026%, 7/25/2037, Series | ||||||||
| 1,293,993 | 2007-7, Class A4d | 1,169,958 | ||||||
J.P. Morgan Mortgage Acquisition Trust | ||||||||
4.480%, 3/25/2047, Series | ||||||||
| 1,369,262 | 2007-HE1, Class AF4f | 1,014,996 | ||||||
Lehman XS Trust | ||||||||
5.440%, 8/25/2035, Series | ||||||||
| 1,094,601 | 2005-2, Class 2A3Bf | 958,921 | ||||||
Marlette Funding Trust | ||||||||
3.060%, 1/17/2023, Series | ||||||||
| 1,287,836 | 2016-1A, Class A* | 1,287,521 | ||||||
Merrill Lynch Mortgage Investors Trust | ||||||||
2.830%, 6/25/2035, Series | ||||||||
| 982,211 | 2005-A5, Class M1 | 657,317 | ||||||
Murray Hill Marketplace Trust | ||||||||
4.190%, 11/25/2022, Series | ||||||||
| 408,199 | 2016-LC1, Class A* | 410,156 | ||||||
NCF Dealer Floorplan Master Trust | ||||||||
3.812%, 3/21/2022, Series | ||||||||
| 750,000 | 2016-1A, Class A*,d | 744,605 | ||||||
NRZ Advance Receivables Trust Advance Receivables Backed | ||||||||
2.751%, 6/15/2049, Series | ||||||||
| 1,300,000 | 2016-T1, Class AT1* | 1,295,125 | ||||||
Preston Ridge Partners Mortgage Trust, LLC | ||||||||
4.000%, 9/27/2021, Series | ||||||||
| 872,720 | 2016-1A, Class A1*,f | 869,341 | ||||||
Pretium Mortgage Credit Partners I, LLC | ||||||||
4.000%, 7/27/2031, Series | ||||||||
| 962,969 | 2016-NPL4, Class A*,f | 962,574 | ||||||
Renaissance Home Equity Loan Trust | ||||||||
5.746%, 5/25/2036, Series | ||||||||
| 330,418 | 2006-1, Class AF6f | 216,810 | ||||||
5.797%, 8/25/2036, Series | ||||||||
| 891,948 | 2006-2, Class AF3f | 537,829 | ||||||
SoFi Consumer Loan Program, LLC | ||||||||
3.050%, 12/26/2025, Series | ||||||||
| 1,280,016 | 2016-3, Class Ae | 1,275,317 | ||||||
Sunset Mortgage Loan Company, LLC | ||||||||
4.459%, 9/18/2045, Series | ||||||||
| 635,680 | 2015-NPL1, Class A*,f | 632,975 | ||||||
3.844%, 7/16/2047, Series | ||||||||
| 453,773 | 2016-NPL1, Class A*,f | 455,318 | ||||||
US Residential Opportunity Fund Trust | ||||||||
3.475%, 7/27/2036, Series | ||||||||
| 1,092,642 | 2016-1III, Class A*,f | 1,088,008 | ||||||
Vericrest Opportunity Loan Transferee | ||||||||
3.375%, 10/25/2058, Series | ||||||||
| 841,672 | 2015-NPL3, Class A1*,f | 840,493 | ||||||
3.500%, 6/26/2045, Series | ||||||||
| 633,390 | 2015-NPL8, Class A1e,f | 634,586 | ||||||
3.625%, 7/25/2045, Series | ||||||||
| 525,118 | 2015-NP10, Class A1e,f | 525,758 | ||||||
3.500%, 2/25/2055, Series | ||||||||
| 209,852 | 2015-NPL4, Class A1*,f | 210,013 | ||||||
|
| |||||||
Total | 20,255,435 | |||||||
|
| |||||||
Basic Materials (0.8%) | ||||||||
Alcoa Nederland Holding BV | ||||||||
| 325,000 | 6.750%, 9/30/2024e | 352,625 | ||||||
ArcelorMittal SA | ||||||||
| 730,000 | 6.500%, 3/1/2021 | 799,350 | ||||||
Dow Chemical Company | ||||||||
| 64,000 | 8.550%, 5/15/2019 | 73,321 | ||||||
First Quantum Minerals, Ltd. | ||||||||
| 322,000 | 6.750%, 2/15/2020e | 321,195 | ||||||
| 322,000 | 7.000%, 2/15/2021e | 320,261 | ||||||
Glencore Funding, LLC | ||||||||
| 60,000 | 1.940%, 4/16/2018d,e | 59,322 | ||||||
INEOS Group Holdings SA | ||||||||
| 400,000 | 5.875%, 2/15/2019e | 409,000 | ||||||
The accompanying Notes to Financial Statements are an integral part of this schedule.
111
Table of Contents
DIVERSIFIED INCOME PLUS PORTFOLIO
Schedule of Investments as of December 31, 2016
| Principal Amount | Long-Term Fixed Income (47.7%) | Value | ||||||
Basic Materials (0.8%) - continued | ||||||||
LyondellBasell Industries NV | ||||||||
| $ | 64,000 | 5.000%, 4/15/2019 | $ | 67,567 | ||||
Newmont Mining Corporation, Convertible | ||||||||
| 670,000 | 1.625%, 7/15/2017 | 682,981 | ||||||
Royal Gold, Inc., Convertible | ||||||||
| 280,000 | 2.875%, 6/15/2019 | 295,750 | ||||||
RPM International, Inc., Convertible | ||||||||
| 560,000 | 2.250%, 12/15/2020 | 670,250 | ||||||
Steel Dynamics, Inc. | ||||||||
| 645,000 | 5.000%, 12/15/2026e | 642,581 | ||||||
|
| |||||||
Total | 4,694,203 | |||||||
|
| |||||||
Capital Goods (1.6%) | ||||||||
AECOM | ||||||||
| 945,000 | 5.875%, 10/15/2024 | 1,008,891 | ||||||
Building Materials Corporation of America | ||||||||
| 785,000 | 6.000%, 10/15/2025e | 826,213 | ||||||
Cemex SAB de CV | ||||||||
| 775,000 | 5.700%, 1/11/2025e | 780,813 | ||||||
CNH Industrial Capital, LLC | ||||||||
| 965,000 | 4.375%, 11/6/2020 | 990,331 | ||||||
Crown Americas Capital Corporation IV | ||||||||
| 730,000 | 4.500%, 1/15/2023 | 744,600 | ||||||
Crown Cork & Seal Company, Inc. | ||||||||
| 410,000 | 7.375%, 12/15/2026 | 459,200 | ||||||
General Electric Company | ||||||||
| 120,000 | 5.000%, 1/21/2021g | 124,524 | ||||||
Ingersoll-Rand Luxembourg Finance SA | ||||||||
| 190,000 | 2.625%, 5/1/2020 | 190,295 | ||||||
L3 Technologies, Inc. | ||||||||
| 280,000 | 4.950%, 2/15/2021 | 298,913 | ||||||
Lockheed Martin Corporation | ||||||||
| 70,000 | 2.500%, 11/23/2020 | 70,537 | ||||||
Owens-Brockway Glass Container, Inc. | ||||||||
| 980,000 | 5.000%, 1/15/2022e | 1,002,050 | ||||||
Reynolds Group Issuer, Inc. | ||||||||
| 1,125,000 | 5.125%, 7/15/2023e | 1,143,281 | ||||||
Roper Technologies, Inc. | ||||||||
| 270,000 | 2.800%, 12/15/2021 | 269,597 | ||||||
Standard Industries, Inc. | ||||||||
| 185,000 | 5.500%, 2/15/2023e | 191,494 | ||||||
Textron, Inc. | ||||||||
| 137,000 | 7.250%, 10/1/2019 | 153,907 | ||||||
United Rentals North America, Inc. | ||||||||
| 780,000 | 5.500%, 7/15/2025 | 795,600 | ||||||
|
| |||||||
Total | 9,050,246 | |||||||
|
| |||||||
Collateralized Mortgage Obligations (10.8%) | ||||||||
Adjustable Rate Mortgage Trust | ||||||||
2.860%, 11/25/2035, Series | ||||||||
| 889,034 | 2005-9, Class 1A4 | 775,739 | ||||||
Alternative Loan Trust | ||||||||
5.500%, 5/25/2035, Series | ||||||||
| 321,793 | 2005-J3, Class 2A13 | 320,874 | ||||||
6.000%, 6/25/2036, Series | ||||||||
| 834,650 | 2006-24CB, Class A9 | 727,374 | ||||||
American Home Mortgage Assets Trust | ||||||||
0.946%, 12/25/2046, Series | ||||||||
| 1,389,575 | 2006-6, Class A1Ad | 982,562 | ||||||
0.946%, 6/25/2047, Series | ||||||||
| 1,356,432 | 2007-5, Class A1d | 984,848 | ||||||
American Home Mortgage Investment Trust | ||||||||
6.750%, 12/25/2036, Series | ||||||||
| 1,376,043 | 2006-3, Class 3A2 | 595,088 | ||||||
Angel Oak Mortgage Trust | ||||||||
4.500%, 11/25/2045, Series | ||||||||
| 519,069 | 2015-1, Class A*,f | 522,074 | ||||||
Banc of America Alternative Loan Trust | ||||||||
1.256%, 4/25/2035, Series | ||||||||
| 323,558 | 2005-3, Class 1CB1d | 249,520 | ||||||
6.000%, 11/25/2035, Series | ||||||||
| 874,233 | 2005-10, Class 3CB1 | 771,271 | ||||||
Banc of America Funding Corporation | ||||||||
3.388%, 5/20/2036, Series | ||||||||
| 257,925 | 2006-D, Class 6A1 | 224,978 | ||||||
Bayview Opportunity Master Fund Trust | ||||||||
3.475%, 7/28/2031, Series | ||||||||
| 754,597 | 2016-RPL3, Class A1e | 750,079 | ||||||
BCAP, LLC Trust | ||||||||
0.936%, 3/25/2037, Series | ||||||||
| 1,086,663 | 2007-AA1, Class 2A1d | 1,008,430 | ||||||
Bear Stearns Adjustable Rate Mortgage Trust | ||||||||
2.830%, 10/25/2035, Series | ||||||||
| 173,578 | 2005-9, Class A1d | 167,122 | ||||||
3.177%, 2/25/2036, Series | ||||||||
| 213,826 | 2005-12, Class 11A1 | 180,532 | ||||||
Bear Stearns ALT-A Trust | ||||||||
5.212%, 7/25/2035, Series | ||||||||
| 1,043,427 | 2005-5, Class 25A1 | 828,793 | ||||||
Citicorp Mortgage Securities Trust | ||||||||
6.000%, 5/25/2037, Series | ||||||||
| 301,387 | 2007-4, Class 1A5 | 299,909 | ||||||
Citigroup Mortgage Loan Trust, Inc. | ||||||||
5.500%, 11/25/2035, Series | ||||||||
| 289,821 | 2005-9, Class 21A2 | 280,035 | ||||||
3.037%, 3/25/2037, Series | ||||||||
| 599,546 | 2007-AR4, Class 2A1A | 510,325 | ||||||
CitiMortgage Alternative Loan Trust | ||||||||
5.750%, 4/25/2037, Series | ||||||||
| 402,837 | 2007-A4, Class 1A5 | 345,142 | ||||||
COLT Mortgage Loan Trust | ||||||||
2.750%, 9/25/2046, Series | ||||||||
| 1,022,499 | 2016-2, Class A1* | 1,027,861 | ||||||
Countrywide Alternative Loan Trust | ||||||||
1.156%, 2/25/2035, Series | ||||||||
| 185,007 | 2005-J1, Class 5A1d | 171,760 | ||||||
2.508%, 10/25/2035, Series | ||||||||
| 625,147 | 2005-43, Class 1A1 | 527,162 | ||||||
3.036%, 10/25/2035, Series | ||||||||
| 446,358 | 2005-43, Class 4A1 | 361,852 | ||||||
5.500%, 2/25/2036, Series | ||||||||
| 316,292 | 2005-85CB, Class 2A2 | 293,499 | ||||||
6.000%, 4/25/2036, Series | ||||||||
| 174,512 | 2006-4CB, Class 1A1 | 140,122 | ||||||
6.500%, 8/25/2036, Series | ||||||||
| 459,188 | 2006-23CB, Class 2A3 | 309,708 | ||||||
6.000%, 1/25/2037, Series | ||||||||
| 148,425 | 2006-39CB, Class 1A16 | 141,722 | ||||||
The accompanying Notes to Financial Statements are an integral part of this schedule.
112
Table of Contents
DIVERSIFIED INCOME PLUS PORTFOLIO
Schedule of Investments as of December 31, 2016
| Principal Amount | Long-Term Fixed Income (47.7%) | Value | ||||||
Collateralized Mortgage Obligations (10.8%) - continued | ||||||||
5.500%, 5/25/2037, Series | ||||||||
| $ | 654,141 | 2007-8CB, Class A1 | $ | 559,817 | ||||
Countrywide Home Loan Mortgage Pass Through Trust | ||||||||
3.155%, 11/25/2035, Series | ||||||||
| 903,504 | 2005-22, Class 2A1 | 740,842 | ||||||
3.147%, 2/20/2036, Series | ||||||||
| 364,570 | 2005-HY10, Class 5A1 | 299,588 | ||||||
CSMC Mortgage-Backed Trust | ||||||||
5.500%, 3/25/2037, Series | ||||||||
| 827,650 | 2007-2, Class 3A4 | 744,641 | ||||||
Deutsche Alt-A Securities, Inc., Mortgage Loan Trust | ||||||||
0.956%, 11/25/2035, Series | ||||||||
| 253,018 | 2005-5, Class 2A1d | 140,106 | ||||||
5.500%, 11/25/2035, Series | ||||||||
| 522,951 | 2005-5, Class 1A4 | 525,146 | ||||||
1.337%, 4/25/2047, Series | ||||||||
| 737,725 | 2007-OA2, Class A1d | 624,875 | ||||||
0.976%, 8/25/2047, Series | ||||||||
| 1,162,960 | 2007-OA5, Class A1Bd | 954,479 | ||||||
Federal Home Loan Mortgage Corporation | ||||||||
2.500%, 12/15/2022, | ||||||||
| 4,710,563 | Series-4155, Class AIh | 258,349 | ||||||
2.500%, 5/15/2027, | ||||||||
| 1,598,496 | Series-4106, Class HIh | 119,553 | ||||||
2.500%, 2/15/2028, | ||||||||
| 1,834,683 | Series-4162, Class AIh | 156,352 | ||||||
2.500%, 3/15/2028, | ||||||||
| 5,815,657 | Series-4177, Class EIh | 523,142 | ||||||
3.000%, 4/15/2028, | ||||||||
| 2,994,409 | Series-4193, Class AIh | 279,719 | ||||||
3.000%, 2/15/2033, | ||||||||
| 2,659,835 | Series-4170, Class IGh | 318,432 | ||||||
Federal National Mortgage Association | ||||||||
2.500%, 2/25/2028, Series | ||||||||
| 2,502,907 | 2013-46, Class CIh | 221,111 | ||||||
3.000%, 4/25/2028, Series | ||||||||
| 2,088,752 | 2013-30, Class DIh | 203,402 | ||||||
3.500%, 1/25/2033, Series | ||||||||
| 2,401,764 | 2012-150, Class YIh | 323,814 | ||||||
First Horizon Alternative Mortgage Securities Trust | ||||||||
2.728%, 3/25/2035, Series | ||||||||
| 679,540 | 2005-AA2, Class 1A1 | 597,251 | ||||||
3.083%, 7/25/2035, Series | ||||||||
| 737,835 | 2005-AA5, Class 2A1 | 664,864 | ||||||
6.000%, 8/25/2036, Series | ||||||||
| 734,448 | 2006-FA4, Class 1A4d | 607,722 | ||||||
First Horizon Mortgage Pass-Through Trust | ||||||||
2.987%, 8/25/2037, Series | ||||||||
| 721,211 | 2007-AR2, Class 1A2 | 572,290 | ||||||
GMAC Mortgage Corporation Loan Trust | ||||||||
3.384%, 5/25/2035, Series | ||||||||
| 1,245,784 | 2005-AR2, Class 4A | 1,149,465 | ||||||
Government National Mortgage Association | ||||||||
4.000%, 1/16/2027, Series | ||||||||
| 2,273,984 | 2012-3, Class IOh | 223,990 | ||||||
Greenpoint Mortgage Funding Trust | ||||||||
0.792%, 10/25/2045, Series | ||||||||
| 589,730 | 2005-AR4, Class G41Bd | 461,051 | ||||||
HarborView Mortgage Loan Trust | ||||||||
3.108%, 7/19/2035, Series | ||||||||
| 1,235,813 | 2005-4, Class 3A1 | 1,082,208 | ||||||
IndyMac IMJA Mortgage Loan Trust | ||||||||
6.250%, 11/25/2037, Series | ||||||||
| 648,682 | 2007-A3, Class A1 | 516,597 | ||||||
IndyMac INDX Mortgage Loan Trust | ||||||||
3.030%, 10/25/2035, Series | ||||||||
| 916,613 | 2005-AR19, Class A1 | 746,831 | ||||||
1.396%, 7/25/2045, Series | ||||||||
| 812,727 | 2005-16IP, Class A1d | 679,858 | ||||||
J.P. Morgan Alternative Loan Trust | ||||||||
6.500%, 3/25/2036, Series | ||||||||
| 881,056 | 2006-S1, Class 1A19 | 768,997 | ||||||
J.P. Morgan Mortgage Trust | ||||||||
6.500%, 1/25/2035, Series | ||||||||
| 175,387 | 2005-S1, Class 1A2 | 165,130 | ||||||
3.247%, 8/25/2035, Series | ||||||||
| 666,799 | 2005-A5, Class 1A2 | 661,176 | ||||||
3.066%, 2/25/2036, Series | ||||||||
| 1,046,827 | 2006-A1, Class 2A2 | 922,738 | ||||||
3.110%, 10/25/2036, Series | ||||||||
| 975,452 | 2006-A6, Class 1A2 | 884,452 | ||||||
1.136%, 1/25/2037, Series | ||||||||
| 643,501 | 2006-S4, Class A8d | 340,619 | ||||||
3.186%, 1/25/2037, Series | ||||||||
| 511,030 | 2006-A7, Class 2A2 | 457,582 | ||||||
6.250%, 8/25/2037, Series | ||||||||
| 363,377 | 2007-S3, Class 1A10 | 269,238 | ||||||
Lehman Mortgage Trust | ||||||||
1.506%, 12/25/2035, Series | ||||||||
| 385,462 | 2005-2, Class 3A1d | 272,715 | ||||||
Master Asset Securitization Trust | ||||||||
1.256%, 6/25/2036, Series | ||||||||
| 473,845 | 2006-2, Class 2A2d | 246,420 | ||||||
MASTR Alternative Loans Trust | ||||||||
6.500%, 7/25/2034, Series | ||||||||
| 183,994 | 2004-6, Class 6A1 | 184,521 | ||||||
1.206%, 12/25/2035, Series | ||||||||
| 383,444 | 2005-6, Class 2A1d | 174,206 | ||||||
Merrill Lynch Alternative Note Asset Trust | ||||||||
6.000%, 3/25/2037, Series | ||||||||
| 536,185 | 2007-F1, Class 2A1 | 417,851 | ||||||
Morgan Stanley Mortgage Loan Trust | ||||||||
3.179%, 11/25/2035, Series | ||||||||
| 415,268 | 2005-6AR, Class 5A1 | 299,401 | ||||||
MortgageIT Trust | ||||||||
1.016%, 12/25/2035, Series | ||||||||
| 726,066 | 2005-5, Class A1d | 670,100 | ||||||
New Century Alternative Mortgage Loan Trust | ||||||||
6.167%, 7/25/2036, Series | ||||||||
| 948,279 | 2006-ALT1, Class AF6f | 552,184 | ||||||
Pretium Mortgage Credit Partners, LLC | ||||||||
4.375%, 11/27/2030, Series | ||||||||
| 1,041,644 | 2015-NPL4, Class A1*,f | 1,050,078 | ||||||
Residential Accredit Loans, Inc. Trust | ||||||||
4.013%, 9/25/2035, Series | ||||||||
| 1,366,589 | 2005-QA10, Class A31 | 1,149,134 | ||||||
The accompanying Notes to Financial Statements are an integral part of this schedule.
113
Table of Contents
DIVERSIFIED INCOME PLUS PORTFOLIO
Schedule of Investments as of December 31, 2016
| Principal Amount | Long-Term Fixed Income (47.7%) | Value | ||||||
Collateralized Mortgage Obligations (10.8%) - continued | ||||||||
5.750%, 9/25/2035, Series | ||||||||
| $ | 543,184 | 2005-QS13, Class 2A3 | $ | 485,034 | ||||
6.000%, 4/25/2036, Series | ||||||||
| 803,433 | 2006-QS4, Class A2 | 689,809 | ||||||
6.000%, 1/25/2037, Series | ||||||||
| 667,632 | 2007-QS1, Class 1A1 | 592,012 | ||||||
5.750%, 4/25/2037, Series | ||||||||
| 1,145,394 | 2007-QS6, Class A28 | 953,367 | ||||||
6.250%, 4/25/2037, Series | ||||||||
| 701,866 | 2007-QS6, Class A6 | 602,071 | ||||||
6.000%, 6/25/2037, Series | ||||||||
| 285,837 | 2007-QS8, Class A10 | 235,563 | ||||||
0.946%, 7/25/2037, Series | ||||||||
| 1,197,894 | 2007-QH6, Class A1d | 1,024,643 | ||||||
Residential Asset Securitization Trust | ||||||||
6.240%, 8/25/2022, Series | ||||||||
| 767,004 | 2007-A8, Class 3A1 | 656,742 | ||||||
5.500%, 4/25/2035, Series | ||||||||
| 421,549 | 2005-A1, Class A3 | 421,089 | ||||||
1.136%, 8/25/2037, Series | ||||||||
| 770,549 | 2007-A8, Class 2A3d | 200,926 | ||||||
Residential Funding Mortgage Security I Trust | ||||||||
5.978%, 12/25/2032, Series | ||||||||
| 648,429 | 2003-S12, Class M1 | 688,059 | ||||||
5.750%, 2/25/2036, Series | ||||||||
| 633,764 | 2006-S2, Class A1 | 589,389 | ||||||
6.000%, 7/25/2037, Series | ||||||||
| 828,940 | 2007-S7, Class A20 | 763,782 | ||||||
Sequoia Mortgage Trust | ||||||||
3.280%, 9/20/2046, Series | ||||||||
| 1,571,901 | 2007-1, Class 4A1 | 1,274,796 | ||||||
Structured Adjustable Rate Mortgage Loan Trust | ||||||||
3.322%, 12/25/2034, Series | ||||||||
| 216,684 | 2004-18, Class 5A | 210,909 | ||||||
3.142%, 7/25/2035, Series | ||||||||
| 582,481 | 2005-15, Class 4A1 | 496,977 | ||||||
3.364%, 9/25/2035, Series | ||||||||
| 320,327 | 2005-18, Class 1A1 | 262,348 | ||||||
Structured Asset Mortgage Investments, Inc. | ||||||||
1.066%, 12/25/2035, Series | ||||||||
| 1,343,357 | 2005-AR4, Class A1d | 981,283 | ||||||
0.966%, 5/25/2046, Series | ||||||||
| 709,389 | 2006-AR5, Class 2A1d | 531,865 | ||||||
Suntrust Alternative Loan Trust | ||||||||
5.750%, 12/25/2035, Series | ||||||||
| 666,083 | 2005-1F, Class 2A5 | 630,929 | ||||||
Vericrest Opportunity Loan Transferee | ||||||||
3.500%, 7/25/2046, Series | ||||||||
| 1,085,600 | 2016-NPL8, Class A1e,f | 1,081,817 | ||||||
WaMu Mortgage Pass Through Certificates | ||||||||
2.752%, 8/25/2036, Series | ||||||||
| 967,899 | 2006-AR8, Class 3A2 | 881,706 | ||||||
2.617%, 11/25/2036, Series | ||||||||
| 550,771 | 2006-AR14, Class 1A1 | 488,333 | ||||||
2.137%, 1/25/2037, Series | ||||||||
| 1,111,024 | 2006-AR18, Class 1A1 | 944,650 | ||||||
2.804%, 8/25/2046, Series | ||||||||
| 100,149 | 2006-AR8, Class 1A1 | 87,076 | ||||||
1.487%, 9/25/2046, Series | ||||||||
| 483,684 | 2006-AR11, Class 3A1Ad | 370,539 | ||||||
1.527%, 9/25/2046, Series | ||||||||
| 1,411,944 | 2006-AR11, Class 1Ad | 1,160,374 | ||||||
1.361%, 12/25/2046, Series | ||||||||
| 1,311,505 | 2006-AR17, Class 1Ad | 1,016,882 | ||||||
1.848%, 3/25/2047, Series | ||||||||
| 529,818 | 2007-OA2, Class 2Ad | 424,498 | ||||||
Washington Mutual Mortgage Pass Through Certificates | ||||||||
1.356%, 6/25/2035, Series | ||||||||
| 422,053 | 2005-4, Class 5A5d | 322,154 | ||||||
6.000%, 11/25/2035, Series | ||||||||
| 668,145 | 2005-10, Class 2A9 | 630,002 | ||||||
7.000%, 4/25/2037, Series | ||||||||
| 954,914 | 2007-2, Class 1A1 | 538,171 | ||||||
Washington Mutual Mortgage Pass Through Certificates Trust | ||||||||
7.000%, 2/25/2036, Series | ||||||||
| 929,836 | 2006-1, Class 2CB1 | 691,846 | ||||||
1.317%, 2/25/2047, Series | ||||||||
| 969,203 | 2007-OA3, Class 2Ad | 722,443 | ||||||
Wells Fargo Mortgage Backed Securities Trust | ||||||||
3.037%, 7/25/2036, Series | ||||||||
| 1,008,747 | 2006-AR10, Class 2A1 | 986,985 | ||||||
6.000%, 7/25/2037, Series | ||||||||
| 314,261 | 2007-8, Class 1A16 | 310,457 | ||||||
6.000%, 11/25/2037, Series | ||||||||
| 437,569 | 2007-15, Class A1 | 433,333 | ||||||
|
| |||||||
Total | 60,663,277 | |||||||
|
| |||||||
Commercial Mortgage-Backed Securities (0.3%) | ||||||||
Greenwich Capital Commercial Funding Corporation | ||||||||
| 650,000 | 5.867%, 12/10/2049 | 664,275 | ||||||
Morgan Stanley Capital, Inc. | ||||||||
| 995,763 | 5.406%, 3/15/2044 | 994,893 | ||||||
|
| |||||||
Total | 1,659,168 | |||||||
|
| |||||||
Communications Services (3.3%) | ||||||||
Altice US Finance I Corporation | ||||||||
| 725,000 | 5.500%, 5/15/2026e | 739,500 | ||||||
AMC Networks, Inc. | ||||||||
| 1,080,000 | 5.000%, 4/1/2024 | 1,082,700 | ||||||
American Tower Corporation | ||||||||
| 60,000 | 2.800%, 6/1/2020 | 59,997 | ||||||
| 98,000 | 3.450%, 9/15/2021 | 99,176 | ||||||
AT&T, Inc. | ||||||||
| 104,000 | 5.875%, 10/1/2019 | 113,612 | ||||||
| 65,000 | 1.928%, 6/30/2020d | 65,353 | ||||||
| 380,000 | 2.800%, 2/17/2021 | 376,670 | ||||||
CCO Holdings, LLC | ||||||||
| 1,000,000 | 5.875%, 4/1/2024e | 1,067,500 | ||||||
CenturyLink, Inc. | ||||||||
| 400,000 | 6.450%, 6/15/2021 | 421,000 | ||||||
Charter Communications Operating, LLC | ||||||||
| 245,000 | 3.579%, 7/23/2020 | 249,784 | ||||||
| 35,000 | 4.464%, 7/23/2022 | 36,539 | ||||||
Clear Channel Worldwide Holdings, Inc. | ||||||||
| 1,070,000 | 6.500%, 11/15/2022 | 1,094,075 | ||||||
Columbus International, Inc. | ||||||||
| 750,000 | 7.375%, 3/30/2021e | 798,105 | ||||||
The accompanying Notes to Financial Statements are an integral part of this schedule.
114
Table of Contents
DIVERSIFIED INCOME PLUS PORTFOLIO
Schedule of Investments as of December 31, 2016
| Principal Amount | Long-Term Fixed Income (47.7%) | Value | ||||||
Communications Services (3.3%) - continued | ||||||||
Comcast Corporation | ||||||||
| $ | 185,000 | 1.625%, 1/15/2022 | $ | 177,010 | ||||
Crown Castle International Corporation | ||||||||
| 140,000 | 3.400%, 2/15/2021 | 141,951 | ||||||
| 210,000 | 2.250%, 9/1/2021 | 202,974 | ||||||
| 800,000 | 5.250%, 1/15/2023 | 861,000 | ||||||
CSC Holdings, LLC | ||||||||
| 80,000 | 5.500%, 4/15/2027e | 81,000 | ||||||
Digicel, Ltd. | ||||||||
| 760,000 | 6.000%, 4/15/2021* | 687,200 | ||||||
DISH Network Corporation, Convertible | ||||||||
| 700,000 | 3.375%, 8/15/2026e | 796,687 | ||||||
Frontier Communications Corporation | ||||||||
| 970,000 | 8.875%, 9/15/2020 | 1,033,050 | ||||||
Hughes Satellite Systems Corporation | ||||||||
| 513,000 | 6.500%, 6/15/2019 | 557,888 | ||||||
Level 3 Communications, Inc. | ||||||||
| 475,000 | 5.375%, 1/15/2024 | 479,750 | ||||||
Level 3 Escrow II, Inc. | ||||||||
| 400,000 | 5.375%, 8/15/2022 | 413,000 | ||||||
Liberty Interactive, LLC, Convertible | ||||||||
| 630,000 | 1.750%, 9/30/2046e | 677,250 | ||||||
Neptune Finco Corporation | ||||||||
| 610,000 | 10.875%, 10/15/2025e | 725,900 | ||||||
Nexstar Escrow Corporation | ||||||||
| 1,210,000 | 5.625%, 8/1/2024e | 1,200,925 | ||||||
Orange SA | ||||||||
| 185,000 | 1.625%, 11/3/2019 | 182,148 | ||||||
Quebecor Media, Inc. | ||||||||
| 635,000 | 5.750%, 1/15/2023 | 658,812 | ||||||
SBA Tower Trust | ||||||||
| 200,000 | 3.598%, 4/15/2043e | 200,738 | ||||||
SFR Group SA | ||||||||
| 770,000 | 6.000%, 5/15/2022e | 790,212 | ||||||
Sprint Corporation | ||||||||
| 760,000 | 7.625%, 2/15/2025 | 798,950 | ||||||
Telefonica Emisiones SAU | ||||||||
| 126,000 | 3.192%, 4/27/2018 | 127,794 | ||||||
T-Mobile USA, Inc. | ||||||||
| 770,000 | 6.125%, 1/15/2022 | 812,350 | ||||||
Verizon Communications, Inc. | ||||||||
| 190,000 | 1.375%, 8/15/2019 | 186,958 | ||||||
| 66,000 | 2.625%, 2/21/2020 | 66,591 | ||||||
| 98,000 | 4.500%, 9/15/2020 | 104,795 | ||||||
Zillow Group, Inc., Convertible | ||||||||
| 330,000 | 2.000%, 12/1/2021e | 338,869 | ||||||
|
| |||||||
Total | 18,507,813 | |||||||
|
| |||||||
Consumer Cyclical (2.5%) | ||||||||
Allison Transmission, Inc. | ||||||||
| 1,115,000 | 5.000%, 10/1/2024e | 1,126,150 | ||||||
Argos Merger Sub, Inc. | ||||||||
| 960,000 | 7.125%, 3/15/2023e | 979,200 | ||||||
BMW US Capital, LLC | ||||||||
| 145,000 | 1.500%, 4/11/2019e | 143,567 | ||||||
Brookfield Residential Properties, Inc. | ||||||||
| 730,000 | 6.125%, 7/1/2022e | 733,650 | ||||||
eBay, Inc. | ||||||||
| 95,000 | 2.500%, 3/9/2018 | 95,822 | ||||||
Ford Motor Credit Company, LLC | ||||||||
| 130,000 | 5.000%, 5/15/2018 | 135,069 | ||||||
| 210,000 | 1.897%, 8/12/2019 | 206,526 | ||||||
| 95,000 | 2.597%, 11/4/2019 | 94,813 | ||||||
General Motors Financial Company, Inc. | ||||||||
| 210,000 | 3.150%, 1/15/2020 | 211,190 | ||||||
| 83,000 | 4.375%, 9/25/2021 | 86,019 | ||||||
Home Depot, Inc. | ||||||||
| 70,000 | 1.333%, 9/15/2017d | 70,118 | ||||||
| 110,000 | 2.000%, 4/1/2021 | 109,031 | ||||||
| 65,000 | 2.625%, 6/1/2022 | 65,244 | ||||||
Jaguar Land Rover Automotive plc | ||||||||
| 200,000 | 4.125%, 12/15/2018e | 205,500 | ||||||
| 383,000 | 5.625%, 2/1/2023e | 399,278 | ||||||
L Brands, Inc. | ||||||||
| 570,000 | 5.625%, 2/15/2022 | 608,475 | ||||||
Lennar Corporation | ||||||||
| 410,000 | 12.250%, 6/1/2017 | 427,425 | ||||||
| 160,000 | 4.125%, 12/1/2018 | 163,600 | ||||||
Live Nation Entertainment, Inc. | ||||||||
| 1,110,000 | 5.375%, 6/15/2022e | 1,148,850 | ||||||
Macy’s Retail Holdings, Inc. | ||||||||
| 176,000 | 7.450%, 7/15/2017 | 181,550 | ||||||
MGM Resorts International | ||||||||
| 775,000 | 6.000%, 3/15/2023 | 837,000 | ||||||
Newell Rubbermaid, Inc. | ||||||||
| 95,000 | 3.150%, 4/1/2021 | 96,601 | ||||||
Prime Security Services Borrower, LLC | ||||||||
| 680,000 | 9.250%, 5/15/2023e | 740,350 | ||||||
PulteGroup, Inc. | ||||||||
| 1,105,000 | 4.250%, 3/1/2021 | 1,129,862 | ||||||
Ralph Lauren Corporation | ||||||||
| 70,000 | 2.625%, 8/18/2020 | 70,656 | ||||||
Rite Aid Corporation | ||||||||
| 905,000 | 6.125%, 4/1/2023e | 972,875 | ||||||
Royal Caribbean Cruises, Ltd. | ||||||||
| 750,000 | 5.250%, 11/15/2022 | 801,563 | ||||||
Starbucks Corporation | ||||||||
| 115,000 | 2.100%, 2/4/2021 | 114,537 | ||||||
Toll Brothers Finance Corporation | ||||||||
| 124,000 | 4.000%, 12/31/2018 | 127,255 | ||||||
Visa, Inc. | ||||||||
| 70,000 | 2.200%, 12/14/2020 | 70,039 | ||||||
Walgreens Boots Alliance, Inc. | ||||||||
| 95,000 | 1.750%, 5/30/2018 | 95,080 | ||||||
| 95,000 | 2.600%, 6/1/2021 | 94,320 | ||||||
West Corporation | ||||||||
| 770,000 | 5.375%, 7/15/2022e | 744,013 | ||||||
Yum! Brands, Inc. | ||||||||
| 1,105,000 | 5.000%, 6/1/2024e | 1,128,481 | ||||||
|
| |||||||
Total | 14,213,709 | |||||||
|
| |||||||
Consumer Non-Cyclical (2.4%) | ||||||||
Abbott Laboratories | ||||||||
| 220,000 | 2.350%, 11/22/2019 | 220,150 | ||||||
Anheuser-Busch InBev Finance, Inc. | ||||||||
| 120,000 | 2.146%, 2/1/2021d | 122,111 | ||||||
| 275,000 | 2.650%, 2/1/2021 | 276,262 | ||||||
Anheuser-Busch InBev Worldwide, Inc. | ||||||||
| 48,000 | 6.500%, 7/15/2018 | 51,402 | ||||||
B&G Foods, Inc. | ||||||||
| 310,000 | 4.625%, 6/1/2021 | 316,200 | ||||||
BAT International Finance plc | ||||||||
| 65,000 | 1.473%, 6/15/2018d,e | 65,012 | ||||||
The accompanying Notes to Financial Statements are an integral part of this schedule.
115
Table of Contents
DIVERSIFIED INCOME PLUS PORTFOLIO
Schedule of Investments as of December 31, 2016
| Principal Amount | Long-Term Fixed Income (47.7%) | Value | ||||||
Consumer Non-Cyclical (2.4%) - continued | ||||||||
Baxter International, Inc. | ||||||||
| $ | 210,000 | 1.700%, 8/15/2021 | $ | 201,839 | ||||
Bayer U.S. Finance, LLC | ||||||||
| 220,000 | 2.375%, 10/8/2019e | 220,285 | ||||||
Boston Scientific Corporation | ||||||||
| 35,000 | 6.000%, 1/15/2020 | 38,436 | ||||||
Bunge Limited Finance Corporation | ||||||||
| 70,000 | 3.500%, 11/24/2020 | 71,193 | ||||||
Celgene Corporation | ||||||||
| 70,000 | 3.550%, 8/15/2022 | 71,713 | ||||||
Cott Beverages, Inc. | ||||||||
| 770,000 | 5.375%, 7/1/2022 | 783,475 | ||||||
CVS Health Corporation | ||||||||
| 64,000 | 2.250%, 12/5/2018 | 64,548 | ||||||
EMD Finance, LLC | ||||||||
| 35,000 | 1.343%, 3/17/2017d,e | 35,008 | ||||||
Envision Healthcare Corporation | ||||||||
| 750,000 | 5.125%, 7/1/2022e | 747,188 | ||||||
Express Scripts Holding Company | ||||||||
| 95,000 | 3.000%, 7/15/2023 | 91,858 | ||||||
Forest Laboratories, Inc. | ||||||||
| 97,000 | 4.375%, 2/1/2019e | 100,761 | ||||||
Gilead Sciences, Inc. | ||||||||
| 200,000 | 1.950%, 3/1/2022 | 193,307 | ||||||
| 70,000 | 3.250%, 9/1/2022 | 71,374 | ||||||
Grifols Worldwide Operations, Ltd. | ||||||||
| 920,000 | 5.250%, 4/1/2022 | 952,200 | ||||||
HCA, Inc. | ||||||||
| 430,000 | 5.250%, 6/15/2026 | 444,512 | ||||||
| 575,000 | 4.500%, 2/15/2027 | 564,937 | ||||||
Iconix Brand Group, Inc., Convertible | ||||||||
| 680,000 | 1.500%, 3/15/2018 | 639,200 | ||||||
Intercept Pharmaceuticals, Inc., Convertible | ||||||||
| 400,000 | 3.250%, 7/1/2023 | 356,500 | ||||||
JBS USA, LLC | ||||||||
| 390,000 | 5.875%, 7/15/2024e | 402,675 | ||||||
| 780,000 | 5.750%, 6/15/2025e | 789,750 | ||||||
Kraft Heinz Foods Company | ||||||||
| 210,000 | 5.375%, 2/10/2020 | 227,313 | ||||||
Laboratory Corporation of America Holdings | ||||||||
| 25,000 | 2.625%, 2/1/2020 | 24,962 | ||||||
Mead Johnson Nutrition Company | ||||||||
| 70,000 | 3.000%, 11/15/2020 | 70,822 | ||||||
Medtronic plc | ||||||||
| 178,000 | 4.375%, 3/15/2035 | 188,016 | ||||||
Molson Coors Brewing Company | ||||||||
| 185,000 | 1.450%, 7/15/2019 | 182,191 | ||||||
Mylan NV | ||||||||
| 65,000 | 3.150%, 6/15/2021e | 63,734 | ||||||
PepsiCo, Inc. | ||||||||
| 210,000 | 1.394%, 10/6/2021d | 210,821 | ||||||
Pernod Ricard SA | ||||||||
| 190,000 | 5.750%, 4/7/2021e | 210,885 | ||||||
Perrigo Finance plc | ||||||||
| 210,000 | 3.500%, 12/15/2021 | 211,487 | ||||||
Pinnacle Foods, Inc. | ||||||||
| 500,000 | 5.875%, 1/15/2024 | 530,000 | ||||||
Reynolds American, Inc. | ||||||||
| 35,000 | 3.250%, 6/12/2020 | 35,843 | ||||||
Shire Acquisitions Investments Ireland Designated Activity Company | ||||||||
| 225,000 | 1.900%, 9/23/2019 | 222,043 | ||||||
Teleflex, Inc. | ||||||||
| 725,000 | 4.875%, 6/1/2026 | 717,750 | ||||||
Tenet Healthcare Corporation | ||||||||
| 1,005,000 | 8.125%, 4/1/2022 | 948,218 | ||||||
Teva Pharmaceutical Finance Netherlands III BV | ||||||||
| 275,000 | 1.700%, 7/19/2019 | 270,076 | ||||||
TreeHouse Foods, Inc. | ||||||||
| 510,000 | 4.875%, 3/15/2022 | 522,750 | ||||||
Tyson Foods, Inc. | ||||||||
| 98,000 | 4.500%, 6/15/2022 | 104,181 | ||||||
VPII Escrow Corporation | ||||||||
| 410,000 | 7.500%, 7/15/2021e | 347,475 | ||||||
VRX Escrow Corporation | ||||||||
| 800,000 | 6.125%, 4/15/2025e | 601,000 | ||||||
|
| |||||||
Total | 13,581,463 | |||||||
|
| |||||||
Energy (2.3%) | ||||||||
Anadarko Petroleum Corporation | ||||||||
| 77,000 | 8.700%, 3/15/2019 | 87,476 | ||||||
| 33,000 | 4.850%, 3/15/2021 | 35,356 | ||||||
Antero Resources Corporation | ||||||||
| 260,000 | 5.125%, 12/1/2022 | 262,600 | ||||||
| 500,000 | 5.625%, 6/1/2023 | 511,875 | ||||||
BP Capital Markets plc | ||||||||
| 180,000 | 1.676%, 5/3/2019 | 178,682 | ||||||
Buckeye Partners, LP | ||||||||
| 98,000 | 2.650%, 11/15/2018 | 98,626 | ||||||
Chesapeake Energy Corporation, Convertible | ||||||||
| 480,000 | 5.500%, 9/15/2026e | 519,600 | ||||||
Chevron Corporation | ||||||||
| 70,000 | 1.421%, 11/16/2018d | 70,281 | ||||||
Concho Resources, Inc. | ||||||||
| 435,000 | 6.500%, 1/15/2022 | 450,094 | ||||||
| 570,000 | 5.500%, 10/1/2022 | 590,662 | ||||||
| 320,000 | 4.375%, 1/15/2025 | 319,363 | ||||||
Contura Energy, Inc. | ||||||||
| 111,000 | 10.000%, 8/1/2021* | 118,493 | ||||||
Crestwood Midstream Partners, LP | ||||||||
| 510,000 | 6.250%, 4/1/2023 | 520,200 | ||||||
Devon Energy Corporation | ||||||||
| 210,000 | 3.250%, 5/15/2022 | 208,450 | ||||||
Ecopetrol SA | ||||||||
| 165,000 | 5.875%, 9/18/2023 | 174,653 | ||||||
Encana Corporation | ||||||||
| 25,000 | 3.900%, 11/15/2021 | 25,179 | ||||||
Enterprise Products Operating, LLC | ||||||||
| 960,000 | 7.034%, 1/15/2068 | 980,002 | ||||||
EOG Resources, Inc. | ||||||||
| 180,000 | 2.625%, 3/15/2023 | 174,314 | ||||||
EQT Corporation | ||||||||
| 60,000 | 5.150%, 3/1/2018 | 61,846 | ||||||
| 62,000 | 8.125%, 6/1/2019 | 69,731 | ||||||
Exxon Mobil Corporation | ||||||||
| 140,000 | 1.708%, 3/1/2019 | 140,270 | ||||||
Marathon Oil Corporation | ||||||||
| 200,000 | 2.800%, 11/1/2022 | 191,035 | ||||||
Marathon Petroleum Corporation | ||||||||
| 70,000 | 3.400%, 12/15/2020 | 71,536 | ||||||
MEG Energy Corporation | ||||||||
| 160,000 | 6.500%, 3/15/2021e | 148,000 | ||||||
| 410,000 | 6.375%, 1/30/2023e | 364,900 | ||||||
MPLX, LP | ||||||||
| 1,010,000 | 4.875%, 12/1/2024 | 1,038,783 | ||||||
The accompanying Notes to Financial Statements are an integral part of this schedule.
116
Table of Contents
DIVERSIFIED INCOME PLUS PORTFOLIO
Schedule of Investments as of December 31, 2016
| Principal Amount | Long-Term Fixed Income (47.7%) | Value | ||||||
Energy (2.3%) - continued | ||||||||
Northern Tier Energy, LLC | ||||||||
| $ | 795,000 | 7.125%, 11/15/2020 | $ | 825,806 | ||||
Petrobras Global Finance BV | ||||||||
| 138,000 | 8.375%, 5/23/2021 | 148,695 | ||||||
Petroleos Mexicanos | ||||||||
| 110,000 | 4.607%, 3/11/2022d,e | 113,437 | ||||||
| 168,000 | 6.500%, 3/13/2027e | 173,292 | ||||||
Regency Energy Partners, LP | ||||||||
| 730,000 | 5.000%, 10/1/2022 | 772,787 | ||||||
Sabine Pass Liquefaction, LLC | ||||||||
| 775,000 | 5.625%, 3/1/2025 | 829,250 | ||||||
Schlumberger Holdings Corporation | ||||||||
| 70,000 | 3.000%, 12/21/2020e | 71,425 | ||||||
Shell International Finance BV | ||||||||
| 60,000 | 1.352%, 5/11/2020d | 60,039 | ||||||
Sinopec Group Overseas Development, Ltd. | ||||||||
| 210,000 | 1.750%, 9/29/2019e | 206,564 | ||||||
Sunoco Logistics Partners Operations, LP | ||||||||
| 70,000 | 4.400%, 4/1/2021 | 73,657 | ||||||
TransCanada Trust | ||||||||
| 545,000 | 5.875%, 8/15/2076 | 566,800 | ||||||
Transcontinental Gas Pipe Line Company, LLC | ||||||||
| 80,000 | 7.850%, 2/1/2026e | 100,754 | ||||||
Weatherford International, Ltd. | ||||||||
| 735,000 | 8.250%, 6/15/2023 | 747,862 | ||||||
Whiting Petroleum Corporation, Convertible | ||||||||
| 605,000 | 1.250%, 4/1/2020 | 530,887 | ||||||
WPX Energy, Inc. | ||||||||
| 500,000 | 7.500%, 8/1/2020 | 537,500 | ||||||
|
| |||||||
Total | 13,170,762 | |||||||
|
| |||||||
Financials (6.7%) | ||||||||
ACE INA Holdings, Inc. | ||||||||
| 70,000 | 2.875%, 11/3/2022 | 70,494 | ||||||
Aegon NV | ||||||||
| 720,000 | 1.677%, 4/15/2017d,g | 515,562 | ||||||
AerCap Ireland Capital, Ltd. | ||||||||
| 545,000 | 3.950%, 2/1/2022 | 549,769 | ||||||
Aetna, Inc. | ||||||||
| 190,000 | 1.900%, 6/7/2019 | 189,515 | ||||||
Air Lease Corporation | ||||||||
| 35,000 | 2.625%, 9/4/2018 | 35,238 | ||||||
Ally Financial, Inc. | ||||||||
| 600,000 | 3.750%, 11/18/2019 | 602,568 | ||||||
| 350,000 | 4.125%, 3/30/2020 | 357,000 | ||||||
American Express Credit Corporation | ||||||||
| 70,000 | 2.009%, 9/14/2020d | 71,166 | ||||||
AMG Capital Trust II, Convertible | ||||||||
| 7,400 | 5.150%, 10/15/2037 | 403,994 | ||||||
BAC Capital Trust XIV | ||||||||
| 560,000 | 4.000%, 1/19/2017d,g | 439,600 | ||||||
Banco de Brasil SA | ||||||||
| 490,000 | 9.000%, 6/18/2024e,g | 460,600 | ||||||
Bank of America Corporation | ||||||||
| 164,000 | 5.700%, 5/2/2017 | 166,233 | ||||||
| 43,000 | 8.000%, 1/30/2018g | 44,183 | ||||||
| 58,000 | 5.650%, 5/1/2018 | 60,762 | ||||||
| 185,000 | 5.625%, 7/1/2020 | 203,279 | ||||||
| 200,000 | 2.625%, 4/19/2021 | 198,456 | ||||||
| 280,000 | 2.061%, 10/21/2022d | 284,848 | ||||||
Bank of Montreal | ||||||||
| 185,000 | 1.500%, 7/18/2019 | 182,496 | ||||||
Barclays Bank plc | ||||||||
| 100,000 | 5.140%, 10/14/2020 | 105,533 | ||||||
Barclays plc | ||||||||
| 210,000 | 3.200%, 8/10/2021 | 207,562 | ||||||
Berkshire Hathaway Finance Corporation | ||||||||
| 215,000 | 1.700%, 3/15/2019 | 214,759 | ||||||
Blackstone Mortgage Trust, Inc., Convertible | ||||||||
| 640,000 | 5.250%, 12/1/2018 | 713,600 | ||||||
BNZ International Funding, Ltd. | ||||||||
| 250,000 | 1.939%, 9/14/2021d,e | 250,664 | ||||||
Caisse Centrale Desjardins du Quebec | ||||||||
| 35,000 | 1.552%, 1/29/2018d,e | 34,964 | ||||||
Capital One NA | ||||||||
| 210,000 | 2.400%, 9/5/2019 | 210,374 | ||||||
Centene Escrow Corporation | ||||||||
| 1,050,000 | 5.625%, 2/15/2021 | 1,103,970 | ||||||
Central Fidelity Capital Trust I | ||||||||
| 790,000 | 1.880%, 4/15/2027d | 712,975 | ||||||
CIT Group, Inc. | ||||||||
| 925,000 | 5.000%, 8/15/2022 | 964,312 | ||||||
Citigroup, Inc. | ||||||||
| 97,000 | 1.850%, 11/24/2017 | 97,177 | ||||||
| 200,000 | 2.050%, 6/7/2019 | 199,162 | ||||||
| 185,000 | 2.650%, 10/26/2020 | 184,988 | ||||||
| 175,000 | 2.361%, 9/1/2023d | 178,480 | ||||||
CNA Financial Corporation | ||||||||
| 250,000 | 5.750%, 8/15/2021 | 279,030 | ||||||
Credit Agricole SA | ||||||||
| 50,000 | 1.923%, 6/10/2020d,e | 50,171 | ||||||
Credit Suisse Group AG | ||||||||
| 400,000 | 7.500%, 12/11/2023e,g | 418,500 | ||||||
| 760,000 | 6.250%, 12/18/2024e,g | 739,632 | ||||||
Credit Suisse Group Funding, Ltd. | ||||||||
| 420,000 | 2.750%, 3/26/2020 | 416,081 | ||||||
CyrusOne, LP | ||||||||
| 570,000 | 6.375%, 11/15/2022 | 599,925 | ||||||
Discover Bank | ||||||||
| 43,000 | 8.700%, 11/18/2019 | 48,800 | ||||||
Discover Financial Services | ||||||||
| 90,000 | 6.450%, 6/12/2017 | 91,843 | ||||||
Duke Realty, LP | ||||||||
| 95,000 | 4.375%, 6/15/2022 | 101,141 | ||||||
Fifth Third Bancorp | ||||||||
| 575,000 | 4.900%, 9/30/2019g | 534,940 | ||||||
Goldman Sachs Group, Inc. | ||||||||
| 88,000 | 2.625%, 1/31/2019 | 88,914 | ||||||
| 307,000 | 7.500%, 2/15/2019 | 340,214 | ||||||
| 200,000 | 2.000%, 4/25/2019 | 199,126 | ||||||
| 35,000 | 2.042%, 4/23/2020d | 35,334 | ||||||
| 160,000 | 2.241%, 11/15/2021d | 160,865 | ||||||
| 60,000 | 2.537%, 11/29/2023d | 61,860 | ||||||
| 420,000 | 5.300%, 11/10/2026g | 402,675 | ||||||
Goldman Sachs Group, Inc., Convertible | ||||||||
| 2,450,000 | 0.500%, 9/24/2022 | 2,706,123 | ||||||
Guardian Life Global Funding | ||||||||
| 200,000 | 2.000%, 4/26/2021e | 194,886 | ||||||
Hartford Financial Services Group, Inc. | ||||||||
| 106,000 | 6.000%, 1/15/2019 | 114,025 | ||||||
HCP, Inc. | ||||||||
| 64,000 | 3.750%, 2/1/2019 | 65,778 | ||||||
The accompanying Notes to Financial Statements are an integral part of this schedule.
117
Table of Contents
DIVERSIFIED INCOME PLUS PORTFOLIO
Schedule of Investments as of December 31, 2016
| Principal Amount | Long-Term Fixed Income (47.7%) | Value | ||||||
Financials (6.7%) - continued | ||||||||
Health Care REIT, Inc. | ||||||||
| $ | 110,000 | 4.700%, 9/15/2017 | $ | 112,359 | ||||
Hospitality Properties Trust | ||||||||
| 80,000 | 4.250%, 2/15/2021 | 82,702 | ||||||
HSBC Holdings plc | ||||||||
| 210,000 | 2.358%, 1/5/2022d | 213,913 | ||||||
Huntington Bancshares, Inc. | ||||||||
| 140,000 | 3.150%, 3/14/2021 | 141,857 | ||||||
Icahn Enterprises, LP | ||||||||
| 400,000 | 6.000%, 8/1/2020 | 408,500 | ||||||
ILFC E-Capital Trust II | ||||||||
| 1,035,000 | 4.920%, 12/21/2065d,e | 910,800 | ||||||
ING Capital Funding Trust III | ||||||||
| 89,000 | 4.438%, 3/31/2017d,g | 88,555 | ||||||
International Lease Finance Corporation | ||||||||
| 390,000 | 5.875%, 8/15/2022 | 423,150 | ||||||
Intesa Sanpaolo SPA | ||||||||
| 41,000 | 3.875%, 1/16/2018 | 41,540 | ||||||
| 100,000 | 3.875%, 1/15/2019 | 101,757 | ||||||
J.P. Morgan Chase & Company | ||||||||
| 77,000 | 7.900%, 4/30/2018g | 79,734 | ||||||
| 88,000 | 6.300%, 4/23/2019 | 96,124 | ||||||
| 30,000 | 2.250%, 1/23/2020 | 29,911 | ||||||
| 185,000 | 4.950%, 3/25/2020 | 199,202 | ||||||
| 210,000 | 2.295%, 8/15/2021 | 205,918 | ||||||
| 160,000 | 2.700%, 5/18/2023 | 156,368 | ||||||
| 215,000 | 2.112%, 10/24/2023d | 219,293 | ||||||
J.P. Morgan Chase Bank NA | ||||||||
| 250,000 | 1.588%, 9/23/2019d | 250,188 | ||||||
KeyBank NA | ||||||||
| 250,000 | 1.600%, 8/22/2019 | 246,464 | ||||||
Liberty Mutual Group, Inc. | ||||||||
| 525,000 | 10.750%, 6/15/2058* | 787,500 | ||||||
| 25,000 | 5.000%, 6/1/2021e | 27,176 | ||||||
Lincoln National Corporation | ||||||||
| 185,000 | 6.250%, 2/15/2020 | 204,193 | ||||||
Lloyds Banking Group plc | ||||||||
| 800,000 | 6.413%, 10/1/2035e,g | 858,000 | ||||||
Macquarie Bank, Ltd. | ||||||||
| 80,000 | 2.060%, 1/15/2019d,e | 80,630 | ||||||
MetLife Capital Trust IV | ||||||||
| 823,000 | 7.875%, 12/15/2037e | 992,126 | ||||||
MGIC Investment Corporation, Convertible | ||||||||
| 310,000 | 9.000%, 4/1/2063e | 386,337 | ||||||
| 65,000 | 2.000%, 4/1/2020 | 96,362 | ||||||
Mitsubishi UFJ Financial Group, Inc. | ||||||||
| 250,000 | 2.017%, 9/13/2021d | 250,362 | ||||||
Mizuho Financial Group, Inc. | ||||||||
| 250,000 | 2.097%, 9/13/2021d | 249,915 | ||||||
Morgan Stanley | ||||||||
| 35,000 | 2.026%, 1/27/2020d | 35,310 | ||||||
| 210,000 | 2.800%, 6/16/2020 | 211,571 | ||||||
| 200,000 | 2.500%, 4/21/2021 | 197,655 | ||||||
| 64,000 | 4.875%, 11/1/2022 | 68,517 | ||||||
| 250,000 | 2.282%, 10/24/2023d | 252,778 | ||||||
MPT Operating Partnership, LP | ||||||||
| 510,000 | 5.500%, 5/1/2024 | 515,100 | ||||||
Murray Street Investment Trust I | ||||||||
| 88,000 | 4.647%, 3/9/2017 | 88,458 | ||||||
National City Corporation | ||||||||
| 86,000 | 6.875%, 5/15/2019 | 94,622 | ||||||
National Westminster Bank plc | ||||||||
| 1,140,000 | 1.188%, 2/2/2017d,g | 791,154 | ||||||
New York Life Global Funding | ||||||||
| 70,000 | 1.550%, 11/2/2018e | 69,786 | ||||||
Nomura Holdings, Inc. | ||||||||
| 85,000 | 2.750%, 3/19/2019 | 85,772 | ||||||
Prudential Financial, Inc. | ||||||||
| 775,000 | 5.625%, 6/15/2043 | 805,031 | ||||||
Quicken Loans, Inc. | ||||||||
| 1,005,000 | 5.750%, 5/1/2025e | 977,362 | ||||||
Realty Income Corporation | ||||||||
| 78,000 | 2.000%, 1/31/2018 | 78,212 | ||||||
Regions Bank | ||||||||
| 28,000 | 7.500%, 5/15/2018 | 29,993 | ||||||
Regions Financial Corporation | ||||||||
| 90,000 | 3.200%, 2/8/2021 | 91,200 | ||||||
Reinsurance Group of America, Inc. | ||||||||
| 160,000 | 5.625%, 3/15/2017 | 161,299 | ||||||
Royal Bank of Scotland Group plc | ||||||||
| 725,000 | 7.640%, 9/30/2017g | 672,438 | ||||||
| 230,000 | 7.648%, 9/30/2031g | 262,775 | ||||||
Santander Uk Group Holdings plc | ||||||||
| 210,000 | 2.875%, 8/5/2021 | 205,350 | ||||||
Santander UK plc | ||||||||
| 64,000 | 3.050%, 8/23/2018 | 64,999 | ||||||
Simon Property Group, LP | ||||||||
| 70,000 | 2.500%, 9/1/2020 | 70,476 | ||||||
| 120,000 | 2.500%, 7/15/2021 | 120,009 | ||||||
Societe Generale SA | ||||||||
| 760,000 | 8.250%, 11/29/2018g | 790,446 | ||||||
| 800,000 | 8.000%, 9/29/2025e,g | 800,400 | ||||||
Standard Chartered plc | ||||||||
| 210,000 | 2.041%, 8/19/2019d,e | 210,851 | ||||||
| 960,000 | 6.409%, 1/30/2027e,g | 734,400 | ||||||
State Street Capital Trust IV | ||||||||
| 1,043,000 | 1.963%, 6/15/2037d | 921,751 | ||||||
State Street Corporation | ||||||||
| 70,000 | 1.809%, 8/18/2020d | 70,936 | ||||||
Sumitomo Mitsui Financial Group, Inc. | ||||||||
| 215,000 | 2.631%, 3/9/2021d | 221,188 | ||||||
SunTrust Banks, Inc. | ||||||||
| 95,000 | 2.900%, 3/3/2021 | 96,263 | ||||||
Synchrony Financial | ||||||||
| 94,000 | 1.875%, 8/15/2017 | 94,073 | ||||||
| 25,000 | 2.111%, 2/3/2020d | 24,717 | ||||||
| 94,000 | 3.750%, 8/15/2021 | 96,530 | ||||||
Toronto-Dominion Bank | ||||||||
| 80,000 | 1.722%, 1/22/2019d | 80,656 | ||||||
| 70,000 | 1.889%, 12/14/2020d | 70,823 | ||||||
UnitedHealth Group, Inc. | ||||||||
| 70,000 | 3.350%, 7/15/2022 | 72,044 | ||||||
USB Realty Corporation | ||||||||
| 760,000 | 2.027%, 1/15/2022d,e,g | 668,800 | ||||||
Voya Financial, Inc. | ||||||||
| 129,000 | 2.900%, 2/15/2018 | 130,582 | ||||||
Wells Fargo & Company | ||||||||
| 35,000 | 1.567%, 1/30/2020d | 34,983 | ||||||
| 210,000 | 2.150%, 1/30/2020 | 208,876 | ||||||
| 205,000 | 2.100%, 7/26/2021 | 199,292 | ||||||
| 250,000 | 2.117%, 10/31/2023d | 253,086 | ||||||
Westpac Banking Corporation | ||||||||
| 275,000 | 1.761%, 8/19/2021d | 275,790 | ||||||
|
| |||||||
Total | 37,611,436 | |||||||
|
| |||||||
The accompanying Notes to Financial Statements are an integral part of this schedule.
118
Table of Contents
DIVERSIFIED INCOME PLUS PORTFOLIO
Schedule of Investments as of December 31, 2016
| Principal Amount | Long-Term Fixed Income (47.7%) | Value | ||||||
Foreign Government (3.5%) | ||||||||
Brazil Government International Bond | ||||||||
| $ | 330,000 | 4.875%, 1/22/2021 | $ | 339,900 | ||||
| 500,000 | 2.625%, 1/5/2023 | 445,000 | ||||||
| 337,000 | 6.000%, 4/7/2026 | 348,795 | ||||||
| 300,000 | 7.125%, 1/20/2037 | 312,750 | ||||||
| 360,000 | 5.000%, 1/27/2045 | 292,032 | ||||||
| 250,000 | 5.625%, 2/21/2047 | 219,375 | ||||||
Colombia Government International Bond | ||||||||
| 300,000 | 4.375%, 7/12/2021 | 314,250 | ||||||
| 350,000 | 2.625%, 3/15/2023 | 329,875 | ||||||
| 250,000 | 4.000%, 2/26/2024 | 252,500 | ||||||
| 154,000 | 5.625%, 2/26/2044 | 158,620 | ||||||
| 360,000 | 5.000%, 6/15/2045 | 341,550 | ||||||
Croatia Government International Bond | ||||||||
| 60,000 | 6.750%, 11/5/2019e | 65,100 | ||||||
| 350,000 | 6.625%, 7/14/2020e | 380,681 | ||||||
| 170,000 | 6.000%, 1/26/2024e | 184,238 | ||||||
Hungary Government International Bond | ||||||||
| 120,000 | 6.375%, 3/29/2021 | 134,371 | ||||||
| 400,000 | 5.750%, 11/22/2023 | 443,500 | ||||||
| 372,000 | 5.375%, 3/25/2024 | 405,480 | ||||||
Indonesia Government International Bond | ||||||||
| 370,000 | 4.875%, 5/5/2021e | 391,686 | ||||||
| 290,000 | 3.375%, 4/15/2023e | 282,889 | ||||||
| 270,000 | 5.875%, 1/15/2024e | 297,892 | ||||||
| 210,000 | 4.125%, 1/15/2025e | 208,076 | ||||||
| 200,000 | 4.750%, 1/8/2026e | 206,457 | ||||||
| 360,000 | 8.500%, 10/12/2035e | 488,373 | ||||||
| 600,000 | 5.125%, 1/15/2045e | 598,654 | ||||||
Mexico Government International Bond | ||||||||
| 62,000 | 5.750%, 10/12/2110 | 57,195 | ||||||
| 180,000 | 3.625%, 3/15/2022 | 180,360 | ||||||
| 454,000 | 4.000%, 10/2/2023 | 455,044 | ||||||
| 350,000 | 3.600%, 1/30/2025 | 337,400 | ||||||
| 370,000 | 4.125%, 1/21/2026 | 367,040 | ||||||
| 120,000 | 6.750%, 9/27/2034 | 142,200 | ||||||
| 118,000 | 6.050%, 1/11/2040 | 127,617 | ||||||
| 366,000 | 4.750%, 3/8/2044 | 332,694 | ||||||
| 180,000 | 5.550%, 1/21/2045 | 184,050 | ||||||
| 196,000 | 4.600%, 1/23/2046 | 175,910 | ||||||
| 200,000 | 4.350%, 1/15/2047 | 171,500 | ||||||
Panama Government International Bond | ||||||||
| 180,000 | 4.000%, 9/22/2024 | 183,150 | ||||||
| 270,000 | 3.750%, 3/16/2025 | 267,975 | ||||||
| 210,000 | 6.700%, 1/26/2036 | 254,835 | ||||||
Peru Government International Bond | ||||||||
| 100,000 | 5.625%, 11/18/2050 | 113,250 | ||||||
| 252,000 | 4.125%, 8/25/2027 | 261,765 | ||||||
| 303,000 | 8.750%, 11/21/2033 | 442,380 | ||||||
Philippines Government International Bond | ||||||||
| 464,000 | 4.000%, 1/15/2021 | 493,505 | ||||||
| 325,000 | 7.750%, 1/14/2031 | 456,863 | ||||||
| 90,000 | 6.375%, 10/23/2034 | 117,065 | ||||||
| 100,000 | 5.000%, 1/13/2037 | 112,842 | ||||||
| 200,000 | 3.950%, 1/20/2040 | 196,902 | ||||||
Romania Government International Bond | ||||||||
| 196,000 | 4.375%, 8/22/2023e | 201,684 | ||||||
| 100,000 | 4.875%, 1/22/2024e | 105,768 | ||||||
| 58,000 | 6.125%, 1/22/2044e | 67,700 | ||||||
Russia Government International Bond | ||||||||
| 180,000 | 3.500%, 1/16/2019e | 182,934 | ||||||
| 920,000 | 5.000%, 4/29/2020e | 976,258 | ||||||
| 336,000 | 4.875%, 9/16/2023e | 353,949 | ||||||
| 240,750 | 7.500%, 3/31/2030e | 289,863 | ||||||
| 720,000 | 5.625%, 4/4/2042e | 774,268 | ||||||
South Africa Government International Bond | ||||||||
| 55,000 | 5.500%, 3/9/2020 | 58,234 | ||||||
| 210,000 | 5.875%, 5/30/2022 | 228,644 | ||||||
| 258,000 | 4.300%, 10/12/2028 | 239,295 | ||||||
Turkey Government International Bond | ||||||||
| 122,000 | 7.500%, 11/7/2019 | 132,675 | ||||||
| 392,000 | 7.000%, 6/5/2020 | 420,899 | ||||||
| 485,000 | 5.125%, 3/25/2022 | 481,314 | ||||||
| 180,000 | 6.250%, 9/26/2022 | 186,939 | ||||||
| 322,000 | 5.750%, 3/22/2024 | 322,931 | ||||||
| 490,000 | 4.250%, 4/14/2026 | 435,559 | ||||||
| 210,000 | 4.875%, 10/9/2026 | 194,291 | ||||||
| 362,000 | 6.875%, 3/17/2036 | 372,360 | ||||||
| 232,000 | 4.875%, 4/16/2043 | 186,876 | ||||||
| 360,000 | 6.625%, 2/17/2045 | 357,966 | ||||||
|
| |||||||
Total | 19,443,993 | |||||||
|
| |||||||
Mortgage-Backed Securities (6.2%) | ||||||||
Federal Home Loan Mortgage Corporation Gold 15-Yr. Pass Through | ||||||||
| 2,950,000 | 3.000%, 1/1/2032c | 3,025,815 | ||||||
Federal National Mortgage Association Conventional 15-Yr. Pass Through | ||||||||
| 7,500,000 | 2.500%, 1/1/2032c | 7,508,250 | ||||||
Federal National Mortgage Association Conventional 30-Yr. Pass Through | ||||||||
| 14,800,000 | 3.000%, 1/1/2047c | 14,691,960 | ||||||
| 5,800,000 | 3.500%, 1/1/2047c | 5,940,940 | ||||||
| 3,850,000 | 4.000%, 1/1/2047c | 4,045,580 | ||||||
|
| |||||||
Total | 35,212,545 | |||||||
|
| |||||||
Technology (1.6%) | ||||||||
Alliance Data Systems Corporation | ||||||||
| 420,000 | 5.375%, 8/1/2022e | 405,300 | ||||||
Apple, Inc. | ||||||||
| 60,000 | 1.202%, 5/6/2020d | 59,951 | ||||||
Automatic Data Processing, Inc. | ||||||||
| 70,000 | 2.250%, 9/15/2020 | 70,310 | ||||||
Cisco Systems, Inc. | ||||||||
| 90,000 | 1.511%, 2/21/2018d | 90,517 | ||||||
| 65,000 | 1.431%, 3/1/2019d | 65,371 | ||||||
CommScope Technologies Finance, LLC | ||||||||
| 580,000 | 6.000%, 6/15/2025e | 614,800 | ||||||
Cypress Semiconductor Corporation, Convertible | ||||||||
| 400,000 | 4.500%, 1/15/2022e | 449,750 | ||||||
Diamond 1 Finance Corporation | ||||||||
| 95,000 | 3.480%, 6/1/2019e | 96,952 | ||||||
The accompanying Notes to Financial Statements are an integral part of this schedule.
119
Table of Contents
DIVERSIFIED INCOME PLUS PORTFOLIO
Schedule of Investments as of December 31, 2016
| Principal Amount | Long-Term Fixed Income (47.7%) | Value | ||||||
Technology (1.6%) - continued | ||||||||
Equinix, Inc. | ||||||||
| $675,000 | 5.750%, 1/1/2025 | $ | 705,375 | |||||
Fidelity National Information Services, Inc. | ||||||||
| 70,000 | 3.625%, 10/15/2020 | 72,415 | ||||||
| 275,000 | 2.250%, 8/15/2021 | 267,884 | ||||||
First Data Corporation | ||||||||
| 510,000 | 5.375%, 8/15/2023e | 529,125 | ||||||
Hewlett Packard Enterprise Company | ||||||||
| 268,000 | 3.600%, 10/15/2020 | 272,439 | ||||||
Intel Corporation | ||||||||
| 160,000 | 1.700%, 5/19/2021 | 156,116 | ||||||
| 70,000 | 3.100%, 7/29/2022 | 71,904 | ||||||
Intel Corporation, Convertible | ||||||||
| 520,000 | 2.950%, 12/15/2035 | 702,325 | ||||||
Micron Technology, Inc., Convertible | ||||||||
| 295,000 | 2.375%, 5/1/2032 | 685,506 | ||||||
| 450,000 | 3.000%, 11/15/2043 | 446,906 | ||||||
Microsoft Corporation | ||||||||
| 210,000 | 1.100%, 8/8/2019 | 207,082 | ||||||
NXP BV | ||||||||
| 565,000 | 3.875%, 9/1/2022e | 572,062 | ||||||
NXP Semiconductors NV, Convertible | ||||||||
| 695,000 | 1.000%, 12/1/2019 | 790,563 | ||||||
Oracle Corporation | ||||||||
| 60,000 | 2.500%, 5/15/2022 | 59,520 | ||||||
Plantronics, Inc. | ||||||||
| 800,000 | 5.500%, 5/31/2023e | 808,000 | ||||||
Sensata Technologies BV | ||||||||
| 725,000 | 4.875%, 10/15/2023e | 741,313 | ||||||
Texas Instruments, Inc. | ||||||||
| 60,000 | 1.750%, 5/1/2020 | 59,303 | ||||||
|
| |||||||
Total | 9,000,789 | |||||||
|
| |||||||
Transportation (0.4%) | ||||||||
American Airlines Pass Through Trust | ||||||||
| 68,724 | 4.950%, 1/15/2023 | 73,277 | ||||||
Avis Budget Car Rental, LLC | ||||||||
| 770,000 | 5.125%, 6/1/2022e | 754,600 | ||||||
Delta Air Lines, Inc. | ||||||||
| 41,550 | 4.950%, 5/23/2019 | 43,544 | ||||||
ERAC USA Finance, LLC | ||||||||
| 175,000 | 2.600%, 12/1/2021e | 172,052 | ||||||
J.B. Hunt Transport Services, Inc. | ||||||||
| 70,000 | 3.300%, 8/15/2022 | 70,204 | ||||||
Korea Expressway Corporation | ||||||||
| 123,000 | 1.625%, 4/28/2017e | 122,925 | ||||||
Trinity Industries, Inc., Convertible | ||||||||
| 266,000 | 3.875%, 6/1/2036 | 340,313 | ||||||
United Airlines Pass Through Trust | ||||||||
| 70,000 | 3.700%, 12/1/2022 | 70,525 | ||||||
XPO Logistics, Inc. | ||||||||
| 705,000 | 6.500%, 6/15/2022e | 740,250 | ||||||
|
| |||||||
Total | 2,387,690 | |||||||
|
| |||||||
U.S. Government and Agencies (0.5%) | ||||||||
U.S. Treasury Notes | ||||||||
| 400,000 | 0.875%, 1/31/2017i | 400,159 | ||||||
| 830,000 | 1.125%, 8/31/2021 | 801,182 | ||||||
| 830,000 | 2.125%, 6/30/2022 | 832,023 | ||||||
| 600,000 | 1.625%, 2/15/2026 | 559,765 | ||||||
|
| |||||||
Total | 2,593,129 | |||||||
|
| |||||||
Utilities (1.2%) | ||||||||
AES Corporation | ||||||||
| 300,000 | 7.375%, 7/1/2021 | 334,170 | ||||||
Ameren Corporation | ||||||||
| 70,000 | 2.700%, 11/15/2020 | 70,322 | ||||||
Calpine Corporation | ||||||||
| 560,000 | 6.000%, 1/15/2022e | 585,200 | ||||||
| 730,000 | 5.375%, 1/15/2023 | 713,575 | ||||||
Dominion Resources, Inc. | ||||||||
| 200,000 | 1.600%, 8/15/2019 | 196,862 | ||||||
Dynegy, Inc. | ||||||||
| 700,000 | 7.375%, 11/1/2022 | 668,500 | ||||||
Electricite de France SA | ||||||||
| 305,000 | 5.250%, 1/19/2023e,g | 286,700 | ||||||
Emera U.S. Finance, LP | ||||||||
| 116,000 | 2.150%, 6/15/2019e | 115,759 | ||||||
Energy Transfer Equity, LP | ||||||||
| 780,000 | 5.500%, 6/1/2027 | 760,500 | ||||||
Energy Transfer Partners, LP | ||||||||
| 165,000 | 4.150%, 10/1/2020 | 170,743 | ||||||
Exelon Generation Company, LLC | ||||||||
| 88,000 | 5.200%, 10/1/2019 | 94,272 | ||||||
Fortis, Inc. | ||||||||
| 180,000 | 2.100%, 10/4/2021e | 173,806 | ||||||
NextEra Energy Capital Holdings, Inc. | ||||||||
| 95,000 | 2.300%, 4/1/2019 | 95,686 | ||||||
NiSource Finance Corporation | ||||||||
| 216,000 | 5.450%, 9/15/2020 | 235,700 | ||||||
NRG Energy, Inc. | ||||||||
| 390,000 | 6.625%, 3/15/2023 | 390,975 | ||||||
PPL Capital Funding, Inc. | ||||||||
| 260,000 | 3.500%, 12/1/2022 | 265,609 | ||||||
PSEG Power, LLC | ||||||||
| 100,000 | 3.000%, 6/15/2021 | 100,220 | ||||||
Southern Company | ||||||||
| 200,000 | 1.850%, 7/1/2019 | 199,295 | ||||||
Tesoro Corporation | ||||||||
| 910,000 | 4.750%, 12/15/2023e | 914,550 | ||||||
Williams Partners, LP | ||||||||
| 200,000 | 5.250%, 3/15/2020 | 213,549 | ||||||
Xcel Energy, Inc. | ||||||||
| 60,000 | 1.200%, 6/1/2017 | 59,942 | ||||||
|
| |||||||
Total | 6,645,935 | |||||||
|
| |||||||
Total Long-Term Fixed Income (cost $265,712,999) | 268,691,593 | |||||||
|
| |||||||
| Shares | Common Stock (26.8%) | |||||||
Consumer Discretionary (4.2%) | ||||||||
| 4,540 | Amazon.com, Inc.j | 3,404,410 | ||||||
| 30,470 | American Axle & Manufacturing Holdings, Inc.j | 588,071 | ||||||
| 9,250 | Aramark | 330,410 | ||||||
| 2,600 | AutoZone, Inc.j | 2,053,454 | ||||||
| 8,558 | Berkeley Group Holdings plc | 295,842 | ||||||
| 1,300 | Brembo SPA | 78,644 | ||||||
| 12,600 | Bridgestone Corporation | 453,358 | ||||||
| 7,842 | Bunzl plc | 203,590 | ||||||
| 6,860 | Burlington Stores, Inc.j | 581,385 | ||||||
| 1,900 | Canon Marketing Japan, Inc. | 31,903 | ||||||
| 5,835 | Cedar Fair, LP | 374,607 | ||||||
| 32,744 | Comcast Corporation | 2,260,973 | ||||||
| 12,500 | Denso Corporation | 540,706 | ||||||
| 12,300 | Eutelsat Communications | 237,854 | ||||||
| 20,800 | Ford Motor Company | 252,304 | ||||||
| 12,800 | Fuji Heavy Industries, Ltd. | 521,529 | ||||||
| 8,650 | General Motors Company | 301,366 | ||||||
| 3,100 | Hakuhodo Dy Holdings, Inc. | 38,171 | ||||||
| 33,000 | Honda Motor Company, Ltd. | 963,445 | ||||||
The accompanying Notes to Financial Statements are an integral part of this schedule.
120
Table of Contents
DIVERSIFIED INCOME PLUS PORTFOLIO
Schedule of Investments as of December 31, 2016
| Shares | Common Stock (26.8%) | Value | ||||||
Consumer Discretionary (4.2%) - continued | ||||||||
| 17,000 | Inchcape plc | $ | 146,914 | |||||
| 2,256 | Intertek Group plc | 96,688 | ||||||
| 1,020 | Linamar Corporation | 43,827 | ||||||
| 1,181 | LVMH Moet Hennessy Louis Vuitton SE | 225,184 | ||||||
| 8,980 | Newell Brands, Inc. | 400,957 | ||||||
| 1,100 | Nifco, Inc. | 57,958 | ||||||
| 38,430 | NIKE, Inc. | 1,953,397 | ||||||
| 1,092 | Nokian Renkaat Oyj | 40,598 | ||||||
| 5,800 | Panasonic Corporation | 58,825 | ||||||
| 13,779 | Persimmon plc | 300,627 | ||||||
| 1,940 | Publicis Groupe SA | 133,675 | ||||||
| 1,630 | Restaurant Brands International, Inc. | 77,686 | ||||||
| 6,986 | Restoration Hardware Holdings, Inc.j | 214,470 | ||||||
| 600 | RTL Group SA | 43,958 | ||||||
| 2,300 | Sekisui Chemical Company, Ltd. | 36,613 | ||||||
| 14,440 | Starbucks Corporation | 801,709 | ||||||
| 13,000 | Sumitomo Forestry Company, Ltd. | 171,695 | ||||||
| 9,500 | Sumitomo Rubber Industries, Ltd. | 150,312 | ||||||
| 700 | Swatch Group AG | 42,720 | ||||||
| 36,540 | Time, Inc. | 652,239 | ||||||
| 16,880 | Toll Brothers, Inc.j | 523,280 | ||||||
| 7,160 | Tractor Supply Company | 542,800 | ||||||
| 200 | Valora Holding AG | 56,810 | ||||||
| 21,870 | Walt Disney Company | 2,279,291 | ||||||
| 840 | Whirlpool Corporation | 152,687 | ||||||
| 1,700 | Whitbread plc | 79,081 | ||||||
| 10,344 | Wolters Kluwer NV | 374,135 | ||||||
| 8,100 | WPP plc | 180,254 | ||||||
| 4,300 | Yokohama Rubber Company, Ltd. | 76,864 | ||||||
|
| |||||||
Total | 23,427,276 | |||||||
|
| |||||||
Consumer Staples (1.2%) | ||||||||
| 12,820 | AdvancePierre Foods Holdings, Inc. | 381,780 | ||||||
| 6,600 | Axfood AB | 103,640 | ||||||
| 29,345 | Coca-Cola Amatil, Ltd. | 214,013 | ||||||
| 11,800 | Coca-Cola HBC AG | 256,950 | ||||||
| 2,400 | Ebro Foods SA | 50,228 | ||||||
| 1,348 | Henkel AG & Company KGaA | 140,291 | ||||||
| 18,527 | Imperial Brands plc | 807,421 | ||||||
| 2,300 | Jeronimo Martins SGPS SA | 35,672 | ||||||
| 1,000 | Kesko Oyj | 49,906 | ||||||
| 6,100 | Kewpie Corporation | 147,948 | ||||||
| 3,100 | Kirin Holdings Company, Ltd. | 50,317 | ||||||
| 43,339 | Koninklijke Ahold Delhaize NV | 912,852 | ||||||
| 7 | Lindt & Spruengli AG | 36,221 | ||||||
| 3,500 | Nestle SA | 250,732 | ||||||
| 15,550 | Philip Morris International, Inc. | 1,422,669 | ||||||
| 2,500 | Suedzucker AG | 59,592 | ||||||
| 11,881 | Tate & Lyle plc | 103,397 | ||||||
| 2,600 | Universal Corporation | 165,750 | ||||||
| 11,970 | Walgreens Boots Alliance, Inc. | 990,637 | ||||||
| 21,920 | Whole Foods Market, Inc. | 674,259 | ||||||
| 21,699 | William Morrison Supermarkets plc | 61,632 | ||||||
|
| |||||||
Total | 6,915,907 | |||||||
|
| |||||||
Energy (1.8%) | ||||||||
| 2,438 | Arch Coal, Inc.j | 190,286 | ||||||
| 279,508 | BP plc | 1,750,689 | ||||||
| 8,610 | Concho Resources, Inc.j | 1,141,686 | ||||||
| 3,232 | Contura Energy, Inc.j | 229,472 | ||||||
| 6,053 | Crescent Point Energy Corporation | 82,275 | ||||||
| 20,410 | Devon Energy Corporation | 932,125 | ||||||
| 7,800 | Galp Energia SGPS SA | 116,285 | ||||||
| 21,600 | Halliburton Company | 1,168,344 | ||||||
| 8,265 | John Wood Group plc | 89,250 | ||||||
| 11,061 | OMV AG | 389,942 | ||||||
| 11,757 | Petrofac, Ltd. | 125,820 | ||||||
| 6,890 | Pioneer Natural Resources Company | 1,240,682 | ||||||
| 10,210 | Range Resources Corporation | 350,816 | ||||||
| 9,089 | Royal Dutch Shell plc | 247,909 | ||||||
| 2,367 | Royal Dutch Shell plc, Class A | 65,338 | ||||||
| 22,102 | Royal Dutch Shell plc, Class B | 635,036 | ||||||
| 8,770 | Statoil ASA | 160,067 | ||||||
| 882 | Tecnicas Reunidas SA | 36,071 | ||||||
| 8,970 | Total SA | 460,092 | ||||||
| 8,970 | Total SA Rightsj,k | 153 | ||||||
| 692 | Vantage Drilling Internationalj | 69,892 | ||||||
| 30,950 | WPX Energy, Inc.j | 450,941 | ||||||
|
| |||||||
Total | 9,933,171 | |||||||
|
| |||||||
Financials (4.7%) | ||||||||
| 58,785 | Aberdeen Asset Management plc | 185,867 | ||||||
| 3,370 | Affiliated Managers Group, Inc.j | 489,661 | ||||||
| 200,000 | Apollo Investment Corporation | 1,172,000 | ||||||
| 115,400 | Ares Capital Corporation | 1,902,946 | ||||||
| 12,042 | ASX, Ltd. | 431,406 | ||||||
| 20,376 | Australia & New Zealand Banking Group, Ltd. | 446,056 | ||||||
| 132,410 | Bank of America Corporation | 2,926,261 | ||||||
| 23,205 | Bank of East Asia, Ltd. | 88,588 | ||||||
| 1,078 | Bank of Montreal | 77,535 | ||||||
| 15,416 | Bank of Nova Scotia | 858,377 | ||||||
| 11,680 | Bank of the Ozarks, Inc. | 614,251 | ||||||
| 2,111 | Canadian Imperial Bank of Commerce | 172,257 | ||||||
| 9,000 | Chiba Bank, Ltd. | 55,171 | ||||||
| 5,588 | CI Financial Corporation | 120,155 | ||||||
| 17,967 | CNP Assurances | 332,558 | ||||||
| 7,789 | Danske Bank AS | 235,647 | ||||||
| 49,686 | Direct Line Insurance Group plc | 226,130 | ||||||
| 29,380 | Encore Capital Group, Inc.j | 841,737 | ||||||
| 5,500 | Erste Group Bank AG | 160,805 | ||||||
| 61,459 | FlexiGroup, Ltd. | 100,021 | ||||||
| 72,000 | Fukuoka Financial Group, Inc. | 319,319 | ||||||
| 6,508 | Genworth MI Canada, Inc.l | 163,154 | ||||||
| 10,900 | Goldman Sachs Group, Inc. | 2,610,005 | ||||||
| 120,000 | Golub Capital BDC, Inc. | 2,206,800 | ||||||
| 7,000 | Hang Seng Bank, Ltd. | 129,812 | ||||||
| 3,900 | Hannover Rueckversicherung SE | 421,308 | ||||||
| 57,600 | Henderson Group plc | 166,245 | ||||||
| 73,508 | HSBC Holdings plc | 593,111 | ||||||
| 2,321 | Intact Financial Corporation | 166,125 | ||||||
| 6,650 | Intercontinental Exchange, Inc. | 375,193 | ||||||
| 44,780 | KeyCorp | 818,131 | ||||||
| 5,318 | Macquarie Group, Ltd. | 333,131 | ||||||
| 117,088 | Mapfre SA | 356,663 | ||||||
| 146,300 | Mizuho Financial Group, Inc. | 262,540 | ||||||
| 2,800 | MS and AD Insurance Group Holdings, Inc. | 86,709 | ||||||
| 17,409 | National Bank of Canada | 707,044 | ||||||
| 17,003 | Nordea Bank AB | 188,404 | ||||||
| 5,197 | Power Corporation of Canada | 116,315 | ||||||
| 6,370 | Raymond James Financial, Inc. | 441,250 | ||||||
| 26,500 | Resona Holdings, Inc. | 135,813 | ||||||
| 1,343 | Schroders plc | 49,326 | ||||||
| 12,000 | Seven Bank, Ltd. | 34,312 | ||||||
| 6,800 | Swiss Re AG | 643,368 | ||||||
| 43,710 | Synchrony Financial | 1,585,362 | ||||||
| 12,000 | T&D Holdings, Inc. | 158,369 | ||||||
| 764 | TMX Group, Ltd. | 40,697 | ||||||
| 17,484 | United Overseas Bank, Ltd. | 245,631 | ||||||
| 21,939 | Westpac Banking Corporation | 514,995 | ||||||
| 15,270 | XL Group, Ltd. | 568,960 | ||||||
The accompanying Notes to Financial Statements are an integral part of this schedule.
121
Table of Contents
DIVERSIFIED INCOME PLUS PORTFOLIO
Schedule of Investments as of December 31, 2016
| Shares | Common Stock (26.8%) | Value | ||||||
Financials (4.7%) - continued | ||||||||
| 13,040 | Zions Bancorporation | $ | 561,242 | |||||
| 449 | Zurich Insurance Group AGj | 123,394 | ||||||
|
| |||||||
Total | 26,560,157 | |||||||
|
| |||||||
Health Care (2.6%) | ||||||||
| 8,970 | Acadia Healthcare Company, Inc.j | 296,907 | ||||||
| 14,320 | Akorn, Inc.j | 312,606 | ||||||
| 5,480 | Allergan plcj | 1,150,855 | ||||||
| 2,370 | Anthem, Inc. | 340,735 | ||||||
| 3,914 | AstraZeneca plc | 213,736 | ||||||
| 24,720 | Bristol-Myers Squibb Company | 1,444,637 | ||||||
| 6,439 | CAE, Inc. | 90,064 | ||||||
| 15,610 | Celgene Corporationj | 1,806,857 | ||||||
| 4,368 | Essilor International SA | 492,835 | ||||||
| 9,193 | GlaxoSmithKline plc | 176,585 | ||||||
| 4,351 | Hikma Pharmaceuticals plc | 101,412 | ||||||
| 11,510 | Hologic, Inc.j | 461,781 | ||||||
| 1,300 | Laboratory Corporation of America Holdingsj | 166,894 | ||||||
| 900 | Lonza Group AG | 155,546 | ||||||
| 24,460 | Medtronic plc | 1,742,286 | ||||||
| 34,610 | Merck & Company, Inc. | 2,037,491 | ||||||
| 2,973 | Merck KGaA | 309,553 | ||||||
| 19,155 | Novartis AG | 1,393,019 | ||||||
| 9,100 | Novo Nordisk AS | 326,437 | ||||||
| 1,000 | Roche Holding AG-Genusschein | 227,953 | ||||||
| 2,410 | Teleflex, Inc. | 388,371 | ||||||
| 8,590 | Vertex Pharmaceuticals, Inc.j | 632,825 | ||||||
| 2,900 | Waters Corporationj | 389,731 | ||||||
|
| |||||||
Total | 14,659,116 | |||||||
|
| |||||||
Industrials (2.9%) | ||||||||
| 35 | A P Moller - Maersk AS | 55,789 | ||||||
| 10,064 | ABB, Ltd. | 211,764 | ||||||
| 6,060 | Acuity Brands, Inc. | 1,399,012 | ||||||
| 6,677 | Adecco SA | 435,853 | ||||||
| 33,800 | Air New Zealand, Ltd. | 51,474 | ||||||
| 21,000 | Asahi Glass Company, Ltd. | 142,478 | ||||||
| 1,500 | Atlas Copco Aktiebolag | 45,505 | ||||||
| 2,848 | Berendsen plc | 30,535 | ||||||
| 6,000 | Dai Nippon Printing Company, Ltd. | 59,200 | ||||||
| 10,270 | Delta Air Lines, Inc. | 505,181 | ||||||
| 4,816 | Deutsche Post AG | 157,941 | ||||||
| 2,800 | DSV AS | 124,349 | ||||||
| 36,135 | El Al Israel Airlines, Ltd. | 23,895 | ||||||
| 3,830 | Equifax, Inc. | 452,821 | ||||||
| 328 | Flughafen Zuerich AG | 60,781 | ||||||
| 1,900 | Fraport AG Frankfurt Airport Services Worldwide | 112,115 | ||||||
| 5,400 | Fuji Machine Manufacturing Company, Ltd. | 61,653 | ||||||
| 2,200 | Hitachi Transport System, Ltd. | 44,571 | ||||||
| 807 | Hochtief AG | 112,668 | ||||||
| 12,626 | Illinois Tool Works, Inc. | 1,546,180 | ||||||
| 3,600 | Inaba Denki Sangyo Company, Ltd. | 123,767 | ||||||
| 51,400 | ITOCHU Corporation | 680,575 | ||||||
| 25,890 | Jacobs Engineering Group, Inc.j | 1,475,730 | ||||||
| 2,400 | Jardine Matheson Holdings, Ltd. | 132,600 | ||||||
| 12,400 | KITZ Corporation | 67,700 | ||||||
| 6,000 | Komatsu, Ltd. | 135,901 | ||||||
| 12,000 | KONE Oyj | 536,205 | ||||||
| 2,912 | Koninklijke Boskalis Westminster NV | 101,024 | ||||||
| 8,200 | Marubeni Corporation | 46,380 | ||||||
| 8,830 | Masonite International Corporationj | 581,014 | ||||||
| 19,605 | Meggitt plc | 110,714 | ||||||
| 4,190 | Middleby Corporationj | 539,714 | ||||||
| 4,900 | MIRAIT Holdings Corporation | 44,160 | ||||||
| 4,200 | Mitsubishi Corporation | 89,202 | ||||||
| 20,300 | Mitsubishi Electric Corporation | 282,356 | ||||||
| 14,000 | Mitsubishi Heavy Industries, Ltd. | 63,645 | ||||||
| 5,000 | Mitsuboshi Belting, Ltd. | 42,516 | ||||||
| 2,900 | Mitsui & Company, Ltd. | 39,737 | ||||||
| 7,822 | National Express Group plc | 34,086 | ||||||
| 2,000 | NIPPO Corporation | 37,261 | ||||||
| 9,300 | Nitto Kogyo Corporation | 126,620 | ||||||
| 3,000 | Okuma Corporation | 28,543 | ||||||
| 8,490 | Oshkosh Corporation | 548,539 | ||||||
| 3,222 | Philips Lighting NVe,j | 79,365 | ||||||
| 2,576 | Randstad Holding NV | 139,536 | ||||||
| 4,600 | RELX NV | 77,372 | ||||||
| 262 | Rieter Holding AG | 45,566 | ||||||
| 11,870 | Rolls-Royce Holdings plcj | 97,495 | ||||||
| 4,800 | Sanwa Holdings Corporation | 45,653 | ||||||
| 795 | Schindler Holding AG, Participation Certificate | 140,010 | ||||||
| 1,047 | Schneider Electric SE | 72,734 | ||||||
| 5,453 | Siemens AG | 667,667 | ||||||
| 2,668 | Skanska AB | 62,816 | ||||||
| 9,698 | SKF AB | 177,824 | ||||||
| 8,394 | Smiths Group plc | 146,116 | ||||||
| 28,400 | Sojitz Corporation | 68,761 | ||||||
| 1,135 | Sulzer, Ltd. | 116,840 | ||||||
| 17,970 | Union Pacific Corporation | 1,863,130 | ||||||
| 7,280 | Vinci SA | 495,221 | ||||||
| 5,040 | WABCO Holdings, Inc.j | 534,996 | ||||||
| 1,592 | Wolseley plc | 97,186 | ||||||
| 2,034 | WSP Global, Inc. | 67,702 | ||||||
| 1,600 | Yuasa Trading Company, Ltd. | 39,856 | ||||||
|
| |||||||
Total | 16,537,600 | |||||||
|
| |||||||
Information Technology (4.0%) | ||||||||
| 1,745 | Advanced Micro Devices, Inc.j | 19,788 | ||||||
| 2,500 | Alliance Data Systems Corporation | 571,250 | ||||||
| 2,120 | Alphabet, Inc., Class Aj | 1,679,994 | ||||||
| 1,104 | Alphabet, Inc., Class Cj | 852,089 | ||||||
| 21,650 | Apple, Inc. | 2,507,503 | ||||||
| 4,900 | Canon, Inc. | 137,995 | ||||||
| 2,996 | Capital Power Corporation | 51,836 | ||||||
| 1,500 | DTS Corporation | 31,907 | ||||||
| 14,180 | Facebook, Inc.j | 1,631,409 | ||||||
| 17,440 | Finisar Corporationj | 527,909 | ||||||
| 11,200 | FUJIFILM Holdings NPV | 424,097 | ||||||
| 18,710 | Juniper Networks, Inc. | 528,745 | ||||||
| 6,100 | Konica Minolta Holdings, Inc. | 60,455 | ||||||
| 25,270 | Microsoft Corporation | 1,570,278 | ||||||
| 4,800 | NEC Networks & System Integration Corporation | 86,540 | ||||||
| 1,642 | Nice, Ltd. | 112,662 | ||||||
| 3,900 | Nichicon Corporation | 33,958 | ||||||
| 1,100 | NTT Data Corporation | 53,143 | ||||||
| 5,605 | NVIDIA Corporation | 598,278 | ||||||
| 8,230 | Palo Alto Networks, Inc.j | 1,029,161 | ||||||
| 54,980 | Pandora Media, Inc.j | 716,939 | ||||||
| 35,640 | PayPal Holdings, Inc.j | 1,406,711 | ||||||
| 9,010 | Plantronics, Inc. | 493,388 | ||||||
| 37,030 | Pure Storage, Inc.j | 418,809 | ||||||
| 600 | Rohm Company, Ltd. | 34,424 | ||||||
| 1,900 | Ryosan Company, Ltd. | 57,282 | ||||||
| 12,790 | Salesforce.com, Inc.j | 875,603 | ||||||
| 623 | SAP SE | 53,893 | ||||||
| 2,810 | Seagate Technology plc | 107,258 | ||||||
| 1,538 | Software AG | 55,743 | ||||||
| 11,492 | Telefonaktiebolaget LM Ericsson | 67,354 | ||||||
| 1,600 | Tokyo Electron, Ltd. | 150,479 | ||||||
The accompanying Notes to Financial Statements are an integral part of this schedule.
122
Table of Contents
DIVERSIFIED INCOME PLUS PORTFOLIO
Schedule of Investments as of December 31, 2016
| Shares | Common Stock (26.8%) | Value | ||||||
Information Technology (4.0%) - continued | ||||||||
| 11,050 | Twitter, Inc.j | $ | 180,115 | |||||
| 15,120 | Vantiv, Inc.j | 901,454 | ||||||
| 25,660 | Visa, Inc. | 2,001,993 | ||||||
| 44,410 | Xilinx, Inc. | 2,681,032 | ||||||
|
| |||||||
Total | 22,711,474 | |||||||
|
| |||||||
Materials (1.1%) | ||||||||
| 2,400 | Adeka Corporation | 32,559 | ||||||
| 4,492 | APERAM | 204,997 | ||||||
| 1,460 | Ashland Global Holdings, Inc. | 159,563 | ||||||
| 3,552 | BHP Billiton plc | 56,559 | ||||||
| 54,919 | BHP Billiton, Ltd. | 983,867 | ||||||
| 36,659 | BlueScope Steel, Ltd. | 243,639 | ||||||
| 1,800 | Croda International plc | 70,794 | ||||||
| 3,760 | Crown Holdings, Inc.j | 197,663 | ||||||
| 21,000 | Daicel Corporation | 230,875 | ||||||
| 4,729 | Domtar Corporation | 184,573 | ||||||
| 1,950 | Eagle Materials, Inc. | 192,133 | ||||||
| 14,101 | Evonik Industries AG | 420,336 | ||||||
| 3,030 | FMC Corporation | 171,377 | ||||||
| 35 | Givaudan SA | 64,056 | ||||||
| 4,200 | JSR Corporation | 66,109 | ||||||
| 9,310 | Kinross Gold Corporationj | 28,954 | ||||||
| 14,700 | Kuraray Company, Ltd. | 220,435 | ||||||
| 3,400 | Kyoei Steel, Ltd. | 64,642 | �� | |||||
| 870 | LafargeHolcim, Ltd. | 45,668 | ||||||
| 17,100 | Mitsubishi Chemical Holdings Corporation | 110,563 | ||||||
| 3,500 | Mitsubishi Gas Chemical Company, Inc. | 59,638 | ||||||
| 2,000 | Mitsubishi Materials Corporation | 61,174 | ||||||
| 500 | Nippon Shokubai Company, Ltd. | 31,139 | ||||||
| 60,505 | Norsk Hydro ASA | 288,774 | ||||||
| 6,718 | Nufarm, Ltd. | 44,266 | ||||||
| 14,840 | Orora, Ltd. | 31,914 | ||||||
| 3,110 | Packaging Corporation of America | 263,790 | ||||||
| 2,130 | PPG Industries, Inc. | 201,839 | ||||||
| 1,647 | Rio Tinto, Ltd. | 70,559 | ||||||
| 8,510 | Steel Dynamics, Inc. | 302,786 | ||||||
| 1,400 | Sumitomo Seika Chemicals Company, Ltd. | 54,829 | ||||||
| 6,300 | Toagosei Company, Ltd. | 61,837 | ||||||
| 7,000 | Tosoh Corporation | 49,378 | ||||||
| 9,397 | UPM-Kymmene Oyj | 229,810 | ||||||
| 18,185 | Verso Corporationj | 129,113 | ||||||
| 1,600 | Yamato Kogyo Company, Ltd. | 44,623 | ||||||
| 11,592 | Yara International ASA | 456,018 | ||||||
| 1,200 | Yodogawa Steel Works, Ltd. | 31,273 | ||||||
|
| |||||||
Total | 6,162,122 | |||||||
|
| |||||||
Real Estate (3.5%) | ||||||||
| 1,700 | Acadia Realty Trust | 55,556 | ||||||
| 800 | Agree Realty Corporation | 36,840 | ||||||
| 7,989 | Alexandria Real Estate Equities, Inc. | 887,818 | ||||||
| 2,300 | American Campus Communities, Inc. | 114,471 | ||||||
| 3,650 | American Homes 4 Rent | 76,577 | ||||||
| 3,500 | Apartment Investment & Management Company | 159,075 | ||||||
| 3,000 | Apple Hospitality REIT, Inc. | 59,940 | ||||||
| 2,300 | AvalonBay Communities, Inc. | 407,445 | ||||||
| 1,100 | Bluerock Residential Growth REIT, Inc. | 15,092 | ||||||
| 4,387 | Boston Properties, Inc. | 551,797 | ||||||
| 3,000 | Brandywine Realty Trust | 49,530 | ||||||
| 29,605 | Brixmor Property Group, Inc. | 722,954 | ||||||
| 9,160 | Camden Property Trust | 770,081 | ||||||
| 33,600 | CapitaLand Retail China Trustj | 31,787 | ||||||
| 1,575 | Care Capital Properties, Inc. | 39,375 | ||||||
| 901 | Chesapeake Lodging Trust | 23,300 | ||||||
| 1,800 | CoreCivic, Inc. | 44,028 | ||||||
| 650 | CoreSite Realty Corporation | 51,590 | ||||||
| 1,700 | Corporate Office Properties Trust | 53,074 | ||||||
| 6,190 | Cousins Properties, Inc. | 52,677 | ||||||
| 5,420 | Crown Castle International Corporation | 470,293 | ||||||
| 4,000 | CubeSmart | 107,080 | ||||||
| 1,900 | CyrusOne, Inc. | 84,987 | ||||||
| 400 | Daito Trust Construction Company, Ltd. | 60,135 | ||||||
| 1,800 | DCT Industrial Trust, Inc. | 86,184 | ||||||
| 5,500 | DDR Corporation | 83,985 | ||||||
| 48,100 | DEXUS Property Group | 333,680 | ||||||
| 1,918 | DiamondRock Hospitality Company | 22,115 | ||||||
| 2,836 | Digital Realty Trust, Inc. | 278,665 | ||||||
| 1,800 | Douglas Emmett, Inc. | 65,808 | ||||||
| 34,320 | Duke Realty Corporation | 911,539 | ||||||
| 1,000 | DuPont Fabros Technology, Inc. | 43,930 | ||||||
| 254 | EastGroup Properties, Inc. | 18,755 | ||||||
| 1,000 | Education Realty Trust, Inc. | 42,300 | ||||||
| 1,166 | EPR Properties | 83,684 | ||||||
| 1,817 | Equinix, Inc. | 649,414 | ||||||
| 2,100 | Equity Commonwealthj | 63,504 | ||||||
| 1,800 | Equity Lifestyle Properties, Inc. | 129,780 | ||||||
| 1,500 | Equity One, Inc. | 46,035 | ||||||
| 9,280 | Equity Residential | 597,261 | ||||||
| 1,250 | Essex Property Trust, Inc. | 290,625 | ||||||
| 2,400 | Extra Space Storage, Inc. | 185,376 | ||||||
| 1,000 | Federal Realty Investment Trust | 142,110 | ||||||
| 1,800 | First Industrial Realty Trust, Inc. | 50,490 | ||||||
| 3,742 | Forest City Realty Trust, Inc. | 77,983 | ||||||
| 3,100 | Gaming and Leisure Properties, Inc. | 94,922 | ||||||
| 10,567 | General Growth Properties, Inc. | 263,964 | ||||||
| 1,200 | GEO Group, Inc. | 43,116 | ||||||
| 4,500 | Gramercy Property Trust | 41,310 | ||||||
| 16,062 | H&R Real Estate Investment Trust | 267,610 | ||||||
| 4,000 | Hamborner REIT AG | 38,051 | ||||||
| 7,800 | HCP, Inc. | 231,816 | ||||||
| 2,200 | Healthcare Realty Trust, Inc. | 66,704 | ||||||
| 3,200 | Healthcare Trust of America, Inc. | 93,152 | ||||||
| 2,500 | Highwoods Properties, Inc. | 127,525 | ||||||
| 3,000 | Hospitality Properties Trust | 95,220 | ||||||
| 12,911 | Host Hotels & Resorts, Inc. | 243,243 | ||||||
| 2,000 | Hudson Pacific Properties, Inc. | 69,560 | ||||||
| 57,000 | Hysan Development Company, Ltd. | 235,070 | ||||||
| 3,900 | Iron Mountain, Inc. | 126,672 | ||||||
| 1,500 | Kilroy Realty Corporation | 109,830 | ||||||
| 8,700 | Kimco Realty Corporation | 218,892 | ||||||
| 1,169 | Lamar Advertising Company | 78,604 | ||||||
| 1,900 | LaSalle Hotel Properties | 57,893 | ||||||
| 2,500 | Liberty Property Trust | 98,750 | ||||||
| 791 | Life Storage, Inc. | 67,441 | ||||||
| 5,500 | Link REIT | 35,657 | ||||||
| 2,650 | Macerich Company | 187,726 | ||||||
| 1,500 | Mack-Cali Realty Corporation | 43,530 | ||||||
| 5,400 | Medical Properties Trust, Inc. | 66,420 | ||||||
| 1,899 | Mid-America Apartment Communities, Inc. | 185,950 | ||||||
| 1,300 | National Health Investors, Inc. | 96,421 | ||||||
| 4,100 | National Retail Properties, Inc. | 181,220 | ||||||
| 1,826 | National Storage Affiliates Trust | 40,300 | ||||||
| 221,356 | New World Development Company, Ltd. | 233,222 | ||||||
The accompanying Notes to Financial Statements are an integral part of this schedule.
123
Table of Contents
DIVERSIFIED INCOME PLUS PORTFOLIO
Schedule of Investments as of December 31, 2016
| Shares | Common Stock (26.8%) | Value | ||||||
Real Estate (3.5%) - continued | ||||||||
| 3,100 | NorthStar Realty Finance Corporation | $ | 46,965 | |||||
| 2,550 | Omega Healthcare Investors, Inc. | 79,713 | ||||||
| 2,100 | Outfront Media, Inc. | 52,227 | ||||||
| 773 | Parkway, Inc.j | 17,199 | ||||||
| 1,000 | Pebblebrook Hotel Trust | 29,750 | ||||||
| 4,000 | Physicians Realty Trust | 75,840 | ||||||
| 800 | Piedmont Office Realty Trust, Inc. | 16,728 | ||||||
| 14,053 | Prologis, Inc. | 741,858 | ||||||
| 3,662 | Public Storage, Inc. | 818,457 | ||||||
| 823 | QTS Realty Trust, Inc. | 40,862 | ||||||
| 1,560 | Quality Care Properties, Inc.j | 24,180 | ||||||
| 3,260 | Realty Income Corporation | 187,385 | ||||||
| 2,600 | Regency Centers Corporation | 179,270 | ||||||
| 1,800 | Retail Opportunity Investments Corporation | 38,034 | ||||||
| 3,000 | Retail Properties of America, Inc. | 45,990 | ||||||
| 2,788 | RLJ Lodging Trust | 68,278 | ||||||
| 2,775 | Senior Housing Property Trust | 52,531 | ||||||
| 7,950 | Simon Property Group, Inc. | 1,412,477 | ||||||
| 1,700 | SL Green Realty Corporation | 182,835 | ||||||
| 13,000 | Spirit Realty Captial, Inc. | 141,180 | ||||||
| 86,919 | Stockland | 287,153 | ||||||
| 3,406 | Store Capital Corporation | 84,162 | ||||||
| 2,898 | Summit Hotel Properties, Inc. | 46,455 | ||||||
| 1,250 | Sun Communities, Inc. | 95,763 | ||||||
| 4,000 | Sun Hung Kai Properties, Ltd. | 50,370 | ||||||
| 3,655 | Sunstone Hotel Investors, Inc. | 55,739 | ||||||
| 1,664 | Tanger Factory Outlet Centers, Inc. | 59,538 | ||||||
| 1,100 | Taubman Centers, Inc. | 81,323 | ||||||
| 4,900 | UDR, Inc. | 178,752 | ||||||
| 1,500 | Urban Edge Properties | 41,265 | ||||||
| 500 | Urstadt Biddle Properties, Inc. | 12,055 | ||||||
| 5,950 | Ventas, Inc. | 371,994 | ||||||
| 12,509 | VEREIT, Inc. | 105,826 | ||||||
| 5,220 | Vornado Realty Trust | 544,811 | ||||||
| 2,200 | Washington Prime Group, Inc. | 22,902 | ||||||
| 2,000 | Weingarten Realty Investors | 71,580 | ||||||
| 5,989 | Welltower, Inc. | 400,844 | ||||||
| 6,000 | Wharf Holdings, Ltd. | 39,744 | ||||||
| 8,000 | Wheelock and Company, Ltd. | 44,898 | ||||||
| 52,100 | Wing Tai Holdings, Ltd. | 57,065 | ||||||
| 1,100 | WP Carey, Inc. | 64,999 | ||||||
|
| |||||||
Total | 19,837,513 | |||||||
|
| |||||||
Telecommunications Services (0.4%) | ||||||||
| 8,239 | Elisa Oyj | 267,451 | ||||||
| 7,100 | Freenet AG | 199,543 | ||||||
| 120,060 | KCOM Group plc | 140,195 | ||||||
| 31,600 | Koninklijke (Royal) KPN NV | 93,445 | ||||||
| 7,200 | Nippon Telegraph & Telephone Corporation | 303,085 | ||||||
| 7,900 | NTT DOCOMO, Inc. | 179,688 | ||||||
| 140,273 | PCCW, Ltd. | 75,829 | ||||||
| 3,500 | Proximus SA | 100,614 | ||||||
| 12,200 | Telefonica Deutschland Holding AG | 52,148 | ||||||
| 7,936 | Telenor ASA | 118,459 | ||||||
| 1,851 | Vivendi SA | 35,108 | ||||||
| 18,930 | Zayo Group Holdings, Inc.j | 622,040 | ||||||
|
| |||||||
Total | 2,187,605 | |||||||
|
| |||||||
Utilities (0.4%) | ||||||||
| 2,674 | ATCO, Ltd. | 88,944 | ||||||
| 43,600 | Centrica plc | 125,571 | ||||||
| 59,800 | Electricidade de Portugal SA | 182,005 | ||||||
| 26,749 | MDU Resources Group, Inc. | 769,569 | ||||||
| 8,336 | NorthWestern Corporation | 474,068 | ||||||
| 72,000 | Osaka Gas Company, Ltd. | 276,268 | ||||||
| 40,500 | Redes Energeticas Nacionais SGPS SA | 114,909 | ||||||
| 6,000 | Toho Gas Company, Ltd. | 48,731 | ||||||
| 8,300 | United Utilities Group plc | 92,000 | ||||||
|
| |||||||
Total | 2,172,065 | |||||||
|
| |||||||
Total Common Stock (cost $142,230,585) | 151,104,006 | |||||||
|
| |||||||
Registered Investment Companies (4.7%) | ||||||||
Equity Funds/ETFs (1.8%) | ||||||||
| 256,500 | Alerian MLP ETF | 3,231,900 | ||||||
| 16,790 | iShares MSCI EAFE Index Fund | 969,287 | ||||||
| 47,910 | Materials Select Sector SPDR Fund | 2,381,127 | ||||||
| 31,780 | Utilities Select Sector SPDR Fund | 1,543,554 | ||||||
| 25,000 | Vanguard High Dividend Yield ETF | 1,894,250 | ||||||
|
| |||||||
Total | 10,020,118 | |||||||
|
| |||||||
Fixed Income Funds/ETFs (2.9%) | ||||||||
| 11,917 | iShares J.P. Morgan USD Emerging Markets Bond ETF | 1,313,492 | ||||||
| 75,300 | iShares S&P U.S. Preferred Stock Index Fund | 2,801,913 | ||||||
| 18,350 | SPDR Bloomberg Barclays High Yield Bond ETF | 668,857 | ||||||
| 144,565 | Vanguard Short-Term Corporate Bond ETF | 11,474,124 | ||||||
|
| |||||||
Total | 16,258,386 | |||||||
|
| |||||||
Total Registered Investment Companies (cost $26,786,285) | 26,278,504 | |||||||
|
| |||||||
Preferred Stock (2.3%) | ||||||||
Consumer Staples (0.3%) | ||||||||
| 3,200 | Bunge, Ltd., Convertible, 4.875%g | 326,752 | ||||||
| 19,000 | CHS, Inc., 6.750%g | 499,320 | ||||||
| 31,200 | CHS, Inc., 7.100%g | 827,112 | ||||||
| 400 | Henkel AG & Company KGaA, 1.470% | 47,616 | ||||||
|
| |||||||
Total | 1,700,800 | |||||||
|
| |||||||
Energy (<0.1%) | ||||||||
| 2,401 | Alpha Natural Resources, Inc., 0.000%j | 48,020 | ||||||
| 2,401 | ANR Holdings, Inc., 0.000%j | 12,965 | ||||||
|
| |||||||
Total | 60,985 | |||||||
|
| |||||||
Financials (1.7%) | ||||||||
| 6,475 | Agribank FCB, 6.875%g | 688,373 | ||||||
| 39,710 | Annaly Capital Management, Inc., 7.500%g | 958,599 | ||||||
| 37,225 | Citigroup, Inc., 6.875%g | 1,018,104 | ||||||
| 26,020 | Citigroup, Inc., 7.257%d | 671,836 | ||||||
| 8,650 | Cobank ACB, 6.250%g | 877,165 | ||||||
| 41,050 | GMAC Capital Trust I, 6.602%d | 1,042,670 | ||||||
| 30,800 | Goldman Sachs Group, Inc., 5.500%g | 781,704 | ||||||
| 13,620 | Morgan Stanley, 6.875%g | 368,285 | ||||||
| 22,200 | Morgan Stanley, 7.125%g | 624,486 | ||||||
| 15,500 | PNC Financial Services Group, Inc., 6.125%g | 422,995 | ||||||
| 28,000 | U.S. Bancorp, 6.500%g | 792,120 | ||||||
| 1,012 | Wells Fargo & Company, Convertible, 7.500%g | 1,204,280 | ||||||
|
| |||||||
Total | 9,450,617 | |||||||
|
| |||||||
Health Care (0.2%) | ||||||||
| 810 | Allergan plc, Convertible, 5.500% | 616,613 | ||||||
The accompanying Notes to Financial Statements are an integral part of this schedule.
124
Table of Contents
DIVERSIFIED INCOME PLUS PORTFOLIO
Schedule of Investments as of December 31, 2016
| Shares | Preferred Stock (2.3%) | Value | ||||||
Health Care (0.2%) - continued | ||||||||
| 250 | Teva Pharmaceutical Industries, Ltd., Convertible, 7.000% | $ | 161,250 | |||||
|
| |||||||
Total | 777,863 | |||||||
|
| |||||||
Real Estate (0.1%) | ||||||||
| 6,900 | American Tower Corporation, Convertible, 5.500% | 721,050 | ||||||
|
| |||||||
Total | 721,050 | |||||||
|
| |||||||
Total Preferred Stock (cost $12,570,149) | 12,711,315 | |||||||
|
| |||||||
Collateral Held for Securities Loaned (<0.1%) | ||||||||
| 172,250 | Thrivent Cash Management Trust | 172,250 | ||||||
Total Collateral Held for Securities Loaned (cost $172,250) | 172,250 | |||||||
|
| |||||||
| Shares or Principal Amount | Short-Term Investments (11.8%)m | |||||||
Federal Home Loan Bank Discount Notes | ||||||||
| 900,000 | 0.440%, 1/17/2017n | 899,867 | ||||||
| 200,000 | 0.345%, 1/20/2017n | 199,964 | ||||||
| 200,000 | 0.355%, 1/25/2017n | 199,954 | ||||||
| 100,000 | 0.490%, 2/10/2017n | 99,947 | ||||||
Thrivent Core Short-Term Reserve Fund | ||||||||
| 6,498,975 | 0.910% | 64,989,751 | ||||||
|
| |||||||
Total Short-Term Investments (cost $66,389,437) | 66,389,483 | |||||||
|
| |||||||
Total Investments (cost $587,476,964) 106.5% | $ | 599,395,957 | ||||||
|
| |||||||
Other Assets and Liabilities, Net (6.5%) | (36,604,159 | ) | ||||||
|
| |||||||
Total Net Assets 100.0% | $ | 562,791,798 | ||||||
|
| |||||||
| a | The stated interest rate represents the weighted average of all contracts within the bank loan facility. |
| b | All or a portion of the loan is unfunded. |
| c | Denotes investments purchased on a when-issued or delayed delivery basis. |
| d | Denotes variable rate securities. Variable rate securities are securities whose yields vary with a designated market index or market rate. The rate shown is as of December 31, 2016. |
| e | Denotes securities sold under Rule 144A of the Securities Act of 1933, which exempts them from registration. These securities may be resold to other dealers in the program or to other qualified institutional buyers. As of December 31, 2016, the value of these investments was $55,496,905 or 9.9% of total net assets. |
| f | Denotes step coupon securities. Step coupon securities pay an initial coupon rate for the first period and then different coupon rates for following periods. The rate shown is as of December 31, 2016. |
| g | Denotes perpetual securities. Perpetual securities pay an indefinite stream of interest and have no contractual maturity date. Date shown, if applicable, is next call date. |
| h | Denotes interest only security. Interest only securities represent the right to receive monthly interest payments on an underlying pool of mortgages or assets. The principal shown is the outstanding par amount of the pool as of the end of the period. The actual effective yield of the security is different than the stated coupon rate. |
| i | At December 31, 2016, $280,111 of investments were segregated to cover exposure to a counterparty for margin on open mortgage-backed security transactions. |
| j | Non-income producing security. |
| k | Security is valued at fair value. Market quotations or prices were not readily available or were determined to be unreliable. Fair value was determined in good faith pursuant to procedures adopted by the Board. Further information on fair valuation can be found in the Notes to Financial Statements. |
| l | All or a portion of the security is on loan. |
| m | The interest rate shown reflects the yield, coupon rate or the discount rate at the date of purchase. |
| n | All or a portion of the security is held on deposit with the counterparty and pledged as the initial margin deposit for open futures contracts. |
| * | Denotes restricted securities. Restricted securities are investment securities which cannot be offered for public sale without first being registered under the Securities Act of 1933. The value of all restricted securities held in Diversified Income Plus Portfolio as of December 31, 2016 was $14,471,160 or 2.6% of total net assets. The following table indicates the acquisition date and cost of restricted securities shown in the schedule as of December 31, 2016. |
Security | Acquisition Date | Cost | ||||||
Angel Oak Mortgage Trust, 11/25/2045 | 12/10/2015 | $ | 517,976 | |||||
Bayview Opportunity Master Fund Trust, 7/28/2034 | 3/19/2015 | 375,213 | ||||||
Citi Held For Asset Issuance, 8/15/2022 | 2/26/2016 | 1,093,832 | ||||||
COLT Mortgage Loan Trust, 9/25/2046 | 9/9/2016 | 1,028,386 | ||||||
Contura Energy, Inc., 8/1/2021 | 11/4/2013 | 158,217 | ||||||
Digicel, Ltd., 4/15/2021 | 6/9/2014 | 777,002 | ||||||
Liberty Mutual Group, Inc., 6/15/2058 | 1/12/2009 | 539,033 | ||||||
Marlette Funding Trust, 1/17/2023 | 7/20/2016 | 1,287,449 | ||||||
Murray Hill Marketplace Trust, 11/25/2022 | 10/6/2016 | 408,188 | ||||||
NCF Dealer Floorplan Master Trust, 3/21/2022 | 4/8/2016 | 736,053 | ||||||
NRZ Advance Receivables Trust Advance Receivables Backed, 6/15/2049 | 6/23/2016 | 1,299,998 | ||||||
Preston Ridge Partners Mortgage Trust, LLC, 9/27/2021 | 9/23/2016 | 872,720 | ||||||
Pretium Mortgage Credit Partners I, LLC, 7/27/2031 | 6/17/2016 | 962,969 | ||||||
Pretium Mortgage Credit Partners, LLC, 11/27/2030 | 11/6/2015 | 1,040,658 | ||||||
Sunset Mortgage Loan Company, LLC, 9/18/2045 | 10/2/2015 | 635,680 | ||||||
Sunset Mortgage Loan Company, LLC, 7/16/2047 | 7/27/2016 | 453,773 | ||||||
US Residential Opportunity Fund Trust, 7/27/2036 | 7/20/2016 | 1,092,642 | ||||||
Vericrest Opportunity Loan Transferee, 10/25/2058 | 2/6/2015 | 837,304 | ||||||
Vericrest Opportunity Loan Transferee, 2/25/2055 | 2/25/2015 | 209,631 | ||||||
The accompanying Notes to Financial Statements are an integral part of this schedule.
125
Table of Contents
DIVERSIFIED INCOME PLUS PORTFOLIO
Schedule of Investments as of December 31, 2016
The following table presents the total amount of securities loaned with continuous maturity, by type, offset by the gross payable upon return of collateral for securities loaned by Thrivent Diversified Income Plus Portfolio as of December 31, 2016:
Securities Lending Transactions
Common Stock | $ | 162,954 | ||
|
| |||
Total lending | $ | 162,954 | ||
Gross amount payable upon return of collateral for securities loaned | $ | 172,250 | ||
|
| |||
Net amounts due to counterparty | $ | 9,296 | ||
|
|
Definitions:
| ETF | - | Exchange Traded Fund. | ||
| REIT | - | Real Estate Investment Trust is a company that buys, develops, manages and/or sells real estate assets. |
The accompanying Notes to Financial Statements are an integral part of this schedule.
126
Table of Contents
OPPORTUNITY INCOME PLUS PORTFOLIO
Schedule of Investments as of December 31, 2016
| Principal Amount | Bank Loans (29.6%)a | Value | ||||||
Basic Materials (1.6%) | ||||||||
Arch Coal, Inc., Term Loan | ||||||||
| $ | 47,130 | 10.000%, 10/5/2021 | $ | 47,739 | ||||
Chemours Company, Term Loan | ||||||||
| 334,756 | 3.770%, 5/12/2022 | 332,456 | ||||||
Fortescue Metals Group, Ltd., Term Loan | ||||||||
| 440,376 | 3.750%, 6/30/2019 | 441,257 | ||||||
Ineos US Finance, LLC, Term Loan | ||||||||
| 732,474 | 3.750%, 12/15/2020 | 735,528 | ||||||
Tronox Pigments BV, Term Loan | ||||||||
| 682,922 | 4.500%, 3/19/2020 | 685,196 | ||||||
|
| |||||||
Total | 2,242,176 | |||||||
|
| |||||||
Capital Goods (1.5%) | ||||||||
Accudyne Industries, LLC, Term Loan | ||||||||
| 221,712 | 4.000%, 12/13/2019 | 209,281 | ||||||
Advanced Disposal Services, Inc., Term Loan | ||||||||
| 585,650 | 3.500%, 11/10/2023 | 590,411 | ||||||
Cortes NP Acquisition Corporation, Term Loan | ||||||||
| 1,025,000 | 6.000%, 11/30/2023 | 1,037,812 | ||||||
Reynolds Group, Inc., Term Loan | ||||||||
| 349,125 | 4.250%, 2/5/2023 | 353,409 | ||||||
|
| |||||||
Total | 2,190,913 | |||||||
|
| |||||||
Communications Services (8.7%) | ||||||||
Altice US Finance I Corporation, Term Loan | ||||||||
| 450,000 | 3.882%, 1/15/2025 | 454,500 | ||||||
Atlantic Broadband Penn, LLC, Term Loan | ||||||||
| 75,278 | 3.250%, 11/30/2019 | 75,466 | ||||||
Beasley Broadcast Group, Inc., Term Loan | ||||||||
| 325,000 | 7.000%, 11/1/2023 | 325,000 | ||||||
Birch Communication Inc., Term Loan | ||||||||
| 406,409 | 8.250%, 7/17/2020 | 357,640 | ||||||
Block Communications, Inc., Term Loan | ||||||||
| 395,959 | 4.248%, 11/7/2021 | 399,423 | ||||||
CBS Radio, Inc., Term Loan | ||||||||
| 384,906 | 4.500%, 10/17/2023 | 388,274 | ||||||
Charter Communications Operating, LLC, Term Loan | ||||||||
| 243,687 | 3.020%, 7/1/2020 | 244,703 | ||||||
| 475,000 | 0.000%, 1/15/2024b,c | 477,461 | ||||||
Cincinnati Bell, Inc., Term Loan | ||||||||
| 150,727 | 4.000%, 9/10/2020 | 151,076 | ||||||
CSC Holdings, LLC, Term Loan | ||||||||
| 312,500 | 3.876%, 10/11/2024 | 315,559 | ||||||
Entercom Radio, LLC, Term Loan | ||||||||
| 300,000 | 4.518%, 11/1/2023 | 303,375 | ||||||
FairPoint Communications, Inc., Term Loan | ||||||||
| 430,344 | 7.500%, 2/14/2019 | 433,976 | ||||||
Grande Communications Networks, LLC, Term Loan | ||||||||
| 246,084 | 4.500%, 5/29/2020 | 247,561 | ||||||
Hargray Communications Group, Inc., Term Loan | ||||||||
| 515,760 | 4.750%, 6/26/2019 | 521,346 | ||||||
Integra Telecom Holdings, Inc., Term Loan | ||||||||
| 240,858 | 5.250%, 8/14/2020 | 241,280 | ||||||
Intelsat Jackson Holdings SA, Term Loan | ||||||||
| 160,000 | 3.750%, 6/30/2019 | 154,483 | ||||||
Level 3 Communications, Inc., Term Loan | ||||||||
| 280,000 | 4.000%, 8/1/2019 | 283,710 | ||||||
Liberty Cablevision of Puerto Rico, LLC, Term Loan | ||||||||
| 475,000 | 4.500%, 1/7/2022 | 471,143 | ||||||
LTS Buyer, LLC, Term Loan | ||||||||
| 669,166 | 4.248%, 4/13/2020 | 672,305 | ||||||
NEP/NCP Holdco, Inc., Term Loan | ||||||||
| 746,173 | 4.250%, 1/22/2020 | 748,039 | ||||||
Nexstar Broadcasting, Inc., Term Loan | ||||||||
| 510,000 | 0.000%, 9/26/2023b,c | 513,983 | ||||||
Numericable US, LLC, Term Loan | ||||||||
| 393,150 | 5.137%, 1/15/2024 | 397,785 | ||||||
SBA Senior Finance II, LLC, Term Loan | ||||||||
| 731,250 | 3.270%, 3/24/2021 | 734,453 | ||||||
| 216,700 | 3.270%, 6/10/2022 | 217,391 | ||||||
TNS, Inc., Term Loan | ||||||||
| 54,235 | 5.000%, 2/14/2020 | 54,693 | ||||||
Univision Communications, Inc., Term Loan | ||||||||
| 245,896 | 4.000%, 3/1/2020 | 247,126 | ||||||
Virgin Media Bristol, LLC, Term Loan | ||||||||
| 550,000 | 3.486%, 1/31/2025 | 552,134 | ||||||
WideOpenWest Finance, LLC, Term Loan | ||||||||
| 922,688 | 4.500%, 8/18/2023 | 931,748 | ||||||
XO Communications, LLC, Term Loan | ||||||||
| 680,750 | 4.250%, 3/20/2021 | 682,452 | ||||||
Yankee Cable Acquisition, LLC, Term Loan | ||||||||
| 229,548 | 4.250%, 3/1/2020 | 229,644 | ||||||
Zayo Group, LLC, Term Loan | ||||||||
| 359,290 | 3.750%, 5/6/2021 | 362,933 | ||||||
|
| |||||||
Total | 12,190,662 | |||||||
|
| |||||||
Consumer Cyclical (4.2%) | ||||||||
Amaya BV, Term Loan | ||||||||
| 624,177 | 5.000%, 8/1/2021 | 626,087 | ||||||
Boyd Gaming Corporation, Term Loan | ||||||||
| 369,075 | 0.000%, 9/15/2023 | 373,094 | ||||||
Burlington Coat Factory Warehouse Corporation, Term Loan | ||||||||
| 249,141 | 3.510%, 8/13/2021 | 250,609 | ||||||
Cengage Learning Acquisitions, Term Loan | ||||||||
| 572,125 | 5.250%, 6/7/2023 | 555,768 | ||||||
Ceridian HCM Holding, Inc., Term Loan | ||||||||
| 131,983 | 4.500%, 9/15/2020 | 130,938 | ||||||
Four Seasons Holdings, Inc., Term Loan | ||||||||
| 535,000 | 3.750%, 11/30/2023 | 540,573 | ||||||
Golden Nugget, Inc., Term Loan | ||||||||
| 288,810 | 4.500%, 11/21/2019 | 291,698 | ||||||
Golden Nugget, Inc., Term Loan Delayed Draw | ||||||||
| 123,776 | 4.500%, 11/21/2019 | 125,014 | ||||||
IMG Worldwide, Inc., Term Loan | ||||||||
| 618,671 | 5.250%, 5/6/2021 | 624,474 | ||||||
| 225,000 | 8.250%, 5/6/2022 | 227,813 | ||||||
The accompanying Notes to Financial Statements are an integral part of this schedule.
127
Table of Contents
OPPORTUNITY INCOME PLUS PORTFOLIO
Schedule of Investments as of December 31, 2016
| Principal Amount | Bank Loans (29.6%)a | Value | ||||||
Consumer Cyclical (4.2%) - continued | ||||||||
KAR Auction Services, Inc., Term Loan | ||||||||
| $ | 377,150 | 4.500%, 3/9/2023 | $ | 381,864 | ||||
Michaels Stores, Inc., Term Loan | ||||||||
| 324,109 | 3.750%, 1/30/2023 | 327,654 | ||||||
Mohegan Tribal Gaming Authority, Term Loan | ||||||||
| 423,937 | 5.500%, 10/13/2023 | 426,854 | ||||||
Scientific Games International, Inc., Term Loan | ||||||||
| 247,350 | 6.000%, 10/18/2020 | 250,494 | ||||||
| 643,747 | 6.000%, 10/1/2021 | 651,395 | ||||||
Seminole Hard Rock Entertainment, Inc., Term Loan | ||||||||
| 116,970 | 3.520%, 5/14/2020 | 117,555 | ||||||
|
| |||||||
Total | 5,901,884 | |||||||
|
| |||||||
Consumer Non-Cyclical (5.0%) | ||||||||
Air Medical Group Holdings, Inc., Term Loan | ||||||||
| 320,887 | 5.000%, 4/28/2022 | 325,502 | ||||||
Albertson’s, LLC, Term Loan | ||||||||
| 337,630 | 0.000%, 12/21/2022b,c | 341,850 | ||||||
| 612,370 | 0.000%, 6/22/2023b,c | 619,767 | ||||||
CHS/Community Health Systems, Inc., Term Loan | ||||||||
| 723,281 | 4.000%, 1/27/2021 | 699,174 | ||||||
Endo Luxembourg Finance I Company SARL, Term Loan | ||||||||
| 361,350 | 3.813%, 9/26/2022 | 362,900 | ||||||
JBS USA, LLC, Term Loan | ||||||||
| 343,532 | 3.750%, 5/25/2018 | 343,817 | ||||||
| 207,900 | 4.000%, 10/30/2022 | 209,632 | ||||||
LTF Merger Sub, Inc., Term Loan | ||||||||
| 396,896 | 4.250%, 6/10/2022 | 399,066 | ||||||
Mallinckrodt International Finance SA, Term Loan | ||||||||
| 153,430 | 3.748%, 3/19/2021 | 153,759 | ||||||
McGraw-Hill Global Education Holdings, LLC, Term Loan | ||||||||
| 462,675 | 5.000%, 5/4/2022 | 462,749 | ||||||
MultiPlan, Inc., Term Loan | ||||||||
| 510,375 | 5.000%, 6/7/2023 | 518,852 | ||||||
Ortho-Clinical Diagnostics, Inc., Term Loan | ||||||||
| 433,134 | 4.750%, 6/30/2021 | 428,959 | ||||||
PetSmart, Inc., Term Loan | ||||||||
| 264,329 | 4.000%, 3/11/2022 | 264,990 | ||||||
Revlon Consumer Products Corporation, Term Loan | ||||||||
| 244,387 | 4.307%, 9/7/2023 | 246,680 | ||||||
Valeant Pharmaceuticals International, Inc., Term Loan | ||||||||
| 1,665,728 | 5.500%, 4/1/2022b,c | 1,666,044 | ||||||
|
| |||||||
Total | 7,043,741 | |||||||
|
| |||||||
Energy (0.9%) | ||||||||
Exgen Renewables I, LLC, Term Loan | ||||||||
| 253,314 | 5.250%, 2/8/2021 | 254,897 | ||||||
Houston Fuel Oil Terminal, LLC, Term Loan | ||||||||
| 233,211 | 4.250%, 8/19/2021 | 231,462 | ||||||
McJunkin Red Man Corporation, Term Loan | ||||||||
| 138,562 | 5.000%, 11/8/2019 | 139,082 | ||||||
MEG Energy Corporation, Term Loan | ||||||||
| 254,641 | 3.750%, 3/31/2020 | 247,002 | ||||||
Pacific Drilling SA, Term Loan | ||||||||
| 246,075 | 4.500%, 6/3/2018 | 86,372 | ||||||
Targa Resources Partners, LP, Term Loan | ||||||||
| 57,000 | 5.750%, 2/27/2022 | 57,285 | ||||||
Western Refining, Inc., Term Loan | ||||||||
| 113,827 | 5.250%, 11/12/2020 | 114,325 | ||||||
| 89,400 | 5.500%, 6/23/2023 | 89,847 | ||||||
|
| |||||||
Total | 1,220,272 | |||||||
|
| |||||||
Financials (1.8%) | ||||||||
Delos Finance Sarl, Term Loan | ||||||||
| 125,000 | 3.748%, 3/6/2021 | 125,804 | ||||||
Harland Clarke Holdings Corporation, Term Loan | ||||||||
| 123,658 | 7.000%, 5/22/2018 | 123,697 | ||||||
| 356,250 | 7.000%, 12/31/2019 | 357,586 | ||||||
MoneyGram International, Inc., Term Loan | ||||||||
| 399,239 | 4.250%, 3/27/2020 | 393,917 | ||||||
Sable International Finance, Ltd., Term Loan | ||||||||
| 630,000 | 5.748%, 1/3/2023b,c | 637,484 | ||||||
TransUnion, LLC, Term Loan | ||||||||
| 525,540 | 3.520%, 4/9/2021 | 529,765 | ||||||
WaveDivision Holdings, LLC, Term Loan | ||||||||
| 384,788 | 4.000%, 10/15/2019 | 386,808 | ||||||
|
| |||||||
Total | 2,555,061 | |||||||
|
| |||||||
Technology (4.3%) | ||||||||
Avago Technoligies Cayman Finance, Ltd., Term Loan | ||||||||
| 572,074 | 3.704%, 2/1/2023 | 579,940 | ||||||
First Data Corporation, Term Loan | ||||||||
| 1,027,606 | 3.756%, 3/24/2021 | 1,039,166 | ||||||
| 361,954 | 3.756%, 7/8/2022 | 365,650 | ||||||
Micron Technologies, Inc., Term Loan | ||||||||
| 328,599 | 4.520%, 4/26/2022 | 333,282 | ||||||
NXP BV, Term Loan | ||||||||
| 279,300 | 3.270%, 12/7/2020 | 280,557 | ||||||
ON Semiconductor Corporation, Term Loan | ||||||||
| 947,625 | 4.020%, 3/31/2023 | 959,129 | ||||||
Rackspace Hosting, LLC, Term Loan | ||||||||
| 650,000 | 4.500%, 12/20/2023 | 657,852 | ||||||
RP Crown Parent, LLC, Term Loan | ||||||||
| 450,000 | 4.500%, 10/12/2023 | 454,388 | ||||||
SS&C European Holdings SARL, Term Loan | ||||||||
| 86,290 | 4.001%, 7/8/2022 | 87,423 | ||||||
| 8,806 | 4.002%, 7/8/2022 | 8,921 | ||||||
Western Digital Corporation, Term Loan | ||||||||
| 721,375 | 4.520%, 4/29/2023 | 732,419 | ||||||
Xerox Business Services, LLC, Term Loan | ||||||||
| 550,000 | 6.250%, 12/7/2023b,c | 556,187 | ||||||
|
| |||||||
Total | 6,054,914 | |||||||
|
| |||||||
Transportation (0.7%) | ||||||||
OSG Bulk Ships, Inc., Term Loan | ||||||||
| 416,979 | 5.250%, 8/5/2019 | 406,034 | ||||||
The accompanying Notes to Financial Statements are an integral part of this schedule.
128
Table of Contents
OPPORTUNITY INCOME PLUS PORTFOLIO
Schedule of Investments as of December 31, 2016
| Principal Amount | Bank Loans (29.6%)a | Value | ||||||
| Transportation (0.7%) - continued | ||||||||
XPO Logistics, Inc., Term Loan | ||||||||
| $539,310 | 4.250%, 11/1/2021 | $ | 545,884 | |||||
|
| |||||||
Total | 951,918 | |||||||
|
| |||||||
Utilities (0.9%) | ||||||||
Calpine Corporation, Term Loan | ||||||||
| 775,000 | 0.000%, 1/15/2024b,c | 777,906 | ||||||
Intergen NV, Term Loan | ||||||||
| 206,383 | 5.500%, 6/12/2020 | 199,848 | ||||||
Talen Energy Supply, LLC, Term Loan | ||||||||
| 267,855 | 6.000%, 12/6/2023 | 271,203 | ||||||
|
| |||||||
Total | 1,248,957 | |||||||
|
| |||||||
Total Bank Loans (cost $41,333,842) | 41,600,498 | |||||||
|
| |||||||
Long-Term Fixed Income (57.7%) | ||||||||
| Asset-Backed Securities (4.3%) | ||||||||
Asset Backed Securities Corporation Home Equity Loan Trust | ||||||||
| 169,321 | 0.896%, 7/25/2036, Series 2006-HE5, Class A4d | 156,046 | ||||||
Bayview Opportunity Master Fund Trust | ||||||||
| 32,764 | 3.623%, 4/28/2030, Series 2015-3, Class A1e | 32,834 | ||||||
| 218,781 | 3.721%, 7/28/2035, Series 2015-NPLA, Class Ae,f | 218,731 | ||||||
CAM Mortgage, LLC | ||||||||
| 1,463 | 3.500%, 7/15/2064, Series 2015-1, Class A*,f | 1,463 | ||||||
Citi Held For Asset Issuance | ||||||||
| 177,460 | 4.480%, 8/15/2022, Series 2016-MF1, Class A* | 179,584 | ||||||
Credit Based Asset Servicing and Securitization, LLC | ||||||||
| 103,726 | 3.503%, 12/25/2036, Series 2006-CB2, Class AF2f | 76,390 | ||||||
Credit-Based Asset Servicing & Securitization, LLC | ||||||||
| 450,000 | 1.176%, 12/25/2035, Series 2005-CB8, Class M1d | 259,475 | ||||||
DRB Prime Student Loan Trust | ||||||||
| 90,731 | 2.890%, 6/25/2040, Series 2016-B, Class A2e | 90,022 | ||||||
Earnest Student Loan Program, LLC | ||||||||
| 252,737 | 2.680%, 7/25/2035, Series 2016-C, Class A2e | 247,857 | ||||||
First Horizon ABS Trust | ||||||||
| 139,032 | 0.916%, 10/25/2034, Series 2006-HE1, Class Ad,g | 135,599 | ||||||
FRS, LLC | ||||||||
| 69,514 | 1.800%, 4/15/2043, Series 2013-1A, Class A1* | 68,077 | ||||||
GMAC Mortgage Corporation Loan Trust | ||||||||
| 238,898 | 1.084%, 8/25/2035, Series 2005-HE1, Class A2d,g | 225,981 | ||||||
| 38,681 | 3.551%, 9/19/2035, Series 2005-AR5, Class 5A1 | 36,268 | ||||||
GSAA Home Equity Trust | ||||||||
| 322,296 | 1.026%, 7/25/2037, Series 2007-7, Class A4d | 291,402 | ||||||
Impac CMB Trust | ||||||||
| 192,840 | 1.276%, 4/25/2035, Series 2005-2, Class 1A1d | 175,925 | ||||||
| 35,066 | 1.396%, 8/25/2035, Series 2005-5, Class A1d | 30,748 | ||||||
J.P. Morgan Mortgage Acquisition Trust | ||||||||
| 136,926 | 4.480%, 3/25/2047, Series 2007-HE1, Class AF4f | 101,500 | ||||||
Lehman XS Trust | ||||||||
| 167,231 | 5.440%, 8/25/2035, Series 2005-2, Class 2A3Bf | 146,502 | ||||||
Marlette Funding Trust | ||||||||
| 257,568 | 3.060%, 1/17/2023, Series 2016-1A, Class A* | 257,505 | ||||||
Merrill Lynch Mortgage Investors Trust | ||||||||
| 253,474 | 2.830%, 6/25/2035, Series 2005-A5, Class M1 | 169,630 | ||||||
MLCC Mortgage Investors, Inc. | ||||||||
| 114,934 | 1.416%, 9/25/2029, Series 2004-D, Class A1d | 113,810 | ||||||
Murray Hill Marketplace Trust | ||||||||
| 106,302 | 4.190%, 11/25/2022, Series 2016-LC1, Class A* | 106,812 | ||||||
NCF Dealer Floorplan Master Trust | ||||||||
| 150,000 | 3.812%, 3/21/2022, Series 2016-1A, Class A*,d | 148,921 | ||||||
NRZ Advance Receivables Trust Advance Receivables Backed | ||||||||
| 300,000 | 2.751%, 6/15/2049, Series 2016-T1, Class AT1* | 298,875 | ||||||
Popular ABS Mortgage Pass-Through Trust | ||||||||
| 100,000 | 4.256%, 11/25/2035, Series 2005-5, Class AF4f | 98,431 | ||||||
Preston Ridge Partners Mortgage Trust, LLC | ||||||||
| 193,938 | 4.000%, 9/27/2021, Series 2016-1A, Class A1*,f | 193,187 | ||||||
Pretium Mortgage Credit Partners I, LLC | ||||||||
| 192,594 | 4.000%, 7/27/2031, Series 2016-NPL4, Class A*,f | 192,515 | ||||||
Renaissance Home Equity Loan Trust | ||||||||
| 234,723 | 5.797%, 8/25/2036, Series 2006-2, Class AF3f | 141,534 | ||||||
| 187,090 | 5.285%, 1/25/2037, Series 2006-4, Class AF2f | 98,710 | ||||||
SoFi Consumer Loan Program, LLC | ||||||||
| 241,512 | 3.050%, 12/26/2025, Series 2016-3, Class Ae | 240,626 | ||||||
Sunset Mortgage Loan Company, LLC | ||||||||
| 105,946 | 4.459%, 9/18/2045, Series 2015-NPL1, Class A*,f | 105,496 | ||||||
| 86,433 | 3.844%, 7/16/2047, Series 2016-NPL1, Class A*,f | 86,727 | ||||||
US Residential Opportunity Fund Trust | ||||||||
| 237,531 | 3.475%, 7/27/2036, Series 2016-1III, Class A*,f | 236,523 | ||||||
Vericrest Opportunity Loan Transferee | ||||||||
| 68,244 | 3.375%, 10/25/2058, Series 2015-NPL3, Class A1*,f | 68,148 | ||||||
| 87,920 | 3.500%, 6/26/2045, Series 2015-NPL9, Class A1e | 87,740 | ||||||
The accompanying Notes to Financial Statements are an integral part of this schedule.
129
Table of Contents
OPPORTUNITY INCOME PLUS PORTFOLIO
Schedule of Investments as of December 31, 2016
| Principal Amount | Long-Term Fixed Income (57.7%) | Value | ||||||
Asset-Backed Securities (4.3%) - continued | ||||||||
| $ | 88,745 | 3.625%, 7/25/2045, Series 2015-NP10, Class A1e,f | $ | 88,853 | ||||
| 247,332 | 3.500%, 10/25/2046, Series 2016-NP11, Class A1e,f | 246,756 | ||||||
Vericrest Opportunity Loan Trust | ||||||||
| 270,213 | 3.625%, 11/26/2046, Series 2016-NP12, Class A1e,f | 269,414 | ||||||
Wachovia Asset Securitization, Inc. | ||||||||
| 297,323 | 0.896%, 7/25/2037, Series 2007-HE1, Class A*,d,g | 253,771 | ||||||
|
| |||||||
Total | 5,978,388 | |||||||
|
| |||||||
Basic Materials (0.7%) | ||||||||
Albemarle Corporation | ||||||||
| 46,000 | 3.000%, 12/1/2019 | 47,021 | ||||||
Alcoa Nederland Holding BV | ||||||||
| 75,000 | 6.750%, 9/30/2024e | 81,375 | ||||||
ArcelorMittal SA | ||||||||
| 120,000 | 6.500%, 3/1/2021 | 131,400 | ||||||
Dow Chemical Company | ||||||||
| 24,000 | 8.550%, 5/15/2019 | 27,495 | ||||||
First Quantum Minerals, Ltd. | ||||||||
| 130,000 | 7.000%, 2/15/2021e | 129,298 | ||||||
Glencore Funding, LLC | ||||||||
| 30,000 | 1.940%, 4/16/2018d,e | 29,661 | ||||||
INEOS Group Holdings SA | ||||||||
| 250,000 | 5.625%, 8/1/2024e | 248,125 | ||||||
LyondellBasell Industries NV | ||||||||
| 26,000 | 5.000%, 4/15/2019 | 27,449 | ||||||
NOVA Chemicals Corporation | ||||||||
| 97,215 | 5.250%, 8/1/2023e | 98,187 | ||||||
Steel Dynamics, Inc. | ||||||||
| 155,000 | 5.000%, 12/15/2026e | 154,419 | ||||||
|
| |||||||
Total | 974,430 | |||||||
|
| |||||||
Capital Goods (1.3%) | ||||||||
AECOM | ||||||||
| 180,000 | 5.875%, 10/15/2024 | 192,170 | ||||||
Building Materials Corporation of America | ||||||||
| 175,000 | 6.000%, 10/15/2025e | 184,188 | ||||||
Cemex SAB de CV | ||||||||
| 130,000 | 5.700%, 1/11/2025e | 130,975 | ||||||
CNH Industrial Capital, LLC | ||||||||
| 195,000 | 4.375%, 11/6/2020 | 200,119 | ||||||
Crown Americas Capital Corporation IV | ||||||||
| 120,000 | 4.500%, 1/15/2023 | 122,400 | ||||||
General Electric Company | ||||||||
| 53,000 | 5.000%, 1/21/2021h | 54,998 | ||||||
Huntington Ingalls Industries, Inc. | ||||||||
| 155,000 | 5.000%, 12/15/2021e | 161,200 | ||||||
L3 Technologies, Inc. | ||||||||
| 75,000 | 4.950%, 2/15/2021 | 80,066 | ||||||
Lockheed Martin Corporation | ||||||||
| 35,000 | 2.500%, 11/23/2020 | 35,268 | ||||||
Owens-Brockway Glass Container, Inc. | ||||||||
| 155,000 | 5.000%, 1/15/2022e | 158,488 | ||||||
Reynolds Group Issuer, Inc. | ||||||||
| 240,000 | 5.125%, 7/15/2023e | 243,900 | ||||||
Roper Industries, Inc. | ||||||||
| 34,000 | 2.050%, 10/1/2018 | 34,109 | ||||||
Roper Technologies, Inc. | ||||||||
| 60,000 | 2.800%, 12/15/2021 | 59,910 | ||||||
United Rentals North America, Inc. | ||||||||
| 170,000 | 5.500%, 7/15/2025 | 173,400 | ||||||
|
| |||||||
Total | 1,831,191 | |||||||
|
| |||||||
Collateralized Mortgage Obligations (5.6%) | ||||||||
Alternative Loan Trust | ||||||||
| 26,523 | 5.500%, 5/25/2035, Series 2005-J3, Class 2A13 | 26,448 | ||||||
American Home Mortgage Assets Trust | ||||||||
| 120,677 | 1.527%, 9/25/2046, Series 2006-2, Class 1A1d | 83,158 | ||||||
| 213,781 | 0.946%, 12/25/2046, Series 2006-6, Class A1Ad | 151,163 | ||||||
Angel Oak Mortgage Trust | ||||||||
| 124,125 | 4.500%, 11/25/2045, Series 2015-1, Class A*,f | 124,844 | ||||||
Bayview Opportunity Master Fund Trust | ||||||||
| 226,379 | 3.475%, 7/28/2031, Series 2016-RPL3, Class A1e | 225,024 | ||||||
Bear Stearns Adjustable Rate Mortgage Trust | ||||||||
| 148,409 | 2.830%, 10/25/2035, Series 2005-9, Class A1d | 142,890 | ||||||
Bear Stearns ALT-A Trust | ||||||||
| 119,716 | 3.108%, 10/25/2033, Series 2003-3, Class 5A | 117,062 | ||||||
| 102,435 | 3.204%, 6/25/2034, Series 2004-5, Class 3A1 | 102,671 | ||||||
ChaseFlex Trust | ||||||||
| 336,084 | 6.500%, 2/25/2035, Series 2005-1, Class 1A5 | 327,020 | ||||||
CitiMortgage Alternative Loan Trust | ||||||||
| 240,024 | 5.750%, 4/25/2037, Series 2007-A4, Class 1A5 | 205,647 | ||||||
COLT Mortgage Loan Trust | ||||||||
| 250,408 | 2.750%, 9/25/2046, Series 2016-2, Class A1* | 251,721 | ||||||
Countrywide Alternative Loan Trust | ||||||||
| 135,257 | 5.750%, 8/25/2035, Series 2005-28CB, Class 2A5 | 118,538 | ||||||
| 144,056 | 5.500%, 10/25/2035, Series 2005-46CB, Class A8 | 136,309 | ||||||
| 51,291 | 5.500%, 2/25/2036, Series 2005-85CB, Class 2A2 | 47,595 | ||||||
| 74,212 | 6.000%, 1/25/2037, Series 2006-39CB, Class 1A16 | 70,861 | ||||||
| 163,535 | 5.500%, 5/25/2037, Series 2007-8CB, Class A1 | 139,954 | ||||||
CSMC Mortgage-Backed Trust | ||||||||
| 215,909 | 5.500%, 3/25/2037, Series 2007-2, Class 3A4 | 194,254 | ||||||
Deutsche Alt-A Securities, Inc., Mortgage Loan Trust | ||||||||
| 110,659 | 1.337%, 4/25/2047, Series 2007-OA2, Class A1d | 93,731 | ||||||
First Horizon Alternative Mortgage Securities Trust | ||||||||
| 194,167 | 3.083%, 7/25/2035, Series 2005-AA5, Class 2A1 | 174,964 | ||||||
GMAC Mortgage Corporation Loan Trust | ||||||||
| 142,798 | 3.384%, 5/25/2035, Series 2005-AR2, Class 4A | 131,758 | ||||||
The accompanying Notes to Financial Statements are an integral part of this schedule.
130
Table of Contents
OPPORTUNITY INCOME PLUS PORTFOLIO
Schedule of Investments as of December 31, 2016
Principal | Long-Term Fixed Income (57.7%) | Value | ||||||
| Collateralized Mortgage Obligations (5.6%) - continued | ||||||||
HarborView Mortgage Loan Trust | ||||||||
| $ | 103,295 | 3.341%, 12/19/2035, Series 2005-14, Class 3A1A | $ | 89,780 | ||||
IndyMac INDA Mortgage Loan Trust | ||||||||
| 150,406 | 3.141%, 8/25/2036, Series 2006-AR1, Class A1 | 142,781 | ||||||
IndyMac INDX Mortgage Loan Trust | ||||||||
| 170,673 | 1.396%, 7/25/2045, Series 2005-16IP, Class A1d | 142,770 | ||||||
| 177,042 | 0.966%, 4/25/2046, Series 2006-AR2, Class 1A1Bd | 145,280 | ||||||
J.P. Morgan Alternative Loan Trust | ||||||||
| 121,427 | 6.500%, 3/25/2036, Series 2006-S1, Class 1A19 | 105,983 | ||||||
J.P. Morgan Mortgage Trust | ||||||||
| 99,386 | 6.500%, 1/25/2035, Series 2005-S1, Class 1A2 | 93,574 | ||||||
| 74,172 | 2.834%, 6/25/2035, Series 2005-A3, Class 3A4 | 73,666 | ||||||
| 64,872 | 3.077%, 6/25/2035, Series 2005-A3, Class 4A1 | 65,111 | ||||||
| 100,632 | 3.167%, 7/25/2035, Series 2007-A1, Class 2A1 | 98,779 | ||||||
| 140,421 | 3.247%, 8/25/2035, Series 2005-A5, Class 1A2 | 139,237 | ||||||
| 194,006 | 2.994%, 6/25/2036, Series 2006-A4, Class 2A2 | 173,485 | ||||||
| 199,753 | 3.110%, 10/25/2036, Series 2006-A6, Class 1A2 | 181,118 | ||||||
MASTR Alternative Loans Trust | ||||||||
| 92,545 | 5.000%, 9/25/2019, Series 2004-10, Class 3A1 | 93,854 | ||||||
Merrill Lynch Mortgage Investors, Inc. | ||||||||
| 124,187 | 2.830%, 6/25/2035, Series 2005-A5, Class A9 | 120,257 | ||||||
Morgan Stanley Mortgage Loan Trust | ||||||||
| 105,201 | 3.179%, 11/25/2035, Series 2005-6AR, Class 5A1 | 75,848 | ||||||
MortgageIT Trust | ||||||||
| 185,695 | 1.016%, 12/25/2035, Series 2005-5, Class A1d | 171,381 | ||||||
Pretium Mortgage Credit Partners, LLC | ||||||||
| 173,607 | 4.375%, 11/27/2030, Series 2015-NPL4, Class A1*,f | 175,013 | ||||||
Residential Accredit Loans, Inc. Trust | ||||||||
| 2,103 | 5.500%, 12/25/2034, Series 2004-QS16, Class 1A1 | 2,098 | ||||||
| 190,773 | 5.500%, 2/25/2035, Series 2005-QS2, Class A1 | 186,999 | ||||||
| 111,812 | 4.013%, 9/25/2035, Series 2005-QA10, Class A31 | 94,020 | ||||||
Sequoia Mortgage Trust | ||||||||
| 172,859 | 1.359%, 11/20/2034, Series 2004-10, Class A1Ad | 161,886 | ||||||
Structured Adjustable Rate Mortgage Loan Trust | ||||||||
| 147,042 | 2.949%, 1/25/2035, Series 2004-19, Class 2A2 | 119,702 | ||||||
Structured Asset Mortgage Investments, Inc. | ||||||||
| 350,005 | 1.066%, 12/25/2035, Series 2005-AR4, Class A1d | 255,668 | ||||||
Vericrest Opportunity Loan Transferee | ||||||||
| 285,684 | 3.500%, 7/25/2046, Series 2016-NPL8, Class A1e,f | 284,689 | ||||||
WaMu Mortgage Pass Through Certificates | ||||||||
| 88,561 | 5.000%, 11/25/2018, Series 2003-S12, Class 3A | 89,746 | ||||||
| 160,981 | 2.752%, 8/25/2036, Series 2006-AR8, Class 3A2 | 146,646 | ||||||
| 105,691 | 2.850%, 10/25/2036, Series 2006-AR12, Class 1A1 | 92,132 | ||||||
| 184,514 | 2.137%, 1/25/2037, Series 2006-AR18, Class 1A1 | 156,884 | ||||||
| 33,383 | 2.804%, 8/25/2046, Series 2006-AR8, Class 1A1 | 29,025 | ||||||
| 234,383 | 1.527%, 9/25/2046, Series 2006-AR11, Class 1Ad | 192,622 | ||||||
| 129,659 | 1.297%, 1/25/2047, Series 2006-AR19, Class 1A1Ad | 116,592 | ||||||
| 141,097 | 1.307%, 1/25/2047, Series 2006-AR19, Class 1Ad | 110,046 | ||||||
Washington Mutual Mortgage Pass Through Certificates Trust | ||||||||
| 181,159 | 1.317%, 2/25/2047, Series 2007-OA3, Class 2Ad | 135,036 | ||||||
Wells Fargo Mortgage Backed Securities Trust | ||||||||
| 147,266 | 3.003%, 3/25/2036, Series 2006-AR2, Class 2A1 | 146,912 | ||||||
| 65,121 | 3.083%, 4/25/2036, Series 2006-AR8, Class 2A4 | 64,016 | ||||||
| 174,643 | 3.073%, 10/25/2036, Series 2006-AR14, Class 2A3 | 162,516 | ||||||
| 139,042 | 6.000%, 7/25/2037, Series 2007-10, Class 1A1 | 137,023 | ||||||
| 249,576 | 6.000%, 7/25/2037, Series 2007-8, Class 1A16 | 246,555 | ||||||
|
| |||||||
Total | 7,884,342 | |||||||
|
| |||||||
| Commercial Mortgage-Backed Securities (<0.1%) | ||||||||
Morgan Stanley Capital, Inc. | ||||||||
| 62,500 | 5.406%, 3/15/2044 | 62,446 | ||||||
|
| |||||||
Total | 62,446 | |||||||
|
| |||||||
| Communications Services (2.7%) | ||||||||
Altice US Finance I Corporation | ||||||||
| 135,000 | 5.500%, 5/15/2026e | 137,700 | ||||||
AMC Networks, Inc. | ||||||||
| 195,000 | 5.000%, 4/1/2024 | 195,488 | ||||||
America Movil SAB de CV | ||||||||
| 21,000 | 5.000%, 10/16/2019 | 22,495 | ||||||
American Tower Corporation | ||||||||
| 30,000 | 2.800%, 6/1/2020 | 29,999 | ||||||
AT&T, Inc. | ||||||||
| 29,000 | 5.875%, 10/1/2019 | 31,680 | ||||||
| 30,000 | 1.928%, 6/30/2020d | 30,163 | ||||||
| 105,000 | 2.800%, 2/17/2021 | 104,080 | ||||||
British Sky Broadcasting Group plc | ||||||||
| 36,000 | 2.625%, 9/16/2019e | 36,130 | ||||||
CCOH Safari, LLC | ||||||||
| 185,000 | 5.750%, 2/15/2026e | 191,475 | ||||||
CenturyLink, Inc. | ||||||||
| 90,000 | 6.450%, 6/15/2021 | 94,725 | ||||||
The accompanying Notes to Financial Statements are an integral part of this schedule.
131
Table of Contents
OPPORTUNITY INCOME PLUS PORTFOLIO
Schedule of Investments as of December 31, 2016
Principal | Long-Term Fixed Income (57.7%) | Value | ||||||
Communications Services (2.7%) - continued | ||||||||
Charter Communications Operating, LLC | ||||||||
| $ | 67,000 | 3.579%, 7/23/2020 | $ | 68,308 | ||||
| 17,000 | 4.464%, 7/23/2022 | 17,747 | ||||||
Clear Channel Worldwide Holdings, Inc. | ||||||||
| 245,000 | 6.500%, 11/15/2022 | 250,512 | ||||||
Columbus International, Inc. | ||||||||
| 120,000 | 7.375%, 3/30/2021e | 127,697 | ||||||
Comcast Corporation | ||||||||
| 65,000 | 1.625%, 1/15/2022 | 62,193 | ||||||
Crown Castle International Corporation | ||||||||
| 35,000 | 3.400%, 2/15/2021 | 35,488 | ||||||
| 45,000 | 2.250%, 9/1/2021 | 43,494 | ||||||
| 200,000 | 5.250%, 1/15/2023 | 215,250 | ||||||
CSC Holdings, LLC | ||||||||
| 20,000 | 5.500%, 4/15/2027e | 20,250 | ||||||
Digicel, Ltd. | ||||||||
| 184,810 | 6.000%, 4/15/2021* | 167,107 | ||||||
FairPoint Communications, Inc. | ||||||||
| 155,000 | 8.750%, 8/15/2019e | 161,781 | ||||||
Frontier Communications Corporation | ||||||||
| 175,000 | 8.875%, 9/15/2020 | 186,375 | ||||||
Gray Television, Inc. | ||||||||
| 200,000 | 5.875%, 7/15/2026e | 198,500 | ||||||
Hughes Satellite Systems Corporation | ||||||||
| 69,000 | 6.500%, 6/15/2019 | 75,038 | ||||||
| 250,000 | 6.625%, 8/1/2026e | 251,250 | ||||||
Neptune Finco Corporation | ||||||||
| 115,000 | 10.875%, 10/15/2025e | 136,850 | ||||||
Nexstar Escrow Corporation | ||||||||
| 235,000 | 5.625%, 8/1/2024e | 233,238 | ||||||
Orange SA | ||||||||
| 60,000 | 1.625%, 11/3/2019 | 59,075 | ||||||
SFR Group SA | ||||||||
| 120,000 | 6.000%, 5/15/2022e | 123,150 | ||||||
Sprint Corporation | ||||||||
| 165,000 | 7.625%, 2/15/2025 | 173,456 | ||||||
Telefonica Emisiones SAU | ||||||||
| 30,000 | 3.192%, 4/27/2018 | 30,427 | ||||||
T-Mobile USA, Inc. | ||||||||
| 125,000 | 6.633%, 4/28/2021 | 130,469 | ||||||
Verizon Communications, Inc. | ||||||||
| 55,000 | 1.375%, 8/15/2019 | 54,119 | ||||||
| 85,000 | 2.625%, 2/21/2020 | 85,761 | ||||||
| 40,000 | 4.500%, 9/15/2020 | 42,773 | ||||||
|
| |||||||
Total | 3,824,243 | |||||||
|
| |||||||
| Consumer Cyclical (2.2%) | ||||||||
Allison Transmission, Inc. | ||||||||
| 245,000 | 5.000%, 10/1/2024e | 247,450 | ||||||
BMW US Capital, LLC | ||||||||
| 50,000 | 1.500%, 4/11/2019e | 49,506 | ||||||
Brookfield Residential Properties, Inc. | ||||||||
| 235,000 | 6.125%, 7/1/2022e | 236,175 | ||||||
Cinemark USA, Inc. | ||||||||
| 80,000 | 4.875%, 6/1/2023 | 81,000 | ||||||
Daimler Finance North America, LLC | ||||||||
| 21,000 | 1.875%, 1/11/2018e | 21,026 | ||||||
eBay, Inc. | ||||||||
| 35,000 | 2.500%, 3/9/2018 | 35,303 | ||||||
ERAC USA Finance, LLC | ||||||||
| 40,000 | 2.350%, 10/15/2019e | 39,945 | ||||||
Ford Motor Credit Company, LLC | ||||||||
| 38,000 | 5.000%, 5/15/2018 | 39,482 | ||||||
| 50,000 | 2.597%, 11/4/2019 | 49,902 | ||||||
General Motors Financial Company, Inc. | ||||||||
| 50,000 | 3.150%, 1/15/2020 | 50,283 | ||||||
| 56,000 | 4.375%, 9/25/2021 | 58,037 | ||||||
GLP Capital, LP | ||||||||
| 120,000 | 4.875%, 11/1/2020 | 126,000 | ||||||
Home Depot, Inc. | ||||||||
| 35,000 | 1.333%, 9/15/2017d | 35,059 | ||||||
| 35,000 | 2.625%, 6/1/2022 | 35,132 | ||||||
Jaguar Land Rover Automotive plc | ||||||||
| 77,000 | 5.625%, 2/1/2023e | 80,272 | ||||||
KB Home | ||||||||
| 71,000 | 4.750%, 5/15/2019 | 72,420 | ||||||
L Brands, Inc. | ||||||||
| 77,000 | 6.625%, 4/1/2021 | 86,432 | ||||||
Lennar Corporation | ||||||||
| 150,000 | 4.750%, 11/15/2022 | 153,750 | ||||||
Live Nation Entertainment, Inc. | ||||||||
| 240,000 | 5.375%, 6/15/2022e | 248,400 | ||||||
Macy’s Retail Holdings, Inc. | ||||||||
| 36,000 | 7.450%, 7/15/2017 | 37,135 | ||||||
MGM Resorts International | ||||||||
| 170,000 | 6.000%, 3/15/2023 | 183,600 | ||||||
Newell Rubbermaid, Inc. | ||||||||
| 35,000 | 3.150%, 4/1/2021 | 35,590 | ||||||
Prime Security Services Borrower, LLC | ||||||||
| 160,000 | 9.250%, 5/15/2023e | 174,200 | ||||||
PulteGroup, Inc. | ||||||||
| 235,000 | 4.250%, 3/1/2021 | 240,288 | ||||||
Ralph Lauren Corporation | ||||||||
| 35,000 | 2.625%, 8/18/2020 | 35,328 | ||||||
Royal Caribbean Cruises, Ltd. | ||||||||
| 119,810 | 5.250%, 11/15/2022 | 128,047 | ||||||
Six Flags Entertainment Corporation | ||||||||
| 110,000 | 5.250%, 1/15/2021e | 112,475 | ||||||
Toll Brothers Finance Corporation | ||||||||
| 52,000 | 4.000%, 12/31/2018 | 53,365 | ||||||
Visa, Inc. | ||||||||
| 35,000 | 2.200%, 12/14/2020 | 35,019 | ||||||
Walgreens Boots Alliance, Inc. | ||||||||
| 35,000 | 1.750%, 5/30/2018 | 35,030 | ||||||
| 35,000 | 2.600%, 6/1/2021 | 34,749 | ||||||
West Corporation | ||||||||
| 120,000 | 5.375%, 7/15/2022e | 115,950 | ||||||
Yum! Brands, Inc. | ||||||||
| 210,000 | 5.000%, 6/1/2024e | 214,463 | ||||||
|
| |||||||
Total | 3,180,813 | |||||||
|
| |||||||
| Consumer Non-Cyclical (2.1%) | ||||||||
Abbott Laboratories | ||||||||
| 75,000 | 2.350%, 11/22/2019 | 75,051 | ||||||
Actavis Funding SCS | ||||||||
| 26,000 | 2.208%, 3/12/2020d | 26,498 | ||||||
Anheuser-Busch InBev Finance, Inc. | ||||||||
| 60,000 | 2.146%, 2/1/2021d | 61,055 | ||||||
| 45,000 | 2.650%, 2/1/2021 | 45,207 | ||||||
Anheuser-Busch InBev Worldwide, Inc. | ||||||||
| 30,000 | 6.500%, 7/15/2018 | 32,126 | ||||||
The accompanying Notes to Financial Statements are an integral part of this schedule.
132
Table of Contents
OPPORTUNITY INCOME PLUS PORTFOLIO
Schedule of Investments as of December 31, 2016
Principal | Long-Term Fixed Income (57.7%) | Value | ||||||
| Consumer Non-Cyclical (2.1%) - continued | ||||||||
B&G Foods, Inc. | ||||||||
| $ | 70,000 | 4.625%, 6/1/2021 | $ | 71,400 | ||||
BAT International Finance plc | ||||||||
| 35,000 | 1.473%, 6/15/2018d,e | 35,007 | ||||||
Baxter International, Inc. | ||||||||
| 50,000 | 1.700%, 8/15/2021 | 48,057 | ||||||
Bayer U.S. Finance, LLC | ||||||||
| 50,000 | 2.375%, 10/8/2019e | 50,065 | ||||||
Boston Scientific Corporation | ||||||||
| 25,000 | 6.000%, 1/15/2020 | 27,454 | ||||||
Bunge Limited Finance Corporation | ||||||||
| 35,000 | 3.500%, 11/24/2020 | 35,596 | ||||||
Celgene Corporation | ||||||||
| 35,000 | 3.550%, 8/15/2022 | 35,857 | ||||||
Cott Beverages, Inc. | ||||||||
| 120,000 | 5.375%, 7/1/2022 | 122,100 | ||||||
CVS Health Corporation | ||||||||
| 24,000 | 2.250%, 12/5/2018 | 24,206 | ||||||
EMD Finance, LLC | ||||||||
| 19,000 | 1.343%, 3/17/2017d,e | 19,004 | ||||||
Envision Healthcare Corporation | ||||||||
| 155,000 | 5.125%, 7/1/2022e | 154,419 | ||||||
Express Scripts Holding Company | ||||||||
| 35,000 | 3.000%, 7/15/2023 | 33,842 | ||||||
Forest Laboratories, Inc. | ||||||||
| 37,000 | 4.375%, 2/1/2019e | 38,435 | ||||||
Gilead Sciences, Inc. | ||||||||
| 25,000 | 1.950%, 3/1/2022 | 24,164 | ||||||
| 35,000 | 3.250%, 9/1/2022 | 35,687 | ||||||
Grifols Worldwide Operations, Ltd. | ||||||||
| 200,000 | 5.250%, 4/1/2022 | 207,000 | ||||||
HCA, Inc. | ||||||||
| 64,810 | 4.750%, 5/1/2023 | 66,349 | ||||||
| 185,000 | 4.500%, 2/15/2027 | 181,763 | ||||||
JBS USA, LLC | ||||||||
| 170,000 | 5.750%, 6/15/2025e | 172,125 | ||||||
Kraft Heinz Foods Company | ||||||||
| 50,000 | 5.375%, 2/10/2020 | 54,122 | ||||||
Laboratory Corporation of America Holdings | ||||||||
| 20,000 | 2.625%, 2/1/2020 | 19,970 | ||||||
Mead Johnson Nutrition Company | ||||||||
| 35,000 | 3.000%, 11/15/2020 | 35,411 | ||||||
Merck & Company, Inc. | ||||||||
| 20,000 | 1.257%, 2/10/2020d | 20,104 | ||||||
Molson Coors Brewing Company | ||||||||
| 60,000 | 1.450%, 7/15/2019 | 59,089 | ||||||
Mylan NV | ||||||||
| 35,000 | 3.150%, 6/15/2021e | 34,318 | ||||||
PepsiCo, Inc. | ||||||||
| 68,000 | 1.394%, 10/6/2021d | 68,266 | ||||||
Pernod Ricard SA | ||||||||
| 50,000 | 5.750%, 4/7/2021e | 55,496 | ||||||
Perrigo Finance plc | ||||||||
| 50,000 | 3.500%, 12/15/2021 | 50,354 | ||||||
Pinnacle Foods, Inc. | ||||||||
| 200,000 | 5.875%, 1/15/2024 | 212,000 | ||||||
Revlon Consumer Products Corporation | ||||||||
| 64,810 | 5.750%, 2/15/2021 | 65,134 | ||||||
Reynolds American, Inc. | ||||||||
| 19,000 | 3.250%, 6/12/2020 | 19,457 | ||||||
Shire Acquisitions Investments Ireland Designated Activity Company | ||||||||
| 55,000 | 1.900%, 9/23/2019 | 54,277 | ||||||
Teleflex, Inc. | ||||||||
| 200,000 | 4.875%, 6/1/2026 | 198,000 | ||||||
Tenet Healthcare Corporation | ||||||||
| 120,000 | 8.125%, 4/1/2022 | 113,220 | ||||||
Teva Pharmaceutical Finance Netherlands III BV | ||||||||
| 45,000 | 1.700%, 7/19/2019 | 44,194 | ||||||
TreeHouse Foods, Inc. | ||||||||
| 110,000 | 4.875%, 3/15/2022 | 112,750 | ||||||
Valeant Pharmaceuticals International | ||||||||
| 64,810 | 7.250%, 7/15/2022e | 52,982 | ||||||
WM Wrigley Jr. Company | ||||||||
| 20,000 | 2.000%, 10/20/2017e | 20,100 | ||||||
|
| |||||||
Total | 2,911,711 | |||||||
|
| |||||||
| Energy (2.1%) | ||||||||
Anadarko Petroleum Corporation | ||||||||
| 40,000 | 8.700%, 3/15/2019 | 45,442 | ||||||
Antero Resources Corporation | ||||||||
| 140,000 | 5.125%, 12/1/2022 | 141,400 | ||||||
BP Capital Markets plc | ||||||||
| 70,000 | 1.676%, 5/3/2019 | 69,487 | ||||||
Buckeye Partners, LP | ||||||||
| 22,000 | 2.650%, 11/15/2018 | 22,140 | ||||||
Cheniere Corpus Christi Holdings, LLC | ||||||||
| 250,000 | 7.000%, 6/30/2024e | 270,625 | ||||||
Chevron Corporation | ||||||||
| 35,000 | 1.421%, 11/16/2018d | 35,140 | ||||||
Concho Resources, Inc. | ||||||||
| 189,810 | 6.500%, 1/15/2022 | 196,396 | ||||||
| 70,000 | 4.375%, 1/15/2025 | 69,861 | ||||||
Contura Energy, Inc. | ||||||||
| 120,000 | 10.000%, 8/1/2021* | 128,100 | ||||||
Crestwood Midstream Partners, LP | ||||||||
| 110,000 | 6.250%, 4/1/2023 | 112,200 | ||||||
Devon Energy Corporation | ||||||||
| 50,000 | 3.250%, 5/15/2022 | 49,631 | ||||||
Ecopetrol SA | ||||||||
| 62,000 | 5.875%, 9/18/2023 | 65,627 | ||||||
Enbridge, Inc. | ||||||||
| 19,000 | 1.384%, 6/2/2017d | 19,002 | ||||||
Encana Corporation | ||||||||
| 14,000 | 3.900%, 11/15/2021 | 14,101 | ||||||
EOG Resources, Inc. | ||||||||
| 45,000 | 2.625%, 3/15/2023 | 43,579 | ||||||
EQT Corporation | ||||||||
| 5,000 | 5.150%, 3/1/2018 | 5,154 | ||||||
| 26,000 | 8.125%, 6/1/2019 | 29,242 | ||||||
Exxon Mobil Corporation | ||||||||
| 55,000 | 1.708%, 3/1/2019 | 55,106 | ||||||
Marathon Oil Corporation | ||||||||
| 25,000 | 2.800%, 11/1/2022 | 23,879 | ||||||
Marathon Petroleum Corporation | ||||||||
| 35,000 | 3.400%, 12/15/2020 | 35,768 | ||||||
MEG Energy Corporation | ||||||||
| 77,000 | 6.375%, 1/30/2023e | 68,530 | ||||||
MPLX, LP | ||||||||
| 330,000 | 4.875%, 12/1/2024 | 339,404 | ||||||
Northern Tier Energy, LLC | ||||||||
| 185,000 | 7.125%, 11/15/2020 | 192,169 | ||||||
The accompanying Notes to Financial Statements are an integral part of this schedule.
133
Table of Contents
OPPORTUNITY INCOME PLUS PORTFOLIO
Schedule of Investments as of December 31, 2016
| Principal Amount | Long-Term Fixed Income (57.7%) | Value | ||||||
| Energy (2.1%) - continued | ||||||||
Petrobras Global Finance BV | ||||||||
| $138,000 | 8.375%, 5/23/2021 | $ | 148,695 | |||||
Petroleos Mexicanos | ||||||||
| 40,000 | 4.607%, 3/11/2022d,e | 41,250 | ||||||
| 168,000 | 6.500%, 3/13/2027e | 173,292 | ||||||
Regency Energy Partners, LP | ||||||||
| 120,000 | 5.000%, 10/1/2022 | 127,033 | ||||||
Rowan Companies, Inc. | ||||||||
| 25,000 | 7.375%, 6/15/2025 | 25,500 | ||||||
Sabine Pass Liquefaction, LLC | ||||||||
| 155,000 | 5.625%, 3/1/2025 | 165,850 | ||||||
Schlumberger Holdings Corporation | ||||||||
| 35,000 | 3.000%, 12/21/2020e | 35,713 | ||||||
Shell International Finance BV | ||||||||
| 30,000 | 1.352%, 5/11/2020d | 30,019 | ||||||
Sunoco Logistics Partners Operations, LP | ||||||||
| 35,000 | 4.400%, 4/1/2021 | 36,829 | ||||||
TransCanada Trust | ||||||||
| 150,000 | 5.875%, 8/15/2076 | 156,000 | ||||||
Transcontinental Gas Pipe Line Company, LLC | ||||||||
| 40,000 | 7.850%, 2/1/2026e | 50,377 | ||||||
|
| |||||||
Total | 3,022,541 | |||||||
|
| |||||||
| Financials (5.2%) | ||||||||
Abbey National Treasury Services plc | ||||||||
| 40,000 | 1.407%, 9/29/2017d | 39,930 | ||||||
ACE INA Holdings, Inc. | ||||||||
| 35,000 | 2.875%, 11/3/2022 | 35,247 | ||||||
AerCap Ireland Capital, Ltd. | ||||||||
| 100,000 | 3.950%, 2/1/2022 | 100,875 | ||||||
Aetna, Inc. | ||||||||
| 80,000 | 1.900%, 6/7/2019 | 79,796 | ||||||
Air Lease Corporation | ||||||||
| 36,000 | 2.125%, 1/15/2018 | 36,061 | ||||||
| 17,000 | 2.625%, 9/4/2018 | 17,115 | ||||||
Ally Financial, Inc. | ||||||||
| 100,000 | 4.750%, 9/10/2018 | 103,000 | ||||||
| 100,000 | 4.125%, 3/30/2020 | 102,000 | ||||||
American Express Credit Corporation | ||||||||
| 35,000 | 2.009%, 9/14/2020d | 35,583 | ||||||
Australia and New Zealand Banking Group, Ltd. | ||||||||
| 200,000 | 6.750%, 6/15/2026e,h | 211,142 | ||||||
BAC Capital Trust XIV | ||||||||
| 200,000 | 4.000%, 1/19/2017d,h | 157,000 | ||||||
Bank of America Corporation | ||||||||
| 44,000 | 5.700%, 5/2/2017 | 44,599 | ||||||
| 40,000 | 1.700%, 8/25/2017 | 40,052 | ||||||
| 20,000 | 8.000%, 1/30/2018h | 20,550 | ||||||
| 76,000 | 2.066%, 3/22/2018d | 76,512 | ||||||
| 15,000 | 5.650%, 5/1/2018 | 15,714 | ||||||
| 60,000 | 5.625%, 7/1/2020 | 65,928 | ||||||
| 40,000 | 2.625%, 4/19/2021 | 39,691 | ||||||
| 90,000 | 2.061%, 10/21/2022d | 91,558 | ||||||
Bank of Montreal | ||||||||
| 65,000 | 1.500%, 7/18/2019 | 64,120 | ||||||
BB&T Corporation | ||||||||
| 38,000 | 2.050%, 6/19/2018 | 38,191 | ||||||
Bear Stearns Companies, LLC | ||||||||
| 45,000 | 6.400%, 10/2/2017 | 46,615 | ||||||
BNP Paribas SA | ||||||||
| 30,000 | 2.375%, 9/14/2017 | 30,200 | ||||||
| 200,000 | 7.625%, 3/30/2021e,h | 211,020 | ||||||
Caisse Centrale Desjardins du Quebec | ||||||||
| 25,000 | 1.552%, 1/29/2018d,e | 24,975 | ||||||
Centene Escrow Corporation | ||||||||
| 180,000 | 5.625%, 2/15/2021 | 189,252 | ||||||
Central Fidelity Capital Trust I | ||||||||
| 195,000 | 1.880%, 4/15/2027d | 175,988 | ||||||
CIT Group, Inc. | ||||||||
| 80,000 | 3.875%, 2/19/2019 | 81,700 | ||||||
Citigroup, Inc. | ||||||||
| 69,000 | 1.850%, 11/24/2017 | 69,126 | ||||||
| 75,000 | 2.050%, 6/7/2019 | 74,686 | ||||||
| 60,000 | 2.650%, 10/26/2020 | 59,996 | ||||||
| 55,000 | 2.361%, 9/1/2023d | 56,094 | ||||||
CNA Financial Corporation | ||||||||
| 55,000 | 5.750%, 8/15/2021 | 61,387 | ||||||
Credit Agricole SA | ||||||||
| 25,000 | 1.923%, 6/10/2020d,e | 25,085 | ||||||
Credit Suisse Group AG | ||||||||
| 150,000 | 7.500%, 12/11/2023e,h | 156,937 | ||||||
CyrusOne, LP | ||||||||
| 64,000 | 6.375%, 11/15/2022 | 67,360 | ||||||
Discover Bank | ||||||||
| 10,000 | 8.700%, 11/18/2019 | 11,349 | ||||||
Discover Financial Services | ||||||||
| 20,000 | 6.450%, 6/12/2017 | 20,410 | ||||||
Fifth Third Bancorp | ||||||||
| 48,000 | 5.450%, 1/15/2017 | 48,066 | ||||||
Goldman Sachs Group, Inc. | ||||||||
| 20,000 | 2.625%, 1/31/2019 | 20,208 | ||||||
| 90,000 | 7.500%, 2/15/2019 | 99,737 | ||||||
| 40,000 | 2.000%, 4/25/2019 | 39,825 | ||||||
| 25,000 | 2.042%, 4/23/2020d | 25,239 | ||||||
| 55,000 | 2.241%, 11/15/2021d | 55,297 | ||||||
| 30,000 | 2.537%, 11/29/2023d | 30,930 | ||||||
| 120,000 | 5.300%, 11/10/2026h | 115,050 | ||||||
Guardian Life Global Funding | ||||||||
| 40,000 | 2.000%, 4/26/2021e | 38,977 | ||||||
Hartford Financial Services Group, Inc. | ||||||||
| 45,000 | 6.000%, 1/15/2019 | 48,407 | ||||||
HCP, Inc. | ||||||||
| 25,000 | 3.750%, 2/1/2019 | 25,694 | ||||||
Health Care REIT, Inc. | ||||||||
| 26,000 | 4.700%, 9/15/2017 | 26,557 | ||||||
Hospitality Properties Trust | ||||||||
| 40,000 | 4.250%, 2/15/2021 | 41,351 | ||||||
Huntington Bancshares, Inc. | ||||||||
| 55,000 | 3.150%, 3/14/2021 | 55,730 | ||||||
Hutchison Whampoa Finance CI, Ltd. | ||||||||
| 46,000 | 1.625%, 10/31/2017e | 45,893 | ||||||
Icahn Enterprises, LP | ||||||||
| 90,000 | 6.000%, 8/1/2020 | 91,912 | ||||||
ILFC E-Capital Trust II | ||||||||
| 300,000 | 4.920%, 12/21/2065d,e | 264,000 | ||||||
ING Capital Funding Trust III | ||||||||
| 25,000 | 4.438%, 3/31/2017d,h | 24,875 | ||||||
International Lease Finance Corporation | ||||||||
| 85,000 | 5.875%, 4/1/2019 | 90,268 | ||||||
Intesa Sanpaolo SPA | ||||||||
| 10,000 | 3.875%, 1/16/2018 | 10,132 | ||||||
| 32,000 | 3.875%, 1/15/2019 | 32,562 | ||||||
J.P. Morgan Chase & Company | ||||||||
| 39,000 | 7.900%, 4/30/2018h | 40,385 | ||||||
The accompanying Notes to Financial Statements are an integral part of this schedule.
134
Table of Contents
OPPORTUNITY INCOME PLUS PORTFOLIO
Schedule of Investments as of December 31, 2016
| Principal Amount | Long-Term Fixed Income (57.7%) | Value | ||||||
| Financials (5.2%) - continued | ||||||||
| $ | 20,000 | 6.300%, 4/23/2019 | $ | 21,846 | ||||
| 15,000 | 2.250%, 1/23/2020 | 14,955 | ||||||
| 60,000 | 4.950%, 3/25/2020 | 64,606 | ||||||
| 60,000 | 2.700%, 5/18/2023 | 58,638 | ||||||
| 71,000 | 2.112%, 10/24/2023d | 72,418 | ||||||
KeyCorp | ||||||||
| 30,000 | 2.300%, 12/13/2018 | 30,173 | ||||||
| 65,000 | 5.000%, 9/15/2026h | 59,963 | ||||||
Liberty Mutual Group, Inc. | ||||||||
| 10,000 | 5.000%, 6/1/2021e | 10,870 | ||||||
Lincoln National Corporation | ||||||||
| 65,000 | 6.250%, 2/15/2020 | 71,743 | ||||||
Lloyds Bank plc | ||||||||
| 25,000 | 1.490%, 3/16/2018d | 25,034 | ||||||
Macquarie Bank, Ltd. | ||||||||
| 40,000 | 2.060%, 1/15/2019d,e | 40,315 | ||||||
MetLife, Inc. | ||||||||
| 36,000 | 1.903%, 12/15/2017 | 36,093 | ||||||
Mizuho Corporate Bank, Ltd. | ||||||||
| 25,000 | 1.550%, 10/17/2017e | 24,976 | ||||||
Morgan Stanley | ||||||||
| 40,000 | 6.625%, 4/1/2018 | 42,296 | ||||||
| 25,000 | 2.026%, 1/27/2020d | 25,221 | ||||||
| 40,000 | 2.500%, 4/21/2021 | 39,531 | ||||||
| 26,000 | 4.875%, 11/1/2022 | 27,835 | ||||||
| 80,000 | 2.282%, 10/24/2023d | 80,889 | ||||||
MPT Operating Partnership, LP | ||||||||
| 110,000 | 5.500%, 5/1/2024 | 111,100 | ||||||
Murray Street Investment Trust I | ||||||||
| 60,000 | 4.647%, 3/9/2017 | 60,313 | ||||||
National City Corporation | ||||||||
| 20,000 | 6.875%, 5/15/2019 | 22,005 | ||||||
New York Life Global Funding | ||||||||
| 35,000 | 1.550%, 11/2/2018e | 34,893 | ||||||
Nomura Holdings, Inc. | ||||||||
| 21,000 | 2.750%, 3/19/2019 | 21,191 | ||||||
Quicken Loans, Inc. | ||||||||
| 190,000 | 5.750%, 5/1/2025e | 184,775 | ||||||
Realty Income Corporation | ||||||||
| 33,000 | 2.000%, 1/31/2018 | 33,090 | ||||||
Regions Bank | ||||||||
| 17,000 | 7.500%, 5/15/2018 | 18,210 | ||||||
Regions Financial Corporation | ||||||||
| 35,000 | 3.200%, 2/8/2021 | 35,467 | ||||||
Reinsurance Group of America, Inc. | ||||||||
| 40,000 | 5.625%, 3/15/2017 | 40,325 | ||||||
Royal Bank of Scotland Group plc | ||||||||
| 217,000 | 7.640%, 9/30/2017h | 201,268 | ||||||
| 162,000 | 7.648%, 9/30/2031h | 185,085 | ||||||
Simon Property Group, LP | ||||||||
| 35,000 | 2.500%, 9/1/2020 | 35,238 | ||||||
| 60,000 | 2.500%, 7/15/2021 | 60,005 | ||||||
Societe Generale SA | ||||||||
| 155,000 | 8.250%, 11/29/2018h | 161,209 | ||||||
Standard Chartered plc | ||||||||
| 280,000 | 6.409%, 1/30/2027e,h | 214,200 | ||||||
State Street Capital Trust IV | ||||||||
| 411,000 | 1.963%, 6/15/2037d | 363,221 | ||||||
State Street Corporation | ||||||||
| 35,000 | 1.809%, 8/18/2020d | 35,468 | ||||||
Sumitomo Mitsui Banking Corporation | ||||||||
| 25,000 | 1.460%, 1/16/2018d | 25,031 | ||||||
SunTrust Banks, Inc. | ||||||||
| 35,000 | 2.900%, 3/3/2021 | 35,465 | ||||||
Synchrony Financial | ||||||||
| 56,000 | 1.875%, 8/15/2017 | 56,044 | ||||||
| 15,000 | 2.111%, 2/3/2020d | 14,830 | ||||||
Toronto-Dominion Bank | ||||||||
| 40,000 | 1.722%, 1/22/2019d | 40,328 | ||||||
| 35,000 | 1.889%, 12/14/2020d | 35,411 | ||||||
UnitedHealth Group, Inc. | ||||||||
| 35,000 | 3.350%, 7/15/2022 | 36,022 | ||||||
USB Realty Corporation | ||||||||
| 195,000 | 2.027%, 1/15/2022d,e,h | 171,600 | ||||||
Voya Financial, Inc. | ||||||||
| 30,000 | 2.900%, 2/15/2018 | 30,368 | ||||||
Wells Fargo & Company | ||||||||
| 25,000 | 1.567%, 1/30/2020d | 24,988 | ||||||
| 35,000 | 2.100%, 7/26/2021 | 34,026 | ||||||
| 80,000 | 2.117%, 10/31/2023d | 80,987 | ||||||
Westpac Banking Corporation | ||||||||
| 75,000 | 1.761%, 8/19/2021d | 75,216 | ||||||
|
| |||||||
Total | 7,272,720 | |||||||
|
| |||||||
| Foreign Government (12.8%) | ||||||||
Argentina Government International Bond | ||||||||
| 140,000 | 7.500%, 4/22/2026e | 147,000 | ||||||
Brazil Government International Bond | ||||||||
| 431,000 | 4.875%, 1/22/2021 | 443,930 | ||||||
| 460,000 | 2.625%, 1/5/2023 | 409,400 | ||||||
| 337,000 | 6.000%, 4/7/2026 | 348,795 | ||||||
| 240,000 | 7.125%, 1/20/2037 | 250,200 | ||||||
| 288,000 | 5.000%, 1/27/2045 | 233,626 | ||||||
| 200,000 | 5.625%, 2/21/2047 | 175,500 | ||||||
Colombia Government International Bond | ||||||||
| 240,000 | 4.375%, 7/12/2021 | 251,400 | ||||||
| 430,000 | 2.625%, 3/15/2023 | 405,275 | ||||||
| 180,000 | 4.000%, 2/26/2024 | 181,800 | ||||||
| 150,000 | 5.625%, 2/26/2044 | 154,500 | ||||||
| 288,000 | 5.000%, 6/15/2045 | 273,240 | ||||||
Croatia Government International Bond | ||||||||
| 48,000 | 6.750%, 11/5/2019e | 52,080 | ||||||
| 255,000 | 6.625%, 7/14/2020e | 277,353 | ||||||
| 150,000 | 6.000%, 1/26/2024e | 162,563 | ||||||
Export-Import Bank of Korea | ||||||||
| 25,000 | 2.250%, 1/21/2020 | 24,852 | ||||||
Hungary Government International Bond | ||||||||
| 96,000 | 6.375%, 3/29/2021 | 107,497 | ||||||
| 386,000 | 5.750%, 11/22/2023 | 427,978 | ||||||
| 334,000 | 5.375%, 3/25/2024 | 364,060 | ||||||
Indonesia Government International Bond | ||||||||
| 340,000 | 4.875%, 5/5/2021e | 359,928 | ||||||
| 225,000 | 3.375%, 4/15/2023e | 219,483 | ||||||
| 282,000 | 5.875%, 1/15/2024e | 311,132 | ||||||
| 210,000 | 4.125%, 1/15/2025e | 208,076 | ||||||
| 277,000 | 4.750%, 1/8/2026e | 285,943 | ||||||
| 350,000 | 8.500%, 10/12/2035e | 474,807 | ||||||
| 480,000 | 5.125%, 1/15/2045e | 478,923 | ||||||
Mexico Government International Bond | ||||||||
| 50,000 | 5.750%, 10/12/2110 | 46,125 | ||||||
| 144,000 | 3.625%, 3/15/2022 | 144,288 | ||||||
| 284,000 | 4.000%, 10/2/2023 | 284,653 | ||||||
| 322,000 | 3.600%, 1/30/2025 | 310,408 | ||||||
The accompanying Notes to Financial Statements are an integral part of this schedule.
135
Table of Contents
OPPORTUNITY INCOME PLUS PORTFOLIO
Schedule of Investments as of December 31, 2016
| Principal Amount | Long-Term Fixed Income (57.7%) | Value | ||||||
| Foreign Government (12.8%) - continued | ||||||||
| $ | 411,000 | 4.125%, 1/21/2026 | $ | 407,712 | ||||
| 96,000 | 6.750%, 9/27/2034 | 113,760 | ||||||
| 120,000 | 6.050%, 1/11/2040 | 129,780 | ||||||
| 454,000 | 4.750%, 3/8/2044 | 412,686 | ||||||
| 188,000 | 5.550%, 1/21/2045 | 192,230 | ||||||
| 196,000 | 4.600%, 1/23/2046 | 175,910 | ||||||
| 200,000 | 4.350%, 1/15/2047 | 171,500 | ||||||
Panama Government International Bond | ||||||||
| 146,000 | 4.000%, 9/22/2024 | 148,555 | ||||||
| 173,000 | 3.750%, 3/16/2025 | 171,702 | ||||||
| 190,000 | 6.700%, 1/26/2036 | 230,565 | ||||||
Peru Government International Bond | ||||||||
| 105,000 | 5.625%, 11/18/2050 | 118,913 | ||||||
| 252,000 | 4.125%, 8/25/2027 | 261,765 | ||||||
| 245,000 | 8.750%, 11/21/2033 | 357,700 | ||||||
Philippines Government International Bond | ||||||||
| 416,000 | 4.000%, 1/15/2021 | 442,453 | ||||||
| 295,000 | 7.750%, 1/14/2031 | 414,691 | ||||||
| 110,000 | 6.375%, 10/23/2034 | 143,079 | ||||||
| 92,000 | 5.000%, 1/13/2037 | 103,815 | ||||||
| 184,000 | 3.950%, 1/20/2040 | 181,150 | ||||||
Romania Government International Bond | ||||||||
| 148,000 | 4.375%, 8/22/2023e | 152,292 | ||||||
| 80,000 | 4.875%, 1/22/2024e | 84,614 | ||||||
| 52,000 | 6.125%, 1/22/2044e | 60,697 | ||||||
Russia Government International Bond | ||||||||
| 188,000 | 3.500%, 1/16/2019e | 191,064 | ||||||
| 880,000 | 5.000%, 4/29/2020e | 933,812 | ||||||
| 335,000 | 4.875%, 9/16/2023e | 352,896 | ||||||
| 251,450 | 7.500%, 3/31/2030e | 302,746 | ||||||
| 507,000 | 5.625%, 4/4/2042e | 545,214 | ||||||
South Africa Government International Bond | ||||||||
| 55,000 | 5.500%, 3/9/2020 | 58,234 | ||||||
| 145,000 | 5.875%, 5/30/2022 | 157,873 | ||||||
| 241,000 | 4.300%, 10/12/2028 | 223,528 | ||||||
Turkey Government International Bond | ||||||||
| 102,000 | 7.500%, 11/7/2019 | 110,925 | ||||||
| 392,000 | 7.000%, 6/5/2020 | 420,899 | ||||||
| 445,000 | 5.125%, 3/25/2022 | 441,618 | ||||||
| 188,000 | 6.250%, 9/26/2022 | 195,247 | ||||||
| 310,000 | 5.750%, 3/22/2024 | 310,896 | ||||||
| 448,000 | 4.250%, 4/14/2026 | 398,225 | ||||||
| 200,000 | 4.875%, 10/9/2026 | 185,039 | ||||||
| 307,000 | 6.875%, 3/17/2036 | 315,786 | ||||||
| 208,000 | 4.875%, 4/16/2043 | 167,544 | ||||||
| 421,000 | 6.625%, 2/17/2045 | 418,621 | ||||||
|
| |||||||
Total | 18,020,551 | |||||||
|
| |||||||
| Mortgage-Backed Securities (14.4%) | ||||||||
Federal Home Loan Mortgage Corporation Gold 15-Yr. Pass Through | ||||||||
| 1,650,000 | 3.000%, 1/1/2032c | 1,692,405 | ||||||
Federal Home Loan Mortgage Corporation Gold 20-Yr. Pass Through | ||||||||
| 28,360 | 5.500%, 9/1/2024 | 31,430 | ||||||
Federal Home Loan Mortgage Corporation Gold 30-Yr. Pass Through | ||||||||
| 750,000 | 4.000%, 1/1/2047c | 787,350 | ||||||
Federal National Mortgage Association Conventional 15-Yr. Pass Through | ||||||||
| 2,100,000 | 2.500%, 1/1/2032c | 2,102,310 | ||||||
Federal National Mortgage Association Conventional 20-Yr. Pass Through | ||||||||
| 211,303 | 6.000%, 8/1/2024 | 239,046 | ||||||
Federal National Mortgage Association Conventional 30-Yr. Pass Through | ||||||||
| 5,000,000 | 3.000%, 1/1/2047c | 4,963,500 | ||||||
| 5,100,000 | 3.500%, 1/1/2047c | 5,223,930 | ||||||
| 3,600,000 | 4.000%, 1/1/2047c | 3,782,880 | ||||||
| 1,325,000 | 4.500%, 1/1/2047c | 1,424,640 | ||||||
|
| |||||||
Total | 20,247,491 | |||||||
|
| |||||||
| Technology (1.2%) | ||||||||
Alliance Data Systems Corporation | ||||||||
| 75,000 | 5.375%, 8/1/2022e | 72,375 | ||||||
Apple, Inc. | ||||||||
| 30,000 | 1.202%, 5/6/2020d | 29,975 | ||||||
Automatic Data Processing, Inc. | ||||||||
| 35,000 | 2.250%, 9/15/2020 | 35,155 | ||||||
Cisco Systems, Inc. | ||||||||
| 40,000 | 1.511%, 2/21/2018d | 40,230 | ||||||
| 35,000 | 1.431%, 3/1/2019d | 35,200 | ||||||
CommScope Technologies Finance, LLC | ||||||||
| 130,000 | 6.000%, 6/15/2025e | 137,800 | ||||||
Diamond 1 Finance Corporation | ||||||||
| 35,000 | 3.480%, 6/1/2019e | 35,719 | ||||||
Equinix, Inc. | ||||||||
| 155,000 | 5.750%, 1/1/2025 | 161,975 | ||||||
Fidelity National Information Services, Inc. | ||||||||
| 37,000 | 1.450%, 6/5/2017 | 37,014 | ||||||
| 35,000 | 3.625%, 10/15/2020 | 36,208 | ||||||
| 75,000 | 2.250%, 8/15/2021 | 73,059 | ||||||
First Data Corporation | ||||||||
| 110,000 | 5.375%, 8/15/2023e | 114,125 | ||||||
Hewlett Packard Enterprise Company | ||||||||
| 58,000 | 3.600%, 10/15/2020 | 58,961 | ||||||
Intel Corporation | ||||||||
| 60,000 | 1.700%, 5/19/2021 | 58,543 | ||||||
| 35,000 | 3.100%, 7/29/2022 | 35,952 | ||||||
Iron Mountain, Inc. | ||||||||
| 64,810 | 6.000%, 8/15/2023 | 68,861 | ||||||
NXP BV | ||||||||
| 170,000 | 3.875%, 9/1/2022e | 172,125 | ||||||
Oracle Corporation | ||||||||
| 30,000 | 2.500%, 5/15/2022 | 29,760 | ||||||
Plantronics, Inc. | ||||||||
| 200,000 | 5.500%, 5/31/2023e | 202,000 | ||||||
Sensata Technologies BV | ||||||||
| 130,000 | 4.875%, 10/15/2023e | 132,925 | ||||||
Texas Instruments, Inc. | ||||||||
| 30,000 | 1.750%, 5/1/2020 | 29,651 | ||||||
Tyco Electronics Group SA | ||||||||
| 38,000 | 6.550%, 10/1/2017 | 39,415 | ||||||
|
| |||||||
Total | 1,637,028 | |||||||
|
| |||||||
The accompanying Notes to Financial Statements are an integral part of this schedule.
136
Table of Contents
OPPORTUNITY INCOME PLUS PORTFOLIO
Schedule of Investments as of December 31, 2016
| Principal Amount | Long-Term Fixed Income (57.7%) | Value | ||||||
| Transportation (0.4%) | ||||||||
Air Canada Pass Through Trust | ||||||||
| $ | 13,975 | 3.875%, 3/15/2023e | $ | 13,485 | ||||
American Airlines Pass Through Trust | ||||||||
| 15,982 | 4.950%, 1/15/2023 | 17,041 | ||||||
Avis Budget Car Rental, LLC | ||||||||
| 105,000 | 5.125%, 6/1/2022e | 102,900 | ||||||
Delta Air Lines, Inc. | ||||||||
| 17,424 | 4.950%, 5/23/2019 | 18,260 | ||||||
ERAC USA Finance, LLC | ||||||||
| 65,000 | 2.600%, 12/1/2021e | 63,905 | ||||||
J.B. Hunt Transport Services, Inc. | ||||||||
| 35,000 | 3.300%, 8/15/2022 | 35,102 | ||||||
Korea Expressway Corporation | ||||||||
| 33,000 | 1.625%, 4/28/2017e | 32,980 | ||||||
United Airlines Pass Through Trust | ||||||||
| 35,000 | 3.700%, 12/1/2022 | 35,263 | ||||||
XPO Logistics, Inc. | ||||||||
| 200,000 | 6.500%, 6/15/2022e | 210,000 | ||||||
|
| |||||||
Total | 528,936 | |||||||
|
| |||||||
| U.S. Government and Agencies (1.5%) | ||||||||
U.S. Treasury Notes | ||||||||
| 925,000 | 1.125%, 8/31/2021 | 892,884 | ||||||
| 1,070,000 | 2.125%, 6/30/2022 | 1,072,608 | ||||||
| 100,000 | 1.625%, 2/15/2026 | 93,294 | ||||||
|
| |||||||
Total | 2,058,786 | |||||||
|
| |||||||
| Utilities (1.2%) | ||||||||
AES Corporation | ||||||||
| 64,000 | 7.375%, 7/1/2021 | 71,290 | ||||||
Ameren Corporation | ||||||||
| 35,000 | 2.700%, 11/15/2020 | 35,161 | ||||||
Arizona Public Service Company | ||||||||
| 20,000 | 2.200%, 1/15/2020 | 20,011 | ||||||
Berkshire Hathaway Energy Company | ||||||||
| 48,000 | 2.400%, 2/1/2020 | 48,101 | ||||||
Calpine Corporation | ||||||||
| 100,000 | 6.000%, 1/15/2022e | 104,500 | ||||||
| 120,000 | 5.375%, 1/15/2023 | 117,300 | ||||||
Dominion Resources, Inc. | ||||||||
| 25,000 | 1.600%, 8/15/2019 | 24,608 | ||||||
DTE Energy Company | ||||||||
| 46,000 | 2.400%, 12/1/2019 | 46,205 | ||||||
Dynegy, Inc. | ||||||||
| 140,000 | 7.375%, 11/1/2022 | 133,700 | ||||||
El Paso Corporation | ||||||||
| 18,000 | 7.000%, 6/15/2017 | 18,417 | ||||||
Emera U.S. Finance, LP | ||||||||
| 40,000 | 2.150%, 6/15/2019e | 39,917 | ||||||
Energy Transfer Equity, LP | ||||||||
| 170,000 | 5.500%, 6/1/2027 | 165,750 | ||||||
Energy Transfer Partners, LP | ||||||||
| 60,000 | 4.150%, 10/1/2020 | 62,088 | ||||||
Eversource Energy | ||||||||
| 15,000 | 1.600%, 1/15/2018 | 14,964 | ||||||
Exelon Generation Company, LLC | ||||||||
| 20,000 | 5.200%, 10/1/2019 | 21,425 | ||||||
| 15,000 | 2.950%, 1/15/2020 | 15,171 | ||||||
Fortis, Inc. | ||||||||
| 55,000 | 2.100%, 10/4/2021e | 53,107 | ||||||
NextEra Energy Capital Holdings, Inc. | ||||||||
| 35,000 | 2.300%, 4/1/2019 | 35,253 | ||||||
NiSource Finance Corporation | ||||||||
| 16,000 | 6.400%, 3/15/2018 | 16,848 | ||||||
| 50,000 | 5.450%, 9/15/2020 | 54,560 | ||||||
NRG Energy, Inc. | ||||||||
| 64,810 | 6.625%, 3/15/2023 | 64,972 | ||||||
Pacific Gas & Electric Company | ||||||||
| 26,000 | 5.625%, 11/30/2017 | 26,963 | ||||||
PG&E Corporation | ||||||||
| 19,000 | 2.400%, 3/1/2019 | 19,068 | ||||||
PPL Capital Funding, Inc. | ||||||||
| 85,000 | 3.500%, 12/1/2022 | 86,834 | ||||||
PSEG Power, LLC | ||||||||
| 75,000 | 3.000%, 6/15/2021 | 75,165 | ||||||
Sempra Energy | ||||||||
| 36,000 | 6.150%, 6/15/2018 | 38,134 | ||||||
| 15,000 | 2.400%, 3/15/2020 | 14,970 | ||||||
Southern California Edison Company | ||||||||
| 10,000 | 2.400%, 2/1/2022 | 9,961 | ||||||
Southern Company | ||||||||
| 80,000 | 1.850%, 7/1/2019 | 79,718 | ||||||
Tesoro Corporation | ||||||||
| 110,000 | 4.750%, 12/15/2023e | 110,550 | ||||||
Williams Partners, LP | ||||||||
| 25,000 | 5.250%, 3/15/2020 | 26,694 | ||||||
Xcel Energy, Inc. | ||||||||
| 30,000 | 1.200%, 6/1/2017 | 29,971 | ||||||
|
| |||||||
Total | 1,681,376 | |||||||
|
| |||||||
Total Long-Term Fixed Income (cost $81,588,786) | 81,116,993 | |||||||
|
| |||||||
| Shares | Registered Investment Companies (7.7%) | |||||||
| Equity Funds/ETFs (0.2%) | ||||||||
| 6,450 | AllianzGI NFJ Dividend Interest & Premium Strategy Fund | 81,334 | ||||||
| 7,200 | BlackRock Resources & Commodities Strategy Trust | 59,544 | ||||||
| 3,200 | Guggenheim Multi-Asset Income ETF | 64,512 | ||||||
|
| |||||||
Total | 205,390 | |||||||
|
| |||||||
| Fixed Income Funds/ETFs (7.5%) | ||||||||
| 32,160 | Aberdeen Asia-Pacific Income Fund, Inc. | 148,901 | ||||||
| 9,425 | Doubleline Income Solutions Fund | 178,981 | ||||||
| 5,211 | First Trust High Income Long/Short Fund | 83,793 | ||||||
| 12,472 | iShares J.P. Morgan USD Emerging Markets Bond ETF | 1,374,664 | ||||||
| 13,400 | iShares S&P U.S. Preferred Stock Index Fund | 498,614 | ||||||
| 29,597 | MFS Intermediate Income Trust | 131,410 | ||||||
| 10,814 | Pimco Dynamic Credit And Mortgage Income Fund | 218,659 | ||||||
| 95,700 | PowerShares Senior Loan Portfolio | 2,235,552 | ||||||
| 43,440 | SPDR Bloomberg Barclays High Yield Bond ETF | 1,583,388 | ||||||
| 24,789 | Templeton Global Income Fund | 160,633 | ||||||
| 45,320 | Vanguard Short-Term Corporate Bond ETF | 3,597,048 | ||||||
| 11,299 | Western Asset Emerging Markets Debt Fund, Inc. | 166,208 | ||||||
| 16,794 | Western Asset High Income Opportunity Fund, Inc. | 83,802 | ||||||
|
| |||||||
Total | 10,461,653 | |||||||
|
| |||||||
Total Registered Investment Companies (cost $10,949,723) | 10,667,043 | |||||||
|
| |||||||
The accompanying Notes to Financial Statements are an integral part of this schedule.
137
Table of Contents
OPPORTUNITY INCOME PLUS PORTFOLIO
Schedule of Investments as of December 31, 2016
| Shares | Preferred Stock (1.3%) | Value | ||||||
| Consumer Staples (<0.1%) | ||||||||
| 2,280 | CHS, Inc., 7.100%h | $ | 60,443 | |||||
|
| |||||||
Total | 60,443 | |||||||
|
| |||||||
| Energy (0.1%) | ||||||||
| 2,602 | Alpha Natural Resources, Inc., 0.000%i | 52,040 | ||||||
| 2,602 | ANR Holdings, Inc., 0.000%i | 14,051 | ||||||
|
| |||||||
Total | 66,091 | |||||||
|
| |||||||
| Financials (1.2%) | ||||||||
| 1,870 | Agribank FCB, 6.875%h | 198,804 | ||||||
| 10,320 | Citigroup, Inc., 6.875%h | 282,252 | ||||||
| 1,445 | Cobank ACB, 6.250%h | 146,532 | ||||||
| 5,180 | Countrywide Capital V, 7.000% | 131,883 | ||||||
| 7,800 | GMAC Capital Trust I, 6.602%d | 198,120 | ||||||
| 7,400 | Goldman Sachs Group, Inc., 5.500%h | 187,812 | ||||||
| 6,900 | Morgan Stanley, 7.125%h | 194,097 | ||||||
| 4,839 | U.S. Bancorp, 6.500%h | 136,895 | ||||||
| 169 | Wells Fargo & Company, Convertible, 7.500%h | 201,110 | ||||||
|
| |||||||
Total | 1,677,505 | |||||||
|
| |||||||
Total Preferred Stock (cost $1,714,094) | 1,804,039 | |||||||
|
| |||||||
Common Stock (0.5%) | ||||||||
Energy (0.3%) | ||||||||
| 851 | Arch Coal, Inc.i | 66,421 | ||||||
| 3,502 | Contura Energy, Inc.i | 248,642 | ||||||
| 341 | Vantage Drilling Internationali | 34,441 | ||||||
|
| |||||||
Total | 349,504 | |||||||
|
| |||||||
| Financials (0.2%) | ||||||||
| 24,100 | Apollo Investment Corporation | 141,226 | ||||||
| 11,100 | Ares Capital Corporation | 183,039 | ||||||
|
| |||||||
Total | 324,265 | |||||||
|
| |||||||
| Materials (<0.1%) | ||||||||
| 7,833 | Verso Corporationi | 55,614 | ||||||
|
| |||||||
Total | 55,614 | |||||||
|
| |||||||
Total Common Stock (cost $678,171) | 729,383 | |||||||
|
| |||||||
| Shares or Principal Amount | Short-Term Investments (19.2%)j | |||||||
Federal Home Loan Bank Discount Notes | ||||||||
| 100,000 | 0.344%, 1/6/2017k | 99,997 | ||||||
| 100,000 | 0.355%, 1/25/2017k | 99,977 | ||||||
| 100,000 | 0.365%, 1/27/2017k | 99,974 | ||||||
Thrivent Core Short-Term Reserve Fund | ||||||||
| 2,664,922 | 0.910% | 26,649,222 | ||||||
|
| |||||||
Total Short-Term Investments (cost $26,949,167) | 26,949,170 | |||||||
|
| |||||||
Total Investments (cost $163,213,783) 116.0% | $ | 162,867,126 | ||||||
|
| |||||||
Other Assets and Liabilities, Net (16.0%) | (22,507,712 | ) | ||||||
|
| |||||||
Total Net Assets 100.0% | $ | 140,359,414 | ||||||
|
| |||||||
| a | The stated interest rate represents the weighted average of all contracts within the bank loan facility. |
| b | All or a portion of the loan is unfunded. |
| c | Denotes investments purchased on a when-issued or delayed delivery basis. |
| d | Denotes variable rate securities. Variable rate securities are securities whose yields vary with a designated market index or market rate. The rate shown is as of December 31, 2016. |
| e | Denotes securities sold under Rule 144A of the Securities Act of 1933, which exempts them from registration. These securities may be resold to other dealers in the program or to other qualified institutional buyers. As of December 31, 2016, the value of these investments was $16,940,677 or 12.1% of total net assets. |
| f | Denotes step coupon securities. Step coupon securities pay an initial coupon rate for the first period and then different coupon rates for following periods. The rate shown is as of December 31, 2016. |
| g | All or a portion of the security is insured or guaranteed. |
| h | Denotes perpetual securities. Perpetual securities pay an indefinite stream of interest and have no contractual maturity date. Date shown, if applicable, is next call date. |
| i | Non-income producing security. |
| j | The interest rate shown reflects the yield, coupon rate or the discount rate at the date of purchase. |
| k | All or a portion of the security is held on deposit with the counterparty and pledged as the initial margin deposit for open futures contracts. |
| * | Denotes restricted securities. Restricted securities are investment securities which cannot be offered for public sale without first being registered under the Securities Act of 1933. The value of all restricted securities held in Opportunity Income Plus Portfolio as of December 31, 2016 was $3,044,389 or 2.2% of total net assets. The following table indicates the acquisition date and cost of restricted securities shown in the schedule as of December 31, 2016. |
Security | Acquisition Date | Cost | ||||||
Angel Oak Mortgage Trust, 11/25/2045 | 12/10/2015 | $ | 123,864 | |||||
CAM Mortgage, LLC, 7/15/2064 | 6/24/2015 | 1,463 | ||||||
Citi Held For Asset Issuance, 8/15/2022 | 2/26/2016 | 177,024 | ||||||
COLT Mortgage Loan Trust, 9/25/2046 | 9/9/2016 | 251,850 | ||||||
Contura Energy, Inc., 8/1/2021 | 11/4/2013 | 188,804 | ||||||
Digicel, Ltd., 4/15/2021 | 8/19/2013 | 186,039 | ||||||
FRS, LLC, 4/15/2043 | 11/17/2016 | 68,341 | ||||||
Marlette Funding Trust, 1/17/2023 | 7/20/2016 | 257,490 | ||||||
Murray Hill Marketplace Trust, 11/25/2022 | 10/6/2016 | 106,299 | ||||||
NCF Dealer Floorplan Master Trust, 3/21/2022 | 4/8/2016 | 147,211 | ||||||
NRZ Advance Receivables Trust Advance Receivables Backed, 6/15/2049 | 6/23/2016 | 300,000 | ||||||
Preston Ridge Partners Mortgage Trust, LLC, 9/27/2021 | 9/23/2016 | 193,938 | ||||||
Pretium Mortgage Credit Partners I, LLC, 7/27/2031 | 6/17/2016 | 192,594 | ||||||
Pretium Mortgage Credit Partners, LLC, 11/27/2030 | 11/6/2015 | 173,443 | ||||||
Sunset Mortgage Loan Company, LLC, 7/16/2047 | 7/27/2016 | 86,433 | ||||||
Sunset Mortgage Loan Company, LLC, 9/18/2045 | 10/2/2015 | 105,947 | ||||||
US Residential Opportunity Fund Trust, 7/27/2036 | 7/20/2016 | 237,531 | ||||||
The accompanying Notes to Financial Statements are an integral part of this schedule.
138
Table of Contents
OPPORTUNITY INCOME PLUS PORTFOLIO
Schedule of Investments as of December 31, 2016
Security | Acquisition Date | Cost | ||||||
Vericrest Opportunity Loan Transferee, 10/25/2058 | 1/13/2016 | $ | 67,305 | |||||
Wachovia Asset Securitization, Inc., 7/25/2037 | 3/16/2007 | 297,323 | ||||||
Definitions:
ETF | - | Exchange Traded Fund. | ||
REIT | - | Real Estate Investment Trust is a company that buys, develops, manages and/or sells real estate assets. |
The accompanying Notes to Financial Statements are an integral part of this schedule.
139
Table of Contents
SMALL CAP INDEX PORTFOLIO
Schedule of Investments as of December 31, 2016
| Shares | Common Stock (97.3%) | Value | ||||||
Consumer Discretionary (13.9%) | ||||||||
| 36,970 | Abercrombie & Fitch Company | $ | 443,640 | |||||
| 40,910 | American Axle & Manufacturing Holdings, Inc.a | 789,563 | ||||||
| 8,750 | American Public Education, Inc.a | 214,813 | ||||||
| 7,050 | Arctic Cat, Inc.a | 105,891 | ||||||
| 10,730 | Asbury Automotive Group, Inc.a | 662,041 | ||||||
| 91,440 | Ascena Retail Group, Inc.a | 566,014 | ||||||
| 21,097 | Barnes & Noble Education, Inc.a | 241,983 | ||||||
| 30,080 | Barnes & Noble, Inc. | 335,392 | ||||||
| 45,690 | Belmond, Ltd.a | 609,961 | ||||||
| 9,530 | Big 5 Sporting Goods Corporation | 165,345 | ||||||
| 538 | Biglari Holdings, Inc.a | 254,582 | ||||||
| 10,680 | BJ’s Restaurants, Inc.a | 419,724 | ||||||
| 6,270 | Blue Nile, Inc. | 254,750 | ||||||
| 10,730 | Bob Evans Farms, Inc. | 570,943 | ||||||
| 44,290 | Boyd Gaming Corporationa | 893,329 | ||||||
| 15,140 | Buckle, Inc.b | 345,192 | ||||||
| 23,715 | Caleres, Inc. | 778,326 | ||||||
| 50,850 | Callaway Golf Company | 557,316 | ||||||
| 6,240 | Capella Education Company | 547,872 | ||||||
| 34,510 | Career Education Corporationa | 348,206 | ||||||
| 13,690 | Cato Corporation | 411,795 | ||||||
| 4,560 | Cavco Industries, Inc.a | 455,316 | ||||||
| 9,750 | Children’s Place, Inc. | 984,262 | ||||||
| 9,110 | Chuy’s Holdings, Inc.a | 295,620 | ||||||
| 9,540 | Cooper-Standard Holdings, Inc.a | 986,245 | ||||||
| 25,020 | Core-Mark Holding Company, Inc. | 1,077,611 | ||||||
| 40,000 | Crocs, Inc.a | 274,400 | ||||||
| 20,160 | Dave & Buster’s Entertainment, Inc.a | 1,135,008 | ||||||
| 9,270 | DineEquity, Inc. | 713,790 | ||||||
| 16,340 | Dorman Products, Inc.a | 1,193,800 | ||||||
| 13,250 | Drew Industries, Inc. | 1,427,688 | ||||||
| 30,673 | E.W. Scripps Companya | 592,909 | ||||||
| 11,650 | El Pollo Loco Holdings, Inc.a | 143,295 | ||||||
| 13,840 | Ethan Allen Interiors, Inc. | 510,004 | ||||||
| 42,450 | Express, Inc.a | 456,762 | ||||||
| 14,320 | Fiesta Restaurant Group, Inc.a | 427,452 | ||||||
| 21,983 | Finish Line, Inc. | 413,500 | ||||||
| 29,700 | Five Below, Inc.a | 1,186,812 | ||||||
| 15,390 | Fox Factory Holding Corporationa | 427,073 | ||||||
| 20,400 | Francesca’s Holdings Corporationa | 367,812 | ||||||
| 19,050 | Fred’s, Inc.b | 353,568 | ||||||
| 9,220 | FTD Companies, Inc.a | 219,805 | ||||||
| 63,360 | Gannett Company, Inc. | 615,226 | ||||||
| 11,260 | Genesco, Inc.a | 699,246 | ||||||
| 19,670 | Gentherm, Inc.a | 665,830 | ||||||
| 23,650 | G-III Apparel Group, Ltd.a | 699,094 | ||||||
| 10,730 | Group 1 Automotive, Inc. | 836,296 | ||||||
| 33,450 | Guess ?, Inc. | 404,745 | ||||||
| 10,190 | Haverty Furniture Companies, Inc. | 241,503 | ||||||
| 12,130 | Hibbett Sports, Inc.a | 452,449 | ||||||
| 30,250 | Iconix Brand Group, Inc.a | 282,535 | ||||||
| 57,080 | ILG, Inc. | 1,037,144 | ||||||
| 10,640 | Installed Building Products, Inc.a | 439,432 | ||||||
| 14,700 | iRobot Corporationa | 859,215 | ||||||
| 7,880 | Kirkland’s, Inc.a | 122,219 | ||||||
| 26,360 | La-Z-Boy, Inc. | 818,478 | ||||||
| 9,220 | LGI Homes, Inc.a,b | 264,891 | ||||||
| 12,660 | Lithia Motors, Inc. | 1,225,868 | ||||||
| 14,700 | Lumber Liquidators Holdings, Inc.a,b | 231,378 | ||||||
| 22,210 | M.D.C. Holdings, Inc. | 569,909 | ||||||
| 13,280 | M/I Homes, Inc.a | 334,390 | ||||||
| 10,150 | Marcus Corporation | 319,725 | ||||||
| 13,380 | MarineMax, Inc.a | 258,903 | ||||||
| 13,080 | Marriott Vacations Worldwide Corporation | 1,109,838 | ||||||
| 20,240 | Meritage Homes Corporationa | 704,352 | ||||||
| 5,880 | Monarch Casino & Resort, Inc.a | 151,586 | ||||||
| 17,400 | Monro Muffler Brake, Inc. | 995,280 | ||||||
| 10,040 | Motorcar Parts of America, Inc.a | 270,277 | ||||||
| 8,250 | Movado Group, Inc. | 237,187 | ||||||
| 16,940 | Nautilus, Inc.a | 313,390 | ||||||
| 28,270 | New Media Investment Group, Inc. | 452,037 | ||||||
| 15,880 | Nutrisystem, Inc. | 550,242 | ||||||
| 25,700 | Ollie’s Bargain Outlet Holdings, Inc.a,b | 731,165 | ||||||
| 8,040 | Oxford Industries, Inc. | 483,445 | ||||||
| 6,530 | Perry Ellis International, Inc.a | 162,662 | ||||||
| 11,080 | PetMed Express, Inc.b | 255,616 | ||||||
| 11,170 | Popeyes Louisiana Kitchen, Inc.a | 675,562 | ||||||
| 6,930 | Red Robin Gourmet Burgers, Inc.a | 390,852 | ||||||
| 19,000 | Regis Corporationa | 275,880 | ||||||
| 28,380 | Rent-A-Center, Inc. | 319,275 | ||||||
| 33,040 | Ruby Tuesday, Inc.a | 106,719 | ||||||
| 16,080 | Ruth’s Hospitality Group, Inc. | 294,264 | ||||||
| 14,460 | Scholastic Corporation | 686,705 | ||||||
| 27,270 | Scientific Games Corporationa,b | 381,780 | ||||||
| 24,290 | Select Comfort Corporationa | 549,440 | ||||||
| 7,140 | Shoe Carnival, Inc. | 192,637 | ||||||
| 14,240 | Sonic Automotive, Inc. | 326,096 | ||||||
| 24,712 | Sonic Corporation | 655,115 | ||||||
| 13,510 | Stage Stores, Inc. | 59,039 | ||||||
| 8,570 | Stamps.com, Inc.a,b | 982,551 | ||||||
| 10,930 | Standard Motor Products, Inc. | 581,695 | ||||||
| 16,750 | Stein Mart, Inc. | 91,790 | ||||||
| 29,445 | Steven Madden, Ltd.a | 1,052,659 | ||||||
| 5,570 | Strayer Education, Inc.a | 449,109 | ||||||
| 10,250 | Sturm, Ruger & Company, Inc.b | 540,175 | ||||||
| 12,380 | Superior Industries International, Inc. | 326,213 | ||||||
| 26,440 | Tailored Brands, Inc. | 675,542 | ||||||
| 17,810 | Tile Shop Holdings, Inc.a | 348,185 | ||||||
| 20,530 | TopBuild Corporationa | 730,868 | ||||||
| 24,870 | Tuesday Morning Corporationa | 134,298 | ||||||
| 8,240 | Unifi, Inc.a | 268,871 | ||||||
| 7,790 | Universal Electronics, Inc.a | 502,844 | ||||||
| 10,630 | Vera Bradley, Inc.a | 124,584 | ||||||
| 12,970 | Vitamin Shoppe, Inc.a | 308,038 | ||||||
| 11,760 | WCI Communities, Inc.a | 275,772 | ||||||
| 15,560 | Wingstop, Inc. | 460,420 | ||||||
| 14,180 | Winnebago Industries, Inc. | 448,797 | ||||||
| 53,740 | Wolverine World Wide, Inc. | 1,179,593 | ||||||
| 20,700 | World Wrestling Entertainment, Inc. | 380,880 | ||||||
| 9,430 | Zumiez, Inc.a | 206,045 | ||||||
|
| |||||||
Total | 55,937,256 | |||||||
|
| |||||||
Consumer Staples (2.8%) | ||||||||
| 13,990 | Andersons, Inc. | 625,353 | ||||||
| 35,860 | B&G Foods, Inc. | 1,570,668 | ||||||
| 8,230 | Calavo Growers, Inc. | 505,322 | ||||||
| 16,000 | Cal-Maine Foods, Inc.b | 706,800 | ||||||
| 5,460 | Central Garden & Pet Companya | 180,671 | ||||||
| 18,190 | Central Garden & Pet Company, Class Aa | 562,071 | ||||||
| 88,980 | Darling Ingredients, Inc.a | 1,148,732 | ||||||
| 9,300 | Inter Parfums, Inc. | 304,575 | ||||||
| 8,010 | J & J Snack Foods Corporation | 1,068,774 | ||||||
| 5,970 | Medifast, Inc. | 248,531 | ||||||
| 10,630 | Sanderson Farms, Inc. | 1,001,771 | ||||||
| 3,310 | Seneca Foods Corporationa | 132,566 | ||||||
| 20,160 | SpartanNash Company | 797,126 | ||||||
| 142,745 | SUPERVALU, Inc.a | 666,619 | ||||||
| 12,250 | Universal Corporation | 780,938 | ||||||
The accompanying Notes to Financial Statements are an integral part of this schedule.
140
Table of Contents
SMALL CAP INDEX PORTFOLIO
Schedule of Investments as of December 31, 2016
| Shares | Common Stock (97.3%) | Value | ||||||
Consumer Staples (2.8%) - continued | ||||||||
| 7,640 | WD-40 Company | $ | 893,116 | |||||
|
| |||||||
| Total | 11,193,633 | |||||||
|
| |||||||
Energy (3.4%) | ||||||||
| 37,400 | Archrock, Inc. | 493,680 | ||||||
| 32,130 | Atwood Oceanics, Inc.b | 421,867 | ||||||
| 37,580 | Bill Barrett Corporationa | 262,684 | ||||||
| 17,120 | Bristow Group, Inc. | 350,618 | ||||||
| 11,150 | CARBO Ceramics, Inc.a | 116,629 | ||||||
| 32,890 | Carrizo Oil & Gas, Inc.a | 1,228,441 | ||||||
| 33,280 | Cloud Peak Energy, Inc.a | 186,701 | ||||||
| 12,140 | Contango Oil & Gas Companya | 113,388 | ||||||
| 10,200 | Era Group, Inc.a | 173,094 | ||||||
| 16,875 | Exterran Corporationa | 403,313 | ||||||
| 7,030 | Geospace Technologies Corporationa | 143,131 | ||||||
| 19,000 | Green Plains, Inc. | 529,150 | ||||||
| 7,110 | Gulf Island Fabrication, Inc. | 84,609 | ||||||
| 60,820 | Helix Energy Solutions Group, Inc.a | 536,432 | ||||||
| 17,160 | Hornbeck Offshore Services, Inc.a | 123,895 | ||||||
| 14,300 | Matrix Service Companya | 324,610 | ||||||
| 46,680 | Newpark Resources, Inc.a | 350,100 | ||||||
| 24,130 | Northern Oil and Gas, Inc.a | 66,357 | ||||||
| 30,010 | PDC Energy, Inc.a | 2,178,126 | ||||||
| 36,820 | Pioneer Energy Services Corporationa | 252,217 | ||||||
| 3,060 | REX American Resources Corporationa | 302,175 | ||||||
| 8,610 | SEACOR Holdings, Inc.a | 613,721 | ||||||
| 107,750 | Synergy Resources Corporationa | 960,053 | ||||||
| 25,270 | Tesco Corporationa | 208,477 | ||||||
| 57,760 | TETRA Technologies, Inc.a | 289,955 | ||||||
| 24,840 | Tidewater, Inc.a | 84,704 | ||||||
| 38,410 | U.S. Silica Holdings, Inc. | 2,177,079 | ||||||
| 27,340 | Unit Corporationa | 734,626 | ||||||
|
| |||||||
| Total | 13,709,832 | |||||||
|
| |||||||
Financials (17.9%) | ||||||||
| 47,270 | American Equity Investment Life Holding Company | 1,065,466 | ||||||
| 19,330 | Ameris Bancorp | 842,788 | ||||||
| 10,380 | AMERISAFE, Inc. | 647,193 | ||||||
| 48,980 | Astoria Financial Corporation | 913,477 | ||||||
| 26,640 | Banc of California, Inc.b | 462,204 | ||||||
| 22,700 | Bank Mutual Corporation | 214,515 | ||||||
| 14,270 | Banner Corporation | 796,409 | ||||||
| 31,290 | Bofi Holding, Inc.a,b | 893,330 | ||||||
| 44,650 | Boston Private Financial Holdings, Inc. | 738,957 | ||||||
| 38,300 | Brookline Bancorp, Inc. | 628,120 | ||||||
| 8,990 | Calamos Asset Management, Inc. | 76,864 | ||||||
| 51,300 | Capstead Mortgage Corporation | 522,747 | ||||||
| 17,770 | Cardinal Financial Corporation | 582,678 | ||||||
| 16,620 | Central Pacific Financial Corporation | 522,200 | ||||||
| 8,200 | City Holding Company | 554,320 | ||||||
| 31,480 | Columbia Banking System, Inc. | 1,406,526 | ||||||
| 24,050 | Community Bank System, Inc. | 1,486,049 | ||||||
| 15,180 | Customers Bancorp, Inc.a | 543,748 | ||||||
| 54,790 | CVB Financial Corporation | 1,256,335 | ||||||
| 16,825 | Dime Community Bancshares, Inc. | 338,182 | ||||||
| 14,193 | Donnelley Financial Solutions, Inc.a | 326,155 | ||||||
| 8,960 | eHealth, Inc.a | 95,424 | ||||||
| 17,310 | Employers Holdings, Inc. | 685,476 | ||||||
| 12,670 | Encore Capital Group, Inc.a,b | 362,996 | ||||||
| 12,637 | Enova International, Inc.a | 158,594 | ||||||
| 20,900 | Evercore Partners, Inc. | 1,435,830 | ||||||
| 26,270 | EZCORP, Inc.a | 279,776 | ||||||
| 11,430 | Fidelity Southern Corporation | 270,548 | ||||||
| 28,690 | Financial Engines, Inc. | 1,054,358 | ||||||
| 72,503 | First BanCorpa | 479,245 | ||||||
| 47,760 | First Commonwealth Financial Corporation | 677,237 | ||||||
| 33,450 | First Financial Bancorp | 951,652 | ||||||
| 35,750 | First Financial Bankshares, Inc.b | 1,615,900 | ||||||
| 43,842 | First Midwest Bancorp, Inc. | 1,106,134 | ||||||
| 8,520 | First NBC Bank Holding Companya | 62,196 | ||||||
| 26,294 | FirstCash, Inc. | 1,235,818 | ||||||
| 41,540 | Glacier Bancorp, Inc. | 1,504,994 | ||||||
| 31,510 | Great Western Bancorp, Inc. | 1,373,521 | ||||||
| 23,720 | Green Dot Corporationa | 558,606 | ||||||
| 14,520 | Greenhill & Company, Inc. | 402,204 | ||||||
| 17,412 | Hanmi Financial Corporation | 607,679 | ||||||
| 4,580 | HCI Group, Inc.b | 180,818 | ||||||
| 67,300 | Home BancShares, Inc. | 1,868,921 | ||||||
| 12,490 | HomeStreet, Inc.a | 394,684 | ||||||
| 68,804 | Hope Bancorp, Inc. | 1,506,120 | ||||||
| 21,620 | Horace Mann Educators Corporation | 925,336 | ||||||
| 14,580 | Independent Bank Corporation | 1,027,161 | ||||||
| 5,930 | Infinity Property & Casualty Corporation | 521,247 | ||||||
| 36,280 | Interactive Brokers Group, Inc. | 1,324,583 | ||||||
| 7,980 | INTL FCStone, Inc.a | 316,008 | ||||||
| 16,690 | Investment Technology Group, Inc. | 329,461 | ||||||
| 22,510 | LegacyTexas Financial Group, Inc. | 969,281 | ||||||
| 3,890 | LendingTree, Inc.a,b | 394,252 | ||||||
| 38,930 | Maiden Holdings, Ltd. | 679,329 | ||||||
| 14,100 | National Bank Holdings Corporation | 449,649 | ||||||
| 5,940 | Navigators Group, Inc. | 699,435 | ||||||
| 23,290 | NBT Bancorp, Inc. | 975,385 | ||||||
| 24,240 | Northfield Bancorp, Inc. | 484,073 | ||||||
| 55,150 | Northwest Bancshares, Inc. | 994,354 | ||||||
| 23,760 | OFG Bancorpb | 311,256 | ||||||
| 73,090 | Old National Bancorp | 1,326,583 | ||||||
| 9,840 | Opus Bank | 295,692 | ||||||
| 20,500 | Oritani Financial Corporation | 384,375 | ||||||
| 23,570 | Pinnacle Financial Partners, Inc. | 1,633,401 | ||||||
| 7,640 | Piper Jaffray Companiesa | 553,900 | ||||||
| 25,270 | PRA Group, Inc.a | 988,057 | ||||||
| 28,540 | ProAssurance Corporation | 1,603,948 | ||||||
| 32,580 | Provident Financial Services, Inc. | 922,014 | ||||||
| 20,640 | RLI Corporation | 1,303,003 | ||||||
| 18,830 | S & T Bancorp, Inc. | 735,123 | ||||||
| 7,640 | Safety Insurance Group, Inc. | 563,068 | ||||||
| 31,430 | Selective Insurance Group, Inc. | 1,353,061 | ||||||
| 24,020 | ServisFirst Bancshares, Inc.b | 899,309 | ||||||
| 16,020 | Simmons First National Corporation | 995,643 | ||||||
| 14,186 | Southside Bancshares, Inc. | 534,387 | ||||||
| 70,839 | Sterling Bancorp | 1,657,633 | ||||||
| 12,620 | Stewart Information Services Corporation | 581,530 | ||||||
| 26,620 | Texas Capital Bancshares, Inc.a | 2,087,008 | ||||||
| 6,510 | Tompkins Financial Corporation | 615,455 | ||||||
| 52,002 | TrustCo Bank Corporation | 455,017 | ||||||
| 43,680 | United Bankshares, Inc.b | 2,020,200 | ||||||
| 38,205 | United Community Banks, Inc. | 1,131,632 | ||||||
| 11,620 | United Fire Group, Inc. | 571,355 | ||||||
| 9,550 | United Insurance Holdings Corporation | 144,587 | ||||||
| 17,330 | Universal Insurance Holdings, Inc.b | 492,172 | ||||||
| 3,040 | Virtus Investment Partners, Inc. | 358,872 | ||||||
| 15,160 | Walker & Dunlop, Inc.a | 472,992 | ||||||
| 13,840 | Westamerica Bancorporationb | 870,951 | ||||||
| 27,880 | Wintrust Financial Corporation | 2,023,252 | ||||||
| 3,192 | World Acceptance Corporationa | 205,182 | ||||||
|
| |||||||
| Total | 71,867,206 | |||||||
|
| |||||||
The accompanying Notes to Financial Statements are an integral part of this schedule.
141
Table of Contents
SMALL CAP INDEX PORTFOLIO
Schedule of Investments as of December 31, 2016
| Shares | Common Stock (97.3%) | Value | ||||||
Health Care (11.1%) | ||||||||
| 12,170 | Abaxis, Inc. | $ | 642,211 | |||||
| 16,130 | Aceto Corporation | 354,376 | ||||||
| 24,770 | Acorda Therapeutics, Inc.a | 465,676 | ||||||
| 8,260 | Adeptus Health, Inc.a | 63,106 | ||||||
| 18,170 | Air Methods Corporationa | 578,715 | ||||||
| 11,990 | Albany Molecular Research, Inc.a,b | 224,932 | ||||||
| 4,790 | Almost Family, Inc.a | 211,239 | ||||||
| 18,380 | AMAG Pharmaceuticals, Inc.a | 639,624 | ||||||
| 15,133 | Amedisys, Inc.a | 645,120 | ||||||
| 25,740 | AMN Healthcare Services, Inc.a | 989,703 | ||||||
| 19,440 | Amphastar Pharmaceuticals, Inc.a | 358,085 | ||||||
| 6,680 | Analogic Corporation | 554,106 | ||||||
| 16,940 | AngioDynamics, Inc.a | 285,778 | ||||||
| 4,300 | ANI Pharmaceuticals, Inc.a | 260,666 | ||||||
| 7,920 | Anika Therapeutics, Inc.a | 387,763 | ||||||
| 15,490 | Biotelemetry, Inc.a | 346,202 | ||||||
| 17,360 | Cambrex Corporationa | 936,572 | ||||||
| 19,615 | Cantel Medical Corporation | 1,544,681 | ||||||
| 8,730 | Chemed Corporation | 1,400,379 | ||||||
| 61,270 | Community Health Systems, Inc.a | 342,499 | ||||||
| 5,780 | Computer Programs and Systems, Inc.b | 136,408 | ||||||
| 13,330 | CONMED Corporation | 588,786 | ||||||
| 5,400 | CorVel Corporationa | 197,640 | ||||||
| 17,670 | Cross Country Healthcare, Inc.a | 275,829 | ||||||
| 14,500 | CryoLife, Inc.a | 277,675 | ||||||
| 12,860 | Cynosure, Inc.a | 586,416 | ||||||
| 33,070 | Depomed, Inc.a,b | 595,921 | ||||||
| 23,140 | Diplomat Pharmacy, Inc.a | 291,564 | ||||||
| 4,200 | Eagle Pharmaceuticals, Inc.a,b | 333,228 | ||||||
| 18,610 | Emergent Biosolutions, Inc.a | 611,152 | ||||||
| 7,460 | Enanta Pharmaceuticals, Inc.a,b | 249,910 | ||||||
| 25,630 | Ensign Group, Inc. | 569,242 | ||||||
| 27,780 | Haemonetics Corporationa | 1,116,756 | ||||||
| 23,180 | HealthEquity, Inc.a | 939,254 | ||||||
| 13,760 | HealthStream, Inc.a | 344,688 | ||||||
| 17,930 | Healthways, Inc.a | 407,907 | ||||||
| 46,060 | HMS Holdings Corporationa | 836,450 | ||||||
| 7,910 | ICU Medical, Inc.a | 1,165,538 | ||||||
| 40,190 | Impax Laboratories, Inc.a | 532,517 | ||||||
| 41,540 | Innoviva, Inc.a,b | 444,478 | ||||||
| 8,680 | Inogen, Inc.a | 583,036 | ||||||
| 14,910 | Integer Holdings Corporationa | 439,099 | ||||||
| 16,080 | Integra LifeSciences Holdings Corporationa | 1,379,503 | ||||||
| 17,230 | Invacare Corporation | 224,852 | ||||||
| 45,589 | Kindred Healthcare, Inc. | 357,874 | ||||||
| 5,130 | Landauer, Inc. | 246,753 | ||||||
| 15,570 | Lannett Company, Inc.a,b | 343,319 | ||||||
| 8,050 | LHC Group, Inc.a | 367,885 | ||||||
| 10,230 | Ligand Pharmaceuticals, Inc.a,b | 1,039,470 | ||||||
| 21,400 | Luminex Corporationa | 432,922 | ||||||
| 12,460 | Magellan Health Services, Inc.a | 937,615 | ||||||
| 23,760 | Masimo Corporationa | 1,601,424 | ||||||
| 37,800 | Medicines Companya,b | 1,282,932 | ||||||
| 29,480 | Medidata Solutions, Inc.a | 1,464,272 | ||||||
| 22,750 | Meridian Bioscience, Inc. | 402,675 | ||||||
| 24,115 | Merit Medical Systems, Inc.a | 639,047 | ||||||
| 53,920 | MiMedx Group, Inc.a,b | 477,731 | ||||||
| 34,320 | Momenta Pharmaceuticals, Inc.a | 516,516 | ||||||
| 17,640 | Natus Medical, Inc.a | 613,872 | ||||||
| 82,150 | Nektar Therapeuticsa | 1,007,980 | ||||||
| 20,315 | Neogen Corporationa | 1,340,790 | ||||||
| 19,870 | Omnicell, Inc.a | 673,593 | ||||||
| 16,920 | PharMerica Corporationa | 425,538 | ||||||
| 9,900 | Phibro Animal Health Corporation | 290,070 | ||||||
| 6,520 | Providence Service Corporationa | 248,086 | ||||||
| 24,930 | Quality Systems, Inc.a | 327,830 | ||||||
| 15,910 | Quorum Health Corporationa | 115,666 | ||||||
| 18,070 | Repligen Corporationa | 556,917 | ||||||
| 27,620 | SciClone Pharmaceuticals, Inc.a | 298,296 | ||||||
| 57,990 | Select Medical Holdings Corporationa | 768,368 | ||||||
| 37,600 | Spectrum Pharmaceuticals, Inc.a | 166,568 | ||||||
| 26,280 | Supernus Pharmaceuticals, Inc.a | 663,570 | ||||||
| 14,970 | Surgical Care Affiliates, Inc.a | 692,662 | ||||||
| 7,050 | SurModics, Inc.a | 179,070 | ||||||
| 6,790 | U.S. Physical Therapy, Inc. | 476,658 | ||||||
| 9,430 | Vascular Solutions, Inc.a | 529,023 | ||||||
| 19,480 | ZELTIQ Aesthetics, Inc.a,b | 847,770 | ||||||
|
| |||||||
| Total | 44,692,044 | |||||||
|
| |||||||
Industrials (17.9%) | ||||||||
| 21,462 | AAON, Inc. | 709,319 | ||||||
| 17,190 | AAR Corporation | 568,130 | ||||||
| 30,160 | ABM Industries, Inc. | 1,231,734 | ||||||
| 31,750 | Actuant Corporation | 823,913 | ||||||
| 18,130 | Aegion Corporationa | 429,681 | ||||||
| 37,730 | Aerojet Rocketdyne Holdings, Inc.a | 677,253 | ||||||
| 10,980 | Aerovironment, Inc.a | 294,593 | ||||||
| 5,090 | Alamo Group, Inc. | 387,349 | ||||||
| 15,490 | Albany International Corporation | 717,187 | ||||||
| 7,020 | Allegiant Travel Company | 1,168,128 | ||||||
| 7,570 | American Woodmark Corporationa | 569,643 | ||||||
| 15,560 | Apogee Enterprises, Inc. | 833,394 | ||||||
| 20,880 | Applied Industrial Technologies, Inc. | 1,240,272 | ||||||
| 13,000 | ArcBest Corporation | 359,450 | ||||||
| 10,270 | Astec Industries, Inc. | 692,814 | ||||||
| 13,550 | Atlas Air Worldwide Holdings, Inc.a | 706,633 | ||||||
| 14,100 | AZZ, Inc. | 900,990 | ||||||
| 27,020 | Barnes Group, Inc. | 1,281,288 | ||||||
| 25,550 | Brady Corporation | 959,403 | ||||||
| 23,040 | Briggs & Stratton Corporation | 512,870 | ||||||
| 24,150 | Brink’s Company | 996,187 | ||||||
| 7,440 | CDI Corporationa | 55,056 | ||||||
| 15,190 | Celadon Group, Inc. | 108,609 | ||||||
| 16,470 | Chart Industries, Inc.a | 593,249 | ||||||
| 8,790 | CIRCOR International, Inc. | 570,295 | ||||||
| 19,800 | Comfort Systems USA, Inc. | 659,340 | ||||||
| 13,440 | Cubic Corporation | 644,448 | ||||||
| 8,400 | DXP Enterprises, Inc.a | 291,816 | ||||||
| 14,920 | Echo Global Logistics, Inc.a | 373,746 | ||||||
| 11,210 | Encore Wire Corporation | 485,954 | ||||||
| 9,542 | Engility Holdings, Inc.a | 321,565 | ||||||
| 11,490 | EnPro Industries, Inc. | 773,966 | ||||||
| 13,850 | ESCO Technologies, Inc. | 784,603 | ||||||
| 20,040 | Essendant, Inc. | 418,836 | ||||||
| 13,870 | Exponent, Inc. | 836,361 | ||||||
| 32,300 | Federal Signal Corporation | 504,203 | ||||||
| 16,410 | Forward Air Corporation | 777,506 | ||||||
| 20,670 | Franklin Electric Company, Inc. | 804,063 | ||||||
| 10,590 | G & K Services, Inc. | 1,021,405 | ||||||
| 26,670 | General Cable Corporation | 508,063 | ||||||
| 16,880 | Gibraltar Industries, Inc.a | 703,052 | ||||||
| 15,280 | Greenbrier Companies, Inc.b | 634,884 | ||||||
| 15,940 | Griffon Corporation | 417,628 | ||||||
| 43,840 | Harsco Corporation | 596,224 | ||||||
| 28,580 | Hawaiian Holdings, Inc.a | 1,629,060 | ||||||
| 39,247 | Healthcare Services Group, Inc. | 1,537,305 | ||||||
| 23,348 | Heartland Express, Inc. | 475,365 | ||||||
| 10,020 | Heidrick & Struggles International, Inc. | 241,983 | ||||||
| 33,960 | Hillenbrand, Inc. | 1,302,366 | ||||||
| 18,060 | Hub Group, Inc.a | 790,125 | ||||||
The accompanying Notes to Financial Statements are an integral part of this schedule.
142
Table of Contents
SMALL CAP INDEX PORTFOLIO
Schedule of Investments as of December 31, 2016
| Shares | Common Stock (97.3%) | Value | ||||||
Industrials (17.9%) - continued | ||||||||
| 10,290 | Insperity, Inc. | $ | 730,076 | |||||
| 9,370 | Insteel Industries, Inc. | 333,947 | ||||||
| 35,170 | Interface, Inc. | 652,403 | ||||||
| 15,700 | John Bean Technologies Corporation | 1,349,415 | ||||||
| 14,630 | Kaman Corporation | 715,846 | ||||||
| 15,870 | Kelly Services, Inc. | 363,740 | ||||||
| 35,720 | Knight Transportation, Inc. | 1,180,546 | ||||||
| 31,290 | Korn/Ferry International | 920,865 | ||||||
| 5,690 | Lindsay Corporationb | 424,531 | ||||||
| 14,313 | LSC Communications, Inc. | 424,810 | ||||||
| 9,300 | Lydall, Inc.a | 575,205 | ||||||
| 12,540 | Marten Transport, Ltd. | 292,182 | ||||||
| 23,220 | Matson, Inc. | 821,756 | ||||||
| 17,410 | Matthews International Corporation | 1,337,959 | ||||||
| 22,400 | Mercury Systems, Inc.a | 676,928 | ||||||
| 24,070 | Mobile Mini, Inc. | 728,117 | ||||||
| 17,290 | Moog, Inc.a | 1,135,607 | ||||||
| 30,910 | Mueller Industries, Inc. | 1,235,164 | ||||||
| 7,040 | Multi-Color Corporation | 546,304 | ||||||
| 8,650 | MYR Group, Inc.a | 325,932 | ||||||
| 2,650 | National Presto Industries, Inc.b | 281,960 | ||||||
| 25,320 | Navigant Consulting, Inc.a | 662,878 | ||||||
| 26,430 | On Assignment, Inc.a | 1,167,149 | ||||||
| 14,840 | Orion Group Holdings, Inc.a | 147,658 | ||||||
| 7,840 | Patrick Industries, Inc.a | 598,192 | ||||||
| 26,320 | PGT Innovations, Inc.a | 301,364 | ||||||
| 4,570 | Powell Industries, Inc. | 178,230 | ||||||
| 13,070 | Proto Labs, Inc.a | 671,145 | ||||||
| 18,335 | Quanex Building Products Corporation | 372,201 | ||||||
| 37,203 | R.R. Donnelley & Sons Company | 607,153 | ||||||
| 19,460 | Raven Industries, Inc. | 490,392 | ||||||
| 15,890 | Resources Connection, Inc. | 305,882 | ||||||
| 16,300 | Roadrunner Transportation Systems, Inc.a | 169,357 | ||||||
| 13,490 | Saia, Inc.a | 595,583 | ||||||
| 21,820 | Simpson Manufacturing Company, Inc. | 954,625 | ||||||
| 27,860 | SkyWest, Inc. | 1,015,497 | ||||||
| 22,510 | SPX Corporationa | 533,937 | ||||||
| 22,780 | SPX FLOW, Inc.a | 730,327 | ||||||
| 6,940 | Standex International Corporation | 609,679 | ||||||
| 27,750 | TASER International, Inc.a | 672,660 | ||||||
| 15,820 | Team, Inc.a | 620,935 | ||||||
| 9,500 | Tennant Company | 676,400 | ||||||
| 30,616 | Tetra Tech, Inc. | 1,321,080 | ||||||
| 23,480 | Titan International, Inc. | 263,211 | ||||||
| 15,820 | Trex Company, Inc.a | 1,018,808 | ||||||
| 23,170 | TrueBlue, Inc.a | 571,140 | ||||||
| 11,700 | U.S. Ecology, Inc. | 575,055 | ||||||
| 8,350 | UniFirst Corporation | 1,199,477 | ||||||
| 10,980 | Universal Forest Products, Inc. | 1,121,936 | ||||||
| 5,050 | Veritiv Corporationa | 271,438 | ||||||
| 10,930 | Viad Corporation | 482,013 | ||||||
| 8,630 | Vicor Corporationa | 130,313 | ||||||
| 33,040 | Wabash National Corporationa | 522,693 | ||||||
| 19,820 | WageWorks, Inc.a | 1,436,950 | ||||||
| 15,120 | Watts Water Technologies, Inc. | 985,824 | ||||||
|
| |||||||
| Total | 71,955,782 | |||||||
|
| |||||||
Information Technology (14.6%) | ||||||||
| 48,790 | 8x8, Inc.a | 697,697 | ||||||
| 25,970 | ADTRAN, Inc. | 580,429 | ||||||
| 21,490 | Advanced Energy Industries, Inc.a | 1,176,577 | ||||||
| 8,300 | Agilysys, Inc.a | 85,988 | ||||||
| 15,320 | Anixter International, Inc.a | 1,241,686 | ||||||
| 15,640 | Badger Meter, Inc. | 577,898 | ||||||
| 4,600 | Bel Fuse, Inc. | 142,140 | ||||||
| 26,600 | Benchmark Electronics, Inc.a | 811,300 | ||||||
| 8,230 | Black Box Corporation | 125,508 | ||||||
| 25,770 | Blackbaud, Inc. | 1,649,280 | ||||||
| 20,740 | Blucora, Inc.a | 305,915 | ||||||
| 19,710 | Bottomline Technologies (de), Inc.a | 493,144 | ||||||
| 37,237 | Brooks Automation, Inc. | 635,636 | ||||||
| 12,940 | Cabot Microelectronics Corporation | 817,420 | ||||||
| 13,170 | CACI International, Inc.a | 1,637,031 | ||||||
| 19,810 | CalAmp Corporationa | 287,245 | ||||||
| 24,420 | Cardtronics, Inc.a | 1,332,599 | ||||||
| 11,450 | CEVA, Inc.a | 384,148 | ||||||
| 39,860 | Ciber, Inc.a | 25,184 | ||||||
| 13,400 | Coherent, Inc.a | 1,840,959 | ||||||
| 13,400 | Cohu, Inc. | 186,260 | ||||||
| 12,730 | Comtech Telecommunications Corporation | 150,850 | ||||||
| 22,030 | Cray, Inc.a | 456,021 | ||||||
| 17,420 | CSG Systems International, Inc. | 843,128 | ||||||
| 17,770 | CTS Corporation | 398,048 | ||||||
| 21,580 | Daktronics, Inc. | 230,906 | ||||||
| 26,860 | DHI Group, Inc.a | 167,875 | ||||||
| 14,040 | Digi International, Inc.a | 193,050 | ||||||
| 20,440 | Diodes, Inc.a | 524,695 | ||||||
| 11,620 | DSP Group, Inc.a | 151,641 | ||||||
| 12,070 | Ebix, Inc.b | 688,594 | ||||||
| 17,930 | Electro Scientific Industries, Inc.a | 106,146 | ||||||
| 25,060 | Electronics for Imaging, Inc.a | 1,099,132 | ||||||
| 3,550 | ePlus, Inc.a | 408,960 | ||||||
| 22,770 | Exar Corporationa | 245,461 | ||||||
| 18,110 | ExlService Holdings, Inc.a | 913,468 | ||||||
| 20,040 | Fabrineta | 807,612 | ||||||
| 9,010 | FARO Technologies, Inc.a | 324,360 | ||||||
| 5,370 | Forrester Research, Inc. | 230,641 | ||||||
| 41,980 | Harmonic, Inc.a | 209,900 | ||||||
| 29,240 | II-VI, Inc.a | 866,966 | ||||||
| 19,205 | Insight Enterprises, Inc.a | 776,650 | ||||||
| 18,050 | Itron, Inc.a | 1,134,442 | ||||||
| 34,270 | Ixiaa | 551,747 | ||||||
| 32,620 | Kopin Corporationa | 92,641 | ||||||
| 38,220 | Kulicke and Soffa Industries, Inc.a | 609,609 | ||||||
| 13,090 | Liquidity Services, Inc.a | 127,627 | ||||||
| 28,730 | LivePerson, Inc.a | 216,912 | ||||||
| 13,920 | LogMeIn, Inc.b | 1,343,976 | ||||||
| 29,470 | Lumentum Holdings, Inc.a | 1,139,016 | ||||||
| 13,650 | ManTech International Corporation | 576,712 | ||||||
| 19,750 | Methode Electronics, Inc. | 816,662 | ||||||
| 5,050 | MicroStrategy, Inc.a | 996,870 | ||||||
| 28,640 | MKS Instruments, Inc. | 1,701,216 | ||||||
| 22,310 | Monotype Imaging Holdings, Inc. | 442,854 | ||||||
| 9,000 | MTS Systems Corporation | 510,300 | ||||||
| 13,450 | Nanometrics, Inc.a | 337,057 | ||||||
| 17,780 | NETGEAR, Inc.a | 966,343 | ||||||
| 33,760 | NIC, Inc. | 806,864 | ||||||
| 9,760 | OSI Systems, Inc.a | 742,931 | ||||||
| 10,280 | Park Electrochemical Corporation | 191,722 | ||||||
| 19,530 | Perficient, Inc.a | 341,580 | ||||||
| 18,070 | Plexus Corporationa | 976,503 | ||||||
| 15,740 | Power Integrations, Inc. | 1,067,959 | ||||||
| 26,260 | Progress Software Corporation | 838,482 | ||||||
| 15,570 | Qualys, Inc.a | 492,791 | ||||||
| 19,480 | QuinStreet, Inc.a | 73,245 | ||||||
| 58,820 | Rambus, Inc.a | 809,951 | ||||||
| 9,710 | Rogers Corporationa | 745,825 | ||||||
| 16,730 | Rudolph Technologies, Inc.a | 390,645 | ||||||
| 39,600 | Sanmina Corporationa | 1,451,340 | ||||||
The accompanying Notes to Financial Statements are an integral part of this schedule.
143
Table of Contents
SMALL CAP INDEX PORTFOLIO
Schedule of Investments as of December 31, 2016
Shares | Common Stock (97.3%) | Value | ||||||
Information Technology (14.6%) - continued | ||||||||
| 13,550 | ScanSource, Inc.a | $ | 546,742 | |||||
| 35,250 | Semtech Corporationa | 1,112,137 | ||||||
| 10,410 | Shutterstock, Inc.a | 494,683 | ||||||
| 9,190 | SPS Commerce, Inc.a | 642,289 | ||||||
| 20,000 | Super Micro Computer, Inc.a | 561,000 | ||||||
| 21,280 | Sykes Enterprises, Inc.a | 614,141 | ||||||
| 22,830 | Synchronoss Technologies, Inc.a | 874,389 | ||||||
| 46,720 | Take-Two Interactive Software, Inc.a | 2,302,829 | ||||||
| 12,590 | Tangoe, Inc.a | 99,209 | ||||||
| 8,590 | TeleTech Holdings, Inc. | 261,995 | ||||||
| 26,130 | Tessera Technologies, Inc. | 1,154,946 | ||||||
| 64,520 | TiVo Corpa | 1,348,468 | ||||||
| 45,160 | TTM Technologies, Inc.a | 615,531 | ||||||
| 12,800 | Ultratech, Inc.a | 306,944 | ||||||
| 16,110 | VASCO Data Security International, Inc.a | 219,902 | ||||||
| 21,850 | Veeco Instruments, Inc.a | 636,927 | ||||||
| 124,170 | Viavi Solutions, Inc.a | 1,015,711 | ||||||
| 14,840 | Virtusa Corporationa | 372,781 | ||||||
| 13,420 | XO Group, Inc.a | 261,019 | ||||||
|
| |||||||
| Total | 58,763,613 | |||||||
|
| |||||||
Materials (6.2%) | ||||||||
| 15,850 | A. Schulman, Inc. | 530,182 | ||||||
| 16,390 | AdvanSix, Inc.a | 362,875 | ||||||
| 166,540 | AK Steel Holding Corporationa | 1,700,373 | ||||||
| 13,890 | American Vanguard Corporation | 265,993 | ||||||
| 17,130 | Balchem Corporation | 1,437,550 | ||||||
| 21,030 | Boise Cascade Companya | 473,175 | ||||||
| 26,840 | Calgon Carbon Corporation | 456,280 | ||||||
| 26,310 | Century Aluminum Companya | 225,214 | ||||||
| 97,180 | Chemours Company | 2,146,706 | ||||||
| 8,950 | Clearwater Paper Corporationa | 586,672 | ||||||
| 5,720 | Deltic Timber Corporation | 440,840 | ||||||
| 29,560 | Flotek Industries, Inc.a,b | 277,568 | ||||||
| 12,230 | FutureFuel Corporation | 169,997 | ||||||
| 27,230 | H.B. Fuller Company | 1,315,481 | ||||||
| 5,140 | Hawkins, Inc. | 277,303 | ||||||
| 6,770 | Haynes International, Inc. | 291,042 | ||||||
| 39,830 | Headwaters, Inc.a | 936,802 | ||||||
| 22,960 | Ingevity Corporationa | 1,259,586 | ||||||
| 10,330 | Innophos Holdings, Inc. | 539,846 | ||||||
| 12,920 | Innospec, Inc. | 885,020 | ||||||
| 9,650 | Kaiser Aluminum Corporation | 749,708 | ||||||
| 47,180 | KapStone Paper and Packaging Corporation | 1,040,319 | ||||||
| 11,130 | Koppers Holdings, Inc.a | 448,539 | ||||||
| 16,920 | Kraton Performance Polymers, Inc.a | 481,882 | ||||||
| 10,780 | LSB Industries, Inc.a,b | 90,768 | ||||||
| 10,810 | Materion Corporation | 428,076 | ||||||
| 11,773 | Myers Industries, Inc. | 168,354 | ||||||
| 9,060 | Neenah Paper, Inc. | 771,912 | ||||||
| 4,830 | Olympic Steel, Inc. | 117,031 | ||||||
| 23,420 | PH Glatfelter Company | 559,504 | ||||||
| 7,150 | Quaker Chemical Corporation | 914,771 | ||||||
| 23,080 | Rayonier Advanced Materials, Inc. | 356,817 | ||||||
| 16,390 | Schweitzer-Mauduit International, Inc. | 746,237 | ||||||
| 10,390 | Stepan Company | 846,577 | ||||||
| 64,990 | Stillwater Mining Companya | 1,046,989 | ||||||
| 34,487 | SunCoke Energy, Inc.a | 391,082 | ||||||
| 20,570 | TimkenSteel Corporationa | 318,424 | ||||||
| 13,340 | Tredegar Corporation | 320,160 | ||||||
| 7,560 | US Concrete, Inc.a,b | 495,180 | ||||||
|
| |||||||
| Total | 24,870,835 | |||||||
|
| |||||||
Real Estate (5.9%) | ||||||||
| 43,588 | Acadia Realty Trust | 1,424,456 | ||||||
| 14,000 | Agree Realty Corporation | 644,700 | ||||||
| 21,550 | American Assets Trust, Inc. | 928,374 | ||||||
| 34,582 | CareTrust REIT, Inc. | 529,796 | ||||||
| 41,060 | Cedar Realty Trust, Inc. | 268,122 | ||||||
| 32,290 | Chesapeake Lodging Trust | 835,019 | ||||||
| 18,240 | CoreSite Realty Corporation | 1,447,709 | ||||||
| 107,957 | DiamondRock Hospitality Company | 1,244,744 | ||||||
| 17,580 | EastGroup Properties, Inc. | 1,298,107 | ||||||
| 14,310 | Forestar Group, Inc.a | 190,323 | ||||||
| 32,133 | Four Corners Property Trust, Inc. | 659,369 | ||||||
| 57,600 | Franklin Street Properties Corporation | 746,496 | ||||||
| 40,476 | GEO Group, Inc. | 1,454,303 | ||||||
| 14,221 | Getty Realty Corporation | 362,493 | ||||||
| 38,310 | Government Properties Income Trust | 730,380 | ||||||
| 18,990 | HFF, Inc. | 574,448 | ||||||
| 44,925 | Kite Realty Group Trust | 1,054,839 | ||||||
| 114,969 | Lexington Realty Trust | 1,241,665 | ||||||
| 21,210 | LTC Properties, Inc. | 996,446 | ||||||
| 22,890 | Parkway, Inc.a | 509,303 | ||||||
| 37,760 | Pennsylvania Real Estate Investment Trust | 715,930 | ||||||
| 10,570 | PS Business Parks, Inc. | 1,231,616 | ||||||
| 9,510 | RE/MAX Holdings, Inc. | 532,560 | ||||||
| 58,800 | Retail Opportunity Investments Corporation | 1,242,444 | ||||||
| 35,280 | Sabra Health Care REIT, Inc. | 861,538 | ||||||
| 6,310 | Saul Centers, Inc. | 420,309 | ||||||
| 47,200 | Summit Hotel Properties, Inc. | 756,616 | ||||||
| 6,690 | Universal Health Realty Income Trust | 438,797 | ||||||
| 15,440 | Urstadt Biddle Properties, Inc. | 372,258 | ||||||
|
| |||||||
| Total | 23,713,160 | |||||||
|
| |||||||
Telecommunications Services (1.1%) | ||||||||
| 5,710 | ATN International, Inc. | 457,542 | ||||||
| 22,666 | Cincinnati Bell, Inc.a | 506,585 | ||||||
| 22,070 | Cogent Communications Holdings | 912,595 | ||||||
| 27,440 | Consolidated Communications Holdings, Inc.b | 736,764 | ||||||
| 14,150 | General Communication, Inc.a | 275,218 | ||||||
| 18,560 | Inteliquent, Inc. | 425,395 | ||||||
| 41,940 | Iridium Communications, Inc.a,b | 402,624 | ||||||
| 12,680 | Lumos Networks Corporationa | 198,062 | ||||||
| 11,050 | Spok Holdings, Inc. | 229,287 | ||||||
|
| |||||||
| Total | 4,144,072 | |||||||
|
| |||||||
Utilities (2.5%) | ||||||||
| 26,653 | ALLETE, Inc. | 1,710,856 | ||||||
| 19,800 | American States Water Company | 902,088 | ||||||
| 35,020 | Avista Corporation | 1,400,450 | ||||||
| 26,060 | California Water Service Group | 883,434 | ||||||
| 21,860 | El Paso Electric Company | 1,016,490 | ||||||
| 15,410 | Northwest Natural Gas Company | 921,518 | ||||||
| 42,620 | South Jersey Industries, Inc. | 1,435,868 | ||||||
| 24,610 | Spire, Inc. | 1,588,575 | ||||||
|
| |||||||
| Total | 9,859,279 | |||||||
|
| |||||||
Total Common Stock (cost $280,269,302) | 390,706,712 | |||||||
|
| |||||||
Collateral Held for Securities Loaned (5.8%) | ||||||||
| 23,458,379 | Thrivent Cash Management Trust | 23,458,379 | ||||||
|
| |||||||
Total Collateral Held for Securities Loaned (cost $23,458,379) | 23,458,379 | |||||||
|
| |||||||
The accompanying Notes to Financial Statements are an integral part of this schedule.
144
Table of Contents
SMALL CAP INDEX PORTFOLIO
Schedule of Investments as of December 31, 2016
| Shares or Principal Amount | Short-Term Investments (2.5%)c | Value | ||||||
Federal Home Loan Bank Discount Notes | ||||||||
| 600,000 | 0.344%, 1/6/2017d | $ | 599,981 | |||||
| 100,000 | 0.385%, 2/1/2017d | 99,960 | ||||||
| 100,000 | 0.440%, 2/13/2017d | 99,943 | ||||||
Thrivent Core Short-Term Reserve Fund | ||||||||
| 930,431 | 0.910% | 9,304,310 | ||||||
|
| |||||||
Total Short-Term Investments (cost $10,104,196) | 10,104,194 | |||||||
|
| |||||||
Total Investments (cost $313,831,877) 105.6% | $ | 424,269,285 | ||||||
|
| |||||||
Other Assets and Liabilities, Net (5.6%) | (22,537,350 | ) | ||||||
|
| |||||||
Total Net Assets 100.0% | $ | 401,731,935 | ||||||
|
| |||||||
| a | Non-income producing security. |
| b | All or a portion of the security is on loan. |
| c | The interest rate shown reflects the yield, coupon rate or the discount rate at the date of purchase. |
| d | All or a portion of the security is held on deposit with the counterparty and pledged as the initial margin deposit for open futures contracts. |
The following table presents the total amount of securities loaned with continuous maturity, by type, offset by the gross payable upon return of collateral for securities loaned by Thrivent Small Cap Index Portfolio as of December 31, 2016:
Securities Lending Transactions
Common Stock | $ | 22,811,867 | ||
|
| |||
Total lending | $ | 22,811,867 | ||
Gross amount payable upon return of collateral for securities loaned | $ | 23,458,379 | ||
|
| |||
Net amounts due to counterparty | $ | 646,512 | ||
|
|
Definitions:
REIT | - | Real Estate Investment Trust is a company that buys, develops, manages and/or sells real estate assets. |
The accompanying Notes to Financial Statements are an integral part of this schedule.
145
Table of Contents
MID CAP INDEX PORTFOLIO
Schedule of Investments as of December 31, 2016
| Shares | Common Stock (96.6%) | Value | ||||||
Consumer Discretionary (10.7%) | ||||||||
| 10,860 | Aaron’s, Inc. | $ | 347,411 | |||||
| 10,090 | AMC Networks, Inc.a | 528,111 | ||||||
| 29,240 | American Eagle Outfitters, Inc.b | 443,571 | ||||||
| 7,630 | Big Lots, Inc. | 383,102 | ||||||
| 8,555 | Brinker International, Inc.b | 423,729 | ||||||
| 15,370 | Brunswick Corporation | 838,280 | ||||||
| 3,120 | Buffalo Wild Wings, Inc.a | 481,728 | ||||||
| 8,790 | Cabela’s, Inc.a | 514,654 | ||||||
| 810 | Cable One, Inc. | 503,601 | ||||||
| 12,540 | Calatlantic Group, Inc. | 426,485 | ||||||
| 8,470 | Carter’s, Inc. | 731,723 | ||||||
| 7,530 | Cheesecake Factory, Inc. | 450,896 | ||||||
| 22,270 | Chico’s FAS, Inc. | 320,465 | ||||||
| 2,110 | Churchill Downs, Inc. | 317,450 | ||||||
| 18,060 | Cinemark Holdings, Inc. | 692,782 | ||||||
| 4,120 | Cracker Barrel Old Country Store, Inc.b | 687,958 | ||||||
| 12,960 | CST Brands, Inc. | 624,024 | ||||||
| 24,840 | Dana, Inc. | 471,463 | ||||||
| 5,470 | Deckers Outdoor Corporationa | 302,983 | ||||||
| 9,760 | DeVry Education Group, Inc. | 304,512 | ||||||
| 15,060 | Dick’s Sporting Goods, Inc. | 799,686 | ||||||
| 8,190 | Domino’s Pizza, Inc. | 1,304,176 | ||||||
| 15,730 | Dunkin’ Brands Group, Inc. | 824,881 | ||||||
| 7,200 | Fossil, Inc.a | 186,192 | ||||||
| 49,200 | Gentex Corporation | 968,748 | ||||||
| 790 | Graham Holdings Company | 404,441 | ||||||
| 4,790 | Helen of Troy, Ltd.a | 404,515 | ||||||
| 5,370 | HSN, Inc. | 184,191 | ||||||
| 4,430 | International Speedway Corporation | 163,024 | ||||||
| 52,400 | J.C. Penney Company, Inc.a,b | 435,444 | ||||||
| 5,560 | Jack in the Box, Inc. | 620,718 | ||||||
| 7,670 | John Wiley and Sons, Inc. | 418,015 | ||||||
| 22,180 | Kate Spade & Companya | 414,101 | ||||||
| 14,310 | KB Homeb | 226,241 | ||||||
| 22,620 | Live Nation Entertainment, Inc.a | 601,692 | ||||||
| 6,310 | Meredith Corporation | 373,236 | ||||||
| 6,190 | Murphy USA, Inc.a | 380,499 | ||||||
| 20,770 | New York Times Company | 276,241 | ||||||
| 600 | NVR, Inc.a | 1,001,400 | ||||||
| 91,280 | Office Depot, Inc. | 412,586 | ||||||
| 3,730 | Panera Bread Companya | 764,986 | ||||||
| 4,560 | Papa John’s International, Inc. | 390,245 | ||||||
| 10,240 | Polaris Industries, Inc.b | 843,674 | ||||||
| 7,090 | Pool Corporation | 739,771 | ||||||
| 6,540 | Restoration Hardware Holdings, Inc.a,b | 200,778 | ||||||
| 24,700 | Sally Beauty Holdings, Inc.a | 652,574 | ||||||
| 32,440 | Service Corporation International | 921,296 | ||||||
| 22,810 | Skechers USA, Inc.a | 560,670 | ||||||
| 7,860 | Sotheby’s Holdings, Inc.a | 313,300 | ||||||
| 8,580 | Tempur Sealy International, Inc.a,b | 585,842 | ||||||
| 10,980 | Texas Roadhouse, Inc. | 529,675 | ||||||
| 8,140 | Thor Industries, Inc. | 814,407 | ||||||
| 17,050 | Time, Inc. | 304,343 | ||||||
| 25,730 | Toll Brothers, Inc.a | 797,630 | ||||||
| 25,130 | Tri Pointe Homes, Inc.a | 288,492 | ||||||
| 8,630 | Tupperware Brands Corporation | 454,111 | ||||||
| 10,000 | Vista Outdoor, Inc.a | 369,000 | ||||||
| 34,254 | Wendy’s Company | 463,114 | ||||||
| 14,040 | Williams-Sonoma, Inc. | 679,396 | ||||||
|
| |||||||
Total | 30,868,259 | |||||||
|
| |||||||
Consumer Staples (4.2%) | ||||||||
| 73,640 | Avon Products, Inc.a | 371,146 | ||||||
| 1,540 | Boston Beer Company, Inc.a | 261,569 | ||||||
| 6,720 | Casey’s General Stores, Inc. | 798,874 | ||||||
| 15,480 | Dean Foods Company | 337,154 | ||||||
| 9,910 | Edgewell Personal Care Companya | 723,331 | ||||||
| 10,590 | Energizer Holdings, Inc. | 472,420 | ||||||
| 31,285 | Flowers Foods, Inc. | 624,761 | ||||||
| 17,570 | Hain Celestial Group, Inc.a | 685,757 | ||||||
| 12,360 | Ingredion, Inc. | 1,544,506 | ||||||
| 23,431 | Lamb Weston Holdings, Inc.a | 886,863 | ||||||
| 3,350 | Lancaster Colony Corporation | 473,656 | ||||||
| 11,080 | Post Holdings, Inc.a | 890,721 | ||||||
| 14,620 | Snyder’s-Lance, Inc. | 560,531 | ||||||
| 23,080 | Sprouts Farmers Markets, Inc.a | 436,674 | ||||||
| 2,986 | Tootsie Roll Industries, Inc.b | 118,694 | ||||||
| 9,680 | TreeHouse Foods, Inc.a | 698,799 | ||||||
| 8,700 | United Natural Foods, Inc.a | 415,164 | ||||||
| 30,330 | WhiteWave Foods Companya | 1,686,348 | ||||||
|
| |||||||
Total | 11,986,968 | |||||||
|
| |||||||
Energy (3.8%) | ||||||||
| 30,420 | Consol Energy, Inc. | 554,557 | ||||||
| 67,910 | Denbury Resources, Inc.a | 249,909 | ||||||
| 10,920 | Diamond Offshore Drilling, Inc.a,b | 193,284 | ||||||
| 6,390 | Dril-Quip, Inc.a | 383,719 | ||||||
| 16,510 | Energen Corporationa | 952,132 | ||||||
| 51,020 | Ensco plc | 495,914 | ||||||
| 26,490 | Gulfport Energy Corporationa | 573,243 | ||||||
| 30,170 | HollyFrontier Corporation | 988,369 | ||||||
| 48,260 | Nabors Industries, Ltd. | 791,464 | ||||||
| 40,780 | Noble Corporation | 241,418 | ||||||
| 16,760 | Oceaneering International, Inc. | 472,800 | ||||||
| 8,780 | Oil States International, Inc.a | 342,420 | ||||||
| 25,200 | Patterson-UTI Energy, Inc. | 678,384 | ||||||
| 41,060 | QEP Resources, Inc.a | 755,914 | ||||||
| 21,220 | Rowan Companies plca | 400,846 | ||||||
| 16,340 | SM Energy Company | 563,403 | ||||||
| 25,810 | Superior Energy Services, Inc. | 435,673 | ||||||
| 13,540 | Western Refining, Inc. | 512,489 | ||||||
| 12,070 | World Fuel Services Corporation | 554,134 | ||||||
| 58,910 | WPX Energy, Inc.a | 858,319 | ||||||
|
| |||||||
Total | 10,998,391 | |||||||
|
| |||||||
Financials (16.5%) | ||||||||
| 2,620 | Alleghany Corporationa | 1,593,274 | ||||||
| 12,505 | American Financial Group, Inc. | 1,101,941 | ||||||
| 10,290 | Aspen Insurance Holdings, Ltd. | 565,950 | ||||||
| 25,413 | Associated Banc-Corp | 627,701 | ||||||
| 14,760 | BancorpSouth, Inc. | 458,298 | ||||||
| 7,330 | Bank of Hawaii Corporation | 650,098 | ||||||
| 15,590 | Bank of the Ozarks, Inc. | 819,878 | ||||||
| 19,760 | Brown & Brown, Inc. | 886,434 | ||||||
| 12,820 | Cathay General Bancorp | 487,545 | ||||||
| 13,930 | CBOE Holdings, Inc. | 1,029,288 | ||||||
| 12,230 | Chemical Financial Corporation | 662,499 | ||||||
| 29,670 | CNO Financial Group, Inc. | 568,180 | ||||||
| 15,001 | Commerce Bancshares, Inc. | 867,208 | ||||||
| 9,560 | Cullen/Frost Bankers, Inc. | 843,479 | ||||||
| 24,690 | East West Bancorp, Inc. | 1,254,993 | ||||||
| 19,460 | Eaton Vance Corporation | 814,985 | ||||||
| 10,990 | Endurance Specialty Holdings, Ltd. | 1,015,476 | ||||||
| 6,920 | Everest Re Group, Ltd. | 1,497,488 | ||||||
| 35,930 | F.N.B. Corporation | 575,958 | ||||||
| 6,830 | FactSet Research Systems, Inc. | 1,116,227 | ||||||
| 15,950 | Federated Investors, Inc. | 451,066 | ||||||
| 18,880 | First American Financial Corporation | 691,574 | ||||||
| 39,900 | First Horizon National Corporation | 798,399 | ||||||
| 29,850 | Fulton Financial Corporation | 561,180 | ||||||
| 85,940 | Genworth Financial, Inc.a | 327,431 | ||||||
| 13,990 | Hancock Holding Company | 602,969 | ||||||
The accompanying Notes to Financial Statements are an integral part of this schedule.
146
Table of Contents
MID CAP INDEX PORTFOLIO
Schedule of Investments as of December 31, 2016
| Shares | Common Stock (96.6%) | Value | ||||||
Financials (16.5%) - continued | ||||||||
| 7,320 | Hanover Insurance Group, Inc. | $ | 666,193 | |||||
| 9,970 | International Bancshares Corporation | 406,776 | ||||||
| 24,290 | Janus Capital Group, Inc. | 322,328 | ||||||
| 8,410 | Kemper Corporation | 372,563 | ||||||
| 15,420 | Legg Mason, Inc. | 461,212 | ||||||
| 6,460 | MarketAxess Holdings, Inc. | 949,103 | ||||||
| 12,230 | MB Financial, Inc. | 577,623 | ||||||
| 6,280 | Mercury General Corporation | 378,119 | ||||||
| 16,150 | MSCI, Inc. | 1,272,297 | ||||||
| 83,541 | New York Community Bancorp, Inc. | 1,329,137 | ||||||
| 41,790 | Old Republic International Corporation | 794,010 | ||||||
| 20,590 | PacWest Bancorp | 1,120,920 | ||||||
| 7,840 | Primerica, Inc. | 542,136 | ||||||
| 13,650 | PrivateBancorp, Inc. | 739,693 | ||||||
| 11,970 | Prosperity Bancshares, Inc. | 859,207 | ||||||
| 21,685 | Raymond James Financial, Inc. | 1,502,120 | ||||||
| 11,040 | Reinsurance Group of America, Inc. | 1,389,163 | ||||||
| 7,010 | RenaissanceRe Holdings, Ltd. | 954,902 | ||||||
| 23,130 | SEI Investments Company | 1,141,697 | ||||||
| 9,270 | Signature Banka | 1,392,354 | ||||||
| 73,390 | SLM Corporationa | 808,758 | ||||||
| 11,300 | Stifel Financial Corporationa | 564,435 | ||||||
| 8,880 | SVB Financial Groupa | 1,524,341 | ||||||
| 21,040 | Synovus Financial Corporation | 864,323 | ||||||
| 29,320 | TCF Financial Corporation | 574,379 | ||||||
| 11,680 | Trustmark Corporation | 416,392 | ||||||
| 7,550 | UMB Financial Corporation | 582,256 | ||||||
| 37,760 | Umpqua Holdings Corporation | 709,133 | ||||||
| 43,714 | Valley National Bancorp | 508,831 | ||||||
| 16,695 | W.R. Berkley Corporation | 1,110,384 | ||||||
| 14,210 | Waddell & Reed Financial, Inc. | 277,237 | ||||||
| 15,357 | Washington Federal, Inc. | 527,513 | ||||||
| 15,670 | Webster Financial Corporation | 850,567 | ||||||
| 19,520 | WisdomTree Investments, Inc.b | 217,453 | ||||||
|
| |||||||
Total | 47,577,074 | |||||||
|
| |||||||
Health Care (7.3%) | ||||||||
| 6,920 | ABIOMED, Inc.a | 779,746 | ||||||
| 14,940 | Akorn, Inc.a | 326,140 | ||||||
| 12,720 | Align Technology, Inc.a | 1,222,774 | ||||||
| 31,450 | Allscripts Healthcare Solutions, Inc.a | 321,104 | ||||||
| 3,560 | Bio-Rad Laboratories, Inc.a | 648,917 | ||||||
| 6,390 | Bio-Techne Corporation | 657,084 | ||||||
| 21,550 | Catalent, Inc.a | 580,988 | ||||||
| 8,090 | Charles River Laboratories International, Inc.a | 616,377 | ||||||
| 12,380 | Globus Medical, Inc.a | 307,148 | ||||||
| 7,980 | Halyard Health, Inc.a | 295,100 | ||||||
| 15,350 | HealthSouth Corporation | 633,034 | ||||||
| 10,230 | Hill-Rom Holdings, Inc. | 574,312 | ||||||
| 15,290 | IDEXX Laboratories, Inc.a | 1,793,058 | ||||||
| 6,930 | LifePoint Health, Inc.a | 393,624 | ||||||
| 7,500 | LivaNova plca | 337,275 | ||||||
| 15,780 | Mednax, Inc.a | 1,051,895 | ||||||
| 7,350 | Molina Healthcare, Inc.a | 398,811 | ||||||
| 8,620 | NuVasive, Inc.a | 580,643 | ||||||
| 10,530 | Owens & Minor, Inc. | 371,604 | ||||||
| 9,130 | PAREXEL International Corporationa | 600,024 | ||||||
| 9,010 | Prestige Brands Holdings, Inc.a | 469,421 | ||||||
| 24,040 | ResMed, Inc. | 1,491,682 | ||||||
| 14,460 | STERIS plc | 974,459 | ||||||
| 7,510 | Teleflex, Inc. | 1,210,236 | ||||||
| 13,820 | Tenet Healthcare Corporationa | 205,089 | ||||||
| 7,240 | United Therapeutics Corporationa | 1,038,433 | ||||||
| 13,900 | VCA Antech, Inc.a | 954,235 | ||||||
| 7,660 | Wellcare Health Plans, Inc.a | 1,050,033 | ||||||
| 12,510 | West Pharmaceutical Services, Inc. | 1,061,223 | ||||||
|
| |||||||
Total | 20,944,469 | |||||||
|
| |||||||
Industrials (14.4%) | ||||||||
| 25,290 | A.O. Smith Corporation | 1,197,482 | ||||||
| 26,310 | AECOMa | 956,632 | ||||||
| 11,610 | AGCO Corporation | 671,755 | ||||||
| 15,240 | Avis Budget Group, Inc.a | 559,003 | ||||||
| 17,380 | B/E Aerospace, Inc. | 1,046,102 | ||||||
| 10,970 | Carlisle Companies, Inc. | 1,209,881 | ||||||
| 5,560 | CEB, Inc. | 336,936 | ||||||
| 8,330 | CLARCOR, Inc. | 686,975 | ||||||
| 8,930 | Clean Harbors, Inc.a | 496,955 | ||||||
| 17,530 | Copart, Inc.a | 971,337 | ||||||
| 8,480 | Crane Company | 611,578 | ||||||
| 7,570 | Curtiss-Wright Corporation | 744,585 | ||||||
| 8,320 | Deluxe Corporation | 595,795 | ||||||
| 22,610 | Donaldson Company, Inc. | 951,429 | ||||||
| 5,380 | Dycom Industries, Inc.a | 431,960 | ||||||
| 10,390 | EMCOR Group, Inc. | 735,196 | ||||||
| 7,440 | EnerSys | 581,064 | ||||||
| 5,080 | Esterline Technologies Corporationa | 453,136 | ||||||
| 7,250 | FTI Consulting, Inc.a | 326,830 | ||||||
| 6,830 | GATX Corporationb | 420,591 | ||||||
| 10,690 | Genesee & Wyoming, Inc.a | 741,993 | ||||||
| 9,520 | Graco, Inc. | 791,017 | ||||||
| 6,800 | Granite Construction, Inc. | 374,000 | ||||||
| 10,340 | Herman Miller, Inc. | 353,628 | ||||||
| 7,650 | HNI Corporation | 427,788 | ||||||
| 8,830 | Hubbell, Inc. | 1,030,461 | ||||||
| 7,951 | Huntington Ingalls Industries, Inc. | 1,464,495 | ||||||
| 13,070 | IDEX Corporation | 1,177,084 | ||||||
| 15,200 | ITT Corporation | 586,264 | ||||||
| 55,595 | JetBlue Airways Corporationa | 1,246,440 | ||||||
| 16,810 | Joy Global, Inc. | 470,680 | ||||||
| 24,430 | KBR, Inc. | 407,737 | ||||||
| 13,720 | Kennametal, Inc. | 428,887 | ||||||
| 9,200 | Kirby Corporationa | 611,800 | ||||||
| 9,045 | KLX, Inc.a | 408,020 | ||||||
| 7,170 | Landstar System, Inc. | 611,601 | ||||||
| 6,650 | Lennox International, Inc. | 1,018,580 | ||||||
| 10,620 | Lincoln Electric Holdings, Inc. | 814,235 | ||||||
| 11,510 | Manpower, Inc. | 1,022,894 | ||||||
| 5,420 | MSA Safety, Inc. | 375,769 | ||||||
| 7,630 | MSC Industrial Direct Company, Inc. | 704,936 | ||||||
| 9,120 | Nordson Corporation | 1,021,896 | ||||||
| 18,390 | NOW, Inc.a | 376,443 | ||||||
| 11,850 | Old Dominion Freight Line, Inc.a | 1,016,612 | ||||||
| 9,960 | Orbital ATK, Inc. | 873,791 | ||||||
| 12,730 | Oshkosh Corporation | 822,485 | ||||||
| 7,690 | Regal-Beloit Corporation | 532,532 | ||||||
| 16,398 | Rollins, Inc. | 553,924 | ||||||
| 6,010 | Teledyne Technologies, Inc.a | 739,230 | ||||||
| 18,400 | Terex Corporation | 580,152 | ||||||
| 12,070 | Timken Company | 479,179 | ||||||
| 18,760 | Toro Company | 1,049,622 | ||||||
| 26,100 | Trinity Industries, Inc. | 724,536 | ||||||
| 8,510 | Triumph Group, Inc. | 225,515 | ||||||
| 3,860 | Valmont Industries, Inc. | 543,874 | ||||||
| 15,220 | Wabtec Corporation | 1,263,564 | ||||||
| 4,430 | Watsco, Inc. | 656,172 | ||||||
| 7,650 | Werner Enterprises, Inc. | 206,167 | ||||||
| 9,510 | Woodward, Inc. | 656,666 | ||||||
|
| |||||||
Total | 41,375,891 | |||||||
|
| |||||||
The accompanying Notes to Financial Statements are an integral part of this schedule.
147
Table of Contents
MID CAP INDEX PORTFOLIO
Schedule of Investments as of December 31, 2016
| Shares | Common Stock (96.6%) | Value | ||||||
Information Technology (17.1%) | ||||||||
| 18,270 | 3D Systems Corporationa,b | $ | 242,808 | |||||
| 19,890 | ACI Worldwide, Inc.a | 361,004 | ||||||
| 13,230 | Acxiom Corporationa | 354,564 | ||||||
| 128,970 | Advanced Micro Devices, Inc.a | 1,462,520 | ||||||
| 14,790 | ANSYS, Inc.a | 1,367,927 | ||||||
| 32,530 | ARRIS International plca | 980,129 | ||||||
| 15,340 | Arrow Electronics, Inc.a | 1,093,742 | ||||||
| 21,860 | Avnet, Inc. | 1,040,755 | ||||||
| 7,200 | Belden, Inc. | 538,344 | ||||||
| 20,320 | Broadridge Financial Solutions, Inc. | 1,347,216 | ||||||
| 68,840 | Brocade Communications Systems, Inc. | 859,812 | ||||||
| 48,870 | Cadence Design Systems, Inc.a | 1,232,501 | ||||||
| 25,480 | CDK Global, Inc. | 1,520,901 | ||||||
| 24,040 | Ciena Corporationa | 586,816 | ||||||
| 10,930 | Cirrus Logic, Inc.a | 617,982 | ||||||
| 14,610 | Cognex Corporation | 929,488 | ||||||
| 7,210 | CommVault Systems, Inc.a | 370,594 | ||||||
| 23,710 | Computer Sciences Corporation | 1,408,848 | ||||||
| 7,670 | comScore, Inc.a | 242,219 | ||||||
| 16,030 | Convergys Corporation | 393,697 | ||||||
| 14,730 | CoreLogic, Inc.a | 542,506 | ||||||
| 16,930 | Cree, Inc.a | 446,783 | ||||||
| 54,280 | Cypress Semiconductor Corporationb | 620,963 | ||||||
| 12,870 | Diebold Nixdorf, Inc. | 323,681 | ||||||
| 5,470 | DST Systems, Inc. | 586,110 | ||||||
| 5,280 | Fair Isaac Corporation | 629,482 | ||||||
| 25,020 | Fortinet, Inc.a | 753,602 | ||||||
| 17,550 | GameStop Corporation | 443,313 | ||||||
| 14,080 | Gartner, Inc.a | 1,423,066 | ||||||
| 22,860 | Integrated Device Technology, Inc.a | 538,582 | ||||||
| 5,780 | InterDigital, Inc. | 528,003 | ||||||
| 23,420 | Intersil Corporation | 522,266 | ||||||
| 6,320 | IPG Photonics Corporationa | 623,847 | ||||||
| 8,220 | j2 Global, Inc. | 672,396 | ||||||
| 31,480 | Jabil Circuit, Inc. | 745,132 | ||||||
| 13,380 | Jack Henry & Associates, Inc. | 1,187,876 | ||||||
| 29,160 | Keysight Technologies, Inc.a | 1,066,381 | ||||||
| 15,230 | Knowles Corporationa | 254,493 | ||||||
| 24,395 | Leidos Holdings, Inc. | 1,247,560 | ||||||
| 3,870 | Littelfuse, Inc. | 587,350 | ||||||
| 12,110 | Manhattan Associates, Inc.a | 642,193 | ||||||
| 11,170 | MAXIMUS, Inc. | 623,174 | ||||||
| 18,750 | Mentor Graphics Corporation | 691,688 | ||||||
| 19,550 | Microsemi Corporationa | 1,055,114 | ||||||
| 6,380 | Monolithic Power Systems, Inc. | 522,713 | ||||||
| 18,082 | National Instruments Corporation | 557,287 | ||||||
| 21,130 | NCR Corporationa | 857,033 | ||||||
| 15,430 | NetScout Systems, Inc.a | 486,045 | ||||||
| 9,310 | NeuStar, Inc.a | 310,954 | ||||||
| 5,700 | Plantronics, Inc. | 312,132 | ||||||
| 19,780 | PTC, Inc.a | 915,221 | ||||||
| 7,634 | Science Applications International Corporation | 647,363 | ||||||
| 7,180 | Silicon Laboratories, Inc.a | 466,700 | ||||||
| 5,930 | Synaptics, Inc.a | 317,729 | ||||||
| 5,030 | SYNNEX Corporation | 608,731 | ||||||
| 25,870 | Synopsys, Inc.a | 1,522,708 | ||||||
| 6,080 | Tech Data Corporationa | 514,854 | ||||||
| 34,440 | Teradyne, Inc. | 874,776 | ||||||
| 42,840 | Trimble, Inc.a | 1,291,626 | ||||||
| 5,670 | Tyler Technologies, Inc.a | 809,506 | ||||||
| 4,950 | Ultimate Software Group, Inc.a | 902,633 | ||||||
| 18,950 | VeriFone Systems, Inc.a | 335,984 | ||||||
| 18,530 | Versum Materials, Inc.a | 520,137 | ||||||
| 8,810 | ViaSat, Inc.a | 583,398 | ||||||
| 22,910 | Vishay Intertechnology, Inc. | 371,142 | ||||||
| 6,690 | WebMD Health Corporationa,b | 331,623 | ||||||
| 6,510 | WEX, Inc.a | 726,516 | ||||||
| 9,000 | Zebra Technologies Corporationa | 771,840 | ||||||
|
| |||||||
Total | 49,266,079 | |||||||
|
| |||||||
Materials (7.1%) | ||||||||
| 18,700 | Allegheny Technologies, Inc.b | 297,891 | ||||||
| 10,710 | AptarGroup, Inc. | 786,650 | ||||||
| 10,650 | Ashland Global Holdings, Inc. | 1,163,938 | ||||||
| 16,050 | Bemis Company, Inc. | 767,511 | ||||||
| 10,700 | Cabot Corporation | 540,778 | ||||||
| 8,020 | Carpenter Technology Corporation | 290,083 | ||||||
| 19,690 | Commercial Metals Company | 428,848 | ||||||
| 5,780 | Compass Minerals International, Inc. | 452,863 | ||||||
| 10,670 | Domtar Corporation | 416,450 | ||||||
| 8,280 | Eagle Materials, Inc. | 815,828 | ||||||
| 4,450 | Greif, Inc. | 228,330 | ||||||
| 24,520 | Louisiana-Pacific Corporationa | 464,164 | ||||||
| 6,060 | Minerals Technologies, Inc. | 468,135 | ||||||
| 1,590 | NewMarket Corporation | 673,906 | ||||||
| 28,310 | Olin Corporation | 725,019 | ||||||
| 27,650 | Owens-Illinois, Inc.a | 481,386 | ||||||
| 15,930 | Packaging Corporation of America | 1,351,183 | ||||||
| 14,400 | PolyOne Corporation | 461,376 | ||||||
| 12,410 | Reliance Steel & Aluminum Company | 987,091 | ||||||
| 11,150 | Royal Gold, Inc. | 706,353 | ||||||
| 22,880 | RPM International, Inc. | 1,231,630 | ||||||
| 7,610 | Scotts Miracle-Gro Company | 727,135 | ||||||
| 7,570 | Sensient Technologies Corporation | 594,851 | ||||||
| 6,410 | Silgan Holdings, Inc. | 328,064 | ||||||
| 17,110 | Sonoco Products Company | 901,697 | ||||||
| 41,610 | Steel Dynamics, Inc. | 1,480,484 | ||||||
| 29,170 | United States Steel Corporation | 962,902 | ||||||
| 12,560 | Valspar Corporation | 1,301,342 | ||||||
| 7,480 | Worthington Industries, Inc. | 354,851 | ||||||
|
| |||||||
Total | 20,390,739 | |||||||
|
| |||||||
Real Estate (10.1%) | ||||||||
| 7,910 | Alexander & Baldwin, Inc. | 354,922 | ||||||
| 13,620 | Alexandria Real Estate Equities, Inc. | 1,513,591 | ||||||
| 22,710 | American Campus Communities, Inc. | 1,130,277 | ||||||
| 14,960 | Camden Property Trust | 1,257,687 | ||||||
| 14,420 | Care Capital Properties, Inc. | 360,500 | ||||||
| 23,950 | Communications Sales & Leasing, Inc. | 608,569 | ||||||
| 20,260 | CoreCivic, Inc. | 495,560 | ||||||
| 16,180 | Corporate Office Properties Trust | 505,140 | ||||||
| 58,780 | Cousins Properties, Inc. | 500,218 | ||||||
| 15,640 | DCT Industrial Trust, Inc. | 748,843 | ||||||
| 24,700 | Douglas Emmett, Inc. | 903,032 | ||||||
| 60,680 | Duke Realty Corporation | 1,611,661 | ||||||
| 12,460 | Education Realty Trust, Inc. | 527,058 | ||||||
| 10,910 | EPR Properties | 783,011 | ||||||
| 15,930 | Equity One, Inc. | 488,892 | ||||||
| 20,100 | First Industrial Realty Trust, Inc. | 563,805 | ||||||
| 19,900 | Healthcare Realty Trust, Inc. | 603,368 | ||||||
| 17,210 | Highwoods Properties, Inc. | 877,882 | ||||||
| 28,320 | Hospitality Properties Trust | 898,877 | ||||||
| 7,760 | Jones Lang LaSalle, Inc. | 784,070 | ||||||
| 15,840 | Kilroy Realty Corporation | 1,159,805 | ||||||
| 14,090 | Lamar Advertising Company | 947,411 | ||||||
| 19,530 | LaSalle Hotel Properties | 595,079 | ||||||
| 25,240 | Liberty Property Trust | 996,980 | ||||||
| 7,960 | Life Storage, Inc. | 678,670 | ||||||
| 15,450 | Mack-Cali Realty Corporation | 448,359 | ||||||
| 55,190 | Medical Properties Trust, Inc. | 678,837 | ||||||
The accompanying Notes to Financial Statements are an integral part of this schedule.
148
Table of Contents
MID CAP INDEX PORTFOLIO
Schedule of Investments as of December 31, 2016
| Shares | Common Stock (96.6%) | Value | ||||||
Real Estate (10.1%) - continued | ||||||||
| 25,250 | National Retail Properties, Inc. | $ | 1,116,050 | |||||
| 33,350 | Omega Healthcare Investors, Inc. | 1,042,521 | ||||||
| 7,007 | Potlatch Corporation | 291,841 | ||||||
| 16,000 | Quality Care Properties, Inc.a | 248,000 | ||||||
| 21,002 | Rayonier, Inc. REIT | 558,653 | ||||||
| 17,960 | Regency Centers Corporation | 1,238,342 | ||||||
| 40,770 | Senior Housing Property Trust | 771,776 | ||||||
| 16,500 | Tanger Factory Outlet Centers, Inc. | 590,370 | ||||||
| 10,260 | Taubman Centers, Inc. | 758,522 | ||||||
| 15,640 | Urban Edge Properties | 430,256 | ||||||
| 31,930 | Washington Prime Group, Inc. | 332,391 | ||||||
| 20,180 | Weingarten Realty Investors | 722,242 | ||||||
|
| |||||||
Total | 29,123,068 | |||||||
|
| |||||||
Telecommunications Services (0.2%) | ||||||||
| 15,905 | Telephone & Data Systems, Inc. | 459,177 | ||||||
|
| |||||||
Total | 459,177 | |||||||
|
| |||||||
Utilities (5.2%) | ||||||||
| 30,382 | Aqua America, Inc. | 912,675 | ||||||
| 17,850 | Atmos Energy Corporation | 1,323,577 | ||||||
| 9,140 | Black Hills Corporation | 560,648 | ||||||
| 36,863 | Great Plains Energy, Inc. | 1,008,203 | ||||||
| 18,560 | Hawaiian Electric Industries, Inc. | 613,779 | ||||||
| 8,600 | IDACORP, Inc. | 692,730 | ||||||
| 33,445 | MDU Resources Group, Inc. | 962,213 | ||||||
| 14,500 | National Fuel Gas Company | 821,280 | ||||||
| 14,800 | New Jersey Resources Corporation | 525,400 | ||||||
| 8,300 | NorthWestern Corporation | 472,021 | ||||||
| 34,250 | OGE Energy Corporation | 1,145,662 | ||||||
| 8,990 | ONE Gas, Inc. | 575,000 | ||||||
| 13,685 | PNM Resources, Inc. | 469,395 | ||||||
| 8,190 | Southwest Gas Holdings, Inc. | 627,518 | ||||||
| 29,770 | UGI Corporation | 1,371,802 | ||||||
| 14,230 | Vectren Corporation | 742,095 | ||||||
| 24,340 | Westar Energy, Inc. | 1,371,559 | ||||||
| 8,770 | WGL Holdings, Inc. | 668,976 | ||||||
|
| |||||||
Total | 14,864,533 | |||||||
|
| |||||||
Total Common Stock (cost $221,145,241) | 277,854,648 | |||||||
|
| |||||||
Collateral Held for Securities Loaned (2.1%) | ||||||||
| 6,191,137 | Thrivent Cash Management Trust | 6,191,137 | ||||||
|
| |||||||
Total Collateral Held for Securities Loaned (cost $6,191,137) | 6,191,137 | |||||||
|
| |||||||
| Shares or Principal Amount | Short-Term Investments (3.2%)c | |||||||
Federal Home Loan Bank Discount Notes | ||||||||
| 100,000 | 0.448%, 1/18/2017d | 99,984 | ||||||
| 300,000 | 0.390%, 2/1/2017d | 299,879 | ||||||
| 200,000 | 0.510%, 2/7/2017 | 199,903 | ||||||
| 200,000 | 0.490%, 2/10/2017d | 199,894 | ||||||
Thrivent Core Short-Term Reserve Fund | ||||||||
| 830,705 | 0.910% | 8,307,047 | ||||||
|
| |||||||
Total Short-Term Investments (cost $9,106,711) | 9,106,707 | |||||||
|
| |||||||
Total Investments (cost $236,443,089) 101.9% | $ | 293,152,492 | ||||||
|
| |||||||
Other Assets and Liabilities, Net (1.9%) | (5,480,334 | ) | ||||||
|
| |||||||
Total Net Assets 100.0% | $ | 287,672,158 | ||||||
|
| |||||||
| a | Non-income producing security. |
| b | All or a portion of the security is on loan. |
| c | The interest rate shown reflects the yield, coupon rate or the discount rate at the date of purchase. |
| d | All or a portion of the security is held on deposit with the counterparty and pledged as the initial margin deposit for open futures contracts. |
The following table presents the total amount of securities loaned with continuous maturity, by type, offset by the gross payable upon return of collateral for securities loaned by Thrivent Mid Cap Index Portfolio as of December 31, 2016:
Securities Lending Transactions
Common Stock | $ | 5,996,089 | ||
|
| |||
Total lending | $ | 5,996,089 | ||
Gross amount payable upon return of collateral for securities loaned | $ | 6,191,137 | ||
|
| |||
Net amounts due to counterparty | $ | 195,048 | ||
|
|
Definitions:
REIT | - | Real Estate Investment Trust is a company that buys, develops, manages and/or sells real estate assets. |
The accompanying Notes to Financial Statements are an integral part of this schedule.
149
Table of Contents
PARTNER WORLDWIDE ALLOCATION PORTFOLIO
Schedule of Investments as of December 31, 2016
| Shares | Common Stock (87.4%) | Value | ||||||
Australia (6.1%) | ||||||||
| 81,027 | Altium, Ltd. | $ | 472,280 | |||||
| 24,344 | Ansell, Ltd. | 433,151 | ||||||
| 24,438 | APN Outdoor Group Pty, Ltd. | 103,921 | ||||||
| 246,111 | Aristocrat Leisure, Ltd. | 2,745,768 | ||||||
| 76,925 | ASX, Ltd. | 2,755,849 | ||||||
| 633,572 | Australia & New Zealand Banking Group, Ltd. | 13,869,665 | ||||||
| 161,009 | Bendigo and Adelaide Bank, Ltd. | 1,472,875 | ||||||
| 165,913 | BHP Billiton, Ltd. | 2,972,310 | ||||||
| 407,186 | BlueScope Steel, Ltd. | 2,706,191 | ||||||
| 170,009 | BWP Trust | 366,282 | ||||||
| 432,634 | Challenger, Ltd. | 3,495,652 | ||||||
| 715,757 | Charter Hall Group | 2,444,794 | ||||||
| 197,440 | Coca-Cola Amatil, Ltd. | 1,439,927 | ||||||
| 35,470 | Cochlear, Ltd. | 3,130,611 | ||||||
| 14,567 | Costa Group Holdings, Ltd. | 36,080 | ||||||
| 745,600 | Cromwell Property Group | 529,412 | ||||||
| 913,167 | CSR, Ltd. | 3,035,980 | ||||||
| 258,423 | Downer EDI, Ltd. | 1,131,559 | ||||||
| 284,100 | FlexiGroup, Ltd. | 462,355 | ||||||
| 829,340 | Fortescue Metals Group, Ltd. | 3,465,821 | ||||||
| 312,032 | Genworth Mortgage Insurance Australia, Ltd. | 735,450 | ||||||
| 253,185 | Investa Office Fund | 862,300 | ||||||
| 84,788 | IOOF Holdings, Ltd. | 562,003 | ||||||
| 128,094 | JB Hi-Fi, Ltd. | 2,589,106 | ||||||
| 37,563 | Macquarie Group, Ltd. | 2,353,029 | ||||||
| 2,133,209 | Metcash, Ltd.a | 3,508,221 | ||||||
| 287,953 | Mineral Resources, Ltd. | 2,506,416 | ||||||
| 1,344,312 | Mirvac Group | 2,064,455 | ||||||
| 57,700 | Monadelphous Group, Ltd.b | 466,319 | ||||||
| 1,159,026 | Myer Holdings, Ltd. | 1,152,208 | ||||||
| 981,537 | Orora, Ltd. | 2,110,804 | ||||||
| 410,266 | OZ Minerals, Ltd. | 2,317,899 | ||||||
| 106,179 | Pact Group Holdings, Ltd. | 515,915 | ||||||
| 767 | Perpetual, Ltd. | 26,906 | ||||||
| 68,299 | Ramsay Health Care, Ltd. | 3,358,040 | ||||||
| 152,706 | Regis Resources, Ltd. | 321,116 | ||||||
| 96,814 | Rio Tinto, Ltd. | 4,147,628 | ||||||
| 44,932 | Seven Group Holdings, Ltd. | 253,394 | ||||||
| 183,272 | Sigma Pharmaceuticals, Ltd. | 170,416 | ||||||
| 1,073,234 | South32, Ltd. | 2,112,722 | ||||||
| 1,382,790 | Southern Cross Media Group, Ltd. | 1,538,485 | ||||||
| 130,316 | St Barbara, Ltd.a | 188,289 | ||||||
| 39,596 | Technology One, Ltd. | 160,921 | ||||||
| 231,314 | Telstra Corporation, Ltd. | 850,007 | ||||||
| 464,222 | Treasury Wine Estates, Ltd. | 3,571,094 | ||||||
| 24,039 | Vita Group, Ltd. | 55,936 | ||||||
| 611,961 | Westpac Banking Corporation | 14,365,145 | ||||||
| 958,574 | Whitehaven Coal, Ltd.a | 1,794,359 | ||||||
|
| |||||||
| Total | 101,729,066 | |||||||
|
| |||||||
Austria (0.8%) | ||||||||
| 96,370 | BUWOG AG | 2,237,226 | ||||||
| 19,695 | Lenzing AG | 2,384,182 | ||||||
| 187,830 | OMV AG | 6,621,720 | ||||||
| 2,041 | Porr AG | 83,623 | ||||||
| 7,076 | S IMMO AG | 74,374 | ||||||
| 9,992 | UNIQA Insurance Group AG | 75,558 | ||||||
| 20,200 | Vienna Insurance Group AG Wiener Versicherung Gruppe | 451,954 | ||||||
| 19,800 | Voestalpine AG | 774,246 | ||||||
|
| |||||||
Total | 12,702,883 | |||||||
|
| |||||||
Belgium (0.9%) | ||||||||
| 149,098 | Agfa-Gevaert NVa | 575,418 | ||||||
| 30,243 | Anheuser-Busch InBev NV | 3,201,050 | ||||||
| 5,302 | Barco NV | 446,717 | ||||||
| 58,845 | bpost SA | 1,391,137 | ||||||
| 25,796 | Galapagos NVa | 1,652,115 | ||||||
| 2,369 | Gimv NV | 131,107 | ||||||
| 8,860 | Ion Beam Applications SA | 387,667 | ||||||
| 16,688 | Melexis NV | 1,116,272 | ||||||
| 1,451 | Mobistar SAa | 30,292 | ||||||
| 105,022 | NV Bekaert SA | 4,244,951 | ||||||
| 21,896 | SA D’Ieteren NV | 967,108 | ||||||
| 4,692 | Solvay SA | 548,528 | ||||||
| 18,669 | Tessenderlo Chemie NVa | 682,250 | ||||||
|
| |||||||
Total | 15,374,612 | |||||||
|
| |||||||
Bermuda (0.1%) | ||||||||
| 3,159,000 | G-Resources Group, Ltd. | 57,660 | ||||||
| 2,681 | HAL Trust | 507,401 | ||||||
| 6,600 | Jardine Matheson Holdings, Ltd. | 364,650 | ||||||
|
| |||||||
Total | 929,711 | |||||||
|
| |||||||
Brazil (1.5%) | ||||||||
| 481,900 | Ambev SA | 2,423,786 | ||||||
| 712,300 | Banco Bradesco SA ADR | 6,204,133 | ||||||
| 200,333 | BRF SA | 2,964,643 | ||||||
| 553,245 | Lojas Renner SA | 3,929,304 | ||||||
| 174,982 | Multiplan Empreendimentos Imobiliarios SA | 3,181,919 | ||||||
| 258,000 | Ultrapar Participacoes SA ADRb | 5,350,920 | ||||||
| 86,490 | Vale SA ADR | 659,054 | ||||||
|
| |||||||
Total | 24,713,759 | |||||||
|
| |||||||
Canada (3.7%) | ||||||||
| 31,880 | ATCO, Ltd. | 1,060,411 | ||||||
| 37,826 | Bank of Montreal | 2,720,632 | ||||||
| 336,655 | Birchcliff Energy, Ltd.a | 2,349,426 | ||||||
| 272,832 | CAE, Inc. | 3,816,173 | ||||||
| 29,201 | Canadian Imperial Bank of Commerce | 2,382,796 | ||||||
| 92,746 | Canadian National Railway Company | 6,241,782 | ||||||
| 47,915 | Capital Power Corporation | 829,006 | ||||||
| 77,660 | CGI Group, Inc.a | 3,727,264 | ||||||
| 70,097 | Dollarama, Inc. | 5,136,218 | ||||||
| 14,395 | Entertainment One, Ltd. | 40,856 | ||||||
| 31,778 | Finning International, Inc. | 622,235 | ||||||
| 30,088 | IGM Financial, Inc. | 856,040 | ||||||
| 795,871 | Kinross Gold Corporationa | 2,483,670 | ||||||
| 58,800 | Loblaw Companies, Ltd. | 3,102,366 | ||||||
| 25,636 | Mullen Group, Ltd. | 378,626 | ||||||
| 34,226 | National Bank of Canada | 1,390,045 | ||||||
| 47,834 | Premium Brands Holdings Corporation | 2,456,808 | ||||||
| 54,097 | Restaurant Brands International, Inc. | 2,576,623 | ||||||
| 132,400 | Seven Generations Energy, Ltd.a | 3,087,509 | ||||||
| 151,599 | Teck Resources, Ltd. | 3,033,900 | ||||||
| 25,781 | TMX Group, Ltd. | 1,373,297 | ||||||
| 57,643 | Toronto-Dominion Bankb | 2,842,974 | ||||||
| 68,300 | Tourmaline Oil Corporationa | 1,826,726 | ||||||
| 97,909 | Transcanada Corporation | 4,414,710 | ||||||
| 202,500 | Veresen, Inc. | 1,977,265 | ||||||
|
| |||||||
Total | 60,727,358 | |||||||
|
| |||||||
Cayman Islands (0.2%) | ||||||||
| 2,817,180 | WH Group, Ltd.c | 2,270,920 | ||||||
| 1,292,000 | Xinyi Glass Holdings Company, Ltd. | 1,052,563 | ||||||
|
| |||||||
| Total | 3,323,483 | |||||||
|
| |||||||
Chile (0.3%) | ||||||||
| 139,315 | Banco Santander Chile SA ADR | 3,046,819 | ||||||
| 220,207 | S.A.C.I. Falabella | 1,742,305 | ||||||
|
| |||||||
Total | 4,789,124 | |||||||
|
| |||||||
The accompanying Notes to Financial Statements are an integral part of this schedule.
150
Table of Contents
PARTNER WORLDWIDE ALLOCATION PORTFOLIO
Schedule of Investments as of December 31, 2016
| Shares | Common Stock (87.4%) | Value | ||||||
China (0.1%) | ||||||||
| 2,578,000 | PetroChina Company, Ltd. | $ | 1,914,628 | |||||
|
| |||||||
Total | 1,914,628 | |||||||
|
| |||||||
Denmark (1.4%) | ||||||||
| 748 | A P Moller - Maersk AS | 1,192,285 | ||||||
| 5,909 | Aktieselskabet Schouw & Company | 439,873 | ||||||
| 45,856 | Danske Bank AS | 1,387,317 | ||||||
| 32,510 | DFDS AS | 1,482,238 | ||||||
| 203,986 | Novo Nordisk AS | 7,317,424 | ||||||
| 20,061 | Pandora AS | 2,618,764 | ||||||
| 66,500 | Royal Unibrew AS | 2,564,095 | ||||||
| 3,365 | Spar Nord Bank AS | 38,546 | ||||||
| 55,842 | Sydbank AS | 1,730,078 | ||||||
| 57,233 | Vestas Wind Systems AS | 3,706,672 | ||||||
|
| |||||||
Total | 22,477,292 | |||||||
|
| |||||||
Faroe Islands (0.1%) | ||||||||
| 35,294 | Bakkafrost PF | 1,399,950 | ||||||
|
| |||||||
Total | 1,399,950 | |||||||
|
| |||||||
Finland (0.8%) | ||||||||
| 20,373 | Cramo Oyj | 510,193 | ||||||
| 42,252 | Elisa Oyj | 1,371,567 | ||||||
| 25,854 | Kemira Oyj | 329,572 | ||||||
| 17,500 | Orion Oyj | 777,560 | ||||||
| 217,287 | Outokumpu Oyja | 1,934,805 | ||||||
| 31,747 | Ramirent Oyj | 246,623 | ||||||
| 113,266 | Sponda Oyj | 520,625 | ||||||
| 84,047 | Stora Enso Oyj | 899,053 | ||||||
| 257,688 | UPM-Kymmene Oyj | 6,301,927 | ||||||
| 76,576 | Valmet Oyj | 1,124,332 | ||||||
|
| |||||||
Total | 14,016,257 | |||||||
|
| |||||||
France (3.9%) | ||||||||
| 5,227 | Alten SA | 366,972 | ||||||
| 11,962 | Altran Technologies SAa | 174,577 | ||||||
| 11,793 | Assystem | 328,597 | ||||||
| 329,108 | AXA SA | 8,296,446 | ||||||
| 44,161 | Cap Gemini SA | 3,720,539 | ||||||
| 80,935 | CNP Assurances | 1,498,057 | ||||||
| 3,001 | Elior Participations SCAc | 68,556 | ||||||
| 2,730 | Euler Hermes Group | 239,763 | ||||||
| 155,990 | Eutelsat Communications | 3,016,491 | ||||||
| 25,075 | Ipsos SA | 787,767 | ||||||
| 15,035 | Kering SA | 3,372,417 | ||||||
| 5,865 | Metropole Television SA | 109,023 | ||||||
| 3,400 | Neopost SA | 106,188 | ||||||
| 44,994 | Nexans SAa | 2,327,038 | ||||||
| 39,621 | Nexity SA | 1,853,144 | ||||||
| 155,436 | Orange SA | 2,357,035 | ||||||
| 20,666 | Publicis Groupe SA | 1,423,987 | ||||||
| 108,140 | Sanofi | 8,744,790 | ||||||
| 26,954 | Schneider Electric SE | 1,872,459 | ||||||
| 23,000 | SCOR SE | 793,750 | ||||||
| 14,977 | Sodexo SA | 1,719,565 | ||||||
| 42,151 | Technicolor SA | 227,909 | ||||||
| 12,795 | Teleperformance SA | 1,282,778 | ||||||
| 43,146 | Thales SA | 4,180,031 | ||||||
| 298,258 | Total SA | 15,298,330 | ||||||
| 298,258 | Total SA Rightsa,d | 5,100 | ||||||
| 3,724 | Vicat SA | 225,989 | ||||||
| 39,926 | Vivendi SA | 757,276 | ||||||
|
| |||||||
Total | 65,154,574 | |||||||
|
| |||||||
Germany (6.6%) | ||||||||
| 63,362 | Aareal Bank AG | 2,376,450 | ||||||
| 23,644 | Adidas AG | 3,729,100 | ||||||
| 62,736 | Allianz SE | 10,353,851 | ||||||
| 22,721 | AURELIUS Equity Opportunities SE & Company KGaA | 1,328,433 | ||||||
| 32,676 | Bayer AG | 3,404,310 | ||||||
| 5,013 | Bechtle AG | 521,237 | ||||||
| 356 | bet-at-home.com AG | 29,936 | ||||||
| 3,619 | Carl Zeiss Meditec AG | 133,164 | ||||||
| 8,363 | Cewe Stiftung & Company KGaA | 741,887 | ||||||
| 41,437 | Covestro AGc | 2,836,275 | ||||||
| 40,885 | Deutsche Pfandbriefbank AGc | 391,607 | ||||||
| 145,803 | Deutsche Post AG | 4,781,631 | ||||||
| 129,231 | Deutsche Telekom AG | 2,217,251 | ||||||
| 11,591 | Deutz AG | 65,033 | ||||||
| 374,032 | E.ON SE | 2,631,303 | ||||||
| 197,508 | Evonik Industries AG | 5,887,500 | ||||||
| 132,054 | Evotec AGa | 1,031,729 | ||||||
| 12,468 | Fraport AG Frankfurt Airport Services Worldwide | 735,714 | ||||||
| 83,599 | Fresenius SE & Company KGaA | 6,521,649 | ||||||
| 32,816 | Gerresheimer AG | 2,433,849 | ||||||
| 14,674 | Grammer AG | 732,154 | ||||||
| 24,777 | Hannover Rueckversicherung SE | 2,676,604 | ||||||
| 6,886 | Homag Group AG | 305,165 | ||||||
| 9,363 | Indus Holding AG | 507,843 | ||||||
| 31,512 | Jenoptik AG | 543,248 | ||||||
| 19,429 | Jungheinrich AG | 556,382 | ||||||
| 186,584 | Kloeckner & Company SEa | 2,329,897 | ||||||
| 10,537 | Koenig & Bauer AGa | 472,994 | ||||||
| 52,227 | Merck KGaA | 5,437,941 | ||||||
| 15,112 | Nemetschek SE | 878,627 | ||||||
| 56,031 | Osram Licht AG | 2,934,095 | ||||||
| 14,946 | Pfeiffer Vacuum Technology AG | 1,394,018 | ||||||
| 9,144 | Rheinmetall AG | 613,663 | ||||||
| 107,068 | SAP SE | 9,261,953 | ||||||
| 160,193 | Siemens AG | 19,614,090 | ||||||
| 66,264 | Software AG | 2,401,644 | ||||||
| 15,535 | Stada Arzneimittel AG | 802,569 | ||||||
| 98,719 | Suedzucker AG | 2,353,132 | ||||||
| 30,074 | TAG Immobilien AG | 396,315 | ||||||
| 15,132 | Takkt AG | 341,936 | ||||||
| 3,304 | Tipp24 SE | 128,207 | ||||||
| 70,607 | Zalando SEa,c | 2,689,730 | ||||||
|
| |||||||
Total | 109,524,116 | |||||||
|
| |||||||
Hong Kong (2.8%) | ||||||||
| 1,403,800 | AIA Group, Ltd. | 7,863,864 | ||||||
| 120,000 | BOC Hong Kong (Holdings), Ltd. | 427,387 | ||||||
| 284,000 | Champion REIT | 153,521 | ||||||
| 574,000 | Cheung Kong Property Holdings, Ltd. | 3,505,415 | ||||||
| 661,300 | China Mobile, Ltd. | 6,972,202 | ||||||
| 264,000 | Giordano International, Ltd. | 142,346 | ||||||
| 18,000 | Great Eagle Holdings, Ltd. | 85,620 | ||||||
| 1,304,000 | Hang Lung Group, Ltd.b | 4,524,748 | ||||||
| 180,000 | Hang Lung Properties, Ltd. | 379,557 | ||||||
| 104,533 | Hong Kong Exchanges and Clearing, Ltd. | 2,458,447 | ||||||
| 163,000 | Hopewell Holdings, Ltd. | 561,420 | ||||||
| 266,000 | Melco International Development, Ltd. | 359,490 | ||||||
| 2,196,972 | New World Development Company, Ltd. | 2,314,746 | ||||||
| 4,796,544 | PCCW, Ltd. | 2,592,931 | ||||||
| 2,172,000 | Shun Tak Holdings, Ltd. | 748,280 | ||||||
| 997,398 | Sino Land Company, Ltd.b | 1,487,169 | ||||||
| 1,434,500 | SmarTone Telecommunications Holdings, Ltd. | 1,925,699 | ||||||
| 75,000 | Sun Hung Kai Properties, Ltd. | 944,436 | ||||||
| 105,000 | Sunlight Real Estate Investment Trust | 60,428 | ||||||
The accompanying Notes to Financial Statements are an integral part of this schedule.
151
Table of Contents
PARTNER WORLDWIDE ALLOCATION PORTFOLIO
Schedule of Investments as of December 31, 2016
| Shares | Common Stock (87.4%) | Value | ||||||
Hong Kong (2.8%) - continued | ||||||||
| 226,000 | Swire Pacific, Ltd. | $ | 2,150,565 | |||||
| 587,500 | Swire Pacific, Ltd., Class B | 1,008,210 | ||||||
| 347,700 | Swire Properties, Ltd. | 957,181 | ||||||
| 576,000 | Texwinca Holdings, Ltd. | 375,998 | ||||||
| 2,814,000 | Truly International Holdings, Ltd. | 1,091,226 | ||||||
| 438,000 | Wharf Holdings, Ltd. | 2,901,303 | ||||||
|
| |||||||
Total | 45,992,189 | |||||||
|
| |||||||
Hungary (0.2%) | ||||||||
| 146,000 | Richter Gedeon Nyrt | 3,083,866 | ||||||
|
| |||||||
Total | 3,083,866 | |||||||
|
| |||||||
India (2.3%) | ||||||||
| 82,840 | Grasim Industries, Ltd. | 1,051,171 | ||||||
| 40,000 | Grasim Industries, Ltd. GDR | 507,600 | ||||||
| 80,600 | Hero Motocorp, Ltd. | 3,608,398 | ||||||
| 277,000 | Hindustan Unilever, Ltd. | 3,367,331 | ||||||
| 464,741 | Housing Development Finance Corporation | 8,619,046 | ||||||
| 1,148,000 | ICICI Bank, Ltd. | 4,298,213 | ||||||
| 237,956 | Infosys, Ltd. | 3,531,873 | ||||||
| 1,742,313 | ITC, Ltd. | 6,188,742 | ||||||
| 66,621 | Tata Consultancy Services, Ltd. | 2,317,474 | ||||||
| 114,696 | Ultra Tech Cement, Ltd. | 5,479,074 | ||||||
| 4,570 | Ultra Tech Cement, Ltd. GDR | 218,851 | ||||||
|
| |||||||
Total | 39,187,773 | |||||||
|
| |||||||
Indonesia (0.7%) | ||||||||
| 14,912,100 | Astra International Tbk PT | 9,118,322 | ||||||
| 2,335,400 | Indocement Tunggal Prakarsa Tbk PT | 2,660,373 | ||||||
|
| |||||||
Total | 11,778,695 | |||||||
|
| |||||||
Ireland (0.4%) | ||||||||
| 125,921 | CRH plc | 4,343,352 | ||||||
| 393,200 | Henderson Group plc | 1,134,856 | ||||||
| 34,000 | Seagate Technology plc | 1,297,780 | ||||||
|
| |||||||
Total | 6,775,988 | |||||||
|
| |||||||
Israel (0.2%) | ||||||||
| 35,237 | Amot Investments, Ltd. | 149,487 | ||||||
| 848,138 | El Al Israel Airlines, Ltd. | 560,856 | ||||||
| 919 | Rami Levy Chain Stores Hashikma Marketing 2006, Ltd. | 37,042 | ||||||
| 69,368 | Shufersal, Ltd. | 258,766 | ||||||
| 76,080 | Teva Pharmaceutical Industries, Ltd. ADR | 2,757,900 | ||||||
|
| |||||||
Total | 3,764,051 | |||||||
|
| |||||||
Italy (1.9%) | ||||||||
| 28,420 | Ascopiave SPA | 81,492 | ||||||
| 361,308 | Assicurazioni Generali SPA | 5,355,457 | ||||||
| 24,770 | Autogrill SPA | 223,513 | ||||||
| 27,967 | Azimut Holding SPA | 465,187 | ||||||
| 12,373 | Banca IFIS SPA | 338,637 | ||||||
| 206,522 | Banca Mediolanum SPA | 1,481,411 | ||||||
| 10,983 | Banca Popolare Di Sondrio SCRL | 36,035 | ||||||
| 79,204 | Banco Popolare Societa Cooperativa | 190,609 | ||||||
| 344,159 | Beni Stabili SPA | 196,718 | ||||||
| 28,653 | Biesse SPA | 576,041 | ||||||
| 177,944 | BPER Banca | 944,422 | ||||||
| 1,051,579 | Credito Valtellinese Societa Cooperativa | 410,596 | ||||||
| 788,236 | Credito Valtellinese Societa Cooperativa Rightsa,d | 83 | ||||||
| 63,821 | DiaSorin SPA | 3,778,955 | ||||||
| 28,599 | Enav SPAa,c | 98,691 | ||||||
| 1,128,002 | Enel SPA | 4,958,375 | ||||||
| 163,863 | Finecobank Banca Fineco SPA | 916,192 | ||||||
| 64,128 | Interpump Group SPA | 1,049,696 | ||||||
| 1,443 | Italmobiliare SPA | 67,823 | ||||||
| 152,461 | Mediaset SPA | 656,641 | ||||||
| 124,618 | Prysmian SPA | 3,194,011 | ||||||
| 132,644 | Recordati SPA | 3,758,791 | ||||||
| 213,342 | Saras SPA | 385,118 | ||||||
| 211,061 | Societa Cattolica di Assicurazioni SCRL | 1,237,510 | ||||||
| 254,500 | Unipol Gruppo Finanziario SPA | 915,154 | ||||||
|
| |||||||
Total | 31,317,158 | |||||||
|
| |||||||
Japan (18.3%) | ||||||||
| 2,100 | Adeka Corporation | 28,489 | ||||||
| 12,600 | Aichi Steel Corporation | 527,140 | ||||||
| 14,500 | Aoyama Trading Company, Ltd. | 503,870 | ||||||
| 344,000 | Asahi Glass Company, Ltd. | 2,333,921 | ||||||
| 61,900 | Asatsu-DK, Inc. | 1,496,700 | ||||||
| 7,600 | ASKA Pharmaceutical Company, Ltd. | 110,626 | ||||||
| 31,900 | Avex Group Holdings, Inc. | 457,887 | ||||||
| 8,600 | BML, Inc. | 204,743 | ||||||
| 256,800 | Bridgestone Corporation | 9,239,866 | ||||||
| 133,900 | Brother Industries, Ltd. | 2,407,177 | ||||||
| 46,800 | Canon Marketing Japan, Inc. | 785,827 | ||||||
| 17,300 | Cawachi, Ltd. | 431,056 | ||||||
| 71,000 | Central Glass Company, Ltd. | 330,358 | ||||||
| 6,800 | Chiyoda Integre Company, Ltd. | 136,773 | ||||||
| 28,000 | Chugoku Marine Paints, Ltd. | 205,784 | ||||||
| 2,100 | CKD Corporation | 23,753 | ||||||
| 59,700 | Daicel Corporation | 656,344 | ||||||
| 16,000 | Daido Steel Company, Ltd. | 66,001 | ||||||
| 174,800 | Daiichi Sankyo Company, Ltd. | 3,569,283 | ||||||
| 38,500 | Daiwa House Industry Company, Ltd. | 1,049,910 | ||||||
| 98,000 | Denka Company, Ltd. | 431,458 | ||||||
| 50,500 | Denso Corporation | 2,184,453 | ||||||
| 55,300 | DIC Corporation | 1,675,883 | ||||||
| 1,600 | DISCO Corporation | 193,442 | ||||||
| 40,100 | Doutor Nichires Holdings Company, Ltd. | 736,457 | ||||||
| 91,608 | DOWA Holdings Company, Ltd. | 696,629 | ||||||
| 88,600 | DTS Corporation | 1,884,671 | ||||||
| 39,400 | DUSKIN Company, Ltd. | 809,030 | ||||||
| 115,600 | EDION Corporation | 1,082,532 | ||||||
| 9,700 | EIZO Corporation | 288,009 | ||||||
| 16,100 | EPS Holdings, Inc. | 187,407 | ||||||
| 44,400 | Fancl Corporation | 620,430 | ||||||
| 31,910 | Fields Corporation | 369,856 | ||||||
| 16,000 | Foster Electric Company, Ltd. | 301,429 | ||||||
| 193,400 | Fuji Heavy Industries, Ltd. | 7,879,968 | ||||||
| 105,000 | Fuji Machine Manufacturing Company, Ltd. | 1,198,804 | ||||||
| 20,400 | Fuji Soft, Inc. | 483,240 | ||||||
| 11,800 | Fujibo Holdings, Inc. | 334,400 | ||||||
| 88,300 | FUJIFILM Holdings NPV | 3,343,550 | ||||||
| 93,100 | Fujikura, Ltd. | 504,170 | ||||||
| 395,000 | Fukuoka Financial Group, Inc. | 1,751,818 | ||||||
| 6,200 | Funai Electric Company, Ltd. | 48,735 | ||||||
| 20,500 | Furukawa Electric Company, Ltd. | 598,229 | ||||||
| 21,700 | Geo Holdings Corporation | 252,250 | ||||||
| 21,100 | Goldcrest Company, Ltd. | 378,797 | ||||||
| 150,300 | Gunma Bank, Ltd. | 821,347 | ||||||
| 334 | Hankyu REIT, Inc. | 417,509 | ||||||
| 64,000 | Hanwa Company, Ltd. | 417,526 | ||||||
| 247,900 | Haseko Corporation | 2,513,463 | ||||||
| 22,200 | Heiwa Corporation | 507,189 | ||||||
| 10,700 | Heiwa Real Estate Company, Ltd. | 145,595 | ||||||
| 463 | Heiwa Real Estate REIT, Inc. | 331,879 | ||||||
| 808,019 | Hiroshima Bank, Ltd. | 3,765,220 | ||||||
| 27,900 | Hitachi Chemical Company, Ltd. | 696,002 | ||||||
The accompanying Notes to Financial Statements are an integral part of this schedule.
152
Table of Contents
PARTNER WORLDWIDE ALLOCATION PORTFOLIO
Schedule of Investments as of December 31, 2016
| Shares | Common Stock (87.4%) | Value | ||||||
Japan (18.3%) - continued | ||||||||
| 78,300 | Hitachi High-Technologies Corporation | $ | 3,149,260 | |||||
| 21,600 | Hitachi Transport System, Ltd. | 437,602 | ||||||
| 538,000 | Hitachi, Ltd. | 2,900,973 | ||||||
| 15,000 | Hokkoku Bank, Ltd. | 53,252 | ||||||
| 136,300 | Hokuhoku Financial Group, Inc. | 2,348,172 | ||||||
| 526,500 | Honda Motor Company, Ltd. | 15,371,333 | ||||||
| 113,900 | Hosiden Corporation | 920,082 | ||||||
| 30,000 | Hyakujushi Bank, Ltd. | 101,711 | ||||||
| 18,100 | IBJ Leasing Company, Ltd. | 404,098 | ||||||
| 518 | Ichigo Real Estate Investment Corporation | 336,674 | ||||||
| 153,900 | Iida Group Holdings Company, Ltd. | 2,917,519 | ||||||
| 19,600 | Inaba Denki Sangyo Company, Ltd. | 673,843 | ||||||
| 34,600 | INES Corporation | 359,723 | ||||||
| 378,000 | ITOCHU Corporation | 5,005,009 | ||||||
| 7,000 | Itochu Enex Company, Ltd. | 54,856 | ||||||
| 32,900 | Iyo Bank, Ltd. | 226,431 | ||||||
| 112,500 | Japan Airlines Company, Ltd. | 3,282,838 | ||||||
| 156,600 | Japan Display, Inc.a | 444,737 | ||||||
| 41,800 | Japan Securities Finance Company, Ltd. | 227,346 | ||||||
| 85,900 | JSR Corporation | 1,352,096 | ||||||
| 156,000 | JTEKT Corporation | 2,487,545 | ||||||
| 91,900 | JVC Kenwood Corporation | 250,325 | ||||||
| 48,500 | Kabu.com Securities Company, Ltd. | 166,643 | ||||||
| 14,000 | Kadokawa Dwango Corporation | 201,961 | ||||||
| 5,600 | Kaga Electronics Company, Ltd. | 90,789 | ||||||
| 46,000 | Kandenko Company, Ltd. | 414,355 | ||||||
| 68,800 | Kao Corporation | 3,256,640 | ||||||
| 89,500 | KDDI Corporation | 2,260,142 | ||||||
| 97,000 | Keihin Corporation | 1,695,308 | ||||||
| 443 | Kenedix Office Investment Corporation | 2,548,329 | ||||||
| 48 | Kenedix Residential Investment Corporation | 130,117 | ||||||
| 138,300 | Kinden Corporation | 1,721,538 | ||||||
| 35,100 | Kissei Pharmaceutical Company, Ltd. | 872,887 | ||||||
| 140,900 | KITZ Corporation | 769,268 | ||||||
| 25,710 | Koei Tecmo Holdings Company, Ltd. | 451,433 | ||||||
| 39,100 | Kohnan Shoji Company, Ltd. | 734,522 | ||||||
| 101,200 | Kokuyo Company, Ltd. | 1,162,603 | ||||||
| 125,800 | Komatsu, Ltd. | 2,849,389 | ||||||
| 89,300 | Konica Minolta Holdings, Inc. | 885,026 | ||||||
| 118,000 | K’s Holdings Corporation | 2,063,062 | ||||||
| 44,000 | Kurabo Industries, Ltd. | 85,973 | ||||||
| 289,700 | Kuraray Company, Ltd. | 4,344,216 | ||||||
| 3,900 | Kuroda Electric Company, Ltd. | 76,925 | ||||||
| 36,100 | Kyocera Corporation | 1,789,857 | ||||||
| 4,500 | Kyoei Steel, Ltd. | 85,556 | ||||||
| 6,900 | Kyokuto Kaihatsu Kogyo Company, Ltd. | 92,544 | ||||||
| 8,600 | Kyokuto Securities Company, Ltd. | 126,848 | ||||||
| 4,400 | KYORIN Holdings, Inc. | 94,157 | ||||||
| 74,000 | Maeda Road Construction Company, Ltd. | 1,234,139 | ||||||
| 347,000 | Makino Milling Machine Company, Ltd. | 2,707,672 | ||||||
| 260,700 | Marubeni Corporation | 1,474,539 | ||||||
| 14,000 | Maruwa Company, Ltd. | 462,716 | ||||||
| 146,700 | Marvelous, Inc. | 969,844 | ||||||
| 23,000 | Matsui Securities Company, Ltd. | 197,799 | ||||||
| 62,200 | Matsumotokiyoshi Holdings Company, Ltd. | 3,059,990 | ||||||
| 1,100 | Melco Holdings, Inc. | 29,856 | ||||||
| 8,900 | Mimasu Semiconductor Industry Company, Ltd. | 125,909 | ||||||
| 58,700 | MIRAIT Holdings Corporation | 529,022 | ||||||
| 210,200 | Mitsubishi Chemical Holdings Corporation | 1,359,082 | ||||||
| 310,900 | Mitsubishi Corporation | 6,603,098 | ||||||
| 228,600 | Mitsubishi Electric Corporation | 3,179,635 | ||||||
| 415,000 | Mitsubishi Heavy Industries, Ltd. | 1,886,608 | ||||||
| 47,800 | Mitsubishi Materials Corporation | 1,462,069 | ||||||
| 808,000 | Mitsubishi UFJ Financial Group, Inc. | 4,983,198 | ||||||
| 222,000 | Mitsui & Company, Ltd. | 3,041,914 | ||||||
| 691,000 | Mitsui Engineering & Shipbuilding Company, Ltd. | 1,068,544 | ||||||
| 4,546,400 | Mizuho Financial Group, Inc. | 8,158,673 | ||||||
| 6,100 | Mochida Pharmaceutical Company, Ltd. | 422,750 | ||||||
| 3,900 | Modec, Inc. | 62,165 | ||||||
| 54,200 | Monex Group, Inc. | 150,476 | ||||||
| 960 | Mori Trust Sogo REIT, Inc. | 1,514,278 | ||||||
| 135,463 | MS and AD Insurance Group Holdings, Inc. | 4,194,958 | ||||||
| 4,500 | Musashino Bank, Ltd. | 129,446 | ||||||
| 46,900 | Namura Shipbuilding Company, Ltd. | 319,839 | ||||||
| 22,900 | NEC Networks & System Integration Corporation | 412,870 | ||||||
| 160,700 | Net One Systems Company, Ltd. | 1,026,686 | ||||||
| 10,700 | Nichicon Corporation | 93,166 | ||||||
| 31,300 | Nichirei Corporation | 647,163 | ||||||
| 4,700 | Nihon Unisys, Ltd. | 58,999 | ||||||
| 21,400 | Nikkon Holdings Company, Ltd. | 445,612 | ||||||
| 449,000 | Nippon Electric Glass Company, Ltd. | 2,422,561 | ||||||
| 34,500 | Nippon Flour Mills Company, Ltd. | 478,794 | ||||||
| 84,200 | Nippon Light Metal Holdings Company, Ltd. | 177,273 | ||||||
| 4,300 | Nippon Paper Industries Company, Ltd. | 72,648 | ||||||
| 21,900 | Nippon Shokubai Company, Ltd. | 1,363,868 | ||||||
| 45,000 | Nippon Telegraph & Telephone Corporation | 1,894,282 | ||||||
| 44,000 | Nippon Thompson Company, Ltd. | 185,445 | ||||||
| 50,000 | Nishimatsu Construction Company, Ltd. | 241,648 | ||||||
| 256,305 | Nissan Motor Company, Ltd. | 2,571,032 | ||||||
| 133,000 | Nisshin OilliO Group, Ltd. | 610,863 | ||||||
| 31,300 | Nisshin Steel Company, Ltd. | 384,433 | ||||||
| 17,200 | Nissin Electric Company, Ltd. | 189,370 | ||||||
| 2,000 | Nittetsu Mining Company, Ltd. | 94,318 | ||||||
| 27,300 | Nitto Denko Corporation | 2,090,119 | ||||||
| 30,217 | Nitto Kogyo Corporation | 411,408 | ||||||
| 33,900 | Noritz Corporation | 571,128 | ||||||
| 148,600 | North Pacific Bank, Ltd. | 611,976 | ||||||
| 34,300 | NSD Company, Ltd. | 537,963 | ||||||
| 197,900 | NTT DOCOMO, Inc. | 4,501,290 | ||||||
| 252,700 | Obayashi Corporation | 2,412,615 | ||||||
| 64,700 | Okamura Corporation | 580,253 | ||||||
| 37,000 | Okasan Securities Group, Inc. | 227,878 | ||||||
| 22,950 | Okinawa Electric Power Company, Inc. | 515,551 | ||||||
| 218,000 | Okuma Corporation | 2,074,158 | ||||||
| 1,568,000 | Osaka Gas Company, Ltd. | 6,016,513 | ||||||
| 112,100 | Otsuka Holdings Company, Ltd. | 4,883,123 | ||||||
| 43,700 | Paltac Corporation | 1,030,671 | ||||||
| 106,100 | Panasonic Corporation | 1,076,083 | ||||||
| 33,700 | Paramount Bed Holdings Company, Ltd. | 1,346,270 | ||||||
| 13,900 | Pioneer Corporationa | 27,960 | ||||||
| 30,700 | Plenus Company, Ltd. | 598,587 | ||||||
| 70,800 | Rengo Company, Ltd. | 384,478 | ||||||
| 260,400 | Resona Holdings, Inc. | 1,334,555 | ||||||
The accompanying Notes to Financial Statements are an integral part of this schedule.
153
Table of Contents
PARTNER WORLDWIDE ALLOCATION PORTFOLIO
Schedule of Investments as of December 31, 2016
| Shares | Common Stock (87.4%) | Value | ||||||
Japan (18.3%) - continued | ||||||||
| 10,700 | Rohm Company, Ltd. | $ | 613,890 | |||||
| 54,300 | Round One Corporation | 375,825 | ||||||
| 7,000 | Ryobi, Ltd. | 27,401 | ||||||
| 14,400 | Ryosan Company, Ltd. | 434,138 | ||||||
| 50,600 | San-in Godo Bank, Ltd. | 421,563 | ||||||
| 130,000 | Sankyu, Inc. | 784,428 | ||||||
| 6,700 | Screen Holdings Company, Ltd. | 414,117 | ||||||
| 18,600 | Seiko Epson Corporation | 392,694 | ||||||
| 186,200 | Seino Holdings Company, Ltd. | 2,063,182 | ||||||
| 1,170 | Sekisui House SI Investment Corporation | 1,303,130 | ||||||
| 175,400 | Sekisui House, Ltd. | 2,914,149 | ||||||
| 77,300 | SENKO Company, Ltd. | 520,804 | ||||||
| 7,400 | Senshu Ikeda Holdings, Inc. | 34,078 | ||||||
| 43,000 | Shimachu Company, Ltd. | 1,144,184 | ||||||
| 70,000 | Shindengen Electric Manufacturing Company, Ltd. | 259,484 | ||||||
| 56,500 | Shinko Electric Industries Company, Ltd. | 380,618 | ||||||
| 125,000 | ShinMaywa Industries, Ltd. | 1,121,427 | ||||||
| 77,600 | Showa Denko KK | 1,108,450 | ||||||
| 938,200 | Sojitz Corporation | 2,271,533 | ||||||
| 176,800 | Sumco Corporation | 2,273,002 | ||||||
| 62,000 | Sumitomo Bakelite Company, Ltd | 346,726 | ||||||
| 286,340 | Sumitomo Corporation | 3,361,463 | ||||||
| 30,400 | Sumitomo Electric Industries, Ltd. | 437,739 | ||||||
| 568,000 | Sumitomo Heavy Industries, Ltd. | 3,647,218 | ||||||
| 89,800 | Sumitomo Mitsui Financial Group, Inc. | 3,419,851 | ||||||
| 18,300 | Sumitomo Mitsui Trust Holdings, Inc. | 654,751 | ||||||
| 19,000 | Taihei Dengyo Kaisha, Ltd. | 184,160 | ||||||
| 24,500 | Tatsuta Electric Wire and Cable Company, Ltd. | 95,137 | ||||||
| 66,300 | TIS, Inc. | 1,417,067 | ||||||
| 179,000 | Toagosei Company, Ltd. | 1,756,946 | ||||||
| 72,300 | Toho Holdings Company, Ltd. | 1,440,950 | ||||||
| 156,600 | Tohoku Electric Power Company, Inc. | 1,974,090 | ||||||
| 20,400 | Tokai Rika Company, Ltd. | 408,386 | ||||||
| 5,000 | Tokyo Broadcasting System Holdings, Inc. | 79,740 | ||||||
| 55,700 | Tokyo Electron, Ltd. | 5,238,553 | ||||||
| 7,700 | Tokyo Seimitsu Company, Ltd. | 227,649 | ||||||
| 916 | Tokyu REIT, Inc. | 1,160,480 | ||||||
| 59,300 | Toppan Forms Company, Ltd. | 617,403 | ||||||
| 2,900 | Topy Industries, Ltd. | 74,544 | ||||||
| 60,500 | Tosei Corporation | 452,666 | ||||||
| 240,000 | Toshiba Machine Company, Ltd. | 959,698 | ||||||
| 229,000 | Tosoh Corporation | 1,615,363 | ||||||
| 27,700 | Toyota Industries Corporation | 1,317,004 | ||||||
| 146,800 | Toyota Motor Corporation | 8,606,651 | ||||||
| 97,000 | Tsubakimoto Chain Company | 786,516 | ||||||
| 9,000 | Tsugami Corporation | 51,538 | ||||||
| 1,500 | Tsumura & Company | 41,285 | ||||||
| 16,600 | TV Asahi Holdings Corporation | 327,057 | ||||||
| 38,000 | UACJ Corporation | 103,806 | ||||||
| 493,000 | Ube Industries, Ltd. | 1,030,175 | ||||||
| 10,600 | ULVAC, Inc. | 323,595 | ||||||
| 1,600 | Unipres Corporation | 31,769 | ||||||
| 98,200 | Valor Company, Ltd. | 2,555,424 | ||||||
| 10,100 | Warabeya Nichiyo Holdings Company, Ltd. | 212,993 | ||||||
| 66,000 | West Japan Railway Company | 4,042,893 | ||||||
| 14,100 | Xebio Holdings Company, Ltd. | 217,388 | ||||||
| 451,100 | Yamada Denki Company, Ltd.b | 2,428,924 | ||||||
| 76,300 | Yamato Kogyo Company, Ltd. | 2,127,959 | ||||||
| 51,700 | Yodogawa Steel Works, Ltd. | 1,347,368 | ||||||
| 14,800 | Yorozu Corporation | 212,389 | ||||||
|
| |||||||
Total | 302,817,638 | |||||||
|
| |||||||
Jersey (0.3%) | ||||||||
| 213,698 | IWG plc | 646,402 | ||||||
| 225,587 | WPP plc | 5,020,113 | ||||||
|
| |||||||
| Total | 5,666,515 | |||||||
|
| |||||||
Luxembourg (0.7%) | ||||||||
| 43,335 | APERAM | 1,977,640 | ||||||
| 1,258 | Millicom International Cellular SA | 53,609 | ||||||
| 383,405 | Subsea 7 SAa | 4,842,129 | ||||||
| 123,000 | Tenaris SA ADRb | 4,392,330 | ||||||
| 32,790 | Ternium SA ADR | 791,879 | ||||||
|
| |||||||
| Total | 12,057,587 | |||||||
|
| |||||||
Malaysia (0.2%) | ||||||||
| 559,343 | CIMB Group Holdings Berhad | 560,894 | ||||||
| 667,400 | Public Bank Berhad | 2,933,823 | ||||||
|
| |||||||
| Total | 3,494,717 | |||||||
|
| |||||||
Mexico (1.0%) | ||||||||
| 83,000 | Fomento Economico Mexicano SAB de CV ADR | 6,325,430 | ||||||
| 24,500 | Grupo Aeroportuario del Sureste SAB de CV ADR | 3,525,305 | ||||||
| 1,272,594 | Grupo Financiero Banorte SAB de CV ADR | 6,267,923 | ||||||
| 259,000 | Organizacion Soriana SAB de CVa | 561,988 | ||||||
|
| |||||||
| Total | 16,680,646 | |||||||
|
| |||||||
Netherlands (2.3%) | ||||||||
| 68,724 | ABN AMRO Group NVc | 1,521,675 | ||||||
| 737,830 | Aegon NV | 4,053,394 | ||||||
| 3,856 | AMG Advanced Metallurgical Group NV | 59,923 | ||||||
| 458,007 | Arcelor Mittala | 3,365,224 | ||||||
| 41,963 | ASM International NV | 1,881,324 | ||||||
| 79,589 | BE Semiconductor Industries NV | 2,647,454 | ||||||
| 27,363 | Corbion NV | 731,783 | ||||||
| 214,500 | Koninklijke Ahold Delhaize NV | 4,518,028 | ||||||
| 92,393 | Koninklijke Boskalis Westminster NV | 3,205,317 | ||||||
| 11,419 | Koninklijke DSM NV | 684,312 | ||||||
| 76,081 | NN Group NV | 2,575,544 | ||||||
| 58,662 | Philips Lighting NVa,b,c | 1,444,968 | ||||||
| 7,865 | PostNL NVa | 33,789 | ||||||
| 22,335 | Randstad Holding NV | 1,209,837 | ||||||
| 57,262 | RELX NV | 963,143 | ||||||
| 28,968 | STMicroelectronics NV | 328,337 | ||||||
| 4,800 | TKH Group NV | 189,832 | ||||||
| 181,237 | Unilever NV | 7,445,031 | ||||||
|
| |||||||
| Total | 36,858,915 | |||||||
|
| |||||||
New Zealand (<0.1%) | ||||||||
| 129,449 | Trade Me Group, Ltd. | 450,140 | ||||||
| 16,312 | Z Energy, Ltd. | 82,230 | ||||||
|
| |||||||
| Total | 532,370 | |||||||
|
| |||||||
Norway (1.4%) | ||||||||
| 108,846 | Aker BP ASA | 1,944,957 | ||||||
| 55,733 | Austevoll Seafood ASA | 540,059 | ||||||
| 113,382 | BW LPG, Ltd.c | 476,310 | ||||||
| 166,353 | Marine Harvest ASA | 3,007,745 | ||||||
| 1,346,647 | Norsk Hydro ASA | 6,427,186 | ||||||
| 95,280 | Orkla ASA | 862,163 | ||||||
| 55,713 | Petroleum Geo-Services ASAa | 187,725 | ||||||
| 3,279 | Petroleum Geo-Services ASA Rightsa,d | 2,505 | ||||||
| 69,922 | SalMar ASA | 2,087,935 | ||||||
| 4,699 | Skandiabanken ASAa,c | 38,221 | ||||||
The accompanying Notes to Financial Statements are an integral part of this schedule.
154
Table of Contents
PARTNER WORLDWIDE ALLOCATION PORTFOLIO
Schedule of Investments as of December 31, 2016
Shares | Common Stock (87.4%) | Value | ||||||
Norway (1.4%) - continued | ||||||||
| 41,669 | SpareBank 1 SMN | $ | 312,444 | |||||
| 17,213 | Statoil ASA | 314,166 | ||||||
| 293,826 | Storebrand ASAa | 1,560,799 | ||||||
| 215,515 | Telenor ASA | 3,216,931 | ||||||
| 44,092 | TGS Nopec Geophysical Company ASA | 977,464 | ||||||
| 42,190 | Yara International ASA | 1,659,715 | ||||||
|
| |||||||
| Total | 23,616,325 | |||||||
|
| |||||||
Philippines (0.5%) | ||||||||
| 12,830 | Ayala Corporation | 188,363 | ||||||
| 7,576,500 | Ayala Land, Inc. | 4,867,883 | ||||||
| 2,112,270 | Bank of the Philippine Islands | 3,773,087 | ||||||
|
| |||||||
| Total | 8,829,333 | |||||||
|
| |||||||
Poland (0.2%) | ||||||||
| 105,348 | Bank Pekao SA | 3,163,248 | ||||||
|
| |||||||
| Total | 3,163,248 | |||||||
|
| |||||||
Portugal (0.9%) | ||||||||
| 6,184,256 | Banco Espirito Santo SAa,d | 651 | ||||||
| 104,038 | CTT-Correios de Portugal SA | 705,194 | ||||||
| 850,200 | Electricidade de Portugal SA | 2,587,633 | ||||||
| 421,119 | Galp Energia SGPS SA | 6,278,164 | ||||||
| 358,591 | Jeronimo Martins SGPS SA | 5,561,636 | ||||||
|
| |||||||
| Total | 15,133,278 | |||||||
|
| |||||||
Russia (0.8%) | ||||||||
| 112,500 | Lukoil ADR | 6,301,755 | ||||||
| 34,097 | Magnit PJSC | 6,112,780 | ||||||
|
| |||||||
| Total | 12,414,535 | |||||||
|
| |||||||
Singapore (0.7%) | ||||||||
| 114,100 | Oversea-Chinese Banking Corporation, Ltd. | 700,762 | ||||||
| 460,800 | StarHub, Ltd. | 892,039 | ||||||
| 284,300 | United Engineers, Ltd. | 502,578 | ||||||
| 405,513 | United Overseas Bank, Ltd.b | 5,697,011 | ||||||
| 331,100 | Venture Corporation, Ltd. | 2,255,162 | ||||||
| 114,700 | Wing Tai Holdings, Ltd. | 125,631 | ||||||
| 2,704,500 | Yangzijiang Shipbuilding Holdings, Ltd. | 1,516,438 | ||||||
| 735,400 | Yanlord Land Group, Ltd. | 670,323 | ||||||
|
| |||||||
| Total | 12,359,944 | |||||||
|
| |||||||
South Africa (0.6%) | ||||||||
| 290,584 | Massmart Holdings, Ltd. | 2,669,342 | ||||||
| 304,479 | MTN Group, Ltd. | 2,788,633 | ||||||
| 680,885 | Truworths International, Ltd. | 3,949,840 | ||||||
|
| |||||||
| Total | 9,407,815 | |||||||
|
| |||||||
South Korea (0.4%) | ||||||||
| 5,959 | Amorepacific Corporation | 1,012,844 | ||||||
| 10,873 | Amorepacific Group | 1,195,011 | ||||||
| 5,609 | NAVER Corporation | 3,591,879 | ||||||
|
| |||||||
| Total | 5,799,734 | |||||||
|
| |||||||
Spain (1.0%) | ||||||||
| 25,759 | Aena SAc | 3,509,446 | ||||||
| 75,756 | Banco Santander SA | 394,105 | ||||||
| 45,364 | CIE Automotive SA | 882,766 | ||||||
| 13,570 | Construcciones y Auxiliar de | |||||||
Ferrocarriles SA | 547,097 | |||||||
| 74,104 | Ebro Foods SA | 1,550,867 | ||||||
| 57,050 | Ence Energia y Celulosa SA | 150,321 | ||||||
| 84,319 | Endesa SA | 1,783,191 | ||||||
| 35,757 | Gamesa Corporacion Tecnologia SA | 722,926 | ||||||
| 8,997 | Let’s GOWEX SAa,d | 1 | ||||||
| 167,626 | Liberbank SAa | 173,235 | ||||||
| 1,810,989 | Mapfre SA | 5,516,471 | ||||||
| 15,176 | Mediaset Espana Comunicacion SA | 177,769 | ||||||
| 21,121 | Papeles y Cartones de Europa SA | 116,434 | ||||||
| 36,302 | Tecnicas Reunidas SA | 1,484,654 | ||||||
|
| |||||||
| Total | 17,009,283 | |||||||
|
| |||||||
Sweden (2.0%) | ||||||||
| 115,700 | Alfa Laval AB | 1,908,514 | ||||||
| 4,236 | Bilia AB | 97,198 | ||||||
| 120,517 | Boliden AB | 3,130,429 | ||||||
| 9,874 | Bonava ABa | 152,964 | ||||||
| 14,005 | Bure Equity AB | 158,773 | ||||||
| 11,744 | Dios Fastigheter AB | 77,267 | ||||||
| 87,723 | Granges AB | 826,599 | ||||||
| 47,537 | Inwido AB | 492,530 | ||||||
| 21,024 | JM AB | 606,080 | ||||||
| 6,358 | Klovern AB, Class B | 6,654 | ||||||
| 50,995 | Loomis AB | 1,514,187 | ||||||
| 4,408 | Nobia AB | 40,986 | ||||||
| 32,600 | Nobina AB* | 181,596 | ||||||
| 902,613 | Nordea Bank AB | 10,001,516 | ||||||
| 13,759 | SAAB AB | 513,128 | ||||||
| 20,391 | Scandic Hotels Group ABa,c | 171,105 | ||||||
| 57,700 | Securitas AB | 905,074 | ||||||
| 95,094 | Skandinaviska Enskilda Banken AB | 993,751 | ||||||
| 35,997 | Skanska AB | 847,527 | ||||||
| 112,340 | SKF AB | 2,059,885 | ||||||
| 133,919 | Svenska Cellulosa AB SCA | 3,769,355 | ||||||
| 35,407 | Swedbank AB | 853,113 | ||||||
| 476,196 | Telefonaktiebolaget LM Ericsson | 2,790,972 | ||||||
| 3,637 | Vitrolife AB | 154,364 | ||||||
|
| |||||||
| Total | 32,253,567 | |||||||
|
| |||||||
Switzerland (6.3%) | ||||||||
| 519,819 | ABB, Ltd. | 10,937,888 | ||||||
| 19,144 | Actelion, Ltd. | 4,137,183 | ||||||
| 64,388 | Adecco SA | 4,203,043 | ||||||
| 7,128 | Ascom Holding AG | 111,841 | ||||||
| 862 | Autoneum Holding AG | 225,955 | ||||||
| 14,331 | BKW FMB Energie | 693,117 | ||||||
| 1,926 | Bobst Group SA | 133,910 | ||||||
| 26,258 | Cembra Money Bank AGa | 1,910,081 | ||||||
| 1,068 | dorma+kaba Holding AG | 792,864 | ||||||
| 719 | Emmi AG | 434,732 | ||||||
| 167,924 | Ferrexpo plca | 278,349 | ||||||
| 1,148 | Forbo Holding AG | 1,478,719 | ||||||
| 26,438 | GAM Holding AGa | 305,969 | ||||||
| 3,630 | Georg Fischer AG | 2,968,705 | ||||||
| 262,627 | Glencore Xstrata plca | 887,392 | ||||||
| 2,176 | Helvetia Holding AG | 1,170,799 | ||||||
| 455 | Implenia AG | 33,624 | ||||||
| 3,493 | Kardex AG | 326,729 | ||||||
| 1,899 | Komax Holding AG | 468,549 | ||||||
| 80,197 | Logitech International SA | 1,995,976 | ||||||
| 25,579 | Lonza Group AG | 4,420,798 | ||||||
| 2,929 | Mobimo Holding AG | 732,753 | ||||||
| 267,828 | Nestle SA | 19,186,552 | ||||||
| 184,549 | Novartis AG | 13,421,049 | ||||||
| 7,383 | Partners Group Holding AG | 3,456,263 | ||||||
| 2,739 | Rieter Holding AG | 476,360 | ||||||
| 7,200 | Roche Holding AG-BR | 1,680,383 | ||||||
| 60,720 | Roche Holding AG-Genusschein | 13,841,280 | ||||||
| 470 | Schweiter Technologies AG | 530,787 | ||||||
| 19,798 | Sulzer, Ltd. | 2,038,065 | ||||||
| 7,114 | Tecan Group AG | 1,109,432 | ||||||
| 4,207 | Valiant Holding AG | 418,924 | ||||||
| 7,684 | Valora Holding AG | 2,182,654 | ||||||
| 82,823 | Wolseley plc | 5,056,058 | ||||||
The accompanying Notes to Financial Statements are an integral part of this schedule.
155
Table of Contents
PARTNER WORLDWIDE ALLOCATION PORTFOLIO
Schedule of Investments as of December 31, 2016
| Shares | Common Stock (87.4%) | Value | ||||||
Switzerland (6.3%) - continued | ||||||||
| 9,439 | Zurich Insurance Group AGa | $ | 2,594,024 | |||||
|
| |||||||
| Total | 104,640,807 | |||||||
|
| |||||||
Taiwan (0.7%) | ||||||||
| 662,300 | Taiwan Mobile Company, Ltd. | 2,132,155 | ||||||
| 1,693,951 | Taiwan Semiconductor Manufacturing Company, Ltd. | 9,488,253 | ||||||
|
| |||||||
| Total | 11,620,408 | |||||||
|
| |||||||
Thailand (0.7%) | ||||||||
| 427,750 | Siam Cement pcl | 5,936,881 | ||||||
| 1,313,500 | Siam Commercial Bank pcl | 5,570,333 | ||||||
|
| |||||||
| Total | 11,507,214 | |||||||
|
| |||||||
Turkey (0.6%) | ||||||||
| 1,427,982 | Akbank TAS | 3,161,064 | ||||||
| 231,340 | BIM Birlesik Magazalar AS | 3,210,331 | ||||||
| 1,370,000 | Turkiye Garanti Bankasi AS | 2,954,573 | ||||||
|
| |||||||
| Total | 9,325,968 | |||||||
|
| |||||||
United Kingdom (12.6%) | ||||||||
| 438,778 | 3i Group plc | 3,795,626 | ||||||
| 70,243 | Abcam plc | 663,176 | ||||||
| 295,109 | Aberdeen Asset Management plc | 933,078 | ||||||
| 100,600 | Aggreko plc | 1,135,620 | ||||||
| 253,080 | Amec Foster Wheeler plc | 1,461,433 | ||||||
| 278,811 | Anglo American plca | 3,939,302 | ||||||
| 68,363 | Ashmore Group plc | 237,612 | ||||||
| 6,424 | ASOS plca | 392,496 | ||||||
| 349,554 | Auto Trader Group plcc | 1,757,402 | ||||||
| 341,801 | Barclays plc | 938,026 | ||||||
| 350,257 | Beazley plc | 1,674,153 | ||||||
| 21,143 | Bellway plc | 644,500 | ||||||
| 107,000 | BHP Billiton plc | 1,683,924 | ||||||
| 51,097 | BHP Billiton plc | 813,623 | ||||||
| 91,194 | Bodycote plc | 723,097 | ||||||
| 5,916 | Bovis Homes Group plc | 59,711 | ||||||
| 1,883,899 | BP plc | 11,799,738 | ||||||
| 174,504 | British American Tobacco plc | 9,890,148 | ||||||
| 63,637 | Bunzl plc | 1,652,111 | ||||||
| 155,449 | Burberry Group plc | 2,864,775 | ||||||
| 587,620 | Cobham plc | 1,183,147 | ||||||
| 206,936 | Compass Group plc | 3,824,523 | ||||||
| 84,861 | Crest Nicholson Holdings plc | 472,488 | ||||||
| 59,572 | CYBG plca | 204,448 | ||||||
| 231,032 | Diageo plc | 5,995,283 | ||||||
| 16,741 | Dialog Semiconductor plca | 703,374 | ||||||
| 149,046 | Direct Line Insurance Group plc | 678,335 | ||||||
| 84,746 | Electrocomponents plc | 497,363 | ||||||
| 60,485 | Faroe Petroleum plca | 77,151 | ||||||
| 116,280 | Fenner plc | 337,840 | ||||||
| 49,124 | Galliford Try plc | 781,378 | ||||||
| 679,528 | GlaxoSmithKline plc | 13,052,796 | ||||||
| 33,902 | Grainger plc | 99,355 | ||||||
| 46,270 | Halma plc | 511,910 | ||||||
| 34,315 | Hiscox, Ltd. | 429,993 | ||||||
| 3,830,829 | HSBC Holdings plc | 30,909,670 | ||||||
| 77,431 | Hunting plc | 597,885 | ||||||
| 136,552 | Inchcape plc | 1,180,084 | ||||||
| 705,485 | Indivior plc | 2,570,551 | ||||||
| 246,664 | Informa plc | 2,066,114 | ||||||
| 231,918 | Intermediate Capital Group plc | 1,996,723 | ||||||
| 86,600 | Interserve plc | 364,738 | ||||||
| 60,775 | Intertek Group plc | 2,604,713 | ||||||
| 421,215 | JD Sports Fashion plc | 1,650,246 | ||||||
| 491,429 | John Wood Group plc | 5,306,706 | ||||||
| 98,287 | JRP Group plc | 181,089 | ||||||
| 131,061 | Jupiter Fund Management plc | 713,736 | ||||||
| 607,978 | Ladbrokes Coral plc | 868,685 | ||||||
| 570,434 | Marks and Spencer Group plc | 2,457,265 | ||||||
| 86,658 | Meggitt plc | 489,377 | ||||||
| 80,729 | Micro Focus International plc | 2,168,076 | ||||||
| 519,500 | Mitie Group plc | 1,434,470 | ||||||
| 227,233 | National Express Group plc | 990,221 | ||||||
| 216,500 | Old Mutual plc | 552,072 | ||||||
| 90,986 | OneSavings Bank plc | 379,006 | �� | |||||
| 102,000 | PageGroup plc | 489,876 | ||||||
| 341,517 | Paragon Group of Companies plc | 1,740,313 | ||||||
| 233,615 | Petrofac, Ltd. | 2,500,071 | ||||||
| 110,331 | Premier Oil plca | 100,502 | ||||||
| 509,199 | QinetiQ Group plc | 1,648,412 | ||||||
| 67,755 | Reckitt Benckiser Group plc | 5,739,424 | ||||||
| 137,091 | Rentokil Initial plc | 375,053 | ||||||
| 124,400 | Restaurant Group plc | 497,214 | ||||||
| 91,433 | Rio Tinto plc | 3,490,750 | ||||||
| 370,633 | Rolls-Royce Holdings plca | 3,044,213 | ||||||
| 83,575 | Royal Dutch Shell plc | 2,279,565 | ||||||
| 81,841 | Royal Dutch Shell plc, Class A | 2,259,115 | ||||||
| 645,855 | Royal Dutch Shell plc, Class B | 18,556,756 | ||||||
| 352,429 | Saga plc | 848,788 | ||||||
| 8,354 | Savills plc | 72,257 | ||||||
| 15,427 | Schroders plc | 566,606 | ||||||
| 51,421 | Shawbrook Group plca,c | 172,308 | ||||||
| 349,653 | Smiths Group plc | 6,086,488 | ||||||
| 12,599 | Spectris plc | 359,009 | ||||||
| 50,496 | Spirax-Sarco Engineering plc | 2,598,763 | ||||||
| 284,440 | Standard Chartered plca | 2,319,599 | ||||||
| 15,742 | Stobart Group, Ltd. | 34,515 | ||||||
| 127,901 | Synthomer plc | 603,078 | ||||||
| 415,588 | Tate & Lyle plc | 3,616,737 | ||||||
| 210,496 | Thomas Cook Group plca | 226,112 | ||||||
| 180,356 | TP ICAP plc | 963,105 | ||||||
| 44,225 | Tritax Big Box REIT plc | 76,032 | ||||||
| 35,717 | UBM plc | 321,501 | ||||||
| 101,399 | Unilever plc | 4,100,586 | ||||||
| 91,433 | Vedanta Resources plc | 981,182 | ||||||
| 12,205 | Vesuvius plc | 59,344 | ||||||
| 79,345 | Virgin Money Holdings (UK) plc | 295,996 | ||||||
| 29,731 | WH Smith plc | 569,673 | ||||||
| 1,138,199 | William Hill plc | 4,065,383 | ||||||
| 291,436 | William Morrison Supermarkets plc | 827,765 | ||||||
|
| |||||||
| Total | 207,876,453 | |||||||
|
| |||||||
United States (0.2%) | ||||||||
| 113,600 | Yum China Holding, Inc.a | 2,967,232 | ||||||
|
| |||||||
| Total | 2,967,232 | |||||||
|
| |||||||
Total Common Stock (cost $1,413,991,147) | 1,446,710,065 | |||||||
|
| |||||||
| Principal Amount | Long-Term Fixed Income (9.4%) | |||||||
Angola (0.1%) | ||||||||
Angola Government International Bond | ||||||||
| $ | 910,000 | 9.500%, 11/12/2025 | 878,405 | |||||
|
| |||||||
| Total | 878,405 | |||||||
|
| |||||||
Argentina (0.5%) | ||||||||
Argentina Government International Bond | ||||||||
| 1,120,000 | 24.255%, 10/9/2017e,f | 74,464 | ||||||
| 750,000 | 6.875%, 4/22/2021c | 798,750 | ||||||
| 6,330,000 | 16.000%, 10/17/2023e | 396,124 | ||||||
| 180,000 | 7.500%, 4/22/2026 | 189,000 | ||||||
| 1,220,000 | 7.500%, 4/22/2026c | 1,281,000 | ||||||
The accompanying Notes to Financial Statements are an integral part of this schedule.
156
Table of Contents
PARTNER WORLDWIDE ALLOCATION PORTFOLIO
Schedule of Investments as of December 31, 2016
| Principal Amount | Long-Term Fixed Income (9.4%) | Value | ||||||
Argentina (0.5%) - continued | ||||||||
| $ | 13,050,000 | 15.500%, 10/17/2026e | $ | 819,943 | ||||
| 230,000 | 6.625%, 7/6/2028c | 225,469 | ||||||
| 949,512 | 7.820%, 12/31/2033g | 959,267 | ||||||
| 350,509 | 8.280%, 12/31/2033 | 363,653 | ||||||
| 218,718 | 8.280%, 12/31/2033 | 233,481 | ||||||
| 1,482,000 | 0.000%, 12/15/2035f,g | 141,963 | ||||||
| 920,000 | 7.125%, 7/6/2036c | 875,150 | ||||||
| 660,000 | 7.125%, 7/6/2036 | 627,825 | ||||||
| 360,000 | 2.500%, 12/31/2038h | 221,400 | ||||||
Cablevision SA | ||||||||
| 160,000 | 6.500%, 6/15/2021 | 162,600 | ||||||
| 150,000 | 6.500%, 6/15/2021c | 152,438 | ||||||
YPF SA | ||||||||
| 340,000 | 8.875%, 12/19/2018 | 369,835 | ||||||
|
| |||||||
Total | 7,892,362 | |||||||
|
| |||||||
Armenia (<0.1%) | ||||||||
Armenia Government International Bond | ||||||||
| 260,000 | 6.000%, 9/30/2020 | 267,930 | ||||||
| 200,000 | 7.150%, 3/26/2025 | 209,824 | ||||||
|
| |||||||
Total | 477,754 | |||||||
|
| |||||||
Azerbaijan (0.1%) | ||||||||
State Oil Company of Azerbaijan Republic | ||||||||
| 1,520,000 | 4.750%, 3/13/2023 | 1,475,540 | ||||||
|
| |||||||
Total | 1,475,540 | |||||||
|
| |||||||
Belize (<0.1%) | ||||||||
Belize Government International Bond | ||||||||
| 116,500 | 5.000%, 2/20/2038*,h | 47,765 | ||||||
|
| |||||||
Total | 47,765 | |||||||
|
| |||||||
Bermuda (0.1%) | ||||||||
Bermuda Government International Bond | ||||||||
| 460,000 | 3.717%, 1/25/2027c | 434,700 | ||||||
Digicel Group, Ltd. | ||||||||
| 210,000 | 8.250%, 9/30/2020c | 180,174 | ||||||
Digicel, Ltd. | ||||||||
| 770,000 | 6.750%, 3/1/2023c | 694,255 | ||||||
TiVo Corporation | ||||||||
| 320,000 | 6.000%, 4/15/2021 | 289,347 | ||||||
|
| |||||||
Total | 1,598,476 | |||||||
|
| |||||||
Brazil (0.4%) | ||||||||
Banco do Brasil SA/Cayman | ||||||||
| 840,000 | 6.250%, 4/15/2024i | 614,460 | ||||||
| 400,000 | 9.000%, 6/18/2024i | 376,000 | ||||||
Brazil Government International Bond | ||||||||
| 422,000 | 6.000%, 8/15/2050j | 407,305 | ||||||
| 230,000 | 2.625%, 1/5/2023 | 204,700 | ||||||
| 340,000 | 4.250%, 1/7/2025 | 317,900 | ||||||
| 200,000 | 5.000%, 1/27/2045 | 162,240 | ||||||
Brazil Letras do Tesouro Nacional NA | ||||||||
| 364,000 | Zero Coupon, 1/1/2018j | 100,335 | ||||||
Brazil Loan Trust 1 | ||||||||
| 136,622 | 5.477%, 7/24/2023 | 133,275 | ||||||
| 853,890 | 5.477%, 7/24/2023* | 832,970 | ||||||
Brazil Minas SPE via State of Minas Gerais | ||||||||
| 409,000 | 5.333%, 2/15/2028 | 381,392 | ||||||
| 930,000 | 5.333%, 2/15/2028* | 867,225 | ||||||
Brazil Notas do Tesoruro Nacional Serie F | ||||||||
| 7,195,000 | 10.000%, 1/1/2027j | 2,040,188 | ||||||
Independencia International, Ltd. | ||||||||
| 95,246 | 12.000%, 12/30/2016*,d,k | 0 | ||||||
Tupy SA | ||||||||
| 450,000 | 6.625%, 7/17/2024c | 432,000 | ||||||
|
| |||||||
Total | 6,869,990 | |||||||
|
| |||||||
Bulgaria (0.2%) | ||||||||
Bulgaria Government International Bond | ||||||||
| 180,000 | 4.250%, 7/9/2017g | 193,798 | ||||||
| 600,000 | 1.875%, 3/21/2023g | 659,332 | ||||||
| 100,000 | 2.950%, 9/3/2024g | 115,249 | ||||||
| 300,000 | 2.625%, 3/26/2027g | 327,735 | ||||||
| 520,000 | 3.000%, 3/21/2028g | 583,397 | ||||||
| 980,000 | 3.125%, 3/26/2035g | 1,026,443 | ||||||
|
| |||||||
Total | 2,905,954 | |||||||
|
| |||||||
Cameroon (<0.1%) | ||||||||
Cameroon Government International Bond | ||||||||
| 200,000 | 9.500%, 11/19/2025 | 215,012 | ||||||
|
| |||||||
Total | 215,012 | |||||||
|
| |||||||
Cayman Islands (0.1%) | ||||||||
Agromercantil Senior Trust | ||||||||
| 110,000 | 6.250%, 4/10/2019 | 112,809 | ||||||
Petrobras International Finance Company | ||||||||
| 510,000 | 5.750%, 1/20/2020 | 516,375 | ||||||
| 600,000 | 5.375%, 1/27/2021 | 586,800 | ||||||
|
| |||||||
Total | 1,215,984 | |||||||
|
| |||||||
Chile (0.2%) | ||||||||
Banco del Estado de Chile | ||||||||
| 500,000 | 4.125%, 10/7/2020 | 520,382 | ||||||
| 260,000 | 4.125%, 10/7/2020c | 270,598 | ||||||
Chile Government International Bond | ||||||||
| 614,000 | 3.125%, 1/21/2026 | 604,790 | ||||||
| 150,000 | 3.625%, 10/30/2042 | 139,425 | ||||||
GNL Quintero SA | ||||||||
| 710,000 | 4.634%, 7/31/2029c | 699,350 | ||||||
Itau CorpBanca | ||||||||
| 552,000 | 3.875%, 9/22/2019c | 568,740 | ||||||
Sociedad Quimica y Minera de Chile SA | ||||||||
| 120,000 | 5.500%, 4/21/2020 | 126,000 | ||||||
| 210,000 | 3.625%, 4/3/2023 | 199,500 | ||||||
| 448,000 | 4.375%, 1/28/2025* | 433,440 | ||||||
|
| |||||||
Total | 3,562,225 | |||||||
|
| |||||||
Colombia (0.3%) | ||||||||
Banco de Bogota SA | ||||||||
| 600,000 | 5.000%, 1/15/2017 | 600,402 | ||||||
| 1,460,000 | 6.250%, 5/12/2026c | 1,489,200 | ||||||
Colombia Government International Bond | ||||||||
| 480,000 | 2.625%, 3/15/2023 | 452,400 | ||||||
| 70,000 | 8.125%, 5/21/2024 | 87,500 | ||||||
| 360,000 | 4.500%, 1/28/2026 | 370,800 | ||||||
| 440,000 | 3.875%, 3/22/2026g | 511,056 | ||||||
| 140,000 | 6.125%, 1/18/2041 | 151,200 | ||||||
| 350,000 | 5.625%, 2/26/2044 | 360,500 | ||||||
| 370,000 | 5.000%, 6/15/2045 | 351,037 | ||||||
|
| |||||||
Total | 4,374,095 | |||||||
|
| |||||||
Costa Rica (0.2%) | ||||||||
Banco de Costa Rica | ||||||||
| 200,000 | 5.250%, 8/12/2018 | 201,740 | ||||||
The accompanying Notes to Financial Statements are an integral part of this schedule.
157
Table of Contents
PARTNER WORLDWIDE ALLOCATION PORTFOLIO
Schedule of Investments as of December 31, 2016
| Principal Amount | Long-Term Fixed Income (9.4%) | Value | ||||||
Costa Rica (0.2%) - continued | ||||||||
| $ | 410,000 | 5.250%, 8/12/2018c | $ | 413,567 | ||||
Banco Nacional de Costa Rica | ||||||||
| 410,000 | 4.875%, 11/1/2018c | 412,050 | ||||||
| 290,000 | 6.250%, 11/1/2023c | 290,725 | ||||||
Costa Rica Government International Bond | ||||||||
| 30,000 | 9.995%, 8/1/2020 | 35,318 | ||||||
| 720,000 | 5.625%, 4/30/2043 | 567,000 | ||||||
| 400,000 | 7.000%, 4/4/2044 | 365,628 | ||||||
| 1,230,000 | 7.158%, 3/12/2045c | 1,140,284 | ||||||
|
| |||||||
Total | 3,426,312 | |||||||
|
| |||||||
Croatia (<0.1%) | ||||||||
Croatia Government International Bond | ||||||||
| 185,000 | 3.875%, 5/30/2022g | 209,162 | ||||||
|
| |||||||
Total | 209,162 | |||||||
|
| |||||||
Dominican Republic (0.4%) | ||||||||
Aeropuertos Dominicanos Siglo XXI SA | ||||||||
| 800,000 | 9.750%, 11/13/2019 | 832,000 | ||||||
Dominican Republic Government International Bond | ||||||||
| 47,935 | 9.040%, 1/23/2018 | 49,570 | ||||||
| 8,100,000 | 15.000%, 4/5/2019l | 192,370 | ||||||
| 3,600,000 | 16.000%, 7/10/2020l | 91,164 | ||||||
| 813,000 | 7.500%, 5/6/2021 | 882,544 | ||||||
| 3,800,000 | 11.500%, 5/10/2024l | 86,250 | ||||||
| 100,000 | 6.875%, 1/29/2026c | 104,060 | ||||||
| 310,000 | 8.625%, 4/20/2027 | 348,332 | ||||||
| 2,700,000 | 18.500%, 2/4/2028c,l | 82,436 | ||||||
| 5,100,000 | 11.375%, 7/6/2029l | 111,661 | ||||||
| 502,000 | 7.450%, 4/30/2044 | 507,020 | ||||||
| 2,237,000 | 6.850%, 1/27/2045 | 2,113,339 | ||||||
| 2,210,000 | 6.850%, 1/27/2045c | 2,087,831 | ||||||
|
| |||||||
Total | 7,488,577 | |||||||
|
| |||||||
Ecuador (0.2%) | ||||||||
Ecuador Government International Bond | ||||||||
| 1,100,000 | 10.750%, 3/28/2022 | 1,193,500 | ||||||
| 790,000 | 7.950%, 6/20/2024 | 754,450 | ||||||
| 470,000 | 9.650%, 12/13/2026c | 480,575 | ||||||
EP PetroEcuador | ||||||||
| 289,474 | 6.627%, 9/24/2019f | 290,559 | ||||||
|
| |||||||
Total | 2,719,084 | |||||||
|
| |||||||
El Salvador (0.2%) | ||||||||
El Salvador Government International Bond | ||||||||
| 100,000 | 7.375%, 12/1/2019 | 103,250 | ||||||
| 220,000 | 7.750%, 1/24/2023 | 228,153 | ||||||
| 203,000 | 5.875%, 1/30/2025 | 185,759 | ||||||
| 285,000 | 6.375%, 1/18/2027 | 262,200 | ||||||
| 130,000 | 8.250%, 4/10/2032 | 131,300 | ||||||
| 1,030,000 | 7.650%, 6/15/2035 | 955,325 | ||||||
| 319,000 | 7.625%, 2/1/2041 | 289,493 | ||||||
|
| |||||||
Total | 2,155,480 | |||||||
|
| |||||||
Gabon (<0.1%) | ||||||||
Gabon Government International Bond | ||||||||
| 320,000 | 6.375%, 12/12/2024 | 297,254 | ||||||
|
| |||||||
Total | 297,254 | |||||||
|
| |||||||
Ghana (<0.1%) | ||||||||
Ghana Government International Bond | ||||||||
| 390,000 | 10.750%, 10/14/2030c | 460,929 | ||||||
|
| |||||||
Total | 460,929 | |||||||
|
| |||||||
Guatemala (0.2%) | ||||||||
Agromercantil Senior Trust | ||||||||
| 320,000 | 6.250%, 4/10/2019c | 328,173 | ||||||
Guatemala Government International Bond | ||||||||
| 850,000 | 5.750%, 6/6/2022 | 913,095 | ||||||
| 210,000 | 4.500%, 5/3/2026 | 202,125 | ||||||
| 760,000 | 4.500%, 5/3/2026c | 731,500 | ||||||
| 380,000 | 4.875%, 2/13/2028c | 366,719 | ||||||
| 780,000 | 4.875%, 2/13/2028 | 752,739 | ||||||
|
| |||||||
Total | 3,294,351 | |||||||
|
| |||||||
Honduras (0.1%) | ||||||||
Honduras Government International Bond | ||||||||
| 675,000 | 8.750%, 12/16/2020 | 751,545 | ||||||
| 1,010,000 | 8.750%, 12/16/2020* | 1,124,534 | ||||||
|
| |||||||
Total | 1,876,079 | |||||||
|
| |||||||
Hong Kong (<0.1%) | ||||||||
China Resources Cement Holdings, Ltd. | ||||||||
| 200,000 | 2.125%, 10/5/2017 | 200,011 | ||||||
Wharf Finance, Ltd. | ||||||||
| 200,000 | 4.625%, 2/8/2017 | 200,458 | ||||||
|
| |||||||
Total | 400,469 | |||||||
|
| |||||||
Hungary (0.3%) | ||||||||
Hungary Government International Bond | ||||||||
| 2,070,000 | 6.250%, 1/29/2020 | 2,264,062 | ||||||
| 160,000 | 6.375%, 3/29/2021 | 179,162 | ||||||
| 540,000 | 5.375%, 2/21/2023 | 585,279 | ||||||
| 1,440,000 | 5.750%, 11/22/2023 | 1,596,600 | ||||||
| 100,000 | 7.625%, 3/29/2041 | 139,725 | ||||||
MFB Magyar Fejlesztesi Bank Zrt | ||||||||
| 210,000 | 6.250%, 10/21/2020c | 231,489 | ||||||
|
| |||||||
Total | 4,996,317 | |||||||
|
| |||||||
India (0.1%) | ||||||||
Greenko Dutch BV | ||||||||
| 200,000 | 8.000%, 8/1/2019 | 211,100 | ||||||
| 480,000 | 8.000%, 8/1/2019c | 506,640 | ||||||
|
| |||||||
Total | 717,740 | |||||||
|
| |||||||
Indonesia (0.7%) | ||||||||
Indonesia Government International Bond | ||||||||
| 500,000 | 3.700%, 1/8/2022c | 501,124 | ||||||
| 560,000 | 2.625%, 6/14/2023c,g | 592,155 | ||||||
| 470,000 | 5.375%, 10/17/2023 | 509,040 | ||||||
| 1,840,000 | 5.875%, 1/15/2024 | 2,030,079 | ||||||
| 570,000 | 3.375%, 7/30/2025g | 614,388 | ||||||
| 1,340,000 | 4.750%, 1/8/2026c | 1,383,261 | ||||||
| 210,000 | 4.750%, 1/8/2026 | 216,780 | ||||||
| 1,060,000 | 4.350%, 1/8/2027c | 1,062,249 | ||||||
| 360,000 | 3.750%, 6/14/2028c,g | 385,277 | ||||||
| 585,000 | 8.500%, 10/12/2035 | 793,606 | ||||||
| 200,000 | 6.625%, 2/17/2037 | 231,267 | ||||||
| 320,000 | 7.750%, 1/17/2038 | 410,648 | ||||||
| 750,000 | 5.250%, 1/17/2042 | 755,860 | ||||||
| 250,000 | 4.625%, 4/15/2043 | 243,080 | ||||||
| 200,000 | 6.750%, 1/15/2044 | 242,072 | ||||||
The accompanying Notes to Financial Statements are an integral part of this schedule.
158
Table of Contents
PARTNER WORLDWIDE ALLOCATION PORTFOLIO
Schedule of Investments as of December 31, 2016
| Principal Amount | Long-Term Fixed Income (9.4%) | Value | ||||||
Indonesia (0.7%) - continued | ||||||||
| $ | 200,000 | 5.950%, 1/8/2046 | $ | 220,817 | ||||
Perusahaan Penerbit SBSN Indonesia | ||||||||
| 200,000 | 4.550%, 3/29/2026 | 201,000 | ||||||
Perusahaan Penerbit SBSN Indonesia II | ||||||||
| 200,000 | 4.000%, 11/21/2018c | 207,000 | ||||||
Perusahaan Penerbit SBSN Indonesia III | ||||||||
| 320,000 | 4.325%, 5/28/2025 | 318,784 | ||||||
| 200,000 | 4.550%, 3/29/2026c | 201,000 | ||||||
PT Perusahaan Gas Negara (Persero) Tbk PT | ||||||||
| 410,000 | 5.125%, 5/16/2024 | 421,161 | ||||||
|
| |||||||
Total | 11,540,648 | |||||||
|
| |||||||
Israel (<0.1%) | ||||||||
Delek and Avner Yam Tethys, Ltd. | ||||||||
| 110,000 | 3.839%, 12/30/2018c | 111,788 | ||||||
|
| |||||||
Total | 111,788 | |||||||
|
| |||||||
Japan (<0.1%) | ||||||||
SoftBank Group Corporation | ||||||||
| 280,000 | 4.500%, 4/15/2020c | 287,000 | ||||||
Universal Entertainment Corporation | ||||||||
| 250,000 | 8.500%, 8/24/2020* | 251,875 | ||||||
|
| |||||||
Total | 538,875 | |||||||
|
| |||||||
Kazakhstan (0.1%) | ||||||||
KazMunayGas National Company JSC | ||||||||
| 1,200,000 | 9.125%, 7/2/2018 | 1,303,920 | ||||||
|
| |||||||
Total | 1,303,920 | |||||||
|
| |||||||
Kenya (<0.1%) | ||||||||
Kenya Government International Bond | ||||||||
| 640,000 | 6.875%, 6/24/2024 | 603,448 | ||||||
|
| |||||||
Total | 603,448 | |||||||
|
| |||||||
Latvia (<0.1%) | ||||||||
Latvia Government International Bond | ||||||||
| 381,000 | 5.250%, 2/22/2017 | 382,715 | ||||||
|
| |||||||
Total | 382,715 | |||||||
|
| |||||||
Luxembourg (0.3%) | ||||||||
Altice Financing SA | ||||||||
| 290,000 | 6.625%, 2/15/2023c | 297,975 | ||||||
| 280,000 | 7.500%, 5/15/2026c | 291,200 | ||||||
Gazprom Neft OAO Via GPN Capital SA | ||||||||
| 1,190,000 | 6.000%, 11/27/2023c | 1,261,400 | ||||||
Gazprom OAO Via Gaz Capital SA | ||||||||
| 690,000 | 9.250%, 4/23/2019 | 781,094 | ||||||
Sberbank of Russia Via SB Capital SA | ||||||||
| 610,000 | 5.500%, 2/26/2024 | 619,912 | ||||||
Severstal OAO | ||||||||
| 370,000 | 6.700%, 10/25/2017 | 382,194 | ||||||
Telefonica Celular del Paraguay SA | ||||||||
| 400,000 | 6.750%, 12/13/2022 | 407,000 | ||||||
Wind Acquisition Finance SA | ||||||||
| 280,000 | 4.000%, 7/15/2020*,g | 300,157 | ||||||
| 370,000 | 7.000%, 4/23/2021g | 405,155 | ||||||
| 890,000 | 7.375%, 4/23/2021 | 925,600 | ||||||
|
| |||||||
Total | 5,671,687 | |||||||
|
| |||||||
Macedonia, The Former Yugoslav Republic Of (0.1%) | ||||||||
Macedonia Government International Bond | ||||||||
| 790,000 | 4.875%, 12/1/2020c,g | 872,104 | ||||||
| 570,000 | 5.625%, 7/26/2023c,g | 619,036 | ||||||
|
| |||||||
Total | 1,491,140 | |||||||
|
| |||||||
Mauritius (0.1%) | ||||||||
Greenko Investment Company | ||||||||
| 200,000 | 4.875%, 8/16/2023c | 188,276 | ||||||
MTN Mauritius Investment, Ltd. | ||||||||
| 610,000 | 6.500%, 10/13/2026c | 600,850 | ||||||
|
| |||||||
Total | 789,126 | |||||||
|
| |||||||
Mexico (0.8%) | ||||||||
America Movil SAB de CV | ||||||||
| 2,600,000 | 6.000%, 6/9/2019m | 119,123 | ||||||
Cemex SAB de CV | ||||||||
| 180,000 | 4.750%, 1/11/2022c,g | 196,394 | ||||||
Gruma, SAB de CV | ||||||||
| 340,000 | 4.875%, 12/1/2024c | 355,470 | ||||||
Grupo Cementos de Chihuahua SAB de CV | ||||||||
| 200,000 | 8.125%, 2/8/2020c | 207,500 | ||||||
Metalsa SA de CV | ||||||||
| 200,000 | 4.900%, 4/24/2023c | 190,250 | ||||||
Mexican Bonos | ||||||||
| 10,391,500 | 8.000%, 12/7/2023m | 519,980 | ||||||
| 9,084,000 | 7.500%, 6/3/2027m | 436,122 | ||||||
Mexico Government International Bond | ||||||||
| 240,000 | 4.000%, 3/15/2115g | 211,561 | ||||||
| 214,000 | 5.750%, 10/12/2110 | 197,415 | ||||||
| 20,082,700 | 10.000%, 12/5/2024m | 1,121,103 | ||||||
| 200,000 | 4.750%, 3/8/2044 | 181,800 | ||||||
| 370,000 | 4.350%, 1/15/2047 | 317,275 | ||||||
Pemex Project Funding Master Trust | ||||||||
| 147,000 | 5.750%, 3/1/2018 | 152,035 | ||||||
Petroleos Mexicanos | ||||||||
| 300,000 | 5.500%, 2/4/2019c | 310,767 | ||||||
| 100,000 | 3.500%, 7/23/2020 | 97,875 | ||||||
| 710,000 | 6.375%, 2/4/2021c | 756,150 | ||||||
| 370,000 | 6.375%, 2/4/2021 | 394,050 | ||||||
| 10,000 | 4.875%, 1/24/2022 | 10,030 | ||||||
| 260,000 | 5.375%, 3/13/2022c | 266,235 | ||||||
| 1,380,000 | 5.125%, 3/15/2023g | 1,568,483 | ||||||
| 1,445,000 | 6.875%, 8/4/2026 | 1,524,475 | ||||||
| 780,000 | 6.875%, 8/4/2026c | 822,900 | ||||||
| 1,100,000 | 6.500%, 3/13/2027c | 1,134,650 | ||||||
| 97,000 | 5.500%, 6/27/2044 | 80,723 | ||||||
| 60,000 | 6.375%, 1/23/2045 | 54,600 | ||||||
| 40,000 | 5.625%, 1/23/2046 | 33,200 | ||||||
| 16,000 | 6.750%, 9/21/2047c | 15,117 | ||||||
Sigma Alimentos SA de CV | ||||||||
| 530,000 | 4.125%, 5/2/2026c | 503,500 | ||||||
Trust F/1401 | ||||||||
| 200,000 | 6.950%, 1/30/2044 | 181,000 | ||||||
|
| |||||||
Total | 11,959,783 | |||||||
|
| |||||||
Mongolia (0.1%) | ||||||||
Mongolia Government International Bond | ||||||||
| 823,000 | 5.125%, 12/5/2022 | 701,627 | ||||||
|
| |||||||
Total | 701,627 | |||||||
|
| |||||||
Montenegro (<0.1%) | ||||||||
Montenegro Government International Bond | ||||||||
| 200,000 | 3.875%, 3/18/2020c,g | 208,432 | ||||||
|
| |||||||
Total | 208,432 | |||||||
|
| |||||||
The accompanying Notes to Financial Statements are an integral part of this schedule.
159
Table of Contents
PARTNER WORLDWIDE ALLOCATION PORTFOLIO
Schedule of Investments as of December 31, 2016
| Principal Amount | Long-Term Fixed Income (9.4%) | Value | ||||||
Mozambique (<0.1%) | ||||||||
Mozambique Government | ||||||||
International Bond | ||||||||
| $ | 200,000 | 10.500%, 1/18/2023 | $ | 118,500 | ||||
|
| |||||||
Total | 118,500 | |||||||
|
| |||||||
Netherlands (0.2%) | ||||||||
IHS Netherlands Holdco BV | ||||||||
| 1,000,000 | 9.500%, 10/27/2021c | 1,023,822 | ||||||
Listrindo Capital BV | ||||||||
| 350,000 | 4.950%, 9/14/2026c | 340,803 | ||||||
Petrobras Global Finance BV | ||||||||
| 805,000 | 4.875%, 3/17/2020 | 795,903 | ||||||
| 1,100,000 | 8.375%, 5/23/2021 | 1,185,250 | ||||||
|
| |||||||
Total | 3,345,778 | |||||||
|
| |||||||
Nigeria (<0.1%) | ||||||||
Nigeria Government International Bond | ||||||||
| 274,000 | 6.750%, 1/28/2021 | 276,263 | ||||||
| 320,000 | 6.375%, 7/12/2023 | 308,909 | ||||||
|
| |||||||
Total | 585,172 | |||||||
|
| |||||||
Pakistan (0.1%) | ||||||||
Pakistan Government International Bond | ||||||||
| 370,000 | 6.875%, 6/1/2017 | 374,995 | ||||||
| 200,000 | 7.250%, 4/15/2019c | 211,680 | ||||||
| 210,000 | 6.750%, 12/3/2019* | 222,002 | ||||||
| 260,000 | 8.250%, 4/15/2024c | 282,026 | ||||||
| 690,000 | 8.250%, 9/30/2025 | 753,656 | ||||||
|
| |||||||
Total | 1,844,359 | |||||||
|
| |||||||
Panama (<0.1%) | ||||||||
Panama Notas del Tesoro | ||||||||
| 110,000 | 4.875%, 2/5/2021 | 116,490 | ||||||
|
| |||||||
Total | 116,490 | |||||||
|
| |||||||
Paraguay (0.2%) | ||||||||
Banco Regional SAECA | ||||||||
| 196,000 | 8.125%, 1/24/2019 | 207,025 | ||||||
| 590,000 | 8.125%, 1/24/2019c | 623,187 | ||||||
Paraguay Government International Bond | ||||||||
| 330,000 | 4.625%, 1/25/2023 | 333,320 | ||||||
| 200,000 | 5.000%, 4/15/2026 | 203,500 | ||||||
| 580,000 | 5.000%, 4/15/2026c | 590,150 | ||||||
| 880,000 | 6.100%, 8/11/2044 | 893,200 | ||||||
|
| |||||||
Total | 2,850,382 | |||||||
|
| |||||||
Peru (0.1%) | ||||||||
Abengoa Transmision Sur SA | ||||||||
| 199,580 | 6.875%, 4/30/2043 | 204,570 | ||||||
| 588,761 | 6.875%, 4/30/2043* | 603,480 | ||||||
Corporacion Financiera de Desarrollo SA | ||||||||
| 200,000 | 4.750%, 2/8/2022 | 209,000 | ||||||
| 200,000 | 4.750%, 2/8/2022c | 209,000 | ||||||
Corporacion Lindley SA | ||||||||
| 70,000 | 6.750%, 11/23/2021c | 78,050 | ||||||
| 690,000 | 6.750%, 11/23/2021 | 769,350 | ||||||
| 92,000 | 4.625%, 4/12/2023 | 93,840 | ||||||
| 100,000 | 4.625%, 4/12/2023c | 102,000 | ||||||
|
| |||||||
Total | 2,269,290 | |||||||
|
| |||||||
Philippines (<0.1%) | ||||||||
Energy Development Corporation | ||||||||
| 430,000 | 6.500%, 1/20/2021 | 477,300 | ||||||
Philippines Government International Bond | ||||||||
| 470,000 | 9.875%, 1/15/2019 | 548,166 | ||||||
|
| |||||||
Total | 1,025,466 | |||||||
|
| |||||||
Poland (0.2%) | ||||||||
Poland Government International Bond | ||||||||
| 14,670,000 | 1.750%, 7/25/2021n | 3,339,851 | ||||||
|
| |||||||
Total | 3,339,851 | |||||||
|
| |||||||
Romania (0.1%) | ||||||||
Romania Government International Bond | ||||||||
| 770,000 | 6.750%, 2/7/2022 | 876,684 | ||||||
| 180,000 | 4.375%, 8/22/2023 | 185,220 | ||||||
| 200,000 | 4.875%, 1/22/2024 | 211,536 | ||||||
| 480,000 | 2.875%, 5/26/2028g | 518,525 | ||||||
| 310,000 | 6.125%, 1/22/2044 | 361,847 | ||||||
|
| |||||||
Total | 2,153,812 | |||||||
|
| |||||||
Russia (0.3%) | ||||||||
Gazprom OAO Via Gaz Capital SA | ||||||||
| 1,110,000 | 7.288%, 8/16/2037 | 1,262,625 | ||||||
Lukoil International Finance BV | ||||||||
| 220,000 | 3.416%, 4/24/2018 | 222,200 | ||||||
| 310,000 | 6.125%, 11/9/2020 | 335,885 | ||||||
Mobile Telesystems OJSC | ||||||||
| 620,000 | 5.000%, 5/30/2023 | 634,800 | ||||||
Phosagro OAO via Phosagro Bond Funding, Ltd. | ||||||||
| 230,000 | 4.204%, 2/13/2018 | 232,647 | ||||||
| 310,000 | 4.204%, 2/13/2018* | 313,568 | ||||||
Russia Government International Bond | ||||||||
| 400,000 | 4.500%, 4/4/2022c | 416,000 | ||||||
| 400,000 | 4.875%, 9/16/2023c | 421,368 | ||||||
| 1,400,000 | 4.750%, 5/27/2026 | 1,432,830 | ||||||
|
| |||||||
Total | 5,271,923 | |||||||
|
| |||||||
South Africa (0.3%) | ||||||||
South Africa Government International Bond | ||||||||
| 1,769,000 | 5.875%, 9/16/2025 | 1,887,434 | ||||||
| 1,050,000 | 4.300%, 10/12/2028 | 973,875 | ||||||
| 310,000 | 5.000%, 10/12/2046 | 286,905 | ||||||
ZAR Sovereign Capital Fund Propriety, Ltd. | ||||||||
| 240,000 | 3.903%, 6/24/2020 | 242,885 | ||||||
|
| |||||||
Total | 3,391,099 | |||||||
|
| |||||||
South Korea (0.1%) | ||||||||
Export-Import Bank of Korea | ||||||||
| 270,000 | 1.527%, 8/14/2017*,f | 269,770 | ||||||
Kookmin Bank | ||||||||
| 640,000 | 1.625%, 8/1/2019c | 630,394 | ||||||
Korea East-West Power Company, Ltd. | ||||||||
| 200,000 | 2.500%, 7/16/2017 | 200,557 | ||||||
|
| |||||||
Total | 1,100,721 | |||||||
|
| |||||||
Sri Lanka (0.2%) | ||||||||
Sri Lanka Government International Bond | ||||||||
| 200,000 | 5.125%, 4/11/2019 | 202,063 | ||||||
| 171,000 | 6.250%, 10/4/2020c | 175,276 | ||||||
| 100,000 | 6.250%, 10/4/2020 | 102,501 | ||||||
| 340,000 | 5.750%, 1/18/2022c | 334,821 | ||||||
| 1,720,000 | 6.850%, 11/3/2025c | 1,689,095 | ||||||
The accompanying Notes to Financial Statements are an integral part of this schedule.
160
Table of Contents
PARTNER WORLDWIDE ALLOCATION PORTFOLIO
Schedule of Investments as of December 31, 2016
| Principal Amount | Long-Term Fixed Income (9.4%) | Value | ||||||
Sri Lanka (0.2%) - continued | ||||||||
| $520,000 | 6.825%, 7/18/2026c | $ | 511,467 | |||||
|
| |||||||
Total | 3,015,223 | |||||||
|
| |||||||
Suriname (<0.1%) | ||||||||
Republic of Suriname | ||||||||
| 630,000 | 9.250%, 10/26/2026c | 613,305 | ||||||
|
| |||||||
Total | 613,305 | |||||||
|
| |||||||
Turkey (0.6%) | ||||||||
Export Credit Bank of Turkey | ||||||||
| 200,000 | 5.875%, 4/24/2019 | 204,348 | ||||||
Turkey Government International Bond | ||||||||
| 761,000 | 7.500%, 7/14/2017 | 782,361 | ||||||
| 280,000 | 6.750%, 4/3/2018 | 292,194 | ||||||
| 1,830,000 | 7.000%, 6/5/2020 | 1,964,911 | ||||||
| 1,596,000 | 6.250%, 9/26/2022 | 1,657,526 | ||||||
| 2,235,000 | 5.750%, 3/22/2024 | 2,241,459 | ||||||
| 853,000 | 7.375%, 2/5/2025 | 935,101 | ||||||
| 652,000 | 4.250%, 4/14/2026 | 579,560 | ||||||
| 50,000 | 8.000%, 2/14/2034 | 57,060 | ||||||
| 330,000 | 6.875%, 3/17/2036 | 339,445 | ||||||
| 410,000 | 6.000%, 1/14/2041 | 379,349 | ||||||
| 250,000 | 4.875%, 4/16/2043 | 201,375 | ||||||
|
| |||||||
Total | 9,634,689 | |||||||
|
| |||||||
Ukraine (<0.1%) | ||||||||
MHP SA | ||||||||
| 200,000 | 8.250%, 4/2/2020 | 192,000 | ||||||
Ukraine Government International Bond | ||||||||
| 100,000 | 7.750%, 9/1/2021 | 97,646 | ||||||
| 548,000 | Zero Coupon, 5/31/2040* | 164,882 | ||||||
|
| |||||||
Total | 454,528 | |||||||
|
| |||||||
United Arab Emirates (0.1%) | ||||||||
Aabar Investments PJSC, Convertible | ||||||||
| 100,000 | 1.000%, 3/27/2022g | 80,107 | ||||||
Abu Dhabi Government International Bond | ||||||||
| 310,000 | 2.125%, 5/3/2021 | 303,608 | ||||||
| 1,100,000 | 3.125%, 5/3/2026 | 1,079,419 | ||||||
Dolphin Energy, Ltd. | ||||||||
| 146,240 | 5.888%, 6/15/2019 | 152,654 | ||||||
| 250,000 | 5.500%, 12/15/2021 | 274,975 | ||||||
Ruwais Power Company PJSC | ||||||||
| 200,000 | 6.000%, 8/31/2036 | 225,500 | ||||||
| 200,000 | 6.000%, 8/31/2036c | 225,500 | ||||||
|
| |||||||
Total | 2,341,763 | |||||||
|
| |||||||
United States (0.5%) | ||||||||
Cemex Finance, LLC. | ||||||||
| 350,000 | 4.625%, 6/15/2024g | 377,271 | ||||||
Comcel Trust | ||||||||
| 200,000 | 6.875%, 2/6/2024c | 201,500 | ||||||
| 210,000 | 6.875%, 2/6/2024 | 211,575 | ||||||
Commonwealth of Puerto Rico G.O. | ||||||||
| 395,000 | 8.000%, 7/1/2035, Ser. Ak | 266,131 | ||||||
Commonwealth of Puerto Rico Public Improvement G.O. | ||||||||
| 105,000 | 5.750%, 7/1/2041, Ser. Ak | 64,575 | ||||||
Commonwealth of Puerto Rico Public Improvement Refg. G.O. | ||||||||
| 5,000 | 5.750%, 7/1/2028, Ser. Ak | 3,119 | ||||||
| 75,000 | 5.500%, 7/1/2032, Ser. Ak | 46,781 | ||||||
Puerto Rico Sales Tax Financing Corporation Refg. Rev. | ||||||||
| 20,000 | 5.375%, 8/1/2038, Ser. C | 9,400 | ||||||
| 835,000 | 5.250%, 8/1/2041, Ser. C | 392,450 | ||||||
| 10,000 | 5.000%, 8/1/2043, Ser. A-1 | 4,700 | ||||||
| 5,000 | 5.250%, 8/1/2043, Ser. A-1 | 2,350 | ||||||
Puerto Rico Sales Tax Financing Corporation Rev. | ||||||||
| 225,000 | 5.250%, 8/1/2027, Ser. A | 105,750 | ||||||
| 175,000 | 5.500%, 8/1/2028, Ser. A | 82,250 | ||||||
| 75,000 | 6.750%, 8/1/2032, Ser. A | 37,688 | ||||||
| 75,000 | 5.500%, 8/1/2037, Ser. A | 35,250 | ||||||
| 70,000 | 5.375%, 8/1/2039, Ser. A | 32,900 | ||||||
| 1,055,000 | 5.500%, 8/1/2042, Ser. A | 495,850 | ||||||
| 200,000 | 6.000%, 8/1/2042, Ser. A | 95,000 | ||||||
U.S. Treasury Bonds | ||||||||
| 240,000 | 3.750%, 11/15/2043 | 271,544 | ||||||
U.S. Treasury Notes | ||||||||
| 4,260,000 | 2.000%, 12/31/2021 | 4,271,319 | ||||||
| 523,000 | 2.250%, 12/31/2023 | 522,601 | ||||||
| 490,000 | 2.250%, 11/15/2025 | 483,014 | ||||||
|
| |||||||
Total | 8,013,018 | |||||||
|
| |||||||
Venezuela (0.3%) | ||||||||
Petroleos de Venezuela SA | ||||||||
| 520,000 | 9.000%, 11/17/2021 | 275,600 | ||||||
| 1,520,000 | 6.000%, 5/16/2024 | 585,200 | ||||||
| 4,236,000 | 6.000%, 11/15/2026 | 1,630,860 | ||||||
| 60,000 | 5.500%, 4/12/2037 | 22,050 | ||||||
Venezuela Government International Bond | ||||||||
| 660,000 | 7.750%, 10/13/2019 | 366,300 | ||||||
| 166,000 | 6.000%, 12/9/2020 | 80,095 | ||||||
| 982,000 | 8.250%, 10/13/2024 | 456,630 | ||||||
| 240,000 | 7.650%, 4/21/2025 | 109,200 | ||||||
| 1,321,000 | 9.250%, 5/7/2028 | 607,660 | ||||||
| 1,000,000 | 9.375%, 1/13/2034 | 462,500 | ||||||
| 100,000 | 7.000%, 3/31/2038 | 42,000 | ||||||
|
| |||||||
Total | 4,638,095 | |||||||
|
| |||||||
Vietnam (<0.1%) | ||||||||
Debt and Asset Trading Corporation | ||||||||
| 200,000 | 1.000%, 10/10/2025 | 112,659 | ||||||
Vietnam Government International Bond | ||||||||
| 450,000 | 6.750%, 1/29/2020c | 487,459 | ||||||
|
| |||||||
Total | 600,118 | |||||||
|
| |||||||
Virgin Islands, British (<0.1%) | ||||||||
Central American Bottling Corporation | ||||||||
| 210,000 | 6.750%, 2/9/2022c | 214,200 | ||||||
| 108,000 | 6.750%, 2/9/2022 | 110,160 | ||||||
|
| |||||||
Total | 324,360 | |||||||
|
| |||||||
Zambia (0.2%) | ||||||||
Zambia Government International Bond | ||||||||
| 778,000 | 5.375%, 9/20/2022 | 702,822 | ||||||
| 790,000 | 8.970%, 7/30/2027c | 780,125 | ||||||
| 2,240,000 | 8.970%, 7/30/2027 | 2,212,000 | ||||||
|
| |||||||
Total | 3,694,947 | |||||||
|
| |||||||
Total Long-Term Fixed Income (cost $160,096,053) | 155,601,394 | |||||||
|
| |||||||
| Shares | Preferred Stock (1.1%) | |||||||
Brazil (0.2%) | ||||||||
| 482,532 | Vale SA ADRb | 3,324,645 | ||||||
|
| |||||||
Total | 3,324,645 | |||||||
|
| |||||||
The accompanying Notes to Financial Statements are an integral part of this schedule.
161
Table of Contents
PARTNER WORLDWIDE ALLOCATION PORTFOLIO
Schedule of Investments as of December 31, 2016
| Shares | Preferred Stock (1.1%) | Value | ||||||
Germany (0.2%) | ||||||||
| 4,158 | Henkel AG & Company KGaA | $ | 494,969 | |||||
| 13,714 | Volkswagen AG | 1,918,830 | ||||||
|
| |||||||
Total | 2,413,799 | |||||||
|
| |||||||
South Korea (0.7%) | ||||||||
| 10,250 | Samsung Electronics Company, Ltd. | 12,136,369 | ||||||
|
| |||||||
Total | 12,136,369 | |||||||
|
| |||||||
Total Preferred Stock (cost $15,839,913) | 17,874,813 | |||||||
|
| |||||||
Registered Investment Companies (<0.1%) | ||||||||
Equity Funds/ETFs (<0.1%) | ||||||||
| 11,480 | iShares MSCI EAFE Index Fund | 662,741 | ||||||
|
| |||||||
Total | 662,741 | |||||||
|
| |||||||
Total Registered Investment Companies (cost $661,937) | 662,741 | |||||||
|
| |||||||
Collateral Held for Securities Loaned (1.0%) | ||||||||
| 16,401,014 | Thrivent Cash Management Trust | 16,401,014 | ||||||
|
| |||||||
Total Collateral Held for Securities Loaned (cost $16,401,014) | 16,401,014 | |||||||
|
| |||||||
| Shares or Principal Amount | Short-Term Investments (1.6%)o | |||||||
Federal Home Loan Bank Discount Notes | ||||||||
| 100,000 | 0.440%, 1/17/2017p | 99,985 | ||||||
| 200,000 | 0.350%, 1/20/2017p | 199,964 | ||||||
| 100,000 | 0.540%, 2/22/2017p | 99,931 | ||||||
Thrivent Core Short-Term Reserve Fund | ||||||||
| 2,583,165 | 0.910% | 25,831,644 | ||||||
|
| |||||||
Total Short-Term Investments (cost $26,231,510) | 26,231,524 | |||||||
|
| |||||||
Total Investments (cost $1,633,221,574) 100.5% | $ | 1,663,481,551 | ||||||
|
| |||||||
Other Assets and Liabilities, Net (0.5%) | (8,744,917 | ) | ||||||
|
| |||||||
Total Net Assets 100.0% | $ | 1,654,736,634 | ||||||
|
| |||||||
| a | Non-income producing security. |
| b | All or a portion of the security is on loan. |
| c | Denotes securities sold under Rule 144A of the Securities Act of 1933, which exempts them from registration. These securities may be resold to other dealers in the program or to other qualified institutional buyers. As of December 31, 2016, the value of these investments was $57,176,304 or 3.5% of total net assets. |
| d | Security is valued at fair value. Market quotations or prices were not readily available or were determined to be unreliable. Fair value was determined in good faith pursuant to procedures adopted by the Board. Further information on fair valuation can be found in the Notes to Financial Statements. |
| e | Principal amount is displayed in Argentine Pesos. |
| f | Denotes variable rate securities. Variable rate securities are securities whose yields vary with a designated market index or market rate. The rate shown is as of December 31, 2016. |
| g | Principal amount is displayed in Euros. |
| h | Denotes step coupon securities. Step coupon securities pay an initial coupon rate for the first period and then different coupon rates for following periods. The rate shown is as of December 31, 2016. |
| i | Denotes perpetual securities. Perpetual securities pay an indefinite stream of interest and have no contractual maturity date. Date shown, if applicable, is next call date. |
| j | Principal amount is displayed in Brazilian Real. |
| k | Defaulted security. Interest is not being accrued. |
| l | Principal amount is displayed in Dominican Republic Pesos. |
| m | Principal amount is displayed in Mexican Pesos. |
| n | Principal amount is displayed in Polish Zloty. |
| o | The interest rate shown reflects the yield, coupon rate or the discount rate at the date of purchase. |
| p | All or a portion of the security is held on deposit with the counterparty and pledged as the initial margin deposit for open futures contracts. |
| * | Denotes restricted securities. Restricted securities are investment securities which cannot be offered for public sale without first being registered under the Securities Act of 1933. The value of all restricted securities held in Partner Worldwide Allocation Portfolio as of December 31, 2016 was $5,613,264 or 0.3% of total net assets. The following table indicates the acquisition date and cost of restricted securities shown in the schedule as of December 31, 2016. |
Security | Acquisition Date | Cost | ||||||
Abengoa Transmision Sur SA, 4/30/2043 | 4/8/2014 | $ | 588,732 | |||||
Belize Government International Bond, 8/20/2017 | 3/20/2013 | 111,337 | ||||||
Brazil Loan Trust 1, 7/24/2023 | 7/25/2013 | 876,018 | ||||||
Brazil Minas SPE via State of Minas Gerais, 2/15/2028 | 3/22/2013 | 966,371 | ||||||
Export-Import Bank of Korea, 8/14/2017 | 5/29/2015 | 270,096 | ||||||
Honduras Government International Bond, 12/16/2020 | 12/11/2013 | 1,010,000 | ||||||
Independencia International, Ltd., 12/30/2016 | 3/29/2010 | 100,623 | ||||||
Nobina AB | 11/7/2016 | 193,891 | ||||||
Pakistan Government International Bond, 12/3/2019 | 11/26/2014 | 210,000 | ||||||
Phosagro OAO via Phosagro Bond Funding, Ltd., 2/13/2018 | 2/6/2013 | 310,000 | ||||||
Sociedad Quimica y Minera de Chile SA, 1/28/2025 | 10/23/2014 | 445,357 | ||||||
Ukraine Government International Bond, 5/31/2040 | 11/12/2015 | 255,901 | ||||||
The accompanying Notes to Financial Statements are an integral part of this schedule.
162
Table of Contents
PARTNER WORLDWIDE ALLOCATION PORTFOLIO
Schedule of Investments as of December 31, 2016
Security | Acquisition Date | Cost | ||||||
Universal Entertainment Corporation, 8/24/2020 | 10/18/2016 | $ | 250,299 | |||||
Wind Acquisition Finance SA, 7/15/2020 | 6/24/2014 | 380,927 | ||||||
The following table presents the total amount of securities loaned with continuous maturity, by type, offset by the gross payable upon return of collateral for securities loaned by Thrivent Partner Worldwide Allocation Portfolio as of December 31, 2016:
Securities Lending Transactions | ||||
Common Stock | $ | 15,613,935 | ||
|
| |||
Total lending | $ | 15,613,935 | ||
Gross amount payable upon return of collateral for securities loaned | $ | 16,401,014 | ||
|
| |||
Net amounts due to counterparty | $ | 787,079 | ||
|
| |||
Definitions:
| ADR | - | American Depositary Receipt, which are certificates for an underlying foreign security’s shares held by an issuing U.S. depository bank. | ||
| GDR | - | Global Depository Receipts, which are certificates for shares of an underlying foreign security’s shares held by an issuing depository bank from more than one country. | ||
| G.O. | - | General Obligation | ||
| REIT | - | Real Estate Investment Trust is a company that buys, develops, manages and/or sells real estate assets. | ||
| Refg. | - | Refunding | ||
| Rev. | - | Revenue | ||
| Ser. | - | Series |
The accompanying Notes to Financial Statements are an integral part of this schedule.
163
Table of Contents
LARGE CAP STOCK PORTFOLIO
Schedule of Investments as of December 31, 2016
| Shares | Common Stock (85.9%) | Value | ||||||
Consumer Discretionary (13.6%) | ||||||||
| 32,112 | Amazon.com, Inc.a | $ | 24,079,825 | |||||
| 26,120 | AutoZone, Inc.a | 20,629,315 | ||||||
| 48,460 | Berkeley Group Holdings plc | 1,675,217 | ||||||
| 7,000 | Brembo SPA | 423,468 | ||||||
| 69,200 | Bridgestone Corporation | 2,489,870 | ||||||
| 44,879 | Bunzl plc | 1,165,125 | ||||||
| 11,200 | Canon Marketing Japan, Inc. | 188,061 | ||||||
| 275,160 | Comcast Corporation | 18,999,798 | ||||||
| 70,000 | Denso Corporation | 3,027,954 | ||||||
| 70,200 | Eutelsat Communications | 1,357,508 | ||||||
| 72,200 | Fuji Heavy Industries, Ltd. | 2,941,746 | ||||||
| 17,300 | Hakuhodo Dy Holdings, Inc. | 213,018 | ||||||
| 181,100 | Honda Motor Company, Ltd. | 5,287,272 | ||||||
| 97,000 | Inchcape plc | 838,275 | ||||||
| 12,344 | Intertek Group plc | 529,043 | ||||||
| 5,819 | Linamar Corporation | 250,027 | ||||||
| 6,741 | LVMH Moet Hennessy Louis Vuitton SE | 1,285,322 | ||||||
| 5,500 | Nifco, Inc. | 289,791 | ||||||
| 5,974 | Nokian Renkaat Oyj | 222,101 | ||||||
| 33,300 | Panasonic Corporation | 337,734 | ||||||
| 78,593 | Persimmon plc | 1,714,724 | ||||||
| 11,067 | Publicis Groupe SA | 762,570 | ||||||
| 9,380 | Restaurant Brands International, Inc. | 447,051 | ||||||
| 3,800 | RTL Group SA | 278,401 | ||||||
| 13,600 | Sekisui Chemical Company, Ltd. | 216,492 | ||||||
| 335,000 | Starbucks Corporation | 18,599,200 | ||||||
| 72,800 | Sumitomo Forestry Company, Ltd. | 961,492 | ||||||
| 52,000 | Sumitomo Rubber Industries, Ltd. | 822,762 | ||||||
| 3,400 | Swatch Group AG | 207,496 | ||||||
| 1,306 | Valora Holding AG | 370,972 | ||||||
| 82,820 | Walt Disney Company | 8,631,500 | ||||||
| 9,700 | Whitbread plc | 451,229 | ||||||
| 56,604 | Wolters Kluwer NV | 2,047,326 | ||||||
| 46,300 | WPP plc | 1,030,340 | ||||||
| 24,300 | Yokohama Rubber Company, Ltd. | 434,369 | ||||||
|
| |||||||
Total | 123,206,394 | |||||||
|
| |||||||
Consumer Staples (5.5%) | ||||||||
| 37,500 | Axfood AB | 588,863 | ||||||
| 160,585 | Coca-Cola Amatil, Ltd. | 1,171,144 | ||||||
| 67,100 | Coca-Cola HBC AG | 1,461,129 | ||||||
| 172,580 | CVS Health Corporation | 13,618,288 | ||||||
| 13,900 | Ebro Foods SA | 290,903 | ||||||
| 7,374 | Henkel AG & Company KGaA | 767,440 | ||||||
| 100,875 | Imperial Brands plc | 4,396,213 | ||||||
| 12,900 | Jeronimo Martins SGPS SA | 200,075 | ||||||
| 5,300 | Kesko Oyj | 264,501 | ||||||
| 30,400 | Kewpie Corporation | 737,316 | ||||||
| 37,190 | Kimberly-Clark Corporation | 4,244,123 | ||||||
| 18,200 | Kirin Holdings Company, Ltd. | 295,408 | ||||||
| 237,157 | Koninklijke Ahold Delhaize NV | 4,995,254 | ||||||
| 47 | Lindt & Spruengli AG | 243,199 | ||||||
| 20,000 | Nestle SA | 1,432,752 | ||||||
| 15,800 | Suedzucker AG | 376,619 | ||||||
| 65,016 | Tate & Lyle plc | 565,815 | ||||||
| 162,810 | Walgreens Boots Alliance, Inc. | 13,474,156 | ||||||
| 123,775 | William Morrison Supermarkets plc | 351,558 | ||||||
|
| |||||||
Total | 49,474,756 | |||||||
|
| |||||||
Energy (6.8%) | ||||||||
| 154,040 | Baker Hughes, Inc. | 10,007,979 | ||||||
| 1,530,567 | BP plc | 9,586,655 | ||||||
| 100,739 | Chevron Corporation | 11,856,980 | ||||||
| 33,123 | Crescent Point Energy Corporation | 450,225 | ||||||
| 62,530 | EQT Corporation | 4,089,462 | ||||||
| 44,500 | Galp Energia SGPS SA | 663,419 | ||||||
| 45,230 | John Wood Group plc | 488,417 | ||||||
| 58,585 | OMV AG | 2,065,344 | ||||||
| 64,340 | Petrofac, Ltd. | 688,546 | ||||||
| 34,910 | Pioneer Natural Resources Company | 6,286,244 | ||||||
| 51,730 | Royal Dutch Shell plc | 1,410,971 | ||||||
| 13,028 | Royal Dutch Shell plc, Class A | 359,621 | ||||||
| 120,903 | Royal Dutch Shell plc, Class B | 3,473,795 | ||||||
| 49,683 | Statoil ASA | 906,798 | ||||||
| 4,828 | Tecnicas Reunidas SA | 197,452 | ||||||
| 50,482 | Total SA | 2,589,336 | ||||||
| 50,482 | Total SA Rightsa,b | 863 | ||||||
| 1,223,990 | Weatherford International plca | 6,107,710 | ||||||
|
| |||||||
Total | 61,229,817 | |||||||
|
| |||||||
Financials (15.8%) | ||||||||
| 321,559 | Aberdeen Asset Management plc | 1,016,708 | ||||||
| 67,039 | ASX, Ltd. | 2,401,682 | ||||||
| 111,458 | Australia & New Zealand Banking Group, Ltd. | 2,439,952 | ||||||
| 580,344 | Bank of America Corporation | 12,825,602 | ||||||
| 131,363 | Bank of East Asia, Ltd. | 501,493 | ||||||
| 5,910 | Bank of Montreal | 425,076 | ||||||
| 87,129 | Bank of Nova Scotia | 4,851,424 | ||||||
| 238,260 | Blackstone Group, LP | 6,440,168 | ||||||
| 12,042 | Canadian Imperial Bank of Commerce | 982,625 | ||||||
| 55,000 | Chiba Bank, Ltd. | 337,157 | ||||||
| 52,260 | Chubb, Ltd. | 6,904,591 | ||||||
| 26,992 | CI Financial Corporation | 580,389 | ||||||
| 356,230 | Citigroup, Inc. | 21,170,749 | ||||||
| 102,489 | CNP Assurances | 1,897,008 | ||||||
| 42,610 | Danske Bank AS | 1,289,113 | ||||||
| 285,291 | Direct Line Insurance Group plc | 1,298,410 | ||||||
| 31,300 | Erste Group Bank AG | 915,126 | ||||||
| 352,889 | FlexiGroup, Ltd. | 574,305 | ||||||
| 401,000 | Fukuoka Financial Group, Inc. | 1,778,428 | ||||||
| 37,371 | Genworth MI Canada, Inc.c | 936,884 | ||||||
| 86,290 | Goldman Sachs Group, Inc. | 20,662,141 | ||||||
| 38,100 | Hang Seng Bank, Ltd. | 706,549 | ||||||
| 21,500 | Hannover Rueckversicherung SE | 2,322,597 | ||||||
| 329,300 | Henderson Group plc | 950,428 | ||||||
| 402,253 | HSBC Holdings plc | 3,245,644 | ||||||
| 13,212 | Intact Financial Corporation | 945,647 | ||||||
| 182,490 | Intercontinental Exchange, Inc. | 10,296,086 | ||||||
| 242,390 | Invesco, Ltd. | 7,354,113 | ||||||
| 30,273 | Macquarie Group, Ltd. | 1,896,367 | ||||||
| 640,729 | Mapfre SA | 1,951,731 | ||||||
| 833,900 | Mizuho Financial Group, Inc. | 1,496,463 | ||||||
| 15,900 | MS and AD Insurance Group Holdings, Inc. | 492,384 | ||||||
| 94,626 | National Bank of Canada | 3,843,113 | ||||||
| 93,011 | Nordea Bank AB | 1,030,620 | ||||||
| 29,656 | Power Corporation of Canada | 663,734 | ||||||
| 145,200 | Resona Holdings, Inc. | 744,153 | ||||||
| 7,599 | Schroders plc | 279,097 | ||||||
| 68,900 | Seven Bank, Ltd. | 197,011 | ||||||
| 37,778 | Swiss Re AG | 3,574,287 | ||||||
| 134,730 | Synchrony Financial | 4,886,657 | ||||||
| 68,200 | T&D Holdings, Inc. | 900,063 | ||||||
| 4,360 | TMX Group, Ltd. | 232,248 | ||||||
| 99,578 | United Overseas Bank, Ltd. | 1,398,961 | ||||||
| 123,096 | Westpac Banking Corporation | 2,889,550 | ||||||
| 2,564 | Zurich Insurance Group AGa | 704,638 | ||||||
|
| |||||||
Total | 143,231,172 | |||||||
|
| |||||||
Health Care (9.2%) | ||||||||
| 40,110 | Alexion Pharmaceuticals, Inc.a | 4,907,459 | ||||||
The accompanying Notes to Financial Statements are an integral part of this schedule.
164
Table of Contents
LARGE CAP STOCK PORTFOLIO
Schedule of Investments as of December 31, 2016
| Shares | Common Stock (85.9%) | Value | ||||||
Health Care (9.2%) - continued | ||||||||
| 34,010 | Allergan plca | $ | 7,142,440 | |||||
| 22,323 | AstraZeneca plc | 1,219,016 | ||||||
| 35,235 | CAE, Inc. | 492,841 | ||||||
| 63,330 | Celgene Corporationa | 7,330,447 | ||||||
| 23,898 | Essilor International SA | 2,696,378 | ||||||
| 46,810 | Express Scripts Holding Companya | 3,220,060 | ||||||
| 95,029 | Gilead Sciences, Inc. | 6,805,027 | ||||||
| 52,438 | GlaxoSmithKline plc | 1,007,262 | ||||||
| 24,826 | Hikma Pharmaceuticals plc | 578,640 | ||||||
| 5,100 | Lonza Group AG | 881,429 | ||||||
| 256,160 | Merck & Company, Inc. | 15,080,139 | ||||||
| 16,958 | Merck KGaA | 1,765,688 | ||||||
| 105,393 | Novartis AG | 7,664,548 | ||||||
| 52,000 | Novo Nordisk AS | 1,865,354 | ||||||
| 489,790 | Pfizer, Inc. | 15,908,379 | ||||||
| 5,800 | Roche Holding AG-Genusschein | 1,322,125 | ||||||
| 48,322 | Vertex Pharmaceuticals, Inc.a | 3,559,882 | ||||||
|
| |||||||
Total | 83,447,114 | |||||||
|
| |||||||
Industrials (10.9%) | ||||||||
| 191 | A P Moller - Maersk AS | 304,447 | ||||||
| 57,411 | ABB, Ltd. | 1,208,027 | ||||||
| 12,900 | Acuity Brands, Inc. | 2,978,094 | ||||||
| 36,540 | Adecco SA | 2,385,215 | ||||||
| 175,865 | Air New Zealand, Ltd. | 267,827 | ||||||
| 119,000 | Asahi Glass Company, Ltd. | 807,374 | ||||||
| 8,400 | Atlas Copco Aktiebolag | 254,827 | ||||||
| 16,255 | Berendsen plc | 174,279 | ||||||
| 77,050 | Boeing Company | 11,995,144 | ||||||
| 45,530 | Cummins, Inc. | 6,222,585 | ||||||
| 39,000 | Dai Nippon Printing Company, Ltd. | 384,799 | ||||||
| 229,810 | Delta Air Lines, Inc. | 11,304,354 | ||||||
| 27,481 | Deutsche Post AG | 901,243 | ||||||
| 16,300 | DSV AS | 723,887 | ||||||
| 206,123 | El Al Israel Airlines, Ltd. | 136,305 | ||||||
| 1,795 | Flughafen Zuerich AG | 332,626 | ||||||
| 11,000 | Fraport AG Frankfurt Airport Services Worldwide | 649,090 | ||||||
| 29,800 | Fuji Machine Manufacturing Company, Ltd. | 340,232 | ||||||
| 12,800 | Hitachi Transport System, Ltd. | 259,320 | ||||||
| 4,700 | Hochtief AG | 656,183 | ||||||
| 20,800 | Inaba Denki Sangyo Company, Ltd. | 715,099 | ||||||
| 287,500 | ITOCHU Corporation | 3,806,720 | ||||||
| 13,800 | Jardine Matheson Holdings, Ltd. | 762,450 | ||||||
| 68,900 | KITZ Corporation | 376,172 | ||||||
| 34,300 | Komatsu, Ltd. | 776,900 | ||||||
| 67,203 | KONE Oyj | 3,002,881 | ||||||
| 15,945 | Koninklijke Boskalis Westminster NV | 553,167 | ||||||
| 45,400 | Marubeni Corporation | 256,786 | ||||||
| 111,672 | Meggitt plc | 630,637 | ||||||
| 27,000 | MIRAIT Holdings Corporationc | 243,332 | ||||||
| 23,500 | Mitsubishi Corporation | 499,108 | ||||||
| 111,500 | Mitsubishi Electric Corporation | 1,550,872 | ||||||
| 78,000 | Mitsubishi Heavy Industries, Ltd. | 354,592 | ||||||
| 31,000 | Mitsuboshi Belting, Ltd. | 263,601 | ||||||
| 16,000 | Mitsui & Company, Ltd. | 219,237 | ||||||
| 42,804 | National Express Group plc | 186,528 | ||||||
| 13,000 | NIPPO Corporation | 242,196 | ||||||
| 52,900 | Nitto Kogyo Corporation | 720,239 | ||||||
| 132,010 | Norfolk Southern Corporation | 14,266,321 | ||||||
| 19,000 | Okuma Corporation | 180,775 | ||||||
| 18,380 | Philips Lighting NVa,d | 452,738 | ||||||
| 14,100 | Randstad Holding NV | 763,765 | ||||||
| 26,250 | RELX NV | 441,523 | ||||||
| 1,624 | Rieter Holding AG | 282,442 | ||||||
| 67,707 | Rolls-Royce Holdings plca | 556,115 | ||||||
| 27,200 | Sanwa Holdings Corporation | 258,699 | ||||||
| 4,347 | Schindler Holding AG, Participation Certificate | 765,564 | ||||||
| 5,979 | Schneider Electric SE | 415,353 | ||||||
| 30,558 | Siemens AG | 3,741,533 | ||||||
| 15,219 | Skanska AB | 358,322 | ||||||
| 53,073 | SKF AB | 973,156 | ||||||
| 45,300 | Smiths Group plc | 788,547 | ||||||
| 162,500 | Sojitz Corporation | 393,439 | ||||||
| 6,215 | Sulzer, Ltd. | 639,791 | ||||||
| 70,830 | Union Pacific Corporation | 7,343,654 | ||||||
| 39,870 | United Parcel Service, Inc. | 4,570,697 | ||||||
| 39,834 | Vinci SA | 2,709,703 | ||||||
| 9,088 | Wolseley plc | 554,791 | ||||||
| 11,596 | WSP Global, Inc. | 385,972 | ||||||
| 9,700 | Yuasa Trading Company, Ltd. | 241,628 | ||||||
|
| |||||||
Total | 98,530,903 | |||||||
|
| |||||||
Information Technology (15.1%) | ||||||||
| 24,634 | Alphabet, Inc., Class Aa | 19,521,213 | ||||||
| 24,660 | Alphabet, Inc., Class Ca | 19,033,081 | ||||||
| 283,598 | Apple, Inc. | 32,846,320 | ||||||
| 28,000 | Canon, Inc. | 788,541 | ||||||
| 17,097 | Capital Power Corporation | 295,806 | ||||||
| 207,180 | Cisco Systems, Inc. | 6,260,980 | ||||||
| 8,700 | DTS Corporation | 185,064 | ||||||
| 129,395 | Facebook, Inc.a | 14,886,895 | ||||||
| 63,000 | FUJIFILM Holdings NPV | 2,385,546 | ||||||
| 33,700 | Konica Minolta Holdings, Inc. | 333,991 | ||||||
| 218,900 | Microsoft Corporation | 13,602,446 | ||||||
| 27,500 | NEC Networks & System Integration Corporation | 495,804 | ||||||
| 9,400 | Nice, Ltd. | 644,957 | ||||||
| 21,700 | Nichicon Corporation | 188,945 | ||||||
| 6,700 | NTT Data Corporation | 323,688 | ||||||
| 34,740 | Palo Alto Networks, Inc.a | 4,344,237 | ||||||
| 84,630 | PayPal Holdings, Inc.a | 3,340,346 | ||||||
| 3,300 | Rohm Company, Ltd. | 189,331 | ||||||
| 10,400 | Ryosan Company, Ltd. | 313,544 | ||||||
| 111,960 | Salesforce.com, Inc.a | 7,664,782 | ||||||
| 3,555 | SAP SE | 307,526 | ||||||
| 15,390 | Seagate Technology plc | 587,436 | ||||||
| 8,414 | Software AG | 304,953 | ||||||
| 62,862 | Telefonaktiebolaget LM Ericsson | 368,432 | ||||||
| 9,100 | Tokyo Electron, Ltd. | 855,850 | ||||||
| 84,420 | Visa, Inc. | 6,586,448 | ||||||
|
| |||||||
Total | 136,656,162 | |||||||
|
| |||||||
Materials (4.4%) | ||||||||
| 14,100 | Adeka Corporation | 191,283 | ||||||
| 25,792 | APERAM | 1,177,046 | ||||||
| 20,272 | BHP Billiton plc | 322,794 | ||||||
| 300,412 | BHP Billiton, Ltd. | 5,381,841 | ||||||
| 209,103 | BlueScope Steel, Ltd. | 1,389,715 | ||||||
| 7,441 | Croda International plc | 292,653 | ||||||
| 119,300 | Daicel Corporation | 1,311,590 | ||||||
| 149,760 | Dow Chemical Company | 8,569,267 | ||||||
| 98,200 | Eastman Chemical Company | 7,385,622 | ||||||
| 76,919 | Evonik Industries AG | 2,292,872 | ||||||
| 191 | Givaudan SA | 349,563 | ||||||
| 22,900 | JSR Corporation | 360,454 | ||||||
| 53,130 | Kinross Gold Corporationa | 165,234 | ||||||
| 80,600 | Kuraray Company, Ltd. | 1,208,643 | ||||||
| 19,000 | Kyoei Steel, Ltd. | 361,235 | ||||||
| 4,763 | LafargeHolcim, Ltd. | 250,020 | ||||||
| 98,000 | Mitsubishi Chemical Holdings Corporation | 633,635 | ||||||
The accompanying Notes to Financial Statements are an integral part of this schedule.
165
Table of Contents
LARGE CAP STOCK PORTFOLIO
Schedule of Investments as of December 31, 2016
| Shares | Common Stock (85.9%) | Value | ||||||
Materials (4.4%) - continued | ||||||||
| 17,500 | Mitsubishi Gas Chemical Company, Inc. | $ | 298,190 | |||||
| 10,500 | Mitsubishi Materials Corporation | 321,166 | ||||||
| 3,200 | Nippon Shokubai Company, Ltd. | 199,287 | ||||||
| 344,238 | Norsk Hydro ASA | 1,642,956 | ||||||
| 36,752 | Nufarm, Ltd. | 242,163 | ||||||
| 96,359 | Orora, Ltd. | 207,221 | ||||||
| 9,014 | Rio Tinto, Ltd. | 386,171 | ||||||
| 7,800 | Sumitomo Seika Chemicals Company, Ltd. | 305,473 | ||||||
| 36,400 | Toagosei Company, Ltd. | 357,278 | ||||||
| 43,000 | Tosoh Corporation | 303,321 | ||||||
| 53,483 | UPM-Kymmene Oyj | 1,307,961 | ||||||
| 9,200 | Yamato Kogyo Company, Ltd. | 256,582 | ||||||
| 62,755 | Yara International ASA | 2,468,723 | ||||||
| 7,100 | Yodogawa Steel Works, Ltd. | 185,035 | ||||||
|
| |||||||
Total | 40,124,994 | |||||||
|
| |||||||
Real Estate (1.0%) | ||||||||
| 191,900 | CapitaLand Retail China Trusta | 181,544 | ||||||
| 2,600 | Daito Trust Construction Company, Ltd. | 390,878 | ||||||
| 273,900 | DEXUS Property Group | 1,900,103 | ||||||
| 82,020 | H&R Real Estate Investment Trust | 1,366,542 | ||||||
| 21,959 | Hamborner REIT AG | 208,892 | ||||||
| 307,000 | Hysan Development Company, Ltd. | 1,266,082 | ||||||
| 29,500 | Link REIT | 191,251 | ||||||
| 1,260,690 | New World Development Company, Ltd. | 1,328,272 | ||||||
| 498,371 | Stockland | 1,646,463 | ||||||
| 23,000 | Sun Hung Kai Properties, Ltd. | 289,627 | ||||||
| 35,000 | Wharf Holdings, Ltd. | 231,839 | ||||||
| 48,000 | Wheelock and Company, Ltd. | 269,388 | ||||||
| 296,600 | Wing Tai Holdings, Ltd. | 324,867 | ||||||
|
| |||||||
Total | 9,595,748 | |||||||
|
| |||||||
Telecommunications Services (1.0%) | ||||||||
| 45,085 | Elisa Oyj | 1,463,530 | ||||||
| 40,400 | Freenet AG | 1,135,429 | ||||||
| 673,467 | KCOM Group plc | 786,412 | ||||||
| 172,920 | Koninklijke (Royal) KPN NV | 511,347 | ||||||
| 39,300 | Nippon Telegraph & Telephone Corporation | 1,654,340 | ||||||
| 45,300 | NTT DOCOMO, Inc. | 1,030,361 | ||||||
| 800,984 | PCCW, Ltd. | 432,999 | ||||||
| 19,900 | Proximus SA | 572,063 | ||||||
| 69,100 | Telefonica Deutschland Holding AG | 295,362 | ||||||
| 44,931 | Telenor ASA | 670,672 | ||||||
| 10,133 | Vivendi SA | 192,193 | ||||||
|
| |||||||
Total | 8,744,708 | |||||||
|
| |||||||
Utilities (2.6%) | ||||||||
| 15,262 | ATCO, Ltd. | 507,654 | ||||||
| 249,300 | Centrica plc | 718,000 | ||||||
| 340,500 | Electricidade de Portugal SA | 1,036,331 | ||||||
| 408,000 | Osaka Gas Company, Ltd. | 1,565,521 | ||||||
| 300,170 | PG&E Corporation | 18,241,331 | ||||||
| 224,500 | Redes Energeticas Nacionais SGPS SA | 636,963 | ||||||
| 24,000 | Toho Gas Company, Ltd. | 194,924 | ||||||
| 47,000 | United Utilities Group plc | 520,965 | ||||||
|
| |||||||
Total | 23,421,689 | |||||||
|
| |||||||
Total Common Stock (cost $625,365,122) | 777,663,457 | |||||||
|
| |||||||
Registered Investment Companies (0.1%) | ||||||||
Equity Funds/ETFs (<0.1%) | ||||||||
| 13,010 | iShares MSCI EAFE Index Fund | 751,067 | ||||||
|
| |||||||
Total | 751,067 | |||||||
|
| |||||||
Total Registered Investment Companies (cost $750,423) | 751,067 | |||||||
|
| |||||||
Preferred Stock (<0.1%) | ||||||||
Consumer Staples (<0.1%) | ||||||||
| 2,285 | Henkel AG & Company KGaA, 1.470% | 272,007 | ||||||
|
| |||||||
Total | 272,007 | |||||||
|
| |||||||
Total Preferred Stock (cost $281,579) | 272,007 | |||||||
|
| |||||||
Collateral Held for Securities Loaned (0.1%) | ||||||||
| 1,213,950 | Thrivent Cash Management Trust | 1,213,950 | ||||||
|
| |||||||
Total Collateral Held for Securities Loaned (cost $1,213,950) | 1,213,950 | |||||||
|
| |||||||
| Shares or Principal Amount | Short-Term Investments (13.9%)e | |||||||
Federal Home Loan Bank Discount Notes | ||||||||
| 4,950,000 | 0.359%, 1/6/2017f | 4,949,842 | ||||||
| 6,560,000 | 0.369%, 1/11/2017 | 6,559,449 | ||||||
| 2,634,000 | 0.385%, 1/12/2017 | 2,633,750 | ||||||
| 10,100,000 | 0.370%, 1/13/2017 | 10,098,929 | ||||||
| 875,000 | 0.440%, 1/17/2017 | 874,871 | ||||||
| 3,875,000 | 0.400%, 1/18/2017 | 3,874,388 | ||||||
| 17,300,000 | 0.443%, 1/25/2017f | 17,295,986 | ||||||
| 6,000,000 | 0.450%, 1/27/2017f | 5,998,482 | ||||||
| 5,200,000 | 0.385%, 2/1/2017f | 5,197,904 | ||||||
| 3,000,000 | 0.460%, 2/2/2017 | 2,998,749 | ||||||
| 5,900,000 | 0.473%, 2/3/2017 | 5,897,457 | ||||||
| 10,000,000 | 0.470%, 2/9/2017 | 9,994,860 | ||||||
| 3,700,000 | 0.515%, 2/16/2017 | 3,697,739 | ||||||
Thrivent Core Short-Term Reserve Fund | ||||||||
| 4,542,764 | 0.910% | 45,427,642 | ||||||
|
| |||||||
Total Short-Term Investments (cost $125,498,170) | 125,500,048 | |||||||
|
| |||||||
Total Investments (cost $753,109,244) 100.0% | $ | 905,400,529 | ||||||
|
| |||||||
Other Assets and Liabilities, Net <0.1% | 24,622 | |||||||
|
| |||||||
Total Net Assets 100.0% | $ | 905,425,151 | ||||||
|
| |||||||
The accompanying Notes to Financial Statements are an integral part of this schedule.
166
Table of Contents
LARGE CAP STOCK PORTFOLIO
Schedule of Investments as of December 31, 2016
| a | Non-income producing security. |
| b | Security is valued at fair value. Market quotations or prices were not readily available or were determined to be unreliable. Fair value was determined in good faith pursuant to procedures adopted by the Board. Further information on fair valuation can be found in the Notes to Financial Statements. |
| c | All or a portion of the security is on loan. |
| d | Denotes securities sold under Rule 144A of the Securities Act of 1933, which exempts them from registration. These securities may be resold to other dealers in the program or to other qualified institutional buyers. As of December 31, 2016, the value of these investments was $452,738 or 0.1% of total net assets. |
| e | The interest rate shown reflects the yield, coupon rate or the discount rate at the date of purchase. |
| f | All or a portion of the security is held on deposit with the counterparty and pledged as the initial margin deposit for open futures contracts. |
The following table presents the total amount of securities loaned with continuous maturity, by type, offset by the gross payable upon return of collateral for securities loaned by Thrivent Large Cap Stock Portfolio as of December 31, 2016:
Securities Lending Transactions | ||||
Common Stock | $ | 1,147,877 | ||
|
| |||
Total lending | $ | 1,147,877 | ||
Gross amount payable upon return of collateral for securities loaned | $ | 1,213,950 | ||
|
| |||
Net amounts due to counterparty | $ | 66,073 | ||
|
| |||
Definitions:
| REIT | - | Real Estate Investment Trust is a company that buys, develops, manages and/or sells real estate assets. |
The accompanying Notes to Financial Statements are an integral part of this schedule.
167
Table of Contents
LARGE CAP INDEX PORTFOLIO
Schedule of Investments as of December 31, 2016
| Shares | Common Stock (97.0%) | Value | ||||||
Consumer Discretionary (11.8%) | ||||||||
| 2,550 | Advance Auto Parts, Inc. | $ | 431,256 | |||||
| 13,650 | Amazon.com, Inc.a | 10,235,725 | ||||||
| 2,270 | AutoNation, Inc.a | 110,435 | ||||||
| 1,000 | AutoZone, Inc.a | 789,790 | ||||||
| 5,320 | Bed Bath & Beyond, Inc. | 216,205 | ||||||
| 9,495 | Best Buy Company, Inc. | 405,152 | ||||||
| 7,040 | BorgWarner, Inc. | 277,658 | ||||||
| 6,630 | CarMax, Inc.a | 426,906 | ||||||
| 14,700 | Carnival Corporation | 765,282 | ||||||
| 13,632 | CBS Corporation | 867,268 | ||||||
| 7,500 | Charter Communications, Inc.a | 2,159,400 | ||||||
| 1,000 | Chipotle Mexican Grill, Inc.a | 377,320 | ||||||
| 9,740 | Coach, Inc. | 341,095 | ||||||
| 82,835 | Comcast Corporation | 5,719,757 | ||||||
| 11,650 | D.R. Horton, Inc. | 318,394 | ||||||
| 4,270 | Darden Restaurants, Inc. | 310,514 | ||||||
| 9,520 | Delphi Automotive plc | 641,172 | ||||||
| 5,260 | Discovery Communications, Inc., Class Aa | 144,177 | ||||||
| 7,640 | Discovery Communications, Inc., Class Ca | 204,599 | ||||||
| 8,960 | Dollar General Corporation | 663,667 | ||||||
| 8,168 | Dollar Tree, Inc.a | 630,406 | ||||||
| 4,180 | Expedia, Inc. | 473,510 | ||||||
| 4,700 | Foot Locker, Inc. | 333,183 | ||||||
| 135,301 | Ford Motor Company | 1,641,201 | ||||||
| 7,592 | Gap, Inc. | 170,364 | ||||||
| 3,990 | Garmin, Ltd. | 193,475 | ||||||
| 48,158 | General Motors Company | 1,677,825 | ||||||
| 5,190 | Genuine Parts Company | 495,853 | ||||||
| 9,140 | Goodyear Tire & Rubber Company | 282,152 | ||||||
| 7,490 | H&R Block, Inc. | 172,195 | ||||||
| 13,090 | Hanesbrands, Inc. | 282,351 | ||||||
| 6,170 | Harley-Davidson, Inc. | 359,958 | ||||||
| 2,430 | Harman International Industries, Inc. | 270,119 | ||||||
| 3,930 | Hasbro, Inc. | 305,715 | ||||||
| 42,240 | Home Depot, Inc. | 5,663,539 | ||||||
| 13,807 | Interpublic Group of Companies, Inc. | 323,222 | ||||||
| 6,070 | Kohl’s Corporation | 299,737 | ||||||
| 8,314 | L Brands, Inc. | 547,394 | ||||||
| 4,660 | Leggett & Platt, Inc. | 227,781 | ||||||
| 6,690 | Lennar Corporation | 287,202 | ||||||
| 10,770 | LKQ Corporationa | 330,100 | ||||||
| 30,190 | Lowe’s Companies, Inc. | 2,147,113 | ||||||
| 10,628 | Macy’s, Inc. | 380,589 | ||||||
| 11,246 | Marriott International, Inc. | 929,819 | ||||||
| 11,950 | Mattel, Inc. | 329,222 | ||||||
| 29,000 | McDonald’s Corporation | 3,529,880 | ||||||
| 5,670 | Michael Kors Holdings, Ltd.a | 243,697 | ||||||
| 2,180 | Mohawk Industries, Inc.a | 435,302 | ||||||
| 14,970 | Netflix, Inc.a | 1,853,286 | ||||||
| 16,793 | Newell Brands, Inc. | 749,807 | ||||||
| 13,255 | News Corporation, Class A | 151,902 | ||||||
| 4,160 | News Corporation, Class B | 49,088 | ||||||
| 46,310 | NIKE, Inc. | 2,353,937 | ||||||
| 4,030 | Nordstrom, Inc. | 193,158 | ||||||
| 8,250 | Omnicom Group, Inc. | 702,157 | ||||||
| 3,270 | O’Reilly Automotive, Inc.a | 910,401 | ||||||
| 1,700 | Priceline Group, Inc.a | 2,492,302 | ||||||
| 10,162 | PulteGroup, Inc. | 186,778 | ||||||
| 2,740 | PVH Corporation | 247,258 | ||||||
| 1,970 | Ralph Lauren Corporation | 177,930 | ||||||
| 14,030 | Ross Stores, Inc. | 920,368 | ||||||
| 5,900 | Royal Caribbean Cruises, Ltd. | 484,036 | ||||||
| 3,310 | Scripps Networks Interactive, Inc. | 236,235 | ||||||
| 2,830 | Sherwin-Williams Company | 760,534 | ||||||
| 2,390 | Signet Jewelers, Ltd. | 225,281 | ||||||
| 2,000 | Snap-On, Inc. | 342,540 | ||||||
| 22,915 | Staples, Inc. | 207,381 | ||||||
| 50,610 | Starbucks Corporation | 2,809,867 | ||||||
| 19,510 | Target Corporation | 1,409,207 | ||||||
| 7,400 | Tegna, Inc. | 158,286 | ||||||
| 3,700 | Tiffany & Company | 286,491 | ||||||
| 27,030 | Time Warner, Inc. | 2,609,206 | ||||||
| 22,590 | TJX Companies, Inc. | 1,697,187 | ||||||
| 4,550 | Tractor Supply Company | 344,935 | ||||||
| 3,980 | TripAdvisor, Inc.a | 184,553 | ||||||
| 16,940 | Twenty-First Century Fox, Inc., Class B | 461,615 | ||||||
| 36,720 | Twenty-First Century Fox, Inc., Class A | 1,029,629 | ||||||
| 2,040 | Ulta Salon Cosmetics & Fragrance, Inc.a | 520,078 | ||||||
| 6,350 | Under Armour, Inc., Class Aa,b | 184,467 | ||||||
| 6,368 | Under Armour, Inc., Class Ca | 160,283 | ||||||
| 3,080 | Urban Outfitters, Inc.a | 87,718 | ||||||
| 11,450 | VF Corporation | 610,857 | ||||||
| 12,172 | Viacom, Inc. | 427,237 | ||||||
| 49,967 | Walt Disney Company | 5,207,561 | ||||||
| 2,597 | Whirlpool Corporation | 472,057 | ||||||
| 3,752 | Wyndham Worldwide Corporation | 286,540 | ||||||
| 2,760 | Wynn Resorts, Ltd. | 238,768 | ||||||
| 12,160 | Yum! Brands, Inc. | 770,093 | ||||||
|
| |||||||
Total | 81,569,690 | |||||||
|
| |||||||
Consumer Staples (9.1%) | ||||||||
| 67,440 | Altria Group, Inc. | 4,560,293 | ||||||
| 20,018 | Archer-Daniels-Midland Company | 913,822 | ||||||
| 6,354 | Brown-Forman Corporation | 285,422 | ||||||
| 6,710 | Campbell Soup Company | 405,754 | ||||||
| 9,020 | Church & Dwight Company, Inc. | 398,594 | ||||||
| 4,490 | Clorox Company | 538,890 | ||||||
| 135,380 | Coca-Cola Company | 5,612,855 | ||||||
| 30,960 | Colgate-Palmolive Company | 2,026,022 | ||||||
| 14,440 | Conagra Brands, Inc. | 571,102 | ||||||
| 6,210 | Constellation Brands, Inc. | 952,055 | ||||||
| 15,050 | Costco Wholesale Corporation | 2,409,655 | ||||||
| 16,160 | Coty, Inc. | 295,890 | ||||||
| 37,154 | CVS Health Corporation | 2,931,822 | ||||||
| 6,410 | Dr Pepper Snapple Group, Inc. | 581,195 | ||||||
| 7,730 | Estee Lauder Companies, Inc. | 591,268 | ||||||
| 20,620 | General Mills, Inc. | 1,273,697 | ||||||
| 4,850 | Hershey Company | 501,635 | ||||||
| 9,340 | Hormel Foods Corporation | 325,125 | ||||||
| 4,031 | J.M. Smucker Company | 516,210 | ||||||
| 8,810 | Kellogg Company | 649,385 | ||||||
| 12,542 | Kimberly-Clark Corporation | 1,431,293 | ||||||
| 20,827 | Kraft Heinz Company | 1,818,614 | ||||||
| 32,850 | Kroger Company | 1,133,654 | ||||||
| 3,980 | McCormick & Company, Inc. | 371,453 | ||||||
| 6,348 | Mead Johnson Nutrition Company | 449,184 | ||||||
| 6,410 | Molson Coors Brewing Company | 623,757 | ||||||
| 53,932 | Mondelez International, Inc. | 2,390,806 | ||||||
| 14,200 | Monster Beverage Corporationa | 629,628 | ||||||
| 50,150 | PepsiCo, Inc. | 5,247,194 | ||||||
| 54,220 | Philip Morris International, Inc. | 4,960,588 | ||||||
| 93,238 | Procter & Gamble Company | 7,839,451 | ||||||
| 28,748 | Reynolds American, Inc. | 1,611,038 | ||||||
| 5,450 | Safeway, Inc. (Casa Ley SA de CV) Contingent Value Rightsa,c | 4,978 | ||||||
| 5,450 | Safeway, Inc. (Property Development Centers, LLC) Contingent Value Rightsa,c | 239 | ||||||
The accompanying Notes to Financial Statements are an integral part of this schedule.
168
Table of Contents
LARGE CAP INDEX PORTFOLIO
Schedule of Investments as of December 31, 2016
| Shares | Common Stock (97.0%) | Value | ||||||
Consumer Staples (9.1%) - continued | ||||||||
| 17,520 | Sysco Corporation | $ | 970,082 | |||||
| 10,180 | Tyson Foods, Inc. | 627,902 | ||||||
| 29,800 | Walgreens Boots Alliance, Inc. | 2,466,248 | ||||||
| 52,340 | Wal-Mart Stores, Inc. | 3,617,741 | ||||||
| 10,980 | Whole Foods Market, Inc. | 337,745 | ||||||
|
| |||||||
Total | 62,872,286 | |||||||
|
| |||||||
Energy (7.4%) | ||||||||
| 19,402 | Anadarko Petroleum Corporation | 1,352,901 | ||||||
| 13,140 | Apache Corporation | 833,996 | ||||||
| 14,753 | Baker Hughes, Inc. | 958,502 | ||||||
| 16,070 | Cabot Oil & Gas Corporation | 375,395 | ||||||
| 26,160 | Chesapeake Energy Corporationa | 183,643 | ||||||
| 65,956 | Chevron Corporation | 7,763,021 | ||||||
| 3,300 | Cimarex Energy Company | 448,470 | ||||||
| 5,040 | Concho Resources, Inc.a | 668,304 | ||||||
| 43,269 | ConocoPhillips | 2,169,508 | ||||||
| 18,310 | Devon Energy Corporation | 836,218 | ||||||
| 20,080 | EOG Resources, Inc. | 2,030,088 | ||||||
| 5,940 | EQT Corporation | 388,476 | ||||||
| 144,900 | Exxon Mobil Corporation | 13,078,674 | ||||||
| 7,900 | FMC Technologies, Inc.a | 280,687 | ||||||
| 30,260 | Halliburton Company | 1,636,763 | ||||||
| 3,760 | Helmerich & Payne, Inc.b | 291,024 | ||||||
| 9,320 | Hess Corporation | 580,543 | ||||||
| 67,280 | Kinder Morgan, Inc. | 1,393,369 | ||||||
| 29,678 | Marathon Oil Corporation | 513,726 | ||||||
| 18,748 | Marathon Petroleum Corporation | 943,962 | ||||||
| 5,690 | Murphy Oil Corporation | 177,130 | ||||||
| 13,120 | National Oilwell Varco, Inc. | 491,213 | ||||||
| 6,920 | Newfield Exploration Companya | 280,260 | ||||||
| 14,970 | Noble Energy, Inc. | 569,758 | ||||||
| 26,890 | Occidental Petroleum Corporation | 1,915,375 | ||||||
| 7,380 | ONEOK, Inc. | 423,686 | ||||||
| 15,494 | Phillips 66 | 1,338,836 | ||||||
| 5,900 | Pioneer Natural Resources Company | 1,062,413 | ||||||
| 6,500 | Range Resources Corporation | 223,340 | ||||||
| 48,549 | Schlumberger, Ltd. | 4,075,688 | ||||||
| 16,680 | Southwestern Energy Companya | 180,478 | ||||||
| 24,584 | Spectra Energy Corporation | 1,010,157 | ||||||
| 4,100 | Tesoro Corporation | 358,545 | ||||||
| 13,470 | Transocean, Ltd.a,b | 198,548 | ||||||
| 15,910 | Valero Energy Corporation | 1,086,971 | ||||||
| 23,490 | Williams Companies, Inc. | 731,479 | ||||||
|
| |||||||
Total | 50,851,147 | |||||||
|
| |||||||
Financials (14.4%) | ||||||||
| 1,920 | Affiliated Managers Group, Inc.a | 278,976 | ||||||
| 14,310 | Aflac, Inc. | 995,976 | ||||||
| 12,792 | Allstate Corporation | 948,143 | ||||||
| 26,880 | American Express Company | 1,991,270 | ||||||
| 34,017 | American International Group, Inc. | 2,221,650 | ||||||
| 5,580 | Ameriprise Financial, Inc. | 619,045 | ||||||
| 9,175 | Aon plc | 1,023,288 | ||||||
| 6,200 | Arthur J. Gallagher & Company | 322,152 | ||||||
| 1,980 | Assurant, Inc. | 183,863 | ||||||
| 355,040 | Bank of America Corporation | 7,846,384 | ||||||
| 37,042 | Bank of New York Mellon Corporation | 1,755,050 | ||||||
| 28,290 | BB&T Corporation | 1,330,196 | ||||||
| 66,049 | Berkshire Hathaway, Inc.a | 10,764,666 | ||||||
| 4,250 | BlackRock, Inc. | 1,617,295 | ||||||
| 16,763 | Capital One Financial Corporation | 1,462,404 | ||||||
| 42,085 | Charles Schwab Corporation | 1,661,095 | ||||||
| 16,198 | Chubb, Ltd. | 2,140,080 | ||||||
| 5,208 | Cincinnati Financial Corporation | 394,506 | ||||||
| 100,173 | Citigroup, Inc. | 5,953,281 | ||||||
| 17,940 | Citizens Financial Group, Inc. | 639,202 | ||||||
| 11,840 | CME Group, Inc. | 1,365,744 | ||||||
| 6,000 | Comerica, Inc. | 408,660 | ||||||
| 13,705 | Discover Financial Services | 987,993 | ||||||
| 9,500 | E*TRADE Financial Corporationa | 329,175 | ||||||
| 26,354 | Fifth Third Bancorp | 710,767 | ||||||
| 11,980 | Franklin Resources, Inc. | 474,168 | ||||||
| 12,940 | Goldman Sachs Group, Inc. | 3,098,483 | ||||||
| 13,150 | Hartford Financial Services Group, Inc. | 626,598 | ||||||
| 37,751 | Huntington Bancshares, Inc. | 499,068 | ||||||
| 20,820 | Intercontinental Exchange, Inc. | 1,174,664 | ||||||
| 14,240 | Invesco, Ltd. | 432,042 | ||||||
| 125,058 | J.P. Morgan Chase & Company | 10,791,255 | ||||||
| 37,760 | KeyCorp | 689,875 | ||||||
| 11,291 | Leucadia National Corporation | 262,516 | ||||||
| 7,944 | Lincoln National Corporation | 526,449 | ||||||
| 9,650 | Loews Corporation | 451,909 | ||||||
| 5,396 | M&T Bank Corporation | 844,096 | ||||||
| 17,940 | Marsh & McLennan Companies, Inc. | 1,212,565 | ||||||
| 38,522 | MetLife, Inc. | 2,075,951 | ||||||
| 5,780 | Moody’s Corporation | 544,881 | ||||||
| 50,440 | Morgan Stanley | 2,131,090 | ||||||
| 3,970 | Nasdaq, Inc. | 266,466 | ||||||
| 10,420 | Navient Corporation | 171,201 | ||||||
| 7,420 | Northern Trust Corporation | 660,751 | ||||||
| 10,800 | People’s United Financial, Inc. | 209,088 | ||||||
| 16,914 | PNC Financial Services Group, Inc. | 1,978,261 | ||||||
| 9,360 | Principal Financial Group, Inc. | 541,570 | ||||||
| 20,250 | Progressive Corporation | 718,875 | ||||||
| 14,990 | Prudential Financial, Inc. | 1,559,859 | ||||||
| 43,057 | Regions Financial Corporation | 618,299 | ||||||
| 9,020 | S&P Global, Inc. | 970,011 | ||||||
| 12,690 | State Street Corporation | 986,267 | ||||||
| 17,130 | SunTrust Banks, Inc. | 939,581 | ||||||
| 27,240 | Synchrony Financial | 987,995 | ||||||
| 8,558 | T. Rowe Price Group, Inc. | 644,075 | ||||||
| 3,850 | Torchmark Corporation | 283,976 | ||||||
| 9,911 | Travelers Companies, Inc. | 1,213,305 | ||||||
| 55,765 | U.S. Bancorp | 2,864,648 | ||||||
| 8,084 | Unum Group | 355,130 | ||||||
| 158,060 | Wells Fargo & Company | 8,710,687 | ||||||
| 4,487 | Willis Towers Watson plc | 548,670 | ||||||
| 9,340 | XL Group, Ltd. | 348,008 | ||||||
| 7,100 | Zions Bancorporation | 305,584 | ||||||
|
| |||||||
Total | 99,668,778 | |||||||
|
| |||||||
Health Care (13.1%) | ||||||||
| 51,050 | Abbott Laboratories | 1,960,830 | ||||||
| 56,300 | AbbVie, Inc. | 3,525,506 | ||||||
| 12,389 | Aetna, Inc. | 1,536,360 | ||||||
| 7,770 | Alexion Pharmaceuticals, Inc.a | 950,659 | ||||||
| 12,912 | Allergan plca | 2,711,649 | ||||||
| 5,790 | AmerisourceBergen Corporation | 452,720 | ||||||
| 25,970 | Amgen, Inc. | 3,797,074 | ||||||
| 9,190 | Anthem, Inc. | 1,321,246 | ||||||
| 17,040 | Baxter International, Inc. | 755,554 | ||||||
| 7,395 | Becton, Dickinson and Company | 1,224,242 | ||||||
| 7,530 | Biogen, Inc.a | 2,135,357 | ||||||
| 47,450 | Boston Scientific Corporationa | 1,026,344 | ||||||
| 57,168 | Bristol-Myers Squibb Company | 3,340,898 | ||||||
| 2,550 | C.R. Bard, Inc. | 572,883 | ||||||
| 11,175 | Cardinal Health, Inc. | 804,265 | ||||||
| 26,900 | Celgene Corporationa | 3,113,675 | ||||||
| 5,980 | Centene Corporationa | 337,930 | ||||||
| 10,490 | Cerner Corporationa | 496,911 | ||||||
| 8,890 | CIGNA Corporation | 1,185,837 | ||||||
| 1,690 | Cooper Companies, Inc. | 295,632 | ||||||
The accompanying Notes to Financial Statements are an integral part of this schedule.
169
Table of Contents
LARGE CAP INDEX PORTFOLIO
Schedule of Investments as of December 31, 2016
| Shares | Common Stock (97.0%) | Value | ||||||
Health Care (13.1%) - continued | ||||||||
| 21,300 | Danaher Corporation | $ | 1,657,992 | |||||
| 5,490 | DaVita, Inc.a | 352,458 | ||||||
| 8,030 | Dentsply Sirona, Inc. | 463,572 | ||||||
| 7,430 | Edwards Lifesciences Corporationa | 696,191 | ||||||
| 33,620 | Eli Lilly and Company | 2,472,751 | ||||||
| 6,810 | Endo International plca | 112,161 | ||||||
| 4,040 | Envision Healthcare Corporationa | 255,692 | ||||||
| 21,525 | Express Scripts Holding Companya | 1,480,705 | ||||||
| 45,770 | Gilead Sciences, Inc. | 3,277,590 | ||||||
| 10,270 | HCA Holdings, Inc.a | 760,185 | ||||||
| 2,810 | Henry Schein, Inc.a | 426,305 | ||||||
| 9,610 | Hologic, Inc.a | 385,553 | ||||||
| 5,250 | Humana, Inc. | 1,071,158 | ||||||
| 5,120 | Illumina, Inc.a | 655,565 | ||||||
| 1,360 | Intuitive Surgical, Inc.a | 862,471 | ||||||
| 94,490 | Johnson & Johnson | 10,886,193 | ||||||
| 3,560 | Laboratory Corporation of America Holdingsa | 457,033 | ||||||
| 3,660 | Mallinckrodt, LLCa | 182,341 | ||||||
| 7,832 | McKesson Corporation | 1,100,004 | ||||||
| 47,899 | Medtronic plc | 3,411,846 | ||||||
| 97,123 | Merck & Company, Inc. | 5,717,631 | ||||||
| 910 | Mettler-Toledo International, Inc.a | 380,890 | ||||||
| 15,930 | Mylan NVa | 607,730 | ||||||
| 2,920 | Patterson Companies, Inc. | 119,808 | ||||||
| 3,790 | PerkinElmer, Inc. | 197,648 | ||||||
| 4,850 | Perrigo Company plc | 403,665 | ||||||
| 211,320 | Pfizer, Inc. | 6,863,674 | ||||||
| 4,830 | Quest Diagnostics, Inc. | 443,877 | ||||||
| 2,620 | Regeneron Pharmaceuticals, Inc.a | 961,776 | ||||||
| 9,944 | St. Jude Medical, Inc. | 797,409 | ||||||
| 10,840 | Stryker Corporation | 1,298,740 | ||||||
| 13,760 | Thermo Fisher Scientific, Inc. | 1,941,536 | ||||||
| 33,460 | UnitedHealth Group, Inc. | 5,354,938 | ||||||
| 3,120 | Universal Health Services, Inc. | 331,906 | ||||||
| 3,240 | Varian Medical Systems, Inc.a | 290,887 | ||||||
| 8,620 | Vertex Pharmaceuticals, Inc.a | 635,035 | ||||||
| 2,800 | Waters Corporationa | 376,292 | ||||||
| 6,990 | Zimmer Biomet Holdings, Inc. | 721,368 | ||||||
| 17,080 | Zoetis, Inc. | 914,292 | ||||||
|
| |||||||
Total | 90,872,440 | |||||||
|
| |||||||
Industrials (9.9%) | ||||||||
| 20,960 | 3M Company | 3,742,827 | ||||||
| 1,540 | Acuity Brands, Inc. | 355,524 | ||||||
| 4,250 | Alaska Air Group, Inc. | 377,103 | ||||||
| 3,301 | Allegion plc | 211,264 | ||||||
| 17,960 | American Airlines Group, Inc. | 838,552 | ||||||
| 8,070 | AMETEK, Inc. | 392,202 | ||||||
| 15,501 | Arconic, Inc. | 287,389 | ||||||
| 19,780 | Boeing Company | 3,079,350 | ||||||
| 4,910 | C.H. Robinson Worldwide, Inc. | 359,707 | ||||||
| 20,620 | Caterpillar, Inc. | 1,912,299 | ||||||
| 2,980 | Cintas Corporation | 344,369 | ||||||
| 32,540 | CSX Corporation | 1,169,162 | ||||||
| 5,320 | Cummins, Inc. | 727,084 | ||||||
| 10,000 | Deere & Company | 1,030,400 | ||||||
| 25,620 | Delta Air Lines, Inc. | 1,260,248 | ||||||
| 5,390 | Dover Corporation | 403,873 | ||||||
| 1,270 | Dun & Bradstreet Corporation | 154,076 | ||||||
| 15,744 | Eaton Corporation plc | 1,056,265 | ||||||
| 22,230 | Emerson Electric Company | 1,239,322 | ||||||
| 4,190 | Equifax, Inc. | 495,384 | ||||||
| 6,270 | Expeditors International of Washington, Inc. | 332,059 | ||||||
| 10,070 | Fastenal Company | 473,089 | ||||||
| 8,520 | FedEx Corporation | 1,586,424 | ||||||
| 2,710 | First Solar, Inc.a | 86,964 | ||||||
| 4,530 | Flowserve Corporation | 217,667 | ||||||
| 4,810 | Fluor Corporation | 252,621 | ||||||
| 10,535 | Fortive Corporation | 564,992 | ||||||
| 5,370 | Fortune Brands Home and Security, Inc. | 287,080 | ||||||
| 9,980 | General Dynamics Corporation | 1,723,147 | ||||||
| 307,567 | General Electric Company | 9,719,117 | ||||||
| 26,345 | Honeywell International, Inc. | 3,052,068 | ||||||
| 10,990 | Illinois Tool Works, Inc. | 1,345,835 | ||||||
| 9,000 | Ingersoll-Rand plc | 675,360 | ||||||
| 4,180 | Jacobs Engineering Group, Inc.a | 238,260 | ||||||
| 3,050 | JB Hunt Transport Services, Inc. | 296,064 | ||||||
| 32,505 | Johnson Controls International plc | 1,338,881 | ||||||
| 3,770 | Kansas City Southern | 319,884 | ||||||
| 2,710 | L-3 Communications Holdings, Inc. | 412,218 | ||||||
| 8,770 | Lockheed Martin Corporation | 2,191,974 | ||||||
| 11,250 | Masco Corporation | 355,725 | ||||||
| 11,710 | Nielsen Holdings plc | 491,234 | ||||||
| 10,170 | Norfolk Southern Corporation | 1,099,072 | ||||||
| 6,138 | Northrop Grumman Corporation | 1,427,576 | ||||||
| 12,177 | PACCAR, Inc. | 778,110 | ||||||
| 4,645 | Parker Hannifin Corporation | 650,300 | ||||||
| 5,759 | Pentair, Ltd. | 322,907 | ||||||
| 6,480 | Pitney Bowes, Inc. | 98,431 | ||||||
| 5,260 | Quanta Services, Inc.a | 183,311 | ||||||
| 10,250 | Raytheon Company | 1,455,500 | ||||||
| 7,970 | Republic Services, Inc. | 454,688 | ||||||
| 4,470 | Robert Half International, Inc. | 218,047 | ||||||
| 4,440 | Rockwell Automation, Inc. | 596,736 | ||||||
| 4,510 | Rockwell Collins, Inc. | 418,348 | ||||||
| 3,530 | Roper Industries, Inc. | 646,272 | ||||||
| 1,840 | Ryder System, Inc. | 136,970 | ||||||
| 21,370 | Southwest Airlines Company | 1,065,081 | ||||||
| 5,210 | Stanley Black & Decker, Inc. | 597,535 | ||||||
| 2,950 | Stericycle, Inc.a | 227,268 | ||||||
| 9,350 | Textron, Inc. | 454,036 | ||||||
| 1,740 | TransDigm Group, Inc. | 433,190 | ||||||
| 28,680 | Union Pacific Corporation | 2,973,542 | ||||||
| 10,120 | United Continental Holdings, Inc.a | 737,546 | ||||||
| 23,920 | United Parcel Service, Inc. | 2,742,189 | ||||||
| 2,910 | United Rentals, Inc.a | 307,238 | ||||||
| 26,280 | United Technologies Corporation | 2,880,814 | ||||||
| 5,410 | Verisk Analytics, Inc.a | 439,130 | ||||||
| 1,920 | W.W. Grainger, Inc. | 445,920 | ||||||
| 14,009 | Waste Management, Inc. | 993,378 | ||||||
| 6,240 | Xylem, Inc. | 309,005 | ||||||
|
| |||||||
Total | 68,489,203 | |||||||
|
| |||||||
Information Technology (20.2%) | ||||||||
| 21,440 | Accenture plc | 2,511,267 | ||||||
| 23,790 | Activision Blizzard, Inc. | 859,057 | ||||||
| 17,160 | Adobe Systems, Inc.a | 1,766,622 | ||||||
| 11,265 | Agilent Technologies, Inc. | 513,233 | ||||||
| 6,030 | Akamai Technologies, Inc.a | 402,080 | ||||||
| 1,990 | Alliance Data Systems Corporation | 454,715 | ||||||
| 10,300 | Alphabet, Inc., Class Aa | 8,162,235 | ||||||
| 10,309 | Alphabet, Inc., Class Ca | 7,956,692 | ||||||
| 10,720 | Amphenol Corporation | 720,384 | ||||||
| 10,660 | Analog Devices, Inc. | 774,129 | ||||||
| 184,890 | Apple, Inc. | 21,413,960 | ||||||
| 37,630 | Applied Materials, Inc. | 1,214,320 | ||||||
| 6,800 | Autodesk, Inc.a | 503,268 | ||||||
| 15,680 | Automatic Data Processing, Inc. | 1,611,590 | ||||||
| 13,813 | Broadcom, Ltd. | 2,441,724 | ||||||
| 10,842 | CA, Inc. | 344,450 | ||||||
| 175,130 | Cisco Systems, Inc. | 5,292,429 | ||||||
The accompanying Notes to Financial Statements are an integral part of this schedule.
170
Table of Contents
LARGE CAP INDEX PORTFOLIO
Schedule of Investments as of December 31, 2016
| Shares | Common Stock (97.0%) | Value | ||||||
Information Technology (20.2%) - continued | ||||||||
| 5,410 | Citrix Systems, Inc.a | $ | 483,167 | |||||
| 20,980 | Cognizant Technology Solutions Corporationa | 1,175,509 | ||||||
| 4,950 | Computer Sciences Government Services, Inc. | 157,608 | ||||||
| 32,890 | Corning, Inc. | 798,240 | ||||||
| 36,110 | eBay, Inc.a | 1,072,106 | ||||||
| 10,440 | Electronic Arts, Inc.a | 822,254 | ||||||
| 2,270 | F5 Networks, Inc.a | 328,514 | ||||||
| 81,920 | Facebook, Inc.a | 9,424,896 | ||||||
| 11,420 | Fidelity National Information Services, Inc. | 863,809 | ||||||
| 7,520 | Fiserv, Inc.a | 799,226 | ||||||
| 4,740 | FLIR Systems, Inc. | 171,541 | ||||||
| 5,280 | Global Payments, Inc. | 366,485 | ||||||
| 4,310 | Harris Corporation | 441,646 | ||||||
| 57,636 | Hewlett Packard Enterprise Company | 1,333,697 | ||||||
| 59,626 | HP, Inc. | 884,850 | ||||||
| 164,020 | Intel Corporation | 5,949,005 | ||||||
| 30,230 | International Business Machines Corporation | 5,017,878 | ||||||
| 8,460 | Intuit, Inc. | 969,601 | ||||||
| 13,170 | Juniper Networks, Inc. | 372,184 | ||||||
| 5,310 | KLA-Tencor Corporation | 417,791 | ||||||
| 5,510 | Lam Research Corporation | 582,572 | ||||||
| 8,360 | Linear Technology Corporation | 521,246 | ||||||
| 33,010 | MasterCard, Inc. | 3,408,283 | ||||||
| 7,500 | Microchip Technology, Inc. | 481,125 | ||||||
| 36,080 | Micron Technology, Inc.a | 790,874 | ||||||
| 268,310 | Microsoft Corporation | 16,672,783 | ||||||
| 5,795 | Motorola Solutions, Inc. | 480,348 | ||||||
| 9,570 | NetApp, Inc. | 337,534 | ||||||
| 18,870 | NVIDIA Corporation | 2,014,184 | ||||||
| 105,177 | Oracle Corporation | 4,044,056 | ||||||
| 11,140 | Paychex, Inc. | 678,203 | ||||||
| 39,020 | PayPal Holdings, Inc.a | 1,540,119 | ||||||
| 4,410 | Qorvo, Inc.a | 232,539 | ||||||
| 51,090 | QUALCOMM, Inc. | 3,331,068 | ||||||
| 6,250 | Red Hat, Inc.a | 435,625 | ||||||
| 22,250 | Salesforce.com, Inc.a | 1,523,235 | ||||||
| 10,380 | Seagate Technology plc | 396,205 | ||||||
| 6,410 | Skyworks Solutions, Inc. | 478,571 | ||||||
| 21,684 | Symantec Corporation | 518,031 | ||||||
| 12,330 | TE Connectivity, Ltd. | 854,222 | ||||||
| 4,530 | Teradata Corporationa | 123,080 | ||||||
| 34,500 | Texas Instruments, Inc. | 2,517,465 | ||||||
| 5,760 | Total System Services, Inc. | 282,413 | ||||||
| 3,160 | VeriSign, Inc.a,b | 240,381 | ||||||
| 65,060 | Visa, Inc. | 5,075,981 | ||||||
| 9,883 | Western Digital Corporation | 671,550 | ||||||
| 16,540 | Western Union Company | 359,249 | ||||||
| 29,635 | Xerox Corporation | 258,714 | ||||||
| 8,730 | Xilinx, Inc. | 527,030 | ||||||
| 30,570 | Yahoo!, Inc.a | 1,182,142 | ||||||
|
| |||||||
Total | 139,350,990 | |||||||
|
| |||||||
Materials (2.6%) | ||||||||
| 7,580 | Air Products and Chemicals, Inc. | 1,090,155 | ||||||
| 3,940 | Albemarle Corporation | 339,155 | ||||||
| 3,100 | Avery Dennison Corporation | 217,682 | ||||||
| 6,140 | Ball Corporation | 460,930 | ||||||
| 8,210 | CF Industries Holdings, Inc. | 258,451 | ||||||
| 38,873 | Dow Chemical Company | 2,224,313 | ||||||
| 30,221 | E.I. du Pont de Nemours and Company | 2,218,221 | ||||||
| 5,120 | Eastman Chemical Company | 385,075 | ||||||
| 9,110 | Ecolab, Inc. | 1,067,874 | ||||||
| 4,680 | FMC Corporation | 264,701 | ||||||
| 44,292 | Freeport-McMoRan, Inc.a | 584,212 | ||||||
| 2,770 | International Flavors & Fragrances, Inc. | 326,389 | ||||||
| 14,351 | International Paper Company | 761,464 | ||||||
| 11,650 | LyondellBasell Industries NV | 999,337 | ||||||
| 2,220 | Martin Marietta Materials, Inc. | 491,797 | ||||||
| 15,278 | Monsanto Company | 1,607,398 | ||||||
| 12,430 | Mosaic Company | 364,572 | ||||||
| 18,678 | Newmont Mining Corporation | 636,360 | ||||||
| 11,210 | Nucor Corporation | 667,219 | ||||||
| 9,140 | PPG Industries, Inc. | 866,106 | ||||||
| 9,940 | Praxair, Inc. | 1,164,869 | ||||||
| 6,732 | Sealed Air Corporation | 305,229 | ||||||
| 4,670 | Vulcan Materials Company | 584,451 | ||||||
| 8,759 | Westrock Company | 444,694 | ||||||
|
| |||||||
Total | 18,330,654 | |||||||
|
| |||||||
Real Estate (2.8%) | ||||||||
| 14,790 | American Tower Corporation | 1,563,007 | ||||||
| 5,436 | Apartment Investment & Management Company | 247,066 | ||||||
| 4,781 | AvalonBay Communities, Inc. | 846,954 | ||||||
| 5,280 | Boston Properties, Inc. | 664,118 | ||||||
| 10,340 | CBRE Group, Inc.a | 325,607 | ||||||
| 12,500 | Crown Castle International Corporation | 1,084,625 | ||||||
| 5,500 | Digital Realty Trust, Inc. | 540,430 | ||||||
| 2,476 | Equinix, Inc. | 884,947 | ||||||
| 12,760 | Equity Residential | 821,234 | ||||||
| 2,260 | Essex Property Trust, Inc. | 525,450 | ||||||
| 4,380 | Extra Space Storage, Inc. | 338,311 | ||||||
| 2,470 | Federal Realty Investment Trust | 351,012 | ||||||
| 20,260 | General Growth Properties, Inc. | 506,095 | ||||||
| 15,960 | HCP, Inc. | 474,331 | ||||||
| 25,781 | Host Hotels & Resorts, Inc. | 485,714 | ||||||
| 8,542 | Iron Mountain, Inc. | 277,444 | ||||||
| 14,690 | Kimco Realty Corporation | 369,600 | ||||||
| 4,170 | Macerich Company | 295,403 | ||||||
| 3,930 | Mid-America Apartment Communities, Inc. | 384,826 | ||||||
| 18,276 | Prologis, Inc. | 964,790 | ||||||
| 5,170 | Public Storage, Inc. | 1,155,495 | ||||||
| 8,850 | Realty Income Corporation | 508,698 | ||||||
| 10,864 | Simon Property Group, Inc. | 1,930,207 | ||||||
| 3,520 | SL Green Realty Corporation | 378,576 | ||||||
| 9,270 | UDR, Inc. | 338,170 | ||||||
| 12,220 | Ventas, Inc. | 763,994 | ||||||
| 5,947 | Vornado Realty Trust | 620,688 | ||||||
| 12,420 | Welltower, Inc. | 831,271 | ||||||
| 25,930 | Weyerhaeuser Company | 780,234 | ||||||
|
| |||||||
Total | 19,258,297 | |||||||
|
| |||||||
Telecommunications Services (2.6%) | ||||||||
| 213,566 | AT&T, Inc. | 9,082,962 | ||||||
| 19,035 | CenturyLink, Inc. | 452,652 | ||||||
| 41,028 | Frontier Communications Corporationb | 138,675 | ||||||
| 10,131 | Level 3 Communications, Inc.a | 570,983 | ||||||
| 141,336 | Verizon Communications, Inc. | 7,544,516 | ||||||
|
| |||||||
Total | 17,789,788 | |||||||
|
| |||||||
Utilities (3.1%) | ||||||||
| 22,850 | AES Corporation | 265,517 | ||||||
| 7,920 | Alliant Energy Corporation | 300,089 | ||||||
| 8,450 | Ameren Corporation | 443,287 | ||||||
| 17,150 | American Electric Power Company, Inc. | 1,079,764 | ||||||
The accompanying Notes to Financial Statements are an integral part of this schedule.
171
Table of Contents
LARGE CAP INDEX PORTFOLIO
Schedule of Investments as of December 31, 2016
| Shares | Common Stock (97.0%) | Value | ||||||
Utilities (3.1%) - continued | ||||||||
| 6,180 | American Water Works Company, Inc. | $ | 447,185 | |||||
| 14,923 | CenterPoint Energy, Inc. | 367,703 | ||||||
| 9,730 | CMS Energy Corporation | 404,963 | ||||||
| 10,600 | Consolidated Edison, Inc. | 781,008 | ||||||
| 21,794 | Dominion Resources, Inc. | 1,669,202 | ||||||
| 6,270 | DTE Energy Company | 617,658 | ||||||
| 24,022 | Duke Energy Corporation | 1,864,588 | ||||||
| 11,420 | Edison International, Inc. | 822,126 | ||||||
| 6,250 | Entergy Corporation | 459,187 | ||||||
| 11,000 | Eversource Energy | 607,530 | ||||||
| 32,284 | Exelon Corporation | 1,145,759 | ||||||
| 14,914 | FirstEnergy Corporation | 461,886 | ||||||
| 16,320 | NextEra Energy, Inc. | 1,949,587 | ||||||
| 11,199 | NiSource, Inc. | 247,946 | ||||||
| 10,920 | NRG Energy, Inc. | 133,879 | ||||||
| 17,670 | PG&E Corporation | 1,073,806 | ||||||
| 3,870 | Pinnacle West Capital Corporation | 301,976 | ||||||
| 23,700 | PPL Corporation | 806,985 | ||||||
| 17,740 | Public Service Enterprise Group, Inc. | 778,431 | ||||||
| 4,970 | SCANA Corporation | 364,202 | ||||||
| 8,695 | Sempra Energy | 875,065 | ||||||
| 34,120 | Southern Company | 1,678,363 | ||||||
| 11,026 | WEC Energy Group, Inc. | 646,675 | ||||||
| 17,745 | Xcel Energy, Inc. | 722,221 | ||||||
|
| |||||||
Total | 21,316,588 | |||||||
|
| |||||||
Total Common Stock (cost $434,891,692) | 670,369,861 | |||||||
|
| |||||||
Collateral Held for Securities Loaned (0.1%) | ||||||||
| 848,560 | Thrivent Cash Management Trust | 848,560 | ||||||
|
| |||||||
Total Collateral Held for Securities Loaned (cost $848,560) | 848,560 | |||||||
|
| |||||||
| Shares or Principal Amount | Short-Term Investments (2.9%)d | |||||||
Federal Home Loan Bank Discount Notes | ||||||||
| 500,000 | 0.435%, 1/25/2017e | 499,884 | ||||||
| 300,000 | 0.418%, 2/1/2017e | 299,879 | ||||||
| 100,000 | 0.515%, 2/9/2017e | 99,949 | ||||||
| 200,000 | 0.490%, 2/10/2017e | 199,894 | ||||||
Federal National Mortgage Association Discount Notes | ||||||||
| 100,000 | 0.345%, 1/11/2017e | 99,992 | ||||||
Thrivent Core Short-Term Reserve Fund | ||||||||
| 1,854,264 | 0.910% | 18,542,637 | ||||||
|
| |||||||
Total Short-Term Investments (cost $19,742,210) | 19,742,235 | |||||||
|
| |||||||
Total Investments (cost $455,482,462) 100.0% | $ | 690,960,656 | ||||||
|
| |||||||
Other Assets and Liabilities, Net <0.1% | 336,374 | |||||||
|
| |||||||
Total Net Assets 100.0% | $ | 691,297,030 | ||||||
|
| |||||||
| a | Non-income producing security. |
| b | All or a portion of the security is on loan. |
| c | Security is valued at fair value. Market quotations or prices were not readily available or were determined to be unreliable. Fair value was determined in good faith pursuant to procedures adopted by the Board. Further information on fair valuation can be found in the Notes to Financial Statements. |
| d | The interest rate shown reflects the yield, coupon rate or the discount rate at the date of purchase. |
| e | All or a portion of the security is held on deposit with the counterparty and pledged as the initial margin deposit for open futures contracts. |
The following table presents the total amount of securities loaned with continuous maturity, by type, offset by the gross payable upon return of collateral for securities loaned by Thrivent Large Cap Index Portfolio as of December 31, 2016:
Securities Lending Transactions
Common Stock | $ | 824,413 | ||
|
| |||
Total lending | $ | 824,413 | ||
Gross amount payable upon return of collateral for securities loaned | $ | 848,560 | ||
|
| |||
Net amounts due to counterparty | $ | 24,147 |
The accompanying Notes to Financial Statements are an integral part of this schedule.
172
Table of Contents
HIGH YIELD PORTFOLIO
Schedule of Investments as of December 31, 2016
| Principal Amount | Bank Loans (2.2%)a | Value | ||||||
Basic Materials (0.3%) | ||||||||
Fortescue Metals Group, Ltd., Term Loan | ||||||||
| $ | 2,350,662 | 3.750%, 6/30/2019 | $ | 2,355,363 | ||||
|
| |||||||
| Total | 2,355,363 | |||||||
|
| |||||||
Capital Goods (0.3%) | ||||||||
Cortes NP Acquisition Corporation, Term Loan | ||||||||
| 2,300,000 | 6.000%, 11/30/2023 | 2,328,750 | ||||||
|
| |||||||
| Total | 2,328,750 | |||||||
|
| |||||||
Consumer Cyclical (1.5%) | ||||||||
IMG Worldwide, Inc., Term Loan | ||||||||
| 3,250,000 | 8.250%, 5/6/2022 | 3,290,625 | ||||||
Mohegan Tribal Gaming Authority, Term Loan | ||||||||
| 3,296,538 | 5.500%, 10/13/2023 | 3,319,218 | ||||||
Scientific Games International, Inc., Term Loan | ||||||||
| 4,949,000 | 6.000%, 10/1/2021 | 5,007,794 | ||||||
|
| |||||||
| Total | 11,617,637 | |||||||
|
| |||||||
Energy (0.1%) | ||||||||
Chesapeake Energy Corporation, Term Loan | ||||||||
| 1,050,000 | 8.500%, 8/23/2021 | 1,141,434 | ||||||
|
| |||||||
| Total | 1,141,434 | |||||||
|
| |||||||
Total Bank Loans (cost $16,833,125) | 17,443,184 | |||||||
|
| |||||||
Long-Term Fixed Income (92.1%) | ||||||||
Asset-Backed Securities (0.1%) | ||||||||
Renaissance Home Equity Loan Trust | ||||||||
5.746%, 5/25/2036, Series | ||||||||
| 1,713,277 | 2006-1, Class AF6b | 1,124,199 | ||||||
|
| |||||||
| Total | 1,124,199 | |||||||
|
| |||||||
Basic Materials (4.4%) | ||||||||
Alcoa Nederland Holding BV | ||||||||
| 1,575,000 | 6.750%, 9/30/2024c | 1,708,875 | ||||||
| 1,575,000 | 7.000%, 9/30/2026c | 1,724,625 | ||||||
ArcelorMittal SA | ||||||||
| 2,065,000 | 6.500%, 3/1/2021d | 2,261,175 | ||||||
Bluescope Steel Finance, Ltd. | ||||||||
| 2,620,000 | 6.500%, 5/15/2021c | 2,776,152 | ||||||
First Quantum Minerals, Ltd. | ||||||||
| 2,205,000 | 6.750%, 2/15/2020c | 2,199,487 | ||||||
| 2,140,000 | 7.000%, 2/15/2021c | 2,128,444 | ||||||
GCP Applied Technologies, Inc. | ||||||||
| 1,440,000 | 9.500%, 2/1/2023c | 1,652,400 | ||||||
Hudbay Minerals, Inc. | ||||||||
| 375,000 | 7.250%, 1/15/2023c | 388,125 | ||||||
| 750,000 | 7.625%, 1/15/2025c | 779,535 | ||||||
INEOS Group Holdings SA | ||||||||
| 3,145,000 | 5.625%, 8/1/2024c,d | 3,121,413 | ||||||
Midwest Vanadium, Pty. Ltd. | ||||||||
| 3,268,453 | 11.500%, 2/15/2018*,e | 49,027 | ||||||
Novelis Corporation | ||||||||
| 1,570,000 | 6.250%, 8/15/2024c | 1,664,200 | ||||||
| 2,240,000 | 5.875%, 9/30/2026c | 2,262,400 | ||||||
PQ Corporation | ||||||||
| 1,050,000 | 6.750%, 11/15/2022c | 1,123,500 | ||||||
Resolute Forest Products, Inc. | ||||||||
| 3,815,000 | 5.875%, 5/15/2023d | 3,433,500 | ||||||
Teck Resources, Ltd. | ||||||||
| 1,570,000 | 8.000%, 6/1/2021c | 1,727,000 | ||||||
| 1,050,000 | 8.500%, 6/1/2024c,d | 1,210,125 | ||||||
Tembec Industries, Inc. | ||||||||
| 3,155,000 | 9.000%, 12/15/2019c | 2,949,925 | ||||||
Versum Materials, Inc. | ||||||||
| 1,570,000 | 5.500%, 9/30/2024c | 1,605,325 | ||||||
|
| |||||||
| Total | 34,765,233 | |||||||
|
| |||||||
Capital Goods (8.1%) | ||||||||
Abengoa Finance SAU | ||||||||
| 3,250,000 | 7.750%, 2/1/2020*,f | 146,250 | ||||||
Abengoa Greenfield SA | ||||||||
| 3,460,000 | 6.500%, 10/1/2019*,f | 155,700 | ||||||
Advanced Disposal Services, Inc. | ||||||||
| 3,155,000 | 5.625%, 11/15/2024c | 3,139,225 | ||||||
AECOM | ||||||||
| 4,240,000 | 5.750%, 10/15/2022 | 4,481,680 | ||||||
| 1,065,000 | 5.875%, 10/15/2024 | 1,137,005 | ||||||
Anixter, Inc. | ||||||||
| 3,455,000 | 5.125%, 10/1/2021 | 3,593,200 | ||||||
Ardagh Packaging Finance plc | ||||||||
| 4,190,000 | 7.250%, 5/15/2024c | 4,415,212 | ||||||
Berry Plastics Corporation | ||||||||
| 6,370,000 | 5.125%, 7/15/2023 | 6,481,475 | ||||||
Bombardier, Inc. | ||||||||
| 4,195,000 | 7.500%, 3/15/2025c | 4,144,744 | ||||||
Building Materials Corporation of America | ||||||||
| 3,990,000 | 6.000%, 10/15/2025c | 4,199,475 | ||||||
Cemex Finance, LLC | ||||||||
| 2,245,000 | 9.375%, 10/12/2022c | 2,447,050 | ||||||
Cemex SAB de CV | ||||||||
| 2,750,000 | 5.700%, 1/11/2025c,d | 2,770,625 | ||||||
CNH Industrial Capital, LLC | ||||||||
| 1,800,000 | 4.375%, 11/6/2020d | 1,847,250 | ||||||
CNH Industrial NV | ||||||||
| 1,800,000 | 4.500%, 8/15/2023 | 1,777,500 | ||||||
CNH Industrial Capital, LLC | ||||||||
| 1,680,000 | 3.625%, 4/15/2018 | 1,701,000 | ||||||
Eagle Materials, Inc. | ||||||||
| 1,570,000 | 4.500%, 8/1/2026 | 1,566,075 | ||||||
Huntington Ingalls Industries, Inc. | ||||||||
| 2,650,000 | 5.000%, 11/15/2025c | 2,752,687 | ||||||
Owens-Brockway Glass Container, Inc. | ||||||||
| 3,070,000 | 5.875%, 8/15/2023c | 3,200,475 | ||||||
Reynolds Group Issuer, Inc. | ||||||||
| 912,067 | 8.250%, 2/15/2021 | 941,709 | ||||||
| 2,175,000 | 5.125%, 7/15/2023c | 2,210,344 | ||||||
Ritchie Bros. Auctioneers, Inc. | ||||||||
| 1,455,000 | 5.375%, 1/15/2025c | 1,484,100 | ||||||
U.S. Concrete, Inc. | ||||||||
| 2,880,000 | 6.375%, 6/1/2024 | 3,045,600 | ||||||
United Rentals North America, Inc. | ||||||||
| 1,625,000 | 6.125%, 6/15/2023 | 1,722,500 | ||||||
| 1,660,000 | 5.500%, 7/15/2025 | 1,693,200 | ||||||
| 2,620,000 | 5.875%, 9/15/2026 | 2,695,325 | ||||||
|
| |||||||
| Total | 63,749,406 | |||||||
|
| |||||||
Communications Services (18.3%) | ||||||||
Altice Financing SA | ||||||||
| 1,840,000 | 6.625%, 2/15/2023c | 1,890,600 | ||||||
| 3,145,000 | 7.500%, 5/15/2026c | 3,270,800 | ||||||
Altice Finco SA | ||||||||
| 1,050,000 | 9.875%, 12/15/2020c,d | 1,107,750 | ||||||
| 540,000 | 8.125%, 1/15/2024c | 558,900 | ||||||
The accompanying Notes to Financial Statements are an integral part of this schedule.
173
Table of Contents
HIGH YIELD PORTFOLIO
Schedule of Investments as of December 31, 2016
| Principal Amount | Long-Term Fixed Income (92.1%) | Value | ||||||
Communications Services (18.3%) - continued | ||||||||
Altice US Finance I Corporation | ||||||||
| $ | 2,900,000 | 5.500%, 5/15/2026c | $ | 2,958,000 | ||||
AMC Networks, Inc. | ||||||||
| 3,800,000 | 4.750%, 12/15/2022 | 3,819,000 | ||||||
| 3,100,000 | 5.000%, 4/1/2024 | 3,107,750 | ||||||
CBS Radio, Inc. | ||||||||
| 3,155,000 | 7.250%, 11/1/2024c | 3,296,975 | ||||||
CCO Holdings, LLC | ||||||||
| 2,165,000 | 5.250%, 3/15/2021 | 2,229,950 | ||||||
| 2,165,000 | 5.250%, 9/30/2022 | 2,240,775 | ||||||
| 5,500,000 | 5.875%, 4/1/2024c | 5,871,250 | ||||||
CCOH Safari, LLC | ||||||||
| 2,500,000 | 5.750%, 2/15/2026c | 2,587,500 | ||||||
CenturyLink, Inc. | ||||||||
| 1,315,000 | 7.500%, 4/1/2024 | 1,380,750 | ||||||
Cincinnati Bell, Inc. | ||||||||
| 2,650,000 | 7.000%, 7/15/2024c | 2,802,375 | ||||||
Clear Channel Worldwide Holdings, Inc. | ||||||||
| 3,195,000 | 6.500%, 11/15/2022 | 3,266,888 | ||||||
Columbus International, Inc. | ||||||||
| 5,060,000 | 7.375%, 3/30/2021c | 5,384,548 | ||||||
CSC Holdings, LLC | ||||||||
| 820,000 | 5.500%, 4/15/2027c | 830,250 | ||||||
Digicel, Ltd. | ||||||||
| 1,680,000 | 7.000%, 2/15/2020* | 1,581,955 | ||||||
| 3,220,000 | 6.000%, 4/15/2021* | 2,911,556 | ||||||
Frontier Communications Corporation | ||||||||
| 6,963,000 | 10.500%, 9/15/2022 | 7,320,202 | ||||||
Gray Television, Inc. | ||||||||
| 3,560,000 | 5.875%, 7/15/2026c | 3,533,300 | ||||||
Hughes Satellite Systems Corporation | ||||||||
| 6,810,000 | 6.625%, 8/1/2026c | 6,844,050 | ||||||
Level 3 Escrow II, Inc. | ||||||||
| 3,000,000 | 5.375%, 8/15/2022 | 3,097,500 | ||||||
Level 3 Financing, Inc. | ||||||||
| 1,620,000 | 6.125%, 1/15/2021 | 1,680,750 | ||||||
McGraw-Hill Global Education Holdings, LLC | ||||||||
| 3,145,000 | 7.875%, 5/15/2024c,d | 3,168,588 | ||||||
Neptune Finco Corporation | ||||||||
| 5,630,000 | 10.875%, 10/15/2025c | 6,699,700 | ||||||
Nexstar Escrow Corporation | ||||||||
| 3,500,000 | 5.625%, 8/1/2024c | 3,473,750 | ||||||
SFR Group SA | ||||||||
| 3,590,000 | 6.000%, 5/15/2022c | 3,684,237 | ||||||
| 2,710,000 | 6.250%, 5/15/2024c | 2,723,550 | ||||||
| 2,620,000 | 7.375%, 5/1/2026c | 2,675,675 | ||||||
Sinclair Television Group, Inc. | ||||||||
| 1,570,000 | 5.875%, 3/15/2026c | 1,573,925 | ||||||
Sprint Communications, Inc. | ||||||||
| 2,870,000 | 7.000%, 3/1/2020c | 3,113,950 | ||||||
| 5,130,000 | 6.000%, 11/15/2022 | 5,168,475 | ||||||
Sprint Corporation | ||||||||
| 12,615,000 | 7.625%, 2/15/2025d | 13,261,519 | ||||||
T-Mobile USA, Inc. | ||||||||
| 3,790,000 | 6.542%, 4/28/2020 | 3,903,700 | ||||||
| 3,450,000 | 6.000%, 4/15/2024 | 3,635,438 | ||||||
Unitymedia Hessen GmbH & Company KG | ||||||||
| 5,100,000 | 5.500%, 1/15/2023c | 5,310,375 | ||||||
Virgin Media Secured Finance plc | ||||||||
| 1,170,000 | 5.250%, 1/15/2026c | 1,155,375 | ||||||
| 1,050,000 | 5.500%, 8/15/2026c | 1,047,375 | ||||||
WMG Acquisition Corporation | ||||||||
| 4,039,000 | 6.750%, 4/15/2022c | 4,251,047 | ||||||
| 785,000 | 5.000%, 8/1/2023c | 788,925 | ||||||
Zayo Group, LLC | ||||||||
| 3,925,000 | 6.375%, 5/15/2025 | 4,101,625 | ||||||
Ziggo Bond Finance BV | ||||||||
| 1,320,000 | 5.875%, 1/15/2025c | 1,320,000 | ||||||
|
| |||||||
| Total | 144,630,603 | |||||||
|
| |||||||
Consumer Cyclical (14.9%) | ||||||||
Allison Transmission, Inc. | ||||||||
| 3,835,000 | 5.000%, 10/1/2024c | 3,873,350 | ||||||
Argos Merger Sub, Inc. | ||||||||
| 4,730,000 | 7.125%, 3/15/2023c,d | 4,824,600 | ||||||
Beazer Homes USA, Inc. | ||||||||
| 1,040,000 | 8.750%, 3/15/2022c | 1,123,200 | ||||||
Brookfield Residential Properties, Inc. | ||||||||
| 3,960,000 | 6.125%, 7/1/2022c | 3,979,800 | ||||||
Choice Hotels International, Inc. | ||||||||
| 3,445,000 | 5.750%, 7/1/2022 | 3,677,538 | ||||||
Churchill Downs, Inc. | ||||||||
| 3,536,000 | 5.375%, 12/15/2021 | 3,668,600 | ||||||
Cinemark USA, Inc. | ||||||||
| 4,475,000 | 4.875%, 6/1/2023 | 4,530,938 | ||||||
CST Brands, Inc. | ||||||||
| 2,110,000 | 5.000%, 5/1/2023 | 2,178,575 | ||||||
Dana Financing Luxembourg SARL | ||||||||
| 3,925,000 | 6.500%, 6/1/2026c,d | 4,101,625 | ||||||
Dollar Tree, Inc. | ||||||||
| 2,120,000 | 5.750%, 3/1/2023 | 2,244,698 | ||||||
Goodyear Tire & Rubber Company | ||||||||
| 3,150,000 | 5.000%, 5/31/2026 | 3,135,636 | ||||||
Hanesbrands, Inc. | ||||||||
| 1,950,000 | 4.875%, 5/15/2026c | 1,906,125 | ||||||
Hilton Escrow Issuer, LLC | ||||||||
| 2,650,000 | 4.250%, 9/1/2024c | 2,570,500 | ||||||
KB Home | ||||||||
| 1,070,000 | 7.250%, 6/15/2018 | 1,134,200 | ||||||
| 2,000,000 | 8.000%, 3/15/2020d | 2,200,000 | ||||||
| 1,580,000 | 7.500%, 9/15/2022 | 1,666,900 | ||||||
L Brands, Inc. | ||||||||
| 1,570,000 | 6.625%, 4/1/2021 | 1,762,325 | ||||||
| 1,860,000 | 5.625%, 2/15/2022 | 1,985,550 | ||||||
Lennar Corporation | ||||||||
| 1,060,000 | 4.500%, 11/15/2019 | 1,101,075 | ||||||
| 3,190,000 | 4.750%, 5/30/2025 | 3,110,250 | ||||||
Live Nation Entertainment, Inc. | ||||||||
| 3,918,000 | 5.375%, 6/15/2022c | 4,055,130 | ||||||
| 3,265,000 | 4.875%, 11/1/2024c | 3,273,162 | ||||||
LKQ Corporation | ||||||||
| 4,005,000 | 4.750%, 5/15/2023 | 3,984,975 | ||||||
Masonite International Corporation | ||||||||
| 3,265,000 | 5.625%, 3/15/2023c | 3,371,113 | ||||||
Mattamy Group Corporation | ||||||||
| 3,180,000 | 6.875%, 12/15/2023c | 3,219,750 | ||||||
Mohegan Tribal Gaming Authority | ||||||||
| 3,150,000 | 7.875%, 10/15/2024c,d | 3,213,000 | ||||||
New Cotai, LLC | ||||||||
| 2,225,660 | 10.625%, 5/1/2019*,d | 1,669,245 | ||||||
Prime Security Services Borrower, LLC | ||||||||
| 3,250,000 | 9.250%, 5/15/2023c | 3,538,437 | ||||||
PulteGroup, Inc. | ||||||||
| 1,325,000 | 5.000%, 1/15/2027 | 1,258,750 | ||||||
The accompanying Notes to Financial Statements are an integral part of this schedule.
174
Table of Contents
HIGH YIELD PORTFOLIO
Schedule of Investments as of December 31, 2016
| Principal Amount | Long-Term Fixed Income (92.1%) | Value | ||||||
Consumer Cyclical (14.9%) - continued | ||||||||
RHP Hotel Properties, LP | ||||||||
| $ | 790,000 | 5.000%, 4/15/2021 | $ | 801,850 | ||||
| 960,000 | 5.000%, 4/15/2023 | 969,600 | ||||||
Rite Aid Corporation | ||||||||
| 3,165,000 | 6.750%, 6/15/2021 | 3,323,250 | ||||||
| 3,160,000 | 6.125%, 4/1/2023c | 3,397,000 | ||||||
Scientific Games International, Inc. | ||||||||
| 2,190,000 | 6.625%, 5/15/2021 | 1,850,550 | ||||||
Seminole Indian Tribe of Florida | ||||||||
| 2,710,000 | 7.804%, 10/1/2020* | 2,696,450 | ||||||
ServiceMaster Company, LLC | ||||||||
| 4,210,000 | 5.125%, 11/15/2024c | 4,273,150 | ||||||
Studio City Finance, Ltd. | ||||||||
| 2,665,000 | 8.500%, 12/1/2020c,d | 2,764,938 | ||||||
Summit Materials, LLC | ||||||||
| 2,650,000 | 6.125%, 7/15/2023 | 2,719,536 | ||||||
Toll Brothers Finance Corporation | ||||||||
| 2,660,000 | 4.875%, 11/15/2025 | 2,613,450 | ||||||
Tunica-Biloxi Gaming Authority | ||||||||
| 4,570,000 | 9.000%, 11/15/2015*,e | 1,599,500 | ||||||
West Corporation | ||||||||
| 2,560,000 | 5.375%, 7/15/2022c | 2,473,600 | ||||||
Yum! Brands, Inc. | ||||||||
| 2,090,000 | 5.250%, 6/1/2026c | 2,121,350 | ||||||
ZF North America Capital, Inc. | ||||||||
| 2,125,000 | 4.500%, 4/29/2022c | 2,191,406 | ||||||
| 2,125,000 | 4.750%, 4/29/2025c | 2,162,187 | ||||||
|
| |||||||
| Total | 118,316,864 | |||||||
|
| |||||||
Consumer Non-Cyclical (11.0%) | ||||||||
Air Medical Merger Sub Corporation | ||||||||
| 3,190,000 | 6.375%, 5/15/2023c | 3,062,400 | ||||||
Albertsons Companies, LLC | ||||||||
| 2,620,000 | 6.625%, 6/15/2024c | 2,731,350 | ||||||
B&G Foods, Inc. | ||||||||
| 3,550,000 | 4.625%, 6/1/2021 | 3,621,000 | ||||||
Cott Beverages, Inc. | ||||||||
| 3,265,000 | 5.375%, 7/1/2022 | 3,322,137 | ||||||
Energizer Holdings, Inc. | ||||||||
| 4,240,000 | 5.500%, 6/15/2025c | 4,250,600 | ||||||
Envision Healthcare Corporation | ||||||||
| 3,795,000 | 5.125%, 7/1/2022c | 3,780,769 | ||||||
Grifols Worldwide Operations, Ltd. | ||||||||
| 4,395,000 | 5.250%, 4/1/2022 | 4,548,825 | ||||||
HCA, Inc. | ||||||||
| 2,645,000 | 6.500%, 2/15/2020 | 2,893,630 | ||||||
| 4,810,000 | 5.875%, 3/15/2022 | 5,182,775 | ||||||
| 2,035,000 | 4.750%, 5/1/2023 | 2,083,331 | ||||||
| 3,705,000 | 5.375%, 2/1/2025 | 3,714,263 | ||||||
| 3,360,000 | 5.875%, 2/15/2026 | 3,460,800 | ||||||
JBS USA, LLC | ||||||||
| 3,250,000 | 5.875%, 7/15/2024c | 3,355,625 | ||||||
| 4,705,000 | 5.750%, 6/15/2025c | 4,763,813 | ||||||
Lamb Weston Holdings, Inc. | ||||||||
| 1,580,000 | 4.625%, 11/1/2024c | 1,583,950 | ||||||
MPH Acquisition Holdings, LLC | ||||||||
| 4,190,000 | 7.125%, 6/1/2024c | 4,410,394 | ||||||
Post Holdings, Inc. | ||||||||
| 3,210,000 | 5.000%, 8/15/2026c | 3,073,575 | ||||||
Prestige Brands, Inc. | ||||||||
| 790,000 | 6.375%, 3/1/2024c | 829,500 | ||||||
Revlon Consumer Products Corporation | ||||||||
| 4,760,000 | 5.750%, 2/15/2021 | 4,783,800 | ||||||
Spectrum Brands Escrow Corporation | ||||||||
| 2,030,000 | 6.625%, 11/15/2022 | 2,156,875 | ||||||
Spectrum Brands, Inc. | ||||||||
| 2,120,000 | 5.750%, 7/15/2025 | 2,199,500 | ||||||
Teleflex, Inc. | ||||||||
| 2,525,000 | 5.250%, 6/15/2024 | 2,591,281 | ||||||
Tenet Healthcare Corporation | ||||||||
| 3,250,000 | 6.000%, 10/1/2020 | 3,388,125 | ||||||
| 530,000 | 7.500%, 1/1/2022c | 552,525 | ||||||
TreeHouse Foods, Inc. | ||||||||
| 4,155,000 | 4.875%, 3/15/2022 | 4,258,875 | ||||||
Valeant Pharmaceuticals International | ||||||||
| 2,600,000 | 7.250%, 7/15/2022c | 2,125,500 | ||||||
| 2,645,000 | 5.500%, 3/1/2023c | 1,983,750 | ||||||
VPII Escrow Corporation | ||||||||
| 3,170,000 | 7.500%, 7/15/2021c | 2,686,575 | ||||||
|
| |||||||
Total | 87,395,543 | |||||||
|
| |||||||
Energy (12.9%) | ||||||||
Alta Mesa Holdings, LP | ||||||||
| 2,250,000 | 7.875%, 12/15/2024c | 2,328,750 | ||||||
Antero Resources Corporation | ||||||||
| 1,585,000 | 5.125%, 12/1/2022 | 1,600,850 | ||||||
| 2,640,000 | 5.625%, 6/1/2023 | 2,702,700 | ||||||
Cheniere Corpus Christi Holdings, LLC | ||||||||
| 2,200,000 | 7.000%, 6/30/2024c | 2,381,500 | ||||||
| 2,750,000 | 5.875%, 3/31/2025c | 2,805,852 | ||||||
Chesapeake Energy Corporation | ||||||||
| 1,590,000 | 8.000%, 1/15/2025c,d | 1,621,800 | ||||||
Concho Resources, Inc. | ||||||||
| 4,740,000 | 6.500%, 1/15/2022 | 4,904,478 | ||||||
| 3,425,000 | 4.375%, 1/15/2025 | 3,418,184 | ||||||
Continental Resources, Inc. | ||||||||
| 3,670,000 | 5.000%, 9/15/2022 | 3,704,461 | ||||||
| 2,610,000 | 4.500%, 4/15/2023 | 2,557,800 | ||||||
Crestwood Midstream Partners, LP | ||||||||
| 2,435,000 | 6.125%, 3/1/2022 | 2,495,875 | ||||||
| 2,635,000 | 6.250%, 4/1/2023 | 2,687,700 | ||||||
Diamondback Energy, Inc. | ||||||||
| 2,105,000 | 4.750%, 11/1/2024c | 2,062,900 | ||||||
Holly Energy Partners, LP | ||||||||
| 915,000 | 6.000%, 8/1/2024c | 953,887 | ||||||
Hornbeck Offshore Services, Inc. | ||||||||
| 2,115,000 | 5.875%, 4/1/2020 | 1,512,225 | ||||||
| 1,590,000 | 5.000%, 3/1/2021 | 1,065,300 | ||||||
MEG Energy Corporation | ||||||||
| 1,055,000 | 6.500%, 3/15/2021c | 975,875 | ||||||
| 3,160,000 | 6.375%, 1/30/2023c | 2,812,400 | ||||||
MPLX, LP | ||||||||
| 4,740,000 | 4.875%, 12/1/2024 | 4,875,081 | ||||||
Murphy Oil Corporation | ||||||||
| 1,310,000 | 6.875%, 8/15/2024d | 1,395,150 | ||||||
Noble Holding International, Ltd. | ||||||||
| 2,120,000 | 7.750%, 1/15/2024d | 1,994,072 | ||||||
Oasis Petroleum, Inc. | ||||||||
| 3,400,000 | 6.875%, 1/15/2023d | 3,485,000 | ||||||
Precision Drilling Corporation | ||||||||
| 1,464,879 | 6.625%, 11/15/2020 | 1,486,852 | ||||||
| 1,060,000 | 6.500%, 12/15/2021 | 1,075,900 | ||||||
| 2,630,000 | 7.750%, 12/15/2023c | 2,774,650 | ||||||
| 1,350,000 | 5.250%, 11/15/2024 | 1,262,250 | ||||||
Range Resources Corporation | ||||||||
| 4,180,000 | 5.000%, 3/15/2023c | 4,138,200 | ||||||
The accompanying Notes to Financial Statements are an integral part of this schedule.
175
Table of Contents
HIGH YIELD PORTFOLIO
Schedule of Investments as of December 31, 2016
| Principal Amount | Long-Term Fixed Income (92.1%) | Value | ||||||
Energy (12.9%) - continued | ||||||||
Rice Energy, Inc. | ||||||||
| $ | 4,605,000 | 6.250%, 5/1/2022 | $ | 4,731,638 | ||||
| 1,060,000 | 7.250%, 5/1/2023 | 1,123,600 | ||||||
Rowan Companies, Inc. | ||||||||
| 5,240,000 | 4.875%, 6/1/2022 | 4,951,800 | ||||||
Sabine Pass Liquefaction, LLC | ||||||||
| 2,645,000 | 5.625%, 2/1/2021 | 2,830,150 | ||||||
| 2,085,000 | 5.625%, 3/1/2025 | 2,230,950 | ||||||
| 2,620,000 | 5.875%, 6/30/2026c | 2,823,050 | ||||||
Sunoco, LP | ||||||||
| 2,665,000 | 5.500%, 8/1/2020 | 2,718,300 | ||||||
| 1,330,000 | 6.375%, 4/1/2023 | 1,346,625 | ||||||
Tesoro Logistics, LP | ||||||||
| 2,400,000 | 5.500%, 10/15/2019 | 2,538,000 | ||||||
| 2,130,000 | 6.250%, 10/15/2022 | 2,257,800 | ||||||
Weatherford International, Ltd. | ||||||||
| 2,095,000 | 7.750%, 6/15/2021d | 2,115,950 | ||||||
| 2,355,000 | 4.500%, 4/15/2022d | 2,042,963 | ||||||
WPX Energy, Inc. | ||||||||
| 2,190,000 | 7.500%, 8/1/2020d | 2,354,250 | ||||||
| 2,670,000 | 8.250%, 8/1/2023d | 2,983,725 | ||||||
|
| |||||||
| Total | 102,128,493 | |||||||
|
| |||||||
Financials (7.7%) | ||||||||
AerCap Ireland Capital, Ltd. | ||||||||
| 1,595,000 | 4.625%, 10/30/2020 | 1,658,800 | ||||||
| 1,870,000 | 3.950%, 2/1/2022 | 1,886,363 | ||||||
Aircastle, Ltd. | ||||||||
| 3,200,000 | 5.000%, 4/1/2023 | 3,264,000 | ||||||
Ally Financial, Inc. | ||||||||
| 4,670,000 | 4.125%, 3/30/2020 | 4,763,400 | ||||||
| 2,380,000 | 4.125%, 2/13/2022 | 2,359,175 | ||||||
Banco do Brasil SA/Cayman Islands | ||||||||
| 1,750,000 | 6.250%, 4/15/2024c,g | 1,280,125 | ||||||
BBVA International Preferred SA Unipersonal | ||||||||
| 1,585,000 | 5.919%, 4/18/2017g | 1,569,150 | ||||||
Centene Escrow Corporation | ||||||||
| 4,440,000 | 6.125%, 2/15/2024 | 4,678,650 | ||||||
CIT Group, Inc. | ||||||||
| 3,765,000 | 3.875%, 2/19/2019 | 3,845,006 | ||||||
Credit Agricole SA | ||||||||
| 1,065,000 | 6.625%, 9/23/2019c,g | 1,037,906 | ||||||
CyrusOne, LP | ||||||||
| 3,540,000 | 6.375%, 11/15/2022 | 3,725,850 | ||||||
Drawbridge Special Opportunities Fund, LP | ||||||||
| 3,785,000 | 5.000%, 8/1/2021c | 3,643,063 | ||||||
Grinding Media, Inc. | ||||||||
| 2,500,000 | 7.375%, 12/15/2023c | 2,626,500 | ||||||
HSBC Holdings plc | ||||||||
| 1,040,000 | 6.875%, 6/1/2021d,g | 1,097,200 | ||||||
Icahn Enterprises, LP | ||||||||
| 3,860,000 | 6.000%, 8/1/2020 | 3,942,025 | ||||||
ILFC E-Capital Trust II | ||||||||
| 1,895,000 | 4.920%, 12/21/2065c,h | 1,667,600 | ||||||
Jefferies Finance, LLC | ||||||||
| 2,650,000 | 7.375%, 4/1/2020* | 2,650,000 | ||||||
Lloyds Banking Group plc | ||||||||
| 1,080,000 | 6.657%, 5/21/2037c,g | 1,161,000 | ||||||
MPT Operating Partnership, LP | ||||||||
| 1,192,000 | 6.375%, 2/15/2022 | 1,235,210 | ||||||
| 3,010,000 | 5.500%, 5/1/2024 | 3,040,100 | ||||||
Quicken Loans, Inc. | ||||||||
| 4,255,000 | 5.750%, 5/1/2025c | 4,137,987 | ||||||
Royal Bank of Scotland Group plc | ||||||||
| $ | 1,865,000 | 7.500%, 8/10/2020g | $ | 1,767,087 | ||||
VEREIT Operating Partnership, LP | ||||||||
| 3,955,000 | 4.875%, 6/1/2026 | 4,005,822 | ||||||
|
| |||||||
| Total | 61,042,019 | |||||||
|
| |||||||
Foreign Government (0.3%) | ||||||||
Argentina Government International Bond | ||||||||
| 2,100,000 | 7.500%, 4/22/2026c | 2,205,000 | ||||||
|
| |||||||
| Total | 2,205,000 | |||||||
|
| |||||||
Technology (6.6%) | ||||||||
Alliance Data Systems Corporation | ||||||||
| 6,880,000 | 5.375%, 8/1/2022c | 6,639,200 | ||||||
Brocade Communications Systems, Inc. | ||||||||
| 3,790,000 | 4.625%, 1/15/2023 | 3,752,100 | ||||||
CommScope Technologies Finance, LLC | ||||||||
| 4,775,000 | 6.000%, 6/15/2025c | 5,061,500 | ||||||
Diamond Finance Corporation | ||||||||
| 1,050,000 | 5.875%, 6/15/2021c | 1,116,793 | ||||||
| 1,570,000 | 7.125%, 6/15/2024c | 1,742,264 | ||||||
Equinix, Inc. | ||||||||
| 3,185,000 | 5.750%, 1/1/2025 | 3,328,325 | ||||||
| 1,030,000 | 5.875%, 1/15/2026 | 1,084,075 | ||||||
First Data Corporation | ||||||||
| 3,000,000 | 5.375%, 8/15/2023c | 3,112,500 | ||||||
| 1,910,000 | 7.000%, 12/1/2023c | 2,034,150 | ||||||
Inception Merger Sub, Inc. | ||||||||
| 2,630,000 | 8.625%, 11/15/2024c | 2,783,724 | ||||||
Micron Technology, Inc. | ||||||||
| 4,730,000 | 5.250%, 8/1/2023c | 4,747,737 | ||||||
NXP Funding, LLC | ||||||||
| 3,715,000 | 5.750%, 3/15/2023c | 3,919,325 | ||||||
Plantronics, Inc. | ||||||||
| 2,390,000 | 5.500%, 5/31/2023c | 2,413,900 | ||||||
Sensata Technologies BV | ||||||||
| 4,870,000 | 4.875%, 10/15/2023c | 4,979,575 | ||||||
SS&C Technologies Holdings, Inc. | ||||||||
| 1,590,000 | 5.875%, 7/15/2023 | 1,647,637 | ||||||
Western Digital Corporation | ||||||||
| 3,200,000 | 10.500%, 4/1/2024c | 3,784,000 | ||||||
|
| |||||||
| Total | 52,146,805 | |||||||
|
| |||||||
Transportation (3.7%) | ||||||||
American Airlines Pass Through Trust | ||||||||
| 3,331,782 | 5.600%, 7/15/2020c | 3,456,724 | ||||||
Avis Budget Car Rental, LLC | ||||||||
| 1,670,000 | 5.125%, 6/1/2022c,d | 1,636,600 | ||||||
| 3,550,000 | 5.500%, 4/1/2023d | 3,487,875 | ||||||
Dynagas LNG Partners, LP | ||||||||
| 2,130,000 | 6.250%, 10/30/2019 | 2,034,150 | ||||||
Eletson Holdings, Inc. | ||||||||
| 2,170,000 | 9.625%, 1/15/2022* | 1,584,100 | ||||||
Navios Maritime Holdings, Inc. | ||||||||
| 2,220,000 | 8.125%, 2/15/2019d | 1,681,650 | ||||||
| 1,895,000 | 8.125%, 11/15/2021c | 1,610,750 | ||||||
Navios South American Logistics, Inc. | ||||||||
| 1,900,000 | 7.250%, 5/1/2022c | 1,795,500 | ||||||
Teekay Offshore Partners, LP | ||||||||
| 3,790,000 | 6.000%, 7/30/2019 | 3,183,600 | ||||||
Ultrapetrol Bahamas, Ltd. | ||||||||
| 3,720,000 | 8.875%, 6/15/2021e | 706,800 | ||||||
The accompanying Notes to Financial Statements are an integral part of this schedule.
176
Table of Contents
HIGH YIELD PORTFOLIO
Schedule of Investments as of December 31, 2016
| Principal Amount | Long-Term Fixed Income (92.1%) | Value | ||||||
Transportation (3.7%) - continued | ||||||||
United Airlines Pass Through Trust | ||||||||
| $ | 1,275,235 | 5.375%, 8/15/2021 | $ | 1,323,056 | ||||
XPO Logistics, Inc. | ||||||||
| 4,710,000 | 6.500%, 6/15/2022c,d | 4,945,500 | ||||||
| 1,570,000 | 6.125%, 9/1/2023c | 1,640,650 | ||||||
|
| |||||||
| Total | 29,086,955 | |||||||
|
| |||||||
Utilities (4.1%) | ||||||||
Calpine Corporation | ||||||||
| 3,720,000 | 5.375%, 1/15/2023d | 3,636,300 | ||||||
Covanta Holding Corporation | ||||||||
| 1,850,000 | 6.375%, 10/1/2022 | 1,877,177 | ||||||
Dynegy, Inc. | ||||||||
| 4,720,000 | 7.625%, 11/1/2024d | 4,354,200 | ||||||
Electricite de France SA | ||||||||
| 2,500,000 | 5.250%, 1/19/2023c,g | 2,350,000 | ||||||
Energy Transfer Equity, LP | ||||||||
| 4,245,000 | 5.500%, 6/1/2027 | 4,138,875 | ||||||
Holly Energy Partners, LP | ||||||||
| 2,700,000 | 6.500%, 3/1/2020 | 2,787,750 | ||||||
Regency Energy Partners, LP | ||||||||
| 4,650,000 | 5.500%, 4/15/2023 | 4,801,125 | ||||||
Targa Resources Partners, LP | ||||||||
| 1,570,000 | 5.375%, 2/1/2027c | 1,554,300 | ||||||
Tesoro Corporation | ||||||||
| 4,745,000 | 4.750%, 12/15/2023c | 4,768,725 | ||||||
Tesoro Logistics, LP | ||||||||
| 2,000,000 | 5.250%, 1/15/2025 | 2,042,500 | ||||||
|
| |||||||
| Total | 32,310,952 | |||||||
|
| |||||||
Total Long-Term Fixed Income (cost $731,484,964) | 728,902,072 | |||||||
|
| |||||||
| Shares | Preferred Stock (1.2%) | |||||||
Consumer Staples (0.2%) | ||||||||
| 43,350 | CHS, Inc., 7.100%g | 1,149,209 | ||||||
|
| |||||||
| Total | 1,149,209 | |||||||
|
| |||||||
Financials (1.0%) | ||||||||
| 62,331 | Citigroup, Inc., 6.875%g | 1,704,753 | ||||||
| 48,000 | Discover Financial Services 6.500%g | 1,232,640 | ||||||
| 86,021 | Goldman Sachs Group, Inc., 5.500%g | 2,183,213 | ||||||
| 20,016 | Morgan Stanley, 6.875%g | 541,232 | ||||||
| 18,720 | PNC Financial Services Group, Inc., 6.125%g | 510,869 | ||||||
| 1,560 | Wells Fargo & Company, Convertible, 7.500%g | 1,856,400 | ||||||
|
| |||||||
| Total | 8,029,107 | |||||||
|
| |||||||
Total Preferred Stock (cost $9,184,908) | 9,178,316 | |||||||
|
| |||||||
Registered Investment Companies (0.8%) | ||||||||
Equity Funds/ETFs (0.8%) | ||||||||
| 54,500 | Energy Select Sector SPDR Fund | 4,104,940 | ||||||
| 58,250 | SPDR S&P Oil & Gas Exploration & Production ETFd | 2,412,715 | ||||||
|
| |||||||
| Total | 6,517,655 | |||||||
|
| |||||||
Total Registered Investment Companies (cost $5,352,250) | 6,517,655 | |||||||
|
| |||||||
Common Stock (0.1%) | ||||||||
Consumer Discretionary (<0.1%) | ||||||||
| 121,520 | TVMAX Holdings, Inc.i,j | 12 | ||||||
|
| |||||||
| Total | 12 | |||||||
|
| |||||||
Common Stock (0.1%) | ||||||||
Energy (0.1%) | ||||||||
| 7,311 | Vantage Drilling Internationalj | 738,411 | ||||||
|
| |||||||
| Total | 738,411 | |||||||
|
| |||||||
Financials (<0.1%) | ||||||||
| 10 | New Cotai, LLCi,j | 0 | ||||||
|
| |||||||
| Total | 0 | |||||||
|
| |||||||
Total Common Stock (cost $7,237,186) | 738,423 | |||||||
|
| |||||||
Collateral Held for Securities Loaned (9.5%) | ||||||||
| 74,873,939 | Thrivent Cash Management Trust | 74,873,939 | ||||||
|
| |||||||
Total Collateral Held for Securities Loaned (cost $74,873,939) | 74,873,939 | |||||||
|
| |||||||
| Shares or Principal Amount | Short-Term Investments (2.1%)k | |||||||
Federal Home Loan Bank Discount Notes | ||||||||
| 4,000,000 | 0.405%, 1/13/2017 | 3,999,576 | ||||||
| 1,400,000 | 0.365%, 1/25/2017 | 1,399,675 | ||||||
Thrivent Core Short-Term Reserve Fund | ||||||||
| 1,167,991 | 0.910% | 11,679,914 | ||||||
|
| |||||||
Total Short-Term Investments (cost $17,079,033) | 17,079,165 | |||||||
|
| |||||||
Total Investments (cost $862,045,405) 108.0% | $ | 854,732,754 | ||||||
|
| |||||||
Other Assets and Liabilities, Net (8.0%) | (63,636,979 | ) | ||||||
|
| |||||||
Total Net Assets 100.0% | $ | 791,095,775 | ||||||
|
| |||||||
The accompanying Notes to Financial Statements are an integral part of this schedule.
177
Table of Contents
HIGH YIELD PORTFOLIO
Schedule of Investments as of December 31, 2016
| a | The stated interest rate represents the weighted average of all contracts within the bank loan facility. |
| b | Denotes step coupon securities. Step coupon securities pay an initial coupon rate for the first period and then different coupon rates for following periods. The rate shown is as of December 31, 2016. |
| c | Denotes securities sold under Rule 144A of the Securities Act of 1933, which exempts them from registration. These securities may be resold to other dealers in the program or to other qualified institutional buyers. As of December 31, 2016, the value of these investments was $352,863,449 or 44.6% of total net assets. |
| d | All or a portion of the security is on loan. |
| e | Defaulted security. Interest is not being accrued. |
| f | In bankruptcy. Interest is not being accrued. |
| g | Denotes perpetual securities. Perpetual securities pay an indefinite stream of interest and have no contractual maturity date. Date shown, if applicable, is next call date. |
| h | Denotes variable rate securities. Variable rate securities are securities whose yields vary with a designated market index or market rate. The rate shown is as of December 31, 2016. |
| i | Security is valued at fair value. Market quotations or prices were not readily available or were determined to be unreliable. Fair value was determined in good faith pursuant to procedures adopted by the Board. Further information on fair valuation can be found in the Notes to Financial Statements. |
| j | Non-income producing security. |
| k | The interest rate shown reflects the yield, coupon rate or the discount rate at the date of purchase. |
| * | Denotes restricted securities. Restricted securities are investment securities which cannot be offered for public sale without first being registered under the Securities Act of 1933. The value of all restricted securities held in High Yield Portfolio as of December 31, 2016 was $15,043,783 or 1.9% of total net assets. The following table indicates the acquisition date and cost of restricted securities shown in the schedule as of December 31, 2016. |
Security | Acquisition Date | Cost | ||||||
Abengoa Finance SAU, 2/1/2020 | 12/6/2013 | $ | 3,250,000 | |||||
Abengoa Greenfield SA, 10/1/2019 | 9/24/2014 | 3,460,000 | ||||||
Digicel, Ltd., 4/15/2021 | 3/19/2013 | 3,220,000 | ||||||
Digicel, Ltd., 2/15/2020 | 2/7/2012 | 1,680,000 | ||||||
Eletson Holdings, Inc., 1/15/2022 | 12/12/2013 | 2,139,989 | ||||||
Jefferies Finance, LLC, 4/1/2020 | 3/19/2013 | 2,650,000 | ||||||
Midwest Vanadium, Pty. Ltd., 2/15/2018 | 2/9/2011 | 3,095,017 | ||||||
New Cotai, LLC, 5/1/2019 | 4/15/2013 | 2,271,097 | ||||||
Seminole Indian Tribe of Florida, 10/1/2020 | 7/8/2010 | 2,593,981 | ||||||
Tunica-Biloxi Gaming Authority, 11/15/2017 | 11/8/2005 | 4,585,435 | ||||||
The following table presents the total amount of securities loaned with continuous maturity, by type, offset by the gross payable upon return of collateral for securities loaned by Thrivent High Yield Portfolio as of December 31, 2016:
Securities Lending Transactions
Taxable Debt Security | $ | 69,702,713 | ||
Common Stock | 2,410,644 | |||
|
| |||
Total lending | $ | 72,113,357 | ||
Gross amount payable upon return of collateral for securities loaned | $ | 74,873,939 | ||
|
| |||
Net amounts due to counterparty | $ | 2,760,582 | ||
|
|
The accompanying Notes to Financial Statements are an integral part of this schedule.
178
Table of Contents
INCOME PORTFOLIO
Schedule of Investments as of December 31, 2016
| Principal Amount | Bank Loans (2.9%)a | Value | ||||||
Basic Materials (0.2%) | ||||||||
Arch Coal, Inc., Term Loan | ||||||||
| $ | 267,456 | 10.000%, 10/5/2021 | $ | 270,912 | ||||
Fortescue Metals Group, Ltd., Term Loan | ||||||||
| 653,530 | 3.750%, 6/30/2019 | 654,838 | ||||||
Ineos US Finance, LLC, Term Loan | ||||||||
| 1,510,623 | 3.750%, 12/15/2020 | 1,516,922 | ||||||
Tronox Pigments BV, Term Loan | ||||||||
| 728,114 | 4.500%, 3/19/2020 | 730,538 | ||||||
|
| |||||||
Total | 3,173,210 | |||||||
|
| |||||||
Capital Goods (0.2%) | ||||||||
Advanced Disposal Services, Inc., Term Loan | ||||||||
| 1,192,332 | 3.500%, 11/10/2023 | 1,202,026 | ||||||
Berry Plastics Group, Inc., Term Loan | ||||||||
| 1,419,070 | 3.500%, 2/8/2020 | 1,428,749 | ||||||
Cortes NP Acquisition Corporation, Term Loan | ||||||||
| 725,000 | 6.000%, 11/30/2023 | 734,062 | ||||||
|
| |||||||
Total | 3,364,837 | |||||||
|
| |||||||
Communications Services (0.9%) | ||||||||
Beasley Broadcast Group, Inc., Term Loan | ||||||||
| 325,000 | 7.000%, 11/1/2023 | 325,000 | ||||||
CSC Holdings, LLC, Term Loan | ||||||||
| 509,868 | 3.876%, 10/11/2024 | 514,860 | ||||||
Hargray Communications Group, Inc., Term Loan | ||||||||
| 1,520,526 | 4.750%, 6/26/2019 | 1,536,993 | ||||||
Intelsat Jackson Holdings SA, Term Loan | ||||||||
| 239,713 | 3.750%, 6/30/2019 | 231,448 | ||||||
Level 3 Communications, Inc., Term Loan | ||||||||
| 1,600,000 | 4.000%, 1/15/2020 | 1,620,800 | ||||||
LTS Buyer, LLC, Term Loan | ||||||||
| 1,536,123 | 4.248%, 4/13/2020 | 1,543,327 | ||||||
NEP/NCP Holdco, Inc., Term Loan | ||||||||
| 1,540,539 | 4.250%, 1/22/2020 | 1,544,390 | ||||||
TNS, Inc., Term Loan | ||||||||
| 824,673 | 5.000%, 2/14/2020 | 831,633 | ||||||
Univision Communications, Inc., Term Loan | ||||||||
| 1,599,910 | 4.000%, 3/1/2020 | 1,607,910 | ||||||
WideOpenWest Finance, LLC, Term Loan | ||||||||
| 723,188 | 4.500%, 8/18/2023 | 730,289 | ||||||
Yankee Cable Acquisition, LLC, Term Loan | ||||||||
| 1,413,526 | 4.250%, 3/1/2020 | 1,414,120 | ||||||
Zayo Group, LLC, Term Loan | ||||||||
| 1,398,974 | 3.750%, 5/6/2021 | 1,413,160 | ||||||
|
| |||||||
Total | 13,313,930 | |||||||
|
| |||||||
Consumer Cyclical (0.4%) | ||||||||
Amaya BV, Term Loan | ||||||||
| 1,536,600 | 5.000%, 8/1/2021 | 1,541,302 | ||||||
Burlington Coat Factory Warehouse | ||||||||
Corporation, Term Loan | ||||||||
| 1,301,838 | 3.510%, 8/13/2021 | 1,309,506 | ||||||
Cengage Learning Acquisitions, Term Loan | ||||||||
| 845,750 | 5.250%, 6/7/2023 | 821,570 | ||||||
IMG Worldwide, Inc., Term Loan | ||||||||
| 1,231,012 | 5.250%, 5/6/2021 | 1,242,559 | ||||||
Mohegan Tribal Gaming Authority, Term Loan | ||||||||
| 603,488 | 5.500%, 10/13/2023 | 607,639 | ||||||
|
| |||||||
Total | 5,522,576 | |||||||
|
| |||||||
Consumer Non-Cyclical (0.4%) | ||||||||
Albertson’s, LLC, Term Loan | ||||||||
| 287,874 | 0.000%, 12/21/2022b,c | 291,472 | ||||||
| 522,126 | 0.000%, 6/22/2023b,c | 528,433 | ||||||
CHS/Community Health Systems, Inc., Term Loan | ||||||||
| 710,678 | 4.000%, 1/27/2021 | 686,992 | ||||||
JBS USA, LLC, Term Loan | ||||||||
| 940,500 | 4.000%, 10/30/2022 | 948,334 | ||||||
McGraw-Hill Global Education | ||||||||
Holdings, LLC, Term Loan | ||||||||
| 432,825 | 5.000%, 5/4/2022 | 432,894 | ||||||
Ortho-Clinical Diagnostics, Inc., Term Loan | ||||||||
| 717,640 | 4.750%, 6/30/2021 | 710,722 | ||||||
Sterigenics-Nordion Holdings, LLC, Term Loan | ||||||||
| 735,687 | 4.250%, 5/16/2022 | 737,990 | ||||||
Valeant Pharmaceuticals International, Inc., Term Loan | ||||||||
| 2,140,829 | 5.500%, 4/1/2022 | 2,141,236 | ||||||
|
| |||||||
Total | 6,478,073 | |||||||
|
| |||||||
Energy (0.1%) | ||||||||
Houston Fuel Oil Terminal, LLC, Term Loan | ||||||||
| 372,145 | 4.250%, 8/19/2021 | 369,353 | ||||||
McJunkin Red Man Corporation, Term Loan | ||||||||
| 336,906 | 5.000%, 11/8/2019 | 338,170 | ||||||
MEG Energy Corporation, Term Loan | ||||||||
| 148,438 | 3.750%, 3/31/2020 | 143,985 | ||||||
Targa Resources Partners, LP, Term Loan | ||||||||
| 57,000 | 5.750%, 2/27/2022 | 57,285 | ||||||
|
| |||||||
Total | 908,793 | |||||||
|
| |||||||
Financials (0.2%) | ||||||||
Harland Clarke Holdings Corporation, Term Loan | ||||||||
| 693,500 | 7.000%, 12/31/2019 | 696,101 | ||||||
WaveDivision Holdings, LLC, Term Loan | ||||||||
| 1,536,056 | 4.000%, 10/15/2019 | 1,544,120 | ||||||
|
| |||||||
Total | 2,240,221 | |||||||
|
| |||||||
Technology (0.4%) | ||||||||
Avago Technoligies Cayman Finance, Ltd., Term Loan | ||||||||
| 905,223 | 3.704%, 2/1/2023 | 917,670 | ||||||
First Data Corporation, Term Loan | ||||||||
| 1,235,103 | 3.756%, 3/24/2021 | 1,248,998 | ||||||
| 125,000 | 3.756%, 7/8/2022 | 126,276 | ||||||
ON Semiconductor Corporation, Term Loan | ||||||||
| 723,187 | 4.020%, 3/31/2023 | 731,967 | ||||||
Rackspace Hosting, LLC, Term Loan | ||||||||
| 300,000 | 4.500%, 12/20/2023 | 303,624 | ||||||
Syniverse Holdings, Inc., Term Loan | ||||||||
| 600,291 | 4.000%, 4/23/2019 | 523,153 | ||||||
The accompanying Notes to Financial Statements are an integral part of this schedule.
179
Table of Contents
INCOME PORTFOLIO
Schedule of Investments as of December 31, 2016
| Principal Amount | Bank Loans (2.9%)a | Value | ||||||
Technology (0.4%) - continued | ||||||||
Western Digital Corporation, Term Loan | ||||||||
| $ | 1,004,950 | 4.520%, 4/29/2023 | $ | 1,020,336 | ||||
Xerox Business Services, LLC, Term Loan | ||||||||
| 285,000 | 6.250%, 12/7/2023 | 288,206 | ||||||
|
| |||||||
Total | 5,160,230 | |||||||
|
| |||||||
Transportation (0.1%) | ||||||||
XPO Logistics, Inc., Term Loan | ||||||||
| 1,119,223 | 4.250%, 11/1/2021 | 1,132,866 | ||||||
|
| |||||||
Total | 1,132,866 | |||||||
|
| |||||||
Total Bank Loans (cost $40,837,467) | 41,294,736 | |||||||
|
| |||||||
Long-Term Fixed Income (91.2%) | ||||||||
Asset-Backed Securities (1.7%) | ||||||||
Bayview Opportunity Master Fund Trust | ||||||||
3.721%, 7/28/2035, Series | ||||||||
| 2,687,879 | 2015-NPLA, Class Ad,e | 2,687,264 | ||||||
CAM Mortgage, LLC | ||||||||
3.500%, 7/15/2064, Series | ||||||||
| 27,438 | 2015-1, Class A*,e | 27,436 | ||||||
Cent CLO 22, Ltd. | ||||||||
2.291%, 11/7/2026, Series | ||||||||
| 3,200,000 | 2014-22A, Class A1R*,f | 3,192,500 | ||||||
Delta Air Lines, Inc. | ||||||||
| 1,748,359 | 4.250%, 7/30/2023 | 1,778,955 | ||||||
GMAC Mortgage Corporation Loan Trust | ||||||||
1.084%, 8/25/2035, Series | ||||||||
| 1,194,489 | 2005-HE1, Class A2f,g | 1,129,906 | ||||||
0.772%, 12/25/2036, Series | ||||||||
| 2,152,720 | 2006-HE4, Class A1f,g | 1,997,376 | ||||||
IndyMac Seconds Asset-Backed Trust | ||||||||
1.096%, 10/25/2036, Series | ||||||||
| 449,284 | 2006-2B, Class Af,g | 283,712 | ||||||
Magnetite XII, Ltd. | ||||||||
2.256%, 4/15/2027, Series | ||||||||
| 3,200,000 | 2015-12A, Class AR*,f | 3,197,583 | ||||||
Preferred Term Securities XXIII, Ltd. | ||||||||
| 2,239,405 | 1.163%, 12/22/2036*,f | 1,802,206 | ||||||
Renaissance Home Equity Loan Trust | ||||||||
5.746%, 5/25/2036, Series | ||||||||
| 1,958,030 | 2006-1, Class AF6e | 1,284,799 | ||||||
Shackleton, Ltd. | ||||||||
2.340%, 4/15/2027, Series | ||||||||
| 3,200,000 | 2015-7A, Class AR*,f | 3,200,000 | ||||||
Vericrest Opportunity Loan Transferee | ||||||||
3.500%, 6/26/2045, Series | ||||||||
| 1,648,493 | 2015-NPL9, Class A1d | 1,645,132 | ||||||
4.250%, 2/26/2046, Series | ||||||||
| 2,399,706 | 2016-NPL1, Class A1d,e | 2,425,147 | ||||||
|
| |||||||
Total | 24,652,016 | |||||||
|
| |||||||
Basic Materials (2.6%) | ||||||||
Anglo American plc | ||||||||
| 1,280,000 | 3.625%, 5/14/2020d | 1,294,336 | ||||||
Barrick Gold Corporation | ||||||||
| 1,879,000 | 4.100%, 5/1/2023 | 1,925,605 | ||||||
CF Industries, Inc. | ||||||||
| 2,560,000 | 3.400%, 12/1/2021d | 2,530,667 | ||||||
Chevron Phillips Chemical Company, LLC | ||||||||
| 640,000 | 3.400%, 12/1/2026d | 637,940 | ||||||
Dow Chemical Company | ||||||||
| 2,570,000 | 4.250%, 11/15/2020 | 2,719,762 | ||||||
| 1,920,000 | 3.000%, 11/15/2022 | 1,918,681 | ||||||
First Quantum Minerals, Ltd. | ||||||||
| 1,280,000 | 7.000%, 2/15/2021d | 1,273,088 | ||||||
Freeport-McMoRan, Inc. | ||||||||
| 2,675,000 | 3.875%, 3/15/2023 | 2,454,312 | ||||||
Georgia-Pacific, LLC | ||||||||
| 3,780,000 | 3.163%, 11/15/2021d | 3,821,467 | ||||||
Glencore Funding, LLC | ||||||||
| 3,180,000 | 4.125%, 5/30/2023d | 3,200,161 | ||||||
International Paper Company | ||||||||
| 2,240,000 | 3.000%, 2/15/2027 | 2,109,988 | ||||||
| 1,190,000 | 4.800%, 6/15/2044 | 1,179,753 | ||||||
Kinross Gold Corporation | ||||||||
| 1,920,000 | 5.950%, 3/15/2024 | 1,944,000 | ||||||
LyondellBasell Industries NV | ||||||||
| 1,900,000 | 6.000%, 11/15/2021 | 2,152,854 | ||||||
| 1,270,000 | 5.750%, 4/15/2024 | 1,446,477 | ||||||
Westlake Chemical Corporation | ||||||||
| 3,200,000 | 3.600%, 8/15/2026d | 3,073,357 | ||||||
Weyerhaeuser Company | ||||||||
| 2,570,000 | 7.375%, 3/15/2032 | 3,250,598 | ||||||
Yara International ASA | ||||||||
| 50,000 | 7.875%, 6/11/2019d | 55,881 | ||||||
|
| |||||||
Total | 36,988,927 | |||||||
|
| |||||||
Capital Goods (2.2%) | ||||||||
AECOM | ||||||||
| 1,230,000 | 5.875%, 10/15/2024 | 1,313,160 | ||||||
BAE Systems plc | ||||||||
| 1,970,000 | 4.750%, 10/11/2021d | 2,128,226 | ||||||
Bombardier, Inc. | ||||||||
| 1,280,000 | 7.500%, 3/15/2025d | 1,264,666 | ||||||
General Electric Capital Corporation | ||||||||
| 3,200,000 | 1.963%, 3/15/2023f | 3,241,677 | ||||||
General Electric Company | ||||||||
| 2,560,000 | 1.261%, 5/5/2026f | 2,476,844 | ||||||
Johnson Controls International plc | ||||||||
| 1,150,000 | 5.250%, 12/1/2041 | 1,235,151 | ||||||
L3 Technologies, Inc. | ||||||||
| 2,560,000 | 4.750%, 7/15/2020 | 2,719,580 | ||||||
| 1,280,000 | 4.950%, 2/15/2021 | 1,366,460 | ||||||
| 800,000 | 3.850%, 12/15/2026 | 794,022 | ||||||
Republic Services, Inc. | ||||||||
| 3,170,000 | 3.550%, 6/1/2022 | 3,289,687 | ||||||
Roper Technologies, Inc. | ||||||||
| 1,920,000 | 3.125%, 11/15/2022 | 1,919,963 | ||||||
| 960,000 | 3.800%, 12/15/2026 | 965,977 | ||||||
Textron, Inc. | ||||||||
| 2,360,000 | 5.600%, 12/1/2017 | 2,443,348 | ||||||
| 1,280,000 | 4.300%, 3/1/2024 | 1,326,258 | ||||||
| 630,000 | 3.875%, 3/1/2025 | 632,681 | ||||||
United Rentals North America, Inc. | ||||||||
| 1,250,000 | 5.500%, 7/15/2025 | 1,275,000 | ||||||
Waste Management, Inc. | ||||||||
| 3,140,000 | 4.100%, 3/1/2045 | 3,101,199 | ||||||
|
| |||||||
Total | 31,493,899 | |||||||
|
| |||||||
Collateralized Mortgage Obligations (0.6%) | ||||||||
CitiMortgage Alternative Loan Trust | ||||||||
5.750%, 4/25/2037, Series | ||||||||
| 1,493,855 | 2007-A4, Class 1A5 | 1,279,900 | ||||||
The accompanying Notes to Financial Statements are an integral part of this schedule.
180
Table of Contents
INCOME PORTFOLIO
Schedule of Investments as of December 31, 2016
| Principal Amount | Long-Term Fixed Income (91.2%) | Value | ||||||
Collateralized Mortgage Obligations (0.6%) - continued | ||||||||
Countrywide Alternative Loan Trust | ||||||||
6.000%, 1/25/2037, Series | ||||||||
| $1,948,074 | 2006-39CB, Class 1A16 | $ | 1,860,102 | |||||
Deutsche Alt-A Securities, Inc., Mortgage Loan Trust | ||||||||
1.337%, 4/25/2047, Series | ||||||||
| 1,844,313 | 2007-OA2, Class A1f | 1,562,189 | ||||||
Wachovia Mortgage Loan Trust, LLC | ||||||||
3.407%, 5/20/2036, Series | ||||||||
| 1,268,650 | 2006-A, Class 2A1 | 1,119,059 | ||||||
WaMu Mortgage Pass Through Certificates | ||||||||
1.046%, 10/25/2045, Series | ||||||||
| 469,281 | 2005-AR13, Class A1A1f | 448,923 | ||||||
Washington Mutual Mortgage Pass Through Certificates Trust | ||||||||
1.317%, 2/25/2047, Series | ||||||||
| 3,260,870 | 2007-OA3, Class 2Af | 2,430,648 | ||||||
|
| |||||||
Total | 8,700,821 | |||||||
|
| |||||||
Commercial Mortgage-Backed Securities (<0.1%) | ||||||||
Bear Stearns Commercial Mortgage Securities, Inc. | ||||||||
| 777,100 | 5.331%, 2/11/2044 | 777,532 | ||||||
|
| |||||||
Total | 777,532 | |||||||
|
| |||||||
Communications Services (9.4%) | ||||||||
21st Century Fox America, Inc. | ||||||||
| 1,900,000 | 7.625%, 11/30/2028 | 2,431,916 | ||||||
America Movil SAB de CV | ||||||||
| 1,920,000 | 3.125%, 7/16/2022 | 1,888,602 | ||||||
American Tower Corporation | ||||||||
| 3,500,000 | 3.450%, 9/15/2021 | 3,542,014 | ||||||
| 2,560,000 | 3.125%, 1/15/2027 | 2,366,684 | ||||||
AT&T, Inc. | ||||||||
| 2,560,000 | 1.928%, 6/30/2020f | 2,573,885 | ||||||
| 3,310,000 | 3.800%, 3/15/2022 | 3,389,804 | ||||||
| 2,540,000 | 3.600%, 2/17/2023 | 2,559,022 | ||||||
| 3,190,000 | 4.450%, 4/1/2024 | 3,321,734 | ||||||
| 1,000,000 | 3.950%, 1/15/2025 | 1,000,495 | ||||||
| 1,240,000 | 3.400%, 5/15/2025 | 1,193,573 | ||||||
| 3,190,000 | 4.300%, 12/15/2042 | 2,850,335 | ||||||
| 3,200,000 | 4.750%, 5/15/2046 | 3,025,965 | ||||||
CenturyLink, Inc. | ||||||||
| 2,200,000 | 5.800%, 3/15/2022 | 2,248,686 | ||||||
Charter Communications Operating, LLC | ||||||||
| 4,370,000 | 4.464%, 7/23/2022 | 4,562,123 | ||||||
| 3,120,000 | 6.484%, 10/23/2045 | 3,600,745 | ||||||
Columbus International, Inc. | ||||||||
| 1,910,000 | 7.375%, 3/30/2021d | 2,032,507 | ||||||
Comcast Corporation | ||||||||
| 3,740,000 | 3.375%, 8/15/2025 | 3,757,608 | ||||||
| 3,210,000 | 2.350%, 1/15/2027 | 2,962,060 | ||||||
| 2,700,000 | 6.400%, 5/15/2038 | 3,451,872 | ||||||
Cox Communications, Inc. | ||||||||
| 1,900,000 | 9.375%, 1/15/2019d | 2,145,752 | ||||||
| 3,317,000 | 3.850%, 2/1/2025d | 3,249,071 | ||||||
| 1,920,000 | 3.350%, 9/15/2026d | 1,830,751 | ||||||
Crown Castle International Corporation | ||||||||
| 960,000 | 3.400%, 2/15/2021 | 973,382 | ||||||
| 4,160,000 | 5.250%, 1/15/2023 | 4,477,200 | ||||||
| 2,700,000 | 4.450%, 2/15/2026 | 2,789,672 | ||||||
Frontier Communications Corporation | ||||||||
| 1,880,000 | 6.875%, 1/15/2025 | 1,593,300 | ||||||
Hughes Satellite Systems Corporation | ||||||||
| 2,322,000 | 6.500%, 6/15/2019 | 2,525,175 | ||||||
Level 3 Financing, Inc. | ||||||||
| 1,280,000 | 5.125%, 5/1/2023 | 1,284,800 | ||||||
Omnicom Group, Inc. | ||||||||
| 4,245,000 | 4.450%, 8/15/2020 | 4,512,223 | ||||||
| 940,000 | 3.650%, 11/1/2024 | 944,324 | ||||||
S&P Global, Inc. | ||||||||
| 1,920,000 | 2.950%, 1/22/2027d | 1,792,408 | ||||||
Scripps Networks Interactive, Inc. | ||||||||
| 3,110,000 | 3.500%, 6/15/2022 | 3,139,641 | ||||||
SES Global Americas Holdings GP | ||||||||
| 3,180,000 | 2.500%, 3/25/2019d | 3,160,411 | ||||||
SFR Group SA | ||||||||
| 1,920,000 | 6.000%, 5/15/2022d | 1,970,400 | ||||||
Sprint Communications, Inc. | ||||||||
| 1,290,000 | 7.000%, 3/1/2020d | 1,399,650 | ||||||
Sprint Corporation | ||||||||
| 1,600,000 | 7.125%, 6/15/2024 | 1,648,000 | ||||||
Time Warner Cable, Inc. | ||||||||
| 3,800,000 | 4.125%, 2/15/2021 | 3,925,609 | ||||||
Time Warner Entertainment Company, LP | ||||||||
| 3,620,000 | 8.375%, 3/15/2023 | 4,548,288 | ||||||
Time Warner, Inc. | ||||||||
| 2,490,000 | 4.750%, 3/29/2021 | 2,665,348 | ||||||
Verizon Communications, Inc. | ||||||||
| 3,277,000 | 2.625%, 2/21/2020 | 3,306,323 | ||||||
| 3,830,000 | 3.450%, 3/15/2021 | 3,950,810 | ||||||
| 5,300,000 | 3.500%, 11/1/2024 | 5,276,452 | ||||||
| 2,560,000 | 2.625%, 8/15/2026 | 2,353,022 | ||||||
| 3,934,000 | 4.272%, 1/15/2036 | 3,759,370 | ||||||
| 3,830,000 | 4.862%, 8/21/2046 | 3,873,359 | ||||||
| 5,457,000 | 4.522%, 9/15/2048 | 5,222,120 | ||||||
Vodafone Group plc | ||||||||
| 1,910,000 | 2.500%, 9/26/2022 | 1,829,671 | ||||||
| 1,270,000 | 4.375%, 2/19/2043 | 1,121,644 | ||||||
|
| |||||||
Total | 134,027,806 | |||||||
|
| |||||||
Consumer Cyclical (4.7%) | ||||||||
CVS Health Corporation | ||||||||
| 3,190,000 | 2.750%, 12/1/2022 | 3,138,915 | ||||||
| 1,870,000 | 4.750%, 12/1/2022 | 2,028,526 | ||||||
| 1,600,000 | 3.875%, 7/20/2025 | 1,648,430 | ||||||
| 3,120,000 | 5.125%, 7/20/2045 | 3,470,385 | ||||||
Dana, Inc. | ||||||||
| 1,280,000 | 6.000%, 9/15/2023 | 1,336,000 | ||||||
Dollar Tree, Inc. | ||||||||
| 1,230,000 | 5.750%, 3/1/2023 | 1,302,349 | ||||||
Ford Motor Credit Company, LLC | ||||||||
| 1,700,000 | 2.597%, 11/4/2019 | 1,696,654 | ||||||
| 2,575,000 | 4.250%, 9/20/2022 | 2,650,126 | ||||||
| 1,850,000 | 3.096%, 5/4/2023 | 1,784,630 | ||||||
| 2,510,000 | 3.664%, 9/8/2024 | 2,446,193 | ||||||
| 3,720,000 | 4.134%, 8/4/2025 | 3,725,550 | ||||||
General Motors Company | ||||||||
| 3,150,000 | 5.000%, 4/1/2035 | 3,067,149 | ||||||
General Motors Financial Company, Inc. | ||||||||
| 2,540,000 | 4.200%, 3/1/2021 | 2,611,404 | ||||||
| 3,100,000 | 3.450%, 4/10/2022 | 3,062,571 | ||||||
| 3,830,000 | 3.700%, 5/9/2023 | 3,764,622 | ||||||
The accompanying Notes to Financial Statements are an integral part of this schedule.
181
Table of Contents
INCOME PORTFOLIO
Schedule of Investments as of December 31, 2016
| Principal Amount | Long-Term Fixed Income (91.2%) | Value | ||||||
Consumer Cyclical (4.7%) - continued | ||||||||
| $2,510,000 | 4.000%, 1/15/2025 | $ | 2,445,827 | |||||
Hilton Worldwide Finance, LLC | ||||||||
| 1,270,000 | 5.625%, 10/15/2021 | 1,311,910 | ||||||
Home Depot, Inc. | ||||||||
| 960,000 | 2.125%, 9/15/2026 | 884,115 | ||||||
| 3,180,000 | 4.250%, 4/1/2046 | 3,331,594 | ||||||
Hyundai Capital America | ||||||||
| 2,065,000 | 2.875%, 8/9/2018d | 2,088,686 | ||||||
| 3,850,000 | 2.450%, 6/15/2021d | 3,758,716 | ||||||
L Brands, Inc. | ||||||||
| 1,260,000 | 5.625%, 2/15/2022 | 1,345,050 | ||||||
Lennar Corporation | ||||||||
| 1,880,000 | 4.500%, 11/15/2019 | 1,952,850 | ||||||
Marriott International, Inc. | ||||||||
| 1,850,000 | 6.750%, 5/15/2018 | 1,971,843 | ||||||
MGM Resorts International | ||||||||
| 1,240,000 | 6.000%, 3/15/2023 | 1,339,200 | ||||||
Scientific Games International, Inc. | ||||||||
| 1,280,000 | 7.000%, 1/1/2022d | 1,372,800 | ||||||
Toll Brothers Finance Corporation | ||||||||
| 2,000,000 | 6.750%, 11/1/2019 | 2,190,000 | ||||||
| 960,000 | 4.375%, 4/15/2023 | 957,600 | ||||||
Visa, Inc. | ||||||||
| 2,860,000 | 3.150%, 12/14/2025 | 2,868,583 | ||||||
ZF North America Capital, Inc. | ||||||||
| 1,230,000 | 4.500%, 4/29/2022d | 1,268,437 | ||||||
|
| |||||||
Total | 66,820,715 | |||||||
|
| |||||||
Consumer Non-Cyclical (10.8%) | ||||||||
Abbott Laboratories | ||||||||
| 3,840,000 | 3.750%, 11/30/2026 | 3,811,384 | ||||||
| 1,440,000 | 4.750%, 11/30/2036 | 1,461,637 | ||||||
AbbVie, Inc. | ||||||||
| 4,460,000 | 3.200%, 5/14/2026 | 4,237,187 | ||||||
Actavis Funding SCS | ||||||||
| 2,480,000 | 3.450%, 3/15/2022 | 2,514,752 | ||||||
| 2,555,000 | 3.850%, 6/15/2024 | 2,574,847 | ||||||
Altria Group, Inc. | ||||||||
| 1,600,000 | 2.625%, 9/16/2026 | 1,512,835 | ||||||
Anheuser-Busch InBev Finance, Inc. | ||||||||
| 2,570,000 | 3.300%, 2/1/2023 | 2,612,891 | ||||||
| 4,470,000 | 3.650%, 2/1/2026 | 4,530,922 | ||||||
| 3,210,000 | 4.700%, 2/1/2036 | 3,375,392 | ||||||
| 3,200,000 | 4.900%, 2/1/2046 | 3,435,946 | ||||||
Anheuser-Busch InBev Worldwide, Inc. | ||||||||
| 4,320,000 | 3.750%, 1/15/2022 | 4,504,702 | ||||||
Baxter International, Inc. | ||||||||
| 1,920,000 | 2.600%, 8/15/2026 | 1,769,791 | ||||||
Bayer U.S. Finance, LLC | ||||||||
| 3,200,000 | 3.375%, 10/8/2024d | 3,180,035 | ||||||
Becton Dickinson and Company | ||||||||
| 3,120,000 | 3.125%, 11/8/2021 | 3,195,651 | ||||||
Biogen, Inc. | ||||||||
| 3,740,000 | 3.625%, 9/15/2022 | 3,834,772 | ||||||
Boston Scientific Corporation | ||||||||
| 4,360,000 | 3.375%, 5/15/2022 | 4,427,004 | ||||||
BRF GmbH | ||||||||
| 2,560,000 | 4.350%, 9/29/2026d | 2,361,600 | ||||||
BRF SA | ||||||||
| 1,910,000 | 4.750%, 5/22/2024d | 1,855,565 | ||||||
Bunge Limited Finance Corporation | ||||||||
| 2,530,000 | 8.500%, 6/15/2019 | 2,897,343 | ||||||
| 1,920,000 | 3.500%, 11/24/2020 | 1,952,713 | ||||||
Celgene Corporation | ||||||||
| 1,770,000 | 3.950%, 10/15/2020 | 1,849,034 | ||||||
| 1,910,000 | 3.250%, 8/15/2022 | 1,924,915 | ||||||
Constellation Brands, Inc. | ||||||||
| 2,560,000 | 4.250%, 5/1/2023 | 2,654,438 | ||||||
Diageo Capital plc | ||||||||
| 3,120,000 | 2.625%, 4/29/2023 | 3,081,193 | ||||||
Express Scripts Holding Company | ||||||||
| 1,920,000 | 4.750%, 11/15/2021 | 2,060,302 | ||||||
| 3,810,000 | 4.500%, 2/25/2026 | 3,917,065 | ||||||
Forest Laboratories, Inc. | ||||||||
| 2,550,000 | 5.000%, 12/15/2021d | 2,754,541 | ||||||
H. J. Heinz Company | ||||||||
| 3,120,000 | 3.500%, 7/15/2022 | 3,163,833 | ||||||
| 1,860,000 | 5.200%, 7/15/2045 | 1,943,456 | ||||||
HCA, Inc. | ||||||||
| 2,560,000 | 4.750%, 5/1/2023 | 2,620,800 | ||||||
Imperial Tobacco Finance plc | ||||||||
| 2,190,000 | 3.750%, 7/21/2022d | 2,245,858 | ||||||
JBS USA, LLC | ||||||||
| 1,910,000 | 7.250%, 6/1/2021d | 1,981,625 | ||||||
Kraft Foods Group, Inc. | ||||||||
| 4,390,000 | 3.500%, 6/6/2022 | 4,461,877 | ||||||
Kraft Heinz Foods Company | ||||||||
| 1,280,000 | 3.000%, 6/1/2026 | 1,199,942 | ||||||
Kroger Company | ||||||||
| 3,200,000 | 2.650%, 10/15/2026 | 2,968,384 | ||||||
Laboratory Corporation of America Holdings | ||||||||
| 1,250,000 | 3.200%, 2/1/2022 | 1,259,129 | ||||||
| 1,250,000 | 4.700%, 2/1/2045 | 1,232,318 | ||||||
Mylan NV | ||||||||
| 1,925,000 | 3.950%, 6/15/2026d | 1,798,966 | ||||||
| 1,920,000 | 5.250%, 6/15/2046d | 1,767,660 | ||||||
Mylan, Inc. | ||||||||
| 1,920,000 | 3.125%, 1/15/2023d | 1,811,103 | ||||||
Newell Rubbermaid, Inc. | ||||||||
| 2,700,000 | 3.850%, 4/1/2023 | 2,797,824 | ||||||
PepsiCo, Inc. | ||||||||
| 2,560,000 | 3.450%, 10/6/2046 | 2,326,950 | ||||||
Pernod Ricard SA | ||||||||
| 3,130,000 | 5.750%, 4/7/2021d | 3,474,053 | ||||||
| 1,910,000 | 4.450%, 1/15/2022d | 2,024,508 | ||||||
Perrigo Finance Unlimited Company | ||||||||
| 2,540,000 | 3.500%, 3/15/2021 | 2,564,399 | ||||||
| 3,350,000 | 4.375%, 3/15/2026 | 3,348,827 | ||||||
Reynolds American, Inc. | ||||||||
| 3,120,000 | 4.000%, 6/12/2022 | 3,259,873 | ||||||
| 1,560,000 | 5.850%, 8/15/2045 | 1,843,830 | ||||||
Shire Acquisitions Investments Ireland Designated Activity Company | ||||||||
| 3,200,000 | 2.875%, 9/23/2023 | 3,037,910 | ||||||
| 1,280,000 | 3.200%, 9/23/2026 | 1,194,469 | ||||||
Teva Pharmaceutical Finance Netherlands III BV | ||||||||
| 3,040,000 | 2.800%, 7/21/2023 | 2,874,375 | ||||||
| 2,560,000 | 3.150%, 10/1/2026 | 2,356,588 | ||||||
Thermo Fisher Scientific, Inc. | ||||||||
| 3,830,000 | 3.000%, 4/15/2023 | 3,760,279 | ||||||
Valeant Pharmaceuticals International | ||||||||
| 2,560,000 | 6.375%, 10/15/2020d | 2,199,194 | ||||||
Watson Pharmaceuticals, Inc. | ||||||||
| 3,180,000 | 3.250%, 10/1/2022 | 3,163,499 | ||||||
Whirlpool Corporation | ||||||||
| 3,245,000 | 3.700%, 3/1/2023 | 3,310,848 | ||||||
The accompanying Notes to Financial Statements are an integral part of this schedule.
182
Table of Contents
INCOME PORTFOLIO
Schedule of Investments as of December 31, 2016
| Principal Amount | Long-Term Fixed Income (91.2%) | Value | ||||||
Consumer Non-Cyclical (10.8%) - continued | ||||||||
Zoetis, Inc. | ||||||||
| $3,190,000 | 3.250%, 2/1/2023 | $ | 3,179,684 | |||||
| 1,280,000 | 4.700%, 2/1/2043 | 1,243,634 | ||||||
|
| |||||||
Total | 154,704,152 | |||||||
|
| |||||||
Energy (9.3%) | ||||||||
Anadarko Petroleum Corporation | ||||||||
| 1,270,000 | 5.550%, 3/15/2026h | 1,419,607 | ||||||
Antero Resources Corporation | ||||||||
| 1,880,000 | 5.625%, 6/1/2023 | 1,924,650 | ||||||
BP Capital Markets plc | ||||||||
| 1,910,000 | 2.750%, 5/10/2023 | 1,873,162 | ||||||
| 2,490,000 | 3.814%, 2/10/2024 | 2,583,841 | ||||||
| 1,590,000 | 3.119%, 5/4/2026 | 1,550,632 | ||||||
| 2,560,000 | 3.017%, 1/16/2027 | 2,469,192 | ||||||
Buckeye Partners, LP | ||||||||
| 640,000 | 3.950%, 12/1/2026 | 623,445 | ||||||
| 1,900,000 | 5.850%, 11/15/2043 | 1,955,651 | ||||||
Canadian Natural Resources, Ltd. | ||||||||
| 3,110,000 | 3.450%, 11/15/2021 | 3,176,255 | ||||||
| 1,600,000 | 6.250%, 3/15/2038 | 1,817,486 | ||||||
Concho Resources, Inc. | ||||||||
| 1,930,000 | 6.500%, 1/15/2022 | 1,996,971 | ||||||
Continental Resources, Inc. | ||||||||
| 2,550,000 | 3.800%, 6/1/2024 | 2,352,375 | ||||||
Ecopetrol SA | ||||||||
| 2,560,000 | 5.875%, 9/18/2023 | 2,709,760 | ||||||
El Paso Pipeline Partners Operating Company, LLC | ||||||||
| 3,850,000 | 5.000%, 10/1/2021 | 4,095,749 | ||||||
| 2,530,000 | 4.300%, 5/1/2024 | 2,585,837 | ||||||
| 1,280,000 | 4.700%, 11/1/2042 | 1,190,431 | ||||||
Enbridge Energy Partners, LP | ||||||||
| 2,550,000 | 5.200%, 3/15/2020 | 2,713,850 | ||||||
| 1,660,000 | 4.375%, 10/15/2020 | 1,731,732 | ||||||
Enbridge, Inc. | ||||||||
| 1,920,000 | 6.000%, 1/15/2077 | 1,915,200 | ||||||
| 960,000 | 4.250%, 12/1/2026 | 981,520 | ||||||
| 1,920,000 | 5.500%, 12/1/2046 | 2,059,788 | ||||||
Encana Corporation | ||||||||
| 2,550,000 | 3.900%, 11/15/2021 | 2,568,309 | ||||||
Energy Transfer Partners, LP | ||||||||
| 1,485,000 | 4.650%, 6/1/2021 | 1,540,520 | ||||||
EnLink Midstream Partners, LP | ||||||||
| 1,280,000 | 4.150%, 6/1/2025 | 1,240,863 | ||||||
| 960,000 | 4.850%, 7/15/2026 | 967,073 | ||||||
Enterprise Products Operating, LLC | ||||||||
| 2,490,000 | 3.700%, 2/15/2026 | 2,495,607 | ||||||
| 1,690,000 | 7.034%, 1/15/2068 | 1,725,211 | ||||||
EQT Midstream Partners, LP | ||||||||
| 3,030,000 | 4.000%, 8/1/2024 | 2,984,771 | ||||||
Exxon Mobil Corporation | ||||||||
| 3,180,000 | 2.726%, 3/1/2023 | 3,187,619 | ||||||
Hornbeck Offshore Services, Inc. | ||||||||
| 1,560,000 | 5.000%, 3/1/2021 | 1,045,200 | ||||||
Magellan Midstream Partners, LP | ||||||||
| 1,280,000 | 5.000%, 3/1/2026 | 1,401,750 | ||||||
| 2,500,000 | 4.200%, 3/15/2045 | 2,253,423 | ||||||
Marathon Oil Corporation | ||||||||
| 2,364,000 | 5.900%, 3/15/2018 | 2,468,087 | ||||||
Marathon Petroleum Corporation | ||||||||
| 1,920,000 | 6.500%, 3/1/2041 | 2,050,439 | ||||||
| 1,280,000 | 4.750%, 9/15/2044 | 1,132,687 | ||||||
MPLX, LP | ||||||||
| 4,470,000 | 4.875%, 6/1/2025 | 4,590,194 | ||||||
Nabors Industries, Inc. | ||||||||
| 640,000 | 5.500%, 1/15/2023d | 666,400 | ||||||
NiSource Finance Corporation | ||||||||
| 1,250,000 | 6.800%, 1/15/2019 | 1,363,971 | ||||||
Occidental Petroleum Corporation | ||||||||
| 2,560,000 | 3.000%, 2/15/2027 | 2,473,091 | ||||||
ONEOK Partners, LP | ||||||||
| 1,920,000 | 3.375%, 10/1/2022 | 1,925,964 | ||||||
Petrobras Global Finance BV | ||||||||
| 3,210,000 | 8.375%, 5/23/2021 | 3,458,775 | ||||||
Petroleos Mexicanos | ||||||||
| 960,000 | 5.375%, 3/13/2022d | 983,021 | ||||||
| 3,200,000 | 4.625%, 9/21/2023d | 3,112,960 | ||||||
Phillips 66 Partners, LP | ||||||||
| 1,600,000 | 3.550%, 10/1/2026 | 1,546,138 | ||||||
Pioneer Natural Resources Company | ||||||||
| 3,150,000 | 3.950%, 7/15/2022 | 3,264,899 | ||||||
Plains All American Pipeline, LP | ||||||||
| 3,210,000 | 2.850%, 1/31/2023 | 3,031,502 | ||||||
| 905,000 | 4.650%, 10/15/2025 | 933,788 | ||||||
Regency Energy Partners, LP | ||||||||
| 3,190,000 | 5.000%, 10/1/2022 | 3,376,972 | ||||||
Sabine Pass Liquefaction, LLC | ||||||||
| 1,910,000 | 5.750%, 5/15/2024 | 2,048,475 | ||||||
Schlumberger Holdings Corporation | ||||||||
| 3,200,000 | 3.625%, 12/21/2022d | 3,313,078 | ||||||
Spectra Energy Partners, LP | ||||||||
| 3,190,000 | 3.375%, 10/15/2026 | 3,046,581 | ||||||
Suncor Energy, Inc. | ||||||||
| 1,920,000 | 3.600%, 12/1/2024 | 1,965,097 | ||||||
Sunoco Logistics Partners Operations, LP | ||||||||
| 3,200,000 | 3.450%, 1/15/2023 | 3,122,934 | ||||||
Tesoro Logistics, LP | ||||||||
| 1,880,000 | 5.500%, 10/15/2019 | 1,988,100 | ||||||
TransCanada Trust | ||||||||
| 1,600,000 | 5.875%, 8/15/2076 | 1,664,000 | ||||||
Transcontinental Gas Pipe Line Company, LLC | ||||||||
| 1,925,000 | 7.850%, 2/1/2026d | 2,424,405 | ||||||
Valero Energy Corporation | ||||||||
| 3,200,000 | 3.400%, 9/15/2026 | 3,061,088 | ||||||
Williams Partners, LP | ||||||||
| 1,930,000 | 4.500%, 11/15/2023 | 1,980,485 | ||||||
| 1,600,000 | 3.900%, 1/15/2025 | 1,567,259 | ||||||
Woodside Finance, Ltd. | ||||||||
| 3,130,000 | 3.650%, 3/5/2025d | 3,053,750 | ||||||
WPX Energy, Inc. | ||||||||
| 1,280,000 | 6.000%, 1/15/2022 | 1,312,000 | ||||||
|
| |||||||
Total | 132,063,620 | |||||||
|
| |||||||
Financials (27.2%) | ||||||||
Aegon NV | ||||||||
| 2,600,000 | 1.677%, 4/15/2017f,i | 1,861,751 | ||||||
AerCap Ireland Capital, Ltd. | ||||||||
| 960,000 | 3.950%, 2/1/2022 | 968,400 | ||||||
Aetna, Inc. | ||||||||
| 3,200,000 | 3.200%, 6/15/2026 | 3,160,992 | ||||||
| 2,560,000 | 4.375%, 6/15/2046 | 2,565,407 | ||||||
Aflac, Inc. | ||||||||
| 2,560,000 | 4.000%, 10/15/2046 | 2,434,429 | ||||||
Air Lease Corporation | ||||||||
| 1,260,000 | 2.125%, 1/15/2018 | 1,262,152 | ||||||
| 2,510,000 | 3.750%, 2/1/2022 | 2,582,948 | ||||||
| 1,260,000 | 4.250%, 9/15/2024 | 1,278,305 | ||||||
The accompanying Notes to Financial Statements are an integral part of this schedule.
183
Table of Contents
INCOME PORTFOLIO
Schedule of Investments as of December 31, 2016
| Principal Amount | Long-Term Fixed Income (91.2%) | Value | ||||||
Financials (27.2%) - continued | ||||||||
Allstate Corporation | ||||||||
| $2,880,000 | 4.200%, 12/15/2046 | $ | 2,932,972 | |||||
Ally Financial, Inc. | ||||||||
| 1,860,000 | 4.125%, 3/30/2020 | 1,897,200 | ||||||
American Express Company | ||||||||
| 1,880,000 | 4.900%, 3/15/2020i | 1,783,650 | ||||||
American International Group, Inc. | ||||||||
| 1,870,000 | 3.750%, 7/10/2025 | 1,879,645 | ||||||
| 3,130,000 | 4.500%, 7/16/2044 | 3,080,443 | ||||||
Aon plc | ||||||||
| 1,910,000 | 3.875%, 12/15/2025 | 1,944,223 | ||||||
Ares Capital Corporation | ||||||||
| 3,190,000 | 4.875%, 11/30/2018 | 3,305,765 | ||||||
Associated Banc-Corporation | ||||||||
| 3,150,000 | 4.250%, 1/15/2025 | 3,117,861 | ||||||
Assured Guaranty US Holdings, Inc. | ||||||||
| 3,200,000 | 5.000%, 7/1/2024h | 3,375,725 | ||||||
Australia and New Zealand Banking Group, Ltd. | ||||||||
| 1,280,000 | 6.750%, 6/15/2026d,i | 1,351,308 | ||||||
AXA SA | ||||||||
| 2,580,000 | 8.600%, 12/15/2030 | 3,547,500 | ||||||
Axis Specialty Finance, LLC | ||||||||
| 920,000 | 5.875%, 6/1/2020 | 1,007,765 | ||||||
Banco de Brasil SA | ||||||||
| 1,371,000 | 9.000%, 6/18/2024d,i | 1,288,740 | ||||||
Bank of America Corporation | ||||||||
| 3,840,000 | 2.066%, 3/22/2018f | 3,865,847 | ||||||
| 3,380,000 | 7.625%, 6/1/2019 | 3,796,649 | ||||||
| 2,870,000 | 2.625%, 4/19/2021 | 2,847,849 | ||||||
| 1,000,000 | 4.100%, 7/24/2023 | 1,043,506 | ||||||
| 3,830,000 | 4.125%, 1/22/2024 | 3,975,896 | ||||||
| 2,830,000 | 4.200%, 8/26/2024 | 2,879,514 | ||||||
| 2,860,000 | 6.500%, 10/23/2024i | 2,988,700 | ||||||
| 2,750,000 | 3.950%, 4/21/2025 | 2,734,094 | ||||||
| 1,270,000 | 3.875%, 8/1/2025 | 1,289,665 | ||||||
| 1,270,000 | 6.300%, 3/10/2026i | 1,327,150 | ||||||
| 1,950,000 | 5.875%, 2/7/2042 | 2,352,720 | ||||||
| 3,110,000 | 4.750%, 4/21/2045 | 3,147,494 | ||||||
Barclays Bank plc | ||||||||
| 1,910,000 | 10.179%, 6/12/2021d | 2,369,794 | ||||||
Berkshire Hathaway, Inc. | ||||||||
| 2,860,000 | 2.750%, 3/15/2023 | 2,846,321 | ||||||
Boston Properties, LP | ||||||||
| 3,200,000 | 2.750%, 10/1/2026 | 2,921,370 | ||||||
BPCE SA | ||||||||
| 1,265,000 | 5.700%, 10/22/2023d | 1,329,873 | ||||||
| 2,190,000 | 5.150%, 7/21/2024d | 2,223,844 | ||||||
Camden Property Trust | ||||||||
| 3,140,000 | 3.500%, 9/15/2024 | 3,091,531 | ||||||
Capital One Financial Corporation | ||||||||
| 3,190,000 | 4.200%, 10/29/2025 | 3,196,358 | ||||||
Centene Escrow Corporation | ||||||||
| 1,270,000 | 5.625%, 2/15/2021 | 1,335,278 | ||||||
Citigroup, Inc. | ||||||||
| 3,200,000 | 2.021%, 12/8/2021f | 3,212,304 | ||||||
| 2,560,000 | 2.361%, 9/1/2023f | 2,610,900 | ||||||
| 4,370,000 | 4.400%, 6/10/2025 | 4,465,008 | ||||||
| 3,305,000 | 5.500%, 9/13/2025 | 3,627,611 | ||||||
| 1,910,000 | 3.700%, 1/12/2026 | 1,897,530 | ||||||
| 2,490,000 | 4.450%, 9/29/2027 | 2,531,516 | ||||||
Citizens Bank NA | ||||||||
| 2,560,000 | 2.550%, 5/13/2021 | 2,542,057 | ||||||
Citizens Financial Group, Inc. | ||||||||
| 1,280,000 | 2.375%, 7/28/2021 | 1,254,071 | ||||||
CNA Financial Corporation | ||||||||
| 1,995,000 | 7.350%, 11/15/2019 | 2,261,520 | ||||||
| 1,870,000 | 7.250%, 11/15/2023 | 2,208,354 | ||||||
Compass Bank | ||||||||
| 1,575,000 | 2.750%, 9/29/2019 | 1,565,698 | ||||||
Cooperatieve Centrale Raiffeisen- Boerenleenbank BA | ||||||||
| 1,290,000 | 11.000%, 6/30/2019d,i | 1,516,137 | ||||||
CoreStates Capital III | ||||||||
| 2,440,000 | 1.476%, 2/15/2027d,f | 2,189,900 | ||||||
Credit Agricole SA | ||||||||
| 2,570,000 | 8.125%, 12/23/2025d,i | 2,704,822 | ||||||
Credit Suisse Group Funding, Ltd. | ||||||||
| 3,190,000 | 3.125%, 12/10/2020 | 3,177,530 | ||||||
| 4,400,000 | 3.750%, 3/26/2025 | 4,327,585 | ||||||
DDR Corporation | ||||||||
| 1,290,000 | 7.875%, 9/1/2020 | 1,501,194 | ||||||
| 2,010,000 | 3.625%, 2/1/2025 | 1,941,939 | ||||||
Discover Bank of Greenwood Delaware | ||||||||
| 1,635,000 | 4.200%, 8/8/2023 | 1,701,607 | ||||||
| 1,600,000 | 4.250%, 3/13/2026 | 1,627,707 | ||||||
| 1,280,000 | 3.450%, 7/27/2026 | 1,234,168 | ||||||
Duke Realty, LP | ||||||||
| 3,220,000 | 3.875%, 10/15/2022 | 3,345,651 | ||||||
Essex Portfolio, LP | ||||||||
| 2,940,000 | 3.500%, 4/1/2025 | 2,891,872 | ||||||
Fairfax Financial Holdings, Ltd. | ||||||||
| 1,915,000 | 5.800%, 5/15/2021d,h | 2,046,744 | ||||||
Five Corners Funding Trust | ||||||||
| 1,910,000 | 4.419%, 11/15/2023d | 2,016,991 | ||||||
GE Capital International Funding Company | ||||||||
| 2,527,000 | 4.418%, 11/15/2035 | 2,643,828 | ||||||
Goldman Sachs Group, Inc. | ||||||||
| 2,900,000 | 5.375%, 3/15/2020 | 3,144,473 | ||||||
| 3,275,000 | 5.250%, 7/27/2021 | 3,586,236 | ||||||
| 3,200,000 | 2.350%, 11/15/2021 | 3,105,965 | ||||||
| 2,190,000 | 4.000%, 3/3/2024 | 2,269,372 | ||||||
| 4,450,000 | 3.850%, 7/8/2024 | 4,537,296 | ||||||
| 2,490,000 | 4.250%, 10/21/2025 | 2,526,075 | ||||||
| 1,920,000 | 5.300%, 11/10/2026i | 1,840,800 | ||||||
| 2,560,000 | 3.500%, 11/16/2026 | 2,507,515 | ||||||
| 3,760,000 | 5.150%, 5/22/2045 | 3,946,804 | ||||||
Hartford Financial Services Group, Inc. | ||||||||
| 3,230,000 | 5.125%, 4/15/2022 | 3,579,095 | ||||||
HCP, Inc. | ||||||||
| 2,200,000 | 4.250%, 11/15/2023 | 2,256,791 | ||||||
Host Hotels & Resorts, LP | ||||||||
| 1,240,000 | 4.000%, 6/15/2025 | 1,219,721 | ||||||
HSBC Finance Corporation | ||||||||
| 3,210,000 | 6.676%, 1/15/2021 | 3,605,421 | ||||||
HSBC Holdings plc | ||||||||
| 1,280,000 | 6.875%, 6/1/2021h,i | 1,350,400 | ||||||
| 1,920,000 | 3.600%, 5/25/2023 | 1,929,030 | ||||||
Huntington Bancshares, Inc. | ||||||||
| 2,850,000 | 7.000%, 12/15/2020 | 3,224,513 | ||||||
Icahn Enterprises, LP | ||||||||
| 1,360,000 | 6.000%, 8/1/2020 | 1,388,900 | ||||||
ILFC E-Capital Trust II | ||||||||
| 2,230,000 | 4.920%, 12/21/2065d,f | 1,962,400 | ||||||
ING Bank NV | ||||||||
| 3,165,000 | 5.800%, 9/25/2023d | 3,474,110 | ||||||
The accompanying Notes to Financial Statements are an integral part of this schedule.
184
Table of Contents
INCOME PORTFOLIO
Schedule of Investments as of December 31, 2016
| Principal Amount | Long-Term Fixed Income (91.2%) | Value | ||||||
Financials (27.2%) - continued | ||||||||
J.P. Morgan Chase & Company | ||||||||
| $1,910,000 | 7.900%, 4/30/2018i | $ | 1,977,805 | |||||
| 1,280,000 | 2.295%, 8/15/2021 | 1,255,121 | ||||||
| 2,560,000 | 6.000%, 8/1/2023i | 2,569,600 | ||||||
| 3,190,000 | 2.112%, 10/24/2023f | 3,253,701 | ||||||
| 1,270,000 | 6.750%, 2/1/2024h,i | 1,368,425 | ||||||
| 2,830,000 | 3.875%, 9/10/2024 | 2,860,049 | ||||||
| 1,270,000 | 3.900%, 7/15/2025 | 1,304,234 | ||||||
| 3,150,000 | 5.500%, 10/15/2040 | 3,714,329 | ||||||
KeyCorp | ||||||||
| 320,000 | 5.000%, 9/15/2026i | 295,200 | ||||||
Kilroy Realty, LP | ||||||||
| 2,550,000 | 4.250%, 8/15/2029 | 2,493,359 | ||||||
Liberty Mutual Group, Inc. | ||||||||
| 3,535,000 | 4.950%, 5/1/2022d | 3,853,210 | ||||||
| 3,190,000 | 4.850%, 8/1/2044d | 3,150,696 | ||||||
Liberty Property, LP | ||||||||
| 1,875,000 | 4.750%, 10/1/2020 | 1,993,069 | ||||||
| 1,910,000 | 4.400%, 2/15/2024 | 2,009,047 | ||||||
Lincoln National Corporation | ||||||||
| 4,150,000 | 4.000%, 9/1/2023 | 4,321,652 | ||||||
| 1,280,000 | 3.625%, 12/12/2026 | 1,275,091 | ||||||
Lloyds Bank plc | ||||||||
| 1,910,000 | 4.650%, 3/24/2026 | 1,931,994 | ||||||
MetLife Capital Trust IV | ||||||||
| 700,000 | 7.875%, 12/15/2037d | 843,850 | ||||||
MetLife Capital Trust X | ||||||||
| 2,250,000 | 9.250%, 4/8/2038d | 3,060,000 | ||||||
Mitsubishi UFJ Financial Group, Inc. | ||||||||
| 1,280,000 | 2.190%, 9/13/2021 | 1,243,575 | ||||||
Mizuho Bank, Ltd. | ||||||||
| 2,400,000 | 3.600%, 9/25/2024d | 2,448,655 | ||||||
Morgan Stanley | ||||||||
| 3,400,000 | 5.500%, 1/26/2020 | 3,683,818 | ||||||
| 2,550,000 | 2.500%, 4/21/2021 | 2,520,096 | ||||||
| 2,560,000 | 2.625%, 11/17/2021 | 2,526,730 | ||||||
| 3,205,000 | 4.875%, 11/1/2022 | 3,431,193 | ||||||
| 3,190,000 | 2.282%, 10/24/2023f | 3,225,444 | ||||||
| 1,870,000 | 4.000%, 7/23/2025 | 1,914,257 | ||||||
| 2,550,000 | 5.000%, 11/24/2025 | 2,720,554 | ||||||
| 1,280,000 | 3.125%, 7/27/2026 | 1,221,062 | ||||||
| 2,510,000 | 4.350%, 9/8/2026 | 2,557,522 | ||||||
| 1,570,000 | 4.300%, 1/27/2045 | 1,561,473 | ||||||
National Retail Properties, Inc. | ||||||||
| 3,200,000 | 3.900%, 6/15/2024 | 3,266,115 | ||||||
Nationwide Building Society | ||||||||
| 2,490,000 | 3.900%, 7/21/2025d | 2,558,896 | ||||||
| 1,920,000 | 4.000%, 9/14/2026d | 1,826,661 | ||||||
Nordea Bank AB | ||||||||
| 1,890,000 | 5.500%, 9/23/2019d,i | 1,878,471 | ||||||
Omega Healthcare Investors, Inc. | ||||||||
| 2,960,000 | 5.875%, 3/15/2024 | 3,053,447 | ||||||
| 1,870,000 | 5.250%, 1/15/2026 | 1,918,723 | ||||||
Peachtree Corners Funding Trust | ||||||||
| 2,800,000 | 3.976%, 2/15/2025d | 2,728,580 | ||||||
Prologis, LP | ||||||||
| 2,510,000 | 4.250%, 8/15/2023 | 2,661,792 | ||||||
Prudential Financial, Inc. | ||||||||
| 1,915,000 | 3.500%, 5/15/2024 | 1,952,318 | ||||||
| 1,425,000 | 6.200%, 11/15/2040 | 1,738,470 | ||||||
Realty Income Corporation | ||||||||
| 3,830,000 | 3.875%, 7/15/2024 | 3,906,340 | ||||||
Regions Bank | ||||||||
| 377,000 | 7.500%, 5/15/2018 | 403,833 | ||||||
Reinsurance Group of America, Inc. | ||||||||
| 1,930,000 | 6.450%, 11/15/2019 | 2,140,189 | ||||||
Royal Bank of Scotland Group plc | ||||||||
| 2,490,000 | 7.500%, 8/10/2020h,i | 2,359,275 | ||||||
| 1,920,000 | 8.625%, 8/15/2021i | 1,958,400 | ||||||
| 2,560,000 | 3.875%, 9/12/2023 | 2,455,516 | ||||||
Santander Holdings USA, Inc. | ||||||||
| 3,210,000 | 2.700%, 5/24/2019 | 3,206,244 | ||||||
| 2,500,000 | 4.500%, 7/17/2025 | 2,481,185 | ||||||
Santander UK Group Holdings plc | ||||||||
| 2,500,000 | 4.750%, 9/15/2025d | 2,447,502 | ||||||
Santander UK plc | ||||||||
| 1,700,000 | 3.125%, 1/8/2021 | 1,696,029 | ||||||
Simon Property Group, LP | ||||||||
| 1,920,000 | 3.250%, 11/30/2026 | 1,881,314 | ||||||
State Street Capital Trust IV | ||||||||
| 1,920,000 | 1.963%, 6/15/2037f | 1,696,800 | ||||||
Sumitomo Mitsui Financial Group, Inc. | ||||||||
| 2,560,000 | 3.010%, 10/19/2026 | 2,446,070 | ||||||
SunTrust Banks, Inc. | ||||||||
| 1,910,000 | 2.900%, 3/3/2021 | 1,935,392 | ||||||
Synchrony Financial | ||||||||
| 2,510,000 | 2.700%, 2/3/2020 | 2,501,187 | ||||||
| 2,690,000 | 4.250%, 8/15/2024 | 2,735,141 | ||||||
| 2,560,000 | 3.700%, 8/4/2026 | 2,457,283 | ||||||
Toronto-Dominion Bank | ||||||||
| 2,560,000 | 3.625%, 9/15/2031 | 2,515,277 | ||||||
Travelers Companies, Inc. | ||||||||
| 1,920,000 | 3.750%, 5/15/2046 | 1,807,828 | ||||||
UBS Group Funding Jersey, Ltd. | ||||||||
| 1,600,000 | 2.650%, 2/1/2022d | 1,553,469 | ||||||
| 2,490,000 | 4.125%, 9/24/2025d | 2,534,601 | ||||||
UnionBanCal Corporation | ||||||||
| 2,580,000 | 3.500%, 6/18/2022 | 2,635,073 | ||||||
UnitedHealth Group, Inc. | ||||||||
| 2,480,000 | 3.350%, 7/15/2022 | 2,552,409 | ||||||
| 1,240,000 | 4.750%, 7/15/2045 | 1,363,266 | ||||||
USB Realty Corporation | ||||||||
| 1,900,000 | 2.027%, 1/15/2022d,f,i | 1,672,000 | ||||||
Voya Financial, Inc. | ||||||||
| 640,000 | 3.650%, 6/15/2026 | 624,874 | ||||||
Wells Fargo & Company | ||||||||
| 3,160,000 | 5.875%, 6/15/2025i | 3,317,684 | ||||||
| 2,560,000 | 3.000%, 4/22/2026 | 2,439,388 | ||||||
| 1,910,000 | 4.100%, 6/3/2026 | 1,932,450 | ||||||
| 3,190,000 | 3.000%, 10/23/2026 | 3,032,972 | ||||||
Welltower, Inc. | ||||||||
| 1,280,000 | 6.125%, 4/15/2020 | 1,419,922 | ||||||
| 3,150,000 | 4.950%, 1/15/2021 | 3,394,645 | ||||||
| 1,550,000 | 4.000%, 6/1/2025 | 1,582,083 | ||||||
Westpac Banking Corporation | ||||||||
| 3,180,000 | 2.850%, 5/13/2026 | 3,045,794 | ||||||
XLIT, Ltd. | ||||||||
| 1,870,000 | 4.450%, 3/31/2025 | 1,851,925 | ||||||
| 1,840,000 | 5.250%, 12/15/2043 | 1,898,002 | ||||||
|
| |||||||
Total | 388,739,441 | |||||||
|
| |||||||
Foreign Government (0.7%) | ||||||||
Argentina Government International Bond | ||||||||
| 1,590,000 | 6.875%, 4/22/2021d | 1,693,350 | ||||||
Brazil Government International Bond | ||||||||
| 1,600,000 | 6.000%, 4/7/2026h | 1,656,000 | ||||||
The accompanying Notes to Financial Statements are an integral part of this schedule.
185
Table of Contents
INCOME PORTFOLIO
Schedule of Investments as of December 31, 2016
| Principal Amount | Long-Term Fixed Income (91.2%) | Value | ||||||
Foreign Government (0.7%) - continued | ||||||||
Mexico Government International Bond | ||||||||
| $1,880,000 | 4.000%, 10/2/2023 | $ | 1,884,324 | |||||
| 2,100,000 | 3.600%, 1/30/2025 | 2,024,400 | ||||||
| 2,880,000 | 4.125%, 1/21/2026 | 2,856,960 | ||||||
|
| |||||||
Total | 10,115,034 | |||||||
|
| |||||||
Mortgage-Backed Securities (5.5%) | ||||||||
Federal Home Loan Mortgage Corporation Gold 15-Yr. Pass Through | ||||||||
| 4,172,500 | 3.000%, 1/1/2032c | 4,279,733 | ||||||
Federal Home Loan Mortgage Corporation Gold 30-Yr. Pass Through | ||||||||
| 6,802,500 | 4.000%, 1/1/2047c | 7,141,265 | ||||||
Federal National Mortgage Association Conventional 15-Yr. Pass Through | ||||||||
| 9,500,000 | 2.500%, 1/1/2032c | 9,510,450 | ||||||
Federal National Mortgage Association Conventional 30-Yr. Pass Through | ||||||||
| 17,200,000 | 3.000%, 1/1/2047c | 17,074,440 | ||||||
| 25,150,000 | 3.500%, 1/1/2047c | 25,761,145 | ||||||
| 11,777,500 | 4.000%, 1/1/2047c | 12,375,797 | ||||||
| 2,025,000 | 4.500%, 1/1/2047c | 2,177,280 | ||||||
|
| |||||||
Total | 78,320,110 | |||||||
|
| |||||||
Technology (2.9%) | ||||||||
Apple, Inc. | ||||||||
| 4,450,000 | 3.250%, 2/23/2026 | 4,445,986 | ||||||
| 2,550,000 | 2.450%, 8/4/2026 | 2,389,615 | ||||||
Diamond 1 Finance Corporation | ||||||||
| 2,560,000 | 4.420%, 6/15/2021d | 2,646,710 | ||||||
| 1,920,000 | 6.020%, 6/15/2026d | 2,077,229 | ||||||
Equinix, Inc. | ||||||||
| 1,890,000 | 5.375%, 1/1/2022 | 1,984,500 | ||||||
Fidelity National Information Services, Inc. | ||||||||
| 3,190,000 | 3.875%, 6/5/2024 | 3,250,658 | ||||||
| 1,920,000 | 3.000%, 8/15/2026 | 1,802,857 | ||||||
First Data Corporation | ||||||||
| 1,250,000 | 5.375%, 8/15/2023d | 1,296,875 | ||||||
Hewlett Packard Enterprise Company | ||||||||
| 2,490,000 | 2.850%, 10/5/2018 | 2,513,610 | ||||||
| 2,500,000 | 3.600%, 10/15/2020 | 2,541,413 | ||||||
Intel Corporation | ||||||||
| 2,870,000 | 4.100%, 5/19/2046 | 2,838,708 | ||||||
Microsoft Corporation | ||||||||
| 2,560,000 | 3.450%, 8/8/2036 | 2,428,710 | ||||||
Oracle Corporation | ||||||||
| 3,850,000 | 2.650%, 7/15/2026 | 3,648,918 | ||||||
| 3,200,000 | 4.000%, 7/15/2046 | 3,054,362 | ||||||
Qualcomm, Inc. | ||||||||
| 2,490,000 | 3.450%, 5/20/2025 | 2,530,373 | ||||||
Sensata Technologies BV | ||||||||
| 1,890,000 | 4.875%, 10/15/2023d | 1,932,525 | ||||||
|
| |||||||
Total | 41,383,049 | |||||||
|
| |||||||
Transportation (2.1%) | ||||||||
American Airlines Pass Through Trust | ||||||||
| 2,177,251 | 4.000%, 7/15/2025 | 2,242,568 | ||||||
British Airways plc | ||||||||
| 3,983,708 | 4.625%, 6/20/2024d | 4,237,670 | ||||||
Burlington Northern Santa Fe, LLC | ||||||||
| 2,500,000 | 4.700%, 9/1/2045 | 2,730,820 | ||||||
Continental Airlines, Inc. | ||||||||
| 755,574 | 7.250%, 11/10/2019 | 844,353 | ||||||
| 1,198,788 | 4.000%, 10/29/2024 | 1,225,761 | ||||||
Delta Air Lines, Inc. | ||||||||
| 1,161,603 | 4.950%, 5/23/2019 | 1,217,361 | ||||||
ERAC USA Finance, LLC | ||||||||
| 3,450,000 | 5.250%, 10/1/2020d | 3,756,715 | ||||||
| 2,000,000 | 3.800%, 11/1/2025d | 2,011,334 | ||||||
| 2,560,000 | 3.300%, 12/1/2026d | 2,452,628 | ||||||
Penske Truck Leasing Company, LP | ||||||||
| 2,510,000 | 3.375%, 2/1/2022d | 2,528,800 | ||||||
United Airlines Pass Through Trust | ||||||||
| 1,498,293 | 3.750%, 9/3/2026 | 1,505,785 | ||||||
US Airways Pass Through Trust | ||||||||
| 2,685,023 | 3.950%, 11/15/2025 | 2,752,417 | ||||||
Virgin Australia Holdings, Ltd. | ||||||||
| 1,728,237 | 5.000%, 10/23/2023d | 1,806,008 | ||||||
|
| |||||||
Total | 29,312,220 | |||||||
|
| |||||||
U.S. Government and Agencies (5.0%) | ||||||||
U.S. Treasury Bonds | ||||||||
| 3,500,000 | 1.500%, 8/15/2026 | 3,213,840 | ||||||
| 4,500,000 | 4.375%, 5/15/2041 | 5,557,523 | ||||||
| 5,307,000 | 3.125%, 2/15/2042 | 5,374,245 | ||||||
| 7,550,000 | 2.500%, 2/15/2045 | 6,709,255 | ||||||
| 7,940,000 | 3.000%, 11/15/2045 | 7,813,111 | ||||||
U.S. Treasury Bonds, TIPS | ||||||||
| 1,642,320 | 0.750%, 2/15/2045 | 1,544,798 | ||||||
| 1,958,611 | 1.000%, 2/15/2046 | 1,966,237 | ||||||
U.S. Treasury Notes | ||||||||
| 1,000,000 | 2.875%, 3/31/2018 | 1,023,391 | ||||||
| 7,000,000 | 1.375%, 10/31/2020 | 6,908,797 | ||||||
| 5,730,000 | 1.125%, 2/28/2021 | 5,570,523 | ||||||
| 3,090,000 | 2.000%, 7/31/2022 | 3,075,304 | ||||||
| 1,960,000 | 1.875%, 8/31/2022 | 1,935,051 | ||||||
| 7,000,000 | 1.875%, 10/31/2022 | 6,899,284 | ||||||
| 7,130,000 | 2.125%, 12/31/2022 | 7,118,014 | ||||||
| 4,840,000 | 1.625%, 5/31/2023 | 4,670,116 | ||||||
U.S. Treasury Notes, TIPS | ||||||||
| 2,581,453 | 0.125%, 7/15/2026 | 2,495,971 | ||||||
|
| |||||||
Total | 71,875,460 | |||||||
|
| |||||||
U.S. Municipals (0.2%) | ||||||||
Denver, CO City & County Airport Rev. | ||||||||
| 2,550,000 | 5.250%, 11/15/2022, Series A, AMT | 2,880,531 | ||||||
|
| |||||||
Total | 2,880,531 | |||||||
|
| |||||||
Utilities (6.3%) | ||||||||
Access Midstream Partners, LP | ||||||||
| 1,270,000 | 4.875%, 5/15/2023 | 1,292,823 | ||||||
AEP Transmission Company, LLC | ||||||||
| 2,560,000 | 3.100%, 12/1/2026d | 2,517,414 | ||||||
American Electric Power Company, Inc. | ||||||||
| 2,565,000 | 2.950%, 12/15/2022 | 2,578,392 | ||||||
Arizona Public Service Company | ||||||||
| 2,880,000 | 8.750%, 3/1/2019 | 3,272,740 | ||||||
Baltimore Gas and Electric Company | ||||||||
| 2,560,000 | 2.400%, 8/15/2026 | 2,386,534 | ||||||
Calpine Corporation | ||||||||
| 1,920,000 | 5.375%, 1/15/2023 | 1,876,800 | ||||||
Cleveland Electric Illuminating Company | ||||||||
| 923,000 | 5.700%, 4/1/2017 | 931,371 | ||||||
The accompanying Notes to Financial Statements are an integral part of this schedule.
186
Table of Contents
INCOME PORTFOLIO
Schedule of Investments as of December 31, 2016
| Principal Amount | Long-Term Fixed Income (91.2%) | Value | ||||||
Utilities (6.3%) - continued | ||||||||
Consolidated Edison Company of New York, Inc. | ||||||||
| $1,280,000 | 2.900%, 12/1/2026 | $ | 1,255,900 | |||||
DCP Midstream Operating, LP | ||||||||
| 2,550,000 | 5.600%, 4/1/2044 | 2,326,875 | ||||||
Duke Energy Corporation | ||||||||
| 3,840,000 | 2.650%, 9/1/2026 | 3,578,492 | ||||||
Dynegy, Inc. | ||||||||
| 1,250,000 | 7.375%, 11/1/2022 | 1,193,750 | ||||||
Electricite de France SA | ||||||||
| 3,200,000 | 5.250%, 1/19/2023d,i | 3,008,000 | ||||||
Emera U.S. Finance, LP | ||||||||
| 3,210,000 | 3.550%, 6/15/2026d | 3,150,952 | ||||||
Energy Transfer Equity, LP | ||||||||
| 1,870,000 | 5.500%, 6/1/2027 | 1,823,250 | ||||||
Enterprise Products Operating, LLC | ||||||||
| 1,930,000 | 6.650%, 4/15/2018 | 2,046,254 | ||||||
Exelon Corporation | ||||||||
| 3,120,000 | 3.950%, 6/15/2025 | 3,203,391 | ||||||
| 1,910,000 | 3.400%, 4/15/2026 | 1,871,355 | ||||||
Exelon Generation Company, LLC | ||||||||
| 2,560,000 | 4.250%, 6/15/2022 | 2,647,122 | ||||||
FirstEnergy Transmission, LLC | ||||||||
| 3,830,000 | 4.350%, 1/15/2025d | 3,957,987 | ||||||
Fortis, Inc. | ||||||||
| 2,560,000 | 3.055%, 10/4/2026d | 2,390,684 | ||||||
Great River Energy | ||||||||
| 6,485 | 5.829%, 7/1/2017* | 6,583 | ||||||
ITC Holdings Corporation | ||||||||
| 5,080,000 | 4.050%, 7/1/2023 | 5,206,299 | ||||||
MidAmerican Energy Holdings Company | ||||||||
| 4,450,000 | 3.750%, 11/15/2023 | 4,648,417 | ||||||
Nevada Power Company | ||||||||
| 2,800,000 | 6.750%, 7/1/2037 | 3,673,110 | ||||||
NiSource Finance Corporation | ||||||||
| 3,200,000 | 5.450%, 9/15/2020 | 3,491,846 | ||||||
Ohio Power Company | ||||||||
| 2,400,000 | 6.050%, 5/1/2018 | 2,528,357 | ||||||
Oncor Electric Delivery Company, LLC | ||||||||
| 2,490,000 | 3.750%, 4/1/2045 | 2,382,258 | ||||||
Pacific Gas and Electric Company | ||||||||
| 1,270,000 | 2.950%, 3/1/2026 | 1,242,430 | ||||||
Pennsylvania Electric Company | ||||||||
| 3,700,000 | 5.200%, 4/1/2020 | 3,959,770 | ||||||
PPL Capital Funding, Inc. | ||||||||
| 3,205,000 | 3.500%, 12/1/2022 | 3,274,138 | ||||||
| 3,190,000 | 3.950%, 3/15/2024 | 3,297,704 | ||||||
| 1,920,000 | 3.100%, 5/15/2026 | 1,834,134 | ||||||
Southern Company | ||||||||
| 1,920,000 | 5.500%, 3/15/2057 | 1,939,317 | ||||||
| 2,560,000 | 3.250%, 7/1/2026 | 2,487,800 | ||||||
Xcel Energy, Inc. | ||||||||
| 2,490,000 | 3.300%, 6/1/2025 | 2,487,410 | ||||||
|
| |||||||
Total | 89,769,659 | |||||||
|
| |||||||
Total Long-Term Fixed Income (cost $1,294,800,201) | 1,302,624,992 | |||||||
|
| |||||||
| Shares | Preferred Stock (1.4%) | |||||||
Consumer Staples (0.2%) | ||||||||
| 76,576 | CHS, Inc., 7.100%i | 2,030,030 | ||||||
|
| |||||||
Total | 2,030,030 | |||||||
|
| |||||||
Financials (1.2%) | ||||||||
| 102,122 | Citigroup, Inc., 7.257%f | 2,636,790 | ||||||
| 22,500 | Cobank ACB, 6.250%i | 2,281,642 | ||||||
| 31,925 | Countrywide Capital V, 7.000% | 812,810 | ||||||
| 90,500 | Discover Financial Services 6.500%i | 2,324,040 | ||||||
| 78,590 | GMAC Capital Trust I, 6.602%f | 1,996,186 | ||||||
| 95,940 | Goldman Sachs Group, Inc., 5.500%i | 2,434,957 | ||||||
| 88,200 | Morgan Stanley, 7.125%i | 2,481,066 | ||||||
| 101,500 | Wells Fargo & Company, 5.850%i | 2,561,860 | ||||||
|
| |||||||
Total | 17,529,351 | |||||||
|
| |||||||
Total Preferred Stock (cost $19,317,283) | 19,559,381 | |||||||
|
| |||||||
Common Stock (<0.1%) | ||||||||
Energy (<0.1%) | ||||||||
| 4,825 | Arch Coal, Inc.h,j | 376,591 | ||||||
| 1,346 | Vantage Drilling Internationalj | 135,946 | ||||||
|
| |||||||
Total | 512,537 | |||||||
|
| |||||||
Total Common Stock (cost $435,960) | 512,537 | |||||||
|
| |||||||
Collateral Held for Securities Loaned (0.6%) | ||||||||
| 7,919,140 | Thrivent Cash Management Trust | 7,919,140 | ||||||
|
| |||||||
Total Collateral Held for Securities Loaned (cost $7,919,140) | 7,919,140 | |||||||
|
| |||||||
| Shares or Principal Amount | Short-Term Investments (9.2%)k | |||||||
Federal Home Loan Bank Discount Notes | ||||||||
| 700,000 | 0.310%, 1/3/2017 | 700,000 | ||||||
| 10,650,000 | 0.383%, 1/6/2017 | 10,649,659 | ||||||
| 850,000 | 0.390%, 1/11/2017 | 849,929 | ||||||
| 6,600,000 | 0.365%, 1/13/2017 | 6,599,300 | ||||||
| 6,700,000 | 0.310%, 1/17/2017 | 6,699,008 | ||||||
| 1,200,000 | 0.450%, 1/20/2017 | 1,199,785 | ||||||
| 2,200,000 | 0.437%, 1/25/2017 | 2,199,490 | ||||||
| 6,100,000 | 0.433%, 1/27/2017 | 6,098,457 | ||||||
| 8,400,000 | 0.430%, 2/1/2017l | 8,396,615 | ||||||
| 3,600,000 | 0.460%, 2/8/2017 | 3,598,200 | ||||||
| 2,000,000 | 0.490%, 2/10/2017l | 1,998,944 | ||||||
| 1,400,000 | 0.515%, 2/16/2017 | 1,399,145 | ||||||
| 4,000,000 | 0.530%, 2/22/2017 | 3,997,224 | ||||||
Thrivent Core Short-Term Reserve Fund | ||||||||
| 7,527,561 | 0.910% | 75,275,609 | ||||||
U.S. Treasury Bills | ||||||||
| 900,000 | 0.495%, 2/9/2017m | 899,586 | ||||||
|
| |||||||
Total Short-Term Investments (cost $130,559,967) | 130,560,951 | |||||||
|
| |||||||
Total Investments (cost $1,493,870,018) 105.3% | $ | 1,502,471,737 | ||||||
|
| |||||||
Other Assets and Liabilities, Net (5.3%) | (75,062,474 | ) | ||||||
|
| |||||||
Total Net Assets 100.0% | $ | 1,427,409,263 | ||||||
|
| |||||||
The accompanying Notes to Financial Statements are an integral part of this schedule.
187
Table of Contents
INCOME PORTFOLIO
Schedule of Investments as of December 31, 2016
| a | The stated interest rate represents the weighted average of all contracts within the bank loan facility. |
| b | All or a portion of the loan is unfunded. |
| c | Denotes investments purchased on a when-issued or delayed delivery basis. |
| d | Denotes securities sold under Rule 144A of the Securities Act of 1933, which exempts them from registration. These securities may be resold to other dealers in the program or to other qualified institutional buyers. As of December 31, 2016, the value of these investments was $189,611,378 or 13.3% of total net assets. |
| e | Denotes step coupon securities. Step coupon securities pay an initial coupon rate for the first period and then different coupon rates for following periods. The rate shown is as of December 31, 2016. |
| f | Denotes variable rate securities. Variable rate securities are securities whose yields vary with a designated market index or market rate. The rate shown is as of December 31, 2016. |
| g | All or a portion of the security is insured or guaranteed. |
| h | All or a portion of the security is on loan. |
| i | Denotes perpetual securities. Perpetual securities pay an indefinite stream of interest and have no contractual maturity date. Date shown, if applicable, is next call date. |
| j | Non-income producing security. |
| k | The interest rate shown reflects the yield, coupon rate or the discount rate at the date of purchase. |
| l | All or a portion of the security is held on deposit with the counterparty and pledged as the initial margin deposit for open futures contracts. |
| m | At December 31, 2016, $649,701 of investments were segregated to cover exposure to a counterparty for margin on open mortgage-backed security transactions. |
| * | Denotes restricted securities. Restricted securities are investment securities which cannot be offered for public sale without first being registered under the Securities Act of 1933. The value of all restricted securities held in Income Portfolio as of December 31, 2016 was $11,426,308 or 0.8% of total net assets. The following table indicates the acquisition date and cost of restricted securities shown in the schedule as of December 31, 2016. |
Security | Acquisition Date | Cost | ||||||
CAM Mortgage, LLC, 7/15/2064 | 6/24/2015 | $ | 27,438 | |||||
Cent CLO 22, Ltd., 11/7/2026 | 11/1/2016 | 3,200,000 | ||||||
Great River Energy, 7/1/2017 | 4/13/2009 | 6,485 | ||||||
Magnetite XII, Ltd., 4/15/2027 | 11/17/2016 | 3,200,000 | ||||||
Preferred Term Securities XXIII, Ltd., 12/22/2036 | 9/14/2006 | 2,239,405 | ||||||
Shackleton, Ltd., 4/15/2027 | 12/16/2016 | 3,200,000 | ||||||
The following table presents the total amount of securities loaned with continuous maturity, by type, offset by the gross payable upon return of collateral for securities loaned by Thrivent Income Portfolio as of December 31, 2016:
Securities Lending Transactions
Taxable Debt Security | $ | 7,275,055 | ||
Common Stock | 374,640 | |||
|
| |||
Total lending | $ | 7,649,695 | ||
Gross amount payable upon return of collateral for securities loaned | $ | 7,919,140 | ||
|
| |||
Net amounts due to counterparty | $ | 269,445 | ||
|
|
Definitions:
AMT | - | Subject to Alternative Minimum Tax | ||
Rev. | - | Revenue | ||
TIPS | - | Treasury Inflation Protected Security. |
The accompanying Notes to Financial Statements are an integral part of this schedule.
188
Table of Contents
LIMITED MATURITY BOND PORTFOLIO
Schedule of Investments as of December 31, 2016
| Principal Amount | Bank Loans (1.7%)a | Value | ||||||
Basic Materials (<0.1%) | ||||||||
Arch Coal, Inc., Term Loan | ||||||||
| $116,142 | 10.000%, 10/5/2021 | $ | 117,643 | |||||
Fortescue Metals Group, Ltd., Term Loan | ||||||||
| 211,687 | 3.750%, 6/30/2019 | 212,110 | ||||||
|
| |||||||
Total | 329,753 | |||||||
|
| |||||||
Capital Goods (0.3%) | ||||||||
Accudyne Industries, LLC, Term Loan | ||||||||
| 620,291 | 4.000%, 12/13/2019 | 585,511 | ||||||
Advanced Disposal Services, Inc., Term Loan | ||||||||
| 925,087 | 3.500%, 11/10/2023 | 932,608 | ||||||
Berry Plastics Group, Inc., Term Loan | ||||||||
| 928,812 | 3.500%, 2/8/2020 | 935,147 | ||||||
|
| |||||||
Total | 2,453,266 | |||||||
|
| |||||||
Communications Services (0.6%) | ||||||||
Grande Communications Networks, LLC, Term Loan | ||||||||
| 931,260 | 4.500%, 5/29/2020 | 936,848 | ||||||
Integra Telecom Holdings, Inc., Term Loan | ||||||||
| 1,170,466 | 5.250%, 8/14/2020 | 1,172,514 | ||||||
LTS Buyer, LLC, Term Loan | ||||||||
| 665,850 | 4.248%, 4/13/2020 | 668,973 | ||||||
NEP/NCP Holdco, Inc., Term Loan | ||||||||
| 929,138 | 4.250%, 1/22/2020 | 931,461 | ||||||
TNS, Inc., Term Loan | ||||||||
| 626,005 | 5.000%, 2/14/2020 | 631,288 | ||||||
Univision Communications, Inc., Term Loan | ||||||||
| 1,169,297 | 4.000%, 3/1/2020 | 1,175,144 | ||||||
|
| |||||||
Total | 5,516,228 | |||||||
|
| |||||||
Consumer Cyclical (0.4%) | ||||||||
Burlington Coat Factory Warehouse Corporation, Term Loan | ||||||||
| 613,955 | 3.510%, 8/13/2021 | 617,572 | ||||||
Cengage Learning Acquisitions, Term Loan | ||||||||
| 457,700 | 5.250%, 6/7/2023 | 444,614 | ||||||
Ceridian HCM Holding, Inc., Term Loan | ||||||||
| 648,132 | 4.500%, 9/15/2020 | 642,999 | ||||||
Mohegan Tribal Gaming Authority, Term Loan | ||||||||
| 274,313 | 5.500%, 10/13/2023 | 276,200 | ||||||
Scientific Games International, Inc., Term Loan | ||||||||
| 1,202,800 | 6.000%, 10/18/2020 | 1,218,087 | ||||||
Seminole Hard Rock Entertainment, Inc., Term Loan | ||||||||
| 468,025 | 3.520%, 5/14/2020 | 470,365 | ||||||
|
| |||||||
Total | 3,669,837 | |||||||
|
| |||||||
Consumer Non-Cyclical (0.1%) | ||||||||
JBS USA, LLC, Term Loan | ||||||||
| 606,525 | 3.750%, 5/25/2018 | 607,028 | ||||||
|
| |||||||
Total | 607,028 | |||||||
|
| |||||||
Energy (0.1%) | ||||||||
Pacific Drilling SA, Term Loan | ||||||||
| 1,172,475 | 4.500%, 6/3/2018 | 411,539 | ||||||
|
| |||||||
Total | 411,539 | |||||||
|
| |||||||
Financials (0.1%) | ||||||||
Harland Clarke Holdings Corporation, Term Loan | ||||||||
| 300,972 | 7.000%, 5/22/2018 | 301,066 | ||||||
| 52,250 | 7.000%, 12/31/2019 | 52,446 | ||||||
WaveDivision Holdings, LLC, Term Loan | ||||||||
| 926,434 | 4.000%, 10/15/2019 | 931,297 | ||||||
|
| |||||||
Total | 1,284,809 | |||||||
|
| |||||||
Technology (0.1%) | ||||||||
First Data Corporation, Term Loan | ||||||||
| 503,922 | 3.756%, 3/24/2021 | 509,591 | ||||||
|
| |||||||
Total | 509,591 | |||||||
|
| |||||||
Utilities (<0.1%) | ||||||||
Intergen NV, Term Loan | ||||||||
| 252,243 | 5.500%, 6/12/2020 | 244,255 | ||||||
|
| |||||||
Total | 244,255 | |||||||
|
| |||||||
Total Bank Loans (cost $15,753,174) | 15,026,306 | |||||||
|
| |||||||
| Principal Amount | Long-Term Fixed Income (94.9%) | |||||||
Asset-Backed Securities (26.6%) | ||||||||
Alm Loan Funding CLO | ||||||||
2.310%, 10/17/2026, Series | ||||||||
| 3,760,000 | 2014-11A, Class A1*,b | 3,766,565 | ||||||
American Homes 4 Rent | ||||||||
| 2,997,675 | 1.736%, 6/17/2031b,c | 2,987,043 | ||||||
Americredit Automobile Receivables Trust | ||||||||
1.340%, 4/8/2020, Series | ||||||||
| 5,000,000 | 2016-4, Class A2A | 4,997,425 | ||||||
Apidos CLO XVIII | ||||||||
2.294%, 7/22/2026, Series | ||||||||
| 3,775,000 | 2014-18A, Class A1*,b | 3,780,821 | ||||||
BA Credit Card Trust | ||||||||
1.084%, 6/15/2021, Series | ||||||||
| 4,800,000 | 2014-A1, Class Ab | 4,812,070 | ||||||
Babson CLO, Ltd. | ||||||||
2.270%, 10/17/2026, Series | ||||||||
| 3,760,000 | 2014-IIA, Class A*,b | 3,766,012 | ||||||
Barclays Dryrock Issuance Trust | ||||||||
1.520%, 5/16/2022, Series | ||||||||
| 2,250,000 | 2016-1, Class A | 2,228,164 | ||||||
Bayview Opportunity Master Fund Trust | ||||||||
3.598%, 9/29/2031, Series | ||||||||
| 1,458,491 | 2016-RN3, Class A1c,d | 1,452,948 | ||||||
3.228%, 7/28/2034, Series | ||||||||
| 1,880,768 | 2014-18NP, Class A*,d | 1,883,464 | ||||||
Betony CLO, Ltd. | ||||||||
2.256%, 4/15/2027, Series | ||||||||
| 3,425,000 | 2015-1A, Class AR*,b | 3,406,158 | ||||||
Birchwood Park CLO, Ltd. | ||||||||
2.320%, 7/15/2026, Series | ||||||||
| 3,760,000 | 2014-1A, Class A*,b | 3,766,907 | ||||||
BlueMountain CLO, Ltd. | ||||||||
2.360%, 10/15/2026, Series | ||||||||
| 3,760,000 | 2014-3A, Class A1*,b | 3,766,024 | ||||||
Brazos Higher Education Authority, Inc. | ||||||||
1.725%, 2/25/2030, Series | ||||||||
| 2,259,931 | 2011-1, Class A2b | 2,259,890 | ||||||
The accompanying Notes to Financial Statements are an integral part of this schedule.
189
Table of Contents
LIMITED MATURITY BOND PORTFOLIO
Schedule of Investments as of December 31, 2016
| Principal Amount | Long-Term Fixed Income (94.9%) | Value | ||||||
Asset-Backed Securities (26.6%) - continued | ||||||||
Capital One Multi-Asset Execution Trust | ||||||||
1.260%, 1/15/2020, Series | ||||||||
| $6,750,000 | 2014-A2, Class A2 | $ | 6,753,735 | |||||
Carlyle Global Market Strategies CLO, Ltd. | ||||||||
2.181%, 7/20/2023, Series | ||||||||
| 3,251,537 | 2012-2A, Class A1R*,b | 3,251,957 | ||||||
2.380%, 10/15/2026, Series | ||||||||
| 3,750,000 | 2014-4A, Class A1*,b | 3,755,876 | ||||||
CarMax Auto Owner Trust | ||||||||
1.210%, 11/15/2019, Series | ||||||||
| 6,300,000 | 2016-4, Class A2 | 6,287,108 | ||||||
Cent CLO 16, LP | ||||||||
2.136%, 8/1/2024, Series | ||||||||
| 3,653,108 | 2012-16A, Class A1AR*,b | 3,653,805 | ||||||
Cent CLO 22, Ltd. | ||||||||
2.291%, 11/7/2026, Series | ||||||||
| 3,750,000 | 2014-22A, Class A1R*,b | 3,741,210 | ||||||
Chase Issuance Trust | ||||||||
1.100%, 1/15/2020, Series | ||||||||
| 2,250,000 | 2016-A6, Class A6 | 2,244,483 | ||||||
1.590%, 2/18/2020, Series | ||||||||
| 3,700,000 | 2015-A2, Class A2 | 3,710,238 | ||||||
1.620%, 7/15/2020, Series | ||||||||
| 2,800,000 | 2015-A7, Class A7 | 2,805,247 | ||||||
1.114%, 5/17/2021, Series | ||||||||
| 3,000,000 | 2016-A1, Class Ab | 3,009,374 | ||||||
Chesapeake Funding II, LLC | ||||||||
1.880%, 6/15/2028, Series | ||||||||
| 4,000,000 | 2016-2A, Class A1c | 3,989,144 | ||||||
Chrysler Capital Auto Receivables Trust | ||||||||
1.360%, 1/15/2020, Series | ||||||||
| 5,000,000 | 2016-BA, Class A2c | 4,992,980 | ||||||
Citibank Credit Card Issuance Trust | ||||||||
1.020%, 2/22/2019, Series | ||||||||
| 6,975,000 | 2014-A2, Class A2 | 6,974,720 | ||||||
Commonbond Student Loan Trust | ||||||||
3.200%, 6/25/2032, Series | ||||||||
| 880,697 | 2015-A, Class A* | 879,670 | ||||||
CPS Auto Receivables Trust | ||||||||
2.070%, 11/15/2019, Series | ||||||||
| 2,116,952 | 2016-B, Class Ac | 2,124,182 | ||||||
Credit Based Asset Servicing and Securitization, LLC | ||||||||
3.503%, 12/25/2036, Series | ||||||||
| 1,555,891 | 2006-CB2, Class AF2d | 1,145,848 | ||||||
Dryden 34 Senior Loan Fund CLO | ||||||||
2.310%, 10/15/2026, Series | ||||||||
| 3,760,000 | 2014-34A, Class A*,b | 3,766,512 | ||||||
Edlinc Student Loan Funding Trust | ||||||||
3.410%, 10/1/2025, Series | ||||||||
| 1,598,141 | 2012-A, Class AT*,b | 1,615,893 | ||||||
Ford Credit Auto Owner Trust | ||||||||
1.040%, 9/15/2019, Series | ||||||||
| 5,500,000 | 2016-C, Class A2A | 5,487,902 | ||||||
2.260%, 11/15/2025, Series | ||||||||
| 3,575,000 | 2014-1, Class Ac | 3,604,291 | ||||||
GMAC Mortgage Corporation Loan Trust | ||||||||
1.084%, 8/25/2035, Series | ||||||||
| 358,347 | 2005-HE1, Class A2b,e | 338,972 | ||||||
5.750%, 10/25/2036, Series | ||||||||
| 713,758 | 2006-HE3, Class A2e | 685,699 | ||||||
0.772%, 12/25/2036, Series | ||||||||
| 1,310,351 | 2006-HE4, Class A1b,e | 1,215,794 | ||||||
GoldenTree Loan Opportunities IX, Ltd. | ||||||||
2.238%, 10/29/2026, Series | ||||||||
| 3,500,000 | 2014-9A, Class AR*,b | 3,497,583 | ||||||
Impac CMB Trust | ||||||||
1.276%, 4/25/2035, Series | ||||||||
| 1,349,878 | 2005-2, Class 1A1b | 1,231,473 | ||||||
1.396%, 8/25/2035, Series | ||||||||
| 420,309 | 2005-5, Class A1b | 368,558 | ||||||
John Deere Owner Trust | ||||||||
1.250%, 6/15/2020, Series | ||||||||
| 1,750,000 | 2016-B, Class A3 | 1,741,360 | ||||||
Kubota Credit Owner Trust | ||||||||
1.500%, 7/15/2020, Series | ||||||||
| 3,000,000 | 2016-1A, Class A3c | 2,969,923 | ||||||
Madison Park Funding XIV CLO, Ltd. | ||||||||
2.331%, 7/20/2026, Series | ||||||||
| 4,150,000 | 2014-14A, Class A2*,b | 4,157,009 | ||||||
Master Credit Card Trust | ||||||||
1.494%, 9/23/2019, Series | ||||||||
| 4,500,000 | 2016-1A, Class Ab,c | 4,517,654 | ||||||
Mill City Mortgage Loan Trust | ||||||||
2.500%, 4/25/2057, Series | ||||||||
| 1,635,251 | 2016-1, Class A1c | 1,626,712 | ||||||
MLCC Mortgage Investors, Inc. | ||||||||
1.416%, 9/25/2029, Series | ||||||||
| 384,308 | 2004-D, Class A1b | 380,549 | ||||||
Mortgage Equity Conversion Asset Trust | ||||||||
1.360%, 1/25/2042, Series | ||||||||
| 4,141,346 | 2007-FF1, Class A*,b | 3,547,063 | ||||||
1.280%, 2/25/2042, Series | ||||||||
| 4,138,472 | 2007-FF2, Class A*,b | 3,517,702 | ||||||
Neuberger Berman CLO, Ltd. | ||||||||
2.346%, 8/4/2025, Series | ||||||||
| 3,000,000 | 2014-17A, Class A*,b | 3,000,078 | ||||||
NextGear Floorplan Master Owner Trust | ||||||||
1.920%, 10/15/2019, Series | ||||||||
| 3,000,000 | 2014-1A, Class A* | 2,999,871 | ||||||
Northstar Education Finance, Inc. | ||||||||
1.456%, 12/26/2031, Series | ||||||||
| 2,297,514 | 2012-1, Class Ab,c | 2,246,081 | ||||||
Octagon Investment Partners XX CLO, Ltd. | ||||||||
2.342%, 8/12/2026, Series | ||||||||
| 3,760,000 | 2014-1A, Class A*,b | 3,766,569 | ||||||
OneMain Direct Auto Receivables Trust | ||||||||
2.040%, 1/15/2021, Series | ||||||||
| 1,642,307 | 2016-1A, Class Ac | 1,645,026 | ||||||
OneMain Financial Issuance Trust | ||||||||
4.100%, 3/20/2028, Series | ||||||||
| 2,000,000 | 2016-2A, Class Ac | 2,038,627 | ||||||
OZLM VIII, Ltd. | ||||||||
2.320%, 10/17/2026, Series | ||||||||
| 3,760,000 | 2014-8A, Class A1A*,b | 3,766,715 | ||||||
Prestige Auto Receivables Trust | ||||||||
1.460%, 7/15/2020, Series | ||||||||
| 5,500,000 | 2016-2A, Class A2c | 5,494,396 | ||||||
Race Point IX CLO, Ltd. | ||||||||
2.390%, 4/15/2027, Series | ||||||||
| 1,500,000 | 2015-9A, Class A1*,b | 1,504,879 | ||||||
The accompanying Notes to Financial Statements are an integral part of this schedule.
190
Table of Contents
LIMITED MATURITY BOND PORTFOLIO
Schedule of Investments as of December 31, 2016
| Principal Amount | Long-Term Fixed Income (94.9%) | Value | ||||||
Asset-Backed Securities (26.6%) - continued | ||||||||
Renaissance Home Equity Loan Trust | ||||||||
| $ | 3,298,262 | 5.608%, 5/25/2036, Series 2006-1, Class AF3d | $ | 2,118,384 | ||||
| 1,169,315 | 5.285%, 1/25/2037, Series 2006-4, Class AF2d | 616,936 | ||||||
Securitized Term Auto Receivables Trust | ||||||||
| 2,750,000 | 1.284%, 11/26/2018, Series 2016-1A, Class A2Ac | 2,747,136 | ||||||
Selene Non-Performing Loans, LLC | ||||||||
| 267,044 | 2.981%, 5/25/2054, Series 2014-1A, Class A* | 266,779 | ||||||
SLM Student Loan Trust | ||||||||
| 1,538,918 | 1.304%, 7/15/2022, Series 2014-A, Class A1b,c | 1,540,177 | ||||||
| 619,320 | 1.304%, 8/15/2022, Series 2013-A, Class A1b,c | 619,694 | ||||||
| 109,543 | 1.454%, 10/16/2023, Series 2012-E, Class A1b,c | 109,567 | ||||||
| 4,627,063 | 1.156%, 3/25/2025, Series 2010-1, Class Ab | 4,506,251 | ||||||
| 2,985,267 | 1.276%, 3/25/2026, Series 2011-1, Class A1b | 2,980,693 | ||||||
| 2,700,000 | 1.754%, 5/17/2027, Series 2013-A, Class A2Bb,c | 2,719,846 | ||||||
SoFi Consumer Loan Program, LLC | ||||||||
| 2,849,846 | 3.050%, 12/26/2025, Series 2016-3, Class Ac | 2,839,384 | ||||||
SoFi Professional Loan Program, LLC | ||||||||
| 2,177,892 | 2.420%, 3/25/2030, Series 2015-A, Class A2c | 2,170,446 | ||||||
| 2,560,221 | 1.480%, 5/26/2031, Series 2016-C, Class A2Ac | 2,555,126 | ||||||
| 1,955,562 | 2.510%, 8/25/2033, Series 2015-C, Class A2c | 1,952,036 | ||||||
| 2,100,000 | 1.380%, 7/25/2039, Series 2016-E, Class A1c | 2,103,174 | ||||||
Springleaf Funding Trust | ||||||||
| 3,650,000 | 2.900%, 11/15/2029, Series 2016-AA, Class Ac | 3,640,495 | ||||||
Symphony CLO VIII, Ltd. | ||||||||
| 3,441,867 | 1.976%, 1/9/2023, Series 2012-8A, Class AR*,b | 3,442,329 | ||||||
Synchrony Credit Card Master Note Trust | ||||||||
| 6,250,000 | 1.360%, 8/17/2020, Series 2012-6, Class A | 6,253,312 | ||||||
Toyota Auto Receivables Owner Trust | ||||||||
| 5,500,000 | 1.060%, 5/15/2019, Series 2016-D, Class A2A | 5,489,185 | ||||||
Vericrest Opportunity Loan Transferee | ||||||||
| 1,868,502 | 3.500%, 6/26/2045, Series 2015-NPL8, Class A1c,d | 1,872,029 | ||||||
| 1,237,349 | 4.250%, 2/26/2046, Series 2016-NPL1, Class A1c,d | 1,250,466 | ||||||
| 2,315,959 | 3.750%, 6/25/2046, Series 2016-NPL7, Class A1c,d | 2,316,917 | ||||||
| 498,047 | 3.375%, 10/26/2054, Series 2014-NPL8, Class A1c | 499,720 | ||||||
Verizon Owner Trust | ||||||||
| 4,000,000 | 1.420%, 1/20/2021, Series 2016-1A, Class Ac | 3,971,169 | ||||||
Voya CLO 3, Ltd. | ||||||||
| 3,760,000 | 2.302%, 7/25/2026, Series 2014-3A, Class A1*,b | 3,766,050 | ||||||
Wachovia Asset Securitization, Inc. | ||||||||
| 743,307 | 0.896%, 7/25/2037, Series 2007-HE1, Class A*,b,e | 634,427 | ||||||
|
| |||||||
Total | 235,907,687 | |||||||
|
| |||||||
Basic Materials (0.5%) | ||||||||
Albemarle Corporation | ||||||||
| 1,095,000 | 3.000%, 12/1/2019 | 1,119,313 | ||||||
Georgia-Pacific, LLC | ||||||||
| 2,555,000 | 2.539%, 11/15/2019c | 2,576,166 | ||||||
Glencore Funding, LLC | ||||||||
| 1,000,000 | 1.940%, 4/16/2018b,c | 988,700 | ||||||
|
| |||||||
Total | 4,684,179 | |||||||
|
| |||||||
Capital Goods (0.5%) | ||||||||
Lockheed Martin Corporation | ||||||||
| 1,500,000 | 2.500%, 11/23/2020 | 1,511,507 | ||||||
Roper Technologies, Inc. | ||||||||
| 867,000 | 1.850%, 11/15/2017 | 869,630 | ||||||
| 1,109,000 | 6.250%, 9/1/2019 | 1,219,298 | ||||||
| 500,000 | 2.800%, 12/15/2021 | 499,253 | ||||||
Textron, Inc. | ||||||||
| 400,000 | 3.875%, 3/1/2025 | 401,702 | ||||||
|
| |||||||
Total | 4,501,390 | |||||||
|
| |||||||
Collateralized Mortgage Obligations (4.2%) | ||||||||
American Home Mortgage Assets Trust | ||||||||
| 2,386,193 | 1.487%, 11/25/2046, Series 2006-5, Class A1b | 1,234,771 | ||||||
BCAP, LLC Trust | ||||||||
| 1,983,987 | 0.936%, 3/25/2037, Series 2007-AA1, Class 2A1b | 1,841,151 | ||||||
Bear Stearns Adjustable Rate Mortgage Trust | ||||||||
| 728,333 | 2.830%, 10/25/2035, Series 2005-9, Class A1b | 701,245 | ||||||
Countrywide Alternative Loan Trust | ||||||||
| 457,338 | 5.500%, 11/25/2035, Series 2005-49CB, Class A1 | 438,079 | ||||||
| 512,905 | 5.500%, 2/25/2036, Series 2005-85CB, Class 2A2 | 475,944 | ||||||
| 927,654 | 6.000%, 1/25/2037, Series 2006-39CB, Class 1A16 | 885,763 | ||||||
Countrywide Home Loans, Inc. | ||||||||
| 1,367,201 | 2.981%, 3/20/2036, Series 2006-HYB1, Class 1A1 | 1,156,789 | ||||||
| 1,265,870 | 3.005%, 9/20/2036, Series 2006-HYB5, Class 2A1 | 999,911 | ||||||
Deutsche Alt-A Securities, Inc., Mortgage Loan Trust | ||||||||
| 2,582,038 | 1.337%, 4/25/2047, Series 2007-OA2, Class A1b | 2,187,064 | ||||||
HarborView Mortgage Loan Trust | ||||||||
| 1,274,526 | 2.660%, 6/19/2034, Series 2004-5, Class 3A | 1,245,650 | ||||||
J.P. Morgan Alternative Loan Trust | ||||||||
| 1,939,668 | 2.972%, 3/25/2036, Series 2006-A1, Class 2A1 | 1,624,299 | ||||||
J.P. Morgan Mortgage Trust | ||||||||
| 298,374 | 3.110%, 10/25/2036, Series 2006-A6, Class 1A2 | 270,538 | ||||||
The accompanying Notes to Financial Statements are an integral part of this schedule.
191
Table of Contents
LIMITED MATURITY BOND PORTFOLIO
Schedule of Investments as of December 31, 2016
| Principal Amount | Long-Term Fixed Income (94.9%) | Value | ||||||
Collateralized Mortgage Obligations (4.2%) - continued | ||||||||
Master Asset Securitization Trust | ||||||||
| $ | 1,148,164 | 1.256%, 6/25/2036, Series 2006-2, Class 2A2b | $ | 597,094 | ||||
Residential Accredit Loans, Inc. Trust | ||||||||
| 993,883 | 4.013%, 9/25/2035, Series 2005-QA10, Class A31 | 835,734 | ||||||
Sequoia Mortgage Trust | ||||||||
| 2,272,319 | 1.950%, 9/20/2034, Series 2004-8, Class A2b | 2,183,247 | ||||||
Structured Adjustable Rate Mortgage Loan Trust | ||||||||
| 27,631 | 3.322%, 12/25/2034, Series 2004-18, Class 5A | 26,894 | ||||||
Structured Asset Securities Corporation Trust | ||||||||
| 1,816,320 | 5.500%, 12/25/2034, Series 2005-10, Class 3A1 | 1,824,682 | ||||||
Wachovia Mortgage Loan Trust, LLC | ||||||||
| 768,879 | 3.407%, 5/20/2036, Series 2006-A, Class 2A1 | 678,218 | ||||||
WaMu Mortgage Pass Through Certificates | ||||||||
| 670,401 | 1.046%, 10/25/2045, Series 2005-AR13, Class A1A1b | 641,318 | ||||||
| 2,166,613 | 1.447%, 10/25/2046, Series 2006-AR13, Class 1Ab | 1,816,834 | ||||||
| 2,104,884 | 1.361%, 12/25/2046, Series 2006-AR17, Class 1Ab | 1,632,033 | ||||||
| 2,116,460 | 1.307%, 1/25/2047, Series 2006-AR19, Class 1Ab | 1,650,687 | ||||||
Washington Mutual Mortgage Pass Through Certificates Trust | ||||||||
| 1,679,931 | 1.487%, 9/25/2046, Series 2006-AR7, Class A1Ab | 1,120,478 | ||||||
| 2,789,855 | 1.317%, 2/25/2047, Series 2007-OA3, Class 2Ab | 2,079,554 | ||||||
Wells Fargo Commercial Mortgage Trust | ||||||||
| 3,575,000 | 2.632%, 5/15/2048 | 3,623,783 | ||||||
Wells Fargo Mortgage Backed Securities Trust | ||||||||
| 2,337,347 | 3.108%, 10/25/2034, Series 2004-V, Class 2A1 | 2,332,341 | ||||||
| 1,159,711 | 5.500%, 8/25/2035, Series 2005-6, Class A12 | 1,184,844 | ||||||
| 794,989 | 3.003%, 3/25/2036, Series 2006-AR2, Class 2A1 | 793,081 | ||||||
| 589,515 | 3.109%, 3/25/2036, Series 2006-AR6, Class 3A1 | 558,105 | ||||||
|
| |||||||
Total | 36,640,131 | |||||||
|
| |||||||
Commercial Mortgage-Backed Securities (2.2%) | ||||||||
Bear Stearns Commercial Mortgage Securities, Inc. | ||||||||
| 1,998,258 | 5.331%, 2/11/2044 | 1,999,368 | ||||||
Citigroup Commercial Mortgage Trust | ||||||||
| 1,004,063 | 1.102%, 11/10/2046 | 1,001,668 | ||||||
| 1,250,000 | 5.711%, 12/10/2049 | 1,260,831 | ||||||
Commercial Mortgage Pass-Through Certificates | ||||||||
| 5,000,000 | 1.699%, 6/8/2030b,c | 5,012,554 | ||||||
Federal National Mortgage Association | ||||||||
| 124,141 | 1.272%, 1/25/2017 | 124,033 | ||||||
GS Mortgage Securities Trust | ||||||||
| 127,195 | 2.999%, 8/10/2044 | 127,132 | ||||||
Morgan Stanley Capital, Inc. | ||||||||
| 2,997,881 | 5.406%, 3/15/2044 | 2,995,263 | ||||||
SCG Trust | ||||||||
| 3,150,000 | 2.104%, 11/15/2026b,c | 3,150,003 | ||||||
WFRBS Commercial Mortgage Trust | ||||||||
| 3,480,351 | 1.406%, 9/15/2046 | 3,480,256 | ||||||
|
| |||||||
Total | 19,151,108 | |||||||
|
| |||||||
Communications Services (2.6%) | ||||||||
American Tower Corporation | ||||||||
| 2,200,000 | 3.450%, 9/15/2021 | 2,226,409 | ||||||
American Tower Trust I | ||||||||
| 1,650,000 | 1.551%, 3/15/2018* | 1,648,504 | ||||||
AT&T, Inc. | ||||||||
| 1,125,000 | 1.750%, 1/15/2018 | 1,125,606 | ||||||
| 1,735,000 | 1.928%, 6/30/2020b | 1,744,411 | ||||||
| 1,750,000 | 2.800%, 2/17/2021 | 1,734,667 | ||||||
Charter Communications Operating, LLC | ||||||||
| 1,397,000 | 3.579%, 7/23/2020 | 1,424,279 | ||||||
| 1,397,000 | 4.464%, 7/23/2022 | 1,458,418 | ||||||
Crown Castle International Corporation | ||||||||
| 250,000 | 3.400%, 2/15/2021 | 253,485 | ||||||
| 1,000,000 | 2.250%, 9/1/2021 | 966,542 | ||||||
Moody’s Corporation | ||||||||
| 1,250,000 | 2.750%, 7/15/2019 | 1,263,731 | ||||||
NBC Universal Enterprise, Inc. | ||||||||
| 2,250,000 | 1.662%, 4/15/2018c | 2,252,306 | ||||||
SES Global Americas Holdings GP | ||||||||
| 1,375,000 | 2.500%, 3/25/2019c | 1,366,530 | ||||||
Verizon Communications, Inc. | ||||||||
| 1,000,000 | 1.351%, 6/9/2017b | 1,001,160 | ||||||
| 2,580,000 | 1.763%, 6/17/2019b | 2,603,457 | ||||||
| 1,825,000 | 3.000%, 11/1/2021 | 1,837,142 | ||||||
|
| |||||||
Total | 22,906,647 | |||||||
|
| |||||||
Consumer Cyclical (1.6%) | ||||||||
BMW US Capital, LLC | ||||||||
| 1,600,000 | 1.500%, 4/11/2019c | 1,584,192 | ||||||
CVS Health Corporation | ||||||||
| 1,065,000 | 2.250%, 8/12/2019 | 1,070,380 | ||||||
Daimler Finance North America, LLC | ||||||||
| 2,500,000 | 1.591%, 8/3/2017b,c | 2,506,540 | ||||||
eBay, Inc. | ||||||||
| 775,000 | 2.500%, 3/9/2018 | 781,705 | ||||||
Home Depot, Inc. | ||||||||
| 825,000 | 1.333%, 9/15/2017b | 826,390 | ||||||
| 2,100,000 | 4.400%, 4/1/2021 | 2,275,134 | ||||||
Newell Rubbermaid, Inc. | ||||||||
| 1,250,000 | 3.150%, 4/1/2021 | 1,271,065 | ||||||
Ralph Lauren Corporation | ||||||||
| 275,000 | 2.625%, 8/18/2020 | 277,577 | ||||||
Walgreens Boots Alliance, Inc. | ||||||||
| 980,000 | 1.750%, 5/30/2018 | 980,830 | ||||||
| 980,000 | 2.600%, 6/1/2021 | 972,985 | ||||||
Yale University | ||||||||
| 1,550,000 | 2.086%, 4/15/2019 | 1,563,077 | ||||||
|
| |||||||
Total | 14,109,875 | |||||||
|
| |||||||
Consumer Non-Cyclical (5.9%) | ||||||||
Abbott Laboratories | ||||||||
| 2,100,000 | 2.350%, 11/22/2019 | 2,101,436 | ||||||
The accompanying Notes to Financial Statements are an integral part of this schedule.
192
Table of Contents
LIMITED MATURITY BOND PORTFOLIO
Schedule of Investments as of December 31, 2016
| Principal Amount | Long-Term Fixed Income (94.9%) | Value | ||||||
Consumer Non-Cyclical (5.9%) - continued | ||||||||
Actavis Funding SCS | ||||||||
| $ | 2,435,000 | 2.208%, 3/12/2020b | $ | 2,481,623 | ||||
Altria Group, Inc. | ||||||||
| 500,000 | 2.850%, 8/9/2022 | 500,062 | ||||||
Anheuser-Busch InBev Finance, Inc. | ||||||||
| 2,290,000 | 2.146%, 2/1/2021b | 2,330,277 | ||||||
BAT International Finance plc | ||||||||
| 2,335,000 | 1.473%, 6/15/2018b,c | 2,335,448 | ||||||
Bayer U.S. Finance, LLC | ||||||||
| 1,250,000 | 2.375%, 10/8/2019c | 1,251,620 | ||||||
Boston Scientific Corporation | ||||||||
| 2,045,000 | 6.000%, 1/15/2020 | 2,245,768 | ||||||
Bunge Limited Finance Corporation | ||||||||
| 1,135,000 | 3.500%, 11/24/2020 | 1,154,338 | ||||||
Celgene Corporation | ||||||||
| 1,270,000 | 3.550%, 8/15/2022 | 1,301,087 | ||||||
Church & Dwight Company, Inc. | ||||||||
| 1,440,000 | 2.450%, 12/15/2019 | 1,446,437 | ||||||
EMD Finance, LLC | ||||||||
| 2,470,000 | 1.343%, 3/17/2017b,c | 2,470,568 | ||||||
Express Scripts Holding Company | ||||||||
| 1,200,000 | 3.000%, 7/15/2023 | 1,160,308 | ||||||
Forest Laboratories, Inc. | ||||||||
| 2,750,000 | 4.375%, 2/1/2019c | 2,856,620 | ||||||
Gilead Sciences, Inc. | ||||||||
| 1,300,000 | 2.550%, 9/1/2020 | 1,314,000 | ||||||
| 1,300,000 | 3.250%, 9/1/2022 | 1,325,525 | ||||||
Howard Hughes Medical Institute | ||||||||
| 1,500,000 | 3.500%, 9/1/2023 | 1,562,294 | ||||||
Imperial Tobacco Finance plc | ||||||||
| 1,750,000 | 3.750%, 7/21/2022c | 1,794,635 | ||||||
Japan Tobacco, Inc. | ||||||||
| 2,500,000 | 2.100%, 7/23/2018c | 2,509,830 | ||||||
Laboratory Corporation of America Holdings | ||||||||
| 1,705,000 | 2.625%, 2/1/2020 | 1,702,437 | ||||||
Mead Johnson Nutrition Company | ||||||||
| 1,150,000 | 3.000%, 11/15/2020 | 1,163,503 | ||||||
Merck & Company, Inc. | ||||||||
| 1,825,000 | 1.257%, 2/10/2020b | 1,834,495 | ||||||
Mondelez International, Inc. | ||||||||
| 1,858,000 | 1.406%, 2/1/2019b | 1,857,896 | ||||||
Mylan NV | ||||||||
| 1,275,000 | 3.150%, 6/15/2021c | 1,250,169 | ||||||
PepsiCo, Inc. | ||||||||
| 1,185,000 | 1.394%, 10/6/2021b | 1,189,635 | ||||||
Reynolds American, Inc. | ||||||||
| 549,000 | 3.250%, 6/12/2020 | 562,216 | ||||||
Shire Acquisitions Investments Ireland Designated Activity Company | ||||||||
| 2,150,000 | 1.900%, 9/23/2019 | 2,121,747 | ||||||
Teva Pharmaceutical Finance Netherlands III BV | ||||||||
| 2,125,000 | 1.700%, 7/19/2019 | 2,086,954 | ||||||
Unilever Capital Corporation | ||||||||
| 2,600,000 | 2.200%, 3/6/2019 | 2,625,319 | ||||||
| 3,650,000 | 2.100%, 7/30/2020 | 3,635,112 | ||||||
|
| |||||||
Total | 52,171,359 | |||||||
|
| |||||||
Energy (3.5%) | ||||||||
Anadarko Petroleum Corporation | ||||||||
| 965,000 | 4.850%, 3/15/2021 | 1,033,883 | ||||||
BP Capital Markets plc | ||||||||
| 1,600,000 | 1.676%, 5/3/2019 | 1,588,281 | ||||||
Cameron International Corporation | ||||||||
| 1,575,000 | 1.400%, 6/15/2017 | 1,574,364 | ||||||
Chevron Corporation | ||||||||
| 3,000,000 | 1.718%, 6/24/2018 | 3,008,736 | ||||||
DCP Midstream Operating, LP | ||||||||
| 1,650,000 | 2.700%, 4/1/2019 | 1,629,375 | ||||||
Ecopetrol SA | ||||||||
| 400,000 | 5.875%, 9/18/2023 | 423,400 | ||||||
Enable Midstream Partners, LP | ||||||||
| 1,250,000 | 2.400%, 5/15/2019 | 1,226,940 | ||||||
Enbridge, Inc. | ||||||||
| 1,700,000 | 1.384%, 6/2/2017b | 1,700,158 | ||||||
Encana Corporation | ||||||||
| 1,115,000 | 3.900%, 11/15/2021 | 1,123,006 | ||||||
EOG Resources, Inc. | ||||||||
| 1,075,000 | 2.625%, 3/15/2023 | 1,041,044 | ||||||
Exxon Mobil Corporation | ||||||||
| 2,100,000 | 1.708%, 3/1/2019 | 2,104,049 | ||||||
| 1,785,000 | 1.316%, 3/6/2022b | 1,772,382 | ||||||
Marathon Petroleum Corporation | ||||||||
| 1,500,000 | 3.400%, 12/15/2020 | 1,532,904 | ||||||
Petroleos Mexicanos | ||||||||
| 1,300,000 | 4.607%, 3/11/2022b,c | 1,340,625 | ||||||
| 1,857,250 | 2.378%, 4/15/2025 | 1,856,453 | ||||||
Schlumberger Holdings Corporation | ||||||||
| 1,500,000 | 3.000%, 12/21/2020c | 1,530,534 | ||||||
Shell International Finance BV | ||||||||
| 1,735,000 | 1.352%, 5/11/2020b | 1,736,119 | ||||||
Sinopec Group Overseas Development, Ltd. | ||||||||
| 1,325,000 | 1.750%, 9/29/2019c | 1,303,320 | ||||||
Sunoco Logistics Partners Operations, LP | ||||||||
| 1,860,000 | 4.400%, 4/1/2021 | 1,957,176 | ||||||
Transcontinental Gas Pipe Line Company, LLC | ||||||||
| 725,000 | 7.850%, 2/1/2026c | 913,087 | ||||||
|
| |||||||
Total | 30,395,836 | |||||||
|
| |||||||
Financials (20.1%) | ||||||||
ABN AMRO Bank NV | ||||||||
| 2,040,000 | 2.450%, 6/4/2020c | 2,028,690 | ||||||
Aetna, Inc. | ||||||||
| 2,200,000 | 1.900%, 6/7/2019 | 2,194,388 | ||||||
Aflac, Inc. | ||||||||
| 2,100,000 | 2.400%, 3/16/2020 | 2,106,218 | ||||||
American Express Credit Corporation | ||||||||
| 2,580,000 | 1.543%, 3/18/2019b | 2,584,923 | ||||||
| 850,000 | 2.009%, 9/14/2020b | 864,160 | ||||||
American International Group, Inc. | ||||||||
| 1,430,000 | 3.300%, 3/1/2021 | 1,463,535 | ||||||
Ares Capital Corporation | ||||||||
| 1,400,000 | 4.875%, 11/30/2018 | 1,450,806 | ||||||
Bank of America Corporation | ||||||||
| 1,800,000 | 1.700%, 8/25/2017 | 1,802,349 | ||||||
| 2,000,000 | 2.066%, 3/22/2018b | 2,013,462 | ||||||
| 2,200,000 | 1.716%, 4/1/2019b | 2,210,351 | ||||||
| 1,185,000 | 2.061%, 10/21/2022b | 1,205,517 | ||||||
| 1,100,000 | 4.000%, 1/22/2025 | 1,100,010 | ||||||
| 1,100,000 | 6.100%, 3/17/2025f | 1,106,050 | ||||||
Bank of America NA | ||||||||
| 2,000,000 | 5.300%, 3/15/2017 | 2,015,486 | ||||||
Bank of New York Mellon Corporation | ||||||||
| 675,000 | 4.500%, 6/20/2023f | 617,254 | ||||||
Bank of Tokyo-Mitsubishi UFJ, Ltd. | ||||||||
| 1,445,000 | 2.850%, 9/8/2021c,g | 1,443,900 | ||||||
The accompanying Notes to Financial Statements are an integral part of this schedule.
193
Table of Contents
LIMITED MATURITY BOND PORTFOLIO
Schedule of Investments as of December 31, 2016
| Principal Amount | Long-Term Fixed Income (94.9%) | Value | ||||||
Financials (20.1%) - continued | ||||||||
BB&T Corporation | ||||||||
| $1,520,000 | 1.595%, 1/15/2020b | $ | 1,525,220 | |||||
Bear Stearns Companies, LLC | ||||||||
| 2,500,000 | 6.400%, 10/2/2017 | 2,589,733 | ||||||
BNZ International Funding, Ltd. | ||||||||
| 1,325,000 | 1.939%, 9/14/2021b,c | 1,328,519 | ||||||
Caisse Centrale Desjardins du Quebec | ||||||||
| 2,155,000 | 1.552%, 1/29/2018b,c | 2,152,804 | ||||||
Citigroup, Inc. | ||||||||
| 1,840,000 | 1.642%, 4/8/2019b | 1,842,237 | ||||||
| 1,725,000 | 2.361%, 9/1/2023b | 1,759,298 | ||||||
CNA Financial Corporation | ||||||||
| 3,000,000 | 5.875%, 8/15/2020 | 3,311,748 | ||||||
| 1,500,000 | 5.750%, 8/15/2021 | 1,674,182 | ||||||
CoBank ACB | ||||||||
| 1,965,000 | 1.563%, 6/15/2022b | 1,879,458 | ||||||
Cooperatieve Centrale Raiffeisen- Boerenleenbank BA | ||||||||
| 1,600,000 | 2.500%, 1/19/2021 | 1,598,438 | ||||||
Credit Agricole SA | ||||||||
| 1,650,000 | 1.680%, 4/15/2019b,c | 1,657,166 | ||||||
| 1,800,000 | 1.923%, 6/10/2020b,c,g | 1,806,149 | ||||||
| 1,050,000 | 8.125%, 12/23/2025c,f | 1,105,083 | ||||||
Credit Suisse Group AG | ||||||||
| 1,500,000 | 6.500%, 8/8/2023c | 1,593,375 | ||||||
| 990,000 | 7.500%, 12/11/2023c,f | 1,035,787 | ||||||
Discover Bank | ||||||||
| 1,850,000 | 8.700%, 11/18/2019 | 2,099,530 | ||||||
Discover Financial Services | ||||||||
| 2,750,000 | 2.600%, 11/13/2018 | 2,773,323 | ||||||
DRB Prime Student Loan Trust | ||||||||
| 3,685,025 | 2.492%, 10/27/2031, Series 2015-B, Class A1*,b | 3,750,579 | ||||||
Fifth Third Bancorp | ||||||||
| 1,440,000 | 2.875%, 10/1/2021 | 1,455,780 | ||||||
Goldman Sachs Capital II | ||||||||
| 88,000 | 4.000%, 2/3/2017b,f | 71,816 | ||||||
Goldman Sachs Group, Inc. | ||||||||
| 1,915,000 | 2.006%, 11/15/2018b | 1,933,204 | ||||||
| 2,160,000 | 2.042%, 4/23/2020b | 2,180,641 | ||||||
| 1,720,000 | 2.241%, 11/15/2021b | 1,729,295 | ||||||
| 1,375,000 | 2.537%, 11/29/2023b | 1,417,635 | ||||||
HCP, Inc. | ||||||||
| 1,330,000 | 4.000%, 12/1/2022 | 1,367,624 | ||||||
Hospitality Properties Trust | ||||||||
| 1,750,000 | 4.250%, 2/15/2021 | 1,809,098 | ||||||
HSBC Holdings plc | ||||||||
| 1,325,000 | 2.358%, 1/5/2022b | 1,349,689 | ||||||
HSBC USA, Inc. | ||||||||
| 1,905,000 | 1.298%, 6/23/2017b | 1,904,095 | ||||||
Huntington Bancshares, Inc. | ||||||||
| 1,600,000 | 3.150%, 3/14/2021 | 1,621,227 | ||||||
ING Bank NV | ||||||||
| 2,750,000 | 1.876%, 8/17/2020b,c | 2,767,014 | ||||||
ING Capital Funding Trust III | ||||||||
| 1,000,000 | 4.438%, 3/31/2017b,f | 995,000 | ||||||
ING Groep NV | ||||||||
| 1,650,000 | 6.000%, 4/16/2020f | 1,608,750 | ||||||
Intesa Sanpaolo SPA | ||||||||
| 1,500,000 | 5.017%, 6/26/2024c | 1,384,740 | ||||||
J.P. Morgan Chase & Company | ||||||||
| 4,000,000 | 1.782%, 1/25/2018b | 4,026,140 | ||||||
| 1,450,000 | 7.900%, 4/30/2018f | 1,501,475 | ||||||
| 1,750,000 | 2.250%, 1/23/2020 | 1,744,785 | ||||||
| 1,750,000 | 3.875%, 9/10/2024 | 1,768,581 | ||||||
J.P. Morgan Chase Bank NA | ||||||||
| 1,350,000 | 1.588%, 9/23/2019b | 1,351,015 | ||||||
Japan Bank for International Cooperation | ||||||||
| 4,000,000 | 1.750%, 7/31/2018 | 4,000,984 | ||||||
KeyBank NA | ||||||||
| 2,750,000 | 1.451%, 6/1/2018b | 2,753,427 | ||||||
Kilroy Realty, LP | ||||||||
| 750,000 | 3.800%, 1/15/2023 | 754,585 | ||||||
Lloyds Bank plc | ||||||||
| 2,475,000 | 1.490%, 3/16/2018b | 2,478,359 | ||||||
Lloyds Banking Group plc | ||||||||
| 350,000 | 4.582%, 12/10/2025 | 351,225 | ||||||
Metropolitan Life Global Funding I | ||||||||
| 3,250,000 | 3.650%, 6/14/2018c | 3,342,882 | ||||||
Mitsubishi UFJ Financial Group, Inc. | ||||||||
| 1,325,000 | 2.017%, 9/13/2021b | 1,326,917 | ||||||
Mizuho Financial Group Cayman 3, Ltd. | ||||||||
| 825,000 | 4.600%, 3/27/2024c | 863,617 | ||||||
Mizuho Financial Group, Inc. | ||||||||
| 1,325,000 | 2.097%, 9/13/2021b | 1,324,550 | ||||||
Morgan Stanley | ||||||||
| 1,000,000 | 5.450%, 7/15/2019f | 990,000 | ||||||
| 2,155,000 | 2.026%, 1/27/2020b | 2,174,065 | ||||||
| 1,100,000 | 5.550%, 7/15/2020f,g | 1,112,375 | ||||||
| 1,600,000 | 2.282%, 10/24/2023b | 1,617,778 | ||||||
| 1,750,000 | 5.000%, 11/24/2025 | 1,867,047 | ||||||
NCUA Guaranteed Notes | ||||||||
| 1,166,159 | 0.999%, 12/7/2020b | 1,163,606 | ||||||
New York Life Global Funding | ||||||||
| 600,000 | 1.550%, 11/2/2018c | 598,166 | ||||||
Peachtree Corners Funding Trust | ||||||||
| 1,375,000 | 3.976%, 2/15/2025c | 1,339,928 | ||||||
Prudential Financial, Inc. | ||||||||
| 1,430,000 | 2.350%, 8/15/2019 | 1,443,146 | ||||||
Realty Income Corporation | ||||||||
| 1,500,000 | 2.000%, 1/31/2018 | 1,504,073 | ||||||
Regions Financial Corporation | ||||||||
| 1,200,000 | 3.200%, 2/8/2021 | 1,216,006 | ||||||
Reliance Standard Life Global Funding II | ||||||||
| 1,740,000 | 2.500%, 4/24/2019c | 1,750,826 | ||||||
Santander UK plc | ||||||||
| 975,000 | 3.125%, 1/8/2021 | 972,722 | ||||||
Simon Property Group, LP | ||||||||
| 1,635,000 | 2.500%, 9/1/2020 | 1,646,120 | ||||||
| 1,600,000 | 2.500%, 7/15/2021 | 1,600,120 | ||||||
Skandinaviska Enskilda Banken AB | ||||||||
| 2,500,000 | 1.375%, 5/29/2018c | 2,489,800 | ||||||
SLM Corporation | ||||||||
| 700,000 | 4.625%, 9/25/2017 | 711,375 | ||||||
Stadshypotek AB | ||||||||
| 2,000,000 | 1.875%, 10/2/2019c | 1,988,780 | ||||||
Standard Chartered plc | ||||||||
| 1,225,000 | 3.950%, 1/11/2023c,g | 1,195,949 | ||||||
State Street Corporation | ||||||||
| 2,499,000 | 1.809%, 8/18/2020b | 2,532,424 | ||||||
Sumitomo Mitsui Banking Corporation | ||||||||
| 2,555,000 | 1.460%, 1/16/2018b | 2,558,204 | ||||||
Sumitomo Mitsui Financial Group, Inc. | ||||||||
| 1,800,000 | 4.436%, 4/2/2024c | 1,876,532 | ||||||
The accompanying Notes to Financial Statements are an integral part of this schedule.
194
Table of Contents
LIMITED MATURITY BOND PORTFOLIO
Schedule of Investments as of December 31, 2016
| Principal Amount | Long-Term Fixed Income (94.9%) | Value | ||||||
Financials (20.1%) - continued | ||||||||
SunTrust Banks, Inc. | ||||||||
| $775,000 | 2.900%, 3/3/2021 | $ | 785,303 | |||||
Svensk Exportkredit AB | ||||||||
| 3,500,000 | 1.182%, 1/23/2017b | 3,500,812 | ||||||
Svenska Handelsbanken AB | ||||||||
| 750,000 | 1.483%, 6/17/2019b | 750,548 | ||||||
Swedbank AB | ||||||||
| 1,750,000 | 1.750%, 3/12/2018c | 1,749,421 | ||||||
Synchrony Financial | ||||||||
| 1,440,000 | 2.111%, 2/3/2020b | 1,423,705 | ||||||
| 1,520,000 | 3.750%, 8/15/2021 | 1,560,918 | ||||||
Toronto-Dominion Bank | ||||||||
| 1,500,000 | 1.889%, 12/14/2020b | 1,517,633 | ||||||
UBS AG | ||||||||
| 2,750,000 | 1.697%, 3/26/2018b | 2,759,147 | ||||||
USB Group Funding Jersey, Ltd. | ||||||||
| 2,250,000 | 2.437%, 9/24/2020b,c | 2,276,057 | ||||||
USB Realty Corporation | ||||||||
| 1,495,000 | 2.027%, 1/15/2022b,c,f | 1,315,600 | ||||||
Voya Financial, Inc. | ||||||||
| 1,500,000 | 2.900%, 2/15/2018 | 1,518,397 | ||||||
| 500,000 | 5.650%, 5/15/2053 | 492,500 | ||||||
Wells Fargo & Company | ||||||||
| 2,155,000 | 1.567%, 1/30/2020b | 2,153,942 | ||||||
| 925,000 | 3.450%, 2/13/2023 | 927,402 | ||||||
| 1,600,000 | 2.117%, 10/31/2023b | 1,619,749 | ||||||
| 1,100,000 | 5.875%, 6/15/2025f | 1,154,890 | ||||||
| 1,100,000 | 4.100%, 6/3/2026 | 1,112,929 | ||||||
Westpac Banking Corporation | ||||||||
| 2,500,000 | 1.250%, 12/15/2017c | 2,494,877 | ||||||
XLIT, Ltd. | ||||||||
| 1,100,000 | 4.450%, 3/31/2025 | 1,089,367 | ||||||
|
| |||||||
Total | 177,426,117 | |||||||
|
| |||||||
Foreign Government (0.8%) | ||||||||
Costa Rica Government International Bond | ||||||||
| 1,650,000 | 4.250%, 1/26/2023c | 1,505,625 | ||||||
Export-Import Bank of Korea | ||||||||
| 2,130,000 | 2.250%, 1/21/2020 | 2,117,424 | ||||||
Kommunalbanken AS | ||||||||
| 3,500,000 | 1.500%, 10/22/2019c | 3,468,346 | ||||||
Poland Government International Bond | ||||||||
| 125,000 | 4.000%, 1/22/2024 | 127,845 | ||||||
|
| |||||||
Total | 7,219,240 | |||||||
|
| |||||||
Mortgage-Backed Securities (3.3%) | ||||||||
Federal Home Loan Mortgage Corporation Gold 15-Yr. Pass Through | ||||||||
| 7,150,000 | 3.000%, 1/1/2032h | 7,333,755 | ||||||
Federal Home Loan Mortgage Corporation Gold 30-Yr. Pass Through | ||||||||
| 444,913 | 6.500%, 9/1/2037 | 504,177 | ||||||
| 6,000,000 | 4.000%, 1/1/2047h | 6,298,800 | ||||||
Federal National Mortgage Association Connecticut Avenue Securities | ||||||||
| 4,222,895 | 2.056%, 4/25/2029, Series 2016-C07, Class 2M1b | 4,227,096 | ||||||
Federal National Mortgage Association Conventional 15-Yr. Pass Through | ||||||||
| 2,015,864 | 2.250%, 6/25/2025, Series 2010-58, Class PT | 2,040,824 | ||||||
Federal National Mortgage Association Conventional 30-Yr. Pass Through | ||||||||
| 601,819 | 5.464%, 9/1/2037b | 637,355 | ||||||
| 358,707 | 5.210%, 10/1/2037b | 358,283 | ||||||
| 2,496,271 | 2.046%, 1/1/2043b | 2,594,431 | ||||||
| 4,935,414 | 1.740%, 7/1/2043b | 5,072,194 | ||||||
|
| |||||||
Total | 29,066,915 | |||||||
|
| |||||||
Technology (2.1%) | ||||||||
Amphenol Corporation | ||||||||
| 1,409,000 | 2.550%, 1/30/2019 | 1,425,422 | ||||||
Apple, Inc. | ||||||||
| 3,050,000 | 1.181%, 5/6/2019b | 3,062,496 | ||||||
| 1,735,000 | 1.202%, 5/6/2020b | 1,733,572 | ||||||
Automatic Data Processing, Inc. | ||||||||
| 1,000,000 | 2.250%, 9/15/2020 | 1,004,425 | ||||||
Cisco Systems, Inc. | ||||||||
| 1,300,000 | 1.511%, 2/21/2018b | 1,307,472 | ||||||
| 2,335,000 | 1.431%, 3/1/2019b | 2,348,326 | ||||||
Diamond 1 Finance Corporation | ||||||||
| 985,000 | 3.480%, 6/1/2019c | 1,005,240 | ||||||
Hewlett Packard Enterprise Company | ||||||||
| 2,800,000 | 2.788%, 10/5/2018b | 2,861,113 | ||||||
Intel Corporation | ||||||||
| 905,000 | 3.100%, 7/29/2022 | 929,620 | ||||||
Oracle Corporation | ||||||||
| 1,675,000 | 2.500%, 5/15/2022 | 1,661,595 | ||||||
Texas Instruments, Inc. | ||||||||
| 1,300,000 | 1.750%, 5/1/2020 | 1,284,895 | ||||||
|
| |||||||
Total | 18,624,176 | |||||||
|
| |||||||
Transportation (1.9%) | ||||||||
Air Canada Pass Through Trust | ||||||||
| 1,388,121 | 3.875%, 3/15/2023c | 1,339,537 | ||||||
American Airlines Pass Through Trust | ||||||||
| 1,222,311 | 5.600%, 7/15/2020c | 1,268,147 | ||||||
| 1,198,671 | 4.950%, 1/15/2023 | 1,278,083 | ||||||
| 943,233 | 3.700%, 5/1/2023 | 919,652 | ||||||
British Airways plc | ||||||||
| 1,333,831 | 4.625%, 6/20/2024c | 1,418,863 | ||||||
Continental Airlines, Inc. | ||||||||
| 2,690,137 | 4.150%, 4/11/2024 | 2,764,116 | ||||||
Delta Air Lines, Inc. | ||||||||
| 649,180 | 4.750%, 5/7/2020 | 678,393 | ||||||
ERAC USA Finance, LLC | ||||||||
| 1,600,000 | 2.600%, 12/1/2021c | 1,573,045 | ||||||
J.B. Hunt Transport Services, Inc. | ||||||||
| 1,450,000 | 3.300%, 8/15/2022 | 1,454,221 | ||||||
TTX Company | ||||||||
| 2,000,000 | 2.250%, 2/1/2019c | 1,998,408 | ||||||
| 800,000 | 4.125%, 10/1/2023* | 813,181 | ||||||
Virgin Australia Holdings, Ltd. | ||||||||
| 1,117,916 | 5.000%, 10/23/2023c | 1,168,222 | ||||||
|
| |||||||
Total | 16,673,868 | |||||||
|
| |||||||
U.S. Government and Agencies (16.4%) | ||||||||
Federal Home Loan Bank | ||||||||
| 1,000,000 | 1.375%, 11/15/2019 | 995,517 | ||||||
Federal National Mortgage Association | ||||||||
| 7,500,000 | 1.250%, 8/17/2021 | 7,247,227 | ||||||
The accompanying Notes to Financial Statements are an integral part of this schedule.
195
Table of Contents
LIMITED MATURITY BOND PORTFOLIO
Schedule of Investments as of December 31, 2016
| Principal Amount | Long-Term Fixed Income (94.9%) | Value | ||||||
U.S. Government and Agencies (16.4%) - continued | ||||||||
U.S. Treasury Bonds | ||||||||
| $ | 8,000,000 | 5.500%, 8/15/2028 | $ | 10,340,888 | ||||
| 200,000 | 3.000%, 5/15/2042 | 197,920 | ||||||
| 1,300,000 | 3.625%, 2/15/2044 | 1,437,877 | ||||||
| 2,800,000 | 2.500%, 5/15/2046 | 2,482,119 | ||||||
U.S. Treasury Bonds, TIPS | ||||||||
| 19,600,020 | 0.125%, 4/15/2019 | 19,843,825 | ||||||
| 7,147,208 | 0.125%, 1/15/2023 | 7,093,618 | ||||||
| 7,756,836 | 0.625%, 1/15/2026 | 7,823,723 | ||||||
| 6,120,900 | 1.000%, 2/15/2046 | 6,144,490 | ||||||
U.S. Treasury Notes | ||||||||
| 300,000 | 0.875%, 1/31/2017i | 300,119 | ||||||
| 5,000,000 | 1.250%, 12/15/2018 | 5,004,390 | ||||||
| 12,350,000 | 1.500%, 10/31/2019 | 12,374,107 | ||||||
| 48,990,000 | 1.125%, 8/31/2021 | 47,289,067 | ||||||
| 13,150,000 | 2.125%, 6/30/2022 | 13,182,047 | ||||||
| 2,565,000 | 1.625%, 8/15/2022 | 2,498,718 | ||||||
| 200,000 | 2.000%, 11/15/2026 | 192,118 | ||||||
|
| |||||||
Total | 144,447,770 | |||||||
|
| |||||||
Utilities (2.7%) | ||||||||
Ameren Corporation | ||||||||
| 1,175,000 | 2.700%, 11/15/2020 | 1,180,404 | ||||||
Berkshire Hathaway Energy Company | ||||||||
| 1,550,000 | 2.400%, 2/1/2020 | 1,553,267 | ||||||
DTE Energy Company | ||||||||
| 730,000 | 2.400%, 12/1/2019 | 733,245 | ||||||
Electricite de France SA | ||||||||
| 1,500,000 | 5.250%, 1/19/2023c,f | 1,410,000 | ||||||
Eversource Energy | ||||||||
| 1,560,000 | 1.600%, 1/15/2018 | 1,556,292 | ||||||
| 1,250,000 | 1.450%, 5/1/2018 | 1,245,710 | ||||||
Exelon Corporation | ||||||||
| 1,650,000 | 2.850%, 6/15/2020 | 1,666,667 | ||||||
Exelon Generation Company, LLC | ||||||||
| 1,385,000 | 2.950%, 1/15/2020 | 1,400,770 | ||||||
National Rural Utilities Cooperative Finance Corporation | ||||||||
| 1,150,000 | 4.750%, 4/30/2043 | 1,156,294 | ||||||
NextEra Energy Capital Holdings, Inc. | ||||||||
| 950,000 | 2.300%, 4/1/2019 | 956,861 | ||||||
Pacific Gas & Electric Company | ||||||||
| 250,000 | 5.625%, 11/30/2017 | 259,258 | ||||||
PG&E Corporation | ||||||||
| 1,500,000 | 2.400%, 3/1/2019 | 1,505,365 | ||||||
PPL Capital Funding, Inc. | ||||||||
| 1,580,000 | 3.500%, 12/1/2022 | 1,614,084 | ||||||
Public Service Electric And Gas Company | ||||||||
| 2,570,000 | 1.800%, 6/1/2019 | 2,566,474 | ||||||
Sempra Energy | ||||||||
| 2,425,000 | 2.300%, 4/1/2017 | 2,429,712 | ||||||
| 1,765,000 | 2.400%, 3/15/2020 | 1,761,435 | ||||||
Southern California Edison Company | ||||||||
| 1,040,000 | 2.400%, 2/1/2022 | 1,035,965 | ||||||
|
| |||||||
Total | 24,031,803 | |||||||
|
| |||||||
Total Long-Term Fixed Income (cost $847,058,382) | 837,958,101 | |||||||
|
| |||||||
| Shares | Preferred Stock (0.4%) | |||||||
Financials (0.3%) | ||||||||
| 66,000 | Citigroup, Inc., 7.257%b | 1,704,120 | ||||||
| 8,125 | Farm Credit Bank of Texas, 6.750%f | 845,000 | ||||||
|
| |||||||
Total | 2,549,120 | |||||||
|
| |||||||
Utilities (0.1%) | ||||||||
| 36,000 | Southern California Edison Company Trust IV, 5.375%f | 888,480 | ||||||
|
| |||||||
Total | 888,480 | |||||||
|
| |||||||
Total Preferred Stock (cost $3,534,100) | 3,437,600 | |||||||
|
| |||||||
Common Stock (<0.1%) | ||||||||
Energy (<0.1%) | ||||||||
| 2,095 | Arch Coal, Inc.j | 163,515 | ||||||
| 816 | Vantage Drilling Internationalj | 82,416 | ||||||
|
| |||||||
Total | 245,931 | |||||||
|
| |||||||
Total Common Stock (cost $209,137) | 245,931 | |||||||
|
| |||||||
Collateral Held for Securities Loaned (0.4%) | �� | |||||||
| 3,886,725 | Thrivent Cash Management Trust | 3,886,725 | ||||||
|
| |||||||
Total Collateral Held for Securities Loaned (cost $3,886,725) | 3,886,725 | |||||||
|
| |||||||
| Shares or Principal Amount | Short-Term Investments (4.3%)k | |||||||
Federal Home Loan Bank Discount Notes | ||||||||
| 300,000 | 0.400%, 1/13/2017l | 299,968 | ||||||
| 1,000,000 | 0.425%, 1/20/2017l | 999,821 | ||||||
Thrivent Core Short-Term Reserve Fund | ||||||||
| 3,694,371 | 0.910% | 36,943,713 | ||||||
|
| |||||||
Total Short-Term Investments (cost $38,243,449) | 38,243,502 | |||||||
|
| |||||||
Total Investments (cost $908,684,967) 101.7% | $ | 898,798,165 | ||||||
|
| |||||||
Other Assets and Liabilities, Net (1.7%) | (14,711,729 | ) | ||||||
|
| |||||||
Total Net Assets 100.0% | $ | 884,086,436 | ||||||
|
| |||||||
The accompanying Notes to Financial Statements are an integral part of this schedule.
196
Table of Contents
LIMITED MATURITY BOND PORTFOLIO
Schedule of Investments as of December 31, 2016
| a | The stated interest rate represents the weighted average of all contracts within the bank loan facility. |
| b | Denotes variable rate securities. Variable rate securities are securities whose yields vary with a designated market index or market rate. The rate shown is as of December 31, 2016. |
| c | Denotes securities sold under Rule 144A of the Securities Act of 1933, which exempts them from registration. These securities may be resold to other dealers in the program or to other qualified institutional buyers. As of December 31, 2016, the value of these investments was $169,330,931 or 19.2% of total net assets. |
| d | Denotes step coupon securities. Step coupon securities pay an initial coupon rate for the first period and then different coupon rates for following periods. The rate shown is as of December 31, 2016. |
| e | All or a portion of the security is insured or guaranteed. |
| f | Denotes perpetual securities. Perpetual securities pay an indefinite stream of interest and have no contractual maturity date. Date shown, if applicable, is next call date. |
| g | All or a portion of the security is on loan. |
| h | Denotes investments purchased on a when-issued or delayed delivery basis. |
| i | At December 31, 2016, $40,016 of investments were segregated to cover exposure to a counterparty for margin on open mortgage-backed security transactions. |
| j | Non-income producing security. |
| k | The interest rate shown reflects the yield, coupon rate or the discount rate at the date of purchase. |
| l | All or a portion of the security is held on deposit with the counterparty and pledged as the initial margin deposit for open futures contracts. |
| * | Denotes restricted securities. Restricted securities are investment securities which cannot be offered for public sale without first being registered under the Securities Act of 1933. The value of all restricted securities held in Limited Maturity Bond Portfolio as of December 31, 2016 was $88,880,192 or 10.1% of total net assets. The following table indicates the acquisition date and cost of restricted securities shown in the schedule as of December 31, 2016. |
Security | Acquisition Date | Cost | ||||||
Alm Loan Funding CLO, 10/17/2026 | 7/31/2014 | $ | 3,758,120 | |||||
American Tower Trust I, 3/15/2018 | 3/6/2013 | 1,650,000 | ||||||
Apidos CLO XVIII, 7/22/2026 | 6/25/2014 | 3,765,563 | ||||||
Babson CLO, Ltd., 10/17/2026 | 8/15/2014 | 3,758,120 | ||||||
Bayview Opportunity Master Fund Trust, 7/28/2034 | 6/27/2014 | 1,878,887 | ||||||
Betony CLO, Ltd., 4/15/2027 | 11/17/2016 | 3,425,000 | ||||||
Birchwood Park CLO, Ltd., 7/15/2026 | 7/31/2014 | 3,760,000 | ||||||
BlueMountain CLO, Ltd., 10/15/2026 | 8/27/2014 | 3,756,203 | ||||||
Carlyle Global Market Strategies CLO, Ltd., 10/15/2026 | 9/19/2014 | 3,750,000 | ||||||
Carlyle Global Market Strategies CLO, Ltd., 7/20/2023 | 7/3/2014 | 3,251,537 | ||||||
Cent CLO 16, LP, 8/1/2024 | 9/5/2014 | 3,653,108 | ||||||
Cent CLO 22, Ltd., 11/7/2026 | 11/1/2016 | 3,750,000 | ||||||
Commonbond Student Loan Trust, 6/25/2032 | 6/17/2015 | 880,474 | ||||||
DRB Prime Student Loan Trust, 10/27/2031 | 9/23/2015 | 3,713,157 | ||||||
Dryden 34 Senior Loan Fund CLO, 10/15/2026 | 7/21/2014 | 3,760,000 | ||||||
Edlinc Student Loan Funding Trust, 10/1/2025 | 11/29/2012 | 1,609,026 | ||||||
GoldenTree Loan Opportunities IX, Ltd., 10/29/2026 | 10/7/2016 | 3,500,000 | ||||||
Madison Park Funding XIV CLO, Ltd., 7/20/2026 | 7/3/2014 | 4,145,020 | ||||||
Mortgage Equity Conversion Asset Trust, 2/25/2042 | 2/14/2007 | 4,138,473 | ||||||
Mortgage Equity Conversion Asset Trust, 1/25/2042 | 1/18/2007 | 4,141,346 | ||||||
Neuberger Berman CLO, Ltd., 8/4/2025 | 6/19/2014 | 3,000,000 | ||||||
NextGear Floorplan Master Owner Trust, 10/15/2019 | 11/3/2014 | 2,999,466 | ||||||
Octagon Investment Partners XX CLO, Ltd., 8/12/2026 | 7/10/2014 | 3,760,000 | ||||||
OZLM VIII, Ltd., 10/17/2026 | 8/7/2014 | 3,738,568 | ||||||
Race Point IX CLO, Ltd., 4/15/2027 | 2/13/2015 | 1,500,000 | ||||||
Selene Non-Performing Loans, LLC, 5/25/2054 | 5/23/2014 | 267,044 | ||||||
Symphony CLO VIII, Ltd., 1/9/2023 | 9/15/2014 | 3,441,867 | ||||||
TTX Company, 10/1/2023 | 9/19/2013 | 799,992 | ||||||
Voya CLO 3, Ltd., 7/25/2026 | 7/10/2014 | 3,754,360 | ||||||
Wachovia Asset Securitization, Inc., 7/25/2037 | 3/16/2007 | 743,307 | ||||||
The following table presents the total amount of securities loaned with continuous maturity, by type, offset by the gross payable upon return of collateral for securities loaned by Thrivent Limited Maturity Bond Portfolio as of December 31, 2016:
Securities Lending Transactions
Taxable Debt Security | $ | 3,756,401 | ||
|
| |||
Total lending | $ | 3,756,401 | ||
Gross amount payable upon return of collateral for securities loaned | $ | 3,886,725 | ||
|
| |||
Net amounts due to counterparty | $ | 130,324 | ||
|
|
Definitions:
CLO | - | Collateralized Loan Obligation | ||
TIPS | - | Treasury Inflation Protected Security. |
The accompanying Notes to Financial Statements are an integral part of this schedule.
197
Table of Contents
| Item 7. | Disclosure of Proxy Voting Policies and Procedures for Closed-End Management Investment Companies |
Not applicable.
| Item 8. | Portfolio Managers of Closed-End Management Investment Companies |
Not applicable.
| Item 9. | Purchases of Equity Securities by Closed-End Management Investment Company and Affiliated Purchasers. |
Not applicable.
| Item 10. | Submission of Matters to a Vote of Security Holders |
There have been no material changes to the procedures by which shareholders may recommend nominees to registrant’s board of directors.
| Item 11. | Controls and Procedures |
(a)(i) Registrant’s President and Treasurer have concluded that registrant’s disclosure controls and procedures (as defined in Rule 30a-3(c) under the Investment Company Act) are effective, based on their evaluation of these controls and procedures as of a date within 90 days of the filing date of this report.
(a)(ii) Registrant’s President and Treasurer are aware of no change in registrant’s internal control over financial reporting (as defined in Rule 30a-3(d) under the Investment Company Act) that occurred during registrant’s most recent fiscal quarter that has materially affected, or is reasonably likely to materially affect, registrant’s internal control over financial reporting.
| Item 12. | Exhibits |
| (a) | The code of ethics pursuant to Item 2 is attached hereto. |
| (b) | Certifications pursuant to Rules 30a-2(a) and 30a-2(b) under the Investment Company Act of 1940 are attached hereto. |
Table of Contents
SIGNATURES
Pursuant to the requirements of the Securities Exchange Act of 1934 and the Investment Company Act of 1940, the registrant has duly caused this report to be signed on its behalf by the undersigned, thereunto duly authorized.
| Date: February 28, 2017 | THRIVENT SERIES FUND, INC. | |||
| By: | /s/ David S. Royal | |||
| David S. Royal | ||||
| President | ||||
Pursuant to the requirements of the Securities Exchange Act of 1934 and the Investment Company Act of 1940, this report has been signed below by the following persons on behalf of the registrant and in the capacities and on the dates indicated.
| Date: February 28, 2017 | By: | /s/ David S. Royal | ||
| David S. Royal | ||||
| President | ||||
| Date: February 28, 2017 | By: | /s/ Gerard V. Vaillancourt | ||
| Gerard V. Vaillancourt | ||||
| Treasurer | ||||