UNITED STATES
SECURITIES AND EXCHANGE COMMISSION
Washington, D.C. 20549
FORM N-CSR
CERTIFIED SHAREHOLDER REPORT OF REGISTERED
MANAGEMENT INVESTMENT COMPANIES
Investment Company Act File No. 811-04604
- ---------------------------------------------------------------------
CREDIT SUISSE CAPITAL FUNDS
- ------------------------------------------------------------------------
(Exact Name of Registrant as Specified in Charter)
Eleven Madison Avenue, New York, New York 10010
- ------------------------------------------------------------------------
(Address of Principal Executive Offices) (Zip Code)
J. Kevin Gao, Esq.
Credit Suisse Capital Funds
Eleven Madison Avenue
New York, New York 10010
Registrant’s telephone number, including area code: (212) 325-2000
Date of fiscal year end: October 31st
Date of reporting period: November 1, 2005 to October 31, 2006
Item 1. Reports to Stockholders.

CREDIT SUISSE FUNDS
Annual Report
October 31, 2006
n CREDIT SUISSE
LARGE CAP VALUE FUND
n CREDIT SUISSE
SMALL CAP CORE FUND
The Funds' investment objectives, risks, charges and expenses (which should be considered carefully before investing), and more complete information about the Funds, are provided in the Prospectus, which should be read carefully before investing. You may obtain additional copies by calling 800-927-2874 or by writing to Credit Suisse Funds, P.O. Box 55030, Boston, MA 02205-5030.
Credit Suisse Asset Management Securities, Inc., Distributor, is located at Eleven Madison Ave., New York, NY 10010. Credit Suisse Funds are advised by Credit Suisse Asset Management, LLC.
Investors in the Credit Suisse Funds should be aware that they may be eligible to purchase Common Class and/or Advisor Class shares (where offered) directly or through certain intermediaries. Such shares are not subject to a sales charge but may be subject to an ongoing service and distribution fee of up to 0.50% of average daily net assets. Investors in the Credit Suisse Funds should also be aware that they may be eligible for a reduction or waiver of the sales charge with respect to Class A, B or C shares (where offered). For more information, please review the relevant prospectuses or consult your financial representative.
The views of the Funds' management are as of the date of the letter and Fund holdings described in this document are as of October 31, 2006; these views and Fund holdings may have changed subsequent to these dates. Nothing in this document is a recommendation to purchase or sell securities.
Fund shares are not deposits or other obligations of Credit Suisse Asset Management, LLC ("Credit Suisse") or any affiliate, are not FDIC-insured and are not guaranteed by Credit Suisse or any affiliate. Fund investments are subject to investment risks, including loss of your investment.
Credit Suisse Large Cap Value Fund
Annual Investment Adviser's Report
October 31, 2006 (unaudited)
December 12, 2006
Dear Shareholder:
Performance Summary
11/01/05 – 10/31/06
| Fund & Benchmark | Performance | ||||||
| Common1 | 19.44 | % | |||||
| Advisor1 | 18.84 | % | |||||
| Class A1,2 | 19.18 | % | |||||
| Class B1,2 | 18.25 | % | |||||
| Class C1, 2 | 18.25 | % | |||||
| Russell 1000® Value Index3 | 21.46 | % | |||||
Performance for the Fund's Class A, Class B and Class C Shares is without the maximum sales charge of 5.75%, 4.00% and 1.00%, respectively.2
Market Overview: Market continues upward on the back of strong earnings
With the exception of a modest correction in the late spring, U.S. stocks climbed steadily over the past year to finish near a five-year high on October 31, 2006. The major drivers of the market were continued strong earnings and a pause by the Federal Reserve from its three-year campaign of raising interest rates. Equity prices were also supported by a pullback in energy prices during the past year.
On balance, we believe that the economic data and management rhetoric presently weigh in favor of the hoped-for "soft landing." This is where the economy is weak enough to hold inflation in check but strong enough to keep employment and profits on a moderate growth path. The most recent data in the third quarter appear to be consistent with this outlook as the GDP slowed to 1.6% while corporate profits, as measured by S&P 500 Index earnings, increased more than 17%.
The strength in the equity market was broad based with all major sectors participating. The strongest returns came from the utility and materials sectors while the weakest returns were from the oil and gas stocks. In our view, this was due mainly to the pullback in energy after a run-up in the wake of an active hurricane season in 2005. Value stocks again outperformed growth stocks during the 12-month period, despite many predictions to the contrary. Growth stocks were hurt by the underperformance of healthcare and technology stocks, which constitute a big share of the growth indexes.
Strategic Review and Outlook: A focus on bottom-up research and quantitative analysis
The Fund modestly underperformed the Russell 1000 Value Index (its benchmark) during the period ended October 31, 2006, due in large part to the conservative positioning of the Fund in a strong market. Most of the underperformance came early in the year as a result of a sharp rally that was paced by lower-quality, more speculative stocks the Fund strives to avoid. An
1
Credit Suisse Large Cap Value Fund
Annual Investment Adviser's Report (continued)
October 31, 2006 (unaudited)
underweight in commodity stocks in an inflationary environment also detracted from performance.
On the positive side, relative performance was helped by strong stock selection in the consumer and oil and gas sectors. Our general overweight and stock selection in industrials and producer durables also boosted returns.
In terms of recent noteworthy portfolio activity, we reduced our substantial overweight in energy stocks during the past year mainly due to our valuation analyses. We are still believers in the long-term case for higher energy prices, but felt a more neutral weighting was prudent in light of the sector's price appreciation. Our holdings in consumer discretionary stocks were trimmed to an underweight mainly in response to concerns over the slowing economy, as well as many of these stocks having reached our price targets. We remain overweight in the industrial and aerospace/defense stocks as we believe they could benefit by the increased pricing and earnings power we normally see at this point in an economic cycle.
Effective December 1, 2006, the fund's investment strategy has changed to a quantitative approach. The Credit Suisse Quantitative Strategies Group is responsible for the day-to-day portfolio management of the funds. The group currently consists of Joseph Cherian, William Weng and Todd Jablonski. Stephen Kaszynski, Robert Rescoe and Adam Scheiner are no longer portfolio managers on the Fund. While the Fund's policy of investing at least 80% of its net assets, plus any borrowings for investment purposes, in equity securities of U.S. companies with large market capitalizations will not change, these securities will be selected using proprietary quantitative stock selection models rather than the more traditional fundamental analysis approach. In addition, in connection with the Fund's change in investment strategy, the Fund's advisory fee was reduced to 0.50% of its average daily net assets. Please see the Fund's prospectus for more details.
Credit Suisse Quantitative Strategies Team
Joseph Cherian
William Weng
Todd Jablonski
The value of investments generally will fluctuate in response to market movements and the Fund's performance will largely depend on the performance of value stocks, which may be more volatile than the overall market.
In addition to historical information, this report contains forward-looking statements that may concern, among other things, domestic and foreign market, industry and economic trends and developments and government regulation and their potential impact on the Fund's investments. These statements are subject to risks and uncertainties and actual trends, developments and regulations in the future, and their impact on the Fund could be materially different from those projected, anticipated or implied. The Fund has no obligation to update or revise forward-looking statements.
2
Credit Suisse Large Cap Value Fund
Annual Investment Adviser's Report (continued)
October 31, 2006 (unaudited)
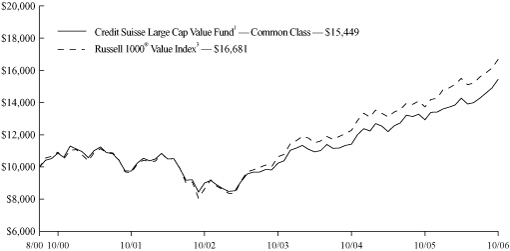
Comparison of Change in Value of $10,000 Investment in the
Credit Suisse Large Cap Value Fund1 Common Class shares, and
the Russell 1000® Value Index3 from Inception (8/01/00).
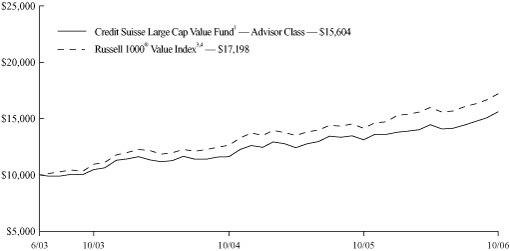
Comparison of Change in Value of $10,000 Investment in the
Credit Suisse Large Cap Value Fund1 Advisor Class shares and
the Russell 1000® Value Index3,4 from Inception (6/6/03).
3
Credit Suisse Large Cap Value Fund
Annual Investment Adviser's Report (continued)
October 31, 2006 (unaudited)
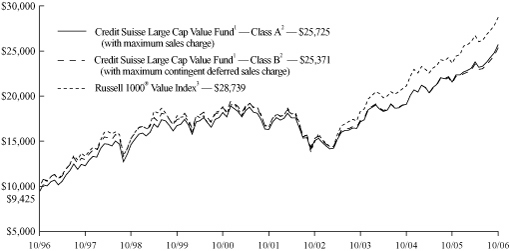
Comparison of Change in Value of $10,000 Investment in the
Credit Suisse Large Cap Value Fund1 Class A shares2 and Class B shares2,
and the Russell 1000® Value Index3 for Ten Years.
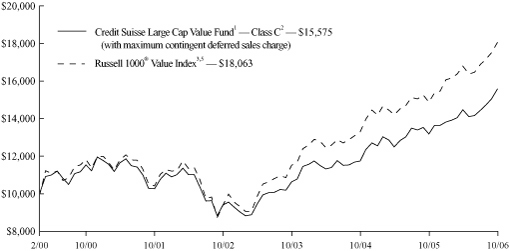
Comparison of Change in Value of $10,000 Investment in the
Credit Suisse Large Cap Value Fund1 Class C shares2 and
the Russell 1000® Value Index3,5 from Inception (2/28/00).
4
Credit Suisse Large Cap Value Fund
Annual Investment Adviser's Report (continued)
October 31, 2006 (unaudited)
Average Annual Returns as of September 30, 20061
1 Year | 5 Years | 10 Years | Since Inception | ||||||||||||||||
| Common Class | 12.25 | % | 8.82 | % | — | 6.69 | % | ||||||||||||
| Advisor Class | 11.68 | % | — | — | 13.12 | % | |||||||||||||
| Class A Without Sales Charge6 | 11.98 | % | 8.71 | % | 10.42 | % | 11.75 | % | |||||||||||
| Class A With Maximum Sales Charge6 | 5.53 | % | 7.43 | % | 9.77 | % | 11.29 | % | |||||||||||
| Class B Without CDSC7 | 11.12 | % | 7.91 | % | 9.62 | % | 9.59 | % | |||||||||||
| Class B With CDSC7 | 7.19 | % | 7.91 | % | 9.62 | % | 9.59 | % | |||||||||||
| Class C Without CDSC | 11.18 | % | 7.91 | % | — | 6.39 | % | ||||||||||||
| Class C With CDSC | 10.20 | % | 7.91 | % | — | 6.39 | % | ||||||||||||
Average Annual Returns as of October 31, 20061
1 Year | 5 Years | 10 Years | Since Inception | ||||||||||||||||
| Common Class | 19.44 | % | 9.64 | % | — | 7.20 | % | ||||||||||||
| Advisor Class | 18.84 | % | — | — | 13.96 | % | |||||||||||||
| Class A Without Sales Charge6 | 19.18 | % | 9.54 | % | 10.56 | % | 11.96 | % | |||||||||||
| Class A With Maximum Sales Charge6 | 12.35 | % | 8.25 | % | 9.91 | % | 11.50 | % | |||||||||||
| Class B Without CDSC7 | 18.25 | % | 8.72 | % | 9.76 | % | 9.87 | % | |||||||||||
| Class B With CDSC7 | 14.25 | % | 8.72 | % | 9.76 | % | 9.87 | % | |||||||||||
| Class C Without CDSC | 18.25 | % | 8.72 | % | — | 6.86 | % | ||||||||||||
| Class C With CDSC | 17.25 | % | 8.72 | % | — | 6.86 | % | ||||||||||||
Returns represent past performance and include change in share price and reinvestment of dividends and capital gains. Past performance cannot guarantee future results. The current performance of the Fund may be lower or higher than the figures shown. Returns and share price will fluctuate, and redemption value may be more or less than original cost. The performance results do not reflect the deduction of taxes that a shareholder would pay on fund distributions or the redemption of fund shares. Performance information current to the most recent month-end is available at www.credit-suisse.com/us.
1 Fee waivers and / or expense reimbursements may reduce expenses for the Fund, without which performance would be lower. Waivers and / or reimbursements may be discontinued at any time.
2 Total return for the Fund's Class A Shares for the reporting period, based on offering price (including maximum sales charge of 5.75%), was 12.35%. Total return for the Fund's Class B Shares for the reporting period, based on redemption value (including maximum contingent deferred sales charge of 4%), was 14.25%. Total return for the Fund's Class C Shares for the reporting period, based on redemption value (including maximum contingent deferred sales charge of 1%), was 17.25%.
3 The Russell 1000® Value Index measures the performance of those companies in the Russell 1000® Index with lower price-to-book ratios and lower forecasted growth values. It is an unmanaged index of common stocks that includes reinvestment of dividends and is compiled by Frank Russell Company. Investors cannot invest directly in an index.
4 Performance for the benchmark is not available for the period beginning June 6, 2003. For that reason, performance of the benchmark is shown from June 1, 2003.
5 Performance for the benchmark is not available for the period beginning February 28, 2000. For that reason, performance of the benchmark is shown from March 1, 2000.
6 Inception Date: 7/9/92.
7 Inception Date: 2/28/96.
5
Credit Suisse Large Cap Value Fund
Annual Investment Adviser's Report (continued)
October 31, 2006 (unaudited)
Information About Your Fund's Expenses
As an investor of the Fund, you incur two types of costs: ongoing expenses and transaction costs. Ongoing expenses include management fees, distribution and service (12b-1) fees and other Fund expenses. Examples of transaction costs include sales charges (loads), redemption fees and account maintenance fees, which are not shown in this section and which would result in higher total expenses. The following table is intended to help you understand your ongoing expenses of investing in the Fund and to help you compare these expenses with the ongoing expenses of investing in other mutual funds. The table is based on an investment of $1,000 made at the beginning of the six month period ended October 31, 2006.
The table illustrates your Fund's expenses in two ways:
• Actual Fund Return. This helps you estimate the actual dollar amount of ongoing expenses paid on a $1,000 investment in the Fund using the Fund's actual return during the period. To estimate the expenses you paid over the period, simply divide your account value by $1,000 (for example, an $8,600 account value divided by $1,000 = 8.6), then multiply the result by the number in the "Expenses Paid per $1,000" line under the share class you hold.
• Hypothetical 5% Fund Return. This helps you to compare your Fund's ongoing expenses with those of other mutual funds using the Fund's actual expense ratio and a hypothetical rate of return of 5% per year before expenses. Examples using a 5% hypothetical fund return may be found in the shareholder reports of other mutual funds. The hypothetical account values and expenses may not be used to estimate the actual ending account balance or expenses you paid for the period.
Please note that the expenses shown in these tables are meant to highlight your ongoing expenses only and do not reflect any transaction costs, such as sales charges (loads) or redemption fees. If these transaction costs had been included, your costs would have been higher. The "Expenses Paid per $1,000" line of the tables is useful in comparing ongoing expenses only and will not help you determine the relative total expenses of owning different funds.
6
Credit Suisse Large Cap Value Fund
Annual Investment Adviser's Report (continued)
October 31, 2006 (unaudited)
Expenses and Value of a $1,000 Investment
for the six month period ended October 31, 2006
| Actual Fund Return | Common Class | Advisor Class | Class A | Class B | Class C | ||||||||||||||||||
| Beginning Account Value 5/1/06 | $ | 1,000.00 | $ | 1,000.00 | $ | 1,000.00 | $ | 1,000.00 | $ | 1,000.00 | |||||||||||||
| Ending Account Value 10/31/06 | $ | 1,082.40 | $ | 1,079.70 | $ | 1,081.20 | $ | 1,077.00 | $ | 1,076.90 | |||||||||||||
| Expenses Paid per $1,000* | $ | 4.51 | $ | 7.13 | $ | 5.82 | $ | 9.74 | $ | 9.74 | |||||||||||||
| Hypothetical 5% Fund Return | |||||||||||||||||||||||
| Beginning Account Value 5/1/06 | $ | 1,000.00 | $ | 1,000.00 | $ | 1,000.00 | $ | 1,000.00 | $ | 1,000.00 | |||||||||||||
| Ending Account Value 10/31/06 | $ | 1,020.87 | $ | 1,018.35 | $ | 1,019.61 | $ | 1,015.83 | $ | 1,015.83 | |||||||||||||
| Expenses Paid per $1,000* | $ | 4.38 | $ | 6.92 | $ | 5.65 | $ | 9.45 | $ | 9.45 | |||||||||||||
| Common Class | Advisor Class | Class A | Class B | Class C | |||||||||||||||||||
| Annualized Expense Ratios* | 0.86 | % | 1.36 | % | 1.11 | % | 1.86 | % | 1.86 | % | |||||||||||||
* Expenses are equal to the Fund's annualized expense ratio for each share class, multiplied by the average account value over the period, multiplied by the number of days in the most recent fiscal half year period, then divided by 365.
The "Expenses Paid per $1,000" and the "Annualized Expense Ratios" in the tables are based on actual expenses paid by the Fund during the period, net of fee waivers and/or expense reimbursements. If those fee waivers and/or expense reimbursements had not been in effect, the Fund's actual expenses would have been higher.
For more information, please refer to the Fund's prospectus.
7
Credit Suisse Large Cap Value Fund
Annual Investment Adviser's Report (continued)
October 31, 2006 (unaudited)
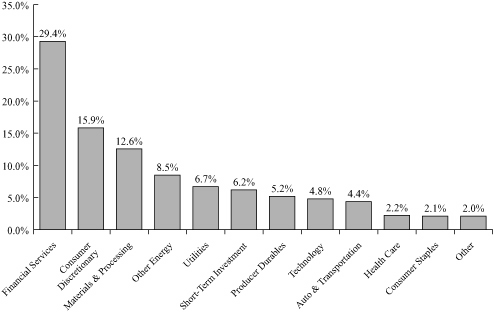
SECTOR BREAKDOWN*
* Expressed as a percentage of total investments (excluding security lending collateral) and may vary over time.
8
Credit Suisse Small Cap Core Fund
Annual Investment Adviser's Report
October 31, 2006 (unaudited)
December 12, 2006
Dear Shareholder:
Performance Summary
11/01/05 – 10/31/06
| Fund & Benchmark | Performance | ||||||
| Common1 | 13.23 | % | |||||
| Class A1,2 | 13.22 | % | |||||
| Class B1,2 | 12.41 | % | |||||
| Class C1,2 | 12.36 | % | |||||
| Russell 2000® Index3 | 19.98 | % | |||||
| Russell 2000® Value Index3 | 22.90 | % | |||||
Performance for the Fund's Class A, Class B and Class C shares is without the maximum sales charge of 5.75%, 4.00% and 1.00%, respectively.2
Market Review: The market continues upward on the back of strong earnings
With the exception of a modest correction in the late spring, U.S. stocks climbed steadily over the past year to finish near a five-year high on October 31, 2006. The period was another strong year for small cap stocks — with low quality stocks dominating. Early market gains were earned in the second quarter when, as inflation fears intensified, a pause by the Federal Reserve from its three-year campaign of raising interest rates ignited a sharp rally. Equity prices were also supported by a pullback in energy prices during the year.
On balance, we believe that the economic data and management rhetoric presently weigh in favor of the hoped-for "soft landing." This is where the economy is weak enough to hold inflation in check but strong enough to keep employment and profits on a moderate growth path. The most recent data in the third quarter appear to be consistent with this outlook as the GDP slowed to 1.6% while corporate profits, as measured by S&P 500 Index earnings, increased more than 17%.
The strength in the equity market was broad-based with all major sectors participating. During the 12-month period, the strongest returns came from the technology and materials sectors with value stocks again outperforming growth stocks despite many predictions to the contrary.
Strategic Review and Outlook: An increasing focus on business quality
For the year ended October 31, 2006, the Fund's Class A shares returned 13.23% compared to 19.98% for the Russell 2000 Index and 22.90% for the Russell 2000 Value Index. Superior stock selection in the utilities and consumer staples sectors contributed to the Fund's performance, while a lack of exposure to REITs in the financials sector detracted from performance. Additionally, an overweight
9
Credit Suisse Small Cap Core Fund
Annual Investment Adviser's Report (continued)
October 31, 2006 (unaudited)
(compared to the Russell 2000 Value Index) in oil exploration, production and service and poor stock selection in healthcare, further reduced Fund performance.
Going forward, we expect the U.S. economy to continue slowing following the Fed's aggressive tightening, with the housing sector probably being the most significant drag. Even so, core inflation trends may take time to moderate, potentially complicating the Fed's policy options going forward. If so, the markets could continue to undervalue quality, and sustain for a while longer, the current higher valuation of small cap stocks relative to large cap stocks.
Effective December 1, 2006, the Fund's investment strategy has changed to a quantitative approach. The Credit Suisse Quantitative Strategies Group is responsible for the day-to-day portfolio management of the Fund. The group currently consists of Joseph Cherian, William Weng and Todd Jablonski. Stephen Kaszynski, Robert Rescoe and T. Ryan Harkins are no longer portfolio managers on the Fund. While the Fund's policy of investing in equity securities of U.S. companies with small market capitalizations will not change, these securities will be selected using proprietary quantitative stock selection models rather than the more traditional fundamental analysis approach. The portfolio managers will apply the proprietary quantitative models to companies that are represented in the Standard & Poor's SmallCap 600 Index (the "S&P 600 Index"), as well as other companies with similar attributes and capitalizations to the companies in the S&P 600 Index. The Fund's new investment strategy, however, will not maintain a value focus. As a result, the name of the Fund has changed to "Credit Suisse Small Cap Core Fund." In addition, the Fund's advisory fee was reduced to the lower of (a) 0.70% of its average daily net assets, or (b) the current fee. Please see the Fund's prospectus for more details.
Credit Suisse Quantitative Strategies Team
Joseph Cherian
William Weng
Todd Jablonski
Because of the nature of the Fund's investments in special-situation, start-up and other small companies, an investment in the Fund may be more volatile and less liquid than investments in larger companies.
In addition to historical information, this report contains forward-looking statements that may concern, among other things, domestic and foreign market, industry and economic trends and developments and government regulation and their potential impact on the Fund's investments. These statements are subject to risks and uncertainties and actual trends, developments and regulations in the future, and their impact on the Fund could be materially different from those projected, anticipated or implied. The Fund has no obligation to update or revise forward-looking statements.
10
Credit Suisse Small Cap Core Fund
Annual Investment Adviser's Report (continued)
October 31, 2006 (unaudited)
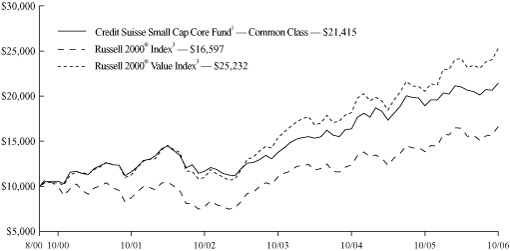
Comparison of Change in Value of $10,000 Investment in the Credit Suisse
Small Cap Core Fund1 Common Class shares, the Russell 2000® Index3 and
the Russell 2000® Value Index3 from Inception (8/01/00).
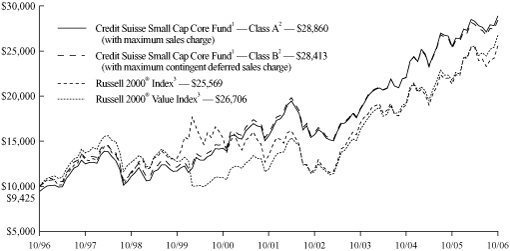
Comparison of Change in Value of $10,000 Investment in the Credit Suisse
Small Cap Core Fund1 Class A shares2 and Class B shares2, the Russell 2000® Index3 and the Russell 2000® Value Index3 for Ten Years.
11
Credit Suisse Small Cap Core Fund
Annual Investment Adviser's Report (continued)
October 31, 2006 (unaudited)
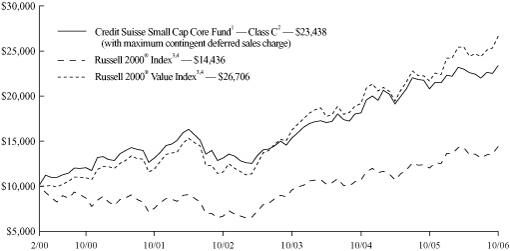
Comparison of Change in Value of $10,000 Investment in the
Credit Suisse Small Cap Core Fund1 Class C shares2, the Russell 2000®
Index3,4 and the Russell 2000® Value Index3,4 from Inception (2/28/00).
12
Credit Suisse Small Cap Core Fund
Annual Investment Adviser's Report (continued)
October 31, 2006 (unaudited)
Average Annual Returns as of September 30, 20061
1 Year | 5 Years | 10 Years | Since Inception | ||||||||||||||||
| Common Class | 4.36 | % | 13.04 | % | — | 12.45 | % | ||||||||||||
| Class A Without Sales Charge5 | 4.34 | % | 13.07 | % | 11.46 | % | 13.46 | % | |||||||||||
| Class A With Maximum Sales Charge5 | (1.67 | )% | 11.74 | % | 10.80 | % | 12.99 | % | |||||||||||
| Class B Without CDSC6 | 3.62 | % | 12.22 | % | 10.63 | % | 10.52 | % | |||||||||||
| Class B With CDSC6 | (0.08 | )% | 12.22 | % | 10.63 | % | 10.52 | % | |||||||||||
| Class C Without CDSC | 3.54 | % | 12.21 | % | — | 13.16 | % | ||||||||||||
| Class C With CDSC | 2.61 | % | 12.21 | % | — | 13.16 | % | ||||||||||||
Average Annual Returns as of October 31, 20061
1 Year | 5 Years | 10 Years | Since Inception | ||||||||||||||||
| Common Class | 13.23 | % | 13.05 | % | — | 12.95 | % | ||||||||||||
| Class A Without Sales Charge5 | 13.22 | % | 13.07 | % | 11.84 | % | 13.67 | % | |||||||||||
| Class A With Maximum Sales Charge5 | 6.71 | % | 11.74 | % | 11.18 | % | 13.20 | % | |||||||||||
| Class B Without CDSC6 | 12.41 | % | 12.24 | % | 11.01 | % | 10.81 | % | |||||||||||
| Class B With CDSC6 | 8.41 | % | 12.24 | % | 11.01 | % | 10.81 | % | |||||||||||
| Class C Without CDSC | 12.36 | % | 12.22 | % | — | 13.61 | % | ||||||||||||
| Class C With CDSC | 11.36 | % | 12.22 | % | — | 13.61 | % | ||||||||||||
Returns represent past performance and include change in share price and reinvestment of dividends and capital gains. Past performance cannot guarantee future results. The current performance of the Fund may be lower or higher than the figures shown. Returns and share price will fluctuate, and redemption value may be more or less than original cost. The performance results do not reflect the deduction of taxes that a shareholder would pay on fund distributions or the redemption of fund shares. Performance information current to the most recent month-end is available at www.credit-suisse.com/us.
1 Fee waivers and/or expense reimbursements may reduce expenses for the Fund, without which performance would be lower. Waivers and / or reimbursements may be discontinued at any time.
2 Total return for the Fund's Class A Shares for the reporting period, based on offering price (including maximum sales charge of 5.75%), was 6.71%. Total return for the Fund's Class B Shares for the reporting period, based on redemption value (including maximum contingent deferred sales charge of 4%), was 8.41%. Total return for the Fund's Class C Shares for the reporting period, based on redemption value (including maximum contingent deferred sales charge of 1%), was 11.36%.
3 The Russell 2000® Index measures the performance of the 2,000 smallest companies in the Russell 3000® Index, which represent approximately 8% of the total market capitalization of the Russell 3000® Index. It is an unmanaged index of common stocks which includes reinvestment of dividends and is compiled by Frank Russell Company. The Russell 2000® Value Index measures the performance of those Russell 2000® companies with lower price-to-book ratios and lower forecasted growth values. Investors cannot invest directly in an index.
4 Performance for the benchmark is not available for the period beginning February 28, 2000. For that reason, performance of the benchmark is shown from March 1, 2000.
5 Inception Date: 7/9/92.
6 Inception Date: 2/28/96.
13
Credit Suisse Small Cap Core Fund
Annual Investment Adviser's Report (continued)
October 31, 2006 (unaudited)
Information About Your Fund's Expenses
As an investor of the Fund, you incur two types of costs: ongoing expenses and transaction costs. Ongoing expenses include management fees, distribution and service (12b-1) fees and other Fund expenses. Examples of transaction costs include sales charges (loads), redemption fees and account maintenance fees, which are not shown in this section and which would result in higher total expenses. The following table is intended to help you understand your ongoing expenses of investing in the Fund and to help you compare these expenses with the ongoing expenses of investing in other mutual funds. The table is based on an investment of $1,000 made at the beginning of the six month period ended October 31, 2006.
The table illustrates your Fund's expenses in two ways:
• Actual Fund Return. This helps you estimate the actual dollar amount of ongoing expenses paid on a $1,000 investment in the Fund using the Fund's actual return during the period. To estimate the expenses you paid over the period, simply divide your account value by $1,000 (for example, an $8,600 account value divided by $1,000 = 8.6), then multiply the result by the number in the "Expenses Paid per $1,000" line under the share class you hold.
• Hypothetical 5% Fund Return. This helps you to compare your Fund's ongoing expenses with those of other mutual funds using the Fund's actual expense ratio and a hypothetical rate of return of 5% per year before expenses. Examples using a 5% hypothetical fund return may be found in the shareholder reports of other mutual funds. The hypothetical account values and expenses may not be used to estimate the actual ending account balance or expenses you paid for the period.
Please note that the expenses shown in these tables are meant to highlight your ongoing expenses only and do not reflect any transaction costs, such as sales charges (loads) or redemption fees. If these transaction costs had been included, your costs would have been higher. The "Expenses Paid per $1,000" line of the tables is useful in comparing ongoing expenses only and will not help you determine the relative total expenses of owning different funds.
14
Credit Suisse Small Cap Core Fund
Annual Investment Adviser's Report (continued)
October 31, 2006 (unaudited)
Expenses and Value of a $1,000 Investment
for the six month period ended October 31, 2006
| Actual Fund Return | Common Class | Class A | Class B | Class C | |||||||||||||||
| Beginning Account Value 5/1/06 | $ | 1,000.00 | $ | 1,000.00 | $ | 1,000.00 | $ | 1,000.00 | |||||||||||
| Ending Account Value 10/31/06 | $ | 1,020.60 | $ | 1,020.50 | $ | 1,016.60 | $ | 1,016.70 | |||||||||||
| Expenses Paid per $1,000* | $ | 7.08 | $ | 7.08 | $ | 10.88 | $ | 10.88 | |||||||||||
| Hypothetical 5% Fund Return | |||||||||||||||||||
| Beginning Account Value 5/1/06 | $ | 1,000.00 | $ | 1,000.00 | $ | 1,000.00 | $ | 1,000.00 | |||||||||||
| Ending Account Value 10/31/06 | $ | 1,018.20 | $ | 1,018.20 | $ | 1,014.42 | $ | 1,014.42 | |||||||||||
| Expenses Paid per $1,000* | $ | 7.07 | $ | 7.07 | $ | 10.87 | $ | 10.87 | |||||||||||
| Common Class | Class A | Class B | Class C | ||||||||||||||||
| Annualized Expense Ratios* | 1.39 | % | 1.39 | % | 2.14 | % | 2.14 | % | |||||||||||
* Expenses are equal to the Fund's annualized expense ratio for each share class, multiplied by the average account value over the period, multiplied by the number of days in the most recent fiscal half year period, then divided by 365.
The "Expenses Paid per $1,000" and the "Annualized Expense Ratios" in the tables are based on actual expenses paid by the Fund during the period, net of fee waivers and/or expense reimbursements. If those fee waivers and/or expense reimbursements had not been in effect, the Fund's actual expenses would have been higher.
For more information, please refer to the Fund's prospectus.
15
Credit Suisse Small Cap Core Fund
Annual Investment Adviser's Report (continued)
October 31, 2006 (unaudited)
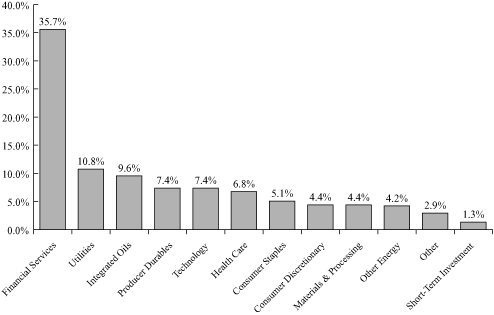
SECTOR BREAKDOWN*
* Expressed as a percentage of total investments (excluding security lending collateral) and may vary over time.
16
Credit Suisse Large Cap Value Fund
Schedule of Investments
October 31, 2006
| Number of Shares | Value | ||||||||||
| COMMON STOCKS (98.9%) | |||||||||||
| Aerospace & Defense (7.6%) | |||||||||||
| Boeing Co. | 32,700 | $ | 2,611,422 | ||||||||
| Goodrich Corp. | 125,600 | 5,537,704 | |||||||||
| L-3 Communications Holdings, Inc. | 92,700 | 7,464,204 | |||||||||
| Precision Castparts Corp.§ | 40,400 | 2,749,624 | |||||||||
| United Technologies Corp. | 103,800 | 6,821,736 | |||||||||
| 25,184,690 | |||||||||||
| Banks (11.0%) | |||||||||||
| Bank of America Corp. | 258,649 | 13,933,422 | |||||||||
| Bank of New York Company, Inc. | 151,800 | 5,217,366 | |||||||||
| Hudson City Bancorp, Inc. | 349,679 | 4,801,093 | |||||||||
| U.S. Bancorp | 198,600 | 6,720,624 | |||||||||
| Wells Fargo & Co. | 159,000 | 5,770,110 | |||||||||
| 36,442,615 | |||||||||||
| Beverages (1.2%) | |||||||||||
| Coca-Cola Co. | 83,600 | 3,905,792 | |||||||||
| Chemicals (1.7%) | |||||||||||
| Dow Chemical Co. | 134,000 | 5,465,860 | |||||||||
| Commingled Fund (4.8%) | |||||||||||
| iShares Russell 1000 Value Index Fund | 197,300 | 15,673,512 | |||||||||
| Communications Equipment (2.2%) | |||||||||||
| Cisco Systems, Inc.* | 145,300 | 3,506,089 | |||||||||
| Motorola, Inc. | 157,700 | 3,636,562 | |||||||||
| 7,142,651 | |||||||||||
| Computers & Peripherals (2.4%) | |||||||||||
| International Business Machines Corp. | 84,500 | 7,801,885 | |||||||||
| Containers & Packaging (1.0%) | |||||||||||
| Crown Holdings, Inc.* | 164,200 | 3,192,048 | |||||||||
| Diversified Financials (15.6%) | |||||||||||
| American Express Co. | 85,000 | 4,913,850 | |||||||||
| Capital One Financial Corp.§ | 75,700 | 6,005,281 | |||||||||
| Citigroup, Inc. | 237,700 | 11,923,032 | |||||||||
| Freddie Mac | 62,300 | 4,298,077 | |||||||||
| Goldman Sachs Group, Inc. | 11,300 | 2,144,627 | |||||||||
| JPMorgan Chase & Co. | 148,600 | 7,049,584 | |||||||||
| Lehman Brothers Holdings, Inc. | 76,600 | 5,962,544 | |||||||||
| Morgan Stanley | 76,700 | 5,862,181 | |||||||||
| Western Union Co.* | 157,100 | 3,464,055 | |||||||||
| 51,623,231 | |||||||||||
See Accompanying Notes to Financial Statements.
17
Credit Suisse Large Cap Value Fund
Schedule of Investments (continued)
October 31, 2006
| Number of Shares | Value | ||||||||||
| COMMON STOCKS | |||||||||||
| Diversified Telecommunication Services (7.2%) | |||||||||||
| ALLTEL Corp. | 61,700 | $ | 3,289,227 | ||||||||
| AT&T, Inc. | 240,700 | 8,243,975 | |||||||||
| Sprint Nextel Corp. | 214,100 | 4,001,529 | |||||||||
| Verizon Communications, Inc. | 132,800 | 4,913,600 | |||||||||
| Windstream Corp. | 240,710 | 3,302,541 | |||||||||
| 23,750,872 | |||||||||||
| Electric Utilities (3.6%) | |||||||||||
| Edison International | 115,600 | 5,137,264 | |||||||||
| Exelon Corp. | 26,800 | 1,661,064 | |||||||||
| PPL Corp. | 145,400 | 5,019,208 | |||||||||
| 11,817,536 | |||||||||||
| Electrical Equipment (1.0%) | |||||||||||
| Emerson Electric Co. | 39,400 | 3,325,360 | |||||||||
| Energy Equipment & Services (1.5%) | |||||||||||
| Halliburton Co. | 149,400 | 4,833,090 | |||||||||
| Food & Drug Retailing (1.0%) | |||||||||||
| CVS Corp. | 107,400 | 3,370,212 | |||||||||
| Healthcare Providers & Services (0.9%) | |||||||||||
| Aetna, Inc. | 74,900 | 3,087,378 | |||||||||
| Hotels, Restaurants & Leisure (0.8%) | |||||||||||
| Carnival Corp.§ | 57,000 | 2,782,740 | |||||||||
| Household Products (1.5%) | |||||||||||
| Procter & Gamble Co. | 75,800 | 4,804,962 | |||||||||
| Industrial Conglomerates (3.0%) | |||||||||||
| General Electric Co. | 278,100 | 9,764,091 | |||||||||
| Insurance (2.4%) | |||||||||||
| Hartford Financial Services Group, Inc. | 23,100 | 2,013,627 | |||||||||
| St. Paul Travelers Companies, Inc. | 116,600 | 5,961,758 | |||||||||
| 7,975,385 | |||||||||||
| IT Consulting & Services (0.9%) | |||||||||||
| First Data Corp. | 129,200 | 3,133,100 | |||||||||
| Machinery (1.0%) | |||||||||||
| Caterpillar, Inc. | 54,400 | 3,302,624 | |||||||||
| Oil & Gas (12.4%) | |||||||||||
| Chevron Corp. | 176,700 | 11,874,240 | |||||||||
| ConocoPhillips | 65,200 | 3,927,648 | |||||||||
| Exxon Mobil Corp. | 224,400 | 16,026,648 | |||||||||
| Newfield Exploration Co.* | 147,900 | 6,032,841 | |||||||||
| Noble Energy, Inc. | 62,200 | 3,024,786 | |||||||||
| 40,886,163 | |||||||||||
See Accompanying Notes to Financial Statements.
18
Credit Suisse Large Cap Value Fund
Schedule of Investments (continued)
October 31, 2006
| Number of Shares | Value | ||||||||||
| COMMON STOCKS | |||||||||||
| Paper & Forest Products (0.9%) | |||||||||||
| International Paper Co. | 90,700 | $ | 3,024,845 | ||||||||
| Pharmaceuticals (5.9%) | |||||||||||
| Abbott Laboratories | 84,200 | 4,000,342 | |||||||||
| Johnson & Johnson | 112,800 | 7,602,720 | |||||||||
| Pfizer, Inc. | 294,600 | 7,851,090 | |||||||||
| 19,454,152 | |||||||||||
| Real Estate (1.0%) | |||||||||||
| Annaly Capital Management, Inc. | 250,800 | 3,290,496 | |||||||||
| Semiconductor Equipment & Products (0.9%) | |||||||||||
| Applied Materials, Inc.§ | 171,100 | 2,975,429 | |||||||||
| Software (0.6%) | |||||||||||
| Microsoft Corp. | 65,800 | 1,889,118 | |||||||||
| Specialty Retail (3.5%) | |||||||||||
| Abercrombie & Fitch Co. Class A | 65,500 | 5,020,575 | |||||||||
| Home Depot, Inc. | 178,400 | 6,659,672 | |||||||||
| 11,680,247 | |||||||||||
| Tobacco (1.4%) | |||||||||||
| Altria Group, Inc. | 56,900 | 4,627,677 | |||||||||
| TOTAL COMMON STOCKS (Cost $265,441,804) | 326,207,761 | ||||||||||
| SHORT-TERM INVESTMENTS (3.4%) | |||||||||||
| State Street Navigator Prime Portfolio§§ | 7,161,642 | 7,161,642 | |||||||||
| Par (000) | |||||||||||
| State Street Bank and Trust Co. Euro Time Deposit, 4.100%, 11/01/06 | $ | 4,237 | 4,237,000 | ||||||||
| TOTAL SHORT-TERM INVESTMENTS (Cost $11,398,642) | 11,398,642 | ||||||||||
| TOTAL INVESTMENTS AT VALUE (102.3%) (Cost $276,840,446) | 337,606,403 | ||||||||||
| LIABILITIES IN EXCESS OF OTHER ASSETS (-2.3%) | (7,721,768 | ) | |||||||||
| NET ASSETS (100.0%) | $ | 329,884,635 | |||||||||
* Non-income producing security.
§ Security or portion thereof is out on loan.
§§ Represents security purchased with cash collateral received for securities on loan.
See Accompanying Notes to Financial Statements.
19
Credit Suisse Small Cap Core Fund
Schedule of Investments
October 31, 2006
| Number of Shares | Value | ||||||||||
| COMMON STOCKS (93.9%) | |||||||||||
| Aerospace & Defense (0.5%) | |||||||||||
| DRS Technologies, Inc.§ | 42,600 | $ | 1,883,772 | ||||||||
| Agriculture (1.9%) | |||||||||||
| Delta and Pine Land Co.§ | 169,700 | 6,874,547 | |||||||||
| Auto Components (3.3%) | |||||||||||
| Accuride Corp.*§ | 560,500 | 6,894,150 | |||||||||
| American Axle & Manufacturing Holdings, Inc.§ | 202,300 | 3,793,125 | |||||||||
| Proliance International, Inc.*§ | 308,398 | 1,332,280 | |||||||||
| 12,019,555 | |||||||||||
| Banks (11.8%) | |||||||||||
| Alabama National Bancorp. | 83,900 | 5,692,615 | |||||||||
| First Midwest Bancorp, Inc.§ | 104,300 | 3,966,529 | |||||||||
| Independent Bank Corp./MA | 130,100 | 4,357,049 | |||||||||
| NewAlliance Bancshares, Inc.§ | 300,100 | 4,645,548 | |||||||||
| Prosperity Bancshares, Inc.§ | 193,000 | 6,695,170 | |||||||||
| Provident Financial Services, Inc. | 313,600 | 5,751,424 | |||||||||
| South Financial Group, Inc.§ | 206,000 | 5,465,180 | |||||||||
| SVB Financial Group*§ | 38,400 | 1,767,168 | |||||||||
| Webster Financial Corp.§ | 94,700 | 4,575,904 | |||||||||
| 42,916,587 | |||||||||||
| Building Products (1.9%) | |||||||||||
| Drew Industries, Inc.*§ | 148,900 | 4,042,635 | |||||||||
| PGT, Inc.*§ | 198,500 | 2,939,785 | |||||||||
| 6,982,420 | |||||||||||
| Commercial Services & Supplies (5.1%) | |||||||||||
| Coinmach Service Corp. Class A§ | 375,200 | 3,752,000 | |||||||||
| Viad Corp. | 162,400 | 6,000,680 | |||||||||
| Watson Wyatt Worldwide, Inc. Class A | 191,200 | 8,632,680 | |||||||||
| 18,385,360 | |||||||||||
| Commingled Fund (4.9%) | |||||||||||
| iShares Russell 2000 Value Index Fund§ | 229,800 | 17,798,010 | |||||||||
| Construction & Engineering (1.2%) | |||||||||||
| EMCOR Group, Inc.*§ | 72,900 | 4,312,035 | |||||||||
| Containers & Packaging (4.0%) | |||||||||||
| Crown Holdings, Inc.*§ | 466,100 | 9,060,984 | |||||||||
| Greif, Inc. Class A | 56,800 | 5,322,728 | |||||||||
| 14,383,712 | |||||||||||
| Distribution & Wholesale (0.7%) | |||||||||||
| Core-Mark Holding Company, Inc.*§ | 74,200 | 2,374,400 | |||||||||
| Diversified Financials (3.0%) | |||||||||||
| Apollo Investment Corp.§ | 232,900 | 5,021,324 | |||||||||
| Assured Guaranty, Ltd. | 230,100 | 5,791,617 | |||||||||
| 10,812,941 | |||||||||||
See Accompanying Notes to Financial Statements.
20
Credit Suisse Small Cap Core Fund
Schedule of Investments (continued)
October 31, 2006
| Number of Shares | Value | ||||||||||
| COMMON STOCKS | |||||||||||
| Diversified Telecommunication Services (2.2%) | |||||||||||
| Eschelon Telecom, Inc.*§ | 221,800 | $ | 3,930,296 | ||||||||
| General Communication, Inc. Class A*§ | 317,537 | 4,162,910 | |||||||||
| 8,093,206 | |||||||||||
| Electric Utilities (1.4%) | |||||||||||
| Empire District Electric Co. | 211,000 | 5,009,140 | |||||||||
| Electrical Equipment (2.0%) | |||||||||||
| Brady Corp. Class A§ | 128,500 | 4,754,500 | |||||||||
| C&D Technologies, Inc.§ | 481,400 | 2,387,744 | |||||||||
| 7,142,244 | |||||||||||
| Electronic Equipment & Instruments (3.9%) | |||||||||||
| Electro Scientific Industries, Inc.*§ | 166,700 | 3,325,665 | |||||||||
| Roper Industries, Inc.§ | 84,100 | 4,024,185 | |||||||||
| Varian, Inc.*§ | 141,400 | 6,630,246 | |||||||||
| 13,980,096 | |||||||||||
| Energy Equipment & Services (1.3%) | |||||||||||
| Allis-Chalmers Energy, Inc.*§ | 318,900 | 4,805,823 | |||||||||
| Food & Drug Retailing (2.1%) | |||||||||||
| Ruddick Corp.§ | 272,000 | 7,670,400 | |||||||||
| Gas Utilities (3.5%) | |||||||||||
| Petrohawk Energy Corp.*§ | 326,534 | 3,699,630 | |||||||||
| South Jersey Industries, Inc.§ | 172,200 | 5,326,146 | |||||||||
| WGL Holdings, Inc.§ | 111,100 | 3,605,195 | |||||||||
| 12,630,971 | |||||||||||
| Healthcare Providers & Services (3.6%) | |||||||||||
| LifePoint Hospitals, Inc.*§ | 226,300 | 8,033,650 | |||||||||
| Service Corp. International§ | 533,600 | 4,866,432 | |||||||||
| 12,900,082 | |||||||||||
| Hotels, Restaurants & Leisure (2.0%) | |||||||||||
| Landry's Restaurants, Inc.§ | 250,900 | 7,351,370 | |||||||||
| Industrial Conglomerates (2.0%) | |||||||||||
| Carlisle Companies, Inc.§ | 87,000 | 7,281,030 | |||||||||
| Insurance (5.2%) | |||||||||||
| Argonaut Group, Inc.*§ | 153,700 | 5,227,337 | |||||||||
| Hanover Insurance Group, Inc. | 121,400 | 5,505,490 | |||||||||
| ProAssurance Corp.*§ | 37,800 | 1,840,860 | |||||||||
| United Fire & Casualty Co.§ | 178,000 | 6,297,640 | |||||||||
| 18,871,327 | |||||||||||
| Internet Software & Services (2.4%) | |||||||||||
| NETGEAR, Inc.*§ | 324,900 | 8,707,320 | |||||||||
See Accompanying Notes to Financial Statements.
21
Credit Suisse Small Cap Core Fund
Schedule of Investments (continued)
October 31, 2006
| Number of Shares | Value | ||||||||||
| COMMON STOCKS | |||||||||||
| Leisure Equipment & Products (1.1%) | |||||||||||
| Smith & Wesson Holding Corp.*§ | 279,100 | $ | 3,823,670 | ||||||||
| Machinery (3.1%) | |||||||||||
| Albany International Corp. Class A§ | 182,500 | 6,133,825 | |||||||||
| Briggs & Stratton Corp.§ | 49,500 | 1,261,755 | |||||||||
| ESCO Technologies, Inc.*§ | 89,500 | 3,886,090 | |||||||||
| 11,281,670 | |||||||||||
| Media (2.4%) | |||||||||||
| Harte-Hanks, Inc.§ | 180,900 | 4,567,725 | |||||||||
| Salem Communications Corp. Class A§ | 184,900 | 2,457,321 | |||||||||
| Source Interlink Companies, Inc.*§ | 180,700 | 1,633,528 | |||||||||
| 8,658,574 | |||||||||||
| Multiline Retail (1.5%) | |||||||||||
| Bon-Ton Stores, Inc.§ | 151,300 | 5,395,358 | |||||||||
| Oil & Gas (6.1%) | |||||||||||
| Comstock Resources, Inc.*§ | 169,500 | 4,729,050 | |||||||||
| Denbury Resources, Inc.*§ | 143,400 | 4,121,316 | |||||||||
| EXCO Resources, Inc.*§ | 385,000 | 5,574,800 | |||||||||
| Forest Oil Corp.*§ | 94,200 | 3,074,688 | |||||||||
| Valero GP Holdings LLC.* | 156,600 | 3,158,622 | |||||||||
| Western Refining, Inc.§ | 66,600 | 1,569,096 | |||||||||
| 22,227,572 | |||||||||||
| Real Estate (5.1%) | |||||||||||
| Affordable Residential Communities*§ | 205,200 | 2,253,096 | |||||||||
| Annaly Capital Management, Inc.§ | 567,900 | 7,450,848 | |||||||||
| DiamondRock Hospitality Co.§ | 287,900 | 4,856,873 | |||||||||
| Eagle Hospitality Properties Trust, Inc.§ | 398,500 | 3,737,930 | |||||||||
| 18,298,747 | |||||||||||
| Road & Rail (1.1%) | |||||||||||
| Florida East Coast Industries, Inc.§ | 67,800 | 4,051,050 | |||||||||
| Textiles & Apparel (3.0%) | |||||||||||
| Hartmarx Corp.*§ | 300,500 | 2,136,555 | |||||||||
| Warnaco Group, Inc.*§ | 404,300 | 8,587,332 | |||||||||
| 10,723,887 | |||||||||||
| Water Utilities (0.6%) | |||||||||||
| SJW Corp.§ | 68,900 | 2,316,418 | |||||||||
| TOTAL COMMON STOCKS (Cost $259,760,625) | 339,963,294 | ||||||||||
See Accompanying Notes to Financial Statements.
22
Credit Suisse Small Cap Core Fund
Schedule of Investments (continued)
October 31, 2006
| Number of Shares | Value | ||||||||||
| SHORT-TERM INVESTMENTS (27.0%) | |||||||||||
| State Street Navigator Prime Portfolio§§ | 75,405,371 | $ | 75,405,371 | ||||||||
| Par (000) | |||||||||||
| State Street Bank and Trust Co. Euro Time Deposit, 4.100%, 11/01/06 | $ | 22,415 | 22,415,000 | ||||||||
| TOTAL SHORT-TERM INVESTMENTS (Cost $97,820,371) | 97,820,371 | ||||||||||
| TOTAL INVESTMENTS AT VALUE (120.9%) (Cost $357,580,996) | 437,783,665 | ||||||||||
| LIABILITIES IN EXCESS OF OTHER ASSETS (-20.9%) | (75,759,209 | ) | |||||||||
| NET ASSETS (100.0%) | $ | 362,024,456 | |||||||||
* Non-income producing security.
§ Security or portion thereof is out on loan.
§§ Represents security purchased with cash collateral received for securities on loan.
See Accompanying Notes to Financial Statements.
23
Credit Suisse Funds
Statements of Assets and Liabilities
October 31, 2006
| Large Cap Value Fund | Small Cap Core Fund | ||||||||||
| Assets | |||||||||||
| Investments at value, including collateral for securities on loan of $7,161,642 and $75,405,371, respectively (Cost $276,840,446, and $357,580,996, respectively) (Note 2) | $ | 337,606,4031 | $ | 437,783,6652 | |||||||
| Cash | 280 | 589 | |||||||||
| Receivable for investments sold | 5,612,947 | — | |||||||||
| Dividend and interest receivable | 263,292 | 75,069 | |||||||||
| Receivable for fund shares sold | 193,046 | 342,413 | |||||||||
| Prepaid expenses and other assets | 31,984 | 50,268 | |||||||||
| Total Assets | 343,707,952 | 438,252,004 | |||||||||
| Liabilities | |||||||||||
| Advisory fee payable (Note 3) | 150,231 | 216,057 | |||||||||
| Administrative services fee payable (Note 3) | 50,878 | 55,755 | |||||||||
| Shareholder servicing/Distribution fee payable (Note 3) | 78,835 | 91,706 | |||||||||
| Payable for investments purchased | 5,442,305 | — | |||||||||
| Payable upon return of securities loaned (Note 2) | 7,161,642 | 75,405,371 | |||||||||
| Payable for fund shares redeemed | 798,084 | 264,872 | |||||||||
| Trustees' fee payable | 3,821 | 3,821 | |||||||||
| Other accrued expenses payable | 137,521 | 189,966 | |||||||||
| Total Liabilities | 13,823,317 | 76,227,548 | |||||||||
| Net Assets | |||||||||||
| Capital stock, $0.001 par value (Note 6) | 14,988 | 14,953 | |||||||||
| Paid-in capital (Note 6) | 204,279,321 | 228,346,950 | |||||||||
| Undistributed net investment income | 297,294 | 1,704,197 | |||||||||
| Accumulated net realized gain on investments and foreign currency transactions | 64,527,075 | 51,755,687 | |||||||||
| Net unrealized appreciation from investments | 60,765,957 | 80,202,669 | |||||||||
| Net Assets | $ | 329,884,635 | $ | 362,024,456 | |||||||
| Common Shares | |||||||||||
| Net assets | $ | 600,451 | $ | 70,525,133 | |||||||
| Shares outstanding | 27,377 | 2,898,877 | |||||||||
| Net asset value, offering price, and redemption price per share | $ | 21.93 | $ | 24.33 | |||||||
| Advisor Shares | |||||||||||
| Net assets | $ | 5,805,776 | N/A | ||||||||
| Shares outstanding | 262,964 | N/A | |||||||||
| Net asset value, offering price, and redemption price per share | $ | 22.08 | N/A | ||||||||
See Accompanying Notes to Financial Statements.
24
Credit Suisse Funds
Statements of Assets and Liabilities (continued)
October 31, 2006
| Large Cap Value Fund | Small Cap Core Fund | ||||||||||
| A Shares | |||||||||||
| Net assets | $ | 305,865,897 | $ | 263,006,345 | |||||||
| Shares outstanding | 13,885,221 | 10,759,758 | |||||||||
| Net asset value and redemption price per share | $ | 22.03 | $ | 24.44 | |||||||
| Maximum offering price per share (net asset value/(1-5.75%)) | $ | 23.37 | $ | 25.93 | |||||||
| B Shares | |||||||||||
| Net assets | $ | 14,994,163 | $ | 12,465,294 | |||||||
| Shares outstanding | 690,826 | 564,734 | |||||||||
| Net asset value and offering price per share | $ | 21.70 | $ | 22.07 | |||||||
| C Shares | |||||||||||
| Net assets | $ | 2,618,348 | $ | 16,027,684 | |||||||
| Shares outstanding | 121,320 | 729,454 | |||||||||
| Net asset value and offering price per share | $ | 21.58 | $ | 21.97 | |||||||
1 Including $7,006,506 of securities on loan.
2 Including $73,501,726 of securities on loan.
See Accompanying Notes to Financial Statements.
25
Credit Suisse Funds
Statements of Operations
For the Year Ended October 31, 2006
| Large Cap Value Fund | Small Cap Core Fund | ||||||||||
| Investment Income (Note 2) | |||||||||||
| Dividends | $ | 7,361,455 | $ | 6,028,103 | |||||||
| Interest | 121,976 | 539,326 | |||||||||
| Securities lending | 7,582 | 100,878 | |||||||||
| Foreign taxes withheld | (2,389 | ) | — | ||||||||
| Total investment income | 7,488,624 | 6,668,307 | |||||||||
| Expenses | |||||||||||
| Investment advisory fees (Note 3) | 1,856,420 | 2,617,497 | |||||||||
| Administrative services fees (Note 3) | 516,902 | 554,937 | |||||||||
| Shareholder servicing/Distribution fee (Note 3) | |||
| Common Class | — | 170,953 | |||||||||
| Advisor Class | 37,023 | — | |||||||||
| Class A | 763,500 | 645,061 | |||||||||
| Class B | 171,352 | 154,116 | |||||||||
| Class C | 32,705 | 169,824 | |||||||||
| Transfer agent fees (Note 3) | 325,439 | 554,378 | |||||||||
| Registration fees | 64,227 | 73,689 | |||||||||
| Printing fees (Note 3) | 43,016 | 55,956 | |||||||||
| Audit and tax fees | 40,958 | 41,334 | |||||||||
| Custodian fees | 35,151 | 36,624 | |||||||||
| Legal fees | 23,912 | 25,898 | |||||||||
| Insurance expense | 19,967 | 20,069 | |||||||||
| Trustees' fees | 12,600 | 12,600 | |||||||||
| Commitment fees (Note 4) | 8,821 | 9,673 | |||||||||
| Miscellaneous expense | 17,474 | 14,412 | |||||||||
| Total expenses | 3,969,467 | 5,157,021 | |||||||||
| Net investment income | 3,519,157 | 1,511,286 | |||||||||
| Net Realized and Unrealized Gain (Loss) from Investments and Foreign Currency Related Items | |||||||||||
| Net realized gain from investments | 64,613,131 | 52,059,311 | |||||||||
| Net realized loss on foreign currency transactions | (2,589 | ) | — | ||||||||
| Net change in unrealized appreciation (depreciation) from investments | (10,171,994 | ) | (10,174,947 | ) | |||||||
| Net realized and unrealized gain from investments | 54,438,548 | 41,884,364 | |||||||||
| Net increase in net assets resulting from operations | $ | 57,957,705 | $ | 43,395,650 | |||||||
See Accompanying Notes to Financial Statements.
26
Credit Suisse Funds
Statements of Changes in Net Assets
| Large Cap Value Fund | Small Cap Core Fund | ||||||||||||||||||
| For the Year Ended October 31, 2006 | For the Year Ended October 31, 2005 | For the Year Ended October 31, 2006 | For the Year Ended October 31, 2005 | ||||||||||||||||
| From Operations | |||||||||||||||||||
| Net investment income (loss) | $ | 3,519,157 | $ | 2,967,789 | $ | 1,511,286 | $ | (793,296 | ) | ||||||||||
| Net realized gain from investments and foreign currency transactions | 64,610,542 | 40,854,220 | 52,059,311 | 36,063,294 | |||||||||||||||
| Net change in unrealized appreciation (depreciation) from investments and foreign currency translations | (10,171,994 | ) | (780,833 | ) | (10,174,947 | ) | 6,808,700 | ||||||||||||
| Net increase in net assets resulting from operations | 57,957,705 | 43,041,176 | 43,395,650 | 42,078,698 | |||||||||||||||
| From Dividends and Distributions | |||||||||||||||||||
| Dividends from net investment income | |||||||||||||||||||
| Common Class shares | (7,242 | ) | (8,380 | ) | — | — | |||||||||||||
| Advisor shares | (55,871 | ) | (72,120 | ) | — | — | |||||||||||||
| Class A shares | (3,096,473 | ) | (3,033,174 | ) | — | — | |||||||||||||
| Class B shares | (47,610 | ) | (53,593 | ) | — | — | |||||||||||||
| Class C shares | (8,918 | ) | (8,921 | ) | — | — | |||||||||||||
| Distributions from net realized gains | |||||||||||||||||||
| Common Class shares | (70,029 | ) | (42,520 | ) | (7,509,989 | ) | (4,991,665 | ) | |||||||||||
| Advisor shares | (969,206 | ) | (730,089 | ) | — | — | |||||||||||||
| Class A shares | (35,411,384 | ) | (19,844,244 | ) | (23,829,327 | ) | (18,702,976 | ) | |||||||||||
| Class B shares | (2,267,901 | ) | (1,556,864 | ) | (1,880,065 | ) | (2,007,856 | ) | |||||||||||
| Class C shares | (426,845 | ) | (248,446 | ) | (1,851,334 | ) | (1,230,506 | ) | |||||||||||
| Net decrease in net assets resulting from dividends and distributions | (42,361,479 | ) | (25,598,351 | ) | (35,070,715 | ) | (26,933,003 | ) | |||||||||||
| From Capital Share Transactions (Note 6) | |||||||||||||||||||
| Proceeds from sale of shares | 34,985,488 | 32,045,431 | 112,745,835 | 105,952,515 | |||||||||||||||
| Reinvestment of dividends and distributions | 39,200,260 | 23,706,286 | 32,583,478 | 24,873,671 | |||||||||||||||
| Net asset value of shares redeemed | (93,328,420 | ) | (84,331,477 | ) | (127,020,125 | ) | (91,459,760 | ) | |||||||||||
| Net increase (decrease) in net assets from capital share transactions | (19,142,672 | ) | (28,579,760 | ) | 18,309,188 | 39,366,426 | |||||||||||||
| Net increase (decrease) in net assets | (3,546,446 | ) | (11,136,935 | ) | 26,634,123 | 54,512,121 | |||||||||||||
| Net Assets | |||||||||||||||||||
| Beginning of year | 333,431,081 | 344,568,016 | 335,390,333 | 280,878,212 | |||||||||||||||
| End of year | $ | 329,884,635 | $ | 333,431,081 | $ | 362,024,456 | $ | 335,390,333 | |||||||||||
| Undistributed net investment income | $ | 297,294 | $ | — | $ | 1,704,197 | $ | — | |||||||||||
See Accompanying Notes to Financial Statements.
27
Credit Suisse Large Cap Value Fund
Financial Highlights
(For a Common Class Share of the Fund Outstanding Throughout Each Year)
| For the Year Ended October 31, | |||||||||||||||||||||||
| 2006 | 2005 | 2004 | 2003 | 2002 | |||||||||||||||||||
| Per share data | |||||||||||||||||||||||
| Net asset value, beginning of year | $ | 20.97 | $ | 19.98 | $ | 18.61 | $ | 16.82 | $ | 19.95 | |||||||||||||
| INVESTMENT OPERATIONS | |||||||||||||||||||||||
| Net investment income1 | 0.28 | 0.24 | 0.23 | 0.14 | 0.17 | ||||||||||||||||||
| Net gain (loss) on investments and foreign currency related items (both realized and unrealized) | 3.42 | 2.32 | 1.87 | 2.10 | (1.45 | ) | |||||||||||||||||
| Total from investment operations | 3.70 | 2.56 | 2.10 | 2.24 | (1.28 | ) | |||||||||||||||||
| LESS DIVIDENDS AND DISTRIBUTIONS | |||||||||||||||||||||||
| Dividends from net investment income | (0.26 | ) | (0.25 | ) | (0.23 | ) | (0.14 | ) | (0.19 | ) | |||||||||||||
| Distributions from net realized gains | (2.48 | ) | (1.32 | ) | (0.50 | ) | (0.31 | ) | (1.66 | ) | |||||||||||||
| Total dividends and distributions | (2.74 | ) | (1.57 | ) | (0.73 | ) | (0.45 | ) | (1.85 | ) | |||||||||||||
| Net asset value, end of year | $ | 21.93 | $ | 20.97 | $ | 19.98 | $ | 18.61 | $ | 16.82 | |||||||||||||
| Total return2 | 19.44 | % | 13.34 | % | 11.51 | % | 13.63 | % | (7.63 | )% | |||||||||||||
| RATIOS AND SUPPLEMENTAL DATA | |||||||||||||||||||||||
| Net assets, end of year (000s omitted) | $ | 600 | $ | 591 | $ | 664 | $ | 737 | $ | 3,061 | |||||||||||||
| Ratio of expenses to average net assets | 0.89 | % | 0.91 | % | 0.95 | % | 1.24 | % | 1.03 | % | |||||||||||||
| Ratio of net investment income to average net assets | 1.37 | % | 1.15 | % | 1.16 | % | 0.82 | % | 0.92 | % | |||||||||||||
| Decrease reflected in above operating expense ratios due to waivers/reimbursements | — | — | — | — | 0.29 | % | |||||||||||||||||
| Portfolio turnover rate | 78 | % | 58 | % | 48 | % | 53 | % | 28 | % | |||||||||||||
1 Per share information is calculated using the average shares outstanding method.
2 Total returns are historical and assume changes in share price and reinvestment of all dividends and distributions. Had certain expenses not been reduced during the year shown, total returns would have been lower.
See Accompanying Notes to Financial Statements.
28
Credit Suisse Large Cap Value Fund
Financial Highlights
(For a Advisor Class Share of the Fund Outstanding Throughout Each Period)
| For the Year Ended October 31, | |||||||||||||||||||
| 2006 | 2005 | 2004 | 20031 | ||||||||||||||||
| Per share data | |||||||||||||||||||
| Net asset value, beginning of period | $ | 21.10 | $ | 20.09 | $ | 18.71 | $ | 17.84 | |||||||||||
| INVESTMENT OPERATIONS | |||||||||||||||||||
| Net investment income2 | 0.18 | 0.14 | 0.13 | 0.04 | |||||||||||||||
| Net gain on investments and foreign currency related items (both realized and unrealized) | 3.44 | 2.34 | 1.88 | 0.83 | |||||||||||||||
| Total from investment operations | 3.62 | 2.48 | 2.01 | 0.87 | |||||||||||||||
| LESS DIVIDENDS AND DISTRIBUTIONS | |||||||||||||||||||
| Dividends from net investment income | (0.16 | ) | (0.15 | ) | (0.13 | ) | (0.00 | )3 | |||||||||||
| Distributions from net realized gains | (2.48 | ) | (1.32 | ) | (0.50 | ) | — | ||||||||||||
| Total dividends and distributions | (2.64 | ) | (1.47 | ) | (0.63 | ) | — | ||||||||||||
| Net asset value, end of period | $ | 22.08 | $ | 21.10 | $ | 20.09 | $ | 18.71 | |||||||||||
| Total return4 | 18.84 | % | 12.81 | % | 10.96 | % | 4.90 | % | |||||||||||
| RATIOS AND SUPPLEMENTAL DATA | |||||||||||||||||||
| Net assets, end of period (000s omitted) | $ | 5,806 | $ | 8,368 | $ | 12,228 | $ | 22,336 | |||||||||||
| Ratio of expenses to average net assets | 1.39 | % | 1.41 | % | 1.45 | % | 1.49 | %5 | |||||||||||
| Ratio of net investment income to average net assets | 0.87 | % | 0.65 | % | 0.66 | % | 0.51 | %5 | |||||||||||
| Portfolio turnover rate | 78 | % | 58 | % | 48 | % | 53 | % | |||||||||||
1 For the period June 6, 2003 (inception date) through October 31, 2003.
2 Per share information is calculated using the average shares outstanding method.
3 This amount represents less than $(0.01) per share.
4 Total returns are historical and assume changes in share price and reinvestment of all dividends and distributions. Total returns for periods less than one year are not annualized.
5 Annualized.
See Accompanying Notes to Financial Statements.
29
Credit Suisse Large Cap Value Fund
Financial Highlights
(For a Class A Share of the Fund Outstanding Throughout Each Year)
| For the Year Ended October 31, | |||||||||||||||||||||||
| 2006 | 2005 | 2004 | 2003 | 2002 | |||||||||||||||||||
| Per share data | |||||||||||||||||||||||
| Net asset value, beginning of year | $ | 21.05 | $ | 20.05 | $ | 18.68 | $ | 16.83 | $ | 19.96 | |||||||||||||
| INVESTMENT OPERATIONS | |||||||||||||||||||||||
| Net investment income1 | 0.22 | 0.19 | 0.18 | 0.14 | 0.17 | ||||||||||||||||||
| Net gain (loss) on investments and foreign currency related items (both realized and unrealized) | 3.45 | 2.33 | 1.87 | 2.15 | (1.45 | ) | |||||||||||||||||
| Total from investment operations | 3.67 | 2.52 | 2.05 | 2.29 | (1.28 | ) | |||||||||||||||||
| LESS DIVIDENDS AND DISTRIBUTIONS | |||||||||||||||||||||||
| Dividends from net investment income | (0.21 | ) | (0.20 | ) | (0.18 | ) | (0.13 | ) | (0.19 | ) | |||||||||||||
| Distributions from net realized gains | (2.48 | ) | (1.32 | ) | (0.50 | ) | (0.31 | ) | (1.66 | ) | |||||||||||||
| Total dividends and distributions | (2.69 | ) | (1.52 | ) | (0.68 | ) | (0.44 | ) | (1.85 | ) | |||||||||||||
| Net asset value, end of year | $ | 22.03 | $ | 21.05 | $ | 20.05 | $ | 18.68 | $ | 16.83 | |||||||||||||
| Total return2 | 19.18 | % | 13.06 | % | 11.19 | % | 13.97 | % | (7.63 | )% | |||||||||||||
| RATIOS AND SUPPLEMENTAL DATA | |||||||||||||||||||||||
| Net assets, end of year (000s omitted) | $ | 305,866 | $ | 300,777 | $ | 302,823 | $ | 306,410 | $ | 114,733 | |||||||||||||
| Ratio of expenses to average net assets | 1.14 | % | 1.16 | % | 1.20 | % | 1.24 | % | 1.03 | % | |||||||||||||
| Ratio of net investment income to average net assets | 1.12 | % | 0.91 | % | 0.91 | % | 0.78 | % | 0.90 | % | |||||||||||||
| Decrease reflected in above operating expense ratios due to waivers/reimbursements | — | — | — | — | 0.28 | % | |||||||||||||||||
| Portfolio turnover rate | 78 | % | 58 | % | 48 | % | 53 | % | 28 | % | |||||||||||||
1 Per share information is calculated using the average shares outstanding method.
2 Total returns are historical and assume changes in share price, reinvestment of all dividends and distributions and no sales charge. Had certain expenses not been reduced during the year shown, total returns would have been lower.
See Accompanying Notes to Financial Statements.
30
Credit Suisse Large Cap Value Fund
Financial Highlights
(For a Class B Share of the Fund Outstanding Throughout Each Year)
| For the Year Ended October 31, | |||||||||||||||||||||||
| 2006 | 2005 | 2004 | 2003 | 2002 | |||||||||||||||||||
| Per share data | |||||||||||||||||||||||
| Net asset value, beginning of year | $ | 20.78 | $ | 19.81 | $ | 18.46 | $ | 16.66 | $ | 19.78 | |||||||||||||
| INVESTMENT OPERATIONS | |||||||||||||||||||||||
| Net investment income1 | 0.07 | 0.04 | 0.03 | 0.01 | 0.03 | ||||||||||||||||||
| Net gain (loss) on investments and foreign currency related items (both realized and unrealized) | 3.39 | 2.30 | 1.85 | 2.13 | (1.43 | ) | |||||||||||||||||
| Total from investment operations | 3.46 | 2.34 | 1.88 | 2.14 | (1.40 | ) | |||||||||||||||||
| LESS DIVIDENDS AND DISTRIBUTIONS | |||||||||||||||||||||||
| Dividends from net investment income | (0.06 | ) | (0.05 | ) | (0.03 | ) | (0.03 | ) | (0.06 | ) | |||||||||||||
| Distributions from net realized gains | (2.48 | ) | (1.32 | ) | (0.50 | ) | (0.31 | ) | (1.66 | ) | |||||||||||||
| Total dividends and distributions | (2.54 | ) | (1.37 | ) | (0.53 | ) | (0.34 | ) | (1.72 | ) | |||||||||||||
| Net asset value, end of year | $ | 21.70 | $ | 20.78 | $ | 19.81 | $ | 18.46 | $ | 16.66 | |||||||||||||
| Total return2 | 18.25 | % | 12.23 | % | 10.40 | % | 13.07 | % | (8.29 | )% | |||||||||||||
| RATIOS AND SUPPLEMENTAL DATA | |||||||||||||||||||||||
| Net assets, end of year (000s omitted) | $ | 14,994 | $ | 20,057 | $ | 25,118 | $ | 29,696 | $ | 28,312 | |||||||||||||
| Ratio of expenses to average net assets | 1.89 | % | 1.91 | % | 1.95 | % | 1.99 | % | 1.78 | % | |||||||||||||
| Ratio of net investment income to average net assets | 0.37 | % | 0.15 | % | 0.16 | % | 0.06 | % | 0.15 | % | |||||||||||||
| Decrease reflected in above operating expense ratios due to waivers/reimbursements | — | — | — | — | 0.27 | % | |||||||||||||||||
| Portfolio turnover rate | 78 | % | 58 | % | 48 | % | 53 | % | 28 | % | |||||||||||||
1 Per share information is calculated using the average shares outstanding method.
2 Total returns are historical and assume changes in share price, reinvestment of all dividends and distributions and no sales charge. Had certain expenses not been reduced during the year shown, total returns would have been lower.
See Accompanying Notes to Financial Statements.
31
Credit Suisse Large Cap Value Fund
Financial Highlights
(For a Class C Share of the Fund Outstanding Throughout Each Year)
| For the Year Ended October 31, | |||||||||||||||||||||||
| 2006 | 2005 | 2004 | 2003 | 2002 | |||||||||||||||||||
| Per share data | |||||||||||||||||||||||
| Net asset value, beginning of year | $ | 20.68 | $ | 19.72 | $ | 18.38 | $ | 16.58 | $ | 19.71 | |||||||||||||
| INVESTMENT OPERATIONS | |||||||||||||||||||||||
| Net investment income1 | 0.07 | 0.03 | 0.03 | 0.01 | 0.03 | ||||||||||||||||||
| Net gain (loss) on investments and foreign currency related items (both realized and unrealized) | 3.37 | 2.30 | 1.84 | 2.13 | (1.43 | ) | |||||||||||||||||
| Total from investment operations | 3.44 | 2.33 | 1.87 | 2.14 | (1.40 | ) | |||||||||||||||||
| LESS DIVIDENDS AND DISTRIBUTIONS | |||||||||||||||||||||||
| Dividends from net investment income | (0.06 | ) | (0.05 | ) | (0.03 | ) | (0.03 | ) | (0.07 | ) | |||||||||||||
| Distributions from net realized gains | (2.48 | ) | (1.32 | ) | (0.50 | ) | (0.31 | ) | (1.66 | ) | |||||||||||||
| Total dividends and distributions | (2.54 | ) | (1.37 | ) | (0.53 | ) | (0.34 | ) | (1.73 | ) | |||||||||||||
| Net asset value, end of year | $ | 21.58 | $ | 20.68 | $ | 19.72 | $ | 18.38 | $ | 16.58 | |||||||||||||
| Total return2 | 18.25 | % | 12.23 | % | 10.39 | % | 13.14 | % | (8.35 | )% | |||||||||||||
| RATIOS AND SUPPLEMENTAL DATA | |||||||||||||||||||||||
| Net assets, end of year (000s omitted) | $ | 2,618 | $ | 3,638 | $ | 3,736 | $ | 3,479 | $ | 2,104 | |||||||||||||
| Ratio of expenses to average net assets | 1.89 | % | 1.91 | % | 1.95 | % | 1.99 | % | 1.78 | % | |||||||||||||
| Ratio of net investment income to average net assets | 0.37 | % | 0.15 | % | 0.16 | % | 0.06 | % | 0.16 | % | |||||||||||||
| Decrease reflected in above operating expense ratios due to waivers/reimbursements | — | — | — | — | 0.28 | % | |||||||||||||||||
| Portfolio turnover rate | 78 | % | 58 | % | 48 | % | 53 | % | 28 | % | |||||||||||||
1 Per share information is calculated using the average shares outstanding method.
2 Total returns are historical and assume changes in share price, reinvestment of all dividends and distributions and no sales charge. Had certain expenses not been reduced during the year shown, total returns would have been lower.
See Accompanying Notes to Financial Statements.
32
Credit Suisse Small Cap Core Fund
Financial Highlights
(For a Common Class Share of the Fund Outstanding Throughout Each Year)
| For the Year Ended October 31, | |||||||||||||||||||||||
| 2006 | 2005 | 2004 | 2003 | 2002 | |||||||||||||||||||
| Per share data | |||||||||||||||||||||||
| Net asset value, beginning of year | $ | 23.84 | $ | 22.66 | $ | 20.02 | $ | 18.56 | $ | 21.07 | |||||||||||||
| INVESTMENT OPERATIONS | |||||||||||||||||||||||
| Net investment income (loss)1 | 0.11 | (0.03 | ) | (0.05 | ) | (0.02 | ) | 0.02 | |||||||||||||||
| Net gain on investments (both realized and unrealized) | 2.85 | 3.39 | 3.75 | 3.08 | 0.31 | ||||||||||||||||||
| Total from investment operations | 2.96 | 3.36 | 3.70 | 3.06 | 0.33 | ||||||||||||||||||
| LESS DIVIDENDS AND DISTRIBUTIONS | |||||||||||||||||||||||
| Dividends from net investment income | — | — | — | (0.01 | ) | (0.05 | ) | ||||||||||||||||
| Distributions from net realized gains | (2.47 | ) | (2.18 | ) | (1.06 | ) | (1.59 | ) | (2.79 | ) | |||||||||||||
| Total dividends and distributions | (2.47 | ) | (2.18 | ) | (1.06 | ) | (1.60 | ) | (2.84 | ) | |||||||||||||
| Net asset value, end of year | $ | 24.33 | $ | 23.84 | $ | 22.66 | $ | 20.02 | $ | 18.56 | |||||||||||||
| Total return2 | 13.23 | % | 15.56 | % | 19.14 | % | 17.75 | % | 0.61 | % | |||||||||||||
| RATIOS AND SUPPLEMENTAL DATA | |||||||||||||||||||||||
| Net assets, end of year (000s omitted) | $ | 70,525 | $ | 74,013 | $ | 50,068 | $ | 47,969 | $ | 45,075 | |||||||||||||
| Ratio of expenses to average net assets | 1.37 | % | 1.38 | % | 1.42 | % | 1.48 | % | 1.32 | % | |||||||||||||
| Ratio of net investment income (loss) to average net assets | 0.47 | % | (0.16 | )% | (0.22 | )% | (0.10 | )% | 0.12 | % | |||||||||||||
| Decrease reflected in above operating expense ratios due to waivers/reimbursements | — | — | — | 0.04 | % | 0.14 | % | ||||||||||||||||
| Portfolio turnover rate | 67 | % | 43 | % | 41 | % | 30 | % | 18 | % | |||||||||||||
1 Per share information is calculated using the average shares outstanding method.
2 Total returns are historical and assume changes in share price and reinvestment of all dividends and distributions. Had certain expenses not been reduced during the years shown, total returns would have been lower.
See Accompanying Notes to Financial Statements.
33
Credit Suisse Small Cap Core Fund
Financial Highlights
(For a Class A Share of the Fund Outstanding Throughout Each Year)
| For the Year Ended October 31, | |||||||||||||||||||||||
| 2006 | 2005 | 2004 | 2003 | 2002 | |||||||||||||||||||
| Per share data | |||||||||||||||||||||||
| Net asset value, beginning of year | $ | 23.94 | $ | 22.75 | $ | 20.10 | $ | 18.62 | $ | 21.09 | |||||||||||||
| INVESTMENT OPERATIONS | |||||||||||||||||||||||
| Net investment income (loss)1 | 0.12 | (0.04 | ) | (0.05 | ) | (0.02 | ) | 0.02 | |||||||||||||||
| Net gain on investments (both realized and unrealized) | 2.85 | 3.42 | 3.76 | 3.10 | 0.33 | ||||||||||||||||||
| Total from investment operations | 2.97 | 3.38 | 3.71 | 3.08 | 0.35 | ||||||||||||||||||
| LESS DIVIDENDS AND DISTRIBUTIONS | |||||||||||||||||||||||
| Dividends from net investment income | — | — | — | (0.01 | ) | (0.03 | ) | ||||||||||||||||
| Distributions from net realized gains | (2.47 | ) | (2.19 | ) | (1.06 | ) | (1.59 | ) | (2.79 | ) | |||||||||||||
| Total dividends and distributions | (2.47 | ) | (2.19 | ) | (1.06 | ) | (1.60 | ) | (2.82 | ) | |||||||||||||
| Net asset value, end of year | $ | 24.44 | $ | 23.94 | $ | 22.75 | $ | 20.10 | $ | 18.62 | |||||||||||||
| Total return2 | 13.22 | % | 15.54 | % | 19.11 | % | 17.80 | % | 0.71 | % | |||||||||||||
| RATIOS AND SUPPLEMENTAL DATA | |||||||||||||||||||||||
| Net assets, end of year (000s omitted) | $ | 263,006 | $ | 227,166 | $ | 198,773 | $ | 188,318 | $ | 151,340 | |||||||||||||
| Ratio of expenses to average net assets | 1.37 | % | 1.38 | % | 1.42 | % | 1.48 | % | 1.32 | % | |||||||||||||
| Ratio of net investment income (loss) to average net assets | 0.47 | % | (0.16 | )% | (0.22 | )% | (0.11 | )% | 0.11 | % | |||||||||||||
| Decrease reflected in above operating expense ratios due to waivers/reimbursements | — | — | — | 0.04 | % | 0.12 | % | ||||||||||||||||
| Portfolio turnover rate | 67 | % | 43 | % | 41 | % | 30 | % | 18 | % | |||||||||||||
1 Per share information is calculated using the average shares outstanding method.
2 Total returns are historical and assume changes in share price, reinvestment of all dividends and distributions and no sales charge. Had certain expenses not been reduced during the years shown, total returns would have been lower.
See Accompanying Notes to Financial Statements.
34
Credit Suisse Small Cap Core Fund
Financial Highlights
(For a Class B Share of the Fund Outstanding Throughout Each Year)
| For the Year Ended October 31, | |||||||||||||||||||||||
| 2006 | 2005 | 2004 | 2003 | 2002 | |||||||||||||||||||
| Per share data | |||||||||||||||||||||||
| Net asset value, beginning of year | $ | 21.99 | $ | 21.20 | $ | 18.93 | $ | 17.74 | $ | 20.33 | |||||||||||||
| INVESTMENT OPERATIONS | |||||||||||||||||||||||
| Net investment loss1 | (0.06 | ) | (0.20 | ) | (0.20 | ) | (0.15 | ) | (0.12 | ) | |||||||||||||
| Net gain on investments (both realized and unrealized) | 2.61 | 3.17 | 3.53 | 2.93 | 0.32 | ||||||||||||||||||
| Total from investment operations | 2.55 | 2.97 | 3.33 | 2.78 | 0.20 | ||||||||||||||||||
| LESS DISTRIBUTIONS | |||||||||||||||||||||||
| Distributions from net realized gains | (2.47 | ) | (2.18 | ) | (1.06 | ) | (1.59 | ) | (2.79 | ) | |||||||||||||
| Net asset value, end of year | $ | 22.07 | $ | 21.99 | $ | 21.20 | $ | 18.93 | $ | 17.74 | |||||||||||||
| Total return2 | 12.41 | % | 14.72 | % | 18.25 | % | 16.88 | % | (0.08 | )% | |||||||||||||
| RATIOS AND SUPPLEMENTAL DATA | |||||||||||||||||||||||
| Net assets, end of year (000s omitted) | $ | 12,465 | $ | 18,133 | $ | 20,425 | $ | 22,669 | $ | 19,999 | |||||||||||||
| Ratio of expenses to average net assets | 2.12 | % | 2.13 | % | 2.17 | % | 2.23 | % | 2.07 | % | |||||||||||||
| Ratio of net investment loss to average net assets | (0.28 | )% | (0.91 | )% | (0.97 | )% | (0.86 | )% | (0.63 | )% | |||||||||||||
| Decrease reflected in above operating expense ratios due to waivers/reimbursements | — | — | — | 0.04 | % | 0.13 | % | ||||||||||||||||
| Portfolio turnover rate | 67 | % | 43 | % | 41 | % | 30 | % | 18 | % | |||||||||||||
1 Per share information is calculated using the average shares outstanding method.
2 Total returns are historical and assume changes in share price, reinvestment of all dividends and distributions and no sales charge. Had certain expenses not been reduced during the years shown, total returns would have been lower.
See Accompanying Notes to Financial Statements.
35
Credit Suisse Small Cap Core Fund
Financial Highlights
(For a Class C Share of the Fund Outstanding Throughout Each Year)
| For the Year Ended October 31, | |||||||||||||||||||||||
| 2006 | 2005 | 2004 | 2003 | 2002 | |||||||||||||||||||
| Per share data | |||||||||||||||||||||||
| Net asset value, beginning of year | $ | 21.91 | $ | 21.13 | $ | 18.87 | $ | 17.69 | $ | 20.28 | |||||||||||||
| INVESTMENT OPERATIONS | |||||||||||||||||||||||
| Net investment loss1 | (0.06 | ) | (0.20 | ) | (0.19 | ) | (0.15 | ) | (0.12 | ) | |||||||||||||
| Net gain on investments (both realized and unrealized) | 2.59 | 3.16 | 3.51 | 2.92 | 0.32 | ||||||||||||||||||
| Total from investment operations | 2.53 | 2.96 | 3.32 | 2.77 | 0.20 | ||||||||||||||||||
| LESS DISTRIBUTIONS | |||||||||||||||||||||||
| Distributions from net realized gains | (2.47 | ) | (2.18 | ) | (1.06 | ) | (1.59 | ) | (2.79 | ) | |||||||||||||
| Net asset value, end of year | $ | 21.97 | $ | 21.91 | $ | 21.13 | $ | 18.87 | $ | 17.69 | |||||||||||||
| Total return2 | 12.36 | % | 14.72 | % | 18.25 | % | 16.87 | % | (0.07 | )% | |||||||||||||
| RATIOS AND SUPPLEMENTAL DATA | |||||||||||||||||||||||
| Net assets, end of year (000s omitted) | $ | 16,028 | $ | 16,079 | $ | 11,613 | $ | 8,138 | $ | 4,271 | |||||||||||||
| Ratio of expenses to average net assets | 2.12 | % | 2.13 | % | 2.17 | % | 2.23 | % | 2.07 | % | |||||||||||||
| Ratio of net investment loss to average net assets | (0.28 | )% | (0.91 | )% | (0.97 | )% | (0.86 | )% | (0.63 | )% | |||||||||||||
| Decrease reflected in above operating expense ratios due to waivers/reimbursements | — | — | — | 0.04 | % | 0.14 | % | ||||||||||||||||
| Portfolio turnover rate | 67 | % | 43 | % | 41 | % | 30 | % | 18 | % | |||||||||||||
1 Per share information is calculated using the average shares outstanding method.
2 Total returns are historical and assume changes in share price, reinvestment of all dividends and distributions and no sales charge. Had certain expenses not been reduced during the years shown, total returns would have been lower.
See Accompanying Notes to Financial Statements.
36
Credit Suisse Funds
Notes to Financial Statements
October 31, 2006
Note 1. Organization
The Credit Suisse Capital Funds (the "Trust") covered in this report are comprised of Credit Suisse Large Cap Value Fund ("Large Cap Value") and Credit Suisse Small Cap Core Fund ("Small Cap Core"), (each a "Fund" and collectively, the "Funds"). The Trust is registered under the Investment Company Act of 1940, as amended (the "1940 Act"), as an open-end management investment company. The Trust was organized under the laws of the Commonwealth of Massachusetts as a business trust on November 26, 1985. Each Fund is classified as diversified. Small Cap Core changed its name from Credit Suisse Small Cap Value Fund, Inc., effective December 1, 2006.
Investment objectives for each Fund are as follows: Large Cap Value seeks long-term capital appreciation and continuity of income; Small Cap Core seeks a high level of growth of capital.
Large Cap Value offers five classes of shares: Common Class shares, Advisor Class shares, Class A shares, Class B shares and Class C shares. Small Cap Core offers four classes of shares: Common Class shares, Class A shares, Class B shares and Class C shares. Effective December 12, 2001, Large Cap Value closed the Common Class to new investments, except for reinvestment of dividends. Large Cap Value's Common Class shareholders as of the close of business on December 12, 2001 may continue to hold Common Class shares but may not add to their accounts. Although no further shares can be purchased, Large Cap Value's shareholders can redeem their Common Class shares through any available method. The Small Cap Core's Common Class shares are closed to new investors, with certain exceptions as set forth in the prospectus. Each class of shares in each Fund represents an equal pro rata interest in each Fund, except that they bear different expenses, whi ch reflect the difference in the range of services provided to them. Class A shares of each Fund are sold subject to a front-end sales charge of up to 5.75%. Class B shares of each Fund are sold subject to a contingent deferred sales charge which declines from 4% to zero depending on the period of time the shares are held. Class C shares of each Fund are sold subject to a contingent deferred sales charge of 1.00% if redeemed within the first year of purchase.
Note 2. Significant Accounting Policies
A) SECURITY VALUATION — The net asset value of each Fund is determined daily as of the close of regular trading on the New York Stock Exchange, Inc. (the "Exchange") on each day the Exchange is open for business. Equity investments are valued at market value, which is generally determined using the closing price on the exchange or market on which the security is
37
Credit Suisse Funds
Notes to Financial Statements (continued)
October 31, 2006
Note 2. Significant Accounting Policies
primarily traded at the time of valuation (the "Valuation Time"). If no sales are reported, equity investments are generally valued at the most recent bid quotation as of the Valuation Time or at the lowest asked quotation in the case of a short sale of securities. Debt securities with a remaining maturity greater than 60 days are valued in accordance with the price supplied by a pricing service, which may use a matrix, formula or other objective method that takes into consideration market indices, yield curves and other specific adjustments. Debt obligations that will mature in 60 days or less are valued on the basis of amortized cost, which approximates market value, unless it is determined that this method would not represent fair value. Investments in mutual funds are valued at the mutual fund's closing net asset value per share on the day of valuation. Securities and other assets for which market quotations are not readily available, or whose values have been materially affected by events occurring before the Funds' Valuation Time but after the close of the securities' primary markets, are valued at fair value as determined in good faith by or under the direction of, the Board of Trustees under procedures established by the Board of Trustees. The Funds may utilize a service provided by an independent third party which has been approved by the Board of Trustees to fair value certain securities. When fair-value pricing is employed, the prices of securities used by a fund to calculate its net asset value may differ from quoted or published prices for the same securities.
B) FOREIGN CURRENCY TRANSACTIONS — The books and records of the Funds are maintained in U.S. dollars. Transactions denominated in foreign currencies are recorded at the current prevailing exchange rates. All assets and liabilities denominated in foreign currencies are translated into U.S. dollar amounts at the current exchange rate at the end of the period. Translation gains or losses resulting from changes in the exchange rate during the reporting period and realized gains and losses on the settlement of foreign currency transactions are reported in the results of operations for the current period. The Funds do not isolate that portion of realized gains and losses on investments in equity securities which is due to changes in the foreign exchange rate from that which is due to changes in market prices of equity securities. The Funds isolate that portion of realized gains and losses on investments in debt securities which is due to changes in the foreign exchange rate from that which is due to changes in market prices of debt securities.
C) SECURITY TRANSACTIONS AND INVESTMENT INCOME — Security transactions are accounted for on a trade date basis. Interest income is recorded on the accrual basis. Dividends are recorded on the ex-dividend date. Certain expenses are class-specific and vary by class. Income, expenses (excluding
38
Credit Suisse Funds
Notes to Financial Statements (continued)
October 31, 2006
Note 2. Significant Accounting Policies
class-specific expenses) and realized/unrealized gains/losses are allocated proportionately to each class of shares based upon the relative net asset value of outstanding shares of that class. The cost of investments sold is determined by use of the specific identification method for both financial reporting and income tax purposes.
D) DIVIDENDS AND DISTRIBUTIONS TO SHAREHOLDERS — Dividends from net investment income, if any, are declared and paid quarterly by Large Cap Value and at least annually by Small Cap Core. Distributions of net realized capital gains, if any, are declared and paid at least annually by the Funds. However, to the extent that a net realized capital gain can be reduced by a capital loss carryforward, such gain will not be distributed. Income and capital gain distributions are determined in accordance with federal income tax regulations, which may differ from accounting principles generally accepted in the United States of America (GAAP).
E) FEDERAL INCOME TAXES — No provision is made for federal taxes as it is each Fund's intention to have each Fund continue to qualify for and elect the tax treatment applicable to regulated investment companies under the Internal Revenue Code of 1986, as amended, and make the requisite distributions to its shareholders which will be sufficient to relieve it from federal income and excise taxes.
F) USE OF ESTIMATES — The preparation of financial statements in conformity with GAAP requires management to make estimates and assumptions that affect the reported amounts of assets and liabilities and disclosure of contingent assets and liabilities at the date of the financial statements and the reported amounts of revenues and expenses during the reporting period. Actual results could differ from these estimates.
G) SHORT-TERM INVESTMENTS — The Funds, together with other funds/portfolios advised by Credit Suisse Asset Management, LLC ("Credit Suisse"), an indirect, wholly-owned subsidiary of Credit Suisse Group, pool available cash into either a short-term variable rate time deposit issued by State Street Bank and Trust Company ("SSB"), the Funds' custodian, or a money market fund advised by Credit Suisse. The short-term time deposit issued by SSB is a variable rate account classified as a short-term investment.
H) SECURITIES LENDING — Loans of securities are required at all times to be secured by collateral at least equal to 102% of the market value of domestic securities on loan (including any accrued interest thereon) and 105% of the market value of foreign securities on loan (including any accrued interest thereon). Cash collateral received by the Funds in connection with securities
39
Credit Suisse Funds
Notes to Financial Statements (continued)
October 31, 2006
Note 2. Significant Accounting Policies
lending activity may be pooled together with cash collateral for other funds/portfolios advised by Credit Suisse and may be invested in a variety of investments, including certain Credit Suisse-advised funds, funds advised by SSB, the Funds' securities lending agent, or money market instruments. However, in the event of default or bankruptcy by the other party to the agreement, realization and/or retention of the collateral may be subject to legal proceedings.
SSB has been engaged by the Funds to act as the Funds' securities lending agent. The Funds' securities lending arrangement provides that the Funds and SSB will share the net income earned from securities lending activities. During the year ended October 31, 2006, total earnings from the Funds' investment in cash collateral received in connection with Large Cap Value and Small Cap Core's security lending arrangements were $327,972, and $3,583,179, respectively, of which $317,946, and $3,451,282, respectively, were rebated to borrowers (brokers). The Funds retained $7,582, and $100,878 in income, respectively, from the cash collateral investment and SSB, as lending agent, was paid $2,444, and $31,019, respectively. The Funds may also be entitled to certain minimum amounts of income from their securities lending activities. Securities lending income is accrued as earned.
I) OTHER — Large Cap Value may invest up to 10% and Small Cap Core may invest up to 15% of its net assets in restricted and other illiquid securities. Non-publicly traded securities may be less liquid than publicly traded securities. Although these securities may be resold in privately negotiated transactions, the prices realized from such sales could differ from the price originally paid by the Funds or the current carrying values, and the difference could be material.
Note 3. Transactions with Affiliates and Related Parties
Credit Suisse serves as investment adviser for the Funds. For its investment advisory services, Credit Suisse is entitled to receive the following fees, computed daily and payable monthly, on each Fund's average daily net assets as follows:
| Fund | Annual Rate | ||||||
| Large Cap Value | 0.75% of average daily net assets up to and including $75 million | ||||||
| 0.50% of average daily net assets in excess of $75 million | |||||||
| Small Cap Core | 0.875% of first $100 million of average daily net assets | ||||||
| 0.75% of next $100 million of average daily net assets | |||||||
| 0.625% of average daily net assets over $200 million | |||||||
40
Credit Suisse Funds
Notes to Financial Statements (continued)
October 31, 2006
Note 3. Transactions with Affiliates and Related Parties
For the year ended October 31, 2006, investment advisory fees earned for each Fund were as follows:
| Fund | Gross Advisory Fee | ||||||
| Large Cap Value | $ | 1,856,420 | |||||
| Small Cap Core | 2,617,497 | ||||||
Effective December 1, 2006, Credit Suisse agreed to change the investment advisory fee of Large Cap Value from tiered fee above to 0.50% and Small Cap Core to the lower of 0.70% or the current tiered fee.
Credit Suisse Asset Management Securities, Inc. ("CSAMSI"), an affiliate of Credit Suisse, and SSB serve as co-administrators to the Funds. For its co-administrative services, CSAMSI currently receives a fee calculated at an annual rate of 0.10% of each Fund's average daily net assets. For the year ended October 31, 2006, co-administrative services fees earned by CSAMSI were as follows:
| Fund | Co-Administration Fee | ||||||
| Large Cap Value | $ | 333,784 | |||||
| Small Cap Core | 358,799 | ||||||
Effective December 1, 2006, the co-administration fee was reduced to an annual rate of 0.09%.
For its co-administrative services, SSB receives a fee, exclusive of out-of-pocket expenses, calculated in total for all the Credit Suisse funds/portfolios co-administered by SSB and allocated based upon relative average net assets of each fund/portfolio, subject to an annual minimum fee. For the year ended October 31, 2006, co-administrative services fees earned by SSB (including out-of-pocket fees) were as follows:
| Fund | Co-Administration Fee | ||||||
| Large Cap Value | $ | 183,118 | |||||
| Small Cap Core | 196,138 | ||||||
In addition to serving as each Fund's co-administrator, CSAMSI currently serves as distributor of each Fund's shares. Pursuant to distribution plans adopted by each Fund pursuant to Rule 12b-1 under the 1940 Act, CSAMSI receives fees for its distribution services. This fee is calculated at an annual rate of 0.25% of the average daily net assets of the Common Class of Small Cap Core and Class A shares of each Fund. Advisor Class shares of Large Cap Value may pay this fee at an annual rate not to exceed 0.75% of such class' average
41
Credit Suisse Funds
Notes to Financial Statements (continued)
October 31, 2006
Note 3. Transactions with Affiliates and Related Parties
daily assets; such fee is currently calculated at the annual rate of 0.50% of the average daily net assets of such class. For the Class B and Class C shares, the fee is calculated at annual rate of 1.00% of average daily net assets of such classes.
Certain brokers, dealers and financial representatives provide transfer agent related services to the Funds, and receive compensation from Credit Suisse. Credit Suisse is then reimbursed by the Funds. For the year ended October 31, 2006, the Small Cap Core Fund reimbursed Credit Suisse the following amount, which is included in the Fund's transfer agent expense as follows:
| Fund | Amount | ||||||
| Small Cap Core | $ | 118,719 | |||||
For the year ended October 31, 2006, CSAMSI and its affiliates advised the Funds that they retained the following amounts from commissions earned on the sale of the Funds' Class A shares:
| Fund | Amount | ||||||
| Large Cap Value | $ | 13,988 | |||||
| Small Cap Core | 19,887 | ||||||
Merrill Corporation ("Merrill"), an affiliate of Credit Suisse, has been engaged by the Funds to provide certain financial printing and fulfillment services. For the year ended October 31, 2006, Merrill was paid for its services by the Funds as follows:
| Fund | Amount | ||||||
| Large Cap Value | $ | 371 | |||||
| Small Cap Core | 371 | ||||||
Note 4. Line of Credit
The Funds, together with other funds/portfolios advised by Credit Suisse (collectively, the "Participating Funds"), participate in a $75 million committed, unsecured line of credit facility ("Credit Facility") for temporary or emergency purposes with Deutsche Bank, A.G. as administrative agent and syndication agent and SSB as operations agent. Under the terms of the Credit Facility, the Participating Funds pay an aggregate commitment fee at a rate of 0.10% per annum on the average unused amount of the Credit Facility, which is allocated among the Participating Funds in such manner as is determined by the governing Boards of the Participating Funds. In addition, the Participating Funds pay interest on borrowings at the Federal Funds rate plus 0.50%. At
42
Credit Suisse Funds
Notes to Financial Statements (continued)
October 31, 2006
Note 4. Line of Credit
October 31, 2006, and during the year ended October 31, 2006, the Funds had no borrowings under the Credit Facility.
Note 5. Purchases and Sales of Securities
For the year ended October 31, 2006, purchases and sales of investment securities (excluding short-term investments) were as follows:
| Purchases | Sales | ||||||||||
| Large Cap Value | $ | 256,860,758 | $ | 313,249,689 | |||||||
| Small Cap Core | 231,694,322 | 244,115,982 | |||||||||
Note 6. Capital Share Transactions
Large Cap Value is authorized to issue an unlimited number of full and fractional shares of beneficial interest, $0.001 par value per share, of which an unlimited number of shares are classified as Common Class shares, Advisor Class shares, Class A shares, Class B shares and Class C shares. Small Cap Core is authorized to issue an unlimited number of full and fractional shares of beneficial interest, $.001 par value per share, of which an unlimited number of shares are classified as Common Class shares, Class A shares, Class B shares and Class C shares. Transactions in capital shares of the Funds were as follows:
| Large Cap Value | |||||||||||||||||||
| Common Class | |||||||||||||||||||
| For the Year Ended October 31, 2006 | For the Year Ended October 31, 2005 | ||||||||||||||||||
| Shares | Value | Shares | Value | ||||||||||||||||
| Shares sold | — | $ | — | — | $ | — | |||||||||||||
| Shares issued in reinvestment of dividends and distributions | 3,892 | 75,906 | 2,481 | 49,506 | |||||||||||||||
| Shares redeemed | (4,705 | ) | (92,528 | ) | (7,513 | ) | (154,832 | ) | |||||||||||
| Net decrease | (813 | ) | $ | (16,622 | ) | (5,032 | ) | $ | (105,326 | ) | |||||||||
43
Credit Suisse Funds
Notes to Financial Statements (continued)
October 31, 2006
Note 6. Capital Share Transactions
| Large Cap Value | |||||||||||||||||||
| Advisor Class | |||||||||||||||||||
| For the Year Ended October 31, 2006 | For the Year Ended October 31, 2005 | ||||||||||||||||||
| Shares | Value | Shares | Value | ||||||||||||||||
| Shares sold | 67,105 | $ | 1,378,725 | 61,977 | $ | 1,287,597 | |||||||||||||
| Shares issued in reinvestment of dividends and distributions | 52,301 | 1,025,063 | 40,096 | 802,200 | |||||||||||||||
| Shares redeemed | (253,100 | ) | (5,156,089 | ) | (314,077 | ) | (6,471,666 | ) | |||||||||||
| Net decrease | (133,694 | ) | $ | (2,752,301 | ) | (212,004 | ) | $ | (4,381,869 | ) | |||||||||
| Large Cap Value | |||||||||||||||||||
| Class A | |||||||||||||||||||
| For the Year Ended October 31, 2006 | For the Year Ended October 31, 2005 | ||||||||||||||||||
| Shares | Value | Shares | Value | ||||||||||||||||
| Shares sold | 1,577,376 | $ | 32,034,528 | 1,390,878 | $ | 28,943,323 | |||||||||||||
| Shares issued in reinvestment of dividends and distributions | 1,835,069 | 35,919,520 | 1,067,455 | 21,352,065 | |||||||||||||||
| Shares redeemed | (3,815,046 | ) | (77,593,150 | ) | (3,275,850 | ) | (67,806,252 | ) | |||||||||||
| Net decrease | (402,601 | ) | $ | (9,639,102 | ) | (817,517 | ) | $ | (17,510,864 | ) | |||||||||
| Large Cap Value | |||||||||||||||||||
| Class B | |||||||||||||||||||
| For the Year Ended October 31, 2006 | For the Year Ended October 31, 2005 | ||||||||||||||||||
| Shares | Value | Shares | Value | ||||||||||||||||
| Shares sold | 62,933 | $ | 1,242,638 | 69,764 | $ | 1,411,742 | |||||||||||||
| Shares issued in reinvestment of dividends and distributions | 93,835 | 1,805,726 | 65,273 | 1,282,519 | |||||||||||||||
| Shares redeemed | (431,250 | ) | (8,672,931 | ) | (437,878 | ) | (8,987,992 | ) | |||||||||||
| Net decrease | (274,482 | ) | $ | (5,624,567 | ) | (302,841 | ) | $ | (6,293,731 | ) | |||||||||
| Large Cap Value | |||||||||||||||||||
| Class C | |||||||||||||||||||
| For the Year Ended October 31, 2006 | For the Year Ended October 31, 2005 | ||||||||||||||||||
| Shares | Value | Shares | Value | ||||||||||||||||
| Shares sold | 17,099 | $ | 329,597 | 20,215 | $ | 402,769 | |||||||||||||
| Shares issued in reinvestment of dividends and distributions | 19,549 | 374,045 | 11,253 | 219,996 | |||||||||||||||
| Shares redeemed | (91,280 | ) | (1,813,722 | ) | (45,000 | ) | (910,735 | ) | |||||||||||
| Net decrease | (54,632 | ) | $ | (1,110,080 | ) | (13,532 | ) | $ | (287,970 | ) | |||||||||
44
Credit Suisse Funds
Notes to Financial Statements (continued)
October 31, 2006
Note 6. Capital Share Transactions
| Small Cap Core | |||||||||||||||||||
| Common Class | |||||||||||||||||||
| For the Year Ended October 31, 2006 | For the Year Ended October 31, 2005 | ||||||||||||||||||
| Shares | Value | Shares | Value | ||||||||||||||||
| Shares sold | 576,180 | $ | 13,468,606 | 1,507,009 | $ | 36,109,474 | |||||||||||||
| Shares issued in reinvestment of dividends and distributions | 330,655 | 7,459,586 | 223,428 | 4,957,871 | |||||||||||||||
| Shares redeemed | (1,112,407 | ) | (25,871,552 | ) | (835,342 | ) | (19,682,856 | ) | |||||||||||
| Net increase (decrease) | (205,572 | ) | $ | (4,943,360 | ) | 895,095 | $ | 21,384,489 | |||||||||||
| Small Cap Core | |||||||||||||||||||
| Class A | |||||||||||||||||||
| For the Year Ended October 31, 2006 | For the Year Ended October 31, 2005 | ||||||||||||||||||
| Shares | Value | Shares | Value | ||||||||||||||||
| Shares sold | 4,062,317 | $ | 94,724,548 | 2,629,854 | $ | 62,247,948 | |||||||||||||
| Shares issued in reinvestment of dividends and distributions | 987,897 | 22,395,554 | 785,344 | 17,505,316 | |||||||||||||||
| Shares redeemed | (3,778,297 | ) | (88,120,027 | ) | (2,664,545 | ) | (62,603,687 | ) | |||||||||||
| Net increase | 1,271,917 | $ | 29,000,075 | 750,653 | $ | 17,149,577 | |||||||||||||
| Small Cap Core | |||||||||||||||||||
| Class B | |||||||||||||||||||
| For the Year Ended October 31, 2006 | For the Year Ended October 31, 2005 | ||||||||||||||||||
| Shares | Value | Shares | Value | ||||||||||||||||
| Shares sold | 32,214 | $ | 682,832 | 95,400 | $ | 2,064,361 | |||||||||||||
| Shares issued in reinvestment of distributions | 78,280 | 1,611,772 | 82,688 | 1,703,368 | |||||||||||||||
| Shares redeemed | (370,527 | ) | (7,935,071 | ) | (316,688 | ) | (6,919,461 | ) | |||||||||||
| Net decrease | (260,033 | ) | $ | (5,640,467 | ) | (138,600 | ) | $ | (3,151,732 | ) | |||||||||
| Small Cap Core | |||||||||||||||||||
| Class C | |||||||||||||||||||
| For the Year Ended October 31, 2006 | For the Year Ended October 31, 2005 | ||||||||||||||||||
| Shares | Value | Shares | Value | ||||||||||||||||
| Shares sold | 183,143 | $ | 3,869,849 | 255,397 | $ | 5,530,732 | |||||||||||||
| Shares issued in reinvestment of distributions | 54,440 | 1,116,566 | 34,443 | 707,116 | |||||||||||||||
| Shares redeemed | (242,079 | ) | (5,093,475 | ) | (105,409 | ) | (2,253,756 | ) | |||||||||||
| Net increase (decrease) | (4,496 | ) | $ | (107,060 | ) | 184,431 | $ | 3,984,092 | |||||||||||
45
Credit Suisse Funds
Notes to Financial Statements (continued)
October 31, 2006
Note 6. Capital Share Transactions
On October 31, 2006, the number of shareholders that held 5% or more of the outstanding shares of each class of the Funds were as follows:
| Fund | Number of Shareholders | Approximate Percentage of Outstanding Shares | |||||||||
| Large Cap Value | |||||||||||
| Common Class | 3 | 49 | % | ||||||||
| Advisor Class | 2 | 99 | % | ||||||||
| Class A | 2 | 19 | % | ||||||||
| Class B | 1 | 9 | % | ||||||||
| Class C | 3 | 29 | % | ||||||||
| Small Cap Core | |||||||||||
| Common Class | 2 | 71 | % | ||||||||
| Class A | 2 | 11 | % | ||||||||
| Class B | 1 | 8 | % | ||||||||
| Class C | 1 | 9 | % | ||||||||
Some of the shareholders are omnibus accounts, which hold shares on behalf of individual shareholders.
Note 7. Federal Income Taxes
Income and capital gain distributions are determined in accordance with federal income tax regulations, which may differ from GAAP.
The tax characteristics of dividends and distributions paid during the years ended October 31, 2006 and 2005, respectively, by the Funds were as follows:
| Ordinary Income | Long-Term Capital Gain | ||||||||||||||||||
| Fund | 2006 | 2005 | 2006 | 2005 | |||||||||||||||
| Large Cap Value | $ | 10,625,672 | $ | 6,721,735 | $ | 31,735,807 | $ | 18,876,616 | |||||||||||
| Small Cap Core | 2,068,455 | 4,844,486 | 33,002,260 | 22,088,517 | |||||||||||||||
At October 31, 2006, the Funds had no capital loss carryforwards available to offset possible future capital gains.
The tax basis of components of distributable earnings differ from the amounts reflected in the Statement of Assets and Liabilities by temporary book/tax differences. These differences are primarily due to losses deferred on wash sales and investment in real estate investment trusts. At October 31, 2006, the components of distributable earnings on a tax basis for the Funds were as follows:
| Large Cap Value | Small Cap Core | ||||||||||
| Undistributed net investment income | $ | 22,291,879 | $ | 5,016,637 | |||||||
| Accumulated realized gain | 42,606,615 | 48,246,479 | |||||||||
| Unrealized appreciation | 60,691,832 | 80,399,437 | |||||||||
| $ | 125,590,326 | $ | 133,662,553 | ||||||||
46
Credit Suisse Funds
Notes to Financial Statements (continued)
October 31, 2006
Note 7. Federal Income Taxes
As of October 31, 2006, the identified cost for federal income tax purposes, as well as the gross unrealized appreciation from investments for those securities having an excess of value over cost, gross unrealized depreciation from investments for those securities having an excess of cost over value and the net unrealized appreciation from investments were as follows:
| Fund | Identified Cost | Gross Unrealized Appreciation | Gross Unrealized (Depreciation) | Net Unrealized Appreciation | |||||||||||||||
| Large Cap Value | $ | 276,914,568 | $ | 62,308,316 | $ | (1,616,484 | ) | $ | 60,691,832 | ||||||||||
| Small Cap Core | 357,384,227 | 83,844,184 | (3,444,747 | ) | 80,399,437 | ||||||||||||||
At October 31, 2006, accumulated undistributed net investment income and accumulated net realized gain (loss) from investments have been adjusted for current period permanent book/tax differences which arose principally from differing book/tax treatments of net operating losses, foreign currency gain/(loss), real estate investment trusts, litigation income and dividend redesignations. Net assets were not affected by these reclassifications:
| Fund | Undistributed Net Investment Income/(Loss) | Accumulated Net Realized Gain/(Loss) on Investment | |||||||||
| Large Cap Value | $ | (5,749 | ) | $ | 5,749 | ||||||
| Small Cap Core | 192,911 | (192,911 | ) | ||||||||
Note 8. Contingencies
In the normal course of business, the Funds may provide general indemnifications pursuant to certain contracts and organizational documents. The Funds' maximum exposure under these arrangements is dependent on future claims that may be made against the Funds and, therefore, cannot be estimated; however, based on experience, the risk of loss from such claims is considered remote.
Note 9. Recent Accounting Pronouncements
During June 2006, the Financial Accounting Standards Board ("FASB") issued FASB Interpretation 48 ("FIN 48" or the "Interpretation"), Accounting for Uncertainty in Income Taxes — an interpretation of FASB statement 109. FIN 48 supplements FASB Statement 109, Accounting for Income Taxes, by defining the confidence level that a tax position must meet in order to be recognized in the financial statements. FIN 48 prescribes a comprehensive model for how the funds should recognize, measure, present, and disclose in its financial statements uncertain tax positions that the funds have taken or expects to take
47
Credit Suisse Funds
Notes to Financial Statements (continued)
October 31, 2006
Note 9. Recent Accounting Pronouncements
on a tax return. FIN 48 requires that the tax effects of a position be recognized only if it is "more likely than not" to be sustained based solely on its technical merits. Management must be able to conclude that the tax law, regulations, case law, and other objective information regarding the technical merits sufficiently support the position's sustainability with a likelihood of more than 50 percent. FIN 48 is effective for fiscal periods beginning after December 15, 2006. At adoption, the financial statements must be adjusted to reflect only those tax positions that are more likely than not to be sustained as of the adoption date.
On September 20, 2006, the FASB released Statement of Financial Accounting Standards No. 157 "Fair Value Measurements" ("FAS 157"). FAS 157 establishes an authoritative definition of fair value, sets out a framework for measuring fair value, and requires additional disclosures about fair-value measurements. The application of FAS 157 is required for fiscal years, beginning after November 15, 2007 and interim periods within those fiscal years.
At this time, management is evaluating the implications of FIN 48 and FAS 157 and their impact on the financial statements has not yet been determined.
48
Credit Suisse Funds
Report of Independent Registered Public Accounting Firm
To the Board of Trustees and Shareholders of
Credit Suisse Large Cap Value Fund and
Credit Suisse Small Cap Core Fund
In our opinion, the accompanying statements of assets and liabilities, including the schedules of investments, and the related statements of operations and of changes in net assets and the financial highlights present fairly, in all material respects, the financial position of Credit Suisse Large Cap Value Fund and Credit Suisse Small Cap Core Fund (hereafter referred to as the "Funds") at October 31, 2006, the results of each of their operations for the year then ended, the changes in each of their net assets for each of the two years in the period then ended and the financial highlights for each of the years (or periods) presented, in conformity with accounting principles generally accepted in the United States of America. These financial statements and financial highlights (hereafter referred to as "financial statements") are the responsibility of the Funds' management; our responsibility is to express an opinion on these financial statem ents based on our audits. We conducted our audits of these financial statements in accordance with the standards of the Public Company Accounting Oversight Board (United States). Those standards require that we plan and perform the audit to obtain reasonable assurance about whether the financial statements are free of material misstatement. An audit includes examining, on a test basis, evidence supporting the amounts and disclosures in the financial statements, assessing the accounting principles used and significant estimates made by management, and evaluating the overall financial statement presentation. We believe that our audits, which included confirmation of securities at October 31, 2006 by correspondence with the custodian and brokers, provide a reasonable basis for our opinion.
PricewaterhouseCoopers LLP
Baltimore, Maryland
December 18, 2006
49
Credit Suisse Funds
Information Concerning Trustees and Officers (unaudited)
| Name, Address and Date of Birth | Position(s) Held with Fund | Term of Office1 and Length of Time Served | Principal Occupation(s) During Past Five Years | Number of Portfolios in Fund Complex Overseen by Trustee | Other Directorships Held by Trustee | ||||||||||||||||||
| Independent Trustees | |||||||||||||||||||||||
| Enrique Arzac c/o Credit Suisse Asset Management, LLC Attn: General Counsel Eleven Madison Avenue New York, New York 10010 Date of Birth: 10/02/41 | Trustee, Nominating Committee Member and Audit Committee Chairman | Since 2005 | Professor of Finance and Economics, Graduate School of Business, Columbia University since 1971. | 42 | Director of The Adams Express Company (a closed-end investment company); Director of Petroleum and Resources Corporation (a closed-end investment company). | ||||||||||||||||||
| Richard H. Francis c/o Credit Suisse Asset Management, LLC Attn: General Counsel Eleven Madison Avenue New York, New York 10010 Date of Birth: 04/23/32 | Trustee, Nominating and Audit Committee Member | Since 2001 | Currently retired | 36 | None | ||||||||||||||||||
| Jeffrey E. Garten Box 208200 New Haven, Connecticut 06520-8200 Date of Birth: 10/29/46 | Trustee, Nominating and Audit Committee Member | Since 2001 | The Juan Trippe Professor in the Practice of International Trade, Finance and Business from July 2005 to present; Partner and Chairman of Garten Rothkopf (consulting firm) from October 2005 to present; Dean of Yale School of Management from November 1995 to June 2005. | 35 | Director of Aetna, Inc. (insurance company); Director of CarMax Group (used car dealers). | ||||||||||||||||||
1 Each Trustee and Officer serves until his or her respective successor has been duly elected and qualified.
50
Credit Suisse Funds
Information Concerning Trustees and Officers (unaudited) (continued)
| Name, Address and Date of Birth | Position(s) Held with Fund | Term of Office1 and Length of Time Served | Principal Occupation(s) During Past Five Years | Number of Portfolios in Fund Complex Overseen by Trustee | Other Directorships Held by Trustee | ||||||||||||||||||
| Independent Trustees | |||||||||||||||||||||||
| Peter F. Krogh 301 ICC Georgetown University Washington, DC 20057 Date of Birth: 02/11/37 | Trustee, Nominating and Audit Committee Member | Since 2001 | Dean Emeritus and Distinguished Professor of International Affairs at the Edmund A. Walsh School of Foreign Service, Georgetown University from June 1995 to present. | 35 | Director of Carlisle Companies Incorporated (diversified manufacturing company). | ||||||||||||||||||
| Steven N. Rappaport Lehigh Court, LLC 40 East 52nd Street New York, New York 10022 Date of Birth: 07/10/48 | Chairman of the Board, of Trustees, Nominating Committee Chairman and Audit Committee Member | Trustee since 2001 and Chairman since 2005 | Partner of Lehigh Court, LLC and RZ Capital (private investment firms) from July 2002 to present; Transition Adviser to SunGard Securities Finance, Inc. from February 2002 to July 2002; President of SunGard Securities Finance, Inc. from 2001 to February 2002; President of Loanet, Inc. (on-line accounting service) from 1997 to 2001. | 42 | Director of Presstek, Inc. (digital imaging technologies company); Director of Wood Resources, LLC. (plywood manufacturing company). | ||||||||||||||||||
| Interested Trustee | |||||||||||||||||||||||
| Michael E. Kenneally 2 c/o Credit Suisse Asset Management, LLC Attn: General Counsel Eleven Madison Avenue New York, New York 10010 Date of Birth: 03/30/54 | Trustee | Since 2004 | Chairman and Global Chief Executive Officer of Credit Suisse from March 2003 to July 2005; Chairman and Chief Investment Officer of Banc of America Capital Management from 1998 to March 2003. | 35 | None | ||||||||||||||||||
2 Mr. Kenneally is a Trustee who is an "interested person" of the Funds as defined in the 1940 Act, because he was an officer of Credit Suisse within the last two fiscal years.
51
Credit Suisse Funds
Information Concerning Trustees and Officers (unaudited) (continued)
Name, Address and Date of Birth | Position(s) Held with Fund | Term of Office1 and Length of Time Served | Principal Occupation(s) During Past Five Years | ||||||||||||
| Officers | |||||||||||||||
| Steven B. Plump Credit Suisse Asset Management, LLC Eleven Madison Avenue New York, New York 10010 Date of Birth: 02/08/59 | Chief Executive Officer and President | Since 2005 | Managing Director; Associated with Credit Suisse or its predecessor since 1995; Officer of other Credit Suisse Funds. | ||||||||||||
| Michael A. Pignataro Credit Suisse Asset Management, LLC Eleven Madison Avenue New York, New York 10010 Date of Birth: 11/15/59 | Chief Financial Officer | Since 1999 | Director and Director of Fund Administration of Credit Suisse; Associated with Credit Suisse or its predecessor since 1984; Officer of other Credit Suisse Funds. | ||||||||||||
| Emidio Morizio Credit Suisse Asset Management, LLC Eleven Madison Avenue New York, New York 10010 Date of Birth: 09/21/66 | Chief Compliance Officer | Since 2004 | Director and Global Head of Compliance of Credit Suisse; Associated with Credit Suisse since July 2000; Officer of other Credit Suisse Funds. | ||||||||||||
| J. Kevin Gao Credit Suisse Asset Management, LLC Eleven Madison Avenue New York, New York 10010 Date of Birth: 10/13/67 | Chief Legal Officer Since 2006, Vice President and Secretary Since 2004 | Since 2004 | Director and Legal Counsel of Credit Suisse; Associated with Credit Suisse since July 2003; Associated with the law firm of Willkie Farr & Gallagher LLP from 1998 to 2003; Officer of other Credit Suisse Funds. | ||||||||||||
| Robert Rizza Credit Suisse Asset Management, LLC Eleven Madison Avenue New York, New York 10010 Date of Birth: 12/09/65 | Treasurer | Since 2006 | Vice President of Credit Suisse; Associated with Credit Suisse since 1998; Officer of other Credit Suisse Funds. | ||||||||||||
The Statement of Additional Information includes additional information about the Trustees and is available, without charge, upon request, by calling 800-927-2874.
52
Credit Suisse Funds
Tax Information Letter
October 31, 2006 (unaudited)
Important Tax Information for Corporate Shareholders
Corporate shareholders should note for the year ended October 31, 2006, the percentage of the Fund's investment income (i.e., net investment income plus short-term capital gains) that qualified for the intercorporate dividends received deduction is 54.36% for the Large Cap Value Fund and 100.00% for the Small Cap Core Fund.
Important Tax Information for Shareholders
For the fiscal year ended October 31, 2006, Large Cap Value and Small Cap Core designates approximately $10,625,672 and $2,068,455, respectively, or up to the maximum amount of such dividends allowable pursuant to the internal Revenue Code, as qualified dividends income eligible for reduced tax rates. These lower rates range from 5% to 15% depending on an individual's tax bracket. If the fund pays a distribution during the calendar year of 2006, complete information will be reported in conjunction with Form 1099-DIV.
During the year ended October 31, 2006, the Funds declared the following dividends that were designated as long-term capital gains dividends:
| Fund | Amount | ||||||
| Large Cap Value | $ | 31,735,807 | |||||
| Small Cap Core | 33,002,260 | ||||||
53
Credit Suisse Funds
Proxy Voting and Portfolio Holdings Information (unaudited)
Information regarding how each Fund voted proxies related to its portfolio securities during the 12 month period ended June 30 of each year, as well as the policies and procedures that each Fund uses to determine how to vote proxies relating to its portfolio securities are available:
• By calling 1-800-927-2874
• On the Funds' website, www.credit-suisse.com/us
• On the website of the Securities and Exchange Commission, www.sec.gov.
Each Fund files a complete schedule of its portfolio holdings for the first and third quarters of its fiscal year with the SEC on Form N-Q. The Funds' Forms N-Q are available on the SEC's website at www.sec.gov and may be reviewed and copied at the SEC's Public Reference Room in Washington, DC. Information on the operation of the SEC's Public Reference Room may be obtained by calling 1-202-551-8090.
54
This page intentionally left blank
This page intentionally left blank

P.O. BOX 55030, BOSTON, MA 02205-5030
800-927-2874 n www.credit-suisse.com/us
CREDIT SUISSE ASSET MANAGEMENT SECURITIES, INC., DISTRIBUTOR. USEQVAL-AR-1006
Item 2. Code of Ethics.
The registrant has adopted a code of ethics applicable to its Chief Executive Officer, President, Chief Financial Officer and Chief Accounting Officer, or persons performing similar functions. A copy of the code is filed as Exhibit 12(a)(1) to this Form. There were no amendments to the code during the fiscal year ended October 31, 2006. There were no waivers or implicit waivers from the code granted by the registrant during the fiscal year ended October 31, 2006.
Item 3. Audit Committee Financial Expert.
The registrant’s governing board has determined that it has three audit committee financial experts serving on its audit committee: Enrique R. Arzac, Richard H. Francis and Steven N. Rappaport. Each audit committee financial expert is “independent” for purposes of this item.
Item 4. Principal Accountant Fees and Services.
(a) through (d). The information in the table below is provided for services rendered to the registrant by its independent registered public accounting firm, PricewaterhouseCoopers LLP (“PwC”), for its fiscal years ended October 31, 2005 and October 31, 2006.
| 2005 |
| 2006 |
| |
|
|
|
|
|
|
Audit Fees |
| $65,612 |
| $70,773 |
|
|
|
|
|
|
|
Audit-Related Fees1 |
| $6,300 |
| $6,490 |
|
|
|
|
|
|
|
Tax Fees2 |
| $4,878 |
| $5,030 |
|
|
|
|
|
|
|
All Other Fees |
| -- |
| -- |
|
|
|
|
|
|
|
Total |
| $76,790 |
| $82,293 |
|
|
|
|
|
|
|
1 Services include agreed-upon procedures in connection with the registrant’s semi-annual financial statements ($6,300 for 2005 and $6,490 for 2006).
2 Tax services in connection with the registrant’s excise tax calculations and review of the registrant’s applicable tax returns.
The information in the table below is provided with respect to non-audit services that directly relate to the registrant’s operations and financial reporting and that were rendered by PwC to the registrant’s investment adviser, Credit Suisse Asset Management, LLC (“Credit Suisse”), and any service provider to the registrant controlling, controlled by or under common control with Credit Suisse that provided ongoing services to the registrant (“Covered Services Provider”), for the registrant’s fiscal years ended October 31, 2005 and October 31, 2006.
| 2005 |
| 2006 |
| |
|
|
|
|
|
|
Audit-Related Fees |
| N/A |
| N/A |
|
|
|
|
|
|
|
2
Tax Fees |
| N/A |
| N/A |
|
|
|
|
|
|
|
All Other Fees |
| $394,000 |
| N/A |
|
|
|
|
|
|
|
Total |
| $394,000 |
| N/A |
|
|
|
|
|
|
|
(e)(1) Pre-Approval Policies and Procedures. The Audit Committee (“Committee”) of the registrant is responsible for pre-approving (i) all audit and permissible non-audit services to be provided by the independent registered public accounting firm to the registrant and (ii) all permissible non-audit services to be provided by the independent registered public accounting firm to Credit Suisse and any Covered Services Provider if the engagement relates directly to the operations and financial reporting of the registrant. The Committee may delegate its responsibility to pre-approve any such audit and permissible non-audit services to the Chairperson of the Committee, and the Chairperson shall report to the Committee, at its next regularly scheduled meeting after the Chairperson’s pre-approval of such services, his or her decision(s). The Committee may also establish detailed pre-approval policies and procedures for pre-approval of such services in accordance with applicable laws, including the delegation of some or all of the Committee’s pre-approval responsibilities to other persons (other than Credit Suisse or the registrant’s officers). Pre-approval by the Committee of any permissible non-audit services shall not be required so long as: (i) the aggregate amount of all such permissible non-audit services provided to the registrant, Credit Suisse and any Covered Services Provider constitutes not more than 5% of the total amount of revenues paid by the registrant to its independent registered public accounting firm during the fiscal year in which the permissible non-audit services are provided; (ii) the permissible non-audit services were not recognized by the registrant at the time of the engagement to be non-audit services; and (iii) such services are promptly brought to the attention of the Committee and approved by the Committee (or its delegate(s)) prior to the completion of the audit.
(e)(2) The information in the table below sets forth the percentages of fees for services (other than audit, review or attest services) rendered by PwC to the registrant for which the pre-approval requirement was waived pursuant to Rule 2-01(c)(7)(i)(C) of Regulation S-X:
| 2005 |
| 2006 |
| |
|
|
|
|
|
|
Audit-Related Fees |
| N/A |
| N/A |
|
|
|
|
|
|
|
Tax Fees |
| N/A |
| N/A |
|
|
|
|
|
|
|
All Other Fees |
| N/A |
| N/A |
|
|
|
|
|
|
|
Total |
| N/A |
| N/A |
|
|
|
|
|
|
|
3
The information in the table below sets forth the percentages of fees for services (other than audit, review or attest services) rendered by PwC to Credit Suisse and any Covered Services Provider required to be approved pursuant to Rule 2-01(c)(7)(ii) of Regulation S-X, for the registrant’s fiscal years ended October 31, 2005 and October 31, 2006:
| 2005 |
| 2006 |
| |
|
|
|
|
|
|
Audit-Related Fees |
| N/A |
| N/A |
|
|
|
|
|
|
|
Tax Fees |
| N/A |
| N/A |
|
|
|
|
|
|
|
All Other Fees |
| N/A |
| N/A |
|
|
|
|
|
|
|
Total |
| N/A |
| N/A |
|
|
|
|
|
|
|
(f) Not Applicable.
(g) The aggregate fees billed by PwC for non-audit services rendered to the registrant, Credit Suisse and Covered Service Providers for the fiscal years ended October 31, 2005 and October 31, 2006 were $11,178 and $11,520, respectively.
(h) Not Applicable.
Item 5. Audit Committee of Listed Registrants.
Form N-CSR disclosure requirement is not applicable to the registrant.
Item 6. Schedule of Investments.
Included as part of the report to shareholders filed under Item 1 of this Form.
Item 7. Disclosure of Proxy Voting Policies and Procedures for Closed-End Management Investment Companies.
Form N-CSR disclosure requirement is not applicable to the registrant.
Item 8. Portfolio Managers of Closed-End Management Investment Companies.
4
Form N-CSR disclosure requirement is not applicable to the registrant.
Item 9. Purchases of Equity Securities by Closed-End Management Investment Company and Affiliated Purchasers.
Form N-CSR disclosure requirement is not applicable to the registrant.
Item 10. Submission of Matters to a Vote of Security Holders.
None.
Item 11. Controls and Procedures.
(a) As of a date within 90 days from the filing date of this report, the principal executive officer and principal financial officer concluded that the registrant’s disclosure controls and procedures (as defined in Rule 30a-3(c) under the Investment Company Act of 1940 (the “Act”)) were effective based on their evaluation of the disclosure controls and procedures required by Rule 30a-3(b) under the Act and Rules 13a-15(b) or 15d-15(b) under the Securities Exchange Act of 1934.
(b) There were no changes in registrant’s internal control over financial reporting (as defined in Rule 30a-3(d) under the Act) that occurred during the second fiscal quarter of the period covered by this report that have materially affected, or are reasonably likely to materially affect, the registrant’s internal control over financial reporting.
Item 12. Exhibits.
(a)(1) Registrant’s Code of Ethics is an exhibit to this report.
(a)(2) The certifications of the registrant as required by Rule 30a-2(a) under the Act are exhibits to this report.
(a)(3) Not applicable.
(b) The certifications of the registrant as required by Rule 30a-2(b) under the Act are an exhibit to this report.
5
SIGNATURES
Pursuant to the requirements of the Securities Exchange Act of 1934 and the Investment Company Act of 1940, the registrant has duly caused this report to be signed on its behalf by the undersigned, thereunto duly authorized.
CREDIT SUISSE CAPITAL FUNDS |
|
| |||
|
|
| |||
/s/ Steven B. Plump |
| ||||
Name: |
| Steven B. Plump | |||
Title: |
| Chief Executive Officer | |||
Date: |
| December 29, 2006 | |||
Pursuant to the requirements of the Securities Exchange Act of 1934 and the Investment Company Act of 1940, this report has been signed below by the following persons on behalf of the registrant and in the capacities and on the dates indicated.
/s/ Steven B. Plump |
| |||
Name: |
| Steven B. Plump | ||
Title: |
| Chief Executive Officer | ||
Date: |
| December 29, 2006 | ||
|
|
| ||
/s/ Michael A. Pignataro |
| |||
Name: |
| Michael A. Pignataro | ||
Title: |
| Chief Financial Officer | ||
Date: |
| December 29, 2006 | ||
6