UNITED STATES
SECURITIES AND EXCHANGE COMMISSION
Washington, D.C. 20549
FORM N-CSR
CERTIFIED SHAREHOLDER REPORT OF REGISTERED
MANAGEMENT INVESTMENT COMPANIES
Investment Company Act file number | 811-04604 | |||||||
| ||||||||
CREDIT SUISSE CAPITAL FUNDS | ||||||||
(Exact name of registrant as specified in charter) | ||||||||
| ||||||||
Eleven Madison Avenue, New York, New York |
| 10010 | ||||||
(Address of principal executive offices) |
| (Zip code) | ||||||
| ||||||||
J. Kevin Gao, Esq. | ||||||||
(Name and address of agent for service) | ||||||||
| ||||||||
Registrant’s telephone number, including area code: | (212) 325-2000 |
| ||||||
| ||||||||
Date of fiscal year end: | October 31st |
| ||||||
| ||||||||
Date of reporting period: | November 1, 2006 to October 31, 2007 |
| ||||||
Item 1. Reports to Stockholders.

CREDIT SUISSE FUNDS
Annual Report
October 31, 2007
n CREDIT SUISSE
LARGE CAP VALUE FUND
n CREDIT SUISSE
SMALL CAP CORE FUND
The Funds' investment objectives, risks, charges and expenses (which should be considered carefully before investing), and more complete information about the Funds, are provided in the Prospectus, which should be read carefully before investing. You may obtain additional copies by calling 800-927-2874 or by writing to Credit Suisse Funds, P.O. Box 55030, Boston, MA 02205-5030.
Credit Suisse Asset Management Securities, Inc., Distributor, is located at Eleven Madison Avenue, New York, NY 10010. Credit Suisse Funds are advised by Credit Suisse Asset Management, LLC.
Investors in the Credit Suisse Funds should be aware that they may be eligible to purchase Common Class and/or Advisor Class shares (where offered) directly or through certain intermediaries. Such shares are not subject to a sales charge but may be subject to an ongoing service and distribution fee of up to 0.50% of average daily net assets. Investors in the Credit Suisse Funds should also be aware that they may be eligible for a reduction or waiver of the sales charge with respect to Class A, B or C shares (where offered). For more information, please review the relevant prospectuses or consult your financial representative.
The views of the Funds' management are as of the date of the letter and Fund holdings described in this document are as of October 31, 2007; these views and Fund holdings may have changed subsequent to these dates. Nothing in this document is a recommendation to purchase or sell securities.
Fund shares are not deposits or other obligations of Credit Suisse Asset Management, LLC ("Credit Suisse") or any affiliate, are not FDIC-insured and are not guaranteed by Credit Suisse or any affiliate. Fund investments are subject to investment risks, including loss of your investment.
Credit Suisse Large Cap Value Fund
Annual Investment Adviser's Report
October 31, 2007 (unaudited)
November 30, 2007
Dear Shareholder:
Performance Summary
11/01/06 – 10/31/07
| Fund & Benchmark | Performance | ||||||
| Common1 | 10.59 | % | |||||
| Advisor1 | 10.01 | % | |||||
| Class A1,2 | 10.32 | % | |||||
| Class B1,2 | 9.49 | % | |||||
| Class C1, 2 | 9.50 | % | |||||
| Russell 1000® Value Index3 | 10.83 | % | |||||
Performance for the Fund's Class A, Class B and Class C Shares is without the maximum sales charge of 5.75%, 4.00% and 1.00%, respectively.2
Market Review: Solid economic growth despite weak housing
In the 12-month period ended October 31, 2007, U.S. stock markets gained with the benchmark Russell 1000 Value Index returning 10.8%, and the bellwether S&P 500 Index posting a 14.6% total return. Eight of ten economic sectors in the large cap S&P 500 Index advanced during the period.
Rising global demand and elevated commodity prices buoyed the energy, materials and information technology sectors to post the highest returns of 36.2%, 31.1%, and 26.1%, respectively. The greatest laggards in the large-cap space were the financials (-5.1%) and consumer discretionary (-1.2%) sectors, both of which were negatively impacted by higher interest rates versus the prior year and a marked slowdown in the housing market.
The U.S. housing sector has weakened significantly in 2007 as mortgage providers tightened their lending standards. Existing home sales fell 8% in September to an annualized rate of 5.04 million, the fewest since recordkeeping began in 1999, according to the National Association of Realtors. Home prices in 20 U.S. metropolitan areas slumped in August 2007 by the greatest amount in at least six years. Values dropped 4.4% in the 12 months ended in August — an eighth consecutive decline — according to the S&P/Case-Shiller home-price index, which has data back to 2001.
The aggressive lending environment over the past few years has led to a rise in mortgage defaults. There were 635,159 foreclosure filings in the third quarter — double from a year earlier — including default notices, auction notices, and bank repossessions, according to RealtyTrac Inc.
1
Credit Suisse Large Cap Value Fund
Annual Investment Adviser's Report (continued)
October 31, 2007 (unaudited)
The U.S. Federal Reserve held its benchmark rate at 5.25% from June 2006 until September 2007 while identifying inflation risks as a major concern for the overall economy. However, more recently sentiment has shifted in response to the mortgage-debt driven liquidity crisis this summer. As a result, in September, the Fed cut its target for the federal funds rate by 50 basis points to 4.75%, marking the first cut in four years. Then in October, the Fed further cut its target rate by 25 basis points to 4.5% as it seeks to prevent some of the adverse effects on the overall economy from the depressed housing market and tighter consumer and corporate lending conditions.
Despite the housing sector slowdown, the economy grew at a solid 3.9% annual rate in July to September of 2007, up from 3.8% in the previous three months. Additionally, inflation appears to be well contained with the core Personal Consumption Expenditures (PCE) deflator for September 2007 up 0.2%. The year-over-year increase was unchanged from the August level of 1.8%, but it has been trending steadily lower from 2.5% in February of this year.
So far in 2007, the labor market has shown some signs of weakening. Non-farm payrolls rose 1,254,000 in the first ten months of the year versus gains of 1,841,000 for the same period in 2006. The household unemployment rate measured 4.7% in October, up modestly from a low of 4.4% in March 2007.
The Reuters/University of Michigan consumer confidence index dropped to 80.9 in October — the lowest level since May 2006 — from 83.4 in September. The measure is trailing the 89.6 average for the first half of the year and is also lower than year-earlier readings.
The Chicago Board Options Exchange Volatility Index (VIX), a measure of expected stock market volatility, reached a five-year low in January 2007. However, market conditions changed rapidly in mid-2007 and the VIX reached a four-year high in August 2007 amid the turmoil in U.S. sub-prime mortgage and commercial paper markets.
The U.S. dollar declined against a broad index of world currencies. And, crude oil rose to a record $95.28 a barrel on October 31, 2007, adding to economic concerns.
Strategic Review and Market Outlook: Economic expansion expected to slow
The leading contributions to performance relative to the benchmark came from stock selection in financials, consumer discretionary, and consumer staples. The largest detractors to performance relative to the benchmark came primarily from stock selection within the information technology, materials, and industrials groups.
2
Credit Suisse Large Cap Value Fund
Annual Investment Adviser's Report (continued)
October 31, 2007 (unaudited)
At the end of the period, the portfolio's largest overweights were in the energy (+1.77%), and healthcare (+0.87%) sectors, while the largest underweights were in the utilities (-1.48%) and materials (-1.15%) sectors.
The Federal Reserve expects that the pace of economic expansion will likely slow in the near term, partly reflecting the intensification of the housing correction. Additionally, while readings on core inflation have improved modestly this year, the Fed expects that recent increases in energy and commodity prices, among other factors, may put renewed upward pressure on inflation.
The Federal Open Market Committee is scheduled to meet next in December 2007 to discuss interest rates. Based on interest-rate futures as of November 7, 2007, traders are expecting the Fed to cut its target rate by an additional 25 basis points in December.
Leading indicators point to the U.S. housing markets potentially remaining depressed through early 2008. And, the consensus does not expect the pace of mergers and acquisitions to reach the level seen in the first half of 2007, as the availability of debt financing has tightened considerably. Further, expectations for U.S. stock market volatility are for above average stock swings.
Given the U.S. economy's current position toward the tail end of a growth cycle, we believe growth stocks could continue to outperform their value counterparts in 2008. We expect companies with solid growth prospects and strong operating results momentum will lead the market, and believe that companies fitting attractive valuation profiles will make a moderate comeback in the coming quarters. From a sector perspective, we are favorable toward the healthcare, energy, commercial services, and consumer staples groups. Conversely, the unsettled credit market and risks of further impact from mortgage losses leads us to underweight financial and consumer discretionary industries.
Credit Suisse Quantitative Strategies Team
Joseph Cherian
William Weng
Todd Jablonski
Eric Leng
The value of investments generally will fluctuate in response to market movements and the Fund's performance will largely depend on the performance of value stocks, which may be more volatile than the overall market.
3
Credit Suisse Large Cap Value Fund
Annual Investment Adviser's Report (continued)
October 31, 2007 (unaudited)
In addition to historical information, this report contains forward-looking statements that may concern, among other things, domestic and foreign market, industry and economic trends and developments and government regulation and their potential impact on the Fund's investments. These statements are subject to risks and uncertainties and actual trends, developments and regulations in the future, and their impact on the Fund could be materially different from those projected, anticipated or implied. The Fund has no obligation to update or revise forward-looking statements.
The Fund adopted new investment strategies effective December 1, 2006 so that its holdings are selected using quantitative stock selection models rather than a more traditional fundamental analysis approach. Investors should be aware that performance information for periods prior to December 1, 2006 does not reflect the current investment strategies.
4
Credit Suisse Large Cap Value Fund
Annual Investment Adviser's Report (continued)
October 31, 2007 (unaudited)
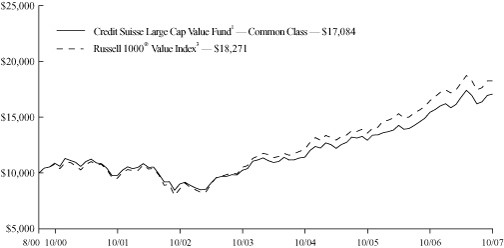
Comparison of Change in Value of $10,000 Investment in the
Credit Suisse Large Cap Value Fund1 Common Class shares, and
the Russell 1000® Value Index3 from Inception (8/01/00).
Comparison of Change in Value of $10,000 Investment in the
Credit Suisse Large Cap Value Fund1 Advisor Class shares and
the Russell 1000® Value Index3,6 from Inception (6/6/03).

5
Credit Suisse Large Cap Value Fund
Annual Investment Adviser's Report (continued)
October 31, 2007 (unaudited)
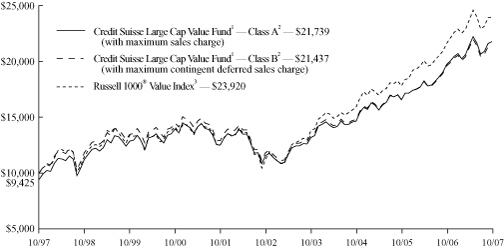
Comparison of Change in Value of $10,000 Investment in the
Credit Suisse Large Cap Value Fund1 Class A shares2 and Class B shares2,
and the Russell 1000® Value Index3 for Ten Years.
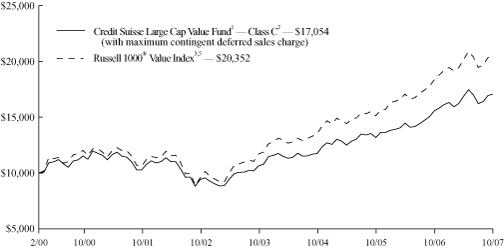
Comparison of Change in Value of $10,000 Investment in the
Credit Suisse Large Cap Value Fund1 Class C shares2 and
the Russell 1000® Value Index3,5 from Inception (2/28/00).
6
Credit Suisse Large Cap Value Fund
Annual Investment Adviser's Report (continued)
October 31, 2007 (unaudited)
Average Annual Returns as of September 30, 20071
1 Year | 5 Years | 10 Years | Since Inception | ||||||||||||||||
| Common Class | 13.77 | % | 14.97 | % | — | 7.65 | % | ||||||||||||
| Advisor Class | 13.21 | % | — | — | 13.14 | % | |||||||||||||
| Class A Without Sales Charge | 13.53 | % | 14.82 | % | 8.50 | % | — | ||||||||||||
| Class A With Maximum Sales Charge | 6.99 | % | 13.47 | % | 7.86 | % | — | ||||||||||||
| Class B Without CDSC | 12.70 | % | 13.96 | % | 7.71 | % | — | ||||||||||||
| Class B With CDSC | 9.11 | % | 13.96 | % | 7.71 | % | — | ||||||||||||
| Class C Without CDSC | 12.66 | % | 13.97 | % | — | 7.20 | % | ||||||||||||
| Class C With CDSC | 11.77 | % | 13.97 | % | — | 7.20 | % | ||||||||||||
Average Annual Returns as of October 31, 20071
1 Year | 5 Years | 10 Years | Since Inception | ||||||||||||||||
| Common Class | 10.59 | % | 13.66 | % | — | 7.66 | % | ||||||||||||
| Advisor Class | 10.01 | % | — | — | 13.05 | % | |||||||||||||
| Class A Without Sales Charge | 10.32 | % | 13.50 | % | 8.72 | % | — | ||||||||||||
| Class A With Maximum Sales Charge | 3.99 | % | 12.16 | % | 8.07 | % | — | ||||||||||||
| Class B Without CDSC | 9.49 | % | 12.65 | % | 7.92 | % | — | ||||||||||||
| Class B With CDSC | 6.01 | % | 12.65 | % | 7.92 | % | — | ||||||||||||
| Class C Without CDSC | 9.50 | % | 12.66 | % | — | 7.20 | % | ||||||||||||
| Class C With CDSC | 8.63 | % | 12.66 | % | — | 7.20 | % | ||||||||||||
Returns represent past performance and include change in share price and reinvestment of dividends and capital gains. Past performance cannot guarantee future results. The current performance of the Fund may be lower or higher than the figures shown. Returns and share price will fluctuate, and redemption value may be more or less than original cost. The performance results do not reflect the deduction of taxes that a shareholder would pay on fund distributions or the redemption of fund shares. Performance information current to the most recent month-end is available at www.credit-suisse.com/us
1 Fee waivers and/or expense reimbursements may reduce expenses for the Fund, without which performance would be lower. Waivers and/or reimbursements may be discontinued at any time.
2 Total return for the Fund's Class A Shares for the reporting period, based on offering price (including maximum sales charge of 5.75%), was 3.99%. Total return for the Fund's Class B Shares for the reporting period, based on redemption value (including maximum contingent deferred sales charge of 4%), was 6.01%. Total return for the Fund's Class C Shares for the reporting period, based on redemption value (including maximum contingent deferred sales charge of 1%), was 8.63%.
7
Credit Suisse Large Cap Value Fund
Annual Investment Adviser's Report (continued)
October 31, 2007 (unaudited)
3 The Russell 1000® Value Index measures the performance of those companies in the Russell 1000® Index with lower price-to-book ratios and lower forecasted growth values. It is an unmanaged index of common stocks that includes reinvestment of dividends and is compiled by Frank Russell Company. Investors cannot invest directly in an index.
4 Performance for the benchmark is not available for the period beginning June 6, 2003. For that reason, performance of the benchmark is shown from July 1, 2003.
5 Performance for the benchmark is not available for the period beginning February 28, 2000. For that reason, performance of the benchmark is shown from March 1, 2000.
8
Credit Suisse Large Cap Value Fund
Annual Investment Adviser's Report (continued)
October 31, 2007 (unaudited)
Information About Your Fund's Expenses
As an investor of the Fund, you incur two types of costs: ongoing expenses and transaction costs. Ongoing expenses include management fees, distribution and service (12b-1) fees and other Fund expenses. Examples of transaction costs include sales charges (loads), redemption fees and account maintenance fees, which are not shown in this section and which would result in higher total expenses. The following table is intended to help you understand your ongoing expenses of investing in the Fund and to help you compare these expenses with the ongoing expenses of investing in other mutual funds. The table is based on an investment of $1,000 made at the beginning of the six month period ended October 31, 2007.
The table illustrates your Fund's expenses in two ways:
• Actual Fund Return. This helps you estimate the actual dollar amount of ongoing expenses paid on a $1,000 investment in the Fund using the Fund's actual return during the period. To estimate the expenses you paid over the period, simply divide your account value by $1,000 (for example, an $8,600 account value divided by $1,000 = 8.6), then multiply the result by the number in the "Expenses Paid per $1,000" line under the share class you hold.
• Hypothetical 5% Fund Return. This helps you to compare your Fund's ongoing expenses with those of other mutual funds using the Fund's actual expense ratio and a hypothetical rate of return of 5% per year before expenses. Examples using a 5% hypothetical fund return may be found in the shareholder reports of other mutual funds. The hypothetical account values and expenses may not be used to estimate the actual ending account balance or expenses you paid for the period.
Please note that the expenses shown in these tables are meant to highlight your ongoing expenses only and do not reflect any transaction costs, such as sales charges (loads) or redemption fees. If these transaction costs had been included, your costs would have been higher. The "Expenses Paid per $1,000" line of the tables is useful in comparing ongoing expenses only and will not help you determine the relative total expenses of owning different funds.
9
Credit Suisse Large Cap Value Fund
Annual Investment Adviser's Report (continued)
October 31, 2007 (unaudited)
Expenses and Value of a $1,000 Investment
for the six months period ended October 31, 2007
| Actual Fund Return | Common Class | Advisor Class | Class A | Class B | Class C | ||||||||||||||||||
| Beginning Account Value 5/1/07 | $ | 1,000.00 | $ | 1,000.00 | $ | 1,000.00 | $ | 1,000.00 | $ | 1,000.00 | |||||||||||||
| Ending Account Value 10/31/07 | $ | 1,015.80 | $ | 1,013.20 | $ | 1,014.50 | $ | 1,010.40 | $ | 1,010.50 | |||||||||||||
| Expenses Paid per $1,000* | $ | 4.22 | $ | 6.75 | $ | 5.48 | $ | 9.27 | $ | 9.27 | |||||||||||||
| Hypothetical 5% Fund Return | |||||||||||||||||||||||
| Beginning Account Value 5/1/07 | $ | 1,000.00 | $ | 1,000.00 | $ | 1,000.00 | $ | 1,000.00 | $ | 1,000.00 | |||||||||||||
| Ending Account Value 10/31/07 | $ | 1,021.02 | $ | 1,018.50 | $ | 1,019.76 | $ | 1,015.98 | $ | 1,015.98 | |||||||||||||
| Expenses Paid per $1,000* | $ | 4.23 | $ | 6.77 | $ | 5.50 | $ | 9.30 | $ | 9.30 | |||||||||||||
| Common Class | Advisor Class | Class A | Class B | Class C | |||||||||||||||||||
| Annualized Expense Ratios* | 0.83 | % | 1.33 | % | 1.08 | % | 1.83 | % | 1.83 | % | |||||||||||||
* Expenses are equal to the Fund's annualized expense ratio for each share class, multiplied by the average account value over the period, multiplied by the number of days in the most recent fiscal half year period, then divided by 365.
The "Expenses Paid per $1,000" and the "Annualized Expense Ratios" in the tables are based on actual expenses paid by the Fund during the period, net of fee waivers and/or expense reimbursements. If those fee waivers and/or expense reimbursements had not been in effect, the Fund's actual expenses would have been higher.
For more information, please refer to the Fund's prospectus.
10
Credit Suisse Large Cap Value Fund
Annual Investment Adviser's Report (continued)
October 31, 2007 (unaudited)
SECTOR BREAKDOWN*
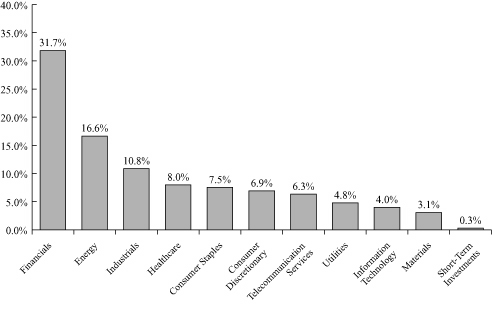
* Expressed as a percentage of total investments (excluding security lending collateral) and may vary over time.
11
Credit Suisse Small Cap Core Fund
Annual Investment Adviser's Report
October 31, 2007 (unaudited)
November 30, 2007
Dear Shareholder:
Performance Summary
11/01/06 – 10/31/07
| Fund & Benchmark | Performance | ||||||
| Common1 | 9.58 | % | |||||
| Class A1,2 | 9.61 | % | |||||
| Class B1,2 | 8.74 | % | |||||
| Class C1,2 | 8.74 | % | |||||
| Standard & Poor's SmallCap 600® Index3 | 11.55 | % | |||||
| Russell 2000® Index3 | 9.27 | % | |||||
| Russell 2000® Value Index3 | 2.05 | % | |||||
Performance for the Fund's Class A, Class B and Class C shares is without the maximum sales charge of 5.75%, 4.00% and 1.00%, respectively.2
Market Review: Solid economic growth despite weak housing
In the 12-month period ended October 31, 2007, U.S. stock markets gained with the benchmark S&P 600 SmallCap Index returning 11.6%.
Rising global demand and elevated commodity prices buoyed the energy, materials and information technology sectors to post the highest returns of 31.2%, 27.2%, and 24.5%, respectively. The greatest laggards in the small-cap space were the financials (-14.3%) and consumer discretionary (-6.2%) sectors, both of which were negatively impacted by higher interest rates versus the prior year as well as the marked slowdown in the housing market.
The U.S. housing sector has weakened significantly in 2007 as mortgage providers tightened their lending standards. Existing home sales fell 8% in September to an annualized rate of 5.04 million, the fewest since recordkeeping began in 1999, according to the National Association of Realtors. Home prices in 20 U.S. metropolitan areas slumped in August 2007 by the greatest amount in at least six years. Values dropped 4.4% in the 12 months ended in August — an eighth consecutive decline — according to the S&P/Case-Shiller home-price index, which has data back to 2001.
The aggressive lending environment over the past few years has led to a rise in mortgage defaults. There were 635,159 foreclosure filings in the third quarter — double from a year earlier — including default notices, auction notices, and bank repossessions, according to RealtyTrac Inc.
12
Credit Suisse Small Cap Core Fund
Annual Investment Adviser's Report (continued)
October 31, 2007 (unaudited)
The U.S. Federal Reserve held its benchmark rate at 5.25% from June 2006 until September 2007 while identifying inflation risks as a major concern for the overall economy. However, more recently sentiment has shifted in response to the mortgage-debt driven liquidity crisis this summer. As a result, in September, the Fed cut its target for the federal funds rate by 50 basis points to 4.75%, marking the first cut in four years. Then in October, the Fed further cut its target rate by 25 basis points to 4.5% as it seeks to prevent some of the adverse effects on the overall economy from the depressed housing market and tighter consumer and corporate lending conditions.
Despite the housing sector slowdown, the economy grew at a solid 3.9% annual rate in July to September of 2007, up from 3.8% in the previous three months. Additionally, inflation appears to be well contained with the core Personal Consumption Expenditures (PCE) deflator for September 2007 up 0.2%. The year-over-year increase was unchanged from the August level of 1.8%, but it has been trending steadily lower from 2.5% in February of this year.
So far in 2007, the labor market has shown some signs of weakening. Non-farm payrolls rose 1,254,000 in the first ten months of the year versus gains of 1,841,000 for the same period in 2006. The household unemployment rate measured 4.7% in October, up modestly from a low of 4.4% in March 2007.
The Reuters/University of Michigan consumer confidence index dropped to 80.9 in October — the lowest level since May 2006 — from 83.4 in September. The measure is trailing the 89.6 average for the first half of the year and is also lower than year-earlier readings.
The Chicago Board Options Exchange Volatility Index (VIX), a measure of expected stock market volatility, reached a five-year low in January 2007. However, market conditions changed rapidly in mid-2007 and the VIX reached a four-year high in August 2007 amid the turmoil in U.S. sub-prime mortgage and commercial paper markets.
The U.S. dollar declined against a broad index of world currencies. And, crude oil rose to a record $95.28 a barrel on October 31, 2007, adding to economic concerns.
Strategic Review and Market Outlook: Economic expansion expected to slow
The largest contributors to performance relative to the benchmark came primarily from stock selection within the materials, consumer discretionary, and energy sectors. The largest detractors to performance relative to the benchmark came primarily from stock selection within the information technology sector, followed closely by the financials and industrials groups.
13
Credit Suisse Small Cap Core Fund
Annual Investment Adviser's Report (continued)
October 31, 2007 (unaudited)
At the period end, the portfolio's largest overweights were in the healthcare (+3.29%) and energy (+3.05%) sectors, while the largest underweights were in the information technology (-4.44%) and financials (-3.65%) sectors.
The Federal Reserve expects that the pace of economic expansion will likely slow in the near term, partly reflecting the intensification of the housing correction. Additionally, while readings on core inflation have improved modestly this year, the Fed expects that recent increases in energy and commodity prices, among other factors, may put renewed upward pressure on inflation.
The Federal Open Market Committee is scheduled to meet next in December 2007 to discuss interest rates. Based on interest-rate futures as of November 7, 2007, traders are expecting the Fed to cut its target rate by an additional 25 basis points in December.
Leading indicators point to the U.S. housing markets potentially remaining depressed through early 2008. And, the consensus does not expect the pace of mergers and acquisitions to reach the level seen in the first half of 2007, as the availability of debt financing has tightened considerably. Further, expectations for U.S. stock market volatility are for above average stock swings.
Given the U.S. economy's current position toward the tail end of a growth cycle, we believe growth stocks could continue to outperform their value counterparts in 2008. We expect companies with solid growth prospects and strong operating results momentum will lead the market, and believe that companies fitting attractive valuation profiles will make a moderate comeback in the coming quarters. From a sector perspective, we are favorable toward the healthcare, energy, commercial services, and consumer staples groups. Conversely, the unsettled credit market and risks of further impact from mortgage losses leads us to underweight financial and consumer discretionary industries.
Credit Suisse Quantitative Strategies Team
Joseph Cherian
William Weng
Todd Jablonski
Eric Leng
Because of the nature of the Fund's investments in special-situation, start-up and other small companies, an investment in the Fund may be more volatile and less liquid than investments in larger companies.
14
Credit Suisse Small Cap Core Fund
Annual Investment Adviser's Report (continued)
October 31, 2007 (unaudited)
In addition to historical information, this report contains forward-looking statements that may concern, among other things, domestic and foreign market, industry and economic trends and developments and government regulation and their potential impact on the Fund's investments. These statements are subject to risks and uncertainties and actual trends, developments and regulations in the future, and their impact on the Fund could be materially different from those projected, anticipated or implied. The Fund has no obligation to update or revise forward-looking statements.
The Fund adopted new investment strategies effective December 1, 2006 so that its holdings are selected using quantitative stock selection models rather than a more traditional fundamental analysis approach. Investors should be aware that performance information for periods prior to December 1, 2006 does not reflect the current investment strategies.
15
Credit Suisse Small Cap Core Fund
Annual Investment Adviser's Report (continued)
October 31, 2007 (unaudited)
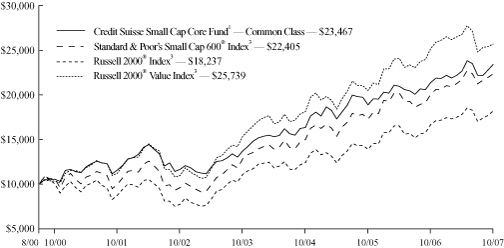
Comparison of Change in Value of $10,000 Investment in the
Credit Suisse Small Cap Core Fund1 Common Class shares,
the Standard & Poor's SmallCap 600® Index3, the Russell 2000®
Index3 and the Russell 2000® Value Index3 from Inception (8/01/00).
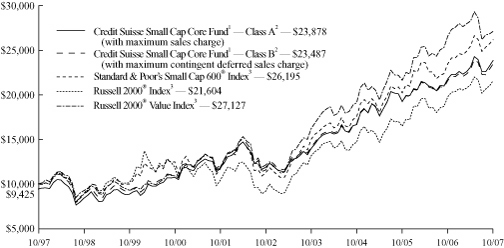
Comparison of Change in Value of $10,000 Investment in the
Credit Suisse Small Cap Core Fund1 Class A shares2 and Class B shares2,
the Standard & Poor's SmallCap 600® Index3, the Russell 2000® Index3 and
the Russell 2000® Value Index3 for Ten Years.
16
Credit Suisse Small Cap Core Fund
Annual Investment Adviser's Report (continued)
October 31, 2007 (unaudited)
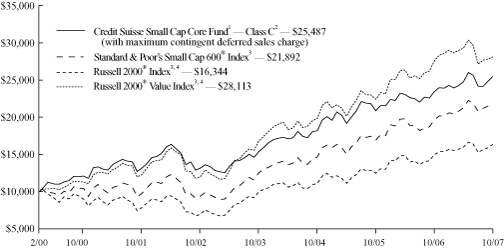
Comparison of Change in Value of $10,000 Investment in the
Credit Suisse Small Cap Core Fund1 Class C shares2, the Standard &
Poor's SmallCap 600® Index3,5, the Russell 2000® Index3,5 and the
Russell 2000® Value Index3,5 from Inception (2/28/00).
Average Annual Returns as of September 30, 20071
1 Year | 5 Years | 10 Years | Since Inception | ||||||||||||||||
| Common Class | 10.69 | % | 14.84 | % | — | 12.21 | % | ||||||||||||
| Class A Without Sales Charge | 10.68 | % | 14.84 | % | 9.09 | % | — | ||||||||||||
| Class A With Maximum Sales Charge | 4.30 | % | 13.49 | % | 8.45 | % | — | ||||||||||||
| Class B Without CDSC | 9.83 | % | 13.99 | % | 8.27 | % | — | ||||||||||||
| Class B With CDSC | 6.19 | % | 13.99 | % | 8.27 | % | — | ||||||||||||
| Class C Without CDSC | 9.83 | % | 13.97 | % | — | 12.72 | % | ||||||||||||
| Class C With CDSC | 8.92 | % | 13.97 | % | — | 12.72 | % | ||||||||||||
17
Credit Suisse Small Cap Core Fund
Annual Investment Adviser's Report (continued)
October 31, 2007 (unaudited)
Average Annual Returns as of October 31, 20071
1 Year | 5 Years | 10 Years | Since Inception | ||||||||||||||||
| Common Class | 9.58 | % | 15.00 | % | — | 12.48 | % | ||||||||||||
| Class A Without Sales Charge | 9.61 | % | 15.01 | % | 9.74 | % | — | ||||||||||||
| Class A With Maximum Sales Charge | 3.31 | % | 13.65 | % | 9.09 | % | — | ||||||||||||
| Class B Without CDSC | 8.74 | % | 14.15 | % | 8.91 | % | — | ||||||||||||
| Class B With CDSC | 5.14 | % | 14.15 | % | 8.91 | % | — | ||||||||||||
| Class C Without CDSC | 8.74 | % | 14.14 | % | — | 12.97 | % | ||||||||||||
| Class C With CDSC | 7.84 | % | 14.14 | % | — | 12.97 | % | ||||||||||||
Returns represent past performance and include change in share price and reinvestment of dividends and capital gains. Past performance cannot guarantee future results. The current performance of the Fund may be lower or higher than the figures shown. Returns and share price will fluctuate, and redemption value may be more or less than original cost. The performance results do not reflect the deduction of taxes that a shareholder would pay on fund distributions or the redemption of fund shares. Performance information current to the most recent month-end is available at www.credit-suisse.com/us
1 Fee waivers and/or expense reimbursements may reduce expenses for the Fund, without which performance would be lower. Waivers and/or reimbursements may be discontinued at any time.
2 Total return for the Fund's Class A Shares for the reporting period, based on offering price (including maximum sales charge of 5.75%), was 3.31%. Total return for the Fund's Class B Shares for the reporting period, based on redemption value (including maximum contingent deferred sales charge of 4%), was 5.14%. Total return for the Fund's Class C Shares for the reporting period, based on redemption value (including maximum contingent deferred sales charge of 1%), was 7.84%.
3 The Standard & Poor's SmallCap 600® Index is an unmanaged market weighted index of 600 U.S. stocks selected on the basis of capitalization, liquidity and industry group representation. It is a registered trademark of The McGraw-Hill Co., Inc. The Standard & Poor's SmallCap 600® Index became the Fund's benchmark index on December 1, 2006 in connection with the change in the Fund's investment stragegy. The Russell 2000® Index measures the performance of the 2,000 smallest companies in the Russell 3000® Index, which represents approximately 8% of the total market capitalization of the Russell 3000® Index. The Russell 2000® Value Index measures the perfomance of those companies in the Russell 2000® Index with lower price-to-book ratios and lower forecasted growth values. The Russell 2000® Index a nd the Russell 2000® Value Index are unmanaged indices of common stocks the include reinvestment of dividends and are compiled by Frank Russell Company. Investors cannot invest directly in an index.
4 Performance for the benchmark is not available for the period beginning February 28, 2000. For that reason, performance of the benchmark is shown from March 1, 2000.
18
Credit Suisse Small Cap Core Fund
Annual Investment Adviser's Report (continued)
October 31, 2007 (unaudited)
Information About Your Fund's Expenses
As an investor of the Fund, you incur two types of costs: ongoing expenses and transaction costs. Ongoing expenses include management fees, distribution and service (12b-1) fees and other Fund expenses. Examples of transaction costs include sales charges (loads), redemption fees and account maintenance fees, which are not shown in this section and which would result in higher total expenses. The following table is intended to help you understand your ongoing expenses of investing in the Fund and to help you compare these expenses with the ongoing expenses of investing in other mutual funds. The table is based on an investment of $1,000 made at the beginning of the six month period ended October 31, 2007.
The table illustrates your Fund's expenses in two ways:
• Actual Fund Return. This helps you estimate the actual dollar amount of ongoing expenses paid on a $1,000 investment in the Fund using the Fund's actual return during the period. To estimate the expenses you paid over the period, simply divide your account value by $1,000 (for example, an $8,600 account value divided by $1,000 = 8.6), then multiply the result by the number in the "Expenses Paid per $1,000" line under the share class you hold.
• Hypothetical 5% Fund Return. This helps you to compare your Fund's ongoing expenses with those of other mutual funds using the Fund's actual expense ratio and a hypothetical rate of return of 5% per year before expenses. Examples using a 5% hypothetical fund return may be found in the shareholder reports of other mutual funds. The hypothetical account values and expenses may not be used to estimate the actual ending account balance or expenses you paid for the period.
Please note that the expenses shown in these tables are meant to highlight your ongoing expenses only and do not reflect any transaction costs, such as sales charges (loads) or redemption fees. If these transaction costs had been included, your costs would have been higher. The "Expenses Paid per $1,000" line of the tables is useful in comparing ongoing expenses only and will not help you determine the relative total expenses of owning different funds.
19
Credit Suisse Small Cap Core Fund
Annual Investment Adviser's Report (continued)
October 31, 2007 (unaudited)
Expenses and Value of a $1,000 Investment
for the six month period ended October 31, 2007
| Actual Fund Return | Common Class | Class A | Class B | Class C | |||||||||||||||
| Beginning Account Value 5/1/07 | $ | 1,000.00 | $ | 1,000.00 | $ | 1,000.00 | $ | 1,000.00 | |||||||||||
| Ending Account Value 10/31/07 | $ | 1,033.70 | $ | 1,033.40 | $ | 1,029.50 | $ | 1,029.50 | |||||||||||
| Expenses Paid per $1,000* | $ | 6.87 | $ | 6.87 | $ | 10.69 | $ | 10.69 | |||||||||||
| Hypothetical 5% Fund Return | |||||||||||||||||||
| Beginning Account Value 5/1/07 | $ | 1,000.00 | $ | 1,000.00 | $ | 1,000.00 | $ | 1,000.00 | |||||||||||
| Ending Account Value 10/31/07 | $ | 1,018.45 | $ | 1,018.45 | $ | 1,014.67 | $ | 1,014.67 | |||||||||||
| Expenses Paid per $1,000* | $ | 6.82 | $ | 6.82 | $ | 10.61 | $ | 10.61 | |||||||||||
| Common Class | Class A | Class B | Class C | ||||||||||||||||
| Annualized Expense Ratios* | 1.34 | % | 1.34 | % | 2.09 | % | 2.09 | % | |||||||||||
* Expenses are equal to the Fund's annualized expense ratio for each share class, multiplied by the average account value over the period, multiplied by the number of days in the most recent fiscal half year period, then divided by 365.
The "Expenses Paid per $1,000" and the "Annualized Expense Ratios" in the tables are based on actual expenses paid by the Fund during the period, net of fee waivers and/or expense reimbursements. If those fee waivers and/or expense reimbursements had not been in effect, the Fund's actual expenses would have been higher.
For more information, please refer to the Fund's prospectus.
20
Credit Suisse Small Cap Core Fund
Annual Investment Adviser's Report (continued)
October 31, 2007 (unaudited)
SECTOR BREAKDOWN*
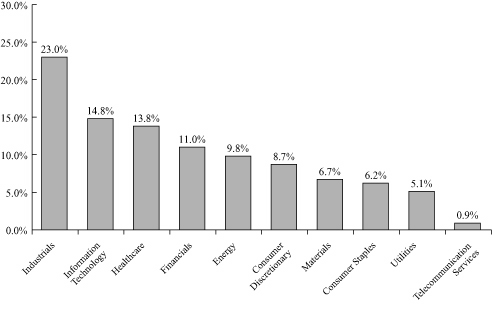
* Expressed as a percentage of total investments (excluding security lending collateral) and may vary over time.
21
Credit Suisse Large Cap Value Fund
Schedule of Investments
October 31, 2007
| Number of Shares | Value | ||||||||||
| COMMON STOCKS (99.7%) | |||||||||||
| Aerospace & Defense (2.0%) | |||||||||||
| Boeing Co. | 17,300 | $ | 1,705,607 | ||||||||
| L-3 Communications Holdings, Inc. | 17,700 | 1,940,628 | |||||||||
| Raytheon Co. | 34,800 | 2,213,628 | |||||||||
| 5,859,863 | |||||||||||
| Air Freight & Couriers (0.3%) | |||||||||||
| FedEx Corp. | 8,300 | 857,722 | |||||||||
| Airlines (0.2%) | |||||||||||
| UAL Corp.*§ | 13,400 | 641,860 | |||||||||
| Auto Components (1.0%) | |||||||||||
| Autoliv, Inc. | 29,500 | 1,863,810 | |||||||||
| BorgWarner, Inc. | 11,400 | 1,205,094 | |||||||||
| 3,068,904 | |||||||||||
| Automobiles (0.7%) | |||||||||||
| Hertz Global Holdings, Inc.*§ | 31,200 | 676,416 | |||||||||
| Thor Industries, Inc. | 33,100 | 1,588,800 | |||||||||
| 2,265,216 | |||||||||||
| Banks (7.4%) | |||||||||||
| Bank of America Corp. | 150,949 | 7,287,818 | |||||||||
| Bank of New York Mellon Corp. | 26,500 | 1,294,525 | |||||||||
| Marshall & Ilsley Corp.§ | 9,600 | 409,920 | |||||||||
| PNC Financial Services Group, Inc. | 30,000 | 2,164,800 | |||||||||
| Synovus Financial Corp.§ | 64,600 | 1,702,856 | |||||||||
| U.S. Bancorp | 18,000 | 596,880 | |||||||||
| Wachovia Corp. | 44,800 | 2,048,704 | |||||||||
| Washington Mutual, Inc.§ | 18,200 | 507,416 | |||||||||
| Wells Fargo & Co. | 176,900 | 6,016,369 | |||||||||
| 22,029,288 | |||||||||||
| Beverages (1.3%) | |||||||||||
| Coca-Cola Co. | 5,200 | 321,152 | |||||||||
| Pepsi Bottling Group, Inc. | 47,500 | 2,046,300 | |||||||||
| PepsiAmericas, Inc. | 39,500 | 1,410,940 | |||||||||
| 3,778,392 | |||||||||||
| Chemicals (1.1%) | |||||||||||
| Dow Chemical Co. | 36,800 | 1,657,472 | |||||||||
| Lubrizol Corp. | 18,800 | 1,276,144 | |||||||||
| Rohm and Haas Co.§ | 6,800 | 352,784 | |||||||||
| 3,286,400 | |||||||||||
| Commercial Services & Supplies (1.0%) | |||||||||||
| Con-way, Inc. | 29,600 | 1,261,256 | |||||||||
| Steelcase, Inc. Class A§ | 89,500 | 1,599,365 | |||||||||
| 2,860,621 | |||||||||||
See Accompanying Notes to Financial Statements.
22
Credit Suisse Large Cap Value Fund
Schedule of Investments (continued)
October 31, 2007
| Number of Shares | Value | ||||||||||
| COMMON STOCKS | |||||||||||
| Commingled Fund (1.0%) | |||||||||||
| iShares Russell 1000 Value Index Fund | 34,400 | $ | 2,960,120 | ||||||||
| Computers & Peripherals (0.8%) | |||||||||||
| Dell, Inc.* | 16,400 | 501,840 | |||||||||
| Western Digital Corp.* | 69,100 | 1,791,072 | |||||||||
| 2,292,912 | |||||||||||
| Diversified Financials (12.7%) | |||||||||||
| AmeriCredit Corp.*§ | 15,200 | 214,472 | |||||||||
| Ameriprise Financial, Inc. | 18,400 | 1,158,832 | |||||||||
| Capital One Financial Corp. | 4,300 | 282,037 | |||||||||
| Citigroup, Inc. | 192,800 | 8,078,320 | |||||||||
| Countrywide Financial Corp.§ | 46,600 | 723,232 | |||||||||
| Eaton Vance Corp.§ | 42,000 | 2,101,260 | |||||||||
| Fannie Mae | 15,500 | 884,120 | |||||||||
| First Marblehead Corp.§ | 16,600 | 644,578 | |||||||||
| Freddie Mac | 9,000 | 470,070 | |||||||||
| Goldman Sachs Group, Inc. | 9,100 | 2,256,072 | |||||||||
| JPMorgan Chase & Co. | 170,800 | 8,027,600 | |||||||||
| Legg Mason, Inc. | 13,800 | 1,144,572 | |||||||||
| Lehman Brothers Holdings, Inc. | 19,800 | 1,254,132 | |||||||||
| Merrill Lynch & Company, Inc. | 47,500 | 3,135,950 | |||||||||
| Morgan Stanley | 64,400 | 4,331,544 | |||||||||
| State Street Corp. | 27,000 | 2,153,790 | |||||||||
| Western Union Co. | 47,800 | 1,053,512 | |||||||||
| 37,914,093 | |||||||||||
| Diversified Telecommunication Services (6.2%) | |||||||||||
| AT&T, Inc. | 216,505 | 9,047,744 | |||||||||
| CenturyTel, Inc. | 22,400 | 986,720 | |||||||||
| Qwest Communications International, Inc.*§ | 149,900 | 1,076,282 | |||||||||
| Sprint Nextel Corp. | 18,200 | 311,220 | |||||||||
| Verizon Communications, Inc. | 152,800 | 7,039,496 | |||||||||
| 18,461,462 | |||||||||||
| Electric Utilities (4.6%) | |||||||||||
| Alliant Energy Corp. | 49,100 | 1,964,000 | |||||||||
| Constellation Energy Group | 16,600 | 1,572,020 | |||||||||
| DTE Energy Co. | 40,500 | 2,008,800 | |||||||||
| Edison International | 12,800 | 744,320 | |||||||||
| FirstEnergy Corp. | 36,600 | 2,551,020 | |||||||||
| FPL Group, Inc. | 6,500 | 444,730 | |||||||||
| Pepco Holdings, Inc. | 60,800 | 1,732,192 | |||||||||
| Public Service Enterprise Group, Inc. | 28,500 | 2,724,600 | |||||||||
| 13,741,682 | |||||||||||
| Electronic Equipment & Instruments (0.5%) | |||||||||||
| Avnet, Inc.* | 33,000 | 1,376,760 | |||||||||
See Accompanying Notes to Financial Statements.
23
Credit Suisse Large Cap Value Fund
Schedule of Investments (continued)
October 31, 2007
| Number of Shares | Value | ||||||||||
| COMMON STOCKS | |||||||||||
| Energy Equipment & Services (0.6%) | |||||||||||
| ENSCO International, Inc. | 30,200 | $ | 1,675,798 | ||||||||
| Food & Drug Retailing (1.4%) | |||||||||||
| Kroger Co. | 63,300 | 1,860,387 | |||||||||
| Safeway, Inc. | 67,200 | 2,284,800 | |||||||||
| 4,145,187 | |||||||||||
| Food Products (0.8%) | |||||||||||
| Corn Products International, Inc. | 37,800 | 1,608,012 | |||||||||
| Kellogg Co. | 5,500 | 290,345 | |||||||||
| Kraft Foods, Inc. Class A | 14,200 | 474,422 | |||||||||
| 2,372,779 | |||||||||||
| Gas Utilities (0.2%) | |||||||||||
| UGI Corp. | 18,600 | 495,132 | |||||||||
| Healthcare Equipment & Supplies (0.2%) | |||||||||||
| Baxter International, Inc. | 5,400 | 324,054 | |||||||||
| Kinetic Concepts, Inc.*§ | 4,700 | 282,470 | |||||||||
| 606,524 | |||||||||||
| Healthcare Providers & Services (2.0%) | |||||||||||
| Aetna, Inc. | 20,500 | 1,151,485 | |||||||||
| Coventry Health Care, Inc.* | 27,700 | 1,670,587 | |||||||||
| Humana, Inc.* | 24,700 | 1,851,265 | |||||||||
| WellPoint, Inc.* | 15,900 | 1,259,757 | |||||||||
| 5,933,094 | |||||||||||
| Hotels, Restaurants & Leisure (0.2%) | |||||||||||
| McDonald's Corp. | 8,900 | 531,330 | |||||||||
| Household Durables (0.8%) | |||||||||||
| American Greetings Corp. Class A§ | 17,300 | 455,682 | |||||||||
| NVR, Inc.*§ | 1,100 | 523,325 | |||||||||
| Whirlpool Corp.§ | 18,600 | 1,472,748 | |||||||||
| 2,451,755 | |||||||||||
| Household Products (2.4%) | |||||||||||
| Clorox Co. | 29,600 | 1,852,072 | |||||||||
| Procter & Gamble Co. | 78,400 | 5,450,368 | |||||||||
| 7,302,440 | |||||||||||
| Industrial Conglomerates (5.4%) | |||||||||||
| 3M Co. | 3,300 | 284,988 | |||||||||
| General Electric Co. | 321,100 | 13,216,476 | |||||||||
| Honeywell International, Inc. | 5,200 | 314,132 | |||||||||
| Tyco International, Ltd. | 57,300 | 2,359,041 | |||||||||
| 16,174,637 | |||||||||||
See Accompanying Notes to Financial Statements.
24
Credit Suisse Large Cap Value Fund
Schedule of Investments (continued)
October 31, 2007
| Number of Shares | Value | ||||||||||
| COMMON STOCKS | |||||||||||
| Insurance (10.5%) | |||||||||||
| ACE, Ltd. | 5,100 | $ | 309,111 | ||||||||
| Aflac, Inc. | 31,000 | 1,946,180 | |||||||||
| Allstate Corp. | 22,900 | 1,199,960 | |||||||||
| American Financial Group, Inc. | 48,150 | 1,439,685 | |||||||||
| American International Group, Inc. | 64,500 | 4,071,240 | |||||||||
| Aon Corp.§ | 15,200 | 688,864 | |||||||||
| Assurant, Inc.§ | 23,800 | 1,390,872 | |||||||||
| Endurance Specialty Holdings, Ltd. | 47,900 | 1,878,159 | |||||||||
| Genworth Financial, Inc. Class A | 17,200 | 469,560 | |||||||||
| Hartford Financial Services Group, Inc. | 3,300 | 320,199 | |||||||||
| HCC Insurance Holdings, Inc. | 29,700 | 887,733 | |||||||||
| Lincoln National Corp. | 4,800 | 299,376 | |||||||||
| Loews Corp. | 52,000 | 2,552,680 | |||||||||
| MetLife, Inc. | 4,400 | 302,940 | |||||||||
| PartnerRe, Ltd.§ | 22,900 | 1,906,425 | |||||||||
| Prudential Financial, Inc. | 30,700 | 2,969,304 | |||||||||
| Reinsurance Group of America, Inc.§ | 27,000 | 1,542,510 | |||||||||
| RenaissanceRe Holdings, Ltd. | 30,700 | 1,791,038 | |||||||||
| Torchmark Corp. | 30,400 | 1,980,864 | |||||||||
| Travelers Companies, Inc. | 6,900 | 360,249 | |||||||||
| W.R. Berkley Corp. | 29,900 | 899,691 | |||||||||
| XL Capital, Ltd. Class A | 27,900 | 2,007,405 | |||||||||
| 31,214,045 | |||||||||||
| Internet & Catalog Retail (0.1%) | |||||||||||
| NutriSystem, Inc.*§ | 7,600 | 228,760 | |||||||||
| IT Consulting & Services (1.6%) | |||||||||||
| Accenture, Ltd. Class A | 40,100 | 1,565,905 | |||||||||
| Computer Sciences Corp.*§ | 34,900 | 2,037,811 | |||||||||
| Electronic Data Systems Corp. | 58,900 | 1,271,651 | |||||||||
| 4,875,367 | |||||||||||
| Leisure Equipment & Products (0.6%) | |||||||||||
| Eastman Kodak Co.§ | 59,000 | 1,690,940 | |||||||||
| Machinery (1.5%) | |||||||||||
| AGCO Corp.* | 5,700 | 340,176 | |||||||||
| ITT Corp. | 4,800 | 321,216 | |||||||||
| Kennametal, Inc. | 14,800 | 1,349,908 | |||||||||
| Parker Hannifin Corp. | 29,700 | 2,386,989 | |||||||||
| 4,398,289 | |||||||||||
| Media (2.9%) | |||||||||||
| Comcast Corp. Class A*§ | 40,000 | 842,000 | |||||||||
| CTC Media, Inc.*§ | 12,900 | 323,661 | |||||||||
| News Corp. Class A | 72,300 | 1,566,741 | |||||||||
| Regal Entertainment Group Class A§ | 74,800 | 1,688,236 | |||||||||
| Time Warner, Inc. | 121,500 | 2,218,590 | |||||||||
| Walt Disney Co. | 60,900 | 2,108,967 | |||||||||
| 8,748,195 | |||||||||||
See Accompanying Notes to Financial Statements.
25
Credit Suisse Large Cap Value Fund
Schedule of Investments (continued)
October 31, 2007
| Number of Shares | Value | ||||||||||
| COMMON STOCKS | |||||||||||
| Metals & Mining (1.2%) | |||||||||||
| Alcoa, Inc. | 27,500 | $ | 1,088,725 | ||||||||
| Nucor Corp. | 39,000 | 2,418,780 | |||||||||
| 3,507,505 | |||||||||||
| Oil & Gas (16.0%) | |||||||||||
| Apache Corp. | 6,400 | 664,384 | |||||||||
| Chevron Corp. | 102,900 | 9,416,379 | |||||||||
| Cimarex Energy Co.§ | 16,500 | 668,415 | |||||||||
| ConocoPhillips | 68,700 | 5,836,752 | |||||||||
| Continental Resources, Inc.*§ | 14,400 | 338,544 | |||||||||
| Devon Energy Corp. | 15,400 | 1,438,360 | |||||||||
| Exxon Mobil Corp. | 195,600 | 17,993,244 | |||||||||
| Hess Corp. | 34,000 | 2,434,740 | |||||||||
| Marathon Oil Corp. | 55,500 | 3,281,715 | |||||||||
| Murphy Oil Corp. | 18,700 | 1,376,881 | |||||||||
| Occidental Petroleum Corp. | 57,900 | 3,997,995 | |||||||||
| Valero Energy Corp. | 4,600 | 323,978 | |||||||||
| 47,771,387 | |||||||||||
| Paper & Forest Products (0.8%) | |||||||||||
| International Paper Co. | 63,600 | 2,350,656 | |||||||||
| Pharmaceuticals (5.8%) | |||||||||||
| Eli Lilly and Co. | 5,200 | 281,580 | |||||||||
| Johnson & Johnson | 46,200 | 3,010,854 | |||||||||
| King Pharmaceuticals, Inc.* | 55,100 | 584,060 | |||||||||
| Merck & Company, Inc. | 31,900 | 1,858,494 | |||||||||
| Pfizer, Inc. | 343,300 | 8,448,613 | |||||||||
| Schering-Plough Corp. | 43,000 | 1,312,360 | |||||||||
| Watson Pharmaceuticals, Inc.*§ | 54,000 | 1,650,240 | |||||||||
| 17,146,201 | |||||||||||
| Real Estate (0.1%) | |||||||||||
| Jones Lang LaSalle, Inc.§ | 4,200 | 400,386 | |||||||||
| Road & Rail (0.5%) | |||||||||||
| Union Pacific Corp. | 11,400 | 1,459,656 | |||||||||
| Semiconductor Equipment & Products (1.1%) | |||||||||||
| Intel Corp. | 58,400 | 1,570,960 | |||||||||
| Teradyne, Inc.* | 117,700 | 1,452,418 | |||||||||
| Texas Instruments, Inc. | 10,400 | 339,040 | |||||||||
| 3,362,418 | |||||||||||
| Specialty Retail (0.4%) | |||||||||||
| Sherwin-Williams Co. | 18,800 | 1,201,696 | |||||||||
| Textiles & Apparel (0.1%) | |||||||||||
| Nike, Inc. Class B | 4,900 | 324,674 | |||||||||
See Accompanying Notes to Financial Statements.
26
Credit Suisse Large Cap Value Fund
Schedule of Investments (continued)
October 31, 2007
| Number of Shares | Value | ||||||||||
| COMMON STOCKS | |||||||||||
| Tobacco (1.6%) | |||||||||||
| Altria Group, Inc. | 12,700 | $ | 926,211 | ||||||||
| Loews Corp.- Carolina Group | 22,400 | 1,921,472 | |||||||||
| UST, Inc.§ | 35,700 | 1,903,524 | |||||||||
| 4,751,207 | |||||||||||
| Wireless Telecommunication Services (0.1%) | |||||||||||
| United States Cellular Corp.*§ | 3,100 | 291,865 | |||||||||
| TOTAL COMMON STOCKS (Cost $256,394,261) | 296,807,218 | ||||||||||
| SHORT-TERM INVESTMENTS (10.0%) | |||||||||||
| State Street Navigator Prime Portfolio§§ | 28,827,223 | 28,827,223 | |||||||||
| Par (000) | |||||||||||
| State Street Bank and Trust Co. Euro Time Deposit, 3.600%, 11/01/07 | $ | 835 | 835,000 | ||||||||
| TOTAL SHORT-TERM INVESTMENTS (Cost $29,662,223) | 29,662,223 | ||||||||||
| TOTAL INVESTMENTS AT VALUE (109.7%) (Cost $286,056,484) | 326,469,441 | ||||||||||
| LIABILITIES IN EXCESS OF OTHER ASSETS (-9.7%) | (28,972,059 | ) | |||||||||
| NET ASSETS (100.0%) | $ | 297,497,382 | |||||||||
* Non-income producing security.
§ Security or portion thereof is out on loan.
§§ Represents security purchased with cash collateral received for securities on loan.
See Accompanying Notes to Financial Statements.
27
Credit Suisse Small Cap Core Fund
Schedule of Investments
October 31, 2007
| Number of Shares | Value | ||||||||||
| COMMON STOCKS (99.8%) | |||||||||||
| Aerospace & Defense (2.1%) | |||||||||||
| Cubic Corp.§ | 49,800 | $ | 2,241,000 | ||||||||
| Curtiss-Wright Corp. | 52,900 | 2,977,741 | |||||||||
| 5,218,741 | |||||||||||
| Airlines (0.5%) | |||||||||||
| Alaska Air Group, Inc.* | 9,700 | 246,380 | |||||||||
| Republic Airways Holdings, Inc.* | 11,500 | 244,835 | |||||||||
| SkyWest, Inc. | 26,300 | 717,727 | |||||||||
| 1,208,942 | |||||||||||
| Auto Components (1.2%) | |||||||||||
| American Axle & Manufacturing Holdings, Inc.§ | 29,400 | 807,324 | |||||||||
| Cooper Tire & Rubber Co. | 57,300 | 1,276,644 | |||||||||
| Lear Corp.* | 27,600 | 980,628 | |||||||||
| 3,064,596 | |||||||||||
| Banks (4.5%) | |||||||||||
| 1st Source Corp. | 5,600 | 107,744 | |||||||||
| BancFirst Corp. | 2,800 | 127,232 | |||||||||
| Banco Latinoamericano de Exportaciones SA | 13,800 | 268,686 | |||||||||
| Boston Private Financial Holdings, Inc. | 15,800 | 454,408 | |||||||||
| Cathay General Bancorp§ | 3,800 | 117,686 | |||||||||
| Central Pacific Financial Corp.§ | 26,200 | 587,666 | |||||||||
| Citizens Republic Bancorp, Inc.§ | 13,400 | 203,948 | |||||||||
| Community Bank System, Inc.§ | 19,200 | 401,472 | |||||||||
| East West Bancorp, Inc. | 39,800 | 1,342,852 | |||||||||
| First BanCorp. | 70,600 | 620,574 | |||||||||
| First Community Bancorp§ | 4,400 | 214,280 | |||||||||
| FirstFed Financial Corp.*§ | 6,200 | 265,236 | |||||||||
| Hanmi Financial Corp.§ | 27,900 | 307,458 | |||||||||
| Pacific Capital Bancorp | 9,900 | 205,227 | |||||||||
| Prosperity Bancshares, Inc.§ | 15,600 | 504,192 | |||||||||
| Provident Bankshares Corp.§ | 13,700 | 337,979 | |||||||||
| Santander BanCorp | 9,200 | 126,040 | |||||||||
| South Financial Group, Inc.§ | 31,000 | 640,460 | |||||||||
| Sterling Bancshares, Inc.§ | 32,350 | 394,670 | |||||||||
| Sterling Financial Corp.§ | 30,600 | 688,500 | |||||||||
| Susquehanna Bancshares, Inc.§ | 22,000 | 443,740 | |||||||||
| SVB Financial Group*§ | 13,100 | 678,449 | |||||||||
| Umpqua Holdings Corp.§ | 50,700 | 858,351 | |||||||||
| United Community Banks, Inc.§ | 27,300 | 604,422 | |||||||||
| Whitney Holding Corp. | 30,700 | 787,762 | |||||||||
| 11,289,034 | |||||||||||
| Beverages (0.6%) | |||||||||||
| Boston Beer Company, Inc. Class A* | 27,000 | 1,410,750 | |||||||||
See Accompanying Notes to Financial Statements.
28
Credit Suisse Small Cap Core Fund
Schedule of Investments (continued)
October 31, 2007
| Number of Shares | Value | ||||||||||
| COMMON STOCKS | |||||||||||
| Biotechnology (3.8%) | |||||||||||
| Acorda Therapeutics, Inc.*§ | 24,700 | $ | 500,669 | ||||||||
| Albany Molecular Research, Inc.* | 28,800 | 520,992 | |||||||||
| BioMarin Pharmaceutical, Inc.* | 48,500 | 1,344,905 | |||||||||
| IDEXX Laboratories, Inc.* | 23,800 | 2,898,364 | |||||||||
| Isis Pharmaceuticals, Inc.*§ | 43,100 | 759,422 | |||||||||
| LifeCell Corp.*§ | 14,900 | 656,494 | |||||||||
| Martek Biosciences Corp.*§ | 13,800 | 421,590 | |||||||||
| Onyx Pharmaceuticals, Inc.* | 11,800 | 551,178 | |||||||||
| Savient Pharmaceuticals, Inc.*§ | 43,200 | 608,256 | |||||||||
| Seattle Genetics, Inc.* | 40,500 | 486,405 | |||||||||
| ViroPharma, Inc.*§ | 90,300 | 777,483 | |||||||||
| 9,525,758 | |||||||||||
| Building Products (0.2%) | |||||||||||
| Apogee Enterprises, Inc. | 12,200 | 287,066 | |||||||||
| Drew Industries, Inc.* | 8,400 | 332,472 | |||||||||
| 619,538 | |||||||||||
| Chemicals (2.6%) | |||||||||||
| Calgon Carbon Corp.*§ | 33,400 | 497,660 | |||||||||
| CF Industries Holdings, Inc. | 24,700 | 2,171,130 | |||||||||
| H.B. Fuller Co. | 10,200 | 300,186 | |||||||||
| Olin Corp. | 23,400 | 533,052 | |||||||||
| OM Group, Inc.* | 36,300 | 1,923,174 | |||||||||
| Valhi, Inc.§ | 18,900 | 504,441 | |||||||||
| W.R. Grace & Co.*§ | 16,600 | 491,360 | |||||||||
| 6,421,003 | |||||||||||
| Commercial Services & Supplies (5.0%) | |||||||||||
| Advance America Cash Advance Centers, Inc. | 24,000 | 229,440 | |||||||||
| Arbitron, Inc. | 13,000 | 658,060 | |||||||||
| Atlas Air Worldwide Holdings, Inc.*§ | 21,500 | 1,259,685 | |||||||||
| Bally Technologies, Inc.* | 6,800 | 274,244 | |||||||||
| Bowne & Company, Inc. | 11,500 | 199,870 | |||||||||
| Bristow Group, Inc.*§ | 10,300 | 513,867 | |||||||||
| Convergys Corp.* | 27,500 | 504,075 | |||||||||
| CSG Systems International, Inc.* | 21,500 | 441,395 | |||||||||
| Deluxe Corp. | 17,100 | 689,814 | |||||||||
| DeVry, Inc. | 27,900 | 1,525,851 | |||||||||
| DynCorp International, Inc. Class A* | 37,300 | 844,472 | |||||||||
| FactSet Research Systems, Inc. | 18,500 | 1,304,620 | |||||||||
| Koppers Holdings, Inc. | 11,200 | 501,760 | |||||||||
| Labor Ready, Inc.*§ | 21,300 | 374,454 | |||||||||
| Pre-Paid Legal Services, Inc.*§ | 16,500 | 983,400 | |||||||||
| Sotheby's | 16,500 | 893,805 | |||||||||
| Spherion Corp.* | 25,800 | 224,976 | |||||||||
| Strayer Education, Inc. | 5,900 | �� | 1,100,114 | ||||||||
| 12,523,902 | |||||||||||
See Accompanying Notes to Financial Statements.
29
Credit Suisse Small Cap Core Fund
Schedule of Investments (continued)
October 31, 2007
| Number of Shares | Value | ||||||||||
| COMMON STOCKS | |||||||||||
| Communications Equipment (1.4%) | |||||||||||
| C-COR, Inc.* | 65,100 | $ | 798,126 | ||||||||
| Comtech Telecommunications Corp.*§ | 32,500 | 1,763,125 | |||||||||
| CPI International, Inc.*§ | 14,300 | 290,576 | |||||||||
| Emulex Corp.* | 23,200 | 502,512 | |||||||||
| Plantronics, Inc. | 9,000 | 246,150 | |||||||||
| 3,600,489 | |||||||||||
| Computers & Peripherals (0.5%) | |||||||||||
| Novatel Wireless, Inc.*§ | 37,200 | 967,200 | |||||||||
| Sigma Designs, Inc.* | 2,600 | 152,802 | |||||||||
| Smart Modular Technologies, Inc.* | 16,000 | 141,440 | |||||||||
| 1,261,442 | |||||||||||
| Construction & Engineering (3.1%) | |||||||||||
| EMCOR Group, Inc.* | 27,100 | 933,053 | |||||||||
| Perini Corp.* | 12,500 | 716,875 | |||||||||
| Shaw Group, Inc.* | 44,700 | 3,334,620 | |||||||||
| URS Corp.* | 31,500 | 1,947,015 | |||||||||
| Washington Group International, Inc.* | 7,900 | 769,065 | |||||||||
| 7,700,628 | |||||||||||
| Containers & Packaging (0.7%) | |||||||||||
| AptarGroup, Inc. | 13,300 | 594,510 | |||||||||
| Myers Industries, Inc. | 13,000 | 275,470 | |||||||||
| Rock-Tenn Co. Class A | 15,900 | 463,644 | |||||||||
| Silgan Holdings, Inc. | 8,700 | 474,759 | |||||||||
| 1,808,383 | |||||||||||
| Diversified Financials (1.1%) | |||||||||||
| CompuCredit Corp.*§ | 10,700 | 213,251 | |||||||||
| GAMCO Investors, Inc. Class A | 5,100 | 315,741 | |||||||||
| Greenhill & Company, Inc.§ | 6,800 | 503,064 | |||||||||
| MCG Capital Corp.§ | 26,900 | 376,869 | |||||||||
| Morningstar, Inc.* | 6,800 | 506,056 | |||||||||
| optionsXpress Holdings, Inc. | 20,100 | 598,176 | |||||||||
| Waddell & Reed Financial, Inc. Class A | 7,700 | 255,794 | |||||||||
| 2,768,951 | |||||||||||
| Diversified Telecommunication Services (0.2%) | |||||||||||
| Premiere Global Services, Inc.* | 31,000 | 510,880 | |||||||||
| Electric Utilities (1.2%) | |||||||||||
| Black Hills Corp.§ | 11,900 | 528,598 | |||||||||
| El Paso Electric Co.* | 41,200 | 1,003,220 | |||||||||
| Ormat Technologies, Inc. | 9,800 | 528,514 | |||||||||
| PNM Resources, Inc. | 11,400 | 285,114 | |||||||||
| Unisource Energy Corp. | 23,800 | 754,936 | |||||||||
| 3,100,382 | |||||||||||
See Accompanying Notes to Financial Statements.
30
Credit Suisse Small Cap Core Fund
Schedule of Investments (continued)
October 31, 2007
| Number of Shares | Value | ||||||||||
| COMMON STOCKS | |||||||||||
| Electrical Equipment (1.8%) | |||||||||||
| Acuity Brands, Inc. | 19,100 | $ | 912,980 | ||||||||
| Belden, Inc.§ | 28,500 | 1,660,695 | |||||||||
| Regal-Beloit Corp. | 13,800 | 676,752 | |||||||||
| Superior Essex, Inc.* | 13,600 | 452,200 | |||||||||
| Woodward Governor Co. | 12,900 | 864,300 | |||||||||
| 4,566,927 | |||||||||||
| Electronic Equipment & Instruments (4.9%) | |||||||||||
| Anixter International, Inc.*§ | 6,900 | 495,765 | |||||||||
| Checkpoint Systems, Inc.* | 16,600 | 502,150 | |||||||||
| Coherent, Inc.* | 13,300 | 436,240 | |||||||||
| FLIR Systems, Inc.*§ | 29,300 | 2,033,127 | |||||||||
| Itron, Inc.* | 12,800 | 1,375,872 | |||||||||
| Littelfuse, Inc.* | 10,200 | 324,666 | |||||||||
| Methode Electronics, Inc.§ | 91,700 | 1,149,918 | |||||||||
| MTS Systems Corp. | 8,200 | 364,818 | |||||||||
| Park Electrochemical Corp.§ | 9,000 | 281,880 | |||||||||
| Plexus Corp.* | 19,900 | 513,420 | |||||||||
| Rofin-Sinar Technologies, Inc.* | 10,600 | 833,372 | |||||||||
| Technitrol, Inc. | 19,100 | 561,731 | |||||||||
| Trimble Navigation, Ltd.* | 52,000 | 2,168,400 | |||||||||
| Varian, Inc.* | 17,500 | 1,293,075 | |||||||||
| 12,334,434 | |||||||||||
| Energy Equipment & Services (4.4%) | |||||||||||
| Atwood Oceanics, Inc.* | 28,100 | 2,367,144 | |||||||||
| Dawson Geophysical Co.*§ | 12,100 | 965,701 | |||||||||
| Dril-Quip, Inc.* | 25,500 | 1,359,915 | |||||||||
| Flotek Industries, Inc.* | 5,300 | 269,240 | |||||||||
| GulfMark Offshore, Inc.*§ | 5,300 | 246,874 | |||||||||
| Lufkin Industries, Inc.§ | 23,400 | 1,391,364 | |||||||||
| NATCO Group, Inc. Class A* | 7,700 | 410,487 | |||||||||
| Oceaneering International, Inc.* | 23,300 | 1,800,391 | |||||||||
| Oil States International, Inc.* | 28,500 | 1,230,915 | |||||||||
| Unit Corp.* | 20,200 | 964,954 | |||||||||
| 11,006,985 | |||||||||||
| Food & Drug Retailing (3.3%) | |||||||||||
| Casey's General Stores, Inc. | 39,700 | 1,131,450 | |||||||||
| Central European Distribution Corp.* | 25,700 | 1,366,726 | |||||||||
| Flowers Foods, Inc. | 34,500 | 756,930 | |||||||||
| Longs Drug Stores Corp. | 26,600 | 1,396,766 | |||||||||
| Nash Finch Co.§ | 12,800 | 479,360 | |||||||||
| Performance Food Group Co.* | 15,200 | 410,248 | |||||||||
| Terra Industries, Inc.*§ | 70,700 | 2,608,123 | |||||||||
| Village Super Market, Inc. Class A§ | 2,394 | 130,688 | |||||||||
| 8,280,291 | |||||||||||
See Accompanying Notes to Financial Statements.
31
Credit Suisse Small Cap Core Fund
Schedule of Investments (continued)
October 31, 2007
| Number of Shares | Value | ||||||||||
| COMMON STOCKS | |||||||||||
| Food Products (1.9%) | |||||||||||
| Cal-Maine Foods, Inc.§ | 28,700 | $ | 687,078 | ||||||||
| Corn Products International, Inc. | 53,200 | 2,263,128 | |||||||||
| Fresh Del Monte Produce, Inc. | 24,000 | 870,720 | |||||||||
| Sanderson Farms, Inc.§ | 21,600 | 751,680 | |||||||||
| USANA Health Sciences, Inc.*§ | 3,600 | 146,916 | |||||||||
| 4,719,522 | |||||||||||
| Gas Utilities (3.7%) | |||||||||||
| Atmos Energy Corp. | 48,000 | 1,346,400 | |||||||||
| Energen Corp. | 62,700 | 4,012,800 | |||||||||
| Southern Union Co. | 55,700 | 1,754,550 | |||||||||
| Southwest Gas Corp. | 27,600 | 821,376 | |||||||||
| UGI Corp. | 47,900 | 1,275,098 | |||||||||
| 9,210,224 | |||||||||||
| Healthcare Equipment & Supplies (5.2%) | |||||||||||
| ArthroCare Corp.*§ | 34,300 | 2,224,012 | |||||||||
| CONMED Corp.* | 20,700 | 588,708 | |||||||||
| Haemonetics Corp.* | 21,500 | 1,104,885 | |||||||||
| Hologic, Inc.* | 44,400 | 3,016,092 | |||||||||
| Immucor, Inc.* | 43,800 | 1,412,550 | |||||||||
| Meridian Bioscience, Inc.§ | 58,099 | 1,922,496 | |||||||||
| Quidel Corp.* | 25,000 | 516,250 | |||||||||
| SurModics, Inc.* | 15,300 | 868,122 | |||||||||
| Ventana Medical Systems, Inc.* | 14,800 | 1,302,400 | |||||||||
| 12,955,515 | |||||||||||
| Healthcare Providers & Services (3.4%) | |||||||||||
| Air Methods Corp.*§ | 14,600 | 787,962 | |||||||||
| Amedisys, Inc.*§ | 10,799 | 458,418 | |||||||||
| Amerigroup Corp.* | 28,900 | 1,011,500 | |||||||||
| AmSurg Corp.* | 13,000 | 343,850 | |||||||||
| Apria Healthcare Group, Inc.* | 7,400 | 178,858 | |||||||||
| Centene Corp.* | 29,200 | 681,236 | |||||||||
| Healthspring, Inc.* | 12,200 | 256,200 | |||||||||
| MedCath Corp.* | 6,100 | 169,153 | |||||||||
| Molina Healthcare, Inc.*§ | 12,200 | 464,942 | |||||||||
| Omnicell, Inc.* | 15,000 | 396,000 | |||||||||
| PARAXEL International Corp.* | 38,700 | 1,780,200 | |||||||||
| Pediatrix Medical Group, Inc.* | 20,900 | 1,368,950 | |||||||||
| Sunrise Senior Living, Inc.*§ | 19,200 | 710,400 | |||||||||
| 8,607,669 | |||||||||||
| Hotels, Restaurants & Leisure (1.3%) | |||||||||||
| CBRL Group, Inc. | 6,200 | 247,380 | |||||||||
| Jack in the Box, Inc.* | 27,300 | 856,401 | |||||||||
| Landry's Restaurants, Inc. | 7,300 | 209,656 | |||||||||
| Monarch Casino & Resort, Inc.* | 46,900 | 1,434,671 | |||||||||
| P.F. Chang's China Bistro, Inc.*§ | 11,600 | 337,676 | |||||||||
| Papa John's International, Inc.* | 10,000 | 233,000 | |||||||||
| 3,318,784 | |||||||||||
See Accompanying Notes to Financial Statements.
32
Credit Suisse Small Cap Core Fund
Schedule of Investments (continued)
October 31, 2007
| Number of Shares | Value | ||||||||||
| COMMON STOCKS | |||||||||||
| Household Durables (0.4%) | |||||||||||
| American Greetings Corp. Class A | 14,100 | $ | 371,394 | ||||||||
| Tempur-Pedic International, Inc.§ | 14,400 | 518,400 | |||||||||
| 889,794 | |||||||||||
| Industrial Conglomerates (0.3%) | |||||||||||
| Chemed Corp.§ | 15,000 | 859,800 | |||||||||
| Insurance (2.9%) | |||||||||||
| Argo Group International Holdings, Ltd.* | 5,800 | 247,138 | |||||||||
| Employers Holdings, Inc. | 12,200 | 233,752 | |||||||||
| IPC Holdings, Ltd.§ | 13,200 | 394,812 | |||||||||
| Max Capital Group, Ltd. | 13,400 | 379,086 | |||||||||
| Navigators Group, Inc.* | 4,600 | 277,380 | |||||||||
| Odyssey Re Holdings Corp. | 10,300 | 382,954 | |||||||||
| Philadelphia Consolidated Holding Corp.* | 37,400 | 1,525,920 | |||||||||
| Phoenix Companies, Inc. | 18,500 | 254,930 | |||||||||
| Platinum Underwriters Holdings, Ltd. | 10,400 | 374,400 | |||||||||
| Presidential Life Corp. | 17,000 | 299,370 | |||||||||
| ProAssurance Corp.* | 14,700 | 810,558 | |||||||||
| Security Capital Assurance, Ltd.§ | 11,300 | 148,256 | |||||||||
| Selective Insurance Group, Inc. | 11,500 | 279,565 | |||||||||
| Triad Guaranty, Inc.*§ | 4,000 | 32,240 | |||||||||
| United Fire & Casualty Co.§ | 12,300 | 394,092 | |||||||||
| Zenith National Insurance Corp. | 27,800 | 1,117,004 | |||||||||
| 7,151,457 | |||||||||||
| Internet & Catalog Retail (0.9%) | |||||||||||
| Blue Nile, Inc.*§ | 6,100 | 482,144 | |||||||||
| Global Sources, Ltd.*§ | 37,200 | 1,205,652 | |||||||||
| Priceline.com, Inc.*§ | 3,300 | 307,230 | |||||||||
| Systemax, Inc.§ | 12,000 | 280,800 | |||||||||
| 2,275,826 | |||||||||||
| Internet Software & Services (1.7%) | |||||||||||
| j2 Global Communications, Inc.* | 21,600 | 727,704 | |||||||||
| Sohu.com, Inc.*§ | 24,300 | 1,455,813 | |||||||||
| United Online, Inc.§ | 84,200 | 1,481,920 | |||||||||
| ValueClick, Inc.* | 19,200 | 522,048 | |||||||||
| 4,187,485 | |||||||||||
| IT Consulting & Services (0.9%) | |||||||||||
| Authorize.Net Holdings, Inc.* | 12,100 | 282,777 | |||||||||
| Phase Forward, Inc.* | 52,300 | 1,244,217 | |||||||||
| SAIC, Inc.* | 19,500 | 384,345 | |||||||||
| Sykes Enterprises, Inc.* | 13,700 | 241,805 | |||||||||
| 2,153,144 | |||||||||||
| Leisure Equipment & Products (0.9%) | |||||||||||
| JAKKS Pacific, Inc.*§ | 34,500 | 914,250 | |||||||||
| Polaris Industries, Inc.§ | 24,900 | 1,224,582 | |||||||||
| 2,138,832 | |||||||||||
See Accompanying Notes to Financial Statements.
33
Credit Suisse Small Cap Core Fund
Schedule of Investments (continued)
October 31, 2007
| Number of Shares | Value | ||||||||||
| COMMON STOCKS | |||||||||||
| Machinery (8.2%) | |||||||||||
| Actuant Corp. Class A | 7,800 | $ | 538,044 | ||||||||
| Applied Industrial Technologies, Inc. | 38,200 | 1,354,190 | |||||||||
| Barnes Group, Inc.§ | 40,700 | 1,494,911 | |||||||||
| Cascade Corp.§ | 4,400 | 277,112 | |||||||||
| Ceradyne, Inc.*§ | 28,800 | 1,970,208 | |||||||||
| Columbus McKinnon Corp.* | 31,400 | 1,041,852 | |||||||||
| Dionex Corp.*§ | 22,400 | 1,971,200 | |||||||||
| EnPro Industries, Inc.*§ | 27,700 | 1,135,977 | |||||||||
| Hurco Companies, Inc.* | 16,300 | 930,730 | |||||||||
| Kaydon Corp.§ | 13,100 | 704,649 | |||||||||
| Manitowoc Company, Inc. | 108,200 | 5,329,932 | |||||||||
| Mueller Industries, Inc. | 38,800 | 1,395,248 | |||||||||
| RBC Bearings, Inc.* | 12,300 | 494,337 | |||||||||
| Robbins & Myers, Inc. | 14,500 | 1,048,350 | |||||||||
| Valmont Industries, Inc. | 10,000 | 957,200 | |||||||||
| 20,643,940 | |||||||||||
| Marine (1.2%) | |||||||||||
| Cal Dive International, Inc.*§ | 34,100 | 451,143 | |||||||||
| Genco Shipping & Trading, Ltd.§ | 24,400 | 1,754,116 | |||||||||
| Golar LNG, Ltd.§ | 29,100 | 756,600 | |||||||||
| 2,961,859 | |||||||||||
| Media (0.3%) | |||||||||||
| Netflix, Inc.* | 9,500 | 251,465 | |||||||||
| Scholastic Corp.* | 13,400 | 530,372 | |||||||||
| 781,837 | |||||||||||
| Metals & Mining (2.8%) | |||||||||||
| Century Aluminum Co.*§ | 34,300 | 1,995,917 | |||||||||
| Cleveland-Cliffs, Inc.§ | 31,600 | 3,022,540 | |||||||||
| GrafTech International, Ltd.* | 28,100 | 531,090 | |||||||||
| Massey Energy Co. | 27,500 | 871,200 | |||||||||
| Quanex Corp.§ | 15,400 | 634,326 | |||||||||
| 7,055,073 | |||||||||||
| Oil & Gas (5.4%) | |||||||||||
| Alon USA Energy, Inc.§ | 21,400 | 786,878 | |||||||||
| Cabot Oil & Gas Corp. | 41,100 | 1,631,259 | |||||||||
| Delek US Holdings, Inc.§ | 60,600 | 1,453,794 | |||||||||
| Exterran Holdings, Inc.*§ | 3,000 | 252,600 | |||||||||
| General Maritime Corp.§ | 18,100 | 510,058 | |||||||||
| Helix Energy Solutions Group, Inc.*§ | 40,300 | 1,863,875 | |||||||||
| Mariner Energy, Inc.* | 52,300 | 1,307,500 | |||||||||
| PetroQuest Energy, Inc.* | 20,100 | 259,290 | |||||||||
| Rosetta Resources, Inc.* | 25,300 | 480,700 | |||||||||
| St. Mary Land & Exploration Co. | 28,000 | 1,186,080 | |||||||||
| Stone Energy Corp.* | 42,800 | 1,908,024 | |||||||||
| Swift Energy Co.*§ | 41,300 | 1,958,859 | |||||||||
| 13,598,917 | |||||||||||
See Accompanying Notes to Financial Statements.
34
Credit Suisse Small Cap Core Fund
Schedule of Investments (continued)
October 31, 2007
| Number of Shares | Value | ||||||||||
| COMMON STOCKS | |||||||||||
| Paper & Forest Products (0.6%) | |||||||||||
| Buckeye Technologies, Inc.* | 58,500 | $ | 1,048,320 | ||||||||
| Potlatch Corp.§ | 10,900 | 519,494 | |||||||||
| 1,567,814 | |||||||||||
| Personal Products (0.2%) | |||||||||||
| Elizabeth Arden, Inc.* | 19,200 | 478,080 | |||||||||
| Pharmaceuticals (1.4%) | |||||||||||
| MGI Pharma, Inc.* | 34,900 | 1,137,042 | |||||||||
| Pharmion Corp.* | 26,400 | 1,270,368 | |||||||||
| Sciele Pharma, Inc.*§ | 45,200 | 1,149,888 | |||||||||
| 3,557,298 | |||||||||||
| Real Estate (2.5%) | |||||||||||
| Alexandria Real Estate Equities, Inc. | 1,200 | 123,768 | |||||||||
| Anthracite Capital, Inc. | 13,000 | 108,160 | |||||||||
| Deerfield Triarc Capital Corp.§ | 28,700 | 274,085 | |||||||||
| Digital Realty Trust, Inc. | 3,700 | 162,763 | |||||||||
| EastGroup Properties, Inc.§ | 10,200 | 486,336 | |||||||||
| Entertainment Properties Trust | 21,600 | 1,185,192 | |||||||||
| Gramercy Capital Corp.§ | 5,100 | 134,487 | |||||||||
| Lexington Realty Trust | 28,600 | 565,994 | |||||||||
| Mid-America Apartment Communities, Inc. | 11,200 | 582,400 | |||||||||
| National Health Investors, Inc.§ | 8,200 | 240,178 | |||||||||
| National Retail Properties, Inc.§ | 60,000 | 1,521,000 | |||||||||
| Pennsylvania Real Estate Investment Trust | 6,500 | 247,975 | |||||||||
| PS Business Parks, Inc. | 7,000 | 408,100 | |||||||||
| Realty Income Corp. | 9,200 | 271,768 | |||||||||
| 6,312,206 | |||||||||||
| Road & Rail (0.5%) | |||||||||||
| Kansas City Southern*§ | 32,400 | 1,253,556 | |||||||||
| Semiconductor Equipment & Products (3.5%) | |||||||||||
| Advanced Energy Industries, Inc.* | 31,300 | 500,800 | |||||||||
| Amkor Technology, Inc.*§ | 58,200 | 659,406 | |||||||||
| Brooks Automation, Inc.* | 28,800 | 373,824 | |||||||||
| Cabot Microelectronics Corp.*§ | 10,300 | 408,704 | |||||||||
| Cymer, Inc.*§ | 31,300 | 1,330,250 | |||||||||
| Diodes, Inc.*§ | 14,000 | 462,840 | |||||||||
| Kulicke and Soffa Industries, Inc.*§ | 38,500 | 291,445 | |||||||||
| MKS Instruments, Inc.* | 54,100 | 1,086,328 | |||||||||
| Monolithic Power Systems, Inc.* | 10,000 | 219,300 | |||||||||
| ON Semiconductor Corp.*§ | 40,100 | 409,020 | |||||||||
| Photronics, Inc.* | 61,200 | 669,528 | |||||||||
| RF Micro Devices, Inc.*§ | 37,300 | 232,006 | |||||||||
| Semtech Corp.* | 12,400 | 212,164 | |||||||||
| Skyworks Solutions, Inc.* | 72,300 | 666,606 | |||||||||
| Varian Semiconductor Equipment Associates, Inc.* | 22,149 | 1,019,297 | |||||||||
| Zoran Corp.* | 12,700 | 323,850 | |||||||||
| 8,865,368 | |||||||||||
See Accompanying Notes to Financial Statements.
35
Credit Suisse Small Cap Core Fund
Schedule of Investments (continued)
October 31, 2007
| Number of Shares | Value | ||||||||||
| COMMON STOCKS | |||||||||||
| Software (1.9%) | |||||||||||
| Aspen Technology, Inc.*§ | 73,700 | $ | 1,285,328 | ||||||||
| Informatica Corp.*§ | 40,100 | 684,908 | |||||||||
| MICROS Systems, Inc.* | 13,900 | 998,298 | |||||||||
| Nuance Communications, Inc.* | 13,300 | 294,063 | |||||||||
| SPSS, Inc.*§ | 31,200 | 1,185,600 | |||||||||
| Sybase, Inc.* | 9,000 | 257,400 | |||||||||
| 4,705,597 | |||||||||||
| Specialty Retail (1.6%) | |||||||||||
| Aeropostale, Inc.* | 31,800 | 728,220 | |||||||||
| Buckle, Inc.§ | 12,100 | 521,510 | |||||||||
| Cato Corp. Class A | 14,300 | 287,144 | |||||||||
| Conn's, Inc.*§ | 4,800 | 122,736 | |||||||||
| Jo-Ann Stores, Inc.* | 11,800 | 227,386 | |||||||||
| Jos. A. Bank Clothiers, Inc.*§ | 8,400 | 245,364 | |||||||||
| Men's Wearhouse, Inc. | 29,200 | 1,233,992 | |||||||||
| Rent-A-Center, Inc.* | 6,700 | 107,200 | |||||||||
| Tractor Supply Co.*§ | 14,900 | 617,456 | |||||||||
| 4,091,008 | |||||||||||
| Textiles & Apparel (2.1%) | |||||||||||
| Crocs, Inc.*§ | 35,000 | 2,616,250 | |||||||||
| Deckers Outdoor Corp.* | 7,500 | 1,048,425 | |||||||||
| Fossil, Inc.* | 26,000 | 976,560 | |||||||||
| Kellwood Co. | 26,200 | 434,134 | |||||||||
| Warnaco Group, Inc.* | 4,900 | 199,381 | |||||||||
| 5,274,750 | |||||||||||
| Tobacco (0.2%) | |||||||||||
| Universal Corp.§ | 5,100 | 248,574 | |||||||||
| Vector Group, Ltd.§ | 10,830 | 236,960 | |||||||||
| 485,534 | |||||||||||
| Water Utilities (0.1%) | |||||||||||
| American States Water Co. | 7,500 | 340,875 | |||||||||
| Wireless Telecommunication Services (0.7%) | |||||||||||
| NTELOS Holdings Corp. | 17,600 | 531,344 | |||||||||
| Syniverse Holdings, Inc.* | 32,900 | 549,101 | |||||||||
| USA Mobility, Inc.* | 44,600 | 697,544 | |||||||||
| 1,777,989 | |||||||||||
| TOTAL COMMON STOCKS (Cost $224,516,239) | 250,441,809 | ||||||||||
See Accompanying Notes to Financial Statements.
36
Credit Suisse Small Cap Core Fund
Schedule of Investments (continued)
October 31, 2007
| Number of Shares | Value | ||||||||||
| SHORT-TERM INVESTMENT (19.6%) | |||||||||||
| State Street Navigator Prime Portfolio§§ (Cost $49,099,007) | 49,099,007 | $ | 49,099,007 | ||||||||
| TOTAL INVESTMENTS AT VALUE (119.4%) (Cost $273,615,246) | 299,540,816 | ||||||||||
| LIABILITIES IN EXCESS OF OTHER ASSETS (-19.4%) | (48,585,716 | ) | |||||||||
| NET ASSETS (100.0%) | $ | 250,955,100 | |||||||||
* Non-income producing security.
§ Security or portion thereof is out on loan.
§§ Represents security purchased with cash collateral received for securities on loan.
See Accompanying Notes to Financial Statements.
37
Credit Suisse Funds
Statements of Assets and Liabilities
October 31, 2007
| Large Cap Value Fund | Small Cap Core Fund | ||||||||||
| Assets | |||||||||||
| Investments at value, including collateral for securities on loan of $28,827,223 and $49,099,007, respectively (Cost $286,056,484 and $273,615,246, respectively) (Note 2) | $ | 326,469,4411 | $ | 299,540,8162 | |||||||
| Cash | 754 | — | |||||||||
| Receivable for investments sold | — | 23,062,666 | |||||||||
| Dividends and interest receivable | 369,244 | 103,077 | |||||||||
| Receivable for fund shares sold | 41,827 | 137,470 | |||||||||
| Prepaid expenses and other assets | 27,438 | 60,746 | |||||||||
| Total Assets | 326,908,704 | 322,904,775 | |||||||||
| Liabilities | |||||||||||
| Advisory fee payable (Note 3) | 127,554 | 150,044 | |||||||||
| Administrative services fee payable (Note 3) | 38,812 | 33,821 | |||||||||
| Shareholder servicing/Distribution fee payable (Note 3) | 71,890 | 69,139 | |||||||||
| Payable upon return of securities loaned (Note 2) | 28,827,223 | 49,099,007 | |||||||||
| Payable for investments purchased | — | 21,215,200 | |||||||||
| Due to custodian | — | 1,074,351 | |||||||||
| Payable for fund shares redeemed | 214,118 | 165,111 | |||||||||
| Trustees' fee payable | 10,269 | 10,269 | |||||||||
| Other accrued expenses payable | 121,456 | 132,733 | |||||||||
| Total Liabilities | 29,411,322 | 71,949,675 | |||||||||
| Net Assets | |||||||||||
| Capital stock, $0.001 par value (Note 6) | 15,443 | 11,285 | |||||||||
| Paid-in capital (Note 6) | 208,816,110 | 143,253,849 | |||||||||
| Undistributed net investment income | 429,852 | — | |||||||||
| Accumulated net realized gain on investments and futures contracts | 47,823,020 | 81,764,396 | |||||||||
| Net unrealized appreciation from investments | 40,412,957 | 25,925,570 | |||||||||
| Net Assets | $ | 297,497,382 | $ | 250,955,100 | |||||||
| Common Shares | |||||||||||
| Net assets | $ | 570,433 | $ | 57,451,551 | |||||||
| Shares outstanding | 29,752 | 2,563,728 | |||||||||
| Net asset value, offering price, and redemption price per share | $ | 19.17 | $ | 22.41 | |||||||
| Advisor Shares | |||||||||||
| Net assets $5,233,858 | N/A | ||||||||||
| Shares outstanding | 270,711 | N/A | |||||||||
| Net asset value, offering price, and redemption price per share | $ | 19.33 | N/A | ||||||||
See Accompanying Notes to Financial Statements.
38
Credit Suisse Funds
Statements of Assets and Liabilities (continued)
October 31, 2007
| Large Cap Value Fund | Small Cap Core Fund | ||||||||||
| A Shares | |||||||||||
| Net assets | $ | 280,329,171 | $ | 169,075,828 | |||||||
| Shares outstanding | 14,541,075 | 7,489,740 | |||||||||
| Net asset value and redemption price per share | $ | 19.28 | $ | 22.57 | |||||||
| Maximum offering price per share (net asset value/(1-5.75%)) | $ | 20.46 | $ | 23.95 | |||||||
| B Shares | |||||||||||
| Net assets | $ | 9,224,225 | $ | 9,122,379 | |||||||
| Shares outstanding | 487,468 | 458,215 | |||||||||
| Net asset value and offering price per share | $ | 18.92 | $ | 19.91 | |||||||
| C Shares | |||||||||||
| Net assets | $ | 2,139,695 | $ | 15,305,342 | |||||||
| Shares outstanding | 113,882 | 773,093 | |||||||||
| Net asset value and offering price per share | $ | 18.79 | $ | 19.80 | |||||||
1 Including $28,145,527 of securities on loan.
2 Including $47,960,839 of securities on loan.
See Accompanying Notes to Financial Statements.
39
Credit Suisse Funds
Statements of Operations
For the Year Ended October 31, 2007
| Large Cap Value Fund | Small Cap Core Fund | ||||||||||
| Investment Income (Note 2) | |||||||||||
| Dividends | $ | 6,752,212 | $ | 2,340,033 | |||||||
| Interest | 87,207 | 203,343 | |||||||||
| Securities lending | 32,560 | 217,152 | |||||||||
| Net investment gain allocated from partnership | — | 4,258 | |||||||||
| Foreign taxes withheld | — | (643 | ) | ||||||||
| Total investment income | 6,871,979 | 2,764,143 | |||||||||
| Expenses | |||||||||||
| Investment advisory fees (Note 3) | 1,581,123 | 2,012,680 | |||||||||
| Administrative services fees (Note 3) | 384,902 | 363,184 | |||||||||
| Shareholder servicing/Distribution fees (Note 3) | |||||||||||
| Common Class | — | 160,675 | |||||||||
| Advisor Class | 28,906 | — | |||||||||
| Class A | 731,024 | 489,989 | |||||||||
| Class B | 118,867 | 107,811 | |||||||||
| Class C | 24,601 | 152,525 | |||||||||
| Transfer agent fees (Note 3) | 326,684 | 432,213 | |||||||||
| Printing fees (Note 3) | 72,729 | 94,768 | |||||||||
| Registration fees | 51,779 | 68,809 | |||||||||
| Audit and tax fees | 42,237 | 42,626 | |||||||||
| Custodian fees | 24,832 | 33,825 | |||||||||
| Legal fees | 24,719 | 26,936 | |||||||||
| Trustees' fees | 21,020 | 21,020 | |||||||||
| Insurance expense | 18,063 | 17,991 | |||||||||
| Commitment fees (Note 4) | 7,728 | 6,808 | |||||||||
| Interest expense (Note 4) | — | 1,628 | |||||||||
| Miscellaneous expense | 10,695 | 13,416 | |||||||||
| Total expenses | 3,469,909 | 4,046,904 | |||||||||
| Net Investment Income (Loss) | 3,402,070 | (1,282,761 | ) | ||||||||
| Net Realized and Unrealized Gain (Loss) from Investments and Futures Contracts | |||||||||||
| Net realized gain from investments | 47,875,606 | 82,922,987 | |||||||||
| Net realized loss from futures contracts | — | (72,371 | ) | ||||||||
| Net change in unrealized appreciation (depreciation) from investments | (20,353,000 | ) | (54,277,099 | ) | |||||||
| Net realized and unrealized gain from investments and futures contracts | 27,522,606 | 28,573,517 | |||||||||
| Net increase in net assets resulting from operations | $ | 30,924,676 | $ | 27,290,756 | |||||||
See Accompanying Notes to Financial Statements.
40
Credit Suisse Funds
Statements of Changes in Net Assets
| Large Cap Value Fund | Small Cap Core Fund | ||||||||||||||||||
| For the Year Ended October 31, 2007 | For the Year Ended October 31, 2006 | For the Year Ended October 31, 2007 | For the Year Ended October 31, 2006 | ||||||||||||||||
| From Operations | |||||||||||||||||||
| Net investment income (loss) | $ | 3,402,070 | $ | 3,519,157 | $ | (1,282,761 | ) | $ | 1,511,286 | ||||||||||
| Net realized gain from investments and futures contracts | 47,875,606 | 64,610,542 | 82,850,616 | 52,059,311 | |||||||||||||||
| Net change in unrealized appreciation (depreciation) from investments | (20,353,000 | ) | (10,171,994 | ) | (54,277,099 | ) | (10,174,947 | ) | |||||||||||
| Net increase in net assets resulting from operations | 30,924,676 | 57,957,705 | 27,290,756 | 43,395,650 | |||||||||||||||
| From Dividends and Distributions | |||||||||||||||||||
| Dividends from net investment income | |||||||||||||||||||
| Common Class shares | (8,128 | ) | (7,242 | ) | (443,533 | ) | — | ||||||||||||
| Advisor Class shares | (47,395 | ) | (55,871 | ) | — | — | |||||||||||||
| Class A shares | (3,148,980 | ) | (3,096,473 | ) | (1,047,496 | ) | — | ||||||||||||
| Class B shares | (35,780 | ) | (47,610 | ) | (7,318 | ) | — | ||||||||||||
| Class C shares | (7,596 | ) | (8,918 | ) | (9,246 | ) | — | ||||||||||||
| Distributions from net realized gains | |||||||||||||||||||
| Common Class shares | (121,952 | ) | (70,029 | ) | (10,787,263 | ) | (7,509,989 | ) | |||||||||||
| Advisor Class shares | (1,189,286 | ) | (969,206 | ) | — | — | |||||||||||||
| Class A shares | (59,880,116 | ) | (35,411,384 | ) | (36,102,988 | ) | (23,829,327 | ) | |||||||||||
| Class B shares | (2,873,710 | ) | (2,267,901 | ) | (2,083,903 | ) | (1,880,065 | ) | |||||||||||
| Class C shares | (536,230 | ) | (426,845 | ) | (2,781,596 | ) | (1,851,334 | ) | |||||||||||
| Net decrease in net assets resulting from dividends and distributions | (67,849,173 | ) | (42,361,479 | ) | (53,263,343 | ) | (35,070,715 | ) | |||||||||||
| From Capital Share Transactions (Note 6) | |||||||||||||||||||
| Proceeds from sale of shares | 21,394,602 | 34,985,488 | 28,165,427 | 112,745,835 | |||||||||||||||
| Reinvestment of dividends and distributions | 62,317,135 | 39,200,260 | 48,478,465 | 32,583,478 | |||||||||||||||
| Net asset value of shares redeemed | (79,174,493 | ) | (93,328,420 | ) | (161,740,661 | ) | (127,020,125 | ) | |||||||||||
| Net increase (decrease) in net assets from capital share transactions | 4,537,244 | (19,142,672 | ) | (85,096,769 | ) | 18,309,188 | |||||||||||||
| Net increase (decrease) in net assets | (32,387,253 | ) | (3,546,446 | ) | (111,069,356 | ) | 26,634,123 | ||||||||||||
| Net Assets | |||||||||||||||||||
| Beginning of year | 329,884,635 | 333,431,081 | 362,024,456 | 335,390,333 | |||||||||||||||
| End of year | $ | 297,497,382 | $ | 329,884,635 | $ | 250,955,100 | $ | 362,024,456 | |||||||||||
| Undistributed net investment income | $ | 429,852 | $ | 297,294 | $ | — | $ | 1,704,197 | |||||||||||
See Accompanying Notes to Financial Statements.
41
Credit Suisse Large Cap Value Fund
Financial Highlights
(For a Common Class Share of the Fund Outstanding Throughout Each Year)
| For the Year Ended October 31, | |||||||||||||||||||||||
| 2007 | 2006 | 2005 | 2004 | 2003 | |||||||||||||||||||
| Per share data | |||||||||||||||||||||||
| Net asset value, beginning of year | $ | 21.93 | $ | 20.97 | $ | 19.98 | $ | 18.61 | $ | 16.82 | |||||||||||||
| INVESTMENT OPERATIONS | |||||||||||||||||||||||
| Net investment income1 | 0.26 | 0.28 | 0.24 | 0.23 | 0.14 | ||||||||||||||||||
| Net gain on investments and foreign currency related items (both realized and unrealized) | 1.68 | 3.42 | 2.32 | 1.87 | 2.10 | ||||||||||||||||||
| Total from investment operations | 1.94 | 3.70 | 2.56 | 2.10 | 2.24 | ||||||||||||||||||
| LESS DIVIDENDS AND DISTRIBUTIONS | |||||||||||||||||||||||
| Dividends from net investment income | (0.25 | ) | (0.26 | ) | (0.25 | ) | (0.23 | ) | (0.14 | ) | |||||||||||||
| Distributions from net realized gains | (4.45 | ) | (2.48 | ) | (1.32 | ) | (0.50 | ) | (0.31 | ) | |||||||||||||
| Total dividends and distributions | (4.70 | ) | (2.74 | ) | (1.57 | ) | (0.73 | ) | (0.45 | ) | |||||||||||||
| Net asset value, end of year | $ | 19.17 | $ | 21.93 | $ | 20.97 | $ | 19.98 | $ | 18.61 | |||||||||||||
| Total return2 | 10.59 | % | 19.44 | % | 13.34 | % | 11.51 | % | 13.63 | % | |||||||||||||
| RATIOS AND SUPPLEMENTAL DATA | |||||||||||||||||||||||
| Net assets, end of year (000s omitted) | $ | 570 | $ | 600 | $ | 591 | $ | 664 | $ | 737 | |||||||||||||
| Ratio of expenses to average net assets | 0.82 | % | 0.89 | % | 0.91 | % | 0.95 | % | 1.24 | % | |||||||||||||
| Ratio of net investment income to average net assets | 1.37 | % | 1.37 | % | 1.15 | % | 1.16 | % | 0.82 | % | |||||||||||||
| Portfolio turnover rate | 163 | % | 78 | % | 58 | % | 48 | % | 53 | % | |||||||||||||
1 Per share information is calculated using the average shares outstanding method.
2 Total returns are historical and assume changes in share price and reinvestment of all dividends and distributions. Had certain expenses not been reduced during the years shown, total returns would have been lower.
See Accompanying Notes to Financial Statements.
42
Credit Suisse Large Cap Value Fund
Financial Highlights
(For an Advisor Class Share of the Fund Outstanding Throughout Each Period)
| For the Year Ended October 31, | |||||||||||||||||||||||
| 2007 | 2006 | 2005 | 2004 | 20031 | |||||||||||||||||||
| Per share data | |||||||||||||||||||||||
| Net asset value, beginning of period | $ | 22.08 | $ | 21.10 | $ | 20.09 | $ | 18.71 | $ | 17.84 | |||||||||||||
| INVESTMENT OPERATIONS | |||||||||||||||||||||||
| Net investment income2 | 0.17 | 0.18 | 0.14 | 0.13 | 0.04 | ||||||||||||||||||
| Net gain on investments and foreign currency related items (both realized and unrealized) | 1.69 | 3.44 | 2.34 | 1.88 | 0.83 | ||||||||||||||||||
| Total from investment operations | 1.86 | 3.62 | 2.48 | 2.01 | 0.87 | ||||||||||||||||||
| LESS DIVIDENDS AND DISTRIBUTIONS | |||||||||||||||||||||||
| Dividends from net investment income | (0.16 | ) | (0.16 | ) | (0.15 | ) | (0.13 | ) | (0.00 | )3 | |||||||||||||
| Distributions from net realized gains | (4.45 | ) | (2.48 | ) | (1.32 | ) | (0.50 | ) | — | ||||||||||||||
| Total dividends and distributions | (4.61 | ) | (2.64 | ) | (1.47 | ) | (0.63 | ) | — | ||||||||||||||
| Net asset value, end of year | $ | 19.33 | $ | 22.08 | $ | 21.10 | $ | 20.09 | $ | 18.71 | |||||||||||||
| Total return4 | 10.01 | % | 18.84 | % | 12.81 | % | 10.96 | % | 4.90 | % | |||||||||||||
| RATIOS AND SUPPLEMENTAL DATA | |||||||||||||||||||||||
| Net assets, end of year (000s omitted) | $ | 5,234 | $ | 5,806 | $ | 8,368 | $ | 12,228 | $ | 22,336 | |||||||||||||
| Ratio of expenses to average net assets | 1.32 | % | 1.39 | % | 1.41 | % | 1.45 | % | 1.49 | %5 | |||||||||||||
| Ratio of net investment income to average net assets | 0.87 | % | 0.87 | % | 0.65 | % | 0.66 | % | 0.51 | %5 | |||||||||||||
| Portfolio turnover rate | 163 | % | 78 | % | 58 | % | 48 | % | 53 | % | |||||||||||||
1 For the period June 6, 2003 (inception date) through October 31, 2003.
2 Per share information is calculated using the average shares outstanding method.
3 This amount represents less than $(0.01) per share.
4 Total returns are historical and assume changes in share price and reinvestment of all dividends and distributions. Had certain expenses not been reduced during the periods shown, total returns would have been lower. Total returns for periods less than one year are not annualized.
5 Annualized.
See Accompanying Notes to Financial Statements.
43
Credit Suisse Large Cap Value Fund
Financial Highlights
(For a Class A Share of the Fund Outstanding Throughout Each Year)
| For the Year Ended October 31, | |||||||||||||||||||||||
| 2007 | 2006 | 2005 | 2004 | 2003 | |||||||||||||||||||
| Per share data | |||||||||||||||||||||||
| Net asset value, beginning of year | $ | 22.03 | $ | 21.05 | $ | 20.05 | $ | 18.68 | $ | 16.83 | |||||||||||||
| INVESTMENT OPERATIONS | |||||||||||||||||||||||
| Net investment income1 | 0.22 | 0.22 | 0.19 | 0.18 | 0.14 | ||||||||||||||||||
| Net gain on investments and foreign currency related items (both realized and unrealized) | 1.69 | 3.45 | 2.33 | 1.87 | 2.15 | ||||||||||||||||||
| Total from investment operations | 1.91 | 3.67 | 2.52 | 2.05 | 2.29 | ||||||||||||||||||
| LESS DIVIDENDS AND DISTRIBUTIONS | |||||||||||||||||||||||
| Dividends from net investment income | (0.21 | ) | (0.21 | ) | (0.20 | ) | (0.18 | ) | (0.13 | ) | |||||||||||||
| Distributions from net realized gains | (4.45 | ) | (2.48 | ) | (1.32 | ) | (0.50 | ) | (0.31 | ) | |||||||||||||
| Total dividends and distributions | (4.66 | ) | (2.69 | ) | (1.52 | ) | (0.68 | ) | (0.44 | ) | |||||||||||||
| Net asset value, end of year | $ | 19.28 | $ | 22.03 | $ | 21.05 | $ | 20.05 | $ | 18.68 | |||||||||||||
| Total return2 | 10.32 | % | 19.18 | % | 13.06 | % | 11.19 | % | 13.97 | % | |||||||||||||
| RATIOS AND SUPPLEMENTAL DATA | |||||||||||||||||||||||
| Net assets, end of year (000s omitted) | $ | 280,329 | $ | 305,866 | $ | 300,777 | $ | 302,823 | $ | 306,410 | |||||||||||||
| Ratio of expenses to average net assets | 1.07 | % | 1.14 | % | 1.16 | % | 1.20 | % | 1.24 | % | |||||||||||||
| Ratio of net investment income to average net assets | 1.12 | % | 1.12 | % | 0.91 | % | 0.91 | % | 0.78 | % | |||||||||||||
| Portfolio turnover rate | 163 | % | 78 | % | 58 | % | 48 | % | 53 | % | |||||||||||||
1 Per share information is calculated using the average shares outstanding method.
2 Total returns are historical and assume changes in share price, reinvestment of all dividends and distributions and no sales charge. Had certain expenses not been reduced during the years shown, total returns would have been lower.
See Accompanying Notes to Financial Statements.
44
Credit Suisse Large Cap Value Fund
Financial Highlights
(For a Class B Share of the Fund Outstanding Throughout Each Year)
| For the Year Ended October 31, | |||||||||||||||||||||||
| 2007 | 2006 | 2005 | 2004 | 2003 | |||||||||||||||||||
| Per share data | |||||||||||||||||||||||
| Net asset value, beginning of year | $ | 21.70 | $ | 20.78 | $ | 19.81 | $ | 18.46 | $ | 16.66 | |||||||||||||
| INVESTMENT OPERATIONS | |||||||||||||||||||||||
| Net investment income1 | 0.07 | 0.07 | 0.04 | 0.03 | 0.01 | ||||||||||||||||||
| Net gain on investments and foreign currency related items (both realized and unrealized) | 1.66 | 3.39 | 2.30 | 1.85 | 2.13 | ||||||||||||||||||
| Total from investment operations | 1.73 | 3.46 | 2.34 | 1.88 | 2.14 | ||||||||||||||||||
| LESS DIVIDENDS AND DISTRIBUTIONS | |||||||||||||||||||||||
| Dividends from net investment income | (0.06 | ) | (0.06 | ) | (0.05 | ) | (0.03 | ) | (0.03 | ) | |||||||||||||
| Distributions from net realized gains | (4.45 | ) | (2.48 | ) | (1.32 | ) | (0.50 | ) | (0.31 | ) | |||||||||||||
| Total dividends and distributions | (4.51 | ) | (2.54 | ) | (1.37 | ) | (0.53 | ) | (0.34 | ) | |||||||||||||
| Net asset value, end of year | $ | 18.92 | $ | 21.70 | $ | 20.78 | $ | 19.81 | $ | 18.46 | |||||||||||||
| Total return2 | 9.49 | % | 18.25 | % | 12.23 | % | 10.40 | % | 13.07 | % | |||||||||||||
| RATIOS AND SUPPLEMENTAL DATA | |||||||||||||||||||||||
| Net assets, end of year (000s omitted) | $ | 9,224 | $ | 14,994 | $ | 20,057 | $ | 25,118 | $ | 29,696 | |||||||||||||
| Ratio of expenses to average net assets | 1.82 | % | 1.89 | % | 1.91 | % | 1.95 | % | 1.99 | % | |||||||||||||
| Ratio of net investment income to average net assets | 0.39 | % | 0.37 | % | 0.15 | % | 0.16 | % | 0.06 | % | |||||||||||||
| Portfolio turnover rate | 163 | % | 78 | % | 58 | % | 48 | % | 53 | % | |||||||||||||
1 Per share information is calculated using the average shares outstanding method.
2 Total returns are historical and assume changes in share price, reinvestment of all dividends and distributions and no sales charge. Had certain expenses not been reduced during the years shown, total returns would have been lower.
See Accompanying Notes to Financial Statements.
45
Credit Suisse Large Cap Value Fund
Financial Highlights
(For a Class C Share of the Fund Outstanding Throughout Each Year)
| For the Year Ended October 31, | |||||||||||||||||||||||
| 2007 | 2006 | 2005 | 2004 | 2003 | |||||||||||||||||||
| Per share data | |||||||||||||||||||||||
| Net asset value, beginning of year | $ | 21.58 | $ | 20.68 | $ | 19.72 | $ | 18.38 | $ | 16.58 | |||||||||||||
| INVESTMENT OPERATIONS | |||||||||||||||||||||||
| Net investment income1 | 0.07 | 0.07 | 0.03 | 0.03 | 0.01 | ||||||||||||||||||
| Net gain on investments and foreign currency related items (both realized and unrealized) | 1.65 | 3.37 | 2.30 | 1.84 | 2.13 | ||||||||||||||||||
| Total from investment operations | 1.72 | 3.44 | 2.33 | 1.87 | 2.14 | ||||||||||||||||||
| LESS DIVIDENDS AND DISTRIBUTIONS | |||||||||||||||||||||||
| Dividends from net investment income | (0.06 | ) | (0.06 | ) | (0.05 | ) | (0.03 | ) | (0.03 | ) | |||||||||||||
| Distributions from net realized gains | (4.45 | ) | (2.48 | ) | (1.32 | ) | (0.50 | ) | (0.31 | ) | |||||||||||||
| Total dividends and distributions | (4.51 | ) | (2.54 | ) | (1.37 | ) | (0.53 | ) | (0.34 | ) | |||||||||||||
| Net asset value, end of year | $ | 18.79 | $ | 21.58 | $ | 20.68 | $ | 19.72 | $ | 18.38 | |||||||||||||
| Total return2 | 9.50 | % | 18.25 | % | 12.23 | % | 10.39 | % | 13.14 | % | |||||||||||||
| RATIOS AND SUPPLEMENTAL DATA | |||||||||||||||||||||||
| Net assets, end of year (000s omitted) | $ | 2,140 | $ | 2,618 | $ | 3,638 | $ | 3,736 | $ | 3,479 | |||||||||||||
| Ratio of expenses to average net assets | 1.82 | % | 1.89 | % | 1.91 | % | 1.95 | % | 1.99 | % | |||||||||||||
| Ratio of net investment income to average net assets | 0.39 | % | 0.37 | % | 0.15 | % | 0.16 | % | 0.06 | % | |||||||||||||
| Portfolio turnover rate | 163 | % | 78 | % | 58 | % | 48 | % | 53 | % | |||||||||||||
1 Per share information is calculated using the average shares outstanding method.
2 Total returns are historical and assume changes in share price, reinvestment of all dividends and distributions and no sales charge. Had certain expenses not been reduced during the years shown, total returns would have been lower.
See Accompanying Notes to Financial Statements.
46
Credit Suisse Small Cap Core Fund
Financial Highlights
(For a Common Class Share of the Fund Outstanding Throughout Each Year)
| For the Year Ended October 31, | |||||||||||||||||||||||
| 2007 | 2006 | 2005 | 2004 | 2003 | |||||||||||||||||||
| Per share data | |||||||||||||||||||||||
| Net asset value, beginning of year | $ | 24.33 | $ | 23.84 | $ | 22.66 | $ | 20.02 | $ | 18.56 | |||||||||||||
| INVESTMENT OPERATIONS | |||||||||||||||||||||||
| Net investment income (loss)1 | (0.08 | ) | 0.11 | (0.03 | ) | (0.05 | ) | (0.02 | ) | ||||||||||||||
| Net gain on investments and futures contracts (both realized and unrealized) | 2.16 | 2.85 | 3.39 | 3.75 | 3.08 | ||||||||||||||||||
| Total from investment operations | 2.08 | 2.96 | 3.36 | 3.70 | 3.06 | ||||||||||||||||||
| LESS DIVIDENDS AND DISTRIBUTIONS | |||||||||||||||||||||||
| Dividends from net investment income | (0.14 | ) | — | — | — | (0.01 | ) | ||||||||||||||||
| Distributions from net realized gains | (3.86 | ) | (2.47 | ) | (2.18 | ) | (1.06 | ) | (1.59 | ) | |||||||||||||
| Total dividends and distributions | (4.00 | ) | (2.47 | ) | (2.18 | ) | (1.06 | ) | (1.60 | ) | |||||||||||||
| Net asset value, end of year | $ | 22.41 | $ | 24.33 | $ | 23.84 | $ | 22.66 | $ | 20.02 | |||||||||||||
| Total return2 | 9.58 | % | 13.23 | % | 15.56 | % | 19.14 | % | 17.75 | % | |||||||||||||
| RATIOS AND SUPPLEMENTAL DATA | |||||||||||||||||||||||
| Net assets, end of year (000s omitted) | $ | 57,452 | $ | 70,525 | $ | 74,013 | $ | 50,068 | $ | 47,969 | |||||||||||||
| Ratio of expenses to average net assets | 1.34 | % | 1.37 | % | 1.38 | % | 1.42 | % | 1.48 | % | |||||||||||||
| Ratio of net investment income (loss) to average net assets | (0.39 | )% | 0.47 | % | (0.16 | )% | (0.22 | )% | (0.10 | )% | |||||||||||||
| Decrease reflected in above operating expense ratios due to waivers/reimbursements | — | — | — | — | 0.04 | % | |||||||||||||||||
| Portfolio turnover rate | 262 | % | 67 | % | 43 | % | 41 | % | 30 | % | |||||||||||||
1 Per share information is calculated using the average shares outstanding method.
2 Total returns are historical and assume changes in share price and reinvestment of all dividends and distributions. Had certain expenses not been reduced during the years shown, total returns would have been lower.
See Accompanying Notes to Financial Statements.
47
Credit Suisse Small Cap Core Fund
Financial Highlights
(For a Class A Share of the Fund Outstanding Throughout Each Year)
| For the Year Ended October 31, | |||||||||||||||||||||||
| 2007 | 2006 | 2005 | 2004 | 2003 | |||||||||||||||||||
| Per share data | |||||||||||||||||||||||
| Net asset value, beginning of year | $ | 24.44 | $ | 23.94 | $ | 22.75 | $ | 20.10 | $ | 18.62 | |||||||||||||
| INVESTMENT OPERATIONS | |||||||||||||||||||||||
| Net investment income (loss)1 | (0.08 | ) | 0.12 | (0.04 | ) | (0.05 | ) | (0.02 | ) | ||||||||||||||
| Net gain on investments and futures contracts (both realized and unrealized) | 2.18 | 2.85 | 3.42 | 3.76 | 3.10 | ||||||||||||||||||
| Total from investment operations | 2.10 | 2.97 | 3.38 | 3.71 | 3.08 | ||||||||||||||||||
| LESS DIVIDENDS AND DISTRIBUTIONS | |||||||||||||||||||||||
| Dividends from net investment income | (0.11 | ) | — | — | — | (0.01 | ) | ||||||||||||||||
| Distributions from net realized gains | (3.86 | ) | (2.47 | ) | (2.19 | ) | (1.06 | ) | (1.59 | ) | |||||||||||||
| Total dividends and distributions | (3.97 | ) | (2.47 | ) | (2.19 | ) | (1.06 | ) | (1.60 | ) | |||||||||||||
| Net asset value, end of year | $ | 22.57 | $ | 24.44 | $ | 23.94 | $ | 22.75 | $ | 20.10 | |||||||||||||
| Total return2 | 9.61 | % | 13.22 | % | 15.54 | % | 19.11 | % | 17.80 | % | |||||||||||||
| RATIOS AND SUPPLEMENTAL DATA | |||||||||||||||||||||||
| Net assets, end of year (000s omitted) | $ | 169,076 | $ | 263,006 | $ | 227,166 | $ | 198,773 | $ | 188,318 | |||||||||||||
| Ratio of expenses to average net assets | 1.35 | % | 1.37 | % | 1.38 | % | 1.42 | % | 1.48 | % | |||||||||||||
| Ratio of net investment income (loss) to average net assets | (0.38 | )% | 0.47 | % | (0.16 | )% | (0.22 | )% | (0.11 | )% | |||||||||||||
| Decrease reflected in above operating expense ratios due to waivers/reimbursements | — | — | — | — | 0.04 | % | |||||||||||||||||
| Portfolio turnover rate | 262 | % | 67 | % | 43 | % | 41 | % | 30 | % | |||||||||||||
1 Per share information is calculated using the average shares outstanding method.
2 Total returns are historical and assume changes in share price, reinvestment of all dividends and distributions and no sales charge. Had certain expenses not been reduced during the years shown, total returns would have been lower.
See Accompanying Notes to Financial Statements.
48
Credit Suisse Small Cap Core Fund
Financial Highlights
(For a Class B Share of the Fund Outstanding Throughout Each Year)
| For the Year Ended October 31, | |||||||||||||||||||||||
| 2007 | 2006 | 2005 | 2004 | 2003 | |||||||||||||||||||
| Per share data | |||||||||||||||||||||||
| Net asset value, beginning of year | $ | 22.07 | $ | 21.99 | $ | 21.20 | $ | 18.93 | $ | 17.74 | |||||||||||||
| INVESTMENT OPERATIONS | |||||||||||||||||||||||
| Net investment loss1 | (0.22 | ) | (0.06 | ) | (0.20 | ) | (0.20 | ) | (0.15 | ) | |||||||||||||
| Net gain on investments and futures contracts (both realized and unrealized) | 1.93 | 2.61 | 3.17 | 3.53 | 2.93 | ||||||||||||||||||
| Total from investment operations | 1.71 | 2.55 | 2.97 | 3.33 | 2.78 | ||||||||||||||||||
| LESS DIVIDENDS AND DISTRIBUTIONS | |||||||||||||||||||||||
| Dividends from net investment income | (0.01 | ) | — | — | — | — | |||||||||||||||||
| Distributions from net realized gains | (3.86 | ) | (2.47 | ) | (2.18 | ) | (1.06 | ) | (1.59 | ) | |||||||||||||
| Total dividends and distributions | (3.87 | ) | (2.47 | ) | (2.18 | ) | (1.06 | ) | (1.59 | ) | |||||||||||||
| Net asset value, end of year | $ | 19.91 | $ | 22.07 | $ | 21.99 | $ | 21.20 | $ | 18.93 | |||||||||||||
| Total return2 | 8.74 | % | 12.41 | % | 14.72 | % | 18.25 | % | 16.88 | % | |||||||||||||
| RATIOS AND SUPPLEMENTAL DATA | |||||||||||||||||||||||
| Net assets, end of year (000s omitted) | $ | 9,122 | $ | 12,465 | $ | 18,133 | $ | 20,425 | $ | 22,669 | |||||||||||||
| Ratio of expenses to average net assets | 2.10 | % | 2.12 | % | 2.13 | % | 2.17 | % | 2.23 | % | |||||||||||||
| Ratio of net investment loss to average net assets | (1.13 | )% | (0.28 | )% | (0.91 | )% | (0.97 | )% | (0.86 | )% | |||||||||||||
| Decrease reflected in above operating expense ratios due to waivers/reimbursements | — | — | — | — | 0.04 | % | |||||||||||||||||
| Portfolio turnover rate | 262 | % | 67 | % | 43 | % | 41 | % | 30 | % | |||||||||||||
1 Per share information is calculated using the average shares outstanding method.
2 Total returns are historical and assume changes in share price, reinvestment of all dividends and distributions and no sales charge. Had certain expenses not been reduced during the years shown, total returns would have been lower.
See Accompanying Notes to Financial Statements.
49
Credit Suisse Small Cap Core Fund
Financial Highlights
(For a Class C Share of the Fund Outstanding Throughout Each Year)
| For the Year Ended October 31, | |||||||||||||||||||||||
| 2007 | 2006 | 2005 | 2004 | 2003 | |||||||||||||||||||
| Per share data | |||||||||||||||||||||||
| Net asset value, beginning of year | $ | 21.97 | $ | 21.91 | $ | 21.13 | $ | 18.87 | $ | 17.69 | |||||||||||||
| INVESTMENT OPERATIONS | |||||||||||||||||||||||
| Net investment loss1 | (0.22 | ) | (0.06 | ) | (0.20 | ) | (0.19 | ) | (0.15 | ) | |||||||||||||
| Net gain on investments and futures contracts (both realized and unrealized) | 1.92 | 2.59 | 3.16 | 3.51 | 2.92 | ||||||||||||||||||
| Total from investment operations | 1.70 | 2.53 | 2.96 | 3.32 | 2.77 | ||||||||||||||||||
| LESS DIVIDENDS AND DSITRIBUTIONS | |||||||||||||||||||||||
| Dividends from net investment income | (0.01 | ) | — | — | — | — | |||||||||||||||||
| Distributions from net realized gains | (3.86 | ) | (2.47 | ) | (2.18 | ) | (1.06 | ) | (1.59 | ) | |||||||||||||
| Total dividends and distributions | (3.87 | ) | (2.47 | ) | (2.18 | ) | (1.06 | ) | (1.59 | ) | |||||||||||||
| Net asset value, end of year | $ | 19.80 | $ | 21.97 | $ | 21.91 | $ | 21.13 | $ | 18.87 | |||||||||||||
| Total return2 | 8.74 | % | 12.36 | % | 14.72 | % | 18.25 | % | 16.87 | % | |||||||||||||
| RATIOS AND SUPPLEMENTAL DATA | |||||||||||||||||||||||
| Net assets, end of year (000s omitted) | $ | 15,305 | $ | 16,028 | $ | 16,079 | $ | 11,613 | $ | 8,138 | |||||||||||||
| Ratio of expenses to average net assets | 2.10 | % | 2.12 | % | 2.13 | % | 2.17 | % | 2.23 | % | |||||||||||||
| Ratio of net investment loss to average net assets | (1.14 | )% | (0.28 | )% | (0.91 | )% | (0.97 | )% | (0.86 | )% | |||||||||||||
| Decrease reflected in above operating expense ratios due to waivers/reimbursements | — | — | — | — | 0.04 | % | |||||||||||||||||
| Portfolio turnover rate | 262 | % | 67 | % | 43 | % | 41 | % | 30 | % | |||||||||||||
1 Per share information is calculated using the average shares outstanding method.
2 Total returns are historical and assume changes in share price, reinvestment of all dividends and distributions and no sales charge. Had certain expenses not been reduced during the years shown, total returns would have been lower.
See Accompanying Notes to Financial Statements.
50
Credit Suisse Funds
Notes to Financial Statements
October 31, 2007
Note 1. Organization
The Credit Suisse Capital Funds (the "Trust") covered in this report are comprised of Credit Suisse Large Cap Value Fund ("Large Cap Value") and Credit Suisse Small Cap Core Fund ("Small Cap Core"), (each a "Fund" and collectively, the "Funds"). The Trust is registered under the Investment Company Act of 1940, as amended (the "1940 Act"), as an open-end management investment company. The Trust was organized under the laws of the Commonwealth of Massachusetts as a business trust on November 26, 1985.
Each Fund is classified as diversified. Small Cap Core changed its name from Credit Suisse Small Cap Value Fund, Inc., effective December 1, 2006. Investment objectives for each Fund are as follows: Large Cap Value seeks long-term capital appreciation and continuity of income; Small Cap Core seeks a high level of growth of capital.
Large Cap Value offers five classes of shares: Common Class shares, Advisor Class shares, Class A shares, Class B shares and Class C shares. Small Cap Core offers four classes of shares: Common Class shares, Class A shares, Class B shares and Class C shares. Effective December 12, 2001, Large Cap Value closed the Common Class to new investments, except for reinvestment of dividends. Large Cap Value's Common Class shareholders as of the close of business on December 12, 2001 may continue to hold Common Class shares but may not add to their accounts. Although no further shares can be purchased, Large Cap Value's shareholders can redeem their Common Class shares through any available method. The Small Cap Core's Common Class shares are closed to new investors, with certain exceptions as set forth in the prospectus. Each class of shares in each Fund represents an equal pro rata interest in each Fund, except that they bear different expenses, whi ch reflect the difference in the range of services provided to them. Class A shares of each Fund are sold subject to a front-end sales charge of up to 5.75%. Class B shares of each Fund are sold subject to a contingent deferred sales charge which declines from 4% to zero depending on the period of time the shares are held. Class C shares of each Fund are sold subject to a contingent deferred sales charge of 1.00% if redeemed within the first year of purchase.
Note 2. Significant Accounting Policies
A) SECURITY VALUATION — The net asset value of each Fund is determined daily as of the close of regular trading on the New York Stock Exchange, Inc. (the "Exchange") on each day the Exchange is open for business. Equity investments are valued at market value, which is generally determined using the closing price on the exchange or market on which the security is
51
Credit Suisse Funds
Notes to Financial Statements (continued)
October 31, 2007
Note 2. Significant Accounting Policies
primarily traded at the time of valuation (the "Valuation Time"). If no sales are reported, equity investments are generally valued at the most recent bid quotation as of the Valuation Time or at the lowest asked quotation in the case of a short sale of securities. Debt securities with a remaining maturity greater than 60 days are valued in accordance with the price supplied by a pricing service, which may use a matrix, formula or other objective method that takes into consideration market indices, yield curves and other specific adjustments. Debt obligations that will mature in 60 days or less are valued on the basis of amortized cost, which approximates market value, unless it is determined that this method would not represent fair value. Investments in mutual funds are valued at the mutual fund's closing net asset value per share on the day of valuation. Securities, futures contracts, and other assets for which market quotations are not r eadily available, or whose values have been materially affected by events occurring before the Funds' Valuation Time but after the close of the securities' primary markets, are valued at fair value as determined in good faith by or under the direction of, the Board of Trustees under procedures established by the Board of Trustees. The Funds may utilize a service provided by an independent third party which has been approved by the Board of Trustees to fair value certain securities. When fair-value pricing is employed, the prices of securities used by a fund to calculate its net asset value may differ from quoted or published prices for the same securities.
B) FOREIGN CURRENCY TRANSACTIONS — The books and records of the Funds are maintained in U.S. dollars. Transactions denominated in foreign currencies are recorded at the current prevailing exchange rates. All assets and liabilities denominated in foreign currencies are translated into U.S. dollar amounts at the current exchange rate at the end of the period. Translation gains or losses resulting from changes in the exchange rate during the reporting period and realized gains and losses on the settlement of foreign currency transactions are reported in the results of operations for the current period. The Funds do not isolate that portion of realized gains and losses on investments in equity securities which is due to changes in the foreign exchange rate from that which is due to changes in market prices of equity securities. The Funds isolate that portion of realized gains and losses on investments in debt securities which is due to changes in the foreign exchange rate from that which is due to changes in market prices of debt securities.
C) SECURITY TRANSACTIONS AND INVESTMENT INCOME — Security transactions are accounted for on a trade date basis. Interest income is recorded on the accrual basis. Dividends are recorded on the ex-dividend date. Certain expenses are class-specific and vary by class. Income, expenses (excluding class-specific expenses) and realized/unrealized gains/losses are allocated
52
Credit Suisse Funds
Notes to Financial Statements (continued)
October 31, 2007
Note 2. Significant Accounting Policies
proportionately to each class of shares based upon the relative net asset value of outstanding shares of that class. The cost of investments sold is determined by use of the specific identification method for both financial reporting and income tax purposes.
D) DIVIDENDS AND DISTRIBUTIONS TO SHAREHOLDERS — Dividends from net investment income, if any, are declared and paid quarterly by Large Cap Value and at least annually by Small Cap Core. Distributions of net realized capital gains, if any, are declared and paid at least annually by the Funds. However, to the extent that a net realized capital gain can be reduced by a capital loss carryforward, such gain will not be distributed. Income and capital gain distributions are determined in accordance with federal income tax regulations, which may differ from accounting principles generally accepted in the United States of America (GAAP).
E) FEDERAL INCOME TAXES — No provision is made for federal taxes as it is each Fund's intention to continue to qualify for and elect the tax treatment applicable to regulated investment companies under the Internal Revenue Code of 1986, as amended, and make the requisite distributions to its shareholders which will be sufficient to relieve it from federal income and excise taxes.
F) USE OF ESTIMATES — The preparation of financial statements in conformity with GAAP requires management to make estimates and assumptions that affect the reported amounts of assets and liabilities and disclosure of contingent assets and liabilities at the date of the financial statements and the reported amounts of income and expenses during the reporting period. Actual results could differ from these estimates.
G) SHORT-TERM INVESTMENTS — The Funds, together with other funds/portfolios advised by Credit Suisse Asset Management, LLC ("Credit Suisse"), an indirect, wholly-owned subsidiary of Credit Suisse Group, pool available cash into either a short-term variable rate time deposit issued by State Street Bank and Trust Company ("SSB"), the Funds' custodian, or a money market fund advised by Credit Suisse. The short-term time deposit issued by SSB is a variable rate account classified as a short-term investment.
H) SECURITIES LENDING — Loans of securities are required at all times to be secured by collateral at least equal to 102% of the market value of domestic securities on loan (including any accrued interest thereon) and 105% of the market value of foreign securities on loan (including any accrued interest thereon). Cash collateral received by the Funds in connection with securities lending activity may be pooled together with cash collateral for other
53
Credit Suisse Funds
Notes to Financial Statements (continued)
October 31, 2007
Note 2. Significant Accounting Policies
funds/portfolios advised by Credit Suisse and may be invested in a variety of investments, including certain Credit Suisse-advised funds, funds advised by SSB, the Funds' securities lending agent, or money market instruments. However, in the event of default or bankruptcy by the other party to the agreement, realization and/or retention of the collateral may be subject to legal proceedings.
SSB has been engaged by the Funds to act as the Funds' securities lending agent. The Funds' securities lending arrangement provides that the Funds and SSB will share the net income earned from securities lending activities. During the year ended October 31, 2007, total earnings from the Fund's investment in cash collateral received in connection with Large Cap Value and Small Cap Core's security lending arrangements were $1,031,298, and $3,258,522, respectively, of which $991,174, and $2,991,450, respectively, were rebated to borrowers (brokers). The Funds retained $32,560, and $217,152, in income, respectively, from the cash collateral investment and SSB, as lending agent, was paid $7,564, and $49,920, respectively. The Funds may also be entitled to certain minimum amounts of income from their securities lending activities. Securities lending income is accrued as earned.
I) FUTURES — The Fund may enter into futures contracts to the extent permitted by its investment policies and objectives. Upon entering into a futures contract, the Fund is required to deposit cash and/or pledge U.S. Government securities as initial margin. Subsequent payments, which are dependent on the daily fluctuations in the value of the underlying instrument, are made or received by the Fund each day (daily variation margin) and are recorded as unrealized gains or losses until the contracts are closed. When the contracts are closed, the Fund records a realized gain or loss equal to the difference between the proceeds from (or cost of) the closing transactions and the Fund's basis in the contract. Risks of entering into futures contracts for hedging purposes include the possibility that a change in the value of the contract may not correlate with the changes in the value of the underlying instruments. In addition, the purchase of a futures contract involves the risk that the Fund could lose more than the original margin deposit and subsequent payments required for a futures transaction. At October 31, 2007, the Fund had no open futures contracts.
J) OTHER — Large Cap Value may invest up to 10% and Small Cap Core may invest up to 15% of its net assets in restricted and other illiquid securities. Non-publicly traded securities may be less liquid than publicly traded securities. Although these securities may be resold in privately negotiated transactions, the prices realized from such sales could differ from the price originally paid by the Funds or the current carrying values, and the difference could be material.
54
Credit Suisse Funds
Notes to Financial Statements (continued)
October 31, 2007
Note 3. Transactions with Affiliates and Related Parties
Credit Suisse serves as investment adviser for the Funds. For its investment advisory services, effective December 1, 2006, Credit Suisse agreed to change the investment advisory fee of Large Cap Value from 0.75% to 0.50%, and Small Cap Core to the lower of 0.70% or the following tiered fee:
| Fund | Annual Rate | ||||||
| Small Cap Core | 0.875% of first $100 million of average daily net assets | ||||||
| 0.75% of next $100 million of average daily net assets | |||||||
| 0.625% of average daily net assets over $200 million | |||||||
For the year ended October 31, 2007, investment advisory fees earned for each Fund were as follows:
| Fund | Gross Advisory Fee | ||||||
| Large Cap Value | $ | 1,581,123 | |||||
| Small Cap Core | 2,012,680 | ||||||
Credit Suisse Asset Management Securities, Inc. ("CSAMSI"), an affiliate of Credit Suisse, and SSB serve as co-administrators to the Funds. For its co-administrative services, CSAMSI currently receives a fee calculated at an annual rate of 0.09% of each Fund's average daily net assets. For the year ended October 31, 2007, co-administrative services fees earned by CSAMSI were as follows:
| Fund | Co-Administration Fee | ||||||
| Large Cap Value | $ | 284,527 | |||||
| Small Cap Core | 260,634 | ||||||
Effective December 1, 2006, the co-administration fee was reduced from an annual rate of 0.10% to 0.09%.
For its co-administrative services, SSB receives a fee, exclusive of out-of-pocket expenses, calculated in total for all the Credit Suisse funds/portfolios co-administered by SSB and allocated based upon relative average net assets of each fund/portfolio, subject to an annual minimum fee. For the year ended October 31, 2007, co-administrative services fees earned by SSB (including out-of-pocket fees) were as follows:
| Fund | Co-Administration Fee | ||||||
| Large Cap Value | $ | 100,375 | |||||
| Small Cap Core | 102,550 | ||||||
55
Credit Suisse Funds
Notes to Financial Statements (continued)
October 31, 2007
Note 3. Transactions with Affiliates and Related Parties
In addition to serving as each Fund's co-administrator, CSAMSI currently serves as distributor of each Fund's shares. Pursuant to distribution plans adopted by each Fund pursuant to Rule 12b-1 under the 1940 Act, CSAMSI receives fees for its distribution services. This fee is calculated at an annual rate of 0.25% of the average daily net assets of the Common Class of Small Cap Core and Class A shares of each Fund. Advisor Class shares of Large Cap Value may pay this fee at an annual rate not to exceed 0.75% of such class' average daily net assets; such fee is currently calculated at the annual rate of 0.50% of the average daily net assets of such class. For the Class B and Class C shares, the fee is calculated at annual rate of 1.00% of average daily net assets of such classes.
Certain brokers, dealers and financial representatives provide transfer agent related services to the Funds, and receive compensation from Credit Suisse. Credit Suisse is then reimbursed by the Funds. For the year ended October 31, 2007, the Small Cap Core Fund reimbursed Credit Suisse the following amount, which is included in the Fund's transfer agent expense as follows:
| Fund | Amount | ||||||
| Small Cap Core | $ | 120,751 | |||||
For the year ended October 31, 2007, CSAMSI and its affiliates advised the Funds that they retained the following amounts from commissions earned on the sale of the Funds' Class A shares:
| Fund | Amount | ||||||
| Large Cap Value | $ | 7,353 | |||||
| Small Cap Core | 6,598 | ||||||
Merrill Corporation ("Merrill"), an affiliate of Credit Suisse, has been engaged by the Funds to provide certain financial printing and fulfillment services. For the year ended October 31, 2007, Merrill was paid for its services by the Funds as follows:
| Fund | Amount | ||||||
| Large Cap Value | $ | 46,630 | |||||
| Small Cap Core | 51,024 | ||||||
Note 4. Line of Credit
The Funds, together with other funds/portfolios advised by Credit Suisse (collectively, the "Participating Funds"), participate in a $50 million committed, unsecured line of credit facility ("Credit Facility") for temporary or emergency purposes with Deutsche Bank, A.G. as administrative agent and syndication agent and SSB as operations agent. Under the terms of the Credit Facility, the
56
Credit Suisse Funds
Notes to Financial Statements (continued)
October 31, 2007
Note 4. Line of Credit
Participating Funds pay an aggregate commitment fee at a rate of 0.10% per annum on the average unused amount of the Credit Facility, which is allocated among the Participating Funds in such manner as is determined by the governing Boards of the Participating Funds. In addition, the Participating Funds pay interest on borrowings at the Federal Funds rate plus 0.50%. At October 31, 2007, the Funds had no borrowings under the Credit Facility. During the year ended October 31, 2007, Small Cap Core had borrowings under the Credit Facility as follows:
| Average Daily Loan Balance | Weighted Average Interest Rate% | Maximum Daily Loan Outstanding | |||||||||
| $ | 3,397,000 | 5.750 | % | $ | 3,397,000 | ||||||
Note 5. Purchases and Sales of Securities
For the year ended October 31, 2007, purchases and sales of investment securities (excluding short-term investments) were as follows:
| Purchases | Sales | ||||||||||
| Large Cap Value | $ | 504,655,628 | $ | 560,354,295 | |||||||
| Small Cap Core | 742,705,993 | 857,100,722 | |||||||||
Note 6. Capital Share Transactions
Large Cap Value is authorized to issue an unlimited number of full and fractional shares of beneficial interest, $0.001 par value per share, of which an unlimited number of shares are classified as Common Class shares, Advisor Class shares, Class A shares, Class B shares and Class C shares. Small Cap Core is authorized to issue an unlimited number of full and fractional shares of beneficial interest, $.001 par value per share, of which an unlimited number of shares are classified as Common Class shares, Class A shares, Class B shares and Class C shares. Transactions in capital shares of the Funds were as follows:
| Large Cap Value | |||||||||||||||||||
| Common Class | |||||||||||||||||||
| For the Year Ended October 31, 2007 | For the Year Ended October 31, 2006 | ||||||||||||||||||
| Shares | Value | Shares | Value | ||||||||||||||||
| Shares sold | — | $ | — | — | $ | — | |||||||||||||
| Shares issued in reinvestment of dividends and distributions | 7,115 | 128,023 | 3,892 | 75,906 | |||||||||||||||
| Shares redeemed | (4,740 | ) | (88,143 | ) | (4,705 | ) | (92,528 | ) | |||||||||||
| Net increase (decrease) | 2,375 | $ | 39,880 | (813 | ) | $ | (16,622 | ) | |||||||||||
57
Credit Suisse Funds
Notes to Financial Statements (continued)
October 31, 2007
Note 6. Capital Share Transactions
| Large Cap Value | |||||||||||||||||||
| Advisor Class | |||||||||||||||||||
| For the Year Ended October 31, 2007 | For the Year Ended October 31, 2006 | ||||||||||||||||||
| Shares | Value | Shares | Value | ||||||||||||||||
| Shares sold | 50,447 | $ | 970,179 | 67,105 | $ | 1,378,725 | |||||||||||||
| Shares issued in reinvestment of dividends and distributions | 68,259 | 1,236,684 | 52,301 | 1,025,063 | |||||||||||||||
| Shares redeemed | (110,959 | ) | (2,099,396 | ) | (253,100 | ) | (5,156,089 | ) | |||||||||||
| Net increase (decrease) | 7,747 | $ | 107,467 | (133,694 | ) | $ | (2,752,301 | ) | |||||||||||
| Large Cap Value | |||||||||||||||||||
| Class A | |||||||||||||||||||
| For the Year Ended October 31, 2007 | For the Year Ended October 31, 2006 | ||||||||||||||||||
| Shares | Value | Shares | Value | ||||||||||||||||
| Shares sold | 1,006,054 | $ | 19,218,085 | 1,577,376 | $ | 32,034,528 | |||||||||||||
| Shares issued in reinvestment of dividends and distributions | 3,227,878 | 58,342,735 | 1,835,069 | 35,919,520 | |||||||||||||||
| Shares redeemed | (3,578,078 | ) | (69,028,836 | ) | (3,815,046 | ) | (77,593,150 | ) | |||||||||||
| Net increase (decrease) | 655,854 | $ | 8,531,984 | (402,601 | ) | $ | (9,639,102 | ) | |||||||||||
| Large Cap Value | |||||||||||||||||||
| Class B | |||||||||||||||||||
| For the Year Ended October 31 , 2007 | For the Year Ended October 31, 2006 | ||||||||||||||||||
| Shares | Value | Shares | Value | ||||||||||||||||
| Shares sold | 40,106 | $ | 734,562 | 62,933 | $ | 1,242,638 | |||||||||||||
| Shares issued in reinvestment of dividends and distributions | 121,867 | 2,156,976 | 93,835 | 1,805,726 | |||||||||||||||
| Shares redeemed | (365,331 | ) | (6,899,682 | ) | (431,250 | ) | (8,672,931 | ) | |||||||||||
| Net decrease | (203,358 | ) | $ | (4,008,144 | ) | (274,482 | ) | $ | (5,624,567 | ) | |||||||||
| Large Cap Value | |||||||||||||||||||
| Class C | |||||||||||||||||||
| For the Year Ended October 31, 2007 | For the Year Ended October 31, 2006 | ||||||||||||||||||
| Shares | Value | Shares | Value | ||||||||||||||||
| Shares sold | 24,990 | $ | 471,776 | 17,099 | $ | 329,597 | |||||||||||||
| Shares issued in reinvestment of dividends and distributions | 25,751 | 452,717 | 19,549 | 374,045 | |||||||||||||||
| Shares redeemed | (58,179 | ) | (1,058,436 | ) | (91,280 | ) | (1,813,722 | ) | |||||||||||
| Net decrease | (7,438 | ) | $ | (133,943 | ) | (54,632 | ) | $ | (1,110,080 | ) | |||||||||
58
Credit Suisse Funds
Notes to Financial Statements (continued)
October 31, 2007
Note 6. Capital Share Transactions
| Small Cap Core | |||||||||||||||||||
| Common Class | |||||||||||||||||||
| For the Year Ended October 31, 2007 | For the Year Ended October 31, 2006 | ||||||||||||||||||
| Shares | Value | Shares | Value | ||||||||||||||||
| Shares sold | 190,146 | $ | 4,167,929 | 576,180 | $ | 13,468,606 | |||||||||||||
| Shares issued in reinvestment of dividends and distributions | 527,601 | 11,174,389 | 330,655 | 7,459,586 | |||||||||||||||
| Shares redeemed | (1,052,896 | ) | (23,121,659 | ) | (1,112,407 | ) | (25,871,552 | ) | |||||||||||
| Net decrease | (335,149 | ) | $ | (7,779,341 | ) | (205,572 | ) | $ | (4,943,360 | ) | |||||||||
| Small Cap Core | |||||||||||||||||||
| Class A | |||||||||||||||||||
| For the Year Ended October 31, 2007 | For the Year Ended October 31, 2006 | ||||||||||||||||||
| Shares | Value | Shares | Value | ||||||||||||||||
| Shares sold | 945,098 | $ | 20,834,263 | 4,062,317 | $ | 94,724,548 | |||||||||||||
| Shares issued in reinvestment of dividends and distributions | 1,599,148 | 34,047,203 | 987,897 | 22,395,554 | |||||||||||||||
| Shares redeemed | (5,814,264 | ) | (130,843,603 | ) | (3,778,297 | ) | (88,120,027 | ) | |||||||||||
| Net increase (decrease) | (3,270,018 | ) | $ | (75,962,137 | ) | 1,271,917 | $ | 29,000,075 | |||||||||||
| Small Cap Core | |||||||||||||||||||
| Class B | |||||||||||||||||||
| For the Year Ended October 31, 2007 | For the Year Ended October 31, 2006 | ||||||||||||||||||
| Shares | Value | Shares | Value | ||||||||||||||||
| Shares sold | 17,794 | $ | 342,299 | 32,214 | $ | 682,832 | |||||||||||||
| Shares issued in reinvestment of dividends and distributions | 94,639 | 1,783,036 | 78,280 | 1,611,772 | |||||||||||||||
| Shares redeemed | (218,952 | ) | (4,281,909 | ) | (370,527 | ) | (7,935,071 | ) | |||||||||||
| Net decrease | (106,519 | ) | $ | (2,156,574 | ) | (260,033 | ) | $ | (5,640,467 | ) | |||||||||
| Small Cap Core | |||||||||||||||||||
| Class C | |||||||||||||||||||
| For the Year Ended October 31, 2007 | For the Year Ended October 31, 2006 | ||||||||||||||||||
| Shares | Value | Shares | Value | ||||||||||||||||
| Shares sold | 145,468 | $ | 2,820,936 | 183,143 | $ | 3,869,849 | |||||||||||||
| Shares issued in reinvestment of dividends and distributions | 78,687 | 1,473,837 | 54,440 | 1,116,566 | |||||||||||||||
| Shares redeemed | (180,516 | ) | (3,493,490 | ) | (242,079 | ) | (5,093,475 | ) | |||||||||||
| Net increase (decrease) | 43,639 | $ | 801,283 | (4,496 | ) | $ | (107,060 | ) | |||||||||||
59
Credit Suisse Funds
Notes to Financial Statements (continued)
October 31, 2007
Note 6. Capital Share Transactions
Effective March 1, 2007, Small Cap Core imposes a 2% redemption fee on all classes of shares currently being offered that are purchased on or after March 1, 2007 and redeemed or exchanged within 30 days from the date of purchase. Reinvested dividends and distributions are not subject to the fee. The fee is charged based on the value of shares at redemption, is paid directly to the Fund and becomes part of the Fund's daily net asset value calculation. When shares are redeemed that are subject to the fee, reinvested dividends are redeemed first, followed by the shares held longest.
On October 31, 2007, the number of shareholders that held 5% or more of the outstanding shares of each class of the Funds were as follows:
| Fund | Number of Shareholders | Approximate Percentage of Outstanding Shares | |||||||||
| Large Cap Value | |||||||||||
| Common Class | 4 | 64 | % | ||||||||
| Advisor Class | 2 | 99 | % | ||||||||
| Class A | 2 | 22 | % | ||||||||
| Class B | 1 | 10 | % | ||||||||
| Class C | 4 | 41 | % | ||||||||
| Small Cap Core | |||||||||||
| Common Class | 2 | 69 | % | ||||||||
| Class A | 2 | 13 | % | ||||||||
| Class B | 1 | 8 | % | ||||||||
| Class C | 1 | 9 | % | ||||||||
Some of the shareholders are omnibus accounts, which hold shares on behalf of individual shareholders.
Note 7. Federal Income Taxes
Income and capital gain distributions are determined in accordance with federal income tax regulations, which may differ from GAAP.
The tax characteristics of dividends and distributions paid during the years ended October 31, 2007 and 2006, respectively, by the Funds were as follows:
| Ordinary Income | Long-Term Capital Gain | ||||||||||||||||||
| Fund | 2007 | 2006 | 2007 | 2006 | |||||||||||||||
| Large Cap Value | $ | 25,213,996 | $ | 10,625,672 | $ | 42,635,177 | $ | 31,735,807 | |||||||||||
| Small Cap Core | 5,016,803 | 2,068,455 | 48,246,540 | 33,002,260 | |||||||||||||||
At October 31, 2007, the Funds had no capital loss carryforwards available to offset possible future capital gains.
60
Credit Suisse Funds
Notes to Financial Statements (continued)
October 31, 2007
Note 7. Federal Income Taxes
The tax basis of components of distributable earnings differ from the amounts reflected in the Statement of Assets and Liabilities by temporary book/tax differences. These differences are primarily due to losses deferred on wash sales. At October 31, 2007, the components of distributable earnings on a tax basis for the Funds were as follows:
| Large Cap Value | Small Cap Core | ||||||||||
| Undistributed net investment income | $ | 23,528,861 | $ | 18,391,696 | |||||||
| Accumulated realized gain | 25,270,367 | 65,321,282 | |||||||||
| Unrealized appreciation | 39,866,601 | 23,976,988 | |||||||||
| $ | 88,665,829 | $ | 107,689,966 | ||||||||
As of October 31, 2007, the identified cost for federal income tax purposes, as well as the gross unrealized appreciation from investments for those securities having an excess of value over cost, gross unrealized depreciation from investments for those securities having an excess of cost over value and the net unrealized appreciation from investments were as follows:
| Fund | Identified Cost | Gross Unrealized Appreciation | Gross Unrealized (Depreciation) | Net Unrealized Appreciation | |||||||||||||||
| Large Cap Value | $ | 286,602,837 | $ | 48,595,736 | $ | (8,729,132 | ) | $ | 39,866,604 | ||||||||||
| Small Cap Core | 275,563,827 | 31,755,350 | (7,778,361 | ) | 23,976,989 | ||||||||||||||
At October 31, 2007, accumulated undistributed net investment income and accumulated net realized gain (loss) from investments have been adjusted for current period permanent book/tax differences which arose principally from differing book/tax treatments of net operating losses, foreign currency gain/(loss), real estate investment trusts and dividend redesignations. Net assets were not affected by these reclassifications:
| Fund | Undistributed Net Investment Income/(Loss) | Accumulated Net Realized Gain/(Loss) on Investment | |||||||||
| Large Cap Value | $ | (21,633 | ) | $ | 21,633 | ||||||
| Small Cap Core | 1,086,157 | (1,086,157 | ) | ||||||||
Note 8. Contingencies
In the normal course of business, the Funds may provide general indemnifications pursuant to certain contracts and organizational documents. The Funds' maximum exposure under these arrangements is dependent on future claims that may be made against the Funds and, therefore, cannot be estimated; however, based on experience, the risk of loss from such claims is considered remote.
61
Credit Suisse Funds
Notes to Financial Statements (continued)
October 31, 2007
Note 9. Recent Accounting Pronouncements
During June 2006, the Financial Accounting Standards Board ("FASB") issued FASB Interpretation 48 ("FIN 48" or the "Interpretation"), Accounting for Uncertainty in Income Taxes — an interpretation of FASB statement 109. FIN 48 supplements FASB Statement 109, Accounting for Income Taxes, by defining the confidence level that a tax position must meet in order to be recognized in the financial statements. FIN 48 prescribes a comprehensive model for how a fund should recognize, measure, present, and disclose in its financial statements uncertain tax positions that the fund has taken or expects to take on a tax return. FIN 48 requires that the t ax effects of a position be recognized only if it is "more likely than not" to be sustained based solely on its technical merits. Management must be able to conclude that the tax law, regulations, case law, and other objective information regarding the technical merits sufficiently support the position's sustainability with a likelihood of more than 50 percent. On December 22, 2006, the SEC indicated that they would not object if the Funds implement FIN 48 in the first required financial statement reporting period for their fiscal year beginning after December 15, 2006. Management is evaluating the application of the Interpretation to the Funds and is not in a position at this time to estimate the significance of its impact, if any, on the Funds' financial statements.
On September 20, 2006, the FASB released Statement of Financial Accounting Standards No. 157 "Fair Value Measurements" ("FAS 157"). FAS 157 establishes an authoritative definition of fair value, sets out a framework for measuring fair value, and requires additional disclosures about fair-value measurements. The application of FAS 157 is required for fiscal years, beginning after November 15, 2007 and interim periods within those fiscal years. As of October 31, 2007, management does not believe the adoption of FAS 157 will impact the amounts reported in the financial statements, however, additional disclosures will be required in subsequent reports.
62
Credit Suisse Funds
Report of Independent Registered Public Accounting Firm
To the Board of Trustees and Shareholders of
Credit Suisse Large Cap Value Fund and
Credit Suisse Small Cap Core Fund:
In our opinion, the accompanying statements of assets and liabilities, including the schedules of investments, and the related statements of operations and of changes in net assets and the financial highlights present fairly, in all material respects, the financial position of Credit Suisse Large Cap Value Fund and Credit Suisse Small Cap Core Fund (hereafter referred to as the "Funds") at October 31, 2007, the results of each of their operations for the year then ended, the changes in each of their net assets for each of the two years in the period then ended and the financial highlights for each of the years (or periods) presented, in conformity with accounting principles generally accepted in the United States of America. These financial statements and financial highlights (hereafter referred to as "financial statements") are the responsibility of the Funds' management; our responsibility is to express an opinion on these financial statem ents based on our audits. We conducted our audits of these financial statements in accordance with the standards of the Public Company Accounting Oversight Board (United States). Those standards require that we plan and perform the audit to obtain reasonable assurance about whether the financial statements are free of material misstatement. An audit includes examining, on a test basis, evidence supporting the amounts and disclosures in the financial statements, assessing the accounting principles used and significant estimates made by management, and evaluating the overall financial statement presentation. We believe that our audits, which included confirmation of securities at October 31, 2007 by correspondence with the custodian and brokers, provide a reasonable basis for our opinion.
PricewaterhouseCoopers LLP
Baltimore, Maryland
December 26, 2007
63
Credit Suisse Funds
Information Concerning Trustees and Officers (unaudited)
| Name, Address (Year of Birth) | Position(s) Held with Fund | Term of Office1 and Length of Time Served | Principal Occupation(s) During Past Five Years | Number of Portfolios in Fund Complex Overseen by Trustee | Other Directorships Held by Trustee | ||||||||||||||||||
| Independent Trustees | |||||||||||||||||||||||
| Enrique Arzac c/o Credit Suisse Asset Management, LLC Attn: General Counsel Eleven Madison Avenue New York, New York 10010 (1941) | Trustee, Nominating Committee Member and Audit Committee Chairman | Since 2005 | Professor of Finance and Economics, Graduate School of Business, Columbia University since 1971. | 36 | Director of Epoch Holding Corporation (an investment management and investment advisory services company); Director of The Adams Express Company (a closed-end investment company); Director of Petroleum and Resources Corporation (a closed-end investment company). | ||||||||||||||||||
| Richard H. Francis c/o Credit Suisse Asset Management, LLC Attn: General Counsel Eleven Madison Avenue New York, New York 10010 (1932) | Trustee, Nominating and Audit Committee Member | Since 2001 | Currently retired | 29 | None | ||||||||||||||||||
1 Each Trustee and Officer serves until his or her respective successor has been duly elected and qualified.
64
Credit Suisse Funds
Information Concerning Trustees and Officers (unaudited) (continued)
| Name, Address (Year of Birth) | Position(s) Held with Fund | Term of Office1 and Length of Time Served | Principal Occupation(s) During Past Five Years | Number of Portfolios in Fund Complex Overseen by Trustee | Other Directorships Held by Trustee | ||||||||||||||||||
| Independent Trustees | |||||||||||||||||||||||
| Jeffrey E. Garten Box 208200 New Haven, Connecticut 06520-8200 (1946) | Trustee, Nominating and Audit Committee Member | Since 2001 | The Juan Trippe Professor in the Practice of International Trade, Finance and Business from July 2005 to present; Partner and Chairman of Garten Rothkopf (consulting firm) from October 2005 to present; Dean of Yale School of Management from November 1995 to June 2005. | 29 | Director of Aetna, Inc. (insurance company); Director of CarMax Group (used car dealers); Director of Alcan, Inc. (smelting and refining of nonferrous metals company). | ||||||||||||||||||
| Peter F. Krogh SFS/ICC 702 Georgetown University Washington, DC 20057 (1937) | Trustee, Nominating and Audit Committee Member | Since 2001 | Dean Emeritus and Distinguished Professor of International Affairs at the Edmund A. Walsh School of Foreign Service, Georgetown University from June 1995 to present. | 29 | Director of Carlisle Companies Incorporated (diversified manufacturing company). | ||||||||||||||||||
| Steven N. Rappaport Lehigh Court, LLC 555 Madison Avenue 29th Floor New York, New York 10022 (1948) | Chairman of the Board of Trustees, Nominating Committee Chairman and Audit Committee Member | Trustee since 2001 and Chairman since 2005 | Partner of Lehigh Court, LLC and RZ Capital (private investment firms) from July 2002 to present. | 36 | Director of iCAD, Inc. (surgical and medical instruments and apparatus company); Director of Presstek, Inc. (digital imaging technologies company); Director of Wood Resources, LLC. (plywood manufacturing company). | ||||||||||||||||||
65
Credit Suisse Funds
Information Concerning Trustees and Officers (unaudited) (continued)
| Name, Address (Year of Birth) | Position(s) Held with Fund | Term of Office1 and Length of Time Served | Principal Occupation(s) During Past Five Years | Number of Portfolios in Fund Complex Overseen by Trustee | Other Directorships Held by Trustee | ||||||||||||||||||
| Interested Trustee | |||||||||||||||||||||||
| Michael E. Kenneally3 c/o Credit Suisse Asset Management, LLC Attn: General Counsel Eleven Madison Avenue New York, New York 10010 (1954) | Trustee | Since 2004 | Chairman and Global Chief Executive Officer of Credit Suisse from March 2003 to July 2005; Chairman and Chief Investment Officer of Banc of America Capital Management from 1998 to March 2003. | 29 | None | ||||||||||||||||||
3 Mr. Kenneally is a Trustee who is an "interested person" of the Funds as defined in the Investment Company Act of 1940, as amended, because he was an officer of Credit Suisse within the last two fiscal years.
66
Credit Suisse Funds
Information Concerning Trustees and Officers (unaudited) (continued)
Name, Address (Year of Birth) | Position(s) Held with Fund | Term of Office1 and Length of Time Served | Principal Occupation(s) During Past Five Years | ||||||||||||
| Officers | |||||||||||||||
| Lawrence D. Haber c/o Credit Suisse Asset Management, LLC. Attn: General Counsel Eleven Madison Avenue New York, New York 10010 (1951) | Chief Executive Officer and President | Since 2007 | Managing Director and Chief Operating Officer of Credit Suisse; Member of Credit Suisse's Management Committee; Chief Financial Officer of Merrill Lynch Investment Managers from 1997 to 2003. | ||||||||||||
| Michael A. Pignataro Credit Suisse Asset Management, LLC Eleven Madison Avenue New York, New York 10010 (1959) | Chief Financial Officer | Since 1999 | Director and Director of Fund Administration of Credit Suisse; Associated with Credit Suisse or its predecessor since 1984; Officer of other Credit Suisse Funds. | ||||||||||||
| Emidio Morizio Credit Suisse Asset Management, LLC Eleven Madison Avenue New York, New York 10010 (1966) | Chief Compliance Officer | Since 2004 | Director and Global Head of Compliance of Credit Suisse; Associated with Credit Suisse since July 2000; Officer of other Credit Suisse Funds. | ||||||||||||
| J. Kevin Gao Credit Suisse Asset Management, LLC Eleven Madison Avenue New York, New York 10010 (1967) | Chief Legal Officer since 2006, Vice President and Secretary since 2004 | Since 2004 | Director and Legal Counsel of Credit Suisse; Associated with Credit Suisse since July 2003; Associated with the law firm of Willkie Farr & Gallagher LLP from 1998 to 2003; Officer of other Credit Suisse Funds. | ||||||||||||
| Robert Rizza Credit Suisse Asset Management, LLC Eleven Madison Avenue New York, New York 10010 (1965) | Treasurer | Since 2006 | Vice President of Credit Suisse; Associated with Credit Suisse since 1998; Officer of other Credit Suisse Funds. | ||||||||||||
The Statement of Additional Information includes additional information about the Trustees and is available, without charge, upon request, by calling 800-927-2874.
67
Credit Suisse Funds
October 31, 2007 (unaudited)
Important Tax Information for Corporate Shareholders
Corporate shareholders should note for the year ended October 31, 2007, the percentage of the Fund's investment income (i.e., net investment income plus short-term capital gains) that qualified for the intercorporate dividends received deduction is 27.46% for the Large Cap Value Fund and 99.06% for the Small Cap Core Fund.
Important Tax Information for Shareholders
For the fiscal year ended October 31, 2007, Large Cap Value and Small Cap Core designates approximately $25,213,996 and $5,016,803, respectively, or up to the maximum amount of such dividends allowable pursuant to the internal Revenue Code, as qualified dividends income eligible for reduced tax rates. These lower rates range from 5% to 15% depending on an individual's tax bracket. If the fund pays a distribution during the calendar year of 2007, complete information will be reported in conjunction with Form 1099-DIV.
During the year ended October 31, 2007, the Funds declared the following dividends that were designated as long-term capital gains dividends:
| Fund | Amount | ||||||
| Large Cap Value | $ | 42,635,177 | |||||
| Small Cap Core | 48,246,540 | ||||||
68
Credit Suisse Funds
Proxy Voting and Portfolio Holdings Information (unaudited)
Information regarding how each Fund voted proxies related to its portfolio securities during the 12 month period ended June 30 of each year, as well as the policies and procedures that each Fund uses to determine how to vote proxies relating to its portfolio securities are available:
• By calling 1-800-927-2874
• On the Fund's website, www.credit-suisse.com/us
• On the website of the Securities and Exchange Commission, www.sec.gov.
Each Fund files a complete schedule of its portfolio holdings for the first and third quarters of its fiscal year with the SEC on Form N-Q. The Funds' Forms N-Q are available on the SEC's website at www.sec.gov and may be reviewed and copied at the SEC's Public Reference Room in Washington, DC. Information on the operation of the SEC's Public Reference Room may be obtained by calling 1-202-551-8090.
69
This page intentionally left blank
This page intentionally left blank
This page intentionally left blank

P.O. BOX 55030, BOSTON, MA 02205-5030
800-927-2874 n www.credit-suisse.com/us
CREDIT SUISSE ASSET MANAGEMENT SECURITIES, INC., DISTRIBUTOR. USEQVAL-AR-1007

CREDIT SUISSE FUNDS
Annual Report
October 31, 2007
n CREDIT SUISSE
ABSOLUTE RETURN FUND
The Fund's investment objectives, risks, charges and expenses (which should be considered carefully before investing), and more complete information about the Fund, are provided in the Prospectus, which should be read carefully before investing. You may obtain additional copies by calling 800-927-2874 or by writing to Credit Suisse Funds, P.O. Box 55030, Boston, MA 02205-5030.
Credit Suisse Asset Management Securities, Inc., Distributor, is located at Eleven Madison Avenue, New York, NY 10010. Credit Suisse Funds are advised by Credit Suisse Asset Management, LLC.
Investors in the Credit Suisse Funds should be aware that they may be eligible to purchase Common Class and/or Advisor Class shares (where offered) directly or through certain intermediaries. Such shares are not subject to a sales charge but may be subject to an ongoing service and distribution fee of up to 0.50% of average daily net assets. Investors in the Credit Suisse Funds should also be aware that they may be eligible for a reduction or waiver of the sales charge with respect to Class A, B or C shares (where offered). For more information, please review the relevant prospectuses or consult your financial representative.
The views of the Fund's management are as of the date of the letter and Fund holdings described in this document are as of October 31, 2007; these views and Fund holdings may have changed subsequent to these dates. Nothing in this document is a recommendation to purchase or sell securities.
Fund shares are not deposits or other obligations of Credit Suisse Asset Management, LLC ("Credit Suisse") or any affiliate, are not FDIC-insured and are not guaranteed by Credit Suisse or any affiliate. Fund investments are subject to investment risks, including loss of your investment.
Credit Suisse Absolute Return Fund
Annual Investment Adviser's Report
October 31, 2007 (unaudited)
November 29, 2007
Dear Shareholder:
Performance Summary
12/29/06 – 10/31/07
| Fund | Performance | ||||||
| Common1 | 9.10 | % | |||||
| Class A1,2 | 8.90 | % | |||||
| Class C1,2 | 8.20 | % | |||||
| LIBOR + 350 bps3 | 7.72 | % | |||||
| Merrill Lynch US Treasury Notes & Bonds 0-1 Year Index4 | 4.47 | % | |||||
Performance for the Fund's Class A and Class C shares is without the maximum sales charge of 4.00% and 1.00%, respectively.2
Market Review: Volatile markets define the period
The Credit Suisse Absolute Return Fund commenced operations on December 29, 2006. The Fund seeks to deliver positive aggregate return streams over a three- to five-year time horizon, regardless of individual market movements. To that end, the Fund employs a dynamic asset allocation-driven strategy that can invest in a wide range of equity and debt securities, exchange-traded funds, commodity-linked derivatives and money market instruments. The Fund generally invests between 30% to 75% of assets in equity markets and 25% to 70% of assets in fixed income or cash securities.
The period from December 29, 2006 (inception), to October 31, 2007, was characterized by equity markets posting differing returns. Consider that the last four years have seen impressive growth supported by earnings growth, valuations, sentiment, bond yields and liquidity. This was the first part of the bull economy. We believe that while the world economy is still in good shape, the second part of the bull market will be more volatile. In the first ten months of 2007 alone, we have already seen two substantial bouts of volatility in the global equity markets. Stock markets corrected sharply in February, and again in July and August.
Global equities were unsettled with fears about bank profits, reduced leveraged buyouts and general risk aversion. It follows from a year of very low global interest rates moving to more normal levels, excess liquidity triggered by generous terms on sub-prime mortgages, and corporate leveraged loans. As the level of interest rates rose and investor risk appetite fell, the sub-prime boom started to unwind earlier this year followed by corporate loans in June. With the cost of corporate credit rising, banks that had underwritten loans at the old low
1
Credit Suisse Absolute Return Fund
Annual Investment Adviser's Report (continued)
October 31, 2007 (unaudited)
level bought protection against further rises, creating an upward spiral in borrowing costs and making it difficult to issue new debt.
We do not think this signals an end to the bull market in equities that started in 2003. However, we do think it ushers in a period of significantly greater volatility, as markets have to cope with higher interest rates, tighter supply of resources like energy, and profit growth below the stellar rates of recent years. In short, the current economic and investment cycles are starting to mature just as we are seeing an increasing number of disruptions from structural change.
The aggressive move from the Fed when cutting the leading interest rate by 50 bps (to 4.75%) indicates a focus on economic growth as opposed to inflation, which historically has been the main driver behind interest rate decisions. This surprisingly large cut implies that perhaps the Fed may be ready to abandon its price stability policy and begin focusing on growth and the financial market milieu. This rather significant change in attitude has been partly enabled as a side effect from the "credit crunch" since it eased the inflationary picture, opening the door for more aggressive central bank policy.
Within the fixed income markets, economic indicators appear to reflect a gradual slowing in economic activity, although the markets have been relieved that so far there has not been a sharp contraction from the recent liquidity crisis. U.S. real GDP is forecast to grow at around 2% for 2007, in spite of the exceptionally weak start to the year, driven by consumer demand and solid growth in the manufacturing and service sectors. Consumer activity, which represents around 70% of domestic demand, is slowing as retail sales have been flat over the last three months and consumer confidence continues to weaken.
Exports have been a positive factor, benefiting from the strong demand in Asia and the Middle East as well as the weak U.S. Dollar. The outlook for the fourth quarter will depend on the potential impact of a weaker housing market on consumer confidence. The Fed's preferred measure of inflation, the Personal Consumption Index, has fallen back below 2% and although domestic inflation pressures remain muted, there are still risks for inflation coming from higher energy and commodity prices, the rise in agricultural and food prices, and the devaluation effects from a weaker currency. The impact for markets has been steepening yield curves as the longer dated maturities move to price in the higher inflation risk premium. The shorter dated maturities are already pricing in further monetary easing from the Fed.
As the Fed's action restored confidence in credit markets, spread differentials have tightened, but are still a ways from their pre-crisis levels. The investment banks, particularly Citi and UBS, have prepared the market for a significant write
2
Credit Suisse Absolute Return Fund
Annual Investment Adviser's Report (continued)
October 31, 2007 (unaudited)
down in earnings for the third quarter. This has left investors with the perception that perhaps the worst of the credit crunch is now over.
Strategic Review and Outlook: Longer term fundamentals still attractive
For the period from inception through October 31, 2007, the Fund, through an effective asset allocation strategy, produced healthy returns.
Main contributors to performance included the Fund's:
• Position (roughly 7.20%) in Swiss and emerging market stocks in April/May
• Large emerging markets stocks position during June (11.74%), September (14.06%), and the end of October (17.17%)
• U.S. stocks position during end of August until end of September (roughly 17.51%)
Main performance detractors included:
• The Fund's position in Japanese stocks from inception until August
• The February correction in equity markets, while we held 28.23% in stocks, on average, during that period
• The second correction in equity markets due to the sub-prime crisis in July and August
Fund performance significantly picked up starting in September and is currently maintaining its good momentum.
Currently, we believe the underlying U.S. economy is still holding up well. Apparent damage to the real economy in the United States still looks limited to homebuilders or industries geared to the housing market and the financial industry. Given the still high supply overhang in the U.S. housing market, we expect it may continue to be a drag on GDP growth. The direct effect is lower residential investments, which could again subtract more than 1% of growth in the fourth quarter of 2007. We do, however, see signs that the downturn in U.S. housing may be coming to an end and we expect home prices to start to rise within the next 12 months.
While the European Central Bank (ECB) had pre-announced a September rate hike, their president, Jean-Claude Trichet, emphasized that the ECB never pre-commits. The recent market turmoil and the tightening of conditions in the money market kept the ECB from tightening in September. They have retained a hawkish bias, but monetary policy is now more likely to remain on hold. Capacity utilization remains high and, with the unemployment rate at the lowest level in
3
Credit Suisse Absolute Return Fund
Annual Investment Adviser's Report (continued)
October 31, 2007 (unaudited)
nearly 25 years, inflationary risks are still in play. Business sentiment, as measured by national surveys and the Eurozone PMI (Purchasing Managers' Index) — an indicator of the economic health of the manufacturing sector in the European Union — has shown weakening of late. This poses a downside risk to our interest rate expectations. Additionally, sentiment and confidence factors are now showing clear signs of rolling over into more negative territory.
Earlier in the year we considered the Japanese economy to be fundamentally sound, though unsupported by performance of their equity market. Private consumption remains subdued despite a tightening labor market. Elsewhere, however, business confidence indices remain upbeat and export growth is starting to accelerate again. Japan will benefit directly from strong growth in the BRIC economies (Brazil, Russia, India and China) and elsewhere in Asia given a very competitive exchange rate. However, the uncertain outlook for the direction of the U.S. economy could well weigh on sentiment in the Japanese equity market.
Overall we believe that markets will rejoin the long-term bull trend given the following factors: A world economy still supported by globalization and expansion in the emerging markets; still attractive equity valuations; and ongoing strong growth in global profits. Therefore, as the longer-term fundamentals still look attractive, we see the current weakness in equities as a correction within a bull market, not a decisive change in trend.
Further, despite the fact that equities globally look relatively cheap, the detailed picture is somewhat more mixed as we see indications of a less favorable equity environment. As one example, the earnings revisions turned negative in the United States, while in the emerging market universe, equity markets are looking somewhat expensive. On the other side, Japan now looks cheap from a pure valuation point of view. Emerging market equities continue to be our preferred market mainly driven by accelerating earnings overshadowing the relatively expensive valuations.
With regard to fixed income, the Fed, in our opinion, has probably done enough to prevent a recession and growth should continue to slow with investors believing that the Fed can rescue the markets. In the near term, government bond valuations are looking fully priced at current levels and may well be vulnerable to disappointment, especially if inflation appears to be accelerating during a period when the economic picture is weakening.
We believe that government yields are likely to drift higher in the near term, but yield curve steepening is likely to be led by lower yields in the shorter dated maturities. In credit markets, although the fundamentals still seem positive with low default rates, healthy corporate balance sheets, and low levels of leveraging,
4
Credit Suisse Absolute Return Fund
Annual Investment Adviser's Report (continued)
October 31, 2007 (unaudited)
the balance of risk has now shifted. We expect slower growth will affect corporate earnings and companies may do more to placate their shareholders by increasing balance sheet leverage at the expense of bondholders.
The Credit Suisse Multi-Asset Class Solutions Team
Guy Stern
Christine Gaelzer
There is no guarantee that the Fund's absolute return will be achieved, and there may be negative returns at any given time. In addition, investments in the Fund are subject to a number of risks, including, but not limited to, asset class risk, issuer risk, credit risk, derivatives risk and foreign securities risk.
In addition to historical information, this report contains forward-looking statements that may concern, among other things, domestic and foreign market, industry and economic trends and developments and government regulation and their potential impact on the Fund's investments. These statements are subject to risks and uncertainties and actual trends, developments and regulations in the future, and their impact on the Fund could be materially different from those projected, anticipated or implied. The Fund has no obligation to update or revise forward-looking statements.
5
Credit Suisse Absolute Return Fund
Annual Investment Adviser's Report (continued)
October 31, 2007 (unaudited)
Comparison of Change in Value of $10,000 Investment in the
Credit Suisse Absolute Return Fund1 Common Class shares,
Class A shares2, Class C shares2, and the Merrill Lynch
US Treasury Notes & Bonds 0-1 year Index4 from Inception (12/29/06).
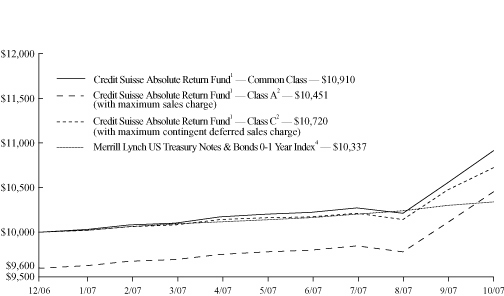
6
Credit Suisse Absolute Return Fund
Annual Investment Adviser's Report (continued)
October 31, 2007 (unaudited)
Cumulative Returns as of September 30, 20071
| Inception to Date | |||||||
| Common Class | 5.50 | % | |||||
| Class A Without Sales Charge | 5.30 | % | |||||
| Class A With Maximum Sales Charge | 1.06 | % | |||||
| Class C Without CDSC | 4.70 | % | |||||
| Class C With CDSC | 3.70 | % | |||||
Cumulative Returns as of October 31, 20071
| Inception to Date | |||||||
| Common Class | 9.10 | % | |||||
| Class A Without Sales Charge | 8.90 | % | |||||
| Class A With Maximum Sales Charge | 4.51 | % | |||||
| Class C Without CDSC | 8.20 | % | |||||
| Class C With CDSC | 7.20 | % | |||||
Returns represent past performance and include change in share price and reinvestment of dividends and capital gains. Past performance cannot guarantee future results. The current performance of the Fund may be lower or higher than the figures shown. Returns and share price will fluctuate, and redemption value may be more or less than original cost. The performance results do not reflect the deduction of taxes that a shareholder would pay on fund distributions or the redemption of fund shares. Performance information current to the most recent month-end is available at www.credit-suisse.com/us.
1 Fee waivers and/or expense reimbursements may reduce expenses for the Fund, without which performance would be lower. Waivers and/or reimbursements may be discontinued at any time.
2 Total return for the Fund's Class A shares for the reporting period, based on offering price (including maximum sales charge of 4.00%), was 4.51%. Total return for the Fund's Class C shares for the reporting period, based on redemption value (including maximum contingent deferred sales charge of 1.00%) was 7.20%.
3 Over a three to five-year economic cycle, the Fund aims to achieve an aggregate positive absolute return of 3-month LIBOR + 350 basis points, gross of fees. The Fund is not designed to achieve consistent annual returns, and the return in any year may be lower than the three- to five-year aggregate return the Fund seeks.
4 The Merrill Lynch US Treasury Notes & Bonds 0-1 Year Index tracks the performance of all outstanding US Treasury Notes and Bonds having less than one year remaining term to maturity and a minimum amount outstanding of $1 billion. The Index is rebalanced daily to take account of issues that are maturing and new additions. Bonds are "purchased" into the Index basket on the day they fall below one year to maturity and are removed on the day they mature. Additional sub-indices are available that segment the Index into quarterly maturity ranges. Investors cannot invest directly in an index.
7
Credit Suisse Absolute Return Fund
Annual Investment Adviser's Report (continued)
October 31, 2007 (unaudited)
Information About Your Fund's Expenses
As an investor of the Fund, you incur two types of costs: ongoing expenses and transaction costs. Ongoing expenses include management fees, distribution and service (12b-1) fees and other Fund expenses. Examples of transaction costs include sales charges (loads), redemption fees and account maintenance fees, which are not shown in this section and which would result in higher total expenses. The following table is intended to help you understand your ongoing expenses of investing in the Fund and to help you compare these expenses with the ongoing expenses of investing in other mutual funds. The table is based on an investment of $1,000 made at the beginning of the six month period ended October 31, 2007.
The table illustrates your Fund's expenses in two ways:
• Actual Fund Return. This helps you estimate the actual dollar amount of ongoing expenses paid on a $1,000 investment in the Fund using the Fund's actual return during the period. To estimate the expenses you paid over the period, simply divide your account value by $1,000 (for example, an $8,600 account value divided by $1,000 = 8.6), then multiply the result by the number in the "Expenses Paid per $1,000" line under the share class you hold.
• Hypothetical 5% Fund Return. This helps you to compare your Fund's ongoing expenses with those of other mutual funds using the Fund's actual expense ratio and a hypothetical rate of return of 5% per year before expenses. Examples using a 5% hypothetical fund return may be found in the shareholder reports of other mutual funds. The hypothetical account values and expenses may not be used to estimate the actual ending account balance or expenses you paid for the period.
Please note that the expenses shown in these tables are meant to highlight your ongoing expenses only and do not reflect any transaction costs, such as sales charges (loads) or redemption fees. If these transaction costs had been included, your costs would have been higher. The "Expenses Paid per $1,000" line of the tables is useful in comparing ongoing expenses only and will not help you determine the relative total expenses of owning different funds.
8
Credit Suisse Absolute Return Fund
Annual Investment Adviser's Report (continued)
October 31, 2007 (unaudited)
Expenses and Value of a $1,000 Investment
for the six month period ended October 31, 2007
| Actual Fund Return | Common Class | Class A | Class C | ||||||||||||
| Beginning Account Value 5/1/07 | $ | 1,000.00 | $ | 1,000.00 | $ | 1,000.00 | |||||||||
| Ending Account Value 10/31/07 | $ | 1,072.80 | $ | 1,071.90 | $ | 1,067.10 | |||||||||
| Expenses Paid per $1,000* | $ | 5.22 | $ | 6.53 | $ | 10.42 | |||||||||
| Hypothetical 5% Fund Return | |||||||||||||||
| Beginning Account Value 5/1/07 | $ | 1,000.00 | $ | 1,000.00 | $ | 1,000.00 | |||||||||
| Ending Account Value 10/31/07 | $ | 1,020.16 | $ | 1,018.90 | $ | 1,015.12 | |||||||||
| Expenses Paid per $1,000* | $ | 5.09 | $ | 6.36 | $ | 10.16 | |||||||||
| Common Class | Class A | Class C | |||||||||||||
| Annualized Expense Ratios* | 1.00 | % | 1.25 | % | 2.00 | % | |||||||||
* Expenses are equal to the Fund's annualized expense ratio for each share class, multiplied by the average account value over the period, multiplied by the number of days in the most recent fiscal half year period, then divided by 365.
The "Expenses Paid per $1,000" and the "Annualized Expense Ratios" in the tables are based on actual expenses paid by the Fund during the period, net of fee waivers and/or expense reimbursements. If those fee waivers and/or expense reimbursements had not been in effect, the Fund's actual expenses would have been higher.
For more information, please refer to the Fund's prospectus.
9
Credit Suisse Absolute Return Fund
Annual Investment Adviser's Report (continued)
October 31, 2007 (unaudited)
| Sector Breakdown* | |||||||
| Commingled Funds | 63.0 | % | |||||
| United States Agency Obligations | 26.0 | % | |||||
| Commercial Paper | 6.6 | % | |||||
| Short-Term Investment | 4.4 | % | |||||
| Total | 100.0 | % | |||||
* Expressed as a percentage of total investments (excluding security lending collateral) and may vary over time.
10
Credit Suisse Absolute Return Fund
Schedule of Investments
October 31, 2007
| Number of Shares | Value | ||||||||||
| COMMON STOCKS (64.5%) | |||||||||||
| Commingled Funds (64.5%) | |||||||||||
| iPATH Dow Jones-AIG Commodity Index Total Return ETN | 6,010 | $ | 334,396 | ||||||||
| iShares Lehman 7-10 Year Treasury Bond Fund | 11,030 | 933,028 | |||||||||
| iShares MSCI Canada Index Fund | 10,400 | 375,232 | |||||||||
| iShares MSCI Emerging Markets Index§ | 7,721 | 1,290,874 | |||||||||
| iShares S&P 500 Index Fund§ | 10,100 | �� | 1,566,813 | ||||||||
| TOTAL COMMON STOCKS (Cost $4,021,385) | 4,500,343 | ||||||||||
| Par (000) | Ratings† (S&P/Moody's) | Maturity | Rate% | ||||||||||||||||||||
| COMMERCIAL PAPER (6.7%) | |||||||||||||||||||||||
| ASSET BACKED (6.7%) | |||||||||||||||||||||||
| $ | 470 | Foxboro Funding, Ltd. (Cost $468,581) | (A-1+, P-1) | 11/20/07 | 5.810 | 468,581 | |||||||||||||||||
| UNITED STATES AGENCY OBLIGATIONS (26.6%) | |||||||||||||||||||||||
| 500 | Fannie Mae Discount Notes | (AAA, Aaa) | 12/05/07 | 4.386 | 497,596 | ||||||||||||||||||
| 300 | Fannie Mae Discount Notes | (AAA, Aaa) | 04/02/08 | 4.361 | 294,651 | ||||||||||||||||||
| 500 | Freddie Mac Discount Notes | (AAA, Aaa) | 12/07/07 | 4.385 | 497,458 | ||||||||||||||||||
| 570 | Freddie Mac Discount Notes | (AAA, Aaa) | 02/11/08 | 4.356 | 563,161 | ||||||||||||||||||
| TOTAL UNITED STATES AGENCY OBLIGATIONS (Cost $1,851,220) | 1,852,866 | ||||||||||||||||||||||
| Number of Shares | |||||||||||
| State Street Navigator Prime Portfolio§§ | 1,959,273 | 1,959,273 | |||||||||
| Par (000) | |||||||||||
| State Street Bank and Trust Co.Euro Time Deposit, 3.600%, 11/01/07 | $ | 311 | 311,000 | ||||||||
| TOTAL SHORT-TERM INVESTMENTS (Cost $2,270,273) | 2,270,273 | ||||||||||
| TOTAL INVESTMENTS AT VALUE (130.4%) (Cost $8,611,459) | 9,092,063 | ||||||
| LIABILITIES IN EXCESS OF OTHER ASSETS (-30.4%) | (2,118,263 | ) | |||||
| NET ASSETS (100.0%) | $ | 6,973,800 | |||||
INVESTMENT ABBREVIATION
ETN = Exchange Traded Note
† Credit ratings given by the Standard & Poor's Division of The McGraw-Hill Companies, Inc. ("S&P") and Moody's Investors Service, Inc. ("Moody's") are unaudited.
§ Security or portion thereof is out on loan.
§§ Represents security purchased with cash collateral received for securities on loan.
See Accompanying Notes to Financial Statements.
11
Credit Suisse Absolute Return Fund
Statement of Assets and Liabilities
October 31, 2007
| Assets | |||||||
| Investments at value, including collateral for securities on loan of $1,959,273 (Cost $8,611,459) (Note 2) | $ | 9,092,0631 | |||||
| Cash | 713 | ||||||
| Offering costs (Note 3) | 27,510 | ||||||
| Receivable from investment adviser (Note 3) | 11,685 | ||||||
| Receivable for fund shares sold | 2,500 | ||||||
| Interest receivable | 31 | ||||||
| Prepaid expenses and other assets | 3,331 | ||||||
| Total Assets | 9,137,833 | ||||||
| Liabilities | |||||||
| Administrative services fee payable (Note 3) | 874 | ||||||
| Distribution fee payable (Note 3) | 365 | ||||||
| Payable upon return of securities loaned (Note 2) | 1,959,273 | ||||||
| Offering costs payable (Note 3) | 159,381 | ||||||
| Trustees' fee payable | 10,269 | ||||||
| Payable for fund shares redeemed | 240 | ||||||
| Other accrued expenses payable | 33,631 | ||||||
| Total Liabilities | 2,164,033 | ||||||
| Net Assets | |||||||
| Capital stock, $0.001 par value (Note 6) | 639 | ||||||
| Paid-in capital (Note 6) | 6,164,685 | ||||||
| Undistributed net investment income | 295,583 | ||||||
| Accumulated net realized gain from investments | 32,289 | ||||||
| Net unrealized appreciation from investments | 480,604 | ||||||
| Net Assets | $ | 6,973,800 | |||||
| Common Shares | |||||||
| Net assets | $ | 5,510,702 | |||||
| Shares outstanding | 505,067 | ||||||
| Net asset value, offering price, and redemption price per share | $ | 10.91 | |||||
| A Shares | |||||||
| Net assets | $ | 1,344,969 | |||||
| Shares outstanding | 123,512 | ||||||
| Net asset value and redemption price per share | $ | 10.89 | |||||
| Maximum offering price per share (net asset value/(1-4.00%)) | $ | 11.34 | |||||
| C Shares | |||||||
| Net assets | $ | 118,129 | |||||
| Shares outstanding | 10,917 | ||||||
| Net asset value and offering price per share | $ | 10.82 | |||||
1 Including $1,919,150 of securities on loan.
See Accompanying Notes to Financial Statements.
12
Credit Suisse Absolute Return Fund
Statement of Operations
For the Period December 29, 20061 through October 31, 2007
| Investment Income (Note 2) | |||||||
| Interest | $ | 181,016 | |||||
| Dividends | 58,472 | ||||||
| Securities lending | 536 | ||||||
| Total investment income | 240,024 | ||||||
| Expenses | |||||||
| Investment advisory fees (Note 3) | 56,180 | ||||||
| Administrative services fees (Note 3) | 9,216 | ||||||
| Distribution fees (Note 3) | |||||||
| Class A | 846 | ||||||
| Class C | 560 | ||||||
| Offering costs (Note 3) | 131,871 | ||||||
| Printing fees (Note 3) | 32,071 | ||||||
| Legal fees | 30,451 | ||||||
| Audit and tax fees | 21,930 | ||||||
| Trustees' fees | 19,671 | ||||||
| Transfer agent fees | 7,207 | ||||||
| Custodian fees | 4,816 | ||||||
| Registration fees | 2,612 | ||||||
| Commitment fees (Note 4) | 586 | ||||||
| Insurance expense | 72 | ||||||
| Miscellaneous expense | 5,105 | ||||||
| Total expenses | 323,194 | ||||||
| Less: fees waived and expenses reimbursed (Note 3) | (246,882 | ) | |||||
| Net expenses | 76,312 | ||||||
| Net investment income | 163,712 | ||||||
| Net Realized and Unrealized Gain from Investments | |||||||
| Net realized gain from investments | 32,289 | ||||||
| Net change in unrealized appreciation (depreciation) from investments | 480,604 | ||||||
| Net realized and unrealized gain from investments | 512,893 | ||||||
| Net increase in net assets resulting from operations | $ | 676,605 | |||||
1 Commencement of operations.
See Accompanying Notes to Financial Statements.
13
Credit Suisse Absolute Return Fund
Statement of Changes in Net Assets
| For the Period Ended October 31, 20071 | |||||||
| From Operations | |||||||
| Net investment income | $ | 163,712 | |||||
| Net realized gain from investments | 32,289 | ||||||
| Net change in unrealized appreciation (depreciation) from investments | 480,604 | ||||||
| Net increase in net assets resulting from operations | 676,605 | ||||||
| From Capital Share Transactions (Note 6) | |||||||
| Proceeds from sale of shares | 1,347,944 | ||||||
| Net asset value of shares redeemed | (5,050,749 | ) | |||||
| Net decrease in net assets from capital share transactions | (3,702,805 | ) | |||||
| Net decrease in net assets | (3,026,200 | ) | |||||
| Net Assets | |||||||
| Beginning of period | 10,000,0002 | ||||||
| End of period | $ | 6,973,800 | |||||
| Undistributed net investment income | $ | 295,583 | |||||
1 For the period December 29, 2006 (commencement of operations) through October 31, 2007.
2 The Fund was seeded on December 29, 2006.
See Accompanying Notes to Financial Statements.
14
Credit Suisse Absolute Return Fund
Financial Highlights
(For a Common Class, Class A and Class C Share of the Fund
Outstanding Throughout the Period)
| For the Period Ended October 31, 20071 | |||||||||||||||
| Common | Class A | Class C | |||||||||||||
| Per share data | |||||||||||||||
| Net asset value, beginning of period | $ | 10.00 | $ | 10.00 | $ | 10.00 | |||||||||
| INVESTMENT OPERATIONS | |||||||||||||||
| Net investment income2 | 0.19 | 0.17 | 0.10 | ||||||||||||
| Net gain on investments (both realized and unrealized) | 0.72 | 0.72 | 0.72 | ||||||||||||
| Total from investment operations | 0.91 | 0.89 | 0.82 | ||||||||||||
| Net asset value, end of period | $ | 10.91 | $ | 10.89 | $ | 10.82 | |||||||||
| Total return3 | 9.10 | % | 8.90 | % | 8.20 | % | |||||||||
| RATIOS AND SUPPLEMENTAL DATA | |||||||||||||||
| Net assets, end of period (000s omitted) | $ | 5,511 | $ | 1,345 | $ | 118 | |||||||||
| Ratio of expenses to average net assets4 | 1.00 | % | 1.25 | % | 2.00 | % | |||||||||
| Ratio of net investment income to average net assets4 | 2.21 | % | 1.90 | % | 1.15 | % | |||||||||
| Decrease reflected in above operating expense ratios due to waivers/reimbursements4 | 3.29 | % | 3.33 | % | 3.37 | % | |||||||||
| Portfolio turnover rate | 206 | % | 206 | % | 206 | % | |||||||||
1 For the period December 29, 2006 (commencement of operations) through October 31, 2007.
2 Per share information is calculated using the average shares outstanding method.
3 Total returns are historical and assume changes in share price, reinvestment of all dividends and distributions and no sales charge. Had certain expenses not been reduced during the period shown, total returns would have been lower. Total returns for periods less than one year are not annualized.
4 Annualized.
See Accompanying Notes to Financial Statements.
15
Credit Suisse Absolute Return Fund
Notes to Financial Statements
October 31, 2007
Note 1. Organization
The Credit Suisse Capital Funds (the "Trust") is an open-end management investment company registered under the Investment Company Act of 1940, as amended (the "1940 Act") and currently offers three managed investment funds of which one, the Absolute Return Fund (the "Fund"), is included in this report. The Trust was organized under the laws of the Commonwealth of Massachusetts as a business trust on November 26, 1985. The Fund is a diversified, open-end management investment company that seeks to achieve a positive absolute return over a three to five year economic cycle.
The Fund is authorized to offer three classes of shares: Common Class shares, Class A shares, and Class C shares. Each class of shares in the Fund represents an equal pro rata interest in the Fund, except that they bear different expenses which reflect the differences in the range of services provided to them. Class A shares are sold subject to a front-end sales charge of up to 4.00%. Class C shares are sold subject to a contingent deferred sales charge of 1.00% if redeemed within the first year of purchase.
Note 2. Significant Accounting Policies
A) SECURITY VALUATION — The net asset value of the Fund is determined daily as of the close of regular trading on The New York Stock Exchange, Inc. (the "Exchange") on each day the Exchange is open for business. Equity investments are valued at market value, which is generally, determined using the closing price on the exchange or market on which the security is primarily traded at the time of valuation (the "Valuation Time"). If no sales are reported, equity investments are generally valued at the most recent bid quotation as of the Valuation Time or at the lowest asked quotation in the case of a short sale of securities. Debt securities with a remaining maturity greater than 60 days are valued in accordance with the price supplied by a pricing service, which may use a matrix, formula or other objective method that takes into consideration market indices, yield curves and other specific adjustments. Debt obligations that will mature in 60 days or less are valued on the basis of amortized cost, which approximates market value, unless it is determined that using this method would not represent fair value. Investments in mutual funds are valued at the mutual fund's closing net asset value per share on the day of valuation. Securities and other assets for which market quotations are not readily available, or whose values have been materially affected by events occurring before the Fund's Valuation Time but after the close of the securities' primary markets, are valued at fair value as determined in good faith by, or under the direction of, the Board of Trustees under procedures established by the Board of Trustees. The Fund may utilize a service provided by an
16
Credit Suisse Absolute Return Fund
Notes to Financial Statements (continued)
October 31, 2007
Note 2. Significant Accounting Policies
independent third party which has been approved by the Board of Trustees to fair value certain securities. When fair-value pricing is employed, the prices of securities used by a fund to calculate its net asset value may differ from quoted or published prices for the same securities.
B) SECURITY TRANSACTIONS AND INVESTMENT INCOME — Security transactions are accounted for on a trade date basis. Interest income is recorded on the accrual basis. Dividends are recorded on the ex-dividend date. Certain expenses are class specific expenses and vary by class. Income, expenses (excluding class-specific expenses) and realized/unrealized gains/losses are allocated proportionately to each class of shares based upon the relative net asset value of outstanding shares of that class. The cost of investments sold is determined by use of the specific identification method for both financial reporting and income tax purposes.
C) DIVIDENDS AND DISTRIBUTIONS TO SHAREHOLDERS — Dividends from net investment income and distributions of net realized capital gains, if any, are declared and paid at least annually. However, to the extent that a net realized capital gain can be reduced by a capital loss carryforward, such gain will not be distributed. Income and capital gain distributions are determined in accordance with federal income tax regulations, which may differ from accounting principles generally accepted in the United States of America ("GAAP").
D) FEDERAL INCOME TAXES — No provision is made for federal taxes as it is the Fund's intention to continue to qualify for and elect the tax treatment applicable to regulated investment companies under the Internal Revenue Code of 1986, as amended, and to make the requisite distributions to its shareholders, which will be sufficient to relieve it from federal income and excise taxes.
E) USE OF ESTIMATES — The preparation of financial statements in conformity with GAAP requires management to make estimates and assumptions that affect the reported amounts of assets and liabilities and disclosure of contingent assets and liabilities at the date of the financial statements and the reported amounts of income and expenses during the reporting period. Actual results could differ from these estimates.
F) SHORT-TERM INVESTMENTS — The Fund, together with other funds/portfolios advised by Credit Suisse Asset Management, LLC ("Credit Suisse"), an indirect, wholly-owned subsidiary of Credit Suisse Group, pools available cash into either a short-term variable rate time deposit issued by State Street Bank and Trust Company ("SSB"), the Fund's custodian, or a money
17
Credit Suisse Absolute Return Fund
Notes to Financial Statements (continued)
October 31, 2007
Note 2. Significant Accounting Policies
market fund advised by Credit Suisse. The short-term time deposit issued by SSB is a variable rate account classified as a short-term investment.
G) SECURITIES LENDING — Loans of securities are required at all times to be secured by collateral at least equal to 102% of the market value of domestic securities on loan (including any accrued interest thereon) and 105% of the market value of foreign securities on loan (including any accrued interest thereon). Cash collateral received by the Fund in connection with securities lending activity may be pooled together with cash collateral for other funds/portfolios advised by Credit Suisse and may be invested in a variety of investments, including certain Credit Suisse-advised funds, funds advised by SSB, the Fund's securities lending agent, or money market instruments. However, in the event of default or bankruptcy by the other party to the agreement, realization and/or retention of the collateral may be subject to legal proceedings.
SSB has been engaged by the Fund to act as the Fund's securities lending agent. The Fund's securities lending arrangement provides that the Fund and SSB will share the net income earned from securities lending activities. During the period ended October 31, 2007, total earnings from the Fund's investment in cash collateral received in connection with securities lending arrangements was $1,759, of which $1,085 was rebated to borrowers (brokers). The Fund retained $536 in income from the cash collateral investment, and SSB, as lending agent, was paid $138. The Fund may also be entitled to certain minimum amounts of income from its securities lending activities. Securities lending income is accrued as earned.
H) OTHER — The Fund may invest up to 15% of its net assets in non-publicly traded securities. Non-publicly traded securities may be less liquid than publicly traded securities. Although these securities may be resold in privately negotiated transactions, the prices realized from such sales could differ from the price originally paid by the Fund or the current carrying values, and the difference could be material.
Note 3. Transactions with Affiliates and Related Parties
Credit Suisse serves as investment adviser for the Fund. For its investment advisory services, Credit Suisse is entitled to receive a fee from the Fund at an annual rate of 0.75% of the Fund's average daily net assets. For the period
18
Credit Suisse Absolute Return Fund
Notes to Financial Statements (continued)
October 31, 2007
Note 3. Transactions with Affiliates and Related Parties
ended October 31, 2007, investment advisory fees earned, voluntarily waived and expenses reimbursed were as follows:
| Gross Advisory Fee | Waiver | Net Advisory Fee | Expense Reimbursement | ||||||||||||
| $ | 56,180 | $ | (56,180 | ) | $ | — | $ | (190,702 | ) | ||||||
Credit Suisse will not recapture from the Fund any fees they waived or reimbursed for the fiscal year ended October 31, 2007. Fee waivers and reimbursements are voluntary and may be discontinued by Credit Suisse at any time.
Credit Suisse Asset Management Securities, Inc. ("CSAMSI"), an affiliate of Credit Suisse, and SSB serve as co-administrators to the Fund. For its co-administrative services, CSAMSI currently receives a fee calculated at an annual rate of 0.09% of the Fund's average daily net assets. For the period ended October 31, 2007, co-administrative services fees earned by CSAMSI were $6,741.
For its co-administrative services, SSB receives a fee, exclusive of out-of-pocket expenses, calculated in total for all the Credit Suisse funds/portfolios co-administered by SSB and allocated based upon relative average net assets of each fund/portfolio, subject to an annual minimum fee. For the period ended October 31, 2007, co-administrative services fees earned by SSB (including out-of-pocket expenses) were $2,475.
In addition to serving as the Fund's co-administrator, CSAMSI currently serves as distributor of the Fund's shares. Pursuant to distribution plans adopted by the Fund pursuant to Rule 12b-1 under the 1940 Act, CSAMSI receives fees for its distribution services. For Class A shares the fees are calculated at an annual rate of 0.25% of the average daily net assets. For Class C shares of the Fund, the fees are calculated at an annual rate of 1.00% of the average daily net assets. Common Class shares do not bear distribution fees.
For the period ended October 31, 2007, CSAMSI and its affiliates advised the Fund that they retained $6,078 from commissions earned on the sale of the Fund's Class A shares.
Merrill Corporation ("Merrill"), an affiliate of Credit Suisse, has been engaged by the Fund to provide certain financial printing and fulfillment services. For the period ended October 31, 2007, Merrill was paid $21,574 for its services to the Fund.
19
Credit Suisse Absolute Return Fund
Notes to Financial Statements (continued)
October 31, 2007
Note 3. Transactions with Affiliates and Related Parties
The Fund will reimburse Credit Suisse for offering costs in the amount of $159,381 that have been paid by Credit Suisse. Offering costs, including initial registration costs, were deferred and will be charged to expenses during the Fund's first year of operation. For the period ended October 31, 2007, $131,871 has been expensed to the Fund.
Note 4. Line of Credit
Effective June 14, 2007, the Fund, together with other funds/portfolios advised by Credit Suisse (collectively, the "Participating Funds"), participates in a $50 million committed, unsecured line of credit facility ("Credit Facility") for temporary or emergency purposes with Deutsche Bank, A.G. as administrative agent and syndication agent and SSB as operations agent. Under the terms of the Credit Facility, the Participating Funds pay an aggregate commitment fee at a rate of 0.10% per annum on the average unused amount of the Credit Facility, which is allocated among the Participating Funds in such manner as is determined by the governing Boards of the Participating Funds. In addition, the Participating Funds pay interest on borrowing at the Federal Funds rate plus 0.50%. At October 31, 2007 and during the period ended October 31, 2007, the Fund had no borrowings under the Credit Facility.
Note 5. Purchases and Sales of Securities
For the period ended October 31, 2007, purchases and sales of investment securities (excluding short-term investments) were $13,512,333 and $9,523,378, respectively.
Note 6. Capital Share Transactions
The Fund is authorized to issue an unlimited number of full and fractional shares of capital stock, $.001 par value per share, of which an unlimited number are classified as Common class shares, Class A shares, and Class C shares. Transactions in capital shares for each class of the fund were as follows:
| Common Class | |||||||||||
| For the Period Ended October 31, 20071,2 | |||||||||||
| Shares | Value | ||||||||||
| Shares sold | 991,922 | $ | 9,919,740 | ||||||||
| Shares redeemed | (486,855 | ) | (5,000,000 | ) | |||||||
| Net increase | 505,067 | $ | 4,919,740 | ||||||||
20
Credit Suisse Absolute Return Fund
Notes to Financial Statements (continued)
October 31, 2007
Note 6. Capital Share Transactions
| Class A | |||||||||||
| For the Period Ended October 31, 20071,3 | |||||||||||
| Shares | Value | ||||||||||
| Shares sold | 128,409 | $ | 1,318,204 | ||||||||
| Shares redeemed | (4,897 | ) | (50,749 | ) | |||||||
| Net increase | 123,512 | $ | 1,267,455 | ||||||||
| Class C | |||||||||||
| For the Period Ended October 31, 20071,3 | |||||||||||
| Shares | Value | ||||||||||
| Shares sold | 10,917 | $ | 110,000 | ||||||||
| Net increase | 10,917 | $ | 110,000 | ||||||||
1 For the period December 29, 2006 (commencement of operations) through October 31, 2007.
2 The Class was seeded on December 29, 2006 with initial capital of $9,900,000 and 990,000 shares.
3 The Classes were seeded on December 29, 2006 with initial capital of $50,000 and 5,000 shares.
On October 31, 2007 the number of shareholders that held 5% or more of the outstanding shares for each class of the Fund was as follows:
| Number of Shareholders | Approximate Percentage of Outstanding Shares | ||||||||||
| Common Class | 1 | 100 | % | ||||||||
| Class A | 2 | 87 | % | ||||||||
| Class C | 2 | 100 | % | ||||||||
Some of the shareholders are omnibus accounts, which hold shares on behalf of individual shareholders.
Note 7. Federal Income Taxes
Income and capital gain distributions are determined in accordance with federal income tax regulations, which may differ from GAAP.
The tax basis of components of distributable earnings differ from the amounts reflected in the Statement of Assets and Liabilities by temporary book/tax differences. These differences are primarily due to losses deferred on wash sales. At October 31, 2007, the components of distributable earnings on a tax basis by the Fund were as follows:
| Undistributed net investment income | $ | 352,749 | |||||
| Accumulated realized gain | 16 | ||||||
| Unrealized appreciation | 455,711 | ||||||
| $ | 808,476 | ||||||
21
Credit Suisse Absolute Return Fund
Notes to Financial Statements (continued)
October 31, 2007
Note 7. Federal Income Taxes
As of October 31, 2007, the identified cost for federal income tax purposes, as well as the gross unrealized appreciation from investments for those securities having an excess of value over cost, were $8,636,352, and $455,711, respectively.
At October 31, 2007, the Fund reclassified $131,871 from undistributed net investment income to paid in capital, to adjust for current period permanent book/tax differences. These permanent differences are due to differing book/tax treatments on organization costs. Net assets were not affected by these reclassifications.
Note 8. Contingencies
In the normal course of business, the Fund may provide general indemnifications pursuant to certain contracts and organizational documents. The Fund's maximum exposure under these arrangements is dependent on future claims that may be made against the Fund and, therefore, cannot be estimated; however, based on experience, the risk of loss from such claims is considered remote.
Note 9. Recent Accounting Pronouncements
During June 2006, the Financial Accounting Standards Board ("FASB") issued FASB Interpretation 48 ("FIN 48" or the "Interpretation"), Accounting for Uncertainty in Income Taxes — an interpretation of FASB statement 109. FIN 48 supplements FASB Statement 109, Accounting for Income Taxes, by defining the confidence level that a tax position must meet in order to be recognized in the financial statements. FIN 48 prescribes a comprehensive model for how a fund should recognize, measure, present, and disclose in its financial statements uncertain tax positions that the fund has taken or expects to take on a tax return. FIN 48 requires that the t ax effects of a position be recognized only if it is "more likely than not" to be sustained based solely on its technical merits. Management must be able to conclude that the tax law, regulations, case law, and other objective information regarding the technical merits sufficiently support the position's sustainability with a likelihood of more than 50 percent. During the period ended October 31, 2007, Management has adopted FIN 48. There was no material impact to the financial statements or disclosures thereto as a result of the adoption of this pronouncement.
On September 20, 2006, the FASB released Statement of Financial Accounting Standards No. 157 "Fair Value Measurements" ("FAS 157"). FAS 157 establishes an authoritative definition of fair value, sets out a framework for measuring fair value, and requires additional disclosures about fair-value measurements. The application of FAS 157 is required for fiscal years, beginning after November 15, 2007 and interim periods within those fiscal years. As of October 31, 2007,
22
Credit Suisse Absolute Return Fund
Notes to Financial Statements (continued)
October 31, 2007
Note 9. Recent Accounting Pronouncements
management does not believe the adoption of FAS 157 will impact the amounts reported in the financial statements, however, additional disclosures will be required in subsequent reports.
23
Credit Suisse Absolute Return Fund
Report of Independent Registered Public Accounting Firm
To the Board of Trustees and Shareholders of
Credit Suisse Absolute Return Fund:
In our opinion, the accompanying statement of assets and liabilities, including the schedule of investments, and the related statements of operations and of changes in net assets and the financial highlights present fairly, in all material respects, the financial position of Credit Suisse Absolute Return Fund (the "Fund") at October 31, 2007, the results of its operations, the changes in its net assets, and the financial highlights for the period then ended, in conformity with accounting principles generally accepted in the United States of America. These financial statements and financial highlights (hereafter referred to as "financial statements") are the responsibility of the Fund's management; our responsibility is to express an opinion on these financial statements based on our audits. We conducted our audits of these financial statements in accordance with the standards of the Public Company Accounting Oversight Board (United States). Those standards require that we plan and perform the audit to obtain reasonable assurance about whether the financial statements are free of material misstatement. An audit includes examining, on a test basis, evidence supporting the amounts and disclosures in the financial statements, assessing the accounting principles used and significant estimates made by management, and evaluating the overall financial statement presentation. We believe that our audits, which included confirmation of securities at October 31, 2007 by correspondence with the custodian and brokers, provide a reasonable basis for our opinion.
PricewaterhouseCoopers LLP
Baltimore, Maryland
December 26, 2007
24
Credit Suisse Absolute Return Fund
Information Concerning Trustees and Officers (unaudited)
| Name, Address (Year of Birth) | Position(s) Held with Fund | Term of Office1 and Length of Time Served | Principal Occupation(s) During Past Five Years | Number of Portfolios in Fund Complex Overseen by Trustee | Other Directorships Held by Director | ||||||||||||||||||
| Independent Trustees | |||||||||||||||||||||||
| Enrique Arzac c/o Credit Suisse Asset Management, LLC Attn: General Counsel Eleven Madison Avenue New York, New York 10010 (1941) | Trustee, Nominating Committee Member and Audit Committee Chairman Since | Fund Inception | Professor of Finance and Economics, Graduate School of Business, Columbia University since 1971. | 36 | Director of Epoch Holding Corporation (an investment management and investment advisory services company); Director of The Adams Express Company (a closed-end investment company); Director of Petroleum and Resources Corporation (a closed-end investment company). | ||||||||||||||||||
| Richard H. Francis c/o Credit Suisse Asset Management, LLC Attn: General Counsel Eleven Madison Avenue New York, New York 10010 (1932) | Trustee, Nominating and Audit Committee Member | Since Fund Inception | Currently retired | 29 | None | ||||||||||||||||||
| Jeffrey E. Garten Box 208200 New Haven, Connecticut 06520-8200 (1946) | Trustee, Nominating and Audit Committee Member | Since Fund Inception | The Juan Trippe Professor in the Practice of International Trade, Finance and Business from July 2005 to present; Partner and Chairman of Garten Rothkopf (consulting firm) from October 2005 to present; Dean of Yale School of Management from November 1995 to June 2005. | 29 | Director of Aetna, Inc. (insurance company); Director of CarMax Group (used car dealers); Director of Alcan, Inc. (smelting and refining of nonferrous metals company). | ||||||||||||||||||
1 Each Trustee and Officer serves until his or her respective successor has been duly elected and qualified.
25
Credit Suisse Absolute Return Fund
Information Concerning Trustees and Officers (unaudited) (continued)
| Name, Address (Year of Birth) | Position(s) Held with Fund | Term of Office1 and Length of Time Served | Principal Occupation(s) During Past Five Years | Number of Portfolios in Fund Complex Overseen by Trustee | Other Directorships Held by Director | ||||||||||||||||||
| Independent Trustees | |||||||||||||||||||||||
| Peter F. Krogh SFS/ICC 702 Georgetown University Washington, DC 20057 (1937) | Trustee, Nominating and Audit Committee Member | Since Fund Inception | Dean Emeritus and Distinguished Professor of International Affairs at the Edmund A. Walsh School of Foreign Service, Georgetown University from June 1995 to present. | 29 | Director of Carlisle Companies Incorporated (diversified manufacturing company). | ||||||||||||||||||
| Steven N. Rappaport Lehigh Court, LLC 555 Madison Avenue 29th Floor New York, New York 10022 (1948) | Chairman of the Board of Trustees, Nominating Committee Chairman and Audit Committee Member | Trustee and Chairman since Fund Inception | Partner of Lehigh Court, LLC and RZ Capital (private investment firms) from July 2002 to present. | 36 | Director of iCAD, Inc. (surgical and medical instruments and apparatus company); Director of Presstek, Inc. (digital imaging technologies company); Director of Wood Resources, LLC. (plywood manufacturing company). | ||||||||||||||||||
| Interested Trustee | |||||||||||||||||||||||
| Michael E. Kenneally2 c/o Credit Suisse Asset Management, LLC Attn: General Counsel Eleven Madison Avenue New York, New York 10010 (1954) | Trustee | Since Fund Inception | Chairman and Global Chief Executive Officer of Credit Suisse from March 2003 to July 2005; Chairman and Chief Investment Officer of Banc of America Capital Management from 1998 to March 2003. | 29 | None | ||||||||||||||||||
2 Mr. Kenneally is a Trustee who is an "interested person" of the Trust as defined in the Investment Company Act of 1940, as amended, because he was an officer of Credit Suisse within the last two fiscal years.
26
Credit Suisse Absolute Return Fund
Information Concerning Trustees and Officers (unaudited) (continued)
| Name, Address (Year of Birth) | Position(s) Held with Fund | Term of Office1 and Length of Time Served | Principal Occupation(s) During Past Five Years | ||||||||||||
| Officers | |||||||||||||||
| Lawrence D. Haber c/o Credit Suisse Asset Management, LLC. Attn: General Counsel Eleven Madison Avenue New York, New York 10010 (1951) | Chief Executive Officer and President | Since 2007 | Managing Director and Chief Operating Officer of Credit Suisse; Member of Credit Suisse's Management Committee; Chief Financial Officer of Merrill Lynch Investment Managers from 1997 to 2003. | ||||||||||||
| Michael A. Pignataro Credit Suisse Asset Management, LLC Eleven Madison Avenue New York, New York 10010 (1959) | Chief Financial Officer | Since Fund Inception | Director and Director of Fund Administration of Credit Suisse; Associated with Credit Suisse or its predecessor since 1984; Officer of other Credit Suisse Funds. | ||||||||||||
| Emidio Morizio Credit Suisse Asset Management, LLC Eleven Madison Avenue New York, New York 10010 (1966) | Chief Compliance Officer | Since Fund Inception | Director and Global Head of Compliance of Credit Suisse; Associated with Credit Suisse since July 2000; Officer of other Credit Suisse Funds. | ||||||||||||
| J. Kevin Gao Credit Suisse Asset Management, LLC Eleven Madison Avenue New York, New York 10010 (1967) | Chief Legal Officer, Vice President and Secretary | Since Fund Inception | Director and Legal Counsel of Credit Suisse; Associated with Credit Suisse since July 2003; Associated with the law firm of Willkie Farr & Gallagher LLP from 1998 to 2003; Officer of other Credit Suisse Funds. | ||||||||||||
| Robert Rizza Credit Suisse Asset Management, LLC Eleven Madison Avenue New York, New York 10010 (1965) | Treasurer | Since Fund Inception | Vice President of Credit Suisse; Associated with Credit Suisse since 1998; Officer of other Credit Suisse Funds. | ||||||||||||
The Statement of Additional Information includes additional information about the Trustees and is available, without charge, upon request, by calling 800-927-2874.
27
Credit Suisse Absolute Return Fund
Proxy Voting and Portfolio Holdings Information (unaudited)
Information regarding how the Fund voted proxies related to its portfolio securities during the 12 month period ended June 30 of each year, as well as the policies and procedures that the Fund uses to determine how to vote proxies relating to its portfolio securities are available:
• By calling 1-800-927-2874
• On the Fund's website, www.credit-suisse.com/us
• On the website of the Securities and Exchange Commission, www.sec.gov.
The Fund files a complete schedule of its portfolio holdings for the first and third quarters of its fiscal year with the SEC on Form N-Q. The Fund's Forms N-Q are available on the SEC's website at www.sec.gov and may be reviewed and copied at the SEC's Public Reference Room in Washington, DC. Information on the operation of the SEC's Public Reference Room may be obtained by calling 1-202-551-8090.
28

P.O. BOX 55030, BOSTON, MA 02205-5030
800-927-2874 n www.credit-suisse.com/us
CREDIT SUISSE ASSET MANAGEMENT SECURITIES, INC., DISTRIBUTOR. AR-AR-1007
Item 2. Code of Ethics.
The registrant has adopted a code of ethics applicable to its Chief Executive Officer, President, Chief Financial Officer and Chief Accounting Officer, or persons performing similar functions. A copy of the code is filed as Exhibit 12(a)(1) to this Form. There were no amendments to the code during the fiscal year ended October 31, 2007. There were no waivers or implicit waivers from the code granted by the registrant during the fiscal year ended October 31, 2007.
Item 3. Audit Committee Financial Expert.
The registrant’s governing board has determined that it has three audit committee financial experts serving on its audit committee: Enrique R. Arzac, Richard H. Francis and Steven N. Rappaport. Each audit committee financial expert is “independent” for purposes of this item.
Item 4. Principal Accountant Fees and Services.
(a) through (d). The information in the table below is provided for services rendered to the registrant by its independent registered public accounting firm, PricewaterhouseCoopers LLP (“PwC”), for its fiscal years ended October 31, 2006 and October 31, 2007.
|
| 2006 |
| 2007 |
| ||
Audit Fees |
| $ | 70,773 |
| $ | 88,896 |
|
Audit-Related Fees(1) |
| $ | 6,490 |
| $ | 10,020 |
|
Tax Fees(2) |
| $ | 5,030 |
| $ | 7,770 |
|
All Other Fees |
| — |
| — |
| ||
Total |
| $ | 82,293 |
| $ | 106,686 |
|
(1) Services include agreed-upon procedures in connection with the registrant’s semi-annual financial statements ($6,490 for 2006 and $10,020 for 2007).
(2) Tax services in connection with the registrant’s excise tax calculations and review of the registrant’s applicable tax returns.
The information in the table below is provided with respect to non-audit services that directly relate to the registrant’s operations and financial reporting and that were rendered by PwC to the registrant’s investment adviser, Credit Suisse Asset Management, LLC (“Credit Suisse”), and any service provider to the registrant controlling, controlled by or under common control with Credit Suisse that provided ongoing services to the registrant (“Covered Services Provider”), for the registrant’s fiscal years ended October 31, 2006 and October 31, 2007.
|
| 2006 |
| 2007 |
|
Audit-Related Fees |
| N/A |
| N/A |
|
Tax Fees |
| N/A |
| N/A |
|
All Other Fees |
| N/A |
| N/A |
|
Total |
| N/A |
| N/A |
|
2
(e)(1) Pre-Approval Policies and Procedures. The Audit Committee (“Committee”) of the registrant is responsible for pre-approving (i) all audit and permissible non-audit services to be provided by the independent registered public accounting firm to the registrant and (ii) all permissible non-audit services to be provided by the independent registered public accounting firm to Credit Suisse and any Covered Services Provider if the engagement relates directly to the operations and financial reporting of the registrant. The Committee may delegate its responsibility to pre-approve any such audit and permissible non-audit services to the Chairperson of the Committee, and the Chairperson shall report to the Committee, at its next regularly scheduled meeting after the Chairperson’s pre-approval of such services, his or her decision(s). The Committee may also establish detailed pre-approval policies and procedures for pre-approval of such services in accordance with applicable laws, including the delegation of some or all of the Committee’s pre-approval responsibilities to other persons (other than Credit Suisse or the registrant’s officers). Pre-approval by the Committee of any permissible non-audit services shall not be required so long as: (i) the aggregate amount of all such permissible non-audit services provided to the registrant, Credit Suisse and any Covered Services Provider constitutes not more than 5% of the total amount of revenues paid by the registrant to its independent registered public accounting firm during the fiscal year in which the permissible non-audit services are provided; (ii) the permissible non-audit services were not recognized by the registrant at the time of the engagement to be non-audit services; and (iii) such services are promptly brought to the attention of the Committee and approved by the Committee (or its delegate(s)) prior to the completion of the audit.
(e)(2) The information in the table below sets forth the percentages of fees for services (other than audit, review or attest services) rendered by PwC to the registrant for which the pre-approval requirement was waived pursuant to Rule 2-01(c)(7)(i)(C) of Regulation S-X:
|
| 2006 |
| 2007 |
|
Audit-Related Fees |
| N/A |
| N/A |
|
Tax Fees |
| N/A |
| N/A |
|
All Other Fees |
| N/A |
| N/A |
|
Total |
| N/A |
| N/A |
|
3
The information in the table below sets forth the percentages of fees for services (other than audit, review or attest services) rendered by PwC to Credit Suisse and any Covered Services Provider required to be approved pursuant to Rule 2-01(c)(7)(ii) of Regulation S-X, for the registrant’s fiscal years ended October 31, 2006 and October 31, 2007:
|
| 2006 |
| 2007 |
|
Audit-Related Fees |
| N/A |
| N/A |
|
Tax Fees |
| N/A |
| N/A |
|
All Other Fees |
| N/A |
| N/A |
|
Total |
| N/A |
| N/A |
|
(f) Not Applicable.
(g) The aggregate fees billed by PwC for non-audit services rendered to the registrant, Credit Suisse and Covered Service Providers for the fiscal years ended October 31, 2006 and October 31, 2007 were $11,520 and $17,790, respectively.
(h) Not Applicable.
Item 5. Audit Committee of Listed Registrants.
Form N-CSR disclosure requirement is not applicable to the registrant.
Item 6. Schedule of Investments.
Included as part of the report to shareholders filed under Item 1 of this Form.
Item 7. Disclosure of Proxy Voting Policies and Procedures for Closed-End Management Investment Companies.
Form N-CSR disclosure requirement is not applicable to the registrant.
4
Item 8. Portfolio Managers of Closed-End Management Investment Companies.
Form N-CSR disclosure requirement is not applicable to the registrant.
Item 9. Purchases of Equity Securities by Closed-End Management Investment Company and Affiliated Purchasers.
Form N-CSR disclosure requirement is not applicable to the registrant.
Item 10. Submission of Matters to a Vote of Security Holders.
None.
Item 11. Controls and Procedures.
(a) As of a date within 90 days from the filing date of this report, the principal executive officer and principal financial officer concluded that the registrant’s disclosure controls and procedures (as defined in Rule 30a-3(c) under the Investment Company Act of 1940 (the “Act”)) were effective based on their evaluation of the disclosure controls and procedures required by Rule 30a-3(b) under the Act and Rules 13a-15(b) or 15d-15(b) under the Securities Exchange Act of 1934.
(b) There were no changes in registrant’s internal control over financial reporting (as defined in Rule 30a-3(d) under the Act) that occurred during the second fiscal quarter of the period covered by this report that have materially affected, or are reasonably likely to materially affect, the registrant’s internal control over financial reporting.
Item 12. Exhibits.
(a)(1) Registrant’s Code of Ethics is an exhibit to this report.
(a)(2) The certifications of the registrant as required by Rule 30a-2(a) under the Act are exhibits to this report.
(a)(3) Not applicable.
(b) The certifications of the registrant as required by Rule 30a-2(b) under the Act are an exhibit to this report.
5
SIGNATURES
Pursuant to the requirements of the Securities Exchange Act of 1934 and the Investment Company Act of 1940, the registrant has duly caused this report to be signed on its behalf by the undersigned, thereunto duly authorized.
CREDIT SUISSE CAPITAL FUNDS
|
| /s/ Lawrence D. Haber |
| |
|
| Name: | Lawrence D. Haber | |
|
| Title: | Chief Executive Officer | |
|
| Date: | January 8, 2008 | |
Pursuant to the requirements of the Securities Exchange Act of 1934 and the Investment Company Act of 1940, this report has been signed below by the following persons on behalf of the registrant and in the capacities and on the dates indicated.
|
| /s/ Lawrence D. Haber |
| ||
|
| Name: | Lawrence D. Haber | ||
|
| Title: | Chief Executive Officer | ||
|
| Date: | January 8, 2008 | ||
|
|
| |||
|
| /s/ Michael A. Pignataro |
| ||
|
| Name: | Michael A. Pignataro | ||
|
| Title: | Chief Financial Officer | ||
|
| Date: | January 8, 2008 | ||
6