UNITED STATES
SECURITIES AND EXCHANGE COMMISSION
Washington, D.C. 20549
FORM N-CSR
CERTIFIED SHAREHOLDER REPORT OF REGISTERED
MANAGEMENT INVESTMENT COMPANIES
Investment Company Act file number | 811-04604 | |||||||
| ||||||||
CREDIT SUISSE CAPITAL FUNDS | ||||||||
(Exact name of registrant as specified in charter) | ||||||||
| ||||||||
Eleven Madison Avenue, New York, New York |
| 10010 | ||||||
(Address of principal executive offices) |
| (Zip code) | ||||||
| ||||||||
J. Kevin Gao, Esq. Credit Suisse Capital Funds Eleven Madison Avenue New York, New York 10010 | ||||||||
(Name and address of agent for service) | ||||||||
| ||||||||
Registrant’s telephone number, including area code: | (212) 325-2000 |
| ||||||
| ||||||||
Date of fiscal year end: | October 31st |
| ||||||
| ||||||||
Date of reporting period: | November 1, 2008 to October 31, 2009 |
| ||||||

CREDIT SUISSE FUNDS
Annual Report
October 31, 2009
n CREDIT SUISSE
LARGE CAP VALUE FUND
n CREDIT SUISSE
SMALL CAP CORE FUND
The Funds' investment objectives, risks, charges and expenses (which should be considered carefully before investing), and more complete information about the Funds, are provided in the Prospectus, which should be read carefully before investing. You may obtain additional copies by calling 877-870-2874 or by writing to Credit Suisse Funds, P.O. Box 55030, Boston, MA 02205-5030.
Credit Suisse Asset Management Securities, Inc., Distributor, is located at Eleven Madison Avenue, New York, NY 10010. Credit Suisse Funds are advised by Credit Suisse Asset Management, LLC.
Investors in the Credit Suisse Funds should be aware that they may be eligible to purchase Common Class and/or Advisor Class shares (where offered) directly or through certain intermediaries. Such shares are not subject to a sales charge but may be subject to an ongoing service and distribution fee of up to 0.50% of average daily net assets. Investors in the Credit Suisse Funds should also be aware that they may be eligible for a reduction or waiver of the sales charge with respect to Class A, B or C shares (where offered). For more information, please review the relevant prospectuses or consult your financial representative.
The views of the Funds' management are as of the date of the letter and the Fund holdings described in this document are as of October 31, 2009; these views and Fund holdings may have changed subsequent to these dates. Nothing in this document is a recommendation to purchase or sell securities.
Fund shares are not deposits or other obligations of Credit Suisse Asset Management, LLC ("Credit Suisse") or any affiliate, are not FDIC-insured and are not guaranteed by Credit Suisse or any affiliate. Fund investments are subject to investment risks, including loss of your investment.
Credit Suisse Large Cap Value Fund
Annual Investment Adviser's Report
October 31, 2009 (unaudited)
December 7, 2009
Dear Shareholder:
Performance Summary
11/01/08 – 10/31/09
| Fund and Benchmark | Performance | ||||||
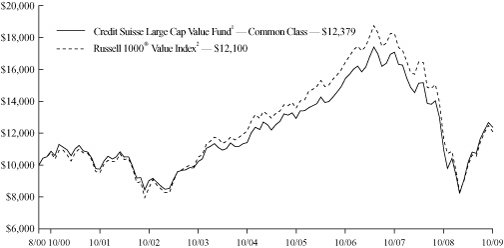
| Common Class1 | 13.74 | % | |||||
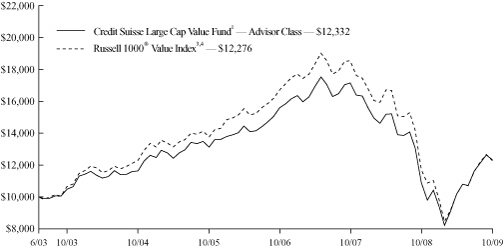
| Advisor Class1 | 13.05 | % | |||||
| Class A1,2 | 13.43 | % | |||||
| Class B1,2 | 12.54 | % | |||||
| Class C1,2 | 12.55 | % | |||||
| Russell 1000 Value Index3 | 4.78 | % | |||||
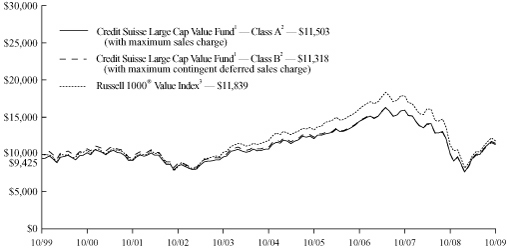
Performance shown for the Fund's Class A, Class B and Class C Shares does not reflect sales charges, which are a maximum of 5.75%, 4.00% and 1.00%, respectively.2
Market Review: Signs of recovery continue
The 12-month period ended October 31, 2009, was a volatile one for equities. The Russell 1000 Value Index returned 4.78% for the year.
As of the end of October, several key economic indicators seemed to point to continued weakness in the U.S. economy. For example, the Conference Board Consumer Confidence Index was at 47.7 on October 27, down from 53.4 in September. Additionally, unemployment rates climbed as non-farm payrolls fell by 190,000 jobs in October (with the greatest losses in construction, manufacturing and retail trade), while the household unemployment rate rose to 10.2%. Six out of ten sectors within the S&P 500 posted gains for the year, with the information technology and consumer discretionary sectors up 29.89% and 18.18%, respectively. Financials and utilities were the worst performing sectors, down by 9.61% and 2.64%, respectively.
Strategic Review and Outlook: Maintaining our long-term approach
For the annual period ended October 31, 2009, the Fund outperformed the Russell 1000 Value Index. Financials was the strongest sector for the period, contributing to outperformance due to stock selection. Consumer discretionary (one of the Fund's largest overweight positions) and industrials also contributed to outperformance due to both stock and sector bets. Conversely, the Fund's significant underweight position in telecomm services also detracted from performance.
During the period, Constantin Filitti and Timothy Schwider joined Jordan Low, the lead manager, as portfolio managers of the Credit Suisse Quantitative
1
Credit Suisse Large Cap Value Fund
Annual Investment Adviser's Report (continued)
October 31, 2009 (unaudited)
Equities Group responsible for the day-to-day portfolio management of the Fund. Please see the supplement to the prospectus for their biographies and other details.
Although we expect the market to remain challenging in the near term, we are comfortable with our proactive, long term-investment strategy going forward.
Credit Suisse Quantitative Equities Group
Jordan Low
Constantin Filitti
Timothy Schwider
The value of investments generally will fluctuate in response to market movements and the Fund's performance will largely depend on the performance of value stocks, which may be more volatile than the overall market.
In addition to historical information, this report contains forward-looking statements, which may concern, among other things, domestic and foreign market, industry and economic trends and developments and government regulation and their potential impact on the Fund's investments. These statements are subject to risks and uncertainties and actual trends, developments and regulations in the future, and their impact on the Fund could be materially different from those projected, anticipated or implied. The Fund has no obligation to update or revise forward-looking statements.
The Fund adopted new investment strategies effective December 1, 2006 so that its holdings are selected using quantitative stock selection models rather than a more traditional fundamental analysis approach. Investors should be aware that performance information for periods prior to December 1, 2006 does not reflect the current investment strategies.
2
Credit Suisse Large Cap Value Fund
Annual Investment Adviser's Report (continued)
October 31, 2009 (unaudited)
Comparison of Change in Value of $10,000 Investment in the
Credit Suisse Large Cap Value Fund1 Common Class shares and
the Russell 1000® Value Index3 from Inception (08/01/00).
Comparison of Change in Value of $10,000 Investment in the
Credit Suisse Large Cap Value Fund1 Advisor Class shares and
the Russell 1000® Value Index3,4 from Inception (06/06/03).
3
Credit Suisse Large Cap Value Fund
Annual Investment Adviser's Report (continued)
October 31, 2009 (unaudited)
Comparison of Change in Value of $10,000 Investment in the
Credit Suisse Large Cap Value Fund1 Class A shares2, Class B shares2
and the Russell 1000® Value Index3 for Ten Years.
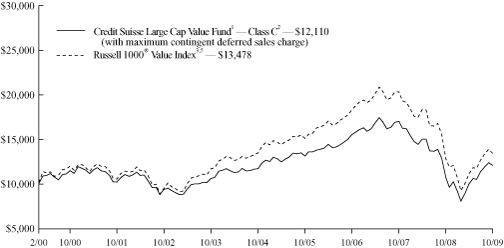
Comparison of Change in Value of $10,000 Investment in the
Credit Suisse Large Cap Value Fund1 Class C shares2 and
the Russell 1000® Value Index3,5 from Inception (02/28/00).
4
Credit Suisse Large Cap Value Fund
Annual Investment Adviser's Report (continued)
October 31, 2009 (unaudited)
Average Annual Returns as of September 30, 20091
| 1 Year | 5 Years | 10 Years | Since Inception | ||||||||||||||||
| Common Class | (2.70 | )% | 2.23 | % | — | 2.61 | % | ||||||||||||
| Advisor Class | (3.18 | )% | 1.74 | % | — | 3.76 | % | ||||||||||||
| Class A Without Sales Charge | (3.02 | )% | 1.96 | % | 2.62 | % | — | ||||||||||||
| Class A With Maximum Sales Charge | (8.62 | )% | 0.76 | % | 2.01 | % | — | ||||||||||||
| Class B Without CDSC | (3.66 | )% | 1.21 | % | 1.86 | % | — | ||||||||||||
| Class B With CDSC | (7.48 | )% | 1.21 | % | 1.86 | % | — | ||||||||||||
| Class C Without CDSC | (3.70 | )% | 1.20 | % | — | 2.27 | % | ||||||||||||
| Class C With CDSC | (4.65 | )% | 1.20 | % | — | 2.27 | % | ||||||||||||
Average Annual Returns as of October 31, 20091
| 1 Year | 5 Years | 10 Years | Since Inception | ||||||||||||||||
| Common Class | 13.74 | % | 1.64 | % | — | 2.33 | % | ||||||||||||
| Advisor Class | 13.05 | % | 1.16 | % | — | 3.33 | % | ||||||||||||
| Class A Without Sales Charge | 13.43 | % | 1.39 | % | 2.01 | % | — | ||||||||||||
| Class A With Maximum Sales Charge | 6.88 | % | 0.20 | % | 1.41 | % | — | ||||||||||||
| Class B Without CDSC | 12.54 | % | 0.62 | % | 1.25 | % | — | ||||||||||||
| Class B With CDSC | 8.54 | % | 0.62 | % | 1.25 | % | — | ||||||||||||
| Class C Without CDSC | 12.55 | % | 0.63 | % | — | 2.00 | % | ||||||||||||
| Class C With CDSC | 11.55 | % | 0.63 | % | — | 2.00 | % | ||||||||||||
Returns represent past performance and include change in share price and reinvestment of dividends and capital gains. Past performance cannot guarantee future results. The current performance of the Fund may be lower or higher than the figures shown. Returns and share price will fluctuate, and redemption value may be more or less than original cost. The performance results do not reflect the deduction of taxes that a shareholder would pay on fund distributions or the redemption of fund shares. Performance information current to the most recent month-end is available at www.credit-suisse.com/us.
The annualized gross expense ratios are 1.19% for Common Class shares, 1.69% for Advisor Class shares, 1.44% for Class A shares, 2.19% for Class B shares and 2.19% for Class C shares. The annualized net expense ratios after fee waivers and/or expense reimbursements are 1.05% for Common Class shares, 1.55% for Advisor Class shares, 1.30% for Class A shares, 2.05% for Class B shares and 2.05% for Class C shares.
1 Fee waivers and/or expense reimbursements may reduce expenses for the Fund, without which performance would be lower. Waivers and/or reimbursements may be discontinued at any time.
5
Credit Suisse Large Cap Value Fund
Annual Investment Adviser's Report (continued)
October 31, 2009 (unaudited)
2 Total return for the Fund's Class A shares for the reporting period, based on offering price (including maximum sales charge of 5.75%), was 6.88%. Total return for the Fund's Class B shares for the reporting period, based on redemption value (including maximum contingent deferred sales charge of 4.00%), was 8.54%. Total return for the Fund's Class C shares for the reporting period, based on redemption value (including maximum contingent deferred sales charge of 1.00%), was 11.55%.
3 The Russell 1000® Value Index measures the performance of those companies in the Russell 1000® Index with lower price-to-book ratios and lower forecasted growth values. It is an unmanaged index of common stocks that includes reinvestment of dividends and is compiled by Frank Russell Company. Investors cannot invest directly in an index.
4 Performance for the benchmark is not available for the period beginning June 6, 2003. For that reason, performance for the benchmark is shown for the period beginning July 1, 2003.
5 Performance for the benchmark is not available for the period beginning February 28, 2000. For that reason, performance for the benchmark is shown for the period beginning March 1, 2000.
6
Credit Suisse Large Cap Value Fund
Annual Investment Adviser's Report (continued)
October 31, 2009 (unaudited)
Information About Your Fund's Expenses
As an investor of the Fund, you incur two types of costs: ongoing expenses and transaction costs. Ongoing expenses include management fees, distribution and service (12b-1) fees and other Fund expenses. Examples of transaction costs include sales charges (loads), redemption fees and account maintenance fees, which are not shown in this section and which would result in higher total expenses. The following table is intended to help you understand your ongoing expenses of investing in the Fund and to help you compare these expenses with the ongoing expenses of investing in other mutual funds. The table is based on an investment of $1,000 made at the beginning of the six month period ended October 31, 2009.
The table illustrates your Fund's expenses in two ways:
• Actual Fund Return. This helps you estimate the actual dollar amount of ongoing expenses paid on a $1,000 investment in the Fund using the Fund's actual return during the period. To estimate the expenses you paid over the period, simply divide your account value by $1,000 (for example, an $8,600 account value divided by $1,000 = 8.6), then multiply the result by the number in the "Expenses Paid per $1,000" line under the share class you hold.
• Hypothetical 5% Fund Return. This helps you to compare your Fund's ongoing expenses with those of other mutual funds using the Fund's actual expense ratio and a hypothetical rate of return of 5% per year before expenses. Examples using a 5% hypothetical fund return may be found in the shareholder reports of other mutual funds. The hypothetical account values and expenses may not be used to estimate the actual ending account balance or expenses you paid for the period.
Please note that the expenses shown in these tables are meant to highlight your ongoing expenses only and do not reflect any transaction costs, such as sales charges (loads) or redemption fees. If these transaction costs had been included, your costs would have been higher. The "Expenses Paid per $1,000" line of the tables is useful in comparing ongoing expenses only and will not help you determine the relative total expenses of owning different funds.
7
Credit Suisse Large Cap Value Fund
Annual Investment Adviser's Report (continued)
October 31, 2009 (unaudited)
Expenses and Value for a $1,000 Investment
for the six month period ended October 31, 2009
| Actual Fund Return | Common Class | Advisor Class | Class A | Class B | Class C | ||||||||||||||||||
| Beginning Account Value 5/1/09 | $ | 1,000.00 | $ | 1,000.00 | $ | 1,000.00 | $ | 1,000.00 | $ | 1,000.00 | |||||||||||||
| Ending Account Value 10/31/09 | $ | 1,215.70 | $ | 1,212.70 | $ | 1,213.90 | $ | 1,210.00 | $ | 1,209.40 | |||||||||||||
| Expenses Paid per $1,000* | $ | 5.86 | $ | 8.64 | $ | 7.25 | $ | 11.42 | $ | 11.42 | |||||||||||||
| Hypothetical 5% Fund Return | |||||||||||||||||||||||
| Beginning Account Value 5/1/09 | $ | 1,000.00 | $ | 1,000.00 | $ | 1,000.00 | $ | 1,000.00 | $ | 1,000.00 | |||||||||||||
| Ending Account Value 10/31/09 | $ | 1,019.91 | $ | 1,017.39 | $ | 1,018.65 | $ | 1,014.87 | $ | 1,014.87 | |||||||||||||
| Expenses Paid per $1,000* | $ | 5.35 | $ | 7.88 | $ | 6.61 | $ | 10.41 | $ | 10.41 | |||||||||||||
| Common Class | Advisor Class | Class A | Class B | Class C | |||||||||||||||||||
| Annualized Expense Ratios* | 1.05 | % | 1.55 | % | 1.30 | % | 2.05 | % | 2.05 | % | |||||||||||||
* Expenses are equal to the Fund's annualized expense ratio for each share class, multiplied by the average account value over the period, multiplied by the number of days in the most recent fiscal half year period, then divided by 365.
The "Expenses Paid per $1,000" and the "Annualized Expense Ratios" in the tables are based on actual expenses paid by the Fund during the period, net of fee waivers and/or expense reimbursements. If those fee waivers and/or expense reimbursements had not been in effect, the Fund's actual expenses would have been higher.
For more information, please refer to the Fund's prospectus.
8
Credit Suisse Large Cap Value Fund
Annual Investment Adviser's Report (continued)
October 31, 2009 (unaudited)
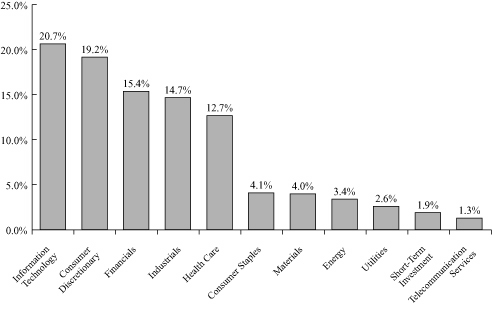
SECTOR BREAKDOWN*
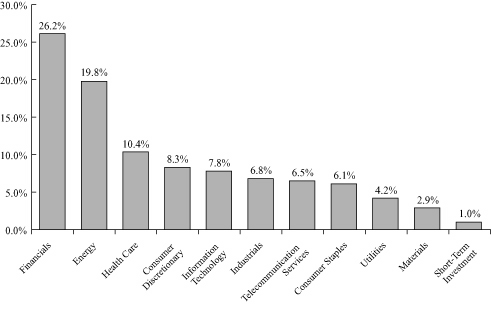
* Expressed as a percentage of total investments (excluding securities lending collateral if applicable) and may vary over time.
9
Credit Suisse Small Cap Core Fund
Annual Investment Adviser's Report
October 31, 2009 (unaudited)
December 7, 2009
Dear Shareholder:
Performance Summary
11/01/08 – 10/31/09
| Fund and Benchmark | Performance | ||||||
| Common Class1 | (1.02 | )% | |||||
| Class A1,2 | (1.01 | )% | |||||
| Class B1,2 | (1.72 | )% | |||||
| Class C1,2 | (1.73 | )% | |||||
| Standard & Poor's SmallCap 600 Index3 | 5.56 | % | |||||
Performance shown for the Fund's Class A, Class B and Class C Shares does not reflect sales charges, which are a maximum of 5.75%, 4.00% and 1.00%, respectively.2
Market Review: Signs of recovery continue
The 12-month period ended October 31, 2009, was a volatile one for equities. The S&P 600 SmallCap Index returned 5.56% for the year.
As of the end of October, several key economic indicators seemed to point to continued weakness in the U.S. economy. For example, the Conference Board Consumer Confidence Index was at 47.7 on October 27, down from 53.4 in September. Additionally, unemployment rates climbed as non-farm payrolls fell by 190,000 jobs in October (with the greatest losses in construction, manufacturing and retail trade), while the household unemployment rate rose to 10.2%. Six out of ten sectors within the S&P 500 posted gains for the year, with the information technology and consumer discretionary sectors up 29.89% and 18.18%, respectively. Financials and utilities were the worst performing sectors, down by 9.61% and 2.64%, respectively.
Strategic Review and Outlook: Maintaining our long-term approach
For the annual period ended October 31, 2009, the Fund underperformed the S&P SmallCap 600 Index. Industrials, although it was the Fund's largest underweight position, was the strongest sector in the 12-month period and contributed positively to Fund performance. Financials and utilities also helped the Fund's performance. The Fund had its biggest overweight position in the consumer discretionary and telecomm services sectors. The Fund's holdings in the consumer discretionary sector underperformed due to both stock selection and sector weighting, while telecomm services remained flat relative to the Index. Healthcare and energy, the worst sectors in the portfolio, also detracted from performance.
Overall, the Fund's performance was fairly steady until July, when the portfolio faced challenges as a result of the rally of stocks with higher volatility. It was a
10
Credit Suisse Small Cap Core Fund
Annual Investment Adviser's Report (continued)
October 31, 2009 (unaudited)
difficult environment for individual stock picks, but a good environment for taking directional bets due to the rapid shift from a bear market to a bull market. Additionally, low summer volume made it harder to trade effectively as increasing retail flows and decreasing professional trades result in more erratic stock moves. These conditions resulted in the Fund underperforming its benchmark. Despite this trend, we do not believe short-term trading based on trends is sustainable or profitable over the long term. Although, we may experience temporary losses, we believe the better strategy is to continue to enter positions at attractive prices and increase the potential for strong longer-term returns going forward.
During the period, Constantin Filitti and Timothy Schwider joined Jordan Low, the lead manager, as portfolio managers of the Credit Suisse Quantitative Equities Group responsible for the day-to-day portfolio management of the Fund. Please see the supplement to the prospectus for their biographies and other details.
Although we expect the market to remain challenging in the near term, we are comfortable with our proactive, long term-investment strategy going forward.
Credit Suisse Quantitative Equities Group
Jordan Low
Constantin Filitti
Timothy Schwider
Because of the nature of the Fund's investments in special-situation, start-up and other small companies, an investment in the Fund may be more volatile and less liquid than investments in larger companies.
In addition to historical information, this report contains forward-looking statements, which may concern, among other things, domestic and foreign market, industry and economic trends and developments and government regulation and their potential impact on the Fund's investments. These statements are subject to risks and uncertainties and actual trends, developments and regulations in the future, and their impact on the Fund could be materially different from those projected, anticipated or implied. The Fund has no obligation to update or revise forward-looking statements.
The Fund adopted new investment strategies effective December 1, 2006 so that its holdings are selected using quantitative stock selection models rather than a more traditional fundamental analysis approach. Investors should be aware that performance information for periods prior to December 1, 2006 does not reflect the current investment strategies.
11
Credit Suisse Small Cap Core Fund
Annual Investment Adviser's Report (continued)
October 31, 2009 (unaudited)
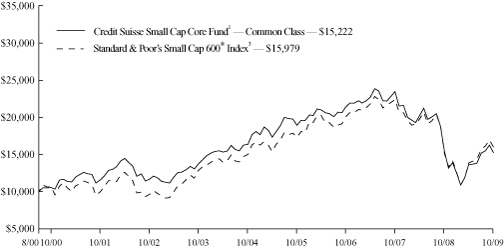
Comparison of Change in Value of $10,000 Investment in the
Credit Suisse Small Cap Core Fund1 Common Class shares and
the Standard & Poor's SmallCap 600® Index3 from Inception (08/01/00).
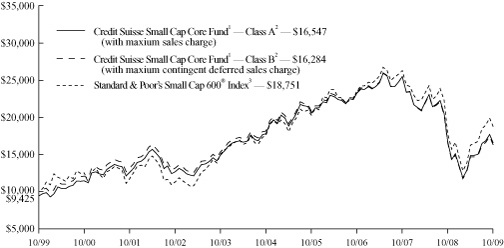
Comparison of Change in Value of $10,000 Investment in the
Credit Suisse Small Cap Core Fund1 Class A shares2, Class B shares2 and
the Standard & Poor's SmallCap 600® Index3 for Ten Years.
12
Credit Suisse Small Cap Core Fund
Annual Investment Adviser's Report (continued)
October 31, 2009 (unaudited)
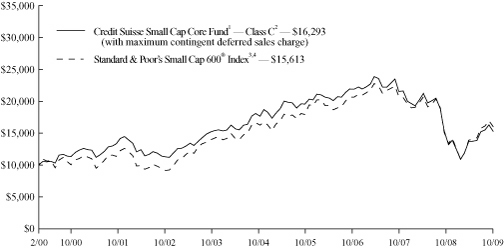
Comparison of Change in Value of $10,000 Investment in the
Credit Suisse Small Cap Core Fund1 Class C shares2 and
the Standard & Poor's SmallCap 600® Index3,4 from Inception (02/28/00).
Average Annual Returns as of September 30, 20091
| 1 Year | 5 Years | 10 Years | Since Inception | ||||||||||||||||
| Common Class | (13.52 | )% | 0.02 | % | — | 5.46 | % | ||||||||||||
| Class A Without Sales Charge | (13.54 | )% | 0.03 | % | 6.53 | % | — | ||||||||||||
| Class A With Maximum Sales Charge | (18.54 | )% | (1.15 | )% | 5.90 | % | — | ||||||||||||
| Class B Without CDSC | (14.13 | )% | (0.72 | )% | 5.74 | % | — | ||||||||||||
| Class B With CDSC | (17.57 | )% | (0.72 | )% | 5.74 | % | — | ||||||||||||
| Class C Without CDSC | (14.26 | )% | (0.75 | )% | — | 5.95 | % | ||||||||||||
| Class C With CDSC | (15.11 | )% | (0.75 | )% | — | 5.95 | % | ||||||||||||
13
Credit Suisse Small Cap Core Fund
Annual Investment Adviser's Report (continued)
October 31, 2009 (unaudited)
Average Annual Returns as of October 31, 20091
| 1 Year | 5 Years | 10 Years | Since Inception | ||||||||||||||||
| Common Class | (1.02 | )% | (1.44 | )% | — | 4.65 | % | ||||||||||||
| Class A Without Sales Charge | (1.01 | )% | (1.43 | )% | 5.79 | % | — | ||||||||||||
| Class A With Maximum Sales Charge | (6.71 | )% | (2.59 | )% | 5.16 | % | — | ||||||||||||
| Class B Without CDSC | (1.72 | )% | (2.16 | )% | 5.00 | % | — | ||||||||||||
| Class B With CDSC | (5.65 | )% | (2.16 | )% | 5.00 | % | — | ||||||||||||
| Class C Without CDSC | (1.73 | )% | (2.17 | )% | — | 5.18 | % | ||||||||||||
| Class C With CDSC | (2.71 | )% | (2.17 | )% | — | 5.18 | % | ||||||||||||
Returns represent past performance and include change in share price and reinvestment of dividends and capital gains. Past performance cannot guarantee future results. The current performance of the Fund may be lower or higher than the figures shown. Returns and share price will fluctuate, and redemption value may be more or less than original cost. The performance results do not reflect the deduction of taxes that a shareholder would pay on fund distributions or the redemption of fund shares. Performance information current to the most recent month-end is available at www.credit-suisse.com/us.
The annualized gross expense ratios are 1.85% for Common Class shares, 1.85% for Class A shares, 2.60% for Class B shares and 2.60% for Class C shares. The annualized net expense ratios after fee waivers and/or expense reimbursements are 1.55% for Common Class shares, 1.55% for Class A shares, 2.30% for Class B shares and 2.30% for Class C shares.
1 Fee waivers and/or expense reimbursements may reduce expenses for the Fund, without which performance would be lower. Waivers and/or reimbursements may be discontinued at any time.
2 Total return for the Fund's Class A shares for the reporting period, based on offering price (including maximum sales charge of 5.75%), was (6.71)%. Total return for the Fund's Class B shares for the reporting period, based on redemption value (including maximum contingent deferred sales charge of 4.00%), was (5.65)%. Total return for the Fund's Class C shares for the reporting period, based on redemption value (including maximum contingent deferred sales charge of 1.00%), was (2.71)%.
3 The Standard & Poor's SmallCap 600® Index is an unmanaged market weighted index of 600 U.S. stocks selected on the basis of capitalization, liquidity and industry group representation. It is a registered trademark of The McGraw-Hill Co., Inc. Investors cannot invest directly in an index.
4 Performance for the benchmark is not available for the period beginning February 28, 2000. For that reason, performance for the benchmark is shown for the period beginning March 1, 2000.
14
Credit Suisse Small Cap Core Fund
Annual Investment Adviser's Report (continued)
October 31, 2009 (unaudited)
Information About Your Fund's Expenses
As an investor of the Fund, you incur two types of costs: ongoing expenses and transaction costs. Ongoing expenses include management fees, distribution and service (12b-1) fees and other Fund expenses. Examples of transaction costs include sales charges (loads), redemption fees and account maintenance fees, which are not shown in this section and which would result in higher total expenses. The following table is intended to help you understand your ongoing expenses of investing in the Fund and to help you compare these expenses with the ongoing expenses of investing in other mutual funds. The table is based on an investment of $1,000 made at the beginning of the six month period ended October 31, 2009.
The table illustrates your Fund's expenses in two ways:
• Actual Fund Return. This helps you estimate the actual dollar amount of ongoing expenses paid on a $1,000 investment in the Fund using the Fund's actual return during the period. To estimate the expenses you paid over the period, simply divide your account value by $1,000 (for example, an $8,600 account value divided by $1,000 = 8.6), then multiply the result by the number in the "Expenses Paid per $1,000" line under the share class you hold.
• Hypothetical 5% Fund Return. This helps you to compare your Fund's ongoing expenses with those of other mutual funds using the Fund's actual expense ratio and a hypothetical rate of return of 5% per year before expenses. Examples using a 5% hypothetical fund return may be found in the shareholder reports of other mutual funds. The hypothetical account values and expenses may not be used to estimate the actual ending account balance or expenses you paid for the period.
Please note that the expenses shown in these tables are meant to highlight your ongoing expenses only and do not reflect any transaction costs, such as sales charges (loads) or redemption fees. If these transaction costs had been included, your costs would have been higher. The "Expenses Paid per $1,000" line of the tables is useful in comparing ongoing expenses only and will not help you determine the relative total expenses of owning different funds.
15
Credit Suisse Small Cap Core Fund
Annual Investment Adviser's Report (continued)
October 31, 2009 (unaudited)
Expenses and Value for a $1,000 Investment
for the six month period ended October 31, 2009
| Actual Fund Return | Common Class | Class A | Class B | Class C | |||||||||||||||
| Beginning Account Value 5/1/09 | $ | 1,000.00 | $ | 1,000.00 | $ | 1,000.00 | $ | 1,000.00 | |||||||||||
| Ending Account Value 10/31/09 | $ | 1,113.70 | $ | 1,113.50 | $ | 1,109.80 | $ | 1,109.30 | |||||||||||
| Expenses Paid per $1,000* | $ | 8.26 | $ | 8.26 | $ | 12.23 | $ | 12.23 | |||||||||||
| Hypothetical 5% Fund Return | |||||||||||||||||||
| Beginning Account Value 5/1/09 | $ | 1,000.00 | $ | 1,000.00 | $ | 1,000.00 | $ | 1,000.00 | |||||||||||
| Ending Account Value 10/31/09 | $ | 1,017.39 | $ | 1,017.39 | $ | 1,013.61 | $ | 1,013.61 | |||||||||||
| Expenses Paid per $1,000* | $ | 7.88 | $ | 7.88 | $ | 11.67 | $ | 11.67 | |||||||||||
| Common Class | Class A | Class B | Class C | ||||||||||||||||
| Annualized Expense Ratios* | 1.55 | % | 1.55 | % | 2.30 | % | 2.30 | % | |||||||||||
* Expenses are equal to the Fund's annualized expense ratio for each share class, multiplied by the average account value over the period, multiplied by the number of days in the most recent fiscal half year period, then divided by 365.
The "Expenses Paid per $1,000" and the "Annualized Expense Ratios" in the tables are based on actual expenses paid by the Fund during the period, net of fee waivers and/or expense reimbursements. If those fee waivers and/or expense reimbursements had not been in effect, the Fund's actual expenses would have been higher.
For more information, please refer to the Fund's prospectus.
16
Credit Suisse Small Cap Core Fund
Annual Investment Adviser's Report (continued)
October 31, 2009 (unaudited)
SECTOR BREAKDOWN*
* Expressed as a percentage of total investments (excluding securities lending collateral if applicable) and may vary over time.
17
Credit Suisse Large Cap Value Fund
Schedule of Investments
October 31, 2009
| Number of Shares | Value | ||||||||||
| COMMON STOCKS (99.2%) | |||||||||||
| Aerospace & Defense (0.6%) | |||||||||||
| Cubic Corp. | 51 | $ | 1,770 | ||||||||
| General Dynamics Corp. | 2,400 | 150,480 | |||||||||
| ITT Corp. | 1,200 | 60,840 | |||||||||
| L-3 Communications Holdings, Inc. | 800 | 57,832 | |||||||||
| Lockheed Martin Corp. | 100 | 6,879 | |||||||||
| Northrop Grumman Corp. | 6,100 | 305,793 | |||||||||
| Orbital Sciences Corp.* | 100 | 1,288 | |||||||||
| Raytheon Co. | 900 | 40,752 | |||||||||
| Rockwell Collins, Inc. | 100 | 5,038 | |||||||||
| Spirit Aerosystems Holdings, Inc. Class A* | 400 | 6,368 | |||||||||
| The Boeing Co. | 5,300 | 253,340 | |||||||||
| United Technologies Corp. | 600 | 36,870 | |||||||||
| 927,250 | |||||||||||
| Air Freight & Logistics (1.4%) | |||||||||||
| FedEx Corp. | 17,000 | 1,235,730 | |||||||||
| United Parcel Service, Inc. Class B | 17,400 | 934,032 | |||||||||
| Uti Worldwide, Inc. | 300 | 3,741 | |||||||||
| 2,173,503 | |||||||||||
| Airlines (0.0%) | |||||||||||
| Southwest Airlines Co. | 3,900 | 32,760 | |||||||||
| Auto Components (0.1%) | |||||||||||
| Autoliv, Inc. | 800 | 26,864 | |||||||||
| Cooper Tire & Rubber Co. | 200 | 3,052 | |||||||||
| Federal Mogul Corp.* | 300 | 3,345 | |||||||||
| Johnson Controls, Inc. | 2,100 | 50,232 | |||||||||
| TRW Automotive Holdings Corp.* | 300 | 4,695 | |||||||||
| 88,188 | |||||||||||
| Automobiles (0.5%) | |||||||||||
| Ford Motor Co.* | 106,500 | 745,500 | |||||||||
| Harley-Davidson, Inc. | 1,800 | 44,856 | |||||||||
| Thor Industries, Inc. | 300 | 7,866 | |||||||||
| 798,222 | |||||||||||
| Beverages (0.6%) | |||||||||||
| Coca-Cola Enterprises, Inc. | 600 | 11,442 | |||||||||
| Constellation Brands, Inc. Class A* | 1,400 | 22,148 | |||||||||
| Dr. Pepper Snapple Group, Inc.* | 2,100 | 57,246 | |||||||||
| Molson Coors Brewing Co. Class B | 800 | 39,176 | |||||||||
| Pepsi Bottling Group, Inc. | 400 | 14,976 | |||||||||
| PepsiCo, Inc. | 9,000 | 544,950 | |||||||||
| The Coca-Cola Co. | 4,000 | 213,240 | |||||||||
| 903,178 | |||||||||||
See Accompanying Notes to Financial Statements.
18
Credit Suisse Large Cap Value Fund
Schedule of Investments (continued)
October 31, 2009
| Number of Shares | Value | ||||||||||
| COMMON STOCKS | |||||||||||
| Biotechnology (1.7%) | |||||||||||
| Amgen, Inc.* | 35,100 | $ | 1,885,923 | ||||||||
| Biogen Idec, Inc.* | 300 | 12,639 | |||||||||
| Genzyme Corp.* | 4,900 | 247,940 | |||||||||
| Gilead Sciences, Inc.* | 11,800 | 502,090 | |||||||||
| 2,648,592 | |||||||||||
| Building Products (0.0%) | |||||||||||
| Armstrong World Industries, Inc.* | 600 | 22,350 | |||||||||
| Masco Corp. | 1,400 | 16,450 | |||||||||
| Owens Corning* | 300 | 6,633 | |||||||||
| USG Corp.* | 200 | 2,628 | |||||||||
| 48,061 | |||||||||||
| Capital Markets (4.8%) | |||||||||||
| American Capital, Ltd.* | 1 | 3 | |||||||||
| Ameriprise Financial, Inc. | 1,800 | 62,406 | |||||||||
| BlackRock, Inc. | 300 | 64,947 | |||||||||
| Blackstone Group LP | 200 | 2,684 | |||||||||
| Franklin Resources, Inc. | 500 | 52,315 | |||||||||
| Invesco, Ltd. | 3,100 | 65,565 | |||||||||
| Investment Technology Group, Inc.* | 400 | 8,628 | |||||||||
| Jefferies Group, Inc.* | 100 | 2,610 | |||||||||
| Legg Mason, Inc. | 1,200 | 34,932 | |||||||||
| Morgan Stanley | 50,800 | 1,631,696 | |||||||||
| Northern Trust Corp. | 100 | 5,025 | |||||||||
| Piper Jaffray Cos.* | 200 | 9,278 | |||||||||
| Raymond James Financial, Inc. | 700 | 16,527 | |||||||||
| State Street Corp. | 1,900 | 79,762 | |||||||||
| TD Ameritrade Holding Corp.* | 100 | 1,930 | |||||||||
| The Bank of New York Mellon Corp. | 107,500 | 2,865,950 | |||||||||
| The Charles Schwab Corp. | 200 | 3,468 | |||||||||
| The Goldman Sachs Group, Inc. | 15,100 | 2,569,567 | |||||||||
| Waddell & Reed Financial, Inc. Class A | 100 | 2,806 | |||||||||
| 7,480,099 | |||||||||||
| Chemicals (1.5%) | |||||||||||
| Air Products & Chemicals, Inc. | 1,000 | 77,130 | |||||||||
| Airgas, Inc. | 500 | 22,180 | |||||||||
| Albemarle Corp. | 600 | 18,948 | |||||||||
| Ashland, Inc. | 700 | 24,178 | |||||||||
| Cabot Corp. | 800 | 17,544 | |||||||||
| Cytec Industries, Inc. | 300 | 9,951 | |||||||||
| E.I. Du Pont de Nemours & Co. | 4,700 | 149,554 | |||||||||
| Eastman Chemical Co. | 700 | 36,757 | |||||||||
| Huntsman Corp. | 1,200 | 9,540 | |||||||||
| Intrepid Potash, Inc.* | 100 | 2,576 | |||||||||
| Lubrizol Corp. | 200 | 13,312 | |||||||||
| Monsanto Co. | 20,100 | 1,350,318 | |||||||||
| PPG Industries, Inc. | 1,200 | 67,716 | |||||||||
| RPM International, Inc. | 400 | 7,048 | |||||||||
See Accompanying Notes to Financial Statements.
19
Credit Suisse Large Cap Value Fund
Schedule of Investments (continued)
October 31, 2009
| Number of Shares | Value | ||||||||||
| COMMON STOCKS | |||||||||||
| Chemicals | |||||||||||
| The Dow Chemical Co. | 20,700 | $ | 486,036 | ||||||||
| The Mosaic Co. | 300 | 14,019 | |||||||||
| The Scotts Miracle-Gro Co. Class A | 100 | 4,062 | |||||||||
| Valspar Corp. | 700 | 17,759 | |||||||||
| Westlake Chemical Corp. | 200 | 4,858 | |||||||||
| 2,333,486 | |||||||||||
| Commercial Banks (5.4%) | |||||||||||
| Associated Banc-Corp. | 1,200 | 15,372 | |||||||||
| Bancorpsouth, Inc. | 600 | 13,548 | |||||||||
| BB&T Corp. | 6,200 | 148,242 | |||||||||
| BOK Financial Corp. | 300 | 12,891 | |||||||||
| CapitalSource, Inc. | 6,200 | 22,072 | |||||||||
| Comerica, Inc. | 1,100 | 30,525 | |||||||||
| Cullen/Frost Bankers, Inc. | 300 | 14,037 | |||||||||
| Fifth Third Bancorp | 6,200 | 55,428 | |||||||||
| First Citizens BancShares, Inc. Class A | 170 | 25,330 | |||||||||
| First Commonwealth Financial Corp. | 200 | 1,050 | |||||||||
| First Horizon National Corp.* | 1,600 | 18,928 | |||||||||
| FirstMerit Corp. | 110 | 2,084 | |||||||||
| FNB Corp. | 200 | 1,416 | |||||||||
| Fulton Financial Corp. | 4,084 | 33,734 | |||||||||
| Huntington Bancshares, Inc. | 22,100 | 84,201 | |||||||||
| Keycorp | 8,000 | 43,120 | |||||||||
| M&T Bank Corp. | 500 | 31,425 | |||||||||
| Marshall & Ilsley Corp. | 3,400 | 18,088 | |||||||||
| PNC Financial Services Group, Inc. | 7,400 | 362,156 | |||||||||
| Regions Financial Corp. | 28,700 | 138,908 | |||||||||
| SunTrust Banks, Inc. | 21,300 | 407,043 | |||||||||
| Synovus Financial Corp. | 11,700 | 25,974 | |||||||||
| U.S. Bancorp | 100,300 | 2,328,966 | |||||||||
| Valley National Bancorp | 1,000 | 13,280 | |||||||||
| Wells Fargo & Co. | 163,900 | 4,510,528 | |||||||||
| Whitney Holding Corp. | 1,022 | 8,207 | |||||||||
| Wilmington Trust Corp. | 1,300 | 15,665 | |||||||||
| Zions Bancorporation | 900 | 12,744 | |||||||||
| 8,394,962 | |||||||||||
| Commercial Services & Supplies (0.2%) | |||||||||||
| Avery Dennison Corp. | 600 | 21,390 | |||||||||
| Cintas Corp. | 1,000 | 27,690 | |||||||||
| Corrections Corp. of America* | 700 | 16,758 | |||||||||
| Covanta Holding Corp.* | 600 | 10,308 | |||||||||
| Deluxe Corp. | 200 | 2,846 | |||||||||
| Pitney Bowes, Inc. | 1,500 | 36,750 | |||||||||
| R. R. Donnelley & Sons Co. | 5,900 | 118,472 | |||||||||
| Republic Services, Inc. | 1,600 | 41,456 | |||||||||
| Steelcase, Inc. Class A | 100 | 577 | |||||||||
| 276,247 | |||||||||||
See Accompanying Notes to Financial Statements.
20
Credit Suisse Large Cap Value Fund
Schedule of Investments (continued)
October 31, 2009
| Number of Shares | Value | ||||||||||
| COMMON STOCKS | |||||||||||
| Communications Equipment (1.6%) | |||||||||||
| CommScope, Inc.* | 600 | $ | 16,212 | ||||||||
| EchoStar Corp. Class A* | 9,500 | 172,520 | |||||||||
| JDS Uniphase Corp.* | 900 | 5,031 | |||||||||
| Juniper Networks, Inc.* | 500 | 12,755 | |||||||||
| Motorola, Inc. | 58,400 | 500,488 | |||||||||
| Polycom, Inc.* | 200 | 4,294 | |||||||||
| QUALCOMM, Inc. | 43,400 | 1,797,194 | |||||||||
| Tellabs, Inc.* | 3,000 | 18,060 | |||||||||
| 2,526,554 | |||||||||||
| Computers & Peripherals (2.9%) | |||||||||||
| Apple, Inc.* | 2,100 | 395,850 | |||||||||
| Dell, Inc.* | 500 | 7,245 | |||||||||
| Diebold, Inc. | 100 | 3,024 | |||||||||
| EMC Corp.* | 177,100 | 2,916,837 | |||||||||
| Hewlett-Packard Co. | 10,200 | 484,092 | |||||||||
| International Business Machines Corp. | 2,900 | 349,769 | |||||||||
| Lexmark International, Inc. Class A* | 500 | 12,750 | |||||||||
| NCR Corp.* | 100 | 1,015 | |||||||||
| QLogic Corp.* | 100 | 1,754 | |||||||||
| SanDisk Corp.* | 900 | 18,432 | |||||||||
| Seagate Technology | 1,500 | 20,925 | |||||||||
| STEC, Inc.* | 100 | 2,132 | |||||||||
| Sun Microsystems, Inc.* | 41,000 | 335,380 | |||||||||
| Synaptics, Inc.* | 100 | 2,250 | |||||||||
| Teradata Corp.* | 100 | 2,788 | |||||||||
| Western Digital Corp.* | 300 | 10,104 | |||||||||
| 4,564,347 | |||||||||||
| Construction & Engineering (0.1%) | |||||||||||
| Aecom Technology Corp.* | 100 | 2,524 | |||||||||
| Dycom Industries, Inc.* | 20 | 197 | |||||||||
| Fluor Corp. | 100 | 4,442 | |||||||||
| Jacobs Engineering Group, Inc.* | 100 | 4,229 | |||||||||
| KBR, Inc. | 1,261 | 25,813 | |||||||||
| Quanta Services, Inc.* | 1,500 | 31,800 | |||||||||
| The Shaw Group, Inc.* | 300 | 7,698 | |||||||||
| URS Corp.* | 500 | 19,430 | |||||||||
| 96,133 | |||||||||||
| Construction Materials (0.0%) | |||||||||||
| Eagle Materials, Inc. | 200 | 4,970 | |||||||||
| Vulcan Materials Co. | 900 | 41,427 | |||||||||
| 46,397 | |||||||||||
See Accompanying Notes to Financial Statements.
21
Credit Suisse Large Cap Value Fund
Schedule of Investments (continued)
October 31, 2009
| Number of Shares | Value | ||||||||||
| COMMON STOCKS | |||||||||||
| Consumer Finance (3.2%) | |||||||||||
| American Express Co. | 73,500 | $ | 2,560,740 | ||||||||
| AmeriCredit Corp.* | 600 | 10,590 | |||||||||
| Capital One Financial Corp. | 65,600 | 2,400,960 | |||||||||
| Discover Financial Services | 4,200 | 59,388 | |||||||||
| SLM Corp.* | 2,700 | 26,190 | |||||||||
| 5,057,868 | |||||||||||
| Containers & Packaging (0.1%) | |||||||||||
| Aptargroup, Inc. | 400 | 14,124 | |||||||||
| Bemis Co., Inc. | 700 | 18,081 | |||||||||
| Packaging Corp. of America | 600 | 10,968 | |||||||||
| Pactiv Corp.* | 300 | 6,927 | |||||||||
| Sealed Air Corp. | 1,100 | 21,153 | |||||||||
| Sonoco Products Co. | 700 | 18,725 | |||||||||
| Temple-Inland, Inc. | 1,000 | 15,450 | |||||||||
| 105,428 | |||||||||||
| Distributors (0.0%) | |||||||||||
| Genuine Parts Co. | 1,100 | 38,489 | |||||||||
| Diversified Consumer Services (0.2%) | |||||||||||
| Career Education Corp.* | 200 | 4,168 | |||||||||
| Coinstar, Inc.* | 1,100 | 34,914 | |||||||||
| Corinthian Colleges, Inc.* | 20,500 | 325,130 | |||||||||
| H&R Block, Inc. | 100 | 1,834 | |||||||||
| ITT Educational Services, Inc.* | 200 | 18,070 | |||||||||
| Regis Corp. | 100 | 1,624 | |||||||||
| 385,740 | |||||||||||
| Diversified Financial Services (7.5%) | |||||||||||
| Bank of America Corp. | 195,744 | 2,853,948 | |||||||||
| Citigroup, Inc. | 433,500 | 1,773,015 | |||||||||
| CME Group, Inc. | 2,000 | 605,220 | |||||||||
| Interactive Brokers Group, Inc. Class A* | 24,700 | 395,447 | |||||||||
| JPMorgan Chase & Co. | 143,900 | 6,010,703 | |||||||||
| Leucadia National Corp.* | 800 | 17,976 | |||||||||
| Moody's Corp. | 100 | 2,368 | |||||||||
| MSCI, Inc. Class A* | 100 | 3,040 | |||||||||
| NYSE Euronext | 1,400 | 36,190 | |||||||||
| The NASDAQ OMX Group, Inc.* | 500 | 9,030 | |||||||||
| 11,706,937 | |||||||||||
| Diversified Telecommunication Services (6.3%) | |||||||||||
| AT&T, Inc. | 204,405 | 5,247,076 | |||||||||
| CenturyTel, Inc. | 2,200 | 71,412 | |||||||||
| Clearwire Corp. Class A* | 400 | 2,504 | |||||||||
| Qwest Communications International, Inc. | 45,400 | 162,986 | |||||||||
| Verizon Communications, Inc. | 146,200 | 4,326,058 | |||||||||
| Windstream Corp. | 1,700 | 16,388 | |||||||||
| 9,826,424 | |||||||||||
See Accompanying Notes to Financial Statements.
22
Credit Suisse Large Cap Value Fund
Schedule of Investments (continued)
October 31, 2009
| Number of Shares | Value | ||||||||||
| COMMON STOCKS | |||||||||||
| Electric Utilities (1.4%) | |||||||||||
| Allegheny Energy, Inc. | 600 | $ | 13,692 | ||||||||
| American Electric Power Co., Inc. | 3,900 | 117,858 | |||||||||
| DPL, Inc. | 700 | 17,738 | |||||||||
| Duke Energy Corp. | 38,200 | 604,324 | |||||||||
| Edison International | 2,400 | 76,368 | |||||||||
| Entergy Corp. | 1,700 | 130,424 | |||||||||
| Exelon Corp. | 4,600 | 216,016 | |||||||||
| FirstEnergy Corp. | 2,600 | 112,528 | |||||||||
| FPL Group, Inc. | 11,500 | 564,650 | |||||||||
| Great Plains Energy, Inc. | 900 | 15,570 | |||||||||
| Hawaiian Electric Industries, Inc. | 900 | 16,065 | |||||||||
| Northeast Utilities | 1,200 | 27,660 | |||||||||
| Pepco Holdings, Inc. | 1,600 | 23,888 | |||||||||
| Pinnacle West Capital Corp. | 700 | 21,924 | |||||||||
| PPL Corp. | 200 | 5,888 | |||||||||
| Progress Energy, Inc. | 2,200 | 82,566 | |||||||||
| Southern Co. | 6,400 | 199,616 | |||||||||
| 2,246,775 | |||||||||||
| Electrical Equipment (0.4%) | |||||||||||
| Cooper Industries PLC Class A | 16,100 | 622,909 | |||||||||
| Emerson Electric Co. | 200 | 7,550 | |||||||||
| First Solar, Inc.* | 100 | 12,193 | |||||||||
| Rockwell Automation, Inc. | 900 | 36,855 | |||||||||
| Thomas & Betts Corp.* | 400 | 13,684 | |||||||||
| 693,191 | |||||||||||
| Electronic Equipment, Instruments & Components (0.1%) | |||||||||||
| Arrow Electronics, Inc.* | 500 | 12,670 | |||||||||
| Avnet, Inc.* | 700 | 17,346 | |||||||||
| AVX Corp. | 300 | 3,396 | |||||||||
| Corning, Inc. | 2,000 | 29,220 | |||||||||
| FLIR Systems, Inc.* | 100 | 2,781 | |||||||||
| Ingram Micro, Inc. Class A* | 1,400 | 24,710 | |||||||||
| Jabil Circuit, Inc. | 600 | 8,028 | |||||||||
| Molex, Inc. | 1,100 | 20,537 | |||||||||
| Tech Data Corp.* | 300 | 11,529 | |||||||||
| 130,217 | |||||||||||
| Energy Equipment & Services (1.2%) | |||||||||||
| BJ Services Co. | 100 | 1,920 | |||||||||
| ENSCO International, Inc. | 900 | 41,211 | |||||||||
| FMC Technologies, Inc.* | 100 | 5,260 | |||||||||
| Global Industries, Ltd.* | 5,000 | 36,450 | |||||||||
| Halliburton Co. | 7,000 | 204,470 | |||||||||
| Helmerich & Payne, Inc. | 500 | 19,010 | |||||||||
| Nabors Industries, Ltd.* | 2,200 | 45,826 | |||||||||
| National-Oilwell Varco, Inc.* | 3,300 | 135,267 | |||||||||
| Oceaneering International, Inc.* | 200 | 10,220 | |||||||||
See Accompanying Notes to Financial Statements.
23
Credit Suisse Large Cap Value Fund
Schedule of Investments (continued)
October 31, 2009
| Number of Shares | Value | ||||||||||
| COMMON STOCKS | |||||||||||
| Energy Equipment & Services | |||||||||||
| Oil States International, Inc.* | 300 | $ | 10,332 | ||||||||
| Patterson-UTI Energy, Inc. | 1,000 | 15,580 | |||||||||
| Pride International, Inc.* | 600 | 17,736 | |||||||||
| Rowan Cos., Inc. | 900 | 20,925 | |||||||||
| Schlumberger, Ltd. | 21,500 | 1,337,300 | |||||||||
| Seahawk Drilling, Inc.* | 6 | 162 | |||||||||
| Smith International, Inc. | 400 | 11,092 | |||||||||
| Unit Corp.* | 200 | 7,816 | |||||||||
| 1,920,577 | |||||||||||
| Food & Staples Retailing (1.3%) | |||||||||||
| CVS Caremark Corp. | 21,900 | 773,070 | |||||||||
| Safeway, Inc. | 3,200 | 71,456 | |||||||||
| SUPERVALU, Inc. | 1,600 | 25,392 | |||||||||
| Sysco Corp. | 100 | 2,645 | |||||||||
| The Kroger Co. | 900 | 20,817 | |||||||||
| Wal-Mart Stores, Inc. | 21,800 | 1,083,024 | |||||||||
| 1,976,404 | |||||||||||
| Food Products (2.3%) | |||||||||||
| Archer-Daniels-Midland Co. | 27,100 | 816,252 | |||||||||
| Bunge, Ltd. | 3,900 | 222,534 | |||||||||
| Chiquita Brands International, Inc.* | 100 | 1,619 | |||||||||
| ConAgra Foods, Inc. | 3,500 | 73,500 | |||||||||
| Corn Products International, Inc. | 500 | 14,090 | |||||||||
| Dean Foods Co.* | 100 | 1,823 | |||||||||
| Del Monte Foods Co. | 1,400 | 15,120 | |||||||||
| General Mills, Inc. | 1,400 | 92,288 | |||||||||
| Hormel Foods Corp. | 400 | 14,584 | |||||||||
| Kraft Foods, Inc. Class A | 76,700 | 2,110,784 | |||||||||
| Lancaster Colony Corp. | 600 | 29,148 | |||||||||
| McCormick & Co., Inc. | 100 | 3,501 | |||||||||
| Ralcorp Holdings, Inc.* | 300 | 16,110 | |||||||||
| Sara Lee Corp. | 4,000 | 45,160 | |||||||||
| Smithfield Foods, Inc.* | 900 | 12,006 | |||||||||
| The Hershey Co. | 300 | 11,337 | |||||||||
| The J.M. Smucker Co. | 800 | 42,184 | |||||||||
| Tyson Foods, Inc. Class A | 7,700 | 96,404 | |||||||||
| 3,618,444 | |||||||||||
| Gas Utilities (0.1%) | |||||||||||
| AGL Resources, Inc. | 500 | 17,480 | |||||||||
| Atmos Energy Corp. | 600 | 16,710 | |||||||||
| Energen Corp. | 500 | 21,940 | |||||||||
| National Fuel Gas Co. | 400 | 18,136 | |||||||||
| New Jersey Resources Corp. | 100 | 3,520 | |||||||||
| Nicor, Inc. | 100 | 3,708 | |||||||||
| Northwest Natural Gas Co. | 200 | 8,362 | |||||||||
| ONEOK, Inc. | 700 | 25,347 | |||||||||
See Accompanying Notes to Financial Statements.
24
Credit Suisse Large Cap Value Fund
Schedule of Investments (continued)
October 31, 2009
| Number of Shares | Value | ||||||||||
| COMMON STOCKS | |||||||||||
| Gas Utilities | |||||||||||
| Questar Corp. | 1,300 | $ | 51,792 | ||||||||
| Southwest Gas Corp. | 100 | 2,499 | |||||||||
| UGI Corp. | 700 | 16,716 | |||||||||
| 186,210 | |||||||||||
| Health Care Equipment & Supplies (0.3%) | |||||||||||
| Becton, Dickinson and Co. | 100 | 6,836 | |||||||||
| Boston Scientific Corp.* | 19,300 | 156,716 | |||||||||
| CareFusion Corp.* | 250 | 5,593 | |||||||||
| Greatbatch, Inc.* | 100 | 1,967 | |||||||||
| Hill-Rom Holdings, Inc. | 300 | 5,877 | |||||||||
| Hologic, Inc.* | 1,700 | 25,126 | |||||||||
| Inverness Medical Innovations, Inc.* | 200 | 7,602 | |||||||||
| ResMed, Inc.* | 100 | 4,921 | |||||||||
| Stryker Corp. | 100 | 4,600 | |||||||||
| Thoratec Corp.* | 3,600 | 94,536 | |||||||||
| Zimmer Holdings, Inc.* | 1,600 | 84,112 | |||||||||
| 397,886 | |||||||||||
| Health Care Providers & Services (0.5%) | |||||||||||
| Aetna, Inc. | 2,700 | 70,281 | |||||||||
| AMERIGROUP Corp.* | 400 | 8,820 | |||||||||
| AmerisourceBergen Corp. | 200 | 4,430 | |||||||||
| Cardinal Health, Inc. | 2,700 | 76,518 | |||||||||
| CIGNA Corp. | 1,900 | 52,896 | |||||||||
| Coventry Health Care, Inc.* | 1,000 | 19,830 | |||||||||
| Emergency Medical Services Corp. Class A* | 100 | 4,802 | |||||||||
| Express Scripts, Inc.* | 100 | 7,992 | |||||||||
| Humana, Inc.* | 1,000 | 37,580 | |||||||||
| Kindred Healthcare, Inc.* | 100 | 1,470 | |||||||||
| LifePoint Hospitals, Inc.* | 300 | 8,499 | |||||||||
| Lincare Holdings, Inc.* | 300 | 9,423 | |||||||||
| McKesson Corp. | 1,000 | 58,730 | |||||||||
| Omnicare, Inc. | 600 | 13,002 | |||||||||
| Quest Diagnostics, Inc. | 100 | 5,593 | |||||||||
| Tenet Healthcare Corp.* | 1,300 | 6,656 | |||||||||
| UnitedHealth Group, Inc. | 9,300 | 241,335 | |||||||||
| Universal Health Services, Inc. Class B | 200 | 11,130 | |||||||||
| WellPoint, Inc.* | 3,428 | 160,293 | |||||||||
| 799,280 | |||||||||||
| Health Care Technology (0.0%) | |||||||||||
| Cerner Corp.* | 100 | 7,604 | |||||||||
| IMS Health, Inc. | 700 | 11,473 | |||||||||
| 19,077 | |||||||||||
See Accompanying Notes to Financial Statements.
25
Credit Suisse Large Cap Value Fund
Schedule of Investments (continued)
October 31, 2009
| Number of Shares | Value | ||||||||||
| COMMON STOCKS | |||||||||||
| Hotels, Restaurants & Leisure (0.8%) | |||||||||||
| Bob Evans Farms, Inc. | 700 | $ | 18,389 | ||||||||
| Boyd Gaming Corp.* | 1,300 | 9,568 | |||||||||
| Carnival Corp. | 18,300 | 532,896 | |||||||||
| Darden Restaurants, Inc. | 100 | 3,031 | |||||||||
| International Speedway Corp. Class A | 300 | 7,653 | |||||||||
| McDonald's Corp. | 100 | 5,861 | |||||||||
| P.F. Chang's China Bistro, Inc.* | 158 | 4,612 | |||||||||
| Panera Bread Co. Class A* | 302 | 18,114 | |||||||||
| Royal Caribbean Cruises, Ltd.* | 2,800 | 56,644 | |||||||||
| Starwood Hotels & Resorts Worldwide, Inc. | 1,200 | 34,872 | |||||||||
| The Cheesecake Factory, Inc.* | 25,000 | 454,500 | |||||||||
| Wendy's/Arby's Group, Inc. Class A | 6,700 | 26,465 | |||||||||
| WMS Industries, Inc.* | 100 | 3,998 | |||||||||
| Wynn Resorts, Ltd.* | 400 | 21,688 | |||||||||
| Yum! Brands, Inc. | 100 | 3,295 | |||||||||
| 1,201,586 | |||||||||||
| Household Durables (0.2%) | |||||||||||
| American Greetings Corp. Class A | 100 | 2,034 | |||||||||
| Black & Decker Corp. | 400 | 18,888 | |||||||||
| D.R. Horton, Inc. | 2,200 | 24,112 | |||||||||
| Fortune Brands, Inc. | 1,100 | 42,845 | |||||||||
| Garmin, Ltd. | 700 | 21,182 | |||||||||
| Harman International Industries, Inc. | 300 | 11,283 | |||||||||
| Jarden Corp. | 600 | 16,434 | |||||||||
| KB Home | 500 | 7,090 | |||||||||
| Leggett & Platt, Inc. | 600 | 11,598 | |||||||||
| Lennar Corp. Class A | 1,200 | 15,120 | |||||||||
| M.D.C. Holdings, Inc. | 300 | 9,786 | |||||||||
| Newell Rubbermaid, Inc. | 2,000 | 29,020 | |||||||||
| NVR, Inc.* | 100 | 66,227 | |||||||||
| Pulte Homes, Inc. | 2,400 | 21,624 | |||||||||
| Tempur-Pedic International, Inc.* | 200 | 3,874 | |||||||||
| Toll Brothers, Inc.* | 1,000 | 17,320 | |||||||||
| Tupperware Brands Corp. | 100 | 4,502 | |||||||||
| Whirlpool Corp. | 500 | 35,795 | |||||||||
| 358,734 | |||||||||||
| Household Products (1.9%) | |||||||||||
| Kimberly-Clark Corp. | 300 | 18,348 | |||||||||
| The Procter & Gamble Co. | 50,400 | 2,923,200 | |||||||||
| 2,941,548 | |||||||||||
| Independent Power Producers & Energy Traders (0.0%) | |||||||||||
| Constellation Energy Group, Inc. | 100 | 3,092 | |||||||||
| Mirant Corp.* | 1,678 | 23,458 | |||||||||
| Ormat Technologies, Inc. | 100 | 3,780 | |||||||||
| RRI Energy, Inc.* | 2,800 | 14,756 | |||||||||
| The AES Corp.* | 1,200 | 15,684 | |||||||||
| 60,770 | |||||||||||
See Accompanying Notes to Financial Statements.
26
Credit Suisse Large Cap Value Fund
Schedule of Investments (continued)
October 31, 2009
| Number of Shares | Value | ||||||||||
| COMMON STOCKS | |||||||||||
| Industrial Conglomerates (3.1%) | |||||||||||
| 3M Co. | 200 | $ | 14,714 | ||||||||
| Carlisle Cos., Inc. | 200 | 6,208 | |||||||||
| General Electric Co. | 340,400 | 4,854,104 | |||||||||
| Textron, Inc. | 2,100 | 37,338 | |||||||||
| 4,912,364 | |||||||||||
| Insurance (4.0%) | |||||||||||
| Aflac, Inc. | 200 | 8,298 | |||||||||
| Allied World Assurance Co. Holdings, Ltd. | 1,500 | 67,140 | |||||||||
| American Financial Group, Inc. | 600 | 14,760 | |||||||||
| American International Group, Inc.* | 68,700 | 2,309,694 | |||||||||
| AON Corp. | 2,300 | 88,573 | |||||||||
| Arch Capital Group, Ltd.* | 1,600 | 107,792 | |||||||||
| Arthur J. Gallagher & Co. | 245 | 5,466 | |||||||||
| Aspen Insurance Holdings, Ltd. | 2,600 | 67,080 | |||||||||
| Assurant, Inc. | 800 | 23,944 | |||||||||
| Axis Capital Holdings, Ltd. | 3,200 | 92,448 | |||||||||
| Brown & Brown, Inc. | 100 | 1,837 | |||||||||
| Cincinnati Financial Corp. | 1,000 | 25,360 | |||||||||
| CNA Financial Corp.* | 300 | 6,531 | |||||||||
| Endurance Specialty Holdings, Ltd. | 100 | 3,599 | |||||||||
| Erie Indemnity Co. Class A | 906 | 31,936 | |||||||||
| Everest Re Group, Ltd. | 1,900 | 166,231 | |||||||||
| Fidelity National Financial, Inc. Class A | 1,500 | 20,355 | |||||||||
| First American Corp. | 900 | 27,351 | |||||||||
| Genworth Financial, Inc. Class A* | 14,100 | 149,742 | |||||||||
| Hartford Financial Services Group, Inc. | 15,400 | 377,608 | |||||||||
| HCC Insurance Holdings, Inc. | 1,000 | 26,390 | |||||||||
| Lincoln National Corp. | 1,800 | 42,894 | |||||||||
| Loews Corp. | 4,200 | 139,020 | |||||||||
| Marsh & McLennan Cos., Inc. | 3,700 | 86,802 | |||||||||
| MBIA, Inc.* | 4,000 | 16,240 | |||||||||
| Mercury General Corp. | 100 | 3,646 | |||||||||
| MetLife, Inc. | 16,800 | 571,704 | |||||||||
| Old Republic International Corp. | 1,800 | 19,224 | |||||||||
| OneBeacon Insurance Group, Ltd. Class A | 700 | 8,344 | |||||||||
| PartnerRe, Ltd. | 1,800 | 137,664 | |||||||||
| Principal Financial Group, Inc. | 100 | 2,504 | |||||||||
| Protective Life Corp. | 600 | 11,550 | |||||||||
| Prudential Financial, Inc. | 5,700 | 257,811 | |||||||||
| Reinsurance Group of America, Inc. | 400 | 18,440 | |||||||||
| RenaissanceRe Holdings, Ltd. | 2,000 | 105,000 | |||||||||
| StanCorp Financial Group, Inc. | 500 | 18,355 | |||||||||
| The Allstate Corp. | 4,500 | 133,065 | |||||||||
| The Chubb Corp. | 2,900 | 140,708 | |||||||||
| The Progressive Corp.* | 4,600 | 73,600 | |||||||||
| The Travelers Cos., Inc. | 11,700 | 582,543 | |||||||||
| Torchmark Corp. | 500 | 20,300 | |||||||||
| Transatlantic Holdings, Inc. | 324 | 16,362 | |||||||||
See Accompanying Notes to Financial Statements.
27
Credit Suisse Large Cap Value Fund
Schedule of Investments (continued)
October 31, 2009
| Number of Shares | Value | ||||||||||
| COMMON STOCKS | |||||||||||
| Insurance | |||||||||||
| Unitrin, Inc. | 838 | $ | 16,425 | ||||||||
| Unum Group | 2,900 | 57,855 | |||||||||
| Validus Holdings, Ltd. | 2,500 | 63,250 | |||||||||
| W.R. Berkley Corp. | 700 | 17,304 | |||||||||
| Wesco Financial Corp. | 100 | 32,800 | |||||||||
| White Mountains Insurance Group, Ltd. | 200 | 61,882 | |||||||||
| XL Capital, Ltd. Class A | 2,800 | 45,948 | |||||||||
| 6,323,375 | |||||||||||
| Internet & Catalog Retail (0.2%) | |||||||||||
| Amazon.com, Inc.* | 200 | 23,762 | |||||||||
| Expedia, Inc.* | 1,300 | 29,471 | |||||||||
| Liberty Media Corp. - Interactive Class A* | 15,800 | 179,172 | |||||||||
| NetFlix, Inc.* | 100 | 5,345 | |||||||||
| priceline.com, Inc.* | 200 | 31,558 | |||||||||
| 269,308 | |||||||||||
| Internet Software & Services (0.5%) | |||||||||||
| eBay, Inc.* | 6,700 | 149,209 | |||||||||
| Google, Inc. Class A* | 1,000 | 536,120 | |||||||||
| Sohu.com, Inc.* | 500 | 27,800 | |||||||||
| 713,129 | |||||||||||
| IT Services (0.2%) | |||||||||||
| Alliance Data Systems Corp.* | 100 | 5,498 | |||||||||
| Amdocs, Ltd.* | 5,300 | 133,560 | |||||||||
| Broadridge Financial Solutions, Inc. | 512 | 10,655 | |||||||||
| Computer Sciences Corp.* | 1,100 | 55,781 | |||||||||
| Convergys Corp.* | 600 | 6,510 | |||||||||
| Global Cash Access Holdings, Inc.* | 100 | 633 | |||||||||
| Mastercard, Inc. Class A | 500 | 109,510 | |||||||||
| SAIC, Inc.* | 300 | 5,313 | |||||||||
| Visa, Inc. Class A | 100 | 7,576 | |||||||||
| Wright Express Corp.* | 100 | 2,791 | |||||||||
| 337,827 | |||||||||||
| Leisure Equipment & Products (0.0%) | |||||||||||
| Callaway Golf Co. | 100 | 684 | |||||||||
| Hasbro, Inc. | 500 | 13,635 | |||||||||
| Mattel, Inc. | 2,500 | 47,325 | |||||||||
| Polaris Industries, Inc. | 100 | 4,207 | |||||||||
| 65,851 | |||||||||||
| Life Sciences Tools & Services (0.1%) | |||||||||||
| Charles River Laboratories International, Inc.* | 100 | 3,652 | |||||||||
| PerkinElmer, Inc. | 600 | 11,166 | |||||||||
| Thermo Fisher Scientific, Inc.* | 2,900 | 130,500 | |||||||||
| Waters Corp.* | 100 | 5,743 | |||||||||
| 151,061 | |||||||||||
See Accompanying Notes to Financial Statements.
28
Credit Suisse Large Cap Value Fund
Schedule of Investments (continued)
October 31, 2009
| Number of Shares | Value | ||||||||||
| COMMON STOCKS | |||||||||||
| Machinery (0.6%) | |||||||||||
| AGCO Corp.* | 600 | $ | 16,866 | ||||||||
| Caterpillar, Inc. | 2,500 | 137,650 | |||||||||
| Crane Co. | 300 | 8,355 | |||||||||
| Cummins, Inc. | 1,000 | 43,060 | |||||||||
| Danaher Corp. | 700 | 47,761 | |||||||||
| Deere & Co. | 2,400 | 109,320 | |||||||||
| Dover Corp. | 300 | 11,304 | |||||||||
| Eaton Corp. | 1,200 | 72,540 | |||||||||
| Federal Signal Corp. | 100 | 614 | |||||||||
| Flowserve Corp. | 100 | 9,821 | |||||||||
| Gardner Denver, Inc.* | 276 | 9,911 | |||||||||
| IDEX Corp. | 200 | 5,686 | |||||||||
| Illinois Tool Works, Inc. | 3,400 | 156,128 | |||||||||
| Lincoln Electric Holdings, Inc. | 300 | 14,232 | |||||||||
| Navistar International Corp.* | 100 | 3,314 | |||||||||
| Oshkosh Corp. | 600 | 18,756 | |||||||||
| Parker Hannifin Corp. | 1,100 | 58,256 | |||||||||
| Pentair, Inc. | 400 | 11,640 | |||||||||
| SPX Corp. | 300 | 15,834 | |||||||||
| Tennant Co. | 200 | 5,332 | |||||||||
| Terex Corp.* | 700 | 14,154 | |||||||||
| The Manitowoc Co., Inc. | 5,300 | 48,442 | |||||||||
| The Stanley Works | 500 | 22,615 | |||||||||
| The Timken Co. | 1,700 | 37,451 | |||||||||
| Trinity Industries, Inc. | 700 | 11,816 | |||||||||
| 890,858 | |||||||||||
| Marine (0.0%) | |||||||||||
| Alexander & Baldwin, Inc. | 800 | 23,064 | |||||||||
| Media (5.2%) | |||||||||||
| Cablevision Systems Corp. Group A | 2,000 | 45,920 | |||||||||
| CBS Corp. Class B | 5,100 | 60,027 | |||||||||
| Central European Media Enterprises, Ltd. Class A* | 1,100 | 27,654 | |||||||||
| Clear Channel Outdoor Holdings, Inc. Class A* | 14,100 | 96,162 | |||||||||
| Comcast Corp. Class A | 96,800 | 1,403,600 | |||||||||
| DISH Network Corp. Class A* | 1,800 | 31,320 | |||||||||
| DreamWorks Animation SKG, Inc. Class A* | 700 | 22,400 | |||||||||
| Gannett Co., Inc. | 1,900 | 18,658 | |||||||||
| Interpublic Group of Cos., Inc.* | 3,600 | 21,672 | |||||||||
| Liberty Global, Inc. Class A* | 2,000 | 41,060 | |||||||||
| Liberty Media Corp. - Capital Series A* | 500 | 10,345 | |||||||||
| Liberty Media Corp. - Entertainment Series A* | 4,000 | 123,280 | |||||||||
| Marvel Entertainment, Inc.* | 100 | 4,997 | |||||||||
| Meredith Corp. | 300 | 8,118 | |||||||||
| News Corp. Class A | 58,300 | 671,616 | |||||||||
| Omnicom Group, Inc. | 100 | 3,428 | |||||||||
| Scripps Networks Interactive, Inc. Class A | 300 | 11,328 | |||||||||
| The DIRECTV Group, Inc.* | 900 | 23,670 | |||||||||
| The McGraw-Hill Cos., Inc. | 100 | 2,878 | |||||||||
See Accompanying Notes to Financial Statements.
29
Credit Suisse Large Cap Value Fund
Schedule of Investments (continued)
October 31, 2009
| Number of Shares | Value | ||||||||||
| COMMON STOCKS | |||||||||||
| Media | |||||||||||
| The Walt Disney Co. | 100 | $ | 2,737 | ||||||||
| Time Warner Cable, Inc. | 10,700 | 422,008 | |||||||||
| Time Warner, Inc. | 162,000 | 4,879,440 | |||||||||
| Viacom, Inc. Class B* | 100 | 2,759 | |||||||||
| Virgin Media, Inc. | 9,800 | 136,906 | |||||||||
| Warner Music Group Corp.* | 1,300 | 7,488 | |||||||||
| 8,079,471 | |||||||||||
| Metals & Mining (1.2%) | |||||||||||
| Alcoa, Inc. | 9,200 | 114,264 | |||||||||
| Allegheny Technologies, Inc. | 700 | 21,602 | |||||||||
| Carpenter Technology Corp. | 300 | 6,309 | |||||||||
| Century Aluminum Co.* | 200 | 1,734 | |||||||||
| Cliffs Natural Resources, Inc. | 800 | 28,456 | |||||||||
| Commercial Metals Co. | 800 | 11,872 | |||||||||
| Freeport-McMoRan Copper & Gold, Inc.* | 7,300 | 535,528 | |||||||||
| Newmont Mining Corp. | 22,400 | 973,504 | |||||||||
| Nucor Corp. | 2,600 | 103,610 | |||||||||
| Reliance Steel & Aluminum Co. | 400 | 14,592 | |||||||||
| Royal Gold, Inc. | 300 | 13,251 | |||||||||
| Schnitzer Steel Industries, Inc. Class A | 300 | 12,972 | |||||||||
| Steel Dynamics, Inc. | 1,600 | 21,424 | |||||||||
| Titanium Metals Corp. | 600 | 5,160 | |||||||||
| United States Steel Corp. | 1,100 | 37,939 | |||||||||
| Walter Energy, Inc. | 100 | 5,850 | |||||||||
| Worthington Industries, Inc. | 4,300 | 47,515 | |||||||||
| 1,955,582 | |||||||||||
| Multi-Utilities (2.6%) | |||||||||||
| Alliant Energy Corp. | 800 | 21,248 | |||||||||
| Ameren Corp. | 1,700 | 41,378 | |||||||||
| Black Hills Corp. | 100 | 2,437 | |||||||||
| CMS Energy Corp. | 1,700 | 22,610 | |||||||||
| Consolidated Edison, Inc. | 2,000 | 81,360 | |||||||||
| Dominion Resources, Inc. | 4,500 | 153,405 | |||||||||
| DTE Energy Co. | 1,200 | 44,376 | |||||||||
| Integrys Energy Group, Inc. | 400 | 13,840 | |||||||||
| MDU Resources Group, Inc. | 1,300 | 26,975 | |||||||||
| NiSource, Inc. | 2,100 | 27,132 | |||||||||
| NSTAR | 700 | 21,665 | |||||||||
| OGE Energy Corp. | 600 | 19,932 | |||||||||
| PG&E Corp. | 3,000 | 122,670 | |||||||||
| Public Service Enterprise Group, Inc. | 105,300 | 3,137,940 | |||||||||
| SCANA Corp. | 800 | 27,072 | |||||||||
| Sempra Energy | 2,000 | 102,900 | |||||||||
| TECO Energy, Inc. | 1,600 | 22,944 | |||||||||
| Vectren Corp. | 500 | 11,270 | |||||||||
| Wisconsin Energy Corp. | 800 | 34,936 | |||||||||
| Xcel Energy, Inc. | 3,700 | 69,782 | |||||||||
| 4,005,872 | |||||||||||
See Accompanying Notes to Financial Statements.
30
Credit Suisse Large Cap Value Fund
Schedule of Investments (continued)
October 31, 2009
| Number of Shares | Value | ||||||||||
| COMMON STOCKS | |||||||||||
| Multiline Retail (0.1%) | |||||||||||
| 99 Cents Only Stores* | 3,900 | $ | 44,343 | ||||||||
| Big Lots, Inc.* | 600 | 15,030 | |||||||||
| Family Dollar Stores, Inc. | 100 | 2,830 | |||||||||
| J.C. Penney Co., Inc. | 1,900 | 62,947 | |||||||||
| Kohl's Corp.* | 400 | 22,888 | |||||||||
| Macy's, Inc. | 3,200 | 56,224 | |||||||||
| Sears Holdings Corp.* | 500 | 33,930 | |||||||||
| 238,192 | |||||||||||
| Office Electronics (0.0%) | |||||||||||
| Xerox Corp. | 4,400 | 33,088 | |||||||||
| Zebra Technologies Corp. Class A* | 100 | 2,500 | |||||||||
| 35,588 | |||||||||||
| Oil, Gas & Consumable Fuels (18.6%) | |||||||||||
| Alpha Natural Resources, Inc.* | 200 | 6,794 | |||||||||
| Anadarko Petroleum Corp. | 25,000 | 1,523,250 | |||||||||
| Apache Corp. | 7,400 | 696,488 | |||||||||
| Arch Coal, Inc. | 1,200 | 25,992 | |||||||||
| Atlas Pipeline Partners LP | 100 | 702 | |||||||||
| Berry Petroleum Co. Class A | 200 | 5,072 | |||||||||
| Cabot Oil & Gas Corp. | 700 | 26,929 | |||||||||
| Chesapeake Energy Corp. | 10,200 | 249,900 | |||||||||
| Chevron Corp. | 50,400 | 3,857,616 | |||||||||
| Cimarex Energy Co. | 600 | 23,496 | |||||||||
| Concho Resources, Inc.* | 500 | 19,055 | |||||||||
| ConocoPhillips | 132,000 | 6,623,760 | |||||||||
| Consol Energy, Inc. | 200 | 8,562 | |||||||||
| Denbury Resources, Inc.* | 1,900 | 27,740 | |||||||||
| Devon Energy Corp. | 4,700 | 304,137 | |||||||||
| El Paso Corp. | 3,900 | 38,259 | |||||||||
| EOG Resources, Inc. | 2,100 | 171,486 | |||||||||
| Exxon Mobil Corp. | 177,800 | 12,742,926 | |||||||||
| Forest Oil Corp.* | 500 | 9,800 | |||||||||
| Frontline, Ltd. | 1,600 | 37,328 | |||||||||
| Hess Corp. | 2,400 | 131,376 | |||||||||
| Marathon Oil Corp. | 5,700 | 182,229 | |||||||||
| Mariner Energy, Inc.* | 200 | 2,548 | |||||||||
| McMoRan Exploration Co.* | 200 | 1,538 | |||||||||
| Murphy Oil Corp. | 1,400 | 85,596 | |||||||||
| Newfield Exploration Co.* | 1,200 | 49,224 | |||||||||
| Noble Energy, Inc. | 1,300 | 85,319 | |||||||||
| Occidental Petroleum Corp. | 19,800 | 1,502,424 | |||||||||
| Overseas Shipholding Group, Inc. | 300 | 11,775 | |||||||||
| Pioneer Natural Resources Co. | 800 | 32,888 | |||||||||
| Range Resources Corp. | 1,000 | 50,050 | |||||||||
| Rex Energy Corp.* | 200 | 1,618 | |||||||||
| SandRidge Energy, Inc.* | 1,200 | 12,276 | |||||||||
| Southern Union Co. | 800 | 15,656 | |||||||||
See Accompanying Notes to Financial Statements.
31
Credit Suisse Large Cap Value Fund
Schedule of Investments (continued)
October 31, 2009
| Number of Shares | Value | ||||||||||
| COMMON STOCKS | |||||||||||
| Oil, Gas & Consumable Fuels | |||||||||||
| Southwestern Energy Co.* | 200 | $ | 8,716 | ||||||||
| Spectra Energy Corp. | 5,100 | 97,512 | |||||||||
| St. Mary Land & Exploration Co. | 300 | 10,230 | |||||||||
| Stone Energy Corp.* | 200 | 3,066 | |||||||||
| Sunoco, Inc. | 800 | 24,640 | |||||||||
| Teekay Corp. | 800 | 16,600 | |||||||||
| Tesoro Corp. | 500 | 7,070 | |||||||||
| The Williams Cos., Inc. | 4,500 | 84,825 | |||||||||
| Valero Energy Corp. | 5,800 | 104,980 | |||||||||
| W&T Offshore, Inc. | 200 | 2,330 | |||||||||
| Whiting Petroleum Corp.* | 300 | 16,920 | |||||||||
| XTO Energy, Inc. | 4,500 | 187,020 | |||||||||
| 29,127,718 | |||||||||||
| Paper & Forest Products (0.1%) | |||||||||||
| International Paper Co. | 3,500 | 78,085 | |||||||||
| MeadWestvaco Corp. | 1,200 | 27,396 | |||||||||
| Schweitzer-Mauduit International, Inc. | 95 | 4,907 | |||||||||
| Weyerhaeuser Co. | 1,800 | 65,412 | |||||||||
| 175,800 | |||||||||||
| Personal Products (0.0%) | |||||||||||
| Alberto-Culver Co. | 200 | 5,364 | |||||||||
| Mead Johnson Nutrition Co. Class A | 500 | 21,020 | |||||||||
| NBTY, Inc.* | 100 | 3,641 | |||||||||
| Nu Skin Enterprises, Inc. Class A | 100 | 2,276 | |||||||||
| 32,301 | |||||||||||
| Pharmaceuticals (7.9%) | |||||||||||
| Abbott Laboratories | 500 | 25,285 | |||||||||
| Bristol-Myers Squibb Co. | 164,900 | 3,594,820 | |||||||||
| Eli Lilly & Co. | 3,700 | 125,837 | |||||||||
| Endo Pharmaceuticals Holdings, Inc.* | 800 | 17,920 | |||||||||
| Forest Laboratories, Inc.* | 2,300 | 63,641 | |||||||||
| Johnson & Johnson | 32,600 | 1,925,030 | |||||||||
| King Pharmaceuticals, Inc.* | 1,900 | 19,247 | |||||||||
| Merck & Co., Inc. | 13,400 | 414,462 | |||||||||
| Mylan, Inc.* | 19,000 | 308,560 | |||||||||
| Pfizer, Inc. | 158,497 | 2,699,204 | |||||||||
| Schering-Plough Corp. | 103,800 | 2,927,160 | |||||||||
| Teva Pharmaceutical Industries, Ltd. ADR | 3,022 | 152,550 | |||||||||
| The Medicines Co.* | 200 | 1,438 | |||||||||
| Valeant Pharmaceuticals International* | 184 | 5,410 | |||||||||
| Watson Pharmaceuticals, Inc.* | 700 | 24,094 | |||||||||
| 12,304,658 | |||||||||||
| Professional Services (0.0%) | |||||||||||
| Manpower, Inc. | 500 | 23,705 | |||||||||
See Accompanying Notes to Financial Statements.
32
Credit Suisse Large Cap Value Fund
Schedule of Investments (continued)
October 31, 2009
| Number of Shares | Value | ||||||||||
| COMMON STOCKS | |||||||||||
| Real Estate Investment Trusts (1.2%) | |||||||||||
| Alexandria Real Estate Equities, Inc. | 300 | $ | 16,251 | ||||||||
| AMB Property Corp. | 1,000 | 21,980 | |||||||||
| Annaly Capital Management, Inc. | 9,200 | 155,572 | |||||||||
| Apartment Investment & Management Co. Class A | 804 | 9,929 | |||||||||
| AvalonBay Communities, Inc. | 531 | 36,522 | |||||||||
| Boston Properties, Inc. | 1,000 | 60,770 | |||||||||
| Brandywine Realty Trust | 900 | 8,604 | |||||||||
| BRE Properties, Inc. | 300 | 8,169 | |||||||||
| Camden Property Trust | 400 | 14,500 | |||||||||
| Chimera Investment Corp. | 20,000 | 69,800 | |||||||||
| Corporate Office Properties Trust | 300 | 9,957 | |||||||||
| Cousins Properties, Inc. | 100 | 732 | |||||||||
| Developers Diversified Realty Corp. | 152 | 1,306 | |||||||||
| Douglas Emmett, Inc. | 900 | 10,620 | |||||||||
| Duke Realty Corp. | 1,600 | 17,984 | |||||||||
| EastGroup Properties, Inc. | 1,500 | 55,215 | |||||||||
| Equity Residential | 2,500 | 72,200 | |||||||||
| Essex Property Trust, Inc. | 300 | 22,554 | |||||||||
| Federal Realty Investment Trust | 300 | 17,709 | |||||||||
| HCP, Inc. | 2,800 | 82,852 | |||||||||
| Health Care REIT, Inc. | 700 | 31,059 | |||||||||
| Healthcare Realty Trust, Inc. | 700 | 14,581 | |||||||||
| Hospitality Properties Trust | 800 | 15,448 | |||||||||
| Host Hotels & Resorts, Inc. | 4,800 | 48,528 | |||||||||
| HRPT Properties Trust | 1,600 | 11,248 | |||||||||
| Kimco Realty Corp. | 2,900 | 36,656 | |||||||||
| Liberty Property Trust | 800 | 23,496 | |||||||||
| Mack-Cali Realty Corp. | 500 | 15,475 | |||||||||
| Nationwide Health Properties, Inc. | 400 | 12,900 | |||||||||
| OMEGA Healthcare Investors, Inc. | 4,400 | 66,704 | |||||||||
| Plum Creek Timber Co., Inc. | 700 | 21,903 | |||||||||
| ProLogis | 3,500 | 39,655 | |||||||||
| Public Storage | 6,300 | 463,680 | |||||||||
| Rayonier, Inc. | 500 | 19,290 | |||||||||
| Realty Income Corp. | 700 | 16,226 | |||||||||
| Regency Centers Corp. | 500 | 16,775 | |||||||||
| Senior Housing Properties Trust | 1,200 | 23,136 | |||||||||
| Simon Property Group, Inc. | 2,022 | 137,274 | |||||||||
| SL Green Realty Corp. | 500 | 19,380 | |||||||||
| Taubman Centers, Inc. | 300 | 9,153 | |||||||||
| The Macerich Co. | 537 | 16,003 | |||||||||
| UDR, Inc. | 1,130 | 16,249 | |||||||||
| Ventas, Inc. | 1,400 | 56,182 | |||||||||
| Vornado Realty Trust | 1,604 | 95,534 | |||||||||
| Walter Investment Management Corp. | 36 | 469 | |||||||||
| Weingarten Realty Investors | 700 | 12,950 | |||||||||
| 1,933,180 | |||||||||||
See Accompanying Notes to Financial Statements.
33
Credit Suisse Large Cap Value Fund
Schedule of Investments (continued)
October 31, 2009
| Number of Shares | Value | ||||||||||
| COMMON STOCKS | |||||||||||
| Real Estate Management & Development (0.0%) | |||||||||||
| Altisource Portfolio Solutions SA* | 33 | $ | 503 | ||||||||
| CB Richard Ellis Group, Inc. Class A* | 100 | 1,035 | |||||||||
| Jones Lang LaSalle, Inc. | 300 | 14,055 | |||||||||
| 15,593 | |||||||||||
| Road & Rail (0.4%) | |||||||||||
| Avis Budget Group, Inc.* | 100 | 840 | |||||||||
| Burlington Northern Santa Fe Corp. | 2,100 | 158,172 | |||||||||
| CSX Corp. | 3,300 | 139,194 | |||||||||
| Hertz Global Holdings, Inc.* | 1,600 | 14,896 | |||||||||
| Norfolk Southern Corp. | 2,400 | 111,888 | |||||||||
| Ryder System, Inc. | 323 | 13,098 | |||||||||
| Union Pacific Corp. | 2,600 | 143,364 | |||||||||
| Werner Enterprises, Inc. | 300 | 5,625 | |||||||||
| 587,077 | |||||||||||
| Semiconductors & Semiconductor Equipment (2.0%) | |||||||||||
| Advanced Micro Devices, Inc.* | 3,900 | 17,940 | |||||||||
| Analog Devices, Inc. | 100 | 2,563 | |||||||||
| Applied Materials, Inc. | 10,300 | 125,660 | |||||||||
| Atmel Corp.* | 14,300 | 53,196 | |||||||||
| Broadcom Corp. Class A* | 500 | 13,305 | |||||||||
| Cree, Inc.* | 100 | 4,210 | |||||||||
| Cypress Semiconductor Corp.* | 400 | 3,372 | |||||||||
| Fairchild Semiconductor International, Inc.* | 900 | 6,732 | |||||||||
| Integrated Device Technology, Inc.* | 3,000 | 17,640 | |||||||||
| Intel Corp. | 38,600 | 737,646 | |||||||||
| International Rectifier Corp.* | 200 | 3,656 | |||||||||
| Intersil Corp. Class A | 600 | 7,530 | |||||||||
| KLA-Tencor Corp. | 1,500 | 48,765 | |||||||||
| Lam Research Corp.* | 100 | 3,372 | |||||||||
| Linear Technology Corp. | 100 | 2,588 | |||||||||
| LSI Corp.* | 14,800 | 75,776 | |||||||||
| Marvell Technology Group, Ltd.* | 1,600 | 21,952 | |||||||||
| Maxim Integrated Products, Inc. | 500 | 8,335 | |||||||||
| Micron Technology, Inc.* | 65,800 | 446,782 | |||||||||
| Novellus Systems, Inc.* | 500 | 10,290 | |||||||||
| Nvidia Corp.* | 300 | 3,588 | |||||||||
| PMC-Sierra, Inc.* | 1,100 | 9,372 | |||||||||
| Silicon Laboratories, Inc.* | 100 | 4,190 | |||||||||
| Teradyne, Inc.* | 117 | 979 | |||||||||
| Tessera Technologies, Inc.* | 100 | 2,211 | |||||||||
| Texas Instruments, Inc. | 62,800 | 1,472,660 | |||||||||
| 3,104,310 | |||||||||||
See Accompanying Notes to Financial Statements.
34
Credit Suisse Large Cap Value Fund
Schedule of Investments (continued)
October 31, 2009
| Number of Shares | Value | ||||||||||
| COMMON STOCKS | |||||||||||
| Software (0.5%) | |||||||||||
| Activision Blizzard, Inc.* | 1,700 | $ | 18,411 | ||||||||
| AsiaInfo Holdings, Inc.* | 200 | 4,412 | |||||||||
| Autodesk, Inc.* | 700 | 17,451 | |||||||||
| CA, Inc. | 800 | 16,736 | |||||||||
| Compuware Corp.* | 3,200 | 22,592 | |||||||||
| Electronic Arts, Inc.* | 100 | 1,824 | |||||||||
| Microsoft Corp. | 16,600 | 460,318 | |||||||||
| Novell, Inc.* | 5,800 | 23,722 | |||||||||
| Red Hat, Inc.* | 400 | 10,324 | |||||||||
| Rovi Corp.* | 300 | 8,265 | |||||||||
| Salesforce.com, Inc.* | 100 | 5,675 | |||||||||
| Sybase, Inc.* | 100 | 3,956 | |||||||||
| Symantec Corp.* | 11,900 | 209,202 | |||||||||
| Synopsys, Inc.* | 300 | 6,600 | |||||||||
| 809,488 | |||||||||||
| Specialty Retail (0.7%) | |||||||||||
| Aaron's, Inc. | 400 | 10,020 | |||||||||
| Aeropostale, Inc.* | 300 | 11,259 | |||||||||
| American Eagle Outfitters, Inc. | 100 | 1,749 | |||||||||
| AnnTaylor Stores Corp.* | 100 | 1,297 | |||||||||
| AutoNation, Inc.* | 700 | 12,068 | |||||||||
| Barnes & Noble, Inc. | 1,200 | 19,932 | |||||||||
| Bed Bath & Beyond, Inc.* | 100 | 3,521 | |||||||||
| Foot Locker, Inc. | 600 | 6,288 | |||||||||
| GameStop Corp. Class A* | 300 | 7,287 | |||||||||
| Home Depot, Inc. | 23,600 | 592,124 | |||||||||
| Lowe's Cos., Inc. | 7,800 | 152,646 | |||||||||
| Limited Brands, Inc. | 600 | 10,560 | |||||||||
| Office Depot, Inc.* | 3,600 | 21,780 | |||||||||
| Penske Auto Group, Inc. | 500 | 7,830 | |||||||||
| PetSmart, Inc. | 300 | 7,059 | |||||||||
| RadioShack Corp. | 1,200 | 20,268 | |||||||||
| Rent-A-Center, Inc.* | 200 | 3,672 | |||||||||
| Sally Beauty Holdings, Inc.* | 100 | 675 | |||||||||
| Staples, Inc. | 100 | 2,170 | |||||||||
| The Gap, Inc. | 700 | 14,938 | |||||||||
| The Gymboree Corp.* | 3,300 | 140,481 | |||||||||
| TJX Cos., Inc. | 100 | 3,735 | |||||||||
| 1,051,359 | |||||||||||
See Accompanying Notes to Financial Statements.
35
Credit Suisse Large Cap Value Fund
Schedule of Investments (continued)
October 31, 2009
| Number of Shares | Value | ||||||||||
| COMMON STOCKS | |||||||||||
| Textiles, Apparel & Luxury Goods (0.3%) | |||||||||||
| Coach, Inc. | 100 | $ | 3,297 | ||||||||
| Jones Apparel Group, Inc. | 111 | 1,986 | |||||||||
| NIKE, Inc. Class B | 5,500 | 341,990 | |||||||||
| Phillips-Van Heusen Corp. | 200 | 8,030 | |||||||||
| Polo Ralph Lauren Corp. | 200 | 14,884 | |||||||||
| Skechers U.S.A., Inc. Class A* | 100 | 2,182 | |||||||||
| The Warnaco Group, Inc.* | 1,900 | 77,007 | |||||||||
| VF Corp. | 400 | 28,416 | |||||||||
| 477,792 | |||||||||||
| Thrifts & Mortgage Finance (0.1%) | |||||||||||
| Astoria Financial Corp. | 100 | 998 | |||||||||
| Hudson City Bancorp, Inc. | 1,500 | 19,710 | |||||||||
| New York Community Bancorp, Inc. | 2,600 | 28,054 | |||||||||
| NewAlliance Bancshares, Inc. | 100 | 1,108 | |||||||||
| Ocwen Financial Corp.* | 100 | 1,093 | |||||||||
| People's United Financial, Inc. | 2,600 | 41,678 | |||||||||
| 92,641 | |||||||||||
| Tobacco (0.1%) | |||||||||||
| Lorillard, Inc. | 300 | 23,316 | |||||||||
| Reynolds American, Inc. | 1,200 | 58,176 | |||||||||
| 81,492 | |||||||||||
| Trading Companies & Distributors (0.0%) | |||||||||||
| GATX Corp. | 100 | 2,718 | |||||||||
| United Rentals, Inc.* | 100 | 949 | |||||||||
| WESCO International, Inc.* | 500 | 12,780 | |||||||||
| 16,447 | |||||||||||
| Water Utilities (0.0%) | |||||||||||
| Aqua America, Inc. | 900 | 13,905 | |||||||||
| Wireless Telecommunication Services (0.3%) | |||||||||||
| Crown Castle International Corp.* | 1,400 | 42,308 | |||||||||
| Leap Wireless International, Inc.* | 400 | 5,288 | |||||||||
| NII Holdings, Inc.* | 1,200 | 32,316 | |||||||||
| Sprint Nextel Corp.* | 92,300 | 273,208 | |||||||||
| Syniverse Holdings, Inc.* | 1,400 | 23,982 | |||||||||
| Telephone & Data Systems, Inc. | 700 | 20,734 | |||||||||
| United States Cellular Corp.* | 300 | 10,983 | |||||||||
| 408,819 | |||||||||||
| TOTAL COMMON STOCKS (Cost $151,033,671) | 155,267,391 | ||||||||||
| PREFERRED STOCK (0.0%) | |||||||||||
| Personal Products (0.0%) | |||||||||||
| Revlon, Inc.*^ (Cost $7,842) | 1,500 | 7,050 | |||||||||
See Accompanying Notes to Financial Statements.
36
Credit Suisse Large Cap Value Fund
Schedule of Investments (continued)
October 31, 2009
| Par (000) | Value | ||||||||||
| SHORT-TERM INVESTMENT (1.0%) | |||||||||||
| State Street Bank and Trust Co. Euro Time Deposit, 0.010%, 11/02/09 (Cost $1,500,000) | $ | 1,500 | $ | 1,500,000 | |||||||
| TOTAL INVESTMENTS AT VALUE (100.2%) (Cost $152,541,513) | 156,774,441 | ||||||||||
| LIABILITIES IN EXCESS OF OTHER ASSETS (-0.2%) | (334,757 | ) | |||||||||
| NET ASSETS (100.0%) | $ | 156,439,684 | |||||||||
INVESTMENT ABBREVIATION
ADR = American Depositary Receipt
* Non-income producing security.
^ Not readily marketable security; security is valued at fair value as determined in good faith by, or under the direction of, the Board of Trustees.
See Accompanying Notes to Financial Statements.
37
Credit Suisse Small Cap Core Fund
Schedule of Investments
October 31, 2009
| Number of Shares | Value | ||||||||||
| COMMON STOCKS (98.9%) | |||||||||||
| Aerospace & Defense (1.8%) | |||||||||||
| AAR Corp.* | 6,200 | $ | 121,582 | ||||||||
| Aerovironment, Inc.* | 1,000 | 26,660 | |||||||||
| American Science and Engineering, Inc. | 2,200 | 145,464 | |||||||||
| Applied Signal Technology, Inc. | 3,300 | 67,617 | |||||||||
| Ceradyne, Inc.* | 1,600 | 25,792 | |||||||||
| Cubic Corp. | 7,396 | 256,715 | |||||||||
| Curtiss-Wright Corp. | 4,600 | 137,172 | |||||||||
| DynCorp International, Inc. Class A* | 2,400 | 40,800 | |||||||||
| Esterline Technologies Corp.* | 3,900 | 164,229 | |||||||||
| GenCorp, Inc.* | 12,300 | 91,512 | |||||||||
| Orbital Sciences Corp.* | 5,900 | 75,992 | |||||||||
| Stanley, Inc.* | 2,200 | 62,150 | |||||||||
| Teledyne Technologies, Inc.* | 6,100 | 208,376 | |||||||||
| Triumph Group, Inc. | 1,400 | 65,534 | |||||||||
| 1,489,595 | |||||||||||
| Air Freight & Logistics (0.1%) | |||||||||||
| Forward Air Corp. | 2,600 | 55,484 | |||||||||
| HUB Group, Inc. Class A* | 2,300 | 57,178 | |||||||||
| 112,662 | |||||||||||
| Airlines (1.2%) | |||||||||||
| Airtran Holdings, Inc.* | 84,190 | 356,124 | |||||||||
| Alaska Air Group, Inc.* | 6,600 | 169,752 | |||||||||
| Allegiant Travel Co.* | 1,300 | 49,023 | |||||||||
| JetBlue Airways Corp.* | 67,800 | 336,288 | |||||||||
| Skywest, Inc. | 5,600 | 78,232 | |||||||||
| 989,419 | |||||||||||
| Auto Components (0.5%) | |||||||||||
| Cooper Tire & Rubber Co. | 5,400 | 82,404 | |||||||||
| Drew Industries, Inc.* | 1,800 | 34,452 | |||||||||
| Fuel Systems Solutions, Inc.* | 1,500 | 49,110 | |||||||||
| Spartan Motors, Inc. | 7,200 | 35,928 | |||||||||
| Standard Motor Products, Inc. | 3,800 | 31,768 | |||||||||
| Superior Industries International, Inc. | 13,200 | 175,296 | |||||||||
| WABCO Holdings, Inc. | 409 | 9,701 | |||||||||
| 418,659 | |||||||||||
| Automobiles (0.1%) | |||||||||||
| Winnebago Industries, Inc.* | 6,500 | 74,750 | |||||||||
| Beverages (0.1%) | |||||||||||
| The Boston Beer Co., Inc. Class A* | 1,800 | 68,400 | |||||||||
| Biotechnology (1.0%) | |||||||||||
| Arqule, Inc.* | 6,400 | 21,440 | |||||||||
| Cephalon, Inc.* | 7,000 | 382,060 | |||||||||
| Cepheid, Inc.* | 2,600 | 34,502 | |||||||||
| Cubist Pharmaceuticals, Inc.* | 7,636 | 129,354 | |||||||||
| Martek Biosciences Corp.* | 2,000 | 35,920 | |||||||||
| Regeneron Pharmaceuticals, Inc.* | 13,033 | 204,618 | |||||||||
| Savient Pharmaceuticals, Inc.* | 4,000 | 50,400 | |||||||||
| 858,294 | |||||||||||
See Accompanying Notes to Financial Statements.
38
Credit Suisse Small Cap Core Fund
Schedule of Investments (continued)
October 31, 2009
| Number of Shares | Value | ||||||||||
| COMMON STOCKS | |||||||||||
| Building Products (2.1%) | |||||||||||
| AAON, Inc. | 3,100 | $ | 55,831 | ||||||||
| Ameron International Corp. | 1,200 | 70,776 | |||||||||
| Apogee Enterprises, Inc. | 6,200 | 82,088 | |||||||||
| Armstrong World Industries, Inc.* | 18,800 | 700,300 | |||||||||
| Gibraltar Industries, Inc. | 6,900 | 74,658 | |||||||||
| Griffon Corp.* | 21,934 | 192,361 | |||||||||
| Quanex Building Products Corp. | 9,400 | 139,778 | |||||||||
| Simpson Manufacturing Co., Inc. | 12,300 | 287,697 | |||||||||
| Universal Forest Products, Inc. | 4,400 | 156,992 | |||||||||
| 1,760,481 | |||||||||||
| Capital Markets (1.2%) | |||||||||||
| Greenhill & Co., Inc. | 1,400 | 120,722 | |||||||||
| Investment Technology Group, Inc.* | 6,890 | 148,617 | |||||||||
| KBW, Inc.* | 2,600 | 72,800 | |||||||||
| LaBranche & Co., Inc.* | 12,100 | 33,396 | |||||||||
| optionsXpress Holdings, Inc. | 4,800 | 75,024 | |||||||||
| Piper Jaffray Cos.* | 7,000 | 324,730 | |||||||||
| Stifel Financial Corp.* | 1,800 | 93,528 | |||||||||
| SWS Group, Inc. | 5,900 | 78,942 | |||||||||
| TradeStation Group, Inc.* | 8,100 | 62,532 | |||||||||
| 1,010,291 | |||||||||||
| Chemicals (1.8%) | |||||||||||
| A. Schulman, Inc. | 6,476 | 112,488 | |||||||||
| American Vanguard Corp. | 5,000 | 41,500 | |||||||||
| Arch Chemicals, Inc. | 3,500 | 96,915 | |||||||||
| Balchem Corp. | 4,300 | 118,637 | |||||||||
| Cabot Corp. | 400 | 8,772 | |||||||||
| Calgon Carbon Corp.* | 28,734 | 455,147 | |||||||||
| H.B. Fuller Co. | 4,900 | 93,639 | |||||||||
| NewMarket Corp. | 900 | 84,150 | |||||||||
| OM Group, Inc.* | 5,300 | 143,206 | |||||||||
| PolyOne Corp.* | 23,100 | 128,898 | |||||||||
| Quaker Chemical Corp. | 2,714 | 55,908 | |||||||||
| Stepan Co. | 1,800 | 103,032 | |||||||||
| Zep, Inc. | 5,300 | 90,630 | |||||||||
| 1,532,922 | |||||||||||
| Commercial Banks (5.0%) | |||||||||||
| Bank of the Ozarks, Inc. | 5,000 | 113,750 | |||||||||
| Boston Private Financial Holdings, Inc. | 14,200 | 84,490 | |||||||||
| Central Pacific Financial Corp. | 7,200 | 10,152 | |||||||||
| Chemical Financial Corp. | 200 | 4,390 | |||||||||
| City Holding Co. | 100 | 3,057 | |||||||||
| Columbia Banking System, Inc. | 6,500 | 95,550 | |||||||||
| Community Bank System, Inc. | 4,700 | 87,467 | |||||||||
| East West Bancorp, Inc. | 19,130 | 172,744 | |||||||||
| First Bancorp | 19,000 | 35,910 | |||||||||
See Accompanying Notes to Financial Statements.
39
Credit Suisse Small Cap Core Fund
Schedule of Investments (continued)
October 31, 2009
| Number of Shares | Value | ||||||||||
| COMMON STOCKS | |||||||||||
| Commercial Banks | |||||||||||
| First Commonwealth Financial Corp. | 21,140 | $ | 110,985 | ||||||||
| First Financial Bancorp | 10,500 | 133,140 | |||||||||
| First Financial Bankshares, Inc. | 8,947 | 433,482 | |||||||||
| First Midwest Bancorp, Inc. | 12,050 | 125,320 | |||||||||
| FNB Corp. | 16,800 | 118,944 | |||||||||
| Fulton Financial Corp. | 6,000 | 49,560 | |||||||||
| Glacier Bancorp, Inc. | 5,230 | 68,461 | |||||||||
| Hancock Holding Co. | 1,600 | 58,032 | |||||||||
| Hanmi Financial Corp.* | 4,700 | 7,191 | |||||||||
| Home Bancshares, Inc. | 1,100 | 23,793 | |||||||||
| Independent Bank Corp./MA | 5,200 | 110,604 | |||||||||
| International Bancshares Corp. | 200 | 2,970 | |||||||||
| M&T Bank Corp. | 17 | 1,069 | |||||||||
| Nara Bancorp, Inc. | 7,200 | 52,992 | |||||||||
| National Penn Bancshares, Inc. | 24,200 | 136,004 | |||||||||
| NBT Bancorp, Inc. | 3,800 | 82,840 | |||||||||
| Old National Bancorp | 20,800 | 215,696 | |||||||||
| PacWest Bancorp | 300 | 5,094 | |||||||||
| Pinnacle Financial Partners, Inc.* | 3,000 | 38,100 | |||||||||
| PrivateBancorp, Inc. | 10,100 | 92,213 | |||||||||
| Prosperity Bancshares, Inc. | 3,300 | 118,107 | |||||||||
| S&T Bancorp, Inc. | 13,300 | 209,475 | |||||||||
| Signature Bank* | 2,400 | 75,744 | |||||||||
| Simmons First National Corp. Class A | 3,100 | 90,706 | |||||||||
| Sterling Bancorp | 4,500 | 30,285 | |||||||||
| Sterling Bancshares, Inc. | 9,225 | 51,383 | |||||||||
| Sterling Financial Corp.* | 11,900 | 9,520 | |||||||||
| Susquehanna Bancshares, Inc. | 18,700 | 103,037 | |||||||||
| The South Financial Group, Inc. | 4,826 | 3,861 | |||||||||
| Tompkins Financial Corp. | 1,700 | 73,729 | |||||||||
| Trustmark Corp. | 2,300 | 43,585 | |||||||||
| UCBH Holdings, Inc. | 13,200 | 12,936 | |||||||||
| UMB Financial Corp. | 12,400 | 493,148 | |||||||||
| Umpqua Holdings Corp. | 11,775 | 116,690 | |||||||||
| United Bankshares, Inc. | 3,900 | 69,615 | |||||||||
| United Community Banks, Inc.* | 5,902 | 23,962 | |||||||||
| Western Alliance Bancorp* | 83 | 361 | |||||||||
| Whitney Holding Corp. | 5,400 | 43,362 | |||||||||
| Wilmington Trust Corp. | 3,600 | 43,380 | |||||||||
| Wilshire Bancorp, Inc. | 4,400 | 30,976 | |||||||||
| Wintrust Financial Corp. | 2,100 | 59,241 | |||||||||
| 4,177,103 | |||||||||||
| Commercial Services & Supplies (2.3%) | |||||||||||
| ABM Industries, Inc. | 10,720 | 201,321 | |||||||||
| ATC Technology Corp.* | 8,400 | 175,560 | |||||||||
| Bowne & Co., Inc.* | 4,100 | 26,773 | |||||||||
| Consolidated Graphics, Inc.* | 3,000 | 60,180 | |||||||||
| Deluxe Corp. | 3,695 | 52,580 | |||||||||
See Accompanying Notes to Financial Statements.
40
Credit Suisse Small Cap Core Fund
Schedule of Investments (continued)
October 31, 2009
| Number of Shares | Value | ||||||||||
| COMMON STOCKS | |||||||||||
| Commercial Services & Supplies | |||||||||||
| EnergySolutions, Inc. | 2,290 | $ | 19,099 | ||||||||
| G&K Services, Inc. Class A | 4,586 | 101,580 | |||||||||
| Healthcare Services Group, Inc. | 7,600 | 150,100 | |||||||||
| Herman Miller, Inc. | 100 | 1,545 | |||||||||
| Interface, Inc. Class A | 19,700 | 152,872 | |||||||||
| Mine Safety Appliances Co. | 3,300 | 84,117 | |||||||||
| Mobile Mini, Inc.* | 8,800 | 127,600 | |||||||||
| SYKES Enterprises, Inc.* | 16,500 | 391,710 | |||||||||
| Tetra Tech., Inc.* | 4,400 | 113,212 | |||||||||
| The Brink's Co. | 100 | 2,373 | |||||||||
| The Geo Group, Inc.* | 6,700 | 141,705 | |||||||||
| The Standard Register Co. | 3,600 | 17,172 | |||||||||
| United Stationers, Inc.* | 1,400 | 65,996 | |||||||||
| Viad Corp. | 2,700 | 47,250 | |||||||||
| 1,932,745 | |||||||||||
| Communications Equipment (2.5%) | |||||||||||
| Acme Packet, Inc.* | 6,400 | 62,656 | |||||||||
| ADC Telecommunications, Inc.* | 48,600 | 315,414 | |||||||||
| Arris Group, Inc.* | 41,084 | 421,522 | |||||||||
| Aruba Networks, Inc.* | 8,500 | 66,470 | |||||||||
| Avocent Corp.* | 4,100 | 101,967 | |||||||||
| Bel Fuse, Inc. Class B | 2,548 | 46,119 | |||||||||
| Black Box Corp. | 2,300 | 60,973 | |||||||||
| Blue Coat Systems, Inc.* | 2,400 | 53,472 | |||||||||
| Comtech Telecommunications Corp.* | 1,700 | 54,604 | |||||||||
| Digi International, Inc.* | 6,100 | 48,495 | |||||||||
| EMS Technologies, Inc.* | 3,700 | 64,491 | |||||||||
| Emulex Corp.* | 22,500 | 227,250 | |||||||||
| Harmonic, Inc.* | 5,800 | 30,450 | |||||||||
| InterDigital, Inc.* | 100 | 2,056 | |||||||||
| Netgear, Inc.* | 2,000 | 36,460 | |||||||||
| Network Equipment Technologies, Inc.* | 7,300 | 24,090 | |||||||||
| PC-Tel, Inc.* | 1,900 | 11,134 | |||||||||
| Plantronics, Inc. | 1,900 | 45,809 | |||||||||
| Riverbed Technology, Inc.* | 10,100 | 206,949 | |||||||||
| Symmetricom, Inc.* | 10,900 | 52,211 | |||||||||
| Tekelec* | 4,200 | 63,084 | |||||||||
| Tollgrade Communications, Inc.* | 1,550 | 9,222 | |||||||||
| Viasat, Inc.* | 3,100 | 90,365 | |||||||||
| 2,095,263 | |||||||||||
| Computers & Peripherals (1.5%) | |||||||||||
| 3PAR, Inc.* | 2,300 | 21,643 | |||||||||
| Adaptec, Inc.* | 30,200 | 96,338 | |||||||||
| Avid Technology, Inc.* | 11,300 | 142,719 | |||||||||
| Hutchinson Technology, Inc.* | 5,900 | 34,338 | |||||||||
| Intermec, Inc.* | 6,400 | 78,848 | |||||||||
| Intevac, Inc.* | 5,400 | 55,080 | |||||||||
See Accompanying Notes to Financial Statements.
41
Credit Suisse Small Cap Core Fund
Schedule of Investments (continued)
October 31, 2009
| Number of Shares | Value | ||||||||||
| COMMON STOCKS | |||||||||||
| Computers & Peripherals | |||||||||||
| Novatel Wireless, Inc.* | 7,600 | $ | 67,792 | ||||||||
| STEC, Inc.* | 11,200 | 238,784 | |||||||||
| Stratasys, Inc.* | 4,800 | 75,744 | |||||||||
| Sun Microsystems, Inc.* | 23,700 | 193,866 | |||||||||
| Synaptics, Inc.* | 10,560 | 237,600 | |||||||||
| 1,242,752 | |||||||||||
| Construction & Engineering (0.4%) | |||||||||||
| Comfort Systems USA, Inc. | 9,200 | 100,280 | |||||||||
| EMCOR Group, Inc.* | 5,700 | 134,634 | |||||||||
| Granite Construction, Inc. | 1,200 | 34,272 | |||||||||
| Insituform Technologies, Inc. Class A* | 2,300 | 48,760 | |||||||||
| Layne Christensen Co.* | 200 | 5,180 | |||||||||
| Orion Marine Group, Inc.* | 100 | 1,904 | |||||||||
| 325,030 | |||||||||||
| Construction Materials (0.2%) | |||||||||||
| Eagle Materials, Inc. | 3,500 | 86,975 | |||||||||
| Headwaters, Inc.* | 12,200 | 50,264 | |||||||||
| Texas Industries, Inc. | 1,682 | 55,994 | |||||||||
| 193,233 | |||||||||||
| Consumer Finance (0.5%) | |||||||||||
| AmeriCredit Corp.* | 9,900 | 174,735 | |||||||||
| Cash America International, Inc. | 1,700 | 51,442 | |||||||||
| EZCORP, Inc. Class A* | 2,900 | 37,613 | |||||||||
| First Cash Financial Services, Inc.* | 2,700 | 46,386 | |||||||||
| World Acceptance Corp.* | 4,000 | 100,360 | |||||||||
| 410,536 | |||||||||||
| Containers & Packaging (0.2%) | |||||||||||
| Myers Industries, Inc. | 7,000 | 61,390 | |||||||||
| Rock-Tenn Co. Class A | 2,400 | 105,120 | |||||||||
| 166,510 | |||||||||||
| Distributors (0.0%) | |||||||||||
| Audiovox Corp. Class A* | 2,300 | 14,858 | |||||||||
| Diversified Consumer Services (1.6%) | |||||||||||
| American Public Education, Inc.* | 1,100 | 35,090 | |||||||||
| Capella Education Co.* | 800 | 55,120 | |||||||||
| Coinstar, Inc.* | 1,800 | 57,132 | |||||||||
| Corinthian Colleges, Inc.* | 36,000 | 570,960 | |||||||||
| Hillenbrand, Inc. | 19,516 | 389,930 | |||||||||
| Lincoln Educational Services Corp.* | 1,100 | 21,802 | |||||||||
| Pre-Paid Legal Services, Inc.* | 1,700 | 67,218 | |||||||||
| Regis Corp. | 5,800 | 94,192 | |||||||||
| Universal Technical Institute, Inc.* | 5,000 | 89,950 | |||||||||
| 1,381,394 | |||||||||||
See Accompanying Notes to Financial Statements.
42
Credit Suisse Small Cap Core Fund
Schedule of Investments (continued)
October 31, 2009
| Number of Shares | Value | ||||||||||
| COMMON STOCKS | |||||||||||
| Diversified Financial Services (0.9%) | |||||||||||
| Financial Federal Corp. | 5,200 | $ | 106,184 | ||||||||
| Interactive Brokers Group, Inc. Class A* | 17,100 | 273,771 | |||||||||
| PHH Corp.* | 6,800 | 109,888 | |||||||||
| Portfolio Recovery Associates, Inc.* | 1,100 | 50,754 | |||||||||
| The NASDAQ OMX Group, Inc.* | 13,000 | 234,780 | |||||||||
| 775,377 | |||||||||||
| Diversified Telecommunication Services (1.1%) | |||||||||||
| Alaska Communications Systems Group, Inc. | 900 | 7,002 | |||||||||
| Cbeyond, Inc.* | 6,300 | 84,105 | |||||||||
| Cogent Communications Group, Inc.* | 12,104 | 122,614 | |||||||||
| Consolidated Communications Holdings, Inc. | 2,000 | 27,640 | |||||||||
| General Communication, Inc. Class A* | 6,500 | 39,975 | |||||||||
| Iowa Telecommunications Services, Inc. | 13,200 | 155,364 | |||||||||
| Neutral Tandem, Inc.* | 22,500 | 474,525 | |||||||||
| Premiere Global Services, Inc.* | 2,300 | 17,181 | |||||||||
| 928,406 | |||||||||||
| Electric Utilities (0.8%) | |||||||||||
| Allete, Inc. | 3,300 | 111,705 | |||||||||
| Central Vermont Public Service Corp. | 2,900 | 56,231 | |||||||||
| El Paso Electric Co.* | 7,300 | 136,875 | |||||||||
| PNM Resources, Inc. | 3,100 | 33,232 | |||||||||
| UIL Holdings Corp. | 5,400 | 138,672 | |||||||||
| Unisource Energy Corp. | 6,200 | 179,056 | |||||||||
| 655,771 | |||||||||||
| Electrical Equipment (1.3%) | |||||||||||
| A.O. Smith Corp. | 1,500 | 59,445 | |||||||||
| Acuity Brands, Inc. | 2,600 | 82,316 | |||||||||
| AZZ, Inc.* | 1,700 | 58,242 | |||||||||
| Baldor Electric Co. | 2,500 | 64,625 | |||||||||
| Belden, Inc. | 11,500 | 263,925 | |||||||||
| Brady Corp. Class A | 5,100 | 138,108 | |||||||||
| C&D Technologies, Inc.* | 2,400 | 4,392 | |||||||||
| Encore Wire Corp. | 1,100 | 22,825 | |||||||||
| EnerSys* | 8,900 | 196,690 | |||||||||
| GrafTech International, Ltd.* | 300 | 4,050 | |||||||||
| II-VI, Inc.* | 1,500 | 39,705 | |||||||||
| Magnetek, Inc.* | 4,200 | 5,250 | |||||||||
| Regal-Beloit Corp. | 2,100 | 98,448 | |||||||||
| Vicor Corp.* | 4,800 | 32,736 | |||||||||
| 1,070,757 | |||||||||||
| Electronic Equipment, Instruments & Components (3.0%) | |||||||||||
| Agilysys, Inc. | 4,700 | 22,137 | |||||||||
| Anixter International, Inc.* | 3,200 | 133,920 | |||||||||
| Benchmark Electronics, Inc.* | 10,516 | 176,669 | |||||||||
| Brightpoint, Inc.* | 35,500 | 261,635 | |||||||||
See Accompanying Notes to Financial Statements.
43
Credit Suisse Small Cap Core Fund
Schedule of Investments (continued)
October 31, 2009
| Number of Shares | Value | ||||||||||
| COMMON STOCKS | |||||||||||
| Electronic Equipment, Instruments & Components | |||||||||||
| Checkpoint Systems, Inc.* | 12,300 | $ | 166,911 | ||||||||
| Cognex Corp. | 4,700 | 75,623 | |||||||||
| Coherent, Inc.* | 100 | 2,513 | |||||||||
| CTS Corp. | 8,400 | 75,264 | |||||||||
| Daktronics, Inc. | 8,500 | 63,920 | |||||||||
| DTS, Inc.* | 4,300 | 121,475 | |||||||||
| Electro Scientific Industries, Inc.* | 6,900 | 75,486 | |||||||||
| FARO Technologies, Inc.* | 3,600 | 55,656 | |||||||||
| Gerber Scientific, Inc.* | 1,700 | 7,854 | |||||||||
| Insight Enterprises, Inc.* | 11,400 | 119,928 | |||||||||
| IPG Photonics Corp.* | 100 | 1,366 | |||||||||
| Keithley Instruments, Inc. | 1,300 | 4,238 | |||||||||
| Littelfuse, Inc.* | 5,400 | 148,824 | |||||||||
| Mercury Computer Systems, Inc.* | 5,700 | 60,990 | |||||||||
| Methode Electronics, Inc. | 9,400 | 68,150 | |||||||||
| MTS Systems Corp. | 4,100 | 108,650 | |||||||||
| Newport Corp.* | 9,100 | 67,704 | |||||||||
| Park Electrochemical Corp. | 5,100 | 114,648 | |||||||||
| Plexus Corp.* | 2,400 | 60,720 | |||||||||
| Radisys Corp.* | 5,500 | 46,805 | |||||||||
| Rogers Corp.* | 4,000 | 103,800 | |||||||||
| Scansource, Inc.* | 1,600 | 40,624 | |||||||||
| SYNNEX Corp.* | 7,300 | 187,829 | |||||||||
| Tech Data Corp.* | 45 | 1,729 | |||||||||
| Technitrol, Inc. | 10,200 | 79,458 | |||||||||
| TTM Technologies, Inc.* | 10,700 | 108,819 | |||||||||
| 2,563,345 | |||||||||||
| Energy Equipment & Services (2.1%) | |||||||||||
| Atwood Oceanics, Inc.* | 3,400 | 120,666 | |||||||||
| Bristow Group, Inc.* | 4,400 | 128,260 | |||||||||
| CARBO Ceramics, Inc. | 1,205 | 70,360 | |||||||||
| Complete Production Services, Inc.* | 900 | 8,577 | |||||||||
| Dril-Quip, Inc.* | 1,800 | 87,462 | |||||||||
| Global Industries, Ltd.* | 75,458 | 550,089 | |||||||||
| Gulf Island Fabrication, Inc. | 3,200 | 61,184 | |||||||||
| Hornbeck Offshore Services, Inc.* | 2,300 | 55,913 | |||||||||
| ION Geophysical Corp.* | 28,600 | 109,538 | |||||||||
| Lufkin Industries, Inc. | 900 | 51,345 | |||||||||
| Matrix Service Co.* | 5,900 | 52,333 | |||||||||
| NATCO Group, Inc. Class A* | 1,200 | 52,416 | |||||||||
| Oil States International, Inc.* | 3,000 | 103,320 | |||||||||
| Pioneer Drilling Co.* | 11,966 | 80,052 | |||||||||
| RPC, Inc. | 1,400 | 13,090 | |||||||||
| SEACOR Holdings, Inc.* | 1,240 | 100,775 | |||||||||
| Superior Well Services, Inc.* | 3,600 | 38,196 | |||||||||
| Tetra Technologies, Inc.* | 7,500 | 70,950 | |||||||||
| Willbros Group, Inc.* | 3,900 | 51,246 | |||||||||
| 1,805,772 | |||||||||||
See Accompanying Notes to Financial Statements.
44
Credit Suisse Small Cap Core Fund
Schedule of Investments (continued)
October 31, 2009
| Number of Shares | Value | ||||||||||
| COMMON STOCKS | |||||||||||
| Food & Staples Retailing (1.4%) | |||||||||||
| Casey's General Stores, Inc. | 14,600 | $ | 460,338 | ||||||||
| Great Atlantic & Pacific Tea Co.* | 18,000 | 178,380 | |||||||||
| Nash Finch Co. | 900 | 26,082 | |||||||||
| Pricesmart, Inc. | 100 | 1,930 | |||||||||
| Spartan Stores, Inc. | 1,400 | 19,824 | |||||||||
| The Andersons, Inc. | 4,681 | 145,251 | |||||||||
| United Natural Foods, Inc.* | 4,400 | 106,084 | |||||||||
| Weis Markets, Inc. | 800 | 28,320 | |||||||||
| Winn-Dixie Stores, Inc.* | 16,900 | 187,421 | |||||||||
| 1,153,630 | |||||||||||
| Food Products (2.0%) | |||||||||||
| Cal-Maine Foods, Inc. | 700 | 19,005 | |||||||||
| Chiquita Brands International, Inc.* | 4,600 | 74,474 | |||||||||
| Darling International, Inc.* | 12,000 | 83,400 | |||||||||
| Diamond Foods, Inc. | 4,100 | 123,615 | |||||||||
| Green Mountain Coffee Roasters, Inc.* | 2,100 | 139,755 | |||||||||
| J & J Snack Foods Corp. | 5,900 | 231,103 | |||||||||
| Lancaster Colony Corp. | 4,991 | 242,463 | |||||||||
| Lance, Inc. | 5,400 | 130,248 | |||||||||
| Sanderson Farms, Inc. | 1,000 | 36,590 | |||||||||
| The Hain Celestial Group, Inc.* | 2,400 | 42,096 | |||||||||
| TreeHouse Foods, Inc.* | 5,700 | 213,180 | |||||||||
| Tyson Foods, Inc. Class A | 28,500 | 356,820 | |||||||||
| 1,692,749 | |||||||||||
| Gas Utilities (1.2%) | |||||||||||
| Ferrellgas Partners LP | 100 | 1,988 | |||||||||
| New Jersey Resources Corp. | 5,700 | 200,640 | |||||||||
| Northwest Natural Gas Co. | 5,000 | 209,050 | |||||||||
| Piedmont Natural Gas Co., Inc. | 8,500 | 197,880 | |||||||||
| South Jersey Industries, Inc. | 2,000 | 70,580 | |||||||||
| Southwest Gas Corp. | 8,900 | 222,411 | |||||||||
| The Laclede Group, Inc. | 3,500 | 107,485 | |||||||||
| 1,010,034 | |||||||||||
| Health Care Equipment & Supplies (3.5%) | |||||||||||
| Abaxis, Inc.* | 5,500 | 125,510 | |||||||||
| Align Technology, Inc.* | 32,700 | 514,044 | |||||||||
| American Medical Systems Holdings, Inc.* | 14,400 | 222,048 | |||||||||
| Analogic Corp. | 700 | 26,138 | |||||||||
| Conmed Corp.* | 1,700 | 36,023 | |||||||||
| CryoLife, Inc.* | 6,900 | 41,400 | |||||||||
| Cyberonics, Inc.* | 5,905 | 85,386 | |||||||||
| ev3, Inc.* | 11,900 | 140,182 | |||||||||
| Greatbatch, Inc.* | 8,940 | 175,850 | |||||||||
| Haemonetics Corp.* | 3,500 | 180,250 | |||||||||
| ICU Medical, Inc.* | 2,600 | 91,000 | |||||||||
| Immucor, Inc.* | 8,400 | 150,192 | |||||||||
See Accompanying Notes to Financial Statements.
45
Credit Suisse Small Cap Core Fund
Schedule of Investments (continued)
October 31, 2009
| Number of Shares | Value | ||||||||||
| COMMON STOCKS | |||||||||||
| Health Care Equipment & Supplies | |||||||||||
| Integra LifeSciences Holdings* | 1,800 | $ | 54,972 | ||||||||
| Invacare Corp. | 5,600 | 125,608 | |||||||||
| Kensey Nash Corp.* | 2,800 | 66,948 | |||||||||
| Meridian Bioscience, Inc. | 2,400 | 53,256 | |||||||||
| Merit Medical Systems, Inc.* | 6,900 | 117,162 | |||||||||
| Natus Medical, Inc.* | 6,900 | 95,841 | |||||||||
| Neogen Corp.* | 3,600 | 114,120 | |||||||||
| Palomar Medical Technologies, Inc.* | 4,500 | 45,720 | |||||||||
| SurModics, Inc.* | 4,400 | 112,684 | |||||||||
| Symmetry Medical, Inc.* | 8,900 | 70,933 | |||||||||
| The Cooper Cos., Inc. | 2,800 | 78,428 | |||||||||
| Theragenics Corp.* | 6,700 | 9,045 | |||||||||
| West Pharmaceutical Services, Inc. | 3,500 | 138,145 | |||||||||
| Zoll Medical Corp.* | 5,200 | 100,984 | |||||||||
| 2,971,869 | |||||||||||
| Health Care Providers & Services (5.5%) | |||||||||||
| Air Methods Corp.* | 2,600 | 79,404 | |||||||||
| Almost Family, Inc.* | 1,685 | 51,140 | |||||||||
| Amedisys, Inc.* | 2,100 | 83,559 | |||||||||
| AMERIGROUP Corp.* | 25,900 | 571,095 | |||||||||
| AMN Healthcare Services, Inc.* | 8,100 | 67,392 | |||||||||
| Amsurg Corp.* | 3,900 | 82,173 | |||||||||
| Bio-Reference Laboratories, Inc.* | 2,800 | 90,524 | |||||||||
| Catalyst Health Solutions, Inc.* | 15,304 | 480,086 | |||||||||
| Centene Corp.* | 2,455 | 43,773 | |||||||||
| Chemed Corp. | 2,800 | 126,896 | |||||||||
| Corvel Corp.* | 1,800 | 51,300 | |||||||||
| Cross Country Healthcare, Inc.* | 7,310 | 60,381 | |||||||||
| Genoptix, Inc.* | 4,700 | 163,513 | |||||||||
| Gentiva Health Services, Inc.* | 4,620 | 110,880 | |||||||||
| Hanger Orthopedic Group, Inc.* | 7,700 | 106,568 | |||||||||
| Healthspring, Inc.* | 9,115 | 130,618 | |||||||||
| Healthways, Inc.* | 3,500 | 56,280 | |||||||||
| HMS Holdings Corp.* | 1,600 | 68,688 | |||||||||
| inVentiv Health, Inc.* | 2,300 | 39,054 | |||||||||
| IPC The Hospitalist Co.* | 3,200 | 96,960 | |||||||||
| Kindred Healthcare, Inc.* | 1,200 | 17,640 | |||||||||
| Landauer, Inc. | 1,600 | 82,864 | |||||||||
| LCA-Vision, Inc.* | 345 | 1,553 | |||||||||
| LHC Group, Inc.* | 17,600 | 491,216 | |||||||||
| Lincare Holdings, Inc.* | 7,500 | 235,575 | |||||||||
| Magellan Health Services, Inc.* | 2,294 | 73,706 | |||||||||
| Medcath Corp.* | 4,300 | 35,303 | |||||||||
| Mednax, Inc.* | 5,800 | 301,136 | |||||||||
| Molina Healthcare, Inc.* | 5,500 | 102,960 | |||||||||
| MWI Veterinary Supply, Inc.* | 3,000 | 106,200 | |||||||||
| Odyssey HealthCare, Inc.* | 8,200 | 114,308 | |||||||||
| PharMerica Corp.* | 3,700 | 57,091 | |||||||||
| PSS World Medical, Inc.* | 12,100 | 244,662 | |||||||||
| RehabCare Group, Inc.* | 4,586 | 85,987 | |||||||||
| Res-Care, Inc.* | 6,350 | 76,390 | |||||||||
| 4,586,875 | |||||||||||
See Accompanying Notes to Financial Statements.
46
Credit Suisse Small Cap Core Fund
Schedule of Investments (continued)
October 31, 2009
| Number of Shares | Value | ||||||||||
| COMMON STOCKS | |||||||||||
| Health Care Technology (0.4%) | |||||||||||
| Computer Programs & Systems, Inc. | 2,300 | $ | 97,152 | ||||||||
| Eclipsys Corp.* | 3,800 | 71,250 | |||||||||
| Omnicell, Inc.* | 7,700 | 75,768 | |||||||||
| Phase Forward, Inc.* | 2,900 | 38,019 | |||||||||
| Quality Systems, Inc. | 1,047 | 63,888 | |||||||||
| 346,077 | |||||||||||
| Hotels, Restaurants & Leisure (3.7%) | |||||||||||
| Ameristar Casinos, Inc. | 2,400 | 35,328 | |||||||||
| BJ's Restaurants, Inc.* | 5,000 | 79,800 | |||||||||
| Bob Evans Farms, Inc. | 17,600 | 462,352 | |||||||||
| Buffalo Wild Wings, Inc.* | 1,412 | 57,906 | |||||||||
| California Pizza Kitchen, Inc.* | 6,100 | 79,239 | |||||||||
| CEC Entertainment, Inc.* | 2,700 | 78,867 | |||||||||
| CKE Restaurants, Inc. | 5,100 | 44,625 | |||||||||
| Cracker Barrel Old Country Store, Inc. | 6,300 | 208,845 | |||||||||
| DineEquity, Inc.* | 11,400 | 241,224 | |||||||||
| Gaylord Entertainment Co.* | 400 | 6,012 | |||||||||
| Interval Leisure Group, Inc.* | 9,500 | 106,020 | |||||||||
| Jack in the Box, Inc.* | 4,000 | 75,040 | |||||||||
| Landry's Restaurants, Inc.* | 2,000 | 21,800 | |||||||||
| Life Time Fitness, Inc.* | 100 | 2,155 | |||||||||
| Marcus Corp. | 4,000 | 46,800 | |||||||||
| Multimedia Games, Inc.* | 2,000 | 9,820 | |||||||||
| O'Charley's, Inc.* | 4,600 | 32,246 | |||||||||
| P.F. Chang's China Bistro, Inc.* | 24,700 | 720,993 | |||||||||
| Papa John's International, Inc.* | 1,300 | 29,250 | |||||||||
| Peet's Coffee & Tea, Inc.* | 2,900 | 98,600 | |||||||||
| Pinnacle Entertainment, Inc.* | 11,700 | 98,865 | |||||||||
| Red Robin Gourmet Burgers, Inc.* | 3,800 | 63,498 | |||||||||
| Ruby Tuesday, Inc.* | 15,700 | 104,562 | |||||||||
| Ruth's Hospitality Group, Inc.* | 2,300 | 7,153 | |||||||||
| Shuffle Master, Inc.* | 13,400 | 104,654 | |||||||||
| Sonic Corp.* | 6,800 | 63,580 | |||||||||
| Texas Roadhouse, Inc. Class A* | 3,200 | 30,304 | |||||||||
| The Cheesecake Factory, Inc.* | 6,700 | 121,806 | |||||||||
| The Steak N Shake Co.* | 5,926 | 69,038 | |||||||||
| 3,100,382 | |||||||||||
| Household Durables (1.2%) | |||||||||||
| Ethan Allen Interiors, Inc. | 2,800 | 34,888 | |||||||||
| Helen of Troy, Ltd.* | 7,400 | 169,016 | |||||||||
| La-Z-Boy, Inc. | 26,500 | 188,150 | |||||||||
| M/I Homes, Inc.* | 4,500 | 50,265 | |||||||||
| Meritage Homes Corp.* | 7,900 | 144,096 | |||||||||
| National Presto Industries, Inc. | 1,200 | 104,316 | |||||||||
| Skyline Corp. | 1,700 | 29,733 | |||||||||
| Standard Pacific Corp.* | 23,100 | 69,300 | |||||||||
| Tempur-Pedic International, Inc.* | 10,100 | 195,637 | |||||||||
| Universal Electronics, Inc.* | 1,800 | 37,080 | |||||||||
| 1,022,481 | |||||||||||
See Accompanying Notes to Financial Statements.
47
Credit Suisse Small Cap Core Fund
Schedule of Investments (continued)
October 31, 2009
| Number of Shares | Value | ||||||||||
| COMMON STOCKS | |||||||||||
| Household Products (0.3%) | |||||||||||
| Central Garden & Pet Co. Class A* | 16,700 | $ | 157,982 | ||||||||
| WD-40 Co. | 2,000 | 62,980 | |||||||||
| 220,962 | |||||||||||
| Industrial Conglomerates (0.2%) | |||||||||||
| Standex International Corp. | 3,048 | 53,584 | |||||||||
| Tredegar Corp. | 8,800 | 119,944 | |||||||||
| 173,528 | |||||||||||
| Insurance (2.0%) | |||||||||||
| American Physicians Capital, Inc. | 2,400 | 67,872 | |||||||||
| AMERISAFE, Inc.* | 4,600 | 85,284 | |||||||||
| Delphi Financial Group, Inc. Class A | 6,600 | 143,220 | |||||||||
| eHealth, Inc.* | 2,300 | 32,729 | |||||||||
| Employers Holdings, Inc. | 6,400 | 94,848 | |||||||||
| FBL Financial Group, Inc. Class A | 100 | 2,015 | |||||||||
| Hilltop Holdings, Inc.* | 200 | 2,368 | |||||||||
| Infinity Property & Casualty Corp. | 2,700 | 104,409 | |||||||||
| National Financial Partners Corp.* | 7,400 | 60,310 | |||||||||
| Navigators Group, Inc.* | 900 | 47,763 | |||||||||
| Presidential Life Corp. | 2,348 | 21,907 | |||||||||
| ProAssurance Corp.* | 3,400 | 170,952 | |||||||||
| RLI Corp. | 3,200 | 160,000 | |||||||||
| Safety Insurance Group, Inc. | 1,912 | 63,994 | |||||||||
| Selective Insurance Group, Inc. | 20,390 | 312,375 | |||||||||
| Stewart Information Services Corp. | 4,500 | 40,230 | |||||||||
| Tower Group, Inc. | 5,100 | 125,358 | |||||||||
| United Fire & Casualty Co. | 2,575 | 45,011 | |||||||||
| Unitrin, Inc. | 2,000 | 39,200 | |||||||||
| Zenith National Insurance Corp. | 2,900 | 82,737 | |||||||||
| 1,702,582 | |||||||||||
| Internet & Catalog Retail (0.7%) | |||||||||||
| Blue Nile, Inc.* | 900 | 54,045 | |||||||||
| Expedia, Inc.* | 1,400 | 31,738 | |||||||||
| HSN, Inc.* | 9,500 | 141,930 | |||||||||
| NutriSystem, Inc. | 7,300 | 157,096 | |||||||||
| PetMed Express, Inc. | 5,600 | 87,864 | |||||||||
| Stamps.com, Inc.* | 2,900 | 29,116 | |||||||||
| Ticketmaster Entertainment, Inc.* | 10,600 | 102,290 | |||||||||
| 604,079 | |||||||||||
| Internet Software & Services (1.3%) | |||||||||||
| comScore, Inc.* | 5,800 | 88,914 | |||||||||
| DealerTrack Holdings, Inc.* | 5,500 | 90,640 | |||||||||
| Infospace, Inc.* | 8,600 | 73,702 | |||||||||
| j2 Global Communications, Inc.* | 19,100 | 390,595 | |||||||||
| Open Text Corp.* | 28 | 1,037 | |||||||||
| Perficient, Inc.* | 8,000 | 65,120 | |||||||||
| The Knot, Inc.* | 1,800 | 19,206 | |||||||||
| United Online, Inc. | 9,900 | 79,200 | |||||||||
| ValueClick, Inc.* | 28,400 | 279,456 | |||||||||
| 1,087,870 | |||||||||||
See Accompanying Notes to Financial Statements.
48
Credit Suisse Small Cap Core Fund
Schedule of Investments (continued)
October 31, 2009
| Number of Shares | Value | ||||||||||
| COMMON STOCKS | |||||||||||
| IT Services (2.2%) | |||||||||||
| Acxiom Corp.* | 7,397 | $ | 84,918 | ||||||||
| CACI International, Inc. Class A* | 3,500 | 166,670 | |||||||||
| Ciber, Inc.* | 16,800 | 54,096 | |||||||||
| CSG Systems International, Inc.* | 18,761 | 306,555 | |||||||||
| Cybersource Corp.* | 16,100 | 263,718 | |||||||||
| Fidelity National Information Services, Inc. | 11,200 | 243,712 | |||||||||
| Forrester Research, Inc.* | 2,200 | 55,726 | |||||||||
| Global Cash Access Holdings, Inc.* | 9,630 | 60,958 | |||||||||
| Heartland Payment Systems, Inc. | 6,500 | 79,885 | |||||||||
| Integral Systems, Inc.* | 300 | 2,520 | |||||||||
| MAXIMUS, Inc. | 3,100 | 143,406 | |||||||||
| StarTek, Inc.* | 1,300 | 7,540 | |||||||||
| TeleTech Holdings, Inc.* | 1,900 | 33,991 | |||||||||
| VeriFone Holdings, Inc.* | 4,100 | 54,530 | |||||||||
| Wright Express Corp.* | 9,285 | 259,144 | |||||||||
| 1,817,369 | |||||||||||
| Leisure Equipment & Products (1.1%) | |||||||||||
| Arctic Cat, Inc. | 500 | 2,970 | |||||||||
| Brunswick Corp. | 35,200 | 333,696 | |||||||||
| Callaway Golf Co. | 400 | 2,736 | |||||||||
| Jakks Pacific, Inc.* | 21,700 | 308,791 | |||||||||
| Nautilus, Inc.* | 2,400 | 4,296 | |||||||||
| Polaris Industries, Inc. | 1,900 | 79,933 | |||||||||
| Pool Corp. | 3,000 | 58,740 | |||||||||
| RC2 Corp.* | 4,600 | 60,076 | |||||||||
| Sturm, Ruger & Co., Inc. | 4,800 | 50,976 | |||||||||
| 902,214 | |||||||||||
| Life Sciences Tools & Services (0.6%) | |||||||||||
| Cambrex Corp.* | 7,200 | 43,200 | |||||||||
| Dionex Corp.* | 3,800 | 257,944 | |||||||||
| Enzo Biochem, Inc.* | 8,100 | 44,631 | |||||||||
| eResearchTechnology, Inc.* | 4,000 | 29,600 | |||||||||
| Kendle International, Inc.* | 3,500 | 59,080 | |||||||||
| Paraxel International Corp.* | 3,800 | 47,576 | |||||||||
| 482,031 | |||||||||||
| Machinery (2.7%) | |||||||||||
| Actuant Corp. Class A | 7,800 | 121,758 | |||||||||
| Albany International Corp. Class A | 3,600 | 59,976 | |||||||||
| Astec Industries, Inc.* | 1,300 | 29,900 | |||||||||
| Badger Meter, Inc. | 4,700 | 175,169 | |||||||||
| Barnes Group, Inc. | 7,600 | 120,460 | |||||||||
| Briggs & Stratton Corp. | 7,900 | 147,730 | |||||||||
| Cascade Corp. | 3,200 | 79,488 | |||||||||
| CIRCOR International, Inc. | 2,000 | 54,500 | |||||||||
| CLARCOR, Inc. | 5,100 | 150,093 | |||||||||
| Colfax Corp.* | 1,200 | 13,056 | |||||||||
See Accompanying Notes to Financial Statements.
49
Credit Suisse Small Cap Core Fund
Schedule of Investments (continued)
October 31, 2009
| Number of Shares | Value | ||||||||||
| COMMON STOCKS | |||||||||||
| Machinery | |||||||||||
| EnPro Industries, Inc.* | 4,900 | $ | 110,642 | ||||||||
| ESCO Technologies, Inc.* | 4,400 | 172,832 | |||||||||
| Gardner Denver, Inc.* | 6,600 | 237,006 | |||||||||
| John Bean Technologies Corp. | 6,900 | 113,298 | |||||||||
| Kaydon Corp. | 3,900 | 136,461 | |||||||||
| Lindsay Corp. | 1,969 | 64,642 | |||||||||
| Lydall, Inc.* | 1,900 | 9,500 | |||||||||
| Mueller Industries, Inc. | 7,300 | 172,718 | |||||||||
| Robbins & Myers, Inc. | 3,682 | 85,422 | |||||||||
| Tennant Co. | 730 | 19,462 | |||||||||
| The Middleby Corp.* | 600 | 27,186 | |||||||||
| Toro Co. | 2,100 | 77,742 | |||||||||
| Watts Water Technologies, Inc. Class A | 4,700 | 132,775 | |||||||||
| 2,311,816 | |||||||||||
| Marine (0.1%) | |||||||||||
| American Commercial Lines, Inc.* | 2,000 | 42,900 | |||||||||
| Media (1.4%) | |||||||||||
| Arbitron, Inc. | 3,200 | 69,376 | |||||||||
| Cinemark Holdings, Inc. | 1,300 | 15,067 | |||||||||
| E.W. Scripps Co. Class A* | 7,300 | 46,428 | |||||||||
| Harte-Hanks, Inc. | 1,165 | 13,677 | |||||||||
| Liberty Global, Inc. Class A* | 36,100 | 741,133 | |||||||||
| Live Nation, Inc.* | 18,900 | 125,874 | |||||||||
| Scholastic Corp. | 1,500 | 37,305 | |||||||||
| Valassis Communications, Inc.* | 5,800 | 105,734 | |||||||||
| 1,154,594 | |||||||||||
| Metals & Mining (1.0%) | |||||||||||
| A.M. Castle & Co. | 4,100 | 46,207 | |||||||||
| AMCOL International Corp. | 4,100 | 106,764 | |||||||||
| Brush Engineered Materials, Inc.* | 5,000 | 92,250 | |||||||||
| Century Aluminum Co.* | 38,700 | 335,529 | |||||||||
| Olympic Steel, Inc. | 2,200 | 55,660 | |||||||||
| RTI International Metals, Inc.* | 2,100 | 43,491 | |||||||||
| Schnitzer Steel Industries, Inc. Class A | 100 | 4,324 | |||||||||
| United States Steel Corp. | 3,300 | 113,817 | |||||||||
| Worthington Industries, Inc. | 3,955 | 43,703 | |||||||||
| 841,745 | |||||||||||
| Multi-Utilities (0.4%) | |||||||||||
| Avista Corp. | 9,300 | 176,328 | |||||||||
| CH Energy Group, Inc. | 3,514 | 145,515 | |||||||||
| NorthWestern Corp. | 100 | 2,415 | |||||||||
| 324,258 | |||||||||||
See Accompanying Notes to Financial Statements.
50
Credit Suisse Small Cap Core Fund
Schedule of Investments (continued)
October 31, 2009
| Number of Shares | Value | ||||||||||
| COMMON STOCKS | |||||||||||
| Multiline Retail (0.5%) | |||||||||||
| 99 Cents Only Stores* | 7,412 | $ | 84,274 | ||||||||
| Fred's, Inc. Class A | 22,400 | 265,216 | |||||||||
| Macy's, Inc. | 1,500 | 26,355 | |||||||||
| Tuesday Morning Corp.* | 7,300 | 23,579 | |||||||||
| 399,424 | |||||||||||
| Oil, Gas & Consumable Fuels (1.3%) | |||||||||||
| Delek US Holdings, Inc. | 100 | 675 | |||||||||
| Goodrich Petroleum Corp.* | 100 | 2,567 | |||||||||
| Holly Corp. | 2,400 | 69,624 | |||||||||
| James River Coal Co.* | 28,600 | 543,114 | |||||||||
| Penn Virginia Corp. | 2,800 | 56,700 | |||||||||
| Petroleum Development Corp.* | 1,200 | 20,040 | |||||||||
| Petroquest Energy, Inc.* | 13,800 | 84,594 | |||||||||
| Sabine Royalty Trust | 100 | 4,151 | |||||||||
| St. Mary Land & Exploration Co. | 3,700 | 126,170 | |||||||||
| Stone Energy Corp.* | 2,700 | 41,391 | |||||||||
| Swift Energy Co.* | 2,300 | 48,714 | |||||||||
| World Fuel Services Corp. | 1,800 | 91,530 | |||||||||
| 1,089,270 | |||||||||||
| Paper & Forest Products (0.8%) | |||||||||||
| Buckeye Technologies, Inc.* | 12,587 | 112,780 | |||||||||
| Clearwater Paper Corp.* | 2,800 | 126,756 | |||||||||
| Deltic Timber Corp. | 1,900 | 80,750 | |||||||||
| Neenah Paper, Inc. | 2,200 | 22,770 | |||||||||
| Schweitzer-Mauduit International, Inc. | 4,720 | 243,788 | |||||||||
| Wausau Paper Corp. | 7,400 | 64,898 | |||||||||
| 651,742 | |||||||||||
| Personal Products (0.1%) | |||||||||||
| Chattem, Inc.* | 1,100 | 69,707 | |||||||||
| Mannatech, Inc. | 1,721 | 5,851 | |||||||||
| 75,558 | |||||||||||
| Pharmaceuticals (1.8%) | |||||||||||
| Mylan, Inc.* | 72,600 | 1,179,024 | |||||||||
| Par Pharmaceutical Cos., Inc.* | 2,100 | 44,037 | |||||||||
| Salix Pharmaceuticals, Ltd.* | 12,600 | 231,714 | |||||||||
| Viropharma, Inc.* | 5,800 | 43,732 | |||||||||
| 1,498,507 | |||||||||||
| Professional Services (1.2%) | |||||||||||
| Administaff, Inc. | 1,500 | 37,230 | |||||||||
| CDI Corp. | 3,200 | 38,976 | |||||||||
| Exponent, Inc.* | 3,300 | 85,833 | |||||||||
| Heidrick & Struggles International, Inc. | 4,200 | 114,912 | |||||||||
| Huron Consulting Group, Inc.* | 13,500 | 313,200 | |||||||||
| Navigant Consulting, Inc.* | 3,800 | 54,112 | |||||||||
| On Assignment, Inc.* | 8,600 | 51,944 | |||||||||
See Accompanying Notes to Financial Statements.
51
Credit Suisse Small Cap Core Fund
Schedule of Investments (continued)
October 31, 2009
| Number of Shares | Value | ||||||||||
| COMMON STOCKS | |||||||||||
| Professional Services | |||||||||||
| School Specialty, Inc.* | 3,900 | $ | 86,775 | ||||||||
| Spherion Corp.* | 11,900 | 58,905 | |||||||||
| TrueBlue, Inc.* | 10,900 | 131,890 | |||||||||
| Volt Information Sciences, Inc.* | 3,000 | 24,330 | |||||||||
| 998,107 | |||||||||||
| Real Estate Investment Trusts (5.3%) | |||||||||||
| Acadia Realty Trust | 8,512 | 135,341 | |||||||||
| BioMed Realty Trust, Inc. | 15,600 | 211,692 | |||||||||
| CBL & Associates Properties, Inc. | 5,900 | 48,144 | |||||||||
| Cedar Shopping Centers, Inc. | 11,200 | 67,984 | |||||||||
| Colonial Properties Trust | 7,200 | 75,816 | |||||||||
| Cousins Properties, Inc. | 3,800 | 27,816 | |||||||||
| DiamondRock Hospitality Co.* | 20,300 | 154,483 | |||||||||
| EastGroup Properties, Inc. | 1,600 | 58,896 | |||||||||
| Entertainment Properties Trust | 4,000 | 136,080 | |||||||||
| Extra Space Storage, Inc. | 10,200 | 97,614 | |||||||||
| Franklin Street Properties Corp. | 17,900 | 192,962 | |||||||||
| HCP, Inc. | 14,100 | 417,219 | |||||||||
| Health Care REIT, Inc. | 6,500 | 288,405 | |||||||||
| Healthcare Realty Trust, Inc. | 22,200 | 462,426 | |||||||||
| Home Properties, Inc. | 2,000 | 78,360 | |||||||||
| Inland Real Estate Corp. | 14,400 | 123,552 | |||||||||
| Kilroy Realty Corp. | 7,100 | 196,102 | |||||||||
| Kite Realty Group Trust | 14,900 | 55,279 | |||||||||
| LaSalle Hotel Properties | 3,900 | 66,924 | |||||||||
| Lexington Realty Trust | 24,469 | 102,525 | |||||||||
| LTC Properties, Inc. | 5,800 | 137,750 | |||||||||
| Medical Properties Trust, Inc. | 18,600 | 148,800 | |||||||||
| Mid-America Apartment Communities, Inc. | 3,200 | 140,224 | |||||||||
| National Retail Properties, Inc. | 5,000 | 96,900 | |||||||||
| Parkway Properties, Inc. | 5,400 | 95,310 | |||||||||
| Pennsylvania Real Estate Investment Trust | 18,400 | 134,872 | |||||||||
| Post Properties, Inc. | 2,900 | 47,821 | |||||||||
| PS Business Parks, Inc. | 3,800 | 186,086 | |||||||||
| Redwood Trust, Inc. | 500 | 6,970 | |||||||||
| Senior Housing Properties Trust | 7,700 | 148,456 | |||||||||
| Sovran Self Storage, Inc. | 4,800 | 144,480 | |||||||||
| Tanger Factory Outlet Centers, Inc. | 2,600 | 98,982 | |||||||||
| Urstadt Biddle Properties, Class A | 5,300 | 78,281 | |||||||||
| 4,462,552 | |||||||||||
| Real Estate Management & Development (0.0%) | |||||||||||
| Forestar Group, Inc.* | 2,300 | 33,948 | |||||||||
| Road & Rail (0.4%) | |||||||||||
| Arkansas Best Corp. | 1,500 | 38,730 | |||||||||
| Heartland Express, Inc. | 3,200 | 43,520 | |||||||||
| Knight Transportation, Inc. | 3,657 | 58,658 | |||||||||
| Marten Transport, Ltd.* | 1,500 | 26,310 | |||||||||
| Old Dominion Freight Line, Inc.* | 1,700 | 44,183 | |||||||||
| Werner Enterprises, Inc. | 5,600 | 105,000 | |||||||||
| 316,401 | |||||||||||
See Accompanying Notes to Financial Statements.
52
Credit Suisse Small Cap Core Fund
Schedule of Investments (continued)
October 31, 2009
| Number of Shares | Value | ||||||||||
| COMMON STOCKS | |||||||||||
| Semiconductors & Semiconductor Equipment (5.5%) | |||||||||||
| Actel Corp.* | 6,500 | $ | 77,480 | ||||||||
| Advanced Energy Industries, Inc.* | 8,200 | 100,122 | |||||||||
| ATMI, Inc.* | 1,800 | 27,270 | |||||||||
| Brooks Automation, Inc.* | 15,200 | 104,576 | |||||||||
| Cabot Microelectronics Corp.* | 1,400 | 44,772 | |||||||||
| Cohu, Inc. | 5,400 | 61,452 | |||||||||
| Cymer, Inc.* | 1,800 | 61,632 | |||||||||
| Cypress Semiconductor Corp.* | 34,100 | 287,463 | |||||||||
| Diodes, Inc.* | 3,900 | 63,882 | |||||||||
| DSP Group, Inc.* | 5,400 | 31,212 | |||||||||
| Exar Corp.* | 10,500 | 72,450 | |||||||||
| Fairchild Semiconductor International, Inc.* | 100 | 748 | |||||||||
| FEI Co.* | 6,700 | 159,527 | |||||||||
| Hittite Microwave Corp.* | 1,200 | 44,160 | |||||||||
| Kopin Corp.* | 17,100 | 75,924 | |||||||||
| Kulicke & Soffa Industries, Inc.* | 14,800 | 68,820 | |||||||||
| Micrel, Inc. | 4,800 | 35,856 | |||||||||
| Micron Technology, Inc.* | 62,400 | 423,696 | |||||||||
| Microsemi Corp.* | 5,403 | 71,914 | |||||||||
| MKS Instruments, Inc.* | 9,000 | 140,760 | |||||||||
| Pericom Semiconductor Corp.* | 6,000 | 56,460 | |||||||||
| Rudolph Technologies, Inc.* | 7,700 | 48,818 | |||||||||
| Semtech Corp.* | 17,660 | 273,200 | |||||||||
| Sigma Designs, Inc.* | 1,700 | 20,417 | |||||||||
| Skyworks Solutions, Inc.* | 88,900 | 927,227 | |||||||||
| Standard Microsystems Corp.* | 5,400 | 104,004 | |||||||||
| Supertex, Inc.* | 2,919 | 70,786 | |||||||||
| Tessera Technologies, Inc.* | 19,800 | 437,778 | |||||||||
| TriQuint Semiconductor, Inc.* | 27,500 | 148,225 | |||||||||
| Ultratech, Inc.* | 5,900 | 76,228 | |||||||||
| Varian Semiconductor Equipment Associates, Inc.* | 4,400 | 124,916 | |||||||||
| Veeco Instruments, Inc.* | 11,900 | 289,765 | |||||||||
| Zoran Corp.* | 11,100 | 98,457 | |||||||||
| 4,629,997 | |||||||||||
| Software (4.9%) | |||||||||||
| Advent Software, Inc.* | 6,500 | 248,430 | |||||||||
| ANSYS, Inc.* | 2,916 | 118,331 | |||||||||
| Ariba, Inc.* | 11,900 | 140,658 | |||||||||
| AsiaInfo Holdings, Inc.* | 14,300 | 315,458 | |||||||||
| Blackbaud, Inc. | 8,900 | 197,491 | |||||||||
| CommVault Systems, Inc.* | 7,300 | 143,810 | |||||||||
| Concur Technologies, Inc.* | 2,969 | 105,815 | |||||||||
| Ebix, Inc.* | 2,200 | 135,520 | |||||||||
| Epicor Software Corp.* | 11,000 | 84,920 | |||||||||
| EPIQ Systems, Inc.* | 1,900 | 23,959 | |||||||||
| JDA Software Group, Inc.* | 6,932 | 137,531 | |||||||||
| Manhattan Associates, Inc.* | 5,700 | 130,815 | |||||||||
| Mentor Graphics Corp.* | 200 | 1,460 | |||||||||
See Accompanying Notes to Financial Statements.
53
Credit Suisse Small Cap Core Fund
Schedule of Investments (continued)
October 31, 2009
| Number of Shares | Value | ||||||||||
| COMMON STOCKS | |||||||||||
| Software | |||||||||||
| Netscout Systems, Inc.* | 4,700 | $ | 57,763 | ||||||||
| Pegasystems, Inc. | 5,500 | 157,685 | |||||||||
| Phoenix Technologies, Ltd.* | 2,953 | 6,910 | |||||||||
| Progress Software Corp.* | 4,800 | 110,880 | |||||||||
| Radiant Systems, Inc.* | 6,900 | 67,896 | |||||||||
| Red Hat, Inc.* | 39,100 | 1,009,171 | |||||||||
| Smith Micro Software, Inc.* | 7,100 | 64,468 | |||||||||
| Sonic Solutions* | 6,400 | 31,104 | |||||||||
| Take-Two Interactive Software, Inc.* | 30,400 | 333,488 | |||||||||
| Taleo Corp. Class A* | 2,000 | 43,480 | |||||||||
| THQ, Inc.* | 30,700 | 160,561 | |||||||||
| TiVo, Inc.* | 7,600 | 82,688 | |||||||||
| Tyler Technologies, Inc.* | 6,300 | 119,826 | |||||||||
| Ultimate Software Group, Inc.* | 500 | 12,755 | |||||||||
| Websense, Inc.* | 4,100 | 65,846 | |||||||||
| 4,108,719 | |||||||||||
| Specialty Retail (5.9%) | |||||||||||
| Barnes & Noble, Inc. | 400 | 6,644 | |||||||||
| Bebe Stores, Inc. | 900 | 5,634 | |||||||||
| Big 5 Sporting Goods Corp. | 5,100 | 75,225 | |||||||||
| Brown Shoe Co., Inc. | 10,400 | 107,848 | |||||||||
| Cabela's, Inc.* | 3,400 | 42,738 | |||||||||
| Christopher & Banks Corp. | 8,900 | 54,201 | |||||||||
| Dress Barn, Inc.* | 34,700 | 626,335 | |||||||||
| Genesco, Inc.* | 5,500 | 143,385 | |||||||||
| Group 1 Automotive, Inc. | 18,100 | 460,102 | |||||||||
| Haverty Furniture Cos., Inc.* | 4,700 | 56,917 | |||||||||
| hhgregg, Inc.* | 13,800 | 227,562 | |||||||||
| Hibbett Sports, Inc.* | 1,700 | 31,858 | |||||||||
| HOT Topic, Inc.* | 47,952 | 369,230 | |||||||||
| Jo-Ann Stores, Inc.* | 6,700 | 178,354 | |||||||||
| JOS. A. Bank Clothiers, Inc.* | 1,077 | 44,135 | |||||||||
| MarineMax, Inc.* | 5,100 | 34,731 | |||||||||
| Midas, Inc.* | 2,700 | 21,762 | |||||||||
| Monro Muffler, Inc. | 2,500 | 77,475 | |||||||||
| OfficeMax, Inc.* | 24,500 | 280,035 | |||||||||
| PEP Boys-Manny, Moe & Jack | 10,600 | 92,962 | |||||||||
| Rent-A-Center, Inc.* | 21,400 | 392,904 | |||||||||
| Ross Stores, Inc. | 12,600 | 554,526 | |||||||||
| Sonic Automotive, Inc. Class A | 9,300 | 83,142 | |||||||||
| Stage Stores, Inc. | 8,912 | 105,162 | |||||||||
| Stein Mart, Inc.* | 6,300 | 59,850 | |||||||||
| The Buckle, Inc. | 1,550 | 46,516 | |||||||||
| The Children's Place Retail Stores, Inc.* | 1,600 | 50,320 | |||||||||
| The Finish Line, Inc. Class A | 14,000 | 141,960 | |||||||||
| The Gymboree Corp.* | 4,800 | 204,336 | |||||||||
| The Men's Wearhouse, Inc. | 3,200 | 74,144 | |||||||||
| Tractor Supply Co.* | 2,200 | 98,340 | |||||||||
| Tween Brands, Inc.* | 6,000 | 50,880 | |||||||||
| Zale Corp.* | 24,500 | 115,885 | |||||||||
| Zumiez, Inc.* | 5,100 | 68,697 | |||||||||
| 4,983,795 | |||||||||||
See Accompanying Notes to Financial Statements.
54
Credit Suisse Small Cap Core Fund
Schedule of Investments (continued)
October 31, 2009
| Number of Shares | Value | ||||||||||
| COMMON STOCKS | |||||||||||
| Textiles, Apparel & Luxury Goods (2.5%) | |||||||||||
| Carter's, Inc.* | 3,300 | $ | 77,880 | ||||||||
| CROCS, Inc.* | 87,000 | 528,960 | |||||||||
| Deckers Outdoor Corp.* | 800 | 71,736 | |||||||||
| Iconix Brand Group, Inc.* | 5,100 | 59,466 | |||||||||
| K-Swiss, Inc. Class A | 3,300 | 26,928 | |||||||||
| Liz Claiborne, Inc. | 23,700 | 136,038 | |||||||||
| Lululemon Athletica, Inc.* | 6,800 | 170,816 | |||||||||
| Maidenform Brands, Inc.* | 4,794 | 67,308 | |||||||||
| Movado Group, Inc. | 4,200 | 44,016 | |||||||||
| Oxford Industries, Inc. | 3,400 | 65,790 | |||||||||
| Perry Ellis International, Inc.* | 2,600 | 35,542 | |||||||||
| Quiksilver, Inc.* | 13,900 | 27,661 | |||||||||
| Skechers U.S.A., Inc. Class A* | 8,800 | 192,016 | |||||||||
| Steven Madden, Ltd.* | 8,100 | 328,050 | |||||||||
| The Timberland Co. Class A* | 2,400 | 38,832 | |||||||||
| True Religion Apparel, Inc.* | 1,500 | 38,655 | |||||||||
| Unifirst Corp. | 2,000 | 84,140 | |||||||||
| Volcom, Inc.* | 3,900 | 64,779 | |||||||||
| Wolverine World Wide, Inc. | 3,000 | 76,740 | |||||||||
| 2,135,353 | |||||||||||
| Thrifts & Mortgage Finance (0.6%) | |||||||||||
| Bank Mutual Corp. | 8,500 | 59,670 | |||||||||
| Brookline Bancorp, Inc. | 6,000 | 58,740 | |||||||||
| Dime Community Bancshares | 1,500 | 16,485 | |||||||||
| NewAlliance Bancshares, Inc. | 3,900 | 43,212 | |||||||||
| Ocwen Financial Corp.* | 13,300 | 145,369 | |||||||||
| Trustco Bank Corp. NY | 25,245 | 150,208 | |||||||||
| 473,684 | |||||||||||
| Tobacco (0.3%) | |||||||||||
| Alliance One International, Inc.* | 22,300 | 98,343 | |||||||||
| Universal Corp. | 3,600 | 149,724 | |||||||||
| 248,067 | |||||||||||
| Trading Companies & Distributors (1.1%) | |||||||||||
| Applied Industrial Technologies, Inc. | 4,500 | 91,035 | |||||||||
| Beacon Roofing Supply, Inc.* | 22,100 | 317,356 | |||||||||
| Kaman Corp. | 4,624 | 95,532 | |||||||||
| Lawson Products, Inc. | 900 | 13,995 | |||||||||
| Watsco, Inc. | 7,400 | 379,028 | |||||||||
| WESCO International, Inc.* | 1,500 | 38,340 | |||||||||
| 935,286 | |||||||||||
| Water Utilities (0.3%) | |||||||||||
| American States Water Co. | 4,100 | 135,915 | |||||||||
| California Water Service Group | 2,500 | 91,425 | |||||||||
| SJW Corp. | 100 | 2,177 | |||||||||
| 229,517 | |||||||||||
See Accompanying Notes to Financial Statements.
55
Credit Suisse Small Cap Core Fund
Schedule of Investments (continued)
October 31, 2009
| Number of Shares | Value | ||||||||||
| COMMON STOCKS | |||||||||||
| Wireless Telecommunication Services (0.2%) | |||||||||||
| Shenandoah Telecommunications Co. | 100 | $ | 1,669 | ||||||||
| Syniverse Holdings, Inc.* | 8,800 | 150,744 | |||||||||
| USA Mobility, Inc. | 1,300 | 14,170 | |||||||||
| 166,583 | |||||||||||
| TOTAL COMMON STOCKS (Cost $81,148,177) | 83,040,880 | ||||||||||
| PREFERRED STOCK (0.0%) | |||||||||||
| Personal Products (0.0%) | |||||||||||
| Revlon, Inc.*^ (Cost $21,936) | 4,100 | 19,270 | |||||||||
| Par (000) | |||||||||||
| SHORT-TERM INVESTMENT (1.9%) | |||||||||||
| State Street Bank and Trust Co. Euro Time Deposit, 0.010%, 11/02/09 (Cost $1,610,000) | $ | 1,610 | 1,610,000 | ||||||||
| TOTAL INVESTMENTS AT VALUE (100.8%) (Cost $82,780,113) | 84,670,150 | ||||||||||
| LIABILITIES IN EXCESS OF OTHER ASSETS (-0.8%) | (650,270 | ) | |||||||||
| NET ASSETS (100.0%) | $ | 84,019,880 | |||||||||
* Non-income producing security.
^ Not readily marketable security; security is valued at fair value as determined in good faith by, or under the direction of, the Board of Trustees.
See Accompanying Notes to Financial Statements.
56
Credit Suisse Funds
Statements of Assets and Liabilities
October 31, 2009
| Large Cap Value Fund | Small Cap Core Fund | ||||||||||
| Assets | |||||||||||
| Investments at value, (Cost $152,541,513 and $82,780,113, respectively) (Note 2) | $ | 156,774,441 | $ | 84,670,150 | |||||||
| Cash | 504 | 564 | |||||||||
| Receivable for investments sold | 2,960,072 | 416,342 | |||||||||
| Dividend and interest receivable | 336,231 | 38,092 | |||||||||
| Receivable for fund shares sold | 65,958 | 26,400 | |||||||||
| Prepaid expenses | 32,540 | 38,674 | |||||||||
| Total Assets | 160,169,746 | 85,190,222 | |||||||||
| Liabilities | |||||||||||
| Advisory fee payable (Note 3) | 74,877 | 39,590 | |||||||||
| Administrative services fee payable (Note 3) | 21,348 | 14,153 | |||||||||
| Shareholder servicing/Distribution fee payable (Note 3) | 37,274 | 25,738 | |||||||||
| Payable for investments purchased | 2,951,459 | 904,817 | |||||||||
| Payable for fund shares redeemed | 488,754 | 51,058 | |||||||||
| Trustees' fee payable | 5,657 | 5,657 | |||||||||
| Other accrued expenses payable | 150,693 | 129,329 | |||||||||
| Total Liabilities | 3,730,062 | 1,170,342 | |||||||||
| Net Assets | |||||||||||
| Capital stock, $.001 par value (Note 6) | 14,068 | 9,388 | |||||||||
| Paid-in capital (Note 6) | 200,911,568 | 130,722,100 | |||||||||
| Undistributed net investment income | 415,318 | 4,061 | |||||||||
| Accumulated net realized loss on investments and foreign currency transactions | (49,134,198 | ) | (48,605,706 | ) | |||||||
| Net unrealized appreciation from investments | 4,232,928 | 1,890,037 | |||||||||
| Net Assets | $ | 156,439,684 | $ | 84,019,880 | |||||||
| Common Shares | |||||||||||
| Net assets | $ | 328,869 | $ | 14,325,051 | |||||||
| Shares outstanding | 29,745 | 1,572,371 | |||||||||
| Net asset value, offering price and redemption price per share | $ | 11.06 | $ | 9.11 | |||||||
| Advisor Shares | |||||||||||
| Net assets | $ | 2,147,651 | N/A | ||||||||
| Shares outstanding | 192,144 | N/A | |||||||||
| Net asset value, offering price and redemption price per share | $ | 11.18 | N/A | ||||||||
| A Shares | |||||||||||
| Net assets | $ | 150,637,514 | $ | 60,425,681 | |||||||
| Shares outstanding | 13,539,098 | 6,551,974 | |||||||||
| Net asset value and redemption price per share | $ | 11.13 | $ | 9.22 | |||||||
| Maximum offering price per share (net asset value/(1-5.75%)) | $ | 11.81 | $ | 9.78 | |||||||
See Accompanying Notes to Financial Statements.
57
Credit Suisse Funds
Statements of Assets and Liabilities (continued)
October 31, 2009
| Large Cap Value Fund | Small Cap Core Fund | ||||||||||
| B Shares | |||||||||||
| Net assets | $ | 2,371,974 | $ | 3,037,567 | |||||||
| Shares outstanding | 218,693 | 411,472 | |||||||||
| Net asset value and offering price per share | $ | 10.85 | $ | 7.38 | |||||||
| C Shares | |||||||||||
| Net assets | $ | 953,676 | $ | 6,231,581 | |||||||
| Shares outstanding | 88,664 | 852,268 | |||||||||
| Net asset value and offering price per share | $ | 10.76 | $ | 7.31 | |||||||
See Accompanying Notes to Financial Statements.
58
Credit Suisse Funds
Statements of Operations
For the Year Ended October 31, 2009
| Large Cap Value Fund | Small Cap Core Fund | ||||||||||
| Investment Income (Note 2) | |||||||||||
| Dividends | $ | 3,787,078 | $ | 1,169,749 | |||||||
| Interest | 95 | 41 | |||||||||
| Securities lending | 1,079 | 649 | |||||||||
| Foreign taxes withheld | (23,109 | ) | (793 | ) | |||||||
| Total investment income | 3,765,143 | 1,169,646 | |||||||||
| Expenses | |||||||||||
| Investment advisory fees (Note 3) | 703,672 | 583,408 | |||||||||
| Administrative services fees (Note 3) | 242,235 | 159,359 | |||||||||
| Shareholder servicing/Distribution fees (Note 3) | |||||||||||
| Common Class | — | 34,742 | |||||||||
| Advisor Class | 9,871 | — | |||||||||
| Class A | 338,229 | 151,923 | |||||||||
| Class B | 22,862 | 31,112 | |||||||||
| Class C | 8,484 | 55,395 | |||||||||
| Transfer agent fees | 308,634 | 211,400 | |||||||||
| Custodian fees | 215,687 | 191,540 | |||||||||
| Printing fees (Note 3) | 51,126 | 51,865 | |||||||||
| Registration fees | 50,745 | 47,659 | |||||||||
| Audit and tax fees | 38,910 | 34,558 | |||||||||
| Legal fees | 26,960 | 21,548 | |||||||||
| Trustees' fees | 16,104 | 16,104 | |||||||||
| Insurance expense | 10,414 | 6,617 | |||||||||
| Commitment fees (Note 4) | 4,122 | 2,407 | |||||||||
| Interest expense (Note 4) | — | 998 | |||||||||
| Miscellaneous expense | 7,561 | 6,177 | |||||||||
| Total expenses | 2,055,616 | 1,606,812 | |||||||||
| Less: fees waived (Note 3) | (198,343 | ) | (250,099 | ) | |||||||
| Net expenses | 1,857,273 | 1,356,713 | |||||||||
| Net investment income (loss) | 1,907,870 | (187,067 | ) | ||||||||
| Net Realized and Unrealized Gain (Loss) from Investments and Foreign Currency Related Items | |||||||||||
| Net realized loss from investments | (23,957,538 | ) | (30,534,342 | ) | |||||||
| Net realized gain from foreign currency transactions | 92 | — | |||||||||
| Net change in unrealized appreciation (depreciation) from investments | 39,359,889 | 27,015,590 | |||||||||
| Net realized and unrealized gain (loss) from investments and foreign currency related items | 15,402,443 | (3,518,752 | ) | ||||||||
| Net increase (decrease) in net assets resulting from operations | $ | 17,310,313 | $ | (3,705,819 | ) | ||||||
See Accompanying Notes to Financial Statements.
59
Credit Suisse Funds
Statements of Changes in Net Assets
| Large Cap Value Fund | Small Cap Core Fund | ||||||||||||||||||
| For the Year Ended October 31, 2009 | For the Year Ended October 31, 2008 | For the Year Ended October 31, 2009 | For the Year Ended October 31, 2008 | ||||||||||||||||
| From Operations | |||||||||||||||||||
| Net investment income (loss) | $ | 1,907,870 | $ | 3,676,133 | $ | (187,067 | ) | $ | 47,202 | ||||||||||
| Net realized loss from investments and foreign currency transactions | (23,957,446 | ) | (24,676,544 | ) | (30,534,342 | ) | (16,280,781 | ) | |||||||||||
| Net change in unrealized appreciation (depreciation) from investments | 39,359,889 | (75,539,918 | ) | 27,015,590 | (51,051,123 | ) | |||||||||||||
| Net increase (decrease) in net assets resulting from operations | 17,310,313 | (96,540,329 | ) | (3,705,819 | ) | (67,284,702 | ) | ||||||||||||
| From Dividends and Distributions | |||||||||||||||||||
| Dividends from net investment income | |||||||||||||||||||
| Common Class shares | (4,407 | ) | (8,192 | ) | — | — | |||||||||||||
| Advisor Class shares | (22,379 | ) | (48,163 | ) | — | — | |||||||||||||
| Class A shares | (1,807,556 | ) | (3,573,660 | ) | — | — | |||||||||||||
| Class B shares | (20,225 | ) | (46,838 | ) | — | — | |||||||||||||
| Class C shares | (7,343 | ) | (13,426 | ) | — | — | |||||||||||||
| Distributions from net realized gains | |||||||||||||||||||
| Common Class shares | — | (93,955 | ) | — | (18,726,350 | ) | |||||||||||||
| Advisor Class shares | — | (809,768 | ) | — | — | ||||||||||||||
| Class A shares | — | (45,714,836 | ) | — | (55,796,349 | ) | |||||||||||||
| Class B shares | — | (1,401,314 | ) | — | (3,314,155 | ) | |||||||||||||
| Class C shares | — | (349,709 | ) | — | (5,876,025 | ) | |||||||||||||
| Distributions from return of capital | |||||||||||||||||||
| Common Class shares | — | — | (9,406 | ) | — | ||||||||||||||
| Advisor Class shares | — | — | — | — | |||||||||||||||
| Class A shares | — | — | (44,485 | ) | — | ||||||||||||||
| Class B shares | — | — | (507 | ) | — | ||||||||||||||
| Class C shares | — | — | (838 | ) | — | ||||||||||||||
| Net decrease in net assets resulting from dividends and distributions | (1,861,910 | ) | (52,059,861 | ) | (55,236 | ) | (83,712,879 | ) | |||||||||||
See Accompanying Notes to Financial Statements.
60
Credit Suisse Funds
Statements of Changes in Net Assets (continued)
| Large Cap Value Fund | Small Cap Core Fund | ||||||||||||||||||
| For the Year Ended October 31, 2009 | For the Year Ended October 31, 2008 | For the Year Ended October 31, 2009 | For the Year Ended October 31, 2008 | ||||||||||||||||
| From Capital Share Transactions (Note 6) | |||||||||||||||||||
| Proceeds from sale of shares | $ | 5,029,255 | $ | 8,518,621 | $ | 5,453,785 | $ | 14,272,135 | |||||||||||
| Reinvestment of dividends and distributions | 1,680,734 | 47,881,522 | 51,416 | 78,197,395 | |||||||||||||||
| Net asset value of shares redeemed | (22,255,405 | ) | (48,760,638 | ) | (24,000,877 | )1 | (86,150,438 | )2 | |||||||||||
| Net increase (decrease) in net assets from capital share transactions | (15,545,416 | ) | 7,639,505 | (18,495,676 | ) | 6,319,092 | |||||||||||||
| Net decrease in net assets | (97,013 | ) | (140,960,685 | ) | (22,256,731 | ) | (144,678,489 | ) | |||||||||||
| Net Assets | |||||||||||||||||||
| Beginning of year | 156,536,697 | 297,497,382 | 106,276,611 | 250,955,100 | |||||||||||||||
| End of year | $ | 156,439,684 | $ | 156,536,697 | $ | 84,019,880 | $ | 106,276,611 | |||||||||||
| Undistributed net investment income | $ | 415,318 | $ | 415,377 | $ | 4,061 | $ | 12,077 | |||||||||||
1 Net of $11 of redemption fees retained by the Fund.
2 Net of $9,830 of redemption fees retained by the Fund.
See Accompanying Notes to Financial Statements.
61
Credit Suisse Large Cap Value Fund
Financial Highlights
(For a Common Class Share of the Fund Outstanding Throughout Each Year)
| For the Year Ended October 31, | |||||||||||||||||||||||
| 2009 | 2008 | 2007 | 2006 | 2005 | |||||||||||||||||||
| Per share data | |||||||||||||||||||||||
| Net asset value, beginning of year | $ | 9.88 | $ | 19.17 | $ | 21.93 | $ | 20.97 | $ | 19.98 | |||||||||||||
| INVESTMENT OPERATIONS | |||||||||||||||||||||||
| Net investment income1 | 0.15 | 0.26 | 0.26 | 0.28 | 0.24 | ||||||||||||||||||
| Net gain (loss) on investments and foreign currency related items (both realized and unrealized) | 1.18 | (6.09 | ) | 1.68 | 3.42 | 2.32 | |||||||||||||||||
| Total from investment operations | 1.33 | (5.83 | ) | 1.94 | 3.70 | 2.56 | |||||||||||||||||
| LESS DIVIDENDS AND DISTRIBUTIONS | |||||||||||||||||||||||
| Dividends from net investment income | (0.15 | ) | (0.26 | ) | (0.25 | ) | (0.26 | ) | (0.25 | ) | |||||||||||||
| Distributions from net realized gains | — | (3.20 | ) | (4.45 | ) | (2.48 | ) | (1.32 | ) | ||||||||||||||
| Total dividends and distributions | (0.15 | ) | (3.46 | ) | (4.70 | ) | (2.74 | ) | (1.57 | ) | |||||||||||||
| Net asset value, end of year | $ | 11.06 | $ | 9.88 | $ | 19.17 | $ | 21.93 | $ | 20.97 | |||||||||||||
| Total return2 | 13.74 | % | (36.29 | )% | 10.59 | % | 19.44 | % | 13.34 | % | |||||||||||||
| RATIOS AND SUPPLEMENTAL DATA | |||||||||||||||||||||||
| Net assets, end of year (000s omitted) | $ | 329 | $ | 300 | $ | 570 | $ | 600 | $ | 591 | |||||||||||||
| Ratio of expenses to average net assets | 1.05 | % | 0.90 | % | 0.82 | % | 0.89 | % | 0.91 | % | |||||||||||||
| Ratio of net investment income to average net assets | 1.61 | % | 1.89 | % | 1.37 | % | 1.37 | % | 1.15 | % | |||||||||||||
| Decrease reflected in above operating expense ratios due to waivers/reimbursements | 0.14 | % | — | — | — | — | |||||||||||||||||
| Portfolio turnover rate | 489 | % | 179 | % | 163 | % | 78 | % | 58 | % | |||||||||||||
1 Per share information is calculated using the average shares outstanding method.
2 Total returns are historical and assume changes in share price and reinvestment of all dividends and distributions. Had certain expenses not been reduced during the years shown, total returns would have been lower.
See Accompanying Notes to Financial Statements.
62
Credit Suisse Large Cap Value Fund
Financial Highlights
(For an Advisor Class Share of the Fund Outstanding Throughout Each Year)
| For the Year Ended October 31, | |||||||||||||||||||||||
| 2009 | 2008 | 2007 | 2006 | 2005 | |||||||||||||||||||
| Per share data | |||||||||||||||||||||||
| Net asset value, beginning of year | $ | 10.01 | $ | 19.33 | $ | 22.08 | $ | 21.10 | $ | 20.09 | |||||||||||||
| INVESTMENT OPERATIONS | |||||||||||||||||||||||
| Net investment income1 | 0.11 | 0.19 | 0.17 | 0.18 | 0.14 | ||||||||||||||||||
| Net gain (loss) on investments and foreign currency related items (both realized and unrealized) | 1.17 | (6.12 | ) | 1.69 | 3.44 | 2.34 | |||||||||||||||||
| Total from investment operations | 1.28 | (5.93 | ) | 1.86 | 3.62 | 2.48 | |||||||||||||||||
| LESS DIVIDENDS AND DISTRIBUTIONS | |||||||||||||||||||||||
| Dividends from net investment income | (0.11 | ) | (0.19 | ) | (0.16 | ) | (0.16 | ) | (0.15 | ) | |||||||||||||
| Distributions from net realized gains | — | (3.20 | ) | (4.45 | ) | (2.48 | ) | (1.32 | ) | ||||||||||||||
| Total dividends and distributions | (0.11 | ) | (3.39 | ) | (4.61 | ) | (2.64 | ) | (1.47 | ) | |||||||||||||
| Net asset value, end of year | $ | 11.18 | $ | 10.01 | $ | 19.33 | $ | 22.08 | $ | 21.10 | |||||||||||||
| Total return2 | 13.05 | % | (36.45 | )% | 10.01 | % | 18.84 | % | 12.81 | % | |||||||||||||
| RATIOS AND SUPPLEMENTAL DATA | |||||||||||||||||||||||
| Net assets, end of year (000s omitted) | $ | 2,148 | $ | 2,097 | $ | 5,234 | $ | 5,806 | $ | 8,368 | |||||||||||||
| Ratio of expenses to average net assets | 1.55 | % | 1.41 | % | 1.32 | % | 1.39 | % | 1.41 | % | |||||||||||||
| Ratio of net investment income to average net assets | 1.11 | % | 1.38 | % | 0.87 | % | 0.87 | % | 0.65 | % | |||||||||||||
| Decrease reflected in above operating expense ratios due to waivers/reimbursements | 0.14 | % | — | — | — | — | |||||||||||||||||
| Portfolio turnover rate | 489 | % | 179 | % | 163 | % | 78 | % | 58 | % | |||||||||||||
1 Per share information is calculated using the average shares outstanding method.
2 Total returns are historical and assume changes in share price and reinvestment of all dividends and distributions. Had certain expenses not been reduced during the years shown, total returns would have been lower.
See Accompanying Notes to Financial Statements.
63
Credit Suisse Large Cap Value Fund
Financial Highlights
(For a Class A Share of the Fund Outstanding Throughout Each Year)
| For the Year Ended October 31, | |||||||||||||||||||||||
| 2009 | 2008 | 2007 | 2006 | 2005 | |||||||||||||||||||
| Per share data | |||||||||||||||||||||||
| Net asset value, beginning of year | $ | 9.95 | $ | 19.28 | $ | 22.03 | $ | 21.05 | $ | 20.05 | |||||||||||||
| INVESTMENT OPERATIONS | |||||||||||||||||||||||
| Net investment income1 | 0.13 | 0.23 | 0.22 | 0.22 | 0.19 | ||||||||||||||||||
| Net gain (loss) on investments and foreign currency related items (both realized and unrealized) | 1.18 | (6.14 | ) | 1.69 | 3.45 | 2.33 | |||||||||||||||||
| Total from investment operations | 1.31 | (5.91 | ) | 1.91 | 3.67 | 2.52 | |||||||||||||||||
| LESS DIVIDENDS AND DISTRIBUTIONS | |||||||||||||||||||||||
| Dividends from net investment income | (0.13 | ) | (0.22 | ) | (0.21 | ) | (0.21 | ) | (0.20 | ) | |||||||||||||
| Distributions from net realized gains | — | (3.20 | ) | (4.45 | ) | (2.48 | ) | (1.32 | ) | ||||||||||||||
| Total dividends and distributions | (0.13 | ) | (3.42 | ) | (4.66 | ) | (2.69 | ) | (1.52 | ) | |||||||||||||
| Net asset value, end of year | $ | 11.13 | $ | 9.95 | $ | 19.28 | $ | 22.03 | $ | 21.05 | |||||||||||||
| Total return2 | 13.43 | % | (36.46 | )% | 10.32 | % | 19.18 | % | 13.06 | % | |||||||||||||
| RATIOS AND SUPPLEMENTAL DATA | |||||||||||||||||||||||
| Net assets, end of year (000s omitted) | $ | 150,638 | $ | 150,304 | $ | 280,329 | $ | 305,866 | $ | 300,777 | |||||||||||||
| Ratio of expenses to average net assets | 1.30 | % | 1.16 | % | 1.07 | % | 1.14 | % | 1.16 | % | |||||||||||||
| Ratio of net investment income to average net assets | 1.38 | % | 1.63 | % | 1.12 | % | 1.12 | % | 0.91 | % | |||||||||||||
| Decrease reflected in above operating expense ratios due to waivers/reimbursements | 0.14 | % | — | — | — | — | |||||||||||||||||
| Portfolio turnover rate | 489 | % | 179 | % | 163 | % | 78 | % | 58 | % | |||||||||||||
1 Per share information is calculated using the average shares outstanding method.
2 Total returns are historical and assume changes in share price, reinvestment of all dividends and distributions and no sales charge. Had certain expenses not been reduced during the years shown, total returns would have been lower.
See Accompanying Notes to Financial Statements.
64
Credit Suisse Large Cap Value Fund
Financial Highlights
(For a Class B Share of the Fund Outstanding Throughout Each Year)
| For the Year Ended October 31, | |||||||||||||||||||||||
| 2009 | 2008 | 2007 | 2006 | 2005 | |||||||||||||||||||
| Per share data | |||||||||||||||||||||||
| Net asset value, beginning of year | $ | 9.73 | $ | 18.92 | $ | 21.70 | $ | 20.78 | $ | 19.81 | |||||||||||||
| INVESTMENT OPERATIONS | |||||||||||||||||||||||
| Net investment income1 | 0.06 | 0.12 | 0.07 | 0.07 | 0.04 | ||||||||||||||||||
| Net gain (loss) on investments and foreign currency related items (both realized and unrealized) | 1.14 | (6.00 | ) | 1.66 | 3.39 | 2.30 | |||||||||||||||||
| Total from investment operations | 1.20 | (5.88 | ) | 1.73 | 3.46 | 2.34 | |||||||||||||||||
| LESS DIVIDENDS AND DISTRIBUTIONS | |||||||||||||||||||||||
| Dividends from net investment income | (0.08 | ) | (0.11 | ) | (0.06 | ) | (0.06 | ) | (0.05 | ) | |||||||||||||
| Distributions from net realized gains | — | (3.20 | ) | (4.45 | ) | (2.48 | ) | (1.32 | ) | ||||||||||||||
| Total dividends and distributions | (0.08 | ) | (3.31 | ) | (4.51 | ) | (2.54 | ) | (1.37 | ) | |||||||||||||
| Net asset value, end of year | $ | 10.85 | $ | 9.73 | $ | 18.92 | $ | 21.70 | $ | 20.78 | |||||||||||||
| Total return2 | 12.54 | % | (36.93 | )% | 9.49 | % | 18.25 | % | 12.23 | % | |||||||||||||
| RATIOS AND SUPPLEMENTAL DATA | |||||||||||||||||||||||
| Net assets, end of year (000s omitted) | $ | 2,372 | $ | 2,864 | $ | 9,224 | $ | 14,994 | $ | 20,057 | |||||||||||||
| Ratio of expenses to average net assets | 2.05 | % | 1.91 | % | 1.82 | % | 1.89 | % | 1.91 | % | |||||||||||||
| Ratio of net investment income to average net assets | 0.66 | % | 0.89 | % | 0.39 | % | 0.37 | % | 0.15 | % | |||||||||||||
| Decrease reflected in above operating expense ratios due to waivers/reimbursements | 0.14 | % | — | — | — | — | |||||||||||||||||
| Portfolio turnover rate | 489 | % | 179 | % | 163 | % | 78 | % | 58 | % | |||||||||||||
1 Per share information is calculated using the average shares outstanding method.
2 Total returns are historical and assume changes in share price, reinvestment of all dividends and distributions and no sales charge. Had certain expenses not been reduced during the years shown, total returns would have been lower.
See Accompanying Notes to Financial Statements.
65
Credit Suisse Large Cap Value Fund
Financial Highlights
(For a Class C Share of the Fund Outstanding Throughout Each Year)
| For the Year Ended October 31, | |||||||||||||||||||||||
| 2009 | 2008 | 2007 | 2006 | 2005 | |||||||||||||||||||
| Per share data | |||||||||||||||||||||||
| Net asset value, beginning of year | $ | 9.65 | $ | 18.79 | $ | 21.58 | $ | 20.68 | $ | 19.72 | |||||||||||||
| INVESTMENT OPERATIONS | |||||||||||||||||||||||
| Net investment income1 | 0.06 | 0.12 | 0.07 | 0.07 | 0.03 | ||||||||||||||||||
| Net gain (loss) on investments and foreign currency related items (both realized and unrealized) | 1.13 | (5.95 | ) | 1.65 | 3.37 | 2.30 | |||||||||||||||||
| Total from investment operations | 1.19 | (5.83 | ) | 1.72 | 3.44 | 2.33 | |||||||||||||||||
| LESS DIVIDENDS AND DISTRIBUTIONS | |||||||||||||||||||||||
| Dividends from net investment income | (0.08 | ) | (0.11 | ) | (0.06 | ) | (0.06 | ) | (0.05 | ) | |||||||||||||
| Distributions from net realized gains | — | (3.20 | ) | (4.45 | ) | (2.48 | ) | (1.32 | ) | ||||||||||||||
| Total dividends and distributions | (0.08 | ) | (3.31 | ) | (4.51 | ) | (2.54 | ) | (1.37 | ) | |||||||||||||
| Net asset value, end of year | $ | 10.76 | $ | 9.65 | $ | 18.79 | $ | 21.58 | $ | 20.68 | |||||||||||||
| Total return2 | 12.55 | % | (36.91 | )% | 9.50 | % | 18.25 | % | 12.23 | % | |||||||||||||
| RATIOS AND SUPPLEMENTAL DATA | |||||||||||||||||||||||
| Net assets, end of year (000s omitted) | $ | 954 | $ | 972 | $ | 2,140 | $ | 2,618 | $ | 3,638 | |||||||||||||
| Ratio of expenses to average net assets | 2.05 | % | 1.91 | % | 1.82 | % | 1.89 | % | 1.91 | % | |||||||||||||
| Ratio of net investment income to average net assets | 0.63 | % | 0.89 | % | 0.39 | % | 0.37 | % | 0.15 | % | |||||||||||||
| Decrease reflected in above operating expense ratios due to waivers/reimbursements | 0.14 | % | — | — | — | — | |||||||||||||||||
| Portfolio turnover rate | 489 | % | 179 | % | 163 | % | 78 | % | 58 | % | |||||||||||||
1 Per share information is calculated using the average shares outstanding method.
2 Total returns are historical and assume changes in share price, reinvestment of all dividends and distributions and no sales charge. Had certain expenses not been reduced during the years shown, total returns would have been lower.
See Accompanying Notes to Financial Statements.
66
Credit Suisse Small Cap Core Fund
Financial Highlights
(For a Common Class Share of the Fund Outstanding Throughout Each Year)
| For the Year Ended October 31, | |||||||||||||||||||||||
| 2009 | 2008 | 2007 | 2006 | 2005 | |||||||||||||||||||
| Per share data | |||||||||||||||||||||||
| Net asset value, beginning of year | $ | 9.21 | $ | 22.41 | $ | 24.33 | $ | 23.84 | $ | 22.66 | |||||||||||||
| INVESTMENT OPERATIONS | |||||||||||||||||||||||
| Net investment income (loss)1 | (0.01 | ) | 0.01 | (0.08 | ) | 0.11 | (0.03 | ) | |||||||||||||||
| Net gain (loss) on investments and futures contracts (both realized and unrealized) | (0.08 | ) | (5.55 | ) | 2.16 | 2.85 | 3.39 | ||||||||||||||||
| Total from investment operations | (0.09 | ) | (5.54 | ) | 2.08 | 2.96 | 3.36 | ||||||||||||||||
| REDEMPTION FEES | 0.002 | 0.002 | — | — | — | ||||||||||||||||||
| LESS DIVIDENDS AND DISTRIBUTIONS | |||||||||||||||||||||||
| Dividends from net investment income | — | — | (0.14 | ) | — | — | |||||||||||||||||
| Distributions from net realized gains | — | (7.66 | ) | (3.86 | ) | (2.47 | ) | (2.18 | ) | ||||||||||||||
| Distributions from return of capital | (0.01 | ) | — | — | — | — | |||||||||||||||||
| Total dividends and distributions | (0.01 | ) | (7.66 | ) | (4.00 | ) | (2.47 | ) | (2.18 | ) | |||||||||||||
| Net asset value, end of year | $ | 9.11 | $ | 9.21 | $ | 22.41 | $ | 24.33 | $ | 23.84 | |||||||||||||
| Total return3 | (1.02 | )% | (34.47 | )% | 9.58 | % | 13.23 | % | 15.56 | % | |||||||||||||
| RATIOS AND SUPPLEMENTAL DATA | |||||||||||||||||||||||
| Net assets, end of year (000s omitted) | $ | 14,325 | $ | 16,565 | $ | 57,452 | $ | 70,525 | $ | 74,013 | |||||||||||||
| Ratio of expenses to average net assets | 1.55 | % | 1.47 | % | 1.34 | % | 1.37 | % | 1.38 | % | |||||||||||||
| Ratio of net investment income (loss) to average net assets | (0.15 | )% | 0.09 | % | (0.39 | )% | 0.47 | % | (0.16 | )% | |||||||||||||
| Decrease reflected in above operating expense ratios due to waivers/reimbursements | 0.30 | % | — | — | — | — | |||||||||||||||||
| Portfolio turnover rate | 423 | % | 195 | % | 262 | % | 67 | % | 43 | % | |||||||||||||
1 Per share information is calculated using the average shares outstanding method.
2 This amount represents less than $0.01 per share.
3 Total returns are historical and assume changes in share price and reinvestment of all dividends and distributions. Had certain expenses not been reduced during the years shown, total returns would have been lower.
See Accompanying Notes to Financial Statements.
67
Credit Suisse Small Cap Core Fund
Financial Highlights
(For a Class A Share of the Fund Outstanding Throughout Each Year)
| For the Year Ended October 31, | |||||||||||||||||||||||
| 2009 | 2008 | 2007 | 2006 | 2005 | |||||||||||||||||||
| Per share data | |||||||||||||||||||||||
| Net asset value, beginning of year | $ | 9.32 | $ | 22.57 | $ | 24.44 | $ | 23.94 | $ | 22.75 | |||||||||||||
| INVESTMENT OPERATIONS | |||||||||||||||||||||||
| Net investment income (loss)1 | (0.01 | ) | 0.01 | (0.08 | ) | 0.12 | (0.04 | ) | |||||||||||||||
| Net gain (loss) on investments and futures contracts (both realized and unrealized) | (0.08 | ) | (5.60 | ) | 2.18 | 2.85 | 3.42 | ||||||||||||||||
| Total from investment operations | (0.09 | ) | (5.59 | ) | 2.10 | 2.97 | 3.38 | ||||||||||||||||
| REDEMPTION FEES | 0.002 | 0.002 | — | — | — | ||||||||||||||||||
| LESS DIVIDENDS AND DISTRIBUTIONS | |||||||||||||||||||||||
| Dividends from net investment income | — | — | (0.11 | ) | — | — | |||||||||||||||||
| Distributions from net realized gains | — | (7.66 | ) | (3.86 | ) | (2.47 | ) | (2.19 | ) | ||||||||||||||
| Distributions from return of capital | (0.01 | ) | — | — | — | — | |||||||||||||||||
| Total dividends and distributions | (0.01 | ) | (7.66 | ) | (3.97 | ) | (2.47 | ) | (2.19 | ) | |||||||||||||
| Net asset value, end of year | $ | 9.22 | $ | 9.32 | $ | 22.57 | $ | 24.44 | $ | 23.94 | |||||||||||||
| Total return3 | (1.01 | )% | (34.44 | )% | 9.61 | % | 13.22 | % | 15.54 | % | |||||||||||||
| RATIOS AND SUPPLEMENTAL DATA | |||||||||||||||||||||||
| Net assets, end of year (000s omitted) | $ | 60,426 | $ | 79,414 | $ | 169,076 | $ | 263,006 | $ | 227,166 | |||||||||||||
| Ratio of expenses to average net assets | 1.55 | % | 1.47 | % | 1.35 | % | 1.37 | % | 1.38 | % | |||||||||||||
| Ratio of net investment income (loss) to average net assets | (0.14 | )% | 0.10 | % | (0.38 | )% | 0.47 | % | (0.16 | )% | |||||||||||||
| Decrease reflected in above operating expense ratios due to waivers/reimbursements | 0.30 | % | — | — | — | — | |||||||||||||||||
| Portfolio turnover rate | 423 | % | 195 | % | 262 | % | 67 | % | 43 | % | |||||||||||||
1 Per share information is calculated using the average shares outstanding method.
2 This amount represents less than $0.01 per share.
3 Total returns are historical and assume changes in share price, reinvestment of all dividends and distributions and no sales charge. Had certain expenses not been reduced during the years shown, total returns would have been lower.
See Accompanying Notes to Financial Statements.
68
Credit Suisse Small Cap Core Fund
Financial Highlights
(For a Class B Share of the Fund Outstanding Throughout Each Year)
| For the Year Ended October 31, | |||||||||||||||||||||||
| 2009 | 2008 | 2007 | 2006 | 2005 | |||||||||||||||||||
| Per share data | |||||||||||||||||||||||
| Net asset value, beginning of year | $ | 7.51 | $ | 19.91 | $ | 22.07 | $ | 21.99 | $ | 21.20 | |||||||||||||
| INVESTMENT OPERATIONS | |||||||||||||||||||||||
| Net investment loss1 | (0.06 | ) | (0.07 | ) | (0.22 | ) | (0.06 | ) | (0.20 | ) | |||||||||||||
| Net gain (loss) on investments and futures contracts (both realized and unrealized) | (0.07 | ) | (4.67 | ) | 1.93 | 2.61 | 3.17 | ||||||||||||||||
| Total from investment operations | (0.13 | ) | (4.74 | ) | 1.71 | 2.55 | 2.97 | ||||||||||||||||
| LESS DIVIDENDS AND DISTRIBUTIONS | |||||||||||||||||||||||
| Dividends from net investment income | — | — | (0.01 | ) | — | — | |||||||||||||||||
| Distributions from net realized gains | — | (7.66 | ) | (3.86 | ) | (2.47 | ) | (2.18 | ) | ||||||||||||||
| Distributions from return of capital | (0.00 | )2 | — | — | — | — | |||||||||||||||||
| Total dividends and distributions | (0.00 | )2 | (7.66 | ) | (3.87 | ) | (2.47 | ) | (2.18 | ) | |||||||||||||
| Net asset value, end of year | $ | 7.38 | $ | 7.51 | $ | 19.91 | $ | 22.07 | $ | 21.99 | |||||||||||||
| Total return3 | (1.72 | )% | (34.96 | )% | 8.74 | % | 12.41 | % | 14.72 | % | |||||||||||||
| RATIOS AND SUPPLEMENTAL DATA | |||||||||||||||||||||||
| Net assets, end of year (000s omitted) | $ | 3,038 | $ | 3,981 | $ | 9,122 | $ | 12,465 | $ | 18,133 | |||||||||||||
| Ratio of expenses to average net assets | 2.30 | % | 2.23 | % | 2.10 | % | 2.12 | % | 2.13 | % | |||||||||||||
| Ratio of net investment loss to average net assets | (0.89 | )% | (0.65 | )% | (1.13 | )% | (0.28 | )% | (0.91 | )% | |||||||||||||
| Decrease reflected in above operating expense ratios due to waivers/reimbursements | 0.30 | % | — | — | — | — | |||||||||||||||||
| Portfolio turnover rate | 423 | % | 195 | % | 262 | % | 67 | % | 43 | % | |||||||||||||
1 Per share information is calculated using the average shares outstanding method.
2 This amount represents less than $(0.01) per share.
3 Total returns are historical and assume changes in share price, reinvestment of all dividends and distributions and no sales charge. Had certain expenses not been reduced during the years shown, total returns would have been lower.
See Accompanying Notes to Financial Statements.
69
Credit Suisse Small Cap Core Fund
Financial Highlights
(For a Class C Share of the Fund Outstanding Throughout Each Year)
| For the Year Ended October 31, | |||||||||||||||||||||||
| 2009 | 2008 | 2007 | 2006 | 2005 | |||||||||||||||||||
| Per share data | |||||||||||||||||||||||
| Net asset value, beginning of year | $ | 7.44 | $ | 19.80 | $ | 21.97 | $ | 21.91 | $ | 21.13 | |||||||||||||
| INVESTMENT OPERATIONS | |||||||||||||||||||||||
| Net investment loss1 | (0.06 | ) | (0.07 | ) | (0.22 | ) | (0.06 | ) | (0.20 | ) | |||||||||||||
| Net gain (loss) on investments and futures contracts (both realized and unrealized) | (0.07 | ) | (4.63 | ) | 1.92 | 2.59 | 3.16 | ||||||||||||||||
| Total from investment operations | (0.13 | ) | (4.70 | ) | 1.70 | 2.53 | 2.96 | ||||||||||||||||
| REDEMPTION FEES | 0.002 | 0.002 | — | — | — | ||||||||||||||||||
| LESS DIVIDENDS AND DISTRIBUTIONS | |||||||||||||||||||||||
| Dividends from net investment income | — | — | (0.01 | ) | — | — | |||||||||||||||||
| Distributions from net realized gains | — | (7.66 | ) | (3.86 | ) | (2.47 | ) | (2.18 | ) | ||||||||||||||
| Distributions from return of capital | (0.00 | )3 | — | — | — | — | |||||||||||||||||
| Total dividends and distributions | (0.00 | )3 | (7.66 | ) | (3.87 | ) | (2.47 | ) | (2.18 | ) | |||||||||||||
| Net asset value, end of year | $ | 7.31 | $ | 7.44 | $ | 19.80 | $ | 21.97 | $ | 21.91 | |||||||||||||
| Total return4 | (1.73 | )% | (34.95 | )% | 8.74 | % | 12.36 | % | 14.72 | % | |||||||||||||
| RATIOS AND SUPPLEMENTAL DATA | |||||||||||||||||||||||
| Net assets, end of year (000s omitted) | $ | 6,232 | $ | 6,318 | $ | 15,305 | $ | 16,028 | $ | 16,079 | |||||||||||||
| Ratio of expenses to average net assets | 2.30 | % | 2.23 | % | 2.10 | % | 2.12 | % | 2.13 | % | |||||||||||||
| Ratio of net investment loss to average net assets | (0.91 | )% | (0.66 | )% | (1.14 | )% | (0.28 | )% | (0.91 | )% | |||||||||||||
| Decrease reflected in above operating expense ratios due to waivers/reimbursements | 0.30 | % | — | — | — | — | |||||||||||||||||
| Portfolio turnover rate | 423 | % | 195 | % | 262 | % | 67 | % | 43 | % | |||||||||||||
1 Per share information is calculated using the average shares outstanding method.
2 This amount represents less than $0.01 per share.
3 This amount represents less than $(0.01) per share.
4 Total returns are historical and assume changes in share price, reinvestment of all dividends and distributions and no sales charge. Had certain expenses not been reduced during the years shown, total returns would have been lower.
See Accompanying Notes to Financial Statements.
70
Credit Suisse Funds
Notes to Financial Statements
October 31, 2009
Note 1. Organization
Credit Suisse Capital Funds (the "Trust") is registered under the Investment Company Act of 1940, as amended (the "1940 Act") as an open-end management investment company and currently offers two managed investment funds, the Credit Suisse Large Cap Value Fund ("Large Cap Value") and Credit Suisse Small Cap Core Fund ("Small Cap Core"), (each a "Fund" and collectively, the "Funds"). The Trust was organized under the laws of the Commonwealth of Massachusetts as a business trust on November 26, 1985. Each Fund is classified as diversified. Investment objectives for each Fund are as follows: Large Cap Value seeks long-term capital appreciation and continuity of income and Small Cap Core seeks a high level of growth of capital.
Large Cap Value offers five classes of shares: Common Class shares, Advisor Class shares, Class A shares, Class B shares and Class C shares. Small Cap Core offers four classes of shares: Common Class shares, Class A shares, Class B shares and Class C shares. Effective December 12, 2001, Large Cap Value closed the Common Class to new investments, except for reinvestment of dividends. Effective December 12, 2001, Small Cap Core's Common Class shares are closed to new investors, with certain exceptions as set forth in the prospectus. Each class of shares in each Fund represents an equal pro rata interest in each Fund, except that they bear different expenses, which reflect the differences in the range of services provided to them. Class A shares of each Fund are sold subject to a front-end sales charge of 5.75%. Class B shares of each Fund are sold subject to a contingent deferred sales charge which declines from 4.00% to zero depending on the period of time the shares are held. Class C shares of each Fund are sold subject to a contingent deferred sales charge of 1.00% if the shares are redeemed within the first year of purchase.
Note 2. Significant Accounting Policies
A) SECURITY VALUATION — The net asset value of each Fund is determined daily as of the close of regular trading on the New York Stock Exchange, Inc. (the "Exchange") on each day the Exchange is open for business. Equity investments are valued at market value, which is generally determined using the closing price on the exchange or market on which the security is primarily traded at the time of valuation (the "Valuation Time"). If no sales are reported, equity investments are generally valued at the most recent bid quotation as of the Valuation Time or at the lowest asked quotation in the case of a short sale of securities. Debt securities with a remaining maturity greater than 60 days are valued in accordance with the price supplied by a pricing service, which may use a matrix, formula or other objective method that takes into consideration market indices, yield curves and other specific adjustments.
71
Credit Suisse Funds
Notes to Financial Statements (continued)
October 31, 2009
Note 2. Significant Accounting Policies
Debt obligations that will mature in 60 days or less are valued on the basis of amortized cost, which approximates market value, unless it is determined that using this method would not represent fair value. Investments in mutual funds are valued at the mutual fund's closing net asset value per share on the day of valuation. Securities and other assets for which market quotations are not readily available, or whose values have been materially affected by events occurring before the Funds' Valuation Time but after the close of the securities' primary markets, are valued at fair value as determined in good faith by, or under the direction of, the Board of Trustees under procedures established by the Board of Trustees. The Funds may utilize a service provided by an independent third party which has been approved by the Board of Trustees to fair value certain securities. When fair-value pricing is employed, the prices of securities used by a fun d to calculate its net asset value may differ from quoted or published prices for the same securities.
In accordance with the authoritative guidance on fair value measurements and disclosures under accounting principles generally accepted in the United States of America ("GAAP"), the Funds disclose the fair value of their investments in a hierarchy that prioritizes the inputs to valuation techniques used to measure the fair value. In accordance with GAAP, fair value is defined as the price that a Fund would receive upon selling an investment in a timely transaction to an independent buyer in the principal or most advantageous market of the investment. GAAP established a three-tier hierarchy to maximize the use of observable market data and minimize the use of unobservable inputs and to establish classification of fair value measurements for disclosure purposes. Inputs refer broadly to the assumptions that market participants would use in pricing the asset or liability, including assumptions about risk, for example, the risk inherent in a part icular valuation technique used to measure fair value including such a pricing model and/or the risk inherent in the inputs to the valuation technique. Inputs may be observable or unobservable. Observable inputs are inputs that reflect the assumptions market participants would use in pricing the asset or liability developed based on market data obtained from sources independent of the reporting entity. Unobservable inputs are inputs that reflect the reporting entity's own assumptions about the assumptions market participants would use in pricing the asset or liability developed based on the best information available in the circumstances. The three-tier hierarchy of inputs is summarized in the three broad Levels listed below.
• Level 1 – quoted prices in active markets for identical investments
• Level 2 – other significant observable inputs (including quoted prices for similar investments, interest rates, prepayment speeds, credit risk, etc.)
72
Credit Suisse Funds
Notes to Financial Statements (continued)
October 31, 2009
Note 2. Significant Accounting Policies
• Level 3 – significant unobservable inputs (including a Fund's own assumptions in determining the fair value of investments)
The inputs or methodology used for valuing securities are not necessarily an indication of the risk associated with investing in those securities.
The following is a summary of the inputs used as of October 31, 2009 in valuing each Fund's investments carried at value:
| Large Cap Value | Level 1 | Level 2 | Level 3 | Total | |||||||||||||||
| Investments in Securities | |||||||||||||||||||
| Common Stocks | $ | 155,267,391 | $ | — | $ | — | $ | 155,267,391 | |||||||||||
| Preferred Stock | — | — | 7,050 | 7,050 | |||||||||||||||
| Short-Term Investment | — | 1,500,000 | — | 1,500,000 | |||||||||||||||
| Other Financial Instruments* | — | — | — | — | |||||||||||||||
| $ | 155,267,391 | $ | 1,500,000 | $ | 7,050 | $ | 156,774,441 | ||||||||||||
*Other financial instruments include futures, forwards and swap contracts.
As of October 31, 2009, the amounts shown by Large Cap Value as being Level 3 securities that were measured at fair value amounted to less than 0.01% of net assets.
| Small Cap Core | Level 1 | Level 2 | Level 3 | Total | |||||||||||||||
| Investments in Securities | |||||||||||||||||||
| Common Stocks | $ | 83,040,880 | $ | — | $ | — | $ | 83,040,880 | |||||||||||
| Preferred Stock | — | — | 19,270 | 19,270 | |||||||||||||||
| Short-Term Investment | — | 1,610,000 | — | 1,610,000 | |||||||||||||||
| Other Financial Instruments* | — | — | — | — | |||||||||||||||
| $ | 83,040,880 | $ | 1,610,000 | $ | 19,270 | $ | 84,670,150 | ||||||||||||
*Other financial instruments include futures, forwards and swap contracts.
As of October 31, 2009, the amounts shown by Small Cap Core as being Level 3 securities that were measured at fair value amounted to 0.02% of net assets.
B) DERIVATIVE INSTRUMENTS AND HEDGING ACTIVITIES — Effective October 31, 2009, each Fund adopted amendments to authoritative guidance on disclosures about derivative instruments and hedging activities which require that each Fund disclose (a) how and why an entity uses derivative instruments, (b) how derivative instruments and hedging activities are accounted for, and (c) how derivative instruments and related hedging activities affect a fund's financial position, financial performance, and cash flows. The Fund has not entered into any derivative or hedging activities during the period covered by this report.
73
Credit Suisse Funds
Notes to Financial Statements (continued)
October 31, 2009
Note 2. Significant Accounting Policies
C) FOREIGN CURRENCY TRANSACTIONS — The books and records of the Funds are maintained in U.S. dollars. Transactions denominated in foreign currencies are recorded at the current prevailing exchange rates. All assets and liabilities denominated in foreign currencies are translated into U.S. dollar amounts at the current exchange rate at the end of the period. Translation gains or losses resulting from changes in the exchange rate during the reporting period and realized gains and losses on the settlement of foreign currency transactions are reported in the results of operations for the current period. The Funds do not isolate that portion of realized gains and losses on investments in equity securities which is due to changes in the foreign exchange rate from that which is due to changes in market prices of equity securities. The Funds isolate that portion of realized gains and losses on investments in debt securities which is due to changes in the foreign exchange rate from that which is due to changes in market prices of debt securities.
D) SECURITY TRANSACTIONS AND INVESTMENT INCOME — Security transactions are accounted for on a trade date basis. Interest income is recorded on the accrual basis. Dividends are recorded on the ex-dividend date. Certain expenses are class-specific expenses and vary by class. Income, expenses (excluding class-specific expenses) and realized/unrealized gains/losses are allocated proportionately to each class of shares based upon the relative net asset value of the outstanding shares of that class. The cost of investments sold is determined by use of the specific identification method for both financial reporting and income tax purposes.
E) DIVIDENDS AND DISTRIBUTIONS TO SHAREHOLDERS — Dividends from net investment income, if any, are declared and paid quarterly by Large Cap Value and at least annually by Small Cap Core. Distributions of net realized capital gains, if any, are declared and paid at least annually by the Funds. However, to the extent that a net realized capital gain can be reduced by a capital loss carryforward, such gain will not be distributed. Income and capital gain distributions are determined in accordance with federal income tax regulations, which may differ from GAAP.
F) FEDERAL INCOME TAXES — No provision is made for federal taxes as it is each Fund's intention to continue to qualify for and elect the tax treatment applicable to regulated investment companies under the Internal Revenue Code of 1986, as amended, and to make the requisite distributions to its shareholders, which will be sufficient to relieve it from federal income and excise taxes.
74
Credit Suisse Funds
Notes to Financial Statements (continued)
October 31, 2009
Note 2. Significant Accounting Policies
Each Fund adopted the authoritative guidance for uncertainty in income taxes and recognizes a tax benefit from an uncertain position only if it is more likely than not that the position is sustainable based solely on its technical merits and consideration of the relevant taxing authority's widely understood administrative practices and procedures. Each Fund has reviewed its current tax positions and has determined that no provision for income tax is required in each Fund's financial statements. Each Fund's federal tax returns for the prior three fiscal years remain subject to examination by the Internal Revenue Service.
G) USE OF ESTIMATES — The preparation of financial statements in conformity with GAAP requires management to make estimates and assumptions that affect the reported amounts of assets and liabilities and disclosure of contingent assets and liabilities at the date of the financial statements and the reported amounts of income and expenses during the reporting period. Actual results could differ from these estimates.
H) SHORT-TERM INVESTMENTS — The Funds, together with other funds/portfolios advised by Credit Suisse Asset Management, LLC ("Credit Suisse"), an indirect, wholly-owned subsidiary of Credit Suisse Group AG, pool available cash into a short-term variable rate time deposit issued by State Street Bank and Trust Company ("SSB"), the Funds' custodian. The short-term time deposit issued by SSB is a variable rate account classified as a short-term investment.
I) SECURITIES LENDING — Loans of securities are required at all times to be secured by collateral at least equal to 102% of the market value of domestic securities on loan (including any accrued interest thereon) and 105% of the market value of foreign securities on loan (including any accrued interest thereon). Cash collateral received by the Funds in connection with securities lending activity may be pooled together with cash collateral for other funds/portfolios advised by Credit Suisse and may be invested in a variety of investments, including funds advised by SSB, the Funds' securities lending agent, or money market instruments. However, in the event of default or bankruptcy by the other party to the agreement, realization and/or retention of the collateral may be subject to legal proceedings.
SSB has been engaged by the Funds to act as the Funds' securities lending agent. The Funds' securities lending arrangement provides that the Funds and SSB will share the net income earned from securities lending activities. During the year ended October 31, 2009, total earnings from the Funds' investment in cash collateral received in connection with Large Cap Value and Small Cap
75
Credit Suisse Funds
Notes to Financial Statements (continued)
October 31, 2009
Note 2. Significant Accounting Policies
Core's securities lending arrangements were $1,206 and $788, respectively, of which $27 and $13, respectively, were rebated to borrowers (brokers). The Funds retained $1,079 and $649 in income, respectively, from the cash collateral investment, and SSB, as lending agent, was paid $100 and $126, respectively. Securities lending income is accrued as earned.
Note 3. Transactions with Affiliates and Related Parties
Credit Suisse serves as investment adviser for each Fund. For its investment advisory services, Credit Suisse is entitled to receive a fee from Large Cap Value at an annual rate of 0.50% and for Small Cap Core, the lower of 0.70% or the following tiered fee:
| Fund | Annual Rate | ||||||
| Small Cap Core | 0.875% of first $100 million of average daily net assets | ||||||
| 0.75% of next $100 million of average daily net assets | |||||||
| 0.625% of average daily net assets over $200 million | |||||||
For the year ended October 31, 2009, investment advisory fees earned and voluntarily waived were as follows:
| Fund | Gross Investment Advisory Fee | Waiver | Net Investment Advisory Fee | ||||||||||||
| Large Cap Value | $ | 703,672 | $ | (198,343 | ) | $ | 505,329 | ||||||||
| Small Cap Core | 583,408 | (250,099 | ) | 333,309 | |||||||||||
Credit Suisse will not recapture from the Funds any fees it waived during the year ended October 31, 2009. Fee waivers and reimbursements are voluntary and may be discontinued by Credit Suisse at any time.
Credit Suisse Asset Management Securities, Inc. ("CSAMSI"), an affiliate of Credit Suisse, and SSB serve as co-administrators to the Funds. For its co-administrative services, CSAMSI currently receives a fee calculated at an annual rate of 0.09% of each Fund's average daily net assets. For the year ended October 31, 2009, co-administrative services fees earned by CSAMSI were as follows:
| Fund | Co-Administration Fee | ||||||
| Large Cap Value | $ | 126,661 | |||||
| Small Cap Core | 75,010 | ||||||
76
Credit Suisse Funds
Notes to Financial Statements (continued)
October 31, 2009
Note 3. Transactions with Affiliates and Related Parties
For its co-administrative services, SSB receives a fee, exclusive of out-of-pocket expenses, calculated in total for all the Credit Suisse funds/portfolios co-administered by SSB and allocated based upon the relative average net assets of each fund/portfolio, subject to an annual minimum fee. For the year ended October 31, 2009, co-administrative services fees earned by SSB (including out-of-pocket expenses) were as follows:
| Fund | Co-Administration Fee | ||||||
| Large Cap Value | $ | 115,574 | |||||
| Small Cap Core | 84,349 | ||||||
In addition to serving as each Fund's co-administrator, CSAMSI currently serves as distributor of each Fund's shares. Pursuant to distribution plans adopted by each Fund pursuant to Rule 12b-1 under the 1940 Act, CSAMSI receives fees for its distribution services. This fee is calculated at an annual rate of 0.25% of the average daily net assets of the Common Class of Small Cap Core and Class A shares of each Fund. Advisor Class shares of Large Cap Value may pay this fee at an annual rate not to exceed 0.75% of such class' average daily net assets; such fee is currently calculated at the annual rate of 0.50% of the average daily net assets of such class. For the Class B and Class C shares of each Fund, the fee is calculated at an annual rate of 1.00% of average daily net assets.
Certain brokers, dealers and financial representatives provide transfer agent related services to the Funds and receive compensation from Credit Suisse. Credit Suisse is then reimbursed by the Funds. For the year ended October 31, 2009, Small Cap Core reimbursed Credit Suisse $23,298, which is included in the Fund's transfer agent expense.
For the year ended October 31, 2009, CSAMSI and its affiliates advised the Funds that they retained the following amounts from commissions earned on the sale of the Funds' Class A shares:
| Fund | Amount | ||||||
| Large Cap Value | $ | 17,143 | |||||
| Small Cap Core | 8,139 | ||||||
Merrill Corporation ("Merrill"), an affiliate of Credit Suisse, has been engaged by each Fund to provide certain financial printing services. For the year ended October 31, 2009, Merrill was paid for its services by the Funds as follows:
| Fund | Amount | ||||||
| Large Cap Value | $ | 37,903 | |||||
| Small Cap Core | 38,718 | ||||||
77
Credit Suisse Funds
Notes to Financial Statements (continued)
October 31, 2009
Note 4. Line of Credit
The Funds, together with other funds/portfolios advised by Credit Suisse (collectively, the "Participating Funds"), participate in a $50 million committed, unsecured line of credit facility ("Credit Facility") for temporary or emergency purposes with SSB. Under the terms of the Credit Facility, the Participating Funds pay an aggregate commitment fee on the average unused amount of the Credit Facility, which is allocated among the Participating Funds in such manner as is determined by the governing Boards of the Participating Funds. In addition, the Participating Funds pay interest on borrowings at either the Overnight Federal Funds rate or the Overnight LIBOR rate plus a spread. At October 31, 2009 and during the year ended October 31, 2009, Large Cap Value had no borrowings under the Credit Facility. At October 31, 2009, Small Cap Core had no loan outstanding under the Credit Facility. During the year ended October 31, 2009, Small Cap Core had borrowings under the Credit Facility as follows:
| Average Daily Loan Balance | Weighted Average Interest Rate % | Maximum Daily Loan Outstanding | |||||||||
| $ | 2,997,000 | 0.857 | % | $ | 4,974,000 | ||||||
Note 5. Purchases and Sales of Securities
For the year ended October 31, 2009, purchases and sales of investment securities (excluding short-term investments) were as follows:
| Fund | Purchases | Sales | |||||||||
| Large Cap Value | $ | 707,514,890 | $ | 721,594,705 | |||||||
| Small Cap Core | 356,928,484 | 376,144,853 | |||||||||
Note 6. Capital Share Transactions
Large Cap Value is authorized to issue an unlimited number of full and fractional shares of beneficial interest, $.001 par value per share, of which an unlimited number of shares are classified as Common Class shares, Advisor Class shares, Class A shares, Class B shares and Class C shares. Small Cap Core is authorized to issue an unlimited number of full and fractional shares of beneficial interest, $.001 par value per share, of which an unlimited number of
78
Credit Suisse Funds
Notes to Financial Statements (continued)
October 31, 2009
Note 6. Capital Share Transactions
shares are classified as Common Class shares, Class A shares, Class B shares and Class C shares. Transactions in capital shares of the Funds were as follows:
| Large Cap Value | |||||||||||||||||||
| Common Class | |||||||||||||||||||
| For the Year Ended October 31, 2009 | For the Year Ended October 31, 2008 | ||||||||||||||||||
| Shares | Value | Shares | Value | ||||||||||||||||
| Shares issued in reinvestment of dividends and distributions | 481 | $ | 4,387 | 6,448 | $ | 96,151 | |||||||||||||
| Shares redeemed | (1,044 | ) | (10,922 | ) | (5,892 | ) | (82,348 | ) | |||||||||||
| Net increase (decrease) | (563 | ) | $ | (6,535 | ) | 556 | $ | 13,803 | |||||||||||
| Advisor Class | |||||||||||||||||||
| For the Year Ended October 31, 2009 | For the Year Ended October 31, 2008 | ||||||||||||||||||
| Shares | Value | Shares | Value | ||||||||||||||||
| Shares sold | 36,539 | $ | 343,128 | 26,713 | $ | 362,974 | |||||||||||||
| Shares issued in reinvestment of dividends and distributions | 2,466 | 22,379 | 56,720 | 857,931 | |||||||||||||||
| Shares redeemed | (56,458 | ) | (554,306 | ) | (144,547 | ) | (2,051,759 | ) | |||||||||||
| Net decrease | (17,453 | ) | $ | (188,799 | ) | (61,114 | ) | $ | (830,854 | ) | |||||||||
| Class A | |||||||||||||||||||
| For the Year Ended October 31, 2009 | For the Year Ended October 31, 2008 | ||||||||||||||||||
| Shares | Value | Shares | Value | ||||||||||||||||
| Shares sold | 487,330 | $ | 4,568,968 | 553,808 | $ | 7,721,476 | |||||||||||||
| Shares issued in reinvestment of dividends and distributions | 179,251 | 1,632,423 | 3,026,522 | 45,501,396 | |||||||||||||||
| Shares redeemed | (2,229,384 | ) | (20,785,132 | ) | (3,019,504 | ) | (42,030,850 | ) | |||||||||||
| Net increase (decrease) | (1,562,803 | ) | $ | (14,583,741 | ) | 560,826 | $ | 11,192,022 | |||||||||||
| Class B | |||||||||||||||||||
| For the Year Ended October 31, 2009 | For the Year Ended October 31, 2008 | ||||||||||||||||||
| Shares | Value | Shares | Value | ||||||||||||||||
| Shares sold | 11,044 | $ | 97,706 | 25,130 | $ | 363,183 | |||||||||||||
| Shares issued in reinvestment of dividends and distributions | 1,842 | 15,953 | 77,347 | 1,142,704 | |||||||||||||||
| Shares redeemed | (88,424 | ) | (797,485 | ) | (295,714 | ) | (4,099,155 | ) | |||||||||||
| Net decrease | (75,538 | ) | $ | (683,826 | ) | (193,237 | ) | $ | (2,593,268 | ) | |||||||||
79
Credit Suisse Funds
Notes to Financial Statements (continued)
October 31, 2009
Note 6. Capital Share Transactions
| Class C | |||||||||||||||||||
| For the Year Ended October 31, 2009 | For the Year Ended October 31, 2008 | ||||||||||||||||||
| Shares | Value | Shares | Value | ||||||||||||||||
| Shares sold | 1,972 | $ | 19,453 | 5,010 | $ | 70,988 | |||||||||||||
| Shares issued in reinvestment of dividends and distributions | 650 | 5,592 | 19,369 | 283,340 | |||||||||||||||
| Shares redeemed | (14,664 | ) | (107,560 | ) | (37,555 | ) | (496,526 | ) | |||||||||||
| Net decrease | (12,042 | ) | $ | (82,515 | ) | (13,176 | ) | $ | (142,198 | ) | |||||||||
| Small Cap Core | |||||||||||||||||||
| Common Class | |||||||||||||||||||
| For the Year Ended October 31, 2009 | For the Year Ended October 31, 2008 | ||||||||||||||||||
| Shares | Value | Shares | Value | ||||||||||||||||
| Shares sold | 119,702 | $ | 979,480 | 186,693 | $ | 2,333,411 | |||||||||||||
| Shares issued in reinvestment of dividends and distributions | 1,193 | 9,282 | 1,445,424 | 18,631,515 | |||||||||||||||
| Shares redeemed | (346,795 | ) | (2,867,227 | ) | (2,397,574 | ) | (30,848,910 | ) | |||||||||||
| Net decrease | (225,900 | ) | $ | (1,878,465 | ) | (765,457 | ) | $ | (9,883,984 | ) | |||||||||
| Class A | |||||||||||||||||||
| For the Year Ended October 31, 2009 | For the Year Ended October 31, 2008 | ||||||||||||||||||
| Shares | Value | Shares | Value | ||||||||||||||||
| Shares sold | 425,464 | $ | 3,430,260 | 790,044 | $ | 9,992,664 | |||||||||||||
| Shares issued in reinvestment of dividends and distributions | 5,208 | 40,982 | 3,984,893 | 51,963,012 | |||||||||||||||
| Shares redeemed | (2,401,105 | ) | (19,377,580 | ) | (3,742,270 | ) | (47,602,280 | ) | |||||||||||
| Net increase (decrease) | (1,970,433 | ) | $ | (15,906,338 | ) | 1,032,667 | $ | 14,353,396 | |||||||||||
| Class B | |||||||||||||||||||
| For the Year Ended October 31, 2009 | For the Year Ended October 31, 2008 | ||||||||||||||||||
| Shares | Value | Shares | Value | ||||||||||||||||
| Shares sold | 21,723 | $ | 142,940 | 31,010 | $ | 326,117 | |||||||||||||
| Shares issued in reinvestment of dividends and distributions | 71 | 453 | 273,541 | 2,894,059 | |||||||||||||||
| Shares redeemed | (140,305 | ) | (915,961 | ) | (232,783 | ) | (2,491,904 | ) | |||||||||||
| Net increase (decrease) | (118,511 | ) | $ | (772,568 | ) | 71,768 | $ | 728,272 | |||||||||||
80
Credit Suisse Funds
Notes to Financial Statements (continued)
October 31, 2009
Note 6. Capital Share Transactions
| Class C | |||||||||||||||||||
| For the Year Ended October 31, 2009 | For the Year Ended October 31, 2008 | ||||||||||||||||||
| Shares | Value | Shares | Value | ||||||||||||||||
| Shares sold | 132,977 | $ | 901,105 | 156,343 | $ | 1,619,943 | |||||||||||||
| Shares issued in reinvestment of dividends and distributions | 111 | 699 | 449,314 | 4,708,809 | |||||||||||||||
| Shares redeemed | (130,072 | ) | (840,109 | ) | (529,498 | ) | (5,207,344 | ) | |||||||||||
| Net increase | 3,016 | $ | 61,695 | 76,159 | $ | 1,121,408 | |||||||||||||
Small Cap Core imposes a 2% redemption fee on all classes of shares currently being offered that are purchased on or after March 1, 2007 and redeemed or exchanged within 30 days from the date of purchase. Reinvested dividends and distributions are not subject to the fee. The fee is charged based on the value of shares at redemption, is paid directly to the Fund and becomes part of the Fund's daily net asset value calculation. When shares are redeemed that are subject to the fee, reinvested dividends are redeemed first, followed by the shares held longest.
On October 31, 2009, the number of shareholders that held 5% or more of the outstanding shares of each class of the Funds was as follows:
| Number of Shareholders | Approximate Percentage of Outstanding Shares | ||||||||||
| Large Cap Value | |||||||||||
| Common Class | 4 | 79 | % | ||||||||
| Advisor Class | 2 | 98 | % | ||||||||
| Class A | 2 | 18 | % | ||||||||
| Class B | 2 | 16 | % | ||||||||
| Class C | 3 | 45 | % | ||||||||
| Small Cap Core | |||||||||||
| Common Class | 4 | 59 | % | ||||||||
| Class A | 1 | 6 | % | ||||||||
| Class B | 1 | 5 | % | ||||||||
| Class C | 1 | 6 | % | ||||||||
Some of the shareholders are omnibus accounts, which hold shares on behalf of individual shareholders.
Note 7. Federal Income Taxes
Income and capital gain distributions are determined in accordance with federal income tax regulations, which may differ from GAAP.
81
Credit Suisse Funds
Notes to Financial Statements (continued)
October 31, 2009
Note 7. Federal Income Taxes
The tax characteristics of dividends and distributions paid during the years ended October 31, 2009 and 2008, respectively, by the Funds were as follows:
| Ordinary Income | Long-Term Capital Gain | Return of Capital | |||||||||||||||||||||||||
| Fund | 2009 | 2008 | 2009 | 2008 | 2009 | 2008 | |||||||||||||||||||||
| Large Cap Value | $ | 1,861,910 | $ | 26,789,138 | $ | 0 | $ | 25,270,723 | $ | 0 | $ | 0 | |||||||||||||||
| Small Cap Core | 0 | 18,377,735 | 0 | 65,335,144 | 55,236 | 0 | |||||||||||||||||||||
The tax basis components of distributable earnings differ from the amounts reflected in the Statement of Assets and Liabilities by temporary book/tax differences. These differences are primarily due to wash sales, real estate investment trusts and cumulative basis adjustments on partnerships. At October 31, 2009, the components of distributable earnings on a tax basis for the Funds were as follows:
| Large Cap Value | Small-Cap Core | ||||||||||
| Undistributed net investment income | $ | 410,092 | $ | — | |||||||
| Accumulated realized loss | (44,774,521 | ) | (44,173,945 | ) | |||||||
| Unrealized depreciation | (121,523 | ) | (2,537,663 | ) | |||||||
| $ | (44,485,952 | ) | $ | (46,711,608 | ) | ||||||
At October 31, 2009, the Funds had capital loss carryforwards available to offset possible future capital gains as follows:
| Expires October 31, | |||||||||||
| Fund | 2016 | 2017 | |||||||||
| Large Cap Value | $ | 20,128,002 | $ | 24,646,519 | |||||||
| Small Cap Core | 16,052,894 | 28,121,051 | |||||||||
During the tax year ended October 31, 2009, the Funds did not utilize any of the capital loss carryforwards.
It is uncertain whether the Funds will be able to realize the benefits of the capital loss carryforwards before they expire.
At October 31, 2009, the identified cost for federal income tax purposes, as well as the gross unrealized appreciation from investments for those securities having an excess of value over cost, gross unrealized depreciation from
82
Credit Suisse Funds
Notes to Financial Statements (continued)
October 31, 2009
Note 7. Federal Income Taxes
investments for those securities having an excess of cost over value and the net unrealized appreciation (depreciation) from investments were as follows:
| Fund | Identified Cost | Gross Unrealized Appreciation | Gross Unrealized Depreciation | Net Unrealized Appreciation/ (Depreciation) | |||||||||||||||
| Large Cap Value | $ | 156,895,960 | $ | 3,782,126 | $ | (3,903,645 | ) | $ | (121,519 | ) | |||||||||
| Small Cap Core | 87,207,813 | 2,642,649 | (5,180,312 | ) | (2,537,663 | ) | |||||||||||||
At October 31, 2009, accumulated undistributed net investment income, accumulated net realized gain (loss) on investments and paid-in capital have been adjusted for current period permanent book/tax differences which arose principally from differing book/tax treatments of foreign currency gain/(loss), partnership investments, real estate investment trusts, net operating losses and dividend redesignations. Net assets were not affected by these reclassifications.
| Fund | Paid-In Capital | Undistributed Net Investment Income/(Loss) | Accumulated Net Realized Gain/(Loss) on Investment | ||||||||||||
| Large Cap Value | $ | (6 | ) | $ | (46,019 | ) | $ | 46,025 | |||||||
| Small Cap Core | (301,826 | ) | 179,051 | 122,775 | |||||||||||
Note 8. Contingencies
In the normal course of business, the Funds may provide general indemnifications pursuant to certain contracts and organizational documents. The Funds' maximum exposure under these arrangements is dependent on future claims that may be made against the Funds and, therefore, cannot be estimated; however, based on experience, the risk of loss from such claims is considered remote.
Note 9. Subsequent Events
Effective October 31, 2009, each Fund adopted the FASB amendments to general standards on accounting for and disclosures of subsequent events. Management has evaluated the possibility of subsequent events existing in the Funds' financial statements through December 23, 2009. Management has determined that there are no material events that would require disclosure in the Funds' financial statements through this date.
83
Credit Suisse Funds
Report of Independent Registered Public Accounting Firm
To the Board of Trustees and Shareholders of
Credit Suisse Large Cap Value Fund and
Credit Suisse Small Cap Core Fund:
In our opinion, the accompanying statements of assets and liabilities, including the schedules of investments, and the related statements of operations and of changes in net assets and the financial highlights present fairly, in all material respects, the financial position of Credit Suisse Large Cap Value Fund and Credit Suisse Small Cap Core Fund (collectively the "Funds"), portfolios of Credit Suisse Capital Funds, at October 31, 2009, the results of their operations for the year then ended and the changes in each of their net assets and the financial highlights for the periods presented, in conformity with accounting principles generally accepted in the United States of America. These financial statements and financial highlights (hereafter referred to as "financial statements") are the responsibility of the Funds' management. Our responsibility is to express an opinion on these financial statements based on our audits. We conducted our audits of these financial statements in accordance with the standards of the Public Company Accounting Oversight Board (United States). Those standards require that we plan and perform the audits to obtain reasonable assurance about whether the financial statements are free of material misstatement. An audit includes examining, on a test basis, evidence supporting the amounts and disclosures in the financial statements, assessing the accounting principles used and significant estimates made by management, and evaluating the overall financial statement presentation. We believe that our audits, which included confirmation of securities at October 31, 2009 by correspondence with the custodian and brokers, provide a reasonable basis for our opinion.
PricewaterhouseCoopers LLP
Boston, Massachusetts
December 23, 2009
84
Credit Suisse Funds
Information Concerning Trustees and Officers (unaudited)
| Name, Address (Year of Birth) | Position(s) Held with Fund | Term of Office1 and Length of Time Served | Principal Occupation(s) During Past Five Years | Number of Portfolios in Fund Complex Overseen by Trustee | Other Directorships Held by Trustee | ||||||||||||||||||
| Independent Trustees | |||||||||||||||||||||||
| Enrique Arzac c/o Credit Suisse Asset Management, LLC Attn: General Counsel Eleven Madison Avenue New York, New York 10010 (1941) | Trustee, Audit Committee Chairman and Nominating Committee Member | Since 2005 | Professor of Finance and Economics, Graduate School of Business, Columbia University since 1971. | 13 | Director of Epoch Holding Corporation (an investment management and investment advisory services company); Director of The Adams Express Company, Petroleum and Resources Corporation, The Chile Fund, Inc., The Indonesia Fund, Inc., The First Israel Fund, Inc., The Latin America Equity Fund, Inc. and The Emerging Markets Telecommunications Fund, Inc. (each a closed-end investment company). | ||||||||||||||||||
| Jeffrey E. Garten Box 208200 New Haven, Connecticut 06520-8200 (1946) | Trustee, Audit and Nominating Committee Member | Since 2001 | The Juan Trippe Professor in the Practice of International Trade, Finance and Business from July 2005 to present; Partner and Chairman of Garten Rothkopf (consulting firm) from October 2005 to present; Dean of Yale School of Management from November 1995 to June 2005. | 11 | Director of Aetna, Inc. (insurance company); Director of CarMax Group (used car dealers). | ||||||||||||||||||
1 Each Trustee and Officer serves until his or her respective successor has been duly elected and qualified.
85
Credit Suisse Funds
Information Concerning Trustees and Officers (unaudited) (continued)
| Name, Address (Year of Birth) | Position(s) Held with Fund | Term of Office1 and Length of Time Served | Principal Occupation(s) During Past Five Years | Number of Portfolios in Fund Complex Overseen by Trustee | Other Directorships Held by Trustee | ||||||||||||||||||
| Independent Trustees | |||||||||||||||||||||||
| Peter F. Krogh SFS/ICC 702 Georgetown University Washington, DC 20057 (1937) | Trustee, Audit and Nominating Committee Member | Since 2001 | Dean Emeritus and Distinguished Professor of International Affairs at the Edmund A. Walsh School of Foreign Service, Georgetown University from June 1995 to present. | 11 | Director of Carlisle Companies Incorporated (diversified manufacturing company). | ||||||||||||||||||
| Steven N. Rappaport Lehigh Court, LLC 555 Madison Avenue 29th Floor New York, New York 10022 (1948) | Chairman of the Board of Trustees, Audit Committee Member and Nominating Committee Chairman | Trustee since 2001 and Chairman since 2005 | Partner of Lehigh Court, LLC and RZ Capital (private investment firms) from July 2002 to present. | 13 | Director of iCAD, Inc. (surgical and medical instruments and apparatus company); Director of Presstek, Inc. (digital imaging technologies company); Director of Wood Resources, LLC. (plywood manufacturing company); Director of The Chile Fund, Inc., The Indonesia Fund, Inc., The First Israel Fund, Inc., The Latin America Equity Fund, Inc. and The Emerging Markets Telecommunications Fund, Inc. (each a closed-end investment company). | ||||||||||||||||||
86
Credit Suisse Funds
Information Concerning Trustees and Officers (unaudited) (continued)
| Name, Address (Year of Birth) | Position(s) Fund | Term of Office1 and Length Held with Served | of Time Principal Occupation(s) During Past Five Years | ||||||||||||
| Officers** | |||||||||||||||
| George R. Hornig Credit Suisse Asset Management, LLC Eleven Madison Avenue New York, New York 10010 (1954) | Chief Executive Officer and President | Since 2008 | Managing Director of Credit Suisse; Co-Chief Operating Officer of Asset Management and Head of Asset Management Americas; Associated with Credit Suisse since 1999; Officer of other Credit Suisse Funds. | ||||||||||||
| Michael A. Pignataro Credit Suisse Asset Management, LLC Eleven Madison Avenue New York, New York 10010 (1959) | Chief Financial Officer | Since 1999 | Director and Director of Fund Administration of Credit Suisse; Associated with Credit Suisse or its predecessor since 1984; Officer of other Credit Suisse Funds. | ||||||||||||
| Emidio Morizio Credit Suisse Asset Management, LLC Eleven Madison Avenue New York, New York 10010 (1966) | Chief Compliance Officer | Since 2004 | Director and Global Head of Compliance of Credit Suisse; Associated with Credit Suisse since July 2000; Officer of other Credit Suisse Funds. | ||||||||||||
| J. Kevin Gao Credit Suisse Asset Management, LLC Eleven Madison Avenue New York, New York 10010 (1967) | Chief Legal Officer since 2006, Vice President and Secretary since 2004 | Since 2004 | Director and Legal Counsel of Credit Suisse; Associated with Credit Suisse since July 2003; Officer of other Credit Suisse Funds. | ||||||||||||
| Cecilia Chau Credit Suisse Asset Management, LLC Eleven Madison Avenue New York, New York 10010 (1973) | Treasurer | Since 2008 | Vice President of Credit Suisse since 2009; Assistant Vice President of Credit Suisse from June 2007 to December 2008; Associated with Alliance Bernstein L.P. from January 2007 to May 2007; Associated with Credit Suisse from August 2000 to December 2006; Officer of other Credit Suisse Funds. | ||||||||||||
** The officers of the Fund shown are officers that make policy decisions.
The Statement of Additional Information includes additional information about the Trustees and is available, without charge, upon request, by calling 877-870-2874.
87
Credit Suisse Funds
Tax Information Letter
October 31, 2009 (unaudited)
Important Tax Information for Corporate Shareholders
Corporate shareholders should note for the year ended October 31, 2009, the percentage of the Fund's investment income (i.e., net investment income plus short-term capital gains) that qualified for the intercorporate dividends received deduction is 100% for the Large Cap Value Fund.
Important Tax Information for Shareholders
For the fiscal year ended October 31, 2009, the Large Cap Value Fund designates approximately $1,861,910, or up to the maximum amount of such dividends allowable pursuant to the Internal Revenue Code, as qualified dividend income eligible for reduced tax rates. These lower rates range from 5% to 15% depending on an individual's tax bracket. If the Fund pays a distribution during the calendar year 2009, complete information will be reported in conjunction with Form 1099-DIV.
88
Credit Suisse Funds
Proxy Voting and Portfolio Holdings Information (unaudited)
Information regarding how each Fund voted proxies related to its portfolio securities during the 12 month period ended June 30 of each year, as well as the policies and procedures that each Fund uses to determine how to vote proxies relating to its portfolio securities are available:
• By calling 1-877-870-2874
• On the Funds' website, www.credit-suisse.com/us
• On the website of the Securities and Exchange Commission, www.sec.gov.
Each Fund files a complete schedule of its portfolio holdings for the first and third quarters of its fiscal year with the SEC on Form N-Q. The Funds' Forms N-Q are available on the SEC's website at www.sec.gov and may be reviewed and copied at the SEC's Public Reference Room in Washington, DC. Information on the operation of the SEC's Public Reference Room may be obtained by calling 1-202-551-8090.
89

P.O. BOX 55030, BOSTON, MA 02205-5030
877-870-2874 n www.credit-suisse.com/us
CREDIT SUISSE ASSET MANAGEMENT SECURITIES, INC., DISTRIBUTOR. USEQVAL-AR-1009
Item 2. Code of Ethics.
The registrant has adopted a code of ethics applicable to its Chief Executive Officer, President, Chief Financial Officer and Chief Accounting Officer, or persons performing similar functions. A copy of the code is filed as Exhibit 12(a)(1) to this Form. There were no amendments to the code during the fiscal year ended October 31, 2009. There were no waivers or implicit waivers from the code granted by the registrant during the fiscal year ended October 31, 2009.
Item 3. Audit Committee Financial Expert.
The registrant’s governing board has determined that it has two audit committee financial experts serving on its audit committee: Enrique R. Arzac and Steven N. Rappaport. Each audit committee financial expert is “independent” for purposes of this item.
Item 4. Principal Accountant Fees and Services.
(a) through (d). The information in the table below is provided for services rendered to the registrant by its independent registered public accounting firm, PricewaterhouseCoopers LLP (“PwC”), for its fiscal years ended October 31, 2008 and October 31, 2009.
|
| 2008 |
| 2009 |
| ||
Audit Fees |
| $ | 76,200 |
| $ | 60,000 |
|
Audit-Related Fees(1) |
| $ | 10,200 |
| $ | 6,800 |
|
Tax Fees(2) |
| $ | 10,200 |
| $ | 5,600 |
|
All Other Fees |
| — |
| — |
| ||
Total |
| $ | 96,600 |
| $ | 72,400 |
|
(1) Services include agreed-upon procedures in connection with the registrant’s semi-annual financial statements ($10,200 for 2008 and $6,800 for 2009).
(2) Tax services in connection with the registrant’s excise tax calculations and review of the registrant’s applicable tax returns.
The information in the table below is provided with respect to non-audit services that directly relate to the registrant’s operations and financial reporting and that were rendered by PwC to the registrant’s
investment adviser, Credit Suisse Asset Management, LLC (“Credit Suisse”), and any service provider to the registrant controlling, controlled by or under common control with Credit Suisse that provided ongoing services to the registrant (“Covered Services Provider”), for the registrant’s fiscal years ended October 31, 2008 and October 31, 2009.
|
| 2008 |
| 2009 |
|
Audit-Related Fees |
| N/A |
| N/A |
|
Tax Fees |
| N/A |
| N/A |
|
All Other Fees |
| N/A |
| N/A |
|
Total |
| N/A |
| N/A |
|
(e)(1) Pre-Approval Policies and Procedures. The Audit Committee (“Committee”) of the registrant is responsible for pre-approving (i) all audit and permissible non-audit services to be provided by the independent registered public accounting firm to the registrant and (ii) all permissible non-audit services to be provided by the independent registered public accounting firm to Credit Suisse and any Covered Services Provider if the engagement relates directly to the operations and financial reporting of the registrant. The Committee may delegate its responsibility to pre-approve any such audit and permissible non-audit services to the Chairperson of the Committee, and the Chairperson shall report to the Committee, at its next regularly scheduled meeting after the Chairperson’s pre-approval of such services, his or her decision(s). The Committee may also establish detailed pre-approval policies and procedures for pre-approval of such services in accordance with applicable laws, including the delegation of some or all of the Committee’s pre-approval responsibilities to other persons (other than Credit Suisse or the registrant’s officers). Pre-approval by the Committee of any permissible non-audit services shall not be required so long as: (i) the aggregate amount of all such permissible non-audit services provided to the registrant, Credit Suisse and any Covered Services Provider constitutes not more than 5% of the total amount of revenues paid by the registrant to its independent registered public accounting firm during the fiscal year in which the permissible non-audit services are provided; (ii) the permissible non-audit services were not recognized by the registrant at the time of the engagement to be non-audit services; and (iii) such services are promptly brought to the attention of the Committee and approved by the Committee (or its delegate(s)) prior to the completion of the audit.
(e)(2) The information in the table below sets forth the percentages of fees for services (other than audit, review or attest services) rendered by PwC to the registrant for which the pre-approval requirement was waived pursuant to Rule 2-01(c)(7)(i)(C) of Regulation S-X:
|
| 2008 |
| 2009 |
|
Audit-Related Fees |
| N/A |
| N/A |
|
Tax Fees |
| N/A |
| N/A |
|
All Other Fees |
| N/A |
| N/A |
|
Total |
| N/A |
| N/A |
|
The information in the table below sets forth the percentages of fees for services (other than audit, review or attest services) rendered by PwC to Credit Suisse and any Covered Services Provider required to be approved pursuant to Rule 2-01(c)(7)(ii) of Regulation S-X, for the registrant’s fiscal years ended October 31, 2008 and October 31, 2009:
|
| 2008 |
| 2009 |
|
Audit-Related Fees |
| N/A |
| N/A |
|
Tax Fees |
| N/A |
| N/A |
|
All Other Fees |
| N/A |
| N/A |
|
Total |
| N/A |
| N/A |
|
(f) Not Applicable.
(g) The aggregate fees billed by PwC for non-audit services rendered to the registrant, Credit Suisse and Covered Service Providers for the fiscal years ended October 31, 2008 and October 31, 2009 were $20,400 and $12,400, respectively.
(h) Not Applicable.
Item 5. Audit Committee of Listed Registrants.
Form N-CSR disclosure requirement is not applicable to the registrant.
Item 6. Schedule of Investments.
Included as part of the report to shareholders filed under Item 1 of this Form.
Item 7. Disclosure of Proxy Voting Policies and Procedures for Closed-End Management Investment Companies.
Form N-CSR disclosure requirement is not applicable to the registrant.
Item 8. Portfolio Managers of Closed-End Management Investment Companies.
Form N-CSR disclosure requirement is not applicable to the registrant.
Item 9. Purchases of Equity Securities by Closed-End Management Investment Company and Affiliated Purchasers.
Form N-CSR disclosure requirement is not applicable to the registrant.
Item 10. Submission of Matters to a Vote of Security Holders.
None.
Item 11. Controls and Procedures.
(a) As of a date within 90 days from the filing date of this report, the principal executive officer and principal financial officer concluded that the registrant’s disclosure controls and procedures (as defined in Rule 30a-3(c) under the Investment Company Act of 1940 (the “Act”)) were effective based on their evaluation of the disclosure controls and procedures required by Rule 30a-3(b) under the Act and Rules 13a-15(b) or 15d-15(b) under the Securities Exchange Act of 1934.
(b) There were no changes in registrant’s internal control over financial reporting (as defined in Rule 30a-3(d) under the Act) that occurred during the second fiscal quarter of the period covered by this report that have materially affected, or are reasonably likely to materially affect, the registrant’s internal control over financial reporting.
Item 12. Exhibits.
(a)(1) Registrant’s Code of Ethics is an exhibit to this report.
(a)(2) The certifications of the registrant as required by Rule 30a-2(a) under the Act are exhibits to this report.
(a)(3) Not applicable.
(b) The certifications of the registrant as required by Rule 30a-2(b) under the Act are an exhibit to this report.
SIGNATURES
Pursuant to the requirements of the Securities Exchange Act of 1934 and the Investment Company Act of 1940, the registrant has duly caused this report to be signed on its behalf by the undersigned, thereunto duly authorized.
| CREDIT SUISSE CAPITAL FUNDS |
|
|
|
|
| /s/ George R. Hornig |
|
| Name: George R. Hornig |
|
| Title: Chief Executive Officer |
|
| Date: January 4, 2010 |
|
Pursuant to the requirements of the Securities Exchange Act of 1934 and the Investment Company Act of 1940, this report has been signed below by the following persons on behalf of the registrant and in the capacities and on the dates indicated.
| /s/ George R. Hornig |
|
| Name: George R. Hornig |
|
| Title: Chief Executive Officer |
|
| Date: January 4, 2010 |
|
|
|
|
| /s/ Michael A. Pignataro |
|
| Name: Michael A. Pignataro |
|
| Title: Chief Financial Officer |
|
| Date: January 4, 2010 |
|