UNITED STATES
SECURITIES AND EXCHANGE COMMISSION
Washington, D.C. 20549
FORM N-CSR
CERTIFIED SHAREHOLDER REPORT OF REGISTERED MANAGEMENT INVESTMENT COMPANIES
Investment Company Act file number: 811-04612
Name of Fund: BlackRock EuroFund
Fund Address: 100 Bellevue Parkway, Wilmington, DE 19809
Name and address of agent for service: John M. Perlowski, Chief Executive Officer, BlackRock EuroFund, 55 East 52nd Street, New York, NY 10055
Registrant’s telephone number, including area code: (800) 441-7762
Date of fiscal year end: 06/30/2014
Date of reporting period: 06/30/2014
Item 1 – Report to Stockholders
JUNE 30, 2014
| | | | | | |
ANNUAL REPORT | | | | | |  |
BlackRock EuroFund
BlackRock Global SmallCap Fund, Inc.
|
| Not FDIC Insured • May Lose Value • No Bank Guarantee |
| | | | | | |
| | | | | | | |
| 2 | | ANNUAL REPORT | | JUNE 30, 2014 | | |
Dear Shareholder,
The latter half of 2013 was a strong period for equities and other risk assets such as high yield bonds, despite the mixed tone of economic and financial news and uncertainty as to when and by how much the U.S. Federal Reserve (the “Fed”) would begin to gradually reduce (or “taper”) its asset purchase programs. Stock markets rallied in September when the Fed defied investors’ expectations with its decision to delay tapering. The momentum was soon disrupted, however, when political brinksmanship over decisions relating to the U.S. debt ceiling led to a partial government shutdown, roiling financial markets broadly until a compromise was struck in mid-October. The remainder of 2013 was generally positive for developed market stocks, while fixed income and emerging market investments struggled as Fed tapering became increasingly imminent. When the central bank ultimately announced its tapering plans in mid-December, equity investors reacted positively, as this action signaled the Fed’s perception of real improvement in the economy.
Financial markets continued to move higher in the first half of 2014 despite the gradual pull back in Fed stimulus. The year got off to a rocky start, however. A number of emerging economies showed signs of stress due to currency weakness, debt problems and uneven growth rates, while facing the broader headwind of diminishing global liquidity. Heightened risks in emerging markets combined with disappointing U.S. economic data caused equities to decline in January while bond markets found renewed strength from investors seeking relatively safer assets.
Although these headwinds persisted, equities were back on the rise in February as investors were encouraged by a one-year extension of the U.S. debt ceiling and market-friendly comments from the new Fed Chairwoman, Janet Yellen. While it was clear that U.S. economic data had softened, investors were assuaged by increasing evidence that the trend was temporary and weather-related, and continued to take on risk given expectations that growth would pick up later in the year.
In the months that followed, interest rates trended lower and bond prices climbed higher in the modest growth environment. Financial markets exhibited a remarkably low level of volatility despite rising geopolitical risks and mixed global economic data. Tensions in Russia and Ukraine and signs of decelerating growth in China caused some turbulence, but markets were resilient as investors focused on better U.S. economic data, stronger corporate earnings and increased merger-and-acquisition activity. Additionally, investors were comforted by comments from the Fed offering reassurance that no changes to short-term interest rates were on the horizon. Equity investors shifted from growth to value stocks as the strong performance of growth stocks in 2013 had pushed valuations higher in many of these sectors. More broadly, the strongest performers of 2013 struggled most in 2014, and vice versa. Emerging markets particularly benefited from this rotation into cheaper valuations. For investors in these markets, technical factors overshadowed the risks and emerging market investments surged even as a military coup in Thailand was added to the growing list of geopolitical issues in May.
Escalating violence in Iraq pushed oil prices sharply higher in June, causing a brief dip in stock markets around the world as investors were reminded of the broader risk that instability in the Middle East and North Africa poses to global oil production, although oil prices retreated later in the month. Improving U.S. data and a steady stream of mergers and acquisitions again took center stage and equities quickly resumed their upward course. Additionally, global investors were encouraged by aggressive measures taken by the European Central Bank to combat the uncomfortably low level of inflation in the eurozone, while the Fed continued to maintain a dovish stance.
All told, the riskier asset classes strongly outperformed higher quality investments for the 12-month period ended June 30. Nonetheless, most fixed income assets performed surprisingly well in the first half of 2014 even as the Fed reduced its open-market bond purchases. U.S. large cap stocks were the strongest performers in both the six- and 12-month periods, while small cap stocks lagged in the last six months given higher valuations resulting from their strong performance in 2013. Short-term interest rates remained near zero, keeping yields on money market securities close to historic lows.
At BlackRock, we believe investors need to think globally, extend their scope across a broad array of asset classes and be prepared to move freely as market conditions change over time. We encourage you to talk with your financial advisor and visit blackrock.com for further insight about investing in today’s world.
Sincerely,

Rob Kapito
President, BlackRock Advisors, LLC

Asset prices pushed higher over the period despite modest global growth, geopolitical risks and a shift toward tighter U.S. monetary policy.
Rob Kapito
President, BlackRock Advisors, LLC
| | | | | | | | |
| Total Returns as of June 30, 2014 | |
| | | 6-month | | | 12-month | |
U.S. large cap equities
(S&P 500® Index) | | | 7.14 | % | | | 24.61 | % |
U.S. small cap equities
(Russell 2000® Index) | | | 3.19 | | | | 23.64 | |
International equities
(MSCI Europe, Australasia,
Far East Index) | | | 4.78 | | | | 23.57 | |
Emerging market equities
(MSCI Emerging
Markets Index) | | | 6.14 | | | | 14.31 | |
3-month Treasury bills
(BofA Merrill Lynch 3-Month
U.S. Treasury Bill Index) | | | 0.02 | | | | 0.05 | |
U.S. Treasury securities
(BofA Merrill Lynch 10-Year
U.S. Treasury Index) | | | 6.13 | | | | 2.84 | |
U.S. investment-grade
bonds (Barclays
U.S. Aggregate Bond Index) | | | 3.93 | | | | 4.37 | |
Tax-exempt municipal
bonds (S&P Municipal
Bond Index) | | | 6.07 | | | | 6.08 | |
U.S. high yield bonds
(Barclays U.S.
Corporate High Yield 2%
Issuer Capped Index) | | | 5.46 | | | | 11.72 | |
| Past performance is no guarantee of future results. Index performance is shown for illustrative purposes only. You cannot invest directly in an index. | |
| | | | | | |
| | | | | | | |
| | THIS PAGE NOT PART OF YOUR FUND REPORT | | | | 3 |
| | |
| Fund Summary as of June 30, 2014 | | BlackRock EuroFund |
BlackRock EuroFund’s (the “Fund”) investment objective is to seek capital appreciation primarily through investment in equities of corporations domiciled in European countries.
| | |
| Portfolio Management Commentary | | |
How did the Fund perform?
| Ÿ | | For the 12-month period ended June 30, 2014, the Fund underperformed its benchmark, the Morgan Stanley Capital International (“MSCI”) Europe Index. |
What factors influenced performance?
| Ÿ | | European equities generated strong performance during the 12-month period as global central bank policies remained accommodative and the region’s economic environment showed signs of improvement. In this environment, both the Fund and the MSCI Europe Index produced strong returns; however, the Fund underperformed the benchmark index due to several factors. At the sector allocation level, an underweight to utilities hindered the Fund’s returns. Stock selection detracted from performance in the health care sector. In particular, shares of German pharmaceutical Merck KGaA fell following the resignation of its Chief Financial Officer, and France’s largest drugmaker Sanofi came under pressure after the company’s management alluded to possible earnings downgrades for 2014. Not owning the Irish-domiciled pharmaceutical firm Shire PLC hurt the Fund’s relative performance as speculation around merger and acquisition activity drove the stock price higher during the period. |
| Ÿ | | Individual positions that detracted from performance included Portuguese food retail business Jeronimo Martins SGPS SA, which suffered amid increasing price competition in the Polish food market. The Fund continued to maintain this position given the investment advisor’s positive view on the company’s competitive position for the longer term. Irish airline Ryanair Holdings PLC was another notable detractor. After declining in the latter half of 2013 on profit warnings, Ryanair Holdings PLC rebounded in the first quarter of 2014 after the company reported strong forward bookings and an easing of price competition in the airline industry. This news lifted investors’ hopes that the stock could regain positive momentum as the company implemented a customer service overhaul. However, the stock sold off again toward the end of the period as a spike in oil prices resulting from geopolitical risk in the Middle East caused further caution from investors. The Fund continued to hold Ryanair Holdings PLC based on the investment advisor’s view that the company is well equipped to deal with oil price volatility and has a strong track record of capacity discipline during such periods. Lastly, the Fund’s position in French media company Publicis Groupe SA had a negative impact on performance as the stock price dropped following news that the company’s plans to merge with Omnicom had deteriorated. |
| Ÿ | | Contributing positively to the Fund’s performance at the sector allocation level was an underweight in consumer staples as the sector significantly lagged the broader equity market. Stock selection in the financials sector proved advantageous with the strongest contributions coming from holdings in Societe Generale SA (France), Commerzbank AG (Germany), ING Groep NV CVA (Netherlands) and KBC Groep NV (Belgium). Additional positive results came from toll road operators Atlantia SpA (Italy) and Vinci SA (France). |
Describe recent portfolio activity.
| Ÿ | | During the 12-month period, the Fund moved to an overweight in the energy sector where earnings revisions continued to improve. The Fund sold BG Group PLC (United Kingdom) early in 2014 and bought it back later in the period given the company’s forecast for an inflection point in free cash flow in 2015 and potential cash returns to investors as the asset base is monetized through developments or disposals. The Fund initiated a position in oil company Total SA (France), which offered an improving cash generation profile. The Fund’s underweight in the materials sector was reduced during the period due to a new position in Swiss cement maker Holcim Ltd. following the announcement of the company’s intentions to merge with Lafarge SA (France). The merger is expected to result in reduced costs and overcapacity for both companies. The Fund also initiated a position in crop chemicals manufacturer Syngenta AG (Switzerland), which has experienced substantial growth driven by new products and business lines and benefited from an increase in soft commodity prices. The Fund took profits on holdings in the media industry with sales of Reed Elsevier NV (Netherlands) and Kabel Deutschland Holding AG (Germany), and within telecommunication services (“telecom”) by selling Vodafone Group PLC (United Kingdom). |
Describe portfolio positioning at period end.
| Ÿ | | Relative to the MSCI Europe Index, the Fund ended the period overweight in the energy, information technology, materials and industrials sectors, with a neutral weighting in health care, and underweight exposures to financials, consumer staples, utilities, consumer discretionary and telecom. |
The views expressed reflect the opinions of BlackRock as of the date of this report and are subject to change based on changes in market, economic or other conditions. These views are not intended to be a forecast of future events and are no guarantee of future results.
| | |
| Ten Largest Holdings | | Percent of
Long-Term Investments |
| | | | |
Royal Dutch Shell PLC, Class B | | | 5 | % |
Total SA | | | 5 | |
Roche Holding AG | | | 4 | |
Bayer AG, Registered Shares | | | 3 | |
Astra Zeneca PLC | | | 3 | |
Imperial Tobacco Group PLC | | | 3 | |
Rio Tinto PLC | | | 3 | |
Prudential PLC | | | 3 | |
Novo Nordisk A/S, Class B | | | 3 | |
Anheuser-Busch InBev NV | | | 3 | |
| | |
| Geographic Allocation | | Percent of
Long-Term Investments |
| | | | |
France | | | 26 | % |
United Kingdom | | | 23 | |
Netherlands | | | 11 | |
Germany | | | 10 | |
Switzerland | | | 9 | |
Italy | | | 7 | |
Belgium | | | 5 | |
Denmark | | | 3 | |
Ireland | | | 2 | |
Spain | | | 2 | |
Portugal | | | 1 | |
Sweden | | | 1 | |
| | | | | | |
| | | | | | | |
| 4 | | ANNUAL REPORT | | JUNE 30, 2014 | | |
| | |
| Total Return Based on a $10,000 Investment | | |
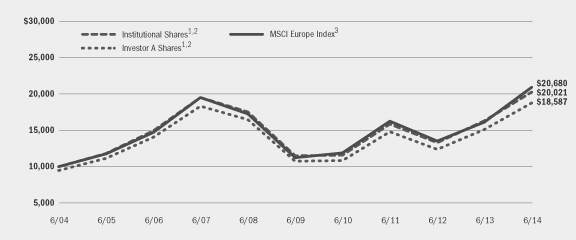
| | 1 | | Assuming maximum sales charge, if any, transaction costs and other operating expenses, including investment advisory fees. Institutional Shares do not have a sales charge. |
| | 2 | | Under normal circumstances, the Fund will invest at least 80% of its net assets in equity securities, including common stock and convertible securities, of companies located in Europe. The Fund currently expects that a majority of the Fund’s assets will be invested in equity securities of companies in Western European countries, but may also invest in emerging markets in Eastern European countries. |
| | 3 | | This index is a free float-adjusted market capitalization weighted index that is designed to measure the equity market performance of the developed markets in Europe. |
| | |
| Performance Summary for the Period Ended June 30, 2014 | | |
| | | | | | | | | | | | | | | | | | | | | | | | | | | | |
| | | | | | Average Annual Total Returns4 | |
| | | | | | 1 Year | | | 5 Years | | | 10 Years | |
| | | 6-Month
Total Returns | | | w/o sales
charge | | | w/sales
charge | | | w/o sales
charge | | | w/sales
charge | | | w/o sales
charge | | | w/sales
charge | |
Institutional | | | 1.34 | % | | | 24.06 | % | | | N/A | | | | 11.84 | % | | | N/A | | | | 7.19 | % | | | N/A | |
Investor A | | | 1.30 | | | | 23.83 | | | | 17.33 | % | | | 11.61 | | | | 10.41 | % | | | 6.97 | | | | 6.40 | % |
Investor C | | | 0.86 | | | | 22.76 | | | | 21.76 | | | | 10.65 | | | | 10.65 | | | | 6.08 | | | | 6.08 | |
Class R | | | 0.96 | | | | 23.05 | | | | N/A | | | | 10.97 | | | | N/A | | | | 6.43 | | | | N/A | |
MSCI Europe Index | | | 5.48 | | | | 29.29 | | | | N/A | | | | 13.03 | | | | N/A | | | | 7.54 | | | | N/A | |
| | 4 | | Assuming maximum sales charges, if any. Average annual total returns with and without sales charges reflect reductions for distribution and service fees. See “About Fund Performance” on page 8 for a detailed description of share classes, including any related sales charges and fees. |
| | | | N/A — Not applicable as share class and index do not have a sales charge. |
| | | | Past performance is not indicative of future results. |
| | | | | | | | | | | | | | | | | | | | | | | | | | | | |
| | | Actual | | | Hypothetical6 | | | | |
| | | Beginning
Account Value
January 1, 2014 | | | Ending
Account Value
June 30, 2014 | | | Expenses Paid
During the
Period5 | | | Beginning
Account Value
January 1, 2014 | | | Ending
Account Value
June 30, 2014 | | | Expenses Paid
During the
Period5 | | | Annualized
Expense Ratio | |
Institutional | | $ | 1,000.00 | | | $ | 1,013.40 | | | $ | 5.19 | | | $ | 1,000.00 | | | $ | 1,019.64 | | | $ | 5.21 | | | | 1.04 | % |
Investor A | | $ | 1,000.00 | | | $ | 1,013.00 | | | $ | 5.94 | | | $ | 1,000.00 | | | $ | 1,018.89 | | | $ | 5.96 | | | | 1.19 | % |
Investor C | | $ | 1,000.00 | | | $ | 1,008.60 | | | $ | 10.21 | | | $ | 1,000.00 | | | $ | 1,014.63 | | | $ | 10.24 | | | | 2.05 | % |
Class R | | $ | 1,000.00 | | | $ | 1,009.60 | | | $ | 8.92 | | | $ | 1,000.00 | | | $ | 1,015.92 | | | $ | 8.95 | | | | 1.79 | % |
| | 5 | | For each class of the Fund, expenses are equal to the annualized net expense ratio for the class, multiplied by the average account value over the period, multiplied by 181/365 (to reflect the one-half year period shown). |
| | 6 | | Hypothetical 5% annual return before expenses is calculated by pro rating the number of days in the most recent fiscal half year divided by 365. |
| | | | See “Disclosure of Expenses” on page 8 for further information on how expenses were calculated. |
| | | | | | |
| | | | | | | |
| | ANNUAL REPORT | | JUNE 30, 2014 | | 5 |
| | |
| Fund Summary as of June 30, 2014 | | BlackRock Global SmallCap Fund, Inc. |
BlackRock Global SmallCap Fund, Inc.’s (the “Fund”) investment objective is to seek long-term growth of capital by investing primarily in a portfolio of equity securities of small cap issuers located in various foreign countries and in the United States.
| | |
| Portfolio Management Commentary | | |
How did the Fund perform?
| Ÿ | | For the 12-month period ended June 30, 2014, the Fund outperformed its benchmark, the MSCI All Country World Small Cap IndexSM and the broad-market MSCI World IndexSM. The following discussion of relative performance pertains to the MSCI All Country World Small Cap IndexSM. |
What factors influenced performance?
| Ÿ | | The Fund’s outperformance was attributable to stock selection in the health care equipment & supplies industry, where a number of holdings delivered robust returns including Edwards Lifesciences Corp. and NuVasive, Inc. Additional contributions to relative performance came from selection within electronic equipment names in the industrials sector, where Vestas Wind Systems A/S was the Fund’s overall largest holding and strongest performer during the period. Security selection within the financials, telecommunication services (“telecom”) and consumer staples sectors also contributed positively to relative performance. On an individual security basis, biotechnology company Insys Therapeutics, Inc. was a standout performer. Other notable contributors included telecom company Leap Wireless International, Inc., Irish pharmaceutical company Mallinckrodt PLC and Swiss-based bakery Aryzta AG. |
| Ÿ | | Conversely, the Fund’s position in household beverage maker SodaStream International Ltd. (consumer discretionary) was the largest detractor from performance for the period. Stock selection in the energy equipment & services industry also had a negative impact on relative returns. In the information technology sector, the Fund’s software holdings hindered results. At the stock-specific level, following SodaStream, biotechnology firm Dendreon Corp. and packaging company Rexam PLC were the largest individual detractors from performance. |
Describe recent portfolio activity.
| Ÿ | | During the 12-month period, the Fund increased exposure to the industrials and materials sectors and decreased exposure to consumer discretionary and health care. |
Describe portfolio positioning at period end.
| Ÿ | | Relative to the MSCI All Country World Small Cap IndexSM, the Fund ended the period overweight in the health care and energy sectors and underweight in financials and consumer discretionary. |
The views expressed reflect the opinions of BlackRock as of the date of this report and are subject to change based on changes in market, economic or other conditions. These views are not intended to be a forecast of future events and are no guarantee of future results.
| | |
| Ten Largest Holdings | | Percent of
Long-Term Investments |
| | | | |
Vestas Wind Systems A/S | | | 3 | % |
Africa Oil Corp. | | | 1 | |
Pitney Bowes, Inc. | | | 1 | |
Tribune Co., Class A | | | 1 | |
Hospira, Inc. | | | 1 | |
Aryzta AG | | | 1 | |
Merit Medical Systems, Inc. | | | 1 | |
Abaxis, Inc. | | | 1 | |
Abercrombie & Fitch Co., Class A | | | 1 | |
The Timken Co. | | | 1 | |
| | |
| Geographic Allocation | | Percent of
Long-Term Investments |
| | | | |
United States | | | 51 | % |
United Kingdom | | | 7 | |
Canada | | | 6 | |
Denmark | | | 4 | |
France | | | 4 | |
Switzerland | | | 3 | |
India | | | 3 | |
Japan | | | 3 | |
Germany | | | 2 | |
South Korea | | | 2 | |
Belgium | | | 2 | |
Ireland | | | 2 | |
Netherlands | | | 2 | |
Other1 | | | 9 | |
| | 1 | | Includes holdings within countries that are 1% or less of long-term investments. Please refer to the Schedule of Investments for such countries. |
| | | | | | |
| | | | | | | |
| 6 | | ANNUAL REPORT | | JUNE 30, 2014 | | |
| | |
| | | BlackRock Global SmallCap Fund, Inc. |
| | |
| Total Return Based on a $10,000 Investment | | |
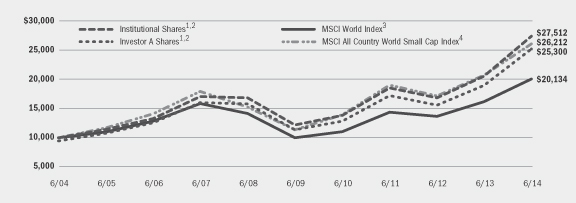
| | 1 | | Assuming maximum sales charge, if any, transaction costs and other operating expenses, including investment advisory fees. Institutional Shares do not have a sales charge. |
| | 2 | | The Fund invests in a diversified portfolio primarily consisting of equity securities of small cap issuers in various foreign countries and in the United States. |
| | 3 | | This index is a free float-adjusted market capitalization weighted index that is designed to measure the equity market performance of developed markets. |
| | 4 | | This index captures small cap representation across 23 developed markets and 23 emerging markets countries. With 6,103 constituents, the index covers about 14% of the free float-adjusted market capitalization in each country. |
| | |
| Performance Summary for the Period Ended June 30, 2014 | | |
| | | | | | | | | | | | | | | | | | | | | | | | | | | | |
| | | | | | Average Annual Total Returns5 | |
| | | | | | 1 Year | | | 5 Years | | | 10 Years | |
| | | 6-Month
Total Returns | | | w/o sales
charge | | | w/sales
charge | | | w/o sales
charge | | | w/sales
charge | | | w/o sales
charge | | | w/sales
charge | |
Institutional | | | 8.56 | % | | | 33.28 | % | | | N/A | | | | 17.62 | % | | | N/A | | | | 10.65 | % | | | N/A | |
Investor A | | | 8.32 | | | | 32.81 | | | | 25.84 | % | | | 17.24 | | | | 15.99 | % | | | 10.32 | | | | 9.73 | % |
Investor B | | | 8.05 | | | | 31.74 | | | | 27.24 | | | | 16.18 | | | | 15.96 | | | | 9.58 | | | | 9.58 | |
Investor C | | | 7.94 | | | | 31.79 | | | | 30.79 | | | | 16.28 | | | | 16.28 | | | | 9.43 | | | | 9.43 | |
Class R | | | 8.14 | | | | 32.32 | | | | N/A | | | | 16.78 | | | | N/A | | | | 9.91 | | | | N/A | |
MSCI World Index | | | 6.18 | | | | 24.05 | | | | N/A | | | | 14.99 | | | | N/A | | | | 7.25 | | | | N/A | |
MSCI All Country World Small Cap Index | | | 6.50 | | | | 25.97 | | | | N/A | | | | 18.17 | | | | N/A | | | | 10.12 | | | | N/A | |
| | 5 | | Assuming maximum sales charges, if any. Average annual total returns with and without sales charges reflect reductions for distribution and service fees. See “About Fund Performance” on page 8 for a detailed description of share classes, including any related sales charges and fees. |
| | | | N/A — Not applicable as share class and index do not have a sales charge. |
| | | | Past performance is not indicative of future results. |
| | | | | | | | | | | | | | | | | | | | | | | | | | | | |
| | | Actual | | | Hypothetical7 | | | | |
| | | Beginning
Account Value
January 1, 2014 | | | Ending
Account Value
June 30, 2014 | | | Expenses Paid
During the Period6 | | | Beginning
Account Value
January 1, 2014 | | | Ending
Account Value
June 30, 2014 | | | Expenses Paid
During the Period6 | | | Annualized
Expense Ratio | |
Institutional | | $ | 1,000.00 | | | $ | 1,085.60 | | | $ | 5.38 | | | $ | 1,000.00 | | | $ | 1,019.64 | | | $ | 5.21 | | | | 1.04 | % |
Investor A | | $ | 1,000.00 | | | $ | 1,083.20 | | | $ | 7.08 | | | $ | 1,000.00 | | | $ | 1,018.00 | | | $ | 6.85 | | | | 1.37 | % |
Investor B | | $ | 1,000.00 | | | $ | 1,080.50 | | | $ | 10.37 | | | $ | 1,000.00 | | | $ | 1,014.83 | | | $ | 10.04 | | | | 2.01 | % |
Investor C | | $ | 1,000.00 | | | $ | 1,079.40 | | | $ | 11.14 | | | $ | 1,000.00 | | | $ | 1,014.08 | | | $ | 10.79 | | | | 2.16 | % |
Class R | | $ | 1,000.00 | | | $ | 1,081.40 | | | $ | 8.77 | | | $ | 1,000.00 | | | $ | 1,016.36 | | | $ | 8.50 | | | | 1.70 | % |
| | 6 | | For each class of the Fund, expenses are equal to the annualized net expense ratio for the class, multiplied by the average account value over the period, multiplied by 181/365 (to reflect the one-half year period shown). |
| | 7 | | Hypothetical 5% annual return before expenses is calculated by pro rating the number of days in the most recent fiscal half year divided by 365. |
| | | | See “Disclosure of Expenses” on page 8 for further information on how expenses were calculated. |
| | | | | | |
| | | | | | | |
| | ANNUAL REPORT | | JUNE 30, 2014 | | 7 |
| Ÿ | | Institutional Shares are not subject to any sales charge. These shares bear no ongoing distribution or service fees and are available only to certain eligible investors. |
| Ÿ | | Investor A Shares are subject to a maximum initial sales charge (front-end load) of 5.25% and a service fee of 0.25% per year (but no distribution fee). Certain redemptions of these shares may be subject to a contingent deferred sales charge (“CDSC”) where no initial sales charge was paid at the time of purchase. On June 10, 2013, all of the issued and outstanding shares of EuroFund’s Investor B Shares were converted into Investor A Shares with the same relative aggregate net asset value (“NAV”). |
| Ÿ | | Investor B Shares (available only in BlackRock Global SmallCap, Inc.) are subject to a maximum CDSC of 4.50% declining to 0% after six years. In addition, these shares are subject to a distribution fee of 0.75% per year and a service fee of 0.25% per year. These shares automatically convert to Investor A Shares after approximately eight years. (There is no initial sales charge for automatic share conversions.) These shares are only available through exchanges and dividend reinvestments by existing shareholders and for purchase by certain employer-sponsored retirement plans. Effective on June 10, 2013, all issued and outstanding Investor B Shares of EuroFund were converted into Investor A Shares. |
| Ÿ | | Investor C Shares are subject to a 1.00% CDSC if redeemed within one year of purchase. In addition, these shares are subject to a distribution fee of 0.75% per year and a service fee of 0.25% per year. |
| Ÿ | | Class R Shares are not subject to any sales charge. These shares are subject to a distribution fee of 0.25% per year and a service fee of 0.25% per year. These shares are available only to certain employer-sponsored retirement plans. |
Performance information reflects past performance and does not guarantee future results. Current performance may be lower or higher than the performance data quoted. Refer to www.blackrock.com/funds to obtain performance data current to the most recent month end. Performance results do not reflect the deduction of taxes that a shareholder would pay on fund distributions or the redemption of fund shares. Figures shown in the performance tables on the previous pages assume reinvestment of all dividends and distributions, if any, at NAV on the ex-dividend date. Investment return and principal value of shares will fluctuate so that shares, when redeemed, may be worth more or less than their original cost. Dividends paid to each class of shares will vary because of the different levels of service, distribution and transfer agency fees applicable to each class, which are deducted from the income available to be paid to shareholders.
Shareholders of these Funds may incur the following charges: (a) transactional expenses, such as sales charges; and (b) operating expenses, including investment advisory fees, service and distribution fees, including 12b-1 fees, and other Fund expenses. The expense examples shown on the previous pages (which are based on hypothetical investments of $1,000 invested on January 1, 2014 and held through June 30, 2014) are intended to assist shareholders both in calculating expenses based on an investment in each Fund and in comparing these expenses with similar costs of investing in other mutual funds.
The expense examples provide information about actual account values and actual expenses. In order to estimate the expenses a shareholder paid during the period covered by this report, shareholders can divide their account value by $1,000 and then multiply the result by the number corresponding to their Fund and share class under the heading entitled “Expenses Paid During the Period.”
The expense examples also provide information about hypothetical account values and hypothetical expenses based on a Fund’s actual expense ratio and an assumed rate of return of 5% per year before expenses. In order to assist shareholders in comparing the ongoing expenses of investing in these Funds and other funds, compare the 5% hypothetical examples with the 5% hypothetical examples that appear in other funds’ shareholder reports.
The expenses shown in the expense examples are intended to highlight shareholders’ ongoing costs only and do not reflect any transactional expenses, such as sales charges, if any. Therefore, the hypothetical examples are useful in comparing ongoing expenses only, and will not help shareholders determine the relative total expenses of owning different funds. If these transactional expenses were included, shareholder expenses would have been higher.
| | | | | | |
| | | | | | | |
| 8 | | ANNUAL REPORT | | JUNE 30, 2014 | | |
| | |
| Derivative Financial Instruments | | |
The Funds may invest in various derivative financial instruments, including financial futures contracts and forward foreign currency exchange contracts, as specified in Note 4 of the Notes to Financial Statements, which may constitute forms of economic leverage. Such derivative financial instruments are used to obtain exposure to a security, index and/or market without owning or taking physical custody of securities or to hedge market and/or foreign currency exchange rate risk. Derivative financial instruments involve risks, including the imperfect correlation between the value of a derivative financial instrument and the underlying asset, possible default of the counterparty to the transaction or illiquidity of the derivative financial instrument. The Funds’ ability to use a derivative financial instrument successfully depends on the investment advisor’s ability to predict pertinent market movements accurately, which cannot be assured. The use of derivative financial instruments may result in losses greater than if they had not been used, may require a Fund to sell or purchase portfolio investments at inopportune times or for distressed values, may limit the amount of appreciation a Fund can realize on an investment, may result in lower dividends paid to shareholders or may cause a Fund to hold an investment that it might otherwise sell. The Funds’ investments in these instruments are discussed in detail in the Notes to Financial Statements.
| | | | | | |
| | | | | | | |
| | ANNUAL REPORT | | JUNE 30, 2014 | | 9 |
| | |
Schedule of Investments June 30, 2014 | | BlackRock EuroFund (Percentages shown are based on Net Assets) |
| | | | | | | | | | |
| Common Stocks | | | | Shares | | | Value | |
Belgium — 4.5% | | | | | | | | | | |
Anheuser-Busch InBev NV | | | | | 101,826 | | | $ | 11,699,834 | |
KBC Groep NV (a) | | | | | 122,425 | | | | 6,660,056 | |
| | | | | | | | | | |
| | | | | | | | | | 18,359,890 | |
Denmark — 2.9% | | | | | | | | | | |
Novo Nordisk A/S, Class B | | | | | 255,875 | | | | 11,809,387 | |
France — 24.8% | | | | | | | | | | |
Accor SA | | | | | 98,127 | | | | 5,100,200 | |
Alcatel-Lucent (a)(b) | | | | | 874,182 | | | | 3,142,751 | |
AXA SA | | | | | 164,767 | | | | 3,936,831 | |
Bouygues SA | | | | | 71,976 | | | | 2,994,936 | |
Cap Gemini SA | | | | | 102,209 | | | | 7,294,015 | |
Compagnie de Saint-Gobain | | | | | 168,178 | | | | 9,488,971 | |
GDF Suez | | | | | 184,993 | | | | 5,096,845 | |
L’Oreal SA | | | | | 35,367 | | | | 6,089,458 | |
Lafarge SA | | | | | 46,447 | | | | 4,038,991 | |
Legrand SA | | | | | 117,458 | | | | 7,193,198 | |
Renault SA | | | | | 40,608 | | | | 3,670,746 | |
Schneider Electric SA | | | | | 85,222 | | | | 8,035,873 | |
Societe Generale SA | | | | | 129,442 | | | | 6,788,283 | |
Total SA | | | | | 261,258 | | | | 18,901,925 | |
Vinci SA | | | | | 121,031 | | | | 9,048,131 | |
| | | | | | | | | | |
| | | | | | | | | | 100,821,154 | |
Germany — 9.8% | | | | | | | | | | |
Bayer AG, Registered Shares | | | | | 89,260 | | | | 12,592,187 | |
Continental AG | | | | | 12,617 | | | | 2,917,185 | |
Deutsche Telekom AG, Registered Shares | | | | | 529,367 | | | | 9,284,575 | |
LEG Immobilien AG (a) | | | | | 74,014 | | | | 4,979,154 | |
Siemens AG, Registered Shares | | | | | 24,659 | | | | 3,255,830 | |
Volkswagen AG, Preference Shares | | | | | 26,198 | | | | 6,861,693 | |
| | | | | | | | | | |
| | | | | | | | | | 39,890,624 | |
Ireland — 1.8% | | | | | | | | | | |
Ryanair Holdings PLC — ADR (a) | | | | | 132,733 | | | | 7,406,501 | |
Italy — 6.5% | | | | | | | | | | |
Enel SpA | | | | | 562,781 | | | | 3,273,494 | |
Intesa Sanpaolo SpA | | | | | 2,804,679 | | | | 8,653,358 | |
Luxottica Group SpA | | | | | 77,288 | | | | 4,475,418 | |
UniCredit SpA | | | | | 1,185,098 | | | | 9,909,045 | |
| | | | | | | | | | |
| | | | | | | | | | 26,311,315 | |
Netherlands — 10.4% | | | | | | | | | | |
Akzo Nobel NV | | | | | 73,099 | | | | 5,480,907 | |
ASML Holding NV | | | | | 95,040 | | | | 8,863,557 | |
ING Groep NV — CVA (a) | | | | | 550,372 | | | | 7,723,087 | |
Royal Dutch Shell PLC, Class B | | | | | 467,490 | | | | 20,317,153 | |
| | | | | | | | | | |
| | | | | | | | | | 42,384,704 | |
Portugal — 1.5% | | | | | | | | | | |
Banco Espirito Santo SA, Registered Shares (b) | | | | | 1,347,980 | | | | 1,109,048 | |
Jeronimo Martins SGPS SA | | | | | 300,016 | | | | 4,932,722 | |
| | | | | | | | | | |
| | | | | | | | | | 6,041,770 | |
| Common Stocks | | | | | Shares | | | Value | |
Spain — 2.1% | | | | | | | | | | | | |
Iberdrola SA | | | | | | | 378,489 | | | $ | 2,895,265 | |
Inditex SA | | | | | | | 36,283 | | | | 5,584,131 | |
| | | | | | | | | | | | |
| | | | | | | | | | | | 8,479,396 | |
Sweden — 1.0% | | | | | | | | | | | | |
Assa Abloy AB, Class B | | | | | | | 77,808 | | | | 3,957,773 | |
Switzerland — 9.2% | | | | | | | | | | | | |
Cie Financiere Richemont SA, Registered Shares | | | | | | | 34,283 | | | | 3,592,489 | |
Holcim Ltd., Registered Shares (a) | | | | | | | 45,618 | | | | 4,006,966 | |
Roche Holding AG | | | | | | | 54,906 | | | | 16,359,616 | |
Syngenta AG, Registered Shares | | | | | | | 15,834 | | | | 5,849,858 | |
UBS AG, Registered Shares (a) | | | | | | | 419,029 | | | | 7,682,687 | |
| | | | | | | | | | | | |
| | | | | | | | | | | | 37,491,616 | |
United Kingdom — 22.5% | | | | | | | | | | | | |
AstraZeneca PLC | | | | | | | 168,760 | | | | 12,555,344 | |
BG Group PLC | | | | | | | 466,624 | | | | 9,846,399 | |
British American Tobacco PLC | | | | | | | 84,890 | | | | 5,051,146 | |
BT Group PLC | | | | | | | 1,003,625 | | | | 6,594,878 | |
Hargreaves Lansdown PLC | | | | | | | 288,832 | | | | 6,114,986 | |
Imperial Tobacco Group PLC | | | | | | | 272,299 | | | | 12,250,195 | |
Johnson Matthey PLC | | | | | | | 145,398 | | | | 7,709,792 | |
Lloyds Banking Group PLC (a) | | | | | | | 2,343,797 | | | | 2,979,135 | |
Merlin Entertainments PLC (a)(c) | | | | | | | 662,028 | | | | 4,058,387 | |
Prudential PLC | | | | | | | 436,059 | | | | 9,990,745 | |
Rio Tinto PLC | | | | | | | 226,399 | | | | 12,224,242 | |
Tesco PLC | | | | | | | 413,915 | | | | 2,011,703 | |
| | | | | | | | | | | | |
| | | | | | | | | | | | 91,386,952 | |
Total Long-Term Investments
(Cost — $346,366,158) — 97.0% | | | | | | | | | | | 394,341,082 | |
| | | | | | | | | | | | |
| | | | | | | | | | | | | |
| | | |
| Short-Term Securities | | | | | | | | | |
Money Market Funds — 0.9% | | | | | | | | | | | | |
BlackRock Liquidity Funds, TempFund, Institutional Class, 0.03% (d)(e) | | | | | | | 361,504 | | | $ | 361,504 | |
| | | |
| | | | | | Beneficial
Interest
(000) | | | | |
BlackRock Liquidity Series, LLC, Money Market Series, 0.18% (d)(e)(f) | | $ | | | | | 3,229 | | | | 3,229,307 | |
| Total Money Market Funds — 0.9% | | | | | | | | | | | 3,590,811 | |
| | |
| Time Deposits | | Par (000) | | | | |
United Kingdom — 2.9% | | | | | | | | | | | | |
Wells Fargo Co., 0.04%, 7/1/14 | | | GBP | | | | 7,061 | | | $ | 12,084,407 | |
| | |
| ADR | | American Depositary Receipts |
| EUR | | Euro |
| GBP | | British Pound |
| HKD | | Hong Kong Dollar |
| JPY | | Japanese Yen |
See Notes to Financial Statements.
| | | | | | |
| | | | | | | |
| 10 | | ANNUAL REPORT | | JUNE 30, 2014 | | |
| | |
Schedule of Investments (continued) | | BlackRock EuroFund (Percentages shown are based on Net Assets) |
| | | | | | | | | | | | |
| Time Deposits | | Par (000) | | | Value | |
Europe — 0.9% | | | | | | | | | | | | |
Brown Brothers Harriman & Co.,
(0.03)%, 7/1/14 | | | EUR | | | | 2,622 | | | $ | 3,590,864 | |
| Total Time Deposits — 3.8% | | | | | | | | | | | 15,675,271 | |
Total Short-Term Securities
(Cost — $19,266,082) — 4.7% | | | | | | | | | | | 19,266,082 | |
| Total Investments (Cost — $365,632,240) — 101.7% | | | | 413,607,164 | |
| Liabilities in Excess of Other Assets — (1.7)% | | | | (7,032,228 | ) |
| | | | | | | | | | | | |
| Net Assets — 100.0% | | | | | | | | | | $ | 406,574,936 | |
| | | | | | | | | | | | |
|
| Notes to Schedule of Investments |
| (a) | | Non-income producing security. |
| (b) | | Security, or a portion of security, is on loan. |
| (c) | | Security exempt from registration pursuant to Rule 144A under the Securities Act of 1933, as amended. These securities may be resold in transactions exempt from registration to qualified institutional investors. |
| (d) | | Represents the current yield as of report date. |
| (e) | | Investments in issuers considered to be an affiliate of the Fund during the year ended June 30, 2014, for purposes of Section 2(a)(3) of the Investment Company Act of 1940, as amended, were as follows: |
| | | | | | | | | | | | | | | | |
| Affiliate | | Shares/Beneficial
Interest Held at
June 30,
2013 | | | Net
Activity | | | Shares/Beneficial
Interest Held at
June 30,
2014 | | | Income | |
BlackRock Liquidity Funds, TempFund, Institutional Class | | | 196,705 | | | | 164,799 | | | | 361,504 | | | $ | 567 | |
BlackRock Liquidity Series, LLC, Money Market Series | | | — | | | $ | 3,229,307 | | | $ | 3,229,307 | | | $ | 14,296 | |
| (f) | | Security was purchased with the cash collateral from loaned securities. The Fund may withdraw up to 25% of its investment daily, although the manager of the BlackRock Liquidity Series, LLC, Money Market Series, in its sole discretion, may permit an investor to withdraw more than 25% on any one day. |
| Ÿ | | Fair Value Measurements — Various inputs are used in determining the fair value of investments. These inputs to valuation techniques are categorized into a disclosure hierarchy consisting of three broad levels for financial statement purposes as follows: |
| | Ÿ | | Level 1 — unadjusted price quotations in active markets/exchanges for identical assets or liabilities that the Fund has the ability to access |
| | Ÿ | | Level 2 — other observable inputs (including, but not limited to, quoted prices for similar assets or liabilities in markets that are active, quoted prices for identical or similar assets or liabilities in markets that are not active, inputs other than quoted prices that are observable for the assets or liabilities (such as interest rates, yield curves, volatilities, prepayment speeds, loss severities, credit risks and default rates) or other market-corroborated inputs) |
| | Ÿ | | Level 3 — unobservable inputs based on the best information available in the circumstances, to the extent observable inputs are not available (including the Fund’s own assumptions used in determining the fair value of investments) |
The hierarchy gives the highest priority to unadjusted quoted prices in active markets for identical assets or liabilities (Level 1 measurements) and the lowest priority to unobservable inputs (Level 3 measurements). Accordingly, the degree of judgment exercised in determining fair value is greatest for instruments categorized in Level 3. The inputs used to measure fair value may fall into different levels of the fair value hierarchy. In such cases, for disclosure purposes, the fair value hierarchy classification is determined based on the lowest level input that is significant to the fair value measurement in its entirety.
Changes in valuation techniques may result in transfers into or out of an assigned level within the disclosure hierarchy. In accordance with the Fund’s policy, transfers between different levels of the fair value disclosure hierarchy are deemed to have occurred as of the beginning of the reporting period. The categorization of a value determined for investments is based on the pricing transparency of the investment and is not necessarily an indication of the risks associated with investing in those securities. For information about the Fund’s policy regarding valuation of investments, please refer to Note 2 of the Notes to Financial Statements.
See Notes to Financial Statements.
| | | | | | |
| | | | | | | |
| | ANNUAL REPORT | | JUNE 30, 2014 | | 11 |
| | |
Schedule of Investments (concluded) | | BlackRock EuroFund |
The following table summarizes the Fund’s investments categorized in the disclosure hierarchy as of June 30, 2014:
| | | | | | | | | | | | | | |
| | | Level 1 | | | Level 2 | | | Level 3 | | Total | |
Assets: | | | | | | | | | | | | | | |
| Investments: | | | | | | | | | | | | | | |
Common Stocks: | | | | | | | | | | | | | | |
Belgium | | | — | | | $ | 18,359,890 | | | — | | $ | 18,359,890 | |
Denmark | | | — | | | | 11,809,387 | | | — | | | 11,809,387 | |
France | | | — | | | | 100,821,154 | | | — | | | 100,821,154 | |
Germany | | | — | | | | 39,890,624 | | | — | | | 39,890,624 | |
Ireland | | $ | 7,406,501 | | | | — | | | — | | | 7,406,501 | |
Italy | | | — | | | | 26,311,315 | | | — | | | 26,311,315 | |
Netherlands | | | — | | | | 42,384,704 | | | — | | | 42,384,704 | |
Portugal | | | — | | | | 6,041,770 | | | — | | | 6,041,770 | |
Spain | | | — | | | | 8,479,396 | | | — | | | 8,479,396 | |
Sweden | | | — | | | | 3,957,773 | | | — | | | 3,957,773 | |
Switzerland | | | — | | | | 37,491,616 | | | — | | | 37,491,616 | |
United Kingdom | | | 4,058,387 | | | | 87,328,565 | | | — | | | 91,386,952 | |
Short-Term Securities: | | | | | | | | | | | | | | |
Money Market Funds | | | 361,504 | | | | 3,229,307 | | | — | | | 3,590,811 | |
Time Deposits | | | — | | | | 15,675,271 | | | — | | | 15,675,271 | |
| | | | | | | | | | | | | | |
Total | | $ | 11,826,392 | | | $ | 401,780,772 | | | — | | $ | 413,607,164 | |
| | | | | | | | | | | | | | |
The Fund may hold assets and/or liabilities in which the fair value approximates the carrying amount for financial statement purposes. As of June 30, 2014, collateral on securities loaned at value of $3,229,307 is categorized as Level 2 within the disclosure hierarchy.
There were no transfers between levels during the year ended June 30, 2014.
See Notes to Financial Statements.
| | | | | | |
| | | | | | | |
| 12 | | ANNUAL REPORT | | JUNE 30, 2014 | | |
| | |
Schedule of Investments June 30, 2014 | | BlackRock Global SmallCap Fund, Inc. (Percentages shown are based on Net Assets) |
| | | | | | | | | | |
| Common Stocks | | | | Shares | | | Value | |
Australia — 1.5% | |
Cochlear Ltd. | | | | | 51,800 | | | $ | 3,015,586 | |
Mirvac Group | | | | | 3,200,684 | | | | 5,386,169 | |
Orocobre Ltd. (a)(b) | | | | | 2,632,281 | | | | 5,614,175 | |
Pancontinental Oil & Gas NL (a) | | | | | 17,769,200 | | | | 384,571 | |
Parnell Pharmaceuticals Holdings Ltd. (a) | | | | | 514,960 | | | | 3,553,224 | |
| | | | | | | | | | |
| | | | | | | | | | 17,953,725 | |
Belgium — 1.7% | |
Befimmo | | | | | 118,423 | | | | 9,027,261 | |
Mobistar SA (a)(b) | | | | | 471,600 | | | | 9,002,111 | |
Ontex Group NV (a) | | | | | 119,070 | | | | 3,074,983 | |
| | | | | | | | | | |
| | | | | | | | | | 21,104,355 | |
Brazil — 0.7% | |
Companhia Hering SA | | | | | 498,200 | | | | 5,014,695 | |
Ser Educacional SA | | | | | 341,500 | | | | 3,945,913 | |
| | | | | | | | | | |
| | | | | | | | | | 8,960,608 | |
Canada — 6.3% | |
Africa Oil Corp. (a)(b) | | | | | 2,441,500 | | | | 16,703,013 | |
Cathedral Energy Services Ltd. | | | | | 641,900 | | | | 2,977,747 | |
Continental Gold, Ltd. (a)(b) | | | | | 3,087,600 | | | | 10,127,548 | |
Diagnocure, Inc. (a)(c) | | | | | 4,852,780 | | | | 704,916 | |
Dollarama, Inc. | | | | | 65,000 | | | | 5,351,436 | |
Halogen Software, Inc. (a) | | | | | 241,000 | | | | 1,784,265 | |
Lundin Mining Corp. (a)(b) | | | | | 1,339,500 | | | | 7,368,788 | |
Painted Pony Petroleum Ltd. (a) | | | | | 375,825 | | | | 4,807,658 | |
Premier Gold Mines, Ltd. (a)(b) | | | | | 2,284,000 | | | | 6,314,418 | |
Sulliden Gold Corp. Ltd. (a) | | | | | 4,223,323 | | | | 5,461,961 | |
Torex Gold Resources, Inc. (a) | | | | | 5,878,700 | | | | 8,980,161 | |
Trevali Mining Corp. (a)(d) | | | | | 4,848,800 | | | | 4,953,088 | |
Trevali Mining Corp. (a)(b) | | | | | 1,439,423 | | | | 1,470,382 | |
| | | | | | | | | | |
| | | | | | | | | | 77,005,381 | |
China — 1.2% | |
21Vianet Group, Inc. — ADR (a)(b) | | | | | 302,204 | | | | 9,057,054 | |
51job, Inc. — ADR (a) | | | | | 23,900 | | | | 1,576,444 | |
Daphne International Holdings Ltd. (b) | | | | | 7,564,300 | | | | 2,967,004 | |
Parkson Retail Group Ltd. (b) | | | | | 2,904,500 | | | | 832,019 | |
| | | | | | | | | | |
| | | | | | | | | | 14,432,521 | |
Denmark — 4.0% | | | | | | | | | | |
ALK-Abello A/S | | | | | 26,300 | | | | 4,068,988 | |
Pandora A/S | | | | | 76,200 | | | | 5,847,874 | |
Vestas Wind Systems A/S (a) | | | | | 789,460 | | | | 39,835,053 | |
| | | | | | | | | | |
| | | | | | | | | | 49,751,915 | |
Finland — 0.5% | |
Sanitec Corp. (a) | | | | | 443,700 | | | | 5,884,275 | |
France — 3.8% | |
Elior SCA (a) | | | | | 250,820 | | | | 4,945,650 | |
Eurofins Scientific SE | | | | | 23,575 | | | | 7,251,450 | |
GameLoft SE (a) | | | | | 763,583 | | | | 7,048,659 | |
Gaztransport Et Technigaz SA | | | | | 93,900 | | | | 6,121,565 | |
Saft Groupe SA | | | | | 295,600 | | | | 11,334,760 | |
UbiSoft Entertainment SA (a) | | | | | 559,600 | | | | 10,301,441 | |
| | | | | | | | | | |
| | | | | | | | | | 47,003,525 | |
Germany — 1.9% | |
GEA Group AG | | | | | 77,850 | | | | 3,680,294 | |
Gerresheimer AG | | | | | 90,700 | | | | 6,249,388 | |
Rheinmetall AG | | | | | 109,200 | | | | 7,721,887 | |
Germany (concluded) | |
Stabilus SA (a) | | | | | 127,186 | | | $ | 4,336,480 | |
Wacker Chemie AG | | | | | 14,900 | | | | 1,715,398 | |
| | | | | | | | | | |
| | | | | | | | | | 23,703,447 | |
Hong Kong — 0.9% | |
Chow Sang Sang Holdings International Ltd. | | | | | 1,412,000 | | | | 3,533,111 | |
Clear Media Ltd. | | | | | 2,091,000 | | | | 2,004,558 | |
Ming Fai International Holdings Ltd. | | | | | 3,539,100 | | | | 319,644 | |
Pacific Basin Shipping Ltd. | | | | | 8,197,000 | | | | 5,096,911 | |
| | | | | | | | | | |
| | | | | | | | | | 10,954,224 | |
India — 2.8% | |
Container Corp. of India | | | | | 172,050 | | | | 3,449,827 | |
GVK Power & Infrastructure, Ltd. (a) | | | | | 20,631,101 | | | | 6,570,554 | |
Indiabulls Real Estate, Ltd. | | | | | 1,486,200 | | | | 2,471,342 | |
LIC Housing Finance Ltd. | | | | | 1,112,700 | | | | 6,060,049 | |
National Aluminium Co., Ltd. | | | | | 3,465,047 | | | | 3,393,062 | |
Tata Power Co. Ltd. | | | | | 2,597,100 | | | | 4,659,747 | |
Zee Entertainment Enterprises Ltd. | | | | | 1,538,800 | | | | 7,510,220 | |
| | | | | | | | | | |
| | | | | | | | | | 34,114,801 | |
Indonesia — 0.4% | |
Tower Bersama Infrastructure Tbk PT | | | | | 7,656,276 | | | | 5,198,905 | |
Ireland — 1.6% | |
Mallinckrodt PLC (a)(b) | | | | | 143,334 | | | | 11,469,586 | |
Ryanair Holdings PLC — ADR (a) | | | | | 156,896 | | | | 8,754,797 | |
| | | | | | | | | | |
| | | | | | | | | | 20,224,383 | |
Italy — 1.1% | |
Banca Popolare di Milano Scarl (a) | | | | | 7,071,810 | | | | 6,331,163 | |
Mediobanca SpA (a) | | | | | 677,100 | | | | 6,742,311 | |
| | | | | | | | | | |
| | | | | | | | | | 13,073,474 | |
Japan — 2.7% | |
Asics Corp. | | | | | 225,350 | | | | 5,262,311 | |
Don Quijote Co., Ltd. | | | | | 78,100 | | | | 4,357,305 | |
Hisaka Works Ltd. | | | | | 217,000 | | | | 2,011,838 | |
Mitsui Chemicals, Inc. | | | | | 1,616,000 | | | | 4,421,555 | |
NGK Insulators Ltd. | | | | | 249,400 | | | | 5,661,576 | |
Nippon Yusen KK | | | | | 1,545,000 | | | | 4,456,674 | |
Rohm Co. Ltd. | | | | | 127,400 | | | | 7,307,013 | |
| | | | | | | | | | |
| | | | | | | | | | 33,478,272 | |
Malaysia — 0.2% | |
AirAsia Bhd | | | | | 4,203,400 | | | | 3,012,271 | |
Netherlands — 1.6% | | | | | | | | | | |
Corio NV | | | | | 140,600 | | | | 7,176,133 | |
Eurocommercial Properties NV CVA | | | | | 146,000 | | | | 7,207,882 | |
Koninklijke Boskalis Westminster NV | | | | | 82,397 | | | | 4,725,259 | |
| | | | | | | | | | |
| | | | | | | | | | 19,109,274 | |
Norway — 1.0% | |
Hoegh Liquified Natural Gas Holdings Ltd. (a)(b) | | | | | 624,400 | | | | 7,736,479 | |
Storebrand ASA (a) | | | | | 894,600 | | | | 5,032,964 | |
| | | | | | | | | | |
| | | | | | | | | | 12,769,443 | |
Portugal — 0.2% | |
Banco Espirito Santo SA, Registered Shares (a) | | | | | 2,960,045 | | | | 2,435,372 | |
South Korea — 1.8% | |
Daum Communications Corp. | | | | | 99,700 | | | | 11,521,850 | |
Industrial Bank of Korea | | | | | 410,600 | | | | 5,477,457 | |
See Notes to Financial Statements.
| | | | | | |
| | | | | | | |
| | ANNUAL REPORT | | JUNE 30, 2014 | | 13 |
| | |
Schedule of Investments (continued) | | BlackRock Global SmallCap Fund, Inc. (Percentages shown are based on Net Assets) |
| | | | | | | | | | |
| Common Stocks | | | | Shares | | | Value | |
South Korea (concluded) | |
KNB Financial Group Co., Ltd. (a)(b) | | | | | 366,600 | | | $ | 4,655,871 | |
| | | | | | | | | | |
| | | | | | | | | | 21,655,178 | |
Spain — 1.3% | |
Acerinox SA (a) | | | | | 495,500 | | | | 8,788,277 | |
Inmobiliaria Colonial SA (a) | | | | | 4,775,900 | | | | 3,801,644 | |
Laboratorios Farmaceuticos Rovi SA | | | | | 232,786 | | | | 3,024,975 | |
| | | | | | | | | | |
| | | | | | | | | | 15,614,896 | |
Switzerland — 3.2% | |
Aryzta AG (a) | | | | | 149,577 | | | | 14,165,559 | |
OC Oerlikon Corp. AG, Registered Shares (a) | | | | | 317,100 | | | | 4,589,958 | |
Straumann Holding AG, Registered Shares | | | | | 32,200 | | | | 7,450,199 | |
Sulzer AG, Registered Shares | | | | | 40,150 | | | | 5,626,275 | |
Swiss Life Holding AG, Registered Shares (a) | | | | | 31,000 | | | | 7,348,291 | |
| | | | | | | | | | |
| | | | | | | | | | 39,180,282 | |
United Arab Emirates — 0.4% | |
Polarcus Ltd. (a)(b) | | | | | 8,039,991 | | | | 4,516,601 | |
United Kingdom — 7.2% | |
Abengoa Yield PLC (a) | | | | | 19,100 | | | | 722,362 | |
APR Energy PLC (b) | | | | | 462,896 | | | | 5,137,715 | |
Arrow Global Group PLC (a) | | | | | 975,700 | | | | 3,839,290 | |
Atlas Mara Co-Nvest, Ltd. (a)(b) | | | | | 549,800 | | | | 6,267,720 | |
B&M European Value Retail SA (a) | | | | | 323,425 | | | | 1,522,151 | |
Babcock International Group PLC | | | | | 366,000 | | | | 7,274,945 | |
Bahamas Petroleum Co. PLC (a) | | | | | 696,099 | | | | 25,017 | |
BowLeven PLC (a)(b) | | | | | 3,653,700 | | | | 2,456,712 | |
Crest Nicholson Holdings PLC | | | | | 827,700 | | | | 4,884,180 | |
easyJet PLC | | | | | 165,916 | | | | 3,874,585 | |
Exova Group PLC (a) | | | | | 1,151,600 | | | | 4,848,286 | |
Inchcape PLC | | | | | 464,400 | | | | 5,037,803 | |
Intertek Group PLC | | | | | 79,400 | | | | 3,733,189 | |
Man Group PLC | | | | | 2,830,900 | | | | 5,094,827 | |
Michael Page International PLC | | | | | 656,200 | | | | 4,838,103 | |
Ophir Energy PLC (a)(b) | | | | | 851,309 | | | | 3,209,617 | |
Oxford Immunotec Global PLC (a) | | | | | 146,525 | | | | 2,466,016 | |
Poundland Group PLC (a) | | | | | 472,700 | | | | 2,551,842 | |
Premier Oil PLC | | | | | 557,500 | | | | 3,182,868 | |
Quotient, Ltd. (a) | | | | | 468,685 | | | | 3,904,146 | |
Rexam PLC | | | | | 739,852 | | | | 6,771,774 | |
Serco Group PLC | | | | | 1,150,300 | | | | 7,195,318 | |
| | | | | | | | | | |
| | | | | | | | | | 88,838,466 | |
United States — 50.5% | |
Abaxis, Inc. | | | | | 290,623 | | | | 12,877,505 | |
Abercrombie & Fitch Co., Class A | | | | | 281,427 | | | | 12,171,718 | |
Albemarle Corp. | | | | | 114,200 | | | | 8,165,300 | |
AMC Entertainment Holdings, Inc., Class A | | | | | 239,879 | | | | 5,965,791 | |
American Campus Communities, Inc. | | | | | 68,500 | | | | 2,619,440 | |
Apollo Education Group, Inc., Class A (a)(b) | | | | | 309,478 | | | | 9,671,188 | |
ARRIS Group, Inc. (a) | | | | | 260,500 | | | | 8,474,065 | |
Ashford Hospitality Prime, Inc. | | | | | 353,932 | | | | 6,073,473 | |
Axiall Corp. | | | | | 144,264 | | | | 6,819,359 | |
Bankrate, Inc. (a)(b) | | | | | 158,567 | | | | 2,781,265 | |
BBCN Bancorp, Inc. | | | | | 374,400 | | | | 5,971,680 | |
Bill Barrett Corp. (a) | | | | | 239,331 | | | | 6,409,284 | |
BioMed Realty Trust, Inc. | | | | | 272,800 | | | | 5,955,224 | |
Blackhawk Network Holdings, Inc. (a) | | | | | 330,214 | | | | 8,866,246 | |
Burlington Stores, Inc. (a) | | | | | 85,900 | | | | 2,736,774 | |
Celanese Corp., Series A | | | | | 116,300 | | | | 7,475,764 | |
United States (concluded) | |
Chart Industries, Inc. (a) | | | | | 4,066 | | | $ | 336,421 | |
The Children’s Place Retail Stores, Inc. | | | | | 80,300 | | | | 3,985,289 | |
CommVault Systems, Inc. (a)(b) | | | | | 129,400 | | | | 6,362,598 | |
Constant Contact, Inc. (a) | | | | | 259,650 | | | | 8,337,362 | |
Corporate Office Properties Trust (b) | | | | | 316,900 | | | | 8,812,989 | |
Deckers Outdoor Corp. (a)(b) | | | | | 82,500 | | | | 7,122,225 | |
Digital Realty Trust, Inc. (b) | | | | | 57,600 | | | | 3,359,232 | |
Discover Financial Services | | | | | 110,100 | | | | 6,823,998 | |
Dorian LPG, Ltd. (a) | | | | | 305,709 | | | | 6,279,797 | |
Drew Industries, Inc. | | | | | 10,151 | | | | 507,652 | |
DSP Group, Inc. (a) | | | | | 429,249 | | | | 3,644,324 | |
Edwards Lifesciences Corp. (a)(b) | | | | | 120,175 | | | | 10,315,822 | |
Emerald Oil, Inc. (a)(b) | | | | | 668,700 | | | | 5,115,555 | |
Enzymotec, Ltd. (a) | | | | | 208,806 | | | | 2,833,497 | |
Essent Group Ltd. (a) | | | | | 238,500 | | | | 4,791,465 | |
Exelixis, Inc. (a)(b) | | | | | 736,147 | | | | 2,495,538 | |
First Solar, Inc. (a) | | | | | 106,500 | | | | 7,567,890 | |
Flowers Foods, Inc. | | | | | 339,764 | | | | 7,162,225 | |
Foot Locker, Inc. | | | | | 110,100 | | | | 5,584,272 | |
HD Supply Holdings, Inc. (a) | | | | | 383,183 | | | | 10,878,565 | |
Helix Energy Solutions Group, Inc. (a) | | | | | 260,600 | | | | 6,856,386 | |
Heritage Insurance Holdings, Inc. (a) | | | | | 435,100 | | | | 6,617,871 | |
Hospira, Inc. (a)(b) | | | | | 278,318 | | | | 14,297,196 | |
IDEX Corp. | | | | | 130,150 | | | | 10,508,311 | |
Informatica Corp. (a) | | | | | 213,000 | | | | 7,593,450 | |
Inogen, Inc. (a) | | | | | 336,710 | | | | 7,596,178 | |
Insys Therapeutics, Inc. (a)(b) | | | | | 317,048 | | | | 9,901,409 | |
j2 Global, Inc. (b) | | | | | 109,100 | | | | 5,548,826 | |
KBR, Inc. | | | �� | | 25,300 | | | | 603,405 | |
The KEYW Holding Corp. (a)(b) | | | | | 264,700 | | | | 3,327,279 | |
Kraton Performance Polymers, Inc. (a) | | | | | 227,900 | | | | 5,102,681 | |
Live Nation Entertainment, Inc. (a) | | | | | 265,900 | | | | 6,565,071 | |
LKQ Corp. (a) | | | | | 134,026 | | | | 3,577,154 | |
MannKind Corp. (a)(b) | | | | | 890,079 | | | | 9,781,968 | |
Manpowergroup, Inc. | | | | | 53,100 | | | | 4,505,535 | |
Merit Medical Systems, Inc. (a) | | | | | 892,182 | | | | 13,471,948 | |
Mistras Group, Inc. (a)(b) | | | | | 102,500 | | | | 2,513,300 | |
Monotype Imaging Holdings, Inc. | | | | | 163,394 | | | | 4,602,809 | |
Nordson Corp. | | | | | 96,200 | | | | 7,714,278 | |
NorthWestern Corp. | | | | | 114,900 | | | | 5,996,631 | |
NuVasive, Inc. (a) | | | | | 270,807 | | | | 9,632,605 | |
Oasis Petroleum, Inc. (a)(b) | | | | | 181,300 | | | | 10,132,857 | |
Office Depot, Inc. (a)(b) | | | | | 1,091,665 | | | | 6,211,574 | |
OSI Systems, Inc. (a) | | | | | 165,200 | | | | 11,027,100 | |
Parsley Energy, Inc., Class A (a) | | | | | 90,900 | | | | 2,187,963 | |
Pinnacle Foods, Inc. | | | | | 99,809 | | | | 3,283,716 | |
Pitney Bowes, Inc. | | | | | 567,824 | | | | 15,683,299 | |
Plantronics, Inc. | | | | | 37,700 | | | | 1,811,485 | |
PNM Resources, Inc. | | | | | 227,900 | | | | 6,684,307 | |
Prestige Brands Holdings, Inc. (a) | | | | | 163,051 | | | | 5,525,798 | |
PrivateBancorp, Inc. | | | | | 140,600 | | | | 4,085,836 | |
Procera Networks, Inc. (a)(b) | | | | | 337,300 | | | | 3,403,357 | |
PVH Corp. | | | | | 27,200 | | | | 3,171,520 | |
Quotient, Ltd. (a) | | | | | 468,685 | | | | 468,685 | |
Rigel Pharmaceuticals, Inc. (a) | | | | | 476,042 | | | | 1,728,033 | |
Rouse Properties, Inc. | | | | | 683,720 | | | | 11,698,449 | |
Scorpio Tankers, Inc. | | | | | 318,400 | | | | 3,238,128 | |
Semtech Corp. (a) | | | | | 217,400 | | | | 5,685,010 | |
ServiceMaster Global Holdings, Inc. (a) | | | | | 448,000 | | | | 8,167,040 | |
Silver Bay Realty Trust Corp. | | | | | 708,426 | | | | 11,561,512 | |
SM Energy Co. | | | | | 76,800 | | | | 6,458,880 | |
See Notes to Financial Statements.
| | | | | | |
| | | | | | | |
| 14 | | ANNUAL REPORT | | JUNE 30, 2014 | | |
| | |
Schedule of Investments (continued) | | BlackRock Global SmallCap Fund, Inc. (Percentages shown are based on Net Assets) |
| | | | | | | | | | |
| Common Stocks | | | | Shares | | | Value | |
United States (concluded) | |
Springleaf Holdings, Inc. (a)(b) | | | | | 245,100 | | | $ | 6,360,345 | |
Steel Dynamics, Inc. | | | | | 489,300 | | | | 8,782,935 | |
Supervalu, Inc. (a) | | | | | 1,322,200 | | | | 10,868,484 | |
TECO Energy, Inc. | | | | | 494,700 | | | | 9,142,056 | |
Teleflex, Inc. | | | | | 77,615 | | | | 8,196,144 | |
TIBCO Software, Inc. (a) | | | | | 505,400 | | | | 10,193,918 | |
The Timken Co. | | | | | 173,200 | | | | 11,749,888 | |
TransEnterix, Inc. (a) | | | | | 1,792,292 | | | | 9,033,152 | |
Tribune Co., Class A (a) | | | | | 170,472 | | | | 14,498,644 | |
Trimble Navigation Ltd. (a) | | | | | 265,900 | | | | 9,825,005 | |
Umpqua Holdings Corp. | | | | | 245,200 | | | | 4,393,984 | |
Valley National Bancorp | | | | | 427,700 | | | | 4,238,507 | |
Valuevision Media, Inc., Class A (a) | | | | | 183,606 | | | | 916,194 | |
Vera Bradley, Inc. (a)(b) | | | | | 335,515 | | | | 7,337,713 | |
Voya Financial, Inc. | | | | | 84,167 | | | | 3,058,629 | |
WebMD Health Corp. (a) | | | | | 101,200 | | | | 4,887,960 | |
Webster Financial Corp. | | | | | 97,400 | | | | 3,071,993 | |
| | | | | | | | | | |
| | | | | | | | | | 620,435,183 | |
| Total Common Stocks — 98.5% | | | | 1,210,410,777 | |
| | | | | | | | | | |
| | | | | | | | | | | |
| | |
| Rights — 0.0% | | | | | | |
Spain — 0.0% | |
Acerinox SA (a) | | | | | 602,000 | | | | 365,173 | |
| | | | | | | | | | |
| | | | | | | | | | | |
| | |
| Warrants (e) — 0.1% | | | | | | |
Canada — 0.0% | |
Torex Gold Resources, Inc. | | | | | 1,321,100 | | | | 173,332 | |
United Kingdom — 0.1% | |
Atlas Mara Co-Nvest, Ltd. | | | | | 549,800 | | | | 824,700 | |
| Total Warrants — 0.1% | | | | 998,032 | |
Total Long-Term Investments
(Cost — $898,979,117) — 98.6% | | | | 1,211,773,982 | |
Money Market Funds — 11.0% | |
BlackRock Liquidity Funds, TempFund, Institutional Class, 0.03% (f)(g) | | | | | | | 13,350,894 | | | $ | 13,350,894 | |
| | | |
| | | | | | Beneficial
Interest
(000) | | | | |
BlackRock Liquidity Series, LLC, Money Market Series, 0.18% (f)(g)(h) | | $ | | | | | 121,421 | | | | 121,421,480 | |
| Total Money Market Funds — 11.0% | | | | 134,772,374 | |
| | |
| Time Deposits | | Par
(000) | | | | |
Hong Kong — 0.0% | | | | | | | | | | | | |
Brown Brothers Harriman & Co., 0.01%, 7/03/14 | | | HKD | | | | 18 | | | $ | 2,294 | |
Japan — 0.0% | | | | | | | | | | | | |
Brown Brothers Harriman & Co., 0.01%, 7/01/14 | | | JPY | | | | 11,167 | | | | 110,234 | |
United States — 0.1% | | | | | | | | | | | | |
Brown Brothers Harriman & Co., 0.02%, 7/03/14 | | | EUR | | | | 879 | | | | 1,203,554 | |
| Total Time Deposits — 0.1% | | | | | | | | | | | 1,316,082 | |
Total Short-Term Securities
(Cost — $136,088,456) — 11.1% | | | | | | | | 136,088,456 | |
| Total Investments (Cost — $1,035,067,573) — 109.7% | | | | 1,347,862,438 | |
| Liabilities in Excess of Other Assets — (9.7)% | | | | (119,374,077 | ) |
| | | | | | | | | | | | |
| Net Assets — 100.0% | | | $ | 1,228,488,361 | |
| | | | | | | | | | | | |
|
| Notes to Schedule of Investments |
| (a) | | Non-income producing security. |
| (b) | | Security, or a portion of security, is on loan. |
| (c) | | Investments in issuers (whereby the Fund held 5% or more of the companies’ outstanding securities) that were considered to be an affiliate during the year, for purposes of Section 2(a)(3) of the Investment Company Act of 1940, as amended, were as follows: |
| | | | | | | | | | | | | | | | | | | | | | | | |
| Affiliate | | Shares Held
at June 30,
2013 | | | Shares
Purchased | | Shares
Sold | | | Shares Held at June 30,
2014 | | | Value at June 30,
2014 | | | Realized
Loss | | | Income |
Diagnocure, Inc. | | | 4,934,180 | | | — | | | (81,400 | ) | | | 4,852,780 | | | $ | 704,916 | | | $ | (355,219 | ) | | — |
| (d) | | Restricted security as to resale. As of report date, the Fund held 0.40% of its net assets, with a current value of $4,953,088 and an original cost of $3,158,512 in these securities. |
| (e) | | Warrants entitle the Fund to purchase a predetermined number of shares of common stock and are non-income producing. The purchase price and number of shares are subject to adjustment under certain conditions until the expiration date, if any. |
See Notes to Financial Statements.
| | | | | | |
| | | | | | | |
| | ANNUAL REPORT | | JUNE 30, 2014 | | 15 |
| | |
Schedule of Investments (continued) | | BlackRock Global SmallCap Fund, Inc. |
| (f) | | Investments in issuers considered to be an affiliate of the Fund during the year ended June 30, 2014, for purposes of Section 2(a)(3) of the Investment Company Act of 1940, as amended, were as follows: |
| | | | | | | | | | | | | | | | |
| Affiliate | | Shares/Beneficial
Interest Held at
June 30, 2013 | | | Net
Activity | | | Shares/Beneficial
Interest Held at
June 30,
2014 | | | Income | |
BlackRock Liquidity Funds, TempFund, Institutional Class | | | 39,123,915 | | | | (25,773,021 | ) | | | 13,350,894 | | | $ | 7,003 | |
BlackRock Liquidity Series, LLC, Money Market Series | | $ | 98,615,100 | | | $ | 22,806,380 | | | $ | 121,421,480 | | | $ | 2,062,362 | |
| (g) | | Represents the current yield as of report date. |
| (h) | | Security was purchased with the cash collateral from loaned securities. The Fund may withdraw up to 25% of its investment daily, although the manager of the BlackRock Liquidity Series, LLC, Money Market Series, in its sole discretion, may permit an investor to withdraw more than 25% on any one day. |
| Ÿ | | Fair Value Measurements — Various inputs are used in determining the fair value of investments. These inputs to valuation techniques are categorized into a disclosure hierarchy consisting of three broad levels for financial statement purposes as follows: |
| | Ÿ | | Level 1 — unadjusted price quotations in active markets/exchanges for identical assets or liabilities that the Fund has the ability to access |
| | Ÿ | | Level 2 — other observable inputs (including, but not limited to, quoted prices for similar assets or liabilities in markets that are active, quoted prices for identical or similar assets or liabilities in markets that are not active, inputs other than quoted prices that are observable for the assets or liabilities (such as interest rates, yield curves, volatilities, prepayment speeds, loss severities, credit risks and default rates) or other market-corroborated inputs) |
| | Ÿ | | Level 3 — unobservable inputs based on the best information available in the circumstances, to the extent observable inputs are not available (including the Fund’s own assumptions used in determining the fair value of investments) |
The hierarchy gives the highest priority to unadjusted quoted prices in active markets for identical assets or liabilities (Level 1 measurements) and the lowest priority to unobservable inputs (Level 3 measurements). Accordingly, the degree of judgment exercised in determining fair value is greatest for instruments categorized in Level 3. The inputs used to measure fair value may fall into different levels of the fair value hierarchy. In such cases, for disclosure purposes, the fair value hierarchy classification is determined based on the lowest level input that is significant to the fair value measurement in its entirety.
Changes in valuation techniques may result in transfers into or out of an assigned level within the disclosure hierarchy. In accordance with the Fund’s policy, transfers between different levels of the fair value disclosure hierarchy are deemed to have occurred as of the beginning of the reporting period. The categorization of a value determined for investments is based on the pricing transparency of the investment and is not necessarily an indication of the risks associated with investing in those securities. For information about the Fund’s policy regarding valuation of investments, please refer to Note 2 of the Notes to Financial Statements.
See Notes to Financial Statements.
| | | | | | |
| | | | | | | |
| 16 | | ANNUAL REPORT | | JUNE 30, 2014 | | |
| | |
Schedule of Investments (concluded) | | BlackRock Global SmallCap Fund, Inc. |
The following table summarizes the Fund’s investments categorized in the disclosure hierarchy as of June 30, 2014:
| | | | | | | | | | | | | | | | |
| | | Level 1 | | | Level 2 | | | Level 3 | | | Total | |
Assets: | | | | | | | | | | | | | | | | |
| Investments: | | | | | | | | | | | | | | | | |
Common Stocks: | | | | | | | | | | | | | | | | |
Australia | | $ | 3,553,224 | | | $ | 14,400,501 | | | | — | | | $ | 17,953,725 | |
Belgium | | | 12,102,244 | | | | 9,002,111 | | | | — | | | | 21,104,355 | |
Brazil | | | 8,960,608 | | | | — | | | | — | | | | 8,960,608 | |
Canada | | | 72,052,293 | | | | 4,953,088 | | | | — | | | | 77,005,381 | |
China | | | 13,600,502 | | | | 832,019 | | | | — | | | | 14,432,521 | |
Denmark | | | — | | | | 49,751,915 | | | | — | | | | 49,751,915 | |
Finland | | | — | | | | 5,884,275 | | | | — | | | | 5,884,275 | |
France | | | 11,067,215 | | | | 35,936,310 | | | | — | | | | 47,003,525 | |
Germany | | | 4,336,480 | | | | 19,366,967 | | | | — | | | | 23,703,447 | |
Hong Kong | | | 2,324,202 | | | | 8,630,022 | | | | — | | | | 10,954,224 | |
India | | | — | | | | 34,114,801 | | | | — | | | | 34,114,801 | |
Indonesia | | | 5,198,905 | | | | — | | | | — | | | | 5,198,905 | |
Ireland | | | 20,224,383 | | | | — | | | | — | | | | 20,224,383 | |
Italy | | | — | | | | 13,073,474 | | | | — | | | | 13,073,474 | |
Japan | | | — | | | | 33,478,272 | | | | — | | | | 33,478,272 | |
Malaysia | | | — | | | | 3,012,271 | | | | — | | | | 3,012,271 | |
Netherlands | | | — | | | | 19,109,274 | | | | — | | | | 19,109,274 | |
Norway | | | 7,736,479 | | | | 5,032,964 | | | | — | | | | 12,769,443 | |
Portugal | | | — | | | | 2,435,372 | | | | — | | | | 2,435,372 | |
South Korea | | | 4,655,871 | | | | 16,999,307 | | | | — | | | | 21,655,178 | |
Spain | | | 3,024,975 | | | | 12,589,921 | | | | — | | | | 15,614,896 | |
Switzerland | | | — | | | | 39,180,282 | | | | — | | | | 39,180,282 | |
United Arab Emirates | | | — | | | | 4,516,601 | | | | — | | | | 4,516,601 | |
United Kingdom | | | 28,777,093 | | | | 60,061,373 | | | | — | | | | 88,838,466 | |
United States | | | 614,155,386 | | | | 6,279,797 | | | | — | | | | 620,435,183 | |
Rights | | | 365,173 | | | | — | | | | — | | | | 365,173 | |
Warrants | | | 173,332 | | | | 824,700 | | | | — | | | | 998,032 | |
| Short-Term Securities: | | | | | | | | | | | | | | | | |
Money Market Funds | | | 13,350,894 | | | | 121,421,480 | | | | — | | | | 134,772,374 | |
Time Deposits | | | — | | | | 1,316,082 | | | | — | | | | 1,316,082 | |
| | | | | | | | | | | | | | | | |
Total | | $ | 825,659,259 | | | $ | 522,203,179 | | | | — | | | $ | 1,347,862,438 | |
| | | | | | | | | | | | | | | | |
The Fund may hold assets and/or liabilities in which the fair value approximates the carrying amount for financial statement purposes. As of June 30, 2014, such assets and/or liabilities are categorized within the disclosure hierarchy as follows:
| | | | | | | | | | | | | | |
| | | Level 1 | | | Level 2 | | | Level 3 | | Total | |
Assets: | | | | | | | | | | | | | | |
Foreign currency at value | | $ | 1,436,215 | | | | — | | | — | | $ | 1,436,215 | |
Liabilities: | | | | | | | | | | | | | | |
Bank overdraft | | | — | | | $ | (460,177 | ) | | — | | | (460,177 | ) |
Collateral on securities loaned at value | | | | | | | (121,421,480 | ) | | | | | (121,421,480 | ) |
| | | | | | | | | | | | | | |
Total | | $ | 1,436,215 | | | $ | (121,881,657 | ) | | — | | $ | (120,445,442 | ) |
| | | | | | | | | | | | | | |
Certain foreign securities are fair valued utilizing an external pricing service to reflect any significant market movements between the time the Fund values such foreign securities and the earlier closing of foreign markets. Such fair valuations are categorized as Level 2 in the disclosure hierarchy. As of June 30, 2013, securities with a value of $19,129,855 were systematically fair valued due to significant market movements, but were not valued using systematic fair values as of June 30, 2014. Therefore, these securities were transferred from Level 2 to Level 1 during the period June 30, 2013 to June 30, 2014.
Certain foreign securities are fair valued utilizing an external pricing service to reflect any significant market movements between the time the Fund values such foreign securities and the earlier closing of foreign markets. Such fair valuations are categorized as Level 2 in the disclosure hierarchy. As of June 30, 2013, the Fund did not utilize the external pricing service model adjustments as significant market movements did not occur. As of June 30, 2014, securities with a value of $16,421,970 were systematically fair valued due to significant market movements. Therefore, these securities were transferred from Level 1 to Level 2 during the period June 30, 2013 to June 30, 2014.
See Notes to Financial Statements.
| | | | | | |
| | | | | | | |
| | ANNUAL REPORT | | JUNE 30, 2014 | | 17 |
| | |
| Statements of Assets and Liabilities | | |
| | | | | | | | |
| June 30, 2014 | | BlackRock
EuroFund | | | BlackRock
Global SmallCap
Fund, Inc. | |
| | | | | | | | |
| Assets | | | | | | | | |
Investments at value — unaffiliated1,2 | | $ | 410,016,353 | | | $ | 1,212,385,148 | |
Investments at value — affiliated3 | | | 3,590,811 | | | | 135,477,290 | |
Investments sold receivable | | | 4,679,594 | | | | 18,049,356 | |
Capital shares sold receivable | | | 106,224 | | | | 2,458,052 | |
Dividends receivable | | | 1,036,825 | | | | 1,139,174 | |
Foreign currency at value4 | | | — | | | | 1,436,215 | |
Securities lending income receivable — affiliated | | | 1,712 | | | | 218,449 | |
Prepaid expenses | | | 34,408 | | | | 64,479 | |
| | | | | | | | |
Total assets | | | 419,465,927 | | | | 1,371,228,163 | |
| | | | | | | | |
| | | | | | | | |
| Liabilities | | | | | | | | |
Bank overdraft | | | — | | | | 460,177 | |
Collateral on securities loaned at value | | | 3,229,307 | | | | 121,421,480 | |
Investments purchased payable | | | 7,536,411 | | | | 16,210,046 | |
Capital shares redeemed payable | | | 1,593,279 | | | | 2,335,176 | |
Investment advisory fees payable | | | 251,839 | | | | 831,440 | |
Service and distribution fees payable | | | 59,576 | | | | 403,939 | |
Deferred foreign capital gain tax payable | | | — | | | | 442,764 | |
Officer’s and Directors’ fees payable | | | 5,351 | | | | 8,126 | |
Other affiliates payable | | | 899 | | | | 2,702 | |
Other accrued expenses payable | | | 214,329 | | | | 623,952 | |
| | | | | | | | |
Total liabilities | | | 12,890,991 | | | | 142,739,802 | |
| | | | | | | | |
Net Assets | | $ | 406,574,936 | | | $ | 1,228,488,361 | |
| | | | | | | | |
| | | | | | | | |
| Net Assets Consist of | | | | | | | | |
Paid-in capital | | $ | 438,761,700 | | | $ | 852,390,996 | |
Undistributed (distributions in excess of) net investment income | | | 12,386,404 | | | | (30,247,289 | ) |
Undistributed net realized gain (accumulated net realized loss) | | | (92,533,246 | ) | | | 93,994,138 | |
Net unrealized appreciation/depreciation | | | 47,960,078 | | | | 312,350,516 | |
| | | | | | | | |
Net Assets | | $ | 406,574,936 | | | $ | 1,228,488,361 | |
| | | | | | | | |
1 Investments at cost — unaffiliated | | $ | 362,041,429 | | | $ | 886,362,468 | |
2 Securities loaned at value | | $ | 2,768,008 | | | $ | 116,575,834 | |
3 Investments at cost — affiliated | | $ | 3,590,811 | | | $ | 148,705,105 | |
4 Foreign currency at cost | | | — | | | $ | 1,445,248 | |
| | | | | | |
| See Notes to Financial Statements. | | | | |
| | | | | | | |
| 18 | | ANNUAL REPORT | | JUNE 30, 2014 | | |
| | |
| Statements of Assets and Liabilities (concluded) | | |
| | | | | | | | |
| June 30, 2014 | | BlackRock
EuroFund | | | BlackRock Global SmallCap
Fund, Inc. | |
| | | | | | | | |
| Net Asset Value | | | | | | | | |
| Institutional: | | | | | | | | |
Net assets | | $ | 187,717,944 | | | $ | 320,704,751 | |
| | | | | | | | |
Shares outstanding | | | 11,254,169 | | | | 10,407,000 | |
| | | | | | | | |
Net asset value | | $ | 16.68 | | | $ | 30.82 | |
| | | | | | | | |
Par value | | $ | 0.10 | | | $ | 0.10 | |
| | | | | | | | |
Shares authorized | | | Unlimited | | | | 100 million | |
| | | | | | | | |
| Investor A: | | | | | | | | |
Net assets | | $ | 195,548,044 | | | $ | 520,435,615 | |
| | | | | | | | |
Shares outstanding | | | 11,946,257 | | | | 17,374,097 | |
| | | | | | | | |
Net asset value | | $ | 16.37 | | | $ | 29.95 | |
| | | | | | | | |
Par value | | $ | 0.10 | | | $ | 0.10 | |
| | | | | | | | |
Shares authorized | | | Unlimited | | | | 100 million | |
| | | | | | | | |
| Investor B: | | | | | | | | |
Net assets | | | — | | | $ | 4,467,246 | |
| | | | | | | | |
Shares outstanding | | | — | | | | 158,488 | |
| | | | | | | | |
Net asset value | | | — | | | $ | 28.19 | |
| | | | | | | | |
Par value | | | — | | | $ | 0.10 | |
| | | | | | | | |
Shares authorized | | | — | | | | 100 million | |
| | | | | | | | |
| Investor C: | | | | | | | | |
Net assets | | $ | 21,838,429 | | | $ | 348,936,639 | |
| | | | | | | | |
Shares outstanding | | | 1,857,312 | | | | 12,962,067 | |
| | | | | | | | |
Net asset value | | $ | 11.76 | | | $ | 26.92 | |
| | | | | | | | |
Par value | | $ | 0.10 | | | $ | 0.10 | |
| | | | | | | | |
Shares authorized | | | Unlimited | | | | 100 million | |
| | | | | | | | |
| Class R: | | | | | | | | |
Net assets | | $ | 1,470,519 | | | $ | 33,944,110 | |
| | | | | | | | |
Shares outstanding | | | 116,856 | | | | 1,199,231 | |
| | | | | | | | |
Net asset value | | $ | 12.58 | | | $ | 28.30 | |
| | | | | | | | |
Par value | | $ | 0.10 | | | $ | 0.10 | |
| | | | | | | | |
Shares authorized | | | Unlimited | | | | 100 million | |
| | | | | | | | |
| | | | | | |
| See Notes to Financial Statements. | | | | |
| | | | | | | |
| | ANNUAL REPORT | | JUNE 30, 2014 | | 19 |
| | | | | | | | |
| Year Ended June 30, 2014 | | BlackRock
EuroFund | | | BlackRock
Global SmallCap
Fund, Inc. | |
| | | | | | | | |
| Investment Income | | | | | | | | |
Dividends — unaffiliated | | $ | 17,866,988 | | | $ | 13,088,022 | |
Securities lending — affiliated — net | | | 14,296 | | | | 2,062,362 | |
Other income — affiliated | | | — | | | | 160,756 | |
Dividends — affiliated | | | 567 | | | | 7,003 | |
Foreign taxes withheld | | | (1,073,090 | ) | | | (561,910 | ) |
| | | | |
Total income | | | 16,808,761 | | | | 14,756,233 | |
| | | | |
| | | | | | | | |
| Expenses | | | | | | | | |
Investment advisory | | | 2,696,362 | | | | 9,249,358 | |
Service — Investor A | | | 444,523 | | | | 1,116,770 | |
Service and distribution — Investor B | | | — | | | | 58,438 | |
Service and distribution — Investor C | | | 188,573 | | | | 3,163,944 | |
Service and distribution — Class R | | | 8,232 | | | | 161,977 | |
Transfer agent — Institutional | | | 227,742 | | | | 320,510 | |
Transfer agent — Investor A | | | 177,119 | | | | 876,961 | |
Transfer agent — Investor B | | | — | | | | 17,125 | |
Transfer agent — Investor C | | | 36,681 | | | | 763,748 | |
Transfer agent — Class R | | | 6,793 | | | | 95,901 | |
Accounting services | | | 88,605 | | | | 277,788 | |
Custodian | | | 112,008 | | | | 191,604 | |
Professional | | | 86,976 | | | | 114,996 | |
Registration | | | 73,418 | | | | 106,169 | |
Printing | | | 37,374 | | | | 52,307 | |
Officer and Directors | | | 25,429 | | | | 33,814 | |
Miscellaneous | | | 35,265 | | | | 54,912 | |
| | | | |
Total expenses | | | 4,245,100 | | | | 16,656,322 | |
Less fees waived by Manager | | | (976 | ) | | | (12,633 | ) |
| | | | |
Total expenses after fees waived | | | 4,244,124 | | | | 16,643,689 | |
| | | | |
Net investment income (loss) | | | 12,564,637 | | | | (1,887,456 | ) |
| | | | |
| | | | | | | | |
| Realized and Unrealized Gain (Loss) | | | | | | | | |
Net realized gain (loss) from: | | | | | | | | |
Investments — unaffiliated | | | 39,685,309 | | | | 159,521,517 | |
Investments — affiliated | | | — | | | | (355,219 | ) |
Financial futures contracts | | | 132,510 | | | | — | |
Foreign currency transactions | | | (537,775 | ) | | | (107,024 | ) |
| | | | |
| | | 39,280,044 | | | | 159,059,274 | |
| | | | |
Net change in unrealized appreciation/depreciation on: | | | | | | | | |
Investments | | | 15,887,372 | | | | 143,030,251 | 1 |
Foreign currency translations | | | (994 | ) | | | 12,022 | |
| | | | |
| | | 15,886,378 | | | | 143,042,273 | |
| | | | |
Total realized and unrealized gain | | | 55,166,422 | | | | 302,101,547 | |
| | | | |
Net Increase in Net Assets Resulting from Operations | | $ | 67,731,059 | | | $ | 300,214,091 | |
| | | | |
1 Net of $(442,764) foreign capital gain tax. | |
| | | | | | |
| See Notes to Financial Statements. | | | | |
| | | | | | | |
| 20 | | ANNUAL REPORT | | JUNE 30, 2014 | | |
| | |
| Statements of Changes in Net Assets | | |
| | | | | | | | | | | | | | | | | | |
| | | BlackRock
EuroFund | | | | | BlackRock Global
SmallCap Fund, Inc. | |
| | | Year Ended June 30, | | | | | Year Ended June 30, | |
| Increase (Decrease) in Net Assets: | | 2014 | | | 2013 | | | | | 2014 | | | 2013 | |
| | | | | | | | | | | | | | | | | | |
| Operations | | | | | | | | | | | | | | | | | | |
Net investment income (loss) | | $ | 12,564,637 | | | $ | 4,950,756 | | | | | $ | (1,887,456 | ) | | $ | 1,561,507 | |
Net realized gain | | | 39,280,044 | | | | 28,971,628 | | | | | | 159,059,274 | | | | 84,286,425 | |
Net change in unrealized appreciation/depreciation | | | 15,886,378 | | | | 23,861,972 | | | | | | 143,042,273 | | | | 77,690,343 | |
| | | | | | | | | | | | | | | | | | |
Net increase in net assets resulting from operations | | | 67,731,059 | | | | 57,784,356 | | | | | | 300,214,091 | | | | 163,538,275 | |
| | | | | | | | | | | | | | | | | | |
| | | | | | | | | | | | | | | | | | |
| Dividends and Distributions to Shareholders From1 | | | | | | | | | | | | | | | | | | |
Net investment income: | | | | | | | | | | | | | | | | | | |
Institutional | | | (2,421,532 | ) | | | (1,036,094 | ) | | | | | (2,290,080 | ) | | | (5,938,089 | ) |
Investor A | | | (1,694,336 | ) | | | (2,325,850 | ) | | | | | (2,834,483 | ) | | | (8,860,041 | ) |
Investor B | | | — | | | | — | | | | | | (5,961 | ) | | | (96,225 | ) |
Investor C | | | (167,648 | ) | | | (84,491 | ) | | | | | (1,049,841 | ) | | | (5,424,300 | ) |
Class R | | | (14,502 | ) | | | (11,724 | ) | | | | | (164,507 | ) | | | (666,507 | ) |
Net realized gain: | | | | | | | | | | | | | | | | | | |
Institutional | | | — | | | | — | | | | | | (29,361,177 | ) | | | — | |
Investor A | | | — | | | | — | | | | | | (45,378,995 | ) | | | — | |
Investor B | | | — | | | | — | | | | | | (660,065 | ) | | | — | |
Investor C | | | — | | | | — | | | | | | (35,634,766 | ) | | | — | |
Class R | | | — | | | | — | | | | | | (3,560,341 | ) | | | — | |
| | | | | | | | | | | | | | | | | | |
Decrease in net assets resulting from dividends and distributions to shareholders | | | (4,298,018 | ) | | | (3,458,159 | ) | | | | | (120,940,216 | ) | | | (20,985,162 | ) |
| | | | | | | | | | | | | | | | | | |
| | | | | | | | | | | | | | | | | | |
| Capital Share Transactions | | | | | | | | | | | | | | | | | | |
Net increase (decrease) in net assets derived from capital share transactions | | | 89,456,834 | | | | (74,147,203 | ) | | | | | 131,169,553 | | | | (28,819,112 | ) |
| | | | | | | | | | | | | | | | | | |
| | | | | | | | | | | | | | | | | | |
| Net Assets | | | | | | | | | | | | | | | | | | |
Total increase (decrease) in net assets | | | 152,889,875 | | | | (19,821,006 | ) | | | | | 310,443,428 | | | | 113,734,001 | |
Beginning of year | | | 253,685,061 | | | | 273,506,067 | | | | | | 918,044,933 | | | | 804,310,932 | |
| | | | | | | | | | | | | | | | | | |
End of year | | $ | 406,574,936 | | | $ | 253,685,061 | | | | | $ | 1,228,488,361 | | | $ | 918,044,933 | |
| | | | | | | | | | | | | | | | | | |
Undistributed (distributions in excess of) net investment income, end of year | | $ | 12,386,404 | | | $ | 4,230,408 | | | | | $ | (30,247,289 | ) | | $ | (23,703,933 | ) |
| | | | | | | | | | | | | | | | | | |
1 Determined in accordance with federal income tax regulations. | |
| | | | | | |
| See Notes to Financial Statements. | | | | |
| | | | | | | |
| | ANNUAL REPORT | | JUNE 30, 2014 | | 21 |
| | |
| Financial Highlights | | BlackRock EuroFund |
| | | | | | | | | | | | | | | | | | | | |
| | | Institutional | |
| | | Year Ended June 30, | |
| | | 2014 | | | 2013 | | | 2012 | | | 2011 | | | 2010 | |
| | | | | | | | | | | | | | | | | | | | |
| Per Share Operating Performance | | | | | | | | | | | | | | | | | | | | |
Net asset value, beginning of year | | $ | 13.62 | | | $ | 11.29 | | | $ | 13.97 | | | $ | 10.41 | | | $ | 10.65 | |
| | | | |
Net investment income1 | | | 0.61 | | | | 0.27 | | | | 0.16 | | | | 0.36 | | | | 0.21 | |
Net realized and unrealized gain (loss) | | | 2.65 | | | | 2.22 | | | | (2.43 | ) | | | 3.41 | | | | (0.05 | ) |
| | | | |
Net increase (decrease) from investment operations | | | 3.26 | | | | 2.49 | | | | (2.27 | ) | | | 3.77 | | | | 0.16 | |
| | | | |
Dividends from net investment income2 | | | (0.20 | ) | | | (0.16 | ) | | | (0.41 | ) | | | (0.21 | ) | | | (0.40 | ) |
| | | | |
Redemption fee | | | — | | | | — | | | | — | | | | 0.00 | 3 | | | 0.00 | 3 |
| | | | |
Net asset value, end of year | | $ | 16.68 | | | $ | 13.62 | | | $ | 11.29 | | | $ | 13.97 | | | $ | 10.41 | |
| | | | |
| | | | | | | | | | | | | | | | | | | | |
| Total Investment Return4 | | | | | | | | | | | | | | | | | | | | |
Based on net asset value | | | 24.06% | | | | 22.10% | | | | (15.99)% | | | | 36.42% | 5 | | | 0.78% | 5 |
| | | | |
| | | | | | | | | | | | | | | | | | | | |
| Ratios to Average Net Assets | | | | | | | | | | | | | | | | | | | | |
Total expenses | | | 1.02% | | | | 1.07% | | | | 1.17% | | | | 1.05% | | | | 1.09% | |
| | | | |
Total expenses after fees waived | | | 1.02% | | | | 1.07% | | | | 1.17% | | | | 1.05% | | | | 1.08% | |
| | | | |
Net investment income | | | 3.81% | | | | 2.09% | | | | 1.40% | | | | 2.80% | | | | 1.73% | |
| | | | |
| | | | | | | | | | | | | | | | | | | | |
| Supplemental Data | | | | | | | | | | | | | | | | | | | | |
Net assets, end of year (000) | | $ | 187,718 | | | $ | 88,713 | | | $ | 81,040 | | | $ | 114,551 | | | $ | 101,632 | |
| | | | |
Portfolio turnover | | | 129% | | | | 115% | | | | 162% | | | | 148% | | | | 161% | |
| | | | |
| 1 | | Based on average shares outstanding. |
| 2 | | Determined in accordance with federal income tax regulations. |
| 3 | | Amount is less than $0.005 per share. |
| 4 | | Where applicable, assumes the reinvestment of dividends and distributions. |
| 5 | | Total return calculation includes redemption fees received by the Fund. The impact to the return is less than 0.005%. |
| | | | | | |
| See Notes to Financial Statements. | | | | |
| | | | | | | |
| 22 | | ANNUAL REPORT | | JUNE 30, 2014 | | |
| | |
| Financial Highlights (continued) | | BlackRock EuroFund |
| | | | | | | | | | | | | | | | | | | | |
| | | Investor A | |
| | | Year Ended June 30, | |
| | | 2014 | | | 2013 | | | 2012 | | | 2011 | | | 2010 | |
| | | | | | | | | | | | | | | | | | | | |
| Per Share Operating Performance | | | | | | | | | | | | | | | | | | | | |
Net asset value, beginning of year | | $ | 13.35 | | | $ | 11.08 | | | $ | 13.71 | | | $ | 10.22 | | | $ | 10.47 | |
| | | | |
Net investment income1 | | | 0.52 | | | | 0.20 | | | | 0.14 | | | | 0.33 | | | | 0.18 | |
Net realized and unrealized gain (loss) | | | 2.65 | | | | 2.22 | | | | (2.39 | ) | | | 3.35 | | | | (0.05 | ) |
| | | | |
Net increase (decrease) from investment operations | | | 3.17 | | | | 2.42 | | | | (2.25 | ) | | | 3.68 | | | | 0.13 | |
| | | | |
Dividends from net investment income2 | | | (0.15 | ) | | | (0.15 | ) | | | (0.38 | ) | | | (0.19 | ) | | | (0.38 | ) |
| | | | |
Redemption fee | | | — | | | | — | | | | — | | | | 0.00 | 3 | | | 0.00 | 3 |
| | | | |
Net asset value, end of year | | $ | 16.37 | | | $ | 13.35 | | | $ | 11.08 | | | $ | 13.71 | | | $ | 10.22 | |
| | | | |
| | | | | | | | | | | | | | | | | | | | |
| Total Investment Return4 | | | | | | | | | | | | | | | | | | | | |
Based on net asset value | | | 23.83% | | | | 21.89% | | | | (16.18)% | | | | 36.15% | 5 | | | 0.53% | 5 |
| | | | |
| | | | | | | | | | | | | | | | | | | | |
| Ratios to Average Net Assets | | | | | | | | | | | | | | | | | | | | |
Total expenses | | | 1.23% | | | | 1.29% | | | | 1.33% | | | | 1.25% | | | | 1.28% | |
| | | | |
Total expenses after fees waived | | | 1.23% | | | | 1.29% | | | | 1.33% | | | | 1.25% | | | | 1.28% | |
| | | | |
Net investment income | | | 3.30% | | | | 1.62% | | | | 1.21% | | | | 2.56% | | | | 1.51% | |
| | | | |
| | | | | | | | | | | | | | | | | | | | |
| Supplemental Data | | | | | | | | | | | | | | | | | | | | |
Net assets, end of year (000) | | $ | 195,548 | | | $ | 149,426 | | | $ | 176,609 | | | $ | 210,047 | | | $ | 189,788 | |
| | | | |
Portfolio turnover | | | 129% | | | | 115% | | | | 162% | | | | 148% | | | | 161% | |
| | | | |
| 1 | | Based on average shares outstanding. |
| 2 | | Determined in accordance with federal income tax regulations. |
| 3 | | Amount is less than $0.005 per share. |
| 4 | | Where applicable, excludes the effects of any sales charges and assumes the reinvestment of dividends and distributions. |
| 5 | | Total return calculation includes redemption fees received by the Fund. The impact to the return is less than 0.005%. |
| | | | | | |
| See Notes to Financial Statements. | | | | |
| | | | | | | |
| | ANNUAL REPORT | | JUNE 30, 2014 | | 23 |
| | |
| Financial Highlights (continued) | | BlackRock EuroFund |
| | | | | | | | | | | | | | | | | | | | |
| | | Investor C | |
| | | Year Ended June 30, | |
| | | 2014 | | | 2013 | | | 2012 | | | 2011 | | | 2010 | |
| | | | | | | | | | | | | | | | | | | | |
| Per Share Operating Performance | | | | | | | | | | | | | | | | | | | | |
Net asset value, beginning of year | | $ | 9.67 | | | $ | 8.05 | | | $ | 10.06 | | | $ | 7.54 | | | $ | 7.81 | |
| | | | |
Net investment income1 | | | 0.31 | | | | 0.09 | | | | 0.03 | | | | 0.16 | | | | 0.06 | |
Net realized and unrealized gain (loss) | | | 1.88 | | | | 1.58 | | | | (1.75 | ) | | | 2.47 | | | | (0.03 | ) |
| | | | |
Net increase (decrease) from investment operations | | | 2.19 | | | | 1.67 | | | | (1.72 | ) | | | 2.63 | | | | 0.03 | |
| | | | |
Dividends from net investment income2 | | | (0.10 | ) | | | (0.05 | ) | | | (0.29 | ) | | | (0.11 | ) | | | (0.30 | ) |
| | | | |
Redemption fee | | | — | | | | — | | | | — | | | | 0.00 | 3 | | | 0.00 | 3 |
| | | | |
Net asset value, end of year | | $ | 11.76 | | | $ | 9.67 | | | $ | 8.05 | | | $ | 10.06 | | | $ | 7.54 | |
| | | | |
| | | | | | | | | | | | | | | | | | | | |
| Total Investment Return4 | | | | | | | | | | | | | | | | | | | | |
Based on net asset value | | | 22.76% | | | | 20.83% | | | | (16.88)% | | | | 35.01% | 5 | | | (0.36)% | 5 |
| | | | |
| | | | | | | | | | | | | | | | | | | | |
| Ratios to Average Net Assets | | | | | | | | | | | | | | | | | | | | |
Total expenses | | | 2.07% | | | | 2.14% | | | | 2.22% | | | | 2.11% | | | | 2.13% | |
| | | | |
Total expenses after fees waived | | | 2.07% | | | | 2.14% | | | | 2.22% | | | | 2.11% | | | | 2.13% | |
| | | | |
Net investment income | | | 2.72% | | | | 0.99% | | | | 0.30% | | | | 1.66% | | | | 0.64% | |
| | | | |
| | | | | | | | | | | | | | | | | | | | |
| Supplemental Data | | | | | | | | | | | | | | | | | | | | |
Net assets, end of year (000) | | $ | 21,838 | | | $ | 13,982 | | | $ | 13,470 | | | $ | 22,169 | | | $ | 20,997 | |
| | | | |
Portfolio turnover | | | 129% | | | | 115% | | | | 162% | | | | 148% | | | | 161% | |
| | | | |
| 1 | | Based on average shares outstanding. |
| 2 | | Determined in accordance with federal income tax regulations. |
| 3 | | Amount is less than $0.005 per share. |
| 4 | | Where applicable, excludes the effects of any sales charges and assumes the reinvestment of dividends and distributions. |
| 5 | | Total return calculation includes redemption fees received by the Fund. The impact to the return is less than 0.005%. |
| | | | | | |
| See Notes to Financial Statements. | | | | |
| | | | | | | |
| 24 | | ANNUAL REPORT | | JUNE 30, 2014 | | |
| | |
| Financial Highlights (concluded) | | BlackRock EuroFund |
| | | | | | | | | | | | | | | | | | | | |
| | | Class R | |
| | | Year Ended June 30, | |
| | | 2014 | | | 2013 | | | 2012 | | | 2011 | | | 2010 | |
| | | | | | | | | | | | | | | | | | | | |
| Per Share Operating Performance | | | | | | | | | | | | | | | | | | | | |
Net asset value, beginning of year | | $ | 10.32 | | | $ | 8.57 | | | $ | 10.72 | | | $ | 8.02 | | | $ | 8.29 | |
| | | | |
Net investment income1 | | | 0.33 | | | | 0.13 | | | | 0.04 | | | | 0.19 | | | | 0.08 | |
Net realized and unrealized gain (loss) | | | 2.04 | | | | 1.69 | | | | (1.87 | ) | | | 2.65 | | | | (0.02 | ) |
| | | | |
Net increase (decrease) from investment operations | | | 2.37 | | | | 1.82 | | | | (1.83 | ) | | | 2.84 | | | | 0.06 | |
| | | | |
Dividends from net investment income2 | | | (0.11 | ) | | | (0.07 | ) | | | (0.32 | ) | | | (0.14 | ) | | | (0.33 | ) |
| | | | |
Redemption fee | | | — | | | | — | | | | — | | | | 0.00 | 3 | | | 0.00 | 3 |
| | | | |
Net asset value, end of year | | $ | 12.58 | | | $ | 10.32 | | | $ | 8.57 | | | $ | 10.72 | | | $ | 8.02 | |
| | | | |
| | | | | | | | | | | | | | | | | | | | |
| Total Investment Return4 | | | | | | | | | | | | | | | | | | | | |
Based on net asset value | | | 23.05% | | | | 21.32% | | | | (16.81)% | | | | 35.54% | 5 | | | (0.05)% | 5 |
| | | | |
| | | | | | | | | | | | | | | | | | | | |
| Ratios to Average Net Assets | | | | | | | | | | | | | | | | | | | | |
Total expenses | | | 1.79% | | | | 1.80% | | | | 1.96% | | | | 1.85% | | | | 1.87% | |
| | | | |
Total expenses after fees waived | | | 1.79% | | | | 1.80% | | | | 1.96% | | | | 1.85% | | | | 1.86% | |
| | | | |
Net investment income | | | 2.77% | | | | 1.34% | | | | 0.46% | | | | 1.90% | | | | 0.87% | |
| | | | |
| | | | | | | | | | | | | | | | | | | | |
| Supplemental Data | | | | | | | | | | | | | | | | | | | | |
Net assets, end of year (000) | | $ | 1,471 | | | $ | 1,564 | | | $ | 1,405 | | | $ | 2,275 | | | $ | 2,083 | |
| | | | |
Portfolio turnover | | | 129% | | | | 115% | | | | 162% | | | | 148% | | | | 161% | |
| | | | |
| 1 | | Based on average shares outstanding. |
| 2 | | Determined in accordance with federal income tax regulations. |
| 3 | | Amount is less than $0.005 per share. |
| 4 | | Where applicable, assumes the reinvestment of dividends and distributions. |
| 5 | | Total return calculation includes redemption fees received by the Fund. The impact to the return is less than 0.005%. |
| | | | | | |
| See Notes to Financial Statements. | | | | |
| | | | | | | |
| | ANNUAL REPORT | | JUNE 30, 2014 | | 25 |
| | |
| Financial Highlights | | BlackRock Global SmallCap Fund, Inc. |
| | | | | | | | | | | | | | | | | | | | |
| | | Institutional | |
| | | Year Ended June 30, | |
| | | 2014 | | | 2013 | | | 2012 | | | 2011 | | | 2010 | |
| | | | | | | | | | | | | | | | | | | | |
| Per Share Operating Performance | | | | | | | | | | | | | | | | | | | | |
Net asset value, beginning of year | | $ | 25.94 | | | $ | 21.87 | | | $ | 24.41 | | | $ | 18.32 | | | $ | 16.17 | |
| | | | |
Net investment income1 | | | 0.09 | | | | 0.18 | | | | 0.07 | | | | 0.13 | | | | 0.06 | |
Net realized and unrealized gain (loss) | | | 8.09 | | | | 4.58 | | | | (2.31 | ) | | | 6.13 | 2 | | | 2.09 | 2 |
| | | | |
Net increase (decrease) from investment operations | | | 8.18 | | | | 4.76 | | | | (2.24 | ) | | | 6.26 | | | | 2.15 | |
| | | | |
| Dividends and distributions from:3 | | | | | | | | | | | | | | | | | | | | |
Net investment income | | | (0.24 | ) | | | (0.69 | ) | | | (0.30 | ) | | | (0.17 | ) | | | — | |
Net realized gain | | | (3.06 | ) | | | — | | | | — | | | | — | | | | — | |
| | | | |
Total dividends and distributions | | | (3.30 | ) | | | (0.69 | ) | | | (0.30 | ) | | | (0.17 | ) | | | — | |
| | | | |
Net asset value, end of year | | $ | 30.82 | | | $ | 25.94 | | | $ | 21.87 | | | $ | 24.41 | | | $ | 18.32 | |
| | | | |
| | | | | | | | | | | | | | | | | | | | |
| Total Investment Return4 | | | | | | | | | | | | | | | | | | | | |
Based on net asset value | | | 33.28% | | | | 22.20% | | | | (9.11)% | | | | 34.25% | 5 | | | 13.30%5 | |
| | | | |
| | | | | | | | | | | | | | | | | | | | |
| Ratios to Average Net Assets | | | | | | | | | | | | | | | | | | | | |
Total expenses | | | 1.03% | | | | 1.02% | | | | 1.12% | | | | 1.08% | | | | 1.12% | |
| | | | |
Total expenses after fees waived | | | 1.03% | | | | 1.02% | | | | 1.12% | | | | 1.08% | | | | 1.12% | |
| | | | |
Net investment income | | | 0.31% | | | | 0.76% | | | | 0.30% | | | | 0.58% | | | | 0.31% | |
| | | | |
| | | | | | | | | | | | | | | | | | | | |
| Supplemental Data | | | | | | | | | | | | | | | | | | | | |
Net assets, end of year (000) | | $ | 320,705 | | | $ | 244,523 | | | $ | 186,022 | | | $ | 461,012 | | | $ | 326,440 | |
| | | | |
Portfolio turnover | | | 77% | | | | 73% | | | | 73% | | | | 82% | | | | 73% | |
| | | | |
| 1 | | Based on average shares outstanding. |
| 2 | | Includes a redemption fee, which is less than $0.005 per share. |
| 3 | | Determined in accordance with federal income tax regulations. |
| 4 | | Where applicable, assumes the reinvestment of dividends and distributions. |
| 5 | | Total return calculation includes redemption fees received by the Fund. The impact to the return is less than 0.005%. |
| | | | | | |
| See Notes to Financial Statements. | | | | |
| | | | | | | |
| 26 | | ANNUAL REPORT | | JUNE 30, 2014 | | |
| | |
| Financial Highlights (continued) | | BlackRock Global SmallCap Fund, Inc. |
| | | | | | | | | | | | | | | | | | | | |
| | | Investor A | |
| | | Year Ended June 30, | |
| | | 2014 | | | 2013 | | | 2012 | | | 2011 | | | 2010 | |
| | | | | | | | | | | | | | | | | | | | |
| Per Share Operating Performance | | | | | | | | | | | | | | | | | | | | |
Net asset value, beginning of year | | $ | 25.33 | | | $ | 21.40 | | | $ | 23.91 | | | $ | 17.95 | | | $ | 15.89 | |
| | | | |
Net investment income (loss)1 | | | (0.00 | )2 | | | 0.08 | | | | 0.02 | | | | 0.06 | | | | (0.00 | )2 |
Net realized and unrealized gain (loss) | | | 7.87 | | | | 4.49 | | | | (2.29 | ) | | | 6.01 | 3 | | | 2.06 | 3 |
| | | | |
Net increase (decrease) from investment operations | | | 7.87 | | | | 4.57 | | | | (2.27 | ) | | | 6.07 | | | | 2.06 | |
| | | | |
| Dividends and distributions from:4 | | | | | | | | | | | | | | | | | | | | |
Net investment income | | | (0.19 | ) | | | (0.64 | ) | | | (0.24 | ) | | | (0.11 | ) | | | — | |
Net realized gain | | | (3.06 | ) | | | — | | | | — | | | | — | | | | — | |
| | | | |
Total dividends and distributions | | | (3.25 | ) | | | (0.64 | ) | | | (0.24 | ) | | | (0.11 | ) | | | — | |
| | | | |
Net asset value, end of year | | $ | 29.95 | | | $ | 25.33 | | | $ | 21.40 | | | $ | 23.91 | | | $ | 17.95 | |
| | | | |
| | | | | | | | | | | | | | | | | | | | |
| Total Investment Return5 | | | | | | | | | | | | | | | | | | | | |
Based on net asset value | | | 32.81% | | | | 21.78% | | | | (9.44)% | | | | 33.88% | 6 | | | 12.96% | 6 |
| | | | |
| | | | | | | | | | | | | | | | | | | | |
| Ratios to Average Net Assets | | | | | | | | | | | | | | | | | | | | |
Total expenses | | | 1.37% | | | | 1.40% | | | | 1.42% | | | | 1.38% | | | | 1.42% | |
| | | | |
Total expenses after fees waived | | | 1.37% | | | | 1.40% | | | | 1.42% | | | | 1.38% | | | | 1.42% | |
| | | | |
Net investment income (loss) | | | (0.01)% | | | | 0.35% | | | | 0.08% | | | | 0.27% | | | | (0.01)% | |
| | | | |
| | | | | | | | | | | | | | | | | | | | |
| Supplemental Data | | | | | | | | | | | | | | | | | | | | |
Net assets, end of year (000) | | $ | 520,436 | | | $ | 364,036 | | | $ | 326,001 | | | $ | 360,144 | | | $ | 264,526 | |
| | | | |
Portfolio turnover | | | 77% | | | | 73% | | | | 73% | | | | 82% | | | | 73% | |
| | | | |
| 1 | | Based on average shares outstanding. |
| 2 | | Amount is less than $(0.005) per share. |
| 3 | | Includes a redemption fee, which is less than $0.005 per share. |
| 4 | | Determined in accordance with federal income tax regulations. |
| 5 | | Where applicable, excludes the effects of any sales charges and assumes the reinvestment of dividends and distributions. |
| 6 | | Total return calculation includes redemption fees received by the Fund. The impact to the return is less than 0.005%. |
| | | | | | |
| See Notes to Financial Statements. | | | | |
| | | | | | | |
| | ANNUAL REPORT | | JUNE 30, 2014 | | 27 |
| | |
| Financial Highlights (continued) | | BlackRock Global SmallCap Fund, Inc. |
| | | | | | | | | | | | | | | | | | | | |
| | | Investor B | |
| | | Year Ended June 30, | |
| | | 2014 | | | 2013 | | | 2012 | | | 2011 | | | 2010 | |
| | | | | | | | | | | | | | | | | | | | |
| Per Share Operating Performance | | | | | | | | | | | | | | | | | | | | |
Net asset value, beginning of year | | $ | 24.05 | | | $ | 20.15 | | | $ | 22.45 | | | $ | 16.93 | | | $ | 15.12 | |
| | | | |
Net investment loss1 | | | (0.25 | ) | | | (0.16 | ) | | | (0.19 | ) | | | (0.14 | ) | | | (0.17 | ) |
Net realized and unrealized gain (loss) | | | 7.48 | | | | 4.27 | | | | (2.11 | ) | | | 5.66 | 2 | | | 1.98 | 2 |
| | | | |
Net increase (decrease) from investment operations | | | 7.23 | | | | 4.11 | | | | (2.30 | ) | | | 5.52 | | | | 1.81 | |
| | | | |
| Dividends and distributions from:3 | | | | | | | | | | | | | | | | | | | | |
Net investment income | | | (0.03 | ) | | | (0.21 | ) | | | — | | | | — | | | | — | |
Net realized gain | | | (3.06 | ) | | | — | | | | — | | | | — | | | | — | |
| | | | |
Total dividends and distributions | | | (3.09 | ) | | | (0.21 | ) | | | — | | | | — | | | | — | |
| | | | |
Net asset value, end of year | | $ | 28.19 | | | $ | 24.05 | | | $ | 20.15 | | | $ | 22.45 | | | $ | 16.93 | |
| | | | |
| | | | | | | | | | | | | | | | | | | | |
| Total Investment Return4 | | | | | | | | | | | | | | | | | | | | |
Based on net asset value | | | 31.74% | | | | 20.55% | | | | (10.25)% | | | | 32.60% | 5 | | | 11.97% | 5 |
| | | | |
| | | | | | | | | | | | | | | | | | | | |
| Ratios to Average Net Assets | | | | | | | | | | | | | | | | | | | | |
Total expenses | | | 2.22% | | | | 2.43% | | | | 2.39% | | | | 2.29% | | | | 2.33% | |
| | | | |
Total expenses after fees waived | | | 2.22% | | | | 2.43% | | | | 2.39% | | | | 2.29% | | | | 2.33% | |
| | | | |
Net investment (loss) | | | (0.94)% | | | | (0.74)% | | | | (0.92)% | | | | (0.67)% | | | | (0.96)% | |
| | | | |
| | | | | | | | | | | | | | | | | | | | |
| Supplemental Data | | | | | | | | | | | | | | | | | | | | |
Net assets, end of year (000) | | $ | 4,467 | | | $ | 7,355 | | | $ | 11,968 | | | $ | 25,054 | | | $ | 28,247 | |
| | | | |
Portfolio turnover | | | 77% | | | | 73% | | | | 73% | | | | 82% | | | | 73% | |
| | | | |
| 1 | | Based on average shares outstanding. |
| 2 | | Includes a redemption fee, which is less than $0.005 per share. |
| 3 | | Determined in accordance with federal income tax regulations. |
| 4 | | Where applicable, excludes the effects of any sales charges and assumes the reinvestment of dividends and distributions. |
| 5 | | Total return calculation includes redemption fees received by the Fund. The impact to the return is less than 0.005%. |
| | | | | | |
| See Notes to Financial Statements. | | | | |
| | | | | | | |
| 28 | | ANNUAL REPORT | | JUNE 30, 2014 | | |
| | |
| Financial Highlights (continued) | | BlackRock Global SmallCap Fund, Inc. |
| | | | | | | | | | | | | | | | | | | | |
| | | Investor C | |
| | | Year Ended June 30, | |
| | | 2014 | | | 2013 | | | 2012 | | | 2011 | | | 2010 | |
| | | | | | | | | | | | | | | | | | | | |
| Per Share Operating Performance | | | | | | | | | | | | | | | | | | | | |
Net asset value, beginning of year | | $ | 23.13 | | | $ | 19.57 | | | $ | 21.83 | | | $ | 16.45 | | | $ | 14.68 | |
| | | | |
Net investment loss1 | | | (0.21 | ) | | | (0.10 | ) | | | (0.15 | ) | | | (0.11 | ) | | | (0.15 | ) |
Net realized and unrealized gain (loss) | | | 7.15 | | | | 4.11 | | | | (2.08 | ) | | | 5.49 | 2 | | | 1.92 | 2 |
| | | | |
Net increase (decrease) from investment operations | | | 6.94 | | | | 4.01 | | | | (2.23 | ) | | | 5.38 | | | | 1.77 | |
| | | | |
| Dividends and distributions from:3 | | | | | | | | | | | | | | | | | | | | |
Net investment income | | | (0.09 | ) | | | (0.45 | ) | | | (0.03 | ) | | | — | | | | — | |
Net realized gain | | | (3.06 | ) | | | — | | | | — | | | | — | | | | — | |
| | | | |
Total dividends and distributions | | | (3.15 | ) | | | (0.45 | ) | | | (0.03 | ) | | | — | | | | — | |
| | | | |
Net asset value, end of year | | $ | 26.92 | | | $ | 23.13 | | | $ | 19.57 | | | $ | 21.83 | | | $ | 16.45 | |
| | | | |
| | | | | | | | | | | | | | | | | | | | |
| Total Investment Return4 | | | | | | | | | | | | | | | | | | | | |
Based on net asset value | | | 31.79% | | | | 20.80% | | | | (10.19)% | | | | 32.71% | 5 | | | 12.06% | 5 |
| | | | |
| | | | | | | | | | | | | | | | | | | | |
| Ratios to Average Net Assets | | | | | | | | | | | | | | | | | | | | |
Total expenses | | | 2.16% | | | | 2.21% | | | | 2.27% | | | | 2.21% | | | | 2.27% | |
| | | | |
Total expenses after fees waived | | | 2.16% | | | | 2.21% | | | | 2.27% | | | | 2.21% | | | | 2.27% | |
| | | | |
Net investment (loss) | | | (0.82)% | | | | (0.45)% | | | | (0.78)% | | | | (0.57)% | | | | (0.86)% | |
| | | | |
| | | | | | | | | | | | | | | | | | | | |
| Supplemental Data | | | | | | | | | | | | | | | | | | | | |
Net assets, end of year (000) | | $ | 348,937 | | | $ | 273,018 | | | $ | 251,459 | | | $ | 345,372 | | | $ | 293,633 | |
| | | | |
Portfolio turnover | | | 77% | | | | 73% | | | | 73% | | | | 82% | | | | 73% | |
| | | | |
| 1 | | Based on average shares outstanding. |
| 2 | | Includes a redemption fee, which is less than $0.005 per share. |
| 3 | | Determined in accordance with federal income tax regulations. |
| 4 | | Where applicable, excludes the effects of any sales charges and assumes the reinvestment of dividends and distributions. |
| 5 | | Total return calculation includes redemption fees received by the Fund. The impact to the return is less than 0.005%. |
| | | | | | |
| See Notes to Financial Statements. | | | | |
| | | | | | | |
| | ANNUAL REPORT | | JUNE 30, 2014 | | 29 |
| | |
| Financial Highlights (concluded) | | BlackRock Global SmallCap Fund, Inc. |
| | | | | | | | | | | | | | | | | | | | |
| | | Class R | |
| | | Year Ended June 30, | |
| | | 2014 | | | 2013 | | | 2012 | | | 2011 | | | 2010 | |
| | | | | | | | | | | | | | | | | | | | |
| Per Share Operating Performance | | | | | | | | | | | | | | | | | | | | |
Net asset value, beginning of year | | $ | 24.13 | | | $ | 20.38 | | | $ | 22.72 | | | $ | 17.09 | | | $ | 15.18 | |
| | | | |
Net investment loss1 | | | (0.10 | ) | | | (0.01 | ) | | | (0.08 | ) | | | (0.03 | ) | | | (0.08 | ) |
Net realized and unrealized gain (loss) | | | 7.47 | | | | 4.28 | | | | (2.14 | ) | | | 5.71 | 2 | | | 1.99 | 2 |
| | | | |
Net increase (decrease) from investment operations | | | 7.37 | | | | 4.27 | | | | (2.22 | ) | | | 5.68 | | | | 1.91 | |
| | | | |
| Dividends and distributions from:3 | | | | | | | | | | | | | | | | | | | | |
Net investment income | | | (0.14 | ) | | | (0.52 | ) | | | (0.12 | ) | | | (0.05 | ) | | | — | |
Net realized gain | | | (3.06 | ) | | | — | | | | — | | | | — | | | | — | |
| | | | |
Total dividends and distributions | | | (3.20 | ) | | | (0.52 | ) | | | (0.12 | ) | | | (0.05 | ) | | | — | |
| | | | |
Net asset value, end of year | | $ | 28.30 | | | $ | 24.13 | | | $ | 20.38 | | | $ | 22.72 | | | $ | 17.09 | |
| | | | |
| | | | | | | | | | | | | | | | | | | | |
| Total Investment Return4 | | | | | | | | | | | | | | | | | | | | |
Based on net asset value | | | 32.32% | | | | 21.28% | | | | (9.76)% | | | | 33.24% | 5 | | | 12.58% | 5 |
| | | | |
| | | | | | | | | | | | | | | | | | | | |
| Ratios to Average Net Assets | | | | | | | | | | | | | | | | | | | | |
Total expenses | | | 1.72% | | | | 1.79% | | | | 1.83% | | | | 1.81% | | | | 1.84% | |
| | | | |
Total expenses after fees waived | | | 1.72% | | | | 1.79% | | | | 1.83% | | | | 1.81% | | | | 1.84% | |
| | | | |
Net investment (loss) | | | (0.38)% | | | | (0.04)% | | | | (0.37)% | | | | (0.16)% | | | | (0.42)% | |
| | | | |
| | | | | | | | | | | | | | | | | | | | |
| Supplemental Data | | | | | | | | | | | | | | | | | | | | |
Net assets, end of year (000) | | $ | 33,944 | | | $ | 29,112 | | | $ | 28,861 | | | $ | 46,316 | | | $ | 38,378 | |
| | | | |
Portfolio turnover | | | 77% | | | | 73% | | | | 73% | | | | 82% | | | | 73% | |
| | | | |
| 1 | | Based on average shares outstanding. |
| 2 | | Includes a redemption fee, which is less than $0.005 per share. |
| 3 | | Determined in accordance with federal income tax regulations. |
| 4 | | Where applicable, assumes the reinvestment of dividends and distributions. |
| 5 | | Total return calculation includes redemption fees received by the Fund. The impact to the return is less than 0.005%. |
| | | | | | |
| See Notes to Financial Statements. | | | | |
| | | | | | | |
| 30 | | ANNUAL REPORT | | JUNE 30, 2014 | | |
| | |
| Notes to Financial Statements | | |
1. Organization:
BlackRock EuroFund (“EuroFund”) and BlackRock Global SmallCap Fund, Inc. (“Global SmallCap”) (the “Funds”), are registered under the Investment Company Act of 1940, as amended (the “1940 Act”), as diversified, open-end management investment companies. EuroFund is organized as a Massachusetts business trust. Global SmallCap is organized as a Maryland corporation.
Each Fund offers multiple classes of shares. Institutional Shares are sold without a sales charge and only to certain eligible investors. Investor A Shares are generally sold with an initial sales charge, but may be subject to a CDSC for certain redemptions where no initial sales charge was paid at the time of purchase. Investor B and Investor C Shares may be subject to a CDSC. Class R Shares are sold without a sales charge and only to certain employer-sponsored retirement plans. All classes of shares have identical voting, dividend, liquidation and other rights and the same terms and conditions, except that Investor A, Investor B, Investor C and Class R Shares bear certain expenses related to the shareholder servicing of such shares, and Investor B, Investor C and Class R Shares also bear certain expenses related to the distribution of such shares. Investor B Shares automatically convert to Investor A Shares after approximately eight years. Investor B Shares are only available through exchanges and dividend reinvestments by existing shareholders and for purchase by certain employer-sponsored retirement plans. Each class has exclusive voting rights with respect to matters relating to its shareholder servicing and distribution expenditures (except that Investor B shareholders may vote on material changes to the Investor A distribution and service plan). On June 10, 2013, all of the issued and oustanding shares of EuroFund’s Investor B Shares were converted into Investor A Shares with the same relative aggregate net asset value.
The Funds, together with certain other registered investment companies advised by BlackRock Advisors, LLC (the “Manager”) or its affiliates, are included in a complex of open-end funds referred to as the Equity-Bond Complex.
2. Significant Accounting Policies:
The Funds’ financial statements are prepared in conformity with accounting principles generally accepted in the United States of America (“U.S. GAAP”), which may require management to make estimates and assumptions that affect the reported amounts of assets and liabilities in the financial statements and the reported amounts of increases and decreases in net assets from operations during the reporting period. Actual results could differ from those estimates. Each Fund is considered an investment company under U.S. GAAP and follows the accounting and reporting guidance applicable to investment companies. The following is a summary of significant accounting policies followed by the Funds:
Valuation: U.S. GAAP defines fair value as the price the Funds would receive to sell an asset or pay to transfer a liability in an orderly transaction between market participants at the measurement date. The Funds determine the fair value of their financial instruments at market value using independent dealers or pricing services under policies approved by the Board of Directors of the Funds (the “Board”). The BlackRock Global Valuation Methodologies Committee (the “Global Valuation Committee”) is the committee formed by management to develop global pricing policies and procedures and to provide oversight of the pricing function for the Funds for all financial instruments.
Equity investments traded on a recognized securities exchange or the NASDAQ Stock Market (“NASDAQ”) are valued at the last reported sale price that day or the NASDAQ official closing price, if applicable. For equity investments traded on more than one exchange, the last reported sale price on the exchange where the stock is primarily traded is used. Equity investments traded on a recognized exchange for which there were no sales on that day are valued at the last available bid (long positions) or ask (short positions) price. Financial futures contracts traded on exchanges are valued at their last sale price. Investments in open-end registered investment companies are valued at NAV each business day. Short-term securities with remaining maturities of 60 days or less may be valued at amortized cost, which approximates fair value.
The Funds value their investments in BlackRock Liquidity Series, LLC Money Market Series (the “Money Market Series”) at fair value, which is ordinarily based upon their pro rata ownership in the underlying fund’s net assets. The Money Market Series seeks current income consistent with maintaining liquidity and preserving capital. Although the Money Market Series is not registered under the 1940 Act, its investments will follow the parameters of investments by a money market fund that is subject to Rule 2a-7 under the 1940 Act. The Funds may withdraw up to 25% of their investment daily, although the manager of the Money Market Series, in its sole discretion, may permit an investor to withdraw more than 25% on any one day.
Securities and other assets and liabilities denominated in foreign currencies are translated into U.S. dollars using exchange rates determined as of the close of business on the New York Stock Exchange (“NYSE”). Foreign currency exchange contracts are valued at the mean between the bid and ask prices and are determined as of the close of business on the NYSE. Interpolated values are derived when the settlement date of the contract is an interim date for which quotations are not available.
| | | | | | |
| | | | | | | |
| | ANNUAL REPORT | | JUNE 30, 2014 | | 31 |
| | |
| Notes to Financial Statements (continued) | | |
In the event that the application of these methods of valuation results in a price for an investment that is deemed not to be representative of the market value of such investment, or if a price is not available, the investment will be valued by the Global Valuation Committee, or its delegate, in accordance with a policy approved by the Board as reflecting fair value (“Fair Value Assets”). When determining the price for Fair Value Assets, the Global Valuation Committee, or its delegate, seeks to determine the price that each Fund might reasonably expect to receive from the current sale of that asset in an arm’s-length transaction. Fair value determinations shall be based upon all available factors that the Global Valuation Committee, or its delegate, deems relevant consistent with the principles of fair value measurement. The pricing of all Fair Value Assets is subsequently reported to the Board or a committee thereof on a quarterly basis.
Generally, trading in foreign instruments is substantially completed each day at various times prior to the close of business on the NYSE. Occasionally, events affecting the values of such instruments may occur between the foreign market close and the close of business on the NYSE that may not be reflected in the computation of each Fund’s net assets. If events (e.g., a company announcement, market volatility or a natural disaster) occur during such periods that are expected to materially affect the value of such instruments, those instruments may be Fair Value Assets and valued at their fair value, as determined in good faith by the Global Valuation Committee, or its delegate, using a pricing service and/or policies approved by the Board. Each business day, the Funds use a pricing service to assist with the valuation of certain foreign exchange-traded equity securities and foreign exchange-traded and over-the–counter (“OTC”) options (the “Systematic Fair Value Price”). Using current market factors, the Systematic Fair Value Price is designed to value such foreign securities and foreign options at fair value as of the close of business on the NYSE, which follows the close of the local markets.
Foreign Currency: The Funds’ books and records are maintained in U.S. dollars. Purchases and sales of investment securities are recorded at the rates of exchange prevailing on the respective date of such transactions. Generally, when the U.S. dollar rises in value against a foreign currency, the Funds’ investments denominated in that currency will lose value because that currency is worth fewer U.S. dollars; the opposite effect occurs if the U.S. dollar falls in relative value.
The Funds do not isolate the portion of the results of operations arising as a result of changes in the forward foreign exchange rates from the changes in the market prices of investments held or sold for financial reporting purposes. Accordingly, the effects of changes in foreign currency exchange rates on investments are not segregated in the Statements of Operations from the effects of changes in market prices of those investments but are included as a component of net realized and unrealized gain (loss) from investments. The Funds report realized currency gains (losses) on foreign currency related transactions as components of net realized gain (loss) for financial reporting purposes, whereas such components may be treated as ordinary income for federal income tax purposes.
Segregation and Collateralization: In cases where the Funds enter into certain investments (e.g., financial futures contracts and forward foreign currency), that would be “senior securities” for 1940 Act purposes, the Funds may segregate or designate on their books and records cash or liquid securities having a market value at least equal to the amount of the Funds’ future obligations under such investments or borrowings. Doing so allows the investment to be excluded from treatment as a “senior security.” Furthermore, if required by an exchange or counterparty agreement, the Funds may be required to deliver/deposit cash and/or securities to/with an exchange, or broker-dealer or custodian as collateral for certain investments or obligations.
Investment Transactions and Investment Income: For financial reporting purposes, investment transactions are recorded on the dates the transactions are entered into (the trade dates). Realized gains and losses on investment transactions are determined on the identified cost basis. Dividend income is recorded on the ex-dividend date. Dividends from foreign securities where the ex-dividend date may have passed are subsequently recorded when the Funds are informed of the ex-dividend date. Under the applicable foreign tax laws, a withholding tax at various rates may be imposed on capital gains, dividends and interest. Upon notification from issuers, some of the dividend income received from a real estate investment trust may be redesignated as a reduction of cost of the related investment and/or realized gain. Interest income, including amortization and accretion of premiums and discounts on debt securities, is recognized on the accrual basis. Income and realized and unrealized gains and losses are allocated daily to each class based on its relative net assets.
Dividends and Distributions: Dividends and distributions paid by the Funds are recorded on the ex-dividend date. The character and timing of dividends and distributions are determined in accordance with federal income tax regulations, which may differ from U.S. GAAP.
Recent Accounting Standard: In June 2014, the Financial Accounting Standards Board issued guidance to improve the financial reporting of reverse repurchase agreements and other similar transactions. The guidance includes expanded disclosure requirements for entities that enter into reverse repurchase agreements and similar transactions accounted for as secured borrowings. The guidance is effective for financial statements with fiscal years beginning on or after December 15, 2014 and interim periods within those fiscal years. Management is evaluating the impact, if any, of this guidance on the Funds’ financial statement disclosures.
| | | | | | |
| | | | | | | |
| 32 | | ANNUAL REPORT | | JUNE 30, 2014 | | |
| | | | |
| Notes to Financial Statements (continued) | | |
Other: Expenses directly related to a Fund or its classes are charged to that Fund or class. Other operating expenses shared by several funds are pro rated among those funds on the basis of relative net assets or other appropriate methods. Expenses directly related to the Funds and other shared expenses pro rated to the Funds are allocated daily to each class based on its relative net assets or other appropriate methods.
The Funds have an arrangement with the custodian whereby fees may be reduced by credits earned on uninvested cash balances, which, if applicable, are shown as fees paid indirectly in the Statements of Operations. The custodian imposes fees on overdrawn cash balances, which can be offset by accumulated credits earned or may result in additional custody charges.
3. Securities and Other Investments:
Securities Lending: Each Fund may lend its securities to approved borrowers, such as, brokers, dealers and other financial institutions. The borrower pledges collateral consisting of cash, an irrevocable letter of credit issued by a bank, or securities issued or guaranteed by the U.S. government. The initial collateral received by each Fund is required to have a value of at least 102% of the current value of the loaned securities for securities traded on U.S. exchanges and a value of at least 105% for all other securities. The collateral is maintained thereafter, at a value equal to at least 100% of the current market value of the securities on loan. The market value of the loaned securities is determined at the close of each business day of the Fund and any additional required collateral is delivered to the Fund on the next business day. During the term of the loan, each Fund earns dividend or interest income on the securities loaned but does not receive interest income on any securities received as collateral. Loans of securities are terminable at any time and the borrower, after notice, is required to return borrowed securities within the standard time period for settlement of securities transactions.
The market value of securities on loan and the value of the related collateral are shown separately in the Statements of Assets and Liabilities as a component of investments at value, and collateral on securities loaned at value, respectively. As of June 30, 2014, any securities on loan were collateralized by cash. The cash collateral invested by the securities lending agent, BlackRock Investment Management, LLC (“BIM”), if any, is disclosed in the Schedules of Investments.
Securities lending transactions are entered into by the Funds under Master Securities Lending Agreements (each, an “MSLA”), which provide the right, in the event of default (including bankruptcy or insolvency), for the non-defaulting party to liquidate the collateral and calculate a net exposure to the defaulting party or request additional collateral. In the event that a borrower defaults, each Fund, as lender, would offset the market value of the collateral received against the market value of the securities loaned. When the value of the collateral is greater than that of the market value of the securities loaned, the lender is left with a net amount payable to the defaulting party. However, bankruptcy or insolvency laws of a particular jurisdiction may impose restrictions on or prohibitions against such a right of offset in the event of an MSLA counterparty’s bankruptcy or insolvency. Under the MSLA, the borrower can resell or re-pledge the loaned securities, and the Funds can reinvest cash collateral, or, upon an event of default, resell or re-pledge the collateral.
The following table is a summary of EuroFund’s securities lending agreements by counterparty, which are subject to offset under an MSLA as of June 30, 2014:
| | | | | | | | | | | | | | |
| Counterparty | | | | Securities
Loaned
at Value | | | Cash Collateral
Received1 | | | Net Amount | |
Credit Suisse Securities (USA) LLC | | | | $ | 1,290,892 | | | $ | (1,290,892 | ) | | | — | |
Goldman Sachs & Co. | | | | | 1,020,541 | | | | (1,020,541 | ) | | | — | |
Morgan Stanley | | | | | 456,575 | | | | (456,575 | ) | | | | |
| | | | | | | | | | | | | | |
Total | | | | $ | 2,768,008 | | | $ | (2,768,008 | ) | | | — | |
| | | | | | | | | | | | | | |
| | 1 | | Collateral with a value of $3,229,307 has been received in connection with securities lending agreements. Excess of collateral received from the individual counterparty is not shown for financial reporting purposes. |
| | | | | | |
| | | | | | | |
| | ANNUAL REPORT | | JUNE 30, 2014 | | 33 |
| | |
| Notes to Financial Statements (continued) | | |
The following table is a summary of Global SmallCap’s securities lending agreements by counterparty, which are subject to offset under an MSLA as of June 30, 2014:
| | | | | | | | | | | | |
| Counterparty | | Securities
Loaned at Value | | | Cash Collateral
Received1 | | | Net Amount | |
Barclays Capital, Inc. | | $ | 9,370,374 | | | $ | (9,370,374 | ) | | | — | |
BNP Paribas S.A. | | | 70,197 | | | | (70,197 | ) | | | | |
Credit Suisse Securities (USA) LLC | | | 1,361,741 | | | | (1,361,741 | ) | | | — | |
Deutsche Bank Securities, Inc. | | | 718,370 | | | | (718,370 | ) | | | — | |
Goldman Sachs & Co. | | | 4,431,707 | | | | (4,431,707 | ) | | | — | |
JP Morgan Securities LLC | | | 7,946,820 | | | | (7,946,820 | ) | | | — | |
Merrill Lynch, Pierce, Fenner & Smith, Inc. | | | 15,863,462 | | | | (15,863,462 | ) | | | — | |
Morgan Stanley | | | 64,973,996 | | | | (64,973,996 | ) | | | — | |
National Financial Services LLC | | | 2,226,021 | | | | (2,226,021 | ) | | | — | |
UBS Securities LLC | | | 9,613,146 | | | | (9,613,146 | ) | | | — | |
| | | | | | | | | | | | |
Total | | $ | 116,575,834 | | | $ | (116,575,834 | ) | | | — | |
| | | | | | | | | | | | |
| | 1 | | Collateral with a value of $121,421,480 has been received in connection with securities lending agreements. Excess of collateral received from the individual counterparty is not shown for financial reporting purposes. |
The risks of securities lending include the risk that the borrower may not provide additional collateral when required or may not return the securities when due. To mitigate these risks, the Funds benefit from a borrower default indemnity provided by BIM. BIM’s indemnity allows for full replacement of the securities lent if the collateral received does not cover the value on the securities loaned in the event of a borrower default. The Funds could suffer a loss if the value of an investment purchased with cash collateral falls below the market value of loaned securities or if the value of an investment purchased with cash collateral falls below the value of the original cash collateral received.
4. Derivative Financial Instruments:
The Funds engage in various portfolio investment strategies using derivative contracts both to increase the returns of the Funds and/or to economically hedge their exposure to certain risks such as foreign currency exchange rate risk. These contracts may be transacted on an exchange or OTC.
Financial Futures Contracts: The Funds purchase and/or sell financial futures contracts and options on financial futures contracts to gain exposure to, or economically hedge against, changes in the value of equity securities (equity risk). Financial futures contracts are agreements between the Funds and a counterparty to buy or sell a specific quantity of an underlying instrument at a specified price and at a specified date. Depending on the terms of the particular contract, financial futures contracts are settled either through physical delivery of the underlying instrument on the settlement date or by payment of a cash settlement amount on the settlement date.
Upon entering into a financial futures contract, the Funds are required to deposit initial margin with the broker in the form of cash or securities in an amount that varies depending on a contract’s size and risk profile. The initial margin deposit must then be maintained at an established level over the life of the contract. Securities deposited as initial margin are designated on the Schedules of Investments and cash deposited, if any, is recorded on the Statements of Assets and Liabilities as cash pledged for financial futures contracts. Pursuant to the contract, the Funds agree to receive from or pay to the broker an amount of cash equal to the daily fluctuation in value of the contract. Such receipts or payments are known as variation margin. Variation margin is recorded by the Funds as unrealized appreciation or depreciation and if applicable, as a receivable or payable for variation margin in the Statements of Assets and Liabilities.
When the contract is closed, the Funds record a realized gain or loss equal to the difference between the value of the contract at the time it was opened and the value at the time it was closed. The use of financial futures contracts involves the risk of an imperfect correlation in the movements in the price of financial futures contracts, interest rates and the underlying assets.
Forward Foreign Currency Exchange Contracts: The Funds enter into forward foreign currency exchange contracts as an economic hedge against either specific transactions or portfolio instruments or to obtain exposure to, or hedge exposure away from, foreign currencies (foreign currency exchange rate risk). A forward foreign currency exchange contract is an agreement between two parties to buy and sell a currency at a set exchange rate on a future date. Forward foreign currency exchange contracts, when used by the Funds, help to manage the overall exposure to the currencies in which some of the investments held by the Funds are denominated. The contract is marked-to-market daily and the change in market value is recorded by the Funds as an unrealized gain or loss. When the contract is closed, the Funds record a realized gain or loss equal to the difference between the value at the time it was opened and the value at the time it was closed. The use of forward foreign currency exchange contracts involves the risk that the value of a foreign currency exchange contract changes unfavorably due to movements in the value of the referenced foreign currencies.
| | | | | | |
| | | | | | | |
| 34 | | ANNUAL REPORT | | JUNE 30, 2014 | | |
| | | | |
| Notes to Financial Statements (continued) | | |
The following is a summary of the Funds’ derivative financial instruments categorized by risk exposure:
| | | | | | | | |
The Effect of Derivative Financial Instruments in the Statements of Operations
Year Ended June 30, 2014 | |
| | | Net Realized Gain (Loss) From | |
| | | EuroFund | | | Global
SmallCap | |
| Equity contracts: | | | | | | | | |
Financial futures contracts | | $ | 132,510 | | | | | |
| Foreign currency exchange contracts: | | | | | | | | |
Foreign currency transactions | | | — | | | $ | (5,700 | ) |
For the year ended June 30, 2014, the average quarterly balances of outstanding derivative financial instruments were as follows:
| | | | | | | | |
| | | EuroFund | | | Global
SmallCap | |
| Financial futures contracts: | | | | | | | | |
Average number of contracts purchased | | | 1 | 1 | | | | |
Average number of contracts sold | | | — | | | | | |
Average notional value of contracts purchased | | $ | 5,170,033 | 1 | | | | |
Average notional value of contracts sold. | | | — | | | | | |
| Forward foreign currency exchange contracts: | | | | | | | | |
Average number of contracts — USD purchased | | | | | | | 1 | 2 |
Average number of contracts — USD sold | | | | | | | 1 | 2 |
Average US dollar amounts purchased | | | | | | $ | 13,508 | 2 |
Average US dollar amounts sold | | | | | | $ | 611,820 | 2 |
| | ¹ | | Actual contract amounts for the period are shown due to limited outstanding derivative financial instruments as of each quarter. |
| | 2 | | Average amounts for the period are shown due to limited outstanding derivative financial instruments as of each quarter. |
Counterparty Credit Risk: A derivative contract may suffer a mark- to-market loss if the value of the contract decreases due to an unfavorable change in the market rates or values of the underlying instrument. Losses can also occur if the counterparty does not perform under the contract. A Fund’s risk of loss from counterparty credit risk on OTC derivatives is generally limited to the aggregate unrealized gain netted against any collateral held by such Fund.
With exchange traded futures, there is less counterparty credit risk to the Funds since the exchange or clearinghouse, as counterparty to such instruments, guarantees against a possible default. The clearinghouse stands between the buyer and the seller of the contract; therefore, credit risk is limited to failure of the clearinghouse. While offset rights may exist under applicable law, the Funds do not have a contractual right of offset against a clearing broker or clearinghouse in the event of a default (including the bankruptcy or insolvency) of the clearing broker or clearinghouse. Additionally, credit risk exists in exchange traded futures with respect to initial and variation margin that is held in a clearing broker’s customer accounts. While clearing brokers are required to segregate customer margin from their own assets, in the event that a clearing broker becomes insolvent or goes into bankruptcy and at that time there is a shortfall in the aggregate amount of margin held by the clearing broker for all its clients, typically the shortfall would be allocated on a pro rata basis across all the clearing broker’s customers, potentially resulting in losses to the Funds.
In order to better define their contractual rights and to secure rights that will help the Funds mitigate their counterparty risk, the Funds may enter into an International Swaps and Derivatives Association, Inc. Master Agreement (“ISDA Master Agreement”) or similar agreement with their counterparties. An ISDA Master Agreement is a bilateral agreement between each Fund and a counterparty that governs certain OTC derivatives and typically contains, among other things, collateral posting terms and netting provisions in the event of a default and/or termination event. Under an ISDA Master Agreement, each Fund may, under certain circumstances, offset with the counterparty certain derivative financial instruments’ payables and/or receivables with collateral held and/or posted and create one single net payment. The provisions of the ISDA Master Agreement typically permit a single net payment in the event of default including the bankruptcy or insolvency of the counterparty. Bankruptcy or insolvency laws of a particular jurisdiction restrict or prohibit the right of offset in bankruptcy, insolvency or other events. In addition, certain ISDA Master Agreements allow counterparties to terminate derivative contracts prior to maturity in the event the Funds’ net assets decline by a stated percentage or the Funds fail to meet the terms of their ISDA Master Agreements. The result would cause the Funds to accelerate payment of any net liability owed to the counterparty.
Collateral Requirements: For derivatives traded under an ISDA Master Agreement, the collateral requirements are typically calculated by netting the mark-to-market amount for each transaction under such agreement and comparing that amount to the value of any collateral currently pledged by the Fund and the counterparty.
| | | | | | |
| | | | | | | |
| | ANNUAL REPORT | | JUNE 30, 2014 | | 35 |
| | |
| Notes to Financial Statements (continued) | | |
Cash collateral that has been pledged to cover obligations of the Funds and cash collateral received from the counterparty, if any, is reported separately on the Statements of Assets and Liabilities as cash pledged as collateral and cash received as collateral, respectively. Non-cash collateral pledged by the Funds, if any, is noted in the Schedules of Investments. Generally, the amount of collateral due from or to a party has to exceed a minimum transfer amount threshold (typically either $250,000 or $500,000) before a transfer is required, which is determined at the close of business of the Fund. Any additional required collateral is delivered to/pledged by the Funds on the next business day. Typically, the Funds and counterparties are not permitted to sell, re-pledge or use the collateral they receive. To the extent amounts due to the Funds from their counterparties are not fully collateralized, each Fund bears the risk of loss from counterparty non-performance. Likewise, to the extent a Fund has delivered collateral to a counterparty and stands ready to perform under the terms of its agreement with such counterparty, a Fund bears the risk of loss from a counterparty in the amount of the value of the collateral in the event the counterparty fails to return such collateral.
For financial reporting purposes, the Funds do not offset derivative assets and derivative liabilities that are subject to netting arrangements, if any, in the Statements of Assets and Liabilities.
5. Investment Advisory Agreement and Other Transactions with Affiliates:
The PNC Financial Services Group, Inc. is the largest stockholder and an affiliate, for 1940 Act purposes, of BlackRock, Inc. (‘BlackRock”).
Each Fund entered into an Investment Advisory Agreement with the Manager, the Funds’ investment advisor, an indirect, wholly owned subsidiary of BlackRock, to provide investment advisory and administration services. The Manager is responsible for the management of each Fund’s portfolio and provides the necessary personnel, facilities, equipment and certain other services necessary to the operations of each Fund. For such services, each Fund pays the Manager a monthly fee at an annual rate of each Fund’s average daily net assets at the following annual rates:
| | | | | | | | |
| | | Investment Advisory Fee | |
| Average Daily Net Assets | | EuroFund | | | Global SmallCap | |
First $1 Billion | | | 0.75% | | | | 0.85% | |
$1 — $3 Billion | | | 0.71% | | | | 0.80% | |
$3 — $5 Billion | | | 0.68% | | | | 0.77% | |
$5 to $10 Billion | | | 0.65% | | | | 0.74% | |
Greater than $10 Billion | | | 0.64% | | | | 0.72% | |
The Manager voluntarily agreed to waive its investment advisory fees by the amount of investment advisory fees each Fund pays to the Manager indirectly through its investment in affiliated money market funds. However, the Manager does not waive its investment advisory fees by the amount of investment advisory fees paid in connection with the Fund’s investment in other affiliated investment companies, if any. This amount is shown as fees waived by Manager in the Statements of Operations.
The Manager, with respect to EuroFund, entered into a sub-advisory agreement with BIM and BlackRock International Ltd, (“BIL”), both affiliates of the Manager. The Manager pays BIM and BIL, for services they provide, a monthly fee that is a percentage of the investment advisory fees paid by the Fund to the Manager. Effective July 1, 2014, the sub-advisory agreement with BIM expired.
The Manager, with respect to Global SmallCap, entered into a subadvisory agreement with BIM. The Manager pays BIM, for services it provides, a monthly fee that is a percentage of the investment advisory fees paid by the Fund to the Manager. Effective July 1, 2014, the sub-advisory agreement expired.
For the year ended June 30, 2014, each Fund reimbursed the Manager for certain accounting services, which is included in accounting services in the Statements of Operations. The reimbursements were as follows:
| | |
| EuroFund | | Global SmallCap |
| $3,670 | | $11,340 |
Each Fund entered into a Distribution Agreement and a Distribution and Service Plan with BlackRock Investments, LLC (“BRIL”), an affiliate of BlackRock. Pursuant to the Distribution and Service Plan and in accordance with Rule 12b-1 under the 1940 Act, each Fund pays BRIL ongoing service and distribution fees. The fees are accrued daily and paid monthly at annual rates based upon the average daily net assets of the relevant share class of each Fund as follows:
| | | | | | | | | | | | | | | | |
| | | Investor A | | | Investor B1 | | | Investor C | | | Class R | |
Service Fee | | | 0.25% | | | | 0.25% | | | | 0.25% | | | | 0.25% | |
Distribution Fee | | | — | | | | 0.75% | | | | 0.75% | | | | 0.25% | |
| | 1 | | For Global SmallCap only. |
| | | | | | |
| | | | | | | |
| 36 | | ANNUAL REPORT | | JUNE 30, 2014 | | |
| | | | |
| Notes to Financial Statements (continued) | | |
Pursuant to sub-agreements with BRIL, broker-dealers and BRIL provide shareholder servicing and distribution services to each Fund. The ongoing service and/or distribution fee compensates BRIL and each broker-dealer for providing shareholder servicing and/or distribution related services to Investor A, Investor B, Investor C and Class R shareholders.
Pursuant to written agreements, certain financial intermediaries, some of which may be affiliates, provide the Funds with sub-accounting, recordkeeping, sub-transfer agency and other administrative services with respect to sub-accounts they service. For these services, these entities receive an annual fee per shareholder account, which will vary depending on share class and/or net assets. For the year ended June 30, 2014, the Funds paid the following to affiliates in return for these services, which are included in transfer agent — class specific in the Statements of Operations:
| | | | |
| | | Institutional | |
EuroFund | | | — | |
Global SmallCap | | $ | 790 | |
The Manager maintains a call center, which is responsible for providing certain shareholder services to the Funds, such as responding to shareholder inquiries and processing transactions based upon instructions from shareholders with respect to the subscription and redemption of Fund shares. For the year ended June 30, 2014, the Funds reimbursed the Manager the following amounts for costs incurred in running the call center, which are included in transfer agent — class specific in the Statements of Operations:
| | | | | | | | | | | | | | | | | | | | |
| | | Institutional | | | Investor A | | | Investor B | | | Investor C | | | Class R | |
EuroFund | | $ | 2,250 | | | $ | 2,702 | | | | — | | | $ | 309 | | | $ | 112 | |
Global SmallCap | | $ | 949 | | | $ | 27,599 | | | $ | 107 | | | $ | 2,025 | | | $ | 1,159 | |
For the year ended June 30, 2014, affiliates earned underwriting discounts, direct commissions and dealer concessions on sales of the Funds’ Investor A Shares as follows:
| | | | |
| | | Investor A | |
EuroFund | | $ | 10,806 | |
Global SmallCap | | $ | 125,380 | |
For the year ended June 30, 2014, affiliates received CDSCs as follows:
| | | | | | | | | | | | |
| | | Investor A | | | Investor B | | | Investor C | |
EuroFund | | $ | 1,174 | | | | — | | | $ | 6,895 | |
Global SmallCap | | $ | 4,873 | | | $ | 1,754 | | | $ | 24,830 | |
The U.S. Securities and Exchange Commission has issued an exemptive order which permits BIM, an affiliate of the Manager, to serve as securities lending agent for the Funds subject to applicable conditions. As securities lending agent, BIM bears all operational costs directly related to securities lending. The Funds are responsible for expenses in connection with the investment of cash collateral received for securities on loan (the “collateral investment expenses”). The cash collateral is invested in a private investment company managed by the Manager or its affiliates. However, BIM has agreed to cap the collateral investment expenses of the private investment company to an annual rate of 0.04%. The investment advisor to the private investment company will not charge any advisory fees with respect to shares purchased by the Funds.
Securities lending income is equal to the total of income earned from the reinvestment of cash collateral, net of fees and other payments to and from borrowers of securities, and less the collateral investment expenses. Each Fund retains a portion of securities lending income and remits a remaining portion to BIM as compensation for its services as securities lending agent.
Pursuant to a securities lending agreement effective February 1, 2014, Global SmallCap retains 70% of securities lending income, and this amount retained can never be less than 65% of the total of securities lending income plus the collateral investment expenses. Pursuant to a securities lending agreement effective February 1, 2014, EuroFund retains 75% of securities lending income (commencing January 1, 2015, the amount the Fund will retain is expected to change to 70% of securities lending income), and these amounts retained can never be less than 65% of the total of securities lending income plus the collateral investment expenses.
In addition, commencing the business day following the date that the aggregate securities lending income earned across the Equity-Bond Complex in a calendar year exceeds the aggregate securities lending income earned across the Equity-Bond Complex in the calendar year 2013, Global SmallCap, pursuant to the securities lending agreement, will retain for the remainder of that calendar year securities lending income as follows: 75% of securities lending income, and this amount retained can never be less than 65% of the total of securities lending income plus the collateral investment expenses.
| | | | | | |
| | | | | | | |
| | ANNUAL REPORT | | JUNE 30, 2014 | | 37 |
| | |
| Notes to Financial Statements (continued) | | |
In addition, commencing the business day following the date that the aggregate securities lending income earned across the Equity-Bond Complex in a calendar year exceeds the aggregate securities lending income earned across the Equity-Bond Complex in the calendar year 2013 (the “Hurdle Date”), EuroFund, pursuant to the securities lending agreement, will retain for the remainder of that calendar year securities lending income as follows: 80% of securities lending income (following any Hurdle Date after January 1, 2015, the Fund will retain 75% of securities lending income), and these amounts retained can never be less than 65% of the total of securities lending income plus the collateral investment expenses.
Prior to February 1, 2014, each Fund retained 65% of securities lending income and paid a fee to BIM equal to 35% of such income. The share of securities lending income earned by each Fund is shown as securities lending — affiliated–net in the Statements of Operations. For the year ended June 30, 2014, each Fund paid BIM the following amounts for securities lending agent services:
| | |
| EuroFund | | Global SmallCap |
| $5,617 | | $983,133 |
Certain officers and/or directors of the Funds are officers and/or directors of BlackRock or its affiliates. The Funds reimburse the Manager for a portion of the compensation paid to the Funds’ Chief Compliance Officer, which is included in officer and directors in the Statements of Operations.
The Funds may purchase securities from, or sell securities to, an affiliated fund provided the affiliation is solely due to having a common investment adviser, common officers, or common trustees. For the year ended June 30, 2014, the purchase and sale transactions with an affiliated fund in compliance with Rule 17a-7 of the 1940 Act were as follows:
| | | | |
| | | Global SmallCap | |
Purchases | | $ | 1,052,097 | |
Sales | | $ | 1,551,706 | |
Global SmallCap recorded a payment from an affiliate to compensate for foregone securities lending revenue in the amount of $160,756, which is shown as other income — affiliated in the Statements of Operations.
6. Purchases and Sales:
Purchases and sales of investments excluding short-term securities for the year ended June 30, 2014, were as follows:
| | | | | | | | |
| | | EuroFund | | | Global SmallCap | |
Purchases | | $ | 544,964,344 | | | $ | 854,018,166 | |
Sales | | $ | 456,801,800 | | | $ | 820,538,514 | |
7. Income Tax Information:
It is the Funds’ policy to comply with the requirements of the Internal Revenue Code of 1986, as amended, applicable to regulated investment companies and to distribute substantially all of their taxable income to their shareholders. Therefore, no federal income tax provision is required.
The Funds file U.S. federal and various state and local tax returns. No income tax returns are currently under examination. The statute of limitations on the Funds’ U.S. federal tax returns remains open for each of the four years ended June 30, 2014. The statutes of limitations on the each Fund’s state and local tax returns may remain open for an additional year depending upon the jurisdiction.
Management has analyzed tax laws and regulations and their application to the Funds’ facts and circumstances and does not believe there are any uncertain tax positions that require recognition of a tax liability.
U.S. GAAP requires that certain components of net assets be adjusted to reflect permanent differences between financial and tax reporting. These reclassifications have no effect on net assets or net asset values per share. As of June 30, 2014, the following permanent difference attributable to foreign currency transactions, the sale of stock of passive foreign investment companies and the character of income from certain securities lending transactions were reclassified to the following accounts:
| | | | | | | | |
| | | EuroFund | | | Global SmallCap | |
Paid-in capital | | | — | | | $ | (47,976 | ) |
Undistributed (distributions in excess of) net investment income | | $ | (110,623 | ) | | $ | 1,688,972 | |
Undistributed net realized gain (accumulated net realized loss) | | $ | 110,623 | | | $ | (1,640,996 | ) |
| | | | | | |
| | | | | | | |
| 38 | | ANNUAL REPORT | | JUNE 30, 2014 | | |
| | | | |
| Notes to Financial Statements (continued) | | |
The tax character of distributions was as follows:
| | | | | | | | | | | | |
| | | | | | EuroFund | | | Global
SmallCap | |
Ordinary income | | | 6/30/14 | | | $ | 4,298,018 | | | $ | 27,291,918 | |
| | | 6/30/13 | | | | 3,458,159 | | | | 20,985.162 | |
Long-term capital gains | | | 6/30/14 | | | | — | | | | 93,648,298 | |
| | | 6/30/13 | | | | — | | | | — | |
| | | | |
Total | | | 6/30/14 | | | $ | 4,298,018 | | | $ | 120,940,216 | |
| | | | |
| | | 6/30/13 | | | $ | 3,458,159 | | | $ | 20,985,162 | |
| | | | |
As of June 30, 2014, the tax components of accumulated net earning (losses) were as follows:
| | | | | | | | |
| | | EuroFund | | | Global
SmallCap | |
Undistributed ordinary income | | $ | 12,292,736 | | | $ | 44,724,704 | |
Undistributed long-term capital gains | | | — | | | $ | 54,021,275 | |
Capital loss carryforwards | | $ | (89,796,614 | ) | | | — | |
Net unrealized gains1 | | $ | 45,317,114 | | | $ | 277,351,386 | |
| | | | | | | | |
Total | | $ | (32,186,764 | ) | | $ | 376,097,365 | |
| | | | | | | | |
| | 1 | | The differences between book-basis and tax-basis net unrealized gains were attributable primarily to the tax deferral of losses on wash sales, the realization for tax purposes of unrealized gains/losses on certain foreign currency exchange contracts, the timing and recognition of partnership income, the character of income from certain securities lending transactions, the timing of expense recognition and the realization for tax purposes of unrealized gains on investments in passive foreign investment companies. |
As of June 30, 2014, EuroFund had capital loss carryforwards available to offset future realized capital gains through the indicated expiration dates as follows:
| | | | |
| Expires June 30, | | EuroFund | |
2017 | | $ | 3,846,553 | |
2018 | | | 85,950,061 | |
| | | | |
Total | | $ | 89,796,614 | |
| | | | |
During the year ended June 30, 2014, EuroFund utilized $40,119,303 of its capital loss carryforward.
As of June 30, 2014, gross unrealized appreciation and depreciation based on cost for federal income tax purposes were as follows:
| | | | | | | | |
| | | EuroFund | | | Global
SmallCap | |
Tax cost | | $ | 368,280,198 | | | $ | 1,070,075,061 | |
| | | | | | | | |
Gross unrealized appreciation | | $ | 50,675,353 | | | $ | 347,305,073 | |
Gross unrealized depreciation | | | (5,348,387 | ) | | | (69,517,696 | ) |
| | | | | | | | |
Net unrealized appreciation | | $ | 45,326,966 | | | $ | 277,787,377 | |
| | | | | | | | |
8. Bank Borrowings:
The Funds, along with certain other funds managed by the Manager and its affiliates (“Participating Funds”), are a party to a 364-day, $1.1 billion credit agreement with a group of lenders, under which the Funds may borrow to fund shareholder redemptions. The agreement expires in April 2015. Excluding commitments designated for a certain individual fund, other Participating Funds, including the Funds, can borrow up to an aggregate commitment amount of $650 million, subject to asset coverage and other limitations as specified in the agreement. The credit agreement has the following terms: a fee of 0.06% per annum on unused commitment amounts and interest at a rate equal to the higher of (a) the one-month LIBOR plus 0.80% per annum or (b) the Fed Funds rate plus 0.80% per annum on amounts borrowed. Participating Funds paid administration and arrangement fees which, along with commitment fees, were allocated among such funds based upon portions of the aggregate commitment available to them and relative net assets of Participating Funds. The Funds did not borrow under the credit agreement during the year ended June 30, 2014.
| | | | | | |
| | | | | | | |
| | ANNUAL REPORT | | JUNE 30, 2014 | | 39 |
| | |
| Notes to Financial Statements (continued) | | |
9. Concentration, Market and Credit Risk:
In the normal course of business, the Funds invest in securities and enter into transactions where risks exist due to fluctuations in the market (market risk) or failure of the issuer of a security to meet all its obligations (issuer credit risk). The value of securities held by the Funds may decline in response to certain events, including those directly involving the issuers whose securities are owned by the Funds; conditions affecting the general economy; overall market changes; local, regional or global political, social or economic instability; and currency and interest rate and price fluctuations. Similar to issuer credit risk, the Funds may be exposed to counterparty credit risk, or the risk that an entity with which the Funds have unsettled or open transactions may fail to or be unable to perform on its commitments. The Funds manage counterparty credit risk by entering into transactions only with counterparties that they believe have the financial resources to honor their obligations and by monitoring the financial stability of those counterparties. Financial assets, which potentially expose the Funds to market, issuer and counterparty credit risks, consist principally of financial instruments and receivables due from counterparties. The extent of the Funds’ exposure to market, issuer and counterparty credit risks with respect to these financial assets is generally approximated by their value recorded in the Statements of Assets and Liabilities, less any collateral held by the Funds.
The Funds invest a substantial amount of their assets in issuers located in a single country or a limited number of countries. When the Funds concentrate their investments in this manner, they assume the risk that economic, political and social conditions in those countries may have a significant impact on their investment performance. Foreign issuers may not be subject to the same uniform accounting, auditing and financial reporting standards and practices as used in the United States. Foreign securities markets may also be less liquid, more volatile, and less subject to governmental supervision not typically associated with investing in U.S. securities. Please see the Schedules of Investments for concentrations in specific countries.
Each Fund invests a significant portion of its assets in securities of issuers located in Europe or with significant exposure to European issuers or countries. The European financial markets have recently experienced volatility and adverse trends due to concerns about economic downturns in, or rising government debt levels of, several European countries. These events may spread to other countries in Europe and may affect the value and liquidity of certain of the Fund’s investments.
As of June 30, 2014, the Funds had the following industry classifications:
| | | | | | | | |
| Industry | | EuroFund | | | Global SmallCap | |
Pharmaceuticals | | | 14 | % | | | 3 | % |
Oil, Gas & Consumable Fuels. | | | 12 | | | | 7 | |
Commercial Banks | | | 9 | | | | 3 | |
Health Care Equipment & Supplies | | | — | | | | 7 | |
Real Estate Investment Trusts (REITs) | | | — | | | | 7 | |
Metals & Mining | | | 3 | | | | 6 | |
Other1 | | | 62 | | | | 67 | |
| | 1 | | All other industries held were each less than 5% of long-term investments. |
10. Capital Share Transactions:
Transactions in capital shares for each class were as follows:
| | | | | | | | | | | | | | | | | | |
| | | Year Ended
June 30, 2014 | | | | | Year Ended
June 30, 2013 | |
| EuroFund | | Shares | | | Amount | | | | | Shares | | | Amount | |
| Institutional | | | | | | | | | | | | | | | | | | |
Shares sold | | | 7,510,419 | | | $ | 117,681,482 | | | | | | 665,181 | | | $ | 8,730,734 | |
Shares issued to shareholders in reinvestment of dividends | | | 139,937 | | | | 2,194,211 | | | | | | 69,951 | | | | 900,947 | |
Shares redeemed | | | (2,907,740 | ) | | | (47,189,779 | ) | | | | | (1,403,525 | ) | | | (18,046,695 | ) |
| | | | | | | | | | |
Net increase (decrease) | | | 4,742,616 | | | $ | 72,685,914 | | | | | | (668,393 | ) | | $ | (8,415,014 | ) |
| | | | | | | | | | |
| | | | | | | | | | | | | | | | | | |
| Investor A | | | | | | | | | | | | | | | | | | |
Shares sold and automatic conversion of shares | | | 2,356,325 | | | $ | 37,677,270 | | | | | | 2,563,311 | | | $ | 31,952,079 | |
Shares issued to shareholders in reinvestment of dividends | | | 93,249 | | | | 1,436,035 | | | | | | 161,813 | | | | 2,045,172 | |
Shares redeemed | | | (1,692,385 | ) | | | (26,607,875 | ) | | | | | (7,469,947 | ) | | | (96,349,545 | ) |
| | | | | | | | | | |
Net increase (decrease) | | | 757,189 | | | $ | 12,505,430 | | | | | | (4,744,823 | ) | | $ | (62,352,294 | ) |
| | | | | | | | | | |
| | | | | | |
| | | | | | | |
| 40 | | ANNUAL REPORT | | JUNE 30, 2014 | | |
| | | | |
| Notes to Financial Statements (continued) | | |
| | | | | | | | | | | | | | | | | | |
| | | Year Ended
June 30, 2014 | | | | | Year Ended
June 30, 2013 | |
| EuroFund (concluded) | | Shares | | | Amount | | | | | Shares | | | Amount | |
| Investor B1 | | | | | | | | | | | | | | | | | | |
Shares sold | | | _ | | | | _ | | | | | | 4,998 | | | $ | 50,389 | |
Shares issued to shareholders in reinvestment of dividends | | | _ | | | | _ | | | | | | _ | | | | _ | |
Shares redeemed and automatic conversion of shares | | | _ | | | | _ | | | | | | (111,871 | ) | | | (1,238,438 | ) |
| | | | | | | | | | |
Net decrease | | | _ | | | | _ | | | | | | (106,873 | ) | | $ | (1,188,049 | ) |
| | | | | | | | | | |
| | | | | | | | | | | | | | | | | | |
| Investor C | | | | | | | | | | | | | | | | | | |
Shares sold | | | 739,265 | | | $ | 8,386,524 | | | | | | 196,950 | | | $ | 1,832,496 | |
Shares issued to shareholders in reinvestment of dividends | | | 12,749 | | | | 141,762 | | | | | | 8,037 | | | | 73,852 | |
Shares redeemed | | | (340,632 | ) | | | (3,843,239 | ) | | | | | (432,802 | ) | | | (3,980,039 | ) |
| | | | | | | | | | |
Net increase (decrease) | | | 411,382 | | | $ | 4,685,047 | | | | | | (227,815 | ) | | $ | (2,073,691 | ) |
| | | | | | | | | | |
| | | | | | | | | | | | | | | | | | |
| Class R | | | | | | | | | | | | | | | | | | |
Shares sold | | | 44,911 | | | $ | 532,805 | | | | | | 48,275 | | | $ | 484,895 | |
Shares issued to shareholders in reinvestment of dividends | | | 1,221 | | | | 14,502 | | | | | | 1,197 | | | | 11,724 | |
Shares redeemed | | | (80,795 | ) | | | (966,864 | ) | | | | | (61,806 | ) | | | (614,774 | ) |
| | | | | | | | | | |
Net decrease | | | (34,663 | ) | | $ | (419,557 | ) | | | | | (12,334 | ) | | $ | (118,155 | ) |
| | | | | | | | | | |
Total Net Increase (Decrease) | | | 5,876,524 | | | $ | 89,456,834 | | | | | | (5,760,238 | ) | | $ | (74,147,203 | ) |
| | | | | | | | | | |
| | 1 | | At the close of business on June 10, 2013, all of the issued and outstanding Investor B shares of EuroFund converted to Investor A Shares of the Fund. |
| | | | | | | | | | | | | | | | | | |
| | | Year Ended
June 30, 2014 | | | | | Year Ended
June 30, 2013 | |
| Global Smallcap | | Shares | | | Amount | | | | | Shares | | | Amount | |
| Institutional | | | | | | | | | | | | | | | | | | |
Shares sold | | | 2,985,293 | | | $ | 86,295,391 | | | | | | 2,690,237 | | | $ | 64,950,373 | |
Shares issued to shareholders in reinvestment of dividends and distributions | | | 921,493 | | | | 24,972,441 | | | | | | 198,443 | | | | 4,520,441 | |
Shares redeemed | | | (2,927,310 | ) | | | (85,142,818 | ) | | | | | (1,968,850 | ) | | | (47,109,236 | ) |
| | | | | | | | | | |
Net increase (decrease) | | | 979,476 | | | $ | 26,125,014 | | | | | | 919,830 | | | $ | 22,361,578 | |
| | | | | | | | | | |
| | | | | | | | | | | | | | | | | | |
| Investor A | | | | | | | | | | | | | | | | | | |
Shares sold and automatic conversion of shares | | | 4,835,299 | | | $ | 136,285,083 | | | | | | 3,420,485 | | | $ | 81,588,752 | |
Shares issued to shareholders in reinvestment of dividends and distributions | | | 1,659,667 | | | | 43,798,495 | | | | | | 350,900 | | | | 7,824,984 | |
Shares redeemed | | | (3,492,552 | ) | | | (98,084,013 | ) | | | | | (4,630,542 | ) | | | (107,465,319 | ) |
| | | | | | | | | | |
Net increase (decrease) | | | 3,002,414 | | | $ | 81,999,565 | | | | | | (859,157 | ) | | $ | (18,051,583 | ) |
| | | | | | | | | | |
| | | | | | | | | | | | | | | | | | |
| Investor B | | | | | | | | | | | | | | | | | | |
Shares sold | | | 11,938 | | | $ | 316,419 | | | | | | 19,237 | | | $ | 427,885 | |
Shares issued to shareholders in reinvestment of dividends and distributions | | | 21,435 | | | | 534,159 | | | | | | 3,416 | | | | 72,669 | |
Shares redeemed and automatic conversion of shares | | | (180,781 | ) | | | (4,770,487 | ) | | | | | (310,754 | ) | | | (6,876,966 | ) |
| | | | | | | | | | |
Net increase (decrease) | | | (147,408 | ) | | $ | (3,919,909 | ) | | | | | (288,101 | ) | | $ | (6,376,412 | ) |
| | | | | | | | | | |
| | | | | | | | | | | | | | | | | | |
| Investor C | | | | | | | | | | | | | | | | | | |
Shares sold | | | 2,334,788 | | | $ | 59,592,008 | | | | | | 1,587,817 | | | $ | 34,569,493 | |
Shares issued to shareholders in reinvestment of dividends and distributions | | | 1,356,225 | | | | 32,305,154 | | | | | | 227,597 | | | | 4,654,199 | |
Shares redeemed | | | (2,532,259 | ) | | | (64,521,861 | ) | | | | | (2,858,564 | ) | | | (61,288,987 | ) |
| | | | | | | | | | |
Net increase (decrease) | | | 1,158,754 | | | $ | 27,375,301 | | | | | | (1,043,150 | ) | | $ | (22,065,295 | ) |
| | | | | | | | | | |
| | | | | | | | | | | | | | | | | | |
| | | | | | |
| | | | | | | |
| | ANNUAL REPORT | | JUNE 30, 2014 | | 41 |
| | |
| Notes to Financial Statements (concluded) | | |
| | | | | | | | | | | | | | | | | | |
| | | Year Ended
June 30, 2014 | | | | | Year Ended
June 30, 2013 | |
| Global Smallcap (concluded) | | Shares | | | Amount | | | | | Shares | | | Amount | |
| Class R | | | | | | | | | | | | | | | | | | |
Shares sold | | | 366,217 | | | $ | 9,761,996 | | | | | | 351,551 | | | $ | 7,942,874 | |
Shares issued to shareholders in reinvestment of dividends and distributions | | | 149,096 | | | | 3,724,423 | | | | | | 31,312 | | | | 666,318 | |
Shares redeemed | | | (522,755 | ) | | | (13,896,837 | ) | | | | | (592,648 | ) | | | (13,296,592 | ) |
| | | | | | | | | | |
Net increase (decrease) | | | (7,442 | ) | | $ | (410,418 | ) | | | | | (209,785 | ) | | $ | (4,687,400 | ) |
| | | | | | | | | | |
Total Net Increase (Decrease) | | | 4,985,794 | | | $ | 131,169,553 | | | | | | (1,480,363 | ) | | $ | (28,819,112 | ) |
| | | | | | | | | | |
11. Subsequent Events:
Management has evaluated the impact of all subsequent events on each Fund through the date the financial statements were issued and has determined that there were no subsequent events requiring adjustment or additional disclosure in the financial statements.
| | | | | | |
| | | | | | | |
| 42 | | ANNUAL REPORT | | JUNE 30, 2014 | | |
|
| Report of Independent Registered Public Accounting Firm |
To the Shareholders and Board of Trustees/Directors of BlackRock EuroFund and BlackRock Global SmallCap Fund, Inc.:
We have audited the accompanying statements of assets and liabilities of BlackRock EuroFund and BlackRock Global SmallCap Fund, Inc., (collectively, the “Funds”), including the schedules of investments, as of June 30, 2014, and the related statements of operations for the year then ended, the statements of changes in net assets for each of the two years in the period then ended, and the financial highlights for each of the five years in the period then ended. These financial statements and financial highlights are the responsibility of the Funds’ management. Our responsibility is to express an opinion on these financial statements and financial highlights based on our audits.
We conducted our audits in accordance with the standards of Public Company Accounting Oversight Board (United States). Those standards require that we plan and perform the audit to obtain reasonable assurance about whether the financial statements and financial highlights are free of material misstatement. The Funds are not required to have, nor were we engaged to perform, audits of their internal controls over financial reporting. Our audits included consideration of internal control over financial reporting as a basis for designing audit procedures that are appropriate in the circumstances, but not for the purpose of expressing an opinion on the effectiveness of the Funds’ internal control over financial reporting. Accordingly, we express no such opinion. An audit also includes examining, on a test basis, evidence supporting the amounts and disclosures in the financial statements, assessing the accounting principles used and significant estimates made by management, as well as evaluating the overall financial statement presentation. Our procedures included confirmation of securities owned as of June 30, 2014, by correspondence with the custodian and brokers; where replies were not received from brokers, we performed other auditing procedures. We believe that our audits provide a reasonable basis for our opinion.
In our opinion, the financial statements and financial highlights referred to above present fairly, in all material respects, the financial positions of the BlackRock EuroFund and BlackRock Global SmallCap Fund, Inc., as of June 30, 2014, the results of their operations for the year then ended, the changes in their net assets for each of the two years in the period then ended, and the financial highlights for each of the five years in the period then ended, in conformity with accounting principles generally accepted in the United States of America.
Deloitte & Touche LLP
Boston, Massachusetts
August 26, 2014
| | |
| Important Tax Information (Unaudited) | | |
The following information is provided with respect to the ordinary income distributions paid during the fiscal year ended June 30, 2014:
| | | | | | | | | | | | |
| | | Payable
Date | | | EuroFund | | | Global
SmallCap | |
Qualified Dividend Income for Individuals | | | 12/12/13 | | | | 100% | 1 | | | 13.28% | |
Dividends Qualifying for the Dividend Received Deduction for Corporations | | | 12/12/13 | | | | — | | | | 6.74% | |
Foreign Source Income | | | 12/12/13 | | | | 100% | 1 | | | — | |
| Foreign Taxes Paid Per Share | | | 12/12/13 | | | | $0.018042 | | | | — | |
| | 1 | | Expressed as a percentage of the cash distribution grossed-up for foreign taxes. |
The foreign taxes paid represent taxes incurred by the Fund on income received by the Fund from foreign sources. Foreign taxes paid may be included in taxable income with an offsetting deduction from gross income or may be taken as a credit for taxes paid to foreign governments. You should consult your tax advisor regarding the appropriate treatment of foreign taxes paid.
Additionally, Global SmallCap Fund distributed long-term capital gains of $2.502005 per share to shareholders of record on December 10, 2013.
| | | | | | |
| | | | | | | |
| | ANNUAL REPORT | | JUNE 30, 2014 | | 43 |
| | |
| Disclosure of Investment Advisory Agreements and Sub-Advisory Agreement |
The Board of Trustees of BlackRock EuroFund (the “EuroFund”) and the Board of Directors of BlackRock Global SmallCap Fund, Inc. (the “Global SmallCap Fund”) (each a “Fund,” and collectively, the “Funds”) (the “Board,” and the members of which are referred to as “Board Members”) met in person on April 8, 2014 (the “April Meeting”) and May 13-14, 2014 (the “May Meeting”) to consider the approval of each Fund’s investment advisory agreement (the “Advisory Agreements”) with BlackRock Advisors, LLC (the “Manager”), each Fund’s investment advisor. The Board also considered the approval of the sub-advisory agreement (the “Sub-Advisory Agreement”) between the Manager and BlackRock International Limited (the “Sub-Advisor”), with respect to the EuroFund. At the May Meeting, it was noted that the sub-advisory agreements between the Manager and BlackRock Investment Management, LLC, with respect to each Fund, would expire effective July 1, 2014. It was also noted that the non-renewal of the impacted sub-advisory agreements would not result in any change in the nature or quality of services provided to the Funds, or in the portfolio management team that serves each Fund. The Manager and, with respect to EuroFund, the Sub-Advisor, are referred to herein as “BlackRock.” The Advisory Agreements and, with respect to the EuroFund, the Sub-Advisory Agreement, are referred to herein as the “Agreements.”
Activities and Composition of the Board
The Board consists of thirteen individuals, ten of whom are not “interested persons” of each Fund as defined in the Investment Company Act of 1940, as amended (the “1940 Act”) (the “Independent Board Members”). The Board Members are responsible for the oversight of the operations of each Fund and perform the various duties imposed on the directors of investment companies by the 1940 Act. The Independent Board Members have retained independent legal counsel to assist them in connection with their duties. The Chairman of the Board is an Independent Board Member. The Board has established five standing committees: an Audit Committee, a Governance and Nominating Committee, a Compliance Committee, a Performance Oversight Committee and an Executive Committee, each of which is chaired by an Independent Board Member and composed of Independent Board Members (except for the Performance Oversight Committee and the Executive Committee, each of which also has one interested Board Member).
The Agreements
Pursuant to the 1940 Act, the Board is required to consider the continuation of the Advisory Agreements, and, with respect to the EuroFund, the Sub-Advisory Agreement, on an annual basis. The Board has four quarterly meetings per year, each extending over two days, and a fifth one-day meeting to consider specific information surrounding the consideration of renewing the Agreements. In connection with this process, the Board assessed, among other things, the nature, scope and quality of the services provided to each Fund by BlackRock, its personnel and its affiliates, including (as applicable) investment management; administrative and shareholder services; oversight of fund service providers; marketing services; risk oversight; compliance and assistance in meeting applicable legal and regulatory requirements.
The Board, acting directly and through its committees, considers at each of its meetings, and from time to time as appropriate, factors that are relevant to its annual consideration of the renewal of the Advisory Agreements and, with respect to the EuroFund, the Sub-Advisory Agreement, including the services and support provided by BlackRock to each Fund and its shareholders. Among the matters the Board considered were: (a) investment performance for one-year, three-year, five-year and/or since inception periods, as applicable, against peer funds, and applicable benchmarks, if any, as well as senior management’s and portfolio managers’ analysis of the reasons for any over-performance or underperformance against its peers and/or benchmark, as applicable; (b) fees, including advisory, administration, if applicable, and other amounts paid to BlackRock and its affiliates by each Fund for services, such as marketing and distribution, call center and fund accounting; (c) Fund operating expenses and how BlackRock allocates expenses to each Fund; (d) the resources devoted to, risk oversight of, and compliance reports relating to, implementation of each Fund’s investment objective, policies and restrictions, and meeting new regulatory requirements; (e) each Fund’s compliance with its Code of Ethics and other compliance policies and procedures; (f) the nature, cost and character of non-investment management services provided by BlackRock and its affiliates; (g) BlackRock’s and other service providers’ internal controls and risk and compliance oversight mechanisms; (h) BlackRock’s implementation of the proxy voting policies approved by the Board; (i) the use of brokerage commissions and execution quality of portfolio transactions; (j) BlackRock’s implementation of each Fund’s valuation and liquidity procedures; (k) an analysis of management fees for products with similar investment objectives across the open-end fund, exchange-traded fund (“ETF”), closed-end fund and institutional account product channels, as applicable, and the similarities and differences between the services provided to these products as compared to each Fund; (l) BlackRock’s compensation methodology for its investment professionals and the incentives it creates; and (m) periodic updates on BlackRock’s business.
The Board has engaged in an ongoing strategic review with BlackRock of opportunities to consolidate funds and of BlackRock’s commitment to investment performance. BlackRock also furnished information to the Board in response to specific questions. These questions covered issues such as: BlackRock’s profitability; investment performance; subadvisory and advisory relationships with other clients (including mutual funds sponsored by third parties); the viability of specific funds; manager capacity and the potential for closing certain funds to new investments; portfolio managers’ investments in funds they manage; supplemental service agreements with third party distribution partners;
| | | | | | |
| | | | | | | |
| 44 | | ANNUAL REPORT | | JUNE 30, 2014 | | |
| | |
| Disclosure of Investment Advisory Agreements and Sub-Advisory Agreement (continued) |
and management fee levels and breakpoints. The Board further discussed with BlackRock: BlackRock’s management structure; portfolio turnover, execution quality and use of soft dollars; BlackRock’s portfolio manager compensation and performance accountability; marketing support for the funds; services provided to the funds by BlackRock affiliates; and BlackRock’s oversight of relationships with third party service providers.
Board Considerations in Approving the Agreements
The Approval Process: Prior to the April Meeting, the Board requested and received materials specifically relating to the Agreements. The Board is continuously engaged in a process with its independent legal counsel and BlackRock to review the nature and scope of the information provided to better assist its deliberations. The materials provided in connection with the April Meeting included (a) information independently compiled and prepared by Lipper, Inc. (“Lipper”) on Fund fees and expenses as compared with a peer group of funds as determined by Lipper (“Expense Peers”) and the investment performance of each Fund as compared with a peer group of funds as determined by Lipper;1 (b) information on the profits realized by BlackRock and its affiliates pursuant to the Agreements and a discussion of fall-out benefits to BlackRock and its affiliates; (c) a general analysis provided by BlackRock concerning investment management fees charged to other clients, such as institutional clients, ETFs and closed-end funds, under similar investment mandates, as well as the performance of such other clients, as applicable; (d) review of non-management fees; (e) the existence, impact and sharing of potential economies of scale; (f) a summary of aggregate amounts paid by each Fund to BlackRock; (g) sales and redemption data regarding each Fund’s shares; and (h) if applicable, a comparison of management fees to similar BlackRock open-end funds, as classified by Lipper.
At the April Meeting, the Board reviewed materials relating to its consideration of the Advisory Agreements and, with respect to the EuroFund, the Sub-Advisory Agreement. As a result of the discussions that occurred during the April Meeting, and as a culmination of the Board’s year-long deliberative process, the Board presented BlackRock with questions and requests for additional information. BlackRock responded to these requests with additional written information in advance of the May Meeting.
At the May Meeting, the Board, including the Independent Board Members, approved the continuation of the Advisory Agreements between the Manager and each Fund, and the Sub-Advisory Agreement between the Manager and the Sub-Advisor with respect to the EuroFund, each for a one-year term ending June 30, 2015. In approving the continuation of the Agreements, the Board considered: (a) the nature, extent and quality of the services provided by BlackRock; (b) the investment performance of each Fund and BlackRock; (c) the advisory fee and the cost of the services and profits to be realized by BlackRock and its affiliates from their relationship with each Fund; (d) each Fund’s costs to investors compared to the costs of Expense Peers and performance compared to the relevant performance comparison as previously discussed; (e) economies of scale; (f) fall-out benefits to BlackRock and its affiliates as a result of its relationship with each Fund; and (g) other factors deemed relevant by the Board Members.
The Board also considered other matters it deemed important to the approval process, such as payments made to BlackRock or its affiliates relating to the distribution of Fund shares and securities lending, services related to the valuation and pricing of Fund portfolio holdings, direct and indirect benefits to BlackRock and its affiliates from their relationship with each Fund and advice from independent legal counsel with respect to the review process and materials submitted for the Board’s review. The Board noted the willingness of BlackRock personnel to engage in open, candid discussions with the Board. The Board did not identify any particular information as determinative, and each Board Member may have attributed different weights to the various items considered.
A. Nature, Extent and Quality of the Services Provided by BlackRock: The Board, including the Independent Board Members, reviewed the nature, extent and quality of services provided by BlackRock, including the investment advisory services and the resulting performance of each Fund. Throughout the year, the Board compared Fund performance to the performance of a comparable group of mutual funds and/or the performance of a relevant benchmark, as applicable. The Board met with BlackRock’s senior management personnel responsible for investment activities, including the senior investment officers. The Board also reviewed the materials provided by each Fund’s portfolio management team discussing each Fund’s performance and the Fund’s investment objective, strategies and outlook.
The Board considered, among other factors, with respect to BlackRock: the number, education and experience of investment personnel generally and each Fund’s portfolio management team; investments by portfolio managers in the funds they manage; portfolio trading capabilities; use of technology; commitment to compliance; credit analysis capabilities; risk analysis and oversight capabilities; and the approach to training and retaining portfolio managers and other research, advisory and management personnel. The Board engaged in a review of BlackRock’s compensation structure with respect to each Fund’s portfolio management team and BlackRock’s ability to attract and retain high-quality talent and create performance incentives.
In addition to advisory services, the Board considered the quality of the administrative and other non-investment advisory services provided to each Fund. BlackRock and its affiliates provide each Fund with certain administrative, shareholder and other services (in addition to any such services provided to each Fund by third parties) and officers and other personnel as are necessary for the operations of each Fund. In
| 1 | | Funds are ranked by Lipper in quartiles, ranging from first to fourth, where first is the most desirable quartile position and fourth is the least desirable. |
| | | | | | |
| | | | | | | |
| | ANNUAL REPORT | | JUNE 30, 2014 | | 45 |
| | |
| Disclosure of Investment Advisory Agreements and Sub-Advisory Agreement (continued) |
particular, BlackRock and its affiliates provide each Fund with the following administrative services including, among others: (i) preparing disclosure documents, such as the prospectus, the summary prospectus (as applicable), the statement of additional information and periodic shareholder reports; (ii) oversight of daily accounting and pricing; (iii) overseeing and coordinating the activities of other service providers; (iv) organizing Board meetings and preparing the materials for such Board meetings; (v) providing legal and compliance support; (vi) furnishing analytical and other support to assist the Board in its consideration of strategic issues such as the merger or consolidation of certain open-end funds; and (vii) performing other administrative functions necessary for the operation of each Fund, such as tax reporting, fulfilling regulatory filing requirements and call center services. The Board reviewed the structure and duties of BlackRock’s fund administration, shareholder services, legal and compliance departments and considered BlackRock’s policies and procedures for assuring compliance with applicable laws and regulations.
B. The Investment Performance of each Fund and BlackRock: The Board, including the Independent Board Members, also reviewed and considered the performance history of each Fund. In preparation for the April Meeting, the Board worked with its independent legal counsel, BlackRock and Lipper to develop a template for, and was provided with, reports independently prepared by Lipper, which included a comprehensive analysis of each Fund’s performance. The Board also reviewed a narrative and statistical analysis of the Lipper data that was prepared by BlackRock, which analyzed various factors that affect Lipper’s rankings. In connection with its review, the Board received and reviewed information regarding the investment performance of each Fund as compared to other funds in its applicable Lipper category. The Board was provided with a description of the methodology used by Lipper to select peer funds and periodically meets with Lipper representatives to review its methodology. The Board and its Performance Oversight Committee regularly review, and meet with Fund management to discuss, the performance of each Fund throughout the year.
The Board noted that for the one-, three- and five-year periods reported, the EuroFund ranked in the second, third and fourth quartiles, respectively, against its Lipper Performance Universe. The Board noted the EuroFund’s improved performance during the one-year period.
The Board and BlackRock reviewed and discussed the reasons for the EuroFund’s underperformance during the three- and five-year periods. The Board was informed that, among other things, stock selection and sector allocation both detracted from performance in 2011, contributing to the weakness of performance in the three- and five-year periods. In 2010, earnings growth was a dominant driver of stock performance, and as such the growth investment style considerably outperformed value as investors focused on cyclical stocks with exposure to rapidly growing end markets such as China. Up until December 2010 the EuroFund was run with a value bias, which was a considerable hindrance for returns during 2010.
The Board and BlackRock also discussed BlackRock’s strategy for improving the EuroFund’s performance and BlackRock’s commitment to providing the resources necessary to assist the EuroFund’s portfolio managers in seeking to improve the EuroFund’s performance.
The Board noted that for the one-, three- and five-year periods reported, the Global SmallCap Fund ranked in the first, first and fourth quartiles, respectively, against its Lipper Performance Universe.
C. Consideration of the Advisory/Management Fees and the Cost of the Services and Profits to be Realized by BlackRock and its Affiliates from their Relationship with each Fund: The Board, including the Independent Board Members, reviewed each Fund’s contractual management fee rate compared with the other funds in its Lipper category. The contractual management fee rate represents a combination of the advisory fee and any administrative fees, before taking into account any reimbursements or fee waivers. The Board also compared each Fund’s total expense ratio, as well as its actual management fee rate, to those of other funds in its Lipper category. The total expense ratio represents a fund’s total net operating expenses, including any 12b-1 or non 12b-1 service fees. The total expense ratio gives effect to any expense reimbursements or fee waivers that benefit a fund, and the actual management fee rate gives effect to any management fee reimbursements or waivers that benefit a fund. The Board considered the services provided and the fees charged by BlackRock and its affiliates to other types of clients with similar investment mandates, as applicable, including institutional accounts.
The Board received and reviewed statements relating to BlackRock’s financial condition. The Board was also provided with a profitability analysis that detailed the revenues earned and the expenses incurred by BlackRock for services provided to each Fund. The Board reviewed BlackRock’s profitability with respect to each Fund and other funds the Board currently oversees for the year ended December 31, 2013 compared to available aggregate profitability data provided for the two prior years. The Board reviewed BlackRock’s profitability with respect to certain other fund complexes managed by the Manager and/or its affiliates. The Board reviewed BlackRock’s assumptions and methodology of allocating expenses in the profitability analysis, noting the inherent limitations in allocating costs among various advisory products. The Board recognized that profitability may be affected by numerous factors including, among other things, fee waivers and expense reimbursements by the Manager, the types of funds managed, precision of expense allocations and business mix. As a result, calculating and comparing profitability at individual fund levels is difficult.
The Board noted that, in general, individual fund or product line profitability of other advisors is not publicly available. The Board reviewed BlackRock’s overall operating margin, in general, compared to that of certain other publicly-traded asset management firms. The Board considered the differences between BlackRock and these other firms,
| | | | | | |
| | | | | | | |
| 46 | | ANNUAL REPORT | | JUNE 30, 2014 | | |
| | |
| Disclosure of Investment Advisory Agreements and Sub-Advisory Agreement (concluded) |
including the contribution of technology at BlackRock, BlackRock’s expense management, and the relative product mix.
In addition, the Board considered the cost of the services provided to each Fund by BlackRock, and BlackRock’s and its affiliates’ profits relating to the management and distribution of each Fund and the other funds advised by BlackRock and its affiliates. As part of its analysis, the Board reviewed BlackRock’s methodology in allocating its costs to the management of each Fund. The Board also considered whether BlackRock has the financial resources necessary to attract and retain high quality investment management personnel to perform its obligations under the Advisory Agreements and, with respect to the EuroFund, the Sub-Advisory Agreement, and to continue to provide the high quality of services that is expected by the Board. The Board further considered factors including but not limited to BlackRock’s commitment of time, assumption of risk and liability profile in servicing each Fund in contrast to what is required of BlackRock with respect to other products with similar investment objectives across the open-end fund, ETF, closed-end fund and institutional account product channels, as applicable.
The Board noted that the EuroFund’s contractual management fee rate ranked in the second quartile, and that the actual management fee rate and total expense ratio each ranked in the first quartile, relative to the EuroFund’s Expense Peers. The Board additionally noted that the EuroFund has an advisory fee arrangement that includes breakpoints that adjust the fee rate downward as the size of the EuroFund increases above certain contractually specified levels.
The Board noted that the Global SmallCap Fund’s contractual management fee rate ranked in the first quartile, and that the actual management fee rate and total expense ratio ranked in the second and first quartiles, respectively, relative to the Global SmallCap Fund’s Expense Peers. The Board also noted that the Global SmallCap Fund has an advisory fee arrangement that includes breakpoints that adjust the fee rate downward as the size of the Global SmallCap Fund increases above certain contractually specified levels.
D. Economies of Scale: The Board, including the Independent Board Members, considered the extent to which economies of scale might be realized as the assets of each Fund increase, as well as the existence of expense caps, as applicable. The Board also considered the extent to which each Fund benefits from such economies and whether there should be changes in the advisory fee rate or breakpoint structure in order to enable each Fund to participate in these economies of scale, for example through the use of revised breakpoints in the advisory fee based upon the asset level of each Fund. In its consideration, the Board Members took into account the existence of any expense caps and further considered the continuation and/or implementation, as applicable, of such caps.
E. Other Factors Deemed Relevant by the Board Members: The Board, including the Independent Board Members, also took into account other ancillary or “fall-out” benefits that BlackRock or its affiliates may derive from their respective relationships with each Fund, both tangible and intangible, such as BlackRock’s ability to leverage its investment professionals who manage other portfolios and risk management personnel, an increase in BlackRock’s profile in the investment advisory community, and the engagement of BlackRock’s affiliates as service providers to each Fund, including for administrative, distribution, securities lending and cash management services. The Board also considered BlackRock’s overall operations and its efforts to expand the scale of, and improve the quality of, its operations. The Board also noted that BlackRock may use and benefit from third party research obtained by soft dollars generated by certain registered fund transactions to assist in managing all or a number of its other client accounts. The Board further noted that it had considered the investment by BlackRock’s funds in ETFs without any offset against the management fees payable by the funds to BlackRock.
In connection with its consideration of the Advisory Agreements, the Board also received information regarding BlackRock’s brokerage and soft dollar practices. The Board received reports from BlackRock which included information on brokerage commissions and trade execution practices throughout the year.
The Board noted the competitive nature of the open-end fund marketplace, and that shareholders are able to redeem their Fund shares if they believe that each Fund’s fees and expenses are too high or if they are dissatisfied with the performance of each Fund.
Conclusion
The Board, including the Independent Board Members, approved the continuation of the Advisory Agreements between the Manager and each Fund for a one-year term ending June 30, 2015, and the Sub-Advisory Agreement between the Manager and the Sub-Advisor with respect to the EuroFund for a one-year term ending June 30, 2015. Based upon its evaluation of all of the aforementioned factors in their totality, the Board, including the Independent Board Members, was satisfied that the terms of the Advisory Agreements and, with respect to the EuroFund, the Sub-Advisory Agreement, were fair and reasonable and in the best interest of each Fund, as applicable, and its shareholders. In arriving at its decision to approve the Agreements, the Board did not identify any single factor or group of factors as all-important or controlling, but considered all factors together, and different Board Members may have attributed different weights to the various factors considered. The Independent Board Members were also assisted by the advice of independent legal counsel in making this determination. The contractual fee arrangements for each Fund reflect the results of several years of review by the Board Members and predecessor Board Members, and discussions between such Board Members (and predecessor Board Members) and BlackRock. As a result, the Board Members’ conclusions may be based in part on their consideration of these arrangements in prior years.
| | | | | | |
| | | | | | | |
| | ANNUAL REPORT | | JUNE 30, 2014 | | 47 |
| | | | | | | | | | |
Name, Address1 and Year of Birth | | Position(s) Held with Funds | | Length of Time Served as
a Director3 | | Principal Occupation(s) During Past Five Years | | Number of BlackRock- Advised Registered Investment Companies (“RICs”) Consisting of Investment Portfolios (“Portfolios”) Overseen | | Public Directorships |
| Independent Directors2 |
Robert M. Hernandez 1944 | | Chairman of the Board and Director | | Since
2007 | | Director, Vice Chairman and Chief Financial Officer of USX Corporation (energy and steel business) from 1991 to 2001; Director, TE Connectivity (electronics) from 2006 to 2012. | | 33 RICs consisting of
155 Portfolios | | ACE Limited (insurance company); Eastman Chemical Company; RTI International Metals, Inc. |
Fred G. Weiss 1941 | | Vice Chairman of the Board and Director | | Since
2007 | | Managing Director, FGW Associates (consulting and investment company) since 1997; Director and Treasurer, Michael J. Fox Foundation for Parkinson’s Research since 2000; Director, BTG International PLC (medical technology commercialization company) from 2001 to 2007. | | 33 RICs consisting of
155 Portfolios | | Actavis, Inc.
(pharmaceuticals) |
James H. Bodurtha 1944 | | Director | | Since
2007 | | Director, The China Business Group, Inc. (consulting and investing firm) since 1996 and Executive Vice President thereof from 1996 to 2003; Chairman of the Board, Berkshire Holding Corporation since 1980. | | 33 RICs consisting of
155 Portfolios | | None |
Bruce R. Bond 1946 | | Director | | Since
2007 | | Trustee and Member of the Governance Committee, State Street Research Mutual Funds from 1997 to 2005; Board Member of Governance, Audit and Finance Committee, Avaya Inc. (computer equipment) from 2003 to 2007. | | 33 RICs consisting of
155 Portfolios | | None |
Donald W. Burton 1944 | | Director | | Since
2007 | | Managing General Partner, The Burton Partnership, LP (an investment partnership) since 1979; Managing General Partner, The South Atlantic Venture Funds from 1983 to 2012; Director, IDology, Inc. (technology solutions) since 2006; Director, Knology, Inc. (telecommunications) from 1996 to 2012; Director, Capital Southwest from 2006 to 2012. | | 33 RICs consisting of
155 Portfolios | | None |
Honorable Stuart E. Eizenstat 1943 | | Director | | Since
2007 | | Partner and Head of International Practice, Covington and Burling LLP (law firm) since 2001; International Advisory Board Member, The Coca-Cola Company from 2002 to 2011; Advisory Board Member, Veracity Worldwide, LLC (risk management) since 2007; Member of the International Advisory Board GML Ltd. (energy) since 2003; Advisory Board Member, BT Americas (telecommunications) from 2004 to 2010. | | 33 RICs consisting of
155 Portfolios | | Alcatel-Lucent (tele-communications); Global Specialty Metallurgical; UPS Corporation (delivery service) |
Kenneth A. Froot 1957 | | Director | | Since
2007 | | Professor, Harvard University since 1992. | | 33 RICs consisting of
155 Portfolios | | None |
John F. O’Brien 1943 | | Director | | Since
2007 | | Chairman of the Corporation, Woods Hole Oceanographic Institute since 2009 and Trustee thereof from 2003 to 2009; Director, Ameresco, Inc. (energy solutions company) from 2006 to 2007. | | 33 RICs consisting of
155 Portfolios | | Cabot Corporation (chemicals); LKQ Corporation (auto parts manufacturing); TJX Companies, Inc. (retailer) |
Roberta Cooper Ramo 1942 | | Director | | Since
2007 | | Shareholder and Attorney, Modrall, Sperling, Roehl, Harris & Sisk, P.A. (law firm) since 1993; Chairman of the Board, Cooper’s Inc., (retail) since 1999; Director, ECMC Group (service provider to students, schools and lenders) since 2001; President, The American Law Institute (non-profit) since 2008. | | 33 RICs consisting of
155 Portfolios | | None |
David H. Walsh 1941 | | Director | | Since
2007 | | Director, National Museum of Wildlife Art since 2007; Trustee, University of Wyoming Foundation from 2008 to 2012; Director, Ruckelshaus Institute and Haub School of Natural Resources at the University of Wyoming from 2006 to 2008; Director, The American Museum of Fly Fishing since 1997. | | 33 RICs consisting of
155 Portfolios | | None |
| | | | | | |
| | | | | | | |
| 48 | | ANNUAL REPORT | | JUNE 30, 2014 | | |
| | |
| Officers and Directors (continued) | | |
| | | | | | | | | | |
Name, Address1 and Year of Birth | | Position(s) Held with Funds | | Length of Time Served as
a Director3 | | Principal Occupation(s) During Past Five Years | | Number of BlackRock- Advised Registered Investment Companies (“RICs”) Consisting of Investment Portfolios (“Portfolios”) Overseen | | Public Directorships |
| Independent Directors2 (concluded) |
| | 1 The address of each Director and Officer is c/o BlackRock, Inc., Park Avenue Plaza 55 East 52nd Street New York, NY 10055. |
| | 2 Each Independent Director holds office until his or her successor is duly elected and qualifies or until his or her earlier death, resignation or removal as provided by the Fund’s by-laws or charter or statute. In no event may an Independent Director hold office beyond December 31 of the year in which he or she turns 74. |
| | 3 Date shown is the earliest date a person has served for the Funds covered by this annual report. Following the combination of Merrill Lynch Investment Managers, L.P. (“MLIM”) and BlackRock, Inc. (“BlackRock”) in September 2006, the various legacy MLIM and legacy BlackRock fund boards were realigned and consolidated into three new fund boards in 2007. As a result, although the chart shows certain Directors as joining the Funds’ board in 2007, those Directors first became members of the boards of other legacy MLIM or legacy BlackRock funds as follows: James H. Bodurtha, 1995; Bruce R. Bond, 2005; Donald W. Burton, 2002; Honorable Stuart E. Eizenstat, 2001; Kenneth A. Froot, 2005; Robert M. Hernandez, 1996; John F. O’Brien, 2005; Roberta Cooper Ramo, 1999; David H. Walsh, 2003; and Fred G. Weiss, 1998. |
| Interested Directors4 |
Paul L. Audet 1953 | | President5 and Director | | Since
2011 | | Senior Managing Director of BlackRock and Head of U.S. Mutual Funds since 2011; Chair of the U.S. Mutual Funds Committee reporting to the Global Executive Committee since 2011; Head of BlackRock’s Real Estate business from 2008 to 2011; Member of BlackRock’s Global Operating and Corporate Risk Management Committees and of the BlackRock Alternative Investors Executive Committee and Investment Committee for the Private Equity Fund of Funds business since 2008; Head of BlackRock’s Global Cash Management business from 2005 to 2010; Acting Chief Financial Officer of BlackRock from 2007 to 2008; Chief Financial Officer of BlackRock from 1998 to 2005. | | 144 RICs consisting of
334 Portfolios | | None |
Laurence D. Fink 1952 | | Director | | Since
2007 | | Chairman and Chief Executive Officer of BlackRock since its formation in 1998 and of BlackRock’s predecessor entities since 1988 and Chairman of the Executive and Management Committees; Formerly Managing Director, The First Boston Corp-oration, Member of its Management Committee, Co-head of its Taxable Fixed Income Division and Head of its Mortgage and Real Estate Products Group; Chairman of the Board of several of BlackRock’s alternative investment vehicles; Director of several of BlackRock’s offshore funds; Member of the Board of Trustees of New York University, Chair of the Financial Affairs Committee and a member of the Executive Committee, the Ad Hoc Committee on Board Governance, and the Committee on Trustees; Co-Chairman of the NYU Hospitals Center Board of Trustees, Chairman of the Development/Trustee Stewardship Committee and Chairman of the Finance Committee; Trustee, The Boys’ Club of New York. | | 29 RICs consisting of
97 Portfolios | | BlackRock |
Henry Gabbay 1947 | | Director | | Since
2007 | | Consultant, BlackRock from 2007 to 2008; Managing Director, BlackRock from 1989 to 2007; Chief Administrative Officer, BlackRock Advisors, LLC from 1998 to 2007; President of BlackRock Funds and BlackRock Bond Allocation Target Shares from 2005 to 2007 and Treasurer of certain closed-end funds in the BlackRock fund complex from 1989 to 2006. | | 144 RICs consisting of
334 Portfolios | | None |
| | 4 Messrs. Audet and Fink are both “interested persons,” as defined in the 1940 Act, of the Funds based on their positions with BlackRock and its affiliates. Mr. Gabbay is an “interested person” of the Funds based on his former positions with BlackRock and its affiliates as well as his ownership of BlackRock and The PNC Financial Services Group, Inc. securities. Mr. Audet and Mr. Gabbay are also Directors of the BlackRock registered closed-end funds and Directors of other BlackRock registered open-end funds. Interested Directors serve until their resignation, removal or death, or until December 31 of the year in which they turn 72. |
| | 5 For EuroFund. |
| | | | | | |
| | | | | | | |
| | ANNUAL REPORT | | JUNE 30, 2014 | | 49 |
|
| Officers and Directors (concluded) |
| | | | | | |
Name, Address1 and Year of Birth | | Position(s)
Held with
Funds | | Length of Time Served | | Principal Occupation(s) During Past Five Years |
| Officers2 |
John M. Perlowski 1964 | | President3 and Chief Executive Officer | | Since 2010 | | Managing Director of BlackRock since 2009; Global Head of BlackRock Fund Services since 2009; Managing Director and Chief Operating Officer of the Global Product Group at Goldman Sachs Asset Management, L.P. from 2003 to 2009; Treasurer of Goldman Sachs Mutual Funds from 2003 to 2009 and Senior Vice President thereof from 2007 to 2009; Director of Goldman Sachs Offshore Funds from 2002 to 2009; Director of Family Resource Network (charitable foundation) since 2009. |
Brendan Kyne 1977 | | Vice President | | Since 2009 | | Managing Director of BlackRock since 2010; Director of BlackRock from 2008 to 2009; Head of Product Development and Management for BlackRock’s U.S. Retail Group from 2009 to 2013 and Co-head thereof from 2007 to 2009; Vice President of BlackRock from 2005 to 2008. |
Neal Andrews 1966 | | Chief Financial Officer | | Since
2007 | | Managing Director of BlackRock since 2006; Senior Vice President and Line of Business Head of Fund Accounting and Administration at PNC Global Investment Servicing (U.S.) Inc. from 1992 to 2006. |
Jay Fife 1970 | | Treasurer | | Since 2007 | | Managing Director of BlackRock since 2007; Director of BlackRock in 2006; Assistant Treasurer of the MLIM and Fund Asset Management, L.P. advised funds from 2005 to 2006; Director of MLIM Fund Services Group from 2001 to 2006. |
Charles Park 1967 | | Chief Compliance Officer and Anti-Money Laundering Officer | | Since 2014 | | Chief Compliance Officer of BlackRock Advisors, LLC and the BlackRock-advised Funds in the Equity-Bond Complex, the Equity-Liquidity Complex and the Closed-End Complex since 2014; Principal of and Chief Compliance Officer for iShares® Delaware Trust Sponsor LLC since 2012 and BlackRock Fund Advisors (“BFA”) since 2006; Chief Compliance Officer for the BFA-advised iShares exchange traded funds since 2006; Chief Compliance Officer for BlackRock Asset Management International Inc. since 2012. |
Benjamin Archibald 1975 | | Secretary | | Since 2012 | | Managing Director of BlackRock since 2014; Director of BlackRock from 2010 to 2013; Assistant Secretary of the BlackRock-advised funds from 2010 to 2012; General Counsel and Chief Operating Officer of Uhuru Capital Management from 2009 to 2010; Executive Director and Counsel of Goldman Sachs Asset Management from 2005 to 2009. |
| | 1 The address of each Director and Officer is c/o BlackRock, Inc., Park Avenue Plaza 55 East 52nd Street New York, NY 10055. 2 Officers of the Funds serve at the pleasure of the Board. 3 For Global SmallCap. |
| | Further information about the Officers and Directors is available in the Funds’ Statement of Additional Information, which can be obtained without charge by calling (800) 441-7762. |
Effective May 14, 2014, Brian Kindelan resigned as Chief Compliance Officer and Anti-Money Laundering Officer of the Funds and Charles Park became Chief Compliance Officer and Anti-Money Laundering Officer of the Funds.
| | | | | | | | |
| | | | | |
Investment Advisor BlackRock Advisors, LLC Wilmington, DE 19809 | | Custodian Brown Brothers Harriman & Co. Boston, MA 02109 | | Accounting Agent State Street Bank and
Trust Company Boston, MA 02110 | | Legal Counsel Willkie Farr & Gallagher LLP New York, NY 10019 | | Address of the Funds 100 Bellevue Parkway Wilmington, DE 19809 |
| | | | |
Sub-Advisors BlackRock Investment Management, LLC Princeton, NJ 08540 | | Transfer Agent BNY Mellon Investment Servicing Inc. Wilmington, DE 19809 | | Distributor BlackRock Investments, LLC New York, NY 10022 | | Independent Registered Public Accounting Firm Deloitte & Touche LLP Boston, MA 02116 | | |
BlackRock International Limited4 Edinburgh, EH3 8BL, United Kingdom | | | | | | | | |
| | | | | | |
| | | | | | | |
| 50 | | ANNUAL REPORT | | JUNE 30, 2014 | | |
Electronic Delivery
Electronic copies of most financial reports and prospectuses are available on the Funds’ website or shareholders can sign up for e-mail notifications of quarterly statements, annual and semi-annual reports and prospectuses by enrolling in the Funds’ electronic delivery program.
To enroll:
Shareholders Who Hold Accounts with Investment Advisors, Banks or Brokerages:
Please contact your financial advisor. Please note that not all investment advisors, banks or brokerages may offer this service.
Shareholders Who Hold Accounts Directly with BlackRock:
| 1) | Access the BlackRock website at http://www.blackrock.com/edelivery |
| 2) | Select “eDelivery” under the “More Information” section |
Householding
The Funds will mail only one copy of shareholder documents, including prospectuses, annual and semi-annual reports and proxy statements, to shareholders with multiple accounts at the same address. This practice is commonly called “householding” and is intended to reduce expenses and eliminate duplicate mailings of shareholder documents. Mailings of your shareholder documents may be householded indefinitely unless you instruct us otherwise. If you do not want the mailing of these documents to be combined with those for other members of your household, please call the Funds at (800) 441-7762.
Availability of Quarterly Schedule of Investments
The Funds file their complete schedule of portfolio holdings with the SEC for the first and third quarters of each fiscal year on Form N-Q. The Funds’ Forms N-Q are available on the SEC’s website at http://www.sec.gov and may also be reviewed and copied at the SEC’s Public Reference Room in Washington, DC. Information on how to access documents on the SEC’s website without charge may be obtained by calling (800) SEC-0330. The Funds’ Forms N-Q may also be obtained upon request and without charge by calling (800) 441-7762.
Availability of Proxy Voting Policies and Procedures
A description of the policies and procedures that the Funds use to determine how to vote proxies relating to portfolio securities is available (1) without charge, upon request, by calling (800) 441-7762; (2) at http://www.blackrock.com; and (3) on the SEC’s website at http://www.sec.gov.
Availability of Proxy Voting Record
Information about how the Funds voted proxies relating to securities held in the Funds’ portfolios during the most recent 12-month period ended June 30 is available upon request and without charge (1) at http://www.blackrock.com or by calling (800) 441-7762 and (2) on the SEC’s website at http://www.sec.gov.
| | | | | | |
| | | | | | | |
| | ANNUAL REPORT | | JUNE 30, 2014 | | 51 |
| | |
| Additional Information (concluded) | | |
Account Information
Call us at (800) 441-7762 from 8:00 AM to 6:00 PM EST on any business day to get information about your account balances, recent transactions and share prices. You can also reach us on the Web at http://www.blackrock.com/funds.
Automatic Investment Plans
Investor Class shareholders who want to invest regularly can arrange to have $50 or more automatically deducted from their checking or savings account and invested in any of the BlackRock funds.
Systematic Withdrawal Plans
Investor Class shareholders can establish a systematic withdrawal plan and receive periodic payments of $50 or more from their BlackRock funds, as long as their account balance is at least $10,000.
Retirement Plans
Shareholders may make investments in conjunction with Traditional, Rollover, Roth, Coverdell, Simple IRAs, SEP IRAs and 403(b) Plans.
| | |
| BlackRock Privacy Principles | | |
BlackRock is committed to maintaining the privacy of its current and former fund investors and individual clients (collectively, “Clients”) and to safeguarding their non-public personal information. The following information is provided to help you understand what personal information BlackRock collects, how we protect that information and why in certain cases we share such information with select parties.
If you are located in a jurisdiction where specific laws, rules or regulations require BlackRock to provide you with additional or different privacy-related rights beyond what is set forth below, then BlackRock will comply with those specific laws, rules or regulations.
BlackRock obtains or verifies personal non-public information from and about you from different sources, including the following: (i) information we receive from you or, if applicable, your financial intermediary, on applications, forms or other documents; (ii) information about your transactions with us, our affiliates, or others; (iii) information we receive from a consumer reporting agency; and (iv) from visits to our websites.
BlackRock does not sell or disclose to non-affiliated third parties any non-public personal information about its Clients, except as permitted by law or as is necessary to respond to regulatory requests or to service Client accounts. These non-affiliated third parties are required to protect the confidentiality and security of this information and to use it only for its intended purpose.
We may share information with our affiliates to service your account or to provide you with information about other BlackRock products or services that may be of interest to you. In addition, BlackRock restricts access to non-public personal information about its Clients to those BlackRock employees with a legitimate business need for the information. BlackRock maintains physical, electronic and procedural safeguards that are designed to protect the non-public personal information of its Clients, including procedures relating to the proper storage and disposal of such information.
| | | | | | |
| | | | | | | |
| 52 | | ANNUAL REPORT | | JUNE 30, 2014 | | |
| | |
| A World-Class Mutual Fund Family | | |
BlackRock offers a diverse lineup of open-end mutual funds crossing all investment styles and managed by experts in equity, fixed income and tax-exempt investing.
BlackRock ACWI ex-US Index Fund
BlackRock All-Cap Energy & Resources Portfolio
BlackRock Basic Value Fund
BlackRock Capital Appreciation Fund
BlackRock Commodity Strategies Fund
BlackRock Disciplined Small Cap Core Fund
BlackRock Emerging Markets Dividend Fund
BlackRock Emerging Markets Fund
BlackRock Emerging Markets Long/Short Equity Fund
BlackRock Energy & Resources Portfolio
BlackRock Equity Dividend Fund
BlackRock EuroFund
BlackRock Flexible Equity Fund
BlackRock Focus Growth Fund
BlackRock Global Dividend Portfolio
BlackRock Global Long/Short Equity Fund
BlackRock Global Opportunities Portfolio
BlackRock Global SmallCap Fund
BlackRock Health Sciences Opportunities Portfolio
BlackRock International Fund
BlackRock International Index Fund
BlackRock International Opportunities Portfolio
BlackRock Large Cap Core Fund
BlackRock Large Cap Core Plus Fund
BlackRock Large Cap Growth Fund
BlackRock Large Cap Value Fund
BlackRock Latin America Fund
BlackRock Long-Horizon Equity Fund
BlackRock Mid-Cap Growth Equity Portfolio
BlackRock Mid Cap Value Opportunities Fund
BlackRock Natural Resources Trust
BlackRock Pacific Fund
BlackRock Real Estate Securities Fund
BlackRock Russell 1000® Index Fund
BlackRock Science & Technology Opportunities Portfolio
BlackRock Small Cap Growth Equity Portfolio
BlackRock Small Cap Growth Fund II
BlackRock Small Cap Index Fund
BlackRock S&P 500 Stock Fund
BlackRock U.S. Opportunities Portfolio
BlackRock Value Opportunities Fund
| | |
| Taxable Fixed Income Funds | | |
BlackRock Bond Index Fund
BlackRock Core Bond Portfolio
BlackRock CoreAlpha Bond Fund
BlackRock CoRI Funds
BlackRock Emerging Markets Flexible Dynamic Bond Portfolio
BlackRock Floating Rate Income Portfolio
BlackRock Global Long/Short Credit Fund
BlackRock GNMA Portfolio
BlackRock High Yield Bond Portfolio
BlackRock Inflation Protected Bond Portfolio
BlackRock Investment Grade Bond Portfolio
BlackRock Low Duration Bond Portfolio
BlackRock Secured Credit Portfolio
BlackRock Short Obligations Fund
BlackRock Short-Term Treasury Fund
BlackRock Strategic Income Opportunities Portfolio
BlackRock Total Return Fund
BlackRock U.S. Government Bond Portfolio
BlackRock U.S. Mortgage Portfolio
BlackRock Ultra-Short Obligations Fund
BlackRock World Income Fund
| | |
| Municipal Fixed Income Funds | | |
BlackRock California Municipal Bond Fund
BlackRock High Yield Municipal Fund
BlackRock National Municipal Fund
BlackRock New Jersey Municipal Bond Fund
BlackRock New York Municipal Bond Fund
BlackRock Pennsylvania Municipal Bond Fund
BlackRock Short-Term Municipal Fund
BlackRock Strategic Municipal Opportunities Fund
| | | | | | | | | | | | | | | | |
BlackRock Balanced Capital Fund | | LifePath® Active Portfolios | | | | LifePath® Index Portfolios |
BlackRock Emerging Market Allocation Portfolio | | | | 2015 | | 2040 | | | | | | | | Retirement | | 2040 |
BlackRock Global Allocation Fund | | | | 2020 | | 2045 | | | | | | | | 2020 | | 2045 |
BlackRock Managed Volatility Portfolio | | | | 2025 | | 2050 | | | | | | | | 2025 | | 2050 |
BlackRock Multi-Asset Income Portfolio | | | | 2030 | | 2055 | | | | | | | | 2030 | | 2055 |
BlackRock Multi-Asset Real Return Fund | | | | 2035 | | | | | | | | | | 2035 | | |
BlackRock Multi-Manager Alternatives Fund | | | | | | | | | | | | | | | | |
BlackRock Strategic Risk Allocation Fund | | | | | | | | | | | | | | | | |
| | LifePath® Portfolios | | | | | | | | | | |
| BlackRock Prepared Portfolios | | | | Retirement | | 2040 | | | | | | | | | | |
Conservative Prepared Portfolio | | | | 2020 | | 2045 | | | | | | | | | | |
Moderate Prepared Portfolio | | | | 2025 | | 2050 | | | | | | | | | | |
Growth Prepared Portfolio | | | | 2030 | | 2055 | | | | | | | | | | |
Aggressive Growth Prepared Portfolio | | | | 2035 | | | | | | | | | | | | |
BlackRock mutual funds are currently distributed by BlackRock Investments, LLC. You should consider the investment objectives, risks, charges and expenses of the funds under consideration carefully before investing. Each fund’s prospectus contains this and other information and is available at www.blackrock.com or by calling (800) 441-7762 or from your financial advisor. The prospectus should be read carefully before investing.
| | | | | | |
| | | | | | | |
| | ANNUAL REPORT | | JUNE 30, 2014 | | 53 |
This report is intended for existing shareholders. It is not authorized for use as an offer of sale or a solicitation of an offer to buy shares of the Funds unless preceded or accompanied by that Fund’s current prospectus. Past performance results shown in this report should not be considered a representation of future performance. Investment returns and principal value of shares will fluctuate so that shares, when redeemed, may be worth more or less than their original cost. Statements and other information herein are as dated and are subject to change.

| | |
| EGSC-6/14-AR | | |
| |
| |  |
| Item 2 – | Code of Ethics – The registrant (or the “Fund”) has adopted a code of ethics, as of the end of the period covered by this report, applicable to the registrant’s principal executive officer, principal financial officer, principal accounting officer or controller, or persons performing similar functions. During the period covered by this report, there have been no amendments to or waivers granted under the code of ethics. A copy of the code of ethics is available without charge at www.blackrock.com. |
| Item 3 – | Audit Committee Financial Expert – The registrant’s board of trustees (the “board of trustees”), has determined that (i) the registrant has the following audit committee financial experts serving on its audit committee and (ii) each audit committee financial expert is independent: |
Robert M. Hernandez
Fred G. Weiss
Stuart E. Eizenstat
Under applicable securities laws, a person determined to be an audit committee financial expert will not be deemed an “expert” for any purpose, including without limitation for the purposes of Section 11 of the Securities Act of 1933, as a result of being designated or identified as an audit committee financial expert. The designation or identification of a person as an audit committee financial expert does not impose on such person any duties, obligations, or liabilities greater than the duties, obligations, and liabilities imposed on such person as a member of the audit committee and board of trustees in the absence of such designation or identification.
| Item 4 – | Principal Accountant Fees and Services |
The following table presents fees billed by Deloitte & Touche LLP (“D&T”) in each of the last two fiscal years for the services rendered to the Fund:
| | | | | | | | | | | | | | | | | | | | | | | | | | | | | | |
| | | (a) Audit Fees | | (b) Audit-Related Fees1 | | (c) Tax Fees2 | | (d) All Other Fees3 |
| Entity Name | | Current
Fiscal
Year End | | | | Previous
Fiscal
Year
End | | | | Current
Fiscal
Year
End | | | | Previous
Fiscal
Year
End | | | | Current
Fiscal
Year
End | | | | Previous
Fiscal
Year
End | | | | Current
Fiscal
Year
End | | | | Previous
Fiscal
Year
End |
BlackRock EuroFund | | $36,163 | | | | $35,463 | | | | $0 | | | | $0 | | | | $13,850 | | | | $13,850 | | | | $0 | | | | $0 |
The following table presents fees billed by D&T that were required to be approved by the registrant’s audit committee (the “Committee”) for services that relate directly to the operations or financial reporting of the Fund and that are rendered on behalf of BlackRock Advisors, LLC (“Investment Adviser” or “BlackRock”) and entities controlling, controlled by, or under common control with BlackRock (not including any sub-adviser whose role is primarily portfolio management and is subcontracted with or overseen by another investment adviser) that provide ongoing services to the Fund (“Fund Service Providers”):
2
| | | | |
| | | Current Fiscal Year End | | Previous Fiscal Year End |
(b) Audit-Related Fees1 | | $0 | | $0 |
(c) Tax Fees2 | | $0 | | $0 |
(d) All Other Fees3 | | $2,555,000 | | $2,865,000 |
1 The nature of the services includes assurance and related services reasonably related to the performance of the audit of financial statements not included in Audit Fees.
2 The nature of the services includes tax compliance, tax advice and tax planning.
3 Aggregate fees borne by BlackRock in connection with the review of compliance procedures and attestation thereto performed by D&T with respect to all of the registered closed-end funds and some of the registered open-end funds advised by BlackRock.
(e)(1) Audit Committee Pre-Approval Policies and Procedures:
The Committee has adopted policies and procedures with regard to the pre-approval of services. Audit, audit-related and tax compliance services provided to the registrant on an annual basis require specific pre-approval by the Committee. The Committee also must approve other non-audit services provided to the registrant and those non-audit services provided to the Investment Adviser and Fund Service Providers that relate directly to the operations and the financial reporting of the registrant. Certain of these non-audit services that the Committee believes are (a) consistent with the SEC’s auditor independence rules and (b) routine and recurring services that will not impair the independence of the independent accountants may be approved by the Committee without consideration on a specific case-by-case basis (“general pre-approval”). The term of any general pre-approval is 12 months from the date of the pre-approval, unless the Committee provides for a different period. Tax or other non-audit services provided to the registrant which have a direct impact on the operations or financial reporting of the registrant will only be deemed pre-approved provided that any individual project does not exceed $10,000 attributable to the registrant or $50,000 per project. For this purpose, multiple projects will be aggregated to determine if they exceed the previously mentioned cost levels.
Any proposed services exceeding the pre-approved cost levels will require specific pre-approval by the Committee, as will any other services not subject to general pre-approval (e.g., unanticipated but permissible services). The Committee is informed of each service approved subject to general pre-approval at the next regularly scheduled in-person board meeting. At this meeting, an analysis of such services is presented to the Committee for ratification. The Committee may delegate to the Committee Chairman the authority to approve the provision of and fees for any specific engagement of permitted non-audit services, including services exceeding pre-approved cost levels.
(e)(2) None of the services described in each of Items 4(b) through (d) were approved by the Committee pursuant to the de minimis exception in paragraph (c)(7)(i)(C) of Rule 2-01 of Regulation S-X.
(f) Not Applicable
(g) The aggregate non-audit fees paid to the accountant for services rendered by the accountant to the registrant, the Investment Adviser and the Fund Service Providers were:
| | | | |
| Entity Name | | Current Fiscal Year End | | Previous Fiscal Year End |
BlackRock EuroFund | | $13,850 | | $13,850 |
3
Additionally, SSAE 16 Review (Formerly, SAS No. 70) fees for the current and previous fiscal years of $2,555,000 and $2,865,000, respectively, were billed by D&T to the Investment Adviser.
(h) The Committee has considered and determined that the provision of non-audit services that were rendered to the Investment Adviser and the Fund Service Providers that were not pre-approved pursuant to paragraph (c)(7)(ii) of Rule 2-01 of Regulation S-X is compatible with maintaining the principal accountant’s independence.
| Item 5 – | Audit Committee of Listed Registrants – Not Applicable |
(a) The registrant’s Schedule of Investments is included as part of the Report to Stockholders filed under Item 1 of this Form.
(b) Not Applicable due to no such divestments during the semi-annual period covered since the previous Form N-CSR filing.
| Item 7 – | Disclosure of Proxy Voting Policies and Procedures for Closed-End Management Investment Companies – Not Applicable |
| Item 8 – | Portfolio Managers of Closed-End Management Investment Companies – Not Applicable |
| Item 9 – | Purchases of Equity Securities by Closed-End Management Investment Company and Affiliated Purchasers – Not Applicable |
| Item 10 – | Submission of Matters to a Vote of Security Holders – There have been no material changes to these procedures. |
| Item 11 – | Controls and Procedures |
(a) The registrant’s principal executive and principal financial officers, or persons performing similar functions, have concluded that the registrant’s disclosure controls and procedures (as defined in Rule 30a-3(c) under the Investment Company Act of 1940, as amended (the “1940 Act”)) are effective as of a date within 90 days of the filing of this report based on the evaluation of these controls and procedures required by Rule 30a-3(b) under the 1940 Act and Rule 15d-15(b) under the Securities Exchange Act of 1934, as amended.
(b) There were no changes in the registrant’s internal control over financial reporting (as defined in Rule 30a-3(d) under the 1940 Act) that occurred during the second fiscal quarter of the period covered by this report that have materially affected, or are reasonably likely to materially affect, the registrant’s internal control over financial reporting.
| Item 12 – | Exhibits attached hereto |
(a)(1) Code of Ethics – See Item 2
(a)(2) Certifications – Attached hereto
(a)(3) Not Applicable
4
(b) Certifications – Attached hereto
5
Pursuant to the requirements of the Securities Exchange Act of 1934 and the Investment Company Act of 1940, the registrant has duly caused this report to be signed on its behalf by the undersigned, thereunto duly authorized.
BlackRock EuroFund
| | | | |
| By: | | /s/ John M. Perlowski | | |
| | John M. Perlowski | | |
| | Chief Executive Officer (principal executive officer) of |
| | BlackRock EuroFund |
| | |
| Date: | | September 3, 2014 | | |
Pursuant to the requirements of the Securities Exchange Act of 1934 and the Investment Company Act of 1940, this report has been signed below by the following persons on behalf of the registrant and in the capacities and on the dates indicated.
| | | | |
| By: | | /s/ John M. Perlowski | | |
| | John M. Perlowski | | |
| | Chief Executive Officer (principal executive officer) of |
| | BlackRock EuroFund |
| | |
| Date: | | September 3, 2014 | | |
| | |
| By: | | /s/ Neal J. Andrews | | |
| | Neal J. Andrews | | |
| | Chief Financial Officer (principal financial officer) of |
| | BlackRock EuroFund |
| | |
| Date: | | September 3, 2014 | | |
6