UNITED STATES
SECURITIES AND EXCHANGE COMMISSION
Washington, D.C. 20549
FORM N-CSR
CERTIFIED SHAREHOLDER REPORT OF REGISTERED MANAGEMENT
INVESTMENT COMPANIES
Investment Company Act file number: 811-04612
Name of Fund: BlackRock EuroFund
Fund Address: 100 Bellevue Parkway, Wilmington, DE 19809
Name and address of agent for service: John M. Perlowski, Chief Executive Officer, BlackRock EuroFund, 55 East 52nd Street, New York, NY 10055
Registrant’s telephone number, including area code: (800) 441-7762
Date of fiscal year end: 06/30/2015
Date of reporting period: 06/30/2015
Item 1 – Report to Stockholders
JUNE 30, 2015
| | | | | | |
ANNUAL REPORT | | | | | |  |
BlackRock EuroFund
BlackRock Global SmallCap Fund, Inc.
|
| Not FDIC Insured • May Lose Value • No Bank Guarantee |

| | | | | | |
| | | | | | | |
| 2 | | ANNUAL REPORT | | JUNE 30, 2015 | | |
Dear Shareholder,
During the 12-month period ended June 30, 2015, market volatility increased from the remarkably low levels seen in recent years, although it remained below the historical average. In the middle of 2014, geopolitical tensions intensified in Ukraine and the Middle East and oil prices became highly volatile, stoking worries about economic growth outside the United States. The U.S. economy, however, was showing improvement, which made investors concerned that the U.S. Federal Reserve (the “Fed”) would raise short-term rates sooner than previously anticipated. The U.S. dollar appreciated and global credit markets tightened, ultimately putting a strain on investor flows.
In the fourth quarter, U.S. growth picked up considerably while the broader global economy showed more signs of slowing. This, combined with rising global risks, drove investors to the relative stability of U.S. assets. International markets continued to struggle even as the European Central Bank (“ECB”) and the Bank of Japan eased monetary policy. Oil prices plummeted due to a global supply-and-demand imbalance, sparking a selloff in energy-related assets and putting stress on emerging markets. Fixed income investors piled into U.S. Treasuries despite their persistently low yields, which had become attractive as compared to the even lower yields on international sovereign debt.
Equity markets reversed in early 2015, with international markets outperforming the United States as global risks abated. Investors had held high expectations for the U.S. economy, but a harsh winter and west coast port strike brought disappointing first-quarter data and high valuations took their toll on U.S. stocks, while bond yields fell to extreme lows. (Bond prices rise as yields fall.) In contrast, economic reports in Europe and Asia easily beat investors’ very low expectations, and accommodative policies from central banks in those regions helped international equities rebound. Oil prices stabilized, providing some relief for emerging market stocks, although a stronger U.S. dollar continued to be a headwind for the asset class.
U.S. economic data regained momentum in the second quarter, helping U.S. stocks resume an upward path. However, meaningful strength in the labor market underscored the likelihood that the Fed would raise short-term rates before the end of 2015 and bond yields moved swiftly higher. The period ended on a downbeat, but temporary, note as Greece’s long-brewing debt troubles came to an impasse. As the drama unfolded around the tumultuous negotiations between Greece and its creditors, investors feared the possibility of Greece leaving the euro zone and the impact such an event might have on global markets. Most asset classes broadly sold off, especially in Europe, even while macroeconomic and company fundamentals continued to improve.
At BlackRock, we believe investors need to think globally, extend their scope across a broad array of asset classes and be prepared to move freely as market conditions change over time. We encourage you to talk with your financial advisor and visit blackrock.com for further insight about investing in today’s markets.
Sincerely,

Rob Kapito
President, BlackRock Advisors, LLC

Rob Kapito
President, BlackRock Advisors, LLC
| | | | | | | | |
| Total Returns as of June 30, 2015 | |
| | | 6-month | | | 12-month | |
U.S. large cap equities
(S&P 500® Index) | | | 1.23 | % | | | 7.42 | % |
U.S. small cap equities
(Russell 2000® Index) | | | 4.75 | | | | 6.49 | |
International equities
(MSCI Europe, Australasia,
Far East Index) | | | 5.52 | | | | (4.22 | ) |
Emerging market equities
(MSCI Emerging
Markets Index) | | | 2.95 | | | | (5.12 | ) |
3-month Treasury bills
(BofA Merrill Lynch 3-Month
U.S. Treasury Bill Index) | | | 0.01 | | | | 0.02 | |
U.S. Treasury securities
(BofA Merrill Lynch 10-Year
U.S. Treasury Index) | | | (0.51 | ) | | | 3.79 | |
U.S. investment-grade
bonds (Barclays
U.S. Aggregate Bond Index) | | | (0.10 | ) | | | 1.86 | |
Tax-exempt municipal
bonds (S&P Municipal
Bond Index) | | | 0.01 | | | | 3.00 | |
U.S. high yield bonds
(Barclays U.S.
Corporate High Yield 2%
Issuer Capped Index) | | | 2.53 | | | | (0.39 | ) |
| Past performance is no guarantee of future results. Index performance is shown for illustrative purposes only. You cannot invest directly in an index. | |
| | | | | | |
| | | | | | | |
| | THIS PAGE NOT PART OF YOUR FUND REPORT | | | | 3 |
| | |
| Fund Summary as of June 30, 2015 | | BlackRock EuroFund |
BlackRock EuroFund’s (the “Fund”) investment objective is to seek capital appreciation primarily through investment in equities of corporations domiciled in European countries.
| | |
| Portfolio Management Commentary | | |
How did the Fund perform?
| • | | For the 12-month period ended June 30, 2015, the Fund outperformed the benchmark, the Morgan Stanley Capital International (“MSCI”) Europe Index. |
What factors influenced performance?
| • | | The Fund’s performance was driven by stock selection, while sector allocation contributed negatively. Stock selection was particularly strong in the financials sector, led by the banking industry. The Fund’s position in Intesa Sanpaolo SpA (Italy) made a substantial contribution to performance. The company, which has benefited from structural changes in the Italian savings market, reported robust results for the start of 2015. KBC Groep NV (Netherlands) and ING Groep NV (Netherlands) also aided relative performance. Stock selection was also strong in the information technology sector, specifically ASML Holding NV (Netherlands) and Cap Gemini (France). The telecommunications (“telecom”) sector was another successful area for the Fund, with both an overweight position and favorable stock selection contributing to returns. A position in Koninklijke KPN NV (Netherlands) outperformed due to rumors that the French telecom group Altice SA would bid for the company. The Fund’s underweight in the lagging utilities sector was also beneficial for performance. |
| • | | The Fund’s allocation to the energy sector was the largest detractor at the sector level, although this was partially offset by stock selection. Royal Dutch Shell PLC (Netherlands), which underperformed following its agreement to acquire BG Group PLC (United Kingdom), was the Fund’s largest detractor in the period. Stock selection was weakest in the materials sector, where positions in Rio Tinto PLC (United Kingdom) and Syngenta AG (Switzerland) hurt performance. |
Describe recent portfolio activity.
| • | | The Fund reduced its allocation to the energy sector during the period, predominantly by closing its position in Total SA (France), as fundamentals in the sector continued to weaken. The Fund increased its weighting in the financials sector, mainly by initiating new positions Bank of Ireland and Lloyds Banking Group PLC (United Kingdom). Lloyds was added due to the cash-generative power of its franchise, its strong market positions and its overcapitalized balance sheet. |
Describe portfolio positioning at period end.
| • | | Relative to the MSCI Europe Index, the Fund ended the period with an overweight allocation to financials, telecommunication services and information technology. The Fund was underweight utilities, consumer staples, industrials, healthcare, energy, materials and consumer discretionary. |
The views expressed reflect the opinions of BlackRock as of the date of this report and are subject to change based on changes in market, economic or other conditions. These views are not intended to be a forecast of future events and are no guarantee of future results.
| | |
| Ten Largest Holdings | | Percent of
Long-Term Investments |
| | | | |
Royal Dutch Shell PLC | | | 4 | % |
Vodafone Group PLC | | | 4 | |
Prudential PLC | | | 3 | |
Bayer AG, Registered Shares | | | 3 | |
lntesa Sanpaolo SpA | | | 3 | |
ASML Holding NV | | | 3 | |
AXA SA | | | 3 | |
KBC Groep NV | | | 3 | |
Novo Nordisk A/S | | | 3 | |
Novartis AG, Registered Shares | | | 3 | |
| | |
| Geographic Allocation | | Percent of
Long-Term Investments |
| | | | |
United Kingdom | | | 31 | % |
France | | | 17 | |
Netherlands | | | 13 | |
Germany | | | 10 | |
Italy | | | 6 | |
Sweden | | | 6 | |
Ireland | | | 6 | |
Switzerland | | | 4 | |
Belgium | | | 3 | |
Denmark | | | 3 | |
Spain | | | 1 | |
| | | | | | |
| | | | | | | |
| 4 | | ANNUAL REPORT | | JUNE 30, 2015 | | |
| | |
| Total Return Based on a $10,000 Investment | | |
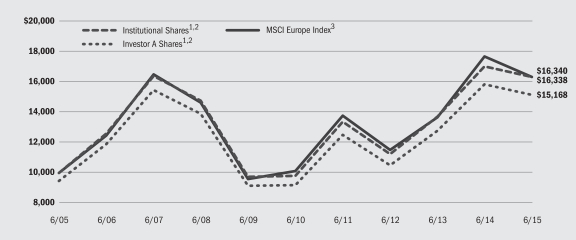
| | 1 | | Assuming maximum sales charge, if any, transaction costs and other operating expenses, including investment advisory fees. Institutional Shares do not have a sales charge. |
| | 2 | | Under normal circumstances, the Fund will invest at least 80% of its net assets in equity securities, including common stock and convertible securities, of companies located in Europe. The Fund currently expects that a majority of the Fund’s assets will be invested in equity securities of companies in Western European countries, but may also invest in emerging markets in Eastern European countries. |
| | 3 | | A free float-adjusted market capitalization weighted index that is designed to measure the equity market performance of the developed markets in Europe. |
| | |
| Performance Summary for the Period Ended June 30, 2015 | | |
| | | | | | | | | | | | | | | | | | | | | | | | | | | | |
| | | | | | Average Annual Total Returns4 | |
| | | | | | 1 Year | | | 5 Years | | | 10 Years | |
| | | 6-Month
Total Returns | | | w/o sales
charge | | | w/sales
charge | | | w/o sales
charge | | | w/sales
charge | | | w/o sales
charge | | | w/sales
charge | |
Institutional | | | 7.41 | % | | | (4.10 | )% | | | N/A | | | | 10.73 | % | | | N/A | | | | 5.03 | % | | | N/A | |
Investor A | | | 7.33 | | | | (4.30 | ) | | | (9.32 | )% | | | 10.51 | | | | 9.33 | % | | | 4.82 | | | | 4.25 | % |
Investor C | | | 6.92 | | | | (5.09 | ) | | | (6.01 | ) | | | 9.58 | | | | 9.58 | | | | 3.95 | | | | 3.95 | |
Class R | | | 7.17 | | | | (4.68 | ) | | | N/A | | | | 9.92 | | | | N/A | | | | 4.27 | | | | N/A | |
MSCI Europe Index | | | 3.82 | | | | (7.65 | ) | | | N/A | | | | 10.02 | | | | N/A | | | | 5.03 | | | | N/A | |
| | 4 | | Assuming maximum sales charges, if any. Average annual total returns with and without sales charges reflect reductions for distribution and service fees. See “About Fund Performance” on page 8 for a detailed description of share classes, including any related sales charges and fees. |
| | | | N/A — Not applicable as share class and index do not have a sales charge. |
| | | | Past performance is not indicative of future results. |
| | | | | | | | | | | | | | | | | | | | | | | | | | | | |
| | | Actual | | | Hypothetical6 | | | | |
| | | Beginning
Account Value
January 1, 2015 | | | Ending
Account Value
June 30, 2015 | | | Expenses Paid
During the
Period5 | | | Beginning
Account Value
January 1, 2015 | | | Ending
Account Value
June 30, 2015 | | | Expenses Paid
During the
Period5 | | | Annualized
Expense Ratio | |
Institutional | | $ | 1,000.00 | | | $ | 1,074.10 | | | $ | 5.19 | | | $ | 1,000.00 | | | $ | 1,019.79 | | | $ | 5.06 | | | | 1.01 | % |
Investor A | | $ | 1,000.00 | | | $ | 1,073.30 | | | $ | 6.22 | | | $ | 1,000.00 | | | $ | 1,018.79 | | | $ | 6.06 | | | | 1.21 | % |
Investor C | | $ | 1,000.00 | | | $ | 1,069.20 | | | $ | 10.47 | | | $ | 1,000.00 | | | $ | 1,014.68 | | | $ | 10.19 | | | | 2.04 | % |
Class R | | $ | 1,000.00 | | | $ | 1,071.70 | | | $ | 8.53 | | | $ | 1,000.00 | | | $ | 1,016.56 | | | $ | 8.30 | | | | 1.66 | % |
| | 5 | | For each class of the Fund, expenses are equal to the annualized net expense ratio for the class, multiplied by the average account value over the period, multiplied by 181/365 (to reflect the one-half year period shown). |
| | 6 | | Hypothetical 5% annual return before expenses is calculated by prorating the number of days in the most recent fiscal half year divided by 365. |
| | | | See “Disclosure of Expenses” on page 8 for further information on how expenses were calculated. |
| | | | | | |
| | | | | | | |
| | ANNUAL REPORT | | JUNE 30, 2015 | | 5 |
| | |
| Fund Summary as of June 30, 2015 | | BlackRock Global SmallCap Fund, Inc. |
BlackRock Global SmallCap Fund, Inc.’s (the “Fund”) investment objective is to seek long-term growth of capital by investing primarily in a portfolio of equity securities of small cap issuers located in various foreign countries and in the United States.
| | |
| Portfolio Management Commentary | | |
How did the Fund perform?
| • | | For the 12-month period ended June 30, 2015, the Fund underperformed its benchmark, the MSCI All Country World Small Cap Index, as well as the broad-market MSCI World Index. The following discussion of relative performance pertains to the MSCI All Country World Small Cap Index. |
What factors influenced performance?
| • | | The largest detractor from relative performance was the combination of an overweight position and stock selection in the energy sector, specifically among companies in the oil, gas and consumable fuels industry. Stock selection in industrials (commercial services & supplies), consumer discretionary (textiles apparel & luxury goods) and consumer staples (food products) also detracted from performance, as did selection in the materials and information technology sectors. |
| • | | Stock selection in the health care sector made the most significant contributor to the Fund’s 12-month results. Performance was particularly strong within the health care equipment and supplies industry, where portfolio holdings Edwards Lifesciences Corp. and Inogen, Inc. both performed well. Within financials, the Fund benefited from positive selection among consumer finance and real estate management & |
| development companies. An underweight position in the utilities sector, which lagged, also helped relative performance. |
Describe recent portfolio activity.
| • | | The Fund increased its allocation to the consumer discretionary sector via additions to the specialty retail and media industries. The Fund’s weighting in financials also rose. The Fund decreased its exposure to the health care sector, with the largest reduction occurring within the pharmaceutical industry. Its weighting in the industrials sector decreased as well. |
Describe portfolio positioning at period end.
| • | | The Fund continued to emphasize high quality, reasonably valued companies with strong balance sheets and the potential for rising market share and substantial growth. Relative to the MSCI All Country World Small Cap Index, the Fund ended the period with overweight positions in the materials, health care, energy, telecommunications and consumer discretionary sectors, while it was underweight in utilities, financials, industrials, consumer staples and information technology. The Fund’s geographic allocation remained consistent during the period, with a modest overweight position in the United States, a larger overweight position in Europe and an underweight position in Japan. The Fund’s emerging markets exposure, which is confined to Asia and Latin America, was also below that of the index. |
The views expressed reflect the opinions of BlackRock as of the date of this report and are subject to change based on changes in market, economic or other conditions. These views are not intended to be a forecast of future events and are no guarantee of future results.
| | |
| Ten Largest Holdings | | Percent of
Long-Term Investments |
| | | | |
Teleflex, Inc. | | | 1 | % |
Merit Medical Systems, Inc. | | | 1 | |
NuVasive, Inc. | | | 1 | |
Pfenex. Inc. | | | 1 | |
Merit Medical Systems, Inc. | | | 1 | |
Owens & Minor, Inc | | | 1 | |
Insulet Corp. | | | 1 | |
CyrusOne, Inc | | | 1 | |
LKQ Corp | | | 1 | |
Verint Systems, Inc | | | 1 | |
| | | | |
| Geographic Allocation | | Percent of
Long-Term Investments | |
United States | | | 54 | % |
United Kingdom | | | 7 | |
Japan | | | 7 | |
Canada | | | 6 | |
France | | | 4 | |
Switzerland | | | 3 | |
Italy | | | 2 | |
Germany | | | 2 | |
Hong Kong | | | 2 | |
Other1 | | | 13 | |
| | 1 | | Includes holdings within countries that are 1% or less of long-term investments. Please refer to the Schedule of Investments for such countries. |
| | | | | | |
| | | | | | | |
| 6 | | ANNUAL REPORT | | JUNE 30, 2015 | | |
| | |
| | | BlackRock Global SmallCap Fund, Inc. |
| | |
| Total Return Based on a $10,000 Investment | | |
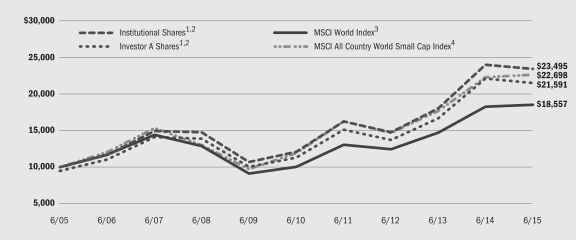
| | 1 | | Assuming maximum sales charge, if any, transaction costs and other operating expenses, including investment advisory fees. Institutional Shares do not have a sales charge. |
| | 2 | | The Fund invests in a diversified portfolio primarily consisting of equity securities of small cap issuers located in various foreign countries and in the United States. |
| | 3 | | A free float-adjusted market capitalization weighted index that is designed to measure the equity market performance of developed markets. The MSCI World Index consists of the following 23 developed market country indexes: Australia, Austria, Belgium, Canada, Denmark, Finland, France, Germany, Hong Kong, Ireland, Israel, Italy, Japan, Netherlands, New Zealand, Norway, Portugal, Singapore, Spain, Sweden, Switzerland, the United Kingdom, and the United States. |
| | 4 | | A free float-adjusted market capitalization weighted index that is designed to measure equity market results of smaller capitalization companies in both developed and emerging markets. |
| | |
| Performance Summary for the Period Ended June 30, 2015 | | |
| | | | | | | | | | | | | | | | | | | | | | | | | | | | |
| | | | | | Average Annual Total Returns5 | |
| | | | | | 1 Year | | | 5 Years | | | 10 Years | |
| | | 6-Month
Total Returns | | | w/o sales
charge | | | w/sales
charge | | | w/o sales
charge | | | w/sales
charge | | | w/o sales
charge | | | w/sales
charge | |
Institutional | | | 4.97 | % | | | (2.45 | )% | | | N/A | | | | 14.16 | % | | | N/A | | | | 8.92 | % | | | N/A | |
Investor A | | | 4.80 | | | | (2.74 | ) | | | (7.85 | )% | | | 13.78 | | | | 12.56 | | | | 8.59 | | | | 8.00 | % |
Investor B | | | 4.38 | | | | (3.62 | ) | | | (7.31 | ) | | | 12.75 | | | | 12.50 | | �� | | 7.83 | | | | 7.83 | |
Investor C | | | 4.39 | | | | (3.53 | ) | | | (4.35 | ) | | | 12.85 | | | | 12.85 | | | | 7.70 | | | | 7.70 | |
Class R | | | 4.63 | | | | (3.08 | ) | | | N/A | | | | 13.34 | | | | N/A | | | | 8.17 | | | | N/A | |
MSCI World Index | | | 2.63 | | | | 1.43 | | | | N/A | | | | 13.10 | | | | N/A | | | | 6.38 | | | | N/A | |
MSCI All Country World Small Cap Index | | | 6.18 | | | | 1.48 | | | | N/A | | | | 13.77 | | | | N/A | | | | 8.54 | | | | N/A | |
| | 5 | | Assuming maximum sales charges, if any. Average annual total returns with and without sales charges reflect reductions for distribution and service fees. See “About Fund Performance” on page 8 for a detailed description of share classes, including any related sales charges and fees. |
| | | | N/A — Not applicable as share class and index do not have a sales charge. |
| | | | Past performance is not indicative of future results. |
| | | | | | | | | | | | | | | | | | | | | | | | | | | | |
| | | Actual | | | Hypothetical7 | | | | |
| | | Beginning
Account Value
January 1, 2015 | | | Ending
Account Value
June 30, 2015 | | | Expenses Paid
During the Period6 | | | Beginning
Account Value
January 1, 2015 | | | Ending
Account Value
June 30, 2015 | | | Expenses Paid
During the Period6 | | | Annualized
Expense Ratio | |
Institutional | | $ | 1,000.00 | | | $ | 1,049.70 | | | $ | 5.49 | | | $ | 1,000.00 | | | $ | 1,019.44 | | | $ | 5.41 | | | | 1.08 | % |
Investor A | | $ | 1,000.00 | | | $ | 1,048.00 | | | $ | 7.11 | | | $ | 1,000.00 | | | $ | 1,017.85 | | | $ | 7.00 | | | | 1.40 | % |
Investor B | | $ | 1,000.00 | | | $ | 1,043.80 | | | $ | 11.45 | | | $ | 1,000.00 | | | $ | 1,013.59 | | | $ | 11.28 | | | | 2.26 | % |
Investor C | | $ | 1,000.00 | | | $ | 1,043.90 | | | $ | 11.10 | | | $ | 1,000.00 | | | $ | 1,013.93 | | | $ | 10.94 | | | | 2.19 | % |
Class R | | $ | 1,000.00 | | | $ | 1,046.30 | | | $ | 8.83 | | | $ | 1,000.00 | | | $ | 1,016.17 | | | $ | 8.70 | | | | 1.74 | % |
| | 6 | | For each class of the Fund, expenses are equal to the annualized net expense ratio for the class, multiplied by the average account value over the period, multiplied by 181/365 (to reflect the one-half year period shown). |
| | 7 | | Hypothetical 5% annual return before expenses is calculated by prorating the number of days in the most recent fiscal half year divided by 365. |
| | | | See “Disclosure of Expenses” on page 8 for further information on how expenses were calculated. |
| | | | | | |
| | | | | | | |
| | ANNUAL REPORT | | JUNE 30, 2015 | | 7 |
| • | | Institutional Shares are not subject to any sales charge. These shares bear no ongoing distribution or service fees and are available only to certain eligible investors. |
| • | | Investor A Shares are subject to a maximum initial sales charge (front-end load) of 5.25% and a service fee of 0.25% per year (but no distribution fee). Certain redemptions of these shares may be subject to a contingent deferred sales charge (“CDSC”) where no initial sales charge was paid at the time of purchase. These shares are generally available through financial intermediaries. On June 10, 2013, all of the issued and outstanding shares of EuroFund’s Investor B Shares were converted into Investor A Shares with the same relative aggregate net asset value (“NAV”). |
| • | | Investor B Shares (available only in BlackRock Global SmallCap, Inc.) are subject to a maximum CDSC of 4.50% declining to 0% after six years. In addition, these shares are subject to a distribution fee of 0.75% per year and a service fee of 0.25% per year. These shares automatically convert to Investor A Shares after approximately eight years. (There is no initial sales charge for automatic share conversions.) These shares are only available through exchanges and dividend reinvestments by existing shareholders and for purchase by certain employer-sponsored retirement plans. Effective on June 10, 2013, all issued and outstanding Investor B Shares of EuroFund were converted into Investor A Shares. |
| • | | Investor C Shares are subject to a 1.00% CDSC if redeemed within one year of purchase. In addition, these shares are subject to a distribution fee of 0.75% per year and a service fee of 0.25% per year. These shares are generally available through financial intermediaries. |
| • | | Class R Shares are not subject to any sales charge. These shares are subject to a distribution fee of 0.25% per year and a service fee of 0.25% per year. These shares are available only to certain employer-sponsored retirement plans. |
Performance information reflects past performance and does not guarantee future results. Current performance may be lower or higher than the performance data quoted. Refer to www.blackrock.com/funds to obtain performance data current to the most recent month end. Performance results do not reflect the deduction of taxes that a shareholder would pay on fund distributions or the redemption of fund shares. Figures shown in the performance tables on the previous pages assume reinvestment of all distributions, if any, at NAV on the ex-dividend date. Investment return and principal value of shares will fluctuate so that shares, when redeemed, may be worth more or less than their original cost. Distributions paid to each class of shares will vary because of the different levels of service, distribution and transfer agency fees applicable to each class, which are deducted from the income available to be paid to shareholders.
BlackRock Advisors, LLC (the “Manager”), the Funds’ investment advisor, has waived a portion of the Funds’ expenses. Without such waiver, the Funds’ performance would have been lower. The Manager is under no obligation to waive or to continue waiving its fees and such voluntary waiver may be reduced or discontinued at any time. See Note 5 of the Notes to Financial Statements for additional information on waivers.
| | | | | | |
| | | | | | | |
| 8 | | ANNUAL REPORT | | JUNE 30, 2015 | | |
Shareholders of these Funds may incur the following charges: (a) transactional expenses, such as sales charges; and (b) operating expenses, including investment advisory fees, service and distribution fees, including 12b-1 fees, acquired fund fees and expenses, and other Fund expenses. The expense examples shown on previous pages (which are based on a hypothetical investment of $1,000 invested on January 1, 2015 and held through June 30, 2015) are intended to assist shareholders both in calculating expenses based on an investment in each Fund and in comparing these expenses with similar costs of investing in other mutual funds.
The expense examples provide information about actual account values and actual expenses. In order to estimate the expenses a shareholder paid during the period covered by this report, shareholders can divide their account value by $1,000 and then multiply the result by the number corresponding to their Fund and share class under the heading entitled “Expenses Paid During the Period.”
The expense examples also provide information about hypothetical account values and hypothetical expenses based on a Fund’s actual expense ratio and an assumed rate of return of 5% per year before expenses. In order to assist shareholders in comparing the ongoing expenses of investing in these Funds and other funds, compare the 5% hypothetical examples with the 5% hypothetical examples that appear in shareholder reports of other funds.
The expenses shown in the expense examples are intended to highlight shareholders’ ongoing costs only and do not reflect any transactional expenses, such as sales charges, if any. Therefore, the hypothetical examples are useful in comparing ongoing expenses only, and will not help shareholders determine the relative total expenses of owning different funds. If these transactional expenses were included, shareholder expenses would have been higher.
| | |
| Derivative Financial Instruments | | |
The Funds may invest in various derivative financial instruments. Derivative financial instruments are used to obtain exposure to a security, index and/or market without owning or taking physical custody of securities or to manage market, equity, credit, interest rate, foreign currency exchange rate, commodity and/or other risks. Derivative financial instruments may give rise to a form of economic leverage. Derivative financial instruments also involve risks, including the imperfect correlation between the value of a derivative financial instrument and the underlying asset, possible default of the counterparty to the transaction or illiquidity of the derivative financial instrument. The Funds’ ability to use a derivative financial instrument successfully depends on the investment advisor’s ability to predict pertinent market movements accurately, which cannot be assured. The use of derivative financial instruments may result in losses greater than if they had not been used, may limit the amount of appreciation a Fund can realize on an investment and/or may result in lower distributions paid to shareholders. The Funds’ investments in these instruments are discussed in detail in the Notes to Financial Statements.
| | | | | | |
| | | | | | | |
| | ANNUAL REPORT | | JUNE 30, 2015 | | 9 |
| | |
Schedule of Investments June 30, 2015 | | BlackRock EuroFund (Percentages shown are based on Net Assets) |
| | | | | | | | | | |
| Common Stocks | | Shares | | | Value | |
Belgium — 3.0% | | | | | | | | | | |
KBC Groep NV | | | | | 227,338 | | | $ | 15,240,312 | |
Denmark — 3.0% | | | | | | | | | | |
Novo Nordisk A/S, Class B | | | | | 269,774 | | | | 14,803,811 | |
France — 16.9% | | | | | | | | | | |
AXA SA | | | | | 603,237 | | | | 15,293,165 | |
Bouygues SA | | | | | 158,139 | | | | 5,912,261 | |
Cap Gemini SA | | | | | 95,182 | | | | 8,444,211 | |
Compagnie de Saint-Gobain | | | | | 147,169 | | | | 6,643,411 | |
Groupe Eurotunnel SA, Registered Shares | | | | | 82,556 | | | | 1,196,996 | |
Hermes International | | | | | 1,771 | | | | 661,255 | |
L’Oreal SA | | | | | 20,081 | | | | 3,592,910 | |
LVMH Moet Hennessy Louis Vuitton SA | | | | | 74,560 | | | | 13,108,411 | |
Pernod Ricard SA | | | | | 88,439 | | | | 10,223,757 | |
Renault SA | | | | | 105,116 | | | | 11,021,135 | |
Societe Television Francaise 1 | | | | | 322,156 | | | | 5,542,372 | |
Unibail-Rodamco SE | | | | | 10,118 | | | | 2,570,019 | |
| | | | | | | | | | |
| | | | | | | | | | 84,209,903 | |
Germany — 9.5% | | | | | | | | | | |
BASF SE | | | | | 139,970 | | | | 12,316,369 | |
Bayer AG, Registered Shares | | | | | 118,469 | | | | 16,590,404 | |
Deutsche Telekom AG, Registered Shares | | | | | 443,304 | | | | 7,642,689 | |
Fresenius SE & Co. KGaA | | | | | 98,350 | | | | 6,314,696 | |
TUI AG | | | | | 282,918 | | | | 4,577,688 | |
| | | | | | | | | | |
| | | | | | | | | | 47,441,846 | |
Ireland — 5.8% | | | | | | | | | | |
Bank of Ireland (a) | | | | | 15,678,442 | | | | 6,346,575 | |
CRH PLC | | | | | 278,562 | | | | 7,815,534 | |
Ryanair Holdings PLC — ADR | | | | | 100,474 | | | | 7,168,820 | |
Shire PLC | | | | | 96,036 | | | | 7,716,449 | |
| | | | | | | | | | |
| | | | | | | | | | 29,047,378 | |
Italy — 6.5% | | | | | | | | | | |
Atlantia SpA | | | | | 422,978 | | | | 10,450,881 | |
Intesa Sanpaolo SpA | | | | | 4,565,169 | | | | 16,578,334 | |
Luxottica Group SpA | | | | | 32,563 | | | | 2,166,021 | |
UniCredit SpA | | | | | 457,191 | | | | 3,072,722 | |
| | | | | | | | | | |
| | | | | | | | | | 32,267,958 | |
Netherlands — 13.3% | | | | | | | | | | |
ASML Holding NV | | | | | 150,257 | | | | 15,629,339 | |
Heineken NV | | | | | 65,452 | | | | 4,976,143 | |
ING Groep NV CVA | | | | | 828,563 | | | | 13,758,591 | |
Koninklijke KPN NV | | | | | 2,697,592 | | | | 10,342,129 | |
Royal Dutch Shell PLC, Class B | | | | | 769,089 | | | | 21,896,354 | |
| | | | | | | | | | |
| | | | | | | | | | 66,602,556 | |
| Common Stocks | | Shares | | | Value | |
Spain — 0.7% | | | | | | | | | | | | |
Inditex SA | | | | | | | 106,698 | | | $ | 3,480,200 | |
Sweden — 5.9% | | | | | | | | | | | | |
Assa Abloy AB | | | | | | | 580,579 | | | | 10,929,860 | |
Electrolux AB, Class B | | | | | | | 171,585 | | | | 5,376,296 | |
Hexagon AB, Class B | | | | | | | 140,308 | | | | 5,082,029 | |
Lundin Petroleum AB (a) | | | | | | | 76,307 | | | | 1,309,164 | |
Nordea Bank AB | | | | | | | 554,384 | | | | 6,914,139 | |
| | | | | | | | | | | | |
| | | | | | | | | | | | 29,611,488 | |
Switzerland — 3.6% | | | | | | | | | | | | |
Novartis AG, Registered Shares | | | | | | | 141,050 | | | | 13,873,742 | |
UBS Group AG (a) | | | | | | | 193,866 | | | | 4,113,154 | |
| | | | | | | | | | | | |
| | | | | | | | | | | | 17,986,896 | |
United Kingdom — 30.6% | | | | | | | | | | | | |
Associated British Foods PLC | | | | | | | 160,130 | | | | 7,215,807 | |
Barclays PLC | | | | | | | 2,953,173 | | | | 12,104,016 | |
BG Group PLC | | | | | | | 445,361 | | | | 7,417,398 | |
BHP Billiton PLC | | | | | | | 443,344 | | | | 8,716,882 | |
BT Group PLC | | | | | | | 1,848,046 | | | | 13,086,646 | |
Carnival PLC | | | | | | | 79,980 | | | | 4,089,353 | |
Hargreaves Lansdown PLC | | | | | | | 458,946 | | | | 8,315,190 | |
Imperial Tobacco Group PLC | | | | | | | 199,105 | | | | 9,589,332 | |
Lloyds Banking Group PLC | | | | | | | 10,250,976 | | | | 13,758,838 | |
London Stock Exchange Group PLC | | | | | | | 248,738 | | | | 9,253,213 | |
Merlin Entertainments PLC (b) | | | | | | | 898,284 | | | | 6,024,661 | |
Prudential PLC | | | | | | | 694,811 | | | | 16,744,621 | |
Rio Tinto PLC | | | | | | | 97,177 | | | | 3,997,179 | |
SABMiller PLC | | | | | | | 154,855 | | | | 8,029,293 | |
Tesco PLC (a) | | | | | | | 1,874,659 | | | | 6,245,949 | |
Vodafone Group PLC | | | | | | | 4,996,301 | | | | 18,225,968 | |
| | | | | | | | | | | | |
| | | | | | | | | | | | 152,814,346 | |
Total Long-Term Investments (Cost — $463,274,586) — 98.8% | | | | | | | | | | | 493,506,694 | |
| | | | | | | | | | | | |
| | | | | | | | | | | | | |
| | | |
| Short-Term Securities | | | | | | | | | |
Money Market Funds — 0.4% | | | | | | | | | | | | |
BlackRock Liquidity Funds, TempFund, Institutional Class, 0.07% (c)(d) | | | | | | | 2,077,341 | | | $ | 2,077,341 | |
| | |
| Time Deposits | | Par (000) | | | | |
Europe — 0.2% | | | | | | | | | | | | |
Brown Brothers Harriman & Co., 0.03%, 7/03/15 | | | EUR | | | | 633 | | | | 706,072 | |
| | |
| ADR | | American Depositary Receipts |
| AUD | | Australian Dollar |
| CAD | | Canadian Dollar |
| CVA | | Certificaten Van Aandelen (Dutch Certificate) |
| EUR | | Euro |
| GBP | | British Pound |
| GDR | | Global Depositary Receipt |
| HKD | | Hong Kong Dollar |
| JPY | | Japanese Yen |
| USD | | U.S. Dollar |
See Notes to Financial Statements.
| | | | | | |
| | | | | | | |
| 10 | | ANNUAL REPORT | | JUNE 30, 2015 | | |
| | |
Schedule of Investments (continued) | | BlackRock EuroFund (Percentages shown are based on Net Assets) |
| | | | | | | | | | | | |
| | | |
| Time Deposits | | | | | Par (000) | | | Value | |
United Kingdom — 0.0% | | | | | | | | | | | | |
Brown Brothers Harriman & Co.,
0.08%, 7/01/15 | | | GBP | | | | 54 | | | $ | 85,624 | |
| Total Time Deposits — 0.2% | | | | | | | | | | | 791,696 | |
Total Short-Term Securities (Cost — $2,869,037) — 0.6% | | | | | | | | | | | 2,869,037 | |
| Total Investments (Cost — $466,143,623) — 99.4% | | | | 496,375,731 | |
| Other Assets Less Liabilities — 0.6% | | | | | | | | | | | 2,905,714 | |
| | | | | | | | | | | | |
| Net Assets — 100.0% | | | | | | | | | | $ | 499,281,445 | |
| | | | | | | | | | | | |
|
| Notes to Schedule of Investments |
| (a) | | Non-income producing security. |
| (b) | | Security exempt from registration pursuant to Rule 144A under the Securities Act of 1933, as amended. These securities may be resold in transactions exempt from registration to qualified institutional investors. |
| (c) | | Represents the current yield as of report date. |
| (d) | | During the year ended June 30, 2015, investments in issuers considered to be affiliates of the Fund for purposes of Section 2(a)(3) of the 1940 Act were as follows: |
| | | | | | | | | | | | | | | | |
| Affiliate | | Shares/Beneficial Interest Held at
June 30, 2014 | | | Net Activity | | | Shares/Beneficial Interest Held at
June 30, 2015 | | | Income | |
BlackRock Liquidity Funds, TempFund, Institutional Class | | | 361,504 | | | | 1,715,837 | | | | 2,077,341 | | | $ | 1,152 | |
BlackRock Liquidity Series, LLC Money Market Series | | $ | 3,229,307 | | | $ | (3,229,307 | ) | | | — | | | $ | 542 | 1 |
| 1 | | Represents securities lending income earned from the reinvestment of cash collateral from loaned securities, net other fees, and other payments to and from borrowers of securities, and less the collateral investment expenses. |
| • | | Fair Value Measurements — Various inputs are used in determining the fair value of investments. These inputs to valuation techniques are categorized into a disclosure hierarchy consisting of three broad levels for financial statement purposes. The hierarchy gives the highest priority to unadjusted quoted prices in active markets for identical assets or liabilities (Level 1 measurements) and the lowest priority to unobservable inputs (Level 3 measurements). Accordingly, the degree of judgment exercised in determining fair value is greatest for instruments categorized in Level 3. The inputs used to measure fair value may fall into different levels of the fair value hierarchy. In such cases, for disclosure purposes, the fair value hierarchy classification is determined based on the lowest level input that is significant to the fair value measurement in its entirety. The categorization of a value determined for investments is based on the pricing transparency of the investment and is not necessarily an indication of the risks associated with investing in those securities. The three levels of the fair value hierarchy are as follows: |
| | • | | Level 1 — unadjusted quoted prices in active markets/exchanges for identical assets or liabilities that the Fund has the ability to access |
| | • | | Level 2 — other observable inputs (including, but not limited to, quoted prices for similar assets or liabilities in markets that are active, quoted prices for identical or similar assets or liabilities in markets that are not active, inputs other than quoted prices that are observable for the assets or liabilities (such as interest rates, yield curves, volatilities, prepayment speeds, loss severities, credit risks and default rates) or other market-corroborated inputs) |
| | • | | Level 3 — unobservable inputs based on the best information available in the circumstances, to the extent observable inputs are not available (including the Fund’s own assumptions used in determining the fair value of investments) |
Changes in valuation techniques may result in transfers into or out of an assigned level within the disclosure hierarchy. In accordance with the Fund’s policy, transfers between different levels of the fair value disclosure hierarchy are deemed to have occurred as of the beginning of the reporting period. For information about the Fund’s policy regarding valuation of investments, refer to Note 2 of the Notes to Financial Statements.
See Notes to Financial Statements.
| | | | | | |
| | | | | | | |
| | ANNUAL REPORT | | JUNE 30, 2015 | | 11 |
| | |
Schedule of Investments (concluded) | | BlackRock EuroFund |
As of June 30, 2015, the following table summarizes the Fund’s investments categorized in the disclosure hierarchy:
| | | | | | | | | | | | | | |
| | | Level 1 | | | Level 2 | | | Level 3 | | Total | |
Assets: | | | | | | | | | | | | | | |
| Investments: | | | | | | | | | | | | | | |
Common Stocks: | | | | | | | | | | | | | | |
Belgium | | | — | | | $ | 15,240,312 | | | — | | $ | 15,240,312 | |
Denmark | | | — | | | | 14,803,811 | | | — | | | 14,803,811 | |
France | | $ | 5,912,261 | | | | 78,297,642 | | | — | | | 84,209,903 | |
Germany | | | — | | | | 47,441,846 | | | — | | | 47,441,846 | |
Ireland | | | 7,168,820 | | | | 21,878,558 | | | — | | | 29,047,378 | |
Italy | | | — | | | | 32,267,958 | | | — | | | 32,267,958 | |
Netherlands | | | — | | | | 66,602,556 | | | — | | | 66,602,556 | |
Spain | | | — | | | | 3,480,200 | | | — | | | 3,480,200 | |
Sweden | | | — | | | | 29,611,488 | | | — | | | 29,611,488 | |
Switzerland | | | — | | | | 17,986,896 | | | — | | | 17,986,896 | |
United Kingdom | | | — | | | | 152,814,346 | | | — | | | 152,814,346 | |
Short-Term Securities: | | | | | | | | | | | | | | |
Time Deposits | | | — | | | | 791,696 | | | — | | | 791,696 | |
Money Market Funds | | | 2,077,341 | | | | — | | | — | | | 2,077,341 | |
| | | | | | | | | | | | | | |
Total | | $ | 15,158,422 | | | $ | 481,217,309 | | | — | | $ | 496,375,731 | |
| | | | | | | | | | | | | | |
The Fund may hold assets and/or liabilities in which the fair value approximates the carrying amount for financial statement purposes. As of June 30, 2015, foreign currency overdraft valued at $(365) is categorized as level 2 within the disclosure hierarchy.
During the year ended June 30, 2015, there were no transfers between levels.
See Notes to Financial Statements.
| | | | | | |
| | | | | | | |
| 12 | | ANNUAL REPORT | | JUNE 30, 2015 | | |
| | |
Schedule of Investments June 30, 2015 | | BlackRock Global SmallCap Fund, Inc. (Percentages shown are based on Net Assets) |
| | | | | | | | |
| Common Stocks | | Shares | | | Value | |
Argentina — 0.3% | | | | | | | | |
Arcos Dorados Holdings, Inc., Class A | | | 551,434 | | | $ | 2,900,543 | |
Australia — 1.7% | | | | | | | | |
Iluka Resources Ltd. | | | 861,900 | | | | 5,097,019 | |
Orocobre Ltd. (a)(b) | | | 3,356,165 | | | | 5,437,844 | |
Pancontinental Oil & Gas NL (a) | | | 17,375,200 | | | | 80,435 | |
Parnell Pharmaceuticals Holdings Ltd. (a) | | | 543,477 | | | | 2,690,211 | |
Stockland | | | 1,550,849 | | | | 4,897,149 | |
| | | | | | | | |
| | | | | | | | 18,202,658 | |
Austria — 0.9% | | | | | | | | |
Schoeller-Bleckmann Oilfield Equipment AG | | | 119,400 | | | | 7,242,073 | |
UNIQA Insurance Group AG | | | 259,100 | | | | 2,337,563 | |
| | | | | | | | |
| | | | | | | | 9,579,636 | |
Belgium — 1.2% | | | | | | | | |
Mobistar SA (a) | | | 487,700 | | | | 9,232,232 | |
Ontex Group NV | | | 125,080 | | | | 3,754,549 | |
| | | | | | | | |
| | | | | | | | 12,986,781 | |
Brazil — 0.6% | | | | | | | | |
Brasil Insurance Participacoes e Administracao SA | | | 1,486,904 | | | | 602,586 | |
Companhia Hering SA | | | 1,132,231 | | | | 4,424,626 | |
Ser Educacional SA | | | 295,120 | | | | 1,364,969 | |
| | | | | | | | |
| | | | | | | | 6,392,181 | |
Canada — 6.5% | | | | | | | | |
Africa Oil Corp. (a)(b) | | | 4,153,400 | | | | 7,515,359 | |
BRP, Inc. (a) | | | 156,000 | | | | 3,645,829 | |
Continental Gold, Inc. (a)(b) | | | 3,959,600 | | | | 9,542,351 | |
Diagnocure, Inc. (a)(c) | | | 4,745,180 | | | | 436,906 | |
Dollarama, Inc. | | | 131,200 | | | | 7,951,833 | |
Element Financial Corp. (a) | | | 570,200 | | | | 9,016,373 | |
Halogen Software, Inc. (a) | | | 148,010 | | | | 1,273,905 | |
Lundin Mining Corp. (a) | | | 1,619,600 | | | | 6,652,160 | |
Mogo Finance Technology, Inc. (a) | | | 365,519 | | | | 2,616,285 | |
Painted Pony Petroleum Ltd. (a) | | | 1,075,025 | | | | 6,851,240 | |
Premier Gold Mines, Ltd. (a) | | | 2,153,100 | | | | 4,171,739 | |
Torex Gold Resources, Inc. (a)(b) | | | 7,152,700 | | | | 6,471,218 | |
Trevali Mining Corp. | | | 4,848,800 | | | | 3,377,467 | |
Trevali Mining Corp. (a)(b) | | | 1,326,723 | | | | 924,139 | |
| | | | | | | | |
| | | | | | | | 70,446,804 | |
China — 0.3% | | | | | | | | |
Angang Steel Co., Ltd. (b) | | | 2,800,000 | | | | 1,927,919 | |
Daphne International Holdings Ltd. (b) | | | 7,436,300 | | | | 1,861,102 | |
| | | | | | | | |
| | | | | | | | 3,789,021 | |
Cyprus — 0.3% | | | | | | | | |
Globaltrans Investment PLC, -GDR (a) | | | 604,600 | | | | 2,871,361 | |
Denmark — 0.9% | | | | | | | | |
ALK-Abello A/S | | | 25,832 | | | | 3,010,948 | |
Sydbank A/S | | | 186,100 | | | | 7,108,638 | |
| | | | | | | | |
| | | | | | | | 10,119,586 | |
France — 3.8% | | | | | | | | |
Elior SCA (d) | | | 297,520 | | | | 5,966,999 | |
Elis SA | | | 491,077 | | | | 9,646,544 | |
Eurofins Scientific SE | | | 7,675 | | | | 2,336,690 | |
GameLoft SE (a) | | | 746,683 | | | | 3,192,532 | |
Klepierre | | | 132,804 | | | | 5,855,249 | |
Saft Groupe SA | | | 157,900 | | | | 6,167,384 | |
UbiSoft Entertainment SA (a) | | | 444,900 | | | | 7,954,226 | |
| | | | | | | | |
| | | | | | | | 41,119,624 | |
Germany — 2.2% | | | | | | | | |
GEA Group AG | | | 86,250 | | | $ | 3,847,866 | |
Rheinmetall AG | | | 118,100 | | | | 5,990,372 | |
Salzgitter AG | | | 149,000 | | | | 5,326,698 | |
Stabilus SA (a) | | | 112,286 | | | | 4,791,143 | |
Vossloh AG (a)(b) | | | 66,700 | | | | 3,984,436 | |
| | | | | | | | |
| | | | | | | | 23,940,515 | |
Hong Kong — 1.9% | | | | | | | | |
China Taiping Insurance Holdings Co. Ltd. (a) | | | 844,840 | | | | 3,024,673 | |
Chow Sang Sang Holdings International Ltd. (b) | | | 1,381,000 | | | | 2,770,504 | |
Clear Media Ltd. | | | 2,045,000 | | | | 2,399,533 | |
Far East Horizon Ltd. | | | 7,137,000 | | | | 6,782,968 | |
Melco International Development, Ltd. (b) | | | 1,992,000 | | | | 2,812,364 | |
MMG, Ltd. (b) | | | 8,252,000 | | | | 2,908,453 | |
| | | | | | | | |
| | | | | | | | 20,698,495 | |
India — 1.3% | | | | | | | | |
Container Corp. of India | | | 168,250 | | | | 4,425,271 | |
Indiabulls Real Estate, Ltd. | | | 4,012,900 | | | | 3,587,755 | |
Sun TV Network Ltd. | | | 240,800 | | | | 1,068,248 | |
Zee Entertainment Enterprises Ltd. | | | 829,500 | | | | 4,787,627 | |
| | | | | | | | |
| | | | | | | | 13,868,901 | |
Indonesia — 1.1% | | | | | | | | |
Bank Tabungan Negara Persero Tbk PT (d) | | | 75,598,200 | | | | 6,728,607 | |
Tower Bersama Infrastructure Tbk PT | | | 7,486,476 | | | | 5,180,030 | |
| | | | | | | | |
| | | | | | | | 11,908,637 | |
Ireland — 0.8% | | | | | | | | |
Ryanair Holdings PLC—ADR | | | 124,496 | | | | 8,882,790 | |
Italy — 2.3% | | | | | | | | |
Banca Popolare di Milano Scarl | | | 9,439,210 | | | | 9,954,862 | |
Beni Stabili SpA SIIQ | | | 4,489,900 | | | | 3,332,699 | |
Credito Valtellinese (a) | | | 1,549,900 | | | | 2,056,492 | |
Massimo Zanetti Beverage Group SpA (a)(d) | | | 260,892 | | | | 3,187,775 | |
Mediolanum SpA | | | 815,100 | | | | 6,727,811 | |
| | | | | | | | |
| | | | | | | | 25,259,639 | |
Japan — 6.5% | | | | | | | | |
Asics Corp. | | | 209,450 | | | | 5,410,761 | |
The Bank of Yokohama Ltd. | | | 1,169,000 | | | | 7,158,924 | |
Credit Saison Co. Ltd. | | | 251,000 | | | | 5,374,078 | |
Don Quijote Co. Ltd. | | | 143,000 | | | | 6,084,500 | |
Hisaka Works Ltd. | | | 212,200 | | | | 1,928,731 | |
JGC Corp. | | | 275,000 | | | | 5,191,216 | |
Mitsui Chemicals, Inc. | | | 2,565,000 | | | | 9,529,677 | |
NGK Insulators Ltd. | | | 243,400 | | | | 6,262,936 | |
Rohm Co. Ltd. | | | 109,000 | | | | 7,302,898 | |
Tokyo Broadcasting System Holdings, Inc. | | | 701,500 | | | | 9,678,976 | |
Tokyo Steel Manufacturing Co. Ltd. | | | 971,000 | | | | 7,143,296 | |
| | | | | | | | |
| | | | | | | | 71,065,993 | |
Malaysia — 0.2% | | | | | | | | |
AirAsia Bhd | | | 4,110,200 | | | | 1,677,633 | |
Norway — 0.5% | | | | | | | | |
Hoegh Liquified Natural Gas Holdings Ltd. (b) | | | 373,000 | | | | 5,941,230 | |
Poland — 0.5% | | | | | | | | |
Alior Bank SA (a) | | | 223,600 | | | | 5,304,528 | |
South Korea — 1.4% | | | | | | | | |
GS Holdings | | | 112,200 | | | | 4,992,684 | |
Lotte Chemical Corp. | | | 38,200 | | | | 9,882,820 | |
| | | | | | | | |
| | | | | | | | 14,875,504 | |
See Notes to Financial Statements.
| | | | | | |
| | | | | | | |
| | ANNUAL REPORT | | JUNE 30, 2015 | | 13 |
| | |
Schedule of Investments (continued) | | BlackRock Global SmallCap Fund, Inc. (Percentages shown are based on Net Assets) |
| | | | | | | | |
| Common Stocks | | Shares | | | Value | |
Sweden — 0.5% | | | | | | | | |
Boliden AB | | | 114,600 | | | $ | 2,089,238 | |
SSAB AB, -A Shares (a) | | | 358,400 | | | | 1,871,831 | |
The Thule Group AB (d) | | | 161,166 | | | | 1,958,718 | |
| | | | | | | | |
| | | | | | | | 5,919,787 | |
Switzerland — 3.0% | | | | | | | | |
Aryzta AG (a) | | | 146,553 | | | | 7,210,893 | |
Basilea Pharmaceutica (a) | | | 49,988 | | | | 6,277,255 | |
Leonteq AG (a) | | | 50,200 | | | | 8,718,598 | |
OC Oerlikon Corp. AG, Registered Shares (a) | | | 386,300 | | | | 4,729,412 | |
Straumann Holding AG, Registered Shares | | | 15,100 | | | | 4,144,674 | |
Valiant Holding AG | | | 16,881 | | | | 1,643,954 | |
| | | | | | | | |
| | | | | | | | 32,724,786 | |
United Kingdom — 7.3% | | | | | | | | |
APR Energy PLC (b) | | | 63,396 | | | | 111,813 | |
Arrow Global Group PLC | | | 1,960,200 | | | | 8,146,505 | |
Atlas Mara Co-Nvest, Ltd. (a) | | | 712,625 | | | | 4,453,906 | |
Aveva Group PLC | | | 178,300 | | | | 5,065,182 | |
B&M European Value Retail SA | | | 316,225 | | | | 1,703,762 | |
Babcock International Group PLC | | | 260,800 | | | | 4,418,586 | |
Balfour Beatty PLC | | | 1,335,800 | | | | 5,077,180 | |
Crest Nicholson Holdings PLC | | | 652,300 | | | | 5,753,062 | |
De La Rue PLC | | | 497,000 | | | | 4,099,243 | |
Exova Group PLC | | | 1,930,519 | | | | 5,270,407 | |
IMI PLC | | | 262,800 | | | | 4,645,642 | |
Intertek Group PLC | | | 177,800 | | | | 6,836,404 | |
Man Group PLC | | | 399,600 | | | | 984,880 | |
Michael Page International PLC | | | 641,600 | | | | 5,487,842 | |
Poundland Group PLC | | | 450,800 | | | | 2,289,997 | |
Quotient, Ltd. (a) | | | 366,134 | | | | 5,583,543 | |
Virgin Money Holdings UK PLC (a) | | | 1,291,687 | | | | 8,934,788 | |
| | | | | | | | |
| | | | | | | | 78,862,742 | |
United States — 53.7% | | | | | | | | |
Albemarle Corp. | | | 116,000 | | | | 6,411,320 | |
AMC Entertainment Holdings, Inc., Class A | | | 181,258 | | | | 5,560,995 | |
American Campus Communities, Inc. | | | 164,600 | | | | 6,203,774 | |
Angie’s List, Inc. (a)(b) | | | 253,700 | | | | 1,562,792 | |
Apollo Education Group, Inc. (a) | | | 47,000 | | | | 605,360 | |
ARRIS Group, Inc. (a) | | | 206,247 | | | | 6,311,158 | |
Axiall Corp. | | | 141,064 | | | | 5,085,357 | |
Barracuda Networks, Inc. (a) | | | 156,400 | | | | 6,196,568 | |
Blackhawk Network Holdings, Inc. (a) | | | 220,752 | | | | 9,094,982 | |
Bloomin’ Brands, Inc. | | | 269,622 | | | | 5,756,430 | |
Burlington Stores, Inc. (a) | | | 107,573 | | | | 5,507,738 | |
Cable One, Inc. (a) | | | 12,771 | | | | 5,434,061 | |
CARBO Ceramics, Inc. (b) | | | 70,600 | | | | 2,939,078 | |
Celanese Corp., Series A | | | 113,700 | | | | 8,172,756 | |
Chart Industries, Inc. (a) | | | 18,900 | | | | 675,675 | |
Constant Contact, Inc. (a) | | | 260,450 | | | | 7,490,542 | |
CyrusOne, Inc. | | | 356,869 | | | | 10,509,792 | |
Deckers Outdoor Corp. (a) | | | 88,403 | | | | 6,362,364 | |
DeVry Education Group, Inc. | | | 70,300 | | | | 2,107,594 | |
DSP Group, Inc. (a) | | | 358,649 | | | | 3,704,844 | |
DSW, Inc., Class A | | | 162,703 | | | | 5,429,399 | |
DXP Enterprises, Inc. (a) | | | 130,500 | | | | 6,068,250 | |
E*Trade Financial Corp. (a) | | | 252,300 | | | | 7,556,385 | |
Essent Group Ltd. (a) | | | 301,500 | | | | 8,246,025 | |
EVINE Live, Inc. (a) | | | 535,819 | | | | 1,441,353 | |
FCB Financial Holdings, Inc., Class A (a) | | | 204,900 | | | | 6,515,820 | |
United States (continued) | | | | | | | | |
First Solar, Inc. (a) | | | 114,400 | | | $ | 5,374,512 | |
Five Below, Inc. (a)(b) | | | 152,400 | | | | 6,024,372 | |
Flowers Foods, Inc. | | | 311,550 | | | | 6,589,283 | |
Foot Locker, Inc. | | | 36,772 | | | | 2,464,092 | |
GNC Holdings, Inc., Class A | | | 180,249 | | | | 8,017,476 | |
Heritage Insurance Holdings, Inc. (a) | | | 272,600 | | | | 6,267,074 | |
IDEX Corp. | | | 118,250 | | | | 9,292,085 | |
Insulet Corp. (a) | | | 362,450 | | | | 11,230,513 | |
Invacare Corp. | | | 350,501 | | | | 7,581,337 | |
j2 Global, Inc. | | | 106,700 | | | | 7,249,198 | |
Jack Henry & Associates, Inc. | | | 33,200 | | | | 2,148,040 | |
KBR, Inc. | | | 399,000 | | | | 7,772,520 | |
The KEYW Holding Corp. (a)(b) | | | 44,500 | | | | 414,740 | |
Kraton Performance Polymers, Inc. (a) | | | 222,800 | | | | 5,320,464 | |
La Quinta Holdings, Inc. (a) | | | 358,531 | | | | 8,192,433 | |
Live Nation Entertainment, Inc. (a) | | | 235,400 | | | | 6,471,146 | |
LKQ Corp. (a) | | | 343,285 | | | | 10,382,655 | |
Manpowergroup, Inc. | | | 83,500 | | | | 7,463,230 | |
Marcus & Millichap, Inc. (a) | | | 297,934 | | | | 13,746,675 | |
The Men’s Wearhouse, Inc. | | | 93,748 | | | | 6,006,434 | |
Mentor Graphics Corp. | | | 308,400 | | | | 8,151,012 | |
Merit Medical Systems, Inc. (a) | | | 567,615 | | | | 12,226,427 | |
Monotype Imaging Holdings, Inc. | | | 159,794 | | | | 3,852,633 | |
MSC Industrial Direct Co., Inc., Class A | | | 81,200 | | | | 5,665,324 | |
New Relic, Inc. (a)(b) | | | 95,100 | | | | 3,346,569 | |
Nordson Corp. | | | 78,500 | | | | 6,114,365 | |
NuVasive, Inc. (a) | | | 280,058 | | | | 13,269,148 | |
Oasis Petroleum, Inc. (a)(b) | | | 376,400 | | | | 5,965,940 | |
OSI Systems, Inc. (a) | | | 122,302 | | | | 8,657,759 | |
Owens & Minor, Inc. | | | 338,585 | | | | 11,511,890 | |
Oxford Industries, Inc. | | | 9,800 | | | | 857,010 | |
Pacific Biosciences of California, Inc. (a)(b) | | | 1,110,473 | | | | 6,396,324 | |
People’s United Financial, Inc. | | | 474,000 | | | | 7,683,540 | |
Pfenex, Inc. (a) | | | 642,369 | | | | 12,461,959 | |
Pinnacle Foods, Inc. | | | 97,609 | | | | 4,445,114 | |
Pitney Bowes, Inc. | | | 306,458 | | | | 6,377,391 | |
Prestige Brands Holdings, Inc. (a) | | | 159,451 | | | | 7,373,014 | |
PrivateBancorp, Inc. | | | 200,600 | | | | 7,987,892 | |
PTC, Inc. (a) | | | 224,200 | | | | 9,196,684 | |
PVH Corp. | | | 39,670 | | | | 4,569,984 | |
QLIK Technologies, Inc. (a) | | | 217,200 | | | | 7,593,312 | |
Rouse Properties, Inc. (b) | | | 565,370 | | | | 9,243,800 | |
Semtech Corp. (a) | | | 253,301 | | | | 5,028,025 | |
Silver Bay Realty Trust Corp. | | | 413,032 | | | | 6,728,291 | |
SM Energy Co. | | | 196,700 | | | | 9,071,804 | |
Smart & Final Stores, Inc. (a) | | | 303,600 | | | | 5,425,332 | |
Steel Dynamics, Inc. | | | 478,500 | | | | 9,912,128 | |
Stratasys Ltd. (a)(b) | | | 167,200 | | | | 5,840,296 | |
Supervalu, Inc. (a) | | | 1,229,081 | | | | 9,943,265 | |
Synovus Financial Corp. | | | 277,200 | | | | 8,543,304 | |
Tanger Factory Outlet Centers | | | 68,080 | | | | 2,158,136 | |
TECO Energy, Inc. | | | 284,500 | | | | 5,024,270 | |
Teleflex, Inc. | | | 106,127 | | | | 14,374,902 | |
Thoratec Corp. (a) | | | 225,025 | | | | 10,029,364 | |
The Timken Co. | | | 80,500 | | | | 2,943,885 | |
TimkenSteel Corp. | | | 128,689 | | | | 3,473,316 | |
TransEnterix, Inc. (a)(b) | | | 1,409,480 | | | | 4,228,440 | |
TransUnion (a) | | | 188,400 | | | | 4,728,840 | |
Tribune Co., Class A | | | 182,701 | | | | 9,754,406 | |
The Ultimate Software Group, Inc. (a) | | | 14,600 | | | | 2,399,364 | |
Urban Outfitters, Inc. (a) | | | 113,080 | | | | 3,957,800 | |
See Notes to Financial Statements.
| | | | | | |
| | | | | | | |
| 14 | | ANNUAL REPORT | | JUNE 30, 2015 | | |
| | |
Schedule of Investments (continued) | | BlackRock Global SmallCap Fund, Inc. (Percentages shown are based on Net Assets) |
| | | | | | | | | | | | |
| Common Stocks | | Shares | | | Value | |
United States (concluded) | | | | | | | | | |
Vera Bradley, Inc. (a) | | | | | | | 281,533 | | | $ | 3,172,877 | |
Verint Systems, Inc. (a) | | | | | | | 165,800 | | | | 10,071,521 | |
Zynga, Inc., Class A (a) | | | | | | | 1,844,700 | | | | 5,275,842 | |
| | | | | | | | | | | | |
| | | | | | | | | | | | 583,991,190 | |
| Total Common Stocks — 99.7% | | | | �� | | | | | | | 1,083,330,565 | |
| | | | | | | | | | | | |
| | | | | | | | | | | | | |
| | | |
| Warrants (e) | | | | | | | | | |
United Kingdom — 0.0% | | | | | | | | | | | | |
Atlas Mara Co-Nvest, Ltd. | | | | | | | 549,800 | | | | 96,215 | |
United States — 0.3% | | | | | | | | | | | | |
Quotient, Ltd. | | | | | | | 468,685 | | | | 2,783,989 | |
| Total Warrants — 0.3% | | | | | | | | | | | 2,880,204 | |
Total Long-Term Investments (Cost — $931,108,508) — 100.0% | | | | | | | | | | | 1,086,210,769 | |
| Short-Term Securities | | | | | Par (000) | | | Value | |
| Time Deposits | | | | | | | | | | | | |
Austrailia — 0.0% | | | | | | | | | | | | |
Brown Brothers Harriman & Co.,
1.00%, 7/01/15 | | | AUD | | | | 509 | | | | 392,647 | |
Canada — 0.0% | | | | | | | | | | | | |
Brown Brothers Harriman & Co.,
0.05%, 7/01/15 | | | CAD | | | | 68 | | | | 54,248 | |
Hong Kong — 0.1% | | | | | | | | | | | | |
Brown Brothers Harriman & Co.,
0.05%, 7/03/15 | | | HKD | | | | 2,004 | | | | 258,520 | |
Japan — 0.0% | | | | | | | | | | | | |
Brown Brothers Harriman & Co.,
0.05%, 7/01/15 | | | JPY | | | | 10,203 | | | | 83,365 | |
United States — 0.2% | | | | | | | | | | | | |
Brown Brothers Harriman & Co.,
0.04%, 7/01/15 | | | USD | | | | 1,939 | | | | 1,939,496 | |
| Total Time Deposits — 0.3% | | | | | | | | | | | 2,728,276 | |
| | | | | | | | | | | | |
| | | | | | | | | | | |
| | | |
| Money Market Funds | | | | Shares | | | | |
BlackRock Liquidity Funds, TempFund, Institutional Class, 0.07% (f)(g) | | | | | 122,722 | | | $ | 122,722 | |
| | | |
| | | | | Beneficial
Interest (000) | | | | |
BlackRock Liquidity Series, LLC, Money Market Series, 0.23% (f)(g)(h) | | | | $ | 33,013 | | | | 33,012,761 | |
| Total Money Market Funds Funds — 3.0% | | | | 33,135,483 | |
Total Short-Term Securities (Cost — $35,863,759) — 3.3% | | | | | | | | | 35,863,759 | |
| Total Investments (Cost — $966,972,267) — 103.3% | | | | 1,122,074,528 | |
| Liabilities in Excess of Other Assets — (3.3)% | | | | (35,666,471 | ) |
| Net Assets — 100.0% | | | | | | $ | 1,086,408,057 | |
| | |
| Notes to Schedule of Investments |
| (a) | | Non-income producing security. |
| (b) | | Security, or a portion of security, is on loan. |
| (c) | | Investments in issuers (whereby the Fund held 5% or more of the companies’ outstanding securities) that were considered to be an affiliate during the period, for purposes of Section 2(a)(3) of the Investment Company Act of 1940, as amended, were as follows: |
| | | | | | | | | | | | | | | | | | | | | | | | |
| Affiliate | | Shares Held
at June 30, 2014 | | | Shares
Purchased | | Shares
Sold | | | Shares Held
at June 30, 2015 | | | Value at
June 20, 2015 | | | Income | | Realized
Loss | |
Diagnocure, Inc. | | | 4,852,780 | | | — | | | (107,600 | ) | | | 4,745,180 | | | $ | 436,906 | | | — | | $ | (474,295 | ) |
| (d) | | Security exempt from registration pursuant to Rule 144A under the Securities Act of 1933, as amended. These securities may be resold in transactions exempt from registration to qualified institutional investors. |
| (e) | | Warrants entitle the Fund to purchase a predetermined number of shares of common stock and are non-income producing. The purchase price and number of shares are subject to adjustment under certain conditions until the expiration date, if any. |
See Notes to Financial Statements.
| | | | | | |
| | | | | | | |
| | ANNUAL REPORT | | JUNE 30, 2015 | | 15 |
| | |
Schedule of Investments (continued) | | BlackRock Global SmallCap Fund, Inc. (Percentages shown are based on Net Assets) |
| (f) | | During the year ended June 30, 2015, investments in issuers considered to be affiliates of the Fund for purposes of Section 2(a)(3) of the 1940 Act were as follows: |
| | | | | | | | | | | | | | | | |
| Affiliate | | Shares/Beneficial Interest Held at
June 30, 2014 | | | Net Activity | | | Shares/Beneficial Interest Held at
June 30, 2015 | | | Income | |
BlackRock Liquidity Funds, TempFund, Institutional Class | | | 13,350,894 | | | | (13,228,172 | ) | | | 122,722 | | | $ | 5,952 | |
BlackRock Liquidity Series, LLC, Money Market Series | | $ | 121,421,480 | | | $ | (88,408,719 | ) | | $ | 33,012,761 | | | $ | 1,825,702 | 1 |
1 Represents securities lending income earned from the reinvestment of cash collateral from loaned securities, net other fees, and other payments to and from borrowers of securities, and less the collateral investment expenses. | |
| (g) | | Represents the current yield as of report date. |
| (h) | | Security was purchased with the cash collateral from loaned securities. The Fund may withdraw up to 25% of its investment daily, although the manager of the BlackRock Liquidity Series, LLC, Money Market Series, in its sole discretion, may permit an investor to withdraw more than 25% on any one day. |
| • | | Fair Value Measurements — Various inputs are used in determining the fair value of investments. These inputs to valuation techniques are categorized into a disclosure hierarchy consisting of three broad levels for financial statement purposes. The hierarchy gives the highest priority to unadjusted quoted prices in active markets for identical assets or liabilities (Level 1 measurements) and the lowest priority to unobservable inputs (Level 3 measurements). Accordingly, the degree of judgment exercised in determining fair value is greatest for instruments categorized in Level 3. The inputs used to measure fair value may fall into different levels of the fair value hierarchy. In such cases, for disclosure purposes, the fair value hierarchy classification is determined based on the lowest level input that is significant to the fair value measurement in its entirety. The categorization of a value determined for investments is based on the pricing transparency of the investment and is not necessarily an indication of the risks associated with investing in those securities. The three levels of the fair value hierarchy are as follows: |
| | • | | Level 1 — unadjusted quoted prices in active markets/exchanges for identical assets or liabilities that the Fund has the ability to access |
| | • | | Level 2 — other observable inputs (including, but not limited to, quoted prices for similar assets or liabilities in markets that are active, quoted prices for identical or similar assets or liabilities in markets that are not active, inputs other than quoted prices that are observable for the assets or liabilities (such as interest rates, yield curves, volatilities, prepayment speeds, loss severities, credit risks and default rates) or other market-corroborated inputs) |
| | • | | Level 3 — unobservable inputs based on the best information available in the circumstances, to the extent observable inputs are not available (including the Fund’s own assumptions used in determining the fair value of investments) |
Changes in valuation techniques may result in transfers into or out of an assigned level within the disclosure hierarchy. In accordance with the Fund’s policy, transfers between different levels of the fair value disclosure hierarchy are deemed to have occurred as of the beginning of the reporting period. For information about the Fund’s policy regarding valuation of investments, refer to Note 2 of the Notes to Financial Statements.
As of June 30, 2015, the following table summarizes the Fund’s investments categorized in the disclosure hierarchy:
| | | | | | | | | | | | | | |
| | | Level 1 | | | Level 2 | | | Level 3 | | Total | |
Assets: | | | | | | | | | | | | | | |
| Investments: | | | | | | | | | | | | | | |
Common Stocks: | | | | | | | | | | | | | | |
Argentina | | $ | 2,900,543 | | | | — | | | — | | $ | 2,900,543 | |
Australia | | | 8,208,490 | | | $ | 9,994,168 | | | — | | | 18,202,658 | |
Austria | | | — | | | | 9,579,636 | | | — | | | 9,579,636 | |
Belgium | | | 9,232,232 | | | | 3,754,549 | | | — | | | 12,986,781 | |
Brazil | | | 6,392,181 | | | | — | | | — | | | 6,392,181 | |
Canada | | | 67,069,337 | | | | 3,377,467 | | | — | | | 70,446,804 | |
China | | | 1,861,102 | | | | 1,927,919 | | | — | | | 3,789,021 | |
Cyprus | | | — | | | | 2,871,361 | | | — | | | 2,871,361 | |
Denmark | | | 3,010,948 | | | | 7,108,638 | | | — | | | 10,119,586 | |
France | | | 9,646,544 | | | | 31,473,080 | | | — | | | 41,119,624 | |
Germany | | | — | | | | 23,940,515 | | | — | | | 23,940,515 | |
Hong Kong | | | — | | | | 20,698,495 | | | — | | | 20,698,495 | |
India | | | 1,068,248 | | | | 12,800,653 | | | — | | | 13,868,901 | |
Indonesia | | | 5,180,030 | | | | 6,728,607 | | | — | | | 11,908,637 | |
Ireland | | | 8,882,790 | | | | — | | | — | | | 8,882,790 | |
Italy | | | 3,187,775 | | | | 22,071,864 | | | — | | | 25,259,639 | |
Japan | | | — | | | | 71,065,993 | | | — | | | 71,065,993 | |
Malaysia | | | 1,677,633 | | | | — | | | — | | | 1,677,633 | |
Norway | | | — | | | | 5,941,230 | | | — | | | 5,941,230 | |
Poland | | | — | | | | 5,304,528 | | | — | | | 5,304,528 | |
South Korea | | | — | | | | 14,875,504 | | | — | | | 14,875,504 | |
Sweden | | | 1,958,718 | | | | 3,961,069 | | | — | | | 5,919,787 | |
Switzerland | | | 1,643,954 | | | | 31,080,832 | | | — | | | 32,724,786 | |
United Kingdom | | | 37,702,295 | | | | 41,160,447 | | | — | | | 78,862,742 | |
United States | | | 583,991,190 | | | | — | | | — | | | 583,991,190 | |
See Notes to Financial Statements.
| | | | | | |
| | | | | | | |
| 16 | | ANNUAL REPORT | | JUNE 30, 2015 | | |
| | |
Schedule of Investments (concluded) | | BlackRock Global SmallCap Fund, Inc. |
| | | | | | | | | | | | | | |
| | | Level 1 | | | Level 2 | | | Level 3 | | Total | |
Assets (concluded): | | | | | | | | | | | | | | |
| Investments (concluded): | | | | | | | | | | | | | | |
Warrants | | $ | 2,783,989 | | | $ | 96,215 | | | — | | $ | 2,880,204 | |
Time Deposits | | | — | | | | 2,728,276 | | | — | | | 2,728,276 | |
Money Market Funds | | | 122,722 | | | | 33,012,761 | | | — | | | 33,135,483 | |
| | | | |
Total | | $ | 756,520,721 | | | $ | 365,553,807 | | | — | | $ | 1,122,074,528 | |
| | | | |
The Fund may hold assets and/or liabilities in which the fair value approximates the carrying amount for financial statement purposes. As of June 30, 2015, such assets and/or liabilities are categorized within the disclosure hierarchy as follows:
| | | | | | | | | | | | | | |
| | | Level 1 | | | Level 2 | | | Level 3 | | Total | |
Assets: | | | | | | | | | | | | | | |
Foreign currency at value | | $ | 517,561 | | | | — | | | — | | $ | 517,561 | |
Liabilities: | | | | | | | | | | | | | | |
Collateral on securities loaned at value | | | — | | | $ | (33,012,761 | ) | | — | | | (33,012,761 | ) |
| | | | |
Total | | $ | 517,561 | | | $ | (33,012,761 | ) | | — | | $ | (32,495,200 | ) |
| | | | |
Transfers between Level 1 and Level 2 were as follows:
| | | | | | | | | | | | | | | | |
| | | Transfers into Level 11 | | | Transfers out
of Level 12 | | | Transfers into Level 22 | | | Transfers out
of Level 21 | |
Assets: | | | | | | | | | | | | | | | | |
| Investments: | | | | | | | | | | | | | | | | |
Common Stocks: | | | | | | | | | | | | | | | | |
Australia | | $ | 5,998,746 | | | | — | | | | — | | | $ | (5,998,746 | ) |
Belgium | | | 9,002,111 | | | $ | (3,074,983 | ) | | $ | 3,074,983 | | | | (9,002,111 | ) |
Denmark | | | 4,068,988 | | | | — | | | | — | | | | (4,068,988 | ) |
France | | | — | | | | (4,945,650 | ) | | | 4,945,650 | | | | — | |
Germany | | | — | | | | (4,336,480 | ) | | | 4,336,480 | | | | — | |
Hong Kong | | | — | | | | (2,004,558 | ) | | | 2,004,558 | | | | — | |
Malaysia | | | 3,012,271 | | | | — | | | | — | | | | (3,012,271 | ) |
Norway | | | — | | | | (7,736,479 | ) | | | 7,736,479 | | | | — | |
United Kingdom | | | 17,796,567 | | | | (4,884,181 | ) | | | 4,884,181 | | | | (17,796,567 | ) |
| | | | | | | | | | | | | | | | |
Total | | $ | 39,878,683 | | | $ | (26,982,331 | ) | | $ | 26,982,331 | | | $ | (39,878,683 | ) |
| | | | | | | | | | | | | | | | |
1 Systematic fair values were not utilized at period end for these investments. | |
2 External pricing service used to reflect any significant market movements between the time the Fund valued such foreign securities and the earlier closing of foreign markets. | |
See Notes to Financial Statements.
| | | | | | |
| | | | | | | |
| | ANNUAL REPORT | | JUNE 30, 2015 | | 17 |
| | |
| Statements of Assets and Liabilities | | |
| | | | | | | | |
| June 30, 2015 | | BlackRock
EuroFund | | | BlackRock
Global SmallCap
Fund, Inc. | |
| | | | | | | | |
| | | | | | | | |
| Assets | | | | | | | | |
Investments at value — unaffiliated1,2 | | $ | 494,298,390 | | | $ | 1,088,502,139 | |
Investments at value — affiliated3 | | | 2,077,341 | | | | 33,572,389 | |
Foreign currency at value4 | | | — | | | | 517,561 | |
| Receivables: | | | | | | | | |
Investments sold | | | 4,483,659 | | | | 14,999,433 | |
Dividends — unaffiliated | | | 1,404,166 | | | | 1,264,816 | |
Capital shares sold | | | 380,719 | | | | 1,555,781 | |
Securities lending income — affiliated | | | — | | | | 57,188 | |
Prepaid expenses | | | 33,441 | | | | 45,936 | |
| | | | | | | | |
Total assets | | | 502,677,716 | | | | 1,140,515,243 | |
| | | | | | | | |
| | | | | | | | |
| Liabilities | | | | | | | | |
Collateral on securities loaned at value | | | — | | | | 33,012,761 | |
Foreign bank overdraft4 | | | 365 | | | | — | |
| Payables: | | | | | | | | |
Investments purchased | | | 2,194,994 | | | | 17,122,625 | |
Capital shares redeemed | | | 560,206 | | | | 2,098,229 | |
Service and distribution fees | | | 69,994 | | | | 377,450 | |
Investment advisory fees | | | 320,625 | | | | 764,758 | |
Other affiliates | | | 2,169 | | | | 5,616 | |
Officer’s and Directors’ fees | | | 1,470 | | | | 3,540 | |
Other accrued expenses payable | | | 246,448 | | | | 722,207 | |
| | | | | | | | |
Total liabilities | | | 3,396,271 | | | | 54,107,186 | |
| | | | | | | | |
Net Assets | | $ | 499,281,445 | | | $ | 1,086,408,057 | |
| | | | | | | | |
| | | | | | | | |
| Net Assets Consist of | | | | | | | | |
Paid-in capital | | $ | 567,657,963 | | | $ | 912,669,975 | |
Undistributed (distributions in excess of) net investment income | | | 6,741,817 | | | | (10,525,184 | ) |
Undistributed net realized gain (accumulated net realized loss) | | | (105,337,038 | ) | | | 29,172,003 | |
Net unrealized appreciation (depreciation) | | | 30,218,703 | | | | 155,091,263 | |
| | | | | | | | |
Net Assets | | $ | 499,281,445 | | | $ | 1,086,408,057 | |
| | | | | | | | |
1 Investments at cost — unaffiliated | | $ | 464,066,282 | | | $ | 920,386,693 | |
2 Securities loaned at value | | | — | | | $ | 28,718,610 | |
3 Investments at cost — affiliated | | $ | 2,077,341 | | | $ | 46,585,574 | |
4 Foreign currency at cost | | $ | (365 | ) | | $ | 517,564 | |
| | | | | | |
| See Notes to Financial Statements. | | | | |
| | | | | | | |
| 18 | | ANNUAL REPORT | | JUNE 30, 2015 | | |
| | |
| Statements of Assets and Liabilities (concluded) | | |
| | | | | | | | |
| June 30, 2015 | | BlackRock
EuroFund | | | BlackRock
Global SmallCap
Fund, Inc. | |
| | | | | | | | |
| Net Asset Value | | | | | | | | |
| Institutional | | | | | | | | |
Net assets | | $ | 221,462,639 | | | $ | 265,840,769 | |
| | | | | | | | |
Shares outstanding | | | 14,275,110 | | | | 10,311,535 | |
| | | | | | | | |
Net asset value | | $ | 15.51 | | | $ | 25.78 | |
| | | | | | | | |
Par value | | $ | 0.10 | | | $ | 0.10 | |
| | | | | | | | |
Shares authorized | | | Unlimited | | | | 100 million | |
| | | | | | | | |
| Investor A | | | | | | | | |
Net assets | | $ | 258,675,492 | | | $ | 474,107,038 | |
| | | | | | | | |
Shares outstanding | | | 16,985,146 | | | | 19,038,745 | |
| | | | | | | | |
Net asset value | | $ | 15.23 | | | $ | 24.90 | |
| | | | | | | | |
Par value | | $ | 0.10 | | | $ | 0.10 | |
| | | | | | | | |
Shares authorized | | | Unlimited | | | | 100 million | |
| | | | | | | | |
| Investor B | | | | | | | | |
Net assets | | | — | | | $ | 1,824,890 | |
| | | | | | | | |
Shares outstanding | | | — | | | | 78,910 | |
| | | | | | | | |
Net asset value | | | — | | | $ | 23.13 | |
| | | | | | | | |
Par value | | | — | | | $ | 0.10 | |
| | | | | | | | |
Shares authorized | | | — | | | | 100 million | |
| | | | | | | | |
| Investor C | | | | | | | | |
Net assets | | $ | 18,020,931 | | | $ | 318,616,207 | |
| | | | | | | | |
Shares outstanding | | | 1,665,479 | | | | 14,573,139 | |
| | | | | | | | |
Net asset value | | $ | 10.82 | | | $ | 21.86 | |
| | | | | | | | |
Par value | | $ | 0.10 | | | $ | 0.10 | |
| | | | | | | | |
Shares authorized | | | Unlimited | | | | 100 million | |
| | | | | | | | |
| Class R | | | | | | | | |
Net assets | | $ | 1,122,383 | | | $ | 26,019,153 | |
| | | | | | | | |
Shares outstanding | | | 96,281 | | | | 1,118,114 | |
| | | | | | | | |
Net asset value | | $ | 11.66 | | | $ | 23.27 | |
| | | | | | | | |
Par value | | $ | 0.10 | | | $ | 0.10 | |
| | | | | | | | |
Shares authorized | | | Unlimited | | | | 100 million | |
| | | | | | | | |
| | | | | | |
| See Notes to Financial Statements. | | | | |
| | | | | | | |
| | ANNUAL REPORT | | JUNE 30, 2015 | | 19 |
| | | | | | | | |
| Year Ended June 30, 2015 | | BlackRock
EuroFund | | | BlackRock Global
SmallCap Fund,
Inc. | |
| | | | | | | | |
| Investment Income | | | | | | | | |
Dividends — unaffiliated | | $ | 14,414,464 | | | $ | 13,888,617 | |
Securities lending — affiliated — net | | | 542 | | | | 1,825,702 | |
Dividends — affiliated | | | 1,152 | | | | 5,952 | |
Other income — unaffiliated | | | 7,097 | | | | 251 | |
Foreign taxes withheld | | | (1,003,142 | ) | | | (592,011 | ) |
| | | | |
Total income | | | 13,420,113 | | | | 15,128,511 | |
| | | | |
| | | | | | | | |
| Expenses | | | | | | | | |
Investment advisory | | | 3,446,297 | | | | 9,422,192 | |
Service — Investor A | | | 452,509 | | | | 1,194,983 | |
Service and distribution — Investor B | | | — | | | | 31,797 | |
Service and distribution — Investor C | | | 178,755 | | | | 3,216,058 | |
Service and distribution — Class R | | | 5,832 | | | | 142,280 | |
Transfer agent — Institutional | | | 361,422 | | | | 351,259 | |
Transfer agent — Investor A | | | 205,258 | | | | 956,311 | |
Transfer agent — Investor B | | | — | | | | 11,310 | |
Transfer agent — Investor C | | | 33,600 | | | | 784,082 | |
Transfer agent — Class R | | | 3,895 | | | | 86,318 | |
Accounting services | | | 117,975 | | | | 298,591 | |
Custodian | | | 116,434 | | | | 262,010 | |
Professional | | | 113,879 | | | | 137,008 | |
Registration | | | 76,944 | | | | 124,562 | |
Printing | | | 30,269 | | | | 65,933 | |
Officer and Directors | | | 19,542 | | | | 27,773 | |
Miscellaneous | | | 30,108 | | | | 44,284 | |
| | | | |
Total expenses | | | 5,192,719 | | | | 17,156,751 | |
Less fees waived by the Manager | | | (1,483 | ) | | | (10,966 | ) |
| | | | |
Total expenses after fees waived | | | 5,191,236 | | | | 17,145,785 | |
| | | | |
Net investment income (loss) | | | 8,228,877 | | | | (2,017,274 | ) |
| | | | |
| | | | | | | | |
| Realized and Unrealized Gain (Loss) | | | | | | | | |
Net realized gain (loss) from: | | | | | | | | |
Investments — unaffiliated | | | (14,749,872 | ) | | | 117,252,881 | |
Investments — affiliated | | | — | | | | (474,295 | ) |
Financial futures contracts | | | 1,078,521 | | | | — | |
Foreign currency transactions | | | (713,153 | ) | | | (88,866 | ) |
| | | | |
| | | (14,384,504 | ) | | | 116,689,720 | |
| | | | |
Net change in unrealized appreciation (depreciation) on: | | | | | | | | |
Investments — unaffiliated | | | (17,742,816 | ) | | | (157,464,470 | )1 |
Investment — affiliated | | | — | | | | 214,630 | |
Foreign currency translations | | | 1,441 | | | | (9,413 | ) |
| | | | |
| | | (17,741,375 | ) | | | (157,259,253 | ) |
| | | | |
Net realized and unrealized loss | | | (32,125,879 | ) | | | (40,569,533 | ) |
| | | | |
Net Decrease in Net Assets Resulting from Operations | | $ | (23,897,002 | ) | | $ | (42,586,807 | ) |
| | | | |
1 Net of $442,764 foreign capital gain tax. | | | | | | | | |
| | | | | | |
| See Notes to Financial Statements. | | | | |
| | | | | | | |
| 20 | | ANNUAL REPORT | | JUNE 30, 2015 | | |
| | |
| Statements of Changes in Net Assets | | BlackRock EuroFund |
| | | | | | | | |
| | | Year Ended June 30, | |
| Increase (Decrease) in Net Assets: | | 2015 | | | 2014 | |
| | | | | | | | |
| Operations | | | | | | | | |
Net investment income | | $ | 8,228,877 | | | $ | 12,564,637 | |
Net realized gain (loss) | | | (14,384,504 | ) | | | 39,280,044 | |
Net change in unrealized appreciation (depreciation) | | | (17,741,375 | ) | | | 15,886,378 | |
| | | | |
Net increase (decrease) in net assets resulting from operations | | | (23,897,002 | ) | | | 67,731,059 | |
| | | | |
| | | | | | | | |
| Distributions to Shareholders From1 | | | | | | | | |
| Net investment income: | | | | | | | | |
Institutional | | | (7,567,115 | ) | | | (2,421,532 | ) |
Investor A | | | (4,208,952 | ) | | | (1,694,336 | ) |
Investor C | | | (487,187 | ) | | | (167,648 | ) |
Class R | | | (29,498 | ) | | | (14,502 | ) |
| | | | |
Decrease in net assets resulting from distributions to shareholders | | | (12,292,752 | ) | | | (4,298,018 | ) |
| | | | |
| | | | | | | | |
| Capital Share Transactions | | | | | | | | |
Net increase in net assets derived from capital share transactions | | | 128,896,263 | | | | 89,456,834 | |
| | | | |
| | | | | | | | |
| Net Assets | | | | | | | | |
Total increase in net assets | | | 92,706,509 | | | | 152,889,875 | |
Beginning of year | | | 406,574,936 | | | | 253,685,061 | |
| | | | |
End of year | | $ | 499,281,445 | | | $ | 406,574,936 | |
| | | | |
Undistributed net investment income, end of year | | $ | 6,741,817 | | | $ | 12,386,404 | |
| | | | |
1 Distributions for annual periods determined in accordance with federal income tax regulations. | | | | | | | | |
| | | | | | |
| See Notes to Financial Statements. | | | | |
| | | | | | | |
| | ANNUAL REPORT | | JUNE 30, 2015 | | 21 |
| | |
| Statements of Changes in Net Assets | | BlackRock Global SmallCap Fund, Inc. |
| | | | | | | | |
| | | Year Ended June 30, | |
| Increase (Decrease) in Net Assets: | | 2015 | | | 2014 | |
| | | | | | | | |
| Operations | | | | | | | | |
Net investment loss | | $ | (2,017,274 | ) | | $ | (1,887,456 | ) |
Net realized gain | | | 116,689,720 | | | | 159,059,274 | |
Net change in unrealized appreciation (depreciation) | | | (157,259,253 | ) | | | 143,042,273 | |
| | | | |
Net increase (decrease) in net assets resulting from operations | | | (42,586,807 | ) | | | 300,214,091 | |
| | | | |
| | | | | | | | |
| Distributions to Shareholders From1 | | | | | | | | |
Net investment income: | | | | | | | | |
Institutional | | | (1,114,270 | ) | | | (2,290,080 | ) |
Investor A | | | (1,069,605 | ) | | | (2,834,483 | ) |
Investor B | | | — | | | | (5,961 | ) |
Investor C | | | — | | | | (1,049,841 | ) |
Class R | | | (4,597 | ) | | | (164,507 | ) |
Net realized gain: | | | | | | | | |
Institutional | | | (39,378,923 | ) | | | (29,361,177 | ) |
Investor A | | | (65,151,603 | ) | | | (45,378,995 | ) |
Investor B | | | (458,909 | ) | | | (660,065 | ) |
Investor C | | | (48,850,849 | ) | | | (35,634,766 | ) |
Class R | | | (4,023,638 | ) | | | (3,560,341 | ) |
| | | | |
Decrease in net assets resulting from distributions to shareholders | | | (160,052,394 | ) | | | (120,940,216 | ) |
| | | | |
| | | | | | | | |
| Capital Share Transactions | | | | | | | | |
Net increase in net assets derived from capital share transactions | | | 60,558,897 | | | | 131,169,553 | |
| | | | |
| | | | | | | | |
| Net Assets | | | | | | | | |
Total increase (decrease) in net assets | | | (142,080,304 | ) | | | 310,443,428 | |
Beginning of year | | | 1,228,488,361 | | | | 918,044,933 | |
| | | | |
End of year | | $ | 1,086,408,057 | | | $ | 1,228,488,361 | |
| | | | |
Distributions in excess on net investment income, end of year | | $ | (10,525,184 | ) | | $ | (30,247,289 | ) |
| | | | |
1 Distributions for annual periods determined in accordance with federal income tax regulations. | | | | | | | | |
| | | | | | |
| See Notes to Financial Statements. | | | | |
| | | | | | | |
| 22 | | ANNUAL REPORT | | JUNE 30, 2015 | | |
| | |
| Financial Highlights | | BlackRock EuroFund |
| | | | | | | | | | | | | | | | | | | | |
| | | Institutional | |
| | | Year Ended June 30, | |
| | | 2015 | | | 2014 | | | 2013 | | | 2012 | | | 2011 | |
| | | | | | | | | | | | | | | | | | | | |
| Per Share Operating Performance | | | | | | | | | | | | | | | | | | | | |
Net asset value, beginning of year | | $ | 16.68 | | | $ | 13.62 | | | $ | 11.29 | | | $ | 13.97 | | | $ | 10.41 | |
| | | | |
Net investment income1 | | | 0.28 | | | | 0.61 | | | | 0.27 | | | | 0.16 | | | | 0.36 | |
Net realized and unrealized gain (loss) | | | (1.00 | ) | | | 2.65 | | | | 2.22 | | | | (2.43 | ) | | | 3.41 | |
| | | | |
Net increase (decrease) from investment operations | | | (0.72 | ) | | | 3.26 | | | | 2.49 | | | | (2.27 | ) | | | 3.77 | |
| | | | |
Distributions from net investment income2 | | | (0.45 | ) | | | (0.20 | ) | | | (0.16 | ) | | | (0.41 | ) | | | (0.21 | ) |
| | | | |
Redemption fee | | | — | | | | — | | | | — | | | | — | | | | 0.00 | 3 |
| | | | |
Net asset value, end of year | | $ | 15.51 | | | $ | 16.68 | | | $ | 13.62 | | | $ | 11.29 | | | $ | 13.97 | |
| | | | |
| | | | | | | | | | | | | | | | | | | | |
| Total Return4 | | | | | | | | | | | | | | | | | | | | |
Based on net asset value | | | (4.10)% | | | | 24.06% | | | | 22.10% | | | | (15.99)% | | | | 36.42% | 5 |
| | | | |
| | | | | | | | | | | | | | | | | | | | |
| Ratios to Average Net Assets | | | | | | | | | | | | | | | | | | | | |
Total expenses | | | 1.00% | | | | 1.02% | | | | 1.07% | | | | 1.17% | | | | 1.05% | |
| | | | |
Total expenses after fees waived | | | 1.00% | | | | 1.02% | | | | 1.07% | | | | 1.17% | | | | 1.05% | |
| | | | |
Net investment income | | | 1.81% | | | | 3.81% | | | | 2.09% | | | | 1.40% | | | | 2.80% | |
| | | | |
| | | | | | | | | | | | | | | | | | | | |
| Supplemental Data | | | | | | | | | | | | | | | | | | | | |
Net assets, end of year (000) | | $ | 221,463 | | | $ | 187,718 | | | $ | 88,713 | | | $ | 81,040 | | | $ | 114,551 | |
| | | | |
Portfolio turnover rate | | | 117% | | | | 129% | | | | 115% | | | | 162% | | | | 148% | |
| | | | |
| | 1 | | Based on average shares outstanding. |
| | 2 | | Distributions for annual periods determined in accordance with federal income tax regulations. |
| | 3 | | Amount is less than $0.005 per share. |
| | 4 | | Where applicable, assumes the reinvestment of distributions. |
| | 5 | | Total return calculation includes redemption fees received by the Fund. The impact to the return is less than 0.005%. |
| | | | | | |
| See Notes to Financial Statements. | | | | |
| | | | | | | |
| | ANNUAL REPORT | | JUNE 30, 2015 | | 23 |
| | |
| Financial Highlights (continued) | | BlackRock EuroFund |
| | | | | | | | | | | | | | | | | | | | |
| | | Investor A | |
| | | Year Ended June 30, | |
| | | 2015 | | | 2014 | | | 2013 | | | 2012 | | | 2011 | |
| | | | | | | | | | | | | | | | | | | | |
| Per Share Operating Performance | | | | | | | | | | | | | | | | | | | | |
Net asset value, beginning of year | | $ | 16.37 | | | $ | 13.35 | | | $ | 11.08 | | | $ | 13.71 | | | $ | 10.22 | |
| | | | |
Net investment income1 | | | 0.29 | | | | 0.52 | | | | 0.20 | | | | 0.14 | | | | 0.33 | |
Net realized and unrealized gain (loss) | | | (1.03 | ) | | | 2.65 | | | | 2.22 | | | | (2.39 | ) | | | 3.35 | |
| | | | |
Net increase (decrease) from investment operations | | | (0.74 | ) | | | 3.17 | | | | 2.42 | | | | (2.25 | ) | | | 3.68 | |
| | | | |
Distributions from net investment income2 | | | (0.40 | ) | | | (0.15 | ) | | | (0.15 | ) | | | (0.38 | ) | | | (0.19 | ) |
| | | | |
Redemption fee | | | — | | | | — | | | | — | | | | — | | | | 0.00 | 3 |
| | | | |
Net asset value, end of year | | $ | 15.23 | | | $ | 16.37 | | | $ | 13.35 | | | $ | 11.08 | | | $ | 13.71 | |
| | | | |
| | | | | | | | | | | | | | | | | | | | |
| Total Return4 | | | | | | | | | | | | | | | | | | | | |
Based on net asset value | | | (4.30)% | | | | 23.83% | | | | 21.89% | | | | (16.18)% | | | | 36.15% | 5 |
| | | | |
| | | | | | | | | | | | | | | | | | | | |
| Ratios to Average Net Assets | | | | | | | | | | | | | | | | | | | | |
Total expenses | | | 1.22% | | | | 1.23% | | | | 1.29% | | | | 1.33% | | | | 1.25% | |
| | | | |
Total expenses after fees waived | | | 1.22% | | | | 1.23% | | | | 1.29% | | | | 1.33% | | | | 1.25% | |
| | | | |
Net investment income | | | 1.88% | | | | 3.30% | | | | 1.62% | | | | 1.21% | | | | 2.56% | |
| | | | |
| | | | | | | | | | | | | | | | | | | | |
| Supplemental Data | | | | | | | | | | | | | | | | | | | | |
Net assets, end of year (000) | | $ | 258,675 | | | $ | 195,548 | | | $ | 149,426 | | | $ | 176,609 | | | $ | 210,047 | |
| | | | |
Portfolio turnover rate | | | 117% | | | | 129% | | | | 115% | | | | 162% | | | | 148% | |
| | | | |
| | 1 | | Based on average shares outstanding. |
| | 2 | | Distributions for annual periods determined in accordance with federal income tax regulations. |
| | 3 | | Amount is less than $0.005 per share. |
| | 4 | | Where applicable, excludes the effects of any sales charges and assumes the reinvestment of distributions. |
| | 5 | | Total return calculation includes redemption fees received by the Fund. The impact to the return is less than 0.005%. |
| | | | | | |
| See Notes to Financial Statements. | | | | |
| | | | | | | |
| 24 | | ANNUAL REPORT | | JUNE 30, 2015 | | |
| | |
| Financial Highlights (continued) | | BlackRock EuroFund |
| | | | | | | | | | | | | | | | | | | | |
| | | Investor C | |
| | | Year Ended June 30, | |
| | | 2015 | | | 2014 | | | 2013 | | | 2012 | | | 2011 | |
| | | | | | | | | | | | | | | | | | | | |
| Per Share Operating Performance | | | | | | | | | | | | | | | | | | | | |
Net asset value, beginning of year | | $ | 11.76 | | | $ | 9.67 | | | $ | 8.05 | | | $ | 10.06 | | | $ | 7.54 | |
| | | | |
Net investment income1 | | | 0.08 | | | | 0.31 | | | | 0.09 | | | | 0.03 | | | | 0.16 | |
Net realized and unrealized gain (loss) | | | (0.70 | ) | | | 1.88 | | | | 1.58 | | | | (1.75 | ) | | | 2.47 | |
| | | | |
Net increase (decrease) from investment operations | | | (0.62 | ) | | | 2.19 | | | | 1.67 | | | | (1.72 | ) | | | 2.63 | |
| | | | |
Distributions from net investment income2 | | | (0.32 | ) | | | (0.10 | ) | | | (0.05 | ) | | | (0.29 | ) | | | (0.11 | ) |
| | | | |
Redemption fee | | | — | | | | — | | | | — | | | | — | | | | 0.00 | 3 |
| | | | |
Net asset value, end of year | | $ | 10.82 | | | $ | 11.76 | | | $ | 9.67 | | | $ | 8.05 | | | $ | 10.06 | |
| | | | |
| | | | | | | | | | | | | | | | | | | | |
| Total Return4 | | | | | | | | | | | | | | | | | | | | |
Based on net asset value | | | (5.09)% | | | | 22.76% | | | | 20.83% | | | | (16.88)% | | | | 35.01% | 5 |
| | | | |
| | | | | | | | | | | | | | | | | | | | |
| Ratios to Average Net Assets | | | | | | | | | | | | | | | | | | | | |
Total expenses | | | 2.05% | | | | 2.07% | | | | 2.14% | | | | 2.22% | | | | 2.11% | |
| | | | |
Total expenses after fees waived | | | 2.05% | | | | 2.07% | | | | 2.14% | | | | 2.22% | | | | 2.11% | |
| | | | |
Net investment income | | | 0.70% | | | | 2.72% | | | | 0.99% | | | | 0.30% | | | | 1.66% | |
| | | | |
| | | | | | | | | | | | | | | | | | | | |
| Supplemental Data | | | | | | | | | | | | | | | | | | | | |
Net assets, end of year (000) | | $ | 18,021 | | | $ | 21,838 | | | $ | 13,982 | | | $ | 13,470 | | | $ | 22,169 | |
| | | | |
Portfolio turnover rate | | | 117% | | | | 129% | | | | 115% | | | | 162% | | | | 148% | |
| | | | |
| | 1 | | Based on average shares outstanding. |
| | 2 | | Distributions for annual periods determined in accordance with federal income tax regulations. |
| | 3 | | Amount is less than $0.005 per share. |
| | 4 | | Where applicable, excludes the effects of any sales charges and assumes the reinvestment of distributions. |
| | 5 | | Total return calculation includes redemption fees received by the Fund. The impact to the return is less than 0.005%. |
| | | | | | |
| See Notes to Financial Statements. | | | | |
| | | | | | | |
| | ANNUAL REPORT | | JUNE 30, 2015 | | 25 |
| | |
| Financial Highlights (concluded) | | BlackRock EuroFund |
| | | | | | | | | | | | | | | | | | | | |
| | | Class R | |
| | | Year Ended June 30, | |
| | | 2015 | | | 2014 | | | 2013 | | | 2012 | | | 2011 | |
| | | | | | | | | | | | | | | | | | | | |
| Per Share Operating Performance | | | | | | | | | | | | | | | | | | | | |
Net asset value, beginning of year | | $ | 12.58 | | | $ | 10.32 | | | $ | 8.57 | | | $ | 10.72 | | | $ | 8.02 | |
| | | | |
Net investment income1 | | | 0.12 | | | | 0.33 | | | | 0.13 | | | | 0.04 | | | | 0.19 | |
Net realized and unrealized gain (loss) | | | (0.73 | ) | | | 2.04 | | | | 1.69 | | | | (1.87 | ) | | | 2.65 | |
| | | | |
Net increase (decrease) from investment operations | | | (0.61 | ) | | | 2.37 | | | | 1.82 | | | | (1.83 | ) | | | 2.84 | |
| | | | |
Distributions from net investment income2 | | | (0.31 | ) | | | (0.11 | ) | | | (0.07 | ) | | | (0.32 | ) | | | (0.14 | ) |
| | | | |
Redemption fee | | | — | | | | — | | | | — | | | | — | | | | 0.00 | 3 |
| | | | |
Net asset value, end of year | | $ | 11.66 | | | $ | 12.58 | | | $ | 10.32 | | | $ | 8.57 | | | $ | 10.72 | |
| | | | |
| | | | | | | | | | | | | | | | | | | | |
| Total Return4 | | | | | | | | | | | | | | | | | | | | |
Based on net asset value | | | (4.68)% | | | | 23.05% | | | | 21.32% | | | | (16.81)% | | | | 35.54% | 5 |
| | | | |
| | | | | | | | | | | | | | | | | | | | |
| Ratios to Average Net Assets | | | | | | | | | | | | | | | | | | | | |
Total expenses | | | 1.69% | | | | 1.79% | | | | 1.80% | | | | 1.96% | | | | 1.85% | |
| | | | |
Total expenses after fees waived | | | 1.69% | | | | 1.79% | | | | 1.80% | | | | 1.96% | | | | 1.85% | |
| | | | |
Net investment income | | | 1.03% | | | | 2.77% | | | | 1.34% | | | | 0.46% | | | | 1.90% | |
| | | | |
| | | | | | | | | | | | | | | | | | | | |
| Supplemental Data | | | | | | | | | | | | | | | | | | | | |
Net assets, end of year (000) | | $ | 1,122 | | | $ | 1,471 | | | $ | 1,564 | | | $ | 1,405 | | | $ | 2,275 | |
| | | | |
Portfolio turnover rate | | | 117% | | | | 129% | | | | 115% | | | | 162% | | | | 148% | |
| | | | |
| | 1 | | Based on average shares outstanding. |
| | 2 | | Distributions for annual periods determined in accordance with federal income tax regulations. |
| | 3 | | Amount is less than $0.005 per share. |
| | 4 | | Where applicable, assumes the reinvestment of distributions. |
| | 5 | | Total return calculation includes redemption fees received by the Fund. The impact to the return is less than 0.005%. |
| | | | | | |
| See Notes to Financial Statements. | | | | |
| | | | | | | |
| 26 | | ANNUAL REPORT | | JUNE 30, 2015 | | |
| | |
| Financial Highlights | | BlackRock Global SmallCap Fund, Inc. |
| | | | | | | | | | | | | | | | | | | | |
| | | Institutional | |
| | | Year Ended June 30, | |
| | | 2015 | | | 2014 | | | 2013 | | | 2012 | | | 2011 | |
| | | | | | | | | | | | | | | | | | | | |
| Per Share Operating Performance | | | | | | | | | | | | | | | | | | | | |
Net asset value, beginning of year | | $ | 30.82 | | | $ | 25.94 | | | $ | 21.87 | | | $ | 24.41 | | | $ | 18.32 | |
| | | | |
Net investment income1 | | | 0.08 | | | | 0.09 | | | | 0.18 | | | | 0.07 | | | | 0.13 | |
Net realized and unrealized gain (loss) | | | (1.17 | ) | | | 8.09 | | | | 4.58 | | | | (2.31 | ) | | | 6.13 | 2 |
| | | | |
Net increase (decrease) from investment operations | | | (1.09 | ) | | | 8.18 | | | | 4.76 | | | | (2.24 | ) | | | 6.26 | |
| | | | |
| Distributions from:3 | | | | | | | | | | | | | | | | | | | | |
Net investment income | | | (0.11 | ) | | | (0.24 | ) | | | (0.69 | ) | | | (0.30 | ) | | | (0.17 | ) |
Net realized gain | | | (3.84 | ) | | | (3.06 | ) | | | — | | | | — | | | | — | |
| | | | |
Total distributions | | | (3.95 | ) | | | (3.30 | ) | | | (0.69 | ) | | | (0.30 | ) | | | (0.17 | ) |
| | | | |
Net asset value, end of year | | $ | 25.78 | | | $ | 30.82 | | | $ | 25.94 | | | $ | 21.87 | | | $ | 24.41 | |
| | | | |
| | | | | | | | | | | | | | | | | | | | |
| Total Return4 | | | | | | | | | | | | | | | | | | | | |
Based on net asset value | | | (2.45)% | | | | 33.28% | | | | 22.20% | | | | (9.11)% | | | | 34.25% | 5 |
| | | | |
| | | | | | | | | | | | | | | | | | | | |
| Ratios to Average Net Assets | | | | | | | | | | | | | | | | | | | | |
Total expenses | | | 1.05% | | | | 1.03% | | | | 1.02% | | | | 1.12% | | | | 1.08% | |
| | | | |
Total expenses after fees waived | | | 1.05% | | | | 1.03% | | | | 1.02% | | | | 1.12% | | | | 1.08% | |
| | | | |
Net investment income | | | 0.29% | | | | 0.31% | | | | 0.76% | | | | 0.30% | | | | 0.58% | |
| | | | |
| | | | | | | | | | | | | | | | | | | | |
| Supplemental Data | | | | | | | | | | | | | | | | | | | | |
Net assets, end of year (000) | | $ | 265,841 | | | $ | 320,705 | | | $ | 244,523 | | | $ | 186,022 | | | $ | 461,012 | |
| | | | |
Portfolio turnover rate | | | 73% | | | | 77% | | | | 73% | | | | 73% | | | | 82% | |
| | | | |
| | 1 | | Based on average shares outstanding. |
| | 2 | | Includes a redemption fee, which is less than $0.005 per share. |
| | 3 | | Distributions for annual periods determined in accordance with federal income tax regulations. |
| | 4 | | Where applicable, assumes the reinvestment of distributions. |
| | 5 | | Total return calculation includes redemption fees received by the Fund. The impact to the return is less than 0.005%. |
| | | | | | |
| See Notes to Financial Statements. | | | | |
| | | | | | | |
| | ANNUAL REPORT | | JUNE 30, 2015 | | 27 |
| | |
| Financial Highlights (continued) | | BlackRock Global SmallCap Fund, Inc. |
| | | | | | | | | | | | | | | | | | | | |
| | | Investor A | |
| | | Year Ended June 30, | |
| | | 2015 | | | 2014 | | | 2013 | | | 2012 | | | 2011 | |
| | | | | | | | | | | | | | | | | | | | |
| Per Share Operating Performance | | | | | | | | | | | | | | | | | | | | |
Net asset value, beginning of year | | $ | 29.95 | | | $ | 25.33 | | | $ | 21.40 | | | $ | 23.91 | | | $ | 17.95 | |
| | | | |
Net investment income (loss)1 | | | (0.00 | )2 | | | (0.00 | )2 | | | 0.08 | | | | 0.02 | | | | 0.06 | |
Net realized and unrealized gain (loss) | | | (1.15 | ) | | | 7.87 | | | | 4.49 | | | | (2.29 | ) | | | 6.01 | 3 |
| | | | |
Net increase (decrease) from investment operations | | | (1.15 | ) | | | 7.87 | | | | 4.57 | | | | (2.27 | ) | | | 6.07 | |
| | | | |
| Distributions from:4 | | | | | | | | | | | | | | | | | | | | |
Net investment income | | | (0.06 | ) | | | (0.19 | ) | | | (0.64 | ) | | | (0.24 | ) | | | (0.11 | ) |
Net realized gain | | | (3.84 | ) | | | (3.06 | ) | | | — | | | | — | | | | — | |
| | | | |
Total distributions | | | (3.90 | ) | | | (3.25 | ) | | | (0.64 | ) | | | (0.24 | ) | | | (0.11 | ) |
| | | | |
Net asset value, end of year | | $ | 24.90 | | | $ | 29.95 | | | $ | 25.33 | | | $ | 21.40 | | | $ | 23.91 | |
| | | | |
| | | | | | | | | | | | | | | | | | | | |
| Total Return5 | | | | | | | | | | | | | | | | | | | | |
Based on net asset value | | | (2.74)% | | | | 32.81% | | | | 21.78% | | | | (9.44)% | | | | 33.88% | 6 |
| | | | |
| | | | | | | | | | | | | | | | | | | | |
| Ratios to Average Net Assets | | | | | | | | | | | | | | | | | | | | |
Total expenses | | | 1.38% | | | | 1.37% | | | | 1.40% | | | | 1.42% | | | | 1.38% | |
| | | | |
Total expenses after fees waived | | | 1.38% | | | | 1.37% | | | | 1.40% | | | | 1.42% | | | | 1.38% | |
| | | | |
Net investment income (loss) | | | (0.02)% | | | | (0.01)% | | | | 0.35% | | | | 0.08% | | | | 0.27% | |
| | | | |
| | | | | | | | | | | | | | | | | | | | |
| Supplemental Data | | | | | | | | | | | | | | | | | | | | |
Net assets, end of year (000) | | $ | 474,107 | | | $ | 520,436 | | | $ | 364,036 | | | $ | 326,001 | | | $ | 360,144 | |
| | | | |
Portfolio turnover rate | | | 73% | | | | 77% | | | | 73% | | | | 73% | | | | 82% | |
| | | | |
| | 1 | | Based on average shares outstanding. |
| | 2 | | Amount is greater than $(0.005) per share. |
| | 3 | | Includes a redemption fee, which is less than $0.005 per share. |
| | 4 | | Distributions for annual periods determined in accordance with federal income tax regulations. |
| | 5 | | Where applicable, excludes the effects of any sales charges and assumes the reinvestment of distributions. |
| | 6 | | Total return calculation includes redemption fees received by the Fund. The impact to the return is less than 0.005%. |
| | | | | | |
| See Notes to Financial Statements. | | | | |
| | | | | | | |
| 28 | | ANNUAL REPORT | | JUNE 30, 2015 | | |
| | |
| Financial Highlights (continued) | | BlackRock Global SmallCap Fund, Inc. |
| | | | | | | | | | | | | | | | | | | | |
| | | Investor B | |
| | | Year Ended June 30, | |
| | | 2015 | | | 2014 | | | 2013 | | | 2012 | | | 2011 | |
| | | | | | | | | | | | | | | | | | | | |
| Per Share Operating Performance | | | | | | | | | | | | | | | | | | | | |
Net asset value, beginning of year | | $ | 28.19 | | | $ | 24.05 | | | $ | 20.15 | | | $ | 22.45 | | | $ | 16.93 | |
| | | | |
Net investment loss1 | | | (0.24 | ) | | | (0.25 | ) | | | (0.16 | ) | | | (0.19 | ) | | | (0.14 | ) |
Net realized and unrealized gain (loss) | | | (1.08 | ) | | | 7.48 | | | | 4.27 | | | | (2.11 | ) | | | 5.66 | 2 |
| | | | |
Net increase (decrease) from investment operations | | | (1.32 | ) | | | 7.23 | | | | 4.11 | | | | (2.30 | ) | | | 5.52 | |
| | | | |
| Distributions from:3 | | | | | | | | | | | | | | | | | | | | |
Net investment income | | | — | | | | (0.03 | ) | | | (0.21 | ) | | | — | | | | — | |
Net realized gain | | | (3.74 | ) | | | (3.06 | ) | | | — | | | | — | | | | — | |
| | | | |
Total distributions | | | (3.74 | ) | | | (3.09 | ) | | | (0.21 | ) | | | — | | | | — | |
| | | | |
Net asset value, end of year | | $ | 23.13 | | | $ | 28.19 | | | $ | 24.05 | | | $ | 20.15 | | | $ | 22.45 | |
| | | | |
| | | | | | | | | | | | | | | | | | | | |
| Total Return4 | | | | | | | | | | | | | | | | | | | | |
Based on net asset value | | | (3.62)% | | | | 31.74% | | | | 20.55% | | | | (10.25)% | | | | 32.60% | 5 |
| | | | |
| | | | | | | | | | | | | | | | | | | | |
| Ratios to Average Net Assets | | | | | | | | | | | | | | | | | | | | |
Total expenses | | | 2.28% | | | | 2.22% | | | | 2.43% | | | | 2.39% | | | | 2.29% | |
| | | | |
Total expenses after fees waived | | | 2.28% | | | | 2.22% | | | | 2.43% | | | | 2.39% | | | | 2.29% | |
| | | | |
Net investment loss | | | (0.99)% | | | | (0.94)% | | | | (0.74)% | | | | (0.92)% | | | | (0.67)% | |
| | | | |
| | | | | | | | | | | | | | | | | | | | |
| Supplemental Data | | | | | | | | | | | | | | | | | | | | |
Net assets, end of year (000) | | $ | 1,825 | | | $ | 4,467 | | | $ | 7,355 | | | $ | 11,968 | | | $ | 25,054 | |
| | | | |
Portfolio turnover rate | | | 73% | | | | 77% | | | | 73% | | | | 73% | | | | 82% | |
| | | | |
| | 1 | | Based on average shares outstanding. |
| | 2 | | Includes a redemption fee, which is less than $0.005 per share. |
| | 3 | | Distributions for annual periods determined in accordance with federal income tax regulations. |
| | 4 | | Where applicable, excludes the effects of any sales charges and assumes the reinvestment of distributions. |
| | 5 | | Total return calculation includes redemption fees received by the Fund. The impact to the return is less than 0.005%. |
| | | | | | |
| See Notes to Financial Statements. | | | | |
| | | | | | | |
| | ANNUAL REPORT | | JUNE 30, 2015 | | 29 |
| | |
| Financial Highlights (continued) | | BlackRock Global SmallCap Fund, Inc. |
| | | | | | | | | | | | | | | | | | | | |
| | | Investor C | |
| | | Year Ended June 30, | |
| | | 2015 | | | 2014 | | | 2013 | | | 2012 | | | 2011 | |
| | | | | | | | | | | | | | | | | | | | |
| Per Share Operating Performance | | | | | | | | | | | | | | | | | | | | |
Net asset value, beginning of year | | $ | 26.92 | | | $ | 23.13 | | | $ | 19.57 | | | $ | 21.83 | | | $ | 16.45 | |
| | | | |
Net investment loss1 | | | (0.19 | ) | | | (0.21 | ) | | | (0.10 | ) | | | (0.15 | ) | | | (0.11 | ) |
Net realized and unrealized gain (loss) | | | (1.07 | ) | | | 7.15 | | | | 4.11 | | | | (2.08 | ) | | | 5.49 | 2 |
| | | | |
Net increase (decrease) from investment operations | | | (1.26 | ) | | | 6.94 | | | | 4.01 | | | | (2.23 | ) | | | 5.38 | |
| | | | |
| Distributions from:3 | | | | | | | | | | | | | | | | | | | | |
Net investment income | | | — | | | | (0.09 | ) | | | (0.45 | ) | | | (0.03 | ) | | | — | |
Net realized gain | | | (3.80 | ) | | | (3.06 | ) | | | — | | | | — | | | | — | |
| | | | |
Total distributions | | | (3.80 | ) | | | (3.15 | ) | | | (0.45 | ) | | | (0.03 | ) | | | — | |
| | | | |
Net asset value, end of year | | $ | 21.86 | | | $ | 26.92 | | | $ | 23.13 | | | $ | 19.57 | | | $ | 21.83 | |
| | | | |
| | | | | | | | | | | | | | | | | | | | |
| Total Return4 | | | | | | | | | | | | | | | | | | | | |
Based on net asset value | | | (3.53)% | | | | 31.79% | | | | 20.80% | | | | (10.19)% | | | | 32.71% | 5 |
| | | | |
| | | | | | | | | | | | | | | | | | | | |
| Ratios to Average Net Assets | | | | | | | | | | | | | | | | | | | | |
Total expenses | | | 2.17% | | | | 2.16% | | | | 2.21% | | | | 2.27% | | | | 2.21% | |
| | | | |
Total expenses after fees waived | | | 2.17% | | | | 2.16% | | | | 2.21% | | | | 2.27% | | | | 2.21% | |
| | | | |
Net investment loss | | | (0.81)% | | | | (0.82)% | | | | (0.45)% | | | | (0.78)% | | | | (0.57)% | |
| | | | |
| | | | | | | | | | | | | | | | | | | | |
| Supplemental Data | | | | | | | | | | | | | | | | | | | | |
Net assets, end of year (000) | | $ | 318,616 | | | $ | 348,937 | | | $ | 273,018 | | | $ | 251,459 | | | $ | 345,372 | |
| | | | |
Portfolio turnover rate | | | 73% | | | | 77% | | | | 73% | | | | 73% | | | | 82% | |
| | | | |
| | 1 | | Based on average shares outstanding. |
| | 2 | | Includes a redemption fee, which is less than $0.005 per share. |
| | 3 | | Distributions for annual periods determined in accordance with federal income tax regulations. |
| | 4 | | Where applicable, excludes the effects of any sales charges and assumes the reinvestment of distributions. |
| | 5 | | Total return calculation includes redemption fees received by the Fund. The impact to the return is less than 0.005%. |
| | | | | | |
| See Notes to Financial Statements. | | | | |
| | | | | | | |
| 30 | | ANNUAL REPORT | | JUNE 30, 2015 | | |
| | |
| Financial Highlights (concluded) | | BlackRock Global SmallCap Fund, Inc. |
| | | | | | | | | | | | | | | | | | | | |
| | | Class R | |
| | | Year Ended June 30, | |
| | | 2015 | | | 2014 | | | 2013 | | | 2012 | | | 2011 | |
| | | | | | | | | | | | | | | | | | | | |
| Per Share Operating Performance | | | | | | | | | | | | | | | | | | | | |
Net asset value, beginning of year | | $ | 28.30 | | | $ | 24.13 | | | $ | 20.38 | | | $ | 22.72 | | | $ | 17.09 | |
| | | | |
Net investment loss1 | | | (0.10 | ) | | | (0.10 | ) | | | (0.01 | ) | | | (0.08 | ) | | | (0.03 | ) |
Net realized and unrealized gain (loss) | | | (1.09 | ) | | | 7.47 | | | | 4.28 | | | | (2.14 | ) | | | 5.71 | 2 |
| | | | |
Net increase (decrease) from investment operations | | | (1.19 | ) | | | 7.37 | | | | 4.27 | | | | (2.22 | ) | | | 5.68 | |
| | | | |
| Distributions from:3 | | | | | | | | | | | | | | | | | | | | |
Net investment income | | | (0.00 | )4 | | | (0.14 | ) | | | (0.52 | ) | | | (0.12 | ) | | | (0.05 | ) |
Net realized gain | | | (3.84 | ) | | | (3.06 | ) | | | — | | | | — | | | | — | |
| | | | |
Total distributions | | | (3.84 | ) | | | (3.20 | ) | | | (0.52 | ) | | | (0.12 | ) | | | (0.05 | ) |
| | | | |
Net asset value, end of year | | $ | 23.27 | | | $ | 28.30 | | | $ | 24.13 | | | $ | 20.38 | | | $ | 22.72 | |
| | | | |
| | | | | | | | | | | | | | | | | | | | |
| Total Return5 | | | | | | | | | | | | | | | | | | | | |
Based on net asset value | | | (3.08)% | | | | 32.32% | | | | 21.28% | | | | (9.76)% | | | | 33.24% | 6 |
| | | | |
| | | | | | | | | | | | | | | | | | | | |
| Ratios to Average Net Assets | | | | | | | | | | | | | | | | | | | | |
Total expenses | | | 1.73% | | | | 1.72% | | | | 1.79% | | | | 1.83% | | | | 1.81% | |
| | | | |
Total expenses after fees waived | | | 1.73% | | | | 1.72% | | | | 1.79% | | | | 1.83% | | | | 1.81% | |
| | | | |
Net investment loss | | | (0.39)% | | | | (0.38)% | | | | (0.04)% | | | | (0.37)% | | | | (0.16)% | |
| | | | |
| | | | | | | | | | | | | | | | | | | | |
| Supplemental Data | | | | | | | | | | | | | | | | | | | | |
Net assets, end of year (000) | | $ | 26,019 | | | $ | 33,944 | | | $ | 29,112 | | | $ | 28,861 | | | $ | 46,316 | |
| | | | |
Portfolio turnover rate | | | 73% | | | | 77% | | | | 73% | | | | 73% | | | | 82% | |
| | | | |
| | 1 | | Based on average shares outstanding. |
| | 2 | | Includes a redemption fee, which is less than $0.005 per share. |
| | 3 | | Distributions for annual periods determined in accordance with federal income tax regulations. |
| | 4 | | Amount is greater than $(0.005) per share. |
| | 5 | | Where applicable, assumes the reinvestment of distributions. |
| | 6 | | Total return calculation includes redemption fees received by the Fund. The impact to the return is less than 0.005%. |
| | | | | | |
| See Notes to Financial Statements. | | | | |
| | | | | | | |
| | ANNUAL REPORT | | JUNE 30, 2015 | | 31 |
| | |
| Notes to Financial Statements | | |
1. Organization:
BlackRock EuroFund and BlackRock Global SmallCap Fund, Inc. are each registered under the Investment Company Act of 1940, as amended (the “1940 Act”), as open-end management investment companies. BlackRock EuroFund is organized as a Massachusetts business trust. BlackRock Global SmallCap Fund, Inc. is organized as a Maryland corporation. The following are referred to herein collectively as the “Funds” or individually, a “Fund”:
| | | | |
| Fund Name | | Herein Referred To As | | Diversification Classification |
| BlackRock EuroFund | | EuroFund | | Diversified |
| BlackRock Global SmallCap Fund, Inc. | | Global SmallCap | | Diversified |
Each Fund offers multiple classes of shares. All classes of shares have identical voting, dividend, liquidation and other rights and are subject to the same terms and conditions, except that certain classes bear expenses related to the shareholder servicing and distribution of such shares. Institutional Shares are sold only to certain eligible investors. Investor B Shares (available only in Global SmallCap) are only available through exchanges and distribution reinvestments by current holders and for purchase by certain employer-sponsored retirement plans. Investor A and Investor C Shares are generally available through financial intermediaries. Class R Shares are sold without a sales charge and only to certain employer-sponsored retirement plans. Each class has exclusive voting rights with respect to matters relating to its shareholder servicing and distribution expenditures (except that Investor B shareholders may vote on material changes to the Investor A distribution and service plan).
| | | | | | |
| Share Name | | Initial Sales Charge | | CDSC | | Conversion |
Institutional Shares | | No | | No | | None |
Investor A Shares | | Yes | | No1 | | None |
Investor B Shares | | No | | Yes | | To Investor A Shares after approximately 8 years |
Investor C Shares | | No | | Yes | | None |
Class R Shares | | No | | No | | None |
| | 1 | | Investor A Shares may be subject to a CDSC for certain redemptions where no initial sales charge was paid at the time of purchase. |
The Funds, together with certain other registered investment companies advised by BlackRock Advisors, LLC (the “Manager”) or its affiliates, are included in a complex of open-end funds referred to as the Equity-Bond Complex.
2. Significant Accounting Policies:
The Funds’ financial statements are prepared in conformity with accounting principles generally accepted in the United States of America (“U.S. GAAP”), which may require management to make estimates and assumptions that affect the reported amounts of assets and liabilities in the financial statements and the reported amounts of increases and decreases in net assets from operations during the reporting period. Actual results could differ from those estimates. Each Fund is considered an investment company under U.S. GAAP and follows the accounting and reporting guidance applicable to investment companies. The following is a summary of significant accounting policies followed by the Funds:
Valuation: The Funds’ investments are valued at fair value as of the close of trading on the New York Stock Exchange (“NYSE”) (generally 4:00 p.m., Eastern time). U.S. GAAP defines fair value as the price the Funds would receive to sell an asset or pay to transfer a liability in an orderly transaction between market participants at the measurement date. The Funds determine the fair values of their financial instruments at market value using independent dealers or pricing services under policies approved by the Board of Directors of each Fund (the “Board”). The BlackRock Global Valuation Methodologies Committee (the “Global Valuation Committee”) is the committee formed by management to develop global pricing policies and procedures and to provide oversight of the pricing function for the Funds for all financial instruments.
Equity investments traded on a recognized securities exchange are valued at the official close price each day, if available. For equity investments traded on more than one exchange, the official close price on the exchange where the stock is primarily traded is used. Equity investments traded on a recognized exchange for which there were no sales on that day may be valued at the last available bid (long positions) or ask (short positions) price. Financial futures contracts traded on exchanges are valued at their last sale price. Investments in open-ended investment companies are valued at NAV each business day.
Securities and other assets and liabilities denominated in foreign currencies are translated into U.S. dollars using exchange rates determined as of the close of business on the NYSE. Forward foreign currency exchange contracts are valued at the mean between the bid and ask prices and are determined as of the close of business on the NYSE. Interpolated values are derived when the settlement date of the contract is an interim date for which quotations are not available.
| | | | | | |
| | | | | | | |
| 32 | | ANNUAL REPORT | | JUNE 30, 2015 | | |
| | | | |
| Notes to Financial Statements (continued) | | |
The Funds value their investment in BlackRock Liquidity Series, LLC, Money Market Series (the “Money Market Series”) at fair value, which is ordinarily based upon their pro rata ownership in the underlying funds’ net assets. The Money Market Series seeks current income consistent with maintaining liquidity and preserving capital. Although the Money Market Series is not registered under the 1940 Act, its investments will follow the parameters of investments by a money market fund that is subject to Rule 2a-7 under the 1940 Act. The Funds may withdraw up to 25% of their investment daily, although the Manager of the Money Market Series, in its sole discretion, may permit an investor to withdraw more than 25% on any one day.
In the event that the application of these methods of valuation results in a price for an investment that is deemed not to be representative of the market value of such investment, or if a price is not available, the investment will be valued by the Global Valuation Committee, or its delegate, in accordance with a policy approved by the Board as reflecting fair value (“Fair Value Investments”). When determining the price for Fair Value Investments, the Global Valuation Committee, or its delegate, seeks to determine the price that each Fund might reasonably expect to receive or pay from the current sale or purchase of that asset or liability in an arm’s-length transaction. Fair value determinations shall be based upon all available factors that the Global Valuation Committee, or its delegate, deems relevant consistent with the principles of fair value measurement. The pricing of all Fair Value Investments is subsequently reported to the Board or a committee thereof on a quarterly basis.
Generally, trading in foreign instruments is substantially completed each day at various times prior to the close of business on the NYSE. Occasionally, events affecting the values of such instruments may occur between the foreign market close and the close of business on the NYSE that may not be reflected in the computation of the Funds’ net assets. If events (e.g., a company announcement, market volatility or a natural disaster) occur during such periods that are expected to materially affect the value of such instruments, those instruments may be Fair Value Investments and be valued at their fair value, as determined in good faith by the Global Valuation Committee, or its delegate, using a pricing service and/or policies approved by the Board. Each business day, the Funds use a pricing service to assist with the valuation of certain foreign exchange-traded equity securities and foreign exchange-traded and over-the-counter (“OTC”) options (the “Systematic Fair Value Price”). Using current market factors, the Systematic Fair Value Price is designed to value such foreign securities and foreign options at fair value as of the close of business on the NYSE, which follows the close of the local markets.
Foreign Currency: Each Fund’s books and records are maintained in U.S. dollars. Purchases and sales of investment securities are recorded at the rates of exchange prevailing on the respective date of such transactions. Generally, when the U.S. dollar rises in value against a foreign currency, each Fund’s investments denominated in that currency will lose value because that currency is worth fewer U.S. dollars; the opposite effect occurs if the U.S. dollar falls in relative value.
Each Fund does not isolate the portion of the results of operations arising as a result of changes in the foreign exchange rates from the changes in the market prices of investments held or sold for financial reporting purposes. Accordingly, the effects of changes in foreign currency exchange rates on investments are not segregated in the Statements of Operations from the effects of changes in market prices of those investments, but are included as a component of net realized and unrealized gain (loss) from investments. Each Fund reports realized currency gains (losses) on foreign currency related transactions as components of net realized gain (loss) for financial reporting purposes, whereas such components are generally treated as ordinary income for federal income tax purposes.
Segregation and Collateralization: In cases where a Fund enters into certain investments (e.g., financial futures contracts and forward foreign currency exchange contracts), that would be “senior securities” for 1940 Act purposes, the Funds may segregate or designate on their books and records cash or liquid securities having a market value at least equal to the amount of the Funds’ future obligations under such investments. Doing so allows the investment to be excluded from treatment as a “senior security.” Furthermore, if required by an exchange or counterparty agreement, the Funds may be required to deliver/deposit cash and/or securities to/with an exchange, or broker-dealer or custodian as collateral for certain investments or obligations.
Investment Transactions and Investment Income: For financial reporting purposes, investment transactions are recorded on the dates the transactions are entered into (the trade dates). Realized gains and losses on investment transactions are determined on the identified cost basis. Dividend income is recorded on the ex-dividend date. Dividends from foreign securities where the ex-dividend date may have passed are subsequently recorded when the Funds are informed of the ex-dividend date. Under the applicable foreign tax laws, a withholding tax at various rates may be imposed on capital gains, dividends and interest. Upon notification from issuers, some of the dividend income received from a real estate investment trust may be redesignated as a reduction of cost of the related investment and/or realized gain. Interest income, including amortization and accretion of premiums and discounts on debt securities, is recognized on the accrual basis. Income, expenses and realized and unrealized gains and losses are allocated daily to each class based on its relative net assets.
| | | | | | |
| | | | | | | |
| | ANNUAL REPORT | | JUNE 30, 2015 | | 33 |
| | |
| Notes to Financial Statements (continued) | | |
Distributions: Distributions paid by the Funds are recorded on the ex-dividend date. The character and timing of distributions are determined in accordance with federal income tax regulations, which may differ from U.S. GAAP.
Other: Expenses directly related to a Fund or its classes are charged to that Fund or the applicable class. Other operating expenses shared by several funds, including other funds managed by the Manager, are prorated among those funds on the basis of relative net assets or other appropriate methods. Expenses directly related to the Funds and other shared expenses prorated to the Funds are allocated daily to each class based on its relative net assets or other appropriate methods.
The Funds have an arrangement with their custodian whereby fees may be reduced by credits earned on uninvested cash balances, which, if applicable, are shown as fees paid indirectly in the Statements of Operations. The custodian imposes fees on overdrawn cash balances, which can be offset by accumulated credits earned or may result in additional custody charges.
3. Securities and Other Investments:
Securities Lending: Certain Funds may lend their securities to approved borrowers, such as brokers, dealers and other financial institutions. The borrower pledges and maintains with the Funds collateral consisting of cash, an irrevocable letter of credit issued by a bank, or securities issued or guaranteed by the U.S. Government. The initial collateral received by each Fund is required to have a value of at least 102% of the current value of the loaned securities for securities traded on U.S. exchanges and a value of at least 105% for all other securities. The collateral is maintained thereafter at a value equal to at least 100% of the current market value of the securities on loan. The market value of the loaned securities is determined at the close of each business day of the Fund and any additional required collateral is delivered to the Fund, or excess collateral returned by the Fund, on the next business day. During the term of the loan, the Fund is entitled to all distributions made on or in respect of the loaned securities. Loans of securities are terminable at any time and the borrower, after notice, is required to return borrowed securities within the standard time period for settlement of securities transactions.
The market value of securities on loan, all of which were classified as common stocks in the Funds’ Schedules of Investments, and the value of the related collateral are shown separately in the Statements of Assets and Liabilities as a component of investments at value-unaffiliated, and collateral on securities loaned at value, respectively. As of June 30, 2015, any securities on loan were collateralized by cash. The cash collateral invested by the securities lending agent, BlackRock Investment Management, LLC (“BIM”), if any, is disclosed in the Schedules of Investments.
Securities lending transactions are entered into by the Funds under Master Securities Lending Agreements (each, an “MSLA”) which provide the right, in the event of default (including bankruptcy or insolvency), for the non-defaulting party to liquidate the collateral and calculate a net exposure to the defaulting party or request additional collateral. In the event that a borrower defaults, the Funds, as lender, would offset the market value of the collateral received against the market value of the securities loaned. When the value of the collateral is greater than that of the market value of the securities loaned, the lender is left with a net amount payable to the defaulting party. However, bankruptcy or insolvency laws of a particular jurisdiction may impose restrictions on or prohibitions against such a right of offset in the event of an MSLA counterparty’s bankruptcy or insolvency. Under the MSLA, the borrower can resell or re-pledge the loaned securities, and the Funds can reinvest cash collateral, or, upon an event of default, resell or re-pledge the collateral.
As of June 30, 2015, the following table is a summary of the Global SmallCap’s securities lending agreements by counterparty, which are subject to offset under an MSLA:
| | | | | | | | | | | | |
| Counterparty | | Securities Loaned at Value | | | Cash Collateral Received1 | | | Net Amount | |
Barclays Capital, Inc. | | $ | 243,038 | | | $ | (243,038 | ) | | | — | |
BNP Paribas Prime, Inc. | | | 2,150,273 | | | | (2,150,273 | ) | | | — | |
Citigroup Global Markets, Inc. | | | 1,271,569 | | | | (1,271,569 | ) | | | — | |
Credit Suisse Securities (USA) LLC | | | 1,440,246 | | | | (1,440,246 | ) | | | — | |
Deutsche Bank Securities, Inc. | | | 2,036,011 | | | | (2,036,011 | ) | | | — | |
Goldman Sachs & Co. | | | 6,488,660 | | | | (6,488,660 | ) | | | — | |
JP Morgan Clearing Corp | | | 4,850,385 | | | | (4,850,385 | ) | | | — | |
Merrill Lynch, Pierce, Fenner & Smith, Inc. | | | 5,737,950 | | | | (5,737,950 | ) | | | — | |
Morgan Stanley & Co. LLC | | | 3,502,768 | | | | (3,502,768 | ) | | | — | |
UBS Securities LLC | | | 997,710 | | | | (997,710 | ) | | | — | |
| | | | |
Total | | $ | 28,718,610 | | | $ | (28,718,610 | ) | | | — | |
| | | | |
| | 1 | | Collateral with a value of $33,012,761 has been received in connection with securities lending agreements. Collateral received in excess of the value of securities loaned from the individual counterparty is not shown for financial reporting purposes. |
| | | | | | |
| | | | | | | |
| 34 | | ANNUAL REPORT | | JUNE 30, 2015 | | |
| | | | |
| Notes to Financial Statements (continued) | | |
The risks of securities lending include the risk that the borrower may not provide additional collateral when required or may not return the securities when due. To mitigate these risks, the Funds benefit from a borrower default indemnity provided by BIM. BIM’s indemnity allows for full replacement of the securities loaned if the collateral received does not cover the value on the securities loaned in the event of borrower default. Each Fund could suffer a loss if the value of an investment purchased with cash collateral falls below the market value of loaned securities or if the value of an investment purchased with cash collateral falls below the value of the original cash collateral received.
4. Derivative Financial Instruments:
The Funds engage in various portfolio investment strategies using derivative contracts both to increase the returns of the Funds and/or to manage economically their exposure to certain risks such as equity risk or foreign currency exchange rate risk. These contracts may be transacted on an exchange OTC.
Financial Futures Contracts: Certain Funds invest in long and/or short positions in financial futures contracts and options on financial futures contracts to gain exposure to, or economically hedge against, changes in the value of equity securities (equity risk) or foreign currencies (foreign currency exchange rate risk). Financial futures contracts are agreements between the Funds and a counterparty to buy or sell a specific quantity of an underlying instrument at a specified price and at a specified date. Depending on the terms of the particular contract, financial futures contracts are settled either through physical delivery of the underlying instrument on the settlement date or by payment of a cash settlement amount on the settlement date.
Upon entering into a financial futures contract, the Funds are required to deposit initial margin with the broker in the form of cash or securities in an amount that varies depending on a contract’s size and risk profile. The initial margin deposit must then be maintained at an established level over the life of the contract. Securities deposited as initial margin are designated on the Schedules of Investments and cash deposited, if any, is recorded on the Statements of Assets and Liabilities as cash pledged for financial futures contracts. Pursuant to the contract, the Funds agree to receive from or pay to the broker an amount of cash equal to the daily fluctuation in value of the contract. Such receipts or payments are known as variation margin. Variation margin is recorded by the Funds as unrealized appreciation (depreciation) and, if applicable, as a receivable or payable for variation margin in the Statements of Assets and Liabilities.
When the contract is closed, the Funds record a realized gain or loss equal to the difference between the value of the contract at the time it was opened and the value at the time it was closed. The use of financial futures contracts involves the risk of an imperfect correlation in the movements in the price of financial futures contracts, interest or foreign currency exchange rates and the underlying assets.
Forward Foreign Currency Exchange Contracts: Certain Funds enter into forward foreign currency exchange contracts as an economic hedge against either specific transactions or portfolio instruments or to obtain exposure to, or hedge exposure away from, foreign currencies (foreign currency exchange rate risk). A forward foreign currency exchange contract is an agreement between two parties to buy and sell a currency at a set exchange rate on a future date. Forward foreign currency exchange contracts, when used by the Funds, help to manage the overall exposure to the currencies in which some of the investments held by the Funds are denominated. Non-deliverable forward foreign currency exchange contracts are settled with the counterparty in cash without the delivery of foreign currency. The contract is marked-to-market daily and the change in market value is recorded by the Funds as an unrealized gain or loss. When the contract is closed, the Funds record a realized gain or loss equal to the difference between the value at the time it was opened and the value at the time it was closed. The use of forward foreign currency exchange contracts involves the risk that the value of a forward foreign currency exchange contract changes unfavorably due to movements in the value of the referenced foreign currencies.
The following is a summary of the Funds’ derivative financial instruments categorized by risk exposure:
| | | | | | | | | | | | | | | | | | |
The Effect of Derivative Financial Instruments in the Statements of Operations Year Ended June 30, 2015 | |
| | | Net Realized Gain From | | | | | Net Change in Unrealized Appreciation (Depreciation) On | |
| | | EuroFund | | | Global SmallCap | | | | | EuroFund | | | Global SmallCap | |
| Foreign currency exchange contracts: | | | | | | | | | | | | | | | | | | |
Forward foreign currency transactions/translations | | | — | | | $ | 7,280 | | | | | | — | | | | — | |
| Equity contracts: | | | | | | | | | | | | | | | | | | |
Financial Futures Contracts | | $ | 1,078,521 | | | | — | | | | | | — | | | | — | |
| | | | |
Total | | $ | 1,078,521 | | | $ | 7,280 | | | | | | — | | | | — | |
| | | | |
| | | | | | |
| | | | | | | |
| | ANNUAL REPORT | | JUNE 30, 2015 | | 35 |
| | |
| Notes to Financial Statements (continued) | | |
For the year ended June 30, 2015, the average quarterly balances of outstanding derivative financial instruments were as follows:
| | | | | | | | |
| | | EuroFund | | | Global SmallCap | |
| Financial futures contracts: | | | | | | | | |
Average notional value of contracts purchased | | $ | 4,623,486 | | | | — | |
| Forward foreign currency exchange contracts: | | | | | | | | |
Average USD amounts purchased | | | — | | | $ | 4,604,889 | 1 |
Average USD amounts sold | | | — | | | $ | 79,077 | |
| | 1 | | Average amounts for the period are shown due to limited outstanding derivative financial instruments as of each quarter. |
Counterparty Credit Risk: A derivative contract may suffer a mark-to-market loss if the value of the contract decreases due to an unfavorable change in the market rates or values of the underlying instrument. Losses can also occur if the counterparty does not perform under the contract.
With exchange-traded futures, there is less counterparty credit risk to the Funds since the exchange or clearinghouse, as counterparty to such instruments, guarantees against a possible default. The clearinghouse stands between the buyer and the seller of the contract; therefore, credit risk is limited to failure of the clearinghouse. While offset rights may exist under applicable law, a Fund does not have a contractual right of offset against a clearing broker or clearinghouse in the event of a default (including the bankruptcy or insolvency) of the clearing broker or clearinghouse. Additionally, credit risk exists in exchange-traded futures with respect to initial and variation margin that is held in a clearing broker’s customer accounts. While clearing brokers are required to segregate customer margin from their own assets, in the event that a clearing broker becomes insolvent or goes into bankruptcy and at that time there is a shortfall in the aggregate amount of margin held by the clearing broker for all its clients, typically the shortfall would be allocated on a pro rata basis across all the clearing broker’s customers, potentially resulting in losses to the Funds.
Collateral Requirements: For derivatives traded under an ISDA Master Agreement, the collateral requirements are typically calculated by netting the mark-to-market amount for each transaction under such agreement and comparing that amount to the value of any collateral currently pledged by the Fund and the counterparty.
Cash collateral that has been pledged to cover obligations of the Funds and cash collateral received from the counterparty, if any, is reported separately on the Statements of Assets and Liabilities as cash pledged as collateral and cash received as collateral, respectively. Non-cash collateral pledged by the Funds, if any, is noted in the Schedules of Investments. Generally, the amount of collateral due from or to a party has to exceed a minimum transfer amount threshold (typically either $250,000 or $500,000) before a transfer is required, which is determined at the close of business of the Funds. Any additional required collateral is delivered to/pledged by the Funds on the next business day. Typically, the Funds and their counterparties are not permitted to sell, re-pledge or use the collateral they receive. To the extent amounts due to the Funds from their counterparties are not fully collateralized, the Funds bear the risk of loss from counterparty non-performance. Likewise, to the extent the Funds have delivered collateral to a counterparty and stand ready to perform under the terms of their agreement with such counterparty, the Funds bear the risk of loss from a counterparty in the amount of the value of the collateral in the event the counterparty fails to return such collateral.
For financial reporting purposes, the Funds do not offset derivative assets and derivative liabilities that are subject to netting arrangements, if any, in the Statements of Assets and Liabilities.
5. Investment Advisory Agreement and Other Transactions with Affiliates:
The PNC Financial Services Group, Inc. is the largest stockholder and an affiliate of BlackRock, for 1940 Act purposes.
Each Fund entered into an Investment Advisory Agreement with the Manager, the Funds’ investment advisor, an indirect, wholly owned subsidiary of BlackRock, to provide investment advisory and administration services. The Manager is responsible for the management of each Fund’s portfolio and provides the necessary personnel, facilities, equipment and certain other services to the operations of each Fund. For such services, each Fund pays the Manager a monthly fee based on a percentage of each Fund’s average daily net assets at the following annual rates:
| | | | | | | | |
| | | Investment Advisory Fee | |
| Average Daily Net Assets | | EuroFund | | | Global
SmallCap | |
First $1 Billion | | | 0.75% | | | | 0.85% | |
$1 — $3 Billion | | | 0.71% | | | | 0.80% | |
$3 — $5 Billion | | | 0.68% | | | | 0.77% | |
$5 to $10 Billion | | | 0.65% | | | | 0.74% | |
Greater than $10 Billion | | | 0.64% | | | | 0.72% | |
| | | | | | |
| | | | | | | |
| 36 | | ANNUAL REPORT | | JUNE 30, 2015 | | |
| | | | |
| Notes to Financial Statements (continued) | | |
The Manager voluntarily agreed to waive its investment advisory fees by the amount of investment advisory fees each Fund pays to the Manager indirectly through its investment in affiliated money market funds. These amounts are included in fees waived by the Manager in the Statements of Operations. However, the Manager does not waive its investment advisory fees by the amount of investment advisory fees paid in connection with each Fund’s investments in other affiliated investment companies, if any.
The Manager, with respect to EuroFund, entered into a sub-advisory agreement with BlackRock International Limited (“BIL”), an affiliate of the Manager. The Manager pays BIL, for services it provides, a monthly fee that is a percentage of the investment advisory fees paid by EuroFund to the Manager.
For the year ended June 30, 2015, the Funds reimbursed the Manager for certain accounting services, which is included in accounting services in the Statements of Operations. The reimbursements were as follows:
| | |
| EuroFund | | Global SmallCap |
| $4,563 | | $11,740 |
Each Fund entered into a Distribution Agreement and a Distribution and Service Plan with BlackRock Investments, LLC (“BRIL”), an affiliate of the Manager. Pursuant to the Distribution and Service Plan and in accordance with Rule 12b-1 under the 1940 Act, each Fund pays BRIL ongoing service and distribution fees. The fees are accrued daily and paid monthly at annual rates based upon the average daily net assets of the relevant share class of each Fund as follows:
| | | | | | | | | | | | | | | | |
| | | Investor A | | | Investor B1 | | | Investor C | | | Class R | |
Service Fee | | | 0.25% | | | | 0.25% | | | | 0.25% | | | | 0.25% | |
Distribution Fee | | | — | | | | 0.75% | | | | 0.75% | | | | 0.25% | |
Pursuant to sub-agreements with BRIL, broker-dealers and BRIL provide shareholder servicing and distribution services to the Funds. The ongoing service and/or distribution fee compensates BRIL and each broker-dealer for providing shareholder servicing and/or distribution related services to Investor A, Investor B, Investor C and Class R shareholders.
Pursuant to written agreements, certain financial intermediaries, some of which may be affiliates, provide the Funds with sub-accounting, recordkeeping, sub-transfer agency and other administrative services with respect to sub-accounts they service. For these services, these entities receive an asset-based fee or an annual fee per shareholder account, which will vary depending on share class and/or net assets. For the year ended June 30, 2015, the Funds paid the following amounts to affiliates of BlackRock in return for these services, which are included in transfer agent — class specific in the Statements of Operations:
| | | | | | | | | | | | |
| | | Institutional | | | Investor A | | | Investor C | |
Global SmallCap | | $ | 1,293 | | | $ | 1 | | | $ | 2 | |
The Manager maintains a call center, which is responsible for providing certain shareholder services to the Funds, such as responding to shareholder inquiries and processing transactions based upon instructions from shareholders with respect to the subscription and redemption of Fund shares. For the year ended June 30, 2015, each Fund reimbursed the Manager the following amounts for costs incurred in running the call center, which are included in transfer agent — class specific in the Statements of Operations:
| | | | | | | | | | | | | | | | |
| | | Institutional | | | Investor A | | | Investor B | | | Investor C | |
EuroFund | | $ | 3,695 | | | $ | 4,801 | | | | — | | | $ | 549 | |
Global SmallCap | | | — | | | | — | | | $ | 117 | | | $ | 4,985 | |
For the year ended June 30, 2015, affiliates earned underwriting discounts, direct commissions and dealer concessions on sales of the Funds’ Investor A Shares as follows:
| | | | |
| | | Investor A | |
EuroFund | | $ | 6,347 | |
Global SmallCap | | $ | 90,552 | |
| | | | | | |
| | | | | | | |
| | ANNUAL REPORT | | JUNE 30, 2015 | | 37 |
| | |
| Notes to Financial Statements (continued) | | |
For the year ended June 30, 2015, affiliates received CDSCs as follows:
| | | | | | | | | | | | |
| | | Investor A | | | Investor B | | | Investor C | |
EuroFund | | $ | 23,182 | | | | — | | | $ | 9,141 | |
Global SmallCap | | $ | 6,273 | | | $ | 365 | | | $ | 33,358 | |
The U.S. Securities and Exchange Commission has issued an exemptive order which permits BIM, an affiliate of the Manager, to serve as securities lending agent for the Funds, subject to applicable conditions. As securities lending agent, BIM bears all operational costs directly related to securities lending. The Funds are responsible for expenses in connection with the investment of cash collateral received for securities on loan (the “collateral investment expenses”). The cash collateral is invested in a private investment company managed by the Manager or its affiliates. However, BIM has agreed to cap the collateral investment expenses of the private investment company to an annual rate of 0.04%. The investment advisor to the private investment company will not charge any advisory fees with respect to shares purchased by the Funds.
Securities lending income is equal to the total of income earned from the reinvestment of cash collateral, net of fees and other payments to and from borrowers of securities, and less the collateral investment expenses. Each Fund retains a portion of securities lending income and remits a remaining portion to BIM as compensation for its services as securities lending agent.
Pursuant to a securities lending agreement effective January 1, 2015, each Fund retains 80% of securities lending income, and this amount retained can never be less than 70% of the total of securities lending income plus the collateral investment expenses.
In addition, commencing the business day following the date that the aggregate securities lending income earned across the Equity-Bond Complex in a calendar year exceeds a specified threshold, each Fund, pursuant to the securities lending agreement, will retain for the remainder of that calendar year securities lending income as follows: 85% of securities lending income, and this amount retained can never be less than 70% of the total of securities lending income plus the collateral investment expenses.
For the period February 1, 2014 through December 31, 2014, EuroFund retained 75% (80% commencing on the business day following the date that the aggregate securities lending income earned across the Equity-Bond Complex in the calendar year 2014 exceeded a specified threshold and for the remainder of that calendar year) of securities lending income, and this amount retained could never be less than 65% of the total of securities lending income plus the collateral investment expenses.
For the period February 1, 2014 through May 31, 2014, Global SmallCap retained 70% (75% commencing on the business day following the date that the aggregate securities lending income earned across the Equity-Bond Complex in the calendar year 2014 exceeded a specified threshold (the “Hurdle Date”) and for the remainder of that calendar year) of securities lending income, and this amount retained could never be less than 65% of the total of securities lending income plus the collateral investment expenses. For the period June 1, 2014 through December 31, 2014, Global SmallCap retained 75% (80% commencing on the Hurdle Date and for the remainder of that calendar year) of securities lending income, and this amount retained could never be less than 65% of the total of securities lending income plus the collateral investment expenses.
The share of securities lending income earned by each Fund is shown as securities lending — affiliated — net in the Statements of Operations. For the year ended June 30, 2015, each Fund paid BIM the following amounts for securities lending agent services:
| | |
| EuroFund | | Global SmallCap |
| $137 | | $470,577 |
Certain officers and/or directors of the Funds are officers and/or directors of BlackRock or its affiliates. The Funds reimburse the Manager for a portion of the compensation paid to the Funds’ Chief Compliance Officer, which is included in officer and directors in the Statements of Operations.
The Funds may purchase securities from, or sell securities to, an affiliated fund provided the affiliation is due solely to having a common investment advisor, common officers, or common trustees. For the year ended June 30, 2015, the purchase and sale transactions with an affiliated fund in compliance with Rule 17a-7 under the 1940 Act were as follows:
| | | | |
| | | Global SmallCap | |
Purchases | | $ | 10,534,880 | |
Sales | | $ | 1,643,631 | |
| | | | | | |
| | | | | | | |
| 38 | | ANNUAL REPORT | | JUNE 30, 2015 | | |
| | | | |
| Notes to Financial Statements (continued) | | |
6. Purchases and Sales:
For the year ended June 30, 2015, purchases and sales of investments excluding short-term securities, were as follows:
| | | | | | | | |
| | | EuroFund | | | Global SmallCap | |
Purchases | | $ | 656,360,850 | | | $ | 809,847,024 | |
Sales | | $ | 525,570,107 | | | $ | 893,696,264 | |
7. Income Tax Information:
It is the Funds’ policy to comply with the requirements of the Internal Revenue Code of 1986, as amended, applicable to regulated investment companies, and to distribute substantially all of their taxable income to their shareholders. Therefore, no federal income tax provision is required.
The Funds file U.S. federal and various state and local tax returns. No income tax returns are currently under examination. The statute of limitations on the Funds’ U.S. federal tax returns remains open for each of the four years ended June 30, 2015. The statutes of limitations on the Funds’ state and local tax returns may remain open for an additional year depending upon the jurisdiction.
Management has analyzed tax laws and regulations and their application to the Funds as of June 30, 2015, inclusive of the open tax return years, and does not believe there are any uncertain tax positions that require recognition of a tax liability in the Funds’ financial statements.
U.S. GAAP requires that certain components of net assets be adjusted to reflect permanent differences between financial and tax reporting. These reclassifications have no effect on net assets or net asset values per share. As of June 30, 2015, the following permanent difference attributable to net operating losses, foreign currency transactions, the sale of stock of passive foreign investment companies and the character of income from certain securities lending transactions were reclassified to the following accounts:
| | | | | | | | |
| | | EuroFund | | | Global SmallCap | |
Paid-in capital | | | — | | | $ | (279,918 | ) |
Undistributed (distributions in excess of) net investment income | | $ | (1,580,712 | ) | | $ | 23,927,851 | |
Undistributed net realized gain (accumulated net realized loss) | | $ | 1,580,712 | | | $ | (23,647,933 | ) |
The tax character of distributions was as follows:
| | | | | | | | | | | | |
| | | | | | EuroFund | | | Global SmallCap | |
Ordinary income | | | 6/30/15 | | | $ | 12,292,752 | | | $ | 46,572,241 | |
| | | 6/30/14 | | | $ | 4,298,018 | | | $ | 27,291,918 | |
Long-term capital gains | | | 6/30/15 | | | | — | | | $ | 113,480,153 | |
| | | 6/30/14 | | | | — | | | $ | 93,648,298 | |
| | | | |
Total | | | 6/30/15 | | | $ | 12,292,752 | | | $ | 160,052,394 | |
| | | | |
| | | 6/30/14 | | | $ | 4,298,018 | | | $ | 120,940,216 | |
| | | | |
As of June 30, 2015, the tax components of accumulated net earnings (losses) were as follows:
| | | | | | | | |
| | | EuroFund | | | Global SmallCap | |
Undistributed ordinary income | | $ | 6,742,480 | | | | — | |
Undistributed long-term capital gains | | | — | | | $ | 33,542,197 | |
Capital loss carryforwards | | $ | (102,479,972 | ) | | | — | |
Net unrealized gains1 | | $ | 27,360,974 | | | $ | 140,755,442 | |
Qualified late-year losses2 | | | — | | | $ | (559,557 | ) |
| | | | | | | | |
Total | | $ | (68,376,518 | ) | | $ | 173,738,082 | |
| | | | | | | | |
| | 1 | | The differences between book-basis and tax-basis net unrealized gains were attributable primarily to the tax deferral of losses on wash sales, the realization for tax purposes of unrealized gains (losses) on certain foreign currency contracts, the timing and recognition of partnership income, and the realization for tax purposes of unrealized gains on investments in passive foreign investment companies. |
| | 2 | | Global SmallCap has elected to defer certain qualified late-year losses and recognize such losses in the next taxable year. |
| | | | | | |
| | | | | | | |
| | ANNUAL REPORT | | JUNE 30, 2015 | | 39 |
| | |
| Notes to Financial Statements (continued) | | |
As of June 30, 2015, EuroFund had capital loss carryforwards available to offset future realized capital gains through the indicated expiration dates as follows:
| | | | |
| Expires June 30, | | EuroFund | |
2017 | | $ | 3,846,553 | |
2018 | | | 85,950,061 | |
No expiration date3 | | | 12,683,358 | |
| | | | |
Total | | $ | 102,479,972 | |
| | | | |
| | 3 | | Must be utilized prior to losses subject to expiration. |
As of June 30, 2015, gross unrealized appreciation and depreciation based on cost for federal income tax purposes were as follows:
| | | | | | | | |
| | | EuroFund | | | Global SmallCap | |
Tax cost | | $ | 469,001,350 | | | $ | 981,377,206 | |
| | | | | | | | |
Gross unrealized appreciation | | $ | 45,633,924 | | | $ | 228,720,262 | |
Gross unrealized depreciation | | | (18,259,543 | ) | | | (88,022,940 | ) |
| | | | | | | | |
Net unrealized appreciation | | $ | 27,374,381 | | | $ | 140,697,322 | |
| | | | | | | | |
8. Bank Borrowings:
The Funds, along with certain other funds managed by the Manager and its affiliates (“Participating Funds”), are a party to a 364-day, $2.1 billion credit agreement with a group of lenders, under which the Funds may borrow to fund shareholder redemptions. Excluding commitments designated for certain individual funds, the Participating Funds, including the Funds, can borrow up to an aggregate commitment amount of $1.6 billion, subject to asset coverage and other limitations as specified in the agreement. The credit agreement has the following terms: a fee of 0.06% per annum on unused commitment amounts and interest at a rate equal to the higher of (a) one-month LIBOR (but, in any event, not less than 0.00%) on the date the loan is made plus 0.80% per annum or (b) the Fed Funds rate (but, in any event, not less than 0.00%) in effect from time to time plus 0.80% per annum on amounts borrowed. The agreement expires in April 2016 unless extended or renewed. Prior to November 25, 2014, the aggregate commitment amount was $1.1 billion, of which the Participating Funds, including the Funds, could borrow up to $650 million at any time outstanding, subject to asset average and other limitations as specified in the agreement. Participating Funds paid administration, legal and arrangement fees, which are included in miscellaneous expenses in the Statements of Operations, and along with commitment fees, were allocated among such funds based upon portions of the aggregate commitment available to them and relative net assets of Participating Funds. During the year ended June 30, 2015, the Funds did not borrow under the credit agreement.
9. Principal Risks:
In the normal course of business, certain Funds invest in securities and enter into transactions where risks exist due to fluctuations in the market (market risk) or failure of the issuer of a security to meet all its obligations, including to pay principal and interest when due (issuer credit risk). The value of securities held by the Funds may decline in response to certain events, including those directly involving the issuers whose securities are owned by the Funds; conditions affecting the general economy; overall market changes; local, regional or global political, social or economic instability; and currency, interest rate and price fluctuations. Similar to issuer credit risk, the Funds may be exposed to counterparty credit risk, or the risk that an entity with which the Funds have unsettled or open transactions may fail to or be unable to perform on its commitments. The Funds manage counterparty credit risk by entering into transactions only with counterparties that the Manager believes have the financial resources to honor their obligations and by monitoring the financial stability of those counterparties. Financial assets, which potentially expose the Funds to market, issuer and counterparty credit risks, consist principally of financial instruments and receivables due from counterparties. The extent of the Funds’ exposure to market, issuer and counterparty credit risks with respect to these financial assets is generally approximated by their value recorded in the Statements of Assets and Liabilities, less any collateral held by the Funds.
Certain Funds invest a substantial amount of their assets in issuers located in a single country or a limited number of countries. When the Funds concentrate their investments in this manner, they assume the risk that economic, political and social conditions in those countries may have a significant impact on their investment performance. Foreign issuers may not be subject to the same uniform accounting, auditing and financial reporting standards and practices as used in the United States. Foreign securities markets may also be less liquid, more volatile, and less subject to governmental supervision not typically associated with investing in U.S. securities. Investment percentages in specific countries are presented in the Schedules of Investments.
| | | | | | |
| | | | | | | |
| 40 | | ANNUAL REPORT | | JUNE 30, 2015 | | |
| | | | |
| Notes to Financial Statements (continued) | | |
Certain Funds invest a significant portion of their assets in securities of issuers located in Europe or with significant exposure to European issuers or countries. The European financial markets have recently experienced volatility and adverse trends due to concerns about economic downturns in, or rising government debt levels of, several European countries. These events may spread to other countries in Europe and may affect the value and liquidity of certain of the Funds’ investments.
As of June 30, 2015, the Funds’ investments had the following industry classifications:
| | | | | | | | |
| Industry | | EuroFund | | | Global SmallCap | |
Banks | | | 15 | % | | | 7 | % |
Pharmaceuticals | | | 11 | | | | — | |
Health Care Equipment & Supplies | | | — | | | | 8 | |
Insurance | | | 7 | | | | — | |
Metals & Mining | | | — | | | | 7 | |
Diversified Telecommunications Services | | | 6 | | | | — | |
Oil, Gas & Consumable Fuels | | | 6 | | | | — | |
Beverages | | | 5 | | | | — | |
Diversified Financial Services | | | 5 | | | | — | |
Software | | | — | | | | 5 | |
Real Estate Investment Trusts | | | — | | | | 5 | |
Other1 | | | 45 | | | | 68 | |
| | 1 | | All other industries held were each less than 5% of long-term investments. |
10. Capital Share Transactions:
Transactions in capital shares for each class were as follows:
| | | | | | | | | | | | | | | | | | |
| | | Year Ended
June 30, 2015 | | | | | Year Ended
June 30, 2014 | |
| EuroFund | | Shares | | | Amount | | | | | Shares | | | Amount | |
| Institutional | | | | | | | | | | | | | | | | | | |
Shares sold | | | 9,413,729 | | | $ | 152,763,697 | | | | | | 7,510,419 | | | $ | 117,681,482 | |
Shares issued in reinvestment of distributions | | | 492,169 | | | | 7,052,700 | | | | | | 139,937 | | | | 2,194,211 | |
Shares redeemed | | | (6,884,957 | ) | | | (108,231,919 | ) | | | | | (2,907,740 | ) | | | (47,189,779 | ) |
| | | | | | | | | | | | | | |
Net increase | | | 3,020,941 | | | $ | 51,584,478 | | | | | | 4,742,616 | | | $ | 72,685,914 | |
| | | | | | | | | | |
| | | | | | | | | | | | | | | | | | |
| Investor A | | | | | | | | | | | | | | | | | | |
Shares sold | | | 8,095,239 | | | $ | 126,015,479 | | | | | | 2,356,325 | | | $ | 37,677,270 | |
Shares issued in reinvestment of distributions | | | 253,377 | | | | 3,569,808 | | | | | | 93,249 | | | | 1,436,035 | |
Shares redeemed | | | (3,309,727 | ) | | | (50,043,050 | ) | | | | | (1,692,385 | ) | | | (26,607,875 | ) |
| | | | | | | | | | | | | | |
Net increase | | | 5,038,889 | | | $ | 79,542,237 | | | | | | 757,189 | | | $ | 12,505,430 | |
| | | | | | | | | | |
| | | | | | | | | | | | | | | | | | |
| Investor C | | | | | | | | | | | | | | | | | | |
Shares sold | | | 487,106 | | | $ | 5,245,801 | | | | | | 739,265 | | | $ | 8,386,524 | |
Shares issued in reinvestment of distributions | | | 40,855 | | | | 410,575 | | | | | | 12,749 | | | | 141,762 | |
Shares redeemed | | | (719,794 | ) | | | (7,649,825 | ) | | | | | (340,632 | ) | | | (3,843,239 | ) |
| | | | | | | | | | | | | | |
Net increase (decrease) | | | (191,833 | ) | | $ | (1,993,449 | ) | | | | | 411,382 | | | $ | 4,685,047 | |
| | | | | | | | | | |
| | | | | | | | | | | | | | | | | | |
| Class R | | | | | | | | | | | | | | | | | | |
Shares sold | | | 73,567 | | | $ | 837,099 | | | | | | 44,911 | | | $ | 532,805 | |
Shares issued in reinvestment of distributions | | | 2,689 | | | | 29,064 | | | | | | 1,221 | | | | 14,502 | |
Shares redeemed | | | (96,831 | ) | | | (1,103,166 | ) | | | | | (80,795 | ) | | | (966,864 | ) |
| | | | | | | | | | | | | | |
Net decrease | | | (20,575 | ) | | $ | (237,003 | ) | | | | | (34,663 | ) | | $ | (419,557 | ) |
| | | | | | | | | | |
Total Net Increase | | | 7,847,422 | | | $ | 128,896,263 | | | | | | 5,876,524 | | | $ | 89,456,834 | |
| | | | | | | | | | |
| | | | | | |
| | | | | | | |
| | ANNUAL REPORT | | JUNE 30, 2015 | | 41 |
| | |
| Notes to Financial Statements (concluded) | | |
| | | | | | | | | | | | | | | | | | |
| | | Year Ended
June 30, 2015 | | | | | Year Ended
June 30, 2014 | |
| Global SmallCap | | Shares | | | Amount | | | | | Shares | | | Amount | |
| Institutional | | | | | | | | | | | | | | | | | | |
Shares sold | | | 3,759,262 | | | $ | 101,806,319 | | | | | | 2,985,293 | | | $ | 86,295,391 | |
Shares issued in reinvestment of distributions | | | 1,438,466 | | | | 34,134,551 | | | | | | 921,493 | | | | 24,972,441 | |
Shares redeemed | | | (5,293,193 | ) | | | (138,781,007 | ) | | | | | (2,927,310 | ) | | | (85,142,818 | ) |
| | | | | | | | �� | | | | | | |
Net increase (decrease) | | | (95,465 | ) | | $ | (2,840,137 | ) | | | | | 979,476 | | | $ | 26,125,014 | |
| | | | | | | | | | |
| | | | | | | | | | | | | | | | | | |
| Investor A | | | | | | | | | | | | | | | | | | |
Shares sold and automatic conversion of shares | | | 4,352,168 | | | $ | 114,243,644 | | | | | | 4,835,299 | | | $ | 136,285,083 | |
Shares issued in reinvestment of distributions | | | 2,665,903 | | | | 61,207,844 | | | | | | 1,659,667 | | | | 43,798,495 | |
Shares redeemed | | | (5,353,423 | ) | | | (139,031,234 | ) | | | | | (3,492,552 | ) | | | (98,084,013 | ) |
| | | | | | | | | | | | | | |
Net increase | | | 1,664,648 | | | $ | 36,420,254 | | | | | | 3,002,414 | | | $ | 81,999,565 | |
| | | | | | | | | | |
| | | | | | | | | | | | | | | | | | |
| Investor B | | | | | | | | | | | | | | | | | | |
Shares sold | | | 8,687 | | | $ | 224,215 | | | | | | 11,938 | | | $ | 316,419 | |
Shares issued in reinvestment of distributions | | | 19,602 | | | | 419,890 | | | | | | 21,435 | | | | 534,159 | |
Shares redeemed and automatic conversion of shares | | | (107,867 | ) | | | (2,610,051 | ) | | | | | (180,781 | ) | | | (4,770,487 | ) |
| | | | | | | | | | | | | | |
Net decrease | | | (79,578 | ) | | $ | (1,965,946 | ) | | | | | (147,408 | ) | | $ | (3,919,909 | ) |
| | | | | | | | | | |
| | | | | | | | | | | | | | | | | | |
| Investor C | | | | | | | | | | | | | | | | | | |
Shares sold | | | 2,423,033 | | | $ | 55,817,938 | | | | | | 2,334,788 | | | $ | 59,592,008 | |
Shares issued in reinvestment of distributions | | | 2,179,352 | | | | 44,108,405 | | | | | | 1,356,225 | | | | 32,305,154 | |
Shares redeemed | | | (2,991,313 | ) | | | (68,468,383 | ) | | | | | (2,532,259 | ) | | | (64,521,861 | ) |
| | | | | | | | | | | | | | |
Net increase | | | 1,611,072 | | | $ | 31,457,960 | | | | | | 1,158,754 | | | $ | 27,375,301 | |
| | | | | | | | | | |
| | | | | | | | | | | | | | | | | | |
| Class R | | | | | | | | | | | | | | | | | | |
Shares sold | | | 274,501 | | | $ | 6,795,070 | | | | | | 366,217 | | | $ | 9,761,996 | |
Shares issued in reinvestment of distributions | | | 187,426 | | | | 4,027,774 | | | | | | 149,096 | | | | 3,724,423 | |
Shares redeemed | | | (543,044 | ) | | | (13,336,078 | ) | | | | | (522,755 | ) | | | (13,896,837 | ) |
| | | | | | | | | | | | | | |
Net decrease | | | (81,117 | ) | | $ | (2,513,234 | ) | | | | | (7,442 | ) | | $ | (410,418 | ) |
| | | | | | | | | | |
Total Net Increase | | | 3,019,560 | | | $ | 60,558,897 | | | | | | 4,985,794 | | | $ | 131,169,553 | |
| | | | | | | | | | |
11. Subsequent Events:
Management has evaluated the impact of all subsequent events on the Funds through the date the financial statements were issued and has determined that there were no subsequent events requiring adjustment or additional disclosure in the financial statements.
| | | | | | |
| | | | | | | |
| 42 | | ANNUAL REPORT | | JUNE 30, 2015 | | |
| | |
| Report of Independent Registered Public Accounting Firm | | |
To the Shareholders and Board of Trustees/Directors of BlackRock EuroFund and BlackRock Global SmallCap Fund, Inc.:
We have audited the accompanying statements of assets and liabilities of BlackRock EuroFund and BlackRock Global SmallCap Fund, Inc., (collectively, the “Funds”), including the schedules of investments, as of June 30, 2015, and the related statements of operations for the year then ended, the statements of changes in net assets for each of the two years in the period then ended, and the financial highlights for each of the five years in the period then ended. These financial statements and financial highlights are the responsibility of the Funds’ management. Our responsibility is to express an opinion on these financial statements and financial highlights based on our audits.
We conducted our audits in accordance with the standards of Public Company Accounting Oversight Board (United States). Those standards require that we plan and perform the audit to obtain reasonable assurance about whether the financial statements and financial highlights are free of material misstatement. The Funds are not required to have, nor were we engaged to perform, audits of their internal controls over financial reporting. Our audits included consideration of internal control over financial reporting as a basis for designing audit procedures that are appropriate in the circumstances, but not for the purpose of expressing an opinion on the effectiveness of the Funds’ internal control over financial reporting. Accordingly, we express no such opinion. An audit also includes examining, on a test basis, evidence supporting the amounts and disclosures in the financial statements, assessing the accounting principles used and significant estimates made by management, as well as evaluating the overall financial statement presentation. Our procedures included confirmation of securities owned as of June 30, 2015, by correspondence with the custodian and brokers; where replies were not received from brokers, we performed other auditing procedures. We believe that our audits provide a reasonable basis for our opinion.
In our opinion, the financial statements and financial highlights referred to above present fairly, in all material respects, the financial position of the BlackRock EuroFund and BlackRock Global SmallCap Fund, Inc., as of June 30, 2015, the results of their operations for the year then ended, the changes in their net assets for each of the two years in the period then ended, and the financial highlights for each of the five years in the period then ended, in conformity with accounting principles generally accepted in the United States of America.
Deloitte & Touche LLP
Boston, Massachusetts
August 24, 2015
| | |
| Important Tax Information (Unaudited) | | |
During the fiscal year ended June 30, 2015, the following information is provided with respect to the ordinary income distributions paid:
| | | | | | | | | | | | |
| | | Payable
Date | | | EuroFund | | | Global
SmallCap | |
Qualified Dividend Income for Individuals | | | 12/17/14 | | | | 100% | 1 | | | 14.43% | |
Dividends Qualifying for the Dividend Received Deduction for Corporations | | | 12/17/14 | | | | — | | | | 4.65% | |
Foreign Source Income | | | 12/17/14 | | | | 100% | 1 | | | — | |
Foreign Taxes Paid Per Share2 | | | 12/17/14 | | | | $0.037153 | | | | — | |
| | 1 | | Expressed as a percentage of the cash distribution grossed-up for foreign taxes. |
| | 2 | | The foreign taxes paid represent taxes incurred by the Fund on income received by the Fund from foreign sources. Foreign taxes paid may be included in taxable income with an offsetting deduction from gross income or may be taken as a credit for taxes paid to foreign governments. You should consult your tax advisor regarding the appropriate treatment of foreign taxes paid. |
Additionally, Global SmallCap Fund distributed long-term capital gains of $2.750373 per share to shareholders of record on December 16, 2014.
| | | | | | |
| | | | | | | |
| | ANNUAL REPORT | | JUNE 30, 2015 | | 43 |
|
| Disclosure of Investment Advisory Agreements and Sub-Advisory Agreement |
The Board of Trustees (the “Board,” and the members of which are referred to as “Board Members”) of BlackRock EuroFund (the “EuroFund”) and the Board of Directors of BlackRock Global SmallCap Fund, Inc. (the “Global SmallCap Fund”) (each a “Fund,” and collectively, the “Funds”) met in person on April 14, 2015 (the “April Meeting”) and May 12-13, 2015 (the “May Meeting”) to consider the approval of each Fund’s investment advisory agreement (the “Advisory Agreements”) with BlackRock Advisors, LLC (the “Manager”), each Fund’s investment advisor. The Board also considered the approval of the sub-advisory agreement (the “Sub-Advisory Agreement”) between the Manager and BlackRock International Limited (the “Sub-Advisor”), with respect to the EuroFund. The Manager and, with respect to EuroFund, the Sub-Advisor, are referred to herein as “BlackRock.” The Advisory Agreements and, with respect to the EuroFund, the Sub-Advisory Agreement, are referred to herein as the “Agreements.”
Activities and Composition of the Board
On the date of the April and May Meetings, the Board consisted of thirteen individuals, ten of whom were not “interested persons” of any Fund as defined in the Investment Company Act of 1940, as amended (the “1940 Act”) (the “Independent Board Members”). One of the Board Members is a non-management interested Board Member by virtue of his former positions with BlackRock, Inc. and its affiliates. The Board Members are responsible for the oversight of the operations of each Fund and perform the various duties imposed on the directors of investment companies by the 1940 Act. The Independent Board Members have retained independent legal counsel to assist them in connection with their duties. The Chairman of the Board is an Independent Board Member. The Board has established five standing committees: an Audit Committee, a Governance and Nominating Committee, a Compliance Committee, a Performance Oversight Committee and an Executive Committee, each of which is chaired by an Independent Board Member and composed of Independent Board Members (except for the Performance Oversight Committee and the Executive Committee, each of which also has one interested Board Member).
The Agreements
Pursuant to the 1940 Act, the Board is required to consider the continuation of the Agreements on an annual basis. The Board has four quarterly meetings per year, each extending over two days, a fifth one-day meeting to consider specific information surrounding the consideration of renewing the Agreements and additional in-person and telephonic meetings as needed. In connection with this year-long deliberative process, the Board assessed, among other things, the nature, extent and quality of the services provided to each Fund by BlackRock, BlackRock’s personnel and affiliates, including (as applicable): investment management services; administrative and shareholder services; the oversight of fund service providers; marketing services; risk oversight; compliance; and ability to meet applicable legal and regulatory requirements.
The Board, acting directly and through its committees, considers at each of its meetings, and from time to time as appropriate, factors that are relevant to its annual consideration of the renewal of the Agreements, including the services and support provided by BlackRock to each Fund and its shareholders. Among the matters the Board considered were: (a) investment performance for one-year, three-year, five-year and/or since inception periods, as applicable, against peer funds, applicable benchmark, and performance metrics, as applicable, as well as senior management’s and portfolio managers’ analysis of the reasons for any over-performance or underperformance relative to peers, benchmarks, and other performance metrics, as applicable; (b) fees, including advisory, administration, if applicable, and other amounts paid to BlackRock and its affiliates by each Fund for services, such as marketing and distribution, call center and fund accounting; (c) Fund operating expenses and how BlackRock allocates expenses to each Fund; (d) the resources devoted to, risk oversight of, and compliance reports relating to, implementation of each Fund’s investment objective(s), policies and restrictions, and meeting new regulatory requirements; (e) each Fund’s compliance with its compliance policies and procedures; (f) the nature, cost and character of non-investment management services provided by BlackRock and its affiliates; (g) BlackRock’s and other service providers’ internal controls and risk and compliance oversight mechanisms; (h) BlackRock’s implementation of the proxy voting policies approved by the Board; (i) the use of brokerage commissions and execution quality of portfolio transactions; (j) BlackRock’s implementation of each Fund’s valuation and liquidity procedures; (k) an analysis of management fees for products with similar investment mandates across the open-end fund, exchange-traded fund (“ETF”), closed-end fund and institutional account product channels, as applicable, and the similarities and differences between these products and the services provided as compared to each Fund; (l) BlackRock’s compensation methodology for its investment professionals and the incentives it creates, along with investment professionals’ investments in the fund(s) they manage; and (m) periodic updates on BlackRock’s business.
The Board has engaged in an ongoing strategic review with BlackRock of opportunities to consolidate funds and of BlackRock’s commitment to investment performance. BlackRock also furnished information to the Board in response to specific questions. These questions covered issues such as: BlackRock’s profitability; investment performance; subadvisory and advisory relationships with other clients (including mutual funds sponsored by third parties); the viability of specific funds; fund size and manager capacity; BlackRock’s research capabilities; portfolio managers’ investments in funds they manage; funds’ portfolio risk targets; and management fee levels and breakpoints. The Board further discussed with BlackRock:
| | | | | | |
| | | | | | | |
| 44 | | ANNUAL REPORT | | JUNE 30, 2015 | | |
| | |
| Disclosure of Investment Advisory Agreements and Sub-Advisory Agreement (continued) |
BlackRock’s management structure; portfolio turnover, execution quality and use of soft dollars; BlackRock’s portfolio manager compensation and performance accountability; marketing support for the funds; services provided to the funds by BlackRock affiliates; and BlackRock’s oversight of relationships with third party service providers.
Board Considerations in Approving the Agreements
The Approval Process: Prior to the April Meeting, the Board requested and received materials specifically relating to the Agreements. The Board is continuously engaged in a process with its independent legal counsel and BlackRock to review the nature and scope of the information provided to better assist its deliberations. The materials provided in connection with the April Meeting included (a) information independently compiled and prepared by Lipper, Inc. (“Lipper”) on Fund fees and expenses as compared with a peer group of funds as determined by Lipper (“Expense Peers”) and the investment performance of each Fund as compared with a peer group of funds as determined by Lipper1; (b) information on the profits realized by BlackRock and its affiliates pursuant to the Agreements and a discussion of fall-out benefits to BlackRock and its affiliates; (c) a general analysis provided by BlackRock concerning investment management fees charged to other clients, such as institutional clients, sub-advised mutual funds, ETFs and closed-end funds, under similar investment mandates, as well as the performance of such other clients, as applicable; (d) review of non-management fees; (e) the existence, impact and sharing of potential economies of scale; (f) a summary of aggregate amounts paid by each Fund to BlackRock; (g) sales and redemption data regarding each Fund’s shares; and (h) if applicable, a comparison of management fees to similar BlackRock open-end funds, as classified by Lipper.
At the April Meeting, the Board reviewed materials relating to its consideration of the Advisory Agreements and, with respect to the EuroFund, the Sub-Advisory Agreement. As a result of the discussions that occurred during the April Meeting, and as a culmination of the Board’s year-long deliberative process, the Board presented BlackRock with questions and requests for additional information. BlackRock responded to these requests with additional written information in advance of the May Meeting.
At the May Meeting, the Board, including the Independent Board Members, approved the continuation of the Advisory Agreements between the Manager and each Fund, and the Sub-Advisory Agreement between the Manager and the Sub-Advisor, with respect to the EuroFund, each for a one-year term ending June 30, 2016. In approving the continuation of the Agreements, the Board considered: (a) the nature, extent and quality of the services provided by BlackRock; (b) the investment performance of each Fund and BlackRock; (c) the advisory fee and the cost of the services and profits to be realized by BlackRock and its affiliates from their relationship with each Fund; (d) each Fund’s costs to investors compared to the costs of Expense Peers and performance compared to the relevant performance comparison as previously discussed; (e) the sharing of potential economies of scale; (f) fall-out benefits to BlackRock and its affiliates as a result of its relationship with each Fund; and (g) other factors deemed relevant by the Board Members.
The Board also considered other matters it deemed important to the approval process, such as payments made to BlackRock or its affiliates relating to the distribution of Fund shares, securities lending and cash management, services related to the valuation and pricing of Fund portfolio holdings, direct and indirect benefits to BlackRock and its affiliates from their relationship with each Fund and advice from independent legal counsel with respect to the review process and materials submitted for the Board’s review. The Board noted the willingness of BlackRock personnel to engage in open, candid discussions with the Board. The Board did not identify any particular information as determinative, and each Board Member may have attributed different weights to the various items considered.
A. Nature, Extent and Quality of the Services Provided by BlackRock: The Board, including the Independent Board Members, reviewed the nature, extent and quality of services provided by BlackRock, including the investment advisory services and the resulting performance of each Fund. Throughout the year, the Board compared Fund performance to the performance of a comparable group of mutual funds, a relevant benchmark, and performance metrics, as applicable. The Board met with BlackRock’s senior management personnel responsible for investment activities, including the senior investment officers. The Board also reviewed the materials provided by each Fund’s portfolio management team discussing each Fund’s performance and the Fund’s investment objective(s), strategies and outlook.
The Board considered, among other factors, with respect to BlackRock: the number, education and experience of investment personnel generally and each Fund’s portfolio management team; BlackRock’s research capabilities; investments by portfolio managers in the funds they manage; portfolio trading capabilities; use of technology; commitment to compliance; credit analysis capabilities; risk analysis and oversight capabilities; and the approach to training and retaining portfolio managers and other research, advisory and management personnel. The Board engaged in a review of
| 1 | | Funds are ranked by Lipper in quartiles, ranging from first to fourth, where first is the most desirable quartile position and fourth is the least desirable. |
| | | | | | |
| | | | | | | |
| | ANNUAL REPORT | | JUNE 30, 2015 | | 45 |
| | |
| Disclosure of Investment Advisory Agreements and Sub-Advisory Agreement (continued) |
BlackRock’s compensation structure with respect to each Fund’s portfolio management team and BlackRock’s ability to attract and retain high-quality talent and create performance incentives.
In addition to advisory services, the Board considered the quality of the administrative and other non-investment advisory services provided to each Fund. BlackRock and its affiliates provide each Fund with certain administrative, shareholder and other services (in addition to any such services provided to each Fund by third parties) and officers and other personnel as are necessary for the operations of each Fund. In particular, BlackRock and its affiliates provide each Fund with the following administrative services including, among others: (i) preparing disclosure documents, such as the prospectus, the summary prospectus (as applicable), the statement of additional information and periodic shareholder reports; (ii) oversight of daily accounting and pricing; (iii) overseeing and coordinating the activities of other service providers; (iv) organizing Board meetings and preparing the materials for such Board meetings; (v) providing legal and compliance support; (vi) furnishing analytical and other support to assist the Board in its consideration of strategic issues such as the merger, consolidation or repurposing of certain open-end funds; and (vii) performing other administrative functions necessary for the operation of each Fund, such as tax reporting, fulfilling regulatory filing requirements and call center services. The Board reviewed the structure and duties of BlackRock’s fund administration, shareholder services, legal and compliance departments and considered BlackRock’s policies and procedures for assuring compliance with applicable laws and regulations.
B. The Investment Performance of each Fund and BlackRock: The Board, including the Independent Board Members, also reviewed and considered the performance history of each Fund. In preparation for the April Meeting, the Board worked with its independent legal counsel, BlackRock and Lipper to develop a template for, and was provided with, reports independently prepared by Lipper, which included a comprehensive analysis of each Fund’s performance. The Board also reviewed a narrative and statistical analysis of the Lipper data that was prepared by BlackRock. In connection with its review, the Board received and reviewed information regarding the investment performance of each Fund as compared to other funds in its applicable Lipper category. The Board was provided with a description of the methodology used by Lipper to select peer funds and periodically meets with Lipper representatives to review its methodology. The Board and its Performance Oversight Committee regularly review, and meet with Fund management to discuss, the performance of each Fund throughout the year.
In evaluating performance, the Board recognized that the performance data reflects a snapshot of a period or as of a particular date and that selecting a different performance period could produce significantly different results. Further, the Board recognized that it is possible that long-term performance can be adversely affected by even one period of significant underperformance so that a single investment decision or theme has the ability to affect long-term performance disproportionately.
The Board noted that for the one-, three- and five-year periods reported, the EuroFund ranked in the fourth, second and fourth quartiles, respectively, against its Lipper Performance Universe. The Board and BlackRock reviewed and discussed the reasons for the EuroFund’s underperformance during the one- and five-year periods. The Board was informed that, among other things, the primary detractor of performance for the one-year period was an underweight position in the energy, materials, food & beverage and personal & household goods sectors, which rallied in the second quarter of 2014. EuroFund management’s positive view on global growth at the start of 2011 was challenged by the Japanese earthquake, the Arab Spring, and rising inflation pressures all combining to produce a negative impact on global growth. Additionally, as a result of the EuroFund’s overexposure to companies with international exposure, the Fund underperformed during the first quarter of 2011.
The Board and BlackRock also discussed BlackRock’s strategy for improving the EuroFund’s performance and BlackRock’s commitment to providing the resources necessary to assist the EuroFund’s portfolio managers in seeking to do so.
The Board noted that for each of the one-, three- and five-year periods reported, the Global SmallCap Fund ranked in the second quartile against its Lipper Performance Universe.
C. Consideration of the Advisory/Management Fees and the Cost of the Services and Profits to be Realized by BlackRock and its Affiliates from their Relationship with each Fund: The Board, including the Independent Board Members, reviewed each Fund’s contractual management fee rate compared with the other funds in its Lipper category. The contractual management fee rate represents a combination of the advisory fee and any administrative fees, before taking into account any reimbursements or fee waivers. The Board also compared each Fund’s total expense ratio, as well as its actual management fee rate, to those of other funds in its Lipper category. The total expense ratio represents a fund’s total net operating expenses, including any 12b-1 or non 12b-1 service fees. The total expense ratio gives effect to any expense reimbursements or fee waivers that benefit a fund, and the actual management fee rate gives effect to any management fee reimbursements or waivers that benefit a fund. The Board considered the services provided and the fees charged by BlackRock and its affiliates to other types of clients with similar investment mandates, as applicable, including institutional accounts and sub-advised mutual funds.
| | | | | | |
| | | | | | | |
| 46 | | ANNUAL REPORT | | JUNE 30, 2015 | | |
| | |
| Disclosure of Investment Advisory Agreements and Sub-Advisory Agreement (continued) |
The Board received and reviewed statements relating to BlackRock’s financial condition. The Board reviewed BlackRock’s profitability methodology and was also provided with a profitability analysis that detailed the revenues earned and the expenses incurred by BlackRock for services provided to each Fund. The Board reviewed BlackRock’s profitability with respect to each Fund and other funds the Board currently oversees for the year ended December 31, 2014 compared to available aggregate profitability data provided for the two prior years. The Board reviewed BlackRock’s profitability with respect to certain other U.S. fund complexes managed by the Manager and/or its affiliates. The Board reviewed BlackRock’s assumptions and methodology of allocating expenses in the profitability analysis, noting the inherent limitations in allocating costs among various advisory products. The Board recognized that profitability may be affected by numerous factors including, among other things, fee waivers and expense reimbursements by the Manager, the types of funds managed, precision of expense allocations and business mix. As a result, calculating and comparing profitability at individual fund levels is difficult.
The Board noted that, in general, individual fund or product line profitability of other advisors is not publicly available. The Board reviewed BlackRock’s overall operating margin, in general, compared to that of certain other publicly-traded asset management firms. The Board considered the differences between BlackRock and these other firms, including the contribution of technology at BlackRock, BlackRock’s expense management, and the relative product mix.
In addition, the Board considered the cost of the services provided to each Fund by BlackRock, and BlackRock’s and its affiliates’ profits relating to the management and distribution of each Fund and the other funds advised by BlackRock and its affiliates. As part of its analysis, the Board reviewed BlackRock’s methodology in allocating its costs to the management of each Fund. The Board may periodically receive and review information from independent third parties as part of its annual evaluation. BlackRock retained an independent third party to evaluate its cost allocation methodologies in the context of BlackRock’s 1940 Act Fund business. The Board considered the results of that evaluation in connection with BlackRock’s profitability reporting. The Board also considered whether BlackRock has the financial resources necessary to attract and retain high quality investment management personnel to perform its obligations under the Agreements and to continue to provide the high quality of services that is expected by the Board. The Board further considered factors including but not limited to BlackRock’s commitment of time, assumption of risk and liability profile in servicing each Fund in contrast to what is required of BlackRock with respect to other products with similar investment mandates across the open-end fund, ETF, closed-end fund, sub-advised mutual fund and institutional account product channels, as applicable.
The Board noted that the EuroFund’s contractual management fee rate ranked in the second quartile, and that the actual management fee rate and total expense ratio each ranked in the first quartile, relative to the EuroFund’s Expense Peers. The Board additionally noted that the EuroFund has an advisory fee arrangement that includes breakpoints that adjust the fee rate downward as the size of the EuroFund increases above certain contractually specified levels.
The Board noted that the Global SmallCap Fund’s contractual management fee rate ranked in the first quartile, and that the actual management fee rate and total expense ratio ranked in the first and second quartiles, respectively, relative to the Global SmallCap Fund’s Expense Peers. The Board also noted that the Global SmallCap Fund has an advisory fee arrangement that includes breakpoints that adjust the fee rate downward as the size of the Global SmallCap Fund increases above certain contractually specified levels.
D. Economies of Scale: The Board, including the Independent Board Members, considered the extent to which economies of scale might be realized as the assets of each Fund increase, as well as the existence of expense caps, as applicable. The Board also considered the extent to which each Fund benefits from such economies and whether there should be changes in the advisory fee rate or breakpoint structure in order to enable each Fund to participate in these economies of scale, for example through the use of revised breakpoints in the advisory fee based upon the asset level of each Fund. In its consideration, the Board Members took into account the existence of any expense caps and further considered the continuation and/or implementation, as applicable, of such caps.
E. Other Factors Deemed Relevant by the Board Members: The Board, including the Independent Board Members, also took into account other ancillary or “fall-out” benefits that BlackRock or its affiliates may derive from their respective relationships with each Fund, both tangible and intangible, such as BlackRock’s ability to leverage its investment professionals who manage other portfolios and risk management personnel, an increase in BlackRock’s profile in the investment advisory community, and the engagement of BlackRock’s affiliates as service providers to each Fund, including for administrative, distribution, securities lending and cash management services. The Board also considered BlackRock’s overall operations and its efforts to expand the scale of, and improve the quality of, its operations. The Board also noted that BlackRock may use and benefit from third party research obtained by soft dollars generated by certain registered fund transactions to assist in managing all or a number of its other client accounts. The Board further noted that it had considered the investment by BlackRock’s funds in affiliated ETFs without any offset against the management fees payable by the funds to BlackRock.
| | | | | | |
| | | | | | | |
| | ANNUAL REPORT | | JUNE 30, 2015 | | 47 |
| | |
| Disclosure of Investment Advisory Agreements and Sub-Advisory Agreement (concluded) |
In connection with its consideration of the Agreements, the Board also received information regarding BlackRock’s brokerage and soft dollar practices. The Board received reports from BlackRock which included information on brokerage commissions and trade execution practices throughout the year.
The Board noted the competitive nature of the open-end fund marketplace, and that shareholders are able to redeem their Fund shares if they believe that each Fund’s fees and expenses are too high or if they are dissatisfied with the performance of each Fund.
Conclusion
The Board, including the Independent Board Members, approved the continuation of the Advisory Agreements between the Manager and each Fund for a one-year term ending June 30, 2016, and the Sub-Advisory Agreement between the Manager and the Sub-Advisor, with respect to the EuroFund, for a one-year term ending June 30, 2016. Based upon its evaluation of all of the aforementioned factors in their totality, the Board, including the Independent Board Members, was satisfied that the terms of the Advisory Agreements and, with respect to the EuroFund, the Sub-Advisory Agreement, were fair and reasonable and in the best interest of each Fund and its shareholders. In arriving at its decision to approve the Agreements, the Board did not identify any single factor or group of factors as all-important or controlling, but considered all factors together, and different Board Members may have attributed different weights to the various factors considered. The Independent Board Members were also assisted by the advice of independent legal counsel in making this determination. The contractual fee arrangements for each Fund reflect the results of several years of review by the Board Members and predecessor Board Members, and discussions between such Board Members (and predecessor Board Members) and BlackRock. As a result, the Board Members’ conclusions may be based in part on their consideration of these arrangements in prior years.
| | | | | | |
| | | | | | | |
| 48 | | ANNUAL REPORT | | JUNE 30, 2015 | | |
| | | | | | | | | | |
Name, Address1 and Year of Birth | | Position(s) Held with Funds | | Length of Time Served as a Director3 | | Principal Occupation(s) During Past Five Years | | Number of BlackRock-
Advised Registered
Investment Companies
(“RICs”) Consisting of
Investment Portfolios
(“Portfolios”) Overseen | | Public Directorships |
| Independent Directors2 |
Robert M. Hernandez 1944 | | Chair of the Board and Director | | Since 2007 | | Director, Vice Chairman and Chief Financial Officer of USX Corporation (energy and steel business) from 1991 to 2001; Director, TE Connectivity (electronics) from 2006 to 2012. | | 28 RICs consisting of 98 Portfolios | | ACE Limited (insurance company); Eastman Chemical Company; RTI International Metals, Inc. |
Fred G. Weiss 1941 | | Vice Chair of the Board and Director | | Since 2007 | | Managing Director, FGW Consultancy LLC (consultancy and investment company) since 1997; Director and Treasurer, Michael J. Fox Foundation for Parkinson’s Research since 2000; Director, BTG International plc (medical technology commercialization company) from 2001 to 2007. | | 28 RICs consisting of 98 Portfolios | | Allergan plc (pharmaceuticals) |
James H. Bodurtha 1944 | | Director | | Since 2002 | | Director, The China Business Group, Inc. (consulting and investing firm) from 1996 to 2013 and Executive Vice President thereof from 1996 to 2003; Chairman of the Board, Berkshire Holding Corporation since 1980. | | 28 RICs consisting of 98 Portfolios | | None |
Bruce R. Bond 1946 | | Director | | Since 2007 | | Trustee and Member of the Governance Committee, State Street Research Mutual Funds from 1997 to 2005; Board Member of Governance, Audit and Finance Committee, Avaya Inc. (computer equipment) from 2003 to 2007. | | 28 RICs consisting of 98 Portfolios | | None |
Valerie G. Brown 1956 | | Director | | Since 2015 | | Chief Executive Officer and Director, Cetera Financial Group (broker-dealer and registered investment adviser services) from 2010 to 2014; Director and Vice Chairman of the Board, Financial Services Institute (trade organization) from 2009 to 2014; Director and Committee Chair, Securities Industry and Financial Markets Association (trade organization) from 2006 to 2014. | | 28 RICs consisting of 98 Portfolios | | None |
Donald W. Burton 1944 | | Director | | Since 2007 | | Managing General Partner, The Burton Partnership, LP (an investment partnership) since 1979; Managing General Partner, The Burton Partnership (QP), LP (an investment partnership) since 2000; Managing General Partner, The South Atlantic Venture Funds from 1983 to 2012; Director, IDology, Inc. (technology solutions) since 2006; Director, Knology, Inc. (telecommunications) from 1996 to 2012; Director, Capital Southwest (financial) from 2006 to 2012. | | 28 RICs consisting of 98 Portfolios | | None |
Honorable Stuart E. Eizenstat 1943 | | Director | | Since 2007 | | Partner and Head of International Practice, Covington and Burling LLP (law firm) since 2001; International Advisory Board Member, The Coca-Cola Company from 2002 to 2011; Advisory Board Member, Veracity Worldwide, LLC (risk management) from 2007 to 2012; Member of the International Advisory Board GML Ltd. (energy) since 2003; Advisory Board Member, BT Americas (telecommunications) from 2004 to 2009. | | 28 RICs consisting of 98 Portfolios | | Alcatel-Lucent (tele- communications); Global Specialty Metallurgical; UPS Corporation (delivery service) |
Kenneth A. Froot 1957 | | Director | | Since 2005 | | Professor, Harvard University from 1993 to 2012. | | 28 RICs consisting of 98 Portfolios | | None |
John F. O’Brien 1943 | | Director | | Since 2007 | | Chairman, Woods Hole Oceanographic Institute since 2009 and Trustee thereof from 2003 to 2009. | | 28 RICs consisting of 98 Portfolios | | Cabot Corporation (chemicals); LKQ Corporation (auto parts manufacturing); TJX Companies, Inc. (retailer) |
| | | | | | |
| | | | | | | |
| | ANNUAL REPORT | | JUNE 30, 2015 | | 49 |
| | |
| Officers and Directors (continued) | | |
| | | | | | | | | | |
Name, Address1 and Year of Birth | | Position(s) Held with Funds | | Length of Time Served as a Director3 | | Principal Occupation(s) During Past Five Years | | Number of BlackRock-
Advised Registered
Investment Companies
(“RICs”) Consisting of
Investment Portfolios
(“Portfolios”) Overseen | | Public Directorships |
| Independent Directors2 (concluded) |
Donald C. Opatrny 1952 | | Director | | Since 2015 | | Trustee, Member of the Executive Committee and Chair of the Investment Committee, Cornell University since 2004; Member of the Board and Investment Committee, University School since 2007; Member of the Investment Committee, Mellon Foundation from 2009 to 2015; President and Trustee, the Center for the Arts, Jackson Hole since 2011; Director, Athena Capital Advisors LLC (investment management firm) since 2013; Trustee and Chair of the Investment Committee, Community Foundation of Jackson Hole since 2014; Trustee, Artstor (a Mellon Foundation affiliate) since 2010; President, Trustee and Member of the Investment Committee, The Aldrich Contemporary Art Museum from 2007 to 2014. | | 28 RICs consisting of 98 Portfolios | | None |
Roberta Cooper Ramo 1942 | | Director | | Since 2007 | | Shareholder and Attorney, Modrall, Sperling, Roehl, Harris & Sisk, P.A. (law firm) since 1993; Chairman of the Board, Cooper’s Inc. (retail) since 1999; Director, ECMC Group (service provider to students, schools and lenders) since 2001; President, The American Law Institute (non-profit) since 2008; Vice President, Santa Fe Opera (non-profit) since 2011; Chair, Think New Mexico (non-profit), since 2013. | | 28 RICs consisting of 98 Portfolios | | None |
David H. Walsh 1941 | | Director | | Since 2007 | | Director, National Museum of Wildlife Art since 2007; Trustee, University of Wyoming Foundation from 2008 to 2012; Director, The American Museum of Fly Fishing since 1997. | | 28 RICs consisting of 98 Portfolios | | None |
| | 1 The address of each Director and Officer is c/o BlackRock, Inc., 55 East 52nd Street, New York, NY 10055. |
| | 2 Each Independent Director holds office until his or her successor is duly elected and qualifies or until his or her earlier death, resignation, retirement or removal as provided by the Funds’ by-laws or charter or statute. In no event may an Independent Director hold office beyond December 31 of the year in which he or she turns 75. |
| | 3 Date shown is the earliest date a person has served for the Funds. Following the combination of Merrill Lynch Investment Managers, L.P. (“MLIM”) and BlackRock, Inc. (“BlackRock”) in September 2006, the various legacy MLIM and legacy BlackRock fund boards were realigned and consolidated into three new fund boards in 2007. As a result, although the chart shows certain Directors as joining the Funds’ board in 2007, those Directors first became members of the boards of other legacy MLIM or legacy BlackRock funds as follows: James H. Bodurtha, 1995; Bruce R. Bond, 2005; Donald W. Burton, 2002; Honorable Stuart E. Eizenstat, 2001; Kenneth A. Froot, 2005; Robert M. Hernandez, 1996; John F. O’Brien, 2005; Roberta Cooper Ramo, 1999; David H. Walsh, 2003; and Fred G. Weiss, 1998. |
| Interested Directors4 |
Robert Fairbairn 1965 | | Director | | Since 2015 | | Senior Managing Director of BlackRock since 2010; Global Head of BlackRock’s Retail and iShares businesses since 2012; Member of BlackRock’s Global Executive and Global Operating Committees; Head of BlackRock’s Global Client Group from 2009 to 2012; Chairman of BlackRock’s international businesses from 2007 to 2010. | | 28 RICs consisting of 98 Portfolios | | None |
Henry Gabbay 1947 | | Director | | Since 2007 | | Consultant, BlackRock from 2007 to 2008; Managing Director, BlackRock from 1989 to 2007; Chief Administrative Officer, BlackRock Advisors, LLC from 1998 to 2007; President of BlackRock Funds and BlackRock Allocation Target Shares (formerly BlackRock Bond Allocation Target Shares) from 2005 to 2007 and Treasurer of certain closed-end funds in the BlackRock fund complex from 1989 to 2006. | | 28 RICs consisting of 98 Portfolios | | None |
| | | | | | |
| | | | | | | |
| 50 | | ANNUAL REPORT | | JUNE 30, 2015 | | |
| | |
| Officers and Directors (continued) | | |
| | | | | | | | | | |
Name, Address1 and Year of Birth | | Position(s) Held with Funds | | Length of Time Served as a Director3 | | Principal Occupation(s) During Past Five Years | | Number of BlackRock-
Advised Registered
Investment Companies
(“RICs”) Consisting of
Investment Portfolios
(“Portfolios”) Overseen | | Public Directorships |
| Interested Directors4 (concluded) |
John M. Perlowski 1964 | | Director, President5 and Chief Executive Officer | | 2015 to present Director; 2010 to present President and Chief Executive Officer | | Managing Director of BlackRock since 2009; Head of BlackRock Global Fund Services since 2009; Managing Director and Chief Operating Officer of the Global Product Group at Goldman Sachs Asset Management, L.P. from 2003 to 2009; Treasurer of Goldman Sachs Mutual Funds from 2003 to 2009 and Senior Vice President thereof from 2007 to 2009; Director of Goldman Sachs Offshore Funds from 2002 to 2009; Director of Family Resource Network (charitable foundation) since 2009. | | 104 RICs consisting of 174 Portfolios | | None |
| | 4 Messrs. Fairbairn and Perlowski are both “interested persons,” as defined in the 1940 Act, of the Funds based on their positions with BlackRock and its affiliates. Mr. Gabbay may be deemed an “interested person” of the Funds based on his former positions with BlackRock and its affiliates. Mr. Gabbay does not currently serve as an officer or employee of BlackRock or its affiliates or own any securities of BlackRock or The PNC Financial Services Group, Inc. Mr. Gabbay is a non-management Interested Director. Interested Directors serve until their successor is duly elected and qualifies or until their earlier death, resignation, retirement or removal as provided by the Funds’ by-laws or charter or statute, or until December 31 of the year in which they turn 72. Officers of the Fund serve at the pleasure of the Board. |
| | | 5 For EuroFund. |
| | | | | | |
| | | | | | | |
| | ANNUAL REPORT | | JUNE 30, 2015 | | 51 |
| | |
| Officers and Directors (concluded) | | |
| | | | | | |
Name, Address1 and Year of Birth | | Position(s) Held with Funds | | Length of Time Served as
an Officer | | Principal Occupation(s) During Past Five Years |
| Officers2 |
Jennifer McGovern 1977 | | Vice President | | Since 2014 | | Director of BlackRock since 2011; Head of Product Structure and Oversight for BlackRock’s U.S. Wealth Advisory Group since 2013; Vice President of BlackRock from 2008 to 2010. |
Neal Andrews 1966 | | Chief Financial Officer | | Since 2007 | | Managing Director of BlackRock since 2006; Senior Vice President and Line of Business Head of Fund Accounting and Administration at PNC Global Investment Servicing (U.S.) Inc. from 1992 to 2006. |
Jay Fife 1970 | | Treasurer | | Since 2007 | | Managing Director of BlackRock since 2007; Director of BlackRock in 2006; Assistant Treasurer of the MLIM and Fund Asset Management, L.P. advised funds from 2005 to 2006; Director of MLIM Fund Services Group from 2001 to 2006. |
Charles Park 1967 | | Chief Compliance Officer | | Since 2014 | | Anti-Money Laundering Compliance Officer for the BlackRock-advised Funds in the Equity-Bond Complex, the Equity-liquidity Complex and the Closed-End Complex from 2014 to 2015; Chief Compliance Officer of BlackRock Advisors LLC and the BlackRock-advised Funds in the Equity Bond Complex since 2014. Principal of and Chief Compliance Officer for iShares® Delaware Trust Sponsor LLC since 2012 and BlackRock Fund Advisors (“BFA”) since 2006; Chief Compliance Officer for the BFA-advised iShares exchange traded funds since 2006; Chief Compliance Officer for BlackRock Asset Management International Inc. since 2012. |
Fernanda Piedra 1969 | | Anti-Money Laundering Compliance Officer | | Since 2015 | | Director of BlackRock since 2014; Anti-Money Laundering Compliance Officer and Regional Head of Financial Crime for the Americas at BlackRock since 2014; Head of Regulatory Changes and Remediation for the Asset Wealth Management Division of Deutsche Bank from 2010 to 2014; Vice President of Goldman Sachs (Anti-Money Laundering/Suspicious Activities Group) from 2004 to 2010. |
Benjamin Archibald 1975 | | Secretary | | Since 2012 | | Managing Director of BlackRock, Inc. since 2014; Director of BlackRock, Inc. from 2010 to 2013; Assistant Secretary of the BlackRock-advised funds from 2010 to 2012; General Counsel and Chief Operating Officer of Uhuru Capital Management from 2009 to 2010; Executive Director and Counsel of Goldman Sachs Asset Management from 2005 to 2009. |
| | 1 The address of each Officer is c/o BlackRock, Inc., 55 East 52nd Street, New York, NY 10055. |
| | 2 Officers of the Funds serve at the pleasure of the Board. |
| | Further information about the Funds’ Officers and Directors is available in the Fund’s Statement of Additional Information, which can be obtained without charge by calling (800) 441-7762. |
Effective March 1, 2015, Charles Park resigned as Anti-Money Laundering Compliance Officer of the Funds and Fernanda Piedra became Anti-Money Laundering Compliance Officer of the Funds.
Effective as of the close of business on May 13, 2015, Valerie G. Brown and Donald C. Opatrny were appointed to serve as Directors of the Funds.
| | | | | | | | |
| | | | | |
Investment Advisor BlackRock Advisors, LLC Wilmington, DE 19809 | | Custodian Brown Brothers
Harriman & Co. Boston, MA 02109 | | Accounting Agent State Street Bank and
Trust Company Boston, MA 02110 | | Legal Counsel Willkie Farr & Gallagher LLP New York, NY 10019 | | Address of the Funds 100 Bellevue Parkway Wilmington, DE 19809 |
| | | | |
Sub-Advisors BlackRock
International Limited3 Edinburgh, EH3 8BL, United Kingdom | | Transfer Agent BNY Mellon Investment
Servicing (US) Inc. Wilmington, DE 19809 | | Distributor BlackRock Investments, LLC New York, NY 10022 | | Independent Registered
Public Accounting Firm Deloitte & Touche LLP Boston, MA 02116 | | |
| | | | | | |
| | | | | | | |
| 52 | | ANNUAL REPORT | | JUNE 30, 2015 | | |
Householding
The Funds will mail only one copy of shareholder documents, including prospectuses, annual and semi-annual reports and proxy statements, to shareholders with multiple accounts at the same address. This practice is commonly called “householding” and is intended to reduce expenses and eliminate duplicate mailings of shareholder documents. Mailings of your shareholder documents may be householded indefinitely unless you instruct us otherwise. If you do not want the mailing of these documents to be combined with those for other members of your household, please call the Funds at (800) 441-7762.
Availability of Quarterly Schedule of Investments
The Funds file their complete schedule of portfolio holdings with the SEC for the first and third quarters of each fiscal year on Form N-Q. The Funds’ Forms N-Q are available on the SEC’s website at http://www.sec.gov and may also be reviewed and copied at the SEC’s Public Reference Room in Washington, D.C. Information on how to access documents on the SEC’s website without charge may be obtained by calling (800) SEC-0330. The Funds’ Forms N-Q may also be obtained upon request and without charge by calling (800) 441-7762.
Availability of Proxy Voting Policies and Procedures
A description of the policies and procedures that the Funds use to determine how to vote proxies relating to portfolio securities is available upon request and without charge (1) by calling (800) 441-7762; (2) at http://www.blackrock.com; and (3) on the SEC’s website at http://www.sec.gov.
Availability of Proxy Voting Record
Information about how the Funds voted proxies relating to securities held in the Funds’ portfolios during the most recent 12-month period ended June 30 is available upon request and without charge (1) at http://www.blackrock.com or by calling (800) 441-7762 and (2) on the SEC’s website at http://www.sec.gov.
BlackRock’s Mutual Fund Family
BlackRock offers a diverse lineup of open-end mutual funds crossing all investment styles and managed by experts in equity, fixed income and tax-exempt investing. Visit http://www.blackrock.com for more information.
| | | | | | |
| | | | | | | |
| | ANNUAL REPORT | | JUNE 30, 2015 | | 53 |
| | |
| Additional Information (concluded) | | |
Account Information
Call us at (800) 441-7762 from 8:00 AM to 6:00 PM EST on any business day to get information about your account balances, recent transactions and share prices. You can also reach us on the Web at http://www.blackrock.com/funds.
Automatic Investment Plans
Investor Class shareholders who want to invest regularly can arrange to have $50 or more automatically deducted from their checking or savings account and invested in any of the BlackRock funds.
Systematic Withdrawal Plans
Investor Class shareholders can establish a systematic withdrawal plan and receive periodic payments of $50 or more from their BlackRock funds, as long as their account balance is at least $10,000.
Retirement Plans
Shareholders may make investments in conjunction with Traditional, Rollover, Roth, Coverdell, Simple IRAs, SEP IRAs and 403(b) Plans.
| | |
| BlackRock Privacy Principles | | |
BlackRock is committed to maintaining the privacy of its current and former fund investors and individual clients (collectively, “Clients”) and to safeguarding their non-public personal information. The following information is provided to help you understand what personal information BlackRock collects, how we protect that information and why in certain cases we share such information with select parties.
If you are located in a jurisdiction where specific laws, rules or regulations require BlackRock to provide you with additional or different privacy-related rights beyond what is set forth below, then BlackRock will comply with those specific laws, rules or regulations.
BlackRock obtains or verifies personal non-public information from and about you from different sources, including the following: (i) information we receive from you or, if applicable, your financial intermediary, on applications, forms or other documents; (ii) information about your transactions with us, our affiliates, or others; (iii) information we receive from a consumer reporting agency; and (iv) from visits to our websites.
BlackRock does not sell or disclose to non-affiliated third parties any non-public personal information about its Clients, except as permitted by law or as is necessary to respond to regulatory requests or to service Client accounts. These non-affiliated third parties are required to protect the confidentiality and security of this information and to use it only for its intended purpose.
We may share information with our affiliates to service your account or to provide you with information about other BlackRock products or services that may be of interest to you. In addition, BlackRock restricts access to non-public personal information about its Clients to those BlackRock employees with a legitimate business need for the information. BlackRock maintains physical, electronic and procedural safeguards that are designed to protect the non-public personal information of its Clients, including procedures relating to the proper storage and disposal of such information.
| | | | | | |
| | | | | | | |
| 54 | | ANNUAL REPORT | | JUNE 30, 2015 | | |
This report is intended for current holders. It is not authorized for use as an offer of sale or a solicitation of an offer to buy shares of the Funds unless preceded or accompanied by the Funds’ current prospectus. Past performance results shown in this report should not be considered a representation of future performance. Investment returns and principal value of shares will fluctuate so that shares, when redeemed, may be worth more or less than their original cost. Statements and other information herein are as dated and are subject to change.

| | |
| EGSC-6/15-AR | | |
| |
| |  |
| Item 2 – | Code of Ethics – The registrant (or the “Fund”) has adopted a code of ethics, as of the end of the period covered by this report, applicable to the registrant’s principal executive officer, principal financial officer, principal accounting officer or controller, or persons performing similar functions. During the period covered by this report, the code of ethics was amended to update certain information and to make other non-material changes. During the period covered by this report, there have been no waivers granted under the code of ethics. A copy of the code of ethics is available without charge at www.blackrock.com. |
| Item 3 – | Audit Committee Financial Expert – The registrant’s board of trustees (the “board of trustees”), has determined that (i) the registrant has the following audit committee financial experts serving on its audit committee and (ii) each audit committee financial expert is independent: |
Robert M. Hernandez
Fred G. Weiss
Stuart E. Eizenstat
Bruce R. Bond
Under applicable securities laws, a person determined to be an audit committee financial expert will not be deemed an “expert” for any purpose, including without limitation for the purposes of Section 11 of the Securities Act of 1933, as a result of being designated or identified as an audit committee financial expert. The designation or identification of a person as an audit committee financial expert does not impose on such person any duties, obligations, or liabilities greater than the duties, obligations, and liabilities imposed on such person as a member of the audit committee and board of trustees in the absence of such designation or identification.
| Item 4 – | Principal Accountant Fees and Services |
The following table presents fees billed by Deloitte & Touche LLP (“D&T”) in each of the last two fiscal years for the services rendered to the Fund:
| | | | | | | | | | | | | | | | | | | | | | | | | | | | | | |
| | | (a) Audit Fees | | (b) Audit-Related Fees1 | | (c) Tax Fees2 | | (d) All Other Fees3 |
| Entity Name | | Current
Fiscal
Year End | | | | Previous
Fiscal
Year
End | | | | Current
Fiscal
Year
End | | | | Previous
Fiscal
Year
End | | | | Current
Fiscal
Year
End | | | | Previous
Fiscal
Year
End | | | | Current
Fiscal
Year
End | | | | Previous
Fiscal
Year
End |
BlackRock EuroFund | | $36,163 | | | | $36,163 | | | | $0 | | | | $0 | | | | $14,127 | | | | $13,850 | | | | $0 | | | | $0 |
The following table presents fees billed by D&T that were required to be approved by the registrant’s audit committee (the “Committee”) for services that relate directly to the operations or financial reporting of the Fund and that are rendered on behalf of BlackRock Advisors, LLC (“Investment Adviser” or “BlackRock”) and entities controlling, controlled by, or under common control with BlackRock (not including any sub-adviser whose role is primarily portfolio management and is subcontracted with or overseen by another investment adviser) that provide ongoing services to the Fund (“Fund Service Providers”):
2
| | | | |
| | | Current Fiscal Year End | | Previous Fiscal Year End |
(b) Audit-Related Fees1 | | $0 | | $0 |
(c) Tax Fees2 | | $0 | | $0 |
(d) All Other Fees3 | | $2,391,000 | | $2,555,000 |
1 The nature of the services includes assurance and related services reasonably related to the performance of the audit of financial statements not included in Audit Fees.
2 The nature of the services includes tax compliance, tax advice and tax planning.
3 Aggregate fees borne by BlackRock in connection with the review of compliance procedures and attestation thereto performed by D&T with respect to all of the registered closed-end funds and some of the registered open-end funds advised by BlackRock.
(e)(1) Audit Committee Pre-Approval Policies and Procedures:
The Committee has adopted policies and procedures with regard to the pre-approval of services. Audit, audit-related and tax compliance services provided to the registrant on an annual basis require specific pre-approval by the Committee. The Committee also must approve other non-audit services provided to the registrant and those non-audit services provided to the Investment Adviser and Fund Service Providers that relate directly to the operations and the financial reporting of the registrant. Certain of these non-audit services that the Committee believes are (a) consistent with the SEC’s auditor independence rules and (b) routine and recurring services that will not impair the independence of the independent accountants may be approved by the Committee without consideration on a specific case-by-case basis (“general pre-approval”). The term of any general pre-approval is 12 months from the date of the pre-approval, unless the Committee provides for a different period. Tax or other non-audit services provided to the registrant which have a direct impact on the operations or financial reporting of the registrant will only be deemed pre-approved provided that any individual project does not exceed $10,000 attributable to the registrant or $50,000 per project. For this purpose, multiple projects will be aggregated to determine if they exceed the previously mentioned cost levels.
Any proposed services exceeding the pre-approved cost levels will require specific pre-approval by the Committee, as will any other services not subject to general pre-approval (e.g., unanticipated but permissible services). The Committee is informed of each service approved subject to general pre-approval at the next regularly scheduled in-person board meeting. At this meeting, an analysis of such services is presented to the Committee for ratification. The Committee may delegate to the Committee Chairman the authority to approve the provision of and fees for any specific engagement of permitted non-audit services, including services exceeding pre-approved cost levels.
(e)(2) None of the services described in each of Items 4(b) through (d) were approved by the Committee pursuant to the de minimis exception in paragraph (c)(7)(i)(C) of Rule 2-01 of Regulation S-X.
(f) Not Applicable
(g) The aggregate non-audit fees paid to the accountant for services rendered by the accountant to the registrant, the Investment Adviser and the Fund Service Providers were:
| | | | |
| Entity Name | | Current Fiscal Year End | | Previous Fiscal Year End |
BlackRock EuroFund | | $14,127 | | $13,850 |
3
| | Additionally, SSAE 16 Review (Formerly, SAS No. 70) fees for the current and previous fiscal years of $2,391,000 and $2,555,000, respectively, were billed by D&T to the Investment Adviser. |
| | (h) The Committee has considered and determined that the provision of non-audit services that were rendered to the Investment Adviser and the Fund Service Providers that were not pre-approved pursuant to paragraph (c)(7)(ii) of Rule 2-01 of Regulation S-X is compatible with maintaining the principal accountant’s independence. |
| Item 5 – | Audit Committee of Listed Registrants – Not Applicable |
| | (a) The registrant’s Schedule of Investments is included as part of the Report to Stockholders filed under Item 1 of this Form. |
| | (b) Not Applicable due to no such divestments during the semi-annual period covered since the previous Form N-CSR filing. |
| Item 7 – | Disclosure of Proxy Voting Policies and Procedures for Closed-End Management Investment Companies – Not Applicable |
| Item 8 – | Portfolio Managers of Closed-End Management Investment Companies – Not Applicable |
| Item 9 – | Purchases of Equity Securities by Closed-End Management Investment Company and Affiliated Purchasers – Not Applicable |
| Item 10 – | Submission of Matters to a Vote of Security Holders – There have been no material changes to these procedures. |
| Item 11 – | Controls and Procedures |
| | (a) The registrant’s principal executive and principal financial officers, or persons performing similar functions, have concluded that the registrant’s disclosure controls and procedures (as defined in Rule 30a-3(c) under the Investment Company Act of 1940, as amended (the “1940 Act”)) are effective as of a date within 90 days of the filing of this report based on the evaluation of these controls and procedures required by
Rule 30a-3(b) under the 1940 Act and Rule 15d-15(b) under the Securities Exchange Act of 1934, as amended. |
| | (b) There were no changes in the registrant’s internal control over financial reporting (as defined in Rule 30a-3(d) under the 1940 Act) that occurred during the second fiscal quarter of the period covered by this report that have materially affected, or are reasonably likely to materially affect, the registrant’s internal control over financial reporting. |
| Item 12 – | Exhibits attached hereto |
| | (a)(1) Code of Ethics – See Item 2 |
| | (a)(2) Certifications – Attached hereto |
4
(b) Certifications – Attached hereto
5
Pursuant to the requirements of the Securities Exchange Act of 1934 and the Investment Company Act of 1940, the registrant has duly caused this report to be signed on its behalf by the undersigned, thereunto duly authorized.
BlackRock EuroFund
| | | | |
| By: | | /s/ John M. Perlowski | | |
| | John M. Perlowski | | |
| | Chief Executive Officer (principal executive officer) of |
| | BlackRock EuroFund |
| | |
| Date: | | September 3, 2015 | | |
Pursuant to the requirements of the Securities Exchange Act of 1934 and the Investment Company Act of 1940, this report has been signed below by the following persons on behalf of the registrant and in the capacities and on the dates indicated.
| | | | |
| By: | | /s/ John M. Perlowski | | |
| | John M. Perlowski | | |
| | Chief Executive Officer (principal executive officer) of |
| | BlackRock EuroFund |
| | |
| Date: | | September 3, 2015 | | |
| | |
| By: | | /s/ Neal J. Andrews | | |
| | Neal J. Andrews | | |
| | Chief Financial Officer (principal financial officer) of |
| | BlackRock EuroFund |
| | |
| Date: | | September 3, 2015 | | |
6