UNITED STATES
SECURITIES AND EXCHANGE COMMISSION
Washington, D.C. 20549
FORM N-CSR
CERTIFIED SHAREHOLDER REPORT OF REGISTERED MANAGEMENT
INVESTMENT COMPANIES
Investment Company Act file number: 811-04612
Name of Fund: BlackRock EuroFund
Fund Address: 100 Bellevue Parkway, Wilmington, DE 19809
Name and address of agent for service: John M. Perlowski, Chief Executive Officer, BlackRock EuroFund,
55 East 52nd Street, New York, NY 10055
Registrant’s telephone number, including area code: (800) 441-7762
Date of fiscal year end: 06/30/2018
Date of reporting period: 06/30/2018
Item 1 – Report to Stockholders
JUNE 30, 2018
| | |
ANNUAL REPORT | |  |
BlackRock Advantage Global Fund, Inc.
BlackRock EuroFund
|
| Not FDIC Insured • May Lose Value • No Bank Guarantee |
The Markets in Review
Dear Shareholder,
In the 12 months ended June 30, 2018, the strongest corporate profits in seven years drove the equity market higher, while rising interest rates constrained bond returns. Though the market’s appetite for risk remained healthy, risk taking was tempered somewhat, as shorter-term, higher-quality securities led the bond market, and U.S. equities outperformed most international stock markets.
Strong equity performance worldwide was driven by synchronized economic growth across the most influential economies. However, volatility in emerging market stocks rose, as U.S.-China trade relations and debt concerns weighed heavily on the Chinese stock market.
Short-term U.S. Treasury interest rates rose the fastest, while longer-term rates slightly increased, leading to a substantial flattening of the yield curve. The annual return for the three-month U.S. Treasury bill surpassed 1.0%, but remained well below the annual headline inflation rate of 2.9%. In contrast, the ten-year U.S. Treasury — a bellwether of the bond market — posted a negative return, as rising inflation expectations drove yields higher. Although the fundamentals in credit markets remained relatively solid, investment-grade bonds declined slightly, and high-yield bonds posted modest returns.
In response to rising growth and inflation, the U.S. Federal Reserve (the “Fed”) increased short-term interest rates three times during the reporting period. The Fed also announced plans to reduce its $4.4 trillion balance sheet by $420 billion in 2018, which began the process of gradually reversing its unprecedented stimulus measures after the financial crisis. Meanwhile, the European Central Bank announced that its bond-purchasing program would conclude at the end of the year, while also expressing an open-ended commitment to low interest rates. In contrast, the Bank of Japan continued to expand its balance sheet through bond purchasing while lowering its expectations for inflation.
The U.S. economy continued to gain momentum despite the Fed’s modest reduction of economic stimulus; unemployment declined to 4.0%, wages increased, and the number of job openings reached a record high. Strong economic performance may justify a more rapid pace of rate hikes in 2018, as the headline inflation rate and investors’ expectations for inflation have already surpassed the Fed’s target of 2.0%.
While U.S. monetary policy is seeking to restrain economic growth and inflation, fiscal policy has produced new sources of growth that could nourish the economy for the next few years. Corporate tax cuts and repatriation of capital held abroad could encourage a virtuous cycle of business spending. Lower individual tax rates coupled with the robust job market may refresh consumer spending. Proposed infrastructure spending would deliver growth from the government sector, generate demand, and improve economic activity in other sectors.
We continue to believe the primary risks to economic expansion are trade protectionism, rapidly rising interest rates, and geopolitical tension. Given the deflationary forces of technology and globalization, a substantial increase in inflation is unlikely to materialize as long as the unemployment rate remains above 3.0%. However, we are closely monitoring trade protectionism and the rise of populism in Western nations. In particular, the outcome of trade negotiations between the United States and China is likely to influence the global growth trajectory and set the tone for free trade in many other nations.
In this environment, investors need to think globally, extend their scope across a broad array of asset classes, and be nimble as market conditions change. We encourage you to talk with your financial advisor and visit blackrock.com for further insight about investing in today’s markets.
Sincerely,

Rob Kapito
President, BlackRock Advisors, LLC

Rob Kapito
President, BlackRock Advisors, LLC
| | | | |
| Total Returns as of June 30, 2018 |
| | | 6-month | | 12-month |
U.S. large cap equities
(S&P 500® Index) | | 2.65% | | 14.37% |
U.S. small cap equities
(Russell 2000® Index) | | 7.66 | | 17.57 |
International equities
(MSCI Europe, Australasia,
Far East Index) | | (2.75) | | 6.84 |
Emerging market equities
(MSCI Emerging Markets Index) | | (6.66) | | 8.20 |
3-month Treasury bills
(ICE BofAML 3-Month U.S. Treasury Bill Index) | | 0.81 | | 1.36 |
U.S. Treasury securities
(ICE BofAML 10-Year U.S. Treasury Index) | | (2.68) | | (2.69) |
U.S. investment grade bonds
(Bloomberg Barclays U.S.
Aggregate Bond Index) | | (1.62) | | (0.40) |
Tax-exempt municipal bonds
(S&P Municipal Bond Index) | | (0.02) | | 1.61 |
U.S. high yield bonds
(Bloomberg Barclays U.S. Corporate High Yield 2% Issuer
Capped Index) | | 0.16 | | 2.62 |
| Past performance is no guarantee of future results. Index performance is shown for illustrative purposes only. You cannot invest directly in an index. |
| | |
| 2 | | THIS PAGEISNOT PARTOF YOUR FUND REPORT |
Table of Contents

| | |
| Fund Summary as of June 30, 2018 | | BlackRock Advantage Global Fund, Inc. |
Investment Objective
BlackRock Advantage Global Fund, Inc.’s (the “Fund”) investment objective is to seek long-term capital appreciation.
On March 27, 2017, the Fund’s Board approved a proposal to change the name of BlackRock Global SmallCap Fund, Inc. to BlackRock Advantage Global Fund, Inc. The Board also approved certain changes to the Fund’s investment objective and investment strategies. In addition, Fund management has determined to change the benchmark indices against which the Fund compares its performance. At a joint special meeting held on August 24, 2017, the shareholders of the Fund approved the change to the Fund’s investment objective. These changes became effective on October 26, 2017. On December 27, 2017, the Fund’s issued and outstanding Investor B Shares converted to Investor A Shares.
Portfolio Management Commentary
How did the Fund perform?
For the 12-month period ended June 30, 2018, the Fund outperformed its new benchmark, the MSCI All Country World Index. For the same period, the Fund underperformed its former benchmark, the MSCI All Country World Small Cap Index.
On October 26, 2017, the Fund changed its name to BlackRock Advantage Global Fund. Concurrently, there were changes to the Fund’s investment objective and investment strategies. Its benchmark changed from the MSCI All Country World Small Cap Index to the MSCI All Country World Index on the same date. The investment adviser believes the MSCI All Country World Index is more relevant to the Fund’s new investment objective and investment strategies. Following the repositioning, the Fund is managed by BlackRock’s Systematic Active Equity (SAE) team, which incorporates a research-driven, systematic approach to identifying differentiated performance opportunities across markets. Performance prior to that date is attributable to the previous portfolio management team.
What factors influenced performance?
Prior to the changes described above, stock selection in the consumer discretionary sector was the largest contributor to relative performance. Specifically, the Fund generated strong results in the hotels, restaurants & leisure industry, where Jubilant Foodworks Ltd. and Arcos Dorados Holdings, Inc. were the leading contributors. Stock selection in the materials, real estate, financials and industrials sectors also added value.
Stock selection in the health care sector, which was weakest within the health care providers & services industry, was the largest detractor from returns under the previous management team. Selection in energy and utilities detracted, as well.
Stock selection was the primary driver of performance following the transition to the new management team. Insights led by more traditional measures of financial quality — specifically signals focusing on dividend growth, operating efficiency and balance sheet quality — outperformed. Trend-based insights that capture executive and broker sentiment through machine reading of company earnings calls and broker reports were also additive. At the individual signal level, an insight that captures market sentiment through comparisons of company balance sheet quality aided returns, as did a signal that captures relative value by examining retail investor positioning.
Macroeconomic thematic insights were the primary detractors following the transition to the new management team. An underweight in the energy sector, which was driven by industry selection insights derived from news flow and the examination of supply chain dynamics, was the top detractor as the sector outperformed due to the rally in oil prices. At the regional level, an overweight to Europe — which was based on country selection insights that focus on monetary policy and currency trends — underperformed as investors grew increasingly worried about uncertainty surrounding the ongoing Brexit negotiations, the Italian elections and U.S. trade policy. At the individual signal level, the more traditional measures of relative value using company sales and cash-flow yields underperformed as investors instead rewarded growth characteristics.
Describe portfolio positioning at period end.
The Fund was overweight in Europe based on insights related to geopolitical trends and monetary policy. From a sector perspective, the Fund’s positioning reflected a more balanced view between growth and value. The Fund was overweight in consumer discretionary and underweight in materials, particularly the diversified metals and chemicals industries. The underweight in materials was driven largely by deteriorating hiring trends and insights related to input costs.
The views expressed reflect the opinions of BlackRock as of the date of this report and are subject to change based on changes in market, economic or other conditions. These views are not intended to be a forecast of future events and are no guarantee of future results.
| | |
| 4 | | 2018 BLACKROCK ANNUAL REPORTTO SHAREHOLDERS |
| | |
| Fund Summary as of June 30, 2018 (continued) | | BlackRock Advantage Global Fund, Inc. |
TOTAL RETURN BASED ON A $10,000 INVESTMENT
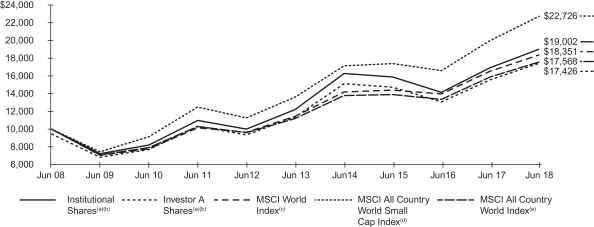
| (a) | Assuming maximum sales charge, if any, transaction costs and other operating expenses, including investment advisory fees. Institutional Shares do not have a sales charge, and how performance was calculated for certain share classes. |
| (b) | The Fund primarily intends to invest in equity securities or other financial instruments that are components of, or have characteristics similar to, the securities included in the MSCI All Country World Index. The Fund’s returns prior to October 26, 2017, are the returns of the Fund when it followed a different investment objective and different investment strategies under the name “BlackRock Global SmallCap Fund, Inc.” |
| (c) | A free float-adjusted market capitalization weighted index that is designed to measure the equity market performance of developed markets. The MSCI World Index consists of the following 23 developed market country indexes: Australia, Austria, Belgium, Canada, Denmark, Finland, France, Germany, Hong Kong, Ireland, Israel, Italy, Japan, Netherlands, New Zealand, Norway, Portugal, Singapore, Spain, Sweden, Switzerland, the United Kingdom, and the United States. |
| (d) | A free float-adjusted market capitalization weighted index that is designed to measure equity market results of smaller capitalization companies in both developed and emerging markets. |
| (e) | A free float-adjusted market capitalization index designed to measure the equity market performance of developed and emerging markets countries. The MSCI All Country World Index consists of 47 country indexes comprising of 23 developed and 24 emerging market country indexes. |
Performance Summary for the Period Ended June 30, 2018
| | | | | | | | | | | | | | | | | | | | | | | | | | | | | | | | | | | | | | | | |
| | | | | | | | | Average Annual Total Returns (a)(b) | |
| | | | | | | | | 1 Year | | | | | | 5 Years | | | | | | 10 Years | |
| | | 6-Month
Total Returns | | | | | | w/o sales
charge | | | w/sales
charge | | | | | | w/o sales
charge | | | w/sales
charge | | | | | | w/o sales
charge | | | w/sales
charge | |
Institutional | | | (0.55 | )% | | | | | | | 12.43 | % | | | N/A | | | | | | | | 9.26 | % | | | N/A | | | | | | | | 6.63 | % | | | N/A | |
Investor A | | | (0.72 | ) | | | | | | | 12.10 | | | | 6.22 | % | | | | | | | 8.89 | | | | 7.72 | % | | | | | | | 6.28 | | | | 5.71 | % |
Investor C | | | (1.06 | ) | | | | | | | 11.23 | | | | 10.44 | | | | | | | | 8.04 | | | | 8.04 | | | | | | | | 5.42 | | | | 5.42 | |
Class K | | | (0.55 | ) | | | | | | | 12.43 | | | | N/A | | | | | | | | 9.26 | | | | N/A | | | | | | | | 6.63 | | | | N/A | |
Class R | | | (0.80 | ) | | | | | | | 11.79 | | | | N/A | | | | | | | | 8.52 | | | | N/A | | | | | | | | 5.87 | | | | N/A | |
MSCI World Index | | | 0.43 | | | | | | | | 11.09 | | | | N/A | | | | | | | | 9.94 | | | | N/A | | | | | | | | 6.26 | | | | N/A | |
MSCI All Country World Small Cap Index | | | 1.46 | | | | | | | | 13.83 | | | | N/A | | | | | | | | 10.80 | | | | N/A | | | | | | | | 8.56 | | | | N/A | |
MSCI All Country World Index | | | (0.43 | ) | | | | | | | 10.73 | | | | N/A | | | | | | | | 9.41 | | | | N/A | | | | | | | | 5.80 | | | | N/A | |
| | (a) | Assuming maximum sales charges, if any. Average annual total returns with and without sales charges reflect reductions for distribution and service fees. See “About Fund Performance” on page 10 for a detailed description of share classes, including any related sales charges and fees, and how performance was calculated for certain share classes. | |
N/A — Not applicable as share class and index do not have a sales charge.
Past performance is not indicative of future results.
Performance results may include adjustments made for financial reporting purposes in accordance with U.S. generally accepted accounting principles.
| | |
| Fund Summary as of June 30, 2018 (continued) | | BlackRock Advantage Global Fund, Inc. |
Expense Example
| | | | | | | | | | | | | | | | | | | | | | | | | | | | | | | | |
| | | Actual | | | | | | Hypothetical (c) | | | | |
| | | Beginning
Account Value
(01/01/2018) | | | Ending
Account Value
(06/30/2018) | | | Expenses
Paid During
the Period (b) | | | | | | Beginning
Account Value
(01/01/2018) | | | Ending
Account Value
(06/30/2018) | | | Expenses
Paid During
the Period (b) | | | Annualized
Expense
Ratio | |
Institutional | | $ | 1,000.00 | | | $ | 994.50 | | | $ | 3.51 | | | | | | | $ | 1,000.00 | | | $ | 1,021.27 | | | $ | 3.56 | | | | 0.71 | % |
Investor A | | | 1,000.00 | | | | 992.80 | | | | 4.79 | | | | | | | | 1,000.00 | | | | 1,019.98 | | | | 4.86 | | | | 0.96 | |
Investor C | | | 1,000.00 | | | | 989.40 | | | | 8.48 | | | | | | | | 1,000.00 | | | | 1,016.27 | | | | 8.60 | | | | 1.71 | |
Class K | | | 1,000.00 | | | | 994.50 | | | | 2.86 | | | | | | | | 1,000.00 | | | | 1,018.51 | | | | 2.89 | | | | 0.66 | |
Class R | | | 1,000.00 | | | | 992.00 | | | | 6.03 | | | | | | | | 1,000.00 | | | | 1,018.74 | | | | 6.11 | | | | 1.21 | |
| | (b) | For each class of the Fund, expenses are equal to the annualized expense ratio for the class, multiplied by the average account value over the period, multiplied by 181/365 (to reflect the one-half year period shown), except Class K which is multiplied by 156/365 (to reflect the period since inception date of January 25, 2018). | |
| | (c) | Hypothetical 5% annual return before expenses is calculated by prorating the number of days in the most recent fiscal half year divided by 365. | |
See “Disclosure of Expenses” on page 10 for further information on how expenses were calculated.
Portfolio Information
TEN LARGEST HOLDINGS
| | | | |
| Security | | Percent of
Net Assets | |
Apple, Inc. | | | 1 | % |
Johnson & Johnson | | | 1 | |
Microsoft Corp. | | | 1 | |
Citigroup, Inc. | | | 1 | |
Mastercard, Inc., Class A | | | 1 | |
Amazon.com, Inc. | | | 1 | |
Adobe Systems, Inc. | | | 1 | |
Prologis, Inc. | | | 1 | |
Banco Bilbao Vizcaya Argentaria SA | | | 1 | |
Humana, Inc. | | | 1 | |
GEOGRAPHIC ALLOCATION
| | | | |
| Country | | Percent of
Net Assets | |
United States | | | 52 | % |
Japan | | | 6 | |
United Kingdom | | | 4 | |
Germany | | | 4 | |
France | | | 4 | |
China | | | 3 | |
Canada | | | 3 | |
Switzerland | | | 2 | |
Netherlands | | | 2 | |
Australia | | | 2 | |
Spain | | | 2 | |
Sweden | | | 2 | |
Norway | | | 2 | |
Finland | | | 1 | |
Italy | | | 1 | |
Brazil | | | 1 | |
Short-Term Securities | | | 3 | |
Other(a) | | | 6 | |
| | (a) | Includes holdings within countries that are 1% or less of net assets. Please refer to the Schedule of Investments for such countries. | |
| | |
| 6 | | 2018 BLACKROCK ANNUAL REPORTTO SHAREHOLDERS |
| | |
| Fund Summary as of June 30, 2018 | | BlackRock EuroFund |
Investment Objective
BlackRock EuroFund’s (the “Fund”) investment objective is to seek capital appreciation primarily through investment in equities of corporations domiciled in European countries.
Portfolio Management Commentary
How did the Fund perform?
For the 12-month period ended June 30, 2018, the Fund underperformed its benchmark, the MSCI Europe Index.
What factors influenced performance?
At the individual stock level, the telecommunications services provider Iliad SA (France) was the largest detractor from performance. The company’s revenue came in below expectations due to weakness in its fixed-line business and slower-than-expected growth in its broadband division. The company requires sustained revenue growth due to its longer-dated free cash flow profile. Although Iliad has consistently delivered on this front over the last three years, it disappointed in the fourth quarter of 2017 and the first quarter of 2018. The Fund sold its position in the stock.
A holding in British American Tobacco PLC (United Kingdom) detracted following 2017 full-year results that came in slightly below expectations due in part to an adverse effect from currency translation. The market was also disappointed by the company’s guidance regarding revenues for its next-generation products. The Fund maintained its investment in the stock. Danske Bank A/S (Denmark) also hurt performance due to a case of alleged money-laundering in Estonia, but the Fund retained the position on the expectation that this event is likely to have a small and manageable financial impact. The lighting company Osram Licht AG (Germany), which cut its 2018 profit guidance due to currency headwinds and slower business development, was also among the largest detractors. Electrolux AB (Sweden) further weighed on returns as its shares fell late in the period due to weaker-than-expected results stemming from rising raw materials prices.
On the positive side, the luxury goods company Kering SA (France) was the leading contributor due to strong sales for its Gucci brand. Kering was the Fund’s top performer in 2017, and it continued to perform well in the first half of this year due to positive management guidance. The combination of an overweight allocation and favorable stock selection in the information technology (“IT”) sector was an additional positive. In particular, the payment provider Worldpay Group PLC (United Kingdom) was among the Fund’s top contributors after the company was bid for by its U.S. rival Vantiv. ASML Holding NV (Netherlands), which benefited from rising demand for its smart chips, also added value in IT. Experian PLC (United Kingdom) helped performance after the credit data company delivered strong results with robust organic growth and positive guidance regarding its outlook. The Fund’s zero weighting in Nestle SA (Switzerland), which underperformed amid a challenging operational environment caused by a lack of pricing power, lower volume growth and increased competition, was a further contributor.
Describe recent portfolio activity.
Since June 30, 2017, the Fund increased its weighting in energy and decreased its allocation to financials. Toward the end of the period, the Fund reduced its positions in some cyclical stocks and added to those with more defensive characteristics. Although this move lowered the Fund’s risk profile, the portfolio continued to have a fairly pro-cyclical tilt with its largest overweight positions in the industrials and IT sectors. In addition, the Fund retained underweights in the more defensive areas of the market.
Describe portfolio positioning at period end.
The Fund was overweight in the industrials, IT and real estate sectors, and it was underweight in financials, consumer staples, telecommunications services, utilities, materials, health care, consumer discretionary and energy.
The views expressed reflect the opinions of BlackRock as of the date of this report and are subject to change based on changes in market, economic or other conditions. These views are not intended to be a forecast of future events and are no guarantee of future results.
| | |
| Fund Summary as of June 30, 2018 (continued) | | BlackRock EuroFund |
TOTAL RETURN BASED ON A $10,000 INVESTMENT
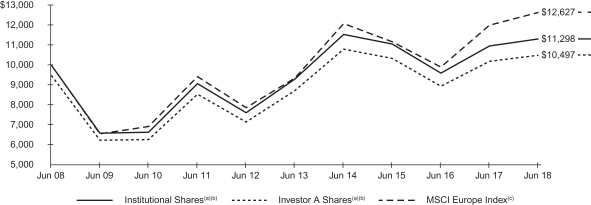
| (a) | Assuming maximum sales charge, if any, transaction costs and other operating expenses, including investment advisory fees. Institutional Shares do not have a sales charge, and how performance was calculated for certain share classes. |
| (b) | Under normal circumstances, the Fund will invest at least 80% of its net assets in equity securities, including common stock and convertible securities, of companies located in Europe. The Fund currently expects that a majority of the Fund’s assets will be invested in equity securities of companies in Western European countries, but may also invest in emerging markets in Eastern European countries. |
| (c) | A free float-adjusted market capitalization weighted index that is designed to measure the equity market performance of the developed markets in Europe. |
Performance Summary for the Period Ended June 30, 2018
| | | | | | | | | | | | | | | | | | | | | | | | | | | | | | | | | | | | | | | | |
| | | | | | | | | Average Annual Total Returns (a) | |
| | | | | | | | | 1 Year | | | | | | 5 Years | | | | | | 10 Years | |
| | | 6-Month
Total Returns | | | | | | w/o sales
charge | | | w/sales
charge | | | | | | w/o sales
charge | | | w/sales
charge | | | | | | w/o sales
charge | | | w/sales
charge | |
Institutional | | | (2.90 | )% | | | | | | | 3.12 | % | | | N/A | | | | | | | | 3.99 | % | | | N/A | | | | | | | | 1.23 | % | | | N/A | |
Investor A | | | (2.96 | ) | | | | | | | 3.02 | | | | (2.39 | )% | | | | | | | 3.79 | | | | 2.68 | % | | | | | | | 1.03 | | | | 0.49 | % |
Investor C | | | (3.36 | ) | | | | | | | 2.27 | | | | 1.27 | | | | | | | | 2.95 | | | | 2.95 | | | | | | | | 0.19 | | | | 0.19 | |
Class K | | | (2.77 | ) | | | | | | | 3.26 | | | | N/A | | | | | | | | 4.02 | | | | N/A | | | | | | | | 1.24 | | | | N/A | |
Class R | | | (3.22 | ) | | | | | | | 2.46 | | | | N/A | | | | | | | | 3.27 | | | | N/A | | | | | | | | 0.47 | | | | N/A | |
MSCI Europe Index | | | (3.23 | ) | | | | | | | 5.28 | | | | N/A | | | | | | | | 6.21 | | | | N/A | | | | | | | | 2.36 | | | | N/A | |
| | (a) | Assuming maximum sales charges, if any. Average annual total returns with and without sales charges reflect reductions for distribution and service fees. See “About Fund Performance” on page 10 for a detailed description of share classes, including any related sales charges and fees, and how performance was calculated for certain share classes. | |
N/A — Not applicable as share class and index do not have a sales charge.
Past performance is not indicative of future results.
Performance results may include adjustments made for financial reporting purposes in accordance with U.S. generally accepted accounting principles.
Expense Example
| | | | | | | | | | | | | | | | | | | | | | | | | | | | | | | | |
| | | Actual | | | | | | Hypothetical (c) | | | | |
| | | Beginning
Account Value
(01/01/2018) | | | Ending
Account Value
(06/30/2018) | | | Expenses
Paid During
the Period (b) | | | | | | Beginning
Account Value
(01/01/2018) | | | Ending
Account Value
(06/30/2018) | | | Expenses
Paid During
the Period (b) | | | Annualized
Expense Ratio | |
Institutional | | $ | 1,000.00 | | | $ | 971.00 | | | $ | 5.47 | | | | | | | $ | 1,000.00 | | | $ | 1,019.24 | | | $ | 5.61 | | | | 1.12 | % |
Investor A | | | 1,000.00 | | | | 970.40 | | | | 6.40 | | | | | | | | 1,000.00 | | | | 1,018.30 | | | | 6.56 | | | | 1.31 | |
Investor C | | | 1,000.00 | | | | 966.40 | | | | 9.95 | | | | | | | | 1,000.00 | | | | 1,014.68 | | | | 10.19 | | | | 2.04 | |
Class K | | | 1,000.00 | | | | 972.30 | | | | 4.00 | | | | | | | | 1,000.00 | | | | 1,017.31 | | | | 4.10 | | | | 0.95 | |
Class R | | | 1,000.00 | | | | 967.80 | | | | 8.83 | | | | | | | | 1,000.00 | | | | 1,015.82 | | | | 9.05 | | | | 1.81 | |
| | (b) | For each class of the Fund, expenses are equal to the annualized expense ratio for the class, multiplied by the average account value over the period, multiplied by 181/365 (to reflect the one-half year period shown), except Class K which is multiplied by 156/365 (to reflect the period since inception date of January 25, 2018). | |
| | (c) | Hypothetical 5% annual return before expenses is calculated by prorating the number of days in the most recent fiscal half year divided by 365. | |
See “Disclosure of Expenses” on page 10 for further information on how expenses were calculated.
| | |
| 8 | | 2018 BLACKROCK ANNUAL REPORTTO SHAREHOLDERS |
| | |
| Fund Summary as of June 30, 2018 (continued) | | BlackRock EuroFund |
Portfolio Information
TEN LARGEST HOLDINGS
| | | | |
Security | | Percent of
Net Assets | |
Royal Dutch Shell PLC, Class A | | | 3 | % |
Novo Nordisk A/S, Class B | | | 3 | |
British American Tobacco PLC | | | 3 | |
Allianz SE, Registered Shares | | | 3 | |
London Stock Exchange Group PLC | | | 3 | |
TOTAL SA | | | 3 | |
Hexagon AB, Class B | | | 3 | |
Prudential PLC | | | 3 | |
Safran SA | | | 3 | |
Worldpay, Inc., Class A | | | 2 | |
Experian PLC | | | 2 | |
GEOGRAPHIC ALLOCATION
| | | | |
Country | | Percent of
Net Assets | |
United Kingdom | | | 31 | % |
France | | | 18 | |
Germany | | | 12 | |
Sweden | | | 7 | |
Denmark | | | 6 | |
Switzerland | | | 5 | |
Finland | | | 4 | |
Italy | | | 4 | |
Spain | | | 4 | |
Netherlands | | | 4 | |
Belgium | | | 2 | |
Portugal | | | 1 | |
Ireland | | | 1 | |
Short-Term Securities | | | 1 | |
About Fund Performance
Institutional Shares and Class K Shares are not subject to any sales charge. These shares bear no ongoing distribution or service fees and are available only to certain eligible investors. Class K Shares performance shown prior to the January 25, 2018 inception date is that of Institutional Shares. The performance of each Fund’s Class K Shares would be substantially similar to Institutional Shares because Class K Shares and Institutional Shares invest in the same portfolio of securities and performance would only differ to the extent that Class K Shares and Institutional Shares have different expenses. The actual returns of Class K Shares would have been higher than those of the Institutional Shares because Class K Shares have lower expenses than the Institutional Shares.
Investor A Shares are subject to a maximum initial sales charge (front-end load) of 5.25% and a service fee of 0.25% per year (but no distribution fee). Certain redemptions of these shares may be subject to a contingent deferred sales charge (“CDSC”) where no initial sales charge was paid at the time of purchase. These shares are generally available through financial intermediaries. On December 27, 2017, BlackRock Advantage Global Fund, Inc.’s issued and outstanding Investor B Shares converted into Investor A Shares, with the same relative aggregate net asset value (“NAV”).
Investor C Shares are subject to a 1.00% CDSC if redeemed within one year of purchase. In addition, these shares are subject to a distribution fee of 0.75% per year and a service fee of 0.25% per year. These shares are generally available through financial intermediaries.
Class R Shares are not subject to any sales charge. These shares are subject to a distribution fee of 0.25% per year and a service fee of 0.25% per year. These shares are available only to certain employer-sponsored retirement plans.
Performance information reflects past performance and does not guarantee future results. Current performance may be lower or higher than the performance data quoted. Refer to www.blackrock.com to obtain performance data current to the most recent month-end. Performance results do not reflect the deduction of taxes that a shareholder would pay on fund distributions or the redemption of fund shares. Figures shown in the performance tables on the previous pages assume reinvestment of all distributions, if any, at NAV on the ex-dividend date. Investment return and principal value of shares will fluctuate so that shares, when redeemed, may be worth more or less than their original cost. Distributions paid to each class of shares will vary because of the different levels of service, distribution and transfer agency fees applicable to each class, which are deducted from the income available to be paid to shareholders.
BlackRock Advisors, LLC (the “Manager”), each Fund’s investment adviser, voluntarily waived and/or reimbursed a portion of the Fund’s expenses. Without such waiver and/or reimbursement, the Fund’s performance would have been lower. The Manager is under no obligation to waive and/or reimburse or to continue waiving and/or reimbursing its fees and such voluntary waiver may be reduced or discontinued at any time. See Note 6 of the Notes to Financial Statements for additional information on waivers and/or reimbursements.
Disclosure of Expenses
Shareholders of these Funds may incur the following charges: (a) transactional expenses, such as sales charges; and (b) operating expenses, including investment advisory fees, service and distribution fees, including 12b-1 fees, acquired fund fees and expenses and other fund expenses. The expense examples shown on previous pages (which are based on a hypothetical investment of $1,000 invested on January 1, 2018 and held through June 30, 2018) except with respect to the Funds’ Class K Shares which are based on a hypothetical investment of $1,000 on January 25, 2018 (commencement of operations) and held through June 30, 2018 are intended to assist shareholders both in calculating expenses based on an investment in each Fund and in comparing these expenses with similar costs of investing in other mutual funds.
The expense examples provide information about actual account values and actual expenses. In order to estimate the expenses a shareholder paid during the period covered by this report, shareholders can divide their account value by $1,000 and then multiply the result by the number corresponding to their Fund and share class under the heading entitled “Expenses Paid During the Period.”
The expense examples also provide information about hypothetical account values and hypothetical expenses based on a Fund’s actual expense ratio and an assumed rate of return of 5% per year before expenses. In order to assist shareholders in comparing the ongoing expenses of investing in these Funds and other funds, compare the 5% hypothetical examples with the 5% hypothetical examples that appear in shareholder reports of other funds.
The expenses shown in the expense examples are intended to highlight shareholders’ ongoing costs only and do not reflect any transactional expenses, such as sales charges, if any. Therefore, the hypothetical examples are useful in comparing ongoing expenses only, and will not help shareholders determine the relative total expenses of owning different funds. If these transactional expenses were included, shareholder expenses would have been higher.
Derivative Financial Instruments
The Funds may invest in various derivative financial instruments. These instruments are used to obtain exposure to a security, commodity, index, market, and/or other assets without owning or taking physical custody of securities, commodities and/or other referenced assets or to manage market, equity, credit, interest rate, foreign currency exchange rate, commodity and/or other risks. Derivative financial instruments may give rise to a form of economic leverage and involve risks, including the imperfect correlation between the value of a derivative financial instrument and the underlying asset, possible default of the counterparty to the transaction or illiquidity of the instrument. The Funds’ successful use of a derivative financial instrument depends on the investment adviser’s ability to predict pertinent market movements accurately, which cannot be assured. The use of these instruments may result in losses greater than if they had not been used, may limit the amount of appreciation a Fund can realize on an investment and/or may result in lower distributions paid to shareholders. The Funds’ investments in these instruments, if any, are discussed in detail in the Notes to Financial Statements.
| | |
| 10 | | 2018 BLACKROCK ANNUAL REPORTTO SHAREHOLDERS |
| | |
Schedule of Investments June 30, 2018 | | BlackRock Advantage Global Fund, Inc. (Percentages shown are based on Net Assets) |
| | | | | | | | |
| Security | | Shares | | | Value | |
Common Stocks — 96.9% | |
|
| Australia — 2.2% | |
Aristocrat Leisure Ltd. | | | 174,371 | | | $ | 3,982,173 | |
BHP Billiton PLC | | | 16,332 | | | | 366,530 | |
BlueScope Steel Ltd. | | | 67,520 | | | | 861,729 | |
CIMIC Group Ltd. | | | 16,563 | | | | 517,764 | |
CSL Ltd. | | | 5,381 | | | | 765,948 | |
Oil Search Ltd. | | | 21,296 | | | | 139,913 | |
Qantas Airways Ltd. | | | 1,011,435 | | | | 4,605,668 | |
Santos Ltd.(a) | | | 165,136 | | | | 764,851 | |
| | | | | | | | |
| | | | 12,004,576 | |
| Austria — 0.2% | |
OMV AG | | | 16,506 | | | | 933,542 | |
| | | | | | | | |
| Belgium — 0.1% | |
UCB SA | | | 9,534 | | | | 747,373 | |
| | | | | | | | |
| Bermuda — 0.0% | |
Golar LNG Ltd. | | | 1,730 | | | | 50,966 | |
| | | | | | | | |
| Brazil — 0.5% | | | | | | |
AMBEV SA | | | 212,172 | | | | 984,288 | |
Banco do Brasil SA | | | 3,400 | | | | 25,133 | |
Cia. Hering | | | 76,852 | | | | 282,562 | |
Cosan Ltd., Class A | | | 2,687 | | | | 20,502 | |
CPFL Energia SA | | | 2,600 | | | | 14,537 | |
Equatorial Energia SA | | | 4,100 | | | | 60,065 | |
Hypera SA | | | 61,030 | | | | 434,764 | |
Iochpe-Maxion SA | | | 2,100 | | | | 11,330 | |
IRB Brasil Resseguros S/A | | | 2,900 | | | | 36,178 | |
JBS SA | | | 111,004 | | | | 266,358 | |
Magazine Luiza SA | | | 800 | | | | 26,419 | |
MRV Engenharia e Participacoes SA | | | 5,000 | | | | 15,533 | |
Pagseguro Digital Ltd., Class A(a) | | | 1,691 | | | | 46,925 | |
Petrobras Distribuidora SA | | | 11,100 | | | | 52,382 | |
Petroleo Brasileiro SA | | | 31,600 | | | | 158,336 | |
Porto Seguro SA | | | 17,922 | | | | 188,110 | |
TIM Participacoes SA | | | 33,300 | | | | 113,241 | |
Ultrapar Participacoes SA | | | 4,795 | | | | 56,848 | |
| | | | | | | | |
| | | | 2,793,511 | |
| Canada — 2.8% | |
Bank of Nova Scotia | | | 80,173 | | | | 4,539,671 | |
BCE, Inc. | | | 1,312 | | | | 53,133 | |
BRP, Inc. | | | 1,015 | | | | 48,934 | |
Canadian Imperial Bank of Commerce | | | 751 | | | | 65,329 | |
Canadian Natural Resources Ltd. | | | 9,656 | | | | 348,516 | |
Canfor Corp.(a) | | | 588 | | | | 14,151 | |
Capital Power Corp. | | | 767 | | | | 14,720 | |
Constellation Software, Inc. | | | 177 | | | | 137,269 | |
Enerplus Corp. | | | 1,248 | | | | 15,739 | |
Lundin Mining Corp. | | | 9,486 | | | | 52,746 | |
Magna International, Inc. | | | 4,616 | | | | 268,466 | |
Manulife Financial Corp. | | | 70,317 | | | | 1,263,369 | |
Norbord, Inc. | | | 458 | | | | 18,833 | |
Parex Resources, Inc.(a) | | | 1,313 | | | | 24,789 | |
Power Corp. of Canada | | | 1,851 | | | | 41,451 | |
Quebecor, Inc., Class B | | | 2,021 | | | | 41,384 | |
Royal Bank of Canada | | | 19,158 | | | | 1,442,552 | |
Sun Life Financial, Inc. | | | 27,140 | | | | 1,090,637 | |
Suncor Energy, Inc. | | | 21,031 | | | | 855,862 | |
TFI International, Inc. | | | 9,503 | | | | 293,117 | |
Toronto-Dominion Bank | | | 84,009 | | | | 4,862,317 | |
Vermilion Energy, Inc. | | | 1,154 | | | | 41,616 | |
| | | | | | | | |
| Security | | Shares | | | Value | |
| Canada (continued) | |
WSP Global, Inc. | | | 968 | | | $ | 50,968 | |
| | | | | | | | |
| | | | 15,585,569 | |
| China — 3.0% | |
3SBio, Inc.(b) | | | 16,000 | | | | 36,155 | |
51job, Inc. — ADR(a) | | | 104 | | | | 10,155 | |
Agricultural Bank of China Ltd., Class H | | | 790,000 | | | | 368,716 | |
Alibaba Group Holding Ltd. — ADR(a)(c) | | | 17,011 | | | | 3,156,051 | |
Angang Steel Co. Ltd. | | | 30,000 | | | | 26,954 | |
Anhui Conch Cement Co. Ltd., Class H | | | 6,500 | | | | 37,069 | |
Autohome, Inc. — ADR | | | 315 | | | | 31,815 | |
BAIC Motor Corp. Ltd., Class H(b) | | | 81,000 | | | | 77,095 | |
Bank of China Ltd., Class H | | | 1,866,000 | | | | 925,395 | |
Bank of Communications Co. Ltd., Class H | | | 190,000 | | | | 145,418 | |
BBMG Corp., Class H | | | 145,000 | | | | 53,288 | |
China Agri-Industries Holdings Ltd. | | | 48,000 | | | | 18,306 | |
China Coal Energy Co. Ltd., Class H | | | 200,000 | | | | 82,542 | |
China Construction Bank Corp., Class H | | | 1,662,000 | | | | 1,520,798 | |
China Eastern Airlines Corp. Ltd. | | | 48,000 | | | | 32,379 | |
China Life Insurance Co. Ltd., Class H | | | 321,000 | | | | 823,522 | |
China Pacific Insurance Group Co. Ltd., Class H | | | 23,200 | | | | 89,367 | |
China Petroleum & Chemical Corp. | | | 175,300 | | | | 171,035 | |
China Petroleum & Chemical Corp., Class H | | | 966,000 | | | | 864,683 | |
China Railway Signal & Communication Corp. Ltd.(b) | | | 82,000 | | | | 58,055 | |
China Reinsurance Group Corp., Class H | | | 397,000 | | | | 86,893 | |
China Shenhua Energy Co. Ltd., Class H | | | 11,500 | | | | 27,200 | |
China Shipping Container Lines Co. Ltd., Class H(a) | | | 210,000 | | | | 34,968 | |
China Telecom Corp. Ltd., Class H | | | 36,000 | | | | 16,893 | |
CITIC Securities Co. Ltd., Class H | | | 43,000 | | | | 85,491 | |
CNOOC Ltd. | | | 757,000 | | | | 1,297,153 | |
Dali Foods Group Co. Ltd.(b) | | | 108,500 | | | | 83,475 | |
Datang International Power Generation Co. Ltd., Class H(a) | | | 242,000 | | | | 73,837 | |
Dongfeng Motor Group Co. Ltd., Class H | | | 130,000 | | | | 137,022 | |
Future Land Development Holdings Ltd. | | | 36,000 | | | | 32,423 | |
Greentown China Holdings Ltd. | | | 20,000 | | | | 26,724 | |
Guangzhou Baiyunshan Pharmaceutical Holdings Co. Ltd., Class H | | | 22,000 | | | | 96,807 | |
Guotai Junan Securities Co. Ltd.(b) | | | 93,200 | | | | 197,508 | |
Huadian Power International Corp. Ltd., Class H | | | 120,000 | | | | 47,352 | |
Industrial & Commercial Bank of China Ltd., Class H | | | 922,000 | | | | 687,664 | |
Kaisa Group Holdings Ltd. | | | 57,000 | | | | 24,247 | |
Legend Holdings Corp.(b) | | | 22,100 | | | | 67,199 | |
Logan Property Holdings Co. Ltd. | | | 52,000 | | | | 70,074 | |
Luye Pharma Group Ltd. | | | 12,000 | | | | 12,261 | |
Maanshan Iron & Steel(a) | | | 84,000 | | | | 37,168 | |
Metallurgical Corp. of China Ltd. | | | 343,000 | | | | 101,064 | |
PetroChina Co. Ltd., Class H | | | 942,000 | | | | 717,629 | |
Shui On Land Ltd. | | | 75,000 | | | | 18,966 | |
SINA Corp.(a) | | | 4,797 | | | | 406,258 | |
Sinopec Engineering Group Co. Ltd., Class H | | | 41,500 | | | | 43,280 | |
Sinotrans Ltd., Class H | | | 60,000 | | | | 31,546 | |
Sohu.com Ltd., ADR(a) | | | 546 | | | | 19,383 | |
Tencent Holdings Ltd. | | | 70,900 | | | | 3,560,270 | |
Uni-President China Holdings Ltd. | | | 42,000 | | | | 53,886 | |
Yuzhou Properties Co. Ltd. | | | 39,000 | | | | 22,919 | |
Zhongsheng Group Holdings Ltd. | | | 11,000 | | | | 32,934 | |
| | | | | | | | |
| | | | 16,679,292 | |
| Czech Republic — 0.0% | |
CEZ AS | | | 940 | | | | 22,272 | |
Komercni Banka AS | | | 1,615 | | | | 67,826 | |
| | | | | | | | |
| | | | 90,098 | |
| Denmark — 0.5% | |
Carlsberg A/S, Class B | | | 23,123 | | | | 2,720,617 | |
| | | | |
| SCHEDULES OF INVESTMENTS | | | 11 | |
| | |
Schedule of Investments (continued) June 30, 2018 | | BlackRock Advantage Global Fund, Inc. (Percentages shown are based on Net Assets) |
| | | | | | | | |
| Security | | Shares | | | Value | |
| Denmark (continued) | |
Genmab A/S(a) | | | 788 | | | $ | 121,248 | |
| | | | | | | | |
| | | | 2,841,865 | |
| Finland — 1.1% | |
Amer Sports OYJ(a) | | | 3,992 | | | | 125,525 | |
Sampo OYJ, Class A | | | 33,643 | | | | 1,638,437 | |
Tieto OYJ | | | 6 | | | | 194 | |
UPM-Kymmene OYJ | | | 123,948 | | | | 4,413,181 | |
Valmet OYJ | | | 1,032 | | | | 19,836 | |
| | | | | | | | |
| | | | 6,197,173 | |
| France — 3.8% | |
Arkema SA | | | 12,376 | | | | 1,460,371 | |
Atos SE | | | 8,719 | | | | 1,185,582 | |
AXA SA | | | 116,641 | | | | 2,849,980 | |
BNP Paribas SA | | | 7,109 | | | | 439,741 | |
Capgemini SE | | | 4,641 | | | | 621,939 | |
Christian Dior SE | | | 1,478 | | | | 617,297 | |
Cie de Saint-Gobain | | | 43,076 | | | | 1,918,818 | |
Cie Generale des Etablissements Michelin SCA | | | 25,587 | | | | 3,095,465 | |
Danone SA | | | 9,730 | | | | 710,411 | |
Engie SA | | | 31,957 | | | | 488,830 | |
Faurecia | | | 15,669 | | | | 1,113,852 | |
Kering SA | | | 1,329 | | | | 748,625 | |
Klepierre SA | | | 6,064 | | | | 227,843 | |
Nexity SA | | | 554 | | | | 34,975 | |
Pernod Ricard SA | | | 4,958 | | | | 809,170 | |
Peugeot SA | | | 119,501 | | | | 2,722,862 | |
UbiSoft Entertainment SA(a) | | | 1,177 | | | | 128,656 | |
Unibail-Rodamco-Westfield | | | 7,945 | | | | 1,749,399 | |
Veolia Environnement SA | | | 4,977 | | | | 106,354 | |
| | | | | | | | |
| | | | 21,030,170 | |
| Germany — 4.0% | |
adidas AG | | | 513 | | | | 111,689 | |
BASF SE | | | 11,012 | | | | 1,051,300 | |
Bayer AG, Registered Shares | | | 10,081 | | | | 1,107,131 | |
Bayerische Motoren Werke AG | | | 26,761 | | | | 2,418,991 | |
Continental AG | | | 141 | | | | 32,088 | |
Deutsche Lufthansa AG, Registered Shares | | | 133,858 | | | | 3,206,918 | |
Deutsche Telekom AG, Registered Shares | | | 126,517 | | | | 1,955,244 | |
E.ON SE | | | 37,984 | | | | 404,700 | |
Evonik Industries AG | | | 592 | | | | 20,254 | |
Fresenius Medical Care AG & Co. KGaA | | | 4,518 | | | | 454,924 | |
Hella GmbH & Co. KGaA | | | 283 | | | | 15,802 | |
Hochtief AG | | | 27,722 | | | | 4,999,189 | |
Infineon Technologies AG | | | 13,398 | | | | 340,327 | |
Puma SE | | | 908 | | | | 530,578 | |
Rheinmetall AG | | | 1,734 | | | | 190,779 | |
Salzgitter AG | | | 726 | | | | 31,587 | |
SAP SE | | | 30,877 | | | | 3,563,752 | |
Siltronic AG | | | 257 | | | | 36,520 | |
Software AG | | | 3,988 | | | | 185,351 | |
Steinhoff International Holdings NV(a)(c) | | | 162,033 | | | | 15,238 | |
Suedzucker AG | | | 53,514 | | | | 850,596 | |
Talanx AG(a) | | | 5,039 | | | | 183,569 | |
Telefonica Deutschland Holding AG | | | 12,504 | | | | 49,190 | |
TUI AG | | | 2,957 | | | | 64,675 | |
Wirecard AG | | | 1,170 | | | | 187,224 | |
| | | | | | | | |
| | | | 22,007,616 | |
| Hong Kong — 0.8% | |
AIA Group Ltd. | | | 12,600 | | | | 109,764 | |
China Mobile Ltd. | | | 311,500 | | | | 2,763,922 | |
China Resources Cement Holdings Ltd. | | | 38,000 | | | | 38,243 | |
CLP Holdings Ltd. | | | 31,500 | | | | 339,298 | |
| | | | | | | | |
| Security | | Shares | | | Value | |
| Hong Kong (continued) | |
Hang Lung Properties Ltd. | | | 17,000 | | | $ | 34,919 | |
Jiayuan International Group Ltd. | | | 12,000 | | | | 20,794 | |
Kingboard Laminates Holdings Ltd. | | | 29,500 | | | | 36,272 | |
KWG Property Holding Ltd. | | | 30,000 | | | | 37,472 | |
Melco Resorts & Entertainment Ltd. — ADR | | | 951 | | | | 26,628 | |
MMG Ltd.(a) | | | 76,000 | | | | 52,910 | |
Shenzhen Investment Ltd. | | | 76,000 | | | | 27,615 | |
SSY Group Ltd. | | | 12,000 | | | | 13,286 | |
Sun Hung Kai Properties Ltd. | | | 71,000 | | | | 1,069,682 | |
Towngas China Co. Ltd.(a) | | | 27,000 | | | | 26,126 | |
Yuexiu Property Co. Ltd. | | | 118,000 | | | | 22,469 | |
| | | | | | | | |
| | | | 4,619,400 | |
| Hungary — 0.3% | |
MOL Hungarian Oil & Gas PLC | | | 83,752 | | | | 805,913 | |
OTP Bank PLC | | | 25,963 | | | | 937,399 | |
Richter Gedeon Nyrt | | | 3,613 | | | | 65,791 | |
| | | | | | | | |
| | | | 1,809,103 | |
| India — 0.9% | |
Aurobindo Pharma Ltd. | | | 35,139 | | | | 311,585 | |
Bharat Forge Ltd. | | | 6,014 | | | | 53,813 | |
Edelweiss Financial Services Ltd. | | | 8,529 | | | | 36,653 | |
GAIL India Ltd. | | | 8,792 | | | | 43,696 | |
Glenmark Pharmaceuticals Ltd. | | | 1,887 | | | | 16,058 | |
HCL Technologies Ltd. | | | 17,764 | | | | 240,028 | |
HDFC Standard Life Insurance Co. Ltd.(b) | | | 18,923 | | | | 126,119 | |
Hero MotoCorp Ltd. | | | 1,281 | | | | 64,953 | |
Hexaware Technologies Ltd. | | | 3,256 | | | | 21,788 | |
Hindustan Unilever Ltd. | | | 20,322 | | | | 486,724 | |
Housing Development Finance Corp. Ltd. | | | 14,215 | | | | 396,095 | |
Indraprastha Gas Ltd. | | | 3,927 | | | | 14,588 | |
IndusInd Bank Ltd.(d) | | | 6,513 | | | | 186,668 | |
Infosys Ltd. | | | 20,230 | | | | 387,829 | |
Jubilant Life Sciences Ltd. | | | 1,486 | | | | 15,190 | |
KEC International Ltd. | | | 2,445 | | | | 11,965 | |
Kotak Mahindra Bank Ltd. | | | 14,222 | | | | 279,115 | |
KPIT Technologies Ltd. | | | 4,888 | | | | 19,410 | |
Mahindra & Mahindra Ltd. | | | 13,668 | | | | 179,123 | |
Mindtree Ltd. | | | 4,386 | | | | 63,155 | |
Mphasis Ltd. | | | 1,076 | | | | 17,026 | |
NIIT Technologies Ltd. | | | 3,593 | | | | 57,587 | |
Page Industries Ltd. | | | 110 | | | | 44,621 | |
Petronet LNG Ltd. | | | 9,296 | | | | 29,814 | |
Pidilite Industries Ltd. | | | 4,792 | | | | 74,396 | |
Power Grid Corp. of India Ltd. | | | 48,077 | | | | 131,172 | |
SBI Life Insurance Co. Ltd.(b) | | | 9,396 | | | | 92,479 | |
Sun Pharmaceutical Industries Ltd. | | | 12,928 | | | | 106,576 | |
Tata Consultancy Services Ltd. | | | 33,494 | | | | 903,339 | |
Tata Global Beverages Ltd. | | | 16,645 | | | | 65,407 | |
Tech Mahindra Ltd. | | | 27,599 | | | | 263,928 | |
Titan Co. Ltd. | | | 2,792 | | | | 35,816 | |
United Spirits Ltd.(a) | | | 37,280 | | | | 362,194 | |
| | | | | | | | |
| | | | 5,138,910 | |
| Indonesia — 0.2% | |
Bank Central Asia Tbk PT | | | 225,900 | | | | 337,366 | |
Bank Negara Indonesia Persero Tbk PT | | | 52,100 | | | | 25,600 | |
Indah Kiat Pulp & Paper Corp. Tbk PT | | | 37,500 | | | | 48,627 | |
Telekomunikasi Indonesia Persero Tbk PT | | | 2,272,800 | | | | 595,234 | |
| | | | | | | | |
| | | | 1,006,827 | |
| Ireland — 0.1% | |
DCC PLC | | | 6,776 | | | | 614,442 | |
| | |
| 12 | | 2018 BLACKROCK ANNUAL REPORTTO SHAREHOLDERS |
| | |
Schedule of Investments (continued) June 30, 2018 | | BlackRock Advantage Global Fund, Inc. (Percentages shown are based on Net Assets) |
| | | | | | | | |
| Security | | Shares | | | Value | |
| Ireland (continued) | |
Smurfit Kappa Group PLC | | | 2,295 | | | $ | 92,652 | |
| | | | | | | | |
| | | | 707,094 | |
| Israel — 0.0% | |
Wix.com Ltd.(a) | | | 445 | | | | 44,633 | |
| | | | | | | | |
| Italy — 1.0% | | | | | | |
Ferrari NV | | | 19,674 | | | | 2,659,318 | |
Hera SpA | | | 4,496 | | | | 13,990 | |
Mediobanca Banca di Credito Finanziario SpA | | | 84,706 | | | | 783,533 | |
Moncler SpA | | | 49,497 | | | | 2,245,926 | |
| | | | | | | | |
| | | | 5,702,767 | |
| Japan — 6.0% | |
Alfresa Holdings Corp. | | | 2,100 | | | | 49,313 | |
Astellas Pharma, Inc. | | | 294,100 | | | | 4,475,783 | |
Capcom Co. Ltd. | | | 600 | | | | 14,754 | |
Chubu Electric Power Co., Inc. | | | 1,000 | | | | 14,994 | |
Dai-ichi Life Holdings, Inc. | | | 4,700 | | | | 83,649 | |
Daicel Corp. | | | 3,000 | | | | 33,141 | |
Daito Trust Construction Co. Ltd. | | | 7,300 | | | | 1,187,518 | |
East Japan Railway Co. | | | 900 | | | | 86,189 | |
en-japan, Inc. | | | 400 | | | | 20,129 | |
FUJIFILM Holdings Corp. | | | 1,300 | | | | 50,703 | |
Fujitsu Ltd. | | | 122,000 | | | | 738,285 | |
Hitachi Ltd. | | | 215,000 | | | | 1,514,671 | |
Hokuhoku Financial Group, Inc. | | | 2,400 | | | | 31,865 | |
Iida Group Holdings Co. Ltd. | | | 4,800 | | | | 92,407 | |
Itochu Techno-Solutions Corp. | | | 800 | | | | 13,800 | |
Japan Tobacco, Inc. | | | 44,800 | | | | 1,251,999 | |
JXTG Holdings, Inc. | | | 579,900 | | | | 4,023,216 | |
Kirin Holdings Co. Ltd. | | | 29,000 | | | | 777,341 | |
Kobayashi Pharmaceutical Co. Ltd. | | | 800 | | | | 69,052 | |
Konami Holdings Corp. | | | 2,100 | | | | 106,704 | |
Leopalace21 Corp. | | | 3,100 | | | | 16,961 | |
Miraca Holdings, Inc. | | | 600 | | | | 17,847 | |
Mitsubishi Chemical Holdings Corp. | | | 255,700 | | | | 2,135,294 | |
Mixi, Inc. | | | 800 | | | | 20,225 | |
Nippon Telegraph & Telephone Corp. | | | 72,500 | | | | 3,293,529 | |
NTT DOCOMO, Inc. | | | 129,200 | | | | 3,292,319 | |
Resona Holdings, Inc. | | | 239,400 | | | | 1,275,948 | |
Secom Co. Ltd. | | | 2,500 | | | | 191,710 | |
Seven & i Holdings Co. Ltd. | | | 18,400 | | | | 802,528 | |
Sojitz Corp. | | | 16,200 | | | | 58,670 | |
Sumitomo Chemical Co. Ltd. | | | 65,000 | | | | 367,616 | |
Sumitomo Mitsui Financial Group, Inc. | | | 119,800 | | | | 4,672,917 | |
Takeda Pharmaceutical Co. Ltd. | | | 25,100 | | | | 1,055,909 | |
TIS, Inc. | | | 700 | | | | 32,169 | |
Tokai Rika Co. Ltd. | | | 2,500 | | | | 47,398 | |
Tokio Marine Holdings, Inc. | | | 800 | | | | 37,427 | |
Tokyo Electron Ltd. | | | 2,000 | | | | 343,307 | |
Trend Micro, Inc. | | | 700 | | | | 39,849 | |
Ulvac, Inc. | | | 5,500 | | | | 209,808 | |
West Japan Railway Co. | | | 4,300 | | | | 316,585 | |
Yahoo! Japan Corp. | | | 5,900 | | | | 19,546 | |
Zeon Corp. | | | 9,200 | | | | 108,530 | |
| | | | | | | | |
| | | | 32,991,605 | |
| Luxembourg — 0.0% | |
Reinet Investments SCA(a) | | | 1,326 | | | | 23,359 | |
| | | | | | | | |
| Malaysia — 0.1% | | | | | | |
Public Bank Bhd | | | 30,900 | | | | 178,754 | |
Tenaga Nasional Bhd | | | 19,800 | | | | 71,783 | |
Top Glove Corp. Bhd | | | 12,400 | | | | 37,180 | |
| | | | | | | | |
| | | | 287,717 | |
| | | | | | | | |
| Security | | Shares | | | Value | |
| Mexico — 0.6% | |
Alsea SAB de CV | | | 7,900 | | | $ | 27,208 | |
America Movil SAB de CV, Series L | | | 1,900,700 | | | | 1,585,811 | |
Cemex SAB de CV(a) | | | 366,910 | | | | 241,278 | |
Fomento Economico Mexicano SAB de CV | | | 25,200 | | | | 221,988 | |
Grupo Aeroportuario del Centro Norte SAB de CV | | | 4,800 | | | | 25,032 | |
Grupo Financiero Banorte SAB de CV, Series O | | | 38,300 | | | | 225,767 | |
Mexichem SAB de CV | | | 12,300 | | | | 35,568 | |
Wal-Mart de Mexico SAB de CV | | | 434,800 | | | | 1,146,316 | |
| | | | | | | | |
| | | | 3,508,968 | |
| Netherlands — 2.3% | |
Aalberts Industries NV | | | 1,534 | | | | 73,280 | |
AerCap Holdings NV(a) | | | 341 | | | | 18,465 | |
BE Semiconductor Industries NV | | | 52,006 | | | | 1,399,473 | |
Koninklijke Ahold Delhaize NV | | | 75,041 | | | | 1,791,798 | |
Koninklijke DSM NV | | | 50,567 | | | | 5,058,673 | |
Koninklijke KPN NV | | | 798,119 | | | | 2,170,227 | |
Koninklijke Philips NV | | | 7,634 | | | | 323,437 | |
Royal Dutch Shell PLC, Class A | | | 25,250 | | | | 873,875 | |
Royal Dutch Shell PLC, Class B | | | 15,676 | | | | 561,405 | |
Wolters Kluwer NV | | | 8,662 | | | | 486,603 | |
| | | | | | | | |
| | | | 12,757,236 | |
| Norway — 1.7% | |
Aker BP ASA | | | 8,573 | | | | 315,342 | |
Statoil ASA | | | 174,251 | | | | 4,607,641 | |
Telenor ASA | | | 191,617 | | | | 3,924,411 | |
TGS Nopec Geophysical Co. ASA | | | 10,458 | | | | 384,069 | |
| | | | | | | | |
| | | | 9,231,463 | |
| Poland — 0.3% | |
Bank Pekao SA | | | 10,664 | | | | 320,981 | |
Energa SA | | | 4,285 | | | | 10,194 | |
KGHM Polska Miedz SA | | | 3,840 | | | | 90,013 | |
PGE Polska Grupa Energetyczna SA(a) | | | 17,114 | | | | 42,529 | |
Polski Koncern Naftowy ORLEN SA | | | 27,334 | | | | 612,200 | |
Powszechna Kasa Oszczednosci Bank Polski SA(a) | | | 8,001 | | | | 78,604 | |
Powszechny Zaklad Ubezpieczen SA | | | 28,458 | | | | 295,038 | |
Tauron Polska Energia SA(a) | | | 23,406 | | | | 14,272 | |
| | | | | | | | |
| | | | 1,463,831 | |
| Russia — 0.2% | |
Gazprom PJSC | | | 42,090 | | | | 94,955 | |
Inter Rao UES PJSC | | | 386,000 | | | | 25,299 | |
Lukoil PJSC | | | 5,296 | | | | 368,304 | |
Magnit PJSC — GDR | | | 4,646 | | | | 83,259 | |
Magnitogorsk Iron & Steel Works PJSC | | | 28,400 | | | | 19,231 | |
MMC Norilsk Nickel PJSC | | | 127 | | | | 23,058 | |
Mobile TeleSystems PJSC — ADR | | | 7,461 | | | | 65,881 | |
Novatek PJSC — GDR | | | 1,176 | | | | 173,827 | |
Severstal PJSC | | | 3,180 | | | | 47,178 | |
Surgutneftegas OJSC | | | 96,675 | | | | 43,997 | |
Tatneft PJSC | | | 15,070 | | | | 163,002 | |
| | | | | | | | |
| | | | 1,107,991 | |
| Singapore — 0.1% | |
Ascendas Real Estate Investment Trust | | | 17,200 | | | | 33,309 | |
Venture Corp. Ltd. | | | 28,200 | | | | 368,433 | |
| | | | | | | | |
| | | | 401,742 | |
| South Africa — 0.3% | |
Barloworld Ltd. | | | 2,010 | | | | 18,956 | |
Bidvest Group Ltd. | | | 32,566 | | | | 466,344 | |
Clicks Group Ltd. | | | 2,327 | | | | 33,226 | |
FirstRand Ltd. | | | 23,954 | | | | 111,276 | |
Investec Ltd. | | | 9,546 | | | | 66,848 | |
Kumba Iron Ore Ltd. | | | 7,303 | | | | 156,307 | |
| | | | |
| SCHEDULES OF INVESTMENTS | | | 13 | |
| | |
Schedule of Investments (continued) June 30, 2018 | | BlackRock Advantage Global Fund, Inc. (Percentages shown are based on Net Assets) |
| | | | | | | | |
| Security | | Shares | | | Value | |
| South Africa (continued) | |
Mr Price Group Ltd. | | | 1,667 | | | $ | 27,358 | |
Naspers Ltd., Class N | | | 424 | | | | 106,909 | |
Sanlam Ltd. | | | 1,973 | | | | 10,024 | |
Standard Bank Group Ltd. | | | 24,395 | | | | 340,607 | |
Tiger Brands Ltd. | | | 1,230 | | | | 29,707 | |
| | | | | | | | |
| | | | 1,367,562 | |
| South Korea — 0.2% | |
Celltrion, Inc.(a) | | | 1,006 | | | | 273,315 | |
HDC Hyundai Development Co-Engineering &
Construction(a) | | | — | (g) | | | 19 | |
KB Financial Group, Inc. | | | 2,104 | | | | 99,039 | |
Korea Electric Power Corp. | | | 652 | | | | 18,701 | |
LG Electronics, Inc. | | | 2,854 | | | | 212,495 | |
LG Uplus Corp. | | | 2,323 | | | | 29,177 | |
Medy-Tox, Inc. | | | 52 | | | | 35,750 | |
POSCO | | | 391 | | | | 115,368 | |
Samsung Electronics Co. Ltd. | | | 1,088 | | | | 45,576 | |
SillaJen, Inc.(a) | | | 770 | | | | 50,543 | |
SK Innovation Co. Ltd. | | | 535 | | | | 96,904 | |
ViroMed Co. Ltd.(a) | | | 166 | | | | 35,036 | |
| | | | | | | | |
| | | | 1,011,923 | |
| Spain — 2.1% | |
ACS Actividades de Construccion y Servicios SA | | | 2,085 | | | | 84,121 | |
Aena SME SA(b) | | | 758 | | | | 137,234 | |
Amadeus IT Group SA | | | 11,980 | | | | 942,016 | |
Banco Bilbao Vizcaya Argentaria SA | | | 736,461 | | | | 5,193,939 | |
EDP Renovaveis SA | | | 2,580 | | | | 26,905 | |
Grifols SA | | | 4,028 | | | | 120,731 | |
Mediaset Espana Comunicacion SA | | | 223,310 | | | | 1,877,080 | |
Repsol SA | | | 155,105 | | | | 3,027,504 | |
Telefonica SA | | | 10,536 | | | | 89,424 | |
| | | | | | | | |
| | | | 11,498,954 | |
| Sweden — 2.0% | |
Electrolux AB, Class B | | | 40,762 | | | | 925,037 | |
SSAB AB, A Shares | | | 22,010 | | | | 103,510 | |
Svenska Cellulosa AB SCA, B Shares | | | 119,849 | | | | 1,297,452 | |
Swedish Match AB | | | 95,926 | | | | 4,740,825 | |
Volvo AB, Class B | | | 242,856 | | | | 3,859,739 | |
| | | | | | | | |
| | | | 10,926,563 | |
| Switzerland — 2.3% | |
Ferguson PLC | | | 11,417 | | | | 923,703 | |
Georg Fischer AG, Registered Shares | | | 269 | | | | 343,509 | |
IWG PLC | | | 9,503 | | | | 39,933 | |
Logitech International SA, Registered Shares | | | 9,204 | | | | 403,235 | |
Roche Holding AG | | | 18,637 | | | | 4,134,767 | |
Sinotruk Hong Kong Ltd. | | | 26,000 | | | | 42,623 | |
STMicroelectronics NV | | | 139,077 | | | | 3,087,967 | |
Swiss Life Holding AG, Registered Shares(a) | | | 612 | | | | 212,212 | |
TE Connectivity Ltd. | | | 39,635 | | | | 3,569,528 | |
| | | | | | | | |
| | | | 12,757,477 | |
| Taiwan — 0.5% | |
Cathay Financial Holding Co. Ltd. | | | 279,000 | | | | 491,431 | |
CTBC Financial Holding Co. Ltd. | | | 422,000 | | | | 303,214 | |
Fubon Financial Holding Co. Ltd. | | | 596,000 | | | | 997,177 | |
TaiMed Biologics, Inc.(a) | | | 2,000 | | | | 20,420 | |
Taiwan Semiconductor Manufacturing Co. Ltd. | | | 76,000 | | | | 539,682 | |
Uni-President Enterprises Corp. | | | 219,000 | | | | 555,126 | |
Walsin Technology Corp. | | | 5,000 | | | | 68,257 | |
| | | | | | | | |
| | | | 2,975,307 | |
| Thailand — 0.3% | |
Gulf Energy Development PCL | | | 20,100 | | | | 37,578 | |
| | | | | | | | |
| Security | | Shares | | | Value | |
| Thailand (continued) | |
PTT Exploration & Production PCL — NVDR | | | 18,600 | | | $ | 78,737 | |
PTT Global Chemical PCL — NVDR | | | 56,200 | | | | 123,711 | |
PTT PCL — NVDR | | | 506,700 | | | | 732,565 | |
Total Access Communication PCL | | | 156,200 | | | | 172,983 | |
True Corp. PCL — NVDR | | | 2,507,400 | | | | 400,550 | |
| | | | | | | | |
| | | | 1,546,124 | |
| Turkey — 0.6% | |
Akbank TAS | | | 253,160 | | | | 413,764 | |
BIM Birlesik Magazalar AS | | | 14,754 | | | | 215,469 | |
Eregli Demir ve Celik Fabrikalari TAS | | | 30,078 | | | | 66,707 | |
Haci Omer Sabanci Holding AS | | | 114,104 | | | | 219,077 | |
KOC Holding AS | | | 57,770 | | | | 178,504 | |
Turkiye Garanti Bankasi AS | | | 312,967 | | | | 570,900 | |
Turkiye Halk Bankasi AS | | | 16,583 | | | | 26,756 | |
Turkiye Is Bankasi AS, Class C | | | 846,741 | | | | 1,050,546 | |
Turkiye Vakiflar Bankasi Tao, Class D | | | 291,272 | | | | 310,770 | |
Yapi ve Kredi Bankasi AS(a)(c) | | | 202,047 | | | | 108,737 | |
| | | | | | | | |
| | | | 3,161,230 | |
| Ukraine — 0.0% | |
Ferrexpo PLC | | | 7,413 | | | | 17,825 | |
| | | | | | | | |
| United Kingdom — 4.3% | |
Anglo American PLC | | | 66,816 | | | | 1,489,022 | |
Ashmore Group PLC | | | 3,136 | | | | 15,375 | |
Ashtead Group PLC | | | 539 | | | | 16,051 | |
ASOS PLC(a) | | | 2,726 | | | | 218,660 | |
Associated British Foods PLC | | | 59,995 | | | | 2,163,318 | |
Auto Trader Group PLC(b) | | | 8,784 | | | | 49,229 | |
Barratt Developments PLC | | | 25,310 | | | | 171,574 | |
Bodycote PLC | | | 2,848 | | | | 36,658 | |
Burberry Group PLC | | | 977 | | | | 27,767 | |
Carnival PLC | | | 39,958 | | | | 2,283,797 | |
Centrica PLC | | | 62,166 | | | | 129,080 | |
Close Brothers Group PLC | | | 2,349 | | | | 45,857 | |
Coca-Cola European Partners PLC | | | 62,366 | | | | 2,534,554 | |
Croda International PLC | | | 2,423 | | | | 153,078 | |
Diageo PLC | | | 89,149 | | | | 3,202,759 | |
Dialog Semiconductor PLC(a)(c) | | | 16,412 | | | | 248,755 | |
Direct Line Insurance Group PLC | | | 23,450 | | | | 105,822 | |
DS Smith PLC | | | 16,157 | | | | 110,702 | |
Electrocomponents PLC | | | 6,705 | | | | 66,844 | |
Evraz PLC | | | 15,376 | | | | 102,626 | |
Fevertree Drinks PLC | | | 1,496 | | | | 66,690 | |
Fiat Chrysler Automobiles NV(a) | | | 3,411 | | | | 64,346 | |
G4S PLC | | | 10,842 | | | | 38,190 | |
GlaxoSmithKline PLC | | | 33,652 | | | | 678,456 | |
Hays PLC | | | 55,770 | | | | 136,954 | |
Imperial Brands PLC | | | 48,930 | | | | 1,817,168 | |
Inchcape PLC | | | 8,154 | | | | 83,827 | |
Indivior PLC(a) | | | 6,110 | | | | 30,767 | |
International Consolidated Airlines Group SA | | | 3,181 | | | | 27,837 | |
Intertek Group PLC | | | 36,446 | | | | 2,740,395 | |
JD Sports Fashion PLC | | | 7,002 | | | | 40,573 | |
Legal & General Group PLC | | | 209,533 | | | | 732,912 | |
Man Group PLC | | | 9,184 | | | | 21,290 | |
Mondi PLC | | | 2,581 | | | | 69,630 | |
Moneysupermarket.com Group PLC | | | 12,085 | | | | 50,224 | |
Nomad Foods Ltd.(a) | | | 1,371 | | | | 26,309 | |
Persimmon PLC | | | 6,634 | | | | 220,977 | |
Petrofac Ltd. | | | 26,901 | | | | 206,655 | |
RELX PLC | | | 7,570 | | | | 161,657 | |
Rentokil Initial PLC | | | 217,783 | | | | 1,004,117 | |
Rightmove PLC | | | 3,048 | | | | 213,063 | |
| | |
| 14 | | 2018 BLACKROCK ANNUAL REPORTTO SHAREHOLDERS |
| | |
Schedule of Investments (continued) June 30, 2018 | | BlackRock Advantage Global Fund, Inc. (Percentages shown are based on Net Assets) |
| | | | | | | | |
| Security | | Shares | | | Value | |
| United Kingdom (continued) | |
Rio Tinto PLC | | | 1,184 | | | $ | 65,260 | |
Royal Mail PLC | | | 15,301 | | | | 101,796 | |
Schroders PLC | | | 789 | | | | 32,741 | |
Spirax-Sarco Engineering PLC | | | 6,747 | | | | 578,580 | |
Tate & Lyle PLC | | | 3,889 | | | | 33,097 | |
Taylor Wimpey PLC | | | 14,337 | | | | 33,750 | |
Thomas Cook Group PLC | | | 362,460 | | | | 513,627 | |
Unilever PLC | | | 7,897 | | | | 436,234 | |
WM Morrison Supermarkets PLC | | | 6,789 | | | | 22,519 | |
| | | | | | | | |
| | | | 23,421,169 | |
| United States — 51.5% | |
Abbott Laboratories | | | 4,926 | | | | 300,437 | |
AbbVie, Inc. | | | 18,045 | | | | 1,671,869 | |
Accenture PLC, Class A | | | 2,793 | | | | 456,907 | |
Adobe Systems, Inc.(a) | | | 23,635 | | | | 5,762,449 | |
Aetna, Inc. | | | 2,403 | | | | 440,950 | |
Agilent Technologies, Inc. | | | 77,483 | | | | 4,791,549 | |
Air Products & Chemicals, Inc. | | | 19,900 | | | | 3,099,027 | |
Alexandria Real Estate Equities, Inc. | | | 1,299 | | | | 163,895 | |
Alexion Pharmaceuticals, Inc.(a) | | | 2,702 | | | | 335,453 | |
Alkermes PLC(a) | | | 2,166 | | | | 89,153 | |
Allstate Corp. | | | 20,423 | | | | 1,864,007 | |
Ally Financial, Inc. | | | 12,270 | | | | 322,333 | |
Alnylam Pharmaceuticals, Inc.(a) | | | 1,094 | | | | 107,748 | |
Alphabet, Inc., Class A(a) | | | 2,042 | | | | 2,305,806 | |
Alphabet, Inc., Class C(a) | | | 4,189 | | | | 4,673,458 | |
Amazon.com, Inc.(a) | | | 3,962 | | | | 6,734,608 | |
Amdocs Ltd. | | | 11,810 | | | | 781,704 | |
American Campus Communities, Inc. | | | 1,243 | | | | 53,300 | |
American Eagle Outfitters, Inc. | | | 2,331 | | | | 54,196 | |
American Express Co. | | | 8,167 | | | | 800,366 | |
American Financial Group, Inc. | | | 4,018 | | | | 431,252 | |
American Water Works Co., Inc. | | | 290 | | | | 24,760 | |
Ameriprise Financial, Inc. | | | 16,999 | | | | 2,377,820 | |
AmerisourceBergen Corp. | | | 13,630 | | | | 1,162,230 | |
AMETEK, Inc. | | | 20,946 | | | | 1,511,463 | |
Amgen, Inc. | | | 8,089 | | | | 1,493,149 | |
Anadarko Petroleum Corp. | | | 2,845 | | | | 208,396 | |
Anthem, Inc. | | | 55 | | | | 13,092 | |
Apartment Investment & Management Co., Class A | | | 468 | | | | 19,796 | |
Apple, Inc. | | | 42,780 | | | | 7,919,006 | |
Archer-Daniels-Midland Co. | | | 64,980 | | | | 2,978,033 | |
Aspen Technology, Inc.(a) | | | 1,885 | | | | 174,815 | |
AT&T, Inc. | | | 5,279 | | | | 169,508 | |
Automatic Data Processing, Inc. | | | 3,240 | | | | 434,614 | |
Bank of America Corp. | | | 46,742 | | | | 1,317,657 | |
Baxter International, Inc. | | | 66,141 | | | | 4,883,851 | |
Bemis Co., Inc. | | | 289 | | | | 12,199 | |
Berkshire Hathaway, Inc., Class A(a) | | | 1 | | | | 282,040 | |
Biogen, Inc.(a) | | | 2,517 | | | | 730,534 | |
BioMarin Pharmaceutical, Inc.(a) | | | 2,147 | | | | 202,247 | |
Boeing Co. | | | 13,595 | | | | 4,561,258 | |
Booz Allen Hamilton Holding Corp. | | | 3,482 | | | | 152,268 | |
BorgWarner, Inc. | | | 40,585 | | | | 1,751,649 | |
Boston Properties, Inc. | | | 1,080 | | | | 135,454 | |
Brandywine Realty Trust | | | 6,411 | | | | 108,218 | |
Bristol-Myers Squibb Co. | | | 45,351 | | | | 2,509,724 | |
Brixmor Property Group, Inc. | | | 3,106 | | | | 54,138 | |
Brown-Forman Corp., Class B | | | 2,341 | | | | 114,732 | |
Bunge Ltd. | | | 1,425 | | | | 99,337 | |
Burlington Stores, Inc.(a) | | | 1,703 | | | | 256,353 | |
Cabot Corp. | | | 3,960 | | | | 244,609 | |
Carnival Corp. | | | 44,980 | | | | 2,577,804 | |
| | | | | | | | |
| Security | | Shares | | | Value | |
| United States (continued) | |
CDW Corp. | | | 576 | | | $ | 46,535 | |
Celgene Corp.(a) | | | 8,950 | | | | 710,809 | |
CenterPoint Energy, Inc. | | | 114,472 | | | | 3,172,019 | |
Chevron Corp. | | | 548 | | | | 69,284 | |
Cigna Corp. | | | 13,052 | | | | 2,218,187 | |
Cinemark Holdings, Inc. | | | 998 | | | | 35,010 | |
Cisco Systems, Inc. | | | 15,304 | | | | 658,531 | |
Citigroup, Inc. | | | 104,237 | | | | 6,975,540 | |
Citizens Financial Group, Inc. | | | 63,060 | | | | 2,453,034 | |
CME Group, Inc. | | | 18,888 | | | | 3,096,121 | |
CMS Energy Corp. | | | 2,184 | | | | 103,260 | |
Conagra Brands, Inc. | | | 43,076 | | | | 1,539,105 | |
ConocoPhillips | | | 68,824 | | | | 4,791,527 | |
Consolidated Edison, Inc. | | | 7,459 | | | | 581,653 | |
Constellation Brands, Inc., Class A | | | 3,775 | | | | 826,234 | |
CubeSmart | | | 726 | | | | 23,392 | |
Dana, Inc. | | | 4,114 | | | | 83,062 | |
Danaher Corp. | | | 44,750 | | | | 4,415,930 | |
Darden Restaurants, Inc. | | | 981 | | | | 105,026 | |
Domino’s Pizza, Inc. | | | 373 | | | | 105,249 | |
Duke Realty Corp. | | | 23,083 | | | | 670,099 | |
Eastman Chemical Co. | | | 10,962 | | | | 1,095,762 | |
eBay, Inc.(a) | | | 62,796 | | | | 2,276,983 | |
Eli Lilly & Co. | | | 4,218 | | | | 359,922 | |
Equity Lifestyle Properties, Inc. | | | 2,357 | | | | 216,608 | |
Estee Lauder Cos., Inc., Class A | | | 20,777 | | | | 2,964,670 | |
Evergy, Inc. | | | 16,808 | | | | 943,769 | |
Extended Stay America, Inc. | | | 1,807 | | | | 39,049 | |
Exxon Mobil Corp. | | | 5,043 | | | | 417,207 | |
Facebook, Inc., Class A(a) | | | 12,670 | | | | 2,462,034 | |
Fidelity National Information Services, Inc. | | | 35,029 | | | | 3,714,125 | |
First American Financial Corp. | | | 5,789 | | | | 299,407 | |
First Data Corp., Class A(a) | | | 3,497 | | | | 73,192 | |
Flex Ltd.(a) | | | 17,127 | | | | 241,662 | |
Fortune Brands Home & Security, Inc. | | | 6,814 | | | | 365,844 | |
Genpact Ltd. | | | 42,305 | | | | 1,223,884 | |
Gilead Sciences, Inc. | | | 15,726 | | | | 1,114,030 | |
GoDaddy, Inc., Class A(a) | | | 1,085 | | | | 76,601 | |
H&R Block, Inc. | | | 51,244 | | | | 1,167,338 | |
Halliburton Co. | | | 5,002 | | | | 225,390 | |
Hanover Insurance Group, Inc. | | | 273 | | | | 32,640 | |
Hartford Financial Services Group, Inc. | | | 10,783 | | | | 551,335 | |
HD Supply Holdings, Inc.(a) | | | 22,980 | | | | 985,612 | |
Herbalife Nutrition Ltd.(a) | | | 1,371 | | | | 73,650 | |
Highwoods Properties, Inc. | | | 495 | | | | 25,111 | |
Honeywell International, Inc. | | | 9,564 | | | | 1,377,694 | |
Host Hotels & Resorts, Inc. | | | 790 | | | | 16,645 | |
HP, Inc. | | | 207,381 | | | | 4,705,475 | |
Humana, Inc. | | | 17,353 | | | | 5,164,773 | |
IDACORP, Inc. | | | 999 | | | | 92,148 | |
IDEXX Laboratories, Inc.(a) | | | 5,841 | | | | 1,272,988 | |
Illinois Tool Works, Inc. | | | 11,760 | | | | 1,629,230 | |
Incyte Corp.(a) | | | 2,193 | | | | 146,931 | |
Ingersoll-Rand PLC | | | 33,402 | | | | 2,997,161 | |
Insperity, Inc. | | | 686 | | | | 65,342 | |
Intercontinental Exchange, Inc. | | | 8,905 | | | | 654,963 | |
InterDigital, Inc. | | | 74 | | | | 5,987 | |
International Business Machines Corp. | | | 26,912 | | | | 3,759,606 | |
Interpublic Group of Cos., Inc. | | | 82,229 | | | | 1,927,448 | |
Intuit, Inc. | | | 13,073 | | | | 2,670,879 | |
Jabil, Inc. | | | 1,629 | | | | 45,058 | |
Johnson & Johnson | | | 65,097 | | | | 7,898,870 | |
Jones Lang LaSalle, Inc. | | | 1,019 | | | | 169,144 | |
JPMorgan Chase & Co. | | | 8,954 | | | | 933,007 | |
| | | | |
| SCHEDULES OF INVESTMENTS | | | 15 | |
| | |
Schedule of Investments (continued) June 30, 2018 | | BlackRock Advantage Global Fund, Inc. (Percentages shown are based on Net Assets) |
| | | | | | | | |
| Security | | Shares | | | Value | |
| United States (continued) | |
KAR Auction Services, Inc. | | | 1,655 | | | $ | 90,694 | |
Kohl’s Corp. | | | 17,942 | | | | 1,307,972 | |
Landstar System, Inc. | | | 3,868 | | | | 422,386 | |
Las Vegas Sands Corp. | | | 14,589 | | | | 1,114,016 | |
Lear Corp. | | | 17,825 | | | | 3,312,063 | |
Liberty Media Corp. — Liberty SiriusXM, Class A(a) | | | 301 | | | | 13,560 | |
Liberty Media Corp. — Liberty SiriusXM, Class C(a) | | | 4,907 | | | | 222,582 | |
Lincoln National Corp. | | | 3,937 | | | | 245,078 | |
lululemon athletica, Inc.(a) | | | 4,787 | | | | 597,657 | |
Macerich Co. | | | 301 | | | | 17,106 | |
ManpowerGroup, Inc. | | | 22,236 | | | | 1,913,630 | |
Marathon Petroleum Corp. | | | 17,042 | | | | 1,195,667 | |
Mastercard, Inc., Class A | | | 35,399 | | | | 6,956,611 | |
Maxim Integrated Products, Inc. | | | 58,401 | | | | 3,425,803 | |
McDonald’s Corp. | | | 29,562 | | | | 4,632,070 | |
McKesson Corp. | | | 9,024 | | | | 1,203,802 | |
Merck & Co., Inc. | | | 23,270 | | | | 1,412,489 | |
Michael Kors Holdings Ltd.(a) | | | 2,313 | | | | 154,046 | |
Microsoft Corp. | | | 79,563 | | | | 7,845,707 | |
Morgan Stanley | | | 59,160 | | | | 2,804,184 | |
Motorola Solutions, Inc. | | | 11,435 | | | | 1,330,691 | |
National Retail Properties, Inc. | | | 2,060 | | | | 90,558 | |
NetApp, Inc. | | | 48,000 | | | | 3,769,440 | |
Netflix, Inc.(a) | | | 981 | | | | 383,993 | |
Newmont Mining Corp. | | | 24,302 | | | | 916,428 | |
Norfolk Southern Corp. | | | 22,005 | | | | 3,319,894 | |
Occidental Petroleum Corp. | | | 200 | | | | 16,736 | |
Oshkosh Corp. | | | 475 | | | | 33,402 | |
Owens Corning | | | 23,742 | | | | 1,504,531 | |
PACCAR, Inc. | | | 46,845 | | | | 2,902,516 | |
Packaging Corp. of America | | | 971 | | | | 108,548 | |
Perrigo Co. PLC | | | 2,955 | | | | 215,449 | |
Philip Morris International, Inc. | | | 11,296 | | | | 912,039 | |
Phillips 66 | | | 14,376 | | | | 1,614,569 | |
Pinnacle West Capital Corp. | | | 14,502 | | | | 1,168,281 | |
Principal Financial Group, Inc. | | | 14,079 | | | | 745,483 | |
Prologis, Inc. | | | 81,460 | | | | 5,351,107 | |
Prudential Financial, Inc. | | | 37,331 | | | | 3,490,822 | |
Quest Diagnostics, Inc. | | | 17,425 | | | | 1,915,704 | |
Ralph Lauren Corp. | | | 22,657 | | | | 2,848,438 | |
Raytheon Co. | | | 4,836 | | | | 934,218 | |
Realty Income Corp. | | | 14,353 | | | | 772,048 | |
Regeneron Pharmaceuticals, Inc.(a) | | | 967 | | | | 333,605 | |
Republic Services, Inc. | | | 11,449 | | | | 782,654 | |
Ross Stores, Inc. | | | 10,744 | | | | 910,554 | |
Royal Caribbean Cruises Ltd. | | | 3,358 | | | | 347,889 | |
Ryder System, Inc. | | | 23,483 | | | | 1,687,488 | |
S&P Global, Inc. | | | 22,542 | | | | 4,596,088 | |
Seattle Genetics, Inc.(a) | | | 1,495 | | | | 99,253 | |
Simon Property Group, Inc. | | | 5,287 | | | | 899,795 | |
SL Green Realty Corp. | | | 307 | | | | 30,863 | |
SunTrust Banks, Inc. | | | 17,773 | | | | 1,173,373 | |
Synopsys, Inc.(a) | | | 14,609 | | | | 1,250,092 | |
Target Corp. | | | 65,683 | | | | 4,999,790 | |
Telephone & Data Systems, Inc. | | | 5,861 | | | | 160,709 | |
Tenneco, Inc. | | | 5,430 | | | | 238,703 | |
Terex Corp. | | | 3,793 | | | | 160,027 | |
Texas Instruments, Inc. | | | 44,375 | | | | 4,892,344 | |
Thermo Fisher Scientific, Inc. | | | 1,206 | | | | 249,811 | |
Tiffany & Co. | | | 13,333 | | | | 1,754,623 | |
Trinseo SA | | | 756 | | | | 53,638 | |
Twilio, Inc., Class A(a) | | | 2,249 | | | | 125,989 | |
Twitter, Inc.(a) | | | 14,860 | | | | 648,936 | |
UGI Corp. | | | 13,199 | | | | 687,272 | |
| | | | | | | | |
| Security | | Shares | | | Value | |
| United States (continued) | |
Union Pacific Corp. | | | 22,895 | | | $ | 3,243,764 | |
United Therapeutics Corp.(a) | | | 649 | | | | 73,434 | |
Unum Group | | | 32,790 | | | | 1,212,902 | |
Urban Outfitters, Inc.(a) | | | 8,495 | | | | 378,452 | |
Valero Energy Corp. | | | 27,143 | | | | 3,008,259 | |
Varian Medical Systems, Inc.(a) | | | 1,293 | | | | 147,040 | |
VeriSign, Inc.(a) | | | 33,944 | | | | 4,664,584 | |
Vertex Pharmaceuticals, Inc.(a) | | | 3,066 | | | | 521,097 | |
VF Corp. | | | 13,887 | | | | 1,132,068 | |
VICI Properties, Inc. | | | 1,904 | | | | 39,299 | |
VMware, Inc., Class A(a) | | | 732 | | | | 107,582 | |
Walmart Inc. | | | 36,954 | | | | 3,165,110 | |
Weingarten Realty Investors | | | 1,963 | | | | 60,480 | |
WellCare Health Plans, Inc.(a) | | | 3,671 | | | | 903,947 | |
Western Union Co. | | | 10,408 | | | | 211,595 | |
Wolverine World Wide, Inc. | | | 569 | | | | 19,784 | |
WR Grace & Co. | | | 720 | | | | 52,783 | |
Yelp, Inc.(a) | | | 4,560 | | | | 178,661 | |
Zoetis, Inc. | | | 32,182 | | | | 2,741,585 | |
| | | | | | | | |
| | | | 284,057,942 | |
| | | | | | | | |
Total Common Stocks — 96.9%
(Cost — $517,664,229) | | | | 534,506,473 | |
| | | | | | | | |
|
Preferred Stocks — 0.5% | |
|
| Brazil — 0.5% | |
Banco Bradesco SA, Preference Shares | | | 38,423 | | | | 266,678 | |
Braskem SA, Preference A Shares | | | 1,500 | | | | 19,645 | |
Cia Energetica de Minas Gerais, Preference Shares | | | 29,000 | | | | 54,622 | |
Cia Paranaense de Energia, Preference ‘B’ Shares | | | 7,100 | | | | 40,155 | |
Gerdau SA, Preference Shares | | | 67,200 | | | | 241,180 | |
Itau Unibanco Holding SA, Preference Shares | | | 196,070 | | | | 2,040,757 | |
Itausa — Investimentos Itau SA, Preference Shares | | | 47,548 | | | | 112,621 | |
Metalurgica Gerdau SA, Preference Shares | | | 19,697 | | | | 31,408 | |
Telefonica Brasil SA, Preference Shares | | | 1,300 | | | | 15,342 | |
| | | | | | | | |
| | | | 2,822,408 | |
| Russia — 0.0% | |
Surgutneftegas OJSC, Preference Shares | | | 81,693 | | | | 40,982 | |
| | | | | | | | |
Total Preferred Stocks — 0.5%
(Cost — $3,730,690) | | | | 2,863,390 | |
| | | | | | | | |
| | |
Rights — 0.0% | | | | | | | | |
| | |
| Spain — 0.0% | | | | | | |
ACS Actividades de Construccion y | | | | | | | | |
Servicios SA (Expires 11/07/18)(a) | | | 2,085 | | | | 2,147 | |
Repsol SA (Expires 07/06/18)(a) | | | 156,803 | | | | 89,012 | |
| | | | | | | | |
Total Rights — 0.0%
(Cost — $90,591) | | | | 91,159 | |
| | | | | | | | |
Total Long-Term Investments — 97.4%
(Cost — $521,485,510) | | | | 537,461,022 | |
| | | | | | | | |
| | |
Short-Term Securities — 2.9% | | | | | | | | |
| | |
| Money Market Fund — 2.4% | | | | | | |
BlackRock Liquidity Funds, T-Fund, | | | | | | | | |
Institutional Class, 1.80%(e)(h) | | | 9,847,320 | | | | 9,847,320 | |
SL Liquidity Series, LLC, Money Market
| | | | | | | | |
Series, 2.16%(e)(f)(h) | | | 3,423,052 | | | | 3,423,395 | |
| | | | | | | | |
Total Money Market Fund — 2.4%
(Cost — $13,270,678) | | | | 13,270,715 | |
| | | | | | | | |
| | |
| 16 | | 2018 BLACKROCK ANNUAL REPORTTO SHAREHOLDERS |
| | |
Schedule of Investments (continued) June 30, 2018 | | BlackRock Advantage Global Fund, Inc. (Percentages shown are based on Net Assets) |
| | | | | | | | | | | | |
| Security | | | | | Par
(000) | | | Value | |
Time Deposits — 0.5% | |
|
| Australia — 0.1% | |
Brown Brothers Harriman & Co., 1.13%, 07/02/18 | | | AUD | | | | 432 | | | $ | 319,658 | |
| | | | | | | | |
| Canada — 0.0% | |
Brown Brothers Harriman & Co., 0.51%, 07/02/18 | | | CAD | | | | 67 | | | | 50,714 | |
| | | | | | | | |
| Europe — 0.0% | |
Brown Brother Harriman & Co., (0.57%), 07/02/18 | | | EUR | | | | 147 | | | | 172,200 | |
| | | | | | | | |
| Hong Kong — 0.1% | |
BNP Paribas S.A., 0.89%, 07/02/18 | | | HKD | | | | 4,717 | | | | 601,229 | |
| | | | | | | | |
| Japan — 0.2% | |
Sumitomo Bank Tokyo, (0.22%), 07/02/18 | | | JPY | | | | 87,590 | | | | 791,133 | |
| | | | | | | | |
| Norway — 0.0% | |
Brown Brothers Harriman & Co., 1.15%, 07/02/18 | | | NOK | | | | 566 | | | | 69,440 | |
| | | | | | | | |
| | | | | | | | | | | | |
| Security | | | | | Par
(000) | | | Value | |
| Singapore — 0.0% | |
Brown Brothers Harriman & Co., 0.43%, 07/02/18 | | | SGD | | | | 56 | | | $ | 40,914 | |
| | | | | | | | |
| United Kingdom — 0.1% | |
Citibank, New York, 0.23%, 07/02/18 | | | GBP | | | | 273 | | | | 360,794 | |
| | | | | | | | |
Total Time Deposits — 0.5%
(Cost — $2,406,082) | | | | 2,406,082 | |
| | | | | | | | |
Total Short-Term Securities — 2.9%
(Cost — $15,676,760) | | | | 15,676,797 | |
| | | | | | | | |
| |
Total Investments — 100.3%
(Cost — $537,162,270) | | | | 553,137,819 | |
Liabilities in Excess of Other Assets — (0.3)% | | | | (1,660,175 | ) |
| | | | | | | | |
Net Assets — 100.0% | | | $ | 551,477,644 | |
| | | | | | | | |
| (a) | Non-income producing security. |
| (b) | Security exempt from registration pursuant to Rule 144A under the Securities Act of 1933, as amended. These securities may be resold in transactions exempt from registration to qualified institutional investors. |
| (c) | Security, or a portion of the security, is on loan. |
| (d) | Security is valued using significant unobservable inputs and is classified as Level 3 in the fair value hierarchy. |
| (e) | Annualized 7-day yield as of period end. |
| (f) | Security was purchased with the cash collateral from loaned securities. |
| (g) | Less than 0.5 shares. |
| (h) | During the year ended June 30, 2018, investments in issuers considered to be affiliates of the Fund for purposes of Section 2(a)(3) of the Investment Company Act of 1940, as amended, were as follows: |
| | | | | | | | | | | | | | | | | | | | | | | | | | | | |
| Affiliate | | Shares
Held at
06/30/17 | | | Net
Activity | | | Shares
Held at
06/30/18 | | | Value at
06/30/18 | | | Income | | | Net
Realized
Gain (Loss) (a) | | | Change in
Unrealized
Appreciation
(Depreciation) | |
BlackRock Liquidity Funds, T-Fund, Institutional Class | | | — | | | | 9,847,320 | | | | 9,847,320 | | | $ | 9,847,320 | | | $ | 132,892 | | | $ | 43 | | | $ | — | |
SL Liquidity Series, LLC, Money Market Series | | | 88,690,601 | | | | (85,267,549 | ) | | | 3,423,052 | | | | 3,423,395 | | | | 460,924 | (b) | | | 2,482 | | | | (6,544 | ) |
| | | | | | | | | | | | | | | | | | | | | | | | | | | | |
| | | $ | 13,270,715 | | | $ | 593,816 | | | $ | 2,525 | | | $ | (6,544 | ) |
| | | | | | | | | | | | | | | | | | | | | | | | | | | | |
| | (a) | Includes net capital gain distributions, if applicable. | |
| | (b) | Represents securities lending income earned from the reinvestment of cash collateral from loaned securities, net of fees and collateral investment expenses, and other payments to and from borrowers of securities. | |
Derivative Financial Instruments Outstanding as of Period End
Futures Contracts
| | | | | | | | | | | | | | | | |
| Description | | Number of
Contracts | | | Expiration
Date | | | Notional
Amount
(000) | | | Value/
Unrealized
Appreciation
(Depreciation) | |
Long Contracts: | | | | | | | | | | | | | | | | |
Yen Denom Nikkei Index | | | 19 | | | | 09/13/18 | | | $ | 1,907 | | | $ | (19,850 | ) |
S&P/TSX 60 Index | | | 3 | | | | 09/20/18 | | | | 440 | | | | 3,295 | |
SPI 200 Index | | | 2 | | | | 09/20/18 | | | | 227 | | | | 5,583 | |
S&P500 E-Mini Index | | | 56 | | | | 09/21/18 | | | | 7,620 | | | | (144,413 | ) |
MSCI Emerging Markets E-Mini Index | | | 23 | | | | 09/21/18 | | | | 1,223 | | | | (59,363 | ) |
FTSE 100 Index | | | 9 | | | | 09/21/18 | | | | 903 | | | | (800 | ) |
EURO STOXX 50 Index | | | 59 | | | | 09/21/18 | | | | 2,336 | | | | (33,888 | ) |
| | | | | | | | | | | | | | | | |
| | | $ | (249,436 | ) |
| | | | | | | | | | | | | | | | |
| | | | |
| SCHEDULES OF INVESTMENTS | | | 17 | |
| | |
Schedule of Investments (continued) June 30, 2018 | | BlackRock Advantage Global Fund, Inc. |
Derivative Financial Instruments Categorized by Risk Exposure
As of year end, the fair values of derivative financial instruments located in the Statements of Assets and Liabilities were as follows:
| | | | | | | | | | | | | | | | | | | | | | | | | | | | |
| | | Commodity
Contracts | | | Credit
Contracts | | | Equity
Contracts | | | Foreign
Currency
Exchange
Contracts | | | Interest Rate
Contracts | | | Other
Contracts | | | Total | |
Assets — Derivative Financial Instruments | | | | | | | | | | | | | | | | | | | | | | | | | |
Futures contracts | | | | | | | | | | | | | | | | | | | | | | | | | | | | |
Net unrealized appreciation(a) | | $ | — | | | $ | — | | | $ | 8,878 | | | $ | — | | | $ | — | | | $ | — | | | $ | 8,878 | |
| | | | | | | | | | | | | | | | | | | | | | | | | | | | |
Liabilities — Derivative Financial Instruments | | | | | | | | | | | | | | | | | | | | | | | | | | | | |
Futures contracts | | | | | | | | | | | | | | | | | | | | | | | | | | | | |
Net unrealized depreciation(a) | | $ | — | | | $ | — | | | $ | 258,314 | | | $ | — | | | $ | — | | | $ | — | | | $ | 258,314 | |
| | | | | | | | | | | | | | | | | | | | | | | | | | | | |
| | (a) | Includes cumulative appreciation (depreciation) on futures contracts if any, as reported in the Schedule of Investments. Only current day’s variation margin is reported within the Statements of Assets and Liabilities. | |
For the year ended June 30, 2018, the effect of derivative financial instruments in the Statements of Operations was as follows:
| | | | | | | | | | | | | | | | | | | | | | | | | | | | |
| | | Commodity
Contracts | | | Credit
Contracts | | | Equity
Contracts | | | Foreign
Currency
Exchange
Contracts | | | Interest Rate
Contracts | | | Other
Contracts | | | Total | |
Net Realized Gain (Loss) from: | | | | | | | | | | | | | | | | | | | | | | | | | | | | |
Futures contracts | | $ | — | | | $ | — | | | $ | 755,604 | | | $ | — | | | $ | | | | $ | — | | | $ | 755,604 | |
| | | | | | | | | | | | | | | | | | | | | | | | | | | | |
| Net Change in Unrealized Appreciation (Depreciation) on: | | | | | | | | | | | | | | | | | | | | | |
Futures contracts | | $ | — | | | $ | — | | | $ | (249,436 | ) | | $ | — | | | $ | | | | $ | — | | | $ | (249,436 | ) |
| | | | | | | | | | | | | | | | | | | | | | | | | | | | |
Average Quarterly Balances of Outstanding Derivative Financial Instruments
| | | | |
Futures contracts: | | | | |
Average notional value of contracts — long | | $ | 11,617,736 | |
Average notional value of contracts — short | | $ | — | (a) |
| | (a) | Derivative not held at quarter end. The amount shown in the Statements of Operations reflect the results of activity during the period. | |
| | |
| 18 | | 2018 BLACKROCK ANNUAL REPORTTO SHAREHOLDERS |
| | |
Schedule of Investments (continued) June 30, 2018 | | BlackRock Advantage Global Fund, Inc. |
Fair Value Hierarchy as of Period End
Various inputs are used in determining the fair value of investments and derivative financial instruments. For information about the Fund’s policy regarding valuation of investments, refer to the Notes to Financial Statements.
The following table summarizes the Fund’s investments and and derivative financial instruments categorized in the disclosure hierarchy:
| | | | | | | | | | | | | | | | |
| | | Level 1 | | | Level 2 | | | Level 3 | | | Total | |
Assets: | | | | | | | | | | | | | | | | |
Investments: | | | | | | | | | | | | | | | | |
Common Stocks: | | | | | | | | | | | | | | | | |
Australia | | $ | — | | | $ | 12,004,576 | | | $ | — | | | $ | 12,004,576 | |
Austria | | | — | | | | 933,542 | | | | — | | | | 933,542 | |
Belgium | | | — | | | | 747,373 | | | | — | | | | 747,373 | |
Bermuda | | | 50,966 | | | | — | | | | — | | | | 50,966 | |
Brazil | | | 2,793,511 | | | | — | | | | — | | | | 2,793,511 | |
Canada | | | 15,585,569 | | | | — | | | | — | | | | 15,585,569 | |
China | | | 3,623,662 | | | | 13,055,630 | | | | — | | | | 16,679,292 | |
Czech Republic | | | — | | | | 90,098 | | | | — | | | | 90,098 | |
Denmark | | | — | | | | 2,841,865 | | | | — | | | | 2,841,865 | |
Finland | | | — | | | | 6,197,173 | | | | — | | | | 6,197,173 | |
France | | | 1,749,399 | | | | 19,280,771 | | | | — | | | | 21,030,170 | |
Germany | | | 62,092 | | | | 21,945,524 | | | | — | | | | 22,007,616 | |
Hong Kong | | | 26,628 | | | | 4,592,772 | | | | — | | | | 4,619,400 | |
Hungary | | | — | | | | 1,809,103 | | | | — | | | | 1,809,103 | |
India | | | 92,479 | | | | 4,859,763 | | | | 186,668 | | | | 5,138,910 | |
Indonesia | | | — | | | | 1,006,827 | | | | — | | | | 1,006,827 | |
Ireland | | | — | | | | 707,094 | | | | — | | | | 707,094 | |
Israel | | | 44,633 | | | | — | | | | — | | | | 44,633 | |
Italy | | | — | | | | 5,702,767 | | | | — | | | | 5,702,767 | |
Japan | | | — | | | | 32,991,605 | | | | — | | | | 32,991,605 | |
Luxembourg | | | 23,359 | | | | — | | | | — | | | | 23,359 | |
Malaysia | | | — | | | | 287,717 | | | | — | | | | 287,717 | |
Mexico | | | 3,508,968 | | | | — | | | | — | | | | 3,508,968 | |
Netherlands | | | 18,465 | | | | 12,738,771 | | | | — | | | | 12,757,236 | |
Norway | | | — | | | | 9,231,463 | | | | — | | | | 9,231,463 | |
Poland | | | — | | | | 1,463,831 | | | | — | | | | 1,463,831 | |
Russia | | | 65,881 | | | | 1,042,110 | | | | — | | | | 1,107,991 | |
Singapore | | | — | | | | 401,742 | | | | — | | | | 401,742 | |
South Africa | | | 66,848 | | | | 1,300,714 | | | | — | | | | 1,367,562 | |
South Korea | | | 19 | | | | 1,011,904 | | | | — | | | | 1,011,923 | |
Spain | | | 26,905 | | | | 11,472,049 | | | | — | | | | 11,498,954 | |
Sweden | | | — | | | | 10,926,563 | | | | — | | | | 10,926,563 | |
Switzerland | | | 3,569,528 | | | | 9,187,949 | | | | — | | | | 12,757,477 | |
Taiwan | | | — | | | | 2,975,307 | | | | — | | | | 2,975,307 | |
Thailand | | | — | | | | 1,546,124 | | | | — | | | | 1,546,124 | |
Turkey | | | — | | | | 3,161,230 | | | | — | | | | 3,161,230 | |
Ukraine | | | — | | | | 17,825 | | | | — | | | | 17,825 | |
United Kingdom | | | 2,611,087 | | | | 20,810,082 | | | | — | | | | 23,421,169 | |
United States | | | 284,057,942 | | | | — | | | | — | | | | 284,057,942 | |
Preferred Stocks | | | 2,822,408 | | | | 40,982 | | | | — | | | | 2,863,390 | |
Rights | | | 91,159 | | | | — | | | | — | | | | 91,159 | |
Short-Term Securities: | | | | | | | | | | | | | | | | |
Money Market Fund | | | 9,847,320 | | | | — | | | | — | | | | 9,847,320 | |
Time Deposits | | | — | | | | 2,406,082 | | | | — | | | | 2,406,082 | |
| | | | | | | | | | | | | | | | |
| | $ | 330,738,828 | | | $ | 218,788,928 | | | $ | 186,668 | | | $ | 549,714,424 | |
| | | | | | | | | | | | | | | | |
Investments Valued at NAV(a) | | | | | | | | | | | | | | | 3,423,395 | |
| | | | | | | | | | | | | | | | |
| | | | | | | | | | | | | | $ | 553,137,819 | |
| | | | | | | | | | | | | | | | |
| | | | |
| SCHEDULES OF INVESTMENTS | | | 19 | |
| | |
Schedule of Investments (continued) June 30, 2018 | | BlackRock Advantage Global Fund, Inc. |
| | | | | | | | | | | | | | | | |
| | | Level 1 | | | Level 2 | | | Level 3 | | | Total | |
Derivative Financial Instruments(b) | | | | | | | | | | | | | | | | |
Assets: | | | | | | | | | | | | | | | | |
Equity contracts | | $ | 8,878 | | | $ | — | | | $ | — | | | $ | 8,878 | |
Liabilities: | | | | | | | | | | | | | | | | |
Equity contracts | | | (258,314 | ) | | | — | | | | — | | | | (258,314 | ) |
| | | | | | | | | | | | | | | | |
| | $ | (249,436 | ) | | $ | — | | | $ | — | | | $ | (249,436 | ) |
| | | | | | | | | | | | | | | | |
| | (a) | As of June 30, 2018, certain of the Fund’s Investments were fair valued using NAV per share as no quoted market value is available and therefore have been excluded from the fair value hierarchy. | |
| | (b) | Derivative financial instruments are futures contracts, which are valued at the unrealized appreciation (depreciation) on the instrument. | |
During the year ended June 30, 2018, there were no transfers between levels.
See notes to financial statements.
| | |
| 20 | | 2018 BLACKROCK ANNUAL REPORTTO SHAREHOLDERS |
| | |
Schedule of Investments June 30, 2018 | | BlackRock EuroFund (Percentages shown are based on Net Assets) |
| | | | | | | | |
| Security | | Shares | | | Value | |
Common Stocks — 99.2% | |
|
| Belgium — 1.9% | |
KBC Group NV | | | 50,430 | | | $ | 3,873,027 | |
| | | | | | | | |
| Denmark — 6.2% | |
Danske Bank A/S | | | 138,133 | | | | 4,303,380 | |
Genmab A/S(a) | | | 14,332 | | | | 2,205,237 | |
Novo Nordisk A/S, Class B | | | 130,466 | | | | 6,026,297 | |
| | | | | | | | |
| | | | 12,534,914 | |
| Finland — 4.4% | |
Kone OYJ, Class B | | | 68,198 | | | | 3,467,563 | |
Konecranes OYJ | | | 54,637 | | | | 2,241,960 | |
Wartsila OYJ | | | 160,515 | | | | 3,142,360 | |
| | | | | | | | |
| | | | 8,851,883 | |
| France — 17.9% | |
Arkema SA | | | 26,445 | | | | 3,120,516 | |
Eiffage SA | | | 28,753 | | | | 3,123,825 | |
Kering SA | | | 5,415 | | | | 3,050,267 | |
Renault SA | | | 31,650 | | | | 2,681,432 | |
Safran SA | | | 41,176 | | | | 4,986,613 | |
Sanofi | | | 48,207 | | | | 3,869,070 | |
STMicroelectronics NV | | | 146,651 | | | | 3,256,135 | |
Thales SA | | | 30,129 | | | | 3,876,212 | |
TOTAL SA | | | 86,903 | | | | 5,277,249 | |
UbiSoft Entertainment SA(a) | | | 26,587 | | | | 2,906,177 | |
| | | | | | | | |
| | | | 36,147,496 | |
| Germany — 11.9% | |
Allianz SE, Registered Shares | | | 25,899 | | | | 5,336,608 | |
Continental AG | | | 20,088 | | | | 4,571,581 | |
Deutsche Wohnen SE, Bearer Shares | | | 81,411 | | | | 3,931,657 | |
Fresenius Medical Care AG & Co. KGaA | | | 41,508 | | | | 4,179,498 | |
Puma SE | | | 2,971 | | | | 1,736,055 | |
Siemens AG, Registered Shares | | | 32,566 | | | | 4,290,760 | |
| | | | | | | | |
| | | | 24,046,159 | |
| Ireland — 1.2% | |
Kingspan Group PLC | | | 50,342 | | | | 2,520,889 | |
| | | | | | | | |
| Italy — 4.2% | | | | | | |
Atlantia SpA | | | 121,494 | | | | 3,581,911 | |
Enel SpA | | | 463,659 | | | | 2,569,218 | |
Tenaris SA | | | 125,187 | | | | 2,284,665 | |
| | | | | | | | |
| | | | 8,435,794 | |
| Netherlands — 3.7% | |
ASML Holding NV | | | 19,511 | | | | 3,860,929 | |
| | | | | | | | |
| Portugal — 1.4% | |
Galp Energia SGPS SA | | | 144,709 | | | | 2,752,893 | |
| | | | | | | | |
| Spain — 3.8% | |
Banco Bilbao Vizcaya Argentaria SA | | | 445,788 | | | | 3,143,949 | |
Industria de Diseno Textil SA | | | 135,957 | | | | 4,629,892 | |
| | | | | | | | |
| | | | 7,773,841 | |
| Sweden — 6.5% | |
Assa Abloy AB, Class B | | | 189,829 | | | | 4,026,575 | |
Electrolux AB, Class B | | | 49,483 | | | | 1,122,948 | |
Hexagon AB, Class B | | | 92,532 | | | | 5,141,737 | |
Volvo AB, Class B | | | 175,360 | | | | 2,787,017 | |
| | | | | | | | |
| | | | 13,078,277 | |
| Switzerland — 5.5% | |
Cie Financiere Richemont SA, Registered Shares | | | 33,101 | | | | 2,798,175 | |
Lonza Group AG, Registered Shares(a) | | | 15,682 | | | | 4,143,911 | |
Sika AG | | | 31,020 | | | | 4,286,017 | |
| | | | | | | | |
| | | | 11,228,103 | |
| | | | | | | | |
| Security | | Shares | | | Value | |
| United Kingdom — 30.7% | |
Associated British Foods PLC | | | 108,157 | | | $ | 3,899,958 | |
British American Tobacco PLC | | | 116,273 | | | | 5,857,063 | |
Bunzl PLC | | | 110,904 | | | | 3,349,426 | |
CRH PLC | | | 72,272 | | | | 2,535,103 | |
Croda International PLC | | | 7,301 | | | | 461,256 | |
Diageo PLC | | | 97,881 | | | | 3,516,464 | |
DS Smith PLC | | | 26,793 | | | | 183,577 | |
Experian PLC | | | 193,046 | | | | 4,762,177 | |
Glencore PLC(a) | | | 713,335 | | | | 3,386,764 | |
London Stock Exchange Group PLC | | | 89,879 | | | | 5,291,132 | |
Prudential PLC | | | 223,224 | | | | 5,088,687 | |
Rentokil Initial PLC | | | 469,523 | | | | 2,164,796 | |
Rotork PLC | | | 544,945 | | | | 2,400,020 | |
Royal Dutch Shell PLC, Class A | | | 190,575 | | | | 6,595,593 | |
Shire PLC | | | 56,242 | | | | 3,168,610 | |
Unilever NV CVA | | | 64,963 | | | | 3,619,540 | |
Unilever PLC | | | 20,926 | | | | 1,155,962 | |
Weir Group PLC | | | 133,197 | | | | 3,498,052 | |
Worldpay, Inc., Class A(a)(b) | | | 59,133 | | | | 4,808,874 | |
| | | | | | | | |
| | | | 65,743,054 | |
| | | | | | | | |
Total Long-Term Investments — 99.2%
(Cost — $196,525,883) | | | | 200,847,259 | |
| | | | | | | | |
| | |
Short-Term Securities — 0.4% | | | | | | | | |
BlackRock Liquidity Funds, T-Fund, | | | | | | | | |
Institutional Class, 1.80%(c)(e) | | | 836,840 | | | | 836,840 | |
SL Liquidity Series, LLC, Money Market | | | | | | | | |
Series, 2.16%(c)(d)(e) | | | 87,751 | | | | 87,760 | |
| | | | | | | | |
Total Short-Term Securities — 0.4%
(Cost — $924,600) | | | | 924,600 | |
| | | | | | | | |
| |
Total Investments — 99.6%
(Cost — $197,450,483) | | | | 201,771,859 | |
Other Assets Less Liabilities — 0.4% | | | | 777,527 | |
| | | | | | | | |
Net Assets — 100.0% | | | $ | 202,549,386 | |
| | | | | | | | |
| (a) | Non-income producing security. |
| (b) | Security, or a portion of the security, is on loan. |
| (c) | Annualized 7-day yield as of period end. |
| (d) | All or a portion of the security was purchased with the cash collateral from loaned securities. |
| | | | |
| SCHEDULES OF INVESTMENTS | | | 21 | |
| | |
Schedule of Investments (continued) June 30, 2018 | | BlackRock EuroFund |
| (e) | During the year ended June 30, 2018, investments in issuers considered to be affiliates of the Fund for purposes of Section 2(a)(3) of the Investment Company Act of 1940, as amended, were as follows: |
| | | | | | | | | | | | | | | | | | | | | | | | | | | | |
| Affiliate | | Shares
Held at
06/30/17 | | | Net
Activity | | | Shares
Held at
06/30/18 | | | Value at
06/30/18 | | | Income | | | Net
Realized
Gain (Loss) (a) | | | Change in
Unrealized
Appreciation
(Depreciation) | |
BlackRock Liquidity Funds, T-Fund, Institutional Class | | | 1,465,665 | | | | (628,825 | ) | | | 836,840 | | | $ | 836,840 | | | $ | 8,143 | | | $ | — | | | $ | — | |
SL Liquidity Series, LLC, Money Market Series | | | — | | | | 87,751 | | | | 87,751 | | | | 87,760 | | | | 378 | (b) | | | 16 | | | | — | |
| | | | | | | | | | | | | | | | | | | | | | | | | | | | |
| | | $ | 924,600 | | | $ | 8,521 | | | $ | 16 | | | $ | — | |
| | | | | | | | | | | | | | | | | | | | | | | | | | | | |
| | (a) | Includes net capital gain distributions, if applicable. | |
| | (b) | Represents securities lending income earned from the reinvestment of cash collateral from loaned securities, net of fees and collateral investment expenses, and other payments to and from borrowers of securities. | |
Fair Value Hierarchy as of Period End
Various inputs are used in determining the fair value of investments. For information about the Fund’s policy regarding valuation of investments, refer to the Notes to Financial Statements.
The following table summarizes the Fund’s investments categorized in the disclosure hierarchy:
| | | | | | | | | | | | | | | | |
| | | Level 1 | | | Level 2 | | | Level 3 | | | Total | |
Assets: | | | | | | | | | | | | | | | | |
Investments: | | | | | | | | | | | | | | | | |
Common Stocks: | | | | | | | | | | | | | | | | |
Belgium | | $ | — | | | $ | 3,873,027 | | | $ | — | | | $ | 3,873,027 | |
Denmark | | | — | | | | 12,534,914 | | | | — | | | | 12,534,914 | |
Finland | | | — | | | | 8,851,883 | | | | — | | | | 8,851,883 | |
France | | | — | | | | 36,147,496 | | | | — | | | | 36,147,496 | |
Germany | | | 287,804 | | | | 23,758,355 | | | | — | | | | 24,046,159 | |
Ireland | | | 2,520,889 | | | | — | | | | — | | | | 2,520,889 | |
Italy | | | — | | | | 8,435,794 | | | | — | | | | 8,435,794 | |
Netherlands | | | — | | | | 3,860,929 | | | | — | | | | 3,860,929 | |
Portugal | | | — | | | | 2,752,893 | | | | — | | | | 2,752,893 | |
Spain | | | — | | | | 7,773,841 | | | | — | | | | 7,773,841 | |
Sweden | | | — | | | | 13,078,277 | | | | — | | | | 13,078,277 | |
Switzerland | | | — | | | | 11,228,103 | | | | — | | | | 11,228,103 | |
United Kingdom | | | 4,808,874 | | | | 60,934,180 | | | | — | | | | 65,743,054 | |
Short-Term Securities | | | 836,840 | | | | — | | | | — | | | | 836,840 | |
| | | | | | | | | | | | | | | | |
| | $ | 8,454,407 | | | $ | 193,229,692 | | | $ | — | | | $ | 201,684,099 | |
| | | | | | | | | | | | | | | | |
Investments Valued at NAV(a) | | | | | | | 87,760 | |
| | | | | | | | | | | | | | | | |
| | | | | | | | | | $ | 201,771,859 | |
| | | | | | | | | | | | | | | | |
| | (a) | As of June 30, 2018, certain of the Fund’s Investments were fair valued using NAV per share as no quoted market value is available and therefore have been excluded from the fair value hierarchy. | |
During the year ended June 30, 2018, there were no transfers between levels.
See notes to financial statements.
| | |
| 22 | | 2018 BLACKROCK ANNUAL REPORTTO SHAREHOLDERS |
Statements of Assets and Liabilities
June 30, 2018
| | | | | | | | |
| | | BlackRock
Advantage Global
Fund, Inc. | | | BlackRock
EuroFund | |
| | |
ASSETS | | | | | | | | |
Investments at value — unaffiliated(a)(b) | | $ | 539,867,104 | | | $ | 200,847,259 | |
Investments at value — affiliated(c) | | | 13,270,715 | | | | 924,600 | |
Foreign currency at value | | | 23,253 | | | | — | |
Cash pledged for futures contracts | | | 632,000 | | | | — | |
Receivables: | | | | | | | | |
Investments sold | | | 11,599,593 | | | | 2,683,605 | |
Dividends — unaffiliated | | | 988,148 | | | | 880,196 | |
Capital shares sold | | | 182,231 | | | | 89,661 | |
Variation margin on futures contracts | | | 51,693 | | | | — | |
Dividends — affiliated | | | 16,948 | | | | 778 | |
Receivable from the Manager | | | 13,705 | | | | — | |
Securities lending income — affiliated | | | 829 | | | | 38 | |
Offering costs | | | 22,932 | | | | 22,932 | |
Prepaid expenses | | | 44,110 | | | | 26,437 | |
| | | | | | | | |
Total assets | | | 566,713,261 | | | | 205,475,506 | |
| | | | | | | | |
| | |
LIABILITIES | | | | | | | | |
Cash collateral on securities loaned at value | | | 3,419,021 | | | | 87,760 | |
Foreign bank overdraft(d) | | | — | | | | 12,959 | |
Payables: | | | | | | | | |
Investments purchased | | | 8,463,270 | | | | 2,219,894 | |
Capital shares redeemed | | | 2,409,953 | | | | 163,925 | |
Investment advisory fees | | | 211,830 | | | | 117,566 | |
Service and distribution fees | | | 145,491 | | | | 38,071 | |
Offering costs | | | 30,534 | | | | 7,302 | |
Board realignment and consolidation | | | 26,581 | | | | 8,622 | |
Variation margin on futures contracts | | | 6,006 | | | | — | |
Directors’ and Officer’s fees | | | 4,710 | | | | 3,398 | |
Other affiliates | | | 2,248 | | | | 709 | |
Other accrued expenses | | | 515,973 | | | | 265,914 | |
| | | | | | | | |
Total liabilities | | | 15,235,617 | | | | 2,926,120 | |
| | | | | | | | |
| | |
NET ASSETS | | $ | 551,477,644 | | | $ | 202,549,386 | |
| | | | | | | | |
| | |
NET ASSETS CONSIST OF | | | | | | | | |
Paid-in capital | | $ | 522,327,456 | | | $ | 207,285,347 | |
Undistributed net investment income | | | 3,788,365 | | | | 2,923,870 | |
Accumulated net realized gain (loss) | | | 9,644,451 | | | | (11,962,286 | ) |
Net unrealized appreciation (depreciation) | | | 15,717,372 | | | | 4,302,455 | |
| | | | | | | | |
NET ASSETS | | $ | 551,477,644 | | | $ | 202,549,386 | |
| | | | | | | | |
| | |
(a) Investments at cost — unaffiliated | | $ | 523,891,592 | | | $ | 196,525,883 | |
(b) Securities loaned at value | | $ | 3,296,562 | | | $ | 81,323 | |
(c) Investments at cost — affiliated | | $ | 13,270,678 | | | $ | 924,600 | |
(d) Foreign currency at cost | | $ | 23,505 | | | $ | (12,923 | ) |
See notes to financial statements.
Statements of Assets and Liabilities (continued)
June 30, 2018
| | | | | | | | |
| | | BlackRock
Advantage Global
Fund, Inc. | | | BlackRock
EuroFund | |
Institutional | | | | | | | | |
Net assets | | $ | 114,869,556 | | | $ | 43,685,637 | |
| | | | | | | | |
Shares outstanding | | | 5,311,332 | | | | 2,899,872 | |
| | | | | | | | |
Net asset value | | $ | 21.63 | | | $ | 15.06 | |
| | | | | | | | |
Par Value | | $ | 0.10 | | | | 0.10 | |
| | | | | | | | |
Shares authorized | | | 100 million | | | | Unlimited | |
| | | | | | | | |
| | |
Investor A | | | | | | | | |
Net assets | | $ | 324,977,926 | | | $ | 149,539,571 | |
| | | | | | | | |
Shares outstanding | | | 15,805,973 | | | | 10,120,828 | |
| | | | | | | | |
Net asset value | | $ | 20.56 | | | $ | 14.78 | |
| | | | | | | | |
Par Value | | $ | 0.10 | | | | 0.10 | |
| | | | | | | | |
Shares authorized | | | 100 million | | | | Unlimited | |
| | | | | | | | |
| | |
Class C | | | | | | | | |
Net assets | | $ | 90,298,921 | | | $ | 7,532,898 | |
| | | | | | | | |
Shares outstanding | | | 5,352,786 | | | | 727,304 | |
| | | | | | | | |
Net asset value | | $ | 16.87 | | | $ | 10.36 | |
| | | | | | | | |
Par Value | | $ | 0.10 | | | | 0.10 | |
| | | | | | | | |
Shares authorized | | | 100 million | | | | Unlimited | |
| | | | | | | | |
| | |
Class K | | | | | | | | |
Net assets | | $ | 4,615,551 | | | $ | 1,005,282 | |
| | | | | | | | |
Shares outstanding | | | 213,364 | | | | 66,681 | |
| | | | | | | | |
Net asset value | | $ | 21.63 | | | $ | 15.08 | |
| | | | | | | | |
Par Value | | $ | 0.10 | | | | 0.10 | |
| | | | | | | | |
Shares authorized | | | 2 billion | | | | Unlimited | |
| | | | | | | | |
| | |
Class R | | | | | | | | |
Net assets | | $ | 16,715,690 | | | $ | 785,998 | |
| | | | | | | | |
Shares outstanding | | | 898,905 | | | | 70,571 | |
| | | | | | | | |
Net asset value | | $ | 18.60 | | | $ | 11.14 | |
| | | | | | | | |
Par Value | | $ | 0.10 | | | | 0.10 | |
| | | | | | | | |
Shares authorized | | | 100 million | | | | Unlimited | |
| | | | | | | | |
See notes to financial statements.
| | |
| 24 | | 2018 BLACKROCK ANNUAL REPORTTO SHAREHOLDERS |
Statements of Operations
Year Ended June 30, 2018
| | | | | | | | |
| | | BlackRock
Advantage Global
Fund, Inc. | | | BlackRock
EuroFund | |
| | |
INVESTMENT INCOME | | | | | | | | |
Dividends — unaffiliated | | $ | 15,762,020 | | | $ | 6,806,513 | |
Securities lending income — affiliated — net | | | 460,924 | | | | 378 | |
Dividends — affiliated | | | 132,892 | | | | 8,143 | |
Foreign taxes withheld | | | (1,076,775 | ) | | | (700,125 | ) |
| | | | | | | | |
Total investment income | | | 15,279,061 | | | | 6,114,909 | |
| | | | | | | | |
| | |
EXPENSES | | | | | | | | |
Investment advisory | | | 5,953,033 | | | | 2,009,479 | |
Service and distribution — class specific | | | 2,159,919 | | | | 489,082 | |
Transfer agent — class specific | | | 1,334,659 | | | | 430,578 | |
Printing | | | 582,502 | | | | 31,341 | |
Custodian | | | 396,950 | | | | 140,696 | |
Accounting services | | | 187,912 | | | | 58,146 | |
Professional | | | 137,047 | | | | 80,343 | |
Registration | | | 99,442 | | | | 70,217 | |
Board realignment and consolidation | | | 26,581 | | | | 8,622 | |
Directors and Officer | | | 25,047 | | | | 19,590 | |
Offering cost | | | 17,118 | | | | 17,118 | |
Miscellaneous | | | 41,398 | | | | 26,434 | |
| | | | | | | | |
Total expenses | | | 10,961,608 | | | | 3,381,646 | |
Less: | | | | | | | | |
Fees waived and/or reimbursed by the Manager | | | (1,740,087 | ) | | | (85,981 | ) |
Transfer agent fees reimbursed — class specific | | | (682,031 | ) | | | — | |
| | | | | | | | |
Total expenses after fees waived and/or reimbursed | | | 8,539,490 | | | | 3,295,665 | |
| | | | | | | | |
Net investment income | | | 6,739,571 | | | | 2,819,244 | |
| | | | | | | | |
| | |
REALIZED AND UNREALIZED GAIN | | | | | | | | |
Net realized gain from: | | | | | | | | |
Investments — unaffiliated | | | 206,699,227 | | | | 38,650,162 | |
Investments — affiliated | | | 2,482 | | | | 16 | |
Futures contracts | | | 755,604 | | | | — | |
Foreign currency transactions | | | 36,450 | | | | 50,460 | |
Capital gain distributions from investment companies — affiliated | | | 43 | | | | — | |
| | | | | | | | |
| | | 207,493,806 | | | | 38,700,638 | |
| | | | | | | | |
Net change in unrealized appreciation (depreciation) on: | | | | | | | | |
Investments — unaffiliated | | | (123,490,291 | ) | | | (29,637,421 | ) |
Investments — affiliated | | | (6,544 | ) | | | — | |
Futures contracts | | | (249,436 | ) | | | — | |
Foreign currency translations | | | (9,145 | ) | | | (3,383 | ) |
| | | | | | | | |
| | | (123,755,416 | ) | | | (29,640,804 | ) |
| | | | | | | | |
Net realized and unrealized gain | | | 83,738,390 | | | | 9,059,834 | |
| | | | | | | | |
NET INCREASE IN NET ASSETS RESULTING FROM OPERATIONS | | $ | 90,477,961 | | | $ | 11,879,078 | |
| | | | | | | | |
See notes to financial statements.
Statements of Changes in Net Assets
| | | | | | | | |
| | | BlackRock Advantage Global Fund, Inc. | |
| | | Year Ended June 30, | |
| | | 2018 | | | 2017 | |
| | |
INCREASE (DECREASE) IN NET ASSETS | | | | | | | | |
| | |
OPERATIONS | | | | | | | | |
Net investment income (loss) | | $ | 6,739,571 | | | $ | (455,782 | ) |
Net realized gain | | | 207,493,806 | | | | 65,771,914 | |
Net change in unrealized appreciation (depreciation) | | | (123,755,416 | ) | | | 85,945,330 | |
| | | | | | | | |
Net increase in net assets resulting from operations | | | 90,477,961 | | | | 151,261,462 | |
| | | | | | | | |
| | |
DISTRIBUTIONS TO SHAREHOLDERS(a) | | | | | | | | |
From net investment income: | | | | | | | | |
Institutional | | | (3,192,349 | ) | | | (2,750,170 | ) |
Investor A | | | (3,732,983 | ) | | | (2,433,397 | ) |
Class R | | | (129,667 | ) | | | (43,752 | ) |
From net realized gain: | | | | | | | | |
Institutional | | | (60,337,167 | ) | | | — | |
Investor A | | | (96,502,725 | ) | | | — | |
Investor B | | | (83,314 | ) | | | — | |
Investor C | | | (35,126,324 | ) | | | — | |
Class R | | | (5,274,116 | ) | | | — | |
| | | | | | | | |
Decrease in net assets resulting from distributions to shareholders | | | (204,378,645 | ) | | | (5,227,319 | ) |
| | | | | | | | |
| | |
CAPITAL SHARE TRANSACTIONS | | | | | | | | |
Net decrease in net assets derived from capital share transactions | | | (143,788,659 | ) | | | (236,746,465 | ) |
| | | | | | | | |
| | |
NET ASSETS | | | | | | | | |
Total decrease in net assets | | | (257,689,343 | ) | | | (90,712,322 | ) |
Beginning of year | | | 809,166,987 | | | | 899,879,309 | |
| | | | | | | | |
End of year | | $ | 551,477,644 | | | $ | 809,166,987 | |
| | | | | | | | |
Undistributed (distributions in excess of) net investment income, end of year | | $ | 3,788,365 | | | $ | (5,719,151 | ) |
| | | | | | | | |
| (a) | Distributions for annual periods determined in accordance with U.S. federal income tax regulations. |
See notes to financial statements.
| | |
| 26 | | 2018 BLACKROCK ANNUAL REPORTTO SHAREHOLDERS |
Statements of Changes in Net Assets
| | | | | | | | |
| | | BlackRock EuroFund | |
| | | Year Ended June 30, | |
| | | 2018 | | | 2017 | |
| | |
INCREASE (DECREASE) IN NET ASSETS | | | | | | | | |
| | |
OPERATIONS | | | | | | | | |
Net investment income | | $ | 2,819,244 | | | $ | 3,288,153 | |
Net realized gain | | | 38,700,638 | | | | 5,566,543 | |
Net change in unrealized appreciation (depreciation) | | | (29,640,804 | ) | | | 31,559,027 | |
| | | | | | | | |
Net increase in net assets resulting from operations | | | 11,879,078 | | | | 40,413,723 | |
| | | | | | | | |
| | |
DISTRIBUTIONS TO SHAREHOLDERS(a) | | | | | | | | |
From net investment income: | | | | | | | | |
Institutional | | | (1,693,589 | ) | | | (3,163,969 | ) |
Investor A | | | (1,574,352 | ) | | | (3,145,485 | ) |
Investor C | | | (23,309 | ) | | | (214,011 | ) |
Class R | | | (6,223 | ) | | | (19,276 | ) |
| | | | | | | | |
Decrease in net assets resulting from distributions to shareholders | | | (3,297,473 | ) | | | (6,542,741 | ) |
| | | | | | | | |
| | |
CAPITAL SHARE TRANSACTIONS | | | | | | | | |
Net decrease in net assets derived from capital share transactions | | | (127,199,184 | ) | | | (68,223,877 | ) |
| | | | | | | | |
| | |
NET ASSETS | | | | | | | | |
Total decrease in net assets | | | (118,617,579 | ) | | | (34,352,895 | ) |
Beginning of year | | | 321,166,965 | | | | 355,519,860 | |
| | | | | | | | |
End of year | | $ | 202,549,386 | | | $ | 321,166,965 | |
| | | | | | | | |
Undistributed net investment income, end of year | | $ | 2,923,870 | | | $ | 3,299,680 | |
| | | | | | | | |
| (a) | Distributions for annual periods determined in accordance with U.S. federal income tax regulations. |
See notes to financial statements.
Financial Highlights
(For a share outstanding throughout each period)
| | | | | | | | | | | | | | | | | | | | |
| | | BlackRock Advantage Global Fund, Inc. | |
| | | Institutional | |
| | | Year Ended June 30, | |
| | | 2018 | | | 2017 | | | 2016 | | | 2015 | | | 2014 | |
Net asset value, beginning of year | | $ | 25.83 | | | $ | 21.85 | | | $ | 25.78 | | | $ | 30.82 | | | $ | 25.94 | |
| | | | | | | | | | | | | | | | | | | | |
Net investment income(a) | | | 0.29 | | | | 0.11 | | | | 0.04 | | | | 0.08 | | | | 0.09 | |
Net realized and unrealized gain (loss) | | | 2.82 | | | | 4.15 | | | | (2.87 | ) | | | (1.17 | ) | | | 8.09 | |
| | | | | | | | | | | | | | | | | | | | |
Net increase (decrease) from investment operations | | | 3.11 | | | | 4.26 | | | | (2.83 | ) | | | (1.09 | ) | | | 8.18 | |
| | | | | | | | | | | | | | | | | | | | |
| Distributions(b) | | | | | | | | | | | | | | | |
From net investment income | | | (0.37 | ) | | | (0.28 | ) | | | — | | | | (0.11 | ) | | | (0.24 | ) |
From net realized gain | | | (6.94 | ) | | | — | | | | (1.10 | ) | | | (3.84 | ) | | | (3.06 | ) |
| | | | | | | | | | | | | | | | | | | | |
Total distributions | | | (7.31 | ) | | | (0.28 | ) | | | (1.10 | ) | | | (3.95 | ) | | | (3.30 | ) |
| | | | | | | | | | | | | | | | | | | | |
Net asset value, end of year | | $ | 21.63 | | | $ | 25.83 | | | $ | 21.85 | | | $ | 25.78 | | | $ | 30.82 | |
| | | | | | | | | | | | | | | | | | | | |
| | | | | |
Total Return(c) | | | | | | | | | | | | | | | | | | | | |
Based on net asset value | | | 12.43 | % | | | 19.60 | % | | | (10.94 | )% | | | (2.45 | )% | | | 33.28 | % |
| | | | | | | | | | | | | | | | | | | | |
| | | | | |
Ratios to Average Net Assets | | | | | | | | | | | | | | | | | | | | |
Total expenses | | | 1.16 | % | | | 1.17 | % | | | 1.07 | % | | | 1.05 | % | | | 1.03 | % |
| | | | | | | | | | | | | | | | | | | | |
Total expenses after fees waived and/or reimbursed and paid indirectly | | | 0.88 | % | | | 1.13 | % | | | 1.07 | % | | | 1.05 | % | | | 1.03 | % |
| | | | | | | | | | | | | | | | | | | | |
Net investment income | | | 1.20 | % | | | 0.47 | % | | | 0.17 | % | | | 0.29 | % | | | 0.31 | % |
| | | | | | | | | | | | | | | | | | | | |
| | | | | |
Supplemental Data | | | | | | | | | | | | | | | | | | | | |
Net assets, end of year (000) | | $ | 114,870 | | | $ | 258,047 | | | $ | 250,041 | | | $ | 265,841 | | | $ | 320,705 | |
| | | | | | | | | | | | | | | | | | | | |
Portfolio turnover rate | | | 189 | % | | | 59 | % | | | 73 | % | | | 73 | % | | | 77 | % |
| | | | | | | | | | | | | | | | | | | | |
| (a) | Based on average shares outstanding. |
| (b) | Distributions for annual periods determined in accordance with U.S. federal income tax regulations. |
| (c) | Where applicable, assumes the reinvestment of distributions. |
See notes to financial statements.
| | |
| 28 | | 2018 BLACKROCK ANNUAL REPORTTO SHAREHOLDERS |
Financial Highlights (continued)
(For a share outstanding throughout each period)
| | | | | | | | | | | | | | | | | | | | |
| | | BlackRock Advantage Global Fund, Inc. (continued) | |
| | | Investor A | |
| | | Year Ended June 30, | |
| | | 2018 | | | 2017 | | | 2016 | | | 2015 | | | 2014 | |
Net asset value, beginning of year | | $ | 24.85 | | | $ | 21.00 | | | $ | 24.90 | | | $ | 29.95 | | | $ | 25.33 | |
| | | | | | | | | | | | | | | | | | | | |
Net investment income (loss)(a) | | | 0.25 | | | | 0.01 | | | | (0.04 | ) | | | (0.00 | )(b) | | | (0.00 | )(b) |
Net realized and unrealized gain (loss) | | | 2.67 | | | | 3.99 | | | | (2.76 | ) | | | (1.15 | ) | | | 7.87 | |
| | | | | | | | | | | | | | | | | | | | |
Net increase (decrease) from investment operations | | | 2.92 | | | | 4.00 | | | | (2.80 | ) | | | (1.15 | ) | | | 7.87 | |
| | | | | | | | | | | | | | | | | | | | |
| Distributions(c) | | | | | | | | | | | | | | | |
From net investment income | | | (0.27 | ) | | | (0.15 | ) | | | — | | | | (0.06 | ) | | | (0.19 | ) |
From net realized gain | | | (6.94 | ) | | | — | | | | (1.10 | ) | | | (3.84 | ) | | | (3.06 | ) |
| | | | | | | | | | | | | | | | | | | | |
Total distributions | | | (7.21 | ) | | | (0.15 | ) | | | (1.10 | ) | | | (3.90 | ) | | | (3.25 | ) |
| | | | | | | | | | | | | | | | | | | | |
Net asset value, end of year | | $ | 20.56 | | | $ | 24.85 | | | $ | 21.00 | | | $ | 24.90 | | | $ | 29.95 | |
| | | | | | | | | | | | | | | | | | | | |
| | | | | |
Total Return(d) | | | | | | | | | | | | | | | | | | | | |
Based on net asset value | | | 12.10 | % | | | 19.10 | % | | | (11.21 | )% | | | (2.74 | )% | | | 32.81 | % |
| | | | | | | | | | | | | | | | | | | | |
| | | | | |
Ratios to Average Net Assets | | | | | | | | | | | | | | | | | | | | |
Total expenses | | | 1.53 | % | | | 1.54 | % | | | 1.42 | % | | | 1.38 | % | | | 1.37 | % |
| | | | | | | | | | | | | | | | | | | | |
Total expenses after fees waived and/or reimbursed and paid indirectly | | | 1.16 | % | | | 1.50 | % | | | 1.42 | % | | | 1.38 | % | | | 1.37 | % |
| | | | | | | | | | | | | | | | | | | | |
Net investment income (loss) | | | 1.06 | % | | | 0.06 | % | | | (0.20 | )% | | | (0.02 | )% | | | (0.01 | )% |
| | | | | | | | | | | | | | | | | | | | |
| | | | | |
Supplemental Data | | | | | | | | | | | | | | | | | | | | |
Net assets, end of year (000) | | $ | 324,978 | | | $ | 395,690 | | | $ | 382,069 | | | $ | 474,107 | | | $ | 520,436 | |
| | | | | | | | | | | | | | | | | | | | |
Portfolio turnover rate | | | 189 | % | | | 59 | % | | | 73 | % | | | 73 | % | | | 77 | % |
| | | | | | | | | | | | | | | | | | | | |
| (a) | Based on average shares outstanding. |
| (b) | Amount is greater than $(0.005) per share. |
| (c) | Distributions for annual periods determined in accordance with U.S. federal income tax regulations. |
| (d) | Where applicable, excludes the effects of any sales charges and assumes the reinvestment of distributions. |
See notes to financial statements.
Financial Highlights (continued)
(For a share outstanding throughout each period)
| | | | | | | | | | | | | | | | | | | | |
| | | BlackRock Advantage Global Fund, Inc. (continued) | |
| | | Investor C | |
| | | Year Ended June 30, | |
| | | 2018 | | | 2017 | | | 2016 | | | 2015 | | | 2014 | |
Net asset value, beginning of year | | $ | 21.45 | | | $ | 18.15 | | | $ | 21.86 | | | $ | 26.92 | | | $ | 23.13 | |
| | | | | | | | | | | | | | | | | | | | |
Net investment income (loss)(a) | | | 0.04 | | | | (0.16 | ) | | | (0.19 | ) | | | (0.19 | ) | | | (0.21 | ) |
Net realized and unrealized gain (loss) | | | 2.31 | | | | 3.46 | | | | (2.42 | ) | | | (1.07 | ) | | | 7.15 | |
| | | | | | | | | | | | | | | | | | | | |
Net increase (decrease) from investment operations | | | 2.35 | | | | 3.30 | | | | (2.61 | ) | | | (1.26 | ) | | | 6.94 | |
| | | | | | | | | | | | | | | | | | | | |
| Distributions(b) | | | | | | | | | | | | | | | |
From net investment income | | | — | | | | — | | | | — | | | | — | | | | (0.09 | ) |
From net realized gain | | | (6.93 | ) | | | — | | | | (1.10 | ) | | | (3.80 | ) | | | (3.06 | ) |
| | | | | | | | | | | | | | | | | | | | |
Total distributions | | | (6.93 | ) | | | — | | | | (1.10 | ) | | | (3.80 | ) | | | (3.15 | ) |
| | | | | | | | | | | | | | | | | | | | |
Net asset value, end of year | | $ | 16.87 | | | $ | 21.45 | | | $ | 18.15 | | | $ | 21.86 | | | $ | 26.92 | |
| | | | | | | | | | | | | | | | | | | | |
| | | | | |
Total Return(c) | | | | | | | | | | | | | | | | | | | | |
Based on net asset value | | | 11.23 | % | | | 18.18 | % | | | (11.93 | )% | | | (3.53 | )% | | | 31.79 | % |
| | | | | | | | | | | | | | | | | | | | |
| | | | | |
Ratios to Average Net Assets | | | | | | | | | | | | | | | | | | | | |
Total expenses | | | 2.34 | % | | | 2.32 | % | | | 2.22 | % | | | 2.17 | % | | | 2.16 | % |
| | | | | | | | | | | | | | | | | | | | |
Total expenses after fees waived and/or reimbursed and paid indirectly | | | 1.95 | % | | | 2.29 | % | | | 2.22 | % | | | 2.17 | % | | | 2.16 | % |
| | | | | | | | | | | | | | | | | | | | |
Net investment income (loss) | | | 0.23 | % | | | (0.81 | )% | | | (1.01 | )% | | | (0.81 | )% | | | (0.82 | )% |
| | | | | | | | | | | | | | | | | | | | |
| | | | | |
Supplemental Data | | | | | | | | | | | | | | | | | | | | |
Net assets, end of year (000) | | $ | 90,299 | | | $ | 135,507 | | | $ | 245,795 | | | $ | 318,616 | | | $ | 348,937 | |
| | | | | | | | | | | | | | | | | | | | |
Portfolio turnover rate | | | 189 | % | | | 59 | % | | | 73 | % | | | 73 | % | | | 77 | % |
| | | | | | | | | | | | | | | | | | | | |
| (a) | Based on average shares outstanding. |
| (b) | Distributions for annual periods determined in accordance with U.S. federal income tax regulations. |
| (c) | Where applicable, excludes the effects of any sales charges and assumes the reinvestment of distributions. |
See notes to financial statements.
| | |
| 30 | | 2018 BLACKROCK ANNUAL REPORTTO SHAREHOLDERS |
Financial Highlights (continued)
(For a share outstanding throughout each period)
| | | | |
| | | BlackRock Advantage
Global Fund, Inc. (continued) | |
| | | Class K | |
| | | Period from
01/25/18 (a) to 06/30/18 | |
Net asset value, beginning of period | | $ | 23.12 | |
| | | | |
Net investment income(b) | | | 0.29 | |
Net realized and unrealized loss | | | (1.78 | ) |
| | | | |
Net decrease from investment operations | | | (1.49 | ) |
| | | | |
Net asset value, end of period | | $ | 21.63 | |
| | | | |
| |
Total Return(c) | | | | |
Based on net asset value | | | (6.44 | )%(d) |
| | | | |
| |
Ratios to Average Net Assets | | | | |
Total expenses | | | 1.07 | %(e)(f) |
| | | | |
Total expenses after fees waived and/or reimbursed and paid indirectly | | | 0.66 | %(e) |
| | | | |
Net investment income | | | 3.09 | %(e) |
| | | | |
| |
Supplemental Data | | | | |
Net assets, end of period (000) | | $ | 4,616 | |
| | | | |
Portfolio turnover rate | | | 189 | % |
| | | | |
| (a) | Commencement of operations. |
| (b) | Based on average shares outstanding. |
| (c) | Where applicable, assumes the reinvestment of distributions. |
| (d) | Aggregate total return. |
| (f) | Offering costs were not annualized in the calculation of the expense ratios. If these expenses were annualized, the total expenses would have been 1.07%. |
See notes to financial statements.
Financial Highlights (continued)
(For a share outstanding throughout each period)
| | | | | | | | | | | | | | | | | | | | |
| | | BlackRock Advantage Global Fund, Inc. (continued) | |
| | | Class R | |
| | | Year Ended June 30, | |
| | | 2018 | | | 2017 | | | 2016 | | | 2015 | | | 2014 | |
Net asset value, beginning of year | | $ | 23.07 | | | $ | 19.48 | | | $ | 23.27 | | | $ | 28.30 | | | $ | 24.13 | |
| | | | | | | | | | | | | | | | | | | | |
Net investment income (loss)(a) | | | 0.17 | | | | (0.07 | ) | | | (0.11 | ) | | | (0.10 | ) | | | (0.10 | ) |
Net realized and unrealized gain (loss) | | | 2.47 | | | | 3.70 | | | | (2.58 | ) | | | (1.09 | ) | | | 7.47 | |
| | | | | | | | | | | | | | | | | | | | |
Net increase (decrease) from investment operations | | | 2.64 | | | | 3.63 | | | | (2.69 | ) | | | (1.19 | ) | | | 7.37 | |
| | | | | | | | | | | | | | | | | | | | |
| Distributions from(b) | | | | | | | | | | | | | | | |
From net investment income | | | (0.17 | ) | | | (0.04 | ) | | | — | | | | (0.00 | )(c) | | | (0.14 | ) |
From net realized gain | | | (6.94 | ) | | | — | | | | (1.10 | ) | | | (3.84 | ) | | | (3.06 | ) |
| | | | | | | | | | | | | | | | | | | | |
Total distributions | | | (7.11 | ) | | | (0.04 | ) | | | (1.10 | ) | | | (3.84 | ) | | | (3.20 | ) |
| | | | | | | | | | | | | | | | | | | | |
Net asset value, end of year | | $ | 18.60 | | | $ | 23.07 | | | $ | 19.48 | | | $ | 23.27 | | | $ | 28.30 | |
| | | | | | | | | | | | | | | | | | | | |
| | | | | |
Total Return(d) | | | | | | | | | | | | | | | | | | | | |
Based on net asset value | | | 11.79 | % | | | 18.67 | % | | | (11.54 | )% | | | (3.08 | )% | | | 32.32 | % |
| | | | | | | | | | | | | | | | | | | | |
| | | | | |
Ratios to Average Net Assets | | | | | | | | | | | | | | | | | | | | |
Total expenses | | | 1.87 | % | | | 1.92 | % | | | 1.77 | % | | | 1.73 | % | | | 1.72 | % |
| | | | | | | | | | | | | | | | | | | | |
Total expenses after fees waived and/or reimbursed and paid indirectly | | | 1.43 | % | | | 1.88 | % | | | 1.77 | % | | | 1.73 | % | | | 1.72 | % |
| | | | | | | | | | | | | | | | | | | | |
Net investment income (loss) | | | 0.80 | % | | | (0.33 | )% | | | (0.56 | )% | | | (0.39 | )% | | | (0.38 | )% |
| | | | | | | | | | | | | | | | | | | | |
| | | | | |
Supplemental Data | | | | | | | | | | | | | | | | | | | | |
Net assets, end of year (000) | | $ | 16,716 | | | $ | 19,642 | | | $ | 21,091 | | | $ | 26,019 | | | $ | 33,944 | |
| | | | | | | | | | | | | | | | | | | | |
Portfolio turnover rate | | | 189 | % | | | 59 | % | | | 73 | % | | | 73 | % | | | 77 | % |
| | | | | | | | | | | | | | | | | | | | |
| (a) | Based on average shares outstanding. |
| (b) | Distributions for annual periods determined in accordance with U.S. federal income tax regulations. |
| (c) | Amount is greater than $(0.00005) per share. |
| (d) | Where applicable, assumes the reinvestment of distributions. |
See notes to financial statements.
| | |
| 32 | | 2018 BLACKROCK ANNUAL REPORTTO SHAREHOLDERS |
Financial Highlights
(For a share outstanding throughout each period)
| | | | | | | | | | | | | | | | | | | | |
| | | BlackRock EuroFund | |
| | | Institutional | |
| | | Year Ended June 30, | |
| | | 2018 | | | 2017 | | | 2016 | | | 2015 | | | 2014 | |
Net asset value, beginning of year | | $ | 14.78 | | | $ | 13.25 | | | $ | 15.51 | | | $ | 16.68 | | | $ | 13.62 | |
| | | | | | | | | | | | | | | | | | | | |
Net investment income(a) | | | 0.13 | | | | 0.16 | (b) | | | 0.25 | | | | 0.28 | | | | 0.61 | |
Net realized and unrealized gain (loss) | | | 0.33 | | | | 1.67 | | | | (2.28 | ) | | | (1.00 | ) | | | 2.65 | |
| | | | | | | | | | | | | | | | | | | | |
Net increase (decrease) from investment operations | | | 0.46 | | | | 1.83 | | | | (2.03 | ) | | | (0.72 | ) | | | 3.26 | |
| | | | | | | | | | | | | | | | | | | | |
Distributions from net investment income(c) | | | (0.18 | ) | | | (0.30 | ) | | | (0.23 | ) | | | (0.45 | ) | | | (0.20 | ) |
| | | | | | | | | | | | | | | | | | | | |
Net asset value, end of year | | $ | 15.06 | | | $ | 14.78 | | | $ | 13.25 | | | $ | 15.51 | | | $ | 16.68 | |
| | | | | | | | | | | | | | | | | | | | |
| | | | | |
Total Return(d) | | | | | | | | | | | | | | | | | | | | |
Based on net asset value | | | 3.12 | % | | | 14.14 | % | | | (13.22 | )% | | | (4.10 | )% | | | 24.06 | % |
| | | | | | | | | | | | | | | | | | | | |
| | | | | |
Ratios to Average Net Assets | | | | | | | | | | | | | | | | | | | | |
Total expenses | | | 1.11 | % | | | 1.10 | % | | | 1.07 | % | | | 1.00 | % | | | 1.02 | % |
| | | | | | | | | | | | | | | | | | | | |
Total expenses after fees waived and/or reimbursed and paid indirectly | | | 1.08 | % | | | 1.10 | % | | | 1.07 | % | | | 1.00 | % | | | 1.02 | % |
| | | | | | | | | | | | | | | | | | | | |
Net investment income | | | 0.87 | % | | | 1.19 | %(b) | | | 1.72 | % | | | 1.81 | % | | | 3.81 | % |
| | | | | | | | | | | | | | | | | | | | |
| | | | | |
Supplemental Data | | | | | | | | | | | | | | | | | | | | |
Net assets, end of year (000) | | $ | 43,686 | | | $ | 146,685 | | | $ | 162,627 | | | $ | 221,463 | | | $ | 187,718 | |
| | | | | | | | | | | | | | | | | | | | |
Portfolio turnover rate | | | 98 | % | | | 93 | % | | | 100 | % | | | 117 | % | | | 129 | % |
| | | | | | | | | | | | | | | | | | | | |
| (a) | Based on average shares outstanding. |
| (b) | Net investment income per share and the ratio of net investment income to average net assets include $0.01 per share and 0.10%, respectively, resulting from a special dividend. |
| (c) | Distributions for annual periods determined in accordance with U.S. federal income tax regulations. |
| (d) | Where applicable, assumes the reinvestment of distributions. |
See notes to financial statements.
Financial Highlights (continued)
(For a share outstanding throughout each period)
| | | | | | | | | | | | | | | | | | | | |
| | | BlackRock EuroFund (continued) | |
| | | Investor A | |
| | | Year Ended June 30, | |
| | | 2018 | | | 2017 | | | 2016 | | | 2015 | | | 2014 | |
Net asset value, beginning of year | | $ | 14.49 | | | $ | 12.98 | | | $ | 15.23 | | | $ | 16.37 | | | $ | 13.35 | |
| | | | | | | | | | | | | | | | | | | | |
Net investment income(a) | | | 0.18 | | | | 0.13 | (b) | | | 0.20 | | | | 0.29 | | | | 0.52 | |
Net realized and unrealized gain (loss) | | | 0.26 | | | | 1.64 | | | | (2.23 | ) | | | (1.03 | ) | | | 2.65 | |
| | | | | | | | | | | | | | | | | | | | |
Net increase (decrease) from investment operations | | | 0.44 | | | | 1.77 | | | | (2.03 | ) | | | (0.74 | ) | | | 3.17 | |
| | | | | | | | | | | | | | | | | | | | |
Distributions from net investment income(c) | | | (0.15 | ) | | | (0.26 | ) | | | (0.22 | ) | | | (0.40 | ) | | | (0.15 | ) |
| | | | | | | | | | | | | | | | | | | | |
Net asset value, end of year | | $ | 14.78 | | | $ | 14.49 | | | $ | 12.98 | | | $ | 15.23 | | | $ | 16.37 | |
| | | | | | | | | | | | | | | | | | | | |
| | | | | |
Total Return(d) | | | | | | | | | | | | | | | | | | | | |
Based on net asset value | | | 3.02 | % | | | 13.92 | % | | | (13.41 | )% | | | (4.30 | )% | | | 23.83 | % |
| | | | | | | | | | | | | | | | | | | | |
| | | | | |
Ratios to Average Net Assets | | | | | | | | | | | | | | | | | | | | |
Total expenses | | | 1.31 | % | | | 1.32 | % | | | 1.28 | % | | | 1.22 | % | | | 1.23 | % |
| | | | | | | | | | | | | | | | | | | | |
Total expenses after fees waived and/or reimbursed and paid indirectly | | | 1.28 | % | | | 1.32 | % | | | 1.28 | % | | | 1.22 | % | | | 1.23 | % |
| | | | | | | | | | | | | | | | | | | | |
Net investment income | | | 1.19 | % | | | 0.97 | %(b) | | | 1.46 | % | | | 1.88 | % | | | 3.30 | % |
| | | | | | | | | | | | | | | | | | | | |
| | | | | |
Supplemental Data | | | | | | | | | | | | | | | | | | | | |
Net assets, end of year (000) | | $ | 149,540 | | | $ | 165,427 | | | $ | 178,374 | | | $ | 258,675 | | | $ | 195,548 | |
| | | | | | | | | | | | | | | | | | | | |
Portfolio turnover rate | | | 98 | % | | | 93 | % | | | 100 | % | | | 117 | % | | | 129 | % |
| | | | | | | | | | | | | | | | | | | | |
| (a) | Based on average shares outstanding. |
| (b) | Net investment income per share and the ratio of net investment income to average net assets include $0.01 per share and 0.10%, respectively, resulting from a special dividend. |
| (c) | Distributions for annual periods determined in accordance with U.S. federal income tax regulations. |
| (d) | Where applicable, excludes the effects of any sales charges and assumes the reinvestment of distributions. |
See notes to financial statements.
| | |
| 34 | | 2018 BLACKROCK ANNUAL REPORTTO SHAREHOLDERS |
Financial Highlights (continued)
(For a share outstanding throughout each period)
| | | | | | | | | | | | | | | | | | | | |
| | | BlackRock EuroFund (continued) | |
| | | Investor C | |
| | | Year Ended June 30, | |
| | | 2018 | | | 2017 | | | 2016 | | | 2015 | | | 2014 | |
Net asset value, beginning of year | | $ | 10.16 | | | $ | 9.17 | | | $ | 10.82 | | | $ | 11.76 | | | $ | 9.67 | |
| | | | | | | | | | | | | | | | | | | | |
Net investment income(a) | | | 0.05 | | | | 0.01 | (b) | | | 0.07 | | | | 0.08 | | | | 0.31 | |
Net realized and unrealized gain (loss) | | | 0.18 | | | | 1.15 | | | | (1.58 | ) | | | (0.70 | ) | | | 1.88 | |
| | | | | | | | | | | | | | | | | | | | |
Net increase (decrease) from investment operations | | | 0.23 | | | | 1.16 | | | | (1.51 | ) | | | (0.62 | ) | | | 2.19 | |
| | | | | | | | | | | | | | | | | | | | |
Distributions from net investment income(c) | | | (0.03 | ) | | | (0.17 | ) | | | (0.14 | ) | | | (0.32 | ) | | | (0.10 | ) |
| | | | | | | | | | | | | | | | | | | | |
Net asset value, end of year | | $ | 10.36 | | | $ | 10.16 | | | $ | 9.17 | | | $ | 10.82 | | | $ | 11.76 | |
| | | | | | | | | | | | | | | | | | | | |
| | | | | |
Total Return(d) | | | | | | | | | | | | | | | | | | | | |
Based on net asset value | | | 2.27 | % | | | 12.94 | % | | | (14.08 | )% | | | (5.09 | )% | | | 22.76 | % |
| | | | | | | | | | | | | | | | | | | | |
| | | | | |
Ratios to Average Net Assets | | | | | | | | | | | | | | | | | | | | |
Total expenses | | | 2.08 | % | | | 2.13 | % | | | 2.09 | % | | | 2.05 | % | | | 2.07 | % |
| | | | | | | | | | | | | | | | | | | | |
Total expenses after fees waived and/or reimbursed and paid indirectly | | | 2.04 | % | | | 2.13 | % | | | 2.09 | % | | | 2.05 | % | | | 2.07 | % |
| | | | | | | | | | | | | | | | | | | | |
Net investment income | | | 0.43 | % | | | 0.14 | %(b) | | | 0.67 | % | | | 0.70 | % | | | 2.72 | % |
| | | | | | | | | | | | | | | | | | | | |
| | | | | |
Supplemental Data | | | | | | | | | | | | | | | | | | | | |
Net assets, end of year (000) | | $ | 7,533 | | | $ | 8,038 | | | $ | 13,659 | | | $ | 18,021 | | | $ | 21,838 | |
| | | | | | | | | | | | | | | | | | | | |
Portfolio turnover rate | | | 98 | % | | | 93 | % | | | 100 | % | | | 117 | % | | | 129 | % |
| | | | | | | | | | | | | | | | | | | | |
| (a) | Based on average shares outstanding. |
| (b) | Net investment income per share and the ratio of net investment income to average net assets include $0.01 per share and 0.10%, respectively, resulting from a special dividend. |
| (c) | Distributions for annual periods determined in accordance with U.S. federal income tax regulations. |
| (d) | Where applicable, excludes the effects of any sales charges and assumes the reinvestment of distributions. |
See notes to financial statements.
Financial Highlights (continued)
(For a share outstanding throughout each period)
| | | | |
| | | BlackRock EuroFund (continued) | |
| | | Class K | |
| | | Period from
01/25/18 (a) to 06/30/18 | |
Net asset value, beginning of period | | $ | 16.57 | |
| | | | |
Net investment income(b) | | | 0.26 | |
Net realized and unrealized loss | | | (1.75 | ) |
| | | | |
Net decrease from investment operations | | | (1.49 | ) |
| | | | |
Net asset value, end of period | | $ | 15.08 | |
| | | | |
| |
Total Return(c) | | | | |
Based on net asset value | | | (8.99 | )%(d) |
| | | | |
| |
Ratios to Average Net Assets | | | | |
Total expenses | | | 0.98 | %(e)(f) |
| | | | |
Total expenses after fees waived and/or reimbursed and paid indirectly | | | 0.95 | %(e) |
| | | | |
Net investment income | | | 3.86 | %(e) |
| | | | |
| |
Supplemental Data | | | | |
Net assets, end of period (000) | | $ | 1,005 | |
| | | | |
Portfolio turnover rate | | | 98 | % |
| | | | |
| (a) | Commencement of operations. |
| (b) | Based on average shares outstanding. |
| (c) | Where applicable, assumes the reinvestment of distributions. |
| (d) | Aggregate total return. |
| (f) | Offering costs were not annualized in the calculation of the expense ratios. If these expenses were annualized, the total expenses would have been 0.99%. |
See notes to financial statements.
| | |
| 36 | | 2018 BLACKROCK ANNUAL REPORTTO SHAREHOLDERS |
Financial Highlights (continued)
(For a share outstanding throughout each period)
| | | | | | | | | | | | | | | | | | | | |
| | | BlackRock EuroFund (continued) | |
| | | Class R | |
| | | Year Ended June 30, | |
| | | 2018 | | | 2017 | | | 2016 | | | 2015 | | | 2014 | |
Net asset value, beginning of year | | $ | 10.96 | | | $ | 9.89 | | | $ | 11.66 | | | $ | 12.58 | | | $ | 10.32 | |
| | | | | | | | | | | | | | | | | | | | |
Net investment income(a) | | | 0.09 | | | | 0.05 | (b) | | | 0.11 | | | | 0.12 | | | | 0.33 | |
Net realized and unrealized gain (loss) | | | 0.18 | | | | 1.24 | | | | (1.71 | ) | | | (0.73 | ) | | | 2.04 | |
| | | | | | | | | | | | | | | | | | | | |
Net increase (decrease) from investment operations | | | 0.27 | | | | 1.29 | | | | (1.60 | ) | | | (0.61 | ) | | | 2.37 | |
| | | | | | | | | | | | | | | | | | | | |
Distributions from net investment income(c) | | | (0.09 | ) | | | (0.22 | ) | | | (0.17 | ) | | | (0.31 | ) | | | (0.11 | ) |
| | | | | | | | | | | | | | | | | | | | |
Net asset value, end of year | | $ | 11.14 | | | $ | 10.96 | | | $ | 9.89 | | | $ | 11.66 | | | $ | 12.58 | |
| | | | | | | | | | | | | | | | | | | | |
| | | | | |
Total Return(d) | | | | | | | | | | | | | | | | | | | | |
Based on net asset value | | | 2.46 | % | | | 13.42 | % | | | (13.82 | )% | | | (4.68 | )% | | | 23.05 | % |
| | | | | | | | | | | | | | | | | | | | |
| | | | | |
Ratios to Average Net Assets | | | | | | | | | | | | | | | | | | | | |
Total expenses | | | 1.81 | % | | | 1.83 | % | | | 1.72 | % | | | 1.69 | % | | | 1.79 | % |
| | | | | | | | | | | | | | | | | | | | |
Total expenses after fees waived and/or reimbursed and paid indirectly | | | 1.77 | % | | | 1.83 | % | | | 1.72 | % | | | 1.69 | % | | | 1.79 | % |
| | | | | | | | | | | | | | | | | | | | |
Net investment income | | | 0.76 | % | | | 0.54 | %(b) | | | 1.08 | % | | | 1.03 | % | | | 2.77 | % |
| | | | | | | | | | | | | | | | | | | | |
| | | | | |
Supplemental Data | | | | | | | | | | | | | | | | | | | | |
Net assets, end of year (000) | | $ | 786 | | | $ | 1,017 | | | $ | 859 | | | $ | 1,122 | | | $ | 1,471 | |
| | | | | | | | | | | | | | | | | | | | |
Portfolio turnover rate | | | 98 | % | | | 93 | % | | | 100 | % | | | 117 | % | | | 129 | % |
| | | | | | | | | | | | | | | | | | | | |
| (a) | Based on average shares outstanding. |
| (b) | Net investment income per share and the ratio of net investment income to average net assets include $0.01 per share and 0.10%, respectively, resulting from a special dividend. |
| (c) | Distributions for annual periods determined in accordance with U.S. federal income tax regulations. |
| (d) | Where applicable, assumes the reinvestment of distributions. |
See notes to financial statements.
Notes to Financial Statements
BlackRock Advantage Global Fund, Inc., (the “Corporation”) and BlackRock EuroFund (the “Trust”) are each registered under the Investment Company Act of 1940, as amended (the “1940 Act”), as open-end management investment companies. The Board of Trustees of the Trust and the Board of Directors of the Corporation are referred to throughout this report as the “Board of Directors” or the “Board.” BlackRock Advantage Global Fund, Inc. is organized as a Maryland corporation. BlackRock EuroFund is organized as a Massachusetts business trust.
The following are referred to herein collectively as the “Funds” or individually as a “Fund”:
| | | | |
| Fund Name | | Herein Referred To As | | Diversification
Classification |
BlackRock Advantage Global Fund, Inc. | | Advantage Global | | Diversified |
BlackRock EuroFund | | EuroFund | | Diversified |
Each Fund offers multiple classes of shares. All classes of shares have identical voting, dividend, liquidation and other rights and are subject to the same terms and conditions, except that certain classes bear expenses related to the shareholder servicing and distribution of such shares. Institutional and Class K Shares are sold only to certain eligible investors. Class R Shares are available only to certain employer-sponsored retirement plans. Investor A and Investor C Shares are generally available through financial intermediaries. Each class has exclusive voting rights with respect to matters relating to its shareholder servicing and distribution expenditures.
| | | | | | | | |
| Share Class | | Initial Sales Charge | | CDSC | | | Conversion Privilege |
Institutional, Class K(a) and Class R Shares | | No | | | No | | | None |
Investor A Shares | | Yes | | | No | (b) | | None |
Investor C Shares | | No | | | Yes | | | None |
| | (a) | Commenced operations on January 25, 2018. | |
| | (b) | Investor A Shares may be subject to a contingent deferred sales charge (“CDSC”) for certain redemptions where no initial sales charge was paid at the time of purchase. | |
On December 27, 2017, Advantage Global’s issued and outstanding Investor B Shares were converted into Investor A Shares, with the same relative aggregate net asset value (“NAV”) as the original shares held immediately prior to conversion.
The Funds, together with certain other registered investment companies advised by BlackRock Advisors, LLC (the “Manager”) or its affiliates, are included in a complex of open-end funds referred to as the Equity-Bond Complex.
| 2. | SIGNIFICANT ACCOUNTING POLICIES |
The financial statements are prepared in conformity with accounting principles generally accepted in the United States of America (“U.S. GAAP”), which may require management to make estimates and assumptions that affect the reported amounts of assets and liabilities in the financial statements, disclosure of contingent assets and liabilities at the date of the financial statements and the reported amounts of increases and decreases in net assets from operations during the reporting period. Actual results could differ from those estimates. Each Fund is considered an investment company under U.S. GAAP and follows the accounting and reporting guidance applicable to investment companies. Below is a summary of significant accounting policies:
Investment Transactions and Income Recognition: For financial reporting purposes, investment transactions are recorded on the dates the transactions are entered into (the “trade dates”). Realized gains and losses on investment transactions are determined on the identified cost basis. Dividend income is recorded on the ex-dividend date. Dividends from foreign securities where the ex-dividend date may have passed are subsequently recorded when the Funds are informed of the ex-dividend date. Under the applicable foreign tax laws, a withholding tax at various rates may be imposed on capital gains, dividends and interest. Upon notification from issuers, a portion of the dividend income received from a real estate investment trust may be redesignated as a reduction of cost of the related investment and/or realized gain. Interest income, including amortization and accretion of premiums and discounts on debt securities, is recognized on an accrual basis. Income, expenses and realized and unrealized gains and losses are allocated daily to each class based on its relative net assets.
Foreign Currency Translation: Each Fund’s books and records are maintained in U.S. dollars. Securities and other assets and liabilities denominated in foreign currencies are translated into U.S. dollars using exchange rates determined as of the close of trading on the New York Stock Exchange (“NYSE”). Purchases and sales of investments are recorded at the rates of exchange prevailing on the respective dates of such transactions. Generally, when the U.S. dollar rises in value against a foreign currency, the investments denominated in that currency will lose value; the opposite effect occurs if the U.S. dollar falls in relative value.
Each Fund does not isolate the portion of the results of operations arising as a result of changes in the exchange rates from the changes in the market prices of investments held or sold for financial reporting purposes. Accordingly, the effects of changes in exchange rates on investments are not segregated in the Statements of Operations from the effects of changes in market prices of those investments, but are included as a component of net realized and unrealized gain (loss) from investments. Each Fund reports realized currency gains (losses) on foreign currency related transactions as components of net realized gain (loss) for financial reporting purposes, whereas such components are generally treated as ordinary income for U.S. federal income tax purposes.
Segregation and Collateralization: In cases where a Fund enters into certain investments (e.g., futures contracts) that would be treated as “senior securities” for 1940 Act purposes, a Fund may segregate or designate on its books and records cash or liquid assets having a market value at least equal to the amount of its future obligations under such investments. Doing so allows the investment to be excluded from treatment as a “senior security.” Furthermore, if required by an exchange or counterparty agreement, the Funds may be required to deliver/deposit cash and/or securities to/with an exchange, or broker-dealer or custodian as collateral for certain investments or obligations.
| | |
| 38 | | 2018 BLACKROCK ANNUAL REPORTTO SHAREHOLDERS |
Notes to Financial Statements (continued)
Distributions: Distributions paid by each Fund are recorded on the ex-dividend date. The character and timing of distributions are determined in accordance with U.S. federal income tax regulations, which may differ from U.S. GAAP.
Offering costs: Offering costs are amortized over a 12-month period beginning with the commencement of operations of a class of shares.
Indemnifications: In the normal course of business, a Fund enters into contracts that contain a variety of representations that provide general indemnification. A Fund’s maximum exposure under these arrangements is unknown because it involves future potential claims against a Fund, which cannot be predicted with any certainty.
Other: Expenses directly related to a Fund or its classes are charged to that Fund or the applicable class. Other operating expenses shared by several funds, including other funds managed by the Manager, are prorated among those funds on the basis of relative net assets or other appropriate methods. Expenses directly related to the Funds and other shared expenses prorated to the Funds are allocated daily to each class based on their relative net assets or other appropriate methods.
The Funds have an arrangement with their custodian whereby credits are earned on uninvested cash balances, which could be used to reduce custody fees and/or overdraft charges. The Funds may incur charges on certain uninvested cash balances and overdrafts, subject to certain conditions.
| 3. | INVESTMENT VALUATION AND FAIR VALUE MEASUREMENTS |
Investment Valuation Policies: The Funds’ investments are valued at fair value (also referred to as “market value” within the financial statements) as of the close of trading on the NYSE (generally 4:00 p.m., Eastern time) (or if the reporting date falls on a day the NYSE is closed, investments are valued at fair value as of the period end). U.S. GAAP defines fair value as the price the Funds would receive to sell an asset or pay to transfer a liability in an orderly transaction between market participants at the measurement date. The Funds determine the fair values of their financial instruments using various independent dealers or pricing services under policies approved by the Board of each Fund. The BlackRock Global Valuation Methodologies Committee (the “Global Valuation Committee”) is the committee formed by management to develop global pricing policies and procedures and to oversee the pricing function for all financial instruments.
Fair Value Inputs and Methodologies: The following methods and inputs are used to establish the fair value of Fund’s assets and liabilities:
| | • | | Equity investments traded on a recognized securities exchange are valued at the official closing price each day, if available. For equity investments traded on more than one exchange, the official closing price on the exchange where the stock is primarily traded is used. Equity investments traded on a recognized exchange for which there were no sales on that day may be valued at the last available bid (long positions) or ask (short positions) price. |
Generally, trading in foreign instruments is substantially completed each day at various times prior to the close of trading on the NYSE. Occasionally, events affecting the values of such instruments may occur between the foreign market close and the close of trading on the NYSE that may not be reflected in the computation of the Funds’ net assets. Each business day, the Funds use a pricing service to assist with the valuation of certain foreign exchange-traded equity securities and foreign exchange-traded and over-the-counter (“OTC”) options (the “Systematic Fair Value Price”). Using current market factors, the Systematic Fair Value Price is designed to value such foreign securities and foreign options at fair value as of the close of trading on the NYSE, which follows the close of the local markets.
| | • | | Investments in open-end U.S. mutual funds are valued at NAV each business day. |
| | • | | The Funds value their investment in SL Liquidity Series, LLC, Money Market Series (the “Money Market Series”) at fair value, which is ordinarily based upon their pro rata ownership in the underlying fund’s net assets. The Money Market Series seeks current income consistent with maintaining liquidity and preserving capital. Although the Money Market Series is not registered under the 1940 Act, its investments may follow the parameters of investments by a money market fund that is subject to Rule 2a-7 under the 1940 Act. |
| | • | | Futures contracts traded on exchanges are valued at their last sale price. |
If events (e.g., a company announcement, market volatility or a natural disaster) occur that are expected to materially affect the value of such investments, or in the event that the application of these methods of valuation results in a price for an investment that is deemed not to be representative of the market value of such investment, or if a price is not available, the investment will be valued by the Global Valuation Committee, or its delegate, in accordance with a policy approved by the Board as reflecting fair value (“Fair Valued Investments”). The fair valuation approaches that may be used by the Global Valuation Committee will include market approach, income approach and cost approach. Valuation techniques such as discounted cash flow, use of market comparables and matrix pricing are types of valuation approaches and are typically used in determining fair value. When determining the price for Fair Valued Investments, the Global Valuation Committee, or its delegate, seeks to determine the price that each Fund might reasonably expect to receive or pay from the current sale or purchase of that asset or liability in an arm’s-length transaction. Fair value determinations shall be based upon all available factors that the Global Valuation Committee, or its delegate, deems relevant and consistent with the principles of fair value measurement. The pricing of all Fair Valued Investments is subsequently reported to the Board or a committee thereof on a quarterly basis.
Fair Value Hierarchy: Various inputs are used in determining the fair value of investments and derivative financial instruments. These inputs to valuation techniques are categorized into a fair value hierarchy consisting of three broad levels for financial statement purposes as follows:
| | • | | Level 1 — Unadjusted price quotations in active markets/exchanges for identical assets or liabilities that each Fund has the ability to access |
| | • | | Level 2 — Other observable inputs (including, but not limited to, quoted prices for similar assets or liabilities in markets that are active, quoted prices for identical or similar assets or liabilities in markets that are not active, inputs other than quoted prices that are observable for the assets or liabilities (such as interest rates, yield curves, volatilities, prepayment speeds, loss severities, credit risks and default rates) or other market–corroborated inputs) |
| | • | | Level 3 — Unobservable inputs based on the best information available in the circumstances, to the extent observable inputs are not available (including each Fund’s own assumptions used in determining the fair value of investments and derivative financial instruments) |
| | | | |
| NOTESTO FINANCIAL STATEMENTS | | | 39 | |
Notes to Financial Statements (continued)
The hierarchy gives the highest priority to unadjusted quoted prices in active markets for identical assets or liabilities (Level 1 measurements) and the lowest priority to unobservable inputs (Level 3 measurements). Accordingly, the degree of judgment exercised in determining fair value is greatest for instruments categorized in Level 3. The inputs used to measure fair value may fall into different levels of the fair value hierarchy. In such cases, for disclosure purposes, the fair value hierarchy classification is determined based on the lowest level input that is significant to the fair value measurement in its entirety. Investments classified within Level 3 have significant unobservable inputs used by the Global Valuation Committee in determining the price for Fair Valued Investments. Level 3 investments include equity or debt issued by privately held companies or funds. There may not be a secondary market, and/or there are a limited number of investors. Level 3 investments may also be adjusted to reflect illiquidity and/or non-transferability, with the amount of such discount estimated by the Global Valuation Committee in the absence of market information. Changes in valuation techniques may result in transfers into or out of an assigned level within the hierarchy. In accordance with each Fund’s policy, transfers between different levels of the fair value hierarchy are deemed to have occurred as of the beginning of the reporting period. The categorization of a value determined for investments and derivative financial instruments is based on the pricing transparency of the investments and derivative financial instruments and is not necessarily an indication of the risks associated with investing in those securities.
As of June 30, 2018, certain investments of the Funds were valued using net asset value per share NAV as no quoted market value is available and therefore have been excluded from the fair value hierarchy.
| 4. | SECURITIES AND OTHER INVESTMENTS |
Preferred Stocks: Preferred stock has a preference over common stock in liquidation (and generally in receiving dividends as well), but is subordinated to the liabilities of the issuer in all respects. As a general rule, the market value of preferred stock with a fixed dividend rate and no conversion element varies inversely with interest rates and perceived credit risk, while the market price of convertible preferred stock generally also reflects some element of conversion value. Because preferred stock is junior to debt securities and other obligations of the issuer, deterioration in the credit quality of the issuer will cause greater changes in the value of a preferred stock than in a more senior debt security with similar stated yield characteristics. Unlike interest payments on debt securities, preferred stock dividends are payable only if declared by the issuer’s board of directors. Preferred stock also may be subject to optional or mandatory redemption provisions.
Securities Lending: Certain Funds may lend their securities to approved borrowers, such as brokers, dealers and other financial institutions. The borrower pledges and maintains with the Funds collateral consisting of cash, an irrevocable letter of credit issued by a bank, or securities issued or guaranteed by the U.S. Government. The initial collateral received by each Fund is required to have a value of at least 102% of the current value of the loaned securities for securities traded on U.S. exchanges and a value of at least 105% for all other securities. The collateral is maintained thereafter at a value equal to at least 100% of the current market value of the securities on loan. The market value of the loaned securities is determined at the close of each business day of the Fund and any additional required collateral is delivered to the Fund, or excess collateral returned by the Fund, on the next business day. During the term of the loan, the Funds are entitled to all distributions made on or in respect of the loaned securities, but do not receive interest income on securities received as collateral. Loans of securities are terminable at any time and the borrower, after notice, is required to return borrowed securities within the standard time period for settlement of securities transactions.
The market value of any securities on loan, all of which were classified as common stocks in the Funds’ Schedules of Investments, and the value of any related collateral are shown separately in the Statements of Assets and Liabilities as a component of investments at value — unaffiliated, and collateral on securities loaned at value, respectively. As of period end, any securities on loan were collateralized by cash and/or U.S. Government obligations. Cash collateral invested by the securities lending agent, BlackRock Investment Management, LLC (“BIM”), if any, is disclosed in the Schedules of Investments.
Securities lending transactions are entered into by the Funds under Master Securities Lending Agreements (each, an “MSLA”), which provide the right, in the event of default (including bankruptcy or insolvency), for the non-defaulting party to liquidate the collateral and calculate a net exposure to the defaulting party or request additional collateral. In the event that a borrower defaults, the Funds, as lender, would offset the market value of the collateral received against the market value of the securities loaned. When the value of the collateral is greater than that of the market value of the securities loaned, the lender is left with a net amount payable to the defaulting party. However, bankruptcy or insolvency laws of a particular jurisdiction may impose restrictions on or prohibitions against such a right of offset in the event of an MSLA counterparty’s bankruptcy or insolvency. Under the MSLA, absent an event of default, the borrower can resell or re-pledge the loaned securities, and a Fund can reinvest cash collateral received in connection with loaned securities. Upon an event of default, the parties’ obligations to return the securities or collateral to the other party are extinguished, and the parties can resell or re-pledge the loaned securities or the collateral received in connection with the loaned securities in order to satisfy the defaulting party’s net payment obligation for all transactions under the MSLA. The defaulting party remains liable for any deficiency.
As of period end, the following table is a summary of the Funds’ securities lending agreements by counterparty which are subject to offset under an MSLA:
| | | | | | | | | | | | |
| Counterparty | | Securities
Loaned at Value | | | Cash Collateral
Received (a) | | | Net
Amount (b) | |
Advantage Global | | | | | | | | | | | | |
JP Morgan Securities LLC | | $ | 3,078,128 | | | $ | (3,078,128 | ) | | $ | — | |
Merrill Lynch, Pierce, Fenner & Smith, Inc | | | 54,690 | | | | (52,911 | ) | | | 1,779 | |
Nomura Securities International, Inc. | | | 148,659 | | | | (148,659 | ) | | | — | |
UBS Securities LLC | | | 15,085 | | | | (15,085 | ) | | | — | |
| | | | | | | | | | | | |
| | $ | 3,296,562 | | | $ | (3,294,783 | ) | | $ | 1,779 | |
| | | | | | | | | | | | |
| | |
| 40 | | 2018 BLACKROCK ANNUAL REPORTTO SHAREHOLDERS |
Notes to Financial Statements (continued)
| | | | | | | | | | | | |
| Counterparty | | Securities
Loaned at Value | | | Cash Collateral
Received (a) | | | Net
Amount | |
EuroFund | | | | | | | | | | | | |
Citigroup Global Markets, Inc. | | $ | 81,323 | | | $ | (81,323 | ) | | $ | — | |
| | | | | | | | | | | | |
| | (a) | Cash collateral with a value of $3,419,021 and $87,760, respectively, has been received in connection with securities lending agreements. Collateral received in excess of the value of securities loaned from the individual counterparty is not shown for financial reporting purposes in the table above. | |
| | (b) | The market value of the loaned securities is determined as of June 30, 2018. Additional collateral is delivered to the Fund on the next business day in accordance with the MSLA. The net amount would be subject to the borrower default indemnity in the event of default by the counterparty. | |
The risks of securities lending include the risk that the borrower may not provide additional collateral when required or may not return the securities when due. To mitigate these risks, the Funds benefit from a borrower default indemnity provided by BIM. BIM’s indemnity allows for full replacement of the securities loaned if the collateral received does not cover the value on the securities loaned in the event of borrower default. Each Fund could incur a loss if the value of an investment purchased with cash collateral falls below the market value of loaned securities or if the value of an investment purchased with cash collateral falls below the value of the original cash collateral received.
| 5. | DERIVATIVE FINANCIAL INSTRUMENTS |
The Funds engage in various portfolio investment strategies using derivative contracts both to increase the returns of the Funds and/or to manage their exposure to certain risks such as credit risk, equity risk, interest rate risk, foreign currency exchange rate risk, commodity price risk or other risks (e.g., inflation risk). Derivative financial instruments categorized by risk exposure are included in the Schedules of Investments. These contracts may be transacted on an exchange or OTC.
Futures Contracts: Futures contracts are purchased or sold to gain exposure to, or manage exposure to, changes in interest rates (interest rate risk), and changes in the value of equity securities (equity risk) or foreign currencies (foreign currency exchange rate risk).
Futures contracts are agreements between the Funds and a counterparty to buy or sell a specific quantity of an underlying instrument at a specified price and on a specified date. Depending on the terms of a contract, it is settled either through physical delivery of the underlying instrument on the settlement date or by payment of a cash amount on the settlement date. Upon entering into a futures contract, the Funds are required to deposit initial margin with the broker in the form of cash or securities in an amount that varies depending on a contract’s size and risk profile. The initial margin deposit must then be maintained at an established level over the life of the contract. Amounts pledged, which are considered restricted, are included in cash pledged for futures contracts on the Statements of Assets and Liabilities.
Securities deposited as initial margin are designated in the Schedules of Investments and cash deposited, if any, is shown as cash pledged for futures contracts in the Statements of Assets and Liabilities. Pursuant to the contract, the Funds agree to receive from or pay to the broker an amount of cash equal to the daily fluctuation in market value of the contract (“variation margin”). Variation margin is recorded as unrealized appreciation (depreciation) and, if any, shown as variation margin receivable (or payable) on futures contracts in the Statements of Assets and Liabilities. When the contract is closed, a realized gain or loss is recorded in the Statements of Operations equal to the difference between the notional amount of the contract at the time it was opened and the notional amount at the time it was closed. The use of futures contracts involves the risk of an imperfect correlation in the movements in the price of futures contracts and interest, foreign currency exchange rates or underlying assets.
| 6. | INVESTMENT ADVISORY AGREEMENT AND OTHER TRANSACTIONS WITH AFFILIATES |
The PNC Financial Services Group, Inc. is the largest stockholder and an affiliate of BlackRock, Inc. (“BlackRock”) for 1940 Act purposes.
Investment Advisory: Each Fund entered into an Investment Advisory Agreement with the Manager, the Funds’ investment adviser, an indirect, wholly-owned subsidiary of BlackRock, to provide investment advisory and administrative services. The Manager is responsible for the management of each Fund’s portfolio and provides the personnel, facilities, equipment and certain other services necessary to the operations of each Fund.
For such services, each Fund pays the Manager a monthly fee at an annual rate equal to the following percentages of the average daily value of each Fund’s net assets:
| | | | | | | | |
| | | Investment Advisory Fee | |
| Average Daily Net Assets | | Advantage Global | | | EuroFund | |
First $1 Billion | | | 0.85 | % | | | 0.75 | % |
$1 Billion — $3 Billion | | | 0.80 | | | | 0.71 | |
$3 Billion — $5 Billion | | | 0.77 | | | | 0.68 | |
$5 Billion — $10 Billion | | | 0.74 | | | | 0.65 | |
Greater than $10 Billion | | | 0.72 | | | | 0.64 | |
The Manager, with respect to EuroFund, entered into a sub-advisory agreement with BlackRock International Limited (“BIL”), an affiliate of the Manager. The Manager pays BIL, for services it provides, a monthly fee that is a percentage of the investment advisory fees paid by EuroFund to the Manager.
| | | | |
| NOTESTO FINANCIAL STATEMENTS | | | 41 | |
Notes to Financial Statements (continued)
Service and Distribution Fees: Each Fund entered into a Distribution Agreement and a Distribution and Service Plan with BlackRock Investments, LLC (“BRIL”), an affiliate of the Manager. Pursuant to the Distribution and Service Plan and in accordance with Rule 12b-1 under the 1940 Act, each Fund pays BRIL ongoing service and distribution fees. The fees are accrued daily and paid monthly at annual rates based upon the average daily net assets of the relevant share class of each Fund as follows:
| | | | | | | | |
| | | Distribution Fees | | | Service Fees | |
Investor A | | | — | % | | | 0.25 | % |
Investor B(a) | | | 0.75 | | | | 0.25 | |
Investor C | | | 0.75 | | | | 0.25 | |
Class R | | | 0.25 | | | | 0.25 | |
| | (a) | On December 27, 2017, Advantage Global’s Investor B Shares converted into Investor A Shares. | |
BRIL and broker-dealers, pursuant to sub-agreements with BRIL, provide shareholder servicing and distribution services to the Funds. The ongoing service and/or distribution fee compensates BRIL and each broker-dealer for providing shareholder servicing and/or distribution related services to shareholders.
For the year ended June 30, 2018, the following table shows the class specific service and distribution fees borne directly by each share class of each Fund:
| | | | | | | | | | | | | | | | | | | | |
| | | Investor A | | | Investor B (a) | | | Investor C | | | Class R | | | Total | |
Advantage Global | | $ | 922,143 | | | $ | 1,431 | | | $ | 1,141,817 | | | $ | 94,528 | | | $ | 2,159,919 | |
EuroFund | | | 403,420 | | | | N/A | | | | 81,450 | | | | 4,212 | | | | 489,082 | |
| | (a) | On December 27, 2017, Advantage Global’s Investor B Shares converted into Investor A Shares. | |
Transfer Agent: Pursuant to written agreements, certain financial intermediaries, some of which may be affiliates, provide the Funds with sub-accounting, recordkeeping, sub-transfer agency and other administrative services with respect to sub-accounts they service. For these services, these entities receive an asset-based fee or an annual fee per shareholder account, which will vary depending on share class and/or net assets. For the year ended June 30, 2018, the Funds paid the following amounts to affiliates of BlackRock in return for these services, which are included in transfer agent — class specific in the Statements of Operations:
| | | | | | | | | | | | |
| | | Institutional | | | Institutional | | | Total | |
Advantage Global | | $ | 126 | | | $ | 676 | | | $ | 802 | |
EuroFund | | | — | | | | 1 | | | | 1 | |
The Manager maintains a call center that is responsible for providing certain shareholder services to the Funds. Shareholder services include responding to inquiries and processing subscriptions and redemptions based upon instructions from shareholders. For the year ended June 30, 2018, each Fund reimbursed the Manager the following amounts for costs incurred in running the call center, which are included in transfer agent — class specific in the Statements of Operations:
| | | | | | | | | | | | | | | | | | | | | | | | |
| | | Institutional | | | Investor A | | | Investor B (a) | | | Investor C | | | Class R | | | Total | |
Advantage Global | | $ | 1,028 | | | $ | 7,194 | | | $ | 28 | | | $ | 2,639 | | | $ | 164 | | | $ | 11,053 | |
EuroFund | | | 2,118 | | | | 3,247 | | | | N/A | | | | 114 | | | | 22 | | | | 5,501 | |
| | (a) | On December 27, 2017, Advantage Global’s Investor B Shares converted into Investor A Shares. | |
For the year ended June 30, 2018, the following table shows the class specific transfer agent fees borne directly by each share class of each Fund:
| | | | | | | | | | | | | | | | | | | | | | | | |
| | | Institutional | | | Investor A | | | Investor B (a) | | | Investor C | | | Class R | | | Total | |
Advantage Global | | $ | 188,685 | | | $ | 776,291 | | | $ | 586 | | | $ | 311,770 | | | $ | 57,327 | | | $ | 1,334,659 | |
EuroFund | | | 195,304 | | | | 219,687 | | | | N/A | | | | 12,388 | | | | 3,199 | | | | 430,578 | |
| | (a) | On December 27, 2017, Advantage Global’s Investor B Shares converted into Investor A Shares. | |
Other Fees: For the year ended June 30, 2018, affiliates earned underwriting discounts, direct commissions and dealer concessions on sales of each Fund’s Investor A Shares as follows:
| | | | |
| | | Investor A | |
Advantage Global | | $ | 5,717 | |
EuroFund | | | 1,369 | |
For the year ended June 30, 2018, affiliates received CDSCs as follows:
| | | | | | | | |
| | | Investor A | | | Investor C | |
Advantage Global | | $ | 5,558 | | | $ | 5,118 | |
EuroFund | | | 210 | | | | 2,250 | |
Expense Limitations, Waivers, Reimbursements and Recoupments: With respect to each Fund, the Manager voluntarily agreed to waive its investment advisory fees by the amount of investment advisory fees each Fund pays to the Manager indirectly through its investment in affiliated money market funds (the “affiliated money market
| | |
| 42 | | 2018 BLACKROCK ANNUAL REPORTTO SHAREHOLDERS |
Notes to Financial Statements (continued)
fund waiver”). The amount of waivers and/or reimbursements of fees and expenses made pursuant to the expense limitation described below will be reduced by the amount of the affiliated money market fund waiver. These amounts are included in fees waived and/or reimbursed by the Manager in the Statements of Operations. For the year ended June 30, 2018, the amounts waived were as follows:
| | | | | | | | |
| | | Advantage Global | | | EuroFund | |
Amounts waived | | $ | 8,025 | | | $ | 489 | |
The Manager has contractually agreed to waive its investment advisory fee with respect to any portion of each Fund’s assets invested in affiliated equity and fixed-income mutual funds and affiliated exchange-traded funds that have a contractual management fee through October 31, 2019. The contractual agreement may be terminated upon 90 days’ notice by a majority of the directors/trustees who are not “interested persons” of a Fund, as defined in the 1940 Act (“Independent Directors”), or by a vote of a majority of the outstanding voting securities of a Fund. For the year ended June 30, 2018, there were no fees waived and/or reimbursed by the Manager.
Effective June 1, 2018, the Manager voluntarily agreed to waive a portion of its investment advisory fees equal to the annual rate of 0.06% of EuroFund’s average daily net assets. Prior to June 1, 2018, the Manager voluntarily agreed to waive a portion of its investment advisory fees equal to the annual rate of 0.03% of EuroFund’s average daily net assets. This amount is included in fees waived and/or reimbursed by the Manager in the Statements of Operations. During the year ended June 30, 2018, the Manager waived $85,492 pursuant to this agreement.
In regards to Advantage Global, the Manager reimbursed the Fund $272,685, which is included in fees waived and/or reimbursed by the Manager in the Statements of Operations.
For the year ended June 30, 2018, the Funds reimbursed the Manager for certain accounting services, which is included in accounting services in the Statements of Operations. The reimbursements were as follows:
| | | | | | | | | | | | | | | | | | | | | | | | | | | | |
| | | Institutional | | | Investor A | | | Investor B (a) | | | Investor C | | | Class K | | | Class R | | | Total | |
Advantage Global | | $ | 2,205 | | | $ | 4,091 | | | $ | 2 | | | $ | 1,274 | | | $ | 13 | | | $ | 210 | | | $ | 7,795 | |
EuroFund | | | 1,026 | | | | 1,658 | | | | N/A | | | | 84 | | | | 3 | | | | 8 | | | | 2,779 | |
| | (a) | On December 27, 2017, Advantage Global’s Investor B Shares converted into Investor A Shares. | |
Effective October 26, 2017, with respect to Advantage Global, the Manager contractually agreed to waive and/or reimburse fees or expenses in order to limit expenses, excluding interest expense, dividend expense, tax expense, acquired fund fees and expenses, and certain other fund expenses, which constitute extraordinary expenses not incurred in the ordinary course of Advantage Global’s business (“expense limitation”). The expense limitations as a percentage of average daily net assets are as follows:
| | | | | | | | | | | | | | | | | | | | | | | | |
| | | Institutional | | | Investor A | | | Investor B (a) | | | Investor C | | | Class K (b) | | | Class R | |
Expense limitations | | | 0.71 | % | | | 0.96 | % | | | 1.71 | % | | | 1.71 | % | | | 0.66 | % | | | 1.21 | % |
| | (a) | On December 27, 2017, Advantage Global’s Investor B Shares converted into Investor A Shares. | |
| | (b) | Effective January 25, 2018. | |
The Manager has agreed not to reduce or discontinue these contractual expense limitations through October 31, 2018 for Institutional, Investors A, Investors C and Class R Shares, except for Class K which is through October 31, 2019, unless approved by the Board of Advantage Global, including a majority of the directors or by a vote of a majority of the outstanding voting securities of Advantage Global. For the year ended June 30, 2018, the Manager waived and/or reimbursed $1,445,672, which is included in fees waived and/or reimbursed by the Manager in the Statements of Operations.
These amounts waived and/or reimbursed are shown as transfer agent fees waived — class specific, in the Statements of Operations. For the year ended June 30, 2018, class specific waivers were as follows:
| | | | | | | | | | | | | | | | | | | | | | | | |
| | | Institutional | | | Investor A | | | Investor B (a) | | | Investor C | | | Class R | | | Total | |
Class specific waivers | | $ | 83,582 | | | $ | 400,595 | | | $ | 162 | | | $ | 164,101 | | | $ | 33,591 | | | $ | 682,031 | |
| | (a) | On December 27, 2017, Advantage Global’s Investor B Shares converted into Investor A Shares. | |
Each fund has begun to incur expenses in connection with a potential realignment and consolidation of the boards of directors of certain BlackRock-advised funds, including the Funds. The Manager has voluntarily agreed to reimburse Advantage Global for all or a portion of such expenses, which amounts are included in fees waived and/or reimbursed by the Manager in the Statements of Operations. For the year ended June 30, 2018, the amount waived and/or reimbursed was $13,705.
With respect to the contractual expense limitation, if during the Fund’s fiscal year the operating expenses of a share class, that at any time during the prior two fiscal years received a waiver and/or reimbursement from the Manager, are less than the current expense limitation for that share class, the Manager is entitled to be reimbursed by such share class up to the lesser of: (a) the amount of fees waived and/or expenses reimbursed during those prior two fiscal years under the agreement and (b) an amount not to exceed either the current expense limitation of that share class or the expense limitation of the share class in effect at the time that the share class received the applicable waiver and/or reimbursement, provided that:
(1) the Fund, of which the share class is a part, has more than $50 million in assets for the fiscal year; and
(2) the Manager or an affiliate continues to serve as a Fund’s investment adviser or administrator.
| | | | |
| NOTESTO FINANCIAL STATEMENTS | | | 43 | |
Notes to Financial Statements (continued)
This repayment applies only to the contractual expense limitation on net expenses and does not apply to the contractual investment advisory fee waiver described above or any voluntary waivers that may be in effect from time to time.
On June 30, 2018, Advantage Global’s fund level and class specific waivers and/or reimbursements subject to possible future recoupment under the expense limitation agreement are as follows:
| | | | |
| | | Expiring June 30, 2020 | |
Fund Level | | $ | 1,445,672 | |
Institutional | | | 83,582 | |
Investor A | | | 400,595 | |
Investor B(a) | | | 162 | |
Investor C | | | 164,101 | |
Class R | | | 33,591 | |
| | (a) | On December 27, 2017, Advantage Global’s Investor B Shares converted into Investor A Shares. | |
Securities Lending: The U.S. Securities and Exchange Commission (“SEC”) has issued an exemptive order which permits BIM, an affiliate of the Manager, to serve as securities lending agent for the Funds, subject to applicable conditions. As securities lending agent, BIM bears all operational costs directly related to securities lending. The Funds are responsible for expenses in connection with the investment of cash collateral received for securities on loan (the “collateral investment expenses”). The cash collateral is invested in a private investment company managed by the Manager or its affiliates. However, BIM has agreed to cap the collateral investment expenses of the private investment company to an annual rate of 0.04%. The investment adviser to the private investment company will not charge any advisory fees with respect to shares purchased by the Funds. The private investment company in which the cash collateral has been invested may, under certain circumstances, impose a liquidity fee of up to 2% of the value withdrawn or temporarily restrict withdrawals for up to 10 business days during a 90 day period, in the event that the private investment company’s weekly liquid assets fall below certain thresholds.
Securities lending income is equal to the total of income earned from the reinvestment of cash collateral, net of fees and other payments to and from borrowers of securities, and less the collateral investment expenses. Each Fund retains a portion of securities lending income and remits a remaining portion to BIM as compensation for its services as securities lending agent.
Pursuant to a securities lending agreement, each Fund retains 80% of securities lending income, and this amount retained can never be less than 70% of the total of securities lending income plus the collateral investment expenses.
In addition, commencing the business day following the date that the aggregate securities lending income earned across the Equity-Bond Complex in a calendar year exceeds a specified threshold, each Fund, pursuant to the securities lending agreement, will retain for the remainder of that calendar year securities lending income in an amount equal to 85% of securities lending income, and this amount retained can never be less than 70% of the total of securities lending income plus the collateral investment expenses.
The share of securities lending income earned by each Fund is shown as securities lending income — affiliated — net in the Statements of Operations. For the year ended June 30, 2018, each Fund paid BIM the following amounts for securities lending agent services:
| | | | | | | | |
| | | Advantage Global | | | EuroFund | |
Amounts for securities lending agent services | | $ | 84,088 | | | $ | 75 | |
Interfund Lending: In accordance with an exemptive order (the “Order”) from the SEC, each Fund may participate in a joint lending and borrowing facility for temporary purposes (the “Interfund Lending Program”), subject to compliance with the terms and conditions of the Order, and to the extent permitted by each Fund’s investment policies and restrictions. Advantage Global is currently permitted to borrow and lend under the Interfund Lending Program. EuroFund is currently permitted to borrow under the Interfund Lending Program.
A lending BlackRock fund may lend in aggregate up to 15% of its net assets, but may not lend more than 5% of its net assets, to any one borrowing fund through the Interfund Lending Program. A borrowing BlackRock fund may not borrow through the Interfund Lending Program or from any other source more than 33 1/3% of its total assets (or any lower threshold provided for by the fund’s investment restrictions). If a borrowing BlackRock fund’s total outstanding borrowings exceed 10% of its total assets, each of its outstanding interfund loans will be subject to collateralization of at least 102% of the outstanding principal value of the loan. All interfund loans are for temporary or emergency purposes and the interest rate to be charged will be the average of the highest current overnight repurchase agreement rate available to a lending fund and the bank loan rate, as calculated according to a formula established by the Board.
During the year ended June 30, 2018, the Funds did not participate in the Interfund Lending Program.
Directors and Officers: Certain Directors and/or officers of the Funds are directors and/or officers of BlackRock or its affiliates. The Funds reimburse the Manager for a portion of the compensation paid to the Funds’ Chief Compliance Officer, which is included in Directors and Officer in the Statements of Operations.
| | |
| 44 | | 2018 BLACKROCK ANNUAL REPORTTO SHAREHOLDERS |
Notes to Financial Statements (continued)
Other Transactions: The Funds may purchase securities from, or sell securities to, an affiliated fund provided the affiliation is due solely to having a common investment adviser, common officers, or common directors. For the year ended June 30, 2018, the purchase and sale transactions and any net realized gains (losses) with affiliated funds in compliance with Rule 17a-7 under the 1940 Act were as follows:
| | | | | | | | | | | | |
| | | Purchases | | | Sales | | | Net Realized Gain (Loss) | |
Advantage Global | | $ | — | | | $ | 726,059 | | | $ | (68,628 | ) |
EuroFund | | | 920,048 | | | | 2,167,332 | | | | 211,291 | |
For the year ended June 30, 2018, purchases and sales of investments, excluding short-term securities, were as follows:
| | | | | | | | |
| | | Advantage Global | | | EuroFund | |
Purchases | | $ | 1,300,403,367 | | | $ | 261,410,297 | |
Sales | | | 1,656,785,547 | | | | 388,382,272 | |
It is each Fund’s policy to comply with the requirements of the Internal Revenue Code of 1986, as amended, applicable to regulated investment companies, and to distribute substantially all of its taxable income to its shareholders. Therefore, no U.S. federal income tax provision is required.
Each Fund files U.S. federal and various state and local tax returns. No income tax returns are currently under examination. The statute of limitations on each Fund’s U.S. federal tax returns generally remains open for each of the four years ended June 30, 2018. The statutes of limitations on each Fund’s state and local tax returns may remain open for an additional year depending upon the jurisdiction.
Management has analyzed tax laws and regulations and their application to the Funds as of June 30, 2018, inclusive of the open tax return years, and does not believe that there are any uncertain tax positions that require recognition of a tax liability in the Funds’ financial statements.
U.S. GAAP requires that certain components of net assets be adjusted to reflect permanent differences between financial and tax reporting. These reclassifications have no effect on net assets or net asset values per share. As of period end, the following permanent differences attributable to foreign currency transactions, the sale of stock of passive foreign investment companies, non-deductible expenses, the expiration of capital loss carryforwards and the use of equalization were reclassified to the following accounts:
| | | | | | | | |
| | | Advantage Global | | | EuroFund | |
Paid-in capital | | $ | 10,828,774 | | | $ | (85,967,179 | ) |
Undistributed net investment income | | | 9,822,944 | | | | 102,419 | |
Accumulated net realized gain (loss) | | | (20,651,718 | ) | | | 85,864,760 | |
The tax character of distributions was as follows:
| | | | | | | | |
| | | Advantage Global * | | | EuroFund | |
Ordinary income | | | | | | | | |
6/30/2018 | | $ | 43,817,062 | | | $ | 3,297,473 | |
6/30/2017 | | | 5,227,319 | | | | 6,542,741 | |
Long-term capital gains | | | | | | | | |
6/30/2018 | | | 171,407,475 | | | | — | |
6/30/2017 | | | — | | | | — | |
| | | | | | | | |
Total | | | | | | | | |
6/30/2018 | | $ | 215,224,537 | | | $ | 3,297,473 | |
| | | | | | | | |
6/30/2017 | | $ | 5,227,319 | | | $ | 6,542,741 | |
| | | | | | | | |
| | * | Distribution amounts may include a portion of the proceeds from redeemed shares. | |
As of period end, the tax components of accumulated net earnings (losses) were as follows:
| | | | | | | | |
| | | Advantage Global | | | EuroFund | |
Undistributed ordinary income | | $ | 12,151,127 | | | $ | 2,923,905 | |
Undistributed long-term capital gains | | | 2,387,009 | | | | — | |
Capital loss carryforwards | | | — | | | | (11,743,061 | ) |
Net unrealized gains(a) | | | 14,612,052 | | | | 4,083,195 | |
| | | | | | | | |
| | $ | 29,150,188 | | | $ | (4,735,961 | ) |
| | | | | | | | |
| | (a) | The differences between book-basis and tax-basis net unrealized gains were attributable primarily to the tax deferral of losses on wash sales, the realization for tax purposes of unrealized gains on investments in passive foreign investment companies, the realization for tax purposes of unrealized gains/losses on certain futures and foreign currency contracts and the timing and recognition of partnership income. | |
| | | | |
| NOTESTO FINANCIAL STATEMENTS | | | 45 | |
Notes to Financial Statements (continued)
As of June 30, 2018, EuroFund had a capital loss carryforward with no expiration of $11,743,061 available to offset future realized capital gains.
During the year ended June 30, 2018, EuroFund utilized $38,172,305 of its respective capital loss carryforward.
As of June 30, 2018, gross unrealized appreciation and depreciation for investments and derivatives based on cost for U.S federal income tax purposes were as follows:
| | | | | | | | |
| | | Advantage Global | | | EuroFund | |
Tax cost | | $ | 538,662,896 | | | $ | 197,669,706 | |
| | | | | | | | |
Gross unrealized appreciation | | $ | 41,981,405 | | | $ | 13,691,314 | |
Gross unrealized depreciation | | | (27,500,899 | ) | | | (9,589,161 | ) |
| | | | | | | | |
Net unrealized appreciation | | $ | 14,480,506 | | | $ | 4,102,153 | |
| | | | | | | | |
The Tax Cuts and Jobs Act (the “Act”) was enacted on December 22, 2017. Certain provisions of the Act were effective upon enactment with the remainder becoming effective for tax years beginning after December 31, 2017. Although the Act does not amend any provisions directly related to the qualification or taxation of regulated investment companies (“RICs”), the Act does change the taxation of entities in which some RICs invest, the tax treatment of income derived from those entities and the taxation of RIC shareholders. While management does not anticipate significant impact to the Fund or to its investors, there is uncertainty in the application of certain provisions in the Act. Specifically, provisions in the Act may increase the amount of or accelerate the recognition of taxable income and may limit the deductibility of certain expenses by RICs. Until full clarity around these provisions is obtained, the impact on the Funds’ financial statements, if any, cannot be fully determined.
The Funds along with certain other funds managed by the Manager and its affiliates (“Participating Funds”), is a party to a 364-day, $2.25 billion credit agreement with a group of lenders. Under this agreement, the Funds may borrow to fund shareholder redemptions. Excluding commitments designated for certain individual funds, the Participating Funds, including the Funds, can borrow up to an aggregate commitment amount of $1.75 billion at any time outstanding, subject to asset coverage and other limitations as specified in the agreement. The credit agreement has the following terms: a fee of 0.10% per annum on unused commitment amounts and interest at a rate equal to the higher of (a) one-month LIBOR (but, in any event, not less than 0.00%) on the date the loan is made plus 0.80% per annum or (b) the Fed Funds rate (but, in any event, not less than 0.00%) in effect from time to time plus 0.80% per annum on amounts borrowed. The agreement expires in April 2019 unless extended or renewed. Prior to April 19, 2018, the aggregate commitment amount was $2.1 billion and the fee was 0.12% per annum. Participating Funds paid an upfront commitment fee of 0.02% on the total commitment amounts, in addition to administration, legal and arrangement fees, which are included in miscellaneous expenses in the Statements of Operations. These fees were allocated among such funds based upon portions of the aggregate commitment available to them and relative net assets of Participating Funds. During the year ended June 30, 2018, the Funds did not borrow under the credit agreement.
In the normal course of business, Funds invest in securities or other instruments and may enter into certain transactions, and such activities subject each Fund to various risks, including among others, fluctuations in the market (market risk) or failure of an issuer to meet all of its obligations. The value of securities or other instruments may also be affected by various factors, including, without limitation: (i) the general economy; (ii) the overall market as well as local, regional or global political and/or social instability; (iii) regulation, taxation or international tax treaties between various countries; or (iv) currency, interest rate and price fluctuations. Fund’s prospectus provides details of the risks to which Fund is subject.
The Funds may be exposed to additional risks when reinvesting cash collateral in money market funds that do not seek to maintain a stable NAV per share of $1.00 and which may be subject to redemption gates or liquidity fees under certain circumstances.
Valuation Risk: The market values of equities, such as common stocks and preferred securities or equity related investments, such as futures and options, may decline due to general market conditions which are not specifically related to a particular company. They may also decline due to factors which affect a particular industry or industries. A Fund may invest in illiquid investments and may experience difficulty in selling those investments in a timely manner at the price that it believe the investments are worth. Prices may fluctuate widely over short or extended periods in response to company, market or economic news. Markets also tend to move in cycles, with periods of rising and falling prices. This volatility may cause each Fund’s NAV to experience significant increases or decreases over short periods of time. If there is a general decline in the securities and other markets, the NAV of a Fund may lose value, regardless of the individual results of the securities and other instruments in which a Fund invests.
Counterparty Credit Risk: The Funds may be exposed to counterparty credit risk, or the risk that an entity may fail to or be unable to perform on its commitments related to unsettled or open transactions. The Funds manage counterparty credit risk by entering into transactions only with counterparties that the Manager believes have the financial resources to honor their obligations and by monitoring the financial stability of those counterparties. Financial assets, which potentially expose the Funds to market, issuer and counterparty credit risks, consist principally of financial instruments and receivables due from counterparties. The extent of the Funds’ exposure to market, issuer and counterparty credit risks with respect to these financial assets is approximately their value recorded in the Statements of Assets and Liabilities, less any collateral held by the Funds.
A derivative contract may suffer a mark-to-market loss if the value of the contract decreases due to an unfavorable change in the market rates or values of the underlying instrument. Losses can also occur if the counterparty does not perform under the contract.
A Fund’s risk of loss from counterparty credit risk on OTC derivatives is generally limited to the aggregate unrealized gain less the value of any collateral held by such Fund.
| | |
| 46 | | 2018 BLACKROCK ANNUAL REPORTTO SHAREHOLDERS |
Notes to Financial Statements (continued)
With exchange-traded futures, there is less counterparty credit risk to the Funds since the exchange or clearinghouse, as counterparty to such instruments, guarantees against a possible default. The clearinghouse stands between the buyer and the seller of the contract; therefore, credit risk is limited to failure of the clearinghouse. While offset rights may exist under applicable law, a Fund does not have a contractual right of offset against a clearing broker or clearinghouse in the event of a default (including the bankruptcy or insolvency). Additionally, credit risk exists in exchange-traded futures with respect to initial and variation margin that is held in a clearing broker’s customer accounts. While clearing brokers are required to segregate customer margin from their own assets, in the event that a clearing broker becomes insolvent or goes into bankruptcy and at that time there is a shortfall in the aggregate amount of margin held by the clearing broker for all its clients, typically the shortfall would be allocated on a pro rata basis across all the clearing broker’s customers, potentially resulting in losses to the Funds.
Concentration Risk: Certain Funds invest a substantial amount of their assets in issuers located in a single country or a limited number of countries. When the Funds concentrate their investments in this manner, it assumes the risk that economic, political and social conditions in those countries may have a significant impact on their investment performance. Foreign issuers may not be subject to the same uniform accounting, auditing and financial reporting standards and practices as used in the United States. Foreign securities markets may also be less liquid, more volatile, and less subject to governmental supervision not typically associated with investing in U.S. securities. Investment percentages in specific countries are presented in the Schedules of Investments.
EuroFund invests a significant portion of its assets in securities of issuers located in Europe or with significant exposure to European issuers or countries. The European financial markets have recently experienced volatility and adverse trends due to concerns about economic downturns in, or rising government debt levels of, several European countries. These events may spread to other countries in Europe and may affect the value and liquidity of certain of the Fund’s investments.
The United Kingdom voted on June 23, 2016 to withdraw from the European Union, which may introduce significant new uncertainties and instability in the financial markets across Europe.
| 11. | CAPITAL SHARE TRANSACTIONS |
Transactions in capital shares for each class were as follows:
| | | | | | | | | | | | | | | | |
| | | Year Ended
06/30/18 | | | Year Ended
06/30/17 | |
| Advantage Global | | Shares | | | Amount | | | Shares | | | Amount | |
Institutional | | | | | | | | | | | | | | | | |
Shares sold | | | 2,493,052 | | | $ | 64,282,041 | | | | 3,025,590 | | | $ | 73,278,388 | |
Shares issued in reinvestment of distributions | | | 2,231,724 | | | | 47,625,004 | | | | 77,244 | | | | 1,846,908 | |
Shares redeemed | | | (9,403,669 | ) | | | (220,440,441 | ) | | | (4,554,125 | ) | | | (108,761,167 | ) |
| | | | | | | | | | | | | | | | |
Net decrease | | | (4,678,893 | ) | | $ | (108,533,396 | ) | | | (1,451,291 | ) | | $ | (33,635,871 | ) |
| | | | | | | | | | | | | | | | |
Investor A | | | | | | | | | | | | | | | | |
Shares sold and automatic conversion of shares | | | 1,048,150 | | | $ | 23,996,146 | | | | 3,531,283 | | | $ | 85,074,455 | |
Shares issued from conversion(a) | | | 14,836 | | | | 307,412 | | | | — | | | | — | |
Shares issued in reinvestment of distributions | | | 4,464,856 | | | | 90,725,938 | | | | 97,463 | | | | 2,247,539 | |
Shares redeemed | | | (5,642,053 | ) | | | (130,749,317 | ) | | | (5,903,725 | ) | | | (136,700,017 | ) |
| | | | | | | | | | | | | | | | |
Net decrease | | | (114,211 | ) | | $ | (15,719,821 | ) | | | (2,274,979 | ) | | $ | (49,378,023 | ) |
| | | | | | | | | | | | | | | | |
Investor B(a) | | | | | | | | | | | | | | | | |
Shares sold | | | — | | | $ | — | | | | 539 | | | $ | 11,606 | |
Shares issued in reinvestment of distributions | | | 4,588 | | | | 83,214 | | | | — | | | | — | |
Shares converted(a) | | | (16,626 | ) | | | (307,412 | ) | | | — | | | | — | |
Shares redeemed and automatic conversion of shares | | | (315 | ) | | �� | (7,222 | ) | | | (34,154 | ) | | | (718,840 | ) |
| | | | | | | | | | | | | | | | |
Net decrease | | | (12,353 | ) | | $ | (231,420 | ) | | | (33,615 | ) | | $ | (707,234 | ) |
| | | | | | | | | | | | | | | | |
Investor C | | | | | | | | | | | | | | | | |
Shares sold | | | 99,113 | | | $ | 1,909,907 | | | | 454,803 | | | $ | 8,968,158 | |
Shares issued in reinvestment of distributions | | | 1,955,492 | | | | 32,734,953 | | | | — | | | | — | |
Shares redeemed | | | (3,019,203 | ) | | | (58,840,195 | ) | | | (7,679,815 | ) | | | (156,979,803 | ) |
| | | | | | | | | | | | | | | | |
Net decrease | | | (964,598 | ) | | $ | (24,195,335 | ) | | | (7,225,012 | ) | | $ | (148,011,645 | ) |
| | | | | | | | | | | | | | | | |
| | |
| | | Period from
01/25/18 (b)
to 06/30/18 | | | | |
Class K | | | | | | | | | | | | | | | | |
Shares sold | | | 233,540 | | | $ | 5,093,029 | | | | | | | | | |
Shares redeemed | | | (20,176 | ) | | | (443,961 | ) | | | | | | | | |
| | | | | | | | | | | | | | | | |
Net increase | | | 213,364 | | | $ | 4,649,068 | | | | | | | | | |
| | | | | | | | | | | | | | | | |
| | | | |
| NOTESTO FINANCIAL STATEMENTS | | | 47 | |
Notes to Financial Statements (continued)
| | | | | | | | | | | | | | | | |
| | | Year Ended
06/30/18 | | | Year Ended
06/30/17 | |
| Advantage Global | | Shares | | | Amount | | | Shares | | | Amount | |
Class R | | | | | | | | | | | | | | | | |
Shares sold | | | 163,877 | | | $ | 3,396,206 | | | | 194,469 | | | $ | 4,153,109 | |
Shares issued in reinvestment of distributions | | | 293,684 | | | | 5,403,788 | | | | 2,037 | | | | 43,690 | |
Shares redeemed | | | (410,110 | ) | | | (8,557,749 | ) | | | (427,813 | ) | | | (9,210,491 | ) |
| | | | | | | | | | | | | | | | |
Net increase (decrease) | | | 47,451 | | | $ | 242,245 | | | | (231,307 | ) | | $ | (5,013,692 | ) |
| | | | | | | | | | | | | | | | |
Total Net Decrease | | | (5,509,240 | ) | | $ | (143,788,659 | ) | | | (11,216,204 | ) | | $ | (236,746,465 | ) |
| | | | | | | | | | | | | | | | |
| | | | | | | | | | | | | | | | |
| | | Year Ended
06/30/18 | | | Year Ended
06/30/17 | |
| EuroFund | | Shares | | | Amount | | | Shares | | | Amount | |
Institutional | | | | | | | | | | | | | | | | |
Shares sold | | | 663,248 | | | $ | 10,217,108 | | | | 868,932 | | | $ | 11,863,461 | |
Shares issued in reinvestment of distributions | | | 101,284 | | | | 1,555,727 | | | | 218,566 | | | | 2,808,575 | |
Shares redeemed | | | (7,790,508 | ) | | | (119,474,736 | ) | | | (3,439,983 | ) | | | (46,043,608 | ) |
| | | | | | | | | | | | | | | | |
Net decrease | | | (7,025,976 | ) | | $ | (107,701,901 | ) | | | (2,352,485 | ) | | $ | (31,371,572 | ) |
| | | | | | | | | | | | | | | | |
Investor A | | | | | | | | | | | | | | | | |
Shares sold | | | 978,653 | | | $ | 14,902,810 | | | | 1,129,690 | | | $ | 15,619,424 | |
Shares issued in reinvestment of distributions | | | 94,217 | | | | 1,420,802 | | | | 225,372 | | | | 2,842,001 | |
Shares redeemed | | | (2,366,698 | ) | | | (35,951,235 | ) | | | (3,680,322 | ) | | | (48,597,155 | ) |
| | | | | | | | | | | | | | | | |
Net decrease | | | (1,293,828 | ) | | $ | (19,627,623 | ) | | | (2,325,260 | ) | | $ | (30,135,730 | ) |
| | | | | | | | | | | | | | | | |
Investor C | | | | | | | | | | | | | | | | |
Shares sold | | | 162,042 | | | $ | 1,748,678 | | | | 118,245 | | | $ | 1,141,854 | |
Shares issued in reinvestment of distributions | | | 1,841 | | | | 19,534 | | | | 20,011 | | | | 177,910 | |
Shares redeemed | | | (227,340 | ) | | | (2,427,305 | ) | | | (837,350 | ) | | | (8,092,171 | ) |
| | | | | | | | | | | | | | | | |
Net decrease | | | (63,457 | ) | | $ | (659,093 | ) | | | (699,094 | ) | | $ | (6,772,407 | ) |
| | | | | | | | | | | | | | | | |
| | |
| | | Period from
01/25/18 (b)
to 06/30/18 | | | | |
Class K | | | | | | | | | | | | | | | | |
Shares sold | | | 71,266 | | | $ | 1,105,835 | | | | | | | | | |
Shares redeemed | | | (4,585 | ) | | | (70,699 | ) | | | | | | | | |
| | | | | | | | | | | | | | | | |
Net increase | | | 66,681 | | | $ | 1,035,136 | | | | | | | | | |
| | | | | | | | | | | | | | | | |
| | |
| | | Year Ended
06/30/18 | | | | |
Class R | | | | | | | | | | | | | | | | |
Shares sold | | | 35,624 | | | $ | 411,637 | | | | 26,893 | | | $ | 267,564 | |
Shares issued in reinvestment of distributions | | | 535 | | | | 6,094 | | | | 1,981 | | | | 18,958 | |
Shares redeemed | | | (58,439 | ) | | | (663,434 | ) | | | (22,883 | ) | | | (230,690 | ) |
| | | | | | | | | | | | | | | | |
Net increase (decrease) | | | (22,280 | ) | | $ | (245,703 | ) | | | 5,991 | | | $ | 55,832 | |
| | | | | | | | | | | | | | | | |
Total Net Decrease | | | (8,338,860 | ) | | $ | (127,199,184 | ) | | | (5,370,848 | ) | | $ | (68,223,877 | ) |
| | | | | | | | | | | | | | | | |
| | (a) | On December 27, 2017, Advantage Global’s Investor B Shares converted into Investor A Shares. | |
| | (b) | Commencement of operations. | |
As of June 30, 2018, shares owned by BlackRock Financial Management, Inc., an affiliate of the Funds, were as follows:
| | | | |
| | | Class K | |
Advantage Global | | | 8,651 | |
EuroFund | | | 12,070 | |
| | |
| 48 | | 2018 BLACKROCK ANNUAL REPORTTO SHAREHOLDERS |
Notes to Financial Statements (continued)
Management has evaluated the impact of all subsequent events on the Funds through the date the financial statements were issued and has determined that there were no subsequent events requiring adjustment or additional disclosure in the financial statements.
| | | | |
| NOTESTO FINANCIAL STATEMENTS | | | 49 | |
Report of Independent Registered Public Accounting Firm
To the Shareholders and the Board of Directors/Trustees of BlackRock EuroFund and BlackRock Advantage Global Fund, Inc.:
Opinion on the Financial Statements and Financial Highlights
We have audited the accompanying statements of assets and liabilities of BlackRock EuroFund and BlackRock Advantage Global Fund, Inc. (formerly, BlackRock Global SmallCap Fund, Inc.) (the “Funds”), including the schedules of investments, as of June 30, 2018, the related statements of operations for the year then ended, the statements of changes in net assets for each of the two years in the period then ended, the financial highlights for each of the five years in the period then ended, and the related notes. In our opinion, the financial statements and financial highlights present fairly, in all material respects, the financial position of the Funds as of June 30, 2018, and the results of their operations for the year then ended, the changes in their net assets for each of the two years in the period then ended, and the financial highlights for each of the five years in the period then ended, in conformity with accounting principles generally accepted in the United States of America.
Basis for Opinion
These financial statements and financial highlights are the responsibility of the Funds’ management. Our responsibility is to express an opinion on the Funds’ financial statements and financial highlights based on our audits. We are a public accounting firm registered with the Public Company Accounting Oversight Board (United States) (PCAOB) and are required to be independent with respect to the Funds in accordance with the U.S. federal securities laws and the applicable rules and regulations of the Securities and Exchange Commission and the PCAOB.
We conducted our audits in accordance with the standards of the PCAOB. Those standards require that we plan and perform the audit to obtain reasonable assurance about whether the financial statements and financial highlights are free of material misstatement, whether due to error or fraud. The Funds are not required to have, nor were we engaged to perform, an audit of their internal control over financial reporting. As part of our audits we are required to obtain an understanding of internal control over financial reporting but not for the purpose of expressing an opinion on the effectiveness of the Funds’ internal control over financial reporting. Accordingly, we express no such opinion.
Our audits included performing procedures to assess the risks of material misstatement of the financial statements and financial highlights, whether due to error or fraud, and performing procedures that respond to those risks. Such procedures included examining, on a test basis, evidence regarding the amounts and disclosures in the financial statements and financial highlights. Our audits also included evaluating the accounting principles used and significant estimates made by management, as well as evaluating the overall presentation of the financial statements and financial highlights. Our procedures included confirmation of securities owned as of June 30, 2018, by correspondence with the custodian and brokers; when replies were not received from brokers, we performed other auditing procedures. We believe that our audits provide a reasonable basis for our opinion.
Deloitte & Touche LLP
Boston, Massachusetts
August 22, 2018
We have served as the auditor of one or more BlackRock investment companies since 1992.
Important Tax Information (unaudited)
During the fiscal year ended June 30, 2018, the following information is provided with respect to the ordinary income distribution paid by the Funds:
| | | | | | | | |
| | | Advantage Global
Fund | | | EuroFund | |
Payable Date | | | 12/05/17 | | | | 12/12/17 | |
Qualified Dividend Income for Individuals | | | 19.85% | | | | 100% | (a) |
Dividends Qualifying for the Dividend Received Deduction for Corporations | | | 10.99% | | | | — | |
Foreign Source Income | | | — | | | | 99.87% | (a) |
Foreign Taxes Paid Per Share(b) | | | — | | | $ | 0.030705 | |
| | (a) | Expressed as a percentage of the cash distribution grossed-up for foreign taxes. | |
| | (b) | The foreign taxes paid represent taxes incurred by the Fund on income received by the Fund from foreign sources. Foreign taxes paid may be included in taxable income with an offsetting deduction from gross income or may be taken as a credit for taxes paid to foreign governments. You should consult your tax advisor regarding the appropriate treatment of foreign taxes paid | |
Additionally, Advantage Global Fund distributed long-term capital gains of $5.945858 per share to shareholders of record on December 1, 2017.
| | |
| 50 | | 2018 BLACKROCK ANNUAL REPORTTO SHAREHOLDERS |
Disclosure of Investment Advisory Agreements and Sub-Advisory Agreement
The Board of Trustees (the “Board,” the members of which are referred to as “Board Members”) of BlackRock EuroFund (the “EuroFund”) and the Board of Directors of BlackRock Advantage Global Fund, Inc. (the “Advantage Global Fund”) (each a “Fund,” and collectively, the “Funds”) met in person on April 10, 2018 (the “April Meeting”) and May 8, 2018 (the “May Meeting”) to consider the approval of each Fund’s investment advisory agreement (the “Advisory Agreements”) with BlackRock Advisors, LLC (the “Manager”), each Fund’s investment advisor. The Board also considered the approval of the sub-advisory agreement (the “Sub-Advisory Agreement”) between the Manager and BlackRock International Limited (the “Sub-Advisor”), with respect to the EuroFund. The Manager and, with respect to the EuroFund, the Sub-Advisor are referred to herein as “BlackRock.” The Advisory Agreements and, with respect to the EuroFund, the Sub-Advisory Agreement are referred to herein as the “Agreements.”
Activities and Composition of the Board
On the date of the May Meeting, the Board consisted of eleven individuals, nine of whom were not “interested persons” of each Fund as defined in the Investment Company Act of 1940, as amended (the “1940 Act”) (the “Independent Board Members”). The Board Members are responsible for the oversight of the operations of each Fund and perform the various duties imposed on the directors of investment companies by the 1940 Act. The Independent Board Members have retained independent legal counsel to assist them in connection with their duties. The Chair of the Board is an Independent Board Member. The Board has established five standing committees: an Audit Committee, a Governance and Nominating Committee, a Compliance Committee, a Performance Oversight Committee and an Executive Committee, each of which is chaired by an Independent Board Member and composed of Independent Board Members (except for the Performance Oversight Committee and the Executive Committee, each of which also has one interested Board Member).
The Agreements
Pursuant to the 1940 Act, the Board is required to consider the continuation of the Agreements on an annual basis. The Board has four quarterly meetings per year, each typically extending for two days, and additional in-person and telephonic meetings throughout the year, as needed. The Board also has a fifth one-day meeting to consider specific information surrounding the consideration of renewing the Agreements. The Board’s consideration of the Agreements is a year-long deliberative process, during which the Board assessed, among other things, the nature, extent and quality of the services provided to each Fund by BlackRock, BlackRock’s personnel and affiliates, including (as applicable): investment management; accounting, administrative and shareholder services; oversight of each Fund’s service providers; marketing and promotional services; risk management and oversight; legal and compliance services; and ability to meet applicable legal and regulatory requirements.
The Board, acting directly and through its committees, considers at each of its meetings, and from time to time as appropriate, factors that are relevant to its annual consideration of the renewal of the Agreements, including the services and support provided by BlackRock to each Fund and its shareholders. BlackRock also furnished additional information to the Board in response to specific questions from the Board. This additional information is discussed further below in the section titled “Board Considerations in Approving the Agreements.” Among the matters the Board considered were: (a) investment performance for one-year, three-year, five-year, ten-year, and/or since inception periods, as applicable, against peer funds, applicable benchmark, and performance metrics, as applicable, as well as senior management’s and portfolio managers’ analysis of the reasons for any over-performance or underperformance relative to its peers, benchmarks, and other performance metrics, as applicable; (b) fees, including advisory, administration, if applicable, and other amounts paid to BlackRock and its affiliates by each Fund for services; (c) Fund operating expenses and how BlackRock allocates expenses to each Fund; (d) the resources devoted to, risk oversight of, and compliance reports relating to, implementation of each Fund’s investment objective(s), policies and restrictions, and meeting regulatory requirements; (e) each Fund’s adherence to its compliance policies and procedures; (f) the nature, character and scope of non-investment management services provided by BlackRock and its affiliates and the estimated cost of such services; (g) BlackRock’s and other service providers’ internal controls and risk and compliance oversight mechanisms; (h) BlackRock’s implementation of the proxy voting policies approved by the Board; (i) the use of brokerage commissions and execution quality of portfolio transactions; (j) BlackRock’s implementation of each Fund’s valuation and liquidity procedures; (k) an analysis of management fees for products with similar investment mandates across the open-end fund, exchange-traded fund (“ETF”), closed-end fund, sub-advised mutual fund, separately managed account, collective investment trust, and institutional separate account product channels, as applicable, and the similarities and differences between these products and the services provided as compared to each Fund; (l) BlackRock’s compensation methodology for its investment professionals and the incentives and accountability it creates, along with investment professionals’ investments in the fund(s) they manage; and (m) periodic updates on BlackRock’s business.
Board Considerations in Approving the Agreements
The Approval Process: Prior to the April Meeting, the Board requested and received materials specifically relating to the Agreements. The Board is continuously engaged in a process with its independent legal counsel and BlackRock to review the nature and scope of the information provided to better assist its deliberations. The materials provided in connection with the April Meeting included, among other things: (a) information independently compiled and prepared by Broadridge Financial Solutions, Inc. (“Broadridge”), based on either a Lipper classification or Morningstar category, regarding each Fund’s fees and expenses as compared with a peer group of funds as determined by Broadridge (“Expense Peers”), the investment performance of each Fund as compared with a peer group of funds (“Performance Peers”) and other metrics, as applicable; (b) information on the composition of the Expense Peers and Performance Peers, and a description of Broadridge’s methodology; (c) information on the estimated profits realized by BlackRock and its affiliates pursuant to the Agreements and a discussion of fall-out benefits to BlackRock and its affiliates; (d) a general analysis provided by BlackRock concerning investment management fees received in connection with other types of investment products, such as institutional accounts, sub-advised mutual funds, ETFs, closed-end funds, open-end funds, and separately managed accounts, under similar investment mandates, as well as the performance of such other products, as applicable; (e) review of non-management fees; (f) the existence and impact of potential economies of scale, if any, and the sharing of potential economies of scale with each Fund; (g) a summary of aggregate amounts paid by each Fund to BlackRock; (h) sales and redemption data regarding each Fund’s shares; and (i) various additional information requested by the Board as appropriate regarding BlackRock’s and each Fund’s operations.
At the April Meeting, the Board reviewed materials relating to its consideration of the Agreements. As a result of the discussions that occurred during the April Meeting, and as a culmination of the Board’s year-long deliberative process, the Board presented BlackRock with questions and requests for additional information. BlackRock responded to these requests with additional written information in advance of the May Meeting.
| | | | |
| DISCLOSUREOF INVESTMENT ADVISORY AGREEMENTSAND SUB-ADVISORY AGREEMENT | | | 51 | |
Disclosure of Investment Advisory Agreements and Sub-Advisory Agreement (continued)
At the May Meeting, the Board considered, among other things: (a) the nature, extent and quality of the services provided by BlackRock; (b) the investment performance of each Fund as compared with Performance Peers and other metrics, as applicable; (c) the advisory fee and the estimated cost of the services and estimated profits realized by BlackRock and its affiliates from their relationship with each Fund; (d) each Fund’s fees and expenses compared to Expense Peers; (e) the sharing of potential economies of scale; (f) fall-out benefits to BlackRock and its affiliates as a result of BlackRock’s relationship with each Fund; and (g) other factors deemed relevant by the Board Members.
The Board also considered other matters it deemed important to the approval process, such as other payments made to BlackRock or its affiliates, securities lending and cash management, services related to the valuation and pricing of Fund portfolio holdings, and advice from independent legal counsel with respect to the review process and materials submitted for the Board’s review. The Board noted the willingness of BlackRock personnel to engage in open, candid discussions with the Board. The Board did not identify any particular information as determinative, and each Board Member may have attributed different weights to the various items considered.
A. Nature, Extent and Quality of the Services Provided by BlackRock: The Board, including the Independent Board Members, reviewed the nature, extent and quality of services provided by BlackRock, including the investment advisory services and the resulting performance of each Fund. Throughout the year, the Board compared Fund performance to the performance of a comparable group of mutual funds, a relevant benchmark, and performance metrics, as applicable. The Board met with BlackRock’s senior management personnel responsible for investment activities, including the senior investment officers. The Board also reviewed the materials provided by each Fund’s portfolio management team discussing each Fund’s performance and each Fund’s investment objective(s), strategies and outlook.
The Board considered, among other factors, with respect to BlackRock: the number, education and experience of investment personnel generally and each Fund’s portfolio management team; BlackRock’s research capabilities; investments by portfolio managers in the funds they manage; portfolio trading capabilities; use of technology; commitment to compliance; credit analysis capabilities; risk analysis and oversight capabilities; and the approach to training and retaining portfolio managers and other research, advisory and management personnel. The Board also considered BlackRock’s overall risk management program, including the continued efforts of BlackRock and its affiliates to address cybersecurity risks and the role of BlackRock’s Risk & Quantitative Analysis Group. The Board engaged in a review of BlackRock’s compensation structure with respect to each Fund’s portfolio management team and BlackRock’s ability to attract and retain high-quality talent and create performance incentives.
In addition to investment advisory services, the Board considered the quality of the administrative and other non-investment advisory services provided to each Fund. BlackRock and its affiliates provide each Fund with certain administrative, shareholder and other services (in addition to any such services provided to each Fund by third parties) and officers and other personnel as are necessary for the operations of each Fund. In particular, BlackRock and its affiliates provide each Fund with administrative services including, among others: (i) responsibility for disclosure documents, such as the prospectus, the summary prospectus (as applicable), the statement of additional information and periodic shareholder reports; (ii) oversight of daily accounting and pricing; (iii) responsibility for periodic filings with regulators; (iv) overseeing and coordinating the activities of other service providers including, among others, each Fund’s custodian, fund accountant, transfer agent, and auditor; (v) organizing Board meetings and preparing the materials for such Board meetings; (vi) providing legal and compliance support; (vii) furnishing analytical and other support to assist the Board in its consideration of strategic issues such as the merger, consolidation or repurposing of certain open-end funds; and (viii) performing administrative functions necessary for the operation of each Fund, such as tax reporting, expense management, fulfilling regulatory filing requirements, overseeing each Fund’s distribution partners, and shareholder call center and other services. The Board reviewed the structure and duties of BlackRock’s fund administration, shareholder services, and legal & compliance departments and considered BlackRock’s policies and procedures for assuring compliance with applicable laws and regulations.
B. The Investment Performance of each Fund and BlackRock: The Board, including the Independent Board Members, also reviewed and considered the performance history of each Fund. In preparation for the April Meeting, the Board was provided with reports independently prepared by Broadridge, which included a comprehensive analysis of each Fund’s performance as of December 31, 2017. Broadridge ranks funds in quartiles, ranging from first to fourth, where first is the most desirable quartile position and fourth is the least desirable. In connection with its review, the Board received and reviewed information regarding the investment performance of each Fund as compared to its Performance Peers. The Board and its Performance Oversight Committee regularly review, and meet with Fund management to discuss, the performance of each Fund throughout the year.
In evaluating performance, the Board recognized that the performance data reflects a snapshot of a period as of a particular date and that selecting a different performance period could produce significantly different results. Further, the Board recognized that it is possible that long-term performance can be impacted by even one period of significant outperformance or underperformance, so that a single investment theme has the ability to affect long-term performance disproportionately.
The Board noted that for the one-, three- and five-year periods reported, the EuroFund ranked in the third, fourth and fourth quartiles, respectively, against its Performance Peers. The Board and BlackRock reviewed the EuroFund’s underperformance during the applicable periods.
The Board and BlackRock discussed BlackRock’s strategy for improving the EuroFund’s investment performance. Discussions covered topics such as performance attribution, the EuroFund’s investment personnel, and the resources appropriate to support the EuroFund’s investment processes.
The Board noted that for the one-, three- and five-year periods reported, the Advantage Global Fund ranked in the third, fourth, and third quartiles, respectively, against its Performance Peers. The Board and BlackRock reviewed the Advantage Global Fund’s underperformance during the applicable periods.
The Board and BlackRock discussed BlackRock’s strategy for improving the Advantage Global Fund’s investment performance. Discussions covered topics such as performance attribution, the Advantage Global Fund’s investment personnel, and the resources appropriate to support the Advantage Global Fund’s investment processes. The Board noted that effective October 26, 2017, the Advantage Global Fund had undergone a change in its investment objective, as well as changes to its investment strategy and portfolio management team, and in connection with such changes, the Fund changed its name from BlackRock Global SmallCap Fund to BlackRock Advantage Global Fund. Finally, the Board noted that the Advantage Global Fund’s one-year investment performance improved from third quartile as of December 2017 to first quartile as of March 2018.
C. Consideration of the Advisory/Management Fees and the Estimated Cost of the Services and Estimated Profits Realized by BlackRock and its Affiliates from their Relationship with each Fund: The Board, including the Independent Board Members, reviewed each Fund’s contractual management fee rate compared with
| | |
| 52 | | 2018 BLACKROCK ANNUAL REPORTTO SHAREHOLDERS |
Disclosure of Investment Advisory Agreements and Sub-Advisory Agreement (continued)
those of its Expense Peers. The contractual management fee rate represents a combination of the advisory fee and any administrative fees, before taking into account any reimbursements or fee waivers. The Board also compared each Fund’s total expense ratio, as well as its actual management fee rate, to those of its Expense Peers. The total expense ratio represents a fund’s total net operating expenses, including any 12b-1 or non 12b-1 service fees. The total expense ratio gives effect to any expense reimbursements or fee waivers that benefit a fund, and the actual management fee rate gives effect to any management fee reimbursements or waivers that benefit a fund. The Board considered the services provided and the fees charged by BlackRock and its affiliates to other types of clients with similar investment mandates, as applicable, including institutional accounts and sub-advised mutual funds (including mutual funds sponsored by third parties).
The Board received and reviewed statements relating to BlackRock’s financial condition. The Board reviewed BlackRock’s profitability methodology and was also provided with an estimated profitability analysis that detailed the revenues earned and the expenses incurred by BlackRock for services provided to each Fund. The Board reviewed BlackRock’s estimated profitability with respect to each Fund and other funds the Board currently oversees for the year ended December 31, 2017 compared to available aggregate estimated profitability data provided for the prior two years. The Board reviewed BlackRock’s estimated profitability with respect to certain other U.S. fund complexes managed by the Manager and/or its affiliates. The Board reviewed BlackRock’s assumptions and methodology of allocating expenses in the estimated profitability analysis, noting the inherent limitations in allocating costs among various advisory products. The Board recognized that profitability may be affected by numerous factors including, among other things, fee waivers and expense reimbursements by the Manager, the types of funds managed, precision of expense allocations and business mix. As a result, calculating and comparing profitability at individual fund levels is difficult.
The Board noted that, in general, individual fund or product line profitability of other advisors is not publicly available. The Board reviewed BlackRock’s overall operating margin, in general, compared to that of certain other publicly-traded asset management firms. The Board considered the differences between BlackRock and these other firms, including the contribution of technology at BlackRock, BlackRock’s expense management, and the relative product mix.
In addition, the Board considered the estimated cost of the services provided to each Fund by BlackRock, and BlackRock’s and its affiliates’ estimated profits relating to the management and distribution of each Fund and the other funds advised by BlackRock and its affiliates. As part of its analysis, the Board reviewed BlackRock’s methodology in allocating its costs of managing the Funds, to each Fund. The Board considered whether BlackRock has the financial resources necessary to attract and retain high quality investment management personnel to perform its obligations under the Agreements and to continue to provide the high quality of services that is expected by the Board. The Board further considered factors including but not limited to BlackRock’s commitment of time, assumption of risk, and liability profile in servicing each Fund in contrast to what is required of BlackRock with respect to other products with similar investment mandates across the open-end fund, ETF, closed-end fund, sub-advised mutual fund, separately managed account, collective investment trust, and institutional separate account product channels, as applicable.
The Board noted that the EuroFund’s contractual management fee rate ranked in the second quartile, and that the actual management fee rate and total expense ratio ranked in the second and first quartiles, respectively, relative to the EuroFund’s Expense Peers. The Board additionally noted that the EuroFund has an advisory fee arrangement that includes breakpoints that adjust the fee rate downward as the size of the EuroFund increases above certain contractually specified levels. In addition, the Board noted that BlackRock has voluntarily agreed to waive a portion of the advisory fee payable by the EuroFund. After discussion between the Board, including the Independent Board Members, and BlackRock, the Board and BlackRock agreed to increase the existing voluntary advisory fee waiver. This waiver increase was implemented on June 1, 2018.
The Board noted that the Advantage Global Fund’s contractual management fee rate ranked in the fourth quartile, and that the actual management fee rate and total expense ratio ranked in the second and first quartiles, respectively, relative to the Advantage Global Fund’s Expense Peers. The Board also noted that the Advantage Global Fund has an advisory fee arrangement that includes breakpoints that adjust the fee rate downward as the size of the Advantage Global Fund increases above certain contractually specified levels. In addition, the Board noted that, in connection with the changes to the Advantage Global Fund’s investment strategy, BlackRock proposed, and the Board agreed to, a contractual expense cap on the Advantage Global Fund’s total expenses as a percentage of the Advantage Global Fund’s average daily net assets on a class-by-class basis. The contractual expense cap was implemented on October 26, 2017.
D. Economies of Scale: The Board, including the Independent Board Members, considered the extent to which economies of scale might be realized as the assets of each Fund increase, including the existence of fee waivers and/or expense caps, as applicable, noting that any contractual fee waivers and expense caps had been approved by the Board. The Board also considered the extent to which each Fund benefits from such economies in a variety of ways, and whether there should be changes in the advisory fee rate or breakpoint structure in order to enable each Fund to more fully participate in these economies of scale. The Board considered each Fund’s asset levels and whether the current fee schedule was appropriate. In its consideration, the Board Members took into account the existence of any expense caps and further considered the continuation and/or implementation, as applicable, of such caps.
E. Other Factors Deemed Relevant by the Board Members: The Board, including the Independent Board Members, also took into account other ancillary or “fall-out” benefits that BlackRock or its affiliates may derive from BlackRock’s respective relationships with each Fund, both tangible and intangible, such as BlackRock’s ability to leverage its investment professionals who manage other portfolios and risk management personnel, an increase in BlackRock’s profile in the investment advisory community, and the engagement of BlackRock’s affiliates as service providers to each Fund, including for administrative, distribution, securities lending and cash management services. The Board also considered BlackRock’s overall operations and its efforts to expand the scale of, and improve the quality of, its operations. The Board also noted that, subject to applicable law, BlackRock may use and benefit from third party research obtained by soft dollars generated by certain registered fund transactions to assist in managing all or a number of its other client accounts.
In connection with its consideration of the Agreements, the Board also received information regarding BlackRock’s brokerage and soft dollar practices. The Board received reports from BlackRock which included information on brokerage commissions and trade execution practices throughout the year.
The Board noted the competitive nature of the open-end fund marketplace, and that shareholders are able to redeem their Fund shares if they believe that each Fund’s fees and expenses are too high or if they are dissatisfied with the performance of each Fund.
| | | | |
| DISCLOSUREOF INVESTMENT ADVISORY AGREEMENTSAND SUB-ADVISORY AGREEMENT | | | 53 | |
Disclosure of Investment Advisory Agreements and Sub-Advisory Agreement (continued)
Conclusion
The Board, including the Independent Board Members, approved the continuation of the Advisory Agreements between the Manager and each Fund for a one-year term ending June 30, 2019, and the Sub-Advisory Agreement between the Manager and the Sub-Advisor, with respect to the EuroFund, for a one-year term ending June 30, 2019. Based upon its evaluation of all of the aforementioned factors in their totality, as well as other information, the Board, including the Independent Board Members, was satisfied that the terms of the Agreements were fair and reasonable and in the best interest of each Fund and its shareholders. In arriving at its decision to approve the Agreements, the Board did not identify any single factor or group of factors as all-important or controlling, but considered all factors together, and different Board Members may have attributed different weights to the various factors considered. The Independent Board Members were also assisted by the advice of independent legal counsel in making this determination.
| | |
| 54 | | 2018 BLACKROCK ANNUAL REPORTTO SHAREHOLDERS |
Director and Officer Information
| | | | | | | | |
| Independent Directors (a) |
| | | | | |
Name Year of Birth (b) | | Position(s) Held
(Length of Service) (c) | | Principal Occupation(s) During Past Five Years | | Number of BlackRock-Advised
Registered Investment Companies
(“RICs”) Consisting of
Investment Portfolios
(“Portfolios”) Overseen | | Public Company and
Other Investment
Company Directorships
Held During
Past Five Years |
Robert M. Hernandez 1944 | | Chair of the Board and Director
(Since 2007) | | Director, Vice Chairman and Chief Financial Officer of USX Corporation (energy and steel business) from 1991 to 2001; Director and non-executive Chairman, RTI International Metals, Inc. from 1990 to 2015; Director, TE Connectivity (electronics) from 2006 to 2012. | | 27 RICs consisting of 96 Portfolios | | Chubb Limited (insurance company); Eastman Chemical Company |
James H. Bodurtha 1944 | | Director
(Since 2007) | | Director, The China Business Group, Inc. (consulting and investing firm) from 1996 to 2013 and Executive Vice President thereof from 1996 to 2003; Chairman of the Board, Berkshire Holding Corporation since 1980; Director, ICI Mutual since 2010. | | 27 RICs consisting of 96 Portfolios | | None |
Bruce R. Bond 1946 | | Director
(Since 2007) | | Trustee and Member of the Governance Committee, State Street Research Mutual Funds from 1997 to 2005; Board Member of Governance, Audit and Finance Committee, Avaya Inc. (computer equipment) from 2003 to 2007. | | 27 RICs consisting of 96 Portfolios | | None |
Honorable Stuart E. Eizenstat 1943 | | Director
(Since 2007) | | Senior Counsel of Covington and Burling LLP (law firm) since 2016, Head of International Practice thereof since 2001, and Partner thereof from 2001 to 2016; Advisory Board Member, OCP S.A. (phosphates) since 2010; International Advisory Board Member, The Coca-Cola Company from 2002 to 2011; Advisory Board Member, Veracity Worldwide, LLC (risk management) from 2007 to 2012; Member of the International Advisory Board GML Ltd. (energy) since 2003; Board of Directors, Ferroglobe (silicon metals) since 2016. | | 27 RICs consisting of 96 Portfolios | | Alcatel-Lucent (telecommunications); Global Specialty Metallurgical; UPS Corporation (delivery service) |
Henry Gabbay 1947 | | Director
(Since 2007) | | Consultant, BlackRock, Inc. from 2007 to 2008; Managing Director, BlackRock, Inc. from 1989 to 2007; Chief Administrative Officer, BlackRock Advisors, LLC from 1998 to 2007; President of BlackRock Funds and BlackRock Allocation Target Shares (formerly, BlackRock Bond Allocation Target Shares) from 2005 to 2007 and Treasurer of certain closed-end funds in the BlackRock fund complex from 1989 to 2006. | | 27 RICs consisting of 96 Portfolios | | None |
Lena G. Goldberg 1949 | | Director
(Since 2016) | | Senior Lecturer, Harvard Business School since 2008; Executive Vice President, FMR LLC/Fidelity Investments (financial services) from 2007 to 2008, Executive Vice President and General Counsel thereof from 2002 to 2007, Senior Vice President and General Counsel thereof from 1999 to 2002, Vice President and General Counsel thereof from 1997 to 1999, Senior Vice President and Deputy General Counsel thereof in 1997, and Vice President and Corporate Counsel thereof from 1996 to 1997; Partner, Sullivan & Worcester LLP from 1985 to 1996 and Associate thereof from 1979 to 1985. | | 27 RICs consisting of 96 Portfolios | | None |
| | | | |
| DIRECTORAND OFFICER INFORMATION | | | 55 | |
Director and Officer Information (continued)
| | | | | | | | |
| Independent Directors (a) (continued) |
| | | | | |
Name Year of Birth (b) | | Position(s) Held
(Length of Service) (c) | | Principal Occupation(s) During Past Five Years | | Number of BlackRock-Advised
Registered Investment Companies
(“RICs”) Consisting of
Investment Portfolios
(“Portfolios”) Overseen | | Public Company and
Other Investment
Company Directorships
Held During
Past Five Years |
Henry R. Keizer 1956 | | Director
(Since 2016) | | Director, Park Indemnity Ltd. (captive insurer) since 2010; Director, MUFG Americas Holdings Corporation and MUFG Union Bank, N.A. (financial and bank holding company) from 2014 to 2016; Director, Montpelier Re Holdings, Ltd. (publicly held property and casual reinsurance) from 2013 to 2015; Director, American Institute of Certified Public Accountants from 2009 to 2011; Director, KPMG LLP (audit, tax and advisory services) from 2004 to 2005 and 2010 to 2012; Director, KPMG International in 2012, Deputy Chairman and Chief Operating Officer thereof from 2010 to 2012 and U.S. Vice Chairman of Audit thereof from 2005 to 2010; Global Head of Audit, KPMGI (consortium of KPMG firms) from 2006 to 2010; Director, YMCA of Greater New York from 2006 to 2010. | | 27 RICs consisting of 96 Portfolios | | Hertz Global Holdings (car rental); WABCO (commercial vehicle safety systems); Sealed Air Corp. (packaging) |
John F. O’Brien 1943 | | Director
(Since 2007) | | Trustee, Woods Hole Oceanographic Institute since 2003 and Chairman thereof from 2009 to 2015; Co-Founder and Managing Director, Board Leaders LLC (director education) since 2005. | | 27 RICs consisting of 96 Portfolios | | Cabot Corporation (chemicals); LKQ Corporation (auto parts manufacturing); TJX Companies, Inc. (retailer) |
Donald C. Opatrny 1952 | | Director
(Since 2015) | | Trustee, Member of the Executive Committee and Chair of the Investment Committee, Cornell University since 2004; Member of the Board and Investment Committee, University School since 2007; Member of the Investment Committee, Mellon Foundation from 2009 to 2015; President and Trustee, the Center for the Arts, Jackson Hole since 2011; Director, Athena Capital Advisors LLC (investment management firm) since 2013; Trustee and Chair of the Investment Committee, Community Foundation of Jackson Hole since 2014; Trustee, Artstor (a Mellon Foundation affiliate) from 2010 to 2015; President, Trustee and Member of the Investment Committee, The Aldrich Contemporary Art Museum from 2007 to 2014. | | 27 RICs consisting of 96 Portfolios | | None |
|
| Interested Directors (a)(d) |
| | | | | |
Name Year of Birth (b) | | Position(s) Held
(Length of Service) (c) | | Principal Occupation(s) During Past Five Years | | Number of BlackRock-Advised
Registered Investment Companies
(“RICs”) Consisting of
Investment Portfolios
(“Portfolios”) Overseen | | Public Company and
Investment Company
Directorships Held
During Past Five Years |
Robert Fairbairn 1965 | | Director
(Since 2018) | | Senior Managing Director of BlackRock, Inc. since 2010; oversees BlackRock’s Strategic Partner Program and Strategic Product Management Group; Member of BlackRock’s Global Executive and Global Operating Committees; Co-Chair of BlackRock’s Human Capital Committee; Global Head of BlackRock’s Retail and iShares® businesses from 2012 to 2016; Head of BlackRock’s Global Client Group from 2009 to 2012; Chairman of BlackRock’s international businesses from 2007 to 2010. | | 125 RICs consisting of 309 Portfolios | | None |
| | |
| 56 | | 2018 BLACKROCK ANNUAL REPORTTO SHAREHOLDERS |
Director and Officer Information (continued)
| | | | | | | | |
| Interested Directors (a)(d) (continued) |
| | | | | |
Name Year of Birth (b) | | Position(s) Held
(Length of Service) (c) | | Principal Occupation(s) During Past Five Years | | Number of BlackRock-Advised
Registered Investment Companies
(“RICs”) Consisting of
Investment Portfolios
(“Portfolios”) Overseen | | Public Company and
Investment Company
Directorships Held
During Past Five Years |
John M. Perlowski 1964 | | Director
(Since 2015);
President and Chief Executive Officer
(Since 2010) | | Managing Director of BlackRock, Inc. since 2009; Head of BlackRock Global Accounting and Product Services since 2009. Advisory Director of Family Resource Network (charitable foundation) since 2009. | | 125 RICs consisting of 309 Portfolios | | None |
(a) The address of each Director is c/o BlackRock, Inc., 55 East 52nd Street, New York, NY 10055. |
(b) Each Independent Director holds office until his or her successor is duly elected and qualifies or until his or her earlier death, resignation, retirement or removal as provided by the Fund’s by-laws or charter or statute, or until December 31 of the year in which he or she turns 75. The Board may determine to extend the terms of Independent Directors on a case-by-case basis, as appropriate. Interested Directors serve until their successor is duly elected and qualifies or until their earlier death, resignation, retirement or removal as provided by the Corporation’s by-laws or statute, or until December 31 of the year in which they turn 72. |
(c) Following the combination of Merrill Lynch Investment Managers, L.P. (“MLIM”) and BlackRock, Inc. in September 2006, the various legacy MLIM and legacy BlackRock fund boards were realigned and consolidated into three new fund boards in 2007. As a result, although the chart shows certain Independent Directors as joining the Fund’s board in 2007, those Directors first became members of the boards of other legacy MLIM or legacy BlackRock funds as follows: James H. Bodurtha, 1995; Bruce R. Bond, 2005; Honorable Stuart E. Eizenstat, 2001; Robert M. Hernandez, 1996; and John F. O’Brien, 2005. |
(d) Mr. Fairbairn and Mr. Perlowski are both “interested persons,” as defined in the 1940 Act, of the Fund based on their positions with BlackRock, Inc. and its affiliates. Mr. Fairbairn and Mr. Perlowski are also board members of the BlackRock Closed-End Complex and the BlackRock Equity-Liquidity Complex. |
| | | | |
| DIRECTORAND OFFICER INFORMATION | | | 57 | |
Director and Officer Information (continued)
| | | | |
| Officers Who Are Not Directors (a) |
| | | |
Name Year of Birth (b) | | Position(s) Held
(Length of Service) | | Principal Occupation(s) During Past Five Years |
Jennifer McGovern 1977 | | Vice President
(Since 2014) | | Managing Director of BlackRock, Inc. since 2016; Director of BlackRock, Inc. from 2011 to 2015; Head of Product Structure and Oversight for BlackRock’s U.S. Wealth Advisory Group since 2013. |
Neal J. Andrews 1966 | | Chief Financial Officer
(Since 2007) | | Managing Director of BlackRock, Inc. since 2006. |
Jay M. Fife 1970 | | Treasurer
(Since 2007) | | Managing Director of BlackRock, Inc. since 2007. |
Charles Park 1967 | | Chief Compliance Officer
(Since 2014) | | Anti-Money Laundering Compliance Officer for the BlackRock-advised Funds in the Equity-Bond Complex, the Equity-Liquidity Complex and the Closed-End Complex from 2014 to 2015; Chief Compliance Officer of BlackRock Advisors, LLC and the BlackRock-advised Funds in the Equity-Bond Complex, the Equity-Liquidity Complex and the Closed-End Complex since 2014; Principal of and Chief Compliance Officer for iShares® Delaware Trust Sponsor LLC since 2012 and BlackRock Fund Advisors (“BFA”) since 2006; Chief Compliance Officer for the BFA-advised iShares® exchange traded funds since 2006; Chief Compliance Officer for BlackRock Asset Management International Inc. since 2012. |
John MacKessy 1972 | | Anti-Money Laundering Compliance Officer
(Since 2018) | | Director of BlackRock, Inc. since 2017; Global Head of Anti-Money Laundering at BlackRock , Inc. since 2017; Director of AML Monitoring and Investigations Group of Citibank from 2015 to 2017; Global Anti-Money Laundering and Economic Sanctions Officer for MasterCard from 2011 to 2015. |
Benjamin Archibald 1975 | | Secretary
(Since 2012) | | Managing Director of BlackRock, Inc. since 2014; Director of BlackRock, Inc. from 2010 to 2013; Secretary of the iShares® exchange traded funds since 2015; Secretary of the BlackRock-advised mutual funds since 2012. |
(a) The address of each Officer is c/o BlackRock, Inc., 55 East 52nd Street, New York, NY 10055. |
(b) Officers of the Funds serve at the pleasure of the Board. |
Further information about the Funds’ Directors and Officers is available in the Fund’s Statement of Additional Information, which can be obtained without charge by calling (800) 441 7762.
Effective May 8, 2018, John MacKessy replaced Fernanda Piedra as the Anti-Money Laundering Compliance Officer of the Funds.
Investment Adviser
BlackRock Advisors, LLC
Wilmington, DE 19809
Sub-Advisor
BlackRock International Limited(a)
Edinburgh, EH3 8BL,
United Kingdom
Custodian
Brown Brothers
Harriman & Co.
Boston, MA 02109
Transfer Agent
BNY Mellon Investment
Servicing (US) Inc.
Wilmington, DE 19809
Accounting Agent
State Street Bank and
Trust Company
Boston, MA 02111
Distributor
BlackRock Investments, LLC
New York, NY 10022
Legal Counsel
Willkie Farr & Gallagher LLP
New York, NY 10019
Independent Registered Public Accounting Firm
Deloitte & Touche LLP
Boston, MA 02116
Address of the Funds
100 Bellevue Parkway
Wilmington, DE 19809
| | |
| 58 | | 2018 BLACKROCK ANNUAL REPORTTO SHAREHOLDERS |
Additional Information
General Information
Householding
The Funds will mail only one copy of shareholder documents, including prospectuses, annual and semi-annual reports and proxy statements, to shareholders with multiple accounts at the same address. This practice is commonly called “householding” and is intended to reduce expenses and eliminate duplicate mailings of shareholder documents. Mailings of your shareholder documents may be householded indefinitely unless you instruct us otherwise. If you do not want the mailing of these documents to be combined with those for other members of your household, please call the Funds at (800) 441-7762.
Availability of Quarterly Schedule of Investments
The Funds file their complete schedule of portfolio holdings with the SEC for the first and third quarters of each fiscal year on Form N-Q. The Funds’ Forms N-Q are available on the SEC’s website at http://www.sec.gov and may also be reviewed and copied at the SEC’s Public Reference Room in Washington, D.C. Information on the operation of the Public Reference Room or how to access documents on the SEC’s website without charge may be obtained by calling (800) SEC-0330. The Funds’ Forms N-Q may also be obtained upon request and without charge by calling (800) 441-7762.
Availability of Proxy Voting Policies and Procedures
A description of the policies and procedures that the Funds use to determine how to vote proxies relating to portfolio securities is available upon request and without charge (1) by calling (800) 441-7762; (2) at http://www.blackrock.com; and (3) on the SEC’s website at http://www.sec.gov.
Availability of Proxy Voting Record
Information about how the Funds voted proxies relating to securities held in the Funds’ portfolios during the most recent 12-month period ended June 30 is available upon request and without charge (1) at http://www.blackrock.com; or by calling (800) 441-7762 and (2) on the SEC’s website at http://www.sec.gov.
BlackRock’s Mutual Fund Family
BlackRock offers a diverse lineup of open-end mutual funds crossing all investment styles and managed by experts in equity, fixed income and tax-exempt investing. Visit http://www.blackrock.com for more information.
Shareholder Privileges
Account Information
Call us at (800) 441-7762 from 8:00 AM to 6:00 PM ET on any business day to get information about your account balances, recent transactions and share prices. You can also reach us on the Web at http://www.blackrock.com.
Automatic Investment Plans
Investor Class shareholders who want to invest regularly can arrange to have $50 or more automatically deducted from their checking or savings account and invested in any of the BlackRock funds.
Systematic Withdrawal Plans
Investor Class shareholders can establish a systematic withdrawal plan and receive periodic payments of $50 or more from their BlackRock funds, as long as their account balance is at least $10,000.
Retirement Plans
Shareholders may make investments in conjunction with Traditional, Rollover, Roth, Coverdell, Simple IRAs, SEP IRAs and 403(b) Plans.
| | | | |
| ADDITIONAL INFORMATION | | | 59 | |
Additional Information (continued)
BlackRock Privacy Principles
BlackRock is committed to maintaining the privacy of its current and former fund investors and individual clients (collectively, “Clients”) and to safeguarding their non-public personal information. The following information is provided to help you understand what personal information BlackRock collects, how we protect that information and why in certain cases we share such information with select parties.
If you are located in a jurisdiction where specific laws, rules or regulations require BlackRock to provide you with additional or different privacy-related rights beyond what is set forth below, then BlackRock will comply with those specific laws, rules or regulations.
BlackRock obtains or verifies personal non-public information from and about you from different sources, including the following: (i) information we receive from you or, if applicable, your financial intermediary, on applications, forms or other documents; (ii) information about your transactions with us, our affiliates, or others; (iii) information we receive from a consumer reporting agency; and (iv) from visits to our websites.
BlackRock does not sell or disclose to non-affiliated third parties any non-public personal information about its Clients, except as permitted by law or as is necessary to respond to regulatory requests or to service Client accounts. These non-affiliated third parties are required to protect the confidentiality and security of this information and to use it only for its intended purpose.
We may share information with our affiliates to service your account or to provide you with information about other BlackRock products or services that may be of interest to you. In addition, BlackRock restricts access to non-public personal information about its Clients to those BlackRock employees with a legitimate business need for the information. BlackRock maintains physical, electronic and procedural safeguards that are designed to protect the non-public personal information of its Clients, including procedures relating to the proper storage and disposal of such information.
| | |
| 60 | | 2018 BLACKROCK ANNUAL REPORTTO SHAREHOLDERS |
Glossary of Terms Used in this Report
| | |
| Currency |
| |
| AUD | | Australian Dollar |
| CAD | | Canadian Dollar |
| EUR | | Euro |
| GBP | | British Pound |
| HKD | | Hong Kong Dollar |
| JPY | | Japanese Yen |
| NOK | | Norwegian Krone |
| SGD | | Singapore Dollar |
| USD | | U.S. Dollar |
| | |
| Portfolio Abbreviations |
| |
| ADR | | American Depositary Receipts |
| CVA | | Certificaten Van Aandelen (Dutch Certificate) |
| GDR | | Global Depositary Receipt |
| NVDR | | Non-voting Depository Receipts |
| S&P | | S&P Global Ratings |
| | | | |
| GLOSSARYOF TERMS USEDINTHIS REPORT | | | 61 | |
This report is intended for current holders. It is not authorized for use as an offer of sale or a solicitation of an offer to buy shares of a Fund unless preceded or accompanied by the Fund’s current prospectus. Past performance results shown in this report should not be considered a representation of future performance. Investment returns and principal value of shares will fluctuate so that shares, when redeemed, may be worth more or less than their original cost. Statements and other information herein are as dated and are subject to change.

| | |
| EGSC-6/18-AR | |  |
| Item 2 – | Code of Ethics – The registrant (or the “Fund”) has adopted a code of ethics, as of the end of the period covered by this report, applicable to the registrant’s principal executive officer, principal financial officer, principal accounting officer or controller, or persons performing similar functions. During the period covered by this report, the code of ethics was amended to clarify an inconsistency as to whom persons covered by the code should report suspected violations of the code. The amendment clarifies that such reporting should be made to BlackRock Advisors, LLC’s (“Investment Adviser” or “BlackRock”) General Counsel, and retains the alternative option of anonymous reporting following “whistleblower” policies. Other non-material changes were also made in connection with this amendment. During the period covered by this report, there have been no waivers granted under the code of ethics. The registrant undertakes to provide a copy of the code of ethics to any person upon request, without charge, who calls 1-800-441-7762. |
| Item 3 – | Audit Committee Financial Expert – The registrant’s board of trustees (the “board of trustees”), has determined that (i) the registrant has the following audit committee financial experts serving on its audit committee and (ii) each audit committee financial expert is independent: |
Robert M. Hernandez
Henry R. Keizer
Bruce R. Bond
Under applicable securities laws, a person determined to be an audit committee financial expert will not be deemed an “expert” for any purpose, including without limitation for the purposes of Section 11 of the Securities Act of 1933, as a result of being designated or identified as an audit committee financial expert. The designation or identification of a person as an audit committee financial expert does not impose on such person any duties, obligations, or liabilities greater than the duties, obligations, and liabilities imposed on such person as a member of the audit committee and board of trustees in the absence of such designation or identification.
| Item 4 – | Principal Accountant Fees and Services |
The following table presents fees billed by Deloitte & Touche LLP (“D&T”) in each of the last two fiscal years for the services rendered to the Fund:
| | | | | | | | | | | | | | | | |
| | | (a) Audit Fees | | (b) Audit-Related
Fees1 | | (c) Tax Fees2 | | (d) All Other Fees |
| Entity Name | | Current Fiscal Year End | | Previous Fiscal Year End | | Current Fiscal Year End | | Previous Fiscal Year End | | Current Fiscal Year End | | Previous Fiscal Year End | | Current Fiscal Year End | | Previous Fiscal Year End |
| BlackRock EuroFund | | $36,924 | | $35,666 | | $0 | | $0 | | $16,200 | | $14,727 | | $0 | | $0 |
The following table presents fees billed by D&T that were required to be approved by the registrant’s audit committee (the “Committee”) for services that relate directly to the operations or financial reporting of the Fund and that are rendered on behalf of BlackRock and entities controlling, controlled by, or under common control with BlackRock (not including any sub-adviser whose role is primarily portfolio management and is subcontracted with or overseen by another investment adviser) that provide ongoing services to the Fund (“Affiliated Service Providers”):
2
| | | | |
| | | Current Fiscal Year End | | Previous Fiscal Year End |
| (b) Audit-Related Fees1 | | $0 | | $0 |
| (c) Tax Fees2 | | $0 | | $0 |
| (d) All Other Fees3 | | $2,274,000 | | $2,129,000 |
1 The nature of the services includes assurance and related services reasonably related to the performance of the audit or review of financial statements not included in Audit Fees, including accounting consultations, agreed-upon procedure reports, attestation reports, comfort letters, out-of-pocket expenses and internal control reviews not required by regulators.
2 The nature of the services includes tax compliance and/or tax preparation, including services relating to the filing or amendment of federal, state or local income tax returns, regulated investment company qualification reviews, taxable income and tax distribution calculations.
3 Non-audit fees of $2,274,000 and $2,129,000 for the current fiscal year and previous fiscal year, respectively, were paid to the Fund’s principal accountant in their entirety by BlackRock, in connection with services provided to the Affiliated Service Providers of the Fund and of certain other funds sponsored and advised by BlackRock or its affiliates for a service organization review and an accounting research tool subscription. These amounts represent aggregate fees paid by BlackRock and were not allocated on a per fund basis.
(e)(1) Audit Committee Pre-Approval Policies and Procedures:
The Committee has adopted policies and procedures with regard to the pre-approval of services. Audit, audit-related and tax compliance services provided to the registrant on an annual basis require specific pre-approval by the Committee. The Committee also must approve other non-audit services provided to the registrant and those non-audit services provided to the Investment Adviser and Affiliated Service Providers that relate directly to the operations and the financial reporting of the registrant. Certain of these non-audit services that the Committee believes are (a) consistent with the SEC’s auditor independence rules and (b) routine and recurring services that will not impair the independence of the independent accountants may be approved by the Committee without consideration on a specific case-by-case basis (“general pre-approval”). The term of any general pre-approval is 12 months from the date of the pre-approval, unless the Committee provides for a different period. Tax or other non-audit services provided to the registrant which have a direct impact on the operations or financial reporting of the registrant will only be deemed pre-approved provided that any individual project does not exceed $10,000 attributable to the registrant or $50,000 per project. For this purpose, multiple projects will be aggregated to determine if they exceed the previously mentioned cost levels.
Any proposed services exceeding the pre-approved cost levels will require specific pre-approval by the Committee, as will any other services not subject to general pre-approval (e.g., unanticipated but permissible services). The Committee is informed of each service approved subject to general pre-approval at the next regularly scheduled in-person board meeting. At this meeting, an analysis of such services is presented to the Committee for ratification. The Committee may delegate to the Committee Chairman the authority to approve the provision of and fees for any specific engagement of permitted non-audit services, including services exceeding pre-approved cost levels.
(e)(2) None of the services described in each of Items 4(b) through (d) were approved by the Committee pursuant to the de minimis exception in paragraph (c)(7)(i)(C) of Rule 2-01 of Regulation S-X.
(f) Not Applicable
3
(g) The aggregate non-audit fees, defined as the sum of the fees shown under “Audit-Related Fees,” “Tax Fees” and “All Other Fees,” paid to the accountant for services rendered by the accountant to the registrant, the Investment Adviser and the Affiliated Service Providers were:
| | | | | | |
| | | Entity Name | | Current Fiscal Year End | | Previous Fiscal Year End |
| | BlackRock EuroFund | | $16,200 | | $14,727 |
Additionally, the amounts billed by D&T in connection with services provided to the Affiliated Service Providers of the Fund and of other funds sponsored and advised by BlackRock or its affiliates during the current and previous fiscal years for a service organization review and an accounting research tool subscription were:
| | |
Current Fiscal Year
End | | Previous Fiscal Year
End |
$2,274,000 | | $2,129,000 |
These amounts represent aggregate fees paid by BlackRock and were not allocated on a per fund basis.
(h) The Committee has considered and determined that the provision of non-audit services that were rendered to the Investment Adviser and the Affiliated Service Providers that were not pre-approved pursuant to paragraph (c)(7)(ii) of Rule 2-01 of Regulation S-X is compatible with maintaining the principal accountant’s independence.
| Item 5 – | Audit Committee of Listed Registrants – Not Applicable |
(a) The registrant’s Schedule of Investments is included as part of the Report to Stockholders filed under Item 1 of this Form.
(b) Not Applicable due to no such divestments during the semi-annual period covered since the previous Form N-CSR filing.
| Item 7 – | Disclosure of Proxy Voting Policies and Procedures for Closed-End Management Investment Companies – Not Applicable |
| Item 8 – | Portfolio Managers of Closed-End Management Investment Companies – Not Applicable |
| Item 9 – | Purchases of Equity Securities by Closed-End Management Investment Company and Affiliated Purchasers – Not Applicable |
| Item 10 – | Submission of Matters to a Vote of Security Holders – There have been no material changes to these procedures. |
| Item 11 – | Controls and Procedures |
(a) The registrant’s principal executive and principal financial officers, or persons performing similar functions, have concluded that the registrant’s disclosure controls and procedures (as defined
4
in Rule 30a-3(c) under the Investment Company Act of 1940, as amended (the “1940 Act”)) are effective as of a date within 90 days of the filing of this report based on the evaluation of these controls and procedures required by Rule 30a-3(b) under the 1940 Act and Rule 15d-15(b) under the Securities Exchange Act of 1934, as amended.
(b) There were no changes in the registrant’s internal control over financial reporting (as defined in Rule 30a-3(d) under the 1940 Act) that occurred during the second fiscal quarter of the period covered by this report that have materially affected, or are reasonably likely to materially affect, the registrant’s internal control over financial reporting.
| Item 12 – | Disclosure of Securities Lending Activities for Closed-End Management Investment Companies – Not Applicable |
| Item 13 – | Exhibits attached hereto |
(a)(1) Code of Ethics – See Item 2
(a)(2) Certifications – Attached hereto
(a)(3) Not Applicable
(a)(4) Not Applicable
(b) Certifications – Attached hereto
5
Pursuant to the requirements of the Securities Exchange Act of 1934 and the Investment Company Act of 1940, the registrant has duly caused this report to be signed on its behalf by the undersigned, thereunto duly authorized.
BlackRock EuroFund
| | |
| By: | | /s/ John M. Perlowski |
| | John M. Perlowski |
| | Chief Executive Officer (principal executive officer) of |
| | BlackRock EuroFund |
Date: September 4, 2018
Pursuant to the requirements of the Securities Exchange Act of 1934 and the Investment Company Act of 1940, this report has been signed below by the following persons on behalf of the registrant and in the capacities and on the dates indicated.
| | |
| By: | | /s/ John M. Perlowski |
| | John M. Perlowski |
| | Chief Executive Officer (principal executive officer) of |
| | BlackRock EuroFund |
Date: September 4, 2018
| | |
| By: | | /s/ Neal J. Andrews |
| | Neal J. Andrews |
| | Chief Financial Officer (principal financial officer) of |
| | BlackRock EuroFund |
Date: September 4, 2018
5