UNITED STATES
SECURITIES AND EXCHANGE COMMISSION
Washington, D.C. 20549
FORM N-CSR
CERTIFIED SHAREHOLDER REPORT OF REGISTERED MANAGEMENT INVESTMENT COMPANIES
Investment Company Act file number: 811-04612
Name of Fund: BlackRock EuroFund
Fund Address: 100 Bellevue Parkway, Wilmington, DE 19809
Name and address of agent for service: John M. Perlowski, Chief Executive Officer, BlackRock EuroFund, 55 East 52nd Street, New York, NY 10055
Registrant’s telephone number, including area code: (800) 441-7762
Date of fiscal year end: 06/30/2020
Date of reporting period: 06/30/2020
Item 1 – Report to Stockholders
| | |
 | | JUNE 30, 2020 |
BlackRock Advantage Global Fund, Inc.
BlackRock EuroFund
Beginning on January 1, 2021, as permitted by regulations adopted by the Securities and Exchange Commission, paper copies of each Fund’s shareholder reports will no longer be sent by mail, unless you specifically request paper copies of the reports from BlackRock or from your financial intermediary, such as a broker-dealer or bank. Instead, the reports will be made available on a website, and you will be notified by mail each time a report is posted and provided with a website link to access the report.
You may elect to receive all future reports in paper free of charge. If you hold accounts directly with BlackRock, you can call (800) 441-7762 to inform BlackRock that you wish to continue receiving paper copies of your shareholder reports. If you hold accounts through a financial intermediary, you can follow the instructions included with this disclosure, if applicable, or contact your financial intermediary to request that you continue to receive paper copies of your shareholder reports. Please note that not all financial intermediaries may offer this service. Your election to receive reports in paper will apply to all funds advised by BlackRock Advisors, LLC, BlackRock Fund Advisors or their affiliates, or all funds held with your financial intermediary, as applicable.
If you already elected to receive shareholder reports electronically, you will not be affected by this change and you need not take any action. You may elect to receive electronic delivery of shareholder reports and other communications by: (i) accessing the BlackRock website at blackrock.com/edelivery and logging into your accounts, if you hold accounts directly with BlackRock, or (ii) contacting your financial intermediary, if you hold accounts through a financial intermediary. Please note that not all financial intermediaries may offer this service.
|
| Not FDIC Insured • May Lose Value • No Bank Guarantee |
The Markets in Review
Dear Shareholder,
The last 12 months have been a time of sudden change in global financial markets, as a long period of growth and positive returns was interrupted in early 2020 by the emergence and spread of the coronavirus. For the first part of the reporting period, U.S. equities and bonds both delivered impressive returns, despite fears and doubts about the economy that were ultimately laid to rest with unprecedented monetary stimulus and a sluggish yet resolute performance from the U.S. economy. But as the threat from the coronavirus became more apparent throughout February and March 2020, leading countries around the world took economically disruptive countermeasures, causing equity prices to fall sharply. While markets have since recovered some of these losses as countries around the world begin reopening, there is still significant uncertainty surrounding the course of the pandemic, and an uptick in U.S. infection rates caused concern late in the reporting period.
Returns for most securities were robust for the first part of the reporting period, as investors began to realize that the U.S. economy was maintaining the modest yet steady growth that had characterized this economic cycle. However, once stay-at-home orders and closures of non-essential businesses became widespread, many workers were laid off and unemployment claims spiked. With large portions of the global economy on hold, all types of international equities ended the 12-month reporting period with negative performance, while in the United States large-capitalization stocks, which investors saw as more resilient than smaller companies, delivered solid returns.
The performance of different types of fixed-income securities diverged substantially due to a reduced investor appetite for risk. Treasuries benefited from the risk-off environment, and posted healthy returns, as the 10-year U.S. Treasury yield (which is inversely related to bond prices) fell to an all-time low. Investment-grade corporate bonds also delivered a solid return, while high-yield corporate returns were flat due to credit concerns.
The U.S. Federal Reserve (the “Fed”) reduced interest rates three times in 2019, to support slowing economic growth. After the coronavirus outbreak, the Fed instituted two emergency rate cuts, pushing short-term interest rates close to zero. To stabilize credit markets, the Fed also announced a new bond-buying program, as did several other central banks around the world, including the European Central Bank and the Bank of Japan.
Looking ahead, while coronavirus-related disruption has clearly hindered worldwide economic growth, we believe that the global expansion is likely to continue once the impact of the outbreak subsides. Several risks remain, however, including a potential resurgence of the virus amid loosened restrictions, policy fatigue among governments already deep into deficit spending, and structural damage to the financial system from lengthy economic interruptions.
Overall, we favor a moderately positive stance toward risk, and in particular toward credit given the extraordinary central bank measures taken in recent months. This support extends beyond investment-grade corporates and into high-yield, leading to attractive opportunities throughout the credit market. We believe that both U.S. Treasuries and sustainable investments can help provide portfolio resilience, and the disruption created by the coronavirus appears to be accelerating the shift toward sustainable investments. We remain neutral on equities overall while favoring European stocks, which are poised for a cyclical upside as re-openings continue.
In this environment, our view is that investors need to think globally, extend their scope across a broad array of asset classes, and be nimble as market conditions change. We encourage you to talk with your financial advisor and visit blackrock.com for further insight about investing in today’s markets.
Sincerely,

Rob Kapito
President, BlackRock Advisors, LLC

Rob Kapito
President, BlackRock Advisors, LLC
| | | | |
| Total Returns as of June 30, 2020 |
| | | 6-month | | 12-month |
U.S. large cap equities
(S&P 500® Index) | | (3.08)% | | 7.51% |
U.S. small cap equities
(Russell 2000® Index) | | (12.98) | | (6.63) |
International equities
(MSCI Europe, Australasia, Far East Index) | | (11.34) | | (5.13) |
Emerging market equities
(MSCI Emerging Markets Index) | | (9.78) | | (3.39) |
3-month Treasury bills
(ICE BofA 3-Month U.S. Treasury Bill Index) | | 0.60 | | 1.63 |
U.S. Treasury securities
(ICE BofA 10-Year U.S. Treasury Index) | | 12.68 | | 14.21 |
U.S. investment grade bonds
(Bloomberg Barclays U.S. Aggregate Bond Index) | | 6.14 | | 8.74 |
Tax-exempt municipal bonds
(S&P Municipal Bond Index) | | 1.97 | | 4.23 |
U.S. high yield bonds
(Bloomberg Barclays U.S. Corporate High Yield 2% Issuer Capped Index) | | (3.83) | | 0.00 |
| Past performance is no guarantee of future results. Index performance is shown for illustrative purposes only. You cannot invest directly in an index. |
| | |
| 2 | | THIS PAGEISNOT PARTOF YOUR FUND REPORT |
Table of Contents

| | |
| Fund Summary as of June 30, 2020 | | BlackRock Advantage Global Fund, Inc. |
Investment Objective
BlackRock Advantage Global Fund, Inc.’s (the “Fund”) investment objective is to seek long-term capital appreciation.
Portfolio Management Commentary
How did the Fund perform?
For the 12-month period ended June 30, 2020, the Fund underperformed its benchmark, the MSCI All Country World Index.
What factors influenced performance?
Trade concerns in August, which caused a broad market decline, gave way to a risk-on rally amid excitement for a trade deal between the United States and China. The anticipation of a trade resolution and the actual deal itself supported stocks through mid-February. However, exuberance quickly faded with the global spread of coronavirus leading to a steep market decline. Investor concerns mounted amid broadly enforced economic shutdowns, as expectations of growth and employment were impacted. The selloff in the first quarter of 2020 represented one of the worst quarterly returns for equities on record as volatility hit levels last observed during the global financial crisis. As a result, policy makers stepped in with both fiscal and monetary packages aimed at supporting markets. The Bank of Japan (“BOJ”), as an example, invested in a record level of exchange-traded funds (“ETFs”) to help bolster their equity market.
The Fund struggled amid the changing backdrop, with weakness most pronounced across sentiment-based stock selection measures. Specifically, signals capturing informed investor positioning and text analyses of executives and analysts were wrong-footed during the sell-off as investors questioned prior guidance. Within macro thematic signals, a style timing model struggled in March through a preference for dividend yield, which drove positioning within real estate securities. These holdings came under significant pressure as investors weighed the impact of economic closures on their business models. An underweight position in Japan retail stocks, such as autos, detracted as the position moved against the BOJ’s ETF purchases.
While markets recovered over the second quarter of 2020, a sharp reversal in market leadership over May and June negatively impacted Fund performance as concerns around the coronavirus pandemic re-emerged. Amid stronger economic data, investor preference initially shifted to pro-cyclical exposures and away from some of the growth names that led the recovery’s early stages. This evolving re-opening theme was successfully captured by higher frequency sentiment insights leading to a more pro-risk posture in early June. As coronavirus cases increased, however, that positioning gave up some of its gains.
The Fund experienced negative relative performance over the first three quarters of the period, followed by strong positive performance over the second quarter of 2020 that largely offset earlier negative relative performance. Positive contributions late in the period were led by a combination of strong performance from macro thematic and fundamental quality insights. Notably, macro thematic insights were able to generate gains through industry positioning. Industry timing insights performed well during the period as the Fund’s pro-growth posture was largely reflected through sector positioning. Specifically, the Fund maintained preferred long positions across pharmaceutical and software companies driven by trends across inventories, supply chains, and business invoicing.
Strong relative performance over the first half of 2020 was led by a combination of macro thematic and sentiment insights. Notably, macro thematic insights were able to generate gains through a combination of industry insights and regime detection signals that drove a preference for growth over value. While sentiment stock selection measures detracted from relative performance over the first quarter of 2020, these insights delivered persistent gains over the second quarter. Proprietary trend measures capturing company linkages, using alternative data focused on consumer trends, and text analyses to evaluate sell-side analyst comments were the main contributors. Collectively, these measures identified several coronavirus-related themes, including e-commerce, which differentiated winners and losers during earnings season. Faster moving contrarian signals also drove gains amid sharp mean reversion from price dislocations observed through the period. A prior preference for U.S. over Japanese banks was additive as the performance gap quickly closed. Over the first quarter, quality insights focused on company profitability and operational sustainability helped insulate the portfolio over the period of an historical drawdown. Namely, measures such as profitability and operational sustainability insights were some of the best performers.
Describe recent portfolio activity.
The Fund maintained a balanced allocation of risk across all major return drivers over the period. There were, however, several new signals added within the stock selection group of insights over the first half of 2020. These included a new insight that expands upon earlier research for machine-learned signal combination. The new signal uses the full library of the investment adviser’s researched insights, and through machine-learning creates bespoke portfolios of those insights at the individual security level. Additionally, a new insight was added that looks to capture investor positioning with respect to companies on the basis of environmental, social and governance factors. Finally, given the dynamism of the current environment, the Fund has instituted enhanced signal constructs to best identify emerging trends, such as “work from home.”
Describe portfolio positioning at period end.
The Fund continued to favor growth over value. At the sector level, this stance was expressed through a preference for areas such as information technology and health care over materials and financials.
Several bottom-up signals underpinned an increasingly contrarian stance at the stock selection level. Aggregated and anonymized alternative data focused on consumer activity has highlighted several opportunities where the investment adviser believes the market has underestimated the pace at which activity is recovering. This included several names hardest hit by the initial outbreak of the coronavirus in areas such as retail and hotels & leisure, driving a relative overweight to consumer discretionary.
A number of holdings reflect evolving hiring intentions captured through alternative data such as on-line job postings that can provide a strong early indication of a company’s confidence. In terms of country positioning, the Fund had a relatively defensive preference for the United States over Canada based on a mixture of policy support and currency strength. Elsewhere, positioning exhibited a more typical contrarian stance, with a valuation-based preference for France and Spain over Sweden and Germany.
The views expressed reflect the opinions of BlackRock as of the date of this report and are subject to change based on changes in market, economic or other conditions. These views are not intended to be a forecast of future events and are no guarantee of future results.
| | |
| 4 | | 2020 BLACKROCK ANNUAL REPORTTO SHAREHOLDERS |
| | |
| Fund Summary as of June 30, 2020 (continued) | | BlackRock Advantage Global Fund, Inc. |
TOTAL RETURN BASED ON A $10,000 INVESTMENT
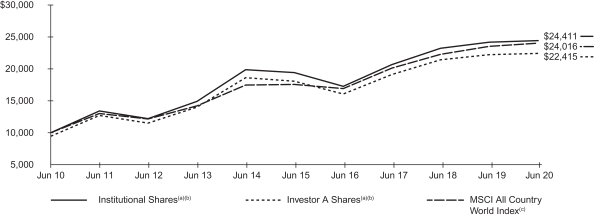
| (a) | Assuming maximum sales charge, if any, transaction costs and other operating expenses, including investment advisory fees. Institutional Shares do not have a sales charge. |
| (b) | The Fund primarily intends to invest in equity securities or other financial instruments that are components of, or have characteristics similar to, the securities included in the MSCI All Country World Index. The Fund’s returns prior to October 26, 2017 are the returns of the Fund when it followed a different investment objective and different investment strategies under the name “BlackRock Global SmallCap Fund, Inc.” |
| (c) | A free float-adjusted market capitalization weighted index that is designed to measure the equity market performance of developed and emerging markets. The index consists of 49 country indexes comprising of 23 developed and 26 emerging market country indexes. |
Performance Summary for the Period Ended June 30, 2020
| | | | | | | | | | | | | | | | | | | | | | | | | | | | | | | | | | | | | | | | |
| | | | | | | | | Average Annual Total Returns (a)(b) | |
| | | | | | | | | 1 Year | | | | | | 5 Years | | | | | | 10 Years | |
| | | 6-Month
Total Returns | | | | | | w/o sales
charge | | | w/sales
charge | | | | | | w/o sales
charge | | | w/sales
charge | | | | | | w/o sales
charge | | | w/sales
charge | |
Institutional | | | (6.12 | )% | | | | | | | 1.08 | % | | | N/A | | | | | | | | 4.72 | % | | | N/A | | | | | | | | 9.33 | % | | | N/A | |
Investor A | | | (6.26 | ) | | | | | | | 0.84 | | | | (4.46 | )% | | | | | | | 4.40 | | | | 3.28 | % | | | | | | | 8.99 | | | | 8.41 | % |
Investor C | | | (6.59 | ) | | | | | | | 0.11 | | | | (0.88 | ) | | | | | | | 3.60 | | | | 3.60 | | | | | | | | 8.13 | | | | 8.13 | |
Class K | | | (6.12 | ) | | | | | | | 1.13 | | | | N/A | | | | | | | | 4.74 | | | | N/A | | | | | | | | 9.35 | | | | N/A | |
Class R | | | (6.34 | ) | | | | | | | 0.58 | | | | N/A | | | | | | | | 4.09 | | | | N/A | | | | | | | | 8.61 | | | | N/A | |
MSCI All Country World Index | | | (6.25 | ) | | | | | | | 2.11 | | | | N/A | | | | | | | | 6.46 | | | | N/A | | | | | | | | 9.16 | | | | N/A | |
| | (a) | Assuming maximum sales charges, if any. Average annual total returns with and without sales charges reflect reductions for distribution and service fees. See “About Fund Performance” on page 10 for a detailed description of share classes, including any related sales charges and fees, and how performance was calculated for certain share classes. | |
| | (b) | The Fund primarily intends to invest in equity securities or other financial instruments that are components of, or have characteristics similar to, the securities included in the MSCI All Country World Index. The Fund’s returns prior to October 26, 2017 are the returns of the Fund when it followed a different investment objective and different investment strategies under the name “BlackRock Global SmallCap Fund, Inc.” | |
N/A — Not applicable as share class and index do not have a sales charge.
Past performance is not indicative of future results.
Performance results may include adjustments made for financial reporting purposes in accordance with U.S. generally accepted accounting principles.
Expense Example
| | | | | | | | | | | | | | | | | | | | | | | | | | | | | | | | |
| | | Actual | | | | | | Hypothetical (b) | | | | |
| | | Beginning
Account Value
(01/01/20) | | | Ending
Account Value
(06/30/20) | | | Expenses
Paid During
the Period (a) | | | | | | Beginning
Account Value
(01/01/20) | | | Ending
Account Value
(06/30/20) | | | Expenses
Paid During
the Period (a) | | | Annualized
Expense
Ratio | |
Institutional | | $ | 1,000.00 | | | $ | 938.80 | | | $ | 3.42 | | | | | | | $ | 1,000.00 | | | $ | 1,021.33 | | | $ | 3.57 | | | | 0.71 | % |
Investor A | | | 1,000.00 | | | | 937.40 | | | | 4.62 | | | | | | | | 1,000.00 | | | | 1,020.09 | | | | 4.82 | | | | 0.96 | |
Investor C | | | 1,000.00 | | | | 934.10 | | | | 8.22 | | | | | | | | 1,000.00 | | | | 1,016.36 | | | | 8.57 | | | | 1.71 | |
Class K | | | 1,000.00 | | | | 938.80 | | | | 3.18 | | | | | | | | 1,000.00 | | | | 1,021.58 | | | | 3.32 | | | | 0.66 | |
Class R | | | 1,000.00 | | | | 936.60 | | | | 5.83 | | | | | | | | 1,000.00 | | | | 1,018.85 | | | | 6.07 | | | | 1.21 | |
| | (a) | For each class of the Fund, expenses are equal to the annualized expense ratio for the class, multiplied by the average account value over the period, multiplied by 182/366 (to reflect the one-half year period shown). | |
| | (b) | Hypothetical 5% annual return before expenses is calculated by prorating the number of days in the most recent fiscal half year divided by 366. | |
See “Disclosure of Expenses” on page 10 for further information on how expenses were calculated.
| | |
| Fund Summary as of June 30, 2020 (continued) | | BlackRock Advantage Global Fund, Inc. |
Portfolio Information
TEN LARGEST HOLDINGS
| | | | |
| Security | | Percent of
Net Assets | |
Microsoft Corp. | | | 4 | % |
Apple, Inc. | | | 4 | |
Amazon.com, Inc. | | | 3 | |
Nestle SA, Registered Shares | | | 1 | |
Alphabet, Inc. | | | 3 | |
Home Depot, Inc. | | | 1 | |
Tencent Holdings Ltd. | | | 1 | |
Adobe, Inc. | | | 1 | |
Facebook, Inc. | | | 1 | |
Taiwan Semiconductor Manufacturing Co. Ltd. | | | 1 | |
GEOGRAPHIC ALLOCATION
| | | | |
| Country/Geographic Region | | Percent of
Net Assets | |
United States | | | 57 | % |
Japan | | | 6 | |
China | | | 5 | |
Switzerland | | | 4 | |
France | | | 3 | |
United Kingdom | | | 3 | |
Germany | | | 2 | |
Taiwan | | | 2 | |
Australia | | | 2 | |
Netherlands | | | 1 | |
Canada | | | 1 | |
South Korea | | | 1 | |
India | | | 1 | |
Sweden | | | 1 | |
South Africa | | | 1 | |
Hong Kong | | | 1 | |
Brazil | | | 1 | |
Other(a) | | | 4 | |
Short-Term Securities | | | 4 | |
| | (a) | Includes holdings within countries that are 1% or less of net assets. Please refer to the Schedule of Investments for such countries. | |
| | |
| 6 | | 2020 BLACKROCK ANNUAL REPORTTO SHAREHOLDERS |
| | |
| Fund Summary as of June 30, 2020 | | BlackRock EuroFund |
Investment Objective
BlackRock EuroFund’s (the “Fund”) investment objective is to seek capital appreciation primarily through investment in equities of corporations domiciled in European countries.
Portfolio Management Commentary
How did the Fund perform?
For the 12-month period ended June 30, 2020, the Fund outperformed its benchmark, the MSCI EMU Index.
What factors influenced performance?
European equities performed well from the beginning of the period until mid-February, reflecting the backdrop of steady global growth and accommodative central bank policies worldwide. The positive environment changed abruptly mid-way through the first quarter of 2020, when the global spread of the coronavirus led to a sharp downturn in equities and other higher-risk assets. While stocks staged an impressive recovery in the second quarter of 2020 due to the aggressive response of world central banks, the benchmark nonetheless finished the full 12-month period in negative territory.
The Fund outpaced the benchmark by a sizable margin, with the largest contribution coming from stock selection. Positioning in information technology was a key contributor to returns, led by an investment in ASML Holding NV. The stock performed well through the disruptions associated with the coronavirus pandemic, as demand for remote connectivity solutions increased.
Holdings in cyclical companies, such as the Denmark-based transport and logistics company DSV Panalpina A/S, were also among the top performers. DSV exceeded profit expectations due in part to its strong management team and impressive execution, and it performed very well following the February — March sell-off due to investors’ anticipation of a recovery in the global economy. Schneider Electric SE, a French-based provider of industrial equipment and sustainable energy technologies, was another contributor of note.
Our position in the Italian financial stock FinecoBank Banca Fineco SpA also performed strongly. The company thrived despite the challenging environment due to its resilient business model and growing brokerage business. A zero weighting to Banco Santander SA (Spain) also aided relative performance.
On the negative side, key detractors included the aerospace companies Safran SA (France), Airbus SE (Netherlands) and MTU Aero Engines AG (Germany), all of which suffered due to the travel bans instituted in many countries. The investment adviser sold the position in Airbus in response to rising short-term risk, but it retained investments in Safran and MTU based on their healthy balance sheets and solid long-term cash flows.
Describe recent portfolio activity.
The Fund increased its weighting in banking stocks in the second half of the period. The investment adviser believed the sector stood to benefit from the combination of substantial government support, banks’ stronger capital positions, and subsidy regimes that allow banks to borrow from the European Central Banks at negative rates.
During the market downturn of early 2020, the investment adviser selectively added positions in certain higher-quality companies where it believed the fundamental investment cases remained intact and where lower valuations presented a compelling entry point. As part of this process, the investment adviser added the elevator and escalator manufacturer Kone Oyj (Finland) and the chipmaker ST Microelectronics NV, both of which had been monitored by the Fund to identify attractive buy points. The investment adviser believed both companies, while vulnerable to near-term disruptions, would be positioned to recover from the crisis due to their robust competitive positions and operations in growing end markets.
Describe portfolio positioning at period end.
The Fund had a pro-cyclical bias, with overweights in industrials, information technology, financials and real estate. The Fund had a neutral weighting in materials and was underweight in consumer staples, communication, utilities, energy, health care and consumer discretionary.
The views expressed reflect the opinions of BlackRock as of the date of this report and are subject to change based on changes in market, economic or other conditions. These views are not intended to be a forecast of future events and are no guarantee of future results.
| | |
| Fund Summary as of June 30, 2020 (continued) | | BlackRock EuroFund |
TOTAL RETURN BASED ON A $10,000 INVESTMENT
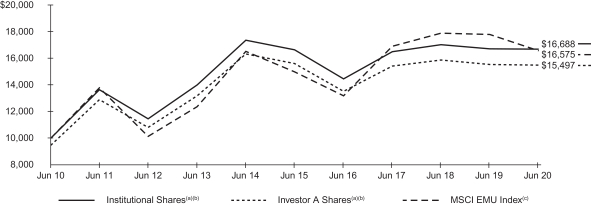
| (a) | Assuming maximum sales charge, if any, transaction costs and other operating expenses, including investment advisory fees. Institutional Shares do not have a sales charge. |
| (b) | Under normal circumstances, the Fund will invest at least 80% of its net assets in equity securities, including common stock and convertible securities, of companies located in Europe. The Fund currently expects that a majority of the Fund’s assets will be invested in equity securities of companies located in countries participating in the European Monetary Union (the ‘‘Eurozone’’). The Fund’s total returns prior to October 23, 2018, are the returns of the Fund when it followed different investment strategies. |
| (c) | MSCI EMU Index captures large and mid-cap representation across the 10 Developed Markets countries in the European Economic and Monetary Union (“EMU”). With 247 constituents, the MSCI EMU Index covers approximately 85% of the free float-adjusted market capitalization of the EMU. |
Performance Summary for the Period Ended June 30, 2020
| | | | | | | | | | | | | | | | | | | | | | | | | | | | | | | | | | | | | | | | |
| | | | | | | | | Average Annual Total Returns (a)(b) | |
| | | | | | | | | 1 Year | | | | | | 5 Years | | | | | | 10 Years | |
| | | 6-Month
Total Returns | | | | | | w/o sales
charge | | | w/sales
charge | | | | | | w/o sales
charge | | | w/sales
charge | | | | | | w/o sales
charge | | | w/sales
charge | |
Institutional | | | (5.23 | )% | | | | | | | (0.17 | )% | | | N/A | | | | | | | | 0.05 | % | | | N/A | | | | | | | | 5.25 | % | | | N/A | |
Investor A | | | (5.26 | ) | | | | | | | (0.30 | ) | | | (5.54 | )% | | | | | | | (0.16 | ) | | | (1.23 | )% | | | | | | | 5.04 | | | | 4.48 | % |
Investor C | | | (5.65 | ) | | | | | | | (1.12 | ) | | | (2.11 | ) | | | | | | | (0.95 | ) | | | (0.95 | ) | | | | | | | 4.18 | | | | 4.18 | |
Class K | | | (5.12 | ) | | | | | | | 0.03 | | | | N/A | | | | | | | | 0.13 | | | | N/A | | | | | | | | 5.30 | | | | N/A | |
Class R | | | (5.43 | ) | | | | | | | (0.76 | ) | | | N/A | | | | | | | | (0.66 | ) | | | N/A | | | | | | | | 4.50 | | | | N/A | |
MSCI EMU Index | | | (12.32 | ) | | | | | | | (6.85 | ) | | | N/A | | | | | | | | 2.03 | | | | N/A | | | | | | | | 5.18 | | | | N/A | |
| | (a) | Assuming maximum sales charges, if any. Average annual total returns with and without sales charges reflect reductions for distribution and service fees. See “About Fund Performance” on page 10 for a detailed description of share classes, including any related sales charges and fees, and how performance was calculated for certain share classes. | |
| | (b) | Under normal circumstances, the Fund will invest at least 80% of its net assets in equity securities, including common stock and convertible securities, of companies located in Europe. The Fund currently expects that a majority of the Fund’s assets will be invested in equity securities of companies located in countries participating in the European Monetary Union (the ‘‘Eurozone’’). The Fund’s total returns prior to October 23, 2018, are the returns of the Fund when it followed different investment strategies. | |
N/A — Not applicable as share class and index do not have a sales charge.
Past performance is not indicative of future results.
Performance results may include adjustments made for financial reporting purposes in accordance with U.S. generally accepted accounting principles.
Expense Example
| | | | | | | | | | | | | | | | | | | | | | | | | | | | | | | | |
| | | Actual | | | | | | Hypothetical (b) | | | | |
| | | Beginning
Account Value
(01/01/20) | | | Ending
Account Value
(06/30/20) | | | Expenses
Paid During
the Period (a) | | | | | | Beginning
Account Value
(01/01/20) | | | Ending
Account Value
(06/30/20) | | | Expenses
Paid During
the Period (a) | | | Annualized
Expense Ratio | |
Institutional | | $ | 1,000.00 | | | $ | 947.70 | | | $ | 5.47 | | | | | | | $ | 1,000.00 | | | $ | 1,019.24 | | | $ | 5.67 | | | | 1.13 | % |
Investor A | | | 1,000.00 | | | | 947.40 | | | | 6.25 | | | | | | | | 1,000.00 | | | | 1,018.45 | | | | 6.47 | | | | 1.29 | |
Investor C | | | 1,000.00 | | | | 943.50 | | | | 10.05 | | | | | | | | 1,000.00 | | | | 1,014.52 | | | | 10.42 | | | | 2.08 | |
Class K | | | 1,000.00 | | | | 948.80 | | | | 4.65 | | | | | | | | 1,000.00 | | | | 1,020.09 | | | | 4.82 | | | | 0.96 | |
Class R | | | 1,000.00 | | | | 945.70 | | | | 7.89 | | | | | | | | 1,000.00 | | | | 1,016.76 | | | | 8.17 | | | | 1.63 | |
| | (a) | For each class of the Fund, expenses are equal to the annualized expense ratio for the class, multiplied by the average account value over the period, multiplied by 182/366 (to reflect the one-half year period shown). | |
| | (b) | Hypothetical 5% annual return before expenses is calculated by prorating the number of days in the most recent fiscal half year divided by 366. | |
See “Disclosure of Expenses” on page 10 for further information on how expenses were calculated.
| | |
| 8 | | 2020 BLACKROCK ANNUAL REPORTTO SHAREHOLDERS |
| | |
| Fund Summary as of June 30, 2020 (continued) | | BlackRock EuroFund |
Portfolio Information
TEN LARGEST HOLDINGS
| | | | |
| Security | | Percent of
Net Assets | |
ASML Holding NV | | | 6 | % |
LVMH Moet Hennessy Louis Vuitton SE | | | 6 | |
SAP SE | | | 5 | |
Sanofi | | | 5 | |
Schneider Electric SE | | | 5 | |
Allianz SE, Registered Shares | | | 4 | |
BNP Paribas SA | | | 4 | |
Kering SA | | | 3 | |
FinecoBank Banca Fineco SpA | | | 3 | |
DSV Panalpina AS | | | 3 | |
GEOGRAPHIC ALLOCATION
| | | | |
| Country/Geographic Region | | Percent of
Net Assets | |
France | | | 36 | % |
Germany | | | 22 | |
Netherlands | | | 12 | |
Italy | | | 8 | |
United Kingdom | | | 5 | |
Finland | | | 4 | |
Switzerland | | | 4 | |
Denmark | | | 3 | |
Spain | | | 2 | |
Belgium | | | 2 | |
Ireland | | | 1 | |
United States | | | 1 | |
Europe | | | — | (a) |
Liabilities in Excess of Other Assets | | | — | (a) |
| | (a) | Represents less than 1%. | |
About Fund Performance
Institutional Shares and Class K Shares are not subject to any sales charge. These shares bear no ongoing distribution or service fees and are available only to certain eligible investors. Class K Shares performance shown prior to the Class K Shares inception date of January 25, 2018 is that of Institutional Shares. The performance of each Fund’s Class K Shares would be substantially similar to Institutional Shares because Class K Shares and Institutional Shares invest in the same portfolio of securities and performance would only differ to the extent that Class K Shares and Institutional Shares have different expenses. The actual returns of Class K Shares would have been higher than those of the Institutional Shares because Class K Shares have lower expenses than the Institutional Shares.
Investor A Shares are subject to a maximum initial sales charge (front-end load) of 5.25% and a service fee of 0.25% per year (but no distribution fee). Certain redemptions of these shares may be subject to a contingent deferred sales charge (“CDSC”) where no initial sales charge was paid at the time of purchase. These shares are generally available through financial intermediaries.
Investor C Shares are subject to a 1.00% CDSC if redeemed within one year of purchase. In addition, these shares are subject to a distribution fee of 0.75% per year and a service fee of 0.25% per year. These shares are generally available through financial intermediaries. These shares automatically convert to Investor A Shares after approximately ten years.
Class R Shares are not subject to any sales charge. These shares are subject to a distribution fee of 0.25% per year and a service fee of 0.25% per year. These shares are available only to certain employer-sponsored retirement plans.
Performance information reflects past performance and does not guarantee future results. Current performance may be lower or higher than the performance data quoted. Refer to blackrock.com to obtain performance data current to the most recent month-end. Performance results do not reflect the deduction of taxes that a shareholder would pay on Fund distributions or the redemption of Fund shares. Figures shown in the performance tables on the previous pages assume reinvestment of all distributions, if any, at net asset value (‘‘NAV’’) on the ex-dividend date or payable date, as applicable. Investment return and principal value of shares will fluctuate so that shares, when redeemed, may be worth more or less than their original cost. Distributions paid to each class of shares will vary because of the different levels of service, distribution and transfer agency fees applicable to each class, which are deducted from the income available to be paid to shareholders.
BlackRock Advisors, LLC (the “Manager”), each Fund’s investment adviser, has contractually and/or voluntarily agreed to waive and/or reimburse a portion of each Fund’s expenses. Without such waiver and/or reimbursement, each Fund’s performance would have been lower. With respect to each Fund’s voluntary waiver, the Manager is under no obligation to waive and/or reimburse or to continue waiving and/or reimbursing its fees and such voluntary waiver may be reduced or discontinued at any time. With respect to each Fund’s contractual waiver, the Manager is under no obligation to continue waiving and/or reimbursing its fees after the applicable termination date of such agreement. See Note 6 of the Notes to Financial Statements for additional information on waivers and/or reimbursements.
Disclosure of Expenses
Shareholders of each Fund may incur the following charges: (a) transactional expenses, such as sales charges; and (b) operating expenses, including investment advisory fees, service and distribution fees, including 12b-1 fees, acquired fund fees and expenses, and other fund expenses. The expense examples shown on the previous pages (which are based on a hypothetical investment of $1,000 invested on January 1, 2020 and held through June 30, 2020) are intended to assist shareholders both in calculating expenses based on an investment in each Fund and in comparing these expenses with similar costs of investing in other mutual funds.
The expense examples provide information about actual account values and actual expenses. In order to estimate the expenses a shareholder paid during the period covered by this report, shareholders can divide their account value by $1,000 and then multiply the result by the number corresponding to their Fund and share class under the heading entitled “Expenses Paid During the Period.”
The expense examples also provide information about hypothetical account values and hypothetical expenses based on a Fund’s actual expense ratio and an assumed rate of return of 5% per year before expenses. In order to assist shareholders in comparing the ongoing expenses of investing in these Funds and other funds, compare the 5% hypothetical examples with the 5% hypothetical examples that appear in shareholder reports of other funds.
The expenses shown in the expense examples are intended to highlight shareholders’ ongoing costs only and do not reflect transactional expenses, such as sales charges, if any. Therefore, the hypothetical examples are useful in comparing ongoing expenses only, and will not help shareholders determine the relative total expenses of owning different funds. If these transactional expenses were included, shareholder expenses would have been higher.
Derivative Financial Instruments
The Funds may invest in various derivative financial instruments. These instruments are used to obtain exposure to a security, commodity, index, market, and/or other assets without owning or taking physical custody of securities, commodities and/or other referenced assets or to manage market, equity, credit, interest rate, foreign currency exchange rate, commodity and/or other risks. Derivative financial instruments may give rise to a form of economic leverage and involve risks, including the imperfect correlation between the value of a derivative financial instrument and the underlying asset, possible default of the counterparty to the transaction or illiquidity of the instrument. The Funds’ successful use of a derivative financial instrument depends on the investment adviser’s ability to predict pertinent market movements accurately, which cannot be assured. The use of these instruments may result in losses greater than if they had not been used, may limit the amount of appreciation a Fund can realize on an investment and/or may result in lower distributions paid to shareholders. The Funds’ investments in these instruments, if any, are discussed in detail in the Notes to Financial Statements.
| | |
| 10 | | 2020 BLACKROCK ANNUAL REPORTTO SHAREHOLDERS |
| | |
Schedule of Investments June 30, 2020 | | BlackRock Advantage Global Fund, Inc. (Percentages shown are based on Net Assets) |
| | | | | | | | |
| Security | | Shares | | | Value | |
|
Common Stocks — 96.4% | |
|
Australia — 1.7% | |
ALS Ltd. | | | 32,773 | | | $ | 149,649 | |
Alumina Ltd. | | | 13,459 | | | | 15,340 | |
AngloGold Ashanti Ltd. | | | 742 | | | | 21,831 | |
Ansell Ltd. | | | 11,544 | | | | 293,448 | |
Aristocrat Leisure Ltd. | | | 71,145 | | | | 1,273,958 | |
ASX Ltd. | | | 511 | | | | 30,373 | |
Atlas Arteria Ltd. | | | 7,394 | | | | 34,146 | |
Bendigo & Adelaide Bank Ltd. | | | 18,907 | | | | 92,336 | |
BHP Group Ltd. | | | 13,020 | | | | 324,170 | |
Brambles Ltd. | | | 32,670 | | | | 247,717 | |
Cochlear Ltd. | | | 571 | | | | 74,966 | |
CSL Ltd. | | | 7,126 | | | | 1,417,283 | |
Downer EDI Ltd. | | | 3,875 | | | | 11,861 | |
GPT Group | | | 176,219 | | | | 511,936 | |
Harvey Norman Holdings Ltd. | | | 61,089 | | | | 150,174 | |
IDP Education Ltd. | | | 14,214 | | | | 154,045 | |
IGO Ltd. | | | 5,534 | | | | 18,882 | |
Insurance Australia Group Ltd. | | | 4,675 | | | | 18,762 | |
Lendlease Group | | | 5,002 | | | | 43,233 | |
Mirvac Group | | | 126,787 | | | | 191,525 | |
Northern Star Resources Ltd. | | | 5,004 | | | | 47,193 | |
OZ Minerals Ltd. | | | 3,447 | | | | 26,485 | |
Perpetual Ltd. | | | 785 | | | | 16,234 | |
Scentre Group | | | 193,510 | | | | 293,776 | |
Sonic Healthcare Ltd. | | | 1,068 | | | | 22,553 | |
Spark Infrastructure Group | | | 9,713 | | | | 14,507 | |
Stockland | | | 49,382 | | | | 114,507 | |
Tabcorp Holdings Ltd. | | | 36,025 | | | | 84,971 | |
Treasury Wine Estates Ltd. | | | 12,605 | | | | 91,712 | |
Vicinity Centres | | | 173,183 | | | | 173,582 | |
Woodside Petroleum Ltd. | | | 27,858 | | | | 421,009 | |
Worley Ltd. | | | 5,786 | | | | 35,403 | |
| | | | | | | | |
| | | | | | | 6,417,567 | |
|
| Austria — 0.1% | |
ams AG(a) | | | 2,937 | | | | 43,786 | |
OMV AG | | | 7,889 | | | | 266,205 | |
Vienna Insurance Group AG Wiener Versicherung Gruppe | | | 1,168 | | | | 26,190 | |
| | | | | | | | |
| | | | | | | 336,181 | |
|
| Belgium — 0.1% | |
Cofinimmo SA | | | 235 | | | | 32,408 | |
Groupe Bruxelles Lambert SA | | | 5,767 | | | | 483,044 | |
| | | | | | | | |
| | | | | | | 515,452 | |
|
| Brazil — 0.4% | |
Ambev SA | | | 11,072 | | | | 28,789 | |
B3 SA — Brasil Bolsa Balcao | | | 4,800 | | | | 48,626 | |
Cia de Locacao das Americas | | | 4,000 | | | | 12,453 | |
Cia. Hering | | | 5,552 | | | | 14,620 | |
Cosan Ltd., Class A | | | 1,156 | | | | 17,409 | |
CPFL Energia SA | | | 3,200 | | | | 18,042 | |
Duratex SA | | | 4,300 | | | | 10,169 | |
EDP — Energias do Brasil SA | | | 8,100 | | | | 25,947 | |
Embraer SA(a) | | | 16,539 | | | | 24,604 | |
Energisa SA | | | 2,300 | | | | 20,724 | |
Lojas Renner SA | | | 4,560 | | | | 35,051 | |
Petroleo Brasileiro SA | | | 19,753 | | | | 81,146 | |
Porto Seguro SA | | | 11,122 | | | | 103,119 | |
Ultrapar Participacoes SA | | | 48,882 | | | | 165,214 | |
WEG SA | | | 25,940 | | | | 241,412 | |
Wheaton Precious Metals Corp. | | | 12,662 | | | | 556,900 | |
XP, Inc., Class A(a) | | | 1,043 | | | | 43,816 | |
| | | | | | | | |
| | | | | | | 1,448,041 | |
| | | | | | | | |
| Security | | Shares | | | Value | |
|
| Canada — 1.5% | |
Agnico Eagle Mines Ltd. | | | 977 | | | $ | 62,559 | |
Allied Properties Real Estate Investment Trust | | | 1,929 | | | | 58,200 | |
Bank of Montreal | | | 28,113 | | | | 1,496,350 | |
Boyd Group Services, Inc. | | | 98 | | | | 14,587 | |
CAE, Inc. | | | 6,887 | | | | 111,706 | |
Canadian Apartment Properties REIT | | | 5,878 | | | | 210,380 | |
CCL Industries, Inc., Class B | | | 5,449 | | | | 176,121 | |
CGI, Inc.(a) | | | 1,580 | | | | 99,541 | |
Dollarama, Inc. | | | 479 | | | | 15,934 | |
Franco-Nevada Corp. | | | 3,126 | | | | 436,687 | |
Great-West Lifeco, Inc. | | | 9,505 | | | | 166,631 | |
Hydro One Ltd.(b) | | | 7,852 | | | | 147,659 | |
Kinaxis, Inc.(a) | | | 193 | | | | 27,588 | |
Manulife Financial Corp. | | | 20,278 | | | | 275,880 | |
Metro, Inc. | | | 2,137 | | | | 88,150 | |
Novagold Resources, Inc.(a) | | | 2,684 | | | | 24,614 | |
Onex Corp. | | | 2,113 | | | | 95,455 | |
Rogers Communications, Inc., Class B | | | 6,136 | | | | 246,552 | |
Royal Bank of Canada | | | 781 | | | | 52,989 | |
Shopify, Inc., Class A(a) | | | 402 | | | | 381,915 | |
SNC-Lavalin Group, Inc. | | | 1,004 | | | | 16,943 | |
TFI International, Inc. | | | 7,898 | | | | 280,351 | |
Toromont Industries Ltd. | | | 309 | | | | 15,334 | |
Toronto-Dominion Bank | | | 22,311 | | | | 995,745 | |
West Fraser Timber Co. Ltd. | | | 465 | | | | 16,345 | |
| | | | | | | | |
| | | | | | | 5,514,216 | |
|
| China — 5.4% | |
3SBio, Inc.(a)(b) | | | 16,000 | | | | 20,365 | |
Alibaba Group Holding Ltd. — ADR(a) | | | 14,772 | | | | 3,186,320 | |
Angang Steel Co. Ltd., Class H | | | 39,000 | | | | 9,592 | |
Anhui Conch Cement Co. Ltd., Class A | | | 2,200 | | | | 16,556 | |
Anhui Conch Cement Co. Ltd., Class H | | | 8,500 | | | | 57,597 | |
BAIC Motor Corp. Ltd., Class H(b) | | | 81,000 | | | | 35,448 | |
Bank of China Ltd., Class H | | | 509,000 | | | | 188,550 | |
Bank of Communications Co. Ltd., Class H | | | 164,000 | | | | 101,544 | |
BBMG Corp., Class H | | | 100,000 | | | | 19,612 | |
Beijing Enterprises Holdings Ltd. | | | 3,000 | | | | 10,074 | |
BOC Hong Kong Holdings Ltd. | | | 159,000 | | | | 509,101 | |
BYD Co. Ltd., Class A | | | 9,839 | | | | 100,700 | |
CanSino Biologics, Inc., Class A(a)(b) | | | 13,000 | | | | 357,959 | |
China Everbright Bank Co. Ltd., Class A | | | 167,400 | | | | 84,945 | |
China Hongqiao Group Ltd. | | | 65,500 | | | | 29,166 | |
China Life Insurance Co. Ltd., Class H | | | 284,000 | | | | 573,045 | |
China Minsheng Banking Corp. Ltd., Class A | | | 69,600 | | | | 55,930 | |
China Mobile Ltd. | | | 70,000 | | | | 472,644 | |
China Pacific Insurance Group Co. Ltd., Class H | | | 23,200 | | | | 62,354 | |
China Petroleum & Chemical Corp., Class H | | | 364,000 | | | | 152,246 | |
China Railway Signal & Communication Corp. Ltd.,
Class H(b) | | | 82,000 | | | | 35,412 | |
China Reinsurance Group Corp., Class H | | | 397,000 | | | | 40,673 | |
China Telecom Corp. Ltd., Class H | | | 36,000 | | | | 10,112 | |
China Unicom Hong Kong Ltd. | | | 718,000 | | | | 390,661 | |
Chongqing Zhifei Biological Products Co. Ltd., Class A | | | 26,700 | | | | 377,631 | |
CNOOC Ltd. | | | 1,158,000 | | | | 1,299,655 | |
CSPC Pharmaceutical Group Ltd. | | | 40,800 | | | | 77,271 | |
Dali Foods Group Co. Ltd.(b) | | | 89,000 | | | | 54,243 | |
Datang International Power Generation Co. Ltd., Class H | | | 242,000 | | | | 31,638 | |
Dongfang Electric Corp. Ltd., Class A | | | 21,000 | | | | 26,377 | |
Dongfeng Motor Group Co. Ltd., Class H | | | 32,000 | | | | 19,299 | |
Foshan Haitian Flavouring & Food Co. Ltd., Class A | | | 2,520 | | | | 44,409 | |
Guangzhou Baiyunshan Pharmaceutical Holdings Co. Ltd., Class H | | | 22,000 | | | | 55,566 | |
Guotai Junan Securities Co. Ltd., Class H(b) | | | 93,200 | | | | 129,613 | |
Huadian Power International Corp. Ltd., Class H | | | 120,000 | | | | 34,680 | |
| | | | |
| SCHEDULES OF INVESTMENTS | | | 11 | |
| | |
Schedule of Investments (continued) June 30, 2020 | | BlackRock Advantage Global Fund, Inc. (Percentages shown are based on Net Assets) |
| | | | | | | | |
| Security | | Shares | | | Value | |
|
| China (continued) | |
Hualan Biological Engineering, Inc., Class A | | | 54,100 | | | $ | 384,400 | |
Industrial & Commercial Bank of China Ltd., Class H | | | 127,000 | | | | 76,780 | |
Industrial Bank Co. Ltd., Class A | | | 55,372 | | | | 124,018 | |
JD.com, Inc. — ADR(a) | | | 18,465 | | | | 1,111,224 | |
Jiangsu Hengrui Medicine Co. Ltd., Class A | | | 9,840 | | | | 128,662 | |
Kaisa Group Holdings Ltd.(a) | | | 57,000 | | | | 21,702 | |
KWG Group Holdings Ltd.(a) | | | 30,000 | | | | 50,972 | |
Legend Holdings Corp., Class H(b) | | | 22,100 | | | | 25,917 | |
Lenovo Group Ltd. | | | 148,000 | | | | 82,575 | |
Li Ning Co. Ltd. | | | 39,000 | | | | 124,895 | |
Logan Group Co. Ltd. | | | 52,000 | | | | 92,904 | |
Luxshare Precision Industry Co. Ltd., Class A | | | 43,648 | | | | 319,284 | |
Meituan Dianping, Class B(a) | | | 7,400 | | | | 165,363 | |
Metallurgical Corp. of China Ltd., Class H | | | 343,000 | | | | 54,740 | |
MMG Ltd.(a) | | | 48,000 | | | | 10,030 | |
NetEase, Inc. — ADR | | | 556 | | | | 238,735 | |
New China Life Insurance Co. Ltd., Class H | | | 4,700 | | | | 15,850 | |
New Oriental Education & Technology Group, Inc. — ADR(a) | | | 2,143 | | | | 279,083 | |
Nexteer Automotive Group Ltd. | | | 23,000 | | | | 15,939 | |
NIO, Inc., ADR(a) | | | 10,526 | | | | 81,261 | |
Oppein Home Group, Inc., Class A | | | 2,200 | | | | 36,172 | |
PetroChina Co. Ltd., Class H | | | 1,770,000 | | | | 591,871 | |
Pinduoduo, Inc., ADR(a) | | | 1,878 | | | | 161,208 | |
Ping An Insurance Group Co. of China Ltd., Class H | | | 5,000 | | | | 49,845 | |
Postal Savings Bank of China Co. Ltd., Class H(b) | | | 232,000 | | | | 133,683 | |
Prosus NV(a) | | | 5,871 | | | | 545,758 | |
Q Technology Group Co. Ltd. | | | 10,000 | | | | 13,172 | |
S/F Holding Co. Ltd., Class A | | | 54,400 | | | | 421,611 | |
Shanghai Fosun Pharmaceutical Group Co. Ltd., Class A | | | 75,900 | | | | 362,953 | |
Shenzhen Investment Ltd. | | | 76,000 | | | | 24,195 | |
Shenzhen Kangtai Biological Products Co. Ltd., Class A | | | 16,700 | | | | 383,137 | |
Shui On Land Ltd. | | | 75,000 | | | | 12,646 | |
Sinopec Engineering Group Co. Ltd., Class H | | | 41,500 | | | | 17,819 | |
Sinotruk Hong Kong Ltd. | | | 26,000 | | | | 67,853 | |
Sunny Optical Technology Group Co. Ltd. | | | 9,600 | | | | 154,507 | |
Tencent Holdings Ltd. | | | 68,500 | | | | 4,389,334 | |
Towngas China Co. Ltd.(a) | | | 27,000 | | | | 12,246 | |
Uni-President China Holdings Ltd. | | | 42,000 | | | | 42,013 | |
Vipshop Holdings Ltd. — ADR(a) | | | 2,099 | | | | 41,791 | |
WuXi AppTec Co. Ltd., Class A | | | 6,200 | | | | 84,729 | |
WuXi AppTec Co. Ltd., Class H(b) | | | 1,680 | | | | 21,940 | |
Wuxi Biologics Cayman, Inc.(a)(b) | | | 6,500 | | | | 119,311 | |
Xiaomi Corp., Class B(a)(b) | | | 158,400 | | | | 263,221 | |
Yihai International Holding Ltd.(a) | | | 3,000 | | | | 30,915 | |
Yuexiu Property Co. Ltd. | | | 118,000 | | | | 21,165 | |
Yuzhou Properties Co. Ltd. | | | 39,000 | | | | 16,991 | |
| | | | | | | | |
| | | | | | | 20,095,408 | |
|
| Czech Republic — 0.0% | |
CEZ AS | | | 4,099 | | | | 87,769 | |
| | | | | | | | |
|
| Denmark — 0.4% | |
Chr Hansen Holding A/S | | | 2,027 | | | | 209,076 | |
Novo Nordisk A/S, Class B | | | 20,536 | | | | 1,337,874 | |
Novozymes A/S, Class B | | | 534 | | | | 30,959 | |
| | | | | | | | |
| | | | | | | 1,577,909 | |
|
| Finland — 0.1% | |
Konecranes OYJ | | | 1,075 | | | | 24,394 | |
UPM-Kymmene OYJ | | | 4,398 | | | | 127,387 | |
Valmet OYJ | | | 727 | | | | 19,055 | |
Wartsila OYJ Abp | | | 40,881 | | | | 339,110 | |
| | | | | | | | |
| | | | | | | 509,946 | |
| | | | | | | | |
| Security | | Shares | | | Value | |
|
| France — 3.6% | |
Airbus SE(a) | | | 1,562 | | | $ | 111,923 | |
AXA SA | | | 15,213 | | | | 320,126 | |
Bouygues SA(a) | | | 1,730 | | | | 59,260 | |
Bureau Veritas SA(a) | | | 786 | | | | 16,671 | |
Carrefour SA | | | 15,315 | | | | 237,506 | |
Christian Dior SE | | | 2,527 | | | | 1,075,172 | |
CNP Assurances(a) | | | 2,012 | | | | 23,336 | |
Danone SA | | | 11,220 | | | | 778,815 | |
Dassault Systemes SE | | | 94 | | | | 16,318 | |
Engie SA(a) | | | 68,101 | | | | 844,583 | |
EssilorLuxottica SA(a) | | | 134 | | | | 17,234 | |
Eutelsat Communications SA | | | 1,960 | | | | 18,131 | |
Gaztransport Et Technigaz SA | | | 563 | | | | 43,203 | |
Gecina SA | | | 1,437 | | | | 177,480 | |
Hermes International | | | 659 | | | | 553,301 | |
Kering SA | | | 196 | | | | 107,157 | |
L’Oreal SA(a) | | | 10,619 | | | | 3,427,243 | |
Legrand SA | | | 1,782 | | | | 135,401 | |
LVMH Moet Hennessy Louis Vuitton SE | | | 3,274 | | | | 1,445,454 | |
Natixis SA(a) | | | 7,299 | | | | 19,251 | |
Orange SA | | | 26,357 | | | | 315,176 | |
Pernod Ricard SA | | | 9,757 | | | | 1,536,399 | |
Peugeot SA(a) | | | 4,421 | | | | 72,501 | |
Renault SA(a) | | | 519 | | | | 13,283 | |
Rexel SA | | | 10,207 | | | | 116,984 | |
Rubis SCA | | | 942 | | | | 45,415 | |
Sanofi | | | 8,565 | | | | 873,498 | |
Sartorius Stedim Biotech | | | 216 | | | | 54,764 | |
Schneider Electric SE | | | 191 | | | | 21,246 | |
SCOR SE(a) | | | 1,209 | | | | 33,390 | |
Societe Generale SA(a) | | | 10,535 | | | | 176,142 | |
Sodexo SA | | | 3,442 | | | | 233,395 | |
Teleperformance | | | 485 | | | | 123,521 | |
UbiSoft Entertainment SA(a) | | | 457 | | | | 37,844 | |
Unibail-Rodamco-Westfield | | | 3,348 | | | | 188,716 | |
Worldline SA(a)(b) | | | 2,484 | | | | 216,579 | |
| | | | | | | | |
| | | | | | | 13,486,418 | |
|
| Germany — 2.2% | |
Beiersdorf AG | | | 15,747 | | | | 1,790,657 | |
Carl Zeiss Meditec AG, Bearer Shares(a) | | | 789 | | | | 76,827 | |
Delivery Hero SE(a)(b) | | | 1,573 | | | | 161,653 | |
Deutsche Boerse AG | | | 16,840 | | | | 3,047,648 | |
GRENKE AG | | | 286 | | | | 22,185 | |
Hella GmbH & Co. KGaA | | | 377 | | | | 15,487 | |
Hochtief AG | | | 666 | | | | 59,260 | |
Jenoptik AG | | | 4 | | | | 93 | |
Knorr-Bremse AG | | | 246 | | | | 24,965 | |
LEG Immobilien AG | | | 613 | | | | 77,750 | |
Merck KGaA | | | 13,169 | | | | 1,533,501 | |
SAP SE | | | 5,025 | | | | 702,442 | |
Symrise AG | | | 3,379 | | | | 394,825 | |
Telefonica Deutschland Holding AG | | | 61,679 | | | | 181,903 | |
TUI AG(d) | | | 7 | | | | 33 | |
Uniper SE | | | 1,513 | | | | 48,823 | |
| | | | | | | | |
| | | | | | | 8,138,052 | |
|
| Hong Kong — 0.7% | |
AIA Group Ltd. | | | 44,400 | | | | 415,477 | |
Alibaba Pictures Group Ltd.(a) | | | 210,000 | | | | 28,114 | |
CK Asset Holdings Ltd. | | | 332 | | | | 1,991 | |
CLP Holdings Ltd. | | | 39,000 | | | | 383,028 | |
Henderson Land Development Co. Ltd. | | | 63,000 | | | | 240,263 | |
HKT Trust & HKT Ltd. | | | 11,000 | | | | 16,142 | |
Hong Kong & China Gas Co. Ltd. | | | 40,950 | | | | 63,643 | |
| | |
| 12 | | 2020 BLACKROCK ANNUAL REPORTTO SHAREHOLDERS |
| | |
Schedule of Investments (continued) June 30, 2020 | | BlackRock Advantage Global Fund, Inc. (Percentages shown are based on Net Assets) |
| | | | | | | | |
| Security | | Shares | | | Value | |
|
| Hong Kong (continued) | |
Hongkong Land Holdings Ltd. | | | 61,600 | | | $ | 256,227 | |
Hysan Development Co. Ltd. | | | 12,000 | | | | 38,739 | |
Kingboard Laminates Holdings Ltd. | | | 29,500 | | | | 29,813 | |
Link REIT | | | 91,800 | | | | 753,693 | |
Swire Pacific Ltd., Class A | | | 18,000 | | | | 95,666 | |
Swire Properties Ltd. | | | 45,800 | | | | 116,935 | |
Techtronic Industries Co. Ltd. | | | 22,000 | | | | 217,680 | |
| | | | | | | | |
| | | | | | | 2,657,411 | |
|
| Hungary — 0.2% | |
MOL Hungarian Oil & Gas PLC(a) | | | 86,023 | | | | 508,579 | |
OTP Bank Nyrt(a) | | | 9,845 | | | | 346,104 | |
| | | | | | | | |
| | | | | | | 854,683 | |
|
| India — 0.8% | |
Asian Paints Ltd. | | | 10,483 | | | | 234,370 | |
Aurobindo Pharma Ltd. | | | 7,994 | | | | 81,693 | |
Axis Bank Ltd. | | | 7,521 | | | | 40,687 | |
Bharat Forge Ltd. | | | 6,014 | | | | 25,435 | |
Bharti Airtel Ltd.(a) | | | 4,864 | | | | 36,125 | |
Century Textiles & Industries Ltd. | | | 1,239 | | | | 4,859 | |
Dr. Reddy’s Laboratories Ltd. | | | 608 | | | | 31,847 | |
Glenmark Pharmaceuticals Ltd. | | | 3,939 | | | | 23,509 | |
HCL Technologies Ltd. | | | 18,076 | | | | 133,399 | |
HDFC Bank Ltd. | | | 22,336 | | | | 313,944 | |
HDFC Life Insurance Co. Ltd.(a)(b) | | | 18,923 | | | | 138,216 | |
Hexaware Technologies Ltd. | | | 3,256 | | | | 14,389 | |
Hindalco Industries Ltd. | | | 15,879 | | | | 31,095 | |
Hindustan Petroleum Corp. Ltd. | | | 7,395 | | | | 21,286 | |
Hindustan Unilever Ltd. | | | 12,422 | | | | 359,129 | |
Housing Development Finance Corp. Ltd. | | | 19,279 | | | | 448,278 | |
ICICI Bank Ltd. | | | 3,813 | | | | 17,777 | |
Indiabulls Housing Finance Ltd. | | | 9,653 | | | | 26,471 | |
Infosys Ltd. | | | 28,393 | | | | 276,000 | |
ITC Ltd. | | | 17,648 | | | | 45,569 | |
Jindal Steel & Power Ltd.(a) | | | 15,033 | | | | 32,700 | |
Jubilant Life Sciences Ltd. | | | 1,486 | | | | 12,973 | |
KEC International Ltd. | | | 2,445 | | | | 8,786 | |
Kotak Mahindra Bank Ltd. | | | 9,069 | | | | 163,695 | |
Mahindra & Mahindra Ltd. | | | 7,717 | | | | 52,381 | |
Mphasis Ltd. | | | 1,076 | | | | 12,554 | |
National Aluminium Co. Ltd. | | | 18,292 | | | | 7,771 | |
Nestle India Ltd. | | | 263 | | | | 59,715 | |
Petronet LNG Ltd. | | | 9,296 | | | | 31,813 | |
Pidilite Industries Ltd. | | | 4,792 | | | | 87,082 | |
Reliance Industries Ltd. | | | 4,086 | | | | 92,942 | |
Steel Authority of India, Ltd. | | | 23,903 | | | | 9,755 | |
Tech Mahindra Ltd. | | | 3,267 | | | | 23,506 | |
| | | | | | | | |
| | | | | | | 2,899,751 | |
|
| Indonesia — 0.1% | |
Bank Central Asia Tbk PT | | | 148,700 | | | | 297,519 | |
Bank Mandiri Persero Tbk PT | | | 208,900 | | | | 72,536 | |
Bank Negara Indonesia Persero Tbk PT | | | 52,100 | | | | 16,834 | |
| | | | | | | | |
| | | | | | | 386,889 | |
|
| Ireland — 0.1% | |
AerCap Holdings NV(a) | | | 349 | | | | 10,749 | |
ICON PLC(a) | | | 105 | | | | 17,688 | |
Kingspan Group PLC(a) | | | 1,756 | | | | 113,361 | |
Smurfit Kappa Group PLC | | | 2,295 | | | | 77,125 | |
| | | | | | | | |
| | | | | | | 218,923 | |
|
| Israel — 0.1% | |
Bank Leumi Le-Israel BM | | | 8 | | | | 40 | |
Wix.com Ltd.(a) | | | 1,487 | | | | 380,999 | |
| | | | | | | | |
| | | | | | | 381,039 | |
| | | | | | | | |
| Security | | Shares | | | Value | |
|
| Italy — 0.4% | |
Amplifon SpA(a) | | | 5,451 | | | $ | 145,623 | |
Assicurazioni Generali SpA | | | 48,287 | | | | 733,492 | |
Banca Mediolanum SpA | | | 2,348 | | | | 16,898 | |
Ferrari NV | | | 2,552 | | | | 437,145 | |
Hera SpA | | | 4,694 | | | | 17,625 | |
Interpump Group SpA | | | 1,103 | | | | 32,885 | |
Italgas SpA | | | 3,152 | | | | 18,343 | |
Terna Rete Elettrica Nazionale SpA | | | 2,149 | | | | 14,823 | |
| | | | | | | | |
| | | | | | | 1,416,834 | |
|
| Japan — 5.8% | |
Alps Alpine Co. Ltd. | | | 4,700 | | | | 60,579 | |
Asahi Group Holdings Ltd. | | | 2,700 | | | | 94,830 | |
Asahi Kasei Corp. | | | 21,800 | | | | 178,450 | |
Astellas Pharma, Inc. | | | 9,300 | | | | 155,306 | |
Bridgestone Corp. | | | 1,600 | | | | 51,641 | |
Canon, Inc. | | | 25,700 | | | | 512,664 | |
Central Japan Railway Co. | | | 1,700 | | | | 262,919 | |
Chugai Pharmaceutical Co. Ltd. | | | 12,000 | | | | 642,479 | |
Citizen Watch Co. Ltd. | | | 4,900 | | | | 15,973 | |
COMSYS Holdings Corp. | | | 700 | | | | 20,759 | |
Dai Nippon Printing Co. Ltd. | | | 3,100 | | | | 71,270 | |
Dai-ichi Life Holdings, Inc. | | | 31,100 | | | | 372,267 | |
Daito Trust Construction Co. Ltd. | | | 1,600 | | | | 147,458 | |
Daiwa House Industry Co. Ltd. | | | 7,700 | | | | 181,835 | |
Denso Corp. | | | 8,700 | | | | 341,188 | |
Dentsu Group Inc. | | | 2,500 | | | | 59,304 | |
DIC Corp. | | | 700 | | | | 17,619 | |
East Japan Railway Co. | | | 17,300 | | | | 1,198,808 | |
Eisai Co. Ltd. | | | 2,200 | | | | 174,788 | |
Electric Power Development Co. Ltd. | | | 1,600 | | | | 30,330 | |
ENEOS Holdings, Inc. | | | 330,800 | | | | 1,179,158 | |
FamilyMart Co. Ltd. | | | 1,000 | | | | 17,168 | |
Fuji Media Holdings, Inc. | | | 3,000 | | | | 29,001 | |
FUJIFILM Holdings Corp. | | | 10,200 | | | | 436,577 | |
House Foods Group, Inc. | | | 400 | | | | 12,929 | |
Inpex Corp. | | | 25,900 | | | | 161,726 | |
Izumi Co. Ltd. | | | 500 | | | | 15,850 | |
J. Front Retailing Co. Ltd. | | | 2,500 | | | | 16,725 | |
Japan Exchange Group, Inc. | | | 5,100 | | | | 118,116 | |
Japan Post Holdings Co. Ltd. | | | 44,300 | | | | 316,155 | |
Japan Post Insurance Co. Ltd. | | | 11,800 | | | | 155,481 | |
Japan Tobacco, Inc. | | | 13,600 | | | | 252,589 | |
Kajima Corp. | | | 37,000 | | | | 442,404 | |
Kaneka Corp. | | | 1,400 | | | | 36,437 | |
Kao Corp. | | | 8,900 | | | | 706,285 | |
KDDI Corp. | | | 35,300 | | | | 1,053,251 | |
Kewpie Corp. | | | 1,000 | | | | 18,844 | |
Keyence Corp. | | | 2,600 | | | | 1,089,560 | |
Kirin Holdings Co. Ltd. | | | 8,500 | | | | 179,178 | |
Konica Minolta, Inc. | | | 35,700 | | | | 124,151 | |
Kyocera Corp. | | | 7,500 | | | | 409,384 | |
Lintec Corp. | | | 700 | | | | 16,683 | |
Matsumotokiyoshi Holdings Co. Ltd. | | | 500 | | | | 18,169 | |
Mitsubishi Chemical Holdings Corp. | | | 69,500 | | | | 405,301 | |
Mitsubishi Motors Corp. | | | 21,300 | | | | 52,791 | |
Murata Manufacturing Co. Ltd. | | | 1,700 | | | | 100,212 | |
Nihon Unisys Ltd. | | | 600 | | | | 18,865 | |
Nikon Corp. | | | 6,200 | | | | 52,070 | |
Nintendo Co. Ltd. | | | 1,400 | | | | 625,896 | |
Nippon Shokubai Co. Ltd. | | | 700 | | | | 36,692 | |
Nippon Telegraph & Telephone Corp. | | | 2,700 | | | | 62,908 | |
Nippon Television Holdings, Inc. | | | 1,500 | | | | 16,246 | |
Nitori Holdings Co. Ltd. | | | 3,300 | | | | 647,028 | |
Nitto Denko Corp. | | | 8,600 | | | | 487,535 | |
| | | | |
| SCHEDULES OF INVESTMENTS | | | 13 | |
| | |
Schedule of Investments (continued) June 30, 2020 | | BlackRock Advantage Global Fund, Inc. (Percentages shown are based on Net Assets) |
| | | | | | | | |
| Security | | Shares | | | Value | |
|
| Japan (continued) | |
NTT DOCOMO, Inc. | | | 3,200 | | | $ | 84,954 | |
Oji Holdings Corp. | | | 8,600 | | | | 40,122 | |
Osaka Gas Co. Ltd. | | | 900 | | | | 17,790 | |
Otsuka Holdings Co. Ltd. | | | 3,600 | | | | 156,895 | |
Pola Orbis Holdings, Inc. | | | 17,400 | | | | 303,779 | |
Recruit Holdings Co. Ltd. | | | 7,500 | | | | 257,926 | |
Rohm Co. Ltd. | | | 300 | | | | 19,947 | |
Ryohin Keikaku Co. Ltd. | | | 7,200 | | | | 102,409 | |
Sanwa Holdings Corp. | | | 1,400 | | | | 12,581 | |
Seiko Epson Corp. | | | 3,200 | | | | 36,658 | |
Sekisui House Ltd. | | | 3,500 | | | | 66,823 | |
Seria Co. Ltd. | | | 800 | | | | 28,533 | |
Seven & i Holdings Co. Ltd. | | | 12,300 | | | | 402,376 | |
Shin-Etsu Chemical Co. Ltd. | | | 1,000 | | | | 117,362 | |
Shionogi & Co. Ltd. | | | 1,500 | | | | 94,100 | |
Shiseido Co. Ltd. | | | 1,000 | | | | 63,721 | |
Softbank Corp. | | | 30,400 | | | | 387,486 | |
Sony Corp. | | | 7,800 | | | | 538,435 | |
Sumitomo Chemical Co. Ltd. | | | 70,900 | | | | 213,324 | |
Sumitomo Mitsui Trust Holdings, Inc. | | | 2,300 | | | | 64,815 | |
Sundrug Co. Ltd. | | | 2,900 | | | | 95,978 | |
Suntory Beverage & Food Ltd. | | | 1,000 | | | | 39,018 | |
Sysmex Corp. | | | 2,700 | | | | 207,257 | |
T&D Holdings, Inc. | | | 34,200 | | | | 293,751 | |
Taisei Corp. | | | 10,900 | | | | 397,263 | |
Taisho Pharmaceutical Holdings Co. Ltd. | | | 300 | | | | 18,410 | |
Takeda Pharmaceutical Co. Ltd. | | | 21,400 | | | | 768,858 | |
Teijin Ltd. | | | 22,200 | | | | 353,460 | |
Tokyo Electron Ltd. | | | 3,800 | | | | 937,626 | |
Ube Industries Ltd. | | | 18,900 | | | | 325,733 | |
Ulvac, Inc. | | | 1,800 | | | | 52,257 | |
Unicharm Corp. | | | 12,700 | | | | 520,859 | |
West Japan Railway Co. | | | 1,100 | | | | 61,698 | |
Yamaha Motor Co. Ltd. | | | 15,400 | | | | 242,549 | |
Z Holdings Corp. | | | 16,500 | | | | 80,977 | |
Zeon Corp. | | | 9,200 | | | | 84,962 | |
| | | | | | | | |
| | | | | | | 21,392,524 | |
|
| Jordan — 0.0% | |
Hikma Pharmaceuticals PLC | | | 2,019 | | | | 55,404 | |
| | | | | | | | |
|
| Luxembourg — 0.1% | |
Aperam SA | | | 1,546 | | | | 43,341 | |
ArcelorMittal SA(a) | | | 4,927 | | | | 52,186 | |
Reinet Investments SCA | | | 1,326 | | | | 23,274 | |
RTL Group SA | | | 963 | | | | 30,896 | |
Tenaris SA | | | 11,795 | | | | 76,651 | |
| | | | | | | | |
| | | | | | | 226,348 | |
|
| Malaysia — 0.1% | |
Hartalega Holdings Bhd | | | 18,100 | | | | 55,211 | |
Public Bank Bhd | | | 42,400 | | | | 163,722 | |
QL Resources Bhd | | | 12,500 | | | | 27,994 | |
Supermax Corp. BHD(a) | | | 16,700 | | | | 31,354 | |
Tenaga Nasional Bhd | | | 19,800 | | | | 53,839 | |
| | | | | | | | |
| | | | | | | 332,120 | |
|
| Mexico — 0.3% | |
America Movil SAB de CV, Series L | | | 1,133,645 | | | | 727,502 | |
Cemex SAB de CV CPO | | | 323,810 | | | | 91,291 | |
Fomento Economico Mexicano SAB de CV | | | 5,102 | | | | 31,629 | |
Grupo Aeroportuario del Pacifico SAB de CV, Class B | | | 1,400 | | | | 10,067 | |
Grupo Financiero Banorte SAB de CV, Series O | | | 6,378 | | | | 22,122 | |
Megacable Holdings SAB de CV CPO | | | 6,900 | | | | 20,195 | |
Orbia Advance Corp. SAB de CV | | | 12,300 | | | | 18,184 | |
| | | | | | | | |
| | | | | | | 920,990 | |
| | | | | | | | |
| Security | | Shares | | | Value | |
|
| Netherlands — 1.6% | |
ABN AMRO Bank NV CVA(b) | | | 33,816 | | | $ | 291,008 | |
Akzo Nobel NV | | | 10,648 | | | | 956,623 | |
Euronext NV(b) | | | 1,062 | | | | 106,895 | |
EXOR NV | | | 2,067 | | | | 118,640 | |
Heineken NV | | | 2,416 | | | | 222,742 | |
Just Eat Takeaway.com NV(a)(b) | | | 3,369 | | | | 352,144 | |
Koninklijke DSM NV | | | 6,153 | | | | 854,147 | |
Koninklijke KPN NV | | | 26,746 | | | | 71,142 | |
Koninklijke Philips NV(a) | | | 18,983 | | | | 885,513 | |
Koninklijke Vopak NV | | | 1,626 | | | | 86,006 | |
NXP Semiconductors NV | | | 2,089 | | | | 238,230 | |
Royal Dutch Shell PLC, Class A | | | 31,749 | | | | 508,342 | |
Royal Dutch Shell PLC, Class B | | | 22,225 | | | | 336,938 | |
Signify NV(a)(b) | | | 702 | | | | 18,048 | |
Wereldhave NV | | | 1 | | | | 9 | |
Wolters Kluwer NV | | | 10,534 | | | | 822,765 | |
| | | | | | | | |
| | | | | | | 5,869,192 | |
|
| New Zealand — 0.0% | |
a2 Milk Co. Ltd.(a) | | | 4,397 | | | | 57,002 | |
Fisher & Paykel Healthcare Corp. Ltd. | | | 4,467 | | | | 102,905 | |
| | | | | | | | |
| | | | | | | 159,907 | |
|
| Norway — 0.3% | |
Orkla ASA | | | 26,895 | | | | 236,127 | |
Telenor ASA | | | 57,056 | | | | 833,067 | |
| | | | | | | | |
| | | | | | | 1,069,194 | |
|
| Peru — 0.0% | |
Southern Copper Corp. | | | 1,032 | | | | 41,043 | |
| | | | | | | | |
|
| Poland — 0.2% | |
Bank Polska Kasa Opieki SA | | | 8,716 | | | | 119,427 | |
Grupa Lotos SA | | | 4,354 | | | | 66,369 | |
PGE Polska Grupa Energetyczna SA(a) | | | 17,114 | | | | 29,925 | |
Polski Koncern Naftowy ORLEN SA | | | 37,031 | | | | 588,479 | |
Powszechna Kasa Oszczednosci Bank Polski SA | | | 8,547 | | | | 49,771 | |
| | | | | | | | |
| | | | | | | 853,971 | |
|
| Portugal — 0.1% | |
Galp Energia SGPS SA | | | 16,042 | | | | 186,087 | |
| | | | | | | | |
|
| Puerto Rico — 0.0% | |
Popular, Inc. | | | 445 | | | | 16,541 | |
| | | | | | | | |
|
| Russia — 0.2% | |
Inter RAO UES PJSC | | | 386,000 | | | | 26,450 | |
Lukoil PJSC | | | 3,211 | | | | 239,433 | |
Magnit PJSC — GDR | | | 3,609 | | | | 46,932 | |
Magnitogorsk Iron & Steel Works PJSC | | | 28,400 | | | | 14,806 | |
MMC Norilsk Nickel PJSC | | | 482 | | | | 127,062 | |
Mobile TeleSystems PJSC — ADR | | | 4,094 | | | | 37,624 | |
Novatek PJSC — GDR | | | 759 | | | | 107,582 | |
PhosAgro PJSC, -GDR | | | 1,139 | | | | 14,067 | |
Severstal PJSC | | | 2,180 | | | | 26,539 | |
Surgutneftegas PJSC | | | 57,305 | | | | 31,097 | |
Tatneft PJSC | | | 10,670 | | | | 83,448 | |
| | | | | | | | |
| | | | | | | 755,040 | |
|
| Singapore — 0.2% | |
Oversea-Chinese Banking Corp. Ltd. | | | 24,100 | | | | 157,079 | |
Singapore Technologies Engineering Ltd. | | | 40,400 | | | | 96,424 | |
Singapore Telecommunications Ltd. | | | 198,600 | | | | 353,289 | |
| | | | | | | | |
| | | | | | | 606,792 | |
|
| South Africa — 0.7% | |
Absa Group, Ltd. | | | 4,472 | | | | 22,077 | |
Anglo American Platinum Ltd. | | | 5,129 | | | | 373,277 | |
Anglo American PLC | | | 59,540 | | | | 1,385,575 | |
| | |
| 14 | | 2020 BLACKROCK ANNUAL REPORTTO SHAREHOLDERS |
| | |
Schedule of Investments (continued) June 30, 2020 | | BlackRock Advantage Global Fund, Inc. (Percentages shown are based on Net Assets) |
| | | | | | | | |
| Security | | Shares | | | Value | |
|
| South Africa (continued) | |
Barloworld Ltd. | | | 2,010 | | | $ | 8,013 | |
Bidvest Group Ltd. | | | 31,477 | | | | 258,263 | |
Clicks Group Ltd. | | | 2,327 | | | | 28,210 | |
FirstRand Ltd. | | | 23,954 | | | | 52,677 | |
Gold Fields Ltd. | | | 2,296 | | | | 21,679 | |
Impala Platinum Holdings Ltd. | | | 2,545 | | | | 17,139 | |
Investec Ltd. | | | 9,546 | | | | 19,070 | |
Kumba Iron Ore Ltd. | | | 7,303 | | | | 195,288 | |
MTN Group Ltd. | | | 9,428 | | | | 28,875 | |
Naspers Ltd., Class N | | | 508 | | | | 93,360 | |
Standard Bank Group Ltd. | | | 32,929 | | | | 198,767 | |
Tiger Brands Ltd. | | | 1,230 | | | | 12,646 | |
| | | | | | | | |
| | | | | | | 2,714,916 | |
|
| South Korea — 1.3% | |
Celltrion, Inc.(a) | | | 2,047 | | | | 523,905 | |
HLB, Inc.(a) | | | 4,552 | | | | 351,734 | |
Hyundai Engineering & Construction Co. Ltd. | | | 368 | | | | 10,194 | |
Hyundai Mobis Co. Ltd. | | | 1,189 | | | | 190,857 | |
Hyundai Motor Co. | | | 3,649 | | | | 299,741 | |
KB Financial Group, Inc. | | | 1,284 | | | | 36,350 | |
Kia Motors Corp. | | | 700 | | | | 18,916 | |
Korea Electric Power Corp.(a) | | | 1,801 | | | | 29,370 | |
Korea Zinc Co. Ltd. | | | 170 | | | | 47,633 | |
LG Chem Ltd. | | | 262 | | | | 108,122 | |
LG Electronics, Inc. | | | 3,308 | | | | 175,310 | |
LG Household & Health Care Ltd. | | | 37 | | | | 41,470 | |
NAVER Corp. | | | 510 | | | | 114,741 | |
POSCO | | | 5,720 | | | | 833,155 | |
Samsung Electronics Co. Ltd. | | | 28,828 | | | | 1,276,147 | |
Samsung Life Insurance Co. Ltd. | | | 1,590 | | | | 59,781 | |
Shinhan Financial Group Co. Ltd. | | | 12,703 | | | | 306,983 | |
SillaJen, Inc.(a)(c) | | | 770 | | | | 7,358 | |
SK Innovation Co. Ltd. | | | 2,014 | | | | 222,650 | |
| | | | | | | | |
| | | | | | | 4,654,417 | |
|
| Spain — 0.5% | |
Acerinox SA | | | 2,583 | | | | 21,000 | |
EDP Renováveis, S.A. | | | 2,169 | | | | 29,974 | |
Endesa SA | | | 2,240 | | | | 55,566 | |
Grifols SA | | | 13,307 | | | | 404,639 | |
Industria de Diseno Textil SA | | | 22,838 | | | | 605,971 | |
Inmobiliaria Colonial Socimi SA | | | 1,249 | | | | 11,044 | |
Naturgy Energy Group SA | | | 18,876 | | | | 352,394 | |
Repsol SA | | | 17,707 | | | | 156,459 | |
Zardoya Otis SA | | | 4,655 | | | | 31,934 | |
| | | | | | | | |
| | | | | | | 1,668,981 | |
|
| Sweden — 0.8% | |
Assa Abloy AB, Class B | | | 18,745 | | | | 383,663 | |
Axfood AB | | | 2,624 | | | | 57,366 | |
Castellum AB | | | 3,354 | | | | 62,847 | |
Dometic Group AB(a)(b) | | | 4,070 | | | | 36,780 | |
Elekta AB, B Shares, Class B | | | 17,059 | | | | 158,911 | |
Fabege AB | | | 50,875 | | | | 598,320 | |
Hufvudstaden AB, A Shares | | | 19,417 | | | | 242,058 | |
Kinnevik AB, Class B | | | 10,074 | | | | 265,926 | |
L E Lundbergforetagen AB, B Shares(a) | | | 1,294 | | | | 58,985 | |
Lifco AB, -B Shares | | | 292 | | | | 18,620 | |
Lundin Energy AB | | | 2,122 | | | | 51,789 | |
Swedish Match AB | | | 4,536 | | | | 320,040 | |
Tele2 AB, Class B | | | 8,895 | | | | 118,409 | |
Telia Co. AB | | | 118,427 | | | | 443,059 | |
| | | | | | | | |
| | | | | | | 2,816,773 | |
| | | | | | | | |
| Security | | Shares | | | Value | |
|
| Switzerland — 3.7% | |
Barry Callebaut AG, Registered Shares | | | 85 | | | $ | 162,251 | |
Belimo Holding AG | | | 3 | | | | 22,202 | |
Chocoladefabriken Lindt & Spruengli AG | | | 12 | | | | 99,112 | |
Clariant AG, Registered Shares(a) | | | 768 | | | | 15,115 | |
Coca-Cola HBC AG | | | 9,734 | | | | 243,672 | |
Geberit AG, Registered Shares | | | 193 | | | | 96,835 | |
Givaudan SA, Registered Shares | | | 530 | | | | 1,981,123 | |
Nestle SA, Registered Shares | | | 49,712 | | | | 5,511,600 | |
Novartis AG, Registered Shares | | | 11,701 | | | | 1,019,403 | |
Roche Holding AG | | | 5,367 | | | | 1,859,395 | |
Sika AG, Registered Shares | | | 13,018 | | | | 2,509,510 | |
Sunrise Communications Group AG(a)(b) | | | 602 | | | | 53,546 | |
Swisscom AG, Registered Shares | | | 74 | | | | 38,806 | |
Tecan Group AG | | | 69 | | | | 24,454 | |
Vifor Pharma AG | | | 296 | | | | 44,781 | |
| | | | | | | | |
| | | | | | | 13,681,805 | |
|
| Taiwan — 1.9% | |
ASPEED Technology, Inc. | | | 1,000 | | | | 42,345 | |
Cathay Financial Holding Co. Ltd. | | | 200,595 | | | | 285,344 | |
Chailease Holding Co. Ltd. | | | 4,284 | | | | 18,263 | |
Chipbond Technology Corp. | | | 10,000 | | | | 21,946 | |
CTBC Financial Holding Co. Ltd. | | | 423,000 | | | | 293,155 | |
Delta Electronics, Inc. | | | 28,000 | | | | 159,779 | |
Fubon Financial Holding Co. Ltd. | | | 567,000 | | | | 846,540 | |
Largan Precision Co. Ltd. | | | 3,000 | | | | 417,120 | |
MediaTek, Inc. | | | 34,000 | | | | 672,201 | |
Parade Technologies Ltd. | | | 2,000 | | | | 67,036 | |
Realtek Semiconductor Corp. | | | 18,000 | | | | 183,465 | |
Taiwan Semiconductor Manufacturing Co. Ltd. | | | 322,000 | | | | 3,438,803 | |
TPK Holding Co. Ltd.(a) | | | 11,000 | | | | 17,427 | |
Uni-President Enterprises Corp. | | | 296,000 | | | | 717,151 | |
| | | | | | | | |
| | | | | | | 7,180,575 | |
|
| Thailand — 0.2% | |
Berli Jucker PCL — NVDR | | | 401,000 | | | | 514,903 | |
Gulf Energy Development PCL | | | 11,000 | | | | 13,435 | |
Muangthai Capital PCL — NVDR(a) | | | 16,600 | | | | 28,196 | |
| | | | | | | | |
| | | | | | | 556,534 | |
|
| Turkey — 0.1% | |
Akbank TAS(a) | | | 39,681 | | | | 35,202 | |
Haci Omer Sabanci Holding AS | | | 132,652 | | | | 178,619 | |
Ipek Dogal Enerji Kaynaklari Ve Uretim(a) | | | 36,875 | | | | 73,712 | |
KOC Holding AS | | | 7,303 | | | | 19,208 | |
Koza Altin Isletmeleri AS(a) | | | 1,617 | | | | 19,697 | |
Koza Anadolu Metal Madencilik Isletmeleri AS(a) | | | 15,699 | | | | 30,695 | |
Turk Telekomunikasyon AS(a) | | | 67,814 | | | | 80,265 | |
Turkiye Is Bankasi AS, Class C(a) | | | 122,700 | | | | 100,216 | |
| | | | | | | | |
| | | | | | | 537,614 | |
|
| United Kingdom — 3.4% | |
AstraZeneca PLC | | | 9,964 | | | | 1,036,997 | |
Auto Trader Group PLC(b) | | | 8,513 | | | | 55,426 | |
Barratt Developments PLC | | | 23,031 | | | | 141,552 | |
Bellway PLC | | | 1,480 | | | | 46,614 | |
Berkeley Group Holdings PLC | | | 5,524 | | | | 284,487 | |
British American Tobacco PLC | | | 15,691 | | | | 601,794 | |
Britvic PLC | | | 1,423 | | | | 13,551 | |
BT Group PLC | | | 308,437 | | | | 436,207 | |
Centrica PLC | | | 160,157 | | | | 76,099 | |
Cineworld Group PLC | | | 30,575 | | | | 22,953 | |
Coca-Cola European Partners PLC | | | 19,537 | | | | 737,717 | |
Compass Group PLC | | | 13,609 | | | | 187,239 | |
Croda International PLC | | | 650 | | | | 42,218 | |
Dechra Pharmaceuticals PLC | | | 9 | | | | 317 | |
| | | | |
| SCHEDULES OF INVESTMENTS | | | 15 | |
| | |
Schedule of Investments (continued) June 30, 2020 | | BlackRock Advantage Global Fund, Inc. (Percentages shown are based on Net Assets) |
| | | | | | | | |
| Security | | Shares | | | Value | |
|
| United Kingdom (continued) | |
Derwent London PLC | | | 1,821 | | | $ | 62,640 | |
Diageo PLC | | | 19,525 | | | | 648,959 | |
Dialog Semiconductor PLC(a) | | | 8,048 | | | | 367,863 | |
Direct Line Insurance Group PLC | | | 23,450 | | | | 78,629 | |
Experian PLC | | | 31,871 | | | | 1,118,636 | |
Farfetch Ltd., Class A(a) | | | 2,701 | | | | 46,646 | |
GlaxoSmithKline PLC | | | 48,143 | | | | 972,474 | |
Great Portland Estates PLC | | | 1,447 | | | | 11,336 | |
Greggs PLC | | | 1,293 | | | | 25,933 | |
HomeServe PLC | | | 11,147 | | | | 180,213 | |
Howden Joinery Group PLC | | | 2,934 | | | | 20,087 | |
IG Group Holdings PLC | | | 16,047 | | | | 162,044 | |
Informa PLC | | | 55,228 | | | | 319,314 | |
Intertek Group PLC | | | 4,611 | | | | 310,556 | |
JD Sports Fashion PLC | | | 3,451 | | | | 26,561 | |
John Wood Group PLC | | | 7,585 | | | | 18,187 | |
Land Securities Group PLC | | | 3,441 | | | | 23,511 | |
Marks & Spencer Group PLC | | | 52,329 | | | | 64,169 | |
Meggitt PLC | | | 22,296 | | | | 81,210 | |
Micro Focus International PLC | | | 13,272 | | | | 70,807 | |
Moneysupermarket.com Group PLC | | | 11,247 | | | | 45,116 | |
Ocado Group PLC(a) | | | 3,485 | | | | 87,579 | |
Rentokil Initial PLC | | | 143,022 | | | | 904,352 | |
Rightmove PLC | | | 26,290 | | | | 177,708 | |
Rolls-Royce Holdings PLC | | | 26,883 | | | | 94,914 | |
Rotork PLC | | | 3,832 | | | | 13,263 | |
SSE PLC | | | 5,717 | | | | 96,807 | |
Subsea 7 SA(a) | | | 14,569 | | | | 92,905 | |
Tate & Lyle PLC | | | 2,858 | | | | 23,626 | |
Taylor Wimpey PLC | | | 14,337 | | | | 25,305 | |
TechnipFMC PLC | | | 27,807 | | | | 190,200 | |
Tesco PLC | | | 22,931 | | | | 64,497 | |
Unilever NV | | | 19,126 | | | | 1,019,755 | |
Unilever PLC | | | 7,713 | | | | 416,048 | |
Vodafone Group PLC | | | 368,729 | | | | 586,190 | |
WM Morrison Supermarkets PLC | | | 151,846 | | | | 357,709 | |
| | | | | | | | |
| | | | | | | 12,488,920 | |
|
| United States — 57.0% | |
3M Co. | | | 451 | | | | 70,352 | |
Abbott Laboratories | | | 18,066 | | | | 1,651,774 | |
AbbVie, Inc. | | | 20,053 | | | | 1,968,804 | |
ACI Worldwide, Inc.(a) | | | 3 | | | | 81 | |
Adobe, Inc.(a)(d) | | | 8,881 | | | | 3,865,988 | |
Advanced Micro Devices, Inc.(a) | | | 738 | | | | 38,826 | |
Aerojet Rocketdyne Holdings, Inc.(a) | | | 906 | | | | 35,914 | |
Aflac, Inc. | | | 9,597 | | | | 345,780 | |
Agilent Technologies, Inc. | | | 6,766 | | | | 597,911 | |
Alexandria Real Estate Equities, Inc. | | | 555 | | | | 90,049 | |
Allegion PLC | | | 15,514 | | | | 1,585,841 | |
Ally Financial, Inc. | | | 14,729 | | | | 292,076 | |
Alphabet, Inc., Class A(a) | | | 3,358 | | | | 4,761,812 | |
Alphabet, Inc., Class C(a) | | | 3,412 | | | | 4,823,237 | |
Altria Group, Inc. | | | 22,324 | | | | 876,217 | |
Amazon.com, Inc.(a) | | | 3,714 | | | | 10,246,257 | |
AMERCO | | | 173 | | | | 52,279 | |
Ameren Corp. | | | 280 | | | | 19,701 | |
American Express Co. | | | 8,898 | | | | 847,090 | |
American Tower Corp. | | | 1,736 | | | | 448,825 | |
American Water Works Co., Inc. | | | 182 | | | | 23,416 | |
Amgen, Inc. | | | 2,810 | | | | 662,767 | |
Annaly Capital Management, Inc. | | | 2,487 | | | | 16,315 | |
ANSYS, Inc.(a) | | | 1,594 | | | | 465,018 | |
Apple, Inc. | | | 36,013 | | | | 13,137,542 | |
Applied Materials, Inc. | | | 3,945 | | | | 238,475 | |
| | | | | | | | |
| Security | | Shares | | | Value | |
|
| United States (continued) | |
Arista Networks, Inc.(a) | | | 1,455 | | | $ | 305,594 | |
Aspen Technology, Inc.(a) | | | 160 | | | | 16,578 | |
AT&T, Inc. | | | 26,714 | | | | 807,564 | |
Atlassian Corp. PLC, Class A(a) | | | 1,399 | | | | 252,198 | |
Automatic Data Processing, Inc. | | | 3,213 | | | | 478,384 | |
AutoNation, Inc.(a) | | | 2,916 | | | | 109,583 | |
AvalonBay Communities, Inc. | | | 312 | | | | 48,248 | |
Avangrid, Inc. | | | 18,572 | | | | 779,653 | |
Avnet, Inc. | | | 6,468 | | | | 180,360 | |
Axis Capital Holdings Ltd. | | | 237 | | | | 9,613 | |
Axon Enterprise, Inc.(a) | | | 1,304 | | | | 127,962 | |
Bank of America Corp. | | | 86,655 | | | | 2,058,056 | |
Bank of New York Mellon Corp. | | | 5,312 | | | | 205,309 | |
Bausch Health Cos., Inc.(a) | | | 2,159 | | | | 39,503 | |
Best Buy Co., Inc. | | | 3,700 | | | | 322,899 | |
Bio-Rad Laboratories, Inc., Class A(a) | | | 37 | | | | 16,705 | |
Black Hills Corp. | | | 699 | | | | 39,605 | |
Boeing Co. | | | 3,790 | | | | 694,707 | |
Boston Scientific Corp.(a) | | | 14,366 | | | | 504,390 | |
Bristol-Myers Squibb Co. | | | 19,538 | | | | 1,148,834 | |
Broadcom, Inc. | | | 1,754 | | | | 553,580 | |
Broadridge Financial Solutions, Inc. | | | 171 | | | | 21,578 | |
Brown-Forman Corp., Class B | | | 2,313 | | | | 147,246 | |
Bruker Corp. | | | 469 | | | | 19,079 | |
CACI International, Inc., Class A(a) | | | 237 | | | | 51,401 | |
Cadence Design Systems, Inc.(a) | | | 5,479 | | | | 525,765 | |
Camden Property Trust | | | 337 | | | | 30,741 | |
Capital One Financial Corp. | | | 4,766 | | | | 298,304 | |
Capri Holdings Ltd.(a) | | | 4,461 | | | | 69,725 | |
Carlisle Cos., Inc. | | | 2,820 | | | | 337,469 | |
CarMax, Inc.(a) | | | 249 | | | | 22,298 | |
Cerner Corp. | | | 2,156 | | | | 147,794 | |
Charles Schwab Corp. | | | 2,022 | | | | 68,222 | |
Chipotle Mexican Grill, Inc.(a) | | | 992 | | | | 1,043,941 | |
Cimarex Energy Co. | | | 1,376 | | | | 37,826 | |
Cirrus Logic, Inc.(a) | | | 2,784 | | | | 171,996 | |
Cisco Systems, Inc. | | | 48,730 | | | | 2,272,767 | |
Citigroup, Inc. | | | 61,240 | | | | 3,129,364 | |
Citizens Financial Group, Inc. | | | 23,831 | | | | 601,494 | |
CME Group, Inc. | | | 5,682 | | | | 923,552 | |
CMS Energy Corp. | | | 11,772 | | | | 687,720 | |
Coca-Cola Co. | | | 45,517 | | | | 2,033,700 | |
Columbia Sportswear Co. | | | 3,822 | | | | 307,977 | |
Comcast Corp., Class A | | | 19,553 | | | | 762,176 | |
Consolidated Edison, Inc. | | | 5,546 | | | | 398,924 | |
Copart, Inc.(a) | | | 1,346 | | | | 112,081 | |
CoreSite Realty Corp. | | | 662 | | | | 80,142 | |
Costco Wholesale Corp. | | | 10,959 | | | | 3,322,878 | |
Crane Co. | | | 8,835 | | | | 525,329 | |
CSX Corp. | | | 8,289 | | | | 578,075 | |
Curtiss-Wright Corp. | | | 2,046 | | | | 182,667 | |
CyberArk Software Ltd.(a) | | | 1,906 | | | | 189,209 | |
Danaher Corp. | | | 7,574 | | | | 1,339,310 | |
Darden Restaurants, Inc. | | | 7,120 | | | | 539,482 | |
Discover Financial Services | | | 3,988 | | | | 199,759 | |
Dolby Laboratories, Inc., Class A | | | 2,367 | | | | 155,914 | |
Domino’s Pizza, Inc. | | | 2,465 | | | | 910,670 | |
DTE Energy Co. | | | 1,252 | | | | 134,590 | |
Ecolab, Inc. | | | 5,942 | | | | 1,182,161 | |
Edison International | | | 6,155 | | | | 334,278 | |
Edwards Lifesciences Corp.(a) | | | 44,622 | | | | 3,083,826 | |
Elanco Animal Health, Inc.(a) | | | 4,138 | | | | 88,760 | |
EMCOR Group, Inc. | | | 1,671 | | | | 110,520 | |
Equity Residential | | | 8,592 | | | | 505,381 | |
Essent Group Ltd. | | | 859 | | | | 31,156 | |
| | |
| 16 | | 2020 BLACKROCK ANNUAL REPORTTO SHAREHOLDERS |
| | |
Schedule of Investments (continued) June 30, 2020 | | BlackRock Advantage Global Fund, Inc. (Percentages shown are based on Net Assets) |
| | | | | | | | |
| Security | | Shares | | | Value | |
|
| United States (continued) | |
Etsy, Inc.(a) | | | 3,435 | | | $ | 364,900 | |
Expedia Group, Inc. | | | 905 | | | | 74,391 | |
Exxon Mobil Corp. | | | 846 | | | | 37,833 | |
Facebook, Inc., Class A(a) | | | 16,625 | | | | 3,775,039 | |
FactSet Research Systems, Inc. | | | 2,463 | | | | 809,022 | |
Ferguson PLC | | | 438 | | | | 35,814 | |
Fifth Third Bancorp | | | 2,996 | | | | 57,763 | |
First Horizon National Corp. | | | 71,992 | | | | 717,040 | |
FirstEnergy Corp. | | | 1,489 | | | | 57,743 | |
Fiserv, Inc.(a) | | | 9,847 | | | | 961,264 | |
FLIR Systems, Inc. | | | 2,438 | | | | 98,910 | |
Floor & Decor Holdings, Inc., Class A(a) | | | 429 | | | | 24,732 | |
FNB Corp. | | | 1,963 | | | | 14,723 | |
Fortinet, Inc.(a) | | | 2,162 | | | | 296,778 | |
Fox Corp., Class B(a) | | | 1,277 | | | | 34,275 | |
Franklin Resources, Inc. | | | 11,404 | | | | 239,142 | |
Gap, Inc. | | | 10,984 | | | | 138,618 | |
General Motors Co. | | | 2,707 | | | | 68,487 | |
Gentex Corp. | | | 1,095 | | | | 28,218 | |
Gilead Sciences, Inc. | | | 14,263 | | | | 1,097,395 | |
Globus Medical, Inc., Class A(a) | | | 395 | | | | 18,845 | |
Graco, Inc. | | | 373 | | | | 17,900 | |
H&R Block, Inc. | | | 4,490 | | | | 64,117 | |
Haemonetics Corp.(a) | | | 498 | | | | 44,601 | |
Hanesbrands, Inc. | | | 7,625 | | | | 86,086 | |
Hanover Insurance Group, Inc. | | | 168 | | | | 17,023 | |
Hasbro, Inc. | | | 218 | | | | 16,339 | |
Hawaiian Electric Industries, Inc. | | | 828 | | | | 29,858 | |
HCA Healthcare, Inc. | | | 94 | | | | 9,124 | |
HealthEquity, Inc.(a) | | | 697 | | | | 40,893 | |
Hewlett Packard Enterprise Co. | | | 41,689 | | | | 405,634 | |
Home Depot, Inc. | | | 17,882 | | | | 4,479,620 | |
Honeywell International, Inc. | | | 19,695 | | | | 2,847,700 | |
Howard Hughes Corp.(a) | | | 455 | | | | 23,637 | |
Hubbell, Inc. | | | 940 | | | | 117,838 | |
HubSpot, Inc.(a) | | | 3,545 | | | | 795,321 | |
IAA, Inc.(a) | | | 1,795 | | | | 69,233 | |
IDACORP, Inc. | | | 15,294 | | | | 1,336,237 | |
IDEX Corp. | | | 2,378 | | | | 375,819 | |
IHS Markit Ltd. | | | 4,309 | | | | 325,330 | |
Illumina, Inc.(a) | | | 1,936 | | | | 716,998 | |
Inovio Pharmaceuticals, Inc.(a) | | | 12,190 | | | | 328,521 | |
Intel Corp. | | | 7,442 | | | | 445,255 | |
Intercontinental Exchange, Inc. | | | 10,803 | | | | 989,555 | |
International Business Machines Corp. | | | 129 | | | | 15,579 | |
International Flavors & Fragrances, Inc. | | | 402 | | | | 49,229 | |
International Game Technology PLC | | | 19,850 | | | | 176,665 | |
Intuit, Inc. | | | 9,619 | | | | 2,849,052 | |
Intuitive Surgical, Inc.(a) | | | 1,793 | | | | 1,021,705 | |
John Bean Technologies Corp. | | | 263 | | | | 22,623 | |
Johnson & Johnson | | | 6,015 | | | | 845,889 | |
JPMorgan Chase & Co. | | | 5,786 | | | | 544,231 | |
Kohl’s Corp. | | | 33,575 | | | | 697,353 | |
L3Harris Technologies, Inc. | | | 8,271 | | | | 1,403,341 | |
Landstar System, Inc. | | | 264 | | | | 29,650 | |
Las Vegas Sands Corp. | | | 10,133 | | | | 461,457 | |
LendingTree, Inc.(a) | | | 148 | | | | 42,850 | |
Lennox International, Inc. | | | 919 | | | | 214,118 | |
Littelfuse, Inc. | | | 110 | | | | 18,769 | |
Lockheed Martin Corp. | | | 6,677 | | | | 2,436,571 | |
Lowe’s Cos., Inc. | | | 5,291 | | | | 714,920 | |
Lululemon Athletica, Inc.(a) | | | 601 | | | | 187,518 | |
Marsh & McLennan Cos., Inc. | | | 12,641 | | | | 1,357,264 | |
Masimo Corp.(a) | | | 1,217 | | | | 277,464 | |
| | | | | | | | |
| Security | | Shares | | | Value | |
|
| United States (continued) | |
Mastercard, Inc., Class A | | | 6,487 | | | $ | 1,918,206 | |
Maxim Integrated Products, Inc. | | | 3,049 | | | | 184,800 | |
Medallia, Inc.(a) | | | 542 | | | | 13,680 | |
Medtronic PLC | | | 17,683 | | | | 1,621,531 | |
Merck & Co., Inc. | | | 6,677 | | | | 516,332 | |
Mercury Systems, Inc.(a) | | | 198 | | | | 15,575 | |
MetLife, Inc. | | | 11,930 | | | | 435,684 | |
Mettler-Toledo International, Inc.(a) | | | 187 | | | | 150,638 | |
MGIC Investment Corp. | | | 9,860 | | | | 80,753 | |
MGM Resorts International | | | 2,504 | | | | 42,067 | |
Microsoft Corp. | | | 69,283 | | | | 14,099,783 | |
Moderna, Inc.(a) | | | 7,350 | | | | 471,944 | |
Mondelez International, Inc., Class A | | | 21,549 | | | | 1,101,800 | |
Monolithic Power Systems, Inc. | | | 148 | | | | 35,076 | |
Moody’s Corp. | | | 2,044 | | | | 561,548 | |
MSA Safety, Inc. | | | 106 | | | | 12,131 | |
National Instruments Corp. | | | 11,085 | | | | 429,100 | |
NeoGenomics, Inc.(a) | | | 681 | | | | 21,097 | |
NetApp, Inc. | | | 6,896 | | | | 305,976 | |
Netflix, Inc.(a) | | | 2,658 | | | | 1,209,496 | |
New Relic, Inc.(a) | | | 5,104 | | | | 351,666 | |
NIKE, Inc., Class B | | | 25,000 | | | | 2,451,250 | |
Norfolk Southern Corp. | | | 1,720 | | | | 301,980 | |
Northern Trust Corp. | | | 232 | | | | 18,407 | |
Northrop Grumman Corp. | | | 7,387 | | | | 2,271,059 | |
Novavax, Inc.(a) | | | 4,273 | | | | 356,155 | |
NuVasive, Inc.(a) | | | 289 | | | | 16,086 | |
NVIDIA Corp. | | | 6,092 | | | | 2,314,412 | |
Ollie’s Bargain Outlet Holdings, Inc.(a) | | | 417 | | | | 40,720 | |
ONE Gas, Inc. | | | 269 | | | | 20,726 | |
Oshkosh Corp. | | | 351 | | | | 25,139 | |
Paycom Software, Inc.(a) | | | 575 | | | | 178,095 | |
Paylocity Holding Corp.(a) | | | 1,582 | | | | 230,798 | |
PayPal Holdings, Inc.(a) | | | 9,333 | | | | 1,626,089 | |
Penn National Gaming, Inc.(a) | | | 3,276 | | | | 100,049 | |
Penumbra, Inc.(a) | | | 45 | | | | 8,047 | |
PepsiCo, Inc. | | | 19,997 | | | | 2,644,803 | |
Performance Food Group Co.(a) | | | 1,299 | | | | 37,853 | |
PerkinElmer, Inc. | | | 203 | | | | 19,912 | |
Pfizer, Inc. | | | 4,987 | | | | 163,075 | |
Philip Morris International, Inc. | | | 8,379 | | | | 587,033 | |
Pool Corp. | | | 2,035 | | | | 553,255 | |
PotlatchDeltic Corp. | | | 2 | | | | 76 | |
Principal Financial Group, Inc. | | | 1,187 | | | | 49,308 | |
Procter & Gamble Co. | | | 17,861 | | | | 2,135,640 | |
Prologis, Inc. | | | 5,148 | | | | 480,463 | |
Prudential Financial, Inc. | | | 34,096 | | | | 2,076,446 | |
Public Service Enterprise Group, Inc. | | | 415 | | | | 20,401 | |
QTS Realty Trust, Inc., Class A | | | 9,511 | | | | 609,560 | |
Quest Diagnostics, Inc. | | | 444 | | | | 50,598 | |
Radian Group, Inc. | | | 7,081 | | | | 109,826 | |
Ralph Lauren Corp. | | | 2,782 | | | | 201,751 | |
Regeneron Pharmaceuticals, Inc.(a) | | | 1,344 | | | | 838,186 | |
Reinsurance Group of America, Inc. | | | 414 | | | | 32,474 | |
ResMed, Inc.(d) | | | 1,991 | | | | 382,272 | |
RH(a) | | | 904 | | | | 225,006 | |
RingCentral, Inc., Class A(a) | | | 309 | | | | 88,068 | |
Robert Half International, Inc. | | | 6,867 | | | | 362,784 | |
Roper Technologies, Inc. | | | 4,725 | | | | 1,834,529 | |
Ross Stores, Inc. | | | 2,881 | | | | 245,576 | |
S&P Global, Inc. | | | 5,092 | | | | 1,677,712 | |
salesforce.com, Inc.(a) | | | 10,931 | | | | 2,047,704 | |
SBA Communications Corp. | | | 1,909 | | | | 568,729 | |
Schlumberger Ltd. | | | 42,286 | | | | 777,640 | |
| | | | |
| SCHEDULES OF INVESTMENTS | | | 17 | |
| | |
Schedule of Investments (continued) June 30, 2020 | | BlackRock Advantage Global Fund, Inc. (Percentages shown are based on Net Assets) |
| | | | | | | | |
| Security | | Shares | | | Value | |
|
| United States (continued) | |
Sempra Energy | | | 479 | | | $ | 56,153 | |
ServiceNow, Inc.(a) | | | 3,245 | | | | 1,314,420 | |
Sherwin-Williams Co. | | | 1,353 | | | | 781,831 | |
Silicon Laboratories, Inc.(a) | | | 4,826 | | | | 483,903 | |
Sirius XM Holdings, Inc. | | | 368,466 | | | | 2,162,895 | |
Skechers U.S.A., Inc., Class A(a) | | | 13,128 | | | | 411,957 | |
Southern Co. | | | 635 | | | | 32,925 | |
Starbucks Corp. | | | 42,912 | | | | 3,157,894 | |
Stryker Corp. | | | 6,845 | | | | 1,233,401 | |
Synchrony Financial | | | 10,343 | | | | 229,201 | |
Synovus Financial Corp. | | | 19,702 | | | | 404,482 | |
Sysco Corp. | | | 664 | | | | 36,294 | |
T. Rowe Price Group, Inc. | | | 3,268 | | | | 403,598 | |
Take-Two Interactive Software, Inc.(a) | | | 1,769 | | | | 246,899 | |
Teledyne Technologies, Inc.(a) | | | 859 | | | | 267,106 | |
Telephone & Data Systems, Inc. | | | 4,833 | | | | 96,080 | |
Teradata Corp.(a) | | | 4,292 | | | | 89,274 | |
Tesla, Inc.(a) | | | 874 | | | | 943,754 | |
Tetra Tech, Inc. | | | 201 | | | | 15,903 | |
Texas Instruments, Inc. | | | 10,288 | | | | 1,306,267 | |
Thermo Fisher Scientific, Inc. | | | 3,374 | | | | 1,222,535 | |
TJX Cos., Inc. | | | 9,860 | | | | 498,522 | |
Toro Co. | | | 9,600 | | | | 636,864 | |
Trane Technologies PLC | | | 5,545 | | | | 493,394 | |
TransUnion | | | 4,383 | | | | 381,496 | |
Travelers Cos., Inc. | | | 1,195 | | | | 136,290 | |
Twitter, Inc.(a) | | | 34,376 | | | | 1,024,061 | |
Uber Technologies, Inc.(a) | | | 6,641 | | | | 206,402 | |
UDR, Inc. | | | 2,234 | | | | 83,507 | |
UGI Corp. | | | 2,643 | | | | 84,047 | |
Umpqua Holdings Corp. | | | 1,240 | | | | 13,194 | |
Union Pacific Corp. | | | 2,991 | | | | 505,688 | |
United Parcel Service, Inc., Class B | | | 10,015 | | | | 1,113,468 | |
UnitedHealth Group, Inc. | | | 6,051 | | | | 1,784,742 | |
Unum Group | | | 6,774 | | | | 112,381 | |
Vail Resorts, Inc. | | | 215 | | | | 39,162 | |
Valero Energy Corp. | | | 544 | | | | 31,998 | |
Varian Medical Systems, Inc.(a) | | | 10,154 | | | | 1,244,068 | |
Veeva Systems, Inc., Class A(a) | | | 4,222 | | | | 989,721 | |
VeriSign, Inc.(a) | | | 630 | | | | 130,303 | |
Verisk Analytics, Inc. | | | 1,050 | | | | 178,710 | |
Verizon Communications, Inc. | | | 21,882 | | | | 1,206,355 | |
Vertex Pharmaceuticals, Inc.(a) | | | 720 | | | | 209,023 | |
VF Corp. | | | 4,711 | | | | 287,088 | |
Vir Biotechnology, Inc.(a) | | | 9,461 | | | | 387,617 | |
Visa, Inc., Class A | | | 14,440 | | | | 2,789,375 | |
VMware, Inc., Class A(a) | | | 8,367 | | | | 1,295,714 | |
W.W. Grainger, Inc. | | | 133 | | | | 41,783 | |
Waters Corp.(a) | | | 4,223 | | | | 761,829 | |
Wayfair, Inc., Class A(a) | | | 669 | | | | 132,201 | |
Webster Financial Corp. | | | 3,006 | | | | 86,002 | |
Wells Fargo & Co. | | | 120,274 | | | | 3,079,014 | |
Williams-Sonoma, Inc. | | | 7,708 | | | | 632,133 | |
Workday, Inc., Class A(a) | | | 2,752 | | | | 515,615 | |
Xerox Holdings Corp.(a) | | | 6,738 | | | | 103,024 | |
Xilinx, Inc. | | | 3,873 | | | | 381,064 | |
Xylem, Inc. | | | 15,122 | | | | 982,325 | |
Yum! Brands, Inc. | | | 2,659 | | | | 231,094 | |
Zions Bancorp. NA | | | 5,074 | | | | 172,516 | |
Zoetis, Inc. | | | 8,574 | | | | 1,174,981 | |
| | | | | | | | |
| | | | 210,890,856 | |
| | | | | | | | |
| |
Total Common Stocks — 96.4%
(Cost — $322,692,102) | | | | 356,619,033 | |
| | | | | | | | |
| | | | | | | | |
| Security | | Shares | | | Value | |
|
Preferred Stocks — 0.3% | |
|
| Brazil — 0.3% | |
Azul SA, Preference Shares(a) | | | 6,054 | | | $ | 22,388 | |
Banco Bradesco SA, Preference Shares | | | 211,695 | | | | 805,812 | |
Itau Unibanco Holding SA, Preference Shares | | | 65,742 | | | | 307,669 | |
Usinas Siderurgicas de Minas Gerais SA Usiminas, Preference ‘A’ Shares | | | 8,446 | | | | 11,291 | |
| | | | | | | | |
| | | | | | | 1,147,160 | |
|
| Germany — 0.0% | |
Sartorius AG, Preference Shares, 0.00% | | | 141 | | | | 46,537 | |
| | | | | | | | |
| |
| Russia — 0.0% | | | | |
Surgutneftegas PJSC, Preference Shares, 0.00% | | | 56,893 | | | | 28,062 | |
| | | | | | | | |
| |
| South Korea — 0.0% | | | | |
Samsung Electronics Co. Ltd., Preference Shares, 0.00% | | | 1,047 | | | | 40,785 | |
| | | | | | | | |
| |
Total Preferred Stocks — 0.3%
(Cost — $1,893,196) | | | | 1,262,544 | |
| | | | | | | | |
|
Rights — 0.0% | |
|
| China — 0.0% | |
Legend Holdings Corp., (Expires 07/20/20)(c) | | | 1,700 | | | | — | |
| | | | | | | | |
|
| Spain — 0.0% | |
Repsol SA, (Expires 07/09/20)(a) | | | 16,032 | | | | 7,805 | |
| | | | | | | | |
|
| United States — 0.0% | |
Bristol-Myers Squibb Co., (Expires 03/31/21)(a)(d) | | | 6,002 | | | | 21,487 | |
| | | | | | | | |
| |
Total Rights — 0.0%
(Cost — $21,648) | | | | 29,292 | |
| | | | | | | | |
| |
Total Long-Term Investments — 96.7%
(Cost — $324,606,946) | | | | 357,910,869 | |
| | | | | | | | |
|
Short-Term Securities — 3.9% | |
|
| Money Market Funds — 3.2% | |
BlackRock Liquidity Funds, T-Fund,
Institutional Class, 0.11%(e)(g) | | | 7,390,660 | | | | 7,390,660 | |
SL Liquidity Series, LLC, Money Market
Series, 0.50%(e)(f)(g) | | | 4,377,995 | | | | 4,381,498 | |
| | | | | | | | |
| |
Total Money Market Funds — 3.2% | | | | 11,772,158 | |
| | | | | | | | |
| | |
| | | Par (000) | | | | |
|
Time Deposits — 0.7% | |
|
| Australia — 0.1% | |
Brown Brothers Harriman & Co., 0.01%, 07/01/20 | | AUD | 615 | | | | 424,083 | |
| | | | | | | | |
|
| Canada — 0.1% | |
Royal Bank of Canada, 0.03%, 07/01/20 | | CAD | 498 | | | | 366,735 | |
| | | | | | | | |
|
| Europe — 0.0% | |
BNP Paribas SA, (0.67%), 07/01/20 | | EUR | 118 | | | | 132,357 | |
| | | | | | | | |
|
| Hong Kong — 0.1% | |
Hongkong & Shanghai Banking Corp. Ltd., 0.04%, 07/02/20 | | HKD | 1,131 | | | | 145,892 | |
| | | | | | | | |
|
| Japan — 0.1% | |
Sumitomo Bank Tokyo, (0.24%), 07/01/20 | | JPY | 54,844 | | | | 507,931 | |
| | | | | | | | |
|
| Norway — 0.1% | |
Brown Brothers Harriman & Co., (0.20%), 07/01/20 | | NOK | 1,636 | | | | 169,994 | |
| | | | | | | | |
| | |
| 18 | | 2020 BLACKROCK ANNUAL REPORTTO SHAREHOLDERS |
| | |
Schedule of Investments (continued) June 30, 2020 | | BlackRock Advantage Global Fund, Inc. (Percentages shown are based on Net Assets) |
| | | | | | | | |
| | | Par (000) | | | | |
|
| Singapore — 0.1% | |
Hongkong & Shanghai Banking Corp. Ltd., 0.00%, 07/01/20 | | SGD | 595 | | | $ | 427,057 | |
| | | | | | | | |
|
| United Kingdom — 0.1% | |
Citibank NA, New York, 0.01%, 07/01/20 | | GBP | 353 | | | | 436,871 | |
| | | | | | | | |
|
| United States — 0.0% | |
Citibank NA, New York, 0.10%, 07/01/20 | | USD | 58 | | | | 58,272 | |
| | | | | | | | |
| |
Total Time Deposits — 0.7% | | | | 2,669,192 | |
| | | | | | | | |
| |
Total Short-Term Securities — 3.9%
(Cost — $14,441,319) | | | | 14,441,350 | |
| | | | | | | | |
| |
Total Investments — 100.6%
(Cost — $339,048,265) | | | | 372,352,219 | |
| |
Liabilities in Excess of Other Assets — (0.6)% | | | | (2,377,811 | ) |
| | | | | | | | |
| |
Net Assets — 100.0% | | | $ | 369,974,408 | |
| | | | | | | | |
| (a) | Non-income producing security. |
| (b) | Security exempt from registration pursuant to Rule 144A under the Securities Act of 1933, as amended. These securities may be resold in transactions exempt from registration to qualified institutional investors. |
| (c) | Security is valued using significant unobservable inputs and is classified as Level 3 in the fair value hierarchy. |
| (d) | All or a portion of this security is on loan. |
| (e) | Annualized 7-day yield as of period end. |
| (f) | Security was purchased with the cash collateral from loaned securities. |
| (g) | Investments in issuers considered to be an affiliate/affiliates of the Fund during the year ended June 30, 2020 for purposes of Section 2(a)(3) of the Investment Company Act of 1940, as amended, were as follows: |
| | | | | | | | | | | | | | | | | | | | | | | | | | | | | | | | |
| Affiliated Issuer | | Shares Held at 06/30/19 | | | Shares Purchased | | | Shares Sold | | | Shares Held at 06/30/20 | | | Value at 06/30/20 | | | Income | | | Net Realized Gain (Loss) (a) | | | Change in Unrealized Appreciation (Depreciation) | |
BlackRock Liquidity Funds, T-Fund, Institutional Class | | | 2,101,908 | | | | 5,288,752 | (b) | | | — | | | | 7,390,660 | | | $ | 7,390,660 | | | $ | 40,707 | | | $ | 8 | | | $ | — | |
SL Liquidity Series, LLC, Money Market Series | | | 2,915,211 | | | | 1,462,784 | (b) | | | — | | | | 4,377,995 | | | | 4,381,498 | | | | 11,357 | (c) | | | 680 | | | | (56 | ) |
| | | | | | | | | | | | | | | | | | | | | | | | | | | | | | | | |
| | | $ | 11,772,158 | | | $ | 52,064 | | | $ | 688 | | | $ | (56 | ) |
| | | | | | | | | | | | | | | | | |
| | (a) | Includes net capital gain distributions, if applicable. | |
| | (b) | Represents net shares purchased (sold). | |
| | (c) | All or a portion represents securities lending income earned from the reinvestment of cash collateral from loaned securities, net of fees and collateral investment expenses, and other payments to and from borrowers of securities. | |
Derivative Financial Instruments Outstanding as of Period End
Futures Contracts
| | | | | | | | | | | | | | | | |
| Description | | Number of
Contracts | | | Expiration
Date | | | Notional
Amount (000) | | | Value /
Unrealized
Appreciation (Depreciation) | |
Long Contracts | | | | | | | | | | | | | | | | |
MSCI EAFE Index | | | 34 | | | | 09/18/20 | | | $ | 3,023 | | | $ | 22,607 | |
MSCI Emerging Markets Index | | | 27 | | | | 09/18/20 | | | | 1,331 | | | | 31,132 | |
S&P 500 E-Mini Index | | | 44 | | | | 09/18/20 | | | | 6,798 | | | | 122,705 | |
| | | | | | | | | | | | | | | | |
| | | | | | | | | | | | | | $ | 176,444 | |
| | | | | | | | | | | | | | | | |
Derivative Financial Instruments Categorized by Risk Exposure
As of year end, the fair values of derivative financial instruments located in the Statements of Assets and Liabilities were as follows:
| | | | | | | | | | | | | | | | | | | | | | | | | | | | |
| | | Commodity
Contracts | | | Credit
Contracts | | | Equity
Contracts | | | Foreign
Currency
Exchange
Contracts | | | Interest
Rate
Contracts | | | Other
Contracts | | | Total | |
Assets — Derivative Financial Instruments | | | | | | | | | | | | | | | | | | | | | | | | | | | | |
Futures contracts | | | | | | | | | | | | | | | | | | | | | | | | | | | | |
Unrealized appreciation on futures contracts(a) | | $ | — | | | $ | — | | | $ | 176,444 | | | $ | — | | | $ | — | | | $ | — | | | $ | 176,444 | |
| | | | | | | | | | | | | | | | | | | | | | | | | | | | |
| | (a) | Net cumulative unrealized appreciation (depreciation) on futures contracts and centrally cleared swaps, if any, are reported in the Schedule of Investments. In the Statements of Assets and Liabilities, only current day’s variation margin is reported in receivables or payables and the net cumulative unrealized appreciation (depreciation) is included in net unrealized appreciation (depreciation). | |
| | | | |
| SCHEDULES OF INVESTMENTS | | | 19 | |
| | |
Schedule of Investments (continued) June 30, 2020 | | BlackRock Advantage Global Fund, Inc. |
Derivative Financial Instruments Categorized by Risk Exposure (continued)
For the year ended June 30, 2020, the effect of derivative financial instruments in the Statements of Operations was as follows:
| | | | | | | | | | | | | | | | | | | | | | | | | | | | |
| | | Commodity
Contracts | | | Credit
Contracts | | | Equity
Contracts | | | Foreign
Currency
Exchange
Contracts | | | Interest
Rate
Contracts | | | Other
Contracts | | | Total | |
Net Realized Gain (Loss) from: | | | | | | | | | | | | | | | | | | | | | | | | | | | | |
Futures contracts | | $ | — | | | $ | — | | | $ | 235,238 | | | $ | — | | | $ | — | | | $ | — | | | $ | 235,238 | |
| | | | | | | | | | | | | | | | | | | | | | | | | | | | |
Net Change in Unrealized Appreciation (Depreciation) on: | | | | | | | | | | | | | | | | | | | | | | | | | | | | |
Futures contracts | | $ | — | | | $ | — | | | $ | (36,851 | ) | | $ | — | | | $ | — | | | $ | — | | | $ | (36,851 | ) |
| | | | | | | | | | | | | | | | | | | | | | | | | | | | |
Average Quarterly Balances of Outstanding Derivative Financial Instruments
| | | | |
Futures contracts: | | | | |
Average notional value of contracts — long | | $ | 11,506,386 | |
Average notional value of contracts — short | | $ | — | (a) |
| | (a) | Derivative not held at quarter-end. The risk exposure table serves as an indicator of activity during the period. | |
For more information about the Fund’s investment risks regarding derivative financial instruments, refer to the Notes to Financial Statements.
Fair Value Hierarchy as of Period End
Various inputs are used in determining the fair value of investments and derivative financial instruments. For information about the Fund’s policy regarding valuation of investments and derivative financial instruments, refer to the Notes to Financial Statements.
The following tables summarize the Fund’s investments categorized in the disclosure hierarchy:
| | | | | | | | | | | | | | | | |
| | | Level 1 | | | Level 2 | | | Level 3 | | | Total | |
Assets: | | | | | | | | | | | | | | | | |
Investments: | | | | | | | | | | | | | | | | |
Common Stocks: | | | | | | | | | | | | | | | | |
Australia | | $ | — | | | $ | 6,417,567 | | | $ | — | | | $ | 6,417,567 | |
Austria | | | — | | | | 336,181 | | | | — | | | | 336,181 | |
Belgium | | | — | | | | 515,452 | | | | — | | | | 515,452 | |
Brazil | | | 1,448,041 | | | | — | | | | — | | | | 1,448,041 | |
Canada | | | 5,514,216 | | | | — | | | | — | | | | 5,514,216 | |
China | | | 5,645,380 | | | | 14,450,028 | | | | — | | | | 20,095,408 | |
Czech Republic | | | — | | | | 87,769 | | | | — | | | | 87,769 | |
Denmark | | | — | | | | 1,577,909 | | | | — | | | | 1,577,909 | |
Finland | | | — | | | | 509,946 | | | | — | | | | 509,946 | |
France | | | — | | | | 13,486,418 | | | | — | | | | 13,486,418 | |
Germany | | | — | | | | 8,138,052 | | | | — | | | | 8,138,052 | |
Hong Kong | | | — | | | | 2,657,411 | | | | — | | | | 2,657,411 | |
Hungary | | | — | | | | 854,683 | | | | — | | | | 854,683 | |
India | | | — | | | | 2,899,751 | | | | — | | | | 2,899,751 | |
Indonesia | | | — | | | | 386,889 | | | | — | | | | 386,889 | |
Ireland | | | 28,437 | | | | 190,486 | | | | — | | | | 218,923 | |
Israel | | | 380,999 | | | | 40 | | | | — | | | | 381,039 | |
Italy | | | — | | | | 1,416,834 | | | | — | | | | 1,416,834 | |
Japan | | | — | | | | 21,392,524 | | | | — | | | | 21,392,524 | |
Jordan | | | — | | | | 55,404 | | | | — | | | | 55,404 | |
Luxembourg | | | 23,274 | | | | 203,074 | | | | — | | | | 226,348 | |
Malaysia | | | — | | | | 332,120 | | | | — | | | | 332,120 | |
Mexico | | | 920,990 | | | | — | | | | — | | | | 920,990 | |
Netherlands | | | 2,255,256 | | | | 3,613,936 | | | | — | | | | 5,869,192 | |
New Zealand | | | — | | | | 159,907 | | | | — | | | | 159,907 | |
Norway | | | — | | | | 1,069,194 | | | | — | | | | 1,069,194 | |
Peru | | | 41,043 | | | | — | | | | — | | | | 41,043 | |
Poland | | | — | | | | 853,971 | | | | — | | | | 853,971 | |
Portugal | | | — | | | | 186,087 | | | | — | | | | 186,087 | |
Puerto Rico | | | 16,541 | | | | — | | | | — | | | | 16,541 | |
Russia | | | 37,624 | | | | 717,416 | | | | — | | | | 755,040 | |
Singapore | | | — | | | | 606,792 | | | | — | | | | 606,792 | |
| | |
| 20 | | 2020 BLACKROCK ANNUAL REPORTTO SHAREHOLDERS |
| | |
Schedule of Investments (continued) June 30, 2020 | | BlackRock Advantage Global Fund, Inc. |
Fair Value Hierarchy as of Period End (continued)
| | | | | | | | | | | | | | | | |
| | | Level 1 | | | Level 2 | | | Level 3 | | | Total | |
South Africa | | $ | 40,856 | | | $ | 2,674,060 | | | $ | — | | | $ | 2,714,916 | |
South Korea | | | — | | | | 4,647,059 | | | | 7,358 | | | | 4,654,417 | |
Spain | | | 29,974 | | | | 1,639,007 | | | | — | | | | 1,668,981 | |
Sweden | | | — | | | | 2,816,773 | | | | — | | | | 2,816,773 | |
Switzerland | | | — | | | | 13,681,805 | | | | — | | | | 13,681,805 | |
Taiwan | | | — | | | | 7,180,575 | | | | — | | | | 7,180,575 | |
Thailand | | | 13,435 | | | | 543,099 | | | | — | | | | 556,534 | |
Turkey | | | 139,609 | | | | 398,005 | | | | — | | | | 537,614 | |
United Kingdom | | | 974,563 | | | | 11,514,357 | | | | — | | | | 12,488,920 | |
United States | | | 210,855,042 | | | | 35,814 | | | | — | | | | 210,890,856 | |
Preferred Stocks | | | 1,147,160 | | | | 115,384 | | | | — | | | | 1,262,544 | |
Rights | | | 29,292 | | | | — | | | | — | | | | 29,292 | |
Short-Term Securities: | | | | | | | | | | | | | | | | |
Money Market Funds | | | 7,390,660 | | | | — | | | | — | | | | 7,390,660 | |
Time Deposits | | | — | | | | 2,669,192 | | | | — | | | | 2,669,192 | |
| | | | | | | | | | | | | | | | |
Subtotal | | $ | 236,932,392 | | | $ | 131,030,971 | | | $ | 7,358 | | | $ | 367,970,721 | |
| | | | | | | | | | | | | | | | |
Investments Valued at NAV(a) | | | | | | | | | | | | | | | 4,381,498 | |
| | | | | | | | | | | | | | | | |
Total Investments | | | | | | | | | | | | | | $ | 372,352,219 | |
| | | | | | | | | | | | | | | | |
Derivative Financial Instruments(b) | | | | | | | | | | | | | | | | |
Assets: | | | | | | | | | | | | | | | | |
Equity contracts | | $ | 176,444 | | | $ | — | | | $ | — | | | $ | 176,444 | |
| | | | | | | | | | | | | | | | |
The breakdown of the Fund’s investments into major categories is disclosed in the Schedule of Investments above.
| | (a) | Certain investments of the Fund were fair valued using NAV per share as no quoted market value is available and therefore have been excluded from the fair value hierarchy. | |
| | (b) | Derivative financial instruments are futures contracts. Futures contracts are valued at the unrealized appreciation (depreciation) on the instrument. | |
See notes to financial statements.
| | | | |
| SCHEDULES OF INVESTMENTS | | | 21 | |
| | |
Schedule of Investments June 30, 2020 | | BlackRock EuroFund (Percentages shown are based on Net Assets) |
| | | | | | | | |
| Security | | Shares | | | Value | |
|
Common Stocks — 99.4% | |
|
| Belgium — 2.1% | |
KBC Group NV(a) | | | 35,467 | | | $ | 2,037,621 | |
| | | | | | | | |
|
| Denmark — 3.1% | |
DSV Panalpina AS | | | 24,018 | | | | 2,950,249 | |
| | | | | | | | |
|
| Finland — 4.1% | |
Kone OYJ, Class B | | | 39,250 | | | | 2,707,048 | |
Neste OYJ | | | 32,875 | | | | 1,291,200 | |
| | | | | | | | |
| | | | 3,998,248 | |
|
| France — 35.9% | |
BNP Paribas SA(a) | | | 75,014 | | | | 2,997,109 | |
Dassault Systemes SE | | | 9,367 | | | | 1,626,044 | |
Eiffage SA(a) | | | 14,188 | | | | 1,300,566 | |
Kering SA | | | 5,969 | | | | 3,263,365 | |
LVMH Moet Hennessy Louis Vuitton SE | | | 13,657 | | | | 6,029,496 | |
Pernod Ricard SA | | | 13,815 | | | | 2,175,397 | |
Safran SA(a) | | | 28,226 | | | | 2,839,289 | |
Sanofi | | | 41,006 | | | | 4,181,979 | |
Schneider Electric SE | | | 32,871 | | | | 3,656,459 | |
Teleperformance | | | 6,439 | | | | 1,639,896 | |
Vinci SA | | | 26,944 | | | | 2,498,334 | |
Worldline SA(a)(b) | | | 27,453 | | | | 2,393,612 | |
| | | | | | | | |
| | | | 34,601,546 | |
|
| Germany — 22.1% | |
adidas AG(a) | | | 9,070 | | | | 2,391,319 | |
Allianz SE, Registered Shares | | | 17,855 | | | | 3,648,531 | |
Deutsche Boerse AG | | | 12,152 | | | | 2,199,229 | |
Deutsche Wohnen SE, Bearer Shares | | | 54,042 | | | | 2,428,410 | |
MorphoSys AG(a) | | | 4,753 | | | | 602,619 | |
MTU Aero Engines AG | | | 10,065 | | | | 1,752,322 | |
Puma SE(a) | | | 13,344 | | | | 1,034,625 | |
Rational AG | | | 1,022 | | | | 572,716 | |
SAP SE | | | 31,578 | | | | 4,414,270 | |
Symrise AG | | | 19,171 | | | | 2,240,067 | |
| | | | | | | | |
| | | | 21,284,108 | |
|
| Ireland — 1.4% | |
Kingspan Group PLC(a) | | | 20,962 | | | | 1,353,229 | |
| | | | | | | | |
|
| Italy — 8.0% | |
Enel SpA | | | 260,045 | | | | 2,248,984 | |
FinecoBank Banca Fineco SpA(a) | | | 235,066 | | | | 3,181,399 | |
IMA Industria Macchine Automatiche SpA(a) | | | 13,094 | | | | 787,044 | |
Moncler SpA(a) | | | 38,439 | | | | 1,478,115 | |
| | | | | | | | |
| | | | 7,695,542 | |
|
| Netherlands — 11.8% | |
ASML Holding NV | | | 16,930 | | | | 6,193,211 | |
ASR Nederland NV | | | 26,060 | | | | 801,797 | |
BE Semiconductor Industries NV | | | 23,912 | | | | 1,060,251 | |
IMCD NV | | | 19,996 | | | | 1,885,611 | |
Koninklijke Philips NV(a) | | | 30,591 | | | | 1,427,000 | |
| | | | | | | | |
| | | | 11,367,870 | |
|
| Spain — 2.3% | |
Amadeus IT Group SA(a) | | | 17,731 | | | | 930,915 | |
Iberdrola SA | | | 111,202 | | | | 1,298,248 | |
| | | | | | | | |
| | | | 2,229,163 | |
|
| Switzerland — 4.1% | |
Sika AG, Registered Shares | | | 9,866 | | | | 1,901,892 | |
STMicroelectronics NV | | | 74,120 | | | | 2,020,382 | |
| | | | | | | | |
| | | | 3,922,274 | |
| | | | | | | | |
| Security | | Shares | | | Value | |
|
| United Kingdom — 4.5% | |
Linde PLC | | | 12,789 | | | $ | 2,708,639 | |
RELX PLC | | | 71,610 | | | | 1,657,468 | |
| | | | | | | | |
| | | | 4,366,107 | |
| |
Total Long-Term Investments — 99.4%
(Cost — $79,386,919) | | | | 95,805,957 | |
| | | | | | | | |
|
Short-Term Securities — 0.7% | |
|
Money Market Funds — 0.4% | |
BlackRock Liquidity Funds, T-Fund,
Institutional Class, 0.11%(c)(d) | | | 453,145 | | | | 453,145 | |
| | | | | | | | |
| |
Total Money Market Funds — 0.4% | | | | 453,145 | |
| | | | | | | | |
|
| | |
| | | | | | | | | | |
| Time Deposits — 0.3% | | | | Par (000) | | | | |
|
| Europe — 0.3% | |
Citibank, New York, 0.67%, 07/01/20 | | EUR | | | 254 | | | | 285,674 | |
| | | | | | | | | | |
| |
| Total Time Deposits — 0.3% | | | 285,674 | |
| | | | | | | | | | |
| |
Total Short-Term Securities — 0.7%
(Cost — $738,819) | | | | 738,819 | |
| | | | | | | | | | |
| |
Total Investments — 100.1%
(Cost — $80,125,738) | | | | 96,544,776 | |
| |
Liabilities in Excess of Other Assets — (0.1)% | | | | (133,793 | ) |
| | | | | | | | | | |
| |
Net Assets — 100.0% | | | $ | 96,410,983 | |
| | | | | |
| (a) | Non-income producing security. |
| (b) | Security exempt from registration pursuant to Rule 144A under the Securities Act of 1933, as amended. These securities may be resold in transactions exempt from registration to qualified institutional investors. |
| (c) | Annualized 7-day yield as of period end. |
| | |
| 22 | | 2020 BLACKROCK ANNUAL REPORTTO SHAREHOLDERS |
| | |
Schedule of Investments (continued) June 30, 2020 | | BlackRock EuroFund |
| (d) | Investments in issuers considered to be an affiliate/affiliates of the Fund during the year ended June 30, 2020 for purposes of Section 2(a)(3) of the Investment Company Act of 1940, as amended, were as follows: |
| | | | | | | | | | | | | | | | | | | | | | | | | | | | | | | | |
| Affiliated Issuer | | Shares
Held at
06/30/19 | | | Shares
Purchased | | | Shares
Sold | | | Shares
Held at
06/30/20 | | | Value at
06/30/20 | | | Income | | | Net
Realized
Gain (Loss) (a) | | | Change in
Unrealized
Appreciation
(Depreciation) | |
BlackRock Liquidity Funds, T-Fund, Institutional Class | | | — | | | | 453,145 | (b) | | | — | | | | 453,145 | | | $ | 453,145 | | | $ | 5,610 | | | $ | 1 | | | $ | — | |
SL Liquidity Series, LLC, Money Market Series(c) | | | 31,839 | | | | — | | | | (31,839 | )(b) | | | — | | | | — | | | | 1 | (d) | | | 3 | | | | (3 | ) |
| | | | | | | | | | | | | | | | | | | | | | | | | | | | | | | | |
| | | $ | 453,145 | | | $ | 5,611 | | | $ | 4 | | | $ | (3 | ) |
| | | | | | | | | | | | | | | | | |
| | (a) | Includes net capital gain distributions, if applicable. | |
| | (b) | Represents net shares purchased (sold). | |
| | (c) | As of period end, the entity is no longer held by the Fund. | |
| | (d) | All or a portion represents securities lending income earned from the reinvestment of cash collateral from loaned securities, net of fees and collateral investment expenses, and other payments to and from borrowers of securities. | |
Fair Value Hierarchy as of Period End
Various inputs are used in determining the fair value of investments. For information about the Fund’s policy regarding valuation of investments, refer to the Notes to Financial Statements.
The following table summarizes the Fund’s investments categorized in the disclosure hierarchy:
| | | | | | | | | | | | | | | | |
| | | Level 1 | | | Level 2 | | | Level 3 | | | Total | |
Assets: | |
Investments: | |
Common Stocks: | |
Belgium | | $ | — | | | $ | 2,037,621 | | | $ | — | | | $ | 2,037,621 | |
Denmark | | | — | | | | 2,950,249 | | | | — | | | | 2,950,249 | |
Finland | | | — | | | | 3,998,248 | | | | — | | | | 3,998,248 | |
France | | | — | | | | 34,601,546 | | | | — | | | | 34,601,546 | |
Germany | | | — | | | | 21,284,108 | | | | — | | | | 21,284,108 | |
Ireland | | | — | | | | 1,353,229 | | | | — | | | | 1,353,229 | |
Italy | | | 787,044 | | | | 6,908,498 | | | | — | | | | 7,695,542 | |
Netherlands | | | 1,427,000 | | | | 9,940,870 | | | | — | | | | 11,367,870 | |
Spain | | | — | | | | 2,229,163 | | | | — | | | | 2,229,163 | |
Switzerland | | | — | | | | 3,922,274 | | | | — | | | | 3,922,274 | |
United Kingdom | | | — | | | | 4,366,107 | | | | — | | | | 4,366,107 | |
Short-Term Securities: | | | | | | | | | | | | | | | | |
Money Market Funds | | | 453,145 | | | | — | | | | — | | | | 453,145 | |
Time Deposits | | | — | | | | 285,674 | | | | — | | | | 285,674 | |
| | | | | | | | | | | | | | | | |
| | $ | 2,667,189 | | | $ | 93,877,587 | | | $ | — | | | $ | 96,544,776 | |
| | | | | | | | | | | | | | | | |
The breakdown of the Fund’s investments into major categories is disclosed in the Schedule of Investments above.
See notes to financial statements.
| | | | |
| SCHEDULES OF INVESTMENTS | | | 23 | |
Statements of Assets and Liabilities
June 30, 2020
| | | | | | | | |
| | | BlackRock
Advantage Global
Fund, Inc. | | | BlackRock
EuroFund | |
|
ASSETS | |
Investments at value — unaffiliated(a)(b) | | $ | 360,580,061 | | | $ | 96,091,631 | |
Investments at value — affiliated(c) | | | 11,772,158 | | | | 453,145 | |
Cash | | | — | | | | 23 | |
Cash pledged for futures contracts | | | 989,000 | | | | — | |
Foreign currency at value(d) | | | 638,192 | | | | — | |
Receivables: | |
Investments sold | | | 5,220,555 | | | | 20,434 | |
Securities lending income — affiliated | | | 2,108 | | | | — | |
Capital shares sold | | | 167,667 | | | | 2,208 | |
Dividends — affiliated | | | 648 | | | | 31 | |
Dividends — unaffiliated | | | 961,178 | | | | 326,186 | |
Variation margin on futures contracts | | | 93,500 | | | | — | |
Prepaid expenses | | | 56,830 | | | | 43,573 | |
| | | | | | | | |
Total assets | | | 380,481,897 | | | | 96,937,231 | |
| | | | | | | | |
|
LIABILITIES | |
Bank overdraft | | | 29,595 | | | | — | |
Foreign bank overdraft(e) | | | — | | | | 5,029 | |
Cash collateral on securities loaned at value | | | 4,374,848 | | | | — | |
Payables: | |
Investments purchased | | | 5,083,634 | | | | 224,023 | |
Capital shares redeemed | | | 539,543 | | | | 103,465 | |
Investment advisory fees | | | 93,254 | | | | 54,174 | |
Directors’ and Officer’s fees | | | 2,886 | | | | 2,258 | |
Other accrued expenses | | | 293,180 | | | | 72,319 | |
Other affiliates | | | 1,376 | | | | 358 | |
Professional fees | | | — | | | | 48,835 | |
Service and distribution fees | | | 78,702 | | | | 15,787 | |
Variation margin on futures contracts | | | 10,471 | | | | — | |
| | | | | | | | |
Total liabilities | | | 10,507,489 | | | | 526,248 | |
| | | | | | | | |
| | |
NET ASSETS | | $ | 369,974,408 | | | $ | 96,410,983 | |
| | | | | | | | |
|
NET ASSETS CONSIST OF | |
Paid-in capital | | $ | 349,053,811 | | | $ | 115,680,887 | |
Accumulated earnings (loss) | | | 20,920,597 | | | | (19,269,904 | ) |
| | | | | | | | |
NET ASSETS | | $ | 369,974,408 | | | $ | 96,410,983 | |
| | | | | | | | |
| | |
(a) Investments at cost — unaffiliated | | $ | 327,276,147 | | | $ | 79,672,593 | |
(b) Securities loaned at value | | $ | 4,206,064 | | | $ | — | |
(c) Investments at cost — affiliated | | $ | 11,772,118 | | | $ | 453,145 | |
(d) Foreign currency at cost | | $ | 631,072 | | | $ | — | |
(e) Foreign bank overdraft at cost | | $ | — | | | $ | 5,029 | |
See notes to financial statements.
| | |
| 24 | | 2020 BLACKROCK ANNUAL REPORTTO SHAREHOLDERS |
Statements of Assets and Liabilities (continued)
June 30, 2020
| | | | | | | | |
| | | BlackRock
Advantage Global
Fund, Inc. | | | BlackRock
EuroFund | |
|
NET ASSET VALUE | |
| Institutional | |
Net assets | | | $75,804,879 | | | | $26,475,961 | |
| | | | | | | | |
Shares outstanding | | | 3,529,263 | | | | 1,850,299 | |
| | | | | | | | |
Net asset value | | $ | 21.48 | | | $ | 14.31 | |
| | | | | | | | |
Par Value | | $ | 0.10 | | | $ | 0.10 | |
| | | | | | | | |
Shares authorized | | | 100 million | | | | Unlimited | |
| | | | | | | | |
|
| Investor A | |
Net assets | | $ | 242,122,581 | | | $ | 65,887,045 | |
| | | | | | | | |
Shares outstanding | | | 11,891,934 | | | | 4,690,531 | |
| | | | | | | | |
Net asset value | | $ | 20.36 | | | $ | 14.05 | |
| | | | | | | | |
Par Value | | $ | 0.10 | | | $ | 0.10 | |
| | | | | | | | |
Shares authorized | | | 100 million | | | | Unlimited | |
| | | | | | | | |
|
| Investor C | |
Net assets | | $ | 35,626,142 | | | $ | 3,088,204 | |
| | | | | | | | |
Shares outstanding | | | 2,149,198 | | | | 318,901 | |
| | | | | | | | |
Net asset value | | $ | 16.58 | | | $ | 9.68 | |
| | | | | | | | |
Par Value | | $ | 0.10 | | | $ | 0.10 | |
| | | | | | | | |
Shares authorized | | | 100 million | | | | Unlimited | |
| | | | | | | | |
|
| Class K | |
Net assets | | $ | 12,107,861 | | | $ | 600,760 | |
| | | | | | | | |
Shares outstanding | | | 563,629 | | | | 42,143 | |
| | | | | | | | |
Net asset value | | $ | 21.48 | | | $ | 14.26 | |
| | | | | | | | |
Par Value | | $ | 0.10 | | | $ | 0.10 | |
| | | | | | | | |
Shares authorized | | | 2 billion | | | | Unlimited | |
| | | | | | | | |
|
| Class R | |
Net assets | | $ | 4,312,945 | | | $ | 359,013 | |
| | | | | | | | |
Shares outstanding | | | 235,355 | | | | 34,337 | |
| | | | | | | | |
Net asset value | | $ | 18.33 | | | $ | 10.46 | |
| | | | | | | | |
Par Value | | $ | 0.10 | | | $ | 0.10 | |
| | | | | | | | |
Shares authorized | | | 100 million | | | | Unlimited | |
| | | | | | | | |
See notes to financial statements.
Statements of Operations
Year Ended June 30, 2020
| | | | | | | | |
| | | BlackRock
Advantage Global
Fund, Inc. | | | BlackRock
EuroFund | |
|
INVESTMENT INCOME | |
Dividends — affiliated | | $ | 40,707 | | | $ | 5,610 | |
Dividends — unaffiliated | | | 9,189,217 | | | | 1,396,414 | |
Securities lending income — affiliated — net | | | 11,357 | | | | 1 | |
Non-cash dividends — unaffiliated | | | — | | | | 144,488 | |
Other income | | | — | | | | 7,557 | |
Foreign taxes withheld | | | (534,920 | ) | | | (181,864 | ) |
| | | | | | | | |
Total investment income | | | 8,706,361 | | | | 1,372,206 | |
| | | | | | | | |
|
EXPENSES | |
Investment advisory | | | 3,407,326 | | | | 775,861 | |
Service and distribution — class specific | | | 1,121,098 | | | | 211,153 | |
Transfer agent —class specific | | | 761,520 | | | | 146,233 | |
Custodian | | | 312,073 | | | | 28,235 | |
Professional | | | 87,917 | | | | 104,501 | |
Accounting services | | | 84,629 | | | | 34,413 | |
Registration | | | 81,887 | | | | 73,957 | |
Printing | | | 48,471 | | | | 26,859 | |
Directors and Officer | | | 10,959 | | | | 8,012 | |
Miscellaneous | | | 56,286 | | | | 21,635 | |
| | | | | | | | |
Total expenses | | | 5,972,166 | | | | 1,430,859 | |
Less: | |
Fees waived and/or reimbursed by the Manager | | | (1,442,979 | ) | | | (62,362 | ) |
Fees paid indirectly | | | (525 | ) | | | (14 | ) |
Transfer agent fees waived and/or reimbursed — class specific | | | (565,254 | ) | | | — | |
| | | | | | | | |
Total expenses after fees waived and/or reimbursed | | | 3,963,408 | | | | 1,368,483 | |
| | | | | | | | |
Net investment income | | | 4,742,953 | | | | 3,723 | |
| | | | | | | | |
|
REALIZED AND UNREALIZED GAIN (LOSS) | |
Net realized gain (loss) from: | |
Capital gain distributions from investment companies — affiliated | | | 8 | | | | 1 | |
Futures contracts | | | 235,238 | | | | — | |
Foreign currency transactions | | | (116,625 | ) | | | (19,749 | ) |
Investments — affiliated | | | 680 | | | | 3 | |
Investments — unaffiliated | | | (5,088,370 | ) | | | (1,910,503 | ) |
| | | | | | | | |
| | | (4,969,069 | ) | | | (1,930,248 | ) |
| | | | | | | | |
Net change in unrealized appreciation (depreciation) on: | | | | | | | | |
Futures contracts | | | (36,851 | ) | | | — | |
Foreign currency translations | | | 11,677 | | | | 19,898 | |
Investments — affiliated | | | (56 | ) | | | (3 | ) |
Investments — unaffiliated | | | 1,794,221 | | | | 510,872 | |
| | | | | | | | |
| | | 1,768,991 | | | | 530,767 | |
| | | | | | | | |
Net realized and unrealized loss | | | (3,200,078 | ) | | | (1,399,481 | ) |
| | | | | | | | |
NET INCREASE (DECREASE) IN NET ASSETS RESULTING FROM OPERATIONS | | | $1,542,875 | | | $ | (1,395,758 | ) |
| | | | | | | | |
See notes to financial statements.
| | |
| 26 | | 2020 BLACKROCK ANNUAL REPORTTO SHAREHOLDERS |
Statements of Changes in Net Assets
| | | | | | | | | | | | | | | | | | | | |
| | | BlackRock Advantage Global Fund, Inc. | | | | | | BlackRock EuroFund | |
| | | Year Ended June 30, | | | | | | Year Ended June 30, | |
| | | 2020 | | | 2019 | | | | | | 2020 | | | 2019 | |
| | | |
INCREASE (DECREASE) IN NET ASSETS | | | | | | | | | | | | | |
| | | |
OPERATIONS | | | | | | | | | | | | | |
Net investment income | | $ | 4,742,953 | | | $ | 6,785,690 | | | | | | | $ | 3,723 | | | $ | 893,745 | |
Net realized loss | | | (4,969,069 | ) | | | (8,141,079 | ) | | | | | | | (1,930,248 | ) | | | (22,475,209 | ) |
Net change in unrealized appreciation (depreciation) | | | 1,768,991 | | | | 16,003,426 | | | | | | | | 530,767 | | | | 11,584,386 | |
| | | | | | | | | | | | | | | | | | | | |
Net increase (decrease) in net assets resulting from operations | | | 1,542,875 | | | | 14,648,037 | | | | | | | | (1,395,758 | ) | | | (9,997,078 | ) |
| | | | | | | | | | | | | | | | | | | | |
| | | |
DISTRIBUTIONS TO SHAREHOLDERS(a) | | | | | | | | | | | | | |
Institutional | | | (1,613,181 | ) | | | (3,311,041 | ) | | | | | | | (145,120 | ) | | | (859,624 | ) |
Investor A | | | (4,905,774 | ) | | | (10,968,689 | ) | | | | | | | (91,353 | ) | | | (1,899,369 | ) |
Investor C | | | (635,057 | ) | | | (2,040,798 | ) | | | | | | | — | | | | (128,586 | ) |
Class K | | | (147,736 | ) | | | (172,264 | ) | | | | | | | (3,865 | ) | | | (23,568 | ) |
Class R | | | (132,081 | ) | | | (514,018 | ) | | | | | | | — | | | | (12,765 | ) |
| | | | | | | | | | | | | | | | | | | | |
Decrease in net assets resulting from distributions to Common shareholders | | | (7,433,829 | ) | | | (17,006,810 | ) | | | | | | | (240,338 | ) | | | (2,923,912 | ) |
| | | | | | | | | | | | | | | | | | | | |
| | | |
CAPITAL SHARE TRANSACTIONS | | | | | | | | | | | | | |
Net decrease in net assets derived from capital share transactions | | | (74,802,101 | ) | | | (98,451,408 | ) | | | | | | | (18,800,724 | ) | | | (72,780,593 | ) |
| | | | | | | | | | | | | | | | | | | | |
| | | |
NET ASSETS | | | | | | | | | | | | | |
Total decrease in net assets | | | (80,693,055 | ) | | | (100,810,181 | ) | | | | | | | (20,436,820 | ) | | | (85,701,583 | ) |
Beginning of year | | | 450,667,463 | | | | 551,477,644 | | | | | | | | 116,847,803 | | | | 202,549,386 | |
| | | | | | | | | | | | | | | | | | | | |
End of year | | $ | 369,974,408 | | | $ | 450,667,463 | | | | | | | $ | 96,410,983 | | | $ | 116,847,803 | |
| | | | | | | | | | | | | | | | | | | | |
| (a) | Distributions for annual periods determined in accordance with U.S. federal income tax regulations. |
See notes to financial statements.
Financial Highlights
(For a share outstanding throughout each period)
| | | | | | | | | | | | | | | | | | | | |
| | | BlackRock Advantage Global Fund, Inc. | |
| |
| | | Institutional | |
| |
| | | Year Ended June 30, | |
| | | 2020 | | | 2019 | | | 2018 | | | 2017 | | | 2016 | |
| | | | | |
Net asset value, beginning of year | | $ | 21.66 | | | $ | 21.63 | | | $ | 25.83 | | | $ | 21.85 | | | $ | 25.78 | |
| | | | | | | | | | | | | | | | | | | | |
Net investment income(a) | | | 0.31 | | | | 0.36 | | | | 0.29 | | | | 0.11 | | | | 0.04 | |
Net realized and unrealized gain (loss) | | | (0.06 | ) | | | 0.43 | | | | 2.82 | | | | 4.15 | | | | (2.87 | ) |
| | | | | | | | | | | | | | | | | | | | |
Net increase (decrease) from investment operations | | | 0.25 | | | | 0.79 | | | | 3.11 | | | | 4.26 | | | | (2.83 | ) |
| | | | | | | | | | | | | | | | | | | | |
| | | | | |
Distributions(b) | | | | | | | | | | | | | | | | | | | | |
From net investment income | | | (0.43 | ) | | | (0.32 | ) | | | (0.37 | ) | | | (0.28 | ) | | | — | |
From net realized gain | | | — | | | | (0.44 | ) | | | (6.94 | ) | | | — | | | | (1.10 | ) |
| | | | | | | | | | | | | | | | | | | | |
Total distributions | | | (0.43 | ) | | | (0.76 | ) | | | (7.31 | ) | | | (0.28 | ) | | | (1.10 | ) |
| | | | | | | | | | | | | | | | | | | | |
| | | | | |
Net asset value, end of year | | $ | 21.48 | | | $ | 21.66 | | | $ | 21.63 | | | $ | 25.83 | | | $ | 21.85 | |
| | | | | | | | | | | | | | | | | | | | |
| | | | | |
Total Return(c) | | | | | | | | | | | | | | | | | | | | |
Based on net asset value | | | 1.08 | % | | | 4.03 | % | | | 12.43 | % | | | 19.60 | % | | | (10.94 | )% |
| | | | | | | | | | | | | | | | | | | | |
| | | | | |
Ratios to Average Net Assets | | | | | | | | | | | | | | | | | | | | |
Total expenses | | | 1.15 | % | | | 1.14 | % | | | 1.16 | % | | | 1.17 | % | | | 1.07 | % |
| | | | | | | | | | | | | | | | | | | | |
Total expenses after fees waived and/or reimbursed and paid indirectly | | | 0.71 | % | | | 0.72 | % | | | 0.88 | % | | | 1.13 | % | | | 1.07 | % |
| | | | | | | | | | | | | | | | | | | | |
Net investment income | | | 1.46 | % | | | 1.72 | % | | | 1.20 | % | | | 0.47 | % | | | 0.17 | % |
| | | | | | | | | | | | | | | | | | | | |
| | | | | |
Supplemental Data | | | | | | | | | | | | | | | | | | | | |
Net assets, end of year (000) | | $ | 75,805 | | | $ | 87,759 | | | $ | 114,870 | | | $ | 258,047 | | | $ | 250,041 | |
| | | | | | | | | | | | | | | | | | | | |
Portfolio turnover rate | | | 182 | % | | | 137 | % | | | 189 | % | | | 59 | % | | | 73 | % |
| | | | | | | | | | | | | | | | | | | | |
| (a) | Based on average shares outstanding. |
| (b) | Distributions for annual periods determined in accordance with U.S. federal income tax regulations. |
| (c) | Where applicable, assumes the reinvestment of distributions. |
See notes to financial statements.
| | |
| 28 | | 2020 BLACKROCK ANNUAL REPORTTO SHAREHOLDERS |
Financial Highlights (continued)
(For a share outstanding throughout each period)
| | | | | | | | | | | | | | | | | | | | |
| | | BlackRock Advantage Global Fund, Inc. (continued) | |
| |
| | | Investor A | |
| |
| | | Year Ended June 30, | |
| | | 2020 | | | 2019 | | | 2018 | | | 2017 | | | 2016 | |
| | | | | |
Net asset value, beginning of year | | $ | 20.55 | | | $ | 20.56 | | | $ | 24.85 | | | $ | 21.00 | | | $ | 24.90 | |
| | | | | | | | | | | | | | | | | | | | |
Net investment income (loss)(a) | | | 0.24 | | | | 0.30 | | | | 0.25 | | | | 0.01 | | | | (0.04 | ) |
Net realized and unrealized gain (loss) | | | (0.05 | ) | | | 0.40 | | | | 2.67 | | | | 3.99 | | | | (2.76 | ) |
| | | | | | | | | | | | | | | | | | | | |
Net increase (decrease) from investment operations | | | 0.19 | | | | 0.70 | | | | 2.92 | | | | 4.00 | | | | (2.80 | ) |
| | | | | | | | | | | | | | | | | | | | |
| | | | | |
Distributions(b) | | | | | | | | | | | | | | | | | | | | |
From net investment income | | | (0.38 | ) | | | (0.27 | ) | | | (0.27 | ) | | | (0.15 | ) | | | — | |
From net realized gain | | | — | | | | (0.44 | ) | | | (6.94 | ) | | | — | | | | (1.10 | ) |
| | | | | | | | | | | | | | | | | | | | |
Total distributions | | | (0.38 | ) | | | (0.71 | ) | | | (7.21 | ) | | | (0.15 | ) | | | (1.10 | ) |
| | | | | | | | | | | | | | | | | | | | |
| | | | | |
Net asset value, end of year | | $ | 20.36 | | | $ | 20.55 | | | $ | 20.56 | | | $ | 24.85 | | | $ | 21.00 | |
| | | | | | | | | | | | | | | | | | | | |
| | | | | |
Total Return(c) | | | | | | | | | | | | | | | | | | | | |
Based on net asset value | | | 0.84 | % | | | 3.77 | % | | | 12.10 | % | | | 19.10 | % | | | (11.21 | )% |
| | | | | | | | | | | | | | | | | | | | |
| | | | | |
Ratios to Average Net Assets | | | | | | | | | | | | | | | | | | | | |
Total expenses | | | 1.46 | % | | | 1.46 | % | | | 1.53 | % | | | 1.54 | % | | | 1.42 | % |
| | | | | | | | | | | | | | | | | | | | |
Total expenses after fees waived and/or reimbursed and paid indirectly | | | 0.96 | % | | | 0.97 | % | | | 1.16 | % | | | 1.50 | % | | | 1.42 | % |
| | | | | | | | | | | | | | | | | | | | |
Net investment income (loss) | | | 1.21 | % | | | 1.48 | % | | | 1.06 | % | | | 0.06 | % | | | (0.20 | )% |
| | | | | | | | | | | | | | | | | | | | |
| | | | | |
Supplemental Data | | | | | | | | | | | | | | | | | | | | |
Net assets, end of year (000) | | $ | 242,123 | | | $ | 289,752 | | | $ | 324,978 | | | $ | 395,690 | | | $ | 382,069 | |
| | | | | | | | | | | | | | | | | | | | |
Portfolio turnover rate | | | 182 | % | | | 137 | % | | | 189 | % | | | 59 | % | | | 73 | % |
| | | | | | | | | | | | | | | | | | | | |
| (a) | Based on average shares outstanding. |
| (b) | Distributions for annual periods determined in accordance with U.S. federal income tax regulations. |
| (c) | Where applicable, excludes the effects of any sales charges and assumes the reinvestment of distributions. |
See notes to financial statements.
Financial Highlights (continued)
(For a share outstanding throughout each period)
| | | | | | | | | | | | | | | | | | | | |
| | | BlackRock Advantage Global Fund, Inc. (continued) | |
| |
| | | Investor C | |
| |
| | | Year Ended June 30, | |
| | | 2020 | | | 2019 | | | 2018 | | | 2017 | | | 2016 | |
| | | | | |
Net asset value, beginning of year | | $ | 16.79 | | | $ | 16.87 | | | $ | 21.45 | | | $ | 18.15 | | | $ | 21.86 | |
| | | | | | | | | | | | | | | | | | | | |
Net investment income (loss)(a) | | | 0.08 | | | | 0.11 | | | | 0.04 | | | | (0.16 | ) | | | (0.19 | ) |
Net realized and unrealized gain (loss) | | | (0.05 | ) | | | 0.34 | | | | 2.31 | | | | 3.46 | | | | (2.42 | ) |
| | | | | | | | | | | | | | | | | | | | |
Net increase (decrease) from investment operations | | | 0.03 | | | | 0.45 | | | | 2.35 | | | | 3.30 | | | | (2.61 | ) |
| | | | | | | | | | | | | | | | | | | | |
| | | | | |
Distributions(b) | | | | | | | | | | | | | | | | | | | | |
From net investment income | | | (0.24 | ) | | | (0.09 | ) | | | — | | | | — | | | | — | |
From net realized gain | | | — | | | | (0.44 | ) | | | (6.93 | ) | | | — | | | | (1.10 | ) |
| | | | | | | | | | | | | | | | | | | | |
Total distributions | | | (0.24 | ) | | | (0.53 | ) | | | (6.93 | ) | | | — | | | | (1.10 | ) |
| | | | | | | | | | | | | | | | | | | | |
| | | | | |
Net asset value, end of year | | $ | 16.58 | | | $ | 16.79 | | | $ | 16.87 | | | $ | 21.45 | | | $ | 18.15 | |
| | | | | | | | | | | | | | | | | | | | |
| | | | | |
Total Return(c) | | | | | | | | | | | | | | | | | | | | |
Based on net asset value | | | 0.11 | % | | | 2.99 | % | | | 11.23 | % | | | 18.18 | % | | | (11.93 | )% |
| | | | | | | | | | | | | | | | | | | | |
| | | | | |
Ratios to Average Net Assets | | | | | | | | | | | | | | | | | | | | |
Total expenses | | | 2.32 | % | | | 2.28 | % | | | 2.34 | % | | | 2.32 | % | | | 2.22 | % |
| | | | | | | | | | | | | | | | | | | | |
Total expenses after fees waived and/or reimbursed and paid indirectly | | | 1.71 | % | | | 1.72 | % | | | 1.95 | % | | | 2.29 | % | | | 2.22 | % |
| | | | | | | | | | | | | | | | | | | | |
Net investment income (loss) | | | 0.46 | % | | | 0.65 | % | | | 0.23 | % | | | (0.81 | )% | | | (1.01 | )% |
| | | | | | | | | | | | | | | | | | | | |
| | | | | |
Supplemental Data | | | | | | | | | | | | | | | | | | | | |
Net assets, end of year (000) | | $ | 35,626 | | | $ | 52,125 | | | $ | 90,299 | | | $ | 135,507 | | | $ | 245,795 | |
| | | | | | | | | | | | | | | | | | | | |
Portfolio turnover rate | | | 182 | % | | | 137 | % | | | 189 | % | | | 59 | % | | | 73 | % |
| | | | | | | | | | | | | | | | | | | | |
| (a) | Based on average shares outstanding |
| (b) | Distributions for annual periods determined in accordance with U.S. federal income tax regulations. |
| (c) | Where applicable, excludes the effects of any sales charges and assumes the reinvestment of distributions. |
See notes to financial statements.
| | |
| 30 | | 2020 BLACKROCK ANNUAL REPORTTO SHAREHOLDERS |
Financial Highlights (continued)
(For a share outstanding throughout each period)
| | | | | | | | | | | | | | | | |
| | | BlackRock Advantage Global
Fund, Inc. (continued) | |
| |
| | | Class K | |
| | | |
| | | Year Ended June 30, | | | | | | Period from 01/25/18 (a) to 06/30/18 | |
| | | 2020 | | | 2019 | |
| | | | | |
Net asset value, beginning of period | | $ | 21.66 | | | $ | 21.63 | | | | | | | $ | 23.12 | |
| | | | | | | | | | | | | | | | |
Net investment income(b) | | | 0.32 | | | | 0.41 | | | | | | | | 0.29 | |
Net realized and unrealized gain (loss) | | | (0.06 | ) | | | 0.39 | | | | | | | | (1.78 | ) |
| | | | | | | | | | | | | | | | |
Net increase (decrease) from investment operations | | | 0.26 | | | | 0.80 | | | | | | | | (1.49 | ) |
| | | | | | | | | | | | | | | | |
| | | | |
Distributions | | | | | | | | | | | | | | | | |
From net investment income | | | (0.44 | ) | | | (0.33 | ) | | | | | | | — | |
From net realized gain | | | — | | | | (0.44 | ) | | | | | | | — | |
| | | | | | | | | | | | | | | | |
Total distributions | | | (0.44 | ) | | | (0.77 | ) | | | | | | | — | |
| | | | | | | | | | | | | | | | |
| | | | |
Net asset value, end of period | | $ | 21.48 | | | $ | 21.66 | | | | | | | $ | 21.63 | |
| | | | | | | | | | | | | | | | |
| | | | |
Total Return(c) | | | | | | | | | | | | | | | | |
Based on net asset value | | | 1.13 | % | | | 4.09 | % | | | | | | | (6.44 | )%(d) |
| | | | | | | | | | | | | | | | |
| | | | |
Ratios to Average Net Assets | | | | | | | | | | | | | | | | |
Total expenses | | | 1.09 | % | | | 1.03 | % | | | | | | | 1.07 | %(e)(f) |
| | | | | | | | | | | | | | | | |
Total expenses after fees waived and/or reimbursed and paid indirectly | | | 0.66 | % | | | 0.66 | % | | | | | | | 0.66 | %(e) |
| | | | | | | | | | | | | | | | |
Net investment income | | | 1.53 | % | | | 1.98 | % | | | | | | | 3.09 | %(e) |
| | | | | | | | | | | | | | | | |
| | | | |
Supplemental Data | | | | | | | | | | | | | | | | |
Net assets, end of period (000) | | $ | 12,108 | | | $ | 10,625 | | | | | | | $ | 4,616 | |
| | | | | | | | | | | | | | | | |
Portfolio turnover rate | | | 182 | % | | | 137 | % | | | | | | | 189 | % |
| | | | | | | | | | | | | | | | |
| (a) | Commencement of operations. |
| (b) | Based on average shares outstanding. |
| (c) | Where applicable, assumes the reinvestment of distributions. |
| (d) | Aggregate total return. |
| (f) | Offering costs were not annualized in the calculation of the expense ratios. If these expenses were annualized, the total expenses would have been 1.07%. |
See notes to financial statements.
Financial Highlights (continued)
(For a share outstanding throughout each period)
| | | | | | | | | | | | | | | | | | | | |
| | | BlackRock Advantage Global Fund, Inc. (continued) | |
| |
| | | Class R | |
| |
| | | Year Ended June 30, | |
| | | 2020 | | | 2019 | | | 2018 | | | 2017 | | | 2016 | |
| | | | | |
Net asset value, beginning of year | | $ | 18.52 | | | $ | 18.60 | | | $ | 23.07 | | | $ | 19.48 | | | $ | 23.27 | |
| | | | | | | | | | | | | | | | | | | | |
Net investment income (loss)(a) | | | 0.18 | | | | 0.21 | | | | 0.17 | | | | (0.07 | ) | | | (0.11 | ) |
Net realized and unrealized gain (loss) | | | (0.06 | ) | | | 0.37 | | | | 2.47 | | | | 3.70 | | | | (2.58 | ) |
| | | | | | | | | | | | | | | | | | | | |
Net increase (decrease) from investment operations | | | 0.12 | | | | 0.58 | | | | 2.64 | | | | 3.63 | | | | (2.69 | ) |
| | | | | | | | | | | | | | | | | | | | |
| | | | | |
Distributions(b) | | | | | | | | | | | | | | | | | | | | |
From net investment income | | | (0.31 | ) | | | (0.22 | ) | | | (0.17 | ) | | | (0.04 | ) | | | — | |
From net realized gain | | | — | | | | (0.44 | ) | | | (6.94 | ) | | | — | | | | (1.10 | ) |
| | | | | | | | | | | | | | | | | | | | |
Total distributions | | | (0.31 | ) | | | (0.66 | ) | | | (7.11 | ) | | | (0.04 | ) | | | (1.10 | ) |
| | | | | | | | | | | | | | | | | | | | |
| | | | | |
Net asset value, end of year | | $ | 18.33 | | | $ | 18.52 | | | $ | 18.60 | | | $ | 23.07 | | | $ | 19.48 | |
| | | | | | | | | | | | | | | | | | | | |
| | | | | |
Total Return(c) | | | | | | | | | | | | | | | | | | | | |
Based on net asset value | | | 0.58 | % | | | 3.52 | % | | | 11.79 | % | | | 18.67 | % | | | (11.54 | )% |
| | | | | | | | | | | | | | | | | | | | |
| | | | | |
Ratios to Average Net Assets | | | | | | | | | | | | | | | | | | | | |
Total expenses | | | 1.77 | % | | | 1.79 | % | | | 1.87 | % | | | 1.92 | % | | | 1.77 | % |
| | | | | | | | | | | | | | | | | | | | |
Total expenses after fees waived and/or reimbursed and paid indirectly | | | 1.21 | % | | | 1.22 | % | | | 1.43 | % | | | 1.88 | % | | | 1.77 | % |
| | | | | | | | | | | | | | | | | | | | |
Net investment income (loss) | | | 0.98 | % | | | 1.18 | % | | | 0.80 | % | | | (0.33 | )% | | | (0.56 | )% |
| | | | | | | | | | | | | | | | | | | | |
| | | | | |
Supplemental Data | | | | | | | | | | | | | | | | | | | | |
Net assets, end of year (000) | | $ | 4,313 | | | $ | 10,407 | | | $ | 16,716 | | | $ | 19,642 | | | $ | 21,091 | |
| | | | | | | | | | | | | | | | | | | | |
Portfolio turnover rate | | | 182 | % | | | 137 | % | | | 189 | % | | | 59 | % | | | 73 | % |
| | | | | | | | | | | | | | | | | | | | |
| (a) | Based on average shares outstanding. |
| (b) | Distributions for annual periods determined in accordance with U.S. federal income tax regulations. |
| (c) | Where applicable, assumes the reinvestment of distributions. |
See notes to financial statements.
| | |
| 32 | | 2020 BLACKROCK ANNUAL REPORTTO SHAREHOLDERS |
Financial Highlights (continued)
(For a share outstanding throughout each period)
| | | | | | | | | | | | | | | | | | | | |
| | | BlackRock EuroFund | |
| |
| | | Institutional | |
| |
| | | Year Ended June 30, | |
| | | 2020 | | | 2019 | | | 2018 | | | 2017 | | | 2016 | |
| | | | | |
Net asset value, beginning of year | | $ | 14.40 | | | $ | 15.06 | | | $ | 14.78 | | | $ | 13.25 | | | $ | 15.51 | |
| | | | | | | | | | | | | | | | | | | | |
Net investment income(a) | | | 0.02 | | | | 0.13 | | | | 0.13 | | | | 0.16 | (b) | | | 0.25 | |
Net realized and unrealized gain (loss) | | | (0.04 | ) | | | (0.45 | ) | | | 0.33 | | | | 1.67 | | | | (2.28 | ) |
| | | | | | | | | | | | | | | | | | | | |
Net increase (decrease) from investment operations | | | (0.02 | ) | | | (0.32 | ) | | | 0.46 | | | | 1.83 | | | | (2.03 | ) |
| | | | | | | | | | | | | | | | | | | | |
Distributions from net investment income(c) | | | (0.07 | ) | | | (0.34 | ) | | | (0.18 | ) | | | (0.30 | ) | | | (0.23 | ) |
| | | | | | | | | | | | | | | | | | | | |
| | | | | |
Net asset value, end of year | | $ | 14.31 | | | $ | 14.40 | | | $ | 15.06 | | | $ | 14.78 | | | $ | 13.25 | |
| | | | | | | | | | | | | | | | | | | | |
| | | | | |
Total Return(d) | | | | | | | | | | | | | | | | | | | | |
Based on net asset value | | | (0.17 | )% | | | (1.77 | )% | | | 3.12 | % | | | 14.14 | % | | | (13.22 | )% |
| | | | | | | | | | | | | | | | | | | | |
| | | | | |
Ratios to Average Net Assets | | | | | | | | | | | | | | | | | | | | |
Total expenses | | | 1.24 | % | | | 1.23 | % | | | 1.11 | % | | | 1.10 | % | | | 1.07 | % |
| | | | | | | | | | | | | | | | | | | | |
Total expenses after fees waived and/or reimbursed | | | 1.18 | % | | | 1.17 | % | | | 1.08 | % | | | 1.10 | % | | | 1.07 | % |
| | | | | | | | | | | | | | | | | | | | |
Net investment income | | | 0.14 | % | | | 0.92 | % | | | 0.87 | % | | | 1.19 | %(b) | | | 1.72 | % |
| | | | | | | | | | | | | | | | | | | | |
| | | | | |
Supplemental Data | | | | | | | | | | | | | | | | | | | | |
Net assets, end of year (000) | | $ | 26,476 | | | $ | 33,178 | | | $ | 43,686 | | | $ | 146,685 | | | $ | 162,627 | |
| | | | | | | | | | | | | | | | | | | | |
Portfolio turnover rate | | | 39 | % | | | 153 | % | | | 98 | % | | | 93 | % | | | 100 | % |
| | | | | | | | | | | | | | | | | | | | |
| (a) | Based on average shares outstanding. |
| (b) | Net investment income per share and the ratio of net investment income to average net assets include $0.01 per share and 0.10%, respectively, resulting from a special dividend. |
| (c) | Distributions for annual periods determined in accordance with U.S. federal income tax regulations. |
| (d) | Where applicable, assumes the reinvestment of distributions. |
See notes to financial statements.
Financial Highlights (continued)
(For a share outstanding throughout each period)
| | | | | | | | | | | | | | | | | | | | |
| | | BlackRock EuroFund (continued) | |
| |
| | | Investor A | |
| |
| | | Year Ended June 30, | |
| | | 2020 | | | 2019 | | | 2018 | | | 2017 | | | 2016 | |
| | | | | |
Net asset value, beginning of year | | $ | 14.11 | | | $ | 14.78 | | | $ | 14.49 | | | $ | 12.98 | | | $ | 15.23 | |
| | | | | | | | | | | | | | | | | | | | |
Net investment income(a) | | | (0.00 | )(b) | | | 0.08 | | | | 0.18 | | | | 0.13 | (c) | | | 0.20 | |
Net realized and unrealized gain (loss) | | | (0.04 | ) | | | (0.44 | ) | | | 0.26 | | | | 1.64 | | | | (2.23 | ) |
| | | | | | | | | | | | | | | | | | | | |
Net increase (decrease) from investment operations | | | (0.04 | ) | | | (0.36 | ) | | | 0.44 | | | | 1.77 | | | | (2.03 | ) |
| | | | | | | | | | | | | | | | | | | | |
Distributions from net investment income(d) | | | (0.02 | ) | | | (0.31 | ) | �� | | (0.15 | ) | | | (0.26 | ) | | | (0.22 | ) |
| | | | | | | | | | | | | | | | | | | | |
| | | | | |
Net asset value, end of year | | $ | 14.05 | | | $ | 14.11 | | | $ | 14.78 | | | $ | 14.49 | | | $ | 12.98 | |
| | | | | | | | | | | | | | | | | | | | |
| | | | | |
Total Return(e) | | | | | | | | | | | | | | | | | | | | |
Based on net asset value | | | (0.30 | )% | | | (2.08 | )% | | | 3.02 | % | | | 13.92 | % | | | (13.41 | )% |
| | | | | | | | | | | | | | | | | | | | |
| | | | | |
Ratios to Average Net Assets | | | | | | | | | | | | | | | | | | | | |
Total expenses | | | 1.40 | % | | | 1.45 | % | | | 1.31 | % | | | 1.32 | % | | | 1.28 | % |
| | | | | | | | | | | | | | | | | | | | |
Total expenses after fees waived and/or reimbursed | | | 1.34 | % | | | 1.39 | % | | | 1.28 | % | | | 1.32 | % | | | 1.28 | % |
| | | | | | | | | | | | | | | | | | | | |
Net investment income (loss) | | | (0.01 | )% | | | 0.56 | % | | | 1.19 | % | | | 0.97 | %(c) | | | 1.46 | % |
| | | | | | | | | | | | | | | | | | | | |
| | | | | |
Supplemental Data | | | | | | | | | | | | | | | | | | | | |
Net assets, end of year (000) | | $ | 65,887 | | | $ | 78,418 | | | $ | 149,540 | | | $ | 165,427 | | | $ | 178,374 | |
| | | | | | | | | | | | | | | | | | | | |
Portfolio turnover rate | | | 39 | % | | | 153 | % | | | 98 | % | | | 93 | % | | | 100 | % |
| | | | | | | | | | | | | | | | | | | | |
| (a) | Based on average shares outstanding. |
| (b) | Amount is greater than $(0.005) per share. |
| (c) | Net investment income per share and the ratio of net investment income to average net assets include $0.01 per share and 0.10%, respectively, resulting from a special dividend. |
| (d) | Distributions for annual periods determined in accordance with U.S. federal income tax regulations. |
| (e) | Where applicable, excludes the effects of any sales charges and assumes the reinvestment of distributions. |
See notes to financial statements.
| | |
| 34 | | 2020 BLACKROCK ANNUAL REPORTTO SHAREHOLDERS |
Financial Highlights (continued)
(For a share outstanding throughout each period)
| | | | | | | | | | | | | | | | | | | | |
| | | BlackRock EuroFund (continued) | |
| |
| | | Investor C | |
| |
| | | Year Ended June 30, | |
| | | 2020 | | | 2019 | | | 2018 | | | 2017 | | | 2016 | |
| | | | | |
Net asset value, beginning of year | | $ | 9.79 | | | $ | 10.36 | | | $ | 10.16 | | | $ | 9.17 | | | $ | 10.82 | |
| | | | | | | | | | | | | | | | | | | | |
Net investment income (loss)(a) | | | (0.08 | ) | | | (0.02 | ) | | | 0.05 | | | | 0.01 | (b) | | | 0.07 | |
Net realized and unrealized gain (loss) | | | (0.03 | ) | | | (0.31 | ) | | | 0.18 | | | | 1.15 | | | | (1.58 | ) |
| | | | | | | | | | | | | | | | | | | | |
Net increase (decrease) from investment operations | | | (0.11 | ) | | | (0.33 | ) | | | 0.23 | | | | 1.16 | | | | (1.51 | ) |
| | | | | | | | | | | | | | | | | | | | |
Distributions from net investment income(c) | | | — | | | | (0.24 | ) | | | (0.03 | ) | | | (0.17 | ) | | | (0.14 | ) |
| | | | | | | | | | | | | | | | | | | | |
| | | | | |
Net asset value, end of year | | $ | 9.68 | | | $ | 9.79 | | | $ | 10.36 | | | $ | 10.16 | | | $ | 9.17 | |
| | | | | | | | | | | | | | | | | | | | |
| | | | | |
Total Return(d) | | | | | | | | | | | | | | | | | | | | |
Based on net asset value | | | (1.12 | )% | | | (2.82 | )% | | | 2.27 | % | | | 12.94 | % | | | (14.08 | )% |
| | | | | | | | | | | | | | | | | | | | |
| | | | | |
Ratios to Average Net Assets | | | | | | | | | | | | | | | | | | | | |
Total expenses | | | 2.19 | % | | | 2.20 | % | | | 2.08 | % | | | 2.13 | % | | | 2.09 | % |
| | | | | | | | | | | | | | | | | | | | |
Total expenses after fees waived and/or reimbursed | | | 2.13 | % | | | 2.14 | % | | | 2.04 | % | | | 2.13 | % | | | 2.09 | % |
| | | | | | | | | | | | | | | | | | | | |
Net investment income (loss) | | | (0.85 | )% | | | (0.17 | )% | | | 0.43 | % | | | 0.14 | %(b) | | | 0.67 | % |
| | | | | | | | | | | | | | | | | | | | |
| | | | | |
Supplemental Data | | | | | | | | | | | | | | | | | | | | |
Net assets, end of year (000) | | $ | 3,088 | | | $ | 4,179 | | | $ | 7,533 | | | $ | 8,038 | | | $ | 13,659 | |
| | | | | | | | | | | | | | | | | | | | |
Portfolio turnover rate | | | 39 | % | | | 153 | % | | | 98 | % | | | 93 | % | | | 100 | % |
| | | | | | | | | | | | | | | | | | | | |
| (a) | Based on average shares outstanding. |
| (b) | Net investment income per share and the ratio of net investment income to average net assets include $0.01 per share and 0.10%, respectively, resulting from a special dividend. |
| (c) | Distributions for annual periods determined in accordance with U.S. federal income tax regulations. |
| (d) | Where applicable, excludes the effects of any sales charges and assumes the reinvestment of distributions. |
See notes to financial statements.
Financial Highlights (continued)
(For a share outstanding throughout each period)
| | | | | | | | | | | | | | | | |
| | | BlackRock EuroFund (continued) | |
| |
| | | Class K | |
| | | |
| | | Year Ended June 30, | | | | | | Period from 01/25/18 (a) to 06/30/18 | |
| | | 2020 | | | 2019 | |
| | | | | |
Net asset value, beginning of period | | $ | 14.34 | | | $ | 15.08 | | | | | | | $ | 16.57 | |
| | | | | | | | | | | | | | | | |
Net investment income(b) | | | 0.03 | | | | 0.14 | | | | | | | | 0.26 | |
Net realized and unrealized loss | | | (0.02 | ) | | | (0.46 | ) | | | | | | | (1.75 | ) |
| | | | | | | | | | | | | | | | |
Net decrease from investment operations | | | 0.01 | | | | (0.32 | ) | | | | | | | (1.49 | ) |
| | | | | | | | | | | | | | | | |
Distributions from net investment income(c) | | | (0.09 | ) | | | (0.42 | ) | | | | | | | — | |
| | | | | | | | | | | | | | | | |
| | | | |
Net asset value, end of period | | $ | 14.26 | | | $ | 14.34 | | | | | | | $ | 15.08 | |
| | | | | | | | | | | | | | | | |
| | | | |
Total Return(d) | | | | | | | | | | | | | | | | |
Based on net asset value | | | 0.03 | % | | | (1.70 | )% | | | | | | | (8.99 | )%(e) |
| | | | | | | | | | | | | | | | |
| | | | |
Ratios to Average Net Assets | | | | | | | | | | | | | | | | |
Total expenses | | | 1.06 | % | | | 1.11 | % | | | | | | | 0.98 | %(f)(g) |
| | | | | | | | | | | | | | | | |
Total expenses after fees waived and/or reimbursed | | | 1.00 | % | | | 1.05 | % | | | | | | | 0.95 | %(f) |
| | | | | | | | | | | | | | | | |
Net investment income | | | 0.18 | % | | | 1.00 | % | | | | | | | 3.86 | %(f) |
| | | | | | | | | | | | | | | | |
| | | | |
Supplemental Data | | | | | | | | | | | | | | | | |
Net assets, end of period (000) | | $ | 601 | | | $ | 710 | | | | | | | $ | 1,005 | |
| | | | | | | | | | | | | | | | |
Portfolio turnover rate | | | 39 | % | | | 153 | % | | | | | | | 98 | % |
| | | | | | | | | | | | | | | | |
| (a) | Commencement of operations. |
| (b) | Based on average shares outstanding. |
| (c) | Distributions for annual periods determined in accordance with U.S. federal income tax regulations. |
| (d) | Where applicable, assumes the reinvestment of distributions. |
| (e) | Aggregate total return. |
| (g) | Offering costs were not annualized in the calculation of the expense ratios. If these expenses were annualized, the total expenses would have been 0.99%. |
See notes to financial statements.
| | |
| 36 | | 2020 BLACKROCK ANNUAL REPORTTO SHAREHOLDERS |
Financial Highlights (continued)
(For a share outstanding throughout each period)
| | | | | | | | | | | | | | | | | | | | |
| | | BlackRock EuroFund (continued) | |
| |
| | | Class R | |
| |
| | | Year Ended June 30, | |
| | | 2020 | | | 2019 | | | 2018 | | | 2017 | | | 2016 | |
| | | | | |
Net asset value, beginning of year | | $ | 10.54 | | | $ | 11.14 | | | $ | 10.96 | | | $ | 9.89 | | | $ | 11.66 | |
| | | | | | | | | | | | | | | | | | | | |
Net investment income (loss)(a) | | | (0.04 | ) | | | (0.01 | ) | | | 0.09 | | | | 0.05 | (b) | | | 0.11 | |
Net realized and unrealized gain (loss) | | | (0.04 | ) | | | (0.33 | ) | | | 0.18 | | | | 1.24 | | | | (1.71 | ) |
| | | | | | | | | | | | | | | | | | | | |
Net increase (decrease) from investment operations | | | (0.08 | ) | | | (0.34 | ) | | | 0.27 | | | | 1.29 | | | | (1.60 | ) |
| | | | | | | | | | | | | | | | | | | | |
Distributions from net investment income(c) | | | — | | | | (0.26 | ) | | | (0.09 | ) | | | (0.22 | ) | | | (0.17 | ) |
| | | | | | | | | | | | | | | | | | | | |
| | | | | |
Net asset value, end of year | | $ | 10.46 | | | $ | 10.54 | | | $ | 11.14 | | | $ | 10.96 | | | $ | 9.89 | |
| | | | | | | | | | | | | | | | | | | | |
| | | | | |
Total Return(d) | | | | | | | | | | | | | | | | | | | | |
Based on net asset value | | | (0.76 | )% | | | (2.66 | )% | | | 2.46 | % | | | 13.42 | % | | | (13.82 | )% |
| | | | | | | | | | | | | | | | | | | | |
| | | | | |
Ratios to Average Net Assets | | | | | | | | | | | | | | | | | | | | |
Total expenses | | | 1.87 | % | | | 2.07 | % | | | 1.81 | % | | | 1.83 | % | | | 1.72 | % |
| | | | | | | | | | | | | | | | | | | | |
Total expenses after fees waived and/or reimbursed | | | 1.81 | % | | | 2.01 | % | | | 1.77 | % | | | 1.83 | % | | | 1.72 | % |
| | | | | | | | | | | | | | | | | | | | |
Net investment income (loss) | | | (0.42 | )% | | | (0.07 | )% | | | 0.76 | % | | | 0.54 | %(b) | | | 1.08 | % |
| | | | | | | | | | | | | | | | | | | | |
| | | | | |
Supplemental Data | | | | | | | | | | | | | | | | | | | | |
Net assets, end of year (000) | | $ | 359 | | | $ | 363 | | | $ | 786 | | | $ | 1,017 | | | $ | 859 | |
| | | | | | | | | | | | | | | | | | | | |
Portfolio turnover rate | | | 39 | % | | | 153 | % | | | 98 | % | | | 93 | % | | | 100 | % |
| | | | | | | | | | | | | | | | | | | | |
| (a) | Based on average shares outstanding. |
| (b) | Net investment income per share and the ratio of net investment income to average net assets include $0.01 per share and 0.10%, respectively, resulting from a special dividend. |
| (c) | Distributions for annual periods determined in accordance with U.S. federal income tax regulations. |
| (d) | Where applicable, assumes the reinvestment of distributions. |
See notes to financial statements.
Notes to Financial Statements
BlackRock Advantage Global Fund, Inc., (the “Corporation”) and BlackRock EuroFund (the “Trust”) are each registered under the Investment Company Act of 1940, as amended (the “1940 Act”), as open-end management investment companies. BlackRock Advantage Global Fund, Inc. is organized as a Maryland corporation. BlackRock EuroFund is organized as a Massachusetts business trust. The following are referred to herein collectively as the “Funds” or individually as a “Fund”:
| | | | |
| Fund Name | | Herein Referred To As | | Diversification
Classification |
BlackRock Advantage Global Fund, Inc. | | Advantage Global | | Diversified |
BlackRock EuroFund | | EuroFund | | Diversified |
Each Fund offers multiple classes of shares. All classes of shares have identical voting, dividend, liquidation and other rights and are subject to the same terms and conditions, except that certain classes bear expenses related to the shareholder servicing and distribution of such shares. Institutional and Class K Shares are sold only to certain eligible investors. Investor A, Investor C and Class R Shares bear certain expenses related to shareholder servicing of such shares, and Investor C and Class R Shares also bear certain expenses related to the distribution of such shares. Investor A and Investor C Shares are generally available through financial intermediaries. Class R Shares are sold only to certain employer-sponsored retirement plans. Each class has exclusive voting rights with respect to matters relating to its shareholder servicing and distribution expenditures (except that Investor C shareholders may vote on material changes to the Investor A Shares distribution and service plan).
| | | | | | | | |
| Share Class | | Initial Sales Charge | | CDSC | | | Conversion Privilege |
Institutional, Class K and Class R Shares | | No | | | No | | | None |
Investor A Shares | | Yes | | | No | (a) | | None |
Investor C Shares | | No | | | Yes | (b) | | To Investor A Shares after approximately 10 years |
| | (a) | Investor A Shares may be subject to a contingent deferred sales charge (“CDSC”) for certain redemptions where no initial sales charge was paid at the time of purchase. | |
| | (b) | A CDSC of 1.00% is assessed on certain redemptions of Investor C Shares made within one year after purchase. | |
The Funds, together with certain other registered investment companies advised by BlackRock Advisors, LLC (the “Manager”) or its affiliates, are included in a complex of equity, multi-asset, index and money market funds referred to as the BlackRock Multi-Asset Complex.
| 2. | SIGNIFICANT ACCOUNTING POLICIES |
The financial statements are prepared in conformity with accounting principles generally accepted in the United States of America (“U.S. GAAP”), which may require management to make estimates and assumptions that affect the reported amounts of assets and liabilities in the financial statements, disclosure of contingent assets and liabilities at the date of the financial statements and the reported amounts of increases and decreases in net assets from operations during the reporting period. Actual results could differ from those estimates. Each Fund is considered an investment company under U.S. GAAP and follows the accounting and reporting guidance applicable to investment companies. Below is a summary of significant accounting policies:
Investment Transactions and Income Recognition: For financial reporting purposes, investment transactions are recorded on the dates the transactions are executed. Realized gains and losses on investment transactions are determined on the identified cost basis. Dividend income and non-cash dividend income, if any, are recorded on the ex-dividend date. Dividends from foreign securities where the ex-dividend date may have passed are subsequently recorded when the Funds are informed of the ex-dividend date. Under the applicable foreign tax laws, a withholding tax at various rates may be imposed on capital gains, dividends and interest. Interest income, including amortization and accretion of premiums and discounts on debt securities, are recognized on an accrual basis. Income, expenses and realized and unrealized gains and losses are allocated daily to each class based on its relative net assets.
Foreign Currency Translation: Each Fund’s books and records are maintained in U.S. dollars. Securities and other assets and liabilities denominated in foreign currencies are translated into U.S. dollars using exchange rates determined as of the close of trading on the New York Stock Exchange (“NYSE”). Purchases and sales of investments are recorded at the rates of exchange prevailing on the respective dates of such transactions. Generally, when the U.S. dollar rises in value against a foreign currency, the investments denominated in that currency will lose value; the opposite effect occurs if the U.S. dollar falls in relative value.
Each Fund does not isolate the portion of the results of operations arising as a result of changes in the exchange rates from the changes in the market prices of investments held or sold for financial reporting purposes. Accordingly, the effects of changes in exchange rates on investments are not segregated in the Statements of Operations from the effects of changes in market prices of those investments, but are included as a component of net realized and unrealized gain (loss) from investments. Each Fund reports realized currency gains (losses) on foreign currency related transactions as components of net realized gain (loss) for financial reporting purposes, whereas such components are generally treated as ordinary income for U.S. federal income tax purposes.
Segregation and Collateralization: In cases where a Fund enters into certain investments (e.g., futures contracts) that would be treated as “senior securities” for 1940 Act purposes, a Fund may segregate or designate on its books and records cash or liquid assets having a market value at least equal to the amount of its future obligations under such investments. Doing so allows the investment to be excluded from treatment as a “senior security.” Furthermore, if required by an exchange or counterparty agreement, the Funds may be required to deliver/deposit cash and/or securities to/with an exchange, or broker-dealer or custodian as collateral for certain investments or obligations.
Distributions: Distributions paid by the Funds are recorded on the ex-dividend dates. The character and timing of distributions are determined in accordance with U.S. federal income tax regulations, which may differ from U.S. GAAP.
| | |
| 38 | | 2020 BLACKROCK ANNUAL REPORTTO SHAREHOLDERS |
Notes to Financial Statements (continued)
Indemnifications: In the normal course of business, a Fund enters into contracts that contain a variety of representations that provide general indemnification. A Fund’s maximum exposure under these arrangements is unknown because it involves future potential claims against a Fund, which cannot be predicted with any certainty.
Other: Expenses directly related to a Fund or its classes are charged to that Fund or the applicable class. Other operating expenses shared by several funds, including other funds managed by the Manager, are prorated among those funds on the basis of relative net assets or other appropriate methods. Expenses directly related to the Funds and other shared expenses prorated to the Funds are allocated daily to each class based on their relative net assets or other appropriate methods.
The Funds have an arrangement with their custodian whereby credits are earned on uninvested cash balances, which could be used to reduce custody fees and/or overdraft charges. The Funds may incur charges on overdrafts, subject to certain conditions.
| 3. | INVESTMENT VALUATION AND FAIR VALUE MEASUREMENTS |
Investment Valuation Policies: The Funds’ investments are valued at fair value (also referred to as “market value” within the financial statements) as of the close of trading on the NYSE (generally 4:00 p.m., Eastern time). U.S. GAAP defines fair value as the price the Funds would receive to sell an asset or pay to transfer a liability in an orderly transaction between market participants at the measurement date. The Funds determine the fair values of their financial instruments using various independent dealers or pricing services under policies approved by the Board of Directors of the Trust (the “Board”). If a security’s market price is not readily available or does not otherwise accurately represent the fair value of the security, the security will be valued in accordance with a policy approved by the Board as reflecting fair value. The BlackRock Global Valuation Methodologies Committee (the “Global Valuation Committee”) is the committee formed by management to develop global pricing policies and procedures and to oversee the pricing function for all financial instruments.
Fair Value Inputs and Methodologies: The following methods and inputs are used to establish the fair value of each Fund’s assets and liabilities:
| | • | | Equity investments traded on a recognized securities exchange are valued at the official closing price each day, if available. For equity investments traded on more than one exchange, the official closing price on the exchange where the stock is primarily traded is used. Equity investments traded on a recognized exchange for which there were no sales on that day may be valued at the last available bid (long positions) or ask (short positions) price. |
Generally, trading in foreign instruments is substantially completed each day at various times prior to the close of trading on the NYSE. Occasionally, events affecting the values of such instruments may occur between the foreign market close and the close of trading on the NYSE that may not be reflected in the computation of the Funds’ net assets. Each business day, the Funds use a pricing service to assist with the valuation of certain foreign exchange-traded equity securities and foreign exchange-traded and over-the-counter (“OTC”) options (the “Systematic Fair Value Price”). Using current market factors, the Systematic Fair Value Price is designed to value such foreign securities and foreign options at fair value as of the close of trading on the NYSE, which follows the close of the local markets.
| | • | | Investments in open-end U.S. mutual funds are valued at net asset value (“NAV”) each business day. |
| | • | | The Funds value their investment in SL Liquidity Series, LLC, Money Market Series (the “Money Market Series”) at fair value, which is ordinarily based upon their pro rata ownership in the underlying fund’s net assets. The Money Market Series seeks current income consistent with maintaining liquidity and preserving capital. Although the Money Market Series is not registered under the 1940 Act, its investments may follow the parameters of investments by a money market fund that is subject to Rule 2a-7 under the 1940 Act. |
| | • | | Futures contracts notional values are determined based on that day’s last reported settlement price on the exchange where the contract is traded. |
If events (e.g., a company announcement, market volatility or a natural disaster) occur that are expected to materially affect the value of such investments, or in the event that the application of these methods of valuation results in a price for an investment that is deemed not to be representative of the market value of such investment, or if a price is not available, the investment will be valued by the Global Valuation Committee, or its delegate, in accordance with a policy approved by the Board as reflecting fair value (“Fair Valued Investments”). The fair valuation approaches that may be used by the Global Valuation Committee will include market approach, income approach and cost approach. Valuation techniques such as discounted cash flow, use of market comparables and matrix pricing are types of valuation approaches and are typically used in determining fair value. When determining the price for Fair Valued Investments, the Global Valuation Committee, or its delegate, seeks to determine the price that each Fund might reasonably expect to receive or pay from the current sale or purchase of that asset or liability in an arm’s-length transaction. Fair value determinations shall be based upon all available factors that the Global Valuation Committee, or its delegate, deems relevant and consistent with the principles of fair value measurement. The pricing of all Fair Valued Investments is subsequently reported to the Board or a committee thereof on a quarterly basis.
For investments in equity or debt issued by privately held companies or funds (“Private Company” or collectively, the “Private Companies”) and other Fair Valued Investments, the fair valuation approaches that are used by the Global Valuation Committee and third party pricing services utilize one or a combination of, but not limited to, the following inputs.
| | |
| | | Standard Inputs Generally Considered By Third Party Pricing Services |
Market approach | | (i) recent market transactions, including subsequent rounds of financing, in the underlying investment or comparable issuers; (ii) recapitalizations and other transactions across the capital structure; and (iii) market multiples of comparable issuers. |
Income approach | | (i) future cash flows discounted to present and adjusted as appropriate for liquidity, credit, and/or market risks; (ii) quoted prices for similar investments or assets in active markets; and (iii) other risk factors, such as interest rates, yield curves, volatilities, prepayment speeds, loss severities, credit risks, recovery rates, liquidation amounts and/or default rates. |
| | |
NOTESTO FINANCIAL STATEMENTS | | 39 |
Notes to Financial Statements (continued)
| | |
| | | Standard Inputs Generally Considered By Third Party Pricing Services |
Cost approach | | (i) audited or unaudited financial statements, investor communications and financial or operational metrics issued by the Private Company; (ii) changes in the valuation of relevant indices or publicly traded companies comparable to the Private Company; (iii) relevant news and other public sources; and (iv) known secondary market transactions in the Private Company’s interests and merger or acquisition activity in companies comparable to the Private Company. |
Investments in series of preferred stock issued by Private Companies are typically valued utilizing market approach in determining the enterprise value of the company. Such investments often contain rights and preferences that differ from other series of preferred and common stock of the same issuer. Valuation techniques such as an option pricing model (“OPM”), a probability weighted expected return model (“PWERM”) or a hybrid of those techniques are used in allocating enterprise value of the company, as deemed appropriate under the circumstances. The use of OPM and PWERM techniques involve a determination of the exit scenarios of the investment in order to appropriately allocate the enterprise value of the company among the various parts of its capital structure.
The Private Companies are not subject to the public company disclosure, timing, and reporting standards as other investments held by a Fund. Typically, the most recently available information by a Private Company is as of a date that is earlier than the date a Fund is calculating its NAV. This factor may result in a difference between the value of the investment and the price a Fund could receive upon the sale of the investment.
Fair Value Hierarchy: Various inputs are used in determining the fair value of investments and derivative financial instruments. These inputs to valuation techniques are categorized into a fair value hierarchy consisting of three broad levels for financial statement purposes as follows:
| | • | | Level 1 — Unadjusted price quotations in active markets/exchanges for identical assets or liabilities that each Fund has the ability to access |
| | • | | Level 2 — Other observable inputs (including, but not limited to, quoted prices for similar assets or liabilities in markets that are active, quoted prices for identical or similar assets or liabilities in markets that are not active, inputs other than quoted prices that are observable for the assets or liabilities (such as interest rates, yield curves, volatilities, prepayment speeds, loss severities, credit risks and default rates) or other market–corroborated inputs) |
| | • | | Level 3 — Unobservable inputs based on the best information available in the circumstances, to the extent observable inputs are not available (including the Global Valuation Committee’s assumptions used in determining the fair value of investments and derivative financial instruments) |
The hierarchy gives the highest priority to unadjusted quoted prices in active markets for identical assets or liabilities (Level 1 measurements) and the lowest priority to unobservable inputs (Level 3 measurements). Accordingly, the degree of judgment exercised in determining fair value is greatest for instruments categorized in Level 3. The inputs used to measure fair value may fall into different levels of the fair value hierarchy. In such cases, for disclosure purposes, the fair value hierarchy classification is determined based on the lowest level input that is significant to the fair value measurement in its entirety. Investments classified within Level 3 have significant unobservable inputs used by the Global Valuation Committee in determining the price for Fair Valued Investments. Level 3 investments include equity or debt issued by privately held companies or funds. There may not be a secondary market, and/or there are a limited number of investors. The categorization of a value determined for investments and derivative financial instruments is based on the pricing transparency of the investments and derivative financial instruments and is not necessarily an indication of the risks associated with investing in those securities.
As of June 30, 2020, certain investments of the Funds were fair valued using NAV per share or its equivalent as no quoted market value is available and therefore have been excluded from the fair value hierarchy.
| 4. | SECURITIES AND OTHER INVESTMENTS |
Preferred Stocks: Preferred stock has a preference over common stock in liquidation (and generally in receiving dividends as well), but is subordinated to the liabilities of the issuer in all respects. As a general rule, the market value of preferred stock with a fixed dividend rate and no conversion element varies inversely with interest rates and perceived credit risk, while the market price of convertible preferred stock generally also reflects some element of conversion value. Because preferred stock is junior to debt securities and other obligations of the issuer, deterioration in the credit quality of the issuer will cause greater changes in the value of a preferred stock than in a more senior debt security with similar stated yield characteristics. Unlike interest payments on debt securities, preferred stock dividends are payable only if declared by the issuer’s board of directors. Preferred stock also may be subject to optional or mandatory redemption provisions.
Securities Lending: Certain Funds may lend their securities to approved borrowers, such as brokers, dealers and other financial institutions. The borrower pledges and maintains with the Funds collateral consisting of cash, an irrevocable letter of credit issued by a bank, or securities issued or guaranteed by the U.S. Government. The initial collateral received by each Fund is required to have a value of at least 102% of the current value of the loaned securities for securities traded on U.S. exchanges and a value of at least 105% for all other securities. The collateral is maintained thereafter at a value equal to at least 100% of the current market value of the securities on loan. The market value of the loaned securities is determined at the close of each business day of the Fund and any additional required collateral is delivered to the Fund, or excess collateral returned by the Fund, on the next business day. During the term of the loan, the Funds are entitled to all distributions made on or in respect of the loaned securities, but do not receive interest income on securities received as collateral. Loans of securities are terminable at any time and the borrower, after notice, is required to return borrowed securities within the standard time period for settlement of securities transactions.
The market value of any securities on loan, all of which were classified as common stocks in the Funds’ Schedules of Investments, and the value of any related collateral are shown separately in the Statements of Assets and Liabilities as a component of investments at value — unaffiliated, and collateral on securities loaned at value, respectively. As of period end, any securities on loan were collateralized by cash and/or U.S. Government obligations. Cash collateral invested by the securities lending agent, BlackRock Investment Management, LLC (“BIM”), if any, is disclosed in the Schedules of Investments.
| | |
| 40 | | 2020 BLACKROCK ANNUAL REPORTTO SHAREHOLDERS |
Notes to Financial Statements (continued)
Securities lending transactions are entered into by the Funds under Master Securities Lending Agreements (each, an “MSLA”), which provide the right, in the event of default (including bankruptcy or insolvency), for the non-defaulting party to liquidate the collateral and calculate a net exposure to the defaulting party or request additional collateral. In the event that a borrower defaults, the Funds, as lender, would offset the market value of the collateral received against the market value of the securities loaned. When the value of the collateral is greater than that of the market value of the securities loaned, the lender is left with a net amount payable to the defaulting party. However, bankruptcy or insolvency laws of a particular jurisdiction may impose restrictions on or prohibitions against such a right of offset in the event of an MSLA counterparty’s bankruptcy or insolvency. Under the MSLA, absent an event of default, the borrower can resell or re-pledge the loaned securities, and a Fund can reinvest cash collateral received in connection with loaned securities. Upon an event of default, the parties’ obligations to return the securities or collateral to the other party are extinguished, and the parties can resell or re-pledge the loaned securities or the collateral received in connection with the loaned securities in order to satisfy the defaulting party’s net payment obligation for all transactions under the MSLA. The defaulting party remains liable for any deficiency.
As of period end, the following table is a summary of Advantage Global’s securities lending agreements by counterparty which are subject to offset under an MSLA:
| | | | | | | | | | | | |
| Counterparty | | Securities
Loaned at Value | | | Cash Collateral
Received (a) | | | Net
Amount (b) | |
Advantage Global | | | | | | | | | | | | |
Credit Suisse Securities (USA) LLC | | $ | 3,827,246 | | | $ | (3,810,606 | ) | | $ | 16,640 | |
Goldman Sachs & Co. | | | 28 | | | | (28 | ) | | | — | |
J.P. Morgan Securities LLC | | | 378,790 | | | | (378,790 | ) | | | — | |
| | | | | | | | | | | | |
| | $ | 4,206,064 | | | $ | (4,189,424 | ) | | $ | 16,640 | |
| | | | | | | | | | | | |
| | (a) | Collateral received in excess of the market value of securities on loan is not presented in this table. The total cash collateral received by the Fund is disclosed in the Fund’s Statements of Assets and Liabilities. | |
| | (b) | The market value of the loaned securities is determined as of June 30, 2020. Additional collateral is delivered to the Fund on the next business day in accordance with the MSLA. The net amount would be subject to the borrower default indemnity in the event of default by the counterparty. | |
The risks of securities lending include the risk that the borrower may not provide additional collateral when required or may not return the securities when due. To mitigate these risks, the Funds benefit from a borrower default indemnity provided by BIM. BIM’s indemnity allows for full replacement of the securities loaned to the extent the collateral received does not cover the value on the securities loaned in the event of borrower default. Each Fund could incur a loss if the value of an investment purchased with cash collateral falls below the market value of loaned securities or if the value of an investment purchased with cash collateral falls below the value of the original cash collateral received. Such losses are borne entirely by the Funds.
| 5. | DERIVATIVE FINANCIAL INSTRUMENTS |
The Funds engage in various portfolio investment strategies using derivative contracts both to increase the returns of the Funds and/or to manage their exposure to certain risks such as credit risk, equity risk, interest rate risk, foreign currency exchange rate risk, commodity price risk or other risks (e.g., inflation risk). Derivative financial instruments categorized by risk exposure are included in the Schedules of Investments. These contracts may be transacted on an exchange or OTC.
Futures Contracts: Futures contracts are purchased or sold to gain exposure to, or manage exposure to, changes in interest rates (interest rate risk) and changes in the value of equity securities (equity risk) or foreign currencies (foreign currency exchange rate risk).
Futures contracts are agreements between the Funds and a counterparty to buy or sell a specific quantity of an underlying instrument at a specified price and on a specified date. Depending on the terms of a contract, it is settled either through physical delivery of the underlying instrument on the settlement date or by payment of a cash amount on the settlement date. Upon entering into a futures contract, the Funds are required to deposit initial margin with the broker in the form of cash or securities in an amount that varies depending on a contract’s size and risk profile. The initial margin deposit must then be maintained at an established level over the life of the contract. Amounts pledged, which are considered restricted, are included in cash pledged for futures contracts in the Statements of Assets and Liabilities.
Securities deposited as initial margin are designated in the Schedules of Investments and cash deposited, if any, are shown as cash pledged for futures contracts in the Statements of Assets and Liabilities. Pursuant to the contract, the Funds agree to receive from or pay to the broker an amount of cash equal to the daily fluctuation in market value of the contract (“variation margin”). Variation margin is recorded as unrealized appreciation (depreciation) and, if any, shown as variation margin receivable (or payable) on futures contracts in the Statements of Assets and Liabilities. When the contract is closed, a realized gain or loss is recorded in the Statements of Operations equal to the difference between the notional amount of the contract at the time it was opened and the notional amount at the time it was closed. The use of futures contracts involves the risk of an imperfect correlation in the movements in the price of futures contracts and interest, foreign currency exchange rates or underlying assets.
| 6. | INVESTMENT ADVISORY AGREEMENT AND OTHER TRANSACTIONS WITH AFFILIATES |
Investment Advisory: Each Fund entered into an Investment Advisory Agreement with the Manager, the Funds’ investment adviser and an indirect, wholly-owned subsidiary of BlackRock, Inc. (“BlackRock”), to provide investment advisory and administrative services. The Manager is responsible for the management of each Fund’s portfolio and provides the personnel, facilities, equipment and certain other services necessary to the operations of each Fund.
| | |
NOTESTO FINANCIAL STATEMENTS | | 41 |
Notes to Financial Statements (continued)
For such services, each Fund pays the Manager a monthly fee at an annual rate equal to the following percentages of the average daily value of each Fund’s net assets:
| | | | | | | | |
| | | Investment Advisory Fee | |
| Average Daily Net Assets | | Advantage Global | | | EuroFund | |
First $1 Billion | | | 0.85 | % | | | 0.75 | % |
$1 Billion — $3 Billion | | | 0.80 | | | | 0.71 | |
$3 Billion — $5 Billion | | | 0.77 | | | | 0.68 | |
$5 Billion — $10 Billion | | | 0.74 | | | | 0.65 | |
Greater than $10 Billion | | | 0.72 | | | | 0.64 | |
The Manager, with respect to EuroFund, entered into a sub-advisory agreement with BlackRock International Limited (“BIL”), an affiliate of the Manager. The Manager pays BIL for services it provides for that portion of the Fund for which BIL acts as sub-adviser, a monthly fee that is equal to a percentage of the investment advisory fees paid by EuroFund to the Manager.
Service and Distribution Fees: The Funds entered into a Distribution Agreement and a Distribution and Service Plans with BlackRock Investments, LLC (“BRIL”), an affiliate of the Manager. Pursuant to the Distribution and Service Plans and in accordance with Rule 12b-1 under the 1940 Act, each Fund pays BRIL ongoing service and distribution fees. The fees are accrued daily and paid monthly at annual rates based upon the average daily net assets of the relevant share class of each Fund as follows:
| | | | | | | | |
| | | Service Fees | | | Distribution Fees | |
Investor A | | | 0.25 | % | | | — | % |
Investor C | | | 0.25 | | | | 0.75 | |
Class R | | | 0.25 | | | | 0.25 | |
BRIL and broker-dealers, pursuant to sub-agreements with BRIL, provide shareholder servicing and distribution services to the Funds. The ongoing service and/or distribution fee compensates BRIL and each broker-dealer for providing shareholder servicing and/or distribution related services to shareholders.
For the year ended June 30, 2020, the following table shows the class specific service and distribution fees borne directly by each share class of each Fund:
| | | | | | | | | | | | | | | | |
| | | Investor A | | | Investor C | | | Class R | | | Total | |
Advantage Global | | $ | 654,569 | | | $ | 429,767 | | | $ | 36,762 | | | $ | 1,121,098 | |
EuroFund | | | 174,241 | | | | 35,274 | | | | 1,638 | | | | 211,153 | |
Transfer Agent: Pursuant to written agreements, certain financial intermediaries, some of which may be affiliates, provide the Funds with sub-accounting, recordkeeping, sub-transfer agency and other administrative services with respect to servicing of underlying investor accounts. For these services, these entities receive an asset-based fee or an annual fee per shareholder account, which will vary depending on share class and/or net assets. For the year ended June 30, 2020, Advantage Global paid the following amounts to affiliates of BlackRock in return for these services, which are included in transfer agent — class specific in the Statements of Operations:
| | | | |
| | | Investor A | |
Advantage Global | | $ | 1,067 | |
For the year ended June 30, 2020, EuroFund did not pay any amounts to affiliates in return for these services.
The Manager maintains a call center that is responsible for providing certain shareholder services to the Funds. Shareholder services include responding to inquiries and processing purchases and sales based upon instructions from shareholders. For the year ended June 30, 2020, each Fund reimbursed the Manager the following amounts for costs incurred in running the call center, which are included in transfer agent — class specific in the Statements of Operations:
| | | | | | | | | | | | | | | | | | | | | | | | |
| | | Institutional | | | Investor A | | | Investor C | | | Class K | | | Class R | | | Total | |
Advantage Global | | $ | 365 | | | $ | 6,741 | | | $ | 1,159 | | | $ | 25 | | | $ | 139 | | | $ | 8,429 | |
EuroFund | | | 1,275 | | | | 2,976 | | | | 96 | | | | 18 | | | | 24 | | | | 4,389 | |
For the year ended June 30, 2020, the following table shows the class specific transfer agent fees borne directly by each share class of each Fund:
| | | | | | | | | | | | | | | | | | | | | | | | |
| | | Institutional | | | Investor A | | | Investor C | | | Class K | | | Class R | | | Total | |
Advantage Global | | $ | 102,267 | | | $ | 504,471 | | | $ | 131,368 | | | $ | 4,608 | | | $ | 18,806 | | | $ | 761,520 | |
EuroFund | | | 58,162 | | | | 81,426 | | | | 5,388 | | | | 155 | | | | 1,102 | | | | 146,233 | |
Other Fees: For the year ended June 30, 2020, affiliates earned underwriting discounts, direct commissions and dealer concessions on sales of each Fund’s Investor A Shares as follows:
| | | | |
| | | Investor A | |
Advantage Global | | $ | 3,286 | |
EuroFund | | | 403 | |
| | |
| 42 | | 2020 BLACKROCK ANNUAL REPORTTO SHAREHOLDERS |
Notes to Financial Statements (continued)
For the year ended June 30, 2020, affiliates received CDSCs as follows:
| | | | | | | | |
| | | Advantage Global | | | EuroFund | |
Investor A | | $ | 613 | | | $ | — | |
Investor C | | | 515 | | | | 3 | |
Expense Limitations, Waivers, Reimbursements, and Recoupments: With respect to each Fund, the Manager voluntarily agreed to waive its investment advisory fees by the amount of investment advisory fees each Fund pays to the Manager indirectly through its investment in affiliated money market funds (the “affiliated money market fund waiver”). The amount of waivers and/or reimbursements of fees and expenses made pursuant to the expense limitation described below will be reduced by the amount of the affiliated money market fund waiver. These amounts are included in fees waived and/or reimbursed by the Manager in the Statements of Operations. For the year ended June 30, 2020, the amounts waived were as follows:
| | | | | | | | |
| | | Advantage Global | | | EuroFund | |
Amounts waived | | $ | 2,858 | | | $ | 293 | |
The Manager has contractually agreed to waive its investment advisory fee with respect to any portion of each Fund’s assets invested in affiliated equity and fixed-income mutual funds and affiliated exchange-traded funds that have a contractual management fee through October 31, 2020. The contractual agreement may be terminated upon 90 days’ notice by a majority of the directors who are not “interested persons” of the Fund, as defined in the 1940 Act (“Independent Directors”), or by a vote of a majority of the outstanding voting securities of a Fund. For the year ended June 30, 2020, there were no fees waived and/or reimbursed by the Manager pursuant to this arrangement.
The Manager voluntarily agreed to waive a portion of its investment advisory fees equal to the annual rate of 0.06% of EuroFund’s average daily net assets. This amount is included in fees waived and/or reimbursed by the Manager in the Statements of Operations. During the year ended June 30, 2020, the Manager waived $62,069 pursuant to this agreement.
For the year ended June 30, 2020, the Funds reimbursed the Manager for certain accounting services, which is included in accounting services in the Statements of Operations. The reimbursements were as follows:
| | | | | | | | | | | | | | | | | | | | | | | | |
| | | Institutional | | | Investor A | | | Investor C | | | Class K | | | Class R | | | Total | |
Advantage Global | | $ | 1,009 | | | $ | 3,290 | | | $ | 542 | | | $ | 102 | | | $ | 94 | | | $ | 5,037 | |
EuroFund | | | 334 | | | | 793 | | | | 40 | | | | 7 | | | | 4 | | | | 1,178 | |
With respect to Advantage Global, the Manager contractually agreed to waive and/or reimburse fees or expenses in order to limit expenses, excluding interest expense, dividend expense, tax expense, acquired fund fees and expenses, and certain other fund expenses, which constitute extraordinary expenses not incurred in the ordinary course of the Fund’s business (“expense limitation”). The expense limitations as a percentage of average daily net assets are as follows:
| | | | | | | | | | | | | | | | | | | | |
| | | Institutional | | | Investor A | | | Investor C | | | Class K | | | Class R | |
Expense limitations | | | 0.71 | % | | | 0.96 | % | | | 1.71 | % | | | 0.66 | % | | | 1.21 | % |
The Manager has agreed not to reduce or discontinue these contractual expense limitations through October 31, 2020, unless approved by the Board, including a majority of the Independent Directors, or by a vote of a majority of the outstanding voting securities of Advantage Global. For the year ended June 30, 2020, the Manager waived and/or reimbursed $1,440,121, which is included in fees waived and/or reimbursed by the Manager in the Statements of Operations.
These amounts waived and/or reimbursed are shown as transfer agent fees waived — class specific, in the Statements of Operations. For the year ended June 30, 2020, class specific waivers were as follows:
| | | | | | | | | | | | | | | | | | | | | | | | |
| | | Institutional | | | Investor A | | | Investor C | | | Class K | | | Class R | | | Total | |
Advantage Global | | $ | 62,081 | | | $ | 373,558 | | | $ | 109,879 | | | $ | 4,607 | | | $ | 15,129 | | | $ | 565,254 | |
With respect to the contractual expense limitation, if during Advantage Global’s fiscal year the operating expenses of a share class, that at any time during the prior two fiscal years received a waiver and/or reimbursement from the Manager, are less than the current expense limitation for that share class, the Manager is entitled to be reimbursed by such share class up to the lesser of: (a) the amount of fees waived and/or expenses reimbursed during those prior two fiscal years under the agreement and (b) an amount not to exceed either the current expense limitation of that share class or the expense limitation of the share class in effect at the time that the share class received the applicable waiver and/or reimbursement, provided that:
(1) the Fund, of which the share class is a part, has more than $50 million in assets for the fiscal year, and
(2) the Manager or an affiliate continues to serve as the Fund’s investment adviser or administrator.
This repayment applies only to the contractual expense limitation on net expenses and does not apply to the contractual investment advisory fee waiver described above or any voluntary waivers that may be in effect from time to time. Effective December 1, 2019, the repayment arrangement between the Fund and the Manager pursuant to which such Fund may be required to repay amounts waived and/or reimbursed under the Fund’s contractual caps on net expenses was terminated.
| | |
NOTESTO FINANCIAL STATEMENTS | | 43 |
Notes to Financial Statements (continued)
The following fund level and class specific waivers and/or reimbursements previously recorded by Advantage Global Fund, which were subject to recoupment by the Manager, expired on December 1, 2019:
| | | | |
Fund Level | | $ | 3,664,549 | |
Institutional | | | 186,656 | |
Investor A | | | 1,017,033 | |
Investor C | | | 363,661 | |
Class K | | | 2,502 | |
Class R | | | 72,831 | |
Securities Lending: The U.S. Securities and Exchange Commission (“SEC”) has issued an exemptive order which permits BIM, an affiliate of the Manager, to serve as securities lending agent for the Funds, subject to applicable conditions. As securities lending agent, BIM bears all operational costs directly related to securities lending. The Funds are responsible for expenses in connection with the investment of cash collateral received for securities on loan (the “collateral investment expenses”). The cash collateral is invested in a private investment company managed by the Manager or its affiliates. However, BIM has agreed to cap the collateral investment expenses of the private investment company to an annual rate of 0.04%. The investment adviser to the private investment company will not charge any advisory fees with respect to shares purchased by the Funds. The private investment company in which the cash collateral has been invested may, under certain circumstances, impose a liquidity fee of up to 2% of the value withdrawn or temporarily restrict withdrawals for up to 10 business days during a 90 day period, in the event that the private investment company’s weekly liquid assets fall below certain thresholds.
Securities lending income is equal to the total of income earned from the reinvestment of cash collateral, net of fees and other payments to and from borrowers of securities, and less the collateral investment expenses. Each Fund retains a portion of securities lending income and remits a remaining portion to BIM as compensation for its services as securities lending agent.
Pursuant to the current securities lending agreement, each Fund retains 82% of securities lending income (which excludes collateral investment expenses), and this amount retained can never be less than 70% of the total of securities lending income plus the collateral investment expenses.
In addition, commencing the business day following the date that the aggregate securities lending income earned across the BlackRock Multi-Asset Complex in a calendar year exceeds a specified threshold, each Fund, pursuant to the securities lending agreement, will retain for the remainder of that calendar year securities lending income in an amount equal to 85% of securities lending income (which excludes collateral investment expenses), and this amount retained can never be less than 70% of the total of securities lending income plus the collateral investment expenses.
The share of securities lending income earned by each Fund is shown as securities lending income — affiliated — net in the Statements of Operations. For the year ended June 30, 2020, each Fund paid BIM the following amounts for securities lending agent services:
| | | | | | | | |
| | | Advantage Global | | | EuroFund | |
Securities lending agent services | | $ | 2,355 | | | $ | — | |
Interfund Lending: In accordance with an exemptive order (the “Order”) from the SEC, each Fund may participate in a joint lending and borrowing facility for temporary purposes (the “Interfund Lending Program”), subject to compliance with the terms and conditions of the Order, and to the extent permitted by each Fund’s investment policies and restrictions. EuroFund is currently permitted to borrow under the Interfund Lending Program. Advantage Global is currently permitted to borrow and lend under the Interfund Lending Program.
A lending BlackRock fund may lend in aggregate up to 15% of its net assets, but may not lend more than 5% of its net assets to any one borrowing fund through the Interfund Lending Program. A borrowing BlackRock fund may not borrow through the Interfund Lending Program or from any other source more than 33 1/3% of its total assets (or any lower threshold provided for by the fund’s investment restrictions). If a borrowing BlackRock fund’s total outstanding borrowings exceed 10% of its total assets, each of its outstanding interfund loans will be subject to collateralization of at least 102% of the outstanding principal value of the loan. All interfund loans are for temporary or emergency purposes and the interest rate to be charged will be the average of the highest current overnight repurchase agreement rate available to a lending fund and the bank loan rate, as calculated according to a formula established by the Board.
During the year ended June 30, 2020, the Funds did not participate in the Interfund Lending Program.
Directors and Officers: Certain directors and/or officers of the Funds are directors and/or officers of BlackRock or its affiliates. The Funds reimburse the Manager for a portion of the compensation paid to the Fund’s Chief Compliance Officer, which is included in Directors and Officer in the Statements of Operations.
For the year ended June 30, 2020, purchases and sales of investments excluding short-term securities, were as follows:
| | | | | | | | |
| | | Advantage Global | | | EuroFund | |
Purchases | | $ | 706,278,267 | | | $ | 40,218,445 | |
Sales | | | 783,117,132 | | | | 59,566,631 | |
It is each Fund’s policy to comply with the requirements of the Internal Revenue Code of 1986, as amended, applicable to regulated investment companies, and to distribute substantially all of its taxable income to its shareholders. Therefore, no U.S. federal income tax provision is required.
| | |
| 44 | | 2020 BLACKROCK ANNUAL REPORTTO SHAREHOLDERS |
Notes to Financial Statements (continued)
Each Fund files U.S. federal and various state and local tax returns. No income tax returns are currently under examination. The statute of limitations on each Fund’s U.S. federal tax returns generally remains open for each of the four years ended June 30, 2020. The statutes of limitations on each Fund’s state and local tax returns may remain open for an additional year depending upon the jurisdiction.
Management has analyzed tax laws and regulations and their application to the Funds as of June 30, 2020, inclusive of the open tax return years, and does not believe that there are any uncertain tax positions that require recognition of a tax liability in the Funds’ financial statements.
The tax character of distributions paid was as follows:
| | | | | | | | | | | | |
| | | | | | Advantage Global | | | EuroFund | |
Ordinary income | | | 06/30/20 | | | $ | 7,433,829 | | | $ | 240,338 | |
| | | 06/30/19 | | | | 14,619,801 | | | | 2,923,912 | |
Long-term capital gains | | | 06/30/20 | | | | — | | | | — | |
| | | 06/30/19 | | | | 2,387,009 | | | | — | |
| | | | | | | | | | | | |
| | | 06/30/20 | | | $ | 7,433,829 | | | $ | 240,338 | |
| | | | | | | | | | | | |
| | | 06/30/19 | | | $ | 17,006,810 | | | $ | 2,923,912 | |
| | | | | | | | | | | | |
As of period end, the tax components of accumulated earnings (loss) were as follows:
| | | | | | | | |
| | | Advantage Global | | | EuroFund | |
Undistributed ordinary income | | $ | 1,704,889 | | | $ | — | |
Non-expiring Capital loss carryforwards(a) | | | (8,961,241 | ) | | | (34,130,399 | ) |
Net unrealized gains(b) | | | 28,176,949 | | | | 14,873,038 | |
Qualified late-year losses(c) | | | — | | | | (12,543 | ) |
| | | | | | | | |
| | $ | 20,920,597 | | | $ | (19,269,904 | ) |
| | | | | | | | |
| | (a) | Amounts available to offset future realized capital gains. | |
| | (b) | The difference between book-basis and tax-basis net unrealized gains was attributable primarily to the tax deferral of losses on wash sales, the realization for tax purposes of unrealized gains on investments in passive foreign investment companies, the realization for tax purposes of unrealized gains/losses on certain futures and foreign currency contracts and the timing and recognition of partnership income. | |
| | (c) | The Fund has elected to defer certain qualified late-year losses and recognize such losses in the next taxable year. | |
As of June 30, 2020, gross unrealized appreciation and depreciation for investments and derivatives based on cost for U.S. federal income tax purposes were as follows:
| | | | | | | | |
| | | Advantage Global | | | EuroFund | |
Tax cost | | $ | 344,214,879 | | | $ | 81,670,308 | |
| | | | | | | | |
Gross unrealized appreciation | | $ | 49,155,564 | | | $ | 17,502,201 | |
Gross unrealized depreciation | | | (21,018,224 | ) | | | (2,627,733 | ) |
| | | | | | | | |
Net unrealized appreciation (depreciation) | | $ | 28,137,340 | | | $ | 14,874,468 | |
| | | | | | | | |
The Funds along with certain other funds managed by the Manager and its affiliates (“Participating Funds”), are parties to a 364-day, $2.25 billion credit agreement with a group of lenders. Under this agreement, the Funds may borrow to fund shareholder redemptions. Excluding commitments designated for certain individual funds, the Participating Funds, including the Funds, can borrow up to an aggregate commitment amount of $1.75 billion at any time outstanding, subject to asset coverage and other limitations as specified in the agreement. The credit agreement has the following terms: a fee of 0.10% per annum on unused commitment amounts and interest at a rate equal to the higher of (a) one-month LIBOR (but, in any event, not less than 0.00%) on the date the loan is made plus 0.80% per annum or (b) the Fed Funds rate (but, in any event, not less than 0.00%) in effect from time to time plus 0.80% per annum on amounts borrowed. The agreement expires in April 2021 unless extended or renewed. These fees were allocated among such funds based upon portions of the aggregate commitment available to them and relative net assets of Participating Funds. During the year ended June 30, 2020, the Funds did not borrow under the credit agreement.
In the normal course of business, certain Funds invest in securities or other instruments and may enter into certain transactions, and such activities subject each Fund to various risks, including among others, fluctuations in the market (market risk) or failure of an issuer to meet all of its obligations. The value of securities or other instruments may also be affected by various factors, including, without limitation: (i) the general economy; (ii) the overall market as well as local, regional or global political and/or social instability; (iii) regulation, taxation or international tax treaties between various countries; or (iv) currency, interest rate and price fluctuations. Local, regional or global events such as war, acts of terrorism, the spread of infectious illness or other public health issues, recessions, or other events could have a significant impact on the Funds and their investments. Each Fund’s prospectus provides details of the risks to which each Fund is subject.
The Funds may be exposed to additional risks when reinvesting cash collateral in money market funds that do not seek to maintain a stable NAV per share of $1.00, which may be subject to redemption gates or liquidity fees under certain circumstances.
| | |
NOTESTO FINANCIAL STATEMENTS | | 45 |
Notes to Financial Statements (continued)
Valuation Risk: The market values of equities, such as common stocks and preferred securities or equity related investments, such as futures and options, may decline due to general market conditions which are not specifically related to a particular company. They may also decline due to factors which affect a particular industry or industries. A Fund may invest in illiquid investments. An illiquid investment is any investment that a Fund reasonably expects cannot be sold or disposed of in current market conditions in seven calendar days or less without the sale or disposition significantly changing the market value of the investment. A Fund may experience difficulty in selling illiquid investments in a timely manner at the price that it believes the investments are worth. Prices may fluctuate widely over short or extended periods in response to company, market or economic news. Markets also tend to move in cycles, with periods of rising and falling prices. This volatility may cause each Fund’s NAV to experience significant increases or decreases over short periods of time. If there is a general decline in the securities and other markets, the NAV of a Fund may lose value, regardless of the individual results of the securities and other instruments in which a Fund invests.
The price a Fund could receive upon the sale of any particular portfolio investment may differ from a Fund’s valuation of the investment, particularly for securities that trade in thin or volatile markets or that are valued using a fair valuation technique or a price provided by an independent pricing service. Changes to significant unobservable inputs and assumptions (i.e., publicly traded company multiples, growth rate, time to exit) due to the lack of observable inputs may significantly impact the resulting fair value and therefore a Fund’s results of operations. As a result, the price received upon the sale of an investment may be less than the value ascribed by a Fund, and a Fund could realize a greater than expected loss or lesser than expected gain upon the sale of the investment. A Fund’s ability to value its investments may also be impacted by technological issues and/or errors by pricing services or other third party service providers.
An outbreak of respiratory disease caused by a novel coronavirus has developed into a global pandemic and has resulted in closing borders, quarantines, disruptions to supply chains and customer activity, as well as general concern and uncertainty. The impact of this pandemic, and other global health crises that may arise in the future, could affect the economies of many nations, individual companies and the market in general in ways that cannot necessarily be foreseen at the present time. This pandemic may result in substantial market volatility and may adversely impact the prices and liquidity of a fund’s investments. The duration of this pandemic and its effects cannot be determined with certainty.
Counterparty Credit Risk: The Funds may be exposed to counterparty credit risk, or the risk that an entity may fail to or be unable to perform on its commitments related to unsettled or open transactions. The Funds manage counterparty credit risk by entering into transactions only with counterparties that the Manager believes have the financial resources to honor their obligations and by monitoring the financial stability of those counterparties. Financial assets, which potentially expose the Funds to market, issuer and counterparty credit risks, consist principally of financial instruments and receivables due from counterparties. The extent of the Funds’ exposure to market, issuer and counterparty credit risks with respect to these financial assets is approximately their value recorded in the Statements of Assets and Liabilities, less any collateral held by the Funds.
A derivative contract may suffer a mark-to-market loss if the value of the contract decreases due to an unfavorable change in the market rates or values of the underlying instrument. Losses can also occur if the counterparty does not perform under the contract.
With exchange-traded futures, there is less counterparty credit risk to the Funds since the exchange or clearinghouse, as counterparty to such instruments, guarantees against a possible default. The clearinghouse stands between the buyer and the seller of the contract; therefore, credit risk is limited to failure of the clearinghouse. While offset rights may exist under applicable law, a Fund does not have a contractual right of offset against a clearing broker or clearinghouse in the event of a default (including the bankruptcy or insolvency). Additionally, credit risk exists in exchange-traded futures with respect to initial and variation margin that is held in a clearing broker’s customer accounts. While clearing brokers are required to segregate customer margin from their own assets, in the event that a clearing broker becomes insolvent or goes into bankruptcy and at that time there is a shortfall in the aggregate amount of margin held by the clearing broker for all its clients, typically the shortfall would be allocated on a pro rata basis across all the clearing broker’s customers, potentially resulting in losses to the Funds.
Concentration Risk: The Funds invest a substantial amount of their assets in issuers located in a single country or a limited number of countries. When the Funds concentrate their investments in this manner, it assumes the risk that economic, political and social conditions in those countries may have a significant impact on their investment performance. Foreign issuers may not be subject to the same uniform accounting, auditing and financial reporting standards and practices as used in the United States. Foreign securities markets may also be more volatile and less liquid than U.S. securities and may be less subject to governmental supervision not typically associated with investing in U.S. securities. Investment percentages in specific countries are presented in the Schedules of Investments.
EuroFund invests a significant portion of its assets in securities of issuers located in Europe or with significant exposure to European issuers or countries. The European financial markets have recently experienced volatility and adverse trends due to concerns about economic downturns in, or rising government debt levels of, several European countries. These events may spread to other countries in Europe and may affect the value and liquidity of certain of the Fund’s investments.
Responses to the financial problems by European governments, central banks and others, including austerity measures and reforms, may not work, may result in social unrest and may limit future growth and economic recovery or have other unintended consequences. Further defaults or restructurings by governments and others of their debt could have additional adverse effects on economies, financial markets and asset valuations around the world. In addition, the United Kingdom has withdrawn from the European Union, and one or more other countries may withdraw from the European Union and/or abandon the Euro, the common currency of the European Union. The impact of these actions, especially if they occur in a disorderly fashion, is not clear but could be significant and far reaching.
| | |
| 46 | | 2020 BLACKROCK ANNUAL REPORTTO SHAREHOLDERS |
Notes to Financial Statements (continued)
| 11. | CAPITAL SHARE TRANSACTIONS |
Transactions in capital shares for each class were as follows:
| | | | | | | | | | | | | | | | |
| | | Year Ended
06/30/20 | | | Year Ended
06/30/19 | |
| Advantage Global Fund, Inc. | | Shares | | | Amount | | | Shares | | | Amount | |
Institutional | | | | | | | | | | | | | | | | |
Shares sold | | | 530,504 | | | $ | 11,111,823 | | | | 1,232,648 | | | $ | 24,912,052 | |
Shares issued in reinvestment of distributions | | | 68,864 | | | | 1,530,165 | | | | 159,143 | | | | 3,133,521 | |
Shares redeemed | | | (1,121,872 | ) | | | (23,282,546 | ) | | | (2,651,356 | ) | | | (55,309,098 | ) |
| | | | | | | | | | | | | | | | |
Net decrease | | | (522,504 | ) | | $ | (10,640,558 | ) | | | (1,259,565 | ) | | $ | (27,263,525 | ) |
| | | | | | | | | | | | | | | | |
| | | | |
Investor A | | | | | | | | | | | | | | | | |
Shares sold and automatic conversion of shares | | | 717,729 | | | $ | 14,211,703 | | | | 1,626,860 | | | $ | 32,489,716 | |
Shares issued in reinvestment of distributions | | | 211,298 | | | | 4,456,265 | | | | 538,218 | | | | 10,069,960 | |
Shares redeemed | | | (3,135,330 | ) | | | (63,175,516 | ) | | | (3,872,814 | ) | | | (76,347,695 | ) |
| | | | | | | | | | | | | | | | |
Net decrease | | | (2,206,303 | ) | | $ | (44,507,548 | ) | | | (1,707,736 | ) | | $ | (33,788,019 | ) |
| | | | | | | | | | | | | | | | |
| |
Investor C | | | | |
Shares sold | | | 37,181 | | | $ | 617,024 | | | | 113,130 | | | $ | 1,800,863 | |
Shares issued in reinvestment of distributions | | | 33,866 | | | | 584,186 | | | | 124,565 | | | | 1,913,305 | |
Shares redeemed and automatic conversion of shares | | | (1,025,892 | ) | | | (16,796,727 | ) | | | (2,486,438 | ) | | | (40,904,182 | ) |
| | | | | | | | | | | | | | | | |
Net decrease | | | (954,845 | ) | | $ | (15,595,517 | ) | | | (2,248,743 | ) | | $ | (37,190,014 | ) |
| | | | | | | | | | | | | | | | |
| |
Class K | | | | |
Shares sold | | | 348,263 | | | $ | 7,664,452 | | | | 363,428 | | | $ | 7,674,626 | |
Shares issued in reinvestment of distributions | | | 6,480 | | | | 143,926 | | | | 8,407 | | | | 165,540 | |
Shares redeemed | | | (281,599 | ) | | | (6,028,708 | ) | | | (94,714 | ) | | | (1,971,467 | ) |
| | | | | | | | | | | | | | | | |
Net increase | | | 73,144 | | | $ | 1,779,670 | | | | 277,121 | | | $ | 5,868,699 | |
| | | | | | | | | | | | | | | | |
| |
Class R | | | | |
Shares sold | | | 62,857 | | | $ | 1,132,067 | | | | 112,045 | | | $ | 2,021,830 | |
Shares issued in reinvestment of distributions | | | 6,948 | | | | 132,081 | | | | 30,451 | | | | 514,018 | |
Shares redeemed | | | (396,509 | ) | | | (7,102,296 | ) | | | (479,342 | ) | | | (8,614,397 | ) |
| | | | | | | | | | | | | | | | |
Net decrease | | | (326,704 | ) | | $ | (5,838,148 | ) | | | (336,846 | ) | | $ | (6,078,549 | ) |
| | | | | | | | | | | | | | | | |
Total Net Decrease | | | (3,937,212 | ) | | $ | (74,802,101 | ) | | | (5,275,769 | ) | | $ | (98,451,408 | ) |
| | | | | | | | | | | | | | | | |
| | | | | | | | | | | | | | | | |
| | | Year Ended
06/30/20 | | | Year Ended
06/30/19 | |
| EuroFund | | Shares | | | Amount | | | Shares | | | Amount | |
Institutional | | | | | | | | | | | | | | | | |
Shares sold | | | 130,041 | | | $ | 1,920,769 | | | | 116,304 | | | $ | 1,632,133 | |
Shares issued in reinvestment of distributions | | | 7,943 | | | | 116,042 | | | | 55,526 | | | | 691,295 | |
Shares redeemed | | | (591,983 | ) | | | (7,983,636 | ) | | | (767,404 | ) | | | (10,555,926 | ) |
| | | | | | | | | | | | | | | | |
Net decrease | | | (453,999 | ) | | $ | (5,946,825 | ) | | | (595,574 | ) | | $ | (8,232,498 | ) |
| | | | | | | | | | | | | | | | |
| | | | |
Investor A | | | | | | | | | | | | | | | | |
Shares sold and automatic conversion of shares | | | 96,451 | | | $ | 1,318,690 | | | | 329,601 | | | $ | 4,582,724 | |
Shares issued in reinvestment of distributions | | | 5,312 | | | | 76,225 | | | | 131,602 | | | | 1,608,202 | |
Shares redeemed | | | (969,030 | ) | | | (13,198,357 | ) | | | (5,024,233 | ) | | | (67,280,467 | ) |
| | | | | | | | | | | | | | | | |
Net decrease | | | (867,267 | ) | | $ | (11,803,442 | ) | | | (4,563,030 | ) | | $ | (61,089,541 | ) |
| | | | | | | | | | | | | | | | |
| |
Investor C | | | | |
Shares sold | | | 9,055 | | | $ | 81,692 | | | | 10,878 | | | $ | 104,553 | |
Shares issued in reinvestment of distributions | | | — | | | | — | | | | 11,884 | | | | 101,134 | |
Shares redeemed and automatic conversion of shares | | | (116,883 | ) | | | (1,025,607 | ) | | | (323,337 | ) | | | (3,029,797 | ) |
| | | | | | | | | | | | | | | | |
Net decrease | | | (107,828 | ) | | $ | (943,915 | ) | | | (300,575 | ) | | $ | (2,824,110 | ) |
| | | | | | | | | | | | | | | | |
| |
Class K | | | | |
Shares sold | | | 8,499 | | | $ | 115,317 | | | | 14,854 | | | $ | 200,174 | |
Shares issued in reinvestment of distributions | | | 195 | | | | 2,829 | | | | 1,495 | | | | 18,527 | |
Shares redeemed | | | (16,051 | ) | | | (225,372 | ) | | | (33,530 | ) | | | (459,486 | ) |
| | | | | | | | | | | | | | | | |
Net decrease | | | (7,357 | ) | | $ | (107,226 | ) | | | (17,181 | ) | | $ | (240,785 | ) |
| | | | | | | | | | | | | | | | |
| | | | |
| NOTESTO FINANCIAL STATEMENTS | | | 47 | |
Notes to Financial Statements (continued)
| | | | | | | | | | | | | | | | |
| | | Year Ended
06/30/20 | | | Year Ended
06/30/19 | |
| EuroFund | | Shares | | | Amount | | | Shares | | | Amount | |
Class R | | | | |
Shares sold | | | 10,440 | | | $ | 105,794 | | | | 8,938 | | | $ | 89,980 | |
Shares issued in reinvestment of distributions | | | — | | | | — | | | | 1,394 | | | | 12,765 | |
Shares redeemed | | | (10,554 | ) | | | (105,110 | ) | | | (46,452 | ) | | | (496,404 | ) |
| | | | | | | | | | | | | | | | |
Net increase (decrease) | | | (114 | ) | | $ | 684 | | | | (36,120 | ) | | $ | (393,659 | ) |
| | | | | | | | | | | | | | | | |
Total Net Decrease | | | (1,436,565 | ) | | $ | (18,800,724 | ) | | | (5,512,480 | ) | | $ | (72,780,593 | ) |
| | | | | | | | | | | | | | | | |
As of June 30, 2020, BlackRock Financial Management, Inc., an affiliate of the Fund, owned 12,070 Class K Shares of EuroFund.
Management has evaluated the impact of all subsequent events on the Funds through the date the financial statements were issued and has determined that there were no subsequent events requiring adjustment or additional disclosure in the financial statements.
| | |
| 48 | | 2020 BLACKROCK ANNUAL REPORTTO SHAREHOLDERS |
Report of Independent Registered Public Accounting Firm
To the Shareholders and Board of Directors/Trustees of BlackRock Advantage Global Fund, Inc. and BlackRock EuroFund:
Opinion on the Financial Statements and Financial Highlights
We have audited the accompanying statements of assets and liabilities of BlackRock Advantage Global Fund, Inc. and BlackRock EuroFund (the “Funds”), including the schedules of investments, as of June 30, 2020, the related statements of operations for the year then ended, the statements of changes in net assets for each of the two years in the period then ended, the financial highlights for each of the five years in the period then ended, and the related notes. In our opinion, the financial statements and financial highlights present fairly, in all material respects, the financial position of the Funds as of June 30, 2020, and the results of their operations for the year then ended, the changes in their net assets for each of the two years in the period then ended, and the financial highlights for each of the five years in the period then ended, in conformity with accounting principles generally accepted in the United States of America.
Basis for Opinion
These financial statements and financial highlights are the responsibility of the Funds’ management. Our responsibility is to express an opinion on the Funds’ financial statements and financial highlights based on our audits. We are a public accounting firm registered with the Public Company Accounting Oversight Board (United States) (PCAOB) and are required to be independent with respect to the Funds in accordance with the U.S. federal securities laws and the applicable rules and regulations of the Securities and Exchange Commission and the PCAOB.
We conducted our audits in accordance with the standards of the PCAOB. Those standards require that we plan and perform the audit to obtain reasonable assurance about whether the financial statements and financial highlights are free of material misstatement, whether due to error or fraud. The Funds are not required to have, nor were we engaged to perform, an audit of their internal control over financial reporting. As part of our audits we are required to obtain an understanding of internal control over financial reporting but not for the purpose of expressing an opinion on the effectiveness of the Funds’ internal control over financial reporting. Accordingly, we express no such opinion.
Our audits included performing procedures to assess the risks of material misstatement of the financial statements and financial highlights, whether due to error or fraud, and performing procedures that respond to those risks. Such procedures included examining, on a test basis, evidence regarding the amounts and disclosures in the financial statements and financial highlights. Our audits also included evaluating the accounting principles used and significant estimates made by management, as well as evaluating the overall presentation of the financial statements and financial highlights. Our procedures included confirmation of securities owned as of June 30, 2020, by correspondence with the custodian and brokers; when replies were not received from brokers, we performed other auditing procedures. We believe that our audits provide a reasonable basis for our opinion.
Deloitte & Touche LLP
Boston, Massachusetts
August 21, 2020
We have served as the auditor of one or more BlackRock investment companies since 1992.
| | |
REPORTOF INDEPENDENT REGISTERED PUBLIC ACCOUNTING FIRM | | 49 |
Important Tax Information (unaudited)
For corporate shareholders, the percentage of ordinary income distributions paid during the fiscal year ended June 30, 2020 that qualified for the dividends-received deduction were as follows:
| | | | |
| Fund | | Dividends-Received
Deduction | |
Advantage Global | | | 82.92 | % |
The following maximum amounts are hereby designated as qualified dividend income for individuals for the fiscal year ended June 30, 2020:
| | | | |
| Fund | | Qualified Dividend
Income | |
Advantage Global | | $ | 7,638,148 | |
EuroFund | | | 1,388,742 | |
| | | | |
| Fund | | Qualified Business
Income | |
Advantage Global | | $ | 456,781 | |
For the period ended June 30, 2020, the Fund earned foreign source income and paid foreign taxes which it intends to pass through to its shareholders:
| | | | | | | | |
| Fund | | Foreign Source
Income Earned | | | Foreign Taxes Paid | |
EuroFund | | $ | 609,217 | | | $ | 368,883 | |
| | |
| 50 | | 2020 BLACKROCK ANNUAL REPORTTO SHAREHOLDERS |
Disclosure of Investment Advisory Agreements and Sub-Advisory Agreement
The Board of Trustees of BlackRock EuroFund (“EuroFund”) met on April 7, 2020 and May 11-13, 2020 to consider the approval of the investment advisory agreement (the “EuroFund Advisory Agreement”) between EuroFund and BlackRock Advisors, LLC (the “Manager”), its investment advisor. The Board of Trustees of EuroFund also considered the approval of the sub-advisory agreement (the “EuroFund Sub-Advisory Agreement”) between the Manager and BlackRock International Limited (the “Sub-Advisor”) with respect to EuroFund.
The Board of Directors of BlackRock Advantage Global Fund, Inc. (“Advantage Global Fund”) met on April 7, 2020 and May 11-13, 2020 to consider the approval of the investment advisory agreement (the “Advantage Global Fund Advisory Agreement”) between Advantage Global Fund and the Manager, its investment advisor.
EuroFund and Advantage Global Fund are referred to herein individually as a “Fund” or collectively as the “Funds.” The Manager and the Sub-Advisor are referred to herein as “BlackRock.” The EuroFund Advisory Agreement, the EuroFund Sub-Advisory Agreement and the Advantage Global Fund Advisory Agreement are referred to herein individually as an “Agreement” or collectively as the “Agreements.” For simplicity: (a) the Board of Trustees of EuroFund and the Board of Directors of Advantage Global Fund are referred to herein individually as the “Board” and collectively as the “Boards” and the members are referred to as “Board Members”; and (b) the meetings held on April 7, 2020 are referred to as the “April Meeting” and the meetings held on May 11-13, 2020 are referred to as the “May Meeting.”
Activities and Composition of the Boards
On the date of the May Meeting, each Board consisted of fourteen individuals, twelve of whom were not “interested persons” of the pertinent Fund as defined in the Investment Company Act of 1940, as amended (the “1940 Act”) (the “Independent Board Members”). The Board Members are responsible for the oversight of the operations of the pertinent Fund and perform the various duties imposed on the directors of investment companies by the 1940 Act. The Independent Board Members have retained independent legal counsel to assist them in connection with their duties. The Chair of each Board is an Independent Board Member. Each Board has established five standing committees: an Audit Committee, a Governance and Nominating Committee, a Compliance Committee, a Performance Oversight Committee and an Ad Hoc Topics Committee, each of which is chaired by an Independent Board Member and composed of Independent Board Members (except for the Ad Hoc Topics Committee, which also has one interested Board Member).
The Agreements
Consistent with the requirements of the 1940 Act, each Board considers the continuation of the pertinent Agreement(s) on an annual basis. The Boards have four quarterly meetings per year, each typically extending for two days, and additional in-person and telephonic meetings throughout the year, as needed. While the Boards also have a fifth one-day meeting to consider specific information surrounding the renewal of the pertinent Agreement(s), each Board’s consideration entails a year-long deliberative process whereby the Board and its committees assess BlackRock’s services to the Fund. In particular, each Board assessed, among other things, the nature, extent and quality of the services provided to the pertinent Fund by BlackRock, BlackRock’s personnel and affiliates, including (as applicable): investment management services; accounting oversight, administrative and shareholder services; oversight of the pertinent Fund’s service providers; risk management and oversight; and legal, regulatory and compliance services. Throughout the year, including during the contract renewal process, the Independent Board Members were advised by independent legal counsel, and met with independent legal counsel in various executive sessions outside of the presence of BlackRock’s management.
During the year, the Boards, acting directly and through their committees, consider information that is relevant to their annual consideration of the renewal of the pertinent Agreement(s), including the services and support provided by BlackRock to the pertinent Fund and its shareholders. BlackRock also furnished additional information to the Boards in response to specific questions from the Boards. This additional information is discussed further in the section titled “Board Considerations in Approving the Agreements.” Among the matters each Board considered, with respect to the pertinent Fund, were: (a) investment performance for one-year, three-year, five-year and/or since inception periods, as applicable, against peer funds, an applicable benchmark, and other performance metrics, as applicable, as well as BlackRock senior management’s and portfolio managers’ analyses of the reasons for any outperformance or underperformance relative to its peers, benchmarks, and other performance metrics, as applicable; (b) fees, including advisory, administration, if applicable, and other amounts paid to BlackRock and its affiliates by the Fund for services; (c) Fund operating expenses and how BlackRock allocates expenses to the Fund; (d) the resources devoted to risk oversight of, and compliance reports relating to, implementation of the Fund’s investment objective, policies and restrictions, and meeting regulatory requirements; (e) BlackRock’s and the Fund’s adherence to applicable compliance policies and procedures; (f) the nature, character and scope of non-investment management services provided by BlackRock and its affiliates and the estimated cost of such services; (g) BlackRock’s and other service providers’ internal controls and risk and compliance oversight mechanisms; (h) BlackRock’s implementation of the proxy voting policies approved by the Board; (i) the use of brokerage commissions and execution quality of portfolio transactions; (j) BlackRock’s implementation of the Fund’s valuation and liquidity procedures; (k) an analysis of management fees for products with similar investment mandates across the open-end fund, exchange-traded fund (“ETF”), closed-end fund, sub-advised mutual fund, separately managed account, collective investment trust, and institutional separate account product channels, as applicable, and the similarities and differences between these products and the services provided as compared to the Fund; (l) BlackRock’s compensation methodology for its investment professionals and the incentives and accountability it creates, along with investment professionals’ investments in the fund(s) they manage; and (m) periodic updates on BlackRock’s business.
Board Considerations in Approving the Agreements
The Approval Process: Prior to the April Meeting, the Boards requested and received materials specifically relating to the Agreements. The Independent Board Members are continuously engaged in a process with their independent legal counsel and BlackRock to review the nature and scope of the information provided to each Board to better assist its deliberations. The materials provided in connection with the April Meeting included, among other things: (a) information independently compiled and prepared by Broadridge Financial Solutions, Inc. (“Broadridge”), based on either a Lipper classification or Morningstar category, regarding the pertinent Fund’s fees and expenses as compared with a peer group of funds as determined by Broadridge (“Expense Peers”) and the investment performance of each Fund as compared with a peer group of funds (“Performance Peers”); (b) information on the composition of the Expense Peers and Performance Peers and a description of Broadridge’s methodology; (c) information on the estimated profits realized by BlackRock and its affiliates pursuant to the Agreements and a discussion of fall-out benefits to BlackRock and its affiliates; (d) a general analysis provided by BlackRock concerning investment management fees received in connection with other types of investment products,
| | |
DISCLOSURE OF INVESTMENT ADVISORY AGREEMENT AND SUB-ADVISORY AGREEMENT | | 51 |
Disclosure of Investment Advisory Agreements and Sub-Advisory Agreement (continued)
such as institutional accounts, sub-advised mutual funds, ETFs, closed-end funds, open-end funds, and separately managed accounts under similar investment mandates, as well as the performance of such other products, as applicable; (e) a review of non-management fees; (f) the existence, impact and sharing of potential economies of scale, if any, with the Funds; (g) a summary of aggregate amounts paid by each Fund to BlackRock; (h) sales and redemption data regarding each Fund’s shares; and (i) various additional information requested by the Boards as appropriate regarding BlackRock’s and the Funds’ operations.
At the April Meeting, each Board reviewed materials relating to its consideration of the pertinent Agreements. As a result of the discussions that occurred during the April Meeting, and as a culmination of each Board’s year-long deliberative process, the Boards presented BlackRock with questions and requests for additional information. BlackRock responded to these questions and requests with additional written information in advance of the May Meeting.
At the May Meeting, each Board concluded, with respect to the pertinent Fund, its assessment of, among other things: (a) the nature, extent and quality of the services provided by BlackRock; (b) the investment performance of the Fund as compared to its Performance Peers and other metrics, as applicable; (c) the advisory fee and the estimated cost of the services and estimated profits realized by BlackRock and its affiliates from their relationship with the Fund; (d) the Fund’s fees and expenses compared to its Expense Peers; (e) the existence and sharing of potential economies of scale; (f) any fall-out benefits to BlackRock and its affiliates as a result of BlackRock’s relationship with the Fund; and (g) other factors deemed relevant by the Board Members.
Each Board also considered other matters it deemed important to the approval process, such as other payments made to BlackRock or its affiliates relating to securities lending and cash management, and BlackRock’s services related to the valuation and pricing of the portfolio holdings of the pertinent Fund. Each Board noted the willingness of BlackRock’s personnel to engage in open, candid discussions with the Board. The Boards did not identify any particular information as determinative, and each Board Member may have attributed different weights to the various items considered.
A. Nature, Extent and Quality of the Services Provided by BlackRock: Each Board, including the Independent Board Members, reviewed the nature, extent and quality of services provided by BlackRock, including the investment advisory services, and the resulting performance of the applicable Fund. Throughout the year, each Board compared Fund performance to the performance of a comparable group of mutual funds, relevant benchmark, and performance metrics, as applicable. The Boards met with BlackRock’s senior management personnel responsible for investment activities, including the senior investment officers. Each Board also reviewed the materials provided by the applicable Fund’s portfolio management team discussing the pertinent Fund’s performance, investment strategies and outlook.
Each Board considered, among other factors, with respect to BlackRock: the number, education and experience of investment personnel generally and the applicable Fund’s portfolio management team; research capabilities; investments by portfolio managers in the funds they manage; portfolio trading capabilities; use of technology; commitment to compliance; credit analysis capabilities; risk analysis and oversight capabilities; and the approach to training and retaining portfolio managers and other research, advisory and management personnel. The Boards also considered BlackRock’s overall risk management program, including the continued efforts of BlackRock and its affiliates to address cybersecurity risks and the role of BlackRock’s Risk & Quantitative Analysis Group. Each Board engaged in a review of BlackRock’s compensation structure with respect to the applicable Fund’s portfolio management team and BlackRock’s ability to attract and retain high-quality talent and create performance incentives.
In addition to investment advisory services, the Boards considered the nature and quality of the administrative and other non-investment advisory services provided to the Funds. BlackRock and its affiliates provide the Funds with certain administrative, shareholder and other services (in addition to any such services provided to the Funds by third parties) and officers and other personnel as are necessary for the operations of the Funds. In particular, BlackRock and its affiliates provide each Fund with administrative services including, among others: (i) responsibility for disclosure documents, such as the prospectus, the summary prospectus (as applicable), the statement of additional information and periodic shareholder reports; (ii) oversight of daily accounting and pricing; (iii) responsibility for periodic filings with regulators; (iv) overseeing and coordinating the activities of third-party service providers, including, among others, the Fund’s custodian, fund accountant, transfer agent, and auditor; (v) organizing Board meetings and preparing the materials for such Board meetings; (vi) providing legal and compliance support; (vii) furnishing analytical and other support to assist the Board in its consideration of strategic issues such as the merger, consolidation or repurposing of certain open-end funds; and (viii) performing or managing administrative functions necessary for the operation of the Fund, such as tax reporting, expense management, fulfilling regulatory filing requirements, overseeing the Fund’s distribution partners, and shareholder call center and other services. The Boards reviewed the structure and duties of BlackRock’s fund administration, shareholder services, and legal & compliance departments and considered BlackRock’s policies and procedures for assuring compliance with applicable laws and regulations.
B. The Investment Performance of the Funds and BlackRock: Each Board, including the Independent Board Members, also reviewed and considered the performance history of the applicable Fund. In preparation for the April Meeting, the Boards were provided with reports independently prepared by Broadridge, which included an analysis of each Fund’s performance as of December 31, 2019, as compared to its Performance Peers. Broadridge ranks funds in quartiles, ranging from first to fourth, where first is the most desirable quartile position and fourth is the least desirable. In connection with its review, each Board received and reviewed information regarding the investment performance of the pertinent Fund as compared to its Performance Peers. Each Board and its Performance Oversight Committee regularly review, and meet with Fund management to discuss, the performance of the pertinent Fund throughout the year.
In evaluating performance, the Boards focused particular attention on funds with less favorable performance records. The Board also noted that while it found the data provided by Broadridge generally useful, it recognized the limitations of such data, including in particular, that notable differences may exist between a fund and its Performance Peers (for example, the investment objectives and strategies). Further, the Boards recognized that the performance data reflects a snapshot of a period as of a particular date and that selecting a different performance period could produce significantly different results. The Board also acknowledged that long-term performance could be impacted by even one period of significant outperformance or underperformance, and that a single investment theme could have the ability to disproportionately affect long-term performance.
The Board of EuroFund noted that for the one-, three- and five-year periods reported, EuroFund ranked in the second, fourth and fourth quartiles, respectively, against its Performance Peers. The Board and BlackRock reviewed the Fund’s underperformance relative to its Performance Peers during the applicable periods. The Board noted that, among other things, effective October 23, 2018 the Fund had undergone changes in its investment strategy and portfolio management team.
| | |
| 52 | | 2020 BLACKROCK ANNUAL REPORTTO SHAREHOLDERS |
Disclosure of Investment Advisory Agreements and Sub-Advisory Agreement (continued)
The Board of EuroFund and BlackRock discussed BlackRock’s strategy for improving the Fund’s investment performance. Discussions covered topics such as performance attribution, the Fund’s investment personnel, and the resources appropriate to support the Fund’s investment processes.
The Board of Advantage Global noted that for each of the one-, three- and five-year periods reported, Advantage Global Fund ranked in the third quartile against its Performance Peers. The Board and BlackRock reviewed the Fund’s underperformance relative to its Performance Peers during the applicable periods.
C. Consideration of the Advisory/Management Fees and the Estimated Cost of the Services and Estimated Profits Realized by BlackRock and its Affiliates from their Relationship with the Funds: Each Board, including the Independent Board Members, reviewed the applicable Fund’s contractual management fee rate compared with those of its Expense Peers. The contractual management fee rate represents a combination of the advisory fee and any administrative fees, before taking into account any reimbursements or fee waivers. Each Board also compared the applicable Fund’s total expense ratio, as well as its actual management fee rate, to those of its Expense Peers. The total expense ratio represents a fund’s total net operating expenses, including any 12b-1 or non-12b-1 service fees. The total expense ratio gives effect to any expense reimbursements or fee waivers, and the actual management fee rate gives effect to any management fee reimbursements or waivers. The Boards considered the services provided and the fees charged by BlackRock and its affiliates to other types of clients with similar investment mandates, as applicable, including institutional accounts and sub-advised mutual funds (including mutual funds sponsored by third parties).
The Boards received and reviewed statements relating to BlackRock’s financial condition. The Boards reviewed BlackRock’s profitability methodology and were also provided with an estimated profitability analysis that detailed the revenues earned and the expenses incurred by BlackRock for services provided to the Funds. The Boards reviewed BlackRock’s estimated profitability with respect to the Funds and other funds the Boards currently oversees for the year ended December 31, 2019 compared to available aggregate estimated profitability data provided for the prior two years. The Boards reviewed BlackRock’s estimated profitability with respect to certain other U.S. fund complexes managed by BlackRock and/or its affiliates. The Boards reviewed BlackRock’s assumptions and methodology of allocating expenses in the estimated profitability analysis, noting the inherent limitations in allocating costs among various advisory products. The Boards recognized that profitability may be affected by numerous factors including, among other things, fee waivers and expense reimbursements by BlackRock, the types of funds managed, precision of expense allocations and business mix. The Boards thus recognized that calculating and comparing profitability at the individual fund level is difficult.
The Boards noted that, in general, individual fund or product line profitability of other advisors is not publicly available. The Boards reviewed BlackRock’s overall operating margin, in general, compared to that of certain other publicly traded asset management firms. The Boards considered the differences between BlackRock and these other firms, including the contribution of technology at BlackRock, BlackRock’s expense management, and the relative product mix.
Each Board considered whether BlackRock has the financial resources necessary to attract and retain high quality investment management personnel to perform its obligations under the pertinent Agreement(s) and to continue to provide the high quality of services that is expected by the Board. The Boards further considered factors including but not limited to BlackRock’s commitment of time, assumption of risk, and liability profile in servicing the Funds, including in contrast to what is required of BlackRock with respect to other products with similar investment mandates across the open-end fund, ETF, closed-end fund, sub-advised mutual fund, separately managed account, collective investment trust, and institutional separate account product channels, as applicable.
The Board of EuroFund noted that EuroFund’s contractual management fee rate ranked in the second quartile, and that the actual management fee rate and total expense ratio ranked in the first and fourth quartiles, respectively, relative to the Fund’s Expense Peers. In addition, the Board noted that BlackRock has voluntarily agreed to waive a portion of the advisory fee payable by the Fund. The Board further noted that BlackRock and the Board had previously agreed to increase the existing voluntary advisory fee waiver. After discussions between the Board, including the Independent Board Members, and BlackRock, the Board and BlackRock agreed to a continuation of the voluntary advisory fee waiver.
The Board of Advantage Global Fund noted that Advantage Global Fund’s contractual management fee rate ranked in the third quartile, and that the actual management fee rate and total expense ratio each ranked in the first quartile relative to the Fund’s Expense Peers. In addition, the Board noted that BlackRock and the Board have contractually agreed to a cap on the Fund’s total expenses as a percentage of the Fund’s average daily net assets on a class-by-class basis.
Each Board noted that the pertinent Fund has an advisory fee arrangement that includes breakpoints that adjust the fee rate downward as the size of the pertinent Fund increases above certain contractually specified levels. The Boards noted that if the size of the pertinent Fund were to decrease, the Fund could lose the benefit of one or more breakpoints.
D. Economies of Scale: Each Board, including the Independent Board Members, considered the extent to which economies of scale might be realized as the assets of the pertinent Fund increase, including the existence of fee waivers and/or expense caps, as applicable, noting that any contractual fee waivers and contractual expense caps had been approved by the Board. In its consideration, each Board further considered the continuation and/or implementation of fee waivers and/or expense caps, as applicable. Each Board also considered the extent to which the applicable Fund benefits from such economies of scale in a variety of ways and whether there should be changes in the advisory fee rate or breakpoint structure in order to enable the Fund to more fully participate in these economies of scale. Each Board considered the applicable Fund’s asset levels and whether the current fee schedule was appropriate.
E. Other Factors Deemed Relevant by the Board Members: Each Board, including the Independent Board Members, also took into account other ancillary or “fall-out” benefits that BlackRock or its affiliates may derive from BlackRock’s respective relationships with the applicable Fund, both tangible and intangible, such as BlackRock’s ability to leverage its investment professionals who manage other portfolios and its risk management personnel, an increase in BlackRock’s profile in the investment advisory community, and the engagement of BlackRock’s affiliates as service providers to the Fund, including for administrative, distribution, securities lending and cash management services. The Board also considered BlackRock’s overall operations and its efforts to expand the scale of, and improve the quality of, its operations. The Board also noted that, subject to applicable law, BlackRock may use and benefit from third-party research obtained by soft dollars generated by certain registered fund transactions to assist in managing all or a number of its other client accounts.
In connection with their consideration of the Agreements, the Boards also received information regarding BlackRock’s brokerage and soft dollar practices. The Boards received reports from BlackRock which included information on brokerage commissions and trade execution practices throughout the year.
| | |
DISCLOSURE OF INVESTMENT ADVISORY AGREEMENT AND SUB-ADVISORY AGREEMENT | | 53 |
Disclosure of Investment Advisory Agreements and Sub-Advisory Agreement (continued)
The Boards noted the competitive nature of the open-end fund marketplace, and that shareholders are able to redeem their Fund shares if they believe that the pertinent Fund’s fees and expenses are too high or if they are dissatisfied with the performance of the Fund.
Conclusion
The Board of EuroFund, including the Independent Board Members, unanimously approved the continuation of the EuroFund Advisory Agreement between the Manager and the EuroFund for a one-year term ending June 30, 2021, and the EuroFund Sub-Advisory Agreement between the Manager and the Sub-Advisor with respect to EuroFund for a one-year term ending June 30, 2021.
The Board of Advantage Global Fund, including the Independent Board Members, unanimously approved the continuation of the Advantage Global Fund Advisory Agreement between the Manager and Advantage Global Fund for a one-year term ending June 30, 2021.
Based upon their evaluation of all of the aforementioned factors in their totality, as well as other information, the Boards, including the Independent Board Members, were satisfied that the terms of the Agreements were fair and reasonable and in the best interest of each Fund, as pertinent, and its shareholders. In arriving at its decision to approve the Agreements, the Boards did not identify any single factor or group of factors as all-important or controlling, but considered all factors together, and different Board Members may have attributed different weights to the various factors considered. The Independent Board Members were also assisted by the advice of independent legal counsel in making this determination.
| | |
| 54 | | 2020 BLACKROCK ANNUAL REPORTTO SHAREHOLDERS |
Director and Officer Information
| | | | | | | | |
| Independent Directors (a) |
| | | | | |
Name
Year of Birth (b) | | Position(s) Held
(Length of Service) (c) | | Principal Occupation(s) During Past Five Years | | Number of BlackRock-Advised
Registered Investment Companies
(“RICs”) Consisting of
Investment Portfolios
(“Portfolios”) Overseen | | Public Company and
Other Investment Company
Directorships Held During
Past Five Years |
Mark Stalnecker 1951 | | Chair of the Board and Director (Since 2019) | | Chief Investment Officer, University of Delaware from 1999 to 2013; Trustee and Chair of the Finance and Investment Committees, Winterthur Museum and Country Estate from 2005 to 2016; Member of the Investment Committee, Delaware Public Employees’ Retirement System since 2002; Member of the Investment Committee, Christiana Care Health System from 2009 to 2017; Member of the Investment Committee, Delaware Community Foundation from 2013 to 2014; Director and Chair of the Audit Committee, SEI Private Trust Co. from 2001 to 2014. | | 36 RICs consisting of 153 Portfolios | | None |
Bruce R. Bond 1946 | | Director (Since 2007) | | Board Member, Amsphere Limited (software) since 2018; Trustee and Member of the Governance Committee, State Street Research Mutual Funds from 1997 to 2005; Board Member of Governance, Audit and Finance Committee, Avaya Inc. (computer equipment) from 2003 to 2007. | | 36 RICs consisting of 153 Portfolios | | None |
Susan J. Carter 1956 | | Director (Since 2019) | | Director, Pacific Pension Institute from 2014 to 2018; Advisory Board Member, Center for Private Equity and Entrepreneurship at Tuck School of Business since 1997; Senior Advisor, Commonfund Capital, Inc. (“CCI”) (investment adviser) in 2015; Chief Executive Officer, CCI from 2013 to 2014; President & Chief Executive Officer, CCI from 1997 to 2013; Advisory Board Member, Girls Who Invest from 2015 to 2018 and Board Member thereof since 2018; Advisory Board Member, Bridges Fund Management since 2016; Trustee, Financial Accounting Foundation since 2017; Practitioner Advisory Board Member, Private Capital Research Institute (“PCRI”) since 2017; Lecturer in the Practice of Management, Yale School of Management since 2019. | | 36 RICs consisting of 153 Portfolios | | None |
Collette Chilton 1958 | | Director (Since 2019) | | Chief Investment Officer, Williams College since 2006; Chief Investment Officer, Lucent Asset Management Corporation from 1998 to 2006. | | 36 RICs consisting of 153 Portfolios | | None |
Neil A. Cotty 1954 | | Director (Since 2019) | | Bank of America Corporation from 1996 to 2015, serving in various senior finance leadership roles, including Chief Accounting Officer from 2009 to 2015, Chief Financial Officer of Global Banking, Markets and Wealth Management from 2008 to 2009, Chief Accounting Officer from 2004 to 2008, Chief Financial Officer of Consumer Bank from 2003 to 2004, Chief Financial Officer of Global Corporate Investment Bank from 1999 to 2002. | | 36 RICs consisting of 153 Portfolios | | None |
Lena G. Goldberg 1949 | | Director (Since 2016) | | Senior Lecturer, Harvard Business School, since 2008; Director, Charles Stark Draper Laboratory, Inc. since 2013; FMR LLC/Fidelity Investments (financial services) from 1996 to 2008, serving in various senior roles including Executive Vice President — Strategic Corporate Initiatives and Executive Vice President and General Counsel; Partner, Sullivan & Worcester LLP from 1985 to 1996 and Associate thereof from 1979 to 1985. | | 36 RICs consisting of 153 Portfolios | | None |
| | |
DIRECTORAND OFFICER INFORMATION | | 55 |
Director and Officer Information (continued)
| | | | | | | | |
| Independent Directors (a) (continued) |
| | | | | |
Name
Year of Birth (b) | | Position(s) Held
(Length of Service) (c) | | Principal Occupation(s) During Past Five Years | | Number of BlackRock-Advised
Registered Investment Companies
(“RICs”) Consisting of
Investment Portfolios
(“Portfolios”) Overseen | | Public Company and
Other Investment Company
Directorships Held During
Past Five Years |
Henry R. Keizer 1956 | | Director (Since 2016) | | Director, Park Indemnity Ltd. (captive insurer) since 2010; Director, MUFG Americas Holdings Corporation and MUFG Union Bank, N.A. (financial and bank holding company) from 2014 to 2016; Director, American Institute of Certified Public Accountants from 2009 to 2011; Director, KPMG LLP (audit, tax and advisory services) from 2004 to 2005 and 2010 to 2012; Director, KPMG International in 2012, Deputy Chairman and Chief Operating Officer thereof from 2010 to 2012 and U.S. Vice Chairman of Audit thereof from 2005 to 2010; Global Head of Audit, KPMGI (consortium of KPMG firms) from 2006 to 2010; Director, YMCA of Greater New York from 2006 to 2010. | | 36 RICs consisting of 153 Portfolios | | Hertz Global Holdings (car rental); Montpelier Re Holdings, Ltd. (publicly held property and casualty reinsurance) from 2013 until 2015; WABCO (commercial vehicle safety systems); Sealed Air Corp. (packaging) |
Cynthia A. Montgomery 1952 | | Director (Since 2019) | | Professor, Harvard Business School since 1989. | | 36 RICs consisting of 153 Portfolios | | Newell Rubbermaid, Inc. (manufacturing) |
Donald C. Opatrny 1952 | | Director (Since 2015) | | Trustee, Vice Chair, Member of the Executive Committee and Chair of the Investment Committee, Cornell University since 2004; President, Trustee and Member of the Investment Committee, The Aldrich Contemporary Art Museum from 2007 to 2014; Member of the Board and Investment Committee, University School from 2007 to 2018; Member of the Investment Committee, Mellon Foundation from 2009 to 2015; Trustee, Artstor (a Mellon Foundation affiliate) from 2010 to 2015; President and Trustee, the Center for the Arts, Jackson Hole from 2011 to 2018; Director, Athena Capital Advisors LLC (investment management firm) since 2013; Trustee and Chair of the Investment Committee, Community Foundation of Jackson Hole since 2014; Member of Affordable Housing Supply Board of Jackson, Wyoming since 2018; Member, Investment Funds Committee, State of Wyoming since 2017; Trustee, Phoenix Art Museum since 2018; Trustee, Arizona Community Foundation and Member of Investment Committee since 2020. | | 36 RICs consisting of 153 Portfolios | | None |
Joseph P. Platt 1947 | | Director (Since 2019) | | General Partner, Thorn Partners, LP (private investments) since 1998; Director, WQED Multi-Media (public broadcasting not-for-profit) since 2001; Chair, Basic Health International (non-profit) since 2015. | | 36 RICs consisting of 153 Portfolios | | Greenlight Capital Re, Ltd. (reinsurance company); Consol Energy Inc. |
Kenneth L. Urish 1951 | | Director (Since 2019) | | Managing Partner, Urish Popeck & Co., LLC (certified public accountants and consultants) since 1976; Past-Chairman of the Professional Ethics Committee of the Pennsylvania Institute of Certified Public Accountants and Committee Member thereof since 2007; Member of External Advisory Board, The Pennsylvania State University Accounting Department since founding in 2001; Principal, UP Strategic Wealth Investment Advisors, LLC since 2013; Trustee, The Holy Family Institute from 2001 to 2010; President and Trustee, Pittsburgh Catholic Publishing Associates from 2003 to 2008; Director, Inter-Tel from 2006 to 2007. | | 36 RICs consisting of 153 Portfolios | | None |
Claire A. Walton 1957 | | Director (Since 2019) | | Chief Operating Officer and Chief Financial Officer of Liberty Square Asset Management, LP from 1998 to 2015; General Partner of Neon Liberty Capital Management, LLC since 2003; Director, Boston Hedge Fund Group from 2009 to 2018; Director, Woodstock Ski Runners since 2013; Director, Massachusetts Council on Economic Education from 2013 to 2015. | | 36 RICs consisting of 153 Portfolios | | None |
| | |
| 56 | | 2020 BLACKROCK ANNUAL REPORTTO SHAREHOLDERS |
Director and Officer Information (continued)
| | | | | | | | |
| Interested Directors (a)(d) |
| | | | | |
Name
Year of Birth (b) | | Position(s) Held
(Length of Service) (c) | | Principal Occupation(s) During Past Five Years | | Number of BlackRock-Advised
Registered Investment Companies
(“RICs”) Consisting of
Investment Portfolios
(“Portfolios”) Overseen | | Public Company and
Other Investment Company
Directorships Held During
Past Five Years |
Robert Fairbairn 1965 | | Director (Since 2015) | | Vice Chairman of BlackRock, Inc. since 2019; Member of BlackRock’s Global Executive and Global Operating Committees; Co-Chair of BlackRock’s Human Capital Committee; Senior Managing Director of BlackRock, Inc. from 2010 to 2019; oversaw BlackRock’s Strategic Partner Program and Strategic Product Management Group from 2012 to 2019; Member of the Board of Managers of BlackRock Investments, LLC from 2011 to 2018; Global Head of BlackRock’s Retail and iShares® businesses from 2012 to 2016. | | 122 RICs consisting of 263 Portfolios | | None |
John M. Perlowski (e) 1964 | | Director (Since 2015); President and Chief Executive Officer (Since 2010) | | Managing Director of BlackRock, Inc. since 2009; Head of BlackRock Global Accounting and Product Services since 2009; Advisory Director of Family Resource Network (charitable foundation) since 2009. | | 123 RICs consisting of 264 Portfolios | | None |
(a) The address of each Director is c/o BlackRock, Inc., 55 East 52nd Street, New York, New York 10055. |
(b) Each Independent Director holds office until his or her successor is duly elected and qualifies or until his or her earlier death, resignation, retirement or removal as provided by the Fund’s by-laws or charter or statute, or until December 31 of the year in which he or she turns 75. Directors who are “interested persons,” as defined in the 1940 Act, serve until their successor is duly elected and qualifies or until their earlier death, resignation, retirement or removal as provided by each Fund’s by-laws or statute, or until December 31 of the year in which they turn 72. The Board may determine to extend the terms of Independent Directors on a case-by-case basis, as appropriate. |
(c) Following the combination of Merrill Lynch Investment Managers, L.P. (“MLIM”) and BlackRock, Inc. in September 2006, the various legacy MLIM and legacy BlackRock fund boards were realigned and consolidated into three new fund boards in 2007. In addition, effective January 1, 2019, three BlackRock Fund Complexes were realigned and consolidated into two BlackRock Fund Complexes. As a result, although the chart shows the year that each Independent Director joined the Board, certain Independent Directors first became members of the boards of other BlackRock-advised Funds, legacy MLIM funds or legacy BlackRock funds as follows: Bruce R. Bond, 2005; Susan J. Carter, 2016; Collette Chilton, 2015; Neil A. Cotty, 2016; Cynthia A. Montgomery, 1994; Joseph P. Platt, 1999; Mark Stalnecker, 2015; Kenneth L. Urish, 1999; Claire A. Walton, 2016. |
(d) Mr. Fairbairn and Mr. Perlowski are both “interested persons,” 1940 Act, of the Funds based on their positions with BlackRock, Inc. and its affiliates. Mr. Fairbairn and Mr. Perlowski are also board members of the BlackRock Fixed-Income Complex. |
(e) Mr. Perlowski is also a trustee of the BlackRock Credit Strategies Fund. |
| | |
DIRECTORAND OFFICER INFORMATION | | 57 |
Director and Officer Information (continued)
| | | | |
| Officers Who Are Not Directors (a) |
| | | |
Name
Year of Birth (b) | | Position(s) Held
(Length of Service) | | Principal Occupation(s) During Past Five Years |
Jennifer McGovern 1977 | | Vice President (Since 2014) | | Managing Director of BlackRock, Inc. since 2016; Director of BlackRock, Inc. from 2011 to 2015; Head of Americas Product Development and Governance for BlackRock’s Global Product Group since 2019; Head of Product Structure and Oversight for BlackRock’s U.S. Wealth Advisory Group from 2013 to 2019. |
Neal J. Andrews 1966 | | Chief Financial Officer (Since 2007) | | Chief Financial Officer of the iShares® exchange traded funds from 2019 to 2020; Managing Director of BlackRock, Inc. since 2006. |
Jay M. Fife 1970 | | Treasurer (Since 2007) | | Managing Director of BlackRock, Inc. since 2007. |
Charles Park 1967 | | Chief Compliance Officer (Since 2014) | | Anti-Money Laundering Compliance Officer for certain BlackRock-advised Funds from 2014 to 2015; Chief Compliance Officer of BlackRock Advisors, LLC and the BlackRock-advised Funds in the BlackRock Multi-Asset Complex and the BlackRock Fixed-Income Complex since 2014; Principal of and Chief Compliance Officer for iShares® Delaware Trust Sponsor LLC since 2012 and BlackRock Fund Advisors (“BFA”) since 2006; Chief Compliance Officer for the BFA-advised iShares® exchange traded funds since 2006; Chief Compliance Officer for BlackRock Asset Management International Inc. since 2012. |
Lisa Belle 1968 | | Anti-Money Laundering Compliance Officer (Since 2019) | | Managing Director of BlackRock, Inc. since 2019; Global Financial Crime Head for Asset and Wealth Management of JP Morgan from 2013 to 2019; Managing Director of RBS Securities from 2012 to 2013; Head of Financial Crimes for Barclays Wealth Americas from 2010 to 2012. |
Janey Ahn 1975 | | Secretary (Since 2019) | | Managing Director of BlackRock, Inc. since 2018; Director of BlackRock, Inc. from 2009 to 2017. |
(a) The address of each Officer is c/o BlackRock, Inc., 55 East 52nd Street, New York, New York 10055. |
(b) Officers of the Funds serve at the pleasure of the Board. |
Further information about the Funds’ Directors and Officers is available in the Funds’ Statement of Additional Information, which can be obtained without charge by calling (800) 441-7762.
Investment Adviser
BlackRock Advisors, LLC
Wilmington, DE 19809
Sub-Advisor
BlackRock International Limited(a)
Edinburgh, EH3 8BL,
United Kingdom
Custodian
Brown Brothers Harriman & Co.
Boston, MA 02109
Transfer Agent
BNY Mellon Investment Servicing (US) Inc.
Wilmington, DE 19809
Accounting Agent
State Street Bank and Trust Company
Boston, MA 02111
Distributor
BlackRock Investments, LLC
New York, NY 10022
Legal Counsel
Sidley Austin LLP
New York, NY 10019
Independent Registered Public Accounting Firm
Deloitte & Touche LLP
Boston, MA 02116
Address of the Funds
100 Bellevue Parkway
Wilmington, DE 19809
| (a) | For BlackRock EuroFund only. |
| | |
| 58 | | 2020 BLACKROCK ANNUAL REPORTTO SHAREHOLDERS |
Additional Information
General Information
Householding
The Funds will mail only one copy of shareholder documents, including prospectuses, annual and semi-annual reports and proxy statements, to shareholders with multiple accounts at the same address. This practice is commonly called “householding” and is intended to reduce expenses and eliminate duplicate mailings of shareholder documents. Mailings of your shareholder documents may be householded indefinitely unless you instruct us otherwise. If you do not want the mailing of these documents to be combined with those for other members of your household, please call the Funds at (800) 441-7762.
Availability of Quarterly Schedule of Investments
The Funds file their complete schedule of portfolio holdings with the SEC for the first and third quarters of each fiscal year as an exhibit to its reports on Form N-PORT. The Funds’ Forms N-PORT are available on the SEC’s website at sec.gov.
Availability of Proxy Voting Policies and Procedures
A description of the policies and procedures that the Funds use to determine how to vote proxies relating to portfolio securities is available upon request and without charge (1) by calling (800) 441-7762; (2) at blackrock.com; and (3) on the SEC’s website at sec.gov.
Availability of Proxy Voting Record
Information about how the Funds voted proxies relating to securities held in the Funds’ portfolios during the most recent 12-month period ended June 30 is available upon request and without charge (1) at blackrock.com; or by calling (800) 441-7762 and (2) on the SEC’s website at sec.gov.
BlackRock’s Mutual Fund Family
BlackRock offers a diverse lineup of open-end mutual funds crossing all investment styles and managed by experts in equity, fixed-income and tax-exempt investing. Visit blackrock.com for more information.
Shareholder Privileges
Account Information
Call us at (800) 441-7762 from 8:00 AM to 6:00 PM ET on any business day to get information about your account balances, recent transactions and share prices. You can also visit blackrock.com for more information.
Automatic Investment Plans
Investor class shareholders who want to invest regularly can arrange to have $50 or more automatically deducted from their checking or savings account and invested in any of the BlackRock funds.
Systematic Withdrawal Plans
Investor class shareholders can establish a systematic withdrawal plan and receive periodic payments of $50 or more from their BlackRock funds, as long as their account balance is at least $10,000.
Retirement Plans
Shareholders may make investments in conjunction with Traditional, Rollover, Roth, Coverdell, Simple IRAs, SEP IRAs and 403(b) Plans.
| | |
ADDITIONAL INFORMATION | | 59 |
Additional Information (continued)
BlackRock Privacy Principles
BlackRock is committed to maintaining the privacy of its current and former fund investors and individual clients (collectively, “Clients”) and to safeguarding their non-public personal information. The following information is provided to help you understand what personal information BlackRock collects, how we protect that information and why in certain cases we share such information with select parties.
If you are located in a jurisdiction where specific laws, rules or regulations require BlackRock to provide you with additional or different privacy-related rights beyond what is set forth below, then BlackRock will comply with those specific laws, rules or regulations.
BlackRock obtains or verifies personal non-public information from and about you from different sources, including the following: (i) information we receive from you or, if applicable, your financial intermediary, on applications, forms or other documents; (ii) information about your transactions with us, our affiliates, or others; (iii) information we receive from a consumer reporting agency; and (iv) from visits to our websites.
BlackRock does not sell or disclose to non-affiliated third parties any non-public personal information about its Clients, except as permitted by law or as is necessary to respond to regulatory requests or to service Client accounts. These non-affiliated third parties are required to protect the confidentiality and security of this information and to use it only for its intended purpose.
We may share information with our affiliates to service your account or to provide you with information about other BlackRock products or services that may be of interest to you. In addition, BlackRock restricts access to non-public personal information about its Clients to those BlackRock employees with a legitimate business need for the information. BlackRock maintains physical, electronic and procedural safeguards that are designed to protect the non-public personal information of its Clients, including procedures relating to the proper storage and disposal of such information.
| | |
| 60 | | 2020 BLACKROCK ANNUAL REPORTTO SHAREHOLDERS |
Glossary of Terms Used in this Report
| | |
| Currency |
| |
| AUD | | Australian Dollar |
| |
| CAD | | Canadian Dollar |
| |
| EUR | | Euro |
| |
| GBP | | British Pound |
| |
| HKD | | Hong Kong Dollar |
| |
| JPY | | Japanese Yen |
| |
| NOK | | Norwegian Krone |
| |
| SGD | | Singapore Dollar |
| |
| USD | | U.S. Dollar |
| | |
| Portfolio Abbreviations |
| |
| ADR | | American Depositary Receipts |
| |
| CVA | | Certificaten Van Aandelen (Dutch Certificate) |
| |
| GDR | | Global Depositary Receipt |
| |
| NVDR | | Non-voting Depository Receipts |
| |
| S&P | | Standard and Poor’s |
| | |
GLOSSARYOF TERMS USEDINTHIS REPORT | | 61 |
Want to know more?
blackrock.com | 800-441-7762
This report is intended for current holders. It is not authorized for use as an offer of sale or a solicitation of an offer to buy shares of the Funds unless preceded or accompanied by the Funds’ current prospectus. Past performance results shown in this report should not be considered a representation of future performance. Investment returns and principal value of shares will fluctuate so that shares, when redeemed, may be worth more or less than their original cost. Statements and other information herein are as dated and are subject to change.
EGSC-6/20-AR
| Item 2 – | Code of Ethics – The registrant (or the “Fund”) has adopted a code of ethics, as of the end of the period covered by this report, applicable to the registrant’s principal executive officer, principal financial officer, principal accounting officer or controller, or persons performing similar functions. During the period covered by this report, the code of ethics was amended to update certain information and to make other non-material changes. During the period covered by this report, there have been no waivers granted under the code of ethics. The registrant undertakes to provide a copy of the code of ethics to any person upon request, without charge, who calls 1-800-441-7762. |
| Item 3 – | Audit Committee Financial Expert – The registrant’s board of directors (the “board of directors”), has determined that (i) the registrant has the following audit committee financial experts serving on its audit committee and (ii) each audit committee financial expert is independent: |
Neil A. Cotty
Henry R. Keizer
Kenneth L. Urish
Under applicable securities laws, a person determined to be an audit committee financial expert will not be deemed an “expert” for any purpose, including without limitation for the purposes of Section 11 of the Securities Act of 1933, as a result of being designated or identified as an audit committee financial expert. The designation or identification of a person as an audit committee financial expert does not impose on such person any duties, obligations, or liabilities greater than the duties, obligations, and liabilities imposed on such person as a member of the audit committee and board of directors in the absence of such designation or identification. The designation or identification of a person as an audit committee financial expert does not affect the duties, obligations, or liability of any other member of the audit committee or board of directors.
| Item 4 – | Principal Accountant Fees and Services |
The following table presents fees billed by Deloitte & Touche LLP (“D&T”) in each of the last two fiscal years for the services rendered to the Fund:
| | | | | | | | | | | | | | | | | | | | | | | | | | | | | | | | | | | | | | | | |
| | | (a) Audit Fees | | (b) Audit-Related Fees1 | | (c) Tax Fees2 | | (d) All Other Fees |
| Entity Name | | Current
Fiscal
Year End | | Previous
Fiscal
Year End | | Current
Fiscal
Year End | | Previous
Fiscal
Year End | | Current
Fiscal
Year End | | Previous
Fiscal
Year End | | Current
Fiscal
Year End | | Previous
Fiscal
Year End |
| BlackRock EuroFund | | $35,700 | | $36,924 | | $0 | | $0 | | $15,800 | | $16,200 | | $0 | | $0 |
The following table presents fees billed by D&T that were required to be approved by the registrant’s audit committee (the “Committee”) for services that relate directly to the operations or financial reporting of the Fund and that are rendered on behalf of BlackRock Advisors, LLC (the “Investment Adviser” or “BlackRock”) and entities controlling, controlled by, or under common control with BlackRock (not including any sub-adviser whose role is primarily portfolio management and is subcontracted with or overseen by another investment adviser) that provide ongoing services to the Fund (“Affiliated Service Providers”):
2
| | | | |
| | | Current Fiscal Year End | | Previous Fiscal Year End |
(b) Audit-Related Fees1 | | $0 | | $0 |
(c) Tax Fees2 | | $0 | | $0 |
(d) All Other Fees3 | | $1,984,000 | | $2,050,500 |
1 The nature of the services includes assurance and related services reasonably related to the performance of the audit or review of financial statements not included in Audit Fees, including accounting consultations, agreed-upon procedure reports, attestation reports, comfort letters, out-of-pocket expenses and internal control reviews not required by regulators.
2 The nature of the services includes tax compliance and/or tax preparation, including services relating to the filing or amendment of federal, state or local income tax returns, regulated investment company qualification reviews, taxable income and tax distribution calculations.
3 Non-audit fees of $1,984,000 and $2,050,500 for the current fiscal year and previous fiscal year, respectively, were paid to the Fund’s principal accountant in their entirety by BlackRock, in connection with services provided to the Affiliated Service Providers of the Fund and of certain other funds sponsored and advised by BlackRock or its affiliates for a service organization review and an accounting research tool subscription. These amounts represent aggregate fees paid by BlackRock and were not allocated on a per fund basis.
(e)(1) Audit Committee Pre-Approval Policies and Procedures:
The Committee has adopted policies and procedures with regard to the pre-approval of services. Audit, audit-related and tax compliance services provided to the registrant on an annual basis require specific pre-approval by the Committee. The Committee also must approve other non-audit services provided to the registrant and those non-audit services provided to the Investment Adviser and Affiliated Service Providers that relate directly to the operations and the financial reporting of the registrant. Certain of these non-audit services that the Committee believes are (a) consistent with the SEC’s auditor independence rules and (b) routine and recurring services that will not impair the independence of the independent accountants may be approved by the Committee without consideration on a specific case-by-case basis (“general pre-approval”). The term of any general pre-approval is 12 months from the date of the pre-approval, unless the Committee provides for a different period. Tax or other non-audit services provided to the registrant which have a direct impact on the operations or financial reporting of the registrant will only be deemed pre-approved provided that any individual project does not exceed $10,000 attributable to the registrant or $50,000 per project. For this purpose, multiple projects will be aggregated to determine if they exceed the previously mentioned cost levels.
Any proposed services exceeding the pre-approved cost levels will require specific pre-approval by the Committee, as will any other services not subject to general pre-approval (e.g., unanticipated but permissible services). The Committee is informed of each service approved subject to general pre-approval at the next regularly scheduled in-person board meeting. At this meeting, an analysis of such services is presented to the Committee for ratification. The Committee may delegate to the Committee Chairman the authority to approve the provision of and fees for any specific engagement of permitted non-audit services, including services exceeding pre-approved cost levels.
(e)(2) None of the services described in each of Items 4(b) through (d) were approved by the Committee pursuant to the de minimis exception in paragraph (c)(7)(i)(C) of Rule 2-01 of Regulation S-X.
(f) Not Applicable
3
(g) The aggregate non-audit fees, defined as the sum of the fees shown under “Audit-Related Fees,” “Tax Fees” and “All Other Fees,” paid to the accountant for services rendered by the accountant to the registrant, the Investment Adviser and the Affiliated Service Providers were:
| | | | | | |
| | | Entity Name | | Current Fiscal
Year End | | Previous Fiscal
Year End |
| | BlackRock EuroFund | | $15,800
| | $16,200
|
Additionally, the amounts billed by D&T in connection with services provided to the Affiliated Service Providers of the Fund and of other funds sponsored and advised by BlackRock or its affiliates during the current and previous fiscal years for a service organization review and an accounting research tool subscription were:
| | |
Current Fiscal Year End | | Previous Fiscal Year End |
$1,984,000 | | $2,050,500 |
These amounts represent aggregate fees paid by BlackRock and were not allocated on a per fund basis.
(h) The Committee has considered and determined that the provision of non-audit services that were rendered to the Investment Adviser and the Affiliated Service Providers that were not pre-approved pursuant to paragraph (c)(7)(ii) of Rule 2-01 of Regulation S-X is compatible with maintaining the principal accountant’s independence.
| Item 5 – | Audit Committee of Listed Registrant – Not Applicable |
(a) The registrant’s Schedule of Investments is included as part of the Report to Stockholders filed under Item 1 of this Form.
(b) Not Applicable due to no such divestments during the semi-annual period covered since the previous Form N-CSR filing.
| Item 7 – | Disclosure of Proxy Voting Policies and Procedures for Closed-End Management Investment Companies – Not Applicable |
| Item 8 – | Portfolio Managers of Closed-End Management Investment Companies – Not Applicable |
| Item 9 – | Purchases of Equity Securities by Closed-End Management Investment Company and Affiliated Purchasers – Not Applicable |
| Item 10 – | Submission of Matters to a Vote of Security Holders – There have been no material changes to these procedures. |
| Item 11 – | Controls and Procedures |
(a) The registrant’s principal executive and principal financial officers, or persons performing similar functions, have concluded that the registrant’s disclosure controls and procedures (as defined
4
in Rule 30a-3(c) under the Investment Company Act of 1940, as amended (the “1940 Act”)) are effective as of a date within 90 days of the filing of this report based on the evaluation of these controls and procedures required by Rule 30a-3(b) under the 1940 Act and Rule 15d-15(b) under the Securities Exchange Act of 1934, as amended.
(b) There were no changes in the registrant’s internal control over financial reporting (as defined in Rule 30a-3(d) under the 1940 Act) that occurred during the period covered by this report that have materially affected, or are reasonably likely to materially affect, the registrant’s internal control over financial reporting.
| Item 12 – | Disclosure of Securities Lending Activities for Closed-End Management Investment Companies – Not Applicable |
| Item 13 – | Exhibits attached hereto |
(a)(1) Code of Ethics – See Item 2
(a)(2) Section 302 Certifications are attached
(a)(3) Not Applicable
(a)(4) Not Applicable
(b) Section 906 Certifications are attached
5
Pursuant to the requirements of the Securities Exchange Act of 1934 and the Investment Company Act of 1940, the registrant has duly caused this report to be signed on its behalf by the undersigned, thereunto duly authorized.
| | |
| BlackRock EuroFund |
| |
| By: | | /s/ John M. Perlowski |
| | John M. Perlowski |
| | Chief Executive Officer (principal executive officer) of BlackRock EuroFund |
Date: September 4, 2020
Pursuant to the requirements of the Securities Exchange Act of 1934 and the Investment Company Act of 1940, this report has been signed below by the following persons on behalf of the registrant and in the capacities and on the dates indicated.
| | |
| By: | | /s/ John M. Perlowski |
| | John M. Perlowski |
| | Chief Executive Officer (principal executive officer) of BlackRock EuroFund |
Date: September 4, 2020
| | |
| By: | | /s/ Neal J. Andrews |
| | Neal J. Andrews |
| | Chief Financial Officer (principal financial officer) of BlackRock EuroFund |
Date: September 4, 2020
6