UNITED STATES
SECURITIES AND EXCHANGE COMMISSION
Washington, D.C. 20549
FORMN-CSR
CERTIFIED SHAREHOLDER REPORT OF REGISTERED MANAGEMENT INVESTMENT COMPANIES
Investment Company Act file number:811-04612
Name of Fund: BlackRock EuroFund
Fund Address: 100 Bellevue Parkway, Wilmington, DE 19809
Name and address of agent for service: John M. Perlowski, Chief Executive Officer, BlackRock EuroFund, 55 East 52nd Street, New York, NY 10055
Registrant’s telephone number, including area code: (800)441-7762
Date of fiscal year end: 06/30/2019
Date of reporting period: 06/30/2019
Item 1 – Report to Stockholders
JUNE 30, 2019
| | |
ANNUAL REPORT | |  |
BlackRock Advantage Global Fund, Inc.
BlackRock EuroFund
Beginning on January 1, 2021, as permitted by regulations adopted by the Securities and Exchange Commission, paper copies of each Fund’s shareholder reports will no longer be sent by mail, unless you specifically request paper copies of the reports from BlackRock or from your financial intermediary, such as a broker-dealer or bank. Instead, the reports will be made available on a website, and you will be notified by mail each time a report is posted and provided with a website link to access the report.
You may elect to receive all future reports in paper free of charge. If you hold accounts directly with BlackRock, you can call (800)441-7762 to inform BlackRock that you wish to continue receiving paper copies of your shareholder reports. If you hold accounts through a financial intermediary, you can follow the instructions included with this disclosure, if applicable, or contact your financial intermediary to request that you continue to receive paper copies of your shareholder reports. Please note that not all financial intermediaries may offer this service. Your election to receive reports in paper will apply to all funds advised by BlackRock Advisors, LLC, BlackRock Fund Advisors or their affiliates, or all funds held with your financial intermediary, as applicable.
If you already elected to receive shareholder reports electronically, you will not be affected by this change and you need not take any action. You may elect to receive electronic delivery of shareholder reports and other communications by: (i) accessing the BlackRock website at www.blackrock.com/edelivery and logging into your accounts, if you hold accounts directly with BlackRock, or (ii) contacting your financial intermediary, if you hold accounts through a financial intermediary. Please note that not all financial intermediaries may offer this service.
|
| Not FDIC Insured • May Lose Value • No Bank Guarantee |
The Markets in Review
Dear Shareholder,
Investment performance in the 12 months ended June 30, 2019 was a tale of two markets. The first half of the reporting period was characterized by restrictive monetary policy, deteriorating economic growth, equity market volatility, and rising fear of an imminent recession. During the second half of the reporting period, stocks and bonds rebounded sharply, as restrained inflation and weak economic growth led the U.S. Federal Reserve (the “Fed”) to stop raising interest rates, which led to broad-based optimism that stimulative monetary policy could help forestall a recession.
After the dust settled, the U.S. equity and bond markets posted mixed returns while weathering significant volatility. Less volatile U.S. large cap equities and U.S. bonds advanced, while equities at the high end of the risk spectrum — emerging markets, international developed, and U.S. small cap — posted relatively flat returns.
Fixed-income securities delivered modest positive returns with relatively low volatility. Short-term U.S. Treasury yields rose, while longer-term yields declined. This led to positive returns for U.S. Treasuries and a substantial flattening of the yield curve. Investment grade and high yield corporate bonds also posted positive returns, as the credit fundamentals in corporate markets remained relatively solid.
In the U.S. equity market, volatility spiked in late 2018, as a wide range of risks were brought to bear on markets, ranging from rising interest rates and slowing global growth to heightened trade tensions and political turmoil. These risks manifested in a broad-basedsell-off in December, leading to the worst December performance on record since 1931.
Volatility also rose in emerging markets, as the rising U.S. dollar and higher interest rates in the U.S. disrupted economic growth abroad. U.S.-China trade relations and debt concerns adversely affected the Chinese stock market, particularly in mainland China, while Turkey and Argentina became embroiled in currency crises, largely due to hyperinflation in both countries. An economic slowdown in Europe led to modest performance for European equities.
As equity performance faltered and global economic growth slowed, the Fed shifted to a more patient perspective on the economy in January 2019. In its last four meetings, the Fed left interest rates unchanged and signaled a slower pace of rate hikes in response to the global economic slowdown. Similarly, the European Central Bank signaled a continuation of accommodative monetary policy, while China committed to looser credit conditions and an increase in fiscal spending.
The outpouring of global economic stimulus led to a sharp rally in risk assets throughout the world. Hopes continued to remain high thereafter, as the current economic expansion became the longest in U.S. history. Looking ahead, markets are pricing in three interest rate cuts by the Fed over the next year, as investors anticipate a steady shift toward more stimulative monetary policy.
We expect a slowing expansion with additional room to run, as opposed to an economic recession. However, escalating trade tensions and the resulting disruptions in global supply chains have become the greatest risk to the global expansion.
We believe U.S. and emerging market equities remain relatively attractive. Within U.S. equities, companies with high-quality earnings and strong balance sheets offer the most attractive risk/rewardtrade-off. For bonds, U.S. Treasuries are likely to help buffer against volatility in risk assets, while income from other types of bonds can continue to offer steady returns.
In this environment, investors need to think globally, extend their scope across a broad array of asset classes, and be nimble as market conditions change. We encourage you to talk with your financial advisor and visitblackrock.com for further insight about investing in today’s markets.
Sincerely,

Rob Kapito
President, BlackRock Advisors, LLC

Rob Kapito
President, BlackRock Advisors, LLC
| | | | |
| Total Returns as of June 30, 2019 |
| | | 6-month | | 12-month |
U.S. large cap equities
(S&P 500® Index) | | 18.54% | | 10.42% |
U.S. small cap equities
(Russell 2000® Index) | | 16.98 | | (3.31) |
International equities
(MSCI Europe, Australasia, Far East Index) | | 14.03 | | 1.08 |
Emerging market equities
(MSCI Emerging Markets Index) | | 10.58 | | 1.21 |
3-month Treasury bills
(ICE BofAML3-Month U.S. Treasury Bill Index) | | 1.24 | | 2.31 |
U.S. Treasury securities
(ICE BofAML10-Year U.S. Treasury Index) | | 7.45 | | 10.38 |
U.S. investment grade bonds
(Bloomberg Barclays U.S. Aggregate Bond Index) | | 6.11 | | 7.87 |
Tax-exempt municipal bonds
(S&P Municipal Bond Index) | | 4.94 | | 6.39 |
U.S. high yield bonds
(Bloomberg Barclays U.S. Corporate High Yield 2% Issuer Capped Index) | | 9.94 | | 7.48 |
| Past performance is no guarantee of future results. Index performance is shown for illustrative purposes only. You cannot invest directly in an index. |
| | |
| 2 | | THIS PAGEISNOT PARTOF YOUR FUND REPORT |
Table of Contents

| | |
| Fund Summary as of June 30, 2019 | | BlackRock Advantage Global Fund, Inc. |
Investment Objective
BlackRock Advantage Global Fund, Inc.’s (the “Fund”) investment objective is to seek long-term capital appreciation.
Portfolio Management Commentary
How did the Fund perform?
For the 12-month period ended June 30, 2019, the Fund underperformed its benchmark, the MSCI All Country World Index.
What factors influenced performance?
The Fund’s underperformance for the period was concentrated in the fourth quarter of 2018 as the market underwent a liquidity dislocation. Macro thematic and sentiment composite strategies were the most significant detractors as tightening financial conditions, deteriorating global growth, signs of stretched valuations and deleveraging in the hedge fund community led to spikes in market volatility. Higher-than-expected realized portfolio risk exposures and increased correlation of insights degraded the Fund’s ability to protect against negative market price action during this period. Insights driven by analyst revisions, which are proprietary sentiment indicators tracking upgrades and downgrades to corporate earnings from the analyst community, were some of the top detractors. With investors seemingly losing faith in the macroeconomic and earnings outlooks, text-based measures of broker and analyst sentiment as well as trend-following quality signals lost their differentiation properties and converged on the large drawdown in generic earnings momentum. Elsewhere, the macro thematic style rotation model’s preference for small cap stocks, which worked well earlier in 2018 given small caps’ relative insulation against a disruption in global trade, was a large detractor as investors rotated toward defensive large cap names in a manner that was erratic relative to past episodes of market distress.
The Fund performed well over the final six months of the period, which encompassed a market recovery. Performance benefited from retained risk in the portfolio and some reversal in the extreme trends observed over the fourth quarter of 2018. Macro thematic models began to successfully settle back towards a pro-growth/quality stance. This coincided with increasingly dovish rhetoric from central bankers, a decline in yield curves and evidence of slowing but still positive growth. The portfolio was well positioned for the extreme divergence in performance between growth and value factors, which evolved through the second quarter of 2019. Successful positioning along these dimensions was further underpinned by proprietary sentiment indicators, which regained a high level of differentiation relative to the continued sluggish performance from generic earnings momentum factors. Furthermore, strong differentiation was also evident across the fundamental model components, enabling the Fund to avoid the unusually large drawdown experienced by traditional value strategies and which challenged many other quantitative managers.
Describe recent portfolio activity.
Over the period, the Fund maintained a balanced allocation of risk across all major return drivers. However, within the macro thematic composite the investment adviser reduced the size of the long growth-short value trade due to the historic performance spread between the two factors and the potential for a rebound in value relative performance.
Describe portfolio positioning at period end.
The Fund was positioned for the continuation of a low interest rate, low inflation and moderate growth environment while staying well diversified across geographies, industries and other drivers of risk. Along the style dimension the Fund had a long stance with respect to both growth and dividend yield. On a geographical basis, the Fund remained long in Europe, although to a lesser degree following a reduction of U.K. exposure in favor of Japan.
The views expressed reflect the opinions of BlackRock as of the date of this report and are subject to change based on changes in market, economic or other conditions. These views are not intended to be a forecast of future events and are no guarantee of future results.
| | |
| 4 | | 2019 BLACKROCK ANNUAL REPORTTO SHAREHOLDERS |
| | |
| Fund Summary as of June 30, 2019 (continued) | | BlackRock Advantage Global Fund, Inc. |
TOTAL RETURN BASED ON A $10,000 INVESTMENT
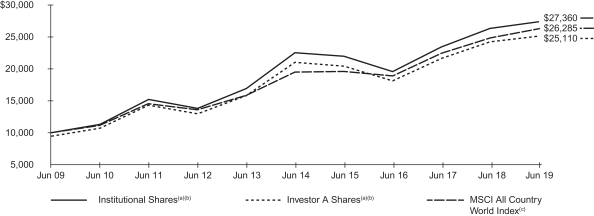
| (a) | Assuming maximum sales charge, if any, transaction costs and other operating expenses, including investment advisory fees. Institutional Shares do not have a sales charge. |
| (b) | The Fund primarily intends to invest in equity securities or other financial instruments that are components of, or have characteristics similar to, the securities included in the MSCI All Country World Index. The Fund’s returns prior to October 26, 2017, are the returns of the Fund when it followed a different investment objective and different investment strategies under the name “BlackRock Global SmallCap Fund, Inc.” |
| (c) | A free float-adjusted market capitalization index that is designed to measure the equity market performance of developed and emerging markets. The MSCI All Country World Index consists of 47 country indexes comprising of 23 developed and 24 emerging market country indexes. |
Performance Summary for the Period Ended June 30, 2019
| | | | | | | | | | | | | | | | | | | | | | | | | | | | | | | | | | | | | | | | |
| | | | | | | | | Average Annual Total Returns (a)(b) | |
| | | | | | | | | 1 Year | | | | | | 5 Years | | | | | | 10 Years | |
| | | 6-Month
Total Returns | | | | | | w/o sales
charge | | | w/sales
charge | | | | | | w/o sales
charge | | | w/sales
charge | | | | | | w/o sales
charge | | | w/sales
charge | |
Institutional | | | 16.89 | % | | | | | | | 4.03 | % | | | N/A | | | | | | | | 3.97 | % | | | N/A | | | | | | | | 10.59 | % | | | N/A | |
Investor A | | | 16.70 | | | | | | | | 3.77 | | | | (1.68 | )% | | | | | | | 3.65 | | | | 2.54 | % | | | | | | | 10.24 | | | | 9.64 | % |
Investor C | | | 16.27 | | | | | | | | 2.99 | | | | 1.99 | | | | | | | | 2.84 | | | | 2.84 | | | | | | | | 9.35 | | | | 9.35 | |
Class K | | | 16.89 | | | | | | | | 4.09 | | | | N/A | | | | | | | | 3.99 | | | | N/A | | | | | | | | 10.60 | | | | N/A | |
Class R | | | 16.62 | | | | | | | | 3.52 | | | | N/A | | | | | | | | 3.32 | | | | N/A | | | | | | | | 9.85 | | | | N/A | |
MSCI All Country World Index | | | 16.23 | | | | | | | | 5.74 | | | | N/A | | | | | | | | 6.16 | | | | N/A | | | | | | | | 10.15 | | | | N/A | |
| | (a) | Assuming maximum sales charges, if any. Average annual total returns with and without sales charges reflect reductions for distribution and service fees. See “About Fund Performance” on page 10 for a detailed description of share classes, including any related sales charges and fees, and how performance was calculated for certain share classes. | |
| | (b) | The Fund primarily intends to invest in equity securities or other financial instruments that are components of, or have characteristics similar to, the securities included in the MSCI All Country World Index. The Fund’s returns prior to October 26, 2017, are the returns of the Fund when it followed a different investment objective and different investment strategies under the name “BlackRock Global SmallCap Fund, Inc.” | |
N/A — Not applicable as share class and index do not have a sales charge.
Past performance is not indicative of future results.
Performance results may include adjustments made for financial reporting purposes in accordance with U.S. generally accepted accounting principles.
Expense Example
| | | | | | | | | | | | | | | | | | | | | | | | | | | | | | | | |
| | | Actual | | | | | | Hypothetical (b) | | | | |
| | | Beginning
Account Value
(01/01/19) | | | Ending
Account Value
(06/30/19) | | | Expenses
Paid During
the Period (a) | | | | | | Beginning
Account Value
(01/01/19) | | | Ending
Account Value
(06/30/19) | | | Expenses
Paid During
the Period (a) | | | Annualized
Expense
Ratio | |
Institutional | | $ | 1,000.00 | | | $ | 1,168.90 | | | $ | 3.82 | | | | | | | $ | 1,000.00 | | | $ | 1,021.27 | | | $ | 3.56 | | | | 0.71 | % |
Investor A | | | 1,000.00 | | | | 1,167.00 | | | | 5.16 | | | | | | | | 1,000.00 | | | | 1,020.03 | | | | 4.81 | | | | 0.96 | |
Investor C | | | 1,000.00 | | | | 1,162.70 | | | | 9.17 | | | | | | | | 1,000.00 | | | | 1,016.32 | | | | 8.55 | | | | 1.71 | |
Class K | | | 1,000.00 | | | | 1,168.90 | | | | 3.55 | | | | | | | | 1,000.00 | | | | 1,021.52 | | | | 3.31 | | | | 0.66 | |
Class R | | | 1,000.00 | | | | 1,166.20 | | | | 6.50 | | | | | | | | 1,000.00 | | | | 1,018.79 | | | | 6.06 | | | | 1.21 | |
| | (a) | For each class of the Fund, expenses are equal to the annualized expense ratio for the class, multiplied by the average account value over the period, multiplied by 181/365 (to reflect theone-half year period shown). | |
| | (b) | Hypothetical 5% annual return before expenses is calculated by prorating the number of days in the most recent fiscal half year divided by 365. | |
See “Disclosure of Expenses” on page 10 for further information on how expenses were calculated.
| | |
| Fund Summary as of June 30, 2019 (continued) | | BlackRock Advantage Global Fund, Inc. |
Portfolio Information
TEN LARGEST HOLDINGS
| | | | |
| Security | | Percent of
Net Assets | |
Amazon.com, Inc. | | | 2 | % |
Microsoft Corp. | | | 1 | |
Johnson & Johnson | | | 1 | |
Apple, Inc. | | | 1 | |
Facebook, Inc. | | | 1 | |
Visa, Inc. | | | 1 | |
Roche Holding AG | | | 1 | |
JPMorgan Chase & Co. | | | 1 | |
salesforce.com, Inc. | | | 1 | |
Merck & Co., Inc. | | | 1 | |
GEOGRAPHIC ALLOCATION
| | | | |
| Country | | Percent of
Net Assets | |
United States | | | 51 | % |
Japan | | | 6 | |
United Kingdom | | | 4 | |
Switzerland | | | 4 | |
China | | | 4 | |
Canada | | | 3 | |
Australia | | | 3 | |
France | | | 3 | |
Germany | | | 2 | |
Netherlands | | | 2 | |
Hong Kong | | | 1 | |
Taiwan | | | 1 | |
India | | | 1 | |
Ireland | | | 1 | |
Brazil | | | 1 | |
Italy | | | 1 | |
Sweden | | | 1 | |
Belgium | | | 1 | |
Finland | | | 1 | |
Mexico | | | 1 | |
Denmark | | | 1 | |
Other(a) | | | 4 | |
Short-Term Securities | | | 3 | |
| | (a) | Includes holdings within countries that are 1% or less of net assets. Please refer to the Schedule of Investments for such countries. | |
| | |
| 6 | | 2019 BLACKROCK ANNUAL REPORTTO SHAREHOLDERS |
| | |
| Fund Summary as of June 30, 2019 | | BlackRock EuroFund |
Investment Objective
BlackRock EuroFund’s (the “Fund”)investment objective is to seek capital appreciation primarily through investment in equities of corporations domiciled in European countries.
On September 20, 2018, the Fund’s Board of Trustees approved certain changes to the Fund’s investment strategies. As such, the Fundtransitioned from a Pan-European mandate (including the United Kingdom) to a Eurozone mandate, focusing primarily on countries that use the euro as their currency. In addition, the Fund’s benchmark was changed from the Morgan Stanley Capital International (“MSCI”) Europe Index to the MSCI EMU Index in USD. These changes became effective on October 23, 2018.
Portfolio Management Commentary
How did the Fund perform?
For the 12-month period ended June 30, 2019, the Fund underperformed both its new benchmark, the MSCI EMU Index, and its former benchmark, the MSCI Europe Index.
What factors influenced performance?
European equities posted a narrow loss, as gauged by the MSCI EMU Index. After falling sharply in late 2018, the markets recovered nicely in the second half of the reporting period. The gain was not sufficient to overcome the earlier weakness, however. Index performance for the full period was pressured by the combination of slowing economic growth across Europe and the ongoing uncertainty surrounding Brexit. The downturn in the euro versus the U.S. dollar was another important headwind for results.
The shortfall in the Fund’s relative performance was largely the result of individual stock selection. Sector allocation also marginally detracted from Fund returns.
Among individual stocks, STMicroelectronics NV (Switzerland) was a key detractor. The stock lagged in the summer of 2018 due to emerging concerns about global growth, destocking in some of the company’s end markets and fears of slowing smartphone sales. The Fund’s investment adviser reduced the position in the autumn before eliminating it altogether later in 2018. Danske Bank A/S (Denmark) also detracted from Fund returns. Danske came under pressure from uncertainty surrounding allegations of money laundering at its Estonian unit. As a result, the stock is no longer held in the Fund. The property company Deutsche Wohnen SE (Germany) was an additional detractor of note. The stock declined in the second quarter of 2019 after the Berlin city council proposed a five-year rent freeze in response to public protests about rental values that had significantly outpaced inflation. While this issue created near-term uncertainty, the investment adviser retained the position on the belief that the company’s net asset value should continue to rise due to population growth in Berlin, lower interest rates and the value of Berlin relative to other global cities.
On the plus side, the aerospace company Safran SA (France) was the leading contributor to Fund returns for the 12-month period. Safran generated sustainable revenue growth from high-margin services for its installed engine base, and it executed well on its introduction of a new engine. Safran has consistently delivered on sales and profit expectations, boosting its shares. A holding in luxury goods company LVMH Moet Hennessy Louis Vuitton SA (France) was another contributor of note. After pulling back significantly on fears about Chinese consumer spending in late 2018, the stock recovered on the strength of better-than-expected growth and improving sentiment surrounding China’s consumer sector. A position in another French aerospace company, Airbus SE, was an additional positive due to its robust profits, strong order growth and the announcement of a new aircraft model.
Describe recent portfolio activity.
The portfolio’s composition changed considerably in the first half of the period, reflecting the shift to the new investment mandate. Separately, the Fund moved to a more defensive posture in response to the weakening prospects for economic growth. The Fund accomplished this by reducing its weighting in the financial sector, largely by decreasing its allocation to insurance and banking stocks. The Fund also decreased its position in information technology. Conversely, the Fund added to defensive sectors such as consumer staples, health care and utilities. Although companies in these areas tend to have lower potential profit growth than the market as a whole, the investment adviser believed their earnings would be more resilient at a time of slower economic conditions.
In the second half of the period, the investment adviser maintained its key areas of conviction despite the market volatility associated with the U.S.-China trade war. At the same time, it adopted a less defensive posture as it identified stock-specific opportunities among higher-quality, cyclical companies. This included the additions of the transportation company DSV SA (Denmark), the luxury apparel producer Moncler SpA (Italy) and Symrise AG (Germany), a producer of flavors and fragrances. The Fund also added Dassault Systemes SA, a French software company that is expanding into new markets. In addition, the investment adviser increased the portfolio’s existing positions in LVMH, Airbus and the semiconductor company ASML Holdings (Netherlands).
Describe portfolio positioning at period end.
The Fund held overweight positions in the industrials, information technology and health care sectors, and was underweight in consumer staples, financials, communication services, consumer discretionary, utilities and energy. The Fund had a neutral sector weighting in real estate and materials.
The views expressed reflect the opinions of BlackRock as of the date of this report and are subject to change based on changes in market, economic or other conditions. These views are not intended to be a forecast of future events and are no guarantee of future results.
| | |
| Fund Summary as of June 30, 2019 (continued) | | BlackRock EuroFund |
TOTAL RETURN BASED ON A $10,000 INVESTMENT
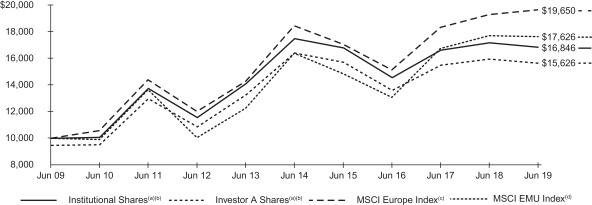
| (a) | Assuming maximum sales charge, if any, transaction costs and other operating expenses, including investment advisory fees. Institutional Shares do not have a sales charge. |
| (b) | Under normal circumstances, the Fund will invest at least 80% of its net assets in equity securities, including common stock and convertible securities, of companies located in Europe. The Fund currently expects that a majority of the Fund’s assets will be invested in equity securities of companies located in countries participating in the European Monetary Union (the ‘‘Eurozone’’). The Fund’s total returns prior to October 23, 2018, are the returns of the Fund when it followed different investment strategies. |
| (c) | A free float-adjusted market capitalization weighted index that is designed to measure the equity market performance of the developed markets in Europe. |
| (d) | MSCI EMU Index captures large and mid-cap representation across the 10 Developed Markets countries in the European Economic and Monetary Union (“EMU”). With 247 constituents, the MSCI EMU Index covers approximately 85% of the free float-adjusted market capitalization of the EMU. |
Performance Summary for the Period Ended June 30, 2019
| | | | | | | | | | | | | | | | | | | | | | | | | | | | | | | | | | | | | | | | |
| | | | | | | | | Average Annual Total Returns (a)(b) | |
| | | | | | | | | 1 Year | | | | | | 5 Years | | | | | | 10 Years | |
| | | 6-Month
Total Returns | | | | | | w/o sales
charge | | | w/sales
charge | | | | | | w/o sales
charge | | | w/sales
charge | | | | | | w/o sales
charge | | | w/sales
charge | |
Institutional | | | 18.81 | % | | | | | | | (1.77 | )% | | | N/A | | | | | | | | (0.75 | )% | | | N/A | | | | | | | | 5.35 | % | | | N/A | |
Investor A | | | 18.67 | | | | | | | | (2.08 | ) | | | (7.22 | )% | | | | | | | (0.97 | ) | | | (2.03 | )% | | | | | | | 5.13 | | | | 4.56 | % |
Investor C | | | 18.24 | | | | | | | | (2.82 | ) | | | (3.77 | ) | | | | | | | (1.75 | ) | | | (1.75 | ) | | | | | | | 4.26 | | | | 4.26 | |
Class K | | | 18.91 | | | | | | | | (1.70 | ) | | | N/A | | | | | | | | (0.71 | ) | | | N/A | | | | | | | | 5.37 | | | | N/A | |
Class R | | | 18.29 | | | | | | | | (2.66 | ) | | | N/A | | | | | | | | (1.46 | ) | | | N/A | | | | | | | | 4.57 | | | | N/A | |
MSCI EMU Index | | | 15.97 | | | | | | | | (0.48 | ) | | | N/A | | | | | | | | 1.48 | | | | N/A | | | | | | | | 5.83 | | | | N/A | |
MSCI Europe Index | | | 15.80 | | | | | | | | 1.88 | | | | N/A | | | | | | | | 1.27 | | | | N/A | | | | | | | | 6.99 | | | | N/A | |
| | (a) | Assuming maximum sales charges, if any. Average annual total returns with and without sales charges reflect reductions for distribution and service fees. See “About Fund Performance” on page 10 for a detailed description of share classes, including any related sales charges and fees, and how performance was calculated for certain share classes. | |
| | (b) | Under normal circumstances, the Fund will invest at least 80% of its net assets in equity securities, including common stock and convertible securities, of companies located in Europe. The Fund currently expects that a majority of the Fund’s assets will be invested in equity securities of companies located in countries participating in the European Monetary Union (the ‘‘Eurozone’’). The Fund’s total returns prior to October 23, 2018, are the returns of the Fund when it followed different investment strategies. | |
N/A — Not applicable as share class and index do not have a sales charge.
Past performance is not indicative of future results.
Performance results may include adjustments made for financial reporting purposes in accordance with U.S. generally accepted accounting principles.
Expense Example
| | | | | | | | | | | | | | | | | | | | | | | | | | | | | | | | |
| | | Actual | | | | | | Hypothetical (b) | | | | |
| | | Beginning
Account Value
(01/01/19) | | | Ending
Account Value
(06/30/19) | | | Expenses
Paid During
the Period (a) | | | | | | Beginning
Account Value
(01/01/19) | | | Ending
Account Value
(06/30/19) | | | Expenses
Paid During
the Period (a) | | | Annualized
Expense Ratio | |
Institutional | | $ | 1,000.00 | | | $ | 1,188.10 | | | $ | 6.67 | | | | | | | $ | 1,000.00 | | | $ | 1,018.70 | | | $ | 6.16 | | | | 1.23 | % |
Investor A | | | 1,000.00 | | | | 1,186.70 | | | | 7.86 | | | | | | | | 1,000.00 | | | | 1,017.60 | | | | 7.25 | | | | 1.45 | |
Investor C | | | 1,000.00 | | | | 1,182.40 | | | | 11.85 | | | | | | | | 1,000.00 | | | | 1,013.94 | | | | 10.94 | | | | 2.19 | |
Class K | | | 1,000.00 | | | | 1,189.10 | | | | 6.13 | | | | | | | | 1,000.00 | | | | 1,019.19 | | | | 5.66 | | | | 1.13 | |
Class R | | | 1,000.00 | | | | 1,182.90 | | | | 11.53 | | | | | | | | 1,000.00 | | | | 1,014.23 | | | | 10.64 | | | | 2.13 | |
| | (a) | For each class of the Fund, expenses are equal to the annualized expense ratio for the class, multiplied by the average account value over the period, multiplied by 181/365 (to reflect theone-half year period shown). | |
| | (b) | Hypothetical 5% annual return before expenses is calculated by prorating the number of days in the most recent fiscal half year divided by 365. | |
See “Disclosure of Expenses” on page 10 for further information on how expenses were calculated.
| | |
| 8 | | 2019 BLACKROCK ANNUAL REPORTTO SHAREHOLDERS |
| | |
| Fund Summary as of June 30, 2019 (continued) | | BlackRock EuroFund |
Portfolio Information
TEN LARGEST HOLDINGS
| | | | |
Security | | Percent of
Net Assets | |
LVMH Moet Hennessy Louis Vuitton SE | | | 6 | % |
Safran SA | | | 5 | |
Sanofi | | | 5 | |
Airbus SE | | | 5 | |
SAP SE | | | 5 | |
Allianz SE, Registered Shares | | | 4 | |
ASML Holding NV | | | 4 | |
Vinci SA | | | 3 | |
Thales SA | | | 3 | |
Linde PLC | | | 3 | |
GEOGRAPHIC ALLOCATION
| | | | |
Country | | Percent of
Net Assets | |
France | | | 40 | % |
Germany | | | 25 | |
Netherlands | | | 8 | |
Spain | | | 4 | |
Italy | | | 4 | |
Finland | | | 4 | |
Belgium | | | 3 | |
Denmark | | | 2 | |
Luxembourg | | | 2 | |
Switzerland | | | 2 | |
Portugal | | | 2 | |
Ireland | | | 2 | |
United Kingdom | | | 2 | |
Other | | | — | (a) |
| | (a) | Includes holdings within countries that are 1% or less of net assets. Please refer to the Schedule of Investments for such countries. | |
About Fund Performance
Institutional Shares and Class K Shares are not subject to any sales charge. These shares bear no ongoing distribution or service fees and are available only to certain eligible investors. Class K Shares performance shown prior to the Class K Shares inception date of January 25, 2018 is that of Institutional Shares. The performance of each Fund’s Class K Shares would be substantially similar to Institutional Shares because Class K Shares and Institutional Shares invest in the same portfolio of securities and performance would only differ to the extent that Class K Shares and Institutional Shares have different expenses. The actual returns of Class K Shares would have been higher than those of the Institutional Shares because Class K Shares have lower expenses than the Institutional Shares.
Investor A Shares are subject to a maximum initial sales charge(front-end load) of 5.25% and a service fee of 0.25% per year (but no distribution fee). Certain redemptions of these shares may be subject to a contingent deferred sales charge (“CDSC”) where no initial sales charge was paid at the time of purchase. These shares are generally available through financial intermediaries.
Investor C Shares are subject to a 1.00% CDSC if redeemed within one year of purchase. In addition, these shares are subject to a distribution fee of 0.75% per year and a service fee of 0.25% per year. These shares are generally available through financial intermediaries. Effective November 8, 2018, the Funds adopted an automatic conversion feature whereby Investor C Shares held for approximately ten years will be automatically converted into Investor A Shares.
Class R Shares are not subject to any sales charge. These shares are subject to a distribution fee of 0.25% per year and a service fee of 0.25% per year. These shares are available only to certain employer-sponsored retirement plans.
Performance information reflects past performance and does not guarantee future results. Current performance may be lower or higher than the performance data quoted. Refer towww.blackrock.com to obtain performance data current to the most recent month-end. Performance results do not reflect the deduction of taxes that a shareholder would pay on fund distributions or the redemption of fund shares. Figures shown in the performance tables on the previous pages assume reinvestment of all distributions, if any, at net asset value (‘‘NAV’’) on theex-dividend date. Investment return and principal value of shares will fluctuate so that shares, when redeemed, may be worth more or less than their original cost. Distributions paid to each class of shares will vary because of the different levels of service, distribution and transfer agency fees applicable to each class, which are deducted from the income available to be paid to shareholders.
BlackRock Advisors, LLC (the “Manager”), each Fund’s investment adviser, has contractually and/or voluntarily agreed to waive and/or reimburse a portion of each Fund’s expenses. Without such waiver and/or reimbursement, each Fund’s performance would have been lower. With respect to any voluntary waiver and/or reimbursement, the Manager is under no obligation to waive and/or reimburse or to continue waiving and/or reimbursing its fees and such voluntary waiver may be reduced or discontinued at any time. With respect to any contractual waiver and/or reimbursement, the Manager is under no obligation to continue waiving and/or reimbursing its fees after the applicable termination date of such agreement. See Note 6 of the Notes to Financial Statements for additional information on waivers and/or reimbursements.
Disclosure of Expenses
Shareholders of each Fund may incur the following charges: (a) transactional expenses, such as sales charges; and (b) operating expenses, including investment advisory fees, service and distribution fees, including12b-1 fees, acquired fund fees and expenses, and other fund expenses. The expense examples shown on the previous pages (which are based on a hypothetical investment of $1,000 invested on January 1, 2019 and held through June 30, 2019) are intended to assist shareholders both in calculating expenses based on an investment in each Fund and in comparing these expenses with similar costs of investing in other mutual funds.
The expense examples provide information about actual account values and actual expenses. In order to estimate the expenses a shareholder paid during the period covered by this report, shareholders can divide their account value by $1,000 and then multiply the result by the number corresponding to their Fund and share class under the heading entitled “Expenses Paid During the Period.”
The expense examples also provide information about hypothetical account values and hypothetical expenses based on a Fund’s actual expense ratio and an assumed rate of return of 5% per year before expenses. In order to assist shareholders in comparing the ongoing expenses of investing in these Funds and other funds, compare the 5% hypothetical examples with the 5% hypothetical examples that appear in shareholder reports of other funds.
The expenses shown in the expense examples are intended to highlight shareholders’ ongoing costs only and do not reflect transactional expenses, such as sales charges, if any. Therefore, the hypothetical examples are useful in comparing ongoing expenses only, and will not help shareholders determine the relative total expenses of owning different funds. If these transactional expenses were included, shareholder expenses would have been higher.
Derivative Financial Instruments
The Funds may invest in various derivative financial instruments. These instruments are used to obtain exposure to a security, commodity, index, market, and/or other assets without owning or taking physical custody of securities, commodities and/or other referenced assets or to manage market, equity, credit, interest rate, foreign currency exchange rate, commodity and/or other risks. Derivative financial instruments may give rise to a form of economic leverage and involve risks, including the imperfect correlation between the value of a derivative financial instrument and the underlying asset, possible default of the counterparty to the transaction or illiquidity of the instrument. The Funds’ successful use of a derivative financial instrument depends on the investment adviser’s ability to predict pertinent market movements accurately, which cannot be assured. The use of these instruments may result in losses greater than if they had not been used, may limit the amount of appreciation a Fund can realize on an investment and/or may result in lower distributions paid to shareholders. The Funds’ investments in these instruments, if any, are discussed in detail in the Notes to Financial Statements.
| | |
| 10 | | 2019 BLACKROCK ANNUAL REPORTTO SHAREHOLDERS |
| | |
Schedule of Investments June 30, 2019 | | BlackRock Advantage Global Fund, Inc. (Percentages shown are based on Net Assets) |
| | | | | | | | |
| Security | | Shares | | | Value | |
|
Common Stocks— 96.6% | |
|
| Argentina— 0.0% | |
MercadoLibre, Inc.(a) | | | 122 | | | $ | 74,636 | |
| | | | | | | | |
|
| Australia— 3.0% | |
AGL Energy Ltd. | | | 12,269 | | | | 172,545 | |
ALS Ltd. | | | 3,174 | | | | 16,397 | |
Altium Ltd. | | | 1,220 | | | | 29,450 | |
Amcor PLC | | | 65,707 | | | | 747,645 | |
Ansell Ltd. | | | 12,297 | | | | 232,191 | |
Aristocrat Leisure Ltd. | | | 72,395 | | | | 1,564,903 | |
AusNet Services | | | 71,707 | | | | 94,500 | |
Beach Energy Ltd. | | | 13,028 | | | | 18,323 | |
BHP Group Ltd. | | | 95,046 | | | | 2,762,849 | |
CIMIC Group Ltd. | | | 15,092 | | | | 474,574 | |
Cochlear Ltd. | | | 2,260 | | | | 329,046 | |
Computershare Ltd. | | | 12,300 | | | | 140,278 | |
CSL Ltd. | | | 4,277 | | | | 647,639 | |
CSR Ltd. | | | 45,617 | | | | 125,481 | |
Downer EDI Ltd. | | | 3,979 | | | | 19,356 | |
Goodman Group | | | 26,284 | | | | 277,816 | |
Harvey Norman Holdings Ltd. | | | 67,757 | | | | 193,892 | |
IDP Education Ltd. | | | 4,209 | | | | 52,336 | |
Macquarie Group Ltd. | | | 13,773 | | | | 1,214,861 | |
Magellan Financial Group Ltd. | | | 4,485 | | | | 161,014 | |
Metcash Ltd. | | | 19,990 | | | | 36,155 | |
Oil Search Ltd. | | | 4,132 | | | | 20,606 | |
Platinum Asset Management Ltd. | | | 5,339 | | | | 18,216 | |
Qantas Airways Ltd. | | | 282,789 | | | | 1,073,151 | |
QBE Insurance Group Ltd. | | | 12,570 | | | | 104,572 | |
REA Group Ltd. | | | 3,676 | | | | 248,325 | |
Santos Ltd. | | | 90,172 | | | | 450,188 | |
Sonic Healthcare Ltd. | | | 3,869 | | | | 73,720 | |
Sydney Airport | | | 20,753 | | | | 117,244 | |
Treasury Wine Estates Ltd. | | | 2,848 | | | | 29,911 | |
Wesfarmers Ltd. | | | 27,275 | | | | 693,336 | |
Woodside Petroleum Ltd. | | | 47,150 | | | | 1,209,329 | |
Woolworths Group Ltd. | | | 14,821 | | | | 346,088 | |
| | | | | | | | |
| | | | 13,695,937 | |
|
| Austria— 0.1% | |
Vienna Insurance Group AG Wiener Versicherung Gruppe | | | 1,168 | | | | 29,950 | |
Wienerberger AG | | | 23,678 | | | | 584,256 | |
| | | | | | | | |
| | | | 614,206 | |
|
| Belgium— 0.8% | |
Groupe Bruxelles Lambert SA | | | 4,109 | | | | 403,714 | |
Solvay SA | | | 7,979 | | | | 828,625 | |
UCB SA | | | 26,543 | | | | 2,202,792 | |
| | | | | | | | |
| | | | 3,435,131 | |
|
| Brazil— 0.5% | |
Ambev SA | | | 240,772 | | | | 1,121,736 | |
B3 SA — Brasil Bolsa Balcao | | | 3,200 | | | | 31,217 | |
Cia. Hering | | | 23,952 | | | | 185,506 | |
EDP — Energias do Brasil SA | | | 8,100 | | | | 39,868 | |
Energisa SA | | | 2,300 | | | | 27,600 | |
Iguatemi Empresa de Shopping Centers SA | | | 1,800 | | | | 21,539 | |
Iochpe-Maxion SA | | | 2,100 | | | | 12,201 | |
IRB Brasil Resseguros S/A | | | 1,000 | | | | 25,651 | |
JBS SA | | | 62,709 | | | | 346,537 | |
Lojas Renner SA | | | 8,160 | | | | 100,216 | |
Petroleo Brasileiro SA | | | 15,700 | | | | 122,740 | |
Porto Seguro SA | | | 16,422 | | | | 221,016 | |
TIM Participacoes SA | | | 26,500 | | | | 80,260 | |
| | | | | | | | |
| | | | 2,336,087 | |
| | | | | | | | |
| Security | | Shares | | | Value | |
|
| Canada— 3.3% | |
Alimentation Couche-Tard, Inc., Class B | | | 8,683 | | | $ | 546,421 | |
Bank of Nova Scotia | | | 15,593 | | | | 837,549 | |
BCE, Inc. | | | 78,847 | | | | 3,587,266 | |
BRP, Inc. | | | 3,094 | | | | 110,572 | |
Canadian Apartment Properties REIT | | | 927 | | | | 34,233 | |
Canadian Utilities Ltd., Class A | | | 672 | | | | 18,966 | |
Capital Power Corp. | | | 662 | | | | 15,241 | |
CGI, Inc.(a) | | | 8,995 | | | | 691,548 | |
Emera, Inc. | | | 14,821 | | | | 605,606 | |
Enbridge, Inc. | | | 29,303 | | | | 1,058,393 | |
FirstService Corp. | | | 219 | | | | 21,071 | |
Fortis, Inc. | | | 4,263 | | | | 168,333 | |
Gibson Energy, Inc. | | | 1,183 | | | | 21,094 | |
Great-West Lifeco, Inc. | | | 30,253 | | | | 696,520 | |
H&R Real Estate Investment Trust | | | 3,605 | | | | 62,875 | |
Hydro One Ltd.(b) | | | 11,923 | | | | 207,950 | |
Kirkland Lake Gold Ltd. | | | 1,977 | | | | 85,176 | |
Manulife Financial Corp. | | | 71,594 | | | | 1,301,162 | |
Northland Power, Inc. | | | 18,791 | | | | 365,905 | |
Open Text Corp. | | | 2,016 | | | | 83,193 | |
Pembina Pipeline Corp. | | | 4,258 | | | | 158,511 | |
Power Corp. of Canada | | | 7,195 | | | | 154,993 | |
Power Financial Corp. | | | 62,762 | | | | 1,443,543 | |
Quebecor, Inc., Class B | | | 42,761 | | | | 1,018,453 | |
Restaurant Brands International, Inc. | | | 3,336 | | | | 231,995 | |
Royal Bank of Canada | | | 219 | | | | 17,404 | |
Suncor Energy, Inc. | | | 1,706 | | | | 53,217 | |
TC Energy Corp. | | | 2,297 | | | | 113,872 | |
TFI International, Inc. | | | 10,775 | | | | 326,076 | |
Thomson Reuters Corp. | | | 5,849 | | | | 377,323 | |
Toronto-Dominion Bank | | | 8,200 | | | | 479,145 | |
WSP Global, Inc. | | | 1,114 | | | | 61,325 | |
| | | | | | | | |
| | | | 14,954,931 | |
|
| China— 3.6% | |
3SBio, Inc.(a)(b) | | | 16,000 | | | | 27,452 | |
58.com, Inc. — ADR(a) | | | 1,140 | | | | 70,874 | |
Agricultural Bank of China Ltd., Class H | | | 479,000 | | | | 200,474 | |
Alibaba Group Holding Ltd. — ADR(a) | | | 21,320 | | | | 3,612,674 | |
Angang Steel Co. Ltd., Class H | | | 39,000 | | | | 17,793 | |
Anhui Conch Cement Co. Ltd., Class A | | | 4,900 | | | | 29,634 | |
Anhui Conch Cement Co. Ltd., Class H | | | 11,000 | | | | 68,830 | |
BAIC Motor Corp. Ltd., Class H(b) | | | 81,000 | | | | 50,831 | |
Bank of China Ltd., Class A | | | 46,400 | | | | 25,281 | |
Bank of China Ltd., Class H | | | 2,013,000 | | | | 849,423 | |
Bank of Communications Co. Ltd., Class A | | | 92,500 | | | | 82,469 | |
Bank of Communications Co. Ltd., Class H | | | 164,000 | | | | 124,529 | |
Baoshan Iron & Steel Co. Ltd., Class A | | | 43,260 | | | | 40,998 | |
BBMG Corp., Class H | | | 100,000 | | | | 32,113 | |
BeiGene Ltd., ADR(a) | | | 339 | | | | 42,019 | |
BYD Electronic International Co. Ltd. | | | 10,000 | | | | 14,309 | |
China Coal Energy Co. Ltd., Class H | | | 200,000 | | | | 83,290 | |
China Construction Bank Corp., Class H | | | 448,000 | | | | 386,178 | |
China Everbright Bank Co. Ltd., Class A | | | 167,400 | | | | 92,926 | |
China Hongqiao Group Ltd. | | | 65,500 | | | | 46,199 | |
China Life Insurance Co. Ltd., Class H | | | 284,000 | | | | 701,953 | |
China Oriental Group Co., Ltd. | | | 30,000 | | | | 17,560 | |
China Pacific Insurance Group Co. Ltd., Class H | | | 23,200 | | | | 90,741 | |
China Petroleum & Chemical Corp., Class A | | | 711,577 | | | | 568,069 | |
China Petroleum & Chemical Corp., Class H | | | 1,208,000 | | | | 822,913 | |
China Railway Signal & Communication Corp. Ltd., Class H(b) | | | 82,000 | | | | 59,587 | |
China Reinsurance Group Corp., Class H | | | 397,000 | | | | 70,671 | |
China Resources Land Ltd. | | | 6,000 | | | | 26,417 | |
China Shenhua Energy Co. Ltd., Class H | | | 11,500 | | | | 24,087 | |
| | | | |
| SCHEDULES OF INVESTMENTS | | | 11 | |
| | |
Schedule of Investments (continued) June 30, 2019 | | BlackRock Advantage Global Fund, Inc. (Percentages shown are based on Net Assets) |
| | | | | | | | |
| Security | | Shares | | | Value | |
|
| China (continued) | |
China Telecom Corp. Ltd., Class H | | | 36,000 | | | $ | 18,128 | |
China Unicom Hong Kong Ltd. | | | 70,000 | | | | 76,538 | |
CNOOC Ltd. | | | 768,000 | | | | 1,310,025 | |
Ctrip.com International Ltd. — ADR(a) | | | 946 | | | | 34,917 | |
Dali Foods Group Co. Ltd.(b) | | | 89,000 | | | | 59,056 | |
Datang International Power Generation Co. Ltd., Class H | | | 242,000 | | | | 60,736 | |
Dongfang Electric Corp., Ltd., Class A(a) | | | 21,000 | | | | 32,516 | |
Dongfeng Motor Group Co. Ltd., Class H | | | 32,000 | | | | 26,239 | |
Geely Automobile Holdings Ltd. | | | 28,000 | | | | 48,010 | |
Greentown China Holdings Ltd. | | | 20,000 | | | | 14,246 | |
Guangzhou Baiyunshan Pharmaceutical Holdings Co. Ltd., Class H | | | 22,000 | | | | 99,298 | |
Guotai Junan Securities Co. Ltd., Class H(b) | | | 93,200 | | | | 166,007 | |
Huadian Power International Corp. Ltd., Class H | | | 120,000 | | | | 47,534 | |
Industrial & Commercial Bank of China Ltd., Class A | | | 34,300 | | | | 29,438 | |
Industrial & Commercial Bank of China Ltd., Class H | | | 889,000 | | | | 648,900 | |
Industrial Bank Co. Ltd., Class A | | | 11,200 | | | | 29,857 | |
JD.com, Inc. — ADR(a) | | | 6,682 | | | | 202,398 | |
Kaisa Group Holdings Ltd.(a) | | | 57,000 | | | | 28,159 | |
KWG Group Holdings Ltd.(a) | | | 30,000 | | | | 30,480 | |
Legend Holdings Corp., Class H(b) | | | 22,100 | | | | 52,155 | |
Lenovo Group Ltd. | | | 112,000 | | | | 86,720 | |
Li Ning Co. Ltd. | | | 17,000 | | | | 40,202 | |
Logan Property Holdings Co. Ltd. | | | 52,000 | | | | 84,085 | |
Maanshan Iron & Steel Co. Ltd., Class H | | | 84,000 | | | | 33,404 | |
Metallurgical Corp. of China Ltd., Class H | | | 343,000 | | | | 91,735 | |
NetEase, Inc. — ADR | | | 358 | | | | 91,566 | |
New China Life Insurance Co. Ltd., Class H | | | 4,700 | | | | 22,870 | |
Oppein Home Group, Inc., Class A | | | 3,200 | | | | 50,265 | |
PetroChina Co. Ltd., Class H | | | 1,468,000 | | | | 809,436 | |
Ping An Insurance Group Co. of China Ltd., Class H | | | 9,000 | | | | 108,224 | |
Shui On Land Ltd. | | | 75,000 | | | | 17,401 | |
Sinopec Engineering Group Co. Ltd., Class H | | | 41,500 | | | | 35,173 | |
Sinotrans Ltd., Class H | | | 60,000 | | | | 21,821 | |
Tencent Holdings Ltd. | | | 65,600 | | | | 2,967,704 | |
Towngas China Co. Ltd.(a) | | | 27,000 | | | | 19,450 | |
Uni-President China Holdings Ltd. | | | 42,000 | | | | 46,784 | |
Vipshop Holdings Ltd. — ADR(a) | | | 4,931 | | | | 42,555 | |
Yihai International Holding Ltd.(a) | | | 9,000 | | | | 46,691 | |
Yum China Holdings, Inc. | | | 6,587 | | | | 304,319 | |
Yuzhou Properties Co. Ltd. | | | 39,000 | | | | 18,320 | |
Zhejiang Semir Garment Co. Ltd., Class A | | | 19,600 | | | | 31,658 | |
| | | | | | | | |
| | | | 16,265,314 | |
|
| Czech Republic— 0.0% | |
CEZ AS | | | 4,099 | | | | 99,058 | |
Komercni Banka AS | | | 398 | | | | 15,859 | |
| | | | | | | | |
| | | | 114,917 | |
|
| Denmark— 0.6% | |
Carlsberg A/S, Class B | | | 13,628 | | | | 1,808,397 | |
DSV A/S | | | 2,793 | | | | 275,027 | |
Genmab A/S(a) | | | 613 | | | | 112,717 | |
GN Store Nord A/S | | | 698 | | | | 32,630 | |
H Lundbeck A/S | | | 2,085 | | | | 82,585 | |
Royal Unibrew A/S | | | 1,470 | | | | 107,465 | |
SimCorp A/S | | | 601 | | | | 58,178 | |
| | | | | | | | |
| | | | 2,476,999 | |
|
| Finland— 0.7% | |
Kesko OYJ, Class B | | | 5,333 | | | | 296,658 | |
Kone OYJ, Class B | | | 36,023 | | | | 2,127,278 | |
Tieto OYJ | | | 6 | | | | 178 | |
UPM-Kymmene OYJ | | | 353 | | | | 9,392 | |
Valmet OYJ | | | 34,762 | | | | 867,219 | |
| | | | | | | | |
| | | | 3,300,725 | |
| | | | | | | | |
| Security | | Shares | | | Value | |
|
| France— 2.9% | |
Air Liquide SA | | | 1,168 | | | $ | 163,366 | |
Arkema SA | | | 5,183 | | | | 481,835 | |
Capgemini SE | | | 1,887 | | | | 234,616 | |
Christian Dior SE | | | 2,778 | | | | 1,456,828 | |
Cie Generale des Etablissements Michelin SCA | | | 4,403 | | | | 556,722 | |
Dassault Systemes SE | | | 679 | | | | 108,304 | |
Edenred | | | 17,474 | | | | 890,554 | |
Engie SA | | | 26,375 | | | | 399,937 | |
Gaztransport Et Technigaz SA | | | 341 | | | | 34,206 | |
Kering SA | | | 2,276 | | | | 1,343,347 | |
L’Oreal SA | | | 14,680 | | | | 4,173,935 | |
Lagardere SCA | | | 1,939 | | | | 50,517 | |
LVMH Moet Hennessy Louis Vuitton SE | | | 2,484 | | | | 1,056,012 | |
Orange SA | | | 5,705 | | | | 89,986 | |
Pernod Ricard SA | | | 3,809 | | | | 701,528 | |
Rubis SCA | | | 942 | | | | 53,039 | |
Sartorius Stedim Biotech | | | 814 | | | | 128,354 | |
Schneider Electric SE | | | 8,792 | | | | 795,525 | |
TOTAL SA | | | 8,281 | | | | 464,512 | |
Ubisoft Entertainment SA(a) | | | 691 | | | | 54,042 | |
Vivendi SA | | | 628 | | | | 17,234 | |
| | | | | | | | |
| | | | 13,254,399 | |
|
| Germany— 2.4% | |
adidas AG | | | 6,184 | | | | 1,913,145 | |
Allianz SE, Registered Shares | | | 10,733 | | | | 2,588,543 | |
alstria officeREIT-AG | | | 2,028 | | | | 32,838 | |
CompuGroup Medical SE | | | 252 | | | | 20,352 | |
CTS Eventim AG & Co. KGaA | | | 266 | | | | 12,368 | |
Deutsche Boerse AG | | | 3,466 | | | | 489,295 | |
Deutsche Post AG, Registered Shares | | | 18,777 | | | | 617,703 | |
Deutsche Telekom AG, Registered Shares | | | 2,909 | | | | 50,397 | |
DWS Group GmbH & Co. KGaA(b) | | | 160 | | | | 5,585 | |
HeidelbergCement AG | | | 7,349 | | | | 594,720 | |
Hochtief AG | | | 13,959 | | | | 1,699,914 | |
Jenoptik AG | | | 802 | | | | 25,935 | |
LEG Immobilien AG | | | 1,062 | | | | 119,775 | |
MTU Aero Engines AG | | | 4,419 | | | | 1,053,978 | |
Nemetschek SE | | | 288 | | | | 17,350 | |
SAP SE | | | 283 | | | | 38,797 | |
Siemens AG, Registered Shares | | | 1,970 | | | | 234,539 | |
Software AG | | | 15,784 | | | | 542,447 | |
Steinhoff International Holdings NV(a)(c) | | | 162,033 | | | | 14,955 | |
Telefonica Deutschland Holding AG | | | 179,395 | | | | 501,204 | |
TUI AG | | | 7 | | | | 69 | |
Uniper SE | | | 1,882 | | | | 57,028 | |
Volkswagen AG | | | 699 | | | | 119,897 | |
| | | | | | | | |
| | | | 10,750,834 | |
|
| Hong Kong— 1.5% | |
AIA Group Ltd. | | | 18,200 | | | | 196,540 | |
Beijing Enterprises Holdings Ltd. | | | 3,000 | | | | 15,250 | |
BOC Hong Kong Holdings Ltd. | | | 138,000 | | | | 543,326 | |
China Agri-Industries Holdings Ltd. | | | 48,000 | | | | 15,438 | |
China Mobile Ltd. | | | 295,500 | | | | 2,690,132 | |
CK Asset Holdings Ltd. | | | 2,500 | | | | 19,585 | |
CK Hutchison Holdings Ltd. | | | 106,500 | | | | 1,050,489 | |
Hong Kong Exchanges & Clearing Ltd. | | | 800 | | | | 28,272 | |
Hongkong Land Holdings Ltd. | | | 23,900 | | | | 154,053 | |
Jardine Matheson Holdings Ltd. | | | 900 | | | | 56,766 | |
Kingboard Laminates Holdings Ltd. | | | 29,500 | | | | 27,066 | |
Melco Resorts & Entertainment Ltd. — ADR | | | 6,503 | | | | 141,245 | |
MMG Ltd.(a) | | | 48,000 | | | | 16,795 | |
MTR Corp. Ltd. | | | 14,500 | | | | 97,670 | |
New World Development Co. Ltd. | | | 30,000 | | | | 46,925 | |
| | |
| 12 | | 2019 BLACKROCK ANNUAL REPORTTO SHAREHOLDERS |
| | |
Schedule of Investments (continued) June 30, 2019 | | BlackRock Advantage Global Fund, Inc. (Percentages shown are based on Net Assets) |
| | | | | | | | |
| Security | | Shares | | | Value | |
|
| Hong Kong (continued) | |
Sands China Ltd. | | | 57,200 | | | $ | 273,248 | |
Shenzhen Investment Ltd. | | | 76,000 | | | | 28,053 | |
Sinotruk Hong Kong Ltd. | | | 26,000 | | | | 45,048 | |
Sun Hung Kai Properties Ltd. | | | 60,500 | | | | 1,026,386 | |
Yuexiu Property Co. Ltd. | | | 118,000 | | | | 26,744 | |
| | | | | | | | |
| | | | 6,499,031 | |
|
| Hungary— 0.5% | |
MOL Hungarian Oil & Gas PLC | | | 86,321 | | | | 958,264 | |
OTP Bank Nyrt | | | 25,537 | | | | 1,016,919 | |
Richter Gedeon Nyrt | | | 3,613 | | | | 66,573 | |
| | | | | | | | |
| | | | 2,041,756 | |
|
| India— 1.2% | |
Aurobindo Pharma Ltd. | | | 22,418 | | | | 197,568 | |
Bharat Electronics Ltd. | | | 15,988 | | | | 26,062 | |
Bharat Forge Ltd. | | | 6,014 | | | | 39,201 | |
Birlasoft Ltd. | | | 4,888 | | | | 6,112 | |
Century Textiles & Industries Ltd. | | | 1,239 | | | | 17,031 | |
Divi’s Laboratories Ltd. | | | 1,991 | | | | 46,076 | |
Dr. Reddy’s Laboratories Ltd. | | | 608 | | | | 22,526 | |
Escorts Ltd. | | | 1,665 | | | | 12,933 | |
GAIL India Ltd. | | | 8,792 | | | | 39,724 | |
HCL Technologies Ltd. | | | 13,466 | | | | 207,732 | |
HDFC Bank Ltd. | | | 8,220 | | | | 291,162 | |
HDFC Standard Life Insurance Co. Ltd.(b) | | | 18,923 | | | | 127,219 | |
Hexaware Technologies Ltd. | | | 3,256 | | | | 17,871 | |
Hindalco Industries Ltd. | | | 15,879 | | | | 47,622 | |
Hindustan Petroleum Corp. Ltd. | | | 7,395 | | | | 30,944 | |
Hindustan Unilever Ltd. | | | 20,295 | | | | 525,745 | |
Housing Development Finance Corp. Ltd. | | | 19,279 | | | | 612,169 | |
Indraprastha Gas Ltd. | | | 3,927 | | | | 17,895 | |
IndusInd Bank Ltd. | | | 4,205 | | | | 85,924 | |
Infosys Ltd. | | | 36,345 | | | | 387,896 | |
Jubilant Life Sciences Ltd. | | | 1,486 | | | | 11,024 | |
KEC International Ltd. | | | 2,445 | | | | 11,380 | |
Kotak Mahindra Bank Ltd. | | | 9,069 | | | | 194,068 | |
KPIT Technologies Ltd.(a) | | | 4,888 | | | | 6,851 | |
Larsen & Toubro Ltd. | | | 5,657 | | | | 127,280 | |
Mahindra & Mahindra Ltd. | | | 12,222 | | | | 116,016 | |
Mindtree Ltd. | | | 4,386 | | | | 58,929 | |
Mphasis Ltd. | | | 1,076 | | | | 15,658 | |
National Aluminium Co., Ltd. | | | 18,292 | | | | 13,082 | |
Nestle India Ltd. | | | 151 | | | | 26,060 | |
NIIT Technologies Ltd. | | | 3,593 | | | | 70,014 | |
Petronet LNG Ltd. | | | 9,296 | | | | 33,006 | |
Pidilite Industries Ltd. | | | 4,792 | | | | 84,300 | |
Reliance Capital Ltd. | | | 9,307 | | | | 8,918 | |
Sun Pharmaceutical Industries Ltd. | | | 8,982 | | | | 52,203 | |
Tata Consultancy Services Ltd. | | | 35,045 | | | | 1,130,882 | |
Tata Global Beverages Ltd. | | | 16,645 | | | | 65,008 | |
Tech Mahindra Ltd. | | | 23,607 | | | | 241,730 | |
UltraTech Cement Ltd. | | | 771 | | | | 50,864 | |
United Breweries Ltd. | | | 1,364 | | | | 26,462 | |
United Spirits Ltd.(a) | | | 37,280 | | | | 315,912 | |
| | | | | | | | |
| | | | 5,419,059 | |
|
| Indonesia— 0.1% | |
Bank Central Asia Tbk PT | | | 172,300 | | | | 365,634 | |
Bank Negara Indonesia Persero Tbk PT | | | 52,100 | | | | 33,943 | |
Bank Rakyat Indonesia Persero Tbk PT | | | 55,900 | | | | 17,258 | |
Bukit Asam Tbk PT | | | 92,500 | | | | 19,402 | |
Pabrik Kertas Tjiwi Kimia Tbk PT | | | 24,400 | | | | 21,732 | |
Telekomunikasi Indonesia Persero Tbk PT | | | 142,700 | | | | 41,823 | |
| | | | | | | | |
| | | | 499,792 | |
| | | | | | | | |
| Security | | Shares | | | Value | |
|
| Ireland— 1.1% | |
AerCap Holdings NV(a) | | | 349 | | | $ | 18,151 | |
Allegion PLC | | | 11,465 | | | | 1,267,456 | |
Kingspan Group PLC | | | 1,756 | | | | 95,365 | |
Medtronic PLC | | | 36,839 | | | | 3,587,750 | |
Smurfit Kappa Group PLC | | | 2,295 | | | | 69,544 | |
| | | | | | | | |
| | | | 5,038,266 | |
|
| Israel— 0.1% | |
Check Point Software Technologies Ltd.(a) | | | 5,390 | | | | 623,138 | |
| | | | | | | | |
|
| Italy— 1.0% | |
A2A SpA | | | 45,830 | | | | 79,557 | |
Ferrari NV | | | 12,939 | | | | 2,097,924 | |
Hera SpA | | | 16,214 | | | | 62,019 | |
Interpump Group SpA | | | 1,103 | | | | 33,940 | |
Mediobanca Banca di Credito Finanziario SpA | | | 9,253 | | | | 95,415 | |
Moncler SpA | | | 41,859 | | | | 1,794,133 | |
Terna Rete Elettrica Nazionale SpA | | | 24,523 | | | | 156,251 | |
| | | | | | | | |
| | | | 4,319,239 | |
|
| Japan— 5.8% | |
Advantest Corp. | | | 36,400 | | | | 1,002,124 | |
AGC, Inc. | | | 3,500 | | | | 121,246 | |
Aoyama Trading Co. Ltd. | | | 700 | | | | 13,742 | |
Asahi Group Holdings Ltd. | | | 600 | | | | 27,011 | |
Astellas Pharma, Inc. | | | 136,800 | | | | 1,949,504 | |
Canon, Inc. | | | 2,900 | | | | 84,921 | |
Chubu Electric Power Co., Inc. | | | 1,900 | | | | 26,690 | |
Chugai Pharmaceutical Co. Ltd. | | | 3,300 | | | | 216,126 | |
Citizen Watch Co. Ltd. | | | 4,900 | | | | 25,214 | |
Dai-ichi Life Holdings, Inc. | | | 38,700 | | | | 585,521 | |
Dentsu, Inc. | | | 1,000 | | | | 34,973 | |
East Japan Railway Co. | | | 15,500 | | | | 1,451,478 | |
Fancl Corp. | | | 800 | | | | 19,788 | |
Fast Retailing Co. Ltd. | | | 400 | | | | 242,119 | |
Fuji Media Holdings, Inc. | | | 1,100 | | | | 15,364 | |
FUJIFILM Holdings Corp. | | | 2,600 | | | | 132,001 | |
Honda Motor Co. Ltd. | | | 1,700 | | | | 43,960 | |
ITOCHU Corp. | | | 10,700 | | | | 204,980 | |
Japan Post Insurance Co. Ltd. | | | 16,000 | | | | 296,833 | |
Japan Tobacco, Inc. | | | 66,200 | | | | 1,459,290 | |
JXTG Holdings, Inc. | | | 518,900 | | | | 2,586,146 | |
Kao Corp. | | | 7,100 | | | | 541,761 | |
KDDI Corp. | | | 10,800 | | | | 274,824 | |
Kirin Holdings Co. Ltd. | | | 71,700 | | | | 1,548,183 | |
Lintec Corp. | | | 700 | | | | 14,614 | |
LIXIL Group Corp. | | | 6,200 | | | | 98,351 | |
Marubeni Corp. | | | 4,600 | | | | 30,534 | |
Mitsubishi Chemical Holdings Corp. | | | 162,500 | | | | 1,137,712 | |
Mitsubishi Gas Chemical Co., Inc. | | | 8,300 | | | | 111,016 | |
Mitsubishi Motors Corp. | | | 24,700 | | | | 118,637 | |
Mitsubishi UFJ Financial Group, Inc. | | | 491,400 | | | | 2,340,526 | |
Mitsui & Co. Ltd. | | | 72,100 | | | | 1,176,881 | |
Mixi, Inc. | | | 1,700 | | | | 34,140 | |
MS&AD Insurance Group Holdings, Inc. | | | 2,500 | | | | 79,466 | |
Nippon Telegraph & Telephone Corp. | | | 18,200 | | | | 847,932 | |
Nissan Motor Co. Ltd. | | | 3,700 | | | | 26,501 | |
Nisshinbo Holdings, Inc. | | | 1,800 | | | | 13,800 | |
Nitto Denko Corp. | | | 9,600 | | | | 475,166 | |
NTN Corp. | | | 6,100 | | | | 18,183 | |
NTT DOCOMO, Inc. | | | 86,500 | | | | 2,018,210 | |
Ono Pharmaceutical Co. Ltd. | | | 1,200 | | | | 21,576 | |
ORIX Corp. | | | 10,400 | | | | 155,427 | |
Otsuka Corp. | | | 600 | | | | 24,196 | |
Otsuka Holdings Co. Ltd. | | | 600 | | | | 19,606 | |
PeptiDream, Inc.(a) | | | 800 | | | | 41,090 | |
| | | | |
| SCHEDULES OF INVESTMENTS | | | 13 | |
| | |
Schedule of Investments (continued) June 30, 2019 | | BlackRock Advantage Global Fund, Inc. (Percentages shown are based on Net Assets) |
| | | | | | | | |
| Security | | Shares | | | Value | |
|
| Japan (continued) | |
Pola Orbis Holdings, Inc. | | | 10,800 | | | $ | 302,638 | |
Resona Holdings, Inc. | | | 20,900 | | | | 87,186 | |
Rohm Co. Ltd. | | | 1,100 | | | | 74,113 | |
Ryohin Keikaku Co. Ltd. | | | 800 | | | | 144,948 | |
SCSK Corp. | | | 1,200 | | | | 59,153 | |
Seria Co. Ltd. | | | 800 | | | | 18,504 | |
Seven & i Holdings Co. Ltd. | | | 1,800 | | | | 60,986 | |
Shin-Etsu Chemical Co. Ltd. | | | 8,200 | | | | 767,207 | |
Sompo Holdings, Inc. | | | 2,900 | | | | 112,177 | |
Sumitomo Chemical Co. Ltd. | | | 76,300 | | | | 355,279 | |
Sumitomo Corp. | | | 23,300 | | | | 353,882 | |
Sundrug Co. Ltd. | | | 1,800 | | | | 48,817 | |
T&D Holdings, Inc. | | | 22,700 | | | | 247,056 | |
TAG Immobilien AG(a) | | | 5,945 | | | | 137,319 | |
Taisei Corp. | | | 600 | | | | 21,787 | |
Takashimaya Co. Ltd. | | | 1,500 | | | | 16,462 | |
Takeda Pharmaceutical Co. Ltd. | | | 13,700 | | | | 487,348 | |
Tokyo Electron Ltd. | | | 3,900 | | | | 548,166 | |
Tokyo Tatemono Co. Ltd. | | | 2,100 | | | | 23,379 | |
Trend Micro, Inc. | | | 2,000 | | | | 89,368 | |
Ube Industries Ltd. | | | 17,300 | | | | 359,924 | |
Ulvac, Inc. | | | 6,300 | | | | 200,737 | |
Zeon Corp. | | | 9,200 | | | | 102,645 | |
| | | | | | | | |
| | | | 26,326,444 | |
|
| Luxembourg— 0.0% | |
Reinet Investments SCA | | | 1,326 | | | | 21,387 | |
| | | | | | | | |
|
| Malaysia— 0.1% | |
Genting Bhd | | | 26,800 | | | | 43,940 | |
Public Bank Bhd | | | 38,200 | | | | 212,712 | |
QL Resources Bhd | | | 12,500 | | | | 20,693 | |
Tenaga Nasional Bhd | | | 19,800 | | | | 66,382 | |
| | | | | | | | |
| | | | 343,727 | |
|
| Mexico— 0.7% | |
Alsea SAB de CV(a) | | | 7,900 | | | | 15,550 | |
America Movil SAB de CV, Series L | | | 1,852,300 | | | | 1,348,180 | |
Banco del Bajio SA(b) | | | 9,700 | | | | 19,401 | |
Cemex SAB de CV CPO | | | 366,910 | | | | 154,649 | |
Fomento Economico Mexicano SAB de CV | | | 18,345 | | | | 177,737 | |
Grupo Aeroportuario del Centro Norte SAB de CV | | | 4,800 | | | | 29,315 | |
Grupo Financiero Banorte SAB de CV, Series O | | | 19,500 | | | | 113,137 | |
Grupo Televisa SAB CPO | | | 9,890 | | | | 16,721 | |
Megacable Holdings SAB de CV CPO | | | 6,900 | | | | 29,313 | |
Mexichem SAB de CV | | | 12,300 | | | | 25,819 | |
Wal-Mart de Mexico SAB de CV | | | 398,922 | | | | 1,089,079 | |
| | | | | | | | |
| | | | 3,018,901 | |
|
| Netherlands— 1.9% | |
Adyen NV(a)(b) | | | 515 | | | | 397,264 | |
ASM International NV | | | 1,602 | | | | 103,974 | |
BE Semiconductor Industries NV(c) | | | 16,892 | | | | 433,453 | |
Flow Traders(b) | | | 629 | | | | 18,367 | |
Heineken Holding NV | | | 266 | | | | 27,862 | |
Koninklijke DSM NV | | | 13,259 | | | | 1,635,954 | |
Koninklijke KPN NV | | | 34,920 | | | | 107,232 | |
Koninklijke Philips NV | | | 2,134 | | | | 92,778 | |
NXP Semiconductors NV | | | 1,154 | | | | 112,642 | |
Randstad NV | | | 347 | | | | 19,044 | |
Royal Dutch Shell PLC, Class A | | | 21,894 | | | | 714,567 | |
Royal Dutch Shell PLC, Class B | | | 11,695 | | | | 383,206 | |
Takeaway.com NV(a)(b) | | | 181 | | | | 16,934 | |
Unilever NV CVA | | | 44,211 | | | | 2,686,178 | |
Wereldhave NV | | | 1 | | | | 26 | |
Wolters Kluwer NV | | | 23,572 | | | | 1,714,893 | |
| | | | | | | | |
| | | | 8,464,374 | |
| | | | | | | | |
| Security | | Shares | | | Value | |
|
| New Zealand— 0.0% | |
a2 Milk Co., Ltd.(a) | | | 13,679 | | | $ | 133,566 | |
| | | | | | | | |
|
| Norway— 0.2% | |
DNB ASA | | | 19,309 | | | | 359,797 | |
Schibsted ASA, Class A | | | 574 | | | | 15,833 | |
Storebrand ASA | | | 13,842 | | | | 101,877 | |
Telenor ASA | | | 9,559 | | | | 203,093 | |
| | | | | | | | |
| | | | 680,600 | |
|
| Poland— 0.5% | |
Bank Polska Kasa Opieki SA | | | 12,203 | | | | 365,678 | |
Grupa Lotos SA | | | 4,354 | | | | 98,811 | |
PGE Polska Grupa Energetyczna SA(a) | | | 17,114 | | | | 44,015 | |
Polski Koncern Naftowy ORLEN SA | | | 37,111 | | | | 895,007 | |
Powszechna Kasa Oszczednosci Bank Polski SA | | | 10,388 | | | | 119,234 | |
Powszechny Zaklad Ubezpieczen SA | | | 49,472 | | | | 578,958 | |
| | | | | | | | |
| | | | 2,101,703 | |
|
| Russia— 0.3% | |
Alrosa PJSC | | | 26,770 | | | | 36,431 | |
Gazprom PJSC | | | 84,934 | | | | 313,276 | |
Inter RAO UES PJSC | | | 386,000 | | | | 27,650 | |
LUKOIL PJSC | | | 3,960 | | | | 332,303 | |
Magnit PJSC — GDR | | | 3,609 | | | | 52,601 | |
Magnitogorsk Iron & Steel Works PJSC | | | 28,400 | | | | 20,207 | |
MMC Norilsk Nickel PJSC | | | 594 | | | | 134,434 | |
Mobile TeleSystems PJSC — ADR | | | 5,512 | | | | 51,317 | |
Novatek PJSC — GDR | | | 910 | | | | 193,439 | |
PhosAgro PJSC, — GDR | | | 1,139 | | | | 14,948 | |
Severstal PJSC | | | 2,180 | | | | 36,798 | |
Surgutneftegas PJSC | | | 96,675 | | | | 40,284 | |
Tatneft PJSC | | | 15,160 | | | | 185,928 | |
| | | | | | | | |
| | | | 1,439,616 | |
|
| Singapore— 0.2% | |
CapitaLand Mall Trust | | | 202,300 | | | | 393,426 | |
Mapletree Commercial Trust | | | 23,800 | | | | 36,776 | |
Oversea-Chinese Banking Corp. Ltd. | | | 30,000 | | | | 253,056 | |
SATS Ltd. | | | 13,300 | | | | 51,316 | |
Singapore Technologies Engineering Ltd. | | | 18,700 | | | | 57,274 | |
Suntec Real Estate Investment Trust | | | 31,100 | | | | 44,616 | |
United Overseas Bank Ltd. | | | 12,900 | | | | 249,385 | |
| | | | | | | | |
| | | | 1,085,849 | |
|
| South Africa— 0.4% | |
Barloworld Ltd. | | | 2,010 | | | | 18,226 | |
Bidvest Group Ltd. | | | 31,477 | | | | 423,577 | |
Clicks Group Ltd. | | | 2,327 | | | | 33,916 | |
FirstRand Ltd. | | | 23,954 | | | | 116,668 | |
Investec Ltd. | | | 9,546 | | | | 62,096 | |
Kumba Iron Ore Ltd. | | | 7,303 | | | | 258,901 | |
Mr Price Group Ltd. | | | 1,667 | | | | 23,476 | |
MultiChoice Group Ltd.(a) | | | 845 | | | | 8,037 | |
Naspers Ltd., Class N | | | 858 | | | | 207,679 | |
Sanlam Ltd. | | | 1,973 | | | | 10,955 | |
Standard Bank Group Ltd. | | | 27,747 | | | | 387,619 | |
Tiger Brands Ltd. | | | 1,230 | | | | 19,538 | |
| | | | | | | | |
| | | | 1,570,688 | |
|
| South Korea— 0.5% | |
Amorepacific Corp. | | | 195 | | | | 27,856 | |
Celltrion, Inc.(a) | | | 813 | | | | 144,901 | |
Fila Korea Ltd. | | | 516 | | | | 34,269 | |
Helixmith Co. Ltd.(a) | | | 166 | | | | 24,303 | |
KB Financial Group, Inc. | | | 591 | | | | 23,427 | |
Kia Motors Corp. | | | 869 | | | | 33,151 | |
Korea Electric Power Corp.(a) | | | 989 | | | | 21,893 | |
LG Electronics, Inc. | | | 2,875 | | | | 197,818 | |
| | |
| 14 | | 2019 BLACKROCK ANNUAL REPORTTO SHAREHOLDERS |
| | |
Schedule of Investments (continued) June 30, 2019 | | BlackRock Advantage Global Fund, Inc. (Percentages shown are based on Net Assets) |
| | | | | | | | |
| Security | | Shares | | | Value | |
|
| South Korea (continued) | |
LG Household & Health Care Ltd. | | | 46 | | | $ | 52,392 | |
Medy-Tox, Inc. | | | 53 | | | | 20,686 | |
POSCO | | | 1,017 | | | | 215,894 | |
Samsung Electronics Co. Ltd. | | | 33,054 | | | | 1,345,969 | |
SillaJen, Inc.(a) | | | 770 | | | | 33,016 | |
SK Innovation Co. Ltd. | | | 131 | | | | 18,057 | |
| | | | | | | | |
| | | | 2,193,632 | |
|
| Spain— 0.4% | |
Acciona SA | | | 3,123 | | | | 335,168 | |
ACS Actividades de Construccion y Servicios SA | | | 5,742 | | | | 229,732 | |
Aena SME SA(b) | | | 619 | | | | 122,688 | |
Cia de Distribucion Integral Logista Holdings SA | | | 585 | | | | 13,247 | |
EDP Renovaveis SA | | | 17 | | | | 174 | |
Endesa SA | | | 11,872 | | | | 305,354 | |
Grifols SA | | | 2,954 | | | | 87,419 | |
Mediaset Espana Comunicacion SA | | | 65,752 | | | | 478,611 | |
Merlin Properties Socimi SA | | | 2,539 | | | | 35,194 | |
Repsol SA | | | 2,249 | | | | 35,293 | |
Telefonica SA | | | 24,950 | | | | 205,171 | |
| | | | | | | | |
| | | | 1,848,051 | |
|
| Sweden— 1.0% | |
Fabege AB | | | 6,710 | | | | 101,033 | |
Lundin Petroleum AB | | | 653 | | | | 20,346 | |
Skandinaviska Enskilda Banken AB, Class A | | | 15,213 | | | | 140,856 | |
Volvo AB, Class B | | | 251,236 | | | | 3,992,059 | |
| | | | | | | | |
| | | | 4,254,294 | |
|
| Switzerland— 4.0% | |
Barry Callebaut AG, Registered Shares | | | 102 | | | | 204,719 | |
Clariant AG, Registered Shares(a) | | | 768 | | | | 15,625 | |
Ferguson PLC(a) | | | 702 | | | | 49,975 | |
Flughafen Zuerich AG, Registered Shares | | | 519 | | | | 97,747 | |
Galenica AG(a)(b) | | | 516 | | | | 25,929 | |
Givaudan SA, Registered Shares | | | 64 | | | | 180,770 | |
Landis+Gyr Group AG(a) | | | 249 | | | | 19,832 | |
Logitech International SA, Registered Shares | | | 52,221 | | | | 2,087,312 | |
Nestle SA, Registered Shares | | | 37,401 | | | | 3,871,834 | |
Novartis AG, Registered Shares | | | 21,455 | | | | 1,958,664 | |
OC Oerlikon Corp. AG, Registered Shares | | | 8,686 | | | | 106,141 | |
PSP Swiss Property AG, Registered Shares | | | 2,623 | | | | 306,550 | |
Roche Holding AG | | | 18,555 | | | | 5,217,437 | |
Sika AG, Registered Shares | | | 17,385 | | | | 2,970,099 | |
Sonova Holding AG, Registered Shares | | | 353 | | | | 80,342 | |
STMicroelectronics NV | | | 19,412 | | | | 344,292 | |
Straumann Holding AG, Registered Shares | | | 214 | | | | 189,107 | |
Sunrise Communications Group AG(a)(b) | | | 1,698 | | | | 126,821 | |
Swiss Re AG | | | 173 | | | | 17,580 | |
Temenos AG, Registered Shares(a) | | | 1,015 | | | | 181,740 | |
| | | | | | | | |
| | | | 18,052,516 | |
|
| Taiwan— 1.3% | |
Accton Technology Corp. | | | 5,000 | | | | 21,239 | |
Cathay Financial Holding Co. Ltd.(a) | | | 279,000 | | | | 386,437 | |
Chailease Holding Co. Ltd. | | | 4,000 | | | | 16,576 | |
China Life Insurance Co. Ltd. | | | 22,883 | | | | 18,315 | |
China Steel Corp. | | | 90,000 | | | | 72,332 | |
Chipbond Technology Corp. | | | 10,000 | | | | 19,500 | |
CTBC Financial Holding Co. Ltd. | | | 458,000 | | | | 314,926 | |
Delta Electronics, Inc. | | | 28,000 | | | | 142,308 | |
Fubon Financial Holding Co. Ltd. | | | 596,000 | | | | 880,740 | |
Largan Precision Co. Ltd. | | | 3,000 | | | | 374,680 | |
MediaTek, Inc. | | | 55,000 | | | | 557,082 | |
Novatek Microelectronics Corp. | | | 19,000 | | | | 106,023 | |
Quanta Computer, Inc. | | | 41,000 | | | | 79,805 | |
Radiant Opto-Electronics Corp. | | | 27,000 | | | | 90,736 | |
| | | | | | | | |
| Security | | Shares | | | Value | |
|
| Taiwan (continued) | |
Realtek Semiconductor Corp. | | | 13,000 | | | $ | 95,749 | |
TaiMed Biologics, Inc.(a) | | | 2,000 | | | | 10,244 | |
Taiwan Semiconductor Manufacturing Co. Ltd. | | | 249,000 | | | | 1,904,446 | |
TPK Holding Co. Ltd. | | | 11,000 | | | | 17,644 | |
Uni-President Enterprises Corp. | | | 311,000 | | | | 828,405 | |
| | | | | | | | |
| | | | 5,937,187 | |
|
| Thailand— 0.1% | |
Berli Jucker PCL — NVDR | | | 218,700 | | | | 360,365 | |
Gulf Energy Development PCL | | | 3,700 | | | | 14,840 | |
Gulf Energy Development PCL — NVDR | | | 8,300 | | | | 33,299 | |
Muangthai Leasing PCL — NVDR | | | 16,600 | | | | 30,608 | |
Thanachart Capital PCL — NVDR | | | 9,300 | | | | 16,837 | |
| | | | | | | | |
| | | | 455,949 | |
|
| Turkey— 0.4% | |
Akbank TAS(a) | | | 141,228 | | | | 167,146 | |
BIM Birlesik Magazalar AS | | | 2,865 | | | | 39,409 | |
Haci Omer Sabanci Holding AS | | | 165,196 | | | | 244,834 | |
KOC Holding AS | | | 57,770 | | | | 174,339 | |
Tupras Turkiye Petrol Rafinerileri AS | | | 757 | | | | 15,015 | |
Turk Telekomunikasyon AS(a) | | | 118,022 | | | | 101,362 | |
Turkiye Garanti Bankasi AS(a) | | | 271,996 | | | | 427,110 | |
Turkiye Is Bankasi AS, Class C(a) | | | 532,887 | | | | 555,738 | |
Turkiye Vakiflar Bankasi Tao, Class D | | | 51,942 | | | | 37,524 | |
Yapi ve Kredi Bankasi AS(a) | | | 68,856 | | | | 28,623 | |
| | | | | | | | |
| | | | 1,791,100 | |
|
| United Kingdom— 4.0% | |
Anglo American PLC | | | 71,202 | | | | 2,035,024 | |
Ashmore Group PLC | | | 3,136 | | | | 20,288 | |
Ashtead Group PLC | | | 5,725 | | | | 164,029 | |
Atlassian Corp. PLC, Class A(a)(c) | | | 1,643 | | | | 214,970 | |
Auto Trader Group PLC(b) | | | 27,751 | | | | 193,279 | |
Barratt Developments PLC | | | 25,310 | | | | 184,181 | |
boohoo Group PLC(a) | | | 13,486 | | | | 36,241 | |
Carnival PLC | | | 22,707 | | | | 999,298 | |
Centrica PLC | | | 62,166 | | | | 69,300 | |
Compass Group PLC | | | 23,453 | | | | 562,210 | |
Diageo PLC | | | 87,342 | | | | 3,759,220 | |
Dialog Semiconductor PLC(a) | | | 19,779 | | | | 795,894 | |
Direct Line Insurance Group PLC | | | 23,450 | | | | 98,848 | |
Electrocomponents PLC | | | 19,157 | | | | 153,902 | |
Fevertree Drinks PLC | | | 1,496 | | | | 44,036 | |
GlaxoSmithKline PLC | | | 44,047 | | | | 882,914 | |
Halma PLC | | | 1,511 | | | | 38,806 | |
IG Group Holdings PLC | | | 16,047 | | | | 118,965 | |
Imperial Brands PLC | | | 24,392 | | | | 572,362 | |
International Game Technology PLC | | | 1,530 | | | | 19,844 | |
Intertek Group PLC | | | 29,040 | | | | 2,030,186 | |
Land Securities Group PLC | | | 3,167 | | | | 33,547 | |
Legal & General Group PLC | | | 181,850 | | | | 623,020 | |
National Grid PLC | | | 73,612 | | | | 782,853 | |
Pagegroup PLC | | | 6,085 | | | | 39,608 | |
Pearson PLC | | | 3,017 | | | | 31,389 | |
Petrofac Ltd. | | | 31,063 | | | | 169,925 | |
Rentokil Initial PLC | | | 192,921 | | | | 973,997 | |
Rightmove PLC | | | 17,246 | | | | 117,325 | |
Rio Tinto Ltd. | | | 21,169 | | | | 1,550,105 | |
Royal Mail PLC | | | 31,049 | | | | 83,554 | |
SSP Group PLC | | | 4,365 | | | | 38,043 | |
Tate & Lyle PLC | | | 3,889 | | | | 36,458 | |
Taylor Wimpey PLC | | | 14,337 | | | | 28,769 | |
Unilever PLC | | | 5,029 | | | | 312,176 | |
Victrex PLC | | | 1,204 | | | | 33,085 | |
Vodafone Group PLC | | | 131,607 | | | | 215,712 | |
| | | | |
| SCHEDULES OF INVESTMENTS | | | 15 | |
| | |
Schedule of Investments (continued) June 30, 2019 | | BlackRock Advantage Global Fund, Inc. (Percentages shown are based on Net Assets) |
| | | | | | | | |
| Security | | Shares | | | Value | |
|
| United Kingdom (continued) | |
WM Morrison Supermarkets PLC | | | 41,578 | | | $ | 106,426 | |
| | | | | | | | |
| | | | 18,169,789 | |
|
| United States— 51.4% | |
AbbVie, Inc. | | | 13,927 | | | | 1,012,771 | |
ACI Worldwide, Inc.(a) | | | 3 | | | | 103 | |
Adobe, Inc.(a) | | | 3,631 | | | | 1,069,874 | |
ADT, Inc. | | | 3,069 | | | | 18,782 | |
Advance Auto Parts, Inc.(c) | | | 1,731 | | | | 266,816 | |
Air Products & Chemicals, Inc. | | | 617 | | | | 139,670 | |
Alexandria Real Estate Equities, Inc. | | | 3,957 | | | | 558,293 | |
Alexion Pharmaceuticals, Inc.(a) | | | 2,208 | | | | 289,204 | |
Align Technology, Inc.(a) | | | 171 | | | | 46,803 | |
Alkermes PLC(a) | | | 1,820 | | | | 41,023 | |
ALLETE, Inc. | | | 390 | | | | 32,452 | |
Allstate Corp. | | | 18,749 | | | | 1,906,586 | |
Ally Financial, Inc. | | | 1,082 | | | | 33,531 | |
Alnylam Pharmaceuticals, Inc.(a) | | | 897 | | | | 65,086 | |
Alphabet, Inc., Class A(a) | | | 1,486 | | | | 1,609,041 | |
Alphabet, Inc., Class C(a) | | | 3,574 | | | | 3,863,172 | |
Amazon.com, Inc.(a) | | | 4,323 | | | | 8,186,162 | |
American Express Co. | | | 3,834 | | | | 473,269 | |
American Financial Group, Inc. | | | 4,796 | | | | 491,446 | |
AmerisourceBergen Corp. | | | 7,119 | | | | 606,966 | |
Amgen, Inc. | | | 5,875 | | | | 1,082,645 | |
AMN Healthcare Services, Inc.(a) | | | 367 | | | | 19,910 | |
Anthem, Inc. | | | 2,598 | | | | 733,182 | |
AO Smith Corp. | | | 11,534 | | | | 543,943 | |
Apartment Investment & Management Co., Class A | | | 9,341 | | | | 468,171 | |
Apple Hospitality REIT, Inc. | | | 50,284 | | | | 797,504 | |
Apple, Inc. | | | 30,410 | | | | 6,018,747 | |
Applied Materials, Inc. | | | 1,555 | | | | 69,835 | |
Archer-Daniels-Midland Co. | | | 3,746 | | | | 152,837 | |
AT&T, Inc. | | | 11,073 | | | | 371,056 | |
Automatic Data Processing, Inc. | | | 9,492 | | | | 1,569,312 | |
AutoZone, Inc.(a) | | | 708 | | | | 778,425 | |
Avista Corp. | | | 12,438 | | | | 554,735 | |
Bank of America Corp. | | | 28,045 | | | | 813,305 | |
Bank of Hawaii Corp. | | | 1,319 | | | | 109,358 | |
Bank of New York Mellon Corp. | | | 4,520 | | | | 199,558 | |
Bausch Health Cos., Inc.(a) | | | 2,147 | | | | 54,169 | |
BB&T Corp. | | | 26,220 | | | | 1,288,189 | |
Berkshire Hathaway, Inc., Class B(a) | | | 6,565 | | | | 1,399,461 | |
Bio-Rad Laboratories, Inc., Class A(a) | | | 248 | | | | 77,522 | |
Biogen, Inc.(a) | | | 1,888 | | | | 441,547 | |
BioMarin Pharmaceutical, Inc.(a) | | | 1,843 | | | | 157,853 | |
Black Hills Corp. | | | 4,086 | | | | 319,403 | |
Black Knight, Inc.(a) | | | 627 | | | | 37,714 | |
Boston Properties, Inc. | | | 1,201 | | | | 154,929 | |
Boyd Gaming Corp.(c) | | | 1,676 | | | | 45,151 | |
Brink’s Co. | | | 197 | | | | 15,992 | |
Bristol-Myers Squibb Co. | | | 19,667 | | | | 891,898 | |
Brixmor Property Group, Inc. | | | 1,428 | | | | 25,533 | |
Broadcom, Inc. | | | 5,066 | | | | 1,458,299 | |
Brown-Forman Corp., Class B | | | 4,450 | | | | 246,663 | |
Bruker Corp. | | | 607 | | | | 30,320 | |
C.H. Robinson Worldwide, Inc. | | | 395 | | | | 33,318 | |
Cabot Microelectronics Corp. | | | 272 | | | | 29,942 | |
Cabot Oil & Gas Corp. | | | 10,220 | | | | 234,651 | |
Capital One Financial Corp. | | | 751 | | | | 68,146 | |
Cargurus, Inc.(a) | | | 1,140 | | | | 41,165 | |
CDW Corp. | | | 11,780 | | | | 1,307,580 | |
Celgene Corp.(a) | | | 6,653 | | | | 615,003 | |
CenterPoint Energy, Inc. | | | 31,732 | | | | 908,487 | |
Charles Schwab Corp. | | | 67,991 | | | | 2,732,558 | |
| | | | | | | | |
| Security | | Shares | | | Value | |
|
| United States (continued) | |
Chevron Corp. | | | 16,015 | | | $ | 1,992,907 | |
Church & Dwight Co., Inc. | | | 1,844 | | | | 134,723 | |
Ciena Corp.(a) | | | 4,932 | | | | 202,853 | |
Cigna Corp. | | | 2,132 | | | | 335,897 | |
Cincinnati Financial Corp. | | | 667 | | | | 69,148 | |
Cinemark Holdings, Inc. | | | 9,622 | | | | 347,354 | |
Cirrus Logic, Inc.(a) | | | 1,400 | | | | 61,180 | |
Cisco Systems, Inc. | | | 43,527 | | | | 2,382,233 | |
Citigroup, Inc. | | | 1,787 | | | | 125,144 | |
Citizens Financial Group, Inc. | | | 85,134 | | | | 3,010,338 | |
Colgate-Palmolive Co. | | | 408 | | | | 29,241 | |
Comcast Corp., Class A | | | 75,438 | | | | 3,189,519 | |
Comerica, Inc. | | | 1,561 | | | | 113,391 | |
ConocoPhillips | | | 30,889 | | | | 1,884,229 | |
Consolidated Edison, Inc. | | | 373 | | | | 32,705 | |
CoreSite Realty Corp. | | | 205 | | | | 23,610 | |
CoStar Group, Inc.(a) | | | 3,170 | | | | 1,756,370 | |
Crane Co. | | | 14,164 | | | | 1,181,844 | |
CubeSmart | | | 664 | | | | 22,204 | |
Cullen/Frost Bankers, Inc. | | | 1,293 | | | | 121,102 | |
Curtiss-Wright Corp. | | | 437 | | | | 55,556 | |
CVS Health Corp. | | | 3,317 | | | | 180,743 | |
Danaher Corp. | | | 16,562 | | | | 2,367,041 | |
Darden Restaurants, Inc. | | | 15,213 | | | | 1,851,878 | |
Dell Technologies, Inc., Class C(a) | | | 19,478 | | | | 989,482 | |
DexCom, Inc.(a) | | | 135 | | | | 20,228 | |
Discover Financial Services | | | 30,771 | | | | 2,387,522 | |
Dominion Energy, Inc. | | | 8,478 | | | | 655,519 | |
Domino’s Pizza, Inc. | | | 166 | | | | 46,194 | |
Dow, Inc. | | | 18,535 | | | | 913,961 | |
DuPont de Nemours, Inc. | | | 1,697 | | | | 127,394 | |
East West Bancorp, Inc. | | | 4,236 | | | | 198,118 | |
EastGroup Properties, Inc. | | | 695 | | | | 80,606 | |
Ecolab, Inc. | | | 897 | | | | 177,104 | |
Equity LifeStyle Properties, Inc. | | | 5,018 | | | | 608,884 | |
Estee Lauder Cos., Inc., Class A | | | 2,164 | | | | 396,250 | |
Etsy, Inc.(a) | | | 321 | | | | 19,700 | |
Evercore, Inc., Class A | | | 589 | | | | 52,168 | |
Evergy, Inc. | | | 18,048 | | | | 1,085,587 | |
Exact Sciences Corp.(a) | | | 1,207 | | | | 142,474 | |
Extended Stay America, Inc. | | | 49,802 | | | | 841,156 | |
Extra Space Storage, Inc. | | | 6,286 | | | | 666,945 | |
Exxon Mobil Corp. | | | 5,923 | | | | 453,879 | |
Facebook, Inc., Class A(a) | | | 29,874 | | | | 5,765,682 | |
FactSet Research Systems, Inc. | | | 1,103 | | | | 316,076 | |
Fidelity National Information Services, Inc. | | | 28,377 | | | | 3,481,290 | |
Fifth Third Bancorp | | | 13,922 | | | | 388,424 | |
First American Financial Corp. | | | 9,221 | | | | 495,168 | |
First Horizon National Corp. | | | 6,477 | | | | 96,702 | |
First Republic Bank | | | 4,415 | | | | 431,125 | |
Fiserv, Inc.(a) | | | 3,948 | | | | 359,900 | |
Fortinet, Inc.(a) | | | 1,401 | | | | 107,639 | |
Fortive Corp. | | | 2,897 | | | | 236,163 | |
GATX Corp. | | | 241 | | | | 19,109 | |
General Mills, Inc. | | | 36,566 | | | | 1,920,446 | |
Genpact Ltd. | | | 12,422 | | | | 473,154 | |
Gilead Sciences, Inc. | | | 12,015 | | | | 811,733 | |
GoDaddy, Inc., Class A(a) | | | 45,812 | | | | 3,213,712 | |
H&R Block, Inc. | | | 24,713 | | | | 724,091 | |
Hartford Financial Services Group, Inc. | | | 667 | | | | 37,165 | |
HCA Healthcare, Inc. | | | 733 | | | | 99,080 | |
HD Supply Holdings, Inc.(a) | | | 1,305 | | | | 52,565 | |
HEICO Corp. | | | 1,632 | | | | 218,378 | |
HEICO Corp., Class A | | | 400 | | | | 41,348 | |
Herbalife Nutrition Ltd.(a) | | | 13,081 | | | | 559,344 | |
| | |
| 16 | | 2019 BLACKROCK ANNUAL REPORTTO SHAREHOLDERS |
| | |
Schedule of Investments (continued) June 30, 2019 | | BlackRock Advantage Global Fund, Inc. (Percentages shown are based on Net Assets) |
| | | | | | | | |
| Security | | Shares | | | Value | |
|
| United States (continued) | |
Hill-Rom Holdings, Inc. | | | 2,079 | | | $ | 217,505 | |
Home Depot, Inc. | | | 2,481 | | | | 515,974 | |
Hubbell, Inc. | | | 322 | | | | 41,989 | |
HubSpot, Inc.(a) | | | 210 | | | | 35,809 | |
Huntington Bancshares, Inc. | | | 30,025 | | | | 414,945 | |
IBERIABANK Corp. | | | 598 | | | | 45,358 | |
IDACORP, Inc. | | | 6,167 | | | | 619,352 | |
Incyte Corp.(a) | | | 1,775 | | | | 150,804 | |
Insperity, Inc. | | | 13,302 | | | | 1,624,706 | |
Integra LifeSciences Holdings Corp.(a) | | | 393 | | | | 21,949 | |
International Business Machines Corp. | | | 1,830 | | | | 252,357 | |
Interpublic Group of Cos., Inc. | | | 106,845 | | | | 2,413,629 | |
Intuit, Inc. | | | 6,678 | | | | 1,745,162 | |
Investors Bancorp, Inc. | | | 2,050 | | | | 22,857 | |
Ionis Pharmaceuticals, Inc.(a) | | | 1,262 | | | | 81,109 | |
J.M. Smucker Co. | | | 499 | | | | 57,480 | |
Johnson & Johnson | | | 45,070 | | | | 6,277,350 | |
JPMorgan Chase & Co. | | | 41,460 | | | | 4,635,228 | |
Kilroy Realty Corp. | | | 591 | | | | 43,622 | |
Kinder Morgan, Inc. | | | 28,878 | | | | 602,973 | |
L3Harris Technologies, Inc. | | | 6,555 | | | | 1,239,747 | |
Lamar Advertising Co., Class A | | | 1,387 | | | | 111,945 | |
Landstar System, Inc. | | | 11,755 | | | | 1,269,422 | |
Las Vegas Sands Corp. | | | 4,912 | | | | 290,250 | |
Liberty Media Corp. — Liberty SiriusXM, Class A(a) | | | 554 | | | | 20,947 | |
Lincoln National Corp. | | | 5,720 | | | | 368,654 | |
Lockheed Martin Corp. | | | 2,179 | | | | 792,154 | |
Lululemon Athletica, Inc.(a) | | | 1,055 | | | | 190,122 | |
Lyft, Inc., Class A(a)(c) | | | 685 | | | | 45,011 | |
LyondellBasell Industries NV, Class A | | | 826 | | | | 71,143 | |
Macquarie Infrastructure Corp. | | | 3,115 | | | | 126,282 | |
Manhattan Associates, Inc.(a) | | | 659 | | | | 45,688 | |
Masimo Corp.(a) | | | 1,608 | | | | 239,303 | |
MasTec, Inc.(a) | | | 602 | | | | 31,021 | |
Match Group, Inc. | | | 1,046 | | | | 70,364 | |
McCormick & Co., Inc. | | | 568 | | | | 88,046 | |
McDonald’s Corp. | | | 13,361 | | | | 2,774,545 | |
MDU Resources Group, Inc. | | | 39,791 | | | | 1,026,608 | |
Merck & Co., Inc. | | | 51,105 | | | | 4,285,154 | |
Meredith Corp. | | | 377 | | | | 20,758 | |
MetLife, Inc. | | | 23,328 | | | | 1,158,702 | |
Mettler-Toledo International, Inc.(a) | | | 763 | | | | 640,920 | |
Microsoft Corp. | | | 48,179 | | | | 6,454,059 | |
Morgan Stanley | | | 55,096 | | | | 2,413,756 | |
National Instruments Corp. | | | 17,418 | | | | 731,382 | |
NCR Corp.(a) | | | 527 | | | | 16,390 | |
Netflix, Inc.(a) | | | 1,951 | | | | 716,641 | |
New Relic, Inc.(a) | | | 2,387 | | | | 206,499 | |
New York Times Co., Class A | | | 4,506 | | | | 146,986 | |
NIKE, Inc., Class B | | | 24,202 | | | | 2,031,758 | |
Nordstrom, Inc. | | | 1,418 | | | | 45,177 | |
NorthWestern Corp. | | | 490 | | | | 35,353 | |
Nu Skin Enterprises, Inc., Class A | | | 2,503 | | | | 123,448 | |
O’Reilly Automotive, Inc.(a) | | | 1,259 | | | | 464,974 | |
OGE Energy Corp. | | | 638 | | | | 27,153 | |
Omnicom Group, Inc. | | | 9,310 | | | | 762,954 | |
OneMain Holdings, Inc. | | | 624 | | | | 21,097 | |
Oracle Corp. | | | 36,547 | | | | 2,082,083 | |
Outfront Media, Inc. | | | 11,149 | | | | 287,533 | |
PACCAR, Inc. | | | 17,999 | | | | 1,289,808 | |
PacWest Bancorp | | | 22,272 | | | | 864,822 | |
Palo Alto Networks, Inc.(a)(c) | | | 2,016 | | | | 410,780 | |
Park Hotels & Resorts, Inc. | | | 68,960 | | | | 1,900,538 | |
Paychex, Inc. | | | 23,851 | | | | 1,962,699 | |
Paycom Software, Inc.(a) | | | 195 | | | | 44,210 | |
| | | | | | | | |
| Security | | Shares | | | Value | |
|
| United States (continued) | |
Paylocity Holding Corp.(a) | | | 196 | | | $ | 18,389 | |
PayPal Holdings, Inc.(a) | | | 556 | | | | 63,640 | |
Penske Automotive Group, Inc. | | | 9,318 | | | | 440,741 | |
Penumbra, Inc.(a)(c) | | | 2,085 | | | | 333,600 | |
PepsiCo, Inc. | | | 11,495 | | | | 1,507,339 | |
Performance Food Group Co.(a) | | | 5,808 | | | | 232,494 | |
Philip Morris International, Inc. | | | 25,612 | | | | 2,011,310 | |
Pinnacle Financial Partners, Inc. | | | 4,084 | | | | 234,748 | |
Pinterest, Inc., Class A(a) | | | 5,496 | | | | 149,601 | |
Planet Fitness, Inc., Class A(a) | | | 1,520 | | | | 110,109 | |
Portland General Electric Co. | | | 2,812 | | | | 152,326 | |
PotlatchDeltic Corp. | | | 2 | | | | 78 | |
PPL Corp. | | | 43,091 | | | | 1,336,252 | |
Procter & Gamble Co. | | | 6,234 | | | | 683,558 | |
Prologis, Inc. | | | 28,567 | | | | 2,288,217 | |
Proofpoint, Inc.(a) | | | 171 | | | | 20,563 | |
Prudential Financial, Inc. | | | 17,793 | | | | 1,797,093 | |
QUALCOMM, Inc. | | | 12,858 | | | | 978,108 | |
Quest Diagnostics, Inc. | | | 2,880 | | | | 293,213 | |
Raytheon Co. | | | 82 | | | | 14,258 | |
Realty Income Corp. | | | 2,524 | | | | 174,080 | |
Red Hat, Inc.(a) | | | 1,664 | | | | 312,433 | |
Regeneron Pharmaceuticals, Inc.(a) | | | 791 | | | | 247,583 | |
Regions Financial Corp. | | | 8,422 | | | | 125,825 | |
Reliance Steel & Aluminum Co. | | | 896 | | | | 84,779 | |
Rexford Industrial Realty, Inc. | | | 1,733 | | | | 69,961 | |
RingCentral, Inc., Class A(a) | | | 3,719 | | | | 427,387 | |
RLJ Lodging Trust | | | 44,466 | | | | 788,827 | |
Robert Half International, Inc. | | | 4,567 | | | | 260,365 | |
Rockwell Automation, Inc. | | | 8,884 | | | | 1,455,466 | |
Royal Caribbean Cruises Ltd. | | | 722 | | | | 87,514 | |
Ryder System, Inc. | | | 20,757 | | | | 1,210,133 | |
Ryman Hospitality Properties, Inc. | | | 9,559 | | | | 775,139 | |
S&P Global, Inc. | | | 4,080 | | | | 929,383 | |
salesforce.com, Inc.(a) | | | 29,534 | | | | 4,481,194 | |
Seattle Genetics, Inc.(a) | | | 1,090 | | | | 75,439 | |
ServiceNow, Inc.(a) | | | 6,961 | | | | 1,911,282 | |
Simon Property Group, Inc. | | | 15,386 | | | | 2,458,067 | |
Sinclair Broadcast Group, Inc., Class A | | | 12,441 | | | | 667,211 | |
Sirius XM Holdings, Inc.(c) | | | 308,951 | | | | 1,723,947 | |
Six Flags Entertainment Corp. | | | 1,034 | | | | 51,369 | |
Snap-on, Inc. | | | 11,082 | | | | 1,835,622 | |
Southwest Gas Holdings, Inc.(a) | | | 1,105 | | | | 99,030 | |
Square, Inc., Class A(a) | | | 3,301 | | | | 239,422 | |
State Street Corp. | | | 281 | | | | 15,753 | |
Stifel Financial Corp. | | | 733 | | | | 43,291 | |
Stryker Corp. | | | 8,451 | | | | 1,737,357 | |
Sunstone Hotel Investors, Inc. | | | 12,152 | | | | 166,604 | |
Synchrony Financial | | | 18,925 | | | | 656,130 | |
Synovus Financial Corp. | | | 3,162 | | | | 110,670 | |
Tableau Software, Inc., Class A(a) | | | 382 | | | | 63,420 | |
TD Ameritrade Holding Corp. | | | 9,620 | | | | 480,230 | |
TEGNA, Inc. | | | 1,420 | | | | 21,513 | |
Teledyne Technologies, Inc.(a) | | | 310 | | | | 84,900 | |
Texas Instruments, Inc. | | | 1,428 | | | | 163,877 | |
Thermo Fisher Scientific, Inc. | | | 3,678 | | | | 1,080,155 | |
TJX Cos., Inc. | | | 8,252 | | | | 436,366 | |
Travelers Cos., Inc. | | | 11,275 | | | | 1,685,838 | |
TriNet Group, Inc.(a)(c) | | | 705 | | | | 47,799 | |
Uber Technologies, Inc.(a)(c) | | | 37,722 | | | | 1,749,546 | |
UGI Corp. | | | 14,276 | | | | 762,481 | |
Ulta Salon Cosmetics & Fragrance, Inc.(a) | | | 466 | | | | 161,651 | |
Umpqua Holdings Corp. | | | 1,916 | | | | 31,786 | |
United Technologies Corp. | | | 1,394 | | | | 181,499 | |
UnitedHealth Group, Inc. | | | 12,456 | | | | 3,039,389 | |
| | | | |
| SCHEDULES OF INVESTMENTS | | | 17 | |
| | |
Schedule of Investments (continued) June 30, 2019 | | BlackRock Advantage Global Fund, Inc. (Percentages shown are based on Net Assets) |
| | | | | | | | |
| Security | | Shares | | | Value | |
|
| United States (continued) | |
Unum Group | | | 46,298 | | | $ | 1,553,298 | |
Valero Energy Corp. | | | 2,073 | | | | 177,470 | |
Veeva Systems, Inc., Class A(a) | | | 15,432 | | | | 2,501,681 | |
VeriSign, Inc.(a) | | | 9,916 | | | | 2,074,031 | |
Verizon Communications, Inc. | | | 65,217 | | | | 3,725,847 | |
Vertex Pharmaceuticals, Inc.(a) | | | 2,435 | | | | 446,530 | |
VF Corp. | | | 1,837 | | | | 160,462 | |
Visa, Inc., Class A | | | 32,278 | | | | 5,601,848 | |
VMware, Inc., Class A | | | 1,248 | | | | 208,678 | |
Vulcan Materials Co. | | | 578 | | | | 79,365 | |
W.W. Grainger, Inc. | | | 375 | | | | 100,586 | |
Waste Connections, Inc. | | | 7,922 | | | | 757,185 | |
Waste Management, Inc. | | | 427 | | | | 49,263 | |
Watsco, Inc. | | | 1,871 | | | | 305,965 | |
Webster Financial Corp. | | | 671 | | | | 32,054 | |
Wells Fargo & Co. | | | 89,049 | | | | 4,213,799 | |
Western Alliance Bancorp(a) | | | 331 | | | | 14,802 | |
Westrock Co. | | | 55,345 | | | | 2,018,432 | |
Williams Cos., Inc. | | | 15,950 | | | | 447,238 | |
Woodward, Inc. | | | 311 | | | | 35,193 | |
Workday, Inc., Class A(a) | | | 7,302 | | | | 1,501,145 | |
Xcel Energy, Inc. | | | 4,949 | | | | 294,416 | |
Xilinx, Inc. | | | 5,141 | | | | 606,227 | |
Yelp, Inc.(a) | | | 6,789 | | | | 232,048 | |
Yum! Brands, Inc. | | | 6,148 | | | | 680,399 | |
Zendesk, Inc.(a) | | | 7,100 | | | | 632,113 | |
Zions Bancorp. NA | | | 14,105 | | | | 648,548 | |
Zynga, Inc., Class A(a) | | | 6,676 | | | | 40,924 | |
| | | | | | | | |
| | | | 231,575,682 | |
| | | | | | | | |
| |
Total Common Stocks — 96.6%
(Cost — $403,911,969) | | | | 435,179,452 | |
| | | | | |
|
Preferred Stocks — 0.6% | |
|
Brazil — 0.6% | |
Banco Bradesco SA, Preference Shares, 0.00% | | | 70,587 | | | | 693,747 | |
Itau Unibanco Holding SA, Preference Shares, 0.00% | | | 195,955 | | | | 1,850,370 | |
| | | | | | | | |
| | | | 2,544,117 | |
|
| Germany — 0.0% | |
Sartorius AG, Preference Shares, 0.00% | | | 204 | | | | 41,837 | |
| | | | | | | | |
|
| Russia — 0.0% | |
Surgutneftegas PJSC, Preference Shares, 0.00% | | | 81,693 | | | | 55,077 | |
| | | | | | | | |
|
| South Korea — 0.0% | |
Samsung Electronics Co. Ltd., Preference Shares, 0.00% | | | 1,243 | | | | 41,223 | |
| | | | | | | | |
| |
Total Preferred Stocks — 0.6%
(Cost — $2,439,802) | | | | 2,682,254 | |
| | | | | |
|
Rights — 0.0% | |
|
China — 0.0% | |
Legend Holdings Corp. (Expires 05/23/19) | | | 1,700 | | | | — | |
| | | | | | | | |
|
| Republic of Korea — 0.0% | |
Helixmith Co. Ltd. (Expires 08/06/19) | | | 11 | | | | 310 | |
| | | | | | | | |
|
| Spain — 0.0% | |
ACS Actividades de Construccion y Servicios SA (Expires 07/11/19) | | | 6,697 | | | | 10,509 | |
| | | | | | | | |
| |
Total Rights — 0.0%
(Cost — $11,060) | | | | 10,819 | |
| | | | | | | | |
| |
Total Long-Term Investments — 97.2%
(Cost — $406,362,831) | | | | 437,872,525 | |
| | | | | |
| | | | | | | | |
| Security | | Shares | | | Value | |
|
Short-Term Securities — 3.4% | |
|
Money Market Funds — 1.1% | |
BlackRock Liquidity Funds,T-Fund, Institutional Class,
2.26%(d)(f) | | | 2,101,908 | | | $ | 2,101,908 | |
SL Liquidity Series, LLC, Money Market Series,
2.55%(d)(e)(f) | | | 2,915,211 | | | | 2,916,085 | |
| | | | | | | | |
| |
Total Money Market Funds — 1.1%
(Cost — $5,017,897) | | | | 5,017,993 | |
| | | | | | | | |
| | | | | | | | | | | | |
| | |
| | | Par
(000) | | | | |
|
| Time Deposits — 2.3% | |
|
| Australia — 0.1% | |
Brown Brothers Harriman & Co., 0.66%, 07/01/19 | | | AUD | | | | 328 | | | | 230,356 | |
| | | | | | | | |
|
| Canada — 0.3% | |
Brown Brothers Harriman & Co., 0.85%, 07/01/19 | | | CAD | | | | 1,914 | | | | 1,461,731 | |
| | | | | | | | |
|
| Europe — 0.7% | |
Citibank, London,, (0.58%), 07/01/19 | | | EUR | | | | 2,727 | | | | 3,100,697 | |
| | | | | | | | |
|
| Hong Kong — 0.0% | |
Hongkong & Shanghai Banking Corp. Ltd., 2.10%, 07/01/19 | | | HKD | | | | 1,529 | | | | 195,726 | |
| | | | | | | | |
|
| Japan — 0.3% | |
Sumitomo Bank Tokyo, (0.27%), 07/01/19 | | | JPY | | | | 165,446 | | | | 1,534,535 | |
| | | | | | | | |
|
| Norway — 0.6% | |
Brown Brothers Harriman & Co., 0.55%, 07/01/19 | | | NOK | | | | 21,706 | | | | 2,544,500 | |
| | | | | | | | |
|
| Singapore — 0.2% | |
Hongkong & Shanghai Banking Corp. Ltd., 0.86%, 07/01/19 | | | SGD | | | | 1,081 | | | | 798,680 | |
| | | | | | | | |
|
| United Kingdom — 0.1% | |
Citibank, New York, 0.36%, 07/01/19 | | | GBP | | | | 568 | | | | 721,675 | |
| | | | | | | | |
| |
Total Time Deposits — 2.3%
(Cost — $10,587,901) | | | | 10,587,900 | |
| | | | | | | | |
| |
Total Short-Term Securities — 3.4%
(Cost — $15,605,798) | | | | 15,605,893 | |
| | | | | | | | |
| |
Total Investments — 100.6%
(Cost — $421,968,629) | | | | 453,478,418 | |
| |
Liabilities in Excess of Other Assets — (0.6)% | | | | (2,810,955 | ) |
| | | | | | | | |
| |
Net Assets — 100.0% | | | $ | 450,667,463 | |
| | | | | | | | |
| (a) | Non-income producing security. |
| (b) | Security exempt from registration pursuant to Rule 144A under the Securities Act of 1933, as amended. These securities may be resold in transactions exempt from registration to qualified institutional investors. |
| (c) | Security, or a portion of the security, is on loan. |
| (d) | Annualized7-day yield as of period end. |
| (e) | Security was purchased with the cash collateral from loaned securities. |
| | |
| 18 | | 2019 BLACKROCK ANNUAL REPORTTO SHAREHOLDERS |
| | |
Schedule of Investments (continued) June 30, 2019 | | BlackRock Advantage Global Fund, Inc. |
| (f) | During the year ended June 30, 2019, investments in issuers considered to be an affiliate/affiliates of the Fund for purposes of Section 2(a)(3) of the Investment Company Act of 1940, as amended, were as follows: |
| | | | | | | | | | | | | | | | | | | | | | | | | | | | |
| Affiliate | | Shares
Held at
06/30/18 | | | Net
Activity | | | Shares
Held at
06/30/19 | | | Value at
06/30/19 | | | Income | | | Net
Realized
Gain (Loss) (a) | | | Change in
Unrealized
Appreciation
(Depreciation) | |
BlackRock Liquidity Funds,T-Fund, Institutional Class | | | 9,847,320 | | | | (7,745,412 | ) | | | 2,101,908 | | | $ | 2,101,908 | | | $ | 132,473 | | | $ | — | | | $ | — | |
SL Liquidity Series, LLC, Money Market Series | | | 3,423,052 | | | | (507,841 | ) | | | 2,915,211 | | | | 2,916,085 | | | | 24,020 | (b) | | | 1,604 | | | | 59 | |
| | | | | | | | | | | | | | | | | | | | | | | | | | | | |
| | | $ | 5,017,993 | | | $ | 156,493 | | | $ | 1,604 | | | $ | 59 | |
| | | | | | | | | | | | | | | | | |
| | (a) | Includes net capital gain distributions, if applicable. | |
| | (b) | All or a portion represents securities lending income earned from the reinvestment of cash collateral from loaned securities, net of fees and collateral investment expenses, and other payments to and from borrowers of securities | |
Derivative Financial Instruments Outstanding as of Period End
Futures Contracts
| | | | | | | | | | | | | | | | |
| Description | | Number of
Contracts | | | Expiration
Date | | | Notional
Amount (000) | | | Value/
Unrealized
Appreciation
(Depreciation) | |
Long Contracts | | | | | | | | | | | | | | | | |
Yen Denom Nikkei Index | | | 17 | | | | 09/12/19 | | | $ | 1,680 | | | $ | 20,632 | |
S&P/TSX 60 Index | | | 3 | | | | 09/19/19 | | | | 448 | | | | 1,894 | |
SPI 200 Index | | | 3 | | | | 09/19/19 | | | | 345 | | | | 1,206 | |
Euro Stoxx 50 Index | | | 54 | | | | 09/20/19 | | | | 2,128 | | | | 49,777 | |
FTSE 100 Index | | | 8 | | | | 09/20/19 | | | | 749 | | | | (876 | ) |
MSCI Emerging MarketsE-Mini Index | | | 21 | | | | 09/20/19 | | | | 1,106 | | | | 38,359 | |
S&P 500E-Mini Index | | | 48 | | | | 09/20/19 | | | | 7,066 | | | | 102,303 | |
| | | | | | | | | | | | | | | | |
| | | | | | | | | | | | | | $ | 213,295 | |
| | | | | | | | | | | | | | | | |
Derivative Financial Instruments Categorized by Risk Exposure
As of year end, the fair values of derivative financial instruments located in the Statements of Assets and Liabilities were as follows:
| | | | | | | | | | | | | | | | | | | | | | | | | | | | |
| | | Commodity
Contracts | | | Credit
Contracts | | | Equity
Contracts | | | Foreign
Currency
Exchange
Contracts | | | Interest
Rate
Contracts | | | Other
Contracts | | | Total | |
Assets — Derivative Financial Instruments | | | | | | | | | | | | | | | | | | | | | | | | | | | | |
Futures contracts | | | | | | | | | | | | | | | | | | | | | | | | | | | | |
Unrealized appreciation on futures contracts(a) | | $ | — | | | $ | — | | | $ | 214,171 | | | $ | — | | | $ | — | | | $ | — | | | $ | 214,171 | |
| | | | | | | | | | | | | | | | | | | | | | | | | | | | |
| | | | | | | |
| Liabilities — Derivative Financial Instruments | | | | | | | | | | | | | | | | | | | | | |
Futures contracts | | | | | | | | | | | | | | | | | | | | | | | | | | | | |
Unrealized depreciation on futures contracts(a) | | $ | — | | | $ | — | | | $ | 876 | | | $ | — | | | $ | — | | | $ | — | | | $ | 876 | |
| | | | | | | | | | | | | | | | | | | | | | | | | | | | |
| | (a) | Net cumulative unrealized appreciation (depreciation) on futures contracts, if any, are reported in the Schedule of Investments. In the Statements of Assets and Liabilities, only current day’s variation margin is reported in receivables or payables and the net cumulative unrealized appreciation (depreciation) is included in accumulated earnings (loss). | |
For the period ended June 30, 2019, the effect of derivative financial instruments in the Statements of Operations was as follows:
| | | | | | | | | | | | | | | | | | | | | | | | | | | | |
| | | Commodity
Contracts | | | Credit
Contracts | | | Equity
Contracts | | | Foreign
Currency
Exchange
Contracts | | | Interest
Rate
Contracts | | | Other
Contracts | | | Total | |
Net Realized Gain (Loss) from: | | | | | | | | | | | | | | | | | | | | | | | | | | | | |
Futures contracts | | $ | — | | | $ | — | | | $ | 53,621 | | | $ | — | | | $ | | | | $ | — | | | $ | 53,621 | |
| | | | | | | | | | | | | | | | | | | | | | | | | | | | |
| | | | | | | |
| Net Change in Unrealized Appreciation (Depreciation) on: | | | | | | | | | | | | | | | | | | | | | |
Futures contracts | | $ | — | | | $ | — | | | $ | 462,731 | | | $ | — | | | $ | | | | $ | — | | | $ | 462,731 | |
| | | | | | | | | | | | | | | | | | | | | | | | | | | | |
| | | | |
| SCHEDULES OF INVESTMENTS | | | 19 | |
| | |
Schedule of Investments (continued) June 30, 2019 | | BlackRock Advantage Global Fund, Inc. |
Average Quarterly Balances of Outstanding Derivative Financial Instruments
| | | | |
Futures contracts: | | | | |
Average notional value of contracts — long | | $ | 11,784,148 | |
Average notional value of contracts — short | | $ | — | (a) |
| | (a) | Derivative not held atquarter-end. The risk exposure table serves as an indicator of activity during the period. | |
For more information about the Fund’s investment risks regarding derivative financial instruments, refer to the Notes to Financial Statements.
Fair Value Hierarchy as of Period End
Various inputs are used in determining the fair value of investments and derivative financial instruments. For information about the Fund’s policy regarding valuation of investments, refer to the Notes to Financial Statements.
The following tables summarize the Fund’s investments and derivative financial instruments categorized in the disclosure hierarchy:
| | | | | | | | | | | | | | | | |
| | | Level 1 | | | Level 2 | | | Level 3 | | | Total | |
Assets: | |
Investments: | |
Common Stocks: | |
Argentina | | $ | 74,636 | | | $ | — | | | $ | — | | | $ | 74,636 | |
Australia | | | — | | | | 13,695,937 | | | | — | | | | 13,695,937 | |
Austria | | | 614,206 | | | | — | | | | — | | | | 614,206 | |
Belgium | | | — | | | | 3,435,131 | | | | — | | | | 3,435,131 | |
Brazil | | | 2,336,087 | | | | — | | | | — | | | | 2,336,087 | |
Canada | | | 14,954,931 | | | | — | | | | — | | | | 14,954,931 | |
China | | | 4,401,322 | | | | 11,863,992 | | | | — | | | | 16,265,314 | |
Czech Republic | | | — | | | | 114,917 | | | | — | | | | 114,917 | |
Denmark | | | 112,717 | | | | 2,364,282 | | | | — | | | | 2,476,999 | |
Finland | | | 296,836 | | | | 3,003,889 | | | | — | | | | 3,300,725 | |
France | | | — | | | | 13,254,399 | | | | — | | | | 13,254,399 | |
Germany | | | 548,997 | | | | 10,201,837 | | | | — | | | | 10,750,834 | |
Hong Kong | | | 141,245 | | | | 6,357,786 | | | | — | | | | 6,499,031 | |
Hungary | | | 66,573 | | | | 1,975,183 | | | | — | | | | 2,041,756 | |
India | | | 6,851 | | | | 5,412,208 | | | | — | | | | 5,419,059 | |
Indonesia | | | — | | | | 499,792 | | | | — | | | | 499,792 | |
Ireland | | | 4,968,722 | | | | 69,544 | | | | — | | | | 5,038,266 | |
Israel | | | 623,138 | | | | — | | | | — | | | | 623,138 | |
Italy | | | — | | | | 4,319,239 | | | | — | | | | 4,319,239 | |
Japan | | | — | | | | 26,326,444 | | | | — | | | | 26,326,444 | |
Luxembourg | | | 21,387 | | | | — | | | | — | | | | 21,387 | |
Malaysia | | | — | | | | 343,727 | | | | — | | | | 343,727 | |
Mexico | | | 3,018,901 | | | | — | | | | — | | | | 3,018,901 | |
Netherlands | | | 131,009 | | | | 8,333,365 | | | | — | | | | 8,464,374 | |
New Zealand | | | — | | | | 133,566 | | | | — | | | | 133,566 | |
Norway | | | — | | | | 680,600 | | | | — | | | | 680,600 | |
Poland | | | — | | | | 2,101,703 | | | | — | | | | 2,101,703 | |
Russia | | | 103,918 | | | | 1,335,698 | | | | — | | | | 1,439,616 | |
Singapore | | | — | | | | 1,085,849 | | | | — | | | | 1,085,849 | |
South Africa | | | 41,953 | | | | 1,528,735 | | | | — | | | | 1,570,688 | |
South Korea | | | — | | | | 2,193,632 | | | | — | | | | 2,193,632 | |
Spain | | | 174 | | | | 1,847,877 | | | | — | | | | 1,848,051 | |
Sweden | | | — | | | | 4,254,294 | | | | — | | | | 4,254,294 | |
Switzerland | | | — | | | | 18,052,516 | | | | — | | | | 18,052,516 | |
Taiwan | | | — | | | | 5,937,187 | | | | — | | | | 5,937,187 | |
Thailand | | | 14,840 | | | | 441,109 | | | | — | | | | 455,949 | |
Turkey | | | 39,409 | | | | 1,751,691 | | | | — | | | | 1,791,100 | |
United Kingdom | | | 318,368 | | | | 17,851,421 | | | | — | | | | 18,169,789 | |
United States | | | 231,575,682 | | | | — | | | | — | | | | 231,575,682 | |
Preferred Stocks | | | 2,544,117 | | | | 138,137 | | | | — | | | | 2,682,254 | |
Rights | | | 10,509 | | | | 310 | | | | — | | | | 10,819 | |
Short-Term Securities | | | | | | | | | | | | | | | | |
Money Market Funds | | | 2,101,908 | | | | — | | | | — | | | | 2,101,908 | |
Time Deposits | | | — | | | | 10,587,900 | | | | — | | | | 10,587,900 | |
| | | | | | | | | | | | | | | | |
Subtotal | | $ | 269,068,436 | | | $ | 181,493,897 | | | $ | — | | | $ | 450,562,333 | |
| | | | | | | | | | | | | | | | |
Investments Valued at NAV(a) | | | | | | | | | | | | | | | 2,916,085 | |
| | | | | |
Total | | | | | | | | | | | | | | $ | 453,478,418 | |
| | | | | |
| | |
| 20 | | 2019 BLACKROCK ANNUAL REPORTTO SHAREHOLDERS |
| | |
Schedule of Investments (continued) June 30, 2019 | | BlackRock Advantage Global Fund, Inc. |
Fair Value Hierarchy as of Period End (continued)
| | | | | | | | | | | | | | | | |
| | | Level 1 | | | Level 2 | | | Level 3 | | | Total | |
Derivative Financial Instruments(b) | |
Assets: | |
Equity contracts | | $ | 214,171 | | | $ | — | | | $ | — | | | $ | 214,171 | |
Liabilities: | |
Equity contracts | | | (876 | ) | | | — | | | | — | | | | (876 | ) |
| | | | | | | | | | | | | | | | |
| | $ | 213,295 | | | $ | — | | | $ | — | | | $ | 213,295 | |
| | | | | | | | | | | | | | | | |
| | (a) | Certain investments of the Fund were fair valued using NAV per share or its equivalent as no quoted market value is available and therefore have been excluded from the fair value hierarchy. | |
| | (b) | Derivative financial instruments are futures contracts which are valued at the unrealized appreciation (depreciation) on the instrument. | |
See notes to financial statements.
| | | | |
| SCHEDULES OF INVESTMENTS | | | 21 | |
| | |
Schedule of Investments June 30, 2019 | | BlackRock EuroFund (Percentages shown are based on Net Assets) |
| | | | | | | | |
| Security | | Shares | | | Value | |
|
Common Stocks — 99.7% | |
|
| Belgium — 2.6% | |
KBC Group NV | | | 47,074 | | | $ | 3,089,245 | |
| | | | | | | | |
|
| Denmark — 2.5% | |
DSV A/S | | | 30,115 | | | | 2,965,422 | |
| | | | | | | | |
|
| Finland — 3.8% | |
Konecranes OYJ(a) | | | 45,459 | | | | 1,736,772 | |
Sampo OYJ, Class A | | | 50,425 | | | | 2,380,283 | |
Wartsila OYJ | | | 21,769 | | | | 316,082 | |
| | | | | | | | |
| | | | 4,433,137 | |
|
| France — 40.0% | |
Airbus SE | | | 38,601 | | | | 5,462,874 | |
Arkema SA | | | 17,280 | | | | 1,606,425 | |
Capgemini SE | | | 14,271 | | | | 1,774,357 | |
Dassault Systemes SE | | | 13,426 | | | | 2,141,519 | |
Eiffage SA | | | 15,528 | | | | 1,534,624 | |
Ipsen SA | | | 9,921 | | | | 1,353,181 | |
LVMH Moet Hennessy Louis Vuitton SE | | | 17,080 | | | | 7,261,142 | |
Pernod Ricard SA | | | 17,102 | | | | 3,149,785 | |
Remy Cointreau SA | | | 13,871 | | | | 1,999,981 | |
Safran SA | | | 41,752 | | | | 6,107,974 | |
Sanofi | | | 63,906 | | | | 5,522,905 | |
Thales SA | | | 29,186 | | | | 3,605,116 | |
Ubisoft Entertainment SA(b) | | | 18,568 | | | | 1,452,176 | |
Vinci SA | | | 37,011 | | | | 3,779,771 | |
| | | | | | | | |
| | | | 46,751,830 | |
|
| Germany — 25.4% | |
adidas AG | | | 8,789 | | | | 2,719,054 | |
Allianz SE, Registered Shares | | | 21,467 | | | | 5,177,328 | |
Deutsche Boerse AG | | | 15,447 | | | | 2,180,652 | |
Deutsche Wohnen SE, Bearer Shares | | | 63,917 | | | | 2,342,117 | |
Fresenius Medical Care AG & Co. KGaA | | | 20,743 | | | | 1,629,014 | |
Knorr-Bremse AG | | | 23,009 | | | | 2,564,027 | |
Linde PLC | | | 16,763 | | | | 3,366,951 | |
Puma SE | | | 23,368 | | | | 1,558,433 | |
SAP SE | | | 38,429 | | | | 5,268,302 | |
Symrise AG | | | 29,789 | | | | 2,868,388 | |
| | | | | | | | |
| | | | 29,674,266 | |
|
| Ireland — 1.6% | |
Kingspan Group PLC | | | 35,481 | | | | 1,926,899 | |
| | | | | | | | |
|
| Italy — 4.2% | |
FinecoBank Banca Fineco SpA | | | 246,285 | | | | 2,747,427 | |
Moncler SpA | | | 49,319 | | | | 2,113,878 | |
| | | | | | | | |
| | | | 4,861,305 | |
|
| Luxembourg — 2.3% | |
Tenaris SA | | | 200,987 | | | | 2,636,104 | |
| | | | | | | | |
|
| Netherlands — 7.6% | |
ASML Holding NV | | | 19,855 | | | | 4,131,624 | |
IMCD NV | | | 25,764 | | | | 2,363,358 | |
Koninklijke Philips NV | | | 54,074 | | | | 2,350,917 | |
| | | | | | | | |
| | | | 8,845,899 | |
|
| Portugal — 1.7% | |
Galp Energia SGPS SA | | | 126,913 | | | | 1,951,829 | |
| | | | | | | | |
|
| Spain — 4.3% | |
Amadeus IT Group SA | | | 25,904 | | | | 2,052,775 | |
Iberdrola SA | | | 292,628 | | | | 2,913,456 | |
| | | | | | | | |
| | | | 4,966,231 | |
|
| Switzerland — 2.1% | |
Straumann Holding AG, Registered Shares | | | 2,775 | | | | 2,452,209 | |
| | | | | | | | |
| | | | | | | | |
| Security | | Shares | | | Value | |
|
| United Kingdom — 1.6% | |
RELX PLC | | | 76,893 | | | $ | 1,864,996 | |
| | | | | | | | |
| |
Total Long-Term Investments — 99.7%
(Cost — $100,511,206) | | | | 116,419,372 | |
| | | | | |
|
Short-Term Securities — 0.0% | |
SL Liquidity Series, LLC, Money Market Series,
2.55%(c)(d)(e) | | | 31,839 | | | | 31,849 | |
| | | | | | | | |
| |
Total Short-Term Securities — 0.0%
(Cost — $31,846) | | | | 31,849 | |
| | | | | |
| |
Total Investments — 99.7%
(Cost — $100,543,052) | | | | 116,451,221 | |
| |
Other Assets Less Liabilities — 0.3% | | | | 396,582 | |
| | | | | |
| |
Net Assets — 100.0% | | | $ | 116,847,803 | |
| | | | | |
| (a) | Security, or a portion of the security, is on loan. |
| (b) | Non-income producing security. |
| (c) | Annualized7-day yield as of period end. |
| (d) | Security was purchased with the cash collateral from loaned securities. |
| | |
| 22 | | 2019 BLACKROCK ANNUAL REPORTTO SHAREHOLDERS |
| | |
Schedule of Investments (continued) June 30, 2019 | | BlackRock EuroFund |
| (e) | During the year ended June 30, 2019, investments in issuers considered to be an affiliate/affiliates of the Fund for purposes of Section 2(a)(3) of the Investment Company Act of 1940, as amended, were as follows: |
| | | | | | | | | | | | | | | | | | | | | | | | | | | | |
| Affiliate | | Shares
Held at
06/30/18 | | | Net
Activity | | | Shares
Held at
06/30/19 | | | Value at
06/30/19 | | | Income | | | Net
Realized
Gain (Loss) (a) | | | Change in
Unrealized
Appreciation
(Depreciation) | |
BlackRock Liquidity Funds,T-Fund, Institutional Class(b) | | | 836,840 | | | | (836,840 | ) | | | — | | | $ | — | | | $ | 13,203 | | | $ | — | | | $ | — | |
SL Liquidity Series, LLC, Money Market Series | | | 87,751 | | | | (55,912 | ) | | | 31,839 | | | | 31,849 | | | | 9,709 | (c) | | | (520 | ) | | | 3 | |
| | | | | | | | | | | | | | | | | | | | | | | | | | | | |
| | | $ | 31,849 | | | $ | 22,912 | | | $ | (520 | ) | | $ | 3 | |
| | | | | | | | | | | | | | | | | |
| | (a) | Includes net capital gain distributions, if applicable. | |
| | (b) | As of period end, the entity is no longer held by the Fund. | |
| | (c) | All or a portion represents securities lending income earned from the reinvestment of cash collateral from loaned securities, net of fees and collateral investment expenses, and other payments to and from borrowers of securities. | |
Fair Value Hierarchy as of Period End
Various inputs are used in determining the fair value of investments. For information about the Fund’s policy regarding valuation of investments, refer to the Notes to Financial Statements.
The following table summarizes the Fund’s investments categorized in the disclosure hierarchy:
| | | | | | | | | | | | | | | | |
| | | Level 1 | | | Level 2 | | | Level 3 | | | Total | |
Assets: | |
Investments: | |
Common Stocks: | |
Belgium | | $ | — | | | $ | 3,089,245 | | | $ | — | | | $ | 3,089,245 | |
Denmark | | | — | | | | 2,965,422 | | | | — | | | | 2,965,422 | |
Finland | | | — | | | | 4,433,137 | | | | — | | | | 4,433,137 | |
France | | | 1,999,981 | | | | 44,751,849 | | | | — | | | | 46,751,830 | |
Germany | | | 4,122,460 | | | | 25,551,806 | | | | — | | | | 29,674,266 | |
Ireland | | | 1,926,899 | | | | — | | | | — | | | | 1,926,899 | |
Italy | | | — | | | | 4,861,305 | | | | — | | | | 4,861,305 | |
Luxembourg | | | — | | | | 2,636,104 | | | | — | | | | 2,636,104 | |
Netherlands | | | — | | | | 8,845,899 | | | | — | | | | 8,845,899 | |
Portugal | | | — | | | | 1,951,829 | | | | — | | | | 1,951,829 | |
Spain | | | — | | | | 4,966,231 | | | | — | | | | 4,966,231 | |
Switzerland | | | — | | | | 2,452,209 | | | | — | | | | 2,452,209 | |
United Kingdom | | | — | | | | 1,864,996 | | | | — | | | | 1,864,996 | |
| | | | | | | | | | | | | | | | |
Subtotal | | $ | 8,049,340 | | | $ | 108,370,032 | | | $ | — | | | $ | 116,419,372 | |
| | | | | | | | | | | | | | | | |
Investments valued at NAV(a) | | | | | | | | | | | | | | | 31,849 | |
| | | | | | | | | | | | | | | | |
Total | | | | | | | | | | | | | | $ | 116,451,221 | |
| | | | | | | | | | | | | | | | |
| | (a) | Certain investments of the Fund were fair valued using NAV per share or its equivalent as no quoted market value is available and therefore have been excluded from the fair value hierarchy. | |
See notes to financial statements.
| | | | |
| SCHEDULES OF INVESTMENTS | | | 23 | |
Statements of Assets and Liabilities
June 30, 2019
| | | | | | | | |
| | | BlackRock
Advantage Global
Fund, Inc. | | | BlackRock
EuroFund | |
|
ASSETS | |
Investments at value — unaffiliated(a)(b) | | $ | 448,460,425 | | | $ | 116,419,372 | |
Investments at value — affiliated(c) | | | 5,017,993 | | | | 31,849 | |
Cash pledged for futures contracts | | | 680,000 | | | | — | |
Foreign currency at value(d) | | | 402,751 | | | | — | |
Receivables: | |
Investments sold | | | 7,758,369 | | | | 196,629 | |
Securities lending income — affiliated | | | 3,290 | | | | 63 | |
Capital shares sold | | | 139,513 | | | | 2,623 | |
Dividends — affiliated | | | 5,315 | | | | 1,150 | |
Dividends — unaffiliated | | | 1,205,967 | | | | 657,331 | |
Variation margin on futures contracts | | | 76,721 | | | | — | |
Prepaid expenses | | | 39,612 | | | | 28,958 | |
| | | | | | | | |
Total assets | | | 463,789,956 | | | | 117,337,975 | |
| | | | | | | | |
|
LIABILITIES | |
Cash collateral on securities loaned at value | | | 2,910,059 | | | | 31,890 | |
Bank overdraft | | | — | | | | 39,780 | |
Payables: | |
Investments purchased | | | 7,464,318 | | | | — | |
Board realignment and consolidation | | | — | | | | 7,610 | |
Capital shares redeemed | | | 1,824,885 | | | | 85,584 | |
Investment advisory fees | | | 230,315 | | | | 64,700 | |
Offering costs | | | 25,738 | | | | — | |
Directors’ and Officer’s fees | | | 7,358 | | | | 5,739 | |
Other accrued expenses | | | 547,359 | | | | 235,130 | |
Other affiliates | | | 1,396 | | | | 487 | |
Service and distribution fees | | | 105,913 | | | | 19,252 | |
Variation margin on futures contracts | | | 5,152 | | | | — | |
| | | | | | | | |
Total liabilities | | | 13,122,493 | | | | 490,172 | |
| | | | | | | | |
| | |
NET ASSETS | | $ | 450,667,463 | | | $ | 116,847,803 | |
| | | | | | | | |
|
NET ASSETS CONSIST OF | |
Paid-in capital | | $ | 423,855,912 | | | $ | 134,481,611 | |
Accumulated earnings (loss) | | | 26,811,551 | | | | (17,633,808 | ) |
| | | | | | | | |
NET ASSETS | | $ | 450,667,463 | | | $ | 116,847,803 | |
| | | | | | | | |
| | |
(a) Investments at cost — unaffiliated | | $ | 416,950,732 | | | $ | 100,511,206 | |
(b) Securities loaned at value | | $ | 2,791,041 | | | $ | 31,332 | |
(c) Investments at cost — affiliated | | $ | 5,017,897 | | | $ | 31,846 | |
(d) Foreign currency at cost | | $ | 407,346 | | | $ | — | |
See notes to financial statements.
| | |
| 24 | | 2019 BLACKROCK ANNUAL REPORTTO SHAREHOLDERS |
Statements of Assets and Liabilities (continued)
June 30, 2019
| | | | | | | | |
| | | BlackRock
Advantage Global
Fund, Inc | | | BlackRock
EuroFund | |
| Institutional | |
Net assets | | $ | 87,758,749 | | | $ | 33,178,271 | |
| | | | | | | | |
Shares outstanding | | | 4,051,767 | | | | 2,304,298 | |
| | | | | | | | |
Net asset value | | $ | 21.66 | | | $ | 14.40 | |
| | | | | | | | |
Par Value | | $ | 0.10 | | | $ | 0.10 | |
| | | | | | | | |
Shares authorized | | | 100 million | | | | Unlimited | |
| | | | | | | | |
|
| Investor A | |
Net assets | | $ | 289,752,238 | | | $ | 78,418,062 | |
| | | | | | | | |
Shares outstanding | | | 14,098,237 | | | | 5,557,798 | |
| | | | | | | | |
Net asset value | | $ | 20.55 | | | $ | 14.11 | |
| | | | | | | | |
Par Value | | $ | 0.10 | | | $ | 0.10 | |
| | | | | | | | |
Shares authorized | | | 100 million | | | | Unlimited | |
| | | | | | | | |
|
| Investor C | |
Net assets | | $ | 52,124,880 | | | $ | 4,178,724 | |
| | | | | | | | |
Shares outstanding | | | 3,104,043 | | | | 426,729 | |
| | | | | | | | |
Net asset value | | $ | 16.79 | | | $ | 9.79 | |
| | | | | | | | |
Par Value | | $ | 0.10 | | | $ | 0.10 | |
| | | | | | | | |
Shares authorized | | | 100 million | | | | Unlimited | |
| | | | | | | | |
|
| Class K | |
Net assets | | $ | 10,624,914 | | | $ | 709,665 | |
| | | | | | | | |
Shares outstanding | | | 490,485 | | | | 49,500 | |
| | | | | | | | |
Net asset value | | $ | 21.66 | | | $ | 14.34 | |
| | | | | | | | |
Par Value | | $ | 0.10 | | | $ | 0.10 | |
| | | | | | | | |
Shares authorized | | | 2 billion | | | | Unlimited | |
| | | | | | | | |
|
| Class R | |
Net assets | | $ | 10,406,682 | | | $ | 363,081 | |
| | | | | | | | |
Shares outstanding | | | 562,059 | | | | 34,451 | |
| | | | | | | | |
Net asset value | | $ | 18.52 | | | $ | 10.54 | |
| | | | | | | | |
Par Value | | $ | 0.10 | | | $ | 0.10 | |
| | | | | | | | |
Shares authorized | | | 100 million | | | | Unlimited | |
| | | | | | | | |
See notes to financial statements.
Statements of Operations
Year Ended June 30, 2019
| | | | | | | | |
| | | BlackRock
Advantage Global
Fund, Inc. | | | BlackRock
EuroFund | |
|
INVESTMENT INCOME | |
Dividends — unaffiliated | | $ | 12,269,647 | | | $ | 3,187,401 | |
Dividends — affiliated | | | 132,473 | | | | 13,203 | |
Securities lending income — affiliated — net | | | 24,020 | | | | 9,709 | |
Foreign taxes withheld | | | (715,936 | ) | | | (368,883 | ) |
| | | | | | | | |
Total investment income | | | 11,710,204 | | | | 2,841,430 | |
| | | | | | | | |
|
EXPENSES | |
Investment advisory | | | 4,083,296 | | | | 1,071,419 | |
Service and distribution — class specific | | | 1,487,423 | | | | 307,915 | |
Transfer agent — class specific | | | 939,786 | | | | 236,551 | |
Custodian | | | 337,023 | | | | 108,583 | |
Registration | | | 91,305 | | | | 77,422 | |
Accounting services | | | 82,195 | | | | 40,247 | |
Professional | | | 70,429 | | | | 84,217 | |
Board realignment and consolidation | | | 56,868 | | | | 15,639 | |
Printing | | | 27,884 | | | | 28,363 | |
Directors and Officer | | | 21,728 | | | | 16,723 | |
Offering cost | | | 20,136 | | | | 23,143 | |
Miscellaneous | | | 50,576 | | | | 23,623 | |
| | | | | | | | |
Total expenses | | | 7,268,649 | | | | 2,033,845 | |
Less: | | | | | | | | |
Fees paid indirectly | | | (173 | ) | | | — | |
Fees waived and/or reimbursed by the Manager | | | (1,641,394 | ) | | | (86,160 | ) |
Transfer agent fees waived and/or reimbursed — class specific | | | (702,568 | ) | | | — | |
| | | | | | | | |
Total expenses after fees waived and/or reimbursed | | | 4,924,514 | | | | 1,947,685 | |
| | | | | | | | |
Net investment income | | | 6,785,690 | | | | 893,745 | |
| | | | | | | | |
|
REALIZED AND UNREALIZED GAIN (LOSS) | |
Net realized gain (loss) from: | |
Investments — unaffiliated | | | (8,274,260 | ) | | | (21,870,952 | ) |
Investments — affiliated | | | 1,604 | | | | (520 | ) |
Futures contracts | | | 53,621 | | | | — | |
Foreign currency transactions | | | 77,956 | | | | (603,737 | ) |
| | | | | | | | |
| | | (8,141,079 | ) | | | (22,475,209 | ) |
| | | | | | | | |
Net change in unrealized appreciation (depreciation) on: | | | | | | | | |
Investments — unaffiliated | | | 15,534,181 | | | | 11,586,790 | |
Investments — affiliated | | | 59 | | | | 3 | |
Futures contracts | | | 462,731 | | | | — | |
Foreign currency translations | | | 6,455 | | | | (2,407 | ) |
| | | | | | | | |
| | | 16,003,426 | | | | 11,584,386 | |
| | | | | | | | |
Net realized and unrealized gain (loss) | | | 7,862,347 | | | | (10,890,823 | ) |
| | | | | | | | |
NET INCREASE (DECREASE) IN NET ASSETS RESULTING FROM OPERATIONS | | $ | 14,648,037 | | | $ | (9,997,078 | ) |
| | | | | | | | |
See notes to financial statements.
| | |
| 26 | | 2019 BLACKROCK ANNUAL REPORTTO SHAREHOLDERS |
Statements of Changes in Net Assets
| | | | | | | | | | | | | | | | | | | | |
| | | BlackRock Advantage Global Fund, Inc. | | | | | | BlackRock EuroFund | |
| | | Year Ended June 30, | | | | | | Year Ended June 30, | |
| | | 2019 | | | 2018 | | | | | | 2019 | | | 2018 | |
| | | |
INCREASE (DECREASE) IN NET ASSETS | | | | | | | | | | | | | |
| | | |
OPERATIONS | | | | | | | | | | | | | |
Net investment income | | $ | 6,785,690 | | | $ | 6,739,571 | | | | | | | $ | 893,745 | | | $ | 2,819,244 | |
Net realized gain (loss) | | | (8,141,079 | ) | | | 207,493,806 | | | | | | | | (22,475,209 | ) | | | 38,700,638 | |
Net change in unrealized appreciation (depreciation) | | | 16,003,426 | | | | (123,755,416 | ) | | | | | | | 11,584,386 | | | | (29,640,804 | ) |
| | | | | | | | | | | | | | | | | | | | |
Net increase (decrease) in net assets resulting from operations | | | 14,648,037 | | | | 90,477,961 | | | | | | | | (9,997,078 | ) | | | 11,879,078 | |
| | | | | | | | | | | | | | | | | | | | |
| | | |
DISTRIBUTIONS TO SHAREHOLDERS(a)(b) | | | | | | | | | | | | | |
Institutional | | | (3,311,041 | ) | | | (63,529,516 | ) | | | | | | | (859,624 | ) | | | (1,693,589 | ) |
Investor A | | | (10,968,689 | ) | | | (100,235,708 | ) | | | | | | | (1,899,369 | ) | | | (1,574,352 | ) |
Investor B | | | — | | | | (83,314 | ) | | | | | | | — | | | | — | |
Investor C | | | (2,040,798 | ) | | | (35,126,324 | ) | | | | | | | (128,586 | ) | | | (23,309 | ) |
Class K | | | (172,264 | ) | | | — | | | | | | | | (23,568 | ) | | | — | |
Class R | | | (514,018 | ) | | | (5,403,783 | ) | | | | | | | (12,765 | ) | | | (6,223 | ) |
| | | | | | | | | | | | | | | | | | | | |
Decrease in net assets resulting from distributions to shareholders | | | (17,006,810 | ) | | | (204,378,645 | ) | | | | | | | (2,923,912 | ) | | | (3,297,473 | ) |
| | | | | | | | | | | | | | | | | | | | |
| | | |
CAPITAL SHARE TRANSACTIONS | | | | | | | | | | | | | |
Net decrease in net assets derived from capital share transactions | | | (98,451,408 | ) | | | (143,788,659 | ) | | | | | | | (72,780,593 | ) | | | (127,199,184 | ) |
| | | | | | | | | | | | | | | | | | | | |
| | | |
NET ASSETS(b) | | | | | | | | | | | | | |
Total decrease in net assets | | | (100,810,181 | ) | | | (257,689,343 | ) | | | | | | | (85,701,583 | ) | | | (118,617,579 | ) |
Beginning of year | | | 551,477,644 | | | | 809,166,987 | | | | | | | | 202,549,386 | | | | 321,166,965 | |
| | | | | | | | | | | | | | | | | | | | |
End of year | | $ | 450,667,463 | | | $ | 551,477,644 | | | | | | | $ | 116,847,803 | | | $ | 202,549,386 | |
| | | | | | | | | | | | | | | | | | | | |
| (a) | Distributions for annual periods determined in accordance with U.S. federal income tax regulations. |
| (b) | Prior year distribution character information and undistributed (distributions in excess of) net investment income has been modified or removed to conform with current yearRegulation S-X presentation changes. Refer to Note 12 of Notes to Financial Statements for this prior year information. |
See notes to financial statements.
Financial Highlights
(For a share outstanding throughout each period)
| | | | | | | | | | | | | | | | | | | | |
| | | BlackRock Advantage Global Fund, Inc. | |
| |
| | | Institutional | |
| |
| | | Year Ended June 30, | |
| | | 2019 | | | 2018 | | | 2017 | | | 2016 | | | 2015 | |
| | | | | |
Net asset value, beginning of year | | $ | 21.63 | | | $ | 25.83 | | | $ | 21.85 | | | $ | 25.78 | | | $ | 30.82 | |
| | | | | | | | | | | | | | | | | | | | |
Net investment income(a) | | | 0.36 | | | | 0.29 | | | | 0.11 | | | | 0.04 | | | | 0.08 | |
Net realized and unrealized gain (loss) | | | 0.43 | | | | 2.82 | | | | 4.15 | | | | (2.87 | ) | | | (1.17 | ) |
| | | | | | | | | | | | | | | | | | | | |
Net increase (decrease) from investment operations | | | 0.79 | | | | 3.11 | | | | 4.26 | | | | (2.83 | ) | | | (1.09 | ) |
| | | | | | | | | | | | | | | | | | | | |
|
Distributions(b) | |
From net investment income | | | (0.32 | ) | | | (0.37 | ) | | | (0.28 | ) | | | — | | | | (0.11 | ) |
From net realized gain | | | (0.44 | ) | | | (6.94 | ) | | | — | | | | (1.10 | ) | | | (3.84 | ) |
| | | | | | | | | | | | | | | | | | | | |
Total distributions | | | (0.76 | ) | | | (7.31 | ) | | | (0.28 | ) | | | (1.10 | ) | | | (3.95 | ) |
| | | | | | | | | | | | | | | | | | | | |
| | | | | |
Net asset value, end of year | | $ | 21.66 | | | $ | 21.63 | | | $ | 25.83 | | | $ | 21.85 | | | $ | 25.78 | |
| | | | | | | | | | | | | | | | | | | | |
| | | | | |
Total Return(c) | | | | | | | | | | | | | | | | | | | | |
Based on net asset value | | | 4.03 | % | | | 12.43 | % | | | 19.60 | % | | | (10.94 | )% | | | (2.45 | )% |
| | | | | | | | | | | | | | | | | | | | |
| | | | | |
Ratios to Average Net Assets | | | | | | | | | | | | | | | | | | | | |
Total expenses | | | 1.14 | % | | | 1.16 | % | | | 1.17 | % | | | 1.07 | % | | | 1.05 | % |
| | | | | | | | | | | | | | | | | | | | |
Total expenses after fees waived and/or reimbursed and paid indirectly | | | 0.72 | % | | | 0.88 | % | | | 1.13 | % | | | 1.07 | % | | | 1.05 | % |
| | | | | | | | | | | | | | | | | | | | |
Net investment income | | | 1.72 | % | | | 1.20 | % | | | 0.47 | % | | | 0.17 | % | | | 0.29 | % |
| | | | | | | | | | | | | | | | | | | | |
| | | | | |
Supplemental Data | | | | | | | | | | | | | | | | | | | | |
Net assets, end of year (000) | | $ | 87,759 | | | $ | 114,870 | | | $ | 258,047 | | | $ | 250,041 | | | $ | 265,841 | |
| | | | | | | | | | | | | | | | | | | | |
Portfolio turnover rate | | | 137 | % | | | 189 | % | | | 59 | % | | | 73 | % | | | 73 | % |
| | | | | | | | | | | | | | | | | | | | |
| (a) | Based on average shares outstanding. |
| (b) | Distributions for annual periods determined in accordance with U.S. federal income tax regulations. |
| (c) | Where applicable, assumes the reinvestment of distributions. |
See notes to financial statements.
| | |
| 28 | | 2019 BLACKROCK ANNUAL REPORTTO SHAREHOLDERS |
Financial Highlights (continued)
(For a share outstanding throughout each period)
| | | | | | | | | | | | | | | | | | | | |
| | | BlackRock Advantage Global Fund, Inc. (continued) | |
| |
| | | Investor A | |
| |
| | | Year Ended June 30, | |
| | | 2019 | | | 2018 | | | 2017 | | | 2016 | | | 2015 | |
| | | | | |
Net asset value, beginning of year | | $ | 20.56 | | | $ | 24.85 | | | $ | 21.00 | | | $ | 24.90 | | | $ | 29.95 | |
| | | | | | | | | | | | | | | | | | | | |
Net investment income (loss)(a) | | | 0.30 | | | | 0.25 | | | | 0.01 | | | | (0.04 | ) | | | (0.00 | )(b) |
Net realized and unrealized gain (loss) | | | 0.40 | | | | 2.67 | | | | 3.99 | | | | (2.76 | ) | | | (1.15 | ) |
| | | | | | | | | | | | | | | | | | | | |
Net increase (decrease) from investment operations | | | 0.70 | | | | 2.92 | | | | 4.00 | | | | (2.80 | ) | | | (1.15 | ) |
| | | | | | | | | | | | | | | | | | | | |
|
Distributions(c) | |
From net investment income | | | (0.27 | ) | | | (0.27 | ) | | | (0.15 | ) | | | — | | | | (0.06 | ) |
From net realized gain | | | (0.44 | ) | | | (6.94 | ) | | | — | | | | (1.10 | ) | | | (3.84 | ) |
| | | | | | | | | | | | | | | | | | | | |
Total distributions | | | (0.71 | ) | | | (7.21 | ) | | | (0.15 | ) | | | (1.10 | ) | | | (3.90 | ) |
| | | | | | | | | | | | | | | | | | | | |
| | | | | |
Net asset value, end of year | | $ | 20.55 | | | $ | 20.56 | | | $ | 24.85 | | | $ | 21.00 | | | $ | 24.90 | |
| | | | | | | | | | | | | | | | | | | | |
| | | | | |
Total Return(d) | | | | | | | | | | | | | | | | | | | | |
Based on net asset value | | | 3.77 | % | | | 12.10 | % | | | 19.10 | % | | | (11.21 | )% | | | (2.74 | )% |
| | | | | | | | | | | | | | | | | | | | |
| | | | | |
Ratios to Average Net Assets | | | | | | | | | | | | | | | | | | | | |
Total expenses | | | 1.46 | % | | | 1.53 | % | | | 1.54 | % | | | 1.42 | % | | | 1.38 | % |
| | | | | | | | | | | | | | | | | | | | |
Total expenses after fees waived and/or reimbursed and paid indirectly | | | 0.97 | % | | | 1.16 | % | | | 1.50 | % | | | 1.42 | % | | | 1.38 | % |
| | | | | | | | | | | | | | | | | | | | |
Net investment income (loss) | | | 1.48 | % | | | 1.06 | % | | | 0.06 | % | | | (0.20 | )% | | | (0.02 | )% |
| | | | | | | | | | | | | | | | | | | | |
| | | | | |
Supplemental Data | | | | | | | | | | | | | | | | | | | | |
Net assets, end of year (000) | | $ | 289,752 | | | $ | 324,978 | | | $ | 395,690 | | | $ | 382,069 | | | $ | 474,107 | |
| | | | | | | | | | | | | | | | | | | | |
Portfolio turnover rate | | | 137 | % | | | 189 | % | | | 59 | % | | | 73 | % | | | 73 | % |
| | | | | | | | | | | | | | | | | | | | |
| (a) | Based on average shares outstanding. |
| (b) | Amount is greater than $(0.005) per share. |
| (c) | Distributions for annual periods determined in accordance with U.S. federal income tax regulations. |
| (d) | Where applicable, excludes the effects of any sales charges and assumes the reinvestment of distributions. |
See notes to financial statements.
Financial Highlights (continued)
(For a share outstanding throughout each period)
| | | | | | | | | | | | | | | | | | | | |
| | | BlackRock Advantage Global Fund, Inc. (continued) | |
| |
| | | Investor C | |
| |
| | | Year Ended June 30, | |
| | | 2019 | | | 2018 | | | 2017 | | | 2016 | | | 2015 | |
| | | | | |
Net asset value, beginning of year | | $ | 16.87 | | | $ | 21.45 | | | $ | 18.15 | | | $ | 21.86 | | | $ | 26.92 | |
| | | | | | | | | | | | | | | | | | | | |
Net investment income (loss)(a) | | | 0.11 | | | | 0.04 | | | | (0.16 | ) | | | (0.19 | ) | | | (0.19 | ) |
Net realized and unrealized gain (loss) | | | 0.34 | | | | 2.31 | | | | 3.46 | | | | (2.42 | ) | | | (1.07 | ) |
| | | | | | | | | | | | | | | | | | | | |
Net increase (decrease) from investment operations | | | 0.45 | | | | 2.35 | | | | 3.30 | | | | (2.61 | ) | | | (1.26 | ) |
| | | | | | | | | | | | | | | | | | | | |
|
Distributions(b) | |
From net investment income | | | (0.09 | ) | | | — | | | | — | | | | — | | | | — | |
From net realized gain | | | (0.44 | ) | | | (6.93 | ) | | | — | | | | (1.10 | ) | | | (3.80 | ) |
| | | | | | | | | | | | | | | | | | | | |
Total distributions | | | (0.53 | ) | | | (6.93 | ) | | | — | | | | (1.10 | ) | | | (3.80 | ) |
| | | | | | | | | | | | | | | | | | | | |
| | | | | |
Net asset value, end of year | | $ | 16.79 | | | $ | 16.87 | | | $ | 21.45 | | | $ | 18.15 | | | $ | 21.86 | |
| | | | | | | | | | | | | | | | | | | | |
| | | | | |
Total Return(c) | | | | | | | | | | | | | | | | | | | | |
Based on net asset value | | | 2.99 | % | | | 11.23 | % | | | 18.18 | % | | | (11.93 | )% | | | (3.53 | )% |
| | | | | | | | | | | | | | | | | | | | |
| | | | | |
Ratios to Average Net Assets | | | | | | | | | | | | | | | | | | | | |
Total expenses | | | 2.28 | % | | | 2.34 | % | | | 2.32 | % | | | 2.22 | % | | | 2.17 | % |
| | | | | | | | | | | | | | | | | | | | |
Total expenses after fees waived and/or reimbursed and paid indirectly | | | 1.72 | % | | | 1.95 | % | | | 2.29 | % | | | 2.22 | % | | | 2.17 | % |
| | | | | | | | | | | | | | | | | | | | |
Net investment income (loss) | | | 0.65 | % | | | 0.23 | % | | | (0.81 | )% | | | (1.01 | )% | | | (0.81 | )% |
| | | | | | | | | | | | | | | | | | | | |
| | | | | |
Supplemental Data | | | | | | | | | | | | | | | | | | | | |
Net assets, end of year (000) | | $ | 52,125 | | | $ | 90,299 | | | $ | 135,507 | | | $ | 245,795 | | | $ | 318,616 | |
| | | | | | | | | | | | | | | | | | | | |
Portfolio turnover rate | | | 137 | % | | | 189 | % | | | 59 | % | | | 73 | % | | | 73 | % |
| | | | | | | | | | | | | | | | | | | | |
| (a) | Based on average shares outstanding. |
| (b) | Distributions for annual periods determined in accordance with U.S. federal income tax regulations. |
| (c) | Where applicable, excludes the effects of any sales charges and assumes the reinvestment of distributions. |
See notes to financial statements.
| | |
| 30 | | 2019 BLACKROCK ANNUAL REPORTTO SHAREHOLDERS |
Financial Highlights (continued)
(For a share outstanding throughout each period)
| | | | | | | | |
| | | BlackRock Advantage Global
Fund, Inc. (continued) | |
| |
| | | Class K | |
| | | Year Ended
June 30, 2019 | | | Period from 01/25/18 (a) to 06/30/18 | |
| | |
Net asset value, beginning of period | | $ | 21.63 | | | $ | 23.12 | |
| | | | | | | | |
Net investment income(b) | | | 0.41 | | | | 0.29 | |
Net realized and unrealized gain (loss) | | | 0.39 | | | | (1.78 | ) |
| | | | | | | | |
Net increase (decrease) from investment operations | | | 0.80 | | | | (1.49 | ) |
| | | | | | | | |
|
Distributions | |
From net investment income | | | (0.33 | ) | | | — | |
From net realized gain | | | (0.44 | ) | | | — | |
| | | | | | | | |
Total distributions | | | (0.77 | ) | | | — | |
| | | | | | | | |
| | |
Net asset value, end of period | | $ | 21.66 | | | $ | 21.63 | |
| | | | | | | | |
| | |
Total Return(c) | | | | | | | | |
Based on net asset value | | | 4.09 | % | | | (6.44 | )%(d) |
| | | | | | | | |
| | |
Ratios to Average Net Assets | | | | | | | | |
Total expenses | | | 1.03 | % | | | 1.07 | %(e)(f) |
| | | | | | | | |
Total expenses after fees waived and/or reimbursed and paid indirectly | | | 0.66 | % | | | 0.66 | %(e) |
| | | | | | | | |
Net investment income | | | 1.98 | % | | | 3.09 | %(e) |
| | | | | | | | |
| | |
Supplemental Data | | | | | | | | |
Net assets, end of period (000) | | $ | 10,625 | | | $ | 4,616 | |
| | | | | | | | |
Portfolio turnover rate | | | 137 | % | | | 189 | % |
| | | | | | | | |
| (a) | Commencement of operations. |
| (b) | Based on average shares outstanding. |
| (c) | Where applicable, assumes the reinvestment of distributions. |
| (d) | Aggregate total return. |
| (f) | Offering costs were not annualized in the calculation of the expense ratios. If these expenses were annualized, the total expenses would have been 1.07%. |
See notes to financial statements.
Financial Highlights (continued)
(For a share outstanding throughout each period)
| | | | | | | | | | | | | | | | | | | | |
| | | BlackRock Advantage Global Fund, Inc. (continued) | |
| |
| | | Class R | |
| |
| | | Year Ended June 30, | |
| | | 2019 | | | 2018 | | | 2017 | | | 2016 | | | 2015 | |
| | | | | |
Net asset value, beginning of year | | $ | 18.60 | | | $ | 23.07 | | | $ | 19.48 | | | $ | 23.27 | | | $ | 28.30 | |
| | | | | | | | | | | | | | | | | | | | |
Net investment income (loss)(a) | | | 0.21 | | | | 0.17 | | | | (0.07 | ) | | | (0.11 | ) | | | (0.10 | ) |
Net realized and unrealized gain (loss) | | | 0.37 | | | | 2.47 | | | | 3.70 | | | | (2.58 | ) | | | (1.09 | ) |
| | | | | | | | | | | | | | | | | | | | |
Net increase (decrease) from investment operations | | | 0.58 | | | | 2.64 | | | | 3.63 | | | | (2.69 | ) | | | (1.19 | ) |
| | | | | | | | | | | | | | | | | | | | |
|
Distributions(b) | |
From net investment income | | | (0.22 | ) | | | (0.17 | ) | | | (0.04 | ) | | | — | | | | (0.00 | )(c) |
From net realized gain | | | (0.44 | ) | | | (6.94 | ) | | | — | | | | (1.10 | ) | | | (3.84 | ) |
| | | | | | | | | | | | | | | | | | | | |
Total distributions | | | (0.66 | ) | | | (7.11 | ) | | | (0.04 | ) | | | (1.10 | ) | | | (3.84 | ) |
| | | | | | | | | | | | | | | | | | | | |
| | | | | |
Net asset value, end of year | | $ | 18.52 | | | $ | 18.60 | | | $ | 23.07 | | | $ | 19.48 | | | $ | 23.27 | |
| | | | | | | | | | | | | | | | | | | | |
| | | | | |
Total Return(d) | | | | | | | | | | | | | | | | | | | | |
Based on net asset value | | | 3.52 | % | | | 11.79 | % | | | 18.67 | % | | | (11.54 | )% | | | (3.08 | )% |
| | | | | | | | | | | | | | | | | | | | |
| | | | | |
Ratios to Average Net Assets | | | | | | | | | | | | | | | | | | | | |
Total expenses | | | 1.79 | % | | | 1.87 | % | | | 1.92 | % | | | 1.77 | % | | | 1.73 | % |
| | | | | | | | | | | | | | | | | | | | |
Total expenses after fees waived and/or reimbursed and paid indirectly | | | 1.22 | % | | | 1.43 | % | | | 1.88 | % | | | 1.77 | % | | | 1.73 | % |
| | | | | | | | | | | | | | | | | | | | |
Net investment income (loss) | | | 1.18 | % | | | 0.80 | % | | | (0.33 | )% | | | (0.56 | )% | | | (0.39 | )% |
| | | | | | | | | | | | | | | | | | | | |
| | | | | |
Supplemental Data | | | | | | | | | | | | | | | | | | | | |
Net assets, end of year (000) | | $ | 10,407 | | | $ | 16,716 | | | $ | 19,642 | | | $ | 21,091 | | | $ | 26,019 | |
| | | | | | | | | | | | | | | | | | | | |
Portfolio turnover rate | | | 137 | % | | | 189 | % | | | 59 | % | | | 73 | % | | | 73 | % |
| | | | | | | | | | | | | | | | | | | | |
| (a) | Based on average shares outstanding. |
| (b) | Distributions for annual periods determined in accordance with U.S. federal income tax regulations. |
| (c) | Amount is greater than $(0.005) per share. |
| (d) | Where applicable, assumes the reinvestment of distributions. |
See notes to financial statements.
| | |
| 32 | | 2019 BLACKROCK ANNUAL REPORTTO SHAREHOLDERS |
Financial Highlights
(For a share outstanding throughout each period)
| | | | | | | | | | | | | | | | | | | | |
| | | BlackRock EuroFund | |
| |
| | | Institutional | |
| |
| | | Year Ended June 30, | |
| | | 2019 | | | 2018 | | | 2017 | | | 2016 | | | 2015 | |
| | | | | |
Net asset value, beginning of year | | $ | 15.06 | | | $ | 14.78 | | | $ | 13.25 | | | $ | 15.51 | | | $ | 16.68 | |
| | | | | | | | | | | | | | | | | | | | |
Net investment income(a) | | | 0.13 | | | | 0.13 | | | | 0.16 | (b) | | | 0.25 | | | | 0.28 | |
Net realized and unrealized gain (loss) | | | (0.45 | ) | | | 0.33 | | | | 1.67 | | | | (2.28 | ) | | | (1.00 | ) |
| | | | | | | | | | | | | | | | | | | | |
Net increase (decrease) from investment operations | | | (0.32 | ) | | | 0.46 | | | | 1.83 | | | | (2.03 | ) | | | (0.72 | ) |
| | | | | | | | | | | | | | | | | | | | |
Distributions from net investment income(c) | | | (0.34 | ) | | | (0.18 | ) | | | (0.30 | ) | | | (0.23 | ) | | | (0.45 | ) |
| | | | | | | | | | | | | | | | | | | | |
| | | | | |
Net asset value, end of year | | $ | 14.40 | | | $ | 15.06 | | | $ | 14.78 | | | $ | 13.25 | | | $ | 15.51 | |
| | | | | | | | | | | | | | | | | | | | |
| | | | | |
Total Return(d) | | | | | | | | | | | | | | | | | | | | |
Based on net asset value | | | (1.77 | )% | | | 3.12 | % | | | 14.14 | % | | | (13.22 | )% | | | (4.10 | )% |
| | | | | | | | | | | | | | | | | | | | |
| | | | | |
Ratios to Average Net Assets | | | | | | | | | | | | | | | | | | | | |
Total expenses | | | 1.23 | % | | | 1.11 | % | | | 1.10 | % | | | 1.07 | % | | | 1.00 | % |
| | | | | | | | | | | | | | | | | | | | |
Total expenses after fees waived and/or reimbursed | | | 1.17 | % | | | 1.08 | % | | | 1.10 | % | | | 1.07 | % | | | 1.00 | % |
| | | | | | | | | | | | | | | | | | | | |
Net investment income | | | 0.92 | % | | | 0.87 | % | | | 1.19 | %(b) | | | 1.72 | % | | | 1.81 | % |
| | | | | | | | | | | | | | | | | | | | |
| | | | | |
Supplemental Data | | | | | | | | | | | | | | | | | | | | |
Net assets, end of year (000) | | $ | 33,178 | | | $ | 43,686 | | | $ | 146,685 | | | $ | 162,627 | | | $ | 221,463 | |
| | | | | | | | | | | | | | | | | | | | |
Portfolio turnover rate | | | 153 | % | | | 98 | % | | | 93 | % | | | 100 | % | | | 117 | % |
| | | | | | | | | | | | | | | | | | | | |
| (a) | Based on average shares outstanding. |
| (b) | Net investment income per share and the ratio of net investment income to average net assets include $0.01 per share and 0.10%, respectively, resulting from a special dividend. |
| (c) | Distributions for annual periods determined in accordance with U.S. federal income tax regulations. |
| (d) | Where applicable, assumes the reinvestment of distributions. |
See notes to financial statements.
Financial Highlights (continued)
(For a share outstanding throughout each period)
| | | | | | | | | | | | | | | | | | | | |
| | | BlackRock EuroFund (continued) | |
| |
| | | Investor A | |
| |
| | | Year Ended June 30, | |
| | | 2019 | | | 2018 | | | 2017 | | | 2016 | | | 2015 | |
| | | | | |
Net asset value, beginning of year | | $ | 14.78 | | | $ | 14.49 | | | $ | 12.98 | | | $ | 15.23 | | | $ | 16.37 | |
| | | | | | | | | | | | | | | | | | | | |
Net investment income(a) | | | 0.08 | | | | 0.18 | | | | 0.13 | (b) | | | 0.20 | | | | 0.29 | |
Net realized and unrealized gain (loss) | | | (0.44 | ) | | | 0.26 | | | | 1.64 | | | | (2.23 | ) | | | (1.03 | ) |
| | | | | | | | | | | | | | | | | | | | |
Net increase (decrease) from investment operations | | | (0.36 | ) | | | 0.44 | | | | 1.77 | | | | (2.03 | ) | | | (0.74 | ) |
| | | | | | | | | | | | | | | | | | | | |
Distributions from net investment income(c) | | | (0.31 | ) | | | (0.15 | ) | | | (0.26 | ) | | | (0.22 | ) | | | (0.40 | ) |
| | | | | | | | | | | | | | | | | | | | |
| | | | | |
Net asset value, end of year | | $ | 14.11 | | | $ | 14.78 | | | $ | 14.49 | | | $ | 12.98 | | | $ | 15.23 | |
| | | | | | | | | | | | | | | | | | | | |
| | | | | |
Total Return(d) | | | | | | | | | | | | | | | | | | | | |
Based on net asset value | | | (2.08 | )% | | | 3.02 | % | | | 13.92 | % | | | (13.41 | )% | | | (4.30 | )% |
| | | | | | | | | | | | | | | | | | | | |
| | | | | |
Ratios to Average Net Assets | | | | | | | | | | | | | | | | | | | | |
Total expenses | | | 1.45 | % | | | 1.31 | % | | | 1.32 | % | | | 1.28 | % | | | 1.22 | % |
| | | | | | | | | | | | | | | | | | | | |
Total expenses after fees waived and/or reimbursed | | | 1.39 | % | | | 1.28 | % | | | 1.32 | % | | | 1.28 | % | | | 1.22 | % |
| | | | | | | | | | | | | | | | | | | | |
Net investment income | | | 0.56 | % | | | 1.19 | % | | | 0.97 | %(b) | | | 1.46 | % | | | 1.88 | % |
| | | | | | | | | | | | | | | | | | | | |
| | | | | |
Supplemental Data | | | | | | | | | | | | | | | | | | | | |
Net assets, end of year (000) | | $ | 78,418 | | | $ | 149,540 | | | $ | 165,427 | | | $ | 178,374 | | | $ | 258,675 | |
| | | | | | | | | | | | | | | | | | | | |
Portfolio turnover rate | | | 153 | % | | | 98 | % | | | 93 | % | | | 100 | % | | | 117 | % |
| | | | | | | | | | | | | | | | | | | | |
| (a) | Based on average shares outstanding. |
| (b) | Net investment income per share and the ratio of net investment income to average net assets include $0.01 per share and 0.10%, respectively, resulting from a special dividend. |
| (c) | Distributions for annual periods determined in accordance with U.S. federal income tax regulations. |
| (d) | Where applicable, excludes the effects of any sales charges and assumes the reinvestment of distributions. |
See notes to financial statements.
| | |
| 34 | | 2019 BLACKROCK ANNUAL REPORTTO SHAREHOLDERS |
Financial Highlights (continued)
(For a share outstanding throughout each period)
| | | | | | | | | | | | | | | | | | | | |
| | | BlackRock EuroFund (continued) | |
| |
| | | Investor C | |
| |
| | | Year Ended June 30, | |
| | | 2019 | | | 2018 | | | 2017 | | | 2016 | | | 2015 | |
| | | | | |
Net asset value, beginning of year | | $ | 10.36 | | | $ | 10.16 | | | $ | 9.17 | | | $ | 10.82 | | | $ | 11.76 | |
| | | | | | | | | | | | | | | | | | | | |
Net investment income (loss)(a) | | | (0.02 | ) | | | 0.05 | | | | 0.01 | (b) | | | 0.07 | | | | 0.08 | |
Net realized and unrealized gain (loss) | | | (0.31 | ) | | | 0.18 | | | | 1.15 | | | | (1.58 | ) | | | (0.70 | ) |
| | | | | | | | | | | | | | | | | | | | |
Net increase (decrease) from investment operations | | | (0.33 | ) | | | 0.23 | | | | 1.16 | | | | (1.51 | ) | | | (0.62 | ) |
| | | | | | | | | | | | | | | | | | | | |
Distributions from net investment income(c) | | | (0.24 | ) | | | (0.03 | ) | | | (0.17 | ) | | | (0.14 | ) | | | (0.32 | ) |
| | | | | | | | | | | | | | | | | | | | |
| | | | | |
Net asset value, end of year | | $ | 9.79 | | | $ | 10.36 | | | $ | 10.16 | | | $ | 9.17 | | | $ | 10.82 | |
| | | | | | | | | | | | | | | | | | | | |
| | | | | |
Total Return(d) | | | | | | | | | | | | | | | | | | | | |
Based on net asset value | | | (2.82 | )% | | | 2.27 | % | | | 12.94 | % | | | (14.08 | )% | | | (5.09 | )% |
| | | | | | | | | | | | | | | | | | | | |
| | | | | |
Ratios to Average Net Assets | | | | | | | | | | | | | | | | | | | | |
Total expenses | | | 2.20 | % | | | 2.08 | % | | | 2.13 | % | | | 2.09 | % | | | 2.05 | % |
| | | | | | | | | | | | | | | | | | | | |
Total expenses after fees waived and/or reimbursed | | | 2.14 | % | | | 2.04 | % | | | 2.13 | % | | | 2.09 | % | | | 2.05 | % |
| | | | | | | | | | | | | | | | | | | | |
Net investment income (loss) | | | (0.17 | )% | | | 0.43 | % | | | 0.14 | %(b) | | | 0.67 | % | | | 0.70 | % |
| | | | | | | | | | | | | | | | | | | | |
| | | | | |
Supplemental Data | | | | | | | | | | | | | | | | | | | | |
Net assets, end of year (000) | | $ | 4,179 | | | $ | 7,533 | | | $ | 8,038 | | | $ | 13,659 | | | $ | 18,021 | |
| | | | | | | | | | | | | | | | | | | | |
Portfolio turnover rate | | | 153 | % | | | 98 | % | | | 93 | % | | | 100 | % | | | 117 | % |
| | | | | | | | | | | | | | | | | | | | |
| (a) | Based on average shares outstanding. |
| (b) | Net investment income per share and the ratio of net investment income to average net assets include $0.01 per share and 0.10%, respectively, resulting from a special dividend. |
| (c) | Distributions for annual periods determined in accordance with U.S. federal income tax regulations. |
| (d) | Where applicable, excludes the effects of any sales charges and assumes the reinvestment of distributions. |
See notes to financial statements.
Financial Highlights (continued)
(For a share outstanding throughout each period)
| | | | | | | | |
| | | BlackRock EuroFund (continued) | |
| |
| | | Class K | |
| | | Year Ended
June 30, 2019 | | | Period from 01/25/18 (a) to 06/30/18 | |
| | |
Net asset value, beginning of period | | $ | 15.08 | | | $ | 16.57 | |
| | | | | | | | |
Net investment income(b) | | | 0.14 | | | | 0.26 | |
Net realized and unrealized loss | | | (0.46 | ) | | | (1.75 | ) |
| | | | | | | | |
Net decrease from investment operations | | | (0.32 | ) | | | (1.49 | ) |
| | | | | | | | |
Distributions from net investment income(c) | | | (0.42 | ) | | | — | |
| | | | | | | | |
| | |
Net asset value, end of period | | $ | 14.34 | | | $ | 15.08 | |
| | | | | | | | |
| | |
Total Return(d) | | | | | | | | |
Based on net asset value | | | (1.70 | )% | | | (8.99 | )%(e) |
| | | | | | | | |
| | |
Ratios to Average Net Assets | | | | | | | | |
Total expenses | | | 1.11 | % | | | 0.98 | %(f)(g) |
| | | | | | | | |
Total expenses after fees waived and/or reimbursed | | | 1.05 | % | | | 0.95 | %(f) |
| | | | | | | | |
Net investment income | | | 1.00 | % | | | 3.86 | %(f) |
| | | | | | | | |
| | |
Supplemental Data | | | | | | | | |
Net assets, end of period (000) | | $ | 710 | | | $ | 1,005 | |
| | | | | | | | |
Portfolio turnover rate | | | 153 | % | | | 98 | % |
| | | | | | | | |
| (a) | Commencement of operations. |
| (b) | Based on average shares outstanding. |
| (c) | Distributions for annual periods determined in accordance with U.S. federal income tax regulations. |
| (d) | Where applicable, assumes the reinvestment of distributions. |
| (e) | Aggregate total return. |
| (g) | Offering costs were not annualized in the calculation of the expense ratios. If these expenses were annualized, the total expenses would have been 0.99%. |
See notes to financial statements.
| | |
| 36 | | 2019 BLACKROCK ANNUAL REPORTTO SHAREHOLDERS |
Financial Highlights (continued)
(For a share outstanding throughout each period)
| | | | | | | | | | | | | | | | | | | | |
| | | BlackRock EuroFund (continued) | |
| |
| | | Class R | |
| |
| | | Year Ended June 30, | |
| | | 2019 | | | 2018 | | | 2017 | | | 2016 | | | 2015 | |
| | | | | |
Net asset value, beginning of year | | $ | 11.14 | | | $ | 10.96 | | | $ | 9.89 | | | $ | 11.66 | | | $ | 12.58 | |
| | | | | | | | | | | | | | | | | | | | |
Net investment income (loss)(a) | | | (0.01 | ) | | | 0.09 | | | | 0.05 | (b) | | | 0.11 | | | | 0.12 | |
Net realized and unrealized gain (loss) | | | (0.33 | ) | | | 0.18 | | | | 1.24 | | | | (1.71 | ) | | | (0.73 | ) |
| | | | | | | | | | | | | | | | | | | | |
Net increase (decrease) from investment operations | | | (0.34 | ) | | | 0.27 | | | | 1.29 | | | | (1.60 | ) | | | (0.61 | ) |
| | | | | | | | | | | | | | | | | | | | |
Distributions from net investment income(c) | | | (0.26 | ) | | | (0.09 | ) | | | (0.22 | ) | | | (0.17 | ) | | | (0.31 | ) |
| | | | | | | | | | | | | | | | | | | | |
| | | | | |
Net asset value, end of year | | $ | 10.54 | | | $ | 11.14 | | | $ | 10.96 | | | $ | 9.89 | | | $ | 11.66 | |
| | | | | | | | | | | | | | | | | | | | |
| | | | | |
Total Return(d) | | | | | | | | | | | | | | | | | | | | |
Based on net asset value | | | (2.66 | )% | | | 2.46 | % | | | 13.42 | % | | | (13.82 | )% | | | (4.68 | )% |
| | | | | | | | | | | | | | | | | | | | |
| | | | | |
Ratios to Average Net Assets | | | | | | | | | | | | | | | | | | | | |
Total expenses | | | 2.07 | % | | | 1.81 | % | | | 1.83 | % | | | 1.72 | % | | | 1.69 | % |
| | | | | | | | | | | | | | | | | | | | |
Total expenses after fees waived and/or reimbursed | | | 2.01 | % | | | 1.77 | % | | | 1.83 | % | | | 1.72 | % | | | 1.69 | % |
| | | | | | | | | | | | | | | | | | | | |
Net investment income (loss) | | | (0.07 | )% | | | 0.76 | % | | | 0.54 | %(b) | | | 1.08 | % | | | 1.03 | % |
| | | | | | | | | | | | | | | | | | | | |
| | | | | |
Supplemental Data | | | | | | | | | | | | | | | | | | | | |
Net assets, end of year (000) | | $ | 363 | | | $ | 786 | | | $ | 1,017 | | | $ | 859 | | | $ | 1,122 | |
| | | | | | | | | | | | | | | | | | | | |
Portfolio turnover rate | | | 153 | % | | | 98 | % | | | 93 | % | | | 100 | % | | | 117 | % |
| | | | | | | | | | | | | | | | | | | | |
| (a) | Based on average shares outstanding. |
| (b) | Net investment income per share and the ratio of net investment income to average net assets include $0.01 per share and 0.10%, respectively, resulting from a special dividend. |
| (c) | Distributions for annual periods determined in accordance with U.S. federal income tax regulations. |
| (d) | Where applicable, assumes the reinvestment of distributions. |
See notes to financial statements.
Notes to Financial Statements
BlackRock Advantage Global Fund Inc., (the “Corporation”) and BlackRock EuroFund (the “Trust”) are each registered under the Investment Company Act of 1940, as amended (the “1940 Act”), asopen-end management investment companies. The Board of Trustees of the Trust and the Board of Directors of the Corporation are referred to throughout this report as the “Board of Directors” or the “Board.” BlackRock Advantage Global Fund, Inc. is organized as a Maryland corporation. BlackRock EuroFund is organized as a Massachusetts business trust.
The following are referred to herein collectively as the “Funds” or individually as a “Fund”:
| | | | |
| Fund Name | | Herein Referred To As | | Diversification
Classification |
BlackRock Advantage Global Fund, Inc. | | Advantage Global | | Diversified |
BlackRock EuroFund | | EuroFund | | Diversified |
Each Fund offers multiple classes of shares. All classes of shares have identical voting, dividend, liquidation and other rights and are subject to the same terms and conditions, except that certain classes bear expenses related to the shareholder servicing and distribution of such shares. Institutional and Class K Shares are sold without a sales charge and only to certain eligible investors. Investor A Shares are generally sold with an initial sales charge, and may be subject to a contingent deferred sales charge (“CDSC”) for certain redemptions where no initial sales charge was paid at the time of purchase. Investor C Shares may be subject to a CDSC. Shares may be subject to a 1.00% CDSC if redeemed within one year of purchase. Class R Shares are sold without a sales charge and only to certain employer-sponsored retirement plans. Investor A, Investor C, and Class R Shares bear certain expenses related to shareholder servicing of such shares, and Investor C and Class R Shares also bear certain expenses related to the distribution of such shares. Investor A and Investor C Shares are generally available through financial intermediaries. Effective November 8, 2018, each fund adopted an automatic conversion feature whereby Investor C Shares held for approximately ten years will be automatically converted into Investor A Shares. Each class has exclusive voting rights with respect to matters relating to its shareholder servicing and distribution expenditures (except that Investor C shareholders may vote on material changes to the Investor A Shares distribution and service plan).
| | | | | | | | |
| Share Class | | Initial Sales Charge | | CDSC | | | Conversion Privilege |
Institutional, Class K(a) and Class R Shares | | No | | | No | | | None |
Investor A Shares | | Yes | | | No | (b) | | None |
Investor C Shares | | No | | | Yes | | | To Investor A Shares after approximately 10 years |
| | (a) | Commenced operations on January 25, 2018. | |
| | (b) | Investor A Shares may be subject to a CDSC for certain redemptions where no initial sales charge was paid at the time of purchase. | |
On December 27, 2017, Advantage Global’s issued and outstanding Investor B Shares were converted into Investor A Shares, with the same relative aggregate net asset value (“NAV”) as the original shares held immediately prior to conversion.
The Funds, together with certain other registered investment companies advised by BlackRock Advisors, LLC (the “Manager”) or its affiliates, are included in a complex of equity, multi-asset, index and money market funds referred to as the BlackRock Multi-Asset Complex.
| 2. | SIGNIFICANT ACCOUNTING POLICIES |
The financial statements are prepared in conformity with accounting principles generally accepted in the United States of America (“U.S. GAAP”), which may require management to make estimates and assumptions that affect the reported amounts of assets and liabilities in the financial statements, disclosure of contingent assets and liabilities at the date of the financial statements and the reported amounts of increases and decreases in net assets from operations during the reporting period. Actual results could differ from those estimates. Each Fund is considered an investment company under U.S. GAAP and follows the accounting and reporting guidance applicable to investment companies. Below is a summary of significant accounting policies:
Investment Transactions and Income Recognition: For financial reporting purposes, investment transactions are recorded on the dates the transactions are executed. Realized gains and losses on investment transactions are determined on the identified cost basis. Dividend income andnon-cash dividend income are recorded on theex-dividend date. Dividends from foreign securities where theex-dividend date may have passed are subsequently recorded when the Funds are informed of theex-dividend date. Under the applicable foreign tax laws, a withholding tax at various rates may be imposed on capital gains, dividends and interest. Interest income, including amortization and accretion of premiums and discounts on debt securities, are recognized on an accrual basis. Income, expenses and realized and unrealized gains and losses are allocated daily to each class based on its relative net assets.
Foreign Currency Translation: Each Fund’s books and records are maintained in U.S. dollars. Securities and other assets and liabilities denominated in foreign currencies are translated into U.S. dollars using exchange rates determined as of the close of trading on the New York Stock Exchange (“NYSE”). Purchases and sales of investments are recorded at the rates of exchange prevailing on the respective dates of such transactions. Generally, when the U.S. dollar rises in value against a foreign currency, the investments denominated in that currency will lose value; the opposite effect occurs if the U.S. dollar falls in relative value.
Each Fund does not isolate the portion of the results of operations arising as a result of changes in the exchange rates from the changes in the market prices of investments held or sold for financial reporting purposes. Accordingly, the effects of changes in exchange rates on investments are not segregated in the Statements of Operations from the effects of changes in market prices of those investments, but are included as a component of net realized and unrealized gain (loss) from investments. Each Fund reports realized currency gains (losses) on foreign currency related transactions as components of net realized gain (loss) for financial reporting purposes, whereas such components are generally treated as ordinary income for U.S. federal income tax purposes.
| | |
| 38 | | 2019 BLACKROCK ANNUAL REPORTTO SHAREHOLDERS |
Notes to Financial Statements (continued)
Segregation and Collateralization: In cases where a Fund enters into certain investments (e.g., futures contracts) that would be treated as “senior securities” for 1940 Act purposes, a Fund may segregate or designate on its books and records cash or liquid assets having a market value at least equal to the amount of its future obligations under such investments. Doing so allows the investment to be excluded from treatment as a “senior security.” Furthermore, if required by an exchange or counterparty agreement, the Funds may be required to deliver/deposit cash and/or securities to/with an exchange, or broker-dealer or custodian as collateral for certain investments or obligations.
Distributions: Distributions paid by the Funds are recorded on theex-dividend date. The character and timing of distributions are determined in accordance with U.S. federal income tax regulations, which may differ from U.S. GAAP.
Indemnifications: In the normal course of business, a Fund enters into contracts that contain a variety of representations that provide general indemnification. A Fund’s maximum exposure under these arrangements is unknown because it involves future potential claims against a Fund, which cannot be predicted with any certainty.
Other: Expenses directly related to a Fund or its classes are charged to that Fund or the applicable class. Other operating expenses shared by several funds, including other funds managed by the Manager, are prorated among those funds on the basis of relative net assets or other appropriate methods. Expenses directly related to the Funds and other shared expenses prorated to the Funds are allocated daily to each class based on their relative net assets or other appropriate methods.
The Funds have an arrangement with their custodian whereby credits are earned on uninvested cash balances, which could be used to reduce custody fees and/or overdraft charges. The Funds may incur charges on certain uninvested cash balances and overdrafts, subject to certain conditions.
| 3. | INVESTMENT VALUATION AND FAIR VALUE MEASUREMENTS |
Investment Valuation Policies: The Funds’ investments are valued at fair value (also referred to as “market value” within the financial statements) as of the close of trading on the NYSE (generally 4:00 p.m., Eastern time) (or if the reporting date falls on a day the NYSE is closed, investments are valued at fair value as of the period end). U.S. GAAP defines fair value as the price the Funds would receive to sell an asset or pay to transfer a liability in an orderly transaction between market participants at the measurement date. The Funds determine the fair values of their financial instruments using various independent dealers or pricing services under policies approved by the Board. The BlackRock Global Valuation Methodologies Committee (the “Global Valuation Committee”) is the committee formed by management to develop global pricing policies and procedures and to oversee the pricing function for all financial instruments.
Fair Value Inputs and Methodologies: The following methods and inputs are used to establish the fair value of each Fund’s assets and liabilities:
| | • | | Equity investments traded on a recognized securities exchange are valued at the official closing price each day, if available. For equity investments traded on more than one exchange, the official closing price on the exchange where the stock is primarily traded is used. Equity investments traded on a recognized exchange for which there were no sales on that day may be valued at the last available bid (long positions) or ask (short positions) price. |
Generally, trading in foreign instruments is substantially completed each day at various times prior to the close of trading on the NYSE. Occasionally, events affecting the values of such instruments may occur between the foreign market close and the close of trading on the NYSE that may not be reflected in the computation of the Funds’ net assets. Each business day, the Funds use a pricing service to assist with the valuation of certain foreign exchange-traded equity securities and foreign exchange-traded andover-the-counter (“OTC”) options (the “Systematic Fair Value Price”). Using current market factors, the Systematic Fair Value Price is designed to value such foreign securities and foreign options at fair value as of the close of trading on the NYSE, which follows the close of the local markets.
| | • | | Investments inopen-end U.S. mutual funds are valued at net asset value (“NAV”) each business day. |
| | • | | The Funds value their investment in SL Liquidity Series, LLC, Money Market Series (the “Money Market Series”) at fair value, which is ordinarily based upon their pro rata ownership in the underlying fund’s net assets. The Money Market Series seeks current income consistent with maintaining liquidity and preserving capital. Although the Money Market Series is not registered under the 1940 Act, its investments may follow the parameters of investments by a money market fund that is subject to Rule2a-7 under the 1940 Act. |
| | • | | Futures contracts traded on exchanges are valued at their last sale price. |
If events (e.g., a company announcement, market volatility or a natural disaster) occur that are expected to materially affect the value of such investments, or in the event that the application of these methods of valuation results in a price for an investment that is deemed not to be representative of the market value of such investment, or if a price is not available, the investment will be valued by the Global Valuation Committee, or its delegate, in accordance with a policy approved by the Board as reflecting fair value (“Fair Valued Investments”). The fair valuation approaches that may be used by the Global Valuation Committee will include market approach, income approach and cost approach. Valuation techniques such as discounted cash flow, use of market comparables and matrix pricing are types of valuation approaches and are typically used in determining fair value. When determining the price for Fair Valued Investments, the Global Valuation Committee, or its delegate, seeks to determine the price that each Fund might reasonably expect to receive or pay from the current sale or purchase of that asset or liability in anarm’s-length transaction. Fair value determinations shall be based upon all available factors that the Global Valuation Committee, or its delegate, deems relevant and consistent with the principles of fair value measurement. The pricing of all Fair Valued Investments is subsequently reported to the Board or a committee thereof on a quarterly basis.
Fair Value Hierarchy: Various inputs are used in determining the fair value of investments and derivative financial instruments. These inputs to valuation techniques are categorized into a fair value hierarchy consisting of three broad levels for financial statement purposes as follows:
| | • | | Level 1 — Unadjusted price quotations in active markets/exchanges for identical assets or liabilities that each Fund has the ability to access |
| | | | |
| NOTESTO FINANCIAL STATEMENTS | | | 39 | |
Notes to Financial Statements (continued)
| | • | | Level 2 — Other observable inputs (including, but not limited to, quoted prices for similar assets or liabilities in markets that are active, quoted prices for identical or similar assets or liabilities in markets that are not active, inputs other than quoted prices that are observable for the assets or liabilities (such as interest rates, yield curves, volatilities, prepayment speeds, loss severities, credit risks and default rates) or other market–corroborated inputs) |
| | • | | Level 3 — Unobservable inputs based on the best information available in the circumstances, to the extent observable inputs are not available (including each Fund’s own assumptions used in determining the fair value of investments and derivative financial instruments) |
The hierarchy gives the highest priority to unadjusted quoted prices in active markets for identical assets or liabilities (Level 1 measurements) and the lowest priority to unobservable inputs (Level 3 measurements). Accordingly, the degree of judgment exercised in determining fair value is greatest for instruments categorized in Level 3. The inputs used to measure fair value may fall into different levels of the fair value hierarchy. In such cases, for disclosure purposes, the fair value hierarchy classification is determined based on the lowest level input that is significant to the fair value measurement in its entirety. Investments classified within Level 3 have significant unobservable inputs used by the Global Valuation Committee in determining the price for Fair Valued Investments. Level 3 investments include equity or debt issued by privately held companies or funds. There may not be a secondary market, and/or there are a limited number of investors. The categorization of a value determined for investments and derivative financial instruments is based on the pricing transparency of the investments and derivative financial instruments and is not necessarily an indication of the risks associated with investing in those securities.
As of June 30, 2019, certain investments of the Funds were valued using NAV per share or its equivalent as no quoted market value is available and therefore have been excluded from the fair value hierarchy.
| 4. | SECURITIES AND OTHER INVESTMENTS |
Preferred Stocks: Preferred stock has a preference over common stock in liquidation (and generally in receiving dividends as well), but is subordinated to the liabilities of the issuer in all respects. As a general rule, the market value of preferred stock with a fixed dividend rate and no conversion element varies inversely with interest rates and perceived credit risk, while the market price of convertible preferred stock generally also reflects some element of conversion value. Because preferred stock is junior to debt securities and other obligations of the issuer, deterioration in the credit quality of the issuer will cause greater changes in the value of a preferred stock than in a more senior debt security with similar stated yield characteristics. Unlike interest payments on debt securities, preferred stock dividends are payable only if declared by the issuer’s board of directors. Preferred stock also may be subject to optional or mandatory redemption provisions.
Securities Lending: The Funds may lend their securities to approved borrowers, such as brokers, dealers and other financial institutions. The borrower pledges and maintains with the Funds collateral consisting of cash, an irrevocable letter of credit issued by a bank, or securities issued or guaranteed by the U.S. Government. The initial collateral received by each Fund is required to have a value of at least 102% of the current value of the loaned securities for securities traded on U.S. exchanges and a value of at least 105% for all other securities. The collateral is maintained thereafter at a value equal to at least 100% of the current market value of the securities on loan. The market value of the loaned securities is determined at the close of each business day of the Fund and any additional required collateral is delivered to the Fund, or excess collateral returned by the Fund, on the next business day. During the term of the loan, the Funds are entitled to all distributions made on or in respect of the loaned securities, but do not receive interest income on securities received as collateral. Loans of securities are terminable at any time and the borrower, after notice, is required to return borrowed securities within the standard time period for settlement of securities transactions.
The market value of any securities on loan, all of which were classified as common stocks in the Funds’ Schedules of Investments, and the value of any related collateral are shown separately in the Statements of Assets and Liabilities as a component of investments at value-unaffiliated, and collateral on securities loaned at value, respectively. As of period end, any securities on loan were collateralized by cash and/or U.S. Government obligations. Cash collateral invested by the securities lending agent, BlackRock Investment Management, LLC (“BIM”), if any, is disclosed in the Schedules of Investments.
Securities lending transactions are entered into by the Funds under Master Securities Lending Agreements (each, an “MSLA”), which provide the right, in the event of default (including bankruptcy or insolvency), for thenon-defaulting party to liquidate the collateral and calculate a net exposure to the defaulting party or request additional collateral. In the event that a borrower defaults, the Funds, as lender, would offset the market value of the collateral received against the market value of the securities loaned. When the value of the collateral is greater than that of the market value of the securities loaned, the lender is left with a net amount payable to the defaulting party. However, bankruptcy or insolvency laws of a particular jurisdiction may impose restrictions on or prohibitions against such a right of offset in the event of an MSLA counterparty’s bankruptcy or insolvency. Under the MSLA, absent an event of default, the borrower can resell orre-pledge the loaned securities, and a Fund can reinvest cash collateral received in connection with loaned securities. Upon an event of default, the parties’ obligations to return the securities or collateral to the other party are extinguished, and the parties can resell orre-pledge the loaned securities or the collateral received in connection with the loaned securities in order to satisfy the defaulting party’s net payment obligation for all transactions under the MSLA. The defaulting party remains liable for any deficiency.
As of period end, the following table is a summary of the Funds’ securities lending agreements by counterparty which are subject to offset under an MSLA:
| | | | | | | | | | | | |
| Counterparty | | Securities
Loaned at Value | | | Cash Collateral
Received (a) | | | Net
Amount (b) | |
Advantage Global | | | | | | | | | | | | |
Barclays Capital Inc. | | $ | 283,707 | | | $ | (283,707 | ) | | $ | — | |
Bofa Securities, Inc. | | | 989,239 | | | | (986,466 | ) | | | 2,773 | |
Citigroup Global Markets, Inc. | | | 54,933 | | | | (54,933 | ) | | | — | |
Credit Suisse Securities (USA) LLC | | | 13,084 | | | | (13,084 | ) | | | — | |
Goldman Sachs & Co | | | 429,116 | | | | (429,116 | ) | | | — | |
JP Morgan Securities LLC | | | 1,019,846 | | | | (1,019,846 | ) | | | — | |
National Financial Services LLC | | | 1,116 | | | | (1,116 | ) | | | — | |
| | | | | | | | | | | | |
| | $ | 2,791,041 | | | $ | (2,788,268 | ) | | $ | 2,773 | |
| | | | | | | | | | | | |
| | |
| 40 | | 2019 BLACKROCK ANNUAL REPORTTO SHAREHOLDERS |
Notes to Financial Statements (unaudited) (continued)
| | | | | | | | | | | | |
| Counterparty | | Securities
Loaned at Value | | | Cash Collateral
Received (a) | | | Net
Amount | |
EuroFund | | | | | | | | | | | | |
Citigroup Global Markets, Inc. | | $ | 31,332 | | | $ | (31,332 | ) | | $ | — | |
| | | | | | | | | | | | |
| | (a) | Cash collateral with a value of $2,910,059 and $31,890, has been received in connection with securities lending agreements. Collateral received in excess of the value of securities loaned from the individual counterparty is not shown for financial reporting purposes in the table above. | |
| | (b) | The market value of the loaned securities is determined as of June 30, 2019. Additional collateral is delivered to the Fund on the next business day in accordance with the MSLA. The net amount would be subject to the borrower default indemnity in the event of default by the counterparty. | |
The risks of securities lending include the risk that the borrower may not provide additional collateral when required or may not return the securities when due. To mitigate these risks, the Funds benefit from a borrower default indemnity provided by BIM.BIM’s indemnity allows for full replacement of the securities loaned to the extent the collateral received does not cover the value on the securities loaned in the event of borrower default. Each Fund could incur a loss if the value of an investment purchased with cash collateral falls below the market value of loaned securities or if the value of an investment purchased with cash collateral falls below the value of the original cash collateral received. Such losses are borne entirely by the Funds.
| 5. | DERIVATIVE FINANCIAL INSTRUMENTS |
The Funds engage in various portfolio investment strategies using derivative contracts both to increase the returns of the Funds and/or to manage their exposure to certain risks such as credit risk, equity risk, interest rate risk, foreign currency exchange rate risk, commodity price risk or other risks (e.g., inflation risk). Derivative financial instruments categorized by risk exposure are included in the Schedules of Investments. These contracts may be transacted on an exchange or OTC.
Futures Contracts: Futures contracts are purchased or sold to gain exposure to, or manage exposure to, changes in interest rates (interest rate risk) and changes in the value of equity securities (equity risk) or foreign currencies (foreign currency exchange rate risk).
Futures contracts are agreements between the Funds and a counterparty to buy or sell a specific quantity of an underlying instrument at a specified price and on a specified date. Depending on the terms of a contract, it is settled either through physical delivery of the underlying instrument on the settlement date or by payment of a cash amount on the settlement date. Upon entering into a futures contract, the Funds are required to deposit initial margin with the broker in the form of cash or securities in an amount that varies depending on a contract’s size and risk profile. The initial margin deposit must then be maintained at an established level over the life of the contract. Amounts pledged, which are considered restricted, are included in cash pledged for futures contracts in the Statements of Assets and Liabilities.
Securities deposited as initial margin are designated in the Schedules of Investments and cash deposited, if any, is shown as cash pledged for futures contracts in the Statements of Assets and Liabilities. Pursuant to the contract, the Funds agree to receive from or pay to the broker an amount of cash equal to the daily fluctuation in market value of the contract (“variation margin”). Variation margin is recorded as unrealized appreciation (depreciation) and, if any, shown as variation margin receivable (or payable) on futures contracts in the Statements of Assets and Liabilities. When the contract is closed, a realized gain or loss is recorded in the Statements of Operations equal to the difference between the notional amount of the contract at the time it was opened and the notional amount at the time it was closed. The use of futures contracts involves the risk of an imperfect correlation in the movements in the price of futures contracts and interest, foreign currency exchange rates or underlying assets.
| 6. | INVESTMENT ADVISORY AGREEMENT AND OTHER TRANSACTIONS WITH AFFILIATES |
Investment Advisory: Each Fund entered into an Investment Advisory Agreement with the Manager, the Funds’ investment adviser and an indirect and wholly-owned subsidiary of BlackRock, Inc. (“BlackRock”), to provide investment advisory and administrative services. The Manager is responsible for the management of each Fund’s portfolio and provides the personnel, facilities, equipment and certain other services necessary to the operations of each Fund.
For such services, each Fund pays the Manager a monthly fee at an annual rate equal to the following percentages of the average daily value of each Fund’s net assets:
| | | | | | | | |
| | | Investment Advisory Fee | |
| Average Daily Net Assets | | Advantage Global | | | EuroFund | |
First $1 Billion | | | 0.85 | % | | | 0.75 | % |
$1 Billion — $3 Billion | | | 0.80 | | | | 0.71 | |
$3 Billion — $5 Billion | | | 0.77 | | | | 0.68 | |
$5 Billion — $10 Billion | | | 0.74 | | | | 0.65 | |
Greater than $10 Billion | | | 0.72 | | | | 0.64 | |
The Manager, with respect to EuroFund, entered into asub-advisory agreement with BlackRock International Limited (“BIL”), an affiliate of the Manager. The Manager pays BIL for services it provides for that portion of the Fund for which BIL acts as subadviser, a monthly fee that is equal to a percentage of the investment advisory fees paid by EuroFund to the Manager.
| | | | |
| NOTESTO FINANCIAL STATEMENTS | | | 41 | |
Notes to Financial Statements (continued)
Distribution and Service Fees: The Funds entered into a Distribution Agreement and Distribution Plans with BlackRock Investments, LLC (“BRIL”), an affiliate of the Manager. Pursuant to the Distribution Plans and in accordance with Rule12b-1 under the 1940 Act, each Fund pays BRIL ongoing service and distribution fees. The fees are accrued daily and paid monthly at annual rates based upon the average daily net assets of the relevant share class of each Fund as follows:
| | | | | | | | |
| | | Distribution Fees | | | Service Fees | |
Investor A | | | — | % | | | 0.25 | % |
Investor C | | | 0.75 | | | | 0.25 | |
Class R | | | 0.25 | | | | 0.25 | |
BRIL and broker-dealers, pursuant tosub-agreements with BRIL, provide shareholder servicing and distribution services to the Funds. The ongoing service and/or distribution fee compensates BRIL and each broker-dealer for providing shareholder servicing and/or distribution related services to shareholders.
For the year ended June 30, 2019, the following table shows the class specific service and distribution fees borne directly by each share class of each Fund:
| | | | | | | | | | | | | | | | |
| | | Investor A | | | Investor C | | | Class R | | | Total | |
Advantage Global | | $ | 748,726 | | | $ | 670,704 | | | $ | 67,993 | | | $ | 1,487,423 | |
EuroFund | | | 251,791 | | | | 53,652 | | | | 2,472 | | | | 307,915 | |
Transfer Agent: Pursuant to written agreements, certain financial intermediaries, some of which may be affiliates, provide the Funds withsub-accounting, recordkeeping,sub-transfer agency and other administrative services with respect to servicing of underlying investor accounts. For these services, these entities receive an asset-based fee or an annual fee per shareholder account, which will vary depending on share class and/or net assets. For the year ended June 30, 2019, Advantage Global paid the following amounts to affiliates of BlackRock in return for these services, which are included in transfer agent — class specific in the Statements of Operations:
| | | | | | | | | | | | |
| | | Institutional | | | Investor A | | | Total | |
Advantage Global | | $ | 20 | | | $ | 1,579 | | | $ | 1,599 | |
For the year ended June 30, 2019, EuroFund did not pay any amount to affiliates in return for these services.
The Manager maintains a call center that is responsible for providing certain shareholder services to the Funds. Shareholder services include responding to inquiries and processing purchases and sales based upon instructions from shareholders. For the year ended June 30, 2019, each Fund reimbursed the Manager the following amounts for costs incurred in running the call center, which are included in transfer agent — class specific in the Statements of Operations:
| | | | | | | | | | | | | | | | | | | | | | | | |
| | | Institutional | | | Investor A | | | Investor C | | | Class K | | | Class R | | | Total | |
Advantage Global | | $ | 429 | | | $ | 7,058 | | | $ | 1,935 | | | $ | 49 | | | $ | 150 | | | $ | 9,621 | |
EuroFund | | | 1,458 | | | | 3,383 | | | | 241 | | | | 12 | | | | 18 | | | | 5,112 | |
For the year ended June 30, 2019, the following table shows the class specific transfer agent fees borne directly by each share class of each Fund:
| | | | | | | | | | | | | | | | | | | | | | | | |
| | | Institutional | | | Investor A | | | Investor C | | | Class K | | | Class R | | | Total | |
Advantage Global | | $ | 121,990 | | | $ | 596,475 | | | $ | 181,209 | | | $ | 2,125 | | | $ | 37,987 | | | $ | 939,786 | |
EuroFund | | | 63,204 | | | | 161,936 | | | | 8,336 | | | | 517 | | | | 2,558 | | | | 236,551 | |
Other Fees: For the year ended June 30, 2019, affiliates earned underwriting discounts, direct commissions and dealer concessions on sales of each Fund’s Investor A Shares as follows:
| | | | |
| | | Investor A | |
Advantage Global | | $ | 4,309 | |
EuroFund | | | 217 | |
For the year ended June 30, 2019, affiliates received CDSCs as follows:
| | | | | | | | |
| | | Investor A | | | Investor C | |
Advantage Global | | $ | 1,214 | | | $ | 562 | |
EuroFund | | | 1,912 | | | | 764 | |
Expense Limitations, Waivers, Reimbursements, and Recoupments: With respect to each Fund, the Manager voluntarily agreed to waive its investment advisory fees by the amount of investment advisory fees each Fund pays to the Manager indirectly through its investment in affiliated money market funds (the “affiliated money market fund waiver”). The amount of waivers and/or reimbursements of fees and expenses made pursuant to the expense limitation described below will be reduced by the amount of the affiliated money market fund waiver. These amounts are included in fees waived and/or reimbursed by the Manager in the Statements of Operations.
For the year ended June 30, 2019, the amounts waived were as follows:
| | | | | | | | |
| | | Advantage Global | | | EuroFund | |
Amounts waived | | $ | 4,705 | | | $ | 446 | |
The Manager has contractually agreed to waive its investment advisory fee with respect to any portion of each Fund’s assets invested in affiliated equity and fixed-income mutual funds and affiliated exchange-traded funds that have a contractual management fee through October 31, 2019. The contractual agreement may be terminated
| | |
| 42 | | 2019 BLACKROCK ANNUAL REPORTTO SHAREHOLDERS |
Notes to Financial Statements (continued)
upon 90 days’ notice by a majority of the Independent Directors who are not “interested persons” of a Fund, as defined in the 1940 Act (“Independent Directors”), or by a vote of a majority of the outstanding voting securities of a Fund. For the year ended June 30, 2019, there were no fees waived and/or reimbursed by the Manager pursuant to this agreement.
The Manager voluntarily agreed to waive a portion of its investment advisory fees equal to the annual rate of 0.06% of EuroFund’s average daily net assets. This amount is included in fees waived and/or reimbursed by the Manager in the Statements of Operations. During the year ended June 30, 2019, the Manager waived $85,714 pursuant to this agreement.
For the year ended June 30, 2019, the Funds reimbursed the Manager for certain accounting services, which is included in accounting services in the Statements of Operations. The reimbursements were as follows:
| | | | | | | | | | | | | | | | | | | | | | | | |
| | | Institutional | | | Investor A | | | Investor C | | | Class K | | | Class R | | | Total | |
Advantage Global | | $ | 980 | | | $ | 3,093 | | | $ | 721 | | | $ | 56 | | | $ | 145 | | | $ | 4,995 | |
EuroFund | | | 394 | | | | 1,173 | | | | 62 | | | | 9 | | | | 6 | | | | 1,644 | |
With respect to Advantage Global, the Manager contractually agreed to waive and/or reimburse fees or expenses in order to limit expenses, excluding interest expense, dividend expense, tax expense, acquired fund fees and expenses, and certain other fund expenses, which constitute extraordinary expenses not incurred in the ordinary course of each Fund’s business (“expense limitation”). The expense limitations as a percentage of average daily net assets are as follows:
| | | | | | | | | | | | | | | | | | | | |
| | | Institutional | | | Investor A | | | Investor C | | | Class K | | | Class R | |
Expense limitations | | | 0.71 | % | | | 0.96 | % | | | 1.71 | % | | | 0.66 | % | | | 1.21 | % |
The Manager has agreed not to reduce or discontinue these contractual expense limitations through October 31, 2019, unless approved by the Board of the Corporation, including a majority of the Independent Directors, or by a vote of a majority of the outstanding voting securities of Advantage Global. For the year ended June 30, 2019, the Manager waived and/or reimbursed $1,608,670, which is included in fees waived and/or reimbursed by the Manager in the Statements of Operations.
These amounts waived and/or reimbursed are shown as transfer agent fees waived — class specific, in the Statements of Operations. For the year ended June 30, 2019, class specific waivers were as follows:
| | | | | | | | | | | | | | | | | | | | | | | | |
| | | Institutional | | | Investor A | | | Investor C | | | Class K | | | Class R | | | Total | |
Advantage Global | | $ | 74,853 | | | $ | 446,728 | | | $ | 147,674 | | | $ | 2,125 | | | $ | 31,188 | | | $ | 702,568 | |
The Funds have incurred expenses in connection with the realignment and consolidation of the boards of directors of certain BlackRock-advised funds. The Manager has voluntarily agreed to reimburse Advantage Global for all or a portion of such expenses, which amounts are included in fees waived and/or reimbursed by the Manager in the Statements of Operations. For the year ended June 30, 2019, the amount reimbursed to Advantage Global was $28,019.
With respect to the contractual expense limitation, if during the Fund’s fiscal year the operating expenses of a share class, that at any time during the prior two fiscal years received a waiver and/or reimbursement from the Manager, are less than the current expense limitation for that share class, the Manager is entitled to be reimbursed by such share class up to the lesser of: (a) the amount of fees waived and/or expenses reimbursed during those prior two fiscal years under the agreement and (b) an amount not to exceed either the current expense limitation of that share class or the expense limitation of the share class in effect at the time that the share class received the applicable waiver and/or reimbursement, provided that:
(1) the Fund of which the share class is a part has more than $50 million in assets for the fiscal year; and
(2) the Manager or an affiliate continues to serve as the Fund’s investment adviser or administrator.
This repayment applies only to the contractual expense limitation on net expenses and does not apply to the contractual investment advisory fee waiver described above or any voluntary waivers that may be in effect from time to time.
On June 30, 2019, Advantage Global’s fund level and class specific waivers and/or reimbursements subject to possible future recoupment under the expense limitation agreement are as follows:
| | | | | | | | |
| | | Expiring June 30, | |
| | | 2020 | | | 2021 | |
Fund Level | | $ | 1,445,672 | | | $ | 1,608,670 | |
Institutional | | | 83,582 | | | | 74,853 | |
Investor A | | | 400,595 | | | | 446,728 | |
Investor B | | | 162 | | | | — | |
Investor C | | | 164,101 | | | | 147,674 | |
Class K | | | — | | | | 2,125 | |
Class R | | | 33,591 | | | | 31,188 | |
| | | | |
| NOTESTO FINANCIAL STATEMENTS | | | 43 | |
Notes to Financial Statements (continued)
Securities Lending: The U.S. Securities and Exchange Commission (“SEC”) has issued an exemptive order which permits BIM, an affiliate of the Manager, to serve as securities lending agent for the Funds, subject to applicable conditions. As securities lending agent, BIM bears all operational costs directly related to securities lending. The Funds are responsible for expenses in connection with the investment of cash collateral received for securities on loan (the “collateral investment expenses”). The cash collateral is invested in a private investment company managed by the Manager or its affiliates. However, BIM has agreed to cap the collateral investment expenses of the private investment company to an annual rate of 0.04%. The investment adviser to the private investment company will not charge any advisory fees with respect to shares purchased by the Funds. The private investment company in which the cash collateral has been invested may, under certain circumstances, impose a liquidity fee of up to 2% of the value withdrawn or temporarily restrict withdrawals for up to 10 business days during a 90 day period, in the event that the private investment company’s weekly liquid assets fall below certain thresholds.
Securities lending income is equal to the total of income earned from the reinvestment of cash collateral, net of fees and other payments to and from borrowers of securities, and less the collateral investment expenses. Each Fund retains a portion of securities lending income and remits a remaining portion to BIM as compensation for its services as securities lending agent.
Pursuant to the current securities lending agreement, each Fund retains 82% of securities lending income (which excludes collateral investment expenses), and this amount retained can never be less than 70% of the total of securities lending income plus the collateral investment expenses.
In addition, commencing the business day following the date that the aggregate securities lending income earned across the BlackRock Multi-Asset Complex in a calendar year exceeds a specified threshold, each Fund , pursuant to the securities lending agreement, will retain for the remainder of that calendar year securities lending income in an amount equal to 85% of securities lending income (which excludes collateral investment expenses), and this amount retained can never be less than 70% of the total of securities lending income plus the collateral investment expenses.
Prior to January 1, 2019, each Fund retained 80% of securities lending income (which excluded collateral investment expenses) and the amount retained could never be less than 70% of the total of securities lending income plus the collateral investment expenses. In addition, commencing the business day following the date that the aggregate securities lending income earned across a complex ofopen-end funds referred to as the Equity-Bond Complex in a calendar year exceeded a specified threshold, each Fund would retain for the remainder of that calendar year 85% of securities lending income (which excluded collateral investment expenses), and the amount retained could never be less than 70% of the total of securities lending income plus the collateral investment expenses.
The share of securities lending income earned by each Fund is shown as securities lending income — affiliated — net in the Statements of Operations. For the year ended June 30, 2019, each Fund paid BIM the following amounts for securities lending agent services:
| | | | | | | | |
| | | Advantage Global | | | EuroFund | |
Amounts for securities lending agent services. | | $ | 5,144 | | | $ | 1,902 | |
Interfund Lending: In accordance with an exemptive order (the “Order”) from the SEC, each Fund may participate in a joint lending and borrowing facility for temporary purposes (the “Interfund Lending Program”), subject to compliance with the terms and conditions of the Order, and to the extent permitted by each Fund’s investment policies and restrictions. EuroFund is currently permitted to borrow under the Interfund Lending Program. Advantage Global is currently permitted to borrow and lend under the Interfund Lending Program.
A lending BlackRock fund may lend in aggregate up to 15% of its net assets, but may not lend more than 5% of its net assets to any one borrowing fund through the Interfund Lending Program. A borrowing BlackRock fund may not borrow through the Interfund Lending Program or from any other source more than 33 1/3% of its total assets (or any lower threshold provided for by the fund’s investment restrictions). If a borrowing BlackRock fund’s total outstanding borrowings exceed 10% of its total assets, each of its outstanding interfund loans will be subject to collateralization of at least 102% of the outstanding principal value of the loan. All interfund loans are for temporary or emergency purposes and the interest rate to be charged will be the average of the highest current overnight repurchase agreement rate available to a lending fund and the bank loan rate, as calculated according to a formula established by the Board.
During the year ended June 30, 2019, the Funds did not participate in the Interfund Lending Program.
Directors and Officers: Certain directors and/or officers of the Funds are directors and/or officers of BlackRock or its affiliates. The Funds reimburse the Manager for a portion of the compensation paid to the Funds’ Chief Compliance Officer, which is included in Directors and Officer in the Statements of Operations.
Other Transactions: The Funds may purchase securities from, or sell securities to, an affiliated fund provided the affiliation is due solely to having a common investment adviser, common officers, or common directors or trustees. For the year ended June 30, 2019, the purchase and sale transactions and any net realized gains (losses) with affiliated funds in compliance with Rule17a-7 under the 1940 Act were as follows:
| | | | | | | | | | | | |
| | | Purchases | | | Sales | | | Net Realized Gain (Loss) | |
EuroFund | | $ | 47,267,813 | | | $ | — | | | $ | — | |
For the year ended June 30, 2019, purchases and sales of investments and excluding short-term securities, were as follows:
| | | | | | | | |
| | | Advantage Global | | | EuroFund | |
Purchases | | $ | 640,812,582 | | | $ | 218,990,360 | |
Sales | | | 747,607,054 | | | | 293,110,568 | |
| | |
| 44 | | 2019 BLACKROCK ANNUAL REPORTTO SHAREHOLDERS |
Notes to Financial Statements (continued)
It is each Fund’s policy to comply with the requirements of the Internal Revenue Code of 1986, as amended, applicable to regulated investment companies, and to distribute substantially all of its taxable income to its shareholders. Therefore, no U.S. federal income tax provision is required.
Each Fund files U.S. federal and various state and local tax returns. No income tax returns are currently under examination. The statute of limitations on each Fund’s U.S. federal tax returns generally remains open for each of the four years ended June 30, 2019. The statutes of limitations on each Fund’s state and local tax returns may remain open for an additional year depending upon the jurisdiction.
Management has analyzed tax laws and regulations and their application to the Funds as of June 30, 2019, inclusive of the open tax return years, and does not believe that there are any uncertain tax positions that require recognition of a tax liability in the Funds’ financial statements.
U.S. GAAP requires that certain components of net assets be adjusted to reflect permanent differences between financial and tax reporting. These reclassifications have no effect on net assets or net asset values per share. As of June 30, 2019, the following permanent differences, attributable to non-deductible expenses, were reclassified to the following accounts:
| | | | | | | | |
| | | Advantage Global | | | EuroFund | |
Paid-in capital | | $ | (20,136 | ) | | $ | (23,143 | ) |
Accumulated earnings (loss) | | | 20,136 | | | | 23,143 | |
The tax character of distributions paid was as follows:
| | | | | | | | | | | | |
| | | | | | Advantage
Global (a) | | | EuroFund | |
Ordinary income | | | 06/30/19 | | | $ | 14,619,801 | | | $ | 2,923,912 | |
| | | 06/30/18 | | | | 43,817,062 | | | | 3,297,473 | |
Long-term capital gains | | | 06/30/19 | | | | 2,387,009 | | | | — | |
| | | 06/30/18 | | | | 171,407,475 | | | | — | |
| | | | | | | | | | | | |
| | | 06/30/19 | | | $ | 17,006,810 | | | $ | 2,923,912 | |
| | | | | | | | | | | | |
| | | 06/30/18 | | | $ | 215,224,537 | | | $ | 3,297,473 | |
| | | | | | | | | | | | |
| | (a) | Distribution amounts may include a portion of the proceeds from redeemed shares. | |
As of June 30, 2019, the tax components of accumulated net earnings (losses) were as follows:
| | | | | | | | |
| | | Advantage Global | | | EuroFund | |
Undistributed ordinary income | | $ | 4,780,263 | | | $ | 240,334 | |
Capital loss carryforwards | | | (6,815,543 | ) | | | (30,664,636 | ) |
Net unrealized gains (losses)(a) | | | 28,846,831 | | | | 12,790,494 | |
| | | | | | | | |
| | $ | 26,811,551 | | | $ | (17,633,808 | ) |
| | | | | | | | |
| | (a) | The differences between book-basis andtax-basis net unrealized gains were attributable primarily to the tax deferral of losses on wash sales, the realization for tax purposes of unrealized gains on investments in passive foreign investment companies, the realization for tax purposes of unrealized gains/losses on certain futures and foreign currency contracts and the timing and recognition of partnership income. | |
As of June 30, 2019, gross unrealized appreciation and depreciation for investments and derivatives based on cost for U.S. federal income tax purposes were as follows:
| | | | | | | | |
| | | Advantage Global | | | EuroFund | |
Tax cost | | $ | 424,676,901 | | | $ | 103,664,939 | |
| | | | | | | | |
Gross unrealized appreciation | | $ | 42,354,510 | | | $ | 15,764,751 | |
Gross unrealized depreciation | | | (13,549,764 | ) | | | (2,978,469 | ) |
| | | | | | | | |
Net unrealized appreciation | | $ | 28,804,746 | | | $ | 12,786,282 | |
| | | | | | | | |
The Funds along with certain other funds managed by the Manager and its affiliates (“Participating Funds”), is a party to a364-day, $2.25 billion credit agreement with a group of lenders. Under this agreement, the Funds may borrow to fund shareholder redemptions. Excluding commitments designated for certain individual funds, the Participating Funds, including the Funds, can borrow up to an aggregate commitment amount of $1.75 billion at any time outstanding, subject to asset coverage and other limitations as specified in the agreement. The credit agreement has the following terms: a fee of 0.10% per annum on unused commitment amounts and interest at a rate equal to the higher of(a) one-month LIBOR (but, in any event, not less than 0.00%) on the date the loan is made plus 0.80% per annum or (b) the Fed Funds rate (but, in any event, not less than 0.00%) in effect from time to time plus 0.80% per annum on amounts borrowed. The agreement expires in April 2020 unless extended or renewed. Prior to April 18, 2019, Participating Funds paid an upfront commitment fee of 0.02% on the total commitment amounts, in addition to administration, legal and
| | | | |
| NOTESTO FINANCIAL STATEMENTS | | | 45 | |
Notes to Financial Statements (continued)
arrangement fees, which are included in miscellaneous expenses in the Statements of Operations. These fees were allocated among such funds based upon portions of the aggregate commitment available to them and relative net assets of Participating Funds. During the year ended June 30, 2019, the Funds did not borrow under the credit agreement.
In the normal course of business, certain Funds invest in securities or other instruments and may enter into certain transactions, and such activities subject each Fund to various risks, including among others, fluctuations in the market (market risk) or failure of an issuer to meet all of its obligations. The value of securities or other instruments may also be affected by various factors, including, without limitation: (i) the general economy; (ii) the overall market as well as local, regional or global political and/or social instability; (iii) regulation, taxation or international tax treaties between various countries; or (iv) currency, interest rate and price fluctuations. Each Fund’s prospectus provides details of the risks to which each Fund is subject.
The Funds may be exposed to additional risks when reinvesting cash collateral in money market funds that do not seek to maintain a stable NAV per share of $1.00, which may be subject to redemption gates or liquidity fees under certain circumstances.
Valuation Risk: The market values of equities, such as common stocks and preferred securities or equity related investments, such as futures and options, may decline due to general market conditions which are not specifically related to a particular company. They may also decline due to factors which affect a particular industry or industries. A Fund may invest in illiquid investments. An illiquid investment is any investment that a Fund reasonably expects cannot be sold or disposed of in current market conditions in seven calendar days or less without the sale or disposition significantly changing the market value of the investment. A Fund may experience difficulty in selling illiquid investments in a timely manner at the price that it believes the investments are worth. Prices may fluctuate widely over short or extended periods in response to company, market or economic news. Markets also tend to move in cycles, with periods of rising and falling prices. This volatility may cause each Fund’s NAV to experience significant increases or decreases over short periods of time. If there is a general decline in the securities and other markets, the NAV of a Fund may lose value, regardless of the individual results of the securities and other instruments in which a Fund invests.
Counterparty Credit Risk: The Funds may be exposed to counterparty credit risk, or the risk that an entity may fail to or be unable to perform on its commitments related to unsettled or open transactions. The Funds manage counterparty credit risk by entering into transactions only with counterparties that the Manager believes have the financial resources to honor their obligations and by monitoring the financial stability of those counterparties. Financial assets, which potentially expose the Funds to market, issuer and counterparty credit risks, consist principally of financial instruments and receivables due from counterparties. The extent of the Funds’ exposure to market, issuer and counterparty credit risks with respect to these financial assets is approximately their value recorded in the Statements of Assets and Liabilities, less any collateral held by the Funds.
A derivative contract may suffer amark-to-market loss if the value of the contract decreases due to an unfavorable change in the market rates or values of the underlying instrument. Losses can also occur if the counterparty does not perform under the contract.
With exchange-traded futures, there is less counterparty credit risk to the Funds since the exchange or clearinghouse, as counterparty to such instruments, guarantees against a possible default. The clearinghouse stands between the buyer and the seller of the contract; therefore, credit risk is limited to failure of the clearinghouse. While offset rights may exist under applicable law, a Fund does not have a contractual right of offset against a clearing broker or clearinghouse in the event of a default (including the bankruptcy or insolvency). Additionally, credit risk exists inexchange-traded futures with respect to initial and variation margin that is held in a clearing broker’s customer accounts. While clearing brokers are required to segregate customer margin from their own assets, in the event that a clearing broker becomes insolvent or goes into bankruptcy and at that time there is a shortfall in the aggregate amount of margin held by the clearing broker for all its clients, typically the shortfall would be allocated on a pro rata basis across all the clearing broker’s customers, potentially resulting in losses to the Funds.
Concentration Risk: The Funds invest a substantial amount of their assets in issuers located in a single country or a limited number of countries. When the Funds concentrate their investments in this manner, it assumes the risk that economic, political and social conditions in those countries may have a significant impact on their investment performance. Foreign issuers may not be subject to the same uniform accounting, auditing and financial reporting standards and practices as used in the United States. Foreign securities markets may also be more volatile and less liquid than U.S. securities and may be less subject to governmental supervision not typically associated with investing in U.S. securities. Investment percentages in specific countries are presented in the Schedules of Investments.
EuroFund invests a significant portion of its assets in securities of issuers located in Europe or with significant exposure to European issuers or countries. The European financial markets have recently experienced volatility and adverse trends due to concerns about economic downturns in, or rising government debt levels of, several European countries. These events may spread to other countries in Europe and may affect the value and liquidity of certain of the Fund’s investments.
Responses to the financial problems by European governments, central banks and others, including austerity measures and reforms, may not work, may result in social unrest and may limit future growth and economic recovery or have other unintended consequences. Further defaults or restructurings by governments and others of their debt could have additional adverse effects on economies, financial markets and asset valuations around the world. In addition, the United Kingdom has voted to withdraw from the European Union, and one or more other countries may withdraw from the European Union and/or abandon the Euro, the common currency of the European Union. The impact of these actions, especially if they occur in a disorderly fashion, is not clear but could be significant and far reaching.
| | |
| 46 | | 2019 BLACKROCK ANNUAL REPORTTO SHAREHOLDERS |
Notes to Financial Statements (continued)
| 11. | CAPITAL SHARE TRANSACTIONS |
Transactions in capital shares for each class were as follows:
| | | | | | | | | | | | | | | | |
| | | Year Ended
06/30/19 | | | Year Ended
06/30/18 | |
| Advantage Global Fund, Inc. | | Shares | | | Amount | | | Shares | | | Amount | |
Institutional | | | | | | | | | | | | | | | | |
Shares sold | | | 1,232,648 | | | $ | 24,912,052 | | | | 2,493,052 | | | $ | 64,282,041 | |
Shares issued in reinvestment of distributions | | | 159,143 | | | | 3,133,521 | | | | 2,231,724 | | | | 47,625,004 | |
Shares redeemed | | | (2,651,356 | ) | | | (55,309,098 | ) | | | (9,403,669 | ) | | | (220,440,441 | ) |
| | | | | | | | | | | | | | | | |
Net decrease | | | (1,259,565 | ) | | $ | (27,263,525 | ) | | | (4,678,893 | ) | | $ | (108,533,396 | ) |
| | | | | | | | | | | | | | | | |
| | | | |
Investor A | | | | | | | | | | | | | | | | |
Shares sold and automatic conversion of shares | | | 1,626,860 | | | $ | 32,489,716 | | | | 1,048,150 | | | $ | 23,996,146 | |
Shares issued from conversion(a) | | | — | | | | — | | | | 14,836 | | | | 307,412 | |
Shares issued in reinvestment of distributions | | | 538,218 | | | | 10,069,960 | | | | 4,464,856 | | | | 90,725,938 | |
Shares redeemed | | | (3,872,814 | ) | | | (76,347,695 | ) | | | (5,642,053 | ) | | | (130,749,317 | ) |
| | | | | | | | | | | | | | | | |
Net decrease | | | (1,707,736 | ) | | $ | (33,788,019 | ) | | | (114,211 | ) | | $ | (15,719,821 | ) |
| | | | | | | | | | | | | | | | |
| | | | |
Investor B(a) | | | | | | | | | | | | | | | | |
Shares issued in reinvestment of distributions | | | — | | | $ | — | | | | 4,588 | | | $ | 83,214 | |
Shares converted(a) | | | — | | | | — | | | | (16,626 | ) | | | (307,412 | ) |
Shares redeemed and automatic conversion of shares | | | — | | | | — | | | | (315 | ) | | | (7,222 | ) |
| | | | | | | | | | | | | | | | |
Net decrease | | | — | | | $ | — | | | | (12,353 | ) | | $ | (231,420 | ) |
| | | | | | | | | | | | | | | | |
| |
Investor C | | | | |
Shares sold | | | 113,130 | | | $ | 1,800,863 | | | | 99,113 | | | $ | 1,909,907 | |
Shares issued in reinvestment of distributions | | | 124,565 | | | | 1,913,305 | | | | 1,955,492 | | | | 32,734,953 | |
Shares redeemed | | | (2,486,438 | ) | | | (40,904,182 | ) | | | (3,019,203 | ) | | | (58,840,195 | ) |
| | | | | | | | | | | | | | | | |
Net decrease | | | (2,248,743 | ) | | $ | (37,190,014 | ) | | | (964,598 | ) | | $ | (24,195,335 | ) |
| | | | | | | | | | | | | | | | |
| | |
| | | | | | Period from
01/25/18 (b)
to 06/30/18 | |
| |
Class K | | | | |
Shares sold | | | 363,428 | | | $ | 7,674,626 | | | | 233,540 | | | $ | 5,093,029 | |
Shares issued in reinvestment of distributions | | | 8,407 | | | | 165,540 | | | | — | | | | — | |
Shares redeemed | | | (94,714 | ) | | | (1,971,467 | ) | | | (20,176 | ) | | | (443,961 | ) |
| | | | | | | | | | | | | | | | |
Net increase | | | 277,121 | | | $ | 5,868,699 | | | | 213,364 | | | $ | 4,649,068 | |
| | | | | | | | | | | | | | | | |
| | |
| | | | | | Year Ended
06/30/18 | |
| |
Class R | | | | |
Shares sold | | | 112,045 | | | $ | 2,021,830 | | | | 163,877 | | | $ | 3,396,206 | |
Shares issued in reinvestment of distributions | | | 30,451 | | | | 514,018 | | | | 293,684 | | | | 5,403,788 | |
Shares redeemed | | | (479,342 | ) | | | (8,614,397 | ) | | | (410,110 | ) | | | (8,557,749 | ) |
| | | | | | | | | | | | | | | | |
Net increase (decrease) | | | (336,846 | ) | | $ | (6,078,549 | ) | | | 47,451 | | | $ | 242,245 | |
| | | | | | | | | | | | | | | | |
Total Net Decrease | | | (5,275,769 | ) | | $ | (98,451,408 | ) | | | (5,509,240 | ) | | $ | (143,788,659 | ) |
| | | | | | | | | | | | | | | | |
| | | | |
| NOTESTO FINANCIAL STATEMENTS | | | 47 | |
Notes to Financial Statements (continued)
| | | | | | | | | | | | | | | | |
| | | Year Ended
06/30/19 | | | Year Ended
06/30/18 | |
| EuroFund | | Shares | | | Amount | | | Shares | | | Amount | |
Institutional | | | | | | | | | | | | | | | | |
Shares sold | | | 116,304 | | | $ | 1,632,133 | | | | 663,248 | | | $ | 10,217,108 | |
Shares issued in reinvestment of distributions | | | 55,526 | | | | 691,295 | | | | 101,284 | | | | 1,555,727 | |
Shares redeemed | | | (767,404 | ) | | | (10,555,926 | ) | | | (7,790,508 | ) | | | (119,474,736 | ) |
| | | | | | | | | | | | | | | | |
Net decrease | | | (595,574 | ) | | $ | (8,232,498 | ) | | | (7,025,976 | ) | | $ | (107,701,901 | ) |
| | | | | | | | | | | | | | | | |
| | | | |
Investor A | | | | | | | | | | | | | | | | |
Shares sold | | | 329,601 | | | $ | 4,582,724 | | | | 978,653 | | | $ | 14,902,810 | |
Shares issued in reinvestment of distributions | | | 131,602 | | | | 1,608,202 | | | | 94,217 | | | | 1,420,802 | |
Shares redeemed | | | (5,024,233 | ) | | | (67,280,467 | ) | | | (2,366,698 | ) | | | (35,951,235 | ) |
| | | | | | | | | | | | | | | | |
Net decrease | | | (4,563,030 | ) | | $ | (61,089,541 | ) | | | (1,293,828 | ) | | $ | (19,627,623 | ) |
| | | | | | | | | | | | | | | | |
|
Investor C | |
Shares sold | | | 10,878 | | | $ | 104,553 | | | | 162,042 | | | $ | 1,748,678 | |
Shares issued in reinvestment of distributions | | | 11,884 | | | | 101,134 | | | | 1,841 | | | | 19,534 | |
Shares redeemed | | | (323,337 | ) | | | (3,029,797 | ) | | | (227,340 | ) | | | (2,427,305 | ) |
| | | | | | | | | | | | | | | | |
Net decrease | | | (300,575 | ) | | $ | (2,824,110 | ) | | | (63,457 | ) | | $ | (659,093 | ) |
| | | | | | | | | | | | | | | | |
| | |
| | | | | | Period from
01/25/18 (b)
to 06/30/18 | |
| |
Class K | | | | |
Shares sold | | | 14,854 | | | $ | 200,174 | | | | 71,266 | | | $ | 1,105,835 | |
Shares issued in reinvestment of distributions | | | 1,495 | | | | 18,527 | | | | — | | | | — | |
Shares redeemed | | | (33,530 | ) | | | (459,486 | ) | | | (4,585 | ) | | | (70,699 | ) |
| | | | | | | | | | | | | | | | |
Net increase (decrease) | | | (17,181 | ) | | $ | (240,785 | ) | | | 66,681 | | | $ | 1,035,136 | |
| | | | | | | | | | | | | | | | |
| | |
| | | | | | Year Ended
06/30/18 | |
| |
Class R | | | | |
Shares sold | | | 8,938 | | | $ | 89,980 | | | | 35,624 | | | $ | 411,637 | |
Shares issued in reinvestment of distributions | | | 1,394 | | | | 12,765 | | | | 535 | | | | 6,094 | |
Shares redeemed | | | (46,452 | ) | | | (496,404 | ) | | | (58,439 | ) | | | (663,434 | ) |
| | | | | | | | | | | | | | | | |
Net decrease | | | (36,120 | ) | | $ | (393,659 | ) | | | (22,280 | ) | | $ | (245,703 | ) |
| | | | | | | | | | | | | | | | |
Total Net Decrease | | | (5,512,480 | ) | | $ | (72,780,593 | ) | | | (8,338,860 | ) | | $ | (127,199,184 | ) |
| | | | | | | | | | | | | | | | |
| | (a) | On December 27, 2017, Advantage Global’s Investor B Shares converted to Investor A Shares. | |
| | (b) | Commencement of operations. | |
As of June 30, 2019, shares owned by BlackRock Financial Management, Inc., an affiliate of the Funds, were as follows:
| | | | |
| | | Class K | |
Advantage Global | | | 8,651 | |
EuroFund | | | 12,070 | |
| 12. | REGULATIONS-X AMENDMENTS |
On August 17, 2018, the SEC adopted amendments to certain disclosure requirements in Securities Act ReleaseNo. 33-10532, Disclosure Update and Simplification. The Funds have adopted the amendments pertinent to RegulationS-X in this shareholder report. The amendments impacted certain disclosure presentation on the Statements of Assets and Liabilities, Statements of Changes in Net Assets and Notes to the Financial Statements.
Prior year distribution information and undistributed (distributions in excess of) net investment income in the Statements of Changes in Net Assets has been modified to conform to the current year presentation in accordance with the RegulationS-X changes.
| | |
| 48 | | 2019 BLACKROCK ANNUAL REPORTTO SHAREHOLDERS |
Notes to Financial Statements (continued)
Distributions for the year ended June 30, 2018 were classified as follows:
| | | | | | | | | | |
| | | Share Class | | Net Investment Income | | | Net Realized Gain | |
Advantage Global | | Institutional | | $ | (3,192,349 | ) | | $ | (60,337,167 | ) |
| | Investor A | | | (3,732,983 | ) | | | (96,502,725 | ) |
| | Investor B (a) | | | — | | | | (83,314 | ) |
| | Investor C | | | — | | | | (35,126,324 | ) |
| | Class R | | | (129,667 | ) | | | (5,274,116 | ) |
EuroFund | | Institutional | | | (1,693,589 | ) | | | — | |
| | Investor A | | | (1,574,352 | ) | | | — | |
| | Investor C | | | (23,309 | ) | | | — | |
| | | Class R | | | (6,223 | ) | | | — | |
| | (a) | On December 27, 2017, Advantage Global’s Investor B Shares converted to Investor A Shares. | |
Undistributed net investment income as of June 30, 2018 was as follows:
| | | | |
| | | Undistributed
Net Investment Income | |
Advantage Global | | $ | 3,788,365 | |
EuroFund | | | 2,923,870 | |
Management has evaluated the impact of all subsequent events on the Funds through the date the financial statements were issued and has determined that there were no subsequent events requiring adjustment or additional disclosure in the financial statements.
| | | | |
| NOTESTO FINANCIAL STATEMENTS | | | 49 | |
Report of Independent Registered Public Accounting Firm
To the Shareholders and the Board of Directors/Trustees of BlackRock Advantage Global Fund, Inc. and BlackRock EuroFund:
Opinion on the Financial Statements and Financial Highlights
We have audited the accompanying statements of assets and liabilities of BlackRock Advantage Global Fund, Inc. and BlackRock EuroFund (the “Funds”), including the schedules of investments, as of June 30, 2019, the related statements of operations for the year then ended, the statements of changes in net assets for each of the two years in the period then ended, the financial highlights for each of the five years in the period then ended, and the related notes. In our opinion, the financial statements and financial highlights present fairly, in all material respects, the financial position of the Funds as of June 30, 2019, and the results of their operations for the year then ended, the changes in their net assets for each of the two years in the period then ended, and the financial highlights for each of the five years in the period then ended, in conformity with accounting principles generally accepted in the United States of America.
Basis for Opinion
These financial statements and financial highlights are the responsibility of the Funds’ management. Our responsibility is to express an opinion on the Funds’ financial statements and financial highlights based on our audits. We are a public accounting firm registered with the Public Company Accounting Oversight Board (United States) (PCAOB) and are required to be independent with respect to the Funds in accordance with the U.S. federal securities laws and the applicable rules and regulations of the Securities and Exchange Commission and the PCAOB.
We conducted our audits in accordance with the standards of the PCAOB. Those standards require that we plan and perform the audit to obtain reasonable assurance about whether the financial statements and financial highlights are free of material misstatement, whether due to error or fraud. The Funds are not required to have, nor were we engaged to perform, an audit of their internal control over financial reporting. As part of our audits we are required to obtain an understanding of internal control over financial reporting but not for the purpose of expressing an opinion on the effectiveness of the Funds’ internal control over financial reporting. Accordingly, we express no such opinion.
Our audits included performing procedures to assess the risks of material misstatement of the financial statements and financial highlights, whether due to error or fraud, and performing procedures that respond to those risks. Such procedures included examining, on a test basis, evidence regarding the amounts and disclosures in the financial statements and financial highlights. Our audits also included evaluating the accounting principles used and significant estimates made by management, as well as evaluating the overall presentation of the financial statements and financial highlights. Our procedures included confirmation of securities owned as of June 30, 2019, by correspondence with the custodian and brokers; when replies were not received from brokers, we performed other auditing procedures. We believe that our audits provide a reasonable basis for our opinion.
Deloitte & Touche LLP
Boston, Massachusetts
August 21, 2019
We have served as the auditor of one or more BlackRock investment companies since 1992.
Important Tax Information (unaudited)
During the fiscal year ended June 30, 2019, the following information is provided with respect to the ordinary income distributions paid by the Funds:
| | | | | | | | |
| | | Advantage Global
Fund | | | EuroFund | |
Payable Date | | | 11/28/18 | | | | 12/07/18 | |
Qualified Dividend Income for Individuals | | | 79.67% | | | | 100% | (a) |
Dividends Qualifying for the Dividend Received Deduction for Corporations | | | 34.63% | | | | — | |
Foreign Source Income | | | — | | | | 98.41% | (a) |
Foreign Taxes Paid Per Share(b) | | $ | — | | | $ | 0.076067 | |
| | (a) | Expressed as a percentage of the cash distribution grossed-up for foreign taxes. | |
| | (b) | The foreign taxes paid represent taxes incurred by the Fund on income received by the Fund from foreign sources. Foreign taxes paid may be included in taxable income with an offsetting deduction from gross income or may be taken as a credit for taxes paid to foreign governments. You should consult your tax advisor regarding the appropriate treatment of foreign taxes paid | |
Additionally, Advantage Global Fund distributed long-term capital gains of $0.097482 per share to shareholders of record on November 26, 2018.
| | |
| 50 | | 2019 BLACKROCK ANNUAL REPORTTO SHAREHOLDERS |
Disclosure of Investment Advisory Agreements andSub-Advisory Agreement
The Board of Trustees of BlackRock EuroFund (“EuroFund”) met in person on April 17, 2019 andMay 14-15, 2019 to consider the approval of the investment advisory agreement (the “EuroFund Advisory Agreement”) between EuroFund and BlackRock Advisors, LLC (the “Manager”), its investment advisor. The Board of Trustees of EuroFund also considered the approval of thesub-advisory agreement (the “EuroFundSub-Advisory Agreement”) between the Manager and BlackRock International Limited (the“Sub-Advisor”) with respect to EuroFund.
The Board of Directors of BlackRock Advantage Global Fund, Inc. (“Advantage Global Fund”) met in person on April 17, 2019 andMay 14-15, 2019 to consider the approval of the investment advisory agreement (the “Advantage Global Fund Advisory Agreement”) between Advantage Global Fund and the Manager, its investment advisor.
Eurofund and Advantage Global Fund are referred to herein individually as a “Fund” or collectively as the “Funds.” The Manager and theSub-Advisor are referred to herein as “BlackRock.” The EuroFund Advisory Agreement, the EuroFundSub-Advisory Agreement and the Advantage Global Fund Advisory Agreement are referred to herein individually as an “Agreement” or collectively as the “Agreements.” For simplicity: (a) the Board of Trustees of EuroFund and the Board of Directors of Advantage Global Fund are referred to herein individually as the “Board” and collectively as the “Boards” and the members are referred to as “Board Members”; and (b) the meetings held on April 17, 2019 are referred to as the “April Meeting” and the meetings held on May14-15, 2019 are referred to as the “May Meeting.”
Activities and Composition of the Boards
On the date of the May Meeting, each Board consisted of fifteen individuals, thirteen of whom were not “interested persons” of the pertinent Fund as defined in the Investment Company Act of 1940, as amended (the “1940 Act”) (the “Independent Board Members”). The Board Members are responsible for the oversight of the operations of the pertinent Fund and perform the various duties imposed on the directors of investment companies by the 1940 Act. The Independent Board Members have retained independent legal counsel to assist them in connection with their duties. The Chair of each Board is an Independent Board Member. Each Board has established five standing committees: an Audit Committee, a Governance and Nominating Committee, a Compliance Committee, a Performance Oversight Committee and an Ad Hoc Topics Committee, each of which is chaired by an Independent Board Member and composed of Independent Board Members (except for the Ad Hoc Topics Committee, which also has one interested Board Member).
The Agreements
Consistent with the requirements of the 1940 Act, each Board considers the continuation of the pertinent Agreement(s) on an annual basis. The Boards have four quarterly meetings per year, each typically extending for two days, and additionalin-person and telephonic meetings throughout the year, as needed. While the Boards also have a fifthone-day meeting to consider specific information surrounding the renewal of the pertinent Agreement(s), each Board’s consideration entails a year-long deliberative process whereby the Board and its committees assess BlackRock’s services to the Fund. In particular, the Board assessed, among other things, the nature, extent and quality of the services provided to the pertinent Fund by BlackRock, BlackRock’s personnel and affiliates, including (as applicable): investment management; accounting, administrative and shareholder services; oversight of the pertinent Fund’s service providers; risk management and oversight; legal and compliance services; and ability to meet applicable legal and regulatory requirements. Throughout the year, including during the contract renewal process, the Independent Board Members were advised by independent legal counsel, and met with independent legal counsel in various executive sessions outside of the presence of management.
During the year, the Boards, acting directly and through their committees, consider information that is relevant to their annual consideration of the renewal of the pertinent Agreement(s), including the services and support provided by BlackRock to the Funds and their shareholders. BlackRock also furnished additional information to the Boards in response to specific questions from the Boards. This additional information is discussed further below in the section titled “Board Considerations in Approving the Agreements.” Among the matters the Boards considered, with respect to each Fund, as pertinent, were: (a) investment performance forone-year, three-year, five-year,ten-year, and/or since inception periods, as applicable, against peer funds, applicable benchmark, and performance metrics, as applicable, as well as senior management’s and portfolio managers’ analyses of the reasons for any over-performance or under-performance relative to its peers, benchmarks, and other performance metrics, as applicable; (b) fees, including advisory, administration, if applicable, and other amounts paid to BlackRock and its affiliates by the Fund for services; (c) Fund operating expenses and how BlackRock allocates expenses to the Fund; (d) the resources devoted to, risk oversight of, and compliance reports relating to, implementation of the Fund’s investment objective, policies and restrictions, and meeting regulatory requirements; (e) BlackRock and the Fund’s adherence to its applicable compliance policies and procedures; (f) the nature, character and scope ofnon-investment management services provided by BlackRock and its affiliates and the estimated cost of such services; (g) BlackRock’s and other service providers’ internal controls and risk and compliance oversight mechanisms; (h) BlackRock’s implementation of the proxy voting policies approved by the Board; (i) the use of brokerage commissions and execution quality of portfolio transactions; (j) BlackRock’s implementation of the Fund’s valuation and liquidity procedures; (k) an analysis of management fees for products with similar investment mandates across theopen-end fund, exchange-traded fund (“ETF”),closed-end fund,sub-advised mutual fund, separately managed account, collective investment trust, and institutional separate account product channels, as applicable, and the similarities and differences between these products and the services provided as compared to the Fund; (l) BlackRock’s compensation methodology for its investment professionals and the incentives and accountability it creates, along with investment professionals’ investments in the fund(s) they manage; and (m) periodic updates on BlackRock’s business.
Board Considerations in Approving the Agreements
The Approval Process: Prior to the April Meeting, the Boards requested and received materials specifically relating to the Agreements. The Independent Board Members are continuously engaged in a process with their independent legal counsel and BlackRock to review the nature and scope of the information provided to better assist their deliberations. The materials provided in connection with the April Meeting included, among other things: (a) information independently compiled and prepared by Broadridge Financial Solutions, Inc. (“Broadridge”), based on either a Lipper classification or Morningstar category, regarding the fees and expenses of each Fund as compared with a peer group of funds as determined by Broadridge (“Expense Peers”) and the investment performance of each Fund as compared with a peer group of funds (“Performance Peers”) and other metrics, as applicable; (b) information on the composition of the Expense Peers and Performance Peers, and a description of Broadridge’s methodology; (c) information on the estimated profits realized by BlackRock and its affiliates pursuant to the Agreements and a discussion offall-out benefits
| | | | |
| DISCLOSUREOF INVESTMENT ADVISORY AGREEMENTSAND SUB-ADVISORY AGREEMENT | | | 51 | |
Disclosure of Investment Advisory Agreements andSub-Advisory Agreement (continued)
to BlackRock and its affiliates; (d) a general analysis provided by BlackRock concerning investment management fees received in connection with other types of investment products, such as institutional accounts,sub-advised mutual funds, ETFs,closed-end funds,open-end funds, and separately managed accounts under similar investment mandates, as well as the performance of such other products, as applicable; (e) review ofnon-management fees; (f) the existence, impact and sharing of potential economies of scale, if any, with the Funds; (g) a summary of aggregate amounts paid by each Fund to BlackRock; (h) sales and redemption data regarding each Fund’s shares; and (i) various additional information requested by the Boards as appropriate regarding BlackRock’s and the Funds’ operations.
At the April Meeting, each Board reviewed materials relating to its consideration of the pertinent Agreements. As a result of the discussions that occurred during the April Meeting, and as a culmination of each Board’s year-long deliberative process, the Boards presented BlackRock with questions and requests for additional information. BlackRock responded to these requests with additional written information in advance of the May Meeting.
At the May Meeting, each Board concluded, with respect to the pertinent Fund, its assessment of, among other things: (a) the nature, extent and quality of the services provided by BlackRock; (b) the investment performance of the Fund as compared with Performance Peers and other metrics, as applicable; (c) the advisory fee and the estimated cost of the services and estimated profits realized by BlackRock and its affiliates from their relationship with the Fund; (d) the Fund’s fees and expenses compared to Expense Peers; (e) the sharing of potential economies of scale;(f) fall-out benefits to BlackRock and its affiliates as a result of BlackRock’s relationship with the Fund; and (g) other factors deemed relevant by the Board Members.
Each Board also considered other matters it deemed important to the approval process, such as other payments made to BlackRock or its affiliates relating to securities lending and cash management, and BlackRock’s services related to the valuation and pricing of the portfolio holdings of the pertinent Fund. Each Board noted the willingness of BlackRock personnel to engage in open, candid discussions with the Board. The Boards did not identify any particular information as determinative, and each Board Member may have attributed different weights to the various items considered.
A. Nature, Extent and Quality of the Services Provided by BlackRock: Each Board, including the Independent Board Members, reviewed the nature, extent and quality of services provided by BlackRock, including the investment advisory services and the resulting performance of the applicable Fund. Throughout the year, each Board compared Fund performance to the performance of a comparable group of mutual funds, relevant benchmark, and performance metrics, as applicable. The Boards met with BlackRock’s senior management personnel responsible for investment activities, including the senior investment officers. Each Board also reviewed the materials provided by the applicable Fund’s portfolio management team discussing the Fund’s performance and the Fund’s investment objective, strategies and outlook.
Each Board considered, among other factors, with respect to BlackRock: the number, education and experience of investment personnel generally and the applicable Fund’s portfolio management team; BlackRock’s research capabilities; investments by portfolio managers in the funds they manage; portfolio trading capabilities; use of technology; commitment to compliance; credit analysis capabilities; risk analysis and oversight capabilities; and the approach to training and retaining portfolio managers and other research, advisory and management personnel. The Boards also considered BlackRock’s overall risk management program, including the continued efforts of BlackRock and its affiliates to address cybersecurity risks and the role of BlackRock’s Risk & Quantitative Analysis Group. Each Board engaged in a review of BlackRock’s compensation structure with respect to the applicable Fund’s portfolio management team and BlackRock’s ability to attract and retain high-quality talent and create performance incentives.
In addition to investment advisory services, the Boards considered the nature and quality of the administrative and othernon-investment advisory services provided to the Funds. BlackRock and its affiliates provide the Funds with certain administrative, shareholder and other services (in addition to any such services provided to the Funds by third parties) and officers and other personnel as are necessary for the operations of the Funds. In particular, BlackRock and its affiliates provide each Fund with administrative services including, among others: (i) responsibility for disclosure documents, such as the prospectus, the summary prospectus (as applicable), the statement of additional information and periodic shareholder reports; (ii) oversight of daily accounting and pricing; (iii) responsibility for periodic filings with regulators; (iv) overseeing and coordinating the activities of other service providers, including, among others, the Fund’s custodian, fund accountant, transfer agent, and auditor; (v) organizing Board meetings and preparing the materials for such Board meetings; (vi) providing legal and compliance support; (vii) furnishing analytical and other support to assist the Fund’s Board in its consideration of strategic issues such as the merger, consolidation or repurposing of certainopen-end funds; and (viii) performing or managing administrative functions necessary for the operation of the Fund, such as tax reporting, expense management, fulfilling regulatory filing requirements, overseeing the Fund’s distribution partners, and shareholder call center and other services. The Boards reviewed the structure and duties of BlackRock’s fund administration, shareholder services, and legal & compliance departments and considered BlackRock’s policies and procedures for assuring compliance with applicable laws and regulations.
B. The Investment Performance of the Funds and BlackRock: Each Board, including the Independent Board Members, also reviewed and considered the performance history of the applicable Fund. In preparation for the April Meeting, the Boards were provided with reports independently prepared by Broadridge, which included a comprehensive analysis of each Fund’s performance as of December 31, 2018. Broadridge ranks funds in quartiles, ranging from first to fourth, where first is the most desirable quartile position and fourth is the least desirable. In connection with its review, each Board received and reviewed information regarding the investment performance of the pertinent Fund as compared to its Performance Peers. Each Board and its Performance Oversight Committee regularly review, and meet with Fund management to discuss, the performance of the pertinent Fund throughout the year.
In evaluating performance, the Boards focused particular attention on funds with less favorable performance records. The Board also noted that while it found the data provided by Broadridge generally useful, it recognized the limitations of such data, including in particular, that notable differences may exist between a fund and the Performance Peer funds (for example, the investment objective(s) and investment strategies). Further, the Boards recognized that the performance data reflects a snapshot of a period as of a particular date and that selecting a different performance period could produce significantly different results. The Board also acknowledged that long-term performance could be impacted by even one period of significant outperformance or underperformance, and that a single investment theme could have the ability to affect long-term performance disproportionately.
The Board of Advantage Global Fund noted that for theone-, three- and five-year periods reported, the Advantage Global Fund ranked in the third, third, and fourth quartiles, respectively, against its Performance Peers. The Board and BlackRock reviewed the Fund’s underperformance during the applicable periods. The Board noted
| | |
| 52 | | 2019 BLACKROCK ANNUAL REPORTTO SHAREHOLDERS |
Disclosure of Investment Advisory Agreements andSub-Advisory Agreement (continued)
that, among other things, effective October 26, 2017, the Fund had undergone a change in its investment objective, as well as changes to its investment strategy and portfolio management team, and in connection with such changes, the Fund changed its name from BlackRock Global SmallCap Fund, Inc. to BlackRock Advantage Global Fund, Inc.
The Board of EuroFund noted that for each of theone-, three- and five-year periods reported, the EuroFund ranked in the fourth quartile, against its Performance Peers. The Board and BlackRock reviewed the Fund’s underperformance during the applicable periods. The Board noted that, among other things, effective October 23, 2018 the Fund had undergone changes in investment strategy and portfolio management team.
Each Board and BlackRock discussed BlackRock’s strategy for improving the pertinent Fund’s investment performance. Discussions covered topics such as performance attribution, the pertinent Fund’s investment personnel, and the resources appropriate to support the pertinent Fund’s investment processes.
C. Consideration of the Advisory/Management Fees and the Estimated Cost of the Services and Estimated Profits Realized by BlackRock and its Affiliates from their Relationship with the Funds: Each Board, including the Independent Board Members, reviewed the applicable Fund’s contractual management fee rate compared with those of its Expense Peers. The contractual management fee rate represents a combination of the advisory fee and any administrative fees, before taking into account any reimbursements or fee waivers. Each Board also compared the applicable Fund’s total expense ratio, as well as its actual management fee rate, to those of its Expense Peers. The total expense ratio represents a fund’s total net operating expenses, including any12b-1 or non12b-1 service fees. The total expense ratio gives effect to any expense reimbursements or fee waivers that benefit a fund, and the actual management fee rate gives effect to any management fee reimbursements or waivers that benefit a fund. The Boards considered the services provided and the fees charged by BlackRock and its affiliates to other types of clients with similar investment mandates, as applicable, including institutional accounts andsub-advised mutual funds (including mutual funds sponsored by third parties).
The Boards received and reviewed statements relating to BlackRock’s financial condition. The Boards reviewed BlackRock’s profitability methodology and were also provided with an estimated profitability analysis that detailed the revenues earned and the expenses incurred by BlackRock for services provided to the Funds. The Boards reviewed BlackRock’s estimated profitability with respect to the Funds and other funds the Boards currently oversee for the year ended December 31, 2018 compared to available aggregate estimated profitability data provided for the prior two years. The Boards reviewed BlackRock’s estimated profitability with respect to certain other U.S. fund complexes managed by the Manager and/or its affiliates. The Boards reviewed BlackRock’s assumptions and methodology of allocating expenses in the estimated profitability analysis, noting the inherent limitations in allocating costs among various advisory products. The Boards recognized that profitability may be affected by numerous factors including, among other things, fee waivers and expense reimbursements by the Manager, the types of funds managed, precision of expense allocations and business mix. The Boards thus recognized that calculating and comparing profitability at individual fund levels is difficult.
The Boards noted that, in general, individual fund or product line profitability of other advisors is not publicly available. The Boards reviewed BlackRock’s overall operating margin, in general, compared to that of certain other publicly-traded asset management firms. The Boards considered the differences between BlackRock and these other firms, including the contribution of technology at BlackRock, BlackRock’s expense management, and the relative product mix.
In addition, each Board considered the estimated cost of the services provided to the applicable Fund by BlackRock, and BlackRock’s and its affiliates’ estimated profits relating to the management of the applicable Fund and the other funds advised by BlackRock and its affiliates. As part of its analysis, each Board reviewed BlackRock’s methodology in allocating its costs of managing the applicable Fund, to the Fund. Each Board considered whether BlackRock has the financial resources necessary to attract and retain high quality investment management personnel to perform its obligations under the pertinent Agreement(s) and to continue to provide the high quality of services that is expected by the Board. The Boards further considered factors including but not limited to BlackRock’s commitment of time, assumption of risk, and liability profile in servicing the Funds, including in contrast to what is required of BlackRock with respect to other products with similar investment mandates across theopen-end fund, ETF,closed-end fund,sub-advised mutual fund, separately managed account, collective investment trust, and institutional separate account product channels, as applicable.
The Board of EuroFund noted that EuroFund’s contractual management fee rate ranked in the second quartile, and that the actual management fee rate and total expense ratio each ranked in the second quartile relative to the Fund’s Expense Peers. In addition, the Board noted that BlackRock has voluntarily agreed to waive a portion of the advisory fee payable by the Fund. The Board further noted that BlackRock and the Board had previously agreed to increase the existing voluntary advisory fee waiver. After discussions between the Board, including the Independent Board Members, and BlackRock, the Board and BlackRock agreed to a continuation of the voluntary advisory fee waiver.
The Board of Advantage Global Fund noted that Advantage Global Fund’s contractual management fee rate ranked in the third quartile, and that the actual management fee rate and total expense ratio each ranked in the first quartile relative to the Fund’s Expense Peers. In addition, the Board noted that BlackRock and the Board have contractually agreed to a cap on the Fund’s total expenses as a percentage of the Fund’s average daily net assets on aclass-by-class basis.
The Boards each noted that the pertinent Fund has an advisory fee arrangement that includes breakpoints that adjust the fee rate downward as the size of the pertinent Fund increases above certain contractually specified levels. The Boards noted that if the size of the pertinent Fund were to decrease, the Fund could lose the benefit of one or more breakpoints.
D. Economies of Scale: Each Board, including the Independent Board Members, considered the extent to which economies of scale might be realized as the assets of the pertinent Fund increase, including the existence of fee waivers and/or expense caps, as applicable, noting that any contractual fee waivers and expense caps had been approved by the Board. Each Board also considered the extent to which the applicable Fund benefits from such economies in a variety of ways and whether there should be changes in the advisory fee rate or breakpoint structure in order to enable the Fund to more fully participate in these economies of scale. Each Board considered the applicable Fund’s asset levels and whether the current fee schedule was appropriate. In their consideration, the Board Members took into account the existence of any expense caps and further considered the continuation and/or implementation, as applicable, of such caps.
E. Other Factors Deemed Relevant by the Board Members: Each Board, including the Independent Board Members, also took into account other ancillary or“fall-out” benefits that BlackRock or its affiliates may derive from BlackRock’s respective relationships with the applicable Fund, both tangible and intangible, such as BlackRock’s
| | | | |
| DISCLOSUREOF INVESTMENT ADVISORY AGREEMENTSAND SUB-ADVISORY AGREEMENT | | | 53 | |
Disclosure of Investment Advisory Agreements andSub-Advisory Agreement (continued)
ability to leverage its investment professionals who manage other portfolios and risk management personnel, an increase in BlackRock’s profile in the investment advisory community, and the engagement of BlackRock’s affiliates as service providers to the Fund, including for administrative, distribution, securities lending and cash management services. The Board also considered BlackRock’s overall operations and its efforts to expand the scale of, and improve the quality of, its operations. The Board also noted that, subject to applicable law, BlackRock may use and benefit from third party research obtained by soft dollars generated by certain registered fund transactions to assist in managing all or a number of its other client accounts.
In connection with their consideration of the Agreements, the Boards also received information regarding BlackRock’s brokerage and soft dollar practices. The Boards received reports from BlackRock which included information on brokerage commissions and trade execution practices throughout the year.
The Boards noted the competitive nature of theopen-end fund marketplace, and that shareholders are able to redeem their Fund shares if they believe that the pertinent Fund’s fees and expenses are too high or if they are dissatisfied with the performance of the Fund.
Conclusion
The Board of EuroFund, including the Independent Board Members, unanimously approved the continuation of the EuroFund Advisory Agreement between the Manager and the EuroFund for aone-year term ending June 30, 2020, and the EuroFundSub-Advisory Agreement between the Manager and theSub-Advisor with respect to EuroFund for aone-year term ending June 30, 2020.
The Board of Advantage Global Fund, including the Independent Board Members, unanimously approved the continuation of the Advantage Global Fund Advisory Agreement between the Manager and Advantage Global Fund for aone-year term ending June 30, 2020.
Based upon their evaluation of all of the aforementioned factors in their totality, as well as other information, the Boards, including the Independent Board Members, were satisfied that the terms of the Agreements were fair and reasonable and in the best interest of each Fund, as pertinent, and its shareholders. In arriving at its decision to approve the Agreements, the Boards did not identify any single factor or group of factors asall-important or controlling, but considered all factors together, and different Board Members may have attributed different weights to the various factors considered. The Independent Board Members were also assisted by the advice of independent legal counsel in making this determination.
| | |
| 54 | | 2019 BLACKROCK ANNUAL REPORTTO SHAREHOLDERS |
Director and Officer Information
| | | | | | | | |
| Independent Directors (a) |
| | | | | |
Name
Year of Birth (b) | | Position(s) Held
(Length of Service) (c) | | Principal Occupation(s) During Past Five Years | | Number of BlackRock-Advised
Registered Investment Companies
(“RICs”) Consisting of
Investment Portfolios
(“Portfolios”) Overseen | | Public Company and Other
Investment Company
Directorships Held During
Past Five Years |
Mark Stalnecker 1951 | | Chair of the Board and Director (Since 2019) | | Chief Investment Officer, University of Delaware from 1999 to 2013; Trustee and Chair of the Finance and Investment Committees, Winterthur Museum and Country Estate from 2005 to 2016; Member of the Investment Committee, Delaware Public Employees’ Retirement System since 2002; Member of the Investment Committee, Christiana Care Health System from 2009 to 2017; Member of the Investment Committee, Delaware Community Foundation from 2013 to 2014; Director and Chair of the Audit Committee, SEI Private Trust Co. from 2001 to 2014. | | 38 RICs consisting of 182 Portfolios | | None |
Bruce R. Bond 1946 | | Director (Since 2007) | | Board Member, Amsphere Limited (software) since 2018; Trustee and Member of the Governance Committee, State Street Research Mutual Funds from 1997 to 2005; Board Member of Governance, Audit and Finance Committee, Avaya Inc. (computer equipment) from 2003 to 2007. | | 38 RICs consisting of 182 Portfolios | | None |
Susan J. Carter 1956 | | Director (Since 2019) | | Director, Pacific Pension Institute from 2014 to 2018; Advisory Board Member, Center for Private Equity and Entrepreneurship at Tuck School of Business since 1997; Senior Advisor, Commonfund Capital, Inc. (“CCI”) (investment adviser) in 2015; Chief Executive Officer, CCI from 2013 to 2014; President & Chief Executive Officer, CCI from 1997 to 2013; Advisory Board Member, Girls Who Invest from 2015 to 2018 and Board Member thereof since 2018; Advisory Board Member, Bridges Fund Management since 2016; Trustee, Financial Accounting Foundation since 2017; Practitioner Advisory Board Member, Private Capital Research Institute (“PCRI”) since 2017. | | 38 RICs consisting of 182 Portfolios | | None |
Collette Chilton 1958 | | Director (Since 2019) | | Chief Investment Officer, Williams College since 2006; Chief Investment Officer, Lucent Asset Management Corporation from 1998 to 2006. | | 38 RICs consisting of 182 Portfolios | | None |
Neil A. Cotty 1954 | | Director (Since 2019) | | Bank of America Corporation from 1996 to 2015, serving in various senior finance leadership roles, including Chief Accounting Officer from 2009 to 2015, Chief Financial Officer of Global Banking, Markets and Wealth Management from 2008 to 2009, Chief Accounting Officer from 2004 to 2008, Chief Financial Officer of Consumer Bank from 2003 to 2004, Chief Financial Officer of Global Corporate Investment Bank from 1999 to 2002. | | 38 RICs consisting of 182 Portfolios | | None |
Lena G. Goldberg 1949 | | Director (Since 2016) | | Senior Lecturer, Harvard Business School, since 2008; Director, Charles Stark Draper Laboratory, Inc. since 2013; FMR LLC/Fidelity Investments (financial services) from 1996 to 2008, serving in various senior roles including Executive Vice President — Strategic Corporate Initiatives and Executive Vice President and General Counsel; Partner, Sullivan & Worcester LLP from 1985 to 1996 and Associate thereof from 1979 to 1985. | | 38 RICs consisting of 182 Portfolios | | None |
Robert M. Hernandez 1944 | | Director (Since 2007) | | Director, Vice Chairman and Chief Financial Officer of USX Corporation (energy and steel business) from 1991 to 2001; Director andnon-executive Chairman, RTI International Metals, Inc. from 1990 to 2015; Director, TE Connectivity (electronics) from 2006 to 2012. | | 38 RICs consisting of 182 Portfolios | | Chubb Limited (insurance company); Eastman Chemical Company
|
| | | | |
| DIRECTORAND OFFICER INFORMATION | | | 55 | |
Director and Officer Information (continued)
| | | | | | | | |
| Independent Directors (a)(continued) |
| | | | | |
Name
Year of Birth (b) | | Position(s) Held
(Length of Service) (c) | | Principal Occupation(s) During Past Five Years | | Number of BlackRock-Advised
Registered Investment Companies
(“RICs”) Consisting of
Investment Portfolios
(“Portfolios”) Overseen | | Public Company and Other
Investment Company
Directorships Held During
Past Five Years |
Henry R. Keizer 1956 | | Director (Since 2016) | | Director, Park Indemnity Ltd. (captive insurer) since 2010; Director, MUFG Americas Holdings Corporation and MUFG Union Bank, N.A. (financial and bank holding company) from 2014 to 2016; Director, American Institute of Certified Public Accountants from 2009 to 2011; Director, KPMG LLP (audit, tax and advisory services) from 2004 to 2005 and 2010 to 2012; Director, KPMG International in 2012, Deputy Chairman and Chief Operating Officer thereof from 2010 to 2012 and U.S. Vice Chairman of Audit thereof from 2005 to 2010; Global Head of Audit, KPMGI (consortium of KPMG firms) from 2006 to 2010; Director, YMCA of Greater New York from 2006 to 2010. | | 38 RICs consisting of 182 Portfolios | | Hertz Global Holdings (car rental); Montpelier Re Holdings, Ltd. (publicly held property and casualty reinsurance) from 2013 until 2015; Sealed Air Corp. (packaging); WABCO (commercial vehicle safety systems) |
Cynthia A. Montgomery 1952 | | Director (Since 2019) | | Professor, Harvard Business School since 1989. | | 38 RICs consisting of 182 Portfolios | | Newell Rubbermaid, Inc. (manufacturing) |
Donald C. Opatrny 1952 | | Director (Since 2015) | | Trustee, Vice Chair, Member of the Executive Committee and Chair of the Investment Committee, Cornell University since 2004; President, Trustee and Member of the Investment Committee, The Aldrich Contemporary Art Museum from 2007 to 2014; Member of the Board and Investment Committee, University School from 2007 to 2018; Member of the Investment Committee, Mellon Foundation from 2009 to 2015; Trustee, Artstor (a Mellon Foundation affiliate) from 2010 to 2015; President and Trustee, the Center for the Arts, Jackson Hole from 2011 to 2018; Director, Athena Capital Advisors LLC (investment management firm) since 2013; Trustee and Chair of the Investment Committee, Community Foundation of Jackson Hole since 2014; Member of Affordable Housing Supply Board of Jackson, Wyoming since 2018; Member, Investment Funds Committee, State of Wyoming since 2017; Trustee, Phoenix Art Museum since 2018. | | 38 RICs consisting of 182 Portfolios | | None |
Joseph P. Platt 1947 | | Director (Since 2019) | | General Partner, Thorn Partners, LP (private investments) since 1998; Director, WQED Multi-Media (public broadcastingnot-for-profit) since 2001; Chair, Basic Health International(non-profit) since 2015. | | 38 RICs consisting of 182 Portfolios | | Greenlight Capital Re, Ltd. (reinsurance company); Consol Energy Inc. |
Kenneth L. Urish 1951 | | Director (Since 2019) | | Managing Partner, Urish Popeck & Co., LLC (certified public accountants and consultants) since 1976; Past-Chairman of the Professional Ethics Committee of the Pennsylvania Institute of Certified Public Accountants and Committee Member thereof since 2007; Member of External Advisory Board, The Pennsylvania State University Accounting Department since founding in 2001; Principal, UP Strategic Wealth Investment Advisors, LLC since 2013; Trustee, The Holy Family Institute from 2001 to 2010; President and Trustee, Pittsburgh Catholic Publishing Associates from 2003 to 2008; Director,Inter-Tel from 2006 to 2007. | | 38 RICs consisting of 182 Portfolios | | None |
Claire A. Walton 1957 | | Director (Since 2019) | | Chief Operating Officer and Chief Financial Officer of Liberty Square Asset Management, LP from 1998 to 2015; General Partner of Neon Liberty Capital Management, LLC since 2003; Director, Boston Hedge Fund Group from 2009 to 2018; Director, Woodstock Ski Runners since 2013; Director, Massachusetts Council on Economic Education from 2013 to 2015. | | 38 RICs consisting of 182 Portfolios | | None |
| | |
| 56 | | 2019 BLACKROCK ANNUAL REPORTTO SHAREHOLDERS |
Director and Officer Information (continued)
| | | | | | | | |
| Interested Directors (a)(d) |
| | | | | |
Name
Year of Birth (b) | | Position(s) Held
(Length of Service) (c) | | Principal Occupation(s) During Past Five Years | | Number of BlackRock-Advised
Registered Investment Companies
(“RICs”) Consisting of
Investment Portfolios
(“Portfolios”) Overseen | | Public Company and Other
Investment Company
Directorships Held During
Past Five Years |
Robert Fairbairn 1965 | | Director (Since 2015) | | Vice Chairman of BlackRock, Inc. since 2019; Member of BlackRock’s Global Executive and Global Operating Committees;Co-Chair of BlackRock’s Human Capital Committee; Senior Managing Director of BlackRock, Inc. from 2010 to 2019; oversaw BlackRock’s Strategic Partner Program and Strategic Product Management Group from 2012 to 2019; Member of the Board of Managers of BlackRock Investments, LLC from 2011 to 2018; Global Head of BlackRock’s Retail and iShares® businesses from 2012 to 2016. | | 124 RICs consisting of 292 Portfolios | | None |
John M. Perlowski (e) 1964 | | Director (Since 2015); President and Chief Executive Officer (Since 2010) | | Managing Director of BlackRock, Inc. since 2009; Head of BlackRock Global Accounting and Product Services since 2009; Advisory Director of Family Resource Network (charitable foundation) since 2009. | | 125 RICs consisting of 293 Portfolios | | None |
(a) The address of each Director is c/o BlackRock, Inc., 55 East 52nd Street, New York, New York 10055. |
(b) Each Independent Director holds office until his or her successor is duly elected and qualifies or until his or her earlier death, resignation, retirement or removal as provided by the Funds’by-laws or charter or statute, or until December 31 of the year in which he or she turns 75. Directors who are “interested persons,” as defined in the 1940 Act, serve until their successor is duly elected and qualifies or until their earlier death, resignation, retirement or removal as provided by the Funds’by-laws or statute, or until December 31 of the year in which they turn 72. The Board may determine to extend the terms of Independent Directors on acase-by-case basis, as appropriate. |
(c) Following the combination of MLIM and BlackRock, Inc. in September 2006, the various legacy MLIM and legacy BlackRock fund boards were realigned and consolidated into three new fund boards in 2007. In addition, effective January 1, 2019, three BlackRock Fund Complexes were realigned and consolidated into two BlackRock Fund Complexes. As a result, although the chart shows the year that each Independent Director joined the Board, certain Independent Directors first became members of the boards of other BlackRock-advised Funds, legacy MLIM funds or legacy BlackRock funds as follows: Bruce R. Bond, 2005; Susan J. Carter, 2016; Collette Chilton, 2015; Neil A. Cotty, 2016; Robert M. Hernandez, 1996; Cynthia A. Montgomery, 1994; Joseph P. Platt, 1999; Mark Stalnecker, 2015; Kenneth L. Urish, 1999; Claire A. Walton, 2016. |
(d) Mr. Fairbairn and Mr. Perlowski are both “interested persons,” as defined in the 1940 Act, of the Funds based on their positions with BlackRock, Inc. and its affiliates. Mr. Fairbairn and Mr. Perlowski are also board members of the BlackRock Fixed-Income Complex. |
(e) Mr. Perlowski is also a trustee of the BlackRock Credit Strategies Fund. |
| | | | |
| DIRECTORAND OFFICER INFORMATION | | | 57 | |
Director and Officer Information (continued)
| | | | |
| Officers Who Are Not Trustees (a) |
| | | |
Name
Year of Birth (b) | | Position(s) Held
(Length of Service) | | Principal Occupation(s) During Past Five Years |
Jennifer McGovern 1977 | | Vice President (Since 2014) | | Managing Director of BlackRock, Inc. since 2016; Director of BlackRock, Inc. from 2011 to 2015; Head of Product Development and Oversight for BlackRock’s Strategic Product Management Group since 2019; Head of Product Structure and Oversight for BlackRock’s U.S. Wealth Advisory Group from 2013 to 2019. |
Neal J. Andrews 1966 | | Chief Financial Officer (Since 2007) | | Chief Financial Officer of the iShares® exchange traded funds since 2019; Managing Director of BlackRock, Inc. since 2006. |
Jay M. Fife 1970 | | Treasurer (Since 2007) | | Managing Director of BlackRock, Inc. since 2007. |
Charles Park 1967 | | Chief Compliance Officer (Since 2014) | | Anti-Money Laundering Compliance Officer for certain BlackRock-advised Funds from 2014 to 2015; Chief Compliance Officer of BlackRock Advisors, LLC and the BlackRock-advised Funds in the BlackRock Multi-Asset Complex and the BlackRock Fixed-Income Complex since 2014; Principal of and Chief Compliance Officer for iShares® Delaware Trust Sponsor LLC since 2012 and BlackRock Fund Advisors (“BFA”) since 2006; Chief Compliance Officer for theBFA-advised iShares® exchange traded funds since 2006; Chief Compliance Officer for BlackRock Asset Management International Inc. since 2012. |
John MacKessy 1972 | | Anti-Money Laundering Compliance Officer (Since 2018) | | Director of BlackRock, Inc. since 2017; Global Head of Anti-Money Laundering at BlackRock, Inc. since 2017; Director of AML Monitoring and Investigations Group of Citibank from 2015 to 2017; Global Anti-Money Laundering and Economic Sanctions Officer for MasterCard from 2011 to 2015. |
Benjamin Archibald 1975 | | Secretary (Since 2012) | | Managing Director of BlackRock, Inc. since 2014; Director of BlackRock, Inc. from 2010 to 2013; Secretary of the iShares® exchange traded funds since 2015; Secretary of the BlackRock-advised mutual funds since 2012. |
(a) The address of each Officer is c/o BlackRock, Inc., 55 East 52nd Street, New York, New York 10055. |
(b) Officers of the Funds serve at the pleasure of the Board. |
Further information about the Funds’ Directors and Officers is available in the Funds’ Statement of Additional Information, which can be obtained without charge by calling (800)441-7762.
Investment Adviser
BlackRock Advisors, LLC
Wilmington, DE 19809
Sub-Advisor
BlackRock International Limited(a)
Edinburgh, EH3 8BL,
United Kingdom
Custodian
Brown Brothers
Harriman & Co.
Boston, MA 02109
Transfer Agent
BNY Mellon Investment
Servicing (US) Inc.
Wilmington, DE 19809
Accounting Agent
State Street Bank and
Trust Company
Boston, MA 02111
Distributor
BlackRock Investments, LLC
New York, NY 10022
Legal Counsel
Sidley Austin LLP
New York, NY 10019
Independent Registered Public Accounting Firm
Deloitte & Touche LLP
Boston, MA 02116
Address of the Funds
100 Bellevue Parkway
Wilmington, DE 19809
| | |
| 58 | | 2019 BLACKROCK ANNUAL REPORTTO SHAREHOLDERS |
Additional Information
General Information
Householding
The Funds will mail only one copy of shareholder documents, including prospectuses, annual and semi-annual reports and proxy statements, to shareholders with multiple accounts at the same address. This practice is commonly called “householding” and is intended to reduce expenses and eliminate duplicate mailings of shareholder documents. Mailings of your shareholder documents may be householded indefinitely unless you instruct us otherwise. If you do not want the mailing of these documents to be combined with those for other members of your household, please call the Funds at(800) 441-7762.
Availability of Quarterly Schedule of Investments
The Funds file their complete schedule of portfolio holdings with the SEC for the first and third quarters of each fiscal year as an exhibit to its reports on Form N-PORT, and for reporting periods ended prior to March 31, 2019, filed such information on FormN-Q. The Funds’ Forms N-PORT andN-Q are available on the SEC’s website at http://www.sec.gov. The Funds’ Forms N-PORT andN-Q may also be obtained upon request and without charge by calling(800) 441-7762.
Availability of Proxy Voting Policies and Procedures
A description of the policies and procedures that the Funds use to determine how to vote proxies relating to portfolio securities is available upon request and without charge (1) by calling(800) 441-7762; (2) athttp://www.blackrock.com; and (3) on the SEC’s website at http://www.sec.gov.
Availability of Proxy Voting Record
Information about how the Funds voted proxies relating to securities held in the Funds’ portfolios during the most recent12-month period ended June 30 is available upon request and without charge (1) athttp://www.blackrock.com; or by calling(800) 441-7762 and (2) on the SEC’s website at http://www.sec.gov.
BlackRock’s Mutual Fund Family
BlackRock offers a diverse lineup of open-end mutual funds crossing all investment styles and managed by experts in equity, fixed-income and tax-exempt investing. Visithttp://www.blackrock.com for more information.
Shareholder Privileges
Account Information
Call us at(800) 441-7762 from 8:00 AM to 6:00 PM ET on any business day to get information about your account balances, recent transactions and share prices. You can also reach us on the Web athttp://www.blackrock.com.
Automatic Investment Plans
Investor Class shareholders who want to invest regularly can arrange to have $50 or more automatically deducted from their checking or savings account and invested in any of the BlackRock funds.
Systematic Withdrawal Plans
Investor Class shareholders can establish a systematic withdrawal plan and receive periodic payments of $50 or more from their BlackRock funds, as long as their account balance is at least $10,000.
Retirement Plans
Shareholders may make investments in conjunction with Traditional, Rollover, Roth, Coverdell, Simple IRAs, SEP IRAs and 403(b) Plans.
| | | | |
| ADDITIONAL INFORMATION | | | 59 | |
Additional Information (continued)
BlackRock Privacy Principles
BlackRock is committed to maintaining the privacy of its current and former fund investors and individual clients (collectively, “Clients”) and to safeguarding theirnon-public personal information. The following information is provided to help you understand what personal information BlackRock collects, how we protect that information and why in certain cases we share such information with select parties.
If you are located in a jurisdiction where specific laws, rules or regulations require BlackRock to provide you with additional or different privacy-related rights beyond what is set forth below, then BlackRock will comply with those specific laws, rules or regulations.
BlackRock obtains or verifies personalnon-public information from and about you from different sources, including the following: (i) information we receive from you or, if applicable, your financial intermediary, on applications, forms or other documents; (ii) information about your transactions with us, our affiliates, or others; (iii) information we receive from a consumer reporting agency; and (iv) from visits to our websites.
BlackRock does not sell or disclose tonon-affiliated third parties anynon-public personal information about its Clients, except as permitted by law or as is necessary to respond to regulatory requests or to service Client accounts. Thesenon-affiliated third parties are required to protect the confidentiality and security of this information and to use it only for its intended purpose.
We may share information with our affiliates to service your account or to provide you with information about other BlackRock products or services that may be of interest to you. In addition, BlackRock restricts access tonon-public personal information about its Clients to those BlackRock employees with a legitimate business need for the information. BlackRock maintains physical, electronic and procedural safeguards that are designed to protect thenon-public personal information of its Clients, including procedures relating to the proper storage and disposal of such information.
| | |
| 60 | | 2019 BLACKROCK ANNUAL REPORTTO SHAREHOLDERS |
Glossary of Terms Used in this Report
| | |
| Currency |
| |
| AUD | | Australian Dollar |
| |
| BRL | | Brazilian Real |
| |
| CAD | | Canadian Dollar |
| |
| CHF | | Swiss Franc |
| |
| EUR | | Euro |
| |
| GBP | | British Pound |
| |
| HKD | | Hong Kong Dollar |
| |
| JPY | | Japanese Yen |
| |
| NOK | | Norwegian Krone |
| |
| SGD | | Singapore Dollar |
| |
| USD | | U.S. Dollar |
| | |
| Portfolio Abbreviations |
| |
| ADR | | American Depositary Receipts |
| |
| CVA | | Certificaten Van Aandelen (Dutch Certificate) |
| |
| GDR | | Global Depositary Receipt |
| |
| NVDR | | Non-voting Depository Receipts |
| |
| S&P | | S&P Global Ratings |
| | | | |
| GLOSSARYOF TERMS USEDINTHIS REPORT | | | 61 | |
This report is intended for current holders. It is not authorized for use as an offer of sale or a solicitation of an offer to buy shares of the Funds unless preceded or accompanied by the Funds’ current prospectus. Past performance results shown in this report should not be considered a representation of future performance. Investment returns and principal value of shares will fluctuate so that shares, when redeemed, may be worth more or less than their original cost. Statements and other information herein are as dated and are subject to change.

| | |
| EGSC-6/19-AR | |  |
| Item 2 – | Code of Ethics – The registrant (or the “Fund”) has adopted a code of ethics, as of the end of the period covered by this report, applicable to the registrant’s principal executive officer, principal financial officer, principal accounting officer or controller, or persons performing similar functions. During the period covered by this report, the code of ethics was amended to update certain information and to make othernon-material changes. During the period covered by this report, there have been no waivers granted under the code of ethics. The registrant undertakes to provide a copy of the code of ethics to any person upon request, without charge, who calls1-800-441-7762. |
| Item 3 – | Audit Committee Financial Expert – The registrant’s board of trustees (the “board of trustees”), has determined that (i) the registrant has the following audit committee financial experts serving on its audit committee and (ii) each audit committee financial expert is independent: |
Neil A. Cotty
Robert M. Hernandez
Henry R. Keizer
Kenneth L. Urish
Claire A. Walton
Under applicable securities laws, a person determined to be an audit committee financial expert will not be deemed an “expert” for any purpose, including without limitation for the purposes of Section 11 of the Securities Act of 1933, as a result of being designated or identified as an audit committee financial expert. The designation or identification of a person as an audit committee financial expert does not impose on such person any duties, obligations, or liabilities greater than the duties, obligations, and liabilities imposed on such person as a member of the audit committee and board of trustees in the absence of such designation or identification. The designation or identification of a person as an audit committee financial expert does not affect the duties, obligations, or liability of any other member of the audit committee or board of trustees.
| Item 4 – | Principal Accountant Fees and Services |
The following table presents fees billed by Deloitte & Touche LLP (“D&T”) in each of the last two fiscal years for the services rendered to the Fund:
| | | | | | | | | | | | | | | | | | | | | | | | | | | | | | | | | | | | | | | | |
| | | (a) Audit Fees | | (b) Audit-Related Fees1 | | (c) Tax Fees2 | | (d) All Other Fees |
| Entity Name | | Current
Fiscal
Year End | | Previous
Fiscal
Year End | | Current
Fiscal
Year End | | Previous
Fiscal
Year End | | Current
Fiscal
Year End | | Previous
Fiscal
Year End | | Current
Fiscal
Year End | | Previous
Fiscal
Year End |
| BlackRock EuroFund | | $36,924 | | $36,924 | | $0 | | $2,000 | | $16,200 | | $16,500 | | $0 | | $0 |
The following table presents fees billed by D&T that were required to be approved by the registrant’s audit committee (the “Committee”) for services that relate directly to the operations or financial reporting of the Fund and that are rendered on behalf of BlackRock Advisors, LLC (the “Investment Adviser” or “BlackRock”) and entities controlling, controlled by, or under common control with BlackRock (not including anysub-adviser whose role is primarily portfolio management and is
2
subcontracted with or overseen by another investment adviser) that provide ongoing services to the Fund (“Affiliated Service Providers”):
| | | | |
| | | Current Fiscal Year End | | Previous Fiscal Year End |
(b) Audit-Related Fees1 | | $0 | | $0 |
(c) Tax Fees2 | | $0 | | $0 |
(d) All Other Fees3 | | $2,050,500 | | $2,274,000 |
1 The nature of the services includes assurance and related services reasonably related to the performance of the audit or review of financial statements not included in Audit Fees, including accounting consultations, agreed-upon procedure reports, attestation reports, comfort letters,out-of-pocket expenses and internal control reviews not required by regulators.
2 The nature of the services includes tax compliance and/or tax preparation, including services relating to the filing or amendment of federal, state or local income tax returns, regulated investment company qualification reviews, taxable income and tax distribution calculations.
3Non-audit fees of $2,050,500 and $2,274,000 for the current fiscal year and previous fiscal year, respectively, were paid to the Fund’s principal accountant in their entirety by BlackRock, in connection with services provided to the Affiliated Service Providers of the Fund and of certain other funds sponsored and advised by BlackRock or its affiliates for a service organization review and an accounting research tool subscription. These amounts represent aggregate fees paid by BlackRock and were not allocated on a per fund basis.
(e)(1) Audit CommitteePre-Approval Policies and Procedures:
The Committee has adopted policies and procedures with regard to thepre-approval of services. Audit, audit-related and tax compliance services provided to the registrant on an annual basis require specificpre-approval by the Committee. The Committee also must approve othernon-audit services provided to the registrant and thosenon-audit services provided to the Investment Adviser and Affiliated Service Providers that relate directly to the operations and the financial reporting of the registrant. Certain of thesenon-audit services that the Committee believes are (a) consistent with the SEC’s auditor independence rules and (b) routine and recurring services that will not impair the independence of the independent accountants may be approved by the Committee without consideration on a specificcase-by-case basis (“generalpre-approval”). The term of any generalpre-approval is 12 months from the date of thepre-approval, unless the Committee provides for a different period. Tax or othernon-audit services provided to the registrant which have a direct impact on the operations or financial reporting of the registrant will only be deemedpre-approved provided that any individual project does not exceed $10,000 attributable to the registrant or $50,000 per project. For this purpose, multiple projects will be aggregated to determine if they exceed the previously mentioned cost levels.
Any proposed services exceeding thepre-approved cost levels will require specificpre-approval by the Committee, as will any other services not subject to generalpre-approval (e.g., unanticipated but permissible services). The Committee is informed of each service approved subject to generalpre-approval at the next regularly scheduledin-person board meeting. At this meeting, an analysis of such services is presented to the Committee for ratification. The Committee may delegate to the Committee Chairman the authority to approve the provision of and fees for any specific engagement of permittednon-audit services, including services exceedingpre-approved cost levels.
(e)(2) None of the services described in each of Items 4(b) through (d) were approved by the Committee pursuant to the de minimis exception in paragraph (c)(7)(i)(C) of Rule2-01 of RegulationS-X.
3
(f) Not Applicable
(g) The aggregatenon-audit fees, defined as the sum of the fees shown under “Audit-Related Fees,” “Tax Fees” and “All Other Fees,” paid to the accountant for services rendered by the accountant to the registrant, the Investment Adviser and the Affiliated Service Providers were:
| | | | | | |
| | | Entity Name | | Current Fiscal
Year End | | Previous Fiscal
Year End |
| | BlackRock EuroFund | | $16,200 | | $18,500 |
Additionally, the amounts billed by D&T in connection with services provided to the Affiliated Service Providers of the Fund and of other funds sponsored and advised by BlackRock or its affiliates during the current and previous fiscal years for a service organization review and an accounting research tool subscription were:
| | |
Current Fiscal Year End | | Previous Fiscal Year End |
$2,050,500 | | $2,274,000 |
These amounts represent aggregate fees paid by BlackRock and were not allocated on a per fund basis.
(h) The Committee has considered and determined that the provision ofnon-audit services that were rendered to the Investment Adviser and the Affiliated Service Providers that were notpre-approved pursuant to paragraph (c)(7)(ii) of Rule2-01 of RegulationS-X is compatible with maintaining the principal accountant’s independence.
| Item 5 – | Audit Committee of Listed Registrants – Not Applicable |
(a) The registrant’s Schedule of Investments is included as part of the Report to Stockholders filed under Item 1 of this Form.
(b) Not Applicable due to no such divestments during the semi-annual period covered since the previous FormN-CSR filing.
| Item 7 – | Disclosure of Proxy Voting Policies and Procedures forClosed-End Management Investment Companies – Not Applicable |
| Item 8 – | Portfolio Managers ofClosed-End Management Investment Companies – Not Applicable |
| Item 9 – | Purchases of Equity Securities byClosed-End Management Investment Company and Affiliated Purchasers – Not Applicable |
| Item 10 – | Submission of Matters to a Vote of Security Holders – There have been no material changes to these procedures. |
| Item 11 – | Controls and Procedures |
4
(a) The registrant’s principal executive and principal financial officers, or persons performing similar functions, have concluded that the registrant’s disclosure controls and procedures (as defined in Rule30a-3(c) under the Investment Company Act of 1940, as amended (the “1940 Act”)) are effective as of a date within 90 days of the filing of this report based on the evaluation of these controls and procedures required by Rule30a-3(b) under the 1940 Act and Rule 15d-15(b) under the Securities Exchange Act of 1934, as amended.
(b) There were no changes in the registrant’s internal control over financial reporting (as defined in Rule30a-3(d) under the 1940 Act) that occurred during the period covered by this report that have materially affected, or are reasonably likely to materially affect, the registrant’s internal control over financial reporting.
| Item 12 – | Disclosure of Securities Lending Activities forClosed-End Management Investment Companies – Not Applicable |
| Item 13 – | Exhibits attached hereto |
(a)(1) Code of Ethics – See Item 2
(a)(2) Certifications – Attached hereto
(a)(3) Not Applicable
(a)(4) Not Applicable
(b) Certifications – Attached hereto
5
Pursuant to the requirements of the Securities Exchange Act of 1934 and the Investment Company Act of 1940, the registrant has duly caused this report to be signed on its behalf by the undersigned, thereunto duly authorized.
| | |
| BlackRock EuroFund |
| |
| By: | | /s/ John M. Perlowski |
| | John M. Perlowski |
| | Chief Executive Officer (principal executive officer) of BlackRock EuroFund |
Pursuant to the requirements of the Securities Exchange Act of 1934 and the Investment Company Act of 1940, this report has been signed below by the following persons on behalf of the registrant and in the capacities and on the dates indicated.
| | |
| By: | | /s/ John M. Perlowski |
| | John M. Perlowski |
| | Chief Executive Officer (principal executive officer) of BlackRock EuroFund |
| | |
| By: | | /s/ Neal J. Andrews |
| | Neal J. Andrews |
| | Chief Financial Officer (principal financial officer) of BlackRock EuroFund |
6