UNITED STATES
SECURITIES AND EXCHANGE COMMISSION
Washington, D.C. 20549
FORM N-CSR
CERTIFIED SHAREHOLDER REPORT OF REGISTERED MANAGEMENT
INVESTMENT COMPANIES
Investment Company Act file number: 811-04612
| Name of Fund: | | BlackRock EuroFund |
| Fund Address: | | 100 Bellevue Parkway, Wilmington, DE 19809 |
Name and address of agent for service: John M. Perlowski, Chief Executive Officer, BlackRock EuroFund, 55 East 52nd Street, New York, NY 10055
Registrant’s telephone number, including area code: (800) 441-7762
Date of fiscal year end: 06/30/2022
Date of reporting period: 06/30/2022
| Item 1 – | Report to Stockholders |
(a) The Report to Shareholders is attached herewith.
| | |

| | JUNE 30, 2022 |
BlackRock Advantage Global Fund, Inc.
BlackRock EuroFund
|
| Not FDIC Insured • May Lose Value • No Bank Guarantee |
The Markets in Review
Dear Shareholder,
The 12-month reporting period as of June 30, 2022 saw the emergence of significant challenges that disrupted the economic recovery and strong financial markets. The U.S. economy shrank in the first quarter of 2022, ending the run of robust growth that followed the reopening of global economies and the development of COVID-19 vaccines. Rapid changes in consumer spending led to supply constraints and elevated inflation, which reached a 40-year high. Moreover, while the foremost effect of Russia’s invasion of Ukraine has been a severe humanitarian crisis, the ongoing war continued to present challenges for both investors and policymakers.
Equity prices fell, as persistently high inflation drove investors’ expectations for higher interest rates, particularly weighing on relatively high-valuation growth stocks and economically sensitive small-capitalization stocks. While both large- and small-capitalization U.S. stocks fell, declines for small-capitalization U.S. stocks were particularly steep. Both emerging market stocks and international equities from developed markets fell significantly, pressured by rising interest rates and a strengthening U.S. dollar.
The 10-year U.S. Treasury yield (which is inversely related to bond prices) rose notably during the reporting period as increasing inflation drove investors’ expectations for higher interest rates. The corporate bond market also faced inflationary headwinds, and increasing uncertainty led to higher corporate bond spreads (the difference in yield between U.S. Treasuries and similarly-dated corporate bonds).
The U.S. Federal Reserve (the “Fed”), acknowledging that inflation is growing faster than expected, raised interest rates three times while indicating that additional large rate hikes were likely. Furthermore, the Fed wound down its bond-buying programs and began to reduce its balance sheet. Continued high inflation and the Fed’s statements led many analysts to anticipate that interest rates have significant room to rise before peaking.
Furthermore, the horrific war in Ukraine has significantly clouded the outlook for the global economy, leading to major volatility in energy and metals markets. Sanctions on Russia, Europe’s top energy supplier, and general wartime disruption have magnified supply problems for key commodities. We believe elevated energy prices will continue to exacerbate inflationary pressure while also constraining economic growth. Combating inflation without stifling a recovery, while buffering against ongoing supply and price shocks, will be an especially challenging environment for setting effective monetary policy. Despite the likelihood of more rate increases on the horizon, we believe the Fed will err on the side of protecting employment, even at the expense of higher inflation. However, markets have been primed to expect sharp tightening, which could weigh on valuations until central banks begin to tap the brakes.
In this environment, while we favor an overweight to equities in the long-term, the market’s concerns over excessive rate hikes from central banks moderate our outlook. Furthermore, the energy shock and a deteriorating economic backdrop in China and Europe are likely to challenge corporate earnings, so we are underweight equities overall in the near-term. We take the opposite view on credit, where higher spreads provide near-term opportunities, while the likelihood of a higher inflation regime leads us to take an underweight stance on credit in the long-term. We believe that investment-grade corporates, U.K. gilts, local-currency emerging market debt, and inflation-protected bonds (particularly in Europe) offer strong opportunities in a six- to twelve-month horizon.
Overall, our view is that investors need to think globally, extend their scope across a broad array of asset classes, and be nimble as market conditions change. We encourage you to talk with your financial advisor and visit blackrock.com for further insight about investing in today’s markets.
Sincerely,

Rob Kapito
President, BlackRock Advisors, LLC

Rob Kapito
President, BlackRock Advisors, LLC
| | | | |
Total Returns as of June 30, 2022 |
| | | |
| | | 6-Month | | 12-Month |
| | |
U.S. large cap equities
(S&P 500® Index) | | (19.96)% | | (10.62)% |
| | |
U.S. small cap equities
(Russell 2000® Index) | | (23.43) | | (25.20) |
| | |
International equities
(MSCI Europe, Australasia, Far East Index) | | (19.57) | | (17.77) |
| | |
Emerging market equities
(MSCI Emerging Markets Index) | | (17.63) | | (25.28) |
| | |
3-month Treasury bills
(ICE BofA 3-Month
U.S. Treasury Bill Index) | | 0.15 | | 0.18 |
| | |
U.S. Treasury securities
(ICE BofA 10-Year
U.S. Treasury Index) | | (11.34) | | (10.94) |
| | |
U.S. investment grade bonds
(Bloomberg U.S. Aggregate Bond Index) | | (10.35) | | (10.29) |
| | |
Tax-exempt municipal bonds
(Bloomberg Municipal Bond Index) | | (8.98) | | (8.57) |
| | |
U.S. high yield bonds
(Bloomberg U.S. Corporate High Yield 2% Issuer Capped Index) | | (14.19) | | (12.82) |
|
| Past performance is not an indication of future results. Index performance is shown for illustrative purposes only. You cannot invest directly in an index. |
| | |
| 2 | | THIS PAGE IS NOT PART OF YOUR FUND REPORT |
Table of Contents

| | |
| Fund Summary as of June 30, 2022 | | BlackRock Advantage Global Fund, Inc. |
Investment Objective
BlackRock Advantage Global Fund, Inc.’s (the “Fund”) investment objective is to seek long-term capital appreciation.
Portfolio Management Commentary
How did the Fund perform?
For the 12-month period ended June 30, 2022, the Fund’s Institutional and Class K shares outperformed the benchmark, the MSCI All Country World Index, while the Investor A shares performed in line. For the same period, the Fund’s Investor C and Class R shares underperformed the benchmark.
What factors influenced performance?
Markets proved highly rotational in the first half of the period as leadership shifted between valuation and secular growth preferences for much of 2021. However, value styles became the dominant market driver in 2022 amid both inflationary pressures and expected policy normalization. The relatively orderly market reaction to 40-year high inflation figures soon turned disorderly as Russia invaded the Ukraine in February 2022. This brought a fresh surge in commodity prices further weighing on global markets and already stretched supply chains. Adding to the economic challenges, China’s COVID policy resulted in rolling lockdowns which adversely impacted its industrial production. Simultaneously, bond yields surged as central bankers began raising rates globally. Taken in combination, investors began to price in stagflation amid concerns that policy error would stifle growth.
Trend-based measures performed well against the evolving market environment. As the reopening theme quickly turned towards inflation concerns, sentiment measures correctly positioned the portfolio. Notably, insights that identify exposure to inflationary pressures through labor market tightness and wage growth were also additive across energy names. Additionally, faster moving trend-based measures were additive as they successfully captured the market evolution including insights looking at mobile application usage as well as those evaluating internet search levels.
Macro thematic insights delivered mixed results from top-down positioning. Several recently added signals that seek to identify themes such as stagflation were notable performers toward period-end as they correctly positioned the portfolio to capture the rising rates regime. Collectively these insights correctly motivated overweight positions across health care and underweight positions across discretionary stocks.
While results were also mixed within fundamental measures, performance was supported by fundamental value insights, which benefited from the market style preference. Traditional valuation measures based on company ownership structures and sources of financing, as well as other financial statement metrics, performed best.
On the downside, as noted, macro thematic insights delivered mixed results from top-down positioning. Insights designed to evaluate beneficiaries of policy normalization were wrong-footed across the European Union, motivating an unsuccessful overweight to German stocks.
Additionally, fundamental quality insights with more of a growth orientation struggled amid the market style preference for value. Nontraditional measures of company quality, such as environmental, social and governance factors, detracted from performance as markets continued to focus on macro dynamics over company results. Insights evaluating company culture, “green” patent issuances, and insights that predict firm-level controversy all struggled, motivating an unsuccessful overweight to information technology stocks.
Describe recent portfolio activity.
The Fund maintained a balanced allocation of risk across all major return drivers over the period. There were, however, several new signals added within the stock selection group of insights. The Fund built upon its alternative data capabilities with enhanced signal constructs to best identify emerging trends, such as sentiment around supply chain disruptions, wage inflation, consumer behavior changes and business sensitivity to the conflict in Ukraine. Additionally, new macro thematic insights were added that use historical observations of stagflation and policy normalization to motivate top-down positioning.
Describe portfolio positioning at period end.
At period end, the Fund’s positioning with respect to both geographical and sector allocation was largely neutral. The Fund had slightly overweight allocations to the health care and consumer staples sectors and slight underweights to communication services and utilities. The Fund had a slight overweight to the United States and a slight underweight to Switzerland.
The views expressed reflect the opinions of BlackRock as of the date of this report and are subject to change based on changes in market, economic or other conditions. These views are not intended to be a forecast of future events and are no guarantee of future results.
| | |
| 4 | | 2 0 2 2 BLACK ROCK ANNUAL REPORT TO SHAREHOLDERS |
| | |
| Fund Summary as of June 30, 2022 (continued) | | BlackRock Advantage Global Fund, Inc. |
GROWTH OF $10,000 INVESTMENT
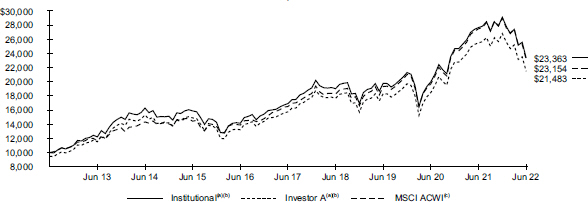
| | (a) | Assuming maximum sales charge, if any, transaction costs and other operating expenses, including investment advisory fees. Institutional Shares do not have a sales charge. | |
| | (b) | The Fund primarily intends to invest in equity securities or other financial instruments that are components of, or have characteristics similar to, the securities included in the MSCI All Country World Index. The Fund’s returns prior to October 26, 2017, are the returns of the Fund when it followed a different investment objective and different investment strategies under the name “BlackRock Global SmallCap Fund, Inc.” | |
| | (c) | An index that captures large- and mid-cap representation across certain developed and emerging markets. | |
Performance
| | | | | | | | | | | | | | | | | | | | | | | | |
| | | Average Annual Total Returns(a)(b) | |
| | | | |
| | | |
| | | 1 Year | | | 5 Years | | | 10 Years | |
| | | | | | | | | | | | |
| | | Without
Sales
Charge | | | With
Sales
Charge | | | Without
Sales
Charge | | | With
Sales
Charge | | | Without
Sales
Charge | | | With
Sales
Charge | |
| | | | | | |
Institutional | | | (15.52 | )% | | | N/A | | | | 6.66 | % | | | N/A | | | | 8.86 | % | | | N/A | |
Investor A | | | (15.73 | ) | | | (20.16 | )% | | | 6.39 | | | | 5.25 | % | | | 8.53 | | | | 7.95 | % |
Investor C | | | (16.36 | ) | | | (17.05 | ) | | | 5.59 | | | | 5.59 | | | | 7.85 | | | | 7.85 | |
Class K | | | (15.46 | ) | | | N/A | | | | 6.72 | | | | N/A | | | | 8.88 | | | | N/A | |
Class R | | | (15.94 | ) | | | N/A | | | | 6.12 | | | | N/A | | | | 8.19 | | | | N/A | |
MSCI ACWI | | | (15.75 | ) | | | N/A | | | | 7.00 | | | | N/A | | | | 8.76 | | | | N/A | |
| | (a) | Assuming maximum sales charges, if any. Average annual total returns with and without sales charges reflect reductions for distribution and service fees. See “About Fund Performance” for a detailed description of share classes, including any related sales charges and fees, and how performance was calculated for certain share classes. | |
| | (b) | The Fund primarily intends to invest in equity securities or other financial instruments that are components of, or have characteristics similar to, the securities included in the MSCI All Country World Index. The Fund’s returns prior to October 26, 2017, are the returns of the Fund when it followed a different investment objective and different investment strategies under the name “BlackRock Global SmallCap Fund, Inc.” | |
N/A — Not applicable as the share class and index do not have a sales charge.
Past performance is not an indication of future results.
Performance results may include adjustments made for financial reporting purposes in accordance with U.S. generally accepted accounting principles.
Expense Example
| | | | | | | | | | | | | | | | | | | | | | | | | | | | | | | | |
| | | Actual | | | | | | Hypothetical 5% Return | | | | | |
| | | | | | | | | |
| | |
| Beginning
Account Value
(01/01/22) |
| |
| Ending
Account Value
(06/30/22) |
| |
| Expenses
Paid During
the Period |
(a) | | | | | |
| Beginning
Account Value
(01/01/22) |
| |
| Ending
Account Value
(06/30/22) |
| |
| Expenses
Paid During
the Period |
(a) | | | | Annualized Expense Ratio |
Institutional | | | $ 1,000.00 | | | | $ 802.60 | | | | $ 3.17 | | | | | | | | $ 1,000.00 | | | | $ 1,021.27 | | | | $ 3.56 | | | | | 0.71% |
Investor A | | | 1,000.00 | | | | 801.60 | | | | 4.29 | | | | | | | | 1,000.00 | | | | 1,020.03 | | | | 4.81 | | | | | 0.96 |
Investor C | | | 1,000.00 | | | | 798.70 | | | | 7.63 | | | | | | | | 1,000.00 | | | | 1,016.31 | | | | 8.55 | | | | | 1.71 |
Class K | | | 1,000.00 | | | | 803.00 | | | | 2.95 | | | | | | | | 1,000.00 | | | | 1,021.52 | | | | 3.31 | | | | | 0.66 |
Class R | | | 1,000.00 | | | | 800.50 | | | | 5.40 | | | | | | | | 1,000.00 | | | | 1,018.79 | | | | 6.06 | | | | | 1.21 |
| | (a) | For each class of the Fund, expenses are equal to the annualized expense ratio for the class, multiplied by the average account value over the period, multiplied by 181/365 (to reflect the one-half year period shown). | |
| | |
| Fund Summary as of June 30, 2022 (continued) | | BlackRock Advantage Global Fund, Inc. |
Portfolio Information
TEN LARGEST HOLDINGS
| | |
|
| |
| Security(a) | | Percent of
Net Assets |
|
| |
Apple, Inc. | | 4.5% |
| |
Microsoft Corp. | | 4.1 |
| |
Johnson & Johnson | | 1.6 |
| |
Alphabet, Inc., Class A | | 1.6 |
| |
Alphabet, Inc., Class C | | 1.5 |
| |
Visa, Inc., Class A | | 1.5 |
| |
JPMorgan Chase & Co. | | 1.5 |
| |
Merck & Co., Inc. | | 1.4 |
| |
Amazon.com, Inc. | | 1.2 |
| |
Intel Corp. | | 1.1 |
|
GEOGRAPHIC ALLOCATION
| | |
|
| |
| Country/Geographic Region | | Percent of
Net Assets |
|
| |
United States | | 58.6% |
| |
Canada | | 4.4 |
| |
China | | 4.4 |
| |
Japan | | 4.0 |
| |
Germany | | 3.5 |
| |
United Kingdom | | 3.2 |
| |
France | | 2.6 |
| |
Taiwan | | 2.3 |
| |
Australia | | 2.1 |
| |
Netherlands | | 1.8 |
| |
Ireland | | 1.6 |
| |
Switzerland | | 1.2 |
| |
Denmark | | 1.1 |
| |
South Korea | | 1.0 |
| |
Other# | | 8.4 |
| |
Liabilities in Excess of Other Assets | | (0.2) |
|
| (a) | Excludes short-term securities. |
| # | Includes holdings within countries/geographic regions that are less than 1.0% of net assets. Please refer to the Schedule of Investments for such countries/geographic regions. |
| | |
| 6 | | 2 0 2 2 BLACK ROCK ANNUAL REPORT TO SHAREHOLDERS |
| | |
| Fund Summary as of June 30, 2022 | | BlackRock EuroFund |
Investment Objective
BlackRock EuroFund’s (the “Fund”) investment objective is to seek capital appreciation primarily through investment in equities of corporations domiciled in European countries.
Portfolio Management Commentary
How did the Fund perform?
For the 12-month period ended June 30, 2022, the Fund underperformed its benchmark, the MSCI EMU Index.
What factors influenced performance?
After performing reasonably well in the second half of 2021, the Eurozone markets moved lower amid the challenges of persistent inflation, expectations for rising interest rates and growing fears of an economic slowdown. These factors caused the performance of many individual stocks to become disconnected from fundamentals, even for higher-quality companies.
In this environment, the Fund’s positions in the freight forwarder DSV A/S (Denmark), and the pharmaceutical and laboratory equipment supplier Sartorius Stedim Biotech (France) lost ground despite reporting positive fundamental news.
Worldline SA (France) and Allfunds Group PLC (Netherlands) detracted due to stock-specific events. Worldline reported weaker-than-expected growth and a disappointing price for the sale of its terminals business. The investment adviser sold the stock from the portfolio. Allfunds lagged after providing weaker-than-expected results for the second half 2021. The investment adviser maintained the position based on the company’s longer-term growth potential. Underweight positions in Sanofi SA (France) and TotalEnergies SE (France) also detracted from relative performance.
On the positive side, Linde PLC (United Kingdom), an industrial gas company that is benefiting from long-term trends related to decarbonization, was the top contributor. Linde has strong pricing power and so far has been able to pass on higher input prices.
The chemicals distributor IMCD NV (Netherlands) also fared well, as its well-positioned distribution businesses benefited from the tightness in supply chains. RELX PLC (United Kingdom) further aided returns in industrials. Zero weightings in SAP SE (Germany) and Zalando SE (Germany) contributed to results, as well.
Describe recent portfolio activity.
During the second half of 2021, the Fund increased its weighting it the health care sector by initiating the position in Sartorius. It also consolidated its positioning in utilities by exiting Enel SpA (Italy) and boosting its weighting in Energias de Portugal SA based on view that the latter company is well positioned in the renewable energy business.
Later in the period, the Fund opened a new position in the Dutch payments company Adyen NV. The investment adviser believed the company had a winning offering in merchant services with best-in-class technology for in-store and online payments. The investment adviser viewed Adyen as a fast-growing and very profitable business that was positioned to benefit from the shift to more complex payment methods.
The Fund initiated a new position in Siemens AG (Germany) within the industrials sector. While the investment adviser typically prefers “pure play” stocks over conglomerates, it believes Siemens provides exposure to structural growth in automation, digitization and building efficiency at a material valuation discount to its key competitors.
The Fund made a number of changes in the first half of 2022 amid the rapidly changing market environment. It shifted its positioning in financials by increasing its weighting in banks the investment adviser believed were undervalued given their ability to benefit from rising rates. The investment adviser added the higher-quality bank KBC Group NV back into the portfolio. New positions in rate-sensitive banks, including Commerzbank AG (Germany) and Intesa Sanpaolo SpA (Italy) were also opened.
The Fund established a position in the energy stock TotalEnergies on the view that the company is better managed than competitors, has sound financial discipline, and possesses a solid strategy to increase revenues from renewables.
In an effort to remain highly selective, particularly within the consumer space, the Fund sold its small remaining position in Adidas AG (Germany) and added to LVMH Moet Hennessy Louis Vuitton SE (France) and Puma SE (Germany). While the investment adviser believes Adidas trades at an attractive valuation given the strength of its brand, the company has been underperforming key competitors.
In industrials, the Fund sold its position in the elevator producer Kone Oyj (Finland) on concerns about the company’s ability to pass on higher commodity prices. Weakness in China’s property market was an additional headwind for the stock. The Fund used the proceeds of the sale to establish a new position in the French industrial group Legrand SA, a potential beneficiary of higher spending on renovations and modernizations across Europe.
Within the aerospace industry, the Fund switched from Safran SA (France) into Airbus SE (France) based on the higher upside potential in the latter company’s earnings.
Describe portfolio positioning at period end.
The Fund was overweight in the industrials and information technology sectors, and it had a neutral weighting in health care. The Fund was underweight in financials, consumer staples, utilities, consumer discretionary, communication services, real estate, materials and energy.
The views expressed reflect the opinions of BlackRock as of the date of this report and are subject to change based on changes in market, economic or other conditions. These views are not intended to be a forecast of future events and are no guarantee of future results.
| | |
| Fund Summary as of June 30, 2022 (continued) | | BlackRock EuroFund |
GROWTH OF $10,000 INVESTMENT
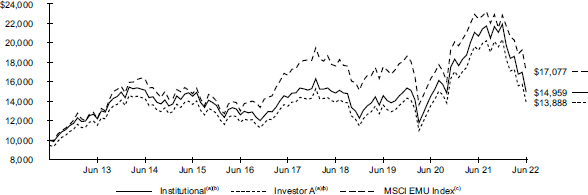
| | (a) | Assuming maximum sales charge, if any, transaction costs and other operating expenses, including investment advisory fees. Institutional Shares do not have a sales charge. | |
| | (b) | Under normal circumstances, the Fund will invest at least 80% of its net assets in equity securities, including common stock and convertible securities, of companies located in Europe. The Fund currently expects that a majority of the Fund’s assets will be invested in equity securities of companies located in countries participating in the European Monetary Union (the ‘‘Eurozone’’). The Fund’s total returns prior to October 23, 2018, are the returns of the Fund when it followed different investment strategies. | |
| | (c) | An index that captures large- and mid-cap representation across certain Developed Markets countries in the European Economic and Monetary Union. | |
Performance
| | | | | | | | | | | | | | | | | | | | | | | | |
| | | Average Annual Total Returns(a)(b) | |
| | | | |
| | | |
| | | 1 Year | | | 5 Years | | | 10 Years | |
| | | | | | | | | | | | |
| | | Without
Sales
Charge | | | With
Sales
Charge | | | Without
Sales
Charge | | | With
Sales
Charge | | | Without
Sales
Charge | | | With
Sales
Charge | |
| | | | | | |
Institutional | | | (27.73 | )% | | | N/A | | | | 0.76 | % | | | N/A | | | | 4.11 | % | | | N/A | |
Investor A | | | (27.90 | ) | | | (31.68 | )% | | | 0.57 | | | | (0.51 | )% | | | 3.90 | | | | 3.34 | % |
Investor C | | | (28.39 | ) | | | (29.11 | ) | | | (0.21 | ) | | | (0.21 | ) | | | 3.23 | | | | 3.23 | |
Class K | | | (27.64 | ) | | | N/A | | | | 0.90 | | | | N/A | | | | 4.18 | | | | N/A | |
Class R | | | (28.26 | ) | | | N/A | | | | 0.08 | | | | N/A | | | | 3.39 | | | | N/A | |
MSCI EMU Index | | | (24.02 | ) | | | N/A | | | | 0.48 | | | | N/A | | | | 5.50 | | | | N/A | |
| | (a) | Assuming maximum sales charges, if any. Average annual total returns with and without sales charges reflect reductions for distribution and service fees. See “About Fund Performance” for a detailed description of share classes, including any related sales charges and fees, and how performance was calculated for certain share classes. | |
| | (b) | Under normal circumstances, the Fund will invest at least 80% of its net assets in equity securities, including common stock and convertible securities, of companies located in Europe. The Fund currently expects that a majority of the Fund’s assets will be invested in equity securities of companies located in countries participating in the European Monetary Union (the ‘‘Eurozone’’). The Fund’s total returns prior to October 23, 2018, are the returns of the Fund when it followed different investment strategies. | |
N/A — Not applicable as the share class and index do not have a sales charge.
Past performance is not an indication of future results.
Performance results may include adjustments made for financial reporting purposes in accordance with U.S. generally accepted accounting principles.
Expense Example
| | | | | | | | | | | | | | | | | | | | | | | | | | | | | | | | |
| | | Actual | | | | | | Hypothetical 5% Return | | | | | |
| | |
| Beginning
Account Value
(01/01/22) |
| |
| Ending
Account Value
(06/30/22) |
| |
| Expenses
Paid During
the Period |
(a) | | | | | |
| Beginning
Account Value
(01/01/22) |
| |
| Ending
Account Value
(06/30/22) |
| |
| Expenses
Paid During
the Period |
(a) | | | | Annualized Expense Ratio |
Institutional | | | $ 1,000.00 | | | | $ 682.40 | | | | $ 4.88 | | | | | | | | $ 1,000.00 | | | | $ 1,018.99 | | | | $ 5.86 | | | | | 1.17% |
Investor A | | | 1,000.00 | | | | 681.70 | | | | 5.80 | | | | | | | | 1,000.00 | | | | 1,017.90 | | | | 6.95 | | | | | 1.39 |
Investor C | | | 1,000.00 | | | | 679.20 | | | | 8.99 | | | | | | | | 1,000.00 | | | | 1,014.08 | | | | 10.79 | | | | | 2.16 |
Class K | | | 1,000.00 | | | | 682.90 | | | | 4.51 | | | | | | | | 1,000.00 | | | | 1,019.44 | | | | 5.41 | | | | | 1.08 |
Class R | | | 1,000.00 | | | | 680.10 | | | | 7.79 | | | | | | | | 1,000.00 | | | | 1,015.52 | | | | 9.35 | | | | | 1.87 |
| | (a) | For each class of the Fund, expenses are equal to the annualized expense ratio for the class, multiplied by the average account value over the period, multiplied by 181/365 (to reflect the one-half year period shown). | |
| | |
| 8 | | 2 0 2 2 BLACK ROCK ANNUAL REPORT TO SHAREHOLDERS |
| | |
| Fund Summary as of June 30, 2022 (continued) | | BlackRock EuroFund |
Portfolio Information
TEN LARGEST HOLDINGS
| | |
|
| |
| Security(a) | | Percent of Net Assets |
|
| |
LVMH Moet Hennessy Louis Vuitton SE | | 8.6% |
| |
ASML Holding NV | | 7.8 |
| |
Schneider Electric SE | | 4.1 |
| |
Siemens AG | | 3.9 |
| |
TotalEnergies SE | | 3.3 |
| |
BNP Paribas SA | | 3.0 |
| |
Linde PLC | | 3.0 |
| |
Teleperformance | | 2.9 |
| |
Vinci SA | | 2.9 |
| |
Airbus SE | | 2.8 |
|
GEOGRAPHIC ALLOCATION
| | |
|
| |
| Country/Geographic Region | | Percent of
Net Assets |
|
| |
France | | 37.8% |
| |
Netherlands | | 18.8 |
| |
Germany | | 16.1 |
| |
Italy | | 6.5 |
| |
United Kingdom | | 5.0 |
| |
United States | | 4.1 |
| |
Switzerland | | 3.0 |
| |
Denmark | | 2.7 |
| |
Finland | | 2.3 |
| |
Belgium | | 1.9 |
| |
Portugal | | 1.8 |
| |
Ireland | | 1.2 |
| |
Sweden | | 1.0 |
| |
Luxembourg | | 0.8 |
| |
Liabilities in Excess of Other Assets | | (3.0) |
|
| (a) | Excludes short-term securities. |
About Fund Performance
Institutional and Class K Shares are not subject to any sales charge. These shares bear no ongoing distribution or service fees and are available only to certain eligible investors. Class K Shares performance shown prior to the Class K Shares inception date of January 25, 2018 is that of Institutional Shares. The performance of each Fund’s Class K Shares would be substantially similar to Institutional Shares because Class K Shares and Institutional Shares invest in the same portfolio of securities and performance would only differ to the extent that Class K Shares and Institutional Shares have different expenses. The actual returns of Class K Shares would have been higher than those of the Institutional Shares because Class K Shares have lower expenses than the Institutional Shares.
Investor A Shares are subject to a maximum initial sales charge (front-end load) of 5.25% and a service fee of 0.25% per year (but no distribution fee). Certain redemptions of these shares may be subject to a contingent deferred sales charge (“CDSC”) where no initial sales charge was paid at the time of purchase. These shares are generally available through financial intermediaries.
Investor C Shares are subject to a 1.00% CDSC if redeemed within one year of purchase. In addition, these shares are subject to a distribution fee of 0.75% per year and a service fee of 0.25% per year. These shares are generally available through financial intermediaries. These shares automatically convert to Investor A Shares after approximately eight years.
Class R Shares are not subject to any sales charge. These shares are subject to a distribution fee of 0.25% per year and a service fee of 0.25% per year. These shares are available only to certain employer-sponsored retirement plans.
Past performance is not an indication of future results. Financial markets have experienced extreme volatility and trading in many instruments has been disrupted. These circumstances may continue for an extended period of time and may continue to affect adversely the value and liquidity of each Fund’s investments. As a result, current performance may be lower or higher than the performance data quoted. Refer to blackrock.com to obtain performance data current to the most recent month-end. Performance results do not reflect the deduction of taxes that a shareholder would pay on Fund distributions or the redemption of Fund shares. Figures shown in the performance table(s) assume reinvestment of all distributions, if any, at net asset value (“NAV”) on the ex-dividend date or payable date, as applicable. Investment return and principal value of shares will fluctuate so that shares, when redeemed, may be worth more or less than their original cost. Distributions paid to each class of shares will vary because of the different levels of service, distribution and transfer agency fees applicable to each class, which are deducted from the income available to be paid to shareholders.
BlackRock Advisors, LLC (the “Manager”), each Fund’s investment adviser, has contractually and/or voluntarily agreed to waive and/or reimburse a portion of each Fund’s expenses. Without such waiver(s) and/or reimbursement(s), each Fund’s performance would have been lower. With respect to each Fund’s voluntary waiver(s), if any, the Manager is under no obligation to waive and/or reimburse or to continue waiving and/or reimbursing its fees and such voluntary waiver(s) may be reduced or discontinued at any time. With respect to each Fund’s contractual waiver(s), if any, the Manager is under no obligation to continue waiving and/or reimbursing its fees after the applicable termination date of such agreement. See the Notes to Financial Statements for additional information on waivers and/or reimbursements.
Disclosure of Expenses
Shareholders of each Fund may incur the following charges: (a) transactional expenses, such as sales charges; and (b) operating expenses, including investment advisory fees, service and distribution fees, including 12b-1 fees, acquired fund fees and expenses, and other fund expenses. The expense examples shown (which are based on a hypothetical investment of $1,000 invested at the beginning of the period and held through the end of the period) are intended to assist shareholders both in calculating expenses based on an investment in each Fund and in comparing these expenses with similar costs of investing in other mutual funds.
The expense examples provide information about actual account values and actual expenses. Annualized expense ratios reflect contractual and voluntary fee waivers, if any. In order to estimate the expenses a shareholder paid during the period covered by this report, shareholders can divide their account value by $1,000 and then multiply the result by the number corresponding to their Fund and share class under the heading entitled “Expenses Paid During the Period.”
The expense examples also provide information about hypothetical account values and hypothetical expenses based on a Fund’s actual expense ratio and an assumed rate of return of 5% per year before expenses. In order to assist shareholders in comparing the ongoing expenses of investing in these Funds and other funds, compare the 5% hypothetical examples with the 5% hypothetical examples that appear in shareholder reports of other funds.
The expenses shown in the expense examples are intended to highlight shareholders’ ongoing costs only and do not reflect transactional expenses, such as sales charges, if any. Therefore, the hypothetical examples are useful in comparing ongoing expenses only and will not help shareholders determine the relative total expenses of owning different funds. If these transactional expenses were included, shareholder expenses would have been higher.
| | |
| 10 | | 2 0 2 2 BLACK ROCK ANNUAL REPORT TO SHAREHOLDERS |
Derivative Financial Instruments
The Funds may invest in various derivative financial instruments. These instruments are used to obtain exposure to a security, commodity, index, market, and/or other assets without owning or taking physical custody of securities, commodities and/or other referenced assets or to manage market, equity, credit, interest rate, foreign currency exchange rate, commodity and/or other risks. Derivative financial instruments may give rise to a form of economic leverage and involve risks, including the imperfect correlation between the value of a derivative financial instrument and the underlying asset, possible default of the counterparty to the transaction or illiquidity of the instrument. The Funds’ successful use of a derivative financial instrument depends on the investment adviser’s ability to predict pertinent market movements accurately, which cannot be assured. The use of these instruments may result in losses greater than if they had not been used, may limit the amount of appreciation a Fund can realize on an investment and/or may result in lower distributions paid to shareholders. The Funds’ investments in these instruments, if any, are discussed in detail in the Notes to Financial Statements.
| | |
DERIVATIVE FINANCIAL INSTRUMENTS | | 11 |
| | |
Schedule of Investments June 30, 2022 | | BlackRock Advantage Global Fund, Inc. (Percentages shown are based on Net Assets) |
| | | | | | | | |
| Security | | Shares | | | Value | |
| |
|
Common Stocks | |
|
Australia — 2.1% | |
AGL Energy Ltd. | | | 38,746 | | | $ | 221,487 | |
AMP Ltd.(a) | | | 25,600 | | | | 16,909 | |
Aristocrat Leisure Ltd. | | | 6,624 | | | | 157,559 | |
BHP Group Ltd., Class DI | | | 138,153 | | | | 3,955,819 | |
BlueScope Steel Ltd. | | | 757 | | | | 8,341 | |
Charter Hall Group | | | 2,154 | | | | 16,157 | |
Commonwealth Bank of Australia | | | 5,371 | | | | 335,561 | |
CSL Ltd. | | | 2,221 | | | | 412,384 | |
Goodman Group | | | 3,546 | | | | 43,785 | |
Harvey Norman Holdings Ltd. | | | 4,709 | | | | 12,074 | |
Iluka Resources Ltd. | | | 12,010 | | | | 78,340 | |
Incitec Pivot Ltd. | | | 17,331 | | | | 39,884 | |
Insignia Financial Ltd. | | | 14,826 | | | | 27,628 | |
JB Hi-Fi Ltd. | | | 645 | | | | 17,155 | |
Macquarie Group Ltd. | | | 2,693 | | | | 306,614 | |
Medibank Pvt Ltd. | | | 97,441 | | | | 219,162 | |
Metcash Ltd. | | | 8,431 | | | | 24,713 | |
Origin Energy Ltd. | | | 15,242 | | | | 60,504 | |
Perpetual Ltd. | | | 785 | | | | 15,670 | |
QBE Insurance Group Ltd. | | | 6,482 | | | | 54,467 | |
REA Group Ltd. | | | 5,160 | | | | 398,459 | |
Scentre Group | | | 15,613 | | | | 28,034 | |
South32 Ltd. | | | 61,490 | | | | 166,619 | |
Stockland | | | 25,424 | | | | 63,478 | |
Telstra Corp. Ltd. | | | 137,286 | | | | 365,150 | |
Wesfarmers Ltd. | | | 4,210 | | | | 121,770 | |
Westpac Banking Corp. | | | 28,498 | | | | 384,407 | |
Woodside Energy Group Ltd. | | | 22,496 | | | | 494,429 | |
| | | | | | | | |
| | |
| | | | | | | 8,046,559 | |
|
| Austria — 0.0% | |
ams-OSRAM AG(a) | | | 3,837 | | | | 34,713 | |
ANDRITZ AG | | | 968 | | | | 39,075 | |
Erste Group Bank AG | | | 1 | | | | 25 | |
OMV AG | | | 397 | | | | 18,671 | |
| | | | | | | | |
| | |
| | | | | | | 92,484 | |
|
| Belgium — 0.1% | |
Ackermans & van Haaren NV | | | 97 | | | | 14,512 | |
Anheuser-Busch InBev SA | | | 1,176 | | | | 63,330 | |
Groupe Bruxelles Lambert SA | | | 594 | | | | 49,795 | |
KBC Group NV | | | 286 | | | | 16,090 | |
Solvay SA | | | 3,474 | | | | 283,013 | |
Warehouses De Pauw CVA | | | 413 | | | | 13,032 | |
| | | | | | | | |
| | |
| | | | | | | 439,772 | |
|
| Brazil — 0.3% | |
Ambev SA | | | 160,624 | | | | 411,270 | |
B3 SA - Brasil Bolsa Balcao | | | 95,640 | | | | 200,291 | |
CPFL Energia SA | | | 12,233 | | | | 72,181 | |
EDP - Energias do Brasil SA | | | 5,803 | | | | 22,742 | |
Energisa SA | | | 6,384 | | | | 49,221 | |
Engie Brasil Energia SA | | | 2,266 | | | | 17,882 | |
Marfrig Global Foods SA | | | 31,156 | | | | 72,094 | |
Minerva SA | | | 9,765 | | | | 24,760 | |
Porto Seguro SA | | | 9,178 | | | | 31,146 | |
Qualicorp Consultoria e Corretora de Seguros SA | | | 5,785 | | | | 12,325 | |
Sendas Distribuidora SA | | | 3,000 | | | | 8,180 | |
| | | | | | | | |
| Security | | Shares | | | Value | |
| |
| | |
Brazil (continued) | | | | | | | | |
StoneCo Ltd., Class A(a) | | | 3,815 | | | $ | 29,376 | |
Ultrapar Participacoes SA | | | 42,365 | | | | 99,650 | |
XP, Inc., Class A(a) | | | 760 | | | | 13,650 | |
| | | | | | | | |
| | |
| | | | | | | 1,064,768 | |
|
| Canada — 4.4% | |
Alimentation Couche-Tard, Inc. | | | 11,648 | | | | 454,355 | |
AltaGas Ltd. | | | 936 | | | | 19,750 | |
Aritzia, Inc.(a) | | | 652 | | | | 17,652 | |
Atco Ltd., Class I | | | 2,707 | | | | 92,743 | |
Bank of Nova Scotia | | | 2,445 | | | | 144,702 | |
BCE, Inc. | | | 19,300 | | | | 948,657 | |
BRP, Inc. | | | 770 | | | | 47,389 | |
Canada Goose Holdings, Inc.(a)(b) | | | 7,813 | | | | 140,712 | |
Canadian National Railway Co. | | | 10,514 | | | | 1,182,662 | |
Canadian Natural Resources Ltd. | | | 40,643 | | | | 2,184,025 | |
Canadian Utilities Ltd., Class A | | | 2,740 | | | | 81,719 | |
Cenovus Energy, Inc. | | | 17,948 | | | | 341,475 | |
Colliers International Group, Inc. | | | 189 | | | | 20,708 | |
Crescent Point Energy Corp. | | | 177,140 | | | | 1,259,191 | |
Dollarama, Inc. | | | 845 | | | | 48,657 | |
Element Fleet Management Corp. | | | 3,770 | | | | 39,305 | |
Emera, Inc. | | | 3,345 | | | | 156,699 | |
Enbridge, Inc. | | | 44,577 | | | | 1,882,540 | |
Enerplus Corp. | | | 1,991 | | | | 26,311 | |
Fairfax Financial Holdings Ltd. | | | 646 | | | | 342,322 | |
FirstService Corp. | | | 3,494 | | | | 423,829 | |
Franco-Nevada Corp. | | | 5,895 | | | | 775,436 | |
George Weston Ltd. | | | 893 | | | | 104,320 | |
Great-West Lifeco, Inc. | | | 24,554 | | | | 599,543 | |
Hydro One Ltd.(c) | | | 4,552 | | | | 122,393 | |
IGM Financial, Inc. | | | 991 | | | | 26,561 | |
Imperial Oil Ltd. | | | 6,463 | | | | 304,673 | |
Intact Financial Corp. | | | 2,823 | | | | 398,185 | |
Manulife Financial Corp. | | | 54,576 | | | | 946,346 | |
Methanex Corp. | | | 352 | | | | 13,446 | |
Nutrien Ltd. | | | 1,596 | | | | 127,102 | |
Onex Corp. | | | 5,717 | | | | 284,695 | |
Parex Resources, Inc. | | | 1,973 | | | | 33,415 | |
Pembina Pipeline Corp. | | | 6,307 | | | | 222,940 | |
Stantec, Inc. | | | 3,224 | | | | 141,238 | |
Suncor Energy, Inc. | | | 29,179 | | | | 1,023,713 | |
Teck Resources Ltd., Class B(a) | | | 11,572 | | | | 353,849 | |
TMX Group Ltd. | | | 210 | | | | 21,372 | |
Tourmaline Oil Corp. | | | 1,367 | | | | 71,079 | |
West Fraser Timber Co. Ltd. | | | 871 | | | | 66,834 | |
Wheaton Precious Metals Corp. | | | 38,683 | | | | 1,393,814 | |
| | | | | | | | |
| | |
| | | | | | | 16,886,357 | |
|
| China — 4.4% | |
37 Interactive Entertainment Network Technology Group Co. Ltd., Class A | | | 8,100 | | | | 25,796 | |
3SBio, Inc.(c) | | | 35,500 | | | | 28,287 | |
Alibaba Group Holding Ltd.(a) | | | 79,300 | | | | 1,131,245 | |
Aluminum Corp. of China Ltd., Class A(a) | | | 111,500 | | | | 79,170 | |
Aluminum Corp. of China Ltd., Class H | | | 26,000 | | | | 9,774 | |
Angang Steel Co. Ltd., Class H | | | 30,000 | | | | 11,231 | |
Anta Sports Products Ltd. | | | 6,200 | | | | 76,300 | |
Asymchem Laboratories Tianjin Co. Ltd., Class A | | | 1,200 | | | | 51,805 | |
Autohome, Inc., ADR | | | 942 | | | | 37,049 | |
| | |
| 12 | | 2 0 2 2 BLACK ROCK ANNUAL REPORT TO SHAREHOLDERS |
| | |
Schedule of Investments (continued) June 30, 2022 | | BlackRock Advantage Global Fund, Inc. (Percentages shown are based on Net Assets) |
| | | | | | | | |
| Security | | Shares | | | Value | |
| |
| | |
China (continued) | | | | | | | | |
BAIC Motor Corp. Ltd., Class H(c) | | | 81,000 | | | $ | 26,974 | |
Baidu, Inc., Class A(a) | | | 70,680 | | | | 1,338,905 | |
BeiGene Ltd.(a) | | | 900 | | | | 11,433 | |
Beijing Wantai Biological Pharmacy Enterprise Co. Ltd., Class A | | | 7,940 | | | | 184,349 | |
BGI Genomics Co. Ltd., Class A | | | 6,600 | | | | 70,760 | |
Bloomage Biotechnology Corp. Ltd., Class A | | | 1,394 | | | | 29,733 | |
BOC Hong Kong Holdings Ltd. | | | 184,500 | | | | 732,645 | |
BYD Co. Ltd., Class A | | | 31,971 | | | | 1,597,891 | |
BYD Co. Ltd., Class H | | | 18,500 | | | | 745,725 | |
China Longyuan Power Group Corp. Ltd., Class H | | | 32,000 | | | | 62,015 | |
China Merchants Bank Co. Ltd., Class H | | | 3,500 | | | | 23,640 | |
China Petroleum & Chemical Corp., Class H | | | 38,000 | | | | 17,123 | |
China Suntien Green Energy Corp. Ltd., Class H | | | 56,000 | | | | 28,525 | |
Chongqing Zhifei Biological Products Co. Ltd., Class A | | | 4,200 | | | | 69,772 | |
CMOC Group Ltd., Class H | | | 30,000 | | | | 16,752 | |
Contemporary Amperex Technology Co. Ltd., Class A | | | 13,700 | | | | 1,097,826 | |
COSCO SHIPPING Holdings Co. Ltd., Class H | | | 85,000 | | | | 119,310 | |
CSPC Pharmaceutical Group Ltd. | | | 138,080 | | | | 138,014 | |
Dali Foods Group Co. Ltd.(c) | | | 89,000 | | | | 47,337 | |
Dongyue Group Ltd. | | | 17,000 | | | | 21,326 | |
Eve Energy Co. Ltd., Class A | | | 5,000 | | | | 73,265 | |
Ganfeng Lithium Co. Ltd., Class A | | | 1,200 | | | | 26,764 | |
Ganfeng Lithium Co. Ltd., Class H(c) | | | 5,400 | | | | 59,517 | |
Geely Automobile Holdings Ltd. | | | 25,000 | | | | 57,259 | |
Gigadevice Semiconductor Beijing, Inc., Class A | | | 1,300 | | | | 27,764 | |
GoerTek, Inc., Class A | | | 17,100 | | | | 85,915 | |
Guangzhou Kingmed Diagnostics Group Co. Ltd., Class A | | | 1,800 | | | | 22,209 | |
Guangzhou Tinci Materials Technology Co. Ltd., Class A | | | 7,200 | | | | 66,908 | |
Hithink RoyalFlush Information Network Co. Ltd., Class A | | | 22,800 | | | | 328,607 | |
Huadian Power International Corp. Ltd., Class H, Class H | | | 120,000 | | | | 43,716 | |
Imeik Technology Development Co. Ltd., Class A | | | 2,300 | | | | 206,734 | |
Innovent Biologics, Inc.(a)(c) | | | 6,500 | | | | 29,081 | |
JD Logistics, Inc.(a)(c) | | | 4,900 | | | | 10,737 | |
Jiangsu Yanghe Brewery Joint-Stock Co. Ltd., Class A | | | 900 | | | | 24,688 | |
KE Holdings, Inc., ADR(a) | | | 4,267 | | | | 76,593 | |
Kingdee International Software Group Co. Ltd.(a) | | | 10,000 | | | | 23,560 | |
Kuaishou Technology(a)(c) | | | 1,600 | | | | 17,982 | |
Kweichow Moutai Co. Ltd., Class A | | | 800 | | | | 244,746 | |
Lenovo Group Ltd. | | | 202,000 | | | | 189,821 | |
Li Ning Co. Ltd. | | | 15,000 | | | | 139,666 | |
Logan Group Co. Ltd.(d) | | | 52,000 | | | | 13,724 | |
Luzhou Laojiao Co. Ltd., Class A | | | 1,000 | | | | 36,919 | |
Meituan, Class B(a)(c) | | | 9,800 | | | | 244,552 | |
Metallurgical Corp. of China Ltd., Class H | | | 94,000 | | | | 22,588 | |
NAURA Technology Group Co. Ltd., Class A | | | 2,900 | | | | 120,578 | |
NavInfo Co. Ltd., Class A | | | 7,000 | | | | 15,782 | |
NetEase, Inc. | | | 19,710 | | | | 371,326 | |
NXP Semiconductors NV | | | 2,552 | | | | 377,773 | |
PetroChina Co. Ltd., Class A | | | 59,900 | | | | 47,234 | |
PetroChina Co. Ltd., Class H | | | 106,000 | | | | 49,715 | |
Pharmaron Beijing Co. Ltd., Class A | | | 4,950 | | | | 70,470 | |
Ping An Insurance Group Co. of China Ltd., Class H | | | 79,000 | | | | 543,776 | |
Postal Savings Bank of China Co. Ltd., Class H(c) | | | 179,000 | | | | 142,648 | |
SF Holding Co. Ltd., Class A | | | 2,300 | | | | 19,214 | |
SG Micro Corp., Class A | | | 3,600 | | | | 98,306 | |
Shandong Nanshan Aluminum Co. Ltd., Class A | | | 102,000 | | | | 56,324 | |
| | | | | | | | |
| Security | | Shares | | | Value | |
| |
| | |
China (continued) | | | | | | | | |
Shanghai Junshi Biosciences Co. Ltd., Class A(a) | | | 7,264 | | | $ | 81,773 | |
Shanghai Junshi Biosciences Co. Ltd.,
Class H(a)(c) | | | 2,000 | | | | 10,761 | |
Shanghai Putailai New Energy Technology Co. Ltd., Class A | | | 2,800 | | | | 35,484 | |
Shanxi Xinghuacun Fen Wine Factory Co. Ltd., Class A | | | 2,179 | | | | 105,977 | |
Shenzhen Capchem Technology Co. Ltd., Class A | | | 15,414 | | | | 121,430 | |
Shenzhen Inovance Technology Co. Ltd., Class A | | | 11,900 | | | | 117,430 | |
Shenzhen Kangtai Biological Products Co. Ltd., Class A | | | 13,440 | | | | 90,919 | |
Shenzhen Mindray Bio-Medical Electronics Co. Ltd., Class A | | | 11,402 | | | | 534,783 | |
Shui On Land Ltd. | | | 75,000 | | | | 10,156 | |
Sinotruk Hong Kong Ltd. | | | 26,000 | | | | 36,593 | |
StarPower Semiconductor Ltd. | | | 1,900 | | | | 109,835 | |
Sunac China Holdings Ltd.(d) | | | 171,000 | | | | 88,025 | |
Sunwoda Electronic Co. Ltd., Class A | | | 15,700 | | | | 74,429 | |
Tencent Holdings Ltd. | | | 35,100 | | | | 1,588,806 | |
Uni-President China Holdings Ltd. | | | 42,000 | | | | 36,116 | |
Vipshop Holdings Ltd., ADR(a) | | | 31,130 | | | | 307,876 | |
WuXi AppTec Co. Ltd., Class A | | | 6,100 | | | | 95,020 | |
WuXi AppTec Co. Ltd., Class H(c) | | | 23,616 | | | | 315,934 | |
Wuxi Biologics Cayman, Inc.(a)(c) | | | 37,500 | | | | 347,453 | |
Wuxi Lead Intelligent Equipment Co. Ltd., Class A | | | 9,600 | | | | 90,811 | |
Yadea Group Holdings Ltd.(c) | | | 64,000 | | | | 125,518 | |
Yunnan Botanee Bio-Technology Group Co. Ltd., Class A | | | 1,400 | | | | 45,520 | |
Yunnan Energy New Material Co. Ltd., Class A | | | 2,700 | | | | 101,251 | |
Zijin Mining Group Co. Ltd., Class A | | | 225,000 | | | | 313,613 | |
Zijin Mining Group Co. Ltd., Class H | | | 172,000 | | | | 209,305 | |
| | | | | | | | |
| | |
| | | | | | | 16,811,991 | |
|
| Colombia — 0.0% | |
Tecnoglass, Inc. | | | 825 | | | | 14,479 | |
| | | | | | | | |
|
| Denmark — 1.1% | |
AP Moller - Maersk A/S, Class A | | | 129 | | | | 299,403 | |
AP Moller - Maersk A/S, Class B | | | 466 | | | | 1,093,981 | |
Carlsberg A/S, Class B | | | 675 | | | | 86,267 | |
Danske Bank A/S | | | 1,075 | | | | 15,300 | |
Genmab A/S(a) | | | 1,053 | | | | 341,640 | |
Novo Nordisk A/S, Class B | | | 20,486 | | | | 2,271,945 | |
| | | | | | | | |
| | |
| | | | | | | 4,108,536 | |
|
| Finland — 0.7% | |
Kone OYJ, Class B | | | 1,544 | | | | 73,796 | |
Nokia OYJ | | | 458,848 | | | | 2,126,782 | |
Nordea Bank Abp | | | 57,187 | | | | 505,162 | |
Outokumpu OYJ | | | 4,680 | | | | 19,533 | |
| | | | | | | | |
| | |
| | | | | | | 2,725,273 | |
|
| France — 2.6% | |
Atos SE(a) | | | 775 | | | | 10,507 | |
AXA SA | | | 13,661 | | | | 312,038 | |
Electricite de France SA | | | 18,137 | | | | 148,975 | |
Engie SA | | | 136,883 | | | | 1,584,963 | |
Hermes International | | | 901 | | | | 1,014,010 | |
Kering SA | | | 984 | | | | 509,935 | |
Legrand SA | | | 8,011 | | | | 594,805 | |
L’Oreal SA | | | 8,618 | | | | 2,992,216 | |
LVMH Moet Hennessy Louis Vuitton SE | | | 740 | | | | 453,529 | |
Pernod Ricard SA | | | 3,549 | | | | 656,120 | |
Remy Cointreau SA | | | 142 | | | | 24,916 | |
Rexel SA | | | 33,801 | | | | 522,293 | |
Rubis SCA | | | 6,716 | | | | 157,959 | |
| | |
SCHEDULE OF INVESTMENTS | | 13 |
| | |
Schedule of Investments (continued) June 30, 2022 | | BlackRock Advantage Global Fund, Inc. (Percentages shown are based on Net Assets) |
| | | | | | | | |
| Security | | Shares | | | Value | |
| |
| | |
France (continued) | | | | | | | | |
Sartorius Stedim Biotech | | | 70 | | | $ | 22,086 | |
Societe Generale SA | | | 24,669 | | | | 545,424 | |
SPIE SA | | | 5 | | | | 109 | |
Teleperformance | | | 429 | | | | 132,468 | |
Valeo | | | 8,781 | | | | 171,106 | |
| | | | | | | | |
| | |
| | | | | | | 9,853,459 | |
| | |
| Germany — 3.1% | | | | | | |
Allianz SE, Registered Shares | | | 11,070 | | | | 2,122,231 | |
BASF SE | | | 6,505 | | | | 284,608 | |
Bayer AG, Registered Shares | | | 12,371 | | | | 738,751 | |
Bayerische Motoren Werke AG | | | 22,856 | | | | 1,771,811 | |
Commerzbank AG(a) | | | 12,591 | | | | 89,335 | |
Deutsche Bank AG, Registered Shares | | | 57,656 | | | | 506,664 | |
DWS Group GmbH & Co. KGaA(c) | | | 361 | | | | 9,517 | |
E.ON SE | | | 17,913 | | | | 150,883 | |
Evonik Industries AG | | | 9,044 | | | | 193,959 | |
Fielmann AG | | | 1,057 | | | | 52,802 | |
Freenet AG | | | 10,679 | | | | 266,315 | |
Fresenius SE & Co. KGaA | | | 794 | | | | 24,147 | |
Hochtief AG | | | 370 | | | | 18,139 | |
HUGO BOSS AG | | | 1,836 | | | | 97,223 | |
Infineon Technologies AG | | | 3,490 | | | | 84,896 | |
Jenoptik AG | | | 4 | | | | 90 | |
K&S AG | | | 2,163 | | | | 52,643 | |
Mercedes-Benz Group AG, Registered Shares | | | 33,391 | | | | 1,939,293 | |
Merck KGaA | | | 220 | | | | 37,317 | |
Nemetschek SE | | | 245 | | | | 14,905 | |
Rheinmetall AG | | | 1,145 | | | | 264,226 | |
RWE AG | | | 702 | | | | 25,964 | |
Scout24 SE(c) | | | 3,948 | | | | 203,383 | |
Siemens AG, Registered Shares | | | 24,366 | | | | 2,504,739 | |
Telefonica Deutschland Holding AG | | | 68,748 | | | | 198,249 | |
TUI AG(a) | | | 7 | | | | 11 | |
Volkswagen AG | | | 295 | | | | 53,951 | |
Wacker Chemie AG | | | 690 | | | | 100,065 | |
| | | | | | | | |
| | |
| | | | | | | 11,806,117 | |
| | |
| Hong Kong — 0.8% | | | | | | |
AIA Group Ltd. | | | 175,800 | | | | 1,920,890 | |
ASM Pacific Technology Ltd. | | | 1,400 | | | | 11,916 | |
Kerry Properties Ltd. | | | 7,500 | | | | 20,856 | |
Link REIT | | | 69,300 | | | | 566,275 | |
Orient Overseas International Ltd. | | | 1,500 | | | | 39,965 | |
Swire Pacific Ltd., Class A | | | 10,000 | | | | 59,723 | |
Swire Properties Ltd. | | | 85,000 | | | | 211,619 | |
Techtronic Industries Co. Ltd. | | | 20,500 | | | | 214,064 | |
Towngas Smart Energy Co. Ltd. | | | 27,000 | | | | 14,398 | |
Yuexiu Property Co. Ltd. | | | 23,600 | | | | 30,326 | |
| | | | | | | | |
| | |
| | | | | | | 3,090,032 | |
| | |
| Hungary — 0.2% | | | | | | |
MOL Hungarian Oil & Gas PLC | | | 78,464 | | | | 606,954 | |
OTP Bank Nyrt | | | 8,499 | | | | 190,681 | |
| | | | | | | | |
| | |
| | | | | | | 797,635 | |
| | |
| India — 0.6% | | | | | | |
Asian Paints Ltd. | | | 5,276 | | | | 180,628 | |
City Union Bank Ltd. | | | 6,503 | | | | 10,987 | |
HDFC Bank Ltd. | | | 26,984 | | | | 462,212 | |
HDFC Life Insurance Co. Ltd.(c) | | | 23,632 | | | | 165,004 | |
Housing Development Finance Corp. Ltd. | | | 9,981 | | | | 276,141 | |
ICICI Prudential Life Insurance Co. Ltd.(c) | | | 8,461 | | | | 52,573 | |
| | | | | | | | |
| Security | | Shares | | | Value | |
| |
| | |
India (continued) | | | | | | | | |
IndusInd Bank Ltd. | | | 5,044 | | | $ | 51,033 | |
Kotak Mahindra Bank Ltd. | | | 28,527 | | | | 603,339 | |
L&T Finance Holdings Ltd.(a) | | | 21,198 | | | | 18,227 | |
PVR Ltd.(a) | | | 669 | | | | 15,813 | |
Reliance Industries Ltd. | | | 1,965 | | | | 64,883 | |
SBI Life Insurance Co. Ltd.(c) | | | 22,819 | | | | 313,377 | |
Titan Co. Ltd. | | | 1,474 | | | | 36,332 | |
TVS Motor Co. Ltd. | | | 4,578 | | | | 49,010 | |
| | | | | | | | |
| | |
| | | | | | | 2,299,559 | |
| | |
| Indonesia — 0.0% | | | | | | |
Perusahaan Gas Negara Tbk PT | | | 139,800 | | | | 14,946 | |
| | | | | | | | |
| | |
| Ireland — 1.6% | | | | | | |
Accenture PLC, Class A | | | 3,916 | | | | 1,087,277 | |
Alkermes PLC(a) | | | 2,496 | | | | 74,356 | |
CRH PLC | | | 1,955 | | | | 67,370 | |
Experian PLC | | | 26,776 | | | | 786,165 | |
Flutter Entertainment PLC(a) | | | 1,497 | | | | 151,285 | |
James Hardie Industries PLC | | | 13,598 | | | | 297,699 | |
Kingspan Group PLC | | | 3,870 | | | | 232,707 | |
Medtronic PLC | | | 36,070 | | | | 3,237,283 | |
| | | | | | | | |
| | |
| | | | | | | 5,934,142 | |
| | |
| Israel — 0.9% | | | | | | |
Bank Hapoalim BM | | | 62,072 | | | | 521,233 | |
Bank Leumi Le-Israel BM | | | 10,098 | | | | 90,337 | |
Bezeq The Israeli Telecommunication Corp. Ltd. | | | 10,019 | | | | 15,617 | |
Check Point Software Technologies Ltd.(a) | | | 12,094 | | | | 1,472,807 | |
Israel Discount Bank Ltd., Class A | | | 34,132 | | | | 178,730 | |
Nice Ltd.(a) | | | 347 | | | | 66,960 | |
Teva Pharmaceutical Industries Ltd.(a) | | | 22,246 | | | | 168,400 | |
Teva Pharmaceutical Industries Ltd., ADR(a) | | | 115,989 | | | | 872,237 | |
Tower Semiconductor Ltd.(a) | | | 4,355 | | | | 203,134 | |
| | | | | | | | |
| | |
| | | | | | | 3,589,455 | |
| | |
| Italy — 0.5% | | | | | | |
Banca Generali SpA | | | 471 | | | | 13,335 | |
Banca Mediolanum SpA | | | 7,315 | | | | 48,262 | |
Banco BPM SpA | | | 8,324 | | | | 23,762 | |
BPER Banca | | | 58,466 | | | | 96,371 | |
Buzzi Unicem SpA | | | 911 | | | | 14,954 | |
Enel SpA | | | 163,782 | | | | 898,217 | |
Eni SpA | | | 3,624 | | | | 42,983 | |
Intesa Sanpaolo SpA | | | 32,530 | | | | 60,879 | |
Leonardo SpA | | | 9,277 | | | | 94,123 | |
Mediobanca Banca di Credito Finanziario SpA | | | 7,046 | | | | 61,107 | |
Moncler SpA | | | 1,337 | | | | 57,606 | |
Snam SpA | | | 5,037 | | | | 26,426 | |
Telecom Italia SpA(a) | | | 65,840 | | | | 17,264 | |
UniCredit SpA | | | 22,479 | | | | 214,817 | |
Unipol Gruppo SpA | | | 10,577 | | | | 48,178 | |
| | | | | | | | |
| | |
| | | | | | | 1,718,284 | |
| | |
| Japan — 4.0% | | | | | | |
Ajinomoto Co., Inc. | | | 2,600 | | | | 63,403 | |
Alps Alpine Co. Ltd. | | | 24,100 | | | | 244,891 | |
Amada Co. Ltd. | | | 39,200 | | | | 288,994 | |
Asahi Kasei Corp. | | | 23,700 | | | | 180,295 | |
Astellas Pharma, Inc. | | | 3,100 | | | | 48,365 | |
Calbee, Inc. | | | 2,300 | | | | 46,354 | |
Canon, Inc. | | | 2,700 | | | | 61,186 | |
Casio Computer Co. Ltd. | | | 1,300 | | | | 12,063 | |
Chugai Pharmaceutical Co. Ltd. | | | 8,300 | | | | 212,318 | |
| | |
| 14 | | 2 0 2 2 BLACK ROCK ANNUAL REPORT TO SHAREHOLDERS |
| | |
Schedule of Investments (continued) June 30, 2022 | | BlackRock Advantage Global Fund, Inc. (Percentages shown are based on Net Assets) |
| | | | | | | | |
| Security | | Shares | | | Value | |
| |
| | |
Japan (continued) | | | | | | | | |
Daifuku Co. Ltd. | | | 1,100 | | | $ | 62,953 | |
Daiichi Sankyo Co. Ltd. | | | 900 | | | | 22,889 | |
Daiwa House Industry Co. Ltd. | | | 2,200 | | | | 51,451 | |
Eisai Co. Ltd. | | | 1,000 | | | | 42,280 | |
Fuji Media Holdings, Inc. | | | 4,200 | | | | 35,573 | |
Honda Motor Co. Ltd. | | | 6,800 | | | | 163,955 | |
Hoya Corp. | | | 6,500 | | | | 556,289 | |
ITOCHU Corp. | | | 10,000 | | | | 269,780 | |
Japan Tobacco, Inc. | | | 181,900 | | | | 3,152,104 | |
JGC Holdings Corp. | | | 2,200 | | | | 28,258 | |
Kao Corp. | | | 5,200 | | | | 210,857 | |
KDDI Corp. | | | 1,800 | | | | 56,762 | |
Kuraray Co. Ltd. | | | 2,200 | | | | 17,749 | |
Kyushu Electric Power Co., Inc. | | | 2,600 | | | | 16,717 | |
Lawson, Inc. | | | 2,200 | | | | 73,217 | |
Lintec Corp. | | | 700 | | | | 11,870 | |
Mitsubishi Corp. | | | 9,800 | | | | 291,856 | |
Mitsui & Co. Ltd. | | | 26,000 | | | | 571,338 | |
Mitsui Fudosan Co. Ltd. | | | 800 | | | | 17,188 | |
Murata Manufacturing Co. Ltd. | | | 3,300 | | | | 179,610 | |
Nikon Corp. | | | 34,400 | | | | 396,694 | |
Nippon Shokubai Co. Ltd. | | | 300 | | | | 11,595 | |
Nippon Telegraph & Telephone Corp. | | | 18,400 | | | | 528,690 | |
Nippon Television Holdings, Inc. | | | 2,800 | | | | 24,915 | |
Nitto Denko Corp. | | | 1,100 | | | | 71,146 | |
Olympus Corp. | | | 6,300 | | | | 127,671 | |
Omron Corp. | | | 4,500 | | | | 229,035 | |
Otsuka Holdings Co. Ltd. | | | 700 | | | | 24,988 | |
Recruit Holdings Co. Ltd. | | | 38,900 | | | | 1,145,622 | |
Ricoh Co. Ltd. | | | 53,400 | | | | 416,902 | |
Rohm Co. Ltd. | | | 400 | | | | 28,040 | |
Santen Pharmaceutical Co. Ltd. | | | 2,000 | | | | 15,778 | |
Sega Sammy Holdings, Inc. | | | 1,200 | | | | 19,275 | |
Sekisui House Ltd. | | | 5,500 | | | | 96,554 | |
Shin-Etsu Chemical Co. Ltd. | | | 1,300 | | | | 146,134 | |
SoftBank Corp. | | | 19,500 | | | | 216,499 | |
SoftBank Group Corp. | | | 8,200 | | | | 317,820 | |
Subaru Corp. | | | 1,100 | | | | 19,457 | |
Sumitomo Chemical Co. Ltd. | | | 381,400 | | | | 1,492,683 | |
Sumitomo Corp. | | | 20,800 | | | | 282,744 | |
Sumitomo Mitsui Financial Group, Inc. | | | 2,200 | | | | 65,395 | |
Sundrug Co. Ltd. | | | 600 | | | | 13,418 | |
Suntory Beverage & Food Ltd. | | | 1,800 | | | | 67,973 | |
Takeda Pharmaceutical Co. Ltd. | | | 1,300 | | | | 36,515 | |
Teijin Ltd. | | | 7,200 | | | | 74,963 | |
Terumo Corp. | | | 10,200 | | | | 308,561 | |
Tokio Marine Holdings, Inc. | | | 300 | | | | 17,494 | |
Tokyo Electron Ltd. | | | 4,900 | | | | 1,599,327 | |
Toshiba Corp. | | | 2,600 | | | | 105,639 | |
Tsuruha Holdings, Inc. | | | 500 | | | | 27,207 | |
Unicharm Corp. | | | 3,200 | | | | 107,383 | |
Yamada Holdings Co. Ltd. | | | 35,400 | | | | 127,304 | |
Yokohama Rubber Co. Ltd. | | | 1,400 | | | | 18,978 | |
| | | | | | | | |
| | |
| | | | | | | 15,172,964 | |
| | |
| Luxembourg — 0.2% | | | | | | |
ArcelorMittal SA | | | 21,224 | | | | 475,956 | |
| | | | | | | | |
| Security | | Shares | | | Value | |
| |
| | |
Luxembourg (continued) | | | | | | | | |
RTL Group SA(a) | | | 2,957 | | | $ | 123,858 | |
SES SA | | | 17 | | | | 149 | |
| | | | | | | | |
| | |
| | | | | | | 599,963 | |
| | |
| Malaysia — 0.7% | | | | | | |
Capital A Bhd(a) | | | 155,600 | | | | 21,573 | |
CIMB Group Holdings Bhd | | | 268,500 | | | | 302,149 | |
Hartalega Holdings Bhd | | | 18,100 | | | | 12,566 | |
Hong Leong Bank Bhd | | | 3,200 | | | | 14,869 | |
Inari Amertron Bhd | | | 15,900 | | | | 9,557 | |
Malayan Banking Bhd | | | 210,000 | | | | 409,280 | |
Press Metal Aluminium Holdings Bhd | | | 138,800 | | | | 150,162 | |
Public Bank Bhd | | | 1,258,400 | | | | 1,248,288 | |
QL Resources Bhd | | | 18,750 | | | | 22,122 | |
RHB Bank Bhd | | | 11,900 | | | | 15,472 | |
Supermax Corp. Bhd | | | 151,412 | | | | 30,101 | |
Telekom Malaysia Bhd | | | 92,200 | | | | 109,891 | |
Tenaga Nasional Bhd | | | 152,500 | | | | 276,092 | |
| | | | | | | | |
| | |
| | | | | | | 2,622,122 | |
| | |
| Mexico — 0.0% | | | | | | |
Fomento Economico Mexicano SAB de CV | | | 7,365 | | | | 49,721 | |
Grupo Financiero Banorte SAB de CV, Class O | | | 16,826 | | | | 93,855 | |
Orbia Advance Corp. SAB de CV | | | 12,300 | | | | 28,784 | |
| | | | | | | | |
| | |
| | | | | | | 172,360 | |
| | |
| Netherlands — 1.8% | | | | | | |
Aalberts NV | | | 404 | | | | 15,688 | |
ASML Holding NV | | | 7,697 | | | | 3,636,355 | |
ASR Nederland NV | | | 2,174 | | | | 87,649 | |
Heineken NV | | | 7,800 | | | | 709,968 | |
IMCD NV | | | 1,252 | | | | 171,192 | |
OCI NV | | | 1,212 | | | | 39,869 | |
Randstad NV | | | 19,798 | | | | 956,845 | |
Signify NV(c) | | | 9,435 | | | | 311,263 | |
Stellantis NV | | | 4,024 | | | | 49,957 | |
Wereldhave NV | | | 1 | | | | 15 | |
Wolters Kluwer NV | | | 8,473 | | | | 821,186 | |
| | | | | | | | |
| | |
| | | | | | | 6,799,987 | |
| | |
| New Zealand — 0.0% | | | | | | |
Fisher & Paykel Healthcare Corp. Ltd. | | | 2,638 | | | | 32,863 | |
| | | | | | | | |
| | |
| Norway — 0.9% | | | | | | |
Equinor ASA | | | 92,625 | | | | 3,227,554 | |
Mowi ASA | | | 2,534 | | | | 57,946 | |
Telenor ASA | | | 6,230 | | | | 83,253 | |
| | | | | | | | |
| | |
| | | | | | | 3,368,753 | |
| | |
| Poland — 0.0% | | | | | | |
PGE Polska Grupa Energetyczna SA(a) | | | 9,153 | | | | 21,854 | |
| | | | | | | | |
| | |
| Portugal — 0.1% | | | | | | |
EDP - Energias de Portugal SA | | | 10,201 | | | | 47,540 | |
Jeronimo Martins SGPS SA | | | 14,524 | | | | 314,856 | |
| | | | | | | | |
| | |
| | | | | | | 362,396 | |
| | |
| Russia(d) — 0.0% | | | | | | |
Alrosa PJSC(a) | | | 18,331 | | | | 3 | |
Gazprom PJSC | | | 16,740 | | | | 3 | |
LUKOIL PJSC | | | 2,916 | | | | 1 | |
MMC Norilsk Nickel PJSC | | | 433 | | | | — | |
Mobile TeleSystems PJSC, ADR | | | 1,880 | | | | 19 | |
| | |
SCHEDULE OF INVESTMENTS | | 15 |
| | |
Schedule of Investments (continued) June 30, 2022 | | BlackRock Advantage Global Fund, Inc. (Percentages shown are based on Net Assets) |
| | | | | | | | |
| Security | | Shares | | | Value | |
| |
| | |
Russia (continued) | | | | | | | | |
Novatek PJSC, GDR, Registered Shares(e) | | | 545 | | | $ | 5 | |
Tatneft PJSC | | | 9,355 | | | | 2 | |
| | | | | | | | |
| | |
| | | | | | | 33 | |
| | |
| Saudi Arabia — 0.6% | | | | | | |
ACWA Power Co.(a) | | | 608 | | | | 24,256 | |
Al Rajhi Bank | | | 38,032 | | | | 837,899 | |
Riyad Bank | | | 2,736 | | | | 23,477 | |
Saudi Arabian Mining Co.(a) | | | 5,274 | | | | 70,390 | |
Saudi Arabian Oil Co.(c) | | | 99,003 | | | | 1,023,206 | |
Saudi National Bank | | | 9,230 | | | | 162,470 | |
Saudi Telecom Co. | | | 2,705 | | | | 70,144 | |
| | | | | | | | |
| | |
| | | | | | | 2,211,842 | |
| | |
| Singapore — 0.1% | | | | | | |
City Developments Ltd. | | | 2,400 | | | | 14,097 | |
Jardine Cycle & Carriage Ltd. | | | 17,500 | | | | 356,713 | |
JOYY, Inc., ADR | | | 732 | | | | 21,858 | |
United Overseas Bank Ltd. | | | 8,600 | | | | 162,472 | |
| | | | | | | | |
| | |
| | | | | | | 555,140 | |
| | |
| South Africa — 0.4% | | | | | | |
AngloGold Ashanti Ltd. | | | 737 | | | | 10,882 | |
Bidvest Group Ltd. | | | 1,879 | | | | 24,207 | |
Capitec Bank Holdings Ltd. | | | 266 | | | | 32,601 | |
FirstRand Ltd. | | | 28,024 | | | | 107,848 | |
Foschini Group Ltd. | | | 13,817 | | | | 103,614 | |
Impala Platinum Holdings Ltd. | | | 2,045 | | | | 22,688 | |
MTN Group Ltd. | | | 5,261 | | | | 42,812 | |
Naspers Ltd., N Shares | | | 8,037 | | | | 1,174,097 | |
Pepkor Holdings Ltd.(c) | | | 19,777 | | | | 23,243 | |
Sibanye Stillwater Ltd. | | | 14,776 | | | | 36,696 | |
Standard Bank Group Ltd. | | | 6,217 | | | | 59,315 | |
Woolworths Holdings Ltd. | | | 19,971 | | | | 66,596 | |
| | | | | | | | |
| | |
| | | | | | | 1,704,599 | |
| | |
| South Korea — 1.0% | | | | | | |
AfreecaTV Co. Ltd. | | | 229 | | | | 14,222 | |
Celltrion, Inc. | | | 677 | | | | 93,461 | |
Coupang, Inc.(a) | | | 2,226 | | | | 28,382 | |
DB HiTek Co. Ltd. | | | 704 | | | | 27,271 | |
Dongkuk Steel Mill Co. Ltd. | | | 1,114 | | | | 11,059 | |
Hugel, Inc.(a) | | | 97 | | | | 7,866 | |
Hyundai Mobis Co. Ltd. | | | 378 | | | | 58,264 | |
Hyundai Motor Co. | | | 301 | | | | 42,064 | |
Kakao Corp. | | | 4,303 | | | | 233,158 | |
Kolon Industries, Inc. | | | 207 | | | | 8,368 | |
Korea Gas Corp. | | | 1,510 | | | | 46,161 | |
KT Corp. | | | 2,538 | | | | 71,364 | |
LG Chem Ltd. | | | 2,238 | | | | 889,117 | |
Mando Corp. | | | 468 | | | | 17,190 | |
NAVER Corp. | | | 4,159 | | | | 775,764 | |
POSCO Holdings, Inc. | | | 901 | | | | 160,682 | |
Samsung C&T Corp. | | | 173 | | | | 16,470 | |
Samsung Electronics Co. Ltd. | | | 20,679 | | | | 912,096 | |
Samsung Engineering Co. Ltd.(a) | | | 2,378 | | | | 39,524 | |
Samsung SDI Co. Ltd. | | | 69 | | | | 28,455 | |
SillaJen, Inc.(a)(d) | | | 770 | | | | 3,947 | |
SK Hynix, Inc. | | | 1,130 | | | | 79,794 | |
| | | | | | | | |
| Security | | Shares | | | Value | |
| |
| | |
South Korea (continued) | | | | | | | | |
SK Innovation Co. Ltd.(a) | | | 1,601 | | | $ | 237,680 | |
S-Oil Corp. | | | 705 | | | | 56,191 | |
| | | | | | | | |
| | |
| | | | | | | 3,858,550 | |
| | |
| Spain — 0.2% | | | | | | |
Acciona SA | | | 147 | | | | 27,086 | |
Banco Santander SA | | | 83,011 | | | | 234,872 | |
Industria de Diseno Textil SA | | | 23,649 | | | | 537,435 | |
Merlin Properties Socimi SA | | | 1,492 | | | | 14,449 | |
| | | | | | | | |
| | |
| | | | | | | 813,842 | |
| | |
| Sweden — 0.7% | | | | | | |
Assa Abloy AB, Class B | | | 13,383 | | | | 285,594 | |
Atlas Copco AB, A Shares | | | 71,884 | | | | 672,837 | |
Castellum AB | | | 5 | | | | 64 | |
Elekta AB, B Shares | | | 12,107 | | | | 83,907 | |
Intrum AB | | | 6 | | | | 115 | |
Investor AB, B Shares | | | 1,027 | | | | 16,937 | |
Pandox AB(a) | | | 6 | | | | 68 | |
Saab AB, Class B | | | 12,172 | | | | 503,341 | |
Telefonaktiebolaget LM Ericsson, B Shares | | | 115,169 | | | | 860,199 | |
Trelleborg AB, B Shares | | | 14,448 | | | | 292,320 | |
| | | | | | | | |
| | |
| | | | | | | 2,715,382 | |
| | |
| Switzerland — 1.2% | | | | | | |
ABB Ltd., Registered Shares | | | 4,132 | | | | 110,813 | |
Belimo Holding AG | | | 35 | | | | 12,323 | |
Cie Financiere Richemont SA, Class A, Registered Shares | | | 5,736 | | | | 616,982 | |
Dufry AG(a) | | | 352 | | | | 11,422 | |
Flughafen Zurich AG(a) | | | 134 | | | | 20,304 | |
Givaudan SA, Registered Shares | | | 4 | | | | 14,099 | |
Julius Baer Group Ltd. | | | 458 | | | | 21,247 | |
Nestle SA, Registered Shares | | | 11,896 | | | | 1,390,317 | |
Novartis AG, Registered Shares | | | 2,970 | | | | 251,798 | |
Roche Holding AG | | | 993 | | | | 335,069 | |
Sika AG, Registered Shares | | | 3,621 | | | | 835,861 | |
Straumann Holding AG, Registered Shares | | | 1,051 | | | | 126,610 | |
Swatch Group AG | | | 1,022 | | | | 242,764 | |
TE Connectivity Ltd. | | | 1,981 | | | | 224,150 | |
UBS Group AG, Registered Shares | | | 24,391 | | | | 394,323 | |
VAT Group AG(c) | | | 134 | | | | 32,047 | |
| | | | | | | | |
| | |
| | | | | | | 4,640,129 | |
| | |
| Taiwan — 2.3% | | | | | | |
ASE Technology Holding Co. Ltd. | | | 26,000 | | | | 66,963 | |
ASPEED Technology, Inc. | | | 1,100 | | | | 70,606 | |
Cathay Financial Holding Co. Ltd. | | | 62,595 | | | | 107,186 | |
CTBC Financial Holding Co. Ltd. | | | 483,000 | | | | 408,546 | |
Delta Electronics, Inc. | | | 54,000 | | | | 402,638 | |
Eva Airways Corp.(a) | | | 270,000 | | | | 288,084 | |
Evergreen Marine Corp. Taiwan Ltd. | | | 16,000 | | | | 45,476 | |
Faraday Technology Corp. | | | 41,000 | | | | 263,951 | |
Global Unichip Corp. | | | 2,000 | | | | 32,438 | |
Hiwin Technologies Corp. | | | 3,000 | | | | 24,109 | |
Kinsus Interconnect Technology Corp. | | | 5,000 | | | | 24,080 | |
Largan Precision Co. Ltd. | | | 1,000 | | | | 58,113 | |
MediaTek, Inc. | | | 58,000 | | | | 1,273,169 | |
momo.com, Inc. | | | 1,560 | | | | 33,562 | |
Nan Ya Printed Circuit Board Corp. | | | 4,000 | | | | 35,186 | |
Nanya Technology Corp. | | | 45,000 | | | | 74,892 | |
| | |
| 16 | | 2 0 2 2 BLACK ROCK ANNUAL REPORT TO SHAREHOLDERS |
| | |
Schedule of Investments (continued) June 30, 2022 | | BlackRock Advantage Global Fund, Inc. (Percentages shown are based on Net Assets) |
| | | | | | | | |
| Security | | Shares | | | Value | |
| |
| | |
Taiwan (continued) | | | | | | | | |
Novatek Microelectronics Corp. | | | 8,000 | | | $ | 81,393 | |
Parade Technologies Ltd. | | | 3,000 | | | | 116,792 | |
Realtek Semiconductor Corp. | | | 23,000 | | | | 281,302 | |
Taiwan Semiconductor Manufacturing Co. Ltd. | | | 258,000 | | | | 4,134,797 | |
Tung Ho Steel Enterprise Corp. | | | 14,500 | | | | 25,315 | |
Unimicron Technology Corp. | | | 14,000 | | | | 74,926 | |
Uni-President Enterprises Corp. | | | 251,000 | | | | 565,932 | |
United Microelectronics Corp. | | | 18,000 | | | | 24,060 | |
Vanguard International Semiconductor Corp. | | | 4,000 | | | | 10,406 | |
Visual Photonics Epitaxy Co. Ltd. | | | 7,000 | | | | 16,970 | |
Wisdom Marine Lines Co. Ltd. | | | 28,000 | | | | 61,140 | |
| | | | | | | | |
| | |
| | | | | | | 8,602,032 | |
| | |
| Thailand — 0.0% | | | | | | |
Energy Absolute PCL, NVDR | | | 33,400 | | | | 77,086 | |
JMT Network Services PCL | | | 26,100 | | | | 54,144 | |
Precious Shipping PCL, NVDR | | | 34,100 | | | | 17,822 | |
| | | | | | | | |
| | |
| | | | | | | 149,052 | |
| | |
| Turkey — 0.1% | | | | | | |
Arcelik A/S | | | 8,421 | | | | 36,655 | |
Kardemir Karabuk Demir Celik Sanayi ve Ticaret A/S, Class D | | | 143,020 | | | | 96,914 | |
KOC Holding A/S | | | 15,484 | | | | 34,189 | |
Koza Altin Isletmeleri A/S(a) | | | 987 | | | | 10,034 | |
Migros Ticaret A/S(a) | | | 4,570 | | | | 13,142 | |
Petkim Petrokimya Holding A/S(a) | | | 49,736 | | | | 26,194 | |
Sok Marketler Ticaret A/S | | | 15,986 | | | | 11,003 | |
Turk Telekomunikasyon A/S | | | 23,910 | | | | 12,613 | |
Turkcell Iletisim Hizmetleri A/S | | | 240,065 | | | | 234,201 | |
Turkiye Petrol Rafinerileri A/S(a) | | | 3,558 | | | | 56,086 | |
| | | | | | | | |
| | |
| | | | | | | 531,031 | |
| | |
| United Kingdom — 3.2% | | | | | | |
Anglo American PLC | | | 23,239 | | | | 832,529 | |
Aviva PLC | | | 26,723 | | | | 130,896 | |
Babcock International Group PLC(a) | | | 5 | | | | 19 | |
Bellway PLC | | | 471 | | | | 12,384 | |
BP PLC, ADR | | | 371,049 | | | | 1,742,259 | |
British American Tobacco PLC | | | 93,720 | | | | 4,017,238 | |
Centrica PLC(a) | | | 135,719 | | | | 132,535 | |
CK Hutchison Holdings Ltd. | | | 8,000 | | | | 54,272 | |
Direct Line Insurance Group PLC | | | 23,450 | | | | 71,978 | |
Dunelm Group PLC | | | 8 | | | | 80 | |
HomeServe PLC | | | 13,142 | | | | 187,494 | |
IG Group Holdings PLC | | | 7,079 | | | | 59,747 | |
Imperial Brands PLC | | | 4,162 | | | | 93,178 | |
ITV PLC | | | 22,816 | | | | 18,220 | |
J Sainsbury PLC | | | 11,813 | | | | 29,398 | |
Janus Henderson Group PLC | | | 1,879 | | | | 44,175 | |
Johnson Matthey PLC | | | 7,280 | | | | 171,667 | |
Kingfisher PLC | | | 95,442 | | | | 285,227 | |
Linde PLC(a) | | | 10,958 | | | | 3,150,754 | |
Lloyds Banking Group PLC | | | 255,326 | | | | 131,367 | |
Phoenix Group Holdings PLC | | | 4,714 | | | | 33,962 | |
RELX PLC | | | 5,763 | | | | 156,473 | |
Rentokil Initial PLC | | | 31,202 | | | | 180,877 | |
Rightmove PLC | | | 81,966 | | | | 568,011 | |
Smiths Group PLC | | | 4,091 | | | | 69,960 | |
WPP PLC | | | 14,618 | | | | 147,660 | |
| | | | | | | | |
| | | | | | | 12,322,360 | |
| | | | | | | | |
| Security | | Shares | | | Value | |
| |
| | |
United States — 56.4% | | | | | | | | |
Abbott Laboratories | | | 24,330 | | | $ | 2,643,455 | |
AbbVie, Inc. | | | 10,690 | | | | 1,637,280 | |
Adobe, Inc.(a) | | | 5,483 | | | | 2,007,107 | |
Advance Auto Parts, Inc. | | | 77 | | | | 13,328 | |
Aflac, Inc. | | | 314 | | | | 17,373 | |
Agilent Technologies, Inc. | | | 25,602 | | | | 3,040,750 | |
Alphabet, Inc., Class A(a) | | | 2,734 | | | | 5,958,097 | |
Alphabet, Inc., Class C(a) | | | 2,647 | | | | 5,790,180 | |
Altria Group, Inc. | | | 69,194 | | | | 2,890,233 | |
Amazon.com, Inc.(a) | | | 42,342 | | | | 4,497,144 | |
Ameren Corp. | | | 651 | | | | 58,824 | |
American Express Co. | | | 7,446 | | | | 1,032,165 | |
American Homes 4 Rent, Class A | | | 8,353 | | | | 296,030 | |
American Tower Corp. | | | 615 | | | | 157,188 | |
Ameriprise Financial, Inc. | | | 1,546 | | | | 367,453 | |
Amgen, Inc. | | | 4,524 | | | | 1,100,689 | |
Amphenol Corp., Class A | | | 1,355 | | | | 87,235 | |
APA Corp. | | | 5,434 | | | | 189,647 | |
Apple, Inc. | | | 124,784 | | | | 17,060,469 | |
Applied Materials, Inc. | | | 12,628 | | | | 1,148,895 | |
AT&T, Inc. | | | 63,428 | | | | 1,329,451 | |
Atmos Energy Corp. | | | 492 | | | | 55,153 | |
Automatic Data Processing, Inc. | | | 112 | | | | 23,524 | |
AutoNation, Inc.(a) | | | 290 | | | | 32,410 | |
AutoZone, Inc.(a) | | | 5 | | | | 10,746 | |
AvalonBay Communities, Inc. | | | 937 | | | | 182,012 | |
Bank of America Corp. | | | 132,842 | | | | 4,135,371 | |
Bank of New York Mellon Corp. | | | 16,933 | | | | 706,275 | |
Berkshire Hathaway, Inc., Class B(a) | | | 4,197 | | | | 1,145,865 | |
Biogen, Inc.(a) | | | 1,893 | | | | 386,058 | |
BioMarin Pharmaceutical, Inc.(a) | | | 3,360 | | | | 278,443 | |
Black Hills Corp. | | | 765 | | | | 55,669 | |
Boeing Co.(a) | | | 11,364 | | | | 1,553,686 | |
Booking Holdings, Inc.(a) | | | 597 | | | | 1,044,147 | |
Booz Allen Hamilton Holding Corp. | | | 2,343 | | | | 211,714 | |
Boston Scientific Corp.(a) | | | 36,807 | | | | 1,371,797 | |
Brighthouse Financial, Inc.(a) | | | 6,277 | | | | 257,483 | |
Bristol-Myers Squibb Co. | | | 13,217 | | | | 1,017,709 | |
Brixmor Property Group, Inc. | | | 749 | | | | 15,137 | |
Brown-Forman Corp., Class B | | | 4,584 | | | | 321,613 | |
Builders FirstSource, Inc.(a) | | | 309 | | | | 16,593 | |
Cadence Design Systems, Inc.(a) | | | 2,498 | | | | 374,775 | |
Capital One Financial Corp. | | | 10,466 | | | | 1,090,453 | |
CBRE Group, Inc., Class A(a) | | | 4,489 | | | | 330,435 | |
Charles Schwab Corp. | | | 13,031 | | | | 823,299 | |
Chevron Corp. | | | 7,030 | | | | 1,017,803 | |
Ciena Corp.(a) | | | 455 | | | | 20,794 | |
Cigna Corp. | | | 8,845 | | | | 2,330,834 | |
Cisco Systems, Inc. | | | 13,134 | | | | 560,034 | |
Citigroup, Inc. | | | 14,486 | | | | 666,211 | |
CMS Energy Corp. | | | 3,012 | | | | 203,310 | |
Coca-Cola Co. | | | 9,305 | | | | 585,378 | |
Cognizant Technology Solutions Corp., Class A | | | 10,664 | | | | 719,713 | |
Colgate-Palmolive Co. | | | 1,288 | | | | 103,220 | |
Comcast Corp., Class A | | | 69,667 | | | | 2,733,733 | |
Costco Wholesale Corp. | | | 5,525 | | | | 2,648,022 | |
Crown Castle International Corp. | | | 10,087 | | | | 1,698,449 | |
CubeSmart | | | 6,406 | | | | 273,664 | |
CVS Health Corp. | | | 1,611 | | | | 149,275 | |
Danaher Corp. | | | 5,646 | | | | 1,431,374 | |
Devon Energy Corp. | | | 5,630 | | | | 310,269 | |
| | |
SCHEDULE OF INVESTMENTS | | 17 |
| | |
Schedule of Investments (continued) June 30, 2022 | | BlackRock Advantage Global Fund, Inc. (Percentages shown are based on Net Assets) |
| | | | | | | | |
| Security | | Shares | | | Value | |
| |
| | |
United States (continued) | | | | | | | | |
Dick’s Sporting Goods, Inc. | | | 619 | | | $ | 46,654 | |
Discover Financial Services | | | 4,582 | | | | 433,366 | |
Dominion Energy, Inc. | | | 6,347 | | | | 506,554 | |
DTE Energy Co. | | | 14,334 | | | | 1,816,835 | |
DuPont de Nemours, Inc. | | | 5,862 | | | | 325,810 | |
DXC Technology Co.(a) | | | 634 | | | | 19,217 | |
East West Bancorp, Inc. | | | 1,211 | | | | 78,473 | |
Eaton Corp. PLC | | | 884 | | | | 111,375 | |
eBay, Inc. | | | 1,801 | | | | 75,048 | |
Ecolab, Inc. | | | 485 | | | | 74,574 | |
Edison International | | | 1,006 | | | | 63,619 | |
Edwards Lifesciences Corp.(a) | | | 4,047 | | | | 384,829 | |
Electronic Arts, Inc. | | | 171 | | | | 20,802 | |
Elevance Health, Inc. | | | 679 | | | | 327,672 | |
Eli Lilly & Co. | | | 6,954 | | | | 2,254,695 | |
Entergy Corp. | | | 11,234 | | | | 1,265,398 | |
EOG Resources, Inc. | | | 17,229 | | | | 1,902,771 | |
EPAM Systems, Inc.(a) | | | 385 | | | | 113,490 | |
Equinix, Inc. | | | 77 | | | | 50,591 | |
Equitable Holdings, Inc. | | | 875 | | | | 22,811 | |
Equity Residential | | | 12,225 | | | | 882,890 | |
Estee Lauder Cos., Inc., Class A | | | 1,568 | | | | 399,323 | |
Exelixis, Inc.(a) | | | 1,638 | | | | 34,103 | |
Expedia Group, Inc.(a) | | | 2,392 | | | | 226,833 | |
Expeditors International of Washington, Inc. | | | 2,693 | | | | 262,460 | |
Exxon Mobil Corp. | | | 48,353 | | | | 4,140,951 | |
Fidelity National Information Services, Inc. | | | 3,144 | | | | 288,211 | |
Flex Ltd.(a) | | | 1,834 | | | | 26,538 | |
Fox Corp., Class A | | | 4,857 | | | | 156,201 | |
Garmin Ltd. | | | 1,692 | | | | 166,239 | |
Gartner, Inc.(a) | | | 3,783 | | | | 914,843 | |
General Dynamics Corp. | | | 18,088 | | | | 4,001,970 | |
General Electric Co. | | | 8,993 | | | | 572,584 | |
General Motors Co.(a) | | | 5,548 | | | | 176,205 | |
Genpact Ltd. | | | 511 | | | | 21,646 | |
Gilead Sciences, Inc. | | | 11,473 | | | | 709,146 | |
Global Payments, Inc. | | | 2,047 | | | | 226,480 | |
Halliburton Co. | | | 1,465 | | | | 45,942 | |
Harley-Davidson, Inc. | | | 625 | | | | 19,788 | |
Hartford Financial Services Group, Inc. | | | 5,008 | | | | 327,673 | |
HEICO Corp., Class A | | | 510 | | | | 53,744 | |
Hewlett Packard Enterprise Co. | | | 58,831 | | | | 780,099 | |
Highwoods Properties, Inc. | | | 417 | | | | 14,257 | |
Hologic, Inc.(a) | | | 1,916 | | | | 132,779 | |
Home Depot, Inc. | | | 7,957 | | | | 2,182,366 | |
Honeywell International, Inc. | | | 15,165 | | | | 2,635,829 | |
HP, Inc. | | | 12,912 | | | | 423,255 | |
IDACORP, Inc. | | | 114 | | | | 12,075 | |
IDEXX Laboratories, Inc.(a) | | | 2,201 | | | | 771,957 | |
Incyte Corp.(a) | | | 489 | | | | 37,149 | |
Intel Corp. | | | 116,771 | | | | 4,368,403 | |
International Game Technology PLC | | | 1,362 | | | | 25,279 | |
Intuit, Inc. | | | 2,629 | | | | 1,013,322 | |
Invesco Ltd. | | | 7,698 | | | | 124,169 | |
Invitation Homes, Inc. | | | 2,988 | | | | 106,313 | |
Jefferies Financial Group, Inc. | | | 665 | | | | 18,367 | |
Johnson & Johnson | | | 34,835 | | | | 6,183,561 | |
Jones Lang LaSalle, Inc.(a) | | | 164 | | | | 28,677 | |
JPMorgan Chase & Co. | | | 49,190 | | | | 5,539,286 | |
Juniper Networks, Inc. | | | 6,534 | | | | 186,219 | |
Keysight Technologies, Inc.(a) | | | 3,263 | | | | 449,805 | |
| | | | | | | | |
| Security | | Shares | | | Value | |
| |
| | |
United States (continued) | | | | | | | | |
KLA Corp. | | | 386 | | | $ | 123,165 | |
Lam Research Corp. | | | 194 | | | | 82,673 | |
Lamar Advertising Co., Class A | | | 164 | | | | 14,427 | |
Lennar Corp., Class A | | | 5,154 | | | | 363,718 | |
Lincoln National Corp. | | | 8,296 | | | | 388,004 | |
Lockheed Martin Corp. | | | 5,860 | | | | 2,519,566 | |
Louisiana-Pacific Corp. | | | 1,941 | | | | 101,728 | |
Lowe’s Cos., Inc. | | | 6,973 | | | | 1,217,974 | |
LyondellBasell Industries NV, Class A | | | 3,412 | | | | 298,414 | |
Macy’s, Inc. | | | 1,526 | | | | 27,956 | |
Manhattan Associates, Inc.(a) | | | 1,815 | | | | 207,999 | |
ManpowerGroup, Inc. | | | 185 | | | | 14,136 | |
Marsh & McLennan Cos., Inc. | | | 1,672 | | | | 259,578 | |
Mastercard, Inc., Class A | | | 3,819 | | | | 1,204,818 | |
Merck & Co., Inc. | | | 56,849 | | | | 5,182,923 | |
Meta Platforms, Inc., Class A(a) | | | 19,376 | | | | 3,124,380 | |
MetLife, Inc. | | | 60,155 | | | | 3,777,132 | |
Mettler-Toledo International, Inc.(a) | | | 673 | | | | 773,122 | |
Microchip Technology, Inc. | | | 744 | | | | 43,212 | |
Micron Technology, Inc. | | | 1,978 | | | | 109,344 | |
Microsoft Corp. | | | 61,064 | | | | 15,683,067 | |
Mid-America Apartment Communities, Inc. | | | 810 | | | | 141,483 | |
Moderna, Inc.(a) | | | 993 | | | | 141,850 | |
Mohawk Industries, Inc.(a) | | | 453 | | | | 56,213 | |
Monolithic Power Systems, Inc. | | | 2,383 | | | | 915,167 | |
Moody’s Corp. | | | 1,040 | | | | 282,849 | |
Mosaic Co. | | | 7,047 | | | | 332,830 | |
NetApp, Inc. | | | 523 | | | | 34,121 | |
Nexstar Media Group, Inc., Class A | | | 307 | | | | 50,004 | |
NextEra Energy, Inc. | | | 4,408 | | | | 341,444 | |
Norfolk Southern Corp. | | | 100 | | | | 22,729 | |
NVIDIA Corp. | | | 12,001 | | | | 1,819,232 | |
OGE Energy Corp. | | | 2,329 | | | | 89,806 | |
Old Dominion Freight Line, Inc. | | | 333 | | | | 85,341 | |
Ovintiv, Inc. | | | 1,101 | | | | 48,703 | |
Owens Corning | | | 2,779 | | | | 206,508 | |
Palo Alto Networks, Inc.(a) | | | 296 | | | | 146,206 | |
Paychex, Inc. | | | 14,358 | | | | 1,634,945 | |
Paycom Software, Inc.(a) | | | 216 | | | | 60,506 | |
PayPal Holdings, Inc.(a) | | | 5,981 | | | | 417,713 | |
PepsiCo, Inc. | | | 783 | | | | 130,495 | |
Pfizer, Inc. | | | 50,255 | | | | 2,634,870 | |
Philip Morris International, Inc. | | | 32,609 | | | | 3,219,813 | |
Phillips 66 | | | 2,310 | | | | 189,397 | |
PNC Financial Services Group, Inc. | | | 4,608 | | | | 727,004 | |
PotlatchDeltic Corp. | | | 2 | | | | 88 | |
Power Integrations, Inc. | | | 242 | | | | 18,152 | |
Principal Financial Group, Inc. | | | 1,229 | | | | 82,085 | |
Procter & Gamble Co. | | | 460 | | | | 66,143 | |
Prologis, Inc. | | | 6,759 | | | | 795,196 | |
Prudential Financial, Inc. | | | 135 | | | | 12,917 | |
Public Service Enterprise Group, Inc. | | | 8,076 | | | | 511,049 | |
PVH Corp. | | | 487 | | | | 27,710 | |
Qualcomm, Inc. | | | 9,586 | | | | 1,224,516 | |
Qualys, Inc.(a) | | | 276 | | | | 34,815 | |
Ralph Lauren Corp., Class A | | | 4,339 | | | | 388,991 | |
Raytheon Technologies Corp. | | | 357 | | | | 34,311 | |
Regeneron Pharmaceuticals, Inc.(a) | | | 407 | | | | 240,590 | |
Reliance Steel & Aluminum Co. | | | 1,456 | | | | 247,316 | |
Salesforce, Inc.(a) | | | 2,133 | | | | 352,030 | |
SBA Communications Corp. | | | 1,956 | | | | 626,018 | |
| | |
| 18 | | 2 0 2 2 BLACK ROCK ANNUAL REPORT TO SHAREHOLDERS |
| | |
Schedule of Investments (continued) June 30, 2022 | | BlackRock Advantage Global Fund, Inc. (Percentages shown are based on Net Assets) |
| | | | | | | | |
| Security | | Shares | | | Value | |
| |
| | |
United States (continued) | | | | | | | | |
Schlumberger NV | | | 31,195 | | | $ | 1,115,533 | |
Semtech Corp.(a) | | | 668 | | | | 36,720 | |
Service Corp. International | | | 2,559 | | | | 176,878 | |
ServiceNow, Inc.(a) | | | 2,645 | | | | 1,257,750 | |
Simon Property Group, Inc. | | | 11,526 | | | | 1,094,048 | |
Sirius XM Holdings, Inc.(b) | | | 144,875 | | | | 888,084 | |
SiteOne Landscape Supply, Inc.(a) | | | 492 | | | | 58,484 | |
Snap-on, Inc. | | | 4,849 | | | | 955,398 | |
Southern Co. | | | 19,563 | | | | 1,395,038 | |
State Street Corp. | | | 4,152 | | | | 255,971 | |
Stifel Financial Corp. | | | 4,229 | | | | 236,909 | |
STORE Capital Corp. | | | 880 | | | | 22,950 | |
Sun Communities, Inc. | | | 215 | | | | 34,262 | |
Synchrony Financial | | | 5,082 | | | | 140,365 | |
Tesla, Inc.(a) | | | 2,563 | | | | 1,725,975 | |
Texas Instruments, Inc. | | | 4,672 | | | | 717,853 | |
Textron, Inc. | | | 2,514 | | | | 153,530 | |
Thermo Fisher Scientific, Inc. | | | 236 | | | | 128,214 | |
Toll Brothers, Inc. | | | 1,608 | | | | 71,717 | |
Travel & Leisure Co. | | | 3,405 | | | | 132,182 | |
Travelers Cos., Inc. | | | 9,707 | | | | 1,641,745 | |
Truist Financial Corp. | | | 1,327 | | | | 62,940 | |
UDR, Inc. | | | 1,473 | | | | 67,817 | |
Ulta Beauty, Inc.(a) | | | 1,114 | | | | 429,425 | |
Union Pacific Corp. | | | 9,167 | | | | 1,955,138 | |
United Parcel Service, Inc., Class B | | | 9,183 | | | | 1,676,265 | |
United Rentals, Inc.(a) | | | 927 | | | | 225,178 | |
United Therapeutics Corp.(a) | | | 97 | | | | 22,857 | |
UnitedHealth Group, Inc. | | | 4,254 | | | | 2,184,982 | |
Unum Group | | | 761 | | | | 25,889 | |
Valero Energy Corp. | | | 1,385 | | | | 147,198 | |
Vertex Pharmaceuticals, Inc.(a) | | | 1,089 | | | | 306,869 | |
Viatris, Inc. | | | 76,435 | | | | 800,274 | |
Visa, Inc., Class A | | | 28,886 | | | | 5,687,365 | |
Vistra Corp. | | | 5,805 | | | | 132,644 | |
Voya Financial, Inc. | | | 14,017 | | | | 834,432 | |
Walt Disney Co.(a) | | | 1,154 | | | | 108,938 | |
Waste Management, Inc. | | | 126 | | | | 19,275 | |
Waters Corp.(a) | | | 139 | | | | 46,006 | |
Wells Fargo & Co. | | | 38,532 | | | | 1,509,298 | |
Western Digital Corp.(a) | | | 1,568 | | | | 70,293 | |
Whirlpool Corp. | | | 617 | | | | 95,555 | |
Wintrust Financial Corp. | | | 469 | | | | 37,590 | |
Workday, Inc., Class A(a) | | | 5,778 | | | | 806,493 | |
Zoetis, Inc., Class A | | | 8,409 | | | | 1,445,423 | |
| | | | | | | | |
| | | | | | | 215,643,206 | |
| | | | | | | | |
| | |
Total Common Stocks — 97.3%
(Cost: $376,878,988) | | | | | | | 372,194,308 | |
| | | | | | | | |
| | |
Preferred Securities | | | | | | | | |
| | |
| Preferred Stocks — 0.6% | | | | | | |
| | |
| Brazil — 0.2% | | | | | | |
Banco Bradesco SA, Preference Shares | | | 173,699 | | | | 570,871 | |
Gerdau SA, Preference Shares | | | 1,514 | | | | 6,466 | |
| | | | | | | | |
| | | | | | | 577,337 | |
| | | | | | | | |
| | |
| Germany — 0.4% | | | | | | |
Bayerische Motoren Werke AG, Preference Shares | | | 228 | | | | 16,262 | |
| | | | | | | | |
| Security | | Shares | | | Value | |
| |
| | |
Germany (continued) | | | | | | | | |
Fuchs Petrolub SE, Preference Shares | | | 2,117 | | | $ | 59,227 | |
Porsche Automobil Holding SE, Preference Shares | | | 220 | | | | 14,632 | |
Sartorius AG, Preference Shares | | | 523 | | | | 183,557 | |
Volkswagen AG, Preference Shares | | | 9,746 | | | | 1,312,198 | |
| | | | | | | | |
| | | | | | | 1,585,876 | |
| | | | | | | | |
| | |
Total Preferred Securities — 0.6%
(Cost: $2,502,715) | | | | | | | 2,163,213 | |
| | | | | | | | |
| |
Total Long-Term Investments — 97.9%
(Cost: $379,381,703) | | | | 374,357,521 | |
| | | | | | | | |
| | |
Short-Term Securities | | | | | | | | |
| | |
Money Market Funds — 2.3% | | | | | | | | |
BlackRock Liquidity Funds, T-Fund, Institutional Class, 1.33%(f)(g) | | | 7,775,998 | | | | 7,775,998 | |
SL Liquidity Series, LLC, Money Market Series, 1.73%(f)(g)(h) | | | 780,291 | | | | 780,135 | |
| | | | | | | | |
| | | | | | | 8,556,133 | |
| | | | | | | | |
| | |
| | | Par (000) | | | | |
|
Time Deposits — 0.0% | |
| |
| Canada — 0.0% | | | | |
Royal Bank of Canada, 0.00%, 07/01/22 | | CAD | 28 | | | | 22,061 | |
| | | | | | | | |
| |
| Hong Kong — 0.0% | | | | |
Brown Brothers Harriman & Co., 0.00%, 07/03/22 | | HKD | 8 | | | | 1,022 | |
| | | | | | | | |
| |
| Japan — 0.0% | | | | |
Sumitomo Bank Tokyo, (0.25%), 07/01/22 | | JPY | 4,523 | | | | 33,335 | |
| | | | | | | | |
| |
| Sweden — 0.0% | | | | |
Brown Brothers Harriman & Co., (0.35%), 07/01/22 | | SEK | 38 | | | | 3,679 | |
| | | | | | | | |
| |
| United States — 0.0% | | | | |
Barclays, 0.83%, 07/01/22 | | USD | 68 | | | | 68,104 | |
| | | | | | | | |
| | | | | | | 128,201 | |
| | | | | | | | |
| | |
Total Short-Term Securities — 2.3%
(Cost: $8,684,414) | | | | | | | 8,684,334 | |
| | | | | | | | |
| | |
Total Investments — 100.2%
(Cost: $388,066,117) | | | | | | | 383,041,855 | |
| |
| Liabilities in Excess of Other Assets — (0.2)% | | | (592,230) | |
| | | | | | | | |
| | |
Net Assets — 100.0% | | | | | | $ | 382,449,625 | |
| | | | | | | | |
| (a) | Non-income producing security. |
| (b) | All or a portion of this security is on loan. |
| (c) | Security exempt from registration pursuant to Rule 144A under the Securities Act of 1933, as amended. These securities may be resold in transactions exempt from registration to qualified institutional investors. |
| (d) | Security is valued using significant unobservable inputs and is classified as Level 3 in the fair value hierarchy. |
| (e) | This security may be resold to qualified foreign investors and foreign institutional buyers under Regulation S of the Securities Act of 1933. |
| (f) | Affiliate of the Fund. |
| (g) | Annualized 7-day yield as of period end. |
| (h) | All or a portion of this security was purchased with the cash collateral from loaned securities. |
| | |
SCHEDULE OF INVESTMENTS | | 19 |
| | |
Schedule of Investments (continued) June 30, 2022 | | BlackRock Advantage Global Fund, Inc. |
Affiliates
Investments in issuers considered to be affiliate(s) of the Fund during the year ended June 30, 2022 for purposes of Section 2(a)(3) of the Investment Company Act of 1940, as amended, were as follows:
| | | | | | | | | | | | | | | | | | | | | | | | | | | | | | | | | | | | |
| | | | | | | | | | |
| Affiliated Issuer | | Value at
06/30/21 | | | Purchases
at Cost | | | Proceeds from Sales | | | Net
Realized
Gain (Loss) | | | Change in
Unrealized
Appreciation
(Depreciation) | | | Value at
06/30/22 | | | Shares
Held at
06/30/22 | | | Income | | | Capital Gain
Distributions
from
Underlying
Funds | |
| | | | | | | | | |
BlackRock Liquidity Funds, T-Fund, Institutional Class | | $ | 15,097,478 | | | $ | — | | | $ | (7,321,480 | )(a) | | $ | — | | | $ | — | | | $ | 7,775,998 | | | | 7,775,998 | | | $ | 12,882 | | | $ | — | |
SL Liquidity Series, LLC, Money Market Series | | | 1,213,407 | | | | — | | | | (432,257 | )(a) | | | (930 | ) | | | (85 | ) | | | 780,135 | | | | 780,291 | | | | 15,155 | (b) | | | — | |
| | | | | | | | | | | | | | | | | | | | | | | | | | | | | | | | | | | | |
| | | | | | | | | |
| | | | | | | | | | | | | | $ | (930 | ) | | $ | (85 | ) | | $ | 8,556,133 | | | | | | | $ | 28,037 | | | $ | — | |
| | | | | | | | | | | | | | | | | | | | | | | | | | | | | | | | | | | | |
| | (a) | Represents net amount purchased (sold). | |
| | (b) | All or a portion represents securities lending income earned from the reinvestment of cash collateral from loaned securities, net of fees and collateral investment expenses, and other payments to and from borrowers of securities. | |
Derivative Financial Instruments Outstanding as of Period End
Futures Contracts
| | | | | | | | | | | | | | | | |
| | | | | |
| Description | | Number of Contracts | | | Expiration Date | | | Notional Amount (000) | | | Value/ Unrealized Appreciation (Depreciation) | |
| | | | |
| Long Contracts | | | | | | | | | | | | |
MSCI EAFE Index | | | 23 | | | | 09/16/22 | | | $ | 2,135 | | | $ | (8,765 | ) |
MSCI Emerging Markets Index | | | 18 | | | | 09/16/22 | | | | 902 | | | | 4,676 | |
S&P 500 E-Mini Index | | | 24 | | | | 09/16/22 | | | | 4,547 | | | | (112,522 | ) |
| | | | | | | | | | | | | | | | |
| | | | | | | | | | | | | | $ | (116,611 | ) |
| | | | | | | | | | | | | | | | |
Derivative Financial Instruments Categorized by Risk Exposure
As of period end, the fair values of derivative financial instruments located in the Statements of Assets and Liabilities were as follows:
| | | | | | | | | | | | | | | | | | | | | | | | | | | | |
| | | | | | | | |
| | | Commodity
Contracts | | | Credit
Contracts | | | Equity
Contracts | | | Foreign
Currency
Exchange
Contracts | | | Interest
Rate
Contracts | | | Other
Contracts | | | Total | |
| | | | | | | |
Assets — Derivative Financial Instruments | | | | | | | | | | | | | | | | | | | | | | | | | | | | |
Futures contracts | | | | | | | | | | | | | | | | | | | | | | | | | | | | |
Unrealized appreciation on futures contracts(a) | | $ | — | | | $ | — | | | $ | 4,676 | | | $ | — | | | $ | — | | | $ | — | | | $ | 4,676 | |
| | | | | | | | | | | | | | | | | | | | | | | | | | | | |
| | | | | | | |
Liabilities — Derivative Financial Instruments | | | | | | | | | | | | | | | | | | | | | | | | | | | | |
Futures contracts | | | | | | | | | | | | | | | | | | | | | | | | | | | | |
Unrealized depreciation on futures contracts(a) | | $ | — | | | $ | — | | | $ | 121,287 | | | $ | — | | | $ | — | | | $ | — | | | $ | 121,287 | |
| | | | | | | | | | | | | | | | | | | | | | | | | | | | |
| | (a) | Net cumulative unrealized appreciation (depreciation) on futures contracts and centrally cleared swaps, if any, are reported in the Schedule of Investments. In the Statements of Assets and Liabilities, only current day’s variation margin is reported in receivables or payables and the net cumulative unrealized appreciation (depreciation) is included in accumulated earnings (loss). | |
For the period ended June 30, 2022, the effect of derivative financial instruments in the Statements of Operations was as follows:
| | | | | | | | | | | | | | | | | | | | | | | | | | | | |
| | | | | | | | |
| | | Commodity Contracts | | | Credit Contracts | | | Equity Contracts | | | Foreign Currency
Exchange Contracts | | | Interest Rate Contracts | | | Other Contracts | | | Total | |
| | | | | | | |
Net Realized Gain (Loss) from: | | | | | | | | | | | | | | | | | | | | | | | | | | | | |
Futures contracts | | $ | — | | | $ | — | | | $ | (1,003,072 | ) | | $ | — | | | $ | — | | | $ | — | | | $ | (1,003,072 | ) |
| | | | | | | | | | | | | | | | | | | | | | | | | | | | |
| | | | | | | |
Net Change in Unrealized Appreciation (Depreciation) on: | | | | | | | | | | | | | | | | | | | | | | | | | | | | |
Futures contracts | | $ | — | | | $ | — | | | $ | (117,648 | ) | | $ | — | | | $ | — | | | $ | — | | | $ | (117,648 | ) |
| | | | | | | | | | | | | | | | | | | | | | | | | | | | |
| | |
| 20 | | 2 0 2 2 BLACK ROCK ANNUAL REPORT TO SHAREHOLDERS |
| | |
Schedule of Investments (continued) June 30, 2022 | | BlackRock Advantage Global Fund, Inc. |
Average Quarterly Balances of Outstanding Derivative Financial Instruments
| | | | |
| | |
Futures contracts: | | | | |
Average notional value of contracts — long | | $ | 8,743,300 | |
For more information about the Fund’s investment risks regarding derivative financial instruments, refer to the Notes to Financial Statements.
Fair Value Hierarchy as of Period End
Various inputs are used in determining the fair value of financial instruments. For a description of the input levels and information about the Fund’s policy regarding valuation of financial instruments, refer to the Notes to Financial Statements.
The following table summarizes the Fund’s financial instruments categorized in the fair value hierarchy. The breakdown of the Fund’s financial instruments into major categories is disclosed in the Schedule of Investments above.
| | | | | | | | | | | | | | | | |
| | | | | |
| | | Level 1 | | | Level 2 | | | Level 3 | | | Total | |
| | | | |
Assets | | | | | | | | | | | | | | | | |
Investments | | | | | | | | | | | | | | | | |
Long-Term Investments | | | | | | | | | | | | | | | | |
Common Stocks | | | | | | | | | | | | | | | | |
| | | | |
Australia | | $ | — | | | $ | 8,046,559 | | | $ | — | | | $ | 8,046,559 | |
Austria | | | — | | | | 92,484 | | | | — | | | | 92,484 | |
Belgium | | | — | | | | 439,772 | | | | — | | | | 439,772 | |
Brazil | | | 1,064,768 | | | | — | | | | — | | | | 1,064,768 | |
Canada | | | 16,886,357 | | | | — | | | | — | | | | 16,886,357 | |
China | | | 881,064 | | | | 15,829,178 | | | | 101,749 | | | | 16,811,991 | |
Colombia | | | 14,479 | | | | — | | | | — | | | | 14,479 | |
Denmark | | | — | | | | 4,108,536 | | | | — | | | | 4,108,536 | |
Finland | | | — | | | | 2,725,273 | | | | — | | | | 2,725,273 | |
France | | | — | | | | 9,853,459 | | | | — | | | | 9,853,459 | |
Germany | | | — | | | | 11,806,117 | | | | — | | | | 11,806,117 | |
Hong Kong | | | — | | | | 3,090,032 | | | | — | | | | 3,090,032 | |
Hungary | | | — | | | | 797,635 | | | | — | | | | 797,635 | |
India | | | — | | | | 2,299,559 | | | | — | | | | 2,299,559 | |
Indonesia | | | — | | | | 14,946 | | | | — | | | | 14,946 | |
Ireland | | | 4,398,916 | | | | 1,535,226 | | | | — | | | | 5,934,142 | |
Israel | | | 2,345,044 | | | | 1,244,411 | | | | — | | | | 3,589,455 | |
Italy | | | — | | | | 1,718,284 | | | | — | | | | 1,718,284 | |
Japan | | | — | | | | 15,172,964 | | | | — | | | | 15,172,964 | |
Luxembourg | | | — | | | | 599,963 | | | | — | | | | 599,963 | |
Malaysia | | | 34,688 | | | | 2,587,434 | | | | — | | | | 2,622,122 | |
Mexico | | | 172,360 | | | | — | | | | — | | | | 172,360 | |
Netherlands | | | — | | | | 6,799,987 | | | | — | | | | 6,799,987 | |
New Zealand | | | — | | | | 32,863 | | | | — | | | | 32,863 | |
Norway | | | — | | | | 3,368,753 | | | | — | | | | 3,368,753 | |
Poland | | | — | | | | 21,854 | | | | — | | | | 21,854 | |
Portugal | | | — | | | | 362,396 | | | | — | | | | 362,396 | |
Russia | | | — | | | | — | | | | 33 | | | | 33 | |
Saudi Arabia | | | — | | | | 2,211,842 | | | | — | | | | 2,211,842 | |
Singapore | | | 21,858 | | | | 533,282 | | | | — | | | | 555,140 | |
South Africa | | | 217,660 | | | | 1,486,939 | | | | — | | | | 1,704,599 | |
South Korea | | | 28,382 | | | | 3,826,221 | | | | 3,947 | | | | 3,858,550 | |
Spain | | | — | | | | 813,842 | | | | — | | | | 813,842 | |
Sweden | | | — | | | | 2,715,382 | | | | — | | | | 2,715,382 | |
Switzerland | | | 224,150 | | | | 4,415,979 | | | | — | | | | 4,640,129 | |
Taiwan | | | — | | | | 8,602,032 | | | | — | | | | 8,602,032 | |
Thailand | | | 25,691 | | | | 123,361 | | | | — | | | | 149,052 | |
Turkey | | | 13,142 | | | | 517,889 | | | | — | | | | 531,031 | |
United Kingdom | | | 3,382,423 | | | | 8,939,937 | | | | — | | | | 12,322,360 | |
United States | | | 215,643,206 | | | | — | | | | — | | | | 215,643,206 | |
Preferred Securities | | | | | | | | | | | | | | | | |
Preferred Stocks | | | | | | | | | | | | | | | | |
Brazil | | | 577,337 | | | | — | | | | — | | | | 577,337 | |
Germany | | | — | | | | 1,585,876 | | | | — | | | | 1,585,876 | |
| | |
SCHEDULE OF INVESTMENTS | | 21 |
| | |
Schedule of Investments (continued) June 30, 2022 | | BlackRock Advantage Global Fund, Inc. |
Fair Value Hierarchy as of Period End (continued)
| | | | | | | | | | | | | | | | |
| | | | | |
| | | Level 1 | | | Level 2 | | | Level 3 | | | Total | |
| | | | |
Short-Term Securities | | | | | | | | | | | | | | | | |
Money Market Funds | | $ | 7,775,998 | | | $ | — | | | $ | — | | | $ | 7,775,998 | |
Time Deposits | | | — | | | | 128,201 | | | | — | | | | 128,201 | |
| | | | | | | | | | | | | | | | |
| | | | |
| | $ | 253,707,523 | | | $ | 128,448,468 | | | $ | 105,729 | | | | 382,261,720 | |
| | | | | | | | | | | | | | | | |
| | | | |
Investments Valued at NAV(a) | | | | | | | | | | | | | | | 780,135 | |
| | | | | | | | | | | | | | | | |
| | | | |
| | | | | | | | | | | | | | $ | 383,041,855 | |
| | | | | | | | | | | | | | | | |
| | | | |
Derivative Financial Instruments(b) | | | | | | | | | | | | | | | | |
Assets | | | | | | | | | | | | | | | | |
Equity Contracts | | $ | 4,676 | | | $ | — | | | $ | — | | | $ | 4,676 | |
Liabilities | | | | | | | | | | | | | | | | |
Equity Contracts | | | (121,287 | ) | | | — | | | | — | | | | (121,287 | ) |
| | | | | | | | | | | | | | | | |
| | $ | (116,611 | ) | | $ | — | | | $ | — | | | $ | (116,611 | ) |
| | | | | | | | | | | | | | | | |
| | (a) | Certain investments of the Fund were fair valued using NAV per share as no quoted market value is available and therefore have been excluded from the fair value hierarchy. | |
| | (b) | Derivative financial instruments are futures contracts. Futures contracts are valued at the unrealized appreciation (depreciation) on the instrument. | |
See notes to financial statements.
| | |
| 22 | | 2 0 2 2 BLACK ROCK ANNUAL REPORT TO SHAREHOLDERS |
| | |
Schedule of Investments June 30, 2022 | | BlackRock EuroFund (Percentages shown are based on Net Assets) |
| | | | | | | | |
| Security | | Shares | | | Value | |
| | |
Common Stocks | | | | | | | | |
| | |
Belgium — 1.9% | | | | | | | | |
Azelis Group NV | | | 44,197 | | | $ | 967,083 | |
KBC Group NV | | | 12,212 | | | | 687,059 | |
| | | | | | | | |
| | | | | | | 1,654,142 | |
| | |
Denmark — 2.7% | | | | | | | | |
DSV A/S | | | 16,649 | | | | 2,341,137 | |
| | | | | | | | |
| | |
Finland — 2.3% | | | | | | | | |
Metso Outotec OYJ | | | 90,971 | | | | 686,638 | |
Neste OYJ | | | 29,443 | | | | 1,309,653 | |
| | | | | | | | |
| | | | | | | 1,996,291 | |
| | |
France — 37.8% | | | | | | | | |
Airbus SE | | | 25,013 | | | | 2,446,518 | |
BNP Paribas SA | | | 55,345 | | | | 2,647,260 | |
Dassault Systemes SE | | | 25,027 | | | | 927,022 | |
Legrand SA | | | 21,087 | | | | 1,565,678 | |
LVMH Moet Hennessy Louis Vuitton SE | | | 12,271 | | | | 7,520,621 | |
Pernod Ricard SA | | | 12,808 | | | | 2,367,876 | |
Sanofi | | | 18,879 | | | | 1,903,872 | |
Sartorius Stedim Biotech | | | 6,524 | | | | 2,058,437 | |
Schneider Electric SE | | | 30,188 | | | | 3,597,066 | |
Teleperformance | | | 8,261 | | | | 2,550,865 | |
TotalEnergies SE | | | 54,226 | | | | 2,854,292 | |
Vinci SA | | | 27,554 | | | | 2,473,286 | |
| | | | | | | | |
| | | | | | | 32,912,793 | |
| | |
Germany — 16.1% | | | | | | | | |
Commerzbank AG(a) | | | 102,973 | | | | 730,607 | |
CTS Eventim AG & Co. KGaA(a) | | | 24,810 | | | | 1,308,709 | |
Merck KGaA | | | 14,323 | | | | 2,429,485 | |
MTU Aero Engines AG | | | 11,205 | | | | 2,052,661 | |
Puma SE | | | 23,792 | | | | 1,578,516 | |
Rational AG | | | 1,355 | | | | 789,951 | |
Siemens AG, Registered Shares | | | 32,866 | | | | 3,378,510 | |
Symrise AG | | | 16,551 | | | | 1,805,138 | |
| | | | | | | | |
| | | | | | | 14,073,577 | |
| | |
Ireland — 1.2% | | | | | | | | |
Kingspan Group PLC | | | 17,088 | | | | 1,027,520 | |
| | | | | | | | |
| | |
Italy — 6.5% | | | | | | | | |
Ferrari NV | | | 8,461 | | | | 1,557,142 | |
FinecoBank Banca Fineco SpA | | | 138,140 | | | | 1,657,205 | |
Intesa Sanpaolo SpA | | | 671,765 | | | | 1,257,187 | |
Moncler SpA | | | 27,599 | | | | 1,189,131 | |
| | | | | | | | |
| | | | | | | 5,660,665 | |
| | |
Luxembourg — 0.8% | | | | | | | | |
Majorel Group Luxembourg SA | | | 25,860 | | | | 691,050 | |
| | | | | | | | |
| | |
Netherlands — 18.7% | | | | | | | | |
Adyen NV(a)(b) | | | 960 | | | | 1,385,407 | |
ASM International NV | | | 8,367 | | | | 2,081,770 | |
ASML Holding NV | | | 14,455 | | | | 6,829,090 | |
| | | | | | | | |
| Security | | Shares | | | Value | |
| | |
Netherlands (continued) | | | | | | | | |
BE Semiconductor Industries NV | | | 12,449 | | | $ | 594,865 | |
IMCD NV | | | 17,845 | | | | 2,440,028 | |
QIAGEN NV(a) | | | 28,587 | | | | 1,344,107 | |
Universal Music Group NV | | | 83,657 | | | | 1,676,153 | |
| | | | | | | | |
| | | | | | | 16,351,420 | |
| | |
| Portugal — 1.8% | | | | | | |
EDP - Energias de Portugal SA | | | 337,620 | | | | 1,573,421 | |
| | | | | | | | |
| | |
| Sweden — 1.0% | | | | | | |
Beijer Ref AB | | | 62,289 | | | | 854,190 | |
| | | | | | | | |
| | |
| Switzerland — 3.0% | | | | | | |
Sika AG, Registered Shares | | | 3,132 | | | | 722,982 | |
STMicroelectronics NV | | | 59,490 | | | | 1,881,375 | |
| | | | | | | | |
| | | | | | | 2,604,357 | |
| | | | | | | | |
| | |
| United Kingdom — 5.0% | | | | | | |
Allfunds Group PLC | | | 97,121 | | | | 746,453 | |
Linde PLC(a) | | | 9,090 | | | | 2,615,195 | |
RELX PLC | | | 38,584 | | | | 1,047,608 | |
| | | | | | | | |
| | | | | | | 4,409,256 | |
| | | | | | | | |
| |
Total Long-Term Investments — 98.8%
(Cost: $80,007,759) | | | | 86,149,819 | |
| | | | | | | | |
| | |
Short-Term Securities | | | | | | | | |
| | |
Money Market Funds — 3.8% | | | | | | | | |
BlackRock Liquidity Funds, T-Fund, Institutional Class, 1.33%(c)(d) | | | 492,237 | | | | 492,237 | |
SL Liquidity Series, LLC, Money Market Series, 1.73%(c)(d) | | | 2,813,819 | | | | 2,813,256 | |
| | | | | | | | |
| | | | | | | 3,305,493 | |
| | | | | | | | |
| | |
| | | Par (000) | | | | |
| | |
Time Deposits — 0.4% | | | | | | | | |
| | |
| United States — 0.4% | | | | | | |
Citibank, (0.79%), 07/01/22 | | EUR | 307 | | | | 321,547 | |
| | | | | | | | |
| |
Total Short-Term Securities — 4.2%
(Cost: $3,627,321) | | | | 3,627,040 | |
| | | | | | | | |
| |
Total Investments — 103.0%
(Cost: $83,635,080) | | | | 89,776,859 | |
| |
Liabilities in Excess of Other Assets — (3.0)% | | | | (2,634,678 | ) |
| | | | | | | | |
| | |
Net Assets — 100.0% | | | | | | $ | 87,142,181 | |
| | | | | | | | |
| (a) | Non-income producing security. |
| (b) | Security exempt from registration pursuant to Rule 144A under the Securities Act of 1933, as amended. These securities may be resold in transactions exempt from registration to qualified institutional investors. |
| (c) | Affiliate of the Fund. |
| (d) | Annualized 7-day yield as of period end. |
| | |
SCHEDULE OF INVESTMENTS | | 23 |
| | |
Schedule of Investments (continued) June 30, 2022 | | BlackRock EuroFund |
Affiliates
Investments in issuers considered to be affiliate(s) of the Fund during the year ended June 30, 2022 for purposes of Section 2(a)(3) of the Investment Company Act of 1940, as amended, were as follows:
| | | | | | | | | | | | | | | | | | | | | | | | | | | | | | | | | | | | |
| | | | | | | | | | | |
| Affiliated Issuer | | Value at 06/30/21 | | | Purchases at Cost | | | Proceeds from Sales | | | Net Realized
Gain (Loss) | | | Change in Unrealized Appreciation (Depreciation) | | | | Value at 06/30/22 | | | Shares Held at 06/30/22 | | | Income | | | Capital Gain Distributions from Underlying Funds | |
| | | | | | | | | | |
BlackRock Liquidity Funds, T-Fund, Institutional Class | | $ | 562,543 | | | $ | — | | | $ | (70,306 | )(a) | | $ | — | | | $ — | | | | $ | 492,237 | | | | 492,237 | | | $ | 661 | | | $ | — | |
| | | | | | | | | | |
SL Liquidity Series, LLC, Money Market Series | | | — | | | | 2,813,549 | (a) | | | — | | | | (12 | ) | | (281) | | | | | 2,813,256 | | | | 2,813,819 | | | | 73 | (b) | | | — | |
| | | | | | | | | | | | | | | | | | | | | | | | | | | | | | | | | | | | |
| | | | | | | | | | |
| | | | | | | | | | | | | | $ | (12 | ) | | $ (281) | | | | $ | 3,305,493 | | | | | | | $ | 734 | | | $ | — | |
| | | | | | | | | | | | | | | | | | | | | | | | | | | | | | | | | | | | |
| | (a) | Represents net amount purchased (sold). | |
| | (b) | All or a portion represents securities lending income earned from the reinvestment of cash collateral from loaned securities, net of fees and collateral investment expenses, and other payments to and from borrowers of securities. | |
Fair Value Hierarchy as of Period End
Various inputs are used in determining the fair value of financial instruments. For a description of the input levels and information about the Fund’s policy regarding valuation of financial instruments, refer to the Notes to Financial Statements.
The following table summarizes the Fund’s financial instruments categorized in the fair value hierarchy. The breakdown of the Fund’s financial instruments into major categories is disclosed in the Schedule of Investments above.
| | | | | | | | | | | | | | | | |
| | | | | |
| | | Level 1 | | | Level 2 | | | Level 3 | | | Total | |
| | | | |
Assets | | | | | | | | | | | | | | | | |
Investments | | | | | | | | | | | | | | | | |
Long-Term Investments | | | | | | | | | | | | | | | | |
Common Stocks | | | | | | | | | | | | | | | | |
Belgium | | $ | 967,083 | | | $ | 687,059 | | | $ | — | | | $ | 1,654,142 | |
Denmark | | | — | | | | 2,341,137 | | | | — | | | | 2,341,137 | |
Finland | | | — | | | | 1,996,291 | | | | — | | | | 1,996,291 | |
France | | | — | | | | 32,912,793 | | | | — | | | | 32,912,793 | |
Germany | | | — | | | | 14,073,577 | | | | — | | | | 14,073,577 | |
Ireland | | | — | | | | 1,027,520 | | | | — | | | | 1,027,520 | |
Italy | | | — | | | | 5,660,665 | | | | — | | | | 5,660,665 | |
Luxembourg | | | 691,050 | | | | — | | | | — | | | | 691,050 | |
Netherlands | | | — | | | | 16,351,420 | | | | — | | | | 16,351,420 | |
Portugal | | | — | | | | 1,573,421 | | | | — | | | | 1,573,421 | |
Sweden | | | — | | | | 854,190 | | | | — | | | | 854,190 | |
Switzerland | | | — | | | | 2,604,357 | | | | — | | | | 2,604,357 | |
United Kingdom | | | — | | | | 4,409,256 | | | | — | | | | 4,409,256 | |
Short-Term Securities | | | | | | | | | | | | | | | | |
Money Market Funds | | | 492,237 | | | | — | | | | — | | | | 492,237 | |
Time Deposits | | | — | | | | 321,547 | | | | — | | | | 321,547 | |
| | | | | | | | | | | | | | | | |
| | $ | 2,150,370 | | | $ | 84,813,233 | | | $ | — | | | | 86,963,603 | |
| | | | | | | | | | | | | | | | |
Investments Valued at NAV(a) | | | | | | | | | | | | | | | 2,813,256 | |
| | | | | | | | | | | | | | | | |
| | | | | | | | | | | | | | $ | 89,776,859 | |
| | | | | | | | | | | | | | | | |
| | (a) | Certain investments of the Fund were fair valued using NAV per share as no quoted market value is available and therefore have been excluded from the fair value hierarchy. | |
See notes to financial statements.
| | |
| 24 | | 2 0 2 2 BLACK ROCK ANNUAL REPORT TO SHAREHOLDERS |
Statements of Assets and Liabilities
June 30, 2022
| | | | | | | | | | | | |
| | | | | | BlackRock
Advantage Global
Fund, Inc. | | | BlackRock
EuroFund | |
| | | |
ASSETS | | | | | | | | | | | | |
Investments, at value — unaffiliated(a)(b) | | | | | | $ | 374,485,722 | | | $ | 86,471,366 | |
Investments, at value — affiliated(c) | | | | | | | 8,556,133 | | | | 3,305,493 | |
Cash pledged for futures contracts | | | | | | | 421,000 | | | | — | |
Foreign currency, at value(d) | | | | | | | 123,374 | | | | — | |
Receivables: | | | | | | | | | | | | |
Investments sold | | | | | | | 5,126,423 | | | | — | |
Securities lending income — affiliated | | | | | | | 2,267 | | | | 72 | |
Capital shares sold | | | | | | | 113,710 | | | | 1,486 | |
Dividends — unaffiliated | | | | | | | 848,874 | | | | 396,939 | |
Dividends — affiliated | | | | | | | 5,941 | | | | 325 | |
Prepaid expenses | | | | | | | 44,257 | | | | 35,027 | |
| | | | | | | | | | | | |
Total assets | | | | | | | 389,727,701 | | | | 90,210,708 | |
| | | | | | | | | | | | |
| | | |
LIABILITIES | | | | | | | | | | | | |
Bank overdraft | | | | | | | 63,694 | | | | — | |
Collateral on securities loaned | | | | | | | 781,151 | | | | 2,813,537 | |
Payables: | | | | | | | | | | | | |
Investments purchased | | | | | | | 5,279,267 | | | | — | |
Accounting services fees | | | | | | | 60,610 | | | | 25,359 | |
Capital shares redeemed | | | | | | | 517,566 | | | | 26,480 | |
Custodian fees | | | | | | | 134,120 | | | | 20,309 | |
Deferred foreign capital gain tax | | | | | | | 732 | | | | — | |
Investment advisory fees | | | | | | | 182,704 | | | | 45,112 | |
Directors’ and Officer’s fees | | | | | | | 2,364 | | | | 1,695 | |
Other accrued expenses | | | | | | | 8,414 | | | | 2,705 | |
Professional fees | | | | | | | 88,226 | | | | 99,428 | |
Service and distribution fees | | | | | | | 59,052 | | | | 13,782 | |
Transfer agent fees | | | | | | | 47,136 | | | | 20,120 | |
Variation margin on futures contracts | | | | | | | 53,040 | | | | — | |
| | | | | | | | | | | | |
| | | |
Total liabilities | | | | | | | 7,278,076 | | | | 3,068,527 | |
| | | | | | | | | | | | |
| | | |
NET ASSETS | | | | | | $ | 382,449,625 | | | $ | 87,142,181 | |
| | | | | | | | | | | | |
| | | |
NET ASSETS CONSIST OF | | | | | | | | | | | | |
| | | |
Paid-in capital | | | | | | $ | 391,909,993 | | | $ | 99,433,284 | |
Accumulated loss | | | | | | | (9,460,368 | ) | | | (12,291,103 | ) |
| | | | | | | | | | | | |
| | | |
NET ASSETS | | | | | | $ | 382,449,625 | | | $ | 87,142,181 | |
| | | | | | | | | | | | |
| | | |
(a) Investments, at cost — unaffiliated | | | | | | $ | 379,509,906 | | | $ | 80,329,306 | |
(b) Securities loaned, at value | | | | | | $ | 730,240 | | | $ | — | |
(c) Investments, at cost — affiliated | | | | | | $ | 8,556,211 | | | $ | 3,305,774 | |
(d) Foreign currency, at cost | | | | | | $ | 115,405 | | | $ | — | |
Statements of Assets and Liabilities (continued)
June 30, 2022
| | | | | | | | | | | | |
| | | BlackRock Advantage Global Fund, Inc. | | | BlackRock EuroFund | |
| |
| | | |
NET ASSET VALUE | | | | | | | | | | | | |
| | | |
Institutional | | | | | | | | | | | | |
| | | |
Net assets | | | | | | $ | 62,235,848 | | | $ | 25,025,022 | |
| | | | | | | | | | | | |
| | | |
Shares outstanding | | | | | | | 3,006,115 | | | | 1,702,056 | |
| | | | | | | | | | | | |
| | | |
Net asset value | | | | | | $ | 20.70 | | | $ | 14.70 | |
| | | | | | | | | | | | |
| | | |
Shares authorized | | | | | | | 100 million | | | | Unlimited | |
| | | | | | | | | | | | |
| | | |
Par value | | | | | | $ | 0.10 | | | $ | 0.10 | |
| | | | | | | | | | | | |
| | | |
| Investor A | | | | | | | | | |
| | | |
Net assets | | | | | | $ | 264,270,417 | | | $ | 59,980,581 | |
| | | | | | | | | | | | |
| | | |
Shares outstanding | | | | | | | 13,628,405 | | | | 4,173,212 | |
| | | | | | | | | | | | |
| | | |
Net asset value | | | | | | $ | 19.39 | | | $ | 14.37 | |
| | | | | | | | | | | | |
| | | |
Shares authorized | | | | | | | 100 million | | | | Unlimited | |
| | | | | | | | | | | | |
| | | |
Par value | | | | | | $ | 0.10 | | | $ | 0.10 | |
| | | | | | | | | | | | |
| | | |
| Investor C | | | | | | | | | |
| | | |
Net assets | | | | | | $ | 3,795,008 | | | $ | 1,054,892 | |
| | | | | | | | | | | | |
| | | |
Shares outstanding | | | | | | | 249,046 | | | | 108,125 | |
| | | | | | | | | | | | |
| | | |
Net asset value | | | | | | $ | 15.24 | | | $ | 9.76 | |
| | | | | | | | | | | | |
| | | |
Shares authorized | | | | | | | 100 million | | | | Unlimited | |
| | | | | | | | | | | | |
| | | |
Par value | | | | | | $ | 0.10 | | | $ | 0.10 | |
| | | | | | | | | | | | |
| | | |
| Class K | | | | | | | | | |
| | | |
Net assets | | | | | | $ | 49,642,726 | | | $ | 886,194 | |
| | | | | | | | | | | | |
| | | |
Shares outstanding | | | | | | | 2,397,400 | | | | 60,346 | |
| | | | | | | | | | | | |
| | | |
Net asset value | | | | | | $ | 20.71 | | | $ | 14.69 | |
| | | | | | | | | | | | |
| | | |
Shares authorized | | | | | | | 2 billion | | | | Unlimited | |
| | | | | | | | | | | | |
| | | |
Par value | | | | | | $ | 0.10 | | | $ | 0.10 | |
| | | | | | | | | | | | |
| | | |
| Class R | | | | | | | | | |
| | | |
Net assets | | | | | | $ | 2,505,626 | | | $ | 195,492 | |
| | | | | | | | | | | | |
| | | |
Shares outstanding | | | | | | | 146,955 | | | | 18,424 | |
| | | | | | | | | | | | |
| | | |
Net asset value | | | | | | $ | 17.05 | | | $ | 10.61 | |
| | | | | | | | | | | | |
| | | |
Shares authorized | | | | | | | 100 million | | | | Unlimited | |
| | | | | | | | | | | | |
| | | |
Par value | | | | | | $ | 0.10 | | | $ | 0.10 | |
| | | | | | | | | | | | |
See notes to financial statements.
| | |
| 26 | | 2 0 2 2 BLACK ROCK ANNUAL REPORT TO SHAREHOLDERS |
Statements of Operations
Year Ended June 30, 2022
| | | | | | | | | | | | |
| | | BlackRock Advantage Global Fund, Inc. | | | BlackRock EuroFund | |
| |
| | | |
INVESTMENT INCOME | | | | | | | | | | | | |
Dividends — unaffiliated | | | | | | $ | 10,257,145 | | | $ | 2,302,504 | |
Dividends — affiliated | | | | | | | 12,882 | | | | 661 | |
Interest — unaffiliated | | | | | | | 230 | | | | — | |
Securities lending income — affiliated — net | | | | | | | 15,155 | | | | 73 | |
Foreign withholding tax claims | | | | | | | 91,703 | | | | 239,553 | |
Foreign taxes withheld | | | | | | | (665,840 | ) | | | (325,143 | ) |
| | | | | | | | | | | | |
| | | |
Total investment income | | | | | | | 9,711,275 | | | | 2,217,648 | |
| | | | | | | | | | | | |
| | | |
EXPENSES | | | | | | | | | | | | |
Investment advisory | | | | | | | 3,952,451 | | | | 930,957 | |
Service and distribution — class specific | | | | | | | 861,023 | | | | 224,942 | |
Transfer agent — class specific | | | | | | | 584,933 | | | | 140,574 | |
Custodian | | | | | | | 284,902 | | | | 58,965 | |
Professional | | | | | | | 167,884 | | | | 114,079 | |
Accounting services | | | | | | | 96,919 | | | | 44,587 | |
Registration | | | | | | | 84,373 | | | | 84,187 | |
Directors and Officer | | | | | | | 9,990 | | | | 8,117 | |
Miscellaneous | | | | | | | 65,091 | | | | 55,746 | |
| | | | | | | | | | | | |
| | | |
Total expenses | | | | | | | 6,107,566 | | | | 1,662,154 | |
Less: | | | | | | | | | | | | |
Fees waived and/or reimbursed by the Manager | | | | | | | (1,587,751 | ) | | | (81,818 | ) |
Transfer agent fees waived and/or reimbursed by the Manager — class specific | | | | | | | (380,802 | ) | | | (6,081 | ) |
| | | | | | | | | | | | |
| | | |
Total expenses after fees waived and/or reimbursed | | | | | | | 4,139,013 | | | | 1,574,255 | |
| | | | | | | | | | | | |
| | | |
Net investment income | | | | | | | 5,572,262 | | | | 643,393 | |
| | | | | | | | | | | | |
| | | |
REALIZED AND UNREALIZED GAIN (LOSS) | | | | | | | | | | | | |
Net realized gain (loss) from: | | | | | | | | | | | | |
Investments — unaffiliated | | | | | | | 10,492,673 | | | | 9,267,394 | |
Investments — affiliated | | | | | | | (930 | ) | | | (12 | ) |
Foreign currency transactions | | | | | | | (27,398 | ) | | | 139,486 | |
Futures contracts | | | | | | | (1,003,072 | ) | | | — | |
| | | | | | | | | | | | |
| | | | | | | 9,461,273 | | | | 9,406,868 | |
| | | | | | | | | | | | |
Net change in unrealized appreciation (depreciation) on: | | | | | | | | | | | | |
Investments — unaffiliated(a) | | | | | | | (86,303,903 | ) | | | (43,216,168 | ) |
Investments — affiliated | | | | | | | (85 | ) | | | (281 | ) |
Foreign currency translations | | | | | | | (15,832 | ) | | | (28,376 | ) |
Futures contracts | | | | | | | (117,648 | ) | | | — | |
| | | | | | | | | | | | |
| | | | | | | (86,437,468 | ) | | | (43,244,825 | ) |
| | | | | | | | | | | | |
| | | |
Net realized and unrealized loss | | | | | | | (76,976,195 | ) | | | (33,837,957 | ) |
| | | | | | | | | | | | |
| | | |
NET DECREASE IN NET ASSETS RESULTING FROM OPERATIONS | | | | | | $ | (71,403,933 | ) | | $ | (33,194,564 | ) |
| | | | | | | | | | | | |
| | | |
(a) Net of reduction in deferred foreign capital gain tax of | | | | | | $ | 136,750 | | | $ | — | |
See notes to financial statements.
Statements of Changes in Net Assets
| | | | | | | | | | | | | | | | | | | | |
| | | BlackRock Advantage Global Fund, Inc. | | | | | | BlackRock EuroFund | |
| | | Year Ended June 30, | | | | | | Year Ended June 30, | |
| | | 2022 | | | 2021 | | | | | | 2022 | | | 2021 | |
| |
| | | | | |
INCREASE (DECREASE) IN NET ASSETS | | | | | | | | | | | | | | | | | | | | |
| | | | | |
OPERATIONS | | | | | | | | | | | | | | | | | | | | |
| | | | | |
Net investment income | | $ | 5,572,262 | | | $ | 3,185,477 | | | | | | | $ | 643,393 | | | $ | 25,043 | |
| | | | | |
Net realized gain | | | 9,461,273 | | | | 81,888,204 | | | | | | | | 9,406,868 | | | | 7,193,178 | |
| | | | | |
Net change in unrealized appreciation (depreciation) | | | (86,437,468 | ) | | | 47,798,581 | | | | | | | | (43,244,825 | ) | | | 32,945,770 | |
| | | | | | | | | | | | | | | | | | | | |
| | | | | |
Net increase (decrease) in net assets resulting from operations | | | (71,403,933 | ) | | | 132,872,262 | | | | | | | | (33,194,564 | ) | | | 40,163,991 | |
| | | | | | | | | | | | | | | | | | | | |
| | | | | |
DISTRIBUTIONS TO SHAREHOLDERS(a) | | | | | | | | | | | | | | | | | | | | |
| | | | | |
Institutional | | | (14,118,216 | ) | | | (3,176,488 | ) | | | | | | | — | | | | — | |
| | | | | |
Investor A | | | (50,223,238 | ) | | | (11,106,083 | ) | | | | | | | — | | | | — | |
| | | | | |
Investor C | | | (1,286,438 | ) | | | (373,623 | ) | | | | | | | — | | | | — | |
| | | | | |
Class K | | | (8,570,266 | ) | | | (566,796 | ) | | | | | | | — | | | | — | |
| | | | | |
Class R | | | (633,981 | ) | | | (162,627 | ) | | | | | | | — | | | | — | |
| | | | | | | | | | | | | | | | | | | | |
| | | | | |
Decrease in net assets resulting from distributions to shareholders | | | (74,832,139 | ) | | | (15,385,617 | ) | | | | | | | — | | | | — | |
| | | | | | | | | | | | | | | | | | | | |
| | | | | |
CAPITAL SHARE TRANSACTIONS | | | | | | | | | | | | | | | | | | | | |
| | | | | |
Net increase (decrease) in net assets derived from capital share transactions | | | 36,861,636 | | | | 4,363,008 | | | | | | | | (52,716,556 | ) | | | 36,478,327 | |
| | | | | | | | | | | | | | | | | | | | |
| | | | | |
NET ASSETS | | | | | | | | | | | | | | | | | | | | |
| | | | | |
Total increase (decrease) in net assets | | | (109,374,436 | ) | | | 121,849,653 | | | | | | | | (85,911,120 | ) | | | 76,642,318 | |
| | | | | |
Beginning of year | | | 491,824,061 | | | | 369,974,408 | | | | | | | | 173,053,301 | | | | 96,410,983 | |
| | | | | | | | | | | | | | | | | | | | |
| | | | | |
End of year | | $ | 382,449,625 | | | $ | 491,824,061 | | | | | | | $ | 87,142,181 | | | $ | 173,053,301 | |
| | | | | | | | | | | | | | | | | | | | |
| (a) | Distributions for annual periods determined in accordance with U.S. federal income tax regulations. |
See notes to financial statements.
| | |
| 28 | | 2 0 2 2 BLACK ROCK ANNUAL REPORT TO SHAREHOLDERS |
Financial Highlights
(For a share outstanding throughout each period)
| | | | | | | | | | | | | | | | | | | | |
| | | BlackRock Advantage Global Fund, Inc. | |
| | | Institutional | |
| | | Year Ended June 30, | |
| | | 2022 | | | 2021 | | | 2020 | | | 2019 | | | 2018 | |
| | | | | |
Net asset value, beginning of year | | $ | 28.57 | | | $ | 21.48 | | | $ | 21.66 | | | $ | 21.63 | | | $ | 25.83 | |
| | | | | | | | | | | | | | | | | | | | |
| | | | | |
Net investment income(a) | | | 0.33 | | | | 0.24 | | | | 0.31 | | | | 0.36 | | | | 0.29 | |
| | | | | |
Net realized and unrealized gain (loss) | | | (4.04 | ) | | | 7.82 | | | | (0.06 | ) | | | 0.43 | | | | 2.82 | |
| | | | | | | | | | | | | | | | | | | | |
| | | | | |
Net increase (decrease) from investment operations | | | (3.71 | ) | | | 8.06 | | | | 0.25 | | | | 0.79 | | | | 3.11 | |
| | | | | | | | | | | | | | | | | | | | |
| | | | | |
Distributions(b) | | | | | | | | | | | | | | | | | | | | |
| | | | | |
From net investment income | | | (0.33 | ) | | | (0.35 | ) | | | (0.43 | ) | | | (0.32 | ) | | | (0.37 | ) |
| | | | | |
From net realized gain | | | (3.83 | ) | | | (0.62 | ) | | | — | | | | (0.44 | ) | | | (6.94 | ) |
| | | | | | | | | | | | | | | | | | | | |
| | | | | |
Total distributions | | | (4.16 | ) | | | (0.97 | ) | | | (0.43 | ) | | | (0.76 | ) | | | (7.31 | ) |
| | | | | | | | | | | | | | | | | | | | |
| | | | | |
Net asset value, end of year | | $ | 20.70 | | | $ | 28.57 | | | $ | 21.48 | | | $ | 21.66 | | | $ | 21.63 | |
| | | | | | | | | | | | | | | | | | | | |
| | | | | |
Total Return(c) | | | | | | | | | | | | | | | | | | | | |
Based on net asset value | | | (15.52 | )% | | | 38.23 | % | | | 1.08 | % | | | 4.03 | % | | | 12.43 | % |
| | | | | | | | | | | | | | | | | | | | |
| | | | | |
Ratios to Average Net Assets(d) | | | | | | | | | | | | | | | | | | | | |
Total expenses | | | 1.10 | % | | | 1.19 | % | | | 1.15 | % | | | 1.14 | % | | | 1.16 | % |
| | | | | | | | | | | | | | | | | | | | |
| | | | | |
Total expenses after fees waived and/or reimbursed | | | 0.71 | % | | | 0.71 | % | | | 0.71 | % | | | 0.72 | % | | | 0.88 | % |
| | | | | | | | | | | | | | | | | | | | |
| | | | | |
Total expenses after fees waived and/or reimbursed and excluding professional fees for foreign withholding taxes | | | 0.71 | % | | | 0.71 | % | | | 0.71 | % | | | 0.72 | % | | | 0.88 | % |
| | | | | | | | | | | | | | | | | | | | |
| | | | | |
Net investment income | | | 1.33 | % | | | 0.96 | % | | | 1.46 | % | | | 1.72 | % | | | 1.20 | % |
| | | | | | | | | | | | | | | | | | | | |
| | | | | |
Supplemental Data | | | | | | | | | | | | | | | | | | | | |
Net assets, end of year (000) | | $ | 62,236 | | | $ | 95,405 | | | $ | 75,805 | | | $ | 87,759 | | | $ | 114,870 | |
| | | | | | | | | | | | | | | | | | | | |
| | | | | |
Portfolio turnover rate | | | 136 | % | | | 311 | % | | | 182 | % | | | 137 | % | | | 189 | % |
| | | | | | | | | | | | | | | | | | | | |
| (a) | Based on average shares outstanding. |
| (b) | Distributions for annual periods determined in accordance with U.S. federal income tax regulations. |
| (c) | Where applicable, assumes the reinvestment of distributions. |
| (d) | Excludes fees and expenses incurred indirectly as a result of investments in underlying funds. |
See notes to financial statements.
Financial Highlights (continued)
(For a share outstanding throughout each period)
| | | | | | | | | | | | | | | | | | | | |
| | | BlackRock Advantage Global Fund, Inc. (continued) | |
| | | Investor A | |
| | | Year Ended June 30, | |
| | | 2022 | | | 2021 | | | 2020 | | | 2019 | | | 2018 | |
| | | | | |
Net asset value, beginning of year | | $ | 27.02 | | | $ | 20.36 | | | $ | 20.55 | | | $ | 20.56 | | | $ | 24.85 | |
| | | | | | | | | | | | | | | | | | | | |
| | | | | |
Net investment income(a) | | | 0.27 | | | | 0.17 | | | | 0.24 | | | | 0.30 | | | | 0.25 | |
| | | | | |
Net realized and unrealized gain (loss) | | | (3.80 | ) | | | 7.41 | | | | (0.05 | ) | | | 0.40 | | | | 2.67 | |
| | | | | | | | | | | | | | | | | | | | |
| | | | | |
Net increase (decrease) from investment operations | | | (3.53 | ) | | | 7.58 | | | | 0.19 | | | | 0.70 | | | | 2.92 | |
| | | | | | | | | | | | | | | | | | | | |
| | | | | |
Distributions(b) | | | | | | | | | | | | | | | | | | | | |
| | | | | |
From net investment income | | | (0.27 | ) | | | (0.30 | ) | | | (0.38 | ) | | | (0.27 | ) | | | (0.27 | ) |
| | | | | |
From net realized gain | | | (3.83 | ) | | | (0.62 | ) | | | — | | | | (0.44 | ) | | | (6.94 | ) |
| | | | | | | | | | | | | | | | | | | | |
| | | | | |
Total distributions | | | (4.10 | ) | | | (0.92 | ) | | | (0.38 | ) | | | (0.71 | ) | | | (7.21 | ) |
| | | | | | | | | | | | | | | | | | | | |
| | | | | |
Net asset value, end of year | | $ | 19.39 | | | $ | 27.02 | | | $ | 20.36 | | | $ | 20.55 | | | $ | 20.56 | |
| | | | | | | | | | | | | | | | | | | | |
| | | | | |
Total Return(c) | | | | | | | | | | | | | | | | | | | | |
Based on net asset value | | | (15.73 | )% | | | 37.91 | % | | | 0.84 | % | | | 3.77 | % | | | 12.10 | % |
| | | | | | | | | | | | | | | | | | | | |
| | | | | |
Ratios to Average Net Assets(d) | | | | | | | | | | | | | | | | | | | | |
Total expenses | | | 1.40 | % | | | 1.51 | % | | | 1.46 | % | | | 1.46 | % | | | 1.53 | % |
| | | | | | | | | | | | | | | | | | | | |
| | | | | |
Total expenses after fees waived and/or reimbursed | | | 0.96 | % | | | 0.96 | % | | | 0.96 | % | | | 0.97 | % | | | 1.16 | % |
| | | | | | | | | | | | | | | | | | | | |
| | | | | |
Total expenses after fees waived and/or reimbursed and excluding professional fees for foreign withholding taxes | | | 0.96 | % | | | 0.96 | % | | | 0.96 | % | | | 0.97 | % | | | 1.16 | % |
| | | | | | | | | | | | | | | | | | | | |
| | | | | |
Net investment income | | | 1.14 | % | | | 0.71 | % | | | 1.21 | % | | | 1.48 | % | | | 1.06 | % |
| | | | | | | | | | | | | | | | | | | | |
| | | | | |
Supplemental Data | | | | | | | | | | | | | | | | | | | | |
Net assets, end of year (000) | | $ | 264,270 | | | $ | 327,701 | | | $ | 242,123 | | | $ | 289,752 | | | $ | 324,978 | |
| | | | | | | | | | | | | | | | | | | | |
| | | | | |
Portfolio turnover rate | | | 136 | % | | | 311 | % | | | 182 | % | | | 137 | % | | | 189 | % |
| | | | | | | | | | | | | | | | | | | | |
| (a) | Based on average shares outstanding. |
| (b) | Distributions for annual periods determined in accordance with U.S. federal income tax regulations. |
| (c) | Where applicable, excludes the effects of any sales charges and assumes the reinvestment of distributions. |
| (d) | Excludes fees and expenses incurred indirectly as a result of investments in underlying funds. |
See notes to financial statements.
| | |
| 30 | | 2 0 2 2 BLACK ROCK ANNUAL REPORT TO SHAREHOLDERS |
Financial Highlights (continued)
(For a share outstanding throughout each period)
| | | | | | | | | | | | | | | | | | | | |
| | | BlackRock Advantage Global Fund, Inc. (continued) | |
| | | Investor C | |
| | | Year Ended June 30, | |
| | | 2022 | | | 2021 | | | 2020 | | | 2019 | | | 2018 | |
| | | | | |
Net asset value, beginning of year | | $ | 22.06 | | | $ | 16.58 | | | $ | 16.79 | | | $ | 16.87 | | | $ | 21.45 | |
| | | | | | | | | | | | | | | | | | | | |
| | | | | |
Net investment income (loss)(a) | | | 0.06 | | | | (0.01 | ) | | | 0.08 | | | | 0.11 | | | | 0.04 | |
| | | | | |
Net realized and unrealized gain (loss) | | | (2.97 | ) | | | 6.04 | | | | (0.05 | ) | | | 0.34 | | | | 2.31 | |
| | | | | | | | | | | | | | | | | | | | |
| | | | | |
Net increase (decrease) from investment operations | | | (2.91 | ) | | | 6.03 | | | | 0.03 | | | | 0.45 | | | | 2.35 | |
| | | | | | | | | | | | | | | | | | | | |
| | | | | |
Distributions(b) | | | | | | | | | | | | | | | | | | | | |
| | | | | |
From net investment income | | | (0.14 | ) | | | — | | | | (0.24 | ) | | | (0.09 | ) | | | — | |
| | | | | |
From net realized gain | | | (3.77 | ) | | | (0.55 | ) | | | — | | | | (0.44 | ) | | | (6.93 | ) |
| | | | | | | | | | | | | | | | | | | | |
| | | | | |
Total distributions | | | (3.91 | ) | | | (0.55 | ) | | | (0.24 | ) | | | (0.53 | ) | | | (6.93 | ) |
| | | | | | | | | | | | | | | | | | | | |
| | | | | |
Net asset value, end of year | | $ | 15.24 | | | $ | 22.06 | | | $ | 16.58 | | | $ | 16.79 | | | $ | 16.87 | |
| | | | | | | | | | | | | | | | | | | | |
| | | | | |
Total Return(c) | | | | | | | | | | | | | | | | | | | | |
Based on net asset value | | | (16.36 | )% | | | 36.88 | % | | | 0.11 | % | | | 2.99 | % | | | 11.23 | % |
| | | | | | | | | | | | | | | | | | | | |
| | | | | |
Ratios to Average Net Assets(d) | | | | | | | | | | | | | | | | | | | | |
| | | | | |
Total expenses | | | 2.19 | % | | | 2.42 | % | | | 2.32 | % | | | 2.28 | % | | | 2.34 | % |
| | | | | | | | | | | | | | | | | | | | |
| | | | | |
Total expenses after fees waived and/or reimbursed | | | 1.71 | % | | | 1.71 | % | | | 1.71 | % | | | 1.72 | % | | | 1.95 | % |
| | | | | | | | | | | | | | | | | | | | |
| | | | | |
Total expenses after fees waived and/or reimbursed and excluding professional fees for foreign withholding taxes | | | 1.71 | % | | | 1.71 | % | | | 1.71 | % | | | 1.72 | % | | | 1.95 | % |
| | | | | | | | | | | | | | | | | | | | |
| | | | | |
Net investment income (loss) | | | 0.31 | % | | | (0.06 | )% | | | 0.46 | % | | | 0.65 | % | | | 0.23 | % |
| | | | | | | | | | | | | | | | | | | | |
| | | | | |
Supplemental Data | | | | | | | | | | | | | | | | | | | | |
| | | | | |
Net assets, end of year (000) | | $ | 3,795 | | | $ | 7,922 | | | $ | 35,626 | | | $ | 52,125 | | | $ | 90,299 | |
| | | | | | | | | | | | | | | | | | | | |
| | | | | |
Portfolio turnover rate | | | 136 | % | | | 311 | % | | | 182 | % | | | 137 | % | | | 189 | % |
| | | | | | | | | | | | | | | | | | | | |
| (a) | Based on average shares outstanding. |
| (b) | Distributions for annual periods determined in accordance with U.S. federal income tax regulations. |
| (c) | Where applicable, excludes the effects of any sales charges and assumes the reinvestment of distributions. |
| (d) | Excludes fees and expenses incurred indirectly as a result of investments in underlying funds. |
See notes to financial statements.
Financial Highlights (continued)
(For a share outstanding throughout each period)
| | | | | | | | | | | | | | | | | | | | |
| | | BlackRock Advantage Global Fund, Inc. (continued) |
| | | Class K |
| | | | | | | | | | | | | | | | | |
| Period from
01/25/18 to 06/30/18 |
(a) |
| | | Year Ended June 30, | |
| | | 2022 | | | 2021 | | | 2020 | | | 2019 | |
| | | | | |
Net asset value, beginning of period | | $ | 28.58 | | | $ | 21.48 | | | $ | 21.66 | | | $ | 21.63 | | | $ | 23.12 | |
| | | | | | | | | | | | | | | | | | | | |
| | | | | |
Net investment income(b) | | | 0.36 | | | | 0.27 | | | | 0.32 | | | | 0.41 | | | | 0.29 | |
| | | | | |
Net realized and unrealized gain (loss) | | | (4.05 | ) | | | 7.81 | | | | (0.06 | ) | | | 0.39 | | | | (1.78 | ) |
| | | | | | | | | | | | | | | | | | | | |
| | | | | |
Net increase (decrease) from investment operations | | | (3.69 | ) | | | 8.08 | | | | 0.26 | | | | 0.80 | | | | (1.49 | ) |
| | | | | | | | | | | | | | | | | | | | |
| | | | | |
Distributions(c) | | | | | | | | | | | | | | | | | | | | |
| | | | | |
From net investment income | | | (0.35 | ) | | | (0.36 | ) | | | (0.44 | ) | | | (0.33 | ) | | | — | |
| | | | | |
From net realized gain | | | (3.83 | ) | | | (0.62 | ) | | | — | | | | (0.44 | ) | | | — | |
| | | | | | | | | | | | | | | | | | | | |
Total distributions | | | (4.18 | ) | | | (0.98 | ) | | | (0.44 | ) | | | (0.77 | ) | | | — | |
| | | | | | | | | | | | | | | | | | | | |
| | | | | |
Net asset value, end of period | | $ | 20.71 | | | $ | 28.58 | | | $ | 21.48 | | | $ | 21.66 | | | $ | 21.63 | |
| | | | | | | | | | | | | | | | | | | | |
| | | | | |
Total Return(d) | | | | | | | | | | | | | | | | | | | | |
| | | | | |
Based on net asset value | | | (15.46 | )% | | | 38.34 | % | | | 1.13 | % | | | 4.09 | % | | | (6.44 | )%(e) |
| | | | | | | | | | | | | | | | | | | | |
| | | | | |
Ratios to Average Net Assets(f) | | | | | | | | | | | | | | | | | | | | |
| | | | | |
Total expenses | | | 1.00 | % | | | 1.13 | % | | | 1.09 | % | | | 1.03 | % | | | 1.07 | %(g)(h) |
| | | | | | | | | | | | | | | | | | | | |
| | | | | |
Total expenses after fees waived and/or reimbursed | | | 0.66 | % | | | 0.66 | % | | | 0.66 | % | | | 0.66 | % | | | 0.66 | %(h) |
| | | | | | | | | | | | | | | | | | | | |
| | | | | |
Total expenses after fees waived and/or reimbursed and excluding professional fees for foreign withholding taxes | | | 0.66 | % | | | 0.66 | % | | | 0.66 | % | | | 0.66 | % | | | 0.66 | %(h) |
| | | | | | | | | | | | | | | | | | | | |
| | | | | |
Net investment income | | | 1.45 | % | | | 1.04 | % | | | 1.53 | % | | | 1.98 | % | | | 3.09 | %(h) |
| | | | | | | | | | | | | | | | | | | | |
| | | | | |
Supplemental Data | | | | | | | | | | | | | | | | | | | | |
| | | | | |
Net assets, end of period (000) | | $ | 49,643 | | | $ | 56,800 | | | $ | 12,108 | | | $ | 10,625 | | | $ | 4,616 | |
| | | | | | | | | | | | | | | | | | | | |
| | | | | |
Portfolio turnover rate | | | 136 | % | | | 311 | % | | | 182 | % | | | 137 | % | | | 189 | % |
| | | | | | | | | | | | | | | | | | | | |
| (a) | Commencement of operations. |
| (b) | Based on average shares outstanding. |
| (c) | Distributions for annual periods determined in accordance with U.S. federal income tax regulations. |
| (d) | Where applicable, assumes the reinvestment of distributions. |
| (e) | Aggregate total return. |
| (f) | Excludes fees and expenses incurred indirectly as a result of investments in underlying funds. |
| (g) | Offering costs were not annualized in the calculation of the expense ratios. If these expenses were annualized, the total expenses would have been 1.07%. |
See notes to financial statements.
| | |
| 32 | | 2 0 2 2 BLACK ROCK ANNUAL REPORT TO SHAREHOLDERS |
Financial Highlights (continued)
(For a share outstanding throughout each period)
| | | | | | | | | | | | | | | | | | | | |
| | | BlackRock Advantage Global Fund, Inc. (continued) | |
| |
| | | Class R | |
| |
| | | Year Ended June 30, | |
| | | | | |
| | | 2022 | | | 2021 | | | 2020 | | | 2019 | | | 2018 | |
| | | | | | |
Net asset value, beginning of year | | $ | 24.24 | | | $ | 18.33 | | | $ | 18.52 | | | $ | 18.60 | | | $ | 23.07 | |
| | | | | | | | | | | | | | | | | | | | |
| | | | | |
Net investment income(a) | | | 0.18 | | | | 0.10 | | | | 0.18 | | | | 0.21 | | | | 0.17 | |
Net realized and unrealized gain (loss) | | | (3.33 | ) | | | 6.65 | | | | (0.06 | ) | | | 0.37 | | | | 2.47 | |
| | | | | | | | | | | | | | | | | | | | |
| | | | | |
Net increase (decrease) from investment operations | | | (3.15 | ) | | | 6.75 | | | | 0.12 | | | | 0.58 | | | | 2.64 | |
| | | | | | | | | | | | | | | | | | | | |
| | | | | |
Distributions(b) | | | | | | | | | | | | | | | | | | | | |
| | | | | |
From net investment income | | | (0.21 | ) | | | (0.22 | ) | | | (0.31 | ) | | | (0.22 | ) | | | (0.17 | ) |
From net realized gain | | | (3.83 | ) | | | (0.62 | ) | | | — | | | | (0.44 | ) | | | (6.94 | ) |
| | | | | | | | | | | | | | | | | | | | |
| | | | | |
Total distributions | | | (4.04 | ) | | | (0.84 | ) | | | (0.31 | ) | | | (0.66 | ) | | | (7.11 | ) |
| | | | | | | | | | | | | | | | | | | | |
| | | | | |
Net asset value, end of year | | $ | 17.05 | | | $ | 24.24 | | | $ | 18.33 | | | $ | 18.52 | | | $ | 18.60 | |
| | | | | | | | | | | | | | | | | | | | |
| | | | | |
Total Return(c) | | | | | | | | | | | | | | | | | | | | |
Based on net asset value | | | (15.94 | )% | | | 37.52 | % | | | 0.58 | % | | | 3.52 | % | | | 11.79 | % |
| | | | | | | | | | | | | | | | | | | | |
| | | | | |
Ratios to Average Net Assets(d) | | | | | | | | | | | | | | | | | | | | |
Total expenses | | | 1.82 | % | | | 1.79 | % | | | 1.77 | % | | | 1.79 | % | | | 1.87 | % |
| | | | | | | | | | | | | | | | | | | | |
| | | | | |
Total expenses after fees waived and/or reimbursed | | | 1.21 | % | | | 1.21 | % | | | 1.21 | % | | | 1.22 | % | | | 1.43 | % |
| | | | | | | | | | | | | | | | | | | | |
| | | | | |
Total expenses after fees waived and/or reimbursed and excluding professional fees for foreign withholding taxes | | | 1.21 | % | | | 1.21 | % | | | 1.21 | % | | | 1.22 | % | | | 1.43 | % |
| | | | | | | | | | | | | | | | | | | | |
| | | | | |
Net investment income | | | 0.85 | % | | | 0.45 | % | | | 0.98 | % | | | 1.18 | % | | | 0.80 | % |
| | | | | | | | | | | | | | | | | | | | |
| | | | | |
Supplemental Data | | | | | | | | | | | | | | | | | | | | |
Net assets, end of year (000) | | $ | 2,506 | | | $ | 3,996 | | | $ | ��4,313 | | | $ | 10,407 | | | $ | 16,716 | |
| | | | | | | | | | | | | | | | | | | | |
| | | | | |
Portfolio turnover rate | | | 136 | % | | | 311 | % | | | 182 | % | | | 137 | % | | | 189 | % |
| | | | | | | | | | | | | | | | | | | | |
| (a) | Based on average shares outstanding. |
| (b) | Distributions for annual periods determined in accordance with U.S. federal income tax regulations. |
| (c) | Where applicable, assumes the reinvestment of distributions. |
| (d) | Excludes fees and expenses incurred indirectly as a result of investments in underlying funds. |
See notes to financial statements.
Financial Highlights (continued)
(For a share outstanding throughout each period)
| | | | | | | | | | | | | | | | | | | | |
| | | BlackRock EuroFund | |
| |
| | | Institutional | |
| |
| | | Year Ended June 30, | |
| | | | | |
| | | 2022 | | | 2021 | | | 2020 | | | 2019 | | | 2018 | |
| | | | | | |
Net asset value, beginning of year | | $ | 20.34 | | | $ | 14.31 | | | $ | 14.40 | | | $ | 15.06 | | | $ | 14.78 | |
| | | | | | | | | | | | | | | | | | | | |
| | | | | |
Net investment income(a) | | | 0.13 | | | | 0.03 | | | | 0.02 | | | | 0.13 | | | | 0.13 | |
Net realized and unrealized gain (loss) | | | (5.77 | ) | | | 6.00 | | | | (0.04 | ) | | | (0.45 | ) | | | 0.33 | |
| | | | | | | | | | | | | | | | | | | | |
Net increase (decrease) from investment operations | | | (5.64 | ) | | | 6.03 | | | | (0.02 | ) | | | (0.32 | ) | | | 0.46 | |
| | | | | | | | | | | | | | | | | | | | |
Distributions from net investment income(b) | | | — | | | | — | | | | (0.07 | ) | | | (0.34 | ) | | | (0.18 | ) |
| | | | | | | | | | | | | | | | | | | | |
| | | | | |
Net asset value, end of year | | $ | 14.70 | | | $ | 20.34 | | | $ | 14.31 | | | $ | 14.40 | | | $ | 15.06 | |
| | | | | | | | | | | | | | | | | | | | |
| | | | | |
Total Return(c) | | | | | | | | | | | | | | | | | | | | |
Based on net asset value | | | (27.73 | )% | | | 42.14 | % | | | (0.17 | )% | | | (1.77 | )% | | | 3.12 | % |
| | | | | | | | | | | | | | | | | | | | |
| | | | | |
Ratios to Average Net Assets(d) | | | | | | | | | | | | | | | | | | | | |
Total expenses | | | 1.17 | % | | | 1.18 | % | | | 1.24 | % | | | 1.23 | % | | | 1.11 | % |
| | | | | | | | | | | | | | | | | | | | |
| | | | | |
Total expenses after fees waived and/or reimbursed | | | 1.10 | % | | | 1.12 | % | | | 1.18 | % | | | 1.17 | % | | | 1.08 | % |
| | | | | | | | | | | | | | | | | | | | |
| | | | | |
Total expenses after fees waived and/or reimbursed and excluding professional fees for foreign withholding taxes | | | 1.09 | % | | | 1.12 | % | | | 1.18 | % | | | 1.17 | % | | | 1.08 | % |
| | | | | | | | | | | | | | | | | | | | |
| | | | | |
Net investment income | | | 0.65 | % | | | 0.19 | % | | | 0.14 | % | | | 0.92 | % | | | 0.87 | % |
| | | | | | | | | | | | | | | | | | | | |
| | | | | |
Supplemental Data | | | | | | | | | | | | | | | | | | | | |
Net assets, end of year (000) | | $ | 25,025 | | | $ | 81,809 | | | $ | 26,476 | | | $ | 33,178 | | | $ | 43,686 | |
| | | | | | | | | | | | | | | | | | | | |
| | | | | |
Portfolio turnover rate | | | 42 | % | | | 26 | % | | | 39 | % | | | 153 | % | | | 98 | % |
| | | | | | | | | | | | | | | | | | | | |
| (a) | Based on average shares outstanding. |
| (b) | Distributions for annual periods determined in accordance with U.S. federal income tax regulations. |
| (c) | Where applicable, assumes the reinvestment of distributions. |
| (d) | Excludes fees and expenses incurred indirectly as a result of investments in underlying funds. |
See notes to financial statements.
| | |
| 34 | | 2 0 2 2 BLACK ROCK ANNUAL REPORT TO SHAREHOLDERS |
Financial Highlights (continued)
(For a share outstanding throughout each period)
| | | | | | | | | | | | | | | | | | | | |
| | | BlackRock EuroFund (continued) | |
| |
| | | Investor A | |
| |
| | | Year Ended June 30, | |
| | | | | |
| | | 2022 | | | 2021 | | | 2020 | | | 2019 | | | 2018 | |
| | | | | | |
Net asset value, beginning of year | | $ | 19.93 | | | $ | 14.05 | | | $ | 14.11 | | | $ | 14.78 | | | $ | 14.49 | |
| | | | | | | | | | | | | | | | | | | | |
| | | | | |
Net investment income (loss)(a) | | | 0.09 | | | | (0.01 | ) | | | (0.00 | )(b) | | | 0.08 | | | | 0.18 | |
Net realized and unrealized gain (loss) | | | (5.65 | ) | | | 5.89 | | | | (0.04 | ) | | | (0.44 | ) | | | 0.26 | |
| | | | | | | | | | | | | | | | | | | | |
Net increase (decrease) from investment operations | | | (5.56 | ) | | | 5.88 | | | | (0.04 | ) | | | (0.36 | ) | | | 0.44 | |
| | | | | | | | | | | | | | | | | | | | |
Distributions from net investment income(c) | | | — | | | | — | | | | (0.02 | ) | | | (0.31 | ) | | | (0.15 | ) |
| | | | | | | | | | | | | | | | | | | | |
| | | | | |
Net asset value, end of year | | $ | 14.37 | | | $ | 19.93 | | | $ | 14.05 | | | $ | 14.11 | | | $ | 14.78 | |
| | | | | | | | | | | | | | | | | | | | |
| | | | | |
Total Return(d) | | | | | | | | | | | | | | | | | | | | |
Based on net asset value | | | (27.90 | )% | | | 41.85 | % | | | (0.30 | )% | | | (2.08 | )% | | | 3.02 | % |
| | | | | | | | | | | | | | | | | | | | |
| | | | | |
Ratios to Average Net Assets(e) | | | | | | | | | | | | | | | | | | | | |
Total expenses | | | 1.40 | % | | | 1.39 | % | | | 1.40 | % | | | 1.45 | % | | | 1.31 | % |
| | | | | | | | | | | | | | | | | | | | |
| | | | | |
Total expenses after fees waived and/or reimbursed | | | 1.33 | % | | | 1.33 | % | | | 1.34 | % | | | 1.39 | % | | | 1.28 | % |
| | | | | | | | | | | | | | | | | | | | |
| | | | | |
Total expenses after fees waived and/or reimbursed and excluding professional fees for foreign withholding taxes | | | 1.32 | % | | | 1.33 | % | | | 1.34 | % | | | 1.39 | % | | | 1.28 | % |
| | | | | | | | | | | | | | | | | | | | |
| | | | | |
Net investment income (loss) | | | 0.48 | % | | | (0.03 | )% | | | (0.01 | )% | | | 0.56 | % | | | 1.19 | % |
| | | | | | | | | | | | | | | | | | | | |
| | | | | |
Supplemental Data | | | | | | | | | | | | | | | | | | | | |
Net assets, end of year (000) | | $ | 59,981 | | | $ | 87,462 | | | $ | 65,887 | | | $ | 78,418 | | | $ | 149,540 | |
| | | | | | | | | | | | | | | | | | | | |
| | | | | |
Portfolio turnover rate | | | 42 | % | | | 26 | % | | | 39 | % | | | 153 | % | | | 98 | % |
| | | | | | | | | | | | | | | | | | | | |
| (a) | Based on average shares outstanding. (b) Amount is greater than $(0.005) per share. |
| (c) | Distributions for annual periods determined in accordance with U.S. federal income tax regulations. |
| (d) | Where applicable, excludes the effects of any sales charges and assumes the reinvestment of distributions. |
| (e) | Excludes fees and expenses incurred indirectly as a result of investments in underlying funds. |
See notes to financial statements.
Financial Highlights (continued)
(For a share outstanding throughout each period)
| | | | | | | | | | | | | | | | | | | | |
| | | BlackRock EuroFund (continued) | |
| |
| | | Investor C | |
| |
| | | Year Ended June 30, | |
| | | | | |
| | | 2022 | | | 2021 | | | 2020 | | | 2019 | | | 2018 | |
| | | | | | |
Net asset value, beginning of year | | $ | 13.63 | | | $ | 9.68 | | | $ | 9.79 | | | $ | 10.36 | | | $ | 10.16 | |
| | | | | | | | | | | | | | | | | | | | |
| | | | | |
Net investment income (loss)(a) | | | (0.06 | ) | | | (0.10 | ) | | | (0.08 | ) | | | (0.02 | ) | | | 0.05 | |
Net realized and unrealized gain (loss) | | | (3.81 | ) | | | 4.05 | | | | (0.03 | ) | | | (0.31 | ) | | | 0.18 | |
| | | | | | | | | | | | | | | | | | | | |
Net increase (decrease) from investment operations | | | (3.87 | ) | | | 3.95 | | | | (0.11 | ) | | | (0.33 | ) | | | 0.23 | |
| | | | | | | | | | | | | | | | | | | | |
Distributions from net investment income(b) | | | — | | | | — | | | | — | | | | (0.24 | ) | | | (0.03 | ) |
| | | | | | | | | | | | | | | | | | | | |
| | | | | |
Net asset value, end of year | | $ | 9.76 | | | $ | 13.63 | | | $ | 9.68 | | | $ | 9.79 | | | $ | 10.36 | |
| | | | | | | | | | | | | | | | | | | | |
| | | | | |
Total Return(c) | | | | | | | | | | | | | | | | | | | | |
Based on net asset value | | | (28.39 | )% | | | 40.81 | % | | | (1.12 | )% | | | (2.82 | )% | | | 2.27 | % |
| | | | | | | | | | | | | | | | | | | | |
| | | | | |
Ratios to Average Net Assets(d) | | | | | | | | | | | | | | | | | | | | |
Total expenses | | | 2.17 | % | | | 2.17 | % | | | 2.19 | % | | | 2.20 | % | | | 2.08 | % |
| | | | | | | | | | | | | | | | | | | | |
| | | | | |
Total expenses after fees waived and/or reimbursed | | | 2.10 | % | | | 2.11 | % | | | 2.13 | % | | | 2.14 | % | | | 2.04 | % |
| | | | | | | | | | | | | | | | | | | | |
| | | | | |
Total expenses after fees waived and/or reimbursed and excluding professional fees for foreign withholding taxes | | | 2.09 | % | | | 2.11 | % | | | 2.13 | % | | | 2.14 | % | | | 2.04 | % |
| | | | | | | | | | | | | | | | | | | | |
| | | | | |
Net investment income (loss) | | | (0.45 | )% | | | (0.86 | )% | | | (0.85 | )% | | | (0.17 | )% | | | 0.43 | % |
| | | | | | | | | | | | | | | | | | | | |
| | | | | |
Supplemental Data | | | | | | | | | | | | | | | | | | | | |
Net assets, end of year (000) | | $ | 1,055 | | | $ | 2,451 | | | $ | 3,088 | | | $ | 4,179 | | | $ | 7,533 | |
| | | | | | | | | | | | | | | | | | | | |
| | | | | |
Portfolio turnover rate | | | 42 | % | | | 26 | % | | | 39 | % | | | 153 | % | | | 98 | % |
| | | | | | | | | | | | | | | | | | | | |
| (a) | Based on average shares outstanding. |
| (b) | Distributions for annual periods determined in accordance with U.S. federal income tax regulations. |
| (c) | Where applicable, excludes the effects of any sales charges and assumes the reinvestment of distributions. |
| (d) | Excludes fees and expenses incurred indirectly as a result of investments in underlying funds. |
See notes to financial statements.
| | |
| 36 | | 2 0 2 2 BLACK ROCK ANNUAL REPORT TO SHAREHOLDERS |
Financial Highlights (continued)
(For a share outstanding throughout each period)
| | | | | | | | | | | | | | | | | | | | | | | | | |
| | | BlackRock EuroFund (continued) |
| | | Class K |
| | | Year Ended June 30, | | Period from 01/25/18(a) to 06/30/18 |
| |
| | | 2022 | | 2021 | | 2020 | | 2019 |
| | | | | |
Net asset value, beginning of period | | | $ | 20.30 | | | | $ | 14.26 | | | | $ | 14.34 | | | | $ | 15.08 | | | | $ | 16.57 | |
| | | | | | | | | | | | | | | | | | | | | | | | | |
| | | | | |
Net investment income(b) | | | | 0.16 | | | | | 0.06 | | | | | 0.03 | | | | | 0.14 | | | | | 0.26 | |
Net realized and unrealized gain (loss) | | | | (5.77 | ) | | | | 5.98 | | | | | (0.02 | ) | | | | (0.46 | ) | | | | (1.75 | ) |
| | | | | | | | | | | | | | | | | | | | | | | | | |
Net increase (decrease) from investment operations | | | | (5.61 | ) | | | | 6.04 | | | | | 0.01 | | | | | (0.32 | ) | | | | (1.49 | ) |
| | | | | | | | | | | | | | | | | | | | | | | | | |
Distributions from net investment income(c) | | | | — | | | | | — | | | | | (0.09 | ) | | | | (0.42 | ) | | | | — | |
| | | | | | | | | | | | | | | | | | | | | | | | | |
| | | | | |
Net asset value, end of period | | | $ | 14.69 | | | | $ | 20.30 | | | | $ | 14.26 | | | | $ | 14.34 | | | | $ | 15.08 | |
| | | | | | | | | | | | | | | | | | | | | | | | | |
| | | | | |
Total Return(d) | | | | | | | | | | | | | | | | | | | | | | | | | |
Based on net asset value | | | | (27.64 | )% | | | | 42.36 | % | | | | 0.03 | % | | | | (1.70 | )% | | | | (8.99 | )%(e) |
| | | | | | | | | | | | | | | | | | | | | | | | | |
| | | | | |
Ratios to Average Net Assets(f) | | | | | | | | | | | | | | | | | | | | | | | | | |
Total expenses | | | | 1.08 | % | | | | 1.04 | % | | | | 1.06 | % | | | | 1.11 | % | | | | 0.98 | %(g)(h) |
| | | | | | | | | | | | | | | | | | | | | | | | | |
| | | | | |
Total expenses after fees waived and/or reimbursed | | | | 1.01 | % | | | | 0.98 | % | | | | 1.00 | % | | | | 1.05 | % | | | | 0.95 | %(h) |
| | | | | | | | | | | | | | | | | | | | | | | | | |
| | | | | |
Total expenses after fees waived and/or reimbursed and excluding professional fees for foreign withholding taxes | | | | 1.00 | % | | | | 0.98 | % | | | | 1.00 | % | | | | 1.05 | % | | | | 0.95 | %(h) |
| | | | | | | | | | | | | | | | | | | | | | | | | |
| | | | | |
Net investment income | | | | 0.83 | % | | | | 0.34 | % | | | | 0.18 | % | | | | 1.00 | % | | | | 3.86 | %(h) |
| | | | | | | | | | | | | | | | | | | | | | | | | |
| | | | | |
Supplemental Data | | | | | | | | | | | | | | | | | | | | | | | | | |
Net assets, end of period (000) | | | $ | 886 | | | | $ | 860 | | | | $ | 601 | | | | $ | 710 | | | | $ | 1,005 | |
| | | | | | | | | | | | | | | | | | | | | | | | | |
| | | | | |
Portfolio turnover rate | | | | 42 | % | | | | 26 | % | | | | 39 | % | | | | 153 | % | | | | 98 | % |
| | | | | | | | | | | | | | | | | | | | | | | | | |
| (a) | Commencement of operations. |
| (b) | Based on average shares outstanding. |
| (c) | Distributions for annual periods determined in accordance with U.S. federal income tax regulations. |
| (d) | Where applicable, assumes the reinvestment of distributions. |
| (e) | Aggregate total return. |
| (f) | Excludes fees and expenses incurred indirectly as a result of investments in underlying funds. |
| (g) | Offering costs were not annualized in the calculation of the expense ratios. If these expenses were annualized, the total expenses would have been 0.99%. |
See notes to financial statements.
Financial Highlights (continued)
(For a share outstanding throughout each period)
| | | | | | | | | | | | | | | | | | | | |
| | | BlackRock EuroFund (continued) | |
| |
| | | Class R | |
| |
| | | Year Ended June 30, | |
| | | | | |
| | | 2022 | | | 2021 | | | 2020 | | | 2019 | | | 2018 | |
| | | | | | |
Net asset value, beginning of year | | $ | 14.79 | | | $ | 10.46 | | | $ | 10.54 | | | $ | 11.14 | | | $ | 10.96 | |
| | | | | | | | | | | | | | | | | | | | |
| | | | | |
Net investment income (loss)(a) | | | (0.06 | ) | | | (0.04 | ) | | | (0.04 | ) | | | (0.01 | ) | | | 0.09 | |
Net realized and unrealized gain (loss) | | | (4.12 | ) | | | 4.37 | | | | (0.04 | ) | | | (0.33 | ) | | | 0.18 | |
| | | | | | | | | | | | | | | | | | | | |
Net increase (decrease) from investment operations | | | (4.18 | ) | | | 4.33 | | | | (0.08 | ) | | | (0.34 | ) | | | 0.27 | |
| | | | | | | | | | | | | | | | | | | | |
Distributions from net investment income(b) | | | — | | | | — | | | | — | | | | (0.26 | ) | | | (0.09 | ) |
| | | | | | | | | | | | | | | | | | | | |
| | | | | |
Net asset value, end of year | | $ | 10.61 | | | $ | 14.79 | | | $ | 10.46 | | | $ | 10.54 | | | $ | 11.14 | |
| | | | | | | | | | | | | | | | | | | | |
| | | | | |
Total Return(c) | | | | | | | | | | | | | | | | | | | | |
Based on net asset value | | | (28.26 | )% | | | 41.40 | % | | | (0.76 | )% | | | (2.66 | )% | | | 2.46 | % |
| | | | | | | | | | | | | | | | | | | | |
| | | | | |
Ratios to Average Net Assets(d) | | | | | | | | | | | | | | | | | | | | |
Total expenses | | | 1.91 | % | | | 1.73 | % | | | 1.87 | % | | | 2.07 | % | | | 1.81 | % |
| | | | | | | | | | | | | | | | | | | | |
| | | | | |
Total expenses after fees waived and/or reimbursed | | | 1.84 | % | | | 1.67 | % | | | 1.81 | % | | | 2.01 | % | | | 1.77 | % |
| | | | | | | | | | | | | | | | | | | | |
| | | | | |
Total expenses after fees waived and/or reimbursed and excluding professional fees for foreign withholding taxes | | | 1.83 | % | | | 1.67 | % | | | 1.81 | % | | | 2.01 | % | | | 1.77 | % |
| | | | | | | | | | | | | | | | | | | | |
| | | | | |
Net investment income (loss) | | | (0.41 | )% | | | (0.32 | )% | | | (0.42 | )% | | | (0.07 | )% | | | 0.76 | % |
| | | | | | | | | | | | | | | | | | | | |
| | | | | |
Supplemental Data | | | | | | | | | | | | | | | | | | | | |
Net assets, end of year (000) | | $ | 195 | | | $ | 471 | | | $ | 359 | | | $ | 363 | | | $ | 786 | |
| | | | | | | | | | | | | | | | | | | | |
| | | | | |
Portfolio turnover rate | | | 42 | % | | | 26 | % | | | 39 | % | | | 153 | % | | | 98 | % |
| | | | | | | | | | | | | | | | | | | | |
| (a) | Based on average shares outstanding. |
| (b) | Distributions for annual periods determined in accordance with U.S. federal income tax regulations. |
| (c) | Where applicable, assumes the reinvestment of distributions. |
| (d) | Excludes fees and expenses incurred indirectly as a result of investments in underlying funds. |
See notes to financial statements.
| | |
| 38 | | 2 0 2 2 BLACK ROCK ANNUAL REPORT TO SHAREHOLDERS |
Notes to Financial Statements
BlackRock Advantage Global Fund, Inc., (the “Corporation”) and BlackRock EuroFund (the “Trust”) are each registered under the Investment Company Act of 1940, as amended (the “1940 Act”), as open-end management investment companies. The Corporation, Inc. is organized as a Maryland corporation. The Trust is organized as a Massachusetts business trust. The following are referred to herein collectively as the “Funds” or individually as a “Fund”:
| | | | |
| | | |
| Fund Name | | Herein Referred To As | | Diversification
Classification |
| | |
BlackRock Advantage Global Fund, Inc. | | Advantage Global | | Diversified |
BlackRock EuroFund | | EuroFund | | Diversified |
Each Fund offers multiple classes of shares. All classes of shares have identical voting, dividend, liquidation and other rights and are subject to the same terms and conditions, except that certain classes bear expenses related to the shareholder servicing and distribution of such shares. Institutional and Class K Shares are sold only to certain eligible investors. Investor A, Investor C and Class R Shares bear certain expenses related to shareholder servicing of such shares, and Investor C and Class R Shares also bear certain expenses related to the distribution of such shares. Investor A and Investor C Shares are generally available through financial intermediaries. Class R Shares are sold only to certain employer-sponsored retirement plans. Each class has exclusive voting rights with respect to matters relating to its shareholder servicing and distribution expenditures (except that Investor C shareholders may vote on material changes to the Investor A Shares distribution and service plan).
| | | | | | | | |
| | | | |
| Share Class | | Initial Sales Charge | | CDSC | | | Conversion Privilege |
| | | |
Institutional, Class K and Class R Shares | | No | | | No | | | None |
Investor A Shares | | Yes | | | No | (a) | | None |
Investor C Shares | | No | | | Yes | (b) | | To Investor A Shares after approximately 8 years |
| | (a) | Investor A Shares may be subject to a contingent deferred sales charge (“CDSC”) for certain redemptions where no initial sales charge was paid at the time of purchase. | |
| | (b) | A CDSC of 1.00% is assessed on certain redemptions of Investor C Shares made within one year after purchase. | |
The Board of Trustees of the Trust and the Board of Directors of the Corporation are collectively referred to throughout this report as the “Board,” and the directors/trustees thereof are collectively referred to throughout this report as “Directors.”
The Funds, together with certain other registered investment companies advised by BlackRock Advisors, LLC (the “Manager”) or its affiliates, are included in a complex of open-end equity, multi-asset, index and money market funds referred to as the BlackRock Multi-Asset Complex.
| 2. | SIGNIFICANT ACCOUNTING POLICIES |
The financial statements are prepared in conformity with accounting principles generally accepted in the United States of America (“U.S. GAAP”), which may require management to make estimates and assumptions that affect the reported amounts of assets and liabilities in the financial statements, disclosure of contingent assets and liabilities at the date of the financial statements and the reported amounts of increases and decreases in net assets from operations during the reporting period. Actual results could differ from those estimates. Each Fund is considered an investment company under U.S. GAAP and follows the accounting and reporting guidance applicable to investment companies. Below is a summary of significant accounting policies:
Investment Transactions and Income Recognition: For financial reporting purposes, investment transactions are recorded on the dates the transactions are executed. Realized gains and losses on investment transactions are determined using the specific identification method. Dividend income and capital gain distributions, if any, are recorded on the ex-dividend dates. Non-cash dividends, if any, are recorded on the ex-dividend dates at fair value. Dividends from foreign securities where the ex-dividend dates may have passed are subsequently recorded when the Funds are informed of the ex-dividend dates. Under the applicable foreign tax laws, a withholding tax at various rates may be imposed on capital gains, dividends and interest. Upon notification from issuers, a portion of the dividend income received from a real estate investment trust may be redesignated as a reduction of cost of the related investment and/or realized gain. Income, expenses and realized and unrealized gains and losses are allocated daily to each class based on its relative net assets.
Foreign Currency Translation: Each Fund’s books and records are maintained in U.S. dollars. Securities and other assets and liabilities denominated in foreign currencies are translated into U.S. dollars using exchange rates determined as of the close of trading on the New York Stock Exchange (“NYSE”). Purchases and sales of investments are recorded at the rates of exchange prevailing on the respective dates of such transactions. Generally, when the U.S. dollar rises in value against a foreign currency, the investments denominated in that currency will lose value; the opposite effect occurs if the U.S. dollar falls in relative value.
Each Fund does not isolate the effect of fluctuations in foreign exchange rates from the effect of fluctuations in the market prices of investments for financial reporting purposes. Accordingly, the effects of changes in exchange rates on investments are not segregated in the Statements of Operations from the effects of changes in market prices of those investments, but are included as a component of net realized and unrealized gain (loss) from investments. Each Fund reports realized currency gains (losses) on foreign currency related transactions as components of net realized gain (loss) for financial reporting purposes, whereas such components are generally treated as ordinary income for U.S. federal income tax purposes.
Foreign Taxes: The Funds may be subject to foreign taxes (a portion of which may be reclaimable) on income, stock dividends, capital gains on investments, or certain foreign currency transactions. All foreign taxes are recorded in accordance with the applicable foreign tax regulations and rates that exist in the foreign jurisdictions in which each Fund invests. These foreign taxes, if any, are paid by each Fund and are reflected in its Statements of Operations as follows: foreign taxes withheld at source are presented as a reduction of income, foreign taxes on securities lending income are presented as a reduction of securities lending income, foreign taxes on stock dividends are presented as “Foreign taxes withheld”, and foreign taxes on capital gains from sales of investments and foreign taxes on foreign currency transactions are included in their respective net realized gain (loss) categories. Foreign taxes payable or deferred as of June 30, 2022, if any, are disclosed in the Statements of Assets and Liabilities.
| | |
NOTES TO FINANCIAL STATEMENTS | | 39 |
Notes to Financial Statements (continued)
The Funds file withholding tax reclaims in certain jurisdictions to recover a portion of amounts previously withheld. The Funds may record a reclaim receivable based on collectability, which includes factors such as the jurisdiction’s applicable laws, payment history and market convention. The Statements of Operations include tax reclaims recorded as well as professional and other fees, if any, associated with recovery of foreign withholding taxes.
Segregation and Collateralization: In cases where a Fund enters into certain investments (e.g., futures contracts) that would be treated as “senior securities” for 1940 Act purposes, a Fund may segregate or designate on its books and records cash or liquid assets having a market value at least equal to the amount of its future obligations under such investments. Doing so allows the investments to be excluded from treatment as a “senior security.” Furthermore, if required by an exchange or counterparty agreement, the Funds may be required to deliver/deposit cash and/or securities to/with an exchange, or broker-dealer or custodian as collateral for certain investments or obligations.
Distributions: Distributions paid by the Funds are recorded on the ex-dividend dates. The character and timing of distributions are determined in accordance with U.S. federal income tax regulations, which may differ from U.S. GAAP.
Indemnifications: In the normal course of business, a Fund enters into contracts that contain a variety of representations that provide general indemnification. A Fund’s maximum exposure under these arrangements is unknown because it involves future potential claims against a Fund, which cannot be predicted with any certainty.
Other: Expenses directly related to a Fund or its classes are charged to that Fund or the applicable class. Expenses directly related to the Funds and other shared expenses prorated to the Funds are allocated daily to each class based on their relative net assets or other appropriate methods. Other operating expenses shared by several funds, including other funds managed by the Manager, are prorated among those funds on the basis of relative net assets or other appropriate methods.
The Funds have an arrangement with their custodian whereby credits are earned on uninvested cash balances, which could be used to reduce custody fees and/or overdraft charges. The Funds may incur charges on overdrafts, subject to certain conditions.
| 3. | INVESTMENT VALUATION AND FAIR VALUE MEASUREMENTS |
Investment Valuation Policies: Each Fund’s investments are valued at fair value (also referred to as “market value” within the financial statements) each day that the Fund is open for business and, for financial reporting purposes, as of the report date. U.S. GAAP defines fair value as the price a fund would receive to sell an asset or pay to transfer a liability in an orderly transaction between market participants at the measurement date. Each Fund determines the fair values of its financial instruments using various independent dealers or pricing services under policies approved by the Board. If a security’s market price is not readily available or does not otherwise accurately represent the fair value of the security, the security will be valued in accordance with a policy approved by the Board as reflecting fair value. The BlackRock Global Valuation Methodologies Committee (the “Global Valuation Committee”) is the committee formed by management to develop global pricing policies and procedures and to oversee the pricing function for all financial instruments.
Fair Value Inputs and Methodologies: The following methods and inputs are used to establish the fair value of each Fund’s assets and liabilities:
| | • | | Equity investments traded on a recognized securities exchange are valued at that day’s official closing price, as applicable, on the exchange where the stock is primarily traded. Equity investments traded on a recognized exchange for which there were no sales on that day may be valued at the last available bid (long positions) or ask (short positions) price. |
| | • | | Investments in open-end U.S. mutual funds (including money market funds) are valued at that day’s published net asset value (“NAV”). |
| | • | | The Funds value their investment in SL Liquidity Series, LLC, Money Market Series (the “Money Market Series”) at fair value, which is ordinarily based upon their pro rata ownership in the underlying fund’s net assets. |
| | • | | Futures contracts are valued based on that day’s last reported settlement or trade price on the exchange where the contract is traded. |
Generally, trading in foreign instruments is substantially completed each day at various times prior to the close of trading on the NYSE. Each business day, the Funds use current market factors supplied by independent pricing services to value certain foreign instruments (“Systematic Fair Value Price”). The Systematic Fair Value Price is designed to value such foreign securities at fair value as of the close of trading on the NYSE, which follows the close of the local markets.
If events (e.g., market volatility, company announcement or a natural disaster) occur that are expected to materially affect the value of such investment, or in the event that application of these methods of valuation results in a price for an investment that is deemed not to be representative of the market value of such investment, or if a price is not available, the investment will be valued by the Global Valuation Committee, or its delegate, in accordance with a policy approved by the Board as reflecting fair value (“Fair Valued Investments”). The fair valuation approaches that may be used by the Global Valuation Committee include market approach, income approach and cost approach. Valuation techniques such as discounted cash flow, use of market comparables and matrix pricing are types of valuation approaches and are typically used in determining fair value. When determining the price for Fair Valued Investments, the Global Valuation Committee, or its delegate, seeks to determine the price that each Fund might reasonably expect to receive or pay from the current sale or purchase of that asset or liability in an arm’s-length transaction. Fair value determinations shall be based upon all available factors that the Global Valuation Committee, or its delegate, deems relevant and consistent with the principles of fair value measurement. The pricing of all Fair Valued Investments is subsequently reported to the Board or a committee thereof on a quarterly basis.
| | |
| 40 | | 2 0 2 2 BLACK ROCK ANNUAL REPORT TO SHAREHOLDERS |
Notes to Financial Statements (continued)
For investments in equity or debt issued by privately held companies or funds (“Private Company” or collectively, the “Private Companies”) and other Fair Valued Investments, the fair valuation approaches that are used by the Global Valuation Committee and third-party pricing services utilize one or a combination of, but not limited to, the following inputs.
| | |
| | |
| | | Standard Inputs Generally Considered By Third-Party Pricing Services |
| |
Market approach | | (i) recent market transactions, including subsequent rounds of financing, in the underlying investment or comparable issuers; (ii) recapitalizations and other transactions across the capital structure; and (iii) market multiples of comparable issuers. |
| |
Income approach | | (i) future cash flows discounted to present and adjusted as appropriate for liquidity, credit, and/or market risks; (ii) quoted prices for similar investments or assets in active markets; and (iii) other risk factors, such as interest rates, yield curves, volatilities, prepayment speeds, loss severities, credit risks, recovery rates, liquidation amounts and/or default rates. |
| |
Cost approach | | (i) audited or unaudited financial statements, investor communications and financial or operational metrics issued by the Private Company; (ii) changes in the valuation of relevant indices or publicly traded companies comparable to the Private Company; (iii) relevant news and other public sources; and (iv) known secondary market transactions in the Private Company’s interests and merger or acquisition activity in companies comparable to the Private Company. |
Investments in series of preferred stock issued by Private Companies are typically valued utilizing market approach in determining the enterprise value of the company. Such investments often contain rights and preferences that differ from other series of preferred and common stock of the same issuer. Enterprise valuation techniques such as an option pricing model (“OPM”), a probability weighted expected return model (“PWERM”), current value method or a hybrid of those techniques are used as deemed appropriate under the circumstances. The use of these valuation techniques involve a determination of the exit scenarios of the investment in order to appropriately allocate the enterprise value of the company among the various parts of its capital structure.
The Private Companies are not subject to the public company disclosure, timing, and reporting standards applicable to other investments held by a Fund. Typically, the most recently available information by a Private Company is as of a date that is earlier than the date a Fund is calculating its NAV. This factor may result in a difference between the value of the investment and the price a Fund could receive upon the sale of the investment.
Fair Value Hierarchy: Various inputs are used in determining the fair value of financial instruments. These inputs to valuation techniques are categorized into a fair value hierarchy consisting of three broad levels for financial reporting purposes as follows:
| | • | | Level 1 – Unadjusted price quotations in active markets/exchanges for identical assets or liabilities that each Fund has the ability to access; |
| | • | | Level 2 – Other observable inputs (including, but not limited to, quoted prices for similar assets or liabilities in markets that are active, quoted prices for identical or similar assets or liabilities in markets that are not active, inputs other than quoted prices that are observable for the assets or liabilities (such as interest rates, yield curves, volatilities, prepayment speeds, loss severities, credit risks and default rates) or other market–corroborated inputs); and |
| | • | | Level 3 – Unobservable inputs based on the best information available in the circumstances, to the extent observable inputs are not available (including the Global Valuation Committee’s assumptions used in determining the fair value of financial instruments). |
The hierarchy gives the highest priority to unadjusted quoted prices in active markets for identical assets or liabilities (Level 1 measurements) and the lowest priority to unobservable inputs (Level 3 measurements). Accordingly, the degree of judgment exercised in determining fair value is greatest for instruments categorized in Level 3. The inputs used to measure fair value may fall into different levels of the fair value hierarchy. In such cases, for disclosure purposes, the fair value hierarchy classification is determined based on the lowest level input that is significant to the fair value measurement in its entirety. Investments classified within Level 3 have significant unobservable inputs used by the Global Valuation Committee in determining the price for Fair Valued Investments. Level 3 investments include equity or debt issued by Private Companies that may not have a secondary market and/or may have a limited number of investors. The categorization of a value determined for financial instruments is based on the pricing transparency of the financial instruments and is not necessarily an indication of the risks associated with investing in those securities.
As of June 30, 2022, certain investments of Advantage Global were fair valued using NAV per share as no quoted market value is available and therefore have been excluded from the fair value hierarchy.
| 4. | SECURITIES AND OTHER INVESTMENTS |
Preferred Stocks: Preferred stock has a preference over common stock in liquidation (and generally in receiving dividends as well), but is subordinated to the liabilities of the issuer in all respects. As a general rule, the market value of preferred stock with a fixed dividend rate and no conversion element varies inversely with interest rates and perceived credit risk, while the market price of convertible preferred stock generally also reflects some element of conversion value. Because preferred stock is junior to debt securities and other obligations of the issuer, deterioration in the credit quality of the issuer will cause greater changes in the value of a preferred stock than in a more senior debt security with similar stated yield characteristics. Unlike interest payments on debt securities, preferred stock dividends are payable only if declared by the issuer’s board of directors. Preferred stock also may be subject to optional or mandatory redemption provisions.
Securities Lending: Certain Funds may lend their securities to approved borrowers, such as brokers, dealers and other financial institutions. The borrower pledges and maintains with the Funds collateral consisting of cash, an irrevocable letter of credit issued by a bank, or securities issued or guaranteed by the U.S. Government. The initial collateral received by each Fund is required to have a value of at least 102% of the current value of the loaned securities for securities traded on U.S. exchanges and a value
| | |
NOTES TO FINANCIAL STATEMENTS | | 41 |
Notes to Financial Statements (continued)
of at least 105% for all other securities. The collateral is maintained thereafter at a value equal to at least 100% of the current market value of the securities on loan. The market value of the loaned securities is determined at the close of each business day of the Fund and any additional required collateral is delivered to the Fund, or excess collateral returned by the Fund, on the next business day. During the term of the loan, the Funds are entitled to all distributions made on or in respect of the loaned securities, but do not receive interest income on securities received as collateral. Loans of securities are terminable at any time and the borrower, after notice, is required to return borrowed securities within the standard time period for settlement of securities transactions.
As of period end, any securities on loan were collateralized by cash and/or U.S. Government obligations. Cash collateral invested by the securities lending agent, BlackRock Investment Management, LLC (“BIM”), if any, is disclosed in the Schedules of Investments. Any non-cash collateral received cannot be sold, re-invested or pledged by the Fund, except in the event of borrower default. The securities on loan, if any, are disclosed in the Funds’ Schedules of Investments. The market value of any securities on loan and the value of any related collateral are shown separately in the Statements of Assets and Liabilities as a component of investments at value – unaffiliated and collateral on securities loaned, respectively.
Securities lending transactions are entered into by the Funds under Master Securities Lending Agreements (each, an “MSLA”), which provide the right, in the event of default (including bankruptcy or insolvency), for the non-defaulting party to liquidate the collateral and calculate a net exposure to the defaulting party or request additional collateral. In the event that a borrower defaults, the Funds, as lender, would offset the market value of the collateral received against the market value of the securities loaned. When the value of the collateral is greater than that of the market value of the securities loaned, the lender is left with a net amount payable to the defaulting party. However, bankruptcy or insolvency laws of a particular jurisdiction may impose restrictions on or prohibitions against such a right of offset in the event of an MSLA counterparty’s bankruptcy or insolvency. Under the MSLA, absent an event of default, the borrower can resell or re-pledge the loaned securities, and the Funds can reinvest cash collateral received in connection with loaned securities. Upon an event of default, the parties’ obligations to return the securities or collateral to the other party are extinguished, and the parties can resell or re-pledge the loaned securities or the collateral received in connection with the loaned securities in order to satisfy the defaulting party’s net payment obligation for all transactions under the MSLA. The defaulting party remains liable for any deficiency.
As of period end, the following table is a summary of the Advantage Global’s securities on loan by counterparty which are subject to offset under an MSLA:
| | | | | | | | | | | | | | | | |
| | | | | |
Fund Name/Counterparty | |
| Securities
Loaned at Value |
| |
| Cash Collateral
Received |
(a) | |
| Non-Cash Collateral
Received, at Fair Value |
| |
| Net
Amount |
|
| | | | |
Advantage Global | | | | | | | | | | | | | | | | |
J.P. Morgan Securities LLC | | $ | 663,603 | | | $ | (663,603 | ) | | $ | — | | | $ | — | |
National Financial Services LLC | | | 66,637 | | | | (66,637 | ) | | | — | | | | — | |
| | | | | | | | | | | | | | | | |
| | | | |
| | $ | 730,240 | | | $ | (730,240 | ) | | $ | — | | | $ | — | |
| | | | | | | | | | | | | | | | |
| | (a) | Collateral received, if any, in excess of the market value of securities on loan is not presented in this table. The total cash collateral received by each Fund is disclosed in the Fund’s Statements of Assets and Liabilities. | |
As of period end, EuroFund received cash collateral for securities loaned that were pending settlement.
The risks of securities lending include the risk that the borrower may not provide additional collateral when required or may not return the securities when due. To mitigate these risks, the Funds benefit from a borrower default indemnity provided by BIM. BIM’s indemnity allows for full replacement of the securities loaned to the extent the collateral received does not cover the value on the securities loaned in the event of borrower default. Each Fund could incur a loss if the value of an investment purchased with cash collateral falls below the market value of loaned securities or if the value of an investment purchased with cash collateral falls below the value of the original cash collateral received. Such losses are borne entirely by the Funds.
| 5. | DERIVATIVE FINANCIAL INSTRUMENTS |
The Funds engage in various portfolio investment strategies using derivative contracts both to increase the returns of the Funds and/or to manage their exposure to certain risks such as credit risk, equity risk, interest rate risk, foreign currency exchange rate risk, commodity price risk or other risks (e.g., inflation risk). Derivative financial instruments categorized by risk exposure are included in the Schedules of Investments. These contracts may be transacted on an exchange or over-the-counter (“OTC”).
Futures Contracts: Futures contracts are purchased or sold to gain exposure to, or manage exposure to, changes in interest rates (interest rate risk) and changes in the value of equity securities (equity risk) or foreign currencies (foreign currency exchange rate risk).
Futures contracts are exchange-traded agreements between the Funds and a counterparty to buy or sell a specific quantity of an underlying instrument at a specified price and on a specified date. Depending on the terms of a contract, it is settled either through physical delivery of the underlying instrument on the settlement date or by payment of a cash amount on the settlement date. Upon entering into a futures contract, the Funds are required to deposit initial margin with the broker in the form of cash or securities in an amount that varies depending on a contract’s size and risk profile. The initial margin deposit must then be maintained at an established level over the life of the contract. Amounts pledged, which are considered restricted, are included in cash pledged for futures contracts in the Statements of Assets and Liabilities.
Securities deposited as initial margin are designated in the Schedules of Investments and cash deposited, if any, are shown as cash pledged for futures contracts in the Statements of Assets and Liabilities. Pursuant to the contract, the Funds agree to receive from or pay to the broker an amount of cash equal to the daily fluctuation in market value of the contract (“variation margin”). Variation margin is recorded as unrealized appreciation (depreciation) and, if any, shown as variation margin receivable (or payable) on futures contracts in the Statements of Assets and Liabilities. When the contract is closed, a realized gain or loss is recorded in the Statements of Operations equal to the difference between the notional amount of the contract at the time it was opened and the notional amount at the time it was closed. The use of futures contracts involves the risk of an imperfect correlation in the movements in the price of futures contracts and interest rates, foreign currency exchange rates or underlying assets.
| | |
| 42 | | 2 0 2 2 BLACK ROCK ANNUAL REPORT TO SHAREHOLDERS |
Notes to Financial Statements (continued)
| 6. | INVESTMENT ADVISORY AGREEMENT AND OTHER TRANSACTIONS WITH AFFILIATES |
Investment Advisory: Each Fund entered into an Investment Advisory Agreement with the Manager, the Funds’ investment adviser and an indirect, wholly-owned subsidiary of BlackRock, Inc. (“BlackRock”), to provide investment advisory and administrative services. The Manager is responsible for the management of each Fund’s portfolio and provides the personnel, facilities, equipment and certain other services necessary to the operations of each Fund.
For such services, each Fund pays the Manager a monthly fee at an annual rate equal to the following percentages of the average daily value of each Fund’s net assets:
| | | | | | | | |
| | |
| | | Investment Advisory Fees | |
| | |
| Average Daily Net Assets | | Advantage Global | | | EuroFund | |
| | |
First $1 billion | | | 0.85 | % | | | 0.75% | |
$1 billion — $3 billion | | | 0.80 | | | | 0.71 | |
$3 billion — $5 billion | | | 0.77 | | | | 0.68 | |
$5 billion — $10 billion | | | 0.74 | | | | 0.65 | |
Greater than $10 billion | | | 0.72 | | | | 0.64 | |
With respect to EuroFund, the Manager entered into a sub-advisory agreement with BlackRock International Limited (“BIL”), an affiliate of the Manager. The Manager pays BIL for services it provides for that portion of the Fund for which BIL acts as sub-adviser, a monthly fee that is equal to a percentage of the investment advisory fees paid by EuroFund to the Manager.
Service and Distribution Fees: The Funds entered into a Distribution Agreement and Distribution and Service Plans with BlackRock Investments, LLC (“BRIL”), an affiliate of the Manager. Pursuant to the Distribution and Service Plan and in accordance with Rule 12b-1 under the 1940 Act, each Fund pays BRIL ongoing service and distribution fees. The fees are accrued daily and paid monthly at annual rates based upon the average daily net assets of the relevant share class of each Fund as follows:
| | | | | | | | |
| | | |
| Share Class | | Service Fees | | | Distribution Fees | |
| | |
Investor A | | | 0.25 | % | | | N/A | |
Investor C | | | 0.25 | | | | 0.75% | |
Class R | | | 0.25 | | | | 0.25 | |
BRIL and broker-dealers, pursuant to sub-agreements with BRIL, provide shareholder servicing and distribution services to the Funds. The ongoing service and/or distribution fee compensates BRIL and each broker-dealer for providing shareholder servicing and/or distribution related services to shareholders.
For the year ended June 30, 2022, the following table shows the class specific service and distribution fees borne directly by each share class of each Fund:
| | | | | | | | | | | | | | | | |
| | | | | |
| Fund Name | | Investor A | | | Investor C | | | Class R | | | Total | |
| | | | |
Advantage Global | | $ | 786,728 | | | $ | 57,559 | | | $ | 16,736 | | | $ | 861,023 | |
EuroFund | | | 204,610 | | | | 18,127 | | | | 2,205 | | | | 224,942 | |
Transfer Agent: Pursuant to written agreements, certain financial intermediaries, some of which may be affiliates, provide the Funds with sub-accounting, recordkeeping, sub-transfer agency and other administrative services with respect to servicing of underlying investor accounts. For these services, these entities receive an asset-based fee or an annual fee per shareholder account, which will vary depending on share class and/or net assets. For the year ended June 30, 2022, the Funds did not pay any amounts to affiliates in return for these services.
The Manager maintains a call center that is responsible for providing certain shareholder services to the Funds. Shareholder services include responding to inquiries and processing purchases and sales based upon instructions from shareholders. For the year ended June 30, 2022, each Fund reimbursed the Manager the following amounts for costs incurred in running the call center, which are included in transfer agent — class specific in the Statements of Operations:
| | | | | | | | | | | | | | | | | | | | | | | | |
| | | | | | | |
| Fund Name | | Institutional | | | Investor A | | | Investor C | | | Class K | | | Class R | | | Total | |
| | | | | | |
Advantage Global | | $ | 374 | | | $ | 4,426 | | | $ | 997 | | | $ | 24 | | | $ | 25 | | | $ | 5,846 | |
EuroFund | | | 1,060 | | | | 2,057 | | | | 175 | | | | 6 | | | | 19 | | | | 3,317 | |
For the year ended June 30, 2022, the following table shows the class specific transfer agent fees borne directly by each share class of each Fund:
| | | | | | | | | | | | | | | | | | | | | | | | |
| | | | | | | |
| Fund Name | | Institutional | | | Investor A | | | Investor C | | | Class K | | | Class R | | | Total | |
| | | | | | |
Advantage Global | | $ | 84,819 | | | $ | 478,079 | | | $ | 10,283 | | | $ | 1,061 | | | $ | 10,691 | | | $ | 584,933 | |
EuroFund | | | 51,262 | | | | 84,942 | | | | 2,350 | | | | 344 | | | | 1,676 | | | | 140,574 | |
Other Fees: For the year ended June 30, 2022, affiliates earned underwriting discounts, direct commissions and dealer concessions on sales of each Fund’s Investor A Shares as follows:
| | | | |
| | |
| Fund Name | | Investor A | |
| |
Advantage Global | | $ | 2,117 | |
EuroFund | | | 771 | |
| | |
NOTES TO FINANCIAL STATEMENTS | | 43 |
Notes to Financial Statements (continued)
For the year ended June 30, 2022, affiliates received CDSCs as follows:
| | | | | | | | |
| |
| | |
| Fund Name | | Investor A | | | Investor C | |
| |
| | |
Advantage Global | | $ | — | | | $ | 88 | |
| | |
EuroFund | | | 2,343 | | | | 20 | |
| |
Expense Limitations, Waivers and Reimbursements: With respect to each Fund, the Manager contractually agreed to waive its investment advisory fees by the amount of investment advisory fees each Fund pays to the Manager indirectly through its investment in affiliated money market funds (the “affiliated money market fund waiver”) through June 30, 2023. The contractual agreement may be terminated upon 90 days’ notice by a majority of the directors who are not “interested persons” of the Funds, as defined in the 1940 Act (“Independent Directors”), or by a vote of a majority of the outstanding voting securities of a Fund. The amount of waivers and/or reimbursements of fees and expenses made pursuant to the expense limitation described below will be reduced by the amount of the affiliated money market fund waiver. These amounts are included in fees waived and/or reimbursed by the Manager in the Statements of Operations. For the year ended June 30, 2022, the amounts waived were as follows:
| | | | |
| |
| |
| Fund Name | | Fees Waived and/or Reimbursed
by the Manager | |
| |
| |
Advantage Global | | $ | 2,996 | |
EuroFund | | | 127 | |
| |
The Manager has contractually agreed to waive its investment advisory fee with respect to any portion of each Fund’s assets invested in affiliated equity and fixed-income mutual funds and affiliated exchange-traded funds that have a contractual management fee through June 30, 2023. The contractual agreement may be terminated upon 90 days’ notice by a majority of the Independent Directors, or by a vote of a majority of the outstanding voting securities of a Fund. For the year ended June 30, 2022, there were no fees waived by the Manager pursuant to this arrangement.
With respect to EuroFund, the Manager voluntarily agreed to waive a portion of its investment advisory fees equal to the annual rate of 0.06% of the Fund’s average daily net assets. Effective June 1, 2022, the voluntary waiver was discontinued. This amount is included in fees waived and/or reimbursed by the Manager in the Statements of Operations. During the year ended June 30, 2022, the Manager waived $69,924 pursuant to this agreement.
With respect to each Fund, the Manager (effective June 1, 2022, for EuroFund) contractually agreed to waive and/or reimburse fees or expenses in order to limit expenses, excluding interest expense, dividend expense, tax expense, acquired fund fees and expenses, and certain other fund expenses, which constitute extraordinary expenses not incurred in the ordinary course of the Fund’s business (“expense limitation”). The expense limitations as a percentage of average daily net assets are as follows:
| | | | | | | | | | | | | | | | | | | | |
| |
| | | | | |
| Fund Name | | Institutional | | | Investor A | | | Investor C | | | Class K | | | Class R | |
| |
| | | | | |
Advantage Global | | | 0.71 | % | | | 0.96 | % | | | 1.71 | % | | | 0.66 | % | | | 1.21% | |
EuroFund | | | 1.04 | | | | 1.29 | | | | 2.04 | | | | 0.99 | | | | 1.54 | |
| |
The Manager has agreed not to reduce or discontinue this contractual expense limitation through June 30, 2023, unless approved by the Board, including a majority of the Independent Directors or by a vote of a majority of the outstanding voting securities of a Fund. For the year ended June 30, 2022, the Manager waived and/or reimbursed the following amounts, which are included in fees waived and/or reimbursed by the Manager in the Statements of Operations.
| | | | |
| |
| |
| Fund Name | | Fees Waived and/or Reimbursed by the Manager | |
| |
| |
Advantage Global | | $ | 1,584,755 | |
| |
EuroFund | | | 11,767 | |
| |
In addition, these amounts waived and/or reimbursed by the Manager are included in transfer agent fees waived and/or reimbursed by the Manager — class specific in the Statements of Operations. For the year ended June 30, 2022, class specific expense waivers and/or reimbursements are as follows:
| | | | | | | | | | | | | | | | | | | | | | | | |
| |
| |
| | | Transfer Agent Fees Waived and/or Reimbursed by the Manager - Class Specific | |
| | | | |
| | | | | | |
| Fund Name | | Institutional | | | Investor A | | | Investor C | | | Class K | | | Class R | | | Total | |
| |
| | | | | | |
Advantage Global | | $ | 42,586 | | | $ | 320,734 | | | $ | 7,404 | | | $ | 1,060 | | | $ | 9,018 | | | $ | 380,802 | |
| | | | | | |
EuroFund | | | 2,634 | | | | 3,337 | | | | 2 | | | | 47 | | | | 61 | | | | 6,081 | |
| |
Securities Lending: The U.S. Securities and Exchange Commission (“SEC”) has issued an exemptive order which permits BIM, an affiliate of the Manager, to serve as securities lending agent for the Funds, subject to applicable conditions. As securities lending agent, BIM bears all operational costs directly related to securities lending. The Funds are responsible for expenses in connection with the investment of cash collateral received for securities on loan (the “collateral investment expenses”). The cash collateral is invested in a private investment company, Money Market Series, managed by the Manager or its affiliates. However, BIM has agreed to cap the collateral investment expenses of the Money Market Series to an annual rate of 0.04%. The investment adviser to the Money Market Series will not charge any advisory fees with respect to shares purchased by the Funds. The Money Market Series may, under certain circumstances, impose a liquidity fee of up to 2% of the value withdrawn or temporarily restrict withdrawals for up to 10 business days during a 90 day period, in the event that the private investment company’s weekly liquid assets fall below certain thresholds. The Money Market Series seeks current income consistent with maintaining liquidity and preserving capital. Although the Money Market Series is not registered under the 1940 Act, its investments may follow the parameters of investments by a money market fund that is subject to Rule 2a-7 under the 1940 Act.
Securities lending income is equal to the total of income earned from the reinvestment of cash collateral, net of fees and other payments to and from borrowers of securities, and less the collateral investment expenses. Each Fund retains a portion of securities lending income and remits a remaining portion to BIM as compensation for its services as securities lending agent.
| | |
| 44 | | 2 0 2 2 BLACK ROCK ANNUAL REPORT TO SHAREHOLDERS |
Notes to Financial Statements (continued)
Pursuant to the current securities lending agreement, each Fund retains 82% of securities lending income (which excludes collateral investment expenses), and this amount retained can never be less than 70% of the total of securities lending income plus the collateral investment expenses.
In addition, commencing the business day following the date that the aggregate securities lending income earned across the BlackRock Multi-Asset Complex in a calendar year exceeds a specified threshold, each Fund, pursuant to the securities lending agreement, will retain for the remainder of that calendar year securities lending income in an amount equal to 85% of securities lending income (which excludes collateral investment expenses), and this amount retained can never be less than 70% of the total of securities lending income plus the collateral investment expenses.
The share of securities lending income earned by each Fund is shown as securities lending income — affiliated — net in the Statements of Operations. For the year ended June 30, 2022, each Fund paid BIM the following amounts for securities lending agent services:
| | | | |
| |
| |
| Fund Name | | Amounts | |
| |
| |
Advantage Global | | $ | 3,460 | |
EuroFund | | | 22 | |
| |
Interfund Lending: In accordance with an exemptive order (the “Order”) from the SEC, each Fund may participate in a joint lending and borrowing facility for temporary purposes (the “Interfund Lending Program”), subject to compliance with the terms and conditions of the Order, and to the extent permitted by each Fund’s investment policies and restrictions. EuroFund is currently permitted to borrow under the Interfund Lending Program. Advantage Global is currently permitted to borrow and lend under the Interfund Lending Program.
A lending BlackRock fund may lend in aggregate up to 15% of its net assets but may not lend more than 5% of its net assets to any one borrowing fund through the Interfund Lending Program. A borrowing BlackRock fund may not borrow through the Interfund Lending Program or from any other source more than 33 1/3% of its total assets (or any lower threshold provided for by the fund’s investment restrictions). If a borrowing BlackRock fund’s total outstanding borrowings exceed 10% of its total assets, each of its outstanding interfund loans will be subject to collateralization of at least 102% of the outstanding principal value of the loan. All interfund loans are for temporary or emergency purposes and the interest rate to be charged will be the average of the highest current overnight repurchase agreement rate available to a lending fund and the bank loan rate, as calculated according to a formula established by the Board.
During the year ended June 30, 2022, the Funds did not participate in the Interfund Lending Program.
Directors and Officers: Certain directors and/or officers of the Funds are directors and/or officers of BlackRock or its affiliates. The Funds reimburse the Manager for a portion of the compensation paid to the Funds’ Chief Compliance Officer, which is included in Directors and Officer in the Statements of Operations.
The Funds may purchase securities from, or sell securities to, an affiliated fund provided the affiliation is due solely to having a common investment adviser, common officers, or common directors. For the year ended June 30, 2022, the purchase and sale transactions and any net realized gains (losses) with an affiliated fund in compliance with Rule 17a-7 under the 1940 Act were as follows:
| | | | | | | | | | | | |
| | | | |
| Fund Name | | Purchases | | | Sales | | | Net Realized
Gain (Loss) | |
Advantage Global | | $ | 15,382,441 | | | $ | 9,818,856 | | | $ | (775,940 | ) |
For the year ended June 30, 2022, purchases and sales of investments, excluding short-term investments, were as follows:
| | | | | | | | |
| | | |
| Fund Name | | Purchases | | | Sales | |
| | |
Advantage Global | | $ | 616,795,242 | | | $ | 642,417,681 | |
EuroFund | | | 51,548,141 | | | | 100,299,212 | |
It is each Fund’s policy to comply with the requirements of the Internal Revenue Code of 1986, as amended, applicable to regulated investment companies, and to distribute substantially all of its taxable income to its shareholders. Therefore, no U.S. federal income tax provision is required.
Each Fund files U.S. federal and various state and local tax returns. No income tax returns are currently under examination. The statute of limitations on each Fund’s U.S. federal tax returns generally remains open for a period of three years after they are filed. The statutes of limitations on each Fund’s state and local tax returns may remain open for an additional year depending upon the jurisdiction.
Management has analyzed tax laws and regulations and their application to the Funds as of June 30, 2022, inclusive of the open tax return years, and does not believe that there are any uncertain tax positions that require recognition of a tax liability in the Funds’ financial statements.
| | |
NOTES TO FINANCIAL STATEMENTS | | 45 |
Notes to Financial Statements (continued)
The tax character of distributions paid was as follows:
| | | | | | | | |
| | | |
Fund Name | |
| Year Ended
06/30/22 |
| |
| Year Ended
06/30/21 |
|
| | |
Advantage Global | | | | | | | | |
Ordinary income | | $ | 52,270,653 | | | $ | 13,160,353 | |
Long-term capital gains | | | 22,561,486 | | | | 3,856,802 | |
| | | | | | | | |
| | |
| | $ | 74,832,139 | | | $ | 17,017,155 | |
| | | | | | | | |
As of June 30, 2022, the tax components of accumulated earnings (loss) were as follows:
| | | | | | | | | | | | | | | | | | | | |
| |
| | | | | |
| Fund Name | | Undistributed
Ordinary Income | | | Non-Expiring
Capital Loss
Carryforwards(a) | | | Net Unrealized
Gains (Losses)(b) | | | Qualified
Late-Year Loss(c) | | | Total | |
| |
| | | | | |
Advantage Global | | $ | 1,674,982 | | | $ | — | | | $ | (8,945,624 | ) | | $ | (2,189,726 | ) | | $ | (9,460,368 | ) |
| | | | | |
EuroFund | | | 528,442 | | | | (18,424,399 | ) | | | 5,604,854 | | | | — | | | | (12,291,103 | ) |
| |
| | (a) | Amounts available to offset future realized capital gains. | |
| | (b) | The difference between book-basis and tax-basis net unrealized gains losses was attributable primarily to the tax deferral of losses on wash sales, the realization for tax purposes of unrealized gains on investments in passive foreign investment companies, the realization for tax purposes of unrealized gains/losses on certain futures and foreign currency contracts, the timing and recognition of partnership income, and characterization of corporate actions. | |
| | (c) | The Fund has elected to defer certain qualified late-year losses and recognize such losses in the next taxable year. | |
During the year ended June 30, 2022, EuroFund utilized $8,756,982 of its capital loss carryforward.
As of June 30, 2022, gross unrealized appreciation and depreciation based on cost of investments (including short positions and derivatives, if any) for U.S. federal income tax purposes were as follows:
| | | | | | | | | | | | | | | | |
| |
| | | | |
| Fund Name | | Tax Cost | | | Gross Unrealized
Appreciation | | | Gross Unrealized
Depreciation | | | Net Unrealized Appreciation (Depreciation) | |
| |
| | | | |
Advantage Global | | $ | 392,003,517 | | | $ | 37,394,628 | | | $ | (46,357,562 | ) | | $ | (8,962,934 | ) |
| | | | |
EuroFund | | | 84,304,381 | | | | 15,865,411 | | | | (10,392,933 | ) | | | 5,472,478 | |
| |
The Funds, along with certain other funds managed by the Manager and its affiliates (“Participating Funds”), are a party to a 364-day, $2.50 billion credit agreement with a group of lenders. Under this agreement, the Funds may borrow to fund shareholder redemptions. Excluding commitments designated for certain individual funds, the Participating Funds, including the Funds, can borrow up to an aggregate commitment amount of $1.75 billion at any time outstanding, subject to asset coverage and other limitations as specified in the agreement. The credit agreement has the following terms: a fee of 0.10% per annum on unused commitment amounts and interest at a rate equal to the higher of (a) Overnight Bank Funding Rate (“OBFR”) (but, in any event, not less than 0.00%) on the date the loan is made plus 0.80% per annum, (b) the Fed Funds rate (but, in any event, not less than 0.00%) in effect from time to time plus 0.80% per annum on amounts borrowed or (c) the sum of (x) Daily Simple Secured Overnight Financing Rate (“SOFR”) (but, in any event, not less than 0.00%) on the date the loan is made plus 0.10% and (y) 0.80% per annum. The agreement expires in April 2023 unless extended or renewed. These fees were allocated among such funds based upon portions of the aggregate commitment available to them and relative net assets of Participating Funds. During the year ended June 30, 2022, the Funds did not borrow under the credit agreement.
In the normal course of business, the Funds invest in securities or other instruments and may enter into certain transactions, and such activities subject each Fund to various risks, including among others, fluctuations in the market (market risk) or failure of an issuer to meet all of its obligations. The value of securities or other instruments may also be affected by various factors, including, without limitation: (i) the general economy; (ii) the overall market as well as local, regional or global political and/or social instability; (iii) regulation, taxation or international tax treaties between various countries; or (iv) currency, interest rate and price fluctuations. Local, regional or global events such as war, acts of terrorism, the spread of infectious illness or other public health issues, recessions, or other events could have a significant impact on the Funds and their investments. Each Fund’s prospectus provides details of the risks to which each Fund is subject.
The Funds may be exposed to additional risks when reinvesting cash collateral in money market funds that do not seek to maintain a stable NAV per share of $1.00, which may be subject to redemption gates or liquidity fees under certain circumstances.
Market Risk: An outbreak of respiratory disease caused by a novel coronavirus has developed into a global pandemic and has resulted in closing borders, quarantines, disruptions to supply chains and customer activity, as well as general concern and uncertainty. The impact of this pandemic, and other global health crises that may arise in the future, could affect the economies of many nations, individual companies and the market in general in ways that cannot necessarily be foreseen at the present time. This pandemic may result in substantial market volatility and may adversely impact the prices and liquidity of a fund’s investments. Although vaccines have been developed and approved for use by various governments, the duration of this pandemic and its effects cannot be determined with certainty.
| | |
| 46 | | 2 0 2 2 BLACK ROCK ANNUAL REPORT TO SHAREHOLDERS |
Notes to Financial Statements (continued)
Valuation Risk: The market values of equities, such as common stocks and preferred securities or equity related investments, such as futures and options, may decline due to general market conditions which are not specifically related to a particular company. They may also decline due to factors which affect a particular industry or industries. A Fund may invest in illiquid investments. An illiquid investment is any investment that a Fund reasonably expects cannot be sold or disposed of in current market conditions in seven calendar days or less without the sale or disposition significantly changing the market value of the investment. A Fund may experience difficulty in selling illiquid investments in a timely manner at the price that it believes the investments are worth. Prices may fluctuate widely over short or extended periods in response to company, market or economic news. Markets also tend to move in cycles, with periods of rising and falling prices. This volatility may cause each Fund’s NAV to experience significant increases or decreases over short periods of time. If there is a general decline in the securities and other markets, the NAV of a Fund may lose value, regardless of the individual results of the securities and other instruments in which a Fund invests.
The price a Fund could receive upon the sale of any particular portfolio investment may differ from a Fund’s valuation of the investment, particularly for securities that trade in thin or volatile markets or that are valued using a fair valuation technique or a price provided by an independent pricing service. Changes to significant unobservable inputs and assumptions (i.e., publicly traded company multiples, growth rate, time to exit) due to the lack of observable inputs may significantly impact the resulting fair value and therefore a Fund’s results of operations. As a result, the price received upon the sale of an investment may be less than the value ascribed by a Fund, and a Fund could realize a greater than expected loss or lesser than expected gain upon the sale of the investment. A Fund’s ability to value its investments may also be impacted by technological issues and/or errors by pricing services or other third-party service providers.
Counterparty Credit Risk: The Funds may be exposed to counterparty credit risk, or the risk that an entity may fail to or be unable to perform on its commitments related to unsettled or open transactions, including making timely interest and/or principal payments or otherwise honoring its obligations. The Funds manage counterparty credit risk by entering into transactions only with counterparties that the Manager believes have the financial resources to honor their obligations and by monitoring the financial stability of those counterparties. Financial assets, which potentially expose the Funds to market, issuer and counterparty credit risks, consist principally of financial instruments and receivables due from counterparties. The extent of the Funds’ exposure to market, issuer and counterparty credit risks with respect to these financial assets is approximately their value recorded in the Statements of Assets and Liabilities, less any collateral held by the Funds.
A derivative contract may suffer a mark-to-market loss if the value of the contract decreases due to an unfavorable change in the market rates or values of the underlying instrument. Losses can also occur if the counterparty does not perform under the contract.
With exchange-traded futures, there is less counterparty credit risk to the Funds since the exchange or clearinghouse, as counterparty to such instruments, guarantees against a possible default. The clearinghouse stands between the buyer and the seller of the contract; therefore, credit risk is limited to failure of the clearinghouse. While offset rights may exist under applicable law, a Fund does not have a contractual right of offset against a clearing broker or clearinghouse in the event of a default (including the bankruptcy or insolvency). Additionally, credit risk exists in exchange-traded futures with respect to initial and variation margin that is held in a clearing broker’s customer accounts. While clearing brokers are required to segregate customer margin from their own assets, in the event that a clearing broker becomes insolvent or goes into bankruptcy and at that time there is a shortfall in the aggregate amount of margin held by the clearing broker for all its clients, typically the shortfall would be allocated on a pro rata basis across all the clearing broker’s customers, potentially resulting in losses to the Funds.
Concentration Risk: A diversified portfolio, where this is appropriate and consistent with a fund’s objectives, minimizes the risk that a price change of a particular investment will have a material impact on the NAV of a fund. The investment concentrations within each Fund’s portfolio are disclosed in its Schedule of Investments.
Certain Funds invest a substantial amount of their assets in issuers located in a single country or a limited number of countries. When a Fund concentrates its investments in this manner, it assumes the risk that economic, regulatory, political and social conditions in those countries may have a significant impact on their investment performance and could affect the income from, or the value or liquidity of, the Fund’s portfolio. Unanticipated or sudden political or social developments may cause uncertainty in the markets and as a result adversely affect the Fund’s investments. Foreign issuers may not be subject to the same uniform accounting, auditing and financial reporting standards and practices as used in the United States. Foreign securities markets may also be more volatile and less liquid than U.S. securities and may be less subject to governmental supervision not typically associated with investing in U.S. securities. Investment percentages in specific countries are presented in the Schedules of Investments.
Certain Funds invest a significant portion of their assets in securities of issuers located in Europe or with significant exposure to European issuers or countries. The European financial markets have recently experienced volatility and adverse trends due to concerns about economic downturns in, or rising government debt levels of, several European countries as well as acts of war in the region. These events may spread to other countries in Europe and may affect the value and liquidity of certain of the Funds’ investments.
Responses to the financial problems by European governments, central banks and others, including austerity measures and reforms, may not work, may result in social unrest and may limit future growth and economic recovery or have other unintended consequences. Further defaults or restructurings by governments and others of their debt could have additional adverse effects on economies, financial markets and asset valuations around the world. The United Kingdom has withdrawn from the European Union, and one or more other countries may withdraw from the European Union and/or abandon the Euro, the common currency of the European Union. The impact of these actions, especially if they occur in a disorderly fashion, is not clear but could be significant and far reaching. In addition, Russia launched a large-scale invasion of Ukraine on February 24, 2022. The extent and duration of the military action, resulting sanctions and resulting future market disruptions in the region are impossible to predict, but could be significant and have a severe adverse effect on the region, including significant negative impacts on the economy and the markets for certain securities and commodities, such as oil and natural gas, as well as other sectors.
Significant Shareholder Redemption Risk: Certain shareholders may own or manage a substantial amount of fund shares and/or hold their fund investments for a limited period of time. Large redemptions of fund shares by these shareholders may force a Fund to sell portfolio securities, which may negatively impact the fund’s NAV, increase the fund’s brokerage costs, and/or accelerate the realization of taxable income/gains and cause the fund to make additional taxable distributions to shareholders.
LIBOR Transition Risk: The United Kingdom’s Financial Conduct Authority announced a phase out of the London Interbank Offered Rate (“LIBOR”). Although many LIBOR rates ceased to be published or no longer are representative of the underlying market they seek to measure after December 31, 2021, a selection of widely used USD LIBOR rates will continue to be published through June 2023 in order to assist with the transition. The Funds may be exposed to financial instruments tied to LIBOR to determine
| | |
NOTES TO FINANCIAL STATEMENTS | | 47 |
Notes to Financial Statements (continued)
payment obligations, financing terms, hedging strategies or investment value. The transition process away from LIBOR might lead to increased volatility and illiquidity in markets for, and reduce the effectiveness of new hedges placed against instruments whose terms currently include LIBOR. The ultimate effect of the LIBOR transition process on the Funds is uncertain.
11. CAPITAL SHARE TRANSACTIONS
Transactions in capital shares for each class were as follows:
| | | | | | | | | | | | | | | | | | | | |
| | | Year Ended
06/30/22 | | | | | | Year Ended
06/30/21 | |
| | | | | | | | | | | | |
| Fund Name / Share Class | | Shares | | | Amounts | | | | | | Shares | | | Amounts | |
Advantage Global | | | | | | | | | | | | | | | | | | | | |
Institutional | | | | | | | | | | | | | | | | | | | | |
Shares sold | | | 516,799 | | | $ | 12,492,114 | | | | | | | | 353,005 | | | $ | 8,961,654 | |
Shares issued in reinvestment of distributions | | | 523,855 | | | | 13,448,762 | | | | | | | | 122,734 | | | | 3,013,121 | |
Shares redeemed | | | (1,373,464 | ) | | | (33,811,641 | ) | | | | | | | (666,077 | ) | | | (16,543,928 | ) |
| | | | | | | | | | | | | | | | | | | | |
| | | (332,810 | ) | | $ | (7,870,765 | ) | | | | | | | (190,338 | ) | | $ | (4,569,153 | ) |
| | | | | | | | | | | | | | | | | | | | |
| | | | | |
Investor A | | | | | | | | | | | | | | | | | | | | |
Shares sold | | | 1,345,196 | | | $ | 30,806,933 | | | | | | | | 1,602,254 | | | $ | 35,969,989 | |
Shares issued in reinvestment of distributions | | | 1,904,545 | | | | 45,920,653 | | | | | | | | 434,436 | | | | 10,100,634 | |
Shares redeemed | | | (1,749,712 | ) | | | (40,119,251 | ) | | | | | | | (1,800,248 | ) | | | (42,539,915 | ) |
| | | | | | | | | | | | | | | | | | | | |
| | | 1,500,029 | | | $ | 36,608,335 | | | | | | | | 236,442 | | | $ | 3,530,708 | |
| | | | | | | | | | | | | | | | | | | | |
| | | | | |
Investor C | | | | | | | | | | | | | | | | | | | | |
Shares sold | | | 14,474 | | | $ | 253,356 | | | | | | | | 20,365 | | | $ | 401,104 | |
Shares issued in reinvestment of distributions | | | 66,995 | | | | 1,282,263 | | | | | | | | 19,276 | | | | 367,401 | |
Shares redeemed and automatic conversion of shares | | | (191,599 | ) | | | (3,624,007 | ) | | | | | | | (1,829,663 | ) | | | (33,139,792 | ) |
| | | | | | | | | | | | | | | | | | | | |
| | | (110,130 | ) | | $ | (2,088,388 | ) | | | | | | | (1,790,022 | ) | | $ | (32,371,287 | ) |
| | | | | | | | | | | | | | | | | | | | |
| | | | | |
Class K | | | | | | | | | | | | | | | | | | | | |
Shares sold | | | 437,784 | | | $ | 11,106,505 | | | | | | | | 1,547,022 | | | $ | 42,438,784 | |
Shares issued in reinvestment of distributions | | | 333,878 | | | | 8,570,267 | | | | | | | | 23,087 | | | | 566,795 | |
Shares redeemed | | | (361,744 | ) | | | (9,088,358 | ) | | | | | | | (146,256 | ) | | | (3,754,533 | ) |
| | | | | | | | | | | | | | | | | | | | |
| | | 409,918 | | | $ | 10,588,414 | | | | | | | | 1,423,853 | | | $ | 39,251,046 | |
| | | | | | | | | | | | | | | | | | | | |
| | | | | |
Class R | | | | | | | | | | | | | | | | | | | | |
Shares sold | | | 21,288 | | | $ | 436,343 | | | | | | | | 35,430 | | | $ | 758,871 | |
Shares issued in reinvestment of distributions | | | 29,767 | | | | 633,880 | | | | | | | | 7,784 | | | | 162,607 | |
Shares redeemed | | | (68,956 | ) | | | (1,446,183 | ) | | | | | | | (113,713 | ) | | | (2,399,784 | ) |
| | | | | | | | | | | | | | | | | | | | |
| | | (17,901 | ) | | $ | (375,960 | ) | | | | | | | (70,499 | ) | | $ | (1,478,306 | ) |
| | | | | | | | | | | | | | | | | | | | |
| | | 1,449,106 | | | $ | 36,861,636 | | | | | | | | (390,564 | ) | | $ | 4,363,008 | |
| | | | | | | | | | | | | | | | | | | | |
| | | | | | | | | | | | | | | | | | | | |
| | | Year Ended
06/30/22 | | | | | | Year Ended
06/30/21 | |
| | | | | | | | | | | | |
| Fund Name / Share Class | | Shares | | | Amounts | | | | | | Shares | | | Amounts | |
EuroFund | | | | | | | | | | | | | | | | | | | | |
Institutional | | | | | | | | | | | | | | | | | | | | |
Shares sold | | | 122,608 | | | $ | 2,411,570 | | | | | | | | 2,405,942 | | | $ | 47,228,958 | |
Shares issued in reinvestment of distributions | | | — | | | | — | | | | | | | | — | | | | — | |
Shares redeemed | | | (2,442,177 | ) | | | (50,674,198 | ) | | | | | | | (234,616 | ) | | | (4,179,416 | ) |
| | | | | | | | | | | | | | | | | | | | |
| | | (2,319,569 | ) | | $ | (48,262,628 | ) | | | | | | | 2,171,326 | | | $ | 43,049,542 | |
| | | | | | | | | | | | | | | | | | | | |
| | | | | |
Investor A | | | | | | | | | | | | | | | | | | | | |
Shares sold | | | 229,654 | | | $ | 4,514,406 | | | | | | | | 266,022 | | | $ | 4,557,168 | |
Shares issued in reinvestment of distributions | | | — | | | | — | | | | | | | | — | | | | — | |
Shares redeemed | | | (444,682 | ) | | | (8,307,512 | ) | | | | | | | (568,313 | ) | | | (9,533,418 | ) |
| | | | | | | | | | | | | | | | | | | | |
| | | (215,028 | ) | | $ | (3,793,106 | ) | | | | | | | (302,291 | ) | | $ | (4,976,250 | ) |
| | | | | | | | | | | | | | | | | | | | |
| | | | | |
Investor C | | | | | | | | | | | | | | | | | | | | |
Shares sold | | | 19,069 | | | $ | 253,465 | | | | | | | | 22,480 | | | $ | 275,997 | |
Shares issued in reinvestment of distributions | | | — | | | | — | | | | | | | | — | | | | — | |
Shares redeemed and automatic conversion of shares | | | (90,724 | ) | | | (1,184,488 | ) | | | | | | | (161,601 | ) | | | (1,858,944 | ) |
| | | | | | | | | | | | | | | | | | | | |
| | | (71,655 | ) | | $ | (931,023 | ) | | | | | | | (139,121 | ) | | $ | (1,582,947 | ) |
| | | | | | | | | | | | | | | | | | | | |
| | |
| 48 | | 2 0 2 2 BLACK ROCK ANNUAL REPORT TO SHAREHOLDERS |
Notes to Financial Statements (continued)
| | | | | | | | | | | | | | | | | | | | |
| | | Year Ended
06/30/22 | | | | | | Year Ended
06/30/21 | |
| | | | | | | | | | | | |
| Fund Name / Share Class (continued) | | Shares | | | Amounts | | | | | | Shares | | | Amounts | |
EuroFund (continued) | | | | | | | | | | | | | | | | | | | | |
| | | | | |
Class K | | | | | | | | | | | | | | | | | | | | |
Shares sold | | | 43,191 | | | $ | 888,954 | | | | | | | | 8,761 | | | $ | 160,552 | |
Shares issued in reinvestment of distributions | | | — | | | | — | | | | | | | | — | | | | — | |
Shares redeemed | | | (25,204 | ) | | | (463,242 | ) | | | | | | | (8,545 | ) | | | (149,452 | ) |
| | | | | | | | | | | | | | | | | | | | |
| | | 17,987 | | | $ | 425,712 | | | | | | | | 216 | | | $ | 11,100 | |
| | | | | | �� | | | | | | | | | | | | | | |
| | | | | |
Class R | | | | | | | | | | | | | | | | | | | | |
Shares sold | | | 8,967 | | | $ | 120,841 | | | | | | | | 4,460 | | | $ | 56,788 | |
Shares issued in reinvestment of distributions | | | — | | | | — | | | | | | | | — | | | | — | |
Shares redeemed | | | (22,404 | ) | | | (276,352 | ) | | | | | | | (6,936 | ) | | | (79,906 | ) |
| | | | | | | | | | | | | | | | | | | | |
| | | (13,437 | ) | | $ | (155,511 | ) | | | | | | | (2,476 | ) | | $ | (23,118 | ) |
| | | | | | | | | | | | | | | | | | | | |
| | | (2,601,702 | ) | | $ | (52,716,556 | ) | | | | | | | 1,727,654 | | | $ | 36,478,327 | |
| | | | | | | | | | | | | | | | | | | | |
As of June 30, 2022, BlackRock Financial Management, Inc., an affiliate of the Fund, owned 12,070 Class K Shares of EuroFund.
12. SUBSEQUENT EVENTS
Management has evaluated the impact of all subsequent events on the Funds through the date the financial statements were issued and has determined that there were no subsequent events requiring adjustment or additional disclosure in the financial statements.
| | |
NOTES TO FINANCIAL STATEMENTS | | 49 |
Report of Independent Registered Public Accounting Firm
To the Shareholders and Board of Directors/Trustees of BlackRock Advantage Global Fund, Inc. and BlackRock EuroFund:
Opinion on the Financial Statements and Financial Highlights
We have audited the accompanying statements of assets and liabilities of BlackRock Advantage Global Fund, Inc. and BlackRock EuroFund (the “Funds”), including the schedules of investments, as of June 30, 2022, the related statements of operations for the year then ended, the statements of changes in net assets for each of the two years in the period then ended, the financial highlights for each of the five years in the period then ended, and the related notes. In our opinion, the financial statements and financial highlights present fairly, in all material respects, the financial position of the Funds as of June 30, 2022, and the results of their operations for the year then ended, the changes in their net assets for each of the two years in the period then ended, and the financial highlights for each of the five years in the period then ended, in conformity with accounting principles generally accepted in the United States of America.
Basis for Opinion
These financial statements and financial highlights are the responsibility of the Funds’ management. Our responsibility is to express an opinion on the Funds’ financial statements and financial highlights based on our audits. We are a public accounting firm registered with the Public Company Accounting Oversight Board (United States) (PCAOB) and are required to be independent with respect to the Funds in accordance with the U.S. federal securities laws and the applicable rules and regulations of the Securities and Exchange Commission and the PCAOB.
We conducted our audits in accordance with the standards of the PCAOB. Those standards require that we plan and perform the audit to obtain reasonable assurance about whether the financial statements and financial highlights are free of material misstatement, whether due to error or fraud. The Funds are not required to have, nor were we engaged to perform, an audit of their internal control over financial reporting. As part of our audits we are required to obtain an understanding of internal control over financial reporting but not for the purpose of expressing an opinion on the effectiveness of the Funds’ internal control over financial reporting. Accordingly, we express no such opinion.
Our audits included performing procedures to assess the risks of material misstatement of the financial statements and financial highlights, whether due to error or fraud, and performing procedures that respond to those risks. Such procedures included examining, on a test basis, evidence regarding the amounts and disclosures in the financial statements and financial highlights. Our audits also included evaluating the accounting principles used and significant estimates made by management, as well as evaluating the overall presentation of the financial statements and financial highlights. Our procedures included confirmation of securities owned as of June 30, 2022, by correspondence with custodians or counterparties; when replies were not received, we performed other auditing procedures. We believe that our audits provide a reasonable basis for our opinion.
Deloitte & Touche LLP
Boston, Massachusetts
August 19, 2022
We have served as the auditor of one or more BlackRock investment companies since 1992.
| | |
| 50 | | 2 0 2 2 B L A C K R O C K A N N U A L R E P O R T T O S H A R E H O L D E R S |
| | |
| Important Tax Information (unaudited) | | |
The following amounts, or maximum amounts allowable by law, are hereby designated as qualified dividend income for individuals for the fiscal year ended June 30, 2022:
| | | | |
| | |
| Fund Name | | Qualified Dividend
Income | |
Advantage Global | | $ | 9,139,200 | |
The following amounts, or maximum amounts allowable by law, are hereby designated as qualified business income for individuals for the fiscal year ended June 30, 2022:
| | | | |
| | |
| Fund Name | | Qualified Business
Income | |
Advantage Global | | $ | 74,319 | |
The following percentage, or maximum percentage allowable by law, of ordinary income distributions paid during the fiscal year ended June 30, 2022 qualified for the dividends-received deduction for corporate shareholders:
| | | | |
| | |
| Fund Name | | Dividends-Received
Deduction | |
Advantage Global | | | 6.60 | % |
The Fund hereby designates the following amount, or maximum amount allowable by law, as qualified short-term capital gains eligible for exemption from U.S. withholding tax for nonresident aliens and foreign corporations for the fiscal year ended June 30, 2022:
| | | | |
| | |
| Fund Name | | Qualified
Short-Term
Capital Gains | |
Advantage Global | | $ | 46,714,914 | |
| | |
I M P O R T A N T T A X I N F O R M A T I O N | | 51 |
Disclosure of Investment Advisory Agreements and Sub-Advisory Agreement
The Board of Trustees of BlackRock EuroFund (“EuroFund”) met on April 20, 2022 and May 10-11, 2022 to consider the approval to continue the investment advisory agreement (the “EuroFund Advisory Agreement”) between EuroFund and BlackRock Advisors, LLC (the “Manager”), its investment advisor. The Board of Trustees of EuroFund also considered the approval of the sub-advisory agreement (the “EuroFund Sub-Advisory Agreement”) between the Manager and BlackRock International Limited (the “Sub-Advisor”) with respect to EuroFund.
The Board of Directors of BlackRock Advantage Global Fund, Inc. (“Advantage Global Fund”) met on April 20, 2022 and May 10-11, 2022 to consider the approval to continue the investment advisory agreement (the “Advantage Global Fund Advisory Agreement”) between Advantage Global Fund and the Manager, its investment advisor.
EuroFund and Advantage Global Fund are referred to herein individually as a “Fund” or collectively as the “Funds.” The Manager and the Sub-Advisor are referred to herein as “BlackRock.” The EuroFund Advisory Agreement, the EuroFund Sub-Advisory Agreement and the Advantage Global Fund Advisory Agreement are referred to herein individually as an “Agreement” or collectively as the “Agreements.” For simplicity: (a) the Board of Trustees of EuroFund and the Board of Directors of Advantage Global Fund are referred to herein individually as the “Board” and collectively as the “Boards” and the members are referred to as “Board Members”; and (b) the meetings held on April 20, 2022 are referred to as the “April Meeting” and the meetings held on May 10-11, 2022 are referred to as the “May Meeting.”
The Approval Process
Consistent with the requirements of the Investment Company Act of 1940 (the “1940 Act”), each Board considers the approval of the continuation of the pertinent Agreement for each Fund on an annual basis. The Board members who are not “interested persons” of the pertinent Fund, as defined in the 1940 Act, are considered independent Board members (the “Independent Board Members”). Each Board’s consideration entailed a year-long deliberative process during which the Board and its committees assessed BlackRock’s various services to each Fund, including through the review of written materials and oral presentations, and the review of additional information provided in response to requests from the Independent Board Members. Each Board had four quarterly meetings per year, each typically extending for two days, as well as additional ad hoc meetings and executive sessions throughout the year, as needed. The committees of each Board similarly met throughout the year. Each Board also had an additional one-day meeting to consider specific information surrounding the renewal of the Agreements. In particular, each Board assessed, among other things, the nature, extent and quality of the services provided to the Fund by BlackRock, BlackRock’s personnel and affiliates, including (as applicable): investment management services; accounting oversight; administrative and shareholder services; oversight of the Fund’s service providers; risk management and oversight; and legal, regulatory and compliance services. Throughout the year, including during the contract renewal process, the Independent Board Members were advised by independent legal counsel, and met with independent legal counsel in various executive sessions outside of the presence of BlackRock’s management.
During the year, each Board, acting directly and through its committees, considered information that was relevant to its annual consideration of the renewal of the Agreements, including the services and support provided by BlackRock to the Fund and its shareholders. BlackRock also furnished additional information to each Board in response to specific questions from the Board. Among the matters each Board considered were: (a) investment performance for one-year, three-year, five-year, and/or since inception periods, as applicable, against peer funds, an applicable benchmark, and other performance metrics, as applicable, as well as BlackRock senior management’s and portfolio managers’ analyses of the reasons for any outperformance or underperformance relative to its peers, benchmarks, and other performance metrics, as applicable; (b) fees, including advisory, administration, if applicable, and other amounts paid to BlackRock and its affiliates by the Fund for services; (c) Fund operating expenses and how BlackRock allocates expenses to the Fund; (d) the resources devoted to risk oversight of, and compliance reports relating to, implementation of the Fund’s investment objective, policies and restrictions, and meeting regulatory requirements; (e) BlackRock’s and the Fund’s adherence to applicable compliance policies and procedures; (f) the nature, character and scope of non-investment management services provided by BlackRock and its affiliates and the estimated cost of such services, as available; (g) BlackRock’s and other service providers’ internal controls and risk and compliance oversight mechanisms; (h) BlackRock’s implementation of the proxy voting policies approved by the Board; (i) the use of brokerage commissions and execution quality of portfolio transactions; (j) BlackRock’s implementation of the Fund’s valuation and liquidity procedures; (k) an analysis of management fees paid to BlackRock for products with similar investment mandates across the open-end fund, exchange-traded fund (“ETF”), closed-end fund, sub-advised mutual fund, separately managed account, collective investment trust, and institutional separate account product channels, as applicable, and the similarities and differences between these products and the services provided as compared to the Fund; (l) BlackRock’s compensation methodology for its investment professionals and the incentives and accountability it creates, along with investment professionals’ investments in the fund(s) they manage; and (m) periodic updates on BlackRock’s business.
Prior to and in preparation for the April Meeting, each Board received and reviewed materials specifically relating to the renewal of the Agreements. The Independent Board Members continuously engaged in a process with their independent legal counsel and BlackRock to review the nature and scope of the information provided to the Board to better assist its deliberations. The materials provided in connection with the April Meeting included, among other things: (a) information independently compiled and prepared by Broadridge Financial Solutions, Inc. (“Broadridge”), based on either a Lipper classification or Morningstar category, regarding each Fund’s fees and expenses as compared with a peer group of funds as determined by Broadridge (“Expense Peers”) and the investment performance of each Fund as compared with a peer group of funds (“Performance Peers”); (b) information on the composition of the Expense Peers and Performance Peers and a description of Broadridge’s methodology; (c) information on the estimated profits realized by BlackRock and its affiliates pursuant to the Agreements and a discussion of fall-out benefits to BlackRock and its affiliates; (d) a general analysis provided by BlackRock concerning investment management fees received in connection with other types of investment products, such as institutional accounts, sub-advised mutual funds, ETFs, closed-end funds, open-end funds, and separately managed accounts, under similar investment mandates, as well as the performance of such other products, as applicable; (e) a review of non-management fees; (f) the existence, impact and sharing of potential economies of scale, if any, with the Funds; (g) a summary of aggregate amounts paid by each Fund to BlackRock; (h) sales and redemption data regarding each Fund’s shares; and (i) various additional information requested by the Board as appropriate regarding BlackRock’s and the Funds’ operations.
At the April Meeting, each Board reviewed materials relating to its consideration of the Agreements and the Independent Board Members presented BlackRock with questions and requests for additional information. BlackRock responded to these questions and requests with additional written information in advance of the May Meeting.
At the May Meeting, each Board concluded its assessment of, among other things: (a) the nature, extent and quality of the services provided by BlackRock; (b) the investment performance of each Fund as compared to its Performance Peers and to other metrics, as applicable; (c) the advisory fee and the estimated cost of the services and estimated profits realized by BlackRock and its affiliates from their relationship with the Funds; (d) each Fund’s fees and expenses compared to its Expense Peers; (e) the existence and
| | |
| 52 | | 2 0 2 2 B L A C K R O C K A N N U A L R E P O R T T O S H A R E H O L D E R S |
Disclosure of Investment Advisory Agreements and Sub-Advisory Agreement (continued)
sharing of potential economies of scale; (f) any fall-out benefits to BlackRock and its affiliates as a result of BlackRock’s relationship with the Funds; and (g) other factors deemed relevant by the Board Members.
Each Board also considered other matters it deemed important to the approval process, such as other payments made to BlackRock or its affiliates relating to securities lending and cash management, and BlackRock’s services related to the valuation and pricing of the portfolio holdings of the pertinent Fund. Each Board noted the willingness of BlackRock’s personnel to engage in open, candid discussions with the Board. The Board Members evaluated the information available to it on a fund-by-fund basis. The following paragraphs provide more information about some of the primary factors that were relevant to each Board’s decision. The Board Members did not identify any particular information, or any single factor as determinative, and each Board Member may have attributed different weights to the various items and factors considered.
A. Nature, Extent and Quality of the Services Provided by BlackRock
Each Board, including the Independent Board Members, reviewed the nature, extent and quality of services provided by BlackRock, including the investment advisory services and the resulting performance of each Fund. Throughout the year, each Board compared each Fund’s performance to the performance of a comparable group of mutual funds, relevant benchmark, and performance metrics, as applicable. The Boards met with BlackRock’s senior management personnel responsible for investment activities, including the senior investment officers. Each Board also reviewed the materials provided by each Fund’s portfolio management team discussing the Fund’s performance, investment strategies and outlook.
Each Board considered, among other factors, with respect to BlackRock: the number, education and experience of investment personnel generally and each Fund’s portfolio management team; research capabilities; investments by portfolio managers in the funds they manage; portfolio trading capabilities; use of technology; commitment to compliance; credit analysis capabilities; risk analysis and oversight capabilities; and the approach to training and retaining portfolio managers and other research, advisory and management personnel. Each Board also considered BlackRock’s overall risk management program, including the continued efforts of BlackRock and its affiliates to address cybersecurity risks and the role of BlackRock’s Risk & Quantitative Analysis Group. Each Board engaged in a review of BlackRock’s compensation structure with respect to each Fund’s portfolio management team and BlackRock’s ability to attract and retain high-quality talent and create performance incentives.
In addition to investment advisory services, each Board considered the nature and quality of the administrative and other non-investment advisory services provided to each Fund. BlackRock and its affiliates provide the Funds with certain administrative, shareholder and other services (in addition to any such services provided to the Funds by third-parties) and officers and other personnel as are necessary for the operations of the Funds. In particular, BlackRock and its affiliates provide the Funds with administrative services including, among others: (i) responsibility for disclosure documents, such as the prospectus, the summary prospectus (as applicable), the statement of additional information and periodic shareholder reports; (ii) oversight of daily accounting and pricing; (iii) responsibility for periodic filings with regulators; (iv) overseeing and coordinating the activities of third-party service providers, including, among others, each Fund’s custodian, fund accountant, transfer agent, and auditor; (v) organizing Board meetings and preparing the materials for such Board meetings; (vi) providing legal and compliance support; (vii) furnishing analytical and other support to assist the Board in its consideration of strategic issues such as the merger, consolidation or repurposing of certain open-end funds; and (viii) performing or managing administrative functions necessary for the operation of the Funds, such as tax reporting, expense management, fulfilling regulatory filing requirements, overseeing each Fund’s distribution partners, and shareholder call center and other services. The Board reviewed the structure and duties of BlackRock’s fund administration, shareholder services, and legal and compliance departments and considered BlackRock’s policies and procedures for assuring compliance with applicable laws and regulations. The Board considered the operation of BlackRock’s business continuity plans, including in light of the ongoing COVID-19 pandemic.
B. The Investment Performance of the Funds and BlackRock
Each Board, including the Independent Board Members, reviewed and considered the performance history of the Fund throughout the year and at the April Meeting. In preparation for the April Meeting, each Board was provided with reports independently prepared by Broadridge, which included an analysis of the Fund’s performance as of December 31, 2021, as compared to its Performance Peers. Broadridge ranks funds in quartiles, ranging from first to fourth, where first is the most desirable quartile position and fourth is the least desirable. In connection with its review, each Board received and reviewed information regarding the investment performance of the Fund as compared to its Performance Peers. Each Board and its Performance Oversight Committee regularly review and meet with Fund management to discuss the performance of each Fund throughout the year.
In evaluating performance, the Boards focused particular attention on funds with less favorable performance records. Each Board also noted that while it found the data provided by Broadridge generally useful, it recognized the limitations of such data, including in particular, that notable differences may exist between a fund and its Performance Peers (for example, the investment objectives and strategies). Further, each Board recognized that the performance data reflects a snapshot of a period as of a particular date and that selecting a different performance period could produce significantly different results. Each Board also acknowledged that long-term performance could be impacted by even one period of significant outperformance or underperformance, and that a single investment theme could have the ability to disproportionately affect long-term performance.
The Board noted that for the one-, three- and five-year periods reported, EuroFund ranked in the second, first and first quartiles, respectively, against its Performance Peers.
The Board noted that for the one-, three- and five-year periods reported, Advantage Global Fund ranked in the third, second and second quartiles, respectively, against its Performance Peers. The Board and BlackRock reviewed the Fund’s underperformance relative to its Performance Peers during the applicable period.
C. Consideration of the Advisory/Management Fees and the Estimated Cost of the Services and Estimated Profits Realized by BlackRock and its Affiliates from their Relationship with the Funds
Each Board, including the Independent Board Members, reviewed each Fund’s contractual management fee rate compared with those of its Expense Peers. The contractual management fee rate represents a combination of the advisory fee and any administrative fees, before taking into account any reimbursements or fee waivers. Each Board also compared each Fund’s total expense ratio, as well as its actual management fee rate, to those of its Expense Peers. The total expense ratio represents a fund’s total net operating expenses, including any 12b-1 or non-12b-1 service fees. The total expense ratio gives effect to any expense reimbursements or fee waivers, and the actual
| | |
D I S C L O S U R E O F I N V E S T M E N T A D V I S O R Y A G R E E M E N T S A N D S U B - A D V I S O R Y A G R E E M E N T | | 53 |
Disclosure of Investment Advisory Agreements and Sub-Advisory Agreement (continued)
management fee rate gives effect to any management fee reimbursements or waivers. The Boards considered the services provided and the fees charged by BlackRock and its affiliates to other types of clients with similar investment mandates, as applicable, including institutional accounts and sub-advised mutual funds (including mutual funds sponsored by third parties).
Each Board received and reviewed statements relating to BlackRock’s financial condition. Each Board reviewed BlackRock’s profitability methodology and was also provided with an estimated profitability analysis that detailed the revenues earned and the expenses incurred by BlackRock for services provided to each Fund. Each Board reviewed BlackRock’s estimated profitability with respect to each Fund and other funds the Board currently oversees for the year ended December 31, 2021 compared to available aggregate estimated profitability data provided for the prior two years. Each Board reviewed BlackRock’s estimated profitability with respect to certain other U.S. fund complexes managed by the Manager and/or its affiliates. Each Board reviewed BlackRock’s assumptions and methodology of allocating expenses in the estimated profitability analysis, noting the inherent limitations in allocating costs among various advisory products. Each Board recognized that profitability may be affected by numerous factors including, among other things, fee waivers and expense reimbursements by the Manager, the types of funds managed, precision of expense allocations and business mix. Each Board thus recognized that calculating and comparing profitability at the individual fund level is difficult.
Each Board noted that, in general, individual fund or product line profitability of other advisors is not publicly available. Each Board reviewed BlackRock’s overall operating margin, in general, compared to that of certain other publicly traded asset management firms. Each Board considered the differences between BlackRock and these other firms, including the contribution of technology at BlackRock, BlackRock’s expense management, and the relative product mix.
Each Board considered whether BlackRock has the financial resources necessary to attract and retain high quality investment management personnel to perform its obligations under the Agreements and to continue to provide the high quality of services that is expected by the Board. The Boards further considered factors including but not limited to BlackRock’s commitment of time, assumption of risk, and liability profile in servicing the Funds, including in contrast to what is required of BlackRock with respect to other products with similar investment mandates across the open-end fund, ETF, closed-end fund, sub-advised mutual fund, separately managed account, collective investment trust, and institutional separate account product channels, as applicable.
The Board noted that EuroFund’s contractual management fee rate ranked in the first quartile, and that the actual management fee rate and total expense ratio ranked in the first and fourth quartiles, respectively, relative to the Fund’s Expense Peers. After discussions between the Board, including the Independent Board Members, and BlackRock, the Board and BlackRock agreed to a new contractual expense cap, on a class-by-class basis. The contractual expense cap was implemented on June 1, 2022.
The Board noted that Advantage Global Fund’s contractual management fee rate ranked in the third quartile, and that the actual management fee rate and total expense ratio ranked in the first and second quartiles, respectively, relative to the Fund’s Expense Peers. In addition, the Board noted that BlackRock and the Board have contractually agreed to a cap on the Fund’s total expenses as a percentage of the Fund’s average daily net assets on a class-by-class basis.
The Board also noted that each Fund has an advisory fee arrangement that includes breakpoints that adjust the fee rate downward as the size of the Fund increases above certain contractually specified levels. The Board noted that if the size of the pertinent Fund were to decrease, the Fund could lose the benefit of one or more breakpoints.
D. Economies of Scale
Each Board, including the Independent Board Members, considered the extent to which economies of scale might be realized as the assets of the Funds increase, including the existence of fee waivers and/or expense caps, as applicable, noting that any contractual fee waivers and contractual expense caps had been approved by the Board. In its consideration, each Board further considered the continuation and/or implementation of fee waivers and/or expense caps, as applicable. Each Board also considered the extent to which the Funds benefit from such economies of scale in a variety of ways and whether there should be changes in the advisory fee rate or breakpoint structure in order to enable the Funds to more fully participate in these economies of scale. Each Board considered each Fund’s asset levels and whether the current fee schedule was appropriate.start from here
E. Other Factors Deemed Relevant by the Board Members
Each Board, including the Independent Board Members, also took into account other ancillary or “fall-out” benefits that BlackRock or its affiliates may derive from BlackRock’s respective relationships with the Funds, both tangible and intangible, such as BlackRock’s ability to leverage its investment professionals who manage other portfolios and its risk management personnel, an increase in BlackRock’s profile in the investment advisory community, and the engagement of BlackRock’s affiliates as service providers to the Funds, including for administrative, distribution, securities lending and cash management services. The Boards also considered BlackRock’s overall operations and its efforts to expand the scale of, and improve the quality of, its operations. The Boards also noted that, subject to applicable law, BlackRock may use and benefit from third-party research obtained by soft dollars generated by certain registered fund transactions to assist in managing all or a number of its other client accounts.
In connection with its consideration of the Agreements, the Boards also received information regarding BlackRock’s brokerage and soft dollar practices. The Boards received reports from BlackRock which included information on brokerage commissions and trade execution practices throughout the year.
The Boards noted the competitive nature of the open-end fund marketplace, and that shareholders are able to redeem their Fund shares if they believe that the pertinent Fund’s fees and expenses are too high or if they are dissatisfied with the performance of the Fund.
Conclusion
The Board of EuroFund, including the Independent Board Members, unanimously approved the continuation of the EuroFund Advisory Agreement between the Manager and EuroFund for a one-year term ending June 30, 2023, and the EuroFund Sub-Advisory Agreement between the Manager and the Sub-Advisor with respect to EuroFund for a one-year term ending June 30, 2023.
The Board of Advantage Global Fund, including the Independent Board Members, unanimously approved the continuation of the Advantage Global Fund Advisory Agreement between the Manager and Advantage Global Fund for a one-year term ending June 30, 2023.
| | |
| 54 | | 2 0 2 2 B L A C K R O C K A N N U A L R E P O R T T O S H A R E H O L D E R S |
Disclosure of Investment Advisory Agreements and Sub-Advisory Agreement (continued)
Based upon its evaluation of all of the aforementioned factors in their totality, as well as other information, the Boards, including the Independent Board Members, were satisfied that the terms of the Agreements were fair and reasonable and, in the best interest of each Fund and its shareholders. In arriving at its decision to approve the Agreements, the Boards did not identify any single factor or group of factors as all-important or controlling, but considered all factors together, and different Board Members may have attributed different weights to the various factors considered. The Independent Board Members were also assisted by the advice of independent legal counsel in making this determination.
| | |
D I S C L O S U R E O F I N V E S T M E N T A D V I S O R Y A G R E E M E N T S A N D S U B - A D V I S O R Y A G R E E M E N T | | 55 |
Director and Officer Information
| | | | | | | | |
| Independent Directors(a) |
| | | | | |
Name Year of Birth(b) | | Position(s) Held (Length of Service)(c) | | Principal Occupation(s) During Past Five Years | | Number of BlackRock-Advised
Registered Investment Companies
(“RICs”) Consisting of
Investment Portfolios
(“Portfolios”) Overseen | | Public Company
and Other
Investment
Company
Directorships Held
During
Past Five Years |
| | | | |
Mark Stalnecker 1951 | | Chair of the Board and Director (Since 2019) | | Chief Investment Officer, University of Delaware from 1999 to 2013; Trustee and Chair of the Finance and Investment Committees, Winterthur Museum and Country Estate from 2005 to 2016; Member of the Investment Committee, Delaware Public Employees’ Retirement System since 2002; Member of the Investment Committee, Christiana Care Health System from 2009 to 2017; Member of the Investment Committee, Delaware Community Foundation from 2013 to 2014; Director and Chair of the Audit Committee, SEI Private Trust Co. from 2001 to 2014. | | 28 RICs consisting of 162 Portfolios | | None |
| | | | |
Susan J. Carter 1956 | | Director (Since 2019) | | Trustee, Financial Accounting Foundation from 2017 to 2021; Advisory Board Member, Center for Private Equity and Entrepreneurship at Tuck School of Business from 1997 to 2021; Director, Pacific Pension Institute from 2014 to 2018; Senior Advisor, Commonfund Capital, Inc. (“CCI”) (investment adviser) in 2015; Chief Executive Officer, CCI from 2013 to 2014; President & Chief Executive Officer, CCI from 1997 to 2013; Advisory Board Member, Girls Who Invest from 2015 to 2018 and Board Member thereof since 2018; Advisory Board Member, Bridges Fund Management since 2016; Practitioner Advisory Board Member, Private Capital Research Institute (“PCRI”) since 2017; Lecturer in the Practice of Management, Yale School of Management since 2019; Advisor to Finance Committee, Altman Foundation since 2020; Investment Committee Member, Tostan since 2021. | | 28 RICs consisting of 162 Portfolios | | None |
| | | | |
Collette Chilton 1958 | | Director (Since 2019) | | Chief Investment Officer, Williams College since 2006; Chief Investment Officer, Lucent Asset Management Corporation from 1998 to 2006; Director, Boys and Girls Club of Boston since 2017; Director, B1 Capital since 2018; Director, David and Lucile Packard Foundation since 2020. | | 28 RICs consisting of 162 Portfolios | | None |
| | | | |
Neil A. Cotty 1954 | | Director (Since 2019) | | Bank of America Corporation from 1996 to 2015, serving in various senior finance leadership roles, including Chief Accounting Officer from 2009 to 2015, Chief Financial Officer of Global Banking, Markets and Wealth Management from 2008 to 2009, Chief Accounting Officer from 2004 to 2008, Chief Financial Officer of Consumer Bank from 2003 to 2004, Chief Financial Officer of Global Corporate Investment Bank from 1999 to 2002. | | 28 RICs consisting of 162 Portfolios | | None |
| | | | |
Lena G. Goldberg 1949 | | Director (Since 2016) | | Director, Charles Stark Draper Laboratory, Inc. since 2013; Senior Lecturer, Harvard Business School from 2008 to 2021; FMR LLC/Fidelity Investments (financial services) from 1996 to 2008, serving in various senior roles including Executive Vice President - Strategic Corporate Initiatives and Executive Vice President and General Counsel; Partner, Sullivan & Worcester LLP from 1985 to 1996 and Associate thereof from 1979 to 1985. | | 28 RICs consisting of 162 Portfolios | | None |
| | |
| 56 | | 2 0 2 2 BLACK ROCK ANNUAL REPORT TO SHAREHOLDERS |
Director and Officer Information (continued)
| | | | | | | | |
| Independent Directors(a) (continued) |
| | | | | |
Name Year of Birth(b) | | Position(s) Held (Length of Service)(c) | | Principal Occupation(s) During Past Five Years | | Number of BlackRock-Advised
Registered Investment Companies
(“RICs”) Consisting of
Investment Portfolios
(“Portfolios”) Overseen | | Public Company
and Other
Investment
Company
Directorships Held
During Past Five Years |
| | | | |
Henry R. Keizer 1956 | | Director (Since 2016) | | Director, Park Indemnity Ltd. (captive insurer) since 2010; Director, MUFG Americas Holdings Corporation and MUFG Union Bank, N.A. (financial and bank holding company) from 2014 to 2016; Director, American Institute of Certified Public Accountants from 2009 to 2011; Director, KPMG LLP (audit, tax and advisory services) from 2004 to 2005 and 2010 to 2012; Director, KPMG International in 2012, Deputy Chairman and Chief Operating Officer thereof from 2010 to 2012 and U.S. Vice Chairman of Audit thereof from 2005 to 2010; Global Head of Audit, KPMGI (consortium of KPMG firms) from 2006 to 2010; Director, YMCA of Greater New York from 2006 to 2010. | | 28 RICs consisting of 162 Portfolios | | Hertz Global Holdings (car rental); GrafTech International Ltd. (materials manufacturing); Montpelier Re Holdings, Ltd. (publicly held property and casualty reinsurance) from 2013 to 2015; WABCO (commercial vehicle safety systems) from 2015 to 2020; Sealed Air Corp. (packaging) from 2015 to 2021. |
| | | | |
Cynthia A. Montgomery 1952 | | Director (Since 2019) | | Professor, Harvard Business School since 1989. | | 28 RICs consisting of 162 Portfolios | | Newell Rubbermaid, Inc. (manufacturing) from 1995 to 2016. |
| | | | |
Donald C. Opatrny 1952 | | Director (Since 2015) | | Director, Athena Capital Advisors LLC (investment management firm) from 2013 to 2020; Trustee, Vice Chair, Member of the Executive Committee and Chair of the Investment Committee, Cornell University from 2004 to 2019; President and Trustee, the Center for the Arts, Jackson Hole from 2011 to 2018; Member of the Board and Investment Committee, University School from 2007 to 2018; Trustee, Artstor (a Mellon Foundation affiliate) from 2010 to 2015; Member of the Investment Committee, Mellon Foundation from 2009 to 2015; President, Trustee and Member of the Investment Committee, The Aldrich Contemporary Art Museum from 2007 to 2014; Trustee and Chair of the Investment Committee, Community Foundation of Jackson Hole since 2014; Member of Affordable Housing Supply Board of Jackson, Wyoming since 2017; Member, Investment Funds Committee, State of Wyoming since 2017; Trustee, Phoenix Art Museum since 2018; Trustee, Arizona Community Foundation and Member of Investment Committee since 2020. | | 28 RICs consisting of 162 Portfolios | | None |
| | | | |
Joseph P. Platt 1947 | | Director (Since 2019) | | General Partner, Thorn Partners, LP (private investments) since 1998; Director, WQED Multi-Media (public broadcasting not-for-profit) since 2001; Chair, Basic Health International (non-profit) since 2015. | | 28 RICs consisting of 162 Portfolios | | Greenlight Capital Re, Ltd. (reinsurance company); Consol Energy Inc. |
| | |
DIRECTOR AND OFFICER INFORMATION | | 57 |
Director and Officer Information (continued)
| | | | | | | | |
| Independent Directors(a) (continued) |
| | | | | |
Name Year of Birth(b) | | Position(s) Held (Length of Service)(c) | | Principal Occupation(s) During Past Five Years | | Number of BlackRock-Advised
Registered Investment Companies
(“RICs”) Consisting of
Investment Portfolios
(“Portfolios”) Overseen | | Public Company
and Other
Investment
Company
Directorships Held
During Past Five Years |
| | | | |
Kenneth L. Urish 1951 | | Director (Since 2019) | | Managing Partner, Urish Popeck & Co., LLC (certified public accountants and consultants) since 1976; Past- Chairman of the Professional Ethics Committee of the Pennsylvania Institute of Certified Public Accountants and Committee Member thereof since 2007; Member of External Advisory Board, The Pennsylvania State University Accounting Department since founding in 2001; Principal, UP Strategic Wealth Investment Advisors, LLC since 2013; Trustee, The Holy Family Institute from 2001 to 2010; President and Trustee, Pittsburgh Catholic Publishing Associates from 2003 to 2008; Director, Inter- Tel from 2006 to 2007; Member, Advisory Board, ESG Competent Boards since 2020. | | 28 RICs consisting of 162 Portfolios | | None |
| | | | |
Claire A. Walton 1957 | | Director (Since 2019) | | Chief Operating Officer and Chief Financial Officer of Liberty Square Asset Management, LP from 1998 to 2015; General Partner of Neon Liberty Capital Management, LLC since 2003; Director, Boston Hedge Fund Group from 2009 to 2018; Director, Woodstock Ski Runners since 2013; Director, Massachusetts Council on Economic Education from 2013 to 2015. | | 28 RICs consisting of 162 Portfolios | | None |
| | |
| 58 | | 2 0 2 2 BLACK ROCK ANNUAL REPORT TO SHAREHOLDERS |
Director and Officer Information (continued)
| | | | | | | | |
| Interested Directors(a)(d) |
| | | | | |
Name Year of Birth(b) | | Position(s) Held (Length of Service)(c) | | Principal Occupation(s) During Past Five Years | | Number of BlackRock-Advised
Registered Investment Companies
(“RICs”) Consisting of
Investment Portfolios
(“Portfolios”) Overseen | | Public Company
and Other
Investment
Company
Directorships
Held During
Past Five Years |
| | | | |
Robert Fairbairn 1965 | | Director (Since 2015) | | Vice Chairman of BlackRock, Inc. since 2019; Member of BlackRock’s Global Executive and Global Operating Committees; Co-Chair of BlackRock’s Human Capital Committee; Senior Managing Director of BlackRock, Inc. from 2010 to 2019; oversaw BlackRock’s Strategic Partner Program and Strategic Product Management Group from 2012 to 2019; Member of the Board of Managers of BlackRock Investments, LLC from 2011 to 2018; Global Head of BlackRock’s Retail and iShares® businesses from 2012 to 2016. | | 97 RICs consisting of 261 Portfolios | | None |
| | | | |
John M. Perlowski(e) 1964 | | Director (Since 2018) President and Chief Executive Officer (Since 2010) | | Managing Director of BlackRock, Inc. since 2009; Head of BlackRock Global Accounting and Product Services since 2009; Advisory Director of Family Resource Network (charitable foundation) since 2009. | | 99 RICs consisting of 263 Portfolios | | None |
| (a) | The address of each Director is c/o BlackRock, Inc., 55 East 52nd Street, New York, New York 10055. |
| (b) | Each Independent Director holds office until his or her successor is duly elected and qualifies or until his or her earlier death, resignation, retirement or removal as provided by the Funds’ by-laws or charter or statute, or until December 31 of the year in which he or she turns 75. Directors who are “interested persons,” as defined in the 1940 Act, serve until their successor is duly elected and qualifies or until their earlier death, resignation, retirement or removal as provided by the Funds’ by-laws or statute, or until December 31 of the year in which they turn 72. The Board may determine to extend the terms of Independent Directors on a case-by-case basis, as appropriate. |
| (c) | Following the combination of Merrill Lynch Investment Managers, L.P. (“MLIM”) and BlackRock, Inc. in September 2006, the various legacy MLIM and legacy BlackRock fund boards were realigned and consolidated into three new fund boards in 2007. In addition, effective January 1, 2019, three BlackRock Fund Complexes were realigned and consolidated into two BlackRock Fund Complexes. As a result, although the chart shows the year that each Independent Director joined the Board, certain Independent Directors first became members of the boards of other BlackRock-advised Funds, legacy MLIM funds or legacy BlackRock funds as follows: Susan J. Carter, 2016; Collette Chilton, 2015; Neil A. Cotty, 2016; Cynthia A. Montgomery, 1994; Joseph P. Platt, 1999; Mark Stalnecker, 2015; Kenneth L. Urish, 1999; Claire A. Walton, 2016. |
| (d) | Mr. Fairbairn and Mr. Perlowski are both “interested persons,” as defined in the 1940 Act, of the Funds based on their positions with BlackRock, Inc. and its affiliates. Mr. Fairbairn and Mr. Perlowski are also board members of the BlackRock Fixed-Income Complex. |
| (e) | Mr. Perlowski is also a trustee of the BlackRock Credit Strategies Fund and BlackRock Private Investments Fund. |
| | | | |
| Officers Who Are Not Directors(a) |
| | | |
Name Year of Birth(b) | | Position(s) Held (Length of Service) | | Principal Occupation(s) During Past Five Years |
| | |
Roland Villacorta 1971 | | Vice President (Since 2022) | | Managing Director of BlackRock, Inc. since 2022; Head of Global Cash Management and Head of Securities Lending within BlackRock’s Portfolio Management Group since 2022; Member of BlackRock’s Global Operating Committee since 2022; Head of Portfolio Management in BlackRock’s Financial Markets Advisory Group within BlackRock Solutions from 2008 to 2015; previously Mrs. Villacorta was Co-Head of BlackRock Solutions’ Portfolio Analytics Group and Co-Head of Fixed Income within BlackRock’s Risk & Quantitative Analysis Group. |
| | |
Jennifer McGovern 1977 | | Vice President (Since 2014) | | Managing Director of BlackRock, Inc. since 2016; Director of BlackRock, Inc. from 2011 to 2015; Head of Americas Product Development and Governance for BlackRock’s Global Product Group since 2019; Head of Product Structure and Oversight for BlackRock’s U.S. Wealth Advisory Group from 2013 to 2019. |
| | |
Trent Walker 1974 | | Chief Financial Officer (Since 2021) | | Managing Director of BlackRock, Inc. since September 2019; Executive Vice President of PIMCO from 2016 to 2019; Senior Vice President of PIMCO from 2008 to 2015; Treasurer from 2013 to 2019 and Assistant Treasurer from 2007 to 2017 of PIMCO Funds, PIMCO Variable Insurance Trust, PIMCO ETF Trust, PIMCO Equity Series, PIMCO Equity Series VIT, PIMCO Managed Accounts Trust, 2 PIMCO-sponsored interval funds and 21 PIMCO-sponsored closed-end funds. |
| | |
Jay M. Fife 1970 | | Treasurer (Since 2007) | | Managing Director of BlackRock, Inc. since 2007. |
| | |
Charles Park 1967 | | Chief Compliance Officer (Since 2014) | | Anti-Money Laundering Compliance Officer for certain BlackRock-advised Funds from 2014 to 2015; Chief Compliance Officer of BlackRock Advisors, LLC and the BlackRock-advised Funds in the BlackRock Multi-Asset Complex and the BlackRock Fixed-Income Complex since 2014; Principal of and Chief Compliance Officer for iShares® Delaware Trust Sponsor LLC since 2012 and BlackRock Fund Advisors (“BFA”) since 2006; Chief Compliance Officer for the BFA-advised iShares® exchange traded funds since 2006; Chief Compliance Officer for BlackRock Asset Management International Inc. since 2012. |
| | |
DIRECTOR AND OFFICER INFORMATION | | 59 |
Director and Officer Information (continued)
| | | | |
| Officers Who Are Not Directors(a) (continued) |
| | | |
Name Year of Birth(b) | | Position(s) Held (Length of Service) | | Principal Occupation(s) During Past Five Years |
| | |
Lisa Belle 1968 | | Anti-Money Laundering Compliance Officer (Since 2019) | | Managing Director of BlackRock, Inc. since 2019; Global Financial Crime Head for Asset and Wealth Management of JP Morgan from 2013 to 2019; Managing Director of RBS Securities from 2012 to 2013; Head of Financial Crimes for Barclays Wealth Americas from 2010 to 2012. |
| | |
Janey Ahn 1975 | | Secretary (Since 2019) | | Managing Director of BlackRock, Inc. since 2018; Director of BlackRock, Inc. from 2009 to 2017. |
| (a) | The address of each Officer is c/o BlackRock, Inc., 55 East 52nd Street, New York, New York 10055. |
| (b) | Officers of each Fund serve at the pleasure of the Board. |
Further information about each Fund’s Directors and Officers is available in each Fund’s Statement of Additional Information, which can be obtained without charge by calling (800) 441-7762.
|
| Effective December 31, 2021, Bruce R. Bond retired as a Director of the Funds. |
Effective March 31, 2022, Thomas Callahan resigned as a Vice President of the Funds and effective May 10, 2022, Roland Villacorta was appointed as a Vice President of the Funds. |
| | |
| 60 | | 2 0 2 2 BLACK ROCK ANNUAL REPORT TO SHAREHOLDERS |
Additional Information
Regulation Regarding Derivatives
On October 28, 2020, the Securities and Exchange Commission (the “SEC”) adopted regulations governing the use of derivatives by registered investment companies (“Rule 18f-4”). The Funds will be required to implement and comply with Rule 18f-4 by August 19, 2022. Once implemented, Rule 18f-4 will impose limits on the amount of derivatives a fund can enter into, eliminate the asset segregation framework currently used by funds to comply with Section 18 of the 1940 Act, treat derivatives as senior securities and require funds whose use of derivatives is more than a limited specified exposure amount to establish and maintain a comprehensive derivatives risk management program and appoint a derivatives risk manager.
General Information
Quarterly performance, semi-annual and annual reports, current net asset value and other information regarding the Funds may be found on BlackRock’s website, which can be accessed at blackrock.com. Any reference to BlackRock’s website in this report is intended to allow investors public access to information regarding the Funds and does not, and is not intended to, incorporate BlackRock’s website in this report.
Householding
The Funds will mail only one copy of shareholder documents, including prospectuses, annual and semi-annual reports, Rule 30e-3 notices and proxy statements, to shareholders with multiple accounts at the same address. This practice is commonly called “householding” and is intended to reduce expenses and eliminate duplicate mailings of shareholder documents. Mailings of your shareholder documents may be householded indefinitely unless you instruct us otherwise. If you do not want the mailing of these documents to be combined with those for other members of your household, please call the Funds at (800) 441-7762.
Availability of Quarterly Schedule of Investments
The Funds file their complete schedules of portfolio holdings with the SEC for the first and third quarters of each fiscal year as an exhibit to their reports on Form N-PORT. The Funds’ Forms N-PORT are available on the SEC’s website at sec.gov. Additionally, each Fund makes its portfolio holdings for the first and third quarters of each fiscal year available at blackrock.com/fundreports.
Availability of Proxy Voting Policies, Procedures and Voting Records
A description of the policies and procedures that the Funds use to determine how to vote proxies relating to portfolio securities and information about how the Funds voted proxies relating to securities held in the Funds’ portfolios during the most recent 12-month period ended June 30 is available without charge, upon request (1) by calling (800) 441-7762; (2) on the BlackRock website at blackrock.com; and (3) on the SEC’s website at sec.gov.
BlackRock’s Mutual Fund Family
BlackRock offers a diverse lineup of open-end mutual funds crossing all investment styles and managed by experts in equity, fixed-income and tax-exempt investing. Visit blackrock.com for more information.
Shareholder Privileges
Account Information
Call us at (800) 441-7762 from 8:00 AM to 6:00 PM ET on any business day to get information about your account balances, recent transactions and share prices. You can also visit blackrock.com for more information.
Automatic Investment Plans
Investor class shareholders who want to invest regularly can arrange to have $50 or more automatically deducted from their checking or savings account and invested in any of the BlackRock funds.
Systematic Withdrawal Plans
Investor class shareholders can establish a systematic withdrawal plan and receive periodic payments of $50 or more from their BlackRock funds, as long as their account balance is at least $10,000.
Retirement Plans
Shareholders may make investments in conjunction with Traditional, Rollover, Roth, Coverdell, Simple IRAs, SEP IRAs and 403(b) Plans.
| | |
ADDITIONAL INFORMATION | | 61 |
Additional Information (continued)
BlackRock Privacy Principles
BlackRock is committed to maintaining the privacy of its current and former fund investors and individual clients (collectively, “Clients”) and to safeguarding their non-public personal information. The following information is provided to help you understand what personal information BlackRock collects, how we protect that information and why in certain cases we share such information with select parties.
If you are located in a jurisdiction where specific laws, rules or regulations require BlackRock to provide you with additional or different privacy-related rights beyond what is set forth below, then BlackRock will comply with those specific laws, rules or regulations.
BlackRock obtains or verifies personal non-public information from and about you from different sources, including the following: (i) information we receive from you or, if applicable, your financial intermediary, on applications, forms or other documents; (ii) information about your transactions with us, our affiliates, or others; (iii) information we receive from a consumer reporting agency; and (iv) from visits to our websites.
BlackRock does not sell or disclose to non-affiliated third parties any non-public personal information about its Clients, except as permitted by law or as is necessary to respond to regulatory requests or to service Client accounts. These non-affiliated third parties are required to protect the confidentiality and security of this information and to use it only for its intended purpose.
We may share information with our affiliates to service your account or to provide you with information about other BlackRock products or services that may be of interest to you. In addition, BlackRock restricts access to non-public personal information about its Clients to those BlackRock employees with a legitimate business need for the information. BlackRock maintains physical, electronic and procedural safeguards that are designed to protect the non-public personal information of its Clients, including procedures relating to the proper storage and disposal of such information.
Fund and Service Providers
Investment Adviser
BlackRock Advisors, LLC
Wilmington, DE 19809
Sub-Adviser
BlackRock International Limited(a)
Edinburgh, EH3 8BL
United Kingdom
Accounting Agent
State Street Bank and Trust Company
Boston, MA 02111
Custodian
Brown Brothers Harriman & Co.
Boston, MA 02109
Transfer Agent
BNY Mellon Investment Servicing (US) Inc.
Wilmington, DE 19809
| (a) | For BlackRock EuroFund. |
Distributor
BlackRock Investments, LLC
New York, NY 10022
Independent Registered Public Accounting Firm
Deloitte & Touche LLP
Boston, MA 02116
Legal Counsel
Sidley Austin LLP
New York, NY 10019
Address of the Funds
100 Bellevue Parkway
Wilmington, DE 19809
| | |
| 62 | | 2 0 2 2 BLACK ROCK ANNUAL REPORT TO SHAREHOLDERS |
Glossary of Terms Used in this Report
| | |
| Currency Abbreviation |
| |
| CAD | | Canadian Dollar |
| |
| EUR | | Euro |
| |
| HKD | | Hong Kong Dollar |
| |
| JPY | | Japanese Yen |
| |
| SEK | | Swedish Krona |
| |
| USD | | United States Dollar |
|
| Portfolio Abbreviation |
| |
| ADR | | American Depositary Receipt |
| |
| CVA | | Certificaten Van Aandelen (Dutch Certificate) |
| |
| GDR | | Global Depositary Receipt |
| |
| MSCI | | Morgan Stanley Capital International |
| |
| NVDR | | Non-Voting Depositary Receipt |
| |
| PCL | | Public Company Limited |
| |
| PJSC | | Public Joint Stock Company |
| |
| REIT | | Real Estate Investment Trust |
| |
| S&P | | Standard & Poor’s |
| |
| SAB | | Special Assessment Bonds |
| |
| SCA | | Societe en Commandite par Actions |
| | |
GLOSSARY OF TERMS USED IN THIS REPORT | | 63 |
Want to know more?
blackrock.com | 800-441-7762
This report is intended for current holders. It is not authorized for use as an offer of sale or a solicitation of an offer to buy shares of the Funds unless preceded or accompanied by the Funds’ current prospectus. Past performance results shown in this report should not be considered a representation of future performance. Investment returns and principal value of shares will fluctuate so that shares, when redeemed, may be worth more or less than their original cost. Statements and other information herein are as dated and are subject to change.
EGSC-06/22-AR
(b) Not Applicable
| Item 2 – | Code of Ethics – The registrant (or the “Fund”) has adopted a code of ethics, as of the end of the period covered by this report, applicable to the registrant’s principal executive officer, principal financial officer, principal accounting officer or controller, or persons performing similar functions. During the period covered by this report, the code of ethics was amended to update certain information and to make other non-material changes. During the period covered by this report, there have been no waivers granted under the code of ethics. The registrant undertakes to provide a copy of the code of ethics to any person upon request, without charge, who calls 1-800-441-7762. |
| Item 3 – | Audit Committee Financial Expert – The registrant’s board of directors (the “board of directors”), has determined that (i) the registrant has the following audit committee financial experts serving on its audit committee and (ii) each audit committee financial expert is independent: |
Neil A. Cotty
Henry R. Keizer
Kenneth L. Urish
Under applicable securities laws, a person determined to be an audit committee financial expert will not be deemed an “expert” for any purpose, including without limitation for the purposes of Section 11 of the Securities Act of 1933, as a result of being designated or identified as an audit committee financial expert. The designation or identification of a person as an audit committee financial expert does not impose on such person any duties, obligations, or liabilities greater than the duties, obligations, and liabilities imposed on such person as a member of the audit committee and board of directors in the absence of such designation or identification. The designation or identification of a person as an audit committee financial expert does not affect the duties, obligations, or liability of any other member of the audit committee or board of directors.
| Item 4 – | Principal Accountant Fees and Services |
The following table presents fees billed by Deloitte & Touche LLP (“D&T”) in each of the last two fiscal years for the services rendered to the Fund:
| | | | | | | | | | | | | | | | |
| | | (a) Audit Fees | | (b) Audit-Related Fees1 | | (c) Tax Fees2 | | (d) All Other Fees |
| Entity Name | | Current
Fiscal Year End | | Previous
Fiscal Year End | | Current
Fiscal Year End | | Previous
Fiscal Year End | | Current
Fiscal Year End | | Previous
Fiscal Year End | | Current
Fiscal Year End | | Previous
Fiscal Year End |
| BlackRock EuroFund | | $34,986 | | $34,643 | | $638 | | $0 | | $15,700 | | $13,700 | | $0 | | $0 |
The following table presents fees billed by D&T that were required to be approved by the registrant’s audit committee (the “Committee”) for services that relate directly to the operations or financial reporting of the Fund and that are rendered on behalf of BlackRock Advisors, LLC (the “Investment Adviser” or “BlackRock”) and entities controlling, controlled by, or under common control with BlackRock (not including any sub-adviser whose role is primarily portfolio management and is subcontracted with or overseen by another investment adviser) that provide ongoing services to the Fund (“Affiliated Service Providers”):
2
| | | | |
| | | Current Fiscal Year End | | Previous Fiscal Year End |
| (b) Audit-Related Fees1 | | $0 | | $0 |
| (c) Tax Fees2 | | $0 | | $0 |
| (d) All Other Fees3 | | $2,098,000 | | $2,032,000 |
1 The nature of the services includes assurance and related services reasonably related to the performance of the audit or review of financial statements not included in Audit Fees, including accounting consultations, agreed-upon procedure reports, attestation reports, comfort letters, out-of-pocket expenses and internal control reviews not required by regulators.
2 The nature of the services includes tax compliance and/or tax preparation, including services relating to the filing or amendment of federal, state or local income tax returns, regulated investment company qualification reviews, taxable income and tax distribution calculations.
3 Non-audit fees of $2,098,000 and $2,032,000 for the current fiscal year and previous fiscal year, respectively, were paid to the Fund’s principal accountant in their entirety by BlackRock, in connection with services provided to the Affiliated Service Providers of the Fund and of certain other funds sponsored and advised by BlackRock or its affiliates for a service organization review and an accounting research tool subscription. These amounts represent aggregate fees paid by BlackRock and were not allocated on a per fund basis.
(e)(1) Audit Committee Pre-Approval Policies and Procedures:
The Committee has adopted policies and procedures with regard to the pre-approval of services. Audit, audit-related and tax compliance services provided to the registrant on an annual basis require specific pre-approval by the Committee. The Committee also must approve other non-audit services provided to the registrant and those non-audit services provided to the Investment Adviser and Affiliated Service Providers that relate directly to the operations and the financial reporting of the registrant. Certain of these non-audit services that the Committee believes are (a) consistent with the SEC’s auditor independence rules and (b) routine and recurring services that will not impair the independence of the independent accountants may be approved by the Committee without consideration on a specific case-by-case basis (“general pre-approval”). The term of any general pre-approval is 12 months from the date of the pre-approval, unless the Committee provides for a different period. Tax or other non-audit services provided to the registrant which have a direct impact on the operations or financial reporting of the registrant will only be deemed pre-approved provided that any individual project does not exceed $10,000 attributable to the registrant or $50,000 per project. For this purpose, multiple projects will be aggregated to determine if they exceed the previously mentioned cost levels.
Any proposed services exceeding the pre-approved cost levels will require specific pre-approval by the Committee, as will any other services not subject to general pre-approval (e.g., unanticipated but permissible services). The Committee is informed of each service approved subject to general pre-approval at the next regularly scheduled in-person board meeting. At this meeting, an analysis of such services is presented to the Committee for ratification. The Committee may delegate to the Committee Chairman the authority to approve the provision of and fees for any specific engagement of permitted non-audit services, including services exceeding pre-approved cost levels.
(e)(2) None of the services described in each of Items 4(b) through (d) were approved by the Committee pursuant to the de minimis exception in paragraph (c)(7)(i)(C) of Rule 2-01 of Regulation S-X.
(f) Not Applicable
3
(g) The aggregate non-audit fees, defined as the sum of the fees shown under “Audit-Related Fees,” “Tax Fees” and “All Other Fees,” paid to the accountant for services rendered by the accountant to the registrant, the Investment Adviser and the Affiliated Service Providers were:
| | | | | | |
| | | Entity Name | | Current Fiscal
Year End | | Previous Fiscal
Year End |
| | BlackRock EuroFund | | $16,338 | | $13,700 |
Additionally, the amounts billed by D&T in connection with services provided to the Affiliated Service Providers of the Fund and of other funds sponsored and advised by BlackRock or its affiliates during the current and previous fiscal years for a service organization review and an accounting research tool subscription were:
| | | | |
| | | Current Fiscal
Year End | | Previous Fiscal
Year End |
| | $2,098,000 | | $2,032,000 |
These amounts represent aggregate fees paid by BlackRock and were not allocated on a per fund basis.
(h) The Committee has considered and determined that the provision of non-audit services that were rendered to the Investment Adviser and the Affiliated Service Providers that were not pre-approved pursuant to paragraph (c)(7)(ii) of Rule 2-01 of Regulation S-X is compatible with maintaining the principal accountant’s independence.
(i) – Not Applicable
(j) – Not Applicable
| Item 5 – | Audit Committee of Listed Registrant – Not Applicable |
(a) The registrant’s Schedule of Investments is included as part of the Report to Stockholders filed under Item 1(a) of this Form.
(b) Not Applicable due to no such divestments during the semi-annual period covered since the previous Form N-CSR filing.
| Item 7 – | Disclosure of Proxy Voting Policies and Procedures for Closed-End Management Investment Companies – Not Applicable |
| Item 8 – | Portfolio Managers of Closed-End Management Investment Companies – Not Applicable |
| Item 9 – | Purchases of Equity Securities by Closed-End Management Investment Company and Affiliated Purchasers – Not Applicable |
| Item 10 – | Submission of Matters to a Vote of Security Holders – There have been no material changes to these procedures. |
4
| Item 11 – | Controls and Procedures |
(a) The registrant’s principal executive and principal financial officers, or persons performing similar functions, have concluded that the registrant’s disclosure controls and procedures (as defined in Rule 30a-3(c) under the Investment Company Act of 1940, as amended (the “1940 Act”)) are effective as of a date within 90 days of the filing of this report based on the evaluation of these controls and procedures required by Rule 30a-3(b) under the 1940 Act and Rule 15d-15(b) under the Securities Exchange Act of 1934, as amended.
(b) There were no changes in the registrant’s internal control over financial reporting (as defined in Rule 30a-3(d) under the 1940 Act) that occurred during the period covered by this report that have materially affected, or are reasonably likely to materially affect, the registrant’s internal control over financial reporting.
| Item 12 – | Disclosure of Securities Lending Activities for Closed-End Management Investment |
Companies – Not Applicable
| Item 13 – | Exhibits attached hereto |
(a)(1) Code of Ethics – See Item 2
(a)(2) Section 302 Certifications are attached
(a)(3) Any written solicitation to purchase securities under Rule 23c-1 – Not Applicable
(a)(4) Change in Registrant’s independent public accountant – Not Applicable
(b) Section 906 Certifications are attached
5
Pursuant to the requirements of the Securities Exchange Act of 1934 and the Investment Company Act of 1940, the registrant has duly caused this report to be signed on its behalf by the undersigned, thereunto duly authorized.
BlackRock EuroFund
| | | | |
| | By: | | /s/ John M. Perlowski |
| | | | John M. Perlowski |
| | | | Chief Executive Officer (principal executive officer) of |
| | | | BlackRock EuroFund |
Date: August 19, 2022
Pursuant to the requirements of the Securities Exchange Act of 1934 and the Investment Company Act of 1940, this report has been signed below by the following persons on behalf of the registrant and in the capacities and on the dates indicated.
| | | | |
| | By: | | /s/ John M. Perlowski |
| | | | John M. Perlowski |
| | | | Chief Executive Officer (principal executive officer) of |
| | | | BlackRock EuroFund |
Date: August 19, 2022
| | | | |
| | By: | | /s/ Trent Walker |
| | | | Trent Walker |
| | | | Chief Financial Officer (principal financial officer) of |
| | | | BlackRock EuroFund |
Date: August 19, 2022
6