UNITED STATES
SECURITIES AND EXCHANGE COMMISSION
Washington, D.C. 20549
FORM N-CSR
CERTIFIED SHAREHOLDER REPORT OF REGISTERED MANAGEMENT INVESTMENT COMPANIES
Investment Company Act file number: 811-04612
| Name of Fund: | | BlackRock EuroFund |
| Fund Address: | | 100 Bellevue Parkway, Wilmington, DE 19809 |
Name and address of agent for service: John M. Perlowski, Chief Executive Officer, BlackRock EuroFund, 50 Hudson Yards, New York, NY 10001
Registrant’s telephone number, including area code: (800) 441-7762
Date of fiscal year end: 06/30/2023
Date of reporting period: 06/30/2023
Item 1 – Report to Stockholders
(a) The Report to Shareholders is attached herewith.
| | |

| | JUNE 30, 2023 |
BlackRock Advantage Global Fund, Inc.
BlackRock EuroFund
|
Not FDIC Insured • May Lose Value • No Bank Guarantee |
The Markets in Review
Dear Shareholder,
Despite an uncertain economic landscape during the 12-month reporting period ended June 30, 2023, the resilience of the U.S. economy in the face of ever tighter financial conditions provided an encouraging backdrop for investors. Inflation remained elevated as labor costs grew rapidly and unemployment rates reached the lowest levels in decades. However, inflation moderated substantially as the period continued, while ongoing strength in consumer spending backstopped the economy.
Equity returns were strong, as continued job growth eased investors’ concerns about the economy’s durability. The U.S. economy resumed growth in the third quarter of 2022 and continued to expand thereafter. Most major classes of equities advanced significantly, including large- and small-capitalization U.S. stocks and international equities from developed markets. Emerging market equities also gained, although at a substantially slower pace, pressured by high interest rates and falling commodities prices.
The 10-year U.S. Treasury yield rose during the reporting period, driving its price down, as investors reacted to elevated inflation and attempted to anticipate future interest rate changes. The corporate bond market also faced inflationary headwinds, although high-yield corporate bond prices fared significantly better than investment-grade bonds as demand from yield-seeking investors remained strong.
The U.S. Federal Reserve (the “Fed”), acknowledging that inflation has been more persistent than expected, raised interest rates seven times. Furthermore, the Fed wound down its bond-buying programs and incrementally reduced its balance sheet by not replacing securities that reach maturity. However, the Fed declined to raise interest rates at its June 2023 meeting, which made it the first meeting without a rate increase since the tightening cycle began in early 2022.
Supply constraints have become an embedded feature of the new macroeconomic environment, making it difficult for developed economies to increase production without sparking higher inflation. Geopolitical fragmentation and an aging population exacerbate these constraints, keeping the labor market tight and wage growth high. Although the Fed has decelerated the pace of interest rate hikes and most recently opted for a pause, we believe that the new economic regime means that the Fed will need to maintain high rates for an extended period to keep inflation under control. Furthermore, ongoing structural changes may mean that the Fed will be hesitant to cut interest rates in the event of faltering economic activity lest inflation accelerate again. We believe investors should expect a period of higher volatility as markets adjust to the new economic reality and policymakers attempt to adapt.
While we favor an overweight to developed market equities in the long term, we prefer an underweight stance in the near term. Expectations for corporate earnings remain elevated, which seems inconsistent with macroeconomic constraints. Nevertheless, we are overweight on emerging market stocks in the near-term as growth trends for emerging markets appear brighter. We also believe that stocks with an A.I. tilt should benefit from an investment cycle that is set to support revenues and margins. We are neutral on credit overall amid tightening credit and financial conditions, however there are selective opportunities in the near term. For fixed income investing with a six- to twelve-month horizon, we see the most attractive investments in short-term U.S. Treasuries, U.S. inflation-linked bonds, U.S. mortgage-backed securities, and emerging market bonds denominated in local currency.
Overall, our view is that investors need to think globally, position themselves to be prepared for a decarbonizing economy, and be nimble as market conditions change. We encourage you to talk with your financial advisor and visit blackrock.com for further insight about investing in today’s markets.
Sincerely,

Rob Kapito
President, BlackRock Advisors, LLC

Rob Kapito
President, BlackRock Advisors, LLC
| | | | |
Total Returns as of June 30, 2023 |
| | | 6-Month | | 12-Month |
U.S. large cap equities
(S&P 500® Index) | | 16.89% | | 19.59% |
U.S. small cap equities
(Russell 2000® Index) | | 8.09 | | 12.31 |
International equities
(MSCI Europe, Australasia, Far East Index) | | 11.67 | | 18.77 |
Emerging market equities (MSCI Emerging Markets Index) | | 4.89 | | 1.75 |
3-month Treasury bills (ICE BofA 3-Month U.S. Treasury Bill Index) | | 2.25 | | 3.60 |
U.S. Treasury securities (ICE BofA 10-Year U.S. Treasury Index) | | 1.70 | | (3.97) |
U.S. investment grade bonds (Bloomberg U.S. Aggregate Bond Index) | | 2.09 | | (0.94) |
Tax-exempt municipal bonds (Bloomberg Municipal Bond Index) | | 2.67 | | 3.19 |
U.S. high yield bonds (Bloomberg U.S. Corporate High Yield 2% Issuer Capped Index) | | 5.38 | | 9.07 |
|
Past performance is not an indication of future results. Index performance is shown for illustrative purposes only. You cannot invest directly in an index. |
| | |
| 2 | | THIS PAGE IS NOT PART OF YOUR FUND REPORT |
Table of Contents

| | |
| Fund Summary as of June 30, 2023 | | BlackRock Advantage Global Fund, Inc. |
Investment Objective
BlackRock Advantage Global Fund, Inc.’s (the “Fund”) investment objective is to seek long-term capital appreciation.
Portfolio Management Commentary
How did the Fund perform?
For the 12-month period ended June 30, 2023, the Fund’s Institutional, Investor A and Class K share classes outperformed its benchmark, the MSCI All Country World Index, while the Fund’s Investor C and Class R share classes underperformed the benchmark.
What factors influenced performance?
The Fund navigated a rapidly shifting market backdrop over the period. The period was highlighted by market volatility as investors weighed the trajectory of monetary policy amid stubbornly high inflation and an evolving economic backdrop. While goods inflation moderated, services inflation remained well above expectations leading to aggressive policy tightening in the second half of 2022. This resulted in a persistently inverted yield curve, often a precursor to an imminent recession.
The strong performance of global equities over the first half of 2023 was achieved with significant intra-period volatility. Markets faced signs of cracks in the financial system as the banking sector came under pressure amid high and rising rates. What began in March 2023 accelerated into April 2023 as the U.S. banking system observed the second largest bank failure in history. As the turmoil weighed on consumer confidence, investor focus shifted to measures taken to support banks and depositors which appear to have prevented a widespread crisis. Later in the reporting period, equities officially entered a bull market, recovering more than 20% from the lows seen in October of 2022. The strong market performance came despite hawkish rhetoric from central banks and increasing evidence that the aggressive tightening cycle was impacting global economic momentum. However, while global economic data continued to soften, resilience in U.S. labor markets and goods inflation in Europe led policy makers to maintain restrictive stances. Short-term bond yields shot higher resulting in a re-inversion of yield curves to earlier extremes. This initially gave rise to concentrated performance leadership across growth-oriented technology stocks which was boosted by the emerging artificial intelligence (“AI”) theme, before broadening to cyclicals through June 2023.
The Fund’s sentiment-based stock selection measures provided persistent gains during the reporting period. These faster moving insights were able to correctly capture the emerging and evolving market trends. Earlier in the period, these were able to correctly position the portfolio as market themes shifted between rising rates and hopes for a dovish policy pivot. Measures designed to capture sentiment from bond markets led contributions as rates rose sharply to combat historic inflation. Later in the period, sentiment insights capturing both management and analyst views drove gains as focus shifted towards growth and the outlook for earnings. Other consumer intent based insights evaluating online search trends and mobile application usage also benefited performance. These insights motivated successful positioning around a few key themes, highlighted through overweight positions in U.S. technology stocks with exposure to the next evolutions in AI and luxury names benefiting from the China reopening theme.
Elsewhere, fundamental measures performed well amid market volatility. Contrarian quality measures which question the sustainability of company growth, dividend consistency, and company financing ability all drove gains. These defensive insights did well amid the broader reflationary theme earlier in the reporting period and also contributed to gains late in the period as market preference shifted toward cyclicals. While contrarian quality insights performed well, fundamental valuation metrics struggled. Insights evaluating company sales, earnings, and other financial statement metrics detracted. Additionally, non-traditional measures of company quality tracking company employee benefits and controversies proved less relevant as markets focused on macro dynamics.
In what was ultimately a macro-led market for much of the reporting period, select macro thematic insights struggled. Measures designed to evaluate company revenue from China detracted as economic momentum in the region slowed.
Describe recent portfolio activity.
The Fund maintained a balanced allocation of risk across all major return drivers over the reporting period. There were, however, several new signals added within the stock selection group of insights. The Fund built upon its alternative data capabilities and instituted enhanced signal constructs to best identify emerging trends, such as sentiment around supply chain disruptions and wage inflation. Additionally, the Fund developed a new bank quality insight to better identify firms with less exposure to uninsured deposits and commercial real estate amid the emerging industry crisis in March 2023. Finally, an insight identifying companies likely to benefit from the emerging theme related to the AI revolution was also implemented in the Fund.
Describe portfolio positioning at period end.
At reporting period end, the Fund’s positioning with respect to sector allocation was essentially neutral. The Fund had slightly overweight allocations to the healthcare and industrials sectors and slight underweights to utilities and communication services.
The views expressed reflect the opinions of BlackRock as of the date of this report and are subject to change based on changes in market, economic or other conditions. These views are not intended to be a forecast of future events and are no guarantee of future results.
| | |
| 4 | | 2 0 2 3 BLACK ROCK ANNUAL REPORT TO SHAREHOLDERS |
| | |
| Fund Summary as of June 30, 2023 (continued) | | BlackRock Advantage Global Fund, Inc. |
GROWTH OF $10,000 INVESTMENT
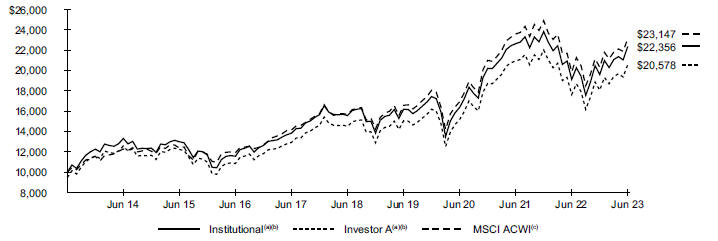
| | (a) | Assuming maximum sales charge, if any, transaction costs and other operating expenses, including investment advisory fees. Institutional Shares do not have a sales charge. | |
| | (b) | The Fund primarily intends to invest in equity securities or other financial instruments that are components of, or have characteristics similar to, the securities included in the MSCI All Country World Index. The Fund’s returns prior to October 26, 2017, are the returns of the Fund when it followed a different investment objective and different investment strategies under the name “BlackRock Global SmallCap Fund, Inc.” | |
| | (c) | An index that captures large- and mid-cap representation across certain developed and emerging markets. | |
Performance
| | | | | | | | | | | | | | | | | | | | | | | | |
| | | Average Annual Total Returns(a)(b) | |
| | | |
| | | 1 Year | | | 5 Years | | | 10 Years | |
| | | | | | |
| | | Without
Sales
Charge | | | With
Sales
Charge | | | Without
Sales
Charge | | | With
Sales
Charge | | | Without
Sales
Charge | | | With
Sales
Charge | |
| | | | | | |
Institutional | | | 16.94 | % | | | N/A | | | | 7.51 | % | | | N/A | | | | 8.38 | % | | | N/A | |
Investor A | | | 16.65 | | | | 10.53 | % | | | 7.24 | | | | 6.09 | % | | | 8.06 | | | | 7.48 | % |
Investor C | | | 15.78 | | | | 14.78 | | | | 6.44 | | | | 6.44 | | | | 7.40 | | | | 7.40 | |
Class K | | | 16.99 | | | | N/A | | | | 7.57 | | | | N/A | | | | 8.41 | | | | N/A | |
Class R | | | 16.34 | | | | N/A | | | | 6.97 | | | | N/A | | | | 7.74 | | | | N/A | |
| | | | | | |
MSCI ACWI | | | 16.53 | | | | N/A | | | | 8.10 | | | | N/A | | | | 8.75 | | | | N/A | |
| | (a) | Assuming maximum sales charges, if any. Average annual total returns with and without sales charges reflect reductions for distribution and service fees. See “About Fund Performance” for a detailed description of share classes, including any related sales charges and fees, and how performance was calculated for certain share classes. | |
| | (b) | The Fund primarily intends to invest in equity securities or other financial instruments that are components of, or have characteristics similar to, the securities included in the MSCI All Country World Index. The Fund’s returns prior to October 26, 2017, are the returns of the Fund when it followed a different investment objective and different investment strategies under the name “BlackRock Global SmallCap Fund, Inc.” | |
N/A — Not applicable as the share class and index do not have a sales charge.
Past performance is not an indication of future results.
Performance results may include adjustments made for financial reporting purposes in accordance with U.S. generally accepted accounting principles.
Expense Example
| | | | | | | | | | | | | | | | | | | | | | | | | | | | | | |
| | | | | | Actual | | | | | | | | Hypothetical 5% Return | | | | |
| | | | | | | | | | | | | | |
| | |
| Beginning
Account Value
(01/01/23) |
| |
| Ending
Account Value
(06/30/23) |
| |
| Expenses
Paid During
the Period |
(a) | | | |
| Beginning
Account Value
(01/01/23) |
| |
| Ending
Account Value
(06/30/23) |
| |
| Expenses
Paid During
the Period |
(a) | |
| Annualized
Expense
Ratio |
|
| | | | | | | | |
Institutional | | | $ 1,000.00 | | | | $ 1,140.60 | | | | $ 3.77 | | | | | | $ 1,000.00 | | | | $ 1,021.27 | | | | $ 3.56 | | | | 0.71 | % |
Investor A | | | 1,000.00 | | | | 1,139.40 | | | | 5.09 | | | | | | 1,000.00 | | | | 1,020.03 | | | | 4.81 | | | | 0.96 | |
Investor C | | | 1,000.00 | | | | 1,134.90 | | | | 9.05 | | | | | | 1,000.00 | | | | 1,016.31 | | | | 8.55 | | | | 1.71 | |
Class K | | | 1,000.00 | | | | 1,141.10 | | | | 3.50 | | | | | | 1,000.00 | | | | 1,021.52 | | | | 3.31 | | | | 0.66 | |
Class R | | | 1,000.00 | | | | 1,137.60 | | | | 6.41 | | | | | | 1,000.00 | | | | 1,018.79 | | | | 6.06 | | | | 1.21 | |
| | (a) | For each class of the Fund, expenses are equal to the annualized expense ratio for the class, multiplied by the average account value over the period, multiplied by 181/365 (to reflect the one-half year period shown). | |
| | |
| Fund Summary as of June 30, 2023 (continued) | | BlackRock Advantage Global Fund, Inc. |
Portfolio Information
| | | | |
| TEN LARGEST HOLDINGS | |
| | |
| Security(a) | | Percent of
Net Assets | |
Microsoft Corp. | | | 4.8 | % |
Apple, Inc. | | | 4.8 | |
Amazon.com, Inc. | | | 3.0 | |
NVIDIA Corp. | | | 2.5 | |
Alphabet, Inc., Class A | | | 1.5 | |
Walmart, Inc. | | | 1.5 | |
Chevron Corp. | | | 1.3 | |
Visa, Inc., Class A | | | 1.2 | |
Novartis AG | | | 1.1 | |
Honeywell International, Inc. | | | 1.1 | |
| | | | |
| GEOGRAPHIC ALLOCATION | |
| | |
| Country/Geographic Region | | Percent of
Net Assets | |
United States | | | 62.4 | % |
Japan | | | 7.4 | |
China | | | 3.8 | |
France | | | 3.1 | |
Canada | | | 2.8 | |
Australia | | | 2.7 | |
Germany | | | 2.5 | |
Switzerland | | | 2.2 | |
Taiwan | | | 1.5 | |
United Kingdom | | | 1.4 | |
Spain | | | 1.2 | |
Brazil | | | 1.1 | |
Other# | | | 8.3 | |
Liabilities in Excess of Other Assets | | | (0.4 | ) |
| (a) | Excludes short-term securities. |
| # | Includes holdings within countries/geographic regions that are less than 1.0% of net assets. Please refer to the Schedule of Investments for such countries/geographic regions. |
| | |
| 6 | | 2 0 2 3 BLACK ROCK ANNUAL REPORT TO SHAREHOLDERS |
| | |
| Fund Summary as of June 30, 2023 | | BlackRock EuroFund |
Investment Objective
BlackRock EuroFund’s (the “Fund”) investment objective is to seek capital appreciation primarily through investment in equities of corporations domiciled in European countries.
Portfolio Management Commentary
How did the Fund perform?
For the 12-month period ended June 30, 2023, all of the Fund’s share classes outperformed its benchmark, the MSCI EMU Index.
What factors influenced performance?
Positioning in the technology sector was the largest contributor to relative performance, led by semiconductor stocks such as ASM International NV, ASML Holding NV and BE Semiconductor Industries NV. The sector staged a rebound following its weak showing in 2022, thanks in part to strong earnings and a better-than-expected outlook for consumer spending. Excitement surrounding the growth of artificial intelligence (“AI”), which will require chips to become “smarter” and more powerful, further propelled the returns of semiconductor companies.
The industrial stock Schneider Electric SE helped returns, as favorable trends around energy efficiency and automation boosted the company’s outlook. Schneider also offers solutions for data-center cooling, which helped establish it as another potential beneficiary of the growth in AI.
Stock selection was robust in the consumer discretionary sector, led by the Fund’s holdings in luxury companies. LVMH Moët Hennessy Louis Vuitton was the top performer behind excellent results, especially in its fashion and leather business. China’s decision to end its COVID-19 restrictions fueled increased demand, as did rising tourism in Europe and Japan. Moncler SpA was another top contributor in the luxury space thanks to strong brand momentum and recovering demand in China.
On the other hand, the French call center operator Teleperformance SE was the largest detractor. The stock came under pressure following an investigation by the Ministry of Labour in Colombia regarding the company’s treatment of content moderators. More recently, the announcement of an acquisition raised questions about the company’s strategy, and concerns emerged about the potential for AI to affect its business. In combination, these factors prompted us to exit the position.
Healthcare stocks that were adversely affected by the industry de-stocking cycle, including Sartorius Stedim Biotech SA and Merck KGaA, also detracted. Within the consumer space, a position in Puma SE was a key detractor due to a management change and concerns about a weaker consumer outlook. The chemical producer Symrise AG also came under pressure following a series of profit warnings in the chemicals sector toward the end of the reporting period. The sector is struggling with customer destocking given lower demand in its end markets.
Describe recent portfolio activity.
The investment adviser increased the Fund’s weighting in European banks on the view that the sector’s above-average interest rate sensitivity, attractive valuations, and capital distribution strategies made it more interesting than it has been in the past. The investment adviser established new positions in UniCredit S.p.A and AIB Group PLC, and it added to Commerzbank AG and BNP Paribas SA. The investment adviser did not materially adjust the Fund’s positioning in banks during the volatility in March 2023. The investment adviser believed 15 years of stringent regulation, restructuring and capital rebuilding have strengthened the banking sector in Europe. The region’s banks have consistently built deposits and are continuing to do so. Cash deposits in European banks are four times higher than in 2015, and debt securities are lower.
The investment adviser used the proceeds from its sale of Puma and Teleperformance to establish a new position in L’Oréal SA, which stands to benefit from the reopening in China. It also added a new holding in the brewer Heineken NV at an attractive valuation. Heineken has a good selection of premium beer brands and interesting geographic exposure, and its new management team has demonstrated a greater focus on cost discipline.
In the travel space, the investment adviser switched from Safran SA into Airbus SE. The latter company is in a very strong competitive position and has the potential to benefit from its offerings of new, more efficient planes in an environment of higher oil prices.
Describe portfolio positioning at period end.
The Fund was overweight in industrials and information technology, and it was underweight in financials, consumer discretionary, communication services, materials, consumer staples, healthcare, real estate and energy.
The views expressed reflect the opinions of BlackRock as of the date of this report and are subject to change based on changes in market, economic or other conditions. These views are not intended to be a forecast of future events and are no guarantee of future results.
| | |
| Fund Summary as of June 30, 2023 (continued) | | BlackRock EuroFund |
GROWTH OF $10,000 INVESTMENT
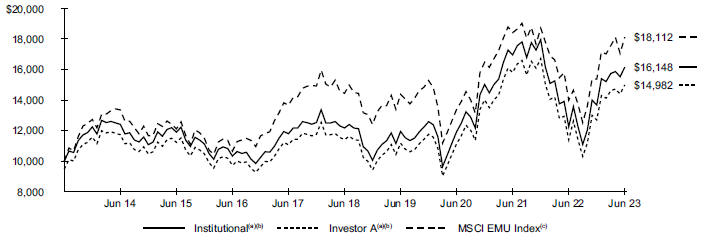
| | (a) | Assuming maximum sales charge, if any, transaction costs and other operating expenses, including investment advisory fees. Institutional Shares do not have a sales charge. | |
| | (b) | Under normal circumstances, the Fund will invest at least 80% of its net assets in equity securities, including common stock and convertible securities, of companies located in Europe. The Fund has no limits on the geographic asset distribution of its investments within Europe. However, the Fund currently expects that a majority of the Fund’s assets will be invested in equity securities of companies located in countries participating in the European Monetary Union (the ‘‘Eurozone’’). The Fund’s total returns prior to October 23, 2018, are the returns of the Fund when it followed different investment strategies. | |
| | (c) | An index that captures large- and mid-cap representation across certain Developed Markets countries in the European Economic and Monetary Union. | |
Performance
| | | | | | | | | | | | | | | | | | | | | | | | |
| | | Average Annual Total Returns(a)(b) | |
| | | |
| | | 1 Year | | | 5 Years | | | 10 Years | |
| | | | | | |
| | | Without
Sales
Charge | | | With
Sales
Charge | | | Without
Sales
Charge | | | With
Sales
Charge | | | Without
Sales
Charge | | | With
Sales
Charge | |
| | | | | | |
Institutional | | | 31.80 | % | | | N/A | | | | 5.82 | % | | | N/A | | | | 4.91 | % | | | N/A | |
Investor A | | | 31.49 | | | | 24.59 | % | | | 5.60 | | | | 4.46 | % | | | 4.69 | | | | 4.13 | % |
Investor C | | | 30.43 | | | | 29.43 | | | | 4.79 | | | | 4.79 | | | | 4.02 | | | | 4.02 | |
Class K | | | 31.81 | | | | N/A | | | | 5.95 | | | | N/A | | | | 4.98 | | | | N/A | |
Class R | | | 31.10 | | | | N/A | | | | 5.14 | | | | N/A | | | | 4.20 | | | | N/A | |
| | | | | | |
MSCI EMU Index | | | 29.49 | | | | N/A | | | | 4.63 | | | | N/A | | | | 6.12 | | | | N/A | |
| | (a) | Assuming maximum sales charges, if any. Average annual total returns with and without sales charges reflect reductions for distribution and service fees. See “About Fund Performance” for a detailed description of share classes, including any related sales charges and fees, and how performance was calculated for certain share classes. | |
| | (b) | Under normal circumstances, the Fund will invest at least 80% of its net assets in equity securities, including common stock and convertible securities, of companies located in Europe. The Fund has no limits on the geographic asset distribution of its investments within Europe. However, the Fund currently expects that a majority of the Fund’s assets will be invested in equity securities of companies located in countries participating in the European Monetary Union (the ‘‘Eurozone’’). The Fund’s total returns prior to October 23, 2018, are the returns of the Fund when it followed different investment strategies. | |
N/A — Not applicable as the share class and index do not have a sales charge.
Past performance is not an indication of future results.
Performance results may include adjustments made for financial reporting purposes in accordance with U.S. generally accepted accounting principles.
Expense Example
| | | | | | | | | | | | | | | | | | | | | | | | | | | | | | |
| | | | | | Actual | | | | | | | | Hypothetical 5% Return | | | | |
| | | | | | | | | | | | | | |
| | |
| Beginning
Account Value
(01/01/23) |
| |
| Ending
Account Value
(06/30/23) |
| |
| Expenses
Paid During
the Period |
(a) | | | |
| Beginning
Account Value
(01/01/23) |
| |
| Ending
Account Value
(06/30/23) |
| |
| Expenses
Paid During
the Period |
(a) | |
| Annualized
Expense
Ratio |
|
| | | | | | | | |
Institutional | | | $ 1,000.00 | | | | $ 1,181.20 | | | | $ 8.11 | | | | | | $ 1,000.00 | | | | $ 1,017.36 | | | | $ 7.50 | | | | 1.50 | % |
Investor A | | | 1,000.00 | | | | 1,180.20 | | | | 9.57 | | | | | | 1,000.00 | | | | 1,016.02 | | | | 8.85 | | | | 1.77 | |
Investor C | | | 1,000.00 | | | | 1,175.40 | | | | 13.65 | | | | | | 1,000.00 | | | | 1,012.25 | | | | 12.62 | | | | 2.53 | |
Class K | | | 1,000.00 | | | | 1,181.60 | | | | 7.74 | | | | | | 1,000.00 | | | | 1,017.70 | | | | 7.15 | | | | 1.43 | |
Class R | | | 1,000.00 | | | | 1,177.80 | | | | 10.91 | | | | | | 1,000.00 | | | | 1,014.78 | | | | 10.09 | | | | 2.02 | |
| | (a) | For each class of the Fund, expenses are equal to the annualized expense ratio for the class, multiplied by the average account value over the period, multiplied by 181/365 (to reflect the one-half year period shown). | |
| | |
| 8 | | 2 0 2 3 BLACK ROCK ANNUAL REPORT TO SHAREHOLDERS |
| | |
| Fund Summary as of June 30, 2023 (continued) | | BlackRock EuroFund |
Portfolio Information
| | | | |
| TEN LARGEST HOLDINGS | |
| | |
| Security(a) | | Percent of
Net Assets | |
ASML Holding NV | | | 8.6 | % |
LVMH Moet Hennessy Louis Vuitton SE | | | 8.2 | |
Schneider Electric SE | | | 4.4 | |
Siemens AG | | | 4.0 | |
Safran SA | | | 3.2 | |
BNP Paribas SA | | | 3.0 | |
SAP SE | | | 3.0 | |
Vinci SA | | | 2.9 | |
Linde PLC | | | 2.9 | |
UniCredit SpA | | | 2.9 | |
| | | | |
| GEOGRAPHIC ALLOCATION | |
| | |
| Country/Geographic Region | | Percent of
Net Assets | |
France | | | 38.3 | % |
Netherlands | | | 20.3 | |
Germany | | | 16.4 | |
Italy | | | 7.9 | |
United States | | | 3.5 | |
Finland | | | 2.8 | |
Denmark | | | 2.6 | |
Switzerland | | | 2.5 | |
United Kingdom | | | 2.2 | |
Spain | | | 1.5 | |
Ireland | | | 1.4 | |
Belgium | | | 1.1 | |
Sweden | | | 1.1 | |
Portugal | | | 0.3 | |
Liabilities in Excess of Other Assets | | | (1.9 | ) |
| (a) | Excludes short-term securities. |
About Fund Performance
Institutional and Class K Shares are not subject to any sales charge. These shares bear no ongoing distribution or service fees and are available only to certain eligible investors. Class K Shares performance shown prior to the Class K Shares inception date of January 25, 2018 is that of Institutional Shares. The performance of each Fund’s Class K Shares would be substantially similar to Institutional Shares because Class K Shares and Institutional Shares invest in the same portfolio of securities and performance would only differ to the extent that Class K Shares and Institutional Shares have different expenses. The actual returns of Class K Shares would have been higher than those of the Institutional Shares because Class K Shares have lower expenses than the Institutional Shares.
Investor A Shares are subject to a maximum initial sales charge (front-end load) of 5.25% and a service fee of 0.25% per year (but no distribution fee). Certain redemptions of these shares may be subject to a contingent deferred sales charge (“CDSC”) where no initial sales charge was paid at the time of purchase. These shares are generally available through financial intermediaries.
Investor C Shares are subject to a 1.00% CDSC if redeemed within one year of purchase. In addition, these shares are subject to a distribution fee of 0.75% per year and a service fee of 0.25% per year. These shares are generally available through financial intermediaries. These shares automatically convert to Investor A Shares after approximately eight years.
Class R Shares are not subject to any sales charge. These shares are subject to a distribution fee of 0.25% per year and a service fee of 0.25% per year. These shares are available only to certain employer-sponsored retirement plans.
Past performance is not an indication of future results. Financial markets have experienced extreme volatility and trading in many instruments has been disrupted. These circumstances may continue for an extended period of time and may continue to affect adversely the value and liquidity of each Fund’s investments. As a result, current performance may be lower or higher than the performance data quoted. Refer to blackrock.com to obtain performance data current to the most recent month-end. Performance results do not reflect the deduction of taxes that a shareholder would pay on Fund distributions or the redemption of Fund shares. Figures shown in the performance table(s) assume reinvestment of all distributions, if any, at net asset value (“NAV”) on the ex-dividend date or payable date, as applicable. Investment return and principal value of shares will fluctuate so that shares, when redeemed, may be worth more or less than their original cost. Distributions paid to each class of shares will vary because of the different levels of service, distribution and transfer agency fees applicable to each class, which are deducted from the income available to be paid to shareholders.
BlackRock Advisors, LLC (the “Manager”), each Fund’s investment adviser, has contractually and/or voluntarily agreed to waive and/or reimburse a portion of each Fund’s expenses. Without such waiver(s) and/or reimbursement(s), each Fund’s performance would have been lower. With respect to each Fund’s voluntary waiver(s), if any, the Manager is under no obligation to waive and/or reimburse or to continue waiving and/or reimbursing its fees and such voluntary waiver(s) may be reduced or discontinued at any time. With respect to each Fund’s contractual waiver(s), if any, the Manager is under no obligation to continue waiving and/or reimbursing its fees after the applicable termination date of such agreement. See the Notes to Financial Statements for additional information on waivers and/or reimbursements.
Disclosure of Expenses
Shareholders of each Fund may incur the following charges: (a) transactional expenses, such as sales charges; and (b) operating expenses, including investment advisory fees, service and distribution fees, including 12b-1 fees, acquired fund fees and expenses, and other fund expenses. The expense examples shown (which are based on a hypothetical investment of $1,000 invested at the beginning of the period and held through the end of the period) are intended to assist shareholders both in calculating expenses based on an investment in each Fund and in comparing these expenses with similar costs of investing in other mutual funds.
The expense examples provide information about actual account values and actual expenses. Annualized expense ratios reflect contractual and voluntary fee waivers, if any. In order to estimate the expenses a shareholder paid during the period covered by this report, shareholders can divide their account value by $1,000 and then multiply the result by the number corresponding to their Fund and share class under the heading entitled “Expenses Paid During the Period.”
The expense examples also provide information about hypothetical account values and hypothetical expenses based on a Fund’s actual expense ratio and an assumed rate of return of 5% per year before expenses. In order to assist shareholders in comparing the ongoing expenses of investing in these Funds and other funds, compare the 5% hypothetical examples with the 5% hypothetical examples that appear in shareholder reports of other funds.
The expenses shown in the expense examples are intended to highlight shareholders’ ongoing costs only and do not reflect transactional expenses, such as sales charges, if any. Therefore, the hypothetical examples are useful in comparing ongoing expenses only and will not help shareholders determine the relative total expenses of owning different funds. If these transactional expenses were included, shareholder expenses would have been higher.
| | |
| 10 | | 2 0 2 3 BLACK ROCK ANNUAL REPORT TO SHAREHOLDERS |
Derivative Financial Instruments
The Funds may invest in various derivative financial instruments. These instruments are used to obtain exposure to a security, commodity, index, market, and/or other assets without owning or taking physical custody of securities, commodities and/or other referenced assets or to manage market, equity, credit, interest rate, foreign currency exchange rate, commodity and/or other risks. Derivative financial instruments may give rise to a form of economic leverage and involve risks, including the imperfect correlation between the value of a derivative financial instrument and the underlying asset, possible default of the counterparty to the transaction or illiquidity of the instrument. Pursuant to Rule 18f-4 under the 1940 Act, among other things, the Funds must either use derivative financial instruments with embedded leverage in a limited manner or comply with an outer limit on fund leverage risk based on value-at-risk. The Funds’ successful use of a derivative financial instrument depends on the investment adviser’s ability to predict pertinent market movements accurately, which cannot be assured. The use of these instruments may result in losses greater than if they had not been used, may limit the amount of appreciation a Fund can realize on an investment and/or may result in lower distributions paid to shareholders. The Funds’ investments in these instruments, if any, are discussed in detail in the Notes to Financial Statements.
| | |
DERIVATIVE FINANCIAL INSTRUMENTS | | 11 |
| | |
Schedule of Investments June 30, 2023 | | BlackRock Advantage Global Fund, Inc. (Percentages shown are based on Net Assets) |
| | | | | | | | |
| Security | | Shares | | | Value | |
|
Common Stocks | |
|
| Argentina — 0.0% | |
MercadoLibre, Inc.(a) | | | 114 | | | $ | 135,044 | |
| | | | | | | | |
| | |
| Australia — 2.7% | | | | | | |
ANZ Group Holdings Ltd. | | | 7,347 | | | | 116,301 | |
Aristocrat Leisure Ltd. | | | 12,417 | | | | 321,263 | |
BHP Group Ltd., Class DI | | | 135,714 | | | | 4,079,828 | |
Charter Hall Group | | | 2,154 | | | | 15,442 | |
CSL Ltd. | | | 1,935 | | | | 358,321 | |
Fortescue Metals Group Ltd. | | | 8,741 | | | | 129,705 | |
Macquarie Group Ltd. | | | 17,557 | | | | 2,089,070 | |
National Australia Bank Ltd. | | | 21,840 | | | | 384,119 | |
Newcrest Mining Ltd. | | | 42,439 | | | | 757,044 | |
Qantas Airways Ltd.(a) | | | 62,064 | | | | 257,200 | |
Rio Tinto Ltd. | | | 2,746 | | | | 210,288 | |
Rio Tinto PLC | | | 1,556 | | | | 98,883 | |
Transurban Group | | | 6,840 | | | | 65,126 | |
Westpac Banking Corp. | | | 122,102 | | | | 1,738,564 | |
| | | | | | | | |
| | |
| | | | | | | 10,621,154 | |
| | |
| Austria — 0.1% | | | | | | |
ANDRITZ AG | | | 968 | | | | 53,985 | |
Erste Group Bank AG | | | 1 | | | | 35 | |
Raiffeisen Bank International AG(a) | | | 13,624 | | | | 216,198 | |
| | | | | | | | |
| | |
| | | | | | | 270,218 | |
| | |
| Belgium — 0.6% | | | | | | |
Ageas SA/NV | | | 410 | | | | 16,621 | |
Solvay SA | | | 20,878 | | | | 2,334,578 | |
| | | | | | | | |
| | |
| | | | | | | 2,351,199 | |
| | |
| Brazil — 0.8% | | | | | | |
Ambev SA | | | 173,739 | | | | 559,149 | |
Auren Energia SA, Class OH | | | 7,164 | | | | 21,440 | |
Banco BTG Pactual SA | | | 4,435 | | | | 29,130 | |
Banco do Brasil SA | | | 28,188 | | | | 290,816 | |
BB Seguridade Participacoes SA | | | 5,861 | | | | 37,664 | |
Cia Paranaense de Energia, Preference Shares | | | 122,769 | | | | 212,555 | |
Cielo SA | | | 15,909 | | | | 15,250 | |
Cogna Educacao SA(a) | | | 145,422 | | | | 99,009 | |
CPFL Energia SA | | | 12,233 | | | | 87,860 | |
CSN Mineracao SA | | | 23,762 | | | | 20,744 | |
Cyrela Brazil Realty SA Empreendimentos e Participacoes | | | 7,782 | | | | 32,716 | |
Embraer SA(a) | | | 5,260 | | | | 20,367 | |
Energisa SA | | | 6,384 | | | | 66,931 | |
Engie Brasil Energia SA | | | 4,736 | | | | 45,192 | |
Equatorial Energia SA | | | 4,315 | | | | 28,973 | |
Fleury SA | | | 23,631 | | | | 79,212 | |
Marcopolo SA, Preference Shares | | | 34,878 | | | | 37,950 | |
Minerva SA | | | 9,765 | | | | 21,679 | |
Multiplan Empreendimentos Imobiliarios SA | | | 4,703 | | | | 27,178 | |
Natura & Co. Holding SA(a) | | | 16,007 | | | | 55,962 | |
NU Holdings Ltd., Class A(a) | | | 24,538 | | | | 193,605 | |
Porto Seguro SA | | | 9,178 | | | | 53,900 | |
StoneCo Ltd., Class A(a) | | | 4,832 | | | | 61,560 | |
Telefonica Brasil SA | | | 2,161 | | | | 19,528 | |
Ultrapar Participacoes SA | | | 33,565 | | | | 132,418 | |
Vale SA | | | 60,407 | | | | 810,187 | |
| | | | | | | | |
| Security | | Shares | | | Value | |
| | |
| Brazil (continued) | | | | | | |
WEG SA | | | 3,034 | | | $ | 23,920 | |
XP, Inc., Class A(a) | | | 1,530 | | | | 35,894 | |
| | | | | | | | |
| | |
| | | | | | | 3,120,789 | |
| | |
| Canada — 2.8% | | | | | | |
Agnico Eagle Mines Ltd. | | | 9,102 | | | | 454,499 | |
Alamos Gold, Inc., Class A | | | 88,461 | | | | 1,053,719 | |
Atco Ltd., Class I | | | 2,707 | | | | 80,592 | |
Barrick Gold Corp. | | | 51,467 | | | | 870,636 | |
BRP, Inc. | | | 770 | | | | 65,093 | |
Canadian Natural Resources Ltd. | | | 33,100 | | | | 1,860,946 | |
Crescent Point Energy Corp. | | | 45,010 | | | | 303,068 | |
Enbridge, Inc. | | | 8,296 | | | | 308,356 | |
Fairfax Financial Holdings Ltd. | | | 359 | | | | 268,905 | |
First Quantum Minerals Ltd. | | | 2,457 | | | | 58,126 | |
FirstService Corp. | | | 1,994 | | | | 307,089 | |
Franco-Nevada Corp. | | | 8,058 | | | | 1,148,466 | |
Imperial Oil Ltd. | | | 6,788 | | | | 347,304 | |
Kinross Gold Corp. | | | 40,557 | | | | 193,486 | |
Lululemon Athletica, Inc.(a) | | | 5,749 | | | | 2,175,996 | |
Manulife Financial Corp. | | | 950 | | | | 17,957 | |
Pan American Silver Corp. | | | 9,437 | | | | 137,486 | |
Stantec, Inc. | | | 8,723 | | | | 569,505 | |
Teck Resources Ltd., Class B(a) | | | 12,121 | | | | 510,002 | |
TransAlta Corp. | | | 1,875 | | | | 17,550 | |
Wheaton Precious Metals Corp. | | | 3,130 | | | | 135,360 | |
| | | | | | | | |
| | |
| | | | | | | 10,884,141 | |
| | |
| China — 3.8% | | | | | | |
3SBio, Inc.(b) | | | 35,500 | | | | 35,723 | |
Alibaba Group Holding Ltd.(a) | | | 126,200 | | | | 1,313,720 | |
ANTA Sports Products Ltd. | | | 21,000 | | | | 215,794 | |
Autohome, Inc., ADR | | | 942 | | | | 27,469 | |
Baidu, Inc., Class A(a) | | | 46,580 | | | | 794,458 | |
BeiGene Ltd.(a) | | | 900 | | | | 12,340 | |
Bilibili, Inc., Class Z(a) | | | 1,380 | | | | 20,552 | |
Bloomage Biotechnology Corp. Ltd., Class A | | | 4,917 | | | | 60,404 | |
BOC Hong Kong Holdings Ltd. | | | 168,000 | | | | 514,639 | |
BOE Technology Group Co. Ltd., Class A | | | 47,100 | | | | 26,556 | |
BYD Co. Ltd., Class A | | | 35,871 | | | | 1,278,290 | |
BYD Co. Ltd., Class H | | | 11,500 | | | | 368,743 | |
China Eastern Airlines Corp. Ltd., Class A(a) | | | 58,400 | | | | 38,276 | |
China Longyuan Power Group Corp. Ltd., Class H | | | 32,000 | | | | 33,052 | |
China Merchants Bank Co. Ltd., Class H | | | 10,500 | | | | 47,891 | |
China Petroleum & Chemical Corp., Class A | | | 36,300 | | | | 31,785 | |
China Railway Group Ltd., Class A | | | 231,200 | | | | 241,538 | |
China Southern Airlines Co. Ltd., Class A(a) | | | 28,500 | | | | 23,655 | |
China Suntien Green Energy Corp. Ltd., Class H | | | 56,000 | | | | 20,142 | |
CMOC Group Ltd., Class H | | | 30,000 | | | | 15,795 | |
Contemporary Amperex Technology Co. Ltd., Class A | | | 19,340 | | | | 610,588 | |
COSCO SHIPPING Holdings Co. Ltd., Class H | | | 16,500 | | | | 14,915 | |
CSPC Pharmaceutical Group Ltd. | | | 138,080 | | | | 120,168 | |
Dali Foods Group Co. Ltd.(b) | | | 89,000 | | | | 39,814 | |
Dongfang Electric Corp. Ltd., Class A | | | 5,700 | | | | 14,648 | |
Dongyue Group Ltd. | | | 17,000 | | | | 12,769 | |
Geely Automobile Holdings Ltd. | | | 160,000 | | | | 196,455 | |
Great Wall Motor Co. Ltd., Class H | | | 17,500 | | | | 20,155 | |
Gree Electric Appliances, Inc. of Zhuhai, Class A | | | 4,400 | | | | 22,130 | |
Hithink RoyalFlush Information Network Co. Ltd., Class A | | | 3,000 | | | | 72,512 | |
| | |
| 12 | | 2 0 2 3 BLACK ROCK ANNUAL REPORT TO SHAREHOLDERS |
| | |
Schedule of Investments (continued) June 30, 2023 | | BlackRock Advantage Global Fund, Inc. (Percentages shown are based on Net Assets) |
| | | | | | | | |
| Security | | Shares | | | Value | |
| | |
| China (continued) | | | | | | |
Huadian Power International Corp. Ltd., Class H, Class H | | | 120,000 | | | $ | 62,772 | |
Innovent Biologics, Inc.(a)(b) | | | 6,500 | | | | 24,689 | |
JD.com, Inc., Class A | | | 20,400 | | | | 347,913 | |
Jiangxi Copper Co. Ltd., Class A | | | 7,258 | | | | 19,025 | |
Jinan Acetate Chemical Co. Ltd. | | | 1,000 | | | | 17,795 | |
Juneyao Airlines Co. Ltd., Class A(a) | | | 5,900 | | | | 12,540 | |
Kingdee International Software Group Co. Ltd.(a) | | | 10,000 | | | | 13,428 | |
Lenovo Group Ltd. | | | 202,000 | | | | 211,671 | |
LONGi Green Energy Technology Co. Ltd., Class A | | | 49,400 | | | | 195,302 | |
Meituan, Class B(a)(b) | | | 23,930 | | | | 375,244 | |
Metallurgical Corp. of China Ltd., Class A | | | 214,500 | | | | 117,304 | |
NetEase, Inc. | | | 19,710 | | | | 381,761 | |
NXP Semiconductors NV | | | 2,285 | | | | 467,694 | |
PetroChina Co. Ltd., Class H | | | 66,000 | | | | 45,828 | |
Ping An Bank Co. Ltd., Class A | | | 9,500 | | | | 14,713 | |
Ping An Insurance Group Co. of China Ltd., Class H | | | 64,000 | | | | 408,762 | |
Postal Savings Bank of China Co. Ltd., Class H(b) | | | 179,000 | | | | 110,382 | |
Power Construction Corp. of China Ltd., Class A | | | 19,100 | | | | 15,081 | |
SF Holding Co. Ltd., Class A | | | 7,200 | | | | 44,715 | |
Shandong Gold Mining Co. Ltd., Class A | | | 23,400 | | | | 75,925 | |
Shandong Nanshan Aluminum Co. Ltd., Class A | | | 61,900 | | | | 25,776 | |
Shanghai International Airport Co. Ltd., Class A(a) | | | 30,500 | | | | 190,937 | |
Shanghai Putailai New Energy Technology Co. Ltd., Class A | | | 14,532 | | | | 76,591 | |
Shanxi Xinghuacun Fen Wine Factory Co. Ltd., Class A | | | 3,700 | | | | 94,311 | |
Shenzhen Capchem Technology Co. Ltd., Class A | | | 12,314 | | | | 88,187 | |
Shenzhen Inovance Technology Co. Ltd., Class A | | | 13,700 | | | | 121,336 | |
Shenzhen Kstar Science And Technology Co. Ltd., Class A | | | 2,400 | | | | 13,244 | |
Shenzhen Mindray Bio-Medical Electronics Co. Ltd., Class A | | | 9,002 | | | | 372,225 | |
Shenzhen SC New Energy Technology Corp., Class A | | | 4,700 | | | | 72,796 | |
Sinotruk Hong Kong Ltd. | | | 26,000 | | | | 50,623 | |
Sunny Optical Technology Group Co. Ltd. | | | 1,600 | | | | 15,957 | |
Sunwoda Electronic Co. Ltd., Class A | | | 15,700 | | | | 35,365 | |
Suzhou Maxwell Technologies Co. Ltd., Class A | | | 1,600 | | | | 37,327 | |
Tencent Holdings Ltd. | | | 67,600 | | | | 2,866,319 | |
Tianqi Lithium Corp., Class H(a) | | | 3,200 | | | | 22,368 | |
Tongling Nonferrous Metals Group Co. Ltd., Class A | | | 40,600 | | | | 16,201 | |
Trip.com Group Ltd.(a) | | | 2,550 | | | | 89,019 | |
Uni-President China Holdings Ltd. | | | 42,000 | | | | 35,419 | |
Vipshop Holdings Ltd., ADR(a) | | | 21,114 | | | | 348,381 | |
Wanhua Chemical Group Co. Ltd., Class A | | | 1,800 | | | | 21,764 | |
Western Mining Co. Ltd., Class A | | | 10,300 | | | | 14,930 | |
WuXi AppTec Co. Ltd., Class H(b) | | | 23,616 | | | | 189,269 | |
Yadea Group Holdings Ltd.(b) | | | 64,000 | | | | 145,995 | |
Zhejiang Jingsheng Mechanical & Electrical Co. Ltd., Class A | | | 2,400 | | | | 23,491 | |
Zhongjin Gold Corp. Ltd., Class A | | | 208,475 | | | | 297,429 | |
Zijin Mining Group Co. Ltd., Class A | | | 71,400 | | | | 112,133 | |
Zijin Mining Group Co. Ltd., Class H | | | 310,000 | | | | 459,073 | |
| | | | | | | | |
| | |
| | | | | | | 15,043,986 | |
| | |
| Colombia — 0.0% | | | | | | |
Tecnoglass, Inc. | | | 825 | | | | 42,619 | |
| | | | | | | | |
| | |
| Denmark — 0.9% | | | | | | |
Genmab A/S(a) | | | 853 | | | | 323,251 | |
| | | | | | | | |
| Security | | Shares | | | Value | |
| | |
| Denmark (continued) | | | | | | |
Novo Nordisk A/S, Class B | | | 18,050 | | | $ | 2,915,792 | |
Novozymes A/S, B Shares | | | 7,388 | | | | 344,717 | |
| | | | | | | | |
| | |
| | | | | | | 3,583,760 | |
| | |
| France — 3.1% | | | | | | |
Air Liquide SA | | | 156 | | | | 27,976 | |
Arkema SA | | | 237 | | | | 22,348 | |
Bureau Veritas SA | | | 6,763 | | | | 185,543 | |
Capgemini SE | | | 761 | | | | 144,090 | |
Cie de Saint-Gobain | | | 1,187 | | | | 72,272 | |
Engie SA | | | 112,655 | | | | 1,876,035 | |
Hermes International | | | 861 | | | | 1,871,572 | |
Legrand SA | | | 4,981 | | | | 494,134 | |
L’Oreal SA | | | 5,900 | | | | 2,752,210 | |
LVMH Moet Hennessy Louis Vuitton SE | | | 1,479 | | | | 1,394,567 | |
Rexel SA | | | 30,601 | | | | 756,271 | |
Sanofi | | | 12,681 | | | | 1,365,183 | |
Schneider Electric SE | | | 3,994 | | | | 725,617 | |
SPIE SA | | | 5 | | | | 162 | |
Thales SA | | | 386 | | | | 57,834 | |
Ubisoft Entertainment SA(a) | | | 3,283 | | | | 92,795 | |
Veolia Environnement SA | | | 5,556 | | | | 175,878 | |
Wendel SE | | | 262 | | | | 26,909 | |
| | | | | | | | |
| | |
| | | | | | | 12,041,396 | |
| | |
| Germany — 2.4% | | | | | | |
Bayerische Motoren Werke AG | | | 1,180 | | | | 145,148 | |
Beiersdorf AG | | | 545 | | | | 72,171 | |
Covestro AG(a)(b) | | | 3,410 | | | | 177,431 | |
Deutsche Bank AG, Registered Shares | | | 14,240 | | | | 149,702 | |
Deutsche Lufthansa AG, Registered Shares(a) | | | 24,753 | | | | 253,806 | |
E.ON SE | | | 38,790 | | | | 495,519 | |
Freenet AG | | | 7,048 | | | | 176,994 | |
GEA Group AG | | | 384 | | | | 16,077 | |
Infineon Technologies AG | | | 2,696 | | | | 111,027 | |
Jenoptik AG | | | 4 | | | | 137 | |
Mercedes-Benz Group AG, Registered Shares | | | 49,177 | | | | 3,958,321 | |
Nemetschek SE | | | 546 | | | | 40,763 | |
SAP SE | | | 5,095 | | | | 696,015 | |
Scout24 SE(b) | | | 2,890 | | | | 183,127 | |
Siemens AG, Registered Shares | | | 16,308 | | | | 2,718,558 | |
thyssenkrupp AG | | | 13,101 | | | | 102,613 | |
| | | | | | | | |
| | |
| | | | | | | 9,297,409 | |
| | |
| Hong Kong — 0.7% | | | | | | |
AIA Group Ltd. | | | 144,400 | | | | 1,466,598 | |
CK Asset Holdings Ltd. | | | 24,000 | | | | 133,362 | |
CK Hutchison Holdings Ltd. | | | 77,000 | | | | 469,958 | |
Galaxy Entertainment Group Ltd.(a) | | | 41,000 | | | | 261,199 | |
Jardine Matheson Holdings Ltd. | | | 4,300 | | | | 218,054 | |
New World Development Co. Ltd. | | | 75,000 | | | | 185,366 | |
Orient Overseas International Ltd. | | | 1,500 | | | | 20,149 | |
Swire Properties Ltd. | | | 24,600 | | | | 60,611 | |
Yuexiu Property Co. Ltd. | | | 23,600 | | | | 27,498 | |
| | | | | | | | |
| | |
| | | | | | | 2,842,795 | |
| | |
| Hungary — 0.2% | | | | | | |
MOL Hungarian Oil & Gas PLC | | | 71,650 | | | | 627,324 | |
OTP Bank Nyrt | | | 8,499 | | | | 302,143 | |
| | | | | | | | |
| | |
| | | | | | | 929,467 | |
| | |
| India — 0.8% | | | | | | |
Asian Paints Ltd. | | | 5,831 | | | | 239,443 | |
| | |
SCHEDULE OF INVESTMENTS | | 13 |
| | |
Schedule of Investments (continued) June 30, 2023 | | BlackRock Advantage Global Fund, Inc. (Percentages shown are based on Net Assets) |
| | | | | | | | |
| Security | | Shares | | | Value | |
| | |
| India (continued) | | | | | | |
City Union Bank Ltd. | | | 6,503 | | | $ | 10,110 | |
Cummins India Ltd. | | | 885 | | | | 21,007 | |
HDFC Bank Ltd. | | | 54,893 | | | | 1,139,184 | |
HDFC Life Insurance Co. Ltd.(b) | | | 15,387 | | | | 122,236 | |
Hindalco Industries Ltd. | | | 3,431 | | | | 17,693 | |
Hindustan Unilever Ltd. | | | 1,123 | | | | 36,716 | |
Housing Development Finance Corp. Ltd. | | | 6,464 | | | | 223,010 | |
ICICI Bank Ltd. | | | 6,889 | | | | 78,872 | |
ICICI Prudential Life Insurance Co. Ltd.(b) | | | 8,461 | | | | 59,156 | |
IndusInd Bank Ltd. | | | 5,044 | | | | 84,843 | |
InterGlobe Aviation Ltd.(a)(b) | | | 640 | | | | 20,523 | |
Kotak Mahindra Bank Ltd. | | | 28,527 | | | | 643,383 | |
L&T Finance Holdings Ltd. | | | 21,198 | | | | 33,096 | |
National Aluminium Co. Ltd. | | | 19,471 | | | | 19,555 | |
Navin Fluorine International Ltd. | | | 285 | | | | 15,666 | |
Power Finance Corp. Ltd. | | | 23,875 | | | | 62,995 | |
PVR Inox Ltd.(a) | | | 669 | | | | 11,221 | |
REC Ltd. | | | 10,623 | | | | 21,367 | |
SBI Life Insurance Co. Ltd.(b) | | | 22,819 | | | | 364,053 | |
TVS Motor Co. Ltd. | | | 2,850 | | | | 46,181 | |
| | | | | | | | |
| | |
| | | | | | | 3,270,310 | |
| | |
| Indonesia — 0.0% | | | | | | |
Perusahaan Gas Negara Tbk PT | | | 139,800 | | | | 12,239 | |
| | | | | | | | |
| | |
| Ireland — 0.4% | | | | | | |
Alkermes PLC(a) | | | 760 | | | | 23,788 | |
CRH PLC | | | 1,955 | | | | 108,139 | |
Experian PLC | | | 26,337 | | | | 1,010,840 | |
Kingspan Group PLC | | | 1,875 | | | | 124,807 | |
Trane Technologies PLC | | | 1,633 | | | | 312,328 | |
| | | | | | | | |
| | |
| | | | | | | 1,579,902 | |
| | |
| Israel — 0.0% | | | | | | |
Wix.com Ltd.(a) | | | 429 | | | | 33,565 | |
| | | | | | | | |
| | |
| Italy — 0.4% | | | | | | |
A2A SpA | | | 17,496 | | | | 32,009 | |
Banca Mediolanum SpA | | | 7,315 | | | | 66,168 | |
Banca Monte dei Paschi di Siena SpA(a) | | | 23,838 | | | | 59,973 | |
Ferrari NV | | | 74 | | | | 24,194 | |
Intesa Sanpaolo SpA | | | 430,610 | | | | 1,128,952 | |
Mediobanca Banca di Credito Finanziario SpA | | | 7,498 | | | | 89,770 | |
Moncler SpA | | | 1,010 | | | | 69,880 | |
Recordati Industria Chimica e Farmaceutica SpA | | | 1,802 | | | | 86,086 | |
Telecom Italia SpA(a) | | | 60,899 | | | | 17,169 | |
UniCredit SpA | | | 6,190 | | | | 143,940 | |
| | | | | | | | |
| | |
| | | | | | | 1,718,141 | |
| | |
| Japan — 7.4% | | | | | | |
Amada Co. Ltd. | | | 43,600 | | | | 430,152 | |
ANA Holdings, Inc.(a) | | | 56,800 | | | | 1,352,992 | |
Asahi Kasei Corp. | | | 5,500 | | | | 37,241 | |
Astellas Pharma, Inc. | | | 48,600 | | | | 723,774 | |
Central Japan Railway Co. | | | 16,300 | | | | 2,042,248 | |
Chubu Electric Power Co., Inc. | | | 3,100 | | | | 37,818 | |
Daiichi Sankyo Co. Ltd. | | | 1,200 | | | | 38,129 | |
Daiwa House Industry Co. Ltd. | | | 12,100 | | | | 319,706 | |
DMG Mori Co. Ltd. | | | 1,700 | | | | 29,554 | |
Ebara Corp. | | | 200 | | | | 9,596 | |
FANUC Corp. | | | 11,500 | | | | 403,715 | |
Fast Retailing Co. Ltd. | | | 2,200 | | | | 564,245 | |
FUJIFILM Holdings Corp. | | | 15,700 | | | | 935,455 | |
| | | | | | | | |
| Security | | Shares | | | Value | |
| | |
| Japan (continued) | | | | | | |
Hitachi Ltd. | | | 5,600 | | | $ | 348,188 | |
Honda Motor Co. Ltd. | | | 9,700 | | | | 293,850 | |
Idemitsu Kosan Co. Ltd. | | | 1,100 | | | | 22,072 | |
ITOCHU Corp. | | | 27,800 | | | | 1,104,259 | |
J Front Retailing Co. Ltd. | | | 1,600 | | | | 15,346 | |
Japan Airlines Co. Ltd. | | | 15,800 | | | | 342,599 | |
Japan Tobacco, Inc. | | | 82,200 | | | | 1,800,672 | |
JGC Holdings Corp. | | | 2,200 | | | | 28,605 | |
Kajima Corp. | | | 3,100 | | | | 46,806 | |
Kansai Electric Power Co., Inc. | | | 2,100 | | | | 26,347 | |
Kirin Holdings Co. Ltd. | | | 1,400 | | | | 20,444 | |
Kobe Steel Ltd. | | | 2,100 | | | | 19,343 | |
Komatsu Ltd. | | | 1,200 | | | | 32,458 | |
Kuraray Co. Ltd. | | | 4,900 | | | | 47,705 | |
Kyowa Kirin Co. Ltd. | | | 1,000 | | | | 18,535 | |
Kyushu Electric Power Co., Inc.(a) | | | 2,400 | | | | 15,347 | |
Lawson, Inc. | | | 17,000 | | | | 753,776 | |
Marubeni Corp. | | | 1,300 | | | | 22,157 | |
Mitsubishi Chemical Group Corp. | | | 83,300 | | | | 501,019 | |
Mitsubishi Corp. | | | 67,500 | | | | 3,263,416 | |
Mitsubishi Electric Corp. | | | 5,200 | | | | 73,512 | |
Mitsubishi Estate Co. Ltd. | | | 9,700 | | | | 115,239 | |
Mitsubishi Gas Chemical Co., Inc. | | | 1,200 | | | | 17,481 | |
Mitsubishi UFJ Financial Group, Inc. | | | 204,400 | | | | 1,506,647 | |
Mitsui & Co. Ltd. | | | 40,600 | | | | 1,536,622 | |
Mitsui Fudosan Co. Ltd. | | | 27,500 | | | | 548,113 | |
Mizuho Financial Group, Inc. | | | 41,900 | | | | 640,461 | |
MS&AD Insurance Group Holdings, Inc. | | | 2,000 | | | | 70,825 | |
NEC Corp. | | | 800 | | | | 38,810 | |
Nikon Corp. | | | 24,200 | | | | 314,186 | |
Nippon Express Holdings, Inc. | | | 300 | | | | 16,922 | |
Nippon Paint Holdings Co. Ltd. | | | 1,800 | | | | 14,897 | |
Nippon Steel Corp. | | | 2,100 | | | | 43,951 | |
Nippon Telegraph & Telephone Corp. | | | 195,000 | | | | 230,745 | |
Nissin Foods Holdings Co. Ltd. | | | 200 | | | | 16,537 | |
Nitto Denko Corp. | | | 3,900 | | | | 289,480 | |
Obic Co. Ltd. | | | 100 | | | | 16,051 | |
Ono Pharmaceutical Co. Ltd. | | | 10,000 | | | | 180,434 | |
ORIX Corp. | | | 1,000 | | | | 18,236 | |
Otsuka Holdings Co. Ltd. | | | 7,500 | | | | 275,112 | |
Recruit Holdings Co. Ltd. | | | 30,900 | | | | 986,183 | |
Renesas Electronics Corp.(a) | | | 900 | | | | 16,985 | |
Ricoh Co. Ltd. | | | 24,400 | | | | 207,934 | |
SCREEN Holdings Co. Ltd. | | | 400 | | | | 45,560 | |
Sekisui House Ltd. | | | 18,400 | | | | 371,672 | |
Seven & i Holdings Co. Ltd. | | | 7,800 | | | | 336,977 | |
Shin-Etsu Chemical Co. Ltd. | | | 2,400 | | | | 80,203 | |
Shionogi & Co. Ltd. | | | 14,700 | | | | 620,038 | |
SMC Corp. | | | 200 | | | | 111,152 | |
SoftBank Corp. | | | 18,100 | | | | 193,404 | |
SoftBank Group Corp. | | | 6,300 | | | | 297,105 | |
Subaru Corp. | | | 5,900 | | | | 111,119 | |
Sumitomo Chemical Co. Ltd. | | | 380,200 | | | | 1,155,584 | |
Sumitomo Corp. | | | 13,400 | | | | 284,281 | |
Sumitomo Mitsui Financial Group, Inc. | | | 12,200 | | | | 522,885 | |
Sumitomo Mitsui Trust Holdings, Inc. | | | 2,800 | | | | 99,332 | |
Sumitomo Realty & Development Co. Ltd. | | | 1,600 | | | | 39,650 | |
Tokio Marine Holdings, Inc. | | | 8,000 | | | | 184,428 | |
Tokyo Electron Ltd. | | | 6,300 | | | | 907,379 | |
Tokyo Tatemono Co. Ltd. | | | 1,600 | | | | 20,604 | |
Toshiba Corp. | | | 2,400 | | | | 75,310 | |
| | |
| 14 | | 2 0 2 3 BLACK ROCK ANNUAL REPORT TO SHAREHOLDERS |
| | |
Schedule of Investments (continued) June 30, 2023 | | BlackRock Advantage Global Fund, Inc. (Percentages shown are based on Net Assets) |
| | | | | | | | |
| Security | | Shares | | | Value | |
| | |
| Japan (continued) | | | | | | |
Toyota Motor Corp. | | | 22,700 | | | $ | 364,836 | |
Tsuruha Holdings, Inc. | | | 2,700 | | | | 201,091 | |
Yamaha Motor Co. Ltd. | | | 600 | | | | 17,249 | |
Yaskawa Electric Corp. | | | 3,900 | | | | 179,802 | |
ZOZO, Inc. | | | 4,100 | | | | 85,053 | |
| | | | | | | | |
| | |
| | | | | | | 29,127,646 | |
| | |
| Luxembourg — 0.4% | | | | | | |
ArcelorMittal SA(a) | | | 55,436 | | | | 1,512,524 | |
SES SA | | | 17 | | | | 100 | |
Tenaris SA | | | 9,846 | | | | 147,287 | |
| | | | | | | | |
| | |
| | | | | | | 1,659,911 | |
| | |
| Malaysia — 0.5% | | | | | | |
CIMB Group Holdings Bhd | | | 268,500 | | | | 291,448 | |
Hong Leong Bank Bhd | | | 3,200 | | | | 13,016 | |
Press Metal Aluminium Holdings Bhd | | | 138,800 | | | | 140,091 | |
Public Bank Bhd | | | 1,209,300 | | | | 998,451 | |
QL Resources Bhd | | | 18,750 | | | | 21,532 | |
Telekom Malaysia Bhd | | | 92,200 | | | | 97,120 | |
Tenaga Nasional Bhd | | | 119,300 | | | | 231,453 | |
| | | | | | | | |
| | |
| | | | | | | 1,793,111 | |
| | |
| Mexico — 0.0% | | | | | | |
Alsea SAB de CV(a) | | | 8,050 | | | | 26,106 | |
Grupo Mexico SAB de CV, Series B | | | 4,078 | | | | 19,634 | |
Orbia Advance Corp. SAB de CV | | | 12,300 | | | | 26,501 | |
| | | | | | | | |
| | |
| | | | | | | 72,241 | |
| | |
| Netherlands — 0.8% | | | | | | |
ASML Holding NV | | | 2,062 | | | | 1,495,628 | |
ASR Nederland NV | | | 3,192 | | | | 143,971 | |
Ferrovial SE | | | 884 | | | | 27,945 | |
Koninklijke Vopak NV | | | 619 | | | | 22,094 | |
Signify NV(b) | | | 9,435 | | | | 264,500 | |
Wereldhave NV | | | 1 | | | | 15 | |
Wolters Kluwer NV | | | 8,653 | | | | 1,098,702 | |
| | | | | | | | |
| | |
| | | | | | | 3,052,855 | |
| | |
| Norway — 0.0% | | | | | | |
Aker BP ASA | | | 3,312 | | | | 77,704 | |
| | | | | | | | |
| | |
| Peru — 0.1% | | | | | | |
Southern Copper Corp. | | | 5,789 | | | | 415,303 | |
| | | | | | | | |
| | |
| Poland — 0.0% | | | | | | |
PGE Polska Grupa Energetyczna SA(a) | | | 9,153 | | | | 16,343 | |
Polski Koncern Naftowy ORLEN SA | | | 2,828 | | | | 44,823 | |
| | | | | | | | |
| | |
| | | | | | | 61,166 | |
| | |
| Russia(c) — 0.0% | | | | | | |
Alrosa PJSC(a) | | | 18,331 | | | | 2 | |
Gazprom PJSC | | | 16,740 | | | | 2 | |
LUKOIL PJSC | | | 2,916 | | | | — | |
MMC Norilsk Nickel PJSC | | | 433 | | | | — | |
Mobile TeleSystems PJSC | | | 3,760 | | | | — | |
Novatek PJSC | | | 5,450 | | | | 1 | |
Tatneft PJSC | | | 9,355 | | | | 1 | |
| | | | | | | | |
| | |
| | | | | | | 6 | |
| | |
| Saudi Arabia — 0.5% | | | | | | |
ACWA Power Co. | | | 608 | | | | 27,178 | |
Al Rajhi Bank | | | 38,032 | | | | 744,369 | |
Riyad Bank | | | 2,736 | | | | 24,705 | |
Saudi Arabian Mining Co.(a) | | | 7,911 | | | | 89,372 | |
| | | | | | | | |
| Security | | Shares | | | Value | |
| | |
| Saudi Arabia (continued) | | | | | | |
Saudi Arabian Oil Co.(b) | | | 102,671 | | | $ | 889,341 | |
Saudi National Bank | | | 12,367 | | | | 121,972 | |
Saudi Telecom Co. | | | 6,762 | | | | 78,843 | |
| | | | | | | | |
| | |
| | | | | | | 1,975,780 | |
| | |
| Singapore — 0.4% | | | | | | |
Jardine Cycle & Carriage Ltd. | | | 15,400 | | | | 397,104 | |
Singapore Airlines Ltd. | | | 206,500 | | | | 1,094,043 | |
| | | | | | | | |
| | |
| | | | | | | 1,491,147 | |
| | |
| South Africa — 0.2% | | | | | | |
Anglo American PLC | | | 1,632 | | | | 46,469 | |
Bidvest Group Ltd. | | | 1,879 | | | | 26,120 | |
FirstRand Ltd. | | | 28,024 | | | | 102,113 | |
Foschini Group Ltd. | | | 13,817 | | | | 69,120 | |
Gold Fields Ltd. | | | 1,144 | | | | 15,904 | |
Impala Platinum Holdings Ltd. | | | 2,045 | | | | 13,624 | |
Naspers Ltd., N Shares | | | 931 | | | | 168,195 | |
Pepkor Holdings Ltd.(b) | | | 19,777 | | | | 17,334 | |
Sibanye Stillwater Ltd. | | | 14,776 | | | | 22,789 | |
Standard Bank Group Ltd. | | | 6,217 | | | | 58,698 | |
Woolworths Holdings Ltd. | | | 19,971 | | | | 75,709 | |
| | | | | | | | |
| | |
| | | | | | | 616,075 | |
| | |
| South Korea — 0.9% | | | | | | |
AfreecaTV Co. Ltd. | | | 229 | | | | 12,820 | |
Celltrion, Inc. | | | 704 | | | | 82,171 | |
CJ Logistics Corp. | | | 547 | | | | 31,835 | |
GS Engineering & Construction Corp. | | | 903 | | | | 12,861 | |
Hugel, Inc.(a) | | | 97 | | | | 8,139 | |
Hyundai Mobis Co. Ltd. | | | 222 | | | | 39,304 | |
KCC Corp. | | | 320 | | | | 47,960 | |
Kia Corp. | | | 5,005 | | | | 337,142 | |
Kolon Industries, Inc. | | | 207 | | | | 7,889 | |
Korea Electric Power Corp.(a) | | | 1,282 | | | | 20,064 | |
Korea Gas Corp.(a) | | | 1,510 | | | | 29,508 | |
LG Chem Ltd. | | | 713 | | | | 362,961 | |
NAVER Corp. | | | 2,852 | | | | 399,237 | |
POSCO Holdings, Inc. | | | 767 | | | | 226,995 | |
Samsung C&T Corp. | | | 173 | | | | 13,924 | |
Samsung Electronics Co. Ltd. | | | 29,257 | | | | 1,610,985 | |
Samsung Engineering Co. Ltd.(a) | | | 2,378 | | | | 51,282 | |
| | | | | | | | |
| | |
| | | | | | | 3,295,077 | |
| | |
| Spain — 1.2% | | | | | | |
Acerinox SA | | | 37,146 | | | | 394,795 | |
Amadeus IT Group SA(a) | | | 2,067 | | | | 157,403 | |
Banco Bilbao Vizcaya Argentaria SA | | | 239,551 | | | | 1,840,400 | |
Banco de Sabadell SA | | | 73,479 | | | | 84,718 | |
Bankinter SA | | | 10,891 | | | | 67,032 | |
CaixaBank SA | | | 62,820 | | | | 260,220 | |
Industria de Diseno Textil SA | | | 24,243 | | | | 940,332 | |
Repsol SA | | | 68,631 | | | | 998,169 | |
| | | | | | | | |
| | |
| | | | | | | 4,743,069 | |
| | |
| Sweden — 0.0% | | | | | | |
Castellum AB | | | 5 | | | | 48 | |
Intrum AB | | | 6 | | | | 39 | |
Pandox AB | | | 6 | | | | 70 | |
| | | | | | | | |
| | |
| | | | | | | 157 | |
| | |
| Switzerland — 2.2% | | | | | | |
ABB Ltd., Registered Shares | | | 7,690 | | | | 302,531 | |
Clariant AG, Registered Shares | | | 3,399 | | | | 49,172 | |
| | |
SCHEDULE OF INVESTMENTS | | 15 |
| | |
Schedule of Investments (continued) June 30, 2023 | | BlackRock Advantage Global Fund, Inc. (Percentages shown are based on Net Assets) |
| | | | | | | | |
| Security | | Shares | | | Value | |
| | |
| Switzerland (continued) | | | | | | |
Flughafen Zurich AG, Registered Shares | | | 134 | | | $ | 27,872 | |
Givaudan SA, Registered Shares | | | 147 | | | | 487,590 | |
Holcim AG, Registered Shares | | | 17,677 | | | | 1,191,557 | |
Nestle SA, Registered Shares | | | 16,037 | | | | 1,929,115 | |
Novartis AG, Registered Shares | | | 42,490 | | | | 4,283,817 | |
Roche Holding AG | | | 220 | | | | 72,243 | |
Sika AG, Registered Shares | | | 89 | | | | 25,490 | |
TE Connectivity Ltd. | | | 2,235 | | | | 313,258 | |
| | | | | | | | |
| | |
| | | | | | | 8,682,645 | |
| | |
| Taiwan — 1.5% | | | | | | |
AUO Corp. | | | 27,000 | | | | 16,204 | |
Delta Electronics, Inc. | | | 45,000 | | | | 498,705 | |
Global Unichip Corp. | | | 2,000 | | | | 103,517 | |
Innolux Corp. | | | 54,000 | | | | 26,579 | |
Largan Precision Co. Ltd. | | | 1,000 | | | | 68,597 | |
MediaTek, Inc. | | | 57,000 | | | | 1,261,743 | |
momo.com, Inc. | | | 1,560 | | | | 34,572 | |
Novatek Microelectronics Corp. | | | 3,000 | | | | 41,191 | |
Parade Technologies Ltd. | | | 2,000 | | | | 69,330 | |
PharmaEssentia Corp.(a) | | | 2,087 | | | | 22,766 | |
Realtek Semiconductor Corp. | | | 23,000 | | | | 286,778 | |
Sino-American Silicon Products, Inc. | | | 4,000 | | | | 20,861 | |
Taiwan Semiconductor Manufacturing Co. Ltd. | | | 150,000 | | | | 2,770,997 | |
Tung Ho Steel Enterprise Corp. | | | 14,500 | | | | 27,743 | |
Uni-President Enterprises Corp. | | | 153,000 | | | | 375,128 | |
United Microelectronics Corp. | | | 27,000 | | | | 42,423 | |
Wistron NeWeb Corp. | | | 6,000 | | | | 18,432 | |
| | | | | | | | |
| | |
| | | | | | | 5,685,566 | |
| | |
| Thailand — 0.1% | | | | | | |
Airports of Thailand PCL, NVDR(a) | | | 55,900 | | | | 113,598 | |
Energy Absolute PCL, NVDR | | | 21,000 | | | | 33,817 | |
Gulf Energy Development PCL, NVDR | | | 14,600 | | | | 19,286 | |
JMT Network Services PCL | | | 12,400 | | | | 13,115 | |
Precious Shipping PCL, NVDR | | | 34,100 | | | | 8,966 | |
| | | | | | | | |
| | |
| | | | | | | 188,782 | |
| | |
| Turkey — 0.2% | | | | | | |
Arcelik A/S(a) | | | 8,421 | | | | 42,138 | |
Eregli Demir ve Celik Fabrikalari TAS, Registered Shares(a) | | | 45,137 | | | | 64,068 | |
KOC Holding A/S | | | 19,700 | | | | 78,890 | |
Koza Altin Isletmeleri A/S | | | 20,727 | | | | 19,883 | |
Migros Ticaret A/S | | | 4,570 | | | | 37,345 | |
Sok Marketler Ticaret A/S(a) | | | 15,986 | | | | 20,462 | |
Tofas Turk Otomobil Fabrikasi A/S | | | 4,207 | | | | 40,954 | |
Turk Hava Yollari AO(a) | | | 23,476 | | | | 174,871 | |
Turk Telekomunikasyon A/S(a) | | | 23,910 | | | | 19,164 | |
Turkcell Iletisim Hizmetleri A/S | | | 240,065 | | | | 334,958 | |
Turkiye Petrol Rafinerileri A/S | | | 25,359 | | | | 77,976 | |
| | | | | | | | |
| | |
| | | | | | | 910,709 | |
| | |
| United Kingdom — 1.4% | | | | | | |
Anglo American PLC | | | 21,395 | | | | 609,883 | |
AstraZeneca PLC | | | 2,396 | | | | 343,477 | |
Babcock International Group PLC(a) | | | 5 | | | | 18 | |
Barclays PLC | | | 51,591 | | | | 100,788 | |
BP PLC | | | 39,925 | | | | 232,458 | |
British American Tobacco PLC | | | 73,395 | | | | 2,438,579 | |
Direct Line Insurance Group PLC | | | 23,450 | | | | 40,544 | |
Dunelm Group PLC | | | 8 | | | | 114 | |
easyJet PLC(a) | | | 9,073 | | | | 55,753 | |
| | | | | | | | |
| Security | | Shares | | | Value | |
| | |
| United Kingdom (continued) | | | | | | |
Endeavour Mining PLC | | | 7,913 | | | $ | 189,649 | |
IG Group Holdings PLC | | | 6,951 | | | | 59,805 | |
Phoenix Group Holdings PLC | | | 4,714 | | | | 31,895 | |
Rightmove PLC | | | 79,269 | | | | 526,603 | |
Smiths Group PLC | | | 4,091 | | | | 85,591 | |
Tesco PLC | | | 260,439 | | | | 821,566 | |
WPP PLC | | | 2,731 | | | | 28,626 | |
| | | | | | | | |
| | |
| | | | | | | 5,565,349 | |
| | |
| United States — 60.6% | | | | | | |
A O Smith Corp. | | | 615 | | | | 44,760 | |
Abbott Laboratories | | | 7,729 | | | | 842,617 | |
AbbVie, Inc. | | | 10,251 | | | | 1,381,117 | |
Adobe, Inc.(a) | | | 6,965 | | | | 3,405,817 | |
AECOM | | | 8,974 | | | | 760,006 | |
Agilent Technologies, Inc. | | | 30,439 | | | | 3,660,290 | |
Alcoa Corp. | | | 618 | | | | 20,969 | |
Allstate Corp. | | | 2,158 | | | | 235,308 | |
Alphabet, Inc., Class A(a) | | | 48,872 | | | | 5,849,978 | |
Alphabet, Inc., Class C(a) | | | 33,994 | | | | 4,112,254 | |
Altria Group, Inc. | | | 22,681 | | | | 1,027,449 | |
Amazon.com, Inc.(a) | | | 88,688 | | | | 11,561,368 | |
American Express Co. | | | 14,364 | | | | 2,502,209 | |
AMETEK, Inc. | | | 9,001 | | | | 1,457,082 | |
Amgen, Inc. | | | 3,815 | | | | 847,006 | |
Analog Devices, Inc. | | | 12,051 | | | | 2,347,655 | |
ANSYS, Inc.(a) | | | 341 | | | | 112,622 | |
Aon PLC, Class A | | | 4,963 | | | | 1,713,228 | |
Apple, Inc. | | | 96,674 | | | | 18,751,856 | |
Applied Materials, Inc. | | | 20,164 | | | | 2,914,505 | |
Archer-Daniels-Midland Co. | | | 784 | | | | 59,239 | |
Ashland, Inc. | | | 424 | | | | 36,850 | |
AutoZone, Inc.(a) | | | 84 | | | | 209,442 | |
Axon Enterprise, Inc.(a) | | | 933 | | | | 182,047 | |
Bank of America Corp | | | 76,257 | | | | 2,187,813 | |
Bank of New York Mellon Corp. | | | 17,584 | | | | 782,840 | |
Berkshire Hathaway, Inc., Class B(a) | | | 4,213 | | | | 1,436,633 | |
Biogen, Inc.(a) | | | 982 | | | | 279,723 | |
Block, Inc.(a) | | | 8,317 | | | | 553,663 | |
Boeing Co.(a) | | | 1,027 | | | | 216,861 | |
Booking Holdings, Inc.(a) | | | 99 | | | | 267,333 | |
Boston Scientific Corp.(a) | | | 27,453 | | | | 1,484,933 | |
Boyd Gaming Corp. | | | 2,643 | | | | 183,345 | |
Brighthouse Financial, Inc.(a) | | | 2,427 | | | | 114,918 | |
Bristol-Myers Squibb Co. | | | 49,701 | | | | 3,178,379 | |
Broadcom, Inc. | | | 1,026 | | | | 889,983 | |
Builders FirstSource, Inc.(a) | | | 1,937 | | | | 263,432 | |
Cadence Design Systems, Inc.(a) | | | 3,402 | | | | 797,837 | |
Caterpillar, Inc. | | | 1,496 | | | | 368,091 | |
ChampionX Corp. | | | 2,055 | | | | 63,787 | |
Chemed Corp. | | | 55 | | | | 29,792 | |
Cheniere Energy, Inc. | | | 1,290 | | | | 196,544 | |
Chevron Corp. | | | 32,280 | | | | 5,079,258 | |
Chubb Ltd. | | | 5,216 | | | | 1,004,393 | |
Cigna Group | | | 1,963 | | | | 550,818 | |
Cintas Corp. | | | 2,239 | | | | 1,112,962 | |
Cisco Systems, Inc. | | | 23,335 | | | | 1,207,353 | |
Citigroup, Inc. | | | 35,766 | | | | 1,646,667 | |
Cleveland-Cliffs, Inc.(a) | | | 1,841 | | | | 30,855 | |
Coca-Cola Co. | | | 63,826 | | | | 3,843,602 | |
Comcast Corp., Class A | | | 19,428 | | | | 807,233 | |
ConocoPhillips | | | 26,638 | | | | 2,759,963 | |
| | |
| 16 | | 2 0 2 3 BLACK ROCK ANNUAL REPORT TO SHAREHOLDERS |
| | |
Schedule of Investments (continued) June 30, 2023 | | BlackRock Advantage Global Fund, Inc. (Percentages shown are based on Net Assets) |
| | | | | | | | |
| Security | | Shares | | | Value | |
| | |
| United States (continued) | | | | | | |
Costco Wholesale Corp. | | | 4,273 | | | $ | 2,300,498 | |
CSX Corp. | | | 3,520 | | | | 120,032 | |
Cummins, Inc. | | | 1,388 | | | | 340,282 | |
CVS Health Corp. | | | 18,285 | | | | 1,264,042 | |
D.R. Horton, Inc. | | | 2,020 | | | | 245,814 | |
Danaher Corp. | | | 8,601 | | | | 2,064,240 | |
Deere & Co. | | | 604 | | | | 244,735 | |
Domino’s Pizza, Inc. | | | 1,432 | | | | 482,570 | |
Donaldson Co., Inc. | | | 346 | | | | 21,628 | |
Dropbox, Inc., Class A(a) | | | 9,712 | | | | 259,019 | |
DTE Energy Co. | | | 14,855 | | | | 1,634,347 | |
DuPont de Nemours, Inc. | | | 19,293 | | | | 1,378,292 | |
Eaton Corp. PLC | | | 1,536 | | | | 308,890 | |
eBay, Inc. | | | 23,342 | | | | 1,043,154 | |
Ecolab, Inc. | | | 2,091 | | | | 390,369 | |
Edwards Lifesciences Corp.(a) | | | 216 | | | | 20,375 | |
Electronic Arts, Inc. | | | 8,623 | | | | 1,118,403 | |
Elevance Health, Inc. | | | 2,050 | | | | 910,795 | |
Eli Lilly & Co. | | | 4,902 | | | | 2,298,940 | |
EMCOR Group, Inc. | | | 1,432 | | | | 264,605 | |
Enovis Corp.(a) | | | 235 | | | | 15,068 | |
EOG Resources, Inc. | | | 12,162 | | | | 1,391,819 | |
Etsy, Inc.(a) | | | 5,590 | | | | 472,970 | |
Everest Re Group Ltd. | | | 94 | | | | 32,135 | |
Exelixis, Inc.(a) | | | 1,688 | | | | 32,258 | |
Exxon Mobil Corp. | | | 29,162 | | | | 3,127,624 | |
Fidelity National Information Services, Inc. | | | 3,633 | | | | 198,725 | |
Fortinet, Inc.(a) | | | 2,558 | | | | 193,359 | |
Fox Corp., Class A | | | 1,430 | | | | 48,620 | |
Fox Corp., Class B | | | 1,998 | | | | 63,716 | |
Freeport-McMoRan, Inc. | | | 1,265 | | | | 50,600 | |
Garmin Ltd. | | | 2,833 | | | | 295,454 | |
Gartner, Inc.(a) | | | 3,559 | | | | 1,246,753 | |
General Dynamics Corp. | | | 10,687 | | | | 2,299,308 | |
General Electric Co. | | | 314 | | | | 34,493 | |
General Motors Co. | | | 12,534 | | | | 483,311 | |
Genpact Ltd. | | | 4,349 | | | | 163,392 | |
Gilead Sciences, Inc. | | | 7,387 | | | | 569,316 | |
Graco, Inc. | | | 1,178 | | | | 101,720 | |
Halliburton Co. | | | 23,782 | | | | 784,568 | |
Hartford Financial Services Group, Inc. | | | 840 | | | | 60,497 | |
Helmerich & Payne, Inc. | | | 4,950 | | | | 175,478 | |
Hershey Co. | | | 1,027 | | | | 256,442 | |
Hewlett Packard Enterprise Co. | | | 17,689 | | | | 297,175 | |
Home Depot, Inc. | | | 8,089 | | | | 2,512,767 | |
Honeywell International, Inc. | | | 20,091 | | | | 4,168,882 | |
HP, Inc. | | | 13,213 | | | | 405,771 | |
IDEXX Laboratories, Inc.(a) | | | 1,926 | | | | 967,295 | |
Illinois Tool Works, Inc. | | | 4,297 | | | | 1,074,938 | |
Incyte Corp.(a) | | | 4,269 | | | | 265,745 | |
Intel Corp. | | | 42,357 | | | | 1,416,418 | |
Invesco Ltd. | | | 1,527 | | | | 25,669 | |
IPG Photonics Corp.(a) | | | 196 | | | | 26,621 | |
ITT, Inc. | | | 676 | | | | 63,010 | |
Johnson & Johnson | | | 19,220 | | | | 3,181,294 | |
JPMorgan Chase & Co. | | | 432 | | | | 62,830 | |
Keysight Technologies, Inc.(a) | | | 1,888 | | | | 316,146 | |
KLA Corp. | | | 137 | | | | 66,448 | |
Knight-Swift Transportation Holdings, Inc. | | | 2,529 | | | | 140,511 | |
Kroger Co. | | | 1,734 | | | | 81,498 | |
Lam Research Corp. | | | 637 | | | | 409,502 | |
| | | | | | | | |
| Security | | Shares | | | Value | |
| | |
| United States (continued) | | | | | | |
Lockheed Martin Corp. | | | 3,256 | | | $ | 1,498,997 | |
Lowe’s Cos., Inc. | | | 2,853 | | | | 643,922 | |
LyondellBasell Industries NV, Class A | | | 207 | | | | 19,009 | |
Manhattan Associates, Inc.(a) | | | 8,784 | | | | 1,755,746 | |
Marathon Petroleum Corp. | | | 11,271 | | | | 1,314,199 | |
Marsh & McLennan Cos., Inc. | | | 2,177 | | | | 409,450 | |
Mastercard, Inc., Class A | | | 7,858 | | | | 3,090,551 | |
McDonald’s Corp. | | | 1,828 | | | | 545,493 | |
Meta Platforms, Inc., Class A(a) | | | 12,695 | | | | 3,643,211 | |
MetLife, Inc. | | | 28,346 | | | | 1,602,399 | |
Mettler-Toledo International, Inc.(a) | | | 1,006 | | | | 1,319,510 | |
MGM Resorts International | | | 6,332 | | | | 278,101 | |
Microchip Technology, Inc. | | | 7,726 | | | | 692,172 | |
Micron Technology, Inc. | | | 6,791 | | | | 428,580 | |
Microsoft Corp. | | | 55,207 | | | | 18,800,192 | |
Moderna, Inc.(a) | | | 515 | | | | 62,573 | |
Mohawk Industries, Inc.(a) | | | 1,549 | | | | 159,795 | |
Mondelez International, Inc., Class A | | | 3,208 | | | | 233,992 | |
Monolithic Power Systems, Inc. | | | 56 | | | | 30,253 | |
Moody’s Corp. | | | 365 | | | | 126,918 | |
Neurocrine Biosciences, Inc.(a) | | | 1,338 | | | | 126,173 | |
New Relic, Inc.(a) | | | 266 | | | | 17,407 | |
Newmont Corp. | | | 3,513 | | | | 149,865 | |
NIKE, Inc., Class B | | | 12,110 | | | | 1,336,581 | |
Norfolk Southern Corp. | | | 3,754 | | | | 851,257 | |
Northrop Grumman Corp. | | | 479 | | | | 218,328 | |
NVIDIA Corp. | | | 23,283 | | | | 9,849,175 | |
O’Reilly Automotive, Inc.(a) | | | 544 | | | | 519,683 | |
Otis Worldwide Corp. | | | 9,626 | | | | 856,810 | |
Owens Corning | | | 3,400 | | | | 443,700 | |
PACCAR, Inc. | | | 1,805 | | | | 150,988 | |
Palo Alto Networks, Inc.(a) | | | 1,875 | | | | 479,081 | |
Parker-Hannifin Corp. | | | 54 | | | | 21,062 | |
Paychex, Inc. | | | 1,695 | | | | 189,620 | |
PayPal Holdings, Inc.(a) | | | 4,564 | | | | 304,556 | |
PepsiCo, Inc. | | | 19,475 | | | | 3,607,159 | |
Philip Morris International, Inc. | | | 6,711 | | | | 655,128 | |
Pioneer Natural Resources Co. | | | 499 | | | | 103,383 | |
PotlatchDeltic Corp. | | | 2 | | | | 106 | |
PPL Corp. | | | 32,081 | | | | 848,863 | |
Procter & Gamble Co. | | | 20,479 | | | | 3,107,483 | |
Prudential Financial, Inc. | | | 1,250 | | | | 110,275 | |
PulteGroup, Inc. | | | 225 | | | | 17,478 | |
PVH Corp. | | | 283 | | | | 24,047 | |
QUALCOMM, Inc. | | | 7,724 | | | | 919,465 | |
Raytheon Technologies Corp. | | | 4,964 | | | | 486,273 | |
Regeneron Pharmaceuticals, Inc.(a) | | | 452 | | | | 324,780 | |
Reliance Steel & Aluminum Co. | | | 2,798 | | | | 759,909 | |
Royal Caribbean Cruises Ltd.(a) | | | 983 | | | | 101,976 | |
S&P Global, Inc. | | | 9,288 | | | | 3,723,466 | |
Salesforce, Inc.(a) | | | 5,063 | | | | 1,069,609 | |
Schlumberger NV | | | 39,107 | | | | 1,920,936 | |
Silicon Laboratories, Inc.(a) | | | 127 | | | | 20,033 | |
Sirius XM Holdings, Inc.(d) | | | 20,260 | | | | 91,778 | |
Snap-on, Inc. | | | 2,841 | | | | 818,748 | |
Southwest Airlines Co. | | | 1,914 | | | | 69,306 | |
Starbucks Corp. | | | 2,679 | | | | 265,382 | |
Synopsys, Inc.(a) | | | 493 | | | | 214,657 | |
Target Corp. | | | 2,059 | | | | 271,582 | |
Taylor Morrison Home Corp.(a) | | | 7,902 | | | | 385,381 | |
Teradata Corp.(a) | | | 605 | | | | 32,313 | |
| | |
SCHEDULE OF INVESTMENTS | | 17 |
| | |
Schedule of Investments (continued) June 30, 2023 | | BlackRock Advantage Global Fund, Inc. (Percentages shown are based on Net Assets) |
| | | | | | | | |
| Security | | Shares | | | Value | |
| | |
| United States (continued) | | | | | | |
Teradyne, Inc. | | | 482 | | | $ | 53,661 | |
Tesla, Inc.(a) | | | 10,710 | | | | 2,803,557 | |
Texas Instruments, Inc. | | | 1,984 | | | | 357,160 | |
Textron, Inc. | | | 1,457 | | | | 98,537 | |
Timken Co. | | | 248 | | | | 22,699 | |
TJX Cos., Inc. | | | 5,635 | | | | 477,792 | |
Toll Brothers, Inc. | | | 3,804 | | | | 300,782 | |
Travelers Cos., Inc. | | | 4,101 | | | | 712,180 | |
U.S. Bancorp | | | 21,570 | | | | 712,673 | |
Uber Technologies, Inc.(a) | | | 9,593 | | | | 414,130 | |
UnitedHealth Group, Inc. | | | 6,045 | | | | 2,905,469 | |
Valero Energy Corp. | | | 3,247 | | | | 380,873 | |
VeriSign, Inc.(a) | | | 2,358 | | | | 532,837 | |
Vertex Pharmaceuticals, Inc.(a) | | | 2,130 | | | | 749,568 | |
Visa, Inc., Class A | | | 19,151 | | | | 4,547,979 | |
Vulcan Materials Co. | | | 1,718 | | | | 387,306 | |
W.W.Grainger, Inc. | | | 798 | | | | 629,295 | |
Walmart, Inc. | | | 37,140 | | | | 5,837,665 | |
Westlake Corp. | | | 1,299 | | | | 155,192 | |
Workday, Inc., Class A(a) | | | 656 | | | | 148,184 | |
Xylem, Inc. | | | 12,115 | | | | 1,364,391 | |
Yum! Brands, Inc. | | | 15,579 | | | | 2,158,470 | |
| | | | | | | | |
| | |
| | | | | | | 237,535,126 | |
| | | | | | | | |
| | |
Total Common Stocks — 98.1%
(Cost: $324,380,191) | | | | | | | 384,727,559 | |
| | | | | | | | |
| | |
| Preferred Securities | | | | | | |
| | |
| Preferred Stocks — 0.4% | | | | | | |
| | |
| Brazil — 0.3% | | | | | | |
Azul SA(a) | | | 83,218 | | | | 379,923 | |
Banco Bradesco SA | | | 68,563 | | | | 235,550 | |
Braskem SAClass A(a) | | | 13,576 | | | | 78,992 | |
Gerdau SA | | | 32,582 | | | | 170,592 | |
Itau Unibanco Holding SA | | | 15,761 | | | | 93,548 | |
Petroleo Brasileiro SA | | | 3,129 | | | | 19,297 | |
Usinas Siderurgicas de Minas Gerais S/A Usiminas | | | 130,206 | | | | 192,255 | |
| | | | | | | | |
| | |
| | | | | | | 1,170,157 | |
| | | | | | | | |
| | |
| Germany — 0.1% | | | | | | |
Volkswagen AG | | | 3,308 | | | | 444,836 | |
| | | | | | | | |
| |
Total Preferred Securities — 0.4%
(Cost: $1,361,908) | | | | 1,614,993 | |
| | | | | | | | |
| |
Total Long-Term Investments — 98.5%
(Cost: $325,742,099) | | | | 386,342,552 | |
| | | | | | | | |
| | | | | | | | |
| Security | | Shares | | | Value | |
| | |
Short-Term Securities | | | | | | | | |
| | |
| Money Market Funds — 1.9% | | | | | | |
BlackRock Liquidity Funds, T-Fund, Institutional Class, 4.98%(e)(f) | | | 7,182,619 | | | $ | 7,182,619 | |
SL Liquidity Series, LLC, Money Market Series, 5.28%(e)(f)(g) | | | 165,157 | | | | 165,157 | |
| | | | | | | | |
| | |
| | | | | | | 7,347,776 | |
| | | | | | | | |
| | | | | | | | | | | | |
| | | |
| | | | | | Par
(000) | | | | |
| | | |
| Time Deposits — 0.0% | | | | | | | | | |
| | | |
| Canada — 0.0% | | | | | | | | | |
Royal Bank of Canada, 3.58%, 07/01/23 | | | CAD | | | | 14 | | | | 10,280 | |
| | | | | | | | | | | | |
| | | |
| Hong Kong — 0.0% | | | | | | | | | |
Brown Brothers Harriman & Co., 2.11%, 07/01/23 | | | HKD | | | | 163 | | | | 20,838 | |
| | | | | | | | | | | | |
| | | |
| Japan — 0.0% | | | | | | | | | |
Sumitomo Bank Tokyo, (0.37%), 07/01/23 | | | JPY | | | | 5,235 | | | | 36,277 | |
| | | | | | | | | | | | |
| | | |
| United States — 0.0% | | | | | | | | | |
Citibank, New York, 2.38%, 07/01/23 | | | EUR | | | | 3 | | | | 3,562 | |
| | | | | | | | | | | | |
| | | | | | | | | | | 70,957 | |
| | | | | | | | | | | | |
| | | |
Total Short-Term Securities — 1.9%
(Cost: $7,418,756) | | | | | | | | 7,418,733 | |
| | | | | | | | | | | | |
| | | |
Total Investments — 100.4%
(Cost: $333,160,855) | | | | | | | | | | | 393,761,285 | |
Liabilities in Excess of Other Assets — (0.4)% | | | | | | | | (1,544,818 | ) |
| | | | | | | | | | | | |
| | | |
Net Assets — 100.0% | | | | | | | | | | $ | 392,216,467 | |
| | | | | | | | | | | | |
| (a) | Non-income producing security. |
| (b) | Security exempt from registration pursuant to Rule 144A under the Securities Act of 1933, as amended. These securities may be resold in transactions exempt from registration to qualified institutional investors. |
| (c) | Security is valued using significant unobservable inputs and is classified as Level 3 in the fair value hierarchy. |
| (d) | All or a portion of this security is on loan. |
| (e) | Affiliate of the Fund. |
| (f) | Annualized 7-day yield as of period end. |
| (g) | All or a portion of this security was purchased with the cash collateral from loaned securities. |
| | |
| 18 | | 2 0 2 3 BLACK ROCK ANNUAL REPORT TO SHAREHOLDERS |
| | |
Schedule of Investments (continued) June 30, 2023 | | BlackRock Advantage Global Fund, Inc. |
Affiliates
Investments in issuers considered to be affiliate(s) of the Fund during the year ended June 30, 2023 for purposes of Section 2(a)(3) of the Investment Company Act of 1940, as amended, were as follows:
| | | | | | | | | | | | | | | | | | | | | | | | | | | | | | | | | | | | | | | | | | | | | | |
| | | | | | | | | | | |
| | | Affiliated Issuer | | Value at
06/30/22 | | | Purchases
at Cost | | | Proceeds
from Sales | | | Net
Realized
Gain (Loss) | | | Change in
Unrealized
Appreciation
(Depreciation) | | | Value at
06/30/23 | | | Shares
Held at
06/30/23 | | | Income | | | Capital Gain
Distributions
from
Underlying
Funds | | | | |
| | BlackRock Liquidity Funds, T-Fund, Institutional Class | | $ | 7,775,998 | | | $ | — | | | $ | (593,379 | )(a) | | $ | — | | | | | | | $ | — | | | $ | 7,182,619 | | | | 7,182,619 | | | $ | 243,080 | | | $ | — | | | | | |
| | | | | | | | | | | | |
| | SL Liquidity Series, LLC, Money Market Series | | | 780,135 | | | | — | | | | (615,879 | )(a) | | | 855 | | | | | | | | 46 | | | | 165,157 | | | | 165,157 | | | | 46,642 | (b) | | | — | | | | | |
| | | | | | | | | | | | | | | | | | | | | | | | | | | | | | | | | | | | | | | | | | | | | | |
| | | | | | | | | | | | | | | | $ | 855 | | | | | | | $ | 46 | | | $ | 7,347,776 | | | | | | | $ | 289,722 | | | $ | — | | | | | |
| | | | | | | | | | | | | | | | | | | | | | | | | | | | | | | | | | | | | | | | | | | | | | |
| | (a) | Represents net amount purchased (sold). | |
| | (b) | All or a portion represents securities lending income earned from the reinvestment of cash collateral from loaned securities, net of fees and collateral investment expenses, and other payments to and from borrowers of securities. | |
Derivative Financial Instruments Outstanding as of Period End
Futures Contracts
| | | | | | | | | | | | | | | | |
| Description | | Number of
Contracts | | | Expiration
Date | | | Notional
Amount (000) | | | Value/
Unrealized
Appreciation
(Depreciation) | |
| | | | |
Long Contracts | | | | | | | | | | | | | | | | |
MSCI EAFE Index | | | 18 | | | | 09/15/23 | | | $ | 1,940 | | | $ | 9,429 | |
MSCI Emerging Markets Index | | | 14 | | | | 09/15/23 | | | | 699 | | | | (6,720 | ) |
S&P 500 E-Mini Index | | | 21 | | | | 09/15/23 | | | | 4,713 | | | | 128,516 | |
| | | | | | | | | | | | | | | | |
| | | | | | | | | | | | | | $ | 131,225 | |
| | | | | | | | | | | | | | | | |
Derivative Financial Instruments Categorized by Risk Exposure
As of period end, the fair values of derivative financial instruments located in the Statements of Assets and Liabilities were as follows:
| | | | | | | | | | | | | | | | | | | | | | | | | | | | |
| | | | | | | | |
| | | Commodity
Contracts | | | Credit
Contracts | | | Equity
Contracts | | | Foreign
Currency
Exchange
Contracts | | | Interest
Rate
Contracts | | | Other
Contracts | | | Total | |
| | | | | | | |
Assets — Derivative Financial Instruments | | | | | | | | | | | | | | | | | | | | | | | | | | | | |
Futures contracts | | | | | | | | | | | | | | | | | | | | | | | | | | | | |
Unrealized appreciation on futures contracts(a) | | $ | — | | | $ | — | | | $ | 137,945 | | | $ | — | | | $ | — | | | $ | — | | | $ | 137,945 | |
| | | | | | | | | | | | | | | | | | | | | | | | | | | | |
| | | | | | | |
Liabilities — Derivative Financial Instruments | | | | | | | | | | | | | | | | | | | | | | | | | | | | |
Futures contracts | | | | | | | | | | | | | | | | | | | | | | | | | | | | |
Unrealized depreciation on futures contracts(a) | | $ | — | | | $ | — | | | $ | 6,720 | | | $ | — | | | $ | — | | | $ | — | | | $ | 6,720 | |
| | | | | | | | | | | | | | | | | | | | | | | | | | | | |
| | (a) | Net cumulative unrealized appreciation (depreciation) on futures contracts and centrally cleared swaps, if any, are reported in the Schedule of Investments. In the Statements of Assets and Liabilities, only current day’s variation margin is reported in receivables or payables and the net cumulative unrealized appreciation (depreciation) is included in accumulated earnings (loss). | |
For the period ended June 30, 2023, the effect of derivative financial instruments in the Statements of Operations was as follows:
| | | | | | | | | | | | | | | | | | | | | | | | | | | | |
| | | | | | | | |
| | | Commodity
Contracts | | | Credit
Contracts | | | Equity
Contracts | | | Foreign
Currency
Exchange
Contracts | | | Interest
Rate
Contracts | | | Other
Contracts | | | Total | |
Net Realized Gain (Loss) from: | | | | | | | | | | | | | | | | | | | | | | | | | | | | |
Futures contracts | | $ | — | | | $ | — | | | $ | 722,722 | | | $ | — | | | $ | — | | | $ | — | | | $ | 722,722 | |
| | | | | | | | | | | | | | | | | | | | | | | | | | | | |
| | | | | | | |
Net Change in Unrealized Appreciation (Depreciation) on: | | | | | | | | | | | | | | | | | | | | | | | | | | | | |
Futures contracts | | $ | — | | | $ | — | | | $ | 247,836 | | | $ | — | | | $ | — | | | $ | — | | | $ | 247,836 | |
| | | | | | | | | | | | | | | | | | | | | | | | | | | | |
| | |
SCHEDULE OF INVESTMENTS | | 19 |
| | |
Schedule of Investments (continued) June 30, 2023 | | BlackRock Advantage Global Fund, Inc. |
Average Quarterly Balances of Outstanding Derivative Financial Instruments
| | | | |
| |
Futures contracts: | | | | |
Average notional value of contracts — long | | $ | 7,206,173 | |
| |
For more information about the Fund’s investment risks regarding derivative financial instruments, refer to the Notes to Financial Statements.
Fair Value Hierarchy as of Period End
Various inputs are used in determining the fair value of financial instruments. For a description of the input levels and information about the Fund’s policy regarding valuation of financial instruments, refer to the Notes to Financial Statements.
The following table summarizes the Fund’s financial instruments categorized in the fair value hierarchy. The breakdown of the Fund’s financial instruments into major categories is disclosed in the Schedule of Investments above.
| | | | | | | | | | | | | | | | |
| | | | | |
| | | Level 1 | | | Level 2 | | | Level 3 | | | Total | |
| | | | |
Assets | | | | | | | | | | | | | | | | |
Investments | | | | | | | | | | | | | | | | |
Long-Term Investments | | | | | | | | | | | | | | | | |
Common Stocks | | | | | | | | | | | | | | | | |
Argentina | | $ | 135,044 | | | $ | — | | | $ | — | | | $ | 135,044 | |
Australia | | | — | | | | 10,621,154 | | | | — | | | | 10,621,154 | |
Austria | | | — | | | | 270,218 | | | | — | | | | 270,218 | |
Belgium | | | — | | | | 2,351,199 | | | | — | | | | 2,351,199 | |
Brazil | | | 3,120,789 | | | | — | | | | — | | | | 3,120,789 | |
Canada | | | 10,884,141 | | | | — | | | | — | | | | 10,884,141 | |
China | | | 843,544 | | | | 14,200,442 | | | | — | | | | 15,043,986 | |
Colombia | | | 42,619 | | | | — | | | | — | | | | 42,619 | |
Denmark | | | — | | | | 3,583,760 | | | | — | | | | 3,583,760 | |
France | | | — | | | | 12,041,396 | | | | — | | | | 12,041,396 | |
Germany | | | — | | | | 9,297,409 | | | | — | | | | 9,297,409 | |
Hong Kong | | | — | | | | 2,842,795 | | | | — | | | | 2,842,795 | |
Hungary | | | — | | | | 929,467 | | | | — | | | | 929,467 | |
India | | | — | | | | 3,270,310 | | | | — | | | | 3,270,310 | |
Indonesia | | | — | | | | 12,239 | | | | — | | | | 12,239 | |
Ireland | | | 336,116 | | | | 1,243,786 | | | | — | | | | 1,579,902 | |
Israel | | | 33,565 | | | | — | | | | — | | | | 33,565 | |
Italy | | | — | | | | 1,718,141 | | | | — | | | | 1,718,141 | |
Japan | | | — | | | | 29,127,646 | | | | — | | | | 29,127,646 | |
Luxembourg | | | — | | | | 1,659,911 | | | | — | | | | 1,659,911 | |
Malaysia | | | 21,532 | | | | 1,771,579 | | | | — | | | | 1,793,111 | |
Mexico | | | 72,241 | | | | — | | | | — | | | | 72,241 | |
Netherlands | | | 27,945 | | | | 3,024,910 | | | | — | | | | 3,052,855 | |
Norway | | | — | | | | 77,704 | | | | — | | | | 77,704 | |
Peru | | | 415,303 | | | | — | | | | — | | | | 415,303 | |
Poland | | | — | | | | 61,166 | | | | — | | | | 61,166 | |
Russia | | | — | | | | — | | | | 6 | | | | 6 | |
Saudi Arabia | | | — | | | | 1,975,780 | | | | — | | | | 1,975,780 | �� |
Singapore | | | — | | | | 1,491,147 | | | | — | | | | 1,491,147 | |
South Africa | | | 101,829 | | | | 514,246 | | | | — | | | | 616,075 | |
South Korea | | | — | | | | 3,295,077 | | | | — | | | | 3,295,077 | |
Spain | | | — | | | | 4,743,069 | | | | — | | | | 4,743,069 | |
Sweden | | | — | | | | 157 | | | | — | | | | 157 | |
Switzerland | | | 313,258 | | | | 8,369,387 | | | | — | | | | 8,682,645 | |
Taiwan | | | — | | | | 5,685,566 | | | | — | | | | 5,685,566 | |
Thailand | | | 13,115 | | | | 175,667 | | | | — | | | | 188,782 | |
Turkey | | | 392,765 | | | | 517,944 | | | | — | | | | 910,709 | |
United Kingdom | | | 189,763 | | | | 5,375,586 | | | | — | | | | 5,565,349 | |
United States | | | 237,535,126 | | | | — | | | | — | | | | 237,535,126 | |
Preferred Securities | | | | | | | | | | | | | | | | |
Preferred Stocks | | | | | | | | | | | | | | | | |
Brazil | | | 1,170,157 | | | | — | | | | — | | | | 1,170,157 | |
Germany | | | — | | | | 444,836 | | | | — | | | | 444,836 | |
| | |
| 20 | | 2 0 2 3 BLACK ROCK ANNUAL REPORT TO SHAREHOLDERS |
| | |
Schedule of Investments (continued) June 30, 2023 | | BlackRock Advantage Global Fund, Inc. |
Fair Value Hierarchy as of Period End (continued)
| | | | | | | | | | | | | | | | |
| | | | | |
| | | Level 1 | | | Level 2 | | | Level 3 | | | Total | |
| | | | |
Short-Term Securities | | | | | | | | | | | | | | | | |
Money Market Funds | | $ | 7,182,619 | | | $ | — | | | $ | — | | | $ | 7,182,619 | |
Time Deposits | | | — | | | | 70,957 | | | | — | | | | 70,957 | |
| | | | | | | | | | | | | | | | |
| | $ | 262,831,471 | | | $ | 130,764,651 | | | $ | 6 | | | | 393,596,128 | |
| | | | | | | | | | | | | | | | |
Investments Valued at NAV(a) | | | | | | | | | | | | | | | 165,157 | |
| | | | | | | | | | | | | | | | |
| | | | | | | | | | | | | | $ | 393,761,285 | |
| | | | | | | | | | | | | | | | |
Derivative Financial Instruments(b) | | | | | | | | | | | | | | | | |
Assets | | | | | | | | | | | | | | | | |
Equity Contracts | | $ | 137,945 | | | $ | — | | | $ | — | | | $ | 137,945 | |
Liabilities | | | | | | | | | | | | | | | | |
Equity Contracts | | | (6,720 | ) | | | — | | | | — | | | | (6,720 | ) |
| | | | | | | | | | | | | | | | |
| | $ | 131,225 | | | $ | — | | | $ | — | | | $ | 131,225 | |
| | | | | | | | | | | | | | | | |
| | (a) | Certain investments of the Fund were fair valued using NAV as a practical expedient as no quoted market value is available and therefore have been excluded from the fair value hierarchy. | |
| | (b) | Derivative financial instruments are futures contracts. Futures contracts are valued at the unrealized appreciation (depreciation) on the instrument. | |
See notes to financial statements.
| | |
SCHEDULE OF INVESTMENTS | | 21 |
| | |
Schedule of Investments June 30, 2023 | | BlackRock EuroFund (Percentages shown are based on Net Assets) |
| | | | | | | | |
| Security | | Shares | | | Value | |
| | |
Common Stocks | | | | | | | | |
| | |
| Belgium — 1.1% | | | | | | |
Azelis Group NV | | | 53,263 | | | $ | 1,215,284 | |
| | | | | | | | |
| | |
| Denmark — 2.6% | | | | | | |
DSV A/S | | | 13,125 | | | | 2,756,794 | |
| | | | | | | | |
| | |
| Finland — 2.8% | | | | | | |
Metso OYJ | | | 161,133 | | | | 1,944,349 | |
Neste OYJ | | | 26,729 | | | | 1,029,153 | |
| | | | | | | | |
| | | | | | | 2,973,502 | |
| | |
| France — 38.3% | | | | | | |
ALD SA(a) | | | 43,683 | | | | 467,756 | |
BNP Paribas SA | | | 52,530 | | | | 3,314,956 | |
Capgemini SE | | | 10,138 | | | | 1,919,555 | |
Dassault Systemes SE | | | 16,169 | | | | 716,464 | |
Hermes International | | | 1,185 | | | | 2,575,857 | |
Legrand SA | | | 18,272 | | | | 1,812,653 | |
L’Oreal SA | | | 3,155 | | | | 1,471,733 | |
LVMH Moet Hennessy Louis Vuitton SE | | | 9,427 | | | | 8,888,833 | |
Pernod Ricard SA | | | 13,311 | | | | 2,941,394 | |
Safran SA | | | 22,404 | | | | 3,510,924 | |
Sanofi | | | 23,233 | | | | 2,501,166 | |
Sartorius Stedim Biotech | | | 5,860 | | | | 1,463,558 | |
Schneider Electric SE | | | 26,434 | | | | 4,802,440 | |
TotalEnergies SE | | | 35,695 | | | | 2,049,058 | |
Vinci SA | | | 27,401 | | | | 3,183,871 | |
| | | | | | | | |
| | | | | | | 41,620,218 | |
| | |
| Germany — 16.4% | | | | | | |
AIXTRON SE | | | 36,383 | | | | 1,235,477 | |
Commerzbank AG | | | 128,350 | | | | 1,422,869 | |
CTS Eventim AG & Co. KGaA | | | 18,132 | | | | 1,146,779 | |
Merck KGaA | | | 10,292 | | | | 1,703,633 | |
MTU Aero Engines AG | | | 11,906 | | | | 3,088,048 | |
SAP SE | | | 23,501 | | | | 3,210,410 | |
Siemens AG, Registered Shares | | | 26,358 | | | | 4,393,903 | |
Symrise AG | | | 15,363 | | | | 1,610,849 | |
| | | | | | | | |
| | | | | | | 17,811,968 | |
| | |
| Ireland — 1.4% | | | | | | |
AIB Group PLC | | | 353,688 | | | | 1,488,531 | |
Kingspan Group PLC | | | 972 | | | | 64,700 | |
| | | | | | | | |
| | | | | | | 1,553,231 | |
| | |
| Italy — 7.9% | | | | | | |
Ferrari NV | | | 7,654 | | | | 2,502,459 | |
FinecoBank Banca Fineco SpA | | | 96,579 | | | | 1,300,012 | |
Moncler SpA | | | 23,853 | | | | 1,650,335 | |
UniCredit SpA | | | 135,856 | | | | 3,159,137 | |
| | | | | | | | |
| | | | | | | 8,611,943 | |
| | |
| Netherlands — 20.3% | | | | | | |
Adyen NV(a)(b) | | | 839 | | | | 1,452,869 | |
ASM International NV | | | 7,263 | | | | 3,083,900 | |
| | | | | | | | |
| Security | | Shares | | | Value | |
| | |
| Netherlands (continued) | | | | | | |
ASML Holding NV | | | 12,894 | | | $ | 9,352,389 | |
BE Semiconductor Industries NV | | | 15,559 | | | | 1,687,438 | |
Heineken NV | | | 25,097 | | | | 2,580,889 | |
IMCD NV | | | 18,441 | | | | 2,653,863 | |
QIAGEN NV(b) | | | 27,211 | | | | 1,223,134 | |
| | | | | | | | |
| | | | | | | 22,034,482 | |
| | |
| Portugal — 0.3% | | | | | | |
EDP - Energias de Portugal SA | | | 74,816 | | | | 365,676 | |
| | | | | | | | |
| | |
| Spain — 1.5% | | | | | | |
CaixaBank SA | | | 397,175 | | | | 1,645,223 | |
| | | | | | | | |
| | |
| Sweden — 1.1% | | | | | | |
Beijer Ref AB | | | 93,652 | | | | 1,196,262 | |
| | | | | | | | |
| | |
| Switzerland — 2.5% | | | | | | |
STMicroelectronics NV | | | 55,196 | | | | 2,752,811 | |
| | | | | | | | |
| | |
| United Kingdom — 2.2% | | | | | | |
Allfunds Group PLC | | | 88,737 | | | | 541,910 | |
RELX PLC | | | 54,351 | | | | 1,813,186 | |
| | | | | | | | |
| | | | | | | 2,355,096 | |
| | |
| United States — 2.9% | | | | | | |
Linde PLC | | | 8,294 | | | | 3,160,678 | |
| | | | | | | | |
| | |
Total Long-Term Investments — 101.3%
(Cost: $80,214,951) | | | | | 110,053,168 | |
| | | | | | | | |
| | |
Short-Term Securities | | | | | | | | |
| | |
| Money Market Funds — 0.5% | | | | | | |
BlackRock Liquidity Funds, T-Fund, Institutional Class, 4.98%(c)(d) | | | 467,555 | | | | 467,555 | |
| | | | | | | | |
| | |
| | | Par (000) | | | | |
| | |
Time Deposits — 0.1% | | | | | | | | |
| | |
| United States — 0.1% | | | | | | |
Citibank, 2.12%, 07/01/23 | | EUR | 109 | | | | 118,976 | |
| | | | | | | | |
| | |
Total Short-Term Securities — 0.6%
(Cost: $586,531) | | | | | | | 586,531 | |
| | | | | | | | |
| |
Total Investments — 101.9%
(Cost: $80,801,482) | | | | 110,639,699 | |
| |
Liabilities in Excess of Other Assets — (1.9)% | | | | (2,031,408 | ) |
| | | | | | | | |
| | |
Net Assets — 100.0% | | | | | | $ | 108,608,291 | |
| | | | | | | | |
| (a) | Security exempt from registration pursuant to Rule 144A under the Securities Act of 1933, as amended. These securities may be resold in transactions exempt from registration to qualified institutional investors. |
| (b) | Non-income producing security. |
| (c) | Affiliate of the Fund. |
| (d) | Annualized 7-day yield as of period end. |
| | |
| 22 | | 2 0 2 3 BLACK ROCK ANNUAL REPORT TO SHAREHOLDERS |
| | |
Schedule of Investments (continued) June 30, 2023 | | BlackRock EuroFund |
Affiliates
Investments in issuers considered to be affiliate(s) of the Fund during the year ended June 30, 2023 for purposes of Section 2(a)(3) of the Investment Company Act of 1940, as amended, were as follows:
| | | | | | | | | | | | | | | | | | | | | | | | | | | | | | | | | | | | | | | | | | | | | | |
| | | | | | | | | | | |
| | | Affiliated Issuer | | Value at
06/30/22 | | | Purchases
at Cost | | | Proceeds
from Sales | | | Net
Realized
Gain (Loss) | | | Change in
Unrealized
Appreciation
(Depreciation) | | | Value at
06/30/23 | | | Shares
Held at
06/30/23 | | | Income | | | Capital Gain
Distributions
from
Underlying
Funds | | | | |
| | BlackRock Liquidity Funds, T-Fund, Institutional Class | | $ | 492,237 | | | $ | — | | | $ | (24,682 | )(a) | | $ | — | | | | | | | $ | — | | | $ | 467,555 | | | | 467,555 | | | $ | 17,883 | | | $ | — | | | | | |
| | | | | | | | | | | | |
| | SL Liquidity Series, LLC, Money Market Series(b) | | | 2,813,256 | | | | — | | | | (2,814,745 | )(a) | | | 1,208 | | | | | | | | 281 | | | | — | | | | — | | | | 28,813 | (c) | | | — | | | | | |
| | | | | | | | | | | | | | | | | | | | | | | | | | | | | | | | | | | | | | | | | | | | | | |
| | | | | | | | | | | | | | | | $ | 1,208 | | | | | | | $ | 281 | | | $ | 467,555 | | | | | | | $ | 46,696 | | | $ | — | | | | | |
| | | | | | | | | | | | | | | | | | | | | | | | | | | | | | | | | | | | | | | | | | | | | | |
| | (a) | Represents net amount purchased (sold). | |
| | (b) | As of period end, the entity is no longer held. | |
| | (c) | All or a portion represents securities lending income earned from the reinvestment of cash collateral from loaned securities, net of fees and collateral investment expenses, and other payments to and from borrowers of securities. | |
Fair Value Hierarchy as of Period End
Various inputs are used in determining the fair value of financial instruments. For a description of the input levels and information about the Fund’s policy regarding valuation of financial instruments, refer to the Notes to Financial Statements.
The following table summarizes the Fund’s financial instruments categorized in the fair value hierarchy. The breakdown of the Fund’s financial instruments into major categories is disclosed in the Schedule of Investments above.
| | | | | | | | | | | | | | | | |
| | | | | |
| | | Level 1 | | | Level 2 | | | Level 3 | | | Total | |
| | | | |
Assets | | | | | | | | | | | | | | | | |
Investments | | | | | | | | | | | | | | | | |
Long-Term Investments | | | | | | | | | | | | | | | | |
Common Stocks | | | | | | | | | | | | | | | | |
Belgium | | $ | — | | | $ | 1,215,284 | | | $ | — | | | $ | 1,215,284 | |
Denmark | | | — | | | | 2,756,794 | | | | — | | | | 2,756,794 | |
Finland | | | — | | | | 2,973,502 | | | | — | | | | 2,973,502 | |
France | | | — | | | | 41,620,218 | | | | — | | | | 41,620,218 | |
Germany | | | — | | | | 17,811,968 | | | | — | | | | 17,811,968 | |
Ireland | | | — | | | | 1,553,231 | | | | — | | | | 1,553,231 | |
Italy | | | — | | | | 8,611,943 | | | | — | | | | 8,611,943 | |
Netherlands | | | — | | | | 22,034,482 | | | | — | | | | 22,034,482 | |
Portugal | | | — | | | | 365,676 | | | | — | | | | 365,676 | |
Spain | | | — | | | | 1,645,223 | | | | — | | | | 1,645,223 | |
Sweden | | | — | | | | 1,196,262 | | | | — | | | | 1,196,262 | |
Switzerland | | | — | | | | 2,752,811 | | | | — | | | | 2,752,811 | |
United Kingdom | | | — | | | | 2,355,096 | | | | — | | | | 2,355,096 | |
United States | | | 3,160,678 | | | | — | | | | — | | | | 3,160,678 | |
Short-Term Securities | | | | | | | | | | | | | | | | |
Money Market Funds | | | 467,555 | | | | — | | | | — | | | | 467,555 | |
Time Deposits | | | — | | | | 118,976 | | | | — | | | | 118,976 | |
| | | | | | | | | | | | | | | | |
| | $ | 3,628,233 | | | $ | 107,011,466 | | | $ | — | | | $ | 110,639,699 | |
| | | | | | | | | | | | | | | | |
See notes to financial statements.
| | |
SCHEDULE OF INVESTMENTS | | 23 |
Statements of Assets and Liabilities
June 30, 2023
| | | | | | | | |
| | | BlackRock
Advantage Global
Fund, Inc. | | | BlackRock
EuroFund | |
| | |
ASSETS | | | | | | | | |
Investments, at value — unaffiliated(a)(b) | | $ | 386,413,509 | | | $ | 110,172,144 | |
Investments, at value — affiliated(c) | | | 7,347,776 | | | | 467,555 | |
Cash pledged for futures contracts | | | 315,000 | | | | — | |
Foreign currency, at value(d) | | | 37,180 | | | | 1,675 | |
Receivables: | | | | | | | | |
Investments sold | | | 5,165,205 | | | | 1,147,639 | |
Securities lending income — affiliated | | | 1,806 | | | | — | |
Capital shares sold | | | 24,881 | | | | 9,135 | |
Dividends — unaffiliated | | | 738,124 | | | | 162,663 | |
Dividends — affiliated | | | 25,917 | | | | 1,984 | |
Variation margin on futures contracts | | | 83,150 | | | | — | |
Prepaid expenses | | | 46,829 | | | | 31,420 | |
| | | | | | | | |
Total assets | | | 400,199,377 | | | | 111,994,215 | |
| | | | | | | | |
| | |
LIABILITIES | | | | | | | | |
Bank overdraft | | | 60,557 | | | | 540,126 | |
Collateral on securities loaned | | | 165,272 | | | | — | |
Payables: | | | | | | | | |
Investments purchased | | | 5,243,582 | | | | 125,329 | |
Accounting services fees | | | 32,923 | | | | 12,548 | |
Capital shares redeemed | | | 1,804,159 | | | | 194,228 | |
Custodian fees | | | 99,624 | | | | 20,414 | |
Deferred foreign capital gain tax | | | 50,966 | | | | — | |
Investment advisory fees | | | 369,469 | | | | 132,051 | |
IRS compliance fee for foreign withholding tax claims | | | — | | | | 2,180,773 | |
Directors’ and Officer’s fees | | | 3,947 | | | | 1,956 | |
Other accrued expenses | | | 9,505 | | | | 6,822 | |
Professional fees | | | 85,952 | | | | 141,998 | |
Service and distribution fees | | | 56,954 | | | | 15,368 | |
Transfer agent fees | | | — | | | | 14,311 | |
| | | | | | | | |
Total liabilities | | | 7,982,910 | | | | 3,385,924 | |
| | | | | | | | |
Commitments and contingent liabilities | | | | | | | | |
NET ASSETS | | $ | 392,216,467 | | | $ | 108,608,291 | |
| | | | | | | | |
| | |
NET ASSETS CONSIST OF | | | | | | | | |
Paid-in capital | | $ | 349,203,847 | | | $ | 95,373,517 | |
Accumulated earnings | | | 43,012,620 | | | | 13,234,774 | |
| | | | | | | | |
NET ASSETS | | $ | 392,216,467 | | | $ | 108,608,291 | |
| | | | | | | | |
| | |
(a) Investments, at cost — unaffiliated | | $ | 325,813,047 | | | $ | 80,333,927 | |
(b) Securities loaned, at value | | $ | 167,710 | | | $ | — | |
(c) Investments, at cost — affiliated | | $ | 7,347,808 | | | $ | 467,555 | |
(d) Foreign currency, at cost | | $ | 41,433 | | | $ | 1,675 | |
| | |
| 24 | | 2 0 2 3 BLACK ROCK ANNUAL REPORT TO SHAREHOLDERS |
Statements of Assets and Liabilities (continued)
June 30, 2023
| | | | | | | | | | |
| | | BlackRock
Advantage Global
Fund, Inc. | | BlackRock
EuroFund |
| | |
NET ASSET VALUE | | | | | | | | | | |
| | |
| Institutional | | | | |
Net assets | | | $ | 56,144,814 | | | | $ | 34,272,305 | |
| | | | | | | | | | |
Shares outstanding | | | | 2,361,697 | | | | | 1,782,434 | |
| | | | | | | | | | |
Net asset value | | | $ | 23.77 | | | | $ | 19.23 | |
| | | | | | | | | | |
Shares authorized | | | | 100 million | | | | | Unlimited | |
| | | | | | | | | | |
Par value | | | $ | 0.10 | | | | $ | 0.10 | |
| | | | | | | | | | |
| | |
| Investor A | | | | |
Net assets | | | $ | 274,646,695 | | | | $ | 71,692,219 | |
| | | | | | | | | | |
Shares outstanding | | | | 12,349,204 | | | | | 3,814,330 | |
| | | | | | | | | | |
Net asset value | | | $ | 22.24 | | | | $ | 18.80 | |
| | | | | | | | | | |
Shares authorized | | | | 100 million | | | | | Unlimited | |
| | | | | | | | | | |
Par value | | | $ | 0.10 | | | | $ | 0.10 | |
| | | | | | | | | | |
| | |
| Investor C | | | | |
Net assets | | | $ | 2,620,302 | | | | $ | 1,266,737 | |
| | | | | | | | | | |
Shares outstanding | | | | 150,458 | | | | | 99,507 | |
| | | | | | | | | | |
Net asset value | | | $ | 17.42 | | | | $ | 12.73 | |
| | | | | | | | | | |
Shares authorized | | | | 100 million | | | | | Unlimited | |
| | | | | | | | | | |
Par value | | | $ | 0.10 | | | | $ | 0.10 | |
| | | | | | | | | | |
| | |
| Class K | | | | |
Net assets | | | $ | 56,521,625 | | | | $ | 1,097,973 | |
| | | | | | | | | | |
Shares outstanding | | | | 2,377,146 | | | | | 57,227 | |
| | | | | | | | | | |
Net asset value | | | $ | 23.78 | | | | $ | 19.19 | |
| | | | | | | | | | |
Shares authorized | | | | 2 billion | | | | | Unlimited | |
| | | | | | | | | | |
Par value | | | $ | 0.10 | | | | $ | 0.10 | |
| | | | | | | | | | |
| | |
| Class R | | | | |
Net assets | | | $ | 2,283,031 | | | | $ | 279,057 | |
| | | | | | | | | | |
Shares outstanding | | | | 116,997 | | | | | 20,060 | |
| | | | | | | | | | |
Net asset value | | | $ | 19.51 | | | | $ | 13.91 | |
| | | | | | | | | | |
Shares authorized | | | | 100 million | | | | | Unlimited | |
| | | | | | | | | | |
Par value | | | $ | 0.10 | | | | $ | 0.10 | |
| | | | | | | | | | |
See notes to financial statements.
Statements of Operations
Year Ended June 30, 2023
| | | | | | | | | | |
| | | BlackRock
Advantage Global
Fund, Inc. | | BlackRock
EuroFund |
| | |
INVESTMENT INCOME | | | | | | | | | | |
Dividends — unaffiliated | | | $ | 9,661,186 | | | | $ | 2,308,750 | |
Dividends — affiliated | | | | 243,080 | | | | | 17,883 | |
Interest — unaffiliated | | | | 16,838 | | | | | — | |
Securities lending income — affiliated — net | | | | 46,642 | | | | | 28,813 | |
Other income — unaffiliated | | | | — | | | | | 595,103 | |
Foreign taxes withheld | | | | (580,505 | ) | | | | (232,299 | ) |
Foreign withholding tax claims | | | | — | | | | | 2,009,946 | |
IRS compliance fee for foreign withholding tax claims | | | | — | | | | | (2,180,773 | ) |
| | | | | | | | | | |
Total investment income | | | | 9,387,241 | | | | | 2,547,423 | |
| | | | | | | | | | |
| | |
EXPENSES | | | | | | | | | | |
Investment advisory | | | | 3,166,818 | | | | | 716,056 | |
Service and distribution — class specific | | | | 712,814 | | | | | 175,181 | |
Transfer agent — class specific | | | | 599,810 | | | | | 130,358 | |
Custodian | | | | 149,819 | | | | | 35,850 | |
Professional | | | | 148,241 | | | | | 334,460 | |
Registration | | | | 85,510 | | | | | 80,236 | |
Accounting services | | | | 75,101 | | | | | 26,354 | |
Printing and postage | | | | 42,455 | | | | | 45,248 | |
Directors and Officer | | | | 10,851 | | | | | 7,338 | |
Miscellaneous | | | | 32,036 | | | | | 22,274 | |
| | | | | | | | | | |
Total expenses | | | | 5,023,455 | | | | | 1,573,355 | |
Less: | | | | | | | | | | |
Fees waived and/or reimbursed by the Manager | | | | (1,204,387 | ) | | | | (81,106 | ) |
Transfer agent fees waived and/or reimbursed by the Manager — class specific | | | | (434,435 | ) | | | | (64,775 | ) |
| | | | | | | | | | |
Total expenses after fees waived and/or reimbursed | | | | 3,384,633 | | | | | 1,427,474 | |
| | | | | | | | | | |
Net investment income | | | | 6,002,608 | | | | | 1,119,949 | |
| | | | | | | | | | |
| | |
REALIZED AND UNREALIZED GAIN (LOSS) | | | | | | | | | | |
Net realized gain (loss) from: | | | | | | | | | | |
Investments — unaffiliated(a) | | | | (13,377,149 | ) | | | | 1,282,180 | |
Investments — affiliated | | | | 855 | | | | | 1,208 | |
Foreign currency transactions | | | | (66,329 | ) | | | | (60,854 | ) |
Futures contracts | | | | 722,722 | | | | | — | |
| | | | | | | | | | |
| | | | (12,719,901 | ) | | | | 1,222,534 | |
| | | | | | | | | | |
Net change in unrealized appreciation (depreciation) on: | | | | | | | | | | |
Investments — unaffiliated(b) | | | | 65,574,412 | | | | | 23,696,157 | |
Investments — affiliated | | | | 46 | | | | | 281 | |
Foreign currency translations | | | | 1,809 | | | | | 15,400 | |
Futures contracts | | | | 247,836 | | | | | — | |
| | | | | | | | | | |
| | | | 65,824,103 | | | | | 23,711,838 | |
| | | | | | | | | | |
Net realized and unrealized gain | | | | 53,104,202 | | | | | 24,934,372 | |
| | | | | | | | | | |
NET INCREASE IN NET ASSETS RESULTING FROM OPERATIONS | | | $ | 59,106,810 | | | | $ | 26,054,321 | |
| | | | | | | | | | |
| | |
(a) Net of foreign capital gain tax and capital gain tax refund, if applicable of | | | $ | (6,383 | ) | | | $ | — | |
(b) Net of increase in deferred foreign capital gain tax of | | | $ | (50,234 | ) | | | $ | — | |
See notes to financial statements.
| | |
| 26 | | 2 0 2 3 BLACK ROCK ANNUAL REPORT TO SHAREHOLDERS |
Statements of Changes in Net Assets
| | | | | | | | | | | | | | | | | | | | | | | | | |
| | | BlackRock Advantage Global Fund, Inc. | | | | BlackRock EuroFund |
| | | Year Ended
06/30/23 | | Year Ended
06/30/22 | | | | Year Ended
06/30/23 | | Year Ended
06/30/22 |
| | | | |
INCREASE (DECREASE) IN NET ASSETS | | | | | | | | | | | | | | | | | | | | | |
| | | | | |
OPERATIONS | | | | | | | | | | | | | | | | | | | | | | | | | |
Net investment income | | | $ | 6,002,608 | | | | $ | 5,572,262 | | | | | | | | | $ | 1,119,949 | | | | $ | 643,393 | |
Net realized gain (loss) | | | | (12,719,901 | ) | | | | 9,461,273 | | | | | | | | | | 1,222,534 | | | | | 9,406,868 | |
Net change in unrealized appreciation (depreciation) | | | | 65,824,103 | | | | | (86,437,468 | ) | | | | | | | | | 23,711,838 | | | | | (43,244,825 | ) |
| | | | | | | | | | | | | | | | | | | | | | | | | |
Net increase (decrease) in net assets resulting from operations | | | | 59,106,810 | | | | | (71,403,933 | ) | | | | | | | | | 26,054,321 | | | | | (33,194,564 | ) |
| | | | | | | | | | | | | | | | | | | | | | | | | |
| | | | | |
DISTRIBUTIONS TO SHAREHOLDERS(a) | | | | | | | | | | | | | | | | | | | | | | | | | |
Institutional | | | | (1,061,923 | ) | | | | (14,118,216 | ) | | | | | | | | | (201,013 | ) | | | | — | |
Investor A | | | | (4,583,971 | ) | | | | (50,223,238 | ) | | | | | | | | | (320,389 | ) | | | | — | |
Investor C | | | | (38,913 | ) | | | | (1,286,438 | ) | | | | | | | | | — | | | | | — | |
Class K | | | | (912,633 | ) | | | | (8,570,266 | ) | | | | | | | | | (7,042 | ) | | | | — | |
Class R | | | | (36,382 | ) | | | | (633,981 | ) | | | | | | | | | — | | | | | — | |
| | | | | | | | | | | | | | | | | | | | | | | | | |
Decrease in net assets resulting from distributions to shareholders | | | | (6,633,822 | ) | | | | (74,832,139 | ) | | | | | | | | | (528,444 | ) | | | | — | |
| | | | | | | | | | | | | | | | | | | | | | | | | |
| | | | | |
CAPITAL SHARE TRANSACTIONS | | | | | | | | | | | | | | | | | | | | | | | | | |
Net increase (decrease) in net assets derived from capital share transactions | | | | (42,706,146 | ) | | | | 36,861,636 | | | | | | | | | | (4,059,767 | ) | | | | (52,716,556 | ) |
| | | | | | | | | | | | | | | | | | | | | | | | | |
| | | | | |
NET ASSETS | | | | | | | | | | | | | | | | | | | | | | | | | |
Total increase (decrease) in net assets | | | | 9,766,842 | | | | | (109,374,436 | ) | | | | | | | | | 21,466,110 | | | | | (85,911,120 | ) |
Beginning of year | | | | 382,449,625 | | | | | 491,824,061 | | | | | | | | | | 87,142,181 | | | | | 173,053,301 | |
| | | | | | | | | | | | | | | | | | | | | | | | | |
End of year | | | $ | 392,216,467 | | | | $ | 382,449,625 | | | | | | | | | $ | 108,608,291 | | | | $ | 87,142,181 | |
| | | | | | | | | | | | | | | | | | | | | | | | | |
| (a) | Distributions for annual periods determined in accordance with U.S. federal income tax regulations. | |
See notes to financial statements.
Financial Highlights
(For a share outstanding throughout each period)
| | | | | | | | | | | | | | | | | | | | | | | | | | | | | | | | | | | | |
| | | BlackRock Advantage Global Fund, Inc. | |
| |
| | | Institutional | |
| | | Year Ended
06/30/23 | | | | | | Year Ended
06/30/22 | | | | | | Year Ended
06/30/21 | | | | | | Year Ended
06/30/20 | | | | | | Year Ended
06/30/19 | |
| | | | | | | | | | |
Net asset value, beginning of year | | $ | 20.70 | | | | | | | $ | 28.57 | | | | | | | $ | 21.48 | | | | | | | $ | 21.66 | | | | | | | $ | 21.63 | |
| | | | | | | | | | | | | | | | | | | | | | | | | | | | | | | | | | | | |
| | | | | | | | | |
Net investment income(a) | | | 0.38 | | | | | | | | 0.33 | | | | | | | | 0.24 | | | | | | | | 0.31 | | | | | | | | 0.36 | |
Net realized and unrealized gain (loss) | | | 3.08 | | | | | | | | (4.04 | ) | | | | | | | 7.82 | | | | | | | | (0.06 | ) | | | | | | | 0.43 | |
| | | | | | | | | | | | | | | | | | | | | | | | | | | | | | | | | | | | |
| | | | | | | | | |
Net increase (decrease) from investment operations | | | 3.46 | | | | | | | | (3.71 | ) | | | | | | | 8.06 | | | | | | | | 0.25 | | | | | | | | 0.79 | |
| | | | | | | | | | | | | | | | | | | | | | | | | | | | | | | | | | | | |
| | | | | | | | | |
Distributions(b) | | | | | | | | | | | | | | | | | | | | | | | | | | | | | | | | | | | | |
From net investment income | | | (0.39 | ) | | | | | | | (0.33 | ) | | | | | | | (0.35 | ) | | | | | | | (0.43 | ) | | | | | | | (0.32 | ) |
From net realized gain | | | — | | | | | | | | (3.83 | ) | | | | | | | (0.62 | ) | | | | | | | — | | | | | | | | (0.44 | ) |
| | | | | | | | | | | | | | | | | | | | | | | | | | | | | | | | | | | | |
| | | | | | | | | |
Total distributions | | | (0.39 | ) | | | | | | | (4.16 | ) | | | | | | | (0.97 | ) | | | | | | | (0.43 | ) | | | | | | | (0.76 | ) |
| | | | | | | | | | | | | | | | | | | | | | | | | | | | | | | | | | | | |
| | | | | | | | | |
Net asset value, end of year | | $ | 23.77 | | | | | | | $ | 20.70 | | | | | | | $ | 28.57 | | | | | | | $ | 21.48 | | | | | | | $ | 21.66 | |
| | | | | | | | | | | | | | | | | | | | | | | | | | | | | | | | | | | | |
| | | | | | | | | |
Total Return(c) | | | | | | | | | | | | | | | | | | | | | | | | | | | | | | | | | | | | |
Based on net asset value | | | 16.94 | % | | | | | | | (15.52 | )% | | | | | | | 38.23 | % | | | | | | | 1.08 | % | | | | | | | 4.03 | % |
| | | | | | | | | | | | | | | | | | | | | | | | | | | | | | | | | | | | |
| | | | | | | | | |
Ratios to Average Net Assets(d) | | | | | | | | | | | | | | | | | | | | | | | | | | | | | | | | | | | | |
Total expenses | | | 1.12 | % | | | | | | | 1.10 | % | | | | | | | 1.19 | % | | | | | | | 1.15 | % | | | | | | | 1.14 | % |
| | | | | | | | | | | | | | | | | | | | | | | | | | | | | | | | | | | | |
| | | | | | | | | |
Total expenses after fees waived and/or reimbursed | | | 0.71 | % | | | | | | | 0.71 | % | | | | | | | 0.71 | % | | | | | | | 0.71 | % | | | | | | | 0.72 | % |
| | | | | | | | | | | | | | | | | | | | | | | | | | | | | | | | | | | | |
| | | | | | | | | |
Total expenses after fees waived and/or reimbursed and excluding professional fees for foreign withholding taxes | | | 0.71 | % | | | | | | | 0.71 | % | | | | | | | 0.71 | % | | | | | | | 0.71 | % | | | | | | | 0.72 | % |
| | | | | | | | | | | | | | | | | | | | | | | | | | | | | | | | | | | | |
| | | | | | | | | |
Net investment income | | | 1.75 | % | | | | | | | 1.33 | % | | | | | | | 0.96 | % | | | | | | | 1.46 | % | | | | | | | 1.72 | % |
| | | | | | | | | | | | | | | | | | | | | | | | | | | | | | | | | | | | |
| | | | | | | | | |
Supplemental Data | | | | | | | | | | | | | | | | | | | | | | | | | | | | | | | | | | | | |
Net assets, end of year (000) | | $ | 56,145 | | | | | | | $ | 62,236 | | | | | | | $ | 95,405 | | | | | | | $ | 75,805 | | | | | | | $ | 87,759 | |
| | | | | | | | | | | | | | | | | | | | | | | | | | | | | | | | | | | | |
| | | | | | | | | |
Portfolio turnover rate | | | 102 | % | | | | | | | 136 | % | | | | | | | 311 | % | | | | | | | 182 | % | | | | | | | 137 | % |
| | | | | | | | | | | | | | | | | | | | | | | | | | | | | | | | | | | | |
| (a) | Based on average shares outstanding. |
| (b) | Distributions for annual periods determined in accordance with U.S. federal income tax regulations. |
| (c) | Where applicable, assumes the reinvestment of distributions. |
| (d) | Excludes fees and expenses incurred indirectly as a result of investments in underlying funds. |
See notes to financial statements.
| | |
| 28 | | 2 0 2 3 BLACK ROCK ANNUAL REPORT TO SHAREHOLDERS |
Financial Highlights (continued)
(For a share outstanding throughout each period)
| | | | | | | | | | | | | | | | | | | | | | | | | | | | | | | | | | | | |
| | | BlackRock Advantage Global Fund, Inc. (continued) | |
| |
| | | Investor A | |
| | | Year Ended
06/30/23 | | | | | | Year Ended
06/30/22 | | | | | | Year Ended
06/30/21 | | | | | | Year Ended
06/30/20 | | | | | | Year Ended
06/30/19 | |
| | | | | | | | | | |
Net asset value, beginning of year | | $ | 19.39 | | | | | | | $ | 27.02 | | | | | | | $ | 20.36 | | | | | | | $ | 20.55 | | | | | | | $ | 20.56 | |
| | | | | | | | | | | | | | | | | | | | | | | | | | | | | | | | | | | | |
| | | | | | | | | |
Net investment income(a) | | | 0.31 | | | | | | | | 0.27 | | | | | | | | 0.17 | | | | | | | | 0.24 | | | | | | | | 0.30 | |
Net realized and unrealized gain (loss) | | | 2.88 | | | | | | | | (3.80 | ) | | | | | | | 7.41 | | | | | | | | (0.05 | ) | | | | | | | 0.40 | |
| | | | | | | | | | | | | | | | | | | | | | | | | | | | | | | | | | | | |
| | | | | | | | | |
Net increase (decrease) from investment operations | | | 3.19 | | | | | | | | (3.53 | ) | | | | | | | 7.58 | | | | | | | | 0.19 | | | | | | | | 0.70 | |
| | | | | | | | | | | | | | | | | | | | | | | | | | | | | | | | | | | | |
| | | | | | | | | |
Distributions(b) | | | | | | | | | | | | | | | | | | | | | | | | | | | | | | | | | | | | |
From net investment income | | | (0.34 | ) | | | | | | | (0.27 | ) | | | | | | | (0.30 | ) | | | | | | | (0.38 | ) | | | | | | | (0.27 | ) |
From net realized gain | | | — | | | | | | | | (3.83 | ) | | | | | | | (0.62 | ) | | | | | | | — | | | | | | | | (0.44 | ) |
| | | | | | | | | | | | | | | | | | | | | | | | | | | | | | | | | | | | |
| | | | | | | | | |
Total distributions | | | (0.34 | ) | | | | | | | (4.10 | ) | | | | | | | (0.92 | ) | | | | | | | (0.38 | ) | | | | | | | (0.71 | ) |
| | | | | | | | | | | | | | | | | | | | | | | | | | | | | | | | | | | | |
| | | | | | | | | |
Net asset value, end of year | | $ | 22.24 | | | | | | | $ | 19.39 | | | | | | | $ | 27.02 | | | | | | | $ | 20.36 | | | | | | | $ | 20.55 | |
| | | | | | | | | | | | | | | | | | | | | | | | | | | | | | | | | | | | |
| | | | | | | | | |
Total Return(c) | | | | | | | | | | | | | | | | | | | | | | | | | | | | | | | | | | | | |
Based on net asset value | | | 16.65 | % | | | | | | | (15.73 | )% | | | | | | | 37.91 | % | | | | | | | 0.84 | % | | | | | | | 3.77 | % |
| | | | | | | | | | | | | | | | | | | | | | | | | | | | | | | | | | | | |
| | | | | | | | | |
Ratios to Average Net Assets(d) | | | | | | | | | | | | | | | | | | | | | | | | | | | | | | | | | | | | |
Total expenses | | | 1.41 | % | | | | | | | 1.40 | % | | | | | | | 1.51 | % | | | | | | | 1.46 | % | | | | | | | 1.46 | % |
| | | | | | | | | | | | | | | | | | | | | | | | | | | | | | | | | | | | |
| | | | | | | | | |
Total expenses after fees waived and/or reimbursed | | | 0.96 | % | | | | | | | 0.96 | % | | | | | | | 0.96 | % | | | | | | | 0.96 | % | | | | | | | 0.97 | % |
| | | | | | | | | | | | | | | | | | | | | | | | | | | | | | | | | | | | |
| | | | | | | | | |
Total expenses after fees waived and/or reimbursed and excluding professional fees for foreign withholding taxes | | | 0.96 | % | | | | | | | 0.96 | % | | | | | | | 0.96 | % | | | | | | | 0.96 | % | | | | | | | 0.97 | % |
| | | | | | | | | | | | | | | | | | | | | | | | | | | | | | | | | | | | |
| | | | | | | | | |
Net investment income | | | 1.51 | % | | | | | | | 1.14 | % | | | | | | | 0.71 | % | | | | | | | 1.21 | % | | | | | | | 1.48 | % |
| | | | | | | | | | | | | | | | | | | | | | | | | | | | | | | | | | | | |
| | | | | | | | | |
Supplemental Data | | | | | | | | | | | | | | | | | | | | | | | | | | | | | | | | | | | | |
Net assets, end of year (000) | | $ | 274,647 | | | | | | | $ | 264,270 | | | | | | | $ | 327,701 | | | | | | | $ | 242,123 | | | | | | | $ | 289,752 | |
| | | | | | | | | | | | | | | | | | | | | | | | | | | | | | | | | | | | |
| | | | | | | | | |
Portfolio turnover rate | | | 102 | % | | | | | | | 136 | % | | | | | | | 311 | % | | | | | | | 182 | % | | | | | | | 137 | % |
| | | | | | | | | | | | | | | | | | | | | | | | | | | | | | | | | | | | |
| (a) | Based on average shares outstanding. |
| (b) | Distributions for annual periods determined in accordance with U.S. federal income tax regulations. |
| (c) | Where applicable, excludes the effects of any sales charges and assumes the reinvestment of distributions. |
| (d) | Excludes fees and expenses incurred indirectly as a result of investments in underlying funds. |
See notes to financial statements.
Financial Highlights (continued)
(For a share outstanding throughout each period)
| | | | | | | | | | | | | | | | | | | | | | | | | | | | | | | | | | | | |
| | | BlackRock Advantage Global Fund, Inc. (continued) | |
| |
| | | Investor C | |
| | | Year Ended
06/30/23 | | | | | | Year Ended
06/30/22 | | | | | | Year Ended
06/30/21 | | | | | | Year Ended
06/30/20 | | | | | | Year Ended
06/30/19 | |
| | | | | | | | | | |
Net asset value, beginning of year | | $ | 15.24 | | | | | | | $ | 22.06 | | | | | | | $ | 16.58 | | | | | | | $ | 16.79 | | | | | | | $ | 16.87 | |
| | | | | | | | | | | | | | | | | | | | | | | | | | | | | | | | | | | | |
| | | | | | | | | |
Net investment income (loss)(a) | | | 0.12 | | | | | | | | 0.06 | | | | | | | | (0.01 | ) | | | | | | | 0.08 | | | | | | | | 0.11 | |
Net realized and unrealized gain (loss) | | | 2.26 | | | | | | | | (2.97 | ) | | | | | | | 6.04 | | | | | | | | (0.05 | ) | | | | | | | 0.34 | |
| | | | | | | | | | | | | | | | | | | | | | | | | | | | | | | | | | | | |
| | | | | | | | | |
Net increase (decrease) from investment operations | | | 2.38 | | | | | | | | (2.91 | ) | | | | | | | 6.03 | | | | | | | | 0.03 | | | | | | | | 0.45 | |
| | | | | | | | | | | | | | | | | | | | | | | | | | | | | | | | | | | | |
| | | | | | | | | |
Distributions(b) | | | | | | | | | | | | | | | | | | | | | | | | | | | | | | | | | | | | |
From net investment income | | | (0.20 | ) | | | | | | | (0.14 | ) | | | | | | | — | | | | | | | | (0.24 | ) | | | | | | | (0.09 | ) |
From net realized gain | | | — | | | | | | | | (3.77 | ) | | | | | | | (0.55 | ) | | | | | | | — | | | | | | | | (0.44 | ) |
| | | | | | | | | | | | | | | | | | | | | | | | | | | | | | | | | | | | |
| | | | | | | | | |
Total distributions | | | (0.20 | ) | | | | | | | (3.91 | ) | | | | | | | (0.55 | ) | | | | | | | (0.24 | ) | | | | | | | (0.53 | ) |
| | | | | | | | | | | | | | | | | | | | | | | | | | | | | | | | | | | | |
| | | | | | | | | |
Net asset value, end of year | | $ | 17.42 | | | | | | | $ | 15.24 | | | | | | | $ | 22.06 | | | | | | | $ | 16.58 | | | | | | | $ | 16.79 | |
| | | | | | | | | | | | | | | | | | | | | | | | | | | | | | | | | | | | |
| | | | | | | | | |
Total Return(c) | | | | | | | | | | | | | | | | | | | | | | | | | | | | | | | | | | | | |
Based on net asset value | | | 15.78 | % | | | | | | | (16.36 | )% | | | | | | | 36.88 | % | | | | | | | 0.11 | % | | | | | | | 2.99 | % |
| | | | | | | | | | | | | | | | | | | | | | | | | | | | | | | | | | | | |
| | | | | | | | | |
Ratios to Average Net Assets(d) | | | | | | | | | | | | | | | | | | | | | | | | | | | | | | | | | | | | |
Total expenses | | | 2.20 | % | | | | | | | 2.19 | % | | | | | | | 2.42 | % | | | | | | | 2.32 | % | | | | | | | 2.28 | % |
| | | | | | | | | | | | | | | | | | | | | | | | | | | | | | | | | | | | |
| | | | | | | | | |
Total expenses after fees waived and/or reimbursed | | | 1.71 | % | | | | | | | 1.71 | % | | | | | | | 1.71 | % | | | | | | | 1.71 | % | | | | | | | 1.72 | % |
| | | | | | | | | | | | | | | | | | | | | | | | | | | | | | | | | | | | |
| | | | | | | | | |
Total expenses after fees waived and/or reimbursed and excluding professional fees for foreign withholding taxes | | | 1.71 | % | | | | | | | 1.71 | % | | | | | | | 1.71 | % | | | | | | | 1.71 | % | | | | | | | 1.72 | % |
| | | | | | | | | | | | | | | | | | | | | | | | | | | | | | | | | | | | |
| | | | | | | | | |
Net investment income (loss) | | | 0.76 | % | | | | | | | 0.31 | % | | | | | | | (0.06 | )% | | | | | | | 0.46 | % | | | | | | | 0.65 | % |
| | | | | | | | | | | | | | | | | | | | | | | | | | | | | | | | | | | | |
| | | | | | | | | |
Supplemental Data | | | | | | | | | | | | | | | | | | | | | | | | | | | | | | | | | | | | |
Net assets, end of year (000) | | $ | 2,620 | | | | | | | $ | 3,795 | | | | | | | $ | 7,922 | | | | | | | $ | 35,626 | | | | | | | $ | 52,125 | |
| | | | | | | | | | | | | | | | | | | | | | | | | | | | | | | | | | | | |
| | | | | | | | | |
Portfolio turnover rate | | | 102 | % | | | | | | | 136 | % | | | | | | | 311 | % | | | | | | | 182 | % | | | | | | | 137 | % |
| | | | | | | | | | | | | | | | | | | | | | | | | | | | | | | | | | | | |
| (a) | Based on average shares outstanding. |
| (b) | Distributions for annual periods determined in accordance with U.S. federal income tax regulations. |
| (c) | Where applicable, excludes the effects of any sales charges and assumes the reinvestment of distributions. |
| (d) | Excludes fees and expenses incurred indirectly as a result of investments in underlying funds. |
See notes to financial statements.
| | |
| 30 | | 2 0 2 3 BLACK ROCK ANNUAL REPORT TO SHAREHOLDERS |
Financial Highlights (continued)
(For a share outstanding throughout each period)
| | | | | | | | | | | | | | | | | | | | | | | | | | | | | | | | | | | | |
| | | BlackRock Advantage Global Fund, Inc. (continued) | |
| |
| | | Class K | |
| | | Year Ended
06/30/23 | | | | | | Year Ended
06/30/22 | | | | | | Year Ended
06/30/21 | | | | | | Year Ended
06/30/20 | | | | | | Year Ended
06/30/19 | |
| | | | | | | | | | |
Net asset value, beginning of year | | $ | 20.71 | | | | | | | $ | 28.58 | | | | | | | $ | 21.48 | | | | | | | $ | 21.66 | | | | | | | $ | 21.63 | |
| | | | | | | | | | | | | | | | | | | | | | | | | | | | | | | | | | | | |
| | | | | | | | | |
Net investment income(a) | | | 0.39 | | | | | | | | 0.36 | | | | | | | | 0.27 | | | | | | | | 0.32 | | | | | | | | 0.41 | |
Net realized and unrealized gain (loss) | | | 3.08 | | | | | | | | (4.05 | ) | | | | | | | 7.81 | | | | | | | | (0.06 | ) | | | | | | | 0.39 | |
| | | | | | | | | | | | | | | | | | | | | | | | | | | | | | | | | | | | |
| | | | | | | | | |
Net increase (decrease) from investment operations | | | 3.47 | | | | | | | | (3.69 | ) | | | | | | | 8.08 | | | | | | | | 0.26 | | | | | | | | 0.80 | |
| | | | | | | | | | | | | | | | | | | | | | | | | | | | | | | | | | | | |
| | | | | | | | | |
Distributions(b) | | | | | | | | | | | | | | | | | | | | | | | | | | | | | | | | | | | | |
From net investment income | | | (0.40 | ) | | | | | | | (0.35 | ) | | | | | | | (0.36 | ) | | | | | | | (0.44 | ) | | | | | | | (0.33 | ) |
From net realized gain | | | — | | | | | | | | (3.83 | ) | | | | | | | (0.62 | ) | | | | | | | — | | | | | | | | (0.44 | ) |
| | | | | | | | | | | | | | | | | | | | | | | | | | | | | | | | | | | | |
| | | | | | | | | |
Total distributions | | | (0.40 | ) | | | | | | | (4.18 | ) | | | | | | | (0.98 | ) | | | | | | | (0.44 | ) | | | | | | | (0.77 | ) |
| | | | | | | | | | | | | | | | | | | | | | | | | | | | | | | | | | | | |
| | | | | | | | | |
Net asset value, end of year | | $ | 23.78 | | | | | | | $ | 20.71 | | | | | | | $ | 28.58 | | | | | | | $ | 21.48 | | | | | | | $ | 21.66 | |
| | | | | | | | | | | | | | | | | | | | | | | | | | | | | | | | | | | | |
| | | | | | | | | |
Total Return(c) | | | | | | | | | | | | | | | | | | | | | | | | | | | | | | | | | | | | |
Based on net asset value | | | 16.99 | % | | | | | | | (15.46 | )% | | | | | | | 38.34 | % | | | | | | | 1.13 | % | | | | | | | 4.09 | % |
| | | | | | | | | | | | | | | | | | | | | | | | | | | | | | | | | | | | |
| | | | | | | | | |
Ratios to Average Net Assets(d) | | | | | | | | | | | | | | | | | | | | | | | | | | | | | | | | | | | | |
Total expenses | | | 0.98 | % | | | | | | | 1.00 | % | | | | | | | 1.13 | % | | | | | | | 1.09 | % | | | | | | | 1.03 | % |
| | | | | | | | | | | | | | | | | | | | | | | | | | | | | | | | | | | | |
| | | | | | | | | |
Total expenses after fees waived and/or reimbursed | | | 0.66 | % | | | | | | | 0.66 | % | | | | | | | 0.66 | % | | | | | | | 0.66 | % | | | | | | | 0.66 | % |
| | | | | | | | | | | | | | | | | | | | | | | | | | | | | | | | | | | | |
| | | | | | | | | |
Total expenses after fees waived and/or reimbursed and excluding professional fees for foreign withholding taxes | | | 0.66 | % | | | | | | | 0.66 | % | | | | | | | 0.66 | % | | | | | | | 0.66 | % | | | | | | | 0.66 | % |
| | | | | | | | | | | | | | | | | | | | | | | | | | | | | | | | | | | | |
| | | | | | | | | |
Net investment income | | | 1.81 | % | | | | | | | 1.45 | % | | | | | | | 1.04 | % | | | | | | | 1.53 | % | | | | | | | 1.98 | % |
| | | | | | | | | | | | | | | | | | | | | | | | | | | | | | | | | | | | |
| | | | | | | | | |
Supplemental Data | | | | | | | | | | | | | | | | | | | | | | | | | | | | | | | | | | | | |
Net assets, end of year (000) | | $ | 56,522 | | | | | | | $ | 49,643 | | | | | | | $ | 56,800 | | | | | | | $ | 12,108 | | | | | | | $ | 10,625 | |
| | | | | | | | | | | | | | | | | | | | | | | | | | | | | | | | | | | | |
| | | | | | | | | |
Portfolio turnover rate | | | 102 | % | | | | | | | 136 | % | | | | | | | 311 | % | | | | | | | 182 | % | | | | | | | 137 | % |
| | | | | | | | | | | | | | | | | | | | | | | | | | | | | | | | | | | | |
| (a) | Based on average shares outstanding. |
| (b) | Distributions for annual periods determined in accordance with U.S. federal income tax regulations. |
| (c) | Where applicable, assumes the reinvestment of distributions. |
| (d) | Excludes fees and expenses incurred indirectly as a result of investments in underlying funds. |
See notes to financial statements.
Financial Highlights (continued)
(For a share outstanding throughout each period)
| | | | | | | | | | | | | | | | | | | | | | | | | | | | | | | | | | | | |
| | | BlackRock Advantage Global Fund, Inc. (continued) | |
| |
| | | Class R | |
| | | Year Ended
06/30/23 | | | | | | Year Ended
06/30/22 | | | | | | Year Ended
06/30/21 | | | | | | Year Ended
06/30/20 | | | | | | Year Ended
06/30/19 | |
| | | | | | | | | | |
Net asset value, beginning of year | | $ | 17.05 | | | | | | | $ | 24.24 | | | | | | | $ | 18.33 | | | | | | | $ | 18.52 | | | | | | | $ | 18.60 | |
| | | | | | | | | | | | | | | | | | | | | | | | | | | | | | | | | | | | |
| | | | | | | | | |
Net investment income(a) | | | 0.22 | | | | | | | | 0.18 | | | | | | | | 0.10 | | | | | | | | 0.18 | | | | | | | | 0.21 | |
Net realized and unrealized gain (loss) | | | 2.53 | | | | | | | | (3.33 | ) | | | | | | | 6.65 | | | | | | | | (0.06 | ) | | | | | | | 0.37 | |
| | | | | | | | | | | | | | | | | | | | | | | | | | | | | | | | | | | | |
| | | | | | | | | |
Net increase (decrease) from investment operations | | | 2.75 | | | | | | | | (3.15 | ) | | | | | | | 6.75 | | | | | | | | 0.12 | | | | | | | | 0.58 | |
| | | | | | | | | | | | | | | | | | | | | | | | | | | | | | | | | | | | |
| | | | | | | | | |
Distributions(b) | | | | | | | | | | | | | | | | | | | | | | | | | | | | | | | | | | | | |
From net investment income | | | (0.29 | ) | | | | | | | (0.21 | ) | | | | | | | (0.22 | ) | | | | | | | (0.31 | ) | | | | | | | (0.22 | ) |
From net realized gain | | | — | | | | | | | | (3.83 | ) | | | | | | | (0.62 | ) | | | | | | | — | | | | | | | | (0.44 | ) |
| | | | | | | | | | | | | | | | | | | | | | | | | | | | | | | | | | | | |
| | | | | | | | | |
Total distributions | | | (0.29 | ) | | | | | | | (4.04 | ) | | | | | | | (0.84 | ) | | | | | | | (0.31 | ) | | | | | | | (0.66 | ) |
| | | | | | | | | | | | | | | | | | | | | | | | | | | | | | | | | | | | |
| | | | | | | | | |
Net asset value, end of year | | $ | 19.51 | | | | | | | $ | 17.05 | | | | | | | $ | 24.24 | | | | | | | $ | 18.33 | | | | | | | $ | 18.52 | |
| | | | | | | | | | | | | | | | | | | | | | | | | | | | | | | | | | | | |
| | | | | | | | | |
Total Return(c) | | | | | | | | | | | | | | | | | | | | | | | | | | | | | | | | | | | | |
Based on net asset value | | | 16.34 | % | | | | | | | (15.94 | )% | | | | | | | 37.52 | % | | | | | | | 0.58 | % | | | | | | | 3.52 | % |
| | | | | | | | | | | | | | | | | | | | | | | | | | | | | | | | | | | | |
| | | | | | | | | |
Ratios to Average Net Assets(d) | | | | | | | | | | | | | | | | | | | | | | | | | | | | | | | | | | | | |
Total expenses | | | 1.76 | % | | | | | | | 1.82 | % | | | | | | | 1.79 | % | | | | | | | 1.77 | % | | | | | | | 1.79 | % |
| | | | | | | | | | | | | | | | | | | | | | | | | | | | | | | | | | | | |
| | | | | | | | | |
Total expenses after fees waived and/or reimbursed | | | 1.21 | % | | | | | | | 1.21 | % | | | | | | | 1.21 | % | | | | | | | 1.21 | % | | | | | | | 1.22 | % |
| | | | | | | | | | | | | | | | | | | | | | | | | | | | | | | | | | | | |
| | | | | | | | | |
Total expenses after fees waived and/or reimbursed and excluding professional fees for foreign withholding taxes | | | 1.21 | % | | | | | | | 1.21 | % | | | | | | | 1.21 | % | | | | | | | 1.21 | % | | | | | | | 1.22 | % |
| | | | | | | | | | | | | | | | | | | | | | | | | | | | | | | | | | | | |
| | | | | | | | | |
Net investment income | | | 1.25 | % | | | | | | | 0.85 | % | | | | | | | 0.45 | % | | | | | | | 0.98 | % | | | | | | | 1.18 | % |
| | | | | | | | | | | | | | | | | | | | | | | | | | | | | | | | | | | | |
| | | | | | | | | |
Supplemental Data | | | | | | | | | | | | | | | | | | | | | | | | | | | | | | | | | | | | |
Net assets, end of year (000) | | $ | 2,283 | | | | | | | $ | 2,506 | | | | | | | $ | 3,996 | | | | | | | $ | 4,313 | | | | | | | $ | 10,407 | |
| | | | | | | | | | | | | | | | | | | | | | | | | | | | | | | | | | | | |
| | | | | | | | | |
Portfolio turnover rate | | | 102 | % | | | | | | | 136 | % | | | | | | | 311 | % | | | | | | | 182 | % | | | | | | | 137 | % |
| | | | | | | | | | | | | | | | | | | | | | | | | | | | | | | | | | | | |
| (a) | Based on average shares outstanding. |
| (b) | Distributions for annual periods determined in accordance with U.S. federal income tax regulations. |
| (c) | Where applicable, assumes the reinvestment of distributions. |
| (d) | Excludes fees and expenses incurred indirectly as a result of investments in underlying funds. |
See notes to financial statements.
| | |
| 32 | | 2 0 2 3 BLACK ROCK ANNUAL REPORT TO SHAREHOLDERS |
Financial Highlights (continued)
(For a share outstanding throughout each period)
| | | | | | | | | | | | | | | | | | | | | | | | | | | | | | | | | | | | |
| | | BlackRock EuroFund | |
| |
| | | Institutional | |
| |
| Year Ended
06/30/23 |
| | | | | |
| Year Ended
06/30/22 |
| | | | | |
| Year Ended
06/30/21 |
| | | | | |
| Year Ended
06/30/20 |
| | | | | |
| Year Ended
06/30/19 |
|
| | | | | | | | | | |
Net asset value, beginning of year | | $ | 14.70 | | | | | | | $ | 20.34 | | | | | | | $ | 14.31 | | | | | | | $ | 14.40 | | | | | | | $ | 15.06 | |
| | | | | | | | | | | | | | | | | | | | | | | | | | | | | | | | | | | | |
| | | | | | | | | |
Net investment income(a) | | | 0.24 | | | | | | | | 0.13 | | | | | | | | 0.03 | | | | | | | | 0.02 | | | | | | | | 0.13 | |
Net realized and unrealized gain (loss) | | | 4.41 | | | | | | | | (5.77 | ) | | | | | | | 6.00 | | | | | | | | (0.04 | ) | | | | | | | (0.45 | ) |
| | | | | | | | | | | | | | | | | | | | | | | | | | | | | | | | | | | | |
| | | | | | | | | |
Net increase (decrease) from investment operations | | | 4.65 | | | | | | | | (5.64 | ) | | | | | | | 6.03 | | | | | | | | (0.02 | ) | | | | | | | (0.32 | ) |
| | | | | | | | | | | | | | | | | | | | | | | | | | | | | | | | | | | | |
| | | | | | | | | |
Distributions from net investment income(b) | | | (0.12 | ) | | | | | | | — | | | | | | | | — | | | | | | | | (0.07 | ) | | | | | | | (0.34 | ) |
| | | | | | | | | | | | | | | | | | | | | | | | | | | | | | | | | | | | |
| | | | | | | | | |
Net asset value, end of year | | $ | 19.23 | | | | | | | $ | 14.70 | | | | | | | $ | 20.34 | | | | | | | $ | 14.31 | | | | | | | $ | 14.40 | |
| | | | | | | | | | | | | | | | | | | | | | | | | | | | | | | | | | | | |
| | | | | | | | | |
Total Return(c) | | | | | | | | | | | | | | | | | | | | | | | | | | | | | | | | | | | | |
Based on net asset value | | | 31.80 | % | | | | | | | (27.73 | )% | | | | | | | 42.14 | % | | | | | | | (0.17 | )% | | | | | | | (1.77 | )% |
| | | | | | | | | | | | | | | | | | | | | | | | | | | | | | | | | | | | |
| | | | | | | | | |
Ratios to Average Net Assets(d) | | | | | | | | | | | | | | | | | | | | | | | | | | | | | | | | | | | | |
Total expenses | | | 1.48 | % | | | | | | | 1.17 | % | | | | | | | 1.18 | % | | | | | | | 1.24 | % | | | | | | | 1.23 | % |
| | | | | | | | | | | | | | | | | | | | | | | | | | | | | | | | | | | | |
| | | | | | | | | |
Total expenses after fees waived and/or reimbursed | | | 1.31 | % | | | | | | | 1.10 | % | | | | | | | 1.12 | % | | | | | | | 1.18 | % | | | | | | | 1.17 | % |
| | | | | | | | | | | | | | | | | | | | | | | | | | | | | | | | | | | | |
| | | | | | | | | |
Total expenses after fees waived and/or reimbursed and excluding professional fees for foreign withholding taxes | | | 1.04 | % | | | | | | | 1.09 | % | | | | | | | 1.12 | % | | | | | | | 1.18 | % | | | | | | | 1.17 | % |
| | | | | | | | | | | | | | | | | | | | | | | | | | | | | | | | | | | | |
| | | | | | | | | |
Net investment income | | | 1.43 | % | | | | | | | 0.65 | % | | | | | | | 0.19 | % | | | | | | | 0.14 | % | | | | | | | 0.92 | % |
| | | | | | | | | | | | | | | | | | | | | | | | | | | | | | | | | | | | |
| | | | | | | | | |
Supplemental Data | | | | | | | | | | | | | | | | | | | | | | | | | | | | | | | | | | | | |
Net assets, end of year (000) | | $ | 34,272 | | | | | | | $ | 25,025 | | | | | | | $ | 81,809 | | | | | | | $ | 26,476 | | | | | | | $ | 33,178 | |
| | | | | | | | | | | | | | | | | | | | | | | | | | | | | | | | | | | | |
| | | | | | | | | |
Portfolio turnover rate | | | 37 | % | | | | | | | 42 | % | | | | | | | 26 | % | | | | | | | 39 | % | | | | | | | 153 | % |
| | | | | | | | | | | | | | | | | | | | | | | | | | | | | | | | | | | | |
| (a) | Based on average shares outstanding. |
| (b) | Distributions for annual periods determined in accordance with U.S. federal income tax regulations. |
| (c) | Where applicable, assumes the reinvestment of distributions. |
| (d) | Excludes fees and expenses incurred indirectly as a result of investments in underlying funds. |
See notes to financial statements.
Financial Highlights (continued)
(For a share outstanding throughout each period)
| | | | | | | | | | | | | | | | | | | | | | | | | | | | | | | | | | | | |
| | | BlackRock EuroFund (continued) | |
| |
| | | Investor A | |
| |
| Year Ended
06/30/23 |
| | | | | |
| Year Ended
06/30/22 |
| | | | | |
| Year Ended
06/30/21 |
| | | | | |
| Year Ended
06/30/20 |
| | | | | |
| Year Ended
06/30/19 |
|
| | | | | | | | | | |
Net asset value, beginning of year | | $ | 14.37 | | | | | | | $ | 19.93 | | | | | | | $ | 14.05 | | | | | | | $ | 14.11 | | | | | | | $ | 14.78 | |
| | | | | | | | | | | | | | | | | | | | | | | | | | | | | | | | | | | | |
| | | | | | | | | |
Net investment income (loss)(a) | | | 0.18 | | | | | | | | 0.09 | | | | | | | | (0.01 | ) | | | | | | | (0.00 | )(b) | | | | | | | 0.08 | |
Net realized and unrealized gain (loss) | | | 4.33 | | | | | | | | (5.65 | ) | | | | | | | 5.89 | | | | | | | | (0.04 | ) | | | | | | | (0.44 | ) |
| | | | | | | | | | | | | | | | | | | | | | | | | | | | | | | | | | | | |
| | | | | | | | | |
Net increase (decrease) from investment operations | | | 4.51 | | | | | | | | (5.56 | ) | | | | | | | 5.88 | | | | | | | | (0.04 | ) | | | | | | | (0.36 | ) |
| | | | | | | | | | | | | | | | | | | | | | | | | | | | | | | | | | | | |
| | | | | | | | | |
Distributions from net investment income(c) | | | (0.08 | ) | | | | | | | — | | | | | | | | — | | | | | | | | (0.02 | ) | | | | | | | (0.31 | ) |
| | | | | | | | | | | | | | | | | | | | | | | | | | | | | | | | | | | | |
| | | | | | | | | |
Net asset value, end of year | | $ | 18.80 | | | | | | | $ | 14.37 | | | | | | | $ | 19.93 | | | | | | | $ | 14.05 | | | | | | | $ | 14.11 | |
| | | | | | | | | | | | | | | | | | | | | | | | | | | | | | | | | | | | |
| | | | | | | | | |
Total Return(d) | | | | | | | | | | | | | | | | | | | | | | | | | | | | | | | | | | | | |
Based on net asset value | | | 31.49 | % | | | | | | | (27.90 | )% | | | | | | | 41.85 | % | | | | | | | (0.30 | )% | | | | | | | (2.08 | )% |
| | | | | | | | | | | | | | | | | | | | | | | | | | | | | | | | | | | | |
| | | | | | | | | |
Ratios to Average Net Assets(e) | | | | | | | | | | | | | | | | | | | | | | | | | | | | | | | | | | | | |
Total expenses | | | 1.71 | % | | | | | | | 1.40 | % | | | | | | | 1.39 | % | | | | | | | 1.40 | % | | | | | | | 1.45 | % |
| | | | | | | | | | | | | | | | | | | | | | | | | | | | | | | | | | | | |
| | | | | | | | | |
Total expenses after fees waived and/or reimbursed | | | 1.56 | % | | | | | | | 1.33 | % | | | | | | | 1.33 | % | | | | | | | 1.34 | % | | | | | | | 1.39 | % |
| | | | | | | | | | | | | | | | | | | | | | | | | | | | | | | | | | | | |
| | | | | | | | | |
Total expenses after fees waived and/or reimbursed and excluding professional fees for foreign withholding taxes | | | 1.29 | % | | | | | | | 1.32 | % | | | | | | | 1.33 | % | | | | | | | 1.34 | % | | | | | | | 1.39 | % |
| | | | | | | | | | | | | | | | | | | | | | | | | | | | | | | | | | | | |
| | | | | | | | | |
Net investment income (loss) | | | 1.07 | % | | | | | | | 0.48 | % | | | | | | | (0.03 | )% | | | | | | | (0.01 | )% | | | | | | | 0.56 | % |
| | | | | | | | | | | | | | | | | | | | | | | | | | | | | | | | | | | | |
| | | | | | | | | |
Supplemental Data | | | | | | | | | | | | | | | | | | | | | | | | | | | | | | | | | | | | |
Net assets, end of year (000) | | $ | 71,692 | | | | | | | $ | 59,981 | | | | | | | $ | 87,462 | | | | | | | $ | 65,887 | | | | | | | $ | 78,418 | |
| | | | | | | | | | | | | | | | | | | | | | | | | | | | | | | | | | | | |
| | | | | | | | | |
Portfolio turnover rate | | | 37 | % | | | | | | | 42 | % | | | | | | | 26 | % | | | | | | | 39 | % | | | | | | | 153 | % |
| | | | | | | | | | | | | | | | | | | | | | | | | | | | | | | | | | | | |
| (a) | Based on average shares outstanding. |
| (b) | Amount is greater than $(0.005) per share. |
| (c) | Distributions for annual periods determined in accordance with U.S. federal income tax regulations. |
| (d) | Where applicable, excludes the effects of any sales charges and assumes the reinvestment of distributions. |
| (e) | Excludes fees and expenses incurred indirectly as a result of investments in underlying funds. |
See notes to financial statements.
| | |
| 34 | | 2 0 2 3 BLACK ROCK ANNUAL REPORT TO SHAREHOLDERS |
Financial Highlights (continued)
(For a share outstanding throughout each period)
| | | | | | | | | | | | | | | | | | | | | | | | | | | | | | | | | | | | |
| | | BlackRock EuroFund (continued) | |
| |
| | | Investor C | |
| |
| Year Ended
06/30/23 |
| | | | | |
| Year Ended
06/30/22 |
| | | | | |
| Year Ended
06/30/21 |
| | | | | |
| Year Ended
06/30/20 |
| | | | | |
| Year Ended
06/30/19 |
|
| | | | | | | | | | |
Net asset value, beginning of year | | $ | 9.76 | | | | | | | $ | 13.63 | | | | | | | $ | 9.68 | | | | | | | $ | 9.79 | | | | | | | $ | 10.36 | |
| | | | | | | | | | | | | | | | | | | | | | | | | | | | | | | | | | | | |
| | | | | | | | | |
Net investment income (loss)(a) | | | 0.04 | | | | | | | | (0.06 | ) | | | | | | | (0.10 | ) | | | | | | | (0.08 | ) | | | | | | | (0.02 | ) |
Net realized and unrealized gain (loss) | | | 2.93 | | | | | | | | (3.81 | ) | | | | | | | 4.05 | | | | | | | | (0.03 | ) | | | | | | | (0.31 | ) |
| | | | | | | | | | | | | | | | | | | | | | | | | | | | | | | | | | | | |
| | | | | | | | | |
Net increase (decrease) from investment operations | | | 2.97 | | | | | | | | (3.87 | ) | | | | | | | 3.95 | | | | | | | | (0.11 | ) | | | | | | | (0.33 | ) |
| | | | | | | | | | | | | | | | | | | | | | | | | | | | | | | | | | | | |
| | | | | | | | | |
Distributions from net investment income(b) | | | — | | | | | | | | — | | | | | | | | — | | | | | | | | — | | | | | | | | (0.24 | ) |
| | | | | | | | | | | | | | | | | | | | | | | | | | | | | | | | | | | | |
| | | | | | | | | |
Net asset value, end of year | | $ | 12.73 | | | | | | | $ | 9.76 | | | | | | | $ | 13.63 | | | | | | | $ | 9.68 | | | | | | | $ | 9.79 | |
| | | | | | | | | | | | | | | | | | | | | | | | | | | | | | | | | | | | |
| | | | | | | | | |
Total Return(c) | | | | | | | | | | | | | | | | | | | | | | | | | | | | | | | | | | | | |
Based on net asset value | | | 30.43 | % | | | | | | | (28.39 | )% | | | | | | | 40.81 | % | | | | | | | (1.12 | )% | | | | | | | (2.82 | )% |
| | | | | | | | | | | | | | | | | | | | | | | | | | | | | | | | | | | | |
| | | | | | | | | |
Ratios to Average Net Assets(d) | | | | | | | | | | | | | | | | | | | | | | | | | | | | | | | | | | | | |
Total expenses | | | 2.44 | % | | | | | | | 2.17 | % | | | | | | | 2.17 | % | | | | | | | 2.19 | % | | | | | | | 2.20 | % |
| | | | | | | | | | | | | | | | | | | | | | | | | | | | | | | | | | | | |
| | | | | | | | | |
Total expenses after fees waived and/or reimbursed | | | 2.32 | % | | | | | | | 2.10 | % | | | | | | | 2.11 | % | | | | | | | 2.13 | % | | | | | | | 2.14 | % |
| | | | | | | | | | | | | | | | | | | | | | | | | | | | | | | | | | | | |
| | | | | | | | | |
Total expenses after fees waived and/or reimbursed and excluding professional fees for foreign withholding taxes | | | 2.02 | % | | | | | | | 2.09 | % | | | | | | | 2.11 | % | | | | | | | 2.13 | % | | | | | | | 2.14 | % |
| | | | | | | | | | | | | | | | | | | | | | | | | | | | | | | | | | | | |
| | | | | | | | | |
Net investment income (loss) | | | 0.36 | % | | | | | | | (0.45 | )% | | | | | | | (0.86 | )% | | | | | | | (0.85 | )% | | | | | | | (0.17 | )% |
| | | | | | | | | | | | | | | | | | | | | | | | | | | | | | | | | | | | |
| | | | | | | | | |
Supplemental Data | | | | | | | | | | | | | | | | | | | | | | | | | | | | | | | | | | | | |
Net assets, end of year (000) | | $ | 1,267 | | | | | | | $ | 1,055 | | | | | | | $ | 2,451 | | | | | | | $ | 3,088 | | | | | | | $ | 4,179 | |
| | | | | | | | | | | | | | | | | | | | | | | | | | | | | | | | | | | | |
| | | | | | | | | |
Portfolio turnover rate | | | 37 | % | | | | | | | 42 | % | | | | | | | 26 | % | | | | | | | 39 | % | | | | | | | 153 | % |
| | | | | | | | | | | | | | | | | | | | | | | | | | | | | | | | | | | | |
| (a) | Based on average shares outstanding. |
| (b) | Distributions for annual periods determined in accordance with U.S. federal income tax regulations. |
| (c) | Where applicable, excludes the effects of any sales charges and assumes the reinvestment of distributions. |
| (d) | Excludes fees and expenses incurred indirectly as a result of investments in underlying funds. |
See notes to financial statements.
Financial Highlights (continued)
(For a share outstanding throughout each period)
| | | | | | | | | | | | | | | | | | | | | | | | | | | | | | | | | | | | |
| | | BlackRock EuroFund (continued) | |
| |
| | | Class K | |
| |
| Year Ended
06/30/23 |
| | | | | |
| Year Ended
06/30/22 |
| | | | | |
| Year Ended
06/30/21 |
| | | | | |
| Year Ended
06/30/20 |
| | | | | |
| Year Ended
06/30/19 |
|
| | | | | | | | | | |
Net asset value, beginning of year | | $ | 14.69 | | | | | | | $ | 20.30 | | | | | | | $ | 14.26 | | | | | | | $ | 14.34 | | | | | | | $ | 15.08 | |
| | | | | | | | | | | | | | | | | | | | | | | | | | | | | | | | | | | | |
| | | | | | | | | |
Net investment income(a) | | | 0.23 | | | | | | | | 0.16 | | | | | | | | 0.06 | | | | | | | | 0.03 | | | | | | | | 0.14 | |
Net realized and unrealized gain (loss) | | | 4.42 | | | | | | | | (5.77 | ) | | | | | | | 5.98 | | | | | | | | (0.02 | ) | | | | | | | (0.46 | ) |
| | | | | | | | | | | | | | | | | | | | | | | | | | | | | | | | | | | | |
| | | | | | | | | |
Net increase (decrease) from investment operations | | | 4.65 | | | | | | | | (5.61 | ) | | | | | | | 6.04 | | | | | | | | 0.01 | | | | | | | | (0.32 | ) |
| | | | | | | | | | | | | | | | | | | | | | | | | | | | | | | | | | | | |
| | | | | | | | | |
Distributions from net investment income(b) | | | (0.15 | ) | | | | | | | — | | | | | | | | — | | | | | | | | (0.09 | ) | | | | | | | (0.42 | ) |
| | | | | | | | | | | | | | | | | | | | | | | | | | | | | | | | | | | | |
| | | | | | | | | |
Net asset value, end of year | | $ | 19.19 | | | | | | | $ | 14.69 | | | | | | | $ | 20.30 | | | | | | | $ | 14.26 | | | | | | | $ | 14.34 | |
| | | | | | | | | | | | | | | | | | | | | | | | | | | | | | | | | | | | |
| | | | | | | | | |
Total Return(c) | | | | | | | | | | | | | | | | | | | | | | | | | | | | | | | | | | | | |
Based on net asset value | | | 31.81 | % | | | | | | | (27.64 | )% | | | | | | | 42.36 | % | | | | | | | 0.03 | % | | | | | | | (1.70 | )% |
| | | | | | | | | | | | | | | | | | | | | | | | | | | | | | | | | | | | |
| | | | | | | | | |
Ratios to Average Net Assets(d) | | | | | | | | | | | | | | | | | | | | | | | | | | | | | | | | | | | | |
Total expenses | | | 1.37 | % | | | | | | | 1.08 | % | | | | | | | 1.04 | % | | | | | | | 1.06 | % | | | | | | | 1.11 | % |
| | | | | | | | | | | | | | | | | | | | | | | | | | | | | | | | | | | | |
| | | | | | | | | |
Total expenses after fees waived and/or reimbursed | | | 1.25 | % | | | | | | | 1.01 | % | | | | | | | 0.98 | % | | | | | | | 1.00 | % | | | | | | | 1.05 | % |
| | | | | | | | | | | | | | | | | | | | | | | | | | | | | | | | | | | | |
| | | | | | | | | |
Total expenses after fees waived and/or reimbursed and excluding professional fees for foreign withholding taxes | | | 0.99 | % | | | | | | | 1.00 | % | | | | | | | 0.98 | % | | | | | | | 1.00 | % | | | | | | | 1.05 | % |
| | | | | | | | | | | | | | | | | | | | | | | | | | | | | | | | | | | | |
| | | | | | | | | |
Net investment income | | | 1.40 | % | | | | | | | 0.83 | % | | | | | | | 0.34 | % | | | | | | | 0.18 | % | | | | | | | 1.00 | % |
| | | | | | | | | | | | | | | | | | | | | | | | | | | | | | | | | | | | |
| | | | | | | | | |
Supplemental Data | | | | | | | | | | | | | | | | | | | | | | | | | | | | | | | | | | | | |
Net assets, end of year (000) | | $ | 1,098 | | | | | | | $ | 886 | | | | | | | $ | 860 | | | | | | | $ | 601 | | | | | | | $ | 710 | |
| | | | | | | | | | | | | | | | | | | | | | | | | | | | | | | | | | | | |
| | | | | | | | | |
Portfolio turnover rate | | | 37 | % | | | | | | | 42 | % | | | | | | | 26 | % | | | | | | | 39 | % | | | | | | | 153 | % |
| | | | | | | | | | | | | | | | | | | | | | | | | | | | | | | | | | | | |
| (a) | Based on average shares outstanding. |
| (b) | Distributions for annual periods determined in accordance with U.S. federal income tax regulations. |
| (c) | Where applicable, assumes the reinvestment of distributions. |
| (d) | Excludes fees and expenses incurred indirectly as a result of investments in underlying funds. |
See notes to financial statements.
| | |
| 36 | | 2 0 2 3 BLACK ROCK ANNUAL REPORT TO SHAREHOLDERS |
Financial Highlights (continued)
(For a share outstanding throughout each period)
| | | | | | | | | | | | | | | | | | | | | | | | | | | | | | | | | | | | |
| | | BlackRock EuroFund (continued) | |
| |
| | | Class R | |
| |
| Year Ended
06/30/23 |
| | | | | |
| Year Ended
06/30/22 |
| | | | | |
| Year Ended
06/30/21 |
| | | | | |
| Year Ended
06/30/20 |
| | | | | |
| Year Ended
06/30/19 |
|
| | | | | | | | | | |
Net asset value, beginning of year | | $ | 10.61 | | | | | | | $ | 14.79 | | | | | | | $ | 10.46 | | | | | | | $ | 10.54 | | | | | | | $ | 11.14 | |
| | | | | | | | | | | | | | | | | | | | | | | | | | | | | | | | | | | | |
| | | | | | | | | |
Net investment income (loss)(a) | | | 0.12 | | | | | | | | (0.06 | ) | | | | | | | (0.04 | ) | | | | | | | (0.04 | ) | | | | | | | (0.01 | ) |
Net realized and unrealized gain (loss) | | | 3.18 | | | | | | | | (4.12 | ) | | | | | | | 4.37 | | | | | | | | (0.04 | ) | | | | | | | (0.33 | ) |
| | | | | | | | | | | | | | | | | | | | | | | | | | | | | | | | | | | | |
| | | | | | | | | |
Net increase (decrease) from investment operations | | | 3.30 | | | | | | | | (4.18 | ) | | | | | | | 4.33 | | | | | | | | (0.08 | ) | | | | | | | (0.34 | ) |
| | | | | | | | | | | | | | | | | | | | | | | | | | | | | | | | | | | | |
| | | | | | | | | |
Distributions from net investment income(b) | | | — | | | | | | | | — | | | | | | | | — | | | | | | | | — | | | | | | | | (0.26 | ) |
| | | | | | | | | | | | | | | | | | | | | | | | | | | | | | | | | | | | |
| | | | | | | | | |
Net asset value, end of year | | $ | 13.91 | | | | | | | $ | 10.61 | | | | | | | $ | 14.79 | | | | | | | $ | 10.46 | | | | | | | $ | 10.54 | |
| | | | | | | | | | | | | | | | | | | | | | | | | | | | | | | | | | | | |
| | | | | | | | | |
Total Return(c) | | | | | | | | | | | | | | | | | | | | | | | | | | | | | | | | | | | | |
Based on net asset value | | | 31.10 | % | | | | | | | (28.26 | )% | | | | | | | 41.40 | % | | | | | | | (0.76 | )% | | | | | | | (2.66 | )% |
| | | | | | | | | | | | | | | | | | | | | | | | | | | | | | | | | | | | |
| | | | | | | | | |
Ratios to Average Net Assets(d) | | | | | | | | | | | | | | | | | | | | | | | | | | | | | | | | | | | | |
Total expenses | | | 2.20 | % | | | | | | | 1.91 | % | | | | | | | 1.73 | % | | | | | | | 1.87 | % | | | | | | | 2.07 | % |
| | | | | | | | | | | | | | | | | | | | | | | | | | | | | | | | | | | | |
| | | | | | | | | |
Total expenses after fees waived and/or reimbursed | | | 1.82 | % | | | | | | | 1.84 | % | | | | | | | 1.67 | % | | | | | | | 1.81 | % | | | | | | | 2.01 | % |
| | | | | | | | | | | | | | | | | | | | | | | | | | | | | | | | | | | | |
| | | | | | | | | |
Total expenses after fees waived and/or reimbursed and excluding professional fees for foreign withholding taxes | | | 1.54 | % | | | | | | | 1.83 | % | | | | | | | 1.67 | % | | | | | | | 1.81 | % | | | | | | | 2.01 | % |
| | | | | | | | | | | | | | | | | | | | | | | | | | | | | | | | | | | | |
| | | | | | | | | |
Net investment income (loss) | | | 0.96 | % | | | | | | | (0.41 | )% | | | | | | | (0.32 | )% | | | | | | | (0.42 | )% | | | | | | | (0.07 | )% |
| | | | | | | | | | | | | | | | | | | | | | | | | | | | | | | | | | | | |
| | | | | | | | | |
Supplemental Data | | | | | | | | | | | | | | | | | | | | | | | | | | | | | | | | | | | | |
Net assets, end of year (000) | | $ | 279 | | | | | | | $ | 195 | | | | | | | $ | 471 | | | | | | | $ | 359 | | | | | | | $ | 363 | |
| | | | | | | | | | | | | | | | | | | | | | | | | | | | | | | | | | | | |
| | | | | | | | | |
Portfolio turnover rate | | | 37 | % | | | | | | | 42 | % | | | | | | | 26 | % | | | | | | | 39 | % | | | | | | | 153 | % |
| | | | | | | | | | | | | | | | | | | | | | | | | | | | | | | | | | | | |
| (a) | Based on average shares outstanding. |
| (b) | Distributions for annual periods determined in accordance with U.S. federal income tax regulations. |
| (c) | Where applicable, assumes the reinvestment of distributions. |
| (d) | Excludes fees and expenses incurred indirectly as a result of investments in underlying funds. |
See notes to financial statements.
Notes to Financial Statements
1. ORGANIZATION
BlackRock Advantage Global Fund, Inc., (the “Corporation”) and BlackRock EuroFund (the “Trust”) are each registered under the Investment Company Act of 1940, as amended (the “1940 Act”), as open-end management investment companies. The Corporation is organized as a Maryland corporation. The Trust is organized as a Massachusetts business trust. The following are referred to herein collectively as the “Funds” or individually as a “Fund”:
| | | | |
| | | |
| Fund Name | | Herein Referred To As | | Diversification
Classification |
BlackRock Advantage Global Fund, Inc. | | Advantage Global | | Diversified |
BlackRock EuroFund | | EuroFund | | Diversified |
Each Fund offers multiple classes of shares. All classes of shares have identical voting, dividend, liquidation and other rights and are subject to the same terms and conditions, except that certain classes bear expenses related to the shareholder servicing and distribution of such shares. Institutional and Class K Shares are sold only to certain eligible investors. Investor A, Investor C and Class R Shares bear certain expenses related to shareholder servicing of such shares, and Investor C and Class R Shares also bear certain expenses related to the distribution of such shares. Investor A and Investor C Shares are generally available through financial intermediaries. Class R Shares are sold only to certain employer-sponsored retirement plans. Each class has exclusive voting rights with respect to matters relating to its shareholder servicing and distribution expenditures (except that Investor C shareholders may vote on material changes to the Investor A Shares distribution and service plan).
| | | | | | |
| | | | |
| Share Class | | Initial Sales Charge | | CDSC | | Conversion Privilege |
Institutional, Class K and Class R Shares | | No | | No | | None |
Investor A Shares | | Yes | | No(a) | | None |
Investor C Shares | | No | | Yes(b) | | To Investor A Shares after approximately 8 years |
| | (a) | Investor A Shares may be subject to a contingent deferred sales charge (“CDSC”) for certain redemptions where no initial sales charge was paid at the time of purchase. | |
| | (b) | A CDSC of 1.00% is assessed on certain redemptions of Investor C Shares made within one year after purchase. | |
The Board of Trustees of the Trust and the Board of Directors of the Corporation are collectively referred to throughout this report as the “Board,” and the directors/trustees thereof are collectively referred to throughout this report as “Directors”.
The Funds, together with certain other registered investment companies advised by BlackRock Advisors, LLC (the “Manager”) or its affiliates, are included in a complex of funds referred to as the BlackRock Multi-Asset Complex.
2. SIGNIFICANT ACCOUNTING POLICIES
The financial statements are prepared in conformity with accounting principles generally accepted in the United States of America (“U.S. GAAP”), which may require management to make estimates and assumptions that affect the reported amounts of assets and liabilities in the financial statements, disclosure of contingent assets and liabilities at the date of the financial statements and the reported amounts of increases and decreases in net assets from operations during the reporting period. Actual results could differ from those estimates. Each Fund is considered an investment company under U.S. GAAP and follows the accounting and reporting guidance applicable to investment companies. Below is a summary of significant accounting policies:
Investment Transactions and Income Recognition: For financial reporting purposes, investment transactions are recorded on the dates the transactions are executed. Realized gains and losses on investment transactions are determined using the specific identification method. Dividend income and capital gain distributions, if any, are recorded on the ex-dividend dates. Non-cash dividends, if any, are recorded on the ex-dividend dates at fair value. Dividends from foreign securities where the ex-dividend dates may have passed are subsequently recorded when the Funds are informed of the ex-dividend dates. Under the applicable foreign tax laws, a withholding tax at various rates may be imposed on capital gains, dividends and interest. Upon notification from issuers, a portion of the dividend income received from a real estate investment trust may be redesignated as a reduction of cost of the related investment and/or realized gain. Income, expenses and realized and unrealized gains and losses are allocated daily to each class based on its relative net assets.
Foreign Currency Translation: Each Fund’s books and records are maintained in U.S. dollars. Securities and other assets and liabilities denominated in foreign currencies are translated into U.S. dollars using exchange rates determined as of the close of trading on the New York Stock Exchange (“NYSE”). Purchases and sales of investments are recorded at the rates of exchange prevailing on the respective dates of such transactions. Generally, when the U.S. dollar rises in value against a foreign currency, the investments denominated in that currency will lose value; the opposite effect occurs if the U.S. dollar falls in relative value.
Each Fund does not isolate the effect of fluctuations in foreign exchange rates from the effect of fluctuations in the market prices of investments for financial reporting purposes. Accordingly, the effects of changes in exchange rates on investments are not segregated in the Statements of Operations from the effects of changes in market prices of those investments, but are included as a component of net realized and unrealized gain (loss) from investments. Each Fund reports realized currency gains (losses) on foreign currency related transactions as components of net realized gain (loss) for financial reporting purposes, whereas such components are generally treated as ordinary income for U.S. federal income tax purposes.
Foreign Taxes: The Funds may be subject to foreign taxes (a portion of which may be reclaimable) on income, stock dividends, capital gains on investments, or certain foreign currency transactions. All foreign taxes are recorded in accordance with the applicable foreign tax regulations and rates that exist in the foreign jurisdictions in which each Fund invests. These foreign taxes, if any, are paid by each Fund and are reflected in its Statements of Operations as follows: foreign taxes withheld at source are presented as a reduction of income, foreign taxes on securities lending income are presented as a reduction of securities lending income, foreign taxes on stock dividends are presented as “Foreign taxes withheld”, and foreign taxes on capital gains from sales of investments and foreign taxes on foreign currency transactions are included in their respective net realized gain (loss) categories. Foreign taxes payable or deferred as of June 30, 2023, if any, are disclosed in the Statements of Assets and Liabilities.
| | |
| 38 | | 2 0 2 3 BLACK ROCK ANNUAL REPORT TO SHAREHOLDERS |
Notes to Financial Statements (continued)
The Funds file withholding tax reclaims in certain jurisdictions to recover a portion of amounts previously withheld. The Funds may record a reclaim receivable based on collectability, which includes factors such as the jurisdiction’s applicable laws, payment history and market convention. The Statements of Operations include tax reclaims recorded as well as professional and other fees, if any, associated with recovery of foreign withholding taxes.
Bank Overdraft: EuroFund had outstanding cash disbursements exceeding deposited cash amounts at the custodian and utilized its ability to temporarily borrow from that custodian for operational purposes. EuroFund is obligated to repay the custodian for any overdraft, including any related costs or expenses, where applicable.
Collateralization: If required by an exchange or counterparty agreement, the Funds may be required to deliver/deposit cash and/or securities to/with an exchange, or broker-dealer or custodian as collateral for certain investments.
Distributions: Distributions paid by the Funds are recorded on the ex-dividend dates. The character and timing of distributions are determined in accordance with U.S. federal income tax regulations, which may differ from U.S. GAAP.
Indemnifications: In the normal course of business, a Fund enters into contracts that contain a variety of representations that provide general indemnification. A Fund’s maximum exposure under these arrangements is unknown because it involves future potential claims against a Fund, which cannot be predicted with any certainty.
Other: Expenses directly related to a Fund or its classes are charged to that Fund or the applicable class. Expenses directly related to the Funds and other shared expenses prorated to the Funds are allocated daily to each class based on their relative net assets or other appropriate methods. Other operating expenses shared by several funds, including other funds managed by the Manager, are prorated among those funds on the basis of relative net assets or other appropriate methods.
The Funds have an arrangement with their custodian whereby credits are earned on uninvested cash balances, which could be used to reduce custody fees and/or overdraft charges. The Funds may incur charges on overdrafts, subject to certain conditions.
3. INVESTMENT VALUATION AND FAIR VALUE MEASUREMENTS
Investment Valuation Policies: Each Fund’s investments are valued at fair value (also referred to as “market value” within the financial statements) each day that the Fund is open for business and, for financial reporting purposes, as of the report date. U.S. GAAP defines fair value as the price a fund would receive to sell an asset or pay to transfer a liability in an orderly transaction between market participants at the measurement date. The Board has approved the designation of each Fund’s Manager as the valuation designee for each Fund. Each Fund determines the fair values of its financial instruments using various independent dealers or pricing services under the Manager’s policies. If a security’s market price is not readily available or does not otherwise accurately represent the fair value of the security, the security will be valued in accordance with the Manager’s policies and procedures as reflecting fair value. The Manager has formed a committee (the “Valuation Committee”) to develop pricing policies and procedures and to oversee the pricing function for all financial instruments, with assistance from other BlackRock pricing committees.
Fair Value Inputs and Methodologies: The following methods and inputs are used to establish the fair value of each Fund’s assets and liabilities:
| | · | | Equity investments traded on a recognized securities exchange are valued at that day’s official closing price, as applicable, on the exchange where the stock is primarily traded. Equity investments traded on a recognized exchange for which there were no sales on that day may be valued at the last available bid (long positions) or ask (short positions) price. |
| | · | | Investments in open-end U.S. mutual funds (including money market funds) are valued at that day’s published net asset value (“NAV”). |
| | · | | The Funds value their investment in SL Liquidity Series, LLC, Money Market Series (the “Money Market Series”) at fair value, which is ordinarily based upon their pro rata ownership in the underlying fund’s net assets. |
| | · | | Futures contracts are valued based on that day’s last reported settlement or trade price on the exchange where the contract is traded. |
Generally, trading in foreign instruments is substantially completed each day at various times prior to the close of trading on the NYSE. Each business day, the Funds use current market factors supplied by independent pricing services to value certain foreign instruments (“Systematic Fair Value Price”). The Systematic Fair Value Price is designed to value such foreign securities at fair value as of the close of trading on the NYSE, which follows the close of the local markets.
If events (e.g., market volatility, company announcement or a natural disaster) occur that are expected to materially affect the value of such investment, or in the event that application of these methods of valuation results in a price for an investment that is deemed not to be representative of the market value of such investment, or if a price is not available, the investment will be valued by the Valuation Committee in accordance with the Manager’s policies and procedures as reflecting fair value (“Fair Valued Investments”). The fair valuation approaches that may be used by the Valuation Committee include market approach, income approach and cost approach. Valuation techniques such as discounted cash flow, use of market comparables and matrix pricing are types of valuation approaches and are typically used in determining fair value. When determining the price for Fair Valued Investments, the Valuation Committee seeks to determine the price that each Fund might reasonably expect to receive or pay from the current sale or purchase of that asset or liability in an arm’s-length transaction. Fair value determinations shall be based upon all available factors that the Valuation Committee deems relevant and consistent with the principles of fair value measurement.
For investments in equity or debt issued by privately held companies or funds (“Private Company” or collectively, the “Private Companies”) and other Fair Valued Investments, the fair valuation approaches that are used by the Valuation Committee and third-party pricing services utilized by the Valuation Committee include one or a combination of, but not limited to, the following inputs.
| | |
| | | Standard Inputs Generally Considered By The Valuation Committee And Third-Party Pricing Services |
Market approach | | (i) recent market transactions, including subsequent rounds of financing, in the underlying investment or comparable issuers; |
| | |
NOTES TO FINANCIAL STATEMENTS | | 39 |
Notes to Financial Statements (continued)
| | |
| | | Standard Inputs Generally Considered By The Valuation Committee And Third-Party Pricing Services |
| | | (ii) recapitalizations and other transactions across the capital structure; and (iii) market multiples of comparable issuers. |
Income approach | | (i) future cash flows discounted to present and adjusted as appropriate for liquidity, credit, and/or market risks; (ii) quoted prices for similar investments or assets in active markets; and (iii) other risk factors, such as interest rates, yield curves, volatilities, prepayment speeds, loss severities, credit risks, recovery rates, liquidation amounts and/or default rates. |
Cost approach | | (i) audited or unaudited financial statements, investor communications and financial or operational metrics issued by the Private Company; (ii) changes in the valuation of relevant indices or publicly traded companies comparable to the Private Company; (iii) relevant news and other public sources; and (iv) known secondary market transactions in the Private Company’s interests and merger or acquisition activity in companies comparable to the Private Company. |
Investments in series of preferred stock issued by Private Companies are typically valued utilizing market approach in determining the enterprise value of the company. Such investments often contain rights and preferences that differ from other series of preferred and common stock of the same issuer. Enterprise valuation techniques such as an option pricing model (“OPM”), a probability weighted expected return model (“PWERM”), current value method or a hybrid of those techniques are used as deemed appropriate under the circumstances. The use of these valuation techniques involve a determination of the exit scenarios of the investment in order to appropriately allocate the enterprise value of the company among the various parts of its capital structure.
The Private Companies are not subject to the public company disclosure, timing, and reporting standards applicable to other investments held by a Fund. Typically, the most recently available information by a Private Company is as of a date that is earlier than the date a Fund is calculating its NAV. This factor may result in a difference between the value of the investment and the price a Fund could receive upon the sale of the investment.
Fair Value Hierarchy: Various inputs are used in determining the fair value of financial instruments. These inputs to valuation techniques are categorized into a fair value hierarchy consisting of three broad levels for financial reporting purposes as follows:
| | · | | Level 1 – Unadjusted price quotations in active markets/exchanges for identical assets or liabilities that each Fund has the ability to access; |
| | · | | Level 2 – Other observable inputs (including, but not limited to, quoted prices for similar assets or liabilities in markets that are active, quoted prices for identical or similar assets or liabilities in markets that are not active, inputs other than quoted prices that are observable for the assets or liabilities (such as interest rates, yield curves, volatilities, prepayment speeds, loss severities, credit risks and default rates) or other market–corroborated inputs); and |
| | · | | Level 3 – Unobservable inputs based on the best information available in the circumstances, to the extent observable inputs are not available (including the Valuation Committee’s assumptions used in determining the fair value of financial instruments). |
The hierarchy gives the highest priority to unadjusted quoted prices in active markets for identical assets or liabilities (Level 1 measurements) and the lowest priority to unobservable inputs (Level 3 measurements). Accordingly, the degree of judgment exercised in determining fair value is greatest for instruments categorized in Level 3. The inputs used to measure fair value may fall into different levels of the fair value hierarchy. In such cases, for disclosure purposes, the fair value hierarchy classification is determined based on the lowest level input that is significant to the fair value measurement in its entirety. Investments classified within Level 3 have significant unobservable inputs used by the Valuation Committee in determining the price for Fair Valued Investments. Level 3 investments include equity or debt issued by Private Companies that may not have a secondary market and/or may have a limited number of investors. The categorization of a value determined for financial instruments is based on the pricing transparency of the financial instruments and is not necessarily an indication of the risks associated with investing in those securities.
As of June 30, 2023, certain investments of Advantage Global were fair valued using NAV as a practical expedient as no quoted market value is available and therefore have been excluded from the fair value hierarchy.
4. SECURITIES AND OTHER INVESTMENTS
Preferred Stocks: Preferred stock has a preference over common stock in liquidation (and generally in receiving dividends as well), but is subordinated to the liabilities of the issuer in all respects. As a general rule, the market value of preferred stock with a fixed dividend rate and no conversion element varies inversely with interest rates and perceived credit risk, while the market price of convertible preferred stock generally also reflects some element of conversion value. Because preferred stock is junior to debt securities and other obligations of the issuer, deterioration in the credit quality of the issuer will cause greater changes in the value of a preferred stock than in a more senior debt security with similar stated yield characteristics. Unlike interest payments on debt securities, preferred stock dividends are payable only if declared by the issuer’s board of directors. Preferred stock also may be subject to optional or mandatory redemption provisions.
Securities Lending: Certain Funds may lend their securities to approved borrowers, such as brokers, dealers and other financial institutions. The borrower pledges and maintains with the Funds collateral consisting of cash, an irrevocable letter of credit issued by a bank, or securities issued or guaranteed by the U.S. Government. The initial collateral received by each Fund is required to have a value of at least 102% of the current value of the loaned securities for securities traded on U.S. exchanges and a value of at least 105% for all other securities. The collateral is maintained thereafter at a value equal to at least 100% of the current market value of the securities on loan. The market value of the loaned securities is determined at the close of each business day of the Fund and any additional required collateral is delivered to the Fund, or excess collateral returned by the Fund, on the next business day. During the term of the loan, the Funds are entitled to all distributions made on or in respect of the loaned securities, but do not receive interest income on securities received as collateral. Loans of securities are terminable at any time and the borrower, after notice, is required to return borrowed securities within the standard time period for settlement of securities transactions.
| | |
| 40 | | 2 0 2 3 BLACK ROCK ANNUAL REPORT TO SHAREHOLDERS |
Notes to Financial Statements (continued)
As of period end, any securities on loan were collateralized by cash and/or U.S. Government obligations. Cash collateral invested by the securities lending agent, BlackRock Investment Management, LLC (“BIM”), if any, is disclosed in the Schedules of Investments. Any non-cash collateral received cannot be sold, re-invested or pledged by the Fund, except in the event of borrower default. The securities on loan, if any, are disclosed in the Funds’ Schedules of Investments. The market value of any securities on loan and the value of related collateral, if any, are shown separately in the Statements of Assets and Liabilities as a component of investments at value – unaffiliated and collateral on securities loaned, respectively.
Securities lending transactions are entered into by the Funds under Master Securities Lending Agreements (each, an “MSLA”), which provide the right, in the event of default (including bankruptcy or insolvency), for the non-defaulting party to liquidate the collateral and calculate a net exposure to the defaulting party or request additional collateral. In the event that a borrower defaults, the Funds, as lender, would offset the market value of the collateral received against the market value of the securities loaned. When the value of the collateral is greater than that of the market value of the securities loaned, the lender is left with a net amount payable to the defaulting party. However, bankruptcy or insolvency laws of a particular jurisdiction may impose restrictions on or prohibitions against such a right of offset in the event of an MSLA counterparty’s bankruptcy or insolvency. Under the MSLA, absent an event of default, the borrower can resell or re-pledge the loaned securities, and the Funds can reinvest cash collateral received in connection with loaned securities. Upon an event of default, the parties’ obligations to return the securities or collateral to the other party are extinguished, and the parties can resell or re-pledge the loaned securities or the collateral received in connection with the loaned securities in order to satisfy the defaulting party’s net payment obligation for all transactions under the MSLA. The defaulting party remains liable for any deficiency.
As of period end, the following table is a summary of the Funds’ securities on loan by counterparty which are subject to offset under an MSLA:
| | | | | | | | | | | | | | | | |
| | | | | |
Fund Name/Counterparty | |
| Securities
Loaned at Value |
| |
| Cash Collateral
Received |
(a) | |
| Non-Cash Collateral
Received, at Fair Value |
(a) | |
| Net
Amount |
(b) |
Advantage Global Jefferies LLC | | $ | 167,710 | | | $ | (165,124 | ) | | $ | — | | | $ | 2,586 | |
| | | | | | | | | | | | | | | | |
| | (a) | Collateral received, if any, in excess of the market value of securities on loan is not presented in this table. The total cash collateral received by each Fund is disclosed in the Fund’s Statements of Assets and Liabilities. | |
| | (b) | The market value of the loaned securities is determined as of June 30, 2023. Additional collateral is delivered to each Fund on the next business day in accordance with the MSLA. The net amount would be subject to the borrower default indemnity in the event of default by the counterparty. | |
The risks of securities lending include the risk that the borrower may not provide additional collateral when required or may not return the securities when due. To mitigate these risks, the Funds benefit from a borrower default indemnity provided by BIM. BIM’s indemnity allows for full replacement of the securities loaned to the extent the collateral received does not cover the value on the securities loaned in the event of borrower default. Each Fund could incur a loss if the value of an investment purchased with cash collateral falls below the market value of loaned securities or if the value of an investment purchased with cash collateral falls below the value of the original cash collateral received. Such losses are borne entirely by the Funds.
5. DERIVATIVE FINANCIAL INSTRUMENTS
The Funds engage in various portfolio investment strategies using derivative contracts both to increase the returns of the Funds and/or to manage their exposure to certain risks such as credit risk, equity risk, interest rate risk, foreign currency exchange rate risk, commodity price risk or other risks (e.g., inflation risk). Derivative financial instruments categorized by risk exposure are included in the Schedules of Investments. These contracts may be transacted on an exchange or over-the-counter (“OTC”).
Futures Contracts: Futures contracts are purchased or sold to gain exposure to, or manage exposure to, changes in interest rates (interest rate risk) and changes in the value of equity securities (equity risk) or foreign currencies (foreign currency exchange rate risk).
Futures contracts are exchange-traded agreements between the Funds and a counterparty to buy or sell a specific quantity of an underlying instrument at a specified price and on a specified date. Depending on the terms of a contract, it is settled either through physical delivery of the underlying instrument on the settlement date or by payment of a cash amount on the settlement date. Upon entering into a futures contract, the Funds are required to deposit initial margin with the broker in the form of cash or securities in an amount that varies depending on a contract’s size and risk profile. The initial margin deposit must then be maintained at an established level over the life of the contract. Amounts pledged, which are considered restricted, are included in cash pledged for futures contracts in the Statements of Assets and Liabilities.
Securities deposited as initial margin are designated in the Schedules of Investments and cash deposited, if any, are shown as cash pledged for futures contracts in the Statements of Assets and Liabilities. Pursuant to the contract, the Funds agree to receive from or pay to the broker an amount of cash equal to the daily fluctuation in market value of the contract (“variation margin”). Variation margin is recorded as unrealized appreciation (depreciation) and, if any, shown as variation margin receivable (or payable) on futures contracts in the Statements of Assets and Liabilities. When the contract is closed, a realized gain or loss is recorded in the Statements of Operations equal to the difference between the notional amount of the contract at the time it was opened and the notional amount at the time it was closed. The use of futures contracts involves the risk of an imperfect correlation in the movements in the price of futures contracts and interest rates, foreign currency exchange rates or underlying assets.
6. INVESTMENT ADVISORY AGREEMENT AND OTHER TRANSACTIONS WITH AFFILIATES
Investment Advisory: Each Fund entered into an Investment Advisory Agreement with the Manager, the Funds’ investment adviser and an indirect, wholly-owned subsidiary of BlackRock, Inc. (“BlackRock”), to provide investment advisory and administrative services. The Manager is responsible for the management of each Fund’s portfolio and provides the personnel, facilities, equipment and certain other services necessary to the operations of each Fund.
| | |
NOTES TO FINANCIAL STATEMENTS | | 41 |
Notes to Financial Statements (continued)
For such services, each Fund pays the Manager a monthly fee at an annual rate equal to the following percentages of the average daily value of each Fund’s net assets:
| | | | | | | | |
| | | Investment Advisory Fees | |
| | |
| Average Daily Net Assets | | Advantage Global | | | EuroFund | |
First $1 billion | | | 0.66 | % | | | 0.75 | % |
$1 billion — $3 billion | | | 0.62 | | | | 0.71 | |
$3 billion — $5 billion | | | 0.59 | | | | 0.68 | |
$5 billion — $10 billion | | | 0.57 | | | | 0.65 | |
Greater than $10 billion | | | 0.56 | | | | 0.64 | |
Prior to June 1, 2023, the annual rates as a percentage of average daily net assets, for Advantage Global were as follows:
| | | | |
| | |
| Average Daily Net Assets | | Investment
Advisory Fees | |
First $1 billion | | | 0.85 | % |
$1 billion — $3 billion | | | 0.80 | |
$3 billion — $5 billion | | | 0.77 | |
$5 billion — $10 billion | | | 0.74 | |
Greater than $10 billion | | | 0.72 | |
With respect to EuroFund, the Manager entered into a sub-advisory agreement with BlackRock International Limited (“BIL”), an affiliate of the Manager. The Manager pays BIL for services it provides for that portion of the Fund for which BIL acts as sub-adviser, a monthly fee that is equal to a percentage of the investment advisory fees paid by EuroFund to the Manager.
Service and Distribution Fees: The Funds entered into a Distribution Agreement and Distribution and Service Plans with BlackRock Investments, LLC (“BRIL”), an affiliate of the Manager. Pursuant to the Distribution and Service Plan and in accordance with Rule 12b-1 under the 1940 Act, each Fund pays BRIL ongoing service and distribution fees. The fees are accrued daily and paid monthly at annual rates based upon the average daily net assets of the relevant share class of each Fund as follows:
| | | | | | | | |
| | | |
| Share Class | | Service Fees | | | Distribution Fees | |
Investor A | | | 0.25 | % | | | N/A | |
Investor C | | | 0.25 | | | | 0.75 | % |
Class R | | | 0.25 | | | | 0.25 | |
BRIL and broker-dealers, pursuant to sub-agreements with BRIL, provide shareholder servicing and distribution services to the Funds. The ongoing service and/or distribution fee compensates BRIL and each broker-dealer for providing shareholder servicing and/or distribution related services to shareholders.
For the year ended June 30, 2023, the following table shows the class specific service and distribution fees borne directly by each share class of each Fund:
| | | | | | | | | | | | | | | | |
| | | | | |
| Fund Name | | Investor A | | | Investor C | | | Class R | | | Total | |
Advantage Global | | $ | 671,107 | | | $ | 30,494 | | | $ | 11,213 | | | $ | 712,814 | |
EuroFund | | | 162,194 | | | | 11,836 | | | | 1,151 | | | | 175,181 | |
Transfer Agent: Pursuant to written agreements, certain financial intermediaries, some of which may be affiliates, provide the Funds with sub-accounting, recordkeeping, sub-transfer agency and other administrative services with respect to servicing of underlying investor accounts. For these services, these entities receive an asset-based fee or an annual fee per shareholder account, which will vary depending on share class and/or net assets. For the year ended June 30, 2023, the Funds did not pay any amounts to affiliates in return for these services.
The Manager maintains a call center that is responsible for providing certain shareholder services to the Funds. Shareholder services include responding to inquiries and processing purchases and sales based upon instructions from shareholders. For the year ended June 30, 2023, each Fund reimbursed the Manager the following amounts for costs incurred in running the call center, which are included in transfer agent — class specific in the Statements of Operations:
| | | | | | | | | | | | | | | | | | | | | | | | |
| | | | | | | |
| Fund Name | | Institutional | | | Investor A | | | Investor C | | | Class K | | | Class R | | | Total | |
Advantage Global | | $ | 547 | | | $ | 10,639 | | | $ | 855 | | | $ | 213 | | | $ | 127 | | | $ | 12,381 | |
EuroFund | | | 2,429 | | | | 4,767 | | | | 214 | | | | 66 | | | | 27 | | | | 7,503 | |
For the year ended June 30, 2023, the following table shows the class specific transfer agent fees borne directly by each share class of each Fund:
| | | | | | | | | | | | | | | | | | | | | | | | |
| | | | | | | |
| Fund Name | | Institutional | | | Investor A | | | Investor C | | | Class K | | | Class R | | | Total | |
Advantage Global | | $ | 80,128 | | | $ | 502,977 | | | $ | 6,530 | | | $ | 3,909 | | | $ | 6,266 | | | $ | 599,810 | |
EuroFund | | | 42,898 | | | | 85,227 | | | | 947 | | | | 443 | | | | 843 | | | | 130,358 | |
Other Fees: For the year ended June 30, 2023, affiliates earned underwriting discounts, direct commissions and dealer concessions on sales of each Fund’s Investor A Shares as follows:
| | | | |
| | |
| Fund Name | | Investor A | |
Advantage Global | | $ | 1,923 | |
EuroFund | | | 530 | |
| | |
| 42 | | 2 0 2 3 BLACK ROCK ANNUAL REPORT TO SHAREHOLDERS |
Notes to Financial Statements (continued)
For the year ended June 30, 2023, affiliates received CDSCs as follows:
| | | | | | | | |
| | | |
| Fund Name | | Investor A | | | Investor C | |
Advantage Global | | $ | 312 | | | $ | 10 | |
EuroFund | | | 7 | | | | 50 | |
Expense Limitations, Waivers and Reimbursements: With respect to each Fund, the Manager contractually agreed to waive its investment advisory fees by the amount of investment advisory fees each Fund pays to the Manager indirectly through its investment in affiliated money market funds (the “affiliated money market fund waiver”) through June 30, 2024. The contractual agreement may be terminated upon 90 days’ notice by a majority of the directors who are not “interested persons” of the Funds, as defined in the 1940 Act (“Independent Directors”), or by a vote of a majority of the outstanding voting securities of a Fund. The amount of waivers and/or reimbursements of fees and expenses made pursuant to the expense limitation described below will be reduced by the amount of the affiliated money market fund waiver. These amounts are included in fees waived and/or reimbursed by the Manager in the Statements of Operations. For the year ended June 30, 2023, the amounts waived were as follows:
| | | | |
| | |
| Fund Name | | Fees Waived and/or Reimbursed
by the Manager | |
Advantage Global | | $ | 4,915 | |
EuroFund | | | 348 | |
The Manager has contractually agreed to waive its investment advisory fee with respect to any portion of each Fund’s assets invested in affiliated equity and fixed-income mutual funds and affiliated exchange-traded funds that have a contractual management fee through June 30, 2024. The contractual agreement may be terminated upon 90 days’ notice by a majority of the Independent Directors, or by a vote of a majority of the outstanding voting securities of a Fund. For the year ended June 30, 2023, there were no fees waived by the Manager pursuant to this arrangement.
With respect to each Fund, the Manager contractually agreed to waive and/or reimburse fees or expenses in order to limit expenses, excluding interest expense, dividend expense, tax expense, acquired fund fees and expenses, and certain other fund expenses, which constitute extraordinary expenses not incurred in the ordinary course of each Fund’s business (“expense limitation”). The expense limitations as a percentage of average daily net assets are as follows:
| | | | | | | | | | | | | | | | | | | | |
| | | | | | |
| Fund Name | | Institutional | | | Investor A | | | Investor C | | | Class K | | | Class R | |
Advantage Global | | | 0.71 | % | | | 0.96 | % | | | 1.71 | % | | | 0.66 | % | | | 1.21 | % |
EuroFund | | | 1.04 | | | | 1.29 | | | | 2.04 | | | | 0.99 | | | | 1.54 | |
The Manager has agreed not to reduce or discontinue this contractual expense limitation through June 30, 2024, unless approved by the Board, including a majority of the Independent Directors or by a vote of a majority of the outstanding voting securities of a Fund. For the year ended June 30, 2023, the Manager waived and/or reimbursed the following amounts, which are included in fees waived and/or reimbursed by the Manager in the Statements of Operations.
| | | | |
| | |
| Fund Name | | Fees Waived and/or Reimbursed by the Manager | |
Advantage Global | | $ | 1,199,472 | |
EuroFund | | | 80,758 | |
In addition, these amounts waived and/or reimbursed by the Manager are included in transfer agent fees waived and/or reimbursed by the Manager — class specific in the Statements of Operations. For the year ended June 30, 2023, class specific expense waivers and/or reimbursements were as follows:
| | | | | | | | | | | | | | | | | | | | | | | | |
| | | Transfer Agent Fees Waived and/or
Reimbursed by the Manager - Class Specific | |
| Fund Name | | Institutional | | | Investor A | | | Investor C | | | Class K | | | Class R | | | Total | |
Advantage Global | | $ | 51,622 | | | $ | 368,754 | | | $ | 5,006 | | | $ | 3,908 | | | $ | 5,145 | | | $ | 434,435 | |
EuroFund | | | 23,038 | | | | 40,362 | | | | 383 | | | | 312 | | | | 680 | | | | 64,775 | |
Securities Lending: The U.S. Securities and Exchange Commission (“SEC”) has issued an exemptive order which permits BIM, an affiliate of the Manager, to serve as securities lending agent for the Funds, subject to applicable conditions. As securities lending agent, BIM bears all operational costs directly related to securities lending. The Funds are responsible for expenses in connection with the investment of cash collateral received for securities on loan (the “collateral investment expenses”). The cash collateral is invested in a private investment company, Money Market Series, managed by the Manager or its affiliates. However, BIM has agreed to cap the collateral investment expenses of the Money Market Series to an annual rate of 0.04%. The investment adviser to the Money Market Series will not charge any advisory fees with respect to shares purchased by the Funds. The Money Market Series may, under certain circumstances, impose a liquidity fee of up to 2% of the value withdrawn or temporarily restrict withdrawals for up to 10 business days during a 90 day period, in the event that the private investment company’s weekly liquid assets fall below certain thresholds. The Money Market Series seeks current income consistent with maintaining liquidity and preserving capital. Although the Money Market Series is not registered under the 1940 Act, its investments may follow the parameters of investments by a money market fund that is subject to Rule 2a-7 under the 1940 Act.
Securities lending income is equal to the total of income earned from the reinvestment of cash collateral, net of fees and other payments to and from borrowers of securities, and less the collateral investment expenses. Each Fund retains a portion of securities lending income and remits a remaining portion to BIM as compensation for its services as securities lending agent.
Pursuant to the current securities lending agreement, each Fund retains 82% of securities lending income (which excludes collateral investment expenses), and this amount retained can never be less than 70% of the total of securities lending income plus the collateral investment expenses.
| | |
NOTES TO FINANCIAL STATEMENTS | | 43 |
Notes to Financial Statements (continued)
In addition, commencing the business day following the date that the aggregate securities lending income earned across the BlackRock Multi-Asset Complex in a calendar year exceeds a specified threshold, each Fund, pursuant to the securities lending agreement, will retain for the remainder of that calendar year securities lending income in an amount equal to 85% of securities lending income (which excludes collateral investment expenses), and this amount retained can never be less than 70% of the total of securities lending income plus the collateral investment expenses.
The share of securities lending income earned by each Fund is shown as securities lending income — affiliated — net in the Statements of Operations. For the year ended June 30, 2023, each Fund paid BIM the following amounts for securities lending agent services:
| | | | |
| | |
| Fund Name | | Amounts | |
Advantage Global | | $ | 9,374 | |
EuroFund | | | 5,818 | |
Interfund Lending: In accordance with an exemptive order (the “Order”) from the SEC, each Fund may participate in a joint lending and borrowing facility for temporary purposes (the “Interfund Lending Program”), subject to compliance with the terms and conditions of the Order, and to the extent permitted by each Fund’s investment policies and restrictions. EuroFund is currently permitted to borrow under the Interfund Lending Program. Advantage Global is currently permitted to borrow and lend under the Interfund Lending Program.
A lending BlackRock fund may lend in aggregate up to 15% of its net assets but may not lend more than 5% of its net assets to any one borrowing fund through the Interfund Lending Program. A borrowing BlackRock fund may not borrow through the Interfund Lending Program or from any other source more than 33 1/3% of its total assets (or any lower threshold provided for by the fund’s investment restrictions). If a borrowing BlackRock fund’s total outstanding borrowings exceed 10% of its total assets, each of its outstanding interfund loans will be subject to collateralization of at least 102% of the outstanding principal value of the loan. All interfund loans are for temporary or emergency purposes and the interest rate to be charged will be the average of the highest current overnight repurchase agreement rate available to a lending fund and the bank loan rate, as calculated according to a formula established by the Board.
During the year ended June 30, 2023, the Funds did not participate in the Interfund Lending Program.
Directors and Officers: Certain directors and/or officers of the Funds are directors and/or officers of BlackRock or its affiliates. The Funds reimburse the Manager for a portion of the compensation paid to the Funds’ Chief Compliance Officer, which is included in Directors and Officer in the Statements of Operations.
The Funds may purchase securities from, or sell securities to, an affiliated fund provided the affiliation is due solely to having a common investment adviser, common officers, or common directors. For the year ended June 30, 2023, the purchase and sale transactions and any net realized gains (losses) with an affiliated fund in compliance with Rule 17a-7 under the 1940 Act were as follows:
| | | | | | | | | | | | |
| | | | |
| Fund Name | | Purchases | | | Sales | | | Net Realized
Gain (Loss) | |
Advantage Global | | $ | 44,614,688 | | | $ | 50,233,380 | | | $ | 437,549 | |
EuroFund | | | 78,800 | | | | — | | | | — | |
For the year ended June 30, 2023, purchases and sales of investments, excluding short-term securities, were as follows:
| | | | | | | | |
| | | |
| Fund Name | | Purchases | | | Sales | |
Advantage Global | | $ | 378,190,685 | | | $ | 418,365,723 | |
EuroFund | | | 35,091,918 | | | | 36,417,408 | |
It is each Fund’s policy to comply with the requirements of the Internal Revenue Code of 1986, as amended, applicable to regulated investment companies, and to distribute substantially all of its taxable income to its shareholders. Therefore, no U.S. federal income tax provision is required.
Each Fund files U.S. federal and various state and local tax returns. No income tax returns are currently under examination. The statute of limitations on each Fund’s U.S. federal tax returns generally remains open for a period of three years after they are filed. The statutes of limitations on each Fund’s state and local tax returns may remain open for an additional year depending upon the jurisdiction.
Management has analyzed tax laws and regulations and their application to the Funds as of June 30, 2023, inclusive of the open tax return years, and does not believe that there are any uncertain tax positions that require recognition of a tax liability in the Funds’ financial statements.
| | |
| 44 | | 2 0 2 3 BLACK ROCK ANNUAL REPORT TO SHAREHOLDERS |
Notes to Financial Statements (continued)
The tax character of distributions paid was as follows:
| | | | | | | | |
| | | |
| Fund Name | | Year Ended
06/30/23 | | | Year Ended
06/30/22 | |
Advantage Global | | | | | | | | |
Ordinary income | | $ | 6,633,822 | | | $ | 52,270,653 | |
Long-term capital gains | | | — | | | | 22,561,486 | |
| | | | | | | | |
| | $ | 6,633,822 | | | $ | 74,832,139 | |
| | | | | | | | |
| | |
EuroFund | | | | | | | | |
Ordinary income | | $ | 528,444 | | | $ | — | |
| | | | | | | | |
As of June 30, 2023, the tax components of accumulated earnings (loss) were as follows:
| | | | | | | | | | | | | | | | |
| | |
| Fund Name | | Undistributed
Ordinary Income | | | Non-Expiring
Capital Loss
Carryforwards(a) | | | Net Unrealized
Gains (Losses)(b) | | | Total | |
| | |
Advantage Global | | $ | 2,048,635 | | | $ | (17,116,281 | ) | | $ | 58,080,266 | | | $ | 43,012,620 | |
EuroFund | | | 1,251,233 | | | | (17,325,944 | ) | | | 29,309,485 | | | | 13,234,774 | |
| | |
| | (a) | Amounts available to offset future realized capital gains. | |
| | (b) | The difference between book-basis and tax-basis net unrealized gains (losses) was attributable primarily to the tax deferral of losses on wash sales, the realization for tax purposes of unrealized gains on investments in passive foreign investment companies, the realization for tax purposes of unrealized gains/losses on certain futures and foreign currency contracts and the timing and recognition of partnership income. | |
During the year ended June 30, 2023, the Fund listed below utilized the following amount of its capital loss carryforward:
| | | | |
| | |
| Fund Name | | Amounts | |
EuroFund | | $ | 1,098,455 | |
As of June 30, 2023, gross unrealized appreciation and depreciation based on cost of investments (including short positions and derivatives, if any) for U.S. federal income tax purposes were as follows:
| | | | | | | | | | | | | | | | |
| | | | | |
| Fund Name | | Tax Cost | | | Gross
Unrealized
Appreciation | | | Gross Unrealized
Depreciation | | | Net Unrealized
Appreciation
(Depreciation) | |
Advantage Global | | $ | 335,657,135 | | | $ | 68,184,637 | | | $ | (10,080,353) | | | $ | 58,104,284 | |
EuroFund | | | 81,395,714 | | | | 32,670,452 | | | | (3,426,467 | ) | | | 29,243,985 | |
The Funds, along with certain other funds managed by the Manager and its affiliates (“Participating Funds”), is party to a 364-day, $2.50 billion credit agreement with a group of lenders. Under this agreement, the Funds may borrow to fund shareholder redemptions. Excluding commitments designated for certain individual funds, the Participating Funds, including the Funds, can borrow up to an aggregate commitment amount of $1.75 billion at any time outstanding, subject to asset coverage and other limitations as specified in the agreement. The credit agreement has the following terms: a fee of 0.10% per annum on unused commitment amounts and interest at a rate equal to the higher of (a) Overnight Bank Funding Rate (“OBFR”) (but, in any event, not less than 0.00%) on the date the loan is made plus 0.80% per annum, (b) the Fed Funds rate (but, in any event, not less than 0.00%) in effect from time to time plus 0.80% per annum on amounts borrowed or (c) the sum of (x) Daily Simple Secured Overnight Financing Rate (“SOFR”) (but, in any event, not less than 0.00%) on the date the loan is made plus 0.10% and (y) 0.80% per annum. The agreement expires in April 2024 unless extended or renewed. These fees were allocated among such funds based upon portions of the aggregate commitment available to them and relative net assets of Participating Funds. During the year ended June 30, 2023, the Funds did not borrow under the credit agreement.
In the normal course of business, the Funds invest in securities or other instruments and may enter into certain transactions, and such activities subject each Fund to various risks, including among others, fluctuations in the market (market risk) or failure of an issuer to meet all of its obligations. The value of securities or other instruments may also be affected by various factors, including, without limitation: (i) the general economy; (ii) the overall market as well as local, regional or global political and/or social instability; (iii) regulation, taxation or international tax treaties between various countries; or (iv) currency, interest rate and price fluctuations. Local, regional or global events such as war, acts of terrorism, the spread of infectious illness or other public health issues, recessions, or other events could have a significant impact on the Funds and their investments. Each Fund’s prospectus provides details of the risks to which each Fund is subject.
The Funds may be exposed to additional risks when reinvesting cash collateral in money market funds that do not seek to maintain a stable NAV per share of $1.00, which may be subject to redemption gates or liquidity fees under certain circumstances.
Infectious Illness Risk: An outbreak of an infectious illness, such as the COVID-19 pandemic, may adversely impact the economies of many nations and the global economy, and may impact individual issuers and capital markets in ways that cannot be foreseen. An infectious illness outbreak may result in, among other things, closed international borders, prolonged quarantines, supply chain disruptions, market volatility or disruptions and other significant economic, social and political impacts.
| | |
NOTES TO FINANCIAL STATEMENTS | | 45 |
Notes to Financial Statements (continued)
Valuation Risk: The market values of equities, such as common stocks and preferred securities or equity related investments, such as futures and options, may decline due to general market conditions which are not specifically related to a particular company. They may also decline due to factors which affect a particular industry or industries. A Fund may invest in illiquid investments. An illiquid investment is any investment that a Fund reasonably expects cannot be sold or disposed of in current market conditions in seven calendar days or less without the sale or disposition significantly changing the market value of the investment. A Fund may experience difficulty in selling illiquid investments in a timely manner at the price that it believes the investments are worth. Prices may fluctuate widely over short or extended periods in response to company, market or economic news. Markets also tend to move in cycles, with periods of rising and falling prices. This volatility may cause each Fund’s NAV to experience significant increases or decreases over short periods of time. If there is a general decline in the securities and other markets, the NAV of a Fund may lose value, regardless of the individual results of the securities and other instruments in which a Fund invests.
The price a Fund could receive upon the sale of any particular portfolio investment may differ from a Fund’s valuation of the investment, particularly for securities that trade in thin or volatile markets or that are valued using a fair valuation technique or a price provided by an independent pricing service. Changes to significant unobservable inputs and assumptions (i.e., publicly traded company multiples, growth rate, time to exit) due to the lack of observable inputs may significantly impact the resulting fair value and therefore a Fund’s results of operations. As a result, the price received upon the sale of an investment may be less than the value ascribed by a Fund, and a Fund could realize a greater than expected loss or lesser than expected gain upon the sale of the investment. A Fund’s ability to value its investments may also be impacted by technological issues and/or errors by pricing services or other third-party service providers.
Counterparty Credit Risk: The Funds may be exposed to counterparty credit risk, or the risk that an entity may fail to or be unable to perform on its commitments related to unsettled or open transactions, including making timely interest and/or principal payments or otherwise honoring its obligations. The Funds manage counterparty credit risk by entering into transactions only with counterparties that the Manager believes have the financial resources to honor their obligations and by monitoring the financial stability of those counterparties. Financial assets, which potentially expose the Funds to market, issuer and counterparty credit risks, consist principally of financial instruments and receivables due from counterparties. The extent of the Funds’ exposure to market, issuer and counterparty credit risks with respect to these financial assets is approximately their value recorded in the Statements of Assets and Liabilities, less any collateral held by the Funds.
A derivative contract may suffer a mark-to-market loss if the value of the contract decreases due to an unfavorable change in the market rates or values of the underlying instrument. Losses can also occur if the counterparty does not perform under the contract.
With exchange-traded futures, there is less counterparty credit risk to the Funds since the exchange or clearinghouse, as counterparty to such instruments, guarantees against a possible default. The clearinghouse stands between the buyer and the seller of the contract; therefore, credit risk is limited to failure of the clearinghouse. While offset rights may exist under applicable law, a Fund does not have a contractual right of offset against a clearing broker or clearinghouse in the event of a default (including the bankruptcy or insolvency). Additionally, credit risk exists in exchange-traded futures with respect to initial and variation margin that is held in a clearing broker’s customer accounts. While clearing brokers are required to segregate customer margin from their own assets, in the event that a clearing broker becomes insolvent or goes into bankruptcy and at that time there is a shortfall in the aggregate amount of margin held by the clearing broker for all its clients, typically the shortfall would be allocated on a pro rata basis across all the clearing broker’s customers, potentially resulting in losses to the Funds.
Geographic/Asset Class Risk: A diversified portfolio, where this is appropriate and consistent with a fund’s objectives, minimizes the risk that a price change of a particular investment will have a material impact on the NAV of a fund. The investment concentrations within each Fund’s portfolio are disclosed in its Schedule of Investments.
Certain Funds invest a substantial amount of their assets in issuers located in a single country or a limited number of countries. When a fund concentrates its investments in this manner, it assumes the risk that economic, regulatory, political and social conditions in those countries may have a significant impact on their investment performance and could affect the income from, or the value or liquidity of, the Fund’s portfolio. Unanticipated or sudden political or social developments may cause uncertainty in the markets and as a result adversely affect the Fund’s investments. Foreign issuers may not be subject to the same uniform accounting, auditing and financial reporting standards and practices as used in the United States. Foreign securities markets may also be more volatile and less liquid than U.S. securities and may be less subject to governmental supervision not typically associated with investing in U.S. securities. Investment percentages in specific countries are presented in the Schedules of Investments.
Certain Funds invest a significant portion of their assets in securities of issuers located in the United States. A decrease in imports or exports, changes in trade regulations, inflation and/or an economic recession in the United States may have a material adverse effect on the U.S. economy and the securities listed on U.S. exchanges. Proposed and adopted policy and legislative changes in the United States may also have a significant effect on U.S. markets generally, as well as on the value of certain securities. Governmental agencies project that the United States will continue to maintain elevated public debt levels for the foreseeable future which may constrain future economic growth. Circumstances could arise that could prevent the timely payment of interest or principal on U.S. government debt, such as reaching the legislative “debt ceiling.” Such non-payment would result in substantial negative consequences for the U.S. economy and the global financial system. If U.S. relations with certain countries deteriorate, it could adversely affect issuers that rely on the United States for trade. The United States has also experienced increased internal unrest and discord. If these trends were to continue, they may have an adverse impact on the U.S. economy and the issuers in which the Funds invest.
Certain Funds invest a significant portion of their assets in securities of issuers located in Europe or with significant exposure to European issuers or countries. The European financial markets have recently experienced volatility and adverse trends due to concerns about economic downturns in, or rising government debt levels of, several European countries as well as acts of war in the region. These events may spread to other countries in Europe and may affect the value and liquidity of certain of the Funds’ investments.
Responses to the financial problems by European governments, central banks and others, including austerity measures and reforms, may not work, may result in social unrest and may limit future growth and economic recovery or have other unintended consequences. Further defaults or restructurings by governments and others of their debt could have additional adverse effects on economies, financial markets and asset valuations around the world. The United Kingdom has withdrawn from the European Union, and one or more other countries may withdraw from the European Union and/or abandon the Euro, the common currency of the European Union. These events and actions have adversely affected, and may in the future adversely affect, the value and exchange rate of the Euro and may continue to significantly affect the economies of every country in Europe, including countries that do not use the Euro and non-European Union member states. The impact of these actions, especially if they occur in a disorderly fashion, is not clear but could be significant and far reaching. In addition, Russia launched a large-scale invasion of Ukraine on February 24, 2022. The extent and duration of the military
| | |
| 46 | | 2 0 2 3 BLACK ROCK ANNUAL REPORT TO SHAREHOLDERS |
Notes to Financial Statements (continued)
action, resulting sanctions and resulting future market disruptions in the region are impossible to predict, but have been, and may continue to be, significant and have a severe adverse effect on the region, including significant negative impacts on the economy and the markets for certain securities and commodities, such as oil and natural gas, as well as other sectors.
Significant Shareholder Redemption Risk: Certain shareholders may own or manage a substantial amount of fund shares and/or hold their fund investments for a limited period of time. Large redemptions of fund shares by these shareholders may force a fund to sell portfolio securities, which may negatively impact the fund’s NAV, increase the fund’s brokerage costs, and/or accelerate the realization of taxable income/gains and cause the fund to make additional taxable distributions to shareholders.
| 11. | CAPITAL SHARE TRANSACTIONS |
Transactions in capital shares for each class were as follows:
| | | | | | | | | | | | | | | | |
| | | Year Ended
06/30/23 | | | Year Ended
06/30/22 | |
| Fund Name / Share Class | | Shares | | | Amounts | | | Shares | | | Amounts | |
Advantage Global | | | | | | | | | | | | | | | | |
Institutional | | | | | | | | | | | | | | | | |
Shares sold | | | 256,079 | | | $ | 5,503,523 | | | | 516,799 | | | $ | 12,492,114 | |
Shares issued in reinvestment of distributions | | | 45,991 | | | | 990,316 | | | | 523,855 | | | | 13,448,762 | |
Shares redeemed | | | (946,488 | ) | | | (20,364,108 | ) | | | (1,373,464 | ) | | | (33,811,641 | ) |
| | | | | | | | | | | | | | | | |
| | | (644,418 | ) | | $ | (13,870,269 | ) | | | (332,810 | ) | | $ | (7,870,765 | ) |
| | | | | | | | | | | | | | | | |
| | | | |
Investor A | | | | | | | | | | | | | | | | |
Shares sold | | | 961,713 | | | $ | 18,916,124 | | | | 1,345,196 | | | $ | 30,806,933 | |
Shares issued in reinvestment of distributions | | | 208,061 | | | | 4,180,976 | | | | 1,904,545 | | | | 45,920,653 | |
Shares redeemed | | | (2,448,975 | ) | | | (49,850,265 | ) | | | (1,749,712 | ) | | | (40,119,251 | ) |
| | | | | | | | | | | | | | | | |
| | | (1,279,201 | ) | | $ | (26,753,165 | ) | | | 1,500,029 | | | $ | 36,608,335 | |
| | | | | | | | | | | | | | | | |
| | | | |
Investor C | | | | | | | | | | | | | | | | |
Shares sold | | | 36,310 | | | $ | 595,928 | | | | 14,474 | | | $ | 253,356 | |
Shares issued in reinvestment of distributions | | | 2,494 | | | | 38,913 | | | | 66,995 | | | | 1,282,263 | |
Shares redeemed and automatic conversion of shares | | | (137,392 | ) | | | (2,192,980 | ) | | | (191,599 | ) | | | (3,624,007 | ) |
| | | | | | | | | | | | | | | | |
| | | (98,588 | ) | | $ | (1,558,139 | ) | | | (110,130 | ) | | $ | (2,088,388 | ) |
| | | | | | | | | | | | | | | | |
| | | | |
Class K | | | | | | | | | | | | | | | | |
Shares sold | | | 368,871 | | | $ | 8,218,955 | | | | 437,784 | | | $ | 11,106,505 | |
Shares issued in reinvestment of distributions | | | 42,395 | | | | 912,633 | | | | 333,878 | | | | 8,570,267 | |
Shares redeemed | | | (431,520 | ) | | | (9,151,527 | ) | | | (361,744 | ) | | | (9,088,358 | ) |
| | | | | | | | | | | | | | | | |
| | | (20,254 | ) | | $ | (19,939 | ) | | | 409,918 | | | $ | 10,588,414 | |
| | | | | | | | | | | | | | | | |
| | | | |
Class R | | | | | | | | | | | | | | | | |
Shares sold | | | 13,008 | | | $ | 228,457 | | | | 21,288 | | | $ | 436,343 | |
Shares issued in reinvestment of distributions | | | 2,061 | | | | 36,383 | | | | 29,767 | | | | 633,880 | |
Shares redeemed | | | (45,027 | ) | | | (769,474 | ) | | | (68,956 | ) | | | (1,446,183 | ) |
| | | | | | | | | | | | | | | | |
| | | (29,958 | ) | | $ | (504,634 | ) | | | (17,901 | ) | | $ | (375,960 | ) |
| | | | | | | | | | | | | | | | |
| | | (2,072,419 | ) | | $ | (42,706,146 | ) | | | 1,449,106 | | | $ | 36,861,636 | |
| | | | | | | | | | | | | | | | |
| | | | | | | | | | | | | | | | |
| | | Year Ended
06/30/23 | | | Year Ended
06/30/22 | |
| Fund Name / Share Class | | Shares | | | Amounts | | | Shares | | | Amounts | |
EuroFund | | | | | | | | | | | | | | | | |
Institutional | | | | | | | | | | | | | | | | |
Shares sold | | | 285,373 | | | $ | 5,270,145 | | | | 122,608 | | | $ | 2,411,570 | |
Shares issued in reinvestment of distributions | | | 10,533 | | | | 173,479 | | | | — | | | | — | |
Shares redeemed | | | (215,528 | ) | | | (3,654,878) | | | | (2,442,177 | ) | | | (50,674,198) | |
| | | | | | | | | | | | | | | | |
| | | 80,378 | | | $ | 1,788,746 | | | | (2,319,569 | ) | | $ | (48,262,628 | ) |
| | | | | | | | | | | | | | | | |
| | | | |
Investor A | | | | | | | | | | | | | | | | |
Shares sold | | | 125,307 | | | $ | 2,160,703 | | | | 229,654 | | | $ | 4,514,406 | |
Shares issued in reinvestment of distributions | | | 16,327 | | | | 263,187 | | | | — | | | | — | |
Shares redeemed | | | (500,516 | ) | | | (8,150,313 | ) | | | (444,682 | ) | | | (8,307,512 | ) |
| | | | | | | | | | | | | | | | |
| | | (358,882 | ) | | $ | (5,726,423 | ) | | | (215,028 | ) | | $ | (3,793,106 | ) |
| | | | | | | | | | | | | | | | |
| | |
NOTES TO FINANCIAL STATEMENTS | | 47 |
Notes to Financial Statements (continued)
| | | | | | | | | | | | | | | | |
| | | Year Ended
06/30/23 | | | Year Ended
06/30/22 | |
| Fund Name / Share Class (continued) | | Shares | | | Amounts | | | Shares | | | Amounts | |
EuroFund (continued) | | | | | | | | | | | | | | | | |
Investor C | | | | | | | | | | | | | | | | |
Shares sold | | | 35,455 | | | $ | 388,635 | | | | 19,069 | | | $ | 253,465 | |
Shares redeemed and automatic conversion of shares | | | (44,073 | ) | | | (514,401) | | | | (90,724 | ) | | | (1,184,488) | |
| | | | | | | | | | | | | | | | |
| | | (8,618 | ) | | $ | (125,766 | ) | | | (71,655 | ) | | $ | (931,023 | ) |
| | | | | | | | | | | | | | | | |
| | | | |
Class K | | | | | | | | | | | | | | | | |
Shares sold | | | 17,347 | | | $ | 311,617 | | | | 43,191 | | | $ | 888,954 | |
Shares issued in reinvestment of distributions | | | 320 | | | | 5,256 | | | | — | | | | — | |
Shares redeemed | | | (20,786 | ) | | | (337,462 | ) | | | (25,204 | ) | | | (463,242 | ) |
| | | | | | | | | | | | | | | | |
| | | (3,119 | ) | | $ | (20,589 | ) | | | 17,987 | | | $ | 425,712 | |
| | | | | | | | | | | | | | | | |
| | | | |
Class R | | | | | | | | | | | | | | | | |
Shares sold | | | 4,503 | | | $ | 56,785 | | | | 8,967 | | | $ | 120,841 | |
Shares redeemed | | | (2,867 | ) | | | (32,520 | ) | | | (22,404 | ) | | | (276,352 | ) |
| | | | | | | | | | | | | | | | |
| | | 1,636 | | | $ | 24,265 | | | | (13,437 | ) | | $ | (155,511 | ) |
| | | | | | | | | | | | | | | | |
| | | (288,605 | ) | | $ | (4,059,767 | ) | | | (2,601,702 | ) | | $ | (52,716,556) | |
| | | | | | | | | | | | | | | | |
As of June 30, 2023, BlackRock Financial Management, Inc., an affiliate of the Fund, owned 12,070 Class K Shares of EuroFund.
| 12. | FOREIGN WITHHOLDINGS TAX CLAIMS |
EuroFund is expected to seek a closing agreement with the Internal Revenue Service (“IRS”) to address any prior years’ U.S. income tax liabilities attributable to Fund shareholders resulting from the recovery of foreign taxes. The closing agreement would result in the Fund paying a compliance fee to the IRS, on behalf of its shareholders, representing the estimated tax savings generated from foreign tax credits claimed by Fund shareholders on their tax returns in prior years. The Fund has accrued a liability for the estimated IRS compliance fee related to foreign withholding tax claims, which is disclosed in the Statements of Assets and Liabilities. The actual IRS compliance fee may differ from the estimate and that difference may be material.
Management has evaluated the impact of all subsequent events on the Funds through the date the financial statements were issued and has determined that there were no subsequent events requiring adjustment or additional disclosure in the financial statements.
| | |
| 48 | | 2 0 2 3 BLACK ROCK ANNUAL REPORT TO SHAREHOLDERS |
Report of Independent Registered Public Accounting Firm
To the Shareholders and the Board of Directors/Trustees of BlackRock Advantage Global Fund, Inc. and BlackRock EuroFund:
Opinion on the Financial Statements and Financial Highlights
We have audited the accompanying statements of assets and liabilities of BlackRock Advantage Global Fund, Inc. and BlackRock EuroFund (the “Funds”), including the schedules of investments, as of June 30, 2023, the related statements of operations for the year then ended, the statements of changes in net assets for each of the two years in the period then ended, the financial highlights for each of the five years in the period then ended, and the related notes. In our opinion, the financial statements and financial highlights present fairly, in all material respects, the financial position of the Funds as of June 30, 2023, and the results of their operations for the year then ended, the changes in their net assets for each of the two years in the period then ended, and the financial highlights for each of the five years in the period then ended, in conformity with accounting principles generally accepted in the United States of America.
Basis for Opinion
These financial statements and financial highlights are the responsibility of the Funds’ management. Our responsibility is to express an opinion on the Funds’ financial statements and financial highlights based on our audits. We are a public accounting firm registered with the Public Company Accounting Oversight Board (United States) (PCAOB) and are required to be independent with respect to the Funds in accordance with the U.S. federal securities laws and the applicable rules and regulations of the Securities and Exchange Commission and the PCAOB.
We conducted our audits in accordance with the standards of the PCAOB. Those standards require that we plan and perform the audit to obtain reasonable assurance about whether the financial statements and financial highlights are free of material misstatement, whether due to error or fraud. The Funds are not required to have, nor were we engaged to perform, an audit of their internal control over financial reporting. As part of our audits we are required to obtain an understanding of internal control over financial reporting but not for the purpose of expressing an opinion on the effectiveness of the Funds’ internal control over financial reporting. Accordingly, we express no such opinion.
Our audits included performing procedures to assess the risks of material misstatement of the financial statements and financial highlights, whether due to error or fraud, and performing procedures that respond to those risks. Such procedures included examining, on a test basis, evidence regarding the amounts and disclosures in the financial statements and financial highlights. Our audits also included evaluating the accounting principles used and significant estimates made by management, as well as evaluating the overall presentation of the financial statements and financial highlights. Our procedures included confirmation of securities owned as of June 30, 2023, by correspondence with custodians or counterparties; when replies were not received, we performed other auditing procedures. We believe that our audits provide a reasonable basis for our opinion.
Deloitte & Touche LLP
Boston, Massachusetts
August 22, 2023
We have served as the auditor of one or more BlackRock investment companies since 1992.
| | |
REPORT OF INDEPENDENT REGISTERED PUBLIC ACCOUNTING FIRM | | 49 |
Important Tax Information (unaudited)
The following amounts, or maximum amounts allowable by law, are hereby designated as qualified dividend income for individuals for the fiscal year ended June 30, 2023:
| | | | |
| | |
| Fund Name | | Qualified Dividend
Income | |
Advantage Global | | $ | 8,254,818 | |
EuroFund | | | 2,259,325 | |
The following amount, or maximum amount allowable by law, is hereby designated as qualified business income for individuals for the fiscal year ended June 30, 2023:
| | | | |
| | |
| Fund Name | | Qualified Business
Income | |
Advantage Global | | $ | 133,712 | |
The Fund intends to pass through to its shareholders the following amount, or maximum amount allowable by law, of foreign source income earned and foreign taxes paid for the fiscal year ended June 30, 2023:
| | | | | | | | |
| | | |
| Fund Name | | Foreign Source
Income Earned | | | Foreign
Taxes Paid | |
EuroFund | | $ | 1,220,567 | | | $ | — | |
The following percentage, or maximum percentage allowable by law, of ordinary income distributions paid during the fiscal year ended June 30, 2023 qualified for the dividends-received deduction for corporate shareholders:
| | | | |
| | |
| Fund Name | | Dividends-Received
Deduction | |
Advantage Global | | | 53.41% | |
The Fund hereby designates the following amount, or maximum amount allowable by law, as interest income eligible to be treated as a Section 163(j) interest dividend for the fiscal year ended June 30, 2023:
| | | | |
| | |
| Fund Name | | Interest
Dividends | |
Advantage Global | | $ | 163,911 | |
The Fund hereby designates the following amount, or maximum amount allowable by law, as interest-related dividends eligible for exemption from U.S. withholding tax for nonresident aliens and foreign corporations for the fiscal year ended June 30, 2023:
| | | | |
| | |
| Fund Name | | Interest
Related
Dividends | |
Advantage Global | | $ | 163,911 | |
| | |
| 50 | | 2 0 2 3 BLACK ROCK ANNUAL REPORT TO SHAREHOLDERS |
Disclosure of Investment Advisory Agreements and Sub-Advisory Agreement
The Board of Trustees of BlackRock EuroFund (“EuroFund”) met on April 18, 2023 and May 23-24, 2023 to consider the approval to continue the investment advisory agreement (the “EuroFund Advisory Agreement”) between EuroFund and BlackRock Advisors, LLC (the “Manager”), its investment advisor. The Board of Trustees of EuroFund also considered the approval of the sub-advisory agreement (the “EuroFund Sub-Advisory Agreement”) between the Manager and BlackRock International Limited (the “Sub-Advisor”) with respect to EuroFund.
The Board of Directors of BlackRock Advantage Global Fund, Inc. (“Advantage Global Fund”) met on April 18, 2023 and May 23-24, 2023 to consider the approval to continue the investment advisory agreement (the “Advantage Global Fund Advisory Agreement”) between Advantage Global Fund and the Manager, its investment advisor.
EuroFund and Advantage Global Fund are referred to herein individually as a “Fund” or collectively as the “Funds.” The Manager and the Sub-Advisor are referred to herein as “BlackRock.” The EuroFund Advisory Agreement, the EuroFund Sub-Advisory Agreement and the Advantage Global Fund Advisory Agreement are referred to herein individually as an “Agreement” or collectively as the “Agreements.” For simplicity: (a) the Board of Trustees of EuroFund and the Board of Directors of Advantage Global Fund are referred to herein individually as the “Board” and collectively as the “Boards” and the members are referred to as “Board Members”; and (b) the meetings held on April 18, 2023 are referred to as the “April Meeting” and the meetings held on May 23-24, 2023 are referred to as the “May Meeting”.
The Approval Process
Consistent with the requirements of the Investment Company Act of 1940 (the “1940 Act”), each Board considers the approval of the continuation of the pertinent Agreement for each Fund on an annual basis. The Board members who are not “interested persons” of the pertinent Fund, as defined in the 1940 Act, are considered independent Board members (the “Independent Board Members”). Each Board’s consideration entailed a year-long deliberative process during which the Board and its committees assessed BlackRock’s various services to each Fund, including through the review of written materials and oral presentations, and the review of additional information provided in response to requests from the Independent Board Members. Each Board had four quarterly meetings per year, each of which extended over a two-day period, as well as additional ad hoc meetings and executive sessions throughout the year, as needed. The committees of each Board similarly met throughout the year. Each Board also had an additional one-day meeting to consider specific information regarding the renewal of the Agreements. In considering the renewal of the Agreements, the Board assessed, among other things, the nature, extent and quality of the services provided to the Fund by BlackRock, BlackRock’s personnel and affiliates, including (as applicable): investment management services; accounting oversight; administrative and shareholder services; oversight of the Fund’s service providers; risk management and oversight; and legal, regulatory and compliance services. Throughout the year, including during the contract renewal process, the Independent Board Members were advised by independent legal counsel, and met with independent legal counsel in various executive sessions outside of the presence of BlackRock’s management.
During the year, each Board, acting directly and through its committees, considered information that was relevant to its annual consideration of the renewal of the Agreements, including the services and support provided by BlackRock to the Fund and its shareholders. BlackRock also furnished additional information to each Board in response to specific questions from the Board. Among the matters each Board considered were: (a) investment performance for one-year, three-year, five-year, and/or since inception periods, as applicable, against peer funds, an applicable benchmark, and other performance metrics, as applicable, as well as BlackRock senior management’s and portfolio managers’ analyses of the reasons for any outperformance or underperformance relative to its peers, benchmarks, and other performance metrics, as applicable; (b) fees, including advisory, administration, if applicable, and other amounts paid to BlackRock and its affiliates by the Fund for services; (c) Fund operating expenses and how BlackRock allocates expenses to the Fund; (d) the resources devoted to, risk oversight of, and compliance reports relating to, implementation of the Fund’s investment objective, policies and restrictions, and meeting regulatory requirements; (e) BlackRock’s and the Fund’s adherence to applicable compliance policies and procedures; (f) the nature, character and scope of non-investment management services provided by BlackRock and its affiliates and the estimated cost of such services, as available; (g) BlackRock’s and other service providers’ internal controls and risk and compliance oversight mechanisms; (h) BlackRock’s implementation of the proxy voting policies approved by the Board; (i) the use of brokerage commissions and execution quality of portfolio transactions; (j) BlackRock’s implementation of the Fund’s valuation and liquidity procedures; (k) an analysis of management fees paid to BlackRock for products with similar investment mandates across the open-end fund, exchange-traded fund (“ETF”), closed-end fund, sub-advised mutual fund, separately managed account, collective investment trust, and institutional separate account product channels, as applicable, and the similarities and differences between these products and the services provided as compared to the Fund; (l) BlackRock’s compensation methodology for its investment professionals and the incentives and accountability it creates, along with investment professionals’ investments in the fund(s) they manage; and (m) periodic updates on BlackRock’s business.
Prior to and in preparation for the April Meeting, each Board received and reviewed materials specifically relating to the renewal of the Agreements. The Independent Board Members are continuously engaged in a process with their independent legal counsel and BlackRock to review the nature and scope of the information provided to the Board to better assist its deliberations. The materials provided in connection with the April Meeting included, among other things: (a) information independently compiled and prepared by Broadridge Financial Solutions, Inc. (“Broadridge”), based on either a Lipper classification or Morningstar category, regarding each Fund’s fees and expenses as compared with a peer group of funds as determined by Broadridge (“Expense Peers”) and the investment performance of each Fund as compared with a peer group of funds (“Performance Peers”); (b) information on the composition of the Expense Peers and Performance Peers and a description of Broadridge’s methodology; (c) information on the estimated profits realized by BlackRock and its affiliates pursuant to the Agreements and a discussion of fall-out benefits to BlackRock and its affiliates; (d) a general analysis provided by BlackRock concerning investment management fees received in connection with other types of investment products, such as institutional accounts, sub-advised mutual funds, ETFs, closed-end funds, open-end funds, and separately managed accounts, under similar investment mandates, as well as the performance of such other products, as applicable; (e) a review of non-management fees; (f) the existence, impact and sharing of potential economies of scale, if any, with the Funds; (g) a summary of aggregate amounts paid by each Fund to BlackRock; (h) sales and redemption data regarding each Fund’s shares; and (i) various additional information requested by the Board as appropriate regarding BlackRock’s and the Funds’ operations.
At the April Meeting, each Board reviewed materials relating to its consideration of the Agreements and the Independent Board Members presented BlackRock with questions and requests for additional information. BlackRock responded to these questions and requests with additional written information in advance of the May Meeting.
At the May Meeting, each Board concluded its assessment of, among other things: (a) the nature, extent and quality of the services provided by BlackRock; (b) the investment performance of each Fund as compared to its Performance Peers and to other metrics, as applicable; (c) the advisory fee and the estimated cost of the services and estimated profits realized by BlackRock and its affiliates from their relationship with the Funds; (d) each Fund’s fees and expenses compared to its Expense Peers; (e) the existence and
| | |
DISCLOSURE OF INVESTMENT ADVISORY AGREEMENTS AND SUB-ADVISORY AGREEMENT | | 51 |
Disclosure of Investment Advisory Agreements and Sub-Advisory Agreement (continued)
sharing of potential economies of scale; (f) any fall-out benefits to BlackRock and its affiliates as a result of BlackRock’s relationship with the Funds; and (g) other factors deemed relevant by the Board Members.
Each Board also considered other matters it deemed important to the approval process, such as other payments made to BlackRock or its affiliates relating to securities lending and cash management, and BlackRock’s services related to the valuation and pricing of the portfolio holdings of the pertinent Fund. Each Board noted the willingness of BlackRock’s personnel to engage in open, candid discussions with the Board. The Board Members evaluated the information available to it on a fund-by-fund basis. The following paragraphs provide more information about some of the primary factors that were relevant to each Board’s decision. The Board Members did not identify any particular information, or any single factor as determinative, and each Board Member may have attributed different weights to the various items and factors considered.
A. Nature, Extent and Quality of the Services Provided by BlackRock
Each Board, including the Independent Board Members, reviewed the nature, extent and quality of services provided by BlackRock, including the investment advisory services and the resulting performance of each Fund. Throughout the year, each Board compared each Fund’s performance to the performance of a comparable group of mutual funds, relevant benchmark, and performance metrics, as applicable. The Boards met with BlackRock’s senior management personnel responsible for investment activities, including the senior investment officers. Each Board also reviewed the materials provided by each Fund’s portfolio management team discussing the Fund’s performance, investment strategies and outlook.
Each Board considered, among other factors, with respect to BlackRock: the experience of investment personnel generally and each Fund’s portfolio management team; research capabilities; investments by portfolio managers in the funds they manage; portfolio trading capabilities; use of technology; commitment to compliance; credit analysis capabilities; risk analysis and oversight capabilities; and the approach to training and retaining portfolio managers and other research, advisory and management personnel. Each Board also considered BlackRock’s overall risk management program, including the continued efforts of BlackRock and its affiliates to address cybersecurity risks and the role of BlackRock’s Risk & Quantitative Analysis Group. Each Board engaged in a review of BlackRock’s compensation structure with respect to each Fund’s portfolio management team and BlackRock’s ability to attract and retain high-quality talent and create performance incentives.
In addition to investment advisory services, each Board considered the nature and quality of the administrative and other non-investment advisory services provided to each Fund. BlackRock and its affiliates provide the Funds with certain administrative, shareholder and other services (in addition to any such services provided to the Funds by third-parties) and officers and other personnel as are necessary for the operations of the Funds. In particular, BlackRock and its affiliates provide the Funds with administrative services including, among others: (i) responsibility for disclosure documents, such as the prospectus, the summary prospectus (as applicable), the statement of additional information and periodic shareholder reports; (ii) oversight of daily accounting and pricing; (iii) responsibility for periodic filings with regulators; (iv) overseeing and coordinating the activities of third-party service providers, including, among others, each Fund’s custodian, fund accountant, transfer agent, and auditor; (v) organizing Board meetings and preparing the materials for such Board meetings; (vi) providing legal and compliance support; (vii) furnishing analytical and other support to assist the Board in its consideration of strategic issues such as the merger, consolidation or repurposing of certain open-end funds; and (viii) performing or managing administrative functions necessary for the operation of the Funds, such as tax reporting, expense management, fulfilling regulatory filing requirements, overseeing each Fund’s distribution partners, and shareholder call center and other services. The Board reviewed the structure and duties of BlackRock’s fund administration, shareholder services, and legal and compliance departments and considered BlackRock’s policies and procedures for assuring compliance with applicable laws and regulations. The Board considered the operation of BlackRock’s business continuity plans.
The Board noted that the engagement of the Sub-Advisor with respect to EuroFund facilitates the provision of investment advice and trading by investment personnel out of non-U.S. jurisdictions. The Board considered that this arrangement provides additional flexibility to the portfolio management team, which may benefit EuroFund and its shareholders.
B. The Investment Performance of the Funds and BlackRock
Each Board, including the Independent Board Members, reviewed and considered the performance history of the Fund throughout the year and at the April Meeting. In preparation for the April Meeting, each Board was provided with reports independently prepared by Broadridge, which included an analysis of the Fund’s performance as of December 31, 2022, as compared to its Performance Peers. Broadridge ranks funds in quartiles, ranging from first to fourth, where first is the most desirable quartile position and fourth is the least desirable. In connection with its review, each Board received and reviewed information regarding the investment performance of the Fund as compared to its Performance Peers and the respective Morningstar Category (“Morningstar Category”). Each Board and its Performance Oversight Committee regularly review and meet with Fund management to discuss the performance of each Fund throughout the year.
In evaluating performance, the Boards focused particular attention on funds with less favorable performance records. Each Board also noted that while it found the data provided by Broadridge generally useful, it recognized the limitations of such data, including in particular, that notable differences may exist between a fund and its Performance Peers (for example, the investment objectives and strategies). Further, each Board recognized that the performance data reflects a snapshot of a period as of a particular date and that selecting a different performance period could produce significantly different results. Each Board also acknowledged that long-term performance could be impacted by even one period of significant outperformance or underperformance, and that a single investment theme could have the ability to disproportionately affect long-term performance.
The Board noted that for the one-, three- and five-year periods reported, Advantage Global Fund ranked in the third, second and third quartiles, respectively, against its Morningstar Category. The Board noted that BlackRock believes that the Morningstar Category is an appropriate performance metric for the Fund, and that BlackRock has explained its rationale for this belief to the Board. The Board and BlackRock reviewed the Fund’s underperformance relative to its Morningstar Category during the applicable periods.
The Board noted that for the one-, three- and five-year periods reported, EuroFund ranked in the fourth, first and third quartiles, respectively, against its Morningstar Category. The Board noted that BlackRock believes that the Morningstar Category is an appropriate performance metric for the Fund, and that BlackRock has explained its rationale for this belief to the Board. The Board and BlackRock reviewed the Fund’s underperformance relative to its Morningstar Category during the applicable periods.
| | |
| 52 | | 2 0 2 3 BLACK ROCK ANNUAL REPORT TO SHAREHOLDERS |
Disclosure of Investment Advisory Agreements and Sub-Advisory Agreement (continued)
C. Consideration of the Advisory/Management Fees and the Estimated Cost of the Services and Estimated Profits Realized by BlackRock and its Affiliates from their Relationship with the Funds
Each Board, including the Independent Board Members, reviewed each Fund’s contractual management fee rate compared with those of its Expense Peers. The contractual management fee rate represents a combination of the advisory fee and any administrative fees, before taking into account any reimbursements or fee waivers. Each Board also compared each Fund’s total expense ratio, as well as its actual management fee rate, to those of its Expense Peers. The total expense ratio represents a fund’s total net operating expenses, including any 12b-1 or non-12b-1 service fees. The total expense ratio gives effect to any expense reimbursements or fee waivers, and the actual management fee rate gives effect to any management fee reimbursements or waivers. The Boards considered that the fee and expense information in the Broadridge report for the Fund reflected information for a specific period and that historical asset levels and expenses may differ from current levels, particularly in a period of market volatility. The Boards considered the services provided and the fees charged by BlackRock and its affiliates to other types of clients with similar investment mandates, as applicable, including institutional accounts and sub-advised mutual funds (including mutual funds sponsored by third parties).
Each Board received and reviewed statements relating to BlackRock’s financial condition. Each Board reviewed BlackRock’s profitability methodology and was also provided with an estimated profitability analysis that detailed the revenues earned and the expenses incurred by BlackRock for services provided to each Fund. Each Board reviewed BlackRock’s estimated profitability with respect to each Fund and other funds the Board currently oversees for the year ended December 31, 2022 compared to available aggregate estimated profitability data provided for the prior two years. Each Board reviewed BlackRock’s estimated profitability with respect to certain other U.S. fund complexes managed by the Manager and/or its affiliates. Each Board reviewed BlackRock’s assumptions and methodology of allocating expenses in the estimated profitability analysis, noting the inherent limitations in allocating costs among various advisory products. Each Board recognized that profitability may be affected by numerous factors including, among other things, fee waivers and expense reimbursements by the Manager, the types of funds managed, precision of expense allocations and business mix. Each Board thus recognized that calculating and comparing profitability at the individual fund level is difficult.
Each Board noted that, in general, individual fund or product line profitability of other advisors is not publicly available. Each Board reviewed BlackRock’s overall operating margin, in general, compared to that of certain other publicly traded asset management firms. Each Board considered the differences between BlackRock and these other firms, including the contribution of technology at BlackRock, BlackRock’s expense management, and the relative product mix.
Each Board considered whether BlackRock has the financial resources necessary to attract and retain high quality investment management personnel to perform its obligations under the Agreements and to continue to provide the high quality of services that is expected by the Board. The Boards further considered factors including but not limited to BlackRock’s commitment of time and resources, assumption of risk, and liability profile in servicing the Funds, including in contrast to what is required of BlackRock with respect to other products with similar investment mandates across the open-end fund, ETF, closed-end fund, sub-advised mutual fund, separately managed account, collective investment trust, and institutional separate account product channels, as applicable.
The Board noted that EuroFund’s contractual management fee rate ranked in the first quartile, and that the actual management fee rate and total expense ratio each ranked in the first quartile relative to the Fund’s Expense Peers. The Board additionally noted that the Fund has an advisory fee arrangement that includes breakpoints that adjust the fee rate downward as the size of the Fund increases above certain contractually specified levels. The Board additionally noted that the breakpoints can, conversely, adjust the advisory fee rate upward as the size of the Fund decreases below certain contractually specified levels.
The Board noted that Advantage Global Fund’s contractual management fee rate ranked in the fourth quartile, and that the actual management fee rate and total expense ratio each ranked in the first quartile relative to the Fund’s Expense Peers. The Board also noted that the Fund has an advisory fee arrangement that includes breakpoints that adjust the fee rate downward as the size of the Fund increases above certain contractually specified levels. The Board additionally noted that the breakpoints can, conversely, adjust the advisory fee rate upward as the size of the Fund decreases below certain contractually specified levels. After discussion between the Board, including the Independent Board Members, and BlackRock, the Board and BlackRock agreed to a contractual adjustment to reduce specified levels within the breakpoint schedule. This adjustment was implemented on June 1, 2023.
The Board further noted that BlackRock and the Board have contractually agreed to a cap on each Fund’s total expenses as a percentage of the pertinent Fund’s average daily net assets on a class-by-class basis.
D. Economies of Scale
Each Board, including the Independent Board Members, considered the extent to which economies of scale might be realized as the assets of the Funds increase, including the existence of fee waivers and/or expense caps, as applicable, noting that any contractual fee waivers and contractual expense caps had been approved by the Board. In its consideration, each Board further considered the continuation and/or implementation of fee waivers and/or expense caps, as applicable. Each Board also considered the extent to which the Funds benefit from such economies of scale in a variety of ways and whether there should be changes in the advisory fee rate or breakpoint structure in order to enable the Funds to more fully participate in these economies of scale. Each Board considered each Fund’s asset levels and whether the current fee schedule was appropriate.
E. Other Factors Deemed Relevant by the Board Members
Each Board, including the Independent Board Members, also took into account other ancillary or “fall-out” benefits that BlackRock or its affiliates may derive from BlackRock’s respective relationships with the Funds, both tangible and intangible, such as BlackRock’s ability to leverage its investment professionals who manage other portfolios and its risk management personnel, an increase in BlackRock’s profile in the investment advisory community, and the engagement of BlackRock’s affiliates as service providers to the Funds, including for administrative, distribution, securities lending and cash management services. With respect to securities lending, during the year the Board also considered information provided by independent third-party consultants related to the performance of each BlackRock affiliate as securities lending agent. The Boards also considered BlackRock’s overall operations and its efforts to expand the scale of, and improve the quality of, its operations. The Boards also noted that, subject to applicable law, BlackRock may use and benefit from third-party research obtained by soft dollars generated by certain registered fund transactions to assist in managing all or a number of its other client accounts.
| | |
DISCLOSURE OF INVESTMENT ADVISORY AGREEMENTS AND SUB-ADVISORY AGREEMENT | | 53 |
Disclosure of Investment Advisory Agreements and Sub-Advisory Agreement (continued)
In connection with its consideration of the Agreements, the Boards also received information regarding BlackRock’s brokerage and soft dollar practices. The Boards received reports from BlackRock which included information on brokerage commissions and trade execution practices throughout the year.
The Boards noted the competitive nature of the open-end fund marketplace, and that shareholders are able to redeem their Fund shares if they believe that the pertinent Fund’s fees and expenses are too high or if they are dissatisfied with the performance of the Fund.
Conclusion
At the May Meeting, in a continuation of the discussions that occurred during the April Meeting, and as a culmination of the Board’s year-long deliberative process, the Board of EuroFund, including the Independent Board Members, unanimously approved the continuation of the EuroFund Advisory Agreement between the Manager and EuroFund for a one-year term ending June 30, 2024, and the EuroFund Sub-Advisory Agreement between the Manager and the Sub-Advisor with respect to EuroFund for a one-year term ending June 30, 2024.
The Board of Advantage Global Fund, including the Independent Board Members, unanimously approved the continuation of the Advantage Global Fund Advisory Agreement between the Manager and Advantage Global Fund for a one-year term ending June 30, 2024.
Based upon its evaluation of all of the aforementioned factors in their totality, as well as other information, the Boards, including the Independent Board Members, were satisfied that the terms of the Agreements were fair and reasonable and in the best interest of each Fund and its shareholders. In arriving at its decision to approve the Agreements, the Boards did not identify any single factor or group of factors as all-important or controlling, but considered all factors together, and different Board Members may have attributed different weights to the various factors considered. The Independent Board Members were advised by independent legal counsel throughout the deliberative process.
| | |
| 54 | | 2 0 2 3 BLACK ROCK ANNUAL REPORT TO SHAREHOLDERS |
Director and Officer Information
| | | | | | | | |
| Independent Directors(a) |
| | | | | |
Name Year of Birth(b) | | Position(s) Held
(Length of Service)(c) | | Principal Occupation(s) During Past 5 Years | | Number of BlackRock-Advised Registered Investment Companies (“RICs”) Consisting of Investment Portfolios (“Portfolios”) Overseen | | Public Company
and Other
Investment
Company
Directorships Held
During Past 5 Years |
| | | | |
Mark Stalnecker 1951 | | Chair of the Board and Director (Since 2019) | | Chief Investment Officer, University of Delaware from 1999 to 2013; Trustee and Chair of the Finance and Investment Committees, Winterthur Museum and Country Estate from 2005 to 2016; Member of the Investment Committee, Delaware Public Employees’ Retirement System since 2002; Member of the Investment Committee, Christiana Care Health System from 2009 to 2017; Member of the Investment Committee, Delaware Community Foundation from 2013 to 2014; Director and Chair of the Audit Committee, SEI Private Trust Co. from 2001 to 2014. | | 28 RICs consisting of 169 Portfolios | | None |
| | | | |
Susan J. Carter 1956 | | Director (Since 2019) | | Trustee, Financial Accounting Foundation from 2017 to 2021; Advisory Board Member, Center for Private Equity and Entrepreneurship at Tuck School of Business from 1997 to 2021; Director, Pacific Pension Institute from 2014 to 2018; Senior Advisor, Commonfund Capital, Inc. (“CCI”) (investment adviser) in 2015; Chief Executive Officer, CCI from 2013 to 2014; President & Chief Executive Officer, CCI from 1997 to 2013; Advisory Board Member, Girls Who Invest from 2015 to 2018 and Board Member thereof from 2018 to 2022; Advisory Board Member, Bridges Fund Management since 2016; Practitioner Advisory Board Member, Private Capital Research Institute (“PCRI”) since 2017; Lecturer in the Practice of Management, Yale School of Management since 2019; Advisor to Finance Committee, Altman Foundation since 2020; Investment Committee Member, Tostan since 2021; Member of the President’s Counsel, Commonfund since 2023. | | 28 RICs consisting of 169 Portfolios | | None |
| | | | |
Collette Chilton 1958 | | Director (Since 2019) | | Chief Investment Officer, Williams College since 2006; Chief Investment Officer, Lucent Asset Management Corporation from 1998 to 2006; Director, Boys and Girls Club of Boston since 2017; Director, B1 Capital since 2018; Director, David and Lucile Packard Foundation since 2020. | | 28 RICs consisting of 169 Portfolios | | None |
| | | | |
Neil A. Cotty 1954 | | Director (Since 2019) | | Bank of America Corporation from 1996 to 2015, serving in various senior finance leadership roles, including Chief Accounting Officer from 2009 to 2015, Chief Financial Officer of Global Banking, Markets and Wealth Management from 2008 to 2009, Chief Accounting Officer from 2004 to 2008, Chief Financial Officer of Consumer Bank from 2003 to 2004, Chief Financial Officer of Global Corporate Investment Bank from 1999 to 2002. | | 28 RICs consisting of 169 Portfolios | | None |
| | | | |
Lena G. Goldberg 1949 | | Director (Since 2016) | | Director, Pioneer Legal Institute since 2023; Director, Charles Stark Draper Laboratory, Inc. from 2013 to 2021; Senior Lecturer, Harvard Business School from 2008 to 2021; FMR LLC/Fidelity Investments (financial services) from 1996 to 2008, serving in various senior roles including Executive Vice President - Strategic Corporate Initiatives and Executive Vice President and General Counsel; Partner, Sullivan & Worcester LLP from 1985 to 1996 and Associate thereof from 1979 to 1985. | | 28 RICs consisting of 169 Portfolios | | None |
| | |
DIRECTOR AND OFFICER INFORMATION | | 55 |
Director and Officer Information (continued)
| | | | | | | | |
| Independent Directors(a) (continued) |
| | | | | |
Name Year of Birth(b) | | Position(s) Held (Length of Service)(c) | | Principal Occupation(s) During Past 5 Years | | Number of BlackRock-Advised Registered Investment Companies (“RICs”) Consisting of Investment Portfolios (“Portfolios”) Overseen | | Public Company
and Other
Investment
Company
Directorships Held
During
Past 5 Years |
| | | | |
Henry R. Keizer 1956 | | Director (Since 2016) | | Director, Park Indemnity Ltd. (captive insurer) from 2010 to 2022. | | 28 RICs consisting of 169 Portfolios | | GrafTech International Ltd. (materials manufacturing); Sealed Air Corp. (packaging); WABCO (commercial vehicle safety systems) from 2015 to 2020; Hertz Global Holdings (car rental) from 2015 to 2021 |
| | | | |
Cynthia A. Montgomery 1952 | | Director (Since 2019) | | Professor, Harvard Business School since 1989. | | 28 RICs consisting of 169 Portfolios | | None |
| | | | |
Donald C. Opatrny 1952 | | Director (Since 2015) | | Chair of the Board of Phoenix Art Museum since 2022 and Trustee thereof since 2018; Chair of the Investment Committee of The Arizona Community Foundation since 2022 and trustee thereof since 2020; Director, Athena Capital Advisors LLC (investment management firm) from 2013 to 2020; Trustee, Vice Chair, Member of the Executive Committee and Chair of the Investment Committee, Cornell University from 2004 to 2019; President and Trustee, the Center for the Arts, Jackson Hole from 2011 to 2018; Member of the Board and Investment Committee, University School from 2007 to 2018; Member of Affordable Housing Supply Board of Jackson, Wyoming since 2017; Member, Investment Funds Committee, State of Wyoming since 2017; Trustee, Artstor (a Mellon Foundation affiliate) from 2010 to 2015; Member of the Investment Committee, Mellon Foundation from 2009 to 2015; President, Trustee and Member of the Investment Committee, The Aldrich Contemporary Art Museum from 2007 to 2014; Trustee and Chair of the Investment Committee, Community Foundation of Jackson Hole since 2014. | | 28 RICs consisting of 169 Portfolios | | None |
| | | | |
Kenneth L. Urish 1951 | | Director (Since 2019) | | Managing Partner, Urish Popeck & Co., LLC (certified public accountants and consultants) since 1976; Past- Chairman of the Professional Ethics Committee of the Pennsylvania Institute of Certified Public Accountants and Committee Member thereof since 2007; Member of External Advisory Board, The Pennsylvania State University Accounting Department since 2001, Emeritus since 2022; Principal, UP Strategic Wealth Investment Advisors, LLC since 2013; Trustee, The Holy Family Institute from 2001 to 2010; President and Trustee, Pittsburgh Catholic Publishing Associates from 2003 to 2008; Director, Inter-Tel from 2006 to 2007; Member, Advisory Board, ESG Competent Boards since 2020. | | 28 RICs consisting of 169 Portfolios | | None |
| | |
| 56 | | 2 0 2 3 BLACK ROCK ANNUAL REPORT TO SHAREHOLDERS |
Director and Officer Information (continued)
| | | | | | | | |
| Independent Directors(a) (continued) |
| | | | | |
Name Year of Birth(b) | | Position(s) Held (Length of Service)(c) | | Principal Occupation(s) During Past 5 Years | | Number of BlackRock-Advised Registered Investment Companies (“RICs”) Consisting of Investment Portfolios (“Portfolios”) Overseen | | Public Company
and Other
Investment
Company
Directorships Held
During Past 5 Years |
| | | | |
Claire A. Walton 1957 | | Director (Since 2019) | | Advisory Board Member, Grossman School of Business at the University of Vermont since 2023; Advisory Board Member, Scientific Financial Systems since 2022; General Partner of Neon Liberty Capital Management, LLC since 2003; Chief Operating Officer and Chief Financial Officer of Liberty Square Asset Management, LP from 1998 to 2015; Director, Boston Hedge Fund Group from 2009 to 2018; Director, Massachusetts Council on Economic Education from 2013 to 2015; Director, Woodstock Ski Runners from 2013 to 2022. | | 28 RICs consisting of 169 Portfolios | | None |
|
| Interested Directors(a)(d) |
| | | | | |
Name Year of Birth(b) | | Position(s) Held (Length of Service)(c) | | Principal Occupation(s) During Past 5 Years | | Number of BlackRock-Advised (“RICs”) Consisting of Investment
Portfolios (“Portfolios”) Overseen | | Public Company
and Other
Investment
Company
Directorships Held
During Past 5 Years |
| | | | |
Robert Fairbairn 1965 | | Director (Since 2015) | | Vice Chairman of BlackRock, Inc. since 2019; Member of BlackRock’s Global Executive and Global Operating Committees; Co-Chair of BlackRock’s Human Capital Committee; Senior Managing Director of BlackRock, Inc. from 2010 to 2019; oversaw BlackRock’s Strategic Partner Program and Strategic Product Management Group from 2012 to 2019; Member of the Board of Managers of BlackRock Investments, LLC from 2011 to 2018; Global Head of BlackRock’s Retail and iShares® businesses from 2012 to 2016. | | 98 RICs consisting of 273 Portfolios | | None |
| | | | |
John M. Perlowski(e) 1964 | | Director (Since 2018) President and Chief Executive Officer (Since 2010) | | Managing Director of BlackRock, Inc. since 2009; Head of BlackRock Global Accounting and Product Services since 2009; Advisory Director of Family Resource Network (charitable foundation) since 2009. | | 100 RICs consisting of 275 Portfolios | | None |
| (a) | The address of each Director is c/o BlackRock, Inc., 50 Hudson Yards, New York, NY 10001. |
| (b) | Each Independent Director holds office until his or her successor is duly elected and qualifies or until his or her earlier death, resignation, retirement or removal as provided by the Funds’ by-laws or charter or statute, or until December 31 of the year in which he or she turns 75. Directors who are “interested persons,” as defined in the 1940 Act, serve until their successor is duly elected and qualifies or until their earlier death, resignation, retirement or removal as provided by the Funds’ by-laws or statute, or until December 31 of the year in which they turn 72. The Board may determine to extend the terms of Independent Directors on a case-by-case basis, as appropriate. |
| (c) | Following the combination of Merrill Lynch Investment Managers, L.P. (“MLIM”) and BlackRock, Inc. in September 2006, the various legacy MLIM and legacy BlackRock fund boards were realigned and consolidated into three new fund boards in 2007. In addition, effective January 1, 2019, three BlackRock Fund Complexes were realigned and consolidated into two BlackRock Fund Complexes. As a result, although the chart shows the year that each Independent Director joined the Board, certain Independent Directors first became members of the boards of other BlackRock-advised Funds, legacy MLIM funds or legacy BlackRock funds as follows: Susan J. Carter, 2016; Collette Chilton, 2015; Neil A. Cotty, 2016; Cynthia A. Montgomery, 1994; Mark Stalnecker, 2015; Kenneth L. Urish, 1999; Claire A. Walton, 2016. |
| (d) | Mr. Fairbairn and Mr. Perlowski are both “interested persons,” as defined in the 1940 Act, of the Funds based on their positions with BlackRock, Inc. and its affiliates. Mr. Fairbairn and Mr. Perlowski are also board members of the BlackRock Fixed-Income Complex. |
| (e) | Mr. Perlowski is also a trustee of the BlackRock Credit Strategies Fund and BlackRock Private Investments Fund. |
| | |
DIRECTOR AND OFFICER INFORMATION | | 57 |
Director and Officer Information (continued)
| | | | |
| Officers Who Are Not Directors(a) |
| | | |
Name Year of Birth(b) | | Position(s) Held (Length of Service) | | Principal Occupation(s) During Past 5 Years |
| | |
Jennifer McGovern 1977 | | Vice President
(Since 2014) | | Managing Director of BlackRock, Inc. since 2016; Director of BlackRock, Inc. from 2011 to 2015; Head of Americas Product Development and Governance for BlackRock’s Global Product Group since 2019; Head of Product Structure and Oversight for BlackRock’s U.S. Wealth Advisory Group from 2013 to 2019. |
| | |
Trent Walker 1974 | | Chief Financial Officer (Since 2021) | | Managing Director of BlackRock, Inc. since September 2019; Executive Vice President of PIMCO from 2016 to 2019; Senior Vice President of PIMCO from 2008 to 2015; Treasurer from 2013 to 2019 and Assistant Treasurer from 2007 to 2017 of PIMCO Funds, PIMCO Variable Insurance Trust, PIMCO ETF Trust, PIMCO Equity Series, PIMCO Equity Series VIT, PIMCO Managed Accounts Trust, 2 PIMCO-sponsored interval funds and 21 PIMCO-sponsored closed-end funds. |
| | |
Jay M. Fife 1970 | �� | Treasurer
(Since 2007) | | Managing Director of BlackRock, Inc. since 2007. |
| | |
Charles Park 1967 | | Chief Compliance Officer (Since 2014) | | Anti-Money Laundering Compliance Officer for certain BlackRock-advised Funds from 2014 to 2015; Chief Compliance Officer of BlackRock Advisors, LLC and the BlackRock-advised Funds in the BlackRock Multi-Asset Complex and the BlackRock Fixed-Income Complex since 2014; Principal of and Chief Compliance Officer for iShares® Delaware Trust Sponsor LLC since 2012 and BlackRock Fund Advisors (“BFA”) since 2006; Chief Compliance Officer for the BFA-advised iShares® exchange traded funds since 2006; Chief Compliance Officer for BlackRock Asset Management International Inc. since 2012. |
| | |
Lisa Belle 1968 | | Anti-Money Laundering Compliance Officer
(Since 2019) | | Managing Director of BlackRock, Inc. since 2019; Global Financial Crime Head for Asset and Wealth Management of JP Morgan from 2013 to 2019; Managing Director of RBS Securities from 2012 to 2013; Head of Financial Crimes for Barclays Wealth Americas from 2010 to 2012. |
| | |
Janey Ahn 1975 | | Secretary (Since 2019) | | Managing Director of BlackRock, Inc. since 2018; Director of BlackRock, Inc. from 2009 to 2017. |
| (a) | The address of each Officer is c/o BlackRock, Inc., 50 Hudson Yards, New York, NY 10001. |
| (b) | Officers of each Fund serve at the pleasure of the Board. |
Further information about each Fund’s Directors and Officers is available in the Fund’s Statement of Additional Information, which can be obtained without charge by calling (800) 441-7762.
Effective December 31, 2022, Joseph P. Platt retired as a Director of each Fund.
Effective July 1, 2023, Aaron Wasserman replaced Charles Park as Chief Compliance Officer of each Fund.
| | |
| 58 | | 2 0 2 3 BLACK ROCK ANNUAL REPORT TO SHAREHOLDERS |
Additional Information
Tailored Shareholder Reports for Mutual Funds and ETFs
Effective January 24, 2023, the SEC adopted rule and form amendments to require mutual funds and ETFs to transmit concise and visually engaging streamlined annual and semiannual reports to shareholders that highlight key information. Other information, including financial statements, will no longer appear in a streamlined shareholder report but must be available online, delivered free of charge upon request, and filed on a semiannual basis on Form N-CSR. The rule and form amendments have a compliance date of July 24, 2024. At this time, management is evaluating the impact of these amendments on the shareholder reports for the Funds.
General Information
Quarterly performance, semi-annual and annual reports, current net asset value and other information regarding the Funds may be found on BlackRock’s website, which can be accessed at blackrock.com. Any reference to BlackRock’s website in this report is intended to allow investors public access to information regarding the Funds and does not, and is not intended to, incorporate BlackRock’s website in this report.
Householding
The Funds will mail only one copy of shareholder documents, including prospectuses, annual and semi-annual reports, Rule 30e-3 notices and proxy statements, to shareholders with multiple accounts at the same address. This practice is commonly called “householding” and is intended to reduce expenses and eliminate duplicate mailings of shareholder documents. Mailings of your shareholder documents may be householded indefinitely unless you instruct us otherwise. If you do not want the mailing of these documents to be combined with those for other members of your household, please call the Funds at (800) 441-7762.
Availability of Quarterly Schedule of Investments
The Funds file their complete schedules of portfolio holdings with the SEC for the first and third quarters of each fiscal year as an exhibit to their reports on Form N-PORT. The Funds’ Forms N-PORT are available on the SEC’s website at sec.gov. Additionally, each Fund makes its portfolio holdings for the first and third quarters of each fiscal year available at blackrock.com/fundreports.
Availability of Proxy Voting Policies, Procedures and Voting Records
A description of the policies and procedures that the Funds use to determine how to vote proxies relating to portfolio securities and information about how the Funds voted proxies relating to securities held in the Funds’ portfolios during the most recent 12-month period ended June 30 is available without charge, upon request (1) by calling (800) 441-7762; (2) on the BlackRock website at blackrock.com; and (3) on the SEC’s website at sec.gov.
BlackRock’s Mutual Fund Family
BlackRock offers a diverse lineup of open-end mutual funds crossing all investment styles and managed by experts in equity, fixed-income and tax-exempt investing. Visit blackrock.com for more information.
Shareholder Privileges
Account Information
Call us at (800) 441-7762 from 8:00 AM to 6:00 PM ET on any business day to get information about your account balances, recent transactions and share prices. You can also visit blackrock.com for more information.
Automatic Investment Plans
Investor class shareholders who want to invest regularly can arrange to have $50 or more automatically deducted from their checking or savings account and invested in any of the BlackRock funds.
Systematic Withdrawal Plans
Investor class shareholders can establish a systematic withdrawal plan and receive periodic payments of $50 or more from their BlackRock funds, as long as their account balance is at least $10,000.
Retirement Plans
Shareholders may make investments in conjunction with Traditional, Rollover, Roth, Coverdell, Simple IRAs, SEP IRAs and 403(b) Plans.
BlackRock Privacy Principles
BlackRock is committed to maintaining the privacy of its current and former fund investors and individual clients (collectively, “Clients”) and to safeguarding their non-public personal information. The following information is provided to help you understand what personal information BlackRock collects, how we protect that information and why in certain cases we share such information with select parties.
| | |
ADDITIONAL INFORMATION | | 59 |
Additional Information (continued)
BlackRock Privacy Principles (continued)
If you are located in a jurisdiction where specific laws, rules or regulations require BlackRock to provide you with additional or different privacy-related rights beyond what is set forth below, then BlackRock will comply with those specific laws, rules or regulations.
BlackRock obtains or verifies personal non-public information from and about you from different sources, including the following: (i) information we receive from you or, if applicable, your financial intermediary, on applications, forms or other documents; (ii) information about your transactions with us, our affiliates, or others; (iii) information we receive from a consumer reporting agency; and (iv) from visits to our websites.
BlackRock does not sell or disclose to non-affiliated third parties any non-public personal information about its Clients, except as permitted by law or as is necessary to respond to regulatory requests or to service Client accounts. These non-affiliated third parties are required to protect the confidentiality and security of this information and to use it only for its intended purpose.
We may share information with our affiliates to service your account or to provide you with information about other BlackRock products or services that may be of interest to you. In addition, BlackRock restricts access to non-public personal information about its Clients to those BlackRock employees with a legitimate business need for the information. BlackRock maintains physical, electronic and procedural safeguards that are designed to protect the non-public personal information of its Clients, including procedures relating to the proper storage and disposal of such information.
Fund and Service Providers
| | |
| Investment Adviser | | Distributor |
| BlackRock Advisors, LLC | | BlackRock Investments, LLC |
| Wilmington, DE 19809 | | New York, NY 10001 |
| |
| Sub-Adviser(a) | | Independent Registered Public Accounting Firm |
| BlackRock International Limited | | Deloitte & Touche LLP |
| Edinburgh, EH3 8BL | | Boston, MA 02116 |
| United Kingdom | | |
| | |
| Accounting Agent | | Legal Counsel |
| State Street Bank and Trust Company | | Sidley Austin LLP |
| Boston, MA 02114 | | New York, NY 10019 |
| | |
| Custodian | | Address of the Funds |
| Brown Brothers Harriman & Co. | | 100 Bellevue Parkway |
| Boston, MA 02109 | | Wilmington, DE 19809 |
| | |
| Transfer Agent | | |
| BNY Mellon Investment Servicing (US) Inc. | | |
| Wilmington, DE 19809 | | |
| |
(a) For BlackRock EuroFund. | | |
| | |
| 60 | | 2 0 2 3 BLACK ROCK ANNUAL REPORT TO SHAREHOLDERS |
Glossary of Terms Used in this Report
Currency Abbreviation
| | |
| CAD | | Canadian Dollar |
| |
| EUR | | Euro |
| |
| HKD | | Hong Kong Dollar |
| |
| JPY | | Japanese Yen |
| | |
| Portfolio Abbreviation |
| |
| ADR | | American Depositary Receipt |
| |
| MSCI | | Morgan Stanley Capital International |
| |
| NVDR | | Non-Voting Depositary Receipt |
| |
| PCL | | Public Company Limited |
| |
| PJSC | | Public Joint Stock Company |
| |
| S&P | | Standard & Poor’s |
| |
| SAB | | Special Assessment Bonds |
| | |
GLOSSARY OF TERMS USED IN THIS REPORT | | 61 |
Want to know more?
blackrock.com | 800-441-7762
This report is intended for current holders. It is not authorized for use as an offer of sale or a solicitation of an offer to buy shares of the Funds unless preceded or accompanied by the Funds’ current prospectus. Past performance results shown in this report should not be considered a representation of future performance. Investment returns and principal value of shares will fluctuate so that shares, when redeemed, may be worth more or less than their original cost. Statements and other information herein are as dated and are subject to change.
EGSC-06/23-AR
(b) Not Applicable
| Item 2 – | Code of Ethics – The registrant (or the “Fund”) has adopted a code of ethics, as of the end of the period covered by this report, applicable to the registrant’s principal executive officer, principal financial officer, principal accounting officer or controller, or persons performing similar functions. During the period covered by this report, the code of ethics was amended to update certain information and to make other non-material changes. During the period covered by this report, there have been no waivers granted under the code of ethics. The registrant undertakes to provide a copy of the code of ethics to any person upon request, without charge, who calls 1-800-441-7762. |
| Item 3 – | Audit Committee Financial Expert – The registrant’s board of directors (the “board of directors”), has determined that (i) the registrant has the following audit committee financial experts serving on its audit committee and (ii) each audit committee financial expert is independent: |
Neil A. Cotty
Henry R. Keizer
Kenneth L. Urish
Under applicable securities laws, a person determined to be an audit committee financial expert will not be deemed an “expert” for any purpose, including without limitation for the purposes of Section 11 of the Securities Act of 1933, as a result of being designated or identified as an audit committee financial expert. The designation or identification of a person as an audit committee financial expert does not impose on such person any duties, obligations, or liabilities greater than the duties, obligations, and liabilities imposed on such person as a member of the audit committee and board of directors in the absence of such designation or identification. The designation or identification of a person as an audit committee financial expert does not affect the duties, obligations, or liability of any other member of the audit committee or board of directors.
| Item 4 – | Principal Accountant Fees and Services |
The following table presents fees billed by Deloitte & Touche LLP (“D&T”) in each of the last two fiscal years for the services rendered to the Fund:
| | | | | | | | | | | | | | | | |
| | | (a) Audit Fees | | (b) Audit-Related Fees1 | | (c) Tax Fees2 | | (d) All Other Fees |
| Entity Name | | Current Fiscal Year End | | Previous Fiscal Year End | | Current Fiscal Year End | | Previous Fiscal Year End | | Current Fiscal Year End | | Previous Fiscal Year End | | Current Fiscal Year End | | Previous Fiscal Year End |
BlackRock EuroFund | | $36,414 | | $34,986 | | $44 | | $638 | | $18,700 | | $15,700 | | $0 | | $0 |
The following table presents fees billed by D&T that were required to be approved by the registrant’s audit committee (the “Committee”) for services that relate directly to the operations or financial reporting of the Fund and that are rendered on behalf of BlackRock Advisors, LLC (the “Investment Adviser” or “BlackRock”) and entities controlling, controlled by, or under common control with BlackRock (not including any sub-adviser whose role is primarily portfolio management and is subcontracted with or overseen by another investment adviser) that provide ongoing services to the Fund (“Affiliated Service Providers”):
| | | | |
| | | Current Fiscal Year End | | Previous Fiscal Year End |
(b) Audit-Related Fees1 | | $0 | | $0 |
(c) Tax Fees2 | | $0 | | $0 |
(d) All Other Fees3 | | $2,154,000 | | $2,098,000 |
| 1 | | The nature of the services includes assurance and related services reasonably related to the performance of the audit or review of financial statements not included in Audit Fees, including accounting consultations, agreed-upon procedure reports, attestation reports, comfort letters, out-of-pocket expenses and internal control reviews not required by regulators. |
| 2 | | The nature of the services includes tax compliance and/or tax preparation, including services relating to the filing or amendment of federal, state or local income tax returns, regulated investment company qualification reviews, taxable income and tax distribution calculations. |
| 3 | | Non-audit fees of $2,154,000 and $2,098,000 for the current fiscal year and previous fiscal year, respectively, were paid to the Fund’s principal accountant in their entirety by BlackRock, in connection with services provided to the Affiliated Service Providers of the Fund and of certain other funds sponsored and advised by BlackRock or its affiliates for a service organization review and an accounting research tool subscription. These amounts represent aggregate fees paid by BlackRock and were not allocated on a per fund basis. |
(e)(1) Audit Committee Pre-Approval Policies and Procedures:
The Committee has adopted policies and procedures with regard to the pre-approval of services. Audit, audit-related and tax compliance services provided to the registrant on an annual basis require specific pre-approval by the Committee. The Committee also must approve other non-audit services provided to the registrant and those non-audit services provided to the Investment Adviser and Affiliated Service Providers that relate directly to the operations and the financial reporting of the registrant. Certain of these non-audit services that the Committee believes are (a) consistent with the SEC’s auditor independence rules and (b) routine and recurring services that will not impair the independence of the independent accountants may be approved by the Committee without consideration on a specific case-by-case basis (“general pre-approval”). The term of any general pre-approval is 12 months from the date of the pre-approval, unless the Committee provides for a different period. Tax or other non-audit services provided to the registrant which have a direct impact on the operations or financial reporting of the registrant will only be deemed pre-approved provided that any individual project does not exceed $10,000 attributable to the registrant or $50,000 per project. For this purpose, multiple projects will be aggregated to determine if they exceed the previously mentioned cost levels.
Any proposed services exceeding the pre-approved cost levels will require specific pre-approval by the Committee, as will any other services not subject to general pre-approval (e.g., unanticipated but permissible services). The Committee is informed of each service approved subject to general pre-approval at the next regularly scheduled in-person board meeting. At this meeting, an analysis of such services is presented to the Committee for ratification. The Committee may delegate to the Committee Chairman the authority to approve the provision of and fees for any specific engagement of permitted non-audit services, including services exceeding pre-approved cost levels.
(e)(2) None of the services described in each of Items 4(b) through (d) were approved by the Committee pursuant to the de minimis exception in paragraph (c)(7)(i)(C) of Rule 2-01 of Regulation S-X.
(f) Not Applicable
(g) The aggregate non-audit fees, defined as the sum of the fees shown under “Audit-Related Fees,” “Tax Fees” and “All Other Fees,” paid to the accountant for services rendered by the accountant to the registrant, the Investment Adviser and the Affiliated Service Providers were:
| | | | | | |
| | | Entity Name | | Current Fiscal
Year End | | Previous Fiscal
Year End |
| | BlackRock EuroFund | | $18,744 | | $16,338 |
Additionally, the amounts billed by D&T in connection with services provided to the Affiliated Service Providers of the Fund and of other funds sponsored and advised by BlackRock or its affiliates during the current and previous fiscal years for a service organization review and an accounting research tool subscription were:
| | | | | | |
| | | Current Fiscal Year End | | Previous Fiscal Year End | | |
| | $2,154,000 | | $2,098,000 | | |
These amounts represent aggregate fees paid by BlackRock and were not allocated on a per fund basis.
(h) The Committee has considered and determined that the provision of non-audit services that were rendered to the Investment Adviser and the Affiliated Service Providers that were not pre-approved pursuant to paragraph (c)(7)(ii) of Rule 2-01 of Regulation S-X is compatible with maintaining the principal accountant’s independence.
(i) – Not Applicable
(j) – Not Applicable
| Item 5 – | Audit Committee of Listed Registrant – Not Applicable |
(a) The registrant’s Schedule of Investments is included as part of the Report to Stockholders filed under Item 1(a) of this Form.
(b) Not Applicable due to no such divestments during the semi-annual period covered since the previous Form N-CSR filing.
| Item 7 – | Disclosure of Proxy Voting Policies and Procedures for Closed-End Management Investment Companies – Not Applicable |
| Item 8 – | Portfolio Managers of Closed-End Management Investment Companies – Not Applicable |
| Item 9 – | Purchases of Equity Securities by Closed-End Management Investment Company and Affiliated Purchasers – Not Applicable |
| Item 10 – | Submission of Matters to a Vote of Security Holders – There have been no material changes to these procedures. |
| Item 11 – | Controls and Procedures |
(a) The registrant’s principal executive and principal financial officers, or persons performing similar functions, have concluded that the registrant’s disclosure controls and procedures (as defined in Rule 30a-3(c) under the Investment Company Act of 1940, as amended (the “1940 Act”)) are effective as of a date within 90 days of the filing of this report based on the evaluation of these controls and procedures required by Rule 30a-3(b) under the 1940 Act and Rule 15d-15(b) under the Securities Exchange Act of 1934, as amended.
(b) There were no changes in the registrant’s internal control over financial reporting (as defined in Rule 30a-3(d) under the 1940 Act) that occurred during the period covered by this report that have materially affected, or are reasonably likely to materially affect, the registrant’s internal control over financial reporting.
| Item 12 – | Disclosure of Securities Lending Activities for Closed-End Management Investment Companies – Not Applicable |
| Item 13 – | Exhibits attached hereto |
(a)(1) Code of Ethics – See Item 2
(a)(2) Section 302 Certifications are attached
(a)(3) Any written solicitation to purchase securities under Rule 23c-1 – Not Applicable
(a)(4) Change in Registrant’s independent public accountant – Not Applicable
(b) Section 906 Certifications are attached
Pursuant to the requirements of the Securities Exchange Act of 1934 and the Investment Company Act of 1940, the registrant has duly caused this report to be signed on its behalf by the undersigned, thereunto duly authorized.
BlackRock EuroFund
| | | | |
| | By: | | /s/ John M. Perlowski |
| | | | John M. Perlowski |
| | | | Chief Executive Officer (principal executive officer) of |
| | | | BlackRock EuroFund |
Date: August 22, 2023
Pursuant to the requirements of the Securities Exchange Act of 1934 and the Investment Company Act of 1940, this report has been signed below by the following persons on behalf of the registrant and in the capacities and on the dates indicated.
| | | | |
| | By: | | /s/ John M. Perlowski |
| | | | John M. Perlowski |
| | | | Chief Executive Officer (principal executive officer) of |
| | | | BlackRock EuroFund |
Date: August 22, 2023
| | | | |
| | By: | | /s/ Trent Walker |
| | | | Trent Walker |
| | | | Chief Financial Officer (principal financial officer) of |
| | | | BlackRock EuroFund |
Date: August 22, 2023