UNITED STATES
SECURITIES AND EXCHANGE COMMISSION
Washington, D.C. 20549
FORM N-CSR
CERTIFIED SHAREHOLDER REPORT OF REGISTERED
MANAGEMENT INVESTMENT COMPANIES
Investment Company Act file number: 811-04612
Name of Fund: BlackRock EuroFund
Fund Address: 100 Bellevue Parkway, Wilmington, DE 19809
Name and address of agent for service: John M. Perlowski, Chief Executive Officer, BlackRock EuroFund, 55 East
52nd Street, New York, NY 10055
Registrant’s telephone number, including area code: (800) 441-7762
Date of fiscal year end: 06/30/2015
Date of reporting period: 12/31/2014
Item 1 – Report to Stockholders
DECEMBER 31, 2014
| | | | | | |
SEMI-ANNUAL REPORT (UNAUDITED) | | | | | |  |
BlackRock EuroFund
BlackRock Global SmallCap Fund, Inc.
|
| Not FDIC Insured • May Lose Value • No Bank Guarantee |

| | | | | | |
| | | | | | | |
| 2 | | SEMI-ANNUAL REPORT | | DECEMBER 31, 2014 | | |
Dear Shareholder,
After an extended period of calm, market volatility increased over the course of 2014, driven largely by higher valuations in risk assets (such as equities and high yield bonds), rising geopolitical risks and expectations around global central bank policies. Several key trends drove strong performance in U.S. markets, particularly large-cap stocks, Treasuries and municipal bonds, while markets outside the U.S. were more challenged.
Investors began the year in search of relatively safer assets due to heightened risks in emerging markets, slowing growth in China and weakening U.S. economic data. As a result, equities globally declined in January while bond markets strengthened despite the expectation that interest rates would rise as the U.S. Federal Reserve had begun reducing its asset purchase programs. Strong demand for relatively safer assets pushed U.S. Treasury bond prices higher and thus kept rates low in the United States. This surprising development, as well as increasing evidence that the soft patch in U.S. economic data had been temporary and weather-related, brought equity investors racing back to the market in February.
In the months that followed, interest rates trended lower in a modest growth environment and more investors turned to equities in search of yield. Markets remained relatively calm despite rising tensions in Russia and Ukraine and further signs of decelerating growth in China. Strong corporate earnings, increased merger and acquisition activity and signs of a strengthening recovery in the U.S. and other developed economies kept equity prices moving higher. Not all segments benefited from these trends, however, as investors ultimately became wary of high valuations, resulting in a broad rotation into cheaper assets.
Volatility ticked up in the summer as geopolitical tensions escalated and investors feared that better U.S. economic indicators may compel the Fed to increase short-term interest rates sooner than previously anticipated. Global credit markets tightened as the U.S. dollar strengthened, ultimately putting a strain on investor flows, and financial markets broadly weakened in the third quarter.
Several themes dominated the markets in the fourth quarter, resulting in higher levels of volatility and the outperformance of U.S. markets versus other areas of the world. Economic growth strengthened considerably in the United States while the broader global economy showed signs of slowing. The European Central Bank and the Bank of Japan took aggressive measures to stimulate growth while the Fed moved toward tighter policy. This divergence in central bank policy caused further strengthening in the U.S. dollar versus other currencies. Oil prices, which had been falling gradually since the summer, plummeted in the fourth quarter due to a global supply-and-demand imbalance. Energy stocks sold off sharply and oil-exporting economies suffered, resulting in the poor performance of emerging market stocks.
At BlackRock, we believe investors need to think globally, extend their scope across a broad array of asset classes and be prepared to move freely as market conditions change over time. We encourage you to talk with your financial advisor and visit blackrock.com for further insight about investing in today’s markets.
Sincerely,

Rob Kapito
President, BlackRock Advisors, LLC

Rob Kapito
President, BlackRock Advisors, LLC
| | | | | | | | |
| Total Returns as of December 31, 2014 | |
| | | 6-month | | | 12-month | |
U.S. large cap equities
(S&P 500® Index) | | | 6.12 | % | | | 13.69 | % |
U.S. small cap equities
(Russell 2000® Index) | | | 1.65 | | | | 4.89 | |
International equities
(MSCI Europe, Australasia,
Far East Index) | | | (9.24 | ) | | | (4.90 | ) |
Emerging market equities
(MSCI Emerging
Markets Index) | | | (7.84 | ) | | | (2.19 | ) |
3-month Treasury bills
(BofA Merrill Lynch 3-Month
U.S. Treasury Bill Index) | | | 0.01 | | | | 0.03 | |
U.S. Treasury securities
(BofA Merrill Lynch 10-Year
U.S. Treasury Index) | | | 4.33 | | | | 10.72 | |
U.S. investment-grade
bonds (Barclays
U.S. Aggregate Bond Index) | | | 1.96 | | | | 5.97 | |
Tax-exempt municipal
bonds (S&P Municipal
Bond Index) | | | 3.00 | | | | 9.25 | |
U.S. high yield bonds
(Barclays U.S.
Corporate High Yield 2%
Issuer Capped Index) | | | (2.84 | ) | | | 2.46 | |
| Past performance is no guarantee of future results. Index performance is shown for illustrative purposes only. You cannot invest directly in an index. | |
| | | | | | |
| | | | | | | |
| | THIS PAGE NOT PART OF YOUR FUND REPORT | | | | 3 |
| | |
| Fund Summary as of December 31, 2014 | | BlackRock EuroFund |
BlackRock EuroFund’s (the “Fund”) investment objective is to seek capital appreciation primarily through investment in equities of corporations domiciled in European countries.
| | |
| Portfolio Management Commentary | | |
How did the Fund perform?
| Ÿ | | For the six-month period ended December 31, 2014, the Fund’s Institutional and Investor A Shares outperformed the benchmark, the Morgan Stanley Capital International (“MSCI”) Europe Index, while the Investor C Shares underperformed and Class R Shares performed in line. |
What factors influenced performance?
| Ÿ | | The Fund’s investments in the financials sector provided strong returns for the period. Positions in KBC Groep NV (Belgium), Prudential PLC (United Kingdom), LEG Immobilien AG (Germany) and Zurich Insurance Group AG (Switzerland) performed well. |
| Ÿ | | The Fund’s stock selection also added value in the health care sector, where Shire PLC (Ireland), AstraZeneca PLC (United Kingdom) and Roche Holding AG (Switzerland) made positive contributions to performance. The Fund made a timely purchase of Shire PLC after the stock fell following a failed bid from the U.S. company AbbVie Inc. The investment manager believed there was significant standalone value in the stock even without the acquisition. The company subsequently released strong quarterly results, and the share price recouped some of its earlier losses. |
| Ÿ | | While an overweight in the energy sector was detrimental to returns given the sharp drop in oil prices, the negative impact was more than offset by the positive contribution from stock selection within the sector. |
| Ÿ | | Although the Fund’s positioning in the energy sector contributed positively to overall performance, positions in BG Group PLC (United Kingdom) and Total SA (France) were the largest individual detractors from returns in the six-month period. Outside of energy, the Fund’s position in the aircraft manufacturer Airbus Group NV (France) was one of the most significant detractors from performance. The company lowered expectations for its operating profit in the 2014-2017 period, a time in which the company will transition between current and new versions of its aircraft platforms. Stock selection in the consumer staples sector also detracted from performance. One of the largest detractors was the Portuguese food retailer Jeronimo Martins SGPS SA. The stock declined on concerns about economic weakness in Eastern Europe, which led to weaker profit margins and reduced guidance for the company’s full-year earnings. |
Describe recent portfolio activity.
| Ÿ | | The Fund increased its weighting in the consumer discretionary sector by adding to existing position in luxury-goods companies such as Cie Financière Richemont SA (Switzerland) and Luxottica Group SpA (Italy), and initiating new positions in LVMH Moet Hennessy Louis Vuitton SE (France) and Kering SA (France). Despite an uncertain outlook for the sector, management saw attractive valuations in these stocks. |
| Ÿ | | The Fund also added to its positions in the consumer staples sector through purchases of the beverage companies Heineken NV (Netherlands), Diageo PLC (United Kingdom) and Pernod Ricard SA (France). The investment manager believed all three companies were positioned to benefit from a pick-up in consumer spending as lower oil prices result in improved disposable income. Within the industrials and materials sectors, the Fund further consolidated its holdings in higher-quality businesses with the potential for greater stability and earnings visibility in a lower-growth environment. |
Describe portfolio positioning at period end.
| Ÿ | | Relative to the MSCI Europe Index, the Fund ended the period with overweight positions in the telecommunications, energy, consumer discretionary, health care and information technology sectors. It held a neutral weighting in financials and consumer staples, and it was underweight in industrials, utilities and materials. |
The views expressed reflect the opinions of BlackRock as of the date of this report and are subject to change based on changes in market, economic or other conditions. These views are not intended to be a forecast of future events and are no guarantee of future results.
| | |
| Ten Largest Holdings | | Percent of
Long-Term Investments |
| | | | |
Royal Dutch Shell PLC | | | 5 | % |
Rio Tinto PLC | | | 4 | |
Bayer AG, Registered Shares | | | 4 | |
Prudential PLC | | | 4 | |
Total SA | | | 3 | |
Novo Nordisk A/S | | | 3 | |
Vodafone Group PLC | | | 3 | |
KBC Groep NV | | | 3 | |
Zurich Insurance Group AG | | | 3 | |
Intesa Sanpaolo SpA | | | 3 | |
| | |
| Geographic Allocation | | Percent of
Long-Term Investments |
| | | | |
United Kingdom | | | 33 | % |
France | | | 17 | |
Germany | | | 13 | |
Netherlands | | | 9 | |
Switzerland | | | 9 | |
Italy | | | 5 | |
Ireland | | | 4 | |
Belgium | | | 3 | |
Denmark | | | 3 | |
Spain | | | 2 | |
Sweden | | | 2 | |
| | | | | | |
| | | | | | | |
| 4 | | SEMI-ANNUAL REPORT | | DECEMBER 31, 2014 | | |
| | |
| Total Return Based on a $10,000 Investment | | |
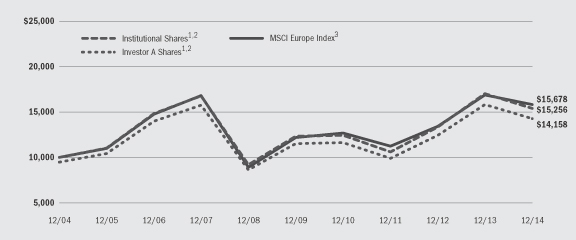
| | 1 | | Assuming maximum sales charge, if any, transaction costs and other operating expenses, including investment advisory fees. Institutional Shares do not have a sales charge. |
| | 2 | | Under normal circumstances, the Fund will invest at least 80% of its net assets in equity securities, including common stock and convertible securities, of companies located in Europe. The Fund currently expects that a majority of the Fund’s assets will be invested in equity securities of companies in Western European countries, but may also invest in emerging markets in Eastern European countries. |
| | 3 | | A free float-adjusted market capitalization weighted index that is designed to measure the equity market performance of the developed markets in Europe. |
| | |
| Performance Summary for the Period Ended December 31, 2014 | | |
| | | | | | | | | | | | | | | | | | | | | | | | | | | | |
| | | | | | Average Annual Total Returns4 | |
| | | | | | 1 Year | | | 5 Years | | | 10 Years | |
| | | 6-Month
Total Returns | | | w/o sales
charge | | | w/sales
charge | | | w/o sales
charge | | | w/sales
charge | | | w/o sales
charge | | | w/sales
charge | |
Institutional | | | (10.71 | )% | | | (9.52 | )% | | | N/A | | | | 4.50 | % | | | N/A | | | | 4.31 | % | | | N/A | |
Investor A | | | (10.83 | ) | | | (9.68 | ) | | | (14.42 | )% | | | 4.28 | | | | 3.16 | % | | | 4.10 | | | | 3.54 | % |
Investor C | | | (11.23 | ) | | | (10.47 | ) | | | (11.34 | ) | | | 3.39 | | | | 3.39 | | | | 3.23 | | | | 3.23 | |
Class R | | | (11.06 | ) | | | (10.20 | ) | | | N/A | | | | 3.67 | | | | N/A | | | | 3.56 | | | | N/A | |
MSCI Europe Index | | | (11.05 | ) | | | (6.18 | ) | | | N/A | | | | 5.28 | | | | N/A | | | | 4.60 | | | | N/A | |
| | 4 | | Assuming maximum sales charges, if any. Average annual total returns with and without sales charges reflect reductions for distribution and service fees. See “About Fund Performance” on page 8 for a detailed description of share classes, including any related sales charges and fees. |
| | | | N/A — Not applicable as share class and index do not have a sales charge. |
| | | | Past performance is not indicative of future results. |
| | | | | | | | | | | | | | | | | | | | | | | | | | | | |
| | | Actual | | | Hypothetical6 | | | | |
| | | Beginning
Account Value
July 1, 2014 | | | Ending
Account Value
December 31, 2014 | | | Expenses Paid
During the
Period5 | | | Beginning
Account Value
July 1, 2014 | | | Ending
Account Value
December 31, 2014 | | | Expenses Paid
During the
Period5 | | | Annualized
Expense Ratio | |
Institutional | | $ | 1,000.00 | | | $ | 892.90 | | | $ | 4.72 | | | $ | 1,000.00 | | | $ | 1,020.21 | | | $ | 5.04 | | | | 0.99 | % |
Investor A | | $ | 1,000.00 | | | $ | 891.70 | | | $ | 5.86 | | | $ | 1,000.00 | | | $ | 1,019.00 | | | $ | 6.26 | | | | 1.23 | % |
Investor C | | $ | 1,000.00 | | | $ | 887.70 | | | $ | 9.75 | | | $ | 1,000.00 | | | $ | 1,014.87 | | | $ | 10.41 | | | | 2.05 | % |
Class R | | $ | 1,000.00 | | | $ | 889.40 | | | $ | 8.19 | | | $ | 1,000.00 | | | $ | 1,016.53 | | | $ | 8.74 | | | | 1.72 | % |
| | 5 | | For each class of the Fund, expenses are equal to the annualized net expense ratio for the class, multiplied by the average account value over the period, multiplied by 184/365 (to reflect the one-half year period shown). |
| | 6 | | Hypothetical 5% annual return before expenses is calculated by pro rating the number of days in the most recent fiscal half year divided by 365. |
| | | | See “Disclosure of Expenses” on page 8 for further information on how expenses were calculated. |
| | | | | | |
| | | | | | | |
| | SEMI-ANNUAL REPORT | | DECEMBER 31, 2014 | | 5 |
| | |
| Fund Summary as of December 31, 2014 | | BlackRock Global SmallCap Fund, Inc. |
BlackRock Global SmallCap Fund, Inc.’s (the “Fund”) investment objective is to seek long-term growth of capital by investing primarily in a portfolio of equity securities of small cap issuers located in various foreign countries and in the United States.
| | |
| Portfolio Management Commentary | | |
How did the Fund perform?
| Ÿ | | For the six-month period ended December 31, 2014, the Fund underperformed its benchmark, the MSCI All Country World Small Cap Index, and the broad-market MSCI World Index. The following discussion of relative performance pertains to the MSCI All Country World Small Cap Index. |
What factors influenced performance?
| Ÿ | | The largest detractor from relative performance during the six-month period was an overweight in the energy sector, together with security selection within the sector. The shortfall in stock selection was mostly due to the Fund’s ownership of oil, gas & consumable fuels companies during a period of falling crude oil prices. A small overweight position and stock selection within the industrials sector also weighed on returns, mostly in the commercial services & supplies and professional services industries. Security selection and an overweight in the materials sector was also a key detractor during the period, as was an underweight in financials, one of the stronger performing sectors during the period. |
| Ÿ | | The largest contributor to relative performance during the period was the combination of stock selection and an overweight position in the health care sector. Stock selection was particularly strong in the health care equipment & supplies industry. An underweight position and stock selection in the utilities sector added to performance, as did strong security selection in the telecommunications services (“telecom”), consumer discretionary, technology and consumer staples sectors. |
Describe recent portfolio activity.
| Ÿ | | The most significant shift within the Fund during the period related to positions initiated within financials, in particular real estate investment trusts and real estate management & development companies. At the same time, the Fund exited positions in the banking and capital markets industries. Within technology, the Fund purchased companies in the software and semiconductor industries, while most of its sales were concentrated in internet software & services companies. Within energy, the Fund added marginally to high-conviction holdings that were impacted by declining oil prices. In the health care sector, the Fund reduced its holdings in the biotechnology industry in favor of equipment & supplies companies. |
Describe portfolio positioning at period end.
| Ÿ | | The Fund continued to emphasize reasonably valued companies with strong balance sheets and the potential for substantial growth. Relative to the MSCI All Country World Small Cap Index, the Fund ended the period with overweight positions in the health care, materials and telecom sectors, while it was underweight in industrials, consumer discretionary and financials. |
The views expressed reflect the opinions of BlackRock as of the date of this report and are subject to change based on changes in market, economic or other conditions. These views are not intended to be a forecast of future events and are no guarantee of future results.
| | |
| Ten Largest Holdings | | Percent of
Long-Term Investments |
| | | | |
Merit Medical Systems, Inc. | | | 2 | % |
NuVasive, Inc. | | | 1 | |
Hospira, Inc. | | | 1 | |
Teleflex, Inc. | | | 1 | |
Rouse Properties, Inc. | | | 1 | |
SLM Corp. | | | 1 | |
Aryzta AG | | | 1 | |
Mobistar SA | | | 1 | |
HD Supply Holdings, Inc. | | | 1 | |
MSC Industrial Direct Co., Inc. | | | 1 | |
| | |
| Geographic Allocation | | Percent of
Long-Term Investments |
| | | | |
United States | | | 57 | % |
United Kingdom | | | 7 | |
Canada | | | 6 | |
Japan | | | 4 | |
France | | | 3 | |
India | | | 3 | |
Switzerland | | | 3 | |
Australia | | | 2 | |
Belgium | | | 2 | |
Germany | | | 2 | |
Hong Kong | | | 2 | |
Other1 | | | 9 | |
| | 1 | | Includes holdings within countries that are 1% or less of long-term investments. Please refer to the Schedule of Investments for such countries. |
| | | | | | |
| | | | | | | |
| 6 | | SEMI-ANNUAL REPORT | | DECEMBER 31, 2014 | | |
| | |
| | | BlackRock Global SmallCap Fund, Inc. |
| | |
| Total Return Based on a $10,000 Investment | | |
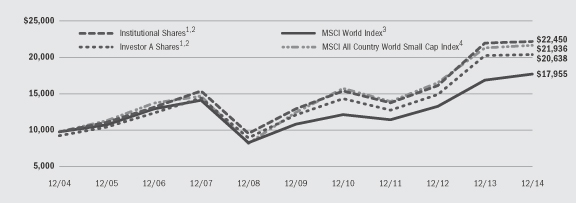
| | 1 | | Assuming maximum sales charge, if any, transaction costs and other operating expenses, including investment advisory fees. Institutional Shares do not have a sales charge. |
| | 2 | | The Fund invests in a diversified portfolio primarily consisting of equity securities of small cap issuers located in various foreign countries and in the United States. |
| | 3 | | A free float-adjusted market capitalization weighted index that is designed to measure the equity market performance of developed markets. The MSCI World Index consists of the following 23 developed market country indexes: Australia, Austria, Belgium, Canada, Denmark, Finland, France, Germany, Hong Kong, Ireland, Israel, Italy, Japan, Netherlands, New Zealand, Norway, Portugal, Singapore, Spain, Sweden, Switzerland, the United Kingdom, and the United States. |
| | 4 | | A free float-adjusted market capitalization weighted index that is designed to measure equity market results of smaller capitalization companies in both developed and emerging markets. |
| | |
| Performance Summary for the Period Ended December 31, 2014 | | |
| | | | | | | | | | | | | | | | | | | | | | | | | | | | |
| | | | | | Average Annual Total Returns5 | |
| | | | | | 1 Year | | | 5 Years | | | 10 Years | |
| | | 6-Month
Total Returns | | | w/o sales
charge | | | w/sales
charge | | | w/o sales
charge | | | w/sales
charge | | | w/o sales
charge | | | w/sales
charge | |
Institutional | | | (7.07 | )% | | | 0.89 | % | | | N/A | | | | 11.26 | % | | | N/A | | | | 8.42 | % | | | N/A | |
Investor A | | | (7.20 | ) | | | 0.52 | | | | (4.75 | )% | | | 10.89 | | | | 9.71 | % | | | 8.10 | | | | 7.51 | % |
Investor B | | | (7.66 | ) | | | (0.23 | ) | | | (4.05 | ) | | | 9.88 | | | | 9.60 | | | | 7.34 | | | | 7.34 | |
Investor C | | | (7.59 | ) | | | (0.26 | ) | | | (1.10 | ) | | | 9.98 | | | | 9.98 | | | | 7.22 | | | | 7.22 | |
Class R | | | (7.37 | ) | | | 0.17 | | | | N/A | | | | 10.45 | | | | N/A | | | | 7.69 | | | | N/A | |
MSCI World Index | | | (1.17 | ) | | | 4.94 | | | | N/A | | | | 10.20 | | | | N/A | | | | 6.03 | | | | N/A | |
MSCI All Country World Small Cap Index | | | (4.43 | ) | | | 1.78 | | | | N/A | | | | 11.61 | | | | N/A | | | | 8.17 | | | | N/A | |
| | 5 | | Assuming maximum sales charges, if any. Average annual total returns with and without sales charges reflect reductions for distribution and service fees. See “About Fund Performance” on page 8 for a detailed description of share classes, including any related sales charges and fees. |
| | | | N/A — Not applicable as share class and index do not have a sales charge. |
| | | | Past performance is not indicative of future results. |
| | | | | | | | | | | | | | | | | | | | | | | | | | | | |
| | | Actual | | | Hypothetical7 | | | | |
| | | Beginning
Account Value
July 1, 2014 | | | Ending
Account Value
December 31, 2014 | | | Expenses Paid
During the Period6 | | | Beginning
Account Value
July 1, 2014 | | | Ending
Account Value
December 31, 2014 | | | Expenses Paid
During the Period6 | | | Annualized
Expense Ratio | |
Institutional | | $ | 1,000.00 | | | $ | 929.30 | | | $ | 5.01 | | | $ | 1,000.00 | | | $ | 1,020.01 | | | $ | 5.24 | | | | 1.03 | % |
Investor A | | $ | 1,000.00 | | | $ | 928.00 | | | $ | 6.61 | | | $ | 1,000.00 | | | $ | 1,018.35 | | | $ | 6.92 | | | | 1.36 | % |
Investor B | | $ | 1,000.00 | | | $ | 923.40 | | | $ | 11.15 | | | $ | 1,000.00 | | | $ | 1,013.61 | | | $ | 11.67 | | | | 2.30 | % |
Investor C | | $ | 1,000.00 | | | $ | 924.10 | | | $ | 10.48 | | | $ | 1,000.00 | | | $ | 1,014.32 | | | $ | 10.97 | | | | 2.16 | % |
Class R | | $ | 1,000.00 | | | $ | 926.30 | | | $ | 8.40 | | | $ | 1,000.00 | | | $ | 1,016.48 | | | $ | 8.79 | | | | 1.73 | % |
| | 6 | | For each class of the Fund, expenses are equal to the annualized net expense ratio for the class, multiplied by the average account value over the period, multiplied by 184/365 (to reflect the one-half year period shown). |
| | 7 | | Hypothetical 5% annual return before expenses is calculated by pro rating the number of days in the most recent fiscal half year divided by 365. |
| | | | See “Disclosure of Expenses” on page 8 for further information on how expenses were calculated. |
| | | | | | |
| | | | | | | |
| | SEMI-ANNUAL REPORT | | DECEMBER 31, 2014 | | 7 |
| Ÿ | | Institutional Shares are not subject to any sales charge. These shares bear no ongoing distribution or service fees and are available only to certain eligible investors. |
| Ÿ | | Investor A Shares are subject to a maximum initial sales charge (front-end load) of 5.25% and a service fee of 0.25% per year (but no distribution fee). Certain redemptions of these shares may be subject to a contingent deferred sales charge (“CDSC”) where no initial sales charge was paid at the time of purchase. These shares are generally available through financial intermediaries. On June 10, 2013, all of the issued and outstanding shares of EuroFund’s Investor B Shares were converted into Investor A Shares with the same relative aggregate net asset value (“NAV”). |
| Ÿ | | Investor B Shares (available only in BlackRock Global SmallCap, Inc.) are subject to a maximum CDSC of 4.50% declining to 0% after six years. In addition, these shares are subject to a distribution fee of 0.75% per year and a service fee of 0.25% per year. These shares automatically convert to Investor A Shares after approximately eight years. (There is no initial sales charge for automatic share conversions.) These shares are only available through exchanges and dividend reinvestments by existing shareholders and for purchase by certain employer-sponsored retirement plans. Effective on June 10, 2013, all issued and outstanding Investor B Shares of EuroFund were converted into Investor A Shares. |
| Ÿ | | Investor C Shares are subject to a 1.00% CDSC if redeemed within one year of purchase. In addition, these shares are subject to a distribution fee of 0.75% per year and a service fee of 0.25% per year. These shares are generally available through financial intermediaries. |
| Ÿ | | Class R Shares are not subject to any sales charge. These shares are subject to a distribution fee of 0.25% per year and a service fee of 0.25% per year. These shares are available only to certain employer-sponsored retirement plans. |
Performance information reflects past performance and does not guarantee future results. Current performance may be lower or higher than the performance data quoted. Refer to www.blackrock.com/funds to obtain performance data current to the most recent month end. Performance results do not reflect the deduction of taxes that a shareholder would pay on fund distributions or the redemption of fund shares. Figures shown in the performance tables on the previous pages assume reinvestment of all distributions, if any, at NAV on the ex-dividend date. Investment return and principal value of shares will fluctuate so that shares, when redeemed, may be worth more or less than their original cost. Distributions paid to each class of shares will vary because of the different levels of service, distribution and transfer agency fees applicable to each class, which are deducted from the income available to be paid to shareholders.
Shareholders of these Funds may incur the following charges: (a) transactional expenses, such as sales charges; and (b) operating expenses, including investment advisory fees, service and distribution fees, including 12b-1 fees, acquired fund fees and expenses and other Fund expenses. The expense examples shown on previous pages (which are based on a hypothetical investment of $1,000 invested on July 1, 2014 and held through December 31, 2014) are intended to assist shareholders both in calculating expenses based on an investment in each Fund and in comparing these expenses with similar costs of investing in other mutual funds.
The expense examples provide information about actual account values and actual expenses. In order to estimate the expenses a shareholder paid during the period covered by this report, shareholders can divide their account value by $1,000 and then multiply the result by the number corresponding to their Fund and share class under the heading entitled “Expenses Paid During the Period.”
The expense examples also provide information about hypothetical account values and hypothetical expenses based on a Fund’s actual expense ratio and an assumed rate of return of 5% per year before expenses. In order to assist shareholders in comparing the ongoing expenses of investing in these Funds and other funds, compare the 5% hypothetical examples with the 5% hypothetical examples that appear in shareholder reports of other funds.
The expenses shown in the expense examples are intended to highlight shareholders’ ongoing costs only and do not reflect any transactional expenses, such as sales charges, if any. Therefore, the hypothetical examples are useful in comparing ongoing expenses only, and will not help shareholders determine the relative total expenses of owning different funds. If these transactional expenses were included, shareholder expenses would have been higher.
| | | | | | |
| | | | | | | |
| 8 | | SEMI-ANNUAL REPORT | | DECEMBER 31, 2014 | | |
| | |
| Derivative Financial Instruments | | |
The Funds may invest in various derivative financial instruments. Derivative financial instruments are used to obtain exposure to a security, index and/or market without owning or taking physical custody of securities or to manage market, equity, credit, interest rate, foreign currency exchange rate, commodity and/or other risks. Derivative financial instruments may give rise to a form of economic leverage. Derivative financial instruments also involve risks, including the imperfect correlation between the value of a derivative financial instrument and the underlying asset, possible default of the counterparty to the transaction or illiquidity of the derivative financial instrument. The Funds’ ability to use a derivative financial instrument successfully depends on the investment advisor’s ability to predict pertinent market movements accurately, which cannot be assured. The use of derivative financial instruments may result in losses greater than if they had not been used, may limit the amount of appreciation a Fund can realize on an investment and/or may result in lower distributions paid to shareholders. The Funds’ investments in these instruments are discussed in detail in the Notes to Financial Statements.
| | | | | | |
| | | | | | | |
| | SEMI-ANNUAL REPORT | | DECEMBER 31, 2014 | | 9 |
| | |
Schedule of Investments December 31, 2014 (Unaudited) | | BlackRock EuroFund (Percentages shown are based on Net Assets) |
| | | | | | | | |
| Common Stocks | | Shares | | | Value | |
Belgium — 2.9% | |
KBC Groep NV (a) | | | 218,241 | | | $ | 12,180,033 | |
Denmark — 3.3% | |
Novo Nordisk A/S, Class B | | | 326,242 | | | | 13,799,958 | |
France — 16.4% | |
Airbus Group NV | | | 67,981 | | | | 3,360,845 | |
AXA SA | | | 309,483 | | | | 7,131,429 | |
Cap Gemini SA | | | 108,948 | | | | 7,791,646 | |
Compagnie de Saint-Gobain | | | 145,073 | | | | 6,145,411 | |
Hermes International | | | 1,572 | | | | 559,762 | |
Kering | | | 21,578 | | | | 4,146,657 | |
L’Oreal SA | | | 57,299 | | | | 9,590,237 | |
LVMH Moet Hennessy Louis Vuitton SA | | | 32,228 | | | | 5,104,968 | |
Pernod Ricard SA | | | 37,946 | | | | 4,217,229 | |
Renault SA | | | 27,093 | | | | 1,973,354 | |
Schneider Electric SE | | | 58,692 | | | | 4,274,492 | |
Total SA | | | 269,493 | | | | 13,806,664 | |
| | | | | | | | |
| | | | | | | | 68,102,694 | |
Germany — 12.5% | |
Bayer AG, Registered Shares | | | 112,459 | | | | 15,329,103 | |
Continental AG | | | 32,212 | | | | 6,794,241 | |
Deutsche Telekom AG, Registered Shares | | | 621,309 | | | | 9,941,149 | |
Fresenius SE & Co. KGaA | | | 105,484 | | | | 5,484,539 | |
LEG Immobilien AG (a) | | | 86,214 | | | | 6,422,403 | |
Volkswagen AG, Preference Shares | | | 35,406 | | | | 7,869,173 | |
| | | | | | | | |
| | | | | | | | 51,840,608 | |
Ireland — 3.6% | |
Ryanair Holdings PLC — ADR (a) | | | 86,971 | | | | 6,198,423 | |
Shire PLC | | | 124,469 | | | | 8,824,862 | |
| | | | | | | | |
| | | | | | | | 15,023,285 | |
Italy — 5.3% | |
Enel SpA | | | 590,088 | | | | 2,630,326 | |
Intesa Sanpaolo SpA | | | 4,032,516 | | | | 11,697,928 | |
Luxottica Group SpA | | | 139,597 | | | | 7,652,544 | |
| | | | | | | | |
| | | | | | | | 21,980,798 | |
Netherlands — 9.3% | |
ASML Holding NV | | | 86,831 | | | | 9,381,871 | |
Heineken NV | | | 140,615 | | | | 9,984,745 | |
Royal Dutch Shell PLC, Class B | | | 563,018 | | | | 19,452,869 | |
| | | | | | | | |
| | | | | | | | 38,819,485 | |
Spain — 1.5% | |
Iberdrola SA | | | 410,958 | | | | 2,770,163 | |
Inditex SA | | | 121,024 | | | | 3,452,256 | |
| | | | | | | | |
| | | | | | | | 6,222,419 | |
| Common Stocks | | Shares | | | Value | |
Sweden — 2.1% | |
Assa Abloy AB, Class B | | | 165,048 | | | $ | 8,717,252 | |
Switzerland — 9.0% | |
Cie Financiere Richemont SA, Registered Shares | | | 97,579 | | | | 8,651,218 | |
Holcim Ltd., Registered Shares (a) | | | 30,465 | | | | 2,177,764 | |
Roche Holding AG | | | 15,584 | | | | 4,222,363 | |
UBS Group AG (a) | | | 596,928 | | | | 10,261,014 | |
Zurich Insurance Group AG (a) | | | 38,408 | | | | 12,002,588 | |
| | | | | | | | |
| | | | | | | | 37,314,947 | |
United Kingdom — 32.7% | |
AstraZeneca PLC | | | 158,698 | | | | 11,208,956 | |
Barclays PLC | | | 2,536,885 | | | | 9,536,992 | |
BG Group PLC | | | 480,245 | | | | 6,426,495 | |
BT Group PLC | | | 1,666,751 | | | | 10,367,292 | |
Diageo PLC | | | 365,940 | | | | 10,483,107 | |
Hargreaves Lansdown PLC | | | 407,357 | | | | 6,373,870 | |
HSBC Holdings PLC | | | 611,368 | | | | 5,777,281 | |
Imperial Tobacco Group PLC | | | 222,265 | | | | 9,783,995 | |
Johnson Matthey PLC | | | 54,653 | | | | 2,875,338 | |
Merlin Entertainments PLC (b) | | | 797,309 | | | | 4,933,466 | |
Prudential PLC | | | 615,894 | | | | 14,239,146 | |
Rio Tinto PLC | | | 349,605 | | | | 16,115,763 | |
SABMiller PLC | | | 205,562 | | | | 10,716,182 | |
Tesco PLC | | | 1,113,127 | | | | 3,245,544 | |
Vodafone Group PLC | | | 4,002,552 | | | | 13,723,255 | |
| | | | | | | | |
| | | | | | | | 135,806,682 | |
Total Long-Term Investments
(Cost — $404,307,721) — 98.6% | | | | 409,808,161 | |
| | | | | | | | |
| | | | | | | | | |
| | |
| Short-Term Securities | | | | | | |
BlackRock Liquidity Funds, TempFund,
Institutional Class, 0.04% (c)(d) | | | 329,588 | | | | 329,588 | |
Total Short-Term Securities
(Cost — $329,588) — 0.1% | | | | 329,588 | |
| Total Investments (Cost — $404,637,309) — 98.7% | | | | 410,137,749 | |
| Other Assets Less Liabilities — 1.3% | | | | | | | 5,262,203 | |
| | | | | | | | |
| Net Assets — 100.0% | | | | | | $ | 415,399,952 | |
| | | | | | | | |
| | | | | | | | | | |
| ADR | | American Depositary Receipts | | EUR | | Euro | | | | |
| CAD | | Canadian Dollar | | USD | | U.S. Dollar | | | | |
See Notes to Financial Statements.
| | | | | | |
| | | | | | | |
| 10 | | SEMI-ANNUAL REPORT | | DECEMBER 31, 2014 | | |
| | |
Schedule of Investments (continued) | | BlackRock EuroFund |
|
| Notes to Schedule of Investments |
| (a) | | Non-income producing security. |
| (b) | | Security exempt from registration pursuant to Rule 144A under the Securities Act of 1933, as amended. These securities may be resold in transactions exempt from registration to qualified institutional investors. |
| (c) | | During the period ended December 31, 2014, investments in issuers considered to be an affiliate of the Fund, for purposes of Section 2(a)(3) of the Investment Company Act of 1940, as amended, were as follows: |
| | | | | | | | | | | | | | | | |
| Affiliate | | Shares/Beneficial
Interest Held at
June 30,
2014 | | | Net
Activity | | | Shares/Beneficial
Interest Held at
December 31,
2014 | | | Income | |
BlackRock Liquidity Funds, TempFund, Institutional Class | | | 361,504 | | | | (31,916 | ) | | | 329,588 | | | $ | 394 | |
BlackRock Liquidity Series, LLC, Money Market Series | | $ | 3,229,307 | | | $ | (3,229,307 | ) | | | — | | | $ | 542 | |
| (d) | | Represents the current yield as of report date. |
| Ÿ | | As of December 31, 2014, financial futures contracts outstanding were as follows: |
| | | | | | | | | | | | | | | | | | | | |
Contracts Purchased | | | Issue | | Exchange | | Expiration | | Notional Value | | | Unrealized
Appreciation | |
| | 165 | | | Euro Stoxx 50 Index | | Eurex Mercantile | | March 2015 | | | USD | | | | 6,255,294 | | | $ | 155,156 | |
| Ÿ | | Fair Value Measurements — Various inputs are used in determining the fair value of investments and derivative financial instruments. These inputs to valuation techniques are categorized into a disclosure hierarchy consisting of three broad levels for financial statement purposes. The hierarchy gives the highest priority to unadjusted quoted prices in active markets for identical assets or liabilities (Level 1 measurements) and the lowest priority to unobservable inputs (Level 3 measurements). Accordingly, the degree of judgment exercised in determining fair value is greatest for instruments categorized in Level 3. The inputs used to measure fair value may fall into different levels of the fair value hierarchy. In such cases, for disclosure purposes, the fair value hierarchy classification is determined based on the lowest level input that is significant to the fair value measurement in its entirety. The categorization of a value determined for investments and derivative financial instruments is based on the pricing transparency of the investment and derivative financial instrument and is not necessarily an indication of the risks associated with investing in those securities. The three levels of the fair value hierarchy are as follows: |
| | Ÿ | | Level 1 — unadjusted price quotations in active markets/exchanges for identical assets or liabilities that the Fund has the ability to access |
| | Ÿ | | Level 2 — other observable inputs (including, but not limited to, quoted prices for similar assets or liabilities in markets that are active, quoted prices for identical or similar assets or liabilities in markets that are not active, inputs other than quoted prices that are observable for the assets or liabilities (such as interest rates, yield curves, volatilities, prepayment speeds, loss severities, credit risks and default rates) or other market-corroborated inputs) |
| | Ÿ | | Level 3 — unobservable inputs based on the best information available in the circumstances, to the extent observable inputs are not available (including the Fund’s own assumptions used in determining the fair value of investments and derivative financial instruments) |
Changes in valuation techniques may result in transfers into or out of an assigned level within the disclosure hierarchy. In accordance with the Fund’s policy, transfers between different levels of the fair value disclosure hierarchy are deemed to have occurred as of the beginning of the reporting period. For information about the Fund’s policy regarding valuation of investments, refer to Note 2 of the Notes to Financial Statements.
As of December 31, 2014, the following tables summarize the Fund’s investments and derivative financial instruments categorized in the disclosure hierarchy:
| | | | | | | | | | | | | | |
| | | Level 1 | | | Level 2 | | | Level 3 | | Total | |
Assets: | | | | | | | | | | | | | | |
| Investments: | | | | | | | | | | | | | | |
Common Stocks: | | | | | | | | | | | | | | |
Belgium | | | — | | | $ | 12,180,033 | | | — | | $ | 12,180,033 | |
Denmark | | | — | | | | 13,799,958 | | | — | | | 13,799,958 | |
France | | | — | | | | 68,102,694 | | | — | | | 68,102,694 | |
Germany | | | — | | | | 51,840,608 | | | — | | | 51,840,608 | |
Ireland | | $ | 6,198,423 | | | | 8,824,862 | | | — | | | 15,023,285 | |
Italy | | | — | | | | 21,980,798 | | | — | | | 21,980,798 | |
Netherlands | | | — | | | | 38,819,485 | | | — | | | 38,819,485 | |
Spain | | | — | | | | 6,222,419 | | | — | | | 6,222,419 | |
Sweden | | | — | | | | 8,717,252 | | | — | | | 8,717,252 | |
Switzerland | | | 10,261,014 | | | | 27,053,933 | | | — | | | 37,314,947 | |
United Kingdom | | | — | | | | 135,806,682 | | | — | | | 135,806,682 | |
Short-Term Securities | | | 329,588 | | | | — | | | — | | | 329,588 | |
| | | | | | | | | | | | | | |
Total | | $ | 16,789,025 | | | $ | 393,348,724 | | | — | | $ | 410,137,749 | |
| | | | | | | | | | | | | | |
See Notes to Financial Statements.
| | | | | | |
| | | | | | | |
| | SEMI-ANNUAL REPORT | | DECEMBER 31, 2014 | | 11 |
| | |
Schedule of Investments (concluded) | | BlackRock EuroFund |
As of December 31, 2014, the following tables summarize the Fund’s investments and derivative financial instruments categorized in the disclosure hierarchy (concluded):
| | | | | | | | | | | | | | |
| | | Level 1 | | | Level 2 | | | Level 3 | | Total | |
| Derivative Financial Instruments1 | | | | | | | |
Assets: | | | | | | | | | | | | | | |
Equity contracts | | $ | 155,156 | | | | — | | | — | | $ | 155,156 | |
1 Derivative financial instruments are financial futures contracts, which are valued at the unrealized appreciation/depreciation on the instrument. | |
The Fund may hold assets and/or liabilities in which the fair value approximates the carrying amount for financial statement purposes. As of December 31, 2014, cash collateral pledged for financial futures contracts of $502,000 are categorized as Level 1 within the disclosure hierarchy.
For the six months ended December 31, 2014, there were no transfers between levels.
See Notes to Financial Statements.
| | | | | | |
| | | | | | | |
| 12 | | SEMI-ANNUAL REPORT | | DECEMBER 31, 2014 | | |
| | |
Schedule of Investments December 31, 2014 (Unaudited) | | BlackRock Global SmallCap Fund, Inc. (Percentages shown are based on Net Assets) |
| | | | | | | | |
| Common Stocks | | Shares | | | Value | |
Argentina — 0.1% | |
Arcos Dorados Holdings, Inc., Class A | | | 306,396 | | | $ | 1,657,603 | |
Australia — 2.1% | |
Cochlear Ltd. | | | 123,800 | | | | 7,810,151 | |
Orocobre Ltd. (a)(b) | | | 2,573,881 | | | | 5,816,983 | |
Pancontinental Oil & Gas NL (a) | | | 17,375,200 | | | | 296,398 | |
Parnell Pharmaceuticals Holdings Ltd. (a) | | | 541,796 | | | | 2,243,035 | |
Stockland | | | 2,067,049 | | | | 6,907,834 | |
| | | | | | | | |
| | | | | | | | 23,074,401 | |
Belgium — 1.9% | |
Befimmo | | | 78,221 | | | | 5,699,709 | |
Mobistar SA (a) | | | 482,500 | | | | 11,446,364 | |
Ontex Group NV (a) | | | 116,470 | | | | 3,342,263 | |
| | | | | | | | |
| | | | | | | | 20,488,336 | |
Brazil — 1.2% | |
Brasil Insurance Participacoes e Administracao SA | | | 1,434,304 | | | | 1,834,562 | |
Cia de Saneamento Basico do Estado de Sao Paulo — ADR | | | 465,200 | | | | 2,926,108 | |
Companhia Hering SA | | | 712,931 | | | | 5,431,063 | |
Ser Educacional SA | | | 295,120 | | | | 3,285,156 | |
| | | | | | | | |
| | | | | | | | 13,476,889 | |
Canada — 5.9% | |
Africa Oil Corp. (a)(b) | | | 2,441,500 | | | | 5,064,568 | |
BlackBerry Ltd. (a)(b) | | | 330,000 | | | | 3,623,400 | |
Cathedral Energy Services Ltd. | | | 627,700 | | | | 1,474,971 | |
Continental Gold, Ltd. (a)(b) | | | 3,890,600 | | | | 6,195,223 | |
Diagnocure, Inc. (a)(c) | | | 4,745,180 | | | | 510,542 | |
Dollarama, Inc. | | | 140,400 | | | | 7,178,310 | |
Element Financial Corp. (a) | | | 551,600 | | | | 6,713,396 | |
Halogen Software, Inc. (a) | | | 241,000 | | | | 1,763,212 | |
Lundin Mining Corp. (a) | | | 1,619,600 | | | | 7,973,930 | |
Painted Pony Petroleum Ltd. (a) | | | 523,925 | | | | 4,171,377 | |
Premier Gold Mines, Ltd. (a) | | | 2,355,000 | | | | 3,831,081 | |
Rio Alto Mining, Ltd. (a)(b) | | | 735,045 | | | | 1,784,151 | |
Sulliden Mining Capital, Inc. (a) | | | 412,932 | | | | 149,278 | |
Torex Gold Resources, Inc. (a) | | | 7,152,700 | | | | 7,572,578 | |
Trevali Mining Corp. | | | 4,848,800 | | | | 4,465,671 | |
Trevali Mining Corp. (a) | | | 1,326,723 | | | | 1,221,892 | |
| | | | | | | | |
| | | | | | | | 63,693,580 | |
Chile — 0.2% | |
Corpbanca SA, ADR | | | 147,700 | | | | 2,626,106 | |
China — 1.2% | |
Angang Steel Co., Ltd. (b) | | | 10,048,000 | | | | 8,497,493 | |
Daphne International Holdings Ltd. | | | 7,802,300 | | | | 2,841,825 | |
Parkson Retail Group Ltd. (b) | | | 3,422,500 | | | | 850,277 | |
TAL Education Group, ADR (a) | | | 31,400 | | | | 882,026 | |
| | | | | | | | |
| | | | | | | | 13,071,621 | |
Denmark — 1.2% | |
ALK-Abello A/S | | | 25,700 | | | | 2,690,208 | |
Pandora A/S | | | 48,900 | | | | 3,963,691 | |
Sydbank A/S (a) | | | 200,000 | | | | 6,152,752 | |
| | | | | | | | |
| | | | | | | | 12,806,651 | |
France — 2.5% | |
Arkema | | | 4,028 | | | | 266,399 | |
Elior SCA (a)(d) | | | 297,520 | | | | 4,396,065 | |
| Common Stocks | | Shares | | | Value | |
France (concluded) | |
Eurofins Scientific SE | | | 7,975 | | | $ | 2,035,635 | |
GameLoft SE (a)(b) | | | 746,683 | | | | 3,017,770 | |
Saft Groupe SA | | | 268,100 | | | | 8,132,050 | |
UbiSoft Entertainment SA (a) | | | 513,900 | | | | 9,368,630 | |
| | | | | | | | |
| | | | | | | | 27,216,549 | |
Germany — 1.5% | |
GEA Group AG | | | 82,950 | | | | 3,646,994 | |
Rheinmetall AG | | | 114,500 | | | | 4,985,225 | |
Stabilus SA (a) | | | 128,286 | | | | 3,931,070 | |
Vossloh AG (b) | | | 65,700 | | | | 4,246,996 | |
| | | | | | | | |
| | | | | | | | 16,810,285 | |
Hong Kong — 2.4% | |
China Taiping Insurance Holdings Co. Ltd. (a) | | | 3,567,440 | | | | 10,138,001 | |
Chow Sang Sang Holdings International Ltd. (b) | | | 1,381,000 | | | | 3,625,277 | |
Clear Media Ltd. | | | 2,045,000 | | | | 2,131,875 | |
Far East Horizon Ltd. | | | 6,790,000 | | | | 6,673,718 | |
Pacific Basin Shipping Ltd. | | | 8,015,000 | | | | 3,206,266 | |
| | | | | | | | |
| | | | | | | | 25,775,137 | |
India — 2.7% | |
Container Corp. of India | | | 168,250 | | | | 3,627,370 | |
GVK Power & Infrastructure, Ltd. (a) | | | 4,153,834 | | | | 574,282 | |
IDFC Ltd. | | | 1,470,000 | | | | 3,745,672 | |
Indiabulls Real Estate, Ltd. | | | 3,680,800 | | | | 3,973,736 | |
LIC Housing Finance Ltd. | | | 501,500 | | | | 3,451,028 | |
National Aluminium Co., Ltd. | | | 4,157,177 | | | | 3,523,944 | |
Sun TV Network Ltd. | | | 391,900 | | | | 2,352,687 | |
Zee Entertainment Enterprises Ltd. | | | 1,300,700 | | | | 7,813,169 | |
| | | | | | | | |
| | | | | | | | 29,061,888 | |
Indonesia — 0.8% | |
Bank Tabungan Negara Persero Tbk PT | | | 28,035,700 | | | | 2,715,511 | |
Tower Bersama Infrastructure Tbk PT | | | 7,486,476 | | | | 5,855,293 | |
| | | | | | | | |
| | | | | 8,570,804 | |
Ireland — 0.8% | |
Ryanair Holdings PLC — ADR (a) | | | 123,696 | | | | 8,815,814 | |
Italy — 0.5% | |
Banca Popolare di Milano Scarl (a) | | | 8,070,310 | | | | 5,257,266 | |
Japan — 3.7% | |
Asics Corp. | | | 220,350 | | | | 5,304,991 | |
Don Quijote Co. Ltd. | | | 76,400 | | | | 5,252,268 | |
Hisaka Works Ltd. | | | 212,200 | | | | 1,717,477 | |
Mitsui Chemicals, Inc. | | | 3,478,000 | | | | 9,851,006 | |
NGK Insulators Ltd. | | | 243,400 | | | | 4,989,285 | |
Rohm Co. Ltd. | | | 118,700 | | | | 7,152,061 | |
Tokyo Steel Manufacturing Co., Ltd. | | | 911,000 | | | | 5,603,195 | |
| | | | | | | | |
| | | | | 39,870,283 | |
Malaysia — 0.3% | |
AirAsia Bhd | | | 4,110,200 | | | | 3,197,410 | |
Netherlands — 0.6% | |
Corio NV | | | 135,530 | | | | 6,637,156 | |
Norway — 0.9% | |
Hoegh Liquified Natural Gas Holdings Ltd. (a)(b) | | | 586,600 | | | | 6,468,681 | |
RenoNorden ASA (a) | | | 487,293 | | | | 3,125,266 | |
| | | | | | | | |
| | | | | 9,593,947 | |
See Notes to Financial Statements.
| | | | | | |
| | | | | | | |
| | SEMI-ANNUAL REPORT | | DECEMBER 31, 2014 | | 13 |
| | |
Schedule of Investments (continued) | | BlackRock Global SmallCap Fund, Inc. (Percentages shown are based on Net Assets) |
| | | | | | | | |
| Common Stocks | | Shares | | | Value | |
South Korea — 0.6% | |
KNB Financial Group Co., Ltd. (a) | | | 627,500 | | | $ | 6,793,659 | |
Sweden — 1.5% | |
Boliden AB | | | 564,800 | | | | 9,028,217 | |
Elekta AB, B Shares | | | 370,000 | | | | 3,782,799 | |
The Thule Group AB (a)(d) | | | 291,866 | | | | 3,350,887 | |
| | | | | | | | |
| | | | | 16,161,903 | |
Switzerland — 3.0% | |
Aryzta AG (a) | | | 150,780 | | | | 11,587,373 | |
Leonteq AG (a) | | | 23,200 | | | | 5,567,524 | |
OC Oerlikon Corp. AG, Registered Shares (a) | | | 386,300 | | | | 4,822,232 | |
Straumann Holding AG, Registered Shares | | | 27,400 | | | | 6,883,984 | |
Sulzer AG, Registered Shares | | | 10,450 | | | | 1,117,849 | |
Swiss Life Holding AG, Registered Shares (a) | | | 12,600 | | | | 2,978,032 | |
| | | | | | | | |
| | | | | 32,956,994 | |
United Arab Emirates — 0.1% | |
Polarcus Ltd. (a)(b) | | | 11,222,791 | | | | 930,782 | |
United Kingdom — 7.5% | |
APR Energy PLC | | | 139,196 | | | | 401,620 | |
Arrow Global Group PLC | | | 1,993,500 | | | | 7,037,066 | |
Atlas Mara Co-Nvest, Ltd. (a) | | | 712,625 | | | | 5,961,970 | |
Aveva Group PLC | | | 178,300 | | | | 3,651,587 | |
B&M European Value Retail SA | | | 316,225 | | | | 1,404,676 | |
Babcock International Group PLC | | | 260,800 | | | | 4,272,496 | |
BowLeven PLC (a)(b) | | | 3,572,700 | | | | 1,740,129 | |
Crest Nicholson Holdings PLC | | | 652,300 | | | | 3,926,547 | |
De La Rue PLC | | | 497,000 | | | | 4,011,383 | |
Exova Group PLC (a) | | | 1,950,590 | | | | 4,864,307 | |
IMI PLC | | | 262,800 | | | | 5,141,406 | |
Intertek Group PLC | | | 175,700 | | | | 6,358,935 | |
Man Group PLC | | | 2,150,100 | | | | 5,350,235 | |
Michael Page International PLC | | | 641,600 | | | | 4,091,396 | |
Ophir Energy PLC (a)(b) | | | 832,409 | | | | 1,829,196 | |
Poundland Group PLC (a) | | | 403,300 | | | | 2,063,012 | |
Quotient, Ltd. (a) | | | 410,624 | | | | 7,366,595 | |
Rexam PLC | | | 723,452 | | | | 5,093,096 | |
RSA Insurance Group PLC (a) | | | 64,000 | | | | 432,094 | |
Serco Group PLC | | | 841,400 | | | | 2,107,431 | |
Virgin Money Holdings UK PLC (a)(b) | | | 912,387 | | | | 4,095,496 | |
| | | | | | | | |
| | | | | 81,200,673 | |
United States — 56.4% | |
Abaxis, Inc. | | | 149,255 | | | | 8,482,162 | |
Abercrombie & Fitch Co., Class A | | | 321,961 | | | | 9,220,963 | |
Albemarle Corp. | | | 116,000 | | | | 6,975,080 | |
AMC Entertainment Holdings, Inc., Class A | | | 234,579 | | | | 6,141,278 | |
American Campus Communities, Inc. | | | 228,700 | | | | 9,459,032 | |
Angie’s List, Inc. (a)(b) | | | 365,600 | | | | 2,277,688 | |
ARRIS Group, Inc. (a) | | | 235,900 | | | | 7,121,821 | |
Ashford Hospitality Prime, Inc. | | | 314,432 | | | | 5,395,653 | |
Axiall Corp. | | | 141,064 | | | | 5,990,988 | |
Bill Barrett Corp. (a) | | | 299,945 | | | | 3,416,373 | |
BioMed Realty Trust, Inc. | | | 202,526 | | | | 4,362,410 | |
Blackhawk Network Holdings, Inc., Class B (a) | | | 267,208 | | | | 10,071,069 | |
Boot Barn Holdings, Inc. (a) | | | 75,600 | | | | 1,375,920 | |
Burlington Stores, Inc. (a) | | | 75,100 | | | | 3,549,226 | |
CARBO Ceramics, Inc. (b) | | | 70,600 | | | | 2,827,530 | |
Celanese Corp., Series A | | | 113,700 | | | | 6,817,452 | |
Chart Industries, Inc. (a) | | | 30,700 | | | | 1,049,940 | |
| Common Stocks | | Shares | | | Value | |
United States (continued) | |
Constant Contact, Inc. (a) | | | 252,950 | | | $ | 9,283,265 | |
Corporate Office Properties Trust | | | 183,685 | | | | 5,211,143 | |
Deckers Outdoor Corp. (a)(b) | | | 47,514 | | | | 4,325,675 | |
Digital Realty Trust, Inc. (b) | | | 82,719 | | | | 5,484,270 | |
Discover Financial Services | | | 107,700 | | | | 7,053,273 | |
Dorian LPG, Ltd. (a) | | | 298,909 | | | | 4,151,846 | |
DSP Group, Inc. (a) | | | 366,649 | | | | 3,985,475 | |
DXP Enterprises, Inc. (a) | | | 14,800 | | | | 747,844 | |
Edwards Lifesciences Corp. (a) | | | 40,583 | | | | 5,169,462 | |
Emerald Oil, Inc. (a)(b) | | | 854,000 | | | | 1,024,800 | |
Essent Group Ltd. (a)(b) | | | 317,500 | | | | 8,162,925 | |
EVINE Live, Inc. (a) | | | 543,200 | | | | 3,579,688 | |
FCB Financial Holdings, Inc., Class A (a) | | | 296,200 | | | | 7,298,368 | |
First Solar, Inc. (a) | | | 141,200 | | | | 6,296,814 | |
Flowers Foods, Inc. | | | 339,764 | | | | 6,520,071 | |
Foot Locker, Inc. | | | 48,868 | | | | 2,745,404 | |
Fossil Group, Inc. (a) | | | 50,459 | | | | 5,587,830 | |
HD Supply Holdings, Inc. (a) | | | 381,673 | | | | 11,255,537 | |
Helix Energy Solutions Group, Inc. (a) | | | 254,800 | | | | 5,529,160 | |
Heritage Insurance Holdings, Inc. (a) | | | 458,200 | | | | 8,902,826 | |
Hospira, Inc. (a) | | | 235,054 | | | | 14,397,057 | |
IDEX Corp. | | | 123,550 | | | | 9,617,132 | |
Informatica Corp. (a) | | | 261,400 | | | | 9,968,489 | |
Inogen, Inc. (a) | | | 338,621 | | | | 10,622,541 | |
j2 Global, Inc. (b) | | | 106,700 | | | | 6,615,400 | |
KBR, Inc. | | | 262,000 | | | | 4,440,900 | |
The KEYW Holding Corp. (a)(b) | | | 258,800 | | | | 2,686,344 | |
Kraton Performance Polymers, Inc. (a) | | | 222,800 | | | | 4,632,012 | |
LendingClub Corp. (a) | | | 61,000 | | | | 1,543,300 | |
Live Nation Entertainment, Inc. (a) | | | 276,900 | | | | 7,229,859 | |
LKQ Corp. (a) | | | 295,326 | | | | 8,304,567 | |
MannKind Corp. (a)(b) | | | 857,955 | | | | 4,474,235 | |
Manpowergroup, Inc. | | | 83,500 | | | | 5,692,195 | |
Marcus & Millichap, Inc. (a) | | | 235,466 | | | | 7,829,244 | |
The Men’s Wearhouse, Inc. | | | 24,786 | | | | 1,094,302 | |
Mentor Graphics Corp. | | | 299,200 | | | | 6,558,464 | |
Merit Medical Systems, Inc. (a) | | | 970,860 | | | | 16,825,004 | |
Monotype Imaging Holdings, Inc. | | | 159,794 | | | | 4,606,861 | |
MSC Industrial Direct Co., Inc., Class A | | | 134,600 | | | | 10,936,250 | |
Nevro Corp. (a) | | | 104,800 | | | | 4,052,616 | |
New Relic, Inc. (a) | | | 47,900 | | | | 1,668,836 | |
Nordson Corp. | | | 82,100 | | | | 6,400,516 | |
NorthWestern Corp. | | | 112,400 | | | | 6,359,592 | |
NuVasive, Inc. (a) | | | 323,742 | | | | 15,267,673 | |
Oasis Petroleum, Inc. (a)(b) | | | 357,100 | | | | 5,906,434 | |
OSI Systems, Inc. (a) | | | 131,400 | | | | 9,299,178 | |
Pacific Biosciences of California, Inc. (a) | | | 1,346,793 | | | | 10,558,857 | |
Pfenex, Inc. (a) | | | 898,060 | | | | 6,573,799 | |
Pinnacle Foods, Inc. | | | 97,609 | | | | 3,445,598 | |
Pitney Bowes, Inc. | | | 388,897 | | | | 9,477,420 | |
Plantronics, Inc. | | | 75,300 | | | | 3,992,406 | |
PNM Resources, Inc. | | | 222,800 | | | | 6,601,564 | |
Prestige Brands Holdings, Inc. (a)(b) | | | 159,451 | | | | 5,536,139 | |
PrivateBancorp, Inc. | | | 137,500 | | | | 4,592,500 | |
Procera Networks, Inc. (a)(b) | | | 409,700 | | | | 2,945,743 | |
PTC, Inc. (a) | | | 187,700 | | | | 6,879,205 | |
PVH Corp. | | | 18,385 | | | | 2,356,405 | |
QLIK Technologies, Inc. (a) | | | 157,800 | | | | 4,874,442 | |
Rouse Properties, Inc. (b) | | | 683,917 | | | | 12,666,143 | |
Semtech Corp. (a) | | | 199,301 | | | | 5,494,729 | |
See Notes to Financial Statements.
| | | | | | |
| | | | | | | |
| 14 | | SEMI-ANNUAL REPORT | | DECEMBER 31, 2014 | | |
| | |
Schedule of Investments (continued) | | BlackRock Global SmallCap Fund, Inc. (Percentages shown are based on Net Assets) |
| | | | | | | | |
| Common Stocks | | Shares | | | Value | |
United States (concluded) | |
ServiceMaster Global Holdings, Inc. (a) | | | 167,126 | | | $ | 4,473,963 | |
Silver Bay Realty Trust Corp. (b) | | | 635,523 | | | | 10,524,261 | |
SLM Corp. | | | 1,236,479 | | | | 12,599,721 | |
SM Energy Co. | | | 140,300 | | | | 5,412,774 | |
Smart & Final Stores, Inc. (a) | | | 303,600 | | | | 4,775,628 | |
Springleaf Holdings, Inc. (a) | | | 109,400 | | | | 3,956,998 | |
Steel Dynamics, Inc. | | | 478,500 | | | | 9,445,590 | |
Supervalu, Inc. (a) | | | 1,113,300 | | | | 10,799,010 | |
TECO Energy, Inc. | | | 416,700 | | | | 8,538,183 | |
Teleflex, Inc. | | | 114,890 | | | | 13,191,670 | |
The Timken Co. | | | 89,600 | | | | 3,824,128 | |
TimkenSteel Corp. | | | 128,689 | | | | 4,765,354 | |
TransEnterix, Inc. (a) | | | 1,800,070 | | | | 5,238,204 | |
Tribune Co., Class A (a) | | | 148,572 | | | | 8,880,148 | |
Urban Outfitters, Inc. (a)(b) | | | 109,500 | | | | 3,846,735 | |
Varonis Systems, Inc. (a)(b) | | | 81,800 | | | | 2,685,494 | |
Vera Bradley, Inc. (a) | | | 414,815 | | | | 8,453,930 | |
Verint Systems, Inc. (a) | | | 143,400 | | | | 8,357,352 | |
Zynga, Inc., Class A (a) | | | 1,261,800 | | | | 3,356,388 | |
| | | | | | | | |
| | | | | | | | 612,999,743 | |
| Total Common Stocks — 99.6% | | | | | | | 1,082,745,480 | |
| | | | | | | | |
| | | | | | | | | |
| | |
| Warrants (e) | | | | | | |
United Kingdom — 0.0% | |
Atlas Mara Co-Nvest, Ltd. | | | 549,800 | | | | 247,410 | |
United States — 0.4% | |
Quotient, Ltd. | | | 468,685 | | | $ | 3,960,388 | |
| Total Warrants — 0.4% | | | | | | | 4,207,798 | |
Total Long-Term Investments
(Cost — $937,598,309) — 100.0% | | | | | | | 1,086,953,278 | |
| | | | | | | | |
| | | | | | | | | |
| | |
| Short-Term Securities | | | | | | |
BlackRock Liquidity Funds,
TempFund, Institutional Class, 0.04% (f)(g) | | | 7,277,221 | | | | 7,277,221 | |
| | |
| | | Beneficial
Interest
(000) | | | | |
BlackRock Liquidity Series, LLC,
Money Market Series, 0.20% (f)(g)(h) | | $ | 61,750 | | | | 61,749,908 | |
Total Short-Term Securities
(Cost — $69,027,129) — 6.4% | | | | 69,027,129 | |
| Total Investments (Cost — $1,006,625,438) — 106.4% | | | | 1,155,980,407 | |
Liabilities in Excess of Other Assets — (6.4)% | | | | (69,460,327 | ) |
| | | | | | | | |
| Net Assets — 100.0% | | | $ | 1,086,520,080 | |
| | | | | | | | |
|
| Notes to Schedule of Investments |
| (a) | | Non-income producing security. |
| (b) | | Security, or a portion of security, is on loan. |
| (c) | | Investments in issuers (whereby the Fund held 5% or more of the companies’ outstanding securities) that were considered to be an affiliate during the period, for purposes of Section 2(a)(3) of the Investment Company Act of 1940, as amended, were as follows: |
| | | | | | | | | | | | | | | | | | | | | | | | | | | | |
| Affiliate | | Shares Held
at June 30,
2014 | | | Shares
Purchased | | | Shares
Sold | | | Shares Held at December 31,
2014 | | | Value at December 31,
2014 | | | Realized
Loss | | | Income | |
Diagnocure, Inc. | | | 4,852,780 | | | | — | | | | (107,600 | ) | | | 4,745,180 | | | $ | 510,542 | | | $ | (474,295 | ) | | | — | |
| (d) | | Security exempt from registration pursuant to Rule 144A under the Securities Act of 1933, as amended. These securities may be resold in transactions exempt from registration to qualified institutional investors. |
| (e) | | Warrants entitle the Fund to purchase a predetermined number of shares of common stock and are non-income producing. The purchase price and number of shares are subject to adjustment under certain conditions until the expiration date, if any. |
| (f) | | During the period ended December 31, 2014, investments in issuers considered to be an affiliate of the Fund, for purposes of Section 2(a)(3) of the Investment Company Act of 1940, as amended, were as follows: |
| | | | | | | | | | | | | | | | |
| Affiliate | | Shares/Beneficial
Interest Held at
June 30,
2014 | | | Net
Activity | | | Shares/Beneficial
Interest Held at
December 31,
2014 | | | Income | |
BlackRock Liquidity Funds, TempFund, Institutional Class | | | 13,350,894 | | | | (6,073,673 | ) | | | 7,277,221 | | | $ | 5,801 | |
BlackRock Liquidity Series, LLC, Money Market Series | | $ | 121,421,480 | | | $ | (59,671,572 | ) | | $ | 61,749,908 | | | $ | 1,086,104 | |
| (g) | | Represents the current yield as of report date. |
| (h) | | Security was purchased with the cash collateral from loaned securities. The Fund may withdraw up to 25% of its investment daily, although the manager of the BlackRock Liquidity Series, LLC, Money Market Series, in its sole discretion, may permit an investor to withdraw more than 25% on any one day. |
See Notes to Financial Statements.
| | | | | | |
| | | | | | | |
| | SEMI-ANNUAL REPORT | | DECEMBER 31, 2014 | | 15 |
| | |
Schedule of Investments (continued) | | BlackRock Global SmallCap Fund, Inc. (Percentages shown are based on Net Assets) |
| Ÿ | | Fair Value Measurements — Various inputs are used in determining the fair value of investments. These inputs to valuation techniques are categorized into a disclosure hierarchy consisting of three broad levels for financial statement purposes. The hierarchy gives the highest priority to unadjusted quoted prices in active markets for identical assets or liabilities (Level 1 measurements) and the lowest priority to unobservable inputs (Level 3 measurements). Accordingly, the degree of judgment exercised in determining fair value is greatest for instruments categorized in Level 3. The inputs used to measure fair value may fall into different levels of the fair value hierarchy. In such cases, for disclosure purposes, the fair value hierarchy classification is determined based on the lowest level input that is significant to the fair value measurement in its entirety. The categorization of a value determined for investments is based on the pricing transparency of the investment and is not necessarily an indication of the risks associated with investing in those securities. The three levels of the fair value hierarchy are as follows: |
| | Ÿ | | Level 1 — unadjusted price quotations in active markets/exchanges for identical assets or liabilities that the Fund has the ability to access |
| | Ÿ | | Level 2 — other observable inputs (including, but not limited to, quoted prices for similar assets or liabilities in markets that are active, quoted prices for identical or similar assets or liabilities in markets that are not active, inputs other than quoted prices that are observable for the assets or liabilities (such as interest rates, yield curves, volatilities, prepayment speeds, loss severities, credit risks and default rates) or other market-corroborated inputs) |
| | Ÿ | | Level 3 — unobservable inputs based on the best information available in the circumstances, to the extent observable inputs are not available (including the Fund’s own assumptions used in determining the fair value of investments) |
Changes in valuation techniques may result in transfers into or out of an assigned level within the disclosure hierarchy. In accordance with the Fund’s policy, transfers between different levels of the fair value disclosure hierarchy are deemed to have occurred as of the beginning of the reporting period. For information about the Fund’s policy regarding valuation of investments, refer to Note 2 of the Notes to Financial Statements.
As of December 31, 2014, the following table summarizes the Fund’s investments categorized in the disclosure hierarchy:
| | | | | | | | | | | | | | | | |
| | | Level 1 | | | Level 2 | | | Level 3 | | | Total | |
Assets: | | | | | | | | | | | | | | | | |
| Investments: | | | | | | | | | | | | | | | | |
Common Stocks: | | | | | | | | | | | | | | | | |
Argentina | | $ | 1,657,603 | | | | — | | | | — | | | $ | 1,657,603 | |
Australia | | | 2,243,035 | | | $ | 20,831,366 | | | | — | | | | 23,074,401 | |
Belgium | | | 14,788,627 | | | | 5,699,709 | | | | — | | | | 20,488,336 | |
Brazil | | | 13,476,889 | | | | — | | | | — | | | | 13,476,889 | |
Canada | | | 59,227,909 | | | | 4,465,671 | | | | — | | | | 63,693,580 | |
Chile | | | 2,626,106 | | | | — | | | | — | | | | 2,626,106 | |
China | | | 882,026 | | | | 12,189,595 | | | | — | | | | 13,071,621 | |
Denmark | | | — | | | | 12,806,651 | | | | — | | | | 12,806,651 | |
France | | | 3,017,770 | | | | 24,198,779 | | | | — | | | | 27,216,549 | |
Germany | | | — | | | | 16,810,285 | | | | — | | | | 16,810,285 | |
Hong Kong | | | — | | | | 25,775,137 | | | | — | | | | 25,775,137 | |
India | | | — | | | | 29,061,888 | | | | — | | | | 29,061,888 | |
Indonesia | | | — | | | | 8,570,804 | | | | — | | | | 8,570,804 | |
Ireland | | | 8,815,814 | | | | — | | | | — | | | | 8,815,814 | |
Italy | | | — | | | | 5,257,266 | | | | — | | | | 5,257,266 | |
Japan | | | — | | | | 39,870,283 | | | | — | | | | 39,870,283 | |
Malaysia | | | 3,197,410 | | | | — | | | | — | | | | 3,197,410 | |
Netherlands | | | — | | | | 6,637,156 | | | | — | | | | 6,637,156 | |
Norway | | | 3,125,266 | | | | 6,468,681 | | | | — | | | | 9,593,947 | |
South Korea | | | 6,793,659 | | | | — | | | | — | | | | 6,793,659 | |
Sweden | | | 7,133,686 | | | | 9,028,217 | | | | — | | | | 16,161,903 | |
Switzerland | | | — | | | | 32,956,994 | | | | — | | | | 32,956,994 | |
United Arab Emirates | | | — | | | | 930,782 | | | | — | | | | 930,782 | |
United Kingdom | | | 27,293,233 | | | | 53,907,440 | | | | — | | | | 81,200,673 | |
United States | | | 612,999,743 | | | | — | | | | — | | | | 612,999,743 | |
Warrants | | | 3,960,388 | | | | 247,410 | | | | — | | | | 4,207,798 | |
Short-Term Securities | | | 7,277,221 | | | | 61,749,908 | | | | — | | | | 69,027,129 | |
| | | | |
Total | | $ | 778,516,385 | | | $ | 377,464,022 | | | | — | | | $ | 1,155,980,407 | |
| | | | |
The Fund may hold assets and/or liabilities in which the fair value approximates the carrying amount for financial statement purposes. As of December 31, 2014, such assets and/or liabilities are categorized within the disclosure hierarchy as follows:
| | | | | | | | | | | | | | | | |
| | | Level 1 | | | Level 2 | | | Level 3 | | | Total | |
Assets: | | | | | | | | | | | | | | | | |
Foreign currency at value | | $ | 423,941 | | | | — | | | | — | | | $ | 423,941 | |
Liabilities: | | | | | | | | | | | | | | | | |
Collateral on securities loaned at value | | | — | | | $ | (61,749,908 | ) | | | — | | | | (61,749,908 | ) |
| | | | | | | | | | | | | | | | |
Total | | $ | 423,941 | | | $ | (61,749,908 | ) | | | — | | | $ | (61,325,967 | ) |
| | | | | | | | | | | | | | | | |
See Notes to Financial Statements.
| | | | | | |
| | | | | | | |
| 16 | | SEMI-ANNUAL REPORT | | DECEMBER 31, 2014 | | |
| | |
Schedule of Investments (continued) | | BlackRock Global SmallCap Fund, Inc. |
Transfers between Level 1 and Level 2 were as follows:
| | | | | | | | | | | | | | | | |
| | | Transfers
into Level 11 | | | Transfers out
of Level 12 | | | Transfers
into Level 22 | | | Transfers out
of Level 21 | |
Assets: | | | | | | | | | | | | | | | | |
| Investments: | | | | | | | | | | | | | | | | |
Long-Term Investments: | | | | | | | | | | | | | | | | |
Common Stocks: | | | | | | | | | | | | | | | | |
Belgium | | $ | 9,002,111 | | | $ | (9,027,261 | ) | | $ | 9,027,261 | | | $ | (9,002,111 | ) |
China | | | — | | | | (2,967,005 | ) | | | 2,967,005 | | | | — | |
France | | | 7,048,658 | | | | (4,945,650 | ) | | | 4,945,650 | | | | (7,048,658 | ) |
Germany | | | — | | | | (4,336,480 | ) | | | 4,336,480 | | | | — | |
Hong Kong | | | — | | | | (2,004,558 | ) | | | 2,004,558 | | | | — | |
Indonesia | | | — | | | | (5,198,905 | ) | | | 5,198,905 | | | | — | |
Malaysia | | | 3,012,271 | | | | — | | | | — | | | | (3,012,271 | ) |
Norway | | | — | | | | (7,736,479 | ) | | | 7,736,479 | | | | — | |
United Kingdom | | | 5,008,554 | | | | (8,093,797 | ) | | | 8,093,797 | | | | (5,008,554 | ) |
United States | | | 6,279,797 | | | | — | | | | — | | | | (6,279,797 | ) |
| | | | | | | | | | | | | | | | |
Total | | $ | 30,351,391 | | | $ | (44,310,135 | ) | | $ | 44,310,135 | | | $ | (30,351,391 | ) |
| | | | | | | | | | | | | | | | |
1 Systematic fair values were not utilized at period end for these investments. | |
2 External pricing service used to reflect any significant market movements between the time the Fund valued such foreign securities and the earlier closing of foreign markets. | |
See Notes to Financial Statements.
| | | | | | |
| | | | | | | |
| | SEMI-ANNUAL REPORT | | DECEMBER 31, 2014 | | 17 |
| | |
| Statements of Assets and Liabilities | | |
| | | | | | | | |
| December 31, 2014 (Unaudited) | | BlackRock
EuroFund | | | BlackRock
Global SmallCap
Fund, Inc. | |
| | | | | | | | |
| Assets | | | | | | | | |
Investments at value — unaffiliated1,2 | | $ | 409,808,161 | | | $ | 1,086,442,736 | |
Investments at value — affiliated3 | | | 329,588 | | | | 69,537,671 | |
Cash pledged for financial futures contracts | | | 502,000 | | | | — | |
Investments sold receivable | | | 5,218,244 | | | | 4,897,356 | |
Dividends receivable | | | 829,177 | | | | 981,425 | |
Capital shares sold receivable | | | 214,026 | | | | 1,489,146 | |
Foreign currency at value4 | | | — | | | | 423,941 | |
Securities lending income receivable — affiliated | | | — | | | | 120,247 | |
Prepaid expenses | | | 47,740 | | | | 77,647 | |
| | | | |
Total assets | | | 416,948,936 | | | | 1,163,970,169 | |
| | | | |
| | | | | | | | |
| Liabilities | | | | | | | | |
Collateral on securities loaned at value | | | — | | | | 61,749,908 | |
Capital shares redeemed payable | | | 1,062,695 | | | | 7,955,079 | |
Investments purchased payable | | | — | | | | 6,112,586 | |
Investment advisory fees payable | | | 271,912 | | | | 784,945 | |
Service and distribution fees payable | | | 47,297 | | | | 378,333 | |
Officer’s and Directors’ fees payable | | | 6,368 | | | | 9,447 | |
Other affiliates payable | | | 1,906 | | | | 5,708 | |
Variation margin payable on financial futures contracts | | | 2,654 | | | | — | |
Income dividends payable | | | 410 | | | | — | |
Other accrued expenses payable | | | 155,742 | | | | 454,083 | |
| | | | |
Total liabilities | | | 1,548,984 | | | | 77,450,089 | |
| | | | |
Net Assets | | $ | 415,399,952 | | | $ | 1,086,520,080 | |
| | | | |
| | | | | | | | |
| Net Assets Consist of | | | | | | | | |
Paid-in capital | | $ | 513,229,189 | | | $ | 962,117,966 | |
Undistributed (distributions in excess of) net investment income | | | 1,280,230 | | | | (34,699,114 | ) |
Undistributed net realized gain (accumulated net realized loss) | | | (104,711,226 | ) | | | 9,764,159 | |
Net unrealized appreciation/depreciation | | | 5,601,759 | | | | 149,337,069 | |
| | | | |
Net Assets | | $ | 415,399,952 | | | $ | 1,086,520,080 | |
| | | | |
1 Investments at cost — unaffiliated | | $ | 404,307,721 | | | $ | 924,148,218 | |
2 Securities loaned at value | | | — | | | $ | 57,941,477 | |
3 Investments at cost — affiliated | | $ | 329,588 | | | $ | 82,477,220 | |
4 Foreign currency at cost | | | — | | | $ | 423,947 | |
| | | | | | |
| See Notes to Financial Statements. | | | | |
| | | | | | | |
| 18 | | SEMI-ANNUAL REPORT | | DECEMBER 31, 2014 | | |
| | |
| Statements of Assets and Liabilities (concluded) | | |
| | | | | | | | |
| December 31, 2014 (Unaudited) | | BlackRock
EuroFund | | | BlackRock Global SmallCap
Fund, Inc. | |
| | | | | | | | |
| Net Asset Value | | | | | | | | |
| Institutional: | | | | | | | | |
Net assets | | $ | 248,620,659 | | | $ | 281,225,955 | |
| | | | | | | | |
Shares outstanding | | | 17,220,993 | | | | 11,452,066 | |
| | | | | | | | |
Net asset value | | $ | 14.44 | | | $ | 24.56 | |
| | | | | | | | |
Par value | | $ | 0.10 | | | $ | 0.10 | |
| | | | | | | | |
Shares authorized | | | Unlimited | | | | 100 million | |
| | | | | | | | |
| Investor A: | | | | | | | | |
Net assets | | $ | 149,693,730 | | | $ | 462,420,533 | |
| | | | | | | | |
Shares outstanding | | | 10,551,646 | | | | 19,463,942 | |
| | | | | | | | |
Net asset value | | $ | 14.19 | | | $ | 23.76 | |
| | | | | | | | |
Par value | | $ | 0.10 | | | $ | 0.10 | |
| | | | | | | | |
Shares authorized | | | Unlimited | | | | 100 million | |
| | | | | | | | |
| Investor B: | | | | | | | | |
Net assets | | | — | | | $ | 3,136,766 | |
| | | | | | | | |
Shares outstanding | | | — | | | | 141,567 | |
| | | | | | | | |
Net asset value | | | — | | | $ | 22.16 | |
| | | | | | | | |
Par value | | | — | | | $ | 0.10 | |
| | | | | | | | |
Shares authorized | | | — | | | | 100 million | |
| | | | | | | | |
| Investor C: | | | | | | | | |
Net assets | | $ | 16,002,563 | | | $ | 312,698,807 | |
| | | | | | | | |
Shares outstanding | | | 1,581,204 | | | | 14,932,776 | |
| | | | | | | | |
Net asset value | | $ | 10.12 | | | $ | 20.94 | |
| | | | | | | | |
Par value | | $ | 0.10 | | | $ | 0.10 | |
| | | | | | | | |
Shares authorized | | | Unlimited | | | | 100 million | |
| | | | | | | | |
| Class R: | | | | | | | | |
Net assets | | $ | 1,083,000 | | | $ | 27,038,019 | |
| | | | | | | | |
Shares outstanding | | | 99,519 | | | | 1,215,798 | |
| | | | | | | | |
Net asset value | | $ | 10.88 | | | $ | 22.24 | |
| | | | | | | | |
Par value | | $ | 0.10 | | | $ | 0.10 | |
| | | | | | | | |
Shares authorized | | | Unlimited | | | | 100 million | |
| | | | | | | | |
| | | | | | |
| See Notes to Financial Statements. | | | | |
| | | | | | | |
| | SEMI-ANNUAL REPORT | | DECEMBER 31, 2014 | | 19 |
| | | | | | | | |
| Six Months Ended December 31, 2014 (Unaudited) | | BlackRock
EuroFund | | | BlackRock
Global SmallCap
Fund, Inc. | |
| | | | | | | | |
| Investment Income | | | | | | | | |
Dividends — unaffiliated | | $ | 3,900,433 | | | $ | 5,645,626 | |
Securities lending — affiliated — net | | | 542 | | | | 1,086,104 | |
Dividends — affiliated | | | 394 | | | | 5,801 | |
Foreign taxes withheld | | | (176,251 | ) | | | (225,498 | ) |
| | | | |
Total income | | | 3,725,118 | | | | 6,512,033 | |
| | | | |
| | | | | | | | |
| Expenses | | | | | | | | |
Investment advisory | | | 1,690,350 | | | | 4,891,255 | |
Service — Investor A | | | 212,737 | | | | 611,109 | |
Service and distribution — Investor B | | | — | | | | 18,935 | |
Service and distribution — Investor C | | | 94,429 | | | | 1,641,527 | |
Service and distribution — Class R | | | 3,085 | | | | 76,727 | |
Transfer agent — Institutional | | | 166,187 | | | | 173,661 | |
Transfer agent — Investor A | | | 104,885 | | | | 467,825 | |
Transfer agent — Investor B | | | — | | | | 7,214 | |
Transfer agent — Investor C | | | 18,122 | | | | 391,541 | |
Transfer agent — Class R | | | 2,235 | | | | 46,834 | |
Accounting services | | | 56,488 | | | | 158,424 | |
Custodian | | | 66,516 | | | | 122,912 | |
Registration | | | 41,043 | | | | 63,458 | |
Professional | | | 44,344 | | | | 52,072 | |
Printing | | | 13,800 | | | | 27,692 | |
Officer and Directors | | | 10,856 | | | | 15,916 | |
Miscellaneous | | | 13,965 | | | | 18,728 | |
| | | | |
Total expenses | | | 2,539,042 | | | | 8,785,830 | |
Less fees waived by Manager | | | (911 | ) | | | (10,444 | ) |
| | | | |
Total expenses after fees waived | | | 2,538,131 | | | | 8,775,386 | |
| | | | |
Net investment income (loss) | | | 1,186,987 | | | | (2,263,353 | ) |
| | | | |
| | | | | | | | |
| Realized and Unrealized Gain (Loss) | | | | | | | | |
Net realized gain (loss) from: | | | | | | | | |
Investments — unaffiliated | | | (11,514,113 | ) | | | 74,153,463 | |
Investments — affiliated | | | — | | | | (474,295 | ) |
Financial futures contracts | | | (562,564 | ) | | | — | |
Foreign currency transactions | | | (101,303 | ) | | | (45,225 | ) |
| | | | |
| | | (12,177,980 | ) | | | 73,633,943 | |
| | | | |
Net change in unrealized appreciation/depreciation on: | | | | | | | | |
Investments | | | (42,474,484 | ) | | | (162,997,132 | ) |
Financial futures contracts | | | 155,156 | | | | — | |
Foreign currency translations | | | (38,991 | ) | | | (16,315 | ) |
| | | | |
| | | (42,358,319 | ) | | | (163,013,447 | ) |
| | | | |
Net realized and unrealized loss | | | (54,536,299 | ) | | | (89,379,504 | ) |
| | | | |
Net Decrease in Net Assets Resulting from Operations | | $ | (53,349,312 | ) | | $ | (91,642,857 | ) |
| | | | |
| | | | | | |
| See Notes to Financial Statements. | | | | |
| | | | | | | |
| 20 | | SEMI-ANNUAL REPORT | | DECEMBER 31, 2014 | | |
| | |
| Statements of Changes in Net Assets | | |
| | | | | | | | | | | | | | | | | | |
| | | BlackRock EuroFund | | | | | BlackRock Global
SmallCap Fund, Inc. | |
| Increase (Decrease) in Net Assets: | | Six Months Ended
December 31,
2014
(Unaudited) | | | Year Ended
June 30,
2014 | | | | | Six Months Ended
December 31,
2014
(Unaudited) | | | Year Ended
June 30,
2014 | |
| | | | | | | | | | | | | | | | | | |
| Operations | | | | | | | | | | | | | | | | | | |
Net investment income (loss) | | $ | 1,186,987 | | | $ | 12,564,637 | | | | | $ | (2,263,353 | ) | | $ | (1,887,456 | ) |
Net realized gain (loss) | | | (12,177,980 | ) | | | 39,280,044 | | | | | | 73,633,943 | | | | 159,059,274 | |
Net change in unrealized appreciation/depreciation | | | (42,358,319 | ) | | | 15,886,378 | | | | | | (163,013,447 | ) | | | 143,042,273 | |
| | | | | | | | | | |
Net increase (decrease) in net assets resulting from operations | | | (53,349,312 | ) | | | 67,731,059 | | | | | | (91,642,857 | ) | | | 300,214,091 | |
| | | | | | | | | | |
| | | | | | | | | | | | | | | | | | |
| Distributions to Shareholders From1 | | | | | | | | | | | | | | | | | | |
Net investment income: | | | | | | | | | | | | | | | | | | |
Institutional | | | (7,567,115 | ) | | | (2,421,532 | ) | | | | | (1,114,270 | ) | | | (2,290,080 | ) |
Investor A | | | (4,209,361 | ) | | | (1,694,336 | ) | | | | | (1,069,605 | ) | | | (2,834,483 | ) |
Investor B | | | — | | | | — | | | | | | — | | | | (5,961 | ) |
Investor C | | | (487,187 | ) | | | (167,648 | ) | | | | | — | | | | (1,049,841 | ) |
Class R | | | (29,498 | ) | | | (14,502 | ) | | | | | (4,597 | ) | | | (164,507 | ) |
Net realized gain: | | | | | | | | | | | | | | | | | | |
Institutional | | | — | | | | — | | | | | | (39,378,923 | ) | | | (29,361,177 | ) |
Investor A | | | — | | | | — | | | | | | (65,151,603 | ) | | | (45,378,995 | ) |
Investor B | | | — | | | | — | | | | | | (458,909 | ) | | | (660,065 | ) |
Investor C | | | — | | | | — | | | | | | (48,850,849 | ) | | | (35,634,766 | ) |
Class R | | | — | | | | — | | | | | | (4,023,638 | ) | | | (3,560,341 | ) |
| | | | | | | | | | |
Decrease in net assets resulting from distributions to shareholders | | | (12,293,161 | ) | | | (4,298,018 | ) | | | | | (160,052,394 | ) | | | (120,940,216 | ) |
| | | | | | | | | | |
| | | | | | | | | | | | | | | | | | |
| Capital Share Transactions | | | | | | | | | | | | | | | | | | |
Net increase in net assets derived from capital share transactions | | | 74,467,489 | | | | 89,456,834 | | | | | | 109,726,970 | | | | 131,169,553 | |
| | | | | | | | | | |
| | | | | | | | | | | | | | | | | | |
| Net Assets | | | | | | | | | | | | | | | | | | |
Total increase (decrease) in net assets | | | 8,825,016 | | | | 152,889,875 | | | | | | (141,968,281 | ) | | | 310,443,428 | |
Beginning of period | | | 406,574,936 | | | | 253,685,061 | | | | | | 1,228,488,361 | | | | 918,044,933 | |
| | | | | | | | | | |
End of period | | $ | 415,399,952 | | | $ | 406,574,936 | | | | | $ | 1,086,520,080 | | | $ | 1,228,488,361 | |
| | | | | | | | | | |
Undistributed (distributions in excess of) net investment income, end of period | | $ | 1,280,230 | | | $ | 12,386,404 | | | | | $ | (34,699,114 | ) | | $ | (30,247,289 | ) |
| | | | | | | | | | |
1 Distributions for annual periods determined in accordance with federal income tax regulations. | | | | | |
| | | | | | |
| See Notes to Financial Statements. | | | | |
| | | | | | | |
| | SEMI-ANNUAL REPORT | | DECEMBER 31, 2014 | | 21 |
| | |
| Financial Highlights | | BlackRock EuroFund |
| | | | | | | | | | | | | | | | | | | | | | | | |
| | | Institutional | |
| | | Six Months Ended
December 31, 2014
(Unaudited) | | | Year Ended June 30, | |
| | | | 2014 | | | 2013 | | | 2012 | | | 2011 | | | 2010 | |
| | | | | | | | | | | | | | | | | | | | | | | | |
| Per Share Operating Performance | | | | | | | | | | | | | | | | | | | | | | | | |
Net asset value, beginning of period | | $ | 16.68 | | | $ | 13.62 | | | $ | 11.29 | | | $ | 13.97 | | | $ | 10.41 | | | $ | 10.65 | |
| | | | |
Net investment income1 | | | 0.05 | | | | 0.61 | | | | 0.27 | | | | 0.16 | | | | 0.36 | | | | 0.21 | |
Net realized and unrealized gain (loss) | | | (1.84 | ) | | | 2.65 | | | | 2.22 | | | | (2.43 | ) | | | 3.41 | | | | (0.05 | ) |
| | | | |
Net increase (decrease) from investment operations | | | (1.79 | ) | | | 3.26 | | | | 2.49 | | | | (2.27 | ) | | | 3.77 | | | | 0.16 | |
| | | | |
Distributions from net investment income2 | | | (0.45 | ) | | | (0.20 | ) | | | (0.16 | ) | | | (0.41 | ) | | | (0.21 | ) | | | (0.40 | ) |
| | | | |
Redemption fee | | | — | | | | — | | | | — | | | | — | | | | 0.00 | 3 | | | 0.00 | 3 |
| | | | |
Net asset value, end of period | | $ | 14.44 | | | $ | 16.68 | | | $ | 13.62 | | | $ | 11.29 | | | $ | 13.97 | | | $ | 10.41 | |
| | | | |
| | | | | | | | | | | | | | | | | | | | | | | | |
| Total Return4 | | | | | | | | | | | | | | | | | | | | | | | | |
Based on net asset value | | | (10.71)% | 5 | | | 24.06% | | | | 22.10% | | | | (15.99)% | | | | 36.42% | 6 | | | 0.78% | 6 |
| | | | |
| | | | | | | | | | | | | | | | | | | | | | | | |
| Ratios to Average Net Assets | | | | | | | | | | | | | | | | | | | | | | | | |
Total expenses | | | 0.99% | 7 | | | 1.02% | | | | 1.07% | | | | 1.17% | | | | 1.05% | | | | 1.09% | |
| | | | |
Total expenses after fees waived | | | 0.99% | 7 | | | 1.02% | | | | 1.07% | | | | 1.17% | | | | 1.05% | | | | 1.08% | |
| | | | |
Net investment income | | | 0.67% | 7 | | | 3.81% | | | | 2.09% | | | | 1.40% | | | | 2.80% | | | | 1.73% | |
| | | | |
| | | | | | | | | | | | | | | | | | | | | | | | |
| Supplemental Data | | | | | | | | | | | | | | | | | | | | | | | | |
Net assets, end of period (000) | | $ | 248,621 | | | $ | 187,718 | | | $ | 88,713 | | | $ | 81,040 | | | $ | 114,551 | | | $ | 101,632 | |
| | | | |
Portfolio turnover rate | | | 55% | | | | 129% | | | | 115% | | | | 162% | | | | 148% | | | | 161% | |
| | | | |
| | 1 | | Based on average shares outstanding. |
| | 2 | | Distributions for annual periods determined in accordance with federal income tax regulations. |
| | 3 | | Amount is less than $0.005 per share. |
| | 4 | | Where applicable, assumes the reinvestment of distributions. |
| | 5 | | Aggregate total return. |
| | 6 | | Total return calculation includes redemption fees received by the Fund. The impact to the return is less than 0.005%. |
| | | | | | |
| See Notes to Financial Statements. | | | | |
| | | | | | | |
| 22 | | SEMI-ANNUAL REPORT | | DECEMBER 31, 2014 | | |
| | |
| Financial Highlights (continued) | | BlackRock EuroFund |
| | | | | | | | | | | | | | | | | | | | | | | | |
| | | Investor A | |
| | | Six Months Ended
December 31, 2014
(Unaudited) | | | Year Ended June 30, | |
| | | | 2014 | | | 2013 | | | 2012 | | | 2011 | | | 2010 | |
| | | | | | | | | | | | | | | | | | | | | | | | |
| Per Share Operating Performance | | | | | | | | | | | | | | | | | | | | | | | | |
Net asset value, beginning of period | | $ | 16.37 | | | $ | 13.35 | | | $ | 11.08 | | | $ | 13.71 | | | $ | 10.22 | | | $ | 10.47 | |
| | | | |
Net investment income1 | | | 0.03 | | | | 0.52 | | | | 0.20 | | | | 0.14 | | | | 0.33 | | | | 0.18 | |
Net realized and unrealized gain (loss) | | | (1.81 | ) | | | 2.65 | | | | 2.22 | | | | (2.39 | ) | | | 3.35 | | | | (0.05 | ) |
| | | | |
Net increase (decrease) from investment operations | | | (1.78 | ) | | | 3.17 | | | | 2.42 | | | | (2.25 | ) | | | 3.68 | | | | 0.13 | |
| | | | |
| Distributions from net investment income2 | | | (0.40 | ) | | | (0.15 | ) | | | (0.15 | ) | | | (0.38 | ) | | | (0.19 | ) | | | (0.38 | ) |
| | | | |
Redemption fee | | | — | | | | — | | | | — | | | | — | | | | 0.00 | 3 | | | 0.00 | 3 |
| | | | |
Net asset value, end of period | | $ | 14.19 | | | $ | 16.37 | | | $ | 13.35 | | | $ | 11.08 | | | $ | 13.71 | | | $ | 10.22 | |
| | | | |
| | | | | | | | | | | | | | | | | | | | | | | | |
| Total Return4 | | | | | | | | | | | | | | | | | | | | | | | | |
Based on net asset value | | | (10.83)% | 5 | | | 23.83% | | | | 21.89% | | | | (16.18)% | | | | 36.15% | 6 | | | 0.53% | 6 |
| | | | |
| | | | | | | | | | | | | | | | | | | | | | | | |
| Ratios to Average Net Assets | | | | | | | | | | | | | | | | | | | | | | | | |
Total expenses | | | 1.23% | 7 | | | 1.23% | | | | 1.29% | | | | 1.33% | | | | 1.25% | | | | 1.28% | |
| | | | |
Total expenses after fees waived | | | 1.23% | 7 | | | 1.23% | | | | 1.29% | | | | 1.33% | | | | 1.25% | | | | 1.28% | |
| | | | |
Net investment income | | | 0.42% | 7 | | | 3.30% | | | | 1.62% | | | | 1.21% | | | | 2.56% | | | | 1.51% | |
| | | | |
| | | | | | | | | | | | | | | | | | | | | | | | |
| Supplemental Data | | | | | | | | | | | | | | | | | | | | | | | | |
Net assets, end of period (000) | | $ | 149,694 | | | $ | 195,548 | | | $ | 149,426 | | | $ | 176,609 | | | $ | 210,047 | | | $ | 189,788 | |
| | | | |
Portfolio turnover rate | | | 55% | | | | 129% | | | | 115% | | | | 162% | | | | 148% | | | | 161% | |
| | | | |
| | 1 | | Based on average shares outstanding. |
| | 2 | | Distributions for annual periods determined in accordance with federal income tax regulations. |
| | 3 | | Amount is less than $0.005 per share. |
| | 4 | | Where applicable, excludes the effects of any sales charges and assumes the reinvestment of distributions. |
| | 5 | | Aggregate total return. |
| | 6 | | Total return calculation includes redemption fees received by the Fund. The impact to the return is less than 0.005%. |
| | | | | | |
| See Notes to Financial Statements. | | | | |
| | | | | | | |
| | SEMI-ANNUAL REPORT | | DECEMBER 31, 2014 | | 23 |
| | |
| Financial Highlights (continued) | | BlackRock EuroFund |
| | | | | | | | | | | | | | | | | | | | | | | | |
| | | Investor C | |
| | | Six Months Ended
December 31, 2014
(Unaudited) | | | Year Ended June 30, | |
| | | | 2014 | | | 2013 | | | 2012 | | | 2011 | | | 2010 | |
| | | | | | | | | | | | | | | | | | | | | | | | |
| Per Share Operating Performance | | | | | | | | | | | | | | | | | | | | | | | | |
Net asset value, beginning of period | | $ | 11.76 | | | $ | 9.67 | | | $ | 8.05 | | | $ | 10.06 | | | $ | 7.54 | | | $ | 7.81 | |
| | | | |
Net investment income (loss)1 | | | (0.02 | ) | | | 0.31 | | | | 0.09 | | | | 0.03 | | | | 0.16 | | | | 0.06 | |
Net realized and unrealized gain (loss) | | | (1.30 | ) | | | 1.88 | | | | 1.58 | | | | (1.75 | ) | | | 2.47 | | | | (0.03 | ) |
| | | | |
Net increase (decrease) from investment operations | | | (1.32 | ) | | | 2.19 | | | | 1.67 | | | | (1.72 | ) | | | 2.63 | | | | 0.03 | |
| | | | |
| Distributions from net investment income2 | | | (0.32 | ) | | | (0.10 | ) | | | (0.05 | ) | | | (0.29 | ) | | | (0.11 | ) | | | (0.30 | ) |
| | | | |
Redemption fee | | | — | | | | — | | | | — | | | | — | | | | 0.00 | 3 | | | 0.00 | 3 |
| | | | |
Net asset value, end of period | | $ | 10.12 | | | $ | 11.76 | | | $ | 9.67 | | | $ | 8.05 | | | $ | 10.06 | | | $ | 7.54 | |
| | | | |
| | | | | | | | | | | | | | | | | | | | | | | | |
| Total Return4 | | | | | | | | | | | | | | | | | | | | | | | | |
Based on net asset value | | | (11.23)% | 5 | | | 22.76% | | | | 20.83% | | | | (16.88)% | | | | 35.01% | 6 | | | (0.36)% | 6 |
| | | | |
| | | | | | | | | | | | | | | | | | | | | | | | |
| Ratios to Average Net Assets | | | | | | | | | | | | | | | | | | | | | | | | |
Total expenses | | | 2.05% | 7 | | | 2.07% | | | | 2.14% | | | | 2.22% | | | | 2.11% | | | | 2.13% | |
| | | | |
Total expenses after fees waived | | | 2.05% | 7 | | | 2.07% | | | | 2.14% | | | | 2.22% | | | | 2.11% | | | | 2.13% | |
| | | | |
Net investment income (loss) | | | (0.40)% | 7 | | | 2.72% | | | | 0.99% | | | | 0.30% | | | | 1.66% | | | | 0.64% | |
| | | | |
| | | | | | | | | | | | | | | | | | | | | | | | |
| Supplemental Data | | | | | | | | | | | | | | | | | | | | | | | | |
Net assets, end of period (000) | | $ | 16,003 | | | $ | 21,838 | | | $ | 13,982 | | | $ | 13,470 | | | $ | 22,169 | | | $ | 20,997 | |
| | | | |
Portfolio turnover rate | | | 55% | | | | 129% | | | | 115% | | | | 162% | | | | 148% | | | | 161% | |
| | | | |
| | 1 | | Based on average shares outstanding. |
| | 2 | | Distributions for annual periods determined in accordance with federal income tax regulations. |
| | 3 | | Amount is less than $0.005 per share. |
| | 4 | | Where applicable, excludes the effects of any sales charges and assumes the reinvestment of distributions. |
| | 5 | | Aggregate total return. |
| | 6 | | Total return calculation includes redemption fees received by the Fund. The impact to the return is less than 0.005%. |
| | | | | | |
| See Notes to Financial Statements. | | | | |
| | | | | | | |
| 24 | | SEMI-ANNUAL REPORT | | DECEMBER 31, 2014 | | |
| | |
| Financial Highlights (concluded) | | BlackRock EuroFund |
| | | | | | | | | | | | | | | | | | | | | | | | |
| | | Class R | |
| | | Six Months Ended
December 31, 2014
(Unaudited) | | | Year Ended June 30, | |
| | | | 2014 | | | 2013 | | | 2012 | | | 2011 | | | 2010 | |
| | | | | | | | | | | | | | | | | | | | | | | | |
| Per Share Operating Performance | | | | | | | | | | | | | | | | | | | | | | | | |
Net asset value, beginning of period | | $ | 12.58 | | | $ | 10.32 | | | $ | 8.57 | | | $ | 10.72 | | | $ | 8.02 | | | $ | 8.29 | |
| | | | |
Net investment income1 | | | — | | | | 0.33 | | | | 0.13 | | | | 0.04 | | | | 0.19 | | | | 0.08 | |
Net realized and unrealized gain (loss) | | | (1.39 | ) | | | 2.04 | | | | 1.69 | | | | (1.87 | ) | | | 2.65 | | | | (0.02 | ) |
| | | | |
Net increase (decrease) from investment operations | | | (1.39 | ) | | | 2.37 | | | | 1.82 | | | | (1.83 | ) | | | 2.84 | | | | 0.06 | |
| | | | |
| Distributions from net investment income2 | | | (0.31 | ) | | | (0.11 | ) | | | (0.07 | ) | | | (0.32 | ) | | | (0.14 | ) | | | (0.33 | ) |
| | | | |
Redemption fee | | | — | | | | — | | | | — | | | | — | | | | 0.00 | 3 | | | 0.00 | 3 |
| | | | |
Net asset value, end of period | | $ | 10.88 | | | $ | 12.58 | | | $ | 10.32 | | | $ | 8.57 | | | $ | 10.72 | | | $ | 8.02 | |
| | | | |
| | | | | | | | | | | | | | | | | | | | | | | | |
| Total Return4 | | | | | | | | | | | | | | | | | | | | | | | | |
Based on net asset value | | | (11.06)% | 5 | | | 23.05% | | | | 21.32% | | | | (16.81)% | | | | 35.54% | 6 | | | (0.05)% | 6 |
| | | | |
| | | | | | | | | | | | | | | | | | | | | | | | |
| Ratios to Average Net Assets | | | | | | | | | | | | | | | | | | | | | | | | |
Total expenses | | | 1.72% | 7 | | | 1.79% | | | | 1.80% | | | | 1.96% | | | | 1.85% | | | | 1.87% | |
| | | | |
Total expenses after fees waived | | | 1.72% | 7 | | | 1.79% | | | | 1.80% | | | | 1.96% | | | | 1.85% | | | | 1.86% | |
| | | | |
Net investment income (loss) | | | (0.04)% | 7 | | | 2.77% | | | | 1.34% | | | | 0.46% | | | | 1.90% | | | | 0.87% | |
| | | | |
| | | | | | | | | | | | | | | | | | | | | | | | |
| Supplemental Data | | | | | | | | | | | | | | | | | | | | | | | | |
Net assets, end of period (000) | | $ | 1,083 | | | $ | 1,471 | | | $ | 1,564 | | | $ | 1,405 | | | $ | 2,275 | | | $ | 2,083 | |
| | | | |
Portfolio turnover rate | | | 55% | | | | 129% | | | | 115% | | | | 162% | | | | 148% | | | | 161% | |
| | | | |
| | 1 | | Based on average shares outstanding. |
| | 2 | | Distributions for annual periods determined in accordance with federal income tax regulations. |
| | 3 | | Amount is less than $0.005 per share. |
| | 4 | | Where applicable, assumes the reinvestment of distributions. |
| | 5 | | Aggregate total return. |
| | 6 | | Total return calculation includes redemption fees received by the Fund. The impact to the return is less than 0.005%. |
| | | | | | |
| See Notes to Financial Statements. | | | | |
| | | | | | | |
| | SEMI-ANNUAL REPORT | | DECEMBER 31, 2014 | | 25 |
| | |
| Financial Highlights | | BlackRock Global SmallCap Fund, Inc. |
| | | | | | | | | | | | | | | | | | | | | | | | |
| | | Institutional | |
| | | Six Months Ended
December 31, 2014
(Unaudited) | | | Year Ended June 30, | |
| | | | 2014 | | | 2013 | | | 2012 | | | 2011 | | | 2010 | |
| | | | | | | | | | | | | | | | | | | | | | | | |
| Per Share Operating Performance | | | | | | | | | | | | | | | | | | | | | | | | |
Net asset value, beginning of period | | $ | 30.82 | | | $ | 25.94 | | | $ | 21.87 | | | $ | 24.41 | | | $ | 18.32 | | | $ | 16.17 | |
| | | | |
Net investment income1 | | | 0.01 | | | | 0.09 | | | | 0.18 | | | | 0.07 | | | | 0.13 | | | | 0.06 | |
Net realized and unrealized gain (loss) | | | (2.32 | ) | | | 8.09 | | | | 4.58 | | | | (2.31 | ) | | | 6.13 | 2 | | | 2.09 | 2 |
| | | | |
Net increase (decrease) from investment operations | | | (2.31 | ) | | | 8.18 | | | | 4.76 | | | | (2.24 | ) | | | 6.26 | | | | 2.15 | |
| | | | |
| Distributions from:3 | | | | | | | | | | | | | | | | | | | | | | | | |
Net investment income | | | (0.11 | ) | | | (0.24 | ) | | | (0.69 | ) | | | (0.30 | ) | | | (0.17 | ) | | | — | |
Net realized gain | | | (3.84 | ) | | | (3.06 | ) | | | — | | | | — | | | | — | | | | — | |
| | | | |
Total distributions | | | (3.95 | ) | | | (3.30 | ) | | | (0.69 | ) | | | (0.30 | ) | | | (0.17 | ) | | | — | |
| | | | |
Net asset value, end of period | | $ | 24.56 | | | $ | 30.82 | | | $ | 25.94 | | | $ | 21.87 | | | $ | 24.41 | | | $ | 18.32 | |
| | | | |
| | | | | | | | | | | | | | | | | | | | | | | | |
| Total Return4 | | | | | | | | | | | | | | | | | | | | | | | | |
Based on net asset value | | | (7.07)% | 5 | | | 33.28% | | | | 22.20% | | | | (9.11)% | | | | 34.25% | 6 | | | 13.30% | 6 |
| | | | |
| | | | | | | | | | | | | | | | | | | | | | | | |
| Ratios to Average Net Assets | | | | | | | | | | | | | | | | | | | | | | | | |
Total expenses | | | 1.04% | 7 | | | 1.03% | | | | 1.02% | | | | 1.12% | | | | 1.08% | | | | 1.12% | |
| | | | |
Total expenses after fees waived | | | 1.03% | 7 | | | 1.03% | | | | 1.02% | | | | 1.12% | | | | 1.08% | | | | 1.12% | |
| | | | |
Net investment income | | | 0.09% | 7 | | | 0.31% | | | | 0.76% | | | | 0.30% | | | | 0.58% | | | | 0.31% | |
| | | | |
| | | | | | | | | | | | | | | | | | | | | | | | |
| Supplemental Data | | | | | | | | | | | | | | | | | | | | | | | | |
Net assets, end of period (000) | | $ | 281,226 | | | $ | 320,705 | | | $ | 244,523 | | | $ | 186,022 | | | $ | 461,012 | | | $ | 326,440 | |
| | | | |
Portfolio turnover rate | | | 36% | | | | 77% | | | | 73% | | | | 73% | | | | 82% | | | | 73% | |
| | | | |
| | 1 | | Based on average shares outstanding. |
| | 2 | | Includes a redemption fee, which is less than $0.005 per share. |
| | 3 | | Distributions for annual periods determined in accordance with federal income tax regulations. |
| | 4 | | Where applicable, assumes the reinvestment of distributions. |
| | 5 | | Aggregate total return. |
| | 6 | | Total return calculation includes redemption fees received by the Fund. The impact to the return is less than 0.005%. |
| | | | | | |
| See Notes to Financial Statements. | | | | |
| | | | | | | |
| 26 | | SEMI-ANNUAL REPORT | | DECEMBER 31, 2014 | | |
| | |
| Financial Highlights (continued) | | BlackRock Global SmallCap Fund, Inc. |
| | | | | | | | | | | | | | | | | | | | | | | | |
| | | Investor A | |
| | | Six Months Ended
December 31, 2014
(Unaudited) | | | Year Ended June 30, | |
| | | | 2014 | | | 2013 | | | 2012 | | | 2011 | | | 2010 | |
| | | | | | | | | | | | | | | | | | | | | | | | |
| Per Share Operating Performance | | | | | | | | | | | | | | | | | | | | | | | | |
Net asset value, beginning of period | | $ | 29.95 | | | $ | 25.33 | | | $ | 21.40 | | | $ | 23.91 | | | $ | 17.95 | | | $ | 15.89 | |
| | | | |
Net investment income (loss)1 | | | (0.03 | ) | | | — | | | | 0.08 | | | | 0.02 | | | | 0.06 | | | | (0.00 | )2 |
Net realized and unrealized gain (loss) | | | (2.26 | ) | | | 7.87 | | | | 4.49 | | | | (2.29 | ) | | | 6.01 | 3 | | | 2.06 | 3 |
| | | | |
Net increase (decrease) from investment operations | | | (2.29 | ) | | | 7.87 | | | | 4.57 | | | | (2.27 | ) | | | 6.07 | | | | 2.06 | |
| | | | |
| Distributions from:4 | | | | | | | | | | | | | | | | | | | | | | | | |
Net investment income | | | (0.06 | ) | | | (0.19 | ) | | | (0.64 | ) | | | (0.24 | ) | | | (0.11 | ) | | | — | |
Net realized gain | | | (3.84 | ) | | | (3.06 | ) | | | — | | | | — | | | | — | | | | — | |
| | | | |
Total distributions | | | (3.90 | ) | | | (3.25 | ) | | | (0.64 | ) | | | (0.24 | ) | | | (0.11 | ) | | | — | |
| | | | |
Net asset value, end of period | | $ | 23.76 | | | $ | 29.95 | | | $ | 25.33 | | | $ | 21.40 | | | $ | 23.91 | | | $ | 17.95 | |
| | | | |
| | | | | | | | | | | | | | | | | | | | | | | | |
| Total Return5 | | | | | | | | | | | | | | | | | | | | | | | | |
Based on net asset value | | | (7.20)% | 6 | | | 32.81% | | | | 21.78% | | | | (9.44)% | | | | 33.88% | 7 | | | 12.96% | 7 |
| | | | |
| | | | | | | | | | | | | | | | | | | | | | | | |
| Ratios to Average Net Assets | | | | | | | | | | | | | | | | | | | | | | | | |
Total expenses | | | 1.36% | 8 | | | 1.37% | | | | 1.40% | | | | 1.42% | | | | 1.38% | | | | 1.42% | |
| | | | |
Total expenses after fees waived | | | 1.36% | 8 | | | 1.37% | | | | 1.40% | | | | 1.42% | | | | 1.38% | | | | 1.42% | |
| | | | |
Net investment income (loss) | | | (0.24)% | 8 | | | (0.01)% | | | | 0.35% | | | | 0.08% | | | | 0.27% | | | | (0.01)% | |
| | | | |
| | | | | | | | | | | | | | | | | | | | | | | | |
| Supplemental Data | | | | | | | | | | | | | | | | | | | | | | | | |
Net assets, end of period (000) | | $ | 462,421 | | | $ | 520,436 | | | $ | 364,036 | | | $ | 326,001 | | | $ | 360,144 | | | $ | 264,526 | |
| | | | |
Portfolio turnover rate | | | 36% | | | | 77% | | | | 73% | | | | 73% | | | | 82% | | | | 73% | |
| | | | |
| | 1 | | Based on average shares outstanding. |
| | 2 | | Amount is less than $(0.005). |
| | 3 | | Includes a redemption fee, which is less than $0.005 per share. |
| | 4 | | Distributions for annual periods determined in accordance with federal income tax regulations. |
| | 5 | | Where applicable, excludes the effects of any sales charges and assumes the reinvestment of distributions. |
| | 6 | | Aggregate total return. |
| | 7 | | Total return calculation includes redemption fees received by the Fund. The impact to the return is less than 0.005%. |
| | | | | | |
| See Notes to Financial Statements. | | | | |
| | | | | | | |
| | SEMI-ANNUAL REPORT | | DECEMBER 31, 2014 | | 27 |
| | |
| Financial Highlights (continued) | | BlackRock Global SmallCap Fund, Inc. |
| | | | | | | | | | | | | | | | | | | | | | | | |
| | | Investor B | |
| | | Six Months Ended
December 31, 2014
(Unaudited) | | | Year Ended June 30, | |
| | | | 2014 | | | 2013 | | | 2012 | | | 2011 | | | 2010 | |
| | | | | | | | | | | | | | | | | | | | | | | | |
| Per Share Operating Performance | | | | | | | | | | | | | | | | | | | | | | | | |
Net asset value, beginning of period | | $ | 28.19 | | | $ | 24.05 | | | $ | 20.15 | | | $ | 22.45 | | | $ | 16.93 | | | $ | 15.12 | |
| | | | |
Net investment loss1 | | | (0.16 | ) | | | (0.25 | ) | | | (0.16 | ) | | | (0.19 | ) | | | (0.14 | ) | | | (0.17 | ) |
Net realized and unrealized gain (loss) | | | (2.13 | ) | | | 7.48 | | | | 4.27 | | | | (2.11 | ) | | | 5.66 | 2 | | | 1.98 | 2 |
| | | | |
Net increase (decrease) from investment operations | | | (2.29 | ) | | | 7.23 | | | | 4.11 | | | | (2.30 | ) | | | 5.52 | | | | 1.81 | |
| | | | |
| Distributions from:3 | | | | | | | | | | | | | | | | | | | | | | | | |
Net investment income | | | — | | | | (0.03 | ) | | | (0.21 | ) | | | — | | | | — | | | | — | |
Net realized gain | | | (3.74 | ) | | | (3.06 | ) | | | — | | | | — | | | | — | | | | — | |
| | | | |
Total distributions | | | (3.74 | ) | | | (3.09 | ) | | | (0.21 | ) | | | — | | | | — | | | | — | |
| | | | |
Net asset value, end of period | | $ | 22.16 | | | $ | 28.19 | | | $ | 24.05 | | | $ | 20.15 | | | $ | 22.45 | | | $ | 16.93 | |
| | | | |
| | | | | | | | | | | | | | | | | | | | | | | | |
| Total Return4 | | | | | | | | | | | | | | | | | | | | | | | | |
Based on net asset value | | | (7.66)% | 5 | | | 31.74% | | | | 20.55% | | | | (10.25)% | | | | 32.60% | 6 | | | 11.97% | 6 |
| | | | |
| | | | | | | | | | | | | | | | | | | | | | | | |
| Ratios to Average Net Assets | | | | | | | | | | | | | | | | | | | | | | | | |
Total expenses | | | 2.30% | 7 | | | 2.22% | | | | 2.43% | | | | 2.39% | | | | 2.29% | | | | 2.33% | |
| | | | |
Total expenses after fees waived | | | 2.30% | 7 | | | 2.22% | | | | 2.43% | | | | 2.39% | | | | 2.29% | | | | 2.33% | |
| | | | |
Net investment (loss) | | | (1.18)% | 7 | | | (0.94)% | | | | (0.74)% | | | | (0.92)% | | | | (0.67)% | | | | (0.96)% | |
| | | | |
| | | | | | | | | | | | | | | | | | | | | | | | |
| Supplemental Data | | | | | | | | | | | | | | | | | | | | | | | | |
Net assets, end of period (000) | | $ | 3,137 | | | $ | 4,467 | | | $ | 7,355 | | | $ | 11,968 | | | $ | 25,054 | | | $ | 28,247 | |
| | | | |
Portfolio turnover rate | | | 36% | | | | 77% | | | | 73% | | | | 73% | | | | 82% | | | | 73% | |
| | | | |
| | 1 | | Based on average shares outstanding. |
| | 2 | | Includes a redemption fee, which is less than $0.005 per share. |
| | 3 | | Distributions for annual periods determined in accordance with federal income tax regulations. |
| | 4 | | Where applicable, excludes the effects of any sales charges and assumes the reinvestment of distributions. |
| | 5 | | Aggregate total return. |
| | 6 | | Total return calculation includes redemption fees received by the Fund. The impact to the return is less than 0.005%. |
| | | | | | |
| See Notes to Financial Statements. | | | | |
| | | | | | | |
| 28 | | SEMI-ANNUAL REPORT | | DECEMBER 31, 2014 | | |
| | |
| Financial Highlights (continued) | | BlackRock Global SmallCap Fund, Inc. |
| | | | | | | | | | | | | | | | | | | | | | | | |
| | | Investor C | |
| | | Six Months Ended
December 31, 2014
(Unaudited) | | | Year Ended June 30, | |
| | | | 2014 | | | 2013 | | | 2012 | | | 2011 | | | 2010 | |
| | | | | | | | | | | | | | | | | | | | | | | | |
| Per Share Operating Performance | | | | | | | | | | | | | | | | | | | | | | | | |
Net asset value, beginning of period | | $ | 26.92 | | | $ | 23.13 | | | $ | 19.57 | | | $ | 21.83 | | | $ | 16.45 | | | $ | 14.68 | |
| | | | |
Net investment loss1 | | | (0.13 | ) | | | (0.21 | ) | | | (0.10 | ) | | | (0.15 | ) | | | (0.11 | ) | | | (0.15 | ) |
Net realized and unrealized gain (loss) | | | (2.05 | ) | | | 7.15 | | | | 4.11 | | | | (2.08 | ) | | | 5.49 | 2 | | | 1.92 | 2 |
| | | | |
Net increase (decrease) from investment operations | | | (2.18 | ) | | | 6.94 | | | | 4.01 | | | | (2.23 | ) | | | 5.38 | | | | 1.77 | |
| | | | |
| Distributions from:3 | | | | | | | | | | | | | | | | | | | | | | | | |
Net investment income | | | — | | | | (0.09 | ) | | | (0.45 | ) | | | (0.03 | ) | | | — | | | | — | |
Net realized gain | | | (3.80 | ) | | | (3.06 | ) | | | — | | | | — | | | | — | | | | — | |
| | | | |
Total distributions | | | (3.80 | ) | | | (3.15 | ) | | | (0.45 | ) | | | (0.03 | ) | | | — | | | | — | |
| | | | |
Net asset value, end of period | | $ | 20.94 | | | $ | 26.92 | | | $ | 23.13 | | | $ | 19.57 | | | $ | 21.83 | | | $ | 16.45 | |
| | | | |
| | | | | | | | | | | | | | | | | | | | | | | | |
| Total Return4 | | | | | | | | | | | | | | | | | | | | | | | | |
Based on net asset value | | | (7.59)% | 5 | | | 31.79% | | | | 20.80% | | | | (10.19)% | | | | 32.71% | 6 | | | 12.06% | 6 |
| | | | |
| | | | | | | | | | | | | | | | | | | | | | | | |
| Ratios to Average Net Assets | | | | | | | | | | | | | | | | | | | | | | | | |
Total expenses | | | 2.16% | 7 | | | 2.16% | | | | 2.21% | | | | 2.27% | | | | 2.21% | | | | 2.27% | |
| | | | |
Total expenses after fees waived | | | 2.16% | 7 | | | 2.16% | | | | 2.21% | | | | 2.27% | | | | 2.21% | | | | 2.27% | |
| | | | |
Net investment (loss) | | | (1.04)% | 7 | | | (0.82)% | | | | (0.45)% | | | | (0.78)% | | | | (0.57)% | | | | (0.86)% | |
| | | | |
| | | | | | | | | | | | | | | | | | | | | | | | |
| Supplemental Data | | | | | | | | | | | | | | | | | | | | | | | | |
Net assets, end of period (000) | | $ | 312,699 | | | $ | 348,937 | | | $ | 273,018 | | | $ | 251,459 | | | $ | 345,372 | | | $ | 293,633 | |
| | | | |
Portfolio turnover rate | | | 36% | | | | 77% | | | | 73% | | | | 73% | | | | 82% | | | | 73% | |
| | | | |
| | 1 | | Based on average shares outstanding. |
| | 2 | | Includes a redemption fee, which is less than $0.005 per share. |
| | 3 | | Distributions for annual periods determined in accordance with federal income tax regulations. |
| | 4 | | Where applicable, excludes the effects of any sales charges and assumes the reinvestment of distributions. |
| | 5 | | Aggregate total return. |
| | 6 | | Total return calculation includes redemption fees received by the Fund. The impact to the return is less than 0.005%. |
| | | | | | |
| See Notes to Financial Statements. | | | | |
| | | | | | | |
| | SEMI-ANNUAL REPORT | | DECEMBER 31, 2014 | | 29 |
| | |
| Financial Highlights (concluded) | | BlackRock Global SmallCap Fund, Inc. |
| | | | | | | | | | | | | | | | | | | | | | | | |
| | | Class R | |
| | | Six Months Ended
December 31, 2014
(Unaudited) | | | Year Ended June 30, | |
| | | | 2014 | | | 2013 | | | 2012 | | | 2011 | | | 2010 | |
| | | | | | | | | | | | | | | | | | | | | | | | |
| Per Share Operating Performance | | | | | | | | | | | | | | | | | | | | | | | | |
Net asset value, beginning of period | | $ | 28.30 | | | $ | 24.13 | | | $ | 20.38 | | | $ | 22.72 | | | $ | 17.09 | | | $ | 15.18 | |
| | | | |
Net investment loss1 | | | (0.08 | ) | | | (0.10 | ) | | | (0.01 | ) | | | (0.08 | ) | | | (0.03 | ) | | | (0.08 | ) |
Net realized and unrealized gain (loss) | | | (2.14 | ) | | | 7.47 | | | | 4.28 | | | | (2.14 | ) | | | 5.71 | 2 | | | 1.99 | 2 |
| | | | |
Net increase (decrease) from investment operations | | | (2.22 | ) | | | 7.37 | | | | 4.27 | | | | (2.22 | ) | | | 5.68 | | | | 1.91 | |
| | | | |
| Distributions from:3 | | | | | | | | | | | | | | | | | | | | | | | | |
Net investment income | | | (0.00 | )4 | | | (0.14 | ) | | | (0.52 | ) | | | (0.12 | ) | | | (0.05 | ) | | | — | |
Net realized gain | | | (3.84 | ) | | | (3.06 | ) | | | — | | | | — | | | | — | | | | — | |
| | | | |
Total distributions | | | (3.84 | ) | | | (3.20 | ) | | | (0.52 | ) | | | (0.12 | ) | | | (0.05 | ) | | | — | |
| | | | |
Net asset value, end of period | | $ | 22.24 | | | $ | 28.30 | | | $ | 24.13 | | | $ | 20.38 | | | $ | 22.72 | | | $ | 17.09 | |
| | | | |
| | | | | | | | | | | | | | | | | | | | | | | | |
| Total Return5 | | | | | | | | | | | | | | | | | | | | | | | | |
Based on net asset value | | | (7.37)% | 6 | | | 32.32% | | | | 21.28% | | | | (9.76)% | | | | 33.24% | 7 | | | 12.58% | 7 |
| | | | |
| | | | | | | | | | | | | | | | | | | | | | | | |
| Ratios to Average Net Assets | | | | | | | | | | | | | | | | | | | | | | | | |
Total expenses | | | 1.73% | 8 | | | 1.72% | | | | 1.79% | | | | 1.83% | | | | 1.81% | | | | 1.84% | |
| | | | |
Total expenses after fees waived | | | 1.73% | 8 | | | 1.72% | | | | 1.79% | | | | 1.83% | | | | 1.81% | | | | 1.84% | |
| | | | |
Net investment (loss) | | | (0.61)% | 8 | | | (0.38)% | | | | (0.04)% | | | | (0.37)% | | | | (0.16)% | | | | (0.42)% | |
| | | | |
| | | | | | | | | | | | | | | | | | | | | | | | |
| Supplemental Data | | | | | | | | | | | | | | | | | | | | | | | | |
Net assets, end of period (000) | | $ | 27,038 | | | $ | 33,944 | | | $ | 29,112 | | | $ | 28,861 | | | $ | 46,316 | | | $ | 38,378 | |
| | | | |
Portfolio turnover rate | | | 36% | | | | 77% | | | | 73% | | | | 73% | | | | 82% | | | | 73% | |
| | | | |
| | 1 | | Based on average shares outstanding. |
| | 2 | | Includes a redemption fee, which is less than $0.005 per share. |
| | 3 | | Distributions for annual periods determined in accordance with federal income tax regulations. |
| | 4 | | Amount is greater than $(0.005) per share. |
| | 5 | | Where applicable, assumes the reinvestment of distributions. |
| | 6 | | Aggregate total return. |
| | 7 | | Total return calculation includes redemption fees received by the Fund. The impact to the return is less than 0.005%. |
| | | | | | |
| See Notes to Financial Statements. | | | | |
| | | | | | | |
| 30 | | SEMI-ANNUAL REPORT | | DECEMBER 31, 2014 | | |
| | | | |
| Notes to Financial Statements (Unaudited) | | |
1. Organization:
BlackRock EuroFund and BlackRock Global SmallCap Fund, Inc. are each registered under the Investment Company Act of 1940, as amended (the “1940 Act”), as open-end management investment companies. BlackRock EuroFund is organized as a Massachusetts business trust. BlackRock Global SmallCap Fund, Inc. is organized as a Maryland corporation. The following are referred to herein collectively as the “Funds” or individually, a “Fund”:
| | | | |
| Fund Name | | Herein referred to as | | Diversification
Classification |
| BlackRock EuroFund | | EuroFund | | Diversified |
| BlackRock Global SmallCap Fund, Inc. | | Global SmallCap | | Diversified |
Each Fund offers multiple classes of shares. Information in this book pertains to the Institutional, Investor A, Investor B, Investor C and Class R Shares. All classes of shares have identical voting, dividend, liquidation and other rights and are subject to the same terms and conditions, except that certain classes bear expenses related to shareholder servicing, expenses related to the distribution, and may be subject to a CDSC of such shares. Institutional Shares are sold only to certain eligible investors. Investor B Shares (available only in Global SmallCap) are only available through exchanges and distribution reinvestments by current holders and for purchase by certain employer-sponsored retirement plans. Investor A and Investor C Shares are generally available through financial intermediaries. Each class has exclusive voting rights with respect to matters relating to its shareholder servicing and distribution expenditures (except that Investor B shareholders may vote on material changes to the Investor A distribution and service plan).
| | | | | | |
| Share Name | | Initial Sales Charge | | CDSC | | Conversion |
Institutional Shares | | No | | No | | None |
Investor A Shares | | Yes | | Yes | | None |
Investor B Shares | | No | | Yes | | To Investor A Shares after approximately 8 years |
Investor C Shares | | No | | Yes | | None |
Class R Shares | | No | | No | | None |
The Funds, together with certain other registered investment companies advised by BlackRock Advisors, LLC (the “Manager”) or its affiliates, are included in a complex of open-end funds referred to as the Equity-Bond Complex.
2. Significant Accounting Policies:
The Funds’ financial statements are prepared in conformity with accounting principles generally accepted in the United States of America (“U.S. GAAP”), which may require management to make estimates and assumptions that affect the reported amounts of assets and liabilities in the financial statements and the reported amounts of increases and decreases in net assets from operations during the reporting period. Actual results could differ from those estimates. Each Fund is considered an investment company under U.S. GAAP and follows the accounting and reporting guidance applicable to investment companies. The following is a summary of significant accounting policies followed by the Funds:
Valuation: The Funds’ investments are valued at fair value as of the close of trading on the New York Stock Exchange (“NYSE”) (generally 4:00 p.m., Eastern time). U.S. GAAP defines fair value as the price the Funds would receive to sell an asset or pay to transfer a liability in an orderly transaction between market participants at the measurement date. The Funds determine the fair values of their financial instruments at market value using independent dealers or pricing services under policies approved by the Board of Directors of each Fund (the “Board”). The BlackRock Global Valuation Methodologies Committee (the “Global Valuation Committee”) is the committee formed by management to develop global pricing policies and procedures and to provide oversight of the pricing function for the Funds for all financial instruments.
Equity investments traded on a recognized securities exchange are valued at the official close each day, if available. For equity investments traded on more than one exchange, the official close price on the exchange where the stock is primarily traded is used. Equity investments traded on a recognized exchange for which there were no sales on that day may be valued at the last available bid (long positions) or ask (short positions) price. Financial futures contracts traded on exchanges are valued at their last sale price.
The Funds value their investments in BlackRock Liquidity Series, LLC Money Market Series (the “Money Market Series”) at fair value, which is ordinarily based upon their pro rata ownership in the underlying fund’s net assets. The Money Market Series seeks current income consistent with maintaining liquidity and preserving capital. Although the Money Market Series is not registered under the 1940 Act, its investments will follow the parameters of investments by a money market fund that is subject to Rule 2a-7 under the 1940 Act. The Funds may withdraw up to 25% of their investment daily, although the manager of the Money Market Series, in its sole discretion, may permit an investor to withdraw more than 25% on any one day.
| | | | | | |
| | | | | | | |
| | SEMI-ANNUAL REPORT | | DECEMBER 31, 2014 | | 31 |
| | |
| Notes to Financial Statements (continued) | | |
Securities and other assets and liabilities denominated in foreign currencies are translated into U.S. dollars using exchange rates determined as of the close of business on the NYSE. Forward foreign currency exchange contracts are valued at the mean between the bid and ask prices and are determined as of the close of business on the NYSE. Interpolated values are derived when the settlement date of the contract is an interim date for which quotations are not available.
In the event that the application of these methods of valuation results in a price for an investment that is deemed not to be representative of the market value of such investment, or if a price is not available, the investment will be valued by the Global Valuation Committee, or its delegate, in accordance with a policy approved by the Board as reflecting fair value (“Fair Value Investments”). When determining the price for Fair Value Investments, the Global Valuation Committee, or its delegate, seeks to determine the price that each Fund might reasonably expect to receive or pay from the current sale or purchase of that asset or liability in an arm’s-length transaction. Fair value determinations shall be based upon all available factors that the Global Valuation Committee, or its delegate, deems relevant consistent with the principles of fair value measurement. The pricing of all Fair Value Investments is subsequently reported to the Board or a committee thereof on a quarterly basis.
Generally, trading in foreign instruments is substantially completed each day at various times prior to the close of business on the NYSE. Occasionally, events affecting the values of such instruments may occur between the foreign market close and the close of business on the NYSE that may not be reflected in the computation of each Fund’s net assets. If events (e.g., a company announcement, market volatility or a natural disaster) occur during such periods that are expected to materially affect the value of such instruments, those instruments may be Fair Value Investments and be valued at their fair value, as determined in good faith by the Global Valuation Committee, or its delegate, using a pricing service and/or policies approved by the Board. Each business day, the Funds use a pricing service to assist with the valuation of certain foreign exchange-traded equity securities and foreign exchange-traded and over-the-counter (“OTC”) options (the “Systematic Fair Value Price”). Using current market factors, the Systematic Fair Value Price is designed to value such foreign securities and foreign options at fair value as of the close of business on the NYSE, which follows the close of the local markets.
Foreign Currency: The Funds’ books and records are maintained in U.S. dollars. Purchases and sales of investment securities are recorded at the rates of exchange prevailing on the respective date of such transactions. Generally, when the U.S. dollar rises in value against a foreign currency, the Funds’ investments denominated in that currency will lose value because that currency is worth fewer U.S. dollars; the opposite effect occurs if the U.S. dollar falls in relative value.
The Funds do not isolate the portion of the results of operations arising as a result of changes in the foreign exchange rates from the changes in the market prices of investments held or sold for financial reporting purposes. Accordingly, the effects of changes in foreign currency exchange rates on investments are not segregated in the Statement of Operations from the effects of changes in market prices of those investments but are included as a component of net realized and unrealized gain (loss) from investments. The Funds report realized currency gains (losses) on foreign currency related transactions as components of net realized gain (loss) for financial reporting purposes, whereas such components are generally treated as ordinary income for federal income tax purposes.
Segregation and Collateralization: In cases where the Funds enter into certain investments (e.g., financial futures contract and forward foreign currency exchange contracts) that would be “senior securities” for 1940 Act purposes, the Funds may segregate or designate on their books and records cash or liquid securities having a market value at least equal to the amount of the Funds’ future obligations under such investments. Doing so allows the investment to be excluded from treatment as a “senior security.” Furthermore, if required by an exchange or counterparty agreement, the Funds may be required to deliver/deposit cash and/or securities to/with an exchange, or broker-dealer or custodian as collateral for certain investments or obligations.
Investment Transactions and Investment Income: For financial reporting purposes, investment transactions are recorded on the dates the transactions are entered into (the trade dates). Realized gains and losses on investment transactions are determined on the identified cost basis. Dividend income is recorded on the ex-dividend date. Dividends from foreign securities where the ex-dividend date may have passed are subsequently recorded when the Funds are informed of the ex-dividend date. Under the applicable foreign tax laws, a withholding tax at various rates may be imposed on capital gains, dividends and interest. Upon notification from issuers, some of the dividend income received from a real estate investment trust may be redesignated as a reduction of cost of the related investment and/or realized gain. Interest income, including amortization and accretion of premiums and discounts on debt securities, is recognized on the accrual basis. Income, expenses and realized and unrealized gains and losses are allocated daily to each class based on its relative net assets.
| | | | | | |
| | | | | | | |
| 32 | | SEMI-ANNUAL REPORT | | DECEMBER 31, 2014 | | |
| | | | |
| Notes to Financial Statements (continued) | | |
Distributions: Distributions paid by the Funds are recorded on the ex-dividend date. The character and timing of distributions are determined in accordance with federal income tax regulations, which may differ from U.S. GAAP.
Recent Accounting Standard: In June 2014, the Financial Accounting Standards Board issued guidance to improve the financial reporting of reverse repurchase agreements and other similar transactions. The guidance will require expanded disclosure for entities that enter into reverse repurchase agreements and similar transactions accounted for as secured borrowings. It is effective for financial statements with fiscal years beginning on or after December 15, 2014 and interim periods within those fiscal years. Management is evaluating the impact, if any, of this guidance on the Funds’ financial statement disclosures.
Other: Expenses directly related to a Fund or its classes are charged to that Fund or the applicable class. Other operating expenses shared by several funds are prorated among those funds on the basis of relative net assets or other appropriate methods. Expenses directly related to the Funds and other shared expenses prorated to the Funds are allocated daily to each class based on its relative net assets or other appropriate methods.
The Funds have an arrangement with the custodian whereby fees may be reduced by credits earned on uninvested cash balances, which, if applicable, are shown as fees paid indirectly in the Statements of Operations. The custodian imposes fees on overdrawn cash balances, which can be offset by accumulated credits earned or may result in additional custody charges.
3. Securities and Other Investments:
Securities Lending: Each Fund may lend its securities to approved borrowers, such as brokers, dealers and other financial institutions. The borrower pledges and maintains with the Funds collateral consisting of cash, an irrevocable letter of credit issued by a bank, or securities issued or guaranteed by the U.S. government. The initial collateral received by each Fund is required to have a value of at least 102% of the current value of the loaned securities for securities traded on U.S. exchanges and a value of at least 105% for all other securities. The collateral is maintained thereafter, at a value equal to at least 100% of the current market value of the securities on loan. The market value of the loaned securities is determined at the close of each business day of the Fund and any additional required collateral is delivered to the Fund on the next business day. During the term of the loan, each Fund is entitled to all distributions made on or in respect of the loaned securities. Loans of securities are terminable at any time and the borrower, after notice, is required to return borrowed securities within the standard time period for settlement of securities transactions.
The market value of securities on loan and the value of the related collateral are shown separately in the Statements of Assets and Liabilities as a component of investments at value-unaffiliated, and collateral on securities loaned at value, respectively. As of December 31, 2014 any securities on loan were collateralized by cash. The cash collateral invested by the securities lending agent, BlackRock Investment Management, LLC (“BIM”), if any, is disclosed in the Schedules of Investments.
Securities lending transactions are entered into by the Funds under Master Securities Lending Agreements (each, an “MSLA”) which provide the right, in the event of default (including bankruptcy or insolvency), for the non-defaulting party to liquidate the collateral and calculate a net exposure to the defaulting party or request additional collateral. In the event that a borrower defaults, each Fund, as lender, would offset the market value of the collateral received against the market value of the securities loaned. When the value of the collateral is greater than that of the market value of the securities loaned, the lender is left with a net amount payable to the defaulting party. However, bankruptcy or insolvency laws of a particular jurisdiction may impose restrictions on or prohibitions against such a right of offset in the event of an MSLA counterparty’s bankruptcy or insolvency. Under the MSLA, the borrower can resell or re-pledge the loaned securities, and the Funds can reinvest cash collateral, or, upon an event of default, resell or re-pledge the collateral.
| | | | | | |
| | | | | | | |
| | SEMI-ANNUAL REPORT | | DECEMBER 31, 2014 | | 33 |
| | |
| Notes to Financial Statements (continued) | | |
As of December 31, 2014, the following table is a summary of Global SmallCap’s securities lending agreements by counterparty which are subject to offset under an MSLA:
| | | | | | | | | | | | | | | | |
| Counterparty | | Securities
Loaned at Value | | Cash Collateral
Received1 | | | Net Amount | |
Barclays Capital, Inc. | | | | $ | 226,001 | | | | | $ | (226,001 | ) | | | — | |
Citigroup Global Markets, Inc. | | | | | 3,373,728 | | | | | | (3,373,728 | ) | | | — | |
Credit Suisse Securities (USA) LLC | | | | | 1,477,798 | | | | | | (1,477,798 | ) | | | — | |
Deutsche Bank Securities, Inc. | | | | | 3,023,920 | | | | | | (3,023,920 | ) | | | — | |
Goldman Sachs & Co. | | | | | 6,300,351 | | | | | | (6,300,351 | ) | | | — | |
JP Morgan Clearing Corp | | | | | 10,687,678 | | | | | | (10,687,678 | ) | | | — | |
Merrill Lynch, Pierce, Fenner & Smith, Inc. | | | | | 7,251,170 | | | | | | (7,251,170 | ) | | | — | |
Morgan Stanley & Co. LLC | | | | | 17,304,905 | | | | | | (17,304,905 | ) | | | — | |
National Financial Services LLC | | | | | 1,274,685 | | | | | | (1,274,685 | ) | | | — | |
Nomura Securities International LLC | | | | | 56,582 | | | | | | (56,582 | ) | | | — | |
SG Americas Securities LLC | | | | | 2,205,483 | | | | | | (2,205,483 | ) | | | — | |
UBS Securities LLC | | | | | 4,759,176 | | | | | | (4,759,176 | ) | | | — | |
| | | | | | | | | | | | | | | | |
Total | | | | $ | 57,941,477 | | | | | $ | (57,941,477 | ) | | | — | |
| | | | | | | | | | | | | | | | |
| | 1 | | Collateral with a value of $61,749,908 has been received in connection with securities lending agreements. Collateral received in excess of the value of securities loaned from the individual counterparty is not shown for financial reporting purposes. |
The risks of securities lending include the risk that the borrower may not provide additional collateral when required or may not return the securities when due. To mitigate these risks, the Funds benefit from a borrower default indemnity provided by BIM. BIM’s indemnity allows for full replacement of the securities lent if the collateral received does not cover the value on the securities loaned in the event of borrower default. Each Fund could suffer a loss if the value of an investment purchased with cash collateral falls below the market value of loaned securities or if the value of an investment purchased with cash collateral falls below the value of the original cash collateral received.
4. Derivative Financial Instruments:
The Funds engage in various portfolio investment strategies using derivative contracts both to increase the returns of the Funds and/or to economically hedge their exposure to certain risks such as equity risk or foreign currency exchange rate risk. These contracts may be transacted on an exchange or OTC.
Financial Futures Contracts: The Funds purchase and/or sell financial futures contracts and options on financial futures contracts to gain exposure to, or economically hedge against, changes in the value of equity securities (equity risk). Financial futures contracts are agreements between the Funds and a counterparty to buy or sell a specific quantity of an underlying instrument at a specified price and at a specified date. Depending on the terms of the particular contract, financial futures contracts are settled either through physical delivery of the underlying instrument on the settlement date or by payment of a cash settlement amount on the settlement date.
Upon entering into a financial futures contract, the Funds are required to deposit initial margin with the broker in the form of cash or securities in an amount that varies depending on a contract’s size and risk profile. The initial margin deposit must then be maintained at an established level over the life of the contract. Securities deposited as initial margin are designated on the Schedule of Investments and cash deposited, if any, is recorded on the Statements of Assets and Liabilities as cash pledged for financial futures contracts. Pursuant to the contract, the Funds agree to receive from or pay to the broker an amount of cash equal to the daily fluctuation in value of the contract. Such receipts or payments are known as variation margin. Variation margin is recorded by the Funds as unrealized appreciation or depreciation and, if applicable, as a receivable or payable for variation margin in the Statements of Assets and Liabilities.
When the contract is closed, the Funds record a realized gain or loss equal to the difference between the value of the contract at the time it was opened and the value at the time it was closed. The use of financial futures contracts involves the risk of an imperfect correlation in the movements in the price of financial futures contracts, interest or foreign currency exchange rates and the underlying assets.
Forward Foreign Currency Exchange Contracts: The Funds enter into forward foreign currency exchange contracts as an economic hedge against either specific transactions or portfolio instruments or to obtain exposure to, or hedge exposure away from, foreign currencies (foreign currency exchange rate risk). A forward foreign currency exchange contract is an agreement between two parties to buy and sell a currency at a set exchange rate on a future date. Forward foreign currency exchange contracts, when used by the Funds, help to manage the overall exposure to the currencies in which some of the investments held by the Funds are denominated. The contract is marked-to-market daily and the change in market value is recorded by
| | | | | | |
| | | | | | | |
| 34 | | SEMI-ANNUAL REPORT | | DECEMBER 31, 2014 | | |
| | | | |
| Notes to Financial Statements (continued) | | |
the Funds as an unrealized gain or loss. When the contract is closed, the Funds record a realized gain or loss equal to the difference between the value at the time it was opened and the value at the time it was closed. The use of forward foreign currency exchange contracts involves the risk that the value of a forward foreign currency exchange contract changes unfavorably due to movements in the value of the referenced foreign currencies.
The following is a summary of the Funds’ derivative financial instruments categorized by risk exposure:
| | | | | | |
| Fair Values of Derivative Financial Instruments as of December 31, 2014 | |
| | | | | Value | |
| | | | | Derivative Assets | |
| | | Statements of Assets and Liabilities Location | | EuroFund | |
Equity contracts | | Net unrealized appreciation1 | | $ | 155,156 | |
| | 1 | | Includes cumulative appreciation/depreciation on financial futures contracts, if any, as reported in the Schedule of Investments. Only current day’s variation margin is reported within the Statements of Assets and Liabilities. |
| | | | | | | | | | | | | | | | |
The Effect of Derivative Financial Instruments in the Statements of Operations
Six Months Ended December 31, 2014 | |
| | | Net Realized Gain (Loss) From | | | Net Change in Unrealized
Appreciation/Depreciation On | |
| | | EuroFund | | | Global
SmallCap | | | EuroFund | | | Global
SmallCap | |
| Foreign currency exchange contracts: | | | | | | | | | | | | | | | | |
Foreign currency transactions | | | — | | | $ | 5,081 | | | | — | | | | — | |
| Equity contracts: | | | | | | | | | | | | | | | | |
Financial futures contracts | | $ | (562,564 | ) | | | — | | | $ | 155,156 | | | | — | |
| | | | | | | | | | | | | | | | |
Total | | $ | (562,564 | ) | | $ | 5,081 | | | $ | 155,156 | | | | — | |
| | | | | | | | | | | | | | | | |
For the six months ended December 31, 2014, the average quarterly balances of outstanding derivative financial instruments were as follows:
| | | | | | | | |
| | | EuroFund | | | Global
SmallCap | |
| Financial futures contracts: | | | | | | | | |
Average notional value of contracts purchased | | $ | 3,127,647 | | | | — | |
| Forward foreign currency exchange contracts: | | | | | | | | |
Average USD amounts purchased | | | — | | | $ | 1,624,523 | 1 |
Average USD dollar amounts sold | | | — | | | | — | |
| | 1 | | Average amounts for the period are shown due to limited outstanding derivative financial instruments as of each quarter. |
Counterparty Credit Risk: A derivative contract may suffer a mark-to-market loss if the value of the contract decreases due to an unfavorable change in the market rates or values of the underlying instrument. Losses can also occur if the counterparty does not perform under the contract. A Fund’s risk of loss from counterparty credit risk on OTC derivatives is generally limited to the aggregate unrealized gain netted against any collateral held by such Fund.
With exchange-traded futures, there is less counterparty credit risk to the Funds since the exchange or clearinghouse, as counterparty to such instruments, guarantees against a possible default. The clearinghouse stands between the buyer and the seller of the contract; therefore, credit risk is limited to failure of the clearinghouse. While offset rights may exist under applicable law, the Funds do not have a contractual right of offset against a clearing broker or clearinghouse in the event of a default (including the bankruptcy or insolvency) of the clearing broker or clearinghouse. Additionally, credit risk exists in exchange-traded futures with respect to initial and variation margin that is held in a clearing broker’s customer accounts. While clearing brokers are required to segregate customer margin from their own assets, in the event that a clearing broker becomes insolvent or goes into bankruptcy and at that time there is a shortfall in the aggregate amount of margin held by the clearing broker for all its clients, typically the shortfall would be allocated on a pro rata basis across all the clearing broker’s customers, potentially resulting in losses to the Funds.
Collateral Requirements: For derivatives traded under an ISDA Master Agreement, the collateral requirements are typically calculated by netting the mark-to-market amount for each transaction under such agreement and comparing that amount to the value of any collateral currently pledged by the Funds and the counterparty.
Cash collateral that has been pledged to cover obligations of the Funds and cash collateral received from the counterparty, if any, is reported separately on the Statements of Assets and Liabilities as cash pledged as collateral and cash received as collateral, respectively. Non-cash collateral
| | | | | | |
| | | | | | | |
| | SEMI-ANNUAL REPORT | | DECEMBER 31, 2014 | | 35 |
| | |
| Notes to Financial Statements (continued) | | |
pledged by the Funds, if any, is noted in the Schedule of Investments. Generally, the amount of collateral due from or to a party has to exceed a minimum transfer amount threshold (typically either $250,000 or $500,000) before a transfer is required, which is determined at the close of business of the Funds. Any additional required collateral is delivered to/pledged by the Funds on the next business day. Typically, the Funds and counterparties are not permitted to sell, re-pledge or use the collateral they receive. To the extent amounts due to the Funds from their counterparties are not fully collateralized, contractually or otherwise, each Fund bears the risk of loss from counterparty non-performance. Likewise, to the extent a Fund has delivered collateral to a counterparty and stands ready to perform under the terms of its agreement with such counterparty, a Fund bears the risk of loss from a counterparty in the amount of the value of the collateral in the event the counterparty fails to return such collateral.
For financial reporting purposes, the Funds do not offset derivative assets and derivative liabilities that are subject to netting arrangements, if any, in the Statements of Assets and Liabilities.
5. Investment Advisory Agreement and Other Transactions with Affiliates:
The PNC Financial Services Group, Inc. is the largest stockholder and an affiliate, for 1940 Act purposes, of BlackRock, Inc. (“BlackRock”).
Each Fund entered into an Investment Advisory Agreement with the Manager, the Funds’ investment advisor, an indirect, wholly owned subsidiary of BlackRock, to provide investment advisory and administration services. The Manager is responsible for the management of each Fund’s portfolio and provides the necessary personnel, facilities, equipment and certain other services to the operations of each Fund. For such services, each Fund pays the Manager a monthly fee based on a percentage of each Fund’s average daily net assets at the following annual rates:
| | | | | | | | |
| | | Investment Advisory Fee | |
| Average Daily Net Assets | | EuroFund | | | Global SmallCap | |
First $1 Billion | | | 0.75% | | | | 0.85% | |
$1 — $3 Billion | | | 0.71% | | | | 0.80% | |
$3 — $5 Billion | | | 0.68% | | | | 0.77% | |
$5 to $10 Billion | | | 0.65% | | | | 0.74% | |
Greater than $10 Billion | | | 0.64% | | | | 0.72% | |
The Manager voluntarily agreed to waive its investment advisory fees by the amount of investment advisory fees each Fund pays to the Manager indirectly through its investment in affiliated money market funds. However, the Manager does not waive its investment advisory fees by the amount of investment advisory fees paid in connection with each Fund’s investment in other affiliated investment companies, if any. This amount is included in fees waived by Manager in the Statements of Operations.
The Manager, with respect to EuroFund, entered into a sub-advisory agreement with BlackRock International Limited LLC, (“BIL”), an affiliate of the Manager. The Manager pays BIL, for services it provides, a monthly fee that is a percentage of the investment advisory fees paid by the Fund to the Manager.
Prior to July 1, 2014, BIM served as a sub-adviser to each Fund and received for its services a monthly fee from the Manager at an annual rate equal to a percentage of the investment advisory fee paid to the Manager under the Investment Advisory Agreements.
For the six months ended December 31, 2014, the Funds reimbursed the Manager for certain accounting services, which is included in accounting services in the Statements of Operations. The reimbursements were as follows:
| | |
| EuroFund | | Global SmallCap |
| $2,024 | | $5,980 |
Each Fund entered into a Distribution Agreement and a Distribution and Service Plan with BlackRock Investments, LLC (“BRIL”), an affiliate of the Manager. Pursuant to the Distribution and Service Plan and in accordance with Rule 12b-1 under the 1940 Act, each Fund pays BRIL ongoing service and distribution fees. The fees are accrued daily and paid monthly at annual rates based upon the average daily net assets of the relevant share class of each Fund as follows:
| | | | | | | | | | | | | | | | |
| | | Investor A | | | Investor B1 | | | Investor C | | | Class R | |
Service Fee | | | 0.25% | | | | 0.25% | | | | 0.25% | | | | 0.25% | |
Distribution Fee | | | — | | | | 0.75% | | | | 0.75% | | | | 0.25% | |
| | | | | | |
| | | | | | | |
| 36 | | SEMI-ANNUAL REPORT | | DECEMBER 31, 2014 | | |
| | | | |
| Notes to Financial Statements (continued) | | |
Pursuant to sub-agreements with BRIL, broker-dealers and BRIL provide shareholder servicing and distribution services to each Fund. The ongoing service and/or distribution fee compensates BRIL and each broker-dealer for providing shareholder servicing and/or distribution related services to Investor A, Investor B, Investor C and Class R shareholders.
Pursuant to written agreements, certain financial intermediaries, some of which may be affiliates, provide the Funds with sub-accounting, recordkeeping, sub-transfer agency and other administrative services with respect to sub-accounts they service. For these services, these entities receive an annual fee per shareholder account, which will vary depending on share class and/or net assets. For the six months ended December 31, 2014, the Funds paid the following amounts to affiliates of BlackRock in return for these services, which are included in transfer agent — class specific in the Statements of Operations:
| | | | |
| | | Institutional | |
Global SmallCap | | $ | 1,243 | |
The Manager maintains a call center, which is responsible for providing certain shareholder services to the Funds, such as responding to shareholder inquiries and processing transactions based upon instructions from shareholders with respect to the subscription and redemption of Fund shares. For the six months ended December 31, 2014, the Funds reimbursed the Manager the following amounts for costs incurred in running the call center, which are included in transfer agent — class specific in the Statements of Operations:
| | | | | | | | | | | | | | | | |
| | | Institutional | | | Investor A | | | Investor B | | | Investor C | |
EuroFund | | $ | 1,852 | | | $ | 2,593 | | | | — | | | $ | 301 | |
Global SmallCap | | | — | | | | — | | | $ | 117 | | | $ | 2,593 | |
For the six months ended December 31, 2014, affiliates earned underwriting discounts, direct commissions and dealer concessions on sales of the Funds’ Investor A Shares as follows:
| | | | |
| | | Investor A | |
EuroFund | | $ | 1,349 | |
Global SmallCap | | $ | 56,138 | |
For the six months ended December 31, 2014, affiliates received CDSCs as follows:
| | | | | | | | | | | | |
| | | Investor A | | | Investor B | | | Investor C | |
EuroFund | | $ | 23,069 | | | | — | | | $ | 6,579 | |
Global SmallCap | | $ | 3,937 | | | $ | 292 | | | $ | 17,815 | |
The U.S. Securities and Exchange Commission has issued an exemptive order which permits BIM, an affiliate of the Manager, to serve as securities lending agent for the Funds subject to applicable conditions. As securities lending agent, BIM bears all operational costs directly related to securities lending. The Funds are responsible for expenses in connection with the investment of cash collateral received for securities on loan (the “collateral investment expenses”). The cash collateral is invested in a private investment company managed by the Manager or its affiliates. However, BIM has agreed to cap the collateral investment expenses of the private investment company to an annual rate of 0.04%. The investment advisor to the private investment company will not charge any advisory fees with respect to shares purchased by the Funds.
Securities lending income is equal to the total of income earned from the reinvestment of cash collateral, net of fees and other payments to and from borrowers of securities, and less the collateral investment expenses. Each Fund retains a portion of securities lending income and remits a remaining portion to BIM as compensation for its services as securities lending agent.
Pursuant to a securities lending agreement effective February 1, 2014: (A) for the period February 1, 2014 to June 1, 2014, Global SmallCap retains 70% of securities lending income, and this amount retained can never be less than 65% of the total of securities lending income plus the collateral investment expenses; and (B) commencing June 1, 2014, Global SmallCap retains 75% of securities lending income (commencing January 1, 2015, the amount Global SmallCap will retain is expected to change to 70% of securities lending income), and these amounts retained can never be less than 65% of the total of securities lending income plus the collateral investment expenses. Pursuant to a securities lending agreement effective February 1, 2014, EuroFund retains 75% of securities lending income (commencing January 1, 2015, the amount EuroFund will retain is expected to change to 70% of securities lending income), and these amounts retained can never be less than 65% of the total of securities lending income plus the collateral investment expenses.
| | | | | | |
| | | | | | | |
| | SEMI-ANNUAL REPORT | | DECEMBER 31, 2014 | | 37 |
| | |
| Notes to Financial Statements (continued) | | |
In addition, commencing the business day following the date that the aggregate securities lending income earned across the Equity-Bond Complex in a calendar year exceeds the aggregate securities lending income earned across the Equity-Bond Complex in the calendar year 2013 (the “Hurdle Date”), Global SmallCap, pursuant to the securities lending agreement, will retain for the remainder of that calendar year securities lending income as follows: (A) for the period February 1, 2014 to June 1, 2014, 75% of securities lending income, and this amount retained can never be less than 65% of the total of securities lending income plus the collateral investment expenses; and (B) commencing June 1, 2014, 80% of securities lending income (following any Hurdle Date after January 1, 2015, Global SmallCap will retain 75% of securities lending income), and these amounts retained can never be less than 65% of the total of securities lending income plus the collateral investment expenses.
In addition, commencing the business day following the Hurdle Date, EuroFund, pursuant to the securities lending agreement, will retain for the remainder of that calendar year securities lending income as follows: 80% of securities lending income (following any Hurdle Date after January 1, 2015, EuroFund will retain 75% of securities lending income), and these amounts retained can never be less than 65% of the total of securities lending income plus the collateral investment expenses.
Prior to February 1, 2014, each Fund retained 65% of securities lending income and paid a fee to BIM equal to 35% of such income. The share of securities lending income earned by each Fund is shown as securities lending – affiliated–net in the Statements of Operations. For the six months ended December 31, 2014, each Fund paid BIM the following amounts for securities lending agent services:
| | |
| EuroFund | | Global SmallCap |
| $137 | | $285,678 |
Certain officers and/or directors of the Funds are officers and/or directors of BlackRock or its affiliates. The Funds reimburse the Manager for a portion of the compensation paid to the Funds’ Chief Compliance Officer, which is included in officer and directors in the Statements of Operations.
The Funds may purchase securities from, or sell securities to, an affiliated fund provided the affiliation is solely due to having a common investment adviser, common officers, or common trustees. For the six months ended December 31, 2014, the purchase and sale transactions with an affiliated fund in compliance with Rule 17a-7 under the 1940 Act were as follows:
| | | | |
| | | Global Small Cap | |
Purchases | | $ | 5,197,339 | |
Sales | | $ | 193,323 | |
6. Purchases and Sales:
For the six months ended December 31, 2014, purchases and sales of investments, excluding short-term securities, were as follows:
| | | | | | | | |
| | | EuroFund | | | Global Small Cap | |
Purchases | | $ | 305,622,560 | | | $ | 409,698,455 | |
Sales | | $ | 237,123,763 | | | $ | 444,480,491 | |
7. Income Tax Information:
It is the Funds’ policy to comply with the requirements of the Internal Revenue Code of 1986, as amended, applicable to regulated investment companies and to distribute substantially all of their taxable income to their shareholders. Therefore, no federal income tax provision is required.
The Funds file U.S. federal and various state and local tax returns. No income tax returns are currently under examination. The statute of limitations on the Funds’ U.S. federal tax returns remains open for each of the four years ended June 30, 2014. The statutes of limitations on each Fund’s state and local tax returns may remain open for an additional year depending upon the jurisdiction.
Management has analyzed tax laws and regulations and their application to the Funds’ facts and circumstances and does not believe that there are any uncertain tax positions that require recognition of a tax liability.
As of June 30, 2014, EuroFund had capital loss carryforwards available to offset future realized capital gains through the indicated expiration dates as follows:
| | | | |
| Expires June 30, | | EuroFund | |
2017 | | $ | 3,846,553 | |
2018 | | | 85,950,061 | |
| | | | |
Total | | $ | 89,796,614 | |
| | | | |
| | | | | | |
| | | | | | | |
| 38 | | SEMI-ANNUAL REPORT | | DECEMBER 31, 2014 | | |
| | | | |
| Notes to Financial Statements (continued) | | |
As of December 31, 2014, gross unrealized appreciation and depreciation based on cost for federal income tax purposes were as follows:
| | | | | | | | |
| | | EuroFund | | | Global
SmallCap | |
Tax cost | | $ | 407,285,267 | | | $ | 1,041,632,925 | |
| | | | | | | | |
Gross unrealized appreciation | | $ | 31,378,238 | | | $ | 242,671,546 | |
Gross unrealized depreciation | | | (28,525,756 | ) | | | (128,324,064 | ) |
| | | | | | | | |
Net unrealized appreciation | | $ | 2,852,482 | | | $ | 114,347,482 | |
| | | | | | | | |
8. Bank Borrowings:
The Funds, along with certain other funds managed by the Manager and its affiliates (“Participating Funds”), were a party to a 364-day, $1.1 billion credit agreement with a group of lenders, under which the Funds may borrow to fund shareholder redemptions. Excluding commitments designated for a certain individual fund, the Participating Funds, including the Funds, could borrow up to an aggregate commitment amount of $650 million, subject to asset coverage and other limitations as specified in the agreement. Effective November 25, 2014, the credit agreement was amended to an aggregate commitment amount of $2.1 billion, of which the Participating Funds, including the Funds, can borrow up to $1.6 billion at any time outstanding, subject to asset coverage and other limitations as specified in the agreement. The agreement terminates on April 23, 2015, unless otherwise extended to November 24, 2015 or renewed for a period of 364 days from April 23, 2015. The amended agreement has the following terms: a fee of 0.06% per annum on unused commitment amounts and interest at a rate equal to the higher of (a) the one-month LIBOR (but in any event, not less than 0.00%) on the date the loan is made plus 0.80% per annum or (b) the Fed Funds rate (but in any event, not less than 0.00%) in effect from time to time plus 0.80% per annum on amounts borrowed. Participating Funds paid administration, legal and arrangement fees, which are included in miscellaneous expenses in the Statements of Operations, and along with commitment fees, were allocated among such funds based upon portions of the aggregate commitment available to them and relative net assets of Participating Funds. During the six months ended December 31, 2014, the Funds did not borrow under the credit agreement.
9. Principal Risks:
In the normal course of business, the Funds invest in securities and enter into transactions where risks exist due to fluctuations in the market (market risk) or failure of the issuer of a security to meet all its obligations (issuer credit risk). The value of securities held by the Funds may decline in response to certain events, including those directly involving the issuers whose securities are owned by the Funds; conditions affecting the general economy; overall market changes; local, regional or global political, social or economic instability; and currency and interest rate and price fluctuations. Similar to issuer credit risk, the Funds may be exposed to counterparty credit risk, or the risk that an entity with which the Funds have unsettled or open transactions may fail to or be unable to perform on its commitments. The Funds manage counterparty credit risk by entering into transactions only with counterparties that they believe have the financial resources to honor their obligations and by monitoring the financial stability of those counterparties. Financial assets, which potentially expose the Funds to market, issuer and counterparty credit risks, consist principally of financial instruments and receivables due from counterparties. The extent of the Funds’ exposure to market, issuer and counterparty credit risks with respect to these financial assets is generally approximated by their value recorded in the Statements of Assets and Liabilities, less any collateral held by the Funds.
The Funds invest a substantial amount of their assets in issuers located in a single country or a limited number of countries. When the Funds concentrate their investments in this manner, they assume the risk that economic, political and social conditions in those countries may have a significant impact on their investment performance. Foreign issuers may not be subject to the same uniform accounting, auditing and financial reporting standards and practices as used in the United States. Foreign securities markets may also be less liquid, more volatile, and less subject to governmental supervision not typically associated with investing in U.S. securities. Investment percentages in specific countries are presented in the Schedule of Investments.
Each Fund invests a significant portion of its assets in securities of issuers located in Europe or with significant exposure to European issuers or countries. The European financial markets have recently experienced volatility and adverse trends due to concerns about economic downturns in, or rising government debt levels of, several European countries. These events may spread to other countries in Europe and may affect the value and liquidity of certain of the Funds’ investments.
| | | | | | |
| | | | | | | |
| | SEMI-ANNUAL REPORT | | DECEMBER 31, 2014 | | 39 |
| | |
| Notes to Financial Statements (continued) | | |
As of December 31, 2014, the Funds had the following industry classifications:
| | | | | | | | |
| Industry | | EuroFund | | | Global SmallCap | |
Pharmaceuticals | | | 13 | % | | | 2 | % |
Oil, Gas & Consumable Fuels | | | 10 | | | | 4 | |
Commercial Banks | | | 10 | | | | 4 | |
Beverages | | | 9 | | | | 1 | |
Insurance | | | 8 | | | | 2 | |
Textiles, Apparel & Luxury Goods | | | 5 | | | | 3 | |
Health Care Equipment & Supplies | | | 1 | | | | 10 | |
Real Estate Investment Trusts (REITs) | | | — | | | | 7 | |
Metals & Mining | | | 4 | | | | 7 | |
Software | | | — | | | | 5 | |
Other1 | | | 40 | | | | 55 | |
| | 1 | | All other industries held were each less than 5% of long-term investments. |
10. Capital Share Transactions:
Transactions in capital shares for each class were as follows:
| | | | | | | | | | | | | | | | | | |
| | | Six Months Ended
December 31, 2014 | | | | | Year Ended
June 30, 2014 | |
| EuroFund | | Shares | | | Amount | | | | | Shares | | | Amount | |
| Institutional | | | | | | | | | | | | | | | | | | |
Shares sold | | | 7,375,703 | | | $ | 121,425,138 | | | | | | 7,510,419 | | | $ | 117,681,482 | |
Shares issued in reinvestment of distributions | | | 492,167 | | | | 7,052,700 | | | | | | 139,937 | | | | 2,194,211 | |
Shares redeemed | | | (1,901,046 | ) | | | (29,593,653 | ) | | | | | (2,907,740 | ) | | | (47,189,779 | ) |
| | | | | | | | | | |
Net increase | | | 5,966,824 | | | $ | 98,884,185 | | | | | | 4,742,616 | | | $ | 72,685,914 | |
| | | | | | | | | | |
| | | | | | | | | | | | | | | | | | |
| Investor A | | | | | | | | | | | | | | | | | | |
Shares sold and automatic conversion of shares | | | 267,473 | | | $ | 4,063,017 | | | | | | 2,356,325 | | | $ | 37,677,270 | |
Shares issued in reinvestment of distributions | | | 253,377 | | | | 3,569,808 | | | | | | 93,249 | | | | 1,436,035 | |
Shares redeemed | | | (1,915,461 | ) | | | (28,855,385 | ) | | | | | (1,692,385 | ) | | | (26,607,875 | ) |
| | | | | | | | | | |
Net increase (decrease) | | | (1,394,611 | ) | | $ | (21,222,560 | ) | | | | | 757,189 | | | $ | 12,505,430 | |
| | | | | | | | | | |
| | | | | | | | | | | | | | | | | | |
| Investor C | | | | | | | | | | | | | | | | | | |
Shares sold | | | 125,024 | | | $ | 1,339,259 | | | | | | 739,265 | | | $ | 8,386,524 | |
Shares issued in reinvestment of distributions | | | 40,855 | | | | 410,575 | | | | | | 12,749 | | | | 141,762 | |
Shares redeemed | | | (441,987 | ) | | | (4,740,431 | ) | | | | | (340,632 | ) | | | (3,843,239 | ) |
| | | | | | | | | | |
Net increase (decrease) | | | (276,108 | ) | | $ | (2,990,597 | ) | | | | | 411,382 | | | $ | 4,685,047 | |
| | | | | | | | | | |
| | | | | | | | | | | | | | | | | | |
| Class R | | | | | | | | | | | | | | | | | | |
Shares sold | | | 42,433 | | | $ | 479,190 | | | | | | 44,911 | | | $ | 532,805 | |
Shares issued in reinvestment of distributions | | | 2,689 | | | | 29,064 | | | | | | 1,221 | | | | 14,502 | |
Shares redeemed | | | (62,459 | ) | | | (711,793 | ) | | | | | (80,795 | ) | | | (966,864 | ) |
| | | | | | | | | | |
Net decrease | | | (17,337 | ) | | $ | (203,539 | ) | | | | | (34,663 | ) | | $ | (419,557 | ) |
| | | | | | | | | | |
Total Net Increase | | | 4,278,768 | | | $ | 74,467,489 | | | | | | 5,876,524 | | | $ | 89,456,834 | |
| | | | | | | | | | |
| | | | | | |
| | | | | | | |
| 40 | | SEMI-ANNUAL REPORT | | DECEMBER 31, 2014 | | |
| | | | |
| Notes to Financial Statements (concluded) | | |
| | | | | | | | | | | | | | | | | | |
| | | Six Months Ended
December 31, 2014 | | | | | Year Ended
June 30, 2014 | |
| Global Smallcap | | Shares | | | Amount | | | | | Shares | | | Amount | |
| Institutional | | | | | | | | | | | | | | | | | | |
Shares sold | | | 1,896,038 | | | $ | 54,455,877 | | | | | | 2,985,293 | | | $ | 86,295,391 | |
Shares issued in reinvestment of distributions | | | 1,438,465 | | | | 34,134,552 | | | | | | 921,493 | | | | 24,972,441 | |
Shares redeemed | | | (2,289,437 | ) | | | (63,943,986 | ) | | | | | (2,927,310 | ) | | | (85,142,818 | ) |
| | | | | | | | | | |
Net increase | | | 1,045,066 | | | $ | 24,646,443 | | | | | | 979,476 | | | $ | 26,125,014 | |
| | | | | | | | | | |
| | | | | | | | | | | | | | | | | | |
| Investor A | | | | | | | | | | | | | | | | | | |
Shares sold and automatic conversion of shares | | | 2,374,252 | | | $ | 65,942,850 | | | | | | 4,835,299 | | | $ | 136,285,083 | |
Shares issued in reinvestment of distributions | | | 2,665,919 | | | | 61,208,207 | | | | | | 1,659,667 | | | | 43,798,495 | |
Shares redeemed | | | (2,950,326 | ) | | | (80,402,147 | ) | | | | | (3,492,552 | ) | | | (98,084,013 | ) |
| | | | | | | | | | |
Net increase | | | 2,089,845 | | | $ | 46,748,910 | | | | | | 3,002,414 | | | $ | 81,999,565 | |
| | | | | | | | | | |
| | | | | | | | | | | | | | | | | | |
| Investor B | | | | | | | | | | | | | | | | | | |
Shares sold | | | 6,278 | | | $ | 170,243 | | | | | | 11,938 | | | $ | 316,419 | |
Shares issued in reinvestment of distributions | | | 19,603 | | | | 419,890 | | | | | | 21,435 | | | | 534,159 | |
Shares redeemed and automatic conversion of shares | | | (42,802 | ) | | | (1,120,493 | ) | | | | | (180,781 | ) | | | (4,770,487 | ) |
| | | | | | | | | | |
Net decrease | | | (16,921 | ) | | $ | (530,360 | ) | | | | | (147,408 | ) | | $ | (3,919,909 | ) |
| | | | | | | | | | |
| | | | | | | | | | | | | | | | | | |
| Investor C | | | | | | | | | | | | | | | | | | |
Shares sold | | | 1,139,178 | | | $ | 28,209,056 | | | | | | 2,334,788 | | | $ | 59,592,008 | |
Shares issued in reinvestment of distributions | | | 2,179,352 | | | | 44,108,405 | | | | | | 1,356,225 | | | | 32,305,154 | |
Shares redeemed | | | (1,347,821 | ) | | | (33,146,325 | ) | | | | | (2,532,259 | ) | | | (64,521,861 | ) |
| | | | | | | | | | |
Net increase | | | 1,970,709 | | | $ | 39,171,136 | | | | | | 1,158,754 | | | $ | 27,375,301 | |
| | | | | | | | | | |
| | | | | | | | | | | | | | | | | | |
| Class R | | | | | | | | | | | | | | | | | | |
Shares sold | | | 149,700 | | | $ | 3,932,900 | | | | | | 366,217 | | | $ | 9,761,996 | |
Shares issued in reinvestment of distributions | | | 187,425 | | | | 4,027,774 | | | | | | 149,096 | | | | 3,724,423 | |
Shares redeemed | | | (320,558 | ) | | | (8,269,833 | ) | | | | | (522,755 | ) | | | (13,896,837 | ) |
| | | | | | | | | | |
Net increase (decrease) | | | 16,567 | | | $ | (309,159 | ) | | | | | (7,442 | ) | | $ | (410,418 | ) |
| | | | | | | | | | |
Total Net Increase | | | 5,105,266 | | | $ | 109,726,970 | | | | | | 4,985,794 | | | $ | 131,169,553 | |
| | | | | | | | | | |
11. Subsequent Events:
Management has evaluated the impact of all subsequent events on each Fund through the date the financial statements were issued and has determined that there were no subsequent events requiring adjustment or additional disclosure in the financial statements.
| | | | | | |
| | | | | | | |
| | SEMI-ANNUAL REPORT | | DECEMBER 31, 2014 | | 41 |
Robert M. Hernandez, Chairman of the Board and Director
Fred G. Weiss, Vice Chairman of the Board and Director
Paul L. Audet, President1 and Director
James H. Bodurtha, Director
Bruce R. Bond, Director
Donald W. Burton, Director
Honorable Stuart E. Eizenstat, Director
Laurence D. Fink, Director
Kenneth A. Froot, Director
Henry Gabbay, Director
John F. O’Brien, Director
Roberta Cooper Ramo, Director
David H. Walsh, Director
John M. Perlowski, President2 and Chief Executive Officer
Jennifer McGovern, Vice President
Neal Andrews, Chief Financial Officer
Jay Fife, Treasurer
Charles Park, Chief Compliance Officer and Anti-Money Laundering Officer
Benjamin Archibald, Secretary
| 2 | | For Global SmallCap Fund. |
Investment Advisor
BlackRock Advisors, LLC
Wilmington, DE 19809
Sub-Advisors
BlackRock International Limited3
Edinburgh, EH3 8BL, United Kingdom
Custodians
Brown Brothers Harriman & Co.
Boston, MA 02109
Transfer Agent
BNY Mellon Investment Servicing (US) Inc.
Wilmington, DE 19809
Accounting Agent
State Street Bank and Trust Company
Boston, MA 02110
Distributor
BlackRock Investments, LLC
New York, NY 10022
Legal Counsel
Willkie Farr & Gallagher LLP
New York, NY 10019
Independent Registered Public Accounting Firm
Deloitte & Touche LLP
Boston, MA 02116
Address of the Funds
100 Bellevue Parkway
Wilmington, DE 19809
Effective September 10, 2014, Brendan Kyne resigned as a Vice President of each Fund and Jennifer McGovern became a Vice President of each Fund.
Effective December 31, 2014, Paul L. Audet and Laurence D. Fink resigned as Directors of each Fund, and Mr. Audet resigned as President of Euro Fund. Effective January 1, 2015, Robert Fairbairn and John M. Perlowski were appointed to serve as Directors of each Fund, and Mr. Perlowski was appointed to serve as President of Euro Fund.
| | | | | | |
| | | | | | | |
| 42 | | SEMI-ANNUAL REPORT | | DECEMBER 31, 2014 | | |
Householding
The Funds will mail only one copy of shareholder documents, including prospectuses, annual and semi-annual reports and proxy statements, to shareholders with multiple accounts at the same address. This practice is commonly called “householding” and is intended to reduce expenses and eliminate duplicate mailings of shareholder documents. Mailings of your shareholder documents may be householded indefinitely unless you instruct us otherwise. If you do not want the mailing of these documents to be combined with those for other members of your household, please call the Funds at (800) 441-7762.
Availability of Quarterly Schedule of Investments
The Funds file their complete schedule of portfolio holdings with the SEC for the first and third quarters of each fiscal year on Form N-Q. The Funds’ Forms N-Q are available on the SEC’s website at http://www.sec.gov and may also be reviewed and copied at the SEC’s Public Reference Room in Washington, DC. Information on how to access documents on the SEC’s website without charge may be obtained by calling (800) SEC-0330. The Funds’ Forms N-Q may also be obtained upon request and without charge by calling (800) 441-7762.
Availability of Proxy Voting Policies and Procedures
A description of the policies and procedures that the Funds use to determine how to vote proxies relating to portfolio securities is available (1) without charge, upon request, by calling (800) 441-7762; (2) at http://www.blackrock.com; and (3) on the SEC’s website at http://www.sec.gov.
Availability of Proxy Voting Record
Information about how the Funds voted proxies relating to securities held in the Funds’ portfolios during the most recent 12-month period ended June 30 is available upon request and without charge (1) at http://www.blackrock.com or by calling (800) 441-7762 and (2) on the SEC’s website at http://www.sec.gov.
BlackRock’s Mutual Fund Family
BlackRock offers a diverse lineup of open-end mutual funds crossing all investment styles and managed by experts in equity, fixed income and tax-exempt investing. Visit http://www.blackrock.com for more information.
| | | | | | |
| | | | | | | |
| | SEMI-ANNUAL REPORT | | DECEMBER 31, 2014 | | 43 |
| | |
| Additional Information (concluded) | | |
Account Information
Call us at (800) 441-7762 from 8:00 AM to 6:00 PM EST on any business day to get information about your account balances, recent transactions and share prices. You can also reach us on the Web at http://www.blackrock.com/funds.
Automatic Investment Plans
Investor Class shareholders who want to invest regularly can arrange to have $50 or more automatically deducted from their checking or savings account and invested in any of the BlackRock funds.
Systematic Withdrawal Plans
Investor Class shareholders can establish a systematic withdrawal plan and receive periodic payments of $50 or more from their BlackRock funds, as long as their account balance is at least $10,000.
Retirement Plans
Shareholders may make investments in conjunction with Traditional, Rollover, Roth, Coverdell, Simple IRAs, SEP IRAs and 403(b) Plans.
| | |
| BlackRock Privacy Principles | | |
BlackRock is committed to maintaining the privacy of its current and former fund investors and individual clients (collectively, “Clients”) and to safeguarding their non-public personal information. The following information is provided to help you understand what personal information BlackRock collects, how we protect that information and why in certain cases we share such information with select parties.
If you are located in a jurisdiction where specific laws, rules or regulations require BlackRock to provide you with additional or different privacy-related rights beyond what is set forth below, then BlackRock will comply with those specific laws, rules or regulations.
BlackRock obtains or verifies personal non-public information from and about you from different sources, including the following: (i) information we receive from you or, if applicable, your financial intermediary, on applications, forms or other documents; (ii) information about your transactions with us, our affiliates, or others; (iii) information we receive from a consumer reporting agency; and (iv) from visits to our websites.
BlackRock does not sell or disclose to non-affiliated third parties any non-public personal information about its Clients, except as permitted by law or as is necessary to respond to regulatory requests or to service Client accounts. These non-affiliated third parties are required to protect the confidentiality and security of this information and to use it only for its intended purpose.
We may share information with our affiliates to service your account or to provide you with information about other BlackRock products or services that may be of interest to you. In addition, BlackRock restricts access to non-public personal information about its Clients to those BlackRock employees with a legitimate business need for the information. BlackRock maintains physical, electronic and procedural safeguards that are designed to protect the non-public personal information of its Clients, including procedures relating to the proper storage and disposal of such information.
| | | | | | |
| | | | | | | |
| 44 | | SEMI-ANNUAL REPORT | | DECEMBER 31, 2014 | | |
This report is intended for current holders. It is not authorized for use as an offer of sale or a solicitation of an offer to buy shares of the Funds unless preceded or accompanied by the Funds’ current prospectus. Past performance results shown in this report should not be considered a representation of future performance. Investment returns and principal value of shares will fluctuate so that shares, when redeemed, may be worth more or less than their original cost. Statements and other information herein are as dated and are subject to change.

| | |
| EGSC-12/14-SAR | | |
| |
| |  |
Item 2 – Code of Ethics – Not Applicable to this semi-annual report
Item 3 – Audit Committee Financial Expert – Not Applicable to this semi-annual report
Item 4 – Principal Accountant Fees and Services – Not Applicable to this semi-annual report
Item 5 – Audit Committee of Listed Registrants – Not Applicable
Item 6 – Investments
(a) The registrant’s Schedule of Investments is included as part of the Report to Stockholders filed under Item 1 of this Form.
(b) Not Applicable due to no such divestments during the semi-annual period covered since the previous Form N-CSR filing.
Item 7 – Disclosure of Proxy Voting Policies and Procedures for Closed-End Management Investment
Companies – Not Applicable
Item 8 – Portfolio Managers of Closed-End Management Investment Companies – Not Applicable
Item 9 – Purchases of Equity Securities by Closed-End Management Investment Company and Affiliated
Purchasers – Not Applicable
Item 10 – Submission of Matters to a Vote of Security Holders –There have been no material changes to these procedures.
Item 11 – Controls and Procedures
(a) – The registrant’s principal executive and principal financial officers, or persons performing similar functions, have concluded that the registrant’s disclosure controls and procedures (as defined in Rule 30a-3(c) under the Investment Company Act of 1940, as amended (the “1940 Act”)) are effective as of a date within 90 days of the filing of this report based on the evaluation of these controls and procedures required by Rule 30a-3(b) under the 1940 Act and Rule 15d-15(b) under the Securities Exchange Act of 1934, as amended.
(b) – There were no changes in the registrant’s internal control over financial reporting (as defined in Rule 30a-3(d) under the 1940 Act) that occurred during the second fiscal quarter of the period covered by this report that have materially affected, or are reasonably likely to materially affect, the registrant’s internal control over financial reporting.
Item 12 – Exhibits attached hereto
(a)(1) – Code of Ethics – Not Applicable to this semi-annual report
(a)(2) – Certifications – Attached hereto
(a)(3) – Not Applicable
(b) – Certifications – Attached hereto
2
Pursuant to the requirements of the Securities Exchange Act of 1934 and the Investment Company Act of 1940, the registrant has duly caused this report to be signed on its behalf by the undersigned, thereunto duly authorized.
| | |
| BlackRock EuroFund |
| |
| By: | | /s/ John M. Perlowski |
| | John M. Perlowski |
| | Chief Executive Officer (principal executive officer) of |
| | BlackRock EuroFund |
Date: February 27, 2015
Pursuant to the requirements of the Securities Exchange Act of 1934 and the Investment Company Act of 1940, this report has been signed below by the following persons on behalf of the registrant and in the capacities and on the dates indicated.
| | |
| By: | | /s/ John M. Perlowski |
| | John M. Perlowski |
| | Chief Executive Officer (principal executive officer) of |
| | BlackRock EuroFund |
Date: February 27, 2015
| | |
| By: | | /s/ Neal J. Andrews |
| | Neal J. Andrews |
| | Chief Financial Officer (principal financial officer) of |
| | BlackRock EuroFund |
Date: February 27, 2015
3