UNITED STATES
SECURITIES AND EXCHANGE COMMISSION
Washington, D.C. 20549
FORM N-CSR
CERTIFIED SHAREHOLDER REPORT OF REGISTERED MANAGEMENT INVESTMENT COMPANIES
Investment Company Act file number: 811-04612
Name of Fund: BlackRock EuroFund
Fund Address: 100 Bellevue Parkway, Wilmington, DE 19809
Name and address of agent for service: John M. Perlowski, Chief Executive Officer, BlackRock EuroFund, 55 East 52nd Street, New York, NY 10055
Registrant’s telephone number, including area code: (800) 441-7762
Date of fiscal year end: 06/30/2017
Date of reporting period: 12/31/2016
Item 1 – Report to Stockholders
DECEMBER 31, 2016
| | | | | | |
SEMI-ANNUAL REPORT (UNAUDITED) | | | | | |  |
BlackRock EuroFund
BlackRock Global SmallCap Fund, Inc.
|
| Not FDIC Insured • May Lose Value • No Bank Guarantee |

| | | | | | |
| | | | | | | |
| 2 | | SEMI-ANNUAL REPORT | | DECEMBER 31, 2016 | | |
Dear Shareholder,
The year 2016 started on a fraught note with worries about slowing growth in China, plunging oil prices and sliding share prices. Then reflationary expectations in the United States helped drive a second-half global growth pick-up and big market reversals. As such, higher-quality asset classes such as Treasury bonds, municipals and investment grade credit prevailed in the first half of the year, only to struggle in the second. In contrast, risk assets sold off at the start of the year and rebounded in the latter half, with some asset classes posting strong year-end returns.
A key takeaway from 2016’s market performance is that economics can trump politics. The global reflationary theme — governments taking policy action to support growth — was the dominant driver of 2016 asset returns, outweighing significant political upheavals and uncertainty. This trend accelerated after the U.S. election on expectations for an extra boost to U.S. growth via fiscal policy.
Markets were remarkably resilient during the year. Spikes in equity volatility after big surprises such as the U.K.’s vote to leave the European Union and the outcome of the U.S. presidential election were short-lived. Instead, political surprises and initial sell-offs were seized upon as buying opportunities. We believe this reinforces the case for taking the long view rather than reacting to short-term market noise.
Asset returns varied widely in 2016. Perceived safe assets such as government bonds and low-volatility shares underperformed the higher-risk areas of the market. And the reversal of longstanding trends created opportunities, such as in the recovery of value stocks and commodities.
We expect some of these trends to extend into 2017 and see the potential for more flows into risk assets this year. Learn more by reading our market insights at blackrock.com.
Sincerely,

Rob Kapito
President, BlackRock Advisors, LLC

Rob Kapito
President, BlackRock Advisors, LLC
| | | | | | | | |
| Total Returns as of December 31, 2016 | |
| | | 6-month | | | 12-month | |
U.S. large cap equities
(S&P 500® Index) | | | 7.82 | % | | | 11.96 | % |
U.S. small cap equities
(Russell 2000® Index) | | | 18.68 | | | | 21.31 | |
International equities
(MSCI Europe, Australasia,
Far East Index) | | | 5.67 | | | | 1.00 | |
Emerging market equities
(MSCI Emerging
Markets Index) | | | 4.49 | | | | 11.19 | |
3-month Treasury bills
(BofA Merrill Lynch 3-Month
U.S. Treasury Bill Index) | | | 0.18 | | | | 0.33 | |
U.S. Treasury securities
(BofA Merrill Lynch 10-Year
U.S. Treasury Index) | | | (7.51 | ) | | | (0.16 | ) |
U.S. investment grade
bonds (Bloomberg Barclays
U.S. Aggregate Bond Index) | | | (2.53 | ) | | | 2.65 | |
Tax-exempt municipal
bonds (S&P Municipal
Bond Index) | | | (3.43 | ) | | | 0.77 | |
U.S. high yield bonds
(Bloomberg Barclays U.S.
Corporate High Yield 2%
Issuer Capped Index) | | | 7.40 | | | | 17.13 | |
| Past performance is no guarantee of future results. Index performance is shown for illustrative purposes only. You cannot invest directly in an index. | |
| | | | | | |
| | | | | | | |
| | THIS PAGE NOT PART OF YOUR FUND REPORT | | | | 3 |
| | |
| Fund Summary as of December 31, 2016 | | BlackRock EuroFund |
BlackRock EuroFund’s (the “Fund”) investment objective is to seek capital appreciation primarily through investment in equities of corporations domiciled in European countries.
| | |
| Portfolio Management Commentary | | |
How did the Fund perform?
| • | | For the six-month period ended December 31, 2016, the Fund underperformed its benchmark, the MSCI Europe Index. |
What factors influenced performance?
| • | | Bond yields moved higher and inflation expectations picked up during the second half of the year, resulting in a significant rally in the financials sector. The Fund’s average underweight in the sector was therefore a key detractor. Not owning HSBC Holdings PLC (United Kingdom) and being underweight in Banco Santander (Spain) had an adverse impact on relative performance. |
| • | | The Fund’s positioning in the materials sector also played a role in its underperformance. Randgold Resources Ltd. (United Kingdom), a gold-mining company that gave back its strong first-half performance in the final six months of the year, was the leading individual detractor in the sector. |
| • | | Investors’ risk appetite rose following Donald Trump’s victory in the U.S. election. Defensive market segments lagged in the resulting rally, which was a positive for the Fund given its underweights in the utilities and health care sectors. In particular, the Fund’s zero weighting in the pharmaceutical stocks Roche Holding AG (Switzerland), Novartis International AG (Switzerland) and GlaxoSmithKline PLC (United Kingdom) was helpful for performance. |
| • | | Similarly, the Fund was helped by its zero weighting in certain “safe haven” stocks that lagged in the rally, including the food and consumer-goods producers Nestle SA (Switzerland) and Unilever (United Kingdom/Netherlands). |
| • | | The energy sector staged a strong rally from mid-November onward, in reaction to the Organization of Petroleum Exporting Countries’ agreement to cut energy production. In this environment, the Fund benefited from its investment in the equipment supplier Tenaris SA (Italy). |
Describe recent portfolio activity.
| • | | The Fund reduced the extent of its underweight exposure to the value style by moving to an overweight in financials. The Fund also increased its weighting in the consumer discretionary sector by re-establishing a position in the German auto parts manufacturer Continental AG. These purchases were funded through reductions in the consumer staples, telecommunications services and real estate sectors. |
Describe portfolio positioning at period end.
| • | | The Fund was overweight in the consumer discretionary, industrials, financials, information technology, materials and telecommunications sectors, and it was underweight in health care, real estate, energy, utilities and consumer staples. |
The views expressed reflect the opinions of BlackRock as of the date of this report and are subject to change based on changes in market, economic or other conditions. These views are not intended to be a forecast of future events and are no guarantee of future results.
| | |
| Ten Largest Holdings | | Percent of
Net Assets |
| | | | |
British American Tobacco PLC | | | 4 | % |
Shire PLC | | | 3 | |
ING Groep NV | | | 3 | |
Renault SA | | | 3 | |
AXA SA | | | 3 | |
Kering | | | 3 | |
Volvo AB, Class B | | | 3 | |
Danske Bank A/S | | | 3 | |
Vinci SA | | | 3 | |
Merck KGaA | | | 2 | |
| | |
| Geographic Allocation | | Percent of
Net Assets |
| | | | |
United Kingdom | | | 34 | % |
France | | | 15 | |
Germany | | | 12 | |
Sweden | | | 9 | |
Netherlands | | | 9 | |
Denmark | | | 5 | |
Italy | | | 4 | |
Spain | | | 3 | |
Belgium | | | 3 | |
Switzerland | | | 3 | |
Ireland | | | 1 | |
Finland | |
| 1
|
|
Other1 | | | 1 | |
| | 1 | | Includes holdings within countries that are 1% or less of net assets. Please refer to the Schedule of Investments for such countries. |
| | | | | | |
| | | | | | | |
| 4 | | SEMI-ANNUAL REPORT | | DECEMBER 31, 2016 | | |
| | |
| Total Return Based on a $10,000 Investment | | |
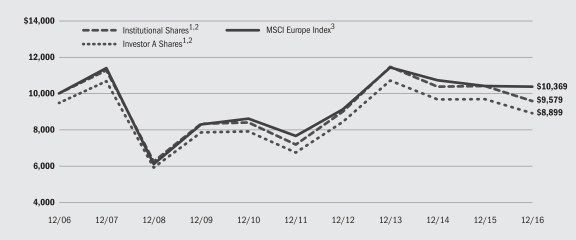
| | 1 | | Assuming maximum sales charge, if any, transaction costs and other operating expenses, including investment advisory fees. Institutional Shares do not have a sales charge. |
| | 2 | | Under normal circumstances, the Fund will invest at least 80% of its net assets in equity securities, including common stock and convertible securities, of companies located in Europe. The Fund currently expects that a majority of the Fund’s assets will be invested in equity securities of companies in Western European countries, but may also invest in emerging markets in Eastern European countries. |
| | 3 | | A free float-adjusted market capitalization weighted index that is designed to measure the equity market performance of the developed markets in Europe. |
| | |
| Performance Summary for the Period Ended December 31, 2016 | | |
| | | | | | | | | | | | | | | | | | | | | | | | | | | | |
| | | | | | Average Annual Total Returns4 | |
| | | | | | 1 Year | | | 5 Years | | | 10 Years | |
| | | 6-Month
Total Returns | | | w/o sales
charge | | | w/sales
charge | | | w/o sales
charge | | | w/sales
charge | | | w/o sales
charge | | | w/sales
charge | |
Institutional | | | (0.92 | )% | | | (7.94 | )% | | | N/A | | | | 5.95 | % | | | N/A | | | | (0.43 | )% | | | N/A | |
Investor A | | | (0.94 | ) | | | (8.09 | ) | | | (12.91 | )% | | | 5.73 | | | | 4.60 | % | | | (0.63 | ) | | | (1.16 | )% |
Investor C | | | (1.40 | ) | | | (8.86 | ) | | | (9.75 | ) | | | 4.87 | | | | 4.87 | | | | (1.46 | ) | | | (1.46 | ) |
Class R | | | (1.17 | ) | | | (8.57 | ) | | | N/A | | | | 5.20 | | | | N/A | | | | (1.18 | ) | | | N/A | |
MSCI Europe Index | | | 4.98 | | | | (0.40 | ) | | | N/A | | | | 6.25 | | | | N/A | | | | 0.36 | | | | N/A | |
| | 4 | | Assuming maximum sales charges, if any. Average annual total returns with and without sales charges reflect reductions for distribution and service fees. See “About Fund Performance” on page 8 for a detailed description of share classes, including any related sales charges and fees. |
| | | | N/A — Not applicable as share class and index do not have a sales charge. |
| | | | Past performance is not indicative of future results. |
| | | | Performance results may include adjustments made for financial reporting purposes in accordance with U.S. generally accepted accounting principles. |
| | | | | | | | | | | | | | | | | | | | | | | | | | | | |
| | | Actual | | | Hypothetical6 | | | | |
| | | Beginning
Account Value
July 1, 2016 | | | Ending
Account Value
December 31, 2016 | | | Expenses Paid
During the
Period5 | | | Beginning
Account Value
July 1, 2016 | | | Ending
Account Value
December 31, 2016 | | | Expenses Paid
During the
Period5 | | | Annualized
Expense Ratio | |
Institutional | | $ | 1,000.00 | | | $ | 990.80 | | | $ | 5.52 | | | $ | 1,000.00 | | | $ | 1,019.66 | | | $ | 5.60 | | | | 1.10 | % |
Investor A | | $ | 1,000.00 | | | $ | 990.60 | | | $ | 6.72 | | | $ | 1,000.00 | | | $ | 1,018.45 | | | $ | 6.82 | | | | 1.34 | % |
Investor C | | $ | 1,000.00 | | | $ | 986.00 | | | $ | 10.71 | | | $ | 1,000.00 | | | $ | 1,014.42 | | | $ | 10.87 | | | | 2.14 | % |
Class R | | $ | 1,000.00 | | | $ | 988.30 | | | $ | 9.02 | | | $ | 1,000.00 | | | $ | 1,016.13 | | | $ | 9.15 | | | | 1.80 | % |
| | 5 | | For each class of the Fund, expenses are equal to the annualized net expense ratio for the class, multiplied by the average account value over the period, multiplied by 184/365 (to reflect the one-half year period shown). |
| | 6 | | Hypothetical 5% annual return before expenses is calculated by prorating the number of days in the most recent fiscal half year divided by 365. |
| | | | See “Disclosure of Expenses” on page 9 for further information on how expenses were calculated. |
| | | | | | |
| | | | | | | |
| | SEMI-ANNUAL REPORT | | DECEMBER 31, 2016 | | 5 |
| | |
| Fund Summary as of December 31, 2016 | | BlackRock Global SmallCap Fund, Inc. |
BlackRock Global SmallCap Fund, Inc.’s (the “Fund”) investment objective is to seek long-term growth of capital by investing primarily in a portfolio of equity securities of small cap issuers located in various foreign countries and in the United States.
| | |
| Portfolio Management Commentary | | |
How did the Fund perform?
| • | | For the six-month period ended December 31, 2016, the Fund underperformed its benchmark, the MSCI All Country World Small Cap Index, except for the Fund’s Institutional Shares, which performed in line with the MSCI All Country World Small Cap Index. For the same period, the Fund outperformed the broad-market MSCI World Index. The following discussion of relative performance pertains to the MSCI All Country World Small Cap Index. |
What factors influenced performance?
| • | | Stock selection in the information technology (“IT”) sector, which was strongest in the internet software & services, software and communications equipment industries, was the most significant contributor to performance. Stock selection in the materials sector was additive, mostly within the metals & mining industry. Selection in industrials was also notable, highlighted by the Fund’s strong showing in the trading companies & distributors, construction & engineering and road & rail industries. An above-benchmark allocation to energy, together with stock selection in the sector, further enhanced returns. |
| • | | Stock selection in the financials sector, particularly the banking industry, was the largest detractor from returns. An overweight in health care, together with stock selection in the sector’s life sciences tools & services industry, also dampened results. Stock selection in the food products industry within consumer staples further weighed on returns. Individual security selection in telecommunications also had a marginally adverse impact on relative performance. |
Describe recent portfolio activity.
| • | | The Fund’s position in the health care sector declined due to the combination of market movements and the investment adviser’s active reduction in the health care equipment & supplies industry. The Fund also reduced the extent of its underweights in the real estate and utilities sectors. |
| • | | On a geographic level, the Fund shifted from an underweight to overweight position by adding to positions in Europe (ex-U.K.). The Fund also reduced its allocation in North America by moving from an overweight to an underweight position in the United States. Additionally, the Fund moved from an underweight to an overweight position in emerging markets. |
Describe portfolio positioning at period end.
| • | | Relative to the MSCI All Country World Small Cap Index, the Fund ended the year with overweight positions in the health care, energy, materials, IT and consumer staples sectors. Conversely, it was underweight in the financials, real estate, industrials, telecommunications services and consumer discretionary sectors. |
| • | | From a geographic perspective, Europe represented the Fund’s largest overweight. The Fund was also overweight in emerging markets, which was driven almost entirely by the Latin America region. The Fund was moderately overweight in North America, with a large overweight in Canadian resources companies offsetting an underweight in the United States. The Fund had a below-benchmark weighting in the Pacific Basin, highlighted by a substantial underweight in Japan. |
The views expressed reflect the opinions of BlackRock as of the date of this report and are subject to change based on changes in market, economic or other conditions. These views are not intended to be a forecast of future events and are no guarantee of future results.
| | |
| Ten Largest Holdings | | Percent of
Net Assets |
| | | | |
Cable One, Inc. | | | 1 | % |
Merit Medical Systems, Inc. | | | 1 | |
Orocobre Ltd. | | | 1 | |
United Therapeutics Corp. | | | 1 | |
Africa Oil Corp. | | | 1 | |
Insulet Corp. | | | 1 | |
Schoeller-Bleckmann Oilfield Equipment AG | | | 1 | |
Bob Evans Farms, Inc. | | | 1 | |
Owens & Minor, Inc. | | | 1 | |
Ciena Corp. | | | 1 | |
| | |
| Geographic Allocation | | Percent of
Net Assets |
| | | | |
United States | | | 64 | % |
Canada | | | 7 | |
United Kingdom | | | 6 | |
Japan | | | 5 | |
Austria | | | 4 | |
India | | | 4 | |
France | | | 3 | |
Switzerland | | | 2 | |
Brazil | | | 2 | |
Hong Kong | | | 2 | |
Other1 | | | 14 | |
Liabilities in Excess of Other Assets | | | (13 | ) |
| | 1 | | Includes holdings within countries that are 1% or less of net assets. Please refer to the Schedule of Investments for such countries. |
| | | | | | |
| | | | | | | |
| 6 | | SEMI-ANNUAL REPORT | | DECEMBER 31, 2016 | | |
| | |
| | | BlackRock Global SmallCap Fund, Inc. |
| | |
| Total Return Based on a $10,000 Investment | | |
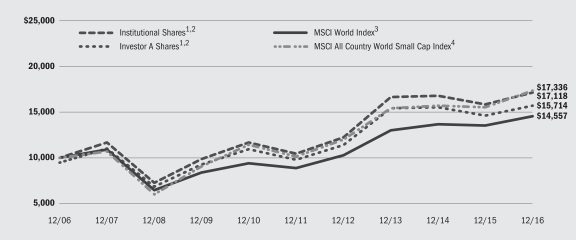
| | 1 | | Assuming maximum sales charge, if any, transaction costs and other operating expenses, including investment advisory fees. Institutional Shares do not have a sales charge. |
| | 2 | | The Fund invests in a diversified portfolio primarily consisting of equity securities of small cap issuers located in various foreign countries and in the United States. |
| | 3 | | A free float-adjusted market capitalization weighted index that is designed to measure the equity market performance of developed markets. The MSCI World Index consists of the following 23 developed market country indexes: Australia, Austria, Belgium, Canada, Denmark, Finland, France, Germany, Hong Kong, Ireland, Israel, Italy, Japan, Netherlands, New Zealand, Norway, Portugal, Singapore, Spain, Sweden, Switzerland, the United Kingdom, and the United States. |
| | 4 | | A free float-adjusted market capitalization weighted index that is designed to measure equity market results of smaller capitalization companies in both developed and emerging markets. |
| | |
| Performance Summary for the Period Ended December 31, 2016 | | |
| | | | | | | | | | | | | | | | | | | | | | | | | | | | |
| | | | | | Average Annual Total Returns5 | |
| | | | | | 1 Year | | | 5 Years | | | 10 Years | |
| | | 6-Month
Total Returns | | | w/o sales
charge | | | w/sales
charge | | | w/o sales
charge | | | w/sales
charge | | | w/o sales
charge | | | w/sales
charge | |
Institutional | | | 9.13 | % | | | 8.04 | % | | | N/A | | | | 10.35 | % | | | N/A | | | | 5.52 | % | | | N/A | |
Investor A | | | 8.89 | | | | 7.61 | | | | 1.96 | % | | | 9.96 | | | | 8.79 | % | | | 5.19 | | | | 4.62 | % |
Investor B | | | 8.42 | | | | 6.70 | | | | 2.20 | | | | 8.97 | | | | 8.69 | | | | 4.44 | | | | 4.44 | |
Investor C | | | 8.43 | | | | 6.73 | | | | 5.73 | | | | 9.09 | | | | 9.09 | | | | 4.33 | | | | 4.33 | |
Class R | | | 8.70 | | | | 7.26 | | | | N/A | | | | 9.57 | | | | N/A | | | | 4.77 | | | | N/A | |
MSCI World Index | | | 6.81 | | | | 7.51 | | | | N/A | | | | 10.41 | | | | N/A | | | | 3.83 | | | | N/A | |
MSCI All Country World Small Cap Index | | | 9.17 | | | | 11.59 | | | | N/A | | | | 11.29 | | | | N/A | | | | 5.66 | | | | N/A | |
| | 5 | | Assuming maximum sales charges, if any. Average annual total returns with and without sales charges reflect reductions for distribution and service fees. See “About Fund Performance” on page 8 for a detailed description of share classes, including any related sales charges and fees. |
| | | | N/A — Not applicable as share class and index do not have a sales charge. |
| | | | Past performance is not indicative of future results. |
| | | | Performance results may include adjustments made for financial reporting purposes in accordance with U.S. generally accepted accounting principles. |
| | | | | | | | | | | | | | | | | | | | | | | | | | | | |
| | | Actual | | | Hypothetical7 | | | | |
| | | Beginning
Account Value
July 1, 2016 | | | Ending
Account Value
December 31, 2016 | | | Expenses Paid
During the Period6 | | | Beginning
Account Value
July 1, 2016 | | | Ending
Account Value
December 31, 2016 | | | Expenses Paid
During the Period6 | | | Annualized
Expense Ratio | |
Institutional | | $ | 1,000.00 | | | $ | 1,091.30 | | | $ | 5.69 | | | $ | 1,000.00 | | | $ | 1,019.76 | | | $ | 5.50 | | | | 1.08 | % |
Investor A | | $ | 1,000.00 | | | $ | 1,088.90 | | | $ | 7.58 | | | $ | 1,000.00 | | | $ | 1,017.95 | | | $ | 7.32 | | | | 1.44 | % |
Investor B | | $ | 1,000.00 | | | $ | 1,084.20 | | | $ | 11.77 | | | $ | 1,000.00 | | | $ | 1,013.91 | | | $ | 11.37 | | | | 2.24 | % |
Investor C | | $ | 1,000.00 | | | $ | 1,084.30 | | | $ | 11.87 | | | $ | 1,000.00 | | | $ | 1,013.81 | | | $ | 11.47 | | | | 2.26 | % |
Class R | | $ | 1,000.00 | | | $ | 1,087.00 | | | $ | 9.63 | | | $ | 1,000.00 | | | $ | 1,015.98 | | | $ | 9.30 | | | | 1.83 | % |
| | 6 | | For each class of the Fund, expenses are equal to the annualized net expense ratio for the class, multiplied by the average account value over the period, multiplied by 184/365 (to reflect the one-half year period shown). |
| | 7 | | Hypothetical 5% annual return before expenses is calculated by prorating the number of days in the most recent fiscal half year divided by 365. |
| | | | See “Disclosure of Expenses” on page 9 for further information on how expenses were calculated. |
| | | | | | |
| | | | | | | |
| | SEMI-ANNUAL REPORT | | DECEMBER 31, 2016 | | 7 |
| • | | Institutional Shares are not subject to any sales charge. These shares bear no ongoing distribution or service fees and are available only to certain eligible investors. |
| • | | Investor A Shares are subject to a maximum initial sales charge (front-end load) of 5.25% and a service fee of 0.25% per year (but no distribution fee). Certain redemptions of these shares may be subject to a contingent deferred sales charge (“CDSC”) where no initial sales charge was paid at the time of purchase. These shares are generally available through financial intermediaries. |
| • | | Investor B Shares (available only in BlackRock Global SmallCap Fund, Inc.) are subject to a maximum CDSC of 4.50% declining to 0% after six years. In addition, these shares are subject to a distribution fee of 0.75% per year and a service fee of 0.25% per year. These shares automatically convert to Investor A Shares after approximately 8 years. (There is no initial sales charge for automatic share conversions.) These shares are only available through exchanges and distribution reinvestments by current holders and for purchase by certain employer-sponsored retirement plans. |
| • | | Investor C Shares are subject to a 1.00% CDSC if redeemed within one year of purchase. In addition, these shares are subject to a distribution fee of 0.75% per year and a service fee of 0.25% per year. These shares are generally available through financial intermediaries. |
| • | | Class R Shares are not subject to any sales charge. These shares are subject to a distribution fee of 0.25% per year and a service fee of 0.25% per year. These shares are available only to certain employer-sponsored retirement plans. |
Performance information reflects past performance and does not guarantee future results. Current performance may be lower or higher than the performance data quoted. Refer to www.blackrock.com/funds to obtain performance data current to the most recent month end. Performance results do not reflect the deduction of taxes that a shareholder would pay on fund distributions or the redemption of fund shares. Figures shown in the performance tables on the previous pages assume reinvestment of all distributions, if any, at net asset value (“NAV”) on the ex-dividend date. Investment return and principal value of shares will fluctuate so that shares, when redeemed, may be worth more or less than their original cost. Distributions paid to each class of shares will vary because of the different levels of service, distribution and transfer agency fees applicable to each class, which are deducted from the income available to be paid to shareholders.
BlackRock Advisors, LLC (the “Manager”), the Funds’ investment adviser, has voluntarily waived a portion of the Funds’ expenses. Without such waiver, the Funds’ performance would have been lower. The Manager is under no obligation to waive or to continue waiving its fees and such voluntary waiver may be reduced or discontinued at any time. See Note 5 of the Notes to Financial Statements for additional information on waivers.
| | | | | | |
| | | | | | | |
| 8 | | SEMI-ANNUAL REPORT | | DECEMBER 31, 2016 | | |
Shareholders of these Funds may incur the following charges: (a) transactional expenses, such as sales charges; and (b) operating expenses, including investment advisory fees, service and distribution fees, including 12b-1 fees, acquired fund fees and expenses, and other fund expenses. The expense examples shown on previous pages (which are based on a hypothetical investment of $1,000 invested on July 1, 2016 and held through December 31, 2016) are intended to assist shareholders both in calculating expenses based on an investment in each Fund and in comparing these expenses with similar costs of investing in other mutual funds.
The expense examples provide information about actual account values and actual expenses. In order to estimate the expenses a shareholder paid during the period covered by this report, shareholders can divide their account value by $1,000 and then multiply the result by the number corresponding to their Fund and share class under the heading entitled “Expenses Paid During the Period.”
The expense examples also provide information about hypothetical account values and hypothetical expenses based on a Fund’s actual expense ratio and an assumed rate of return of 5% per year before expenses. In order to assist shareholders in comparing the ongoing expenses of investing in these Funds and other funds, compare the 5% hypothetical examples with the 5% hypothetical examples that appear in shareholder reports of other funds.
The expenses shown in the expense examples are intended to highlight shareholders’ ongoing costs only and do not reflect any transactional expenses, such as sales charges, if any. Therefore, the hypothetical examples are useful in comparing ongoing expenses only, and will not help shareholders determine the relative total expenses of owning different funds. If these transactional expenses were included, shareholder expenses would have been higher.
| | |
| Derivative Financial Instruments | | |
The Funds may invest in various derivative financial instruments. These instruments are used to obtain exposure to a security, commodity, index, market, and/or other asset without owning or taking physical custody of securities, commodities and/or other referenced assets or to manage market, equity, credit, interest rate, foreign currency exchange rate, commodity and/or other risks. Derivative financial instruments may give rise to a form of economic leverage and involve risks, including the imperfect correlation between the value of a derivative financial instrument and the underlying asset, possible default of the
counterparty to the transaction or illiquidity of the instrument. The Funds’ successful use of a derivative financial instrument depends on the investment adviser’s ability to predict pertinent market movements accurately, which cannot be assured. The use of these instruments may result in losses greater than if they had not been used, may limit the amount of appreciation a Fund can realize on an investment and/or may result in lower distributions paid to shareholders. The Funds’ investments in these instruments, if any, are discussed in detail in the Notes to Financial Statements.
| | | | | | |
| | | | | | | |
| | SEMI-ANNUAL REPORT | | DECEMBER 31, 2016 | | 9 |
| | |
Schedule of Investments December 31, 2016 (Unaudited) | | BlackRock EuroFund (Percentages shown are based on Net Assets) |
| | | | | | | | | | | | |
| Common Stocks | | Shares | | | Value | |
Belgium — 3.3% | |
KBC Group NV | | | | | | | 82,693 | | | $ | 5,109,417 | |
Telenet Group Holding NV (a) | | | | | | | 85,097 | | | | 4,716,645 | |
| | | | | | | | | | | | |
| | | | | 9,826,062 | |
Denmark — 4.9% | |
Carlsberg A/S, Class B | | | | | | | 7,725 | | | | 665,348 | |
Danske Bank A/S | | | | | | | 253,571 | | | | 7,671,472 | |
DSV A/S | | | | | | | 40,794 | | | | 1,811,671 | |
Nets A/S (a)(b) | | | | | | | 105,290 | | | | 1,842,668 | |
Pandora A/S | | | | | | | 21,050 | | | | 2,747,867 | |
| | | | | | | | | | | | |
| | | | | 14,739,026 | |
Finland — 1.2% | |
Wartsila OYJ | | | | | | | 78,981 | | | | 3,541,221 | |
France — 15.5% | |
AXA SA | | | | | | | 330,478 | | | | 8,330,949 | |
BNP Paribas SA | | | | | | | 114,608 | | | | 7,293,414 | |
Kering | | | | | | | 34,858 | | | | 7,818,773 | |
Renault SA | | | | | | | 93,884 | | | | 8,338,476 | |
Teleperformance | | | | | | | 36,287 | | | | 3,637,982 | |
Thales SA | | | | | | | 32,869 | | | | 3,184,372 | |
Vinci SA | | | | | | | 112,875 | | | | 7,678,279 | |
| | | | | | | | | | | | |
| | | | | 46,282,245 | |
Germany — 11.8% | |
Continental AG | | | | | | | 27,407 | | | | 5,280,145 | |
Fresenius Medical Care AG & Co. KGaA | | | | | | | 73,842 | | | | 6,241,194 | |
Fresenius SE & Co. KGaA | | | | | | | 54,667 | | | | 4,264,618 | |
HeidelbergCement AG | | | | | | | 37,959 | | | | 3,533,222 | |
Innogy SE (a)(b) | | | | | | | 34,222 | | | | 1,189,146 | |
Merck KGaA | | | | | | | 70,929 | | | | 7,385,187 | |
Schaeffler AG | | | | | | | 136,920 | | | | 2,020,420 | |
Scout24 AG (a)(b) | | | | | | | 49,258 | | | | 1,755,592 | |
Steinhoff International Holdings NV | | | | | | | 702,758 | | | | 3,617,825 | |
| | | | | | | | | | | | |
| | | | | 35,287,349 | |
Ireland — 1.2% | |
Bank of Ireland (a) | | | | | | | 14,187,217 | | | | 3,474,691 | |
Italy — 3.5% | |
Atlantia SpA | | | | | | | 104,462 | | | | 2,444,028 | |
Tenaris SA | | | | | | | 309,014 | | | | 5,516,062 | |
UniCredit SpA | | | | | | | 880,322 | | | | 2,528,047 | |
| | | | | | | | | | | | |
| | | | | 10,488,137 | |
Netherlands — 9.1% | |
ASML Holding NV | | | | | | | 20,885 | | | | 2,340,590 | |
ING Groep NV | | | | | | | 629,480 | | | | 8,862,291 | |
Koninklijke DSM NV | | | | | | | 82,232 | | | | 4,927,937 | |
Koninklijke KPN NV | | | | | | | 2,370,664 | | | | 7,010,343 | |
NN Group NV | | | | | | | 121,083 | | | | 4,098,966 | |
| | | | | | | | | | | | |
| | | | | 27,240,127 | |
| | | | | | | | | | | | |
| Common Stocks | | Shares | | | Value | |
Spain — 3.4% | |
Banco Santander SA | | | | | | | 613,321 | | | $ | 3,190,662 | |
Telefonica SA | | | | | | | 750,317 | | | | 6,927,193 | |
| | | | | | | | | | | | |
| | | | | 10,117,855 | |
Sweden — 9.4% | |
Assa Abloy AB, Class B | | | | | | | 175,982 | | | | 3,256,306 | |
Hennes & Mauritz AB, Class B | | | | | | | 122,893 | | | | 3,406,730 | |
Hexagon AB, Class B | | | | | | | 201,813 | | | | 7,187,758 | |
Lundin Petroleum AB (a) | | | | | | | 85,709 | | | | 1,857,453 | |
Sandvik AB | | | | | | | 380,606 | | | | 4,695,180 | |
Volvo AB, Class B | | | | | | | 666,673 | | | | 7,761,413 | |
| | | | | | | | | | | | |
| | | | | 28,164,840 | |
Switzerland — 3.1% | |
Geberit AG, Registered Shares | | | | | | | 4,821 | | | | 1,930,120 | |
Sika AG, Bearer Shares | | | | | | | 442 | | | | 2,120,652 | |
Zurich Insurance Group AG (a) | | | | | | | 18,533 | | | | 5,093,235 | |
| | | | | | | | | | | | |
| | | | | 9,144,007 | |
United Kingdom — 33.6% | |
Associated British Foods PLC | | | | | | | 79,866 | | | | 2,694,843 | |
AstraZeneca PLC | | | | | | | 129,503 | | | | 7,071,865 | |
Auto Trader Group PLC (b) | | | | | | | 600,708 | | | | 3,020,071 | |
BAE Systems PLC | | | | | | | 592,963 | | | | 4,312,941 | |
BHP Billiton PLC | | | | | | | 290,079 | | | | 4,618,932 | |
British American Tobacco PLC | | | | | | | 201,264 | | | | 11,406,710 | |
CRH PLC | | | | | | | 179,315 | | | | 6,218,500 | |
Imperial Brands PLC | | | | | | | 113,227 | | | | 4,934,493 | |
John Wood Group PLC | | | | | | | 338,194 | | | | 3,651,969 | |
Lloyds Banking Group PLC | | | | | | | 5,758,218 | | | | 4,421,599 | |
London Stock Exchange Group PLC | | | | | | | 152,522 | | | | 5,451,301 | |
Merlin Entertainments PLC (b) | | | | | | | 784,632 | | | | 4,331,553 | |
Prudential PLC | | | | | | | 124,056 | | | | 2,475,843 | |
Randgold Resources Ltd. | | | | | | | 58,003 | | | | 4,456,221 | |
Rio Tinto PLC | | | | | | | 75,836 | | | | 2,895,265 | |
Royal Dutch Shell PLC, Class B | | | | | | | 212,677 | | | | 6,110,614 | |
Shire PLC | | | | | | | 167,777 | | | | 9,579,937 | |
Weir Group PLC | | | | | | | 253,638 | | | | 5,894,345 | |
Worldpay Group PLC (b) | | | | | | | 873,251 | | | | 2,899,272 | |
WPP PLC | | | | | | | 183,549 | | | | 4,084,592 | |
| | | | | | | | | | | | |
| | | | | 100,530,866 | |
Total Long-Term Investments
(Cost — $295,497,501) — 100.0% | | | | 298,836,426 | |
| | | | | | | | | | | | |
| | | | | | | | | | | | | |
| | |
| Short-Term Securities | | | | | | | |
Money Market Fund — 0.3% | | | | | | | | | |
BlackRock Liquidity Funds, T-Fund, Institutional Class, 0.36% (c)(d) | | | | | | | 884,025 | | | | 884,025 | |
| | | | | | |
| ADR | | American Depositary Receipts | | GBP | | British Pound |
| CAD | | Canadian Dollar | | GDR | | Global Depositary Receipt |
| EUR | | Euro | | PCL | | Public Company Limited |
See Notes to Financial Statements.
| | | | | | |
| | | | | | | |
| 10 | | SEMI-ANNUAL REPORT | | DECEMBER 31, 2016 | | |
| | |
Schedule of Investments (concluded) | | BlackRock EuroFund |
| | | | | | | | | | | | |
| | |
| Time Deposits | | | Par (000) | | | Value | |
United Kingdom — 0.0% | |
Brown Brothers Harriman & Co.,
0.05%, 1/03/17 | | | GBP | | | | 63 | | | $ | 77,882 | |
Total Short-Term Securities
(Cost — $961,907) — 0.3% | | | | 961,907 | |
| Total Investments (Cost — $296,459,408) — 100.3% | | | | 299,798,333 | |
Liabilities in Excess of Other Assets — (0.3)% | | | | (899,823 | ) |
| | | | | | | | | | | | |
Net Assets — 100.0% | | | $ | 298,898,510 | |
| | | | | | | | | | | | |
|
| Notes to Schedule of Investments |
| (a) | | Non-income producing security. |
| (b) | | Security exempt from registration pursuant to Rule 144A under the Securities Act of 1933, as amended. These securities may be resold in transactions exempt from registration to qualified institutional investors. |
| (c) | | During the period ended December 31, 2016, investments in issuers considered to be affiliates of the Fund for purposes of Section 2(a)(3) of the Investment Company Act of 1940, as amended, were as follows: |
| | | | | | | | | | | | | | | | | | | | |
| Affiliate | | Shares/
Investment
Value Held at
June 30,
2016 | | | Net
Activity | | | Shares/
Investment
Value Held at
December 31,
2016 | | | Value at
December 31,
2016 | | | Income | |
BlackRock Liquidity Funds, T-Fund, Institutional Class | | | — | | | | 884,025 | | | | 884,025 | | | $ | 884,025 | | | $ | 437 | |
BlackRock Liquidity Funds, TempFund, Institutional Class | | | 916,097 | | | | (916,097 | ) | | | — | | | | — | | | | 635 | |
SL Liquidity Series, LLC, Money Market Series1 | | | — | | | | — | | | | — | | | | — | | | | 2,292 | 2 |
Total | | | $ | 884,025 | | | $ | 3,364 | |
| | | | | | | | | | | | | | | | |
1 No longer held by the Fund as of period end. | | | | | |
2 Represents securities lending income earned from the reinvestment of cash collateral from loaned securities, net of fees and collateral investment expenses, and other payments to and from borrowers of securities. | |
| (d) | | Current yield as of period end. |
| | |
| Fair Value Hierarchy as of Period End | | |
Various inputs are used in determining the fair value of investments. For information about the Fund’s policy regarding valuation of investments, refer to the Notes to Financial Statements.
The following tables summarize the Fund’s investments categorized in the disclosure hierarchy:
| | | | | | | | | | | | | | |
| | | Level 1 | | | Level 2 | | | Level 3 | | Total | |
Assets: | |
| Investments: | |
| Common Stocks: | |
Belgium | | | — | | | $ | 9,826,062 | | | — | | $ | 9,826,062 | |
Denmark | | $ | 1,842,668 | | | | 12,896,358 | | | — | | | 14,739,026 | |
Finland | | | — | | | | 3,541,221 | | | — | | | 3,541,221 | |
France | | | — | | | | 46,282,245 | | | — | | | 46,282,245 | |
Germany | | | 1,189,146 | | | | 30,480,378 | | | — | | | 31,669,524 | |
Ireland | | | — | | | | 9,693,191 | | | — | | | 9,693,191 | |
Italy | | | — | | | | 10,488,137 | | | — | | | 10,488,137 | |
Netherlands | | | — | | | | 36,968,566 | | | — | | | 36,968,566 | |
Spain | | | — | | | | 10,117,855 | | | — | | | 10,117,855 | |
Sweden | | | — | | | | 28,164,840 | | | — | | | 28,164,840 | |
Switzerland | | | — | | | | 9,144,007 | | | — | | | 9,144,007 | |
United Kingdom | | | — | | | | 88,201,752 | | | — | | | 88,201,752 | |
Time Deposits | | | — | | | | 77,882 | | | — | | | 77,882 | |
Short-Term Securities | | | 884,025 | | | | — | | | — | | | 884,025 | |
| | | | | | | | | | | | | | |
Total | | $ | 3,915,839 | | | $ | 295,882,494 | | | — | | $ | 299,798,333 | |
| | | | | | | | | | | | | | |
During the six months ended December 31, 2016, there were no transfers between levels.
See Notes to Financial Statements.
| | | | | | |
| | | | | | | |
| | SEMI-ANNUAL REPORT | | DECEMBER 31, 2016 | | 11 |
| | |
Schedule of Investments December 31, 2016 (Unaudited) | | BlackRock Global SmallCap Fund, Inc. (Percentages shown are based on Net Assets) |
| | | | | | | | | | | | |
| Common Stocks | | Shares | | | Value | |
Argentina — 1.2% | |
Arcos Dorados Holdings, Inc., Class A (a) | | | | | | | 931,452 | | | $ | 5,029,841 | |
Grupo Supervielle SA, ADR (a) | | | | | | | 378,682 | | | | 4,975,881 | |
| | | | | | | | | | | | |
| | | | | | | | | | | | 10,005,722 | |
Australia — 2.6% | |
Metals X, Ltd. (a)(b) | | | | | | | 4,649,902 | | | | 1,874,517 | |
Orocobre Ltd. (a)(b) | | | | | | | 3,320,878 | | | | 10,781,009 | |
OZ Minerals, Ltd. | | | | | | | 486,890 | | | | 2,750,798 | |
Parnell Pharmaceuticals Holdings Ltd. (a) | | | | | | | 511,878 | | | | 353,247 | |
Western Areas, Ltd. (a) | | | | | | | 1,403,800 | | | | 3,082,164 | |
Westgold Resources, Ltd. (a)(b) | | | | | | | 2,324,951 | | | | 2,768,372 | |
| | | | | | | | | | | | |
| | | | | | | | | | | | 21,610,107 | |
Austria — 1.2% | |
Schoeller-Bleckmann Oilfield Equipment AG (b) | | | | | | | 125,037 | | | | 10,052,329 | |
Belgium — 1.0% | |
Nyrstar NV (a)(b) | | | | | | | 500,618 | | | | 4,107,776 | |
Ontex Group NV | | | | | | | 149,480 | | | | 4,437,759 | |
| | | | | | | | | | | | |
| | | | | 8,545,535 | |
Brazil — 1.5% | |
Cia de Saneamento Basico do Estado de Sao Paulo — ADR | | | | | | | 459,500 | | | | 3,988,460 | |
Companhia Hering SA | | | | | | | 1,004,531 | | | | 4,666,638 | |
Totvs SA | | | | | | | 604,564 | | | | 4,465,456 | |
| | | | | | | | | | | | |
| | | | | 13,120,554 | |
Canada — 7.1% | |
Africa Oil Corp. (a)(b) | | | | | | | 5,250,400 | | | | 10,401,865 | |
Canadian Western Bank (b) | | | | | | | 231,500 | | | | 5,231,229 | |
Continental Gold, Inc. (a)(b) | | | | | | | 2,507,396 | | | | 8,216,991 | |
The Descartes Systems Group, Inc. (a) | | | | | | | 108,564 | | | | 2,314,965 | |
Dollarama, Inc. | | | | | | | 58,600 | | | | 4,293,798 | |
Entertainment One Ltd. | | | | | | | 1,624,800 | | | | 4,611,534 | |
Lithium Americas Corp. (a)(b) | | | | | | | 2,580,900 | | | | 1,537,795 | |
Lundin Mining Corp. (a) | | | | | | | 317,650 | | | | 1,514,140 | |
Methanex Corp. | | | | | | | 167,100 | | | | 7,318,980 | |
Painted Pony Petroleum Ltd. (a)(b) | | | | | | | 1,034,009 | | | | 7,100,557 | |
Torex Gold Resources, Inc. (a) | | | | | | | 189,147 | | | | 2,928,809 | |
Trevali Mining Corp. | | | | | | | 4,848,800 | | | | 4,080,843 | |
| | | | | | | | | | | | |
| | | | | 59,551,506 | |
China — 0.4% | |
Agile Group Holdings Ltd. | | | | | | | 1,076,000 | | | | 546,297 | |
Colour Life Services Group Co. Ltd. (a) | | | | | | | 4,089,000 | | | | 3,057,556 | |
| | | | | | | | | | | | |
| | | | | 3,603,853 | |
Denmark — 0.5% | |
Nets A/S (a)(c) | | | | | | | 248,800 | | | | 4,354,220 | |
France — 2.9% | |
Elior SCA (c) | | | | | | | 266,820 | | | | 6,095,314 | |
Elis SA | | | | | | | 403,677 | | | | 7,198,781 | |
UbiSoft Entertainment SA (a) | | | | | | | 150,300 | | | | 5,341,012 | |
Virbac SA (a)(b) | | | | | | | 34,779 | | | | 6,116,580 | |
| | | | | | | | | | | | |
| | | | | 24,751,687 | |
Georgia — 0.6% | |
BGEO Group PLC | | | | | | | 138,402 | | | | 5,089,707 | |
Germany — 1.3% | |
Aareal Bank AG | | | | | | | 153,600 | | | | 5,760,886 | |
Aixtron SE (a) | | | | | | | 882,948 | | | | 2,872,993 | |
| | | | | | | | | | | | |
| Common Stocks | | Shares | | | Value | |
Germany (continued) | |
Rheinmetall AG | | | | | | | 38,000 | | | $ | 2,550,208 | |
| | | | | | | | | | | | |
| | | | | 11,184,087 | |
Hong Kong — 1.5% | |
Clear Media Ltd. | | | | | | | 2,067,000 | | | | 1,999,162 | |
KWG Property Holding Ltd. | | | | | | | 3,112,000 | | | | 1,758,984 | |
Lee & Man Paper Manufacturing Ltd. | | | | | | | 5,528,000 | | | | 4,262,565 | |
Melco International Development Ltd. | | | | | | | 3,477,000 | | | | 4,699,038 | |
| | | | | | | | | | | | |
| | | | | 12,719,749 | |
India — 3.6% | |
Azure Power Global, Ltd. (a)(b) | | | | | | | 218,682 | | | | 3,717,594 | |
Bank of Baroda (a) | | | | | | | 1,046,000 | | | | 2,353,449 | |
Container Corp. of India | | | | | | | 183,950 | | | | 3,002,156 | |
Jubilant Foodworks, Ltd. | | | | | | | 327,600 | | | | 4,107,266 | |
Kaveri Seed Co., Ltd. (a) | | | | | | | 437,700 | | | | 2,635,461 | |
MakeMyTrip Ltd. (a)(b) | | | | | | | 275,000 | | | | 6,105,000 | |
Oberoi Realty Ltd. | | | | | | | 1,379,400 | | | | 5,987,496 | |
Zee Entertainment Enterprises Ltd. | | | | | | | 336,100 | | | | 2,237,164 | |
| | | | | | | | | | | | |
| | | | | 30,145,586 | |
Indonesia — 1.2% | |
Bank Tabungan Negara Persero Tbk PT | | | | | | | 54,826,800 | | | | 7,056,900 | |
Tower Bersama Infrastructure Tbk PT | | | | | | | 7,589,276 | | | | 2,805,314 | |
| | | | | | | | | | | | |
| | | | | 9,862,214 | |
Ireland — 0.7% | |
Ryanair Holdings PLC, — ADR (a) | | | | | | | 69,981 | | | | 5,826,618 | |
Italy — 0.8% | |
Beni Stabili SpA SIIQ (a) | | | | | | | 11,658,943 | | | | 6,664,126 | |
Japan — 4.8% | |
Don Quijote Holdings Co. Ltd. | | | | | | | 90,200 | | | | 3,328,857 | |
Horiba Ltd. | | | | | | | 60,100 | | | | 2,775,576 | |
JGC Corp. | | | | | | | 449,300 | | | | 8,139,649 | |
NOK Corp. | | | | | | | 209,500 | | | | 4,237,265 | |
NTN Corp. | | | | | | | 277,000 | | | | 1,117,476 | |
Pioneer Corp. (a) | | | | | | | 1,523,300 | | | | 3,064,099 | |
Rohm Co. Ltd. | | | | | | | 113,700 | | | | 6,523,303 | |
Seven Bank Ltd. | | | | | | | 1,019,500 | | | | 2,915,131 | |
Tokyo Tatemono Co. Ltd. | | | | | | | 647,800 | | | | 8,648,420 | |
| | | | | | | | | | | | |
| | | | | 40,749,776 | |
Luxembourg — 1.2% | |
B&M European Value Retail SA | | | | | | | 987,200 | | | | 3,382,328 | |
Eurofins Scientific SE | | | | | | | 5,775 | | | | 2,460,403 | |
Stabilus SA (a) | | | | | | | 81,586 | | | | 4,383,394 | |
| | | | | | | | | | | | |
| | | | | 10,226,125 | |
Malaysia — 0.3% | |
AirAsia Bhd | | | | | | | 5,362,800 | | | | 2,737,586 | |
Netherlands — 1.5% | |
Intertrust NV (c) | | | | | | | 164,600 | | | | 2,893,787 | |
Koninklijke Boskalis Westminster NV | | | | | | | 130,600 | | | | 4,530,785 | |
TomTom NV (a)(b) | | | | | | | 566,500 | | | | 5,089,702 | |
| | | | | | | | | | | | |
| | | | | 12,514,274 | |
Panama — 0.4% | |
Copa Holdings SA, Class A | | | | | | | 38,100 | | | | 3,460,623 | |
Russia — 0.8% | |
Globaltrans Investment PLC, — GDR | | | | | | | 1,093,900 | | | | 6,904,652 | |
See Notes to Financial Statements.
| | | | | | |
| | | | | | | |
| 12 | | SEMI-ANNUAL REPORT | | DECEMBER 31, 2016 | | |
| | |
Schedule of Investments (continued) | | BlackRock Global SmallCap Fund, Inc. |
| | | | | | | | | | | | |
| Common Stocks | | Shares | | | Value | |
South Africa — 0.8% | |
MMI Holdings Ltd. | | | | | | | 737,363 | | | $ | 1,259,247 | |
Petra Diamonds, Ltd. (a) | | | | | | | 2,807,100 | | | | 5,388,705 | |
| | | | | | | | | | | | |
| | | | | 6,647,952 | |
South Korea — 0.9% | |
Korea Gas Corp. (a) | | | | | | | 185,800 | | | | 7,456,613 | |
Spain — 0.3% | |
Atento SA (a) | | | | | | | 248,200 | | | | 1,886,320 | |
Merlin Properties Socimi SA | | | | | | | 64,045 | | | | 694,897 | |
| | | | | | | | | | | | |
| | | | | 2,581,217 | |
Sweden — 1.4% | |
Hoist Finance AB (b)(c) | | | | | | | 590,117 | | | | 5,489,475 | |
SSAB AB, A Shares (a)(b) | | | | | | | 947,030 | | | | 3,576,774 | |
SSAB AB, B Shares (a) | | | | | | | 927,900 | | | | 2,920,850 | |
| | | | | | | | | | | | |
| | | | | 11,987,099 | |
Switzerland — 1.9% | |
Aryzta AG (a) | | | | | | | 130,822 | | | | 5,753,067 | |
GAM Holding AG (a) | | | | | | | 406,800 | | | | 4,707,931 | |
Leonteq AG (a)(b) | | | | | | | 48,600 | | | | 1,617,491 | |
Sulzer AG, Registered Shares | | | | | | | 38,300 | | | | 3,942,713 | |
| | | | | | | | | | | | |
| | | | | 16,021,202 | |
Thailand — 0.5% | |
Indorama Ventures PCL | | | | | | | 4,214,000 | | | | 3,942,112 | |
United Kingdom — 6.5% | |
Arrow Global Group PLC | | | | | | | 1,666,844 | | | | 6,121,570 | |
Ashmore Group PLC | | | | | | | 502,901 | | | | 1,747,944 | |
Atlas Mara Co-Nvest Ltd. (a)(b) | | | | | | | 718,496 | | | | 1,401,067 | |
Britvic PLC | | | | | | | 463,700 | | | | 3,237,724 | |
Dialog Semiconductor PLC (a) | | | | | | | 116,100 | | | | 4,877,931 | |
Elementis PLC | | | | | | | 778,986 | | | | 2,663,102 | |
Exova Group PLC | | | | | | | 1,951,673 | | | | 4,569,959 | |
Grainger PLC | | | | | | | 1,457,142 | | | | 4,270,368 | |
IMI PLC | | | | | | | 259,900 | | | | 3,323,805 | |
Intertek Group PLC | | | | | | | 117,800 | | | | 5,048,674 | |
Nomad Foods Ltd. (a) | | | | | | | 462,146 | | | | 4,422,737 | |
Rentokil Initial PLC | | | | | | | 1,784,000 | | | | 4,880,631 | |
UNITE Group PLC | | | | | | | 989,900 | | | | 7,396,571 | |
Virgin Money Holdings UK PLC | | | | | | | 175,225 | | | | 653,672 | |
| | | | | | | | | | | | |
| | | | | 54,615,755 | |
United States — 51.0% | |
Actuant Corp., Class A | | | | | | | 108,700 | | | | 2,820,765 | |
Allison Transmission Holdings, Inc. | | | | | | | 240,700 | | | | 8,109,183 | |
Bob Evans Farms, Inc. | | | | | | | 183,366 | | | | 9,756,905 | |
Boot Barn Holdings, Inc. (a)(b) | | | | | | | 101,300 | | | | 1,268,276 | |
Boston Beer Co., Inc., Class A (a)(b) | | | | | | | 27,127 | | | | 4,607,521 | |
Bottomline Technologies, Inc. (a) | | | | | | | 280,582 | | | | 7,020,162 | |
Burlington Stores, Inc. (a) | | | | | | | 57,773 | | | | 4,896,262 | |
Cable One, Inc. | | | | | | | 19,701 | | | | 12,248,703 | |
CARBO Ceramics, Inc. (a) | | | | | | | 370,081 | | | | 3,871,047 | |
Chart Industries, Inc. (a) | | | | | | | 130,389 | | | | 4,696,612 | |
Ciena Corp. (a) | | | | | | | 379,300 | | | | 9,258,713 | |
ComScore, Inc. (a)(b) | | | | | | | 141,800 | | | | 4,478,044 | |
Energen Corp. (a) | | | | | | | 158,200 | | | | 9,123,394 | |
Essent Group Ltd. (a) | | | | | | | 166,200 | | | | 5,379,894 | |
Five Below, Inc. (a)(b) | | | | | | | 108,300 | | | | 4,327,668 | |
Flex Ltd. (a) | | | | | | | 59,500 | | | | 855,015 | |
G-III Apparel Group Ltd. (a)(b) | | | | | | | 127,100 | | | | 3,757,076 | |
| | | | | | | | | | | | |
| Common Stocks | | Shares | | | Value | |
United States (continued) | |
Generac Holdings, Inc. (a)(b) | | | | | | | 133,200 | | | $ | 5,426,568 | |
Genesee & Wyoming, Inc., Class A (a) | | | | | | | 66,300 | | | | 4,601,883 | |
Hain Celestial Group, Inc. (a) | | | | | | | 112,200 | | | | 4,379,166 | |
Halyard Health, Inc. (a) | | | | | | | 247,920 | | | | 9,168,082 | |
Haynes International, Inc. | | | | | | | 128,400 | | | | 5,519,916 | |
Iberiabank Corp. | | | | | | | 78,300 | | | | 6,557,625 | |
IDEX Corp. | | | | | | | 80,550 | | | | 7,254,333 | |
Insulet Corp. (a)(b) | | | | | | | 276,025 | | | | 10,400,622 | |
Insys Therapeutics, Inc. (a)(b) | | | | | | | 189,023 | | | | 1,739,012 | |
Integrated Device Technology, Inc. (a) | | | | | | | 284,398 | | | | 6,700,417 | |
Invacare Corp. | | | | | | | 492,031 | | | | 6,421,005 | |
Kate Spade & Co. (a) | | | | | | | 165,100 | | | | 3,082,417 | |
KBR, Inc. | | | | | | | 452,900 | | | | 7,558,901 | |
LKQ Corp. (a) | | | | | | | 209,085 | | | | 6,408,455 | |
Marcus & Millichap, Inc. (a) | | | | | | | 301,174 | | | | 8,047,369 | |
MDU Resources Group, Inc. | | | | | | | 235,320 | | | | 6,770,156 | |
Merit Medical Systems, Inc. (a) | | | | | | | 408,294 | | | | 10,819,791 | |
MSC Industrial Direct Co., Inc., Class A | | | | | | | 83,000 | | | | 7,668,370 | |
Murphy USA, Inc. (a) | | | | | | | 22,400 | | | | 1,376,928 | |
National Fuel Gas Co. | | | | | | | 41,200 | | | | 2,333,568 | |
National Instruments Corp. | | | | | | | 270,484 | | | | 8,336,317 | |
Netscout Systems, Inc. (a)(b) | | | | | | | 240,631 | | | | 7,579,877 | |
Nordson Corp. | | | | | | | 63,600 | | | | 7,126,380 | |
OPKO Health, Inc. (a)(b) | | | | | | | 725,877 | | | | 6,750,656 | |
Opus Bank | | | | | | | 156,200 | | | | 4,693,810 | |
Outfront Media, Inc. | | | | | | | 312,047 | | | | 7,760,609 | |
Owens & Minor, Inc. | | | | | | | 266,803 | | | | 9,415,478 | |
Pacific Biosciences of California, Inc. (a)(b) | | | | | | | 752,254 | | | | 2,858,565 | |
Patterson Cos., Inc. | | | | | | | 181,815 | | | | 7,459,869 | |
Pebblebrook Hotel Trust (b) | | | | | | | 258,912 | | | | 7,702,632 | |
Pfenex, Inc. (a)(b) | | | | | | | 678,058 | | | | 6,149,986 | |
PTC, Inc. (a)(b) | | | | | | | 181,600 | | | | 8,402,632 | |
Qorvo, Inc. (a) | | | | | | | 78,600 | | | | 4,144,578 | |
Quotient Ltd. (a)(b) | | | | | | | 675,872 | | | | 3,271,220 | |
Rambus, Inc. (a)(b) | | | | | | | 321,900 | | | | 4,432,563 | |
Seritage Growth Properties, Class A (b) | | | | | | | 176,026 | | | | 7,518,070 | |
Skechers U.S.A., Inc., Class A (a) | | | | | | | 224,100 | | | | 5,508,378 | |
SM Energy Co. | | | | | | | 106,800 | | | | 3,682,464 | |
Smart & Final Stores, Inc. (a)(b) | | | | | | | 327,300 | | | | 4,614,930 | |
Superior Energy Services, Inc. | | | | | | | 350,200 | | | | 5,911,376 | |
Supervalu, Inc. (a)(b) | | | | | | | 1,429,081 | | | | 6,673,808 | |
Tanger Factory Outlet Centers, Inc. | | | | | | | 240,648 | | | | 8,610,385 | |
Texas Capital Bancshares, Inc. (a) | | | | | | | 91,400 | | | | 7,165,760 | |
TreeHouse Foods, Inc. (a)(b) | | | | | | | 49,300 | | | | 3,558,967 | |
Triumph Group, Inc. | | | | | | | 161,400 | | | | 4,277,100 | |
U.S. Silica Holdings, Inc. | | | | | | | 43,400 | | | | 2,459,912 | |
Ultimate Software Group, Inc. (a)(b) | | | | | | | 20,900 | | | | 3,811,115 | |
United Therapeutics Corp. (a)(b) | | | | | | | 73,177 | | | | 10,495,777 | |
Urban Outfitters, Inc. (a)(b) | | | | | | | 66,239 | | | | 1,886,487 | |
Verint Systems, Inc. (a)(b) | | | | | | | 257,064 | | | | 9,061,506 | |
VWR Corp. (a)(b) | | | | | | | 261,526 | | | | 6,545,996 | |
Whiting Petroleum Corp. (a)(b) | | | | | | | 491,000 | | | | 5,901,820 | |
Yelp, Inc. (a)(b) | | | | | | | 187,155 | | | | 7,136,220 | |
Zions Bancorporation | | | | | | | 139,900 | | | | 6,021,296 | |
Zynga, Inc., Class A (a) | | | | | | | 1,640,000 | | | | 4,214,800 | |
| | | | | | | | | | | | |
| | | | | 429,851,163 | |
| Total Common Stocks — 100.4% | | | | 846,783,749 | |
| | | | | | | | | | | | |
See Notes to Financial Statements.
| | | | | | |
| | | | | | | |
| | SEMI-ANNUAL REPORT | | DECEMBER 31, 2016 | | 13 |
| | |
Schedule of Investments (continued) | | BlackRock Global SmallCap Fund, Inc. |
| | | | | | | | | | | | |
| | |
| Warrants — 0.0% | | Shares | | | Value | |
United Kingdom — 0.0% | |
Atlas Mara Co-Nvest Ltd. (Issued/exercisable 12/17/13, 1 share for 1 warrant, Expires 8/21/17, Strike Price $11.50) (a) | | | | | | | 549,800 | | | $ | 2,776 | |
Total Long-Term Investments
(Cost — $754,178,306) — 100.4% | | | | 846,786,525 | |
| | | | | | | | | | | | |
| | | | | | | | | | | | | |
|
| Short-Term Securities | |
Money Market Fund — 12.6% | | | | | | | | | |
SL Liquidity Series, LLC, Money Market Series, 0.95% (d)(e)(f) | | | | | | | 105,810,791 | | | | 105,821,372 | |
| | |
| Time Deposits | | Par (000) | | | | |
Canada — 0.0% | |
Brown Brothers Harriman & Co.,
0.05%, 12/31/49 | | | CAD | | | | 279 | | | | 207,689 | |
| | | | | | | | | | | | |
| Time Deposits | | Par (000) | | | Value | |
Europe — 0.0% | |
Brown Brothers Harriman & Co.,
(0.57)%, 12/31/49 | | | EUR | | | | 51 | | | $ | 53,773 | |
United Kingdom — 0.0% | |
Brown Brothers Harriman & Co.,
0.05%, 12/31/49 | | | GBP | | | | 47 | | | | 57,737 | |
| Total Time Deposits — 0.0% | | | | 319,199 | |
Total Short-Term Securities
(Cost — $106,131,927) — 12.6% | | | | 106,140,571 | |
| Total Investments (Cost — $860,310,233) — 113.0% | | | | 952,927,096 | |
Liabilities in Excess of Other Assets — (13.0)% | | | | (109,701,856 | ) |
| | | | | | | | | | | | |
Net Assets — 100.0% | | | $ | 843,225,240 | |
| | | | | | | | | | | | |
| | |
| Notes to Schedule of Investments | | |
| (a) | | Non-income producing security. |
| (b) | | Security, or a portion of security, is on loan. |
| (c) | | Security exempt from registration pursuant to Rule 144A under the Securities Act of 1933, as amended. These securities may be resold in transactions exempt from registration to qualified institutional investors. |
| (d) | | During the period ended December 31, 2016, investments in issuers considered to be affiliates of the Fund for purposes of Section 2(a)(3) of the Investment Company Act of 1940, as amended, were as follows: |
| | | | | | | | | | | | | | | | | | | | | | | | |
| Affiliate | | Shares/ Investment
Value Held at
June 30, 2016 | | | Net
Activity | | | Shares/ Investment
Value Held at
December 31,
2016 | | | Value at
December 31,
2016 | | | Income | | | Realized
Gain | |
BlackRock Liquidity Funds, T-Fund, Institutional Class1 | | | — | | | | — | | | | — | | | | — | | | $ | 341 | | | | — | |
BlackRock Liquidity Funds, TempFund, Institutional Class | | | 4,449,500 | | | | (4,449,500 | ) | | | — | | | | — | | | | 1,355 | | | | — | |
SL Liquidity Series, LLC, Money Market Series | | | 94,140,099 | | | | 11,670,692 | | | | 105,810,791 | | | $ | 105,821,372 | | | | 954,343 | 2 | | $ | 181 | |
Total | | | $ | 105,821,372 | | | $ | 956,039 | | | $ | 181 | |
| | | | | | | | | | | | | | | | |
1 No longer held by the Fund as of period end. | | | | | | | | | |
2 Represents securities lending income earned from the reinvestment of cash collateral from loaned securities, net of fees and collateral investment expenses, and other payments to and from borrowers of securities. | |
| (e) | | Current yield as of period end. |
| (f) | | Security was purchased with the cash collateral from loaned securities. |
| * | | During the six months ended December 31, 2016, investments in issuers that are affiliated persons and/or related parties of the Fund, as applicable, were as follows: |
| | | | | | | | | | | | | | | | | | | | |
| Affiliate | | Shares Held
at June 30, 2016 | | | Shares
Purchased | | Shares Sold | | | Shares Held
at December 31, 2016 | | Value at December 31, 2016 | | Income | | Realized
Loss | |
Diagnocure, Inc. | | | 3,952,880 | | | — | | | (3,952,880 | ) | | — | | — | | — | | $ | (10,089,032 | ) |
See Notes to Financial Statements.
| | | | | | |
| | | | | | | |
| 14 | | SEMI-ANNUAL REPORT | | DECEMBER 31, 2016 | | |
| | |
Schedule of Investments (continued) | | BlackRock Global SmallCap Fund, Inc. |
| | |
| Fair Value Hierarchy as of Period End | | |
Various inputs are used in determining the fair value of investments. For information about the Fund’s policy regarding valuation of investments, refer to the Notes to Financial Statements.
The following tables summarize the Fund’s investments categorized in the disclosure hierarchy:
| | | | | | | | | | | | | | | | |
| | | Level 1 | | | Level 2 | | | Level 3 | | | Total | |
Assets: | |
| Investments: | |
| Common Stocks: | |
Argentina | | $ | 10,005,722 | | | $ | — | | | | — | | | $ | 10,005,722 | |
Australia | | | 3,121,619 | | | | 18,488,488 | | | | — | | | | 21,610,107 | |
Austria | | | — | | | | 10,052,329 | | | | — | | | | 10,052,329 | |
Belgium | | | 4,107,776 | | | | 4,437,759 | | | | — | | | | 8,545,535 | |
Brazil | | | 13,120,554 | | | | — | | | | — | | | | 13,120,554 | |
Canada | | | 55,470,663 | | | | 4,080,843 | | | | — | | | | 59,551,506 | |
China | | | — | | | | 3,603,853 | | | | — | | | | 3,603,853 | |
Denmark | | | 4,354,220 | | | | — | | | | — | | | | 4,354,220 | |
France | | | — | | | | 24,751,687 | | | | — | | | | 24,751,687 | |
Georgia | | | 5,089,707 | | | | — | | | | — | | | | 5,089,707 | |
Germany | | | — | | | | 11,184,087 | | | | — | | | | 11,184,087 | |
Hong Kong | | | 1,999,162 | | | | 10,720,587 | | | | — | | | | 12,719,749 | |
India | | | 9,822,594 | | | | 20,322,992 | | | | — | | | | 30,145,586 | |
Indonesia | | | 2,805,314 | | | | 7,056,900 | | | | — | | | | 9,862,214 | |
Ireland | | | 5,826,618 | | | | — | | | | — | | | | 5,826,618 | |
Italy | | | 6,664,126 | | | | — | | | | — | | | | 6,664,126 | |
Japan | | | — | | | | 40,749,776 | | | | — | | | | 40,749,776 | |
Luxembourg | | | 4,383,394 | | | | 5,842,731 | | | | — | | | | 10,226,125 | |
Malaysia | | | 2,737,586 | | | | — | | | | — | | | | 2,737,586 | |
Netherlands | | | — | | | | 12,514,274 | | | | — | | | | 12,514,274 | |
Panama | | | 3,460,623 | | | | — | | | | — | | | | 3,460,623 | |
Russia | | | — | | | | 6,904,652 | | | | — | | | | 6,904,652 | |
South Africa | | | — | | | | 6,647,952 | | | | — | | | | 6,647,952 | |
South Korea | | | — | | | | 7,456,613 | | | | — | | | | 7,456,613 | |
Spain | | | 1,886,320 | | | | 694,897 | | | | — | | | | 2,581,217 | |
Sweden | | | 5,489,475 | | | | 6,497,624 | | | | — | | | | 11,987,099 | |
Switzerland | | | — | | | | 16,021,202 | | | | — | | | | 16,021,202 | |
Thailand | | | 3,942,112 | | | | — | | | | — | | | | 3,942,112 | |
United Kingdom | | | 21,841,601 | | | | 32,774,154 | | | | — | | | | 54,615,755 | |
United States | | | 429,851,163 | | | | — | | | | — | | | | 429,851,163 | |
Warrants | | | — | | | | 2,776 | | | | — | | | | 2,776 | |
Time Deposits | | | — | | | | 319,199 | | | | — | | | | 319,199 | |
| | | | | | | | | | | | | | | | |
Subtotal | | $ | 595,980,349 | | | $ | 251,125,375 | | | | — | | | $ | 847,105,724 | |
Investments Valued at NAV1 | | | | | | | | | | | | | | | 105,821,372 | |
| | | | | | | | | | | | | | | | |
Total | | | | | | | | | | | | | | $ | 952,927,096 | |
| | | | | | | | | | | | | | | | |
| | | | |
1 As of December 31, 2016, certain of the Fund’s investments were valued using NAV per share (or its equivalent) as no quoted market value is available and have been excluded from the fair value hierarchy. | | | | |
See Notes to Financial Statements.
| | | | | | |
| | | | | | | |
| | SEMI-ANNUAL REPORT | | DECEMBER 31, 2016 | | 15 |
| | |
Schedule of Investments (concluded) | | BlackRock Global SmallCap Fund, Inc. |
Transfers between Level 1 and Level 2 were as follows:
| | | | | | | | | | | | | | | | |
| | | Transfers Into
Level 11 | | | Transfers Out of Level 12 | | | Transfers Into
Level 22 | | | Transfers Out of Level 21 | |
Assets: | | | | | | | | | |
| Investments: | | | | | | | | | | | | | | | | |
Common Stocks: | | | | | | | | | | | | | | | | |
France | | | — | | | $ | (7,836,151 | ) | | $ | 7,836,151 | | | | — | |
Georgia | | $ | 5,274,315 | | | | — | | | | — | | | $ | (5,274,315 | ) |
Hong Kong | | | 1,839,888 | | | | — | | | | — | | | | (1,839,888 | ) |
Indonesia | | | 3,874,966 | | | | — | | | | — | | | | (3,874,966 | ) |
Italy | | | 6,332,436 | | | | — | | | | — | | | | (6,332,436 | ) |
Luxembourg | | | 4,981,757 | | | | — | | | | — | | | | (4,981,757 | ) |
Russia | | | — | | | | (3,697,344 | ) | | | 3,697,344 | | | | — | |
Sweden | | | 4,657,920 | | | | — | | | | — | | | | (4,657,920 | ) |
United Kingdom | | | 8,539,638 | | | | — | | | | — | | | | (8,539,638 | ) |
| | | | |
Total | | $ | 35,500,920 | | | $ | (11,533,495 | ) | | $ | 11,533,495 | | | $ | (35,500,920 | ) |
| | | | |
1 Systematic Fair Value Prices were not utilized at period end for these investments. | |
2 External pricing service used to reflect any significant market movements between the time the Fund valued such foreign securities and the earlier closing of foreign markets. | |
See Notes to Financial Statements.
| | | | | | |
| | | | | | | |
| 16 | | SEMI-ANNUAL REPORT | | DECEMBER 31, 2016 | | |
| | |
| Statements of Assets and Liabilities | | |
| | | | | | | | |
| December 31, 2016 (Unaudited) | | BlackRock
EuroFund | | | BlackRock
Global SmallCap
Fund, Inc. | |
| | | | | | | | |
| Assets | |
Investments at value — unaffiliated1,2 | | $ | 298,914,308 | | | $ | 847,105,724 | |
Investments at value — affiliated3 | | | 884,025 | | | | 105,821,372 | |
Foreign currency at value4 | | | — | | | | 200,600 | |
| Receivables: | |
Dividends — unaffiliated | | | 479,963 | | | | 866,752 | |
Capital shares sold | | | 391,220 | | | | 2,705,346 | |
Investments sold | | | 148,958 | | | | 6,141,252 | |
Dividends — affiliated | | | 87 | | | | — | |
Securities lending income — affiliated | | | — | | | | 165,491 | |
Prepaid expenses | | | 47,743 | | | | 64,713 | |
| | | | |
Total assets | | | 300,866,304 | | | | 963,071,250 | |
| | | | |
| | | | | | | | |
| Liabilities | |
Cash collateral on securities loaned at value | | | — | | | | 105,812,547 | |
Foreign bank overdraft4 | | | 54 | | | | — | |
Bank overdraft | | | — | | | | 2,083,942 | |
| Payables: | |
Capital shares redeemed | | | 1,355,266 | | | | 8,695,991 | |
Other accrued expenses | | | 346,712 | | | | 827,356 | |
Investment advisory fees | | | 191,518 | | | | 619,058 | |
Service and distribution fees | | | 42,199 | | | | 282,394 | |
Investments purchased | | | 23,589 | | | | 1,511,462 | |
Officer’s and Directors’ fees | | | 5,811 | | | | 7,654 | |
Other affiliates | | | 2,645 | | | | 5,606 | |
| | | | |
Total liabilities | | | 1,967,794 | | | | 119,846,010 | |
| | | | |
Net Assets | | $ | 298,898,510 | | | $ | 843,225,240 | |
| | | | |
| | | | | | | | |
| Net Assets Consist of | |
Paid-in capital | | $ | 445,222,758 | | | $ | 764,434,142 | |
Undistributed (distributions in excess of) net investment income | | | 193,401 | | | | (18,704,656 | ) |
Undistributed net realized gain (accumulated net realized loss) | | | (149,804,757 | ) | | | 4,897,894 | |
Net unrealized appreciation (depreciation) | | | 3,287,108 | | | | 92,597,860 | |
| | | | |
Net Assets | | $ | 298,898,510 | | | $ | 843,225,240 | |
| | | | |
1 Investments at cost — unaffiliated | | $ | 295,575,383 | | | $ | 754,497,505 | |
2 Securities loaned at value | | | — | | | $ | 98,640,240 | |
3 Investments at cost — affiliated | | $ | 884,025 | | | $ | 105,812,728 | |
4 Foreign currency at cost | | $ | (54 | ) | | $ | 200,602 | |
| | | | | | |
| See Notes to Financial Statements. | | | | |
| | | | | | | |
| | SEMI-ANNUAL REPORT | | DECEMBER 31, 2016 | | 17 |
| | |
| Statements of Assets and Liabilities (concluded) | | |
| | | | | | | | |
| December 31, 2016 (Unaudited) | | BlackRock
EuroFund | | | BlackRock
Global SmallCap
Fund, Inc. | |
| | | | | | | | |
| Net Asset Value | |
| Institutional | |
Net assets | | $ | 134,556,672 | | | $ | 235,829,825 | |
| | | | |
Shares outstanding | | | 10,483,893 | | | | 10,006,991 | |
| | | | |
Net asset value | | $ | 12.83 | | | $ | 23.57 | |
| | | | |
Par value | | $ | 0.10 | | | $ | 0.10 | |
| | | | |
Shares authorized | | | Unlimited | | | | 100 million | |
| | | | |
| Investor A | |
Net assets | | $ | 152,516,401 | | | $ | 362,618,410 | |
| | | | |
Shares outstanding | | | 12,106,210 | | | | 15,960,548 | |
| | | | |
Net asset value | | $ | 12.60 | | | $ | 22.72 | |
| | | | |
Par value | | $ | 0.10 | | | $ | 0.10 | |
| | | | |
Shares authorized | | | Unlimited | | | | 100 million | |
| | | | |
| Investor B | |
Net assets | | | — | | | $ | 503,393 | |
| | | | |
Shares outstanding | | | — | | | | 24,139 | |
| | | | |
Net asset value | | | — | | | $ | 20.85 | |
| | | | |
Par value | | | — | | | $ | 0.10 | |
| | | | |
Shares authorized | | | — | | | | 100 million | |
| | | | |
| Investor C | |
Net assets | | $ | 10,907,129 | | | $ | 223,167,136 | |
| | | | |
Shares outstanding | | | 1,229,463 | | | | 11,337,717 | |
| | | | |
Net asset value | | $ | 8.87 | | | $ | 19.68 | |
| | | | |
Par value | | $ | 0.10 | | | $ | 0.10 | |
| | | | |
Shares authorized | | | Unlimited | | | | 100 million | |
| | | | |
| Class R | |
Net assets | | $ | 918,308 | | | $ | 21,106,476 | |
| | | | |
Shares outstanding | | | 96,146 | | | | 999,032 | |
| | | | |
Net asset value | | $ | 9.55 | | | $ | 21.13 | |
| | | | |
Par value | | $ | 0.10 | | | $ | 0.10 | |
| | | | |
Shares authorized | | | Unlimited | | | | 100 million | |
| | | | |
| | | | | | |
| See Notes to Financial Statements. | | | | |
| | | | | | | |
| 18 | | SEMI-ANNUAL REPORT | | DECEMBER 31, 2016 | | |
| | | | | | | | |
| Six Months Ended December 31, 2016 (Unaudited) | | BlackRock
EuroFund | | | BlackRock
Global SmallCap
Fund, Inc. | |
| | | | | | | | |
| Investment Income | |
Dividends — unaffiliated | | $ | 2,363,160 | 1 | | $ | 3,984,859 | |
Securities lending — affiliated — net | | | 2,292 | | | | 954,343 | |
Dividends — affiliated | | | 1,072 | | | | 1,696 | |
Foreign taxes withheld | | | (107,461 | ) | | | (123,984 | ) |
| | | | |
Total investment income | | | 2,259,063 | | | | 4,816,914 | |
| | | | |
| | | | | | | | |
| Expenses | |
Investment advisory | | | 1,229,487 | | | | 3,789,449 | |
Service and distribution — class specific | | | 273,668 | | | | 1,755,079 | |
Transfer agent — class specific | | | 323,623 | | | | 1,083,755 | |
Custodian | | | 69,583 | | | | 137,331 | |
Professional | | | 56,488 | | | | 58,542 | |
Accounting services | | | 40,207 | | | | 91,543 | |
Registration | | | 34,961 | | | | 48,571 | |
Printing | | | 20,815 | | | | 34,318 | |
Officer and Directors | | | 11,444 | | | | 15,664 | |
Miscellaneous | | | 15,368 | | | | 22,223 | |
| | | | |
Total expenses | | | 2,075,644 | | | | 7,036,475 | |
| Less: | | | | | | | | |
Fees waived by Manager | | | (227 | ) | | | (361 | ) |
Fees paid indirectly | | | (103 | ) | | | (2,359 | ) |
| | | | |
Total expenses after fees waived and paid indirectly | | | 2,075,314 | | | | 7,033,755 | |
| | | | |
Net investment income (loss) | | | 183,749 | | | | (2,216,841 | ) |
| | | | |
| | | | | | | | |
| Realized and Unrealized Gain (Loss) | |
Net realized gain (loss) from: | |
Investments — unaffiliated | | | (3,876,899 | ) | | | 49,339,892 | |
Investments — affiliated | | | — | | | | (10,088,851 | ) |
Foreign currency transactions | | | 11,047 | | | | 68,312 | |
| | | | |
| | | (3,865,852 | ) | | | 39,319,353 | |
| | | | |
| Net change in unrealized appreciation (depreciation) on: | | | | | | | | |
Investments — unaffiliated | | | 893,011 | | | | 29,020,889 | |
Investments — affiliated | | | — | | | | 10,051,782 | |
Foreign currency translations | | | 9,865 | | | | (2,269 | ) |
| | | | |
| | | 902,876 | | | | 39,070,402 | |
| | | | |
Net realized and unrealized gain (loss) | | | (2,962,976 | ) | | | 78,389,755 | |
| | | | |
Net Increase (Decrease) in Net Assets Resulting from Operations | | $ | (2,779,227 | ) | | $ | 76,172,914 | |
| | | | |
1 Includes non-recurring dividends in the amount of $182,061. | | | | | | | | |
| | | | | | |
| See Notes to Financial Statements. | | | | |
| | | | | | | |
| | SEMI-ANNUAL REPORT | | DECEMBER 31, 2016 | | 19 |
| | |
| Statements of Changes in Net Assets | | |
| | | | | | | | | | | | | | | | | | | | |
| | | BlackRock EuroFund | | | | | | BlackRock Global SmallCap Fund, Inc. | |
| Increase (Decrease) in Net Assets: | | Six Months Ended
December 31,
2016
(Unaudited) | | | Year Ended
June 30,
2016 | | | | | | Six Months Ended
December 31,
2016
(Unaudited) | | | Year Ended
June 30,
2016 | |
| | | | | | | | | | | | | | | | | | | | |
| Operations | | | | | | | | | | | | | | | | | | | | |
Net investment income (loss) | | $ | 183,749 | | | $ | 6,514,698 | | | | | | | $ | (2,216,841 | ) | | $ | (3,297,915 | ) |
Net realized gain (loss) | | | (3,865,852 | ) | | | (40,563,485 | ) | | | | | | | 39,319,353 | | | | (13,195,380 | ) |
Net change in unrealized appreciation (depreciation) | | | 902,876 | | | | (27,834,471 | ) | | | | | | | 39,070,402 | | | | (101,563,805 | ) |
| | | | | | | | | | | | |
Net increase (decrease) in net assets resulting from operations | | | (2,779,227 | ) | | | (61,883,258 | ) | | | | | | | 76,172,914 | | | | (118,057,100 | ) |
| | | | | | | | | | | | |
| | | | | | | | | | | | | | | | | | | | |
| Distributions to Shareholders1 | | | | | | | | | | | | | | | | | | | | |
| From net investment income: | | | | | | | | | | | | | |
Institutional | | | (3,163,969 | ) | | | (2,952,513 | ) | | | | | | | (2,750,170 | ) | | | — | |
Investor A | | | (3,145,485 | ) | | | (3,544,726 | ) | | | | | | | (2,433,397 | ) | | | — | |
Investor C | | | (214,011 | ) | | | (227,669 | ) | | | | | | | — | | | | — | |
Class R | | | (19,276 | ) | | | (17,596 | ) | | | | | | | (43,752 | ) | | | — | |
| From net realized gain: | | | | | | | | | | | | | |
Institutional | | | — | | | | — | | | | | | | | — | | | | (10,362,846 | ) |
Investor A | | | — | | | | — | | | | | | | | — | | | | (20,728,613 | ) |
Investor B | | | — | | | | — | | | | | | | | — | | | | (69,998 | ) |
Investor C | | | — | | | | — | | | | | | | | — | | | | (15,477,586 | ) |
Class R | | | — | | | | — | | | | | | | | — | | | | (1,196,436 | ) |
| | | | | | | | | | | | |
Decrease in net assets resulting from distributions to shareholders | | | (6,542,741 | ) | | | (6,742,504 | ) | | | | | | | (5,227,319 | ) | | | (47,835,479 | ) |
| | | | | | | | | | | | |
| | | | | | | | | | | | | | | | | | | | |
| Capital Share Transactions | | | | | | | | | | | | | | | | | | | | |
Net decrease in net assets derived from capital share transactions | | | (47,299,382 | ) | | | (75,135,823 | ) | | | | | | | (127,599,664 | ) | | | (20,636,169 | ) |
| | | | | | | | | | | | |
| | | | | | | | | | | | | | | | | | | | |
| Net Assets | | | | | | | | | | | | | | | | | | | | |
Total decrease in net assets | | | (56,621,350 | ) | | | (143,761,585 | ) | | | | | | | (56,654,069 | ) | | | (186,528,748 | ) |
Beginning of period | | | 355,519,860 | | | | 499,281,445 | | | | | | | | 899,879,309 | | | | 1,086,408,057 | |
| | | | | | | | | | | | |
End of period | | $ | 298,898,510 | | | $ | 355,519,860 | | | | | | | $ | 843,225,240 | | | $ | 899,879,309 | |
| | | | | | | | | | | | |
Undistributed (distributions in excess of) net investment income, end of period | | $ | 193,401 | | | $ | 6,552,393 | | | | | | | $ | (18,704,656 | ) | | $ | (11,260,496 | ) |
| | | | | | | | | | | | |
| | 1 | | Distributions for annual periods determined in accordance with federal income tax regulations. |
| | | | | | |
| See Notes to Financial Statements. | | | | |
| | | | | | | |
| 20 | | SEMI-ANNUAL REPORT | | DECEMBER 31, 2016 | | |
| | |
| Financial Highlights | | BlackRock EuroFund |
| | | | | | | | | | | | | | | | | | | | | | | | | | | | |
| | | Institutional | |
| | | Six Months Ended
December 31,
2016
(Unaudited) | | | Year Ended June 30, | |
| | | | 2016 | | | 2015 | | | 2014 | | | 2013 | | | 2012 | | | | |
| | | | | | | | | | | | | | | | | | | | | | | | | | | | |
| Per Share Operating Performance | | | | | | | | | | | | | | | | | | | | | | | | | | | | |
Net asset value, beginning of period | | $ | 13.25 | | | $ | 15.51 | | | $ | 16.68 | | | $ | 13.62 | | | $ | 11.29 | | | $ | 13.97 | | | | | |
| | | | |
Net investment income1 | | | 0.02 | 2 | | | 0.25 | | | | 0.28 | | | | 0.61 | | | | 0.27 | | | | 0.16 | | | | | |
Net realized and unrealized gain (loss) | | | (0.14 | ) | | | (2.28 | ) | | | (1.00 | ) | | | 2.65 | | | | 2.22 | | | | (2.43 | ) | | | | |
| | | | |
Net increase (decrease) from investment operations | | | (0.12 | ) | | | (2.03 | ) | | | (0.72 | ) | | | 3.26 | | | | 2.49 | | | | (2.27 | ) | | | | |
| | | | |
Distributions from net investment income3 | | | (0.30 | ) | | | (0.23 | ) | | | (0.45 | ) | | | (0.20 | ) | | | (0.16 | ) | | | (0.41 | ) | | | | |
| | | | |
Net asset value, end of period | | $ | 12.83 | | | $ | 13.25 | | | $ | 15.51 | | | $ | 16.68 | | | $ | 13.62 | | | $ | 11.29 | | | | | |
| | | | |
| | | | | | | | | | | | | | | | | | | | | | | | | | | | |
| Total Return4 | | | | | | | | | | | | | | | | | | | | | | | | | | | | |
Based on net asset value | | | (0.92)% | 5 | | | (13.22)% | | | | (4.10)% | | | | 24.06% | | | | 22.10% | | | | (15.99)% | | | | | |
| | | | |
| | | | | | | | | | | | | | | | | | | | | | | | | | | | |
| Ratios to Average Net Assets | | | | | | | | | | | | | | | | | | | | | | | | | | | | |
Total expenses | | | 1.10% | 6 | | | 1.07% | | | | 1.00% | | | | 1.02% | | | | 1.07% | | | | 1.17% | | | | | |
| | | | |
Total expenses after fees waived and paid indirectly | | | 1.10% | 6 | | | 1.07% | | | | 1.00% | | | | 1.02% | | | | 1.07% | | | | 1.17% | | | | | |
| | | | |
Net investment income | | | 0.27% | 2,6 | | | 1.72% | | | | 1.81% | | | | 3.81% | | | | 2.09% | | | | 1.40% | | | | | |
| | | | |
| | | | | | | | | | | | | | | | | | | | | | | | | | | | |
| Supplemental Data | | | | | | | | | | | | | | | | | | | | | | | | | | | | |
Net assets, end of period (000) | | $ | 134,557 | | | $ | 162,627 | | | $ | 221,463 | | | $ | 187,718 | | | $ | 88,713 | | | $ | 81,040 | | | | | |
| | | | |
Portfolio turnover rate | | | 56% | | | | 100% | | | | 117% | | | | 129% | | | | 115% | | | | 162% | | | | | |
| | | | |
| | 1 | | Based on average shares outstanding. |
| | 2 | | Net investment income per share and the ratio of net investment income to average net assets include less than $0.01 per share and 0.11%, respectively, resulting from a special dividend from Steinhoff International Holdings NV in December 2016. |
| | 3 | | Distributions for annual periods determined in accordance with federal income tax regulations. |
| | 4 | | Where applicable, assumes the reinvestment of distributions. |
| | 5 | | Aggregate total return. |
| | | | | | |
| See Notes to Financial Statements. | | | | |
| | | | | | | |
| | SEMI-ANNUAL REPORT | | DECEMBER 31, 2016 | | 21 |
| | |
| Financial Highlights (continued) | | BlackRock EuroFund |
| | | | | | | | | | | | | | | | | | | | | | | | | | | | |
| | | Investor A | |
| | | Six Months Ended
December 31,
2016
(Unaudited) | | | Year Ended June 30, | |
| | | | 2016 | | | 2015 | | | 2014 | | | 2013 | | | 2012 | | | | |
| | | | | | | | | | | | | | | | | | | | | | | | | | | | |
| Per Share Operating Performance | | | | | | | | | | | | | | | | | | | | | | | | | | | | |
Net asset value, beginning of period | | $ | 12.98 | | | $ | 15.23 | | | $ | 16.37 | | | $ | 13.35 | | | $ | 11.08 | | | $ | 13.71 | | | | | |
| | | | |
Net investment income1 | | | 0.00 | 2,3 | | | 0.20 | | | | 0.29 | | | | 0.52 | | | | 0.20 | | | | 0.14 | | | | | |
Net realized and unrealized gain (loss) | | | (0.12 | ) | | | (2.23 | ) | | | (1.03 | ) | | | 2.65 | | | | 2.22 | | | | (2.39 | ) | | | | |
| | | | |
Net increase (decrease) from investment operations | | | (0.12 | ) | | | (2.03 | ) | | | (0.74 | ) | | | 3.17 | | | | 2.42 | | | | (2.25 | ) | | | | |
| | | | |
Distributions from net investment income4 | | | (0.26 | ) | | | (0.22 | ) | | | (0.40 | ) | | | (0.15 | ) | | | (0.15 | ) | | | (0.38 | ) | | | | |
| | | | |
Net asset value, end of period | | $ | 12.60 | | | $ | 12.98 | | | $ | 15.23 | | | $ | 16.37 | | | $ | 13.35 | | | $ | 11.08 | | | | | |
| | | | |
| | | | | | | | | | | | | | | | | | | | | | | | | | | | |
| Total Return5 | | | | | | | | | | | | | | | | | | | | | | | | | | | | |
Based on net asset value | | | (0.94)% | 6 | | | (13.41)% | | | | (4.30)% | | | | 23.83% | | | | 21.89% | | | | (16.18)% | | | | | |
| | | | |
| | | | | | | | | | | | | | | | | | | | | | | | | | | | |
| Ratios to Average Net Assets | | | | | | | | | | | | | | | | | | | | | | | | | | | | |
Total expenses | | | 1.34% | 7 | | | 1.28% | | | | 1.22% | | | | 1.23% | | | | 1.29% | | | | 1.33% | | | | | |
| | | | |
Total expenses after fees waived and paid indirectly | | | 1.34% | 7 | | | 1.28% | | | | 1.22% | | | | 1.23% | | | | 1.29% | | | | 1.33% | | | | | |
| | | | |
Net investment income | | | 0.04% | 3,7 | | | 1.46% | | | | 1.88% | | | | 3.30% | | | | 1.62% | | | | 1.21% | | | | | |
| | | | |
| | | | | | | | | | | | | | | | | | | | | | | | | | | | |
| Supplemental Data | | | | | | | | | | | | | | | | | | | | | | | | | | | | |
Net assets, end of period (000) | | $ | 152,516 | | | $ | 178,374 | | | $ | 258,675 | | | $ | 195,548 | | | $ | 149,426 | | | $ | 176,609 | | | | | |
| | | | |
Portfolio turnover rate | | | 56% | | | | 100% | | | | 117% | | | | 129% | | | | 115% | | | | 162% | | | | | |
| | | | |
| | 1 | | Based on average shares outstanding. |
| | 2 | | Amount is less than $0.005 per share. |
| | 3 | | Net investment income per share and the ratio of net investment income to average net assets include less than $0.01 per share and 0.11%, respectively, resulting from a special dividend from Steinhoff International Holdings NV in December 2016. |
| | 4 | | Distributions for annual periods determined in accordance with federal income tax regulations. |
| | 5 | | Where applicable, excludes the effects of any sales charges and assumes the reinvestment of distributions. |
| | 6 | | Aggregate total return. |
| | | | | | |
| See Notes to Financial Statements. | | | | |
| | | | | | | |
| 22 | | SEMI-ANNUAL REPORT | | DECEMBER 31, 2016 | | |
| | |
| Financial Highlights (continued) | | BlackRock EuroFund |
| | | | | | | | | | | | | | | | | | | | | | | | | | | | |
| | | Investor C | |
| | | Six Months Ended
December 31,
2016
(Unaudited) | | | Year Ended June 30, | |
| | | | 2016 | | | 2015 | | | 2014 | | | 2013 | | | 2012 | | | | |
| | | | | | | | | | | | | | | | | | | | | | | | | | | | |
| Per Share Operating Performance | | | | | | | | | | | | | | | | | | | | | | | | | | | | |
Net asset value, beginning of period | | $ | 9.17 | | | $ | 10.82 | | | $ | 11.76 | | | $ | 9.67 | | | $ | 8.05 | | | $ | 10.06 | | | | | |
| | | | |
Net investment income (loss)1 | | | (0.03 | )2 | | | 0.07 | | | | 0.08 | | | | 0.31 | | | | 0.09 | | | | 0.03 | | | | | |
Net realized and unrealized gain (loss) | | | (0.10 | ) | | | (1.58 | ) | | | (0.70 | ) | | | 1.88 | | | | 1.58 | | | | (1.75 | ) | | | | |
| | | | |
Net increase (decrease) from investment operations | | | (0.13 | ) | | | (1.51 | ) | | | (0.62 | ) | | | 2.19 | | | | 1.67 | | | | (1.72 | ) | | | | |
| | | | |
Distributions from net investment income3 | | | (0.17 | ) | | | (0.14 | ) | | | (0.32 | ) | | | (0.10 | ) | | | (0.05 | ) | | | (0.29 | ) | | | | |
| | | | |
Net asset value, end of period | | $ | 8.87 | | | $ | 9.17 | | | $ | 10.82 | | | $ | 11.76 | | | $ | 9.67 | | | $ | 8.05 | | | | | |
| | | | |
| | | | | | | | | | | | | | | | | | | | | | | | | | | | |
| Total Return4 | | | | | | | | | | | | | | | | | | | | | | | | | | | | |
Based on net asset value | | | (1.40)% | 5 | | | (14.08)% | | | | (5.09)% | | | | 22.76% | | | | 20.83% | | | | (16.88)% | | | | | |
| | | | |
| | | | | | | | | | | | | | | | | | | | | | | | | | | | |
| Ratios to Average Net Assets | | | | | | | | | | | | | | | | | | | | | | | | | | | | |
Total expenses | | | 2.14% | 6 | | | 2.09% | | | | 2.05% | | | | 2.07% | | | | 2.14% | | | | 2.22% | | | | | |
| | | | |
Total expenses after fees waived and paid indirectly | | | 2.14% | 6 | | | 2.09% | | | | 2.05% | | | | 2.07% | | | | 2.14% | | | | 2.22% | | | | | |
| | | | |
Net investment income (loss) | | | (0.75)% | 2,6 | | | 0.67% | | | | 0.70% | | | | 2.72% | | | | 0.99% | | | | 0.30% | | | | | |
| | | | |
| | | | | | | | | | | | | | | | | | | | | | | | | | | | |
| Supplemental Data | | | | | | | | | | | | | | | | | | | | | | | | | | | | |
Net assets, end of period (000) | | $ | 10,907 | | | $ | 13,659 | | | $ | 18,021 | | | $ | 21,838 | | | $ | 13,982 | | | $ | 13,470 | | | | | |
| | | | |
Portfolio turnover rate | | | 56% | | | | 100% | | | | 117% | | | | 129% | | | | 115% | | | | 162% | | | | | |
| | | | |
| | 1 | | Based on average shares outstanding. |
| | 2 | | Net investment income per share and the ratio of net investment income to average net assets include less than $0.01 per share and 0.11%, respectively, resulting from a special dividend from Steinhoff International Holdings NV in December 2016. |
| | 3 | | Distributions for annual periods determined in accordance with federal income tax regulations. |
| | 4 | | Where applicable, excludes the effects of any sales charges and assumes the reinvestment of distributions. |
| | 5 | | Aggregate total return. |
| | | | | | |
| See Notes to Financial Statements. | | | | |
| | | | | | | |
| | SEMI-ANNUAL REPORT | | DECEMBER 31, 2016 | | 23 |
| | |
| Financial Highlights (concluded) | | BlackRock EuroFund |
| | | | | | | | | | | | | | | | | | | | | | | | | | | | |
| | | Class R | |
| | | Six Months Ended
December 31,
2016
(Unaudited) | | | Year Ended June 30, | |
| | | | 2016 | | | 2015 | | | 2014 | | | 2013 | | | 2012 | | | | |
| | | | | | | | | | | | | | | | | | | | | | | | | | | | |
| Per Share Operating Performance | | | | | | | | | | | | | | | | | | | | | | | | | | | | |
Net asset value, beginning of period | | $ | 9.89 | | | $ | 11.66 | | | $ | 12.58 | | | $ | 10.32 | | | $ | 8.57 | | | $ | 10.72 | | | | | |
| | | | |
Net investment income (loss)1 | | | (0.02 | )2 | | | 0.11 | | | | 0.12 | | | | 0.33 | | | | 0.13 | | | | 0.04 | | | | | |
Net realized and unrealized gain (loss) | | | (0.10 | ) | | | (1.71 | ) | | | (0.73 | ) | | | 2.04 | | | | 1.69 | | | | (1.87 | ) | | | | |
| | | | |
Net increase (decrease) from investment operations | | | (0.12 | ) | | | (1.60 | ) | | | (0.61 | ) | | | 2.37 | | | | 1.82 | | | | (1.83 | ) | | | | |
| | | | |
Distributions from net investment income3 | | | (0.22 | ) | | | (0.17 | ) | | | (0.31 | ) | | | (0.11 | ) | | | (0.07 | ) | | | (0.32 | ) | | | | |
| | | | |
Net asset value, end of period | | $ | 9.55 | | | $ | 9.89 | | | $ | 11.66 | | | $ | 12.58 | | | $ | 10.32 | | | $ | 8.57 | | | | | |
| | | | |
| | | | | | | | | | | | | | | | | | | | | | | | | | | | |
| Total Return4 | | | | | | | | | | | | | | | | | | | | | | | | | | | | |
Based on net asset value | | | (1.17)% | 5 | | | (13.82)% | | | | (4.68)% | | | | 23.05% | | | | 21.32% | | | | (16.81)% | | | | | |
| | | | |
| | | | | | | | | | | | | | | | | | | | | | | | | | | | |
| Ratios to Average Net Assets | | | | | | | | | | | | | | | | | | | | | | | | | | | | |
Total expenses | | | 1.80% | 6 | | | 1.72% | | | | 1.69% | | | | 1.79% | | | | 1.80% | | | | 1.96% | | | | | |
| | | | |
Total expenses after fees waived and paid indirectly | | | 1.80% | 6 | | | 1.72% | | | | 1.69% | | | | 1.79% | | | | 1.80% | | | | 1.96% | | | | | |
| | | | |
Net investment income (loss) | | | (0.43)% | 2,6 | | | 1.08% | | | | 1.03% | | | | 2.77% | | | | 1.34% | | | | 0.46% | | | | | |
| | | | |
| | | | | | | | | | | | | | | | | | | | | | | | | | | | |
| Supplemental Data | | | | | | | | | | | | | | | | | | | | | | | | | | | | |
Net assets, end of period (000) | | $ | 918 | | | $ | 859 | | | $ | 1,122 | | | $ | 1,471 | | | $ | 1,564 | | | $ | 1,405 | | | | | |
| | | | |
Portfolio turnover rate | | | 56% | | | | 100% | | | | 117% | | | | 129% | | | | 115% | | | | 162% | | | | | |
| | | | |
| | 1 | | Based on average shares outstanding. |
| | 2 | | Net investment income per share and the ratio of net investment income to average net assets include less than $0.01 per share and 0.11%, respectively, resulting from a special dividend from Steinhoff International Holdings NV in December 2016. |
| | 3 | | Distributions for annual periods determined in accordance with federal income tax regulations. |
| | 4 | | Where applicable, assumes the reinvestment of distributions. |
| | 5 | | Aggregate total return. |
| | | | | | |
| See Notes to Financial Statements. | | | | |
| | | | | | | |
| 24 | | SEMI-ANNUAL REPORT | | DECEMBER 31, 2016 | | |
| | |
| Financial Highlights | | BlackRock Global SmallCap Fund, Inc. |
| | | | | | | | | | | | | | | | | | | | | | | | | | | | |
| | | Institutional | |
| | | Six Months Ended
December 31,
2016
(Unaudited) | | | Year Ended June 30, | |
| | | | 2016 | | | 2015 | | | 2014 | | | 2013 | | | 2012 | | | | |
| | | | | | | | | | | | | | | | | | | | | | | | | | | | |
| Per Share Operating Performance | | | | | | | | | | | | | | | | | | | | | | | | | | | | |
Net asset value, beginning of period | | $ | 21.85 | | | $ | 25.78 | | | $ | 30.82 | | | $ | 25.94 | | | $ | 21.87 | | | $ | 24.41 | | | | | |
| | | | |
Net investment income (loss)1 | | | (0.00 | )2 | | | 0.04 | | | | 0.08 | | | | 0.09 | | | | 0.18 | | | | 0.07 | | | | | |
Net realized and unrealized gain (loss) | | | 2.00 | | | | (2.87 | ) | | | (1.17 | ) | | | 8.09 | | | | 4.58 | | | | (2.31 | ) | | | | |
| | | | |
Net increase (decrease) from investment operations | | | 2.00 | | | | (2.83 | ) | | | (1.09 | ) | | | 8.18 | | | | 4.76 | | | | (2.24 | ) | | | | |
| | | | |
| Distributions:3 | | | | | | | | | | | | | | | | | | | | | | | | | | | | |
From net investment income | | | (0.28 | ) | | | — | | | | (0.11 | ) | | | (0.24 | ) | | | (0.69 | ) | | | (0.30 | ) | | | | |
From net realized gain | | | — | | | | (1.10 | ) | | | (3.84 | ) | | | (3.06 | ) | | | — | | | | — | | | | | |
| | | | |
Total distributions | | | (0.28 | ) | | | (1.10 | ) | | | (3.95 | ) | | | (3.30 | ) | | | (0.69 | ) | | | (0.30 | ) | | | | |
| | | | |
Net asset value, end of period | | $ | 23.57 | | | $ | 21.85 | | | $ | 25.78 | | | $ | 30.82 | | | $ | 25.94 | | | $ | 21.87 | | | | | |
| | | | |
| | | | | | | | | | | | | | | | | | | | | | | | | | | | |
| Total Return4 | | | | | | | | | | | | | | | | | | | | | | | | | | | | |
Based on net asset value | | | 9.13% | 5 | | | (10.94)% | | | | (2.45)% | | | | 33.28% | | | | 22.20% | | | | (9.11)% | | | | | |
| | | | |
| | | | | | | | | | | | | | | | | | | | | | | | | | | | |
| Ratios to Average Net Assets | | | | | | | | | | | | | | | | | | | | | | | | | | | | |
Total expenses | | | 1.08% | 6 | | | 1.07% | | | | 1.05% | | | | 1.03% | | | | 1.02% | | | | 1.12% | | | | | |
| | | | |
Total expenses after fees waived and paid indirectly | | | 1.08% | 6 | | | 1.07% | | | | 1.05% | | | | 1.03% | | | | 1.02% | | | | 1.12% | | | | | |
| | | | |
Net investment income (loss) | | | (0.00)% | 6 | | | 0.17% | | | | 0.29% | | | | 0.31% | | | | 0.76% | | | | 0.30% | | | | | |
| | | | |
| | | | | | | | | | | | | | | | | | | | | | | | | | | | |
| Supplemental Data | | | | | | | | | | | | | | | | | | | | | | | | | | | | |
Net assets, end of period (000) | | $ | 235,830 | | | $ | 250,041 | | | $ | 265,841 | | | $ | 320,705 | | | $ | 244,523 | | | $ | 186,022 | | | | | |
| | | | |
Portfolio turnover rate | | | 32% | | | | 73% | | | | 73% | | | | 77% | | | | 73% | | | | 73% | | | | | |
| | | | |
| | 1 | | Based on average shares outstanding. |
| | 2 | | Amount is greater than $(0.005) per share. |
| | 3 | | Distributions for annual periods determined in accordance with federal income tax regulations. |
| | 4 | | Where applicable, assumes the reinvestment of distributions. |
| | 5 | | Aggregate total return. |
| | | | | | |
| See Notes to Financial Statements. | | | | |
| | | | | | | |
| | SEMI-ANNUAL REPORT | | DECEMBER 31, 2016 | | 25 |
| | |
| Financial Highlights (continued) | | BlackRock Global SmallCap Fund, Inc. |
| | | | | | | | | | | | | | | | | | | | | | | | | | | | |
| | | Investor A | |
| | | Six Months Ended
December 31,
2016
(Unaudited) | | | Year Ended June 30, | |
| | | | 2016 | | | 2015 | | | 2014 | | | 2013 | | | 2012 | | | | |
| | | | | | | | | | | | | | | | | | | | | | | | | | | | |
| Per Share Operating Performance | | | | | | | | | | | | | | | | | | | | | | | | | | | | |
Net asset value, beginning of period | | $ | 21.00 | | | $ | 24.90 | | | $ | 29.95 | | | $ | 25.33 | | | $ | 21.40 | | | $ | 23.91 | | | | | |
| | | | |
Net investment income (loss)1 | | | (0.04 | ) | | | (0.04 | ) | | | (0.00 | )2 | | | (0.00 | )2 | | | 0.08 | | | | 0.02 | | | | | |
Net realized and unrealized gain (loss) | | | 1.91 | | | | (2.76 | ) | | | (1.15 | ) | | | 7.87 | | | | 4.49 | | | | (2.29 | ) | | | | |
| | | | |
Net increase (decrease) from investment operations | | | 1.87 | | | | (2.80 | ) | | | (1.15 | ) | | | 7.87 | | | | 4.57 | | | | (2.27 | ) | | | | |
| | | | |
| Distributions:3 | | | | | | | | | | | | | | | | | | | | | | | | | | | | |
From net investment income | | | (0.15 | ) | | | — | | | | (0.06 | ) | | | (0.19 | ) | | | (0.64 | ) | | | (0.24 | ) | | | | |
From net realized gain | | | — | | | | (1.10 | ) | | | (3.84 | ) | | | (3.06 | ) | | | — | | | | — | | | | | |
| | | | |
Total distributions | | | (0.15 | ) | | | (1.10 | ) | | | (3.90 | ) | | | (3.25 | ) | | | (0.64 | ) | | | (0.24 | ) | | | | |
| | | | |
Net asset value, end of period | | $ | 22.72 | | | $ | 21.00 | | | $ | 24.90 | | | $ | 29.95 | | | $ | 25.33 | | | $ | 21.40 | | | | | |
| | | | |
| | | | | | | | | | | | | | | | | | | | | | | | | | | | |
| Total Return4 | | | | | | | | | | | | | | | | | | | | | | | | | | | | |
Based on net asset value | | | 8.89% | 5 | | | (11.21)% | | | | (2.74)% | | | | 32.81% | | | | 21.78% | | | | (9.44)% | | | | | |
| | | | |
| | | | | | | | | | | | | | | | | | | | | | | | | | | | |
| Ratios to Average Net Assets | | | | | | | | | | | | | | | | | | | | | | | | | | | | |
Total expenses | | | 1.44% | 6 | | | 1.42% | | | | 1.38% | | | | 1.37% | | | | 1.40% | | | | 1.42% | | | | | |
| | | | |
Total expenses after fees waived and paid indirectly | | | 1.44% | 6 | | | 1.42% | | | | 1.38% | | | | 1.37% | | | | 1.40% | | | | 1.42% | | | | | |
| | | | |
Net investment income (loss) | | | (0.36)% | 6 | | | (0.20)% | | | | (0.02)% | | | | (0.01)% | | | | 0.35% | | | | 0.08% | | | | | |
| | | | |
| | | | | | | | | | | | | | | | | | | | | | | | | | | | |
| Supplemental Data | | | | | | | | | | | | | | | | | | | | | | | | | | | | |
Net assets, end of period (000) | | $ | 362,618 | | | $ | 382,069 | | | $ | 474,107 | | | $ | 520,436 | | | $ | 364,036 | | | $ | 326,001 | | | | | |
| | | | |
Portfolio turnover rate | | | 32% | | | | 73% | | | | 73% | | | | 77% | | | | 73% | | | | 73% | | | | | |
| | | | |
| | 1 | | Based on average shares outstanding. |
| | 2 | | Amount is greater than $(0.005) per share. |
| | 3 | | Distributions for annual periods determined in accordance with federal income tax regulations. |
| | 4 | | Where applicable, excludes the effects of any sales charges and assumes the reinvestment of distributions. |
| | 5 | | Aggregate total return. |
| | | | | | |
| See Notes to Financial Statements. | | | | |
| | | | | | | |
| 26 | | SEMI-ANNUAL REPORT | | DECEMBER 31, 2016 | | |
| | |
| Financial Highlights (continued) | | BlackRock Global SmallCap Fund, Inc. |
| | | | | | | | | | | | | | | | | | | | | | | | | | | | |
| | | Investor B | |
| | | Six Months Ended
December 31,
2016
(Unaudited) | | | Year Ended June 30, | |
| | | | 2016 | | | 2015 | | | 2014 | | | 2013 | | | 2012 | | | | |
| | | | | | | | | | | | | | | | | | | | | | | | | | | | |
| Per Share Operating Performance | | | | | | | | | | | | | | | | | | | | | | | | | | | | |
Net asset value, beginning of period | | $ | 19.23 | | | $ | 23.13 | | | $ | 28.19 | | | $ | 24.05 | | | $ | 20.15 | | | $ | 22.45 | | | | | |
| | | | |
Net investment loss1 | | | (0.11 | ) | | | (0.24 | ) | | | (0.24 | ) | | | (0.25 | ) | | | (0.16 | ) | | | (0.19 | ) | | | | |
Net realized and unrealized gain (loss) | | | 1.73 | | | | (2.56 | ) | | | (1.08 | ) | | | 7.48 | | | | 4.27 | | | | (2.11 | ) | | | | |
| | | | |
Net increase (decrease) from investment operations | | | 1.62 | | | | (2.80 | ) | | | (1.32 | ) | | | 7.23 | | | | 4.11 | | | | (2.30 | ) | | | | |
| | | | |
| Distributions:2 | | | | | | | | | | | | | | | | | | | | | | | | | | | | |
From net investment income | | | — | | | | — | | | | — | | | | (0.03 | ) | | | (0.21 | ) | | | — | | | | | |
From net realized gain | | | — | | | | (1.10 | ) | | | (3.74 | ) | | | (3.06 | ) | | | — | | | | — | | | | | |
| | | | |
Total distributions | | | — | | | | (1.10 | ) | | | (3.74 | ) | | | (3.09 | ) | | | (0.21 | ) | | | — | | | | | |
| | | | |
Net asset value, end of period | | $ | 20.85 | | | $ | 19.23 | | | $ | 23.13 | | | $ | 28.19 | | | $ | 24.05 | | | $ | 20.15 | | | | | |
| | | | |
| | | | | | | | | | | | | | | | | | | | | | | | | | | | |
| Total Return3 | | | | | | | | | | | | | | | | | | | | | | | | | | | | |
Based on net asset value | | | 8.42% | 4 | | | (12.06)% | | | | (3.62)% | | | | 31.74% | | | | 20.55% | | | | (10.25)% | | | | | |
| | | | |
| | | | | | | | | | | | | | | | | | | | | | | | | | | | |
| Ratios to Average Net Assets | | | | | | | | | | | | | | | | | | | | | | | | | | | | |
Total expenses | | | 2.24% | 5 | | | 2.38% | | | | 2.28% | | | | 2.22% | | | | 2.43% | | | | 2.39% | | | | | |
| | | | |
Total expenses after fees waived and paid indirectly | | | 2.24% | 5 | | | 2.38% | | | | 2.28% | | | | 2.22% | | | | 2.43% | | | | 2.39% | | | | | |
| | | | |
Net investment loss | | | (1.10)% | 5 | | | (1.21)% | | | | (0.99)% | | | | (0.94)% | | | | (0.74)% | | | | (0.92)% | | | | | |
| | | | |
| | | | | | | | | | | | | | | | | | | | | | | | | | | | |
| Supplemental Data | | | | | | | | | | | | | | | | | | | | | | | | | | | | |
Net assets, end of period (000) | | $ | 503 | | | $ | 884 | | | $ | 1,825 | | | $ | 4,467 | | | $ | 7,355 | | | $ | 11,968 | | | | | |
| | | | |
Portfolio turnover rate | | | 32% | | | | 73% | | | | 73% | | | | 77% | | | | 73% | | | | 73% | | | | | |
| | | | |
| | 1 | | Based on average shares outstanding. |
| | 2 | | Distributions for annual periods determined in accordance with federal income tax regulations. |
| | 3 | | Where applicable, excludes the effects of any sales charges and assumes the reinvestment of distributions. |
| | 4 | | Aggregate total return. |
| | | | | | |
| See Notes to Financial Statements. | | | | |
| | | | | | | |
| | SEMI-ANNUAL REPORT | | DECEMBER 31, 2016 | | 27 |
| | |
| Financial Highlights (continued) | | BlackRock Global SmallCap Fund, Inc. |
| | | | | | | | | | | | | | | | | | | | | | | | | | | | |
| | | Investor C | |
| | | Six Months Ended
December 31,
2016
(Unaudited) | | | Year Ended June 30, | |
| | | | 2016 | | | 2015 | | | 2014 | | | 2013 | | | 2012 | | | | |
| | | | | | | | | | | | | | | | | | | | | | | | | | | | |
| Per Share Operating Performance | | | | | | | | | | | | | | | | | | | | | | | | | | | | |
Net asset value, beginning of period | | $ | 18.15 | | | $ | 21.86 | | | $ | 26.92 | | | $ | 23.13 | | | $ | 19.57 | | | $ | 21.83 | | | | | |
| | | | |
Net investment loss1 | | | (0.11 | ) | | | (0.19 | ) | | | (0.19 | ) | | | (0.21 | ) | | | (0.10 | ) | | | (0.15 | ) | | | | |
Net realized and unrealized gain (loss) | | | 1.64 | | | | (2.42 | ) | | | (1.07 | ) | | | 7.15 | | | | 4.11 | | | | (2.08 | ) | | | | |
| | | | |
Net increase (decrease) from investment operations | | | 1.53 | | | | (2.61 | ) | | | (1.26 | ) | | | 6.94 | | | | 4.01 | | | | (2.23 | ) | | | | |
| | | | |
| Distributions:2 | | | | | | | | | | | | | | | | | | | | | | | | | | | | |
From net investment income | | | — | | | | — | | | | — | | | | (0.09 | ) | | | (0.45 | ) | | | (0.03 | ) | | | | |
From net realized gain | | | — | | | | (1.10 | ) | | | (3.80 | ) | | | (3.06 | ) | | | — | | | | — | | | | | |
| | | | |
Total distributions | | | — | | | | (1.10 | ) | | | (3.80 | ) | | | (3.15 | ) | | | (0.45 | ) | | | (0.03 | ) | | | | |
| | | | |
Net asset value, end of period | | $ | 19.68 | | | $ | 18.15 | | | $ | 21.86 | | | $ | 26.92 | | | $ | 23.13 | | | $ | 19.57 | | | | | |
| | | | |
| | | | | | | | | | | | | | | | | | | | | | | | | | | | |
| Total Return3 | | | | | | | | | | | | | | | | | | | | | | | | | | | | |
Based on net asset value | | | 8.43% | 4 | | | (11.93)% | | | | (3.53)% | | | | 31.79% | | | | 20.80% | | | | (10.19)% | | | | | |
| | | | |
| | | | | | | | | | | | | | | | | | | | | | | | | | | | |
| Ratios to Average Net Assets | | | | | | | | | | | | | | | | | | | | | | | | | | | | |
Total expenses | | | 2.26% | 5 | | | 2.22% | | | | 2.17% | | | | 2.16% | | | | 2.21% | | | | 2.27% | | | | | |
| | | | |
Total expenses after fees waived and paid indirectly | | | 2.26% | 5 | | | 2.22% | | | | 2.17% | | | | 2.16% | | | | 2.21% | | | | 2.27% | | | | | |
| | | | |
Net investment loss | | | (1.17)% | 5 | | | (1.01)% | | | | (0.81)% | | | | (0.82)% | | | | (0.45)% | | | | (0.78)% | | | | | |
| | | | |
| | | | | | | | | | | | | | | | | | | | | | | | | | | | |
| Supplemental Data | | | | | | | | | | | | | | | | | | | | | | | | | | | | |
Net assets, end of period (000) | | $ | 223,167 | | | $ | 245,795 | | | $ | 318,616 | | | $ | 348,937 | | | $ | 273,018 | | | $ | 251,459 | | | | | |
| | | | |
Portfolio turnover rate | | | 32% | | | | 73% | | | | 73% | | | | 77% | | | | 73% | | | | 73% | | | | | |
| | | | |
| | 1 | | Based on average shares outstanding. |
| | 2 | | Distributions for annual periods determined in accordance with federal income tax regulations. |
| | 3 | | Where applicable, excludes the effects of any sales charges and assumes the reinvestment of distributions. |
| | 4 | | Aggregate total return. |
| | | | | | |
| See Notes to Financial Statements. | | | | |
| | | | | | | |
| 28 | | SEMI-ANNUAL REPORT | | DECEMBER 31, 2016 | | |
| | |
| Financial Highlights (concluded) | | BlackRock Global SmallCap Fund, Inc. |
| | | | | | | | | | | | | | | | | | | | | | | | | | | | |
| | | Class R | |
| | | Six Months Ended
December 31,
2016
(Unaudited) | | | Year Ended June 30, | |
| | | | 2016 | | | 2015 | | | 2014 | | | 2013 | | | 2012 | | | | |
| | | | | | | | | | | | | | | | | | | | | | | | | | | | |
| Per Share Operating Performance | | | | | | | | | | | | | | | | | | | | | | | | | | | | |
Net asset value, beginning of period | | $ | 19.48 | | | $ | 23.27 | | | $ | 28.30 | | | $ | 24.13 | | | $ | 20.38 | | | $ | 22.72 | | | | | |
| | | | |
Net investment loss1 | | | (0.08 | ) | | | (0.11 | ) | | | (0.10 | ) | | | (0.10 | ) | | | (0.01 | ) | | | (0.08 | ) | | | | |
Net realized and unrealized gain (loss) | | | 1.77 | | | | (2.58 | ) | | | (1.09 | ) | | | 7.47 | | | | 4.28 | | | | (2.14 | ) | | | | |
| | | | |
Net increase (decrease) from investment operations | | | 1.69 | | | | (2.69 | ) | | | (1.19 | ) | | | 7.37 | | | | 4.27 | | | | (2.22 | ) | | | | |
| | | | |
| Distributions:2 | | | | | | | | | | | | | | | | | | | | | | | | | | | | |
From net investment income | | | (0.04 | ) | | | — | | | | (0.00 | )3 | | | (0.14 | ) | | | (0.52 | ) | | | (0.12 | ) | | | | |
From net realized gain | | | — | | | | (1.10 | ) | | | (3.84 | ) | | | (3.06 | ) | | | — | | | | — | | | | | |
| | | | |
Total distributions | | | (0.04 | ) | | | (1.10 | ) | | | (3.84 | ) | | | (3.20 | ) | | | (0.52 | ) | | | (0.12 | ) | | | | |
| | | | |
Net asset value, end of period | | $ | 21.13 | | | $ | 19.48 | | | $ | 23.27 | | | $ | 28.30 | | | $ | 24.13 | | | $ | 20.38 | | | | | |
| | | | |
| | | | | | | | | | | | | | | | | | | | | | | | | | | | |
| Total Return4 | | | | | | | | | | | | | | | | | | | | | | | | | | | | |
Based on net asset value | | | 8.70% | 5 | | | (11.54)% | | | | (3.08)% | | | | 32.32% | | | | 21.28% | | | | (9.76)% | | | | | |
| | | | |
| | | | | | | | | | | | | | | | | | | | | | | | | | | | |
| Ratios to Average Net Assets | | | | | | | | | | | | | | | | | | | | | | | | | | | | |
Total expenses | | | 1.83% | 6 | | | 1.77% | | | | 1.73% | | | | 1.72% | | | | 1.79% | | | | 1.83% | | | | | |
| | | | |
Total expenses after fees waived and paid indirectly | | | 1.83% | 6 | | | 1.77% | | | | 1.73% | | | | 1.72% | | | | 1.79% | | | | 1.83% | | | | | |
| | | | |
Net investment loss | | | (0.75)% | 6 | | | (0.56)% | | | | (0.39)% | | | | (0.38)% | | | | (0.04)% | | | | (0.37)% | | | | | |
| | | | |
| | | | | | | | | | | | | | | | | | | | | | | | | | | | |
| Supplemental Data | | | | | | | | | | | | | | | | | | | | | | | | | | | | |
Net assets, end of period (000) | | $ | 21,106 | | | $ | 21,091 | | | $ | 26,019 | | | $ | 33,944 | | | $ | 29,112 | | | $ | 28,861 | | | | | |
| | | | |
Portfolio turnover rate | | | 32% | | | | 73% | | | | 73% | | | | 77% | | | | 73% | | | | 73% | | | | | |
| | | | |
| | 1 | | Based on average shares outstanding. |
| | 2 | | Distributions for annual periods determined in accordance with federal income tax regulations. |
| | 3 | | Amount is greater than $(0.005) per share. |
| | 4 | | Where applicable, assumes the reinvestment of distributions. |
| | 5 | | Aggregate total return. |
| | | | | | |
| See Notes to Financial Statements. | | | | |
| | | | | | | |
| | SEMI-ANNUAL REPORT | | DECEMBER 31, 2016 | | 29 |
| | | | |
| Notes to Financial Statements (Unaudited) | | |
1. Organization:
BlackRock EuroFund and BlackRock Global SmallCap Fund, Inc., collectively, the “Corporations”) are each registered under the Investment Company Act of 1940, as amended (the “1940 Act”), as open-end management investment companies. BlackRock EuroFund is organized as a Massachusetts business trust. BlackRock Global SmallCap Fund, Inc. is organized as a Maryland corporation. The following are referred to herein collectively as the “Funds” or individually, a “Fund”:
| | | | |
| Fund Name | | Herein Referred To As | | Diversification Classification |
| BlackRock EuroFund | | EuroFund | | Diversified |
| BlackRock Global SmallCap Fund, Inc. | | Global SmallCap | | Diversified |
Each Fund offers multiple classes of shares. All classes of shares have identical voting, dividend, liquidation and other rights and are subject to the same terms and conditions, except that certain classes bear expenses related to the shareholder servicing and distribution of such shares. Institutional Shares are sold only to certain eligible investors. Class R Shares are available only to certain employer-sponsored retirement plans. Investor A and Investor C Shares are generally available through financial intermediaries. Investor B Shares are available only through exchanges and dividend and capital gain reinvestments by existing shareholders, and for purchase by certain employer-sponsored retirement plans. Each class has exclusive voting rights with respect to matters relating to its shareholder servicing and distribution expenditures (except that Investor B shareholders may vote on material changes to the Investor A distribution and service plan).
| | | | | | |
| Share Class | | Initial Sales Charge | | CDSC | | Conversion Privilege |
Institutional and Class R Shares | | No | | No | | None |
Investor A Shares | | Yes | | No1 | | None |
Investor B Shares | | No | | Yes | | To Investor A Shares after approximately 8 years |
Investor C Shares | | No | | Yes | | None |
| | 1 | | Investor A Shares may be subject to a contingent deferred sales charge (“CDSC”) for certain redemptions where no initial sales charge was paid at the time of purchase. |
The Funds, together with certain other registered investment companies advised by BlackRock Advisors, LLC ( the “Manager”) or its affiliates, are included in a complex of open-end funds referred to as the Equity-Bond Complex.
2. Significant Accounting Policies:
The financial statements are prepared in conformity with accounting principles generally accepted in the United States of America (“U.S. GAAP”), which may require management to make estimates and assumptions that affect the reported amounts of assets and liabilities in the financial statements, disclosure of contingent assets and liabilities at the date of the financial statements and the reported amounts of increases and decreases in net assets from operations during the reporting period. Actual results could differ from those estimates. Each Fund is considered an investment company under U.S. GAAP and follows the accounting and reporting guidance applicable to investment companies. Below is a summary of significant accounting policies:
Foreign Currency: Each Fund’s books and records are maintained in U.S. dollars. Purchases and sales of investments are recorded at the rates of exchange prevailing on the respective dates of such transactions. Generally, when the U.S. dollar rises in value against a foreign currency, the investments denominated in that currency will lose value; the opposite effect occurs if the U.S. dollar falls in relative value.
Each Fund does not isolate the portion of the results of operations arising as a result of changes in the exchange rates from the changes in the market prices of investments held or sold for financial reporting purposes. Accordingly, the effects of changes in exchange rates on investments are not segregated in the Statements of Operations from the effects of changes in market prices of those investments, but are included as a component of net realized and unrealized gain (loss) from investments. Each Fund reports realized currency gains (losses) on foreign currency related transactions as components of net realized gain (loss) for financial reporting purposes, whereas such components are generally treated as ordinary income for federal income tax purposes.
Investment Transactions and Investment Income: For financial reporting purposes, investment transactions are recorded on the dates the transactions are entered into (the trade dates). Realized gains and losses on investment transactions are determined on the identified cost basis. Dividend income is recorded on the ex-dividend date. Dividends from foreign securities where the ex-dividend date may have passed are subsequently recorded when the Funds are informed of the ex-dividend date. Under the applicable foreign tax laws, a withholding tax at various rates may be imposed on capital
| | | | | | |
| | | | | | | |
| 30 | | SEMI-ANNUAL REPORT | | DECEMBER 31, 2016 | | |
| | | | |
| Notes to Financial Statements (continued) | | |
gains, dividends and interest. Upon notification from issuers, some of the dividend income received from a real estate investment trust may be redesignated as a reduction of cost of the related investment and/or realized gain. Income, expenses and realized and unrealized gains and losses are allocated daily to each class based on its relative net assets.
Distributions: Distributions paid by the Funds are recorded on the ex-dividend date. The character and timing of distributions are determined in accordance with federal income tax regulations, which may differ from U.S. GAAP.
Recent Accounting Standard: In April 2015, the Financial Accounting Standards Board issued “Disclosures for Investments in Certain Entities that Calculate Net Asset Value (“NAV”) per Share” which eliminates the requirement to categorize investments within the fair value hierarchy when fair value is based on the NAV per share and no quoted market value is available. As of December 31, 2016, certain investments of each Fund were valued using NAV per share or its equivalent as no quoted market value is available and have been excluded from the fair value hierarchy.
In November 2016, the Financial Accounting Standards Board issued Accounting Standards Update “Restricted Cash” which will require entities to include the total of cash, cash equivalents, restricted cash, and restricted cash equivalents in the beginning and ending cash balances in the Statement of Cash Flows. The guidance will be applied retrospectively and is effective for fiscal years beginning after December 15, 2017, and interim periods within those years. Management is evaluating the impact, if any, of this guidance on each Fund’s presentation in the Statement of Cash Flows.
Indemnifications: In the normal course of business, a Fund enters into contracts that contain a variety of representations that provide general indemnification. A Fund’s maximum exposure under these arrangements is unknown because it involves future potential claims against a Fund, which cannot be predicted with any certainty.
Other: Expenses directly related to a Fund or its classes are charged to that Fund or the applicable class. Other operating expenses shared by several funds, including other funds managed by the Manager, are prorated among those funds on the basis of relative net assets or other appropriate methods. Expenses directly related to the Funds and other shared expenses prorated to the Funds are allocated daily to each class based on its relative net assets or other appropriate methods.
The Funds have an arrangement with their custodian whereby credits are earned on uninvested cash balances, which could be used to reduce custody fees and/or overdraft charges. The Funds may incur charges on certain uninvested cash balances and overdrafts, subject to certain conditions.
3. Investment Valuation and Fair Value Measurements:
Investment Valuation Policies: The Funds’ investments are valued at fair value (also referred to as “market value” within the financial statements) as of the close of trading on the New York Stock Exchange (“NYSE”) (generally 4:00 p.m., Eastern time) (or if the reporting date falls on a day the NYSE is closed, investments are valued at fair value as of the period end). U.S. GAAP defines fair value as the price the Funds would receive to sell an asset or pay to transfer a liability in an orderly transaction between market participants at the measurement date. The Funds determine the fair values of their financial instruments using various independent dealers or pricing services under policies approved by the Board of Directors of each Fund (the “Board”). The BlackRock Global Valuation Methodologies Committee (the “Global Valuation Committee”) is the committee formed by management to develop global pricing policies and procedures and to oversee the pricing function for all financial instruments.
Fair Value Inputs and Methodologies: The following methods and inputs are used to establish the fair value of each Fund’s assets and liabilities:
| • | | Equity investments traded on a recognized securities exchange are valued at the official closing price each day, if available. For equity investments traded on more than one exchange, the official closing price on the exchange where the stock is primarily traded is used. Equity investments traded on a recognized exchange for which there were no sales on that day may be valued at the last available bid (long positions) or ask (short positions) price. Generally, trading in foreign instruments is substantially completed each day at various times prior to the close of trading on the NYSE. Occasionally, events affecting the values of such instruments may occur between the foreign market close and the close of trading on the NYSE that may not be reflected in the computation of a Fund’s net assets. Each business day, the Funds use a pricing service to assist with the valuation of certain foreign exchange-traded equity securities and foreign exchange-traded and over-the-counter (“OTC”) options (the “Systematic Fair Value Price”). Using current market factors, the Systematic Fair Value Price is designed to value such foreign securities and foreign options at fair value as of the close of trading on the NYSE, which follows the close of the local markets. |
| • | | Investments in open-end U.S. mutual funds are valued at NAV each business day. |
| | | | | | |
| | | | | | | |
| | SEMI-ANNUAL REPORT | | DECEMBER 31, 2016 | | 31 |
| | |
| Notes to Financial Statements (continued) | | |
| • | | The Funds value their investment in SL Liquidity Series, LLC, Money Market Series (the “Money Market Series”) at fair value, which is ordinarily based upon their pro rata ownership in the underlying fund’s net assets. The Money Market Series seeks current income consistent with maintaining liquidity and preserving capital. Although the Money Market Series is not registered under the 1940 Act, its investments may follow the parameters of investments by a money market fund that is subject to Rule 2a-7 under the 1940 Act. |
| • | | Securities and other assets and liabilities denominated in foreign currencies are translated into U.S. dollars using exchange rates determined as of the close of trading on the NYSE. Forward foreign currency exchange contracts are valued at the mean between the bid and ask prices and are determined as of the close of trading on the NYSE. Interpolated values are derived when the settlement date of the contract is an interim date for which quotations are not available |
If events (e.g., a company announcement, market volatility or a natural disaster) occur that are expected to materially affect the value of such investments, or in the event that the application of these methods of valuation results in a price for an investment that is deemed not to be representative of the market value of such investment, or if a price is not available, the investment will be valued by the Global Valuation Committee, or its delegate, in accordance with a policy approved by the Board as reflecting fair value (“Fair Valued Investments”). The fair valuation approaches that may be used by the Global Valuation Committee will include Market approach, Income approach and the Cost approach. Valuation techniques such as discounted cash flow, use of market comparables and matrix pricing are types of valuation approaches and typically used in determining fair value. When determining the price for Fair Valued Investments, the Global Valuation Committee, or its delegate, seeks to determine the price that each Fund might reasonably expect to receive or pay from the current sale or purchase of that asset or liability in an arm’s-length transaction. Fair value determinations shall be based upon all available factors that the Global Valuation Committee, or its delegate, deems relevant and consistent with the principles of fair value measurement. The pricing of all Fair Valued Investments is subsequently reported to the Board or a committee thereof on a quarterly basis.
Fair Value Hierarchy: Various inputs are used in determining the fair value of investments. These inputs to valuation techniques are categorized into a fair value hierarchy consisting of three broad levels for financial statement purposes as follows:
| • | | Level 1 — unadjusted price quotations in active markets/exchanges for identical assets or liabilities that each Fund has the ability to access |
| • | | Level 2 — other observable inputs (including, but not limited to, quoted prices for similar assets or liabilities in markets that are active, quoted prices for identical or similar assets or liabilities in markets that are not active, inputs other than quoted prices that are observable for the assets or liabilities (such as interest rates, yield curves, volatilities, prepayment speeds, loss severities, credit risks and default rates) or other market–corroborated inputs) |
| • | | Level 3 — unobservable inputs based on the best information available in the circumstances, to the extent observable inputs are not available including each Fund’s own assumptions used in determining the fair value of investments) |
The hierarchy gives the highest priority to unadjusted quoted prices in active markets for identical assets or liabilities (Level 1 measurements) and the lowest priority to unobservable inputs (Level 3 measurements). Accordingly, the degree of judgment exercised in determining fair value is greatest for instruments categorized in Level 3. The inputs used to measure fair value may fall into different levels of the fair value hierarchy. In such cases, for disclosure purposes, the fair value hierarchy classification is determined based on the lowest level input that is significant to the fair value measurement in its entirety. Investments classified within Level 3 have significant unobservable inputs used by the Global Valuation Committee in determining the price for Fair Valued investments. Level 3 investments include equity or debt issued by private companies. There may not be a secondary market, and/or there are a limited number of investors. Level 3 investments may also be adjusted to reflect illiquidity and/or non-transferability, with the amount of such discount estimated by the Global Valuation Committee in the absence of market information.
Changes in valuation techniques may result in transfers into or out of an assigned level within the hierarchy. In accordance with each Fund’s policy, transfers between different levels of the fair value hierarchy are deemed to have occurred as of the beginning of the reporting period. The categorization of a value determined for investments is based on the pricing transparency of the investments and is not necessarily an indication of the risks associated with investing in those securities.
4. Securities and Other Investments:
Warrants: Warrants entitle a Fund to purchase a specified number of shares of common stock and are non-income producing. The purchase price and number of shares are subject to adjustment under certain conditions until the expiration date of the warrants, if any. If the price of the underlying stock does not rise above the strike price before the warrant expires, the warrant generally expires without any value and a Fund will lose any amount
| | | | | | |
| | | | | | | |
| 32 | | SEMI-ANNUAL REPORT | | DECEMBER 31, 2016 | | |
| | | | |
| Notes to Financial Statements (continued) | | |
it paid for the warrant. Thus, investments in warrants may involve more risk than investments in common stock. Warrants may trade in the same markets as their underlying stock; however, the price of the warrant does not necessarily move with the price of the underlying stock.
Securities Lending: Certain Funds may lend their securities to approved borrowers, such as brokers, dealers and other financial institutions. The borrower pledges and maintains with the Funds collateral consisting of cash, an irrevocable letter of credit issued by a bank, or securities issued or guaranteed by the U.S. Government. The initial collateral received by each Fund is required to have a value of at least 102% of the current value of the loaned securities for securities traded on U.S. exchanges and a value of at least 105% for all other securities. The collateral is maintained thereafter at a value equal to at least 100% of the current market value of the securities on loan. The market value of the loaned securities is determined at the close of each business day of the Fund and any additional required collateral is delivered to the Fund, or excess collateral returned by the Fund, on the next business day. During the term of the loan, the Funds are entitled to all distributions made on or in respect of the loaned securities, but does not receive interest income on securities received as collateral. Loans of securities are terminable at any time and the borrower, after notice, is required to return borrowed securities within the standard time period for settlement of securities transactions.
The market value of any securities on loan, all of which were classified as common stocks in the Funds’ Schedules of Investments, and the value of any related collateral are shown separately in the Statements of Assets and Liabilities as a component of investments at value-unaffiliated, and collateral on securities loaned at value, respectively. As of period end, any securities on loan were collateralized by cash and/or U.S. Government obligations. Cash collateral invested by the securities lending agent, BlackRock Investment Management, LLC (“BIM”), if any, is disclosed in the Schedules of Investments.
Securities lending transactions are entered into by the Funds under Master Securities Lending Agreements (each, an “MSLA”), which provide the right, in the event of default (including bankruptcy or insolvency), for the non-defaulting party to liquidate the collateral and calculate a net exposure to the defaulting party or request additional collateral. In the event that a borrower defaults, the Funds, as lender, would offset the market value of the collateral received against the market value of the securities loaned. When the value of the collateral is greater than that of the market value of the securities loaned, the lender is left with a net amount payable to the defaulting party. However, bankruptcy or insolvency laws of a particular jurisdiction may impose restrictions on or prohibitions against such a right of offset in the event of an MSLA counterparty’s bankruptcy or insolvency. Under the MSLA, absent an event of default, the borrower can resell or re-pledge the loaned securities, and a Fund can reinvest cash collateral received in connection with loaned securities. Upon an event of default, the parties’ obligations to return the securities or collateral to the other party are extinguished, and the parties can resell or re-pledge the loaned securities or the collateral received in connection with the loaned securities in order to satisfy the defaulting party’s net payment obligation for all transactions under the MSLA. The defaulting party remains liable for any deficiency.
As of period end, the following table is a summary of the Funds’ securities lending agreements by counterparty which are subject to offset under an MSLA:
| | | | | | | | | | | | |
| Global SmallCap | |
| Counterparty | | Securities
Loaned
at Value | | | Cash
Collateral
Received1 | | | Net
Amount | |
Barclays Capital, Inc. | | $ | 114,213 | | | $ | (114,213 | ) | | | — | |
BNP Paribas Prime Brokerage, Inc. | | | 63,287 | | | | (63,287 | ) | | | — | |
Citigroup Global Markets, Inc. | | | 6,894,797 | | | | (6,894,797 | ) | | | — | |
Credit Suisse Securities (USA) LLC | | | 974,990 | | | | (974,990 | ) | | | — | |
Deutsche Bank Securities, Inc. | | | 5,978,254 | | | | (5,978,254 | ) | | | — | |
Goldman Sachs & Co. | | | 22,759,839 | | | | (22,759,839 | ) | | | — | |
J.P. Morgan Securities LLC | | | 28,712,825 | | | | (28,712,825 | ) | | | — | |
Merrill Lynch, Pierce, Fenner & Smith, Inc. | | | 2,043,367 | | | | (2,043,367 | ) | | | — | |
Morgan Stanley & Co. LLC | | | 18,310,728 | | | | (18,310,728 | ) | | | — | |
State Street Bank & Trust Co. | | | 7,552,228 | | | | (7,552,228 | ) | | | — | |
UBS Securities LLC | | | 5,235,712 | | | | (5,235,712 | ) | | | — | |
| | | | | | | | | | | | |
Total | | $ | 98,640,240 | | | $ | (98,640,240 | ) | | | — | |
| | | | | | | | | | | | |
| | 1 | | Cash collateral with a value of $105,812,547 has been received in connection with securities lending agreements. Collateral received in excess of the value of securities loaned from the individual counterparty is not shown for financial reporting purposes in the table above. |
The risks of securities lending include the risk that the borrower may not provide additional collateral when required or may not return the securities when due. To mitigate these risks, the Funds benefit from a borrower default indemnity provided by BIM. BIM’s indemnity allows for full replacement of the securities loaned if the collateral received does not cover the value on the securities loaned in the event of borrower default. Each Fund could
| | | | | | |
| | | | | | | |
| | SEMI-ANNUAL REPORT | | DECEMBER 31, 2016 | | 33 |
| | |
| Notes to Financial Statements (continued) | | |
suffer a loss if the value of an investment purchased with cash collateral falls below the market value of loaned securities or if the value of an investment purchased with cash collateral falls below the value of the original cash collateral received.
5. Investment Advisory Agreement and Other Transactions with Affiliates:
The PNC Financial Services Group, Inc. is the largest stockholder and an affiliate of BlackRock, Inc. (“BlackRock”) for 1940 Act purposes.
Investment Advisory: Each Fund entered into an Investment Advisory Agreement with the Manager, the Funds’ investment adviser, an indirect, wholly owned subsidiary of BlackRock, to provide investment advisory and administration services. The Manager is responsible for the management of each Fund’s portfolio and provides the personnel, facilities, equipment and certain other services necessary to the operations of each Fund.
For such services, each Fund pays the Manager a monthly fee at an annual rate equal to the following percentages of the average daily value of each Fund’s net assets.
| | | | | | | | |
| | | Investment Advisory Fee | |
| Average Daily Net Assets | | EuroFund | | | Global
SmallCap | |
First $1 Billion | | | 0.75% | | | | 0.85% | |
$1 — $3 Billion | | | 0.71% | | | | 0.80% | |
$3 — $5 Billion | | | 0.68% | | | | 0.77% | |
$5 to $10 Billion | | | 0.65% | | | | 0.74% | |
Greater than $10 Billion | | | 0.64% | | | | 0.72% | |
The Manager, with respect to the EuroFund, entered into a sub-advisory agreement with BlackRock International Limited (“BIL”), an affiliate of the Manager. The Manager pays BIL, for services it provides, a monthly fee that is a percentage of the investment advisory fees paid by the EuroFund to the Manager.
Service and Distribution Fees: Each Fund entered into a Distribution Agreement and a Distribution and Service Plan with BlackRock Investments, LLC (“BRIL”), an affiliate of the Manager. Pursuant to the Distribution and Service Plan and in accordance with Rule 12b-1 under the 1940 Act, each Fund pays BRIL ongoing service and distribution fees. The fees are accrued daily and paid monthly at annual rates based upon the average daily net assets of the relevant share class of each Fund as follows:
| | | | | | | | |
| | | Distribution Fees | | | Service Fees | |
Investor A | | | — | | | | 0.25% | |
Investor B1 | | | 0.75% | | | | 0.25% | |
Investor C | | | 0.75% | | | | 0.25% | |
Class R | | | 0.25% | | | | 0.25% | |
BRIL and broker-dealers, pursuant to sub-agreements with BRIL, provide shareholder servicing and distribution services to the Funds. The ongoing service and/or distribution fee compensates BRIL and each broker-dealer for providing shareholder servicing and/or distribution related services to the shareholders.
For the six months ended December 31, 2016, the following table shows the class specific service and distribution fees borne directly by each share class of each Fund:
| | | | | | | | | | | | | | | | | | | | |
| | | Investor A | | | Investor B | | | Investor C | | | Class R | | | Total | |
EuroFund | | $ | 208,894 | | | | — | | | $ | 62,594 | | | $ | 2,180 | | | $ | 273,668 | |
Global SmallCap | | $ | 481,938 | | | $ | 3,782 | | | $ | 1,215,468 | | | $ | 53,891 | | | $ | 1,755,079 | |
Transfer Agent: Pursuant to written agreements, certain financial intermediaries, some of which may be affiliates, provide the Funds with sub-accounting, recordkeeping, sub-transfer agency and other administrative services with respect to sub-accounts they service. For these services, these entities receive an asset-based fee or an annual fee per shareholder account, which will vary depending on share class and/or net assets. For the six months ended December 31, 2016, the Funds paid the following amounts to affiliates of BlackRock in return for these services, which are included in transfer agent— class specific in the Statements of Operations:
| | | | | | | | |
| | | Institutional | | | Investor A | |
EuroFund | | | — | | | $ | 3 | |
Global SmallCap | | $ | 53 | | | | — | |
| | | | | | |
| | | | | | | |
| 34 | | SEMI-ANNUAL REPORT | | DECEMBER 31, 2016 | | |
| | | | |
| Notes to Financial Statements (continued) | | |
The Manager maintains a call center that is responsible for providing certain shareholder services to the Funds. Shareholder services include responding to inquiries and processing subscription and redemption transactions based upon instructions from shareholders. For the six months ended December 31, 2016, each Fund reimbursed the Manager the following amounts for costs incurred in running the call center, which are included in transfer agent — class specific in the Statements of Operations:
| | | | | | | | | | | | | | | | | | | | | | | | |
| | | Institutional | | | Investor A | | | Investor B | | | Investor C | | | Class R | | | Total | |
EuroFund | | $ | 989 | | | $ | 2,218 | | | | — | | | $ | 528 | | | $ | 3 | | | $ | 3,738 | |
Global SmallCap | | $ | 420 | | | $ | 2,684 | | | $ | 78 | | | $ | 1,902 | | | $ | 155 | | | $ | 5,239 | |
For the six months ended December 31, 2016, the following table shows the class specific transfer agent fees borne directly by each class of each Fund:
| | | | | | | | | | | | | | | | | | | | | | | | |
| | | Institutional | | | Investor A | | | Investor B | | | Investor C | | | Class R | | | Total | |
EuroFund | | $ | 146,505 | | | $ | 160,232 | | | | — | | | $ | 15,148 | | | $ | 1,738 | | | $ | 323,623 | |
Global SmallCap | | $ | 164,664 | | | $ | 490,526 | | | $ | 1,131 | | | $ | 385,609 | | | $ | 41,825 | | | $ | 1,083,755 | |
Other Fees: For the six months ended December 31, 2016, affiliates earned underwriting discounts, direct commissions and dealer concessions on sales of each Fund’s Investor A Shares as follows:
| | | | |
| | | Investor A | |
EuroFund | | $ | 841 | |
Global SmallCap | | $ | 8,378 | |
For the six months ended December 31, 2016, affiliates received CDSCs as follows:
| | | | | | | | | | |
| | | Investor A | | | Investor B | | Investor C | |
EuroFund | | $ | 1,559 | | | — | | $ | 1,742 | |
Global SmallCap | | $ | 4,280 | | | — | | $ | 9,565 | |
Expense Waivers and Reimbursements: With respect to each Fund, the Manager voluntarily agreed to waive its investment advisory fees by the amount of investment advisory fees each Fund pays to the Manager indirectly through its investment in affiliated money market funds. These amounts are included in fees waived by the Manager in the Statements of Operations. For the six months ended December 31, 2016, the amounts waived were as follows:
| | | | | | | | |
| | | EuroFund | | | Global
SmallCap | |
Amount waived | | $ | 227 | | | $ | 361 | |
For the period September 1, 2016 through October 28, 2016, the Manager voluntarily agreed to waive the investment advisory fee payable by each Fund with respect to any portion of such Fund’s assets estimated to be attributable to investments in other equity and fixed-income exchange-traded funds managed by the Manager or its affiliates that have a contractual management fee. Effective October 28, 2016, the waiver became contractual through October 31, 2017. This contractual agreement may be terminated upon 90 days’ notice by a majority of the non-interested directors of each Corporation, or by a vote of a majority of the outstanding voting securities of such Fund.
For the six months ended December 31, 2016, the Funds reimbursed the Manager for certain accounting services, which is included in accounting services in the Statements of Operations. The reimbursements were as follows:
| | | | | | | | | | | | | | | | | | | | | | | | |
| | | Institutional | | | Investor A | | | Investor B | | | Investor C | | | Class R | | | Total | |
EuroFund | | $ | 1,072 | | | $ | 1,221 | | | | — | | | $ | 92 | | | $ | 7 | | | $ | 2,392 | |
Global SmallCap | | $ | 2,660 | | | $ | 4,623 | | | $ | 15 | | | $ | 3,022 | | | $ | 249 | | | $ | 10,569 | |
Securities Lending: The U.S. Securities and Exchange Commission has issued an exemptive order which permits BIM, an affiliate of the Manager, to serve as securities lending agent for the Funds, subject to applicable conditions. As securities lending agent, BIM bears all operational costs directly related to securities lending. The Funds are responsible for expenses in connection with the investment of cash collateral received for securities on loan (the “collateral investment expenses”). The cash collateral is invested in a private investment company managed by the Manager or its affiliates. However, BIM has agreed to cap the collateral investment expenses of the private investment company to an annual rate of 0.04%. The investment adviser to the private investment company will not charge any advisory fees with respect to shares purchased by the Funds.
| | | | | | |
| | | | | | | |
| | SEMI-ANNUAL REPORT | | DECEMBER 31, 2016 | | 35 |
| | |
| Notes to Financial Statements (continued) | | |
Securities lending income is equal to the total of income earned from the reinvestment of cash collateral, net of fees and other payments to and from borrowers of securities, and less the collateral investment expenses. Each Fund retains a portion of securities lending income and remits a remaining portion to BIM as compensation for its services as securities lending agent.
Pursuant to a securities lending agreement, each Fund retains 80% of securities lending income, and this amount retained can never be less than 70% of the total of securities lending income plus the collateral investment expenses.
In addition, commencing the business day following the date that the aggregate securities lending income earned across the Equity-Bond Complex in a calendar year exceeds a specified threshold, each Fund, pursuant to the securities lending agreement, will retain for the remainder of that calendar year securities lending income as follows: 85% of securities lending income, and this amount retained can never be less than 70% of the total of securities lending income plus the collateral investment expenses.
The share of securities lending income earned by each Fund is shown as securities lending — affiliated — net in the Statements of Operations. For the six months ended December 31, 2016, each Fund paid BIM the following amounts for securities lending agent services:
| | |
| EuroFund | | Global SmallCap |
| $404 | | $168,414 |
Interfund Lending: In accordance with an exemptive order (the “Order”) from the U.S. Securities and Exchange Commission, Global SmallCap may participate in a joint lending and borrowing facility for temporary purposes (the “Interfund Lending Program”), subject to compliance with the terms and conditions of the Order, and to the extent permitted by Global SmallCap’s investment policies and restrictions. Global SmallCap is currently permitted to borrow under the Interfund Lending Program.
A Fund may lend in aggregate up to 15% of its net assets, but no more than 5% of its net assets, to any one borrowing fund through the Interfund Lending Program. Global SmallCap may not borrow through the Interfund Lending Program or from any other source more than 33 1/3% of its total assets or any lower threshold provided for by the Fund’s investment restrictions. If Global SmallCap’s total outstanding borrowings exceed 10% of its total assets, each of its outstanding interfund loans will be subject to collateralization of at least 102% of the outstanding principal value of the loan. All interfund loans are for temporary or emergency purposes and the interest rate to be charged will be the average of the highest current overnight repurchase agreement rate available to a lending fund and the bank loan rate, as calculated according to a formula established by the Board.
During the period ended December 31, 2016, the Global SmallCap did not participate in the Interfund Lending Program.
Officers and Directors: Certain officers and/or directors of the Funds are officers and/or directors of BlackRock or its affiliates. The Funds reimburse the Manager for a portion of the compensation paid to the Funds’ Chief Compliance Officer, which is included in Officer and Directors in the Statements of Operations.
Other Transactions: The Funds may purchase securities from, or sell securities to, an affiliated fund provided the affiliation is due solely to having a common investment adviser, common officers, or common directors. For the six months ended December 31, 2016, the purchase and sale transactions and any net realized gains (losses) with affiliated funds in compliance with Rule 17a-7 under the 1940 Act were as follows:
| | | | | | | | | | | | |
| | | Purchases | | | Sales | | | Net Realized
Gain | |
EuroFund | | $ | 692,402 | | | | — | | | | — | |
Global SmallCap | | $ | 1,012,833 | | | $ | 1,211,184 | | | $ | 566,221 | |
6. Purchases and Sales:
For the six months ended December 31, 2016, purchases and sales of investments excluding short-term securities were as follows:
| | | | | | | | |
| | | EuroFund | | | Global SmallCap | |
Purchases | | $ | 182,396,827 | | | $ | 285,434,204 | |
Sales | | $ | 231,213,218 | | | $ | 404,916,694 | |
7. Income Tax Information:
It is the Funds’ policy to comply with the requirements of the Internal Revenue Code of 1986, as amended, applicable to regulated investment companies, and to distribute substantially all of their taxable income to their shareholders. Therefore, no federal income tax provision is required.
Each Fund files U.S. federal and various state and local tax returns. No income tax returns are currently under examination. The statute of limitations on each Fund’s U.S. federal tax returns generally remains open for each of the four years ended June 30, 2016. The statutes of limitations on each Fund’s state and local tax returns may remain open for an additional year depending upon the jurisdiction.
| | | | | | |
| | | | | | | |
| 36 | | SEMI-ANNUAL REPORT | | DECEMBER 31, 2016 | | |
| | | | |
| Notes to Financial Statements (continued) | | |
Management has analyzed tax laws and regulations and their application to the Funds as of December 31, 2016, inclusive of the open tax return years, and does not believe that there are any uncertain tax positions that require recognition of a tax liability in the Funds’ financial statements.
As of June 30, 2016, EuroFund had capital loss carryforwards available to offset future realized capital gains through the indicated expiration dates as follows:
| | | | |
| Expires June, | | EuroFund | |
No expiration date1 | | $ | 51,879,429 | |
2017 | | | 3,846,553 | |
2018 | | | 85,950,061 | |
| | | | |
Total | | $ | 141,676,043 | |
| | | | |
| | 1 | | Must be utilized prior to losses subject to expiration. |
As of December 31, 2016, gross unrealized appreciation and depreciation based on cost for federal income tax purposes were as follows:
| | | | | | | | |
| | | EuroFund | | | Global
SmallCap | |
Tax cost | | $ | 300,722,268 | | | $ | 882,481,820 | |
| | | | | | | | |
Gross unrealized appreciation | | $ | 18,291,714 | | | $ | 153,280,317 | |
Gross unrealized depreciation | | | (19,215,649 | ) | | | (82,835,041 | ) |
| | | | | | | | |
Net unrealized appreciation | | $ | (923,935 | ) | | $ | 70,445,276 | |
| | | | | | | | |
8. Bank Borrowings:
The Funds, along with certain other funds managed by the Manager and its affiliates (“Participating Funds”), is a party to a 364-day, $2.1 billion credit agreement with a group of lenders. Under this agreement, the Funds may borrow to fund shareholder redemptions. Excluding commitments designated for certain individual funds, the Participating Funds, including the Funds, can borrow up to an aggregate commitment amount of $1.6 billion at any time outstanding, subject to asset coverage and other limitations as specified in the agreement. The credit agreement has the following terms: a fee of 0.12% per annum on unused commitment amounts and interest at a rate equal to the higher of (a) one-month LIBOR (but, in any event, not less than 0.00%) on the date the loan is made plus 0.80% per annum or (b) the Fed Funds rate (but, in any event, not less than 0.00%) in effect from time to time plus 0.80% per annum on amounts borrowed. The agreement expires in April 2017 unless extended or renewed. Prior to April 21, 2016, the credit agreement had a fee per annum of 0.06% on unused commitment amounts and interest at a rate equal to the higher of (a) one-month LIBOR (but, in any event, not less than 0.00%) on the date the loan is made plus 0.80% per annum or (b) the Fed Funds rate (but, in any event, not less than 0.00%) in effect from time to time plus 0.80% per annum on amounts borrowed. Participating Funds paid administration, legal and arrangement fees, which, if applicable, are included in miscellaneous expenses in the Statements of Operations. These fees were allocated among such funds based upon portions of the aggregate commitment available to them and relative net assets of Participating Funds. During the six months ended December 31, 2016, the Funds did not borrow under the credit agreement.
9. Principal Risks:
In the normal course of business, the Funds invest in securities and enters into transactions where risks exist due to fluctuations in the market (market risk) or failure of the issuer to meet all its obligations, including the ability to pay principal and interest when due (issuer credit risk). The value of securities held by the Funds may decline in response to certain events, including those directly involving the issuers of securities owned by the Funds. Changes arising from the general economy, the overall market and local, regional or global political and/or social instability, as well as currency, interest rate and price fluctuations, may also affect the securities’ value.
On October 11, 2016, BlackRock implemented certain changes required by amendments to Rule 2a-7 under the 1940 Act, which governs the operations of U.S. money market funds. The Funds may be exposed to additional risks when reinvesting cash collateral in money market funds that do not seek to maintain a stable NAV per share of $1.00 and which may be subject to redemption gates or liquidity fees under certain circumstances.
Valuation Risk: The market values of equities, such as common stocks and preferred securities or equity related investments, such as futures and options, may decline due to general market conditions which are not specifically related to a particular company. They may also decline due to factors which affect a particular industry or industries. A Fund may invest in illiquid investments and may experience difficulty in selling those investments in a timely manner at the price that they believe the investments are worth. Prices may fluctuate widely over short or extended periods in response to company, market or economic news. Markets also tend to move in cycles, with periods of rising and falling prices. This volatility may
| | | | | | |
| | | | | | | |
| | SEMI-ANNUAL REPORT | | DECEMBER 31, 2016 | | 37 |
| | |
| Notes to Financial Statements (continued) | | |
cause each Fund’s NAV to experience significant increases or decreases over short periods of time. If there is a general decline in the securities and other markets, the NAV of a Fund may lose value, regardless of the individual results of the securities and other instruments in which the Fund invests.
Counterparty Credit Risk: Similar to issuer credit risk, the Funds may be exposed to counterparty credit risk, or the risk that an entity may fail to or be unable to perform on its commitments related to unsettled or open transactions. The Funds manage counterparty credit risk by entering into transactions only with counterparties that the Manager believes have the financial resources to honor their obligations and by monitoring the financial stability of those counterparties. Financial assets, which potentially expose the Funds to market, issuer and counterparty credit risks, consist principally of financial instruments and receivables due from counterparties. The extent of the Funds’ exposure to market, issuer and counterparty credit risks with respect to these financial assets is approximately their value recorded in the Statements of Assets and Liabilities, less any collateral held by the Funds.
Concentration Risk: Certain Funds invest a substantial amount of their assets in issuers located in a single country or a limited number of countries. When the Funds concentrate their investments in this manner, it assumes the risk that economic, political and social conditions in those countries may have a significant impact on their investment performance. Foreign issuers may not be subject to the same uniform accounting, auditing and financial reporting standards and practices as used in the United States. Foreign securities markets may also be less liquid, more volatile and less subject to governmental supervision not typically associated with investing in U.S. securities. Investment percentages in specific countries are presented in the Schedules of Investments.
EuroFund invests a significant portion of its assets in securities of issuers located in Europe or with significant exposure to European issuers or countries. The European financial markets have recently experienced volatility and adverse trends due to concerns about economic downturns in, or rising government debt levels of, several European countries. These events may spread to other countries in Europe and may affect the value and liquidity of certain of the Fund’s investments.
The United Kingdom voted on June 23, 2016 to withdraw from the European Union, which may introduce significant new uncertainties and instability in the financial markets across Europe.
10. Capital Share Transactions:
Transactions in capital shares for each class were as follows:
| | | | | | | | | | | | | | | | | | | | |
| | | Six Months Ended
December 31, 2016 | | | | | | Year Ended
June 30, 2016 | |
| EuroFund | | Shares | | | Amount | | | | | | Shares | | | Amount | |
| Institutional | | | | | | | | | | | | | | | | | | | | |
Shares sold | | | 451,189 | | | $ | 6,000,568 | | | | | | | | 1,127,830 | | | $ | 16,115,553 | |
Shares issued in reinvestment of distributions | | | 218,566 | | | | 2,808,575 | | | | | | | | 189,648 | | | | 2,672,138 | |
Shares redeemed | | | (2,464,195 | ) | | | (32,655,489 | ) | | | | | | | (3,314,255 | ) | | | (47,088,894 | ) |
| | | | | | | | | | | | |
Net decrease | | | (1,794,440 | ) | | $ | (23,846,346 | ) | | | | | | | (1,996,777 | ) | | $ | (28,301,203 | ) |
| | | | | | | | | | | | |
| | | | | | | | | | | | | | | | | | | | |
| Investor A | | | | | | | | | | | | | | | | | | | | |
Shares sold | | | 313,522 | | | $ | 4,036,768 | | | | | | | | 3,150,016 | | | $ | 45,007,926 | |
Shares issued in reinvestment of distributions | | | 225,372 | | | | 2,842,002 | | | | | | | | 232,920 | | | | 3,221,307 | |
Shares redeemed | | | (2,172,600 | ) | | | (28,045,966 | ) | | | | | | | (6,628,166 | ) | | | (93,410,491 | ) |
| | | | | | | | | | | | |
Net decrease | | | (1,633,706 | ) | | $ | (21,167,196 | ) | | | | | | | (3,245,230 | ) | | $ | (45,181,258 | ) |
| | | | | | | | | | | | |
| | | | | | | | | | | | | | | | | | | | |
| Investor C | | | | | | | | | | | | | | | | | | | | |
Shares sold | | | 41,160 | | | $ | 376,883 | | | | | | | | 263,329 | | | $ | 2,713,950 | |
Shares issued in reinvestment of distributions | | | 20,012 | | | | 177,910 | | | | | | | | 19,636 | | | | 192,629 | |
Shares redeemed | | | (321,564 | ) | | | (2,928,947 | ) | | | | | | | (458,589 | ) | | | (4,472,969 | ) |
| | | | | | | | | | | | |
Net decrease | | | (260,392 | ) | | $ | (2,374,154 | ) | | | | | | | (175,624 | ) | | $ | (1,566,390 | ) |
| | | | | | | | | | | | |
| | | | | | | | | | | | | | | | | | | | |
| Class R | | | | | | | | | | | | | | | | | | | | |
Shares sold | | | 14,841 | | | $ | 143,265 | | | | | | | | 31,182 | | | $ | 335,357 | |
Shares issued in reinvestment of distributions | | | 1,981 | | | | 18,958 | | | | | | | | 1,644 | | | | 17,357 | |
Shares redeemed | | | (7,536 | ) | | | (73,909 | ) | | | | | | | (42,247 | ) | | | (439,686 | ) |
| | | | | | | | | | | | |
Net increase (decrease) | | | 9,286 | | | $ | 88,314 | | | | | | | | (9,421 | ) | | $ | (86,972 | ) |
| | | | | | | | | | | | |
Total Net Decrease | | | (3,679,252 | ) | | $ | (47,299,382 | ) | | | | | | | (5,427,052 | ) | | $ | (75,135,823 | ) |
| | | | | | | | | | | | |
| | | | | | |
| | | | | | | |
| 38 | | SEMI-ANNUAL REPORT | | DECEMBER 31, 2016 | | |
| | | | |
| Notes to Financial Statements (concluded) | | |
| | | | | | | | | | | | | | | | | | | | |
| | | Six Months Ended
December 31, 2016 | | | | | | Year Ended
June 30, 2016 | |
| Global SmallCap | | Shares | | | Amount | | | | | | Shares | | | Amount | |
| Institutional | | | | | | | | | | | | | | | | | | | | |
Shares sold | | | 1,116,450 | | | $ | 25,949,271 | | | | | | | | 6,138,670 | | | $ | 128,244,016 | |
Shares issued in reinvestment of distributions | | | 77,244 | | | | 1,846,908 | | | | | | | | 426,656 | | | | 9,258,442 | |
Shares redeemed | | | (2,628,219 | ) | | | (60,748,132 | ) | | | | | | | (5,435,345 | ) | | | (119,741,638 | ) |
| | | | | | | | | | | | |
Net increase (decrease) | | | (1,434,525 | ) | | $ | (32,951,953 | ) | | | | | | | 1,129,981 | | | $ | 17,760,820 | |
| | | | | | | | | | | | |
| | | | | | | | | | | | | | | | | | | | |
| Investor A | | | | | | | | | | | | | | | | | | | | |
Shares sold | | | 705,724 | | | $ | 15,735,654 | | | | | | | | 3,722,233 | | | $ | 80,726,331 | |
Shares issued in reinvestment of distributions | | | 97,463 | | | | 2,247,539 | | | | | | | | 925,894 | | | | 19,341,922 | |
Shares redeemed | | | (3,037,802 | ) | | | (67,946,857 | ) | | | | | | | (5,491,709 | ) | | | (117,605,482 | ) |
| | | | | | | | | | | | |
Net decrease | | | (2,234,615 | ) | | $ | (49,963,664 | ) | | | | | | | (843,582 | ) | | $ | (17,537,229 | ) |
| | | | | | | | | | | | |
| | | | | | | | | | | | | | | | | | | | |
| Investor B | | | | | | | | | | | | | | | | | | | | |
Shares sold | | | — | | | $ | — | | | | | | | | 199 | | | $ | 4,033 | |
Shares issued in reinvestment of distributions | | | — | | | | — | | | | | | | | 3,433 | | | | 65,985 | |
Shares redeemed | | | (21,829 | ) | | | (446,184 | ) | | | | | | | (36,574 | ) | | | (724,692 | ) |
| | | | | | | | | | | | |
Net decrease | | | (21,829 | ) | | $ | (446,184 | ) | | | | | | | (32,942 | ) | | $ | (654,674 | ) |
| | | | | | | | | | | | |
| | | | | | | | | | | | | | | | | | | | |
| Investor C | | | | | | | | | | | | | | | | | | | | |
Shares sold | | | 286,967 | | | $ | 5,528,592 | | | | | | | | 2,180,378 | | | $ | 40,812,950 | |
Shares issued in reinvestment of distributions | | | — | | | | — | | | | | | | | 779,383 | | | | 14,130,223 | |
Shares redeemed | | | (2,491,646 | ) | | | (48,038,278 | ) | | | | | | | (3,990,504 | ) | | | (74,339,301 | ) |
| | | | | | | | | | | | |
Net decrease | | | (2,204,679 | ) | | $ | (42,509,686 | ) | | | | | | | (1,030,743 | ) | | $ | (19,396,128 | ) |
| | | | | | | | | | | | |
| | | | | | | | | | | | | | | | | | | | |
| Class R | | | | | | | | | | | | | | | | | | | | |
Shares sold | | | 111,059 | | | $ | 2,304,418 | | | | | | | | 385,174 | | | $ | 7,728,944 | |
Shares issued in reinvestment of distributions | | | 2,037 | | | | 43,690 | | | | | | | | 61,633 | | | | 1,196,295 | |
Shares redeemed | | | (196,825 | ) | | | (4,076,285 | ) | | | | | | | (482,160 | ) | | | (9,734,197 | ) |
| | | | | | | | | | | | |
Net decrease | | | (83,729 | ) | | $ | (1,728,177 | ) | | | | | | | (35,353 | ) | | $ | (808,958 | ) |
| | | | | | | | | | | | |
Total Net Decrease | | | (5,979,377 | ) | | $ | (127,599,664 | ) | | | | | | | (812,639 | ) | | $ | (20,636,169 | ) |
| | | | | | | | | | | | |
11. Subsequent Events:
Management has evaluated the impact of all subsequent events on the Funds through the date the financial statements were issued and has determined that there were no subsequent events requiring adjustment or additional disclosure in the financial statements.
| | | | | | |
| | | | | | | |
| | SEMI-ANNUAL REPORT | | DECEMBER 31, 2016 | | 39 |
Robert M. Hernandez, Chair of the Board and Director
Fred G. Weiss, Vice Chair of the Board and Director
James H. Bodurtha, Director
Bruce R. Bond, Director
Donald W. Burton, Director
Honorable Stuart E. Eiszenstat, Director
Lena G. Goldberg, Director
John F. O’Brien, Director
Donald C. Opatrny, Director
Roberta Cooper Ramo, Director
David H. Walsh, Director
Robert Fairbairn, Director
Henry Gabbay, Director
Henry R. Keizer, Director
John M. Perlowski, Director, President and Chief Executive Officer
Jennifer McGovern, Vice President
Neal J. Andrews, Chief Financial Officer
Jay M. Fife, Treasurer
Charles Park, Chief Compliance Officer
Fernanda Piedra, Anti-Money Laundering Compliance Officer
Benjamin Archibald, Secretary
On September 26, 2016, the Board appointed Lena G. Goldberg as a Director of the Funds effective November 4, 2016.
Effective January 31, 2017, David H. Walsh and Fred G. Weiss retired as Directors of the Funds.
| | | | | | | | |
| | | | | |
Investment Adviser BlackRock Advisors, LLC Wilmington, DE 19809 | | Custodian Brown Brothers
Harriman & Co. Boston, MA 02109 | | Accounting Agent State Street Bank and
Trust Company Boston, MA 02110 | | Legal Counsel Willkie Farr & Gallagher LLP New York, NY 10019 | | Address of the Funds 100 Bellevue Parkway Wilmington, DE 19809 |
| | | | |
Sub-Advisers BlackRock
International Limited1 Edinburgh, EH3 8BL, United Kingdom | | Transfer Agent BNY Mellon Investment
Servicing (US) Inc. Wilmington, DE 19809 | | Distributor BlackRock Investments, LLC New York, NY 10022 | | Independent Registered
Public Accounting Firm Deloitte & Touche LLP Boston, MA 02116 | | |
| | | | | | |
| | | | | | | |
| 40 | | SEMI-ANNUAL REPORT | | DECEMBER 31, 2016 | | |
Householding
The Funds will mail only one copy of shareholder documents, including prospectuses, annual and semi-annual reports and proxy statements, to shareholders with multiple accounts at the same address. This practice is commonly called “householding” and is intended to reduce expenses and eliminate duplicate mailings of shareholder documents. Mailings of your shareholder documents may be householded indefinitely unless you instruct us otherwise. If you do not want the mailing of these documents to be combined with those for other members of your household, please call the Funds at (800) 441-7762.
Availability of Quarterly Schedule of Investments
The Funds file their complete schedule of portfolio holdings with the SEC for the first and third quarters of each fiscal year on Form N-Q. The Funds’ Forms N-Q are available on the SEC’s website at http://www.sec.gov and may also be reviewed and copied at the SEC’s Public Reference Room in Washington, D.C. Information on the operation of the Public Reference Room or how to access documents on the SEC’s website without charge may be obtained by calling (800) SEC-0330. The Funds’ Forms N-Q may also be obtained upon request and without charge by calling (800) 441-7762.
Availability of Proxy Voting Policies and Procedures
A description of the policies and procedures that the Funds use to determine how to vote proxies relating to portfolio securities is available upon request and without charge (1) by calling (800) 441-7762; (2) at http://www.blackrock.com; and (3) on the SEC’s website at http://www.sec.gov.
Availability of Proxy Voting Record
Information about how the Funds voted proxies relating to securities held in the Funds’ portfolios during the most recent 12-month period ended June 30 is available upon request and without charge (1) at http://www.blackrock.com or by calling (800) 441-7762 and (2) on the SEC’s website at http://www.sec.gov.
BlackRock’s Mutual Fund Family
BlackRock offers a diverse lineup of open-end mutual funds crossing all investment styles and managed by experts in equity, fixed income and tax-exempt investing. Visit http://www.blackrock.com for more information.
| | | | | | |
| | | | | | | |
| | SEMI-ANNUAL REPORT | | DECEMBER 31, 2016 | | 41 |
| | |
| Additional Information (concluded) | | |
Account Information
Call us at (800) 441-7762 from 8:00 AM to 6:00 PM ET on any business day to get information about your account balances, recent transactions and share prices. You can also reach us on the Web at http://www.blackrock.com/funds.
Automatic Investment Plans
Investor Class shareholders who want to invest regularly can arrange to have $50 or more automatically deducted from their checking or savings account and invested in any of the BlackRock funds.
Systematic Withdrawal Plans
Investor Class shareholders can establish a systematic withdrawal plan and receive periodic payments of $50 or more from their BlackRock funds, as long as their account balance is at least $10,000.
Retirement Plans
Shareholders may make investments in conjunction with Traditional, Rollover, Roth, Coverdell, Simple IRAs, SEP IRAs and 403(b) Plans.
| | |
| BlackRock Privacy Principles | | |
BlackRock is committed to maintaining the privacy of its current and former fund investors and individual clients (collectively, “Clients”) and to safeguarding their non-public personal information. The following information is provided to help you understand what personal information BlackRock collects, how we protect that information and why in certain cases we share such information with select parties.
If you are located in a jurisdiction where specific laws, rules or regulations require BlackRock to provide you with additional or different privacy-related rights beyond what is set forth below, then BlackRock will comply with those specific laws, rules or regulations.
BlackRock obtains or verifies personal non-public information from and about you from different sources, including the following: (i) information we receive from you or, if applicable, your financial intermediary, on applications, forms or other documents; (ii) information about your transactions with us, our affiliates, or others; (iii) information we receive from a consumer reporting agency; and (iv) from visits to our websites.
BlackRock does not sell or disclose to non-affiliated third parties any non-public personal information about its Clients, except as permitted by law or as is necessary to respond to regulatory requests or to service Client accounts. These non-affiliated third parties are required to protect the confidentiality and security of this information and to use it only for its intended purpose.
We may share information with our affiliates to service your account or to provide you with information about other BlackRock products or services that may be of interest to you. In addition, BlackRock restricts access to non-public personal information about its Clients to those BlackRock employees with a legitimate business need for the information. BlackRock maintains physical, electronic and procedural safeguards that are designed to protect the non-public personal information of its Clients, including procedures relating to the proper storage and disposal of such information.
| | | | | | |
| | | | | | | |
| 42 | | SEMI-ANNUAL REPORT | | DECEMBER 31, 2016 | | |
This report is intended for current holders. It is not authorized for use as an offer of sale or a solicitation of an offer to buy shares of a Fund unless preceded or accompanied by the Fund’s current prospectus. Past performance results shown in this report should not be considered a representation of future performance. Investment returns and principal value of shares will fluctuate so that shares, when redeemed, may be worth more or less than their original cost. Statements and other information herein are as dated and are subject to change.

| | |
| EGSC-12/16-SAR | | |
| |
| |  |
Item 2 – Code of Ethics – Not Applicable to this semi-annual report
Item 3 – Audit Committee Financial Expert – Not Applicable to this semi-annual report
Item 4 – Principal Accountant Fees and Services – Not Applicable to this semi-annual report
Item 5 – Audit Committee of Listed Registrants – Not Applicable
Item 6 – Investments
(a) The registrant’s Schedule of Investments is included as part of the Report to Stockholders filed under Item 1 of this Form.
(b) Not Applicable due to no such divestments during the semi-annual period covered since the previous Form N-CSR filing.
Item 7 – Disclosure of Proxy Voting Policies and Procedures for Closed-End Management Investment Companies – Not Applicable
Item 8 – Portfolio Managers of Closed-End Management Investment Companies – Not Applicable
Item 9 – Purchases of Equity Securities by Closed-End Management Investment Company and Affiliated Purchasers – Not Applicable
Item 10 – Submission of Matters to a Vote of Security Holders –There have been no material changes to these procedures.
Item 11 – Controls and Procedures
(a) – The registrant’s principal executive and principal financial officers, or persons performing similar functions, have concluded that the registrant’s disclosure controls and procedures (as defined in Rule 30a-3(c) under the Investment Company Act of 1940, as amended (the “1940 Act”)) are effective as of a date within 90 days of the filing of this report based on the evaluation of these controls and procedures required by Rule 30a-3(b) under the 1940 Act and Rule 15d-15(b) under the Securities Exchange Act of 1934, as amended.
(b) – There were no changes in the registrant’s internal control over financial reporting (as defined in Rule 30a-3(d) under the 1940 Act) that occurred during the second fiscal quarter of the period covered by this report that have materially affected, or are reasonably likely to materially affect, the registrant’s internal control over financial reporting.
Item 12 – Exhibits attached hereto
(a)(1) – Code of Ethics – Not Applicable to this semi-annual report
(a)(2) – Certifications – Attached hereto
(a)(3) – Not Applicable
(b) – Certifications – Attached hereto
2
Pursuant to the requirements of the Securities Exchange Act of 1934 and the Investment Company Act of 1940, the registrant has duly caused this report to be signed on its behalf by the undersigned, thereunto duly authorized.
| | |
| BlackRock EuroFund |
| |
| By: | | /s/ John M. Perlowski |
| | John M. Perlowski |
| | Chief Executive Officer (principal executive officer) of |
| | BlackRock EuroFund |
Date: March 6, 2017
Pursuant to the requirements of the Securities Exchange Act of 1934 and the Investment Company Act of 1940, this report has been signed below by the following persons on behalf of the registrant and in the capacities and on the dates indicated.
| | |
| By: | | /s/ John M. Perlowski |
| | John M. Perlowski |
| | Chief Executive Officer (principal executive officer) of |
| | BlackRock EuroFund |
Date: March 6, 2017
| | |
| By: | | /s/ Neal J. Andrews |
| | Neal J. Andrews |
| | Chief Financial Officer (principal financial officer) of |
| | BlackRock EuroFund |
Date: March 6, 2017
3