|
|
Vanguard® Convertible Securities Fund |
|
|
> Annual Report |
|
|
|
|
|
November 30, 2006 |
|
|
> | For the fiscal year ended November 30, 2006, Vanguard Convertible Securities |
| Fund returned 15.7%, well ahead of its benchmark index and the average return |
| among peer funds. |
> | The 12-month period provided a favorable investment environment for the |
| fund, as many of the stocks underlying its convertible securities were |
| strong performers. |
> | The broad bond market was up 5.9% for the year; gains in the equity market were |
| strongest among small-capitalization and international stocks. |
Contents | |
| |
Your Fund’s Total Returns | 1 |
Chairman’s Letter | 2 |
Advisor’s Report | 7 |
Fund Profile | 10 |
Performance Summary | 11 |
Financial Statements | 13 |
Your Fund’s After-Tax Returns | 23 |
About Your Fund’s Expenses | 24 |
Glossary | 26 |
Please note: The opinions expressed in this report are just that—informed opinions. They should not be considered promises or advice. Also, please keep in mind that the information and opinions cover the period through the date on the cover of this report. Of course, the risks of investing in your fund are spelled out in the prospectus.
Your Fund’s Total Returns
Fiscal Year Ended November 30, 2006 | |
| Total |
| Returns |
Vanguard Convertible Securities Fund | 15.7% |
Merrill Lynch All US Convertibles Index | 13.3 |
Average Convertible Securities Fund1 | 11.5 |
Dow Jones Wilshire 5000 Index | 14.7 |
Your Fund’s Performance at a Glance | | | | |
November 30, 2005–November 30, 2006 | | | | |
| | | Distributions Per Share |
| Starting | Ending | Income | Capital |
| Share Price | Share Price | Dividends | Gains |
Vanguard Convertible Securities Fund | $13.57 | $14.81 | $0.38 | $0.43 |
1 | Derived from data provided by Lipper Inc. |
1

Chairman’s Letter
Dear Shareholder,
The equity and fixed income markets performed well during the 12 months ended November 30, 2006, providing a favorable investment environment for convertible securities. Vanguard Convertible Securities Fund flourished during its 2006 fiscal year, returning 15.7%, outperforming its benchmark index and its average peer fund, and besting the broad stock market by 1 percentage point.
The fund invests in convertible securities, which are hybrid securities that combine the investment characteristics of bonds and stocks. Convertible securities include corporate bonds and preferred stocks that are convertible into common stock, as well as debt securities with common stock attached. In selecting these securities, your fund concentrates on convertible bonds with favorable risk-return profiles, issued by companies that have high growth prospects. During the 2006 fiscal year, investors showed faith in the growth prospects of these companies, and demand for convertible securities was strong.
Weaker parts of the economy drew bond investors’ notice
In the first half of the fiscal year, the Federal Reserve Board continued to tighten monetary policy, raising its target for the federal funds rate five times through the end of June. Longer-term bond yields generally followed the upward trend until late summer, when they began to backslide. Weakness in the housing
2
and manufacturing sectors persuaded bond investors that inflation was not a threat, prompting a rally (bond prices rose and yields fell).
The broad taxable bond market returned 5.9%. Municipal bonds did better still.
Economic uncertainty didn’t stop a stock rally
Despite being caught in a crosscurrent of opinions on the economy, stocks more than held their own. The housing market and automobile makers produced a drumbeat of bad news; however, corporate profits and job creation remained strong. Amid such mixed signals, stocks rose sharply beginning in mid-July. The broad market gained 14.7% for the year; in October, the narrower Dow Jones Industrial Average broke through its January 2000 high—and kept going.
Small-capitalization stocks enjoyed an edge over large-cap stocks by a margin of roughly 3 percentage points. Among both small-cap and large-cap stocks, value-oriented stocks outperformed their growth-oriented counterparts by wide margins.
Investors in international stocks were rewarded by both a falling U.S. dollar and strong economic gains in Europe and emerging markets.
Market Barometer | | | |
| | Average Annual Total Returns |
| Periods Ended November 30, 2006 |
| One Year | Three Years | Five Years |
Bonds | | | |
Lehman Aggregate Bond Index (Broad taxable market) | 5.9% | 4.2% | 5.0% |
Lehman Municipal Bond Index | 6.1 | 4.7 | 5.4 |
Citigroup 3-Month Treasury Bill Index | 4.7 | 2.9 | 2.3 |
| | | |
| | | |
Stocks | | | |
Russell 1000 Index (Large-caps) | 14.2% | 12.2% | 6.8% |
Russell 2000 Index (Small-caps) | 17.4 | 14.2 | 12.7 |
Dow Jones Wilshire 5000 Index (Entire market) | 14.7 | 12.8 | 7.8 |
MSCI All Country World Index ex USA (International) | 29.2 | 23.6 | 16.5 |
| | | |
| | | |
CPI | | | |
Consumer Price Index | 2.0% | 3.0% | 2.6% |
| | | | | |
3
Your advisor’s security selection helped the fund to thrive
For the 2006 fiscal year, your fund’s return outpaced its comparative standards. This performance was due, in part, to the advisor’s superior security selection, and also to the fund’s focus solely on convertibles—unlike peer funds, which tend to include common stocks and traditional bonds that do not offer a conversion feature. This focused strategy helps your fund to balance upside potential with downside protection.
Your fund’s manager, Oaktree Capital Management, did an admirable job of selecting convertible bonds and convertible preferred stocks. Top performers represented a wide range of industries, including telecommunication services, industrials (specifically, transportation) and utilities. The fund’s comparatively light exposure to the besieged auto industry (within the consumer discretionary sector) curbed returns as the convertibles of both Ford and General Motors moved higher.
A more detailed discussion of the advisor’s strategy and the portfolio’s holdings is included in the Advisor’s Report that begins on page 7.
Your fund also benefited from a fixed income environment that favored lower-credit-quality bonds. In a relatively strong economic environment, investors believe lower-rated bonds are less likely to default, and they tend to bid up the prices of these potentially higher-returning securities. During the year, demand for convertible securities was high, boosting prices for the 90% of the portfolio invested in convertible
Expense Ratios1 | | |
Your fund compared with its peer group | | |
| | Average |
| | Convertible |
| Fund | Securities Fund |
Convertible Securities Fund | 0.87% | 1.51% |
1 | Fund expense ratio reflects the 12 months ended November 30, 2006. Peer-group expense ratio is derived from data provided by Lipper Inc. and captures information through year-end 2005. |
4
bonds. Strong returns for many of the stocks underlying the fund’s securities also helped to lift performance.
The fund’s long-term record reflects solid performance
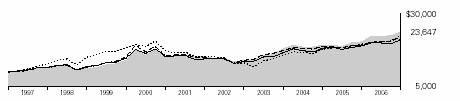
Over the past ten years, the Convertible Securities Fund has generated an average annual return of 9.0%, outperforming its benchmark index, its average peer fund, and the broad stock market.
An investment of $10,000 in the Convertible Securities Fund ten years ago would have grown to $23,647 by November 30, 2006. The table below shows how the same investments in the fund’s comparative measures would have fared and, relative to those standards, that the fund’s long-term performance has been solid. Compared with its peer funds, the fund is also a very low-cost investment, providing a distinct advantage as more of the fund’s returns are available to keep working for you.
Diversification and a long-term perspective are important
With its emphasis on hybrid securities, your fund can provide some of the return potential of stocks along with some of the relative stability of bonds. Since the fund concentrates solely on convertible securities, its fixed income component provides more volatility protection than an all-equity portfolio, while the bonds’ link to stock performance provides the potential for higher returns—an unusual combination that can help diversify a portfolio made up of traditional stock or bond investments.
Total Returns | | |
Ten Years Ended November 30, 2006 | | |
| Average | Final Value of a $10,000 |
| Annual Return | Initial Investment |
Convertible Securities Fund | 9.0% | $23,647 |
Spliced Convertibles Index1 | 8.2 | 21,911 |
Average Convertible Securities Fund | 7.8 | 21,221 |
Dow Jones Wilshire 5000 Index | 8.4 | 22,447 |
The figures shown represent past performance, which is not a guarantee of future results. (Current performance may be lower or higher than the performance data cited. For performance data current to the most recent month-end, visit our website at www.vanguard.com.) Note, too, that both investment returns and principal value can fluctuate widely, so an investor’s shares, when sold, could be worth more or less than their original cost. Performance data does not reflect the deduction of purchase and redemption fees. If these fees were included, the performance would be lower.
1 | CS First Boston Convertibles Index through November 30, 2004; Merrill Lynch All US Convertibles Index thereafter. |
5
Vanguard Convertible Securities Fund has performed admirably for the past several years. That said, it’s important to remember that the portfolio’s lower-quality bonds are particularly sensitive to the performance of the overall economy. If the economy softens and the perceived threat of defaults increases, investors may turn away from the lower-rated bonds the portfolio customarily holds.
As we have counseled investors through the years, sticking with a carefully considered, balanced portfolio of stock, bond, and money market mutual funds suited to your unique circumstances can be key to your long-term investing success.
By providing you with exposure to a unique segment of the market, the Convertible Securities Fund can play an important role in such a diversified portfolio.
Thank you for investing your assets with Vanguard.
Sincerely,

John J. Brennan
Chairman and Chief Executive Officer
December 18, 2006
6
Advisor’s Report
Vanguard Convertible Securities Fund performed well throughout the 2006 fiscal year. The fund was propelled by fairly consistent strength in the equity markets, and many of the stocks underlying our convertible security investments were above-average performers. During this relatively strong period, the fund solidly outperformed its primary benchmark, the Merrill Lynch All US Convertibles Index, by 2.4 percentage points. This performance was attributable to our specific investment strategies that emphasize convertible securities with a favorable balance of downside protection characteristics and upside participation potential.
The investment environment
With the Federal Reserve Board finally pausing its campaign of interest rate hikes—following its June action—both the equity and fixed income markets performed well during the second half of fiscal 2006. This created a favorable environment for convertible securities. Convertibles particularly benefited from the strength in the mid-capitalization equity markets, and convertible prices rose during the fiscal second half to their highest level of the year. Demand was strong for convertibles from a wide variety of investors, but especially from convertible hedge (arbitrage) investors who returned to the market, lured by a few quarters of better performance.
Compared with the second half of fiscal 2005, when hurricanes and skyrocketing energy and commodity prices dominated, credit spreads were the most important influences during the second six months of 2006. Credit spreads continued to be relatively tight, and volatility remained high amid a mix of up and down second- and third-quarter earnings reports and ongoing debate about the direction of the U.S. economy. During the fiscal first half, the market posted strong returns in the telecommunication services, industrials (especially, transportation), consumer discretionary, and utility sectors, while energy, health care, and technology were the market’s laggards.
Convertible new issuance was at a modest pace for the fiscal period. By November 30, issuance stood at approximately $57.5 billion, boosting the size of the total U.S. convertible market to about $285 billion. Most new issues are coupon-bearing convertible bonds, continuing a trend that began about two years ago. Among the high-profile issuers were EMC, Equity Office Properties, Symantec, U.S. Bancorp, and Vornado Realty. In a highly unusual concentration of issuers, the REIT industry was extremely active in issuing convertible paper during the period. The convertible market now comprises 83% convertible bonds and 17% convertible preferreds/mandatories,
7
compared with a 65%/35% ratio at year-end 2000. Our portfolio is currently weighted about 90% convertible bonds and 10% convertible preferreds/mandatories.
Our successes
As usual, a wide variety of securities influenced the fund’s performance. We were fortunate not to have any material decliners in the portfolio, and none of our investments experienced negative credit developments. Top contributors included convertibles from L-3 Communications, Fisher Scientific, AMR, Hilton Hotels, and Interpublic Group. Other positive performers during the final few months of the fiscal year were convertibles from Dicks Sporting Goods, McMoRan Exploration, and Symantec. Given the acceleration in new convertible issuance in the past couple of months, several new issues had an immediate positive impact on the portfolio: EMC, MedImmune, and Triumph Group. Among the new names purchased over the past few months were Itron, UAL, and WESCO International.
Our shortfalls
Although we were pleased with our overall performance, our relative performance over the past several months was negatively affected by the very strong performance of the auto sector, as the convertibles of both Ford and General Motors (the two largest weightings in the Merrill Lynch All US Convertibles Index) moved substantially higher. While we had an average position in the GM 6.25% convert, we held less than half the index’s weighting of the surging auto issues. Given the strong advance in both the GM common stock and its relatively tight credit spread, we recently reduced our GM position to an approximate 0.5% weighting. We do not hold any of the Ford preferred issue. From a convertibles perspective, the strong performance of the auto issues, along with a few other specific issues, made it difficult for most active convertibles managers to outperform the index during 2006. This is illustrated by the lagging return of the average convertible securities fund relative to that of the Merrill Lynch Index.
Underperformers in the portfolio included the convertible holdings in Conexant Systems, Conseco, Powerwave Technologies, and Teva Pharmaceutical. During the period, we eliminated our holdings in American Express, ArvinMeritor, BankUnited Capital Trust, and MGI PHARMA. American Express convertibles were sold after the bonds approached their callable date, while the other holdings were sold after developing higher-than-acceptable conversion premiums.
The fund’s positioning
As we approach the end of calendar 2006, optimism is quite evident in the equity markets and is driving most convertible prices to new highs. Demand for convertibles is strong from both hedge
8
funds and outright convertible investors and has pushed many individual securities to new levels.
The fund remains fully invested in a diversified portfolio of balanced convertibles and has no direct exposure to common-stock investments. We continue to take profits in highly appreciated securities and will reinvest the proceeds in securities with clear upside potential and strong relative downside protection.
Larry W. Keele, CFA
Principal and Founder
Oaktree Capital Management, LLC
December 12, 2006
Major Portfolio Changes: | |
Fiscal Year Ended November 30, 2006 | |
| |
Additions | Comments |
EMC | Newly issued, statistically attractive convertible purchased on |
(1.75% convertible note due 12/1/2011) | improving equity story. |
UAL | Attractive yield and moderate conversion premium convertible |
(5.00% convertible note due 2/1/2021) | bond. Bonds are puttable at par on 2/1/2011. |
Itron | Long-term investment in attractive fundamental story. Bonds |
(2.50% convertible note due 8/1/2026) | puttable at 100 on 8/1/2011. |
LSI Logic | Added to existing position. Security has superior imbalance of |
(4.00% convertible note due 5/15/2010) | upside potential to downside risk. |
| |
| |
Reductions | Comments |
Dick’s Sporting Goods | Sold after significant appreciation. |
(1.61% convertible note due 2/18/2024) | |
Goodrich Petroleum | Sold the preferred after substantial price appreciation and |
(5.38% convertible preferred) | switched into a convertible bond from the same issuer. |
American Express | Sold after security neared its call date. |
(1.85% convertible note due 12/1/2033) | |
Vornado Realty Trust | Sold after reaching price target. |
(3.88% convertible note due 4/15/2025) | |
9
Fund Profile
As of November 30, 2006
Portfolio Characteristics | |
| |
Number of Securities | 102 |
Yield | 3.5% |
Conversion Premium | 25.3% |
Average Weighted Maturity | 4.0 years |
Average Coupon | 2.6% |
Average Quality1 | Ba3/BB– |
Average Duration | 4.9 years |
Foreign Holdings | 8.1% |
Turnover Rate | 138% |
Expense Ratio | 0.87% |
Short-Term Reserves | 1% |
Volatility Measures2 | |
| Fund Versus |
| Spliced Index3 |
R-Squared | 0.84 |
Beta | 1.08 |
Distribution by Maturity | |
(% of fixed income portfolio) | |
| |
Under 1 Year | 0% |
1–5 Years | 83 |
5–10 Years | 17 |
Distribution by Credit Quality1 | |
(% of fixed income portfolio) | |
| |
Aaa/AAA | 0% |
Aa/AA | 0 |
A/A | 3 |
Baa/BBB | 20 |
Ba/BB | 15 |
B/B | 20 |
Below B/B | 5 |
Not Rated | 37 |
Ten Largest Holdings4 (% of total net assets) |
| | |
LSI Logic | semiconductors | 3.4% |
Chesapeake Energy Corp. | oil and gas exploration and production | 3.0 |
Gilead Sciences Inc. | biotechnology | 2.9 |
The Interpublic Group of Companies, Inc. | advertising | 2.5 |
Fisher Scientific International Inc. | life sciences tools and services | 2.4 |
L-3 Communications Corp. | aerospace and defense | 2.3 |
Wyeth | pharmaceuticals | 2.3 |
Genzyme Corp. | biotechnology | 2.1 |
MedImmune Inc. | biotechnology | 2.1 |
Andrew Corp. | communications equipment | 2.0 |
Top Ten | | 25.0% |
Sector Diversification (% of portfolio) | |
| |
Consumer Discretionary | 8% |
Consumer Staples | 2 |
Energy | 10 |
Financials | 4 |
Health Care | 29 |
Industrials | 13 |
Information Technology | 23 |
Materials | 2 |
Telecommunication Services | 6 |
Utilities | 2 |
Short-Term Reserves | 1% |
1 | Ratings: Moody’s Investors Service, Standard & Poor’s. |
2 | For an explanation of R-squared, beta, and other terms used here, see the Glossary on page 26. |
3 | CS First Boston Convertibles Index through November 30, 2004; Merrill Lynch All US Convertibles Index thereafter. |
4 | “Ten Largest Holdings” excludes any temporary cash investments and equity index products. |
10
Performance Summary
All of the returns in this report represent past performance, which is not a guarantee of future results that may be achieved by the fund. (Current performance may be lower or higher than the performance data cited. For performance data current to the most recent month-end, visit our website at www.vanguard.com.) Note, too, that both investment returns and principal value can fluctuate widely, so an investor’s shares, when sold, could be worth more or less than their original cost. The returns shown do not reflect taxes that a shareholder would pay on fund distributions or on the sale of fund shares.
Cumulative Performance: November 30, 1996–November 30, 2006
Initial Investment of $10,000
| | | |
| Average Annual Total Returns | Final Value |
| Periods Ended November 30, 2006 | of a $10,000 |
| One Year | Five Years | Ten Years | Investment |
Convertible Securities Fund1 | 15.70% | 9.03% | 8.99% | $23,647 |
Dow Jones Wilshire 5000 Index | 14.68 | 7.79 | 8.42 | 22,447 |
Spliced Convertibles Index2 | 13.30 | 7.94 | 8.16 | 21,911 |
Average Convertible Securities Fund3 | 11.50 | 7.91 | 7.81 | 21,221 |
1 | Total return figures do not reflect the 1% fee assessed on redemptions of shares purchased on or after September 15, 2005, and held for less than one year. |
2 | CS First Boston Convertibles Index through November 30, 2004; Merrill Lynch All US Convertibles Index thereafter. |
3 | Derived from data provided by Lipper Inc. |
11
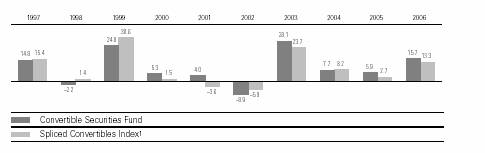
Fiscal-Year Total Returns (%): November 30, 1996–November 30, 2006
Average Annual Total Returns: Periods Ended September 30, 2006 | | | |
This table presents average annual total returns through the latest calendar quarter—rather than through the |
end of the fiscal period. Securities and Exchange Commission rules require that we provide this information. |
| | | | | | |
| | | | | | Ten Years |
| Inception Date | One Year | Five Years | Capital | Income | Total |
Convertible Securities Fund2 | 6/17/1986 | 13.66% | 9.94% | 4.62% | 4.02% | 8.64% |
1 | CS First Boston Convertibles Index through November 30, 2004; Merrill Lynch All US Convertibles Index thereafter. |
2 | Total return figures do not reflect the 1% fee assessed on redemptions of shares purchased on or after September 15, 2005, and held for less than one year. |
Note: See Financial Highlights table on page 18 for dividend and capital gains information.
12
Financial Statements
Statement of Net Assets
As of November 30, 2006
The fund provides a complete list of its holdings four times in each fiscal year, at the quarter-ends. For the second and fourth fiscal quarters, the lists appear in the fund’s semiannual and annual reports to shareholders. For the first and third fiscal quarters, the fund files the lists with the Securities and Exchange Commission on Form N-Q. Shareholders can look up the fund’s Forms N-Q on the SEC’s website at www.sec.gov. Forms N-Q may also be reviewed and copied at the SEC’s Public Reference Room (see the back cover of this report for further information).
| | Face | Market |
| | Amount | Value• |
| | ($000) | ($000) |
Convertible Bonds (89.7%) | | |
Consumer Discretionary (8.0%) | | |
| Caesars Entertainment, Inc. | | |
| 5.506%, 4/15/24 | 1,525 | 1,916 |
| Eastman Kodak Corp. | | |
| 3.375%, 10/15/33 | 2,000 | 2,105 |
| General Motors Corp. | | |
| 5.250%, 3/6/32 | 85† | 1,753 |
| 6.250%, 7/15/33 | 159† | 3,587 |
| Hilton Hotels Corp. | | |
| 3.375%, 4/15/23 | 5,915 | 8,836 |
| Interpublic Group Inc. | | |
1 | 4.250%, 3/15/23 | 9,775 | 11,754 |
| Liberty Media Corp. | | |
| 0.750%, 3/30/08 | 4,885 | 5,801 |
| Priceline.com | | |
| 2.250%, 1/15/25 | 645 | 802 |
| Rare Hospitality | | |
| International Inc. | | |
1 | 2.500%, 11/15/26 | 2,210 | 2,210 |
| Scientific Games Corp. | | |
1 | 0.750%, 12/1/24 | 4,665 | 5,201 |
| Sirius Satellite Radio Inc. | | |
| 3.250%, 10/15/11 | 4,700 | 4,947 |
| The Interpublic Group of | | |
| Companies, Inc. | | |
| 4.500%, 3/15/23 | 5,310 | 6,206 |
| United Auto Group, Inc. | | |
1 | 3.500%, 4/1/26 | 1,860 | 2,148 |
| 3.500%, 4/1/26 | 1,125 | 1,299 |
| | | 58,565 |
Consumer Staples (0.5%) | | |
| Wild Oats Markets, Inc. | | |
| 3.250%, 5/15/34 | 3,485 | 3,777 |
| | | |
Energy (6.6%) | | |
| Cameron International Corp. | | |
| 2.500%, 6/15/26 | 13,310 | 14,475 |
| Hornbeck Offshore | | |
| Services, Inc. | | |
1 | 1.625%, 11/15/26 | 5,630 | 5,837 |
| | | | |
| | Face | Market |
| | Amount | Value• |
| | ($000) | ($000) |
| McMoRan Exploration Co. | | |
1 | 5.250%, 10/6/11 | 4,920 | 5,646 |
| 5.250%, 10/6/11 | 405 | 465 |
| Nabors Industries Inc. | | |
| 0.000%, 6/15/23 | 12,310 | 13,649 |
| Oil States International, Inc. | | |
| 2.375%, 7/1/25 | 3,575 | 4,692 |
| SEACOR Holdings Inc. | | |
| 2.875%, 12/15/24 | 2,125 | 2,962 |
| | | 47,726 |
Financials (2.0%) | | |
| CapitalSource Inc. | | |
| 3.500%, 7/15/34 | 3,865 | 4,372 |
| Conseco Inc. | | |
1 | 3.500%, 9/30/35 | 6,575 | 6,583 |
| EOP Operating LP | | |
1 | 4.000%, 7/15/26 | 2,935 | 3,485 |
| Fairfax Financial Holdings Ltd. | | |
| 5.000%, 7/15/23 | 310 | 313 |
| | | 14,753 |
Health Care (29.0%) | | |
| Allergan, Inc. | | |
1 | 1.500%, 4/1/26 | 10,665 | 11,438 |
| Amgen Inc. | | |
1 | 0.125%, 2/1/11 | 7,115 | 7,124 |
| Biomartin Pharmaceutical Inc. | | |
| 2.500%, 3/29/13 | 1,270 | 1,578 |
| Cephalon Inc. | | |
| 0.000%, 6/15/33 | 1,310 | 1,724 |
| China Medical | | |
| Technologies, Inc. | | |
1 | 3.500%, 11/15/11 | 3,230 | 3,234 |
| Cubist Pharmaceuticals Inc. | | |
| 2.250%, 6/15/13 | 8,525 | 8,056 |
| Cytyc Corp. | | |
| 2.250%, 3/15/24 | 5,890 | 6,111 |
| First Horizon | | |
| Pharmaceutical Corp. | | |
| 1.750%, 3/8/24 | 9,155 | 10,082 |
13
| | | Face | Market |
| | | Amount | Value• |
| | | ($000) | ($000) |
| Fisher Scientific | | |
| | International Inc. | | |
^ | | 3.250%, 3/1/11 | 13,935 | 17,576 |
| Five Star Quality Care Inc. | | |
1 | | 3.750%, 10/15/26 | 5,500 | 5,638 |
| Genzyme Corp. | | |
| | 1.250%, 12/1/08 | 14,380 | 15,279 |
| Gilead Sciences Inc. | | |
1 | | 0.500%, 5/1/11 | 20,170 | 20,800 |
| Invitrogen Corp. | | |
| | 2.000%, 8/1/23 | 5,675 | 5,611 |
| Manor Care, Inc. | | |
1 | | 2.125%, 8/1/35 | 11,920 | 13,693 |
| | 2.125%, 8/1/35 | 515 | 592 |
| Medarex Inc. | | |
1 | | 2.250%, 5/15/11 | 5,050 | 6,047 |
| | 2.250%, 5/15/11 | 1,465 | 1,754 |
| Medicis Pharmaceutical Corp. | | |
| | 1.500%, 6/4/33 | 10,305 | 11,078 |
| MedImmune, Inc. | | |
1 | | 1.375%, 7/15/11 | 11,570 | 13,204 |
| | 1.375%, 7/15/11 | 1,730 | 1,974 |
| Medtronic Inc. | | |
1 | | 1.500%, 4/15/11 | 1,300 | 1,355 |
| Regeneron | | |
| | Pharmaceutical, Inc. | | |
| | 5.500%, 10/17/08 | 4,105 | 4,397 |
| Teva Pharmaceutical | | |
| | Finance LLC | | |
| | 0.500%, 2/1/24 | 12,525 | 12,807 |
| Thoratec Corp. | | |
| | 1.379%, 5/16/34 | 10,320 | 6,192 |
| Tizetto Group | | |
| | 2.750%, 10/1/25 | 5,805 | 6,668 |
| Wyeth | | |
| | 5.109%, 1/15/24 | 15,805 | 16,737 |
| | | | 210,749 |
Industrials (12.7%) | | |
| Alliant Techsystems Inc. | | |
| | 2.750%, 2/15/24 | 3,000 | 3,274 |
1 | | 2.750%, 9/15/11 | 6,830 | 6,915 |
| AMR Corp. | | |
| | 4.500%, 2/15/24 | 1,555 | 2,449 |
| DRS Technologies Inc. | | |
1 | | 2.000%, 2/1/26 | 9,460 | 9,708 |
| General Cable Corp. | | |
| | 0.875%, 11/15/13 | 5,495 | 5,783 |
| Jetblue Airways | | |
| | 3.750%, 3/15/35 | 11,385 | 11,954 |
| L-3 Communications Corp. | | |
| | 3.000%, 8/1/35 | 16,375 | 17,010 |
| Triumph Group | | |
1 | | 2.625%, 10/1/26 | 6,620 | 7,712 |
| UAL Corp. | | |
| | 5.000%, 2/1/21 | 10,950 | 12,233 |
| | | | | |
| | | Face | Market |
| | | Amount | Value• |
| | | ($000) | ($000) |
| Waste Connections Inc. | | |
| | 3.750%, 4/1/26 | 930 | 971 |
1 | | 3.750%, 4/1/26 | 7,280 | 7,599 |
| WESCO International, Inc. | | |
1 | | 1.750%, 11/15/26 | 6,925 | 6,977 |
| | | | 92,585 |
Information Technology (23.1%) | |
| Amdocs Ltd. | | |
| | 0.500%, 3/15/24 | 11,975 | 12,619 |
| Arris Group, Inc. | | |
| | 2.000%, 11/15/26 | 8,860 | 9,076 |
| Cadence Design | | |
| | 0.000%, 8/15/23 | 3,175 | 3,842 |
| Ciena Corp. | | |
| | 0.250%, 5/1/13 | 4,920 | 4,293 |
| Coherent, Inc. | | |
1 | | 2.750%, 3/1/11 | 8,355 | 9,023 |
| | 2.750%, 3/1/11 | 85 | 92 |
| Digital River, Inc. | | |
| | 1.250%, 1/1/24 | 2,750 | 3,946 |
| Electronic Data Systems | | |
| | 3.875%, 7/15/23 | 10,735 | 11,299 |
| EMC Corp. | | |
1 | | 1.750%, 12/1/11 | 13,230 | 13,693 |
| Euronet Worldwide, Inc. | | |
| | 1.625%, 12/15/24 | 10,945 | 12,546 |
| FEI Co. | | |
1 | ^ | 2.875%, 6/1/13 | 3,150 | 3,441 |
| Flextronics International Ltd. | | |
| | 1.000%, 8/1/10 | 8,995 | 8,703 |
| Itron Inc. | | |
| | 2.500%, 8/1/26 | 11,905 | 12,277 |
| KEMET Corp. | | |
1 | | 2.250%, 11/15/26 | 5,630 | 5,736 |
| LeCroy Corp. | | |
1 | | 4.000%, 10/15/26 | 1,010 | 1,055 |
| LSI Logic | | |
| | 4.000%, 5/15/10 | 22,670 | 24,739 |
| Macrovision Corp. | | |
1 | | 2.625%, 8/15/11 | 7,750 | 9,271 |
| Powerwave Technologies Inc. | | |
| | 1.875%, 11/15/24 | 5,620 | 5,128 |
| Sybase Inc. | | |
| | 1.750%, 2/22/25 | 4,700 | 5,170 |
| Symantec Corp. | | |
1 | | 0.750%, 6/15/11 | 9,605 | 11,694 |
| | | | 167,643 |
Materials (0.3%) | | |
| Minefinders Corp. | | |
1 | | 4.500%, 12/15/11 | 2,005 | 2,191 |
| | | | |
Telecommunication Services (6.3%) | |
| Andrew Corp. | | |
| | 3.250%, 8/15/13 | 14,540 | 14,576 |
| FiberTower Corp. | | |
1 | | 9.000%, 11/15/12 | 5,235 | 5,929 |
| | | | | |
14
| | Face | Market |
| | Amount | Value• |
| | ($000) | ($000) |
| Level 3 Communications, Inc. | | |
| 2.875%, 7/15/10 | 2,390 | 2,492 |
| 3.500%, 6/15/12 | 5,650 | 6,674 |
| RF Micro. Devices Inc. | | |
| 1.500%, 7/1/10 | 12,310 | 14,080 |
| Time Warner Telecom Inc. | | |
| 2.375%, 4/1/26 | 1,635 | 1,950 |
| | | 45,701 |
Utilities (1.2%) | | |
| CMS Energy Corp. | | |
| 2.875%, 12/1/24 | 6,750 | 8,437 |
Total Convertible Bonds | | |
(Cost $619,336) | | 652,127 |
| | | |
| | | |
| | Shares | |
Convertible Preferred Stocks (9.1%) | |
Consumer Staples (1.3%) | | |
| Bunge Ltd. | | |
* | 4.875% Cvt. Pfd. | 95,500 | 9,825 |
| | | |
Energy (3.7%) | | |
| Bristow Group | | |
| 5.500% Cvt. Pfd. | 101,400 | 5,032 |
| Chesapeake Energy Corp. | | |
| 4.500% Cvt. Pfd. | 20,700 | 2,106 |
| 5.000% Cvt. Pfd. | 28,200 | 3,180 |
1 | 5.000% Cvt. Pfd. | 147,400 | 16,619 |
| | | 26,937 |
Financials (1.6%) | | |
| Aspen Insurance Holdings, Ltd. | |
| 5.625% Cvt. Pfd. | 154,900 | 8,500 |
| Travelers Property Casualty Corp. | |
| 4.500% Cvt. Pfd. | 109,225 | 2,876 |
| | | 11,376 |
Materials (1.4%) | | |
| Celanese Corp. Series | | |
| 4.250% Cvt. Pfd. | 317,900 | 10,054 |
| | Market |
| | Value• |
| Shares | ($000) |
Utilities (1.1%) | | |
NRG Energy, Inc. | | |
4.000% Cvt. Pfd. | 710 | 1,072 |
5.750% Cvt. Pfd. | 25,200 | 6,880 |
| | 7,952 |
Total Convertible Preferred Stocks | |
(Cost $60,949) | | 66,144 |
Temporary Cash Investments (2.2%) | |
2 Vanguard Market Liquidity | | |
Fund, 5.290% | 10,005,943 | 10,006 |
2 Vanguard Market Liquidity | | |
Fund, 5.290%—Note F | 5,836,700 | 5,837 |
Total Temporary Cash Investments | |
(Cost $15,843) | | 15,843 |
Total Investments (101.0%) | | |
(Cost $696,128) | | 734,114 |
Other Assets and Liabilities (–1.0%) | |
Other Assets—Note C | | 6,114 |
Liabilities—Note F | | (13,230) |
| | (7,116) |
Net Assets (100%) | | |
Applicable to 49,079,229 outstanding | |
$.001 par value shares of beneficial | |
interest (unlimited authorization) | 726,998 |
Net Asset Value Per Share | | $14.81 |
At November 30, 2006, net assets consisted of:3 |
| Amount | Per |
| ($000) | Share |
Paid-in Capital | 635,778 | $12.95 |
Undistributed Net | | |
Investment Income | 3,393 | .07 |
Accumulated Net Realized Gains | 49,841 | 1.02 |
Unrealized Appreciation | 37,986 | .77 |
Net Assets | 726,998 | $14.81 |
• | See Note A in Notes to Financial Statements. |
* | Non-income-producing security. |
† | Represents shares in thousands. |
^ | Part of security position is on loan to broker-dealers. See Note F in Notes to Financial Statements. |
1 | Security exempt from registration under Rule 144A of the Securities Act of 1933. Such securities may be sold in transactions exempt from registration, normally to qualified institutional buyers. At November 30, 2006, the aggregate value of these securities was $242,960,000, representing 33.4% of net assets. |
2 | Affiliated money market fund available only to Vanguard funds and certain trusts and accounts managed by Vanguard. Rate shown is the 7-day yield. |
3 | See Note D in Notes to Financial Statements for the tax-basis components of net assets. |
15
Statement of Operations
| Year Ended |
| November 30, 2006 |
| ($000) |
Investment Income | |
Income | |
Dividends | 3,306 |
Interest1 | 21,789 |
Security Lending | 194 |
Total Income | 25,289 |
Expenses | |
Investment Advisory Fees—Note B | |
Basic Fee | 2,327 |
Performance Adjustment | 1,372 |
The Vanguard Group—Note C | |
Management and Administrative | 1,571 |
Marketing and Distribution | 133 |
Custodian Fees | 21 |
Auditing Fees | 24 |
Shareholders’ Reports | 18 |
Trustees’ Fees and Expenses | 1 |
Total Expenses | 5,467 |
Net Investment Income | 19,822 |
Realized Net Gain (Loss) on Investment Securities Sold | 53,501 |
Change in Unrealized Appreciation (Depreciation) of Investment Securities | 16,800 |
Net Increase (Decrease) in Net Assets Resulting from Operations | 90,123 |
1 | Interest income from an affiliated company of the fund was $1,042,000. |
16
Statement of Changes in Net Assets
| Year Ended November 30, |
| 2006 | 2005 |
| ($000) | ($000) |
Increase (Decrease) in Net Assets | | |
Operations | | |
Net Investment Income | 19,822 | 14,691 |
Realized Net Gain (Loss) | 53,501 | 21,903 |
Change in Unrealized Appreciation (Depreciation) | 16,800 | (12,213) |
Net Increase (Decrease) in Net Assets Resulting from Operations | 90,123 | 24,381 |
Distributions | | |
Net Investment Income | (16,633) | (17,976) |
Realized Capital Gain1 | (17,355) | (34,225) |
Total Distributions | (33,988) | (52,201) |
Capital Share Transactions—Note G | | |
Issued | 181,669 | 47,507 |
Issued in Lieu of Cash Distributions | 29,617 | 45,081 |
Redeemed2 | (92,645) | (471,096) |
Net Increase (Decrease) from Capital Share Transactions | 118,641 | (378,508) |
Total Increase (Decrease) | 174,776 | (406,328) |
Net Assets | | |
Beginning of Period | 552,222 | 958,550 |
End of Period3 | 726,998 | 552,222 |
1 | Includes fiscal 2006 and 2005 short-term gain distributions totaling $2,825,000 and $9,035,000, respectively. Short-term gain distributions are treated as ordinary income dividends for tax purposes. |
2 | Net of redemption fees of $83,000 and $0. |
3 | Net Assets—End of Period includes undistributed net investment income of $3,393,000 and $1,846,000. |
17
Financial Highlights
| | | Year Ended November 30, |
For a Share Outstanding Throughout Each Period | 2006 | 2005 | 2004 | 2003 | 2002 |
Net Asset Value, Beginning of Period | $13.57 | $13.62 | $13.05 | $10.57 | $12.12 |
Investment Operations | | | | | |
Net Investment Income | .43 | .29 | .39 | .41 | .47 |
Net Realized and Unrealized Gain (Loss) | | | | | |
on Investments | 1.62 | .48 | .60 | 2.48 | (1.53) |
Total from Investment Operations | 2.05 | .77 | .99 | 2.89 | (1.06) |
Distributions | | | | | |
Dividends from Net Investment Income | (.38) | (.32) | (.42) | (.41) | (.49) |
Distributions from Realized Capital Gains | (.43) | (.50) | — | — | — |
Total Distributions | (.81) | (.82) | (.42) | (.41) | (.49) |
Net Asset Value, End of Period | $14.81 | $13.57 | $13.62 | $13.05 | $10.57 |
| | | | | |
Total Return1 | 15.70% | 5.92% | 7.71% | 28.07% | –8.88% |
| | | | | |
Ratios/Supplemental Data | | | | | |
Net Assets, End of Period (Millions) | $727 | $552 | $959 | $817 | $291 |
Ratio of Total Expenses to Average Net Assets2 | 0.87% | 0.86% | 0.68% | 0.84% | 0.95% |
Ratio of Net Investment Income to | | | | | |
Average Net Assets | 3.14% | 2.18% | 2.94% | 3.82% | 4.27% |
Portfolio Turnover Rate | 138% | 86% | 123% | 127% | 118% |
1 | Total returns do not reflect the 1% fee assessed on redemptions of shares purchased on or after September 15, 2005, and held for less than one year. |
2 | Includes performance-based investment advisory fee increases (decreases) of 0.22%, 0.20%, 0.06%, 0.13%, and 0.21%. See accompanying Notes, which are an integral part of the Financial Statements. |
18
Notes to Financial Statements
Vanguard Convertible Securities Fund is registered under the Investment Company Act of 1940 as an open-end investment company, or mutual fund.
A. The following significant accounting policies conform to generally accepted accounting principles for U.S. mutual funds. The fund consistently follows such policies in preparing its financial statements.
1. Security Valuation: Securities are valued as of the close of trading on the New York Stock Exchange (generally 4:00 p.m. Eastern time) on the valuation date. Equity securities are valued at the latest quoted sales prices or official closing prices taken from the primary market in which each security trades; such securities not traded on the valuation date are valued at the mean of the latest quoted bid and asked prices. Bonds, and temporary cash investments acquired over 60 days to maturity, are valued using the latest bid prices or using valuations based on a matrix system (which considers such factors as security prices, yields, maturities, and ratings), both as furnished by independent pricing services. Investments in Vanguard Market Liquidity Fund are valued at that fund’s net asset value. Other temporary cash investments are valued at amortized cost, which approximates market value. Securities for which market quotations are not readily available, or whose values have been materially affected by events occurring before the fund’s pricing time but after the close of the securities’ primary markets, are valued by methods deemed by the board of trustees to represent fair value.
2. Federal Income Taxes: The fund intends to continue to qualify as a regulated investment company and distribute all of its taxable income. Accordingly, no provision for federal income taxes is required in the financial statements.
3. Distributions: Distributions to shareholders are recorded on the ex-dividend date.
4. Security Lending: The fund may lend its securities to qualified institutional borrowers to earn additional income. Security loans are required to be secured at all times by collateral at least equal to the market value of securities loaned. The fund invests cash collateral received in Vanguard Market Liquidity Fund, and records a liability for the return of the collateral, during the period the securities are on loan. Security lending income represents the income earned on investing cash collateral, less expenses associated with the loan.
5. Other: Dividend income is recorded on the ex-dividend date. Interest income includes income distributions received from Vanguard Market Liquidity Fund and is accrued daily. Premiums and discounts on debt securities purchased are amortized and accreted, respectively, to interest income over the lives of the respective securities. Security transactions are accounted for on the date securities are bought or sold. Costs used to determine realized gains (losses) on the sale of investment securities are those of the specific securities sold. Fees assessed on redemptions of capital shares are credited to paid-in capital.
B. Oaktree Capital Management, LLC, provides investment advisory services to the fund for a fee calculated at an annual percentage rate of average net assets. The basic fee is subject to quarterly adjustments based on the fund’s performance for the preceding three years relative to the Credit Suisse First Boston Convertible Securities Index for periods prior to December 1, 2004, and the Merrill Lynch All US Convertibles Index beginning December 1, 2004. The benchmark change will be fully phased in by November 30, 2007. For the year ended November 30, 2006, the investment advisory fee represented an effective annual basic rate of 0.37% of the fund’s average net assets before an increase of $1,372,000 (0.22%) based on performance.
19
C. The Vanguard Group furnishes at cost corporate management, administrative, marketing, and distribution services. The costs of such services are allocated to the fund under methods approved by the board of trustees. The fund has committed to provide up to 0.40% of its net assets in capital contributions to Vanguard. At November 30, 2006, the fund had contributed capital of $71,000 to Vanguard (included in Other Assets), representing 0.01% of the fund’s net assets and 0.07% of Vanguard’s capitalization. The fund’s trustees and officers are also directors and officers of Vanguard.
D. Distributions are determined on a tax basis and may differ from net investment income and realized capital gains for financial reporting purposes. Differences may be permanent or temporary. Permanent differences are reclassified among capital accounts in the financial statements to reflect their tax character. Temporary differences arise when certain items of income, expense, gain, or loss are recognized in different periods for financial statement and tax purposes; these differences will reverse at some time in the future. Differences in classification may also result from the treatment of short-term gains as ordinary income for tax purposes.
Certain of the fund’s convertible preferred stock investments are treated as debt securities for tax purposes. During the year ended November 30, 2006, the fund realized gains of $24,000 from the sale of these securities, which are included in distributable net investment income for tax purposes; accordingly, such gains have been reclassified from accumulated net realized gains to undistributed net investment income.
Certain of the fund’s convertible bond investments are in securities considered to be “contingent payment debt instruments,” for which any realized gains increase (and all or part of any realized losses decrease) income for tax purposes. During the year ended November 30, 2006, the fund realized net losses of $1,666,000 from the sale of these securities, which reduced distributable net income for tax purposes; accordingly, such losses have been reclassified from accumulated net realized gains to undistributed net investment income.
The fund used a tax accounting practice to treat a portion of the price of capital shares redeemed during the year as distributions from realized capital gains. Accordingly, the fund has reclassified $5,304,000 from accumulated net realized gains to paid-in capital.
For tax purposes, at November 30, 2006, the fund had $28,944,000 of ordinary income and $25,516,000 of long-term gains available for distribution.
At November 30, 2006, the cost of investment securities for tax purposes was $696,208,000. Net unrealized appreciation of investment securities for tax purposes was $37,906,000, consisting of unrealized gains of $43,935,000 on securities that had risen in value since their purchase and $6,029,000 in unrealized losses on securities that had fallen in value since their purchase.
E. During the year ended November 30, 2006, the fund purchased $934,028,000 of investment securities and sold $833,994,000 of investment securities, other than temporary cash investments.
F. The market value of securities on loan to broker-dealers at November 30, 2006, was $5,649,000, for which the fund received cash collateral of $5,837,000.
20
G. Capital shares issued and redeemed were:
| Year Ended November 30, |
| 2006 | 2005 |
| Shares | Shares |
| (000) | (000) |
Issued | 12,806 | 3,643 |
Issued in Lieu of Cash Distributions | 2,164 | 3,418 |
Redeemed | (6,577) | (36,767) |
Net Increase (Decrease) in Shares Outstanding | 8,393 | (29,706) |
H. In June 2006, the Financial Accounting Standards Board issued Interpretation No. 48 (“FIN 48”), “Accounting for Uncertainty in Income Taxes.” FIN 48 establishes the minimum threshold for recognizing, and a system for measuring, the benefits of tax-return positions in financial statements. FIN 48 will be effective for the fund’s fiscal year beginning December 1, 2007. Management is in the process of analyzing the fund’s tax positions for purposes of implementing FIN 48; based on the analysis completed to date, management does not believe the adoption of FIN 48 will result in any material impact to the fund’s financial statements.
21
Report of Independent Registered Public Accounting Firm
To the Trustees and Shareholders of Vanguard Convertible Securities Fund:
In our opinion, the accompanying statement of net assets and the related statements of operations and of changes in net assets and the financial highlights present fairly, in all material respects, the financial position of Vanguard Convertible Securities Fund (the “Fund”) at November 30, 2006, the results of its operations for the year then ended, the changes in its net assets for each of the two years in the period then ended and the financial highlights for each of the five years in the period then ended, in conformity with accounting principles generally accepted in the United States of America. These financial statements and financial highlights (hereafter referred to as “financial statements”) are the responsibility of the Fund’s management; our responsibility is to express an opinion on these financial statements based on our audits. We conducted our audits of these financial statements in accordance with the standards of the Public Company Accounting Oversight Board (United States). Those standards require that we plan and perform the audit to obtain reasonable assurance about whether the financial statements are free of material misstatement. An audit includes examining, on a test basis, evidence supporting the amounts and disclosures in the financial statements, assessing the accounting principles used and significant estimates made by management, and evaluating the overall financial statement presentation. We believe that our audits, which included confirmation of securities at November 30, 2006 by correspondence with the custodian and by agreement to the underlying ownership records for Vanguard Market Liquidity Fund, provide a reasonable basis for our opinion.
PricewaterhouseCoopers LLP
Philadelphia, Pennsylvania
January 11, 2007
Special 2006 tax information (unaudited) for Vanguard Convertible Securities Fund
This information for the fiscal year ended November 30, 2006, is included pursuant to provisions of the Internal Revenue Code.
The fund distributed $17,255,000 as capital gain dividends (from net long-term capital gains) to shareholders during the fiscal year.
The fund distributed $534,000 of qualified dividend income to shareholders during the fiscal year.
For corporate shareholders, 4.4% of investment income (dividend income plus short-term gains, if any) qualifies for the dividends-received deduction.
22
Your Fund’s After-Tax Returns
This table presents returns for your fund both before and after taxes. The after-tax returns are shown in two ways: (1) assuming that an investor owned the fund during the entire period and paid taxes on the fund’s distributions, and (2) assuming that an investor paid taxes on the fund’s distributions and sold all shares at the end of each period.
Calculations are based on the highest individual federal income tax and capital gains tax rates in effect at the times of the distributions and the hypothetical sales. State and local taxes were not considered. After-tax returns reflect any qualified dividend income, using actual prior-year figures and estimates for 2006. (In the example, returns after the sale of fund shares may be higher than those assuming no sale. This occurs when the sale would have produced a capital loss. The calculation assumes that the investor received a tax deduction for the loss.)
Please note that your actual after-tax returns will depend on your tax situation and may differ from those shown. Also note that if you own the fund in a tax-deferred account, such as an individual retirement account or a 401(k) plan, this information does not apply to you. Such accounts are not subject to current taxes.
Finally, keep in mind that a fund’s performance—whether before or after taxes—does not guarantee future results.
Average Annual Total Returns: Convertible Securities Fund1 | | | |
Periods Ended November 30, 2006 | | | |
| One | Five | Ten |
| Year | Years | Years |
Returns Before Taxes | 15.70% | 9.03% | 8.99% |
Returns After Taxes on Distributions | 14.04 | 7.50 | 6.25 |
Returns After Taxes on Distributions and Sale of Fund Shares | 10.71 | 6.92 | 6.03 |
1 | Total return figures do not reflect the 1% fee assessed on redemptions of shares purchased on or after September 15, 2005, and held for less than one year. |
23
About Your Fund’s Expenses
As a shareholder of the fund, you incur ongoing costs, which include costs for portfolio management, administrative services, and shareholder reports (like this one), among others. Operating expenses, which are deducted from a fund’s gross income, directly reduce the investment return of the fund.
A fund’s expenses are expressed as a percentage of its average net assets. This figure is known as the expense ratio. The following examples are intended to help you understand the ongoing costs (in dollars) of investing in your fund and to compare these costs with those of other mutual funds. The examples are based on an investment of $1,000 made at the beginning of the period shown and held for the entire period.
The table below illustrates your fund’s costs in two ways:
• Based on actual fund return. This section helps you to estimate the actual expenses that you paid over the period. The “Ending Account Value” shown is derived from the fund’s actual return, and the third column shows the dollar amount that would have been paid by an investor who started with $1,000 in the fund. You may use the information here, together with the amount you invested, to estimate the expenses that you paid over the period.
To do so, simply divide your account value by $1,000 (for example, an $8,600 account value divided by $1,000 = 8.6), then multiply the result by the number given for your fund under the heading “Expenses Paid During Period.”
• Based on hypothetical 5% yearly return. This section is intended to help you compare your fund’s costs with those of other mutual funds. It assumes that the fund had a yearly return of 5% before expenses, but that the expense ratio is unchanged. In this case—because the return used is not the fund’s actual return—the results do not apply to your investment. The example is useful in making comparisons because the Securities and Exchange Commission requires all mutual funds to calculate expenses based on a 5% return. You can assess your fund’s costs by comparing this hypothetical example with the hypothetical examples that appear in shareholder reports of other funds.
Six Months Ended November 30, 2006 | | | |
| Beginning | Ending | Expenses |
| Account Value | Account Value | Paid During |
Convertible Securities Fund | 5/31/2006 | 11/30/2006 | Period1 |
Based on Actual Fund Return | $1,000.00 | $1,066.95 | $4.51 |
Based on Hypothetical 5% Yearly Return | 1,000.00 | 1,020.71 | 4.41 |
Note that the expenses shown in the table are meant to highlight and help you compare ongoing costs only and do not reflect any transactional costs or account maintenance fees. They do not include your fund’s low-balance fee or the 1% fee assessed on redemptions of shares held less than one year. These fees are fully described in the prospectus. If these fees were applied to your account, your costs would be higher. Your fund does not carry a “sales load.”
1 | These calculations are based on expenses incurred in the most recent six-month period. The fund’s annualized six-month expense ratio for that period was 0.84%. The dollar amounts shown as “Expenses Paid” are equal to the annualized expense ratio multiplied by the average account value over the period, multiplied by the number of days in the most recent six-month period, then divided by the number of days in the most recent 12-month period. |
24
The calculations assume no shares were bought or sold during the period. Your actual costs may have been higher or lower, depending on the amount of your investment and the timing of any purchases or redemptions.
You can find more information about the fund’s expenses, including annual expense ratios, in the Financial Statements section of this report. For additional information on operating expenses and other shareholder costs, please refer to the appropriate fund prospectus.
25
Glossary
Average Coupon. The average interest rate paid on the fixed income securities held by a fund. It is expressed as a percentage of face value.
Average Duration. An estimate of how much the value of the bonds held by a fund will fluctuate in response to a change in interest rates. To see how the value could change, multiply the average duration by the change in rates. If interest rates rise by 1 percentage point, the value of the bonds in a fund with an average duration of five years would decline by about 5%. If rates decrease by a percentage point, the value would rise by 5%.
Average Quality. An indicator of credit risk, this figure is the average of the ratings assigned to a fund’s holdings by credit-rating agencies. The agencies make their judgment after appraising an issuer’s ability to meet its obligations. Quality is graded on a scale, with Aaa or AAA indicating the most creditworthy bond issuers.
Average Weighted Maturity. The average length of time until fixed income securities held by a fund reach maturity and are repaid. The figure reflects the proportion of fund assets represented by each security.
Beta. A measure of the magnitude of a fund’s past share-price fluctuations in relation to the ups and downs of a given market index. The index is assigned a beta of 1.00. Compared with a given index, a fund with a beta of 1.20 typically would have seen its share price rise or fall by 12% when the index rose or fell by 10%. A fund’s beta should be reviewed in conjunction with its R-squared (see definition below). The lower the R-squared, the less correlation there is between the fund and the index, and the less reliable beta is as an indicator of volatility.
Conversion Premium. The average percentage by which the weighted average market price of the convertible securities held by a fund exceeds the weighted average market price of their underlying common stocks. For example, if a stock is trading at $25 per share and a bond convertible into the stock is trading at a price equivalent to $30 per share of stock, the conversion premium is 20% ($5 ÷ $25 = 20%).
Expense Ratio. The percentage of a fund’s average net assets used to pay its annual administrative and advisory expenses. These expenses directly reduce returns to investors.
Foreign Holdings. The percentage of a fund’s net assets represented by securities of companies based outside the United States.
R-Squared. A measure of how much of a fund’s past returns can be explained by the returns from the market in general, as measured by a given index. If a fund’s total returns were precisely synchronized with an index’s returns, its R-squared would be 1.00. If the fund’s returns bore no relationship to the index’s returns, its R-squared would be 0.
Short-Term Reserves. The percentage of a fund invested in highly liquid, short-term securities that can be readily converted to cash.
Turnover Rate. An indication of the fund’s trading activity. Funds with high turnover rates incur higher transaction costs and may be more likely to distribute capital gains (which may be taxable to investors). The turnover rate excludes in-kind transactions, which have minimal impact on costs.
Yield. A snapshot of a fund’s income from interest and dividends. The yield, expressed as a percentage of the fund’s net asset value, is based on income earned over the past 30 days and is annualized, or projected forward for the coming year.
26
This page intentionally left blank.
The People Who Govern Your Fund
The trustees of your mutual fund are there to see that the fund is operated and managed in your best interests since, as a shareholder, you are a part owner of the fund. Your fund’s trustees also serve on the board of directors of The Vanguard Group, Inc., which is owned by the Vanguard funds and provides services to them on an at-cost basis.
A majority of Vanguard’s board members are independent, meaning that they have no affiliation with Vanguard or the funds they oversee, apart from the sizable personal investments they have made as private individuals.
Our independent board members bring distinguished backgrounds in business, academia, and public service to their task of working with Vanguard officers to establish the policies and oversee the activities of the funds. Among board members’ responsibilities are selecting investment advisors for the funds; monitoring fund operations, performance, and costs; reviewing contracts; nominating and selecting new trustees/directors; and electing Vanguard officers.
Each trustee serves a fund until its termination; or until the trustee’s retirement, resignation, or death; or otherwise as specified in the fund’s organizational documents. Any trustee may be removed at a shareholders’ meeting by a vote representing two-thirds of the net asset value of all shares of the fund together with shares of other Vanguard funds organized within the same trust. The table on these two pages shows information for each trustee and executive officer of the fund. The mailing address of the trustees and officers is P.O. Box 876, Valley Forge, PA 19482.
Chairman of the Board, Chief Executive Officer, and Trustee |
| |
John J. Brennan1 | |
Born 1954 | Principal Occupation(s) During the Past Five Years: Chairman of the Board, Chief |
Trustee since May 1987; | Executive Officer, and Director/Trustee of The Vanguard Group, Inc., and of each |
Chairman of the Board and | of the investment companies served by The Vanguard Group. |
Chief Executive Officer | |
145 Vanguard Funds Overseen |
| |
Independent Trustees | |
| |
Charles D. Ellis | |
Born 1937 | Principal Occupation(s) During the Past Five Years: Applecore Partners (pro bono ventures |
Trustee since January 2001 | in education); Senior Advisor to Greenwich Associates (international business strategy |
145 Vanguard Funds Overseen | consulting); Successor Trustee of Yale University; Overseer of the Stern School of Business |
| at New York University; Trustee of the Whitehead Institute for Biomedical Research. |
| |
Rajiv L. Gupta | |
Born 1945 | Principal Occupation(s) During the Past Five Years: Chairman and Chief Executive Officer |
Trustee since December 20012 | of Rohm and Haas Co. (chemicals); Board Member of the American Chemistry Council; |
145 Vanguard Funds Overseen | Director of Tyco International, Ltd. (diversified manufacturing and services) (since 2005); |
| Trustee of Drexel University and of the Chemical Heritage Foundation. |
| |
Amy Gutmann | |
Born 1949 | Principal Occupation(s) During the Past Five Years: President of the University of |
Trustee since June 2006 | Pennsylvania since 2004; Professor in the School of Arts and Sciences, Annenberg School |
145 Vanguard Funds Overseen | for Communication, and Graduate School of Education of the University of Pennsylvania |
| since 2004; Provost (2001–2004) and Laurance S. Rockefeller Professor of Politics and the |
| University Center for Human Values (1990–2004), Princeton University; Director of Carnegie |
| Corporation of New York and of Philadelphia 2016 (since 2005) and of Schuylkill River |
| Development Corporation and Greater Philadelphia Chamber of Commerce (since 2004). |
JoAnn Heffernan Heisen | |
Born 1950 | Principal Occupation(s) During the Past Five Years: Corporate Vice President and Chief |
Trustee since July 1998 | Global Diversity Officer (since January 2006), Vice President and Chief Information |
145 Vanguard Funds Overseen | Officer (1997–2005), and Member of the Executive Committee of Johnson & Johnson |
| (pharmaceuticals/consumer products); Director of the University Medical Center at |
| Princeton and Women’s Research and Education Institute. |
| |
André F. Perold | |
Born 1952 | Principal Occupation(s) During the Past Five Years: George Gund Professor of Finance and |
Trustee since December 2004 | Banking, Harvard Business School (since 2000); Senior Associate Dean, Director of Faculty |
145 Vanguard Funds Overseen | Recruiting, and Chair of Finance Faculty, Harvard Business School; Director and Chairman |
| of UNX, Inc. (equities trading firm) (since 2003); Director of registered investment |
| companies advised by Merrill Lynch Investment Managers and affiliates (1985–2004), |
| Genbel Securities Limited (South African financial services firm) (1999–2003), Gensec |
| Bank (1999–2003), Sanlam, Ltd. (South African insurance company) (2001–2003), and |
| Stockback, Inc. (credit card firm) (2000–2002). |
| |
Alfred M. Rankin, Jr. | |
Born 1941 | Principal Occupation(s) During the Past Five Years: Chairman, President, Chief Executive |
Trustee since January 1993 | Officer, and Director of NACCO Industries, Inc. (forklift trucks/housewares/ lignite); |
145 Vanguard Funds Overseen | Director of Goodrich Corporation (industrial products/aircraft systems and services). |
| |
J. Lawrence Wilson | |
Born 1936 | Principal Occupation(s) During the Past Five Years: Retired Chairman and Chief Executive |
Trustee since April 1985 | Officer of Rohm and Haas Co. (chemicals); Director of Cummins Inc. (diesel engines), |
145 Vanguard Funds Overseen | MeadWestvaco Corp. (packaging products), and AmerisourceBergen Corp. (pharmaceutical |
| distribution); Trustee of Vanderbilt University and of Culver Educational Foundation. |
| |
Executive Officers1 | |
| |
Heidi Stam | |
Born 1956 | Principal Occupation(s) During the Past Five Years: Managing Director of The Vanguard |
Secretary since July 2005 | Group, Inc., since 2006; General Counsel of The Vanguard Group since 2005; Secretary |
145 Vanguard Funds Overseen | of The Vanguard Group, and each of the investment companies served by The Vanguard |
| Group, since 2005; Principal of The Vanguard Group (1997-2006). |
| |
Thomas J. Higgins | |
Born 1957 | Principal Occupation(s) During the Past Five Years: Principal of The Vanguard Group, Inc.; |
Treasurer since July 1998 | Treasurer of each of the investment companies served by The Vanguard Group. |
145 Vanguard Funds Overseen | |
| |
Vanguard Senior Management Team |
| |
R. Gregory Barton | Kathleen C. Gubanich | Michael S. Miller |
Mortimer J. Buckley | Paul A. Heller | Ralph K. Packard |
James H. Gately | F. William McNabb, III | George U. Sauter |
| |
Founder | |
| |
John C. Bogle | |
Chairman and Chief Executive Officer, 1974–1996 |
1 Officers of the funds are “interested persons” as defined in the Investment Company Act of 1940.
2 December 2002 for Vanguard Equity Income Fund, Vanguard Growth Equity Fund, the Vanguard Municipal Bond Funds, and the Vanguard State Tax-Exempt Funds.
More information about the trustees is in the Statement of Additional Information, available from The Vanguard Group.
| 
|
| P.O. Box 2600 |
| Valley Forge, PA 19482-2600 |
Connect with Vanguard™ > www.vanguard.com
Fund Information > 800-662-7447 | Vanguard, Connect with Vanguard, and the ship logo |
| are trademarks of The Vanguard Group, Inc. |
Direct Investor Account Services > 800-662-2739 | |
| All other marks are the exclusive property of their |
Institutional Investor Services > 800-523-1036 | respective owners. |
| |
Text Telephone > 800-952-3335 | All comparative mutual fund data are from Lipper Inc. |
| or Morningstar, Inc., unless otherwise noted. |
| |
| |
| |
| |
This material may be used in conjunction | You can obtain a free copy of Vanguard’s proxy voting |
with the offering of shares of any Vanguard | guidelines by visiting our website, www.vanguard.com, |
fund only if preceded or accompanied by | and searching for “proxy voting guidelines,” or by calling |
the fund’s current prospectus. | Vanguard at 800-662-2739. They are also available from |
| the SEC’s website, www.sec.gov. In addition, you may |
| obtain a free report on how your fund voted the proxies for |
| securities it owned during the 12 months ended June 30. |
| To get the report, visit either www.vanguard.com |
| or www.sec.gov. |
| |
| You can review and copy information about your fund |
| at the SEC’s Public Reference Room in Washington, D.C. |
| To find out more about this public service, call the SEC |
| at 202-551-8090. Information about your fund is also |
| available on the SEC’s website, and you can receive |
| copies of this information, for a fee, by sending a |
| request in either of two ways: via e-mail addressed to |
| publicinfo@sec.gov or via regular mail addressed to the |
| Public Reference Section, Securities and Exchange |
| Commission, Washington, DC 20549-0102. |
| |
| |
| |
| |
| © 2007 The Vanguard Group, Inc. |
| All rights reserved. |
| Vanguard Marketing Corporation, Distributor. |
| |
| Q820 012007 |
Item 4: Principal Accountant Fees and Services.
(a) Audit Fees.
(b) Audit-Related Fees.
Includes fees billed in connection with assurance and related services provided to the Registrant, The Vanguard Group, Inc., Vanguard Marketing Corporation, and other registered investment companies in the Vanguard Group.
(c) Tax Fees.
Includes fees billed in connection with tax compliance, planning and advice services provided to the Registrant, The Vanguard Group, Inc., Vanguard Marketing Corporation, and other registered investment companies in the Vanguard Group and related to income and excise taxes.
(d) All Other Fees.
Includes fees billed for services related to risk management and privacy matters. Services were provided to the Registrant, The Vanguard Group, Inc., Vanguard Marketing Corporation, and other registered investment companies in the Vanguard Group.
(e) (1) Pre-Approval Policies. The policy of the Registrant’s Audit Committee is to consider and, if appropriate, approve before the principal accountant is engaged for such services, all specific audit and non-audit services provided to: (1) the Registrant; (2) The Vanguard Group, Inc.; (3) other entities controlled by The Vanguard Group, Inc. that provide ongoing services to the Registrant; and (4) other registered investment companies in the Vanguard Group. In making a determination, the Audit Committee considers whether the services are consistent with maintaining the principal accountant’s independence.
In the event of a contingency situation in which the principal accountant is needed to provide services in between scheduled Audit Committee meetings, the Chairman of the Audit Committee would be called on to consider and, if appropriate, pre-approve audit or permitted non-audit services in an amount sufficient to complete services through the next Audit Committee meeting, and to determine if such services would be consistent with maintaining the accountant’s independence. At the next scheduled Audit Committee meeting, services and fees would be presented to the Audit Committee for formal consideration, and, if appropriate, approval by the entire Audit Committee. The Audit Committee would again consider whether such services and fees are consistent with maintaining the principal accountant’s independence.
The Registrant’s Audit Committee is informed at least annually of all audit and non-audit services provided by the principal accountant to the Vanguard complex, whether such services are provided to: (1) the Registrant; (2) The Vanguard Group, Inc.; (3) other entities controlled by The Vanguard Group, Inc. that provide ongoing services to the Registrant; or other registered investment companies in the Vanguard Group.
(2) No percentage of the principal accountant’s fees or services were approved pursuant to the waiver provision of paragraph (c)(7)(i)(C) of Rule 2-01 of Regulation S-X.
(g) Aggregate Non-Audit Fees.
Includes fees billed for non-audit services provided to the Registrant, The Vanguard Group, Inc., Vanguard Marketing Corporation, and other registered investment companies in the Vanguard Group.
(h) For the most recent fiscal year, the Audit Committee has determined that the provision of all non-audit services was consistent with maintaining the principal accountant’s independence.
(a) Disclosure Controls and Procedures. The Principal Executive and Financial Officers concluded that the Registrant’s Disclosure Controls and Procedures are effective based on their evaluation of the Disclosure Controls and Procedures as of a date within 90 days of the filing date of this report.
(b) Internal Control Over Financial Reporting. There were no significant changes in Registrant’s internal control over financial reporting or in other factors that could significantly affect this control subsequent to the date of the evaluation, including any corrective actions with regard to significant deficiencies and material weaknesses.
(a) Code of Ethics.
(b) Certifications.
Pursuant to the requirements of the Securities Exchange Act of 1934 and the Investment Company Act of 1940, the registrant has duly caused this report to be signed on its behalf by the undersigned, thereunto duly authorized.
Pursuant to the requirements of the Securities Exchange Act of 1934 and the Investment Company Act of 1940, this report has been signed below by the following persons on behalf of the registrant and in the capacities and on the dates indicated.
* By Power of Attorney. See File Number 002-65955-99, filed on July 27, 2006. Incorporated by Reference.