UNITED STATES
SECURITIES AND EXCHANGE COMMISSION
Washington, D.C. 20549
FORM N-CSR
CERTIFIED SHAREHOLDER REPORT
OF
REGISTERED MANAGEMENT INVESTMENT COMPANIES
Investment Company Act file number: 811-4627
Name of Registrant: Vanguard Convertible Securities Fund
Address of Registrant:
P.O. Box 2600
Valley Forge, PA 19482
Name and address of agent for service:
Heidi Stam, Esquire
P.O. Box 876
Valley Forge, PA 19482
Registrant’s telephone number, including area code: (610) 669-1000
Date of fiscal year end: November 30
Date of reporting period: December 1, 2007– November 30, 2008
Item 1: Reports to Shareholders |

> For fiscal year 2008, Vanguard Convertible Securities Fund returned approximately –35%, a disappointing absolute result, but a strong relative performance in a battered market.
> Global credit-market turmoil and the bankruptcy of a major investment bank had an outsized impact on the performance of most convertible securities.
> The advisor’s conservative approach, along with a relatively light exposure to battered financial stocks, helped the fund’s relative results.
Contents | |
| |
Your Fund’s Total Returns | 1 |
President’s Letter | 2 |
Advisor’s Report | 7 |
Fund Profile | 10 |
Performance Summary | 11 |
Financial Statements | 13 |
Your Fund’s After-Tax Returns | 24 |
About Your Fund’s Expenses | 25 |
Glossary | 27 |
Please note: The opinions expressed in this report are just that—informed opinions. They should not be considered promises or advice. Also, please keep in mind that the information and opinions cover the period through the date on the front of this report. Of course, the risks of investing in your fund are spelled out in the prospectus.
Your Fund’s Total Returns
Fiscal Year Ended November 30, 2008 | | |
| Ticker | Total |
| Symbol | Returns |
Vanguard Convertible Securities Fund | VCVSX | –34.81% |
Merrill Lynch All Convertibles–All Qualities Index1 | | –39.76 |
Average Convertible Securities Fund2 | | –38.12 |
Your Fund’s Performance at a Glance | | | | |
November 30, 2007–November 30, 2008 | | | | |
| | | Distributions Per Share |
| Starting | Ending | Income | Capital |
| Share Price | Share Price | Dividends | Gains |
Vanguard Convertible Securities Fund | $14.95 | $8.86 | $0.501 | $0.820 |
1 Formerly named the Merrill Lynch All US Convertibles Index.
2 Derived from data provided by Lipper Inc.
1

President’s Letter
Dear Shareholder,
The fiscal year ended November 30, 2008, was especially challenging for convertible securities, which combine some of the characteristics of common stocks and bonds.
Typically, because these two asset classes tend not to rise or fall in tandem, convertibles can be expected to benefit either from gains in the underlying common stock or from the relative price stability and income cushion provided by bonds and preferred stock dividends. But there was nothing “normal” about the year 2008, when stocks and many bonds suffered steep declines as financial and economic turmoil intensified.
In this environment, Vanguard Convertible Securities Fund returned –34.81% for the 12 months. In the hard-hit convertibles market, this disappointing absolute return was superior to the returns of the fund’s benchmark index, the peer-group average, and the broad U.S. stock market.
The advisor’s focus on convertible bonds that appear to offer better protection if their underlying common stock price falls helped the fund’s relative performance during this difficult period. In contrast, some fund managers concentrate more on the appreciation potential in convertibles’ equity features, and invest directly in common
2
stock, potentially resulting in more risk. Your advisor’s positioning also moderated the damage from some of the market’s weakest performers, especially in the financial sector.
If you own shares of the fund in a taxable account, see page 24 for a report on after-tax returns for the 12 months, based on the highest tax bracket.
Stock market weakness was sharp and broad-based
Stock markets worldwide, including the U.S. stock market, registered some of the worst 12-month performances in many years. Stocks were weak throughout the year, but declines accelerated in September as the financial crisis deepened and several large financial institutions collapsed, received government assistance, or were taken over by competitors. Market volatility spiked, and daily stock market swings of several percentage points became common.
The effects of the financial crisis, which originated in the U.S. fixed income markets, continued to hamper the broader economy. Unemployment increased, consumer confidence declined, and production levels fell. Shortly after the close of the fund’s fiscal year, the National Bureau of Economic Research (the body responsible for dating the nation’s business cycles) confirmed that the U.S. economy had been in recession since December 2007.
Market Barometer | | | |
| Average Annual Total Returns |
| Periods Ended November 30, 2008 |
| One Year | Three Years | Five Years |
Stocks | | | |
Russell 1000 Index (Large-caps) | –38.98% | –9.10% | –1.43% |
Russell 2000 Index (Small-caps) | –37.46 | –10.13 | –1.65 |
Dow Jones Wilshire 5000 Index (Entire market) | –38.84 | –8.96 | –1.16 |
MSCI All Country World Index ex USA (International) | –48.95 | –6.84 | 3.37 |
| | | |
| | | |
Bonds | | | |
Barclays Capital U.S. Aggregate Bond Index | | | |
(Broad taxable market) | 1.74% | 4.56% | 4.10% |
Barclays Capital Municipal Bond Index | –3.61 | 1.66 | 2.58 |
Citigroup 3-Month Treasury Bill Index | 2.07 | 3.86 | 3.11 |
| | | |
| | | |
CPI | | | |
Consumer Price Index | 1.07% | 2.44% | 2.86% |
3
For the fund’s fiscal year, the broad U.S. stock market returned –38.84%. International stocks fared worse, returning –48.95%.
Amid economic uncertainty, bond investors preferred Treasuries
Credit markets remained unsettled throughout the 12-month period. Bond investors grew increasingly reluctant to lend to corporations and even credit-worthy states and municipalities. Instead, investors preferred the liquidity and relative safety of U.S. Treasury securities. This tendency persisted throughout the year and intensified toward the close of the period, as demand for Treasuries drove their prices higher and yields lower. At the end of November, the yield of the shortest-term Treasuries neared 0%, and the yield of the 10-year Treasury note dipped below 3% for the first time in five decades, indicating a remarkable level of risk-aversion for investors across the maturity spectrum.
The U.S. Federal Reserve Board responded to the credit crisis by creating new lending programs and dramatically easing monetary policy. During the year, the Fed reduced its target for the federal funds rate from 4.50% to 1.00%.
For the 12 months, the broad taxable bond market returned 1.74%; the tax-exempt bond market returned –3.61%.
Turmoil in credit markets took a heavy toll on convertibles
In a tumultuous market for stocks and bonds, convertible securities were buffeted from all sides. These relatively specialized securities were also hit by a number of technical developments with unique consequences for the convertibles market.
With common stocks caught in the tight grip of the first bear market since 2002, the prices—and returns—of convertibles followed suit. And as anxious investors sold anything not issued by the U.S. Treasury, they pushed down prices of corporate bonds, especially medium-to-lower quality issues such as convertibles—negating much of the downside protection these securities might otherwise offer.
In addition to these broad-based challenges, convertibles came under specific and disproportionate pressure in September when the bankruptcy of Lehman Brothers Holdings, a major presence in the convertibles market, led to heavy selling. Also in September, new Securities and Exchange Commission restrictions on short sales of financial stocks put severe pressure on prices of many convertibles that were used in complex trading strategies involving selling stocks short. The net result of credit-market turmoil was a significant decrease in demand for convertibles, not only in terms of their intrinsic investment value but also as tools for other strategies.
4
Among the market’s hardest-hit sectors were financial and consumer discretionary companies, which, fortunately, were significantly underrepresented in the Convertible Securities Fund. As in 2007, the advisor’s light exposure to the financial sector in fiscal 2008 helped the fund sidestep some of the considerable damage to a broad range of financial companies. During the year, the fund held some of these companies—including American International Group (AIG), Citigroup, Federal National Mortgage Association (FNMA), Lehman Brothers, and Washington Mutual—but the positions were not significant.
The prospects of consumer discretionary firms were dimmed by the global economic slowdown, coupled with housing woes and several months of record-high gas prices at the pump, which forced consumers to cut back on nonessential spending.
Two of the fund’s largest positions—health care and energy—held up better than most other market sectors. Energy stocks, which had been among the best gainers in the fiscal first half, traced a path similar to the steep reversal in oil prices during the second half. However, the advisor was able to take profits in some energy and health care holdings, especially earlier in
Expense Ratios1 | | |
Your Fund Compared With Its Peer Group | | |
| | Average |
| | Convertible |
| Fund | Securities Fund |
Convertible Securities Fund | 0.77% | 1.43% |
Total Returns | |
Ten Years Ended November 30, 2008 | |
| Average |
| Annual Return |
Convertible Securities Fund | 4.42% |
Spliced Convertibles Index2 | 1.83 |
Average Convertible Securities Fund3 | 1.88 |
The figures shown represent past performance, which is not a guarantee of future results. (Current performance may be lower or higher than the performance data cited. For performance data current to the most recent month-end, visit our website at www.vanguard.com/performance.) Note, too, that both investment returns and principal value can fluctuate widely, so an investor’s shares, when sold, could be worth more or less than their original cost.
1 The fund expense ratio shown is from the prospectus dated March 24, 2008. For the fiscal year ended November 30, 2008, the fund’s expense ratio was 0.71%. The peer-group expense ratio is derived from data provided by Lipper Inc. and captures information through year-end 2007.
2 CS First Boston Convertibles Index through November 30, 2004; Merrill Lynch All Convertibles–All Qualities Index thereafter.
3 Derived from data provided by Lipper Inc.
5
the year, helping to reduce the portfolio’s exposure to the more recent weakness in these sectors.
For more information on the fund’s positioning and performance during the year, please see the Advisor’s Report, which begins on page 7.
Credit analysis and discipline support long-term results
As shareholders, you know that Vanguard encourages investors not to evaluate a fund based on its short-term results, which can be much more volatile. But even long-term results can vary widely depending on when measurement begins and ends.
The decade through November 2008 is a case in point. The steep 2008 bear market joined the 2000–2002 bear market in the fund’s ten-year performance calculation, replacing the robust stock returns of fiscal 1998. The impact of a simple one-year shift was dramatic: Last year, the ten-year average annual return of the Convertible Securities Fund was 8.75%, compared with 6.60% for the broad U.S. stock market (as measured by the Dow Jones Wilshire 5000 Index).
One year later, for the decade ended November 30, 2008, the Convertible Securities Fund had a more modest average annual return of 4.42%, outperforming (by more than 2.50 percentage points) its unmanaged benchmark index, the peer group’s average return, and the slight decline of the broad U.S. stock market for the decade. The fund benefited from the advisor’s strong credit analysis, focus on superior downside protection, and disciplined approach to selling holdings. And the fund’s low expenses help investors keep more of the portfolio’s returns.
There’s no doubt that the entire past decade has been a disappointment, and such rough patches can understandably shake investor confidence. But history suggests that following the time-tested principles of diversification and balance among the major asset classes can help position you to benefit from the market’s long-term opportunities. The Convertible Securities Fund, which seeks to earn stocklike returns with less risk over time, can play a useful and complementary role within a diversified portfolio.
Thank you for entrusting your assets to Vanguard.
Sincerely,

F. William McNabb III
President and Chief Executive Officer
December 15, 2008
6
Advisor’s Report
Vanguard Convertible Securities Fund performed relatively well in one of the most dramatic and turbulent times in U.S. financial history. Even though the fund outperformed its primary benchmark, however, it is hard to feel pleased given the very negative absolute level of return. The convertible securities market was hurt not only by the turmoil in the stock and credit markets, but also by events specific to convertible securities.
The investment environment
For most of the fiscal year, the convertibles market hummed along with good daily trading volumes and merger-and-acquisition activity, as well as reasonably strong new issuance. Most importantly, convertibles offered the normal (if not better-than-normal) downside protection they can provide in a difficult equity market. However, the environment changed dramatically late in the period, as several events created dramatic dislocations in trading activity and, more significant, valuations. The prices of convertible securities began falling sharply in September as demand evaporated and selling increased to very high levels.
Although valuations had declined somewhat prior to the implosion of Lehman Brothers in mid-September, the investment bank’s bankruptcy filing started waves of selling in convertibles. Lehman had posted its
Major Portfolio Changes | |
Fiscal Year Ended November 30, 2008 | |
| |
Additions | Comments |
Amgen | Attractive, short-dated convertible bond of leading |
(0.13% convertible note due 2/01/11) | biotech company. |
AMR | Attractive bond purchased in high 80s with put at 100 in |
(4.50% convertible note due 2/15/24) | February 2009. |
CommScope | Convertible with stable equity story. Bonds can be put to issuer |
(1.00% convertible note due 3/15/24) | in March 2009. |
EMC | Statistically attractive with high credit quality. |
(1.75% convertible note due 12/01/11) | |
Medtronic | Long-term attractive equity story, with very favorable return/risk |
(1.50% convertible note due 4/15/11) | convertible structure. |
| |
| |
Reductions | Comments |
American International Group | Sold all because of rapidly deteriorating fundamentals. |
(8.50% mandatory convertible) | |
CIT Group | Sold all to reduce our overall exposure to convertible preferreds. |
(8.75% convertible preferred) | |
General Motors | Sold all because of rapidly deteriorating fundamentals. |
(6.25% convertible note due 7/15/33) | |
Nabors Industries Ltd. | Sold all after developing very high conversion premium. |
(0.94% convertible note due 5/15/11) | |
7
convertible holdings as collateral to many commercial banks. After the bankruptcy filing, a number of lenders (both domestic and foreign banks) sold this collateral at prices well below previous trading levels. These lenders were not careful sellers, had little market information, and simply wanted to get enough from the collateral to cover their loan balances.
The liquidation of Lehman’s multibillion-dollar portfolio at lowball prices over the course of less than a week caused great concern and pain among market participants. Especially hurt were those with leveraged convertible portfolios that theoretically were “hedged”—holding long positions in convertibles while short-selling an appropriate amount of the underlying common stock. This strategy of convertible investing is a very significant factor in the convertible securities market.
Also in mid-September, the Securities and Exchange Commission announced a surprising temporary ban on short selling of approximately 800 financial stocks, later expanding the order to cover nearly 1,000 names that included many nonfinancial companies. The SEC’s intent was to stabilize the prices of financial stocks, protect the integrity of the securities market, and strengthen investor confidence. However, the ban had the opposite impact on convertible hedge portfolios (also known as arbitrage or “arb” portfolios), wreaking havoc on their basic long/short strategy. This caused many convertible arbitrage managers to quickly unwind their positions, selling whatever they could as quickly as they could. The distress was compounded by accelerating redemptions from the arb portfolios, which were already experiencing a higher level of redemptions due to lackluster or poor performance over the last several quarters.
The coincident timing of Lehman’s liquidation and the short-selling ban could not have been worse, given all the other negative macroeconomic and liquidity conditions in the financial markets. Valuations were crushed across a wide swath of convertibles. Short-term investment-grade paper fell as much as longer-term non-investment-grade issues. Any holding on the Lehman list was particularly hard hit, as were financial preferred stocks—which underperformed the underlying common shares, themselves declining. In summary, the unprecedented ban on short selling was a dramatic and destabilizing factor across the convertible securities market.
The good news is that securities are finding a price that gets the trade done. We, along with pure equity funds, equity-income portfolios, multi-strategy funds, and other convertible managers, have been taking advantage of the forced selling to buy in our market. Several companies are also buying back their convertibles.
8
New convertible issuance was $6.1 billion for the third calendar quarter, bringing total proceeds for the first nine months of the year to $57.8 billion. As we write, there has been no new issuance since early September.
Our successes and shortfalls
Despite our emphasis on securities offering downside protection, we were nearly fully invested as usual and could not escape the quick and painful drop in convertible prices. In comparison with the benchmark index, our significant underweighting in financial issues benefited us greatly, but our overweighted energy exposure hurt as the price of energy (oil, gas, and coal) retreated sharply with the expected slowdown in global energy needs.
Our biggest underperformers during the period were convertibles from Chesapeake Energy, Ciena, ON Semiconductor, and Bank of America. On the positive side, our better performers included Alpharma, Gilead Sciences, AMR, and Goodrich Petroleum. At the time of their demise, we did not hold any convertibles from Lehman Brothers (we had previously held a small position), Washington Mutual, Fannie Mae, or Wachovia. We did suffer with a holding in American International Group, which we sold in mid-September, but not before the position took about 50 basis points off the fund’s return that month.
The fund’s positioning
Despite the recent pain in the convertibles market, it is important to remember that the portfolio’s ultimate total return comes from the companies in which we invest. The portfolio is heavily weighted in short- to intermediate-term convertible bonds from companies that we believe are creditworthy. At the fiscal year-end, these bonds represented about 92% of our invested portfolio, with only 8% in convertible preferreds.
We remain in the crosscurrent of a mismatch between buyers and sellers and do not count on a sudden snapback in valuation. The overhang of potential redemptions from convertible arbitrage portfolios remains ominous and could take a few months to resolve. However, we believe firmly that company valuations will win out in the end, and bonds will trade higher (and closer to their par value). Despite the short-term dislocation and unusual market conditions, we are confident that we will achieve our long-term objective: equity-type returns with less volatility and less fundamental risk.
Larry W. Keele, CFA
Principal and Founder
Oaktree Capital Management, L.P.
December 12, 2008
9
Convertible Securities Fund
Fund Profile
As of November 30, 2008
Portfolio Characteristics | |
| |
Number of Securities | 113 |
Yield1 | 4.7% |
Conversion Premium | 92.0% |
Average Weighted Maturity | 3.6 years |
Average Coupon | 2.5% |
Average Quality2 | Ba2/BB |
Average Duration | 3.6 years |
Foreign Holdings | 6.7% |
Turnover Rate | 77% |
Expense Ratio (11/30/2007)3 | 0.77% |
Short-Term Reserves | 8.0% |
Distribution by Maturity | |
(% of fixed income portfolio) | |
| |
Under 1 Year | 6.1% |
1–5 Years | 76.4 |
5–10 Years | 14.9 |
10–20 Years | 2.6 |
Distribution by Credit Quality2 | |
(% of fixed income portfolio) | |
| |
Aaa/AAA | 0.0% |
Aa/AA | 0.0 |
A/A | 15.9 |
Baa/BBB | 7.7 |
Ba/BB | 17.2 |
B/B | 17.3 |
Below B/B | 6.0 |
Not Rated | 35.9 |
Volatility Measures4 | |
| Fund Versus |
| Comparative Index5 |
R-Squared | 0.96 |
Beta | 0.93 |
Sector Diversification (% of market exposure) |
| |
Consumer Discretionary | 3.1% |
Consumer Staples | 5.2 |
Energy | 17.5 |
Financials | 5.6 |
Health Care | 33.1 |
Industrials | 14.8 |
Information Technology | 17.5 |
Materials | 1.2 |
Telecommunication Services | 2.0 |
Utilities | 0.0 |
Ten Largest Holdings6 (% of total net assets) |
| | |
Transocean Inc. | oil and gas drilling | 3.5% |
Gilead Sciences Inc. | biotechnology | 3.3 |
AMR Corp. | airlines | 2.9 |
Teva Pharmaceutical | | |
Financial | pharmaceuticals | 2.9 |
Amgen Inc. | biotechnology | 2.8 |
Bank of America Corp. | diversified financial | |
| services | 2.7 |
Medtronic Inc. | health care | |
| equipment | 2.3 |
Allergan, Inc. | pharmaceuticals | 2.3 |
Cubist | | |
Pharmaceuticals Inc. | biotechnology | 2.2 |
Chesapeake Energy Corp. | oil and gas | |
| exploration and | |
| production | 2.1 |
Top Ten | | 27.0% |
1 30-day SEC yield. See the Glossary.
2 Ratings: Moody’s Investors Service, Standard & Poor’s.
3 The expense ratio shown is from the prospectus dated March 24, 2008. For the fiscal year ended November 30, 2008, the expense ratio was 0.71%.
4 For an explanation of R-squared, beta, and other terms used here, see the Glossary.
5 Merrill Lynch All Convertibles–All Qualities Index.
6 The holdings listed exclude any temporary cash investments and equity index products.
10
Convertible Securities Fund
Performance Summary
All of the returns in this report represent past performance, which is not a guarantee of future results that may be achieved by the fund. (Current performance may be lower or higher than the performance data cited. For performance data current to the most recent month-end, visit our website at www.vanguard.com/performance.) Note, too, that both investment returns and principal value can fluctuate widely, so an investor’s shares, when sold, could be worth more or less than their original cost. The returns shown do not reflect taxes that a shareholder would pay on fund distributions or on the sale of fund shares.
Cumulative Performance: November 30, 1998–November 30, 2008
Initial Investment of $10,000
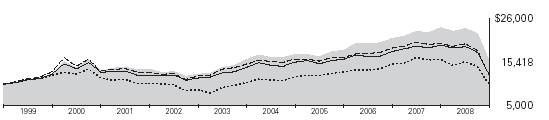
| Average Annual Total Returns | Final Value |
| Periods Ended November 30, 2008 | of a $10,000 |
| One Year | Five Years | Ten Years | Investment |
Convertible Securities Fund1 | –34.81% | –0.67% | 4.42% | $15,418 |
Dow Jones Wilshire 5000 Index | –38.84 | –1.16 | –0.19 | 9,807 |
Spliced Convertibles Index2 | –39.76 | –4.23 | 1.83 | 11,993 |
Average Convertible Securities Fund3 | –38.12 | –3.03 | 1.88 | 12,043 |
1 Total returns do not reflect the 1% fee assessed on redemptions of shares purchased on or after September 15, 2005, and held for less than one year, or the account service fee that may be applicable to certain accounts with balances below $10,000.
2 CS First Boston Convertibles Index through November 30, 2004; Merrill Lynch All Convertibles–All Qualities Index thereafter.
3 Derived from data provided by Lipper Inc.
11
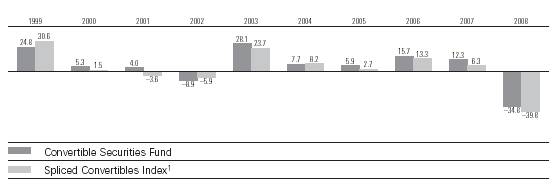
Convertible Securities Fund
Fiscal-Year Total Returns (%): November 30, 1998–November 30, 2008
Average Annual Total Returns: Periods Ended September 30, 2008
This table presents average annual total returns through the latest calendar quarter—rather than through the end of the fiscal period. Securities and Exchange Commission rules require that we provide this information.
| | | | | | Ten Years |
| Inception Date | One Year | Five Years | Capital | Income | Total |
Convertible Securities Fund2 | 6/17/1986 | –16.19% | 5.64% | 3.78% | 3.88% | 7.66% |
1 CS First Boston Convertibles Index through November 30, 2004; Merrill Lynch All Convertibles–All Qualities Index thereafter.
2 Total returns do not reflect the 1% fee assessed on redemptions of shares purchased on or after September 15, 2005, and held for less than one year, or the account service fee that may be applicable to certain accounts with balances below $10,000.
Note: See Financial Highlights table for dividend and capital gains information.
12
Convertible Securities Fund
Financial Statements
Statement of Net Assets
As of November 30, 2008
The fund provides a complete list of its holdings four times in each fiscal year, at the quarter-ends. For the second and fourth fiscal quarters, the lists appear in the fund’s semiannual and annual reports to shareholders. For the first and third fiscal quarters, the fund files the lists with the Securities and Exchange Commission on Form N-Q. Shareholders can look up the fund’s Forms N-Q on the SEC’s website at www.sec.gov. Forms N-Q may also be reviewed and copied at the SEC’s Public Reference Room (see the back cover of this report for further information).
| | | | Face | Market |
| | | Maturity | Amount | Value• |
| | Coupon | Date | ($000) | ($000) |
Convertible Bonds (84.1%) | | | | |
Consumer Discretionary (2.9%) | | | | |
1 | American Real Estate | 4.000% | 8/15/13 | 4,170 | 1,835 |
| Ford Motor Co. | 4.250% | 12/15/36 | 7,055 | 2,169 |
1 | Iconix Brand Group | 1.875% | 6/30/12 | 8,455 | 4,143 |
| Interpublic Group | 4.250% | 3/15/23 | 15,875 | 10,636 |
1 | Stewart Enterprises | 3.125% | 7/15/14 | 4,245 | 1,825 |
| | | | | 20,608 |
Consumer Staples (4.4%) | | | | |
1 | Archer-Daniels-Midland Co. | 0.875% | 2/15/14 | 4,820 | 4,218 |
| Archer-Daniels-Midland Co. | 0.875% | 2/15/14 | 7,910 | 6,921 |
| Chattem Inc. | 1.625% | 5/1/14 | 6,960 | 7,729 |
| Molson Coors Brewing Co. | 2.500% | 7/30/13 | 7,475 | 7,998 |
| Smithfield Foods Inc. | 4.000% | 6/30/13 | 4,085 | 2,104 |
| Tyson Foods Inc. | 3.250% | 10/15/13 | 4,060 | 2,878 |
| | | | | 31,848 |
Energy (16.0%) | | | | |
| Bill Barrett Corp. | 5.000% | 3/15/28 | 9,235 | 6,245 |
| Bristow Group | 3.000% | 6/15/38 | 6,385 | 3,264 |
| Cameron International Corp. | 2.500% | 6/15/26 | 3,540 | 3,275 |
| Carrizo Oil & Gas | 4.375% | 6/1/28 | 14,550 | 7,275 |
| Chesapeake Energy Corp. | 2.250% | 12/15/38 | 30,950 | 14,701 |
| Goodrich Petroleum Corp. | 3.250% | 12/1/26 | 11,565 | 9,397 |
| Hornbeck Offshore Services | 1.625% | 11/15/26 | 11,965 | 6,459 |
| Massey Energy Co. | 3.250% | 8/1/15 | 3,350 | 1,633 |
| Parker Drilling | 2.125% | 7/15/12 | 2,700 | 1,806 |
1 | Patriot Coal Corp. | 3.250% | 5/31/13 | 5,740 | 2,892 |
| Pennsylvania Virginia Co. | 4.500% | 11/15/12 | 9,220 | 6,638 |
| Pioneer Natural Resources | 2.875% | 1/15/38 | 2,945 | 1,958 |
| St. Mary Land & Exploration | 3.500% | 4/1/27 | 16,675 | 10,672 |
1 | Superior Energy Services, Inc. | 1.500% | 12/15/26 | 3,440 | 2,335 |
| Superior Energy Services, Inc. | 1.500% | 12/15/26 | 10,825 | 7,347 |
| Transocean Inc. | 1.500% | 12/15/37 | 3,290 | 2,468 |
| Transocean Inc. | 1.500% | 12/15/37 | 15,300 | 11,934 |
| Transocean Inc. | 1.625% | 12/15/37 | 12,740 | 10,781 |
| Trico Marine | 3.000% | 1/15/27 | 7,415 | 2,150 |
1 | Trico Marine | 6.500% | 5/15/28 | 3,830 | 1,494 |
| | | | | 114,724 |
13
Convertible Securities Fund
| | | | Face | Market |
| | | Maturity | Amount | Value• |
| | Coupon | Date | ($000) | ($000) |
Financials (0.2%) | | | | |
| CapitalSource Inc. | 7.250% | 7/15/37 | 3,340 | 1,904 |
| | | | | |
Health Care (29.1%) | | | | |
| Allergan, Inc. | 1.500% | 4/1/26 | 7,760 | 7,236 |
1 | Allergan, Inc. | 1.500% | 4/1/26 | 10,005 | 9,330 |
| Alpharma Inc. | 2.125% | 3/15/27 | 6,740 | 8,231 |
| American Medical Systems Holdings, Inc. | 3.250% | 7/1/36 | 3,780 | 2,495 |
| Amerigroup Corp. | 2.000% | 5/15/12 | 11,205 | 8,138 |
| Amgen Inc. | 0.125% | 2/1/11 | 13,070 | 11,812 |
| Amgen Inc. | 0.375% | 2/1/13 | 9,440 | 8,142 |
| Chemed Corp. | 1.875% | 5/15/14 | 2,610 | 1,755 |
| China Medical Technologies | 4.000% | 8/15/13 | 9,235 | 4,381 |
| Cubist Pharmaceuticals Inc. | 2.250% | 6/15/13 | 17,555 | 15,514 |
1 | Cyberonics Inc. | 3.000% | 9/27/12 | 5,265 | 3,383 |
1 | Gilead Sciences Inc. | 0.500% | 5/1/11 | 17,810 | 21,194 |
| Gilead Sciences Inc. | 0.500% | 5/1/11 | 1,745 | 2,077 |
| Hologic Inc. | 2.000% | 12/15/37 | 17,130 | 10,023 |
1 | Integra Lifesciences | 2.375% | 6/1/12 | 7,790 | 5,190 |
1 | Inverness Medical Innovations Inc. | 3.000% | 5/15/16 | 8,400 | 5,093 |
| Invitrogen Corp. | 1.500% | 2/15/24 | 11,500 | 8,596 |
| Invitrogen Corp. | 3.250% | 6/15/25 | 6,455 | 5,398 |
| Kendle International Inc. | 3.375% | 7/15/12 | 3,515 | 2,403 |
| Lifepoint Hospital, Inc. | 3.500% | 5/15/14 | 3,825 | 2,132 |
1 | Medtronic Inc. | 1.500% | 4/15/11 | 820 | 732 |
| Medtronic Inc. | 1.500% | 4/15/11 | 17,780 | 15,869 |
1 | Nuvasive Inc. | 2.250% | 3/15/13 | 8,095 | 7,215 |
1 | PSS World Medical Inc. | 3.125% | 8/1/14 | 5,875 | 5,442 |
| SFBC International, Inc. | 2.250% | 8/15/24 | 9,190 | 6,709 |
| Teva Pharmaceutical Financial | 1.750% | 2/1/26 | 20,398 | 20,882 |
| Valeant Pharmaceuticals International | 3.000% | 8/16/10 | 3,595 | 3,056 |
| Valeant Pharmaceuticals International | 4.000% | 11/15/13 | 1,170 | 971 |
1 | Wilson Greatbatch | 2.250% | 6/15/13 | 6,010 | 4,755 |
| | | | | 208,154 |
Industrials (13.3%) | | | | |
1 | AAR Corp. | 1.625% | 3/1/14 | 5,110 | 3,238 |
| Albany International Corp. | 2.250% | 3/15/26 | 2,355 | 1,345 |
1 | Alliant Techsystems Inc. | 2.750% | 9/15/11 | 6,675 | 6,516 |
| AMR Corp. | 4.500% | 2/15/24 | 22,175 | 21,066 |
1 | Barnes Group Inc. | 3.375% | 3/15/27 | 6,080 | 4,651 |
| Barnes Group Inc. | 3.375% | 3/15/27 | 2,490 | 1,905 |
| Covanta Holding | 1.000% | 2/1/27 | 10,915 | 9,305 |
| Energy Conversion Devices, Inc. | 3.000% | 6/15/13 | 5,055 | 2,521 |
1 | General Cable Corp. | 1.000% | 10/15/12 | 12,580 | 6,667 |
| JA Solar Holdings Co. Ltd. | 4.500% | 5/15/13 | 1,890 | 487 |
| L-3 Communications Corp. | 3.000% | 8/1/35 | 14,312 | 13,221 |
| SunPower Corp. | 0.750% | 8/1/27 | 5,840 | 3,457 |
| Suntech Power Holdings | 0.250% | 2/15/12 | 3,171 | 1,918 |
1 | Suntech Power Holdings | 3.000% | 3/15/13 | 11,380 | 3,798 |
| Triumph Group | 2.625% | 10/1/26 | 3,815 | 3,238 |
| UAL Corp. | 4.500% | 6/30/21 | 11,775 | 5,613 |
1 | Waste Connections, Inc. | 3.750% | 4/1/26 | 4,185 | 3,960 |
| Waste Connections, Inc. | 3.750% | 4/1/26 | 2,280 | 2,157 |
| | | | | 95,063 |
14
Convertible Securities Fund
| | | | Face | Market |
| | | Maturity | Amount | Value• |
| | Coupon | Date | ($000) | ($000) |
Information Technology (16.0%) | | | | |
1 | Alliance Data Systems, Inc. | 1.750% | 8/1/13 | 6,085 | 4,305 |
| Arris Group, Inc. | 2.000% | 11/15/26 | 6,805 | 4,068 |
| CACI International Inc. | 2.125% | 5/1/14 | 5,175 | 4,748 |
1 | CACI International Inc. | 2.125% | 5/1/14 | 1,575 | 1,445 |
| Ciena Corp. | 0.250% | 5/1/13 | 18,620 | 9,617 |
| CommScope, Inc. | 1.000% | 3/15/24 | 9,490 | 9,039 |
| CSG Systems International, Inc. | 2.500% | 6/15/24 | 5,915 | 4,821 |
| EMC Corp. | 1.750% | 12/1/11 | 13,995 | 12,858 |
| Equinix Inc. | 2.500% | 4/15/12 | 17,880 | 10,782 |
| Equinix Inc. | 3.000% | 10/15/14 | 2,520 | 1,345 |
| FEI Co. | 2.875% | 6/1/13 | 5,605 | 4,645 |
| Flextronics International Ltd. | 1.000% | 8/1/10 | 4,065 | 3,191 |
| Informatica Corp. | 3.000% | 3/15/26 | 6,990 | 6,343 |
1 | Lawson Software Inc. | 2.500% | 4/15/12 | 9,355 | 6,443 |
| Lawson Software Inc. | 2.500% | 4/15/12 | 3,705 | 2,552 |
| Magma Design Automation Inc. | 2.000% | 5/15/10 | 235 | 159 |
1 | Magma Design Automation Inc. | 2.000% | 5/15/10 | 2,086 | 1,411 |
1 | NetApp Inc. | 1.750% | 6/1/13 | 12,090 | 8,539 |
| ON Semiconductor | 2.625% | 12/15/26 | 18,745 | 9,302 |
| Symantec Corp. | 0.750% | 6/15/11 | 8,330 | 7,081 |
1 | Synnex Corp. | 4.000% | 5/15/18 | 2,435 | 1,732 |
| | | | | 114,426 |
Materials (1.1%) | | | | |
1 | Kinross Gold Corp. | 1.750% | 3/15/28 | 5,045 | 3,607 |
1 | Rayonier TRS Holdings Inc. | 3.750% | 10/15/12 | 4,940 | 4,150 |
| | | | | 7,757 |
Telecommunication Services (1.1%) | | | | |
| NII Holdings | 3.125% | 6/15/12 | 300 | 166 |
1 | SBA Communications Corp. | 1.875% | 5/1/13 | 13,300 | 7,481 |
| | | | | 7,647 |
Total Convertible Bonds (Cost $840,469) | | | | 602,131 |
| | | | | |
| | | | | |
| | | | Shares | |
Convertible Preferred Stocks (7.4%) | | | | |
Consumer Staples (0.3%) | | | | |
| Archer-Daniels-Midland Co. | 6.250% | | 55,400 | 1,937 |
| | | | | |
Financials (4.9%) | | | | |
| Aspen Insurance Holdings, Ltd. | 5.625% | | 165,460 | 5,336 |
| Bank of America Corp. | 7.250% | | 31,940 | 19,523 |
| Citigroup Inc. | 6.500% | | 166,400 | 4,358 |
| KeyCorp | 7.750% | | 76,700 | 5,572 |
| | | | | 34,789 |
Health Care (1.2%) | | | | |
† | Inverness Medical Innovations Inc. | 3.000% | | 57,957 | 6,407 |
| Schering-Plough Corp. | 6.000% | | 16,000 | 2,475 |
| | | | | 8,882 |
Industrials (0.3%) | | | | |
| Continental Airlines Financial Trust | 6.000% | | 114,900 | 2,032 |
15
Convertible Securities Fund
| | | Market |
| | | Value• |
| Coupon | Shares | ($000) |
Telecommunication Services (0.7%) | | | |
Crown Castle International Corp. | 6.250% | 157,800 | 5,247 |
Total Convertible Preferred Stocks (Cost $90,590) | | | 52,887 |
Temporary Cash Investment (8.0%) | | | |
2 Vanguard Market Liquidity Fund | | | |
(Cost $56,934) | 2.116% | 56,933,871 | 56,934 |
Total Investments (99.5%) (Cost $987,993) | | | 711,952 |
Other Assets and Liabilities (0.5%) | | | |
Other Assets | | | 7,762 |
Liabilities | | | (3,947) |
| | | 3,815 |
Net Assets (100%) | | | |
Applicable to 80,780,114 outstanding $.001 par value shares of | | |
beneficial interest (unlimited authorization) | | | 715,767 |
Net Asset Value Per Share | | | $8.86 |
| | | |
| | | |
| | | |
At November 30, 2008, net assets consisted of: | | | |
| | | Amount |
| | | ($000) |
Paid-in Capital | | | 1,056,313 |
Undistributed Net Investment Income | | | 5,438 |
Accumulated Net Realized Losses | | | (69,943) |
Unrealized Appreciation (Depreciation) | | | (276,041) |
Net Assets | | | 715,767 |
• See Note A in Notes to Financial Statements.
† Payment-in-kind security.
1 Security exempt from registration under Rule 144A of the Securities Act of 1933. Such securities may be sold in transactions exempt from registration, normally to qualified institutional buyers. At November 30, 2008, the aggregate value of these securities was $149,019,000, representing 20.8% of net assets.
2 Affiliated money market fund available only to Vanguard funds and certain trusts and accounts managed by Vanguard. Rate shown is the 7-day yield.
See accompanying Notes, which are an integral part of the Financial Statements.
16
Convertible Securities Fund
Statement of Operations
| Year Ended |
| November 30, 2008 |
| ($000) |
Investment Income | |
Income | |
Dividends | 7,073 |
Interest1 | 28,204 |
Total Income | 35,277 |
Expenses | |
Investment Advisory Fees—Note B | |
Basic Fee | 3,134 |
Performance Adjustment | 1,320 |
The Vanguard Group—Note C | |
Management and Administrative | 1,572 |
Marketing and Distribution | 217 |
Custodian Fees | 8 |
Auditing Fees | 29 |
Shareholders’ Reports | 24 |
Trustees’ Fees and Expenses | 1 |
Total Expenses | 6,305 |
Net Investment Income | 28,972 |
Realized Net Gain (Loss) on Investment Securities Sold | (69,374) |
Change in Unrealized Appreciation (Depreciation) of Investment Securities | (317,452) |
Net Increase (Decrease) in Net Assets Resulting from Operations | (357,854) |
1 Interest income from an affiliated company of the fund was $1,274,000.
See accompanying Notes, which are an integral part of the Financial Statements.
17
Convertible Securities Fund
Statement of Changes in Net Assets
| Year Ended November 30, |
| 2008 | 2007 |
| ($000) | ($000) |
Increase (Decrease) in Net Assets | | |
Operations | | |
Net Investment Income | 28,972 | 22,207 |
Realized Net Gain (Loss) | (69,374) | 64,494 |
Change in Unrealized Appreciation (Depreciation) | (317,452) | 3,425 |
Net Increase (Decrease) in Net Assets Resulting from Operations | (357,854) | 90,126 |
Distributions | | |
Net Investment Income | (33,367) | (27,011) |
Realized Capital Gain1 | (48,731) | (49,952) |
Total Distributions | (82,098) | (76,963) |
Capital Share Transactions | | |
Issued | 431,344 | 207,475 |
Issued in Lieu of Cash Distributions | 73,425 | 68,629 |
Redeemed2 | (220,694) | (144,621) |
Net Increase (Decrease) from Capital Share Transactions | 284,075 | 131,483 |
Total Increase (Decrease) | (155,877) | 144,646 |
Net Assets | | |
Beginning of Period | 871,644 | 726,998 |
End of Period3 | 715,767 | 871,644 |
1 Includes fiscal 2008 and 2007 short-term gain distributions totaling $28,823,000 and $24,339,000, respectively. Short-term gain distributions are treated as ordinary income dividends for tax purposes.
2 Net of redemption fees of $388,000 and $185,000.
3 Net Assets—End of Period includes undistributed net investment income of $5,438,000 and $9,231,000. See accompanying Notes, which are an integral part of the Financial Statements.
18
Convertible Securities Fund
Financial Highlights | | | | | |
| | | | | |
| | | |
For a Share Outstanding | Year Ended November 30, |
Throughout Each Period | 2008 | 2007 | 2006 | 2005 | 2004 |
Net Asset Value, Beginning of Period | $14.95 | $14.81 | $13.57 | $13.62 | $13.05 |
Investment Operations | | | | | |
Net Investment Income | .401 | .420 | .430 | .290 | .390 |
Net Realized and Unrealized Gain (Loss) | | | | | |
on Investments | (5.170) | 1.250 | 1.620 | .480 | .600 |
Total from Investment Operations | (4.769) | 1.670 | 2.050 | .770 | .990 |
Distributions | | | | | |
Dividends from Net Investment Income | (.501) | (.510) | (.380) | (.320) | (.420) |
Distributions from Realized Capital Gains | (.820) | (1.020) | (.430) | (.500) | — |
Total Distributions | (1.321) | (1.530) | (.810) | (.820) | (.420) |
Net Asset Value, End of Period | $8.86 | $14.95 | $14.81 | $13.57 | $13.62 |
| | | | | |
| | | | | |
Total Return1 | –34.81% | 12.34% | 15.70% | 5.92% | 7.71% |
| | | | | |
| | | | | |
Ratios/Supplemental Data | | | | | |
Net Assets, End of Period (Millions) | $716 | $872 | $727 | $552 | $959 |
Ratio of Total Expenses to | | | | | |
Average Net Assets2 | 0.71% | 0.77% | 0.87% | 0.86% | 0.68% |
Ratio of Net Investment Income to | | | | | |
Average Net Assets | 3.28% | 2.83% | 3.14% | 2.18% | 2.94% |
Portfolio Turnover Rate | 77% | 116% | 138% | 86% | 123% |
1 Total returns do not reflect the 1% fee assessed on redemptions of shares purchased on or after September 15, 2005, and held for less than one year, or the account service fee that may be applicable to certain accounts with balances below $10,000.
2 Includes performance-based investment advisory fee increases (decreases) of 0.15%, 0.16%, 0.22%, 0.20%, and 0.06%. See accompanying Notes, which are an integral part of the Financial Statements.
19
Convertible Securities Fund
Notes to Financial Statements
Vanguard Convertible Securities Fund is registered under the Investment Company Act of 1940 as an open-end investment company, or mutual fund.
A. The following significant accounting policies conform to generally accepted accounting principles for U.S. mutual funds. The fund consistently follows such policies in preparing its financial statements.
1. Security Valuation: Securities are valued as of the close of trading on the New York Stock Exchange (generally 4 p.m., Eastern time) on the valuation date. Equity securities are valued at the latest quoted sales prices or official closing prices taken from the primary market in which each security trades; such securities not traded on the valuation date are valued at the mean of the latest quoted bid and asked prices. Bonds, and temporary cash investments acquired over 60 days to maturity, are valued using the latest bid prices or using valuations based on a matrix system (which considers such factors as security prices, yields, maturities, and ratings), both as furnished by independent pricing services. Investments in Vanguard Market Liquidity Fund are valued at that fund’s net asset value. Other temporary cash investments are valued at amortized cost, which approximates market value. Securities for which market quotations are not readily available, or whose values have been materially affected by events occurring before the fund’s pricing time but after the close of the securities’ primary markets, are valued by methods deemed by the board of trustees to represent fair value.
2. Federal Income Taxes: The fund intends to continue to qualify as a regulated investment company and distribute all of its taxable income. Management has analyzed the fund’s tax positions taken on federal income tax returns for all open tax years (tax years ended November 30, 2005–2008) and has concluded that no provision for federal income tax is required in the fund’s financial statements.
3. Distributions: Distributions to shareholders are recorded on the ex-dividend date.
4. Other: Dividend income is recorded on the ex-dividend date. Interest income includes income distributions received from Vanguard Market Liquidity Fund and is accrued daily. Premiums and discounts on debt securities purchased are amortized and accreted, respectively, to interest income over the lives of the respective securities. Security transactions are accounted for on the date securities are bought or sold. Costs used to determine realized gains (losses) on the sale of investment securities are those of the specific securities sold. Fees assessed on redemptions of capital shares are credited to paid-in capital.
B. Oaktree Capital Management, L.P., provides investment advisory services to the fund for a fee calculated at an annual percentage rate of average net assets. The basic fee is subject to quarterly adjustments based on the fund’s performance for the preceding three years relative to the Merrill Lynch All Convertibles–All Qualities Index. For the year ended November 30, 2008, the investment advisory fee represented an effective annual basic rate of 0.35% of the fund’s average net assets before an increase of $1,320,000 (0.15%) based on performance.
C. The Vanguard Group furnishes at cost corporate management, administrative, marketing, and distribution services. The costs of such services are allocated to the fund under methods approved by the board of trustees. The fund has committed to provide up to 0.40% of its net assets in capital contributions to Vanguard. At November 30, 2008, the fund had contributed capital of $72,000 to Vanguard (included in Other Assets), representing 0.01% of the fund’s net assets and 0.07% of Vanguard’s capitalization. The fund’s trustees and officers are also directors and officers of Vanguard.
20
Convertible Securities Fund
D. Distributions are determined on a tax basis and may differ from net investment income and realized capital gains for financial reporting purposes. Differences may be permanent or temporary. Permanent differences are reclassified among capital accounts in the financial statements to reflect their tax character. Temporary differences arise when certain items of income, expense, gain, or loss are recognized in different periods for financial statement and tax purposes; these differences will reverse at some time in the future. Differences in classification may also result from the treatment of short-term gains as ordinary income for tax purposes.
Certain of the fund’s convertible preferred stock investments are treated as debt securities for tax purposes. During the year ended November 30, 2008, the fund realized gains of $423,000 from the sale of these securities, which are included in distributable net investment income for tax purposes; accordingly, such gains have been reclassified from accumulated net realized losses to undistributed net investment income.
Certain of the fund’s convertible bond investments are in securities considered to be “contingent payment debt instruments,” for which any realized gains increase (and all or part of any realized losses decrease) income for tax purposes. During the year ended November 30, 2008, the fund realized net gains of $179,000 from the sale of these securities, which increased distributable net income for tax purposes; accordingly, such gains have been reclassified from accumulated net realized losses to undistributed net investment income.
For tax purposes, at November 30, 2008, the fund had $7,292,000 of ordinary income available for distribution. The fund had available realized losses of $69,976,000 to offset future net capital gains through November 30, 2016.
At November 30, 2008, the cost of investment securities for tax purposes was $988,016,000. Net unrealized depreciation of investment securities for tax purposes was $276,064,000, consisting of unrealized gains of $5,725,000 on securities that had risen in value since their purchase and $281,789,000 in unrealized losses on securities that had fallen in value since their purchase.
E. During the year ended November 30, 2008, the fund purchased $854,026,000 of investment securities and sold $646,463,000 of investment securities, other than temporary cash investments.
F. Capital shares issued and redeemed were:
| Year Ended November 30, |
| 2008 | 2007 |
| Shares | Shares |
| (000) | (000) |
Issued | 35,899 | 14,411 |
Issued in Lieu of Cash Distributions | 5,474 | 4,965 |
Redeemed | (18,911) | (10,137) |
Net Increase (Decrease) in Shares Outstanding | 22,462 | 9,239 |
21
Convertible Securities Fund
G. In September 2006, the Financial Accounting Standards Board issued Statement of Financial Accounting Standards No. 157 (“FAS 157”), “Fair Value Measurements.” FAS 157 establishes a framework for measuring fair value and expands disclosures about fair value measurements in financial statements.
The various inputs that may be used to determine the value of the fund’s investments are summarized in three broad levels. The inputs or methodologies used for valuing securities are not necessarily an indication of the risk associated with investing in those securities.
Level 1—Quoted prices in active markets for identical securities.
Level 2—Other significant observable inputs (including quoted prices for similar securities, interest rates, prepayment speeds, credit risk, etc.).
Level 3—Significant unobservable inputs (including the fund’s own assumptions used to determine the fair value of investments).
The following table summarizes the fund’s investments as of November 30, 2008, based on the inputs used to value them:
| Investments |
| in Securities |
Valuation Inputs | ($000) |
Level 1—Quoted prices | 109,821 |
Level 2—Other significant observable inputs | 602,131 |
Level 3—Significant unobservable inputs | — |
Total | 711,952 |
22
Report of Independent Registered
Public Accounting Firm
To the Trustees and Shareholders of Vanguard Convertible Securities Fund:
In our opinion, the accompanying statement of net assets and the related statements of operations and of changes in net assets and the financial highlights present fairly, in all material respects, the financial position of Vanguard Convertible Securities Fund (the “Fund”) at November 30, 2008, the results of its operations for the year then ended, the changes in its net assets for each of the two years in the period then ended and the financial highlights for each of the five years in the period then ended, in conformity with accounting principles generally accepted in the United States of America. These financial statements and financial highlights (hereafter referred to as “financial statements”) are the responsibility of the Fund’s management; our responsibility is to express an opinion on these financial statements based on our audits. We conducted our audits of these financial statements in accordance with the standards of the Public Company Accounting Oversight Board (United States). Those standards require that we plan and perform the audit to obtain reasonable assurance about whether the financial statements are free of material misstatement. An audit includes examining, on a test basis, evidence supporting the amounts and disclosures in the financial statements, assessing the accounting principles used and significant estimates made by management, and evaluating the overall financial statement presentation. We believe that our audits, which included confirmation of securities at November 30, 2008 by correspondence with the custodian and by agreement to the underlying ownership records for Vanguard Market Liquidity Fund, provide a reasonable basis for our opinion.
PricewaterhouseCoopers LLP
Philadelphia, Pennsylvania
January 20, 2009
Special 2008 tax information (unaudited) for Vanguard Convertible Securities Fund
This information for the fiscal year ended November 30, 2008, is included pursuant to provisions of the Internal Revenue Code.
The fund distributed $19,938,000 as capital gain dividends (from net long-term capital gains) to shareholders during the fiscal year.
For nonresident alien shareholders, 100% of short-term capital gain dividends distributed by the fund are qualified short-term capital gains.
The fund distributed $1,224,000 of qualified dividend income to shareholders during the fiscal year.
For corporate shareholders, 16.7% of investment income (dividend income plus short-term gains, if any) qualifies for the dividends-received deduction.
23
Your Fund’s After-Tax Returns
This table presents returns for your fund both before and after taxes. The after-tax returns are shown in two ways: (1) assuming that an investor owned the fund during the entire period and paid taxes on the fund’s distributions, and (2) assuming that an investor paid taxes on the fund’s distributions and sold all shares at the end of each period.
Calculations are based on the highest individual federal income tax and capital gains tax rates in effect at the times of the distributions and the hypothetical sales. State and local taxes were not considered. After-tax returns reflect any qualified dividend income, using actual prior-year figures and estimates for 2008. (In the example, returns after the sale of fund shares may be higher than those assuming no sale. This occurs when the sale would have produced a capital loss. The calculation assumes that the investor received a tax deduction for the loss.)
Please note that your actual after-tax returns will depend on your tax situation and may differ from those shown. Also note that if you own the fund in a tax-deferred account, such as an individual retirement account or a 401(k) plan, this information does not apply to you. Such accounts are not subject to current taxes.
Finally, keep in mind that a fund’s performance—whether before or after taxes—does not guarantee future results.
Average Annual Total Returns: Convertible Securities Fund1 | | | |
Periods Ended November 30, 2008 | | | |
| One | Five | Ten |
| Year | Years | Years |
Returns Before Taxes | –34.81% | –0.67% | 4.42% |
Returns After Taxes on Distributions | –36.60 | –2.58 | 2.24 |
Returns After Taxes on Distributions and Sale of Fund Shares | –21.59 | –1.07 | 2.80 |
1 Total returns do not reflect the 1% fee assessed on redemptions of shares purchased on or after September 15, 2005, and held for less than one year, or the account service fee that may be applicable to certain accounts with balances below $10,000.
24
About Your Fund’s Expenses
As a shareholder of the fund, you incur ongoing costs, which include costs for portfolio management, administrative services, and shareholder reports (like this one), among others. Operating expenses, which are deducted from a fund’s gross income, directly reduce the investment return of the fund.
A fund’s expenses are expressed as a percentage of its average net assets. This figure is known as the expense ratio. The following examples are intended to help you understand the ongoing costs (in dollars) of investing in your fund and to compare these costs with those of other mutual funds. The examples are based on an investment of $1,000 made at the beginning of the period shown and held for the entire period.
The accompanying table illustrates your fund’s costs in two ways:
• Based on actual fund return. This section helps you to estimate the actual expenses that you paid over the period. The “Ending Account Value” shown is derived from the fund’s actual return, and the third column shows the dollar amount that would have been paid by an investor who started with $1,000 in the fund. You may use the information here, together with the amount you invested, to estimate the expenses that you paid over the period.
To do so, simply divide your account value by $1,000 (for example, an $8,600 account value divided by $1,000 = 8.6), then multiply the result by the number given for your fund under the heading “Expenses Paid During Period.”
• Based on hypothetical 5% yearly return. This section is intended to help you compare your fund’s costs with those of other mutual funds. It assumes that the fund had a yearly return of 5% before expenses, but that the expense ratio is unchanged. In this case—because the return used is not the fund’s actual return—the results do not apply to your investment. The example is useful in making comparisons because the Securities and Exchange Commission requires all mutual funds to calculate expenses based on a 5% return. You can assess your fund’s costs by comparing this hypothetical example with the hypothetical examples that appear in shareholder reports of other funds.
Six Months Ended November 30, 2008 | | | |
| Beginning | Ending | Expenses |
| Account Value | Account Value | Paid During |
Convertible Securities Fund | 5/31/2008 | 11/30/2008 | Period1 |
Based on Actual Fund Return | $1,000.00 | $657.37 | $3.03 |
Based on Hypothetical 5% Yearly Return | 1,000.00 | 1,021.41 | 3.70 |
1 The calculations are based on expenses incurred in the most recent six-month period. The fund’s annualized six-month expense ratio for that period is 0.73%. The dollar amounts shown as “Expenses Paid” are equal to the annualized expense ratio multiplied by the average account value over the period, multiplied by the number of days in the most recent six-month period, then divided by the number of days in the most recent 12-month period.
25
Note that the expenses shown in the table are meant to highlight and help you compare ongoing costs only and do not reflect transaction costs incurred by the fund for buying and selling securities. Further, the expenses do not include the 1% fee on redemptions of shares held for less than one year, nor do they include the account service fee described in the prospectus. If such fees were applied to your account, your costs would be higher. Your fund does not carry a “sales load.”
The calculations assume no shares were bought or sold during the period. Your actual costs may have been higher or lower, depending on the amount of your investment and the timing of any purchases or redemptions.
You can find more information about the fund’s expenses, including annual expense ratios, in the Financial Statements section of this report. For additional information on operating expenses and other shareholder costs, please refer to your fund’s current prospectus.
26
Glossary
Average Coupon. The average interest rate paid on the fixed income securities held by a fund. It is expressed as a percentage of face value.
Average Duration. An estimate of how much the value of the bonds held by a fund will fluctuate in response to a change in interest rates. To see how the value could change, multiply the average duration by the change in rates. If interest rates rise by 1 percentage point, the value of the bonds in a fund with an average duration of five years would decline by about 5%. If rates decrease by a percentage point, the value would rise by 5%.
Average Quality. An indicator of credit risk, this figure is the average of the ratings assigned to a fund’s holdings by credit-rating agencies. The agencies make their judgment after appraising an issuer’s ability to meet its obligations. Quality is graded on a scale, with Aaa or AAA indicating the most creditworthy bond issuers.
Average Weighted Maturity. The average length of time until fixed income securities held by a fund reach maturity and are repaid. The figure reflects the proportion of fund assets represented by each security.
Beta. A measure of the magnitude of a fund’s past share-price fluctuations in relation to the ups and downs of a given market index. The index is assigned a beta of 1.00. Compared with a given index, a fund with a beta of 1.20 typically would have seen its share price rise or fall by 12% when the index rose or fell by 10%. For this report, beta is based on returns over the past 36 months for both the fund and the index. Note that a fund’s beta should be reviewed in conjunction with its R-squared (see definition). The lower the R-squared, the less correlation there is between the fund and the index, and the less reliable beta is as an indicator of volatility.
Conversion Premium. The average percentage by which the weighted average market price of the convertible securities held by a fund exceeds the weighted average market price of their underlying common stocks. For example, if a stock is trading at $25 per share and a bond convertible into the stock is trading at a price equivalent to $30 per share of stock, the conversion premium is 20% ($5 ÷ $25 = 20%).
Expense Ratio. The percentage of a fund’s average net assets used to pay its annual administrative and advisory expenses. These expenses directly reduce returns to investors.
Foreign Holdings. The percentage of a fund’s net assets represented by securities of companies based outside the United States.
Inception Date. The date on which the assets of a fund (or one of its share classes) are first invested in accordance with the fund’s investment objective. For funds with a subscription period, the inception date is the day after that period ends. Investment performance is measured from the inception date.
Market Exposure. A measure that reflects a fund’s security investments excluding any holdings in short-term reserves.
R-Squared. A measure of how much of a fund’s past returns can be explained by the returns from the market in general, as measured by a given index. If a fund’s total returns were precisely synchronized with an index’s returns, its R-squared would be 1.00. If the fund’s returns bore no relationship to the index’s returns, its R-squared would be 0. For this report, R-squared is based on returns over the past 36 months for both the fund and the index.
27
Short-Term Reserves. The percentage of a fund invested in highly liquid, short-term securities that can be readily converted to cash.
Turnover Rate. An indication of the fund’s trading activity. Funds with high turnover rates incur higher transaction costs and may be more likely to distribute capital gains (which may be taxable to investors). The turnover rate excludes in-kind transactions, which have minimal impact on costs.
Yield. A fund’s 30-day SEC yield is derived using a formula specified by the U.S. Securities and Exchange Commission. Under the formula, data related to the fund’s security holdings in the previous 30 days are used to calculate the fund’s hypothetical net income for that period, which is then annualized and divided by the fund’s estimated average net assets over the calculation period. For the purposes of this calculation, a security’s income is based on its current market yield to maturity (in the case of bonds) or its projected dividend yield (for stocks). Because the SEC yield represents hypothetical annualized income, it will differ—at times significantly—from the fund’s actual experience. As a result, the fund’s income distributions may be higher or lower than implied by the SEC yield.
28
This page intentionally left blank.
This page intentionally left blank.
This page intentionally left blank.
The People Who Govern Your Fund
The trustees of your mutual fund are there to see that the fund is operated and managed in your best interests since, as a shareholder, you are a part owner of the fund. Your fund’s trustees also serve on the board of directors of The Vanguard Group, Inc., which is owned by the Vanguard funds and provides services to them on an at-cost basis.
A majority of Vanguard’s board members are independent, meaning that they have no affiliation with Vanguard or the funds they oversee, apart from the sizable personal investments they have made as private individuals. The independent board members have distinguished backgrounds in business, academia, and public service. Each of the trustees and executive officers oversees 156 Vanguard funds.
The following table provides information for each trustee and executive officer of the fund. More information about the trustees is in the Statement of Additional Information, which can be obtained, without charge, by contacting Vanguard at 800-662-7447, or online at www.vanguard.com.
Chairman of the Board and Interested Trustee
John J. Brennan1
Born 1954. Trustee Since May 1987. Chairman of the Board. Principal Occupation(s) During the Past Five Years: Chairman of the Board and Director/Trustee of The Vanguard Group, Inc., and of each of the investment companies served by The Vanguard Group; Chief Executive Officer and President of The Vanguard Group and of each of the investment companies served by The Vanguard Group (1996–2008).
Independent Trustees
Charles D. Ellis
Born 1937. Trustee Since January 2001. Principal Occupation(s) During the Past Five Years: Applecore Partners (pro bono ventures in education); Senior Advisor to Greenwich Associates (international business strategy consulting); Successor Trustee of Yale University; Overseer of the Stern School of Business at New York University; Trustee of the Whitehead Institute for Biomedical Research.
Emerson U. Fullwood
Born 1948. Trustee Since January 2008. Principal Occupation(s) During the Past Five Years: Retired Executive Chief Staff and Marketing Officer for North America and Corporate Vice President of Xerox Corporation (photocopiers and printers); Director of SPX Corporation (multi-industry manufacturing), of the United Way of Rochester, and of the Boy Scouts of America.
Rajiv L. Gupta
Born 1945. Trustee Since December 2001.2 Principal Occupation(s) During the Past Five Years: Chairman, President, and Chief Executive Officer of Rohm and Haas Co. (chemicals); Board Member of the American Chemistry Council; Director of Tyco International, Ltd. (diversified manufacturing and services), since 2005.
Amy Gutmann
Born 1949. Trustee Since June 2006. Principal
Occupation(s) During the Past Five Years: President of the University of Pennsylvania since 2004; Professor in the School of Arts and Sciences, Annenberg School for Communication, and Graduate School of Education of the University of Pennsylvania since 2004; Provost (2001–2004) and Laurance S. Rockefeller Professor of Politics and the University Center for Human Values (1990–2004), Princeton University; Director of Carnegie Corporation of New York since 2005 and of Schuylkill River Development Corporation and Greater Philadelphia Chamber of Commerce since 2004; Trustee of the National Constitution Center since 2007.
JoAnn Heffernan Heisen
Born 1950. Trustee Since July 1998. Principal Occupation(s) During the Past Five Years: Retired Corporate Vice President, Chief Global Diversity Officer, and Member of the Executive Committee of Johnson & Johnson (pharmaceuticals/consumer products); Vice President and Chief Information Officer (1997–2005) of Johnson & Johnson; Director of the University Medical Center at Princeton and Women’s Research and Education Institute.
André F. Perold
Born 1952. Trustee Since December 2004. Principal Occupation(s) During the Past Five Years: George Gund Professor of Finance and Banking, Senior Associate Dean, and Director of Faculty Recruiting, Harvard Business School; Director and Chairman of UNX, Inc. (equities trading firm); Chair of the Investment Committee of HighVista Strategies LLC (private investment firm) since 2005.
Alfred M. Rankin, Jr.
Born 1941. Trustee Since January 1993. Principal Occupation(s) During the Past Five Years: Chairman, President, Chief Executive Officer, and Director of NACCO Industries, Inc. (forklift trucks/housewares/ lignite); Director of Goodrich Corporation (industrial products/aircraft systems and services).
J. Lawrence Wilson
Born 1936. Trustee Since April 1985. Principal Occupation(s) During the Past Five Years: Retired Chairman and Chief Executive Officer of Rohm and Haas Co. (chemicals); Director of Cummins Inc. (diesel engines) and AmerisourceBergen Corp. (pharmaceutical distribution); Trustee of Vanderbilt University and of Culver Educational Foundation.
Executive Officers
Thomas J. Higgins1
Born 1957. Chief Financial Officer Since September 2008. Principal Occupation(s) During the Past Five Years: Principal of The Vanguard Group, Inc.; Chief Financial Officer of each of the investment companies served by The Vanguard Group since 2008; Treasurer of each of the investment companies served by The Vanguard Group (1998–2008).
Kathryn J. Hyatt1
Born 1955. Treasurer Since November 2008. Principal Occupation(s) During the Past Five Years: Principal of The Vanguard Group, Inc.; Treasurer of each of the investment companies served by The Vanguard Group since 2008; Assistant Treasurer of each of the investment companies served by The Vanguard Group (1988–2008).
F. William McNabb III1
Born 1957. Chief Executive Officer Since August 2008. President Since March 2008. Principal Occupation(s) During the Past Five Years: Chief Executive Officer, Director, and President of The Vanguard Group, Inc., since 2008; Chief Executive Officer and President of each of the investment companies served by The Vanguard Group since 2008; Director of Vanguard Marketing Corporation; Managing Director of The Vanguard Group (1995–2008).
Heidi Stam1
Born 1956. Secretary Since July 2005. Principal Occupation(s) During the Past Five Years: Managing Director of The Vanguard Group, Inc., since 2006; General Counsel of The Vanguard Group since 2005; Secretary of The Vanguard Group and of each of the investment companies served by The Vanguard Group since 2005; Director and Senior Vice President of Vanguard Marketing Corporation since 2005; Principal of The Vanguard Group (1997–2006).
Vanguard Senior Management Team |
| |
| |
R. Gregory Barton | James M. Norris |
Mortimer J. Buckley | Ralph K. Packard |
Kathleen C. Gubanich | Glenn W. Reed |
Paul A. Heller | George U. Sauter |
Michael S. Miller | |
Founder
John C. Bogle
Chairman and Chief Executive Officer, 1974–1996
1 These individuals are “interested persons” as defined in the Investment Company Act of 1940.
2 December 2002 for Vanguard Equity Income Fund, Vanguard Growth Equity Fund, the Vanguard Municipal Bond Funds, and the Vanguard State Tax-Exempt Funds.

P.O. Box 2600
Valley Forge, PA 19482-2600
Connect with Vanguard® > www.vanguard.com
Fund Information > 800-662-7447 | All comparative mutual fund data are from Lipper Inc. |
| or Morningstar, Inc., unless otherwise noted. |
Direct Investor Account Services > 800-662-2739 | |
| You can obtain a free copy of Vanguard’s proxy voting |
Institutional Investor Services > 800-523-1036 | guidelines by visiting our website, www.vanguard.com, |
| and searching for “proxy voting guidelines,” or by |
Text Telephone for People | calling Vanguard at 800-662-2739. The guidelines are |
With Hearing Impairment > 800-952-3335 | also available from the SEC’s website, www.sec.gov. |
| In addition, you may obtain a free report on how your |
| fund voted the proxies for securities it owned during |
| the 12 months ended June 30. To get the report, visit |
This material may be used in conjunction | either www.vanguard.com or www.sec.gov. |
with the offering of shares of any Vanguard | |
fund only if preceded or accompanied by | |
the fund’s current prospectus. | |
| |
| You can review and copy information about your fund |
| at the SEC’s Public Reference Room in Washington, D.C. |
| To find out more about this public service, call the SEC |
The funds or securities referred to herein are not | at 202-551-8090. Information about your fund is also |
sponsored, endorsed, or promoted by MSCI, and MSCI | available on the SEC’s website, and you can receive |
bears no liability with respect to any such funds or | copies of this information, for a fee, by sending a |
securities. For any such funds or securities, the | request in either of two ways: via e-mail addressed to |
prospectus or the Statement of Additional Information | publicinfo@sec.gov or via regular mail addressed to the |
contains a more detailed description of the limited | Public Reference Section, Securities and Exchange |
relationship MSCI has with The Vanguard Group and | Commission, Washington, DC 20549-0102. |
any related funds. | |
| |
Russell is a trademark of The Frank Russell Company. | |
| |
| |
| |
| |
| |
| |
| |
| |
| |
| © 2009 The Vanguard Group, Inc. |
| All rights reserved. |
| Vanguard Marketing Corporation, Distributor. |
| |
| Q820 012009 |
Item 2: Code of Ethics. The Registrant has adopted a code of ethics that applies to the Registrant’s principal executive officer, principal financial officer, principal accounting officer or controller or persons performing similar functions. The Code of Ethics was amended during the reporting period covered by this report to make certain technical, non-material changes.
Item 3: Audit Committee Financial Expert. The following members of the Audit Committee have been determined by the Registrant’s Board of Trustees to be Audit Committee Financial Experts serving on its Audit Committee, and to be independent: Charles D. Ellis, Rajiv L. Gupta, JoAnn Heffernan Heisen, André F. Perold, Alfred M. Rankin, Jr., and J. Lawrence Wilson.
Item 4: Principal Accountant Fees and Services.
(a) Audit Fees.
Audit Fees of the Registrant
Fiscal Year Ended November 30, 2008: $29,000
Fiscal Year Ended November 30, 2007: $41,000
Aggregate Audit Fees of Registered Investment Companies in the Vanguard Group.
Fiscal Year Ended November 30, 2008: $3,055,590
Fiscal Year Ended November 30, 2007: $2,835,320
(b) Audit-Related Fees.
Fiscal Year Ended November 30, 2008: $626,240
Fiscal Year Ended November 30, 2007: $630,400
Includes fees billed in connection with assurance and related services provided to the Registrant, The Vanguard Group, Inc., Vanguard Marketing Corporation, and other registered investment companies in the Vanguard Group.
(c) Tax Fees.
Fiscal Year Ended November 30, 2008: $230,400
Fiscal Year Ended November 30, 2007: $215,900
Includes fees billed in connection with tax compliance, planning and advice services provided to the Registrant, The Vanguard Group, Inc., Vanguard Marketing Corporation, and other registered investment companies in the Vanguard Group and related to income and excise taxes.
(d) All Other Fees.
Fiscal Year Ended November 30, 2008: $0
Fiscal Year Ended November 30, 2007: $0
Includes fees billed for services related to risk management and privacy matters. Services were provided to the Registrant, The Vanguard Group, Inc., Vanguard Marketing Corporation, and other registered investment companies in the Vanguard Group.
(e) (1) Pre-Approval Policies. The policy of the Registrant’s Audit Committee is to consider and, if appropriate, approve before the principal accountant is engaged for such services, all specific audit and non-audit services provided to: (1) the Registrant; (2) The Vanguard Group, Inc.; (3) other entities controlled by The Vanguard Group, Inc. that provide ongoing services to the Registrant; and (4) other registered investment companies in the Vanguard Group. In making a determination, the Audit Committee considers whether the services are consistent with maintaining the principal accountant’s independence.
In the event of a contingency situation in which the principal accountant is needed to provide services in between scheduled Audit Committee meetings, the Chairman of the Audit Committee would be called on to consider and, if appropriate, pre-approve audit or permitted non-audit services in an amount sufficient to complete services through the next Audit Committee meeting, and to determine if such services would be consistent with maintaining the accountant’s independence. At the next scheduled Audit Committee meeting, services and fees would be presented to the Audit Committee for formal consideration, and, if appropriate, approval by the entire Audit Committee. The Audit Committee would again consider whether such services and fees are consistent with maintaining the principal accountant’s independence.
The Registrant’s Audit Committee is informed at least annually of all audit and non-audit services provided by the principal accountant to the Vanguard complex, whether such services are provided to: (1) the Registrant; (2) The Vanguard Group, Inc.; (3) other entities controlled by The Vanguard Group, Inc. that provide ongoing services to the Registrant; or (4) other registered investment companies in the Vanguard Group.
(2) No percentage of the principal accountant’s fees or services were approved pursuant to the waiver provision of paragraph (c)(7)(i)(C) of Rule 2-01 of Regulation S-X.
(f) For the most recent fiscal year, over 50% of the hours worked under the principal accountant’s engagement were not performed by persons other than full-time, permanent employees of the principal accountant.
(g) Aggregate Non-Audit Fees.
Fiscal Year Ended November 30, 2008: $230,400
Fiscal Year Ended November 30, 2007: $215,900
Includes fees billed for non-audit services provided to the Registrant, The Vanguard Group, Inc., Vanguard Marketing Corporation, and other registered investment companies in the Vanguard Group.
(h) For the most recent fiscal year, the Audit Committee has determined that the provision of all non-audit services was consistent with maintaining the principal accountant’s independence.
Item 5: Not Applicable.
Item 6: Not Applicable.
Item 7: Not Applicable.
Item 8: Not Applicable.
Item 9: Not Applicable.
Item 10: Not Applicable.
Item 11: Controls and Procedures.
(a) Disclosure Controls and Procedures. The Principal Executive and Financial Officers concluded that the Registrant's Disclosure Controls and Procedures are effective based on their evaluation of the Disclosure Controls and Procedures as of a date within 90 days of the filing date of this report.
(b) Internal Control Over Financial Reporting. There were no significant changes in Registrant’s Internal Control Over Financial Reporting or in other factors that could significantly affect this control subsequent to the date of the evaluation, including any corrective actions with regard to significant deficiencies and material weaknesses.
Item 12: Exhibits.
(a) Code of Ethics.
(b) Certifications.
Pursuant to the requirements of the Securities Exchange Act of 1934 and the Investment Company Act of 1940, the registrant has duly caused this report to be signed on its behalf by the undersigned, thereunto duly authorized.
| Vanguard Convertible Securities Fund |
| |
BY: | /s/ F. WILLIAM MCNABB III* |
| F. WILLIAM MCNABB III |
| CHIEF EXECUTIVE OFFICER |
Date: January 16, 2009
Pursuant to the requirements of the Securities Exchange Act of 1934 and the Investment Company Act of 1940, this report has been signed below by the following persons on behalf of the registrant and in the capacities and on the dates indicated.
| Vanguard Convertible Securities Fund |
| |
BY: | /s/ F. WILLIAM MCNABB III* |
| F. WILLIAM MCNABB III |
| CHIEF EXECUTIVE OFFICER |
Date: January 16, 2009
| Vanguard Convertible Securities Fund |
| |
BY: | /s/ THOMAS J. HIGGINS * |
| THOMAS J. HIGGINS |
| CHIEF FINANCIAL OFFICER |
Date: January 16, 2009
* By: /s/ Heidi Stam
Heidi Stam, pursuant to a Power of Attorney filed on January 18, 2008, see file Number 2-29601, Incorporated by Reference; and pursuant to a Power of Attorney filed on September 26, 2008, see File Number 2-47371, Incorporated by Reference.