UNITED STATES
SECURITIES AND EXCHANGE COMMISSION
Washington, D.C. 20549
FORM N-CSR
CERTIFIED SHAREHOLDER REPORT
OF
REGISTERED MANAGEMENT INVESTMENT COMPANIES
Investment Company Act file number: 811-4627
Name of Registrant: Vanguard Convertible Securities Fund
Address of Registrant:
P.O. Box 2600
Valley Forge, PA 19482
Name and address of agent for service:
Heidi Stam, Esquire
P.O. Box 876
Valley Forge, PA 19482
Registrant’s telephone number, including area code: (610) 669-1000
Date of fiscal year end: November 30
Date of reporting period: December 1, 2009 – November 30, 2010
Item 1: Reports to Shareholders
 |
| Vanguard Convertible Securities Fund |
| Annual Report |
|
| November 30, 2010 |
 |
> Vanguard Convertible Securities Fund returned 19.39% for the fiscal year ended November 30, 2010, ahead of both the return of its benchmark index and the average return of its peer group.
> For the second straight fiscal year, convertible securities posted higher returns than the broader U.S. stock and bond markets.
> The fund benefited from good security selection across a variety of sectors.
| |
| Contents | |
| Your Fund’s Total Returns. | 1 |
| Chairman’s Letter. | 2 |
| Advisor’s Report. | 8 |
| Fund Profile. | 11 |
| Performance Summary. | 13 |
| Financial Statements. | 15 |
| Your Fund’s After-Tax Returns. | 26 |
| About Your Fund’s Expenses. | 27 |
| Glossary. | 29 |
Please note: The opinions expressed in this report are just that—informed opinions. They should not be considered promises or advice. Also, please keep in mind that the information and opinions cover the period through the date on the front of this report. Of course, the risks of investing in your fund are spelled out in the prospectus.
See the Glossary for definitions of investment terms used in this report.
Cover photograph: Jean Maher.
| |
| Your Fund’s Total Returns | |
| |
| |
| |
| |
| Fiscal Year Ended November 30, 2010 | |
| | Total |
| | Returns |
| Vanguard Convertible Securities Fund | 19.39% |
| Bank of America Merrill Lynch All US Convertibles Index | 17.24 |
| Convertible Securities Funds Average | 15.78 |
| Convertible Securities Funds Average: Derived from data provided by Lipper Inc. | |
Your Fund’s Performance at a Glance
November 30, 2009 , Through November 30, 2010
| | | | |
| | | | Distributions Per Share |
| | Starting | Ending | Income | Capital |
| | Share Price | Share Price | Dividends | Gains |
| Vanguard Convertible Securities Fund | $12.12 | $13.85 | $0.567 | $0.000 |
1

Chairman’s Letter
Dear Shareholder,
Convertible securities outperformed the broad U.S. stock and bond markets for the 12 months ended November 30, 2010. Vanguard Convertible Securities Fund’s return of 19.39% for the period surpassed the 17.24% return of its benchmark, the Bank of America Merrill Lynch All US Convertibles Index, and the 15.78% average return of peer funds.
As its name implies, the Convertible Securities Fund invests mostly in corporate bonds and preferred stocks that can be converted into common stocks at a predetermined price. While convertible securities usually post returns between those of bonds and stocks, the prices of convertibles have risen over the past two years as investors sought alternatives to the volatile stock market and the low-yielding bond market.
After the close of the fund’s fiscal year, the Convertible Securities Fund’s trustees lifted the restrictions on investing in foreign securities (previously, such investments were limited to 20% of fund assets) and, to better reflect this more global mandate, changed the fund’s benchmark to a composite benchmark consisting of 70% U.S. convertibles and 30% international convertibles. So that the fund can take full
2
advantage of the greater opportunities that come with this more flexible mandate, its management team from Oaktree Capital Management, L.P., has been expanded to include Jean-Paul Nedelec and Abe Ofer; they join Larry Keele, who has managed the fund since 1996. Vanguard believes that the addition of this pair of skilled, internationally focused portfolio managers will yield two important benefits for shareholders: increased diversification, and the expansion of our strong partnership with Oaktree.
If you hold shares of the fund in a taxable account, you may wish to review the section later in this report on the fund’s after-tax returns.
Bonds produced good returns amid fiscal and monetary drama
Although global stock markets produced superior returns, bond markets were the more dramatic setting in the past year. The yield of the 10-year U.S. Treasury note declined sharply as a variety of forces—including Europe’s sovereign debt crisis and anticipation that the Federal Reserve would begin a new round of Treasury buying—drove investors into low-yielding government bonds.
The municipal bond market contended with somewhat sensational headlines about the strains on state and municipal budgets and changes in the composition of the bond supply resulting largely from the
| | | |
| Market Barometer | | | |
| |
| | | Average Annual Total Returns |
| | | Periods Ended November 30, 2010 |
| | One | Three | Five |
| | Year | Years | Years |
| Stocks | | | |
| Russell 1000 Index (Large-caps) | 11.48% | -4.66% | 1.30% |
| Russell 2000 Index (Small-caps) | 26.98 | -0.37 | 2.79 |
| Dow Jones U.S. Total Stock Market Index | 13.39 | -3.88 | 1.84 |
| MSCI All Country World Index ex USA (International) | 5.69 | -7.41 | 4.69 |
| |
| Bonds | | | |
| Barclays Capital U.S. Aggregate Bond Index (Broad | | | |
| taxable market) | 6.02% | 6.39% | 6.23% |
| Barclays Capital Municipal Bond Index (Broad | | | |
| tax-exempt market) | 4.76 | 4.86 | 4.67 |
| Citigroup Three-Month U.S. Treasury Bill Index | 0.12 | 0.79 | 2.36 |
| |
| CPI | | | |
| Consumer Price Index | 1.14% | 1.35% | 2.06% |
3
fast-growing inventory of Build America Bonds. The broad U.S. bond market returned about 6% for the full year, while the tax-exempt municipal market returned almost 5%.
As bond prices rise and yields decline, the opportunity for continued strength in the bond market diminishes. Near the end of the period, prices retreated in both the taxable and tax-exempt markets. The Fed’s target for short-term interest rates remained near zero throughout the period, keeping money market fund returns at historical lows.
Periods of strength and weakness added up to solid stock market returns
Stock prices followed a tortuous path to solid 12-month gains. Strength at the start of the year was followed by a summer of weakness and then an autumn revival. The broad U.S. stock market returned more than 13% for the period. Non-U.S. markets had a more modest return approaching 6%, restrained by the fiscal and political dramas in Europe and the dollar’s gains relative to the euro.
Economic environment suited convertible securities
Convertible securities, battered during the financial crisis of 2008, have benefited as the economy has slowly recovered.
Expense Ratios
Your Fund Compared With Its Peer Group
| | |
| | | Peer Group |
| | Fund | Average |
| Convertible Securities Fund | 0.72% | 1.41% |
The fund expense ratio shown is from the prospectus dated March 24, 2010, and represents estimated costs for the current fiscal year. For the fiscal year ended November 30, 2010, the fund’s expense ratio was 0.68%. The peer-group expense ratio is derived from data provided by Lipper Inc. and captures information through year-end 2009.
Peer group: Convertible Securities Funds.
4
Because they have characteristics of both stocks and bonds, convertible securities aren’t typically in position to outperform both asset classes in a given time period. These have been atypical times, however, and convertibles have been able to produce better returns than stocks and bonds in each of the past two fiscal years.
Increased investor demand has lifted the prices of convertibles; the positive performance of the underlying stocks has also played a role. Moreover, investor’s appetite for lower-quality fixed income securities boded well for convertible securities in general and the Convertible Securities Fund in particular. The fact that the average credit quality for the overall convertible securities universe is BB+ while the fund’s average quality is B+ also provided the fund with a nice tailwind for the period as lower-rated bonds bested investment-grade securities. Oaktree relies on its deep and talented research staff to find hidden gems in unrated bonds and bonds rated below investment grade (BB+ or lower as rated by Standard & Poor’s).
Strong sector choices also worked in the fund’s favor. Oaktree’s decision to invest in more information technology securities than the benchmark helped keep the fund a few steps ahead of the index, while selections in the financial sector also enhanced performance.
Total Returns
Ten Years Ended November 30, 2010
| |
| | Average |
| | Annual Return |
| Convertible Securities Fund | 7.16% |
| Spliced Convertibles Index | 4.82 |
| Convertible Securities Funds Average | 4.48 |
Spliced Convertibles Index: CS First Boston Convertibles Index through November 30, 2004; Bank of America Merrill Lynch All US Convertibles Index through December 31, 2010; and 70% Bank of America Merrill Lynch All US Convertibles Index and 30% Bank of America Merrill Lynch Global 300 Convertibles ex-US Index thereafter.
Convertible Securities Funds Average: Derived from data provided by Lipper Inc.
The figures shown represent past performance, which is not a guarantee of future results. (Current performance may be lower or higher than the performance data cited. For performance data current to the most recent month-end, visit our website at vanguard.com/performance.) Note, too, that both investment returns and principal value can fluctuate widely, so an investor’s shares, when sold, could be worth more or less than their original cost.
5
Choices in the consumer discretionary sector were a bright spot as shoppers, heartened by the improving economy, opened their wallets for restaurant meals, travel, and large items they may have been holding off on buying. The advisor’s avoidance of some of the hardest-hit securities in the energy sector also helped the fund’s relative performance.
For more information on the fund’s positioning and performance during the year, please see the Advisor’s Report that follows this letter.
Ten-year performance outshines benchmark, peers
Shareholders in the Convertible Securities Fund have been well served by the fund’s skilled and experienced advisor. Oaktree Capital Management’s research-intensive and careful yet opportunistic approach has helped the fund stay ahead of its comparative standards over the past decade. For the ten years ended November 30, 2010, the fund returned an average of 7.16% per year, more than 2 percentage points ahead of the return of its benchmark index and peer-group average.
It is worth noting that the advisor was able to achieve a commendable performance during a period that included two major bear markets––the dot-com bust at the beginning of the decade and the recent financial crisis. We are confident in the fund’s future prospects as Oaktree continues to follow the same rigorous approach, helped by the fund’s low costs.
Focus on long-term goals regardless of past returns
Although convertible securities have enjoyed higher returns than stocks and bonds over the past two fiscal years, it’s unwise to believe this trend will continue over longer periods. As mentioned earlier in this letter, the performance of these hybrid securities is more likely to fall between those of stocks and bonds.
Of course, even the most experienced professionals can’t accurately predict the future for the financial markets or convertible securities. While you can’t control the market, you can control how you invest your money and how much you pay for that investment. Vanguard encourages you to develop and maintain
6
an investment plan that includes a mix of stocks, bonds, and short-term investments that is appropriate for your long-term goals, risk tolerance, and time horizon.
Convertible securities offer investors a chance to diversify their portfolios further by investing in instruments that, as the past two years have shown, can perform quite differently from the rest of the financial markets. The Convertible Securities Fund, which features skilled advisors and low expenses, can serve an important role in such a well-balanced portfolio.
Thank you for investing your assets at Vanguard.
Sincerely,

F. William McNabb III
Chairman and Chief Executive Officer
December 20, 2010
7
Advisor’s Report
Equities and convertible securities rebounded sharply in the second half of the 2010 fiscal year and produced strong absolute returns for the period; Vanguard Convertible Securities Fund returned about 19% for the full fiscal year. Despite the release of generally uninspiring macroeconomic data throughout the period, investors finally focused on cheap equity valuations and pushed most financial assets higher by late 2010. Convertible securities were driven higher by their underlying stocks and by strong and steady demand from a wide variety of investors. We were pleased with the performance of the fund, which generated an attractive absolute return and outperformed our primary benchmark, the Bank of America Merrill Lynch All US Convertibles Index.
Our security selection produced several above-average performers and no significant detractors from results.
The investment environment
Fund performance was very rewarding during a period that saw no significant developments or noteworthy changes in the convertible securities market. During the second six months of the fiscal year, convertibles responded as expected, moving higher as their underlying stocks advanced, credit spreads remained at relatively low levels, and investors continued to add funds to an asset class that again proved defensive yet rewarding in a relatively volatile investing environment. The equity advance was a result of cheap equity valuations finally being
Major Portfolio Changes
Fiscal Year Ended November 30, 2010
| |
| Additions | Comments |
| General Motors | New attractively priced convertible preferred on vastly |
| (4.75% convertible preferred due 12/01/13) | improved fundamental story. |
| Hologic | Purchased attractively priced new issue at 94.75, puttable in |
| (2.00% convertible note due 12/15/37) | six years at 100 with six years of call protection. |
| Micron Technology | Attractive new convertible with favorable balance of upside |
| (1.875% convertible note due 06/01/27) | potential to downside risk. |
| SanDisk | Cheap convertible security on attractive flash memory |
| (1.50% convertible note due 08/15/17) | storage producer. |
| |
| Reductions | Comments |
| NetApp | |
| (1.75% convertible note due 06/01/13) | Sold all after substantial appreciation. Reduced risk in the portfolio. |
| TRW Automotive | Sold all after substantial appreciation. Put proceeds into other |
| (3.50% convertible note due 12/01/15) | auto parts suppliers. |
| United Continental Holdings | Sold all after substantial appreciation. Put some of the proceeds |
| (4.50% convertible note due 01/15/15) | into other more favorably balanced airline convertibles. |
| Virgin Media | |
| (6.50% convertible note due 11/15/16) | Sold all after substantial appreciation. Reduced risk in the portfolio. |
8
recognized, as well as the generally positive second and third quarter earnings reports from a wide variety of companies. From a credit-quality perspective, speculative-grade convertibles easily outperformed investment-grade convertibles for the period. The top-performing sectors in the index were transportation, technology, and consumer discretionary, while utilities and consumer staples were the laggards. As you would expect, given their high sensitivity to the strong equity advance, high-delta convertibles (those whose prices are keenly sensitive to the prices of the underlying stock) were generally the top individual performers.
Again, demand for convertible paper was noticeably strong from our perspective. As equity investors became more confident that the economy was not heading into a double-dip recession, they, along with fixed income investors, became more aggressive in their purchases of convertibles, attracted by rising yields and upside participation potential. Prices also rose as several companies issued nonconvertible high-yield or high-grade bonds to retire convertibles with upcoming maturities or put dates. Of course, many companies with solid credit––with or without convertible debt––have been enticed by the attractive opportunity created by the historically low cost of debt and the opportunity to buy back their common shares. Share buybacks, which had evaporated over the last couple of years, appear to be coming back in vogue; they contributed somewhat to the strong quarterly return for equities. We will continue to monitor the positives a nd negatives of this new releveraging of corporate balance sheets.
New issuance of convertible securities was relatively quiet throughout the period; during the past several months new issuance was subdued even more by the absolute low level of rates and the wide-open straight bond markets. Overall it was not an important factor in the fund’s performance. Some of the larger new convertibles issued were from Apache, General Motors, Gilead Sciences, and SanDisk. Because of the strong recent uptick in equity prices, and despite the recent slowdown in convertible security issuance, we are hopeful that the next few months will be more fruitful.
Our successes
Our strong relative performance in the six-month period was the result of many of our investments advancing at an above-average rate and an absence of serious detractors from performance. Our best contributors during the period were convertibles from Liberty Global, priceline.com, TRW Automotive, and Virgin Media. Unsurprisingly, given the high absolute return for the period, we were reasonably active in profit-taking, as several convertibles appreciated to pure-equity levels. During the latter part of the period, we sold all of our holdings in Biovail, NetApp, Salesforce.com, Transocean, and TRW Automotive and substantially reduced our positions in EMC, Liberty Global, and priceline.com. These positions were liquidated or reduced in response to strong appreciation, with the proceeds put into more balanced securities sourced from the primary or secondary markets.
9
As usual, our scaled profit-taking has had the desired impact of reducing the overall equity sensitivity (risk) of the portfolio as prices rise. Despite the overall positive investing sentiment and the strong demand for convertible paper, we had no trouble finding attractive, balanced convertibles in which to reinvest the sale proceeds. It is somewhat unusual that a few of our new additions to the portfolio were in the convertible preferred structure, which, as you may know, is not our most favored investing vehicle. During the last six months of the period, our preferred exposure increased to approximately 14% of assets, from 8.0%; we added convertibles from Apache, Citigroup, El Paso, Energy XXI, and General Motors. Given our preference for bonds (and their fixed maturities), we are unlikely to purchase any additional preferred securities without a corresponding reduction in an existing convertible preferred holding.
Our shortfalls
There were very few absolute negative performers for the period. Of course, any well-diversified portfolio will have its share of relative underperformers, and our positions in American Medical Systems, International Game Technology, Newpark Resources, and NuVasive did not perform as well as the index or as well as we had believed they would. Our performance relative to the index was also negatively affected by our underweighting in Ford Motor, where the stock and the high-delta convertibles were stellar performers. On balance, we had very few negative fundamental surprises during the period, and we were able to outperform the index through careful security selection and our normal scaled selling discipline.
The fund’s positioning
We are positive on equities and believe convertibles represent an attractive investment option that can capture a reasonable portion of any additional equity advance, while providing a good measure of downside protection should it become needed. The portfolio remains, as usual, fully invested, with approximately 3% cash and an invested portion comprising 83% convertible bonds and 14% convertible preferreds. Our current yield is relatively attractive at about 3%, with a reasonable average conversion premium of 35%. (The fund’s SEC yield, a somewhat different measure, was 3.06% at the end of the period.) The credit composition of the portfolio remains stable to improving, and we’re pleased to close out another fiscal year with no negative credit events in the fund. We believe our diversified convertibles portfolio will do relatively well in a wide variety of investing scenarios. This adaptability remains the beauty of investing in convertible securities.
Larry W. Keele, CFA Principal and Founder
Oaktree Capital Management, L.P.
December 10, 2010
10
Convertible Securities Fund
Fund Profile
As of November 30, 2010
| |
| Portfolio Characteristics | |
| Ticker Symbol | VCVSX |
| Number of Securities | 122 |
| 30-Day SEC yield | 3.06% |
| Conversion Premium | 35.0% |
| Average Weighted Maturity | 5.2 years |
| Average Coupon | 3.0% |
| Average Duration | 4.5 years |
| Foreign Holdings | 3.0% |
| Turnover Rate | 103% |
| Expense Ratio1 | 0.72% |
| Short-Term Reserves | 2.8% |
| |
| Distribution by Maturity (% of fixed income |
| portfolio) | |
| Under 1 Year | 0.3% |
| 1 - 5 Years | 73.0 |
| 5 - 10 Years | 22.9 |
| 20 - 30 Years | 3.8 |
| |
| |
| Distribution by Credit Quality (% of fixed | |
| income portfolio) | |
| AAA | 0.4% |
| A | 1.9 |
| BBB | 3.6 |
| BB | 16.7 |
| B | 20.2 |
| Below B | 8.8 |
| Not Rated | 48.4 |
For information about these ratings, see the Glossary entry for Credit Quality.
| | |
| Total Fund Volatility Measures | |
| | BofAML | DJ |
| | All US | U.S. Total |
| | Convertibles | Market |
| | Index | Index |
| R-Squared | 0.97 | 0.78 |
| Beta | 0.93 | 0.72 |
These measures show the degree and timing of the fund’s fluctuations compared with the indexes over 36 months.
| | |
| Ten Largest Holdings (% of total net assets) |
| SBA Communications | Wireless | |
| Corp. | Telecommunication | |
| | Services | 3.1% |
| General Motors Co. Pfd. | Automobile | |
| | Manufacturers | 2.9 |
| Equinix Inc. | Internet Software & | |
| | Services | 2.8 |
| Micron Technology Inc. | Semiconductors | 2.5 |
| Gilead Sciences Inc. | Biotechnology | 2.4 |
| MGM Resorts | Casinos & Gaming | |
| International | | 2.3 |
| AMR Corp. | Airlines | 1.9 |
| Life Technologies Corp. | Life Sciences Tools | |
| | & Services | 1.9 |
| Interpublic Group of Cos. | Advertising | |
| Inc. | | 1.9 |
| ON Semiconductor Corp. | Semiconductors | 1.8 |
| Top Ten | | 23.5% |
The holdings listed exclude any temporary cash investments and equity index products.
1 The expense ratio shown is from the prospectus dated March 24, 2010, and represents estimated costs for the current fiscal year. For the fiscal year ended November 30, 2010, the expense ratio was 0.68%.
11
Convertible Securities Fund
| | | |
| Sector Diversification (% of market exposure) |
| | | BofAML | |
| | | All US | DJ |
| | | Convertibl | U.S. Total |
| | | es | Market |
| | Fund | Index | Index |
| Consumer | | | |
| Discretionary | 14.4% | 12.9% | 12.2% |
| Consumer Staples | 2.2 | 2.9 | 9.8 |
| Energy | 9.7 | 9.2 | 10.4 |
| Financials | 8.9 | 20.2 | 16.1 |
| Health Care | 19.4 | 18.2 | 10.8 |
| Industrials | 9.3 | 7.4 | 11.3 |
| Information | | | |
| Technology | 25.3 | 20.4 | 19.0 |
| Materials | 6.3 | 4.8 | 4.4 |
| Telecommunication | | | |
| Services | 4.4 | 2.2 | 2.7 |
| Utilities | 0.1 | 1.8 | 3.3 |
12
Convertible Securities Fund
Performance Summary
All of the returns in this report represent past performance, which is not a guarantee of future results that may be achieved by the fund. (Current performance may be lower or higher than the performance data cited. For performance data current to the most recent month-end, visit our website at vanguard.com/performance.) Note, too, that both investment returns and principal value can fluctuate widely, so an investor’s shares, when sold, could be worth more or less than their original cost. The returns shown do not reflect taxes that a shareholder would pay on fund distributions or on the sale of fund shares.
Cumulative Performance: November 30, 2000, Through November 30, 2010
Initial Investment of $10,000
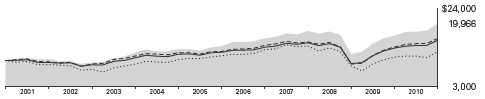
| | | | |
| | Average Annual Total Returns | |
| | Periods Ended November 30, 2010 | |
| | | | | Final Value |
| | One | Five | Ten | of a $10,000 |
| | Year | Years | Years | Investment |
| Convertible Securities Fund | 19.39% | 7.60% | 7.16% | $19,966 |
| Dow Jones U.S. Total Stock Market | | | | |
| Index | 13.39 | 1.84 | 2.15 | 12,374 |
| Spliced Convertibles Index | 17.24 | 5.12 | 4.82 | 16,010 |
| Convertible Securities Funds Average | 15.78 | 4.83 | 4.48 | 15,501 |
Spliced Convertibles Index: CS First Boston Convertibles Index through November 30, 2004; Bank of America Merrill Lynch All US Convertibles Index through December 31, 2010; and 70% Bank of America Merrill Lynch All US Convertibles Index and 30% Bank of America Merrill Lynch Global 300 Convertibles ex-US Index thereafter.
Convertible Securities Funds Average: Derived from data provided by Lipper Inc.
Vanguard fund returns do not reflect the 1% fee on redemptions of shares held for less than one year.
See Financial Highlights for dividend and capital gains information.
13
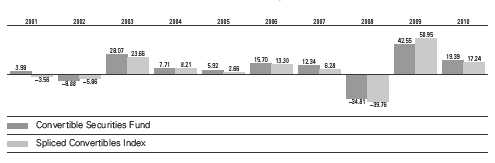
Convertible Securities Fund
Fiscal-Year Total Returns (%): November 30, 2000, Through November 30, 2010
Average Annual Total Returns: Periods Ended September 30, 2010
This table presents average annual total returns through the latest calendar quarter—rather than through the end of the fiscal period. Securities and Exchange Commission rules require that we provide this information.
| | | | | | |
| | | | | | | Ten Years |
| | Inception Date | One Year | Five Years | Income | Capital | Total |
| Convertible Securities | | | | | | |
| Fund | 6/17/1986 | 14.43% | 7.19% | 3.76% | 1.22% | 4.98% |
Vanguard fund returns do not reflect the 1% fee on redemptions of shares held for less than one year.
14
Convertible Securities Fund
Financial Statements
Statement of Net Assets
As of November 30, 2010
The fund reports a complete list of its holdings in regulatory filings four times in each fiscal year, at the quarter-ends. For the second and fourth fiscal quarters, the lists appear in the fund’s semiannual and annual reports to shareholders. For the first and third fiscal quarters, the fund files the lists with the Securities and Exchange Commission on Form N-Q. Shareholders can look up the fund’s Forms N-Q on the SEC’s website at sec.gov. Forms N-Q may also be reviewed and copied at the SEC’s Public Reference Room (see the back cover of this report for further information).
| | | | |
| | | | Face | Market |
| | | Maturity | Amount | Value |
| | Coupon | Date | ($000) | ($000) |
| Convertible Bonds (82.5%) | | | | |
| Consumer Discretionary (8.2%) | | | | |
| DR Horton Inc. Cvt. | 2.000% | 5/15/14 | 850 | 881 |
| 1 Gaylord Entertainment Co. Cvt. | 3.750% | 10/1/14 | 15,175 | 21,492 |
| Interpublic Group of Cos. Inc. Cvt. | 4.250% | 3/15/23 | 13,630 | 15,163 |
| 1 Lennar Corp. Cvt. | 2.750% | 12/15/20 | 10,945 | 10,521 |
| Liberty Global Inc. Cvt. | 4.500% | 11/15/16 | 2,545 | 3,767 |
| Liberty Media LLC Cvt. | 3.125% | 3/30/23 | 13,700 | 15,070 |
| 1 MGM Resorts International Cvt. | 4.250% | 4/15/15 | 40,935 | 40,526 |
| 1 priceline.com Inc. Cvt. | 1.250% | 3/15/15 | 4,735 | 6,937 |
| Saks Inc. Cvt. | 2.000% | 3/15/24 | 17,570 | 18,404 |
| Stanley Black & Decker Inc. Cvt. | 0.000% | 5/17/12 | 8,925 | 9,735 |
| | | | | 142,496 |
| Consumer Staples (2.1%) | | | | |
| Nash Finch Co. Cvt. | 1.631% | 3/15/35 | 12,230 | 5,779 |
| Smithfield Foods Inc. Cvt. | 4.000% | 6/30/13 | 12,185 | 13,236 |
| Tyson Foods Inc. Cvt. | 3.250% | 10/15/13 | 14,845 | 17,331 |
| | | | | 36,346 |
| Energy (4.4%) | | | | |
| Alpha Natural Resources Inc. Cvt. | 2.375% | 4/15/15 | 9,462 | 11,520 |
| BPZ Resources Inc. Cvt. | 6.500% | 3/1/15 | 7,010 | 6,563 |
| Chesapeake Energy Corp. Cvt. | 2.750% | 11/15/35 | 2,487 | 2,294 |
| Goodrich Petroleum Corp. Cvt. | 5.000% | 10/1/29 | 9,481 | 8,711 |
| 1 James River Coal Co. Cvt. | 4.500% | 12/1/15 | 11,830 | 12,776 |
| Newpark Resources Inc. Cvt. | 4.000% | 10/1/17 | 1,925 | 1,709 |
| Peabody Energy Corp. Cvt. | 4.750% | 12/15/41 | 15,275 | 19,075 |
| 1 Petroleum Development Corp. Cvt. | 3.250% | 5/15/16 | 7,450 | 7,962 |
| Quicksilver Resources Inc. Cvt. | 1.875% | 11/1/24 | 4,385 | 4,730 |
| | | | | 75,340 |
| Financials (5.8%) | | | | |
| 1 American Equity Investment Life Holding Co. Cvt. | 3.500% | 9/15/15 | 11,375 | 12,242 |
| 1 American Equity Investment Life Holding Co. Cvt. | 5.250% | 12/6/29 | 5,950 | 8,040 |
| 1 BioMed Realty LP Cvt. | 3.750% | 1/15/30 | 1,680 | 1,886 |
| Dollar Financial Corp. Cvt. | 3.000% | 4/1/28 | 13,780 | 15,313 |
| Forest City Enterprises Inc. Cvt. | 3.625% | 10/15/14 | 7,460 | 8,891 |
| 1 Host Hotels & Resorts LP Cvt. | 2.500% | 10/15/29 | 17,485 | 23,321 |
| PHH Corp. Cvt. | 4.000% | 9/1/14 | 10,070 | 10,850 |
| Radian Group Inc. Cvt. | 3.000% | 11/15/17 | 12,160 | 11,096 |
15
| | | | |
| Convertible Securities Fund | | | | |
| |
| |
| |
| | | | Face | Market |
| | | Maturity | Amount | Value |
| | Coupon | Date | ($000) | ($000) |
| Rayonier TRS Holdings Inc. Cvt. | 3.750% | 10/15/12 | 130 | 142 |
| 1 Rayonier TRS Holdings Inc. Cvt. | 3.750% | 10/15/12 | 4,940 | 5,385 |
| 1 Rayonier TRS Holdings Inc. Cvt. | 4.500% | 8/15/15 | 2,290 | 2,734 |
| | | | | 99,900 |
| Health Care (18.7%) | | | | |
| Alere Inc. Cvt. | 3.000% | 5/15/16 | 16,030 | 15,810 |
| American Medical Systems Holdings Inc. Cvt. | 3.250% | 7/1/36 | 2,016 | 2,102 |
| American Medical Systems Holdings Inc. Cvt. | 4.000% | 9/15/41 | 6,914 | 8,184 |
| BioMarin Pharmaceutical Inc. Cvt. | 1.875% | 4/23/17 | 9,750 | 14,113 |
| Cephalon Inc. Cvt. | 2.500% | 5/1/14 | 24,060 | 27,639 |
| Chemed Corp. Cvt. | 1.875% | 5/15/14 | 12,692 | 12,613 |
| Cubist Pharmaceuticals Inc. Cvt. | 2.500% | 11/1/17 | 17,670 | 17,007 |
| Endo Pharmaceuticals Holdings Inc. Cvt. | 1.750% | 4/15/15 | 9,875 | 13,245 |
| 1 Gilead Sciences Inc. Cvt. | 1.625% | 5/1/16 | 40,055 | 42,058 |
| Hologic Inc. Cvt. | 2.000% | 12/15/37 | 17,535 | 16,965 |
| Isis Pharmaceuticals Inc. Cvt. | 2.625% | 2/15/27 | 6,080 | 5,860 |
| 1 Kinetic Concepts Inc. Cvt. | 3.250% | 4/15/15 | 7,915 | 8,212 |
| Life Technologies Corp. Cvt. | 1.500% | 2/15/24 | 28,737 | 32,940 |
| LifePoint Hospitals Inc. Cvt. | 3.500% | 5/15/14 | 13,579 | 13,664 |
| Lincare Holdings Inc. Cvt. | 2.750% | 11/1/37 | 7,772 | 8,335 |
| Mylan Inc. Cvt. | 1.250% | 3/15/12 | 16,840 | 17,429 |
| PDL BioPharma Inc. Cvt. | 2.875% | 2/15/15 | 17,300 | 17,603 |
| 1 PSS World Medical Inc. Cvt. | 3.125% | 8/1/14 | 3,400 | 3,952 |
| Teleflex Inc. Cvt. | 3.875% | 8/1/17 | 7,280 | 7,344 |
| Vertex Pharmaceuticals Inc. Cvt. | 3.350% | 10/1/15 | 22,580 | 22,495 |
| Viropharma Inc. Cvt. | 2.000% | 3/15/17 | 15,608 | 16,759 |
| | | | | 324,329 |
| Industrials (8.6%) | | | | |
| 1 AAR Corp. Cvt. | 1.625% | 3/1/14 | 2,505 | 2,411 |
| Alliant Techsystems Inc. Cvt. | 3.000% | 8/15/24 | 13,983 | 15,661 |
| AMR Corp. Cvt. | 6.250% | 10/15/14 | 27,982 | 33,578 |
| ArvinMeritor Inc. Cvt. | 4.625% | 3/1/26 | 25,130 | 29,434 |
| 1 Barnes Group Inc. Cvt. | 3.375% | 3/15/27 | 5,240 | 5,247 |
| Barnes Group Inc. Cvt. | 3.375% | 3/15/27 | 8,215 | 8,225 |
| 1 CBIZ Inc. Cvt. | 4.875% | 10/1/15 | 2,565 | 2,786 |
| Covanta Holding Corp. Cvt. | 3.250% | 6/1/14 | 17,570 | 19,876 |
| 1 Kaman Corp. Cvt. | 3.250% | 11/15/17 | 5,305 | 5,530 |
| MasTec Inc. Cvt. | 4.000% | 6/15/14 | 5,105 | 6,101 |
| Navistar International Corp. Cvt. | 3.000% | 10/15/14 | 15,790 | 19,481 |
| | | | | 148,330 |
| Information Technology (24.5%) | | | | |
| Alliance Data Systems Corp. Cvt. | 1.750% | 8/1/13 | 13,055 | 13,381 |
| CACI International Inc. Cvt. | 2.125% | 5/1/14 | 9,215 | 10,206 |
| 1 CACI International Inc. Cvt. | 2.125% | 5/1/14 | 1,575 | 1,744 |
| 1 Cadence Design Systems Inc. Cvt. | 2.625% | 6/1/15 | 10,195 | 12,476 |
| 1 Ciena Corp. Cvt. | 3.750% | 10/15/18 | 10,560 | 10,705 |
| 1 Ciena Corp. Cvt. | 4.000% | 3/15/15 | 17,555 | 18,389 |
| Comtech Telecommunications Corp. Cvt. | 3.000% | 5/1/29 | 14,680 | 15,818 |
| 1 CSG Systems International Inc. Cvt. | 3.000% | 3/1/17 | 3,855 | 3,947 |
| 1 Digital River Inc. Cvt. | 2.000% | 11/1/30 | 19,745 | 19,671 |
| EMC Corp. Cvt. | 1.750% | 12/1/13 | 5,890 | 8,452 |
| Equinix Inc. Cvt. | 2.500% | 4/15/12 | 30,275 | 30,767 |
| Equinix Inc. Cvt. | 3.000% | 10/15/14 | 6,715 | 6,564 |
| Equinix Inc. Cvt. | 4.750% | 6/15/16 | 8,850 | 10,587 |
16
| | | | |
| Convertible Securities Fund | | | | |
| |
| |
| |
| | | | Face | Market |
| | | Maturity | Amount | Value |
| | Coupon | Date | ($000) | ($000) |
| GSI Commerce Inc. Cvt. | 2.500% | 6/1/27 | 4,215 | 4,594 |
| 1 Intel Corp. Cvt. | 3.250% | 8/1/39 | 10,985 | 13,361 |
| Microchip Technology Inc. Cvt. | 2.125% | 12/15/37 | 10,205 | 12,169 |
| Micron Technology Inc. Cvt. | 1.875% | 6/1/14 | 42,830 | 39,243 |
| Micron Technology Inc. Cvt. | 1.875% | 6/1/27 | 3,525 | 3,212 |
| 1 Microsoft Corp. Cvt. | 0.000% | 6/15/13 | 6,805 | 7,094 |
| Nuance Communications Inc. Cvt. | 2.750% | 8/15/27 | 7,255 | 8,389 |
| ON Semiconductor Corp. Cvt. | 2.625% | 12/15/26 | 28,518 | 30,514 |
| 1 Quantum Corp. Cvt. | 3.500% | 11/15/15 | 12,085 | 13,006 |
| RF Micro Devices Inc. Cvt. | 1.000% | 4/15/14 | 6,900 | 7,590 |
| 1 RightNow Technologies Inc. Cvt. | 2.500% | 11/15/30 | 10,510 | 10,773 |
| 1 Rovi Corp. Cvt. | 2.625% | 2/15/40 | 17,200 | 22,812 |
| SanDisk Corp. Cvt. | 1.500% | 8/15/17 | 23,535 | 25,153 |
| Solarfun Power Holdings Co. Ltd. Cvt. | 3.500% | 1/15/18 | 10,980 | 9,223 |
| 1 SunPower Corp. Cvt. | 4.500% | 3/15/15 | 16,230 | 13,875 |
| SunPower Corp. Cvt. | 4.750% | 4/15/14 | 12,875 | 11,298 |
| TTM Technologies Inc. Cvt. | 3.250% | 5/15/15 | 6,461 | 7,236 |
| VeriSign Inc. Cvt. | 3.250% | 8/15/37 | 8,899 | 10,112 |
| 1 Xilinx Inc. Cvt. | 2.625% | 6/15/17 | 10,230 | 11,649 |
| | | | | 424,010 |
| Materials (6.0%) | | | | |
| 1 Cemex SAB de CV Cvt. | 4.875% | 3/15/15 | 22,171 | 21,866 |
| 1 Kaiser Aluminum Corp. Cvt. | 4.500% | 4/1/15 | 7,825 | 9,335 |
| 1 Owens-Brockway Glass Container Inc. Cvt. | 3.000% | 6/1/15 | 17,545 | 17,150 |
| 1 Sino-Forest Corp. Cvt. | 4.250% | 12/15/16 | 14,419 | 18,024 |
| Steel Dynamics Inc. Cvt. | 5.125% | 6/15/14 | 23,315 | 27,512 |
| Stillwater Mining Co. Cvt. | 1.875% | 3/15/28 | 9,990 | 10,889 |
| | | | | 104,776 |
| Telecommunication Services (4.2%) | | | | |
| SBA Communications Corp. Cvt. | 1.875% | 5/1/13 | 49,974 | 54,409 |
| tw telecom inc Cvt. | 2.375% | 4/1/26 | 17,375 | 18,917 |
| | | | | 73,326 |
| Total Convertible Bonds (Cost $1,310,541) | | | | 1,428,853 |
| |
| | | | Shares | |
| Convertible Preferred Stock (13.9%) | | | | |
| Consumer Discretionary (5.6%) | | | | |
| 1 Dana Holding Corp. Pfd. | 4.000% | | 120,362 | 15,557 |
| Ford Motor Co. Capital Trust II Pfd. | 6.500% | | 108,700 | 5,591 |
| * General Motors Co. Pfd. | 4.750% | | 994,800 | 50,436 |
| Interpublic Group of Cos. Inc. Pfd. | 5.250% | | 17,400 | 17,400 |
| * Stanley Black & Decker Inc. Pfd. | 4.750% | | 89,300 | 9,097 |
| | | | | 98,081 |
| Energy (5.0%) | | | | |
| Apache Corp. Pfd. | 6.000% | | 477,700 | 28,990 |
| El Paso Corp. Pfd. | 4.990% | | 12,770 | 14,957 |
| * Energy XXI Bermuda Ltd. Pfd. | 5.625% | | 45,490 | 13,206 |
| Goodrich Petroleum Corp. Pfd. | 5.375% | | 278,000 | 8,809 |
| 1 SandRidge Energy Inc. Pfd. | 7.000% | | 129,300 | 12,332 |
| SandRidge Energy Inc. Pfd. | 8.500% | | 87,890 | 8,674 |
| | | | | 86,968 |
17
| | | |
| Convertible Securities Fund | | | |
| |
| |
| |
| | | | Market |
| | | | Value |
| | Coupon | Shares | ($000) |
| Financials (2.8%) | | | |
| Citigroup Inc. Pfd. | 7.500% | 156,290 | 19,536 |
| Fifth Third Bancorp Pfd. | 8.500% | 130,630 | 17,080 |
| Hartford Financial Services Group Inc. Pfd. | 7.250% | 140,300 | 3,236 |
| New York Community Capital Trust V Pfd. | 6.000% | 175,100 | 8,613 |
| | | | 48,465 |
| Industrials (0.4%) | | | |
| Continental Airlines Finance Trust II Pfd. | 6.000% | 163,300 | 6,573 |
| |
| Utilities (0.1%) | | | |
| NextEra Energy Inc. Pfd. | 7.000% | 41,200 | 1,916 |
| Total Convertible Preferred Stocks (Cost $211,221) | | | 242,003 |
| Temporary Cash Investment (2.8%) | | | |
| Money Market Fund (2.8%) | | | |
| 2 Vanguard Market Liquidity Fund | | | |
| (Cost $48,076) | 0.216% | 48,076,264 | 48,076 |
| Total Investments (99.2%) (Cost $1,569,838) | | | 1,718,932 |
| Other Assets and Liabilities (0.8%) | | | |
| Other Assets | | | 24,229 |
| Liabilities | | | (10,570) |
| | | | 13,659 |
| Net Assets (100%) | | | |
| Applicable to 125,130,324 outstanding $.001 par value shares of | | |
| beneficial interest (unlimited authorization) | | | 1,732,591 |
| Net Asset Value Per Share | | | $13.85 |
| |
| |
| At November 30, 2010, net assets consisted of: | | | |
| | | | Amount |
| | | | ($000) |
| Paid-in Capital | | | 1,451,342 |
| Undistributed Net Investment Income | | | 10,647 |
| Accumulated Net Realized Gains | | | 121,508 |
| Unrealized Appreciation (Depreciation) | | | 149,094 |
| Net Assets | | | 1,732,591 |
See Note A in Notes to Financial Statements.
* Non-income-producing security. New issue that has not paid a dividend as of November 30, 2010.
1 Security exempt from registration under Rule 144A of the Securities Act of 1933. Such securities may be sold in transactions exempt from registration, normally to qualified institutional buyers. At November 30, 2010, the aggregate value of these securities was $477,784,000, representing 27.6% of net assets.
2 Affiliated money market fund available only to Vanguard funds and certain trusts and accounts managed by Vanguard. Rate shown is the 7-day yield.
See accompanying Notes, which are an integral part of the Financial Statements.
18
| |
| Convertible Securities Fund | |
| |
| |
| Statement of Operations | |
| |
| | Year Ended |
| | November 30, 2010 |
| | ($000) |
| Investment Income | |
| Income | |
| Dividends | 11,704 |
| Interest1 | 68,555 |
| Total Income | 80,259 |
| Expenses | |
| Investment Advisory Fees—Note B | |
| Basic Fee | 5,723 |
| Performance Adjustment | 2,099 |
| The Vanguard Group—Note C | |
| Management and Administrative | 3,147 |
| Marketing and Distribution | 483 |
| Custodian Fees | 20 |
| Auditing Fees | 32 |
| Shareholders’ Reports | 23 |
| Trustees’ Fees and Expenses | 3 |
| Total Expenses | 11,530 |
| Net Investment Income | 68,729 |
| Realized Net Gain (Loss) on Investment Securities Sold | 188,469 |
| Change in Unrealized Appreciation (Depreciation) of Investment Securities | 40,819 |
| Net Increase (Decrease) in Net Assets Resulting from Operations | 298,017 |
1 Interest income from an affiliated company of the fund was $56,000.
See accompanying Notes, which are an integral part of the Financial Statements.
19
| | |
| Convertible Securities Fund | | |
| |
| |
| Statement of Changes in Net Assets | | |
| |
| | Year Ended November 30, |
| | 2010 | 2009 |
| | ($000) | ($000) |
| Increase (Decrease) in Net Assets | | |
| Operations | | |
| Net Investment Income | 68,729 | 63,335 |
| Realized Net Gain (Loss) | 188,469 | 14,693 |
| Change in Unrealized Appreciation (Depreciation) | 40,819 | 384,316 |
| Net Increase (Decrease) in Net Assets Resulting from Operations | 298,017 | 462,344 |
| Distributions | | |
| Net Investment Income | (73,612) | (52,335) |
| Realized Capital Gain | — | — |
| Total Distributions | (73,612) | (52,335) |
| Capital Share Transactions | | |
| Issued | 212,318 | 793,297 |
| Issued in Lieu of Cash Distributions | 62,394 | 44,451 |
| Redeemed1 | (481,368) | (248,682) |
| Net Increase (Decrease) from Capital Share Transactions | (206,656) | 589,066 |
| Total Increase (Decrease) | 17,749 | 999,075 |
| Net Assets | | |
| Beginning of Period | 1,714,842 | 715,767 |
| End of Period2 | 1,732,591 | 1,714,842 |
1 Net of redemption fees for fiscal 2010 and 2009 of $318,000 and $1,027,000, respectively.
2 Net Assets—End of Period includes undistributed net investment income of $10,647,000 and $14,803,000.
See accompanying Notes, which are an integral part of the Financial Statements.
20
| | | | | |
| Convertible Securities Fund | | | | | |
| |
| |
| Financial Highlights | | | | | |
| |
| |
| For a Share Outstanding | | | Year Ended November 30, |
| Throughout Each Period | 2010 | 2009 | 2008 | 2007 | 2006 |
| Net Asset Value, Beginning of Period | $12.12 | $8.86 | $14.95 | $14.81 | $13.57 |
| Investment Operations | | | | | |
| Net Investment Income | .555 | .475 | .401 | .420 | .430 |
| Net Realized and Unrealized Gain (Loss) | | | | | |
| on Investments | 1.742 | 3.211 | (5.170) | 1.250 | 1.620 |
| Total from Investment Operations | 2.297 | 3.686 | (4.769) | 1.670 | 2.050 |
| Distributions | | | | | |
| Dividends from Net Investment Income | (.567) | (.426) | (.501) | (.510) | (.380) |
| Distributions from Realized Capital Gains | — | — | (.820) | (1.020) | (.430) |
| Total Distributions | (.567) | (.426) | (1.321) | (1.530) | (.810) |
| Net Asset Value, End of Period | $13.85 | $12.12 | $8.86 | $14.95 | $14.81 |
| |
| Total Return1 | 19.39% | 42.55% | -34.81% | 12.34% | 15.70% |
| |
| Ratios/Supplemental Data | | | | | |
| Net Assets, End of Period (Millions) | $1,733 | $1,715 | $716 | $872 | $727 |
| Ratio of Total Expenses to | | | | | |
| Average Net Assets2 | 0.68% | 0.72% | 0.71% | 0.77% | 0.87% |
| Ratio of Net Investment Income to | | | | | |
| Average Net Assets | 4.08% | 4.65% | 3.28% | 2.83% | 3.14% |
| Portfolio Turnover Rate | 103% | 103% | 77% | 116% | 138% |
1 Total returns do not include transaction or account service fees that may have applied in the periods shown. Fund prospectuses provide information about any applicable transaction and account service fees.
2 Includes performance-based investment advisory fee increases (decreases) of 0.12%, 0.12%, 0.15%, 0.16%, and 0.22%.
See accompanying Notes, which are an integral part of the Financial Statements.
21
Convertible Securities Fund
Notes to Financial Statements
Vanguard Convertible Securities Fund is registered under the Investment Company Act of 1940 as an open-end investment company, or mutual fund.
A. The following significant accounting policies conform to generally accepted accounting principles for U.S. mutual funds. The fund consistently follows such policies in preparing its financial statements.
1. Security Valuation: Securities are valued as of the close of trading on the New York Stock Exchange (generally 4 p.m., Eastern time) on the valuation date. Equity securities are valued at the latest quoted sales prices or official closing prices taken from the primary market in which each security trades; such securities not traded on the valuation date are valued at the mean of the latest quoted bid and asked prices. Bonds, and temporary cash investments acquired over 60 days to maturity, are valued using the latest bid prices or using valuations based on a matrix system (which considers such factors as security prices, yields, maturities, and ratings), both as furnished by independent pricing services. Investments in Vanguard Market Liquidity Fund are valued at that fund’s net asset value. Other temporary cash investments are valued at amortized cost, which approximates market value. Securities for which market quotations are not readily available, or whose values have been materially affected by events occurring before the fund’s pricing time but after the close of the securities’ primary markets, are valued by methods deemed by the board of trustees to represent fair value.
2. Federal Income Taxes: The fund intends to continue to qualify as a regulated investment company and distribute all of its taxable income. Management has analyzed the fund’s tax positions taken for all open federal income tax years (November 30, 2007–2010), and has concluded that no provision for federal income tax is required in the fund’s financial statements.
3. Distributions: Distributions to shareholders are recorded on the ex-dividend date.
4. Other: Dividend income is recorded on the ex-dividend date. Interest income includes income distributions received from Vanguard Market Liquidity Fund and is accrued daily. Premiums and discounts on debt securities purchased are amortized and accreted, respectively, to interest income over the lives of the respective securities. Security transactions are accounted for on the date securities are bought or sold. Costs used to determine realized gains (losses) on the sale of investment securities are those of the specific securities sold. Fees assessed on redemptions of capital shares are credited to paid-in capital.
B. Oaktree Capital Management, L.P., provides investment advisory services to the fund for a fee calculated at an annual percentage rate of average net assets. The basic fee is subject to quarterly adjustments based on the fund’s performance for the preceding three years relative to the Bank of America Merrill Lynch All US Convertibles Index (previously Merrill Lynch All Convertibles-All Qualities Index). For the year ended November 30, 2010, the investment advisory fee represented an effective annual basic rate of 0.34% of the fund’s average net assets before an increase of $2,099,000 (0.12%) based on performance.
C. The Vanguard Group furnishes at cost corporate management, administrative, marketing, and distribution services. The costs of such services are allocated to the fund under methods approved by the board of trustees. The fund has committed to provide up to 0.40% of its net assets in capital contributions to Vanguard. At November 30, 2010, the fund had contributed capital of $302,000 to Vanguard (included in Other Assets), representing 0.02% of the fund’s net assets and 0.12% of Vanguard’s capitalization. The fund’s trustees and officers are also directors and officers of Vanguard.
22
Convertible Securities Fund
D. Various inputs may be used to determine the value of the fund’s investments. These inputs are summarized in three broad levels for financial statement purposes. The inputs or methodologies used to value securities are not necessarily an indication of the risk associated with investing in those securities.
Level 1—Quoted prices in active markets for identical securities.
Level 2—Other significant observable inputs (including quoted prices for similar securities, interest rates, prepayment speeds, credit risk, etc.).
Level 3—Significant unobservable inputs (including the fund’s own assumptions used to determine the fair value of investments).
The following table summarizes the fund’s investments as of November 30, 2010, based on the inputs used to value them:
| | | |
| | Level 1 | Level 2 | Level 3 |
| Investments | ($000) | ($000) | ($000) |
| Convertible Preferred Stocks | 242,003 | — | — |
| Convertible Bonds | — | 1,428,853 | — |
| Temporary Cash Investments | 48,076 | — | — |
| Total | 290,079 | 1,428,853 | — |
E. Distributions are determined on a tax basis and may differ from net investment income and realized capital gains for financial reporting purposes. Differences may be permanent or temporary. Permanent differences are reclassified among capital accounts in the financial statements to reflect their tax character. Temporary differences arise when certain items of income, expense, gain, or loss are recognized in different periods for financial statement and tax purposes; these differences will reverse at some time in the future. Differences in classification may also result from the treatment of short-term gains as ordinary income for tax purposes.
Certain of the fund’s convertible preferred stock investments are treated as debt securities for tax purposes. During the year ended November 30, 2010, the fund realized losses of $930,000 from the sale of these securities, which reduced distributable net investment income for tax purposes; accordingly, such losses have been reclassified from accumulated net realized gains to undistributed net investment income.
Certain of the fund’s convertible bond investments are in securities considered to be “contingent payment debt instruments,” for which any realized gains increase (and all or part of any realized losses decrease) income for tax purposes. During the year ended November 30, 2010, the fund realized net gains of $1,657,000 from the sale of these securities, which increased distributable net income for tax purposes; accordingly, such gains have been reclassified from accumulated net realized gains to undistributed net investment income.
The fund used a tax accounting practice to treat a portion of the price of capital shares redeemed during the year as distributions from realized capital gains. Accordingly, the fund has reclassified $12,619,000 from accumulated net realized gains to paid-in capital.
For tax purposes, at November 30, 2010, the fund had $84,565,000 of ordinary income and $49,847,000 of long-term capital gains available for distribution. The fund used a capital loss carryforward of $53,640,000 to offset taxable capital gains realized during the year ended November 30, 2010, reducing the amount of capital gains that would otherwise be available to distribute to shareholders.
23
Convertible Securities Fund
At November 30, 2010, the cost of investment securities for tax purposes was $1,570,156,000. Net unrealized appreciation of investment securities for tax purposes was $148,776,000 consisting of unrealized gains of $165,683,000 on securities that had risen in value since their purchase and $16,907,000 in unrealized losses on securities that had fallen in value since their purchase.
F. During the year ended November 30, 2010, the fund purchased $1,696,272,000 of investment securities and sold $1,961,880,000 of investment securities, other than temporary cash investments.
G. Capital shares issued and redeemed were:
| | |
| | Year Ended November 30, |
| | 2010 | 2009 |
| | Shares | Shares |
| | (000) | (000) |
| Issued | 16,162 | 80,121 |
| Issued in Lieu of Cash Distributions | 4,846 | 4,244 |
| Redeemed | (37,355) | (23,668) |
| Net Increase (Decrease) in Shares Outstanding | (16,347) | 60,697 |
H. In preparing the financial statements as of November 30, 2010, management considered the impact of subsequent events for potential recognition or disclosure in these financial statements. Effective December 20, 2010, the fund’s investment strategy was expanded to include both foreign currency and U.S. dollar-denominated international convertible securities, with a target allocation of approximately 30% of the fund’s assets.
24
Report of Independent Registered Public Accounting Firm
To the Trustees and Shareholders of Vanguard Convertible Securities Fund:
In our opinion, the accompanying statement of net assets and the related statements of operations and of changes in net assets and the financial highlights present fairly, in all material respects, the financial position of Vanguard Convertible Securities Fund (the “Fund”) at November 30, 2010, the results of its operations for the year then ended, the changes in its net assets for each of the two years in the period then ended and the financial highlights for each of the five years in the period then ended, in conformity with accounting principles generally accepted in the United States of America. These financial statements and financial highlights (hereafter referred to as “financial statements”) are the responsibility of the Fund’s management; our responsibility is to express an opinion on these financial statements based on our audits. We conducted our audits of these financial statements in accordance with the standards of the Public Com pany Accounting Oversight Board (United States). Those standards require that we plan and perform the audit to obtain reasonable assurance about whether the financial statements are free of material misstatement. An audit includes examining, on a test basis, evidence supporting the amounts and disclosures in the financial statements, assessing the accounting principles used and significant estimates made by management, and evaluating the overall financial statement presentation. We believe that our audits, which included confirmation of securities at November 30, 2010 by correspondence with the custodian and by agreement to the underlying ownership records of Vanguard Market Liquidity Fund, provide a reasonable basis for our opinion.
PricewaterhouseCoopers LLP
Philadelphia, Pennsylvania
January 13, 2011
|
| Special 2010 tax information (unaudited) for Vanguard Convertible Securities Fund |
This information for the fiscal year ended November 30, 2010, is included pursuant to provisions of the Internal Revenue Code.
The fund distributed $5,178,000 as capital gain dividends (from net long-term capital gains) to shareholders during the fiscal year.
The fund distributed $10,291,000 of qualified dividend income to shareholders during the fiscal year.
For corporate shareholders, 5.5% of investment income (dividend income plus short-term gains, if any) qualifies for the dividends-received deduction.
25
Your Fund’s After-Tax Returns
This table presents returns for your fund both before and after taxes. The after-tax returns are shown in two ways: (1) assuming that an investor owned the fund during the entire period and paid taxes on the fund’s distributions, and (2) assuming that an investor paid taxes on the fund’s distributions and sold all shares at the end of each period.
Calculations are based on the highest individual federal income tax and capital gains tax rates in effect at the times of the distributions and the hypothetical sales. State and local taxes were not considered. After-tax returns reflect any qualified dividend income , using actual prior-year figures and estimates for 2010. (In the example, returns after the sale of fund shares may be higher than those assuming no sale. This occurs when the sale would have produced a capital loss. The calculation assumes that the investor received a tax deduction for the loss.)
Please note that your actual after-tax returns will depend on your tax situation and may differ from those shown. Also note that if you own the fund in a tax-deferred account, such as an individual retirement account or a 401(k) plan, this information does not apply to you. Such accounts are not subject to current taxes.
Finally, keep in mind that a fund’s performance—whether before or after taxes—does not guarantee future results.
Average Annual Total Returns: Convertible Securities Fund
Periods Ended November 30, 2010
| | | |
| | One | Five | Ten |
| | Year | Years | Years |
| Returns Before Taxes | 19.39% | 7.60% | 7.16% |
| Returns After Taxes on Distributions | 17.62 | 5.51 | 5.21 |
| Returns After Taxes on Distributions and Sale of Fund Shares | 12.54 | 5.41 | 5.07 |
Returns do not reflect the 1% fee on redemptions of shares held for less than one year.
26
About Your Fund’s Expenses
As a shareholder of the fund, you incur ongoing costs, which include costs for portfolio management, administrative services, and shareholder reports (like this one), among others. Operating expenses, which are deducted from a fund’s gross income, directly reduce the investment return of the fund.
A fund’s expenses are expressed as a percentage of its average net assets. This figure is known as the expense ratio. The following examples are intended to help you understand the ongoing costs (in dollars) of investing in your fund and to compare these costs with those of other mutual funds. The examples are based on an investment of $1,000 made at the beginning of the period shown and held for the entire period.
The accompanying table illustrates your fund’s costs in two ways:
• Based on actual fund return. This section helps you to estimate the actual expenses that you paid over the period. The ”Ending Account Value“ shown is derived from the fund‘s actual return, and the third column shows the dollar amount that would have been paid by an investor who started with $1,000 in the fund. You may use the information here, together with the amount you invested, to estimate the expenses that you paid over the period.
To do so, simply divide your account value by $1,000 (for example, an $8,600 account value divided by $1,000 = 8.6), then multiply the result by the number given for your fund under the heading ”Expenses Paid During Period.“
• Based on hypothetical 5% yearly return. This section is intended to help you compare your fund‘s costs with those of other mutual funds. It assumes that the fund had a yearly return of 5% before expenses, but that the expense ratio is unchanged. In this case—because the return used is not the fund’s actual return—the results do not apply to your investment. The example is useful in making comparisons because the Securities and Exchange Commission requires all mutual funds to calculate expenses based on a 5% return. You can assess your fund’s costs by comparing this hypothetical example with the hypothetical examples that appear in shareholder reports of other funds.
Note that the expenses shown in the table are meant to highlight and help you compare ongoing costs only and do not reflect transaction costs incurred by the fund for buying and selling securities. Further, the expenses do not include the 1% fee on redemptions of shares held for less than one year, nor do they include the account service fee described in the prospectus. If such fees were applied to your account, your costs would be higher. Your fund does not carry a “sales load.”
The calculations assume no shares were bought or sold during the period. Your actual costs may have been higher or lower, depending on the amount of your investment and the timing of any purchases or redemptions.
You can find more information about the fund’s expenses, including annual expense ratios, in the Financial Statements section of this report. For additional information on operating expenses and other shareholder costs, please refer to your fund’s current prospectus.
27
| | | |
| Six Months Ended November 30, 2010 | | | |
| | Beginning | Ending | Expenses |
| | Account Value | Account Value | Paid During |
| Convertible Securities Fund | 5/31/2010 | 11/30/2010 | Period |
| Based on Actual Fund Return | $1,000.00 | $1,119.72 | $3.67 |
| Based on Hypothetical 5% Yearly Return | 1,000.00 | 1,021.61 | 3.50 |
The calculations are based on expenses incurred in the most recent six-month period. The fund’s annualized six-month expense ratio for that period is 0.69%. The dollar amounts shown as “Expenses Paid” are equal to the annualized expense ratio multiplied by the average account value over the period, multiplied by the number of days in the most recent six-month period, then divided by the number of days in the most recent 12-month period.
28
Glossary
30-Day SEC Yield. A fund’s 30-day SEC yield is derived using a formula specified by the U.S. Securities and Exchange Commission. Under the formula, data related to the fund’s security holdings in the previous 30 days are used to calculate the fund’s hypothetical net income for that period, which is then annualized and divided by the fund’s estimated average net assets over the calculation period. For the purposes of this calculation, a security’s income is based on its current market yield to maturity (in the case of bonds) or its projected dividend yield (for stocks). Because the SEC yield represents hypothetical annualized income, it will differ—at times significantly—from the fund’s actual experience. As a result, the fund’s income distributions may be higher or lower than implied by the SEC yield.
Average Coupon. The average interest rate paid on the fixed income securities held by a fund. It is expressed as a percentage of face value.
Average Duration. An estimate of how much the value of the bonds held by a fund will fluctuate in response to a change in interest rates. To see how the value could change, multiply the average duration by the change in rates. If interest rates rise by 1 percentage point, the value of the bonds in a fund with an average duration of five years would decline by about 5%. If rates decrease by a percentage point, the value would rise by 5%.
Average Weighted Maturity. The average length of time until fixed income securities held by a fund reach maturity and are repaid. The figure reflects the proportion of fund assets represented by each security.
Beta. A measure of the magnitude of a fund’s past share-price fluctuations in relation to the ups and downs of a given market index. The index is assigned a beta of 1.00. Compared with a given index, a fund with a beta of 1.20 typically would have seen its share price rise or fall by 12% when the index rose or fell by 10%. For this report, beta is based on returns over the past 36 months for both the fund and the index. Note that a fund’s beta should be reviewed in conjunction with its R-squared (see definition). The lower the R-squared, the less correlation there is between the fund and the index, and the less reliable beta is as an indicator of volatility.
Conversion Premium. The average percentage by which the weighted average market price of the convertible securities held by a fund exceeds the weighted average market price of their underlying common stocks. For example, if a stock is trading at $25 per share and a bond that is convertible into the stock is trading at a price equivalent to $30 per share of stock, the conversion premium is 20% ($5 ÷ $25 = 20%).
Credit Quality. The credit ratings assigned to fixed income securities are an indicator of risk. They represent a rating agency’s assessment of the issuer’s ability to meet its obligations. For this report, credit-quality ratings are obtained from Standard & Poor’s.
Expense Ratio. The percentage of a fund’s average net assets used to pay its annual administrative and advisory expenses. These expenses directly reduce returns to investors.
Foreign Holdings. The percentage of a fund represented by stocks or depositary receipts of companies based outside the United States.
29
Inception Date. The date on which the assets of a fund (or one of its share classes) are first invested in accordance with the fund’s investment objective. For funds with a subscription period, the inception date is the day after that period ends. Investment performance is measured from the inception date.
Market Exposure. A measure that reflects a fund’s security investments excluding any holdings in short-term reserves.
R-Squared. A measure of how much of a fund’s past returns can be explained by the returns from the market in general, as measured by a given index. If a fund’s total returns were precisely synchronized with an index’s returns, its R-squared would be 1.00. If the fund’s returns bore no relationship to the index’s returns, its R-squared would be 0. For this report, R-squared is based on returns over the past 36 months for both the fund and the index.
Short-Term Reserves. The percentage of a fund invested in highly liquid, short-term securities that can be readily converted to cash.
Turnover Rate. An indication of the fund’s trading activity. Funds with high turnover rates incur higher transaction costs and may be more likely to distribute capital gains (which may be taxable to investors). The turnover rate excludes in-kind transactions, which have minimal impact on costs.
30
This page intentionally left blank.
The People Who Govern Your Fund
The trustees of your mutual fund are there to see that the fund is operated and managed in your best interests since, as a shareholder, you are a part owner of the fund. Your fund’s trustees also serve on the board of directors of The Vanguard Group, Inc., which is owned by the Vanguard funds and provides services to them on an at-cost basis.
A majority of Vanguard’s board members are independent, meaning that they have no affiliation with Vanguard or the funds they oversee, apart from the sizable personal investments they have made as private individuals. The independent board members have distinguished backgrounds in business, academia, and public service. Each of the trustees and executive officers oversees 179 Vanguard funds.
The following table provides information for each trustee and executive officer of the fund. More information about the trustees is in the Statement of Additional Information, which can be obtained, without charge, by contacting Vanguard at 800-662-7447, or online at vanguard.com.
| |
| Interested Trustee1 | Amy Gutmann |
| | Born 1949. Trustee Since June 2006. Principal |
| F. William McNabb III | Occupation(s) During the Past Five Years: President |
| Born 1957. Trustee Since July 2009. Chairman of the | of the University of Pennsylvania; Christopher H. |
| Board. Principal Occupation(s) During the Past Five | Browne Distinguished Professor of Political Science |
| Years: Chairman of the Board of The Vanguard Group, | in the School of Arts and Sciences with secondary |
| Inc., and of each of the investment companies served | appointments at the Annenberg School for Commu- |
| by The Vanguard Group, since January 2010; Director | nication and the Graduate School of Education |
| of The Vanguard Group since 2008; Chief Executive | of the University of Pennsylvania; Director of |
| Officer and President of The Vanguard Group and of | Carnegie Corporation of New York, Schuylkill River |
| each of the investment companies served by The | Development Corporation, and Greater Philadelphia |
| Vanguard Group since 2008; Director of Vanguard | Chamber of Commerce; Trustee of the National |
| Marketing Corporation; Managing Director of The | Constitution Center; Chair of the Presidential |
| Vanguard Group (1995–2008) . | Commission for the Study of Bioethical Issues. |
| |
| | JoAnn Heffernan Heisen |
| Independent Trustees | Born 1950. Trustee Since July 1998. Principal |
| | Occupation(s) During the Past Five Years: Corporate |
| Emerson U. Fullwood | Vice President and Chief Global Diversity Officer |
| Born 1948. Trustee Since January 2008. Principal | since 2006 (retired 2008) and Member of the |
| Occupation(s) During the Past Five Years: Executive | Executive Committee (retired 2008) of Johnson & |
| Chief Staff and Marketing Officer for North America | Johnson (pharmaceuticals/consumer products); Vice |
| and Corporate Vice President (retired 2008) of Xerox | President and Chief Information Officer of Johnson & |
| Corporation (document management products and | Johnson (1997–2005); Director of the University |
| services); Director of SPX Corporation (multi-industry | Medical Center at Princeton and Women’s Research |
| manufacturing), the United Way of Rochester, | and Education Institute; Member of the Advisory |
| Amerigroup Corporation (managed health care), | Board of the Maxwell School of Citizenship and Public |
| the University of Rochester Medical Center, and | Affairs at Syracuse University. |
| Monroe Community College Foundation. | |
| | F. Joseph Loughrey |
| Rajiv L. Gupta | Born 1949. Trustee Since October 2009. Principal |
| Born 1945. Trustee Since December 2001.2 | Occupation(s) During the Past Five Years: President |
| Principal Occupation(s) During the Past Five Years: | and Chief Operating Officer since 2005 (retired 2009) |
| Chairman and Chief Executive Officer (retired 2009) | and Vice Chairman of the Board (2008–2009) of |
| and President (2006–2008) of Rohm and Haas Co. | Cummins Inc. (industrial machinery); Director of |
| (chemicals); Director of Tyco International, Ltd. | SKF AB (industrial machinery), Hillenbrand, Inc. |
| (diversified manufacturing and services) and Hewlett- | (specialized consumer services), Sauer-Danfoss Inc. |
| Packard Co. (electronic computer manufacturing); | (machinery), the Lumina Foundation for Education, |
| Trustee of The Conference Board; Member of the | and Oxfam America; Chairman of the Advisory |
| Board of Managers of Delphi Automotive LLP | Council for the College of Arts and Letters at the |
| (automotive components) . | University of Notre Dame. |
| | |
| André F. Perold | Kathryn J. Hyatt | |
| Born 1952. Trustee Since December 2004. Principal | Born 1955. Treasurer Since November 2008. Principal |
| Occupation(s) During the Past Five Years: George | Occupation(s) During the Past Five Years: Principal |
| Gund Professor of Finance and Banking at the Harvard | of The Vanguard Group, Inc.; Treasurer of each of |
| Business School; Chair of the Investment Committee | the investment companies served by The Vanguard |
| of HighVista Strategies LLC (private investment firm) . | Group since 2008; Assistant Treasurer of each of the |
| | investment companies served by The Vanguard Group |
| Alfred M. Rankin, Jr. | (1988–2008) . | |
| Born 1941. Trustee Since January 1993. Principal | | |
| Occupation(s) During the Past Five Years: Chairman, | Heidi Stam | |
| President, and Chief Executive Officer of NACCO | Born 1956. Secretary Since July 2005. Principal |
| Industries, Inc. (forklift trucks/housewares/lignite); | Occupation(s) During the Past Five Years: Managing |
| Director of Goodrich Corporation (industrial products/ | Director of The Vanguard Group, Inc., since 2006; |
| aircraft systems and services); Chairman of the | General Counsel of The Vanguard Group since 2005; |
| Federal Reserve Bank of Cleveland; Trustee of The | Secretary of The Vanguard Group and of each of the |
| Cleveland Museum of Art. | investment companies served by The Vanguard Group |
| | since 2005; Director and Senior Vice President of |
| Peter F. Volanakis | Vanguard Marketing Corporation since 2005; |
| Born 1955. Trustee Since July 2009. Principal | Principal of The Vanguard Group (1997–2006). |
| Occupation(s) During the Past Five Years: President | | |
| since 2007 and Chief Operating Officer since 2005 | | |
| of Corning Incorporated (communications equipment); | Vanguard Senior Management Team |
| President of Corning Technologies (2001–2005); | | |
| Director of Corning Incorporated and Dow Corning; | R. Gregory Barton | Michael S. Miller |
| Trustee of the Corning Incorporated Foundation and | Mortimer J. Buckley | James M. Norris |
| the Corning Museum of Glass; Overseer of the | Kathleen C. Gubanich | Glenn W. Reed |
| Amos Tuck School of Business Administration at | Paul A. Heller | George U. Sauter |
| Dartmouth College. | | |
| |
| | Chairman Emeritus and Senior Advisor |
| Executive Officers | | |
| | John J. Brennan | |
| Glenn Booraem | Chairman, 1996–2009 | |
| Born 1967. Controller Since July 2010. Principal | Chief Executive Officer and President, 1996–2008 |
| Occupation(s) During the Past Five Years: Principal | | |
| of The Vanguard Group, Inc.; Controller of each of | | |
| the investment companies served by The Vanguard | Founder | |
| Group since 2010; Assistant Controller of each of | | |
| the investment companies served by The Vanguard | John C. Bogle | |
| Group (2001–2010) . | Chairman and Chief Executive Officer, 1974–1996 |
| |
| Thomas J. Higgins | | |
| Born 1957. Chief Financial Officer Since September | | |
| 2008. Principal Occupation(s) During the Past Five | | |
| Years: Principal of The Vanguard Group, Inc.; Chief | | |
| Financial Officer of each of the investment companies | | |
| served by The Vanguard Group since 2008; Treasurer | | |
| of each of the investment companies served by The | | |
| Vanguard Group (1998–2008) . | | |
1 Mr. McNabb is considered an “interested person,” as defined in the Investment Company Act of 1940, because he is an officer of the Vanguard funds.
2 December 2002 for Vanguard Equity Income Fund, Vanguard Growth Equity Fund, the Vanguard Municipal Bond Funds, and the Vanguard State Tax-Exempt Funds.
|  |
| P.O. Box 2600 |
| Valley Forge, PA 19482-2600 |
Connect with Vanguard® > vanguard.com
| |
| Fund Information > 800-662-7447 | CFA® is a trademark owned by CFA Institute. |
| Direct Investor Account Services > 800-662-2739 | |
| Institutional Investor Services > 800-523-1036 | |
| Text Telephone for People | |
| With Hearing Impairment > 800-749-7273 | |
| |
| This material may be used in conjunction | |
| with the offering of shares of any Vanguard | |
| fund only if preceded or accompanied by | |
| the fund’s current prospectus. | |
| |
| All comparative mutual fund data are from Lipper Inc. or | |
| Morningstar, Inc., unless otherwise noted. | |
| |
| You can obtain a free copy of Vanguard’s proxy voting | |
| guidelines by visiting vanguard.com/proxyreporting or by | |
| calling Vanguard at 800-662-2739. The guidelines are | |
| also available from the SEC’s website, sec.gov. In | |
| addition, you may obtain a free report on how your fund | |
| voted the proxies for securities it owned during the 12 | |
| months ended June 30. To get the report, visit either | |
| vanguard.com/proxyreporting or sec.gov. | |
| |
| You can review and copy information about your fund at | |
| the SEC’s Public Reference Room in Washington, D.C. To | |
| find out more about this public service, call the SEC at | |
| 202-551-8090. Information about your fund is also | |
| available on the SEC’s website, and you can receive | |
| copies of this information, for a fee, by sending a | |
| request in either of two ways: via e-mail addressed to | |
| publicinfo@sec.gov or via regular mail addressed to the | |
| Public Reference Section, Securities and Exchange | |
| Commission, Washington, DC 20549-1520. | |
| |
| |
| | © 2011 The Vanguard Group, Inc. |
| | All rights reserved. |
| | Vanguard Marketing Corporation, Distributor. |
| |
| | Q820 012011 |
Item 2: Code of Ethics. The Registrant has adopted a code of ethics that applies to the Registrant’s principal executive officer, principal financial officer, principal accounting officer or controller or persons performing similar functions. The Code of Ethics was amended during the reporting period covered by this report to make certain technical, non-material changes.
Item 3: Audit Committee Financial Expert. The following members of the Audit Committee have been determined by the Registrant’s Board of Trustees to be Audit Committee Financial Experts serving on its Audit Committee, and to be independent: Charles D. Ellis, Rajiv L. Gupta, JoAnn Heffernan Heisen, André F. Perold, and Alfred M. Rankin, Jr.
Item 4: Principal Accountant Fees and Services.
(a) Audit Fees.
Audit Fees of the Registrant
Fiscal Year Ended November 30, 2010: $32,000
Fiscal Year Ended November 30, 2009: $29,000
Aggregate Audit Fees of Registered Investment Companies in the Vanguard Group.
Fiscal Year Ended November 30, 2010: $3,607,060
Fiscal Year Ended November 30, 2009: $3,354,640
(b) Audit-Related Fees.
Fiscal Year Ended November 30, 2010: $791,350
Fiscal Year Ended November 30, 2009: $876,210
Includes fees billed in connection with assurance and related services provided to the Registrant, The Vanguard Group, Inc., Vanguard Marketing Corporation, and other registered investment companies in the Vanguard Group.
(c) Tax Fees.
Fiscal Year Ended November 30, 2010: $336,090
Fiscal Year Ended November 30, 2009: $423,070
Includes fees billed in connection with tax compliance, planning and advice services provided to the Registrant, The Vanguard Group, Inc., Vanguard Marketing Corporation, and other registered investment companies in the Vanguard Group and related to income and excise taxes.
(d) All Other Fees.
Fiscal Year Ended November 30, 2010: $16,000
Fiscal Year Ended November 30, 2009: $0
Includes fees billed for services related to risk management and privacy matters. Services were provided to the Registrant, The Vanguard Group, Inc., Vanguard Marketing Corporation, and other registered investment companies in the Vanguard Group.
(e) (1) Pre-Approval Policies. The policy of the Registrant’s Audit Committee is to consider and, if appropriate, approve before the principal accountant is engaged for such services, all specific audit and non-audit services provided to: (1) the Registrant; (2) The Vanguard Group, Inc.; (3) other entities controlled by The Vanguard Group, Inc. that provide ongoing services to the Registrant; and (4) other registered investment companies in the Vanguard Group. In making a determination, the Audit Committee considers whether the services are consistent with maintaining the principal accountant’s independence.
In the event of a contingency situation in which the principal accountant is needed to provide services in between scheduled Audit Committee meetings, the Chairman of the Audit Committee would be called on to consider and, if appropriate, pre-approve audit or permitted non-audit services in an amount sufficient to complete services through the next Audit Committee meeting, and to determine if such services would be consistent with maintaining the accountant’s independence. At the next scheduled Audit Committee meeting, services and fees would be presented to the Audit Committee for formal consideration, and, if appropriate, approval by the entire Audit Committee. The Audit Committee would again consider whether such services and fees are consistent with maintaining the principal accountant’s independence.
The Registrant’s Audit Committee is informed at least annually of all audit and non-audit services provided by the principal accountant to the Vanguard complex, whether such services are provided to: (1) the Registrant; (2) The Vanguard Group, Inc.; (3) other entities controlled by The Vanguard Group, Inc. that provide ongoing services to the Registrant; or (4) other registered investment companies in the Vanguard Group.
(2) No percentage of the principal accountant’s fees or services were approved pursuant to the waiver provision of paragraph (c)(7)(i)(C) of Rule 2-01 of Regulation S-X.
(f) For the most recent fiscal year, over 50% of the hours worked under the principal accountant’s engagement were not performed by persons other than full-time, permanent employees of the principal accountant.
(g) Aggregate Non-Audit Fees.
Fiscal Year Ended November 30, 2010: $352,090
Fiscal Year Ended November 30, 2009: $423,070
Includes fees billed for non-audit services provided to the Registrant, The Vanguard Group, Inc., Vanguard Marketing Corporation, and other registered investment companies in the Vanguard Group.
(h) For the most recent fiscal year, the Audit Committee has determined that the provision of all non-audit services was consistent with maintaining the principal accountant’s independence.
Item 5: Audit Committee of Listed Registrants.
Not Applicable.
Item 6: Investments.
Not Applicable.
Item 7: Disclosure of Proxy Voting Policies and Procedures for Closed-End Management Investment Companies.
Not Applicable.
Item 8: Portfolio Managers of Closed-End Management Investment Companies.
Not Applicable.
Item 9: Purchase of Equity Securities by Closed-End Management Investment Company and Affiliated Purchasers.
Not Applicable.
Item 10: Submission of Matters to a Vote of Security Holders.
Not Applicable.
Item 11: Controls and Procedures.
(a) Disclosure Controls and Procedures. The Principal Executive and Financial Officers concluded that the Registrant's Disclosure Controls and Procedures are effective based on their evaluation of the Disclosure Controls and Procedures as of a date within 90 days of the filing date of this report.
(b) Internal Control Over Financial Reporting. There were no significant changes in Registrant’s Internal Control Over Financial Reporting or in other factors that could significantly affect this control subsequent to the date of the evaluation, including any corrective actions with regard to significant deficiencies and material weaknesses.
Item 12: Exhibits.
(a) Code of Ethics.
(b) Certifications.
Pursuant to the requirements of the Securities Exchange Act of 1934 and the Investment Company Act of 1940, the registrant has duly caused this report to be signed on its behalf by the undersigned, thereunto duly authorized.
| |
| | VANGUARD CONVERTIBLE SECURITIES FUND |
| |
| By: | /s/ F. WILLIAM MCNABB III* |
| | F. WILLIAM MCNABB III |
| | CHIEF EXECUTIVE OFFICER |
| |
| Date: January 25, 2011 |
Pursuant to the requirements of the Securities Exchange Act of 1934 and the Investment Company Act of 1940, this report has been signed below by the following persons on behalf of the registrant and in the capacities and on the dates indicated.
| |
| | VANGUARD CONVERTIBLE SECURITIES FUND |
| |
| By: | /s/ F. WILLIAM MCNABB III* |
| | F. WILLIAM MCNABB III |
| | CHIEF EXECUTIVE OFFICER |
| |
| Date: January 25, 2011 |
| |
| | VANGUARD CONVERTIBLE SECURITIES FUND |
| |
| By: | /s/ THOMAS J. HIGGINS* |
| | THOMAS J. HIGGINS |
| | CHIEF FINANCIAL OFFICER |
| |
| Date: January 25, 2011 |
* By: /s/ Heidi Stam
Heidi Stam, pursuant to a Power of Attorney filed on April 26, 2010, see file Number
33-53683, Incorporated by Reference.