UNITED STATES
SECURITIES AND EXCHANGE COMMISSION
Washington, D.C. 20549
FORM N-CSR
CERTIFIED SHAREHOLDER REPORT
OF
REGISTERED MANAGEMENT INVESTMENT COMPANIES
Investment Company Act file number: 811-04627
Name of Registrant: Vanguard Convertible Securities Fund
Address of Registrant:
P.O. Box 2600
Valley Forge, PA 19482
Name and address of agent for service:
Heidi Stam, Esquire
P.O. Box 876
Valley Forge, PA 19482
Registrant’s telephone number, including area code: (610) 669-1000
Date of fiscal year end: November 30
Date of reporting period: December 1, 2011 – November 30, 2012
Item 1: Reports to Shareholders

|
| Annual Report | November 30, 2012 |
| Vanguard Convertible Securities Fund |
|
 |
> Vanguard Convertible Securities Fund returned 13.18% for the fiscal year ended November 30, 2012.
> The fund’s return surpassed that of its benchmark index and the average return of its peer group.
> U.S.-based securities in the portfolio outperformed their international counterparts.
| |
| Contents | |
| Your Fund’s Total Returns. | 1 |
| Chairman’s Letter. | 2 |
| Advisor’s Report. | 8 |
| Fund Profile. | 11 |
| Performance Summary. | 13 |
| Financial Statements. | 15 |
| Your Fund’s After-Tax Returns. | 29 |
| About Your Fund’s Expenses. | 30 |
| Glossary. | 32 |
Please note: The opinions expressed in this report are just that—informed opinions. They should not be considered promises or advice. Also, please keep in mind that the information and opinions cover the period through the date on the front of this report. Of course, the risks of investing in your fund are spelled out in the prospectus.
See the Glossary for definitions of investment terms used in this report.
About the cover: Our cover photograph shows rigging on the HMSSurprise, a replica of an 18th-century Royal Navy frigate. It was featured in the 2003 movie Master and Commander: The Far Side of the World, which was based on Patrick O’Brian’s sea novels, set amid the Napoleonic Wars. Vanguard was named for another ship of that era, the HMSVanguard, which was the flagship of British Admiral Horatio Nelson at the Battle of the Nile.
Your Fund’s Total Returns
| |
| Fiscal Year Ended November 30, 2012 | |
| | Total |
| | Returns |
| Vanguard Convertible Securities Fund | 13.18% |
| Convertibles Composite Index | 11.47 |
| Convertible Securities Funds Average | 9.01 |
For a benchmark description, see the Glossary.
Convertible Securities Funds Average: Derived from data provided by Lipper Inc.
| | | | |
| Your Fund’s Performance at a Glance | | | | |
| November 30, 2011, Through November 30, 2012 | | | | |
| | | | Distributions Per Share |
| | Starting | Ending | Income | Capital |
| | Share Price | Share Price | Dividends | Gains |
| Vanguard Convertible Securities Fund | $12.12 | $12.95 | $0.534 | $0.177 |
1

Chairman’s Letter
Dear Shareholder,
Advances in the U.S. stock market helped Vanguard Convertible Securities Fund to bounce back strongly from its losses a year ago. For the 12 months ended November 30, 2012, the fund returned 13.18%, outperforming both its benchmark, the Convertibles Composite Index (+11.47%), and the average return of its peer group (+9.01%).
Convertible securities are bonds and preferred stocks that can be exchanged for common stocks at a predetermined price. These hybrid securities typically produce returns somewhere between those of the stocks and traditional bonds issued by the smaller companies that dominate this segment of the financial markets. The Convertible Securities Fund posted results consistent with that pattern, after several years of diverging from expectations.
In addition to the strength of the U.S. stock market, slightly stronger demand for convertible securities abroad and the advisor’s selection of securities boosted the fund’s performance for the period.
Stocks weathered turbulence to record a healthy advance Global stock markets seesawed through the 12 months ended November 30, ultimately finishing with double-digit gains. U.S. stocks led the way, returning about
16%, followed by European and emerging markets stocks. Stocks in the developed markets of the Pacific region had the smallest return but still rose about 10%.
2
The gains masked a significant level of apprehension during the period, with investors concerned about U.S. economic growth and the finances of European governments and banks. Worries about Europe, in particular, flared up in the spring and then quieted in the summer. The president of the European Central Bank declared in July that policymakers would do whatever was needed to preserve the euro common currency.
Although investors’ worries have eased, Europe’s financial troubles aren’t resolved. Vanguard economists believe the most likely scenario is that the Eurozone will “muddle through” for several years, with occasional spikes in market volatility, as fiscal tightening persists in the face of weak economic growth.
As the period drew to a close soon after the U.S. elections, attention to the United States’s considerable budgetary challenges intensified. The near-term focus on the “fiscal cliff” led to unsettling headlines and nervousness in the markets. But it also sparked serious debate about spending and tax policy options, and such attention could prove a first step to a long-term solution that resolves the nation’s fiscal imbalance and opens the way for growth.
Bonds notched solid results, but challenges lie ahead The broad U.S. taxable bond market returned more than 5% for the 12 months. Municipal bonds performed robustly, with returns of about 10%.
| | | |
| Market Barometer | | | |
| |
| | | Average Annual Total Returns |
| | Periods Ended November 30, 2012 |
| | One | Three | Five |
| | Year | Years | Years |
| Stocks | | | |
| Russell 1000 Index (Large-caps) | 16.19% | 11.63% | 1.57% |
| Russell 2000 Index (Small-caps) | 13.09 | 13.85 | 2.82 |
| Russell 3000 Index (Broad U.S. market) | 15.95 | 11.80 | 1.67 |
| MSCI All Country World Index ex USA (International) | 11.65 | 3.41 | -3.84 |
| |
| Bonds | | | |
| Barclays U.S. Aggregate Bond Index (Broad taxable market) | 5.51% | 5.68% | 6.04% |
| Barclays Municipal Bond Index (Broad tax-exempt market) | 10.17 | 7.13 | 6.23 |
| Citigroup Three-Month U.S. Treasury Bill Index | 0.07 | 0.08 | 0.50 |
| |
| CPI | | | |
| Consumer Price Index | 1.76% | 2.10% | 1.84% |
3
As bond prices rose, the yield of the 10-year U.S. Treasury note slipped to a record low in July, closing below 1.5%. (Bond yields and prices move in opposite directions.) By the end of the period, the yield had climbed, but it still remained exceptionally low by historical standards.
After years of relatively high bond returns, investors shouldn’t be surprised if future results are much more modest. The low yields mean the opportunity for similarly strong returns has diminished.
As it has since late 2008, the Federal Reserve held its target for short-term interest rates between 0% and 0.25%, which kept a tight lid on returns from money market funds and savings accounts. Shortly after the period closed, the Fed announced it would not boost interest rates until unemployment fell to 6.5% or lower, provided the long-term inflation outlook remains about 2%. Based on current Fed projections, short-term interest rates are expected to remain near zero into 2015.
Investors’ appetite for risk boosted the fund’s result
The Convertible Securities Fund invests in a narrow and somewhat complex slice of the global bond market, as well as in the specialized realm of preferred stocks. The fund aims to give investors some of the best characteristics of bonds and stocks: the income and relative stability of bonds along with the potential for growth if the underlying companies’ stocks appreciate.
| | |
| Expense Ratios | | |
| Your Fund Compared With Its Peer Group | | |
| | | Peer Group |
| | Fund | Average |
| Convertible Securities Fund | 0.59% | 1.35% |
The fund expense ratio shown is from the prospectus dated March 27, 2012, and represents estimated costs for the current fiscal year. For the fiscal year ended November 30, 2012, the fund’s expense ratio was 0.52%. The peer-group expense ratio is derived from data provided by Lipper Inc. and captures information through year-end 2011.
Peer group: Convertible Securities Funds.
4
Convertible securities often are issued by small and midsized companies that have difficulty securing traditional sources of financing at a reasonable cost. Because they have low credit quality or are unrated, these securities expose the fund to more credit risk than more familiar investment-grade bonds do. Differentiating among unrated or poorly rated securities can be a challenge for most investors, so those who invest in this fund benefit significantly from its advisor’s skill and extensive research abilities.
During the 12-month period, some of the best-performing assets were large-cap U.S. stocks. The Convertibles Securities Fund benefited from some, but not all, of this enthusiasm for U.S. stocks, as its portfolio is more closely attuned to the performance of small- and mid-cap stocks, which lagged by a few steps. Weakness in the global stock markets—including worries about the Eurozone—also weighed on returns.
Still, investors overall were more willing than they were a year ago to invest in convertibles, which provided an alternative to stock market volatility and low bond yields.
The U.S. stock market’s robust rise contributed the most to the Convertible Securities Fund’s performance. The advisor’s security selections in the construction industry and health care added to the fund’s results.
| |
| Total Returns | |
| Ten Years Ended November 30, 2012 | |
| | Average |
| | Annual Return |
| Convertible Securities Fund | 8.76% |
| Convertibles Composite Index | 6.73 |
| Convertible Securities Funds Average | 6.55 |
For a benchmark description, see the Glossary.
Convertible Securities Funds Average: Derived from data provided by Lipper Inc.
The figures shown represent past performance, which is not a guarantee of future results. (Current performance may be lower or higher than the performance data cited. For performance data current to the most recent month-end, visit our website at vanguard.com/performance.) Note, too, that both investment returns and principal value can fluctuate widely, so an investor’s shares, when sold, could be worth more or less than their original cost.
5
The advisor also took advantage of increased issuance of convertibles abroad. Given the tightness in global credit markets amid the European debt crisis, opportunities to buy convertibles outside the United States have increased. Because borrowing from European banks and other more traditional financing sources is a bigger challenge for companies without high credit ratings, more of them are open to issuing convertible securities.
In choosing international securities, the advisor focuses on those of higher quality. Foreign issues made up about 19% of the portfolio as of November 30, and their share is expected to gradually rise to about 30% in coming years.
For more information on the fund’s positioning and performance during the year, please see the Advisor’s Report that follows this letter.
The fund has delivered impressive long-term results
The Convertible Securities Fund returned an average of 8.76% a year for the decade ended November 30, 2012. As you can see in the table on page 5, this is about 2 percentage points above the average yearly return of both its benchmark index and its peer group.
As I noted earlier, convertible securities have typically returned a bit more than bonds and a bit less than stocks. In times of extreme market volatility, however, the fund’s results have veered from expectations. In fiscal years 2009 and 2010, the fund outperformed both the stock and the bond markets as investors turned to convertibles as an alternative way to increase their returns. In fiscal year 2011, the fund lagged those same markets as investors fled to the safety of U.S. Treasuries. Investors’ unpredictable desire for risk largely influences these extreme variations in performance.
The fund’s advisor, Oaktree Capital Management, has produced benchmark-beating returns over the years, including seven of the past ten. Such a track record is not easily achieved, particularly given the unprecedented market conditions we witnessed during the 2008–2009 financial crisis. Oaktree’s success stems from its skilled and experienced staff and its ability to identify distinctive investment opportunities in a highly specialized market segment.
How our core purpose informs our approach to active management
At Vanguard, we sum up our core purpose this way: to take a stand for all investors, to treat them fairly, and to give them the best chance for investment success. When it comes to our actively managed funds, such as the Convertible Securities Fund, this commitment is reflected both in our rigorous process for selecting fund advisors and in our efforts to keep the costs of our funds low. We believe our approach gives investors the opportunity to outperform market indexes over the long term.
6
But make no mistake: Outperformance is hard to come by. For one thing, competition among investors is fierce. Charles Ellis, author of one of my favorite books on investing, Winning the Loser’s Game, points out that the competition is not between the skilled and the inept—it’s between the skilled and the skilled. “It’s like the Williams sisters playing tennis against each other,” as he put it in a recent Vanguard webcast.
Winning is not impossible, however, and the chances of success increase when managers such as the talented ones at Oaktree deliver their services to clients at low cost, letting investors keep more of their returns.
As always, thank you for entrusting your assets to Vanguard.
Sincerely,

F. William McNabb III
Chairman and Chief Executive Officer
December 17, 2012
7
Advisor’s Report
The fiscal year ended November 30, 2012, was rewarding for convertible securities, with strong absolute and relative performance. Convertibles posted positive returns for all but three of the 12 months and performed in relative terms as expected, capturing much of the gain of equities while providing significant downside protection during periods of market weakness.
Vanguard Convertible Securities Fund returned 13.18% for the 12 months. That exceeded the 11.47% return of its blended benchmark, which is 70% Bank of America Merrill Lynch All US Convertibles Index and 30% Bank of America Merrill Lynch Global 300 Convertibles ex-US Index (hedged).
The investment environment
Late 2011 was tumultuous for investors as they grappled with macroeconomic concerns such as the uncertain fate of the euro, disappointing projections for global economic growth, and the challenging U.S. political situation. Convertibles achieved a positive return in this investment environ-ment, but their participation in the price gains of underlying equities was relatively limited.
In early 2012, markets reacted well to encouraging announcements from the European Central Bank and to positive U.S. economic reports and indicators. Investors also were pleased by solid earnings reports for 2011’s fourth quarter, and they appeared less concerned with the negative macroeconomic news that had consumed so much of that year. Stock markets followed their strong late-2011 advance with an impressive return for the first calendar quarter of 2012, and spreads tightened in the global credit markets. These vibrant conditions favored convertibles, resulting in an exceptionally strong quarter.
However, convertible securities retreated in the following three months, as equity markets weakened with investors growing more concerned about Europe’s sovereign-debt crisis—which was again at the forefront—and about data indicating slow economic growth in China. This produced a “risk off” investing environment marked by increased volatility and a broad retracement in credit markets. Convertibles were hurt by falling stock prices and wider credit spreads. The main driver of their returns was, as usual, the underlying stock performance, which declined with the overall equity market retreat. Fortunately, the second quarter ended with a strong advance for stocks; the last day of the period saw one of the biggest daily gains of the year. This late shift to “risk on” substantially reduced the negative returns experienced for most of the quarter.
The improved market tone lasted through the third calendar quarter. Convertible securities moved substantially higher on the heels of equity advances and continued tightening of spreads in global credit markets. The environment was characterized by optimism as investors reacted to generally positive second-
8
quarter earnings reports and, more importantly, to global stimulus measures. Investors stayed in a “risk on” mood in large part because of encouraging announcements from the European Central Bank, the U.S. Federal Reserve, and the Bank of Japan.
The markets weakened once again in October. Equities retraced significantly, but convertible bonds provided downside protection and declined only fractionally for the month. Despite some volatility and weakness early in November, both equities and convertible bonds recovered to post positive returns for that month.
New issuance was reasonable throughout the fiscal year, and we were encouraged by the relative pickup in primary market activity in the third quarter of 2012. Although the pace was not torrid by any means, it was helpful to have a steady flow of new convertible paper, much of it priced attractively. Primary market new-issue proceeds for the 12 months were $51 billion ($19 billion in the United States and $32 billion outside it), with September the busiest month.
Our successes
Although returns were broad-based, portfolio performance was enhanced by exposure to a number of holdings with strong stock moves. Among the top contributors were convertibles from Cemex, a building materials company, and Aegis, a U.K. advertising agency. Other notable performers included Brookdale Senior Living, Gilead Sciences, and Lennar. From an industry perspective, our relative performance benefited from superior selection among building-products and real estate securities, as well as from our overweight position in health services.
Our shortfalls
The portfolio had a small position (approximately 0.4%) in the convertible bonds of Knight Capital Group, a New Jersey-based securities firm. In August 2012, the company announced it could potentially realize losses of $440 million because of a trading error triggered by an internal software bug. We exited our position after this news. The performance impact was small (approximately 0.1% over the 12 months). Overall, the portfolio had no significant performance detractors or credit issues during the period.
The fund’s positioning
Trading was reasonably active as we responded to opportunities in the new-issue market as well as to those born of market volatility. New-issue purchases led us to sell some of our holdings with relatively high conversion premiums as well as many of our highly appreciated, very equity-sensitive names, particularly in the last three months of the period.
Importantly, the convertible new issue calendar got much busier recently and gave us some excellent long-term investing opportunities. The new issues enabled us to restock the portfolio with the balanced convertibles that we seek,
9
increasing exposure to movements in the underlying equities without sacrificing protection against substantial market downdrafts. In summary, the period was conducive to rebalancing risk within the portfolio as we shed some appreciated securities in favor of others with desirable balanced qualities.
We remain fully invested, as usual, in a highly diversified, well-balanced portfolio of convertible securities, with a heavy emphasis on short- to intermediate-term bonds. The portfolio is slowly ramping up to its target 30% allocation to non-U.S. convertibles. As of November 30, 2012, the non-U.S. convertibles allocation was 19.1%, up from 16.3% a year earlier.
The portfolio is poised to participate meaningfully in potential equity rallies, while also conservatively positioned to provide relative downside protection.
Larry W. Keele, CFA
Principal and Founder
Jean-Paul Nedelec, Managing Director
Abe Ofer, Managing Director
Oaktree Capital Management, L.P.
December 21, 2012
10
Convertible Securities Fund
Fund Profile
As of November 30, 2012
| |
| Portfolio Characteristics | |
| Ticker Symbol | VCVSX |
| Number of Securities | 208 |
| 30-Day SEC yield | 2.85% |
| Conversion Premium | 49.1% |
| Average Weighted Maturity | 6.3 years |
| Average Coupon | 2.8% |
| Average Duration | 5.3 years |
| Foreign Holdings | 19.1% |
| Turnover Rate | 82% |
| Expense Ratio1 | 0.59% |
| Short-Term Reserves | 2.4% |
| |
| Distribution by Maturity (% of fixed income |
| portfolio) | |
| Under 1 Year | 3.2% |
| 1 - 5 Years | 55.4 |
| 5 - 10 Years | 30.9 |
| 10 - 20 Years | 3.6 |
| 20 - 30 Years | 6.9 |
| |
| Distribution by Credit Quality (% of fixed | |
| income portfolio) | |
| AAA | 0.2% |
| AA | 0.3 |
| A | 2.2 |
| BBB | 6.0 |
| BB | 16.2 |
| B | 20.0 |
| Below B | 0.2 |
| Not Rated | 54.9 |
For information about these ratings, see the Glossary entry for Credit Quality.
| | |
| Total Fund Volatility Measures | |
| | Conv. | DJ U.S. |
| | Comp. | Stock Market |
| | Index | Float Adj Idx |
| R-Squared | 0.98 | 0.91 |
| Beta | 1.14 | 0.72 |
These measures show the degree and timing of the fund’s fluctuations compared with the indexes over 36 months.
| | |
| Ten Largest Holdings (% of total net assets) |
| Cemex SAB de CV | Cement | 2.5% |
| Micron Technology Inc. | Semiconductors | 2.2 |
| Hologic Inc. | Health Care | |
| | Equipment | 2.1 |
| Omnicare Inc. | Health Care Services | 2.0 |
| Brookdale Senior Living | | |
| Inc. | Health Care Facilities | 1.9 |
| SanDisk Corp. | Computer Storage & | |
| | Peripherals | 1.9 |
| Salix Pharmaceuticals | | |
| Ltd. | Pharmaceuticals | 1.8 |
| priceline.com Inc. | Internet Retail | 1.7 |
| Jarden Corp. | Housewares & | |
| | Specialties | 1.7 |
| Nuance | | |
| Communications Inc. | Application Software | 1.6 |
| Top Ten | | 19.4% |
The holdings listed exclude any temporary cash investments and equity index products.
1 The expense ratio shown is from the prospectus dated March 27, 2012, and represents estimated costs for the current fiscal year. For the fiscal year ended November 30, 2012, the expense ratio was 0.52%.
11
Convertible Securities Fund
| |
| Sector Diversification (% of market | |
| exposure) | |
| Consumer | |
| Discretionary | 12.6% |
| Consumer Staples | 2.0 |
| Energy | 11.9 |
| Financials | 13.4 |
| Health Care | 19.7 |
| Industrials | 11.5 |
| Information | |
| Technology | 17.0 |
| Materials | 10.0 |
| Telecommunication | |
| Services | 1.3 |
| Utilities | 0.6 |
12
Convertible Securities Fund
Performance Summary
All of the returns in this report represent past performance, which is not a guarantee of future results that may be achieved by the fund. (Current performance may be lower or higher than the performance data cited. For performance data current to the most recent month-end, visit our website at vanguard.com/performance.) Note, too, that both investment returns and principal value can fluctuate widely, so an investor’s shares, when sold, could be worth more or less than their original cost. The returns shown do not reflect taxes that a shareholder would pay on fund distributions or on the sale of fund shares.
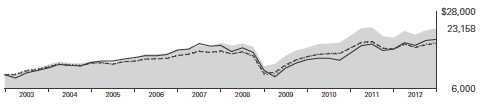
Cumulative Performance: November 30, 2002, Through November 30, 2012
Initial Investment of $10,000
| | | | |
| | | Average Annual Total Returns | |
| | Periods Ended November 30, 2012 | |
| | | | | Final Value |
| | One | Five | Ten | of a $10,000 |
| | Year | Years | Years | Investment |
| Convertible Securities Fund | 13.18% | 4.05% | 8.76% | $23,158 |
| •••••••• Convertibles Composite Index | 11.47 | 3.00 | 6.73 | 19,177 |
| – – – – Dow Convertible Jones U. Securities S. Total Stock Funds Market Average | 9.01 | 2.35 | 6.55 | 18,855 |
| Float-Adjusted Index | 15.92 | 1.84 | 7.20 | 20,046 |
For a benchmark description, see the Glossary.
Convertible Securities Funds Average: Derived from data provided by Lipper Inc.
See Financial Highlights for dividend and capital gains information.
13
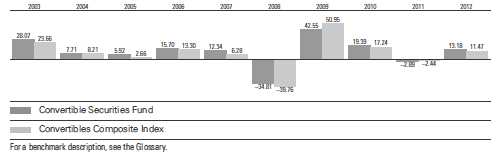
Convertible Securities Fund
Fiscal-Year Total Returns (%): November 30, 2002, Through November 30, 2012
Average Annual Total Returns: Periods Ended September 30, 2012
This table presents returns through the latest calendar quarter—rather than through the end of the fiscal period.
Securities and Exchange Commission rules require that we provide this information.
| | | | | | |
| | | | | | | Ten Years |
| | Inception Date | One Year | Five Years | Income | Capital | Total |
| Convertible Securities | | | | | | |
| Fund | 6/17/1986 | 17.88% | 4.35% | 3.81% | 5.52% | 9.33% |
14
Convertible Securities Fund
Financial Statements
Statement of Net Assets
As of November 30, 2012
The fund reports a complete list of its holdings in regulatory filings four times in each fiscal year, at the quarter-ends. For the second and fourth fiscal quarters, the lists appear in the fund’s semiannual and annual reports to shareholders. For the first and third fiscal quarters, the fund files the lists with the Securities and Exchange Commission on Form N-Q. Shareholders can look up the fund’s Forms N-Q on the SEC’s website at sec.gov. Forms N-Q may also be reviewed and copied at the SEC’s Public Reference Room (see the back cover of this report for further information).
| | | | | |
| | | | | Face | Market |
| | | Maturity | | Amount | Value |
| | Coupon | Date | Currency | (000) | ($000) |
| Convertible Bonds (86.1%) | | | | | |
| Consumer Discretionary (10.2%) | | | | | |
| Faurecia Cvt. | 3.250% | 1/1/18 | EUR | 1,418 | 1,694 |
| Group 1 Automotive Inc. Cvt. | 2.250% | 6/15/36 | USD | 6,770 | 7,908 |
| Hengdeli Holdings Ltd. Cvt. | 2.500% | 10/20/15 | HKD | 22,000 | 2,884 |
| 1 Iconix Brand Group Inc. Cvt. | 2.500% | 6/1/16 | USD | 4,615 | 4,652 |
| Intime Department Store Group Co. Ltd. Cvt. | 1.750% | 10/27/13 | HKD | 19,000 | 2,570 |
| 1 Jarden Corp. Cvt. | 1.875% | 9/15/18 | USD | 27,865 | 28,649 |
| Meritage Homes Corp. Cvt. | 1.875% | 9/15/32 | USD | 5,940 | 5,814 |
| MGM Resorts International Cvt. | 4.250% | 4/15/15 | USD | 20,345 | 20,714 |
| Misarte Cvt. | 3.250% | 1/1/16 | EUR | 2,842 | 4,382 |
| Newford Capital Ltd. Cvt. | 0.000% | 5/12/16 | USD | 5,300 | 5,234 |
| Nokian Renkaat OYJ Cvt. | 0.000% | 6/27/14 | EUR | 3,100 | 4,834 |
| 1 priceline.com Inc. Cvt. | 1.000% | 3/15/18 | USD | 26,255 | 28,684 |
| Ryland Group Inc. Cvt. | 1.625% | 5/15/18 | USD | 5,845 | 7,518 |
| Sekisui House Ltd. Cvt. | 0.000% | 7/5/16 | JPY | 150,000 | 1,862 |
| Standard Pacific Corp. Cvt. | 1.250% | 8/1/32 | USD | 14,425 | 16,156 |
| Steinhoff Finance Holding GmbH Cvt. | 4.500% | 3/31/18 | EUR | 200 | 260 |
| Steinhoff Finance Holding GmbH Cvt. | 5.000% | 5/22/16 | EUR | 5,550 | 7,835 |
| 1 Toll Brothers Finance Corp. Cvt. | 0.500% | 9/15/32 | USD | 11,730 | 11,642 |
| TUI Travel plc Cvt. | 4.900% | 4/27/17 | GBP | 1,900 | 3,186 |
| TUI Travel plc Cvt. | 6.000% | 10/5/14 | GBP | 200 | 337 |
| | | | | | 166,815 |
| Consumer Staples (1.6%) | | | | | |
| Aeon Co. Ltd. Cvt. | 0.300% | 11/22/13 | JPY | 107,000 | 1,399 |
| Glory River Holdings Ltd. Cvt. | 1.000% | 7/29/15 | HKD | 13,500 | 1,776 |
| Marine Harvest ASA Cvt. | 4.500% | 2/23/15 | EUR | 700 | 1,039 |
| Olam International Ltd. Cvt. | 6.000% | 10/15/16 | USD | 3,100 | 2,821 |
| Pescanova SA Cvt. | 5.125% | 4/20/17 | EUR | 2,500 | 3,190 |
| Pescanova SA Cvt. | 6.750% | 3/5/15 | EUR | 1,900 | 2,517 |
| Tyson Foods Inc. Cvt. | 3.250% | 10/15/13 | USD | 1,090 | 1,307 |
| Unicharm Corp. Cvt. | 0.000% | 9/24/15 | JPY | 310,000 | 4,300 |
| Vector Group Ltd. Cvt. | 2.500% | 1/15/19 | USD | 7,245 | 7,870 |
| Wilmar International Ltd. Cvt. | 0.000% | 12/18/12 | USD | 400 | 470 |
| | | | | | 26,689 |
| Energy (7.7%) | | | | | |
| BPZ Resources Inc. Cvt. | 6.500% | 3/1/15 | USD | 7,785 | 6,043 |
| Cam 2012 SPA Cvt. | 5.625% | 10/26/17 | EUR | 800 | 1,126 |
15
Convertible Securities Fund
| | | | | |
| | | | | Face | Market |
| | | Maturity | | Amount | Value |
| | Coupon | Date | Currency | (000) | ($000) |
| Cie Generale de Geophysique - Veritas Cvt. | 1.750% | 1/1/16 | EUR | 2,060 | 3,022 |
| Endeavour International Corp. Cvt. | 5.500% | 7/15/16 | USD | 7,960 | 6,885 |
| Eni SPA Cvt. | 0.250% | 11/30/15 | EUR | 3,200 | 4,191 |
| ExterranHoldings Inc. Cvt. | 4.250% | 6/15/14 | USD | 3,165 | 3,618 |
| Helix Energy Solutions Group Inc. Cvt. | 3.250% | 3/15/32 | USD | 17,385 | 19,254 |
| 1 Hornbeck Offshore Services Inc. Cvt. | 1.500% | 9/1/19 | USD | 24,620 | 25,343 |
| Lukoil International Finance BV Cvt. | 2.625% | 6/16/15 | USD | 5,300 | 5,915 |
| McMoRan Exploration Co. Cvt. | 4.000% | 12/30/17 | USD | 870 | 709 |
| Paladin Energy Ltd. Cvt. | 3.625% | 11/4/15 | USD | 2,591 | 2,060 |
| Paladin Energy Ltd. Cvt. | 6.000% | 4/30/17 | USD | 2,634 | 2,166 |
| 1 PDC Energy Inc. Cvt. | 3.250% | 5/15/16 | USD | 7,055 | 7,875 |
| Pembina Pipeline Corp. Cvt. | 5.750% | 12/31/18 | CAD | 3,360 | 3,708 |
| Pembina Pipeline Corp. Cvt. | 5.750% | 11/30/20 | CAD | 435 | 480 |
| Petrominerales Ltd. Cvt. | 2.625% | 8/25/16 | USD | 1,900 | 1,839 |
| Seadrill Ltd. Cvt. | 3.375% | 10/27/17 | USD | 2,100 | 2,828 |
| 1 Stone Energy Corp. Cvt. | 1.750% | 3/1/17 | USD | 23,900 | 21,510 |
| Subsea 7 SA Cvt. | 2.250% | 10/11/13 | USD | 1,300 | 1,472 |
| Technip SA Cvt. | 0.500% | 1/1/16 | EUR | 831 | 1,328 |
| TMK Bonds SA Cvt. | 5.250% | 2/11/15 | USD | 4,200 | 4,286 |
| | | | | | 125,658 |
| Financials (11.7%) | | | | | |
| 1 American Equity Investment Life | | | | | |
| Holding Co. Cvt. | 3.500% | 9/15/15 | USD | 15,465 | 17,388 |
| 1 Amtrust Financial Services Inc. Cvt. | 5.500% | 12/15/21 | USD | 9,645 | 11,857 |
| Annaly Capital Management Inc. Cvt. | 5.000% | 5/15/15 | USD | 7,415 | 7,540 |
| BES Finance Ltd. Cvt. | 1.625% | 4/15/13 | USD | 5,500 | 5,489 |
| 1 BioMed Realty LP Cvt. | 3.750% | 1/15/30 | USD | 5,485 | 6,459 |
| BNP Paribas SA Cvt. | 0.250% | 9/21/15 | EUR | 2,900 | 3,241 |
| CapitaCommercial Trust Cvt. | 2.500% | 9/12/17 | SGD | 4,000 | 3,577 |
| CapitaLand Ltd. Cvt. | 2.875% | 9/3/16 | SGD | 4,750 | 4,093 |
| ChinaOverseas Grand Oceans Finance | | | | | |
| Cayman Ltd. Cvt. | 2.000% | 3/21/17 | HKD | 31,000 | 4,494 |
| DFC Global Corp. Cvt. | 3.000% | 4/1/28 | USD | 8,726 | 9,610 |
| 1 DFC Global Corp. Cvt. | 3.250% | 4/15/17 | USD | 14,490 | 15,568 |
| Fidelity National Financial Inc. Cvt. | 4.250% | 8/15/18 | USD | 5,640 | 7,283 |
| Fonciere Des Regions Cvt. | 3.340% | 1/1/17 | EUR | 3,453 | 4,807 |
| Forest City Enterprises Inc. Cvt. | 4.250% | 8/15/18 | USD | 22,052 | 22,796 |
| Gecina SA Cvt. | 2.125% | 1/1/16 | EUR | 1,973 | 2,819 |
| Graubuendner Kantonalbank Cvt. | 2.000% | 5/8/14 | CHF | 4,390 | 4,869 |
| 1 Host Hotels & Resorts LP Cvt. | 2.500% | 10/15/29 | USD | 12,880 | 16,180 |
| Industrivarden AB Cvt. | 2.500% | 2/27/15 | EUR | 1,950 | 2,998 |
| 1 NorthStar Realty Finance LP Cvt. | 7.500% | 3/15/31 | USD | 11,585 | 13,431 |
| Old Republic International Corp. Cvt. | 3.750% | 3/15/18 | USD | 8,515 | 8,749 |
| ORIXCorp. Cvt. | 1.000% | 3/31/14 | JPY | 300,000 | 4,494 |
| ShersonLtd. Cvt. | 0.000% | 6/4/14 | HKD | 28,610 | 4,513 |
| ShuiOn Land Ltd. Cvt. | 4.500% | 9/29/15 | CNY | 4,000 | 673 |
| TAG Immobilien AG Cvt. | 5.500% | 6/28/19 | EUR | 700 | 1,109 |
| Walter Investment Management Corp. Cvt. | 4.500% | 11/1/19 | USD | 8,195 | 8,625 |
| | | | | | 192,662 |
| Health Care (17.5%) | | | | | |
| Brookdale Senior Living Inc. Cvt. | 2.750% | 6/15/18 | USD | 27,475 | 31,905 |
| ChemedCorp. Cvt. | 1.875% | 5/15/14 | USD | 6,955 | 7,251 |
| Hologic Inc. Cvt. | 2.000% | 12/15/37 | USD | 15,900 | 17,281 |
| Hologic Inc. Cvt. | 2.000% | 3/1/42 | USD | 17,690 | 17,060 |
16
Convertible Securities Fund
| | | | | |
| | | | | Face | Market |
| | | Maturity | | Amount | Value |
| | Coupon | Date | Currency | (000) | ($000) |
| 1 Illumina Inc. Cvt. | 0.250% | 3/15/16 | USD | 9,100 | 8,696 |
| Insulet Corp. Cvt. | 3.750% | 6/15/16 | USD | 4,839 | 5,359 |
| Integra LifeSciences Holdings Corp. Cvt. | 1.625% | 12/15/16 | USD | 18,973 | 19,151 |
| 1 Isis Pharmaceuticals Inc. Cvt. | 2.750% | 10/1/19 | USD | 12,113 | 11,500 |
| LifePoint Hospitals Inc. Cvt. | 3.500% | 5/15/14 | USD | 6,644 | 6,802 |
| 1 Medicines Co. Cvt. | 1.375% | 6/1/17 | USD | 4,600 | 4,732 |
| Medivation Inc. Cvt. | 2.625% | 4/1/17 | USD | 1,755 | 2,262 |
| Molina Healthcare Inc. Cvt. | 3.750% | 10/1/14 | USD | 10,775 | 12,661 |
| Omnicare Inc. Cvt. | 3.750% | 4/1/42 | USD | 32,434 | 32,596 |
| Orpea Cvt. | 3.875% | 1/1/16 | EUR | 2,593 | 3,630 |
| Qiagen Euro Finance SA Cvt. | 3.250% | 5/16/26 | USD | 3,500 | 4,203 |
| 1 Salix Pharmaceuticals Ltd. Cvt. | 1.500% | 3/15/19 | USD | 28,280 | 27,502 |
| Salix Pharmaceuticals Ltd. Cvt. | 2.750% | 5/15/15 | USD | 1,575 | 1,847 |
| Sawai Pharmaceutical Co. Ltd. Cvt. | 0.000% | 9/17/15 | JPY | 256,000 | 3,414 |
| Teleflex Inc. Cvt. | 3.875% | 8/1/17 | USD | 4,120 | 5,186 |
| United Therapeutics Corp. Cvt. | 1.000% | 9/15/16 | USD | 15,500 | 19,376 |
| Volcano Corp. Cvt. | 2.875% | 9/1/15 | USD | 7,920 | 9,326 |
| 1 WellPoint Inc. Cvt. | 2.750% | 10/15/42 | USD | 19,760 | 20,489 |
| 1 Wright Medical Group Inc. Cvt. | 2.000% | 8/15/17 | USD | 14,255 | 15,199 |
| | | | | | 287,428 |
| Industrials (9.8%) | | | | | |
| Abengoa SA Cvt. | 4.500% | 2/3/17 | EUR | 800 | 940 |
| 1 Air Lease Corp. Cvt. | 3.875% | 12/1/18 | USD | 20,440 | 22,267 |
| Asahi Glass Co. Ltd. Cvt. | 0.000% | 11/14/14 | JPY | 110,000 | 1,322 |
| Avis Budget Group Inc. Cvt. | 3.500% | 10/1/14 | USD | 11,180 | 14,925 |
| Barnes Group Inc. Cvt. | 3.375% | 3/15/27 | USD | 7,740 | 7,948 |
| 1 Barnes Group Inc. Cvt. | 3.375% | 3/15/27 | USD | 1,165 | 1,196 |
| 1 CBIZInc. Cvt. | 4.875% | 10/1/15 | USD | 2,435 | 2,502 |
| ChartIndustries Inc. Cvt. | 2.000% | 8/1/18 | USD | 8,090 | 9,516 |
| ChinaMerchants Holdings Pacific Ltd. Cvt. | 1.250% | 11/6/17 | HKD | 12,000 | 1,591 |
| Covanta Holding Corp. Cvt. | 3.250% | 6/1/14 | USD | 12,720 | 15,805 |
| GenCorp Inc. Cvt. | 4.063% | 12/31/39 | USD | 3,020 | 3,707 |
| Greenbrier Cos. Inc. Cvt. | 3.500% | 4/1/18 | USD | 5,620 | 5,339 |
| 1 Kaman Corp. Cvt. | 3.250% | 11/15/17 | USD | 5,380 | 6,718 |
| KFW Cvt. | 1.500% | 7/30/14 | EUR | 1,200 | 1,883 |
| Kloeckner & Co. Financial Services SA Cvt. | 2.500% | 12/22/17 | EUR | 3,300 | 4,065 |
| Larsen & Toubro Ltd. Cvt. | 3.500% | 10/22/14 | USD | 2,600 | 2,778 |
| 1 Lufthansa Malta Blues LP Cvt. | 0.750% | 4/5/17 | EUR | 1,882 | 2,631 |
| Nexans SA Cvt. | 4.000% | 1/1/16 | EUR | 2,485 | 3,423 |
| Nidec Corp. Cvt. | 0.000% | 9/18/15 | JPY | 20,000 | 242 |
| PB Issuer No 2 Ltd. Cvt. | 1.750% | 4/12/16 | USD | 340 | 329 |
| PB Issuer No 3 Ltd. Cvt. | 1.875% | 10/22/18 | USD | 3,586 | 3,747 |
| Power Regal Group Ltd. Cvt. | 2.250% | 6/2/14 | HKD | 19,180 | 3,001 |
| Russel Metals Inc. Cvt. | 7.750% | 9/30/16 | CAD | 3,325 | 4,050 |
| San Miguel Corp. Cvt. | 2.000% | 5/5/14 | USD | 5,400 | 5,573 |
| SGL Carbon SE Cvt. | 0.750% | 5/16/13 | EUR | 450 | 588 |
| SGL Carbon SE Cvt. | 2.750% | 1/25/18 | EUR | 3,200 | 4,206 |
| Siem Industries Inc. Cvt. | 1.000% | 9/12/19 | USD | 4,200 | 4,243 |
| Siemens Financieringsmaatschappij NV Cvt. | 1.050% | 8/16/17 | USD | 2,000 | 2,014 |
| Siemens Financieringsmaatschappij NV Cvt. | 1.650% | 8/16/19 | USD | 1,000 | 1,006 |
| SMInvestments Corp. Cvt. | 1.625% | 2/15/17 | USD | 3,600 | 4,158 |
| Societa Iniziative Autostradali e Servizi SPA Cvt. | 2.625% | 6/30/17 | EUR | 1,195 | 1,490 |
| Tem SAS Cvt. | 4.250% | 1/1/15 | EUR | 1,758 | 2,402 |
| 1 Titan Machinery Inc. Cvt. | 3.750% | 5/1/19 | USD | 5,385 | 4,890 |
17
Convertible Securities Fund
| | | | | | |
| | | | | | Face | Market |
| | | | Maturity | | Amount | Value |
| | | Coupon | Date | Currency | (000) | ($000) |
| | Wabash National Corp. Cvt. | 3.375% | 5/1/18 | USD | 7,255 | 7,663 |
| | XPOLogistics Inc. Cvt. | 4.500% | 10/1/17 | USD | 1,990 | 2,244 |
| | | | | | | 160,402 |
| Information Technology (16.6%) | | | | | |
| | Atos Cvt. | 2.500% | 1/1/16 | EUR | 2,466 | 4,043 |
| | AU Optronics Corp. Cvt. | 0.000% | 10/13/15 | USD | 3,200 | 2,656 |
| | BroadSoft Inc. Cvt. | 1.500% | 7/1/18 | USD | 7,590 | 7,970 |
| | Cap Gemini SA Cvt. | 3.500% | 1/1/14 | EUR | 1,402 | 2,043 |
| 1 | Ciena Corp. Cvt. | 3.750% | 10/15/18 | USD | 15,865 | 17,481 |
| | Comtech Telecommunications Corp. Cvt. | 3.000% | 5/1/29 | USD | 9,640 | 9,905 |
| 1 | CSG Systems International Inc. Cvt. | 3.000% | 3/1/17 | USD | 9,590 | 10,135 |
| 1 | DealerTrack Holdings Inc. Cvt. | 1.500% | 3/15/17 | USD | 7,120 | 7,351 |
| | Econocom Group Cvt. | 4.000% | 6/1/16 | EUR | 1,946 | 2,802 |
| | GTAdvanced Technologies Inc. Cvt. | 3.000% | 10/1/17 | USD | 3,180 | 2,433 |
| | Hanwha SolarOne Co. Ltd. Cvt. | 3.500% | 1/15/18 | USD | 2,023 | 1,558 |
| | Hon Hai Precision Industry Co. Ltd. Cvt. | 0.000% | 10/12/13 | USD | 100 | 104 |
| | Intel Corp. Cvt. | 2.950% | 12/15/35 | USD | 4,410 | 4,595 |
| | Ixia Cvt. | 3.000% | 12/15/15 | USD | 5,866 | 6,574 |
| | Lam Research Corp. Cvt. | 0.500% | 5/15/16 | USD | 5 | 5 |
| | Lam Research Corp. Cvt. | 1.250% | 5/15/18 | USD | 11,590 | 11,300 |
| | Mentor Graphics Corp. Cvt. | 4.000% | 4/1/31 | USD | 15,550 | 17,406 |
| | Micron Technology Inc. Cvt. | 1.500% | 8/1/31 | USD | 17,725 | 15,620 |
| | Micron Technology Inc. Cvt. | 1.875% | 6/1/27 | USD | 3,904 | 3,482 |
| | Micron Technology Inc. Cvt. | 1.875% | 8/1/31 | USD | 3,660 | 3,200 |
| 1 | Micron Technology Inc. Cvt. | 3.125% | 5/1/32 | USD | 15,125 | 14,104 |
| | Neopost SA Cvt. | 3.750% | 2/1/15 | EUR | 2,845 | 3,777 |
| | Novellus Systems Inc. Cvt. | 2.625% | 5/15/41 | USD | 8,120 | 9,922 |
| | Nuance Communications Inc. Cvt. | 2.750% | 11/1/31 | USD | 23,975 | 26,283 |
| | ON Semiconductor Corp. Cvt. | 2.625% | 12/15/26 | USD | 13,237 | 13,899 |
| | SanDisk Corp. Cvt. | 1.500% | 8/15/17 | USD | 27,735 | 30,855 |
| | Take-Two Interactive Software Inc. Cvt. | 1.750% | 12/1/16 | USD | 3,915 | 3,842 |
| 1 | TIBCO Software Inc. Cvt. | 2.250% | 5/1/32 | USD | 10,025 | 9,699 |
| | VeriSign Inc. Cvt. | 3.250% | 8/15/37 | USD | 15,320 | 17,781 |
| 1 | Vishay Intertechnology Inc. Cvt. | 2.250% | 11/15/40 | USD | 2,875 | 2,465 |
| 1 | Vishay Intertechnology Inc. Cvt. | 2.250% | 5/15/41 | USD | 10,745 | 8,039 |
| 1 | Vishay Intertechnology Inc. Cvt. | 2.250% | 6/1/42 | USD | 2,215 | 2,108 |
| | | | | | | 273,437 |
| Materials (9.8%) | | | | | |
| | African Minerals Ltd. Cvt. | 8.500% | 2/10/17 | USD | 2,800 | 2,721 |
| | AK Steel Corp. Cvt. | 5.000% | 11/15/19 | USD | 9,400 | 9,659 |
| | AngloGold Ashanti Holdings Finance plc Cvt. | 3.500% | 5/22/14 | USD | 2,300 | 2,387 |
| | Cemex SAB de CV Cvt. | 3.250% | 3/15/16 | USD | 15,788 | 16,498 |
| | Cemex SAB de CV Cvt. | 4.875% | 3/15/15 | USD | 24,044 | 24,645 |
| | Glencore Finance Europe SA Cvt. | 5.000% | 12/31/14 | USD | 2,100 | 2,569 |
| | Goldcorp Inc. Cvt. | 2.000% | 8/1/14 | USD | 1,085 | 1,228 |
| | Kaiser Aluminum Corp. Cvt. | 4.500% | 4/1/15 | USD | 5,570 | 7,627 |
| | Petropavlovsk 2010 Ltd. Cvt. | 4.000% | 2/18/15 | USD | 3,100 | 2,914 |
| | Royal Gold Inc. Cvt. | 2.875% | 6/15/19 | USD | 12,710 | 14,132 |
| | RTI International Metals Inc. Cvt. | 3.000% | 12/1/15 | USD | 11,885 | 12,524 |
| | Salzgitter Finance BV Cvt. | 2.000% | 11/8/17 | EUR | 2,650 | 4,065 |
| 1,2 | ShengdaTechInc. Cvt. | 6.500% | 12/15/15 | USD | 305 | 3 |
| | Steel Dynamics Inc. Cvt. | 5.125% | 6/15/14 | USD | 8,087 | 8,597 |
| | Stillwater Mining Co. Cvt. | 1.750% | 10/15/32 | USD | 16,425 | 17,996 |
| | Tata Steel Ltd. Cvt. | 4.500% | 11/21/14 | USD | 3,531 | 3,533 |
18
Convertible Securities Fund
| | | | | |
| | | | | Face | Market |
| | | Maturity | | Amount | Value |
| | Coupon | Date | Currency | (000) | ($000) |
| United States Steel Corp. Cvt. | 4.000% | 5/15/14 | USD | 24,585 | 25,615 |
| Welspun Corp. Ltd. Cvt. | 4.500% | 10/17/14 | USD | 2,700 | 2,599 |
| Western Areas NL Cvt. | 6.375% | 7/2/14 | AUD | 1,185 | 1,227 |
| Western Areas NL Cvt. | 6.400% | 7/2/15 | AUD | 500 | 521 |
| | | | | | 161,060 |
| Telecommunication Services (0.6%) | | | | | |
| Billion Express Investments Ltd. Cvt. | 0.750% | 10/18/15 | USD | 4,800 | 5,064 |
| Inmarsat plc Cvt. | 1.750% | 11/16/17 | USD | 1,300 | 1,679 |
| SKTelecom Co. Ltd. Cvt. | 1.750% | 4/7/14 | USD | 2,961 | 3,279 |
| | | | | | 10,022 |
| Utilities (0.6%) | | | | | |
| Tata Power Co. Ltd. Cvt. | 1.750% | 11/21/14 | USD | 2,700 | 2,788 |
| YTLCorp. Finance Labuan Ltd. Cvt. | 1.875% | 3/18/15 | USD | 5,800 | 6,648 |
| | | | | | 9,436 |
| Total Convertible Bonds (Cost $1,373,623) | | | | | 1,413,609 |
| |
| | | | | Shares | |
| Convertible Preferred Stocks (12.0%) | | | | | |
| Consumer Discretionary (2.3%) | | | | | |
| General Motors Co. Pfd. | 4.750% | | | 502,400 | 20,363 |
| Interpublic Group of Cos. Inc. Pfd. | 5.250% | | | 15,740 | 16,571 |
| | | | | | 36,934 |
| Consumer Staples (0.3%) | | | | | |
| Bunge Ltd. Pfd. | 4.875% | | | 52,700 | 5,355 |
| |
| Energy (4.1%) | | | | | |
| 1 ChesapeakeEnergy Corp. Pfd. | 5.750% | | | 16,250 | 14,422 |
| Energy XXI Bermuda Ltd. Pfd. | 5.625% | | | 51,920 | 17,807 |
| Goodrich Petroleum Corp. Pfd. | 5.375% | | | 358,000 | 10,740 |
| 1 Sanchez Energy Corp. Pfd. | 4.875% | | | 201,300 | 10,153 |
| SandRidge Energy Inc. Pfd. | 8.500% | | | 134,880 | 13,547 |
| | | | | | 66,669 |
| Financials (1.4%) | | | | | |
| Entertainment Properties Trust Pfd. | 5.750% | | | 237,600 | 5,211 |
| Health Care REIT Inc. Pfd. | 6.500% | | | 184,733 | 10,420 |
| Wintrust Financial Corp. Pfd. | 5.000% | | | 7,530 | 7,737 |
| | | | | | 23,368 |
| Health Care (1.8%) | | | | | |
| HealthSouth Corp. Pfd. | 6.500% | | | 16,430 | 17,190 |
| Omnicare Capital Trust II Pfd. | 4.000% | | | 253,600 | 12,260 |
| | | | | | 29,450 |
| Industrials (1.5%) | | | | | |
| Continental Airlines Finance Trust II Pfd. | 6.000% | | | 37,030 | 1,226 |
| Genesee & Wyoming Inc. Pfd. | 5.000% | | | 107,100 | 11,793 |
| United Technologies Corp. Pfd. | 7.500% | | | 226,000 | 12,367 |
| | | | | | 25,386 |
| Telecommunication Services (0.6%) | | | | | |
| 1 Iridium Communications Inc. Pfd. | 7.000% | | | 112,500 | 10,210 |
| Total Convertible Preferred Stocks (Cost $193,477) | | | | | 197,372 |
19
Convertible Securities Fund
| | | |
| | | | Market |
| | | | Value |
| | Coupon | Shares | ($000) |
| Temporary Cash Investment (2.4%) | | | |
| Money Market Fund (2.4%) | | | |
| 3 Vanguard Market Liquidity Fund | | | |
| (Cost $39,740) | 0.167% | 39,740,130 | 39,740 |
| Total Investments (100.5%) (Cost $1,606,840) | | | 1,650,721 |
| Other Assets and Liabilities (-0.5%) | | | |
| Other Assets | | | 24,878 |
| Liabilities | | | (33,034) |
| | | | (8,156) |
| Net Assets (100%) | | | |
| Applicable to 126,859,151 outstanding $.001 par value shares of | | |
| beneficial interest (unlimited authorization) | | | 1,642,565 |
| Net Asset Value Per Share | | | $12.95 |
| |
| At November 30, 2012, net assets consisted of: | |
| | Amount |
| | ($000) |
| Paid-in Capital | 1,539,880 |
| Undistributed Net Investment Income | 10,546 |
| Accumulated Net Realized Gains | 47,248 |
| Unrealized Appreciation (Depreciation) | |
| Investment Securities | 43,881 |
| Forward Currency Contracts | 958 |
| Foreign Currencies | 52 |
| Net Assets | 1,642,565 |
See Note A in Notes to Financial Statements.
1 Security exempt from registration under Rule 144A of the Securities Act of 1933. Such securities may be sold in transactions exempt from registration, normally to qualified institutional buyers. At November 30, 2012, the aggregate value of these securities was $443,730,000, representing 27.0% of net assets.
2 Non-income-producing security—interest payments in default.
3 Affiliated money market fund available only to Vanguard funds and certain trusts and accounts managed by Vanguard. Rate shown is the 7-day yield.
REIT—Real Estate Investment Trust.
AUD—Australian dollars.
CAD—Canadian dollars.
CHF—Swiss francs.
CNY—Chinese yuan.
EUR—Euro.
GBP—British pounds.
HKD—Hong Kong dollars.
JPY—Japanese yen.
SGD—Singapore dollars.
USD—United States dollars.
See accompanying Notes, which are an integral part of the Financial Statements.
20
Convertible Securities Fund
| |
| Statement of Operations | |
| |
| | Year Ended |
| | November 30, 2012 |
| | ($000) |
| Investment Income | |
| Income | |
| Dividends | 10,269 |
| Interest1,2 | 52,810 |
| Total Income | 63,079 |
| Expenses | |
| Investment Advisory Fees—Note B | |
| Basic Fee | 5,706 |
| Performance Adjustment | (616) |
| The Vanguard Group—Note C | |
| Management and Administrative | 3,280 |
| Marketing and Distribution | 302 |
| Custodian Fees | 55 |
| Auditing Fees | 36 |
| Shareholders’ Reports | 20 |
| Trustees’ Fees and Expenses | 4 |
| Total Expenses | 8,787 |
| Net Investment Income | 54,292 |
| Realized Net Gain (Loss) | |
| Investment Securities Sold | 63,369 |
| Foreign Currencies and Forward Currency Contracts | 3,982 |
| Realized Net Gain (Loss) | 67,351 |
| Change in Unrealized Appreciation (Depreciation) | |
| Investment Securities | 86,436 |
| Foreign Currencies and Forward Currency Contracts | (823) |
| Change in Unrealized Appreciation (Depreciation) | 85,613 |
| Net Increase (Decrease) in Net Assets Resulting from Operations | 207,256 |
1 Interest income is net of foreign withholding taxes of $14,000.
2 Interest income from an affiliated company of the fund was $55,000.
See accompanying Notes, which are an integral part of the Financial Statements.
21
Convertible Securities Fund
| | |
| Statement of Changes in Net Assets | | |
| |
| | Year Ended November 30, |
| | 2012 | 2011 |
| | ($000) | ($000) |
| Increase (Decrease) in Net Assets | | |
| Operations | | |
| Net Investment Income | 54,292 | 65,989 |
| Realized Net Gain (Loss) | 67,351 | 50,338 |
| Change in Unrealized Appreciation (Depreciation) | 85,613 | (189,816) |
| Net Increase (Decrease) in Net Assets Resulting from Operations | 207,256 | (73,489) |
| Distributions | | |
| Net Investment Income | (71,050) | (68,040) |
| Realized Capital Gain1 | (24,089) | (121,860) |
| Total Distributions | (95,139) | (189,900) |
| Capital Share Transactions | | |
| Issued | 164,727 | 538,457 |
| Issued in Lieu of Cash Distributions | 82,817 | 166,796 |
| Redeemed2 | (397,521) | (494,030) |
| Net Increase (Decrease) from Capital Share Transactions | (149,977) | 211,223 |
| Total Increase (Decrease) | (37,860) | (52,166) |
| Net Assets | | |
| Beginning of Period | 1,680,425 | 1,732,591 |
| End of Period3 | 1,642,565 | 1,680,425 |
1 Includes fiscal 2012 and 2011 short-term gain distributions totaling $3,130,000 and $71,840,000, respectively. Short-term gain distributions are treated as ordinary income dividends for tax purposes.
2 Net of redemption fees for fiscal 2012 and 2011 of $174,000 and $945,000, respectively. Effective May 23, 2012, the redemption fee was eliminated.
3 Net Assets—End of Period includes undistributed net investment income of $10,546,000 and $16,842,000.
See accompanying Notes, which are an integral part of the Financial Statements.
22
Convertible Securities Fund
| | | | | |
| Financial Highlights | | | | | |
| |
| |
| For a Share Outstanding | | | Year Ended November 30, |
| Throughout Each Period | 2012 | 2011 | 2010 | 2009 | 2008 |
| Net Asset Value, Beginning of Period | $12.12 | $13.85 | $12.12 | $8.86 | $14.95 |
| Investment Operations | | | | | |
| Net Investment Income | .407 | .451 | .555 | .475 | .401 |
| Net Realized and Unrealized Gain (Loss) | | | | | |
| on Investments | 1.134 | (.752) | 1.742 | 3.211 | (5.170) |
| Total from Investment Operations | 1.541 | (.301) | 2.297 | 3.686 | (4.769) |
| Distributions | | | | | |
| Dividends from Net Investment Income | (.534) | (.474) | (.567) | (.426) | (.501) |
| Distributions from Realized Capital Gains | (.177) | (.955) | — | — | (.820) |
| Total Distributions | (.711) | (1.429) | (.567) | (.426) | (1.321) |
| Net Asset Value, End of Period | $12.95 | $12.12 | $13.85 | $12.12 | $8.86 |
| |
| Total Return1 | 13.18% | -2.89% | 19.39% | 42.55% | -34.81% |
| |
| Ratios/Supplemental Data | | | | | |
| Net Assets, End of Period (Millions) | $1,643 | $1,680 | $1,733 | $1,715 | $716 |
| Ratio of Total Expenses to | | | | | |
| Average Net Assets2 | 0.52% | 0.59% | 0.68% | 0.72% | 0.71% |
| Ratio of Net Investment Income to | | | | | |
| Average Net Assets | 3.23% | 3.36% | 4.08% | 4.65% | 3.28% |
| Portfolio Turnover Rate | 82% | 90% | 103% | 103% | 77% |
1 Total returns do not include transaction or account service fees that may have applied in the periods shown. Fund prospectuses provide information about any applicable transaction and account service fees.
2 Includes performance-based investment advisory fee increases (decreases) of (0.04%), 0.03%, 0.12%, 0.12%, and 0.15%.
See accompanying Notes, which are an integral part of the Financial Statements.
23
Convertible Securities Fund
Notes to Financial Statements
Vanguard Convertible Securities Fund is registered under the Investment Company Act of 1940 as an open-end investment company, or mutual fund. The fund invests in securities of foreign issuers, which may subject it to investment risks not normally associated with investing in securities of United States corporations.
A. The following significant accounting policies conform to generally accepted accounting principles for U.S. mutual funds. The fund consistently follows such policies in preparing its financial statements.
1. Security Valuation: Securities are valued as of the close of trading on the New York Stock Exchange (generally 4 p.m., Eastern time) on the valuation date. Equity securities are valued at the latest quoted sales prices or official closing prices taken from the primary market in which each security trades; such securities not traded on the valuation date are valued at the mean of the latest quoted bid and asked prices. Bonds, and temporary cash investments acquired over 60 days to maturity, are valued using the latest bid prices or using valuations based on a matrix system (which considers such factors as security prices, yields, maturities, and ratings), both as furnished by independent pricing services. Investments in Vanguard Market Liquidity Fund are valued at that fund’s net asset value. Other temporary cash investments are valued at amortized cost, which approximates market value. Securities for which market quotations are not readily available, or whose values have been affected by events occurring before the fund’s pricing time but after the close of the securities’ primary markets, are valued by methods deemed by the board of trustees to represent fair value.
2. Foreign Currency: Securities and other assets and liabilities denominated in foreign currencies are translated into U.S. dollars using exchange rates obtained from an independent third party as of the fund’s pricing time on the valuation date. Realized gains (losses) and unrealized appreciation (depreciation) on investment securities include the effects of changes in exchange rates since the securities were purchased, combined with the effects of changes in security prices. Fluctuations in the value of other assets and liabilities resulting from changes in exchange rates are recorded as unrealized foreign currency gains (losses) until the assets or liabilities are settled in cash, at which time they are recorded as realized foreign currency gains (losses).
3. Forward Currency Contracts: The fund enters into forward currency contracts to protect the value of securities and related receivables and payables against changes in future foreign exchange rates. The fund’s risks in using these contracts include movement in the values of the foreign currencies relative to the U.S. dollar and the ability of the counterparties to fulfill their obligations under the contracts. The fund attempts to mitigate this risk by, among other things, performing a credit analysis of counterparties, monitoring exposure to counterparties, and requiring counterparties to post collateral to secure such exposure. The forward currency contracts contain provisions whereby a counterparty may terminate open contracts if the fund’s net assets decline below a certain level, triggering a payment by the fund if the fund is in a net liability position at the time of the termination. The payment amount would be reduced by any collateral the fund has posted. Any securities posted as collateral for open contracts are noted in the Statement of Net Assets.
Forward currency contracts are valued at their quoted daily prices obtained from an independent third party, adjusted for currency risk based on the expiration date of each contract. The aggregate principal amounts of the contracts are not recorded in the Statement of Net Assets. Fluctuations in the value of the contracts are recorded in the Statement of Net Assets as an asset (liability) and in the Statement of Operations as unrealized appreciation (depreciation) until the contracts are closed, when they are recorded as realized forward currency contract gains (losses).
24
Convertible Securities Fund
During the year ended November 30, 2012, the fund’s average investment in forward currency contracts represented 9% of net assets, based on quarterly average notional amounts.
4. Federal Income Taxes: The fund intends to continue to qualify as a regulated investment company and distribute all of its taxable income. Management has analyzed the fund’s tax positions taken for all open federal income tax years (November 30, 2009–2012), and has concluded that no provision for federal income tax is required in the fund’s financial statements.
5. Distributions: Distributions to shareholders are recorded on the ex-dividend date.
6. Other: Dividend income is recorded on the ex-dividend date. Interest income includes income distributions received from Vanguard Market Liquidity Fund and is accrued daily. Premiums and discounts on debt securities purchased are amortized and accreted, respectively, to interest income over the lives of the respective securities. Security transactions are accounted for on the date securities are bought or sold. Costs used to determine realized gains (losses) on the sale of investment securities are those of the specific securities sold. Fees assessed on redemptions of capital shares prior to May 23, 2012, were credited to paid-in capital.
B. Oaktree Capital Management, L.P., provides investment advisory services to the fund for a fee calculated at an annual percentage rate of average net assets. The basic fee is subject to quarterly adjustments based on the fund’s performance for the preceding three years relative to the Bank of America Merrill Lynch All US Convertibles Index (previously Merrill Lynch All Convertibles-All Qualities Index) for periods prior to March 1, 2011, and a composite index weighted 70% Bank of America Merrill Lynch All US Convertibles Index and 30% Bank of America Merrill Lynch Global 300 Convertibles ex-US Index (hedged) thereafter. The benchmark change will be fully phased in by February 2014. For the year ended November 30, 2012, the investment advisory fee represented an effective annual basic rate of 0.34% of the fund’s average net assets before a decrease of $616,000 (0.04%) based on performance.
C. The Vanguard Group furnishes at cost corporate management, administrative, marketing, and distribution services. The costs of such services are allocated to the fund under methods approved by the board of trustees. The fund has committed to provide up to 0.40% of its net assets in capital contributions to Vanguard. At November 30, 2012, the fund had contributed capital of $229,000 to Vanguard (included in Other Assets), representing 0.01% of the fund’s net assets and 0.09% of Vanguard’s capitalization. The fund’s trustees and officers are also directors and officers of Vanguard.
D. Various inputs may be used to determine the value of the fund’s investments. These inputs are summarized in three broad levels for financial statement purposes. The inputs or methodologies used to value securities are not necessarily an indication of the risk associated with investing in those securities.
Level 1—Quoted prices in active markets for identical securities.
Level 2—Other significant observable inputs (including quoted prices for similar securities, interest rates, prepayment speeds, credit risk, etc.).
Level 3—Significant unobservable inputs (including the fund’s own assumptions used to determine the fair value of investments).
25
Convertible Securities Fund
The following table summarizes the market value of the fund’s investments as of November 30, 2012, based on the inputs used to value them:
| | | |
| | Level 1 | Level 2 | Level 3 |
| Investments | ($000) | ($000) | ($000) |
| Convertible Bonds | — | 1,413,609 | — |
| Convertible Preferred Stocks | 197,372 | — | — |
| Temporary Cash Investments | 39,740 | — | — |
| Forward Currency Contracts—Assets | — | 1,043 | — |
| Forward Currency Contracts—Liabilities | — | (85) | — |
| Total | 237,112 | 1,414,567 | — |
E. At November 30, 2012, the fund had open forward currency contracts to receive and deliver currencies as follows. Unrealized appreciation (depreciation) on open forward currency contracts is treated as realized gain (loss) for tax purposes.
| | | | | | |
| | | | | | | Unrealized |
| | Contract | | | | | Appreciation |
| | Settlement | | | Contract Amount (000) | (Depreciation) |
| Counterparty | Date | | Receive | | Deliver | ($000) |
| UBS AG | 1/17/13 | USD | 89,931 | EUR | 69,110 | 220 |
| UBS AG | 1/17/13 | USD | 21,856 | HKD | 169,378 | (5) |
| UBS AG | 1/17/13 | USD | 16,870 | JPY | 1,390,580 | 751 |
| UBS AG | 1/17/13 | USD | 8,402 | CAD | 8,355 | 57 |
| UBS AG | 1/17/13 | USD | 7,387 | SGD | 9,015 | (6) |
| UBS AG | 1/17/13 | USD | 6,506 | EUR | 5,000 | (35) |
| UBS AG | 1/17/13 | USD | 4,990 | CHF | 4,620 | (2) |
| UBS AG | 1/17/13 | USD | 3,373 | GBP | 2,105 | 15 |
| UBS AG | 1/17/13 | USD | 1,897 | AUD | 1,825 | (37) |
| | | | | | | 958 |
| AUD—Australian dollar. |
| CAD—Canadian dollar. |
| CHF—Swiss franc. |
| EUR—Euro. |
| GBP—British pound. |
| HKD—Hong Kong dollar. |
| JPY—Japanese yen. |
| SGD—Singapore dollar. |
| USD—U.S. dollar. |
F. Distributions are determined on a tax basis and may differ from net investment income and realized capital gains for financial reporting purposes. Differences may be permanent or temporary. Permanent differences are reclassified among capital accounts in the financial statements to reflect their tax character. Temporary differences arise when certain items of income, expense, gain, or loss
26
Convertible Securities Fund
are recognized in different periods for financial statement and tax purposes; these differences will reverse at some time in the future. Differences in classification may also result from the treatment of short-term gains as ordinary income for tax purposes.
During the year ended November 30, 2012, the fund realized net foreign currency gains of $11,000, (including the foreign currency component on sales of foreign currency denominated bonds), which increased distributable net income for tax purposes; accordingly, such gains have been reclassified from accumulated net realized gains to undistributed net investment income.
Certain of the fund’s convertible preferred stock investments are treated as debt securities for tax purposes. During the year ended November 30, 2012, the fund realized gains of $329,000 from the sale of these securities, which are included in distributable net investment income for tax purposes; accordingly, such gains have been reclassified from accumulated net realized gains to undistributed net investment income.
Certain of the fund’s convertible bond investments are in securities considered to be “contingent payment debt instruments,” for which any realized gains increase (and all or part of any realized losses decrease) income for tax purposes. During the year ended November 30, 2012, the fund realized net gains of $10,985,000 from the sale of these securities, which increased distributable net income for tax purposes; accordingly, such gains have been reclassified from accumulated net realized gains to undistributed net investment income.
The fund used a tax accounting practice to treat a portion of the price of capital shares redeemed during the year as distributions from realized capital gains. Accordingly, the fund has reclassified $7,342,000 from accumulated net realized gains to paid-in capital.
For tax purposes, at November 30, 2012, the fund had $13,967,000 of ordinary income and $48,571,000 of long-term capital gains available for distribution.
At November 30, 2012, the cost of investment securities for tax purposes was $1,606,688,000. Net unrealized appreciation of investment securities for tax purposes was $44,033,000, consisting of unrealized gains of $91,901,000 on securities that had risen in value since their purchase and $47,868,000 in unrealized losses on securities that had fallen in value since their purchase.
G. During the year ended November 30, 2012, the fund purchased $1,335,924,000 of investment securities and sold $1,497,531,000 of investment securities, other than temporary cash investments.
H. Capital shares issued and redeemed were:
| | |
| | Year Ended November 30, |
| | 2012 | 2011 |
| | Shares | Shares |
| | (000) | (000) |
| Issued | 13,049 | 39,245 |
| Issued in Lieu of Cash Distributions | 6,780 | 12,534 |
| Redeemed | (31,617) | (38,263) |
| Net Increase (Decrease) in Shares Outstanding | (11,788) | 13,516 |
I. In preparing the financial statements as of November 30, 2012, management considered the impact of subsequent events for potential recognition or disclosure in these financial statements.
27
Report of Independent Registered Public Accounting Firm
To the Trustees and Shareholders of Vanguard Convertible Securities Fund:
In our opinion, the accompanying statement of net assets and the related statements of operations and of changes in net assets and the financial highlights present fairly, in all material respects, the financial position of Vanguard Convertible Securities Fund (the “Fund”) at November 30, 2012, the results of its operations for the year then ended, the changes in its net assets for each of the two years in the period then ended and the financial highlights for each of the five years in the period then ended, in conformity with accounting principles generally accepted in the United States of America. These financial statements and financial highlights (hereafter referred to as “financial statements”) are the responsibility of the Fund’s management; our responsibility is to express an opinion on these financial statements based on our audits. We conducted our audits of these financial statements in accordance with the standards of the Public Company Accounting Oversight Board (United States). Those standards require that we plan and perform the audit to obtain reasonable assurance about whether the financial statements are free of material misstatement. An audit includes examining, on a test basis, evidence supporting the amounts and disclosures in the financial statements, assessing the accounting principles used and significant estimates made by management, and evaluating the overall financial statement presentation. We believe that our audits, which included confirmation of securities at November 30, 2012 by correspondence with the custodian and broker and by agreement to the underlying ownership records of the transfer agent, provide a reasonable basis for our opinion.
PricewaterhouseCoopers LLP
Philadelphia, Pennsylvania
January 14, 2013
|
| Special 2012 tax information (unaudited) for Vanguard Convertible Securities Fund |
This information for the fiscal year ended November 30, 2012, is included pursuant to provisions of the Internal Revenue Code.
The fund distributed $28,300,000 as capital gain dividends (from net long-term capital gains) to shareholders during the fiscal year.
The fund distributed $9,462,000 of qualified dividend income to shareholders during the fiscal year.
For corporate shareholders, 10.3% of investment income (dividend income plus short-term gains, if any) qualifies for the dividends-received deduction.
28
Your Fund’s After-Tax Returns
This table presents returns for your fund both before and after taxes. The after-tax returns are shown in two ways: (1) assuming that an investor owned the fund during the entire period and paid taxes on the fund’s distributions, and (2) assuming that an investor paid taxes on the fund’s distributions and sold all shares at the end of each period.
Calculations are based on the highest individual federal income tax and capital gains tax rates in effect at the times of the distributions and the hypothetical sales. State and local taxes were not considered. After-tax returns reflect any qualified dividend income, using actual prior-year figures and estimates for 2012. (In the example, returns after the sale of fund shares may be higher than those assuming no sale. This occurs when the sale would have produced a capital loss. The calculation assumes that the investor received a tax deduction for the loss.)
Please note that your actual after-tax returns will depend on your tax situation and may differ from those shown. Also note that if you own the fund in a tax-deferred account, such as an individual retirement account or a 401(k) plan, this information does not apply to you. Such accounts are not subject to current taxes.
Finally, keep in mind that a fund’s performance—whether before or after taxes—does not guarantee future results.
| | | |
| Average Annual Total Returns: Convertible Securities Fund | | | |
| Periods Ended November 30, 2012 | | | |
| | One | Five | Ten |
| | Year | Years | Years |
| Returns Before Taxes | 13.18% | 4.05% | 8.76% |
| Returns After Taxes on Distributions | 11.27 | 1.98 | 6.79 |
| Returns After Taxes on Distributions and Sale of Fund Shares | 8.78 | 2.34 | 6.60 |
29
About Your Fund’s Expenses
As a shareholder of the fund, you incur ongoing costs, which include costs for portfolio management, administrative services, and shareholder reports (like this one), among others. Operating expenses, which are deducted from a fund’s gross income, directly reduce the investment return of the fund.
A fund’s expenses are expressed as a percentage of its average net assets. This figure is known as the expense ratio. The following examples are intended to help you understand the ongoing costs (in dollars) of investing in your fund and to compare these costs with those of other mutual funds. The examples are based on an investment of $1,000 made at the beginning of the period shown and held for the entire period.
The accompanying table illustrates your fund’s costs in two ways:
• Based on actual fund return. This section helps you to estimate the actual expenses that you paid over the period. The ”Ending Account Value“ shown is derived from the fund‘s actual return, and the third column shows the dollar amount that would have been paid by an investor who started with $1,000 in the fund. You may use the information here, together with the amount you invested, to estimate the expenses that you paid over the period.
To do so, simply divide your account value by $1,000 (for example, an $8,600 account value divided by $1,000 = 8.6), then multiply the result by the number given for your fund under the heading ”Expenses Paid During Period.“
• Based on hypothetical 5% yearly return. This section is intended to help you compare your fund‘s costs with those of other mutual funds. It assumes that the fund had a yearly return of 5% before expenses, but that the expense ratio is unchanged. In this case—because the return used is not the fund’s actual return—the results do not apply to your investment. The example is useful in making comparisons because the Securities and Exchange Commission requires all mutual funds to calculate expenses based on a 5% return. You can assess your fund’s costs by comparing this hypothetical example with the hypothetical examples that appear in shareholder reports of other funds.
Note that the expenses shown in the table are meant to highlight and help you compare ongoing costs only and do not reflect transaction costs incurred by the fund for buying and selling securities. Further, the expenses do not include any purchase, redemption, or account service fees described in the fund prospectus. If such fees were applied to your account, your costs would be higher. Your fund does not carry a “sales load.”
The calculations assume no shares were bought or sold during the period. Your actual costs may have been higher or lower, depending on the amount of your investment and the timing of any purchases or redemptions.
You can find more information about the fund’s expenses, including annual expense ratios, in the Financial Statements section of this report. For additional information on operating expenses and other shareholder costs, please refer to your fund’s current prospectus.
30
| | | |
| Six Months Ended November 30, 2012 | | | |
| | Beginning | Ending | Expenses |
| | Account Value | Account Value | Paid During |
| Convertible Securities Fund | 5/31/2012 | 11/30/2012 | Period |
| Based on Actual Fund Return | $1,000.00 | $1,083.88 | $3.50 |
| Based on Hypothetical 5% Yearly Return | 1,000.00 | 1,021.71 | 3.40 |
The calculations are based on expenses incurred in the most recent six-month period. The fund’s annualized six-month expense ratio for that period is 0.67%. The dollar amounts shown as “Expenses Paid” are equal to the annualized expense ratio multiplied by the average account value over the period, multiplied by the number of days in the most recent six-month period, then divided by the number of days in the most recent 12-month period.
31
Glossary
30-Day SEC Yield. A fund’s 30-day SEC yield is derived using a formula specified by the U.S. Securities and Exchange Commission. Under the formula, data related to the fund’s security holdings in the previous 30 days are used to calculate the fund’s hypothetical net income for that period, which is then annualized and divided by the fund’s estimated average net assets over the calculation period. For the purposes of this calculation, a security’s income is based on its current market yield to maturity (for bonds), its actual income (for asset-backed securities), or its projected dividend yield (for stocks). Because the SEC yield represents hypothetical annualized income, it will differ—at times significantly—from the fund’s actual experience. As a result, the fund’s income distributions may be higher or lower than implied by the SEC yield.
Average Coupon. The average interest rate paid on the fixed income securities held by a fund. It is expressed as a percentage of face value.
Average Duration. An estimate of how much the value of the bonds held by a fund will fluctuate in response to a change in interest rates. To see how the value could change, multiply the average duration by the change in rates. If interest rates rise by 1 percentage point, the value of the bonds in a fund with an average duration of five years would decline by about 5%. If rates decrease by a percentage point, the value would rise by 5%.
Average Weighted Maturity. The average length of time until fixed income securities held by a fund reach maturity and are repaid. The figure reflects the proportion of fund assets represented by each security.
Beta. A measure of the magnitude of a fund’s past share-price fluctuations in relation to the ups and downs of a given market index. The index is assigned a beta of 1.00. Compared with a given index, a fund with a beta of 1.20 typically would have seen its share price rise or fall by 12% when the index rose or fell by 10%. For this report, beta is based on returns over the past 36 months for both the fund and the index. Note that a fund’s beta should be reviewed in conjunction with its R-squared (see definition). The lower the R-squared, the less correlation there is between the fund and the index, and the less reliable beta is as an indicator of volatility.
Conversion Premium. The average percentage by which the weighted average market price of the convertible securities held by a fund exceeds the weighted average market price of their underlying common stocks. For example, if a stock is trading at $25 per share and a bond that is convertible into the stock is trading at a price equivalent to $30 per share of stock, the conversion premium is 20% ($5 ÷ $25 = 20%).
Credit Quality. For this report, credit-quality ratings are measured on a scale that generally ranges from AAA (highest) to D (lowest). “Not Rated” is used to classify securities for which a rating is not available. Credit-quality ratings are obtained from S&P.
Expense Ratio. A fund’s total annual operating expenses expressed as a percentage of the fund’s average net assets. The expense ratio includes management and administrative expenses, but does not include the transaction costs of buying and selling portfolio securities.
Foreign Holdings. The percentage of a fund represented by securities or depositary receipts of companies based outside the United States.
32
Inception Date. The date on which the assets of a fund (or one of its share classes) are first invested in accordance with the fund’s investment objective. For funds with a subscription period, the inception date is the day after that period ends. Investment performance is measured from the inception date.
Market Exposure. A measure that reflects a fund’s security investments excluding any holdings in short-term reserves.
R-Squared. A measure of how much of a fund’s past returns can be explained by the returns from the market in general, as measured by a given index. If a fund’s total returns were precisely synchronized with an index’s returns, its R-squared would be 1.00. If the fund’s returns bore no relationship to the index’s returns, its R-squared would be 0. For this report, R-squared is based on returns over the past 36 months for both the fund and the index.
Short-Term Reserves. The percentage of a fund invested in highly liquid, short-term securities that can be readily converted to cash.
Turnover Rate. An indication of the fund’s trading activity. Funds with high turnover rates incur higher transaction costs and may be more likely to distribute capital gains (which may be taxable to investors). The turnover rate excludes in-kind transactions, which have minimal impact on costs.
Benchmark Information
Convertibles Composite Index: CS First Boston Convertible Securities Index through November 30, 2004; Bank of America Merrill Lynch All US Convertibles Index (formerly Bank of America Merrill Lynch All Convertibles-All Qualities Index) through December 31, 2010; and 70% Bank of America Merrill Lynch All US Convertibles Index and 30% Bank of America Merrill Lynch Global 300 Convertibles ex-US Index (hedged) thereafter.
33
This page intentionally left blank.
This page intentionally left blank.
The People Who Govern Your Fund
The trustees of your mutual fund are there to see that the fund is operated and managed in your best interests since, as a shareholder, you are a part owner of the fund. Your fund’s trustees also serve on the board of directors of The Vanguard Group, Inc., which is owned by the Vanguard funds and provides services to them on an at-cost basis.
A majority of Vanguard’s board members are independent, meaning that they have no affiliation with Vanguard or the funds they oversee, apart from the sizable personal investments they have made as private individuals. The independent board members have distinguished backgrounds in business, academia, and public service. Each of the trustees and executive officers oversees 180 Vanguard funds.
The following table provides information for each trustee and executive officer of the fund. More information about the trustees is in the Statement of Additional Information, which can be obtained, without charge, by contacting Vanguard at 800-662-7447, or online at vanguard.com.
| |
| InterestedTrustee1 | and Delphi Automotive LLP (automotive components); |
| | Senior Advisor at New Mountain Capital; Trustee of |
| F. William McNabb III | The Conference Board. |
| Born 1957. Trustee Since July 2009. Chairman of the | |
| Board. Principal Occupation(s) During the Past Five | Amy Gutmann |
| Years: Chairman of the Board of The Vanguard Group, | Born 1949. Trustee Since June 2006. Principal |
| Inc., and of each of the investment companies served | Occupation(s) During the Past Five Years: President |
| by The Vanguard Group, since January 2010; Director | of the University of Pennsylvania; Christopher H. |
| of The Vanguard Group since 2008; Chief Executive | Browne Distinguished Professor of Political Science |
| Officer and President of The Vanguard Group and of | in the School of Arts and Sciences with secondary |
| each of the investment companies served by The | appointments at the Annenberg School for |
| Vanguard Group since 2008; Director of Vanguard | Communication and the Graduate School of Education |
| Marketing Corporation; Managing Director of The | of the University of Pennsylvania; Member of the |
| Vanguard Group (1995–2008). | National Commission on the Humanities and Social |
| | Sciences; Trustee of Carnegie Corporation of New |
| IndependentTrustees | York and of the National Constitution Center; Chair |
| | of the U.S. Presidential Commission for the Study |
| Emerson U. Fullwood | of Bioethical Issues. |
| Born 1948. Trustee Since January 2008. Principal | |
| Occupation(s) During the Past Five Years: Executive | JoAnn Heffernan Heisen |
| Chief Staff and Marketing Officer for North America | Born 1950. Trustee Since July 1998. Principal |
| and Corporate Vice President (retired 2008) of Xerox | Occupation(s) During the Past Five Years: Corporate |
| Corporation (document management products and | Vice President and Chief Global Diversity Officer |
| services); Executive in Residence and 2010 | (retired 2008) and Member of the Executive |
| Distinguished Minett Professor at the Rochester | Committee (1997–2008) of Johnson & Johnson |
| Institute of Technology; Director of SPX Corporation | (pharmaceuticals/medical devices/consumer |
| (multi-industry manufacturing), the United Way of | products); Director of Skytop Lodge Corporation |
| Rochester, Amerigroup Corporation (managed health | (hotels), the University Medical Center at Princeton, |
| care), the University of Rochester Medical Center, | the Robert Wood Johnson Foundation, and the Center |
| Monroe Community College Foundation, and North | for Talent Innovation; Member of the Advisory Board |
| Carolina A&T University. | of the Maxwell School of Citizenship and Public Affairs |
| | at Syracuse University. |
| Rajiv L. Gupta | |
| Born 1945. Trustee Since December 2001. 2 | F. Joseph Loughrey |
| Principal Occupation(s) During the Past Five Years: | Born 1949. Trustee Since October 2009. Principal |
| Chairman and Chief Executive Officer (retired 2009) | Occupation(s) During the Past Five Years: President |
| and President (2006–2008) of Rohm and Haas Co. | and Chief Operating Officer (retired 2009) of Cummins |
| (chemicals); Director of Tyco International, Ltd. | Inc. (industrial machinery); Director of SKF AB |
| (diversified manufacturing and services), Hewlett- | (industrial machinery), Hillenbrand, Inc. (specialized |
| Packard Co. (electronic computer manufacturing), | consumer services), the Lumina Foundation for |
| | |
| Education, and Oxfam America; Chairman of the | Executive Officers | |
| Advisory Council for the College of Arts and Letters | | |
| and Member of the Advisory Board to the Kellogg | Glenn Booraem | |
| Institute for International Studies at the University | Born 1967. Controller Since July 2010. Principal |
| of Notre Dame. | Occupation(s) During the Past Five Years: Principal |
| | of The Vanguard Group, Inc.; Controller of each of |
| Mark Loughridge | the investment companies served by The Vanguard |
| Born 1953. Trustee Since March 2012. Principal | Group; Assistant Controller of each of the investment |
| Occupation(s) During the Past Five Years: Senior Vice | companies served by The Vanguard Group (2001–2010). |
| President and Chief Financial Officer at IBM (information | | |
| technology services); Fiduciary Member of IBM’s | Thomas J. Higgins | |
| Retirement Plan Committee. | Born 1957. Chief Financial Officer Since September |
| | 2008. Principal Occupation(s) During the Past Five |
| Scott C. Malpass | Years: Principal of The Vanguard Group, Inc.; Chief |
| Born 1962. Trustee Since March 2012. Principal | Financial Officer of each of the investment companies |
| Occupation(s) During the Past Five Years: Chief | served by The Vanguard Group; Treasurer of each of |
| Investment Officer and Vice President at the University | the investment companies served by The Vanguard |
| of Notre Dame; Assistant Professor of Finance at the | Group (1998–2008). | |
| Mendoza College of Business at Notre Dame; Member | | |
| of the Notre Dame 403(b) Investment Committee; | Kathryn J. Hyatt | |
| Director of TIFF Advisory Services, Inc. (investment | Born 1955. Treasurer Since November 2008. Principal |
| advisor); Member of the Investment Advisory | Occupation(s) During the Past Five Years: Principal of |
| Committees of the Financial Industry Regulatory | The Vanguard Group, Inc.; Treasurer of each of the |
| Authority (FINRA) and of Major League Baseball. | investment companies served by The Vanguard |
| | Group; Assistant Treasurer of each of the investment |
| André F. Perold | companies served by The Vanguard Group (1988–2008). |
| Born 1952. Trustee Since December 2004. Principal | | |
| Occupation(s) During the Past Five Years: George | Heidi Stam | |
| Gund Professor of Finance and Banking at the Harvard | Born 1956. Secretary Since July 2005. Principal |
| Business School (retired 2011); Chief Investment | Occupation(s) During the Past Five Years: Managing |
| Officer and Managing Partner of HighVista Strategies | Director of The Vanguard Group, Inc.; General Counsel |
| LLC (private investment firm); Director of Rand | of The Vanguard Group; Secretary of The Vanguard |
| Merchant Bank; Overseer of the Museum of Fine | Group and of each of the investment companies |
| Arts Boston. | served by The Vanguard Group; Director and Senior |
| | Vice President of Vanguard Marketing Corporation. |
| Alfred M. Rankin, Jr. | | |
| Born 1941. Trustee Since January 1993. Principal | Vanguard Senior ManagementTeam |
| Occupation(s) During the Past Five Years: Chairman, | | |
| President, and Chief Executive Officer of NACCO | Mortimer J. Buckley | Michael S. Miller |
| Industries, Inc. (forklift trucks/housewares/lignite); | Kathleen C. Gubanich | James M. Norris |
| Director of Goodrich Corporation (industrial products/ | Paul A. Heller | Glenn W. Reed |
| aircraft systems and services) and the National | Martha G. King | George U. Sauter |
| Association of Manufacturers; Chairman of the Board | Chris D. McIsaac | |
| of the Federal Reserve Bank of Cleveland and of | | |
| University Hospitals of Cleveland; Advisory Chairman | | |
| of the Board of The Cleveland Museum of Art. | Chairman Emeritus and Senior Advisor |
| | | |
| Peter F. Volanakis | John J. Brennan | |
| | Chairman, 1996–2009 | |
| Born 1955. Trustee Since July 2009. Principal | Chief Executive Officer and President, 1996–2008 |
| Occupation(s) During the Past Five Years: President | | |
| and Chief Operating Officer (retired 2010) of Corning | | |
| Incorporated (communications equipment); Director | Founder | |
| of SPX Corporation (multi-industry manufacturing); | | |
| Overseer of the Amos Tuck School of Business | John C. Bogle | |
| Administration at Dartmouth College; Advisor to the | Chairman and Chief Executive Officer, 1974–1996 |
| Norris Cotton Cancer Center. | | |
1 Mr. McNabb is considered an “interested person,” as defined in the Investment Company Act of 1940, because he is an officer of the Vanguard funds.
2 December 2002 for Vanguard Equity Income Fund, Vanguard Growth Equity Fund, the Vanguard Municipal Bond Funds, and the Vanguard State Tax-Exempt Funds.
|  |
| P.O. Box 2600 |
| Valley Forge, PA 19482-2600 |
Connect with Vanguard® > vanguard.com
| |
| Fund Information > 800-662-7447 | CFA® is a trademark owned by CFA Institute. |
| Direct Investor Account Services > 800-662-2739 | |
| Institutional Investor Services > 800-523-1036 | |
| Text Telephone for People | |
| With Hearing Impairment > 800-749-7273 | |
| |
| This material may be used in conjunction | |
| with the offering of shares of any Vanguard | |
| fund only if preceded or accompanied by | |
| the fund’s current prospectus. | |
| |
| All comparative mutual fund data are from Lipper Inc. or | |
| Morningstar, Inc., unless otherwise noted. | |
| |
| You can obtain a free copy of Vanguard’s proxy voting | |
| guidelines by visiting vanguard.com/proxyreporting or by | |
| calling Vanguard at 800-662-2739. The guidelines are | |
| also available from the SEC’s website, sec.gov. In | |
| addition, you may obtain a free report on how your fund | |
| voted the proxies for securities it owned during the 12 | |
| months ended June 30. To get the report, visit either | |
| vanguard.com/proxyreporting or sec.gov. | |
| |
| You can review and copy information about your fund at | |
| the SEC’s Public Reference Room in Washington, D.C. To | |
| find out more about this public service, call the SEC at | |
| 202-551-8090. Information about your fund is also | |
| available on the SEC’s website, and you can receive | |
| copies of this information, for a fee, by sending a | |
| request in either of two ways: via e-mail addressed to | |
| publicinfo@sec.gov or via regular mail addressed to the | |
| Public Reference Section, Securities and Exchange | |
| Commission, Washington, DC 20549-1520. | |
| | © 2013 The Vanguard Group, Inc. |
| | All rights reserved. |
| | Vanguard Marketing Corporation, Distributor. |
| |
| | Q820 012013 |
Item 2: Code of Ethics. The Registrant has adopted a code of ethics that applies to the Registrant’s principal executive officer, principal financial officer, principal accounting officer or controller or persons performing similar functions. The Code of Ethics was amended during the reporting period covered by this report to make certain technical, non-material changes.
Item 3: Audit Committee Financial Expert. The following members of the Audit Committee have been determined by the Registrant’s Board of Trustees to be Audit Committee Financial Experts serving on its Audit Committee, and to be independent: Rajiv L. Gupta, Amy Gutmann, JoAnn Heffernan Heisen, F. Joseph Loughrey, Mark Loughridge, Scott C. Malpass, André F. Perold, and Alfred M. Rankin, Jr.
Item 4: Principal Accountant Fees and Services.
(a) Audit Fees.
Audit Fees of the Registrant
Fiscal Year Ended November 30, 2012: $36,000
Fiscal Year Ended November 30, 2011: $36,000
Aggregate Audit Fees of Registered Investment Companies in the Vanguard Group.
Fiscal Year Ended November 30, 2012: $4,809,780
Fiscal Year Ended November 30, 2011: $3,978,540
(b) Audit-Related Fees.
Fiscal Year Ended November 30, 2012: $1,812,565
Fiscal Year Ended November 30, 2011: $1,341,750
Includes fees billed in connection with assurance and related services provided to the Registrant, The Vanguard Group, Inc., Vanguard Marketing Corporation, and other registered investment companies in the Vanguard Group.
(c) Tax Fees.
Fiscal Year Ended November 30, 2012: $490,518
Fiscal Year Ended November 30, 2011: $373,830
Includes fees billed in connection with tax compliance, planning and advice services provided to the Registrant, The Vanguard Group, Inc., Vanguard Marketing Corporation, and other registered investment companies in the Vanguard Group and related to income and excise taxes.
(d) All Other Fees.
Fiscal Year Ended November 30, 2012: $16,000
Fiscal Year Ended November 30, 2011: $16,000
Includes fees billed for services related to risk management and privacy matters. Services were provided to the Registrant, The Vanguard Group, Inc., Vanguard Marketing Corporation, and other registered investment companies in the Vanguard Group.
(e) (1) Pre-Approval Policies. The policy of the Registrant’s Audit Committee is to consider and, if appropriate, approve before the principal accountant is engaged for such services, all specific audit and non-audit services provided to: (1) the Registrant; (2) The Vanguard Group, Inc.; (3) other entities controlled by The Vanguard Group, Inc. that provide ongoing services to the Registrant; and (4) other registered investment companies in the Vanguard Group. In making a determination, the Audit Committee considers whether the services are consistent with maintaining the principal accountant’s independence.
In the event of a contingency situation in which the principal accountant is needed to provide services in between scheduled Audit Committee meetings, the Chairman of the Audit Committee would be called on to consider and, if appropriate, pre-approve audit or permitted non-audit services in an amount sufficient to complete services through the next Audit Committee meeting, and to determine if such services would be consistent with maintaining the accountant’s independence. At the next scheduled Audit Committee meeting, services and fees would be presented to the Audit Committee for formal consideration, and, if appropriate, approval by the entire Audit Committee. The Audit Committee would again consider whether such services and fees are consistent with maintaining the principal accountant’s independence.
The Registrant’s Audit Committee is informed at least annually of all audit and non-audit services provided by the principal accountant to the Vanguard complex, whether such services are provided to: (1) the Registrant; (2) The Vanguard Group, Inc.; (3) other entities controlled by The Vanguard Group, Inc. that provide ongoing services to the Registrant; or (4) other registered investment companies in the Vanguard Group.
(2) No percentage of the principal accountant’s fees or services were approved pursuant to the waiver provision of paragraph (c)(7)(i)(C) of Rule 2-01 of Regulation S-X.
(f) For the most recent fiscal year, over 50% of the hours worked under the principal accountant’s engagement were not performed by persons other than full-time, permanent employees of the principal accountant.
(g) Aggregate Non-Audit Fees.
Fiscal Year Ended November 30, 2012: $506,518
Fiscal Year Ended November 30, 2011: $389,830
Includes fees billed for non-audit services provided to the Registrant, The Vanguard Group, Inc., Vanguard Marketing Corporation, and other registered investment companies in the Vanguard Group.
(h) For the most recent fiscal year, the Audit Committee has determined that the provision of all non-audit services was consistent with maintaining the principal accountant’s independence.
Item 5: Audit Committee of Listed Registrants.
Not Applicable.
Item 6: Investments.
Not Applicable.
Item 7: Disclosure of Proxy Voting Policies and Procedures for Closed-End Management Investment Companies.
Not Applicable.
Item 8: Portfolio Managers of Closed-End Management Investment Companies.
Not Applicable.
Item 9: Purchase of Equity Securities by Closed-End Management Investment Company and Affiliated Purchasers.
Not Applicable.
Item 10: Submission of Matters to a Vote of Security Holders.
Not Applicable.
Item 11: Controls and Procedures.
(a) Disclosure Controls and Procedures. The Principal Executive and Financial Officers concluded that the Registrant's Disclosure Controls and Procedures are effective based on their evaluation of the Disclosure Controls and Procedures as of a date within 90 days of the filing date of this report.
(b) Internal Control Over Financial Reporting. There were no significant changes in Registrant’s Internal Control Over Financial Reporting or in other factors that could significantly affect this control subsequent to the date of the evaluation, including any corrective actions with regard to significant deficiencies and material weaknesses.
Item 12: Exhibits.
(a) Code of Ethics.
(b) Certifications.
Pursuant to the requirements of the Securities Exchange Act of 1934 and the Investment Company Act of 1940, the registrant has duly caused this report to be signed on its behalf by the undersigned, thereunto duly authorized.
| |
| | VANGUARD CONVERTIBLE SECURITIES FUND |
| |
| By: | /s/ F. WILLIAM MCNABB III* |
| | F. WILLIAM MCNABB III |
| | CHIEF EXECUTIVE OFFICER |
| |
| Date: January 21, 2013 |
Pursuant to the requirements of the Securities Exchange Act of 1934 and the Investment Company Act of 1940, this report has been signed below by the following persons on behalf of the registrant and in the capacities and on the dates indicated.
| |
| | VANGUARD CONVERTIBLE SECURITIES FUND |
| |
| By: | /s/ F. WILLIAM MCNABB III* |
| | F. WILLIAM MCNABB III |
| | CHIEF EXECUTIVE OFFICER |
| |
| Date: January 21, 2013 |
| |
| | VANGUARD CONVERTIBLE SECURITIES FUND |
| |
| By: | /s/ THOMAS J. HIGGINS* |
| | THOMAS J. HIGGINS |
| | CHIEF FINANCIAL OFFICER |
| |
| Date: January 21, 2013 |
* By: /s/ Heidi Stam
Heidi Stam, pursuant to a Power of Attorney filed on March 27, 2012 see file Number 2-11444,
Incorporated by Reference.