UNITED STATES
SECURITIES AND EXCHANGE COMMISSION
Washington, D.C. 20549
FORM N-CSR
CERTIFIED SHAREHOLDER REPORT
OF
REGISTERED MANAGEMENT INVESTMENT COMPANIES
| | |
| Investment Company Act file number: | 811-04627 |
Name of Registrant: | Vanguard Convertible Securities Fund |
Address of Registrant: | P.O. Box 2600 |
| | Valley Forge, PA 19482 |
Name and address of agent for service: | Heidi Stam, Esquire |
| | P.O. Box 876 |
| | Valley Forge, PA 19482 |
Registrant’s telephone number, including area code: (610) 669-1000 |
Date of fiscal year end: November 30 | |
Date of reporting period: December 1, 2012 – November 30, 2013 |
Item 1: Reports to Shareholders | |

Annual Report | November 30, 2013
Vanguard Convertible Securities Fund

Vanguard’s Principles for Investing Success
We want to give you the best chance of investment success. These principles,
grounded in Vanguard’s research and experience, can put you on the right path.
Goals. Create clear, appropriate investment goals.
Balance. Develop a suitable asset allocation using broadly diversified funds.
Cost. Minimize cost.
Discipline. Maintain perspective and long-term discipline.
A single theme unites these principles: Focus on the things you can control.
We believe there is no wiser course for any investor.
| |
| Contents | |
| Your Fund’s Total Returns. | 1 |
| Chairman’s Letter. | 2 |
| Advisor’s Report. | 8 |
| Fund Profile. | 12 |
| Performance Summary. | 14 |
| Financial Statements. | 16 |
| Your Fund’s After-Tax Returns. | 32 |
| About Your Fund’s Expenses. | 33 |
| Glossary. | 35 |
Please note: The opinions expressed in this report are just that—informed opinions. They should not be considered promises or advice.
Also, please keep in mind that the information and opinions cover the period through the date on the front of this report. Of course, the
risks of investing in your fund are spelled out in the prospectus.
See the Glossary for definitions of investment terms used in this report.
About the cover: The ship's wheel represents leadership and guidance, essential qualities in navigating difficult seas.
This one is a replica based on an 18th-century British vessel. The HMS Vanguard, another ship of that era, served as the
flagship for Admiral Horatio Nelson when he defeated a French fleet at the Battle of the Nile.
Your Fund’s Total Returns
| |
| Fiscal Year Ended November 30, 2013 | |
| |
| | Total |
| | Returns |
| Vanguard Convertible Securities Fund | 19.65% |
| Convertibles Composite Index | 22.58 |
| Convertible Securities Funds Average | 21.49 |
| For a benchmark description, see the Glossary. |
| Convertible Securities Funds Average: Derived from data provided by Lipper, a Thomson Reuters Company. |
| | | | |
| Your Fund’s Performance at a Glance | | |
| November 30, 2012, Through November 30, 2013 | | |
| |
| | | | Distributions Per Share |
| | Starting | Ending | | |
| | Share | Share | Income | Capital |
| | Price | Price | Dividends | Gains |
| Vanguard Convertible Securities Fund | $12.95 | $14.64 | $0.355 | $0.389 |
1

Chairman’s Letter
Dear Shareholder,
For the 12 months ended November 30, 2013, Vanguard Convertible Securities Fund returned 19.65%, buoyed by the strength of global stock markets. Although the fund delivered its best fiscal-year result since 2009, it trailed its benchmark, the Convertibles Composite Index (22.58%), and the average return of its peers (21.49%). The fund was less heavily invested than its benchmark in some of the higher-priced convertibles that posted large gains for the period.
Convertible securities are corporate bonds and preferred stocks that may be exchanged for common stocks at a preset price. These hybrid securities benefit from rising stock markets if the value of their underlying stocks increases.
Over the past fiscal year, advances in stock prices, in tandem with higher interest rates and gradual improvements in the global economy, boosted demand for convertible securities. Global issuance between December 2012 and November 2013 totaled about $93.8 billion, well ahead of the $51 billion issued between December 2011 and November 2012. The increased availability of these securities is a notable reversal from the contraction experienced in the wake of the 2008–2009 financial crisis.
2
Despite some jolts, U.S. stocks notched an impressive 12-month gain
U.S. stocks powered to a return of about 32% for the 12 months ended November 30, despite encountering a few bumps along the way.
Uncertainty surrounding Federal Reserve policy contributed to market declines in June and August. But stocks bounced back in September when, to the surprise of some investors, the Fed announced it had no immediate plans to scale back its bond-buying program. (In mid-December, the Fed ended several months of speculation by announcing that it would begin scaling back bond purchases in January 2014.) Corporate profit growth, though not robust, was generally solid during the fiscal year.
International stocks returned about 18% in aggregate. Although the developed markets of Europe and the Pacific region performed well for the period, gains were modest for emerging-market stocks.
Bond prices fell as yields rose over the period’s second half
Bonds, which held onto slight gains through the first five months of the fiscal year, retreated in May. For the full period, the broad U.S. taxable bond market returned –1.61%. The yield of the 10-year Treasury note closed at 2.74%, up from 1.61% at the end of November 2012. (Bond yields and prices move in opposite directions.) Municipal bonds returned –3.51%.
| | | |
| Market Barometer | | | |
| |
| | Average Annual Total Returns |
| | Periods Ended November 30, 2013 |
| | One | Three | Five |
| | Year | Years | Years |
| Stocks | | | |
| Russell 1000 Index (Large-caps) | 30.96% | 17.78% | 18.33% |
| Russell 2000 Index (Small-caps) | 40.99 | 17.89 | 20.97 |
| Russell 3000 Index (Broad U.S. market) | 31.71 | 17.78 | 18.54 |
| MSCI All Country World Index ex USA (International) | 18.24 | 7.50 | 13.87 |
| |
| Bonds | | | |
| Barclays U.S. Aggregate Bond Index (Broad taxable market) | -1.61% | 3.09% | 5.33% |
| Barclays Municipal Bond Index (Broad tax-exempt market) | -3.51 | 4.23 | 6.26 |
| Citigroup Three-Month U.S. Treasury Bill Index | 0.05 | 0.07 | 0.10 |
| |
| CPI | | | |
| Consumer Price Index | 1.24% | 2.13% | 1.87% |
3
International bond markets (as measured by the Barclays Global Aggregate Index ex USD) returned –2.93%. Returns of money market funds and savings accounts continued to be restrained by the Fed’s 0%–0.25% target for short-term interest rates.
The bond market’s downturn, coupled with the upswing in stocks, provides an occasion for investors to review their portfolio’s asset allocation. In a powerful stock market rally, a portfolio’s mix of stocks and bonds can drift away from its target allocation, as Fran Kinniry, a principal in our Investment Strategy Group, recently reminded clients in an article on our website. “Buying stocks now may actually run counter to what many prudent investors should be doing,” he noted.
“If you have an equity-heavy portfolio, you will most likely need to direct new cash flows to bond mutual funds or sell stock mutual funds to maintain your target asset allocation.”
Underlying stocks’ strength drove the fund’s performance
The Convertible Securities Fund gives investors the opportunity to invest in a somewhat complex asset class, one that combines the characteristics of stocks and bonds. As I mentioned earlier, these hybrid securities offer the potential for equity-like returns when their underlying stocks rise, along with some of the downside protection of bonds during periods of stock market weakness.
| | |
| Expense Ratios | | |
| Your Fund Compared With Its Peer Group | | |
| | | Peer Group |
| | Fund | Average |
| Convertible Securities Fund | 0.52% | 1.25% |
The fund expense ratio shown is from the prospectus dated March 27, 2013, and represents estimated costs for the current fiscal year. For
the fiscal year ended November 30, 2013, the fund’s expense ratio was 0.63%. This increase from the estimated expense ratio reflects a
performance-based investment advisory fee adjustment. When the performance adjustment is positive, the fund’s expenses increase; when it
is negative, expenses decrease. The peer-group expense ratio is derived from data provided by Lipper, a Thomson Reuters Company, and
captures information through year-end 2012.
Peer group: Convertible Securities Funds.
4
During the fiscal year, investors gravitated toward small- and mid-cap stocks. They were also more willing to take on higher risk by investing in alternatives such as convertible securities, which can earn higher returns than conventional bonds held to maturity. These trends benefited convertible securities issuers, which are mostly small or midsized firms. Because they tend to have poor credit quality and to not be rated by credit-rating agencies, such companies generally have difficulty accessing traditional sources of financing. Issuing convertible securities rather than below-investment-grade bonds gives them better access to lower-interest loans.
The Convertible Securities Fund’s results typically fall between those of the U.S. stock and bond markets. (U.S. securities make up about 79% of the fund’s assets.) This year was no exception. The fund’s underlying stocks clearly drove its performance, as returns for the broad U.S. stock market far surpassed those of U.S. taxable bonds.
For several years now, your fund’s advisor, Oaktree Capital Management, L.P., has focused on diversifying the fund’s holdings by increasing its exposure to international convertibles. International issues made up about 21% of the portfolio as of November, and that share is expected to gradually rise to about 30% in coming years.
Despite the challenges faced by convertible securities in international markets since the financial crisis, the European and Asian convertible markets
| |
| Total Returns | |
| Ten Years Ended November 30, 2013 | |
| | Average |
| | Annual Return |
| Convertible Securities Fund | 8.02% |
| Convertibles Composite Index | 6.63 |
| Convertible Securities Funds Average | 6.53 |
For a benchmark description, see the Glossary.
Convertible Securities Funds Average: Derived from data provided by Lipper, a Thomson Reuters Company.
The figures shown represent past performance, which is not a guarantee of future results. (Current performance may be
lower or higher than the performance data cited. For performance data current to the most recent month-end, visit our
website at vanguard.com/performance.) Note, too, that both investment returns and principal value can fluctuate widely, so
an investor’s shares, when sold, could be worth more or less than their original cost.
5
improved during the period. With investors apparently less concerned about the sovereign-debt crisis, the European market delivered particularly strong results.
For more information on the fund’s positioning and performance during the year, please see the Advisor’s Report that follows this letter.
The fund has produced solid long-term results
For the decade ended November 30, 2013, the Convertible Securities Fund delivered an average annual return of 8.02%, ahead of both the Convertibles Composite Index (6.63%) and the average return of peers (6.53%).
This decade included periods of extreme volatility. As I mentioned earlier, it has taken a while for the global convertible securities market to recover from the 2008–2009 financial crisis. The fund’s return plunged to about –35% in 2008. In 2009, it bounced back to about 43% as investors sought alternatives to conventional investment vehicles. But convertible issuance has only recently begun to pick up.
Despite challenging market conditions, the fund has delivered solid long-term results. Its performance is a tribute to the acumen of its advisors at Oaktree Capital Management, which has kept the fund competitive over the years.
Diversification and low costs are key to investment success
Excessive attention to one fiscal year’s result—good or bad—can impede good investment decisions. That’s why Vanguard encourages you to maintain a long-term focus along with a diversified portfolio that includes a balanced mix of stock, bond, and money market funds that complement your long-term goals. And it’s also why the end of a strong year for the stock markets is a good time to reflect on your investment portfolio as a whole and on your long-term goals.
The Convertible Securities Fund can play a supporting role in a diversified portfolio, providing opportunity for growth during bull markets and potentially offering some protection during bear markets. But as I’ve noted in previous letters, convertible securities have a higher correlation to stocks than to bonds—they are not substitutes for conventional bonds. Short-term challenges notwithstanding, we continue to believe that traditional bonds can serve as a good cushion to equity market volatility in your portfolio.
We also believe that the Convertible Securities Fund gives you an opportunity to benefit from the stewardship of a highly skilled advisor operating in a specialized segment of the market. And, of course, the fund’s low costs allow you to keep more of your returns. Fund performance can fluctuate year-over-year, but as Vanguard research has shown (see
6
The Case for Vanguard Active Management: Solving the Low-Cost/Top-Talent Paradox? available at vanguard.com/research), the most reliable quantitative indicator of future manager success is low expenses.
As always, thank you for investing with Vanguard.
Sincerely,

F. William McNabb III
Chairman and Chief Executive Officer
December 19, 2013
7
Advisor’s Report
For the 12 months ended November 30, 2013, Vanguard Convertible Securities Fund reported a very strong return of 19.65%. The fund’s blended benchmark—70% Bank of America Merrill Lynch All US Convertibles Index, 30% Bank of America Merrill Lynch Global 300 Convertibles ex-US Index (Hedged)—returned 22.58%.
The investment strategy of Vanguard Convertible Securities Fund is to create a highly diversified global portfolio of convertible securities. The fund emphasizes investments in convertible bonds that have a relatively near-term maturity or put date. It also focuses on “balanced” convertibles—securities with reasonable yield, stable credit quality, good call protection, and low to moderate conversion premiums. We believe these securities have a favorable balance of upside potential to downside risk.
In addition, the fund underweights convertible preferred shares, which are riskier but may offer higher returns; we do, however, consider them part of our investable universe and thus make some use of them. We do not attempt market timing and therefore are fully invested, holding only a small amount of cash for potential investments. We believe that a portfolio of carefully selected, attractive convertible securities can produce equity-type returns with relatively low volatility and structural risk over long periods.
The investment environment
The past fiscal year was a very rewarding period for convertible securities, which benefited from strength in their underlying equities as well as from the downside protection provided by their bonds during periods of market weakness. Market conditions were very positive, marked by robust and steady demand as investors searched for securities that could potentially participate in the upside of equities.
Strong stock markets drove convertible performance. The Standard & Poor’s 500 Index was up 30.30%, the Russell 2000 Index returned 40.99%, and the MSCI EAFE (USD hedged) Index gained 25.44%. Although convertible bonds could not keep pace with stocks, they performed as expected and participated in their underlying equities’ rise.
New issuance improved during the period, with $93.8 billion in new convertible bond deals brought to market between December 2012 and November 2013. This compares very favorably to the previous year (only $51 billion in new issuance came to market between December 2011 and November 2012). Two trends we have noticed in the primary markets are a growth in issuance from small-cap companies in non-U.S. markets and a global increase in nonrated issuance. So far in 2013, nonrated convertibles have accounted for roughly 70% of global primary markets.
8
Major Portfolio Changes
Fiscal Year Ended November 30, 2013
| |
| Additions | Comments |
| Ciena | A balanced way to obtain convertible exposure to an |
| (0.875% convertible note due 06/15/17) | attractive equity. |
| Davis & Henderson | Offered excellent downside protection coupled with material |
| (6.0% convertible note due 09/30/18) | participation in the stock’s appreciation. |
| La Caixa | A balanced convertible with exposure to one of Spain’s |
| (1.0% convertible note due 11/25/17) | leading banks. |
| Liberty Media | An attractive new issue. |
| (1.375% convertible note due 10/15/23) | |
| Omnicare | Purchased in secondary market after the company |
| (3.5% convertible note due 02/15/44) | conducted an exchange offer. |
| Priceline.com | Purchased at cheaper valuation in secondary market shortly |
| (0.35% convertible note due 06/15/20 | after it was issued. Much more balanced security than the |
| | other Priceline.com issues in the market. |
| SanDisk | An attractive new issue. Much more balanced than the other |
| (0.5% convertible note due 10/15/20) | SanDisk issues in the market. |
| |
| |
| Reductions | Comments |
| Micron Technology | Sold entire position after substantial gains; rotated some proceeds |
| (1.625% convertible note due 02/15/33) | into new, more balanced issue. |
| Nexans | Sold after it developed a very high conversion premium coupled |
| (4.0% convertible note due 01/01/16) | with a very modest yield to maturity. |
| Omnicare | Sold entire position as bonds became highly equity-sensitive |
| (3.75% convertible note due 04/01/42) | and rotated into a new, more balanced issue. |
| Salix Pharmaceuticals | Profit-taking on large position as bonds traded up substantially. |
| (1.5% convertible note due 03/15/19) | |
| SanDisk | Sold majority of position as bonds appreciated and rotated into a |
| (1.5% convertible note due 08/15/17) | new, more balanced issue. |
| Sawai Pharmaceutical | Sold after substantial appreciation because the bonds no longer |
| (0% convertible note due 09/17/15) | offered good downside protection. |
| Tesla Motors | Sold entire position after substantial appreciation. |
| (1.5% convertible note due 06/01/18) | |
9
Our successes
While returns were broad-based, a few companies performed particularly well. The top individual contributors were convertibles from Micron Technology, Salix Pharmaceuticals, Omnicare, Jarden, and Illumina.
Our shortfalls
Though we trailed the benchmark, we were pleased to generally keep pace during a period when many equity-sensitive, high-priced convertibles posted large gains. We underweighted such securities because of their unbalanced nature and lack of downside protection, and this hurt our relative returns.
Several issues, particularly in the biotechnology and pharmaceuticals sectors, have had extremely strong underlying stock performance and remain outstanding in the index because they are still within their call protection period. For example, Micron Technology convertible, a leader in the portfolio for the fiscal year, is now trading north of $220. As their prices rose, we redeployed profits from Micron, Tesla Motors, and several other top performers into more balanced convertibles.
As we discussed in our semiannual letter, returns were also restrained by our investment in Pescanova, a Spanish fishing company that unexpectedly announced in early March that it was considering bankruptcy. At that point we became very concerned about the accuracy of the company’s financial statements, and we decided to sell the entire position. Soon after we exited, the company confirmed our suspicions, disclosing in April that its total debt was in the neighborhood of €2.7 billion, rather than the reported €1 billion. Pescanova represented approximately 0.4% of the overall portfolio and subtracted 20 basis points from its performance.
The fund’s positioning
We remain fully invested, as usual, in a highly diversified, well-balanced portfolio of convertible securities with a heavy emphasis on short- to intermediate-term bonds. Seventy-nine percent of the fund’s assets are in U.S. investments and 21% are invested outside of the country as we continue to ramp up to our target 30% allocation to non-U.S. convertibles. The fund is well-positioned, with an attractive 30-day SEC yield of 2.24% (as of November 30).
Unsurprisingly, given the volatility of the fiscal year, particularly the roller-coaster trajectory of the third quarter, we were reasonably active in trimming advancing positions and reinvesting the proceeds into more balanced existing or new issues.
Looking ahead, we feel positive about convertible securities. We believe they continue to offer reasonable upside participation in an equity market that could
10
continue to move higher and should also provide reasonable downside protection should recent gains prove temporary. As strong equity markets couple with stable to rising interest rates (making high-yield issuance less attractive), we remain optimistic about a substantial new issue calendar in 2014.
Larry W. Keele, CFA
Principal and Founder
Jean-Paul Nedelec, Managing Director
Abe Ofer, Managing Director
Oaktree Capital Management, L.P.
December 17, 2013
11
Convertible Securities Fund
Fund Profile
As of November 30, 2013
| |
| Portfolio Characteristics | |
| Ticker Symbol | VCVSX |
| Number of Securities | 227 |
| 30-Day SEC Yield | 2.24% |
| Conversion Premium | 33.3% |
| Average Weighted Maturity | 5.6 years |
| Average Coupon | 2.2% |
| Average Duration | 5.0 years |
| Foreign Holdings | 20.6% |
| Turnover Rate | 101% |
| Expense Ratio1 | 0.52% |
| Short-Term Reserves | 2.4% |
| |
| Distribution by Maturity | |
| (% of fixed income portfolio) | |
| Under 1 Year | 1.5% |
| 1 - 5 Years | 60.1 |
| 5 - 10 Years | 32.8 |
| 10 - 20 Years | 1.3 |
| 20 - 30 Years | 4.3 |
| |
| Distribution by Credit Quality (% of fixed | |
| income portfolio) | |
| AAA | 0.0% |
| AA | 0.3 |
| A | 2.4 |
| BBB | 5.1 |
| BB | 17.4 |
| B | 13.3 |
| Below B | 1.3 |
| Not Rated | 60.2 |
| For information about these ratings, see the Glossary entry for Credit Quality. |
| | |
| Total Fund Volatility Measures | | |
| | | DJ U.S. |
| | | Stock |
| | Conv. | Market |
| | Comp. | Float Adj |
| | Index | Idx |
| R-Squared | 0.96 | 0.90 |
| Beta | 1.13 | 0.73 |
| These measures show the degree and timing of the fund’s fluctuations compared with the indexes over 36 months. |
| | |
| Ten Largest Holdings (% of total net assets) |
| Jarden Corp. | Housewares & | |
| | Specialties | 2.5% |
| Illumina Inc. | Life Sciences Tools & | |
| | Services | 2.0 |
| MGM Resorts | | |
| International | Casinos & Gaming | 2.0 |
| Cobalt International | Oil & Gas Exploration | |
| Energy Inc. | & Production | 1.9 |
| priceline.com Inc. | Internet Retail | 1.8 |
| SEACOR Holdings Inc. | Oil & Gas Equipment | |
| | & Services | 1.7 |
| Liberty Media Corp. | Broadcasting | 1.7 |
| Ciena Corp. | Communications | |
| | Equipment | 1.6 |
| SanDisk Corp. | Computer Storage & | |
| | Peripherals | 1.6 |
| HealthSouth Corp. | Health Care Facilities | 1.5 |
| Top Ten | | 18.3% |
| The holdings listed exclude any temporary cash investments and equity index products. |
1 The expense ratio shown is from the prospectus dated March 27, 2013, and represents estimated costs for the current fiscal year. For the
fiscal year ended November 30, 2013, the expense ratio was 0.63%.
12
Convertible Securities Fund
| |
| Sector Diversification (% of market | |
| exposure) | |
| |
| Consumer | |
| Discretionary | 13.5% |
| Consumer Staples | 1.9 |
| Energy | 15.9 |
| Financials | 11.3 |
| Health Care | 19.0 |
| Industrials | 10.0 |
| Information | |
| Technology | 21.7 |
| Materials | 4.3 |
| Telecommunication | |
| Services | 1.7 |
| Utilities | 0.7 |
13
Convertible Securities Fund
Performance Summary
All of the returns in this report represent past performance, which is not a guarantee of future results that may be achieved by the fund. (Current performance may be lower or higher than the performance data cited. For performance data current to the most recent month-end, visit our website at vanguard.com/performance.) Note, too, that both investment returns and principal value can fluctuate widely, so an investor’s shares, when sold, could be worth more or less than their original cost. The returns shown do not reflect taxes that a shareholder would pay on fund distributions or on the sale of fund shares.
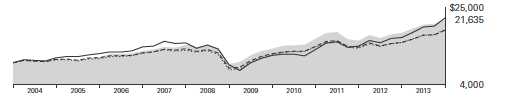
Cumulative Performance: November 30, 2003, Through November 30, 2013
Initial Investment of $10,000
| | | | | |
| | | Average Annual Total Returns | |
| | | Periods Ended November 30, 2013 | |
| | | | | | Final Value |
| | | One | Five | Ten | of a $10,000 |
| | | Year | Years | Years | Investment |
| | Convertible Securities Fund | 19.65% | 17.48% | 8.02% | $21,635 |
| •••••••• | Convertibles Composite Index | 22.58 | 18.73 | 6.63 | 19,009 |
| – – – – | Convertible Securities Funds Average | 21.49 | 17.10 | 6.53 | 18,826 |
| | Dow Jones U.S. Total Stock Market | | | | |
| | Float Adjusted Index | 31.64 | 18.65 | 8.29 | 22,175 |
| For a benchmark description, see the Glossary. |
| Convertible Securities Funds Average: Derived from data provided by Lipper, a Thomson Reuters Company. |
See Financial Highlights for dividend and capital gains information.
14
Convertible Securities Fund
Fiscal-Year Total Returns (%): November 30, 2003, Through November 30, 2013
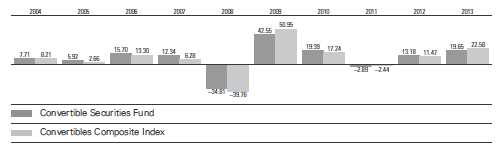
For a benchmark description, see the Glossary.
Average Annual Total Returns: Periods Ended September 30, 2013
This table presents returns through the latest calendar quarter—rather than through the end of the fiscal period.
Securities and Exchange Commission rules require that we provide this information.
| | | | | | |
| | | | | Ten Years |
| | Inception Date | One Year | Five Years | Income | Capital | Total |
| Convertible Securities | | | | | | |
| Fund | 6/17/1986 | 17.47% | 11.64% | 3.67% | 4.93% | 8.60% |
15
Convertible Securities Fund
Financial Statements
Statement of Net Assets
As of November 30, 2013
The fund reports a complete list of its holdings in regulatory filings four times in each fiscal year, at the quarter-ends. For the second and fourth fiscal quarters, the lists appear in the fund’s semiannual and annual reports to shareholders. For the first and third fiscal quarters, the fund files the lists with the Securities and Exchange Commission on Form N-Q. Shareholders can look up the fund’s Forms N-Q on the SEC’s website at sec.gov. Forms N-Q may also be reviewed and copied at the SEC’s Public Reference Room (see the back cover of this report for further information).
| | | | | |
| | | | | | Market |
| | | | | | Value |
| | | | | Shares | ($000) |
| Common Stocks (0.0%) | | | | | |
| Energy (0.0%) | | | | | |
| Halcon Resources Corp. | | | | 57,424 | 230 |
| Total Common Stocks (Cost $271) | | | | | 230 |
| | | | | Face | |
| | | Maturity | | Amount | |
| | Coupon | Date | Currency | (000) | |
| Convertible Bonds (89.1%) | | | | | |
| Consumer Discretionary (13.3%) | | | | | |
| ABC-Mart Inc. Cvt. | 0.000% | 2/5/18 | JPY | 340,000 | 3,907 |
| Cineplex Inc. Cvt. | 4.500% | 12/31/18 | CAD | 3,135 | 3,024 |
| Enterprise Funding Ltd. Cvt. | 3.500% | 9/10/20 | GBP | 1,200 | 2,028 |
| Faurecia Cvt. | 3.250% | 1/1/18 | EUR | 4,313 | 2,795 |
| Group 1 Automotive Inc. Cvt. | 2.250% | 6/15/36 | USD | 1,496 | 1,848 |
| 1 Iconix Brand Group Inc. Cvt. | 1.500% | 3/15/18 | USD | 13,650 | 18,701 |
| Iconix Brand Group Inc. Cvt. | 2.500% | 6/1/16 | USD | 6,330 | 8,735 |
| 1 Jarden Corp. Cvt. | 1.500% | 6/15/19 | USD | 17,115 | 19,736 |
| 1 Jarden Corp. Cvt. | 1.875% | 9/15/18 | USD | 23,515 | 31,025 |
| 1 Liberty Interactive LLC Cvt. | 0.750% | 3/30/43 | USD | 15,900 | 19,855 |
| 1 Liberty Media Corp. Cvt. | 1.375% | 10/15/23 | USD | 33,140 | 34,341 |
| Lotte Shopping Co. Ltd. Cvt. | 0.000% | 1/24/18 | KRW | 4,200,000 | 4,284 |
| Meritage Homes Corp. Cvt. | 1.875% | 9/15/32 | USD | 9,480 | 10,286 |
| MGM Resorts International Cvt. | 4.250% | 4/15/15 | USD | 34,020 | 41,186 |
| Misarte Cvt. | 3.250% | 1/1/16 | EUR | 2,842 | 4,909 |
| Newford Capital Ltd. Cvt. | 0.000% | 5/12/16 | USD | 3,400 | 3,502 |
| NH Hoteles SA Cvt. | 4.000% | 11/8/18 | EUR | 1,500 | 2,172 |
| Nokian Renkaat OYJ Cvt. | 0.000% | 6/27/14 | EUR | 3,100 | 5,158 |
| 1 priceline.com Inc. Cvt. | 0.350% | 6/15/20 | USD | 32,445 | 37,129 |
| Sekisui House Ltd. Cvt. | 0.000% | 7/5/16 | JPY | 450,000 | 6,249 |
| Toll Brothers Finance Corp. Cvt. | 0.500% | 9/15/32 | USD | 5,175 | 5,285 |
| TUI AG Cvt. | 2.750% | 3/24/16 | EUR | 2,131 | 3,255 |
| TUI Travel plc Cvt. | 4.900% | 4/27/17 | GBP | 1,900 | 3,711 |
| TUI Travel plc Cvt. | 6.000% | 10/5/14 | GBP | 200 | 370 |
| | | | | | 273,491 |
16
| | | | | |
| Convertible Securities Fund | | | | | |
| |
| |
| |
| | | | | Face | Market |
| | | Maturity | | Amount | Value |
| | Coupon | Date | Currency | (000) | ($000) |
| Consumer Staples (1.6%) | | | | | |
| Asahi Group Holdings Ltd. Cvt. | 0.000% | 5/26/28 | JPY | 257,000 | 3,431 |
| Hengan International Group Co. Ltd. Cvt. | 0.000% | 6/27/18 | HKD | 28,000 | 3,937 |
| Marine Harvest ASA Cvt. | 2.375% | 5/8/18 | EUR | 5,000 | 7,380 |
| Olam International Ltd. Cvt. | 6.000% | 10/15/16 | USD | 5,500 | 5,404 |
| Rallye SA Cvt. | 1.000% | 10/2/20 | EUR | 2,815 | 4,130 |
| Vector Group Ltd. Cvt. | 2.500% | 1/15/19 | USD | 7,160 | 8,435 |
| | | | | | 32,717 |
| Energy (11.9%) | | | | | |
| Alpha Natural Resources Inc. Cvt. | 3.750% | 12/15/17 | USD | 8,335 | 8,200 |
| BPZ Resources Inc. Cvt. | 8.500% | 10/1/17 | USD | 10,330 | 9,646 |
| Bristow Group Inc. Cvt. | 3.000% | 6/15/38 | USD | 2,805 | 3,639 |
| Cam 2012 SPA Cvt. | 5.625% | 10/26/17 | EUR | 3,300 | 5,553 |
| CGG SA Cvt. | 1.750% | 1/1/16 | EUR | 2,072 | 2,769 |
| Cobalt International Energy Inc. Cvt. | 2.625% | 12/1/19 | USD | 39,900 | 40,025 |
| 1 Energy XXI Bermuda Ltd. Cvt. | 3.000% | 12/15/18 | USD | 18,675 | 18,442 |
| Eni SPA Cvt. | 0.250% | 11/30/15 | EUR | 3,200 | 4,468 |
| Golar LNG Ltd. Cvt. | 3.750% | 3/7/17 | USD | 3,600 | 3,678 |
| Goodrich Petroleum Corp. Cvt. | 5.000% | 10/1/32 | USD | 12,565 | 13,115 |
| Helix Energy Solutions Group Inc. Cvt. | 3.250% | 3/15/32 | USD | 13,470 | 16,139 |
| Hornbeck Offshore Services Inc. Cvt. | 1.500% | 9/1/19 | USD | 25,725 | 31,095 |
| Lukoil International Finance BV Cvt. | 2.625% | 6/16/15 | USD | 5,300 | 5,711 |
| Pembina Pipeline Corp. Cvt. | 5.750% | 12/31/18 | CAD | 3,540 | 4,044 |
| Pembina Pipeline Corp. Cvt. | 5.750% | 11/30/20 | CAD | 1,135 | 1,314 |
| 1 SEACOR Holdings Inc. Cvt. | 2.500% | 12/15/27 | USD | 20,940 | 26,083 |
| 1 SEACOR Holdings Inc. Cvt. | 3.000% | 11/15/28 | USD | 8,680 | 8,669 |
| Siem Industries Inc. Cvt. | 1.000% | 9/12/19 | USD | 7,200 | 7,301 |
| Stone Energy Corp. Cvt. | 1.750% | 3/1/17 | USD | 25,210 | 27,211 |
| Subsea 7 SA Cvt. | 1.000% | 10/5/17 | USD | 1,000 | 1,021 |
| Technip SA Cvt. | 0.500% | 1/1/16 | EUR | 1,271 | 1,907 |
| TMK Bonds SA Cvt. | 5.250% | 2/11/15 | USD | 4,200 | 4,252 |
| | | | | | 244,282 |
| Financials (10.2%) | | | | | |
| Alstria Office REIT-AG Cvt. | 2.750% | 6/14/18 | EUR | 2,600 | 3,720 |
| Azimut Holding SPA Cvt. | 2.125% | 11/25/20 | EUR | 3,200 | 4,288 |
| Beni Stabili SPA Cvt. | 3.375% | 1/17/18 | EUR | 1,600 | 2,283 |
| BES Finance Ltd. Cvt. | 3.500% | 12/6/15 | USD | 6,900 | 7,359 |
| BNP Paribas SA Cvt. | 0.250% | 9/21/15 | EUR | 4,300 | 6,143 |
| BNP Paribas SA Cvt. | 0.250% | 9/27/16 | EUR | 900 | 1,285 |
| British Land Co. Jersey Ltd. Cvt. | 1.500% | 9/10/17 | GBP | 2,200 | 3,960 |
| Caja de Ahorros y Pensiones de Barcelona Cvt. | 1.000% | 11/25/17 | EUR | 2,800 | 3,877 |
| CapitaCommercial Trust Cvt. | 2.500% | 9/12/17 | SGD | 4,000 | 3,431 |
| CapitaLand Ltd. Cvt. | 1.850% | 6/19/20 | SGD | 1,750 | 1,285 |
| 1 CapitaLand Ltd. Cvt. | 1.850% | 6/19/20 | SGD | 4,500 | 3,304 |
| CapitaLand Ltd. Cvt. | 1.950% | 10/17/23 | SGD | 1,500 | 1,198 |
| CapitaLand Ltd. Cvt. | 2.875% | 9/3/16 | SGD | 4,750 | 3,922 |
| China Overseas Grand Oceans | | | | | |
| Finance Cayman Ltd. Cvt. | 2.000% | 3/21/17 | HKD | 34,000 | 5,043 |
| Colony Financial Inc. Cvt. | 5.000% | 4/15/23 | USD | 10,800 | 11,137 |
17
Convertible Securities Fund
| | | | | |
| | | | | Face | Market |
| | | Maturity | | Amount | Value |
| | Coupon | Date | Currency | (000) | ($000) |
| Deutsche Euroshop AG Cvt. | 1.750% | 11/20/17 | EUR | 2,500 | 3,763 |
| Deutsche Wohnen AG Cvt. | 0.500% | 11/22/20 | EUR | 400 | 544 |
| DFC Global Corp. Cvt. | 3.250% | 4/15/17 | USD | 12,900 | 11,529 |
| Fonciere Des Regions Cvt. | 3.340% | 1/1/17 | EUR | 1,482 | 2,146 |
| Forest City Enterprises Inc. Cvt. | 4.250% | 8/15/18 | USD | 21,662 | 24,316 |
| Gecina SA Cvt. | 2.130% | 1/1/16 | EUR | 1,973 | 3,172 |
| 1 Goldman Sachs Group Inc. Cvt. | 0.000% | 7/25/16 | USD | 4,135 | 4,285 |
| Graubuendner Kantonalbank Cvt. | 2.000% | 5/8/14 | CHF | 4,870 | 5,440 |
| Hansteen Jersey Securities Ltd. Cvt. | 4.000% | 7/15/18 | EUR | 2,100 | 3,414 |
| Industrivarden AB Cvt. | 2.500% | 2/27/15 | EUR | 1,950 | 3,305 |
| MGIC Investment Corp. Cvt. | 2.000% | 4/1/20 | USD | 5,545 | 7,444 |
| 1 NorthStar Realty Finance LP Cvt. | 5.375% | 6/15/33 | USD | 12,650 | 13,488 |
| Old Republic International Corp. Cvt. | 3.750% | 3/15/18 | USD | 2,310 | 2,823 |
| 1 Portfolio Recovery Associates Inc. Cvt. | 3.000% | 8/1/20 | USD | 17,185 | 19,881 |
| SBI Holdings Inc. Cvt. | 0.000% | 11/2/17 | JPY | 140,000 | 1,551 |
| Sherson Ltd. Cvt. | 0.000% | 6/4/14 | HKD | 21,010 | 3,435 |
| Shizuoka Bank Ltd. Cvt. | 0.000% | 4/25/18 | USD | 2,800 | 3,046 |
| Starwood Property Trust Inc. Cvt. | 4.000% | 1/15/19 | USD | 10,065 | 11,116 |
| Starwood Property Trust Inc. Cvt. | 4.550% | 3/1/18 | USD | 6,895 | 7,563 |
| TAG Immobilien AG Cvt. | 5.500% | 6/28/19 | EUR | 700 | 1,194 |
| Unite Jersey Issuer Ltd. Cvt. | 2.500% | 10/10/18 | GBP | 1,900 | 3,188 |
| Walter Investment Management Corp. Cvt. | 4.500% | 11/1/19 | USD | 11,640 | 12,069 |
| | | | | | 210,947 |
| Health Care (17.7%) | | | | | |
| Alere Inc. Cvt. | 3.000% | 5/15/16 | USD | 5,360 | 5,896 |
| 1 Allscripts Healthcare Solutions Inc. Cvt. | 1.250% | 7/1/20 | USD | 14,195 | 15,641 |
| BioMarin Pharmaceutical Inc. Cvt. | 0.750% | 10/15/18 | USD | 5,240 | 5,558 |
| BioMarin Pharmaceutical Inc. Cvt. | 1.500% | 10/15/20 | USD | 14,400 | 15,579 |
| Brookdale Senior Living Inc. Cvt. | 2.750% | 6/15/18 | USD | 23,485 | 29,019 |
| 1 Cubist Pharmaceuticals Inc. Cvt. | 1.125% | 9/1/18 | USD | 16,365 | 18,451 |
| 1 Cubist Pharmaceuticals Inc. Cvt. | 1.875% | 9/1/20 | USD | 3,455 | 3,874 |
| HealthSouth Corp. Cvt. | 2.000% | 12/1/43 | USD | 29,040 | 32,198 |
| HeartWare International Inc. Cvt. | 3.500% | 12/15/17 | USD | 9,250 | 11,164 |
| Hologic Inc. Cvt. | 2.000% | 12/15/37 | USD | 4,025 | 4,682 |
| Hologic Inc. Cvt. | 2.000% | 3/1/42 | USD | 4,390 | 4,483 |
| 1 Illumina Inc. Cvt. | 0.250% | 3/15/16 | USD | 32,960 | 41,900 |
| 1 Incyte Corp. Ltd. Cvt. | 1.250% | 11/15/20 | USD | 7,025 | 8,127 |
| 1 Medidata Solutions Inc. Cvt. | 1.000% | 8/1/18 | USD | 14,365 | 18,100 |
| 1 Molina Healthcare Inc. Cvt. | 1.125% | 1/15/20 | USD | 25,635 | 26,692 |
| NuVasive Inc. Cvt. | 2.750% | 7/1/17 | USD | 19,475 | 21,228 |
| Omnicare Inc. Cvt. | 3.500% | 2/15/44 | USD | 31,075 | 30,531 |
| Orpea Cvt. | 1.750% | 1/1/20 | EUR | 1,412 | 2,144 |
| Orpea Cvt. | 3.880% | 1/1/16 | EUR | 3,276 | 5,227 |
| QIAGEN Euro Finance Luxembourg SA Cvt. | 3.250% | 5/16/26 | USD | 500 | 634 |
| Salix Pharmaceuticals Ltd. Cvt. | 1.500% | 3/15/19 | USD | 18,831 | 27,034 |
| 1 Vivus Inc. Cvt. | 4.500% | 5/1/20 | USD | 5,330 | 4,720 |
| WellPoint Inc. Cvt. | 2.750% | 10/15/42 | USD | 1,830 | 2,514 |
| WellPoint Inc. Cvt. | 2.750% | 10/15/42 | USD | 2,255 | 3,098 |
| Wright Medical Group Inc. Cvt. | 2.000% | 8/15/17 | USD | 19,724 | 25,949 |
| | | | | | 364,443 |
18
| | | | | |
| Convertible Securities Fund | | | | | |
| |
| |
| |
| | | | | Face | Market |
| | | Maturity | | Amount | Value |
| | Coupon | Date | Currency | (000) | ($000) |
| Industrials (7.9%) | | | | | |
| Aecon Group Inc. Cvt. | 5.500% | 12/31/18 | CAD | 2,318 | 2,252 |
| Air France-KLM Cvt. | 2.030% | 2/15/23 | EUR | 2,951 | 4,146 |
| Air Lease Corp. Cvt. | 3.875% | 12/1/18 | USD | 17,630 | 23,547 |
| Asahi Glass Co. Ltd. Cvt. | 0.000% | 11/14/14 | JPY | 50,000 | 489 |
| Astaldi SPA Cvt. | 4.500% | 1/31/19 | EUR | 1,400 | 2,332 |
| Balfour Beatty Finance No.2 Ltd. Cvt. | 1.875% | 12/3/18 | GBP | 2,200 | 3,625 |
| China Merchants Holdings Pacific Ltd. Cvt. | 1.250% | 11/6/17 | HKD | 16,000 | 2,205 |
| Deutsche Post AG Cvt. | 0.600% | 12/6/19 | EUR | 2,400 | 4,354 |
| Ebara Corp. Cvt. | 0.000% | 3/19/18 | JPY | 309,000 | 4,244 |
| Greenbrier Cos. Inc. Cvt. | 3.500% | 4/1/18 | USD | 2,540 | 2,943 |
| GVM Debentures Lux 1 SA Cvt. | 5.750% | 2/14/18 | EUR | 2,300 | 3,705 |
| IHI Corp. Cvt. | 0.000% | 3/29/16 | JPY | 240,000 | 3,521 |
| 1 Kaman Corp. Cvt. | 3.250% | 11/15/17 | USD | 1,201 | 1,550 |
| Kawasaki Kisen Kaisha Ltd. Cvt. | 0.000% | 9/26/18 | JPY | 280,000 | 2,839 |
| KUKA AG Cvt. | 2.000% | 2/12/18 | EUR | 2,500 | 3,955 |
| 1 Lufthansa Malta Blues LP Cvt. | 0.750% | 4/5/17 | EUR | 3,310 | 6,305 |
| 1 Meritor Inc. Cvt. | 7.875% | 3/1/26 | USD | 4,305 | 5,395 |
| MISUMI Group Inc. Cvt. | 0.000% | 10/22/18 | USD | 2,900 | 2,978 |
| Nagoya Railroad Co. Ltd. Cvt. | 0.000% | 10/3/23 | JPY | 510,000 | 5,291 |
| Nagoya Railroad Co. Ltd. Cvt. | 0.500% | 3/31/15 | JPY | 35,000 | 409 |
| Nexans SA Cvt. | 4.000% | 1/1/16 | EUR | 1,862 | 2,664 |
| OCI Cvt. | 3.875% | 9/25/18 | EUR | 2,300 | 3,408 |
| OSG Corp. Cvt. | 0.000% | 4/4/22 | JPY | 200,000 | 2,362 |
| PB Issuer No 3 Ltd. Cvt. | 1.875% | 10/22/18 | USD | 4,586 | 5,945 |
| Prysmian SPA Cvt. | 1.250% | 3/8/18 | EUR | 3,300 | 5,118 |
| Russel Metals Inc. Cvt. | 7.750% | 9/30/16 | CAD | 4,900 | 5,442 |
| Schindler Holding AG Cvt. | 0.375% | 6/5/17 | CHF | 3,300 | 3,726 |
| SGL Carbon SE Cvt. | 2.750% | 1/25/18 | EUR | 3,500 | 4,892 |
| Siemens Financieringsmaatschappij NV Cvt. | 1.050% | 8/16/17 | USD | 2,000 | 2,281 |
| Siemens Financieringsmaatschappij NV Cvt. | 1.650% | 8/16/19 | USD | 4,250 | 4,905 |
| Societa Iniziative Autostradali e Servizi SPA Cvt. | 2.625% | 6/30/17 | EUR | 1,195 | 1,620 |
| SolarCity Corp. Cvt. | 2.750% | 11/1/18 | USD | 10,200 | 11,545 |
| Tem SAS Cvt. | 4.250% | 1/1/15 | EUR | 1,758 | 2,596 |
| Tong Jie Ltd. Cvt. | 0.000% | 2/18/18 | HKD | 27,000 | 3,583 |
| Wabash National Corp. Cvt. | 3.375% | 5/1/18 | USD | 7,115 | 9,272 |
| XPO Logistics Inc. Cvt. | 4.500% | 10/1/17 | USD | 3,335 | 5,142 |
| Yamato Holdings Co. Ltd. Cvt. | 0.000% | 3/7/16 | JPY | 170,000 | 2,095 |
| | | | | | 162,681 |
| Information Technology (21.4%) | | | | | |
| Advanced Semiconductor Engineering Inc. Cvt. | 0.000% | 9/5/18 | USD | 3,800 | 4,171 |
| AU Optronics Corp. Cvt. | 0.000% | 10/13/15 | USD | 3,200 | 3,300 |
| Bottomline Technologies de Inc. Cvt. | 1.500% | 12/1/17 | USD | 6,340 | 8,309 |
| Cap Gemini SA Cvt. | 0.000% | 1/1/19 | EUR | 25 | 2,384 |
| 1 Cardtronics Inc. Cvt. | 1.000% | 12/1/20 | USD | 13,005 | 12,891 |
| Ciena Corp. Cvt. | 0.875% | 6/15/17 | USD | 25,490 | 25,283 |
| 1 Ciena Corp. Cvt. | 3.750% | 10/15/18 | USD | 6,070 | 8,342 |
| 1 Concur Technologies Inc. Cvt. | 0.500% | 6/15/18 | USD | 17,900 | 19,947 |
| 1 Cornerstone OnDemand Inc. Cvt. | 1.500% | 7/1/18 | USD | 7,655 | 8,980 |
| 1 CSG Systems International Inc. Cvt. | 3.000% | 3/1/17 | USD | 8,955 | 11,843 |
| Davis & Henderson Corp. Cvt. | 6.000% | 9/30/18 | CAD | 4,653 | 4,905 |
| Dealertrack Technologies Inc. Cvt. | 1.500% | 3/15/17 | USD | 7,557 | 9,541 |
| Econocom Group Cvt. | 4.000% | 6/1/16 | EUR | 1,946 | 3,681 |
| 1 Emulex Corp. Cvt. | 1.750% | 11/15/18 | USD | 9,500 | 9,458 |
19
| | | | | | |
| Convertible Securities Fund | | | | | |
| |
| |
| |
| | | | | | Face | Market |
| | | | Maturity | | Amount | Value |
| | | Coupon | Date | Currency | (000) | ($000) |
| | Epistar Corp. Cvt. | 0.000% | 8/7/18 | USD | 3,900 | 4,090 |
| | Hanwha SolarOne Co. Ltd. Cvt. | 3.500% | 1/15/18 | USD | 2,563 | 2,372 |
| | Indra Sistemas SA Cvt. | 1.750% | 10/17/18 | EUR | 2,200 | 3,049 |
| | Intel Corp. Cvt. | 2.950% | 12/15/35 | USD | 13,765 | 14,935 |
| | Intel Corp. Cvt. | 3.250% | 8/1/39 | USD | 10,940 | 13,976 |
| 1 | JDS Uniphase Corp. Cvt. | 0.625% | 8/15/33 | USD | 24,985 | 24,735 |
| | Lam Research Corp. Cvt. | 0.500% | 5/15/16 | USD | 21,719 | 24,000 |
| | Lam Research Corp. Cvt. | 1.250% | 5/15/18 | USD | 3,565 | 4,278 |
| | Mentor Graphics Corp. Cvt. | 4.000% | 4/1/31 | USD | 14,140 | 18,179 |
| | Micron Technology Inc. Cvt. | 3.000% | 11/15/43 | USD | 25,595 | 24,427 |
| | Nihon Unisys Ltd. Cvt. | 0.000% | 6/20/16 | JPY | 195,000 | 2,015 |
| 1 | NVIDIA Corp. Cvt. | 1.000% | 12/1/18 | USD | 23,150 | 23,179 |
| | ON Semiconductor Corp. Cvt. | 2.625% | 12/15/26 | USD | 23,082 | 24,380 |
| | Photronics Inc. Cvt. | 3.250% | 4/1/16 | USD | 7,857 | 8,844 |
| 1 | Salesforce.com Inc. Cvt. | 0.250% | 4/1/18 | USD | 25,590 | 27,077 |
| 1 | SanDisk Corp. Cvt. | 0.500% | 10/15/20 | USD | 26,955 | 26,450 |
| | SanDisk Corp. Cvt. | 1.500% | 8/15/17 | USD | 4,665 | 6,680 |
| | Semiconductor Manufacturing | | | | | |
| | International Corp. Cvt. | 0.000% | 11/7/18 | USD | 3,000 | 3,046 |
| 1 | SINA Corp.Cvt. | 1.000% | 12/1/18 | USD | 3,055 | 2,971 |
| | Take-Two Interactive Software Inc. Cvt. | 1.000% | 7/1/18 | USD | 11,205 | 11,716 |
| | Take-Two Interactive Software Inc. Cvt. | 1.750% | 12/1/16 | USD | 9,294 | 10,555 |
| 1 | Vishay Intertechnology Inc. Cvt. | 2.250% | 11/15/40 | USD | 4,195 | 4,384 |
| 1 | Vishay Intertechnology Inc. Cvt. | 2.250% | 5/15/41 | USD | 10,745 | 9,127 |
| | Web.com Group Inc. Cvt. | 1.000% | 8/15/18 | USD | 12,270 | 13,052 |
| | | | | | | 440,552 |
| Materials (4.1%) | | | | | |
| | African Minerals Ltd. Cvt. | 8.500% | 2/10/17 | USD | 2,000 | 1,950 |
| | APERAM Cvt. | 2.625% | 9/30/20 | USD | 3,800 | 4,241 |
| | Buzzi Unicem SPA Cvt. | 1.375% | 7/17/19 | EUR | 2,300 | 3,344 |
| | Cemex SAB de CV Cvt. | 3.250% | 3/15/16 | USD | 4,494 | 5,629 |
| | Cemex SAB de CV Cvt. | 4.875% | 3/15/15 | USD | 18,679 | 21,516 |
| | Glencore Finance Europe SA Cvt. | 5.000% | 12/31/14 | USD | 3,000 | 3,354 |
| | Logo Star Ltd. Cvt. | 1.500% | 11/22/18 | HKD | 26,000 | 3,241 |
| | RTI International Metals Inc. Cvt. | 1.625% | 10/15/19 | USD | 14,955 | 16,020 |
| | RTI International Metals Inc. Cvt. | 3.000% | 12/1/15 | USD | 11,420 | 13,140 |
| | Salzgitter Finance BV Cvt. | 2.000% | 11/8/17 | EUR | 2,650 | 4,056 |
| 1,2 | ShengdaTech Inc. Cvt. | 6.500% | 12/15/15 | USD | 305 | 3 |
| | United States Steel Corp. Cvt. | 2.750% | 4/1/19 | USD | 5,050 | 6,237 |
| | Western Areas Ltd. Cvt. | 6.375% | 7/2/14 | AUD | 1,185 | 1,081 |
| | Western Areas Ltd. Cvt. | 6.400% | 7/2/15 | AUD | 750 | 672 |
| | | | | | | 84,484 |
| Telecommunication Services (0.4%) | | | | | |
| | Billion Express Investments Ltd. Cvt. | 0.750% | 10/18/15 | USD | 4,800 | 5,021 |
| | Inmarsat plc Cvt. | 1.750% | 11/16/17 | USD | 2,000 | 2,667 |
| | | | | | | 7,688 |
| Utilities (0.6%) | | | | | |
| | ENN Energy Holdings Ltd. Cvt. | 0.000% | 2/26/18 | USD | 4,000 | 5,043 |
| | Parpublica - Participacoes Publicas | | | | | |
| | SGPS SA Cvt. | 5.250% | 9/28/17 | EUR | 2,850 | 4,206 |
| | YTL Corp. Finance Labuan Ltd. Cvt. | 1.875% | 3/18/15 | USD | 4,200 | 4,483 |
| | | | | | | 13,732 |
| Total Convertible Bonds (Cost $1,689,105) | | | | | 1,835,017 |
20
| | | | |
| Convertible Securities Fund | | | |
| |
| |
| |
| | | | | Market |
| | | | | Value |
| | | Coupon | Shares | ($000) |
| Convertible Preferred Stocks (9.0%) | | | |
| Consumer Staples (0.3%) | | | |
| | Bunge Ltd. Pfd. | 4.875% | 52,700 | 5,599 |
| |
| Energy (3.7%) | | | |
| 1 | Chesapeake Energy Corp. Pfd. | 5.750% | 17,250 | 19,773 |
| | Energy XXI Bermuda Ltd. Pfd. | 5.625% | 41,450 | 12,215 |
| | Goodrich Petroleum Corp. Pfd. | 5.375% | 352,300 | 14,687 |
| | Halcon Resources Corp. Pfd. | 5.750% | 16,650 | 14,329 |
| 1 | Sanchez Energy Corp. Pfd. | 4.875% | 91,800 | 5,938 |
| | SandRidge Energy Inc. Pfd. | 8.500% | 93,310 | 9,288 |
| | | | | 76,230 |
| Financials (0.8%) | | | |
| | EPR Properties Pfd. | 5.750% | 105,400 | 2,199 |
| | Health Care REIT Inc. Pfd. | 6.500% | 103,744 | 5,592 |
| | Wintrust Financial Corp. Pfd. | 5.000% | 7,530 | 9,201 |
| | | | | 16,992 |
| Health Care (0.9%) | | | |
| | Alere Inc. Pfd. | 3.000% | 70,140 | 19,663 |
| |
| Industrials (1.9%) | | | |
| | Continental Airlines Finance Trust II Pfd. | 6.000% | 244,410 | 11,686 |
| | Genesee & Wyoming Inc. Pfd. | 5.000% | 121,740 | 15,875 |
| | United Technologies Corp. Pfd. | 7.500% | 171,800 | 11,229 |
| | | | | 38,790 |
| Materials (0.1%) | | | |
| | ArcelorMittal Pfd. | 6.000% | 98,100 | 2,478 |
| |
| Telecommunication Services (1.3%) | | | |
| | Crown Castle International Corp. Pfd. | 4.500% | 161,600 | 16,281 |
| 1 | Iridium Communications Inc. Pfd. | 7.000% | 105,900 | 9,624 |
| | | | | 25,905 |
| Total Convertible Preferred Stocks (Cost $171,851) | | | 185,657 |
| Temporary Cash Investment (2.4%) | | | |
| Money Market Fund (2.4%) | | | |
| 3 | Vanguard Market Liquidity Fund | | | |
| | (Cost $50,485) | 0.127% | 50,485,000 | 50,485 |
| Total Investments (100.5%) (Cost $1,911,712) | | | 2,071,389 |
| Other Assets and Liabilities (-0.5%) | | | |
| Other Assets | | | 29,490 |
| Liabilities | | | (40,429) |
| | | | | (10,939) |
| Net Assets (100%) | | | |
| Applicable to 140,743,440 outstanding $.001 par value shares of | | | |
| beneficial interest (unlimited authorization) | | | 2,060,450 |
| Net Asset Value Per Share | | | $14.64 |
21
| |
| Convertible Securities Fund | |
| |
| |
| |
| At November 30, 2013, net assets consisted of: | |
| | Amount |
| | ($000) |
| Paid-in Capital | 1,741,429 |
| Undistributed Net Investment Income | 23,298 |
| Accumulated Net Realized Gains | 131,448 |
| Unrealized Appreciation (Depreciation) | |
| Investment Securities | 159,677 |
| Forward Currency Contracts | 4,608 |
| Foreign Currencies | (10) |
| Net Assets | 2,060,450 |
See Note A in Notes to Financial Statements.
1 Security exempt from registration under Rule 144A of the Securities Act of 1933. Such securities may be sold in transactions exempt from
registration, normally to qualified institutional buyers. At November 30, 2013, the aggregate value of these securities was $630,416,000,
representing 30.6% of net assets.
2 Non-income-producing security—interest payments in default.
3 Affiliated money market fund available only to Vanguard funds and certain trusts and accounts managed by Vanguard. Rate shown is the
7-day yield.
REIT—Real Estate Investment Trust.
AUD—Australian dollar.
CAD—Canadian dollar.
CHF—Swiss franc.
EUR—Euro.
GBP—British pound.
HKD—Hong Kong dollar.
JPY—Japanese yen.
KRW—Korean won.
SGD—Singapore dollar.
USD—United States dollar.
See accompanying Notes, which are an integral part of the Financial Statements.
22
| |
| Convertible Securities Fund | |
| |
| |
| Statement of Operations | |
| |
| | Year Ended |
| | November 30, 2013 |
| | ($000) |
| Investment Income | |
| Income | |
| Dividends | 11,902 |
| Interest1 | 43,972 |
| Total Income | 55,874 |
| Expenses | |
| Investment Advisory Fees—Note B | |
| Basic Fee | 6,221 |
| Performance Adjustment | 1,276 |
| The Vanguard Group—Note C | |
| Management and Administrative | 3,638 |
| Marketing and Distribution | 278 |
| Custodian Fees | 64 |
| Auditing Fees | 37 |
| Shareholders’ Reports | 21 |
| Trustees’ Fees and Expenses | 5 |
| Total Expenses | 11,540 |
| Net Investment Income | 44,334 |
| Realized Net Gain (Loss) | |
| Investment Securities Sold | 161,313 |
| Foreign Currencies and Forward Currency Contracts | (2,483) |
| Realized Net Gain (Loss) | 158,830 |
| Change in Unrealized Appreciation (Depreciation) | |
| Investment Securities | 115,796 |
| Foreign Currencies and Forward Currency Contracts | 3,588 |
| Change in Unrealized Appreciation (Depreciation) | 119,384 |
| Net Increase (Decrease) in Net Assets Resulting from Operations | 322,548 |
| 1 Interest income from an affiliated company of the fund was $73,000. |
See accompanying Notes, which are an integral part of the Financial Statements.
23
| | |
| Convertible Securities Fund | | |
| |
| |
| Statement of Changes in Net Assets | | |
| |
| | Year Ended November 30, |
| | 2013 | 2012 |
| | ($000) | ($000) |
| Increase (Decrease) in Net Assets | | |
| Operations | | |
| Net Investment Income | 44,334 | 54,292 |
| Realized Net Gain (Loss) | 158,830 | 67,351 |
| Change in Unrealized Appreciation (Depreciation) | 119,384 | 85,613 |
| Net Increase (Decrease) in Net Assets Resulting from Operations | 322,548 | 207,256 |
| Distributions | | |
| Net Investment Income | (46,333) | (71,050) |
| Realized Capital Gain1 | (48,619) | (24,089) |
| Total Distributions | (94,952) | (95,139) |
| Capital Share Transactions | | |
| Issued | 431,189 | 164,727 |
| Issued in Lieu of Cash Distributions | 84,161 | 82,817 |
| Redeemed 2 | (325,061) | (397,521) |
| Net Increase (Decrease) from Capital Share Transactions | 190,289 | (149,977) |
| Total Increase (Decrease) | 417,885 | (37,860) |
| Net Assets | | |
| Beginning of Period | 1,642,565 | 1,680,425 |
| End of Period3 | 2,060,450 | 1,642,565 |
1 Includes fiscal 2013 and 2012 short-term gain distributions totaling $0 and $3,130,000, respectively. Short-term gain distributions are
treated as ordinary income dividends for tax purposes.
2 Net of redemption fees for fiscal 2013 and 2012 of $0 and $174,000, respectively. Effective May 23, 2012, the redemption fee was
eliminated.
3 Net Assets—End of Period includes undistributed net investment income of $23,298,000 and $10,546,000.
See accompanying Notes, which are an integral part of the Financial Statements.
24
| | | | | |
| Convertible Securities Fund | | | | | |
| |
| |
| Financial Highlights | | | | | |
| |
| |
| |
| For a Share Outstanding | Year Ended November 30, |
| Throughout Each Period | 2013 | 2012 | 2011 | 2010 | 2009 |
| Net Asset Value, Beginning of Period | $12.95 | $12.12 | $13.85 | $12.12 | $8.86 |
| Investment Operations | | | | | |
| Net Investment Income | . 333 | . 407 | .451 | .555 | .475 |
| Net Realized and Unrealized Gain (Loss) | | | | | |
| on Investments | 2.101 | 1.134 | (.752) | 1.742 | 3.211 |
| Total from Investment Operations | 2.434 | 1.541 | (.301) | 2.297 | 3.686 |
| Distributions | | | | | |
| Dividends from Net Investment Income | (.355) | (.534) | (.474) | (.567) | (.426) |
| Distributions from Realized Capital Gains | (.389) | (.177) | (.955) | — | — |
| Total Distributions | (.744) | (.711) | (1.429) | (.567) | (.426) |
| Net Asset Value, End of Period | $14.64 | $12.95 | $12.12 | $13.85 | $12.12 |
| |
| Total Return1 | 19.65% | 13.18% | -2.89% | 19.39% | 42.55% |
| |
| Ratios/Supplemental Data | | | | | |
| Net Assets, End of Period (Millions) | $2,060 | $1,643 | $1,680 | $1,733 | $1,715 |
| Ratio of Total Expenses to | | | | | |
| Average Net Assets2 | 0.63% | 0.52% | 0.59% | 0.68% | 0.72% |
| Ratio of Net Investment Income to | | | | | |
| Average Net Assets | 2.41% | 3.23% | 3.36% | 4.08% | 4.65% |
| Portfolio Turnover Rate | 101% | 82% | 90% | 103% | 103% |
1 Total returns do not include transaction or account service fees that may have applied in the periods shown. Fund prospectuses provide
information about any applicable transaction and account service fees.
2 Includes performance-based investment advisory fee increases (decreases) of 0.07%, (0.04%), 0.03%, 0.12%, and 0.12%.
See accompanying Notes, which are an integral part of the Financial Statements.
25
Convertible Securities Fund
Notes to Financial Statements
Vanguard Convertible Securities Fund is registered under the Investment Company Act of 1940 as an open-end investment company, or mutual fund. The fund invests in securities of foreign issuers, which may subject it to investment risks not normally associated with investing in securities of United States corporations.
A. The following significant accounting policies conform to generally accepted accounting principles for U.S. mutual funds. The fund consistently follows such policies in preparing its financial statements.
1. Security Valuation: Securities are valued as of the close of trading on the New York Stock Exchange (generally 4 p.m., Eastern time) on the valuation date. Equity securities are valued at the latest quoted sales prices or official closing prices taken from the primary market in which each security trades; such securities not traded on the valuation date are valued at the mean of the latest quoted bid and asked prices. Bonds, and temporary cash investments acquired over 60 days to maturity, are valued using the latest bid prices or using valuations based on a matrix system (which considers such factors as security prices, yields, maturities, and ratings), both as furnished by independent pricing services. Investments in Vanguard Market Liquidity Fund are valued at that fund’s net asset value. Other temporary cash investments are valued at amortized cost, which approximates market value. Securities for which market quotations are not readily available, or whose values have been affected by events occurring before the fund’s pricing time but after the close of the securities’ primary markets, are valued at their fair values calculated according to procedures adopted by the board of trustees. These procedures include obtaining quotations from an independent pricing service, monitoring news to identify significant market- or security-specific events, and evaluating changes in the values of foreign market proxies (for example, ADRs, futures contracts, or exchange-traded funds), between the time the foreign markets close and the fund’s pricing time. When fair-value pricing is employed, the prices of securities used by a fund to calculate its net asset value may differ from quoted or published prices for the same securities.
2. Foreign Currency: Securities and other assets and liabilities denominated in foreign currencies are translated into U.S. dollars using exchange rates obtained from an independent third party as of the fund’s pricing time on the valuation date. Realized gains (losses) and unrealized appreciation (depreciation) on investment securities include the effects of changes in exchange rates since the securities were purchased, combined with the effects of changes in security prices. Fluctuations in the value of other assets and liabilities resulting from changes in exchange rates are recorded as unrealized foreign currency gains (losses) until the assets or liabilities are settled in cash, at which time they are recorded as realized foreign currency gains (losses).
3. Forward Currency Contracts: The fund may enter into forward currency contracts to protect the value of securities and related receivables and payables against changes in future foreign exchange rates. The fund’s risks in using these contracts include movement in the values of the foreign currencies relative to the U.S. dollar and the ability of the counterparties to fulfill their obligations under the contracts. The fund mitigates its counterparty risk by entering into forward currency contracts only with a diverse group of prequalified counterparties, monitoring their financial strength, entering into master netting arrangements with its counterparties, and requiring its counterparties to transfer collateral as security for their performance. The master netting arrangements provide that, in the event of a counterparty’s default (including bankruptcy), the fund may terminate the forward
26
Convertible Securities Fund
currency contracts, determine the net amount owed by either party in accordance with its master netting arrangements, and sell or retain any collateral held up to the net amount owed to the fund under the master netting arrangements. The forward currency contracts contain provisions whereby a counterparty may terminate open contracts if the fund’s net assets decline below a certain level, triggering a payment by the fund if the fund is in a net liability position at the time of the termination. The payment amount would be reduced by any collateral the fund has pledged. Any assets pledged as collateral for open contracts are noted in the Statement of Net Assets. The value of collateral received or pledged is compared daily to the value of the forward currency contracts exposure with each counterparty, and any difference, if in excess of a specified minimum transfer amount, is adjusted and settled within two business days.
Forward currency contracts are valued at their quoted daily prices obtained from an independent third party, adjusted for currency risk based on the expiration date of each contract. The aggregate notional amounts of the contracts are not recorded in the Statement of Net Assets. Fluctuations in the value of the contracts are recorded in the Statement of Net Assets as an asset (liability) and in the Statement of Operations as unrealized appreciation (depreciation) until the contracts are closed, when they are recorded as realized forward currency contract gains (losses).
During the year ended November 30, 2013, the fund’s average investment in forward currency contracts represented 11% of net assets, based on quarterly average notional amounts.
4. Federal Income Taxes: The fund intends to continue to qualify as a regulated investment company and distribute all of its taxable income. Management has analyzed the fund’s tax positions taken for all open federal income tax years (November 30, 2010–2013), and has concluded that no provision for federal income tax is required in the fund’s financial statements.
5. Distributions: Distributions to shareholders are recorded on the ex-dividend date.
6. Other: Dividend income is recorded on the ex-dividend date. Interest income includes income distributions received from Vanguard Market Liquidity Fund and is accrued daily. Premiums and discounts on debt securities purchased are amortized and accreted, respectively, to interest income over the lives of the respective securities. Security transactions are accounted for on the date securities are bought or sold. Costs used to determine realized gains (losses) on the sale of investment securities are those of the specific securities sold.
B. Oaktree Capital Management, L.P., provides investment advisory services to the fund for a fee calculated at an annual percentage rate of average net assets. The basic fee is subject to quarterly adjustments based on the fund’s performance for the preceding three years relative to the Bank of America Merrill Lynch All US Convertibles Index (previously Merrill Lynch All Convertibles-All Qualities Index) for periods prior to March 1, 2011, and a composite index weighted 70% Bank of America Merrill Lynch All US Convertibles Index and 30% Bank of America Merrill Lynch Global 300 Convertibles ex-US Index (hedged) thereafter. The benchmark change will be fully phased in by February 2014. For the year ended November 30, 2013, the investment advisory fee represented an effective annual basic rate of 0.34% of the fund’s average net assets before an increase of $1,276,000 (0.07%) based on performance.
27
Convertible Securities Fund
C. The Vanguard Group furnishes at cost corporate management, administrative, marketing, and distribution services. The costs of such services are allocated to the fund under methods approved by the board of trustees. The fund has committed to provide up to 0.40% of its net assets in capital contributions to Vanguard. At November 30, 2013, the fund had contributed capital of $234,000 to Vanguard (included in Other Assets), representing 0.01% of the fund’s net assets and 0.09% of Vanguard’s capitalization. The fund’s trustees and officers are also directors and officers of Vanguard.
D. Various inputs may be used to determine the value of the fund’s investments. These inputs are summarized in three broad levels for financial statement purposes. The inputs or methodologies used to value securities are not necessarily an indication of the risk associated with investing in those securities.
Level 1—Quoted prices in active markets for identical securities.
Level 2—Other significant observable inputs (including quoted prices for similar securities, interest rates, prepayment speeds, credit risk, etc.).
Level 3—Significant unobservable inputs (including the fund’s own assumptions used to determine the fair value of investments).
The following table summarizes the market value of the fund’s investments as of November 30, 2013, based on the inputs used to value them:
| | | |
| | Level 1 | Level 2 | Level 3 |
| Investments | ($000) | ($000) | ($000) |
| Common Stocks | 230 | — | — |
| Convertible Bonds | — | 1,835,017 | — |
| Convertible Preferred Stocks | — | 185,657 | — |
| Temporary Cash Investments | 50,485 | — | — |
| Forward Currency Contracts—Assets | — | 4,796 | — |
| Forward Currency Contracts—Liabilities | — | (188) | — |
| Total | 50,715 | 2,025,282 | — |
Convertible preferred stocks valued at $185,657,000 on November 30, 2013, based on Level 2 inputs were trasferred from Level 1 during the fiscal year. The transfer was due to the use of additional observable market inputs to derive the value of these securities.
E. At November 30, 2013, the fund had open forward currency contracts to receive and deliver currencies as follows. Unrealized appreciation (depreciation) on open forward currency contracts is treated as realized gain (loss) for tax purposes.
Convertible Securities Fund
| | | | | | |
| | | | | | | Unrealized |
| | Contract | | | | | Appreciation |
| | Settlement | Contract Amount (000) | (Depreciation) |
| Counterparty | Date | | Receive | | Deliver | ($000) |
| UBS AG | 1/23/14 | USD | 158,465 | EUR | 115,010 | 2,184 |
| UBS AG | 1/23/14 | USD | 38,454 | JPY | 3,773,525 | 1,604 |
| UBS AG | 1/23/14 | USD | 21,494 | HKD | 166,614 | — |
| UBS AG | 1/23/14 | USD | 20,750 | CAD | 21,492 | 552 |
| UBS AG | 1/23/14 | USD | 16,617 | GBP | 10,256 | (158) |
| UBS AG | 1/23/14 | USD | 13,580 | SGD | 16,775 | 212 |
| UBS AG | 1/23/14 | USD | 9,231 | CHF | 8,250 | 124 |
| UBS AG | 1/23/14 | USD | 4,057 | KRW | 4,326,380 | (17) |
| UBS AG | 1/23/14 | USD | 2,002 | AUD | 2,075 | 120 |
| UBS AG | 1/23/14 | USD | 1,346 | EUR | 1,000 | (13) |
| | | | | | | 4,608 |
| AUD—Australian dollar. |
| CAD—Canadian dollar. |
| CHF—Swiss franc. |
| EUR—Euro. |
| GBP—British pound. |
| HKD—Hong Kong dollar. |
| JPY—Japanese yen. |
| KRW—Korean won. |
| SGD—Singapore dollar. |
| USD—U.S. dollar. |
At November 30, 2013, the counterparty had deposited in segregated accounts securities with a value of $4,467,000 in connection with amounts due to the fund for open forward currency contracts.
F. Distributions are determined on a tax basis and may differ from net investment income and realized capital gains for financial reporting purposes. Differences may be permanent or temporary. Permanent differences are reclassified among capital accounts in the financial statements to reflect their tax character. Temporary differences arise when certain items of income, expense, gain, or loss are recognized in different periods for financial statement and tax purposes; such differences are primarily attributed to contingent payment debt instruments. These differences will reverse at some time in the future. Differences in classification may also result from the treatment of short-term gains as ordinary income for tax purposes.
During the year ended November 30, 2013, the fund realized net foreign currency losses of $1,513,000, (including the foreign currency component on sales of foreign currency denominated bonds), which decreased distributable net income for tax purposes; accordingly, such losses have been reclassified from accumulated net realized gains to undistributed net investment income.
29
Convertible Securities Fund
Certain of the fund’s convertible preferred stock investments are treated as debt securities for tax purposes. During the year ended November 30, 2013, the fund realized gains of $312,000 from the sale of these securities, which are included in distributable net investment income for tax purposes; accordingly, such gains have been reclassified from accumulated net realized gains to undistributed net investment income.
Certain of the fund’s convertible bond investments are in securities considered to be “contingent payment debt instruments,” for which any realized gains increase (and all or part of any realized losses decrease) income for tax purposes. During the year ended November 30, 2013, the fund realized net gains of $15,952,000 from the sale of these securities, which increased distributable net income for tax purposes; accordingly, such gains have been reclassified from accumulated net realized gains to undistributed net investment income.
The fund used a tax accounting practice to treat a portion of the price of capital shares redeemed during the year as distributions from realized capital gains. Accordingly, the fund has reclassified $11,260,000 from accumulated net realized gains to paid-in capital.
For tax purposes, at November 30, 2013, the fund had $66,903,000 of ordinary income and $95,457,000 of long-term capital gains available for distribution.
At November 30, 2013, the cost of investment securities for tax purposes was $1,911,893,000. Net unrealized appreciation of investment securities for tax purposes was $159,496,000, consisting of unrealized gains of $181,631,000 on securities that had risen in value since their purchase and $22,135,000 in unrealized losses on securities that had fallen in value since their purchase.
G. During the year ended November 30, 2013, the fund purchased $1,908,803,000 of investment securities and sold $1,785,569,000 of investment securities, other than temporary cash investments.
H. Capital shares issued and redeemed were:
| | |
| | Year Ended November 30 |
| | 2013 | 2012 |
| | Shares | Shares |
| | (000) | (000) |
| Issued | 31,218 | 13,049 |
| Issued in Lieu of Cash Distributions | 6,509 | 6,780 |
| Redeemed | (23,843) | (31,617) |
| Net Increase (Decrease) in Shares Outstanding | 13,884 | (11,788) |
I. Management has determined that no material events or transactions occurred subsequent to November 30, 2013, that would require recognition or disclosure in these financial statements.
30
Report of Independent Registered
Public Accounting Firm
To the Trustees and Shareholders of Vanguard Convertible Securities Fund:
In our opinion, the accompanying statement of net assets and the related statements of operations and of changes in net assets and the financial highlights present fairly, in all material respects, the financial position of Vanguard Convertible Securities Fund (the “Fund”) at November 30, 2013, the results of its operations for the year then ended, the changes in its net assets for each of the two years in the period then ended, and the financial highlights for each of the five years in the period then ended, in conformity with accounting principles generally accepted in the United States of America. These financial statements and financial highlights (hereafter referred to as “financial statements”) are the responsibility of the Fund’s management; our responsibility is to express an opinion on these financial statements based on our audits. We conducted our audits of these financial statements in accordance with the standards of the Public Company Accounting Oversight Board (United States). Those standards require that we plan and perform the audit to obtain reasonable assurance about whether the financial statements are free of material misstatement. An audit includes examining, on a test basis, evidence supporting the amounts and disclosures in the financial statements, assessing the accounting principles used and significant estimates made by management, and evaluating the overall financial statement presentation. We believe that our audits, which included confirmation of securities at November 30, 2013 by correspondence with the custodian and brokers and by agreement to the underlying ownership records of the transfer agent, provide a reasonable basis for our opinion.
/s/PricewaterhouseCoopers LLP
Philadelphia, Pennsylvania
January 15, 2014
Special 2013 tax information (unaudited) for Vanguard Convertible Securities Fund
This information for the fiscal year ended November 30, 2013, is included pursuant to provisions
of the Internal Revenue Code.
The fund distributed $56,531,000 as capital gain dividends (from net long-term capital gains) to
shareholders during the fiscal year.
The fund distributed $6,995,000 of qualified dividend income to shareholders during the fiscal year.
For corporate shareholders, 8.1% of investment income (dividend income plus short-term gains,
if any) qualifies for the dividends-received deduction.
31
Your Fund’s After-Tax Returns
This table presents returns for your fund both before and after taxes. The after-tax returns are shown in two ways: (1) assuming that an investor owned the fund during the entire period and paid taxes on the fund’s distributions, and (2) assuming that an investor paid taxes on the fund’s distributions and sold all shares at the end of each period.
Calculations are based on the highest individual federal income tax and capital gains tax rates in effect at the times of the distributions and the hypothetical sales. State and local taxes were not considered. After-tax returns reflect any qualified dividend income, using actual prior-year figures and estimates for 2013. (In the example, returns after the sale of fund shares may be higher than those assuming no sale. This occurs when the sale would have produced a capital loss. The calculation assumes that the investor received a tax deduction for the loss.)
Please note that your actual after-tax returns will depend on your tax situation and may differ from those shown. Also note that if you own the fund in a tax-deferred account, such as an individual retirement account or a 401(k) plan, this information does not apply to you. Such accounts are not subject to current taxes.
Finally, keep in mind that a fund’s performance—whether before or after taxes—does not guarantee future results.
| | | |
| Average Annual Total Returns: Convertible Securities Fund | | | |
| Periods Ended November 30, 2013 | | | |
| | One | Five | Ten |
| | Year | Years | Years |
| Returns Before Taxes | 19.65% | 17.48% | 8.02% |
| Returns After Taxes on Distributions | 17.96 | 15.46 | 6.07 |
| Returns After Taxes on Distributions and Sale of Fund Shares | 12.04 | 13.47 | 5.78 |
32
About Your Fund’s Expenses
As a shareholder of the fund, you incur ongoing costs, which include costs for portfolio management, administrative services, and shareholder reports (like this one), among others. Operating expenses, which are deducted from a fund’s gross income, directly reduce the investment return of the fund.
A fund’s expenses are expressed as a percentage of its average net assets. This figure is known as the expense ratio. The following examples are intended to help you understand the ongoing costs (in dollars) of investing in your fund and to compare these costs with those of other mutual funds. The examples are based on an investment of $1,000 made at the beginning of the period shown and held for the entire period.
The accompanying table illustrates your fund’s costs in two ways:
• Based on actual fund return. This section helps you to estimate the actual expenses that you paid over the period. The ”Ending Account Value“ shown is derived from the fund‘s actual return, and the third column shows the dollar amount that would have been paid by an investor who started with $1,000 in the fund. You may use the information here, together with the amount you invested, to estimate the expenses that you paid over the period.
To do so, simply divide your account value by $1,000 (for example, an $8,600 account value divided by $1,000 = 8.6), then multiply the result by the number given for your fund under the heading ”Expenses Paid During Period.“
• Based on hypothetical 5% yearly return. This section is intended to help you compare your fund‘s costs with those of other mutual funds. It assumes that the fund had a yearly return of 5% before expenses, but that the expense ratio is unchanged. In this case—because the return used is not the fund’s actual return—the results do not apply to your investment. The example is useful in making comparisons because the Securities and Exchange Commission requires all mutual funds to calculate expenses based on a 5% return. You can assess your fund’s costs by comparing this hypothetical example with the hypothetical examples that appear in shareholder reports of other funds.
Note that the expenses shown in the table are meant to highlight and help you compare ongoing costs only and do not reflect transaction costs incurred by the fund for buying and selling securities. Further, the expenses do not include any purchase, redemption, or account service fees described in the fund prospectus. If such fees were applied to your account, your costs would be higher. Your fund does not carry a “sales load.”
The calculations assume no shares were bought or sold during the period. Your actual costs may have been higher or lower, depending on the amount of your investment and the timing of any purchases or redemptions.
You can find more information about the fund’s expenses, including annual expense ratios, in the Financial Statements section of this report. For additional information on operating expenses and other shareholder costs, please refer to your fund’s current prospectus.
33
| | | |
| Six Months Ended November 30, 2013 | | | |
| | Beginning | Ending | Expenses |
| | Account Value | Account Value | Paid During |
| Convertible Securities Fund | 5/31/2013 | 11/30/2013 | Period |
| Based on Actual Fund Return | $1,000.00 | $1,064.01 | $2.79 |
| Based on Hypothetical 5% Yearly Return | 1,000.00 | 1,022.36 | 2.74 |
The calculations are based on expenses incurred in the most recent six-month period. The fund’s annualized six-month expense ratio for that
period is 0.54%. The dollar amounts shown as “Expenses Paid” are equal to the annualized expense ratio multiplied by the average account
value over the period, multiplied by the number of days in the most recent six-month period, then divided by the number of days in the most
recent 12-month period.
34
Glossary
30-Day SEC Yield. A fund’s 30-day SEC yield is derived using a formula specified by the U.S. Securities and Exchange Commission. Under the formula, data related to the fund’s security holdings in the previous 30 days are used to calculate the fund’s hypothetical net income for that period, which is then annualized and divided by the fund’s estimated average net assets over the calculation period. For the purposes of this calculation, a security’s income is based on its current market yield to maturity (for bonds), its actual income (for asset-backed securities), or its projected dividend yield (for stocks). Because the SEC yield represents hypothetical annualized income, it will differ—at times significantly—from the fund’s actual experience. As a result, the fund’s income distributions may be higher or lower than implied by the SEC yield.
Average Coupon. The average interest rate paid on the fixed income securities held by a fund. It is expressed as a percentage of face value.
Average Duration. An estimate of how much the value of the bonds held by a fund will fluctuate in response to a change in interest rates. To see how the value could change, multiply the average duration by the change in rates. If interest rates rise by 1 percentage point, the value of the bonds in a fund with an average duration of five years would decline by about 5%. If rates decrease by a percentage point, the value would rise by 5%.
Average Weighted Maturity. The average length of time until fixed income securities held by a fund reach maturity and are repaid. The figure reflects the proportion of fund assets represented by each security.
Beta. A measure of the magnitude of a fund’s past share-price fluctuations in relation to the ups and downs of a given market index. The index is assigned a beta of 1.00. Compared with a given index, a fund with a beta of 1.20 typically would have seen its share price rise or fall by 12% when the index rose or fell by 10%. For this report, beta is based on returns over the past 36 months for both the fund and the index. Note that a fund’s beta should be reviewed in conjunction with its R-squared (see definition). The lower the R-squared, the less correlation there is between the fund and the index, and the less reliable beta is as an indicator of volatility.
Conversion Premium. The average percentage by which the weighted average market price of the convertible securities held by a fund exceeds the weighted average market price of their underlying common stocks. For example, if a stock is trading at $25 per share and a bond that is convertible into the stock is trading at a price equivalent to $30 per share of stock, the conversion premium is 20% ($5 ÷ $25 = 20%).
Credit Quality. For this report, credit-quality ratings are measured on a scale that generally ranges from AAA (highest) to D (lowest). “Not Rated” is used to classify securities for which a rating is not available. Credit-quality ratings are obtained from S&P.
Expense Ratio. A fund’s total annual operating expenses expressed as a percentage of the fund’s average net assets. The expense ratio includes management and administrative expenses, but does not include the transaction costs of buying and selling portfolio securities.
Foreign Holdings. The percentage of a fund represented by securities or depositary receipts of companies based outside the United States.
35
Inception Date. The date on which the assets of a fund (or one of its share classes) are first invested in accordance with the fund’s investment objective. For funds with a subscription period, the inception date is the day after that period ends. Investment performance is measured from the inception date.
Market Exposure. A measure that reflects a fund’s security investments excluding any holdings in short-term reserves.
R-Squared. A measure of how much of a fund’s past returns can be explained by the returns from the market in general, as measured by a given index. If a fund’s total returns were precisely synchronized with an index’s returns, its R-squared would be 1.00. If the fund’s returns bore no relationship to the index’s returns, its R-squared would be 0. For this report, R-squared is based on returns over the past 36 months for both the fund and the index.
Short-Term Reserves. The percentage of a fund invested in highly liquid, short-term securities that can be readily converted to cash.
Turnover Rate. An indication of the fund’s trading activity. Funds with high turnover rates incur higher transaction costs and may be more likely to distribute capital gains (which may be taxable to investors). The turnover rate excludes in-kind transactions, which have minimal impact on costs.
Benchmark Information
Convertibles Composite Index: CS First Boston Convertible Securities Index through November
30, 2004; Bank of America Merrill Lynch All US Convertibles Index (formerly Bank of America Merrill Lynch All Convertibles-All Qualities Index) through December 31, 2010; and 70% Bank of America Merrill Lynch All US Convertibles Index and 30% Bank of America Merrill Lynch Global 300 Convertibles ex-US Index (hedged) thereafter.
36
This page intentionally left blank.
This page intentionally left blank.
This page intentionally left blank.
The People Who Govern Your Fund
The trustees of your mutual fund are there to see that the fund is operated and managed in your best interests since, as a shareholder, you are a part owner of the fund. Your fund’s trustees also serve on the board of directors of The Vanguard Group, Inc., which is owned by the Vanguard funds and provides services to them on an at-cost basis.
A majority of Vanguard’s board members are independent, meaning that they have no affiliation with Vanguard or the funds they oversee, apart from the sizable personal investments they have made as private individuals. The independent board members have distinguished backgrounds in business, academia, and public service. Each of the trustees and executive officers oversees 181 Vanguard funds.
The following table provides information for each trustee and executive officer of the fund. More information about the trustees is in the Statement of Additional Information, which can be obtained, without charge, by contacting Vanguard at 800-662-7447, or online at vanguard.com.
| |
| InterestedTrustee1 | and Delphi Automotive LLP (automotive components); |
| | Senior Advisor at New Mountain Capital; Trustee of |
| F. William McNabb III | The Conference Board. |
| Born 1957. Trustee Since July 2009. Chairman of the | |
| Board. Principal Occupation(s) During the Past Five | Amy Gutmann |
| Years: Chairman of the Board of The Vanguard Group, | Born 1949. Trustee Since June 2006. Principal |
| Inc., and of each of the investment companies served | Occupation(s) During the Past Five Years: President |
| by The Vanguard Group, since January 2010; Director | of the University of Pennsylvania; Christopher H. |
| of The Vanguard Group since 2008; Chief Executive | Browne Distinguished Professor of Political Science |
| Officer and President of The Vanguard Group and of | in the School of Arts and Sciences with secondary |
| each of the investment companies served by The | appointments at the Annenberg School for |
| Vanguard Group since 2008; Director of Vanguard | Communication and the Graduate School of Education |
| Marketing Corporation; Managing Director of The | of the University of Pennsylvania; Member of the |
| Vanguard Group (1995–2008). | National Commission on the Humanities and Social |
| | Sciences; Trustee of Carnegie Corporation of New |
| IndependentTrustees | York and of the National Constitution Center; Chair |
| of the U.S. Presidential Commission for the Study |
| Emerson U. Fullwood | of Bioethical Issues. |
| Born 1948. Trustee Since January 2008. Principal | |
| Occupation(s) During the Past Five Years: Executive | JoAnn Heffernan Heisen |
| Chief Staff and Marketing Officer for North America | Born 1950. Trustee Since July 1998. Principal |
| and Corporate Vice President (retired 2008) of Xerox | Occupation(s) During the Past Five Years: Corporate |
| Corporation (document management products and | Vice President and Chief Global Diversity Officer |
| services); Executive in Residence and 2010 | (retired 2008) and Member of the Executive |
| Distinguished Minett Professor at the Rochester | Committee (1997–2008) of Johnson & Johnson |
| Institute of Technology; Director of SPX Corporation | (pharmaceuticals/medical devices/consumer |
| (multi-industry manufacturing), the United Way of | products); Director of Skytop Lodge Corporation |
| Rochester, Amerigroup Corporation (managed health | (hotels), the University Medical Center at Princeton, |
| care), the University of Rochester Medical Center, | the Robert Wood Johnson Foundation, and the Center |
| Monroe Community College Foundation, and North | for Talent Innovation; Member of the Advisory Board |
| Carolina A&T University. | of the Maxwell School of Citizenship and Public Affairs |
| | at Syracuse University. |
| Rajiv L. Gupta | |
| Born 1945. Trustee Since December 2001.2 | F. Joseph Loughrey |
| Principal Occupation(s) During the Past Five Years: | Born 1949. Trustee Since October 2009. Principal |
| Chairman and Chief Executive Officer (retired 2009) | Occupation(s) During the Past Five Years: President |
| and President (2006–2008) of Rohm and Haas Co. | and Chief Operating Officer (retired 2009) of Cummins |
| (chemicals); Director of Tyco International, Ltd. | Inc. (industrial machinery); Chairman of the Board of |
| (diversified manufacturing and services), Hewlett- | Hillenbrand, Inc. (specialized consumer services) and |
| Packard Co. (electronic computer manufacturing), | of Oxfam America; Director of SKF AB (industrial |
| | |
| machinery), Hyster-Yale Materials Handling, Inc. | Executive Officers | |
| (forklift trucks), and the Lumina Foundation for | | |
| Education; Member of the Advisory Council for the | Glenn Booraem | |
| College of Arts and Letters and of the Advisory Board | Born 1967. Controller Since July 2010. Principal |
| to the Kellogg Institute for International Studies, both | Occupation(s) During the Past Five Years: Principal |
| at the University of Notre Dame. | of The Vanguard Group, Inc.; Controller of each of |
| | the investment companies served by The Vanguard |
| Mark Loughridge | Group; Assistant Controller of each of the investment |
| Born 1953. Trustee Since March 2012. Principal | companies served by The Vanguard Group (2001–2010). |
| Occupation(s) During the Past Five Years: Senior Vice | | |
| President and Chief Financial Officer at IBM (information | Thomas J. Higgins | |
| technology services); Fiduciary Member of IBM’s | Born 1957. Chief Financial Officer Since September |
| Retirement Plan Committee. | 2008. Principal Occupation(s) During the Past Five |
| | Years: Principal of The Vanguard Group, Inc.; Chief |
| Scott C. Malpass | Financial Officer of each of the investment companies |
| Born 1962. Trustee Since March 2012. Principal | served by The Vanguard Group; Treasurer of each of |
| Occupation(s) During the Past Five Years: Chief | the investment companies served by The Vanguard |
| Investment Officer and Vice President at the University | Group (1998–2008). | |
| of Notre Dame; Assistant Professor of Finance at the | | |
| Mendoza College of Business at Notre Dame; Member | Kathryn J. Hyatt | |
| of the Notre Dame 403(b) Investment Committee; | Born 1955. Treasurer Since November 2008. Principal |
| Director of TIFF Advisory Services, Inc. (investment | Occupation(s) During the Past Five Years: Principal of |
| advisor); Member of the Investment Advisory | The Vanguard Group, Inc.; Treasurer of each of the |
| Committees of the Financial Industry Regulatory | investment companies served by The Vanguard |
| Authority (FINRA) and of Major League Baseball. | Group; Assistant Treasurer of each of the investment |
| | companies served by The Vanguard Group (1988–2008). |
| André F. Perold | | |
| Born 1952. Trustee Since December 2004. Principal | Heidi Stam | |
| Occupation(s) During the Past Five Years: George | Born 1956. Secretary Since July 2005. Principal |
| Gund Professor of Finance and Banking at the Harvard | Occupation(s) During the Past Five Years: Managing |
| Business School (retired 2011); Chief Investment | Director of The Vanguard Group, Inc.; General Counsel |
| Officer and Managing Partner of HighVista Strategies | of The Vanguard Group; Secretary of The Vanguard |
| LLC (private investment firm); Director of Rand | Group and of each of the investment companies |
| Merchant Bank; Overseer of the Museum of Fine | served by The Vanguard Group; Director and Senior |
| Arts Boston. | Vice President of Vanguard Marketing Corporation. |
| |
| Alfred M. Rankin, Jr. | | |
| | Vanguard Senior ManagementTeam |
| Born 1941. Trustee Since January 1993. Principal | | |
| Occupation(s) During the Past Five Years: Chairman, | Mortimer J. Buckley | Chris D. McIsaac |
| President, and Chief Executive Officer of NACCO | Kathleen C. Gubanich | Michael S. Miller |
| Industries, Inc. (housewares/lignite) and of Hyster-Yale | Paul A. Heller | James M. Norris |
| Materials Handling, Inc. (forklift trucks); Director of | Martha G. King | Glenn W. Reed |
| the National Association of Manufacturers; Chairman | John T. Marcante | |
| of the Board of University Hospitals of Cleveland; | | |
| Advisory Chairman of the Board of The Cleveland | Chairman Emeritus and Senior Advisor |
| Museum of Art. | |
| | John J. Brennan | |
| Peter F. Volanakis | Chairman, 1996–2009 | |
| Born 1955. Trustee Since July 2009. Principal | Chief Executive Officer and President, 1996–2008 |
| Occupation(s) During the Past Five Years: President | | |
| and Chief Operating Officer (retired 2010) of Corning | | |
| Incorporated (communications equipment); Director | Founder | |
| of SPX Corporation (multi-industry manufacturing); | John C. Bogle | |
| Overseer of the Amos Tuck School of Business | Chairman and Chief Executive Officer, 1974–1996 |
| Administration at Dartmouth College; Advisor to the | |
| Norris Cotton Cancer Center. | | |
1 Mr. McNabb is considered an “interested person,” as defined in the Investment Company Act of 1940, because he is an officer of the
Vanguard funds.
2 December 2002 for Vanguard Equity Income Fund, Vanguard Growth Equity Fund, the Vanguard Municipal Bond Funds, and the Vanguard
State Tax-Exempt Funds.
|  |
| | P.O. Box 2600 |
| | Valley Forge, PA 19482-2600 |
| |
| |
| |
| Connect with Vanguard® > vanguard.com | |
| |
| |
| |
| Fund Information > 800-662-7447 | CFA® is a trademark owned by CFA Institute. |
| Direct Investor Account Services > 800-662-2739 | |
| Institutional Investor Services > 800-523-1036 | |
| Text Telephone for People | |
| With Hearing Impairment > 800-749-7273 | |
| |
| This material may be used in conjunction | |
| with the offering of shares of any Vanguard | |
| fund only if preceded or accompanied by | |
| the fund’s current prospectus. | |
| |
| All comparative mutual fund data are from Lipper, a | |
| Thomson Reuters Company, or Morningstar, Inc., unless | |
| otherwise noted. | |
| |
| You can obtain a free copy of Vanguard’s proxy voting | |
| guidelines by visiting vanguard.com/proxyreporting or by | |
| calling Vanguard at 800-662-2739. The guidelines are | |
| also available from the SEC’s website, sec.gov. In | |
| addition, you may obtain a free report on how your fund | |
| voted the proxies for securities it owned during the 12 | |
| months ended June 30. To get the report, visit either | |
| vanguard.com/proxyreporting or sec.gov. | |
| |
| You can review and copy information about your fund at | |
| the SEC’s Public Reference Room in Washington, D.C. To | |
| find out more about this public service, call the SEC at | |
| 202-551-8090. Information about your fund is also | |
| available on the SEC’s website, and you can receive | |
| copies of this information, for a fee, by sending a | |
| request in either of two ways: via e-mail addressed to | |
| publicinfo@sec.gov or via regular mail addressed to the | |
| Public Reference Section, Securities and Exchange | |
| Commission, Washington, DC 20549-1520. | |
| |
| | © 2014 The Vanguard Group, Inc. |
| | All rights reserved. |
| | Vanguard Marketing Corporation, Distributor. |
| |
| | Q820 012014 |
Item 2: Code of Ethics. The Registrant has adopted a code of ethics that applies to the Registrant’s principal executive officer, principal financial officer, principal accounting officer or controller or persons performing similar functions. The Code of Ethics was amended during the reporting period covered by this report to make certain technical, non-material changes.
Item 3: Audit Committee Financial Expert. The following members of the Audit Committee have been determined by the Registrant’s Board of Trustees to be Audit Committee Financial Experts serving on its Audit Committee, and to be independent: Rajiv L. Gupta, Amy Gutmann, JoAnn Heffernan Heisen, F. Joseph Loughrey, Mark Loughridge, Scott C. Malpass, André F. Perold, and Alfred M. Rankin, Jr.
Item 4: Principal Accountant Fees and Services.
(a) Audit Fees.
Audit Fees of the Registrant
Fiscal Year Ended November 30, 2013: $37,000
Fiscal Year Ended November 30, 2012: $36,000
Aggregate Audit Fees of Registered Investment Companies in the Vanguard Group.
Fiscal Year Ended November 30, 2013: $5,714,113
Fiscal Year Ended November 30, 2012: $4,809,780
Includes fees billed in connection with audits of the Registrant and other registered investment companies in the Vanguard complex. Also includes fees billed in connection with audits of The Vanguard Group, Inc. and Vanguard Marketing Corporation for Fiscal Year Ended November 30, 2013.
(b) Audit-Related Fees.
Fiscal Year Ended November 30, 2013: $1,552,950
Fiscal Year Ended November 30, 2012: $1,812,565
Includes fees billed in connection with assurance and related services provided to the Registrant, other registered investment companies in the Vanguard complex, The Vanguard Group, Inc., and Vanguard Marketing Corporation.
(c) Tax Fees.
Fiscal Year Ended November 30, 2013: $110,000
Fiscal Year Ended November 30, 2012: $490,518
Includes fees billed in connection with tax compliance, planning, and advice services provided to the Registrant, other registered investment companies in the Vanguard complex, The Vanguard Group, Inc., and Vanguard Marketing Corporation. Also includes fees billed in connection with certain tax services related to audits of the Registrant and other registered investment companies in the Vanguard complex for Fiscal Year Ended November 30, 2012.
(d) All Other Fees.
Fiscal Year Ended November 30, 2013: $132,000
Fiscal Year Ended November 30, 2012: $16,000
Includes fees billed for services related to tax reported information provided to the Registrant, other registered investment companies in the Vanguard complex, The Vanguard Group, Inc., and Vanguard Marketing Corporation.
(e) (1) Pre-Approval Policies. The policy of the Registrant’s Audit Committee is to consider and, if appropriate, approve before the principal accountant is engaged for such services, all specific audit and non-audit services provided to: the Registrant, other registered investment companies in the Vanguard complex, The Vanguard Group, Inc., and entities controlled by The Vanguard Group, Inc. that provide ongoing services to the Registrant. In making a determination, the Audit Committee considers whether the services are consistent with maintaining the principal accountant’s independence.
In the event of a contingency situation in which the principal accountant is needed to provide services in between scheduled Audit Committee meetings, the Chairman of the Audit Committee would be called on to consider and, if appropriate, pre-approve audit or permitted non-audit services in an amount sufficient to complete services through the next Audit Committee meeting, and to determine if such services would be consistent with maintaining the accountant’s independence. At the next scheduled Audit Committee meeting, services and fees would be presented to the Audit Committee for formal consideration, and, if appropriate, approval by the entire Audit Committee. The Audit Committee would again consider whether such services and fees are consistent with maintaining the principal accountant’s independence.
The Registrant’s Audit Committee is informed at least annually of all audit and non-audit services provided by the principal accountant to the Vanguard complex, whether such services are provided to: the Registrant, other registered investment companies in the Vanguard complex, The Vanguard Group, Inc., or other entities controlled by The Vanguard Group, Inc. that provide ongoing services to the Registrant.
(2) No percentage of the principal accountant’s fees or services were approved pursuant to the waiver provision of paragraph (c)(7)(i)(C) of Rule 2-01 of Regulation S-X.
(f) For the most recent fiscal year, over 50% of the hours worked under the principal accountant’s engagement were not performed by persons other than full-time, permanent employees of the principal accountant.
(g) Aggregate Non-Audit Fees.
Fiscal Year Ended November 30, 2013: $242,000
Fiscal Year Ended November 30, 2012: $506,518
Includes fees billed for non-audit services provided to the Registrant, other registered investment companies in the Vanguard complex, The Vanguard Group, Inc., and Vanguard Marketing Corporation.
(h) For the most recent fiscal year, the Audit Committee has determined that the provision of all non-audit services was consistent with maintaining the principal accountant’s independence.
Item 5: Audit Committee of Listed Registrants.
Not Applicable.
Item 6: Investments.
Not Applicable.
Item 7: Disclosure of Proxy Voting Policies and Procedures for Closed-End Management
Investment Companies.
Not Applicable.
Item 8: Portfolio Managers of Closed-End Management Investment Companies.
Not Applicable.
Item 9: Purchase of Equity Securities by Closed-End Management Investment Company and
Affiliated Purchasers.
Not Applicable.
Item 10: Submission of Matters to a Vote of Security Holders.
Not Applicable.
Item 11: Controls and Procedures.
(a) Disclosure Controls and Procedures. The Principal Executive and Financial Officers concluded that the Registrant’s Disclosure Controls and Procedures are effective based on their evaluation of the Disclosure Controls and Procedures as of a date within 90 days of the filing date of this report.
(b) Internal Control Over Financial Reporting. There were no significant changes in Registrant’s Internal Control Over Financial Reporting or in other factors that could significantly affect this control subsequent to the date of the evaluation, including any corrective actions with regard to significant deficiencies and material weaknesses.
Item 12: Exhibits.
(a) Code of Ethics.
(b) Certifications.
Pursuant to the requirements of the Securities Exchange Act of 1934 and the Investment Company Act of 1940, the registrant has duly caused this report to be signed on its behalf by the undersigned, thereunto duly authorized.
| |
| | VANGUARD CONVERTIBLE SECURITIES FUND |
| |
| |
| BY: | /s/ F. WILLIAM MCNABB III* |
| | F. WILLIAM MCNABB III |
| | CHIEF EXECUTIVE OFFICER |
| |
| Date: January 21, 2014 |
Pursuant to the requirements of the Securities Exchange Act of 1934 and the Investment Company Act of 1940, this report has been signed below by the following persons on behalf of the registrant and in the capacities and on the dates indicated.
| |
| | VANGUARD CONVERTIBLE SECURITIES FUND |
| |
BY: | /s/ F. WILLIAM MCNABB III* |
| | F. WILLIAM MCNABB III |
| | CHIEF EXECUTIVE OFFICER |
Date: January 21, 2014 |
| VANGUARD CONVERTIBLE SECURITIES FUND |
| |
BY: | /s/ THOMAS J. HIGGINS* |
| | THOMAS J. HIGGINS |
| | CHIEF FINANCIAL OFFICER |
Date: January 21, 2014 |
* By: /s/ Heidi Stam
Heidi Stam, pursuant to a Power of Attorney filed on March 27, 2012 see file Number 2-11444, Incorporated by Reference.