UNITED STATES
SECURITIES AND EXCHANGE COMMISSION
Washington, D.C. 20549
FORM N-CSR
CERTIFIED SHAREHOLDER REPORT
OF
REGISTERED MANAGEMENT INVESTMENT COMPANIES
| | |
| Investment Company Act file number: | 811-04627 |
Name of Registrant: | Vanguard Convertible Securities Fund |
Address of Registrant: | P.O. Box 2600 |
| | Valley Forge, PA 19482 |
Name and address of agent for service: | Anne E. Robinson, Esquire |
| | P.O. Box 876 |
| | Valley Forge, PA 19482 |
Registrant’s telephone number, including area code: (610) 669-1000 |
Date of fiscal year end: November 30 | |
Date of reporting period: December 1, 2015 – November 30, 2016 |
Item 1: Reports to Shareholders | |
Annual Report | November 30, 2016
Vanguard Convertible Securities Fund
A new format, unwavering commitment
As you begin reading this report, you’ll notice that we’ve made some improvements
to the opening sections—based on feedback from you, our clients.
Page 1 starts with a new ”Your Fund’s Performance at a Glance,” a concise, handy
summary of how your fund performed during the period.
In the renamed ”Chairman’s Perspective,” Bill McNabb will focus on enduring
principles and investment insights.
We’ve modified some tables, and eliminated some redundancy, but we haven’t
removed any information.
At Vanguard, we’re always looking for better ways to communicate and to help you
make sound investment decisions. Thank you for entrusting your assets to us.
| |
| Contents | |
| Your Fund’s Performance at a Glance. | 1 |
| Chairman’s Perspective. | 3 |
| Advisor’s Report. | 7 |
| Fund Profile. | 11 |
| Performance Summary. | 13 |
| Financial Statements. | 15 |
| Your Fund’s After-Tax Returns. | 30 |
| About Your Fund’s Expenses. | 31 |
| Glossary. | 33 |
Please note: The opinions expressed in this report are just that—informed opinions. They should not be considered promises or advice.
Also, please keep in mind that the information and opinions cover the period through the date on the front of this report. Of course, the
risks of investing in your fund are spelled out in the prospectus.
See the Glossary for definitions of investment terms used in this report.
About the cover: No matter what language you speak, Vanguard has one consistent message and set of principles. Our primary
focus is on you, our clients. We conduct our business with integrity as a faithful steward of your assets. This message is shown
translated into seven languages, reflecting our expanding global presence.
Your Fund’s Performance at a Glance
• Vanguard Convertible Securities Fund provides investors exposure to corporate bonds
and preferred stocks that can be exchanged for common stocks at a predetermined price.
• For the 12 months ended November 30, 2016, the Convertible Securities Fund
returned 3.11%. The fund trailed both its benchmark and the average return of its peers.
• Limited exposure to higher-risk preferred stocks weighed on the fund’s performance
relative to its benchmark.
• Although the fund invests primarily in U.S. convertibles, about a third of its assets
are in international securities. Broadening the fund’s mandate over the years to include
international securities has enhanced its diversification.
• Please note that Jean-Paul Nedelec, co-portfolio manager of the fund’s non-U.S.
securities, retired from Oaktree Capital Management, the fund’s advisor, at the end
of 2016. We are grateful for his leadership and tremendous contribution to the fund’s
international strategy since 2010.
| |
| Total Returns: Fiscal Year Ended November 30, 2016 | |
| | Total |
| | Returns |
| Vanguard Convertible Securities Fund | 3.11% |
| Convertibles Composite Index | 4.62 |
| Convertible Securities Funds Average | 4.41 |
| For a benchmark description, see the Glossary. | |
| Convertible Securities Funds Average: Derived from data provided by Lipper, a Thomson Reuters Company. | |
| |
| Total Returns: Ten Years Ended November 30, 2016 | |
| | Average |
| | Annual Return |
| Convertible Securities Fund | 5.89% |
| Convertibles Composite Index | 5.81 |
| Convertible Securities Funds Average | 5.17 |
| For a benchmark description, see the Glossary. | |
| Convertible Securities Funds Average: Derived from data provided by Lipper, a Thomson Reuters Company. | |
The figures shown represent past performance, which is not a guarantee of future results. (Current performance may be
lower or higher than the performance data cited. For performance data current to the most recent month-end, visit our
website at vanguard.com/performance.) Note, too, that both investment returns and principal value can fluctuate widely, so
an investor’s shares, when sold, could be worth more or less than their original cost.
1
| | |
| Expense Ratios | | |
| Your Fund Compared With Its Peer Group | | |
| | | Peer Group |
| | Fund | Average |
| Convertible Securities Fund | 0.38% | 1.30% |
The fund expense ratio shown is from the prospectus dated March 29, 2016, and represents estimated costs for the current fiscal year. For
the fiscal year ended November 30, 2016, the fund’s expense ratio was 0.3 %. This decrease from the estimated expense ratio reflects a
performance-based investment advisory fee adjustment. When the performance adjustment is positive, the fund’s expenses increase; when
it is negative, expenses decrease. The peer-group expense ratio is derived from data provided by Lipper, a Thomson Reuters Company, and
captures information through year-end 2015.
Peer group: Convertible Securities Funds.
2
Chairman’s Perspective

Bill McNabb
Chairman and Chief Executive Officer
Dear Shareholder,
If you’re like most investors, a big question on your mind is: What’s in store for the markets and the economy in 2017?
At Vanguard, we’re just as curious about the immediate future. But our curiosity is tempered by our belief that forecasts should give a range of possible outcomes, not pinpoint predictions. After all, there are bound to be occurrences the experts won’t see coming.
What really matters for investors
In 2016, we saw two cases in point: The United Kingdom’s June vote to exit the European Union and the November election of Donald Trump as U.S. president. Both unexpected outcomes triggered swift market reactions. But despite some short-term volatility, the markets’ 12-month performance as of November 30, 2016, proved to be less dramatic. U.S. stocks and bonds posted returns close to their long-term averages. International stocks and bonds also advanced, although returns for U.S. investors were reduced by the strength of the U.S. dollar.
The surprises of 2016 remind us to be skeptical of overly precise short-term predictions about 2017. At the cusp of a new year, market prognosticators forecast where the Standard & Poor’s 500 Index or the yield on the 10-year Treasury note will end up in 12 months. Such predictions can be attention-getting. They can also be dead wrong.
3
Investors are better off taking note of long-term trends that stand to influence our economies and markets. We’re watching these trends closely, and we discuss our latest assessment in our 2017 economic and market outlook, which you can read at vanguard.com/research.
Our global economic outlook: Expect stabilization, not stagnation
One phenomenon in particular that we’re watching is the low-growth, low-interest-rate environment that has marked the global economy since the 2008–09 financial crisis. We don’t think this economic backdrop is simply the result of cyclically weak demand or long-term stagnation. Instead, certain structural forces are contributing: Falling technology costs are restraining the amounts businesses are spending on capital investment, an aging population is weighing on growth in the developed world, and the free movement of capital and products across the globe has restrained prices and wages.
In the near term, these forces will continue to dampen growth, inflation, and interest rates. They also make it unlikely that further monetary stimulus from central banks will do much to spur growth.
I realize this all may sound gloomy, but that’s not how we see it. We expect global growth to stabilize at more modest levels, not stagnate. The world isn’t headed for Japanese-style deflation, in which a widespread sustained drop in prices puts economic activity into hibernation.
| | | |
| Market Barometer | | | |
| | Average Annual Total Returns |
| | Periods Ended November 30, 2016 |
| | One | Three | Five |
| | Year | Years | Years |
| Stocks | | | |
| Russell 1000 Index (Large-caps) | 8.01% | 8.88% | 14.45% |
| Russell 2000 Index (Small-caps) | 12.08 | 6.45 | 13.98 |
| Russell 3000 Index (Broad U.S. market) | 8.31 | 8.68 | 14.41 |
| FTSE All-World ex US Index (International) | 0.26 | -1.76 | 4.71 |
| |
| Bonds | | | |
| Bloomberg Barclays U.S. Aggregate Bond Index | | | |
| (Broad taxable market) | 2.17% | 2.79% | 2.43% |
| Bloomberg Barclays Municipal Bond Index | | | |
| (Broad tax-exempt market) | -0.22 | 3.64 | 3.43 |
| Citigroup Three-Month U.S. Treasury Bill Index | 0.25 | 0.08 | 0.07 |
| |
| CPI | | | |
| Consumer Price Index | 1.69% | 1.17% | 1.30% |
4
In fact, we believe that global growth could pick up modestly over time. Our expectation is based on a potential rebound in productivity as new digital technologies are used more effectively. We also anticipate a slight recovery in the labor force as the baby boom generation finishes its transition to retirement, nudging up demand for workers.
Put expansion in perspective
Looking to the United States, the world’s largest economy remains firmly on a long-term-growth path of about 2% per year. That’s lower than the historical average of 3.25% since 1950. We see such growth at this level as fundamentally sound, rather than abnormally low. Our evaluation takes into account lower U.S. population growth and the reality that the economic expansion from the 1980s until the financial crisis was fueled by debt, distorting the numbers.
Turning to prices, we think that core U.S. inflation should modestly exceed 2% in 2017. That, in turn, will support further interest rate hikes by the Federal Reserve, similar to the one at the end of 2016.
We expect the Fed to raise rates in 2017 before taking an extended pause, and we see the federal funds rate staying below 2% through at least 2018.
Prepare for muted returns
And what about prospects for the markets? Vanguard’s outlook for global stocks and bonds remains the most guarded in ten years, given fairly high stock valuations
| Expect more modest returns, rely on time-tested principles |
| |
| In Vanguard’s economic and market outlook for 2017, Global Chief Economist Joseph Davis |
| and his team offer a projection of more modest returns from the global stock and bond |
| markets. They caution that, over the next decade, returns for a balanced portfolio are likely |
| to be moderately below long-run historical averages. |
| |
| The team’s simulations indicate that for the decade ending in 2026, the average annualized |
| return of a 60% stock/40% bond portfolio is likely to be centered in the 3%–5% range after |
| inflation. That’s below the actual average after-inflation return of 6% for the same portfolio |
| for the nine decades since 1926. |
| |
| Ultimately, our global market outlook points toward a somewhat more challenging environment, |
| yet one in which, over time, investors with an appropriate level of discipline, diversification, and |
| patience are likely to be rewarded with reasonable inflation-adjusted returns. |
| |
| For more information about our expectations and the probability of various outcomes, see 2017 |
| Economic and Market Outlook: Stabilization, Not Stagnation, available at vanguard.com/research. |
IMPORTANT: The projections and other information generated by the Vanguard Capital Markets Model® (VCMM)
regarding the likelihood of various investment outcomes are hypothetical in nature, do not reflect actual investment
results, and are not guarantees of future results. Distribution of return outcomes from the VCMM are derived
from 10,000 simulations for each modeled asset class. Simulations as of September 30, 2016. Results from the
model may vary with each use and over time. For more information, see page 6.
5
and the low-interest-rate environment. We don’t expect global bond yields to increase materially from year-end 2016 levels.
Our outlook for global equities is annualized returns of 5%–8% over the next decade. This outlook isn’t bearish, but is actually fairly positive when you take into account the current low-rate environment. (See the box on page 5 for more.)
Focus on the four keys to investment success
Significant trends often happen gradually. Like shifting tides, they’re sometimes barely noticeable at first but ultimately can change the landscape entirely. Other times, apparent trends can end up receding before they have much of a long-term impact. Given the future’s inherent unpredictability, it’s not reasonable to expect a surefire block-buster revelation from any prognosticator or investment firm.
What to conclude, then? No matter what scenario plays out, we believe investors have the best chance for success if they stay focused on what they can control: their goals, asset allocation, and investment costs, along with the discipline to stick to a plan. As Tim Buckley, our chief investment officer, likes to say, this can be easy to say but harder to do, especially in times of uncertainty. Investors who can stay focused on those four keys will find themselves well-positioned to weather any market.
As always, thank you for investing with Vanguard.
Sincerely,

F. William McNabb III
Chairman and Chief Executive Officer
December 12, 2016
IMPORTANT: The projections and other information generated by the Vanguard Capital Markets Model regarding
the likelihood of various investment outcomes are hypothetical in nature, do not reflect actual investment results,
and are not guarantees of future results. VCMM results will vary with each use and over time.
The VCMM projections are based on a statistical analysis of historical data. Future returns may behave differently from the
historical patterns captured in the VCMM. More important, the VCMM may be underestimating extreme negative scenarios
unobserved in the historical period on which the model estimation is based.
The VCMM is a proprietary financial simulation tool developed and maintained by Vanguard’s Investment Strategy Group.
The model forecasts distributions of future returns for a wide array of broad asset classes. Those asset classes include U.S.
and international equity markets, several maturities of the U.S. Treasury and corporate fixed income markets, international
fixed income markets, U.S. money markets, commodities, and certain alternative investment strategies. The theoretical and
empirical foundation for the Vanguard Capital Markets Model is that the returns of various asset classes reflect the compensation
investors require for bearing different types of systematic risk (beta). At the core of the model are estimates of the dynamic
statistical relationship between risk factors and asset returns, obtained from statistical analysis based on available monthly
financial and economic data. Using a system of estimated equations, the model then applies a Monte Carlo simulation method
to project the estimated interrelationships among risk factors and asset classes as well as uncertainty and randomness over
time. The model generates a large set of simulated outcomes for each asset class over several time horizons. Forecasts are
obtained by computing measures of central tendency in these simulations. Results produced by the tool will vary with each
use and over time.
6
Advisor’s Report
The investment strategy of Vanguard Convertible Securities Fund is to create a highly diversified global portfolio of convertible securities. The fund emphasizes investments in convertible bonds with relatively near-term maturities or put dates. We focus on “balanced” convertibles,
where the securities have a reasonable yield and stable credit quality, good call protection, and low to moderate conversion premiums. We believe these securities have a favorable balance of upside potential and downside risk. The fund underweights convertible preferred
| |
| Major Portfolio Changes | |
| Fiscal Year Ended November 30, 2016 | |
| |
| Additions | Comments |
| Inphi | Balanced convertibles with attractive growth profile. Realized profit |
| (1.125% convertible note due 12/01/20) | on the old issue and rotated into the more balanced new issue. |
| (0.75% convertible note due 09/01/21) | |
| Micron Technology | Balanced convertible with strong equity catalysts. |
| (3.00% convertible note due 11/15/43) | |
| SanDisk | Balanced convertible with limited downside and attractive upside |
| (0.50% convertible note due 10/15/20) | participation. |
| Semiconductor Manufacturing | Balanced convertible with limited downside risk and attractive equity |
| (0.00% convertible note due 07/07/22) | story. |
| Starwood Property Trust | Balanced convertibles with limited downside and attractive upside |
| (4.55% convertible note due 03/01/18) | participation. |
| (4.00% convertible note due 01/15/19) | |
| Steinhoff International | Acted on temporary weakness to add this balanced convertible. |
| (1.25% convertible note due 08/11/22) | |
| |
| Reductions | Comments |
| Criteria Caixa (ex. CaixaBank) | Sold bond as it lost its optionality and lacked a balanced profile. |
| (1.00% convertible note due 11/25/17) | |
| Red Hat | Sold out of position as bonds lacked a balanced profile. |
| (0.25% convertible note due 10/01/19) | |
| SanDisk | Sold after acquisition by Western Digital received shareholder |
| (0.50% convertible note due 10/15/20) | approval. |
| Terumo | Sold position after it appreciated materially and lacked downside |
| (0.00% convertible note due 12/06/21) | protection. |
| WebMD | Sold as bonds lacked a balanced profile. |
| (2.50% convertible note due 01/31/18) | |
| (1.50% convertible note due 12/01/20) | |
| (2.625% convertible note due 06/15/23) | |
| Wright Medical Group | Swapped into the more balanced new issue and realized profits in |
| (2.00% convertible note due 02/15/20) | the new issue after the bonds were no longer balanced. |
| (2.25% convertible note due 11/15/21) | |
7
shares, which are riskier but may offer higher returns. We do, however, consider them part of our investable universe and make some use of them.
Importantly, the fund does not invest in common stocks or nonconvertible debt. We do not attempt market-timing and therefore are fully invested, holding only a small amount of cash for potential investments. We believe that a portfolio of attractive, carefully selected convertible securities can produce equity-type returns with lower volatility and lower structural risk over long periods.
We are pleased to report that despite volatile market conditions, the fund returned 3.11% for the 12 months ended November 30, 2016. Convertible securities participated in the strength of underlying equities during market rallies, while providing downside protection during periods of volatility.
The fund underperformed the 4.62% return of its blended benchmark (70% Bank of America Merrill Lynch All US Convertibles Index and 30% Bank of America Merrill Lynch Global 300 Convertibles ex-US Index [hedged]).
The investment environment
Equities declined and credit spreads widened during the first three months of the period before reversing course. The rally was sparked by a combination of factors: the European Central Bank’s decision in early February to increase the size and scope of its quantitative easing program, the Federal Reserve’s dovish comments about the anticipated number of interest rate increases in 2016, rising energy and commodity prices, and capital flows into the high-yield bond market.
Through most of the second quarter, the market continued to move higher, and volatility was dampened. Financial markets pulled back sharply immediately after the United Kingdom’s June 23 Brexit vote, but they quickly bounced back and reached new highs by mid-July. Equity and corporate credit markets rallied sharply higher during the third quarter as investors moved past the Brexit vote and shifted their focus to corporate earnings and to a search in July and August for higher-yielding securities.
Modest gains continued into September as the markets digested policy announcements from a number of central banks. Investors also focused in September on uncertainty created by the U.S. presidential election campaign, by fallout from the Brexit result, and by Italy’s pending constitutional referendum. This uncertainty led the markets to decline in October, only to rebound in November after Donald Trump won the election.
The fund remains highly sensitive to underlying equity performance as a result of convertible bonds’ historically low coupons in the current interest rate environment. The portfolio remains structurally conservative, with short-to intermediate-term bonds—defined as bonds with maturities or puts within
8
seven years—accounting for 92% of investments. Convertible preferred shares constitute almost 4% of the portfolio, a significant underweight versus the index. We are comfortable with our current portfolio construction, with its balance between equity participation and the downside protection provided by the fixed income component.
The new-issue market maintained the lackluster pace we saw in the second half of 2015. Issuance totaled $79.8 billion for the period, with the largest share of the supply ($38.5 billion) coming from the United States. Europe provided $28.1 billion in new deals, and Asia and Japan provided a combined $13.2 billion. Although we are disappointed in the volume of issuance, the recent rise in medium-term U.S. interest rates makes us optimistic that levels will pick up in the coming year.
Our successes
The portfolio’s sources of return were broad-based. Top absolute contributors to performance were convertibles issued by Cemex, SAB, WPX Energy, and Microchip Technology. By industry, our security selection in pharmaceuticals generated strong returns for the fund relative to the benchmark.
Our shortfalls
Although we trailed the benchmark for the 12 months, we are satisfied with our performance given our strategy of focusing on balanced convertibles. Our chief detractors were LinkedIn, which reported slower-than-expected growth, and Scorpio Tankers, which weakened amid concerns of oversupply in the oil product tanker market. By industry, our holdings in semiconductor firms hurt relative performance.
The fund’s positioning
We remain fully invested in a highly diversified, well-balanced portfolio of convertible securities. At the end of the period, 66% of the fund’s investments were in U.S.-based companies and the rest outside the United States. The fund had an attractive current yield of 2.0% and an average credit quality of Ba3/BB–. The vast majority of issuers in the fund are performing well and, importantly, enjoy good to strong credit fundamentals.
Mandatory convertible preferred securities dominated the U.S. new-issue market during the period. This structure was often used by acquisition-oriented companies implementing an equity-like financing package that credit agencies would treat favorably (but that would not protect holders in case of equity declines). Convertible preferred securities, though higher-yielding and traditionally from larger-capitalization issuers, provide less downside protection than our favored structure of intermediate-term bonds. Relative to the benchmark, we remain underweighted in convertible preferreds.
By maintaining our portfolio construction discipline on issuers that are balanced between equity participation and the downside protection provided by the fixed income component, the fund should perform relatively well in volatile equity markets.
9
The market outlook
Our outlook remains cautiously constructive. Demand for new issuance has remained strong, as market participants seek balanced paper. Our analysts continue to focus heavily on underlying credit fundamentals, as this component of the valuation protects us in a volatile equity market.
We note that over the past 20 years, convertibles have performed well when intermediate-term interest rates are rising. Therefore, we continue to believe that a portfolio of convertible securities that uses Oaktree’s investment approach (with its emphasis on minimizing losses during bad times, while participating in a meaningful part of the stock market’s appreciation) is a strategic means of generating equity-market-type returns with about two-thirds of its volatility.
Stu Spangler, CFA, Managing Director
Jean-Paul Nedelec, Managing Director
Abe Ofer, Managing Director
Jean-Pierre Latrille, Senior Vice President
Petar Raketic, Senior Vice President
Oaktree Capital Management, L.P.
December 19, 2016
10
Convertible Securities Fund
Fund Profile
As of November 30, 2016
| |
| Portfolio Characteristics | |
| Ticker Symbol | VCVSX |
| Number of Securities | 169 |
| 30-Day SEC Yield | 1.97% |
| Conversion Premium | 39.1% |
| Average Weighted Maturity | 4.4 years |
| Average Coupon | 2.2% |
| Average Duration | 4.1 years |
| Foreign Holdings | 33.9% |
| Turnover Rate | 103% |
| Expense Ratio1 | 0.38% |
| Short-Term Reserves | 0.7% |
| |
| |
| Distribution by Maturity | |
| (% of fixed income portfolio) | |
| Under 1 Year | 1.5% |
| 1 - 5 Years | 70.1 |
| 5 - 10 Years | 25.0 |
| 10 - 20 Years | 3.0 |
| 20 - 30 Years | 0.4 |
| |
| Distribution by Credit Quality (% of fixed | |
| income portfolio) | |
| AAA | 0.0% |
| AA | 0.0 |
| A | 2.4 |
| BBB | 3.7 |
| BB | 10.0 |
| B | 10.1 |
| Below B | 2.5 |
| Not Rated | 71.3 |
Credit-quality ratings are obtained from S&P. "Not Rated" is used to classify securities for which a rating is not available. Not rated
securities include a fund's investment in Vanguard Market Liquidity Fund or Vanguard Municipal Cash Management Fund, each of
which invests in high-quality money market instruments and may serve as a cash management vehicle for the Vanguard funds,
trusts, and accounts. For more information about these ratings, see the Glossary entry for Credit Quality.
| | |
| Total Fund Volatility Measures | |
| | | DJ |
| | Convertibles | U.S. Total |
| | Composite | Market |
| | Index | FA Index |
| R-Squared | 0.90 | 0.70 |
| Beta | 0.94 | 0.54 |
These measures show the degree and timing of the fund’s
fluctuations compared with the indexes over 36 months.
Ten Largest Holdings (% of total net assets)
| | |
| Micron Technology Inc. | Semiconductors & | |
| | Semiconductor | |
| | Equipment | 2.4% |
| Liberty Media Corp. | Media | 2.2 |
| Ctrip.com International | Internet & Direct | |
| Ltd. | Marketing Retail | 2.2 |
| Cemex SAB de CV | Construction | |
| | Materials | 1.9 |
| Priceline Group Inc. | Internet & Direct | |
| | Marketing Retail | 1.8 |
| Citrix Systems Inc. | Software | 1.6 |
| Herbalife Ltd. | Personal Products | 1.5 |
| DISH Network Corp. | Media | 1.4 |
| Rovi Corp. | Software | 1.4 |
| NuVasive Inc. | Health Care | |
| | Equipment & | |
| | Supplies | 1.3 |
| Top Ten | | 17.7% |
The holdings listed exclude any temporary cash investments and
equity index products.
1 The expense ratio shown is from the prospectus dated March 29, 2016, and represents estimated costs for the current fiscal year. For the
fiscal year ended November 30, 2016, the expense ratio was 0.34%.
11
Convertible Securities Fund
| |
| Sector Diversification (% of market exposure) |
| |
| Consumer Discretionary | 15.1% |
| Consumer Staples | 4.2 |
| Energy | 8.1 |
| Financials | 8.7 |
| Health Care | 12.1 |
| Industrials | 11.2 |
| Information Technology | 26.7 |
| Materials | 5.6 |
| Real Estate | 5.0 |
| Telecommunication Services | 1.4 |
| Utilities | 1.9 |
12
Performance Summary
All of the returns in this report represent past performance, which is not a guarantee of future results that may be achieved by the fund. (Current performance may be lower or higher than the performance data cited. For performance data current to the most recent month-end, visit our website at vanguard.com/performance.) Note, too, that both investment returns and principal value can fluctuate widely, so an investor’s shares, when sold, could be worth more or less than their original cost. The returns shown do not reflect taxes that a shareholder would pay on fund distributions or on the sale of fund shares.
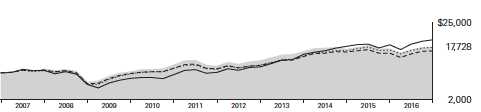
Cumulative Performance: November 30, 2006, Through November 30, 2016
Initial Investment of $10,000
| | | | | |
| | | Average Annual Total Returns | |
| | | Periods Ended November 30, 2016 | |
| | | | | | Final Value |
| | | One | Five | Ten | of a $10,000 |
| | | Year | Years | Years | Investment |
| | Convertible Securities Fund | 3.11% | 7.93% | 5.89% | $17,728 |
| • • • • • • • • | Convertibles Composite Index | 4.62 | 9.74 | 5.81 | 17,589 |
| – – – – | Convertible Securities Funds Average | 4.41 | 8.11 | 5.17 | 16,559 |
| | Dow Jones U.S. Total Stock Market | | | | |
| | Float Adjusted Index | 8.24 | 14.34 | 7.10 | 19,850 |
| For a benchmark description, see the Glossary. |
| Convertible Securities Funds Average: Derived from data provided by Lipper, a Thomson Reuters Company. |
See Financial Highlights for dividend and capital gains information.
13
Convertible Securities Fund
Fiscal-Year Total Returns (%): November 30, 2006, Through November 30, 2016
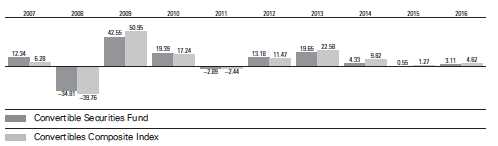
For a benchmark description, see the Glossary.
Average Annual Total Returns: Periods Ended September 30, 2016
This table presents returns through the latest calendar quarter—rather than through the end of the fiscal period.
Securities and Exchange Commission rules require that we provide this information.
| | | | | | |
| | | | | Ten Years |
| | Inception Date | One Year | Five Years | Income | Capital | Total |
| Convertible Securities | | | | | | |
| Fund | 6/17/1986 | 6.20% | 8.93% | 3.43% | 2.89% | 6.32% |
14
Convertible Securities Fund
Financial Statements
Statement of Net Assets
As of November 30, 2016
The fund reports a complete list of its holdings in regulatory filings four times in each fiscal year, at the quarter-ends. For the second and fourth fiscal quarters, the lists appear in the fund’s semiannual and annual reports to shareholders. For the first and third fiscal quarters, the fund files the lists with the Securities and Exchange Commission on Form N-Q. Shareholders can look up the fund’s Forms N-Q on the SEC’s website at sec.gov. Forms N-Q may also be reviewed and copied at the SEC’s Public Reference Room (see the back cover of this report for further information).
| | | | | |
| | | | | Face | Market |
| | | Maturity | | Amount | Value• |
| | Coupon | Date | Currency | (000) | ($000) |
| Convertible Bonds (94.6%) | | | | | |
| Consumer Discretionary (14.8%) | | | | | |
| Cineplex Inc. Cvt. | 4.500% | 12/31/18 | CAD | 5,713 | 4,478 |
| Ctrip.com International Ltd. Cvt. | 1.000% | 7/1/20 | USD | 19,905 | 21,485 |
| 1 Ctrip.com International Ltd. Cvt. | 1.250% | 9/15/22 | USD | 10,800 | 10,786 |
| 1 DISH Network Corp. Cvt. | 3.375% | 8/15/26 | USD | 18,649 | 20,840 |
| Iida Group Holdings Co. Ltd. Cvt. | 0.000% | 6/18/20 | JPY | 620,000 | 5,899 |
| K’s Holdings Corp. Cvt. | 0.000% | 12/20/19 | JPY | 260,000 | 2,793 |
| 1 Liberty Interactive LLC Cvt. | 1.750% | 9/30/46 | USD | 14,775 | 15,606 |
| Liberty Media Corp. Cvt. | 1.375% | 10/15/23 | USD | 18,369 | 20,057 |
| 1 Liberty Media Corp. Cvt. | 2.250% | 9/30/46 | USD | 11,930 | 12,348 |
| Live Nation Entertainment Inc. Cvt. | 2.500% | 5/15/19 | USD | 10,928 | 11,768 |
| LVMH Moet Hennessy Louis Vuitton SE Cvt. | 0.000% | 2/16/21 | USD | 6,591 | 6,789 |
| NH Hoteles SA Cvt. | 4.000% | 11/8/18 | EUR | 5,100 | 5,776 |
| NHK Spring Co. Ltd. Cvt. | 0.000% | 9/20/19 | USD | 4,450 | 4,695 |
| Priceline Group Inc. Cvt. | 0.350% | 6/15/20 | USD | 3,280 | 4,241 |
| Priceline Group Inc. Cvt. | 0.900% | 9/15/21 | USD | 20,485 | 21,983 |
| ResortTrust Inc. Cvt. | 0.000% | 12/1/21 | JPY | 560,000 | 5,152 |
| SAF-Holland SA Cvt. | 1.000% | 9/12/20 | EUR | 2,100 | 2,676 |
| Sony Corp. Cvt. | 0.000% | 9/30/22 | JPY | 960,000 | 8,853 |
| Steinhoff Finance Holdings GmbH Cvt. | 1.250% | 8/11/22 | EUR | 8,700 | 9,082 |
| Sumitomo Forestry Co. Ltd. Cvt. | 0.000% | 8/24/18 | JPY | 430,000 | 3,957 |
| Suzuki Motor Corp. Cvt. | 0.000% | 3/31/23 | JPY | 810,000 | 8,107 |
| Valeo SA Cvt. | 0.000% | 6/16/21 | USD | 6,000 | 6,338 |
| Vipshop Holdings Ltd. Cvt. | 1.500% | 3/15/19 | USD | 7,950 | 7,950 |
| | | | | | 221,659 |
| Consumer Staples (3.2%) | | | | | |
| Co Economica Delta SA Cvt. | 1.000% | 12/1/23 | EUR | 3,300 | 3,484 |
| Herbalife Ltd. Cvt. | 2.000% | 8/15/19 | USD | 24,072 | 22,071 |
| Marine Harvest ASA Cvt. | 0.125% | 11/5/20 | EUR | 8,000 | 10,332 |
| Vector Group Ltd. Cvt. | 1.750% | 4/15/20 | USD | 11,155 | 12,521 |
| | | | | | 48,408 |
| Energy (7.0%) | | | | | |
| BW Group Ltd. Cvt. | 1.750% | 9/10/19 | USD | 6,400 | 5,760 |
| Cheniere Energy Inc. Cvt. | 4.250% | 3/15/45 | USD | 10,245 | 6,230 |
| 1 Chesapeake Energy Corp. Cvt. | 5.500% | 9/15/26 | USD | 10,380 | 10,977 |
| 1 Green Plains Inc. Cvt. | 4.125% | 9/1/22 | USD | 6,370 | 7,405 |
| Helix Energy Solutions Group Inc. Cvt. | 4.250% | 5/1/22 | USD | 7,430 | 8,085 |
15
Convertible Securities Fund
| | | | | |
| | | | | Face | Market |
| | | Maturity | | Amount | Value• |
| | Coupon | Date Currency | (000) | ($000) |
| Oasis Petroleum Inc. Cvt. | 2.625% | 9/15/23 | USD | 6,370 | 8,799 |
| PDC Energy Inc. Cvt. | 1.125% | 9/15/21 | USD | 10,341 | 11,485 |
| 1 Scorpio Tankers Inc. Cvt. | 2.375% | 7/1/19 | USD | 7,955 | 6,160 |
| SEACOR Holdings Inc. Cvt. | 3.000% | 11/15/28 | USD | 9,702 | 8,210 |
| SM Energy Co. Cvt. | 1.500% | 7/1/21 | USD | 6,610 | 8,106 |
| Technip SA Cvt. | 0.875% | 1/25/21 | EUR | 2,200 | 3,120 |
| TOTAL SA Cvt. | 0.500% | 12/2/22 | USD | 8,000 | 8,090 |
| Weatherford International Ltd. Cvt. | 5.875% | 7/1/21 | USD | 11,225 | 12,151 |
| | | | | | 104,578 |
| Financials (12.1%) | | | | | |
| AmTrust Financial Services Inc. Cvt. | 2.750% | 12/15/44 | USD | 12,385 | 10,140 |
| Apollo Commercial Real Estate Finance Inc. Cvt. | 5.500% | 3/15/19 | USD | 10,480 | 11,011 |
| Aroundtown Property Holdings plc Cvt. | 1.500% | 1/18/21 | EUR | 6,000 | 6,566 |
| Aroundtown Property Holdings plc Cvt. | 3.000% | 5/5/20 | EUR | 4,500 | 6,100 |
| Azimut Holding SPA Cvt. | 2.125% | 11/25/20 | EUR | 9,400 | 10,077 |
| Blackstone Mortgage Trust Inc. Cvt. | 5.250% | 12/1/18 | USD | 8,775 | 9,751 |
| Brait SE Cvt. | 2.750% | 9/18/20 | GBP | 2,900 | 3,320 |
| BUWOG AG Cvt. | 0.000% | 9/9/21 | EUR | 5,900 | 6,288 |
| CapitaLand Ltd. Cvt. | 2.800% | 6/8/25 | SGD | 15,000 | 10,159 |
| China Overseas Finance Investment | | | | | |
| Cayman V Ltd. Cvt. | 0.000% | 1/5/23 | USD | 3,800 | 3,849 |
| Colony Financial Inc. Cvt. | 5.000% | 4/15/23 | USD | 9,169 | 9,324 |
| Colony Starwood Homes Cvt. | 3.000% | 7/1/19 | USD | 1,265 | 1,427 |
| 1 Element Financial Corp. Cvt. | 4.250% | 6/30/20 | CAD | 8,650 | 6,504 |
| 1 Element Financial Corp. Cvt. | 5.125% | 6/30/19 | CAD | 15,464 | 12,467 |
| 1 Empire State Realty OP LP Cvt. | 2.625% | 8/15/19 | USD | 2,035 | 2,303 |
| Encore Capital Group Inc. Cvt. | 3.000% | 7/1/20 | USD | 9,415 | 8,697 |
| EZCORP Inc. Cvt. | 2.125% | 6/15/19 | USD | 8,986 | 8,919 |
| Glanbia Co-operative Society Ltd. Cvt. | 1.375% | 6/9/21 | EUR | 5,300 | 5,730 |
| Nexity SA Cvt. | 0.125% | 1/1/23 | EUR | 6,960 | 7,264 |
| Portfolio Recovery Associates Inc. Cvt. | 3.000% | 8/1/20 | USD | 9,424 | 8,593 |
| Remgro Jersey GBP Ltd. Cvt. | 2.625% | 3/22/21 | GBP | 3,000 | 3,664 |
| Spirit Realty Capital Inc. Cvt. | 2.875% | 5/15/19 | USD | 5,865 | 6,085 |
| St. Modwen Properties Securities Jersey | | | | | |
| Ltd. Cvt. | 2.875% | 3/6/19 | GBP | 4,800 | 5,663 |
| Starwood Property Trust Inc. Cvt. | 4.550% | 3/1/18 | USD | 6,106 | 6,659 |
| Wells Fargo & Co. Cvt. | 0.250% | 11/6/23 | USD | 10,745 | 10,730 |
| | | | | | 181,290 |
| Health Care (11.9%) | | | | | |
| Allscripts Healthcare Solutions Inc. Cvt. | 1.250% | 7/1/20 | USD | 5,545 | 5,340 |
| Array BioPharma Inc. Cvt. | 3.000% | 6/1/20 | USD | 6,015 | 7,887 |
| BioMarin Pharmaceutical Inc. Cvt. | 0.750% | 10/15/18 | USD | 11,455 | 13,223 |
| Depomed Inc. Cvt. | 2.500% | 9/1/21 | USD | 7,099 | 8,457 |
| 1 Evolent Health Inc. Cvt. | 2.000% | 12/1/21 | USD | 5,950 | 5,950 |
| HealthSouth Corp. Cvt. | 2.000% | 12/1/43 | USD | 11,801 | 14,021 |
| Horizon Pharma Investment Ltd. Cvt. | 2.500% | 3/15/22 | USD | 13,911 | 14,302 |
| 1 Insulet Corp. Cvt. | 1.250% | 9/15/21 | USD | 13,375 | 12,021 |
| Ironwood Pharmaceuticals Inc. Cvt. | 2.250% | 6/15/22 | USD | 10,929 | 12,801 |
| 1 Medicines Co. Cvt. | 2.750% | 7/15/23 | USD | 7,450 | 7,306 |
| Medidata Solutions Inc. Cvt. | 1.000% | 8/1/18 | USD | 9,870 | 11,338 |
| Nevro Corp. Cvt. | 1.750% | 6/1/21 | USD | 5,965 | 6,424 |
| 1 NuVasive Inc. Cvt. | 2.250% | 3/15/21 | USD | 16,190 | 20,015 |
| Qiagen NV Cvt. | 0.375% | 3/19/19 | USD | 3,400 | 3,796 |
| Qiagen NV Cvt. | 0.875% | 3/19/21 | USD | 4,600 | 5,319 |
16
| | | | | |
| Convertible Securities Fund | | | | | |
| |
| |
| |
| | | | | Face | Market |
| | | Maturity | | Amount | Value• |
| | Coupon | Date | Currency | (000) | ($000) |
| Recipharm AB Cvt. | 2.750% | 10/6/21 | SEK | 34,000 | 3,599 |
| Spectranetics Corp. Cvt. | 2.625% | 6/1/34 | USD | 10,473 | 10,237 |
| Wright Medical Group Inc. Cvt. | 2.000% | 2/15/20 | USD | 15,100 | 15,676 |
| | | | | | 177,712 |
| Industrials (11.0%) | | | | | |
| 51job Inc. Cvt. | 3.250% | 4/15/19 | USD | 12,459 | 13,308 |
| Aecon Group Inc. Cvt. | 5.500% | 12/31/18 | CAD | 1,852 | 1,430 |
| Airbus Group SE Cvt. | 0.000% | 6/14/21 | EUR | 6,600 | 7,541 |
| Brenntag Finance BV Cvt. | 1.875% | 12/2/22 | USD | 9,500 | 9,804 |
| Carillion Finance Jersey Ltd. Cvt. | 2.500% | 12/19/19 | GBP | 5,600 | 6,769 |
| CRRC Corp. Ltd. Cvt. | 0.000% | 2/5/21 | USD | 8,000 | 8,460 |
| DP World Ltd. Cvt. | 1.750% | 6/19/24 | USD | 7,400 | 7,234 |
| Dycom Industries Inc. Cvt. | 0.750% | 9/15/21 | USD | 5,567 | 5,825 |
| General Cable Corp. Cvt. | 4.500% | 11/15/29 | USD | 10,170 | 7,748 |
| GVM Debentures Lux 1 SA Cvt. | 5.750% | 2/14/18 | EUR | 7,200 | 6,654 |
| Huron Consulting Group Inc. Cvt. | 1.250% | 10/1/19 | USD | 12,197 | 11,961 |
| Johnson Electric Holdings Ltd. Cvt. | 1.000% | 4/2/21 | USD | 4,500 | 4,763 |
| Keihan Electric Railway Co. Ltd. Cvt. | 0.000% | 3/30/21 | JPY | 490,000 | 4,409 |
| KEYW Holding Corp. Cvt. | 2.500% | 7/15/19 | USD | 6,675 | 6,891 |
| Larsen & Toubro Ltd. Cvt. | 0.675% | 10/22/19 | USD | 5,715 | 5,501 |
| LIXIL Group Corp. Cvt. | 0.000% | 3/4/22 | JPY | 280,000 | 2,533 |
| Macquarie Infrastructure Corp. Cvt. | 2.000% | 10/1/23 | USD | 12,720 | 12,728 |
| Nagoya Railroad Co. Ltd. Cvt. | 0.000% | 12/11/24 | JPY | 750,000 | 7,465 |
| Prysmian SPA Cvt. | 1.250% | 3/8/18 | EUR | 3,300 | 3,987 |
| Sacyr SA Cvt. | 4.000% | 5/8/19 | EUR | 4,400 | 3,780 |
| Safran SA Cvt. | 0.000% | 12/31/20 | EUR | 3,430 | 3,789 |
| Shimizu Corp. Cvt. | 0.000% | 10/16/20 | JPY | 580,000 | 5,513 |
| Siemens Financieringsmaatschappij NV Cvt. | 1.650% | 8/16/19 | USD | 5,250 | 5,888 |
| Siemens Financieringsmaatschappij NV Cvt. | 1.650% | 8/16/19 | USD | 500 | 579 |
| 1 Tutor Perini Corp. Cvt. | 2.875% | 6/15/21 | USD | 9,150 | 10,122 |
| | | | | | 164,682 |
| Information Technology (25.9%) | | | | | |
| Abigrove Ltd. Cvt. | 0.500% | 4/29/21 | USD | 4,000 | 4,960 |
| Advanced Micro Devices Inc. Cvt. | 2.125% | 9/1/26 | USD | 3,190 | 4,141 |
| Advanced Semiconductor Engineering Inc. Cvt. | 0.000% | 3/27/18 | USD | 6,600 | 6,260 |
| Akamai Technologies Inc. Cvt. | 0.000% | 2/15/19 | USD | 7,760 | 8,046 |
| 1 Blackhawk Network Holdings Inc. Cvt. | 1.500% | 1/15/22 | USD | 13,765 | 14,040 |
| Canadian Solar Inc. Cvt. | 4.250% | 2/15/19 | USD | 1,535 | 1,421 |
| Cardtronics Inc. Cvt. | 1.000% | 12/1/20 | USD | 15,232 | 16,870 |
| 1 Ciena Corp. Cvt. | 3.750% | 10/15/18 | USD | 3,825 | 4,772 |
| Citrix Systems Inc. Cvt. | 0.500% | 4/15/19 | USD | 20,855 | 23,566 |
| 1 CSG Systems International Inc. Cvt. | 4.250% | 3/15/36 | USD | 12,690 | 13,927 |
| 1 Cypress Semiconductor Corp. Cvt. | 4.500% | 1/15/22 | USD | 17,355 | 19,383 |
| 1 DH Corp. Cvt. | 5.000% | 9/30/20 | CAD | 10,493 | 7,636 |
| Electronics For Imaging Inc. Cvt. | 0.750% | 9/1/19 | USD | 15,515 | 16,407 |
| Envestnet Inc. Cvt. | 1.750% | 12/15/19 | USD | 6,410 | 6,118 |
| Euronet Worldwide Inc. Cvt. | 1.500% | 10/1/44 | USD | 10,404 | 12,004 |
| Finisar Corp. Cvt. | 0.500% | 12/15/33 | USD | 12,505 | 15,569 |
| Indra Sistemas SA Cvt. | 1.250% | 10/7/23 | EUR | 5,300 | 5,122 |
| 1 Inphi Corp. Cvt. | 0.750% | 9/1/21 | USD | 14,650 | 15,776 |
| Integrated Device Technology Inc. Cvt. | 0.875% | 11/15/22 | USD | 12,704 | 12,958 |
| InterDigital Inc. Cvt. | 1.500% | 3/1/20 | USD | 16,027 | 19,443 |
| j2 Global Inc. Cvt. | 3.250% | 6/15/29 | USD | 13,971 | 17,202 |
| 1 Knowles Corp. Cvt. | 3.250% | 11/1/21 | USD | 9,785 | 11,094 |
17
| | | | | |
| Convertible Securities Fund | | | | | |
| |
| |
| |
| | | | | Face | Market |
| | | Maturity | | Amount | Value• |
| | Coupon | Date | Currency | (000) | ($000) |
| Microchip Technology Inc. Cvt. | 1.625% | 2/15/25 | USD | 11,090 | 14,708 |
| Micron Technology Inc. Cvt. | 3.000% | 11/15/43 | USD | 38,645 | 35,433 |
| 1 Nuance Communications Inc. Cvt. | 1.000% | 12/15/35 | USD | 7,080 | 6,562 |
| Nuance Communications Inc. Cvt. | 1.500% | 11/1/35 | USD | 3,080 | 3,072 |
| ON Semiconductor Corp. Cvt. | 1.000% | 12/1/20 | USD | 16,465 | 16,444 |
| Proofpoint Inc. Cvt. | 0.750% | 6/15/20 | USD | 9,505 | 11,252 |
| Rovi Corp. Cvt. | 0.500% | 3/1/20 | USD | 20,129 | 20,330 |
| Semiconductor Manufacturing International | | | | | |
| Corp. Cvt. | 0.000% | 7/7/22 | USD | 3,000 | 3,825 |
| Synchronoss Technologies Inc. Cvt. | 0.750% | 8/15/19 | USD | 12,351 | 14,265 |
| Ubisoft Entertainment SA Cvt. | 0.000% | 9/27/21 | EUR | 2,906 | 3,213 |
| Workday Inc. Cvt. | 0.750% | 7/15/18 | USD | 1,005 | 1,175 |
| | | | | | 386,994 |
| Materials (5.5%) | | | | | |
| APERAM Cvt. | 0.625% | 7/8/21 | USD | 6,200 | 7,595 |
| Bekaert SA Cvt. | 0.000% | 6/9/21 | EUR | 4,500 | 4,853 |
| Buzzi Unicem SPA Cvt. | 1.375% | 7/17/19 | EUR | 2,100 | 2,993 |
| Cemex SAB de CV Cvt. | 3.720% | 3/15/20 | USD | 18,082 | 18,816 |
| Cemex SAB de CV Cvt. | 3.720% | 3/15/20 | USD | 9,120 | 9,559 |
| 1 Chemtrade Logistics Income Fund Cvt. | 5.250% | 6/30/21 | CAD | 5,331 | 4,050 |
| Kansai Paint Co. Ltd. Cvt. | 0.000% | 6/17/22 | JPY | 600,000 | 5,364 |
| OCI Cvt. | 3.875% | 9/25/18 | EUR | 4,600 | 4,558 |
| Outokumpu OYJ Cvt. | 3.250% | 2/26/20 | EUR | 1,600 | 1,918 |
| Silver Standard Resources Inc. Cvt. | 2.875% | 2/1/33 | USD | 6,705 | 6,257 |
| Stillwater Mining Co. Cvt. | 1.750% | 10/15/32 | USD | 7,227 | 9,305 |
| Teijin Ltd. Cvt. | 0.000% | 12/12/18 | JPY | 80,000 | 804 |
| Teijin Ltd. Cvt. | 0.000% | 12/10/21 | JPY | 610,000 | 6,472 |
| | | | | | 82,544 |
| Telecommunication Services (1.3%) | | | | | |
| America Movil SAB de Cvt. | 0.000% | 5/28/20 | EUR | 5,600 | 5,739 |
| Inmarsat plc Cvt. | 3.875% | 9/9/23 | USD | 6,200 | 6,419 |
| Telenor East Holding II AS Cvt. | 0.250% | 9/20/19 | USD | 7,600 | 7,954 |
| | | | | | 20,112 |
| Utilities (1.9%) | | | | | |
| China Yangtze Power International BVI 1 Ltd. | | | | | |
| Cvt. | 0.000% | 11/9/21 | USD | 4,785 | 4,773 |
| Northland Power Inc. Cvt. | 4.750% | 6/30/20 | CAD | 6,225 | 5,075 |
| Northland Power Inc. Cvt. | 5.000% | 6/30/19 | CAD | 2,661 | 2,160 |
| 1 NRG Yield Inc. Cvt. | 3.250% | 6/1/20 | USD | 5,935 | 5,712 |
| Pattern Energy Group Inc. Cvt. | 4.000% | 7/15/20 | USD | 9,210 | 8,974 |
| Superior Plus Corp. Cvt. | 6.000% | 6/30/19 | CAD | 2,522 | 1,930 |
| | | | | | 28,624 |
| Total Convertible Bonds (Cost $1,388,211) | | | | | 1,416,603 |
18
Convertible Securities Fund
| | | |
| | | | Market |
| | | | Value• |
| | Coupon | Shares | ($000) |
| Convertible Preferred Stocks (3.7%) | | | |
| Consumer Staples (0.9%) | | | |
| Bunge Ltd. Pfd. | 4.875% | 129,625 | 12,882 |
| |
| Energy (1.0%) | | | |
| Southwestern Energy Co. Pfd. | 6.250% | 306,700 | 8,405 |
| WPX Energy Inc. Pfd. | 6.250% | 86,416 | 6,057 |
| | | | 14,462 |
| Financials (1.3%) | | | |
| American Tower Corp. Pfd. | 5.500% | 165,500 | 16,819 |
| 1 Mandatory Exchangeable Trust Pfd. | 5.750% | 29,900 | 3,452 |
| | | | 20,271 |
| Information Technology (0.5%) | | | |
| Belden Inc. Pfd. | 6.750% | 66,700 | 7,071 |
| Total Convertible Preferred Stocks (Cost $50,099) | | | 54,686 |
| Temporary Cash Investment (0.7%) | | | |
| Money Market Fund (0.7%) | | | |
| 2 Vanguard Market Liquidity Fund (Cost $9,914) | 0.691% | 99,136 | 9,914 |
| Total Investments (99.0%) (Cost $1,448,224) | | | 1,481,203 |
| |
| | | | Amount |
| | | | ($000) |
| Other Assets and Liabilities (1.0%) | | | |
| Other Assets | | | |
| Investment in Vanguard | | | 115 |
| Receivables for Investment Securities Sold | | | 16,865 |
| Receivables for Accrued Income | | | 8,147 |
| Receivables for Capital Shares Issued | | | 2,175 |
| Other Assets | | | 16,927 |
| Total Other Assets | | | 44,229 |
| Liabilities | | | |
| Payables for Investment Securities Purchased | | | (21,184) |
| Payables for Capital Shares Redeemed | | | (3,059) |
| Payables to Vanguard | | | (3,646) |
| Other Liabilities | | | (827) |
| Total Liabilities | | | (28,716) |
| Net Assets (100%) | | | |
| Applicable to 118,129,111 outstanding $.001 par value shares of | | | |
| beneficial interest (unlimited authorization) | | | 1,496,716 |
| Net Asset Value Per Share | | | $12.67 |
19
Convertible Securities Fund
| |
| At November 30, 2016, net assets consisted of: | |
| | Amount |
| | ($000) |
| Paid-in Capital | 1,495,680 |
| Undistributed Net Investment Income | 1,994 |
| Accumulated Net Realized Losses | (46,584) |
| Unrealized Appreciation (Depreciation) | |
| Investment Securities | 32,979 |
| Forward Currency Contracts | 12,675 |
| Foreign Currencies | (28) |
| Net Assets | 1,496,716 |
• See Note A in Notes to Financial Statements.
1 Security exempt from registration under Rule 144A of the Securities Act of 1933. Such securities may be sold in transactions exempt from
registration, normally to qualified institutional buyers. At November 30, 2016, the aggregate value of these securities was $267,214,000,
representing 17.9% of net assets.
2 Affiliated money market fund available only to Vanguard funds and certain trusts and accounts managed by Vanguard. Rate shown is the
7-day yield.
CAD—Canadian dollar.
EUR—Euro.
GBP—British pound.
JPY—Japanese yen.
SEK—Swedish krona.
SGD—Singapore dollar.
USD—U.S. dollar.
See accompanying Notes, which are an integral part of the Financial Statements.
20
Convertible Securities Fund
Statement of Operations
| |
| | Year Ended |
| | November 30, 2016 |
| | ($000) |
| Investment Income | |
| Income | |
| Dividends | 5,876 |
| Interest1,2 | 30,675 |
| Total Income | 36,551 |
| Expenses | |
| Investment Advisory Fees—Note B | |
| Basic Fee | 5,227 |
| Performance Adjustment | (3,200) |
| The Vanguard Group—Note C | |
| Management and Administrative | 2,813 |
| Marketing and Distribution | 265 |
| Custodian Fees | 72 |
| Auditing Fees | 43 |
| Shareholders’ Reports | 17 |
| Trustees’ Fees and Expenses | 3 |
| Total Expenses | 5,240 |
| Net Investment Income | 31,311 |
| Realized Net Gain (Loss)1 | |
| Investment Securities Sold | (46,583) |
| Foreign Currencies and Forward Currency Contracts | 3,932 |
| Realized Net Gain (Loss) | (42,651) |
| Change in Unrealized Appreciation (Depreciation) | |
| Investment Securities | 52,356 |
| Foreign Currencies and Forward Currency Contracts | (4,046) |
| Change in Unrealized Appreciation (Depreciation) | 48,310 |
| Net Increase (Decrease) in Net Assets Resulting from Operations | 36,970 |
| 1 Interest income and realized net gain (loss) from affiliated companies of the fund were $142,000 and $5,000, respectively. |
| 2 Interest income is net of foreign withholding taxes of $42,000. | |
See accompanying Notes, which are an integral part of the Financial Statements.
21
Convertible Securities Fund
Statement of Changes in Net Assets
| | |
| | Year Ended November 30, |
| | 2016 | 2015 |
| | ($000) | ($000) |
| Increase (Decrease) in Net Assets | | |
| Operations | | |
| Net Investment Income | 31,311 | 34,926 |
| Realized Net Gain (Loss) | (42,651) | 26,394 |
| Change in Unrealized Appreciation (Depreciation) | 48,310 | (48,891) |
| Net Increase (Decrease) in Net Assets Resulting from Operations | 36,970 | 12,429 |
| Distributions | | |
| Net Investment Income | (30,592) | (34,408) |
| Realized Capital Gain1 | (18,604) | (143,706) |
| Total Distributions | (49,196) | (178,114) |
| Capital Share Transactions | | |
| Issued | 109,702 | 141,337 |
| Issued in Lieu of Cash Distributions | 44,703 | 161,732 |
| Redeemed | (386,378) | (397,715) |
| Net Increase (Decrease) from Capital Share Transactions | (231,973) | (94,646) |
| Total Increase (Decrease) | (244,199) | (260,331) |
| Net Assets | | |
| Beginning of Period | 1,740,915 | 2,001,246 |
| End of Period2 | 1,496,716 | 1,740,915 |
1 Includes fiscal 2016 and 2015 short-term gain distributions totaling $0 and $40,124,000, respectively. Short-term gain distributions are
treated as ordinary income dividends for tax purposes.
2 Net Assets—End of Period includes undistributed (overdistributed) net investment income of $1,994,000 and $13,980,000.
See accompanying Notes, which are an integral part of the Financial Statements.
22
Convertible Securities Fund
Financial Highlights
| | | | | |
| For a Share Outstanding | Year Ended November 30, |
| Throughout Each Period | 2016 | 2015 | 2014 | 2013 | 2012 |
| Net Asset Value, Beginning of Period | $12.67 | $13.85 | $14.64 | $12.95 | $12.12 |
| Investment Operations | | | | | |
| Net Investment Income | .259 | .251 | .287 | .333 | .407 |
| Net Realized and Unrealized Gain (Loss) | | | | | |
| on Investments | .117 | (.180) | .313 | 2.101 | 1.134 |
| Total from Investment Operations | .376 | .071 | .600 | 2.434 | 1.541 |
| Distributions | | | | | |
| Dividends from Net Investment Income | (. 237) | (. 241) | (. 425) | (. 355) | (. 534) |
| Distributions from Realized Capital Gains | (.139) | (1.010) | (. 965) | (. 389) | (.177) |
| Total Distributions | (.376) | (1.251) | (1.390) | (.744) | (.711) |
| Net Asset Value, End of Period | $12.67 | $12.67 | $13.85 | $14.64 | $12.95 |
| |
| Total Return1 | 3.11% | 0.55% | 4.33% | 19.65% | 13.18% |
| |
| Ratios/Supplemental Data | | | | | |
| Net Assets, End of Period (Millions) | $1,497 | $1,741 | $2,001 | $2,060 | $1,643 |
| Ratio of Total Expenses to Average Net Assets2 | 0.34% | 0.38% | 0.41% | 0.63% | 0.52% |
| Ratio of Net Investment Income to | | | | | |
| Average Net Assets | 2.04% | 1.86% | 2.02% | 2.41% | 3.23% |
| Portfolio Turnover Rate | 103% | 95% | 85% | 101% | 82% |
1 Total returns do not include transaction or account service fees that may have applied in the periods shown. Fund prospectuses provide
information about any applicable transaction and account service fees.
2 Includes performance-based investment advisory fee increases (decreases) of (0.21%), (0.17%), (0.15%), 0.07%, and (0.04%).
See accompanying Notes, which are an integral part of the Financial Statements.
23
Convertible Securities Fund
Notes to Financial Statements
Vanguard Convertible Securities Fund is registered under the Investment Company Act of 1940 as an open-end investment company, or mutual fund. The fund invests in securities of foreign issuers, which may subject it to investment risks not normally associated with investing in securities of U.S. corporations.
A. The following significant accounting policies conform to generally accepted accounting principles for U.S. investment companies. The fund consistently follows such policies in preparing its financial statements.
1. Security Valuation: Securities are valued as of the close of trading on the New York Stock Exchange (generally 4 p.m., Eastern time) on the valuation date. Equity securities are valued at the latest quoted sales prices or official closing prices taken from the primary market in which each security trades; such securities not traded on the valuation date are valued at the mean of the latest quoted bid and asked prices. Bonds and temporary cash investments are valued using the latest bid prices or using valuations based on a matrix system (which considers such factors as security prices, yields, maturities, and ratings), both as furnished by independent pricing services. Investments in Vanguard Market Liquidity Fund are valued at that fund’s net asset value. Securities for which market quotations are not readily available, or whose values have been affected by events occurring before the fund’s pricing time but after the close of the securities’ primary markets, are valued at their fair values calculated according to procedures adopted by the board of trustees. These procedures include obtaining quotations from an independent pricing service, monitoring news to identify significant market- or security-specific events, and evaluating changes in the values of foreign market proxies (for example, ADRs, futures contracts, or exchange-traded funds), between the time the foreign markets close and the fund’s pricing time. When fair-value pricing is employed, the prices of securities used by a fund to calculate its net asset value may differ from quoted or published prices for the same securities.
2. Foreign Currency: Securities and other assets and liabilities denominated in foreign currencies are translated into U.S. dollars using exchange rates obtained from an independent third party as of the fund’s pricing time on the valuation date. Realized gains (losses) and unrealized appreciation (depreciation) on investment securities include the effects of changes in exchange rates since the securities were purchased, combined with the effects of changes in security prices. Fluctuations in the value of other assets and liabilities resulting from changes in exchange rates are recorded as unrealized foreign currency gains (losses) until the assets or liabilities are settled in cash, at which time they are recorded as realized foreign currency gains (losses).
3. Forward Currency Contracts: The fund enters into forward currency contracts to protect the value of securities and related receivables and payables against changes in future foreign exchange rates. The fund’s risks in using these contracts include movement in the values of the foreign currencies relative to the U.S. dollar and the ability of the counterparties to fulfill their obligations under the contracts. The fund mitigates its counterparty risk by entering into forward currency contracts only with a diverse group of prequalified counterparties, monitoring their financial strength, entering into master netting arrangements with its counterparties, and requiring its counterparties to transfer collateral as security for their performance. In the absence of a default, the collateral pledged or received by the fund cannot be repledged, resold or rehypothecated. The master netting arrangements provide that, in the event of a counterparty’s default (including bankruptcy), the fund may terminate the forward currency contracts, determine the net amount owed by either party in accordance with its master netting arrangements, and sell or retain any collateral held up to the net
24
Convertible Securities Fund
amount owed to the fund under the master netting arrangements. The forward currency contracts contain provisions whereby a counterparty may terminate open contracts if the fund’s net assets decline below a certain level, triggering a payment by the fund if the fund is in a net liability position at the time of the termination. The payment amount would be reduced by any collateral the fund has pledged. Any assets pledged as collateral for open contracts are noted in the Statement of Net Assets. The value of collateral received or pledged is compared daily to the value of the forward currency contracts exposure with each counterparty, and any difference, if in excess of a specified minimum transfer amount, is adjusted and settled within two business days.
Forward currency contracts are valued at their quoted daily prices obtained from an independent third party, adjusted for currency risk based on the expiration date of each contract. The notional amounts of the contracts are not recorded in the Statement of Net Assets. Fluctuations in the value of the contracts are recorded in the Statement of Net Assets as an asset (liability) and in the Statement of Operations as unrealized appreciation (depreciation) until the contracts are closed, when they are recorded as realized forward currency contract gains (losses).
During the year ended November 30, 2016, the fund’s average investment in forward currency contracts represented 22% of net assets, based on the average of notional amounts at each quarter-end during the period.
4. Federal Income Taxes: The fund intends to continue to qualify as a regulated investment company and distribute all of its taxable income. Management has analyzed the fund’s tax positions taken for all open federal income tax years (November 30, 2013–2016), and has concluded that no provision for federal income tax is required in the fund’s financial statements.
5. Distributions: Distributions to shareholders are recorded on the ex-dividend date.
6. Credit Facility: The fund and certain other funds managed by The Vanguard Group (“Vanguard”) participate in a $3.1 billion committed credit facility provided by a syndicate of lenders pursuant to a credit agreement that may be renewed annually; each fund is individually liable for its borrowings, if any, under the credit facility. Borrowings may be utilized for temporary and emergency purposes, and are subject to the fund’s regulatory and contractual borrowing restrictions. The participating funds are charged administrative fees and an annual commitment fee of 0.10% of the undrawn amount of the facility; these fees are allocated to the funds based on a method approved by the fund’s board of trustees and included in Management and Administrative expenses on the fund’s Statement of Operations. Any borrowings under this facility bear interest at a rate based upon the higher of the one-month London Interbank Offered Rate, federal funds effective rate, or overnight bank funding rate plus an agreed-upon spread.
The fund had no borrowings outstanding at November 30, 2016, or at any time during the period then ended.
7. Other: Dividend income is recorded on the ex-dividend date. Interest income includes income distributions received from Vanguard Market Liquidity Fund and is accrued daily. Premiums and discounts on debt securities purchased are amortized and accreted, respectively, to interest income over the lives of the respective securities. Security transactions are accounted for on the date securities are bought or sold. Costs used to determine realized gains (losses) on the sale of investment securities are those of the specific securities sold.
25
Convertible Securities Fund
B. Oaktree Capital Management, L.P., provides investment advisory services to the fund for a fee calculated at an annual percentage rate of average net assets. The basic fee is subject to quarterly adjustments based on the fund’s performance for the preceding three years relative to a composite index weighted 70% Bank of America Merrill Lynch All US Convertibles Index and 30% Bank of America Merrill Lynch Global 300 Convertibles ex-US Index (hedged). For the year ended November 30, 2016, the investment advisory fee represented an effective annual basic rate of 0.34% of the fund’s average net assets before a decrease of $3,200,000 (0.21%) based on performance.
C. In accordance with the terms of a Funds’ Service Agreement (the “FSA”) between Vanguard and the fund, Vanguard furnishes to the fund corporate management, administrative, marketing, distribution, and cash management services at Vanguard’s cost of operations (as defined by the FSA). These costs of operations are allocated to the fund based on methods and guidelines approved by the board of trustees. Vanguard does not require reimbursement in the current period for certain costs of operations (such as deferred compensation/benefits and risk/insurance costs); the fund’s liability for these costs of operations is included in Payables to Vanguard on the Statement of Net Assets.
Upon the request of Vanguard, the fund may invest up to 0.40% of its net assets as capital in Vanguard. At November 30, 2016, the fund had contributed to Vanguard capital in the amount of $115,000, representing 0.01% of the fund’s net assets and 0.05% of Vanguard’s capitalization. The fund’s trustees and officers are also directors and employees, respectively, of Vanguard.
D. Various inputs may be used to determine the value of the fund’s investments. These inputs are summarized in three broad levels for financial statement purposes. The inputs or methodologies used to value securities are not necessarily an indication of the risk associated with investing in those securities.
Level 1—Quoted prices in active markets for identical securities.
Level 2—Other significant observable inputs (including quoted prices for similar securities, interest rates, prepayment speeds, credit risk, etc.).
Level 3—Significant unobservable inputs (including the fund’s own assumptions used to determine the fair value of investments).
The following table summarizes the market value of the fund’s investments as of November 30, 2016, based on the inputs used to value them:
| | | |
| | Level 1 | Level 2 | Level 3 |
| Investments | ($000) | ($000) | ($000) |
| Convertible Bonds | — | 1,410,653 | 5,950 |
| Convertible Preferred Stocks | — | 54,686 | — |
| Temporary Cash Investments | 9,914 | — | — |
| Forward Currency Contracts—Assets | — | 13,378 | — |
| Forward Currency Contracts—Liabilities | — | (703) | — |
| Total | 9,914 | 1,478,014 | 5,950 |
26
Convertible Securities Fund
E. At November 30, 2016, the fund had open forward currency contracts to receive and deliver currencies as follows. Unrealized appreciation (depreciation) on open forward currency contracts, except for Singapore dollar currency contracts, is treated as realized gain (loss) for tax purposes.
| | | | | | |
| | | | | | | Unrealized |
| | Contract | | | | | Appreciation |
| | Settlement | Contract Amount (000) | (Depreciation) |
| Counterparty | Date | | Receive | | Deliver | ($000) |
| UBS AG | 1/19/17 | EUR | 11,786 | USD | 12,894 | (369) |
| UBS AG | 1/19/17 | CAD | 1,779 | USD | 1,327 | (1) |
| UBS AG | 1/19/17 | CAD | 740 | USD | 551 | — |
| UBS AG | 1/19/17 | JPY | 61,500 | USD | 539 | — |
| UBS AG | 1/19/17 | USD | 145,969 | EUR | 132,446 | 5,205 |
| UBS AG | 1/19/17 | USD | 70,099 | JPY | 7,264,310 | 6,415 |
| UBS AG | 1/19/17 | USD | 50,548 | CAD | 66,225 | 1,217 |
| UBS AG | 1/19/17 | USD | 19,433 | GBP | 15,765 | (322) |
| UBS AG | 1/19/17 | USD | 10,689 | SGD | 14,800 | 363 |
| UBS AG | 1/19/17 | USD | 3,875 | SEK | 33,985 | 178 |
| UBS AG | 1/19/17 | USD | 3,135 | EUR | 2,960 | (11) |
| | | | | | | 12,675 |
| Refer to the Statement of Net Assets for currency abbreviations. | | | | | |
At November 30, 2016, counterparties had deposited in segregated accounts securities and cash with a value of $11,531,000 in connection with open forward currency contracts. After November 30, 2016, the counterparty posted additional collateral of $1,720,000 in connection with open forward currency contracts as of November 30, 2016.
F. Distributions are determined on a tax basis and may differ from net investment income and realized capital gains for financial reporting purposes. Differences may be permanent or temporary. Permanent differences are reclassified among capital accounts in the financial statements to reflect their tax character. Temporary differences arise when certain items of income, expense, gain, or loss are recognized in different periods for financial statement and tax purposes; such differences are primarily attributed to mark-to-market of open forward currency contracts. These differences will reverse at some time in the future. Differences in classification may also result from the treatment of short-term gains as ordinary income for tax purposes.
During the year ended November 30, 2016, the fund realized net foreign currency losses of $8,526,000 (including the foreign currency component on sales of foreign currency denominated bonds), which decreased distributable net income for tax purposes; accordingly, such losses have been reclassified from accumulated net realized losses to undistributed net investment income.
Certain of the fund’s convertible bond investments are in securities considered to be “contingent payment debt instruments,” for which any realized gains increase (and all or part of any realized losses decrease) income for tax purposes. During the year ended November 30, 2016, the fund realized net losses of $4,179,000 from the sale of these securities, which decreased distributable net income for tax purposes; accordingly, such losses have been reclassified from accumulated net realized losses to undistributed net investment income.
27
Convertible Securities Fund
For tax purposes, at November 30, 2016, the fund had $4,922,000 of ordinary income available for distribution. The fund had available capital losses totaling $34,211,000 that may be carried forward indefinitely to offset future net capital gains.
At November 30, 2016, the cost of investment securities for tax purposes was $1,448,224,000. Net unrealized appreciation of investment securities for tax purposes was $32,979,000, consisting of unrealized gains of $75,230,000 on securities that had risen in value since their purchase and $42,251,000 in unrealized losses on securities that had fallen in value since their purchase.
G. During the year ended November 30, 2016, the fund purchased $1,556,781,000 of investment securities and sold $1,773,536,000 of investment securities, other than temporary cash investments.
H. Capital shares issued and redeemed were:
| | |
| | Year Ended November 30, |
| | 2016 | 2015 |
| | Shares | Shares |
| | (000) | (000) |
| Issued | 8,932 | 10,764 |
| Issued in Lieu of Cash Distributions | 3,668 | 12,705 |
| Redeemed | (31,874) | (30,554) |
| Net Increase (Decrease) in Shares Outstanding | (19,274) | (7,085) |
I. Management has determined that no material events or transactions occurred subsequent to November 30, 2016, that would require recognition or disclosure in these financial statements.
28
Report of Independent Registered
Public Accounting Firm
To the Board of Trustees and Shareholders of Vanguard Convertible Securities Fund:
In our opinion, the accompanying statement of net assets and the related statements of operations and of changes in net assets and the financial highlights present fairly, in all material respects, the financial position of Vanguard Convertible Securities Fund (the “Fund”) at November 30, 2016, the results of its operations for the year then ended, the changes in its net assets for each of the two years in the period then ended, and the financial highlights for each of the five years in the period then ended, in conformity with accounting principles generally accepted in the United States of America. These financial statements and financial highlights (hereafter referred to as “financial statements”) are the responsibility of the Fund’s management. Our responsibility is to express an opinion on these financial statements based on our audits. We conducted our audits of these financial statements in accordance with the standards of the Public Company Accounting Oversight Board (United States). Those standards require that we plan and perform the audit to obtain reasonable assurance about whether the financial statements are free of material misstatement. An audit includes examining, on a test basis, evidence supporting the amounts and disclosures in the financial statements, assessing the accounting principles used and significant estimates made by management, and evaluating the overall financial statement presentation. We believe that our audits, which included confirmation of securities at November 30, 2016 by correspondence with the custodian and brokers and by agreement to the underlying ownership records of the transfer agent, provide a reasonable basis for our opinion.
/s/PricewaterhouseCoopers LLP
Philadelphia, Pennsylvania
January 12, 2017

Special 2016 tax information (unaudited) for Vanguard Convertible Securities Fund
This information for the fiscal year ended November 30, 2016, is included pursuant to provisions
of the Internal Revenue Code.
The fund distributed $18,615,000 as capital gain dividends (20% rate gain distributions) to
shareholders during the fiscal year.
The fund distributed $3,528,000 of qualified dividend income to shareholders during the fiscal year.
For corporate shareholders, 19.3% of investment income (dividend income plus short-term gains,
if any) qualifies for the dividends-received deduction.
29
Your Fund’s After-Tax Returns
This table presents returns for your fund both before and after taxes. The after-tax returns are shown in two ways: (1) assuming that an investor owned the fund during the entire period and paid taxes on the fund’s distributions, and (2) assuming that an investor paid taxes on the fund’s distributions and sold all shares at the end of each period.
Calculations are based on the highest individual federal income tax and capital gains tax rates in effect at the times of the distributions and the hypothetical sales. State and local taxes were not considered. After-tax returns reflect any qualified dividend income, using actual prior-year figures and estimates for 2016. (In the example, returns after the sale of fund shares may be higher than those assuming no sale. This occurs when the sale would have produced a capital loss. The calculation assumes that the investor received a tax deduction for the loss.)
Please note that your actual after-tax returns will depend on your tax situation and may differ from those shown. Also note that if you own the fund in a tax-deferred account, such as an individual retirement account or a 401(k) plan, this information does not apply to you. Such accounts are not subject to current taxes.
Finally, keep in mind that a fund’s performance—whether before or after taxes—does not guarantee future results.
| | | |
| Average Annual Total Returns: Convertible Securities Fund | | | |
| Periods Ended November 30, 2016 | | | |
| | One | Five | Ten |
| | Year | Years | Years |
| Returns Before Taxes | 3.11% | 7.93% | 5.89% |
| Returns After Taxes on Distributions | 2.02 | 5.77 | 3.66 |
| Returns After Taxes on Distributions and Sale of Fund Shares | 1.99 | 5.61 | 3.93 |
30
About Your Fund’s Expenses
As a shareholder of the fund, you incur ongoing costs, which include costs for portfolio management, administrative services, and shareholder reports (like this one), among others. Operating expenses, which are deducted from a fund’s gross income, directly reduce the investment return of the fund.
A fund’s expenses are expressed as a percentage of its average net assets. This figure is known as the expense ratio. The following examples are intended to help you understand the ongoing costs (in dollars) of investing in your fund and to compare these costs with those of other mutual funds. The examples are based on an investment of $1,000 made at the beginning of the period shown and held for the entire period.
The accompanying table illustrates your fund’s costs in two ways:
• Based on actual fund return. This section helps you to estimate the actual expenses that you paid over the period. The ”Ending Account Value“ shown is derived from the fund‘s actual return, and the third column shows the dollar amount that would have been paid by an investor who started with $1,000 in the fund. You may use the information here, together with the amount you invested, to estimate the expenses that you paid over the period.
To do so, simply divide your account value by $1,000 (for example, an $8,600 account value divided by $1,000 = 8.6), then multiply the result by the number given for your fund under the heading ”Expenses Paid During Period.“
• Based on hypothetical 5% yearly return. This section is intended to help you compare your fund‘s costs with those of other mutual funds. It assumes that the fund had a yearly return of 5% before expenses, but that the expense ratio is unchanged. In this case—because the return used is not the fund’s actual return—the results do not apply to your investment. The example is useful in making comparisons because the Securities and Exchange Commission requires all mutual funds to calculate expenses based on a 5% return. You can assess your fund’s costs by comparing this hypothetical example with the hypothetical examples that appear in shareholder reports of other funds.
Note that the expenses shown in the table are meant to highlight and help you compare ongoing costs only and do not reflect transaction costs incurred by the fund for buying and selling securities. Further, the expenses do not include any purchase, redemption, or account service fees described in the fund prospectus. If such fees were applied to your account, your costs would be higher. Your fund does not carry a “sales load.”
The calculations assume no shares were bought or sold during the period. Your actual costs may have been higher or lower, depending on the amount of your investment and the timing of any purchases or redemptions.
You can find more information about the fund’s expenses, including annual expense ratios, in the Financial Statements section of this report. For additional information on operating expenses and other shareholder costs, please refer to your fund’s current prospectus.
31
| | | |
| Six Months Ended November 30, 2016 | | | |
| | Beginning | Ending | Expenses |
| | Account Value | Account Value | Paid During |
| Convertible Securities Fund | 5/31/2016 | 11/30/2016 | Period |
| Based on Actual Fund Return | $1,000.00 | $1,044.78 | $1.74 |
| Based on Hypothetical 5% Yearly Return | 1,000.00 | 1,023.30 | 1.72 |
The calculations are based on expenses incurred in the most recent six-month period. The fund’s annualized six-month expense ratio for that
period is 0.34%. The dollar amounts shown as “Expenses Paid” are equal to the annualized expense ratio multiplied by the average account
value over the period, multiplied by the number of days in the most recent six-month period, then divided by the number of days in the most
recent 12-month period (183/366).
32
Glossary
30-Day SEC Yield. A fund’s 30-day SEC yield is derived using a formula specified by the U.S. Securities and Exchange Commission. Under the formula, data related to the fund’s security holdings in the previous 30 days are used to calculate the fund’s hypothetical net income for that period, which is then annualized and divided by the fund’s estimated average net assets over the calculation period. For the purposes of this calculation, a security’s income is based on its current market yield to maturity (for bonds), its actual income (for asset-backed securities), or its projected dividend yield (for stocks). Because the SEC yield represents hypothetical annualized income, it will differ—at times significantly—from the fund’s actual experience. As a result, the fund’s income distributions may be higher or lower than implied by the SEC yield.
Average Coupon. The average interest rate paid on the fixed income securities held by a fund. It is expressed as a percentage of face value.
Average Duration. An estimate of how much the value of the bonds held by a fund will fluctuate in response to a change in interest rates. To see how the value could change, multiply the average duration by the change in rates. If interest rates rise by 1 percentage point, the value of the bonds in a fund with an average duration of five years would decline by about 5%. If rates decrease by a percentage point, the value would rise by 5%.
Average Weighted Maturity. The average length of time until fixed income securities held by a fund reach maturity and are repaid. The figure reflects the proportion of fund assets represented by each security.
Beta. A measure of the magnitude of a fund’s past share-price fluctuations in relation to the ups and downs of a given market index. The index is assigned a beta of 1.00. Compared with a given index, a fund with a beta of 1.20 typically would have seen its share price rise or fall by 12% when the index rose or fell by 10%. For this report, beta is based on returns over the past 36 months for both the fund and the index. Note that a fund’s beta should be reviewed in conjunction with its R-squared (see definition). The lower the R-squared, the less correlation there is between the fund and the index, and the less reliable beta is as an indicator of volatility.
Conversion Premium. The average percentage by which the weighted average market price of the convertible securities held by a fund exceeds the weighted average market price of their underlying common stocks. For example, if a stock is trading at $25 per share and a bond that is convertible into the stock is trading at a price equivalent to $30 per share of stock, the conversion premium is 20% ($5 ÷ $25 = 20%).
Credit Quality. Credit-quality ratings are measured on a scale that generally ranges from AAA (highest) to D (lowest). Credit-quality ratings are obtained from S&P. “Not Rated” is used to classify securities for which a rating is not available. Not rated securities include a fund’s investment in Vanguard Market Liquidity Fund or Vanguard Municipal Cash Management Fund, each of which invests in high-quality money market instruments and may serve as a cash management vehicle for the Vanguard funds, trusts, and accounts.
Expense Ratio. A fund’s total annual operating expenses expressed as a percentage of the fund’s average net assets. The expense ratio includes management and administrative expenses, but does not include the transaction costs of buying and selling portfolio securities.
33
Foreign Holdings. The percentage of a fund represented by securities or depositary receipts of companies based outside the United States.
Inception Date. The date on which the assets of a fund (or one of its share classes) are first invested in accordance with the fund’s investment objective. For funds with a subscription period, the inception date is the day after that period ends. Investment performance is measured from the inception date.
Market Exposure. A measure that reflects a fund’s security investments excluding any holdings in short-term reserves.
R-Squared. A measure of how much of a fund’s past returns can be explained by the returns from the market in general, as measured by a given index. If a fund’s total returns were precisely synchronized with an index’s returns, its R-squared would be 1.00. If the fund’s returns bore no relationship to the index’s returns, its R-squared would be 0. For this report, R-squared is based on returns over the past 36 months for both the fund and the index.
Short-Term Reserves. The percentage of a fund invested in highly liquid, short-term securities that can be readily converted to cash.
Turnover Rate. An indication of the fund’s trading activity. Funds with high turnover rates incur higher transaction costs and may be more likely to distribute capital gains (which may be taxable to investors). The turnover rate excludes in-kind transactions, which have minimal impact on costs.
Benchmark Information
Convertibles Composite Index: CS First Boston Convertible Securities Index through November
30, 2004; Bank of America Merrill Lynch All US Convertibles Index (formerly Bank of America Merrill
Lynch All Convertibles-All Qualities Index) through December 31, 2010; and 70% Bank of America
Merrill Lynch All US Convertibles Index and 30% Bank of America Merrill Lynch Global 300
Convertibles ex-US Index (hedged) thereafter.
34
This page intentionally left blank.
The People Who Govern Your Fund
The trustees of your mutual fund are there to see that the fund is operated and managed in your best interests since, as a shareholder, you are a part owner of the fund. Your fund’s trustees also serve on the board of directors of The Vanguard Group, Inc., which is owned by the Vanguard funds and provides services to them on an at-cost basis.
A majority of Vanguard’s board members are independent, meaning that they have no affiliation with Vanguard or the funds they oversee, apart from the sizable personal investments they have made as private individuals. The independent board members have distinguished backgrounds in business, academia, and public service. Each of the trustees and executive officers oversees 198 Vanguard funds.
The following table provides information for each trustee and executive officer of the fund. The mailing address of the trustees and officers is P.O. Box 876, Valley Forge, PA 19482. More information about the trustees is in the Statement of Additional Information, which can be obtained, without charge, by contacting Vanguard at 800-662-7447, or online at vanguard.com.
InterestedTrustee1
F. William McNabb III
Born 1957. Trustee Since July 2009. Chairman of the Board. Principal Occupation(s) During the Past Five Years and Other Experience: Chairman of the Board of The Vanguard Group, Inc., and of each of the investment companies served by The Vanguard Group, since January 2010; Director of The Vanguard Group since 2008; Chief Executive Officer and President of The Vanguard Group, and of each of the investment companies served by The Vanguard Group, since 2008; Director of Vanguard Marketing Corporation; Managing Director of The Vanguard Group (1995–2008).
IndependentTrustees
Emerson U. Fullwood
Born 1948. Trustee Since January 2008. Principal Occupation(s) During the Past Five Years and Other Experience: Executive Chief Staff and Marketing Officer for North America and Corporate Vice President (retired 2008) of Xerox Corporation (document management products and services); Executive in Residence and 2009–2010 Distinguished Minett Professor at the Rochester Institute of Technology; Lead Director of SPX FLOW, Inc. (multi-industry manufacturing); Director of the United Way of Rochester, the University of Rochester Medical Center, Monroe Community College Foundation, North Carolina A&T University, and Roberts Wesleyan College.
Rajiv L. Gupta
Born 1945. Trustee Since December 2001.2 Principal Occupation(s) During the Past Five Years and Other Experience: Chairman and Chief Executive Officer (retired 2009) and President (2006–2008) of Rohm and Haas Co. (chemicals); Director of Tyco International plc (diversified manufacturing and services), HP Inc. (printer and personal computer manufacturing), and Delphi Automotive plc (automotive components); Senior Advisor at New Mountain Capital.
Amy Gutmann
Born 1949. Trustee Since June 2006. Principal Occupation(s) During the Past Five Years and Other Experience: President of the University of Pennsylvania; Christopher H. Browne Distinguished Professor of Political Science, School of Arts and Sciences, and Professor of Communication, Annenberg School for Communication, with secondary faculty appointments in the Department of Philosophy, School of Arts and Sciences, and at the Graduate School of Education, University of Pennsylvania; Trustee of the National Constitution Center; Chair of the Presidential Commission for the Study of Bioethical Issues.
JoAnn Heffernan Heisen
Born 1950. Trustee Since July 1998. Principal Occupation(s) During the Past Five Years and Other Experience: Corporate Vice President and Chief Global Diversity Officer (retired 2008) and Member of the Executive Committee (1997–2008) of Johnson & Johnson (pharmaceuticals/medical devices/consumer products); Director of Skytop Lodge Corporation (hotels) and the Robert Wood Johnson Foundation; Member of the Advisory Board of the Institute for Women’s Leadership at Rutgers University.
F. Joseph Loughrey
Born 1949. Trustee Since October 2009. Principal Occupation(s) During the Past Five Years and Other Experience: President and Chief Operating Officer (retired 2009) of Cummins Inc. (industrial machinery); Chairman of the Board of Hillenbrand, Inc. (specialized consumer services), and of Oxfam America; Director of SKF AB (industrial machinery), Hyster-Yale Materials Handling, Inc. (forklift trucks), the Lumina Foundation for Education, and the V Foundation for Cancer Research; Member of the Advisory Council for the College of Arts and Letters and of the Advisory Board to the Kellogg Institute for International Studies, both at the University of Notre Dame.
Mark Loughridge
Born 1953. Trustee Since March 2012. Principal Occupation(s) During the Past Five Years and Other Experience: Senior Vice President and Chief Financial Officer (retired 2013) at IBM (information technology services); Fiduciary Member of IBM’s Retirement Plan Committee (2004–2013); Director of the Dow Chemical Company; Member of the Council on Chicago Booth.
Scott C. Malpass
Born 1962. Trustee Since March 2012. Principal Occupation(s) During the Past Five Years and Other Experience: Chief Investment Officer and Vice President at the University of Notre Dame; Assistant Professor of Finance at the Mendoza College of Business at Notre Dame; Member of the Notre Dame 403(b) Investment Committee, the Board of Advisors for Spruceview Capital Partners, and the Investment Advisory Committee of Major League Baseball; Board Member of TIFF Advisory Services, Inc., and Catholic Investment Services, Inc. (investment advisors).
André F. Perold
Born 1952. Trustee Since December 2004. Principal Occupation(s) During the Past Five Years and Other Experience: George Gund Professor of Finance and Banking, Emeritus at the Harvard Business School (retired 2011); Chief Investment Officer and Managing Partner of HighVista Strategies LLC (private investment firm); Director of Rand Merchant Bank; Overseer of the Museum of Fine Arts Boston.
Peter F. Volanakis
Born 1955. Trustee Since July 2009. Principal Occupation(s) During the Past Five Years and Other Experience: President and Chief Operating Officer (retired 2010) of Corning Incorporated (communications equipment); Chairman of the Board of Trustees of Colby-Sawyer College; Member of the Advisory Board of the Norris Cotton Cancer Center.
Executive Officers
Glenn Booraem
Born 1967. Treasurer Since May 2015. Principal Occupation(s) During the Past Five Years and Other Experience: Principal of The Vanguard Group, Inc.; Treasurer of each of the investment companies served by The Vanguard Group; Controller of each of the investment companies served by The Vanguard Group (2010–2015); Assistant Controller of each of the investment companies served by The Vanguard Group (2001–2010).
Thomas J. Higgins
Born 1957. Chief Financial Officer Since September 2008. Principal Occupation(s) During the Past Five Years and Other Experience: Principal of The Vanguard Group, Inc.; Chief Financial Officer of each of the investment companies served by The Vanguard Group; Treasurer of each of the investment companies served by The Vanguard Group (1998–2008).
Peter Mahoney
Born 1974. Controller Since May 2015. Principal Occupation(s) During the Past Five Years and Other Experience: Head of Global Fund Accounting at The Vanguard Group, Inc.; Controller of each of the investment companies served by The Vanguard Group; Head of International Fund Services at The Vanguard Group (2008–2014).
Anne E. Robinson
Born 1970. Secretary Since September 2016. Principal Occupation(s) During the Past Five Years and Other Experience: Managing Director of The Vanguard Group, Inc.; General Counsel of The Vanguard Group; Secretary of The Vanguard Group and of each of the investment companies served by The Vanguard Group; Director and Senior Vice President of Vanguard Marketing Corporation; Managing Director and General Counsel of Global Cards and Consumer Services at Citigroup (2014–2016); Counsel at American Express (2003–2014).
| |
| Vanguard Senior Management Team |
| Mortimer J. Buckley | James M. Norris |
| Kathleen C. Gubanich | Thomas M. Rampulla |
| Martha G. King | Glenn W. Reed |
| John T. Marcante | Karin A. Risi |
| Chris D. McIsaac | Michael Rollings |
|
| Chairman Emeritus and Senior Advisor |
| John J. Brennan |
| Chairman, 1996–2009 |
| Chief Executive Officer and President, 1996–2008 |
| |
| Founder |
| John C. Bogle |
| Chairman and Chief Executive Officer, 1974–1996 |
1 Mr. McNabb is considered an “interested person,” as defined in the Investment Company Act of 1940, because he is an officer of the Vanguard funds.
2 December 2002 for Vanguard Equity Income Fund, the Vanguard Municipal Bond Funds, and the Vanguard State Tax-Exempt Funds.
|  |
| | P.O. Box 2600 |
| | Valley Forge, PA 19482-2600 |
| |
| |
| |
| Connect with Vanguard® > vanguard.com | |
| |
| |
| |
| Fund Information > 800-662-7447 | CFA® is a registered trademark owned by CFA Institute. |
| Direct Investor Account Services > 800-662-2739 | |
| Institutional Investor Services > 800-523-1036 | |
| Text Telephone for People | |
| Who Are Deaf or Hard of Hearing > 800-749-7273 | |
| |
| This material may be used in conjunction | |
| with the offering of shares of any Vanguard | |
| fund only if preceded or accompanied by | |
| the fund’s current prospectus. | |
| |
| All comparative mutual fund data are from Lipper, a | |
| Thomson Reuters Company, or Morningstar, Inc., unless | |
| otherwise noted. | |
| |
| You can obtain a free copy of Vanguard’s proxy voting | |
| guidelines by visiting vanguard.com/proxyreporting or by | |
| calling Vanguard at 800-662-2739. The guidelines are | |
| also available from the SEC’s website, sec.gov. In | |
| addition, you may obtain a free report on how your fund | |
| voted the proxies for securities it owned during the 12 | |
| months ended June 30. To get the report, visit either | |
| vanguard.com/proxyreporting or sec.gov. | |
| |
| You can review and copy information about your fund at | |
| the SEC’s Public Reference Room in Washington, D.C. To | |
| find out more about this public service, call the SEC at | |
| 202-551-8090. Information about your fund is also | |
| available on the SEC’s website, and you can receive | |
| copies of this information, for a fee, by sending a | |
| request in either of two ways: via email addressed to | |
| publicinfo@sec.gov or via regular mail addressed to the | |
| Public Reference Section, Securities and Exchange | |
| Commission, Washington, DC 20549-1520. | |
| |
| | © 2017 The Vanguard Group, Inc. |
| | All rights reserved. |
| | Vanguard Marketing Corporation, Distributor. |
| |
| | Q820 012017 |
Item 2: Code of Ethics. The Registrant has adopted a code of ethics that applies to the Registrant’s principal executive officer, principal financial officer, principal accounting officer or controller or persons performing similar functions. The Code of Ethics was amended during the reporting period covered by this report to make certain technical, non-material changes.
Item 3: Audit Committee Financial Expert. All members of the Audit Committee have been determined by the Registrant’s Board of Trustees to be Audit Committee Financial Experts and to be independent: Rajiv L. Gupta, JoAnn Heffernan Heisen, F. Joseph Loughrey, Mark Loughridge, and Peter F. Volanakis.
Item 4: Principal Accountant Fees and Services.
(a) Audit Fees.
Audit Fees of the Registrant
Fiscal Year Ended November 30, 2016: $43,000
Fiscal Year Ended November 30, 2015: $42,000
Aggregate Audit Fees of Registered Investment Companies in the Vanguard Group.
Fiscal Year Ended November 30, 2016: $9,629,849
Fiscal Year Ended November 30, 2015: $7,000,200
Includes fees billed in connection with audits of the Registrant, other registered investment companies in the Vanguard complex, The Vanguard Group, Inc. and Vanguard Marketing Corporation.
(b) Audit-Related Fees.
Fiscal Year Ended November 30, 2016: $2,717,627
Fiscal Year Ended November 30, 2015: $2,899,096
Includes fees billed in connection with assurance and related services provided to the Registrant, other registered investment companies in the Vanguard complex, The Vanguard Group, Inc., and Vanguard Marketing Corporation.
(c) Tax Fees.
Fiscal Year Ended November 30, 2016: $254,050
Fiscal Year Ended November 30, 2015: $353,389
Includes fees billed in connection with tax compliance, planning, and advice services provided to the Registrant, other registered investment companies in the Vanguard complex, The Vanguard Group, Inc., and Vanguard Marketing Corporation.
(d) All Other Fees.
Fiscal Year Ended November 30, 2016: $214,225
Fiscal Year Ended November 30, 2015: $202,313
Includes fees billed for services related to tax reported information provided to the Registrant, other registered investment companies in the Vanguard complex, The Vanguard Group, Inc., and Vanguard Marketing Corporation.
(e) (1) Pre-Approval Policies. The policy of the Registrant’s Audit Committee is to consider and, if appropriate, approve before the principal accountant is engaged for such services, all specific audit and non-audit services provided to: the Registrant, other registered investment companies in the Vanguard complex, The Vanguard Group, Inc., and entities controlled by The Vanguard Group, Inc. that provide ongoing services to the Registrant. In making a determination, the Audit Committee considers whether the services are consistent with maintaining the principal accountant’s independence.
In the event of a contingency situation in which the principal accountant is needed to provide services in between scheduled Audit Committee meetings, the Chairman of the Audit Committee would be called on to consider and, if appropriate, pre-approve audit or permitted non-audit services in an amount sufficient to complete services through the next Audit Committee meeting, and to determine if such services would be consistent with maintaining the accountant’s independence. At the next scheduled Audit Committee meeting, services and fees would be presented to the Audit Committee for formal consideration, and, if appropriate, approval by the entire Audit Committee. The Audit Committee would again consider whether such services and fees are consistent with maintaining the principal accountant’s independence.
The Registrant’s Audit Committee is informed at least annually of all audit and non-audit services provided by the principal accountant to the Vanguard complex, whether such services are provided to: the Registrant, other registered investment companies in the Vanguard complex, The Vanguard Group, Inc., or other entities controlled by The Vanguard Group, Inc. that provide ongoing services to the Registrant.
(2) No percentage of the principal accountant’s fees or services were approved pursuant to the waiver provision of paragraph (c)(7)(i)(C) of Rule 2-01 of Regulation S-X.
(f) For the most recent fiscal year, over 50% of the hours worked under the principal accountant’s engagement were not performed by persons other than full-time, permanent employees of the principal accountant.
(g) Aggregate Non-Audit Fees.
Fiscal Year Ended November 30, 2016: $468,275
Fiscal Year Ended November 30, 2015: $555,702
Includes fees billed for non-audit services provided to the Registrant, other registered investment companies in the Vanguard complex, The Vanguard Group, Inc., and Vanguard Marketing Corporation.
(h) For the most recent fiscal year, the Audit Committee has determined that the provision of all non-audit services was consistent with maintaining the principal accountant’s independence.
Item 5: Audit Committee of Listed Registrants.
Not Applicable.
Item 6: Investments.
Not Applicable.
Item 7: Disclosure of Proxy Voting Policies and Procedures for Closed-End Management
Investment Companies.
Not Applicable.
Item 8: Portfolio Managers of Closed-End Management Investment Companies.
Not Applicable.
Item 9: Purchase of Equity Securities by Closed-End Management Investment Company and
Affiliated Purchasers.
Not Applicable.
Item 10: Submission of Matters to a Vote of Security Holders.
Not Applicable.
Item 11: Controls and Procedures.
(a) Disclosure Controls and Procedures. The Principal Executive and Financial Officers concluded that the Registrant’s Disclosure Controls and Procedures are effective based on their evaluation of the Disclosure Controls and Procedures as of a date within 90 days of the filing date of this report.
(b) Internal Control Over Financial Reporting. There were no significant changes in Registrant’s Internal Control Over Financial Reporting or in other factors that could significantly affect this control subsequent to the date of the evaluation, including any corrective actions with regard to significant deficiencies and material weaknesses.
Item 12: Exhibits.
(a) Code of Ethics.
(b) Certifications.
Pursuant to the requirements of the Securities Exchange Act of 1934 and the Investment Company Act of 1940, the registrant has duly caused this report to be signed on its behalf by the undersigned, thereunto duly authorized.
| |
| | VANGUARD CONVERTIBLE SECURITIES FUND |
| |
| |
| BY: | /s/ F. WILLIAM MCNABB III* |
| | F. WILLIAM MCNABB III |
| | CHIEF EXECUTIVE OFFICER |
| |
| Date: January 17, 2017 |
Pursuant to the requirements of the Securities Exchange Act of 1934 and the Investment Company Act of 1940, this report has been signed below by the following persons on behalf of the registrant and in the capacities and on the dates indicated.
| |
| | VANGUARD CONVERTIBLE SECURITIES FUND |
| |
| BY: | /s/ F. WILLIAM MCNABB III* |
| | F. WILLIAM MCNABB III |
| | CHIEF EXECUTIVE OFFICER |
Date: January 17, 2017 |
| VANGUARD CONVERTIBLE SECURITIES FUND |
BY: | /s/ THOMAS J. HIGGINS* |
| | THOMAS J. HIGGINS |
| | CHIEF FINANCIAL OFFICER |
| Date: January 17, 2017 |
* By: /s/ Anne E. Robinson
Anne E. Robinson, pursuant to a Power of Attorney filed on October 4, 2016 see file Number
33-32548, Incorporated by Reference.