UNITED STATES
SECURITIES AND EXCHANGE COMMISSION
Washington, D.C. 20549
FORM N-CSR
CERTIFIED SHAREHOLDER REPORT
OF
REGISTERED MANAGEMENT INVESTMENT COMPANIES
Investment Company Act file number: 811-04627
Name of Registrant: | | Vanguard Convertible Securities Fund |
Address of Registrant: | | P.O. Box 2600 |
| | Valley Forge, PA 19482 |
| | |
Name and address of agent for service: | | Anne E. Robinson, Esquire |
| | P.O. Box 876 |
| | Valley Forge, PA 19482 |
Registrant’s telephone number, including area code: (610) 669-1000
Date of fiscal year end: November 30
Date of reporting period: December 1, 2017—November 30, 2018
Item 1: Reports to Shareholders

| |
| |
| |
| Annual Report| November 30, 2018 |
| |
| |
| |
| Vanguard Convertible Securities Fund |
| |
| |
| |
| |
| |
| |
| |
| |
| |
| |
| |
| |
| |
| |
| |
| |
| |
| |
| |
| |
| |
| |
| |
| |
| |
| |
| |
| |
| |
| |
| |
| |
| |
| |
| |
| |
| |
| See the inside front cover for important information about access |
| to your fund's annual and semiannual shareholder reports. |
| |
| |
Important information about access to shareholder reports
Beginning on January 1, 2021, as permitted by regulations adopted by the Securities and Exchange Commission, paper copies of your fund's annual and semiannual shareholder reports will no longer be sent to you by mail, unless you specifically request them. Instead, you will be notified by mail each time a report is posted on the website and will be provided with a link to access the report.
If you have already elected to receive shareholder reports electronically, you will not be affected by this change and do not need to take any action. You may elect to receive shareholder reports and other communications from the fund electronically by contacting your financial intermediary (such as a broker-dealer or bank) or, if you invest directly with the fund, by calling Vanguard at one of the phone numbers on the back cover of this report or by logging on to vanguard.com.
You may elect to receive paper copies of all future shareholder reports free of charge. If you invest through a financial intermediary, you can contact the intermediary to request that you continue to receive paper copies. If you invest directly with the fund, you can call Vanguard at one of the phone numbers on the back cover of this report or log on to vanguard.com. Your election to receive paper copies will apply to all the funds you hold through an intermediary or directly with Vanguard.
Contents
| A Note From Our CEO | 1 |
| | |
| Your Fund's Performance at a Glance | 2 |
| | |
| Advisor's Report | 3 |
| | |
| About Your Fund's Expenses | 7 |
| | |
| Performance Summary | 9 |
| | |
| Financial Statements | 11 |
Please note: The opinions expressed in this report are just that—informed opinions. They should not be considered promises or advice. Also, please keep in mind that the information and opinions cover the period through the date on the front of this report. Of course, the risks of investing in your fund are spelled out in the prospectus.
A Note From Our CEO

Tim Buckley
President and Chief Executive Officer
Dear Shareholder,
Over the years, I've found that prudent investors exhibit a common trait: discipline. No matter how the markets move or what new investing fad hits the headlines, those who stay focused on their goals and tune out the noise are set up for long-term success.
The prime gateway to investing is saving, and you don't usually become a saver without a healthy dose of discipline. Savers make the decision to sock away part of their income, which means spending less and delaying gratification, no matter how difficult that may be.
Of course, disciplined investing extends beyond diligent saving. The financial markets, in the short term especially, are unpredictable; I have yet to meet the investor who can time them perfectly. It takes discipline to resist the urge to go all-in when markets are frothy or to retreat when things look bleak.
Staying put with your investments is one strategy for handling volatility. Another, rebalancing, requires even more discipline because it means steering your money away from strong performers and toward poorer performers.
Patience—a form of discipline—is also the friend of long-term investors. Higher returns are the potential reward for weathering the market's turbulence and uncertainty.
It's important to be prepared for that turbulence, whenever it appears. Don't panic. Don't chase returns or look for answers outside the asset classes you trust. And be sure to rebalance periodically, even when there's turmoil.
Whether you're a master of self-control, get a boost from technology, or work with a professional advisor, know that discipline is necessary to get the most out of your investment portfolio. And know that Vanguard is with you for the entire ride.
Thank you for your continued loyalty.
Sincerely,

Mortimer J. Buckley
President and Chief Executive Officer
December 18, 2018
Your Fund's Performance at a Glance
· Vanguard Convertible Securities Fund offers investors exposure to corporate bonds and preferred stocks that can be exchanged for common stocks at a predetermined price.
· For the 12 months ended November 30, 2018, the fund returned 0.04%, trailing its composite benchmark by more than 3 percentage points.
· The fund's limited exposure to higher-risk preferred stocks, compared with its benchmark, weighed on relative performance.
· The fund invests primarily in U.S. convertibles, with approximately a third of its assets in international securities.
· In late December, after the period covered by this report, the fund's board of trustees voted to liquidate the fund on or about March 19, 2019. On the liquidation date, the fund's remaining assets will be sold and the proceeds distributed to any remaining shareholders.
Market Barometer
| | | Average Annual Total Returns Periods Ended November 30, 2018 | |
| | | One Year | | | Three Years | | | Five Years | |
| Stocks | | | | | | | | | |
| Russell 1000 Index (Large-caps) | | | 5.92 | % | | | 11.94 | % | | | 10.89 | % |
| Russell 2000 Index (Small-caps) | | | 0.57 | | | | 10.08 | | | | 7.50 | |
| Russell 3000 Index (Broad U.S. market) | | | 5.53 | | | | 11.80 | | | | 10.62 | |
| FTSE All-World ex US Index (International) | | | -7.98 | | | | 5.59 | | | | 2.17 | |
| | | | | | | | | | | | | |
| Bonds | | | | | | | | | | | | |
| Bloomberg Barclays U.S. Aggregate Bond Index (Broad taxable market) | | | -1.34 | % | | | 1.33 | % | | | 2.03 | % |
| Bloomberg Barclays Municipal Bond Index (Broad tax-exempt market) | | | 1.13 | | | | 2.13 | | | | 3.52 | |
| FTSE Three-Month U.S. Treasury Bill Index | | | 1.76 | | | | 0.92 | | | | 0.55 | |
| | | | | | | | | | | | | |
| CPI | | | | | | | | | | | | |
| Consumer Price Index | | | 2.18 | % | | | 2.02 | % | | | 1.58 | % |
Advisor's Report
The investment strategy of Vanguard Convertible Securities Fund is to create a highly diversified global portfolio of convertible securities that will participate significantly when equity markets rise and provide downside protection in weaker markets.
The fund focuses on "balanced" convertibles—securities that have a reasonable yield and stable credit quality, along with good call protection and low to moderate conversion premiums. We believe these securities have a favorable balance of upside potential to downside risk. This approach leads to an emphasis on convertible bonds with a relatively near-term maturity or put date and to an underweight to riskier convertible preferred shares.
Importantly, the fund does not invest in common stocks or nonconvertible debt. The fund does not attempt to market-time and therefore is usually fully invested, holding only a small amount of cash for potential investments. With careful security selection, we believe that a portfolio of attractive convertible securities can produce equity-type returns with lower volatility and lower structural risk over full market cycles.
The fund returned 0.04% for the 12 months ended November 30, 2018, underperforming the 3.22% return of its blended benchmark (70% ICE BofAML All US Convertibles Index and 30% ICE BofAML Global 300 Convertibles ex-US Index [hedged]). Our relative performance suffered from our lack of exposure to highly equity-sensitive technology positions (which lack downside protection) combined with lackluster returns from technology-related holdings.
The investment environment
Global equity markets were up 0.68% (as measured by the MSCI World Index) during the review period, with notable differences in performance between U.S. and international markets. U.S. equity markets were buoyant through the first ten months of the period. Solid second-quarter earnings results, upbeat corporate outlooks, and improving U.S. economic growth lifted stocks in the review period. In the third quarter alone, the Standard and Poor's 500 Index was up over 7% and overall sentiment remained positive, with the CBOE Volatility Index (VIX Index) at just over 12 as of September 30.
Outside the U.S., after a flat performance in the first half of 2018, equity markets rose 1.35% (as measured by the MSCI EAFE Index) during the third quarter. Markets were volatile primarily because of rapid developments in global trade issues.
Most regions generated positive returns as investors viewed the trade risks as being adequately reflected in stock valuations. Japanese stocks were the best performers for two reasons: (1) a weaker Japanese yen versus the U.S. dollar, which should lead to higher earnings for Japanese exporting companies; and (2) political and economic policy continuity with the reelection of Shinzo Abe as his party's leader. This puts him on track to become Japan's longest-serving prime
minister. Equities in Asia ex-Japan continued to lag as investors remained concerned about the fallout from worsening U.S.-China trade relations, which could hurt consumer and business confidence in the region.
A dramatic shift in sentiment occurred at the beginning of the fourth quarter, with global stocks falling 6.22% (as measured by the MSCI World Index) from October through November, their second meaningful correction of the year. Investors faced a multitude of concerns that spanned the globe. The sell-off in October was broad- based, and no region was immune to the negative sentiment.
In the U.S., the S&P 500 Index fell 4.93% from October through November, triggered by concerns about the Federal Reserve reducing its balance sheet and the rise of long-term interest rates. The yield on 10-year U.S. Treasuries rose as high as 3.3%. Japanese stocks began the two months at their highest level since November 1991 but ended down more than 8%. Asia ex-Japan was particularly weak (with the Hang Seng down more than 4%) after China's third-quarter GDP came in at 6.5% (versus a 6.6% consensus), renewing fears of a trade war-induced economic slowdown. Europe's EuroStoxx 50 Index ended down approximately 7% as investors focused on Italy's fiscal situation.
For the first nine months of 2018, global new issuance totaled $76 billion, similar to last year's pace. With over $46 billion in issuance since the beginning of the year, the U.S. new-issue market is projected to raise over $60 billion in 2018. This would be the highest amount raised in over ten years.
The appeal for issuers of convertible financing lies in three factors: higher interest rates, higher equity prices, and more robust economic activity.
Higher interest rates, as we have discussed in previous reports, have created a more compelling environment for convertible financing versus high-yield and bank-loan financing. In the first nine months of 2018, non-U.S. convertible bond issuance was a respectable $30 billion. The volume was $6 billion in the seasonally slow third quarter. Issuance was well-diversified by region and sector and included a healthy number of first-time issuers. In contrast to recent years, non-investment-grade corporates originated the most placements.
Our process continues to focus on companies in our universe with strong credit fundamentals combined with favorable equity valuations and prospects for appreciation. We then construct a portfolio of balanced convertibles that should capture most of a stock market rise, while meaningfully constraining losses when the market declines. Properly executed, this approach should generate equity-type returns with much lower volatility over full market cycles.
Successes
The portfolio benefited from our holdings in the consumer staples and utilities sectors. The top relative contributors to the fund's performance were convertibles from Herbalife, in consumer staples, and NRG Energy, in utilities.
Shortfalls
Security selection in information technology and health care detracted most from the fund's performance. The chief relative detractors were II-VI, in information technology, and Molina Healthcare, which is included in the index but was not held by the fund.
The fund's positioning
We remain fully invested in a highly diversified, well-balanced portfolio of convertible securities. At the end of the period, the fund's investments were 68% in the U.S. and 32% outside the U.S. The fund had an attractive current yield of 1.6% and an average credit quality of Ba2/BB. The business operations of almost all the issuers are performing in line with or better than expectations and, importantly, are fundamentally sound credits.
Andrew Watts, CFA, Managing Director
Stu Spangler, CFA, Managing Director
Jean-Pierre Latrille, Managing Director
Abe Ofer, Managing Director
Petar Raketic, CFA, Managing Director
Oaktree Capital Management, L.P.
December 13, 2018
Major Portfolio Changes
12 Months Ended November 30, 2018
| Additions | Comments |
| Tesla | Balanced convertible with strong equity catalysts. |
| 1.250% convertible note due 03/01/2021 | |
| 2.375% convertible note due 03/15/2022 | |
| Akamai Technologies | Balanced convertible with good risk/reward. |
| 0.000% convertible note due 02/15/2019 | |
| 0.125% convertible note due 05/01/2025 | |
| Herbalife Nutrition | Balanced convertible with attractive valuation. |
| 2.000% convertible note due 08/15/2019 | |
| 2.625% convertible note due 03/15/2024 | |
| Biomarin Pharmaceutical | Balanced issues with strong equity story. |
| 0.750% convertible note due 10/15/2018 | |
| 1.500% convertible note due 10/15/2020 | |
| 0.599% convertible note due 08/01/2024 | |
| Booking Holdings (formerly Priceline) | Undervalued security with strong equity upside. |
| 0.900% convertible note due 09/15/2021 | |
| Reductions | Comments |
| Tesla | Rotated into more balanced names. |
| 1.250% convertible note due 03/01/2021 | |
| 2.375% convertible note due 03/15/2022 | |
| Herbalife Nutrition | Took profits and rotated into more balanced names. |
| 2.000% convertible note due 08/15/2019 | |
| 2.625% convertible note due 03/15/2024 | |
| Akamai Technologies | Rotated into more balanced names. |
| 0.000% convertible note due 02/15/2019 | |
| 0.125% convertible note due 05/01/2025 | |
| II-VI | Rotated into names with more balanced convertible profile. |
| 0.250% convertible note due 09/01/2022 | |
| Microchip Technology | Rotated into more balanced names. |
| 1.625% convertible note due 02/15/2027 | |
About Your Fund's Expenses
As a shareholder of the fund, you incur ongoing costs, which include costs for portfolio management, administrative services, and shareholder reports (like this one), among others. Operating expenses, which are deducted from a fund's gross income, directly reduce the investment return of the fund.
A fund's expenses are expressed as a percentage of its average net assets. This figure is known as the expense ratio. The following examples are intended to help you understand the ongoing costs (in dollars) of investing in your fund and to compare these costs with those of other mutual funds. The examples are based on an investment of $1,000 made at the beginning of the period shown and held for the entire period.
The accompanying table illustrates your fund's costs in two ways:
· Based on actual fund return.This section helps you to estimate the actual expenses that you paid over the period. The "Ending Account Value" shown is derived from the fund's actual return, and the third column shows the dollar amount that would have been paid by an investor who started with $1,000 in the fund. You may use the information here, together with the amount you invested, to estimate the expenses that you paid over the period.
To do so, simply divide your account value by $1,000 (for example, an $8,600 account value divided by $1,000 = 8.6), then multiply the result by the number given for your fund under the heading "Expenses Paid During Period."
· Based on hypothetical 5% yearly return.This section is intended to help you compare your fund's costs with those of other mutual funds. It assumes that the fund had a yearly return of 5% before expenses, but that the expense ratio is unchanged. In this case—because the return used is not the fund's actual return—the results do not apply to your investment. The example is useful in making comparisons because the Securities and Exchange Commission requires all mutual funds to calculate expenses based on a 5% return. You can assess your fund's costs by comparing this hypothetical example with the hypothetical examples that appear in shareholder reports of other funds.
Note that the expenses shown in the table are meant to highlight and help you compareongoingcosts only and do not reflect transaction costs incurred by the fund for buying and selling securities. Further, the expenses do not include any purchase, redemption, or account service fees described in the fund prospectus. If such fees were applied to your account, your costs would be higher. Your fund does not carry a "sales load."
The calculations assume no shares were bought or sold during the period. Your actual costs may have been higher or lower, depending on the amount of your investment and the timing of any purchases or redemptions.
You can find more information about the fund's expenses, including annual expense ratios, in the Financial Statements section of this report. For additional information on operating expenses and other shareholder costs, please refer to your fund's current prospectus.
Six Months Ended November 30, 2018
| | | Beginning | | | Ending | | | Expenses | |
| | | Account Value | | | Account Value | | | Paid During | |
| Convertible Securities Fund | | 5/31/2018 | | | 11/30/2018 | | | Period | |
| Based on Actual Fund Return | | | $1,000.00 | | | | $976.87 | | | | $1.64 | |
| Based on Hypothetical 5% Yearly Return | | | 1,000.00 | | | | 1,023.41 | | | | 1.67 | |
The calculations are based on expenses incurred in the most recent six-month period. The fund's annualized six-month expense ratio for that period is 0.33%. The dollar amounts shown as "Expenses Paid" are equal to the annualized expense ratio multiplied by the average account value over the period, multiplied by the number of days in the most recent six-month period, then divided by the number of days in the most recent 12-month period (183/365).
Convertible Securities Fund
Performance Summary
All of the returns in this report represent past performance, which is not a guarantee of future results that may be achieved by the fund. (Current performance may be lower or higher than the performance data cited. For performance data current to the most recent month-end, visit our website at vanguard.com/performance.) Note, too, that both investment returns and principal value can fluctuate widely, so an investor's shares, when sold, could be worth more or less than their original cost.The returns shown do not reflect taxes that a shareholder would pay on fund distributions or on the sale of fund shares.
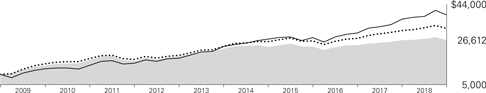
Cumulative Performance: November 30, 2008, Through November 30, 2018
Initial Investment of $10,000
| | | | Average Annual Total Returns
Periods Ended November 30, 2018 | | |
| | | | | | | | | | | | | Final Value | |
| | | | One | | | Five | | | Ten | | | of a $10,000 | |
| | | | Year | | | Years | | | Years | | | Investment | |
 | Convertible Securities Fund | | | 0.04 | % | | | 3.52 | % | | | 10.28 | % | | $ | 26,612 | |
 | Convertibles Composite Index | | | 3.22 | | | | 6.47 | | | | 12.43 | | | | 32,273 | |
| ____ | Dow Jones U.S. Total Stock Market Float Adjusted Index | | | 5.50 | | | | 10.56 | | | | 14.53 | | | | 38,847 | |
Convertibles Composite Index: CS First Boston Convertible Securities Index through November 30, 2004; Bank of America Merrill Lynch All US Convertibles Index (formerly Bank of America Merrill Lynch All Convertibles-All Qualities Index) through December 31, 2010; and 70% ICE BofAML All US Convertibles Index and 30% ICE BofAML Global 300 Convertibles ex-US Index (hedged) thereafter.
Average Annual Total Returns: Periods Ended September 30, 2018
This table presents returns through the latest calendar quarter—rather than through the end of the fiscal period. Securities and Exchange Commission rules require that we provide this information.
| | | | | | | | | | | | | | | | | | | | | | Ten Years | |
| | | Inception Date | | | One Year | | | | Five Years | | | | Income | | | | Capital | | | | Total | |
| Convertible Securities Fund | | 6/17/1986 | | | 7.33 | % | | | 5.04 | % | | | 3.06 | % | | | 5.23 | % | | | 8.29 | % |
See Financial Highlights for dividend and capital gains information.
Convertible Securities Fund
Sector Diversification
As of November 30, 2018
| Communication Services | | | 7.3 | % |
| Consumer Discretionary | | | 9.1 | |
| Consumer Staples | | | 2.7 | |
| Energy | | | 5.0 | |
| Financials | | | 5.1 | |
| Health Care | | | 17.5 | |
| Industrials | | | 11.1 | |
| Information Technology | | | 20.1 | |
| Materials | | | 5.7 | |
| Real Estate | | | 7.7 | |
| Utilities | | | 8.7 | |
The table reflects the fund's market exposure. Any holdings in short-term reserves are excluded. Sector categories are based on the Global Industry Classification Standard ("GICS”), except for the "Other” category (if applicable), which includes securities that have not been provided a GICS classification as of the effective reporting period.
The Global Industry Classification Standard ("GICS”) was developed by and is the exclusive property and a service mark of MSCI Inc. ("MSCI”) and Standard and Poor's, a division of McGraw-Hill Companies, Inc. ("S&P”), and is licensed for use by Vanguard. Neither MSCI, S&P nor any third party involved in making or compiling the GICS or any GICS classification makes any express or implied warranties or representations with respect to such standard or classification (or the results to be obtained by the use thereof), and all such parties hereby expressly disclaim all warranties of originality, accuracy, completeness, merchantability or fitness for a particular purpose with respect to any such standard or classification. Without limiting any of the foregoing, in no event shall MSCI, S&P, any of its affiliates or any third party involved in making or compiling the GICS or any GICS classification have any liability for any direct, indirect, special, punitive, consequential or any other damages (including lost profits) even if notified of the possibility of such damages.
Convertible Securities Fund
Financial Statements
Statement of Net Assets
As of November 30, 2018
The fund reports a complete list of its holdings in regulatory filings four times in each fiscal year, at the quarter-ends. For the second and fourth fiscal quarters, the lists appear in the fund's semiannual and annual reports to shareholders. For the first and third fiscal quarters, the fund files the lists with the Securities and Exchange Commission on Form N-Q. Shareholders can look up the fund's Forms N-Q on the SEC's website at sec.gov.
| | | | | | | | | | | | Face | | | Market | |
| | | | | | | | Maturity | | | | Amount | | | Value· | |
| | | | | Coupon | | | Date | | Currency | | (000) | | | ($000) | |
| Convertible Bonds (79.1%) | | | | | | | | | | | | | |
| Communication Services (6.4%) | | | | | | | | | | | | | | | | |
| | | CyberAgent Inc. Cvt. | | | 0.000 | % | | 2/17/23 | | JPY | | | 170,000 | | | | 1,670 | |
| | | CyberAgent Inc. Cvt. | | | 0.000 | % | | 2/19/25 | | JPY | | | 240,000 | | | | 2,419 | |
| 1 | | Gannett Co. Inc. Cvt. | | | 4.750 | % | | 4/15/24 | | USD | | | 4,675 | | | | 4,925 | |
| 1 | | GCI Liberty Inc. Cvt. | | | 1.750 | % | | 9/30/46 | | USD | | | 8,055 | | | | 8,488 | |
| 1 | | IAC FinanceCo Inc. Cvt. | | | 0.875 | % | | 10/1/22 | | USD | | | 1,936 | | | | 2,508 | |
| | | Inmarsat plc Cvt. | | | 3.875 | % | | 9/9/23 | | USD | | | 3,000 | | | | 3,236 | |
| | | Kakao Corp. Cvt. | | | 0.000 | % | | 5/11/21 | | KRW | | | 5,400,000 | | | | 5,060 | |
| | | Liberty Media Corp-Liberty | | | | | | | | | | | | | | | | |
| | | Formula One Cvt. | | | 1.000 | % | | 1/30/23 | | USD | | | 6,180 | | | | 6,321 | |
| 1 | | Liberty Media Corp. Cvt. | | | 2.125 | % | | 3/31/48 | | USD | | | 5,660 | | | | 5,423 | |
| 1 | | Liberty Media Corp. Cvt. | | | 2.250 | % | | 12/1/48 | | USD | | | 4,090 | | | | 4,235 | |
| 1 | | Live Nation Entertainment Inc. Cvt. | | | 2.500 | % | | 3/15/23 | | USD | | | 6,050 | | | | 6,459 | |
| | | Pandora Media Inc. Cvt. | | | 1.750 | % | | 12/1/20 | | USD | | | 2,080 | | | | 1,983 | |
| 1 | | Twitter Inc. Cvt. | | | 0.250 | % | | 6/15/24 | | USD | | | 9,685 | | | | 8,728 | |
| | | | | | | | | | | | | | | | | | 61,455 | |
| Consumer Discretionary (7.9%) | | | | | | | | | | | | | | | |
| | | Booking Holdings, Inc. Cvt. | | | 0.900 | % | | 9/15/21 | | USD | | | 9,173 | | | | 10,541 | |
| 1 | | Chegg Inc. Cvt. | | | 0.250 | % | | 5/15/23 | | USD | | | 2,485 | | | | 2,964 | |
| | | EDION Corp. Cvt. | | | 0.000 | % | | 6/19/25 | | JPY | | | 230,000 | | | | 2,281 | |
| 1 | | Etsy Inc. Cvt. | | | 0.000 | % | | 3/1/23 | | USD | | | 1,460 | | | | 2,326 | |
| | | Harvest International Co. Cvt. | | | 0.000 | % | | 11/21/22 | | HKD | | | 35,000 | | | | 4,184 | |
| | | KB Home Cvt. | | | 1.375 | % | | 2/1/19 | | USD | | | 4,752 | | | | 4,722 | |
| | | Kyoritsu Maintenance Co. Ltd. Cvt. | | | 0.000 | % | | 3/31/21 | | JPY | | | 200,000 | | | | 1,958 | |
| 1 | | Liberty Expedia Holdings Inc. Cvt. | | | 1.000 | % | | 6/30/47 | | USD | | | 6,525 | | | | 6,307 | |
| | | Lotte Shopping Co. Ltd. Cvt. | | | 0.000 | % | | 4/4/23 | | KRW | | | 6,200,000 | | | | 5,175 | |
| | | LVMH Moet Hennessy Louis Vuitton | | | | | | | | | | | | | | | | |
| | | SE Cvt. | | | 0.000 | % | | 2/16/21 | | USD | | | 2,087 | | | | 2,598 | |
| | | NHK Spring Co. Ltd. Cvt. | | | 0.000 | % | | 9/20/19 | | USD | | | 3,100 | | | | 3,065 | |
| | | SEB SA Regs Cvt. | | | 0.000 | % | | 11/17/21 | | EUR | | | 3,638 | | | | 4,258 | |
| | | Sony Corp. Cvt. | | | 0.000 | % | | 9/30/22 | | JPY | | | 669,000 | | | | 7,635 | |
| | | Tesla Inc. Cvt. | | | 1.250 | % | | 3/1/21 | | USD | | | 9,070 | | | | 10,385 | |
| | | Tesla Inc. Cvt. | | | 2.375 | % | | 3/15/22 | | USD | | | 2,895 | | | | 3,581 | |
| | | Zhongsheng Group Holdings Ltd. Cvt. | | | 0.000 | % | | 5/23/23 | | HKD | | | 38,000 | | | | 4,511 | |
| | | | | | | | | | | | | | | | | | 76,491 | |
Convertible Securities Fund
| | | | | | | | | | | | Face | | | Market | |
| | | | | | | | Maturity | | | | Amount | | | Value· | |
| | | Coupon | | | Date | | Currency | | | (000) | | | ($000) | |
| Consumer Staples (2.3%) | | | | | | | | | | | | | | |
| | | Carrefour SA Cvt. | | | 0.000 | % | | 3/27/24 | | USD | | | 4,800 | | | 4,342 | |
| | | Corp Economica Delta SA Cvt. | | | 1.000 | % | | 12/1/23 | | EUR | | | 2,900 | | | 3,186 | |
| 1 | | Herbalife Ltd. Cvt. | | | 2.625 | % | | 3/15/24 | | USD | | | 9,510 | | | 10,403 | |
| | | Orpar SA Cvt. | | | 0.000 | % | | 6/20/24 | | EUR | | | 3,600 | | | 4,231 | |
| | | | | | | | | | | | | | | | | 22,162 | |
| Energy (4.3%) | | | | | | | | | | | | | | | |
| | | Borr Drilling Ltd. Cvt. | | | 3.875 | % | | 5/23/23 | | USD | | | 4,000 | | | 3,557 | |
| | | BP Capital Markets plc Cvt. | | | 1.000 | % | | 4/28/23 | | GBP | | | 1,300 | | | 2,063 | |
| | | BW Group Ltd. Cvt. | | | 1.750 | % | | 9/10/19 | | USD | | | 3,600 | | | 3,494 | |
| 1 | | Cheniere Energy Inc. Cvt. | | | 0.000 | % | | 5/28/21 | | USD | | | 5,710 | | | 5,851 | |
| | | Cheniere Energy Inc. Cvt. | | | 4.250 | % | | 3/15/45 | | USD | | | 2,283 | | | 1,704 | |
| | | Chesapeake Energy Corp. Cvt. | | | 5.500 | % | | 9/15/26 | | USD | | | 3,035 | | | 2,627 | |
| | | Ensco Jersey Finance Ltd. Cvt. | | | 3.000 | % | | 1/31/24 | | USD | | | 2,825 | | | 2,227 | |
| | | Golar LNG Ltd. Cvt. | | | 2.750 | % | | 2/15/22 | | USD | | | 11,923 | | | 12,077 | |
| | | Green Plains Inc. Cvt. | | | 4.125 | % | | 9/1/22 | | USD | | | 2,650 | | | 2,457 | |
| | | TOTAL SA Cvt. | | | 0.500 | % | | 12/2/22 | | USD | | | 5,200 | | | 5,460 | |
| | | | | | | | | | | | | | | | | 41,517 | |
| Financials (4.2%) | | | | | | | | | | | | | | | |
| | | Apollo Commercial Real Estate | | | | | | | | | | | | | | | |
| | | Finance Inc. Cvt. | | | 4.750 | % | | 8/23/22 | | USD | | | 7,139 | | | 6,915 | |
| | | Archer Obligations SA Cvt. | | | 0.000 | % | | 3/31/23 | | EUR | | | 2,400 | | | 3,126 | |
| | | Blackstone Mortgage Trust Inc. Cvt. | | | 4.375 | % | | 5/5/22 | | USD | | | 10,510 | | | 10,503 | |
| | | BofA Finance LLC Cvt. | | | 0.250 | % | | 5/1/23 | | USD | | | 2,690 | | | 2,471 | |
| | | JPMorgan Chase Bank NA Cvt. | | | 0.000 | % | | 12/30/20 | | USD | | | 2,800 | | | 2,969 | |
| 1 | | JPMorgan Chase Financial Co. LLC Cvt. | | | 0.250 | % | | 5/1/23 | | USD | | | 4,515 | | | 4,244 | |
| | | PRA Group Inc. Cvt. | | | 3.500 | % | | 6/1/23 | | USD | | | 3,000 | | | 2,782 | |
| | | Redwood Trust Inc. Cvt. | | | 5.625 | % | | 7/15/24 | | USD | | | 7,105 | | | 6,960 | |
| | | | | | | | | | | | | | | | | 39,970 | |
| Health Care (14.0%) | | | | | | | | | | | | | | | |
| | | Allscripts Healthcare Solutions Inc. Cvt. | | | 1.250 | % | | 7/1/20 | | USD | | | 5,060 | | | 4,886 | |
| | | BioMarin Pharmaceutical Inc. Cvt. | | | 0.599 | % | | 8/1/24 | | USD | | | 2,975 | | | 3,125 | |
| | | BioMarin Pharmaceutical Inc. Cvt. | | | 1.500 | % | | 10/15/20 | | USD | | | 4,975 | | | 5,969 | |
| 1 | | DexCom Inc. Cvt. | | | 0.750 | % | | 12/1/23 | | USD | | | 1,945 | | | 2,026 | |
| | | Exact Sciences Corp. Cvt. | | | 1.000 | % | | 1/15/25 | | USD | | | 5,557 | | | 6,804 | |
| | | GN Store Nord A/S Cvt. | | | 0.000 | % | | 5/31/22 | | EUR | | | 1,400 | | | 1,715 | |
| | | Horizon Pharma Investment Ltd. Cvt. | | | 2.500 | % | | 3/15/22 | | USD | | | 9,955 | | | 9,909 | |
| | | Illumina Inc. Cvt. | | | 0.000 | % | | 6/15/19 | | USD | | | 6,865 | | | 9,223 | |
| 1 | | Illumina Inc. Cvt. | | | 0.000 | % | | 8/15/23 | | USD | | | 3,210 | | | 3,437 | |
| | | Innoviva Inc. Cvt. | | | 2.125 | % | | 1/15/23 | | USD | | | 7,550 | | | 8,339 | |
| | | Intercept Pharmaceuticals Inc. Cvt. | | | 3.250 | % | | 7/1/23 | | USD | | | 4,900 | | | 4,691 | |
| | | Ionis Pharmaceuticals Inc. Cvt. | | | 1.000 | % | | 11/15/21 | | USD | | | 10,335 | | | 11,438 | |
| | | Jazz Investments I Ltd. Cvt. | | | 1.875 | % | | 8/15/21 | | USD | | | 4,868 | | | 5,017 | |
| | | Korian SA Cvt. | | | 2.500 | % | | Perpetual | | EUR | | | 2,979 | | | 3,532 | |
| 1 | | Ligand Pharmaceuticals Inc. Cvt. | | | 0.750 | % | | 5/15/23 | | USD | | | 7,060 | | | 6,565 | |
| | | Medipal Holdings Corp. Cvt. | | | 0.000 | % | | 10/7/22 | | JPY | | | 140,000 | | | 1,502 | |
| | | NuVasive Inc. Cvt. | | | 2.250 | % | | 3/15/21 | | USD | | | 5,580 | | | 6,606 | |
| | | Pacira Pharmaceuticals Inc. Cvt. | | | 2.375 | % | | 4/1/22 | | USD | | | 5,150 | | | 5,384 | |
| | | PTC Therapeutics Inc. Cvt. | | | 3.000 | % | | 8/15/22 | | USD | | | 1,575 | | | 1,585 | |
| | | QIAGEN NV Cvt. | | | 0.500 | % | | 9/13/23 | | USD | | | 2,600 | | | 2,731 | |
| | | Retrophin Inc. Cvt. | | | 2.500 | % | | 9/15/25 | | USD | | | 3,450 | | | 3,179 | |
| 1 | | Supernus Pharmaceuticals Inc. Cvt. | | | 0.625 | % | | 4/1/23 | | USD | | | 1,800 | | | 1,950 | |
| | | Teva Pharmaceutical Finance Co. LLC Cvt. | | | 0.250 | % | | 2/1/26 | | USD | | | 11,635 | | | 10,737 | |
Convertible Securities Fund
| | | | | | | | | | | | | Face | | | Market | |
| | | | | | | | Maturity | | | | | Amount | | | Value· | |
| | | | | | Coupon | | | Date | | | Currency | | | | (000) | | | | ($000) | |
| | | Toho Holdings Co. Ltd. Cvt. | | | 0.000 | % | | 6/23/23 | | | JPY | | | | 430,000 | | | | 4,041 | |
| 1 | | Wright Medical Group Inc. Cvt. | | | 1.625 | % | | 6/15/23 | | | USD | | | | 10,228 | | | | 10,576 | |
| | | | | | | | | | | | | | | | | | | | 134,967 | |
| Industrials (9.5%) | | | | | | | | | | | | | | | | | |
| | | Airbus Group SE Cvt. | | | 0.000 | % | | 6/14/21 | | | EUR | | | | 2,100 | | | | 2,707 | |
| | | Airbus SE Cvt. | | | 0.000 | % | | 7/1/22 | | | EUR | | | | 2,000 | | | | 2,694 | |
| | | ANA Holdings Inc. Cvt. | | | 0.000 | % | | 9/19/24 | | | JPY | | | | 420,000 | | | | 3,792 | |
| | | Brenntag Finance BV Cvt. | | | 1.875 | % | | 12/2/22 | | | USD | | | | 5,500 | | | | 5,202 | |
| | | China Conch Venture Holdings International Ltd. Cvt. | | | 0.000 | % | | 9/5/23 | | | HKD | | | | 31,000 | | | | 3,868 | |
| | | China Railway Construction Corp. Ltd. Cvt. | | | 0.000 | % | | 1/29/21 | | | USD | | | | 3,750 | | | | 4,128 | |
| | | DP World Ltd. Cvt. | | | 1.750 | % | | 6/19/24 | | | USD | | | | 4,600 | | | | 4,382 | |
| | | Echo Global Logistics Inc. Cvt. | | | 2.500 | % | | 5/1/20 | | | USD | | | | 3,255 | | | | 3,241 | |
| | | Elis SA Cvt. | | | 0.000 | % | | 10/6/23 | | | EUR | | | | 1,769 | | | | 1,937 | |
| 1 | | FTI Consulting Inc. Cvt. | | | 2.000 | % | | 8/15/23 | | | USD | | | | 10,649 | | | | 10,188 | |
| | | Huron Consulting Group Inc. Cvt. | | | 1.250 | % | | 10/1/19 | | | USD | | | | 1,940 | | | | 1,919 | |
| | | Kandenko Co. Ltd. Cvt. | | | 0.000 | % | | 3/31/21 | | | JPY | | | | 140,000 | | | | 1,392 | |
| 1 | | KBR Inc. Cvt. | | | 2.500 | % | | 11/1/23 | | | USD | | | | 3,005 | | | | 2,900 | |
| | | Larsen & Toubro Ltd. Cvt. | | | 0.675 | % | | 10/22/19 | | | USD | | | | 2,214 | | | | 2,221 | |
| | | Macquarie Infrastructure Corp. Cvt. | | | 2.875 | % | | 7/15/19 | | | USD | | | | 6,782 | | | | 6,729 | |
| | | Minebea Mitsumi Inc. Cvt. | | | 0.000 | % | | 8/3/22 | | | JPY | | | | 290,000 | | | | 3,013 | |
| | | Nagoya Railroad Co. Ltd. Cvt. | | | 0.000 | % | | 12/11/24 | | | JPY | | | | 540,000 | | | | 5,314 | |
| | | Park24 Co. Ltd. Cvt. | | | 0.000 | % | | 10/29/25 | | | JPY | | | | 240,000 | | | | 2,184 | |
| | | Safran SA Cvt. | | | 0.000 | % | | 6/21/23 | | | EUR | | | | 1,961 | | | | 2,364 | |
| | | Seven Group Holdings Ltd. Cvt. | | | 2.200 | % | | 3/5/25 | | | AUD | | | | 5,500 | | | | 3,738 | |
| | | Shanghai Port Group BVI Holding Co. Ltd. Cvt. | | | 0.000 | % | | 8/9/22 | | | USD | | | | 5,469 | | | | 5,586 | |
| | | Shimizu Corp. Cvt. | | | 0.000 | % | | 10/16/20 | | | JPY | | | | 460,000 | | | | 4,152 | |
| | | Vinci SA Cvt. | | | 0.375 | % | | 2/16/22 | | | USD | | | | 4,800 | | | | 5,030 | |
| | | Vinpearl JSC Cvt. | | | 3.500 | % | | 6/14/23 | | | USD | | | | 3,000 | | | | 3,000 | |
| | | | | | | | | | | | | | | | | | | | 91,681 | |
| Information Technology (17.5%) | | | | | | | | | | | | | | | | | | |
| | | Akamai Technologies Inc. Cvt. | | | 0.000 | % | | 2/15/19 | | | USD | | | | 17,730 | | | | 17,570 | |
| 1 | | Akamai Technologies Inc. Cvt. | | | 0.125 | % | | 5/1/25 | | | USD | | | | 2,135 | | | | 2,034 | |
| 1 | | Atlassian Inc. Cvt. | | | 0.625 | % | | 5/1/23 | | | USD | | | | 5,225 | | | | 6,412 | |
| | | Cardtronics Inc. Cvt. | | | 1.000 | % | | 12/1/20 | | | USD | | | | 5,035 | | | | 4,882 | |
| | | Citrix Systems Inc. Cvt. | | | 0.500 | % | | 4/15/19 | | | USD | | | | 5,142 | | | | 7,728 | |
| 1 | | Cree Inc. Cvt. | | | 0.875 | % | | 9/1/23 | | | USD | | | | 9,360 | | | | 9,194 | |
| | | Electronics For Imaging Inc. Cvt. | | | 0.750 | % | | 9/1/19 | | | USD | | | | 7,266 | | | | 7,070 | |
| 1 | | Envestnet Inc. Cvt. | | | 1.750 | % | | 6/1/23 | | | USD | | | | 2,945 | | | | 3,079 | |
| 1 | | FireEye Inc. Cvt. | | | 0.875 | % | | 6/1/24 | | | USD | | | | 3,130 | | | | 3,460 | |
| 1 | | Five9 Inc. Cvt. | | | 0.125 | % | | 5/1/23 | | | USD | | | | 3,875 | | | | 4,652 | |
| | | Guidewire Software Inc. Cvt. | | | 1.250 | % | | 3/15/25 | | | USD | | | | 3,320 | | | | 3,421 | |
| | | Indra Sistemas SA Cvt. | | | 1.250 | % | | 10/7/23 | | | EUR | | | | 1,900 | | | | 2,121 | |
| | | Inphi Corp. Cvt. | | | 1.125 | % | | 12/1/20 | | | USD | | | | 6,225 | | | | 7,283 | |
| | | Nuance Communications Inc. Cvt. | | | 1.000 | % | | 12/15/35 | | | USD | | | | 8,955 | | | | 8,138 | |
| | | Nuance Communications Inc. Cvt. | | | 1.250 | % | | 4/1/25 | | | USD | | | | 4,040 | | | | 3,878 | |
| | | NXP Semiconductors NV Cvt. | | | 1.000 | % | | 12/1/19 | | | USD | | | | 8,357 | | | | 8,624 | |
| | | ON Semiconductor Corp. Cvt. | | | 1.000 | % | | 12/1/20 | | | USD | | | | 4,865 | | | | 5,796 | |
| | | OSI Systems Inc. Cvt. | | | 1.250 | % | | 9/1/22 | | | USD | | | | 9,265 | | | | 8,555 | |
| 1 | | Palo Alto Networks Inc. Cvt. | | | 0.750 | % | | 7/1/23 | | | USD | | | | 5,355 | | | | 5,109 | |
| 1 | | Rapid7 Inc. Cvt. | | | 1.250 | % | | 8/1/23 | | | USD | | | | 1,645 | | | | 1,677 | |
| 1 | | RingCentral Inc. Cvt. | | | 0.000 | % | | 3/15/23 | | | USD | | | | 2,165 | | | | 2,561 | |
Convertible Securities Fund
| | | | | | | | | | | | | Face | | | Market | |
| | | | | | | | Maturity | | | | | Amount | | | Value· | |
| | | | | | Coupon | | | | Date | | | Currency | | | (000) | | | | ($000) | |
| | | SCREEN Holdings Co. Ltd. Cvt. | | | 0.000 | % | | | 6/11/25 | | | JPY | | | 190,000 | | | | 1,636 | |
| | | Semiconductor Manufacturing International Corp. Cvt. | | | 0.000 | % | | | 7/7/22 | | | USD | | | 1,000 | | | | 1,005 | |
| 1 | | Splunk Inc. Cvt. | | | 0.500 | % | | | 9/15/23 | | | USD | | | 3,020 | | | | 3,027 | |
| 1 | | Splunk Inc. Cvt. | | | 1.125 | % | | | 9/15/25 | | | USD | | | 3,500 | | | | 3,494 | |
| 1 | | Square Inc. Cvt. | | | 0.500 | % | | | 5/15/23 | | | USD | | | 4,395 | | | | 5,057 | |
| | | STMicroelectronics NV Cvt. | | | 0.250 | % | | | 7/3/24 | | | USD | | | 4,200 | | | | 4,275 | |
| 1 | | Twilio Inc. Cvt. | | | 0.250 | % | | | 6/1/23 | | | USD | | | 1,555 | | | | 2,300 | |
| | | Verint Systems Inc. Cvt. | | | 1.500 | % | | | 6/1/21 | | | USD | | | 8,295 | | | | 8,203 | |
| | | Viavi Solutions Inc. Cvt. | | | 1.000 | % | | | 3/1/24 | | | USD | | | 1,040 | | | | 1,037 | |
| | | Workday Inc. Cvt. | | | 0.250 | % | | | 10/1/22 | | | USD | | | 9,275 | | | | 11,565 | |
| 1 | | Zendesk Inc. Cvt. | | | 0.250 | % | | | 3/15/23 | | | USD | | | 1,945 | | | | 2,208 | |
| | | Zhen Ding Technology Holding Ltd. Cvt. | | | 0.000 | % | | | 6/26/19 | | | USD | | | 1,000 | | | | 1,014 | |
| | | | | | | | | | | | | | | | | | | | 168,065 | |
| Materials (4.2%) | | | | | | | | | | | | | | | | | |
| | | Angang Steel Co. Ltd. Cvt. | | | 0.000 | % | | | 5/25/23 | | | HKD | | | 35,000 | | | | 4,348 | |
| | | Asia Cement Corp. Cvt. | | | 0.000 | % | | | 9/21/23 | | | USD | | | 500 | | | | 507 | |
| | | Glencore Funding LLC Cvt. | | | 0.000 | % | | | 3/27/25 | | | USD | | | 3,400 | | | | 2,958 | |
| | | LG Chem Ltd. Cvt. | | | 0.000 | % | | | 4/16/21 | | | USD | | | 3,200 | | | | 3,176 | |
| | | Mitsubishi Chemical Holdings Corp. Cvt. | | | 0.000 | % | | | 3/29/24 | | | JPY | | | 550,000 | | | | 5,065 | |
| | | RAG-Stiftung Cvt. | | | 0.000 | % | | | 3/16/23 | | | EUR | | | 4,500 | | | | 5,169 | |
| | | Royal Gold Inc. Cvt. | | | 2.875 | % | | | 6/15/19 | | | USD | | | 9,820 | | | | 9,765 | |
| | | Sika AG Cvt. | | | 0.150 | % | | | 6/5/25 | | | CHF | | | 3,080 | | | | 3,144 | |
| | | Teijin Ltd. Cvt. | | | 0.000 | % | | | 12/10/21 | | | JPY | | | 90,000 | | | | 886 | |
| | | Toray Industries Inc. Cvt. | | | 0.000 | % | | | 8/30/19 | | | JPY | | | 520,000 | | | | 4,932 | |
| | | | | | | | | | | | | | | | | | | | 39,950 | |
| Real Estate (5.1%) | | | | | | | | | | | | | | | | | |
| | | ADLER Real Estate AG Cvt. | | | 2.500 | % | | | 7/19/21 | | | EUR | | | 2,974 | | | | 3,956 | |
| | | CA Immobilien Anlagen AG Cvt. | | | 0.750 | % | | | 4/4/25 | | | EUR | | | 3,600 | | | | 4,578 | |
| | | Consus Real Estate AG Cvt. | | | 4.000 | % | | | 11/29/22 | | | EUR | | | 6,000 | | | | 6,254 | |
| | | Cromwell SPV Finance Pty Ltd. Cvt. | | | 2.500 | % | | | 3/29/25 | | | EUR | | | 3,000 | | | | 3,322 | |
| | | Deutsche Wohnen SE Cvt. | | | 0.600 | % | | | 1/5/26 | | | EUR | | | 1,900 | | | | 2,314 | |
| 1 | | Empire State Realty LP Cvt. | | | 2.625 | % | | | 8/15/19 | | | USD | | | 2,669 | | | | 2,662 | |
| 1 | | Extra Space Storage LP Cvt. | | | 3.125 | % | | | 10/1/35 | | | USD | | | 9,540 | | | | 10,618 | |
| | | Grand City Properties SA Cvt. | | | 0.250 | % | | | 3/2/22 | | | EUR | | | 700 | | | | 849 | |
| | | IH Merger Sub LLC Cvt. | | | 3.500 | % | | | 1/15/22 | | | USD | | | 3,894 | | | | 4,102 | |
| | | Nexity SA Cvt. | | | 0.125 | % | | | 1/1/23 | | | EUR | | | 5,212 | | | | 5,990 | |
| | | Spirit Realty Capital Inc. Cvt. | | | 2.875 | % | | | 5/15/19 | | | USD | | | 4,211 | | | | 4,179 | |
| | | | | | | | | | | | | | | | | | | | 48,824 | |
| Utilities (3.7%) | | | | | | | | | | | | | | | | | | |
| | | China Yangtze Power International BVI 1 Ltd. Cvt. | | | 0.000 | % | | | 11/9/21 | | | USD | | | 4,772 | | | | 5,173 | |
| | | Kyushu Electric Power Co. Inc. Cvt. | | | 0.000 | % | | | 3/31/22 | | �� | JPY | | | 330,000 | | | | 3,067 | |
| 1 | | NextEra Energy Partners LP Cvt. | | | 1.500 | % | | | 9/15/20 | | | USD | | | 9,447 | | | | 9,282 | |
| 1 | | NRG Energy Inc. Cvt. | | | 2.750 | % | | | 6/1/48 | | | USD | | | 10,410 | | | | 11,156 | |
| | | Pattern Energy Group Inc. Cvt. | | | 4.000 | % | | | 7/15/20 | | | USD | | | 7,180 | | | | 7,097 | |
| | | | | | | | | | | | | | | | | | | | 35,775 | |
| Total Convertible Bonds (Cost $765,089) | | | | | | | | | | | | | 760,857 | |
Convertible Securities Fund
| | | | | | | | | | | Market | |
| | | | | | Maturity | | | | | Value· | |
| | | Coupon | | | Date | | | Shares | | | | ($000) | |
| Convertible Preferred Stocks (8.0%) | | | | | | | | | | | | | | |
| Financials (0.3%) | | | | | | | | | | | | | | |
| Wells Fargo & Co. Pfd. | | | 7.500 | % | | Perpetual | | | 2,325 | | | | 2,936 | |
| | | | | | | | | | | | | | | |
| Health Care (1.2%) | | | | | | | | | | | | | | |
| Becton Dickinson and Co. Pfd. | | | 6.125 | % | | 5/1/20 | | | 181,940 | | | | 11,510 | |
| | | | | | | | | | | | | | | |
| Industrials (0.2%) | | | | | | | | | | | | | | |
| Fortive Corp. Pfd. | | | 5.000 | % | | 7/1/21 | | | 1,646 | | | | 1,616 | |
| | | | | | | | | | | | | | | |
| Materials (0.8%) | | | | | | | | | | | | | | |
| International Flavors & Fragrances Inc. Pfd. | | | 6.000 | % | | 9/15/21 | | | 135,300 | | | | 7,601 | |
| | | | | | | | | | | | | | | |
| Real Estate (1.7%) | | | | | | | | | | | | | | |
| Crown Castle International Corp. Pfd. | | | 6.875 | % | | 8/1/20 | | | 11,013 | | | | 11,918 | |
| QTS Realty Trust Inc. Pfd. | | | 6.500 | % | | Perpetual | | | 40,060 | | | | 4,049 | |
| | | | | | | | | | | | | | 15,967 | |
| Utilities (3.8%) | | | | | | | | | | | | | | |
| Dominion Energy Inc. Pfd. | | | 6.750 | % | | 8/15/19 | | | 201,600 | | | | 9,763 | |
| DTE Energy Co. Pfd. | | | 6.500 | % | | 10/1/19 | | | 25,200 | | | | 1,379 | |
| NextEra Energy Inc. Pfd. | | | 6.123 | % | | 9/1/19 | | | 200,210 | | | | 11,985 | |
| Sempra Energy Pfd. | | | 6.750 | % | | 7/15/21 | | | 79,050 | | | | 8,039 | |
| South Jersey Industries Inc. Pfd. | | | 7.250 | % | | 4/15/21 | | | 69,000 | | | | 3,529 | |
| Vistra Energy Corp. Pfd. | | | 7.000 | % | | 7/1/19 | | | 23,800 | | | | 2,225 | |
| | | | | | | | | | | | | | 36,920 | |
| Total Convertible Preferred Stocks (Cost $74,407) | | | | | | | | | | | | | | | 76,550 | |
| Temporary Cash Investment (14.9%) | | | | | | | | | | | | | | | | |
| Money Market Fund (14.9%) | | | | | | | | | | | | | | | | |
| 2 Vanguard Market Liquidity Fund(Cost $143,824) | | | 2.407 | % | | | | | | | 1,438,197 | | | | 143,820 | |
| Total Investments (102.0%) (Cost $983,320) | | | | | | | | | | | | | | | 981,227 | |
| Other Assets and Liabilities (-2.0%) | | | | | | | | | | | | | | | | |
| Other Assets | | | | | | | | | | | | | | | 11,305 | |
| Liabilities | | | | | | | | | | | | | | | (30,266 | ) |
| | | | | | | | | | | | | | | | (18,961 | ) |
| Net Assets (100%) | | | | | | | | | | | | | | | | |
| Applicable to 72,226,651 outstanding $.001 par value shares of beneficial interest (unlimited authorization) | | | | | | | | | | | | | | | 962,266 | |
| Net Asset Value Per Share | | | | | | | | | | | | | | | $13.32 | |
Convertible Securities Fund
| | | Amount | |
| | | | ($000) | |
| Statement of Assets and Liabilities | | | | |
| Assets | | | | |
| Investments in Securities, at Value | | | | |
| Unaffiliated Issuers | | | 837,407 | |
Affiliated Issuers | | | 143,820 | |
| Total Investments in Securities | | | 981,227 | |
| Investment in Vanguard | | | 52 | |
| Receivables for Investment Securities Sold | | | 4,585 | |
| Receivables for Accrued Income | | | 3,460 | |
| Receivables for Capital Shares Issued | | | 162 | |
| Unrealized Appreciation—Forward Currency Contracts | | | 2,919 | |
| Other Assets | | | 127 | |
| Total Assets | | | 992,532 | |
| Liabilities | | | | |
| Payables to Investment Advisor | | | 296 | |
| Payables for Investment Securities Purchased | | | 26,944 | |
| Payables for Capital Shares Redeemed | | | 490 | |
| Payables to Vanguard | | | 2,195 | |
| Unrealized Depreciation—Forward Currency Contracts | | | 341 | |
| Total Liabilities | | | 30,266 | |
| Net Assets | | | 962,266 | |
At November 30, 2018, net assets consisted of:
| | | Amount | |
| | | | ($000) | |
| Paid-in Capital | | | 878,463 | |
| Total Distributable Earnings (Loss) | | | 83,803 | |
| Net Assets | | | 962,266 | |
| · | See Note A in Notes to Financial Statements. |
| 1 | Security exempt from registration under Rule 144A of the Securities Act of 1933. Such securities may be sold in transactions exempt from registration, normally to qualified institutional buyers. At November 30, 2018, the aggregate value of these securities was $198,485,000, representing 20.6% of net assets. |
| 2 | Affiliated money market fund available only to Vanguard funds and certain trusts and accounts managed by Vanguard. Rate shown is the 7-day yield. |
Convertible Securities Fund
| Derivative Financial Instruments Outstanding as of Period End |
| Forward Currency Contracts |
| | | | | | | | | | | | | | | Unrealized | |
| | | Contract | | | | | | | | | | | | Appreciation | |
| | | Settlement | | Contract Amount (000) | | (Depreciation) | |
| Counterparty | | Date | | | | | Receive | | | | | | Deliver | | | | ($000) | |
| UBS AG | | 1/17/19 | | EUR | | | 3,232 | | | USD | | | 3,692 | | | | (15 | ) |
| UBS AG | | 1/17/19 | | CAD | | | 4,178 | | | USD | | | 3,155 | | | | (6 | ) |
| UBS AG | | 1/17/19 | | JPY | | | 313,000 | | | USD | | | 2,791 | | | | (20 | ) |
| UBS AG | | 1/17/19 | | SEK | | | 16,376 | | | USD | | | 1,822 | | | | (14 | ) |
| UBS AG | | 1/17/19 | | JPY | | | 188,700 | | | USD | | | 1,667 | | | | 3 | |
| UBS AG | | 1/17/19 | | CNH | | | 3,875 | | | USD | | | 556 | | | | 1 | |
| UBS AG | | 1/17/19 | | AUD | | | 348 | | | USD | | | 247 | | | | 7 | |
| UBS AG | | 1/17/19 | | AUD | | | 253 | | | USD | | | 185 | | | | — | |
| UBS AG | | 1/17/19 | | CHF | | | 66 | | | USD | | | 67 | | | | (1 | ) |
| UBS AG | | 1/17/19 | | GBP | | | 39 | | | USD | | | 50 | | | | — | |
| UBS AG | | 1/17/19 | | USD | | | 71,190 | | | EUR | | | 61,013 | | | | 1,784 | |
| UBS AG | | 1/17/19 | | USD | | | 62,454 | | | JPY | | | 6,957,280 | | | | 870 | |
| UBS AG | | 1/17/19 | | USD | | | 17,029 | | | HKD | | | 133,260 | | | | (27 | ) |
| UBS AG | | 1/17/19 | | USD | | | 10,006 | | | KRW | | | 11,374,315 | | | | (160 | ) |
| UBS AG | | 1/17/19 | | USD | | | 4,091 | | | AUD | | | 5,722 | | | | (95 | ) |
| UBS AG | | 1/17/19 | | USD | | | 3,199 | | | CAD | | | 4,130 | | | | 87 | |
| UBS AG | | 1/17/19 | | USD | | | 3,190 | | | CHF | | | 3,130 | | | | 40 | |
| UBS AG | | 1/17/19 | | USD | | | 2,200 | | | GBP | | | 1,660 | | | | 79 | |
| UBS AG | | 1/17/19 | | USD | | | 1,849 | | | SEK | | | 16,332 | | | | 46 | |
| UBS AG | | 1/17/19 | | USD | | | 559 | | | CNH | | | 3,875 | | | | 2 | |
| UBS AG | | 1/17/19 | | USD | | | 501 | | | TWD | | | 15,406 | | | | (2 | ) |
| UBS AG | | 1/17/19 | | USD | | | 333 | | | JPY | | | 37,700 | | | | (1 | ) |
| UBS AG | | 1/17/19 | | USD | | | 76 | | | CHF | | | 76 | | | | — | |
| | | | | | | | | | | | | | | | | | 2,578 | |
AUD—Australian dollar.
CAD—Canadian dollar.
CHF—Swiss franc.
CNH—Chinese yuan (offshore).
EUR—euro.
GBP—British pound.
HKD—Hong Kong dollar.
JPY—Japanese yen.
KRW—South Korean won.
SEK—Swedish krona.
TWD—Taiwanese dollar.
USD—U.S. dollar.
At November 30, 2018, a counterparty had deposited in a segregated account securities with a value of $2,442,000 in connection with open forward currency contracts.
See accompanying Notes, which are an integral part of the Financial Statements.
Convertible Securities Fund
Statement of Operations
| | | Year Ended | |
| | | November 30, 2018 | |
| | | | ($000) | |
| Investment Income | | | | |
| Income | | | | |
| Dividends | | | 4,991 | |
| Interest1 | | | 15,139 | |
| Total Income | | | 20,130 | |
| Expenses | | | | |
| Investment Advisory Fees—Note B | | | | |
| Basic Fee | | | 3,881 | |
| Performance Adjustment | | | (2,465 | ) |
| The Vanguard Group—Note C | | | | |
| Management and Administrative | | | 2,116 | |
| Marketing and Distribution | | | 139 | |
| Custodian Fees | | | 28 | |
| Auditing Fees | | | 42 | |
| Shareholders' Reports and Proxy | | | 19 | |
| Trustees' Fees and Expenses | | | 2 | |
| Total Expenses | | | 3,762 | |
| Net Investment Income | | | 16,368 | |
| Realized Net Gain (Loss) | | | | |
| Investment Securities Sold1 | | | 76,654 | |
| Forward Currency Contracts | | | 4,396 | |
| Foreign Currencies | | | (148 | ) |
| Realized Net Gain (Loss) | | | 80,902 | |
| Change in Unrealized Appreciation (Depreciation) | | | | |
| Investment Securities1 | | | (94,108 | ) |
| Forward Currency Contracts | | | 3,399 | |
| Foreign Currencies | | | (6 | ) |
| Change in Unrealized Appreciation (Depreciation) | | | (90,715 | ) |
| Net Increase (Decrease) in Net Assets Resulting from Operations | | | 6,555 | |
| 1 | | Interest income, realized net gain (loss), and change in unrealized appreciation (depreciation) from affiliated companies of the fund were $1,496,000, ($8,000), and ($3,000), respectively. Purchases and sales are for temporary cash investment purposes. |
See accompanying Notes, which are an integral part of the Financial Statements.
Convertible Securities Fund
Statement of Changes in Net Assets
| | | Year Ended November 30, | |
| | | 2018 | | | 2017 | |
| | | ($000) | | | ($000) | |
| Increase (Decrease) in Net Assets | | | | | | | | |
| Operations | | | | | | | | |
| Net Investment Income | | | 16,368 | | | | 29,634 | |
| Realized Net Gain (Loss) | | | 80,902 | | | | 58,640 | |
| Change in Unrealized Appreciation (Depreciation) | | | (90,715 | ) | | | 45,560 | |
| Net Increase (Decrease) in Net Assets Resulting from Operations | | | 6,555 | | | | 133,834 | |
| Distributions | | | | | | | | |
| Net Investment Income | | | (20,080 | ) | | | (19,753 | ) |
| Realized Capital Gain1 | | | (16,965 | ) | | | — | |
| Total Distributions | | | (37,045 | ) | | | (19,753 | ) |
| Capital Share Transactions | | | | | | | | |
| Issued | | | 65,175 | | | | 75,249 | |
| Issued in Lieu of Cash Distributions | | | 33,457 | | | | 17,875 | |
| Redeemed | | | (398,043 | ) | | | (411,754 | ) |
| Net Increase (Decrease) from Capital Share Transactions | | | (299,411 | ) | | | (318,630 | ) |
| Total Increase (Decrease) | | | (329,901 | ) | | | (204,549 | ) |
| Net Assets | | | | | | | | |
| Beginning of Period | | | 1,292,167 | | | | 1,496,716 | |
| End of Period | | | 962,266 | | | | 1,292,167 | |
| 1 | | Includes fiscal 2018 and 2017 short-term gain distributions totaling $0 and $0, respectively. Short-term gain distributions are treated as ordinary income dividends for tax purposes. |
See accompanying Notes, which are an integral part of the Financial Statements.
Convertible Securities Fund
Financial Highlights
| For a Share Outstanding | | Year Ended November 30, |
| Throughout Each Period | | 2018 | | 2017 | | 2016 | | 2015 | | 2014 |
| Net Asset Value, Beginning of Period | | $13.73 | | $12.67 | | $12.67 | | $13.85 | | $14.64 |
| Investment Operations | | | | | | | | | | |
| Net Investment Income | | .2001 | | .2771 | | .259 | | .251 | | .287 |
| Net Realized and Unrealized Gain (Loss) on Investments | | (.191) | | .967 | | .117 | | (.180) | | .313 |
| Total from Investment Operations | | .009 | | 1.244 | | .376 | | .071 | | .600 |
| Distributions | | | | | | | | | | |
| Dividends from Net Investment Income | | (.235) | | (.184) | | (.237) | | (.241) | | (.425) |
| Distributions from Realized Capital Gains | | (.184) | | — | | (.139) | | (1.010) | | (.965) |
| Total Distributions | | (.419) | | (.184) | | (.376) | | (1.251) | | (1.390) |
| Net Asset Value, End of Period | | $13.32 | | $13.73 | | $12.67 | | $12.67 | | $13.85 |
| | | | | | | | | | | |
| Total Return2 | | 0.04% | | 9.89% | | 3.11% | | 0.55% | | 4.33% |
| | | | | | | | | | | |
| Ratios/Supplemental Data | | | | | | | | | | |
| Net Assets, End of Period (Millions) | | $962 | | $1,292 | | $1,497 | | $1,741 | | $2,001 |
| Ratio of Total Expenses to Average Net Assets3 | | 0.34% | | 0.35% | | 0.34% | | 0.38% | | 0.41% |
| Ratio of Net Investment Income to Average Net Assets | | 1.47% | | 2.10% | | 2.04% | | 1.86% | | 2.02% |
| Portfolio Turnover Rate | | 210% | | 130% | | 103% | | 95% | | 85% |
| 1 | Calculated based on average shares outstanding. |
| 2 | | Total returns do not include account service fees that may have applied in the periods shown. Fund prospectuses provide information about any applicable account service fees. |
| 3 | Includes performance-based investment advisory fee increases (decreases) of (0.22%), (0.20%), (0.21%), (0.17%), and (0.15%). |
See accompanying Notes, which are an integral part of the Financial Statements.
Convertible Securities Fund
Notes to Financial Statements
Vanguard Convertible Securities Fund is registered under the Investment Company Act of 1940 as an open-end investment company, or mutual fund. The fund invests in securities of foreign issuers, which may subject it to investment risks not normally associated with investing in securities of U.S. corporations.
A. The following significant accounting policies conform to generally accepted accounting principles for U.S. investment companies. The fund consistently follows such policies in preparing its financial statements.
1. Security Valuation: Securities are valued as of the close of trading on the New York Stock Exchange (generally 4 p.m., Eastern time) on the valuation date. Equity securities are valued at the latest quoted sales prices or official closing prices taken from the primary market in which each security trades; such securities not traded on the valuation date are valued at the mean of the latest quoted bid and asked prices. Bonds and temporary cash investments are valued using the latest bid prices or using valuations based on a matrix system (which considers such factors as security prices, yields, maturities, and ratings), both as furnished by independent pricing services. Investments in Vanguard Market Liquidity Fund are valued at that fund's net asset value. Securities for which market quotations are not readily available, or whose values have been affected by events occurring before the fund's pricing time but after the close of the securities' primary markets, are valued at their fair values calculated according to procedures adopted by the board of trustees. These procedures include obtaining quotations from an independent pricing service, monitoring news to identify significant market- or security-specific events, and evaluating changes in the values of foreign market proxies (for example, ADRs, futures contracts, or exchange-traded funds), between the time the foreign markets close and the fund's pricing time. When fair-value pricing is employed, the prices of securities used by a fund to calculate its net asset value may differ from quoted or published prices for the same securities.
2. Foreign Currency: Securities and other assets and liabilities denominated in foreign currencies are translated into U.S. dollars using exchange rates obtained from an independent third party as of the fund's pricing time on the valuation date. Realized gains (losses) and unrealized appreciation (depreciation) on investment securities include the effects of changes in exchange rates since the securities were purchased, combined with the effects of changes in security prices. Fluctuations in the value of other assets and liabilities resulting from changes in exchange rates are recorded as unrealized foreign currency gains (losses) until the assets or liabilities are settled in cash, at which time they are recorded as realized foreign currency gains (losses).
3. Forward Currency Contracts: The fund enters into forward currency contracts to protect the value of securities and related receivables and payables against changes in future foreign exchange rates. The fund's risks in using these contracts include movement in the values of the foreign currencies relative to the U.S. dollar and the ability of the counterparties to fulfill their obligations under the contracts. The fund mitigates its counterparty risk by entering into forward currency contracts only with a diverse group of prequalified counterparties, monitoring their financial strength, entering into master netting arrangements with its counterparties, and requiring its counterparties to transfer collateral as security for their performance. In the absence of a default, the collateral pledged or received by the fund cannot be repledged, resold, or rehypothecated. The master netting arrangements provide that, in the event of a counterparty's default (including bankruptcy), the fund may terminate the forward currency contracts, determine the net amount owed by either party in accordance with its master netting arrangements, and sell or retain any collateral held up to the net amount owed to the fund under the master netting arrangements. The forward currency contracts contain provisions
Convertible Securities Fund
whereby a counterparty may terminate open contracts if the fund's net assets decline below a certain level, triggering a payment by the fund if the fund is in a net liability position at the time of the termination. The payment amount would be reduced by any collateral the fund has pledged. Any assets pledged as collateral for open contracts are noted in the Statement of Net Assets. The value of collateral received or pledged is compared daily to the value of the forward currency contracts exposure with each counterparty, and any difference, if in excess of a specified minimum transfer amount, is adjusted and settled within two business days.
Forward currency contracts are valued at their quoted daily prices obtained from an independent third party, adjusted for currency risk based on the expiration date of each contract. The notional amounts of the contracts are not recorded in the Statement of Net Assets. Fluctuations in the value of the contracts are recorded in the Statement of Assets and Liabilities as an asset (liability) and in the Statement of Operations as unrealized appreciation (depreciation) until the contracts are closed, when they are recorded as realized forward currency contract gains (losses).
During the year ended November 30, 2018, the fund's average investment in forward currency contracts represented 22% of net assets, based on the average of notional amounts at each quarter-end during the period.
4. Federal Income Taxes: The fund intends to continue to qualify as a regulated investment company and distribute all of its taxable income. Management has analyzed the fund's tax positions taken for all open federal income tax years (November 30, 2015–2018), and has concluded that no provision for federal income tax is required in the fund's financial statements.
5. Distributions: Distributions to shareholders are recorded on the ex-dividend date. Distributions are determined on a tax basis and may differ from net investment income and realized capital gains for financial reporting purposes.
6. Credit Facility: The fund and certain other funds managed by The Vanguard Group ("Vanguard") participate in a $3.1 billion committed credit facility provided by a syndicate of lenders pursuant to a credit agreement that may be renewed annually; each fund is individually liable for its borrowings, if any, under the credit facility. Borrowings may be utilized for temporary and emergency purposes, and are subject to the fund's regulatory and contractual borrowing restrictions. The participating funds are charged administrative fees and an annual commitment fee of 0.10% of the undrawn amount of the facility; these fees are allocated to the funds based on a method approved by the fund's board of trustees and included in Management and Administrative expenses on the fund's Statement of Operations. Any borrowings under this facility bear interest at a rate based upon the higher of the one-month London Interbank Offered Rate, federal funds effective rate, or overnight bank funding rate plus an agreed-upon spread.
The fund had no borrowings outstanding at November 30, 2018, or at any time during the period then ended.
7. Other: Dividend income is recorded on the ex-dividend date. Interest income includes income distributions received from Vanguard Market Liquidity Fund and is accrued daily. Premiums and discounts on debt securities purchased are amortized and accreted, respectively, to interest income over the lives of the respective securities. Security transactions are accounted for on the date securities are bought or sold. Costs used to determine realized gains (losses) on the sale of investment securities are those of the specific securities sold.
Convertible Securities Fund
B. Oaktree Capital Management, L.P., provides investment advisory services to the fund for a fee calculated at an annual percentage rate of average net assets. The basic fee is subject to quarterly adjustments based on the fund's performance for the preceding three years relative to a composite index weighted 70% ICE BofAML All US Convertibles Index and 30% ICE BofAML Global 300 Convertibles ex-US index (hedged). For the year ended November 30, 2018, the investment advisory fee represented an effective annual basic rate of 0.35% of the fund's average net assets before a decrease of $2,465,000 (0.22%) based on performance.
C. In accordance with the terms of a Funds' Service Agreement (the "FSA") between Vanguard and the fund, Vanguard furnishes to the fund corporate management, administrative, marketing, and distribution services at Vanguard's cost of operations (as defined by the FSA). These costs of operations are allocated to the fund based on methods and guidelines approved by the board of trustees. Vanguard does not require reimbursement in the current period for certain costs of operations (such as deferred compensation/benefits and risk/insurance costs); the fund's liability for these costs of operations is included in Payables to Vanguard on the Statement of Assets and Liabilities. All other costs of operations payable to Vanguard are generally settled twice a month.
Upon the request of Vanguard, the fund may invest up to 0.40% of its net assets as capital in Vanguard. At November 30, 2018, the fund had contributed to Vanguard capital in the amount of $52,000, representing 0.01% of the fund's net assets and 0.02% of Vanguard's capitalization. The fund's trustees and officers are also directors and employees, respectively, of Vanguard.
D. Various inputs may be used to determine the value of the fund's investments. These inputs are summarized in three broad levels for financial statement purposes. The inputs or methodologies used to value securities are not necessarily an indication of the risk associated with investing in those securities.
Level 1—Quoted prices in active markets for identical securities.
Level 2—Other significant observable inputs (including quoted prices for similar securities, interest rates, prepayment speeds, credit risk, etc.).
Level 3—Significant unobservable inputs (including the fund's own assumptions used to determine the fair value of investments). Any investments valued with significant unobservable inputs are noted on the Statement of Net Assets.
The following table summarizes the market value of the fund's investments as of November 30, 2018, based on the inputs used to value them:
| | | Level 1 | | | Level 2 | | | Level 3 | |
| Investments | | | ($000) | | | | ($000) | | | | ($000) | |
| Convertible Bonds | | | — | | | | 760,857 | | | | — | |
| Convertible Preferred Stocks | | | — | | | | 76,550 | | | | — | |
| Temporary Cash Investments | | | 143,820 | | | | — | | | | — | |
| Forward Currency Contracts—Assets | | | — | | | | 2,919 | | | | — | |
| Forward Currency Contracts—Liabilities | | | — | | | | (341 | ) | | | — | |
| Total | | | 143,820 | | | | 839,985 | | | | — | |
Convertible Securities Fund
E. Permanent differences between book-basis and tax-basis components of net assets are reclassified among capital accounts in the financial statements to reflect their tax character. These reclassifications have no effect on net assets or net asset value per share. As of period end, permanent differences primarily attributable to the accounting for foreign currency transactions and distributions in connection with fund share redemptions were reclassified between the following accounts:
| | | Amount | |
| | | | ($000) | |
| Paid-in Capital | | | 41 | |
| Total Distributable Earnings (Loss) | | | (41 | ) |
Temporary differences between book-basis and tax-basis components of total distributable earnings (loss) arise when certain items of income, gain, or loss are recognized in different periods for financial statement and tax purposes; these differences will reverse at some time in the future. The differences are primarily related to the tax deferral of losses on wash sales; the realization of unrealized gains or losses on certain forward currency contracts; the difference in the classification of securities for tax purposes and the tax recognition of income on contingent payment debt instruments. As of period end, the tax-basis components of total distributable earnings (loss) are detailed in the table as follows:
| | | Amount | |
| | | | ($000) | |
| Undistributed Ordinary Income | | | 24,379 | |
| Undistributed Long-Term Gains | | | 64,478 | |
| Capital Loss Carryforwards (Non-expiring) | | | — | |
| Net Unrealized Gains (Losses) | | | (3,058 | ) |
As of November 30, 2018, gross unrealized appreciation and depreciation for investments and derivatives based on cost for U.S. federal income tax purposes were as follows:
| | | Amount | |
| | | | ($000) | |
| Tax Cost | | | 984,244 | |
| Gross Unrealized Appreciation | | | 19,950 | |
| Gross Unrealized Depreciation | | | (22,994 | ) |
| Net Unrealized Appreciation (Depreciation) | | | (3,044 | ) |
F. During the year ended November 30, 2018, the fund purchased $2,127,848,000 of investment securities and sold $2,538,236,000 of investment securities, other than temporary cash investments.
Convertible Securities Fund
G. Capital shares issued and redeemed were:
| | | Year Ended November 30, | |
| | | 2018 | | | 2017 | |
| | | Shares | | | Shares | |
| | | | (000) | | | | (000) | |
| Issued | | | 4,770 | | | | 5,714 | |
| Issued in Lieu of Cash Distributions | | | 2,473 | | | | 1,364 | |
| Redeemed | | | (29,137 | ) | | | (31,086 | ) |
| Net Increase (Decrease) in Shares Outstanding | | | (21,894 | ) | | | (24,008 | ) |
H. On December 21, 2018, the fund's board of trustees voted to liquidate the fund on or about March 19, 2019. On the liquidation date, the fund's remaining assets will be sold and the proceeds distributed to any remaining shareholders.
Management has determined that no other events or transactions occurred subsequent to November 30, 2018, that would require recognition or disclosure in these financial statements.
Report of Independent Registered
Public Accounting Firm
To the Board of Trustees and Shareholders of Vanguard Convertible Securities Fund
Opinion on the Financial Statements
We have audited the accompanying statement of net assets and statement of assets and liabilities of Vanguard Convertible Securities Fund (the "Fund") as of November 30, 2018, the related statement of operations for the year ended November 30, 2018, the statement of changes in net assets for each of the two years in the period ended November 30, 2018, including the related notes, and the financial highlights for each of the five years in the period ended November 30, 2018 (collectively referred to as the "financial statements"). In our opinion, the financial statements present fairly, in all material respects, the financial position of the Fund as of November 30, 2018, the results of its operations for the year then ended, the changes in its net assets for each of the two years in the period ended November 30, 2018 and the financial highlights for each of the five years in the period ended November 30, 2018 in conformity with accounting principles generally accepted in the United States of America.
Basis for Opinion
These financial statements are the responsibility of the Fund's management. Our responsibility is to express an opinion on the Fund's financial statements based on our audits. We are a public accounting firm registered with the Public Company Accounting Oversight Board (United States) ("PCAOB") and are required to be independent with respect to the Fund in accordance with the U.S. federal securities laws and the applicable rules and regulations of the Securities and Exchange Commission and the PCAOB.
We conducted our audits of these financial statements in accordance with the standards of the PCAOB. Those standards require that we plan and perform the audit to obtain reasonable assurance about whether the financial statements are free of material misstatement, whether due to error or fraud.
Our audits included performing procedures to assess the risks of material misstatement of the financial statements, whether due to error or fraud, and performing procedures that respond to those risks. Such procedures included examining, on a test basis, evidence regarding the amounts and disclosures in the financial statements. Our audits also included evaluating the accounting principles used and significant estimates made by management, as well as evaluating the overall presentation of the financial statements. Our procedures included confirmation of securities owned as of November 30, 2018 by correspondence with the custodian, transfer agent and brokers; when replies were not received from brokers, we performed other auditing procedures. We believe that our audits provide a reasonable basis for our opinion.
Subsequent Event
As discussed in Note H to the financial statements, the Fund's board of trustees voted to liquidate the Fund on or about March 19, 2019.
/s/PricewaterhouseCoopers LLP
Philadelphia, Pennsylvania
January 17, 2019
We have served as the auditor of one or more investment companies in The Vanguard Group of Funds since 1975.
Special 2018 tax information (unaudited) for Vanguard Convertible Securities Fund
This information for the fiscal year ended November 30, 2018, is included pursuant to provisions of the Internal Revenue Code.
The fund distributed $16,965,000 as capital gain dividends (20% rate gain distributions) to shareholders during the fiscal year.
The fund distributed $2,431,000 of qualified dividend income to shareholders during the fiscal year.
For corporate shareholders, 10.4% of investment income (dividend income plus short-term gains, if any) qualifies for the dividends-received deduction.
This page intentionally left blank.
This page intentionally left blank.
This page intentionally left blank.
The People Who Govern Your Fund
The trustees of your mutual fund are there to see that the fund is operated and managed in your best interests since, as a shareholder, you are a part owner of the fund. Your fund's trustees also serve on the board of directors of The Vanguard Group, Inc., which is owned by the Vanguard funds and provides services to them.
A majority of Vanguard's board members are independent, meaning that they have no affiliation with Vanguard or the funds they oversee, apart from the sizable personal investments they have made as private individuals. The independent board members have distinguished backgrounds in business, academia, and public service. Each of the trustees and executive officers oversees 212 Vanguard funds.
Information for each trustee and executive officer of the fund appears below. The mailing address of the trustees and officers is P.O. Box 876, Valley Forge, PA 19482. More information about the trustees is in theStatement of Additional Information, which can be obtained, without charge, by contacting Vanguard at 800-662-7447, or online at vanguard.com.
Interested Trustees1
F. William McNabb III
Born in 1957. Trustee since July 2009. Principal occupation(s) during the past five years and other experience: chairman of the board (January 2010–present) of Vanguard and of each of the investment companies served by Vanguard, trustee (2009–present) of each of the investment companies served by Vanguard, and director (2008–present) of Vanguard. Chief executive officer and president (2008–2017) of Vanguard and each of the investment companies served by Vanguard, managing director (1995–2008) of Vanguard, and director (1997–2018) of Vanguard Marketing Corporation. Director (2018–present) of UnitedHealth Group.
Mortimer J. Buckley
Born in 1969. Trustee since January 2018. Principal occupation(s) during the past five years and other experience: chief executive officer (January 2018–present) of Vanguard; chief executive officer, president, and trustee (January 2018–present) of each of the investment companies served by Vanguard; president and director (2017–present) of Vanguard; and president (February 2018–present) of Vanguard Marketing Corporation. Chief investment officer (2013–2017), managing director (2002–2017), head of the Retail Investor Group (2006–2012), and chief information officer (2001–2006) of Vanguard. Chairman of the board (2011–2017) of the Children's Hospital of Philadelphia.
Independent Trustees
Emerson U. Fullwood
Born in 1948. Trustee since January 2008. Principal occupation(s) during the past five years and other experience: executive chief staff and marketing officer for North America and corporate vice president (retired 2008) of Xerox Corporation (document management products and services). Former president of the Worldwide Channels Group, Latin America, and Worldwide Customer Service and executive chief staff officer of Developing Markets of Xerox. Executive in residence and 2009–2010 Distinguished Minett Professor at the Rochester Institute of Technology. Lead director of SPX FLOW, Inc. (multi-industry manufacturing). Director of the University of Rochester Medical Center, the Monroe Community College Foundation, the United Way of Rochester, North Carolina A&T University, and Roberts Wesleyan College. Trustee of the University of Rochester.
Amy Gutmann
Born in 1949. Trustee since June 2006. Principal occupation(s) during the past five years and other experience: president (2004–present) of the University of Pennsylvania. Christopher H. Browne Distinguished Professor of Political Science, School of Arts and Sciences, and professor of communication, Annenberg School for Communication, with secondary faculty appointments in the Department of Philosophy, School of Arts and Sciences, and at the Graduate School of Education, University of Pennsylvania. Trustee of the National Constitution Center.
| 1 | Mr. McNabb and Mr. Buckley are considered “Interested persons,” as defined in the Investment Company Act of 1940, because they are officers of the Vanguard funds. |
JoAnn Heffernan Heisen
Born in 1950. Trustee since July 1998. Principal occupation(s) during the past five years and other experience: corporate vice president of Johnson & Johnson (pharmaceuticals/medical devices/consumer products) and member of its executive committee (1997–2008). Chief global diversity officer (retired 2008), vice president and chief information officer (1997–2006), controller (1995–1997), treasurer (1991–1995), and assistant treasurer (1989–1991) of Johnson & Johnson. Director of Skytop Lodge Corporation (hotels) and the Robert Wood Johnson Foundation. Member of the advisory board of the Institute for Women's Leadership at Rutgers University.
F. Joseph Loughrey
Born in 1949. Trustee since October 2009. Principal occupation(s) during the past five years and other experience: president and chief operating officer (retired 2009) and vice chairman of the board (2008–2009) of Cummins Inc. (industrial machinery). Chairman of the board of Hillenbrand, Inc. (specialized consumer services), Oxfam America, and the Lumina Foundation for Education. Director of the V Foundation for Cancer Research. Member of the advisory council for the College of Arts and Letters and chair of the advisory board to the Kellogg Institute for International Studies, both at the University of Notre Dame.
Mark Loughridge
Born in 1953. Trustee since March 2012. Principal occupation(s) during the past five years and other experience: senior vice president and chief financial officer (retired 2013) of IBM (information technology services). Fiduciary member of IBM's Retirement Plan Committee (2004–2013), senior vice president and general manager (2002–2004) of IBM Global Financing, vice president and controller (1998–2002) of IBM, and a variety of other prior management roles at IBM. Member of the Council on Chicago Booth.
Scott C. Malpass
Born in 1962. Trustee since March 2012. Principal occupation(s) during the past five years and other experience: chief investment officer (1989–present) and vice president (1996–present) of the University of Notre Dame. Assistant professor of finance at the Mendoza College of Business, University of Notre Dame, and member of the Notre Dame 403(b) Investment Committee. Chairman of the board of TIFF Advisory Services, Inc. Member of the board of Catholic Investment Services, Inc. (investment advisors), the board of advisors for Spruceview Capital Partners, and the board of superintendence of the Institute for the Works of Religion.
Deanna Mulligan
Born in 1963. Trustee since January 2018. Principal occupation(s) during the past five years and other experience: president (2010–present) and chief executive officer (2011–present) of The Guardian Life Insurance Company of America. Chief operating officer (2010–2011) and executive vice president (2008–2010) of Individual Life and Disability of The Guardian Life Insurance Company of America. Member of the board of The Guardian Life Insurance Company of America, the American Council of Life Insurers, the Partnership for New York City (business leadership), and the Committee Encouraging Corporate Philanthropy. Trustee of the Economic Club of New York and the Bruce Museum (arts and science). Member of the Advisory Council for the Stanford Graduate School of Business.
André F. Perold
Born in 1952. Trustee since December 2004. Principal occupation(s) during the past five years and other experience: George Gund Professor of Finance and Banking, Emeritus at the Harvard Business School (retired 2011). Chief investment officer and co-managing partner of HighVista Strategies LLC (private investment firm). Overseer of the Museum of Fine Arts Boston.
Sarah Bloom Raskin
Born in 1961. Trustee since January 2018. Principal occupation(s) during the past five years and other experience: deputy secretary (2014–2017) of the United States Department of the Treasury. Governor (2010–2014) of the Federal Reserve Board. Commissioner (2007–2010) of financial regulation for the State of Maryland. Member of the board of directors (2012–2014) of Neighborhood Reinvestment Corporation. Director of i(x) Investments, LLC.
Peter F. Volanakis
Born in 1955. Trustee since July 2009. Principal occupation(s) during the past five years and other experience: president and chief operating officer (retired 2010) of Corning Incorporated (communications equipment) and director of Corning Incorporated (2000–2010) and Dow Corning (2001–2010). Director (2012) of SPX Corporation (multi-industry manufacturing). Overseer of the Amos Tuck School of Business Administration, Dartmouth College (2001–2013). Chairman of the board of trustees of Colby-Sawyer College. Member of the Board of Hypertherm Inc. (industrial cutting systems, software, and consumables).
Executive Officers
Glenn Booraem
Born in 1967. Principal occupation(s) during the past five years and other experience: principal of Vanguard. Investment stewardship officer (2017–present), treasurer (2015–2017), controller (2010–2015), and assistant controller (2001–2010) of each of the investment companies served by Vanguard.
Christine M. Buchanan
Born in 1970. Principal occupation(s) during the past five years and other experience: principal of Vanguard and global head of Fund Administration at Vanguard. Treasurer (2017–present) of each of the investment companies served by Vanguard. Partner (2005–2017) at KPMG LLP (audit, tax, and advisory services).
Brian Dvorak
Born in 1973. Principal occupation(s) during the past five years and other experience: principal of Vanguard. Chief compliance officer (2017–present) of Vanguard and each of the investment companies served by Vanguard. Assistant vice president (2017–present) of Vanguard Marketing Corporation. Vice president and director of Enterprise Risk Management (2011–2013) at Oppenheimer Funds, Inc.
Thomas J. Higgins
Born in 1957. Principal occupation(s) during the past five years and other experience: principal of Vanguard. Chief financial officer (2008–present) and treasurer (1998–2008) of each of the investment companies served by Vanguard.
Peter Mahoney
Born in 1974. Principal occupation(s) during the past five years and other experience: principal of Vanguard. Controller (2015–present) of each of the investment companies served by Vanguard. Head of International Fund Services (2008–2014) at Vanguard.
Anne E. Robinson
Born in 1970. Principal occupation(s) during the past five years and other experience: general counsel (2016–present) of Vanguard. Secretary (2016–present) of Vanguard and of each of the investment companies served by Vanguard. Managing director (2016–present) of Vanguard. Director and senior vice president (2016–2018) of Vanguard Marketing Corporation. Managing director and general counsel of Global Cards and Consumer Services (2014–2016) at Citigroup. Counsel (2003–2014) at American Express.
Michael Rollings
Born in 1963. Principal occupation(s) during the past five years and other experience: finance director (2017–present) and treasurer (2017) of each of the investment companies served by Vanguard. Managing director (2016–present) of Vanguard. Chief financial officer (2016–present) of Vanguard. Director (2016–present) of Vanguard Marketing Corporation. Executive vice president and chief financial officer (2006–2016) of MassMutual Financial Group.
Vanguard Senior Management Team
| Joseph Brennan | Chris D. McIsaac |
| Mortimer J. Buckley | James M. Norris |
| Gregory Davis | Thomas M. Rampulla |
| John James | Karin A. Risi |
| Martha G. King | Anne E. Robinson |
| John T. Marcante | Michael Rollings |
Chairman Emeritus and Senior Advisor
John J. Brennan
Chairman, 1996–2009
Chief Executive Officer and President, 1996–2008
Founder
John C. Bogle
Chairman and Chief Executive Officer, 1974–1996
| |  |
| | |
| | P.O. Box 2600 |
| | Valley Forge, PA 19482-2600 |
Connect with Vanguard®> vanguard.com
Fund Information> 800-662-7447
Direct Investor Account Services> 800-662-2739
Institutional Investor Services> 800-523-1036
Text Telephone for People
Who Are Deaf or Hard of Hearing> 800-749-7273
This material may be used in conjunction with the offering of shares of any Vanguard fund only if preceded or accompanied by the fund's current prospectus.
All comparative mutual fund data are from Lipper, a Thomson Reuters Company, or Morningstar, Inc., unless otherwise noted.
You can obtain a free copy of Vanguard's proxy voting guidelines by visiting vanguard.com/proxyreporting or by calling Vanguard at 800-662-2739. The guidelines are also available from the SEC's website, sec.gov. In addition, you may obtain a free report on how your fund voted the proxies for securities it owned during the 12 months ended June 30. To get the report, visit either vanguard.com/proxyreporting or sec.gov.
You can review information about your fund on the SEC's website, and you can receive copies of this information, for a fee, by sending a request via email addressed to publicinfo@sec.gov.
Source for Bloomberg Barclays indexes: Bloomberg Index Services Limited. Copyright 2019, Bloomberg. All rights reserved.
CFA®is a registered trademark owned by CFA Institute.
© 2019 The Vanguard Group, Inc.
All rights reserved.
Vanguard Marketing Corporation, Distributor.
Q820 012019
Item 2: Code of Ethics. The Registrant has adopted a code of ethics that applies to the Registrant’s principal executive officer, principal financial officer, principal accounting officer or controller or persons performing similar functions. The Code of Ethics was amended during the reporting period covered by this report to make certain technical, non-material changes.
Item 3: Audit Committee Financial Expert. All members of the Audit Committee have been determined by the Registrant’s Board of Trustees to be Audit Committee Financial Experts and to be independent: JoAnn Heffernan Heisen, F. Joseph Loughrey, Mark Loughridge, Sarah Bloom Raskin, and Peter F. Volanakis.
Item 4: Principal Accountant Fees and Services.
(a) Audit Fees.
Audit Fees of the Registrant.
Fiscal Year Ended November 30, 2018: $42,000
Fiscal Year Ended November 30, 2017: $44,000
Aggregate Audit Fees of Registered Investment Companies in the Vanguard Group.
Fiscal Year Ended November 30, 2018: $9,734,277
Fiscal Year Ended November 30, 2017: $8,424,459
Includes fees billed in connection with audits of the Registrant, other registered investment companies in the Vanguard complex, The Vanguard Group, Inc. and Vanguard Marketing Corporation.
(b) Audit-Related Fees.
Fiscal Year Ended November 30, 2018: $5,581,336
Fiscal Year Ended November 30, 2017: $3,194,093
Includes fees billed in connection with assurance and related services provided to the Registrant, other registered investment companies in the Vanguard complex, The Vanguard Group, Inc., and Vanguard Marketing Corporation.
(c) Tax Fees.
Fiscal Year Ended November 30, 2018: $347,985
Fiscal Year Ended November 30, 2017: $274,313
Includes fees billed in connection with tax compliance, planning, and advice services provided to the Registrant, other registered investment companies in the Vanguard complex, The Vanguard Group, Inc., and Vanguard Marketing Corporation.
(d) All Other Fees.
Fiscal Year Ended November 30, 2018: $0
Fiscal Year Ended November 30, 2017: $0
Includes fees billed for services related to tax reported information provided to the Registrant, other registered investment companies in the Vanguard complex, The Vanguard Group, Inc., and Vanguard Marketing Corporation.
(e) (1) Pre-Approval Policies. The policy of the Registrant’s Audit Committee is to consider and, if appropriate, approve before the principal accountant is engaged for such services, all specific audit and non-audit services provided to: the Registrant, other registered investment companies in the Vanguard complex, The Vanguard Group, Inc., and entities controlled by The Vanguard Group, Inc. that provide ongoing services to the Registrant. In making a determination, the Audit Committee considers whether the services are consistent with maintaining the principal accountant’s independence.
In the event of a contingency situation in which the principal accountant is needed to provide services in between scheduled Audit Committee meetings, the Chairman of the Audit Committee would be called on to consider and, if appropriate, pre-approve audit or permitted non-audit services in an amount sufficient to complete services through the next Audit Committee meeting, and to determine if such services would be consistent with maintaining the accountant’s independence. At the next scheduled Audit Committee meeting, services and fees would be presented to the Audit Committee for formal consideration, and, if appropriate, approval by the entire Audit Committee. The Audit Committee would again consider whether such services and fees are consistent with maintaining the principal accountant’s independence.
The Registrant’s Audit Committee is informed at least annually of all audit and non-audit services provided by the principal accountant to the Vanguard complex, whether such services are provided to: the Registrant, other registered investment companies in the Vanguard complex, The Vanguard Group, Inc., or other entities controlled by The Vanguard Group, Inc. that provide ongoing services to the Registrant.
(2) No percentage of the principal accountant’s fees or services were approved pursuant to the waiver provision of paragraph (c)(7)(i)(C) of Rule 2-01 of Regulation S-X.
(f) For the most recent fiscal year, over 50% of the hours worked under the principal accountant’s engagement were not performed by persons other than full-time, permanent employees of the principal accountant.
(g) Aggregate Non-Audit Fees.
Fiscal Year Ended November 30, 2018: $347,985
Fiscal Year Ended November 30, 2017: $274,313
Includes fees billed for non-audit services provided to the Registrant, other registered investment companies in the Vanguard complex, The Vanguard Group, Inc., and Vanguard Marketing Corporation.
(h) For the most recent fiscal year, the Audit Committee has determined that the provision of all non-audit services was consistent with maintaining the principal accountant’s independence.
Item 5: Audit Committee of Listed Registrants.
The Registrant is a listed issuer as defined in rule 10A-3 under the Securities Exchange Act of 1934 (“Exchange Act”). The Registrant has a separately-designated standing audit committee established in accordance with Section 3(a)(58)(A) of the Exchange Act. The Registrant’s audit committee members are: JoAnn Heffernan Heisen, F. Joseph Loughrey, Mark Loughridge, Sarah Bloom Raskin, and Peter F. Volanakis.
Item 6: Investments.
Not Applicable.
Item 7: Disclosure of Proxy Voting Policies and Procedures for Closed-End Management Investment Companies.
Not Applicable.
Item 8: Portfolio Managers of Closed-End Management Investment Companies.
Not Applicable.
Item 9: Purchase of Equity Securities by Closed-End Management Investment Company and Affiliated Purchasers.
Not Applicable.
Item 10: Submission of Matters to a Vote of Security Holders.
Not Applicable.
Item 11: Controls and Procedures.
(a) Disclosure Controls and Procedures. The Principal Executive and Financial Officers concluded that the Registrant’s Disclosure Controls and Procedures are effective based on their evaluation of the Disclosure Controls and Procedures as of a date within 90 days of the filing date of this report.
(b) Internal Control Over Financial Reporting. There were no significant changes in Registrant’s Internal Control Over Financial Reporting or in other factors that could significantly affect this control subsequent to the date of the evaluation, including any corrective actions with regard to significant deficiencies and material weaknesses.
Item 12: Disclosure of Securities Lending Activities for Closed-End Management Investment Companies.
Not Applicable.
Item 13: Exhibits.
(a) Code of Ethics.
(b) Certifications.
Pursuant to the requirements of the Securities Exchange Act of 1934 and the Investment Company Act of 1940, the registrant has duly caused this report to be signed on its behalf by the undersigned, thereunto duly authorized.
| VANGUARD CONVERTIBLE SECURITIES FUND |
| |
BY: | /s/ MORTIMER J. BUCKLEY* | |
| | |
| MORTIMER J. BUCKLEY | |
| CHIEF EXECUTIVE OFFICER | |
Date: January 22, 2019
Pursuant to the requirements of the Securities Exchange Act of 1934 and the Investment Company Act of 1940, this report has been signed below by the following persons on behalf of the registrant and in the capacities and on the dates indicated.
| VANGUARD CONVERTIBLE SECURITIES FUND |
| |
BY: | /s/ MORTIMER J. BUCKLEY * | |
| | |
| MORTIMER J. BUCKLEY | |
| CHIEF EXECUTIVE OFFICER | |
|
Date: January 22, 2019 |
|
| VANGUARD CONVERTIBLE SECURITIES FUND |
| |
BY: | /s/ THOMAS J. HIGGINS* | |
| | |
| THOMAS J. HIGGINS | |
| CHIEF FINANCIAL OFFICER | |
| |
Date: January 22, 2019 | |
* By: /s/ Anne E. Robinson
Anne E. Robinson, pursuant to a Power of Attorney filed on January 18, 2018 see file Number 33-32216, Incorporated by Reference.