UNITED STATES
SECURITIES AND EXCHANGE COMMISSION
Washington, D.C. 20549
FORM N-CSR
CERTIFIED SHAREHOLDER REPORT
OF
REGISTERED MANAGEMENT INVESTMENT COMPANIES
| | |
| Investment Company Act file number: | 811-04627 | |
Name of Registrant: | Vanguard Convertible Securities Fund |
Address of Registrant: | P.O. Box 2600 |
| | Valley Forge, PA 19482 |
Name and address of agent for service: | Heidi Stam, Esquire |
| | P.O. Box 876 |
| | Valley Forge, PA 19482 |
Registrant’s telephone number, including area code: (610) 669-1000 |
Date of fiscal year end: November 30 | |
Date of reporting period: December 1, 2013 – November 30, 2014 |
Item 1: Reports to Shareholders | |
Annual Report | November 30, 2014
Vanguard Convertible Securities Fund
The mission continues
On May 1, 1975, Vanguard began operations, a fledgling company based on the simple but revolutionary idea that a mutual fund company should be managed solely in the interest of its investors.
Four decades later, that revolutionary spirit continues to animate the enterprise. Vanguard remains on a mission to give investors the best chance of investment success.
As we mark our 40th anniversary, we thank you for entrusting your assets to Vanguard and giving us the opportunity to help you reach your financial goals in the decades to come.
| |
| Contents | |
| Your Fund’s Total Returns. | 1 |
| Chairman’s Letter. | 2 |
| Advisor’s Report. | 8 |
| Fund Profile. | 11 |
| Performance Summary. | 13 |
| Financial Statements. | 15 |
| Your Fund’s After-Tax Returns. | 31 |
| About Your Fund’s Expenses. | 32 |
| Glossary. | 34 |
Please note: The opinions expressed in this report are just that—informed opinions. They should not be considered promises or advice.
Also, please keep in mind that the information and opinions cover the period through the date on the front of this report. Of course, the
risks of investing in your fund are spelled out in the prospectus.
See the Glossary for definitions of investment terms used in this report.
About the cover: Since our founding, Vanguard has drawn inspiration from the enterprise and valor demonstrated by British
naval hero Horatio Nelson and his command at the Battle of the Nile in 1798. The photograph displays a replica of a merchant
ship from the same era as Nelson’s flagship, the HMS Vanguard.
Your Fund’s Total Returns
| |
| Fiscal Year Ended November 30, 2014 | |
| |
| | Total |
| | Returns |
| Vanguard Convertible Securities Fund | 4.33% |
| Convertibles Composite Index | 9.82 |
| Convertible Securities Funds Average | 9.23 |
| For a benchmark description, see the Glossary. | |
| Convertible Securities Funds Average: Derived from data provided by Lipper, a Thomson Reuters Company. |
| | | | |
| Your Fund’s Performance at a Glance | | | | |
| November 30, 2013, Through November 30, 2014 | | | | |
| |
| | | | Distributions Per Share |
| | Starting | Ending | | |
| | Share | Share | Income | Capital |
| | Price | Price | Dividends | Gains |
| Vanguard Convertible Securities Fund | $14.64 | $13.85 | $0.425 | $0.965 |
1

Chairman’s Letter
Dear Shareholder,
For the 12 months ended November 30, 2014, Vanguard Convertible Securities Fund returned 4.33%, a more modest result than the nearly 20% return of a year ago. The fund’s result trailed the 9.82% return of its benchmark, the Convertibles Composite Index, and the 9.23% average return of its peers.
Convertible securities are corporate bonds and preferred stocks that may be exchanged for common stocks at a predetermined price. Convertibles combine the features of bonds and stocks; they offer steady income along with the potential to benefit if the value of their underlying stocks increases.
The fund leans away from riskier convertible securities that lack downside protection, and therefore it did not benefit from the market’s preference for higher-risk convertibles, which boosted the benchmark’s return.
Monetary actions gave U.S. stocks a boost, as did corporate earnings
The broad U.S. stock market gained more than 15% for the 12 months. Generally accommodative global monetary actions and strong corporate earnings offset investor concern about geopolitical issues such as economic struggles in Europe and strife in the Middle East.
2
Investors seemed to take comfort in assurances from the Federal Reserve that it would keep short-term interest rates low, even as it ended its stimulative bond-buying program as anticipated. Meanwhile, the Bank of Japan, the European Central Bank, and the People’s Bank of China all announced more stimulus measures.
As many foreign currencies weakened against the U.S. dollar, international stocks managed a return of about 1% in dollar terms. Emerging markets fared better than the developed markets of Europe and the Pacific region.
Bond prices continued to climb after slipping over the summer
Global central-bank stimulus also helped the broad U.S. taxable bond market, which returned 5.27%. Bond prices, which slipped during the summer, generally rose over the period. The strong returns surprised most analysts, who had predicted that already low yields wouldn’t continue to drop. Even though the Fed began winding down its bond purchases in January, prices rose and yields fell. (Bond prices and yields move in opposite directions.) The yield of the 10-year U.S. Treasury note ended November at 2.25%, down from 2.74% a year earlier.
| | | |
| Market Barometer | | | |
| |
| | Average Annual Total Returns |
| | Periods Ended November 30, 2014 |
| | One | Three | Five |
| | Year | Years | Years |
| Stocks | | | |
| Russell 1000 Index (Large-caps) | 16.56% | 21.05% | 16.25% |
| Russell 2000 Index (Small-caps) | 3.99 | 18.36 | 16.69 |
| Russell 3000 Index (Broad U.S. market) | 15.53 | 20.84 | 16.28 |
| FTSE All-World ex US Index (International) | 1.05 | 10.29 | 5.94 |
| |
| Bonds | | | |
| Barclays U.S. Aggregate Bond Index (Broad taxable market) | 5.27% | 3.00% | 4.10% |
| Barclays Municipal Bond Index (Broad tax-exempt market) | 8.23 | 4.78 | 5.12 |
| Citigroup Three-Month U.S. Treasury Bill Index | 0.04 | 0.04 | 0.06 |
| |
| CPI | | | |
| Consumer Price Index | 1.32% | 1.44% | 1.77% |
3
Municipal bonds returned 8.23% as a combination of diminished supply and greater demand pushed prices higher.
International bond markets (as measured by the Barclays Global Aggregate Index ex USD) posted a –2.53% result.
Money market funds and savings accounts barely budged as the Fed kept its target for short-term interest rates at 0%–0.25%.
The stock and bond markets both helped convertibles do well
The Convertible Securities Fund allows investors to benefit from some of the characteristics of both stocks and bonds. During the fiscal year, U.S. stocks continued
their advance, while bond prices rose as interest rates unexpectedly declined. These developments extended the bullish environment for convertible securities.
On the other hand, small-capitalization U.S. stocks underperformed large-caps for the 12 months, a switch from the previous fiscal year. This reversal tapped the brakes a bit on U.S. convertibles’ performance because they more closely correlate with how small-caps do. Convertible securities tend to be issued by small or midsized firms that often have difficulty accessing other sources of financing. They are an attractive funding method because they typically require lower interest payments than bonds.
| | |
| Expense Ratios | | |
| Your Fund Compared With Its Peer Group | | |
| | | Peer Group |
| | Fund | Average |
| Convertible Securities Fund | 0.63% | 1.25% |
The fund expense ratio shown is from the prospectus dated March 26, 2014, and represents estimated costs for the current fiscal year. For
the fiscal year ended November 30, 2014, the fund’s expense ratio was 0.41%. This decrease from the estimated expense ratio reflects a
performance-based investment advisory fee adjustment. When the performance adjustment is positive, the fund’s expenses increase; when it
is negative, expenses decrease. The peer-group expense ratio is derived from data provided by Lipper, a Thomson Reuters Company, and
captures information through year-end 2013.
Peer group: Convertible Securities Funds.
4
Globally, the issuance of convertibles during the period nearly matched last year’s level. A healthy volume of new issues outside the United States reflected a welcome expansion of the international convertibles market. The fund continued to make progress toward its goal of holding approximately 30% of assets in non-U.S. securities, ending the period with about 25%. These foreign convertibles were hurt by the bearish sentiment that prevailed in many major international markets in the latter half of the fiscal year.
The fund’s advisor, Oaktree Capital Management, favors convertible securities considered to have the best balance of total return potential and downside protection, including those with call protection. This feature lessens the risk that a bond will be called by the issuer before it can reach its full return potential—but it can also limit the bond’s upside for investors. Higher-price, higher-risk convertibles that have extended call protection performed extremely well during the period, helping the benchmark outdistance the fund. These types of convertibles are considered outside of Oakmark’s investable universe.
| |
| Total Returns | |
| Ten Years Ended November 30, 2014 | |
| | Average |
| | Annual Return |
| Convertible Securities Fund | 7.68% |
| Convertibles Composite Index | 6.79 |
| Convertible Securities Funds Average | 6.54 |
For a benchmark description, see the Glossary.
Convertible Securities Funds Average: Derived from data provided by Lipper, a Thomson Reuters Company.
The figures shown represent past performance, which is not a guarantee of future results. (Current performance may be
lower or higher than the performance data cited. For performance data current to the most recent month-end, visit our
website at vanguard.com/performance.) Note, too, that both investment returns and principal value can fluctuate widely, so
an investor’s shares, when sold, could be worth more or less than their original cost.
5
The fund’s performance was also hindered by its overweight exposure to oil and gas companies in the energy sector, which were hurt by falling oil prices.
For more information on the fund’s positioning and performance during the year, please see the Advisor’s Report that follows this letter.
The fund’s long-term record reflects the advisor’s expertise
The Convertible Securities Fund delivered an average annual return of 7.68% over the ten years ended November 30, besting both the Convertibles Composite Index (6.79%) and the average return of peers (6.54%).
The fund’s solid long-term result is evidence of the skill and experience of Oaktree Capital Management. Oaktree, which oversees nearly $100 billion in high-yield and distressed debt, convertibles, and other alternative assets, successfully navigated the fund during an unusually turbulent decade in the world’s equity and bond markets.
The global financial crisis of 2008–2009 dramatically reduced the new issuance of convertibles, a development that has finally eased. Also, the extraordinarily low interest rates in most major markets have increased investors’ appetite for riskier, higher-yielding securities. Oaktree has admirably steered the fund through these unusual crosscurrents. The fund’s low expense ratio—nearly half the peer fund average—helps the advisor pass on more of the fund’s returns to you.
Realistic expectations are key to reaching your long-term goals
Over the last several years, investors have grown accustomed to mostly strong returns from both stocks and bonds. This, of course, has been a welcome development for our clients as they strive to achieve their financial goals. But as any experienced investor knows, markets aren’t always so favorable.
Our recently published economic and market outlook research paper cautions that, over the next decade, returns for a balanced 60% equity/40% bond portfolio are likely to be moderately below long-run historical averages. (For more details, see Vanguard’s Economic and Investment Outlook, available at vanguard.com/research.)
I point out our modest projections not to be discouraging but to be helpful. Realistic expectations are the foundation of a sound plan to reach your long-term objective, whether it’s establishing a secure retirement, paying for a child’s education, or achieving some other goal.
If you expect too much from the markets, you might not save sufficiently. You might also take on excessive risk in your portfolio in the pursuit of unrealistically high returns.
6
We firmly believe that a better course is to follow Vanguard’s principles for investing success:
• Goals. Create clear, appropriate
investment goals.
• Balance. Develop a suitable asset
allocation using broadly diversified funds.
• Cost. Minimize cost.
• Discipline. Maintain perspective and
long-term discipline.
The beauty of these principles is that, unlike market returns, each one is within your control, and focusing on them can put you on the right path.
As always, thank you for investing with Vanguard.
Sincerely,

F. William McNabb III
Chairman and Chief Executive Officer
December 11, 2014
7
Advisor’s Report
The investment strategy of Vanguard Convertible Securities Fund is to create a highly diversified global portfolio of convertible securities. The fund emphasizes investments in convertible bonds with relatively near-term maturities or put dates. We focus on “balanced” convertibles with reasonable yields, stable credit quality, good call protection, and low to moderate conversion premiums. We believe these securities have a favorable balance of upside potential and downside
risk. The fund underweights convertible preferred shares, which are riskier but may offer higher returns; we do, however, consider them part of our investable universe and make some use of them.
Importantly, the fund does not invest in common stocks or nonconvertible debt. We do not attempt market timing and therefore are nearly fully invested, holding only a small amount of cash for potential investments. We believe that a portfolio of
| |
| Major Portfolio Changes | |
| Fiscal Year Ended November 30, 2014 | |
| Additions | Comments |
| APERAM | Balanced convertible with exposure to a strengthening credit |
| (0.625% convertible note due 07/08/21) | and strong equity catalysts. |
| Cobalt International Energy | Balanced new issue with much better equity exposure than the |
| (3.125% convertible note due 05/15/24) | higher-premium existing 2.625% issue. |
| Element Financial | Balanced new issue on a company with a good growth profile |
| (5.125% convertible note due 06/30/19) | and attractive equity valuation. |
| SolarCity | Attractive new issue on a compelling growth story. |
| (1.625% convertible note due 11/01/19) | |
| SunEdison | Balanced new issue on an attractive growth company. |
| (0.25% convertible note due 01/15/20) | |
| Tesla Motors | Balanced new issue that provides a defensive way to play a |
| (1.25% convertible note due 03/01/21) | compelling growth story. |
| |
| Reductions | Comments |
| Cobalt International Energy | Sold and rotated into the more balanced 3.125% issue. |
| (2.625% convertible note due 12/01/19) | |
| Golar LNG | Sold after substantial appreciation and bonds developed significant |
| (3.75% convertible note due 03/07/17) | downside risk. |
| Illumina | Sold after substantial appreciation and bonds developed significant |
| (0.25% convertible note due 03/15/16) | downside risk. |
| MGM Resorts | Sold after substantial appreciation and bonds mature in early 2015. |
| (4.25% convertible note due 04/15/15) | |
| Pembina Pipeline | Sold after substantial appreciation and bonds developed significant |
| (5.75% convertible note due 12/31/18) | downside risk. |
| SanDisk | Sold after substantial appreciation and bonds developed significant |
| (1.5% convertible note due 08/15/17) | downside risk. |
8
attractive, carefully selected convertible securities can produce equity-type returns with lower volatility and lower structural risk over long periods.
For the 12 months ended November 30, 2014, convertible securities participated in the strength of underlying equities during market rallies while providing downside protection during periods of volatility. Vanguard Convertible Securities Fund returned 4.33%, lagging the 9.82% return of its blended benchmark.
The investment environment
The convertible bond market generated positive returns over the 12 months, buoyed by strong technical and fundamental market conditions. Demand was strong, and convertibles were pushed higher by advances in both the equity and credit markets. The period was highlighted by the impressive strength of equities and the resumption of a robust pace of new issues of convertibles. Convertible bonds performed in relative terms as expected, capturing much of the performance of equities while providing significant downside protection during times of market weakness.
Given the relatively low level of defaults, credit spreads tightened further throughout the period as investors stretched for yield given low interest rates. Equity markets showed momentum and hit record highs in recent months. The U.S. equity market was strong thanks to solid corporate earnings reports, more merger and acquisition (M&A) activity, and recent improvement in economic data. Generally
speaking, relative weakness in the Russell 2000 Index—to which the convertible bond market is most correlated—affected the U.S. convertible bonds held in the fund. Outside the United States, steady but modest economic growth and dovish comments by the European Central Bank and the Federal Reserve inspired investor confidence, as did share buybacks and the increased M&A activity. A range of geopolitical events, coupled with a drop in oil prices, weaker growth in China, and stagnant European economies, helped instigate volatility. Overall, convertible bonds participated meaningfully in the equity market advance, even outpacing the small- and mid-capitalization equities to which they tend to correlate most closely.
During the 12 months, we were encouraged by solid new-issue volumes. We were able to participate in new deals and add to positions when appropriate. New issuance totaled $91.2 billion, with non-U.S. issuance of $47.1 billion slightly outpacing U.S. issuance of $44.1 billion. U.S. issuance was driven by higher equity prices and potential issuers’ stronger economic outlook. We are seeing companies use new-issue proceeds for increased capital spending, M&A activity, and stock buybacks. Outside the United States, many convertibles were placed by first-time issuers, broadening the investment universe. With this, the supply surge soaked up some of the strong demand from investors, causing securities to cheapen in early June.
This was particularly true of investment-grade convertibles.
9
Overall, we participated in about one-quarter of the issuance in the global convertible bond market; however, most deals have not performed well because of the subsequent fall in equity prices and widening credit spreads. As a result of the price declines in recent months, some attractive values are beginning to reappear.
Our successes
The portfolio returns were broad-based, though helped by exposure to a number of individual holdings with particularly strong underlying stock moves. The top individual contributors were convertibles from Micron Technology, SunEdison, SanDisk, Illumina, and Omnicare. By industry, our security selection in the leisure facilities, energy, and steel sectors generated strong returns for the portfolio relative to the index.
Our shortfalls
Our underperformance versus the index was a result not of what we owned but rather of what we didn’t own. High-priced and extremely equity-sensitive securities powered the index, but they offer no downside protection; the yield to maturity is highly negative, and the conversion premium is basically zero. We do not invest in these securities, but several are in the index because they are noncallable. Although we trailed the benchmark, we were pleased to generally keep pace during a period when our portfolio had several winners and no major detractors. Our chief detractors were Cobalt Energy, Goodrich Petroleum, Energy XXI Bermuda, Hornbeck Offshore Services, and Penn Virginia. By industry, our oil and gas
holdings hurt our relative performance. We are overweight in this sector, and many of our holdings declined.
The fund’s positioning
We remain fully invested in a highly diversified, well-balanced portfolio of convertible securities. The fund is invested 75% in the United States and 25% outside, as we continue to ramp up to a target 30% allocation to non-U.S. convertibles. The portfolio has an attractive current yield of 2.1% and an average credit quality of Ba3/BB–. The vast majority of issuers in the portfolio are performing well fundamentally and, importantly, are positioned well from a credit perspective.
We will add to our favorite issues opportunistically while being cognizant of the absolute performance that stocks and convertibles have had over the past several quarters (with stocks and convertible bonds near record-high prices). Our focus is on securities with downside protection characteristics. Overall, we will continue to favor balanced, intermediate-term bonds with extended call protection issued by stable-to-improving credit companies.
We believe this will produce equity-type performance over time with constrained volatility and risk.
Larry W. Keele, CFA, Principal and Founder
Jean-Paul Nedelec, Managing Director
Abe Ofer, Managing Director
Oaktree Capital Management, L.P.
December 17, 2014
10
Convertible Securities Fund
| |
| Fund Profile | |
| As of November 30, 2014 | |
| |
| Portfolio Characteristics | |
| Ticker Symbol | VCVSX |
| Number of Securities | 223 |
| 30-Day SEC Yield | 2.11% |
| Conversion Premium | 34.6% |
| Average Weighted Maturity | 5.2 years |
| Average Coupon | 2.2% |
| Average Duration | 4.7 years |
| Foreign Holdings | 25.1% |
| Turnover Rate | 85% |
| Expense Ratio1 | 0.63% |
| Short-Term Reserves | 2.6% |
| |
| Distribution by Maturity | |
| (% of fixed income portfolio) | |
| Under 1 Year | 2.3% |
| 1 - 5 Years | 59.5 |
| 5 - 10 Years | 34.1 |
| 10 - 20 Years | 1.7 |
| 20 - 30 Years | 2.4 |
| |
| Distribution by Credit Quality (% of fixed | |
| income portfolio) | |
| AAA | 0.0% |
| AA | 0.1 |
| A | 0.7 |
| BBB | 7.5 |
| BB | 14.6 |
| B | 13.8 |
| Below B | 1.9 |
| Not Rated | 61.4 |
Credit-quality ratings are obtained from S&P. "Not Rated" is used to classify securities for which a rating is not available. For more information about these ratings, see the Glossary entry for Credit Quality.
| | |
| Total Fund Volatility Measures | |
| | | DJ |
| | Convertibles | U.S. Total |
| | Composite | Market |
| | Index | FA Index |
| R-Squared | 0.91 | 0.75 |
| Beta | 1.04 | 0.65 |
These measures show the degree and timing of the fund’s fluctuations compared with the indexes over 36 months.
| | |
| Ten Largest Holdings (% of total net assets) |
| Hologic Inc. | Health Care | |
| | Equipment & | |
| | Supplies | 2.1% |
| Jarden Corp. | Household Durables | 2.1 |
| BioMarin Pharmaceutical | | |
| Inc. | Biotechnology | 2.1 |
| Omnicare Inc. | Health Care Services | 2.0 |
| Priceline Group Inc. | Internet & Catalog | |
| | Retail | 1.9 |
| Jazz Investments I Ltd. | Pharmaceuticals | 1.9 |
| NVIDIA Corp. | Semiconductors & | |
| | Semiconductor | |
| | Equipment | 1.9 |
| HealthSouth Corp. | Health Care Facilities | 1.7 |
| NuVasive Inc. | Health Care | |
| | Equipment & | |
| | Supplies | 1.7 |
| Red Hat Inc. | Systems Software | 1.5 |
| Top Ten | | 18.9% |
The holdings listed exclude any temporary cash investments and equity index products.
1 The expense ratio shown is from the prospectus dated March 26, 2014, and represents estimated costs for the current fiscal year. For the
fiscal year ended November 30, 2014, the expense ratio was 0.41%.

Convertible Securities Fund
| |
| Sector Diversification (% of market | |
| exposure) | |
| |
| Consumer | |
| Discretionary | 10.3% |
| Consumer Staples | 2.4 |
| Energy | 8.8 |
| Financials | 10.3 |
| Health Care | 26.8 |
| Industrials | 9.3 |
| Information | |
| Technology | 26.2 |
| Materials | 3.5 |
| Telecommunication | |
| Services | 1.3 |
| Utilities | 1.1 |
12
Convertible Securities Fund
Performance Summary
All of the returns in this report represent past performance, which is not a guarantee of future results that may be achieved by the fund. (Current performance may be lower or higher than the performance data cited. For performance data current to the most recent month-end, visit our website at vanguard.com/performance.) Note, too, that both investment returns and principal value can fluctuate widely, so an investor’s shares, when sold, could be worth more or less than their original cost. The returns shown do not reflect taxes that a shareholder would pay on fund distributions or on the sale of fund shares.
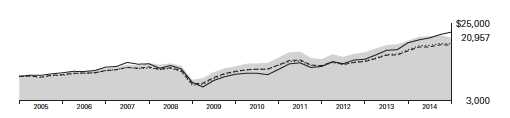
Cumulative Performance: November 30, 2004, Through November 30, 2014
Initial Investment of $10,000
| | | | | |
| | | Average Annual Total Returns | |
| | | Periods Ended November 30, 2014 | |
| | | | | | Final Value |
| | | One | Five | Ten | of a $10,000 |
| | | Year | Years | Years | Investment |
| | Convertible Securities Fund | 4.33% | 10.37% | 7.68% | $20,957 |
| •••••••• | Convertibles Composite Index | 9.82 | 11.41 | 6.79 | 19,292 |
| – – – – | Convertible Securities Funds Average | 9.23 | 10.54 | 6.54 | 18,851 |
| | Dow Jones U.S. Total Stock Market | | | | |
| | Float Adjusted Index | 15.44 | 16.37 | 8.48 | 22,568 |
| For a benchmark description, see the Glossary. | | | | |
| Convertible Securities Funds Average: Derived from data provided by Lipper, a Thomson Reuters Company. |
See Financial Highlights for dividend and capital gains information.
13
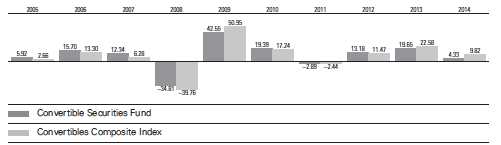
Convertible Securities Fund
Fiscal-Year Total Returns (%): November 30, 2004, Through November 30, 2014
For a benchmark description, see the Glossary.
Average Annual Total Returns: Periods Ended September 30, 2014
This table presents returns through the latest calendar quarter—rather than through the end of the fiscal period.
Securities and Exchange Commission rules require that we provide this information.
| | | | | | |
| | | | | Ten Years |
| | Inception Date | One Year | Five Years | Income | Capital | Total |
| Convertible Securities | | | | | | |
| Fund | 6/17/1986 | 6.52% | 10.28% | 3.64% | 4.38% | 8.02% |
14
Convertible Securities Fund
Financial Statements
Statement of Net Assets
As of November 30, 2014
The fund reports a complete list of its holdings in regulatory filings four times in each fiscal year, at the quarter-ends. For the second and fourth fiscal quarters, the lists appear in the fund’s semiannual and annual reports to shareholders. For the first and third fiscal quarters, the fund files the lists with the Securities and Exchange Commission on Form N-Q. Shareholders can look up the fund’s Forms N-Q on the SEC’s website at sec.gov. Forms N-Q may also be reviewed and copied at the SEC’s Public Reference Room (see the back cover of this report for further information).
| | | | | |
| | | | | Face | Market |
| | | Maturity | | Amount | Value• |
| | Coupon | Date | Currency | (000) | ($000) |
| Convertible Bonds (89.8%) | | | | | |
| Consumer Discretionary (10.0%) | | | | | |
| ABC-Mart Inc. Cvt. | 0.000% | 2/5/18 | JPY | 560,000 | 6,233 |
| Asics Corp. Cvt. | 0.000% | 3/1/19 | JPY | 150,000 | 1,570 |
| Cineplex Inc. Cvt. | 4.500% | 12/31/18 | CAD | 4,253 | 3,905 |
| Ctrip.com International Ltd. | 1.250% | 10/15/18 | USD | 10,637 | 10,996 |
| Enterprise Funding Ltd. Cvt. | 3.500% | 9/10/20 | GBP | 1,600 | 2,353 |
| FF Group Finance Luxembourg Cvt. | 1.750% | 7/3/19 | EUR | 4,600 | 5,425 |
| Iconix Brand Group Inc. Cvt. | 1.500% | 3/15/18 | USD | 1,950 | 2,650 |
| 1 Jarden Corp. Cvt. | 1.125% | 3/15/34 | USD | 19,709 | 20,867 |
| Jarden Corp. Cvt. | 1.500% | 6/15/19 | USD | 16,735 | 20,825 |
| 1 Liberty Media Corp. Cvt. | 1.375% | 10/15/23 | USD | 28,195 | 28,265 |
| Lotte Shopping Co. Ltd. Cvt. | 0.000% | 1/24/18 | KRW | 4,200,000 | 3,805 |
| Misarte Cvt. | 3.250% | 1/1/16 | EUR | 2,842 | 4,506 |
| NH Hoteles SA Cvt. | 4.000% | 11/8/18 | EUR | 4,000 | 5,290 |
| 1 Priceline Group Inc. Cvt. | 0.900% | 9/15/21 | USD | 11,335 | 10,797 |
| Priceline Group Inc. Cvt. | 0.350% | 6/15/20 | USD | 24,535 | 27,433 |
| ResortTrust Inc. Cvt. | 0.000% | 7/27/18 | JPY | 255,000 | 2,612 |
| ResortTrust Inc. Cvt. | 0.000% | 12/1/21 | JPY | 180,000 | 1,570 |
| SAF-Holland SA Cvt. | 1.000% | 9/12/20 | EUR | 3,200 | 4,260 |
| Sekisui House Ltd. Cvt. | 0.000% | 7/5/16 | JPY | 140,000 | 1,887 |
| Sogefi SPA Cvt. | 2.000% | 5/21/21 | EUR | 1,000 | 1,090 |
| Steinhoff Finance Holding GmbH Cvt. | 4.000% | 1/30/21 | EUR | 4,000 | 6,421 |
| Takashimaya Co. Ltd. Cvt. | 0.000% | 12/11/20 | JPY | 420,000 | 3,759 |
| Tesla Motors Inc. Cvt. | 1.250% | 3/1/21 | USD | 21,035 | 20,023 |
| TUI AG Cvt. | 2.750% | 3/24/16 | EUR | 2,131 | 3,173 |
| | | | | | 199,715 |
| Consumer Staples (2.3%) | | | | | |
| Hengan International Group Co. Ltd. Cvt. | 0.000% | 6/27/18 | HKD | 28,000 | 3,714 |
| 1 Herbalife Ltd. Cvt. | 2.000% | 8/15/19 | USD | 19,840 | 15,525 |
| J Sainsbury PLC Cvt. | 1.250% | 11/21/19 | GBP | 3,200 | 5,023 |
| Marine Harvest ASA Cvt. | 2.375% | 5/8/18 | EUR | 3,500 | 5,952 |
| Olam International Ltd. Cvt. | 6.000% | 10/15/16 | USD | 6,600 | 7,013 |
| Rallye SA Cvt. | 1.000% | 10/2/20 | EUR | 3,380 | 4,622 |
| Sonae Investments BV Cvt. | 1.625% | 6/11/19 | EUR | 3,800 | 4,394 |
| | | | | | 46,243 |
15
| | | | | |
| Convertible Securities Fund | | | | | |
| |
| |
| |
| | | | | Face | Market |
| | | Maturity | | Amount | Value• |
| | Coupon | Date | Currency | (000) | ($000) |
| Energy (5.8%) | | | | | |
| BPZ Resources Inc. Cvt. | 8.500% | 10/1/17 | USD | 7,060 | 4,580 |
| BW Group Ltd. Cvt. | 1.750% | 9/10/19 | USD | 3,200 | 2,665 |
| Cam 2012 SPA Cvt. | 5.625% | 10/26/17 | EUR | 3,900 | 5,701 |
| Cobalt International Energy Inc. Cvt. | 3.125% | 5/15/24 | USD | 25,530 | 17,807 |
| 1 Emerald Oil Inc. Cvt. | 2.000% | 4/1/19 | USD | 1,155 | 647 |
| Goodrich Petroleum Corp. Cvt. | 5.000% | 10/1/32 | USD | 2,657 | 1,787 |
| Helix Energy Solutions Group Inc. Cvt. | 3.250% | 3/15/32 | USD | 1,951 | 2,292 |
| Lukoil International Finance BV Cvt. | 2.625% | 6/16/15 | USD | 6,800 | 6,664 |
| 1 Scorpio Tankers Inc. Cvt. | 2.375% | 7/1/19 | USD | 27,610 | 26,161 |
| SEACOR Holdings Inc. Cvt. | 2.500% | 12/15/27 | USD | 18,625 | 19,428 |
| SEACOR Holdings Inc. Cvt. | 3.000% | 11/15/28 | USD | 8,680 | 8,040 |
| Stone Energy Corp. Cvt. | 1.750% | 3/1/17 | USD | 21,620 | 18,323 |
| Subsea 7 SA Cvt. | 1.000% | 10/5/17 | USD | 400 | 368 |
| Technip SA Cvt. | 0.500% | 1/1/16 | EUR | 1,271 | 1,568 |
| | | | | | 116,031 |
| Financials (8.7%) | | | | | |
| Alstria Office REIT-AG Cvt. | 2.750% | 6/14/18 | EUR | 2,600 | 3,560 |
| American Realty Capital Properties Inc. Cvt. | 3.750% | 12/15/20 | USD | 17,625 | 16,050 |
| Azimut Holding SPA Cvt. | 2.125% | 11/25/20 | EUR | 6,200 | 8,531 |
| Beni Stabili SPA Cvt. | 3.375% | 1/17/18 | EUR | 1,600 | 2,228 |
| BES Finance Ltd. Cvt. | 3.500% | 12/6/15 | USD | 4,800 | 4,781 |
| BNP Paribas SA Cvt. | 0.250% | 9/21/15 | EUR | 4,300 | 5,755 |
| BNP Paribas SA Cvt. | 0.250% | 9/27/16 | EUR | 1,600 | 2,179 |
| British Land Jersey Ltd. Cvt. | 1.500% | 9/10/17 | GBP | 2,200 | 4,016 |
| Caja de Ahorros y Pensiones de Barcelona Cvt. | 1.000% | 11/25/17 | EUR | 4,700 | 6,639 |
| CapitaCommercial Trust Cvt. | 2.500% | 9/12/17 | SGD | 4,000 | 3,417 |
| CapitaLand Ltd. Cvt. | 1.850% | 6/19/20 | SGD | 1,750 | 1,276 |
| 1 CapitaLand Ltd. Cvt. | 1.850% | 6/19/20 | SGD | 4,500 | 3,281 |
| CapitaLand Ltd. Cvt. | 1.950% | 10/17/23 | SGD | 1,500 | 1,166 |
| China Overseas Grand Oceans Finance | | | | | |
| Cayman Ltd. Cvt. | 2.000% | 3/21/17 | HKD | 27,000 | 3,481 |
| Colony Financial Inc. Cvt. | 5.000% | 4/15/23 | USD | 9,164 | 9,920 |
| Deutsche Euroshop AG Cvt. | 1.750% | 11/20/17 | EUR | 2,700 | 3,841 |
| Deutsche Wohnen AG Cvt. | 0.500% | 11/22/20 | EUR | 4,100 | 5,856 |
| 1 Element Financial Corp. Cvt. | 5.125% | 6/30/19 | CAD | 9,284 | 9,134 |
| Fonciere Des Regions Cvt. | 3.340% | 1/1/17 | EUR | 1,482 | 2,011 |
| Forest City Enterprises Inc. Cvt. | 4.250% | 8/15/18 | USD | 9,407 | 10,771 |
| GAGFAH SA Cvt. | 1.500% | 5/20/19 | EUR | 5,300 | 7,444 |
| Grand City Properties SA Cvt. | 1.500% | 2/24/19 | EUR | 2,700 | 4,207 |
| Industrivarden AB Cvt. | 0.000% | 5/15/19 | SEK | 13,000 | 1,867 |
| INTU Jersey Ltd. Cvt. | 2.500% | 10/4/18 | GBP | 1,900 | 3,339 |
| National Bank of Abu Dhabi PJSC Cvt. | 1.000% | 3/12/18 | USD | 1,000 | 1,080 |
| Nexity SA Cvt. | 0.625% | 1/1/20 | EUR | 1,910 | 2,382 |
| Portfolio Recovery Associates Inc. Cvt. | 3.000% | 8/1/20 | USD | 20,868 | 23,724 |
| SBI Holdings Inc. Cvt. | 0.000% | 11/2/17 | JPY | 330,000 | 3,019 |
| Shizuoka Bank Ltd. Cvt. | 0.000% | 4/25/18 | USD | 2,800 | 2,726 |
| Siem Industries Inc. Cvt. | 1.000% | 9/12/19 | USD | 7,200 | 6,624 |
16
Convertible Securities Fund
| | | | | |
| | | | | Face | Market |
| | | Maturity | | Amount | Value• |
| | Coupon | Date | Currency | (000) | ($000) |
| St. Modwen Properties Securities Jersey | | | | | |
| Ltd. Cvt. | 2.875% | 3/6/19 | GBP | 2,100 | 3,244 |
| Swiss Life Holding AG Cvt. | 0.000% | 12/2/20 | CHF | 140 | 164 |
| Unite Jersey Issuer Ltd. Cvt. | 2.500% | 10/10/18 | GBP | 3,700 | 6,148 |
| | | | | | 173,861 |
| Health Care (25.0%) | | | | | |
| Alere Inc. Cvt. | 3.000% | 5/15/16 | USD | 7,723 | 8,235 |
| Allscripts Healthcare Solutions Inc. Cvt. | 1.250% | 7/1/20 | USD | 20,165 | 19,295 |
| BioMarin Pharmaceutical Inc. Cvt. | 0.750% | 10/15/18 | USD | 10,670 | 12,631 |
| BioMarin Pharmaceutical Inc. Cvt. | 1.500% | 10/15/20 | USD | 23,385 | 28,676 |
| Brookdale Senior Living Inc. Cvt. | 2.750% | 6/15/18 | USD | 20,965 | 28,001 |
| 1 Cepheid Inc. Cvt. | 1.250% | 2/1/21 | USD | 13,075 | 14,587 |
| Cubist Pharmaceuticals Inc. Cvt. | 1.125% | 9/1/18 | USD | 13,215 | 15,379 |
| Cubist Pharmaceuticals Inc. Cvt. | 1.875% | 9/1/20 | USD | 5,104 | 6,150 |
| Depomed Inc. Cvt. | 2.500% | 9/1/21 | USD | 13,390 | 14,336 |
| Elekta AB Cvt. | 2.750% | 4/25/17 | SEK | 26,207 | 3,663 |
| Fresenius Medical Care AG & Co. KGaA Cvt. | 1.125% | 1/31/20 | EUR | 800 | 1,066 |
| HealthSouth Corp. Cvt. | 2.000% | 12/1/43 | USD | 29,465 | 34,161 |
| HeartWare International Inc. Cvt. | 3.500% | 12/15/17 | USD | 7,025 | 7,367 |
| Hologic Inc. Cvt. | 2.000% | 12/15/37 | USD | 8,175 | 10,306 |
| Hologic Inc. Cvt. | 2.000% | 3/1/42 | USD | 28,611 | 31,776 |
| 1 Illumina Inc. Cvt. | 0.500% | 6/15/21 | USD | 21,230 | 24,375 |
| Incyte Corp. Ltd. Cvt. | 0.375% | 11/15/18 | USD | 2,625 | 4,075 |
| Insulet Corp. Cvt. | 2.000% | 6/15/19 | USD | 9,839 | 11,782 |
| 1 Jazz Investments I Ltd. Cvt. | 1.875% | 8/15/21 | USD | 32,052 | 37,621 |
| 1 Ligand Pharmaceuticals Inc. Cvt. | 0.750% | 8/15/19 | USD | 8,845 | 8,812 |
| Medidata Solutions Inc. Cvt. | 1.000% | 8/1/18 | USD | 16,955 | 17,782 |
| Molina Healthcare Inc. Cvt. | 1.125% | 1/15/20 | USD | 5,600 | 7,507 |
| Molina Healthcare Inc. Cvt. | 1.625% | 8/15/44 | USD | 5,305 | 5,743 |
| 1 Molina Healthcare Inc. Cvt. | 1.625% | 8/15/44 | USD | 12,645 | 13,688 |
| Nikkiso Co. Ltd. Cvt. | 0.000% | 8/2/18 | JPY | 245,000 | 2,092 |
| NuVasive Inc. Cvt. | 2.750% | 7/1/17 | USD | 27,605 | 33,782 |
| Omnicare Inc. Cvt. | 3.250% | 12/15/35 | USD | 7,993 | 9,127 |
| Omnicare Inc. Cvt. | 3.500% | 2/15/44 | USD | 26,860 | 31,527 |
| Orpea Cvt. | 1.750% | 1/1/20 | EUR | 2,687 | 4,316 |
| Qiagen NV Cvt | 0.375% | 3/19/19 | USD | 2,600 | 2,713 |
| Qiagen NV Cvt | 0.875% | 3/19/21 | USD | 3,600 | 3,807 |
| Spectranetics Corp. Cvt. | 2.625% | 6/1/34 | USD | 14,940 | 18,610 |
| Terumo Corp. Cvt. | 0.000% | 12/6/21 | JPY | 580,000 | 5,008 |
| Wright Medical Group Inc. Cvt. | 2.000% | 8/15/17 | USD | 16,699 | 21,416 |
| | | | | | 499,412 |
| Industrials (8.3%) | | | | | |
| 1 51job Inc. Cvt. | 3.250% | 4/15/19 | USD | 3,875 | 4,112 |
| Aecon Group Inc. Cvt. | 5.500% | 12/31/18 | CAD | 4,503 | 3,968 |
| Air Lease Corp. Cvt. | 3.875% | 12/1/18 | USD | 5,229 | 7,657 |
| Astaldi SPA Cvt. | 4.500% | 1/31/19 | EUR | 1,300 | 1,658 |
| Chart Industries Inc. Cvt. | 2.000% | 8/1/18 | USD | 6,995 | 7,122 |
| China Merchants Holdings Pacific Ltd. Cvt. | 1.250% | 11/6/17 | HKD | 16,000 | 2,264 |
| Daifuku Co. Ltd. Cvt. | 0.000% | 10/2/17 | JPY | 100,000 | 936 |
| DP World Ltd. Cvt. | 1.750% | 6/19/24 | USD | 400 | 427 |
17
Convertible Securities Fund
| | | | | |
| | | | | Face | Market |
| | | Maturity | | Amount | Value• |
| | Coupon | Date | Currency | (000) | ($000) |
| GS Yuasa Corp. Cvt. | 0.000% | 3/13/19 | JPY | 220,000 | 1,895 |
| GVM Debentures Lux 1 SA Cvt. | 5.750% | 2/14/18 | EUR | 3,900 | 5,019 |
| 1 Huron Consulting Group Inc. Cvt. | 1.250% | 10/1/19 | USD | 10,835 | 11,275 |
| Johnson Electric Holdings Ltd. Cvt. | 1.000% | 4/2/21 | USD | 5,250 | 5,518 |
| Kawasaki Kisen Kaisha Ltd. Cvt. | 0.000% | 9/26/18 | JPY | 530,000 | 5,085 |
| KEYW Holding Corp. Cvt. | 2.500% | 7/15/19 | USD | 9,445 | 8,654 |
| Larsen & Toubro Ltd. Cvt. | 0.675% | 10/22/19 | USD | 315 | 325 |
| Macquarie Infrastructure Co. LLC Cvt. | 2.875% | 7/15/19 | USD | 8,960 | 10,063 |
| MISUMI Group Inc. Cvt. | 0.000% | 10/22/18 | USD | 4,000 | 4,250 |
| Nagoya Railroad Co. Ltd. Cvt. | 0.000% | 10/3/23 | JPY | 310,000 | 3,256 |
| Nagoya Railroad Co. Ltd. Cvt. | 0.000% | 12/11/24 | JPY | 190,000 | 1,641 |
| OCI Cvt. | 3.875% | 9/25/18 | EUR | 5,200 | 6,957 |
| OSG Corp. Cvt. | 0.000% | 4/4/22 | JPY | 200,000 | 2,123 |
| PB Issuer No 3 Ltd. Cvt. | 1.875% | 10/22/18 | USD | 4,586 | 4,747 |
| Prysmian SPA Cvt. | 1.250% | 3/8/18 | EUR | 3,300 | 4,112 |
| Sacyr SA Cvt. | 4.000% | 5/8/19 | EUR | 3,900 | 4,214 |
| Schindler Holding AG Cvt. | 0.375% | 6/5/17 | CHF | 3,300 | 3,519 |
| Shine Power International Ltd. Cvt. | 0.000% | 7/28/19 | HKD | 4,000 | 495 |
| Siemens Financieringsmaatschappij NV Cvt. | 1.050% | 8/16/17 | USD | 2,000 | 2,190 |
| Siemens Financieringsmaatschappij NV Cvt. | 1.650% | 8/16/19 | USD | 8,500 | 9,688 |
| Societa Iniziative Autostradali e Servizi SPA Cvt. | 2.625% | 6/30/17 | EUR | 1,195 | 1,561 |
| 1 SolarCity Corp. Cvt. | 1.625% | 11/1/19 | USD | 22,135 | 20,461 |
| Tong Jie Ltd. Cvt. | 0.000% | 2/18/18 | HKD | 30,000 | 3,883 |
| 1 UTi Worldwide Inc. Cvt. | 4.500% | 3/1/19 | USD | 15,095 | 16,774 |
| Yamato Holdings Co. Ltd. Cvt. | 0.000% | 3/7/16 | JPY | 70,000 | 851 |
| | | | | | 166,700 |
| Information Technology (25.3%) | | | | | |
| Advanced Semiconductor Engineering Inc. Cvt. | 0.000% | 9/5/18 | USD | 3,800 | 4,611 |
| Alps Electric Co. Ltd. Cvt. | 0.000% | 3/25/19 | JPY | 240,000 | 2,772 |
| 1 AOL Inc. Cvt. | 0.750% | 9/1/19 | USD | 21,320 | 22,586 |
| ASM Pacific Technology Ltd. Cvt. | 2.000% | 3/28/19 | HKD | 18,000 | 2,455 |
| 1 Canadian Solar Inc. Cvt. | 4.250% | 2/15/19 | USD | 2,615 | 2,381 |
| Cap Gemini SA Cvt. | 0.000% | 1/1/19 | EUR | 1,657 | 2,456 |
| Cardtronics Inc. Cvt. | 1.000% | 12/1/20 | USD | 13,885 | 13,868 |
| 1 Ciena Corp. Cvt. | 3.750% | 10/15/18 | USD | 14,400 | 16,587 |
| 1 Citrix Systems Inc. Cvt. | 0.500% | 4/15/19 | USD | 23,325 | 24,462 |
| Davis and Henderson Corp Cvt | 6.000% | 9/30/18 | CAD | 4,653 | 5,265 |
| Econocom Group Cvt. | 1.500% | 1/15/19 | EUR | 3,105 | 3,829 |
| Epistar Corp. Cvt. | 0.000% | 8/7/18 | USD | 4,500 | 4,933 |
| Hanwha SolarOne Co. Ltd. Cvt. | 3.500% | 1/15/18 | USD | 2,563 | 2,384 |
| Indra Sistemas SA Cvt. | 1.750% | 10/17/18 | EUR | 1,400 | 1,589 |
| InvenSense Inc. Cvt. | 1.750% | 11/1/18 | USD | 8,120 | 7,465 |
| j2 Global Inc. Cvt. | 3.250% | 6/15/29 | USD | 16,351 | 17,056 |
| Mentor Graphics Corp. Cvt. | 4.000% | 4/1/31 | USD | 11,765 | 14,155 |
| Micron Technology Inc. Cvt. | 3.000% | 11/15/43 | USD | 22,280 | 29,939 |
| NetSuite Inc. Cvt. | 0.250% | 6/1/18 | USD | 6,950 | 7,654 |
| Nihon Unisys Ltd. Cvt. | 0.000% | 6/20/16 | JPY | 350,000 | 3,235 |
| 1 NVIDIA Corp. Cvt. | 1.000% | 12/1/18 | USD | 31,865 | 37,262 |
| 1 NXP Semiconductor NV Cvt. | 1.000% | 12/1/19 | USD | 26,201 | 26,774 |
| ON Semiconductor Corp. Cvt. | 2.625% | 12/15/26 | USD | 25,817 | 29,286 |
18
Convertible Securities Fund
| | | | | | |
| | | | | | Face | Market |
| | | | Maturity | | Amount | Value• |
| | | Coupon | Date | Currency | (000) | ($000) |
| 1 | Palo Alto Networks Inc. Cvt. | 0.000% | 7/1/19 | USD | 7,550 | 9,697 |
| | Photronics Inc. Cvt. | 3.250% | 4/1/16 | USD | 7,947 | 8,523 |
| 1 | Proofpoint Inc. Cvt. | 1.250% | 12/15/18 | USD | 9,280 | 11,907 |
| 1 | Red Hat Inc. Cvt. | 0.250% | 10/1/19 | USD | 27,840 | 30,624 |
| | Salesforce.com Inc. Cvt. | 0.250% | 4/1/18 | USD | 24,440 | 27,907 |
| | SanDisk Corp. Cvt. | 0.500% | 10/15/20 | USD | 11,955 | 14,884 |
| | Semiconductor Manufacturing International | | | | | |
| | Corp. Cvt. | 0.000% | 11/7/18 | USD | 4,200 | 4,751 |
| 1 | SunEdison Inc. Cvt. | 0.250% | 1/15/20 | USD | 19,370 | 20,096 |
| 1 | SunPower Corp. Cvt. | 0.875% | 6/1/21 | USD | 2,050 | 1,919 |
| | Synchronoss Technologies Inc. Cvt. | 0.750% | 8/15/19 | USD | 7,775 | 8,314 |
| 1 | Trina Solar Ltd. Cvt. | 3.500% | 6/15/19 | USD | 1,790 | 1,714 |
| | TTM Technologies Inc. Cvt. | 1.750% | 12/15/20 | USD | 10,143 | 9,452 |
| 1 | Twitter Inc. Cvt. | 1.000% | 9/15/21 | USD | 15,860 | 14,462 |
| | Verint Systems Inc. Cvt. | 1.500% | 6/1/21 | USD | 23,805 | 27,004 |
| 1 | Vishay Intertechnology Inc. Cvt. | 2.250% | 11/15/40 | USD | 2,789 | 3,047 |
| 1 | Vishay Intertechnology Inc. Cvt. | 2.250% | 5/15/41 | USD | 10,635 | 9,472 |
| 1 | WebMD Health Corp. Cvt. | 1.500% | 12/1/20 | USD | 10,320 | 9,933 |
| | WebMD Health Corp. Cvt. | 2.500% | 1/31/18 | USD | 6,690 | 6,590 |
| 1 | Yandex NV Cvt. | 1.125% | 12/15/18 | USD | 2,721 | 2,405 |
| | | | | | | 505,705 |
| Materials (3.3%) | | | | | |
| | APERAM Cvt. | 0.625% | 7/8/21 | USD | 7,200 | 7,351 |
| | Buzzi Unicem SPA Cvt. | 1.375% | 7/17/19 | EUR | 3,700 | 4,948 |
| | Cemex SAB de CV Cvt. | 4.875% | 3/15/15 | USD | 2,135 | 2,442 |
| 1 | Chemtrade Logistics Income Fund Cvt. | 5.250% | 6/30/21 | CAD | 5,076 | 4,550 |
| | Chemtrade Logistics Income Fund Cvt. | 5.750% | 12/31/18 | CAD | 332 | 319 |
| | Gabriel Finance LP Cvt. | 2.000% | 11/26/16 | EUR | 4,100 | 4,953 |
| | Glencore Finance Europe SA Cvt. | 5.000% | 12/31/14 | USD | 2,200 | 2,198 |
| | Logo Star Ltd. Cvt. | 1.500% | 11/22/18 | HKD | 24,000 | 3,408 |
| | NV Bekaert SA Cvt. | 0.750% | 6/18/18 | EUR | 5,200 | 6,348 |
| | RTI International Metals Inc. Cvt. | 1.625% | 10/15/19 | USD | 14,605 | 13,865 |
| | Salzgitter Finance BV Cvt. | 2.000% | 11/8/17 | EUR | 4,650 | 6,473 |
| 1,2 | ShengdaTech Inc. Cvt. | 6.500% | 12/15/15 | USD | 305 | 1 |
| | Teijin Ltd. Cvt. | 0.000% | 12/10/21 | JPY | 340,000 | 2,970 |
| | Toray Industries Inc. Cvt. | 0.000% | 8/31/21 | JPY | 560,000 | 5,819 |
| | | | | | | 65,645 |
| Telecommunication Services (0.1%) | | | | | |
| | Inmarsat PLC Cvt. | 1.750% | 11/16/17 | USD | 2,000 | 2,755 |
| |
| Utilities (1.0%) | | | | | |
| | ENN Energy Holdings Ltd. Cvt. | 0.000% | 2/26/18 | USD | 4,000 | 4,500 |
| | Northland Power Inc. Cvt. | 5.000% | 6/30/19 | CAD | 4,096 | 3,714 |
| | Parpublica - Participacoes Publicas | | | | | |
| | SGPS SA Cvt. | 5.250% | 9/28/17 | EUR | 2,850 | 3,865 |
| | Suez Environnement Co. Cvt. | 0.000% | 2/27/20 | EUR | 2,336 | 3,092 |
| | Superior Plus Corp. Cvt. | 6.000% | 6/30/19 | CAD | 1,067 | 980 |
| | YTL Corp. Finance Labuan Ltd. Cvt. | 1.875% | 3/18/15 | USD | 4,200 | 4,210 |
| | | | | | | 20,361 |
| Total Convertible Bonds (Cost $1,741,695) | | | | | 1,796,428 |
19
| | | | |
| Convertible Securities Fund | | | |
| |
| |
| |
| | | | | Market |
| | | | | Value |
| | | Coupon | Shares | ($000) |
| Convertible Preferred Stocks (6.8%) | | | |
| Energy (2.7%) | | | |
| 1 | Chesapeake Energy Corp. Pfd. | 5.750% | 15,490 | 16,107 |
| | Energy XXI Ltd. Pfd. | 5.625% | 41,450 | 4,346 |
| | Goodrich Petroleum Corp. Pfd. | 5.375% | 349,600 | 6,905 |
| | Halcon Resources Corp. Pfd. | 5.750% | 16,120 | 8,433 |
| | McDermott International Inc. Pfd. | 6.250% | 421,500 | 6,137 |
| 1 | Penn Virginia Corp. Pfd. | 6.000% | 132,578 | 7,830 |
| | Rex Energy Corp. Pfd. | 6.000% | 81,900 | 5,285 |
| | | | | 55,043 |
| Financials (1.3%) | | | |
| | Crown Castle International Corp. Pfd. | 4.500% | 178,500 | 18,921 |
| | Wintrust Financial Corp. Pfd. | 5.000% | 5,640 | 6,867 |
| | | | | 25,788 |
| Health Care (1.0%) | | | |
| | Alere Inc. Pfd. | 3.000% | 28,706 | 9,236 |
| | Amsurg Corp. Pfd. | 5.250% | 99,100 | 10,752 |
| | | | | 19,988 |
| Industrials (0.7%) | | | |
| | Genesee & Wyoming Inc. Pfd. | 5.000% | 106,340 | 13,498 |
| |
| Materials (0.1%) | | | |
| | ArcelorMittal Pfd. | 6.000% | 78,500 | 1,532 |
| |
| Telecommunication Services (1.0%) | | | |
| | Iridium Communications Inc. Pfd. | 6.750% | 27,290 | 9,695 |
| | Iridium Communications Inc. Pfd. | 7.000% | 101,800 | 11,739 |
| | | | | 21,434 |
| Total Convertible Preferred Stocks (Cost $157,151) | | | 137,283 |
| Temporary Cash Investment (2.6%) | | | |
| Money Market Fund (2.6%) | | | |
| 3 | Vanguard Market Liquidity Fund | | | |
| | (Cost $51,561) | 0.116% | 51,560,922 | 51,561 |
| Total Investments (99.2%) (Cost $1,950,407) | | | 1,985,272 |
| Other Assets and Liabilities (0.8%) | | | |
| Other Assets | | | 61,482 |
| Liabilities | | | (45,508) |
| | | | | 15,974 |
| Net Assets (100%) | | | |
| Applicable to 144,487,948 outstanding $.001 par value shares of | | | |
| beneficial interest (unlimited authorization) | | | 2,001,246 |
| Net Asset Value Per Share | | | $13.85 |
20
Convertible Securities Fund
| |
| At November 30, 2014, net assets consisted of: | |
| | Amount |
| | ($000) |
| Paid-in Capital | 1,811,708 |
| Undistributed Net Investment Income | 10,863 |
| Accumulated Net Realized Gains | 132,468 |
| Unrealized Appreciation (Depreciation) | |
| Investment Securities | 34,865 |
| Forward Currency Contracts | 11,415 |
| Foreign Currencies | (73) |
| Net Assets | 2,001,246 |
• See Note A in Notes to Financial Statements.
1 Security exempt from registration under Rule 144A of the Securities Act of 1933. Such securities may be sold in transactions exempt from
registration, normally to qualified institutional buyers. At November 30, 2014, the aggregate value of these securities was $540,198,000,
representing 27.0% of net assets.
2 Non-income-producing security--interest payments in default.
3 Affiliated money market fund available only to Vanguard funds and certain trusts and accounts managed by Vanguard. Rate shown is the
7-day yield.
REIT—Real Estate Investment Trust.
CAD—Canadian dollar.
CHF—Swiss franc.
EUR—Euro.
GBP—British pound.
HKD—Hong Kong dollar.
JPY—Japanese yen.
KRW—South Korean won.
SEK—Swedish krona.
SGD—Singapore dollar.
USD—U.S. dollar.
See accompanying Notes, which are an integral part of the Financial Statements.
21
Convertible Securities Fund
Statement of Operations
| |
| | Year Ended |
| | November 30, 2014 |
| | ($000) |
| Investment Income | |
| Income | |
| Dividends | 9,427 |
| Interest1 | 42,191 |
| Total Income | 51,618 |
| Expenses | |
| Investment Advisory Fees—Note B | |
| Basic Fee | 7,153 |
| Performance Adjustment | (3,140) |
| The Vanguard Group—Note C | |
| Management and Administrative | 4,168 |
| Marketing and Distribution | 346 |
| Custodian Fees | 83 |
| Auditing Fees | 41 |
| Shareholders’ Reports | 29 |
| Trustees’ Fees and Expenses | 4 |
| Total Expenses | 8,684 |
| Net Investment Income | 42,934 |
| Realized Net Gain (Loss) | |
| Investment Securities Sold | 141,037 |
| Foreign Currencies and Forward Currency Contracts | 21,897 |
| Realized Net Gain (Loss) | 162,934 |
| Change in Unrealized Appreciation (Depreciation) | |
| Investment Securities | (124,812) |
| Foreign Currencies and Forward Currency Contracts | 6,744 |
| Change in Unrealized Appreciation (Depreciation) | (118,068) |
| Net Increase (Decrease) in Net Assets Resulting from Operations | 87,800 |
| 1 Interest income from an affiliated company of the fund was $63,000. |
See accompanying Notes, which are an integral part of the Financial Statements.
22
Convertible Securities Fund
Statement of Changes in Net Assets
| | |
| | Year Ended November 30, |
| | 2014 | 2013 |
| | ($000) | ($000) |
| Increase (Decrease) in Net Assets | | |
| Operations | | |
| Net Investment Income | 42,934 | 44,334 |
| Realized Net Gain (Loss) | 162,934 | 158,830 |
| Change in Unrealized Appreciation (Depreciation) | (118,068) | 119,384 |
| Net Increase (Decrease) in Net Assets Resulting from Operations | 87,800 | 322,548 |
| Distributions | | |
| Net Investment Income | (62,172) | (46,333) |
| Realized Capital Gain1 | (135,778) | (48,619) |
| Total Distributions | (197,950) | (94,952) |
| Capital Share Transactions | | |
| Issued | 266,327 | 431,189 |
| Issued in Lieu of Cash Distributions | 178,681 | 84,161 |
| Redeemed | (394,062) | (325,061) |
| Net Increase (Decrease) from Capital Share Transactions | 50,946 | 190,289 |
| Total Increase (Decrease) | (59,204) | 417,885 |
| Net Assets | | |
| Beginning of Period | 2,060,450 | 1,642,565 |
| End of Period2 | 2,001,246 | 2,060,450 |
1 Includes fiscal 2014 and 2013 short-term gain distributions totaling $40,382,000 and $0, respectively. Short-term gain distributions are treated as ordinary income dividends for tax purposes.
2 Net Assets—End of Period includes undistributed (overdistributed) net investment income of $10,863,000 and $23,298,000.
See accompanying Notes, which are an integral part of the Financial Statements.
23
Convertible Securities Fund
Financial Highlights
| | | | | |
| For a Share Outstanding | | | Year Ended November 30, |
| Throughout Each Period | 2014 | 2013 | 2012 | 2011 | 2010 |
| Net Asset Value, Beginning of Period | $14.64 | $12.95 | $12.12 | $13.85 | $12.12 |
| Investment Operations | | | | | |
| Net Investment Income | . 287 | .333 | .407 | .451 | .555 |
| Net Realized and Unrealized Gain (Loss) | | | | | |
| on Investments | .313 | 2.101 | 1.134 | (.752) | 1.742 |
| Total from Investment Operations | .600 | 2.434 | 1.541 | (.301) | 2.297 |
| Distributions | | | | | |
| Dividends from Net Investment Income | (. 425) | (. 355) | (. 534) | (. 474) | (. 567) |
| Distributions from Realized Capital Gains | (.965) | (.389) | (.177) | (.955) | — |
| Total Distributions | (1.390) | (.744) | (.711) | (1.429) | (.567) |
| Net Asset Value, End of Period | $13.85 | $14.64 | $12.95 | $12.12 | $13.85 |
| |
| Total Return1 | 4.33% | 19.65% | 13.18% | -2.89% | 19.39% |
| |
| Ratios/Supplemental Data | | | | | |
| Net Assets, End of Period (Millions) | $2,001 | $2,060 | $1,643 | $1,680 | $1,733 |
| Ratio of Total Expenses to Average Net Assets2 | 0.41% | 0.63% | 0.52% | 0.59% | 0.68% |
| Ratio of Net Investment Income to | | | | | |
| Average Net Assets | 2.02% | 2.41% | 3.23% | 3.36% | 4.08% |
| Portfolio Turnover Rate | 85% | 101% | 82% | 90% | 103% |
1 Total returns do not include transaction or account service fees that may have applied in the periods shown. Fund prospectuses provide information about any applicable transaction and account service fees.
2 Includes performance-based investment advisory fee increases (decreases) of (0.15%), 0.07%, (0.04%), 0.03%, and 0.12%.
See accompanying Notes, which are an integral part of the Financial Statements.
24
Convertible Securities Fund
Notes to Financial Statements
Vanguard Convertible Securities Fund is registered under the Investment Company Act of 1940 as an open-end investment company, or mutual fund. The fund invests in securities of foreign issuers, which may subject it to investment risks not normally associated with investing in securities of United States corporations.
A. The following significant accounting policies conform to generally accepted accounting principles for U.S. investment companies. The fund consistently follows such policies in preparing its financial statements.
1. Security Valuation: Securities are valued as of the close of trading on the New York Stock Exchange (generally 4 p.m., Eastern time) on the valuation date. Equity securities are valued at the latest quoted sales prices or official closing prices taken from the primary market in which each security trades; such securities not traded on the valuation date are valued at the mean of the latest quoted bid and asked prices. Bonds, and temporary cash investments acquired over 60 days to maturity, are valued using the latest bid prices or using valuations based on a matrix system (which considers such factors as security prices, yields, maturities, and ratings), both as furnished by independent pricing services. Investments in Vanguard Market Liquidity Fund are valued at that fund’s net asset value. Other temporary cash investments are valued at amortized cost, which approximates market value. Securities for which market quotations are not readily available, or whose values have been affected by events occurring before the fund’s pricing time but after the close of the securities’ primary markets, are valued at their fair values calculated according to procedures adopted by the board of trustees. These procedures include obtaining quotations from an independent pricing service, monitoring news to identify significant market- or security-specific events, and evaluating changes in the values of foreign market proxies (for example, ADRs, futures contracts, or exchange-traded funds), between the time the foreign markets close and the fund’s pricing time. When fair-value pricing is employed, the prices of securities used by a fund to calculate its net asset value may differ from quoted or published prices for the same securities.
2. Foreign Currency: Securities and other assets and liabilities denominated in foreign currencies are translated into U.S. dollars using exchange rates obtained from an independent third party as of the fund’s pricing time on the valuation date. Realized gains (losses) and unrealized appreciation (depreciation) on investment securities include the effects of changes in exchange rates since the securities were purchased, combined with the effects of changes in security prices. Fluctuations in the value of other assets and liabilities resulting from changes in exchange rates are recorded as unrealized foreign currency gains (losses) until the assets or liabilities are settled in cash, at which time they are recorded as realized foreign currency gains (losses).
3. Forward Currency Contracts: The fund enters into forward currency contracts to protect the value of securities and related receivables and payables against changes in future foreign exchange rates. The fund’s risks in using these contracts include movement in the values of the foreign currencies relative to the U.S. dollar and the ability of the counterparties to fulfill their obligations under the contracts. The fund mitigates its counterparty risk by entering into forward currency contracts only with a diverse group of prequalified counterparties, monitoring their financial strength, entering into master netting arrangements with its counterparties, and requiring its counterparties to transfer collateral as security for their performance. The master netting arrangements provide that, in the event of a counterparty’s default (including bankruptcy), the fund may terminate the forward currency contracts, determine the net amount owed by either party in accordance with its master netting arrangements, and sell or retain any collateral held up to the net amount owed to the fund under the master netting arrangements. The forward currency contracts contain provisions whereby a counterparty may terminate open contracts if the fund’s net assets decline below a certain level,
25
Convertible Securities Fund
triggering a payment by the fund if the fund is in a net liability position at the time of the termination. The payment amount would be reduced by any collateral the fund has pledged. Any assets pledged as collateral for open contracts are noted in the Statement of Net Assets. The value of collateral received or pledged is compared daily to the value of the forward currency contracts exposure with each counterparty, and any difference, if in excess of a specified minimum transfer amount, is adjusted and settled within two business days.
Forward currency contracts are valued at their quoted daily prices obtained from an independent third party, adjusted for currency risk based on the expiration date of each contract. The aggregate notional amounts of the contracts are not recorded in the Statement of Net Assets. Fluctuations in the value of the contracts are recorded in the Statement of Net Assets as an asset (liability) and in the Statement of Operations as unrealized appreciation (depreciation) until the contracts are closed, when they are recorded as realized forward currency contract gains (losses).
During the year ended November 30, 2014, the fund’s average investment in forward currency contracts represented 16% of net assets, based on the average of notional amounts at each quarter-end during the period.
4. Federal Income Taxes: The fund intends to continue to qualify as a regulated investment company and distribute all of its taxable income. Management has analyzed the fund’s tax positions taken for all open federal income tax years (November 30, 2011–2014), and has concluded that no provision for federal income tax is required in the fund’s financial statements.
5. Distributions: Distributions to shareholders are recorded on the ex-dividend date.
6. Credit Facility: The fund and certain other funds managed by The Vanguard Group participate in a $2.89 billion committed credit facility provided by a syndicate of lenders pursuant to a credit agreement that may be renewed annually; each fund is individually liable for its borrowings, if any, under the credit facility. Borrowings may be utilized for temporary and emergency purposes, and are subject to the fund’s regulatory and contractual borrowing restrictions. The participating funds are charged administrative fees and an annual commitment fee of 0.06% of the undrawn amount of the facility; these fees are allocated to the funds based on a method approved by the fund’s board of trustees and included in Management and Administrative expenses on the fund’s Statement of Operations. Any borrowings under this facility bear interest at a rate equal to the higher of the federal funds rate or LIBOR reference rate plus an agreed-upon spread.
The fund had no borrowings outstanding at November 30, 2014, or at any time during the period then ended.
7. Other: Dividend income is recorded on the ex-dividend date. Interest income includes income distributions received from Vanguard Market Liquidity Fund and is accrued daily. Premiums and discounts on debt securities purchased are amortized and accreted, respectively, to interest income over the lives of the respective securities. Security transactions are accounted for on the date securities are bought or sold. Costs used to determine realized gains (losses) on the sale of investment securities are those of the specific securities sold.
B. Oaktree Capital Management, L.P., provides investment advisory services to the fund for a fee calculated at an annual percentage rate of average net assets. The basic fee is subject to quarterly adjustments based on the fund’s performance for the preceding three years relative to a composite index weighted 70% Bank of America Merrill Lynch All US Convertibles Index and
26
Convertible Securities Fund
30% Bank of America Merrill Lynch Global 300 Convertibles ex-US Index (hedged). For the year ended November 30, 2014, the investment advisory fee represented an effective annual basic rate of 0.34% of the fund’s average net assets before a decrease of $3,140,000 (0.15%) based on performance.
C. The Vanguard Group furnishes at cost corporate management, administrative, marketing, and distribution services. The costs of such services are allocated to the fund based on methods approved by the board of trustees. The fund has committed to invest up to 0.40% of its net assets in Vanguard. At November 30, 2014, the fund had contributed capital of $198,000 to Vanguard (included in Other Assets), representing 0.01% of the fund’s net assets and 0.08% of Vanguard’s capitalization. The fund’s trustees and officers are also directors and officers of Vanguard.
D. Various inputs may be used to determine the value of the fund’s investments. These inputs are summarized in three broad levels for financial statement purposes. The inputs or methodologies used to value securities are not necessarily an indication of the risk associated with investing in those securities.
Level 1—Quoted prices in active markets for identical securities.
Level 2—Other significant observable inputs (including quoted prices for similar securities, interest
rates, prepayment speeds, credit risk, etc.).
Level 3—Significant unobservable inputs (including the fund’s own assumptions used to determine
the fair value of investments).
The following table summarizes the market value of the fund’s investments as of November 30, 2014, based on the inputs used to value them:
| | | |
| | Level 1 | Level 2 | Level 3 |
| Investments | ($000) | ($000) | ($000) |
| Convertible Bonds | — | 1,772,418 | 24,010 |
| Convertible Preferred Stocks | — | 137,283 | — |
| Temporary Cash Investments | 51,561 | — | — |
| Forward Currency Contracts—Assets | — | 11,419 | — |
| Forward Currency Contracts—Liabilities | — | (4) | — |
| Total | 51,561 | 1,921,116 | 24,010 |
The determination of Level 3 fair value measurements is governed by documented policies and procedures adopted by the board of trustees. The board has designated a pricing review committee, as an agent of the board, to ensure the timely analysis and valuation of Level 3 securities held by the fund in accordance with established policies and procedures. The pricing review committee employs various methods for calibrating valuation approaches, including a regular review of key inputs and assumptions, transactional back-testing or disposition analysis, and reviews of any related market activity. All valuation decisions made by the pricing review committee are reported to the board on a quarterly basis for review and ratification. The board reviews the adequacy of the fair value measurement policies and procedures in place on an annual basis.
27
Convertible Securities Fund
The following table summarizes changes in investments valued based on Level 3 inputs during the year ended November 30, 2014. Transfers into or out of Level 3 are recognized based on values as of the date of transfer.
| |
| | Investments in |
| | Convertible Bonds |
| Amount Valued Based on Level 3 Inputs | ($000) |
| Balance as of November 30, 2013 | — |
| Purchases | 4,669 |
| Transfers into Level 3 | 19,400 |
| Change in Unrealized Appreciation (Depreciation) | (59) |
| Balance as of November 30, 2014 | 24,010 |
The fund’s investments that are categorized as Level 3 are valued utilizing recent transaction prices or third party pricing information without adjustment (which is based on unobservable inputs).
Significant increases or decreases in the significant unobservable inputs used in the fair value measurement of the fund’s Level 3 securities, in isolation, could result in a significantly higher or lower fair value measurement.
E. At November 30, 2014, the fund had open forward currency contracts to receive and deliver currencies as follows. Unrealized appreciation (depreciation) on open forward currency contracts, except for Hong Kong dollar and Singapore dollar currency contracts, is treated as realized gain (loss) for tax purposes.
| | | | | | |
| | | | | | | Unrealized |
| | Contract | | | | | Appreciation |
| | Settlement | | | Contract Amount (000) | (Depreciation) |
| Counterparty | Date | | Receive | | Deliver | ($000) |
| UBS AG | 1/22/15 | USD | 186,798 | EUR | 146,715 | 4,298 |
| UBS AG | 1/22/15 | USD | 52,947 | JPY | 5,648,340 | 5,330 |
| UBS AG | 1/22/15 | USD | 31,813 | CAD | 35,816 | 531 |
| UBS AG | 1/22/15 | USD | 23,991 | GBP | 14,976 | 606 |
| UBS AG | 1/22/15 | USD | 19,090 | HKD | 148,078 | (4) |
| UBS AG | 1/22/15 | USD | 9,214 | SGD | 11,715 | 235 |
| UBS AG | 1/22/15 | USD | 5,482 | SEK | 39,565 | 175 |
| UBS AG | 1/22/15 | USD | 3,890 | KRW | 4,127,800 | 174 |
| UBS AG | 1/22/15 | USD | 3,725 | CHF | 3,530 | 70 |
| | | | | | | 11,415 |
Refer to the Statement of Net Assets for currency abbreviations.
At November 30, 2014, the counterparty had deposited in segregated accounts securities with a value of $10,334,000 in connection with amounts due to the fund for open forward currency contracts.
F. Distributions are determined on a tax basis and may differ from net investment income and realized capital gains for financial reporting purposes. Differences may be permanent or temporary. Permanent differences are reclassified among capital accounts in the financial statements to reflect their tax character. Temporary differences arise when certain items of income, expense, gain, or loss
28
Convertible Securities Fund
are recognized in different periods for financial statement and tax purposes. These differences will reverse at some time in the future. Differences in classification may also result from the treatment of short-term gains as ordinary income for tax purposes.
During the year ended November 30, 2014, the fund realized net foreign currency losses of $378,000, (including the foreign currency component on sales of foreign currency denominated bonds), which decreased distributable net income for tax purposes; accordingly, such losses have been reclassified from accumulated net realized gains to undistributed net investment income.
Certain of the fund’s convertible preferred stock investments are treated as debt securities for tax purposes. During the year ended November 30, 2014, the fund realized gains of $101,000 from the sale of these securities, which are included in distributable net investment income for tax purposes; accordingly, such gains have been reclassified from accumulated net realized gains to undistributed net investment income.
Certain of the fund’s convertible bond investments are in securities considered to be “contingent payment debt instruments,” for which any realized gains increase (and all or part of any realized losses decrease) income for tax purposes. During the year ended November 30, 2014, the fund realized net gains of $7,080,000 from the sale of these securities, which increased distributable net income for tax purposes; accordingly, such gains have been reclassified from accumulated net realized gains to undistributed net investment income.
The fund used a tax accounting practice to treat a portion of the price of capital shares redeemed during the year as distributions from realized capital gains. Accordingly, the fund has reclassified $19,333,000 from accumulated net realized gains to paid-in capital.
For tax purposes, at November 30, 2014, the fund had $54,155,000 of ordinary income and $103,600,000 of long-term capital gains available for distribution.
At November 30, 2014, the cost of investment securities for tax purposes was $1,950,490,000. Net unrealized appreciation of investment securities for tax purposes was $34,782,000, consisting of unrealized gains of $134,319,000 on securities that had risen in value since their purchase and $99,537,000 in unrealized losses on securities that had fallen in value since their purchase.
G. During the year ended November 30, 2014, the fund purchased $1,757,683,000 of investment securities and sold $1,876,269,000 of investment securities, other than temporary cash investments.
H. Capital shares issued and redeemed were:
| | |
| | Year Ended November 30, |
| | 2014 | 2013 |
| | Shares | Shares |
| | (000) | (000) |
| Issued | 18,911 | 31,218 |
| Issued in Lieu of Cash Distributions | 13,040 | 6,509 |
| Redeemed | (28,206) | (23,843) |
| Net Increase (Decrease) in Shares Outstanding | 3,745 | 13,884 |
I. Management has determined that no material events or transactions occurred subsequent to November 30, 2014, that would require recognition or disclosure in these financial statements.
29
Report of Independent Registered
Public Accounting Firm
To the Board of Trustees and Shareholders of Vanguard Convertible Securities Fund:
In our opinion, the accompanying statement of net assets and the related statements of operations and of changes in net assets and the financial highlights present fairly, in all material respects, the financial position of Vanguard Convertible Securities Fund (the “Fund”) at November 30, 2014, the results of its operations for the year then ended, the changes in its net assets for each of the two years in the period then ended, and the financial highlights for each of the five years in the period then ended, in conformity with accounting principles generally accepted in the United States of America. These financial statements and financial highlights (hereafter referred to as “financial statements”) are the responsibility of the Fund’s management. Our responsibility is to express an opinion on these financial statements based on our audits. We conducted our audits of these financial statements in accordance with the standards of the Public Company Accounting Oversight Board (United States). Those standards require that we plan and perform the audit to obtain reasonable assurance about whether the financial statements are free of material misstatement. An audit includes examining, on a test basis, evidence supporting the amounts and disclosures in the financial statements, assessing the accounting principles used and significant estimates made by management, and evaluating the overall financial statement presentation. We believe that our audits, which included confirmation of securities at November 30, 2014 by correspondence with the custodian and broker, by agreement to the underlying ownership records of the transfer agent and the application of alternative auditing procedures where securities purchased had not been received, provide a reasonable basis for our opinion.
/s/PricewaterhouseCoopers LLP
Philadelphia, Pennsylvania
January 13, 2015
Special 2014 tax information (unaudited) for Vanguard Convertible Securities Fund
This information for the fiscal year ended November 30, 2014, is included pursuant to provisions of
the Internal Revenue Code.
The fund distributed $109,337,000 as capital gain dividends (from net long-term capital gains) to
shareholders during the fiscal year.
For nonresident alien shareholders, 100% of short-term capital gain dividends distributed by the fund
are qualified short-term capital gains.
The fund distributed $10,328,000 of qualified dividend income to shareholders during the fiscal year.
For corporate shareholders, 7.9% of investment income (dividend income plus short-term gains,
if any) qualifies for the dividends-received deduction.
30
Your Fund’s After-Tax Returns
This table presents returns for your fund both before and after taxes. The after-tax returns are shown in two ways: (1) assuming that an investor owned the fund during the entire period and paid taxes on the fund’s distributions, and (2) assuming that an investor paid taxes on the fund’s distributions and sold all shares at the end of each period.
Calculations are based on the highest individual federal income tax and capital gains tax rates in effect at the times of the distributions and the hypothetical sales. State and local taxes were not considered. After-tax returns reflect any qualified dividend income, using actual prior-year figures and estimates for 2014. (In the example, returns after the sale of fund shares may be higher than those assuming no sale. This occurs when the sale would have produced a capital loss. The calculation assumes that the investor received a tax deduction for the loss.)
Please note that your actual after-tax returns will depend on your tax situation and may differ from those shown. Also note that if you own the fund in a tax-deferred account, such as an individual retirement account or a 401(k) plan, this information does not apply to you. Such accounts are not subject to current taxes.
Finally, keep in mind that a fund’s performance—whether before or after taxes—does not guarantee future results.
| | | |
| Average Annual Total Returns: Convertible Securities Fund | | | |
| Periods Ended November 30, 2014 | | | |
| | One | Five | Ten |
| | Year | Years | Years |
| Returns Before Taxes | 4.33% | 10.37% | 7.68% |
| Returns After Taxes on Distributions | 1.06 | 8.06 | 5.50 |
| Returns After Taxes on Distributions and Sale of Fund Shares | 3.37 | 7.49 | 5.42 |
31
About Your Fund’s Expenses
As a shareholder of the fund, you incur ongoing costs, which include costs for portfolio management, administrative services, and shareholder reports (like this one), among others. Operating expenses, which are deducted from a fund’s gross income, directly reduce the investment return of the fund.
A fund’s expenses are expressed as a percentage of its average net assets. This figure is known as the expense ratio. The following examples are intended to help you understand the ongoing costs (in dollars) of investing in your fund and to compare these costs with those of other mutual funds. The examples are based on an investment of $1,000 made at the beginning of the period shown and held for the entire period.
The accompanying table illustrates your fund’s costs in two ways:
• Based on actual fund return. This section helps you to estimate the actual expenses that you paid over the period. The ”Ending Account Value“ shown is derived from the fund‘s actual return, and the third column shows the dollar amount that would have been paid by an investor who started with $1,000 in the fund. You may use the information here, together with the amount you invested, to estimate the expenses that you paid over the period.
To do so, simply divide your account value by $1,000 (for example, an $8,600 account value divided by $1,000 = 8.6), then multiply the result by the number given for your fund under the heading ”Expenses Paid During Period.“
• Based on hypothetical 5% yearly return. This section is intended to help you compare your fund‘s costs with those of other mutual funds. It assumes that the fund had a yearly return of 5% before expenses, but that the expense ratio is unchanged. In this case—because the return used is not the fund’s actual return—the results do not apply to your investment. The example is useful in making comparisons because the Securities and Exchange Commission requires all mutual funds to calculate expenses based on a 5% return. You can assess your fund’s costs by comparing this hypothetical example with the hypothetical examples that appear in shareholder reports of other funds.
Note that the expenses shown in the table are meant to highlight and help you compare ongoing costs only and do not reflect transaction costs incurred by the fund for buying and selling securities. Further, the expenses do not include any purchase, redemption, or account service fees described in the fund prospectus. If such fees were applied to your account, your costs would be higher. Your fund does not carry a “sales load.”
The calculations assume no shares were bought or sold during the period. Your actual costs may have been higher or lower, depending on the amount of your investment and the timing of any purchases or redemptions.
You can find more information about the fund’s expenses, including annual expense ratios, in the Financial Statements section of this report. For additional information on operating expenses and other shareholder costs, please refer to your fund’s current prospectus.
32
| | | |
| Six Months Ended November 30, 2014 | | | |
| | Beginning | Ending | Expenses |
| | Account Value | Account Value | Paid During |
| Convertible Securities Fund | 5/31/2014 | 11/30/2014 | Period |
| Based on Actual Fund Return | $1,000.00 | $979.61 | $2.03 |
| Based on Hypothetical 5% Yearly Return | 1,000.00 | 1,023.01 | 2.08 |
The calculations are based on expenses incurred in the most recent six-month period. The fund’s annualized six-month expense ratio for that period is 0.41%. The dollar amounts shown as “Expenses Paid” are equal to the annualized expense ratio multiplied by the average account value over the period, multiplied by the number of days in the most recent six-month period, then divided by the number of days in the most recent 12-month period.
33
Glossary
30-Day SEC Yield. A fund’s 30-day SEC yield is derived using a formula specified by the U.S. Securities and Exchange Commission. Under the formula, data related to the fund’s security holdings in the previous 30 days are used to calculate the fund’s hypothetical net income for that period, which is then annualized and divided by the fund’s estimated average net assets over the calculation period. For the purposes of this calculation, a security’s income is based on its current market yield to maturity (for bonds), its actual income (for asset-backed securities), or its projected dividend yield (for stocks). Because the SEC yield represents hypothetical annualized income, it will differ—at times significantly—from the fund’s actual experience. As a result, the fund’s income distributions may be higher or lower than implied by the SEC yield.
Average Coupon. The average interest rate paid on the fixed income securities held by a fund. It is expressed as a percentage of face value.
Average Duration. An estimate of how much the value of the bonds held by a fund will fluctuate in response to a change in interest rates. To see how the value could change, multiply the average duration by the change in rates. If interest rates rise by 1 percentage point, the value of the bonds in a fund with an average duration of five years would decline by about 5%. If rates decrease by a percentage point, the value would rise by 5%.
Average Weighted Maturity. The average length of time until fixed income securities held by a fund reach maturity and are repaid. The figure reflects the proportion of fund assets represented by each security.
Beta. A measure of the magnitude of a fund’s past share-price fluctuations in relation to the ups and downs of a given market index. The index is assigned a beta of 1.00. Compared with a given index, a fund with a beta of 1.20 typically would have seen its share price rise or fall by 12% when the index rose or fell by 10%. For this report, beta is based on returns over the past 36 months for both the fund and the index. Note that a fund’s beta should be reviewed in conjunction with its R-squared (see definition). The lower the R-squared, the less correlation there is between the fund and the index, and the less reliable beta is as an indicator of volatility.
Conversion Premium. The average percentage by which the weighted average market price of the convertible securities held by a fund exceeds the weighted average market price of their underlying common stocks. For example, if a stock is trading at $25 per share and a bond that is convertible into the stock is trading at a price equivalent to $30 per share of stock, the conversion premium is 20% ($5 ÷ $25 = 20%).
Credit Quality. For this report, credit-quality ratings are measured on a scale that generally ranges from AAA (highest) to D (lowest). “Not Rated” is used to classify securities for which a rating is not available. Credit-quality ratings are obtained from S&P.
Expense Ratio. A fund’s total annual operating expenses expressed as a percentage of the fund’s average net assets. The expense ratio includes management and administrative expenses, but does not include the transaction costs of buying and selling portfolio securities.
Foreign Holdings. The percentage of a fund represented by securities or depositary receipts of companies based outside the United States.
34
Inception Date. The date on which the assets of a fund (or one of its share classes) are first invested in accordance with the fund’s investment objective. For funds with a subscription period, the inception date is the day after that period ends. Investment performance is measured from the inception date.
Market Exposure. A measure that reflects a fund’s security investments excluding any holdings in short-term reserves.
R-Squared. A measure of how much of a fund’s past returns can be explained by the returns from the market in general, as measured by a given index. If a fund’s total returns were precisely synchronized with an index’s returns, its R-squared would be 1.00. If the fund’s returns bore no relationship to the index’s returns, its R-squared would be 0. For this report, R-squared is based on returns over the past 36 months for both the fund and the index.
Short-Term Reserves. The percentage of a fund invested in highly liquid, short-term securities that can be readily converted to cash.
Turnover Rate. An indication of the fund’s trading activity. Funds with high turnover rates incur higher transaction costs and may be more likely to distribute capital gains (which may be taxable to investors). The turnover rate excludes in-kind transactions, which have minimal impact on costs.
Benchmark Information
Convertibles Composite Index: CS First Boston Convertible Securities Index through November 30, 2004; Bank of America Merrill Lynch All US Convertibles Index (formerly Bank of America Merrill Lynch All Convertibles-All Qualities Index) through December 31, 2010; and 70% Bank of America Merrill Lynch All US Convertibles Index and 30% Bank of America Merrill Lynch Global 300 Convertibles ex-US Index (hedged) thereafter.
35
The People Who Govern Your Fund
The trustees of your mutual fund are there to see that the fund is operated and managed in your best interests since, as a shareholder, you are a part owner of the fund. Your fund’s trustees also serve on the board of directors of The Vanguard Group, Inc., which is owned by the Vanguard funds and provides services to them on an at-cost basis.
A majority of Vanguard’s board members are independent, meaning that they have no affiliation with Vanguard or the funds they oversee, apart from the sizable personal investments they have made as private individuals. The independent board members have distinguished backgrounds in business, academia, and public service. Each of the trustees and executive officers oversees 177 Vanguard funds.
The following table provides information for each trustee and executive officer of the fund. More information about the trustees is in the Statement of Additional Information, which can be obtained, without charge, by contacting Vanguard at 800-662-7447, or online at vanguard.com.
| |
| InterestedTrustee1 | and Delphi Automotive LLP (automotive components); |
| | Senior Advisor at New Mountain Capital. |
| F. William McNabb III | |
| Born 1957. Trustee Since July 2009. Chairman of the | Amy Gutmann |
| Board. Principal Occupation(s) During the Past Five | Born 1949. Trustee Since June 2006. Principal |
| Years: Chairman of the Board of The Vanguard Group, | Occupation(s) During the Past Five Years: President of |
| Inc., and of each of the investment companies served | the University of Pennsylvania; Christopher H. Browne |
| by The Vanguard Group, since January 2010; Director | Distinguished Professor of Political Science, School of |
| of The Vanguard Group since 2008; Chief Executive | Arts and Sciences, and Professor of Communication, |
| Officer and President of The Vanguard Group, and of | Annenberg School for Communication, with secondary |
| each of the investment companies served by The | faculty appointments in the Department of Philosophy, |
| Vanguard Group, since 2008; Director of Vanguard | School of Arts and Sciences, and at the Graduate |
| Marketing Corporation; Managing Director of The | School of Education, University of Pennsylvania; |
| Vanguard Group (1995–2008). | Trustee of the National Constitution Center; Chair |
| | of the Presidential Commission for the Study of |
| | Bioethical Issues. |
| IndependentTrustees | |
| |
| Emerson U. Fullwood | JoAnn Heffernan Heisen |
| Born 1948. Trustee Since January 2008. Principal | Born 1950. Trustee Since July 1998. Principal |
| Occupation(s) During the Past Five Years: Executive | Occupation(s) During the Past Five Years: Corporate |
| Chief Staff and Marketing Officer for North America | Vice President and Chief Global Diversity Officer |
| and Corporate Vice President (retired 2008) of Xerox | (retired 2008) and Member of the Executive |
| Corporation (document management products and | Committee (1997–2008) of Johnson & Johnson |
| services); Executive in Residence and 2009–2010 | (pharmaceuticals/medical devices/consumer |
| Distinguished Minett Professor at the Rochester | products); Director of Skytop Lodge Corporation |
| Institute of Technology; Director of SPX Corporation | (hotels), the University Medical Center at Princeton, |
| (multi-industry manufacturing), the United Way of | the Robert Wood Johnson Foundation, and the Center |
| Rochester, Amerigroup Corporation (managed health | for Talent Innovation; Member of the Advisory Board |
| care), the University of Rochester Medical Center, | of the Maxwell School of Citizenship and Public Affairs |
| Monroe Community College Foundation, and North | at Syracuse University. |
| Carolina A&T University. | |
| F. Joseph Loughrey |
| | Born 1949. Trustee Since October 2009. Principal |
| Rajiv L. Gupta | Occupation(s) During the Past Five Years: President |
| Born 1945. Trustee Since December 2001.2 | and Chief Operating Officer (retired 2009) of Cummins |
| Principal Occupation(s) During the Past Five Years: | Inc. (industrial machinery); Chairman of the Board |
| Chairman and Chief Executive Officer (retired 2009) | of Hillenbrand, Inc. (specialized consumer services), |
| and President (2006–2008) of Rohm and Haas Co. | and of Oxfam America; Director of SKF AB (industrial |
| (chemicals); Director of Tyco International, Ltd. | machinery), Hyster-Yale Materials Handling, Inc. |
| (diversified manufacturing and services), Hewlett- | (forklift trucks), the Lumina Foundation for Education, |
| Packard Co. (electronic computer manufacturing), | |
| | |
| and the V Foundation for Cancer Research; Member | Executive Officers | |
| of the Advisory Council for the College of Arts and | | |
| Letters and of the Advisory Board to the Kellogg | Glenn Booraem | |
| Institute for International Studies, both at the | Born 1967. Controller Since July 2010. Principal |
| University of Notre Dame. | Occupation(s) During the Past Five Years: Principal |
| | of The Vanguard Group, Inc.; Controller of each of |
| Mark Loughridge | the investment companies served by The Vanguard |
| Born 1953. Trustee Since March 2012. Principal | Group; Assistant Controller of each of the investment |
| Occupation(s) During the Past Five Years: Senior Vice | companies served by The Vanguard Group (2001–2010). |
| President and Chief Financial Officer (retired 2013) | | |
| at IBM (information technology services); Fiduciary | Thomas J. Higgins | |
| Member of IBM’s Retirement Plan Committee (2004– | Born 1957. Chief Financial Officer Since September |
| 2013); Member of the Council on Chicago Booth. | 2008. Principal Occupation(s) During the Past Five |
| | Years: Principal of The Vanguard Group, Inc.; Chief |
| Scott C. Malpass | Financial Officer of each of the investment companies |
| Born 1962. Trustee Since March 2012. Principal | served by The Vanguard Group; Treasurer of each of |
| Occupation(s) During the Past Five Years: Chief | the investment companies served by The Vanguard |
| Investment Officer and Vice President at the University | Group (1998–2008). | |
| of Notre Dame; Assistant Professor of Finance at the | | |
| Mendoza College of Business at Notre Dame; Member | Kathryn J. Hyatt | |
| of the Notre Dame 403(b) Investment Committee; | Born 1955. Treasurer Since November 2008. Principal |
| Board Member of TIFF Advisory Services, Inc. | Occupation(s) During the Past Five Years: Principal of |
| (investment advisor); Member of the Investment | The Vanguard Group, Inc.; Treasurer of each of the |
| Advisory Committees of the Financial Industry | investment companies served by The Vanguard |
| Regulatory Authority (FINRA) and of Major League | Group; Assistant Treasurer of each of the investment |
| Baseball. | companies served by The Vanguard Group (1988–2008). |
| |
| André F. Perold | Heidi Stam | |
| Born 1952. Trustee Since December 2004. Principal | Born 1956. Secretary Since July 2005. Principal |
| Occupation(s) During the Past Five Years: George | Occupation(s) During the Past Five Years: Managing |
| Gund Professor of Finance and Banking, Emeritus | Director of The Vanguard Group, Inc.; General Counsel |
| at the Harvard Business School (retired 2011); | of The Vanguard Group; Secretary of The Vanguard |
| Chief Investment Officer and Managing Partner of | Group and of each of the investment companies |
| HighVista Strategies LLC (private investment firm); | served by The Vanguard Group; Director and Senior |
| Director of Rand Merchant Bank; Overseer of the | Vice President of Vanguard Marketing Corporation. |
| Museum of Fine Arts Boston. | | |
| | Vanguard Senior ManagementTeam |
| Alfred M. Rankin, Jr. | | |
| Born 1941. Trustee Since January 1993. Principal | Mortimer J. Buckley | Chris D. McIsaac |
| Occupation(s) During the Past Five Years: Chairman, | Kathleen C. Gubanich | Michael S. Miller |
| President, and Chief Executive Officer of NACCO | Paul A. Heller | James M. Norris |
| Industries, Inc. (housewares/lignite), and of Hyster- | Martha G. King | Glenn W. Reed |
| Yale Materials Handling, Inc. (forklift trucks); Chairman | John T. Marcante | |
| of the Board of University Hospitals of Cleveland. | | |
| |
| Peter F. Volanakis | Chairman Emeritus and Senior Advisor |
| Born 1955. Trustee Since July 2009. Principal | | |
| Occupation(s) During the Past Five Years: President | John J. Brennan | |
| and Chief Operating Officer (retired 2010) of Corning | Chairman, 1996–2009 | |
| Incorporated (communications equipment); Trustee of | Chief Executive Officer and President, 1996–2008 |
| Colby-Sawyer College; Member of the Advisory Board | | |
| of the Norris Cotton Cancer Center and of the Advisory | Founder | |
| Board of the Parthenon Group (strategy consulting). | John C. Bogle | |
| | Chairman and Chief Executive Officer, 1974–1996 |
1 Mr. McNabb is considered an “interested person,” as defined in the Investment Company Act of 1940, because he is an officer of the Vanguard funds.
2 December 2002 for Vanguard Equity Income Fund, the Vanguard Municipal Bond Funds, and the Vanguard State Tax-Exempt Funds.
|  |
| | P.O. Box 2600 |
| | Valley Forge, PA 19482-2600 |
| |
| |
| |
| Connect with Vanguard® > vanguard.com | |
| |
| |
| |
| Fund Information > 800-662-7447 | CFA® is a registered trademark owned by CFA Institute. |
| Direct Investor Account Services > 800-662-2739 | |
| Institutional Investor Services > 800-523-1036 | |
| Text Telephone for People | |
| Who Are Deaf or Hard of Hearing> 800-749-7273 | |
| |
| This material may be used in conjunction | |
| with the offering of shares of any Vanguard | |
| fund only if preceded or accompanied by | |
| the fund’s current prospectus. | |
| |
| All comparative mutual fund data are from Lipper, a | |
| Thomson Reuters Company, or Morningstar, Inc., unless | |
| otherwise noted. | |
| |
| You can obtain a free copy of Vanguard’s proxy voting | |
| guidelines by visiting vanguard.com/proxyreporting or by | |
| calling Vanguard at 800-662-2739. The guidelines are | |
| also available from the SEC’s website, sec.gov. In | |
| addition, you may obtain a free report on how your fund | |
| voted the proxies for securities it owned during the 12 | |
| months ended June 30. To get the report, visit either | |
| vanguard.com/proxyreporting or sec.gov. | |
| |
| You can review and copy information about your fund at | |
| the SEC’s Public Reference Room in Washington, D.C. To | |
| find out more about this public service, call the SEC at | |
| 202-551-8090. Information about your fund is also | |
| available on the SEC’s website, and you can receive | |
| copies of this information, for a fee, by sending a | |
| request in either of two ways: via e-mail addressed to | |
| publicinfo@sec.gov or via regular mail addressed to the | |
| Public Reference Section, Securities and Exchange | |
| Commission, Washington, DC 20549-1520. | |
| |
| | © 2015 The Vanguard Group, Inc. |
| | All rights reserved. |
| | Vanguard Marketing Corporation, Distributor. |
| |
| | Q820 012015 |
Item 2: Code of Ethics. The Registrant has adopted a code of ethics that applies to the Registrant’s principal executive officer, principal financial officer, principal accounting officer or controller or persons performing similar functions. The Code of Ethics was amended during the reporting period covered by this report to make certain technical, non-material changes.
Item 3: Audit Committee Financial Expert. The following members of the Audit Committee have been determined by the Registrant’s Board of Trustees to be Audit Committee Financial Experts serving on its Audit Committee, and to be independent: Rajiv L. Gupta, Amy Gutmann, JoAnn Heffernan Heisen, F. Joseph Loughrey, Mark Loughridge, Scott C. Malpass, and André F. Perold.
Item 4: Principal Accountant Fees and Services.
(a) Audit Fees.
Audit Fees of the Registrant
Fiscal Year Ended November 30, 2014: $41,000
Fiscal Year Ended November 30, 2013: $37,000
Aggregate Audit Fees of Registered Investment Companies in the Vanguard Group.
Fiscal Year Ended November 30, 2014: $6,605,127
Fiscal Year Ended November 30, 2013: $5,714,113
Includes fees billed in connection with audits of the Registrant, other registered investment companies in the Vanguard complex, The Vanguard Group, Inc. and Vanguard Marketing Corporation.
(b) Audit-Related Fees.
Fiscal Year Ended November 30, 2014: $2,176,479
Fiscal Year Ended November 30, 2013: $1,552,950
Includes fees billed in connection with assurance and related services provided to the Registrant, other registered investment companies in the Vanguard complex, The Vanguard Group, Inc., and Vanguard Marketing Corporation.
(c) Tax Fees.
Fiscal Year Ended November 30, 2014: $316,869
Fiscal Year Ended November 30, 2013: $110,000
Includes fees billed in connection with tax compliance, planning, and advice services provided to the Registrant, other registered investment companies in the Vanguard complex, The Vanguard Group, Inc., and Vanguard Marketing Corporation.
(d) All Other Fees.
Fiscal Year Ended November 30, 2014: $198,163
Fiscal Year Ended November 30, 2013: $132,000
Includes fees billed for services related to tax reported information provided to the Registrant, other registered investment companies in the Vanguard complex, The Vanguard Group, Inc., and Vanguard Marketing Corporation.
(e) (1) Pre-Approval Policies. The policy of the Registrant’s Audit Committee is to consider and, if appropriate, approve before the principal accountant is engaged for such services, all specific audit and non-audit services provided to: the Registrant, other registered investment companies in the Vanguard complex, The Vanguard Group, Inc., and entities controlled by The Vanguard Group, Inc. that provide ongoing services to the Registrant. In making a determination, the Audit Committee considers whether the services are consistent with maintaining the principal accountant’s independence.
In the event of a contingency situation in which the principal accountant is needed to provide services in between scheduled Audit Committee meetings, the Chairman of the Audit Committee would be called on to consider and, if appropriate, pre-approve audit or permitted non-audit services in an amount sufficient to complete services through the next Audit Committee meeting, and to determine if such services would be consistent with maintaining the accountant’s independence. At the next scheduled Audit Committee meeting, services and fees would be presented to the Audit Committee for formal consideration, and, if appropriate, approval by the entire Audit Committee. The Audit Committee would again consider whether such services and fees are consistent with maintaining the principal accountant’s independence.
The Registrant’s Audit Committee is informed at least annually of all audit and non-audit services provided by the principal accountant to the Vanguard complex, whether such services are provided to: the Registrant, other registered investment companies in the Vanguard complex, The Vanguard Group, Inc., or other entities controlled by The Vanguard Group, Inc. that provide ongoing services to the Registrant.
(2) No percentage of the principal accountant’s fees or services were approved pursuant to the waiver provision of paragraph (c)(7)(i)(C) of Rule 2-01 of Regulation S-X.
(f) For the most recent fiscal year, over 50% of the hours worked under the principal accountant’s engagement were not performed by persons other than full-time, permanent employees of the principal accountant.
(g) Aggregate Non-Audit Fees.
Fiscal Year Ended November 30, 2014: $515,032
Fiscal Year Ended November 30, 2013: $242,000
Includes fees billed for non-audit services provided to the Registrant, other registered investment companies in the Vanguard complex, The Vanguard Group, Inc., and Vanguard Marketing Corporation.
(h) For the most recent fiscal year, the Audit Committee has determined that the provision of all non-audit services was consistent with maintaining the principal accountant’s independence.
Item 5: Audit Committee of Listed Registrants.
Not Applicable.
Item 6: Investments.
Not Applicable.
Item 7: Disclosure of Proxy Voting Policies and Procedures for Closed-End Management
Investment Companies.
Not Applicable.
Item 8: Portfolio Managers of Closed-End Management Investment Companies.
Not Applicable.
Item 9: Purchase of Equity Securities by Closed-End Management Investment Company and
Affiliated Purchasers.
Not Applicable.
Item 10: Submission of Matters to a Vote of Security Holders.
Not Applicable.
Item 11: Controls and Procedures.
(a) Disclosure Controls and Procedures. The Principal Executive and Financial Officers concluded that the Registrant’s Disclosure Controls and Procedures are effective based on their evaluation of the Disclosure Controls and Procedures as of a date within 90 days of the filing date of this report.
(b) Internal Control Over Financial Reporting. There were no significant changes in Registrant’s Internal Control Over Financial Reporting or in other factors that could significantly affect this control subsequent to the date of the evaluation, including any corrective actions with regard to significant deficiencies and material weaknesses.
Item 12: Exhibits.
(a) Code of Ethics.
(b) Certifications.
Pursuant to the requirements of the Securities Exchange Act of 1934 and the Investment Company Act of 1940, the registrant has duly caused this report to be signed on its behalf by the undersigned, thereunto duly authorized.
| |
| | VANGUARD CONVERTIBLE SECURITIES FUND |
| |
| |
| BY: | /s/ F. WILLIAM MCNABB III* |
| | F. WILLIAM MCNABB III |
| | CHIEF EXECUTIVE OFFICER |
| |
| Date: January 21, 2015 |
Pursuant to the requirements of the Securities Exchange Act of 1934 and the Investment Company Act of 1940, this report has been signed below by the following persons on behalf of the registrant and in the capacities and on the dates indicated.
| |
| | VANGUARD CONVERTIBLE SECURITIES FUND |
| |
| BY: | /s/ F. WILLIAM MCNABB III* |
| | F. WILLIAM MCNABB III |
| | CHIEF EXECUTIVE OFFICER |
Date: January 21, 2015 |
| VANGUARD CONVERTIBLE SECURITIES FUND |
BY: | /s/ THOMAS J. HIGGINS* |
| | THOMAS J. HIGGINS |
| | CHIEF FINANCIAL OFFICER |
Date: January 21, 2015 |
* By: /s/ Heidi Stam
Heidi Stam, pursuant to a Power of Attorney filed on April 22, 2014 see file Number 2-17620, Incorporated by Reference.