UNITED STATES
SECURITIES AND EXCHANGE COMMISSION
Washington, D.C. 20549
FORM N-CSR
CERTIFIED SHAREHOLDER REPORT
OF
REGISTERED MANAGEMENT INVESTMENT COMPANIES
| | |
| Investment Company Act file number: 811-4627 |
|
| Name of Registrant: | Vanguard Convertible Securities Fund |
| |
| Address of Registrant: | P.O. Box 2600 |
| | Valley Forge, PA 19482 |
| |
| Name and address of agent for service: | Heidi Stam, Esquire |
| | P.O. Box 876 |
| | Valley Forge, PA 19482 |
| | |
| Registrant’s telephone number, including area code: (610) 669-1000 |
|
| Date of fiscal year end: November 30 | |
| |
| Date of reporting period: December 1, 2010 – November 30, 2011 |
|
| Item 1: Reports to Shareholders | |

Annual Report | November 30, 2011
Vanguard Convertible Securities Fund
> For the fiscal year ended November 30, 2011, Vanguard Convertible Securities
Fund returned –2.89%.
> The fund trailed both the return of its benchmark index and the average return
of its peer group.
> Holdings in economically sensitive industries, such as airlines and energy, hurt
the fund’s performance for the fiscal year, as did its focus on the securities of
small- to mid-sized companies.
| |
| Contents | |
| Your Fund’s Total Returns. | 1 |
| Chairman’s Letter. | 2 |
| Advisor’s Report. | 8 |
| Fund Profile. | 12 |
| Performance Summary. | 14 |
| Financial Statements. | 16 |
| Your Fund’s After-Tax Returns. | 30 |
| About Your Fund’s Expenses. | 31 |
| Glossary. | 33 |
Please note: The opinions expressed in this report are just that—informed opinions. They should not be considered promises or advice. Also, please keep in mind that the information and opinions cover the period through the date on the front of this report. Of course, the risks of investing in your fund are spelled out in the prospectus.
See the Glossary for definitions of investment terms used in this report.
About the cover: Vanguard was named for the HMS Vanguard, flagship of British Admiral Horatio Nelson. A ship—whose performance and safety depend on the work of all hands—has served as a fitting metaphor for the Vanguard crew as we strive to help clients reach their financial goals.
Your Fund’s Total Returns
| |
| Fiscal Year Ended November 30, 2011 | |
| |
| | Total |
| | Returns |
| Vanguard Convertible Securities Fund | -2.89% |
| Spliced Convertibles Composite Index | -2.44 |
| Convertible Securities Funds Average | -1.46 |
Spliced Convertibles Composite Index: CS First Boston Convertible Securities Index through November 30, 2004; Bank of America Merrill
Lynch All US Convertibles Index (formerly Bank of America Merrill Lynch All Convertibles-All Qualities Index) through December 31, 2010; and
70% Bank of America Merrill Lynch All US Convertibles Index and 30% Bank of America Merrill Lynch Global 300 Convertibles ex-US Index
(hedged) thereafter.
Convertible Securities Funds Average: Derived from data provided by Lipper Inc.
Your Fund’s Performance at a Glance
November 30, 2010 , Through November 30, 2011
| | | | |
| | | | Distributions Per Share |
| | Starting | Ending | Income | Capital |
| | Share Price | Share Price | Dividends | Gains |
| Vanguard Convertible Securities Fund | $13.85 | $12.12 | $0.474 | $0.955 |
1

Chairman’s Letter
Dear Shareholder,
Vanguard Convertible Securities Fund returned –2.89% for the 12 months ended November 30—its weakest fiscal-year result since 2008. The fund trailed both its benchmark index (–2.44%) and the average return of its peer group (–1.46%).
The Convertible Securities Fund focuses on a narrow investment universe, valued at about $500 billion globally as of September 2011, according to various published estimates. The fund’s holdings primarily consist of medium- to low-rated convertible bonds and some preferred stocks issued by small and mid-sized companies.
Typically, convertible securities have produced returns somewhere between those of the broader U.S. stock and bond markets. But the past few years have been anything but typical. After two years of outperforming both the bond and stock markets, the fund came in below both of them in the fiscal year just ended.
The fund’s subpar performance stemmed in part from an unusually turbulent seven months for the stock and bond markets. As global growth declined and the European debt crisis worsened, anxious investors sought the relative safety of higher-quality
2
securities such as U.S. Treasuries and those of larger companies. This trend pushed down the prices of lower-rated corporate bonds and of convertible securities—negating much of the downside protection that convertibles might otherwise offer.
Although both the benchmark index and the fund’s holdings suffered in such a climate, the fund’s performance was further restrained by some poor security selections. Also, the small- and mid-sized companies that the fund favors were seen by investors as more vulnerable to an economic slowdown than their larger counterparts.
Despite the year’s stresses, the broad bond market did well
Volatility in global stock markets helped generate enthusiasm for the relative stability of U.S. bonds. The broad taxable investment-grade bond market returned
5.52% for the 12 months through
November as anxious investors bid up bond prices.
Yields, already low, dropped even farther.
At the start of the fiscal year, the yield of the 10-year U.S. Treasury note, a benchmark for longer-term interest rates, stood at 2.80%; at the end, the note yielded just 2.07%. Municipal bonds also performed strongly.
| | | |
| Market Barometer | | | |
| |
| | Average Annual Total Returns |
| | Periods Ended November 30, 2011 |
| | One | Three | Five |
| | Year | Years | Years |
| Stocks | | | |
| Russell 1000 Index (Large-caps) | 7.38% | 15.10% | 0.07% |
| Russell 2000 Index (Small-caps) | 2.75 | 17.56 | 0.09 |
| Dow Jones U.S. Total Stock Market Index | 6.57 | 15.67 | 0.36 |
| MSCI All Country World Index ex USA (International) | -5.90 | 13.19 | -2.11 |
| |
| Bonds | | | |
| Barclays Capital U.S. Aggregate Bond Index (Broad | | | |
| taxable market) | 5.52% | 7.69% | 6.14% |
| Barclays Capital Municipal Bond Index (Broad | | | |
| tax-exempt market) | 6.53 | 8.41 | 4.75 |
| Citigroup Three-Month U.S. Treasury Bill Index | 0.09 | 0.12 | 1.44 |
| |
| CPI | | | |
| Consumer Price Index | 3.39% | 2.12% | 2.34% |
3
The returns of money market instruments hovered near 0%, consistent with the
Federal Reserve Board’s target for the shortest-term interest rates.
For stocks, a tumultuous path to unremarkable returns
The broad U.S. stock market produced a single-digit gain for the fiscal year.
International stocks recorded a single-digit loss. On the way to these unremarkable returns, however, global stock markets traversed dramatic highs and lows.
Stock prices surged through the first half of the period, as the U.S. economy seemed to be grinding into gear. But investors’
optimism faded in the second half, as Europe’s sovereign-debt crisis took center stage and political gridlock led to high-stakes brinkmanship over a bill to raise the U.S. debt ceiling. The drama prompted Standard & Poor’s to downgrade the U.S. credit rating, a shock that reverberated through global financial markets. (Vanguard’s confidence in the full faith and credit of the U.S. Treasury remains unshaken.)
U.S. stocks tumbled through the summer, then rebounded in the period’s final months. International stock markets traced similar trajectories before finishing the year with a negative return.
| | |
| Expense Ratios | | |
| Your Fund Compared With Its Peer Group | | |
| | | Peer Group |
| | Fund | Average |
| Convertible Securities Fund | 0.68% | 1.40% |
The fund expense ratio shown is from the prospectus dated March 23, 2011, and represents estimated costs for the current fiscal year. For the fiscal year ended November 30, 2011, the fund’s expense ratio was 0.59%. The peer-group expense ratio is derived from data provided by Lipper Inc. and captures information through year-end 2010.
Peer group: Convertible Securities Funds.
4
Smaller-cap, lower-rated securities faced a challenging environment
Vanguard Convertible Securities Fund holds about 200 securities, primarily corporate bonds and some preferred stocks that can be converted to common stocks for a predetermined price.
Convertibles can be attractive because they offer some features of both bonds and stocks: Investors can get the income and downside protection associated with bonds along with the opportunity to benefit if the underlying common stock appreciates.
However, convertible securities can be battered in extreme market conditions. That was evident during the 2008 financial crisis and, to a lesser extent, in the past fiscal year as well.
Early in the period, as equity markets rallied, the fund’s convertible securities rose in tandem with their underlying stocks. But those gains quickly dissipated when global stock and credit markets began to plunge in late spring. Both the fund and its benchmark index posted declines in six of the past seven months.
Although fiscal year 2011 was by no means as challenging as 2008—the demand for convertibles stayed much stronger this time around—the fund struggled as security prices dipped and investors turned away from the small- and medium-sized companies on which the fund tends to focus. This trend was consistent with that seen in the broader
| |
| Total Returns | |
| Ten Years Ended November 30, 2011 | |
| | Average |
| | Annual Return |
| Convertible Securities Fund | 6.43% |
| Spliced Convertibles Composite Index | 4.94 |
| Convertible Securities Funds Average | 4.87 |
Spliced Convertibles Composite Index: CS First Boston Convertible Securities Index through November 30, 2004; Bank of America Merrill
Lynch All US Convertibles Index (formerly Bank of America Merrill Lynch All Convertibles-All Qualities Index) through December 31, 2010; and
70% Bank of America Merrill Lynch All US Convertibles Index and 30% Bank of America Merrill Lynch Global 300 Convertibles ex-US Index
(hedged) thereafter.
Convertible Securities Funds Average: Derived from data provided by Lipper Inc.
The figures shown represent past performance, which is not a guarantee of future results. (Current performance may be
lower or higher than the performance data cited. For performance data current to the most recent month-end, visit our
website at vanguard.com/performance.) Note, too, that both investment returns and principal value can fluctuate widely, so
an investor’s shares, when sold, could be worth more or less than their original cost.
5
U.S. stock market; large-cap stocks outperformed small-caps in the latter part of the period.
Relative to the benchmark’s performance, the Convertible Securities Fund was held back by the costs of managing a real-world portfolio and a number of poor security selections. Some of its losses came from economically sensitive holdings, including those within the energy, industrial, and materials sectors, which have been hit hard as the economic recovery earlier in the year rapidly fizzled.
International securities—which represented about 13% of fund assets, on average, during the period—also took a toll on performance. Two of the fund’s Chinese holdings encountered credit problems, a rare event for the fund given the advisor’s rigorous credit analysis.
The advisor continues to focus on international securities. Early in the fiscal year, the board of trustees removed restrictions on the fund’s ability to invest in other countries. As a result, the fund is expected to benefit over the long term from a wider range of investment opportunities. Foreign issues now make up about 16% of the portfolio and are expected to rise gradually to about 30%.
For more information on the fund’s positioning and performance during the year, please see the Advisor’s Report that follows this letter.
Over a turbulent decade, the fund notched benchmark-beating returns
For the ten years ended November 30, 2011, the Convertible Securities Fund returned an average of 6.43% annually. As you can see in the table on page 5, this is about 1.5 percentage points above the average yearly return of its benchmark index and the peer-group average.
The fund’s advisor, Oaktree Capital Management, has a long record of outperforming the benchmark; it did so in six of the past ten fiscal years. Oaktree has achieved this feat despite the decade’s many turbulent episodes, including the financial crisis in 2008. The advisor’s experienced staff has distinguished itself over time by finding many opportunities for investors in this complicated segment of the capital markets.
Diversification is important in weathering volatile markets
In last year’s letter to shareholders, following a strong performance for convertible securities and your fund, I noted that it would be unwise to expect returns exceeding those of the broad stock market over the long term. Similarly, it would be unwise to assume that the past year’s disappointing results will persist indefinitely. As I mentioned earlier, returns for convertible securities historically have fallen between those of the broader stock and bond markets.
6
The extreme market conditions we have seen over the past several years have been challenging and impossible to predict. Such market volatility can be unsettling for investors, but it’s times like these that remind us how critical it is to maintain a well-balanced, diversified portfolio. Vanguard believes that such a portfolio should include stock, bond, and money market funds in proportions consistent with one’s goals, time horizon, and risk tolerance.
Vanguard Convertible Securities Fund can play a useful complementary role in a diversified portfolio by providing opportunities for possible growth in bull markets and potential protection in bear markets.
Thank you for investing your assets at Vanguard.
Sincerely,

F. William McNabb III
Chairman and Chief Executive Officer
December 15, 2011
Advisor’s Report
The beginning of the 2011 fiscal year was a rewarding period for investing in convertible securities, as equities rallied and credit spreads tightened in the high-yield bond market. Unfortunately, the environment then became much more volatile and quite negative. Overall, convertibles reflected the tumultuous state of the equity and credit markets; however, they managed to provide relatively good downside protection in a very difficult investing environment.
Vanguard Convertible Securities Fund returned –2.89% for the 12 months ended November 30. Although this performance was disappointing on an absolute basis, it was in line with that of the fund’s blended benchmark (weighted 70% in U.S. convertibles and 30% in global convertibles), which returned –2.44% for the same period.
| |
| Major portfolio changes | |
| Fiscal Year Ended November 30, 2011 | |
| |
| Additions | Comments |
| Air Lease | New-issue convertible with very attractive terms and |
| (3.875% convertible note due 12/1/18) | an excellent long-term equity story. |
| Chart Industries | Attractive fundamentals and cheap convertible with |
| (2.00% convertible note due 8/1/18) | seven years of call protection. |
| Greenbrier | Balanced convertible play on a company |
| (3.50% convertible note due 4/1/18) | with improving fundamentals. |
| Hengdeli Holdings | Balanced convertible with attractive yield and strong credit; |
| (2.50% convertible note due 10/20/15) | company has good prospects. |
| New World Development (Sherson) | Attractive investment with robust asset coverage and stable, |
| (0.00% convertible note due 6/4/14) | recurring income streams. |
| |
| Reductions | Comments |
| Cubist Pharmaceuticals | |
| (2.50% convertible note due 11/1/17) | Substantially reduced the position after strong appreciation. |
| Illumina | Reduced after the company reported weakening fundamentals |
| (0.25% convertible note due 3/15/16) | and the convertible developed a very high conversion premium. |
| Micron Technology | Sold all after the convertible developed a high conversion premium |
| (1.875% convertible note due 6/1/14) | and we had the opportunity to buy a balanced new-issue |
| | convertible on the same name. |
| Owens-Brockway | |
| (3.00% convertible note due 6/1/15) | Sold all after the convertible became statistically unattractive. |
| RightNow Technologies | Sold all in the mid 140s after the company agreed |
| (2.50% convertible note due 11/15/30) | to be acquired by Oracle. |
| SGL Carbon | Sold after the bonds appreciated to the 140s |
| (3.50% convertible note due 6/30/16) | following takeover speculation. |
8
The investment environment
Convertible securities produced solid results from late 2010 through the first quarter of 2011. During this period, these securities performed as expected on the downside, offering protection relative to stocks during several spells of market weakness, and did slightly better than expected on the upside, culminating in a very satisfying total return. Convertibles captured nearly all of the return of their underlying stocks in a period when most stocks performed well.
As the second quarter started, convertible bonds continued to benefit from stock rallies and from a tightening of credit spreads in the high-yield bond market. However, by mid-quarter the environment turned tumultuous, as investors reacted to a wide variety of unwelcome macro-economic news, in particular the European sovereign-debt crisis and the slowdown in the global economy. In the third and fourth quarters, convertibles reflected the stresses in both the equity and credit markets. The investing environment was characterized by strong risk-aversion and extremely high market volatility. Sentiment improved significantly in October, but the market retreated again in November.
Demand for convertibles was generally strong throughout the 12 months. We were hoping for some panic selling in the weaker days of the third and fourth quarters, but this did not occur. On the
contrary, many investors in stocks and convertibles appeared to wait in the wings to buy on weakness.
Issuance of new convertibles was lackluster during the fiscal year. Reasons included the attractive interest rates on other types of debt and, more recently, falling equity prices and a diminished outlook for economic growth. Given the current market dynamics, we are not optimistic that issuance will increase very soon.
Our successes
As noted earlier, when the equity market advanced, convertibles captured most of the returns of their underlying stocks, and when the market was weak, they provided a strong measure of downside protection. The fund’s return was boosted by investments in the software, pharmaceuticals, commercial services, and wireless communications industries. Top individual contributors were holdings in Cubist Pharmaceuticals, Gilead Sciences, RightNow Technologies, and SandRidge Energy.
Our shortfalls
We saw disappointing performance from many of our underlying stocks. The portfolio’s exposure to cyclical industries was also detrimental in the period.
Convertibles issued by very large-capitalization, investment-grade companies held up relatively well thanks to the strength in the underlying stocks.
9
On the other hand, many small- to mid-cap stocks, which align more closely with the Convertible Securities Fund, declined 20% to 50% in the past few months. This had a significant effect on the performance of related convertibles. Compared with big companies, many smaller firms are more susceptible to a slowing economy. They also are more vulnerable to a tightening of credit for non-investment-grade borrowers. During the fiscal year, the latter factor hurt convertibles from small- to mid-cap issuers, since these are usually rated below investment grade.
The cyclical industries with negative impact on the portfolio included airlines, energy, auto parts, and building materials. Convertibles in these industries suffered most because their underlying equities declined disproportionately during the market volatility in the second half of the year. Additionally, our health care holdings performed poorly as the sector—which is usually very defensive—was hit by uncertainty over reimbursement cuts from the government. The portfolio’s top detractors for the period were Cemex, General Motors, Illumina, James River, and Meritor.
A rare and surprising blow to performance came from credit problems affecting three of our investments. Two of them, Sino-Forest and ShengdaTech, are Chinese companies that were accused of fraud earlier this year. We fully exited our small investment in Sino-Forest and have only a
small position remaining in ShengdaTech. The fund also had a position in AMR, which we began to sell after the company’s poor third-quarter earnings announcement. We have since fully exited our position, getting out almost completely before AMR’s bankruptcy filing.
The fund’s positioning
We expect high market volatility to continue until there is a clear resolution of the European debt crisis. Given the uncertainty that persists among investors, stocks could continue to decline as earnings expectations for 2012 are ratcheted lower. We feel that our convertible portfolio will provide strong relative downside protection should stocks fall further. Of course, the fund’s performance will be affected by that of the underlying common stocks, many of which are from the small- to mid-cap universe. The overall convertibles market is cheaper than it was earlier in 2011, but not nearly as attractive as it was in late 2008.
We plan to hold most of our positions at their current levels, but we will continue to supplant some convertibles carrying very high conversion premiums with more balanced securities. We think this strategy will reward us with better performance over time. We believe the vast majority of our investments remain solid, although the prospect of a global recession has taken its toll on the security prices of companies in highly cyclical industries. We will continue to monitor them closely.
10
In December 2010, the Convertible Securities Fund’s board of trustees expanded the fund’s mandate to employ Oaktree’s international convertibles capabilities. The fund’s target allocation now includes 30% in non-U.S. convertibles. To facilitate this shift, all cash inflows to the fund are currently being allocated to international convertibles. As of the fiscal year-end, about 16% of the portfolio was invested in non-U.S. securities.
Larry W. Keele, CFA
Principal and Founder
Jean-Paul Nedelec, Managing Director
Abe Ofer, Managing Director
Oaktree Capital Management, L.P.
December 22, 2011
11
Convertible Securities Fund
Fund Profile
As of November 30, 2011
| |
| Portfolio Characteristics | |
| Ticker Symbol | VCVSX |
| Number of Securities | 202 |
| 30-Day SEC yield | 3.75% |
| Conversion Premium | 40.3% |
| Average Weighted Maturity | 4.9 years |
| Average Coupon | 2.9% |
| Average Duration | 4.3 years |
| Foreign Holdings | 16.3% |
| Turnover Rate | 90% |
| Expense Ratio1 | 0.68% |
| Short-Term Reserves | 3.2% |
| |
| Distribution by Maturity (% of fixed income |
| portfolio) | |
| Under 1 Year | 0.6% |
| 1 - 5 Years | 68.6 |
| 5 - 10 Years | 26.0 |
| 10 - 20 Years | 0.4 |
| 20 - 30 Years | 4.4 |
| |
| Distribution by Credit Quality (% of fixed | |
| income portfolio) | |
| AAA | 0.1% |
| AA | 0.3 |
| A | 6.2 |
| BBB | 3.0 |
| BB | 21.0 |
| B | 16.6 |
| Below B | 2.2 |
| Not Rated | 50.6 |
| For information about these ratings, see the Glossary entry for |
| Credit Quality. | |
| | |
| Total Fund Volatility Measures | |
| | Spliced | DJ |
| | Conv. | U.S. Total |
| | Comp. | Market |
| | Index | Index |
| R-Squared | 0.96 | 0.78 |
| Beta | 1.04 | 0.61 |
| These measures show the degree and timing of the fund’s |
| fluctuations compared with the indexes over 36 months. |
| | |
| Ten Largest Holdings (% of total net assets) |
| Gilead Sciences Inc. | Biotechnology | 3.1% |
| SBA Communications | Wireless | |
| Corp. | Telecommunication | |
| | Services | 2.8 |
| Micron Technology Inc. | Semiconductors | 2.8 |
| Intel Corp. | Semiconductors | 2.3 |
| SanDisk Corp. | Computer Storage | |
| | & Peripherals | 2.0 |
| MGM Resorts | | |
| International | Casinos & Gaming | 1.9 |
| Lennar Corp. | Residential | |
| | Construction | 1.9 |
| Lam Research Corp. | Semiconductors | 1.7 |
| General Motors Co. | Automobile | |
| | Manufacturers | 1.6 |
| Chesapeake Energy | Oil & Gas | |
| Corp. | Exploration & | |
| | Production | 1.5 |
| Top Ten | | 21.6% |
| The holdings listed exclude any temporary cash investments and equity index products. |
1 The expense ratio shown is from the prospectus dated March 23, 2011, and represents estimated costs for the current fiscal year. For the
fiscal year ended November 30, 2011, the expense ratio was 0.59%.
12
Convertible Securities Fund
Sector Diversification (% of market
exposure)
| |
| Consumer | |
| Discretionary | 12.2% |
| Consumer Staples | 1.7 |
| Energy | 10.1 |
| Financials | 13.8 |
| Health Care | 15.7 |
| Industrials | 11.8 |
| Information | |
| Technology | 22.7 |
| Materials | 6.6 |
| Telecommunication | |
| Services | 4.8 |
| Utilities | 0.6 |
13
Convertible Securities Fund
Performance Summary
All of the returns in this report represent past performance, which is not a guarantee of future results that may be achieved by the fund. (Current performance may be lower or higher than the performance data cited. For performance data current to the most recent month-end, visit our website at vanguard.com/performance.) Note, too, that both investment returns and principal value can fluctuate widely, so an investor’s shares, when sold, could be worth more or less than their original cost. The returns shown do not reflect taxes that a shareholder would pay on fund distributions or on the sale of fund shares.
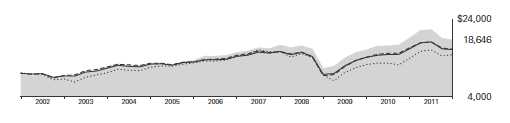
Cumulative Performance: November 30, 2001, Through November 30, 2011
Initial Investment of $10,000
| | | | | |
| | | Average Annual Total Returns | |
| | | Periods Ended November 30, 2011 | |
| | | | | | Final Value |
| | | One | Five | Ten | of a $10,000 |
| | | Year | Years | Years | Investment |
| | Convertible Securities Fund | -2.89% | 3.89% | 6.43% | $18,646 |
| •••••••• | Dow Jones U.S. Total Stock Market | | | | |
| | Index | 6.57 | 0.36 | 4.01 | 14,815 |
| – – – – | Spliced Convertibles Composite Index | -2.44 | 2.02 | 4.94 | 16,196 |
| | Convertible Securities Funds Average | -1.46 | 2.32 | 4.87 | 16,090 |
Spliced Convertibles Composite Index: CS First Boston Convertible Securities Index through November 30, 2004; Bank of America Merrill
Lynch All US Convertibles Index (formerly Bank of America Merrill Lynch All Convertibles-All Qualities Index) through December 31, 2010; and
70% Bank of America Merrill Lynch All US Convertibles Index and 30% Bank of America Merrill Lynch Global 300 Convertibles ex-US Index
(hedged) thereafter.
Convertible Securities Funds Average: Derived from data provided by Lipper Inc.
Vanguard fund returns do not reflect the 1% fee on redemptions of shares held for less than one year.
See Financial Highlights for dividend and capital gains information.
14
Convertible Securities Fund
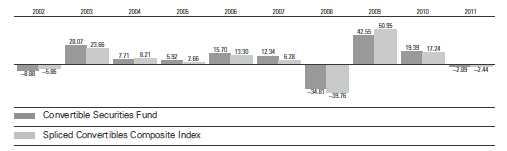
Fiscal-Year Total Returns (%): November 30, 2001, Through November 30, 2011
Average Annual Total Returns: Periods Ended September 30, 2011
This table presents returns through the latest calendar quarter—rather than through the end of the fiscal period.
Securities and Exchange Commission rules require that we provide this information.
| | | | | | |
| | | | | Ten Years |
| | Inception Date | One Year | Five Years | Income | Capital | Total |
| Convertible Securities | | | | | | |
| Fund | 6/17/1986 | -3.35% | 3.77% | 3.73% | 3.08% | 6.81% |
Vanguard fund returns do not reflect the 1% fee on redemptions of shares held for less than one year.
15
Convertible Securities Fund
Financial Statements
Statement of Net Assets
As of November 30, 2011
The fund reports a complete list of its holdings in regulatory filings four times in each fiscal year, at the quarter-ends. For the second and fourth fiscal quarters, the lists appear in the fund’s semiannual and annual reports to shareholders. For the first and third fiscal quarters, the fund files the lists with the Securities and Exchange Commission on Form N-Q. Shareholders can look up the fund’s Forms N-Q on the SEC’s website at sec.gov. Forms N-Q may also be reviewed and copied at the SEC’s Public Reference Room (see the back cover of this report for further information).
| | | | |
| | | | Face | Market |
| | | Maturity | Amount‡ | Value |
| | Coupon | Date | (000) | ($000) |
| Convertible Bonds (84.0%) | | | | |
| Consumer Discretionary (9.1%) | | | | |
| 1 Aegis Group Capital Jersey Ltd. Cvt. | 2.500% | 4/20/15 | 2,400 | 4,076 |
| 2 Aeon Co. Ltd. Cvt. | 0.300% | 11/22/13 | 107,000 | 1,626 |
| 3 Gaylord Entertainment Co. Cvt. | 3.750% | 10/1/14 | 11,965 | 12,518 |
| 4 GOME Electrical Appliances Holding Ltd. Cvt. | 3.000% | 9/25/14 | 14,500 | 2,274 |
| Group 1 Automotive Inc. Cvt. | 2.250% | 6/15/36 | 1,950 | 2,016 |
| 5 Hengdeli Holdings Ltd. Cvt. | 2.500% | 10/20/15 | 22,000 | 2,791 |
| 3 Iconix Brand Group Inc. Cvt. | 2.500% | 6/1/16 | 7,900 | 7,515 |
| Interpublic Group of Cos. Inc. Cvt. | 4.750% | 3/15/23 | 7,200 | 7,902 |
| 5 Intime Department Store Group Co. Ltd. Cvt. | 1.750% | 10/27/13 | 19,000 | 2,493 |
| 3 Lennar Corp. Cvt. | 2.750% | 12/15/20 | 30,520 | 32,275 |
| Liberty Interactive LLC Cvt. | 3.125% | 3/30/23 | 22,835 | 24,947 |
| MGM Resorts International Cvt. | 4.250% | 4/15/15 | 34,990 | 32,453 |
| Newford Capital Ltd. Cvt. | 0.000% | 5/12/16 | 4,700 | 3,971 |
| 6 Nokian Renkaat OYJ Cvt. | 0.000% | 6/27/14 | 3,000 | 4,321 |
| 5 Power Regal Group Ltd. Cvt. | 2.250% | 6/2/14 | 19,180 | 2,821 |
| 2 Sekisui House Ltd. Cvt. | 0.000% | 7/5/16 | 150,000 | 1,980 |
| 6 Steinhoff Finance Holding GmbH Cvt. | 5.000% | 5/22/16 | 3,500 | 4,407 |
| 1 TUI Travel plc Cvt. | 4.900% | 4/27/17 | 1,900 | 2,163 |
| 1 WPP plc Cvt. | 5.750% | 5/19/14 | 500 | 995 |
| | | | | 153,544 |
| Consumer Staples (1.7%) | | | | |
| 5 Glory River Holdings Ltd. Cvt. | 1.000% | 7/29/15 | 26,600 | 3,189 |
| 6 Marine Harvest ASA Cvt. | 4.500% | 2/23/15 | 700 | 733 |
| Nash Finch Co. Cvt. | 1.631% | 3/15/35 | 12,230 | 5,534 |
| Olam International Ltd. Cvt. | 6.000% | 10/15/16 | 2,700 | 2,896 |
| 6 Pescanova SA Cvt. | 5.125% | 4/20/17 | 1,850 | 2,206 |
| 6 Pescanova SA Cvt. | 6.750% | 3/5/15 | 2,050 | 2,953 |
| San Miguel Corp. Cvt. | 2.000% | 5/5/14 | 5,400 | 5,797 |
| Smithfield Foods Inc. Cvt. | 4.000% | 6/30/13 | 1,770 | 2,166 |
| Wilmar International Ltd. Cvt. | 0.000% | 12/18/12 | 2,000 | 2,372 |
| | | | | 27,846 |
| Energy (5.9%) | | | | |
| BPZ Resources Inc. Cvt. | 6.500% | 3/1/15 | 7,405 | 6,442 |
| ChesapeakeEnergy Corp. Cvt. | 2.750% | 11/15/35 | 15,520 | 15,966 |
| 6 Cie Generale de Geophysique - Veritas Cvt. | 1.750% | 1/1/16 | 2,060 | 2,593 |
| 3 James River Coal Co. Cvt. | 3.125% | 3/15/18 | 16,964 | 10,158 |
| James River Coal Co. Cvt. | 4.500% | 12/1/15 | 12,245 | 9,918 |
| Lukoil International Finance BV Cvt. | 2.625% | 6/16/15 | 5,300 | 5,456 |
16
Convertible Securities Fund
| | | | |
| | | | Face | Market |
| | | Maturity | Amount‡ | Value |
| | Coupon | Date | (000) | ($000) |
| Newpark Resources Inc. Cvt. | 4.000% | 10/1/17 | 8,964 | 9,827 |
| Paladin Energy Ltd. Cvt. | 3.625% | 11/4/15 | 4,757 | 3,687 |
| Peabody Energy Corp. Cvt. | 4.750% | 12/15/41 | 7,885 | 8,250 |
| 3 Petroleum Development Corp. Cvt. | 3.250% | 5/15/16 | 7,800 | 8,112 |
| Petrominerales Ltd. Cvt. | 2.625% | 8/25/16 | 2,600 | 2,393 |
| 7 Progress Energy Resources Corp. Cvt. | 5.250% | 10/31/14 | 3,467 | 3,569 |
| Seadrill Ltd. Cvt. | 3.375% | 10/27/17 | 3,700 | 4,211 |
| Subsea 7 SA Cvt. | 2.250% | 10/11/13 | 3,500 | 3,841 |
| 6 Technip SA Cvt. | 0.500% | 1/1/16 | 831 | 1,212 |
| TMK Bonds SA Cvt. | 5.250% | 2/11/15 | 3,900 | 3,619 |
| | | | | 99,254 |
| Financials (9.9%) | | | | |
| 1 Aberdeen Asset Management plc Cvt. | 3.500% | 12/17/14 | 600 | 1,093 |
| 3 American Equity Investment Life Holding Co. Cvt. | 3.500% | 9/15/15 | 15,465 | 16,335 |
| 3 American Equity Investment Life Holding Co. Cvt. | 5.250% | 12/6/29 | 5,755 | 7,366 |
| BES Finance Ltd. Cvt. | 1.625% | 4/15/13 | 5,600 | 4,396 |
| Billion Express Investments Ltd. Cvt. | 0.750% | 10/18/15 | 3,700 | 4,237 |
| 3 BioMed Realty LP Cvt. | 3.750% | 1/15/30 | 6,785 | 7,659 |
| 8 CapitaLand Ltd. Cvt. | 2.875% | 9/3/16 | 5,250 | 3,845 |
| DFC Global Corp. Cvt. | 3.000% | 4/1/28 | 12,195 | 13,963 |
| 6 Fonciere Des Regions Cvt. | 3.340% | 1/1/17 | 2,991 | 3,264 |
| Forest City Enterprises Inc. Cvt. | 3.625% | 10/15/14 | 805 | 828 |
| 3 Forest City Enterprises Inc. Cvt. | 4.250% | 8/15/18 | 18,275 | 15,579 |
| 3 Goldman Sachs Group Inc. Cvt. | 0.250% | 2/28/17 | 22,205 | 17,330 |
| 9 Graubuendner Kantonalbank Cvt. | 2.000% | 5/8/14 | 4,390 | 4,997 |
| 3 Host Hotels & Resorts LP Cvt. | 2.500% | 10/15/29 | 20,315 | 24,530 |
| 6 Industrivarden AB Cvt. | 1.875% | 2/27/17 | 1,350 | 1,605 |
| 6 Industrivarden AB Cvt. | 2.500% | 2/27/15 | 1,400 | 1,972 |
| 6 Kreditanstalt fuer Wiederaufbau Cvt. | 1.500% | 7/30/14 | 1,200 | 1,738 |
| 3 NorthStar Realty Finance LP Cvt. | 7.500% | 3/15/31 | 9,555 | 8,528 |
| Old Republic International Corp. Cvt. | 3.750% | 3/15/18 | 2,425 | 1,967 |
| 2 ORIX Corp. Cvt. | 1.000% | 3/31/14 | 275,000 | 3,900 |
| PHH Corp. Cvt. | 4.000% | 9/1/14 | 11,965 | 11,202 |
| QBEFunding Trust Cvt. | 0.000% | 5/12/30 | 955 | 574 |
| 5 ShersonLtd. Cvt. | 0.000% | 6/4/14 | 32,110 | 4,495 |
| 4 ShuiOn Land Ltd. Cvt. | 4.500% | 9/29/15 | 4,000 | 541 |
| 3 SLGreen Operating Partnership LP Cvt. | 3.000% | 10/15/17 | 1,580 | 1,594 |
| 6 Wereldhave NV Cvt. | 2.875% | 11/18/15 | 2,750 | 3,232 |
| | | | | 166,770 |
| Health Care (13.5%) | | | | |
| Alere Inc. Cvt. | 3.000% | 5/15/16 | 9,875 | 9,258 |
| Brookdale Senior Living Inc. Cvt. | 2.750% | 6/15/18 | 19,240 | 15,753 |
| CharlesRiver Laboratories International Inc. Cvt. | 2.250% | 6/15/13 | 4,731 | 4,613 |
| ChemedCorp. Cvt. | 1.875% | 5/15/14 | 16,727 | 15,786 |
| ChinaMedical Technologies Inc. Cvt. | 4.000% | 8/15/13 | 2,649 | 1,695 |
| Cubist Pharmaceuticals Inc. Cvt. | 2.500% | 11/1/17 | 540 | 788 |
| Gilead Sciences Inc. Cvt. | 0.625% | 5/1/13 | 3,420 | 3,920 |
| Gilead Sciences Inc. Cvt. | 1.625% | 5/1/16 | 43,925 | 48,647 |
| Hologic Inc. Cvt. | 2.000% | 12/15/37 | 19,665 | 21,779 |
| 3 Illumina Inc. Cvt. | 0.250% | 3/15/16 | 15,225 | 11,647 |
| 3 Integra LifeSciences Holdings Corp. Cvt. | 1.625% | 12/15/16 | 6,850 | 5,857 |
| LifePoint Hospitals Inc. Cvt. | 3.500% | 5/15/14 | 14,367 | 14,888 |
| NuVasive Inc. Cvt. | 2.750% | 7/1/17 | 8,790 | 6,384 |
| Omnicare Inc. Cvt. | 3.750% | 12/15/25 | 4,745 | 6,305 |
| Onyx Pharmaceuticals Inc. Cvt. | 4.000% | 8/15/16 | 7,097 | 9,519 |
| 6 Orpea Cvt. | 3.875% | 1/1/16 | 1,559 | 2,007 |
17
Convertible Securities Fund
| | | | |
| | | | Face | Market |
| | | Maturity | Amount‡ | Value |
| | Coupon | Date | (000) | ($000) |
| Qiagen Euro Finance SA Cvt. | 3.250% | 5/16/26 | 2,300 | 2,395 |
| Salix Pharmaceuticals Ltd. Cvt. | 2.750% | 5/15/15 | 7,992 | 9,660 |
| Teleflex Inc. Cvt. | 3.875% | 8/1/17 | 8,990 | 10,676 |
| 2 Unicharm Corp. Cvt. | 0.000% | 9/24/15 | 260,000 | 3,646 |
| Vertex Pharmaceuticals Inc. Cvt. | 3.350% | 10/1/15 | 3,414 | 3,346 |
| Viropharma Inc. Cvt. | 2.000% | 3/15/17 | 12,315 | 17,687 |
| | | | | 226,256 |
| Industrials (10.7%) | | | | |
| 3 3D Systems Corp. Cvt. | 5.500% | 12/15/16 | 8,535 | 8,257 |
| 3 AAR Corp. Cvt. | 1.625% | 3/1/14 | 2,505 | 2,283 |
| 6 Abengoa SA Cvt. | 4.500% | 2/3/17 | 3,250 | 3,712 |
| 3 Air Lease Corp. Cvt. | 3.875% | 12/1/18 | 18,715 | 18,013 |
| Alliant Techsystems Inc. Cvt. | 3.000% | 8/15/24 | 13,411 | 14,048 |
| 2 Asahi Glass Co. Ltd. Cvt. | 0.000% | 11/14/14 | 210,000 | 2,710 |
| Avis Budget Group Inc. Cvt. | 3.500% | 10/1/14 | 13,660 | 14,377 |
| Barnes Group Inc. Cvt. | 3.375% | 3/15/27 | 8,215 | 8,944 |
| 3 Barnes Group Inc. Cvt. | 3.375% | 3/15/27 | 5,240 | 5,705 |
| 3 CBIZInc. Cvt. | 4.875% | 10/1/15 | 2,715 | 2,919 |
| ChartIndustries Inc. Cvt. | 2.000% | 8/1/18 | 15,336 | 17,464 |
| Covanta Holding Corp. Cvt. | 3.250% | 6/1/14 | 21,720 | 23,838 |
| 3 Greenbrier Cos. Inc. Cvt. | 3.500% | 4/1/18 | 15,225 | 13,950 |
| 6 Iliad SA Cvt. | 2.200% | 1/1/12 | 400 | 545 |
| 3 Kaman Corp. Cvt. | 3.250% | 11/15/17 | 5,380 | 5,972 |
| 6 Kloeckner & Co. Financial Services SA Cvt. | 2.500% | 12/22/17 | 3,300 | 3,697 |
| Larsen & Toubro Ltd. Cvt. | 3.500% | 10/22/14 | 2,600 | 2,601 |
| 6 Misarte Cvt. | 3.250% | 1/1/16 | 2,842 | 3,848 |
| Navistar International Corp. Cvt. | 3.000% | 10/15/14 | 5,875 | 6,264 |
| 6 Nexans SA Cvt. | 1.500% | 1/1/16 | 2,485 | 3,643 |
| 2 Nidec Corp. Cvt. | 0.000% | 9/18/15 | 270,000 | 3,554 |
| PB Issuer No 2 Ltd. Cvt. | 1.750% | 4/12/16 | 2,810 | 2,389 |
| 7 Russel Metals Inc. Cvt. | 7.750% | 9/30/16 | 3,325 | 3,643 |
| 6 SGL Carbon SE Cvt. | 0.750% | 5/16/13 | 1,750 | 2,910 |
| 6 Societa Iniziative Autostradali e Servizi SPA Cvt. | 2.625% | 6/30/17 | 2,993 | 3,076 |
| 6 Tem SAS Cvt. | 4.250% | 1/1/15 | 1,758 | 2,334 |
| | | | | 180,696 |
| Information Technology (21.7%) | | | | |
| Alliance Data Systems Corp. Cvt. | 1.750% | 8/1/13 | 11,350 | 15,436 |
| 6 Atos Cvt. | 2.500% | 1/1/16 | 2,466 | 3,677 |
| AUOptronics Corp. Cvt. | 0.000% | 10/13/15 | 3,200 | 2,528 |
| 3 BroadSoft Inc. Cvt. | 1.500% | 7/1/18 | 8,685 | 8,935 |
| CACI International Inc. Cvt. | 2.125% | 5/1/14 | 8,695 | 10,260 |
| 3 CACI International Inc. Cvt. | 2.125% | 5/1/14 | 1,575 | 1,858 |
| 6 Cap Gemini SA Cvt. | 3.500% | 1/1/14 | 1,402 | 2,054 |
| 3 Ciena Corp. Cvt. | 3.750% | 10/15/18 | 7,145 | 6,681 |
| Comtech Telecommunications Corp. Cvt. | 3.000% | 5/1/29 | 8,815 | 9,443 |
| 3 Concur Technologies Inc. Cvt. | 2.500% | 4/15/15 | 9,335 | 10,689 |
| 6 Econocom Group Cvt. | 4.000% | 6/1/16 | 1,946 | 2,313 |
| 3 Electronic Arts Inc. Cvt. | 0.750% | 7/15/16 | 10,695 | 10,829 |
| EquinixInc. Cvt. | 4.750% | 6/15/16 | 8,925 | 12,406 |
| Hanwha SolarOne Co. Ltd. Cvt. | 3.500% | 1/15/18 | 2,460 | 1,208 |
| Hon Hai Precision Industry Co. Ltd. Cvt. | 0.000% | 10/12/13 | 200 | 190 |
| 6 Ingenico Cvt. | 2.750% | 1/1/17 | 1,256 | 1,910 |
| Intel Corp. Cvt. | 2.950% | 12/15/35 | 5,995 | 6,415 |
| Intel Corp. Cvt. | 3.250% | 8/1/39 | 24,911 | 31,699 |
| 3 Lam Research Corp. Cvt. | 0.500% | 5/15/16 | 11,705 | 11,295 |
| 3 Lam Research Corp. Cvt. | 1.250% | 5/15/18 | 17,410 | 16,779 |
Convertible Securities Fund
| | | | | |
| | | | | Face | Market |
| | | | Maturity | Amount‡ | Value |
| | | Coupon | Date | (000) | ($000) |
| | Linear Technology Corp. Cvt. | 3.000% | 5/1/27 | 575 | 589 |
| 3 | Mentor Graphics Corp. Cvt. | 4.000% | 4/1/31 | 12,665 | 12,428 |
| 3 | Micron Technology Inc. Cvt. | 1.500% | 8/1/31 | 16,860 | 14,479 |
| | Micron Technology Inc. Cvt. | 1.875% | 6/1/27 | 27,749 | 23,725 |
| 3 | Micron Technology Inc. Cvt. | 1.875% | 8/1/31 | 10,060 | 8,601 |
| 1 | Misys plc Cvt. | 2.500% | 11/22/15 | 1,500 | 2,385 |
| 6 | NEOPOST SA CVT. | 3.750% | 2/1/15 | 2,845 | 3,813 |
| 3 | Nuance Communications Inc. Cvt. | 2.750% | 11/1/31 | 19,450 | 20,544 |
| | ON Semiconductor Corp. Cvt. | 2.625% | 12/15/26 | 19,592 | 21,502 |
| 3 | Photronics Inc. Cvt. | 3.250% | 4/1/16 | 3,230 | 3,016 |
| | RF Micro Devices Inc. Cvt. | 1.000% | 4/15/14 | 7,500 | 7,912 |
| | Rovi Corp. Cvt. | 2.625% | 2/15/40 | 4,985 | 5,022 |
| | SanDisk Corp. Cvt. | 1.500% | 8/15/17 | 29,370 | 34,143 |
| | SunPower Corp. Cvt. | 4.500% | 3/15/15 | 13,976 | 10,045 |
| 3 | Take-Two Interactive Software Inc. Cvt. | 1.750% | 12/1/16 | 9,015 | 8,812 |
| | TPK Holding Co. Ltd. Cvt. | 0.000% | 4/20/14 | 600 | 504 |
| | TTM Technologies Inc. Cvt. | 3.250% | 5/15/15 | 3,786 | 3,961 |
| | VeriSign Inc. Cvt. | 3.250% | 8/15/37 | 6,969 | 7,919 |
| 3 | Vishay Intertechnology Inc. Cvt. | 2.250% | 5/15/41 | 11,195 | 8,144 |
| 3 | WebMD Health Corp. Cvt. | 2.500% | 1/31/18 | 275 | 249 |
| | | | | | 364,398 |
| Materials (6.3%) | | | | |
| | AngloGold Ashanti Holdings Finance plc Cvt. | 3.500% | 5/22/14 | 2,300 | 2,651 |
| | AquariusPlatinum Ltd. Cvt. | 4.000% | 12/18/15 | 2,400 | 2,103 |
| | ArcelorMittal Cvt. | 5.000% | 5/15/14 | 1,295 | 1,379 |
| | Cemex SAB de CV Cvt. | 4.875% | 3/15/15 | 21,272 | 12,072 |
| | Goldcorp Inc. Cvt. | 2.000% | 8/1/14 | 1,085 | 1,466 |
| 3 | Kaiser Aluminum Corp. Cvt. | 4.500% | 4/1/15 | 8,605 | 10,131 |
| 3 | Molycorp Inc. Cvt. | 3.250% | 6/15/16 | 7,875 | 7,284 |
| | Petropavlovsk 2010 Ltd. Cvt. | 4.000% | 2/18/15 | 3,100 | 2,674 |
| | RTIInternational Metals Inc. Cvt. | 3.000% | 12/1/15 | 11,670 | 12,604 |
| 6 | Salzgitter Finance BV Cvt. | 1.125% | 10/6/16 | 200 | 242 |
| 6 | Salzgitter Finance BV Cvt. | 2.000% | 11/8/17 | 2,650 | 3,742 |
| 3 | ShengdaTechInc. Cvt. | 6.500% | 12/15/15 | 305 | 30 |
| | Steel Dynamics Inc. Cvt. | 5.125% | 6/15/14 | 17,740 | 19,203 |
| | Tata Steel Ltd. Cvt. | 4.500% | 11/21/14 | 3,531 | 3,169 |
| | United States Steel Corp. Cvt. | 4.000% | 5/15/14 | 21,140 | 23,545 |
| | Welspun Corp. Ltd. Cvt. | 4.500% | 10/17/14 | 2,700 | 2,167 |
| 10 | Western Areas NL Cvt. | 6.375% | 7/2/14 | 1,185 | 1,192 |
| 10 | Western Areas NL Cvt. | 6.400% | 7/2/15 | 500 | 531 |
| | | | | | 106,185 |
| Telecommunication Services (4.6%) | | | | |
| 3 | InterDigital Inc. Cvt. | 2.500% | 3/15/16 | 135 | 144 |
| 6 | Portugal Telecom International Finance BV Cvt. | 4.125% | 8/28/14 | 1,200 | 1,326 |
| | SBACommunications Corp. Cvt. | 1.875% | 5/1/13 | 43,194 | 47,675 |
| | SKTelecom Co. Ltd. Cvt. | 1.750% | 4/7/14 | 2,961 | 3,158 |
| | twtelecom inc Cvt. | 2.375% | 4/1/26 | 21,540 | 24,906 |
| | | | | | 77,209 |
| Utilities (0.6%) | | | | |
| 6 | International Power Finance Jersey III Ltd. Cvt. | 4.750% | 6/5/15 | 1,500 | 2,107 |
| | Tata Power Co. Ltd. Cvt. | 1.750% | 11/21/14 | 1,700 | 1,577 |
| | YTL Corp. Finance Labuan Ltd. Cvt. | 1.875% | 3/18/15 | 5,800 | 5,757 |
| | | | | | 9,441 |
| Total Convertible Bonds (Cost $1,441,347) | | | | 1,411,599 |
19
Convertible Securities Fund
| | | |
| | | | Market |
| | | | Value |
| | Coupon | Shares | ($000) |
| Convertible Preferred Stocks (11.8%) | | | |
| Consumer Discretionary (2.6%) | | | |
| General Motors Co. Pfd. | 4.750% | 805,000 | 27,470 |
| Interpublic Group of Cos. Inc. Pfd. | 5.250% | 16,639 | 15,358 |
| | | | 42,828 |
| Energy (3.8%) | | | |
| Apache Corp. Pfd. | 6.000% | 328,900 | 18,624 |
| ATPOil & Gas Corp. Pfd. | 8.000% | 24,200 | 911 |
| ATPOil & Gas Corp. Pfd. | 8.000% | 55,060 | 2,072 |
| 3 ChesapeakeEnergy Corp. Pfd. | 5.750% | 8,590 | 9,191 |
| Energy XXI Bermuda Ltd. Pfd. | 5.625% | 65,610 | 21,651 |
| Goodrich Petroleum Corp. Pfd. | 5.375% | 349,900 | 11,350 |
| | | | 63,799 |
| Financials (3.3%) | | | |
| Citigroup Inc. Pfd. | 7.500% | 100,600 | 8,476 |
| Entertainment Properties Trust Pfd. | 5.750% | 206,200 | 3,978 |
| Fifth Third Bancorp Pfd. | 8.500% | 121,540 | 17,228 |
| Health Care REIT Inc. Pfd. | 6.500% | 122,533 | 5,996 |
| MetLife Inc. Pfd. | 5.000% | 338,700 | 20,590 |
| | | | 56,268 |
| Health Care (1.6%) | | | |
| HealthSouth Corp. Pfd. | 6.500% | 16,430 | 14,701 |
| Omnicare Capital Trust II Pfd. | 4.000% | 275,500 | 12,225 |
| | | | 26,926 |
| Industrials (0.5%) | | | |
| Continental Airlines Finance Trust II Pfd. | 6.000% | 65,700 | 1,799 |
| Stanley Black & Decker Inc. Pfd. | 4.750% | 62,320 | 7,059 |
| | | | 8,858 |
| Total Convertible Preferred Stocks (Cost $211,486) | | | 198,679 |
| Temporary Cash Investment (3.2%) | | | |
| Money Market Fund (3.2%) | | | |
| 11 Vanguard Market Liquidity Fund | | | |
| (Cost $53,583) | 0.135% | 53,582,868 | 53,583 |
| Total Investments (99.0%) (Cost $1,706,416) | | | 1,663,861 |
| Other Assets and Liabilities (1.0%) | | | |
| Other Assets | | | 27,093 |
| Liabilities | | | (10,529) |
| | | | 16,564 |
| Net Assets (100%) | | | |
| Applicable to 138,646,737 outstanding $.001 par value shares of | | |
| beneficial interest (unlimited authorization) | | | 1,680,425 |
| Net Asset Value Per Share | | | $12.12 |
20
Convertible Securities Fund
| |
| At November 30, 2011, net assets consisted of: | |
| | Amount |
| | ($000) |
| Paid-in Capital | 1,682,515 |
| Undistributed Net Investment Income | 16,842 |
| Accumulated Net Realized Gains | 21,790 |
| Unrealized Appreciation (Depreciation) | |
| Investment Securities | (42,555) |
| Forward Currency Contracts | 1,876 |
| Foreign Currencies | (43) |
| Net Assets | 1,680,425 |
See Note A in Notes to Financial Statements.
‡ Face amount is stated in U.S. dollars unless otherwise indicated.
1 Face amount denominated in British pounds.
2 Face amount denominated in Japanese yen.
3 Security exempt from registration under Rule 144A of the Securities Act of 1933. Such securities may be sold in transactions exempt from
registration, normally to qualified institutional buyers. At November 30, 2011, the aggregate value of these securities was $414,221,000,
representing 24.6% of net assets.
4 Face amount denominated in Chinese yuan.
5 Face amount denominated in Hong Kong dollars.
6 Face amount denominated in Euro.
7 Face amount denominated in Canadian dollars.
8 Face amount denominated in Singapore dollars.
9 Face amount denominated in Swiss francs.
10 Face amount denominated in Australian dollars.
11 Affiliated money market fund available only to Vanguard funds and certain trusts and accounts managed by Vanguard. Rate shown is the
7-day yield.
REIT—Real Estate Investment Trust.
See accompanying Notes, which are an integral part of the Financial Statements.
21
Convertible Securities Fund
Statement of Operations
| |
| | Year Ended |
| | November 30, 2011 |
| | ($000) |
| Investment Income | |
| Income | |
| Dividends | 13,196 |
| Interest1,2 | 64,329 |
| Total Income | 77,525 |
| Expenses | |
| Investment Advisory Fees—Note B | |
| Basic Fee | 6,644 |
| Performance Adjustment | 569 |
| The Vanguard Group—Note C | |
| Management and Administrative | 3,747 |
| Marketing and Distribution | 447 |
| Custodian Fees | 59 |
| Auditing Fees | 36 |
| Shareholders’ Reports | 30 |
| Trustees’ Fees and Expenses | 4 |
| Total Expenses | 11,536 |
| Net Investment Income | 65,989 |
| Realized Net Gain (Loss) | |
| Investment Securities Sold | 51,892 |
| Foreign Currencies and Forward Currency Contracts | (1,554) |
| Realized Net Gain (Loss) | 50,338 |
| Change in Unrealized Appreciation (Depreciation) | |
| Investment Securities | (191,649) |
| Foreign Currencies and Forward Currency Contracts | 1,833 |
| Change in Unrealized Appreciation (Depreciation) | (189,816) |
| Net Increase (Decrease) in Net Assets Resulting from Operations | (73,489) |
| 1 Interest income is net of foreign withholding taxes of $14,000. |
| 2 Interest income from an affiliated company of the fund was $117,000. |
See accompanying Notes, which are an integral part of the Financial Statements.
22
Convertible Securities Fund
Statement of Changes in Net Assets
| | |
| | Year Ended November 30, |
| | 2011 | 2010 |
| | ($000) | ($000) |
| Increase (Decrease) in Net Assets | | |
| Operations | | |
| Net Investment Income | 65,989 | 68,729 |
| Realized Net Gain (Loss) | 50,338 | 188,469 |
| Change in Unrealized Appreciation (Depreciation) | (189,816) | 40,819 |
| Net Increase (Decrease) in Net Assets Resulting from Operations | (73,489) | 298,017 |
| Distributions | | |
| Net Investment Income | (68,040) | (73,612) |
| Realized Capital Gain1 | (121,860) | — |
| Total Distributions | (189,900) | (73,612) |
| Capital Share Transactions | | |
| Issued | 538,457 | 212,318 |
| Issued in Lieu of Cash Distributions | 166,796 | 62,394 |
| Redeemed2 | (494,030) | (481,368) |
| Net Increase (Decrease) from Capital Share Transactions | 211,223 | (206,656) |
| Total Increase (Decrease) | (52,166) | 17,749 |
| Net Assets | | |
| Beginning of Period | 1,732,591 | 1,714,842 |
| End of Period3 | 1,680,425 | 1,732,591 |
1 Includes fiscal 2011 short-term gain distributions totaling $71,840,000. Short-term gain distributions are treated as ordinary income
dividends for tax purposes.
2 Net of redemption fees for fiscal 2011 and 2010 of $945,000 and $318,000, respectively.
3 Net Assets—End of Period includes undistributed net investment income of $16,842,000 and $10,647,000.
See accompanying Notes, which are an integral part of the Financial Statements.
23
Convertible Securities Fund
Financial Highlights
| | | | | |
| For a Share Outstanding | Year Ended November 30, |
| Throughout Each Period | 2011 | 2010 | 2009 | 2008 | 2007 |
| Net Asset Value, Beginning of Period | $13.85 | $12.12 | $8.86 | $14.95 | $14.81 |
| Investment Operations | | | | | |
| Net Investment Income | .451 | .555 | .475 | .401 | .420 |
| Net Realized and Unrealized Gain (Loss) | | | | | |
| on Investments | (.752) | 1.742 | 3.211 | (5.170) | 1.250 |
| Total from Investment Operations | (.301) | 2.297 | 3.686 | (4.769) | 1.670 |
| Distributions | | | | | |
| Dividends from Net Investment Income | (.474) | (.567) | (.426) | (.501) | (.510) |
| Distributions from Realized Capital Gains | (.955) | — | — | (.820) | (1.020) |
| Total Distributions | (1.429) | (.567) | (.426) | (1.321) | (1.530) |
| Net Asset Value, End of Period | $12.12 | $13.85 | $12.12 | $8.86 | $14.95 |
| |
| Total Return1 | -2.89% | 19.39% | 42.55% | -34.81% | 12.34% |
| |
| Ratios/Supplemental Data | | | | | |
| Net Assets, End of Period (Millions) | $1,680 | $1,733 | $1,715 | $716 | $872 |
| Ratio of Total Expenses to | | | | | |
| Average Net Assets2 | 0.59% | 0.68% | 0.72% | 0.71% | 0.77% |
| Ratio of Net Investment Income to | | | | | |
| Average Net Assets | 3.36% | 4.08% | 4.65% | 3.28% | 2.83% |
| Portfolio Turnover Rate | 90% | 103% | 103% | 77% | 116% |
1 Total returns do not include transaction or account service fees that may have applied in the periods shown. Fund prospectuses provide
information about any applicable transaction and account service fees.
2 Includes performance-based investment advisory fee increases (decreases) of 0.03%, 0.12%, 0.12%, 0.15%, and 0.16%.
See accompanying Notes, which are an integral part of the Financial Statements.
24
Convertible Securities Fund
Notes to Financial Statements
Vanguard Convertible Securities Fund is registered under the Investment Company Act of 1940 as an open-end investment company, or mutual fund. The fund invests in securities of foreign issuers, which may subject it to investment risks not normally associated with investing in securities of United States corporations.
A. The following significant accounting policies conform to generally accepted accounting principles for U.S. mutual funds. The fund consistently follows such policies in preparing its financial statements.
1. Security Valuation: Securities are valued as of the close of trading on the New York Stock Exchange (generally 4 p.m., Eastern time) on the valuation date. Equity securities are valued at the latest quoted sales prices or official closing prices taken from the primary market in which each security trades; such securities not traded on the valuation date are valued at the mean of the latest quoted bid and asked prices. Bonds, and temporary cash investments acquired over 60 days to maturity, are valued using the latest bid prices or using valuations based on a matrix system (which considers such factors as security prices, yields, maturities, and ratings), both as furnished by independent pricing services. Investments in Vanguard Market Liquidity Fund are valued at that fund’s net asset value. Other temporary cash investments are valued at amortized cost, which approximates market value. Securities for which market quotations are not readily available, or whose values have been materially affected by events occurring before the fund’s pricing time but after the close of the securities’ primary markets, are valued by methods deemed by the board of trustees to represent fair value.
2. Foreign Currency: Securities and other assets and liabilities denominated in foreign currencies are translated into U.S. dollars using exchange rates obtained from an independent third party as of the fund’s pricing time on the valuation date. Realized gains (losses) and unrealized appreciation (depreciation) on investment securities include the effects of changes in exchange rates since the securities were purchased, combined with the effects of changes in security prices. Fluctuations in the value of other assets and liabilities resulting from changes in exchange rates are recorded as unrealized foreign currency gains (losses) until the assets or liabilities are settled in cash, at which time they are recorded as realized foreign currency gains (losses).
3. Forward Currency Contracts: The fund enters into forward currency contracts to protect the value of securities and related receivables and payables against changes in future foreign exchange rates. The fund’s risks in using these contracts include movement in the values of the foreign currencies relative to the U.S. dollar and the ability of the counterparties to fulfill their obligations under the contracts. Counterparty risk is mitigated by entering into forward currency contracts only with highly rated counterparties, by a master netting arrangement between the fund and the counterparty, and by the posting of collateral by the counterparty. The forward currency contracts contain provisions whereby a counterparty may terminate open contracts if the fund’s net assets decline below a certain level, triggering a payment by the fund if the fund is in a net liability position at the time of the termination. The payment amount would be reduced by any collateral the fund has posted. Any securities posted as collateral for open contracts are noted in the Statement of Net Assets.
Forward currency contracts are valued at their quoted daily prices obtained from an independent third party, adjusted for currency risk based on the expiration date of each contract. The aggregate principal amounts of the contracts are not recorded in the Statement of Net Assets. Fluctuations in the value of
25
Convertible Securities Fund
the contracts are recorded in the Statement of Net Assets as an asset (liability) and in the Statement of Operations as unrealized appreciation (depreciation) until the contracts are closed, when they are recorded as realized forward currency contract gains (losses).
4. Federal Income Taxes: The fund intends to continue to qualify as a regulated investment company and distribute all of its taxable income. Management has analyzed the fund’s tax positions taken for all open federal income tax years (November 30, 2008–2011), and has concluded that no provision for federal income tax is required in the fund’s financial statements.
5. Distributions: Distributions to shareholders are recorded on the ex-dividend date.
6. Other: Dividend income is recorded on the ex-dividend date. Interest income includes income distributions received from Vanguard Market Liquidity Fund and is accrued daily. Premiums and discounts on debt securities purchased are amortized and accreted, respectively, to interest income over the lives of the respective securities. Security transactions are accounted for on the date securities are bought or sold. Costs used to determine realized gains (losses) on the sale of investment securities are those of the specific securities sold. Fees assessed on redemptions of capital shares are credited to paid-in capital.
B. Oaktree Capital Management, L.P., provides investment advisory services to the fund for a fee calculated at an annual percentage rate of average net assets. Effective March 1, 2011, the basic fee is subject to quarterly adjustments based on the fund’s performance for the preceding three years relative to the Bank of America Merrill Lynch All US Convertibles Index (previously Merrill Lynch All Convertibles-All Qualities Index) for periods prior to March 1, 2011, and a composite index weighted 70% Bank of America Merrill Lynch All US Convertibles Index and 30% Bank of America Merrill Lynch Global 300 Convertibles ex-US Index (hedged) thereafter. The benchmark change will be fully phased in by February 2014. For the year ended November 30, 2011, the investment advisory fee represented an effective annual basic rate of 0.34% of the fund’s average net assets before an increase of $569,000 (0.03%) based on performance.
C. The Vanguard Group furnishes at cost corporate management, administrative, marketing, and distribution services. The costs of such services are allocated to the fund under methods approved by the board of trustees. The fund has committed to provide up to 0.40% of its net assets in capital contributions to Vanguard. At November 30, 2011, the fund had contributed capital of $281,000 to Vanguard (included in Other Assets), representing 0.02% of the fund’s net assets and 0.11% of Vanguard’s capitalization. The fund’s trustees and officers are also directors and officers of Vanguard.
D. Various inputs may be used to determine the value of the fund’s investments. These inputs are summarized in three broad levels for financial statement purposes. The inputs or methodologies used to value securities are not necessarily an indication of the risk associated with investing in those securities.
Level 1—Quoted prices in active markets for identical securities.
Level 2—Other significant observable inputs (including quoted prices for similar securities, interest
rates, prepayment speeds, credit risk, etc.).
Level 3—Significant unobservable inputs (including the fund’s own assumptions used to determine
the fair value of investments).
Convertible Securities Fund
The following table summarizes the market value of the fund’s investments as of November 30, 2011, based on the inputs used to value them:
| | | |
| | Level 1 | Level 2 | Level 3 |
| Investments | ($000) | ($000) | ($000) |
| Convertible Bonds | — | 1,411,599 | — |
| Convertible Preferred Stocks | 198,679 | — | — |
| Temporary Cash Investments | 53,583 | — | — |
| Forward Currency Contracts—Assets | — | 1,917 | — |
| Forward Currency Contracts—Liabilities | — | (41) | — |
| Total | 252,262 | 1,413,475 | — |
E. At November 30, 2011, the fund had open forward currency contracts to receive and deliver currencies as follows. Unrealized appreciation (depreciation) on open forward currency contracts is treated as realized gain (loss) for tax purposes.
| | | | | | |
| | | | | | | Unrealized |
| | Contract | | | | | Appreciation |
| | Settlement | Contract Amount (000) | (Depreciation) |
| Counterparty | Date | | Receive | | Deliver | ($000) |
| UBS AG | 1/19/12 | USD | 82,277 | EUR | 61,085 | 1,615 |
| UBS AG | 1/19/12 | USD | 17,281 | JPY | 1,339,865 | 189 |
| UBS AG | 1/19/12 | USD | 14,291 | HKD | 111,094 | 6 |
| UBS AG | 1/19/12 | USD | 10,942 | GBP | 6,960 | (19) |
| UBS AG | 1/19/12 | USD | 7,171 | CAD | 7,300 | (7) |
| UBS AG | 1/19/12 | USD | 5,304 | CHF | 4,820 | 63 |
| UBS AG | 1/19/12 | USD | 4,059 | SGD | 5,200 | 44 |
| UBS AG | 1/19/12 | USD | 1,705 | AUD | 1,670 | (14) |
| UBS AG | 1/19/12 | USD | 1,081 | HKD | 8,402 | (1) |
AUD—Australian dollar.
CAD—Canadian dollar.
CHF—Swiss franc.
EUR—Euro.
GBP—British pound.
HKD—Hong Kong dollar.
JPY—Japanese yen.
SGD—Singapore dollar.
USD—U.S. dollar.
F. Distributions are determined on a tax basis and may differ from net investment income and realized capital gains for financial reporting purposes. Differences may be permanent or temporary. Permanent differences are reclassified among capital accounts in the financial statements to reflect their tax character. Temporary differences arise when certain items of income, expense, gain, or loss are recognized in different periods for financial statement and tax purposes; these differences will reverse at some time in the future. Differences in classification may also result from the treatment of short-term gains as ordinary income for tax purposes.
27
Convertible Securities Fund
During the year ended November 30, 2011, the fund realized net foreign currency gains of $23,000 (including the foreign currency component on sales of foreign currency denominated bonds), which increased distributable net income for tax purposes; accordingly, such gains have been reclassified from accumulated net realized gains to undistributed net investment income.
Certain of the fund’s convertible preferred stock investments are treated as debt securities for tax purposes. During the year ended November 30, 2011, the fund realized losses of $18,000 from the sale of these securities, which are included in distributable net investment income for tax purposes; accordingly, such losses have been reclassified from accumulated net realized gains to undistributed net investment income.
Certain of the fund’s convertible bond investments are in securities considered to be “contingent payment debt instruments,” for which any realized gains increase (and all or part of any realized losses decrease) income for tax purposes. During the year ended November 30, 2011, the fund realized net gains of $8,241,000 from the sale of these securities, which increased distributable net income for tax purposes; accordingly, such gains have been reclassified from accumulated net realized gains to undistributed net investment income.
The fund used a tax accounting practice to treat a portion of the price of capital shares redeemed during the year as distributions from realized capital gains. Accordingly, the fund has reclassified $19,950,000 from accumulated net realized gains to paid-in capital.
For tax purposes, at November 30, 2011, the fund had $22,914,000 of ordinary income and $20,959,000 of long-term capital gains available for distribution.
At November 30, 2011, the cost of investment securities for tax purposes was $1,706,589,000. Net unrealized depreciation of investment securities for tax purposes was $42,728,000, consisting of unrealized gains of $96,205,000 on securities that had risen in value since their purchase and $138,933,000 in unrealized losses on securities that had fallen in value since their purchase.
G. During the year ended November 30, 2011, the fund purchased $1,760,432,000 of investment securities and sold $1,698,576,000 of investment securities, other than temporary cash investments.
H. Capital shares issued and redeemed were:
| | |
| | Year Ended November 30, |
| | 2011 | 2010 |
| | Shares | Shares |
| | (000) | (000) |
| Issued | 39,245 | 16,162 |
| Issued in Lieu of Cash Distributions | 12,534 | 4,846 |
| Redeemed | (38,263) | (37,355) |
| Net Increase (Decrease) in Shares Outstanding | 13,516 | (16,347) |
I. In preparing the financial statements as of November 30, 2011, management considered the impact of subsequent events for potential recognition or disclosure in these financial statements.
28
Report of Independent Registered
Public Accounting Firm
To the Trustees and Shareholders of Vanguard Convertible Securities Fund:
In our opinion, the accompanying statement of net assets and the related statements of operations and of changes in net assets and the financial highlights present fairly, in all material respects, the financial position of Vanguard Convertible Securities Fund (the “Fund”) at November 30, 2011, the results of its operations for the year then ended, the changes in its net assets for each of the two years in the period then ended and the financial highlights for each of the five years in the period then ended, in conformity with accounting principles generally accepted in the United States of America. These financial statements and financial highlights (hereafter referred to as “financial statements”) are the responsibility of the Fund’s management; our responsibility is to express an opinion on these financial statements based on our audits. We conducted our audits of these financial statements in accordance with the standards of the Public Company Accounting Oversight Board (United States). Those standards require that we plan and perform the audit to obtain reasonable assurance about whether the financial statements are free of material misstatement. An audit includes examining, on a test basis, evidence supporting the amounts and disclosures in the financial statements, assessing the accounting principles used and significant estimates made by management, and evaluating the overall financial statement presentation. We believe that our audits, which included confirmation of securities at November 30, 2011 by correspondence with the custodian and broker and by agreement to the underlying ownership records of Vanguard Market Liquidity Fund, provide a reasonable basis for our opinion.
PricewaterhouseCoopers LLP
Philadelphia, Pennsylvania
January 13, 2012
Special 2011 tax information (unaudited) for Vanguard Convertible Securities Fund
This information for the fiscal year ended November 30, 2011, is included pursuant to provisions of
the Internal Revenue Code.
The fund distributed $67,354,000 as capital gain dividends (from net long-term capital gains) to
shareholders during the fiscal year.
For corporate shareholders, 13.5% of investment income (dividend income plus short-term gains,
if any) qualifies for the dividends-received deduction.
29
Your Fund’s After-Tax Returns
This table presents returns for your fund both before and after taxes. The after-tax returns are shown in two ways: (1) assuming that an investor owned the fund during the entire period and paid taxes on the fund’s distributions, and (2) assuming that an investor paid taxes on the fund’s distributions and sold all shares at the end of each period.
Calculations are based on the highest individual federal income tax and capital gains tax rates in effect at the times of the distributions and the hypothetical sales. State and local taxes were not considered. After-tax returns reflect any qualified dividend income, using actual prior-year figures and estimates for 2011. (In the example, returns after the sale of fund shares may be higher than those assuming no sale. This occurs when the sale would have produced a capital loss. The calculation assumes that the investor received a tax deduction for the loss.)
Please note that your actual after-tax returns will depend on your tax situation and may differ from those shown. Also note that if you own the fund in a tax-deferred account, such as an individual retirement account or a 401(k) plan, this information does not apply to you. Such accounts are not subject to current taxes.
Finally, keep in mind that a fund’s performance—whether before or after taxes—does not guarantee future results.
Average Annual Total Returns: Convertible Securities Fund
Periods Ended November 30, 2011
| | | |
| | One | Five | Ten |
| | Year | Years | Years |
| Returns Before Taxes | -2.89% | 3.89% | 6.43% |
| Returns After Taxes on Distributions | -5.76 | 1.57 | 4.50 |
| Returns After Taxes on Distributions and Sale of Fund Shares | -1.15 | 2.17 | 4.55 |
Returns do not reflect the 1% fee on redemptions of shares held for less than one year.
30
About Your Fund’s Expenses
As a shareholder of the fund, you incur ongoing costs, which include costs for portfolio management, administrative services, and shareholder reports (like this one), among others. Operating expenses, which are deducted from a fund’s gross income, directly reduce the investment return of the fund.
A fund’s expenses are expressed as a percentage of its average net assets. This figure is known as the expense ratio. The following examples are intended to help you understand the ongoing costs (in dollars) of investing in your fund and to compare these costs with those of other mutual funds. The examples are based on an investment of $1,000 made at the beginning of the period shown and held for the entire period.
The accompanying table illustrates your fund’s costs in two ways:
• Based on actual fund return. This section helps you to estimate the actual expenses that you paid over the period. The ”Ending Account Value“ shown is derived from the fund‘s actual return, and the third column shows the dollar amount that would have been paid by an investor who started with $1,000 in the fund. You may use the information here, together with the amount you invested, to estimate the expenses that you paid over the period.
To do so, simply divide your account value by $1,000 (for example, an $8,600 account value divided by $1,000 = 8.6), then multiply the result by the number given for your fund under the heading ”Expenses Paid During Period.“
• Based on hypothetical 5% yearly return. This section is intended to help you compare your fund‘s costs with those of other mutual funds. It assumes that the fund had a yearly return of 5% before expenses, but that the expense ratio is unchanged. In this case—because the return used is not the fund’s actual return—the results do not apply to your investment. The example is useful in making comparisons because the Securities and Exchange Commission requires all mutual funds to calculate expenses based on a 5% return. You can assess your fund’s costs by comparing this hypothetical example with the hypothetical examples that appear in shareholder reports of other funds.
Note that the expenses shown in the table are meant to highlight and help you compare ongoing costs only and do not reflect transaction costs incurred by the fund for buying and selling securities. Further, the expenses do not include any purchase, redemption, or account service fees described in the fund prospectus. If such fees were applied to your account, your costs would be higher. Your fund does not carry a “sales load.”
The calculations assume no shares were bought or sold during the period. Your actual costs may have been higher or lower, depending on the amount of your investment and the timing of any purchases or redemptions.
You can find more information about the fund’s expenses, including annual expense ratios, in the Financial Statements section of this report. For additional information on operating expenses and other shareholder costs, please refer to your fund’s current prospectus.
31
| | | |
| Six Months Ended November 30, 2011 | | | |
| | Beginning | Ending | Expenses |
| | Account Value | Account Value | Paid During |
| Convertible Securities Fund | 5/31/2011 | 11/30/2011 | Period |
| Based on Actual Fund Return | $1,000.00 | $873.18 | $2.30 |
| Based on Hypothetical 5% Yearly Return | 1,000.00 | 1,022.61 | 2.48 |
The calculations are based on expenses incurred in the most recent six-month period. The fund’s annualized six-month expense ratio for that period is 0.49%. The dollar amounts shown as “Expenses Paid” are equal to the annualized expense ratio multiplied by the average account value over the period, multiplied by the number of days in the most recent six-month period, then divided by the number of days in the most recent 12-month period.
32
Glossary
30-Day SEC Yield. A fund’s 30-day SEC yield is derived using a formula specified by the U.S. Securities and Exchange Commission. Under the formula, data related to the fund’s security holdings in the previous 30 days are used to calculate the fund’s hypothetical net income for that period, which is then annualized and divided by the fund’s estimated average net assets over the calculation period. For the purposes of this calculation, a security’s income is based on its current market yield to maturity (for bonds), its actual income (for asset-backed securities), or its projected dividend yield (for stocks). Because the SEC yield represents hypothetical annualized income, it will differ—at times significantly—from the fund’s actual experience. As a result, the fund’s income distributions may be higher or lower than implied by the SEC yield.
Average Coupon. The average interest rate paid on the fixed income securities held by a fund. It is expressed as a percentage of face value.
Average Duration. An estimate of how much the value of the bonds held by a fund will fluctuate in response to a change in interest rates. To see how the value could change, multiply the average duration by the change in rates. If interest rates rise by 1 percentage point, the value of the bonds in a fund with an average duration of five years would decline by about 5%. If rates decrease by a percentage point, the value would rise by 5%.
Average Weighted Maturity. The average length of time until fixed income securities held by a fund reach maturity and are repaid. The figure reflects the proportion of fund assets represented by each security.
Beta. A measure of the magnitude of a fund’s past share-price fluctuations in relation to the ups and downs of a given market index. The index is assigned a beta of 1.00. Compared with a given index, a fund with a beta of 1.20 typically would have seen its share price rise or fall by 12% when the index rose or fell by 10%. For this report, beta is based on returns over the past 36 months for both the fund and the index. Note that a fund’s beta should be reviewed in conjunction with its R-squared (see definition). The lower the R-squared, the less correlation there is between the fund and the index, and the less reliable beta is as an indicator of volatility.
Conversion Premium. The average percentage by which the weighted average market price of the convertible securities held by a fund exceeds the weighted average market price of their underlying common stocks. For example, if a stock is trading at $25 per share and a bond that is convertible into the stock is trading at a price equivalent to $30 per share of stock, the conversion premium is 20% ($5 ÷ $25 = 20%).
Credit Quality. For this report, credit-quality ratings are measured on a scale that generally ranges from AAA (highest) to D (lowest). “Not Rated” is used to classify securities for which a rating is not available. Credit-quality ratings are obtained from S&P.
Expense Ratio. A fund’s total annual operating expenses expressed as a percentage of the fund’s average net assets. The expense ratio includes management and administrative expenses, but does not include the transaction costs of buying and selling portfolio securities.
Foreign Holdings. The percentage of a fund represented by securities or depositary receipts of companies based outside the United States.
33
Inception Date. The date on which the assets of a fund (or one of its share classes) are first invested in accordance with the fund’s investment objective. For funds with a subscription period, the inception date is the day after that period ends. Investment performance is measured from the inception date.
Market Exposure. A measure that reflects a fund’s security investments excluding any holdings in short-term reserves.
R-Squared. A measure of how much of a fund’s past returns can be explained by the returns from the market in general, as measured by a given index. If a fund’s total returns were precisely synchronized with an index’s returns, its R-squared would be 1.00. If the fund’s returns bore no relationship to the index’s returns, its R-squared would be 0. For this report, R-squared is based on returns over the past 36 months for both the fund and the index.
Short-Term Reserves. The percentage of a fund invested in highly liquid, short-term securities that can be readily converted to cash.
Turnover Rate. An indication of the fund’s trading activity. Funds with high turnover rates incur higher transaction costs and may be more likely to distribute capital gains (which may be taxable to investors). The turnover rate excludes in-kind transactions, which have minimal impact on costs.
34
This page intentionally left blank.
The People Who Govern Your Fund
The trustees of your mutual fund are there to see that the fund is operated and managed in your best interests since, as a shareholder, you are a part owner of the fund. Your fund’s trustees also serve on the board of directors of The Vanguard Group, Inc., which is owned by the Vanguard funds and provides services to them on an at-cost basis.
A majority of Vanguard’s board members are independent, meaning that they have no affiliation with Vanguard or the funds they oversee, apart from the sizable personal investments they have made as private individuals. The independent board members have distinguished backgrounds in business, academia, and public service. Each of the trustees and executive officers oversees 180 Vanguard funds.
The following table provides information for each trustee and executive officer of the fund. More information about the trustees is in the Statement of Additional Information, which can be obtained, without charge, by contacting Vanguard at 800-662-7447, or online at vanguard.com.
| |
| Interested Trustee1 | and President (2006–2008) of Rohm and Haas Co. |
| | (chemicals); Director of Tyco International, Ltd. |
| F. William McNabb III | (diversified manufacturing and services) and Hewlett- |
| Born 1957. Trustee Since July 2009. Chairman of the | Packard Co. (electronic computer manufacturing); |
| Board. Principal Occupation(s) During the Past Five | Senior Advisor at New Mountain Capital; Trustee |
| Years: Chairman of the Board of The Vanguard Group, | of The Conference Board; Member of the Board of |
| Inc., and of each of the investment companies served | Managers of Delphi Automotive LLP (automotive |
| by The Vanguard Group, since January 2010; Director | components). |
| of The Vanguard Group since 2008; Chief Executive | |
| Officer and President of The Vanguard Group and of | Amy Gutmann |
| each of the investment companies served by The | Born 1949. Trustee Since June 2006. Principal |
| Vanguard Group since 2008; Director of Vanguard | Occupation(s) During the Past Five Years: President |
| Marketing Corporation; Managing Director of The | of the University of Pennsylvania; Christopher H. |
| Vanguard Group (1995–2008). | Browne Distinguished Professor of Political Science |
| | in the School of Arts and Sciences with secondary |
| | appointments at the Annenberg School for Commu- |
| Independent Trustees | nication and the Graduate School of Education |
| | of the University of Pennsylvania; Director of |
| Emerson U. Fullwood | Carnegie Corporation of New York, Schuylkill River |
| Born 1948. Trustee Since January 2008. Principal | Development Corporation, and Greater Philadelphia |
| Occupation(s) During the Past Five Years: Executive | Chamber of Commerce; Trustee of the National |
| Chief Staff and Marketing Officer for North America | Constitution Center; Chair of the Presidential |
| and Corporate Vice President (retired 2008) of Xerox | Commission for the Study of Bioethical Issues. |
| Corporation (document management products and | |
| services); Executive in Residence and 2010 | JoAnn Heffernan Heisen |
| Distinguished Minett Professor at the Rochester | Born 1950. Trustee Since July 1998. Principal |
| Institute of Technology; Director of SPX Corporation | Occupation(s) During the Past Five Years: Corporate |
| (multi-industry manufacturing), the United Way of | Vice President and Chief Global Diversity Officer |
| Rochester, Amerigroup Corporation (managed health | (retired 2008) and Member of the Executive |
| care), the University of Rochester Medical Center, | Committee (1997–2008) of Johnson & Johnson |
| Monroe Community College Foundation, and North | (pharmaceuticals/consumer products); Director of |
| Carolina A&T University. | Skytop Lodge Corporation (hotels), the University |
| | Medical Center at Princeton, the Robert Wood |
| Rajiv L. Gupta | Johnson Foundation, and the Center for Work Life |
| Born 1945. Trustee Since December 2001. 2 | Policy; Member of the Advisory Board of the |
| Principal Occupation(s) During the Past Five Years: | Maxwell School of Citizenship and Public Affairs |
| Chairman and Chief Executive Officer (retired 2009) | at Syracuse University. |
| | |
| F. Joseph Loughrey | Thomas J. Higgins | |
| Born 1949. Trustee Since October 2009. Principal | Born 1957. Chief Financial Officer Since September |
| Occupation(s) During the Past Five Years: President | 2008. Principal Occupation(s) During the Past Five |
| and Chief Operating Officer (retired 2009) and Vice | Years: Principal of The Vanguard Group, Inc.; Chief |
| Chairman of the Board (2008–2009) of Cummins Inc. | Financial Officer of each of the investment companies |
| (industrial machinery); Director of SKF AB (industrial | served by The Vanguard Group since 2008; Treasurer |
| machinery), Hillenbrand, Inc. (specialized consumer | of each of the investment companies served by The |
| services), the Lumina Foundation for Education, and | Vanguard Group (1998–2008). |
| Oxfam America; Chairman of the Advisory Council | | |
| for the College of Arts and Letters and Member | Kathryn J. Hyatt | |
| of the Advisory Board to the Kellogg Institute for | Born 1955. Treasurer Since November 2008. Principal |
| International Studies at the University of Notre Dame. | Occupation(s) During the Past Five Years: Principal |
| | of The Vanguard Group, Inc.; Treasurer of each of |
| André F. Perold | the investment companies served by The Vanguard |
| Born 1952. Trustee Since December 2004. Principal | Group since 2008; Assistant Treasurer of each of the |
| Occupation(s) During the Past Five Years: George | investment companies served by The Vanguard Group |
| Gund Professor of Finance and Banking at the Harvard | (1988–2008). | |
| Business School (retired July 2011); Chief Investment | | |
| Officer and co-Managing Partner of HighVista | Heidi Stam | |
| Strategies LLC (private investment firm); Director of | Born 1956. Secretary Since July 2005. Principal |
| Rand Merchant Bank; Overseer of the Museum of | Occupation(s) During the Past Five Years: Managing |
| Fine Arts Boston. | Director of The Vanguard Group, Inc., since 2006; |
| | General Counsel of The Vanguard Group since 2005; |
| Alfred M. Rankin, Jr. | Secretary of The Vanguard Group and of each of the |
| Born 1941. Trustee Since January 1993. Principal | investment companies served by The Vanguard Group |
| Occupation(s) During the Past Five Years: Chairman, | since 2005; Director and Senior Vice President of |
| President, and Chief Executive Officer of NACCO | Vanguard Marketing Corporation since 2005; |
| Industries, Inc. (forklift trucks/housewares/lignite); | Principal of The Vanguard Group (1997–2006). |
| Director of Goodrich Corporation (industrial products/ | | |
| aircraft systems and services) and the National | | |
| Association of Manufacturers; Chairman of the | Vanguard Senior Management Team |
| Federal Reserve Bank of Cleveland; Vice Chairman | | |
| of University Hospitals of Cleveland; President of | R. Gregory Barton | Chris D. McIsaac |
| the Board of The Cleveland Museum of Art. | Mortimer J. Buckley | Michael S. Miller |
| | Kathleen C. Gubanich | James M. Norris |
| Peter F. Volanakis | Paul A. Heller | Glenn W. Reed |
| Born 1955. Trustee Since July 2009. Principal | Martha G. King | George U. Sauter |
| Occupation(s) During the Past Five Years: President | | |
| and Chief Operating Officer (retired 2010) of Corning | | |
| Incorporated (communications equipment); Director of | Chairman Emeritus and Senior Advisor |
| Corning Incorporated (2000–2010) and Dow Corning | | |
| (2001–2010); Overseer of the Amos Tuck School of | John J. Brennan | |
| Business Administration at Dartmouth College. | Chairman, 1996–2009 | |
| | Chief Executive Officer and President, 1996–2008 |
| |
| Executive Officers | | |
| | Founder | |
| Glenn Booraem | | |
| Born 1967. Controller Since July 2010. Principal | John C. Bogle | |
| Occupation(s) During the Past Five Years: Principal | Chairman and Chief Executive Officer, 1974–1996 |
| of The Vanguard Group, Inc.; Controller of each of | | |
| the investment companies served by The Vanguard | | |
| Group since 2010; Assistant Controller of each of | | |
| the investment companies served by The Vanguard | | |
| Group (2001–2010). | | |
1 Mr. McNabb is considered an “interested person,” as defined in the Investment Company Act of 1940, because he is an officer of the
Vanguard funds.
2 December 2002 for Vanguard Equity Income Fund, Vanguard Growth Equity Fund, the Vanguard Municipal Bond Funds, and the Vanguard
State Tax-Exempt Funds.

| |
| | P.O. Box 2600 |
| | Valley Forge, PA 19482-2600 |
| |
| |
| |
| Connect with Vanguard® > vanguard.com | |
| |
| |
| |
| Fund Information > 800-662-7447 | CFA® is a trademark owned by CFA Institute. |
| Direct Investor Account Services > 800-662-2739 | |
| Institutional Investor Services > 800-523-1036 | |
| Text Telephone for People | |
| With Hearing Impairment > 800-749-7273 | |
| |
| This material may be used in conjunction | |
| with the offering of shares of any Vanguard | |
| fund only if preceded or accompanied by | |
| the fund’s current prospectus. | |
| |
| All comparative mutual fund data are from Lipper Inc. or | |
| Morningstar, Inc., unless otherwise noted. | |
| |
| You can obtain a free copy of Vanguard’s proxy voting | |
| guidelines by visiting vanguard.com/proxyreporting or by | |
| calling Vanguard at 800-662-2739. The guidelines are | |
| also available from the SEC’s website, sec.gov. In | |
| addition, you may obtain a free report on how your fund | |
| voted the proxies for securities it owned during the 12 | |
| months ended June 30. To get the report, visit either | |
| vanguard.com/proxyreporting or sec.gov. | |
| |
| You can review and copy information about your fund at | |
| the SEC’s Public Reference Room in Washington, D.C. To | |
| find out more about this public service, call the SEC at | |
| 202-551-8090. Information about your fund is also | |
| available on the SEC’s website, and you can receive | |
| copies of this information, for a fee, by sending a | |
| request in either of two ways: via e-mail addressed to | |
| publicinfo@sec.gov or via regular mail addressed to the | |
| Public Reference Section, Securities and Exchange | |
| Commission, Washington, DC 20549-1520. | |
| |
| |
| | © 2012 The Vanguard Group, Inc. |
| | All rights reserved. |
| | Vanguard Marketing Corporation, Distributor. |
| |
| | Q820 012012 |
Item 2: Code of Ethics. The Registrant has adopted a code of ethics that applies to the Registrant’s principal executive officer, principal financial officer, principal accounting officer or controller or persons performing similar functions. The Code of Ethics was amended during the reporting period covered by this report to make certain technical, non-material changes.
Item 3: Audit Committee Financial Expert. The following members of the Audit Committee have been determined by the Registrant’s Board of Trustees to be Audit Committee Financial Experts serving on its Audit Committee, and to be independent: Charles D. Ellis, Rajiv L. Gupta, JoAnn Heffernan Heisen, André F. Perold, and Alfred M. Rankin, Jr.
Item 4: Principal Accountant Fees and Services.
(a) Audit Fees.
Audit Fees of the Registrant
Fiscal Year Ended November 30, 2011: $36,000
Fiscal Year Ended November 30, 2010: $32,000
Aggregate Audit Fees of Registered Investment Companies in the Vanguard Group.
Fiscal Year Ended November 30, 2011: $3,978,540
Fiscal Year Ended November 30, 2010: $3,607,060
(b) Audit-Related Fees.
Fiscal Year Ended November 30, 2011: $1,341,750
Fiscal Year Ended November 30, 2010: $791,350
Includes fees billed in connection with assurance and related services provided to the Registrant, The Vanguard Group, Inc., Vanguard Marketing Corporation, and other registered investment companies in the Vanguard Group.
(c) Tax Fees.
Fiscal Year Ended November 30, 2011: $373,830
Fiscal Year Ended November 30, 2010: $336,090
Includes fees billed in connection with tax compliance, planning and advice services provided to the Registrant, The Vanguard Group, Inc., Vanguard Marketing Corporation, and other registered investment companies in the Vanguard Group and related to income and excise taxes.
(d) All Other Fees.
Fiscal Year Ended November 30, 2011: $16,000
Fiscal Year Ended November 30, 2010: $16,000
Includes fees billed for services related to risk management and privacy matters. Services were provided to the Registrant, The Vanguard Group, Inc., Vanguard Marketing Corporation, and other registered investment companies in the Vanguard Group.
(e) (1) Pre-Approval Policies. The policy of the Registrant’s Audit Committee is to consider and, if appropriate, approve before the principal accountant is engaged for such services, all specific audit and non-audit services provided to: (1) the Registrant; (2) The Vanguard Group, Inc.; (3) other entities controlled by The Vanguard Group, Inc. that provide ongoing services to the Registrant; and (4) other registered investment companies in the Vanguard Group. In making a determination, the Audit Committee considers whether the services are consistent with maintaining the principal accountant’s independence.
In the event of a contingency situation in which the principal accountant is needed to provide services in between scheduled Audit Committee meetings, the Chairman of the Audit Committee would be called on to consider and, if appropriate, pre-approve audit or permitted non-audit services in an amount sufficient to complete services through the next Audit Committee meeting, and to determine if such services would be consistent with maintaining the accountant’s independence. At the next scheduled Audit Committee meeting, services and fees would be presented to the Audit Committee for formal consideration, and, if appropriate, approval by the entire Audit Committee. The Audit Committee would again consider whether such services and fees are consistent with maintaining the principal accountant’s independence.
The Registrant’s Audit Committee is informed at least annually of all audit and non-audit services provided by the principal accountant to the Vanguard complex, whether such services are provided to: (1) the Registrant; (2) The Vanguard Group, Inc.; (3) other entities controlled by The Vanguard Group, Inc. that provide ongoing services to the Registrant; or (4) other registered investment companies in the Vanguard Group.
(2) No percentage of the principal accountant’s fees or services were approved pursuant to the waiver provision of paragraph (c)(7)(i)(C) of Rule 2-01 of Regulation S-X.
(f) For the most recent fiscal year, over 50% of the hours worked under the principal accountant’s engagement were not performed by persons other than full-time, permanent employees of the principal accountant.
(g) Aggregate Non-Audit Fees.
Fiscal Year Ended November 30, 2011: $389,830
Fiscal Year Ended November 30, 2010: $352,090
Includes fees billed for non-audit services provided to the Registrant, The Vanguard Group, Inc., Vanguard Marketing Corporation, and other registered investment companies in the Vanguard Group.
(h) For the most recent fiscal year, the Audit Committee has determined that the provision of all non-audit services was consistent with maintaining the principal accountant’s independence.
Item 5: Audit Committee of Listed Registrants.
Not Applicable.
Item 6: Investments.
Not Applicable.
Item 7: Disclosure of Proxy Voting Policies and Procedures for Closed-End Management Investment Companies.
Not Applicable.
Item 8: Portfolio Managers of Closed-End Management Investment Companies.
Not Applicable.
Item 9: Purchase of Equity Securities by Closed-End Management Investment Company and Affiliated Purchasers.
Not Applicable.
Item 10: Submission of Matters to a Vote of Security Holders.
Not Applicable.
Item 11: Controls and Procedures.
(a) Disclosure Controls and Procedures. The Principal Executive and Financial Officers concluded that the Registrant's Disclosure Controls and Procedures are effective based on their evaluation of the Disclosure Controls and Procedures as of a date within 90 days of the filing date of this report.
(b) Internal Control Over Financial Reporting. There were no significant changes in Registrant’s Internal Control Over Financial Reporting or in other factors that could significantly affect this control subsequent to the date of the evaluation, including any corrective actions with regard to significant deficiencies and material weaknesses.
Item 12: Exhibits.
(a) Code of Ethics.
(b) Certifications.
Pursuant to the requirements of the Securities Exchange Act of 1934 and the Investment Company Act of 1940, the registrant has duly caused this report to be signed on its behalf by the undersigned, thereunto duly authorized.
| | VANGUARD CONVERTIBLE SECURITIES FUND |
| |
| BY: | /s/ F. WILLIAM MCNABB III* |
| | F. WILLIAM MCNABB III |
| | CHIEF EXECUTIVE OFFICER |
| |
| Date: January 20, 2012 |
Pursuant to the requirements of the Securities Exchange Act of 1934 and the Investment Company Act of 1940, this report has been signed below by the following persons on behalf of the registrant and in the capacities and on the dates indicated.
| | VANGUARD CONVERTIBLE SECURITIES FUND |
| |
| BY: | /s/ F. WILLIAM MCNABB III* |
| | F. WILLIAM MCNABB III |
| | CHIEF EXECUTIVE OFFICER |
| |
| Date: January 20, 2012 |
|
| | VANGUARD CONVERTIBLE SECURITIES FUND |
| |
| BY: | /s/ THOMAS J. HIGGINS* |
| | THOMAS J. HIGGINS |
| | CHIEF FINANCIAL OFFICER |
| |
| Date: January 20, 2012 |
* By: /s/ Heidi Stam
Heidi Stam, pursuant to a Power of Attorney filed on November 28, 2011 see file Number
33-23444, Incorporated by Reference.