
Vanguard Convertible Securities Fund Annual Report

Vanguard Convertible Securities Fund returned 42.55% for the fiscal year ended November 30, 2009.
The fund’s performance for the period lagged both the return of its benchmark index, the Merrill Lynch All Convertibles-All Qualities Index, and the average return for peer funds.
The advisor’s conservative approach, focusing on convertibles with downside protection, limited the fund’s results relative to more aggressive portfolios.
| |
| Contents | |
| |
| Your Fund’s Total Returns | 1 |
| President’s Letter | 2 |
| Advisor’s Report | 8 |
| Results of Proxy Voting | 11 |
| Fund Profile | 12 |
| Performance Summary | 14 |
| Financial Statements | 16 |
| Your Fund’s After-Tax Returns | 28 |
| About Your Fund’s Expenses | 29 |
| Glossary | 31 |
Please note: The opinions expressed in this report are just that—informed opinions. They should not be considered promises or advice. Also, please keep in mind that the information and opinions cover the period through the date on the front of this report. Of course, the risks of investing in your fund are spelled out in the prospectus.
Cover photograph: Veronica Coia.
| | | | |
| Your Fund’s Total Returns | | | |
| |
| |
| |
| |
| Fiscal Year Ended November 30, 2009 | | | | |
| | | | Ticker | Total |
| | | | Symbol | Returns |
| Vanguard Convertible Securities Fund | | | VCVSX | 42.55% |
| Merrill Lynch All Convertibles-All Qualities Index | | | 50.95 |
| Convertible Securities Funds Average1 | | | | 45.70 |
| |
| |
| Your Fund’s Performance at a Glance | | | | |
| November 30, 2008–November 30, 2009 | | | | |
| | | | Distributions Per Share |
| | Starting | Ending | Income | Capital |
| | Share Price | Share Price | Dividends | Gains |
| Vanguard Convertible Securities Fund | $8.86 | $12.12 | $0.426 | $0.000 |
1 Derived from data provided by Lipper Inc.
1

President’s Letter
Dear Shareholder,
The fiscal year ended November 30, 2009, began as one of the most challenging market environments ever for Vanguard Convertible Securities Fund, but ended up being its most favorable. The fund posted its best performance since its inception in 1986.
The Convertible Securities Fund, which consists mostly of corporate bonds that can be converted into common stocks, returned 42.55% for the fiscal year. Not surprisingly, the fund fell a few steps behind both the result for its benchmark index (+50.95%) and the average return of its peer group (+45.70%), a shortfall consistent with the fund’s risk-conscious character. The fund’s portfolio tends to be more conservative than the index, emphasizing convertible bonds that appear to offer better downside protection in the event the underlying stock prices fall.
The fund also sold off convertibles that appeared overvalued. As investors’ risk tolerance increased, some of these pricier securities continued to appreciate after their sale.
If you hold shares of the fund in a taxable account, you may wish to review the section later in this report on the fund’s after-tax returns.
Stock markets worldwide produced double-digit returns
For the 12 months ended November 30, U.S. stocks posted significant gains, as the steep losses suffered during the first few months were more than erased by the rally
2
that began in March. The stock market’s rebound seemed to anticipate an improvement in the broader economy, which began to show signs of growth in the second half of the period.
The story was similar in many international markets: They collapsed in late 2008 and early 2009, then rebounded at a startling rate. The recovery was especially swift and powerful in emerging markets, many of which came out of the financial crisis in better fiscal and economic shape than their developed-market counterparts.
Despite the strong performance seen since March, the longer-term returns of most stock market indexes bear witness to the trials suffered by many investors in the not-so-distant past. Over the past
three years, for example, both U.S. and international stock indexes have declined. Five-year annualized returns for U.S. stocks as of November 30 were mostly positive, but far from impressive. Stock markets abroad fared better over this longer period, posting average annual returns of almost 7%.
For bonds, a period of panic was followed by robust returns
Volatility was also a theme in the fixed income market over the past 12 months. At the peak of the credit crisis in late 2008, investors shunned just about any security not issued by the U.S. Treasury. This stampede to quality led to the widest gap between the very low yields of Treasuries and the much higher yields of corporate bonds since the Great Depression.
| | | |
| Market Barometer | | | |
| | | Average Annual Total Returns |
| | | Periods Ended November 30, 2009 |
| | One Year | Three Years | Five Years |
| Stocks | | | |
| Russell 1000 Index (Large-caps) | 27.38% | –5.71% | 1.02% |
| Russell 2000 Index (Small-caps) | 24.53 | –8.36 | –0.46 |
| Dow Jones U.S. Total Stock Market Index | 28.06 | –5.55 | 1.24 |
| MSCI All Country World Index ex USA (International) | 47.13 | –2.73 | 6.75 |
| |
| Bonds | | | |
| Barclays Capital U.S. Aggregate Bond Index | | | |
| (Broad taxable market) | 11.63% | 6.40% | 5.49% |
| Barclays Capital Municipal Bond Index | 14.17 | 4.17 | 4.50 |
| Citigroup 3-Month Treasury Bill Index | 0.20 | 2.36 | 2.91 |
| |
| CPI | | | |
| Consumer Price Index | 1.84% | 2.40% | 2.52% |
3
In early spring, “green shoots” began to emerge—signs that aggressive fiscal and monetary policies were getting the global economy back on its feet. Investors’ appetite for risk returned to more normal levels and the demand for corporate bonds increased, raising their prices and bringing down their yields. For the 12 months ended November 30, taxable and municipal bonds each notched double-digit results, returning about 12% and 14%, respectively.
Shorter-term savings vehicles, including money market funds, didn’t fare as well. They became casualties of the Fed’s dramatic cuts in short-term interest rates, which were intended to nurse the economy, markets, and banks back to health. In December 2008, the Fed reduced its
target for the federal funds rate, a benchmark for the interest rates paid by money market instruments and other very short-term securities, to between 0% and 0.25%. The target has stayed there ever since. After its meeting in early November, the Fed said it expected to maintain the target at this level “for an extended period.”
Strong demand in second half led to fund’s record performance
Vanguard Convertible Securities Fund offers investors a unique opportunity to capture the most attractive features of both stocks and bonds. Like a conventional bond, a convertible bond provides investors with some degree of protection of principal, while also allowing investors to benefit from strength in the issuing company’s common stock.
| | |
| Expense Ratios1 | | |
| Your Fund Compared With Its Peer Group | | |
| | | Convertible |
| | | Securities |
| | Fund | Funds Average |
| Convertible Securities Fund | 0.72% | 1.41% |
1 The fund expense ratio shown is from the prospectus dated March 20, 2009, and represents estimated costs for the current fiscal year based on the fund’s net assets as of the prospectus date. For the fiscal year ended November 30, 2009, the expense ratio was 0.72%.
The peer-group expense ratio is derived from data provided by Lipper Inc. and captures information through year-end 2008.
4
Typically, bonds and stocks don’t move in tandem, so this feature allows the fund’s securities to appreciate in value during upswings in the stock market while their relative price stability and income provide investors some insulation during declining stock markets. (These attractive attributes come at a price, of course. Many convertibles are issued by smaller companies with weaker balance sheets and a higher risk of default.)
But the end of 2008 was anything but typical. By some measures, the value of convertible bonds fell more sharply than stocks. The aftermath of Lehman Brothers’ bankruptcy, combined with the delever-aging of hedge funds in the wake of stricter government regulation on short-
selling, led to massive sales of convertible securities at cut-rate prices. Investor avoidance of lower-quality securities (the securities in the Convertible Securities Fund had an average rating of BB–, which is considered below investment grade) only made matters worse.
Although the Convertible Securities Fund suffered in first-quarter 2009, the emphasis of its advisor—Oaktree Capital Management, L.P.—on securities with good downside protection helped to curb the fund’s losses on a relative basis. During this period of turmoil, the fund’s limited exposure to the battered financial sector benefited its performance and allowed it to outperform its benchmark and its peers for the quarter.
| |
| Total Returns | |
| Ten Years Ended November 30, 2009 | |
| | Average |
| | Annual Return |
| Convertible Securities Fund | 5.82% |
| Spliced Convertibles Index1 | 3.32 |
| Convertible Securities Funds Average2 | 3.35 |
The figures shown represent past performance, which is not a guarantee of future results. (Current performance may be lower or higher than the performance data cited. For performance data current to the most recent month-end, visit our website at www.vanguard.com/performance.) Note, too, that both investment returns and principal value can fluctuate widely, so an investor’s shares, when sold, could be worth more or less than their original cost.
1 CS First Boston Convertibles Index through November 30, 2004; Merrill Lynch All Convertibles-All Qualities Index thereafter.
2 Derived from data provided by Lipper Inc.
5
By spring, the federal government’s attempts to rescue the nation’s financial institutions and instill confidence in investors began to take hold. As the stock market rebounded, investors took advantage of the relatively cheap convertible securities market. Many companies with convertible bonds were wary of taking on additional debt, so the issuance of convertible securities remained low; however, demand for these hybrid securities continued and prices shot up, led by the prices of lower-quality, riskier securities.
In the five months ended June 30, 2009, the assets of the Convertible Securities Fund increased by more than 50%, to about $1.5 billion, through a combination of net cash flow and market appreciation. Vanguard closed the fund to new investors on June 19 to protect the interests of existing shareholders.
Although the fund had an outstanding absolute return for the fiscal year, the advisor’s conservative approach to convertibles restrained the fund’s overall performance relative to its benchmark index. The advisor’s commitment to risk reduction led it to shy away from preferred stock convertibles (which, unlike bonds, don’t promise to return your principal after a period). This strategy limited the fund’s gains from these and other riskier convertibles.
From an industry standpoint, the fund’s 12-month relative performance suffered from the portfolio’s underexposure to the financial sector and overexposure to the energy sector. The fund benefited from its investments in information technology.
For more information on the fund’s positioning and performance during the year, please see the Advisor’s Report that follows this letter.
The advisor’s disciplined approach has paid off in the long term
For the ten years ended November 30, 2009, the Convertible Securities Fund returned an average of 5.82% per year—more than 2 percentage points ahead of the results of its benchmark index and peer-group average.
The fund’s solid long-term performance, despite the 2008 bear market, is a testament to the advisory skills of Oaktree Capital Management. Oaktree’s careful credit analysis and focus on downside protection have helped the fund stay ahead of the curve.
Think long-term and stay diversified, regardless of market conditions
Financial markets are largely unpredictable—and can vary wildly even within a short period—as we have witnessed over the past 12 months.
6
At Vanguard, we encourage you to focus on the long term and avoid making hasty decisions based on the markets’ short-term volatility. It’s important to stick with time-tested principles of balance and diversification, both within and across asset classes.
One of the best ways to do that is to develop a well-balanced and diversified portfolio that is consistent with your long-term goals, time horizon, and risk tolerance. Such a portfolio should include a cost-efficient mix of stocks, bonds, and short-term reserves.
Vanguard Convertible Securities Fund can play an important complementary role in such a diversified portfolio by providing opportunities for possible growth in bull markets and potential protection in bear markets.
On another matter, I would like to inform you that on January 1, 2010, we will complete a leadership transition that began in March 2008. I will succeed Jack Brennan as chairman of Vanguard and each of the funds. Jack has agreed to serve as chairman emeritus and senior advisor.
Under Jack’s leadership, Vanguard has grown to become a preeminent firm in the mutual fund industry. Jack’s energy, his relentless pursuit of perfection, and his unwavering focus on always doing the right thing for our clients are evident in every facet of Vanguard policy today.
Thank you for investing your assets at Vanguard.
Sincerely,

F. William McNabb III
President and Chief Executive Officer
December 14, 2009
7
Advisor’s Report
Well, what a difference a year makes! As you know, one year ago the investment world was in total disarray, with serious talk about the possibility of a complete financial meltdown. What we’ve seen since spring was the complete opposite—stock prices rebounded strongly and credit spreads tightened. The turnaround in security prices and investor psychology has been dramatic.
Convertible securities’ prices soared in this environment as both the equity and fixed income components of these securities pushed valuations higher month after month. For the fiscal year ended November 30, 2009, Vanguard Convertible Securities Fund returned 42.55%. We are pleased with the fund’s performance, especially during the past several months. It lagged the Merrill Lynch All
Convertibles-All Qualities Index (+50.95%) in this exceptionally strong environment, but that was not unexpected given our emphasis on securities with downside protection characteristics and our normal profit-taking strategy.
The investment environment
As it turned out, after a very rocky start, the 2009 fiscal year was not only the opposite of the previous year in terms of performance but was also very different in terms of macro factors affecting the convertibles market. In a nutshell, despite the fund’s high absolute returns, the last six months were uneventful and even included a long summer lull. Needless to say, we’ll take an uneventful, high-performance period any time over the kind of sharp declines we saw a year ago.
| |
| Major Portfolio Changes | |
| Fiscal Year Ended November 30, 2009 | |
| Additions | Comments |
| Ford Motor | Statistically attractive new issue with excellent upside |
| (4.25% convertible note due 11/15/16) | and downside profile. |
| Liberty Global | |
| (4.50% convertible note due 11/15/16) | Attractive new issue on a good long-term equity story. |
| Smithfield Foods | |
| (4.00% convertible note due 6/30/13) | Statistically attractive convertible. |
| Peabody Energy | Attractive secondary-market purchase that increased our |
| (4.75% convertible note due 12/15/41) | coal industry exposure. |
| |
| Reductions | Comments |
| Transocean | Sold all because of diminished equity sensitivity as the security |
| (1.50% convertible note due 12/15/37) | developed a high conversion premium. |
| Textron | |
| (4.50% convertible note due 5/1/13) | Sold all after substantial appreciation. |
| Bank of America | Reduced after the conversion premium doubled and lessened |
| (7.25% convertible preferred) | the attractiveness of the security. |
| Newell Rubbermaid | |
| (5.50% convertible note due 3/15/14) | Sold all after substantial appreciation. |
8
The most consistent factor in our market over the past several months has been continued strong demand for convertibles resulting from the steady flow of capital into the market. Cash moved into dedicated convertible portfolios as investors searched for any asset class with a reasonable current yield in a rising equity market. There was also considerable demand from a number of companies that were actively repurchasing convertible issues. Finally, crossover equity and traditional yield-only investors continued to buy convertibles, although some of these investors took profits as the period progressed and then returned to their core investment areas.
In the second half of the fiscal year, the convertible market gained nearly 21%, as tracked by the Merrill Lynch All Convertibles-All Qualities Index. The market was supported not only by the inflow of cash but by factors that typically favor convertibles’ performance: Stocks underlying convertibles advanced 26% for the period, while credit spreads continued to tighten for the most speculative bonds. When these two powerful factors occur together, convertible securities can perform extremely well on an absolute and relative basis.
New issuance has been relatively light and was not a significant factor in the convertibles market during the period. Many potential issuers of convertibles chose to finance their debt in the high-grade or high-yield bond markets, given the low absolute rates and the relatively low level of credit spreads over U.S. Treasuries. Some of the
larger convertible offerings during the period came from AMR, Ford Motor, Intel, Navistar International, and Sybase.
Compared with issuance in fiscal-year 2008, the major difference in the past year has been the absence of multibillion-dollar convertible deals from ultra-large-cap firms. In 2008, we had very large preferred offerings from financial companies; in fiscal 2009, the issuers and the deals were typically smaller. Although it’s impossible to predict what is coming in 2010, we are cautiously optimistic that many companies will choose to issue convertibles over the next few quarters.
Our successes
Good returns came from a wide variety of our holdings, including many in the fund’s top ten. Some of the best contributors were convertibles from Fifth Third Bancorp, Micron Technology, SBA Communications, and Textron.
Despite the low level of new convertible issuance and the generally uneventful environment, we made a fair number of changes in the portfolio. As you might expect, we were active in profit-taking as several holdings appreciated to price levels of $150 and above.
We sold our stakes in Newell Rubbermaid, Teradyne, Textron, Whiting Petroleum, and Wyndham Worldwide after they delivered above-average appreciation. These sales reduced the overall equity sensitivity (risk) of the portfolio. Despite the generally bullish sentiment during the period, we had no trouble finding attractive and
9
balanced convertibles in the secondary market to reinvest the proceeds from our sales.
Our shortfalls
We lagged the Merrill Lynch All Convertibles-All Qualities Index for the past six months and for the fiscal year as a whole. This underperformance resulted primarily from our not owning specific issuers and types of convertibles, as opposed to making investments that were disappointments. In general, we certainly don’t expect to match or outperform the Merrill Lynch index when it advances more than 20% in a six-month period. Such gains are normally due to equity-sensitive convertibles that rise as their underlying stocks move higher with the overall equity market (these are usually convertibles that we have sold or substantially reduced). These convertibles remain in the fund’s benchmark index as long as the issue has not been called or converted.
While this normal bull-market impact was a major cause for our underperformance, another reason was our de-emphasis of preferred and mandatory convertible structures. These structures (especially mandatory convertibles) are very equity-sensitive, and many of them were strong performers for the period. In total, we have approximately half the index weighting in these riskier structures. Lastly, some individual high-risk, speculative securities
that we did not own were above-average performers. This was clearly a period when the most inferior structures, with the most speculative credits and risky equity names, have been the top performers.
The fund’s positioning
In the near term, we would not be surprised to see the stock market retreat somewhat, given the strong results of the past several months. If that happens, we believe that our recent profit-taking and conservative portfolio positioning will be highly beneficial to the fund’s relative performance. The overall equity market is clearly conflicted over the persistence of consumer weakness, high unemployment, and a depressed housing market at a time when corporate earnings have come in above expectations.
The portfolio remains fully invested, with approximately 90% in convertible bonds and 10% in convertible preferred stocks, compared with the 80%/20% split in our market benchmark. Our average credit rating is BB–, using our Oaktree ratings for nonrated convertibles. We’re pleased to say we had no negative credit events during 2009.
Larry W. Keele, CFA Principal and Founder
Oaktree Capital Management, L.P.
December 18, 2009
10
Results of Proxy Voting
At a special meeting of shareholders on July 2, 2009, fund shareholders approved the following two proposals:
Proposal 1—Elect trustees for each fund.*
The individuals listed in the table below were elected as trustees for each fund. All trustees with the exception of Messrs. McNabb and Volanakis (both of whom already served as directors of The Vanguard Group, Inc.) served as trustees to the funds prior to the shareholder meeting.
| | | |
| | | | Percentage |
| Trustee | For | Withheld | For |
| John J. Brennan | 77,783,971 | 1,901,238 | 97.6% |
| Charles D. Ellis | 71,121,245 | 8,563,964 | 89.3% |
| Emerson U. Fullwood | 77,328,466 | 2,356,744 | 97.0% |
| Rajiv L. Gupta | 77,664,791 | 2,020,418 | 97.5% |
| Amy Gutmann | 77,775,360 | 1,909,849 | 97.6% |
| JoAnn Heffernan Heisen | 77,709,788 | 1,975,421 | 97.5% |
| F. William McNabb III | 77,765,054 | 1,920,156 | 97.6% |
| André F. Perold | 77,276,646 | 2,408,563 | 97.0% |
| Alfred M. Rankin, Jr. | 77,725,869 | 1,959,340 | 97.5% |
| Peter F. Volanakis | 77,721,249 | 1,963,961 | 97.5% |
| * Results are for all funds within the same trust. | | | |
Proposal 2—Update and standardize the funds’ fundamental policies regarding:
(a) Purchasing and selling real estate.
(b) Issuing senior securities.
(c) Borrowing money.
(d) Making loans.
(e) Purchasing and selling commodities.
(f) Concentrating investments in a particular industry or group of industries.
(g) Eliminating outdated fundamental investment policies not required by law.
The revised fundamental policies are clearly stated and simple, yet comprehensive, making oversight and compliance more efficient than under the former policies. The revised fundamental policies will allow the funds to respond more quickly to regulatory and market changes, while avoiding the costs and delays associated with successive shareholder meetings.
| | | | | |
| | | | | Broker | Percentage |
| Vanguard Fund | For | Abstain | Against | Non-Votes | For |
| Convertible Securities Fund | | | | | |
| 2a | 69,819,908 | 1,461,263 | 1,661,007 | 6,743,031 | 87.6% |
| 2b | 69,749,621 | 1,514,899 | 1,677,658 | 6,743,031 | 87.5% |
| 2c | 68,990,423 | 1,446,422 | 2,505,335 | 6,743,030 | 86.6% |
| 2d | 69,198,180 | 1,404,655 | 2,339,341 | 6,743,033 | 86.8% |
| 2e | 69,230,269 | 1,453,557 | 2,258,350 | 6,743,034 | 86.9% |
| 2f | 69,675,637 | 1,476,550 | 1,789,994 | 6,743,028 | 87.4% |
| 2g | 70,310,536 | 1,431,615 | 1,200,032 | 6,743,026 | 88.2% |
11
Convertible Securities Fund
Fund Profile
As of November 30, 2009
| |
| Portfolio Characteristics | |
| |
| Number of Securities | 135 |
| Yield1 | 4.0% |
| Conversion Premium | 36.2% |
| Average Weighted Maturity | 4.8 years |
| Average Coupon | 3.1% |
| Average Quality2 | Ba3/BB– |
| Average Duration | 4.1 years |
| Foreign Holdings | 7.1% |
| Turnover Rate | 103% |
| Expense Ratio3 | 0.72% |
| Short-Term Reserves | 1.2% |
| |
| |
| Distribution by Maturity | |
| (% of fixed income portfolio) | |
| |
| Under 1 Year | 1.4% |
| 1– 5 Years | 79.5 |
| 5–10 Years | 15.9 |
| 10–20 Years | 0.0 |
| 20–30 Years | 3.2 |
| |
| Distribution by Credit Quality2 | |
| (% of fixed income portfolio) | |
| |
| Aaa/AAA | 0.0% |
| Aa/AA | 0.0 |
| A/A | 6.3 |
| Baa/BBB | 7.9 |
| Ba/BB | 19.7 |
| B/B | 21.0 |
| Below B/B | 8.1 |
| Not Rated | 37.0 |
| |
| |
| Volatility Measures4 | |
| | Fund Versus |
| | Comparative Index5 |
| R-Squared | 0.97 |
| Beta | 0.90 |
1 30-day SEC yield. See the Glossary.
2 Ratings: Moody’s Investors Service, Standard & Poor’s.
3 The expense ratio shown is from the prospectus dated March 20, 2009, and represents estimated costs for the current fiscal year based on the fund’s net assets as of the prospectus date. For the fiscal year ended November 30, 2009, the expense ratio was 0.72%.
4 For an explanation of R-squared, beta, and other terms used here, see the Glossary.
5 Merrill Lynch All Convertibles-All Qualities Index.
12
Convertible Securities Fund
Ten Largest Holdings1 (% of total net assets)
| | |
| SBA Communications | wireless | |
| Corp. | telecommunication | |
| | services | 4.1% |
| Equinix Inc. | Internet software | |
| | and services | 3.3 |
| Life Technologies Corp. | life sciences tools | |
| | and services | 3.0 |
| EMC Corp. | computer storage | |
| | and peripherals | 2.5 |
| Ford Motor Co. | automobile | |
| | manufacturers | 2.4 |
| Micron Technology Inc. | semiconductors | 2.4 |
| ON Semiconductor Corp. | semiconductors | 2.1 |
| Gilead Sciences Inc. | biotechnology | 2.0 |
| Covanta Holding Corp. | environmental and | |
| | facilities services | 1.9 |
| Inverness Medical | health care | |
| Innovations Inc. | supplies | 1.8 |
| Top Ten | | 25.5% |
Sector Diversification (% of market exposure)
| |
| Consumer Discretionary | 11.2% |
| Consumer Staples | 1.9 |
| Energy | 10.7 |
| Financials | 8.3 |
| Health Care | 24.3 |
| Industrials | 11.4 |
| Information Technology | 23.0 |
| Materials | 2.9 |
| Telecommunication Services | 6.0 |
| Utilities | 0.3 |
1 The holdings listed exclude any temporary cash investments and equity index products.
13
Convertible Securities Fund
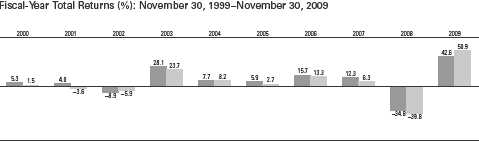
Performance Summary
All of the returns in this report represent past performance, which is not a guarantee of future results that may be achieved by the fund. (Current performance may be lower or higher than the performance data cited. For performance data current to the most recent month-end, visit our website at www.vanguard.com/performance.) Note, too, that both investment returns and principal value can fluctuate widely, so an investor’s shares, when sold, could be worth more or less than their original cost. The returns shown do not reflect taxes that a shareholder would pay on fund distributions or on the sale of fund shares.
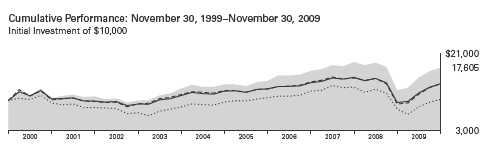
| | | | |
| | | Average Annual Total Returns | Final Value |
| | Periods Ended November 30, 2009 | of a $10,000 |
| | One Year | Five Years | Ten Years | Investment |
| Convertible Securities Fund1 | 42.55% | 5.05% | 5.82% | $17,605 |
| Dow Jones U.S. Total Stock Market Index | 28.06 | 1.24 | 0.27 | 10,278 |
| Spliced Convertibles Index2 | 50.95 | 2.37 | 3.32 | 13,866 |
| Convertible Securities Funds Average3 | 45.70 | 2.69 | 3.35 | 13,909 |
1 Total returns do not reflect the 1% fee assessed on redemptions of shares purchased on or after September 15, 2005, and held for less than one year, or the account service fee that may be applicable to certain accounts with balances below $10,000.
2 CS First Boston Convertibles Index through November 30, 2004; Merrill Lynch All Convertibles-All Qualities Index thereafter.
3 Derived from data provided by Lipper Inc.
See Financial Highlights for dividend and capital gains information.
14
Convertible Securities Fund
Convertible Securities Fund
Spliced Convertibles Index1
Average Annual Total Returns: Periods Ended September 30, 2009
This table presents average annual total returns through the latest calendar quarter—rather than through the end of the fiscal period. Securities and Exchange Commission rules require that we provide this information.
| | | | | | |
| | | | | | | Ten Years |
| | Inception Date | One Year | Five Years | Capital | Income | Total |
| Convertible Securities Fund2 | 6/17/1986 | 13.24% | 5.80% | 3.20% | 3.77% | 6.97% |
1 CS First Boston Convertibles Index through November 30, 2004; Merrill Lynch All Convertibles-All Qualities Index thereafter.
2 Total returns do not reflect the 1% fee assessed on redemptions of shares purchased on or after September 15, 2005, and held for less than one year or the account service fee that may be applicable to certain accounts with balances below $10,000.
15
Convertible Securities Fund
Financial Statements
Statement of Net Assets
As of November 30, 2009
The fund reports a complete list of its holdings in regulatory filings four times in each fiscal year, at the quarter-ends. For the second and fourth fiscal quarters, the lists appear in the fund’s semiannual and annual reports to shareholders. For the first and third fiscal quarters, the fund files the lists with the Securities and Exchange Commission on Form N-Q. Shareholders can look up the fund’s Forms N-Q on the SEC’s website at www.sec.gov. Forms N-Q may also be reviewed and copied at the SEC’s Public Reference Room (see the back cover of this report for further information).
| | | | |
| | | | Face | Market |
| | | Maturity | Amount | Value• |
| | Coupon | Date | ($000) | ($000) |
| Convertible Bonds (90.7%) | | | | |
| Consumer Discretionary (9.6%) | | | | |
| Coinstar Inc. | 4.000% | 9/1/14 | 7,710 | 7,459 |
| DR Horton Inc. | 2.000% | 5/15/14 | 21,514 | 23,074 |
| 1 Eastman Kodak Co. | 7.000% | 4/1/17 | 9,030 | 7,721 |
| Ford Motor Co. | 4.250% | 11/15/16 | 36,285 | 41,320 |
| 1 Gaylord Entertainment Co. | 3.750% | 10/1/14 | 5,575 | 5,254 |
| Group 1 Automotive Inc. | 2.250% | 6/15/36 | 11,462 | 8,410 |
| 1 International Game Technology | 3.250% | 5/1/14 | 12,450 | 15,220 |
| 1 Liberty Global Inc. | 4.500% | 11/15/16 | 19,875 | 19,651 |
| Liberty Media LLC | 3.125% | 3/30/23 | 13,550 | 13,533 |
| Liberty Media LLC | 3.500% | 1/15/31 | 15,480 | 7,663 |
| Saks Inc. | 2.000% | 3/15/24 | 15,640 | 12,199 |
| 1 Stewart Enterprises Inc. | 3.125% | 7/15/14 | 4,245 | 3,598 |
| | | | | 165,102 |
| Consumer Staples (1.9%) | | | | |
| Chattem Inc. | 1.625% | 5/1/14 | 11,235 | 11,474 |
| Nash Finch Co. | 1.631% | 3/15/35 | 12,895 | 5,674 |
| Smithfield Foods Inc. | 4.000% | 6/30/13 | 15,685 | 15,528 |
| | | | | 32,676 |
| Energy (10.0%) | | | | |
| Alpha Natural Resources Inc. | 2.375% | 4/15/15 | 11,900 | 11,662 |
| Chesapeake Energy Corp. | 2.750% | 11/15/35 | 31,186 | 28,925 |
| Exterran Holdings Inc. | 4.250% | 6/15/14 | 3,710 | 4,271 |
| GMX Resources Inc. | 5.000% | 2/1/13 | 5,770 | 4,876 |
| GMX Resources Inc. | 4.500% | 5/1/15 | 7,515 | 6,970 |
| Goodrich Petroleum Corp. | 5.000% | 10/1/29 | 18,680 | 18,190 |
| Hanover Compressor Co. | 4.750% | 1/15/14 | 9,690 | 8,600 |
| Hornbeck Offshore Services Inc. | 1.625% | 11/15/26 | 20,835 | 17,501 |
| 1 James River Coal Co. | 4.500% | 12/1/15 | 4,215 | 4,062 |
| Peabody Energy Corp. | 4.750% | 12/15/41 | 17,190 | 16,846 |
| Quicksilver Resources Inc. | 1.875% | 11/1/24 | 14,180 | 15,793 |
| SESI LLC | 1.500% | 12/15/26 | 8,830 | 7,936 |
| St. Mary Land & Exploration Co. | 3.500% | 4/1/27 | 11,730 | 11,349 |
| Trico Marine Services Inc. | 8.125% | 2/1/13 | 16,307 | 13,739 |
| | | | | 170,720 |
| Financials (4.7%) | | | | |
| 1 Digital Realty Trust LP | 5.500% | 4/15/29 | 3,765 | 4,824 |
| Dollar Financial Corp. | 2.875% | 6/30/27 | 7,540 | 7,003 |
16
| | | | |
| Convertible Securities Fund | | | | |
| |
| |
| |
| | | | Face | Market |
| | | Maturity | Amount | Value• |
| | Coupon | Date | ($000) | ($000) |
| Forest City Enterprises Inc. | 3.625% | 10/15/14 | 17,605 | 16,571 |
| 1 Forest City Enterprises Inc. | 5.000% | 10/15/16 | 4,615 | 4,725 |
| National Retail Properties Inc. | 5.125% | 6/15/28 | 10,425 | 10,672 |
| 1 PHH Corp. | 4.000% | 9/1/14 | 8,550 | 7,332 |
| 1 Rayonier TRS Holdings Inc. | 3.750% | 10/15/12 | 4,940 | 5,150 |
| Rayonier TRS Holdings Inc. | 3.750% | 10/15/12 | 130 | 135 |
| 1 Rayonier TRS Holdings Inc. | 4.500% | 8/15/15 | 10,875 | 12,071 |
| 1 SVB Financial Group | 3.875% | 4/15/11 | 11,930 | 12,183 |
| | | | | 80,666 |
| Health Care (22.8%) | | | | |
| Allergan Inc. | 1.500% | 4/1/26 | 11,630 | 13,026 |
| 1 Allergan Inc. | 1.500% | 4/1/26 | 1,360 | 1,523 |
| American Medical Systems Holdings Inc. | 3.250% | 7/1/36 | 2,016 | 2,160 |
| American Medical Systems Holdings Inc. | 4.000% | 9/15/41 | 12,749 | 14,422 |
| Amgen Inc. | 0.375% | 2/1/13 | 15,805 | 15,726 |
| Beckman Coulter Inc. | 2.500% | 12/15/36 | 8,252 | 9,356 |
| 1 Biovail Corp. | 5.375% | 8/1/14 | 25,390 | 29,929 |
| Cephalon Inc. | 2.500% | 5/1/14 | 29,245 | 29,830 |
| Chemed Corp. | 1.875% | 5/15/14 | 6,130 | 5,142 |
| China Medical Technologies Inc. | 3.500% | 11/15/11 | 5,485 | 4,388 |
| Cubist Pharmaceuticals Inc. | 2.250% | 6/15/13 | 19,530 | 17,479 |
| 1 Gilead Sciences Inc. | 0.500% | 5/1/11 | 15,735 | 19,531 |
| Gilead Sciences Inc. | 0.500% | 5/1/11 | 1,745 | 2,166 |
| Gilead Sciences Inc. | 0.625% | 5/1/13 | 9,980 | 12,812 |
| 1 Greatbatch Inc. | 2.250% | 6/15/13 | 6,010 | 5,026 |
| Greatbatch Inc. | 2.250% | 6/15/13 | 1,540 | 1,288 |
| 1 Incyte Corp. Ltd. | 4.750% | 10/1/15 | 3,310 | 4,071 |
| 1 Integra LifeSciences Holdings Corp. | 2.375% | 6/1/12 | 7,790 | 6,962 |
| 1 Inverness Medical Innovations Inc. | 3.000% | 5/15/16 | 8,400 | 9,608 |
| Inverness Medical Innovations Inc. | 3.000% | 5/15/16 | 4,460 | 5,101 |
| Isis Pharmaceuticals Inc. | 2.625% | 2/15/27 | 2,970 | 2,925 |
| 1 Kinetic Concepts Inc. | 3.250% | 4/15/15 | 10,080 | 9,311 |
| Life Technologies Corp. | 1.500% | 2/15/24 | 34,820 | 39,564 |
| Life Technologies Corp. | 3.250% | 6/15/25 | 10,515 | 12,250 |
| Millipore Corp. | 3.750% | 6/1/26 | 10,350 | 10,544 |
| Mylan Inc. | 1.250% | 3/15/12 | 23,815 | 24,262 |
| 1 NuVasive Inc. | 2.250% | 3/15/13 | 19,570 | 19,301 |
| Onyx Pharmaceuticals Inc. | 4.000% | 8/15/16 | 7,485 | 7,831 |
| OSI Pharmaceuticals Inc. | 3.250% | 9/8/23 | 9,680 | 8,881 |
| PDL BioPharma Inc. | 2.000% | 2/15/12 | 14,115 | 13,374 |
| 1 PSS World Medical Inc. | 3.125% | 8/1/14 | 6,055 | 6,623 |
| Teva Pharmaceutical Finance Co. BV | 1.750% | 2/1/26 | 14,083 | 16,741 |
| Valeant Pharmaceuticals International | 4.000% | 11/15/13 | 8,535 | 10,295 |
| | | | | 391,448 |
| Industrials (10.9%) | | | | |
| 1 AAR Corp. | 1.625% | 3/1/14 | 5,110 | 4,197 |
| 1 Alliant Techsystems Inc. | 2.750% | 9/15/11 | 6,675 | 6,992 |
| Alliant Techsystems Inc. | 2.750% | 9/15/11 | 3,910 | 4,096 |
| AMR Corp. | 6.250% | 10/15/14 | 22,366 | 19,402 |
| Barnes Group Inc. | 3.750% | 8/1/25 | 10,530 | 10,846 |
| Barnes Group Inc. | 3.375% | 3/15/27 | 7,065 | 6,411 |
| 1 Barnes Group Inc. | 3.375% | 3/15/27 | 6,080 | 5,518 |
| Continental Airlines Inc. | 5.000% | 6/15/23 | 20,600 | 20,986 |
| 1 Covanta Holding Corp. | 3.250% | 6/1/14 | 9,795 | 10,762 |
| Covanta Holding Corp. | 1.000% | 2/1/27 | 23,870 | 21,901 |
17
| | | | |
| Convertible Securities Fund | | | | |
| |
| |
| |
| | | | Face | Market |
| | | Maturity | Amount | Value• |
| | Coupon | Date | ($000) | ($000) |
| DryShips Inc. | 5.000% | 12/1/14 | 9,260 | 9,607 |
| General Cable Corp. | 0.875% | 11/15/13 | 1,760 | 1,520 |
| L-3 Communications Holdings Inc. | 3.000% | 8/1/35 | 27,716 | 28,340 |
| Navistar International Corp. | 3.000% | 10/15/14 | 14,610 | 13,770 |
| SunPower Corp. | 4.750% | 4/15/14 | 3,965 | 4,039 |
| Suntech Power Holdings Co. Ltd. | 3.000% | 3/15/13 | 12,470 | 9,462 |
| 1 Suntech Power Holdings Co. Ltd. | 3.000% | 3/15/13 | 2,685 | 2,037 |
| Trina Solar Ltd. | 4.000% | 7/15/13 | 740 | 1,094 |
| Triumph Group Inc. | 2.625% | 10/1/26 | 6,025 | 6,560 |
| | | | | 187,540 |
| Information Technology (22.6%) | | | | |
| Alliance Data Systems Corp. | 1.750% | 8/1/13 | 18,420 | 18,029 |
| Arris Group Inc. | 2.000% | 11/15/26 | 5,760 | 5,386 |
| CACI International Inc. | 2.125% | 5/1/14 | 9,215 | 9,572 |
| 1 CACI International Inc. | 2.125% | 5/1/14 | 1,575 | 1,636 |
| Ciena Corp. | 0.875% | 6/15/17 | 1,135 | 670 |
| CommScope Inc. | 3.250% | 7/1/15 | 8,320 | 9,599 |
| Earthlink Inc. | 3.250% | 11/15/26 | 12,380 | 13,432 |
| EMC Corp. | 1.750% | 12/1/11 | 20,555 | 24,460 |
| EMC Corp. | 1.750% | 12/1/13 | 15,190 | 18,456 |
| Equinix Inc. | 2.500% | 4/15/12 | 30,915 | 32,693 |
| Equinix Inc. | 3.000% | 10/15/14 | 3,120 | 3,311 |
| Equinix Inc. | 4.750% | 6/15/16 | 15,190 | 20,791 |
| FEI Co. | 2.875% | 6/1/13 | 3,125 | 3,336 |
| GSI Commerce Inc. | 2.500% | 6/1/27 | 1,520 | 1,476 |
| Informatica Corp. | 3.000% | 3/15/26 | 12,940 | 15,868 |
| 1 Intel Corp. | 3.250% | 8/1/39 | 18,310 | 20,255 |
| Itron Inc. | 2.500% | 8/1/26 | 9,650 | 11,471 |
| Micron Technology Inc. | 1.875% | 6/1/14 | 50,105 | 40,648 |
| NetApp Inc. | 1.750% | 6/1/13 | 22,240 | 25,965 |
| Nuance Communications Inc. | 2.750% | 8/15/27 | 11,880 | 12,816 |
| ON Semiconductor Corp. | 2.625% | 12/15/26 | 35,052 | 35,709 |
| Photronics Inc. | 5.500% | 10/1/14 | 2,517 | 2,687 |
| 1 Sybase Inc. | 3.500% | 8/15/29 | 19,880 | 22,439 |
| Symantec Corp. | 0.750% | 6/15/11 | 14,075 | 15,342 |
| 1 SYNNEX Corp. | 4.000% | 5/15/18 | 7,405 | 8,692 |
| TTM Technologies Inc. | 3.250% | 5/15/15 | 6,461 | 6,057 |
| VeriSign Inc. | 3.250% | 8/15/37 | 7,170 | 5,969 |
| | | | | 386,765 |
| Materials (2.8%) | | | | |
| 1 Goldcorp Inc. | 2.000% | 8/1/14 | 14,715 | 17,290 |
| Steel Dynamics Inc. | 5.125% | 6/15/14 | 25,405 | 31,058 |
| | | | | 48,348 |
| Telecommunication Services (5.1%) | | | | |
| SBA Communications Corp. | 1.875% | 5/1/13 | 50,019 | 49,831 |
| 1 SBA Communications Corp. | 4.000% | 10/1/14 | 15,770 | 19,752 |
| tw telecom Inc. | 2.375% | 4/1/26 | 17,480 | 17,655 |
| | | | | 87,238 |
| Utilities (0.3%) | | | | |
| Unisource Energy Corp. | 4.500% | 3/1/35 | 4,405 | 4,234 |
| Total Convertible Bonds (Cost $1,468,447) | | | | 1,554,737 |
18
| | | |
| Convertible Securities Fund | | | |
| |
| |
| |
| | | | Market |
| | | | Value• |
| | Coupon | Shares | ($000) |
| Convertible Preferred Stocks (7.4%) | | | |
| Consumer Discretionary (1.4%) | | | |
| Interpublic Group of Cos. Inc. | 5.250% | 34,930 | 23,927 |
| |
| Energy (0.5%) | | | |
| McMoRan Exploration Co. | 6.750% | 16,790 | 1,041 |
| McMoRan Exploration Co. | 8.000% | 6,212 | 7,982 |
| | | | 9,023 |
| Financials (3.4%) | | | |
| Aspen Insurance Holdings Ltd. | 5.625% | 165,460 | 8,811 |
| Bank of America Corp. | 7.250% | 3,670 | 3,129 |
| Fifth Third Bancorp | 8.500% | 243,360 | 30,074 |
| Keycorp | 7.750% | 110,805 | 9,180 |
| New York Community Capital Trust V | 6.000% | 175,100 | 6,917 |
| | | | 58,111 |
| Health Care (1.0%) | | | |
| Inverness Medical Innovations Inc. | 3.000% | 62,088 | 16,795 |
| |
| Industrials (0.2%) | | | |
| Continental Airlines Finance Trust II | 6.000% | 163,300 | 3,399 |
| |
| Telecommunication Services (0.8%) | | | |
| Crown Castle International Corp. | 6.250% | 244,110 | 14,036 |
| |
| Utilities (0.1%) | | | |
| FPL Group Inc. | 8.375% | 31,200 | 1,556 |
| Total Convertible Preferred Stocks (Cost $104,862) | | | 126,847 |
| Temporary Cash Investment (1.2%) | | | |
| Money Market Fund (1.2%) | | | |
| 2 Vanguard Market Liquidity Fund | | | |
| (Cost $20,431) | 0.199% | 20,431,046 | 20,431 |
| Total Investments (99.3%) (Cost $1,593,740) | | | 1,702,015 |
| Other Assets and Liabilities (0.7%) | | | |
| Other Assets | | | 20,129 |
| Liabilities | | | (7,302) |
| | | | 12,827 |
| Net Assets (100%) | | | |
| Applicable to 141,477,415 outstanding $.001 par value shares of | | |
| beneficial interest (unlimited authorization) | | | 1,714,842 |
| Net Asset Value Per Share | | | $12.12 |
19
| |
| Convertible Securities Fund | |
| |
| |
| |
| At November 30, 2009, net assets consisted of: | |
| | Amount |
| | ($000) |
| Paid-in Capital | 1,645,379 |
| Undistributed Net Investment Income | 14,803 |
| Accumulated Net Realized Losses | (53,615) |
| Unrealized Appreciation (Depreciation) | 108,275 |
| Net Assets | 1,714,842 |
• See Note A in Notes to Financial Statements.
1 Security exempt from registration under Rule 144A of the Securities Act of 1933. Such securities may be sold in transactions exempt from registration, normally to qualified institutional buyers. At November 30, 2009, the aggregate value of these securities was $333,246,000, representing 19.4% of net assets.
2 Affiliated money market fund available only to Vanguard funds and certain trusts and accounts managed by Vanguard. Rate shown is the 7-day yield.
See accompanying Notes, which are an integral part of the Financial Statements.
20
| |
| Convertible Securities Fund | |
| |
| |
| Statement of Operations | |
| |
| | Year Ended |
| | November 30, 2009 |
| | ($000) |
| Investment Income | |
| Income | |
| Dividends | 9,455 |
| Interest1 | 63,656 |
| Total Income | 73,111 |
| Expenses | |
| Investment Advisory Fees—Note B | |
| Basic Fee | 4,666 |
| Performance Adjustment | 1,597 |
| The Vanguard Group—Note C | |
| Management and Administrative | 3,045 |
| Marketing and Distribution | 337 |
| Custodian Fees | 19 |
| Auditing Fees | 29 |
| Shareholders’ Reports and Proxies | 81 |
| Trustees’ Fees and Expenses | 2 |
| Total Expenses | 9,776 |
| Net Investment Income | 63,335 |
| Realized Net Gain (Loss) on Investment Securities Sold | 14,693 |
| Change in Unrealized Appreciation (Depreciation) of Investment Securities | 384,316 |
| Net Increase (Decrease) in Net Assets Resulting from Operations | 462,344 |
| 1 Interest income from an affiliated company of the fund was $247,000. | |
| |
| |
| |
| |
| See accompanying Notes, which are an integral part of the Financial Statements. | |
21
| | |
| Convertible Securities Fund | | |
| |
| |
| Statement of Changes in Net Assets | | |
| |
| | Year Ended November 30, |
| | 2009 | 2008 |
| | ($000) | ($000) |
| Increase (Decrease) in Net Assets | | |
| Operations | | |
| Net Investment Income | 63,335 | 28,972 |
| Realized Net Gain (Loss) | 14,693 | (69,374) |
| Change in Unrealized Appreciation (Depreciation) | 384,316 | (317,452) |
| Net Increase (Decrease) in Net Assets Resulting from Operations | 462,344 | (357,854) |
| Distributions | | |
| Net Investment Income | (52,335) | (33,367) |
| Realized Capital Gain1 | — | (48,731) |
| Total Distributions | (52,335) | (82,098) |
| Capital Share Transactions | | |
| Issued | 793,297 | 431,344 |
| Issued in Lieu of Cash Distributions | 44,451 | 73,425 |
| Redeemed2 | (248,682) | (220,694) |
| Net Increase (Decrease) from Capital Share Transactions | 589,066 | 284,075 |
| Total Increase (Decrease) | 999,075 | (155,877) |
| Net Assets | | |
| Beginning of Period | 715,767 | 871,644 |
| End of Period3 | 1,714,842 | 715,767 |
| 1 | Includes fiscal 2008 short-term gain distributions totaling $28,823,000. Short-term gain distributions are treated as ordinary income dividends for tax purposes. |
| 2 | Net of redemption fees for fiscal 2009 and 2008 of $1,027,000 and $388,000, respectively. |
| 3 | Net Assets—End of Period includes undistributed net investment income of $14,803,000 and $5,438,000. |
See accompanying Notes, which are an integral part of the Financial Statements.
22
| | | | | |
| Convertible Securities Fund | | | | | |
| |
| |
| Financial Highlights | | | | | |
| |
| |
| For a Share Outstanding | | | Year Ended November 30, |
| Throughout Each Period | 2009 | 2008 | 2007 | 2006 | 2005 |
| Net Asset Value, Beginning of Period | $8.86 | $14.95 | $14.81 | $13.57 | $13.62 |
| Investment Operations | | | | | |
| Net Investment Income | .475 | .401 | .420 | .430 | .290 |
| Net Realized and Unrealized Gain (Loss) | | | | | |
| on Investments | 3.211 | (5.170) | 1.250 | 1.620 | .480 |
| Total from Investment Operations | 3.686 | (4.769) | 1.670 | 2.050 | .770 |
| Distributions | | | | | |
| Dividends from Net Investment Income | (.426) | (.501) | (.510) | (.380) | (.320) |
| Distributions from Realized Capital Gains | — | (.820) | (1.020) | (.430) | (.500) |
| Total Distributions | (.426) | (1.321) | (1.530) | (.810) | (.820) |
| Net Asset Value, End of Period | $12.12 | $8.86 | $14.95 | $14.81 | $13.57 |
| |
| Total Return1 | 42.55% | –34.81% | 12.34% | 15.70% | 5.92% |
| |
| Ratios/Supplemental Data | | | | | |
| Net Assets, End of Period (Millions) | $1,715 | $716 | $872 | $727 | $552 |
| Ratio of Total Expenses to | | | | | |
| Average Net Assets2 | 0.72% | 0.71% | 0.77% | 0.87% | 0.86% |
| Ratio of Net Investment Income to | | | | | |
| Average Net Assets | 4.65% | 3.28% | 2.83% | 3.14% | 2.18% |
| Portfolio Turnover Rate | 103% | 77% | 116% | 138% | 86% |
| 1 | Total returns do not reflect the 1% fee assessed on redemptions of shares purchased on or after September 15, 2005, and held for less than one year, or the account service fee that may be applicable to certain accounts with balances below $10,000. |
| 2 | Includes performance-based investment advisory fee increases (decreases) of 0.12%, 0.15%, 0.16%, 0.22%, and 0.20%. |
See accompanying Notes, which are an integral part of the Financial Statements.
23
Convertible Securities Fund
Notes to Financial Statements
Vanguard Convertible Securities Fund is registered under the Investment Company Act of 1940 as an open-end investment company, or mutual fund.
A. The following significant accounting policies conform to generally accepted accounting principles for U.S. mutual funds. The fund consistently follows such policies in preparing its financial statements.
1. Security Valuation: Securities are valued as of the close of trading on the New York Stock Exchange (generally 4 p.m., Eastern time) on the valuation date. Equity securities are valued at the latest quoted sales prices or official closing prices taken from the primary market in which each security trades; such securities not traded on the valuation date are valued at the mean of the latest quoted bid and asked prices. Bonds, and temporary cash investments acquired over 60 days to maturity, are valued using the latest bid prices or using valuations based on a matrix system (which considers such factors as security prices, yields, maturities, and ratings), both as furnished by independent pricing services. Investments in Vanguard Market Liquidity Fund are valued at that fund’s net asset value. Other temporary cash investments are valued at amortized cost, which approximates market value. Securities for which market quotations are not readily available, or whose values have been materially affected by events occurring before the fund’s pricing time but after the close of the securities’ primary markets, are valued by methods deemed by the board of trustees to represent fair value.
2. Federal Income Taxes: The fund intends to continue to qualify as a regulated investment company and distribute all of its taxable income. Management has analyzed the fund’s tax positions taken for all open federal income tax years (November 30, 2006–2009), and has concluded that no provision for federal income tax is required in the fund’s financial statements.
3. Distributions: Distributions to shareholders are recorded on the ex-dividend date.
4. Other: Dividend income is recorded on the ex-dividend date. Interest income includes income distributions received from Vanguard Market Liquidity Fund and is accrued daily. Premiums and discounts on debt securities purchased are amortized and accreted, respectively, to interest income over the lives of the respective securities. Security transactions are accounted for on the date securities are bought or sold. Costs used to determine realized gains (losses) on the sale of investment securities are those of the specific securities sold. Fees assessed on redemptions of capital shares are credited to paid-in capital.
B. Oaktree Capital Management, L.P., provides investment advisory services to the fund for a fee calculated at an annual percentage rate of average net assets. The basic fee is subject to quarterly adjustments based on the fund’s performance for the preceding three years relative to the Merrill Lynch All Convertibles-All Qualities Index. For the year ended November 30, 2009, the investment advisory fee represented an effective annual basic rate of 0.34% of the fund’s average net assets before an increase of $1,597,000 (0.12%) based on performance.
C. The Vanguard Group furnishes at cost corporate management, administrative, marketing, and distribution services. The costs of such services are allocated to the fund under methods approved by the board of trustees. The fund has committed to provide up to 0.40% of its net assets in capital contributions to Vanguard. At November 30, 2009, the fund had contributed capital of $352,000 to Vanguard (included in Other Assets), representing 0.02% of the fund’s net assets and 0.14% of Vanguard’s capitalization. The fund’s trustees and officers are also directors and officers of Vanguard.
24
Convertible Securities Fund
D. Various inputs may be used to determine the value of the fund’s investments. These inputs are summarized in three broad levels for financial statement purposes. The inputs or methodologies used to value securities are not necessarily an indication of the risk associated with investing in those securities.
Level 1—Quoted prices in active markets for identical securities.
Level 2—Other significant observable inputs (including quoted prices for similar securities, interest rates, prepayment speeds, credit risk, etc.).
Level 3—Significant unobservable inputs (including the fund’s own assumptions used to determine the fair value of investments).
The following table summarizes the fund’s investments as of November 30, 2009, based on the inputs used to value them:
| | | |
| | Level 1 | Level 2 | Level 3 |
| Investments | ($000) | ($000) | ($000) |
| Convertible Preferred Stocks | 126,847 | — | — |
| Convertible Bonds | — | 1,554,737 | — |
| Temporary Cash Investments | 20,431 | — | — |
| Total | 147,278 | 1,554,737 | — |
E. Distributions are determined on a tax basis and may differ from net investment income and realized capital gains for financial reporting purposes. Differences may be permanent or temporary. Permanent differences are reclassified among capital accounts in the financial statements to reflect their tax character. Temporary differences arise when certain items of income, expense, gain, or loss are recognized in different periods for financial statement and tax purposes; these differences will reverse at some time in the future. Differences in classification may also result from the treatment of short-term gains as ordinary income for tax purposes.
Certain of the fund’s convertible bond investments are in securities considered to be “contingent payment debt instruments,” for which any realized gains increase (and all or part of any realized losses decrease) income for tax purposes. During the year ended November 30, 2009, the fund realized net losses of $1,635,000 from the sale of these securities, which decreased distributable net income for tax purposes; accordingly, such losses have been reclassified from accumulated net realized losses to undistributed net investment income.
For tax purposes, at November 30, 2009, the fund had $16,903,000 of ordinary income available for distribution. The fund had available capital loss carryforwards totaling $53,640,000 to offset future net capital gains through November 30, 2016.
At November 30, 2009, the cost of investment securities for tax purposes was $1,593,769,000. Net unrealized appreciation of investment securities for tax purposes was $108,246,000, consisting of unrealized gains of $142,189,000 on securities that had risen in value since their purchase and $33,943,000 in unrealized losses on securities that had fallen in value since their purchase.
F. During the year ended November 30, 2009, the fund purchased $1,941,319,000 of investment securities and sold $1,341,809,000 of investment securities, other than temporary cash investments.
25
Convertible Securities Fund
| | |
| G. Capital shares issued and redeemed were: | | |
| | Year Ended November 30, |
| | 2009 | 2008 |
| | Shares | Shares |
| | (000) | (000) |
| Issued | 80,121 | 35,899 |
| Issued in Lieu of Cash Distributions | 4,244 | 5,474 |
| Redeemed | (23,668) | (18,911) |
| Net Increase (Decrease) in Shares Outstanding | 60,697 | 22,462 |
H. In preparing the financial statements as of November 30, 2009, management considered the impact of subsequent events occurring through January 11, 2010, for potential recognition or disclosure in these financial statements.
26
Report of Independent Registered Public Accounting Firm
To the Trustees and Shareholders of Vanguard Convertible Securities Fund:
In our opinion, the accompanying statement of net assets and the related statements of operations and of changes in net assets and the financial highlights present fairly, in all material respects, the financial position of Vanguard Convertible Securities Fund (the “Fund”) at November 30, 2009, the results of its operations for the year then ended, the changes in its net assets for each of the two years in the period then ended and the financial highlights for each of the five years in the period then ended, in conformity with accounting principles generally accepted in the United States of America. These financial statements and financial highlights (hereafter referred to as “financial statements”) are the responsibility of the Fund’s management; our responsibility is to express an opinion on these financial statements based on our audits. We conducted our audits of these financial statements in accordance with the standards of the Public Company Accounting Oversight Board (United States). Those standards require that we plan and perform the audit to obtain reasonable assurance about whether the financial statements are free of material misstatement. An audit includes examining, on a test basis, evidence supporting the amounts and disclosures in the financial statements, assessing the accounting principles used and significant estimates made by management, and evaluating the overall financial statement presentation. We believe that our audits, which included confirmation of securities at November 30, 2009 by correspondence with the custodian and by agreement to the underlying ownership records of Vanguard Market Liquidity Fund, provide a reasonable basis for our opinion.
PricewaterhouseCoopers LLP
Philadelphia, Pennsylvania
January 11, 2010
Special 2009 tax information (unaudited) for Vanguard Convertible Securities Fund
This information for the fiscal year ended November 30, 2009, is included pursuant to provisions of the Internal Revenue Code.
The fund distributed $2,111,000 of qualified dividend income to shareholders during the fiscal year.
For corporate shareholders, 13.5% of investment income (dividend income plus short-term gains, if any) qualifies for the dividends-received deduction.
27
Your Fund’s After-Tax Returns
This table presents returns for your fund both before and after taxes. The after-tax returns are shown in two ways: (1) assuming that an investor owned the fund during the entire period and paid taxes on the fund’s distributions, and (2) assuming that an investor paid taxes on the fund’s distributions and sold all shares at the end of each period.
Calculations are based on the highest individual federal income tax and capital gains tax rates in effect at the times of the distributions and the hypothetical sales. State and local taxes were not considered. After-tax returns reflect any qualified dividend income, using actual prior-year figures and estimates for 2009. (In the example, returns after the sale of fund shares may be higher than those assuming no sale. This occurs when the sale would have produced a capital loss. The calculation assumes that the investor received a tax deduction for the loss.)
Please note that your actual after-tax returns will depend on your tax situation and may differ from those shown. Also note that if you own the fund in a tax-deferred account, such as an individual retirement account or a 401(k) plan, this information does not apply to you. Such accounts are not subject to current taxes.
Finally, keep in mind that a fund’s performance—whether before or after taxes—does not guarantee future results.
| | | |
| Average Annual Total Returns: Convertible Securities Fund1 | | | |
| Periods Ended November 30, 2009 | | | |
| | One | Five | Ten |
| | Year | Years | Years |
| Returns Before Taxes | 42.55% | 5.05% | 5.82% |
| Returns After Taxes on Distributions | 40.59 | 2.99 | 3.67 |
| Returns After Taxes on Distributions and Sale of Fund Shares | 27.51 | 3.34 | 3.80 |
1 Total returns do not reflect the 1% fee assessed on redemptions of shares purchased on or after September 15, 2005, and held for less than one year, or the account service fee that may be applicable to certain accounts with balances below $10,000.
28
About Your Fund’s Expenses
As a shareholder of the fund, you incur ongoing costs, which include costs for portfolio management, administrative services, and shareholder reports (like this one), among others. Operating expenses, which are deducted from a fund’s gross income, directly reduce the investment return of the fund.
A fund’s expenses are expressed as a percentage of its average net assets. This figure is known as the expense ratio. The following examples are intended to help you understand the ongoing costs (in dollars) of investing in your fund and to compare these costs with those of other mutual funds. The examples are based on an investment of $1,000 made at the beginning of the period shown and held for the entire period.
The accompanying table illustrates your fund’s costs in two ways:
• Based on actual fund return. This section helps you to estimate the actual expenses that you paid over the period. The “Ending Account Value” shown is derived from the fund’s actual return, and the third column shows the dollar amount that would have been paid by an investor who started with $1,000 in the fund. You may use the information here, together with the amount you invested, to estimate the expenses that you paid over the period.
To do so, simply divide your account value by $1,000 (for example, an $8,600 account value divided by $1,000 = 8.6), then multiply the result by the number given for your fund under the heading “Expenses Paid During Period.”
• Based on hypothetical 5% yearly return. This section is intended to help you compare your fund’s costs with those of other mutual funds. It assumes that the fund had a yearly return of 5% before expenses, but that the expense ratio is unchanged. In this case—because the return used is not the fund’s actual return—the results do not apply to your investment. The example is useful in making comparisons because the Securities and Exchange Commission requires all mutual funds to calculate expenses based on a 5% return. You can assess your fund’s costs by comparing this hypothetical example with the hypothetical examples that appear in shareholder reports of other funds.
Note that the expenses shown in the table are meant to highlight and help you compare ongoing costs only and do not reflect transaction costs incurred by the fund for buying and selling securities. Further, the expenses do not include the 1% fee on redemptions of shares held for less than one year, nor do they include the account service fee described in the prospectus. If such fees were applied to your account, your costs would be higher. Your fund does not carry a “sales load.”
The calculations assume no shares were bought or sold during the period. Your actual costs may have been higher or lower, depending on the amount of your investment and the timing of any purchases or redemptions.
You can find more information about the fund’s expenses, including annual expense ratios, in the Financial Statements section of this report. For additional information on operating expenses and other shareholder costs, please refer to your fund’s current prospectus.
29
| | | |
| Six Months Ended November 30, 2009 | | | |
| | Beginning | Ending | Expenses |
| | Account Value | Account Value | Paid During |
| Convertible Securities Fund | 5/31/2009 | 11/30/2009 | Period1 |
| Based on Actual Fund Return | $1,000.00 | $1,149.47 | $3.72 |
| Based on Hypothetical 5% Yearly Return | 1,000.00 | 1,021.61 | 3.50 |
1 The calculations are based on expenses incurred in the most recent six-month period. The fund’s annualized six-month expense ratio for that period is 0.69%. The dollar amounts shown as “Expenses Paid” are equal to the annualized expense ratio multiplied by the average account value over the period, multiplied by the number of days in the most recent six-month period, then divided by the number of days in the most recent 12-month period.
30
Glossary
Average Coupon. The average interest rate paid on the fixed income securities held by a fund. It is expressed as a percentage of face value.
Average Duration. An estimate of how much the value of the bonds held by a fund will fluctuate in response to a change in interest rates. To see how the value could change, multiply the average duration by the change in rates. If interest rates rise by 1 percentage point, the value of the bonds in a fund with an average duration of five years would decline by about 5%. If rates decrease by a percentage point, the value would rise by 5%.
Average Quality. An indicator of credit risk, this figure is the average of the ratings assigned to a fund’s holdings by credit-rating agencies. The agencies make their judgment after appraising an issuer’s ability to meet its obligations. Quality is graded on a scale, with Aaa or AAA indicating the most creditworthy bond issuers.
Average Weighted Maturity. The average length of time until fixed income securities held by a fund reach maturity and are repaid. The figure reflects the proportion of fund assets represented by each security.
Beta. A measure of the magnitude of a fund’s past share-price fluctuations in relation to the ups and downs of a given market index. The index is assigned a beta of 1.00. Compared with a given index, a fund with a beta of 1.20 typically would have seen its share price rise or fall by 12% when the index rose or fell by 10%. For this report, beta is based on returns over the past 36 months for both the fund and the index. Note that a fund’s beta should be reviewed in conjunction with its R-squared (see definition). The lower the R-squared, the less correlation there is between the fund and the index, and the less reliable beta is as an indicator of volatility.
Conversion Premium. The average percentage by which the weighted average market price of the convertible securities held by a fund exceeds the weighted average market price of their underlying common stocks. For example, if a stock is trading at $25 per share and a bond convertible into the stock is trading at a price equivalent to $30 per share of stock, the conversion premium is 20% ($5 ÷ $25 = 20%).
Expense Ratio. The percentage of a fund’s average net assets used to pay its annual administrative and advisory expenses. These expenses directly reduce returns to investors.
Foreign Holdings. The percentage of a fund’s net assets represented by securities of companies based outside the United States.
Inception Date. The date on which the assets of a fund (or one of its share classes) are first invested in accordance with the fund’s investment objective. For funds with a subscription period, the inception date is the day after that period ends. Investment performance is measured from the inception date.
Market Exposure. A measure that reflects a fund’s security investments excluding any holdings in short-term reserves.
R-Squared. A measure of how much of a fund’s past returns can be explained by the returns from the market in general, as measured by a given index. If a fund’s total returns were precisely synchronized with an index’s returns, its R-squared would be 1.00. If the fund’s returns bore no relationship to the index’s returns, its R-squared would be 0. For this report, R-squared is based on returns over the past 36 months for both the fund and the index.
31
Short-Term Reserves. The percentage of a fund invested in highly liquid, short-term securities that can be readily converted to cash.
Turnover Rate. An indication of the fund’s trading activity. Funds with high turnover rates incur higher transaction costs and may be more likely to distribute capital gains (which may be taxable to investors). The turnover rate excludes in-kind transactions, which have minimal impact on costs.
Yield. A fund’s 30-day SEC yield is derived using a formula specified by the U.S. Securities and Exchange Commission. Under the formula, data related to the fund’s security holdings in the previous 30 days are used to calculate the fund’s hypothetical net income for that period, which is then annualized and divided by the fund’s estimated average net assets over the calculation period. For the purposes of this calculation, a security’s income is based on its current market yield to maturity (in the case of bonds) or its projected dividend yield (for stocks). Because the SEC yield represents hypothetical annualized income, it will differ—at times significantly—from the fund’s actual experience. As a result, the fund’s income distributions may be higher or lower than implied by the SEC yield.
32
This page intentionally left blank.
This page intentionally left blank.
This page intentionally left blank.
The People Who Govern Your Fund
The trustees of your mutual fund are there to see that the fund is operated and managed in your best interests since, as a shareholder, you are a part owner of the fund. Your fund’s trustees also serve on the board of directors of The Vanguard Group, Inc., which is owned by the Vanguard funds and provides services to them on an at-cost basis.
A majority of Vanguard’s board members are independent, meaning that they have no affiliation with Vanguard or the funds they oversee, apart from the sizable personal investments they have made as private individuals. The independent board members have distinguished backgrounds in business, academia, and public service. Each of the trustees and executive officers oversees 163 Vanguard funds.
The following table provides information for each trustee and executive officer of the fund. More information about the trustees is in the Statement of Additional Information, which can be obtained, without charge, by contacting Vanguard at 800-662-7447, or online at www.vanguard.com.
Interested Trustees1
John J. Brennan
Born 1954. Trustee Since May 1987. Chairman of the Board. Principal Occupation(s) During the Past Five Years: Chairman of the Board and Director/Trustee of The Vanguard Group, Inc., and of each of the investment companies served by The Vanguard Group; Chief Executive Officer (1996–2008) and President (1989–2008) of The Vanguard Group and of each of the investment companies served by The Vanguard Group; Chairman of the Financial Accounting Foundation; Governor of the Financial Industry Regulatory Authority (FINRA); Director of United Way of Southeastern Pennsylvania.
F. William McNabb III
Born 1957. Trustee Since July 2009. Principal Occupation(s) During the Past Five Years: Director of The Vanguard Group, Inc., since 2008; Chief Executive Officer and President of The Vanguard Group and of each of the investment companies served by The Vanguard Group since 2008; Director of Vanguard Marketing Corporation; Managing Director of The Vanguard Group (1995–2008).
Independent Trustees
Charles D. Ellis
Born 1937. Trustee Since January 2001. Principal Occupation(s) During the Past Five Years: Applecore Partners (pro bono ventures in education); Senior Advisor to Greenwich Associates (international business strategy consulting); Successor Trustee of Yale University; Overseer of the Stern School of Business at New York University; Trustee of the Whitehead Institute for Biomedical Research.
Emerson U. Fullwood
Born 1948. Trustee Since January 2008. Principal Occupation(s) During the Past Five Years: Executive Chief Staff and Marketing Officer for North America and Corporate Vice President (retired 2008) of Xerox Corporation (photocopiers and printers); Director of SPX Corporation (multi-industry manufacturing), the United Way of Rochester, the Boy Scouts of America, Amerigroup Corporation (direct health and medical insurance carriers), and Monroe Community College Foundation.
Rajiv L. Gupta
Born 1945. Trustee Since December 2001.2 Principal Occupation(s) During the Past Five Years: Chairman and Chief Executive Officer (retired 2009) and President (2006–2008) of Rohm and Haas Co. (chemicals); Board Member of American Chemistry Council; Director of Tyco International, Ltd. (diversified manufacturing and services) and Hewlett-Packard Co. (electronic computer manufacturing); Trustee of The Conference Board.
Amy Gutmann
Born 1949. Trustee Since June 2006. Principal Occupation(s) During the Past Five Years: President of the University of Pennsylvania; Christopher H. Browne Distinguished Professor of Political Science in the School of Arts and Sciences with secondary appointments at the Annenberg School for Communication and the Graduate School of Education of the University of Pennsylvania; Director of Carnegie Corporation of New York, Schuylkill River Development Corporation, and Greater Philadelphia Chamber of Commerce; Trustee of the National Constitution Center.
JoAnn Heffernan Heisen
Born 1950. Trustee Since July 1998. Principal Occupation(s) During the Past Five Years: Corporate Vice President and Chief Global Diversity Officer since 2006 (retired 2008) and Member of the Executive Committee (retired 2008) of Johnson & Johnson (pharmaceuticals/consumer products); Vice President and Chief Information Officer of Johnson & Johnson (1997–2005); Director of the University Medical Center at Princeton and Women’s Research and Education Institute; Member of the Advisory Board of the Maxwell School of Citizenship and Public Affairs at Syracuse University.
F. Joseph Loughrey
Born 1949. Trustee Since October 2009. Principal Occupation(s) During the Past Five Years: President and Chief Operating Officer since 2005 (retired 2009) and Vice Chairman of the Board (2008–2009) of Cummins Inc. (industrial machinery); Director of SKF AB (industrial machinery), Hillenbrand, Inc. (specialized consumer services), Sauer-Danfoss Inc. (machinery), the Lumina Foundation for Education, and the Columbus Community Education Coalition; Chairman of the Advisory Council for the College of Arts and Letters at the University of Notre Dame.
André F. Perold
Born 1952. Trustee Since December 2004. Principal Occupation(s) During the Past Five Years: George Gund Professor of Finance and Banking, Harvard Business School; Chair of the Investment Committee of HighVista Strategies LLC (private investment firm).
Alfred M. Rankin, Jr.
Born 1941. Trustee Since January 1993. Principal Occupation(s) During the Past Five Years: Chairman, President, and Chief Executive Officer of NACCO Industries, Inc. (forklift trucks/housewares/lignite); Director of Goodrich Corporation (industrial products/ aircraft systems and services); Deputy Chairman of the Federal Reserve Bank of Cleveland; Trustee of University Hospitals of Cleveland, The Cleveland Museum of Art, and Case Western Reserve University.
Peter F. Volanakis
Born 1955. Trustee Since July 2009. Principal Occupation(s) During the Past Five Years: President since 2007 and Chief Operating Officer since 2005 of Corning Incorporated (communications equipment); President of Corning Technologies (2001–2005); Director of Corning Incorporated and Dow Corning; Trustee of the Corning Incorporated Foundation and the Corning Museum of Glass; Overseer of the Amos Tuck School of Business Administration at Dartmouth College.
Executive Officers
Thomas J. Higgins
Born 1957. Chief Financial Officer Since September 2008. Principal Occupation(s) During the Past Five Years: Principal of The Vanguard Group, Inc.; Chief Financial Officer of each of the investment companies served by The Vanguard Group since 2008; Treasurer of each of the investment companies served by The Vanguard Group (1998–2008).
Kathryn J. Hyatt
Born 1955. Treasurer Since November 2008. Principal Occupation(s) During the Past Five Years: Principal of The Vanguard Group, Inc.; Treasurer of each of the investment companies served by The Vanguard Group since 2008; Assistant Treasurer of each of the investment companies served by The Vanguard Group (1988–2008).
Heidi Stam
Born 1956. Secretary Since July 2005. Principal Occupation(s) During the Past Five Years: Managing Director of The Vanguard Group, Inc., since 2006; General Counsel of The Vanguard Group since 2005; Secretary of The Vanguard Group and of each of the investment companies served by The Vanguard Group since 2005; Director and Senior Vice President of Vanguard Marketing Corporation since 2005; Principal of The Vanguard Group (1997–2006).
Vanguard Senior Management Team
R. Gregory Barton
Mortimer J. Buckley
Kathleen C. Gubanich
Paul A. Heller
Michael S. Miller
James M. Norris
Glenn W. Reed
George U. Sauter
Founder
John C. Bogle
Chairman and Chief Executive Officer, 1974–1996
1 These individuals are considered “interested persons,” as defined in the Investment Company Act of 1940, because they are officers of the Vanguard funds.
2 December 2002 for Vanguard Equity Income Fund, Vanguard Growth Equity Fund, the Vanguard Municipal Bond Funds, and the Vanguard State Tax-Exempt Funds.

P.O. Box 2600
Valley Forge, PA 19482-2600
Connect with Vanguard® > www.vanguard.com
Fund Information > 800-662-7447
Direct Investor Account Services > 800-662-2739
Institutional Investor Services > 800-523-1036
Text Telephone for People
With Hearing Impairment > 800-749-7273
This material may be used in conjunction with the offering of shares of any Vanguard fund only if preceded or accompanied by the fund’s current prospectus.
CFA® is a trademark owned by CFA Institute.
All comparative mutual fund data are from Lipper Inc. or Morningstar, Inc., unless otherwise noted.
You can obtain a free copy of Vanguard’s proxy voting guidelines by visiting our website, www.vanguard.com, and searching for “proxy voting guidelines,” or by calling Vanguard at 800-662-2739. The guidelines are also available from the SEC’s website, www.sec.gov. In addition, you may obtain a free report on how your fund voted the proxies for securities it owned during the 12 months ended June 30. To get the report, visit either www.vanguard.com or www.sec.gov.
You can review and copy information about your fund at the SEC’s Public Reference Room in Washington, D.C. To find out more about this public service, call the SEC at 202-551-8090. Information about your fund is also available on the SEC’s website, and you can receive copies of this information, for a fee, by sending a request in either of two ways: via e-mail addressed to publicinfo@sec.gov or via regular mail addressed to the Public Reference Section, Securities and Exchange Commission, Washington, DC 20549-1520.
© 2010 The Vanguard Group, Inc. All rights reserved.
Vanguard Marketing Corporation, Distributor.
Q820 012010