UNITED STATES
SECURITIES AND EXCHANGE COMMISSION
Washington, D.C. 20549
|
FORM N-CSR
CERTIFIED SHAREHOLDER REPORT OF REGISTERED
MANAGEMENT INVESTMENT COMPANIES
|
Investment Company Act file number 811- 4630
John Hancock Investment Trust III
(Exact name of registrant as specified in charter)
|
601 Congress Street, Boston, Massachusetts 02210
(Address of principal executive offices) (Zip code)
|
Alfred P. Ouellette
Senior Attorney and Assistant Secretary
|
601 Congress Street
Boston, Massachusetts 02210
(Name and address of agent for service)
|
Registrant's telephone number, including area code: 617-663-4324
| Date of fiscal year end: | October 31 |
| | |
| | |
| Date of reporting period: | April 30, 2006 |
ITEM 1. REPORT TO SHAREHOLDERS.

| Table of contents |
|
| Your fund at a glance |
| page 1 |
|
| Managers’ report |
| page 2 |
|
| A look at performance |
| page 6 |
|
| Growth of $10,000 |
| page 7 |
|
| Your expenses |
| page 8 |
|
| Fund’s investments |
| page 10 |
|
| Financial statements |
| page 14 |
|
| For more information |
| page 29 |
|
To Our Shareholders,
After producing modest returns in 2005, the stock market has advanced smartly in the first four months of 2006. The major indexes all advanced and produced four-month returns that were ahead of the market’s returns for all of 2005. For example, the Standard & Poor’s 500 Index returned 5.61% year-to-date through April 2006, versus 4.91% last year in total. Investors were encouraged by solid corporate earnings, a healthy economy and stable inflation, which suggested the Federal Reserve could be coming close to the end of its 18-month campaign of raising interest rates.
Despite the good results to date, it is anyone’s guess where the market will end 2006, especially given the wild cards of interest rate moves and record-high energy prices and their impact on corporate profits and the economy.
One thing we do know, however, is that the stock market’s pattern is one of extremes. Consider the last 10 years. From 1995 through 1999, we saw double-digit returns in excess of 20% per year, only to have 2000 through 2002 produce ever-increasing negative results, followed by another 20%-plus up year in 2004 and a less than 5% advance in 2005. Since 1926, the market, as measured by the Standard & Poor’s 500 Index, has produced average annual results of 10.4% . However, that “normal” return is rarely produced in any given year. In fact, calendar-year returns of 8% to 12% have occurred only five times in the 80 years since 1926.
Although the past in no way predicts the future, we have learned at least one lesson from history: Expect highs and lows in the short term, but always invest for the long term. Equally important: Work with your financial professional to maintain a diversified portfolio, spread out among not only different asset classes — stocks, bonds and cash — but also among various investment styles. It’s the best way we know of to benefit from, and weather, the market’s extremes.
Sincerely,

Keith F. Hartstein,
President and Chief Executive Officer
This commentary reflects the CEO’s views as of April 30, 2006. They are subject to change at any time.
YOUR FUND
AT A GLANCE
The Fund seeks long-term capital appreciation by normally investing at least 80% of its assets in equity securities of companies located in China, Hong Kong, or Taiwan.
Over the last six months
* The Fund posted a strong double-digit gain during the period, beating its peer group but trailing its benchmark index.
* The Chinese economy continued its red-hot growth, expanding at an annualized rate of 10.2% in the first quarter of 2006.
* Given the prospects for further appreciation of the yuan versus the U.S. dollar and the Chinese government’s commitment to developing domestic markets, we continued to favor domestic stocks over exporters.
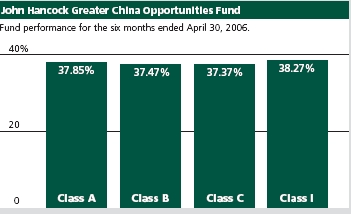
Total returns for the Fund are at net asset value with all distributions reinvested. These returns do not reflect the deduction of the maximum sales charge, which would reduce the performance shown above.
| Top 10 holdings |
| 8.8% | PetroChina Co., Ltd. |
| 8.0% | China Mobile (Hong Kong) Ltd. |
| 6.0% | China Life Insurance Co., Ltd. |
| 4.1% | China Construction Bank |
| 3.6% | CNOOC Ltd. |
| 3.3% | China Petroleum & Chemical Corp. |
| 3.1% | HSBC Holdings Plc |
| 3.0% | iShares MSCI Taiwan Index Fund |
| 2.3% | Bank of East Asia Ltd. |
| 2.3% | Denway Motors Ltd. |
| As a percentage of net assets on April 30, 2006. |
1
MANAGERS’
REPORT
BY PAULINE DAN, CFA, AND SETON LOR, FOR THE MFC GLOBAL INVESTMENT
MANAGEMENT (U.S.A.) LIMITED’S PORTFOLIO MANAGEMENT TEAM
JOHN HANCOCK
Greater China Opportunities Fund
Stocks in the Greater China region posted exceptionally strong gains for the six-month reporting period. In part, the gains were driven by continued robust economic growth in China, where GDP (gross domestic product) for 2005 expanded at a 9.8% pace. For the first quarter of 2006, GDP growth accelerated slightly to a 10.2% rate on an annualized basis. The rally began in December, when the Chinese government unveiled its 11th five-year economic plan — subsequently adopted in March 2006 — which included initiatives aimed at increasing domestic consumption, reducing reliance on fossil fuels and narrowing the income gap between rural and urban areas.
“Stocks in the Greater China
region posted exceptionally
strong gains for the six-month
reporting period.”
Another significant development was Chinese President Hu Jintao’s visit to the United States in April. Hu used the opportunity to announce a series of reforms, including the gradual appreciation of China’s currency, the yuan, against the U.S. dollar. Further, he said that China will allow domestic financial institutions to invest overseas. All of these factors helped to fuel a strong flow of investment capital into the region’s stocks during the period.
On the interest rate front, the People’s Bank of China boosted its one-year benchmark lending rate by 0.27% to 5.85% near the end of April. Chinese stocks responded by selling off briefly but then resumed their upward march.
Looking at performance
For the six months ending April 30, 2006, John Hancock Greater China Opportunities Fund’s Class A, Class B, Class C and Class I shares returned 37.85%, 37.47%, 37.37% and 38.27%, respectively, at net asset value. By comparison, the average Pacific/Asia ex-Japan fund monitored by Morningstar, Inc. returned 36.14%, 1 while the
2

Morgan Stanley Capital International (MSCI) China Free Index finished with a 41.17% return. Keep in mind that your returns will differ from those listed above if you were not invested in the Fund for the entire period and did not reinvest all distributions. Historical performance information can be found on pages six and seven.
The Fund maintained a defensive posture early in the period, as we were cautious in advance of learning the details of the five-year plan. Following that announcement, we shifted to a more aggressive position. However, strong flows of capital into the Fund made it difficult to stay fully invested, exerting a drag on performance given the exceptionally strong market.
Consumer discretionary and industrials picks shine
The Fund was aided by favorable stock picking in the consumer discretionary and industrials sectors. In the former, we tried to position the Fund in stocks that might benefit from China’s growing middle class, which has money to spend on automobiles, consumer electronics, apparel and other discretionary items. China Resources Enterprise Ltd. was one holding in the sector that performed well. The company owns a supermarket chain, a meat processing division and a beer company. Another meat processor, China Yurun Food Group Ltd., also posted strong gains, and we sold the stock to lock in profits.
“The Fund was aided by
favorable stock picking in the
consumer discretionary and
industrials sectors.”
In the industrials sector, we focused on companies with a technological edge and progressive management teams. One example was Shanghai Electric Group Co., Ltd., an industrial conglomerate that might be compared with General Electric in the United States. The company’s power-generating business experienced strong earnings growth, responding to the robust demand in that industry resulting from China’s growing infrastructure. Automaker Geely Automobile Holdings Ltd. also outperformed. One of the leading small-car manufacturers in China, Geely continued to improve its designs and production process while keeping costs low.
Materials was the sector with the highest absolute return, as the market value of the Fund’s holdings there more than doubled
3
| Sector | |
| distribution2 | |
|
| Financials | 29% |
|
| Energy | 17% |
|
| Telecommunication |
| service | 12% |
|
| Industrials | 10% |
|
| Consumer | |
| discretionary | 6% |
|
| Materials | 5% |
|
| Information | |
| technology | 5% |
|
| Utilities | 1% |
|
| Consumer | |
| staples | 1% |
during the period. However, compared with the MSCI China Free Index, the benefit of favorable stock picking was more than offset by our decision to underweight the sector. Nevertheless, one stock in the group worthy of mention was Sino-Forest Corp., a forest management company that saw its profits and share price climb sharply because of healthy demand for wood from the furniture and paper-goods industries.
Telecommunication services, consumer staples lag
Conversely, the Fund’s results suffered from our stock selection in telecommunication services. In particular, China Telecom Corp. Ltd. — a fixed-line operator — failed to keep pace with the overall market. In the consumer staples sector, Lianhua Supermarkets Holdings Ltd. disappointed us. Profit margins suffered temporarily due to the company’s aggressive expansion initiatives, but we thought that problem would correct itself over time. Meanwhile, industrials holding Sinotrans Ltd. held back our performance. The freight carrier, which can be compared with United States carrier FedEx, was hurt by competition from smaller rivals.
Outlook
While we continue to be positive about the longer-term prospects for the region’s stock markets, we are cautious about the short-term outlook. The markets have recently had strong runs, and some consolidation of share prices might be needed before they can advance further. Additionally, valuations have risen to levels at which investors could be more sensitive to earnings disappointments. Consequently, we believe stock selection will play an even more important role over the near term for investors seeking competitive
4

“The markets have recently had
strong runs, and some consolidation
of share prices might be needed
before they can advance further.”
performance. Another risk factor is the U.S. stock market because we feel that investors there have underestimated the potential for further interest rate hikes after the Federal Reserve Board’s May 10 meeting. Given the Chinese government’s commitment to increasing domestic consumption, along with the likelihood of further adjustments to the yuan/U.S. dollar relationship, we are inclined to continue favoring companies driven by domestic demand rather than exporters. The export market has been the primary engine of growth for China in the past, but its export/import imbalance has created a huge stockpile of U.S. dollar reserves, putting pressure on China to revalue its currency and alleviate the growing U.S. current account deficit. We therefore believe that China’s attempt to develop its domestic markets and create a more balanced approach to economic growth is an important, long term trend. As always, we will employ a combination of top-down analysis and careful bottom-up research in our attempts to find the region’s most competitive companies.
This commentary reflects the views of the portfolio managers through the end of the Fund’s period discussed in this report. The managers’ statements reflect their own opinions. As such, they are in no way guarantees of future events and are not intended to be used as investment advice or a recommendation regarding any spe-cific security. They are also subject to change at any time as market and other conditions warrant.
International investing involves special risks such as political, economic and currency risks and differences in accounting standards and financial reporting. Sector investing is subject to greater risks than the market as a whole.
1 Figures from Morningstar, Inc. include reinvested dividends and do not take into account sales charges. Actual load-adjusted performance is lower.
2 As a percentage of net assets on April 30, 2006.
5
A LOOK AT
PERFORMANCE
For the period ended
April 30, 2006
| | Class A | Class B | Class C | Class I1 |
| Inception date | 6-8-05 | 6-8-05 | 6-8-05 | 6-8-05 |
|
| Cumulative total returns with maximum sales charge (POP) | |
| | |
| Six months | 30.96 | 32.47 | 36.37 | 38.27 |
|
| Since inception | 34.10 | 35.36 | 39.26 | 41.86 |
|
Performance figures assume all distributions are reinvested. Returns with maximum sales charge reflect a sales charge on Class A shares of 5%, and the applicable contingent deferred sales charge (CDSC) on Class B and Class C shares. The Class B shares’ CDSC declines annually between years 1–6 according to the following schedule: 5, 4, 3, 3, 2, 1%. No sales charge will be assessed after the sixth year. Class C shares held for less than one year are subject to a 1% CDSC. Sales charge is not applicable for Class I shares.
The returns reflect past results and should not be considered indicative of future performance. The return and principal value of an investment will fluctuate so that shares, when redeemed, may be worth more or less than their original cost. Due to market volatility, the Fund’s current performance may be higher or lower than the performance shown. For performance data current to the most recent month-end, please call 1-800-225-5291 or visit the Fund’s Web site at www.jhfunds.com.
The performance table above and the chart on the next page do not reflect the deduction of taxes that a shareholder would pay on fund distributions or the redemption of fund shares.
The Fund’s performance results reflect any applicable expense reductions, without which the expenses would increase and results would have been less favorable.
1For certain types of investors as described in the Fund’s Class I share prospectus.
6
GROWTH OF
$10,000
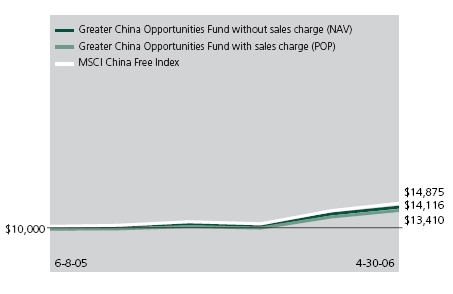
This chart shows what happened to a hypothetical $10,000 investment in Class A shares for the period indicated. For comparison, we’ve shown the same investment in the MSCI China Free Index.
| | Class B | Class C | Class I1 |
| Period beginning | 6-8-05 | 6-8-05 | 6-8-05 |
|
| |
| Without sales charge | $14,036 | $14,026 | $14,186 |
|
| With maximum sales charge | 13,536 | 13,926 | 14,186 |
|
| Index | 14,875 | 14,875 | 14,875 |
|
Assuming all distributions were reinvested for the period indicated, the table above shows the value of a $10,000 investment in the Fund’s Class B, Class C and Class I shares, respectively, as of April 30, 2006. Performance of the classes will vary based on the difference in sales charges paid by shareholders investing in the different classes and the fee structure of those classes.
MSCI China Free Index is an unmanaged market capitalization-weighted index of Chinese companies available to non-domestic investors.
It is not possible to invest directly in an index. Index figures do not reflect sales charges and would be lower if they did.
1 For certain types of investors as described in the Fund’s Class I share prospectus.
7
YOUR
EXPENSES
These examples are intended to help you understand your ongoing operating expenses.
Understanding fund expenses
As a shareholder of the Fund, you incur two types of costs:
* Transaction costs which include sales charges (loads) on purchases or redemptions (varies by share class), minimum account fee charge, etc.
* Ongoing operating expenses including management fees, distribution and service fees (if applicable) and other fund expenses.
We are going to present only your ongoing operating expenses here.
Actual expenses/actual returns
This example is intended to provide information about your fund’s actual ongoing operating expenses, and is based on your fund’s actual return. It assumes an account value of $1,000.00 on October 31, 2005, with the same investment held until April 30, 2006.
| Account value | | Expenses paid |
| $1,000.00 | Ending value | during period |
| on 10-31-05 | on 4-30-06 | ended 4-30-061 |
|
| Class A | $1,378.50 | $11.65 |
| Class B | 1,374.70 | 15.79 |
| Class C | 1,373.70 | 15.79 |
| Class I | 1,382.70 | 8.55 |
Together with the value of your account, you may use this information to estimate the operating expenses that you paid over the period. Simply divide your account value at April 30, 2006 by $1,000.00, then multiply it by the “expenses paid” for your share class from the table above. For example, for an account value of $8,600.00, the operating expenses should be calculated as follows:
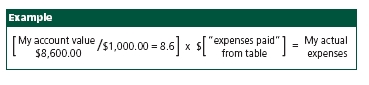
8
Hypothetical example for comparison purposes
This table allows you to compare your fund’s ongoing operating expenses with those of any other fund. It provides an example of the Fund’s hypothetical account values and hypothetical expenses based on each class’s actual expense ratio and an assumed 5% annual return before expenses (which is not your fund’s actual return). It assumes an account value of $1,000.00 on October 31, 2005, with the same investment held until April 30, 2006. Look in any other fund shareholder report to find its hypothetical example and you will be able to compare these expenses.
| Account value | | Expenses paid |
| $1,000.00 | Ending value | during period |
| on 10-31-05 | on 4-30-06 | ended 4-30-061 |
|
| Class A | $1,015.00 | $9.87 |
| Class B | 1,011.50 | 13.38 |
| Class C | 1,011.50 | 13.38 |
| Class I | 1,017.61 | 7.24 |
Remember, these examples do not include any transaction costs, such as sales charges; therefore, these examples will not help you to determine the relative total costs of owning different funds. If transaction costs were included, your expenses would have been higher. See the prospectus for details regarding transaction costs.
1 Expenses are equal to the Fund’s annualized expense ratio of 1.98%, 2.68%, 2.68% and 1.45% for Class A, Class B, Class C and Class I, respectively, multiplied by the average account value over the period, multiplied by number of days in most recent fiscal half-year/365 or 366 (to reflect the one-half year period).
9
F I N A N C I A L S TAT E M E N T S
FUND’S
INVESTMENTS
Securities owned
by the Fund on
April 30, 2006
(unaudited)
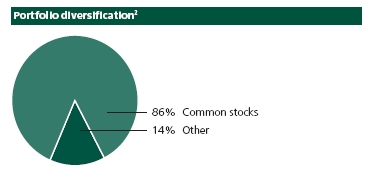
This schedule consists of one main category: common stocks.
Common stocks are further broken down by industry group.
| Issuer | Shares | Value |
|
| Common stocks 86.36% | | $47,467,613 |
| (Cost $41,201,989) | | |
| Air Freight & Logistics 0.56% | | 310,499 |
|
| Sinotrans Ltd. (China) | 900,000 | 310,499 |
| Airlines 1.78% | | 981,215 |
|
| China National Aviation Co., Ltd. (Hong Kong) | 1,900,000 | 470,488 |
|
| China Southern Airlines Co., Ltd. (China) | 2,000,000 | 510,727 |
| Airport Services 0.14% | | 74,288 |
|
| Beijing Capital International Airport Co., Ltd. (China) | 128,000 | 74,288 |
| Aluminum 0.77% | | 421,066 |
|
| Aluminum Corp. of China Ltd. (China) | 424,000 | 421,066 |
| Apparel, Accessories & Luxury Goods 1.26% | | 694,099 |
|
| Bauhaus International Holdings Ltd. (Hong Kong) | 470,000 | 56,980 |
|
| China Ting Group Holdings Ltd. (Hong Kong) (I) | 1,000,000 | 280,513 |
|
| Glorious Sun Enterprises Ltd. (Hong Kong) | 700,000 | 356,606 |
| Asset Management & Custody Banks 2.95% | | 1,619,280 |
|
| iShares MSCI Taiwan Index Fund (Taiwan) | 117,000 | 1,619,280 |
| Automobile Manufacturers 2.52% | | 1,387,249 |
|
| Denway Motors Ltd. (Hong Kong) | 3,070,000 | 1,237,320 |
|
| Geely Automobile Holdings Ltd. (Hong Kong) | 1,250,000 | 149,929 |
| Coal & Consumable Fuels 1.32% | | 724,820 |
|
| China Shenhua Energy Co., Ltd. (China) (I) | 400,000 | 724,820 |
| Commodity Chemicals 0.49% | | 266,971 |
|
| Sinopec Shanghai Petrochemical Co., Ltd. (China) | 450,000 | 266,971 |
| Computer Storage & Peripherals 0.98% | | 537,347 |
|
| TPV Technology Ltd. (Hong Kong) | 496,000 | 537,347 |
| Construction Materials 0.94% | | 518,466 |
|
| Anhui Conch Cement Co., Ltd. (China) | 300,000 | 518,466 |
See notes to financial statements.
10
F I N A N C I A L S TAT E M E N T S
| Issuer | Shares | Value |
| Consumer Electronics 0.80% | | $440,804 |
|
| Fujikon Industrial Holdings Ltd. (Hong Kong) | 1,818,000 | 440,804 |
| Distributors 0.78% | | 428,185 |
|
| China Resources Enterprise Ltd. (Hong Kong) | 200,000 | 428,185 |
| Diversified Banks 12.21% | | 6,711,072 |
|
| Bank of Communications Ltd. (China) (I)(S) | 1,810,000 | 1,102,997 |
|
| Bank of East Asia Ltd. (The) (Hong Kong) | 300,000 | 1,253,603 |
|
| China Construction Bank (China) (I)(S) | 5,108,000 | 2,206,935 |
|
| CITIC International Financial Holdings Ltd. (Hong Kong) | 750,000 | 442,534 |
|
| HSBC Holdings Plc (United Kingdom) | 100,000 | 1,705,003 |
| Diversified Metals & Mining 1.26% | | 691,042 |
|
| China Rare Earth Holdings Ltd. (China) | 994,000 | 224,346 |
|
| Jiangxi Copper Co., Ltd. (China) | 444,000 | 466,696 |
| Diversified REIT’s 1.92% | | 1,054,774 |
|
| GZI Real Estate Investment Trust (Hong Kong) (I) | 1,082,000 | 443,062 |
|
| Guangzhou Investment Co., Ltd. (Hong Kong) | 3,060,000 | 611,712 |
| Electrical Components & Equipment 0.49% | | 267,229 |
|
| China Solar Energy Holdings Ltd. (Hong Kong) | 2,800,000 | 267,229 |
| Electronic Equipment Manufacturers 2.90% | | 1,595,252 |
|
| Au Optronics Corp., American Depositary Receipt (Taiwan) | 50,000 | 821,500 |
|
| GST Holdings Ltd. (Hong Kong) | 1,100,000 | 425,606 |
|
| Kingboard Chemical Holdings Ltd. (Hong Kong) | 132,000 | 348,146 |
| Fertilizers & Agricultural Chemicals 0.53% | | 289,412 |
|
| Sinochem Hong Kong Holding Ltd. (Hong Kong) | 680,000 | 289,412 |
| Footwear 0.52% | | 285,607 |
|
| Prime Success International Group Ltd. (Hong Kong) | 430,000 | 285,607 |
| Forest Products 0.88% | | 484,292 |
|
| Sino-Forest Corp. (Canada) (I) | 90,900 | 484,292 |
| Gas Utilities 0.45% | | 248,980 |
|
| Xinao Gas Holdings Ltd. (China) | 270,000 | 248,980 |
| Heavy Electrical Equipment 2.16% | | 1,186,861 |
|
| Harbin Power Equipment Co., Ltd. (China) | 1,050,000 | 954,712 |
|
| Shanghai Electric Group Co., Ltd. (China) (I) | 600,000 | 232,149 |
| Highways & Railtracks 0.65% | | 357,058 |
|
| Anhui Expressway Co., Ltd. (China) | 490,000 | 357,058 |
See notes to financial statements.
11
F I N A N C I A L S TAT E M E N T S
| Issuer | Shares | Value |
| Home Furnishings 0.41% | | $224,410 |
|
| Kasen International Holdings Ltd. (China) (I) | 725,000 | 224,410 |
| Hypermarkets & Super Centers 0.75% | | 410,852 |
|
| Lianhua Supermarket Holdings Ltd. (China) | 352,000 | 410,852 |
| Independent Power Producers & Energy Traders 1.12% | | 616,999 |
|
| China Resources Power Holdings Co., Ltd. (Hong Kong) | 730,000 | 546,065 |
|
| Datang International Power Generation Co., Ltd. (China) | 100,000 | 70,934 |
| Industrial Conglomerates 1.66% | | 910,797 |
|
| Beijing Enterprises Holdings Ltd. (Hong Kong) | 120,000 | 263,102 |
|
| Citic Pacific Ltd. (Hong Kong) | 180,000 | 647,695 |
| Industrial Machinery 0.39% | | 215,589 |
|
| Enric Energy Equipment Holdings Ltd. (Hong Kong) (I) | 336,000 | 215,589 |
| Integrated Oil & Gas 11.93% | | 6,557,911 |
|
| China Petroleum & Chemical Corp. (China) | 2,790,000 | 1,772,165 |
|
| PetroChina Co., Ltd. (China) | 4,340,000 | 4,785,746 |
| Integrated Telecommunication Services 4.20% | | 2,308,274 |
|
| China Netcom Group Corp. (Hong Kong) Ltd. (Hong Kong) | 597,000 | 1,089,493 |
|
| China Telecom Corp. Ltd. (China) | 3,500,000 | 1,218,781 |
| IT Consulting & Other Services 0.66% | | 363,700 |
|
| SinoCom Software Group Ltd. (China) | 300,000 | 363,700 |
| Life & Health Insurance 5.92% | | 3,254,822 |
|
| China Life Insurance Co., Ltd. (China) (I) | 2,415,000 | 3,254,822 |
| Marine 0.99% | | 544,325 |
|
| China COSCO Holdings Co., Ltd. (China) (I) | 400,000 | 207,644 |
|
| China Shipping Development Co., Ltd. (China) | 230,000 | 176,498 |
|
| Pacific Basin Shipping Ltd. (Hong Kong) | 360,000 | 160,183 |
| Marine Ports & Services 0.81% | | 443,469 |
|
| China Merchants Holdings International Co., Ltd. (Hong Kong) | 130,000 | 443,469 |
| Oil & Gas Drilling 0.49% | | 270,163 |
|
| China Oilfield Services Ltd. (China) | 490,000 | 270,163 |
| Oil & Gas Exploration & Production 3.61% | | 1,985,355 |
|
| CNOOC Ltd. (Hong Kong) | 2,463,000 | 1,985,355 |
| Railroads 0.55% | | 303,115 |
|
| Guangshen Railway Co., Ltd. (China) | 790,000 | 303,115 |
See notes to financial statements.
12
F I N A N C I A L S TAT E M E N T S
| Issuer | Shares | Value |
| Real Estate Management & Development 5.18% | | $2,844,582 |
|
| Beijing North Star Co., Ltd. (China) | 900,000 | 249,560 |
|
| Cheung Kong Holdings Ltd. (Hong Kong) | 106,000 | 1,194,160 |
|
| China Overseas Land & Investment Ltd. (Hong Kong) | 1,000,000 | 638,409 |
|
| China Resources Land Ltd. (Hong Kong) | 720,000 | 487,512 |
|
| Coastal Greenland Ltd. (Hong Kong) (I) | 3,230,000 | 274,941 |
| Semiconductors 0.13% | | 74,177 |
|
| Advanced Semiconductor Manufacturing Corp. (China) (I) | 298,000 | 74,177 |
| Wireless Telecommunication Services 8.30% | | 4,563,205 |
|
| China Mobile (Hong Kong) Ltd. (Hong Kong) | 745,000 | 4,333,378 |
|
| China Unicom Ltd. (Hong Kong) | 270,000 | 229,827 |
|
| |
| Total investments 86.36% | | $47,467,613 |
|
| |
| Other assets and liabilities, net 13.64% | | $7,497,677 |
|
| |
| Total net assets 100.00% | | $54,965,290 |
(I) Non-income-producing security.
(S) These securities are exempt from registration under Rule 144A of the Securities Act of 1933. Such securities may be resold, normally to qualified institutional buyers, in transactions exempt from registration. Rule 144A securities amounted to $3,309,932 or 6.02% of the Fund’s net assets as of April 30, 2006.
Parenthetical disclosure of a foreign country in the security description represents country of a foreign issuer.
The percentage shown for each investment category is the total value of that category as a percentage of the net assets of the Fund.
See notes to financial statements.
13
F I N A N C I A L S TAT E M E N T S
ASSETS AND
LIABILITIES
April 30, 2006
(unaudited)
This Statement of Assets and Liabilities is the Fund’s balance sheet. It shows the value of what the Fund owns, is due and owes. You’ll also find the net asset value and the maximum offering price per share.
| Assets | |
| Investments at value (cost $41,201,989) | $47,467,613 |
| Cash | 4,405,026 |
| Foreign cash, at value (cost $1,193,532) | 1,194,095 |
| Receivable for investments sold | 676,663 |
| Receivable for shares sold | 1,696,477 |
| Dividends receivable | 199,563 |
| Total assets | 55,639,437 |
|
| Liabilities | |
| Payable for investments purchased | 516,569 |
| Payable for shares repurchased | 77,926 |
| Payable to affiliates | |
| Management fees | 40,282 |
| Distribution and service fees | 3,487 |
| Other | 18,055 |
| Other payables and accrued expenses | 17,828 |
| Total liabilities | 674,147 |
|
| Net assets | |
| Capital paid-in | 47,129,648 |
| Accumulated net realized gain on investments | |
| and foreign currency transactions | 1,569,219 |
| Net unrealized appreciation of investments | |
| and translation of assets and liabilities | |
| in foreign currencies | 6,266,273 |
| Accumulated net investment income | 150 |
| Net assets | $54,965,290 |
|
| Net asset value per share | |
| Based on net asset values and shares outstanding — | |
| the Fund has an unlimited number of shares | |
| authorized with no par value | |
| Class A ($40,784,784 ÷ 2,897,992 shares) | $14.07 |
| Class B ($8,362,940 ÷ 597,965 shares) | $13.99 |
| Class C ($5,518,129 ÷ 394,659 shares) | $13.98 |
| Class I ($299,437 ÷ 21,178 shares) | $14.14 |
|
| Maximum offering price per share | |
| Class A1 ($14.07 ÷ 95%) | $14.81 |
1 On single retail sales of less than $50,000. On sales of $50,000 or more and on group sales the offering price is reduced.
See notes to financial statements.
14
F I N A N C I A L S TAT E M E N T S
OPERATIONS
For the period ended
April 30, 2006
(unaudited)1
This Statement of Operations summarizes the Fund’s investment income earned and expenses incurred in operating the Fund. It also shows net gains (losses) for the period stated.
| Investment income | |
| Dividends | $256,649 |
| Interest | 3,691 |
| Total investment income | 260,340 |
|
| Expenses | |
| Investment management fees | 139,950 |
| Class A distribution and service fees | 32,992 |
| Class B distribution and service fees | 16,660 |
| Class C distribution and service fees | 12,497 |
| Class A, B and C transfer agent fees | 38,947 |
| Class I transfer agent fees | 41 |
| Registration and filing fees | 34,805 |
| Custodian fees | 17,928 |
| Miscellaneous | 13,161 |
| Professional fees | 11,567 |
| Printing | 8,602 |
| Accounting and legal services fees | 3,064 |
| Trustees’ fees | 590 |
| Compliance fees | 381 |
| Total expenses | 331,185 |
| Less expense reductions | (34,118) |
| Net expenses | 297,067 |
| Net investment loss | (36,727) |
|
| Net realized and unrealized gain (loss) | |
| Net realized gain (loss) on | |
| Investments | 1,592,132 |
| Foreign currency transactions | (4,002) |
| Change in net unrealized appreciation (depreciation) of | |
| Investments | 6,633,688 |
| Translation of assets and liabilities in foreign currencies | 1,419 |
| Net realized and unrealized gain | 8,223,237 |
| Increase in net assets from operations | $8,186,510 |
1 Semiannual period from 11-1-05 through 4-30-06.
See notes to financial statements.
15
F I N A N C I A L S TAT E M E N T S
CHANGES IN
NET ASSETS
These Statements of Changes in Net Assets show how the value of the Fund’s net assets has changed during the last two periods. The difference reflects earnings less expenses, any investment gains and losses, distributions, if any, paid to shareholders and the net of Fund share transactions.
| | Period | Period |
| | ended | ended |
| | 10-31-05 | 4-30-061 |
|
| |
| Increase (decrease) in net assets | | |
| From operations | | |
| Net investment income (loss) | $26,526 | ($36,727) |
| Net realized gain | 38,512 | 1,588,130 |
| Change in net unrealized | | |
| appreciation (depreciation) | (368,834) | 6,635,107 |
| Increase (decrease) in net assets | | |
| resulting from operations | (303,796) | 8,186,510 |
| Distributions to shareholders | | |
| From net realized gain | | |
| Class A | — | (44,190) |
| Class B | — | (5,067) |
| Class C | — | (4,308) |
| Class I | — | (351) |
| | — | (53,916) |
| From Fund share transactions | 15,402,390 | 31,734,102 |
|
| |
| Net assets | | |
| Beginning of period | — | 15,098,594 |
| End of period2 | $15,098,594 | $54,965,290 |
| |
| 1 Semiannual period from 11-1-05 through 4-30-06. Unaudited. | |
| 2 Includes accumulated net investment income of $36,877 and $150, respectively. |
See notes to financial statements.
16
F I N A N C I A L H I G H L I G H T S
FINANCIAL
HIGHLIGHTS
CLASS A SHARES
The Financial Highlights show how the Fund’s net asset value for a
share has changed since the end of the previous period.
| Period ended | 10-31-051 | 4-30-062 |
|
| Per share operating performance | | |
| Net asset value, | | |
| beginning of period | $10.00 | $10.24 |
| Net investment income (loss)3 | 0.03 | (0.01) |
| Net realized and unrealized | | |
| gain on investments | 0.21 | 3.88 |
| Total from | | |
| investment operations | 0.24 | 3.87 |
| Less distributions | | |
| From net realized gain | — | (0.04) |
| Net asset value, | | |
| end of period | $10.24 | $14.07 |
| Total return4,5 (%) | 2.406 | 37.856 |
|
| Ratios and supplemental data | | |
| Net assets, end of period | | |
| (in millions) | $12 | $41 |
| Ratio of expenses | | |
| to average net assets (%) | 1.937 | 1.987 |
| Ratio of gross expenses | | |
| to average net assets8 (%) | 4.447 | 2.227 |
| Ratio of net investment income | | |
| (loss) to average net assets | 0.687 | (0.17)7 |
| Portfolio turnover (%) | 28 | 53 |
See notes to financial statements.
17
F I N A N C I A L H I G H L I G H T S
CLASS B SHARES
| Period ended | 10-31-051 | 4-30-062 |
|
| Per share operating performance | | |
| Net asset value, | | |
| beginning of period | $10.00 | $10.21 |
| Net investment income (loss)3 | 0.02 | (0.03) |
| Net realized and unrealized | | |
| gain on investments | 0.19 | 3.85 |
| Total from | | |
| investment operations | 0.21 | 3.82 |
| Less distributions | | |
| From net realized gain | — | (0.04) |
| Net asset value, | | |
| end of period | $10.21 | $13.99 |
| Total return4,5 (%) | 2.106 | 37.476 |
|
| Ratios and supplemental data | | |
| Net assets, end of period | | |
| (in millions) | $1 | $8 |
| Ratio of expenses | | |
| to average net assets (%) | 2.637 | 2.687 |
| Ratio of gross expenses | | |
| to average net assets8 (%) | 5.147 | 2.927 |
| Ratio of net investment income | | |
| (loss) to average net assets | 0.437 | (0.55)7 |
| Portfolio turnover (%) | 28 | 53 |
See notes to financial statements.
18
F I N A N C I A L H I G H L I G H T S
CLASS C SHARES
| Period ended | 10-31-051 | 4-30-062 |
|
| Per share operating performance | | |
| Net asset value, | | |
| beginning of period | $10.00 | $10.21 |
| Net investment income (loss)3 | 0.03 | (0.04) |
| Net realized and unrealized | | |
| gain on investments | 0.18 | 3.85 |
| Total from | | |
| investment operations | 0.21 | 3.81 |
| Less distributions | | |
| From net realized gain | — | (0.04) |
| Net asset value, | | |
| end of period | $10.21 | $13.98 |
| Total return4,5 (%) | 2.106 | 37.376 |
|
| Ratios and supplemental data | | |
| Net assets, end of period | | |
| (in millions) | $1 | $6 |
| Ratio of expenses | | |
| to average net assets (%) | 2.627 | 2.687 |
| Ratio of gross expenses | | |
| to average net assets8 (%) | 5.137 | 2.927 |
| Ratio of net investment income (loss) | | |
| to average net assets | 0.617 | (0.70)7 |
| Portfolio turnover (%) | 28 | 53 |
See notes to financial statements.
19
F I N A N C I A L H I G H L I G H T S
CLASS I SHARES
| Period ended | 10-31-051 | 4-30-062 |
|
| Per share operating performance | | |
| Net asset value, | | |
| beginning of period | $10.00 | $10.26 |
| Net investment income3 | 0.03 | 0.02 |
| Net realized and unrealized | | |
| gain on investments | 0.23 | 3.90 |
| Total from | | |
| investment operations | 0.26 | 3.92 |
| Less distributions | | |
| From net realized gain | — | (0.04) |
| Net asset value, end of period | $10.26 | $14.14 |
| Total return4,5 (%) | 2.606 | 38.276 |
|
| Ratios and supplemental data | | |
| Net assets, end of period | | |
| (in millions) | —9 | —9 |
| Ratio of expenses | | |
| to average net assets (%) | 1.457 | 1.457 |
| Ratio of gross expenses | | |
| to average net assets8 (%) | 3.967 | 1.697 |
| Ratio of net investment income | | |
| to average net assets | 0.767 | 0.357 |
| Portfolio turnover (%) | 28 | 53 |
1 Period from beginning of operations on 6-9-05 through 10-31-05.
2 Semiannual period from 11-1-05 through 4-30-06. Unaudited.
3 Based on the average of the shares outstanding.
4 Assumes dividend reinvestment and does not reflect the effect of sales charges.
5 Total return would have been lower had certain expenses not been reduced during the periods shown.
6 Not annualized.
7 Annualized.
8 Does not take into consideration expense reductions during the periods shown.
9 Less than $500,000.
See notes to financial statements.
20
NOTES TO
STATEMENTS
Unaudited
Note A
Accounting policies
John Hancock Greater China Opportunities (the “Fund”) is a non-diversified series of John Hancock Investment Trust III (the “Trust”), an open-end management investment company registered under the Investment Company Act of 1940. The investment objective of the Fund is to achieve long-term capital appreciation.
The Trustees have authorized the issuance of multiple classes of shares of the Fund, designated as Class A, Class B, Class C and Class I shares. The shares of each class represent an interest in the same portfolio of investments of the Fund and have equal rights as to voting, redemptions, dividends and liquidation, except that certain expenses, subject to the approval of the Trustees, may be applied differently to each class of shares in accordance with current regulations of the Securities and Exchange Commission and the Internal Revenue Service. Shareholders of a class that bears distribution and service expenses under the terms of a distribution plan have exclusive voting rights to that distribution plan.
Significant accounting policies of the Fund are as follows:
Valuation of investments
Securities in the Fund’s portfolio are valued on the basis of market quotations, valuations provided by independent pricing services or, if quotations are not readily available, or the value has been materially affected by events occurring after the close of a foreign market, at fair value as determined in good faith in accordance with procedures approved by the Trustees. Short-term debt investments which have a remaining maturity of 60 days or less may be valued at amortized cost, which approximates market value. All portfolio transactions initially expressed in terms of foreign currencies have been translated into U.S. dollars as described in “Foreign currency translation” below.
Joint repurchase agreement
Pursuant to an exemptive order issued by the Securities and Exchange Commission, the Fund, along with other registered investment companies having a management contract with John Hancock Advisers, LLC (the “Adviser”), a wholly owned subsidiary of John Hancock Financial Services, Inc., a subsidiary of Manulife Financial Corporation (“MFC”), may participate in a joint repurchase agreement transaction. Aggregate cash balances are invested in one or more large repurchase agreements, whose underlying securities are obligations of the U.S. government and/or its agencies. The Fund’s custodian bank receives delivery of the underlying securities for the joint account on the Fund’s behalf. The Adviser is responsible for ensuring that the agreement is fully collateralized at all times.
21
Foreign currency translation
All assets or liabilities initially expressed in terms of foreign currencies are translated into U.S. dollars based on London currency exchange quotations as of 4:00 P.M., London time, on the date of any determination of the net asset value of the Fund. Transactions affecting statement of operations accounts and net realized gain (loss) on investments are translated at the rates prevailing at the dates of the transactions.
The Fund does not isolate that portion of the results of operations resulting from changes in foreign exchange rates on investments from the fluctuations arising from changes in market prices of securities held. Such fluctua-tions are included with the net realized and unrealized gain or loss from investments.
Reported net realized foreign currency exchange gains or losses arise from sales of foreign currency, currency gains or losses realized between the trade and settlement dates on securities transactions, and the difference between the amounts of dividends, interest and foreign withholding taxes recorded on the Fund’s books and the U.S. dollar equivalent of the amounts actually received or paid. Net unrealized foreign currency exchange gains and losses arise from changes in the value of assets and liabilities, other than investments in securities, resulting from changes in the exchange rates.
Investment transactions
Investment transactions are recorded as of the date of purchase, sale or maturity. Net realized gains and losses on sales of investments are determined on the identified cost basis. Capital gains realized on some foreign securities are subject to foreign taxes, which are accrued as applicable.
Class allocations
Income, common expenses and realized and unrealized gains (losses) are determined at the fund level and allocated daily to each class of shares based on the appropriate net asset value of the respective classes. Distribution and service fees, if any, and transfer agent fees for Class I shares, are calculated daily at the class level based on the appropriate net asset value of each class and the specific expense rate(s) applicable to each class.
Expenses
The majority of expenses are directly identifiable to an individual fund. Expenses that are not readily identifi-able to a specific fund are allocated in such a manner as deemed equitable, taking into consideration, among other things, the nature and type of expense and the relative size of the funds.
Bank borrowings
The Fund is permitted to have bank borrowings for temporary or emergency purposes, including the meeting of redemption requests that otherwise might require the untimely disposition of securities. The Fund has entered into a syndicated line of credit agreement with various banks. This agreement enables the Fund to participate, with other funds managed by the Adviser, in an unsecured line of credit with banks, which permits borrowings of up to $150 million, collectively. Interest is charged to each fund based on its borrowing. In addition, a commitment fee is charged to each fund based on the average daily unused portion of the line of credit and is allocated among the participating funds. The Fund had no borrowing activity under the line of credit during the period ended April 30, 2006.
Forward foreign currency exchange contracts
The Fund may enter into forward foreign currency exchange contracts as a hedge against the effect of fluctuations in currency exchange rates. A forward foreign currency exchange contract involves an obligation to purchase or sell a specific currency at a future date at a set price. The aggregate principal amounts of the contracts are marked to market daily at the applicable
22
foreign currency exchange rates. Any resulting unrealized gains and losses are included in the determination of the Fund’s daily net asset value. The Fund records realized gains and losses at the time the forward foreign currency exchange contracts are closed out. Risks may arise upon entering these contracts from the potential inability of coun-terparties to meet the terms of the contracts and from unanticipated movements in the value of a foreign currency relative to the U.S. dollar. These contracts involve market or credit risk in excess of the unrealized gain or loss reflected in the Fund’s Statement of Assets and Liabilities.
The Fund may also purchase and sell forward contracts to facilitate the settlement of foreign currency denominated portfolio transactions, under which it intends to take delivery of the foreign currency. Such contracts normally involve no market risk if they are offset by the currency amount of the underlying transactions.
The Fund had no open forward foreign currency exchange contracts on April 30, 2006.
Federal income taxes
The Fund qualifies as a “regulated investment company” by complying with the applicable provisions of the Internal Revenue Code and will not be subject to federal income tax on taxable income that is distributed to shareholders. Therefore, no federal income tax provision is required.
Dividends, interest and distributions
Dividend income on investment securities is recorded on the ex-dividend date or, in the case of some foreign securities, on the date thereafter when the Fund identifies the dividend. Interest income on investment securities is recorded on the accrual basis. Foreign income may be subject to foreign withholding taxes, which are accrued as applicable.
The Fund records distributions to shareholders from net investment income and net realized gains, if any, on the ex-dividend date. Distributions paid by the Fund with respect to each class of shares are calculated in the same manner, at the same time and are in the same amount, except for the effect of expenses that may be applied differently to each class.
Such distributions, on a tax basis, are determined in conformity with income tax regulations, which may differ from accounting principles generally accepted in the United States of America. Distributions in excess of tax basis earnings and profits, if any, are reported in the Fund’s financial statements as a return of capital.
Use of estimates
The preparation of these financial statements, in accordance with accounting principles generally accepted in the United States of America, incorporates estimates made by management in determining the reported amount of assets, liabilities, revenues and expenses of the Fund. Actual results could differ from these estimates.
Note B
Management fee and transactions with affiliates and others
The Fund has an investment management contract with the Adviser. Under the investment management contract, the Fund pays a daily management fee to the Adviser equivalent, at an annual rate of 1.00% of the Fund’s average daily net asset value. The Fund has a sub-advisory agreement with MFC Global Investment Management (U.S.A.) Limited, an affiliate of John Hancock Financial Services, Inc. The Fund is not responsible for payment of the subadvisory fees.
The Adviser has agreed to limit the Fund’s expenses, excluding distribution and service fees and transfer agent fees to 1.40% on an annual basis of the Fund’s average daily net asset value, at least until February 28, 2007. Accordingly, the expense reductions related to this total expense limitation amounted to $34,118 for the period
23
ended April 30, 2006. The Adviser reserves the right to terminate these limitations in the future.
The Trust has a Distribution Agreement with John Hancock Funds, LLC (“JH Funds”), a wholly owned subsidiary of the Adviser. The Fund has adopted Distribution Plans with respect to Class A, Class B and Class C, pursuant to Rule 12b-1 under the Investment Company Act of 1940, to reimburse JH Funds for the services it provides as distributor of shares of the Fund. Accordingly, the Fund makes monthly payments to JH Funds at an annual rate not to exceed 0.30%, 1.00%, and 1.00% of the average daily net asset value of Class A, Class B and Class C, respectively. A maximum of 0.25% of such payments may be service fees, as defined by the Conduct Rules of the National Association of Securities Dealers. Under the Conduct Rules, curtailment of a portion of the Fund’s 12b-1 payments could occur under certain circumstances.
Class A shares are assessed up-front sales charges. During the period ended April 30, 2006, JH Funds received net up-front sales charges of $364,711 with regard to sales of Class A shares. Of this amount, $58,215 was retained and used for printing prospectuses, advertising, sales literature and other purposes, $304,716 was paid as sales commissions to unrelated broker-dealers and $1,780 was paid as sales commissions to sales personnel of Signator Investors, Inc. (“Signator Investors”), a related broker-dealer. The Adviser’s indirect parent John Hancock Life Insurance Company (“JHLICo”), a subsidiary of MFC, is the indirect sole shareholder of Signator Investors.
Class B shares that are redeemed within six years of purchase are subject to a contingent deferred sales charge (“CDSC”) at declining rates, beginning at 5.00% of the lesser of the current market value at the time of redemption or the original purchase cost of the shares being redeemed. Class C shares that are redeemed within one year of purchase are subject to a CDSC at a rate of 1.00% of the lesser of the current market value at the time of redemption or the original purchase cost of the shares being redeemed. Proceeds from the CDSCs are paid to JH Funds and are used, in whole or in part, to defray its expenses for providing distribution-related services to the Fund in connection with the sale of Class B and Class C shares. During the period ended April 30, 2006, CDSCs received by JH Funds amounted to $2,006 for Class B shares and $627 for Class C shares.
The Fund has a transfer agent agreement with John Hancock Signature Services, Inc. (“Signature Services”), an indirect subsidiary of JHLICo. For Class A, Class B and Class C shares, the Fund pays a monthly transfer agent fee at an annual rate of 0.05% of each class’s average daily net asset value, plus a fee based on the number of shareholder accounts and reimbursement for certain out-of-pocket expenses, aggregated and allocated to each class on the basis of its relative net asset value. For Class I shares the Fund pays a monthly transfer agent fee at a total annual rate of 0.05% of Class I average daily net asset value. Signature Services has agreed to limit transfer agent fees on Class A, Class B and Class C shares to 0.40% of each class’s average daily net asset value, at least until February 28, 2007. Signature Services agreed to voluntarily reduce the Fund’s asset-based portion of the transfer agent fee for Class A, Class B and Class C shares if the total transfer agent fee exceeds the Lipper, Inc. median transfer agency fee for comparable mutual funds by greater than 0.05% . There were no transfer agent fee reductions during the period ended April 30, 2006. Signature Services reserves the right to terminate this limitation at any time.
The Fund has an agreement with the Adviser and affiliates
24
to perform necessary tax, accounting and legal services for the Fund. The compensa tion for the period amounted to $3,064. The Fund also paid the Adviser the amount of $578 for certain publishing services, included in the printing fees. The Fund reimbursed JHLICo for certain compliance costs, included in the Fund’s Statement of Operations.
The Adviser and other subsidiaries of JHLICo owned 470,000 Class A, 10,000 Class B, 10,000 Class C and 10, 000 Class I shares of beneficial interest of the Fund on April 30, 2006.
Mr. James R. Boyle is Chairman of the Adviser, as well as affiliated Trustee of the Fund, and is compensated by the Adviser and/or its affiliates. The compensation of unaffiliated Trustees is borne by the Fund. The unaffiliated Trustees may elect to defer, for tax purposes, their receipt of this compensation under the John Hancock Group of Funds Deferred Compensation Plan. The Fund makes investments into other John Hancock funds, as applicable, to cover its liability for the deferred compensation. Investments to cover the Fund’s deferred compensation liability are recorded on the Fund’s books as another asset. The deferred compensation liability and the related other asset are always equal and are marked to market on a periodic basis to reflect any income earned by the investments, as well as any unrealized gains or losses. The Deferred Compensation Plan investments had no impact on the operations of the Fund.
Note C
Fund share transactions
This listing illustrates the number of Fund shares sold and repurchased during the last two periods, along with the corresponding dollar value.
| | Period ended 10-31-051 | Period ended 4-30-062 |
| | Shares | Amount | Shares | Amount |
|
| Class A shares | | | | |
| Sold | 1,235,094 | $12,852,805 | 1,811,931 | $23,509,433 |
| Distributions reinvested | — | — | 2,330 | 24,951 |
| Repurchased | (19,657) | (208,796) | (131,706) | (1,670,766) |
| Net increase | 1,215,437 | $12,644,009 | 1,682,555 | $21,863,618 |
|
| |
| Class B shares | | | | |
| Sold | 140,806 | $1,500,503 | 483,566 | $6,319,075 |
| Distributions reinvested | — | — | 424 | 4,525 |
| Repurchased | (7,545) | (79,732) | (19,286) | (235,050) |
| Net increase | 133,261 | $1,420,771 | 464,704 | $6,088,550 |
|
| |
| Class C shares | | | | |
| Sold | 116,695 | $1,239,980 | 290,622 | $3,778,406 |
| Distributions reinvested | — | — | 285 | 3,039 |
| Repurchased | (212) | (2,370) | (12,731) | (148,116) |
| Net increase | 116,483 | $1,237,610 | 278,176 | $3,633,329 |
|
| |
| Class I shares | | | | |
| Sold | 10,000 | $100,000 | 11,178 | $148,605 |
| Net increase | 10,000 | $100,000 | 11,178 | $148,605 |
|
| |
| Net increase | 1,475,181 | $15,402,390 | 2,436,613 | $31,734,102 |
| |
| 1 Beginning of operations from 6-9-05 through 10-31-05. | | |
| 2 Semiannual period from 11-1-05 through 4-30-06. Unaudited. | | |
25
Note D Investment transactions
Purchases and proceeds from sales or maturities of securities, other than short-term securities and obligations of the U.S. government, during the period ended April 30, 2006, aggregated $40,198,480 and $13,773,952, respectively.
The cost of investments owned on April 30, 2006, including short-term investments, for federal income tax purposes, was $41,224,948. Gross unrealized appreciation and depreciation of investments aggregated $6,745,269 and $502,604 respectively, resulting in net unrealized appreciation of $6,242,665. The difference between book basis and tax basis net unrealized appreciation of investments is attributable primarily to the tax deferral of losses on certain sales of securities.
26
OUR FAMILY
OF FUNDS
|
| | |
| Equity | Balanced Fund |
| | Classic Value Fund |
| | Core Equity Fund |
| | Focused Equity Fund |
| | Growth Trends Fund |
| | Large Cap Equity Fund |
| | Large Cap Select Fund |
| | Mid Cap Equity Fund |
| | Mid Cap Growth Fund |
| | Multi Cap Growth Fund |
| | Small Cap Fund |
| | Small Cap Equity Fund |
| | Small Cap Intrinsic Value Fund |
| | Sovereign Investors Fund |
| | U.S. Global Leaders Growth Fund |
|
| |
| Asset Allocation and | Allocation Growth + Value Portfolio |
| Lifestyle Portfolios | Allocation Core Portfolio |
| | Lifestyle Aggressive Portfolio |
| | Lifestyle Growth Portfolio |
| | Lifestyle Balanced Portfolio |
| | Lifestyle Moderate Portfolio |
| | Lifestyle Conservative Portfolio |
|
| |
| Sector | Financial Industries Fund |
| | Health Sciences Fund |
| | Real Estate Fund |
| | Regional Bank Fund |
| | Technology Fund |
| | Technology Leaders Fund |
|
| |
| International | Greater China Opportunities Fund |
| | International Fund |
| | International Classic Value Fund |
|
| |
| Income | Bond Fund |
| | Government Income Fund |
| | High Yield Fund |
| | Investment Grade Bond Fund |
| | Strategic Income Fund |
|
| |
| Tax-Free Income | California Tax-Free Income Fund |
| | High Yield Municipal Bond Fund |
| | Massachusetts Tax-Free Income Fund |
| | New York Tax-Free Income Fund |
| | Tax-Free Bond Fund |
|
| |
| Money Market | Money Market Fund |
| | U.S. Government Cash Reserve |
|
For more complete information on any John Hancock Fund and a prospectus, which includes charges and expenses, call your financial professional, or John Hancock Funds at 1-800-225-5291. Please read the prospectus carefully before investing or sending money.
27
ELECTRONIC
DELIVERY
Now available from
John Hancock Funds
Instead of sending annual and semiannual reports and prospectuses through the U.S. mail, we’ll notify you by e-mail when these documents are available for online viewing.
How does electronic delivery benefit you?
* No more waiting for the mail to arrive; you’ll receive an e-mail notification as soon as the document is ready for online viewing.
* Reduces the amount of paper mail you receive from John Hancock Funds.
* Reduces costs associated with printing and mailing.
Sign up for electronic delivery today at
www.jhfunds.com/edelivery
For more information
The Fund’s proxy voting policies, procedures and records are available without charge, upon request:
| By phone | On the Fund’s Web site | On the SEC’s Web site |
| 1-800-225-5291 | www.jhfunds.com/proxy | www.sec.gov |
|
| |
| |
| |
| Trustees | Francis V. Knox, Jr. | Principal distributor |
| Ronald R. Dion, Chairman | Vice President and | John Hancock Funds, LLC |
| James R. Boyle† | Chief Compliance Officer | 601 Congress Street |
| James F. Carlin | John G. Vrysen | Boston, MA 02210-2805 |
| Richard P. Chapman, Jr.* | Executive Vice President and | |
| William H. Cunningham | Chief Financial Officer | Custodian |
| Charles L. Ladner* | | The Bank of New York |
| Dr. John A. Moore* | Investment adviser | One Wall Street |
| Patti McGill Peterson* | John Hancock Advisers, LLC | New York, NY 10286 |
| Steven R. Pruchansky | 601 Congress Street | |
| *Members of the Audit Committee | Boston, MA 02210-2805 | Transfer agent |
| †Non-Independent Trustee | | John Hancock Signature |
| Subadviser | Services, Inc. |
| | MFC Global Investment | 1 John Hancock Way, |
| Officers | Management (U.S.A.) Limited | Suite 1000 |
| Keith F. Hartstein | 200 Bloor Street East | Boston, MA 02217-1000 |
| President and | Toronto, Ontario, Canada | |
| Chief Executive Officer | M4W 1E5 | Legal counsel |
| William H. King | | Wilmer Cutler Pickering |
| Vice President and Treasurer | | Hale and Dorr LLP |
| | 60 State Street |
| | Boston, MA 02109-1803 |
The Fund’s investment objective, risks, charges and expenses are included in the prospectus and should be considered carefully before investing. For a prospectus, call your financial professional, call John Hancock Funds at 1-800-225-5291, or visit the Fund’s Web site at www.jhfunds.com. Please read the prospectus carefully before investing or sending money.
| How to contact us | |
|
| |
| Internet | www.jhfunds.com | |
|
| |
| Mail | Regular mail: | Express mail: |
| | John Hancock | John Hancock |
| | Signature Services, Inc. | Signature Services, Inc. |
| | 1 John Hancock Way, Suite 1000 | Mutual Fund Image Operations |
| | Boston, MA 02217-1000 | 380 Stuart Street |
| | | Boston, MA 02116 |
|
| |
| Phone | Customer service representatives | 1-800-225-5291 |
| | 24-hour automated information | 1-800-338-8080 |
| | TDD line | 1-800-554-6713 |
A listing of month-end portfolio holdings is available on our Web site, www.jhfunds.com. A more detailed portfolio holdings summary is available on a quarterly basis 60 days after the fiscal quarter on our Web site or upon request by calling 1-800-225-5291, or on the Securities and Exchange Commission’s Web site, www.sec.gov.
29

1-800-225-5291
1-800-554-6713 (TDD)
1-800-338-8080 EASI-Line
www.jhfundscom
Now available: electronic delivery
www.jhfundscom/edelivery
This report is for the information of
the shareholders of John Hancock
Greater China Opportunities Fund.
080SA 4/06
6/06

| Table of contents |
|
| Your fund at a glance |
| page 1 |
|
| Manager’s report |
| page 2 |
|
| A look at performance |
| page 6 |
|
| Growth of $10,000 |
| page 7 |
|
| Your expenses |
| page 8 |
|
| Fund’s investments |
| page 10 |
|
| Financial statements |
| page 13 |
|
| For more information |
| page 25 |
|
To Our Shareholders,
After producing modest returns in 2005, the stock market has advanced smartly in the first four months of 2006. The major indexes all advanced and produced four-month returns that were ahead of the market’s returns for all of 2005. For example, the Standard & Poor’s 500 Index returned 5.61% year-to-date through April 2006, versus 4.91% last year in total. Investors were encouraged by solid corporate earnings, a healthy economy and stable inflation, which suggested the Federal Reserve could be coming close to the end of its 18-month campaign of raising interest rates.
Despite the good results to date, it is anyone’s guess where the market will end 2006, especially given the wild cards of interest rate moves and record-high energy prices and their impact on corporate profits and the economy.
One thing we do know, however, is that the stock market’s pattern is one of extremes. Consider the last 10 years. From 1995 through 1999, we saw double-digit returns in excess of 20% per year, only to have 2000 through 2002 produce ever-increasing negative results, followed by another 20%-plus up year in 2004 and a less than 5% advance in 2005. Since 1926, the market, as measured by the Standard & Poor’s 500 Index, has produced average annual results of 10.4% . However, that “normal” return is rarely produced in any given year. In fact, calendar-year returns of 8% to 12% have occurred only five times in the 80 years since 1926.
Although the past in no way predicts the future, we have learned at least one lesson from history: Expect highs and lows in the short term, but always invest for the long term. Equally important: Work with your financial professional to maintain a diversified portfolio, spread out among not only different asset classes — stocks, bonds and cash — but also among various investment styles. It’s the best way we know of to benefit from, and weather, the market’s extremes.
Sincerely,

Keith F. Hartstein,
President and Chief Executive Officer
|
This commentary reflects the CEO’s views as of April 30, 2006. They are subject to change at any time.
YOUR FUND AT A GLANCE
The Fund seeks long-term capital appreciation by investing at least 80% of its assets in stocks of medium-capitalization companies (in the capitalization range of the Russell Midcap Growth Index) with above-average earnings growth.
| | Over the last six months |
| |
| * | Stocks moved higher, buoyed by economic strength and positive |
| | corporate earnings growth. |
| |
| * | Mid-cap stocks posted strong returns, beating their large-cap peers |
| | but modestly trailing small-cap stocks. |
| |
| * | Strong stock picking, especially in the technology, consumer |
| | discretionary and industrial sectors, drove Fund performance. |
Total returns for the Fund are at net asset value with all distributions reinvested. These returns do not reflect the deduction of the maximum sales charge, which would reduce the performance shown above.
| Top 10 holdings |
| 5.9% | Sotheby’s Holdings, Inc. (Class A) |
| 5.0% | Rockwell Automation, Inc. |
| 5.0% | Jarden Corp. |
| 4.4% | Comverse Technology, Inc. |
| 4.3% | MEMC Electronic Materials, Inc. |
| 3.9% | Owens-Illinois, Inc. |
| 3.8% | Varian Semiconductor Equipment Associates, Inc. |
| 3.8% | Gen-Probe, Inc. |
| 3.4% | Abercrombie & Fitch Co. (Class A) |
| 3.4% | Advance Auto Parts, Inc. |
| As a percentage of net assets on April 30, 2006. |
1
BY THOMAS P. NORTON, CFA, FOR THE SOVEREIGN ASSET MANAGEMENT LLC
PORTFOLIO MANAGEMENT TEAM
|
JOHN HANCOCK
Mid Cap Growth Fund
Stocks gained ground during the six months ended April 30, 2006, amid favorable market conditions. Economic growth was strong and much better than expected, which bolstered earnings growth at many companies. In addition, corporate balance sheets were solid, while stock valuations stayed at reasonable or attractive levels. Although interest rates continued to climb, they remained at relatively low levels by historical standards. In addition, a warmer-than-expected winter kept energy prices from rising as much as originally feared. During this six-month period, the Russell Midcap Growth Index returned 15.18%, beating the 9.64% return of the larger-cap Standard & Poor’s 500 Index, but modestly trailing small-cap stock returns. Growth stocks lagged value stocks by a small margin.
“Stocks gained ground during
the six months ended April 30,
2006, amid favorable market
conditions.”
|
Performance and strategy review
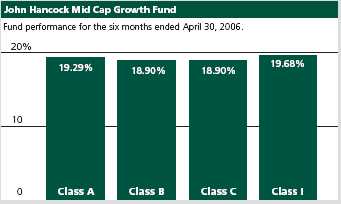
John Hancock Mid Cap Growth Fund’s Class A, Class B, Class C and Class I shares returned 19.29%, 18.90%, 18.90% and 19.68%, respectively, at net asset value for the six-month period. These gains were ahead of the 16.08% average return for the Morningstar group of mid-cap growth funds over the same time.1 Keep in mind that your net asset valuereturn will be different from the Fund’s if you were not invested in the Fund for the entire period and did not reinvest all distributions. Long-term performance information can be found on pages six and seven.
The Fund remained diversified across industries with a concentration in stocks that we believed had the best earnings and revenue growth prospects. We focused on companies with market capitalizations between $3 billion and $10 billion that had above-average earnings growth potential, sustainable competitive advantages and improving returns on invested capital. Our bottom-up stock
2

selection process remained unchanged. We started with a quantitative screen, followed by our own research. Once we added a name to the portfolio, we monitored it closing by putting both a ceiling and floor on its stock price. When a name hit one of these targets, we re-evaluated and decided whether to shift our price range. Our findings also helped determine whether we would stay put, add, trim or exit a particular position.
“Positive stock selection, particu-
larly in the technology, consumer
discretionary and industrials
sectors, drove performance.”
|
Winners in technology and consumer
Positive stock selection, particularly in the technology, consumer discretionary and industrials sectors, drove performance. As we found good businesses in the technology and consumer discretionary sectors whose stocks were selling at attractive valuations, we boosted our overweighted stakes in both. Tech holdings Redback Networks, Inc. and MEMC Electronic Materials, Inc. were especially strong contributors to performance. Redback, which makes routers that improve the efficiency of wireline and wireless networks, benefited as the company gained a competitive edge from improving its products and entering a lucrative contract with BellSouth. MEMC Electronics sells polysilica, the raw material used to make the wafers on which semiconductors are imprinted. It also manufactures and sells wafers. The stock benefited as industry supply constraints led to improved pricing for wafers. In addition, the company announced its intention to bolster revenues by selling finished wafers rather than raw polysilica to solar panel companies. In consumer discretionary, our focus remained on companies that were less vulnerable to a slowdown in consumer spending. Art auctioneer Sotheby’s Holdings, Inc. was a standout, benefiting from a restructuring of its cost structure as well as continued strong demand for its services.
Additional gains from industrials and health care
Industrial stocks were a smaller weight in the portfolio than in the Russell index, but returns were quite strong. Rockwell Automation, Inc., a company that makes automation equipment for factories, was the biggest standout. It rallied nicely amid strong
3
| Sector | |
| distribution2 | |
|
| Consumer | |
| discretionary | 32% |
|
| Information | |
| technology | 24% |
|
| Energy | 14% |
|
| Health care | 10% |
|
| Materials | 9% |
|
| Industrials | 7% |
|
| Financials | 2% |
demand for its products and services. Monster Worldwide, the online search firm, also had a sizable run-up. We took profits and sold our position. Certain health care stocks, including Cephalon, Inc. and Gen-Probe, Inc., were also top contributors to performance. Cephalon is a biotechnology company that specializes in drugs for sleep and neurological disorders, as well as cancer and pain. The stock climbed as the company moved closer to gaining regulatory approval for some of its new products. Gen-Probe rallied as the Red Cross began adopting the company’s new blood testing equipment. In addition, the stock moved up after the company indicated its decision to develop on-site testing equipment for industrial applications, such as food plants.
Modestly disappointing stock selection
No one sector was a significant disappointment, although returns from the energy, materials and health care sectors were slightly behind those in the index. We maintained overweights in energy and materials — sectors that continued to rally as commodity prices rose. However, we did not own some of the biggest gainers in either sector, which cost the Fund some ground. In the health care sector, where the Fund had an underweight, Rigel Pharmaceutical and Taro Pharmaceutical were sizable disappointments. Rigel had negative results from clinical tests for a new allergy drug, and Taro Pharmaceutical suffered when large distributors decided to cut their inventories. We sold both names. In addition, a few technology stocks fell short of expectations, including Comverse Technology, Inc., which makes voice mail software. Although Comverse’s business remained strong, worries about an internal investigation of the company’s options-granting practices pressured the stock.
4

“We believe the market could generate
average or above-average returns in
the coming year amid slower but
relatively stable economic growth.”
|
Cautiously optimistic outlook
We believe the market could generate average or above-average returns in the coming year amid slower but relatively stable economic growth. Many companies have strong earnings growth prospects that could help drive up valuations. In addition, the Federal Reserve appears closer to the end of its interest rate hikes, which bodes well for stocks. We think mid-cap stocks could benefit from being in the sweet spot of growth. In a rising market, they often have stronger upside than large-cap stocks; in a declining market,they tend to have more limited downside than small-cap stocks. We plan to focus on mid-cap stocks with accelerating returns or those on the cusp of an acceleration. We expect to tilt the portfolio toward companies that serve other businesses rather than those that serve the consumer. We may also seek out companies with greater exposure to non-U.S. markets.
This commentary reflects the views of the portfolio manager through the end of the Fund’s period discussed in this report. The manager’s statements reflect his own opinions. As such, they are in no way guarantees of future events and are not intended to be used as investment advice or a recommendation regarding any specific security. They are also subject to change at any time as market and other conditions warrant.
1 Figures from Morningstar, Inc. include reinvested dividends and do not take into account sales charges. Actual load-adjusted performance is lower.
2 As a percentage of net assets on April 30, 2006.
5
A LOOK AT
PERFORMANCE
For the period ended
April 30, 2006
|
| | Class A | Class B | Class C | Class I1 |
| Inception date | 11-1-93 | 11-1-93 | 6-1-98 | 3-1-02 |
|
| Average annual returns with maximum sales charge (POP) | |
| One year | 32.64% | 33.58% | 37.58% | 40.52% |
|
| Five years | 0.91 | 0.88 | 1.26 | — |
|
| Ten years | 3.27 | 3.20 | — | — |
|
| Since inception | — | — | 2.03 | 9.39 |
|
| Cumulative total returns with maximum sales charge (POP) | |
| Six months | 13.30 | 13.90 | 17.90 | 19.68 |
|
| One year | 32.64 | 33.58 | 37.58 | 40.52 |
|
| Five years | 4.64 | 4.46 | 6.46 | — |
|
| Ten years | 37.91 | 37.05 | — | — |
|
| Since inception | — | — | 17.23 | 45.34 |
|
Performance figures assume all distributions are reinvested. Returns with maximum sales charge reflect a sales charge on Class A shares of 5% and the applicable contingent deferred sales charge (CDSC) on Class B and Class C shares. The returns for Class C shares have been adjusted to reflect the elimination of the front-end sales charge effective July 15, 2004. The Class B shares’ CDSC declines annually between years 1–6 according to the following schedule: 5, 4, 3, 3, 2, 1%. No sales charge will be assessed after the sixth year. Class C shares held for less than one year are subject to a 1% CDSC. Sales charge is not applicable for Class I shares.
The returns reflect past results and should not be considered indicative of future performance. The return and principal value of an investment will fluctuate so that shares, when redeemed, may be worth more or less than their original cost. Due to market volatility, the Fund’s current performance may be higher or lower than the performance shown. For performance data current to the most recent month end, please call 1-800-225-5291 or visit the Fund’s Web site at www.jhfunds.com.
The performance table above and the chart on the next page do not reflect the deduction of taxes that a shareholder would pay on fund distributions or the redemption of fund shares.
The Fund’s performance results reflect any applicable expense reductions, without which the expenses would increase and results would have been less favorable.
1For certain types of investors as described in the Fund’s Class I share prospectus.
6
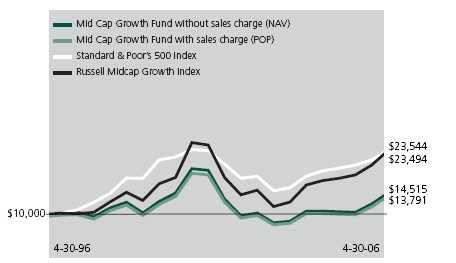
This chart shows what happened to a hypothetical $10,000 investment in Class A shares for the period indicated. For comparison, we’ve shown the same investment in two separate indexes.
| | Class B1 | Class C1 | Class I2 |
| Period beginning | 4-30-96 | 6-1-98 | 3-1-02 |
|
| |
| Mid Cap Growth Fund | $13,705 | $11,723 | $14,534 |
|
| Index 1 | 23,544 | 13,568 | 12,461 |
|
| Index 2 | 23,494 | 16,920 | 15,421 |
|
Assuming all distributions were reinvested for the period indicated, the table above shows the value of a $10,000 investment in the Fund’s Class B, Class C and Class I shares, respectively, as of April 30, 2006. The Class C shares investment with maximum sales charge has been adjusted to reflect the elimination of the front-end sales charge effective July 15, 2004. Performance of the classes will vary based on the difference in sales charges paid by shareholders investing in the different classes and the fee structure of those classes.
Standard & Poor’s 500 Index — Index 1 — is an unmanaged index that includes 500 widely traded common stocks.
Russell Midcap Growth Index — Index 2 — is an unmanaged index that contains those stocks from the Russell Midcap Index with a greater-than-average growth orientation.
It is not possible to invest directly in an index. Index figures do not reflect sales charges and would be lower if they did.
1 No contingent deferred sales charge applicable.
2 For certain types of investors as described in the Fund’s Class I share prospectus.
7
These examples are intended to help you understand your ongoing
operating expenses.
Understanding fund expenses
As a shareholder of the Fund, you incur two types of costs:
| * | Transaction costs which include sales charges (loads) on |
| purchases or redemptions (varies by share class), minimum |
| account fee charge, etc. |
* | Ongoing operating expenses including management |
| fees, distribution and service fees (if applicable) and other |
| fund expenses. |
We are going to present only your ongoing operating expenses here.
Actual expenses/actual returns
This example is intended to provide information about your fund’s actual ongoing operating expenses, and is based on your fund’s actual return. It assumes an account value of $1,000.00 on October 31, 2005, with the same investment held until April 30, 2006.
| Account value | | Expenses paid |
| $1,000.00 | Ending value | during period |
| on 10-31-05 | on 4-30-06 | ended 4-30-061 |
|
| Class A | $1,192.90 | $9.10 |
| Class B | 1,189.00 | 12.92 |
| Class C | 1,189.00 | 12.92 |
| Class I | 1,196.80 | 5.49 |
Together with the value of your account, you may use this information to estimate the operating expenses that you paid over the period. Simply divide your account value at April 30, 2006 by $1,000.00, then multiply it by the “expenses paid” for your share class from the table above. For example, for an account value of $8,600.00, the operating expenses should be calculated as follows:
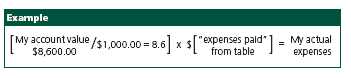
8
Hypothetical example for comparison purposes
This table allows you to compare your fund’s ongoing operating expenses with those of any other fund. It provides an example of the Fund’s hypothetical account values and hypothetical expenses based on each class’s actual expense ratio and an assumed 5% annual return before expenses (which is not your fund’s actual return). It assumes an account value of $1,000.00 on October 31, 2005, with the same investment held until April 30, 2006. Look in any other fund shareholder report to find its hypothetical example, and you will be able to compare these expenses.
| Account value | | Expenses paid |
| $1,000.00 | Ending value | during period |
| on 10-31-05 | on 4-30-06 | ended 4-30-061 |
|
| Class A | $1,016.50 | $8.37 |
| Class B | 1,013.00 | 11.88 |
| Class C | 1,013.00 | 11.88 |
| Class I | 1,019.80 | 5.05 |
Remember, these examples do not include any transaction costs, such as sales charges; therefore, these examples will not help you to determine the relative total costs of owning different funds. If transaction costs were included, your expenses would have been higher. See the prospectus for details regarding transaction costs.
1 Expenses are equal to the Fund’s annualized expense ratio of 1.68%, 2.38%, 2.38% and 1.02% for Class A, Class B, Class C and Class I, respectively, multiplied by the average account value over the period, multiplied by the number of days in most recent fiscal half-year/365 or 366 (to reflect the one-half year period).
9
F I N A N C I A L S TAT E M E N T S
FUND’S
INVESTMENTS
Securities owned
by the Fund on
April 30, 2006
(unaudited)
|
This schedule is divided into two main categories: common stocks and short-term investments. Common stocks are further broken down by industry group. Short-term investments, which represent the Fund’s cash position, are listed last.
| Issuer | | Shares | Value |
|
| Common stocks 97.55% | | | $150,560,578 |
| (Cost $115,591,986) | | | |
Apparel, Accessories & Luxury Goods 2.69% | | 4,160,520 |
|
| Coach, Inc. (I) | | 126,000 | 4,160,520 |
Apparel Retail 6.43% | | | 9,923,510 |
|
| Abercrombie & Fitch Co. (Class A) | | 87,000 | 5,283,510 |
|
| Urban Outfitters, Inc. (I)(L) | | 200,000 | 4,640,000 |
Asset Management & Custody Banks 2.08% | | 3,206,145 |
|
| Affiliated Managers Group, Inc. (I)(L) | | 31,650 | 3,206,145 |
Auto Parts & Equipment 3.41% | | | 5,268,820 |
|
| Advance Auto Parts, Inc. (I) | | 131,000 | 5,268,820 |
Biotechnology 1.13% | | | 1,739,990 |
|
| Cephalon, Inc. (I)(L) | | 26,500 | 1,739,990 |
Broadcasting & Cable TV 3.16% | | | 4,873,020 |
|
| XM Satellite Radio Holdings, Inc. (Class A) (I)(L) | 241,000 | 4,873,020 |
Communications Equipment 4.40% | | | 6,795,000 |
|
| Comverse Technology, Inc. (I) | | 300,000 | 6,795,000 |
Computer Storage & Peripherals 3.24% | | 4,994,400 |
|
| QLogic Corp. (I) | | 240,000 | 4,994,400 |
Diversified Commercial Services 5.86% | | 9,049,483 |
|
| Sotheby’s Holdings, Inc. (Class A) (I)(L) | | 301,750 | 9,049,483 |
Diversified Metals & Mining 2.70% | | | 4,171,596 |
|
| Phelps Dodge Corp. | | 48,400 | 4,171,596 |
Electrical Components & Equipment 5.00% | | 7,724,236 |
|
| Rockwell Automation, Inc. (L) | | 106,600 | 7,724,236 |
Electronic Equipment Manufacturers 4.31% | | 6,658,400 |
|
| MEMC Electronic Materials, Inc. (I) | | 164,000 | 6,658,400 |
See notes to
financial statements.
|
10
F I N A N C I A L S TAT E M E N T S
| Issuer | | Shares | Value |
| Electronic Manufacturing Services 2.24% | | $3,462,312 |
|
| Jabil Circuit, Inc. (I) | | 88,800 | 3,462,312 |
| Health Care Services 2.84% | | 4,377,438 |
|
| PDL BioPharma, Inc. (I) | | 152,100 | 4,377,438 |
| Health Care Supplies 3.78% | | 5,828,230 |
|
| Gen-Probe, Inc. (I)(L) | | 109,000 | 5,828,230 |
| Hotels, Resorts & Cruise Lines 2.68% | | 4,131,360 |
|
| Starwood Hotels & Resorts Worldwide, Inc. (L) | 72,000 | 4,131,360 |
| Internet Retail 3.25% | | 5,017,600 |
|
| Redback Networks, Inc. (I) | 224,000 | 5,017,600 |
Leisure Products 4.99% | | 7,701,000 |
|
| Jarden Corp. (I)(L) | | 226,500 | 7,701,000 |
Metal & Glass Containers 6.14% | | 9,475,615 |
|
| Crown Holdings, Inc. (I) | | 220,500 | 3,534,615 |
|
| Owens-Illinois, Inc. (I)(L) | | 325,000 | 5,941,000 |
Oil & Gas Drilling 2.46% | | 3,797,790 |
|
| ENSCO International, Inc. | 71,000 | 3,797,790 |
Oil & Gas Equipment & Services 4.87% | | 7,514,350 |
|
| BJ Services Co. | | 71,000 | 2,701,550 |
|
| Grant Prideco, Inc. (I) | | 94,000 | 4,812,800 |
Oil & Gas Exploration & Production 8.46% | | 13,051,540 |
|
| Chesapeake Energy Corp. | 115,000 | 3,643,200 |
|
| Pinnacle Gas Resources, Inc. (B)(S) | 300,000 | 3,300,000 |
|
| Rosetta Resources, Inc. (I) | 104,150 | 2,096,540 |
|
| Toreador Resources Corp. (I) | 130,000 | 4,011,800 |
Pharmaceuticals 1.91% | | 2,950,270 |
|
| Medicines Co. (The) (I)(L) | 153,500 | 2,950,270 |
Semiconductor Equipment 9.52% | | 14,687,953 |
|
| Broadcom Corp. (Class A) (I)(L) | 98,850 | 4,063,723 |
|
| Teradyne, Inc. (I)(L) | | 280,500 | 4,729,230 |
|
| Varian Semiconductor Equipment Associates, Inc. (I)(L) | 180,000 | 5,895,000 |
See notes to
financial statements.
|
11
F I N A N C I A L S TAT E M E N T S
| | | Interest | Par value | |
| Issuer, description, maturity date | | rate | (000) | Value |
|
| Short-term investments 35.41% | | | $54,649,730 |
| (Cost $54,649,730) | | | | |
| Joint Repurchase Agreement 2.68% | | | 4,139,000 |
|
| Investment in a joint repurchase agreement transaction | | | |
| with Barclays — Dated 4-28-06, due 5-1-06 (Secured | | | |
| by U.S. Treasury Inflation Indexed Bond 3.875%, | | | |
| due 4-15-29 and U.S. Treasury Inflation Indexed | | | |
| Note 2.375%, due 4-15-11) | | 4.710% | $4,139 | 4,139,000 |
| |
| | | | Shares | |
| Cash Equivalents 32.73% | | | | 50,510,730 |
|
| AIM Cash Investment Trust (T) | | | 50,510,730 | 50,510,730 |
|
| Total investments 132.96% | | | | $205,210,308 |
|
| |
| Other assets and liabilities, net (32.96%) | | | ($50,868,927) |
|
| |
| Total net assets 100.00% | | | | $154,341,381 |
(B) This security is fair valued in good faith under procedures established by the Board of Trustees.
(I) Non-income-producing security.
(L) All or a portion of this security is on loan as of April 30, 2006.
(S) These securities are exempt from registration under Rule 144A of the Securities Act of 1933. Such securities may be resold, normally to qualified institutional buyers, in transactions exempt from registration. Rule 144A securities amounted to $3,300,000 or 2.14% of the Fund’s net assets as of April 30, 2006.
(T) Represents investment of securities lending collateral.
The percentage shown for each investment category is the total value of that category as a percentage of the net assets of the Fund.
See notes to
financial statements.
|
12
F I N A N C I A L S TAT E M E N T S
ASSETS AND
LIABILITIES
April 30, 2006
(unaudited)
|
This Statement of Assets and Liabilities is the Fund’s balance sheet. It shows the value of what the Fund owns, is due and owes.
You’ll also find the net asset value and the maximum offering price per share.
| Assets | |
|
| Investments at value (cost $170,241,716) | |
| including $49,858,366 of securities loaned | $205,210,308 |
| Cash | 661 |
| Receivable for shares sold | 262,868 |
| Interest receivable | 1,625 |
| Other assets | 19,695 |
| Total assets | 205,495,157 |
|
| Liabilities | |
|
| Payable for shares repurchased | 352,188 |
| Payable upon receipt of securities loaned | 50,510,730 |
| Payable to affiliates | |
| Management fees | 101,236 |
| Distribution and service fees | 9,221 |
| Other | 110,096 |
| Other payables and accrued expenses | 70,305 |
| Total liabilities | 51,153,776 |
|
| Net assets | |
|
| Capital paid-in | 190,081,468 |
| Accumulated net realized loss on investments | (69,904,734) |
| Net unrealized appreciation of investments | 34,968,592 |
| Accumulated net investment loss | (803,945) |
| Net assets | $154,341,381 |
|
| Net asset value per share | |
|
| Based on net asset values and shares outstanding — | |
| the Fund has an unlimited number of shares | |
| authorized with no par value | |
| Class A ($119,116,931 ÷ 10,355,976 shares) | $11.50 |
| Class B ($27,829,549 ÷ 2,681,855 shares) | $10.38 |
| Class C ($4,121,502 ÷ 397,077 shares) | $10.38 |
| Class I ($3,273,399 ÷ 275,887 shares) | $11.86 |
|
| Maximum offering price per share | |
|
| Class A1 ($11.50 ÷ 95%) | $12.11 |
1 On single retail sales of less than $50,000. On sales of $50,000 or more and on group sales the offering price is reduced.
See notes to
financial statements.
|
13
F I N A N C I A L S TAT E M E N T S
OPERATIONS
For the period ended
April 30, 2006
(unaudited)1
|
This Statement of Operations summarizes the Fund’s investment income earned and expenses incurred in operating the Fund. It also shows net gains (losses) for the period stated.
| Investment income | |
|
| Dividends | $437,350 |
| Interest | 70,248 |
| Securities lending | 29,341 |
| Total investment income | 536,939 |
|
| Expenses | |
|
| Investment management fees | 580,576 |
| Class A distribution and service fees | 166,567 |
| Class B distribution and service fees | 137,343 |
| Class C distribution and service fees | 18,141 |
| Class A, B and C transfer agent fees | 336,777 |
| Class I transfer agent fees | 751 |
| Printing | 26,607 |
| Registration and filing fees | 26,009 |
| Custodian fees | 18,988 |
| Professional fees | 16,749 |
| Accounting and legal services fees | 15,368 |
| Miscellaneous | 7,394 |
| Trustees’ fees | 4,034 |
| Compliance fees | 2,819 |
| Securities lending fees | 1,151 |
| Interest | 789 |
Total expenses | 1,360,063 |
| Less expense reductions | (40,777) |
Net expenses | 1,319,286 |
Net investment loss | (782,347) |
|
| Realized and unrealized gain | |
|
| Net realized gain on investments | 8,849,421 |
| Change in net unrealized appreciation (depreciation) | |
| of investments | 17,164,726 |
Net realized and unrealized gain | 26,014,147 |
| Increase in net assets from operations | $25,231,800 |
1 Semiannual period from 11-1-05 through 4-30-06.
See notes to
financial statements.
|
14
F I N A N C I A L S TAT E M E N T S
These Statements of Changes in Net Assets show how the value of the Fund’s net assets has changed during the last two periods. The difference reflects earnings less expenses, any investment gains and losses, distributions, if any, paid to shareholders and the net of Fund share transactions.
| | Year | Period |
| | ended | ended |
| | 10-31-05 | 4-30-061 |
|
| |
| Increase (decrease) in net assets | | |
| From operations | | |
| Net investment loss | ($2,034,837) | ($782,347) |
| Net realized gain | 14,025,629 | 8,849,421 |
| Change in net unrealized | | |
| appreciation (depreciation) | 7,653,313 | 17,164,726 |
| Increase in net assets resulting | | |
| from operations | 19,644,105 | 25,231,800 |
| From Fund share transactions | (23,917,624) | (3,945,243) |
|
| Net assets | | |
|
| Beginning of period | 137,328,343 | 133,054,824 |
| End of period2 | $133,054,824 | $154,341,381 |
1 Semiannual period from 11-1-05 through 4-30-06. Unaudited.
2 Includes accumulated net investment loss of $21,598 and $803,945, respectively.
See notes to financial statements.
15
F I N A N C I A L H I G H L I G H T S
CLASS A SHARES
The Financial Highlights show how the Fund’s net asset value for a
share has changed since the end of the previous period.
| Period ended | 10-31-01 | 10-31-02 | 10-31-03 | 10-31-04 | 10-31-05 | 4-30-061 |
|
| Per share operating performance | | | | | | |
| Net asset value, | | | | | | |
| beginning of period | $16.03 | $7.66 | $6.47 | $8.43 | $8.33 | $9.64 |
| Net investment loss2 | (0.12) | (0.11) | (0.11) | (0.12) | (0.12) | (0.05) |
| Net realized and unrealized | | | | | | |
| gain (loss) on investments | (7.48) | (1.08) | 2.07 | 0.02 | 1.43 | 1.91 |
| Total from | | | | | | |
| investment operations | (7.60) | (1.19) | 1.96 | (0.10) | 1.31 | 1.86 |
| Less distributions | | | | | | |
| From net realized gain | (0.77) | — | — | — | — | — |
| Net asset value, | | | | | | |
| end of period | $7.66 | $6.47 | $8.43 | $8.33 | $9.64 | $11.50 |
| Total return3 (%) | (49.87) | (15.54) | 30.29 | (1.19)4 | 15.734 | 19.294,5 |
|
| Ratios and supplemental data | | | | | | |
|
| Net assets, end of period | | | | | | |
| (in millions) | $85 | $85 | $107 | $98 | $101 | $119 |
| Ratio of expenses | | | | | | |
| to average net assets (%) | 1.63 | 1.89 | 1.98 | 1.75 | 1.74 | 1.686 |
| Ratio of gross expenses | | | | | | |
| to average net assets7 (%) | — | — | — | 1.79 | 1.79 | 1.746 |
| Ratio of net investment loss | | | | | | |
| to average net assets (%) | (1.13) | (1.52) | (1.62) | (1.44) | (1.35) | (0.94)6 |
| Portfolio turnover (%) | 211 | 2678 | 183 | 75 | 71 | 38 |
See notes to
financial statements.
|
16
F I N A N C I A L H I G H L I G H T S
CLASS B SHARES
| Period ended | 10-31-01 | 10-31-02 | 10-31-03 | 10-31-04 | 10-31-05 | 4-30-061 |
|
| Per share operating performance | | | | | | |
| Net asset value, | | | | | | |
| beginning of period | $15.08 | $7.13 | $5.98 | $7.74 | $7.59 | $8.73 |
| Net investment loss2 | (0.18) | (0.16) | (0.15) | (0.17) | (0.17) | (0.08) |
| Net realized and unrealized | | | | | | |
| gain (loss) on investments | (7.00) | (0.99) | 1.91 | 0.02 | 1.31 | 1.73 |
| Total from | | | | | | |
| investment operations | (7.18) | (1.15) | 1.76 | (0.15) | 1.14 | 1.65 |
| Less distributions | | | | | | |
| From net realized gain | (0.77) | — | — | — | — | — |
| Net asset value, | | | | | | |
| end of period | $7.13 | $5.98 | $7.74 | $7.59 | $8.73 | $10.38 |
| Total return3 (%) | (50.24) | (16.13) | 29.43 | (1.94)4 | 15.024 | 18.904,5 |
|
| Ratios and supplemental data | | | | | | |
|
| Net assets, end of period | | | | | | |
| (in millions) | $101 | $46 | $48 | $34 | $26 | $28 |
| Ratio of expenses | | | | | | |
| to average net assets (%) | 2.33 | 2.56 | 2.67 | 2.45 | 2.44 | 2.386 |
| Ratio of gross expenses | | | | | | |
| to average net assets7 (%) | — | — | — | 2.49 | 2.49 | 2.446 |
| Ratio of net investment loss | | | | | | |
| to average net assets (%) | (1.83) | (2.20) | (2.31) | (2.14) | (2.03) | (1.63)6 |
| Portfolio turnover (%) | 211 | 2678 | 183 | 75 | 71 | 38 |
See notes to
financial statements.
|
17
F I N A N C I A L H I G H L I G H T S
CLASS C SHARES
| Period ended | 10-31-01 | 10-31-02 | 10-31-03 | 10-31-04 | 10-31-05 | 4-30-061 |
|
| Per share operating performance | | | | | | |
| Net asset value, | | | | | | |
| beginning of period | $15.07 | $7.13 | $5.99 | $7.74 | $7.59 | $8.73 |
| Net investment loss2 | (0.18) | (0.16) | (0.15) | (0.17) | (0.17) | (0.08) |
| Net realized and unrealized | | | | | | |
| gain (loss) on investments | (6.99) | (0.98) | 1.90 | 0.02 | 1.31 | 1.73 |
| Total from | | | | | | |
| investment operations | (7.17) | (1.14) | 1.75 | (0.15) | 1.14 | 1.65 |
| Less distributions | | | | | | |
| From net realized gain | (0.77) | — | — | — | — | — |
| Net asset value, | | | | | | |
| end of period | $7.13 | $5.99 | $7.74 | $7.59 | $8.73 | $10.38 |
| Total return3 (%) | (50.21) | (15.99) | 29.22 | (1.94)4 | 15.024 | 18.904,5 |
|
| Ratios and supplemental data | | | | | | |
|
| Net assets, end of period | | | | | | |
| (in millions) | $3 | $2 | $3 | $3 | $3 | $4 |
| Ratio of expenses | | | | | | |
| to average net assets (%) | 2.33 | 2.58 | 2.68 | 2.45 | 2.44 | 2.386 |
| Ratio of gross expenses | | | | | | |
| to average net assets7 (%) | — | — | — | 2.49 | 2.49 | 2.446 |
| Ratio of net investment loss | | | | | | |
| to average net assets (%) | (1.83) | (2.21) | (2.32) | (2.14) | (2.05) | (1.65)6 |
| Portfolio turnover (%) | 211 | 2678 | 183 | 75 | 71 | 38 |
See notes to
financial statements.
|
18
F I N A N C I A L H I G H L I G H T S
CLASS I SHARES
| Period ended | 10-31-029 | 10-31-03 | 10-31-04 | 10-31-05 | 4-30-061 |
|
| Per share operating performance | | | | | |
| Net asset value, | | | | | |
| beginning of period | $8.16 | $6.51 | $8.54 | $8.50 | $9.91 |
| Net investment loss2 | (0.06) | (0.06) | (0.06) | (0.06) | (0.02) |
| Net realized and unrealized | | | | | |
| gain (loss) on investments | (1.59) | 2.09 | 0.02 | 1.47 | 1.97 |
| Total from | | | | | |
| investment operations | (1.65) | 2.03 | (0.04) | 1.41 | 1.95 |
| Net asset value, | | | | | |
| end of period | $6.51 | $8.54 | $8.50 | $9.91 | $11.86 |
| Total return3 (%) | (20.22)5 | 31.18 | (0.47) | 16.59 | 19.685 |
|
| Ratios and supplemental data | | | | | |
|
| Net assets, end of period | | | | | |
| (in millions) | $3 | $3 | $3 | $3 | $3 |
| Ratio of expenses | | | | | |
| to average net assets (%) | 1.466 | 1.22 | 1.02 | 1.04 | 1.026 |
| Ratio of net investment loss | | | | | |
| to average net assets (%) | (1.00)6 | (0.85) | (0.71) | (0.65) | (0.28)6 |
| Portfolio turnover (%) | 2678 | 183 | 75 | 71 | 38 |
1 Semiannual period from 11-1-05 through 4-30-06. Unaudited.
2 Based on the average of the shares outstanding.
3 Assumes dividend reinvestment and does not reflect the effect of sales charges.
4 Total returns would have been lower had certain expenses not been reduced during the periods shown.
5 Not annualized.
6 Annualized.
7 Does not take into consideration expense reductions during the periods shown.
8 Excludes merger activity.
9 Class I shares began operations on 3-1-02.
|
See notes to
financial statements.
|
19
NOTES TO
STATEMENTS
Unaudited
|
Note A
Accounting policies
John Hancock Mid Cap Growth Fund (the “Fund”) is a diversified series of John Hancock Investment Trust III (the “Trust”), an open-end management investment company registered under the Investment Company Act of 1940. The investment objective of the Fund is to achieve long-term capital appreciation.
The Trustees have authorized the issuance of multiple classes of shares of the Fund, designated as Class A, Class B, Class C and Class I shares. The shares of each class represent an interest in the same portfolio of investments of the Fund and have equal rights as to voting, redemptions, dividends and liquidation, except that certain expenses, subject to the approval of the Trustees, may be applied differently to each class of shares in accordance with current regulations of the Securities and Exchange Commission and the Internal Revenue Service. Shareholders of a class that bears distribution and service expenses under the terms of a distribution plan have exclusive voting rights to that distribution plan.
Significant accounting policies
of the Fund are as follows:
Valuation of investments
Securities in the Fund’s portfolio are valued on the basis of market quotations, valuations provided by independent pricing services or, if quotations are not readily available, or the value has been materially affected by events occurring after the close of a foreign market, at fair value as determined in good faith in accordance with procedures approved by the Trustees. Short-term debt investments which have a remaining maturity of 60 days or less may be valued at amortized cost, which approximates market value. Investments in AIM Cash Investment Trust are valued at their net asset value each business day.
Joint repurchase agreement
Pursuant to an exemptive order issued by the Securities and Exchange Commission, the Fund, along with other registered investment companies having a management contract with John Hancock Advisers, LLC (the “Adviser”), a wholly owned subsidiary of John Hancock Financial Services, Inc., a subsidiary of Manulife Financial Corporation (“MFC”), may participate in a joint repurchase agreement transaction. Aggregate cash balances are invested in one or more large repurchase agreements, whose underlying securities are obligations of the U.S. government and/or its agencies. The Fund’s custodian bank receives delivery of the underlying securities for the joint account on the Fund’s behalf. The Adviser is responsible for ensuring that the agreement is fully collateralized at all times.
20
Investment transactions
Investment transactions are recorded as of the date of purchase, sale or maturity. Net realized gains and losses on sales of investments are determined on the identified cost basis.
Class allocations
Income, common expenses and realized and unrealized gains (losses) are determined at the fund level and allocated daily to each class of shares based on the appropriate net asset value of the respective classes. Distribution and service fees, if any, and transfer agent fees for Class I shares, are calculated daily at the class level based on the appropriate net asset value of each class and the specific expense rate(s) applicable to each class.
Expenses
The majority of expenses are directly identifiable to an individual fund. Expenses that are not readily identifi-able to a specific fund are allocated in such a manner as deemed equitable, taking into consideration, among other things, the nature and type of expense and the relative size of the funds.
Bank borrowings
The Fund is permitted to have bank borrowings for temporary or emergency purposes, including the meeting of redemption requests that otherwise might require the untimely disposition of securities.
The Fund has entered into a syndicated line of credit agreement with various banks. This agreement enables the Fund to participate, with other funds managed by the Adviser, in an unsecured line of credit with banks, which permits borrowings of up to $150 million, collectively. Interest is charged to each fund based on its borrowing. In addition, a commitment fee is charged to each fund based on the average daily unused portion of the line of credit and is allocated among the participating funds. The Fund had no borrowing activity under the line of credit during the period ended April 30, 2006.
Securities lending
The Fund may lend securities to certain qualified brokers who pay the Fund negotiated lender fees. The loans are collateralized at all times with cash or securities with a market value at least equal to the market value of the securities on loan. As with other extensions of credit, the Fund may bear the risk of delay of the loaned securities in recovery or even loss of rights in the collateral, should the borrower of the securities fail financially. At April 30, 2006, the Fund loaned securities having a market value of $49,858,366 collateralized by cash in the amount of $50,510,730. The cash collateral was invested in a short-term instrument.
Securities lending expenses are paid by the Fund to the Adviser.
Federal income taxes
The Fund qualifies as a “regulated investment company” by complying with the applicable provisions of the Internal Revenue Code and will not be subject to federal income tax on taxable income that is distributed to shareholders. Therefore, no federal income tax provision is required. For federal income tax purposes, the Fund has $78,754,155 of a capital loss carryforward available, to the extent provided by regulations, to offset future net realized capital gains. To the extent that such carryforward is used by the Fund, no capital gain distributions will be made. The loss carry-forward expires as follows: October 31, 2008 —$616,263, October 31, 2009 — $53,131,446 and October 31, 2010 —$25,006,446. Availability of a certain amount of the loss carryforward, which was acquired on June 7, 2002 in a merger, may be limited in a given year.
Dividends, interest
and distributions
Dividend income on investment securities is recorded on the ex-dividend date or, in the case of some foreign securities, on the date thereafter when the Fund identifies the dividend. Interest income
21
on investment securities is recorded on the accrual basis. Foreign income may be subject to foreign withholding taxes, which are accrued as applicable.
The Fund records distributions to shareholders from net investment income and net realized gains, if any, on the ex-dividend date. Distributions paid by the Fund with respect to each class of shares are calculated in the same manner, at the same time and are in the same amount, except for the effect of expenses that may be applied differently to each class.
Such distributions, on a tax basis, are determined in conformity with income tax regulations, which may differ from accounting principles generally accepted in the United States of America. Distributions in excess of tax basis earnings and profits, if any, are reported in the Fund’s financial statements as a return of capital.
Use of estimates
The preparation of these financial statements, in accordance with accounting principles generally accepted in the United States of America, incorporates estimates made by management in determining the reported amount of assets, liabilities, revenues and expenses of the Fund. Actual results could differ from these estimates.
Note B
Management fee and
transactions with
affiliates and others
The Fund has an investment management contract with the Adviser. Under the investment management contract, the Fund pays a monthly management fee to the Adviser equivalent, on an annual basis, to the sum of: (a) 0.80% of the first $500,000,000 of the Fund’s average daily net asset value, (b) 0.75% of the next $500,000,000 and (c) 0.70% of the Fund’s average daily net asset value in excess of $1,000,000,000.
Effective December 31, 2005, the investment management teams of the Adviser were reorganized into Sovereign Asset Management LLC (“Sovereign”), a wholly owned indirect subsidiary of John Hancock Life Insurance Company (“JHLICo”), a subsidiary of MFC. The Adviser remains the principal advisor on the Fund and Sovereign acts as subadviser under the supervision of the Adviser. The restructuring did not have an impact on the Fund, which continues to be managed using the same investment philosophy and process. The Fund is not responsible for payment of the subadvisory fees.
The Trust has a Distribution Agreement with John Hancock Funds, LLC (“JH Funds”), a wholly owned subsidiary of the Adviser. The Fund has adopted Distribution Plans with respect to Class A, Class B and Class C, pursuant to Rule 12b-1 under the Investment Company Act of 1940, to reimburse JH Funds for the services it provides as distributor of shares of the Fund. Accordingly, the Fund makes monthly payments to JH Funds at an annual rate not to exceed 0.30%, 1.00% and 1.00% of average daily net asset value of Class A, Class B and Class C, respectively. A maximum of 0.25% of such payments may be service fees, as defined by the Conduct Rules of the National Association of Securities Dealers. Under the Conduct Rules, curtailment of a portion of the Fund’s 12b-1 payments could occur under certain circumstances.
Class A shares are assessed up-front sales charges. During the period ended April 30, 2006, JH Funds received net up-front sales charges of $53,646 with regard to sales of Class A shares. Of this amount, $7,364 was retained and used for printing prospectuses, advertising, sales literature and other purposes, $43,885 was paid as sales commissions to unrelated broker-dealers and $2,397 was paid as sales commissions to sales personnel of Signator Investors, Inc. (“Signator Investors”), a related broker-dealer. The
22
Adviser’s indirect parent JHLICo, is the indirect sole shareholder of Signator Investors.
Class B shares that are redeemed within six years of purchase are subject to a contingent deferred sales charge (“CDSC”) at declining rates, beginning at 5.00% of the lesser of the current market value at the time of redemption or the original purchase cost of the shares being redeemed. Class C shares that are redeemed within one year of purchase are subject to a CDSC at a rate of 1.00% of the lesser of the current market value at the time of redemption or the original purchase cost of the shares being redeemed. Proceeds from the CDSCs are paid to JH Funds and are used, in whole or in part, to defray its expenses for providing distribution-related services to the Fund in connection with the sale of Class B and Class C shares. During the period ended April 30, 2006, CDSCs received by JH Funds amounted to $22,649 for Class B shares and $187 for Class C shares.
The Fund has a transfer agent agreement with John Hancock Signature Services, Inc. (“Signature Services”), an indirect subsidiary of JHLICo. For Class A, Class B and Class C shares, the Fund pays a monthly transfer agent fee at an annual rate of 0.05% of each class’s average daily net asset value, plus a fee based on the number of shareholder accounts and reimbursement for certain out-of-pocket expenses, aggregated and allocated to each class on the basis of its relative net asset value. For Class I shares the Fund pays a monthly transfer agent fee at a total annual rate of 0.05% of Class I average daily net asset value. Signature Services agreed to voluntarily reduce the Fund’s asset-based portion of the transfer agent fee for Class A, Class B and Class C shares if the total transfer agent fee exceeds the Lipper, Inc. median transfer agency fee for comparable mutual funds by greater than 0.05% . Accordingly, the transfer agent expense for Class A, Class B and Class C shares was reduced by $40,777 for the period ended April 30, 2006. Signature Services reserves the right to terminate this limitation at any time.
The Fund has an agreement with the Adviser and affiliates to perform necessary tax, accounting and legal services for the Fund. The compensation for the period amounted to $15,368. The Fund also paid the Adviser the amount of $381 for certain publishing services, included in the printing fees. The Fund reimbursed JHLICo for certain compliance costs, included in the Fund’s Statement of Operations.
Mr. James R. Boyle is Chairman of the Adviser, as well as affiliated Trustee of the Fund, and is compensated by the Adviser and/or its affiliates. The compensation of unaffiliated Trustees is borne by the Fund. The unaffiliated Trustees may elect to defer, for tax purposes, their receipt of this compensation under the John Hancock Group of Funds Deferred Compensation Plan. The Fund makes investments into other John Hancock funds, as applicable, to cover its liability for the deferred compensation. Investments to cover the Fund’s deferred compensation liability are recorded on the Fund’s books as an other asset. The deferred compensation liability and the related other asset are always equal and are marked to market on a periodic basis to reflect any income earned by the investments, as well as any unrealized gains or losses. The Deferred Compensation Plan investments had no impact on the operations of the Fund.
23
Note C
Fund share transactions
This listing illustrates the number of Fund shares sold and repurchased during the last two periods, along with the corresponding dollar value.
| | Year ended 10-31-05 | Period ended 4-30-061 |
| | Shares | Amount | Shares | Amount |
|
| Class A shares | | | | |
| Sold | 1,409,247 | $12,651,836 | 922,786 | $10,113,217 |
| Repurchased | (2,642,146) | (23,854,729) | (1,084,676) | (11,732,993) |
| Net decrease | (1,232,899) | ($11,202,893) | (161,890) | ($1,619,776) |
|
| Class B shares | | | | |
| Sold | 360,358 | $2,949,863 | 292,532 | $2,885,467 |
| Repurchased | (1,864,803) | (15,142,628) | (579,085) | (5,692,519) |
| Net decrease | (1,504,445) | ($12,192,765) | (286,553) | ($2,807,052) |
|
| Class C shares | | | | |
| Sold | 71,585 | $588,127 | 72,012 | $720,878 |
| Repurchased | (97,294) | (795,276) | (42,085) | (410,602) |
| Net increase (decrease) | (25,709) | ($207,149) | 29,927 | $310,276 |
|
| Class I shares | | | | |
| Sold | 34,207 | $316,376 | 52,841 | $591,464 |
| Repurchased | (69,584) | (631,193) | (36,720) | (420,155) |
| Net increase (decrease) | (35,377) | ($314,817) | 16,121 | $171,309 |
|
| Net decrease | (2,798,430) | ($23,917,624) | (402,395) | ($3,945,243) |
1 Semiannual period from 11-1-05 through 4-30-06. Unaudited.
Note D
Investment
transactions
Purchases and proceeds from sales or maturities of securities, other than short-term securities and obligations of the U.S. government, during the period ended April 30, 2006, aggregated $53,376,615 and $59,682,040, respectively.
The cost of investments owned on April 30, 2006, including short-term investments, for federal income tax purposes, was $170,241,716. Gross unrealized appreciation and depreciation of investments aggregated $37,816,688 and $2,848,096, respectively, resulting in net unrealized appreciation of $34,968,592.
24
For more information
The Fund’s proxy voting policies, procedures and records are available without charge, upon request:
| By phone | On the Fund’s Web site | On the SEC’s Web site |
| 1-800-225-5291 | www.jhfunds.com/proxy | www.sec.gov |
|
| Trustees | Francis V. Knox, Jr. | Custodian |
| Ronald R. Dion, Chairman | Vice President and | The Bank of New York |
| James R. Boyle† | Chief Compliance Officer | One Wall Street |
| James F. Carlin | John G. Vrysen | New York, NY 10286 |
| Richard P. Chapman, Jr.* | Executive Vice President and | |
| William H. Cunningham | Chief Financial Officer | Transfer agent |
| Charles L. Ladner* | | John Hancock Signature |
| Dr. John A. Moore* | Investment adviser | Services, Inc. |
| Patti McGill Peterson* | John Hancock Advisers, LLC | 1 John Hancock Way, |
| Steven R. Pruchansky | 601 Congress Street | Suite 1000 |
| *Members of the Audit Committee | Boston, MA 02210-2805 | Boston, MA 02217-1000 |
| †Non-Independent Trustee | | |
| Subadviser | Legal counsel |
| Officers | Sovereign Asset | Wilmer Cutler Pickering |
| Keith F. Hartstein | Management LLC | Hale and Dorr LLP |
| President and | 101 Huntington Avenue | 60 State Street |
| Chief Executive Officer | Boston, MA 02199 | Boston, MA 02109-1803 |
| William H. King | | |
| Vice President and Treasurer | Principal distributor | |
| John Hancock Funds, LLC | |
| 601 Congress Street | |
| Boston, MA 02210-2805 | |
| | | |
The Fund’s investment objective, risks, charges and expenses are included in the prospectus and should be considered carefully before investing. For a prospectus, call your financial professional, call John Hancock Funds at 1-800-225-5291, or visit the Fund’s Web site at www.jhfunds.com. Please read the prospectus carefully before investing or sending money.

A listing of month-end portfolio holdings is available on our Web site, www.jhfunds.com. A more detailed portfolio holdings summary is available on a quarterly basis 60 days after the fiscal quarter on our Web site or upon request by calling 1-800-225-5291, or on the Securities and Exchange Commission’s Web site, www.sec.gov.
25
1-800-225-5291
1-800-554-6713 (TDD)
1-800-338-8080 EASI-Line
www.jhfunds.com
|
Now available: electronic delivery
www.jhfunds.com/edelivery
|
This report is for the information of
the shareholders of John Hancock
Mid Cap Growth Fund.
|

| Table of contents |
|
| Your fund at a glance |
| page 1 |
|
| Managers’ report |
| page 2 |
|
| A look at performance |
| page 6 |
|
| Growth of $10,000 |
| page 7 |
|
| Your expenses |
| page 8 |
|
| Fund’s investments |
| page 10 |
|
| Financial statements |
| page 14 |
|
| For more information |
| page 29 |
|
To Our Shareholders,
After producing modest returns in 2005, the stock market has advanced smartly in the first four months of 2006. The major indexes all advanced and produced four-month returns that were ahead of the market’s returns for all of 2005. For example, the Standard & Poor’s 500 Index returned 5.61% year-to-date through April 2006, versus 4.91% last year in total. Investors were encouraged by solid corporate earnings, a healthy economy and stable inflation, which suggested the Federal Reserve could be coming close to the end of its 18-month campaign of raising interest rates.
Despite the good results to date, it is anyone’s guess where the market will end 2006, especially given the wild cards of interest rate moves and record-high energy prices and their impact on corporate profits and the economy.
One thing we do know, however, is that the stock market’s pattern is one of extremes. Consider the last 10 years. From 1995 through 1999, we saw double-digit returns in excess of 20% per year, only to have 2000 through 2002 produce ever-increasing negative results, followed by another 20%-plus up year in 2004 and a less than 5% advance in 2005. Since 1926, the market, as measured by the Standard & Poor’s 500 Index, has produced average annual results of 10.4% . However, that “normal” return is rarely produced in any given year. In fact, calendar-year returns of 8% to 12% have occurred only five times in the 80 years since 1926.
Although the past in no way predicts the future, we have learned at least one lesson from history: Expect highs and lows in the short term, but always invest for the long term. Equally important: Work with your financial professional to maintain a diversified portfolio, spread out among not only different asset classes — stocks, bonds and cash — but also among various investment styles. It’s the best way we know of to benefit from, and weather, the market’s extremes.
Sincerely,

Keith F. Hartstein,
President and Chief Executive Officer
|
This commentary reflects the CEO’s views as of April 30, 2006. They are subject to change at any time.
The Fund seeks long-term growth of capital by normally investing at least 80% of its assets in stocks of foreign companies.
| | Over the last six months |
| |
| * | Healthy economic and earnings growth worldwide boosted |
| | international markets. |
| |
| * | Stock selection helped the Fund outperform its benchmark index |
| | and peers. |
| |
| * | The Fund’s growth-oriented strategy detracted from performance as |
| | growth stocks trailed international value stocks. |
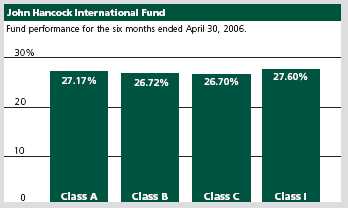
Total returns for the Fund are at net asset value with all distributions reinvested. These returns do not reflect the deduction of the maximum sales charge, which would reduce the performance shown above.
| Top 10 holdings |
| 3.5% | Sanofi-Aventis SA |
| 2.9% | Sumitomo Mitsui Financial Group, Inc. |
| 2.6% | San Paolo IMI SpA |
| 2.5% | Siemens AG |
| 2.2% | CRH Plc |
| 2.1% | ABB Ltd. |
| 2.1% | Stolt Offshore SA |
| 2.0% | Rogers Communications, Inc. |
| 2.0% | Cameco Corp. |
| 2.0% | Commerzbank AG |
| As a percentage of net assets on April 30, 2006. |
1
BY HORACIO A. VALEIRAS, CFA, FOR THE NICHOLAS-APPLEGATE
CAPITAL MANAGEMENT PORTFOLIO MANAGEMENT TEAM
|
JOHN HANCOCK
International Fund
|
International equity markets posted impressive increases during the six months ended April 30, 2006, driven by healthy economic and earnings growth worldwide. The U.S. dollar weakened against a basket of foreign currencies, further boosting international equity returns when translated into dollar terms.
In Japan, the largest non-U.S. stock market, equity performance was strong and broadly in line with the return of the MSCI All Country World Ex-U.S. Index. Japan’s economic recovery, which began in 2002, continued to gain momentum, evidenced by robust gains in exports, wages, industrial production and consumer con-fidence. Underscoring the country’s economic resurgence, the Bank of Japan announced that it was abandoning “quantitative easing,” the ultra-loose monetary policy adopted in March 2001 to combat deflation.
“International equity markets
posted impressive increases
during the six months ended
April 30, 2006...”
|
Although modestly trailing Japanese equities, stock markets in developed European countries also produced exceptional gains. Sluggish economies throughout Continental Europe showed signs of stirring, and the European Central Bank began raising short-term interest rates from historically low levels. In the United Kingdom, equities advanced but turned in the worst performance among developed European countries. Surging oil prices and a downturn in the housing market have taken a toll on the country’s economy, which, in 2005, grew at its slowest pace in thirteen years.Stocks in emerging markets delivered the best returns, fueled by rising commodity prices and a relatively stable monetary, fiscal and political environment. Several of the best-performing markets were those with abundant natural resources, such as Venezuela, Russia and South Africa. Equities in China and India also outperformed, as structural reforms have paved the way for rapid economic growth in these two countries.
2
Fund performance explained
For the six months ended April 30, 2006, John Hancock International Fund’s Class A, Class B, Class C and Class I shares gained 27.17%, 26.72%, 26.70% and 27.60%, respectively, at net asset value. During the same period, the average foreign large-cap growth fund rose 25.08%, according to Morningstar, Inc.1, and the benchmark MSCI All Country World Ex-U.S. Index advanced 23.58% . Keep in mind that your net asset value return will be different from the Fund’s performance if you were not invested in the Fund for the entire period and did not reinvest all distributions. See pages six and seven for historical performance information.
The Fund’s holdings in the vast majority of countries and all sectors posted increases, resulting in a strong total return for the six-month period. The Fund also performed well compared to its Morningstar peer group and the MSCI All Country World Ex-U.S. Index. Major sources of strength relative to the index included stock selection in China, Switzerland and Hong Kong and an underweight in the United Kingdom. From a sector perspective, stock selection among telecommunication services, information technology and industrial companies was particularly strong.
“The Fund’s holdings in the vast
majority of countries and all
sectors posted increases, resulting
in a strong total return for the
six-month period.”
|
Growth trails value
The Fund employs a growth-oriented investment approach, while the style-neutral MSCI All Country Ex-U.S. Index includes a mix of growth and value equities. The Fund’s emphasis on growth stocks negatively impacted relative performance because international growth stocks trailed their value counterparts this period. Other areas of relative weakness included stock selection in France and the health care and financials sectors, as well as an overweight in telecommunication services. Telecommunication services was the worst-performing sector in the index amid intense competition among providers.
Top-performing positions included ABB Ltd., a Swiss supplier of power and automation technologies that experienced robust demand; Foxconn International Holdings, a Chinese handset manufacturer that benefited from a positive outlook for the global
3
| Sector | |
| distribution2 | |
|
| Financials | 18% |
|
| Industrials | 16% |
|
| Consumer | |
| discretionary | 15% |
|
| Materials | 10% |
|
| Information | |
| technology | 9% |
|
| Telecommunication |
| services | 8% |
|
| Energy | 8% |
|
| Health care | 7% |
|
| Consumer | |
| staples | 6% |
|
| Utilities | 1% |
handset market; and Tokyo Electron Ltd., a Japanese provider of semiconductor production equipment that reported stronger-than-expected orders. Decliners included Hokuhoku Financial Group, Inc., a Japanese regional bank that was weak on concerns that a potential change in its capital structure would dilute earnings per share; Alcatel SA, a French communications equipment supplier whose plans to merge with Lucent Technologies made investors anxious; and Générale de Santé, a French health care services provider that fell on expectations that the government would lower hospital rates.
Fund moves
During the period, there were changes in the Fund’s country and sector weightings as a result of our stock-by-stock investment decisions. Assets were shifted from emerging nations in the Asia Pacific region, most notably China, in favor of opportunities identified in developed European countries, such as Italy and Sweden. Changes in sector weightings included a decrease in the Fund’s exposure to telecommunication services and financials and an increase in exposure to industrials and consumer discretionary stocks.

The Fund’s holdings remained well diversified at the end of the period, with broad representation across countries and sectors. Compared to the MSCI All Country World Ex-U.S. Index, the Fund was overweight stocks in developed Asia Pacific countries, including Japan, and underweight companies in developed European markets, particularly the United Kingdom. The Fund was overweight industrials, consumer discretionary and telecommunication services stocks and underweight financials, utilities and energy.
4
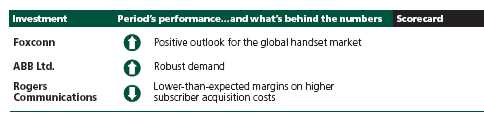
“We are cautiously optimistic in
our outlook for international
stock markets.”
|
Outlook
We are cautiously optimistic in our outlook for international stock markets. Global economic growth is expected to slow in response to soaring energy prices and rising interest rates. Geopolitical tensions are high, and there is the potential for an oil shock, resurgent inflation or a downturn in export activity due to a falling U.S. dollar. That said, a number of factors bode well for future equity price gains. Economic expansion in the United States remains robust, and Japan’s recovery is still on track. The pace of growth in Europe is improving, and brisk merger and acquisition activity is lending support to stock prices throughout the region. In emerging markets, economies are healthy, and corporate profit growth continues to be strong.
Regardless of how big-picture events unfold, we remain focused on being early to identify positive fundamental changes taking place within individual companies. By consistently applying our bottom-up stock-selection process in all market environments, we are confident that we will continue to uncover exciting investment opportunities for the Fund.
This commentary reflects the views of the portfolio management team through the end of the Fund’s period discussed in this report. The managers’ statements reflect their own opinions. As such, they are in no way guarantees of future events and are not intended to be used as investment advice or a recommendation regarding any specific security. They are also subject to change at any time as market and other conditions warrant.
International investing involves special risks such as political, economic and currency risks and differences in accounting standards and financial reporting.
1 Figures from Morningstar, Inc. include reinvested dividends and do not take into account sales charges. Actual load-adjusted performance is lower.
2 As a percentage of net assets on April 30, 2006.
5
A LOOK AT
PERFORMANCE
For the period ended
April 30, 2006
|
| | Class A | Class B | Class C | Class I1 |
| Inception date | 1-3-94 | 1-3-94 | 6-1-98 | 3-1-02 |
|
| Average annual returns with maximum sales charge (POP) | |
| One year | 33.21% | 34.09% | 38.26% | 41.22% |
|
| Five years | 4.53 | 4.51 | 4.84 | — |
|
| Ten years | 1.45 | 1.40 | — | — |
|
| Since inception | — | — | 0.65 | 13.90 |
|
| Cumulative total returns with maximum sales charge (POP) | |
| Six months | 20.78 | 21.72 | 25.70 | 27.60 |
|
| One year | 33.21 | 34.09 | 38.26 | 41.22 |
|
| Five years | 24.81 | 24.66 | 26.64 | — |
|
| Ten years | 15.44 | 14.95 | — | — |
|
| Since inception | — | — | 5.25 | 71.95 |
|
Performance figures assume all distributions are reinvested. Returns with maximum sales charge reflect a sales charge on Class A shares of 5%, and the applicable contingent deferred sales charge (CDSC) on Class B and Class C shares. The returns for Class C shares have been adjusted to reflect the elimination of the front-end sales charge effective July 15, 2004. The Class B shares’ CDSC declines annually between years 1–6 according to the following schedule: 5, 4, 3, 3, 2, 1%. No sales charge will be assessed after the sixth year. Class C shares held for less than one year are subject to a 1% CDSC. Sales charge is not applicable for Class I shares.
The returns reflect past results and should not be considered indicative of future performance. The return and principal value of an investment will fluctuate so that shares, when redeemed, may be worth more or less than their original cost. Due to market volatility, the Fund’s current performance may be higher or lower than the performance shown. For performance data current to the most recent month-end, please call 1-800-225-5291 or visit the Fund’s Web site at www.jhfunds.com.
The performance table above and the chart on the next page do not reflect the deduction of taxes that a shareholder would pay on fund distributions or the redemption of fund shares.
The Fund’s performance results reflect any applicable expense reductions, without which the expenses would increase and results would have been less favorable.
1For certain types of investors as described in the Fund’s Class I share prospectus.
6
This chart shows what happened to a hypothetical $10,000 investment in Class A shares for the period indicated. For comparison, we’ve shown the same investment in the MSCI All Country World Ex-U.S. Index.
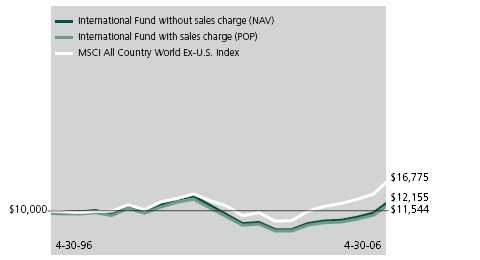
| | Class B1 | Class C1 | Class I2 |
| Period beginning | 4-30-96 | 6-1-98 | 3-1-02 |
|
| |
| International Fund | $11,495 | $10,525 | $17,195 |
|
| Index | 16,775 | 15,326 | 18,159 |
|
Assuming all distributions were reinvested for the period indicated, the table above shows the value of a $10,000 investment in the Fund’s Class B, Class C and Class I shares, respectively, as of April 30, 2006. The Class C shares investment with maximum sales charge has been adjusted to reflect the elimination of the front-end sales charge effective July 15, 2004. Performance of the classes will vary based on the difference in sales charges paid by shareholders investing in the different classes and the fee structure of those classes.
Morgan Stanley Capital International (MSCI) All Country World Ex-U.S. Index is an unmanaged index of freely traded stocks of foreign companies.
It is not possible to invest directly in an index. Index figures do not reflect sales charges and would be lower if they did.
1 No contingent deferred sales charge applicable.
2 For certain types of investors as described in the Fund’s Class I share prospectus.
7
These examples are intended to help you understand your ongoing
operating expenses.
Understanding fund expenses
As a shareholder of the Fund, you incur two types of costs:
| * | Transaction costs, which include sales charges (loads) on |
| purchases or redemptions (varies by share class), minimum |
| account fee charge, etc. |
* | Ongoing operating expenses, including management |
| fees, distribution and service fees (if applicable) and other |
| fund expenses. |
We are going to present only your ongoing operating expenses here.
Actual expenses/actual returns
This example is intended to provide information about your fund’s actual ongoing operating expenses, and is based on your fund’s actual return. It assumes an account value of $1,000.00 on October 31, 2005, with the same investment held until April 30, 2006.
| Account value | | Expenses paid |
| $1,000.00 | Ending value | during period |
| on 10-31-05 | on 4-30-06 | ended 4-30-061 |
|
| Class A | $1,271.70 | $10.45 |
| Class B | 1,267.20 | 14.40 |
| Class C | 1,267.00 | 14.40 |
| Class I | 1,276.00 | 6.56 |
Together with the value of your account, you may use this information to estimate the operating expenses that you paid over the period. Simply divide your account value at April 30, 2006 by $1,000.00, then multiply it by the “expenses paid” for your share class from the table above. For example, for an account value of $8,600.00, the operating expenses should be calculated as follows:
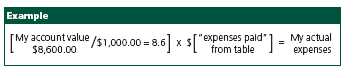
8
Hypothetical example for comparison purposes
This table allows you to compare your fund’s ongoing operating expenses with those of any other fund. It provides an example of the Fund’s hypothetical account values and hypothetical expenses based on each class’s actual expense ratio and an assumed 5% annual return before expenses (which is not your fund’s actual return). It assumes an account value of $1,000.00 on October 31, 2005, with the same investment held until April 30, 2006. Look in any other fund shareholder report to find its hypothetical example and you will be able to compare these expenses.
| Account value | | Expenses paid |
| $1,000.00 | Ending value | during period |
| on 10-31-05 | on 4-30-06 | ended 4-30-061 |
|
| Class A | $1,015.60 | $9.27 |
| Class B | 1,012.10 | 12.78 |
| Class C | 1,012.10 | 12.78 |
| Class I | 1,019.03 | 5.82 |
Remember, these examples do not include any transaction costs, such as sales charges; therefore, these examples will not help you to determine the relative total costs of owning different funds. If transaction costs were included, your expenses would have been higher. See the prospectus for details regarding transaction costs.
1 Expenses are equal to the Fund’s annualized expense ratio of 1.86%, 2.56%, 2.56% and 1.16% for Class A, Class B, Class C and Class I, respectively, multiplied by the average account value over the period, multiplied by the number of days in the most recent fiscal half-year/365 or 366 (to reflect the one-half year period).
9
F I N A N C I A L S TAT E M E N T S
FUND’S INVESTMENTS
Securities owned by the Fund on April 30, 2006 (unaudited)
This schedule is divided into three main categories: common stocks, warrants and short-term investments. The common stocks and warrants are further broken down by country. Short-term investments, which represent the Fund’s cash position, are listed last.
| Issuer | Shares | Value |
|
| Common stocks 96.99% | | $127,379,531 |
| (Cost $100,295,235) | | |
Australia 1.12% | | 1,467,335 |
|
| Goodman Fielder Ltd. (Packaged Foods & Meats) (I) | 871,119 | 1,467,335 |
Brazil 1.01% | | 1,319,948 |
|
| Vivo Participacoes SA, American Depositary Receipt (ADR) | | |
| (Wireless Telecommunication Services) | 319,600 | 1,319,948 |
Canada 6.91% | | 9,070,472 |
|
| Cameco Corp. (Coal & Consumable Fuels) | 64,500 | 2,618,451 |
|
| EnCana Corp. (Oil & Gas Exploration & Production) | 25,700 | 1,281,617 |
|
| Petrobank Energy & Resources Ltd. | | |
| (Oil & Gas Exploration & Production) (I) | 43,000 | 533,399 |
|
| Rogers Communications, Inc. (Class B) | | |
| (Wireless Telecommunication Services) | 62,800 | 2,655,921 |
|
| Teck Cominco Ltd. (Class B) (Diversified Metals & Mining) | 28,800 | 1,981,084 |
China 0.75% | | 990,981 |
|
| Suntech Power Holdings Co., Ltd., ADR | | |
| (Electrical Components & Equipment) (I) | 28,900 | 990,981 |
Finland 2.06% | | 2,708,913 |
|
| M-real Oyj (B Shares) (Paper Products) | 142,400 | 925,571 |
|
| Nokia Corp., ADR (Communications Equipment) | 78,700 | 1,783,342 |
France 9.11% | | 11,965,412 |
|
| Alcatel SA (Communications Equipment) | 79,925 | 1,150,745 |
|
| Lafarge SA (Construction Materials) | 19,724 | 2,422,421 |
|
| Publicis Groupe SA (Advertising) | 32,187 | 1,335,937 |
|
| Sanofi-Aventis SA (Pharmaceuticals) | 49,006 | 4,614,350 |
|
| Total SA (Integrated Oil & Gas) | 6,191 | 1,709,430 |
|
| Veolia Environnment SA (Multi-Utilities) | 12,279 | 732,529 |
See notes to
financial statements.
|
10
F I N A N C I A L S TAT E M E N T S
| Issuer | Shares | Value |
Germany 6.63% | | $8,700,249 |
|
| Bayer AG (Diversified Chemicals) | 26,706 | 1,227,868 |
|
| Commerzbank AG (Diversified Banks) | 63,304 | 2,611,515 |
|
| Henkel KGaA (Household Products) | 12,704 | 1,527,128 |
|
| Siemens AG (Industrial Conglomerates) | 35,217 | 3,333,738 |
Greece 1.52% | | 1,998,316 |
|
| National Bank of Greece SA (Diversified Banks) | 40,305 | 1,998,316 |
Hong Kong 2.63% | | 3,449,872 |
|
| Hutchison Telecommunications International Ltd. | | |
| (Wireless Telecommunication Services) (I) | 1,199,000 | 2,110,793 |
|
| Melco International Development Ltd. (Industrial Conglomerates) | 595,000 | 1,339,079 |
Hungary 1.07% | | 1,408,600 |
|
| MOL Magyar Olaj-es Gazipari Rt. (Integrated Oil & Gas) | 11,855 | 1,408,600 |
Ireland 3.11% | | 4,083,318 |
|
| Bank of Ireland (Diversified Banks) | 67,095 | 1,257,144 |
|
| CRH Plc (Construction Materials) | 76,968 | 2,826,174 |
Italy 5.16% | | 6,775,783 |
|
| Autogrill SpA (Restaurants) | 84,929 | 1,381,123 |
|
| Mediaset SpA (Broadcasting & Cable TV) | 156,222 | 1,973,755 |
|
| San Paolo IMI SpA (Diversified Banks) | 182,388 | 3,420,905 |
Japan 24.80% | | 32,572,694 |
|
| Aoyama Trading Co., Ltd. (Apparel Retail) | 17,200 | 575,342 |
|
| Calsonic Kansei Corp. (Auto Parts & Equipment) | 136,081 | 1,134,406 |
|
| Chugai Pharmaceutical Co., Ltd. (Pharmaceuticals) | 65,400 | 1,411,655 |
|
| Fuji Electric Holdings Co., Ltd. (Electrical Components & Equipment) | 246,000 | 1,421,716 |
|
| Haseko Corp. (Homebuilding) (I) | 412,500 | 1,560,420 |
|
| Hisamitsu Pharmaceutical Co., Inc. (Pharmaceuticals) | 25,000 | 768,389 |
|
| Hitachi Construction Machinery Co., Ltd. | | |
| (Construction & Farm Machinery & Heavy Trucks) | 88,200 | 2,401,944 |
|
| Hokuhoku Financial Group, Inc. (Regional Banks) | 538,000 | 2,185,919 |
|
| Japan Tobacco, Inc. (Tobacco) | 565 | 2,265,937 |
|
| Kajima Corp. (Construction & Engineering) | 180,000 | 1,015,061 |
|
| Mitsubishi Estate Co., Ltd. (Real Estate Management & Development) | 84,000 | 1,831,524 |
|
| Mitsui & Co., Ltd. (Trading Companies & Distributors) | 115,000 | 1,733,056 |
|
| Nitori Co., Ltd. (Homefurnishing Retail) | 18,360 | 990,347 |
|
| Okasan Holdings, Inc. (Investment Banking & Brokerage) | 43,000 | 483,844 |
|
| Rakuten, Inc. (Internet Retail) | 818 | 658,984 |
|
| Seven & I Holdings Co., Ltd. (Food Retail) | 33,500 | 1,293,651 |
|
| Sumitomo Mitsubishi Silicon Corp. (Semiconductors) | 25,200 | 1,502,732 |
See notes to
financial statements.
|
11
F I N A N C I A L S TAT E M E N T S
| Issuer | Shares | Value |
Japan (continued) | | |
|
| Sumitomo Mitsui Financial Group, Inc. (Diversified Banks) | 343 | $3,754,378 |
|
| Teijin Ltd. (Commodity Chemicals) | 249,000 | 1,702,881 |
|
| Tokyo Electron Ltd. (Semiconductor Equipment) | 19,200 | 1,378,634 |
|
| Toyota Motor Corp. (Automobile Manufacturers) | 42,900 | 2,501,874 |
Luxembourg 3.47% | | 4,556,357 |
|
| Millicom International Cellular SA | | |
| (Wireless Telecommunication Services) (I) | 37,800 | 1,859,004 |
|
| Stolt Offshore SA (Oil & Gas Equipment & Services) (I) | 165,800 | 2,697,353 |
Netherlands 2.00% | | 2,625,155 |
|
| ASML Holding NV (Semiconductor Equipment) (I) | 62,960 | 1,332,368 |
|
| Royal Numico NV (Packaged Foods & Meats) | 28,572 | 1,292,787 |
Norway 0.97% | | 1,275,484 |
|
| Telenor ASA (Integrated Telecommunication Services) | 110,200 | 1,275,484 |
South Africa 1.42% | | 1,866,480 |
|
| Harmony Gold Mining Co., Ltd., ADR (Gold) (I) | 111,100 | 1,866,480 |
South Korea 3.30% | | 4,338,615 |
|
| Daewoo Shipbuilding & Marine Engineering Co., Ltd. | | |
| (Construction & Farm Machinery & Heavy Trucks) | 43,770 | 1,278,481 |
|
| Kookmin Bank, ADR (Diversified Banks) | 15,200 | 1,353,560 |
|
| LG Electronics, Inc. (Consumer Electronics) | 20,610 | 1,706,574 |
Sweden 3.67% | | 4,825,219 |
|
| ASSA ABLOY AB (Building Products) | 105,800 | 2,041,282 |
|
| Modern Times Group MTG AB (B Shares) (Broadcasting & Cable TV) (I) | 26,900 | 1,471,418 |
|
| Telefonaktiebolaget LM Ericsson (B Shares) | | |
| (Communications Equipment) | 370,000 | 1,312,519 |
Switzerland 9.27% | | 12,175,194 |
|
| ABB Ltd. (Heavy Electrical Equipment) | 191,143 | 2,720,186 |
|
| Adecco SA (Human Resource & Employment Services) | 27,414 | 1,694,984 |
|
| Compagnie Financiere Richemont AG | | |
| (Apparel, Accessories & Luxury Goods) | 26,846 | 1,386,818 |
|
| Panalpina Welttransport Holding AG (Air Freight & Logistics) | 7,804 | 778,047 |
|
| Roche Holding AG (Pharmaceuticals) | 12,001 | 1,840,073 |
|
| Straumann AG (Health Care Equipment) | 5,016 | 1,230,054 |
|
| UBS AG (Diversified Capital Markets) | 21,364 | 2,525,032 |
Taiwan 1.21% | | 1,593,956 |
|
| United Microelectronics Corp., ADR (Semiconductors) | 422,800 | 1,593,956 |
See notes to
financial statements.
|
12
F I N A N C I A L S TAT E M E N T S
| Issuer | | | Shares | Value |
| Thailand 0.56% | | | | $730,317 |
|
| Kasikornbank Public Co. Ltd. (Diversified Banks) | | 403,500 | 730,317 |
United Kingdom 4.67% | | | | 6,128,081 |
|
| Aegis Group Plc (Advertising) | | | 551,492 | 1,368,302 |
|
| ARM Holdings Plc (Semiconductors) | | | 739,734 | 1,828,625 |
|
| HSBC Holdings Plc (Diversified Banks) | | | 88,566 | 1,525,304 |
|
| Travis Perkins Plc (Home Improvement Retail) | | 49,170 | 1,405,850 |
United States 0.57% | | | | 752,780 |
|
| Southern Copper Corp. (Diversified Metals & Mining) | | 7,600 | 752,780 |
| |
| Issuer | | | Shares | Value |
|
| Warrants 1.12% | | | | $1,465,870 |
| (Cost $1,408,617) | | | | |
India 1.12% | | | | 1,465,870 |
|
| Bharti Tele-Ventures Ltd. | | | | |
| (Integrated Telecommunication Services) (B)(I)(R) | | 162,100 | 1,465,870 |
| |
| | | Interest | Par value | |
| Issuer, description, maturity date | | rate | (000) | Value |
|
| Short-term investments 1.61% | | | | $2,114,000 |
| (Cost $2,114,000) | | | | |
| Joint Repurchase Agreement 1.61% | | | 2,114,000 |
|
| Investment in a joint repurchase agreement transaction | | | |
| with Barclays Capital, Inc. — Dated 4-28-06 due 5-1-06 | | | |
| (secured by U.S. Treasury Inflation Indexed Bond 3.875% | | | |
| due 4-15-29 and U.S. Treasury Inflation Indexed | | | |
| Note 2.375% due 4-15-11) | | 4.710% | $2,114 | 2,114,000 |
|
| |
| Total investments 99.72% | | | | $130,959,401 |
|
| |
| Other assets and liabilities, net 0.28% | | | $367,483 |
|
| |
| Total net assets 100.00% | | | | $131,326,884 |
(B) This security is fair valued in good faith under procedures established by the Board of Trustees.
(I) Non-income-producing security.
(R) Equity-linked warrant.
The percentage shown for each investment category is the total value of that category as a percentage of the net assets of the Fund.
See notes to
financial statements.
|
13
F I N A N C I A L S TAT E M E N T S
ASSETS AND
LIABILITIES
April 30, 2006
(unaudited)
|
This Statement of Assets and Liabilities is the Fund’s balance sheet. It shows the value of what the Fund owns, is due and owes. You’ll also find the net asset value and the maximum offering price per share.
| Assets | |
|
| Investments at value (cost $103,817,852) | $130,959,401 |
| Cash | 350 |
| Foreign cash, at value (cost $7,397) | 7,822 |
| Receivable for investments sold | 1,984,347 |
| Receivable for shares sold | 204,422 |
| Dividends and interest receivable | 314,066 |
| Other assets | 11,358 |
| Total assets | 133,481,766 |
|
| Liabilities | |
|
| Payable for investments purchased | 1,514,371 |
| Payable for shares repurchased | 410,576 |
| Payable to affiliates | |
| Management fees | 92,613 |
| Distribution and service fees | 8,511 |
| Other | 70,151 |
| Other payables and accrued expenses | 58,660 |
| Total liabilities | 2,154,882 |
|
| Net assets | |
|
| Capital paid-in | 159,678,820 |
| Accumulated net realized loss on investments | |
| and foreign currency transactions | (55,046,143) |
| Net unrealized appreciation of investments | |
| and translation of assets and liabilities in foreign currencies | 27,145,060 |
| Accumulated net investment loss | (450,853) |
| Net assets | $131,326,884 |
|
| Net asset value per share | |
|
| Based on net asset values and shares outstanding — | |
| the Fund has an unlimited number of shares | |
| authorized with no par value | |
| Class A ($95,213,862 ÷ 10,419,444 shares) | $9.14 |
| Class B ($28,226,784 ÷ 3,395,058 shares) | $8.31 |
| Class C ($5,552,331 ÷ 667,454 shares) | $8.32 |
| Class I ($2,333,907 ÷ 245,903 shares) | $9.49 |
|
| Maximum offering price per share | |
|
| Class A1 ($9.14 ÷ 95%) | $9.62 |
1 On single retail sales of less than $50,000. On sales of $50,000 or more and on group sales the offering price is reduced.
See notes to financial statements.
14
F I N A N C I A L S TAT E M E N T S
OPERATIONS
For the period ended
April 30, 2006
(unaudited)1
|
This Statement of Operations summarizes the Fund’s investment income earned and expenses incurred in operating the Fund. It also shows net gains (losses) for the period stated.
| Investment income | |
|
| Dividends (net of foreign withholding taxes of $64,633) | $693,011 |
| Interest | 60,027 |
| Total investment income | 753,038 |
|
| Expenses | |
|
| Investment management fees | 518,439 |
| Class A distribution and service fees | 126,510 |
| Class B distribution and service fees | 130,691 |
| Class C distribution and service fees | 24,378 |
| Class A, B and C transfer agent fees | 252,550 |
| Class I transfer agent fees | 465 |
| Custodian fees | 44,379 |
| Registration and filing fees | 27,655 |
| Professional fees | 18,669 |
| Printing | 15,424 |
| Miscellaneous | 14,209 |
| Accounting and legal services fees | 13,513 |
| Trustees’ fees | 2,260 |
| Compliance fees | 1,585 |
| Interest | 329 |
| Total expenses | 1,191,056 |
| Net investment loss | (438,018) |
|
| Realized and unrealized gain (loss) | |
|
Net realized gain (loss) on | |
| Investments | 12,931,819 |
| Foreign currency transactions | (233,904) |
Change in net unrealized appreciation (depreciation) of | |
| Investments | 15,317,088 |
| Translation of assets and liabilities in foreign currencies | 3,843 |
Net realized and unrealized gain | 28,018,846 |
Increase in net assets from operations | $27,580,828 |
1 Semiannual period from 11-1-05 through 4-30-06.
See notes to
financial statements.
|
15
F I N A N C I A L S TAT E M E N T S
These Statements of Changes in Net Assets show how the value of the Fund’s net assets has changed during the last two periods. The difference reflects earnings less expenses, any investment gains and losses, distributions, if any, paid to shareholders and the net of Fund share transactions.
| | Year | Period |
| | ended | ended |
| | 10-31-05 | 4-30-061 |
|
| Increase (decrease) in net assets | | |
| From operations | | |
| Net investment loss | ($442,075) | ($438,018) |
| Net realized gain | 14,558,323 | 12,697,915 |
| Change in net unrealized | | |
| appreciation (depreciation) | 2,830,230 | 15,320,931 |
Increase in net assets | | |
| resulting from operations | 16,946,478 | 27,580,828 |
Distributions to shareholders | | |
| From net realized gain | | |
| Class A | (1,112,572) | (7,182,339) |
| Class B | (483,477) | (2,506,385) |
| Class C | (70,732) | (445,786) |
| Class I | (22,383) | (134,042) |
| | (1,689,164) | (10,268,552) |
| From Fund share transactions | (7,706,210) | 12,012,402 |
|
| |
| Net assets | | |
|
| Beginning of period | 94,451,102 | 102,002,206 |
| End of period2 | $102,002,206 | $131,326,884 |
1 Semiannual period from 11-1-05 through 4-30-06. Unaudited.
2 Includes accumulated net investment loss of $12,835 and $450,853, respectively.
See notes to
financial statements.
|
16
F I N A N C I A L H I G H L I G H T S
CLASS A SHARES
The Financial Highlights show how the Fund’s net asset value for a
share has changed since the end of the previous period.
| Period ended | 10-31-01 | 10-31-02 | 10-31-03 | 10-31-04 | 10-31-05 | 4-30-061 |
|
| Per share operating performance | | | | | | |
| Net asset value, | | | | | | |
| beginning of period | $9.45 | $6.18 | $5.10 | $6.21 | $6.78 | $7.94 |
| Net investment loss2 | (0.05) | (0.04) | (0.04) | (0.02) | (0.02) | (0.02) |
| Net realized and unrealized | | | | | | |
| gain (loss) on investments | (3.22) | (1.04) | 1.15 | 0.59 | 1.30 | 2.00 |
| Total from | | | | | | |
| investment operations | (3.27) | (1.08) | 1.11 | 0.57 | 1.28 | 1.98 |
| Less distributions | | | | | | |
| From net realized gain | — | — | — | — | (0.12) | (0.78) |
| Net asset value, end of period | $6.18 | $5.10 | $6.21 | $6.78 | $7.94 | $9.14 |
| Total return3 (%) | (34.60)4 | (17.48)4 | 21.764 | 9.184 | 19.144 | 27.175 |
|
| Ratios and supplemental data | | | | | | |
|
| Net assets, end of period | | | | | | |
| (in millions) | $8 | $6 | $62 | $64 | $73 | $95 |
| Ratio of expenses | | | | | | |
| to average net assets (%) | 2.23 | 2.38 | 2.45 | 2.04 | 2.08 | 1.866 |
| Ratio of gross expenses | | | | | | |
| to average net assets7 (%) | 3.83 | 4.43 | 3.00 | 2.07 | 2.12 | — |
| Ratio of net investment loss | | | | | | |
| to average net assets (%) | (0.65) | (0.68) | (0.63) | (0.27) | (0.24) | (0.57)6 |
| Portfolio turnover (%) | 278 | 2288 | 2168 | 201 | 176 | 66 |
See notes to
financial statements.
|
17
F I N A N C I A L H I G H L I G H T S
CLASS B SHARES
| Period ended | 10-31-01 | 10-31-02 | 10-31-03 | 10-31-04 | 10-31-05 | 4-30-061 |
|
| Per share operating performance | | | | | | |
| Net asset value, | | | | | | |
| beginning of period | $9.04 | $5.86 | $4.81 | $5.81 | $6.30 | $7.31 |
| Net investment loss2 | (0.10) | (0.08) | (0.07) | (0.06) | (0.07) | (0.05) |
| Net realized and unrealized | | | | | | |
| gain (loss) on investments | (3.08) | (0.97) | 1.07 | 0.55 | 1.20 | 1.83 |
| Total from | | | | | | |
| investment operations | (3.18) | (1.05) | 1.00 | 0.49 | 1.13 | 1.78 |
| Less distributions | | | | | | |
| From net realized gain | — | — | — | — | (0.12) | (0.78) |
| Net asset value, end of period | $5.86 | $4.81 | $5.81 | $6.30 | $7.31 | $8.31 |
| Total return3 (%) | (35.18)4 | (17.92)4 | 20.794 | 8.434 | 18.204 | 26.725 |
|
| Ratios and supplemental data | | | | | | |
|
| Net assets, end of period | | | | | | |
| (in millions) | $6 | $5 | $30 | $26 | $24 | $28 |
| Ratio of expenses | | | | | | |
| to average net assets (%) | 2.93 | 3.08 | 3.15 | 2.74 | 2.78 | 2.566 |
| Ratio of gross expenses | | | | | | |
| to average net assets7 (%) | 4.53 | 5.13 | 3.70 | 2.77 | 2.82 | — |
| Ratio of net investment loss | | | | | | |
| to average net assets (%) | (1.34) | (1.38) | (1.28) | (0.98) | (0.97) | (1.29)6 |
| Portfolio turnover (%) | 278 | 2288 | 2168 | 201 | 176 | 66 |
See notes to
financial statements.
|
18
F I N A N C I A L H I G H L I G H T S
CLASS C SHARES
| Period ended | 10-31-01 | 10-31-02 | 10-31-03 | 10-31-04 | 10-31-05 | 4-30-061 |
|
| Per share operating performance | | | | | | |
| Net asset value, | | | | | | |
| beginning of period | $9.05 | $5.87 | $4.81 | $5.81 | $6.30 | $7.32 |
| Net investment loss2 | (0.10) | (0.08) | (0.06) | (0.06) | (0.07) | (0.05) |
| Net realized and unrealized | | | | | | |
| gain (loss) on investments | (3.08) | (0.98) | 1.06 | 0.55 | 1.21 | 1.83 |
| Total from | | | | | | |
| investment operations | (3.18) | (1.06) | 1.00 | 0.49 | 1.14 | 1.78 |
| Less distributions | | | | | | |
| From net realized gain | — | — | — | — | (0.12) | (0.78) |
| Net asset value, end of period | $5.87 | $4.81 | $5.81 | $6.30 | $7.32 | $8.32 |
| Total return3 (%) | (35.14)4 | (18.06)4 | 20.794 | 8.434 | 18.364 | 26.705 |
|
| Ratios and supplemental data | | | | | | |
|
| Net assets, end of period | | | | | | |
| (in millions) | $1 | $1 | $3 | $4 | $4 | $6 |
| Ratio of expenses | | | | | | |
| to average net assets (%) | 2.93 | 3.08 | 3.15 | 2.73 | 2.78 | 2.566 |
| Ratio of gross expenses | | | | | | |
| to average net assets7 (%) | 4.53 | 5.13 | 3.70 | 2.76 | 2.82 | — |
| Ratio of net investment loss | | | | | | |
| to average net assets (%) | (1.35) | (1.38) | (1.11) | (0.96) | (1.00) | (1.27)6 |
| Portfolio turnover (%) | 278 | 2288 | 2168 | 201 | 176 | 66 |
See notes to
financial statements.
|
19
F I N A N C I A L H I G H L I G H T S
CLASS I SHARES
| Period ended | 10-31-029 | 10-31-03 | 10-31-04 | 10-31-05 | 4-30-061 |
|
| Per share operating performance | | | | | |
| Net asset value, | | | | | |
| beginning of period | $6.18 | $5.12 | $6.30 | $6.94 | $8.19 |
| Net investment income (loss)2 | (0.01) | 0.03 | 0.04 | 0.04 | 0.01 |
| Net realized and unrealized gain (loss) | | | | | |
| on investments | (1.05) | 1.15 | 0.60 | 1.33 | 2.07 |
| Total from | | | | | |
| investment operations | (1.06) | 1.18 | 0.64 | 1.37 | 2.08 |
| Less distributions | | | | | |
| From net realized gain | — | — | — | (0.12) | (0.78) |
| Net asset value, end of period | $5.12 | $6.30 | $6.94 | $8.19 | $9.49 |
| Total return3 (%) | (17.15)4,5 | 23.054 | 10.16 | 20.004 | 27.605 |
|
| Ratios and supplemental data | | | | | |
|
| Net assets, end of period | | | | | |
| (in millions) | $1 | $1 | $1 | $1 | $2 |
| Ratio of expenses | | | | | |
| to average net assets (%) | 2.046 | 1.60 | 1.17 | 1.32 | 1.166 |
| Ratio of gross expenses | | | | | |
| to average net assets7 (%) | 4.096 | 2.15 | — | 1.33 | — |
| Ratio of net investment income (loss) | | | | | |
| to average net assets (%) | (0.34)6 | 0.58 | 0.60 | 0.51 | 0.196 |
| Portfolio turnover (%) | 2288 | 2168 | 201 | 176 | 66 |
1 Semiannual period from 11-1-05 through 4-30-06. Unaudited.
2 Based on the average of the shares outstanding.
3 Assumes dividend reinvestment and does not reflect the effect of sales charges.
4 Total returns would have been lower had certain expenses not been reduced during the periods shown.
5 Not annualized.
6 Annualized.
7 Does not take into consideration expense reductions during the periods shown.
8 Excludes merger activity.
9 Class I shares began operations on 3-1-02.
|
See notes to
financial statements.
|
20
NOTES TO
STATEMENTS
Unaudited
|
Note A
Accounting policies
John Hancock International Fund (the “Fund”) is a diversified series of John Hancock Investment Trust III (the “Trust”), an open-end management investment company registered under the Investment Company Act of 1940. The investment objective of the Fund is to achieve long-term growth of capital.
The Trustees have authorized the issuance of multiple classes of shares of the Fund, designated as Class A, Class B, Class C and Class I shares. The shares of each class represent an interest in the same portfolio of investments of the Fund and have equal rights as to voting, redemptions, dividends and liquidation, except that certain expenses, subject to the approval of the Trustees, may be applied differently to each class of shares in accordance with current regulations of the Securities and Exchange Commission and the Internal Revenue Service. Shareholders of a class that bears distribution and service expenses under the terms of a distribution plan have exclusive voting rights to that distribution plan.
Significant accounting policies
of the Fund are as follows:
Valuation of investments
Securities in the Fund’s portfolio are valued on the basis of market quotations, valuations provided by independent pricing services or, if quotations are not readily available, or the value has been materially affected by events occurring after the close of a foreign market, at fair value as determined in good faith in accordance with procedures approved by the Trustees. Short-term debt investments which have a remaining maturity of 60 days or less may be valued at amortized cost, which approximates market value. All portfolio transactions initially expressed in terms of foreign currencies have been translated into U.S. dollars as described in “Foreign currency translation” below.
Joint repurchase agreement
Pursuant to an exemptive order issued by the Securities and Exchange Commission, the Fund, along with other registered investment companies having a management contract with John Hancock Advisers, LLC (the “Adviser”), a wholly owned subsidiary of John Hancock Financial Services, Inc., a subsidiary of Manulife Financial Corporation (“MFC”), may participate in a joint repurchase agreement transaction. Aggregate cash balances are invested in one or more large repurchase agreements, whose underlying securities are obligations of the U.S. government and/or its agencies. The Fund’s custodian bank receives delivery of the underlying securities for the joint account on the Fund’s behalf. The Adviser is responsible for ensuring that the agreement is fully collateralized at all times.
Foreign currency translation
All assets or liabilities initially expressed in terms of foreign
21
currencies are translated into U.S. dollars based on London currency exchange quotations as of 4:00 P.M., London time, on the date of any determination of the net asset value of the Fund. Transactions affecting statement of operations accounts and net realized gain (loss) on investments are translated at the rates prevailing at the dates of the transactions.
The Fund does not isolate that portion of the results of operations resulting from changes in foreign exchange rates on investments from the fluctuations arising from changes in market prices of securities held. Such fluctua-tions are included with the net realized and unrealized gain or loss from investments.
Reported net realized foreign currency exchange gains or losses arise from sales of foreign currency, currency gains or losses realized between the trade and settlement dates on securities transactions, and the difference between the amounts of dividends, interest and foreign withholding taxes recorded on the Fund’s books and the U.S. dollar equivalent of the amounts actually received or paid. Net unrealized foreign currency exchange gains and losses arise from changes in the value of assets and liabilities, other than investments in securities, resulting from changes in the exchange rates.
Investment transactions
Investment transactions are recorded as of the date of purchase, sale or maturity. Net realized gains and losses on sales of investments are determined on the identified cost basis. Capital gains realized on some foreign securities are subject to foreign taxes, which are accrued as applicable.
Class allocations
Income, common expenses and realized and unrealized gains (losses) are determined at the fund level and allocated daily to each class of shares based on the appropriate net asset value of the respective classes. Distribution and service fees, if any, and transfer agent fees for Class I shares, are calculated daily at the class level based on the appropriate net asset value of each class and the specific expense rate(s) applicable to each class.
Expenses
The majority of expenses are directly identifiable to an individual fund. Expenses that are not readily identifiable to a specific fund are allocated in such a manner as deemed equitable, taking into consideration, among other things, the nature and type of expense and the relative sizes of the funds.
Bank borrowings
The Fund is permitted to have bank borrowings for temporary or emergency purposes, including the meeting of redemption requests that otherwise might require the untimely disposition of securities. The Fund has entered into a syndicated line of credit agreement with various banks. This agreement enables the Fund to participate, with other funds managed by the Adviser, in an unsecured line of credit with banks, which permits borrowings of up to $150 million, collectively. Interest is charged to each fund based on its borrowing. In addition, a commitment fee is charged to each fund based on the average daily unused portion of the line of credit, and is allocated among the participating funds. The Fund had no borrowing activity under the line of credit during the period ended April 30, 2006.
Equity-linked warrants
The Fund may buy and sell equity-linked warrants. The Fund purchases the equity-linked warrants from a broker, who in turn purchases the shares in the local market and issues a call warrant hedged on the underlying holding. If the Fund exercises its call and closes its position, the shares are sold and the warrant redeemed with the proceeds. Each warrant represents one share of the underlying stock, therefore the price, performance and liquidity of the warrant are all directly linked to the underlying stock. The warrants can be redeemed for 100% of the
22
value of the underlying stock, less transaction costs. Equity-linked warrants are subject to risks related to the counterparty’s ability to perform under the contract, and to the market risk of the underlying holding. The Fund may also suffer losses if it is unable to sell outstanding equity-linked warrants or reduce its exposure through offsetting transactions.
Forward foreign currency exchange contracts
The Fund may enter into forward foreign currency exchange contracts as a hedge against the effect of fluctuations in currency exchange rates. A forward foreign currency exchange contract involves an obligation to purchase or sell a specific currency at a future date at a set price. The aggregate principal amounts of the contracts are marked to market daily at the applicable foreign currency exchange rates. Any resulting unrealized gains and losses are included in the determination of the Fund’s daily net asset value. The Fund records realized gains and losses at the time the forward foreign currency exchange contracts are closed out. Risks may arise upon entering these contracts from the potential inability of coun-terparties to meet the terms of the contracts and from unanticipated movements in the value of a foreign currency relative to the U.S. dollar. These contracts involve market or credit risk in excess of the unrealized gain or loss reflected in the Fund’s Statement of Assets and Liabilities.
The Fund may also purchase and sell forward contracts to facilitate the settlement of foreign currency denominated portfolio transactions, under which it intends to take delivery of the foreign currency. Such contracts normally involve no market risk if they are offset by the currency amount of the underlying transactions.
The Fund had no open forward foreign currency exchange contracts on April 30, 2006.
Federal income taxes
The Fund qualifies as a “regulated investment company” by complying with the applicable provisions of the Internal Revenue Code and will not be subject to federal income tax on taxable income that is distributed to shareholders. Therefore, no federal income tax provision is required. For federal income tax purposes, the Fund has $67,715,810 of a capital loss carryforward available, to the extent provided by regulations, to offset future net realized capital gains. To the extent that such carryforward is used by the Fund, no capital gain distributions will be made. The loss carry-forward expires as follows: October 31, 2006 — $846,665, October 31, 2007 — $362,323, October 31, 2008 — $48,654,862, October 31, 2009 —$13,925,126 and October 31, 2010 — $3,926,834. Availability of a certain amount of the carryforwards, which were acquired in a merger on June 7, 2002, May 9, 2003 and on September 26, 2003, may be limited in a given year.
Dividends, interest and distributions
Dividend income on investment securities is recorded on the ex-dividend date or, in the case of some foreign securities, on the date thereafter when the Fund identifies the dividend. Interest income on investment securities is recorded on the accrual basis. Foreign income may be subject to foreign withholding taxes, which are accrued as applicable.
The Fund records distributions to shareholders from net investment income and net realized gains, if any, on the ex-dividend date. During the year ended October 31, 2005, the tax character of distributions paid was as follows: long-term capital gain: $1,689,164. Distributions paid by the Fund with respect to each class of shares are calculated in the same manner, at the same time and are in the same amount, except for the effect of expenses that may be
23
applied differently to each class.
Such distributions, on a tax basis, are determined in conformity with income tax regulations, which may differ from accounting principles generally accepted in the United States of America. Distributions in excess of tax basis earnings and profits, if any, are reported in the Fund’s financial statements as a return of capital.
Use of estimates
The preparation of these financial statements, in accordance with accounting principles generally accepted in the United States of America, incorporates estimates made by management in determining the reported amount of assets, liabilities, revenues and expenses of the Fund. Actual results could differ from these estimates.
Note B
Management fee and
transactions with affiliates
and others
The Fund has an investment management contract with the Adviser. Under the investment management contract, the Fund pays a monthly management fee to the Adviser equivalent, on an annual basis, to the sum of: (a) 0.90% of the first $100,000,000 of the Fund’s average daily net asset value, (b) 0.80% of the next $200,000,000, (c) 0.75% of the next $200,000,000 and (d) 0.625% of the Fund’s average daily net asset value in excess of $500,000,000. The Adviser has a sub-advisory agreement with Nicholas-Applegate Capital Management LP. The Fund is not responsible for payment of the subadvisory fees.
The Adviser has agreed to limit the Fund’s total expenses, excluding the distribution and service fees and transfer agent fees, to 1.27% of the Fund’s average daily net asset value, on an annual basis, and net operating expenses for Class A, Class B and Class C shares to 2.35%, 3.05% and 3.05%, respectively, at least until February 28, 2007. There were no expense reductions related to the Fund’s total expense limitation for the period ended April 30, 2006. The Adviser reserves the right to terminate these limitations in the future.
The Trust has a Distribution Agreement with John Hancock Funds, LLC (“JH Funds”), a wholly owned subsidiary of the Adviser. The Fund has adopted Distribution Plans with respect to Class A, Class B and Class C, pursuant to Rule 12b-1 under the Investment Company Act of 1940, to reimburse JH Funds for the services it provides as distributor of shares of the Fund. Accordingly, the Fund makes monthly payments to JH Funds at an annual rate not to exceed 0.30%, 1.00% and 1.00% of the average daily net asset value of Class A, Class B and Class C, respectively. A maximum of 0.25% of such payments may be service fees, as defined by the Conduct Rules of the National Association of Securities Dealers. Under the Conduct Rules, curtailment of a portion of the Fund’s 12b-1 payments could occur under certain circumstances.
Class A shares are assessed up-front sales charges. During the period ended April 30, 2006, JH Funds received net up-front sales charges of $82,921 with regard to sales of Class A shares. Of this amount, $13,067 was retained and used for printing prospectuses, advertising, sales literature and other purposes, $67,818 was paid as sales commissions to unrelated broker-dealers and $2,036 was paid as sales commissions to sales personnel of Signator Investors, Inc. (“Signator Investors”), a related broker-dealer. The Adviser’s indirect parent, John Hancock Life Insurance Company (“JHLICo”), a subsidiary of MFC, is the indirect sole shareholder of Signator Investors.
Class B shares that are redeemed within six years of purchase are subject to a contingent deferred sales charge (“CDSC”) at declining rates, beginning at 5.00% of the lesser of the current market value at the time of redemption or the original purchase cost of the shares
24
being redeemed. Class C shares that are redeemed within one year of purchase are subject to a CDSC at a rate of 1.00% of the lesser of the current market value at the time of redemption or the original purchase cost of the shares being redeemed. Proceeds from the CDSCs are paid to JH Funds and are used, in whole or in part, to defray its expenses for providing distribution-related services to the Fund in connection with the sale of Class B and Class C shares. During the period ended April 30, 2006, CDSCs received by JH Funds amounted to $31,756 for Class B shares and $389 for Class C shares.
The Fund has a transfer agent agreement with John Hancock Signature Services, Inc. (“Signature Services”), an indirect subsidiary of JHLICo. For Class A, Class B and Class C shares, the Fund pays a monthly transfer agent fee at an annual rate of 0.05% of each class’s average daily net asset value, plus a fee based on the number of shareholder accounts and reimbursement for certain out-of-pocket expenses, aggregated and allocated to each class on the basis of its relative net asset value. For Class I shares, the Fund pays a monthly transfer agent fee at a total annual rate of 0.05% of Class I average daily net asset value. Signature Services agreed to limit Class A, Class B and Class C shares transfer agent fee to 0.78% of each class’s average daily net asset value, at least until February 28, 2007. There were no transfer agent fee reductions under this limitation during the period ended April 30, 2006. Signature Services also agreed to voluntarily reduce the Fund’s asset-based portion of the transfer agent fee for Class A, Class B and Class C shares, if the total transfer agent fee exceeds the Lipper, Inc. median transfer agency for comparable mutual funds by greater than 0.05% . There were no transfer agent fee reductions during the period ended April 30, 2006. Signature Services reserves the right to terminate this limitation at any time.
The Fund has an agreement with the Adviser and affili-ates to perform necessary tax, accounting and legal services for the Fund. The compensation for the period amounted to $13,513. The Fund also paid the adviser the amount of $381 for certain publishing services, included in the printing fees. The Fund reimbursed JHLICo for certain compliance costs, included in the Fund’s Statement of Operations.
Mr. James R. Boyle is Chairman of the Adviser, as well as affiliated Trustee of the Fund, and is compensated by the Adviser and/or its affiliates. The compensation of unaffiliated Trustees is borne by the Fund. The unaffiliated Trustees may elect to defer, for tax purposes, their receipt of this compensation under the John Hancock Group of Funds Deferred Compensation Plan. The Fund makes investments into other John Hancock funds, as applicable, to cover its liability for the deferred compensation. Investments to cover the Fund’s deferred compensation liability are recorded on the Fund’s books as an other asset. The deferred compensation liability and the related other asset are always equal and are marked to market on a periodic basis to reflect any income earned by the investments, as well as any unrealized gains or losses. The Deferred Compensation Plan investments had no impact on the operations of the Fund.
25
Note C
Fund share transactions
This listing illustrates the number of Fund shares sold, reinvested and repurchased during the last two periods, along with the corresponding dollar value.
| | Year ended 10-31-05 | Period ended 4-30-061 |
| | Shares | Amount | Shares | Amount |
|
| |
| Class A shares | | | | |
| Sold | 1,907,087 | $14,310,047 | 1,415,969 | $11,952,391 |
| Distributions reinvested | 153,373 | 1,067,479 | 928,761 | 6,909,982 |
| Repurchased | (2,248,267) | (16,706,148) | (1,133,884) | (9,465,152) |
| Net increase (decrease) | (187,807) | ($1,328,622) | 1,210,846 | $9,397,221 |
|
| |
| Class B shares | | | | |
| Sold | 735,091 | $5,111,257 | 567,454 | $4,375,664 |
| Distributions reinvested | 71,179 | 459,815 | 353,037 | 2,397,118 |
| Repurchased | (1,661,206) | (11,394,043) | (745,279) | (5,719,950) |
| Net increase (decrease) | (854,936) | ($5,822,971) | 175,212 | $1,052,832 |
|
| |
| Class C shares | | | | |
| Sold | 216,694 | $1,484,170 | 147,112 | $1,131,154 |
| Distributions reinvested | 10,744 | 69,404 | 64,902 | 440,684 |
| Repurchased | (291,680) | (1,993,970) | (84,905) | (658,009) |
| Net increase (decrease) | (64,243) | ($440,396) | 127,109 | $913,829 |
|
| |
| Class I shares | | | | |
| Sold | 51,705 | $398,210 | 91,478 | $807,529 |
| Distributions reinvested | 3,135 | 22,383 | 17,408 | 134,042 |
| Repurchased | (71,242) | (534,814) | (32,324) | (293,051) |
| Net increase (decrease) | (16,402) | ($114,221) | 76,562 | $648,520 |
|
| |
| Net increase (decrease) | (1,123,388) | ($7,706,210) | 1,589,729 | $12,012,402 |
1 Semiannual period from 11-1-05 through 4-30-06. Unaudited.
Note D
Investment
transactions
Purchases and proceeds from sales or maturities of securities, other than short-term securities and obligations of the U.S. government, during the period ended April 30, 2006, aggregated $76,859,508 and $77,053,652, respectively.
The cost of investments owned on April 30, 2006, including short-term investments, for federal income tax purposes, was $103,833,966. Gross unrealized appreciation and depreciation of investments aggregated $27,912,106 and $786,671, respectively, resulting in net unrealized appreciation of $27,125,435. The difference between book basis and tax basis net unrealized appreciation of investments is attributable primarily to the tax deferral of losses on certain sales of securities.
26
|
| Equity | Balanced Fund |
| | Classic Value Fund |
| | Core Equity Fund |
| | Focused Equity Fund |
| | Growth Trends Fund |
| | Large Cap Equity Fund |
| | Large Cap Select Fund |
| | Mid Cap Equity Fund |
| | Mid Cap Growth Fund |
| | Multi Cap Growth Fund |
| | Small Cap Fund |
| | Small Cap Equity Fund |
| | Small Cap Intrinsic Value Fund |
| | Sovereign Investors Fund |
| | U.S. Global Leaders Growth Fund |
|
| |
| Asset Allocation and | Allocation Growth + Value Portfolio |
| Lifestyle Portfolios | Allocation Core Portfolio |
| | Lifestyle Aggressive Portfolio |
| | Lifestyle Growth Portfolio |
| | Lifestyle Balanced Portfolio |
| | Lifestyle Moderate Portfolio |
| | Lifestyle Conservative Portfolio |
|
| |
| Sector | Financial Industries Fund |
| | Health Sciences Fund |
| | Real Estate Fund |
| | Regional Bank Fund |
| | Technology Fund |
| | Technology Leaders Fund |
|
| |
| International | Greater China Opportunities Fund |
| | International Fund |
| | International Classic Value Fund |
|
| |
| Income | Bond Fund |
| | Government Income Fund |
| | High Yield Fund |
| | Investment Grade Bond Fund |
| | Strategic Income Fund |
|
| |
| Tax-Free Income | California Tax-Free Income Fund |
| | High Yield Municipal Bond Fund |
| | Massachusetts Tax-Free Income Fund |
| | New York Tax-Free Income Fund |
| | Tax-Free Bond Fund |
|
| |
| Money Market | Money Market Fund |
| | U.S. Government Cash Reserve |
|
For more complete information on any John Hancock Fund and a prospectus, which includes charges and expenses, call your financial professional, or John Hancock Funds at 1-800-225-5291. Please read the prospectus carefully before investing or sending money.
27
ELECTRONIC
DELIVERY
Now available from
John Hancock Funds
|
Instead of sending annual and semiannual reports and prospectuses through the U.S. mail, we’ll notify you by e-mail when these documents are available for online viewing.
How does electronic delivery benefit you?
| * | No more waiting for the mail to arrive; you’ll receive an |
| | e-mail notification as soon as the document is ready for |
| | online viewing. |
| |
| * | Reduces the amount of paper mail you receive from |
| | John Hancock Funds. |
| |
| * | Reduces costs associated with printing and mailing. |
Sign up for electronic delivery today at
www.jhfunds.com/edelivery
|
28
For more information
The Fund’s proxy voting policies, procedures and records are available without charge, upon request:
| By phone | On the Fund’s Web site | On the SEC’s Web site |
| 1-800-225-5291 | www.jhfunds.com/proxy | www.sec.gov |
|
| Trustees | Francis V. Knox, Jr. | Custodian |
| Ronald R. Dion, Chairman | Vice President and | The Bank of New York |
| James R. Boyle† | Chief Compliance Officer | One Wall Street |
| James F. Carlin | John G. Vrysen | New York, NY 10286 |
| Richard P. Chapman, Jr.* | Executive Vice President and | |
| William H. Cunningham | Chief Financial Officer | Transfer agent |
| Charles L. Ladner* | | John Hancock Signature |
| Dr. John A. Moore* | Investment adviser | Services, Inc. |
| Patti McGill Peterson* | John Hancock Advisers, LLC | 1 John Hancock Way, |
| Steven R. Pruchansky | 601 Congress Street | Suite 1000 |
| *Members of the Audit Committee | Boston, MA 02210-2805 | Boston, MA 02217-1000 |
| †Non-Independent Trustee | | |
| Subadviser | Legal counsel |
| Officers | Nicholas-Applegate Capital | Wilmer Cutler Pickering |
| Keith F. Hartstein | Management, LLC | Hale and Dorr LLP |
| President and | 600 West Broadway | 60 State Street |
| Chief Executive Officer | San Diego, CA 92101 | Boston, MA 02109-1803 |
| William H. King | | |
| Vice President and Treasurer | Principal distributor | |
| John Hancock Funds, LLC | |
| 601 Congress Street | |
| Boston, MA 02210-2805 | |
| | | |
The Fund’s investment objective, risks, charges and expenses are included in the prospectus and should be considered carefully before investing. For a prospectus, call your financial professional, call John Hancock Funds at 1-800-225-5291, or visit the Fund’s Web site at www.jhfunds.com. Please read the prospectus carefully before investing or sending money.
| How to contact us | |
|
| Internet | www.jhfunds.com | |
|
| |
| Mail | Regular mail: | Express mail: |
| | John Hancock | John Hancock |
| | Signature Services, Inc. | Signature Services, Inc. |
| | 1 John Hancock Way, Suite 1000 | Mutual Fund Image Operations |
| | Boston, MA 02217-1000 | 380 Stuart Street |
| | | Boston, MA 02116 |
|
| |
| Phone | Customer service representatives | 1-800-225-5291 |
| | 24-hour automated information | 1-800-338-8080 |
| | TDD line | 1-800-554-6713 |
A listing of month-end portfolio holdings is available on our Web site, www.jhfunds.com. A more detailed portfolio holdings summary is available on a quarterly basis 60 days after the fiscal quarter on our Web site or upon request by calling 1-800-225-5291, or on the Securities and Exchange Commission’s Web site, www.sec.gov.
29

1-800-225-5291
1-800-554-6713 (TDD)
1-800-338-8080 EASI-Line
www.jhfunds.com
|
Now available: electronic delivery
www.jhfunds.com/edelivery
|
This report is for the information of
the shareholders of John Hancock
International Fund.
|
ITEM 2. CODE OF ETHICS.
As of the end of the period, April 30, 2006, the registrant has adopted a code of ethics, as defined in Item 2 of Form N-CSR, that applies to its Chief Executive Officer, Chief Financial Officer and Treasurer (respectively, the principal executive officer, the principal financial officer and the principal accounting officer, the “Senior Financial Officers”). A copy of the code of ethics is filed as an exhibit to this Form N-CSR.
The code of ethics was amended effective February 1, 2005 to address new Rule 204A-1 under the Investment Advisers Act of 1940 and to make other related changes.
The most significant amendments were:
(a) Broadening of the General Principles of the code to cover compliance with all federal securities laws.
(b) Eliminating the interim requirements (since the first quarter of 2004) for access persons to preclear their personal trades of John Hancock mutual funds. This was replaced by post-trade reporting and a 30 day hold requirement for all employees.
(c) A new requirement for “heightened preclearance” with investment supervisors by any access person trading in a personal position worth $100,000 or more.
ITEM 3. AUDIT COMMITTEE FINANCIAL EXPERT.
Not applicable at this time.
ITEM 4. PRINCIPAL ACCOUNTANT FEES AND SERVICES.
Not applicable at this time.
ITEM 5. AUDIT COMMITTEE OF LISTED REGISTRANTS.
Not applicable at this time.
ITEM 6. SCHEDULE OF INVESTMENTS.
Not applicable.
ITEM 7. DISCLOSURE OF PROXY VOTING POLICIES AND PROCEDURES FOR CLOSED-END
MANAGEMENT INVESTMENT COMPANIES.
Not applicable.
ITEM 8. PORTFOLIO MANAGERS OF CLOSED-END MANAGEMENT INVESTMENT
COMPANIES.
Not applicable.
ITEM 9. PURCHASES OF EQUITY SECURITIES BY CLOSED-END MANAGEMENT
INVESTMENT COMPANY AND AFFILIATED PURCHASERS.
Not applicable.
ITEM 10. SUBMISSION OF MATTERS TO A VOTE OF SECURITY HOLDERS.
There were no material changes to previously disclosed John Hancock Funds - Administration Committee Charter and John Hancock Funds – Governance Committee Charter.
ITEM 11. CONTROLS AND PROCEDURES.
|
(a) Based upon their evaluation of the registrant's disclosure controls and procedures as conducted within 90 days of the filing date of this Form N-CSR, the registrant's principal executive officer and principal financial officer have concluded that those disclosure controls and procedures provide reasonable assurance that the material information required to be disclosed by the registrant on this report is recorded, processed, summarized and reported within the time periods specified in the Securities and Exchange Commission's rules and forms.
(b) There were no changes in the registrant's internal control over financial reporting that occurred during the registrant's most recent fiscal half-year (the registrant's second fiscal half-year in the case of an annual report) that have materially affected, or are reasonably likely to materially affect, the registrant's internal control over financial reporting.
(a)(1) Code of Ethics for Senior Financial Officers is attached.
(a)(2) Separate certifications for the registrant's principal executive officer and principal financial officer, as required by Section 302 of the Sarbanes-Oxley Act of 2002 and Rule 30a-2(a) under the Investment Company Act of 1940, are attached.
(b) Separate certifications for the registrant's principal executive officer and principal financial officer, as required by 18 U.S.C. Section 1350, as adopted pursuant to Section 906 of the Sarbanes-Oxley Act of 2002, and Rule 30a-2(b) under the Investment Company Act of 1940, are attached. The certifications furnished pursuant to this paragraph are not deemed to be "filed" for purposes of Section 18 of the Securities Exchange Act of 1934, or otherwise subject to the liability of that section. Such certifications are not deemed to be incorporated by reference into any filing under the Securities Act of 1933 or the Securities Exchange Act of 1934, except to the extent that the Registrant specifically incorporates them by reference.
(c) Contact person at the registrant.
|
Pursuant to the requirements of the Securities Exchange Act of 1934 and the Investment Company Act of 1940, the registrant has duly caused this report to be signed on its behalf by the undersigned, thereunto duly authorized.
John Hancock Investment Trust lll
|
By: /s/ Keith F. Hartstein
-------------------------------------
Keith F. Hartstein
President and Chief Executive Officer
Date: June 27, 2006
|
Pursuant to the requirements of the Securities Exchange Act of 1934 and the Investment Company Act of 1940, this report has been signed below by the following persons on behalf of the registrant and in the capacities and on the dates indicated.
By: /s/ Keith F. Hartstein
-------------------------------------
Keith F. Hartstein
President and Chief Executive Officer
Date: June 27, 2006
|
By: /s/ John G. Vrysen
-------------------------------------
John G. Vrysen
Executive Vice President and Chief Financial Officer