UNITED STATES
SECURITIES AND EXCHANGE COMMISSION
Washington, D.C. 20549
FORM N-CSR
CERTIFIED SHAREHOLDER REPORT OF REGISTERED
MANAGEMENT INVESTMENT COMPANIES
Investment Company Act file number 811- 4630
John Hancock Investment Trust III
(Exact name of registrant as specified in charter)
601 Congress Street, Boston, Massachusetts 02210
(Address of principal executive offices) (Zip code)
Alfred P. Ouellette
Senior Counsel and Assistant Secretary
601 Congress Street
Boston, Massachusetts 02210
(Name and address of agent for service)
Registrant's telephone number, including area code: 617-663-4324
| | |
| Date of fiscal year end: | October 31 | |
| | | |
| Date of reporting period: | October 31, 2007 | |
ITEM 1. REPORT TO SHAREHOLDERS.


|
| TABLE OF CONTENTS |
|
| Your fund at a glance |
| page 1 |
|
| Manager’s report |
| page 2 |
|
| A look at performance |
| page 6 |
|
| Your expenses |
| page 8 |
|
| Fund’s investments |
| page 10 |
|
| Financial statements |
| page 14 |
|
| Notes to financial |
| statements |
| page 22 |
|
| Trustees and officers |
| page 34 |
|
| For more information |
| page 40 |
|
CEO corner
To Our Shareholders,
The performance of Greater China financial markets for the year ended October 31, 2007 was nothing short of spectacular. Even with a sharp drop in February 2007, which briefly spread to other markets worldwide, Greater China markets treated investors to returns in excess of 100% during the period. The results were primarily driven by the continued dynamic growth of the Chinese economy and a speculative surge in demand for stocks by retail investors.
In the midst of this euphoria, however, talk of a bubble on the verge of bursting has grown stronger. This same fear caused the sell-off earlier this year, and analysts and pundits are still waiting for the other shoe to drop, believing that this level of return is unsustainable. Indeed, investors who survived the three-year U.S. bear market from 2000 through 2002 that followed the Internet bubble burst can be forgiven, if not applauded, for feeling apprehensive about the Greater China financial markets at this juncture. John Hancock Greater China Opportunities Fund also performed exceedingly well in this period, providing shareholders with more than a 110% return. On the following pages, our fund manager explains performance, but also interjects a strong note of caution. We couldn’t agree more and encourage our shareholders to scale back their expectations. In 2006, this fund rose by 70%, and already this year, the Fund has returned 7 7% year-to-date through October 2007.
We remain bullish on the long-term outlook for this region and believe there is a place in almost any diversified portfolio for exposure to this dynamic part of the world. But given the Fund’s higher volatility and its explosive returns since inception in 2005, it may be time to consult with your investment professional about locking in some profits and ensuring that Greater China has not grown to be too large a piece of your portfolio. Although larger and more established than many emerging markets, the Greater China region functions in many ways as an emerging market and carries with it high levels of risk and volatility. While we are extremely pleased with the Fund’s performance, we would like to take this opportunity to remind you that the Greater China Opportunities Fund is not for the faint of heart and should play a supporting role in a well-diversified portfolio. Sincerely,

Keith F. Hartstein,
President and Chief Executive Officer
This commentary reflects the CEO’s views as of October 31, 2007. They are subject to change at any time.
Your fund at a glance
The Fund seeks long-term capital appreciation by normally investing at least 80% of its assets in equity securities of companies located in China, Hong Kong or Taiwan.
Over the last twelve months
► The activity in Greater China stocks reached speculative bubble proportions, as the Fund's benchmark rose by more than 150% in a one-year period.
► While the Fund participated in this raging bull market and more than doubled shareholders' money, our emphasis on quality, rotation to less-volatile names and an influx of cash caused the Fund to trail the benchmark.
► The 17th Chinese Communist Party Congress convened in October and emerged with a firm consensus that more effective steps must be taken to slow the nation's overheating economy and achieve balanced growth.
| | | | |
| Top 10 issuers | | | | |
| | | | | |
| China Mobile (Hong Kong) Ltd. | 11.9% | | CNOOC Ltd. | 3.1% |
| |
|
| PetroChina Co., Ltd. | 6.2% | | China Shenhua Energy Co., Ltd. | 1.9% |
| |
|
| China Life Insurance Co., Ltd. | 5.8% | | China Telecom Corp. Ltd. | 1.8% |
| |
|
| China Construction Bank | 4.8% | | China Communications | |
| | Constructions Ltd. | 1.8% |
| Industrial & Commercial Bank of China | 4.2% | |
|
| | |
| China Petroleum and Chemical Corp. | | | | |
| (Sinopec) | 3.5% | | | |
| | |
As a percentage of net assets on October 31, 2007.
1
Manager’s report
John Hancock
Greater China Opportunities Fund
Stocks in Greater China markets delivered extraordinarily strong gains during the 12-month review period, as speculation was rampant and many stocks rose for reasons having little to do with the fundamental attractiveness of their underlying businesses. The Chinese economy continued to expand at a brisk pace, with gross domestic product (GDP) rising 11.5% through the first three quarters of 2007, well above the government’s recent target of 8% to 9%. GDP growth remained exceptionally robust despite the government’s attempts to cool it with repeated increases in both interest rates and the banking reserve requirement, the latter of which was hiked by eight increments of 0.50% to end the period at 13%.
As was the case in previous periods, speculation was most evident in the Shanghai Stock Exchange Composite Index A-shares, which include many lower-quality issues with less transparency in their corporate governance. The Fund continued to concentrate its buying in H-shares, which are listed in Hong Kong and tend to be stocks of companies that are financially stronger, more established in their respective markets and more shareholder-friendly. To help offset money pouring into China through corporate investments and the country’s soaring trade surplus, the government announced in August that it planned to allow mainland
SCORECARD
| | |
| INVESTMENT | | PERIOD’S PERFORMANCE AND WHAT’S BEHIND THE NUMBERS |
| | | |
| China Power | ▲ | Injection of assets by the government |
| New Energy | | |
| |
| China Everbright | ▲ | Turnaround story |
| |
| Century Sunshine | ▼ | Rising costs |
| Ecological | | |
| Technology | | |
| Holdings | | |
2

Portfolio Manager, MFC Global Investment Management (U.S.A.) Limited
Pauline Dan, CFA
Chinese citizens to invest in the Hong Kong stock market, which would
constitute the most significant easing to date of the barriers that prevent
most Chinese from investing internationally. Although the plan had yet
to be implemented at period end, this announcement sparked a fresh wave
of buying in Hong Kong stocks.
“Stocks in Greater China markets
delivered extraordinarily strong
gains during the 12-month review
period…”
Looking at performance
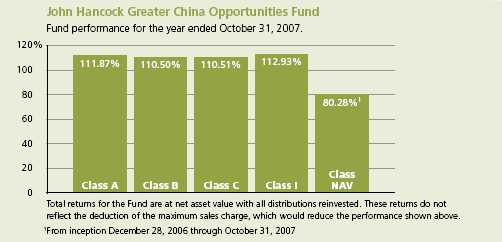
For the 12 months ended October 31, 2007, John Hancock Greater China Opportunities Fund’s Class A, Class B, Class C and Class I shares returned 111.87%, 110.50%, 110.51% and 112.93%, respectively, at net asset value. Class NAV shares, which were launched December 28, 2006, returned 80.28% from inception through October 31, 2007. By comparison, the average Pacific/Asia ex-Japan fund monitored by Morningstar, Inc. returned 95.69%, 1 while the Morgan Stanley Capital International (MSCI) China Index finished with a 155.68% return. Keep in mind that your returns will differ from those listed above if you were not invested in the Fund for the entire period or did not reinvest all distributions. Historical performance information can be found on pages six and seven.
As the period progressed and valuations became increasingly stretched, we positioned the Fund more defensively, rotating money out of higher-volatility names and into more stable stocks, largely the shares of companies based in Hong Kong and Taiwan. That decision, together with the Fund’s emphasis on quality, put us in the peculiar position of more than doubling our shareholders’ money yet trailing our benchmark by a substantial margin. However, although our cautious stance hurt performance in the short term, we believe it will help the Fund’s results over the longer term. History
Greater China Opportunities Fund
3
has repeatedly shown that those who throw caution to the wind during speculative manias live to regret it. Additionally, our performance lagged to some extent because of the surplus of cash we carried, a result of how rapidly the Fund’s assets grew in a period of soaring share prices.
Contributors and detractors
The Fund benefited from its positions in a number of stocks. For example, in the technology sector, we received a boost from China Power New Energy Development Ltd. This company, which is involved in alternative energy generation, was helped by an injection of assets by the Chinese government. In the financial sector, an underweighting in China CITIC Bank H was helpful, as was our overweighting in China Everbright Ltd. The latter was a turnaround story, with businesses in securities and banking, and the company’s banking unit was expected to gain its own exchange listing. Another financials holding that contributed to performance was China Insurance International H. A small property and casualty insurance company, China Insurance entered the life insurance business with good results. In the materials sector, Sino-Forest Corp. was a standout, returning over 400%. The largest forest management company in China, Sino-Forest was aided by rising demand for wood pulp. We sold our stakes in China Power, China CITIC Bank and China Insurance International during the period.
On the negative side, the sectors that detracted most from performance versus the benchmark were industrials, financials and materials. In industrials, not having a position in China COSCO Holdings Co. Ltd., an H-share stock, was costly, as the share price rocketed to a gain of almost 1,000% following an injection of assets by the government. In materials, organic fertilizer maker Century Sunshine Ecological Technology Holdings Ltd. suffered from rising costs and delays in the start-up of a manufacturing facility, and we sold our position. Another detractor from the materials sector, Aluminum Corp. of China Ltd., hurt us because of the Fund’s underweighting.
| |
| SECTOR DISTRIBUTION2 |
| Financials | 31% |
| Industrials | 19% |
| Energy | 15% |
| Telecommunication | |
| services | 15% |
| Materials | 5% |
| Consumer discretionary | 4% |
| Information technology | 2% |
| Consumer staples | 2% |
| Utilities | 2% |
As happened with many stocks during the period, the mere announcement of the company’s intention to obtain an A-share listing was enough to trigger an outsized gain. In financials, a negligible exposure to Ping An Insurance (Group) Co. of
Greater China Opportunities Fund
4
China was counterproductive. Despite having what we considered an excessively rich valuation, the stock gained more than 300% on the strength of the company’s progress in transforming itself into a financial supermarket and solid returns on its investment portfolio.
“As the period progressed and
valuations became increasingly
stretched, we positioned the
Fund more defensively…”
Outlook
In October, the Chinese Communist Party convened in Beijing for a Party Congress, an event that is held only once every five years. Much attention was focused on this gathering because it came at such a critical time in China’s development. One significant development was that a new generation of politicians began to gain influence in the party. Further, there was a consensus that monetary policy to date has been ineffective in producing balanced growth and preventing the economy from overheating. Given these developments, we think it likely that more stringent measures will be adopted at some point soon to cool economic growth in China. We cannot forecast exactly when this will occur, but it will likely coincide with a return to less-speculative stock market conditions and a renewed investor focus on fundamentals. We therefore caution our shareholders to moderate their expe ctations about future returns for the Fund. For our part, we will continue to invest in companies with sound fundamentals, knowing that such a policy best serves our shareholders’ long-term interests.
This commentary reflects the views of the portfolio manager through the end of the Fund’s period discussed in this report. The manager’s statements reflect her own opinions. As such, they are in no way guarantees of future events, and are not intended to be used as investment advice or a recommendation regarding any specific security. They are also subject to change at any time as market and other conditions warrant.
International investing involves special risks such as political, economic and currency risks and differences in accounting standards and financial reporting. Although they are larger and/or more established than many emerging markets, the markets of Greater China function in many ways as emerging markets, and carry the high levels of risk associated with emerging markets. Non-diversified funds tend to be more volatile than diversified funds and the market as a whole.
1 Figures from Morningstar, Inc. include reinvested dividends and do not take into account sales charges. Actual load-adjusted performance is lower.
2 As a percentage of net assets on October 31, 2007.
Greater China Opportunities Fund
5
A look at performance
For the periods ended October 31, 2007
| | | | | | | | | | | |
| | | | Average annual returns | | | | Cumulative total returns |
| | | | with maximum sales charge (POP) | | | with maximum sales charge (POP) |
| | | | | | | | | | | | |
| | Inception | | | | | Since | | | | | Since |
| Class | date | | 1-year | 5-year | 10-year | inception | | 1-year | 5-year | 10-year | inception |
|
| A | 6-9-05 | | 101.28% | — | — | 62.22% | | 101.28% | — | — | 218.93% |
|
| B | 6-9-05 | | 105.50 | — | — | 63.94 | | 105.50 | — | — | 227.10 |
|
| C | 6-9-05 | | 109.51 | — | — | 64.57 | | 109.51 | — | — | 230.10 |
|
| I1 | 6-9-05 | | 112.93 | — | — | 66.52 | | 112.93 | — | — | 239.55 |
|
| NAV1 | 12-28-06 | | — | — | — | — | | — | — | — | 80.28 |
|
Performance figures assume all distributions are reinvested. Public offering price (POP) figures reflect maximum sales charge on Class A shares of 5%, and the applicable contingent deferred sales charge (CDSC) on Class B and Class C shares. The Class B shares’ CDSC declines annually between years 1 to 6 according to the following schedule: 5, 4, 3, 3, 2, 1%. No sales charge will be assessed after the sixth year. Class C shares held for less than one year are subject to a 1% CDSC. Sales charge is not applicable for Class I and Class NAV shares.
The expense ratios of the Fund, both net (including any fee waivers or expense limitations) and gross (excluding any fee waivers or expense limitations), are set forth according to the most recent publicly available Prospectuses for the Fund and may differ from the expense ratios disclosed in the Financial Highlights tables in this report. The gross expenses are as follows: Class A — 1.92%, Class B — 2.62%, Class C — 2.62%, Class I — 1.49%, Class NAV — 1.25% .
The returns reflect past results and should not be considered indicative of future performance. The return and principal value of an investment will fluctuate so that shares, when redeemed, may be worth more or less than their original cost. Due to market volatility, the Fund’s current performance may be higher or lower than the performance shown. For performance data current to the most recent month end, please call 1-800-225-5291 or visit the Fund’s Web site at www.jhfunds.com.
The performance table above and the chart on the next page do not reflect the deduction of taxes that a shareholder would pay on fund distributions or the redemption of fund shares.
The Fund’s performance results reflect any applicable expense reductions, without which the expenses would increase and results would have been less favorable.
1 For certain types of investors as described in the Fund’s Class I and NAV share prospectuses.
Greater China Opportunities Fund
6
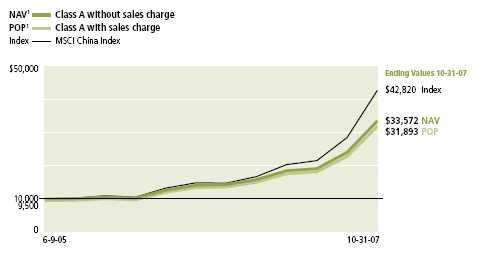
Growth of $10,000
This chart shows what happened to a hypothetical $10,000 investment in Greater China
Opportunities Fund Class A shares for the period indicated. For comparison, we’ve shown
the same investment in the MSCI China Index.
| | | | |
| | | | With maximum | |
| Class | Period beginning | Without sales charge | sales charge | Index |
|
| B | 6-9-05 | $33,010 | $32,710 | $42,820 |
|
| C2 | 6-9-05 | 33,010 | 33,010 | 42,820 |
|
| I3 | 6-9-05 | 33,955 | 33,955 | 42,820 |
|
| NAV3 | 12-28-06 | 18,028 | 18,028 | 20,381 |
|
Assuming all distributions were reinvested for the period indicated, the table above shows the value of a $10,000 investment in the Fund’s Class B, Class C and Class I shares, respectively, as of October 31, 2007. Performance of the classes will vary based on the difference in sales charges paid by shareholders investing in the different classes and the fee structure of those classes.
MSCI China Index is an unmanaged market capitalization-weighted index of Chinese companies available to non-domestic investors.
It is not possible to invest directly in an index. Index figures do not reflect sales charges, which would have resulted in lower values if they did.
1 NAV represents net asset value and POP represents public offering price.
2 No contingent deferred sales charge applicable.
3 For certain types of investors as described in the Fund’s Class I and NAV share prospectuses.
Greater China Opportunities Fund
7
Your expenses
These examples are intended to help you understand your ongoing operating expenses.
Understanding fund expenses
As a shareholder of the Fund, you incur two types of costs:
▪ Transaction costs which include sales charges (loads) on purchases or redemptions (varies by share class), minimum account fee charge, etc.
▪ Ongoing operating expenses including management fees, distribution and service fees (if applicable), and other fund expenses.
We are going to present only your ongoing operating expenses here.
Actual expenses/actual returns
This example is intended to provide information about your fund’s actual ongoing operating expenses, and is based on your fund’s actual return. It assumes an account value of $1,000.00 on May 1, 2007, with the same investment held until October 31, 2007.
| | | |
| | Account value | Ending value | Expenses paid during |
| | on 5-1-07 | on 10-31-07 | period ended 10-31-071 |
|
| Class A | $1,000.00 | $1,752.30 | $11.83 |
|
| Class B | 1,000.00 | 1,745.90 | 16.61 |
|
| Class C | 1,000.00 | 1,745.90 | 16.61 |
|
| Class I | 1,000.00 | 1,756.60 | 8.83 |
|
| Class NAV | 1,000.00 | 1,757.30 | 6.59 |
|
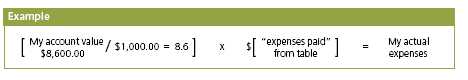
Together with the value of your account, you may use this information to estimate the operating expenses that you paid over the period. Simply divide your account value at October 31, 2007, by $1,000.00, then multiply it by the “expenses paid” for your share class from the table above. For example, for an account value of $8,600.00, the operating expenses should be calculated as follows:
Greater China Opportunities Fund
8
Hypothetical example for comparison purposes
This table allows you to compare your fund’s ongoing operating expenses with those of any other fund. It provides an example of the Fund’s hypothetical account values and hypothetical expenses based on each class’s actual expense ratio and an assumed 5% annualized return before expenses (which is not your fund’s actual return). It assumes an account value of $1,000.00 on May 1, 2007, with the same investment held until October 31, 2007. Look in any other fund shareholder report to find its hypothetical example and you will be able to compare these expenses.
| | | |
| | Account value | Ending value | Expenses paid during |
| | on 5-1-07 | on 10-31-07 | period ended 10-31-071 |
|
| Class A | $1,000.00 | $1,016.60 | $8.67 |
|
| Class B | 1,000.00 | 1,013.10 | 12.18 |
|
| Class C | 1,000.00 | 1,013.10 | 12.18 |
|
| Class I | 1,000.00 | 1,018.80 | 6.47 |
|
| Class NAV | 1,000.00 | 1,020.42 | 4.83 |
|
Remember, these examples do not include any transaction costs, such as sales charges; therefore, these examples will not help you to determine the relative total costs of owning different funds. If transaction costs were included, your expenses would have been higher. See the prospectus for details regarding transaction costs.
1 Expenses are equal to the Fund’s annualized expense ratio of 1.70%, 2.40%, 2.40%, 1.27% and 0.95% for Class A, Class B, Class C, Class I and Class NAV, respectively, multiplied by the average account value over the period, multiplied by number of days in most recent fiscal half-year/365 or 366 (to reflect the one-half year period).
Greater China Opportunities Fund
9
Fund’s investments
F I N A N C I A L S T A T E M E N T S
Securities owned by the Fund on 10-31-07
This schedule consists of one main category: common stocks. Common stocks are further
broken down by industry group.
| | |
| Issuer | Shares | Value |
|
| Common stocks 95.98% | | $388,445,498 |
| (Cost $213,345,972) | | |
| | | |
| Airlines 0.99% | | 4,023,146 |
|
| China Eastern Airlines Corp. Ltd. (China) (F)(I) | 2,710,000 | 2,949,423 |
|
| China Southern Airlines Co. Ltd. (China) (F)(I) | 770,000 | 1,073,723 |
| | | |
| Aluminum 1.37% | | 5,555,177 |
|
| Aluminum Corp. of China Ltd. (China) (F) | 1,948,000 | 5,555,177 |
| | | |
| Automobile Manufacturers 1.12% | | 4,551,248 |
|
| Denway Motors Ltd. (Hong Kong) (F) | 6,450,000 | 4,551,248 |
| | | |
| Broadcasting & Cable TV 0.27% | | 1,076,194 |
|
| Phoenix Satellite Television Holdings Ltd. (Hong Kong) (F) | 4,466,000 | 1,076,194 |
| | | |
| Coal & Consumable Fuels 2.90% | | 11,740,904 |
|
| China Shenhua Energy Co. Ltd. (China) (F) | 1,182,500 | 7,619,921 |
|
| Yanzhou Coal Mining Co. Ltd. (China) (F) | 1,912,000 | 4,120,983 |
| | | |
| Commodity Chemicals 0.51% | | 2,067,948 |
|
| Sinopec Shanghai Petrochemical Co. Ltd. (China) (F)(W) | 2,530,000 | 2,067,948 |
| | | |
| Computer Storage & Peripherals 0.22% | | 879,400 |
|
| TPV Technology Ltd. (Hong Kong) (F) | 1,306,000 | 879,400 |
| | | |
| Construction & Engineering 4.44% | | 17,975,733 |
|
| China Communications Constructions Ltd. (China) (F) | 2,239,000 | 7,103,866 |
|
| COSCO International Holdings Ltd. (Hong Kong) (F) | 4,422,000 | 6,812,030 |
|
| Shui On Construction and Material Ltd. (Hong Kong) (F) | 1,040,000 | 4,059,837 |
| | | |
| Construction & Farm Machinery & Heavy Trucks 0.92% | | 3,706,754 |
|
| China Infrastructure Machinery Holdings, Ltd. (China) (F) | 950,000 | 2,110,485 |
|
| Weichai Power Co. Ltd. (China) (F)(I) | 155,000 | 1,596,269 |
| | | |
| Distributors 1.38% | | 5,579,092 |
|
| China Resources Enterprise Ltd. (Hong Kong) (F) | 1,272,000 | 5,579,092 |
| | | |
| Diversified Banks 13.67% | | 55,329,444 |
|
| Bank of China Ltd. (China) (F) | 9,333,000 | 6,152,994 |
|
| Bank of East Asia Ltd. (Hong Kong) (F) | 811,017 | 5,517,777 |
|
| China Construction Bank (China) (F) | 17,205,000 | 19,558,372 |
|
| China Merchants Bank Co. Ltd. (China) (F) | 386,000 | 1,990,183 |
|
| CITIC International Financial Holdings Ltd. (Hong Kong) (F) | 775,000 | 666,788 |
See notes to financial statements
Greater China Opportunities Fund
10
F I N A N C I A L S T A T E M E N T S
| | |
| Issuer | Shares | Value |
| Diversified Banks (continued) | | |
|
| HSBC Holdings Plc (United Kingdom) (F) | 233,200 | $4,596,331 |
|
| Industrial & Commercial Bank of China (China) (F) | 17,640,000 | 16,846,999 |
| | | |
| Diversified Metals & Mining 0.67% | | 2,726,811 |
|
| Jiangxi Copper Co. Ltd. (China) (F) | 771,000 | 2,726,811 |
| | | |
| Diversified REITs 0.76% | | 3,061,678 |
|
| GZI Real Estate Investment Trust (Hong Kong) (F) | 7,561,000 | 3,061,678 |
| | | |
| Electronic Equipment Manufacturers 1.52% | | 6,174,619 |
|
| Au Optronics Corp. ADR (Taiwan) (F) | 52,525 | 1,141,368 |
|
| Chi Mei Optoelectronice Corp. (Taiwan) (F) | 2,366,400 | 3,427,417 |
|
| Kingboard Chemical Holdings Ltd. (Hong Kong) (F) | 244,500 | 1,605,834 |
| | | |
| Forest Products 0.59% | | 2,404,094 |
|
| Sino-Forest Corp. (Canada) (F)(I) | 90,900 | 2,404,094 |
| | | |
| Gas Utilities 0.86% | | 3,477,937 |
|
| Xinao Gas Holdings Ltd. (China) (F) | 1,626,000 | 3,094,631 |
|
| Zhengzhou Gas Co. Ltd. (China) (F) | 1,900,000 | 383,306 |
| | | |
| Gold 0.68% | | 2,751,488 |
|
| Zijin Mining Group Co. Ltd. (China) (F) | 1,576,000 | 2,751,488 |
| | | |
| Heavy Electrical Equipment 1.78% | | 7,193,565 |
|
| Harbin Power Equipment Co. Ltd. (China) (F) | 1,636,000 | 5,354,599 |
|
| Shanghai Electric Group Co. Ltd. (China) (F) | 1,852,000 | 1,838,966 |
| | | |
| Highways & Railtracks 1.66% | | 6,707,256 |
|
| Road King Infrastructure Ltd. (Hong Kong) (F) | 2,675,000 | 5,410,508 |
|
| Zhejiang Expressway Co. Ltd. (China) (F) | 898,000 | 1,296,748 |
| | | |
| Hotels, Resorts & Cruise Lines 0.31% | | 1,238,801 |
|
| China Travel International Investment Hong Kong Ltd. (Hong Kong) (F) | 1,542,000 | 1,238,801 |
| | | |
| Hypermarkets & Super Centers 0.66% | | 2,654,990 |
|
| Lianhua Supermarket Holdings Ltd. (China) (F) | 1,693,000 | 2,654,990 |
| | | |
| Independent Power Producers & Energy Traders 2.11% | | 8,537,882 |
|
| China Power International Development Ltd. (Hong Kong) (F) | 5,339,000 | 2,859,581 |
|
| China Resources Power Holdings Co. Ltd. (Hong Kong) (F) | 1,518,000 | 5,678,301 |
| | | |
| Industrial Conglomerates 3.15% | | 12,766,926 |
|
| Beijing Enterprises Holdings Ltd. (Hong Kong) (F) | 424,000 | 2,637,189 |
|
| Citic Pacific Ltd. (Hong Kong) (F) | 812,000 | 5,120,008 |
|
| Hutchison Whampoa Ltd. (Hong Kong) (F) | 256,000 | 3,217,346 |
|
| Shanghai Industrial Holdings Ltd. (Hong Kong) (F) | 306,000 | 1,792,383 |
| | | |
| Industrial Machinery 1.74% | | 7,038,995 |
|
| Enric Energy Equipment Holdings, Ltd. (Hong Kong) (F)(I) | 2,244,000 | 3,149,818 |
|
| EVA Precision Industrial Holdings, Ltd. (Hong Kong) (F) | 3,294,000 | 1,243,718 |
|
| Shanghai Prime Machinery Co. (China) (F) | 5,620,000 | 2,645,459 |
| | | |
| Integrated Oil & Gas 9.70% | | 39,258,980 |
|
| China Petroleum and Chemical Corp. (Sinopec) (China) (F)(W) | 8,968,000 | 14,278,158 |
|
| PetroChina Co. Ltd. (China) (F) | 9,676,000 | 24,980,822 |
See notes to financial statements
Greater China Opportunities Fund
11
F I N A N C I A L S T A T E M E N T S
| | |
| Issuer | Shares | Value |
| | | |
| Integrated Telecommunication Services 2.57% | | $10,385,048 |
|
| China Netcom Group Corp. (Hong Kong) Ltd. (Hong Kong) (F) | 1,020,000 | 3,134,616 |
|
| China Telecom Corp. Ltd. (China) (F) | 8,386,000 | 7,250,432 |
| | | |
| Investment Banking & Brokerage 1.12% | | 4,535,888 |
|
| Goldbond Group Holdings Ltd. (Hong Kong) (F)(I) | 17,610,000 | 1,599,691 |
|
| Meadville Holdings Ltd. (Hong Kong) (F) | 11,888,000 | 2,936,197 |
| | | |
| Leisure Products 0.56% | | 2,277,276 |
|
| Li Ning Co. Ltd. (Hong Kong) (F) | 606,000 | 2,277,276 |
| | | |
| Life & Health Insurance 6.95% | | 28,110,082 |
|
| China Life Insurance Co. Ltd. (China) (F) | 3,530,000 | 23,561,080 |
|
| Ping An Insurance (Group) Co. of China Ltd. (China) (F) | 325,000 | 4,549,002 |
| | | |
| Marine 1.50% | | 6,089,260 |
|
| China Shipping Container Lines Co. Ltd. (China) (F) | 619,000 | 821,000 |
|
| Cosco Corp. (Singapore) Ltd. (Singapore) (F) | 460,000 | 2,494,803 |
|
| Pacific Basin Shipping Ltd. (Hong Kong) (F) | 1,238,000 | 2,773,457 |
| | | |
| Marine Ports & Services 1.62% | | 6,536,861 |
|
| China Merchants Holdings International Co. Ltd. (Hong Kong) (F) | 654,670 | 4,617,384 |
|
| Cosco Pacific Ltd. (Hong Kong) (F) | 616,000 | 1,919,477 |
| | | |
| Oil & Gas Exploration & Production 3.05% | | 12,347,719 |
|
| CNOOC Ltd. (Hong Kong) (F) | 5,714,000 | 12,347,719 |
| | | |
| Other Diversified Financial Services 0.90% | | 3,638,320 |
|
| China Everbright Ltd. (Hong Kong) (F)(I) | 809,000 | 3,638,320 |
| | | |
| Packaged Foods & Meats 1.65% | | 6,694,195 |
|
| China Mengniu Dairy Co. Ltd. (Hong Kong) (F) | 620,000 | 2,633,656 |
|
| China Yurun Food Group Ltd. (Hong Kong) (F) | 2,312,000 | 4,060,539 |
| | | |
| Personal Products 0.33% | | 1,353,228 |
|
| Hengan International Group Co. Ltd. (Hong Kong) (F) | 347,000 | 1,353,228 |
| | | |
| Property & Casualty Insurance 0.79% | | 3,189,503 |
|
| PICC Property and Casualty Co. Ltd. (China) (F) | 1,526,000 | 3,189,503 |
| Railroads 0.40% | | 1,620,132 |
|
| Guangshen Railway Co. Ltd. (China) (F)(W) | 1,898,000 | 1,620,132 |
| Real Estate Management & Development 6.56% | | 26,529,211 |
|
| Cheung Kong Holdings Ltd. (Hong Kong) (F) | 178,000 | 3,491,298 |
|
| China Overseas Land & Investment Ltd. (Hong Kong) (F) | 2,696,000 | 6,452,696 |
|
| China Resources Land Ltd. (Hong Kong) (F) | 1,934,000 | 4,892,723 |
|
| Guangzhou Investment Co. Ltd. (Hong Kong) (F) | 6,616,000 | 2,818,403 |
|
| Shenzhen Investment Ltd. (Hong Kong) (F) | 1,832,000 | 1,770,950 |
|
| Shimao Property Holdings Ltd. (China) (F) | 775,000 | 2,774,384 |
|
| Shui On Land Ltd. (China) (F) | 3,110,000 | 4,328,757 |
| | | |
| Semiconductors 0.20% | | 805,477 |
|
| Advanced Semiconductor Manufacturing Corp. (China) (F)(I) | 13,160,000 | 805,477 |
| | | |
| Steel 0.73% | | 2,958,609 |
|
| Maanshan Iron & Steel Co. Ltd. (China) (F) | 3,320,000 | 2,958,609 |
See notes to financial statements
Greater China Opportunities Fund
12
F I N A N C I A L S T A T E M E N T S
| | |
| Issuer | Shares | Value |
| | | |
| Technology Distributors 1.13% | | $4,585,161 |
|
| Digital China Holdings Ltd. (Hong Kong) (F) | 6,995,800 | 4,585,161 |
| | | |
| Wireless Telecommunication Services 11.94% | | 48,310,466 |
|
| China Mobile (Hong Kong) Ltd. (Hong Kong) (F) | 2,337,000 | 48,310,466 |
|
| Total investments (Cost $213,345,972) 95.98% | | $388,445,498 |
|
| Other assets and liabilities, net 4.02% | | 16,262,888 |
|
| Total net assets 100.00% | | $404,708,386 |
|
The percentage shown for each investment category is the total value of that category as a percentage of the net assets of the Fund.
ADR American Depositary Receipt
(F) Parenthetical disclosure of a foreign country in the security description represents country of a foreign issuer.
(I) Non-income-producing security.
(W) Fund owns 5% or more of the outstanding voting securities of the issuer.
See notes to financial statements
Greater China Opportunities Fund
13
Financial statements
F I N A N C I A L S T A T E M E N T S
Statement of assets and liabilities 10-31-07
This Statement of Assets and Liabilities is the Fund’s balance sheet. It shows the value
of what the Fund owns, is due and owes. You’ll also find the net asset value and the
maximum offering price per share.
| |
| Assets | |
|
| Investments in unaffiliated issuers, at value (cost $203,451,272) | $370,479,260 |
| Investments in affiliated issuers, at value (cost $9,894,700) | 17,966,238 |
| Total investments, at value (cost $213,345,972) | 388,445,498 |
| Cash | 8,780,957 |
| Foreign currency at value (cost $2,473,285) | 2,487,269 |
| Receivable for investments sold | 3,095,016 |
| Receivable for shares sold | 3,714,514 |
| Dividends receivable | 62,937 |
| Other assets | 2,200 |
| Total assets | 406,588,391 |
| |
| Liabilities | |
|
| Payable for investments purchased | 307,527 |
| Payable for shares repurchased | 1,044,895 |
| Payable to affiliates | |
| Management fees | 329,465 |
| Distribution and service fees | 26,418 |
| Other | 44,869 |
| Other payables and accrued expenses | 126,831 |
| Total liabilities | 1,880,005 |
| |
| Net assets | |
|
| Capital paid-in | 206,864,377 |
| Accumulated net realized gain on investments and foreign currency transactions | 22,261,019 |
| Net unrealized appreciation of investments and translation of assets and | |
| liabilities in foreign currencies | 175,113,610 |
| Undistributed net investment income | 469,380 |
| Net assets | $404,708,386 |
| |
| Net asset value per share | |
|
| Based on net asset values and shares outstanding — the Fund has an | |
| unlimited number of shares authorized with no par value | |
| Class A ($283,307,581 ÷ 8,705,850 shares) | $32.54 |
| Class B ($55,326,795 ÷ 1,720,100 shares)1 | $32.16 |
| Class C ($58,919,566 ÷ 1,832,007 shares)1 | $32.16 |
| Class I ($6,140,538 ÷ 187,852 shares) | $32.69 |
| Class NAV ($1,013,906 ÷ 30,990 shares) | $32.72 |
| |
| Maximum offering price per share | |
|
| Class A2 ($32.54 ÷ 95%) | $34.25 |
1 Redemption price per share is equal to net asset value less any applicable contingent deferred sales charge.
2 On single retail sales of less than $50,000. On sales of $50,000 or more and on group sales the offering price is reduced.
See notes to financial statements
Greater China Opportunities Fund
14
F I N A N C I A L S T A T E M E N T S
Statement of operations For the year ended 10-31-07
This Statement of Operations summarizes the Fund’s investment income earned
and expenses incurred in operating the Fund. It also shows net gains (losses) for
the period stated.
| |
| Investment income | |
|
| Dividends from unaffiliated issuers (net of foreign withholding taxes of $2,070) | $4,352,765 |
| Dividends from affiliated issuers | 214,142 |
| Interest | 32,241 |
| Total investment income | 4,599,148 |
| |
| Expenses | |
|
| Investment management fees (Note 2) | 2,261,370 |
| Distribution and service fees (Note 2) | 1,096,978 |
| Class A, B and C transfer agent fees (Note 2) | 446,045 |
| Class I transfer agent fees (Note 2) | 2,427 |
| Accounting and legal services fees (Note 2) | 25,503 |
| Custodian fees | 156,734 |
| Blue sky fees | 95,645 |
| Printing fees | 54,580 |
| Professional fees | 28,212 |
| Trustees’ fees | 8,156 |
| Miscellaneous | 25,336 |
| | |
| Total expenses | 4,200,986 |
| | |
| Net investment income | 398,162 |
| |
| Realized and unrealized gain | |
|
| Net realized gain on | |
| Investments in unaffiliated issuers | 26,401,084 |
| Investments in affiliated issuers | 569,375 |
| Foreign currency transactions | 71,218 |
| | 27,041,677 |
| Change in net unrealized appreciation (depreciation) of | |
| Investments in unaffiliated issuers | 152,610,262 |
| Investments in affiliated issuers | 8,071,538 |
| Translation of assets and liabilities in foreign currencies | 15,790 |
| | 160,697,590 |
| Net realized and unrealized gain | 187,739,267 |
| | |
| Increase in net assets from operations | $188,137,429 |
See notes to financial statements
Greater China Opportunities Fund
15
F I N A N C I A L S T A T E M E N T S
Statement of changes in net assets
These Statements of Changes in Net Assets show how the value of the Fund’s net assets
has changed during the last two periods. The difference reflects earnings less expenses,
any investment gains and losses, distributions, if any, paid to shareholders and the net of
Fund share transactions.
| | |
| | Year | Year |
| | ended | ended |
| | 10-31-06 | 10-31-07 |
|
| Increase in net assets | | |
|
| From operations | | |
| Net investment income | $521,107 | $398,162 |
| Net realized gain | 2,822,442 | 27,041,677 |
| Change in net unrealized appreciation (depreciation) | 14,784,854 | 160,697,590 |
| | | |
| Increase in net assets resulting from operations | 18,128,403 | 188,137,429 |
| | |
| Distributions to shareholders | | |
| From net investment income | | |
| Class A | (34,481) | (446,999) |
| Class B | — | (7,633) |
| Class C | — | (6,002) |
| Class I | (4,277) | (38,951) |
| From net realized gain | | |
| Class A | (44,190) | (2,043,716) |
| Class B | (5,067) | (419,850) |
| Class C | (4,308) | (330,123) |
| Class I | (351) | (111,132) |
| | (92,674) | (3,404,406) |
| From Fund share transactions (Note 4) | 78,905,420 | 107,935,620 |
| | | |
| Total increase | 96,941,149 | 292,668,643 |
| |
| Net assets | | |
|
| Beginning of year | 15,098,594 | 112,039,743 |
| End of year1 | $112,039,743 | $404,708,386 |
1 Includes undistributed net investment income of $499,607 and $469,380, respectively.
See notes to financial statements
Greater China Opportunities Fund
16
F I N A N C I A L S T A T E M E N T S
Financial highlights
The Financial Highlights show how the Fund’s net asset value for a share has changed
since the end of the previous period.
| | | | | | |
| CLASS A SHARES | | | | | | |
| |
| Period ended | | | | 10-31-051 | 10-31-06 | 10-31-07 |
|
| Per share operating performance | | | | | | |
|
| Net asset value, beginning of period | | | | $10.00 | $10.24 | $15.78 |
| Net investment income2 | | | | 0.03 | 0.16 | 0.07 |
| Net realized and unrealized | | | | | | |
| gain on investments | | | | 0.21 | 5.43 | 17.14 |
| Total from investment operations | | | | 0.24 | 5.59 | 17.21 |
| Less distributions | | | | | | |
| From net investment income | | | | — | (0.01) | (0.08) |
| From net realized gain | | | | — | (0.04) | (0.37) |
| | | | | — | (0.05) | (0.45) |
| Net asset value, end of period | | | | $10.24 | $15.78 | $32.54 |
| Total return3 (%) | | | | 2.404,5 | 54.744 | 111.87 |
| |
| Ratios and supplemental data | | | | | | |
|
| Net assets, end of period | | | | | | |
| (in millions) | | | | $12 | $79 | $283 |
| Ratio of net expenses to average | | | | | | |
| net assets (%) | | | | 1.936 | 1.89 | 1.68 |
| Ratio of gross expenses to average | | | | | | |
| net assets (%) | | | | 4.446,7 | 1.927 | 1.68 |
| Ratio of net investment income | | | | | | |
| to average net assets | | | | 0.686 | 1.14 | 0.34 |
| Portfolio turnover (%) | | | | 285 | 57 | 85 |
1 Beginning of operations on 6-9-05 to 10-31-05.
2 Based on the average of the shares outstanding.
3 Assumes dividend reinvestment and does not reflect the effect of sales charges.
4 Total return would have been lower had certain expenses not been reduced during the periods shown.
5 Not annualized.
6 Annualized.
7 Does not take into consideration expense reductions during the periods shown.
See notes to financial statements
Greater China Opportunities Fund
17
Financial highlights
F I N A N C I A L S T A T E M E N T S
| | | | | | |
| CLASS B SHARES | | | | | | |
| |
| Period ended | | | | 10-31-051 | 10-31-06 | 10-31-07 |
| |
| Per share operating performance | | | | | | |
|
| Net asset value, beginning of period | | | | $10.00 | $10.21 | $15.63 |
| Net investment income (loss)2 | | | | 0.02 | 0.09 | (0.07) |
| Net realized and unrealized | | | | | | |
| gain on investments | | | | 0.19 | 5.37 | 16.98 |
| Total from investment operations | | | | 0.21 | 5.46 | 16.91 |
| Less distributions | | | | | | |
| From net investment income | | | | — | — | (0.01) |
| From net realized gain | | | | — | (0.04) | (0.37) |
| | | | | — | (0.04) | (0.38) |
| Net asset value, end of period | | | | $10.21 | $15.63 | $32.16 |
| Total return3 (%) | | | | 2.104,5 | 53.594 | 110.50 |
| |
| Ratios and supplemental data | | | | | | |
|
| Net assets, end of period | | | | | | |
| (in millions) | | | | $1 | $16 | $55 |
| Ratio of net expenses to average | | | | | | |
| net assets (%) | | | | 2.636 | 2.59 | 2.38 |
| Ratio of gross expenses to average | | | | | | |
| net assets (%) | | | | 5.146,7 | 2.627 | 2.38 |
| Ratio of net investment income | | | | | | |
| (loss) to average net assets | | | | 0.436 | 0.63 | (0.32) |
| Portfolio turnover (%) | | | | 285 | 57 | 85 |
1 Beginning of operations on 6-9-05 to 10-31-05.
2 Based on the average of the shares outstanding.
3 Assumes dividend reinvestment and does not reflect the effect of sales charges.
4 Total return would have been lower had certain expenses not been reduced during the periods shown.
5 Not annualized.
6 Annualized.
7 Does not take into consideration expense reductions during the periods shown.
See notes to financial statements
Greater China Opportunities Fund
18
F I N A N C I A L S T A T E M E N T S
Financial highlights
| | | | | | |
| CLASS C SHARES | | | | | | |
| |
| Period ended | | | | 10-31-051 | 10-31-06 | 10-31-07 |
| |
| Per share operating performance | | | | | | |
|
| Net asset value, beginning of period | | | | $10.00 | $10.21 | $15.63 |
| Net investment income (loss)2 | | | | 0.03 | 0.08 | (0.05) |
| Net realized and unrealized | | | | | | |
| gain on investments | | | | 0.18 | 5.38 | 16.96 |
| Total from investment operations | | | | 0.21 | 5.46 | 16.91 |
| Less distributions | | | | | | |
| From net investment income | | | | — | — | (0.01) |
| From net realized gain | | | | — | (0.04) | (0.37) |
| | | | | — | (0.04) | (0.38) |
| Net asset value, end of period | | | | $10.21 | $15.63 | $32.16 |
| Total return3 (%) | | | | 2.104,5 | 53.594 | 110.51 |
| |
| Ratios and supplemental data | | | | | | |
|
| Net assets, end of period | | | | | | |
| (in millions) | | | | $1 | $13 | $59 |
| Ratio of net expenses to average | | | | | | |
| net assets (%) | | | | 2.626 | 2.59 | 2.38 |
| Ratio of gross expenses to average | | | | | | |
| net assets (%) | | | | 5.136,7 | 2.627 | 2.38 |
| Ratio of net investment income | | | | | | |
| (loss) to average net assets | | | | 0.616 | 0.55 | (0.25) |
| Portfolio turnover (%) | | | | 285 | 57 | 85 |
1 Beginning of operations on 6-9-05 to 10-31-05.
2 Based on the average of the shares outstanding.
3 Assumes dividend reinvestment and does not reflect the effect of sales charges.
4 Total return would have been lower had certain expenses not been reduced during the periods shown.
5 Not annualized.
6 Annualized.
7 Does not take into consideration expense reductions during the periods shown.
See notes to financial statements
Greater China Opportunities Fund
19
F I N A N C I A L S T A T E M E N T S
Financial highlights
| | | | | | |
| CLASS I SHARES | | | | | | |
| |
| Period ended | | | | 10-31-051 | 10-31-06 | 10-31-07 |
|
| Per share operating performance | | | | | | |
|
| Net asset value, beginning of period | | | | $10.00 | $10.26 | $15.82 |
| Net investment income2 | | | | 0.03 | 0.24 | 0.09 |
| Net realized and unrealized | | | | | | |
| gain on investments | | | | 0.23 | 5.42 | 17.28 |
| Total from investment operations | | | | 0.26 | 5.66 | 17.37 |
| Less distributions | | | | | | |
| From net investment income | | | | — | (0.06) | (0.13) |
| From net realized gain | | | | — | (0.04) | (0.37) |
| | | | | — | (0.10) | (0.50) |
| Net asset value, end of period | | | | $10.26 | $15.82 | $32.69 |
| Total return3 (%) | | | | 2.604,5 | 55.434 | 112.93 |
| |
| Ratios and supplemental data | | | | | | |
|
| Net assets, end of period | | | | | | |
| (in millions) | | | | —8 | $4 | $6 |
| Ratio of net expenses to average | | | | | | |
| net assets (%) | | | | 1.456 | 1.46 | 1.22 |
| Ratio of gross expenses to average | | | | | | |
| net assets (%) | | | | 3.966,7 | 1.497 | 1.22 |
| Ratio of net investment income | | | | | | |
| to average net assets | | | | 0.766 | 1.70 | 0.44 |
| Portfolio turnover (%) | | | | 285 | 57 | 85 |
1 Beginning of operations on 6-9-05 to 10-31-05.
2 Based on the average of the shares outstanding.
3 Assumes dividend reinvestment and does not reflect the effect of sales charges.
4 Total return would have been lower had certain expenses not been reduced during the periods shown.
5 Not annualized.
6 Annualized.
7 Does not take into consideration expense reductions during the periods shown.
8 Less than $500,000.
See notes to financial statements
Greater China Opportunities Fund
20
F I N A N C I A L S T A T E M E N T S
Financial highlights
| |
| CLASS NAV SHARES | |
| |
| Period ended | 10-31-071 |
| |
| Per share operating performance | |
|
| Net asset value, beginning of period | $18.15 |
| Net investment income2 | 0.35 |
| Net realized and unrealized | |
| gain on investments | 14.22 |
| Total from investment operations | 14.57 |
| Net asset value, end of period | $32.72 |
| Total return3 (%) | 80.284 |
| |
| Ratios and supplemental data | |
|
| Net assets, end of period | |
| (in millions) | $1 |
| Ratio of net expenses to average | |
| net assets (%) | 1.125 |
| Ratio of net investment income | |
| to average net assets | 1.565 |
| Portfolio turnover (%) | 85 |
1 Beginning of operations from 12-28-06 to 10-31-07.
2 Based on the average of the shares outstanding.
3 Assumes dividend reinvestment and does not reflect the effect of sales charges.
4 Not annualized.
5 Annualized.
See notes to financial statements
Greater China Opportunities Fund
21
Notes to financial statements
Note 1
Accounting policies
John Hancock Greater China Opportunities Fund (the Fund) is a non-diversified series of John Hancock Investment Trust III (the Trust), an open-end management investment company registered under the Investment Compa ny Act of 1940, as amended (the 1940 Act). The investment objective of the Fund is to achieve long-term capital appreciation.
The Trustees have authorized the issuance of multiple classes of shares of the Fund, designated as Class A, Class B, Class C, Class I and Class NAV shares. The shares of each class represent an interest in the same portfolio of investments of the Fund and have equal rights as to voting, redemptions, dividends and liquidation, except that certain expenses, subject to the approval of the Trustees, may be applied differently to each class of shares in accordance with current regulations of the Securities and Exchange Commission (SEC) and the Internal Revenue Service. Shareholders of a class that bears distribution and service expenses under the terms of a distribution plan have exclusive voting rights to that distribution plan. Class B shares will convert to Class A shares eight years after purchase.
Significant accounting policies
The financial statements have been prepared in conformity with accounting principles generally accepted in the United States of America, which require management to make certain estimates and assumptions at the date of the financial statements. The following summarizes the significant accounting policies of the Fund:
Security valuation
The net asset value of Class A, Class B, Class C, Class I and Class NAV shares of the Fund is determined daily as of the close of the New York Stock Exchange (NYSE), normally at 4:00 p.m., Eastern Time. Short-term debt investments that have a remaining maturity of 60 days or less are valued at amortized cost, and thereafter assume a constant amortization to maturity of any discount or premium, which approximates market value. Investments in John Hancock Cash Investment Trust (JHCIT), an affiliate of John Hancock Advisers, LLC (the Adviser), a wholly owned subsidiary of John Hancock Financial Services, Inc., a subsidiary of Manulife Financial Corporation (MFC), are valued at their net asset value each business day. All other securities held by the Fund are valued at the last sale price or official closing price (closing bid price or last evaluated quote if no sale has occurred) as of the close of business on the principal securities exchange (domestic or foreign) on which they trade or, lacking any sales, at the closing bid price. Securities traded only in the over-the-counter market are valued at the last bid price quoted by brokers making markets in the securities at the close of trading. Securities for which there are no such quotations, principally debt securities, are valued based on the valuation provided by an independent pricing service, which utilizes both dealer-supplied and electronic data processing techniques, which take into account factors such as institutional-size trading in similar groups of securities, yield, quality, coupon rate, maturity, type of issue, trading characteristics and other market data.
Other assets and securities for which no such quotations are readily available are valued at fair value as determined in good faith under consistently applied procedures established by and under the general supervision of the Board of Trustees. Generally, trading in non-U.S. securities is substantially completed each day at various times prior to the close of trading on the NYSE. The values of such securities used in computing the net asset value of the Fund’s shares are generally determined as of such times. Occasionally, significant events that affect the values of such securities may occur between the times at which such values are generally determined and the close of the
Greater China Opportunities Fund
22
NYSE. Upon such an occurrence, these securities will be valued at fair value as determined in good faith under consistently applied procedures established by and under the general supervision of the Board of Trustees.
Joint repurchase agreement
Pursuant to an exemptive order issued by the SEC, the Fund, along with other registered investment companies having a management contract with the Adviser may participate in a joint repurchase agreement transaction. Aggregate cash balances are invested in one or more large repurchase agreements, whose underlying securities are obligations of the U.S. government and/or its agencies. The Fund’s custodian bank receives delivery of the underlying securities for the joint account on the Fund’s behalf. The Adviser is responsible for ensuring that the agreement is fully collatera lized at all times.
Foreign currency translations
The books and records of the Fund are maintained in U.S. dollars. Investment securities and other assets and liabilities denominated in a foreign currency are translated into U.S. dollars at the prevailing exchange rates at period end. Purchases and sales of investment securities, income and expenses are translated into U.S. dollars at the prevailing exchange rates on the respective dates of the transactions.
Net realized and unrealized gains and losses on foreign currency transactions represent net gains and losses between trade and settlement dates on securities transactions, the disposition of forward foreign currency exchange contracts and foreign currencies, and the difference between the amount of net investment income accrued and the U.S. dollar amount actually received. That portion of both realized and unrealized gains and losses on investments that results from fluctuations in foreign currency exchange rates is not separately disclosed but is included with net realized and unrealized gain/appreciation and loss/depreciation on investments.
Investment transactions
Investment transactions are accounted for on a trade date plus one basis for daily net asset value calculations. However, for financial reporting purposes, investment security transactions are reported on trade date. Interest income is recorded on the accrual basis. Dividend income is recorded on the ex-dividend date net of foreign withholding taxes. Certain dividends from foreign securities may be recorded subsequent to the ex-dividend date as soon as the Fund is informed of such dividends. Realized gains and losses from investment transactions are recorded on an identified cost basis.
Class allocations
Income, common expenses and realized and unrealized gains (losses) are determined at the fund level and allocated daily to each class of shares based on the appropriate net asset value of the respective classes. Distribution and service fees, if any, and transfer agent fees for Class A, Class B, Class C and Class I shares are calculated daily at the class level based on the appropriate net asset value of each class and the specific expense rate(s) applicable to each class.
Expenses
The majority of expenses are directly identifiable to an individual fund. Expenses that are not readily identifiable to a specific fund are allocated in such a manner as deemed equitable, taking into consideration, among other things, the nature and type of expense and the relative size of the funds.
Bank borrowings
The Fund is permitted to have bank borrowings for temporary or emergency purposes, including the meeting of redemption requests that otherwise might require the untimely disposition of securities. The Fund has entered into a line of credit agreement with The Bank of New York Mellon (BNYM), the Swing Line Lender and Administrative Agent. This agreement enables the Fund to participate, with other funds managed by the Adviser, in an unsecured line of credit with BNYM, which permits borrowings of up to $100 million, collectively. Interest is charged to each fund based on its borrowing. In addition, a commitment fee is charged to each fund based on the average daily unused portion of the line of credit, and is allocated among the participating funds. The Fund had no borrowing activity under the line of credit during the year ended October 31, 2007.
Greater China Opportunities Fund
23
Securities lending
The Fund has entered into an agreement with Morgan Stanley & Co. Incorporated and MS Securities Services Inc. (collectively, Morgan Stanley) which permits the Fund to lend securities to Morgan Stanley on a principal basis. It is presently anticipated that Morgan Stanley will be the primary borrower of securities of the Fund. The risk of having one primary borrower of Fund securities (as opposed to several borrowers) is that should Morgan Stanley fail financially, all securities lent will be affected by the failure and by any delays in recovery of the securities (or in the rare event, loss of rights in the collateral).
The Fund may lend portfolio securities from time to time in order to earn additional income. The Fund retains beneficial ownership of the securities it has loaned and continues to receive interest and dividends paid by the issuer of securities and to participate in any changes in their value. On the settlement date of the loan, the Fund receives collateral against the loaned securities and maintains collateral in an amount not less than 100% of the market value of the loaned securities during the period of the loan. The market value of the loaned securities is determined at the close of business of the Fund and any additional required collateral is delivered to the Fund on the next business day. Any cash collateral received is invested in the JHCIT. If the borrower defaults on its obligation to return the securities loaned because of insolvency or other reasons, a fund could experience delays and costs in recovering the securities loaned or in gaining access to the colla teral. The Fund receives compensation for lending their securities either in the form of fees, guarantees, and/or by retaining a portion of interest on the investment of any cash received as collateral.
Federal income taxes
The Fund qualifies as a “regulated investment company” by complying with the applicable provisions of the Internal Revenue Code and will not be subject to federal income tax on taxable income that is distributed to shareholders. Therefore, no federal income tax provision is required.
New accounting pronouncements
In June 2006, Financial Accounting Standards Board (FASB) Interpretation No. 48, Accounting for Uncertainty in Income Taxes, an interpretation of FASB Statement 109 (FIN 48), was issued and is effective for fiscal years beginning after December 15, 2006, and is to be applied to all open tax years as of the effective date. On December 22, 2006, the SEC delayed the implementation of FIN 48 for regulated investment companies for an additional six months. FIN 48 prescribes a minimum threshold for financial statement recognition of the benefit of a tax position taken or expected to be taken in a tax return, and requires certain expanded disclosures. Management has concluded that the adoption of FIN 48 will not result in a material impact on the Fund’s net assets, results of operations and financial statement disclosures.
In September 2006, FASB Standard No. 157, Fair Value Measurements (FAS 157), was issued and is effective for fiscal years beginning after November 15, 2007. FAS 157 defines fair value, establishing a framework for measuring fair value and expands disclosure about fair value measurements. Management is currently evaluating the application of FAS 157 to the Fund and its impact, if any, resulting from the adoption of FAS 157 on the Fund’s financial statements.
Dividends, interest and distributions
Dividend income on investment securities is recorded on the ex-dividend date or, in the case of some foreign dividends, when the Fund becomes aware of the dividends from cash collections. Interest income on investm ent securities is recorded on the accrual basis. Discounts/premiums are accreted/amortized for financial reporting purposes. Foreign income may be subject to foreign withholding taxes, which are accrued as applicable.
The Fund records distributions to shareholders from net investment income and net realized gains, if any, on the ex-dividend date. During the year ended October 31, 2006, the tax character of distributions paid was as follows: ordinary income $92,674. During the year ended October 31, 2007, the tax character of distributions paid was as f ollows: ordinary income $3,404,406. Distributions paid by the
Greater China Opportunities Fund
24
Fund with respect to each class of shares are calculated in the same manner, at the same time and are in the same amount, except for the effect of expenses that may be applied differently to each class.
As of October 31, 2007, the components of distributable earnings on a tax basis included $23,088,186 of undistributed ordinary income and $86,034 of undistributed long-term gain.
Such distributions and distributable earnings, on a tax basis, are determined in conformity with income tax regulations, which may differ from accounting principles generally accepted in the United States of America. Distributions in excess of tax basis earnings and profits, if any, are reported in the Fund’s financial statements as a return of capital.
Note 2
Management fee and transactions with
affiliates and others
The Fund has an investment management contract with the Adviser. Under the investment management contract, the Fund pays a daily management fee to the Adviser equivalent, at an annual rate of 1.00% of the Fund’s average daily net asset value. The Fund has a subadvisory agreement with MFC Global Investment Management (U.S.A.), LLC, an affiliate of John Hancock Financial Services, Inc. The Fund is not responsible for payment of the subadvisory fees.
The Adviser has agreed to limit the Fund’s total expenses, excluding distribution and service fees and transfer agent fees to 1.40% on an annual basis of the Fund’s average daily net asset value until February 29, 2008. There were no management fee reductions related to this limitation for the year ended October 31, 2007.
The Fund has a Distribution Agreement with John Hancock Funds, LLC (JH Funds), a wholly owned subsidiary of the Adviser. The Fund has adopted Distribution Plans with respect to Class A, Class B and Class C, pursuant to Rule 12b-1 under the 1940 Act, to reimburse JH Funds for the services it provides as distributor of shares of the Fund. Accordingly, the Fund makes monthly payments to JH Funds at an annual rate not to exceed 0.30%, 1.00% and 1.00% average daily net asset value of Class A, Class B and Class C, respectively. A maximum of 0.25% of such payments may be service fees, as defined by the Conduct Rules of the Financial Industry Regulatory Authority (formerly the National Association of Securities Dealers.) Under the Conduct Rules, curtailment of a portion of the Fund’s 12b-1 payments could occur under certain circumstances.
Expenses under the agreements described above for the year ended October 31, 2007 were as follows:
| | |
| | Transfer agent | Distribution and |
| Share class | fees | service fees |
|
| |
| Class A | $79,209 | $475,252 |
| Class B | 15,644 | 312,886 |
| Class C | 15,442 | 308,840 |
| Class I | 295 | — |
| Total | $110,590 | $1,096,978 |
Additionally, there are out-of-pocket expenses included in transfer agent fees.
Class A shares are assessed up-front sales charges. During the year ended October 31, 2007, JH Funds received net up-front sales charges of $2,484,773 with regard to sales of Class A shares. Of this amount, $395,821 was retained and used for printing prospectuses, advertising, sales literature and other purposes, $2,067,978 was paid as sales commissions to unrelated broker-dealers and $20,974 was paid as sales commissions to sales personnel of Signator Investors, Inc. (Signator Investors), a related broker-dealer. The Adviser’s indirect parent, John Hancock Life Insurance Company (JHLICO), is the indirect sole shareholder of Signator Investors.
Class B shares that are redeemed within six years of purchase are subject to a contingent deferred sales charge (CDSC) at declining rates, beginning at 5.00% of the lesser of the current market value at the time of redemption or the original purchase cost of the shares being redeemed. Class C shares that are redeemed within one year of purchase are subject to a CDSC at a rate of 1.00% of the lesser of the current market value at the time of redemption or the original purchase cost of the shares being redeemed. Proceed s from the CDSCs are paid to JH Funds and are used in whole or in part to defray
Greater China Opportunities Fund
25
its expenses for providing distribution-related services to the Fund in connection with the sale of Class B and Class C shares. During the year ended October 31, 2007, CDSCs received by JH Funds amounted to $87,005 for Class B shares and $37,019 for Class C shares.
The Fund has a transfer agent agreement with John Hancock Signature Services, Inc. (Signature Services), an indirect subsidiary of JHLICO. The Fund pays a monthly fee which is based on an annual rate of $15.00 for each Class A shareholder account, $17.50 for each Class B shareholder account, $16.50 for each Class C shareholder account and $15.00 for each Class I shareholder account. For Class A, Class B and Class C shares, the Fund pays a monthly transfer agent fee at an annual rate of 0.05% of each class’s average daily net asset value, plus a fee based on the number of shareholder accounts and reimbursement for certain out-of-pocket expenses, aggregated and allocated to each class on the basis of its relative net asset value. For Class I shares, the Fund pays a monthly transfer agent fee at a total annual rate of 0.05% of Class I average daily net asset value. Effective June 1, 2007, for Class I shares, the Fund pays a monthly transfer agent fee at a total annual rate of 0.04% of the Class I average daily net asset value. Signature Services had agreed to limit Class A, Class B and Class C transfer agent fee to 0.40% of each respective class’s average daily net asset value until February 29, 2008. There were no transfer agent fee reductions during the year end ed October 31, 2007. Signature Services reserves the right to terminate this limitation in the future.
The Fund has an agreement with the Adviser and affiliates to perform necessary tax, accounting, compliance and legal services for the Fund. The compensation for the year amounted to $25,503 with an effective rate of 0.01% of the Fund’s average daily net asset value.
The Adviser and other subsidiaries of JHLICO owned 5,510 Class NAV shares of beneficial interest of the Fund on October 31, 2007.
Mr. James R. Boyle is Chairman of the Adviser, as well as affiliated Trustee of the Fund, and is compensated by the Adviser and/or its affiliates. The compensation of unaffiliated Trustees is borne by the Fund. The unaffiliated Trustees may elect to defer, for tax purposes, their receipt of this compensation under the John Hancock Group of Funds Deferred Compensation Plan. The Fund makes investments into other John Hancock funds, as applicable, to cover its liability for the deferred compensation. Investments to cover the Fund’s deferred compensation liability are recorded on the Fund’s books as an other asset. The deferred compensation liability and the related other asset are always equal and are marked to market on a periodic basis to reflect any income earned by the investments, as well as any unrealized gains or losses. The Deferred Compensation Plan investments had no impact on the operations of the Fund.
Note 3
Guarantees and indemnifications
Under the Fund’s organizational documents, its Officers and Trustees are indemnified against certain liability arising out of the performance of their duties to the Fund. Additionally, in the normal course of business, the Fund enters into contracts with service providers that contain general indemnification clauses. The Fund’s maximum exposure under these arrangements is unknown, as this would involve future claims that may be made against the Fund that have not yet occurred. However, based on experience, the Fund believes the risk of loss to be remote.
Greater China Opportunities Fund
26
Note 4
Fund share transactions
This listing illustrates the number of Fund shares sold, reinvested and repurchased during the years ended October 31, 2006 and October 31, 2007, along with the corresponding dollar value.
| | | | |
| | Year ended 10-31-06 | Year ended 10-31-07 |
| | Shares | Amount | Shares | Amount |
| Class A shares | | | | |
|
| Sold | 4,403,727 | $61,366,745 | 8,447,940 | $169,306,235 |
| Distributions reinvested | 4,465 | 52,705 | 126,904 | 2,074,872 |
| Repurchased | (612,866) | (8,460,937) | (4,879,757) | (96,220,516) |
| Net increase | 3,795,326 | $52,958,513 | 3,695,087 | $75,160,591 |
| |
| Class B shares | | | | |
|
| Sold | 1,005,055 | $13,949,422 | 1,301,863 | $26,168,795 |
| Distributions reinvested | 424 | 4,524 | 23,890 | 388,693 |
| Repurchased | (84,729) | (1,165,271) | (659,664) | (13,439,521) |
| Net increase | 920,750 | $12,788,675 | 666,089 | $13,117,967 |
| |
| Class C shares | | | | |
|
| Sold | 752,789 | $10,545,210 | 1,673,930 | $34,330,490 |
| Distributions reinvested | 284 | 3,039 | 18,411 | 299,354 |
| Repurchased | (53,331) | (722,035) | (676,559) | (14,357,628) |
| Net increase | 699,742 | $9,826,214 | 1,015,782 | $20,272,216 |
| |
| Class I shares | | | | |
|
| Sold | 233,955 | $3,432,104 | 476,048 | $8,842,958 |
| Distributions reinvested | 274 | 3,562 | 8,254 | 134,958 |
| Repurchased | (7,363) | (103,648) | (533,316) | (9,915,657) |
| Net increase (decrease) | 226,866 | $3,332,018 | (49,014) | ($937,741) |
| |
| Class NAV shares1 | | | | |
|
| Sold | — | — | 52,804 | $985,385 |
| Repurchased | — | — | (21,814) | (662,798) |
| Net increase | — | — | 30,990 | $322,587 |
| |
| Net increase | 5,642,684 | $78,905,420 | 5,358,934 | $107,935,620 |
1Beginning of operations from 12-28-06 to 10-31-07.
Note 5
Investment transactions
Purchases and proceeds from sales or maturities of securities, other than short-term securities and obligations of the U.S. government, during the year ended October 31, 2007, aggregated $286,239,193 and $186,711,239, respectively.
The cost of investments owned on October 31, 2007, including short-term investments, for federal income tax purposes was $213,789,793. Gross unrealized appreciation and depreciation of investments aggregated $177,350,246 and $2,694,541, respectively, resulting in net unrealized appreciation of $174,655,705. The difference between book basis and tax basis net unrealized appreciation of investments is attributable primarily to the tax deferral of losses on certain sales of securities.
Note 6
Reclassification of accounts
Capital accounts within financial statements are adjusted for permanent book tax differences. These adjustments have no impact on net assets or the results of operations. Temporary book tax differences will reverse in a subsequent period. During the year ended October 31, 2007, the
Greater China Opportunities Fund
27
Fund reclassified amounts to reflect a decrease in accumulated net realized gain on investments of $4,694,252, an increase in accumulated net investment income of $71,196 and an increase in capital paid-in of $4,623,056. These reclassifications are primarily attributable to certain differences in the computation of distributable income and capital gains under federal tax rules versus accounting principles generally accepted in the United States of America for foreign currency transactions, and treating a portion of the proceeds from redemptions as distribution for tax purposes. The calculation of net investment income (loss) per share in the Fund’s Financial Highlights excludes these adjustments.
Note 7
Transactions in securities of affiliated issuers
Affiliated issuers, as defined by the Investment Company Act of 1040, are those in which the Fund’s holdings of an issuer represent 5% or more of the outstanding voting securities of the issuer. A summary of the Fund’s transactions in the securities of these issuers during the year ended October 31, 2007, is set forth below.
| | | | | |
| | Beginning | Ending | | | |
| | share | share | Realized | Dividend | Ending |
| Affiliate | amount | amount | gain (loss) | income | value |
| | | | | | |
| Sinopec Shanghai | | | | | |
| Petrochemical Co. Ltd. | | | | | |
| bought: 3,280,000 | | | | | |
| sold: 750,000 | — | 2,530,000 | $138,887 | $17,153 | $2,067,948 |
| | | | | | |
| China Petroleum and | | | | | |
| Chemical Corp. | | | | | |
| bought: 8,428,000 | | | | | |
| sold: 2,250,000 | 2,790,000 | 8,968,000 | 430,488 | 177,086 | 14,278,158 |
| | | | | | |
| Guangshen Railway | | | | | |
| Co., Ltd. | | | | | |
| bought: none | | | | | |
| sold: none | 1,898,000 | 1,898,000 | — | 19,903 | 1,620,132 |
| | | | | | |
| Total | | | $569,375 | $214,142 | $17,966,238 |
Greater China Opportunities Fund
28
Auditors’ report
Report of Independent Registered Public Accounting Firm
To the Board of Trustees of the John Hancock Investment Trust III and Shareholders of
John Hancock Greater China Opportunities Fund,
In our opinion, the accompanying statement of assets and liabilities, including the schedule of investments, and the related statements of operations and of changes in net assets and the financial highlights present fairly, in all material respects, the financial position of John Hancock Greater China Opportunities Fund (the Fund) at October 31, 2007, and the results of its operations, the changes in its net assets, and the financial highlights for the periods indicated, in conformity with accounting principles generally accepted in the United States of America. These financial statements and financial highlights (hereafter referred to as “financial statements”) are the responsibility of the Fund’s management; our responsibility is to express an opinion on these financial statements based on our audits. We conducted our audits of these financial statements in accordance with the standards of the Public Company Accounting Oversight Board (United States). Th ose standards require that we plan and perform the audit to obtain reasonable assurance about whether the financial statements are free of material misstatement. An audit includes examining, on a test basis, evidence supporting the amounts and disclosures in the financial statements, assessing the accounting principles used and significant estimates made by management, and evaluating the overall financial statement presentation. We believe that our audits, which included confirmation of securities at October 31, 2007 by correspondence with the custodian and brokers, provide a reasonable basis for our opinion.
PricewaterhouseCoopers LLP
Boston, Massachusetts
December 21, 2007
29
Tax information
Unaudited
For federal income tax purposes, the following information is furnished with respect to the distributions of the Fund, if any, paid during its taxable year ended October 31, 2007.
The Fund has designated distributions to shareholders of $4,623,056 as a long-term capital gain dividend.
The Fund hereby designates the maximum amount allowable of its net taxable income as qualified dividend income as provided in the Jobs and Growth Tax Relief Reconciliation Act of 2003. This amount will be reflected on Form 1099-DIV for the calendar year 2007.
Shareholders will be mailed a 2007 U.S. Treasury Department Form 1099-DIV in January 2008. This will reflect the total of all distributions that are taxable for calendar year 2007.
30
Board Consideration of and
Continuation of Investment Advisory
Agreement and Subadvisory
Agreement: John Hancock Greater
China Opportunities Fund
The Investment Company Act of 1940 (the 1940 Act) requires the Board of Trustees (the Board) of John Hancock Investment Trust III (the Trust), including a majority of the Trustees who have no direct or indirect interest in the investment advisory agreement and are not “interested persons” of the Trust, as defined in the 1940 Act (the Independent Trustees), annually to meet in person to review and consider the continuation of: (i) the investment advisory agreement (the Advisory Agreement) with John Hancock Advisers, LLC (the Adviser) and (ii) the investment Subadvisory agreement (the Subadvisory Agreement) with MFC Global Investment Management (U.S.A.), Limited (the Subadviser) for the John Hancock Greater China Opportunities Fund (the Fund). The Advisory Agreement with the Adviser and the Subadvisory Agreement with the Subadviser are collectively referred to as the Advisory Agreements.
At meetings held on May 7 and June 4–5, 2007, the Board considered the factors and reached the conclusions described below relating to the selection of the Adviser and Subadviser and the continuation of the Advisory Agreements. During such meetings, the Board’s Contracts/ Operations Committee and the Independent Trustees also met in executive sessions with their independent legal counsel.
In evaluating the Advisory Agreements, the Board, including the Contracts/Operations Committee and the Independent Trustees, reviewed a broad range of information requested for this purpose by the Independent Trustees, including: (i) the investment performance of the Fund relative to a category of relevant funds (the Category) and a peer group of comparable funds (the Peer Group) each selected by Morningstar, Inc. (Morningstar), an independent provider of investment company data, for a range of periods ended December 31, 2006, (ii) advisory and other fees incurred by, and the expense ratios of, the Fund relative to a Category and a Peer Group,
(iii) the advisory fees of comparable portfolios of other clients of the Adviser and the Subadviser, (iv) the Adviser’s financial results and condition, including its and certain of its affiliates’ profitability from services performed for the Fund, (v) breakpoints in the Fund’s and the Peer Group’s fees, and information about economies of scale, (vi) the Adviser’s and Subadviser’s record of compliance with applicable laws and regulations, with the Fund’s investment policies and restrictions, and with the applicable Code of Ethics, and the structure and responsibilities of the Adviser’s and Subadviser’s compliance department, (vii) the background and experience of senior management and investment professionals, and (viii) the nature, cost and character of advisory and non-investment management services provided by the Adviser and its affiliates and by the Subadviser.
The Independent Trustees considered the legal advice of independent legal counsel and relied on their own business judgment in determining the factors to be considered in evaluating the materials that were presented to them and the weight to be given to each such factor. The Board’s review and conclusions were based on a comprehensive consideration of all information presented to the Board and not the result of any single controlling factor. They principally considered performance and other information from Morningstar as of December 31, 2006. The Board also considered updated performance information provided to it by the Adviser or Subadviser at the May and June 2007 meetings. Performance and other information may be quite different as of the date of this shareholders report. The key factors considered by the Board and the conclusions reached are described below.
Nature, extent and quality of services
The Board considered the ability of the Adviser and the Subadviser, based on their resources, reputation and other attributes, to attract and retain qualified investment professionals, including research, advisory and supervisory personnel. The Board considered the investment philosophy, research and investment decision-making processes of the Adviser and Subadviser. The Board further considered the culture of
31
compliance, resources dedicated to compliance, compliance programs and compliance records of the Adviser and Subadviser. In addition, the Board took into account the administrative and other non-advisory services provided to the Fund by the Adviser and its affiliates.
Based on the above factors, together with those referenced below, the Board concluded that, within the context of its full deliberations, the nature, extent and quality of the investment advisory services provided to the Fund by the Adviser and Subadviser supported renewal of the Advisory Agreements.
Fund performance
The Board noted that the Fund had less than three full years of operational history, and considered the performance results for the Fund since its inception through December 31, 2006. The Board also considered these results in comparison to the performance of the Category, as well as the Fund’s Peer Group and benchmark index. Morningstar determined the Category and Peer Group for the Fund. The Board reviewed with a representative of Morningstar the methodology used by Morningstar to select the funds in the Category and the Peer Group.
The Board recognized the relatively short operational history of the Fund and viewed favorably that the Fund’s performance during the 1-year period under review was higher than the performance of the Peer Group median and appreciably higher than the performance of the Category median. The Board noted that the Fund’s performance was below the performance of its benchmark index, the MSCI China ID Index, as was the performance of the Peer Group and Category medians.
Investment advisory fee and subadvisory fee rates and expenses
The Board reviewed and considered the contractual investment advisory fee rate payable by the Fund to the Adviser for investment advisory services (the Advisory Agreement Rate). The Board received and considered information comparing the Advisory Agreement Rate with the advisory fees for the Peer Group and Category. The Board noted that the Advisory Agreement Rate was lower than the median rates of the Peer Group and Category.
The Board received and considered expense information regarding the Fund’s various components, including advisory fees, distribution and fees other than advisory and distribution fees, including transfer agent fees, custodian fees, and other miscellaneous fees (e.g., fees for accounting and legal services). The Board considered comparisons of these expenses to the Peer Group median. The Board also received and considered expense information regarding the Fund’s total operating expense ratio (Gross Expense Ratio) and total operating expense ratio after taking the fee waiver arrangement applicable to the Advisory Agreement Rate into account (Net Expense Ratio). The Board received and considered information comparing the Gross Expense Ratio and Net Expense Ratio of the Fund to that of the Peer Group and Category medians. The Board noted that the Fund’s Gross and Net Expense Ratios were lower than the median of its Category and Peer Group.
The Adviser also discussed the Morningstar data and rankings, and other relevant information, for the Fund. Based on the above-referenced considerations and other factors, the Board concluded that the Fund’s overall expenses and performance supported the re-approval of the Advisory Agreements.
The Board also received information about the investment Subadvisory fee rate (the Subadvisory Agreement Rate) payable by the Adviser to the Subadviser for investment Subadvisory services. The Board concluded that the Subadvisory Agreement Rate was fair and equitable, based on its consideration of the factors described here.
Profitability
The Board received and considered a detailed profitability analysis of the Adviser based on the Advisory Agreements, as well as on other relationships between the Fund and the Adviser and its affiliates, including the Subadviser. The Board also considered a comparison of the Adviser’s profitability to that of other similar investment advisers whose profitability information is publicly available. The Board concluded that, in light of the costs of
32
providing investment management and other services to the Fund, the profits and other ancillary benefits reported by the Adviser were not unreasonable.
Economies of scale
The Board received and considered general information regarding economies of scale with respect to the management of the Fund, including the Fund’s ability to appropriately benefit from economies of scale under the Fund’s fee structure. The Board recognized the inherent limitations of any analysis of economies of scale, stemming largely from the Board’s understanding that most of the Adviser’s costs are not specific to individual Funds, but rather are incurred across a variety of products and services. The Board observed that the Advisory Agreement did not offer breakpoints and considered the Fund’s current asset level. The Board concluded that the fee structure was acceptable at this time and determined that it would continue to assess the reasonableness of the Fund’s fee structure as the Fund’s assets increase over time.
Information about services to other clients
The Board also received information about the nature, extent and quality of services and fee rates offered by the Adviser and Subadviser to their other clients, including other registered investment companies, institutional investors and separate accounts. The Board concluded that the Advisory Agreement Rate and the Subadvisory Agreement Rate were not unreasonable, taking into account fee rates offered to others by the Adviser and Subadviser, respectively, after giving effect to differences in services.
Other benefits to the Adviser
The Board received information regarding potential “fall-out” or ancillary benefits received by the Adviser and its affiliates as a result of the Adviser’s relationship with the Fund. Such benefits could include, among others, benefits directly attributable to the relationship of the Adviser with the Fund and benefits potentially derived from an increase in the business of the Adviser as a result of its relationship with the Fund (such as the ability to market to shareholders other financial products offered by the Adviser and its affiliates).
The Board also considered the effectiveness of the Adviser’s, Subadviser’s and Fund’s policies and procedures for complying with the requirements of the federal securities laws, including those relating to best execution of portfolio transactions and brokerage allocation.
Other factors and broader review
As discussed above, the Board reviewed detailed materials received from the Adviser and Subadviser as part of the annual re-approval process. The Board also regularly reviews and assesses the quality of the services that the Fund receives throughout the year. In this regard, the Board reviews reports of the Adviser at least quarterly, which include, among other things, a detailed portfolio review, detailed fund performance reports and compliance reports. In addition, the Board meets with portfolio managers and senior investment officers at various times throughout the year.
After considering the above-described factors and based on its deliberations and its evaluation of the information described above, the Board concluded that approval of the continuation of the Advisory Agreements for the Fund was in the best interest of the Fund and its shareholders. Accordingly, the Board unanimously approved the continuation of the Advisory Agreements.
33
Trustees and Officers
This chart provides information about the Trustees and Officers who oversee your John
Hancock fund. Officers elected by the Trustees manage the day-to-day operations of the
Fund and execute policies formulated by the Trustees.
| | |
| Independent Trustees | | |
| |
| Name, year of birth | | Number of |
| Position(s) held with Fund | Trustee | John Hancock |
| Principal occupation(s) and other | of Fund | funds overseen |
| directorships during past 5 years | since1 | by Trustee |
| |
| James F. Carlin, Born: 1940 | 2005 | 57 |
|
| Interim Chairman (since December 2007); Director and Treasurer, Alpha Analytical Laboratories, Inc. |
| (chemical analysis) (since 1985); Part Owner and Treasurer, Lawrence Carlin Insurance Agency, Inc. |
| (since 1995); Part Owner and Vice President, Mone Lawrence Carlin Insurance Agency, Inc. (until 2005); |
| Chairman and Chief Executive Officer, Carlin Consolidated, Inc. (management/investments) (since 1987); |
| Trustee, Massachusetts Health and Education Tax Exempt Trust (1993–2003). | | |
| |
| William H. Cunningham, Born: 1944 | 2005 | 57 |
|
| Former Chancellor, University of Texas System, and former President, University of Texas at Austin; |
| Chairman and Chief Executive Officer, IBT Technologies (until 2001); Director of the following: |
| Hire.com (until 2004), STC Broadcasting, Inc. and Sunrise Television Corp. (until 2001), Symtx, Inc. |
| (electronic manufacturing) (since 2001), Adorno/Rogers Technology, Inc. (until 2004), Pinnacle Foods |
| Corporation (until 2003), rateGenius (until 2003), Lincoln National Corporation (insurance) (since 2006), |
| Jefferson-Pilot Corporation (diversified life insurance company) (until 2006), New Century Equity |
| Holdings (formerly Billing Concepts) (until 2001), eCertain (until 2001), ClassMap.com (until 2001), |
| Agile Ventures (until 2001), AskRed.com (until 2001), Southwest Airlines (since 2000), Introgen (man- |
| ufacturer of biopharmaceuticals) (since 2000) and Viasystems Group, Inc. (electronic manufacturer) |
| (until 2003); Advisory Director, Interactive Bridge, Inc. (college fundraising) (until 2001); Advisory |
| Director, Q Investments (until 2003); Advisory Director, JPMorgan Chase Bank (formerly Texas Commerce |
| Bank–Austin), LIN Television (since 2002), WilTel Communications (until 2003) and Hayes Lemmerz |
| International, Inc. (diversified automotive parts supply company) (since 2003). | |
| |
| Charles L. Ladner, 2 Born: 1938 | 2005 | 57 |
|
| Chairman and Trustee, Dunwoody Village, Inc. (retirement services) (until 2003); Senior Vice President |
| and Chief Financial Officer, UGI Corporation (public utility holding company) (retired 1998); Vice |
| President and Director, AmeriGas, Inc. (retired 1998); Director, AmeriGas Partners, L.P. (gas distribution) |
| (until 1997); Director, EnergyNorth, Inc. (until 1997); Director, Parks and History Association (until 2007). |
| |
| John A. Moore,2 Born: 1939 | 2005 | 57 |
|
| President and Chief Executive Officer, Institute for Evaluating Health Risks (nonprofit institution) |
| (until 2001); Senior Scientist, Sciences International (health research) (until 2003); Former Assistant |
| Administrator and Deputy Administrator, Environmental Protection Agency; Principal, Hollyhouse (con- |
| sulting) (since 2000); Director, CIIT Center for Health Science Research (nonprofit research) (since 2002). |
34
| | |
| Independent Trustees (continued) | | |
| |
| Name, year of birth | | Number of |
| Position(s) held with Fund | Trustee | John Hancock |
| Principal occupation(s) and other | of Fund | funds overseen |
| directorships during past 5 years | since1 | by Trustee |
| |
| Patti McGill Peterson,2 Born: 1943 | 2005 | 57 |
|
| Executive Director, Council for International Exchange of Scholars and Vice President, Institute of In- |
| ternational Education (since 1998); Senior Fellow, Cornell Institute of Public Affairs, Cornell University |
| (until 1998); Former President, Wells College, Aurora, NY, and St. Lawrence University, Canton, NY; |
| Director, Niagara Mohawk Power Corporation (until 2003); Director, Ford Foundation, International |
| Fellowships Program (since 2002); Director, Lois Roth Endowment (since 2002); Director, Council for |
| International Educational Exchange (since 2003). | | |
| |
| Steven R. Pruchansky, Born: 1944 | 2005 | 57 |
|
| Chairman and Chief Executive Officer, Greenscapes of Southwest Florida, Inc. (since 2000); Director and |
| President, Greenscapes of Southwest Florida, Inc. (until 2000); Managing Director, JonJames, LLC (real |
| estate) (since 2001); Director, First Signature Bank & Trust Company (until 1991); Director, Mast Realty |
| Trust (until 1994); President, Maxwell Building Corp. (until 1991). | | |
| |
| Non-Independent Trustees3 | | |
| |
| Name, year of birth | | Number of |
| Position(s) held with Fund | Trustee | John Hancock |
| Principal occupation(s) and other | of Fund | funds overseen |
| directorships during past 5 years | since1 | by Trustee |
| |
| James R. Boyle, Born: 1959 | 2005 | 250 |
|
| President, John Hancock Variable Life Insurance Company (since March 2007); Executive Vice President, |
| John Hancock Life Insurance Company (since June 2004); Chairman and Director, John Hancock |
| Advisers, LLC (the Adviser), John Hancock Funds, LLC and The Berkeley Financial Group, LLC (The |
| Berkeley Group) (holding company) (since 2005); Senior Vice President, The Manufacturers Life Insurance |
| Company (U.S.A.) (until 2004). | | |
35
| |
| Principal officers who are not Trustees | |
| |
| Name, year of birth | |
| Position(s) held with Fund | Officer |
| Principal occupation(s) and other | of Fund |
| directorships during past 5 years | since |
| |
| Keith F. Hartstein, Born: 1956 | 2005 |
|
| President and Chief Executive Officer | |
| Senior Vice President, Manulife Financial Corporation (since 2004); Director, President and Chief | |
| Executive Officer, the Adviser, The Berkeley Group and John Hancock Funds, LLC (since 2005); Director, |
| MFC Global Investment Management (U.S.), LLC (MFC Global (U.S.)) (since 2005); Director, John | |
| Hancock Signature Services, Inc. (since 2005); President and Chief Executive Officer, John Hancock |
| Investment Management Services, LLC (since 2006); President and Chief Executive Officer, John Hancock |
| Funds, John Hancock Funds II, John Hancock Funds III and John Hancock Trust (since 2005); Director, |
| Chairman and President, NM Capital Management, Inc. (since 2005); Chairman, Investment Company |
| Institute Sales Force Marketing Committee (since 2003); Director, President and Chief Executive Officer, |
| MFC Global (U.S.) (2005–2006); Executive Vice President, John Hancock Funds, LLC (until 2005). | |
| |
| Thomas M. Kinzler, Born: 1955 | 2006 |
|
| Secretary and Chief Legal Officer | |
| Vice President and Counsel, John Hancock Life Insurance Company (U.S.A.) (since 2006); Secretary |
| and Chief Legal Officer, John Hancock Funds and John Hancock Funds III (since 2006); Secretary, John |
| Hancock Funds II and Assistant Secretary, John Hancock Trust (since June 2007); Vice President and |
| Associate General Counsel, Massachusetts Mutual Life Insurance Company (1999–2006); Secretary and |
| Chief Legal Counsel, MML Series Investment Fund (2000–2006); Secretary and Chief Legal Counsel, |
| MassMutual Institutional Funds (2000–2004); Secretary and Chief Legal Counsel, MassMutual Select |
| Funds and MassMutual Premier Funds (2004–2006). | |
| |
| Francis V. Knox, Jr., Born: 1947 | 2005 |
|
| Chief Compliance Officer | |
| Vice President and Chief Compliance Officer, John Hancock Investment Management Services, LLC, |
| the Adviser and MFC Global (U.S.) (since 2005); Vice President and Chief Compliance Officer, John |
| Hancock Funds, John Hancock Funds II, John Hancock Funds III and John Hancock Trust (since 2005); |
| Vice President and Assistant Treasurer, Fidelity Group of Funds (until 2004); Vice President and Ethics & |
| Compliance Officer, Fidelity Investments (until 2001). | |
| |
| Charles A. Rizzo, Born: 1957 | 2007 |
|
| Chief Financial Officer | |
| Chief Financial Officer, John Hancock Funds, John Hancock Funds II, John Hancock Funds III and John |
| Hancock Trust (since June 2007); Assistant Treasurer, Goldman Sachs Mutual Fund Complex (regis- |
| tered investment companies) (2005–June 2007); Vice President, Goldman Sachs (2005–June 2007); |
| Managing Director and Treasurer of Scudder Funds, Deutsche Asset Management (2003–2005); | |
| Director, Tax and Financial Reporting, Deutsche Asset Management (2002–2003); Vice President and |
| Treasurer, Deutsche Global Fund Services (1999–2002). | |
| |
| Gordon M. Shone, Born: 1956 | 2006 |
|
| Treasurer | |
| Treasurer, John Hancock Funds (since 2006), John Hancock Funds II, John Hancock Funds III and John |
| Hancock Trust (since 2005); Vice President and Chief Financial Officer, John Hancock Trust (2003–2005); |
| Senior Vice President, John Hancock Life Insurance Company (U.S.A.) (since 2001); Vice President, John |
| Hancock Investment Management Services, Inc., John Hancock Advisers, LLC (since 2006) and The |
| Manufacturers Life Insurance Company (U.S.A.) (1998–2000). | |
36
| |
| Principal officers who are not Trustees (continued) | |
| |
| Name, year of birth | |
| Position(s) held with Fund | Officer |
| Principal occupation(s) and other | of Fund |
| directorships during past 5 years | since |
| |
| John G. Vrysen, Born: 1955 | 2005 |
|
| Chief Operating Officer | |
| Senior Vice President, Manulife Financial Corporation (since 2006); Director, Executive Vice President |
| and Chief Operating Officer, the Adviser, The Berkeley Group and John Hancock Funds, LLC (since |
| June 2007); Chief Operating Officer, John Hancock Funds, John Hancock Funds II, John Hancock Funds III |
| and John Hancock Trust (since June 2007); Director, Executive Vice President and Chief Financial Officer, |
| the Adviser, The Berkeley Group and John Hancock Funds, LLC (until June 2007); Executive Vice President |
| and Chief Financial Officer, John Hancock Investment Management Services, LLC (since 2005); Vice |
| President and Chief Financial Officer, MFC Global (U.S.) (since 2005); Director, John Hancock Signature |
| Services, Inc. (since 2005); Chief Financial Officer, John Hancock Funds, John Hancock Funds II, John |
| Hancock Funds III and John Hancock Trust (2005–June 2007); Vice President and General Manager, Fixed |
| Annuities, U.S. Wealth Management (until 2005); Vice President, Operations, Manulife Wood Logan |
| (2000–2004). | |
The business address for all Trustees and Officers is 601 Congress Street, Boston, Massachusetts 02210-2805.
The Statement of Additional Information of the Fund includes additional information about members of the Board of Trustees of the Fund and is available without charge, upon request, by calling 1-800-225-5291.
1 Each Trustee serves until resignation, retirement age or until his or her successor is elected.
2 Member of Audit and Compliance Committee.
3 Non-Independent Trustee holds positions with the Fund’s investment adviser, underwriter and certain other affiliates.
37
Why John Hancock Funds?
For more than three decades, John Hancock Funds has been helping individual, corporate and institutional clients reach their most important financial goals. With so many fund companies to choose from, why should you invest with us?
► A name you know and trust
When you invest with John Hancock Funds, you are investing with one of the most recognized and respected names in the financial services industry. Our parent company has been helping individuals and institutions increase and protect wealth since 1862.
► Solutions across the investing spectrum
We offer equity, income, international, sector and asset allocation investment solutions managed by leading institutional money managers. Each of our funds utilizes a disciplined, team approach to portfolio management and research, leveraging the expertise of seasoned investment professionals.
► Committed to you
Our shareholders come first. We work hard to provide you with the products you need to build a solid financial foundation. We’re proud to offer you award-winning services and tools, like the www.jhfunds.com Web site, to help you every step of the way.
For immediate insight and answers,
turn to www.jhfunds.com
Discover the new and improved www.jhfunds.com.

▪ View accounts, statements and
fund information.
▪ Access college and retirement
planning calculators and investment
education.
▪ Gain investment ideas, expand your
knowledge and become a more
informed investor.
This is just the beginning of how much you can do.
Now is the ideal time to experience our Web site that received the following recognition in 2006:
 “Best Innovation: Redesigned Web Site” by the Mutual Fund Education Alliance.
 “Outstanding Web Site” by the Web Marketing Association.
 “Creative excellence on the Web, Silver Award winner” by W3.
Discover convenience and comprehensive resources at one easy-to-access location. Your financial professional can steer you to the tools that will help you the most and enable you to transform your knowledge into action.
See how far www.jhfunds.com can take you!
For more information
The Fund’s proxy voting policies, procedures and records are available without charge, upon request:
| | |
| By phone | On the Fund’s Web site | On the SEC’s Web site |
| 1-800-225-5291 | www.jhfunds.com/proxy | www.sec.gov |
|
| |
| Investment adviser | Custodian | Legal counsel |
| John Hancock Advisers, LLC | The Bank of New York | Kirkpatrick & Lockhart |
| 601 Congress Street | One Wall Street | Preston Gates Ellis LLP |
| Boston, MA 02210-2805 | New York, NY 10286 | One Lincoln Street |
| | Boston, MA 02111-2950 |
| Subadviser | Transfer agent | |
| MFC Global (U.S.A.) Limited | John Hancock Signature | Independent registered public |
| 200 Bloor Street East | Services, Inc. | accounting firm |
| Toronto, Ontario, Canada | P.O. Box 9510 | PricewaterhouseCoopers LLP |
| M4W IE5 | Portsmouth, NH 03802-9510 | 125 High Street |
| | | Boston, MA 02110 |
| Principal distributor | | |
| John Hancock Funds, LLC | | |
| 601 Congress Street | | |
| Boston, MA 02210-2805 | | |
| | |
| How to contact us | |
|
| |
| Internet | www.jhfunds.com | |
|
| |
| Mail | Regular mail: | Express mail: |
| | John Hancock Signature | John Hancock Signature |
| | Services, Inc. | Services, Inc. |
| | P.O. Box 9510 | Mutual Fund Image Operations |
| | Portsmouth, NH 03802-9510 | 164 Corporate Drive |
| | | Portsmouth, NH 03801 |
|
| |
| Phone | Customer service representatives | 1-800-225-5291 |
| | EASI-Line | 1-800-338-8080 |
| | TDD line | 1-800-554-6713 |
|
A listing of month-end portfolio holdings is available on our Web site, www.jhfunds.com. A more detailed portfolio holdings summary is available on a quarterly basis 60 days after the fiscal quarter on our Web site or upon request by calling 1-800-225-5291, or on the SEC’s Web site, www.sec.gov.
40
J O H N H A N C O C K F A M I L Y O F F U N D S
| |
| EQUITY | SECTOR |
| Balanced Fund | Financial Industries Fund |
| Classic Value Fund | Health Sciences Fund |
| Classic Value Fund II | Real Estate Fund |
| Classic Value Mega Cap Fund | Regional Bank Fund |
| Core Equity Fund | Technology Fund |
| Growth Fund | Technology Leaders Fund |
| Growth Opportunities Fund | |
| Growth Trends Fund | INTERNATIONAL/GLOBAL |
| Intrinsic Value Fund | Global Opportunities Fund |
| Large Cap Equity Fund | Global Shareholder Yield Fund |
| Large Cap Select Fund | Greater China Opportunities Fund |
| Mid Cap Equity Fund | International Allocation Portfolio |
| Small Cap Equity Fund | International Classic Value Fund |
| Small Cap Fund | International Core Fund |
| Small Cap Intrinsic Value Fund | International Growth Fund |
| Sovereign Investors Fund | |
| U.S. Core Fund | INCOME |
| U.S. Global Leaders Growth Fund | Bond Fund |
| Value Opportunities Fund | Government Income Fund |
| High Yield Fund |
| ASSET ALLOCATION | Investment Grade Bond Fund |
| Lifecycle 2010 Portfolio | Strategic Income Fund |
| Lifecycle 2015 Portfolio | |
| Lifecycle 2020 Portfolio | TAX - FREE INCOME |
| Lifecycle 2025 Portfolio | California Tax-Free Income Fund |
| Lifecycle 2030 Portfolio | High Yield Municipal Bond Fund |
| Lifecycle 2035 Portfolio | Massachusetts Tax-Free Income Fund |
| Lifecycle 2040 Portfolio | New York Tax-Free Income Fund |
| Lifecycle 2045 Portfolio | Tax-Free Bond Fund |
| Lifecycle Retirement Portfolio | |
| Lifestyle Aggressive Portfolio | MONEY MARKET |
| Lifestyle Balanced Portfolio | Money Market Fund |
| Lifestyle Conservative Portfolio | |
| Lifestyle Growth Portfolio | CLOSED - END |
| Lifestyle Moderate Portfolio | Bank and Thrift Opportunity Fund |
| Income Securities Trust |
| | Investors Trust |
| | Patriot Premium Dividend Fund II |
| | Preferred Income Fund |
| | Preferred Income II Fund |
| | Preferred Income III Fund |
| | Tax-Advantaged Dividend Income Fund |
| | Tax-Advantaged Global Shareholder Yield Fund |
A Fund’s investment objectives, risks, charges and expenses should be considered carefully before investing. The prospectus includes this and other important information about the Fund. To obtain a prospectus, contact your financial professional, call John Hancock Funds at 1-800-225-5291 or visit the Fund’s Web site at www.jhfunds.com. Please read the prospectus carefully before investing or sending money.

1-800-225-5291
1-800-554-6713 TDD
1-800-338-8080 EASI-Line
www.jhfunds. com
Now available: electronic delivery
www.jhfunds. com/edelivery
This report is for the information of the shareholders of John Hancock Greater China Opportunities Fund.
It is not authorized for distribution to prospective investors unless preceded or accompanied by a prospectus.
0800A 10/07
12/07
As of the end of the period, October 31, 2007, the registrant has adopted a code of ethics, as defined in Item 2 of Form N-CSR, that applies to its Chief Executive Officer, Chief Financial Officer and Treasurer (respectively, the principal executive officer, the principal financial officer and the principal accounting officer, the "Senior Financial Officers"). A copy of the code of ethics is filed as an exhibit to this Form N-CSR.
ITEM 3. AUDIT COMMITTEE FINANCIAL EXPERT.
Charles L. Ladner is the audit committee financial expert and is "independent", pursuant to general instructions on Form N-CSR Item 3.
ITEM 4. PRINCIPAL ACCOUNTANT FEES AND SERVICES.
(a) Audit Fees
The aggregate fees billed for professional services rendered by the principal accountant(s) for the audit of the registrant's annual financial statements or services that are normally provided by the accountant(s) in connection with statutory and regulatory filings or engagements amounted to $19,000 for the fiscal year ended October 31, 2007 (broken out as follows: John Hancock Greater China Opportunities Fund - $19,000; John Hancock International Fund and John Hancock Mid Cap Growth Fund merged into other funds on May 25, 2007 ) and $74,650 for the fiscal year ended October 31, 2006 (broken out as follows: John Hancock International Fund - $32,000, John Hancock Mid Cap Growth Fund - $23,650 and John Hancock Greater China Opportunities Fund - $19,000 ). John Hancock Greater China Opportunities Fund commenced operations on June 8, 2005. These fees were billed to the registrant and were approved by the registrant's audit committee.
(b) Audit-Related Services
There were no audit-related fees during the fiscal year ended October 31, 2007 and fiscal year ended October 31, 2006 billed to the registrant or to the registrant's investment adviser (not including any sub-adviser whose role is primarily portfolio management and is subcontracted with or overseen by another investment adviser), and any entity controlling, controlled by, or under common control with the adviser that provides ongoing services to the registrant ("control affiliates").
(c) Tax Fees
The aggregate fees billed for professional services rendered by the principal accountant(s) for the tax compliance, tax advice and tax planning ("tax fees") amounted to $9,400 for the fiscal year ended October 31, 2007 (broken out as follows: $3,500 and John Hancock Greater China Opportunities Fund - $3,500) and $9,750 for the fiscal year ended October 31, 2006 (broken out as follows: John Hancock International Fund - $3,500, John Hancock Mid Cap Growth Fund - $2,750 and John Hancock Greater China Opportunities Fund - $3,500). The nature of the services comprising the tax fees was the review of the registrant's income tax returns and tax distribution requirements. These fees were billed to the registrant and were approved by the registrant's audit committee. There were no tax fees billed to the control affiliates.
(d) All Other Fees
There were no other fees during the fiscal year ended October 31, 2007 and fiscal year ended October 31, 2006 billed to the registrant or to the control affiliates.
(e)(1) See attachment "Approval of Audit, Audit-related, Tax and Other Services", with the audit committee pre-approval policies and procedures.
(e)(2) There were no fees that were approved by the audit committee pursuant to the de minimis exception for the fiscal years ended October 31, 2007 and October 31, 2006 on behalf of the
registrant or on behalf of the control affiliates that relate directly to the operations and financial reporting of the registrant.
(f) According to the registrant's principal accountant, for the fiscal year ended October 31, 2007, the percentage of hours spent on the audit of the registrant's financial statements for the most recent fiscal year that were attributed to work performed by persons who were not full-time, permanent employees of principal accountant was less than 50%.
(g) The aggregate non-audit fees billed by the registrant's accountant(s) for services rendered to the registrant and rendered to the registrant's control affiliates for each of the last two fiscal years of the registrant were $1,412,569 for the fiscal year ended October 31, 2007 and $520,432 for the fiscal year ended October 31, 2006.
(h) The audit committee of the registrant has considered the non-audit services provided by the registrant's principal accountant(s) to the control affiliates and has determined that the services that were not pre-approved are compatible with maintaining the principal accountant(s)' independence.
ITEM 5. AUDIT COMMITTEE OF LISTED REGISTRANTS.
The registrant has a separately-designated standing audit committee comprised of independent trustees. The members of the audit committee are as follows:
Dr. John A. Moore - Chairman
Richard P. Chapman, Jr.
Charles L. Ladner
Patti McGill Peterson
ITEM 6. SCHEDULE OF INVESTMENTS. |
ITEM 7. DISCLOSURE OF PROXY VOTING POLICIES AND PROCEDURES FOR CLOSED-END MANAGEMENT INVESTMENT COMPANIES.
ITEM 8. PORTFOLIO MANAGERS OF CLOSED-END MANAGEMENT INVESTMENT COMPANIES.
ITEM 9. PURCHASES OF EQUITY SECURITIES BY CLOSED-END MANAGEMENT INVESTMENT COMPANY AND AFFILIATED PURCHASERS.
ITEM 10. SUBMISSION OF MATTERS TO A VOTE OF SECURITY HOLDERS.
The registrant has adopted procedures by which shareholders August recommend nominees to the registrant's Board of Trustees. A copy of the procedures is filed as an exhibit to this Form N-CSR. See attached "John Hancock Funds - Governance Committee Charter".
| ITEM 11. CONTROLS AND PROCEDURES. |
(a) Based upon their evaluation of the registrant's disclosure controls and procedures as conducted within 90 days of the filing date of this Form N-CSR, the registrant's principal executive officer and principal financial officer have concluded that those disclosure controls and procedures provide reasonable assurance that the material information required to be disclosed by the registrant on this report is recorded, processed, summarized and reported within the time periods specified in the Securities and Exchange Commission's rules and forms.
(b) There were no changes in the registrant's internal control over financial reporting that occurred during the registrant's most recent fiscal half-year (the registrant's second fiscal half-year in the case of an annual report) that have materially affected, or are reasonably likely to materially affect, the registrant's internal control over financial reporting.
(a)(1) Code of Ethics for Senior Financial Officers is attached.
(a)(2) Separate certifications for the registrant's principal executive officer and principal financial officer, as required by Section 302 of the Sarbanes-Oxley Act of 2002 and Rule 30a-2(a) under the Investment Company Act of 1940, are attached.
(b) Separate certifications for the registrant's principal executive officer and principal financial officer, as required by 18 U.S.C. Section 1350, as adopted pursuant to Section 906 of the Sarbanes-Oxley Act of 2002, and Rule 30a-2(b) under the Investment Company Act of 1940, are attached. The certifications furnished pursuant to this paragraph are not deemed to be "filed" for purposes of Section 18 of the Securities Exchange Act of 1934, or otherwise subject to the liability of that section. Such certifications are not deemed to be incorporated by reference into any filing under the Securities Act of 1933 or the Securities Exchange Act of 1934, except to the extent that the Registrant specifically incorporates them by reference.
(c)(1) Approval of Audit, Audit-related, Tax and Other Services is attached.
(c)(2) Submission of Matters to a Vote of Security Holders is attached. See attached "John Hancock Funds - Governance Committee Charter".
| (c)(3) Contact person at the registrant. |
Pursuant to the requirements of the Securities Exchange Act of 1934 and the Investment Company Act of 1940, the registrant has duly caused this report to be signed on its behalf by the undersigned, thereunto duly authorized.
| John Hancock Investment Trust III |
By: /s/ Keith F. Hartstein
-------------------------------------
Keith F. Hartstein
President and Chief Executive Officer
Date: December 19, 2007 |
Pursuant to the requirements of the Securities Exchange Act of 1934 and the Investment Company Act of 1940, this report has been signed below by the following persons on behalf of the registrant and in the capacities and on the dates indicated.
By: /s/ Keith F. Hartstein
-------------------------------------
Keith F. Hartstein
President and Chief Executive Officer
Date: December 19, 2007 |
By: /s/ Charles A. Rizzo
-------------------------------------
Charles A. Rizzo
Chief Financial Officer
Date: December 19, 2007 |