UNITED STATES
SECURITIES AND EXCHANGE COMMISSION
Washington, D.C. 20549
FORM N-CSR
CERTIFIED SHAREHOLDER REPORT OF REGISTERED
MANAGEMENT INVESTMENT COMPANIES
Investment Company Act file number 811- 4630
John Hancock Investment Trust III
(Exact name of registrant as specified in charter)
601 Congress Street, Boston, Massachusetts 02210
(Address of principal executive offices) (Zip code)
Alfred P. Ouellette
Senior Attorney and Assistant Secretary
601 Congress Street
Boston, Massachusetts 02210
(Name and address of agent for service)
Registrant's telephone number, including area code: 617-663-4324
| Date of fiscal year end: | October 31 | |
| | | |
| Date of reporting period: | October 31, 2006 | |
ITEM 1. REPORT TO SHAREHOLDERS.

CEO corner

| TABLE OF CONTENTS |
|
| |
| Your fund at a glance |
| page 1 |
|
| |
| Manager’s report |
| page 2 |
|
| |
| A look at performance |
| page 6 |
|
| |
| Your expenses |
| page 8 |
|
| |
| Fund’s investments |
| page 1 0 |
|
| |
| Financial statements |
| page 1 4 |
|
| |
| Notes to financial |
| statements |
| page 2 1 |
|
| |
| Trustees and officers |
| page 3 3 |
|
| |
| For more information |
| page 40 |
|
To Our Shareholders,
The future has arrived at John Hancock Funds.
We have always been firm believers in the powerful role the Internet can play in providing fund information to our shareholders and prospective investors. Recently, we launched a redesigned, completely overhauled Web site that is more visually pleasing, easier to navigate and, most importantly, provides more fund information and learning tools without overwhelming the user.
Not long after we embarked on this major project, a study was released by the Investment Company Institute, the mutual fund industry’s main trade group, which found that an overwhelming majority of shareholders consider the Internet the “wave of the future” for accessing fund information.
Our new site sports fresher and faster ways to access account information. New innovations allow investors to view funds by risk level, track the performance of the John Hancock funds of their choice or sort funds by Morningstar, Inc.’s star ratings. Investors who own a John Hancock fund through a qualified retirement plan and don’t pay sales charges when making a purchase have the option of sorting by a “Load Waived” Morningstar Rating, thereby creating an apples-to-apples comparison with no-load funds that may also be available in their retirement plan.
The new site also has more educational tools and interactive modules to educate and assist investors with their financial goals, from college savings to retirement planning. A new “I want to…” feature allows investors to check performance, invest more money, update personal information or download prospectuses and forms quickly and easily.
In another of our ongoing efforts to provide our shareholders with top-notch service, we also redesigned our shareholder reports, as you may have noticed with this report. We hope the larger size, more colorful cover and redesigned presentation of the commentary and data tables will draw you in and make them easier to read.
After you’ve read your shareholder report, we encourage you to visit our new Web site — www.jhfunds.com — and take a tour. It’s easy, fast and fun and allows you to be in control of what you see and do. In short, it’s the wave of the future!
Sincerely,

Keith F. Hartstein,
President and Chief Executive Officer
This commentary reflects the CEO’s views as of October 31, 2006. They are subject to change at any time.
Your fund at a glance
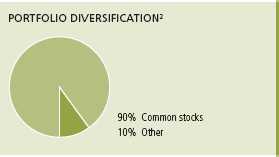
The Fund seeks long-term capital appreciation by normally investing at least 80% of its assets in equity securities of companies located in China, Hong Kong or Taiwan.
Over the last twelve months
► In a sharply rising market, the Fund handily beat its peer group but slightly trailed its benchmark index due to strong cash inflows and defensive positioning at the beginning of the period.
► Despite the government’s attempts to moderate growth, the Chinese economy grew faster through the first ten months of 2006 than its torrid 9.8% pace in 2005.
► The yuan appreciated modestly versus the U.S. dollar and the U.S. Treasury Secretary visited Beijing to help stabilize the huge and growing U.S. trade deficit with China.
John Hancock Greater China Opportunities Fund
Fund performance for the year ended October 31, 2006.

Total returns for the Fund are at net asset value with all distributions reinvested. These returns do not reflect the deduction of the maximum sales charge, which would reduce the performance shown above.
| Top 10 holdings | | | |
| | | | |
| China Mobile (Hong Kong) Ltd. | 8.6% | China Telecom Corp. Ltd. | 2.9% |
|
| PetroChina Co., Ltd. | 7.9% | HSBC Holdings Plc | 2.7% |
|
| China Construction Bank | 4.2% | Bank of Communications Co., Ltd. | 2.4% |
|
| China Life Insurance Co., Ltd. | 3.6% | Bank of China, Ltd. | 1.8% |
|
| CNOOC Ltd. | 3.4% | CITIC International Financial | |
| | | Holdings Ltd. | 1.8% |
|
| As a percentage of net assets on October 31, 2006. | | |
1
Manager’s report
John Hancock
Greater China Opportunities Fund
Greater China stock markets posted very strong gains during the one-year review period. In large part, these gains were driven by the continued robust growth of the Chinese economy, which expanded by more than 10% during the period despite attempts by the Chinese government to moderate its growth. That was up from the 9.8% rise in GDP, or gross domestic product, for 2005 overall. Among other measures, Chinese officials hiked the nation’s banking reserve requirement and also increased the interbank rate, both by one-half of a percentage point. It was hoped that modestly tighter monetary policy would contain growth without triggering a recession or otherwise creating undue strain on the economy.
One ongoing theme during the period was friction between the United States and China over the latter’s control of its currency, the yuan — also known as the renminbe. For years, the yuan was pegged to the U.S. dollar, resulting in a relatively stable exchange rate. In July 2005, responding to massive inflows of Chinese goods to the United States and a burgeoning stockpile of U.S. dollar reserves in China’s coffers, Beijing pegged the yuan to a basket of currencies and allowed its value to rise modestly versus the U.S. dollar. U.S. officials would like to see further appreciation of the yuan and, in support of that policy, U.S. Treasury Secretary Henry Paulson visited China in September. During the review
SCORECARD
| INVESTMENT | | PERIOD’S PERFORMANCE... AND WHAT’S BEHIND THE NUMBERS |
| |
| China National | ▲ | Acquired at a favorable price |
| Aviation | | |
| Harbin Power | ▲ | Strong demand for power generation |
| Equipment | | |
| Kasen International | ▼ | Rising costs, worries about U.S. housing slowdown |
| Holdings | | |
2

Portfolio Manager, MFC Global Investment Management (U.S.A.) Limited
Pauline Dan, CFA
period, modest appreciation by the yuan, which is contained within a narrow trading band, bolstered the Fund’s gains in U.S. dollar terms.
“Greater China stock markets
posted very strong gains during
the one-year review period.”
Looking at performance
For the 12 months ending October 31, 2006, John Hancock Greater China Opportunities Fund’s Class A, Class B, Class C and Class I shares returned 54.74%, 53.59%, 53.59% and 55.43%, respectively, at net asset value. By comparison, the average Pacific/Asia ex-Japan fund monitored by Morningstar, Inc. returned 40.07%, 1 while the Morgan Stanley Capital International (MSCI) China Index finished with a 58.94% return. Keep in mind that your returns will differ from those listed above if you were not invested in the Fund for the entire period and did not reinvest all distributions. Historical performance information can be found on pages six and seven.
Industrials and materials bolster performance
The Fund was aided by favorable stock selection in almost all sectors relative to the MSCI index. The two biggest boosts to performance came from industrials and materials. In the former, China National Aviation was an important contributor, as the airline was acquired at a premium price by rival Cathay Pacific. The Fund also benefited from its position in Citic Pacific, Ltd., a holding company that had a stake in China National Aviation and was helped by the buyout of that company. We’ll also mention Harbin Power Equipment Co., Ltd., a maker of power generation turbines. The stock posted a strong gain during the period amid the huge inflows of investment capital aimed at expanding and modernizing China’s electric power infrastructure.
In the materials sector, underweighting steel stocks helped, as they lagged the MSCI index. Additionally, performance was aided by gold mining stock
Greater China Opportunities Fund
3
Lingbao Gold Co., Ltd., Nine Dragons Paper Holdings, a paper producer, and Hunan Nonferrous Metals, a mine primarily producing zinc and other industrial metals. Strong contributors in other sectors included Bank of China, Ltd., in financials and China Yurun Food Group Ltd. in consumer staples.
Although we cannot state this with certainty, the Fund likely finished ahead of its peer group in part because of lower exposure to Taiwanese technology stocks and Hong Kong industrial shares, both of which lagged the MSCI index.
Detractors
The stellar performance of stocks in the region produced strong inflows of investment capital for the Fund, which made it hard to stay fully invested. Additionally, we began the period with a defensive posture while waiting to learn the details of the Chinese government’s latest five-year plan. Although we quickly moved to a more aggressive stance once that news was released, our caution resulted in the Fund’s losing some ground against the advancing MSCI index.
Not having a large enough stake in telecommunication services provider China Mobile Ltd. also worked against the Fund’s performance. While the stock accounted for approximately 17.5% of the MSCI index at the end of the period, for diversification reasons we try to limit our position in any one stock to 10%. That policy penalized the Fund during the period given China Mobile’s exceptionally strong performance. A sizable position in telecom operator China Netcom Group Corp., which was not a benchmark component, was a further drag on performance because the stock’s gain fell considerably short of the benchmark’s return.
Other detractors included Kasen International Holdings Ltd., a furniture manufacturer deriving a significant portion of its revenues from exports to the United States. Rising material costs and investors’ concerns about a slowing U.S. housing market hampered the stock. Both HSBC Holdings Plc and GZI Real Estate Investment Trust were overweighted in the Fund and underperformed the benchmark. We bought HSBC, which is headquartered in London but has its roots in Hong Kong and Shanghai, because its valuation was more attractive compared
| SECTOR DISTRIBUTION2 |
| Industrials | 27% |
| Consumer discretionary | 17% |
| Financials | 13% |
| Information technology | 12% |
| Materials | 7% |
| Energy | 4% |
| Utilities | 4% |
| Telecommunication | |
| services | 4% |
| Consumer staples | 3% |
Greater China Opportunities Fund
4
with most domestic Chinese banks. In GZI’s case, a generous yield was the main attraction.
“The Fund was aided by favorable
stock selection in almost all
sectors relative to the MSCI
index.“
Outlook
Widespread expectations for further appreciation of the yuan, coupled with the potential for continued slowing of the U.S. economy, could present near-term challenges for Chinese companies that sell goods and services to the United States. Accordingly, we anticipate favoring stocks positioned to benefit from the strong growth in China’s domestic spending, especially the consumer discretionary and financial sectors. Within the financial sector, we like not only banks but also companies specializing in insurance and real estate. The high savings rate of Chinese consumers, together with relatively low mortgage rates, the growth of the country’s middle class and a loosening of the restrictions on property ownership have contributed to a strong real estate market and advancing stock prices for real estate stocks. We will be monitoring these and other opportunities in the months ahead. In closing, alt hough we remain confident about the favorable long-term prospects of the Greater China markets, we caution our shareholders not to expect a repeat of the performance achieved during this exceptionally strong period.
This commentary reflects the views of the portfolio manager through the end of the Fund’s period discussed in this report. The manager’s statements reflect her own opinions. As such, they are in no way guarantees of future events, and are not intended to be used as investment advice or recommendation regarding any specific security. They are also subject to change at any time as market and other conditions warrant.
International investing involves special risks such as political, economic and currency risks and differences in accounting standards and financial reporting. Sector investing is subject to greater risks than the market as a whole.
1 Figures from Morningstar, Inc. include reinvested dividends and do not take into account sales charges. Actual load-adjusted performance is lower.
2 As a percentage of net assets on October 31, 2006.
Greater China Opportunities Fund
5
A look at performance
For the periods ending October 31, 2006
| | | Average annual returns | | Cumulative total returns | | |
| | | with maximum sales charge (POP) | with maximum sales charge (POP) | |
| | Inception | | | | Since | | | | Since |
| Class | date | 1-year | 5-year | 10-year | inception | 1-year | 5-year | 10-year | inception |
|
| A | 6-8-05 | 47.00% | — | — | 34.00% | 47.00% | — | — | 50.53% |
|
| B | 6-8-05 | 48.59 | — | — | 35.46 | 48.59 | — | — | 52.81 |
|
| C | 6-8-05 | 52.59 | — | — | 37.99 | 52.59 | — | — | 56.81 |
|
| I1 | 6-8-05 | 55.43 | — | — | 39.65 | 55.43 | — | — | 59.47 |
|
Performance figures assume all distributions are reinvested. Returns with maximum sales charge reflect a sales charge on Class A shares of 5%, and the applicable contingent deferred sales charge (CDSC) on Class B and Class C shares. The Class B shares’ CDSC declines annually between years 1–6 according to the following schedule: 5, 4, 3, 3, 2, 1%. No sales charge will be assessed after the sixth year. Class C shares held for less than one year are subject to a 1% CDSC. Sales charge is not applicable for Class I shares.
The returns reflect past results and should not be considered indicative of future performance. The return and principal value of an investment will fluctuate so that shares, when redeemed, may be worth more or less than their original cost. Due to market volatility, the Fund’s current performance may be higher or lower than the performance shown. For performance data current to the most recent month-end, please call 1-800-225-5291 or visit the Fund’s Web site at www.jhfunds.com.
The performance table above and the chart on the next page do not reflect the deduction of taxes that a shareholder would pay on fund distributions or the redemption of fund shares.
The Fund’s performance results reflect any applicable expense reductions, without which the expenses would increase and results would have been less favorable.
1 For certain types of investors as described in the Fund’s Class I share prospectus.
Greater China Opportunities Fund
6
Growth of $10,000
This chart shows what happened to a hypothetical $10,000 investment in Class A shares for the period indicated. For comparison, we’ve shown the same investment in the MSCI China Free Index.
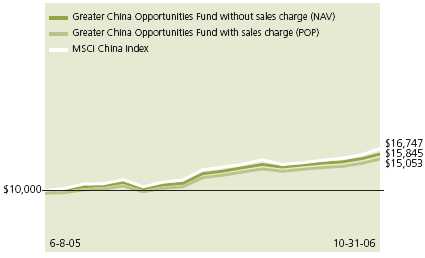
| | | | With maximum | |
| Class | Period beginning | Without sales charge | sales charge | Index |
|
| B | 6-8-05 | $15,681 | $15,281 | $16,747 |
|
| C | 6-8-05 | 15,681 | 15,681 | 16,747 |
|
| I1 | 6-8-05 | 15,947 | 15,947 | 16,747 |
|
Assuming all distributions were reinvested for the period indicated, the table above shows the value of a $10,000 investment in the Fund’s Class B, Class C and Class I shares, respectively, as of October 31, 2006. Performance of the classes will vary based on the difference in sales charges paid by shareholders investing in the different classes and the fee structure of those classes.
MSCI China Index is an unmanaged market capitalization-weighted index of Chinese companies available to non-domestic investors.
It is not possible to invest directly in an index. Index figures do not reflect sales charges which would have resulted in lower values if they did.
1 For certain types of investors as described in the Fund’s Class I share prospectus.
Greater China Opportunities Fund
7
Your expenses
These examples are intended to help you understand your ongoing operating expenses.
Understanding fund expenses
As a shareholder of the Fund, you incur two types of costs:
■ Transaction costs which include sales charges (loads) on purchases or redemptions (varies by share class), minimum account fee charge, etc.
■ Ongoing operating expenses including management fees, distribution and service fees (if applicable) and other fund expenses.
We are going to present only your ongoing operating expenses here.
Actual expenses/actual returns
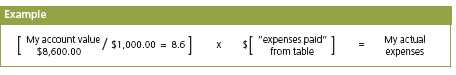
This example is intended to provide information about your fund’s actual ongoing operating expenses, and is based on your fund’s actual return. It assumes an account value of $1,000.00 on May 1, 2006, with the same investment held until October 31, 2006.
| | Account value | Ending value | Expenses paid during period |
| | on 5-1-06 | on 10-31-06 | ended 10-31-061 |
|
| Class A | $1,000.00 | $1,122.50 | $9.87 |
|
| Class B | 1,000.00 | 1,117.20 | 13.66 |
|
| Class C | 1,000.00 | 1,118.00 | 13.66 |
|
| Class I | 1,000.00 | 1,124.10 | 7.80 |
|
Together with the value of your account, you may use this information to estimate the operating expenses that you paid over the period. Simply divide your account value at October 31, 2006 by $1,000.00, then multiply it by the “expenses paid” for your share class from the table above. For example, for an account value of $8,600.00, the operating expenses should be calculated as follows:
Greater China Opportunities Fund
8
Hypothetical example for comparison purposes
This table allows you to compare your fund’s ongoing operating expenses with those of any other fund. It provides an example of the Fund’s hypothetical account values and hypothetical expenses based on each class’s actual expense ratio and an assumed 5% annual return before expenses (which is not your fund’s actual return). It assumes an account value of $1,000.00 on May 1, 2006, with the same investment held until October 31, 2006. Look in any other fund shareholder report to find its hypothetical example and you will be able to compare these expenses.
| | Account value | Ending value | Expenses paid during period |
| | on 5-1-06 | on 10-31-06 | ended 10-31-061 |
|
| Class A | $1,000.00 | $1,015.90 | $9.37 |
|
| Class B | 1,000.00 | 1,012.30 | 12.98 |
|
| Class C | 1,000.00 | 1,012.30 | 12.98 |
|
| Class I | 1,000.00 | 1,017.87 | 7.41 |
|
Remember, these examples do not include any transaction costs, such as sales charges; therefore, these examples will not help you to determine the relative total costs of owning different funds. If transaction costs were included, your expenses would have been higher. See the prospectus for details regarding transaction costs.
1 Expenses are equal to the Fund’s annualized expense ratio of 1.85%, 2.56%, 2.56% and 1.46% for Class A, Class B, Class C and Class I, respectively, multiplied by the average account value over the period, multiplied by number of days in most recent fiscal half-year/365 or 366 (to reflect the one-half year period).
Greater China Opportunities Fund
9
Fund’s investments
F I N A N C I A L S T A T E M E N T S
Securities owned by the Fund on 10-31-06
This schedule consists of one main category: common stocks. Common stocks are further broken down by industry group.
| Issuer | Shares | Value |
|
| Common stocks 90.38% | | $101,265,285 |
| (Cost $86,847,559) | | |
| Air Freight & Logistics 0.64% | | 717,972 |
|
| Sinotrans Ltd. (China) | 2,100,000 | 717,972 |
| Airlines 1.31% | | 1,462,678 |
|
| Air China Ltd. (China) | 1,600,000 | 802,031 |
|
| China Southern Airlines Co., Ltd. (China) (I) | 2,000,000 | 660,647 |
| Airport Services 0.52% | | 582,361 |
|
| Beijing Capital International Airport Co. Ltd. (China) | 908,000 | 582,361 |
| Aluminum 0.27% | | 295,919 |
|
| Aluminum Corp. of China Ltd. (China) | 424,000 | 295,919 |
| Apparel, Accessories & Luxury Goods 0.73% | | 819,254 |
|
| China Ting Group Holdings Ltd. (Hong Kong) | 2,180,000 | 504,354 |
|
| Glorious Sun Enterprises Ltd. (Hong Kong) | 700,000 | 314,900 |
| Application Software 0.34% | | 380,772 |
|
| Kingdee International Software Group Co., Ltd. (China) | 750,000 | 380,772 |
| Asset Management & Custody Banks 1.38% | | 1,549,080 |
|
| iShares MSCI Taiwan Index Fund (Taiwan) | 117,000 | 1,549,080 |
| Auto Parts & Equipment 0.15% | | 165,085 |
|
| Zhejiang Shibao Co., Ltd. (China) (I) | 1,690,000 | 165,085 |
| Automobile Manufacturers 1.63% | | 1,825,649 |
|
| Denway Motors Ltd. (Hong Kong) | 4,550,000 | 1,684,265 |
|
| Geely Automobile Holdings Ltd. (Hong Kong) | 1,250,000 | 141,384 |
| Coal & Consumable Fuels 1.00% | | 1,125,311 |
|
| China Shenhua Energy Co., Ltd. (China) | 640,000 | 1,125,311 |
| Computer Storage & Peripherals 0.88% | | 986,269 |
|
| TPV Technology Ltd. (Hong Kong) | 1,186,000 | 986,269 |
| Construction & Engineering 1.04% | | 1,168,086 |
|
| COSCO International Holdings Ltd. (Hong Kong) | 3,200,000 | 1,168,086 |
| Construction Materials 0.60% | | 667,074 |
|
| Anhui Conch Cement Co., Ltd. (China) | 300,000 | 667,074 |
See notes to financial statements
Greater China Opportunities Fund
10
F I N A N C I A L S T A T E M E N T S
| Issuer | Shares | Value |
|
| Consumer Electronics 0.48% | | $542,240 |
|
| Fujikon Industrial Holdings Ltd. (Hong Kong) | 2,318,000 | 542,240 |
| Department Stores 1.30% | | 1,453,038 |
|
| Parkson Retail Group Ltd. (China) | 350,000 | 1,453,038 |
| Distributors 1.20% | | 1,343,350 |
|
| China Resources Enterprise Ltd. (Hong Kong) | 580,000 | 1,343,350 |
| Diversified Banks 15.45% | | 17,309,278 |
|
| Bank of China Ltd. (China) (I) | 4,622,000 | 1,990,129 |
|
| Bank of Communications Co., Ltd. (China) | 3,510,000 | 2,634,671 |
|
| Bank of East Asia Ltd. (Hong Kong) | 341,400 | 1,630,155 |
|
| China Construction Bank (China) (S) | 10,510,000 | 4,727,997 |
|
| CITIC International Financial Holdings Ltd. (Hong Kong) | 2,940,000 | 1,972,533 |
|
| HSBC Holdings Plc (Hong Kong) | 162,000 | 3,056,663 |
|
| Industrial and Commercial Bank of China (China) (I) | 2,900,000 | 1,297,130 |
| Diversified Metals & Mining 0.08% | | 88,285 |
|
| China Rare Earth Holdings Ltd. (China) | 424,000 | 88,285 |
| Diversified REIT’s 1.14% | | 1,279,805 |
|
| GZI Real Estate Investment Trust (Hong Kong) | 3,212,000 | 1,279,805 |
| Electronic Equipment Manufacturers 2.80% | | 3,137,778 |
|
| Au Optronics Corp., American Depositary Receipt (Taiwan) | 51,500 | 699,370 |
|
| GST Holdings Ltd. (Hong Kong) | 1,300,000 | 501,269 |
|
| Kingboard Chemical Holdings Ltd. (Hong Kong) | 342,000 | 1,215,424 |
|
| Yorkey Optical International Cayman Ltd. (Hong Kong) | 2,072,000 | 721,715 |
| Fertilizers & Agricultural Chemicals 0.21% | | 236,856 |
|
| Sinochem Hong Kong Holdings Ltd. (Hong Kong) | 680,000 | 236,856 |
| Footwear 0.31% | | 352,611 |
|
| Prime Success International Group Ltd. (Hong Kong) | 430,000 | 352,611 |
| Forest Products 0.42% | | 472,166 |
|
| Sino-Forest Corp. (Canada) (I) | 90,900 | 472,166 |
| Gas Utilities 2.12% | | 2,377,880 |
|
| Hong Kong & China Gas Co., Ltd. (Hong Kong) | 375,000 | 858,905 |
|
| Xinao Gas Holdings Ltd. (China) | 600,000 | 603,837 |
|
| Zhengzhou Gas Co., Ltd. (China) | 8,000,000 | 915,138 |
| Gold 0.43% | | 480,704 |
|
| Lingbao Gold Co., Ltd. (Hong Kong) | 550,000 | 480,704 |
| Health Care Supplies 0.21% | | 235,797 |
|
| Shandong Weigao Group Medical Polymer Co., Ltd. (China) | 312,000 | 235,797 |
| Heavy Electrical Equipment 0.54% | | 609,749 |
|
| Harbin Power Equipment Co., Ltd. (China) | 340,000 | 292,793 |
|
| Shanghai Electric Group Co., Ltd. (China) | 900,000 | 316,956 |
See notes to financial statements
Greater China Opportunities Fund
11
F I N A N C I A L S T A T E M E N T S
| Issuer | Shares | Value |
|
| Highways & Railtracks 1.61% | | $1,807,574 |
|
| Anhui Expressway Co., Ltd. (China) | 990,000 | 673,127 |
|
| Zhejiang Expressway Co., Ltd. (China) | 1,678,000 | 1,134,447 |
| Home Furnishings 0.42% | | 470,325 |
|
| Kasen International Holdings Ltd. (China) | 2,975,000 | 470,325 |
| Hotels, Resorts & Cruise Lines 0.17% | | 191,412 |
|
| Home Inns & Hotels Management, Inc. ADR (China) (I) | 7,800 | 191,412 |
| Hypermarkets & Super Centers 0.86% | | 958,761 |
|
| Lianhua Supermarket Holdings Co., Ltd. (China) | 755,000 | 958,761 |
| Independent Power Producers & Energy Traders 3.10% | | 3,474,912 |
|
| China Resources Power Holdings Co., Ltd. (Hong Kong) | 1,220,000 | 1,521,031 |
|
| Huaneng Power International, Inc. (China) | 2,488,000 | 1,953,881 |
| Industrial Conglomerates 1.86% | | 2,082,838 |
|
| Beijing Enterprises Holdings Ltd. (Hong Kong) | 380,000 | 761,929 |
|
| CITIC Pacific Ltd. (Hong Kong) | 430,000 | 1,320,909 |
| Industrial Machinery 1.33% | | 1,485,248 |
|
| Enric Energy Equipment Holdings Ltd. (Hong Kong) (I) | 764,000 | 481,167 |
|
| Shanghai Prime Machinery Co., Ltd. (China) (I) | 3,100,000 | 1,004,081 |
| Integrated Oil & Gas 9.65% | | 10,814,588 |
|
| China Petroleum & Chemical Corp. (China) | 2,790,000 | 1,936,442 |
|
| PetroChina Co., Ltd. (China) | 8,060,000 | 8,878,146 |
| Integrated Telecommunication Services 3.87% | | 4,331,547 |
|
| China Netcom Group Corp. (Hong Kong) Ltd. (Hong Kong) | 597,000 | 1,060,447 |
|
| China Telecom Corp. Ltd. (China) | 8,686,000 | 3,271,100 |
| IT Consulting & Other Services 0.47% | | 529,494 |
|
| Chinasoft International Ltd. (China) | 1,730,000 | 293,512 |
|
| SinoCom Software Group Ltd. (Hong Kong) | 1,200,000 | 235,982 |
| Life & Health Insurance 3.60% | | 4,031,708 |
|
| China Life Insurance Co., Ltd. (China) | 1,915,000 | 4,031,708 |
| Marine 0.80% | | 898,917 |
|
| China COSCO Holdings Co., Ltd. (China) | 400,000 | 186,112 |
|
| China Shipping Development Co., Ltd. (China) | 230,000 | 250,095 |
|
| Pacific Basin Shipping Ltd. (Hong Kong) | 720,000 | 462,710 |
| Marine Ports & Services 2.43% | | 2,726,326 |
|
| China Merchants Holdings International Co., Ltd. (Hong Kong) | 650,000 | 1,900,646 |
|
| COSCO Pacific Ltd. (Hong Kong) | 400,000 | 825,680 |
| Office REITs 1.35% | | 1,513,190 |
|
| Champion Real Estate Investment Trust (Hong Kong) (I) | 3,050,000 | 1,513,190 |
| Oil & Gas Drilling 0.70% | | 780,733 |
|
| China Oilfield Services Ltd. (China) | 1,390,000 | 780,733 |
See notes to financial statements
Greater China Opportunities Fund
12
F I N A N C I A L S T A T E M E N T S
| Issuer | Shares | Value |
|
| Oil & Gas Exploration & Production 3.38% | | $3,781,814 |
|
| CNOOC Ltd. (Hong Kong) | 4,499,000 | 3,781,814 |
| Packaged Foods & Meats 0.60% | | 677,356 |
|
| China Yurun Food Group Ltd. (Hong Kong) | 775,000 | 677,356 |
| Personal Products 0.74% | | 826,092 |
|
| China Flavors & Fragrances Co., Ltd. (Hong Kong) (I) | 2,060,000 | 826,092 |
| Railroads 0.80% | | 892,861 |
|
| Guangshen Railway Co., Ltd. (China) | 1,898,000 | 892,861 |
| Real Estate Management & Development 3.35% | | 3,750,401 |
|
| China Overseas Land & Investment Ltd. (Hong Kong) | 1,000,000 | 911,282 |
|
| China Resources Land Ltd. (Hong Kong) | 1,270,000 | 1,013,682 |
|
| Guangzhou Investment Co., Ltd. (Hong Kong) | 4,560,000 | 879,149 |
|
| Shenzhen Investment Ltd. (Hong Kong) | 2,406,000 | 946,288 |
| Semiconductors 0.44% | | 495,645 |
|
| Advanced Semiconductor Manufacturing Corp. (China) (I) | 3,268,000 | 495,645 |
| Technology Distributors 1.36% | | 1,525,333 |
|
| Digital China Holdings Ltd. (Hong Kong) | 3,662,800 | 1,525,333 |
| Wireless Telecommunication Services 10.31% | | 11,553,163 |
|
| China Mobile (Hong Kong) Ltd. (Hong Kong) | 1,180,000 | 9,585,296 |
|
| China Unicom Ltd. (Hong Kong) | 1,770,000 | 1,967,867 |
|
| |
| Total investments (cost $86,847,559) 90.38% | | $101,265,285 |
|
| |
| Other assets and liabilities, net 9.62% | | $10,774,458 |
|
| |
| Total net assets 100.00% | | $112,039,743 |
(I) Non-income producing security.
(S) This security is exempt from registration under Rule 144A of the Securities Act of 1933. Such security [securities] may be resold, normally to qualified institutional buyers, in transactions exempt from registration. Rule 144A securities amounted to $4,727,997 or 4.22% of the Fund’s net assets as of October 31, 2006.
Parenthetical disclosure of a foreign country in the security description represents country of a foreign issuer.
The percentage shown for each investment category is the total value of that category as a percentage of the net assets of the Fund.
See notes to financial statements
Greater China Opportunities Fund
13
Financial statements
F I N A N C I A L S T A T E M E N T S
Statement of assets and liabilities 10-31-06
This Statement of Assets and Liabilities is the Fund’s balance sheet. It shows the value of what the Fund owns, is due and owes. You’ll also find the net asset value and the maximum offering price per share.
| Assets | |
|
| Investments at value (cost $86,847,559) | $101,265,285 |
| Cash | 3,147,714 |
| Foreign cash, at value (cost $5,587,117) | 5,577,584 |
| Receivable for investments sold | 119,207 |
| Receivable for shares sold | 2,760,793 |
| Dividends and interest receivable | 113,555 |
| Receivable from affiliates | 13,111 |
| Total assets | 112,997,249 |
| |
| Liabilities | |
|
| Payable for investments purchased | 535,258 |
| Payable for shares repurchased | 243,455 |
| Payable to affiliates | |
| Management fees | 87,608 |
| Distribution and service fees | 7,039 |
| Other payables and accrued expenses | 84,146 |
| Total liabilities | 957,506 |
| |
| Net assets | |
|
| Capital paid-in | 94,305,701 |
| Accumulated net realized gain on investments and foreign currency transactions | 2,818,415 |
| Net unrealized appreciation of investments and translation of assets and | |
| liabilities in foreign currencies | 14,416,020 |
| Accumulated net investment income | 499,607 |
| Net assets | $112,039,743 |
| |
| Net asset value per share | |
|
| Based on net asset values and shares outstanding — the Fund has an | |
| unlimited number of shares authorized with no par value | |
| Class A ($79,053,650 ÷ 5,010,763 shares) | $15.78 |
| Class B ($16,479,364 ÷ 1,054,011 shares) | $15.63 |
| Class C ($12,759,979 ÷ 816,225 shares) | $15.63 |
| Class I ($3,746,750 ÷ 236,866 shares) | $15.82 |
| |
| Maximum offering price per share | |
|
| Class A1 ($15.78 ÷ 95%) | $16.61 |
1 On single retail sales of less than $50,000. On sales of $50,000 or more and on group sales the offering price is reduced.
See notes to financial statements
Greater China Opportunities Fund
14
F I N A N C I A L S T A T E M E N T S
Statement of operations For the year ended 10-31-06.
This Statement of Operations summarizes the Fund’s investment income earned and expenses incurred in operating the Fund. It also shows net gains (losses) for the period stated.
| Investment income | |
|
| Dividends (net of foreign withholding taxes of $620) | $1,546,030 |
| Interest | 28,300 |
| Total investment income | 1,574,330 |
| |
| Expenses | |
|
| Investment management fees (Note 2) | 513,012 |
| Distribution and service fees (Note 2) | 239,014 |
| Class A, B and C transfer agent fees (Note 2) | 107,551 |
| Class I transfer agent fees (Note 2) | 359 |
| Accounting and legal services fees (Note 2) | 8,361 |
| Compliance fees | 771 |
| Blue sky fees | 63,771 |
| Custodian fees | 59,686 |
| Professional fees | 23,249 |
| Printing fees | 23,060 |
| Trustees’ fees | 1,538 |
| Miscellaneous | 29,313 |
| Total expenses | 1,069,685 |
| Less expense reductions (Note 2) | (16,462) |
| Net expenses | 1,053,223 |
| Net investment income | 521,107 |
| |
| Net realized and unrealized gain (loss) | |
|
| Net realized gain (loss) on | |
| Investments | 2,844,859 |
| Foreign currency transactions | (22,417) |
| Change in net unrealized appreciation (depreciation) of | |
| Investments | 14,785,790 |
| Translation of assets and liabilities in foreign currencies | (936) |
| Net realized and unrealized gain | 17,607,296 |
| Increase in net assets from operations | $18,128,403 |
See notes to financial statements
Greater China Opportunities Fund
15
F I N A N C I A L S T A T E M E N T S
Statement of changes in net assets
These Statements of Changes in Net Assets show how the value of the Fund’s net assets has changed during the last two periods. The difference reflects earnings less expenses, any investment gains and losses, distributions, if any, paid to shareholders and the net of Fund share transactions.
| | Year | Year |
| | ended | ended |
| | 10-31-051 | 10-31-06 |
| Increase (decrease) in net assets | | |
|
| From operations | | |
| Net investment income | $26,526 | $521,107 |
| Net realized gain | 38,512 | 2,822,442 |
| Change in net unrealized appreciation (depreciation) | (368,834) | 14,784,854 |
| Increase (decrease) in net assets resulting from operations | (303,796) | 18,128,403 |
| Distributions to shareholders | | |
| From net investment income | | |
| Class A | — | (34,481) |
| Class B | — | 0 |
| Class C | — | 0 |
| Class I | — | (4,277) |
| From net realized gain | | |
| Class A | — | (44,190) |
| Class B | — | (5,067) |
| Class C | — | (4,308) |
| Class I | — | (351) |
| | — | (92,674) |
| From Fund share transactions | 15,402,390 | 78,905,420 |
| |
| Net assets | | |
|
| Beginning of period | — | 15,098,594 |
| End of period2 | $15,098,594 | $112,039,743 |
1 Beginning of operations from 6-9-05 through 10-31-05.
2 Includes accumulated net invesment income of $36,877 and $499,607, respectively.
See notes to financial statements
Greater China Opportunities Fund
16
F I N A N C I A L S T A T E M E N T S
Financial highlights
The Financial highlights show how the Fund’s net asset value for a share has changed since the end of the previous period.
| CLASS A SHARES | | |
| |
| Period ended | 10-31-051 | 10-31-06 |
| Per share operating performance | | |
|
| Net asset value, beginning of period | $10.00 | $10.24 |
| Net investment income (loss)2 | 0.03 | 0.16 |
| Net realized and unrealized | | |
| gain on investments | 0.21 | 5.43 |
| Total from investment operations | 0.24 | 5.59 |
| Less distributions | | |
| From net investment income | — | (0.01) |
| From net realized gain | — | (0.04) |
| | | (0.05) |
| Net asset value, end of period | $10.24 | $15.78 |
| Total return3,4 (%) | 2.40 5 | 54.74 |
| |
| Ratios and supplemental data | | |
|
| Net assets, end of period | | |
| (in millions) | $12 | $79 |
| Ratio of net expenses to average | | |
| net assets (%) | 1.936 | 1.89 |
| Ratio of gross expenses to average | | |
| net assets7 (%) | 4.446 | 1.92 |
| Ratio of net investment income | | |
| (loss) to average net assets | 0.686 | 1.14 |
| Portfolio turnover (%) | 28 | 57 |
See notes to financial statements
Greater China Opportunities Fund
17
F I N A N C I A L S T A T E M E N T S
Financial highlights
| CLASS B SHARES | | |
| |
| Period ended | 10-31-051 | 10-31-06 |
| Per share operating performance | | |
|
| Net asset value, beginning of period | $10.00 | $10.21 |
| Net investment income (loss)2 | 0.02 | 0.09 |
| Net realized and unrealized | | |
| gain on investments | 0.19 | 5.37 |
| Total from investment operations | 0.21 | 5.46 |
| Less distributions | | |
| From net realized gain | — | (0.04) |
| Net asset value, end of period | $10.21 | $15.63 |
| Total return3,4 (%) | 2.10 5 | 53.59 |
| |
| Ratios and supplemental data | | |
|
| Net assets, end of period | | |
| (in millions) | $1 | $16 |
| Ratio of net expenses to average | | |
| net assets (%) | 2.636 | 2.59 |
| Ratio of gross expenses to average | | |
| net assets7 (%) | 5.146 | 2.62 |
| Ratio of net investment income | | |
| (loss) to average net assets | 0.436 | 0.63 |
| Portfolio turnover (%) | 28 | 57 |
See notes to financial statements
Greater China Opportunities Fund
18
F I N A N C I A L S T A T E M E N T S
Financial highlights
| CLASS C SHARES | | |
| |
| Period ended | 10-31-051 | 10-31-06 |
| Per share operating performance | | |
|
| Net asset value, beginning of period | $10.00 | $10.21 |
| Net investment income (loss)2 | 0.03 | 0.08 |
| Net realized and unrealized | | |
| gain on investments | 0.18 | 5.38 |
| Total from investment operations | 0.21 | 5.46 |
| Less distributions | | |
| From net realized gain | — | (0.04) |
| Net asset value, end of period | $10.21 | $15.63 |
| Total return3,4 (%) | 2.10 5 | 53.59 |
| |
| Ratios and supplemental data | | |
|
| Net assets, end of period | | |
| (in millions) | $1 | $13 |
| Ratio of net expenses to average | | |
| net assets (%) | 2.626 | 2.59 |
| Ratio of gross expenses to average | | |
| net assets7 (%) | 5.136 | 2.62 |
| Ratio of net investment income | | |
| (loss) to average net assets | 0.616 | 0.55 |
| Portfolio turnover (%) | 28 | 57 |
See notes to financial statements
Greater China Opportunities Fund
19
F I N A N C I A L S T A T E M E N T S
Financial highlights
| CLASS I SHARES | | |
| |
| Period ended | 10-31-051 | 10-31-06 |
| Per share operating performance | | |
|
| Net asset value, beginning of period | $10.00 | $10.26 |
| Net investment income2 | 0.03 | 0.24 |
| Net realized and unrealized | | |
| gain on investments | 0.23 | 5.42 |
| Total from investment operations | 0.26 | 5.66 |
| Less distributions | | |
| From net investment income | — | (0.06) |
| From net realized gain | — | (0.04) |
| | | (0.10) |
| Net asset value, end of period | $10.26 | $15.82 |
| Total return3,4 (%) | 2.605 | 55.43 |
| |
| Ratios and supplemental data | | |
|
| Net assets, end of period | | |
| (in millions) | —8 | $4 |
| Ratio of net expenses to average | | |
| net assets (%) | 1.456 | 1.46 |
| Ratio of gross expenses to average | | |
| net assets7 (%) | 3.966 | 1.49 |
| Ratio of net investment income | | |
| to average net assets | 0.766 | 1.70 |
| Portfolio turnover (%) | 28 | 57 |
1 Beginning of operations on 6-9-05 through 10-31-05.
2 Based on the average of the shares outstanding.
3 Assumes dividend reinvestment and does not reflect the effect of sales charges.
4 Total return would have been lower had certain expenses not been reduced during the periods shown.
5 Not annualized.
6 Annualized.
7 Does not take into consideration expense reductions during the periods shown.
8 Less than $500,000.
See notes to financial statements
Greater China Opportunities Fund
20
Notes to financial statements
Note 1 Accounting policies
John Hancock Greater China Opportunities (the “Fund”) is a non-diversified series of John Hancock Investment Trust III (the “Trust”), an open-end management investment company registered under the Investment Company Act of 1940 (the “1940 Act”), as amended. The investment objective of the Fund is to achieve long-term capital appreciation.
The Trustees have authorized the issuance of multiple classes of shares of the Fund, designated as Class A, Class B, Class C and Class I shares. The shares of each class represent an interest in the same portfolio of investments of the Fund and have equal rights as to voting, redemptions, dividends and liquidation, except that certain expenses, subject to the approval of the Trustees, may be applied differently to each class of shares in accordance with current regulations of the Securities and Exchange Commission and the Internal Revenue Service. Shareholders of a class that bears distribution and service expenses under the terms of a distribution plan have exclusive voting rights to that distribution plan. Class B shares will convert to Class A shares eight years after purchase.
Significant accounting policies of the Fund are as follows:
Valuation of investments
Securities in the Fund’s portfolio are valued on the basis of market quotations, valuations provided by independent pricing services or, if quotations are not readily available, or the value has been materially affected by events occurring after the close of a foreign market, at fair value as determined in good faith in accordance with procedures approved by the Trustees. Short-term debt investments which have a remaining maturity of 60 days or less may be valued at amortized cost, which approximates market value. All portfolio transactions initially expressed in terms of foreign currencies have been translated into U.S. dollars as described in “Foreign currency translation” below.
Joint repurchase agreement
Pursuant to an exemptive order issued by the Securities and Exchange Commission, the Fund, along with other registered investment companies having a management contract with John Hancock Advisers, LLC (the “Adviser”), a wholly owned subsidiary of John Hancock Financial Services, Inc., a subsidiary of Manulife Financial Corporation (“MFC”), may participate in a joint repurchase agreement transaction. Aggregate cash balances are invested in one or more large repurchase agreements, whose underlying securities are obligations of the U.S. government and/or its agencies. The Fund’s custodian bank receives delivery of the underlying securities for the joint account on the Fund’s behalf. The Adviser is responsible for ensuring that the agreement is fully collateralized at all times.
Foreign currency translation
All assets or liabilities initially expressed in terms of foreign currencies are translated into U.S. dollars based on London currency exchange quotations as of 4:00 P.M., London time, on the date of any determination of the net asset value of the Fund. Transactions affecting statement of operations accounts and net realized gain (loss) on investments are translated at the rates prevailing at the dates of the transactions.
The Fund does not isolate that portion of the results of operations resulting from changes in foreign exchange rates on investments from the fluctuations arising from changes in market prices of securities held. Such fluctuations are included with the net realized and unrealized gain or loss from investments.
Greater China Opportunities Fund
21
Reported net realized foreign currency exchange gains or losses arise from sales of foreign currency, currency gains or losses realized between the trade and settlement dates on securities transactions, and the difference between the amounts of dividends, interest and foreign withholding taxes recorded on the Fund’s books and the U.S. dollar equivalent of the amounts actually received or paid. Net unrealized foreign currency exchange gains and losses arise from changes in the value of assets and liabilities, other than investments in securities, resulting from changes in the exchange rates.
Investment transactions
Investment transactions are accounted for on a trade date plus one basis for daily net asset value calculations. However, for financial reporting purposes, investment transactions are reported on trade date. Net realized gains and losses on sales of investments are determined on the identified cost basis. Capital gains realized on some foreign securities are subject to foreign taxes, which are accrued as applicable.
Class allocations
Income, common expenses and realized and unrealized gains (losses) are determined at the fund level and allocated daily to each class of shares based on the appropriate net asset value of the respective classes. Distribution and service fees, if any, and transfer agent fees for Class I shares, are calculated daily at the class level based on the appropriate net asset value of each class and the specific expense rate(s) applicable to each class.
Expenses
The majority of expenses are directly identifiable to an individual fund. Expenses that are not readily identifiable to a specific fund are allocated in such a manner as deemed equitable, taking into consideration, among other things, the nature and type of expense and the relative size of the funds.
Bank borrowings
The Fund is permitted to have bank borrowings for temporary or emergency purposes, including the meeting of redemption requests that otherwise might require the untimely disposition of securities. The Fund has entered into a syndicated line of credit agreement with various banks. This agreement enables the Fund to participate, with other funds managed by the Adviser, in an unsecured line of credit with banks, which permits borrowings of up to $150 million, collectively. Interest is charged to each fund based on its borrowing. In addition, a commitment fee is charged to each fund based on the average daily unused portion of the line of credit, and is allocated among the participating funds. The Fund had no borrowing activity under the line of credit during the year ended October 31, 2006.
Forward foreign currency exchange contracts
The Fund may enter into forward foreign currency exchange contracts as a hedge against the effect of fluctuations in currency exchange rates. A forward foreign currency exchange contract involves an obligation to purchase or sell a specific currency at a future date at a set price. The aggregate principal amounts of the contracts are marked to market daily at the applicable foreign currency exchange rates. Any resulting unrealized gains and losses are included in the determination of the Fund’s daily net asset value. The Fund records realized gains and losses at the time the forward foreign currency exchange contracts are closed out. Risks may arise upon entering these contracts from the potential inability of counterparties to meet the terms of the contracts and from unanticipated movements in the value of a foreign currency relative to the U.S. dollar. These contracts involve market or credit risk in excess of the unrealized gain or loss reflected in the Fund’ ;s Statement of Assets and Liabilities.
The Fund may also purchase and sell forward contracts to facilitate the settlement of foreign currency denominated portfolio transactions, under which it intends to take delivery of the foreign currency. Such contracts normally involve no market risk if they are offset by the currency amount of the underlying transactions.
The Fund had no open forward foreign currency exchange contracts on October 31, 2006.
Greater China Opportunities Fund
22
Federal income taxes
The Fund qualifies as a “regulated investment company” by complying with the applicable provisions of the Internal Revenue Code and will not be subject to federal income tax on taxable income that is distributed to shareholders. Therefore, no federal income tax provision is required.
New accounting pronouncements
In June 2006, Financial Accounting Standards Board (“FASB”) Interpretation No. 48, Accounting for Uncertainty in Income Taxes (the “Interpretation”) was issued, and is effective for fiscal years beginning after December 15, 2006 and is to be applied to all open tax years as of the effective date. The Interpretation prescribes a minimum threshold for financial statement recognition of the benefit of a tax position taken or expected to be taken in a tax return and requires certain expanded disclosures. Management is currently evaluating the application of the Interpretation to the Fund and has not at this time quantified the impact, if any, resulting from the adoption of the Interpretation on the Fund’s financial statements.
In September 2006, FASB Standard No. 157, Fair Value Measurements (“FAS 157”) was issued, and is effective for fiscal years beginning after November 15, 2007. FAS 157 defines fair value, establishing a framework for measuring fair value and expands disclosure about fair value measurements. Management is currently evaluating the application of FAS 157 to the Fund and its impact, if any, resulting from the adoption of FAS 157 on the Fund’s financial statements.
Dividends, interest and distributions
Dividend income on investment securities is recorded on the ex-dividend date or, in the case of some foreign securities, on the date thereafter when the Fund identifies the dividend. Interest income on investment securities is recorded on the accrual basis. Foreign income may be subject to foreign withholding taxes, which are accrued as applicable.
The Fund records distributions to shareholders from net investment income and net realized gains, if any, on the ex-dividend date. There were no distributions during the year ended October 31, 2005. During the year ended October 31, 2006, the tax character of distributions paid was as follows: ordinary income $92,674. Distributions paid by the Fund with respect to each class of shares are calculated in the same manner, at the same time and are in the same amount, except for the effect of expenses that may be applied differently to each class.
As of October 31, 2006, the components of distributable earnings on a tax basis included $3,404,387 of undistributed ordinary income.
Such distributions and distributable earnings, on a tax basis, are determined in conformity with income tax regulations, which may differ from accounting principles generally accepted in the United States of America. Distributions in excess of tax basis earnings and profits, if any, are reported in the Fund’s financial statements as a return of capital.
Use of estimates
The preparation of these financial statements, in accordance with accounting principles generally accepted in the United States of America, incorporates estimates made by management in determining the reported amount of assets, liabilities, revenues and expenses of the Fund. Actual results could differ from these estimates.
Note 2
Management fee and transactions with affiliates and others
The Fund has an investment management contract with the Adviser. Under the investment management contract, the Fund pays a daily management fee to the Adviser equivalent, at an annual rate of 1.00% of the Fund’s average daily net asset value. The Fund has a sudadvisory agreement with MFC Global Investment Management (U.S), LLC., an affiliate of John Hancock Financial Services, Inc. The Fund is not responsible for payment of the subadvisory fees.
Effective December 31, 2005, the investment management teams of the Adviser were reorganized into Sovereign Asset Management LLC (“Sovereign”), a wholly owned indirect subsidiary of John Hancock Life Insurance Company (“JHLICO”), a subsidiary of MFC. The Adviser remains the principal advisor on
Greater China Opportunities Fund
23
the Fund and Sovereign acts as subadviser under the supervision of the Adviser. The restructuring did not have an impact on the Fund, which continues to be managed using the same investment philosophy and process. The Fund is not responsible for payment of the subadvisory fees.
Effective October 1, 2006, Sovereign changed its name to MFC Global Investment Management (U.S.), LLC.
The Adviser has agreed to limit the Fund’s expenses, excluding distribution and service fees and transfer agent fees to 1.40% on an annual basis of the Fund’s average daily net asset value with respect to Class A, Class B and Class C shares and net operating expenses of Class A, Class B, Class C and Class I shares to 2.10%, 2.80%, 2.80% and 1.45% of each respective class’ average daily net asset value at least until February 28, 2007. Accordingly, the expense reductions related to this total expense limitation amounted to $16,462 for the year ended October 31, 2006. The Adviser reserves the right to terminate these limitations in the future.
The Fund has a Distribution Agreement with John Hancock Funds, LLC (“JH Funds”), a wholly owned subsidiary of the Adviser. The Fund has adopted Distribution Plans with respect to Class A, Class B and Class C, pursuant to Rule 12b-1 under the 1940 Act, as amended, to reimburse JH Funds for the services it provides as distributor of shares of the Fund. Accordingly, the Fund makes monthly payments to JH Funds at an annual rate not to exceed 0.30%, 1.00% and 1.00% of average daily net asset value of Class A, Class B and Class C, respectively. A maximum of 0.25% of such payments may be service fees, as defined by the Conduct Rules of the National Association of Securities Dealers. Under the Conduct Rules, curtailment of a portion of the Fund’s 12b-1 payments could occur under certain circumstances.
Expenses under the agreements described above for the period ended October 31, 2006 were as follows:
| | Distribution and |
| Share class | service fees |
|
| |
| Class A | $114,347 |
| Class B | 72,690 |
| Class C | 51,977 |
| Total | $239,014 |
Class A shares are assessed up-front sales charges. During the year ended October 31, 2006, JH Funds received net up-front sales charges of $822,658 with regard to sales of Class A shares. Of this amount, $131,308 was retained and used for printing prospectuses, advertising, sales literature and other purposes, $685,619 was paid as sales commissions to unrelated broker-dealers and $5,731 was paid as sales commissions to sales personnel of Signator Investors, Inc. (“Signator Investors”), a related broker-dealer. The Adviser’s indirect parent JHLICO, a subsidiary of MFC, is the indirect sole shareholder of Signator Investors.
Class B shares that are redeemed within six years of purchase are subject to a contingent deferred sales charge (“CDSC”) at declining rates, beginning at 5.00% of the lesser of the current market value at the time of redemption or the original purchase cost of the shares being redeemed. Class C shares that are redeemed within one year of purchase are subject to a CDSC at a rate of 1.00% of the lesser of the current market value at the time of redemption or the original purchase cost of the shares being redeemed. Proceeds from the CDSCs are paid to JH Funds and are used, in whole or in part, to defray its expenses for providing distribution-related services to the Fund in connection with the sale of Class B and Class C shares. During the year ended October 31, 2006, CDSCs received by JH Funds amounted to $8,876 for Class B shares and $2,252 for Class C shares.
The Fund has a transfer agent agreement with John Hancock Signature Services, Inc. (“Signature Services”), an indirect subsidiary of JHLICO. For Class A, Class B and Class C shares, the Fund pays a monthly transfer
Greater China Opportunities Fund
24
agent fee at an annual rate of 0.05% of each class’ average daily net asset value, plus a fee based on the number of shareholder accounts and reimbursement for certain out-of-pocket expenses, aggregated and allocated to each class on the basis of its relative net asset value. For Class I shares the Fund pays a monthly transfer agent fee at a total annual rate of 0.05% of Class I average daily net asset value. Signature Services has agreed to limit transfer agent fees on Class A, Class B and Class C shares to 0.40% of each class’s average daily net asset value, at least until February 28, 2007. Signature Services agreed to voluntarily reduce the Fund’s asset-based portion of the transfer agent fee for Class A, Class B and Class C shares if the total transfer agent fee exceeded the median transfer agency fee for comparable mutual funds by greater than 0.05% . There were no transfer agent fee reductions during the year ended October 31, 2006. Signature Servic es reserves the right to terminate this reimbursement limitation at any time.
The Fund has an agreement with the Adviser to perform necessary tax, accounting and legal services for the Fund. The compensation for the period amounted to $8,361. The Fund also paid the Adviser the amount of $759 for certain publishing services, included in the printing fees. The Fund reimbursed JHLICO for certain compliance costs, included in the Fund’s Statement of Operations.
The Adviser and other subsidiaries of JHLICO owned 470,000 Class A, 10,000 Class B, 10,000 Class C and 10,000 Class I shares of beneficial interest of the Fund on October 31, 2006.
Mr. James R. Boyle is Chairman of the Adviser, as well as affiliated Trustee of the Fund, and is compensated by the Adviser and/or its affiliates. The compensation of unaffiliated Trustees is borne by the Fund. The unaffiliated Trustees may elect to defer, for tax purposes, their receipt of this compensation under the John Hancock Group of Funds Deferred Compensation Plan. The Fund makes investments into other John Hancock funds, as applicable, to cover its liability for the deferred compensation. Investments to cover the Fund’s deferred compensation liability are recorded on the Fund’s books as an other asset. The deferred compensation liability and the related other asset are always equal and are marked to market on a periodic basis to reflect any income earned by the investments, as well as any unrealized gains or losses. The Deferred Compensation Plan investments had no impact on the operations of the Fund.
Greater China Opportunities Fund
25
Note 3
Fund share transactions
This listing illustrates the number of Fund shares sold, reinvested and repurchased during the last two periods, along with the corresponding dollar value.
| | Year ended 10-31-051 | Year ended 10-31-06 |
| | Shares | Amount | Shares | Amount |
|
| Class A shares | | | | |
|
| Sold | 1,235,094 | $12,852,805 | 4,403,727 | $61,366,745 |
| Distributions reinvested | — | — | 4,465 | 52,705 |
| Repurchased | (19,657) | (208,796) | (612,866) | (8,460,937) |
| Net increase | 1,215,437 | $12,644,009 | 3,795,326 | $52,958,513 |
| |
| |
| Class B shares | | | | |
|
| Sold | 140,806 | $1,500,503 | 1,005,055 | $13,949,422 |
| Distributions reinvested | — | — | 424 | 4,524 |
| Repurchased | (7,545) | (79,732) | (84,729) | (1,165,271) |
| Net increase | 133,261 | $1,420,771 | 920,750 | $12,788,675 |
| |
| |
| Class C shares | | | | |
|
| Sold | 116,695 | $1,239,980 | 752,789 | $10,545,210 |
| Distributions reinvested | — | — | 284 | 3,039 |
| Repurchased | (212) | (2,370) | (53,331) | (722,035) |
| Net increase | 116,483 | $1,237,610 | 699,742 | $9,826,214 |
| |
| |
| Class I shares | | | | |
|
| Sold | 10,000 | $100,000 | 233,955 | $3,432,104 |
| Distributions reinvested | — | — | 274 | 3,562 |
| Repurchased | — | — | (7,363) | (103,648) |
| Net increase | 10,000 | $100,000 | 226,866 | $3,332,018 |
| |
| |
| Net increase | 1,475,181 | $15,402,390 | 5,642,684 | $78,905,420 |
1 Beginning of operation from 6-9-05 through 10-31-05.
Note 4
Investment transactions
Purchases and proceeds from sales or maturities of securities, other than short-term securities and obligations of the U.S. government, during the year ended October 31, 2006, aggregated $97,479,697 and $26,662,326, respectively.
The cost of investments owned on October 31, 2006, including short-term investments, for federal income tax purposes was $86,933,924. Gross unrealized appreciation and depreciation of investments aggregated $15,470,381 and $1,139,020, respectively, resulting in net unrealized appreciation of $14,331,361. The difference between book basis and tax basis net unrealized appreciation of investments is attributable primarily to the tax deferral of losses on certain sales of securities.
Note 5
Reclassification of accounts
During the year ended October 31, 2006, the Fund reclassified amounts to reflect an increase in accumulated net realized gain on investments of $14,884, a decrease in accumulated net investment income of $19,619 and an increase in capital paid-in of $4,735. This represents the amounts necessary to report these balances on a tax basis, excluding certain temporary differences, as of October 31, 2006. Additional adjustments may be needed in subsequent reporting periods. These reclassifications, which have no impact on the net asset value of the Fund, are
Greater China Opportunities Fund
26
primarily attributable to certain differences in the computation of distributable income and capital gains under federal tax rules versus accounting principles generally accepted in the United States of America, book and tax differences in accounting for certain foreign currency adjustments and equalization. The calculation of net investment income per share in the Fund’s Financial Highlights excludes these adjustments.
Greater China Opportunities Fund
27
Auditors’ report
Report of Independent Registered Public Accounting Firm
To the Board of Trustees of the John Hancock Investment Trust III and Shareholders of John Hancock Greater China Opportunities Fund,
In our opinion, the accompanying statement of assets and liabilities, including the schedule of investments, and the related statements of operations and of changes in net assets and the financial highlights present fairly, in all material respects, the financial position of John Hancock Greater China Opportunity Fund (the “Fund”) as of October 31, 2006, the results of its operations, the changes in its net assets and the financial highlights for the periods then ended, in conformity with accounting principles generally accepted in the United States of America. These financial statements and financial highlights (hereafter referred to as “financial statements”) are the responsibility of the Fund’s management; our responsibility is to express an opinion on these financial statements based on our audits. We conducted our audits of these financial statements in accordance with the standards of the Public Company Accounting Oversight Board (United States). Those standards require that we plan and perform the audit to obtain reasonable assurance about whether the financial statements are free of material misstatement. An audit includes examining, on a test basis, evidence supporting the amounts and disclosures in the financial statements, assessing the accounting principles used and significant estimates made by management, and evaluating the overall financial statement presentation. We believe that our audits, which included confirmation of securities as of October 31, 2006 by correspondence with the custodian and brokers, provide a reasonable basis for our opinion.
PricewaterhouseCoopers LLP
Boston, Massachusetts
December 13, 2006
28
Tax information
Unaudited
For federal income tax purposes, the following information is furnished with respect to the distributions of the Fund, if any, paid during its taxable year ended October 31, 2006.
The Fund has designated distributions to shareholders of $2,608 as a long-term capital gain dividend.
With respect to the ordinary dividends paid by the Fund for the fiscal year ended October 31, 2006, 18.76% of the dividends qualifies for the corporate dividends-received deduction.
The Fund hereby designates the maximum amount allowable of its net taxable income as qualified dividend income as provided in the Jobs and Growth Tax Relief Reconciliation Act of 2003. This amount will be reflected on Form 1099-DIV for the calendar year 2006.
Shareholders will be mailed a 2006 U.S. Treasury Department Form 1099-DIV in January 2007. This will reflect the total of all distributions that are taxable for calendar year 2006.
29
Board Consideration of and Continuation of Investment Advisory Agreement and Sub-Advisory Agreement: John Hancock Greater China Opportunities Fund
The Investment Company Act of 1940 (the “1940 Act”) requires the Board of Trustees (the “Board”) of John Hancock Investment Trust III (the “Trust”), including a majority of the Trustees who have no direct or indirect interest in the investment advisory agreement and are not “interested persons” of the Trust, as defined in the 1940 Act (the “Independent Trustees”), annually to review and consider the continuation of: (i) the investment advisory agreement (the “Advisory Agreement”) with John Hancock Advisers, LLC (the “Adviser”) and (ii) the investment sub-advisory agreement (the “Sub-Advisory Agreement”) with MFC Global Investment Management (U.S.A.), Limited (the “Sub-Adviser”) for the John Hancock Greater China Opportunities Fund (the “Fund”). The Advisory Agreement and the Sub-Advisory Agreement are collectively referred to as the “Advisory Agreements.”
At meetings held on May 1-2 and June 5-6, 2006,1 the Board considered the factors and reached the conclusions described below relating to the selection of the Adviser and Sub-Adviser and the continuation of the Advisory Agreements. During such meetings, the Board’s Contracts/Operations Committee and the Independent Trustees also met in executive sessions with their independent legal counsel.
In evaluating the Advisory Agreements, the Board, including the Contracts/Operations Committee and the Independent Trustees, reviewed a broad range of information requested for this purpose by the Independent Trustees, including: (i) the investment performance of the Fund relative to a category of relevant funds (the “Category”) and a peer group of comparable funds (the “Peer Group”) each selected by Morningstar Inc. (“Morningstar”), an independent provider of investment company data, for a range of periods ended December 31, 2005; (ii) advisory and other fees incurred by, and the expense ratios of, the Fund relative to a Category and a Peer Group; (iii) the advisory fees of comparable portfolios of other clients of the Adviser and the Sub-Adviser; (iv) the Adviser’s financial results and condition, including its and certain of its affiliates’ profitability from services performed for the Fund; (v) br eakpoints in the Fund’s and the Peer Group’s fees, and information about economies of scale; (vi) the Adviser’s and Sub-Adviser’s record of compliance with applicable laws and regulations, with the Fund’s investment policies and restrictions and with the applicable Code of Ethics, and the structure and responsibilities of the Adviser’s and Sub-Adviser’s compliance department; (vii) the background and experience of senior management and investment professionals and (viii) the nature, cost and character of advisory and non-investment management services provided by the Adviser and its affiliates and by the Sub-Adviser.
The Board’s review and conclusions were based on a comprehensive consideration of all information presented to the Board and not the result of any single controlling factor. It was based on performance and other information as of December 31, 2005; facts may have changed between that date and the date of this shareholders report. The key factors considered by the Board and the conclusions reached are described below.
Nature, extent and quality of services
The Board considered the ability of the Adviser and the Sub-Adviser, based on their resources, reputation and other attributes, to attract and retain qualified investment professionals, including research, advisory and supervisory personnel. The Board further considered the compliance programs and compliance records of the Adviser and Sub-Adviser. In addition, the Board took into account the administrative services provided to the Fund by the Adviser and its affiliates.
Based on the above factors, together with those referenced below, the Board concluded that, within the context of its full deliberations, the nature, extent and quality of the investment advisory services provided to the Fund by the Adviser and Sub-Adviser were sufficient to support renewal of the Advisory Agreements.
30
Fund performance
The Board recognized that the Fund had less than one year of operational history and, therefore, did not receive a comparative analysis of the Fund’s investment performance from Morningstar.
Investment advisory fee and sub-advisory fee rates and expenses
The Board reviewed and considered the contractual investment advisory fee rate payable by the Fund to the Adviser for investment advisory services (the “Advisory Agreement Rate”). The Board received and considered information comparing the Advisory Agreement Rate with the advisory fees for the Peer Group and Category. The Board noted that the Advisory Agreement Rate was equal to the median rate of the Peer Group and not appreciably higher than the median rate of the Category.
The Board received and considered expense information regarding the Fund’s various components, including advisory fees, distribution and fees other than advisory and distribution fees, including transfer agent fees, custodian fees and other miscellaneous fees (e.g., fees for accounting and legal services). The Board considered comparisons of these expenses to the Peer Group median. The Board also received and considered expense information regarding the Fund’s total operating expense ratio (“Gross Expense Ratio”) and total operating expense ratio after taking the fee waiver arrangement applicable to the Advisory Agreement Rate into account (“Net Expense Ratio”). The Board received and considered information comparing the Gross Expense Ratio and Net Expense Ratio of the Fund to that of the Peer Group and Category medians. The Board noted that the Fund’s Gross Expense Ratio was higher than the median of its Category and Peer Group. The Bo ard also noted that the Fund’s Net Expense Ratio was higher than the median of its Category and lower than the median of its Peer Group. The Board favorably considered the impact of fee caps towards ultimately lowering the Fund’s total operating expense ratio.
The Adviser also discussed the Morningstar data and rankings, and other relevant information, for the Fund. Based on the above-referenced considerations and other factors, the Board concluded that the Fund’s overall expenses supported the re-approval of the Advisory Agreements.
The Board also received information about the investment sub-advisory fee rate (the “Sub-Advisory Agreement Rate”) payable by the Adviser to the Sub-Adviser for investment sub-advisory services. The Board concluded that the Sub-Advisory Agreement Rate was fair and equitable, based on its consideration of the factors described here.
Profitability
The Board received and considered a detailed profitability analysis of the Adviser based on the Advisory Agreements, as well as on other relationships between the Fund and the Adviser and its affiliates, including the Sub-Adviser. The Board concluded that, in light of the costs of providing investment management and other services to the Fund, the profits and other ancillary benefits reported by the Adviser were not unreasonable.
Economies of scale
The Board received and considered general information regarding economies of scale with respect to the management of the Fund, including the Fund’s ability to appropriately benefit from economies of scale under the Fund’s fee structure. The Board recognized the inherent limitations of any analysis of economies of scale, stemming largely from the Board’s understanding that most of the Adviser’s costs are not specific to individual Funds, but rather are incurred across a variety of products and services.
Information about services to other clients
The Board also received information about the nature, extent and quality of services and fee rates offered by the Adviser and Sub-Adviser to their other clients, including other registered investment companies, institutional investors and separate accounts. The Board concluded that the Advisory Agreement Rate and the Sub-Advisory Agreement Rate were not unreasonable, taking into account fee rates offered to others by the Adviser and Sub-Adviser, respectively, after giving effect to differences in services.
31
Other benefits to the Adviser
The Board received information regarding potential “fall-out” or ancillary benefits received by the Adviser and its affiliates as a result of the Adviser’s relationship with the Fund. Such benefits could include, among others, benefits directly attributable to the relationship of the Adviser with the Fund and benefits potentially derived from an increase in the business of the Adviser as a result of its relationship with the Fund (such as the ability to market to shareholders other financial products offered by the Adviser and its affiliates).
The Board also considered the effectiveness of the Adviser’s, Sub-Adviser’s and Fund’s policies and procedures for complying with the requirements of the federal securities laws, including those relating to best execution of portfolio transactions and brokerage allocation.
Other factors and broader review
As discussed above, the Board reviewed detailed materials received from the Adviser and Sub-Adviser as part of the annual re-approval process. The Board also regularly reviews and assesses the quality of the services that the Fund receives throughout the year. In this regard, the Board reviews reports of the Adviser and Sub-Adviser at least quarterly, which include, among other things, fund performance reports and compliance reports. In addition, the Board meets with portfolio managers and senior investment officers at various times throughout the year.
After considering the above-described factors and based on its deliberations and its evaluation of the information described above, the Board concluded that approval of the continuation of the Advisory Agreements for the Fund was in the best interest of the Fund and its shareholders. Accordingly, the Board unanimously approved the continuation of the Advisory Agreements.
1 The Board previously considered information about the Sub-Advisory Agreement at the September and December 2005 Board meetings in connection with the Adviser’s reorganization.
32
Trustees and Officers
This chart provides information about the Trustees and Officers who oversee your John Hancock fund. Officers elected by the Trustees manage the day-to-day operations of the Fund and execute policies formulated by the Trustees.
| Independent Trustees | | |
| |
| Name, age | | Number of |
| Position(s) held with Fund | Trustee | John Hancock |
| Principal occupation(s) and other | of Fund | funds overseen |
| directorships during past 5 years | since1 | by Trustee |
|
| Ronald R. Dion , Born: 1946 | 2005 | 53 |
| Independent Chairman (since 2005); Chairman and Chief Executive Officer, | | |
| R.M. Bradley & Co., Inc.; Director, The New England Council and Massachusetts | |
| Roundtable; Trustee, North Shore Medical Center; Director, Boston Stock | | |
| Exchange; Director, BJ’s Wholesale Club, Inc. and a corporator of the Eastern | | |
| Bank; Trustee, Emmanuel College; Director, Boston Municipal Research Bureau; | |
| Member of the Advisory Board, Carroll Graduate School of Management at | | |
| Boston College. | | |
|
| |
| James F. Carlin, Born: 1940 | 2005 | 53 |
| Director and Treasurer, Alpha Analytical Laboratories Inc. (chemical analysis) | | |
| (since 1985); Part Owner and Treasurer, Lawrence Carlin Insurance Agency, | | |
| Inc. (since 1995); Part Owner and Vice President, Mone Lawrence Carlin | | |
| Insurance Agency, Inc. (until 2005); Director and Treasurer, Rizzo Associates | | |
| (engineering) (until 2000); Chairman and CEO, Carlin Consolidated, Inc. | | |
| (management/investments) (since 1987); Director and Partner, Proctor Carlin | | |
| & Co., Inc. (until 1999); Trustee, Massachusetts Health and Education Tax | | |
| Exempt Trust (since 1993); Director of the following: Uno Restaurant Corp. | | |
| (until 2001), Arbella Mutual (insurance) (until 2000), HealthPlan Services, Inc. | | |
| (until 1999), Flagship Healthcare, Inc. (until 1999), Carlin Insurance Agency, Inc. | |
| (until 1999); Chairman, Massachusetts Board of Higher Education (until 1999). | |
|
| |
| Richard P. Chapman, Jr.,2 Born: 1935 | 2005 | 53 |
| President and Chief Executive Officer, Brookline Bancorp, Inc. (lending) (since | | |
| 1972); Chairman and Director, Lumber Insurance Co. (insurance) (until 2000); | | |
| Chairman and Director, Northeast Retirement Services, Inc. (retirement | | |
| administration) (since 1998); Vice Chairman, Northeastern University Board | | |
| of Trustees (since 2004). | | |
|
| |
| William H. Cunningham, Born: 1944 | 2005 | 158 |
| Former Chancellor, University of Texas System and former President of the | | |
| University of Texas, Austin, Texas; Chairman and CEO, IBT Technologies (until | | |
| 2001); Director of the following: Hire.com (until 2004), STC Broadcasting, Inc. | | |
| and Sunrise Television Corp. (until 2001), Symtx, Inc. (electronic manufacturing) | |
| (since 2001), Adorno/Rogers Technology, Inc. (until 2004), Pinnacle Foods | | |
| Corporation (until 2003), rateGenius (until 2003), Lincoln National Corporation | |
| (insurance) (since 2006), Jefferson-Pilot Corporation (diversified life insurance | | |
| company) (until 2006), New Century Equity Holdings (formerly Billing Concepts) | |
33
| Independent Trustees (continued) | | |
| |
| Name, age | | Number of |
| Position(s) held with Fund | Trustee | John Hancock |
| Principal occupation(s) and other | of Fund | funds overseen |
| directorships during past 5 years | since1 | by Trustee |
|
| William H. Cunningham, Born: 1944 (continued) | 2005 | 158 |
| (until 2001), eCertain (until 2001), ClassMap.com (until 2001), Agile Ventures | | |
| (until 2001), AskRed.com (until 2001), Southwest Airlines, Introgen and | | |
| Viasystems Group, Inc. (electronic manufacturer) (until 2003); Advisory | | |
| Director, Interactive Bridge, Inc. (college fundraising) (until 2001); Advisory | | |
| Director, Q Investments (until 2003); Advisory Director, JPMorgan Chase Bank | | |
| (formerly Texas Commerce Bank – Austin), LIN Television (since 2002), WilTel | | |
| Communications (until 2003) and Hayes Lemmerz International, Inc. | | |
| (diversified automotive parts supply company) (since 2003). | | |
|
| |
| Charles L. Ladner,2 Born: 1938 | 2005 | 158 |
| Chairman and Trustee, Dunwoody Village, Inc. (retirement services) (until 2003); | |
| Senior Vice President and Chief Financial Officer, UGI Corporation (public utility | |
| holding company) (retired 1998); Vice President and Director for AmeriGas, Inc. | |
| (retired 1998); Director of AmeriGas Partners, L.P. (gas distribution) (until 1997); | |
| Director, EnergyNorth, Inc. (until 1995); Director, Parks and History Association | |
| (until 2007). | | |
|
| |
| John A. Moore,2 Born: 1939 | 2005 | 53 |
| President and Chief Executive Officer, Institute for Evaluating Health Risks, | | |
| (nonprofit institution) (until 2001); Senior Scientist, Sciences International | | |
| (health research) (until 2003); Former Assistant Administrator and Deputy | | |
| Administrator, Environmental Protection Agency; Principal, Hollyhouse | | |
| (consulting) (since 2000); Director, CIIT Center for Health Science Research | | |
| (nonprofit research) (since 2002). | | |
|
| |
| Patti McGill Peterson,2 Born: 1943 | 2005 | 53 |
| Executive Director, Council for International Exchange of Scholars and Vice | | |
| President, Institute of International Education (since 1998); Senior Fellow, Cornell | |
| Institute of Public Affairs, Cornell University (until 1998); Former President of | | |
| Wells College and St. Lawrence University; Director, Niagara Mohawk Power | | |
| Corporation (until 2003); Director, Ford Foundation, International Fellowships | | |
| Program (since 2002); Director, Lois Roth Endowment (since 2002); Director, | | |
| Council for International Educational Exchange (since 2003). | | |
|
| |
| Steven R. Pruchansky, Born: 1944 | 2005 | 53 |
| Chairman and Chief Executive Officer, Greenscapes of Southwest Florida, Inc. | | |
| (since 2000); Director and President, Greenscapes of Southwest Florida, Inc. | | |
| (until 2000); Managing Director, JonJames, LLC (real estate) (since 2001); | | |
| Director, First Signature Bank & Trust Company (until 1991); Director, Mast | | |
| Realty Trust (until 1994); President, Maxwell Building Corp. (until 1991). | | |
34
| Non-Independent Trustee3 | | |
| |
| Name, age | | Number of |
| Position(s) held with Fund | Trustee | John Hancock |
| Principal occupation(s) and other | of Fund | funds overseen |
| directorships during past 5 years | since1 | by Trustee |
|
| James R. Boyle, Born: 1959 | 2005 | 260 |
| President, John Hancock Annuities; Executive Vice President, John Hancock | | |
| Life Insurance Company (since June, 2004); Chairman and Director, John | | |
| Hancock Advisers, LLC (the “Adviser”), John Hancock Funds, LLC and The | | |
| Berkeley Financial Group, LLC (“The Berkeley Group”) (holding company) (since | |
| 2005); President, U.S. Annuities; Senior Vice President, The Manufacturers | | |
| Life Insurance Company (U.S.A.) (until 2004). | | |
| |
| Principal officers who are not Trustees | | |
| |
| Name, age | | |
| Position(s) held with Fund | | Officer |
| Principal occupation(s) and | | of Fund |
| directorships during past 5 years | | since |
|
| Keith F. Hartstein, Born: 1956 | | 2005 |
| President and Chief Executive Officer | | |
| Senior Vice President, Manulife Financial Corporation (since 2004); Director, | | |
| President and Chief Executive Officer, the Adviser, The Berkeley Group, John | | |
| Hancock Funds, LLC (since 2005); Director, MFC Global Investment Management | |
| (U.S.), LLC (“MFC Global (U.S.)”) (since 2005); Director, John Hancock Signature | |
| Services, Inc. (since 2005); President and Chief Executive Officer, John Hancock | |
| Investment Management Services, LLC (since 2006); President and Chief Executive | |
| Officer, John Hancock Funds II, John Hancock Funds III and John Hancock Trust; | |
| Director, Chairman and President, NM Capital Management, Inc. (since 2005); | | |
| Chairman, Investment Company Institute Sales Force Marketing Committee | | |
| (since 2003); Director, President and Chief Executive Officer, MFC Global (U.S.) | |
| (2005–2006); Executive Vice President, John Hancock Funds, LLC (until 2005). | | |
|
| |
| Thomas M. Kinzler, Born: 1955 | | 2006 |
| Secretary and Chief Legal Officer | | |
| Vice President and Counsel, John Hancock Life Insurance Company (U.S.A.) | | |
| (since 2006); Secretary and Chief Legal Officer, John Hancock Funds, John | | |
| Hancock Funds II, John Hancock Funds III and John Hancock Trust (since 2006); | |
| Vice President and Associate General Counsel, Massachusetts Mutual Life | | |
| Insurance Company (1999–2006); Secretary and Chief Legal Counsel, MML | | |
| Series Investment Fund (2000–2006); Secretary and Chief Legal Counsel, | | |
| MassMutual Institutional Funds (2000–2004); Secretary and Chief Legal Counsel, | |
| MassMutual Select Funds and MassMutual Premier Funds (2004–2006). | | |
|
| |
| Francis V. Knox, Jr., Born: 1947 | | 2005 |
| Chief Compliance Officer | | |
| Vice President and Chief Compliance Officer, John Hancock Investment | | |
| Management Services, LLC, the Adviser and MFC Global (U.S.) (since 2005); | | |
| Vice President and Chief Compliance Officer, John Hancock Funds II, John | | |
| Hancock Funds III and John Hancock Trust (since 2005); Vice President and | | |
| Assistant Treasurer, Fidelity Group of Funds (until 2004); Vice President and | | |
| Ethics & Compliance Officer, Fidelity Investments (until 2001). | | |
35
| Principal officers who are not Trustees (continued) | |
| |
| Name, age | |
| Position(s) held with Fund | Officer |
| Principal occupation(s) and | of Fund |
| directorships during past 5 years | since |
|
| Gordon M. Shone, Born: 1956 | 2006 |
| Treasurer | |
| Treasurer, John Hancock Funds (since 2006), John Hancock Funds II, John | |
| Hancock Funds III and John Hancock Trust (since 2005); Vice President and | |
| Chief Financial Officer, John Hancock Trust (2003–2005); Senior Vice President, | |
| John Hancock Life Insurance Company (U.S.A.) (since 2001); Vice President, | |
| John Hancock Investment Management Services, Inc., John Hancock Advisers, | |
| LLC (since 2006) and The Manufacturers Life Insurance Company (U.S.A.) | |
| (1998–2000). | |
|
| |
| John G. Vrysen, Born: 1955 | 2005 |
| Chief Financial Officer | |
| Director, Executive Vice President and Chief Financial Officer, the Adviser, The | |
| Berkeley Group and John Hancock Funds, LLC (since 2005); Executive Vice | |
| President and Chief Financial Officer, John Hancock Investment Management | |
| Services, LLC (since 2005); Vice President and Chief Financial Officer, MFC Global | |
| (U.S.) (since 2005); Director, John Hancock Signature Services, Inc. (since 2005); | |
| Chief Financial Officer, John Hancock Funds II, John Hancock Funds III and John | |
| Hancock Trust (since 2005); Vice President and General Manager, Fixed Annuities, | |
| U.S. Wealth Management (until 2005); Vice President, Operations, Manulife | |
| Wood Logan (2000–2004). | |
The business address for all Trustees and Officers is 601 Congress Street, Boston, Massachusetts 02210-2805.
The Statement of Additional Information of the Fund includes additional information about members of the Board of Trustees of the Fund and is available, without charge, upon request, by calling 1-800-225-5291.
1Each Trustee serves until resignation, retirement age or until his or her successor is elected.
2Member of Audit Committee.
3Non-Independent Trustee holds positions with the Fund’s investment adviser, underwriter and certain other affiliates.
36
For more information
The Fund’s proxy voting policies, procedures and records are available without charge, upon request:
| By phone | On the Fund’s Web site | On the SEC’s Web site |
| 1-800-225-5291 | www.jhfunds.com/proxy | www.sec.gov |
|
| |
| Investment adviser | Custodian | Legal counsel |
| John Hancock Advisers, LLC | The Bank of New York | Kirkpatrick & Lockhart |
| 601 Congress Street | One Wall Street | Nicholson Graham LLP |
| Boston, MA 02210-2805 | New York, NY 10286 | 1 Lincoln Street |
| | | Boston, MA 02110-2950 |
| Subadviser | Transfer agent | |
| MFC Global Investment | John Hancock Signature | Independent registered |
| Management (U.S.A.) Limited | Services, Inc. | public accounting firm |
| 200 Bloor Street East | 1 John Hancock Way, | PricewaterhouseCoopers LLP |
| Toronto, Ontario, Canada | Suite 1000 | 125 High Street |
| M4W 1E5 | Boston, MA 02217-1000 | Boston, MA 02110 |
| Principal distributor | | |
| John Hancock Funds, LLC | | |
| 601 Congress Street | | |
| Boston, MA 02210-2805 | | |
The Fund’s investment objective, risks, charges and expenses are included in the prospectus and should be considered carefully before investing. For a prospectus, call your financial professional, call John Hancock Funds at 1-800-225-5291 or visit the Fund’s Web site at www.jhfunds.com. Please read the prospectus carefully before investing or sending money.
| How to contact us | |
|
| |
| Internet | www.jhfunds.com | |
|
| |
| Mail | Regular mail: | Express mail: |
| | John Hancock | John Hancock |
| | Signature Services, Inc. | Signature Services, Inc. |
| | 1 John Hancock Way, Suite 1000 | Mutual Fund Image Operations |
| | Boston, MA 02217-1000 | 380 Stuart Street |
| | | Boston, MA 02116 |
|
| |
| Phone | Customer service representatives | 1-800-225-5291 |
| | 24-hour automated information | 1-800-338-8080 |
| | TDD line | 1-800-554-6713 |
A listing of month-end portfolio holdings is available on our Web site, www.jhfunds.com. A more detailed portfolio holdings summary is available on a quarterly basis 60 days after the fiscal quarter on our Web site or upon request by calling 1-800-225-5291, or on the Securities and Exchange Commission’s Web site, www.sec.gov.
40
J O H N H A N C O C K F A M I L Y O F
F U N D S
| EQUITY | INTERNATIONAL |
| Balanced Fund | Greater China Opportunities Fund |
| Classic Value Fund | International Classic Value Fund |
| Classic Value Fund II | International Core Fund |
| Core Equity Fund | International Fund |
| Focused Equity Fund | International Growth Fund |
| Growth Fund | |
| Growth Opportunities Fund | INCOME |
| Growth Trends Fund | Bond Fund |
| Intrinsic Value Fund | Government Income Fund |
| Large Cap Equity Fund | High Yield Fund |
| Large Cap Select Fund | Investment Grade Bond Fund |
| Mid Cap Equity Fund | Strategic Income Fund |
| Mid Cap Growth Fund | |
| Multi Cap Growth Fund | TAX- FREE INCOME |
| Small Cap Equity Fund | California Tax-Free Income Fund |
| Small Cap Fund | High Yield Municipal Bond Fund |
| Small Cap Intrinsic Value Fund | Massachusetts Tax-Free Income Fund |
| Sovereign Investors Fund | New York Tax-Free Income Fund |
| U.S. Core Fund | Tax-Free Bond Fund |
| U.S. Global Leaders Growth Fund | |
| Value Opportunities Fund | MONEY MARKET |
| | Money Market Fund |
| ASSET ALLOCATION & LIFESTYLE | U.S. Government Cash Reserve |
| Allocation Core Portfolio | |
| Allocation Growth + Value Portfolio | CLOSED-END |
| Lifestyle Aggressive Portfolio | Bank & Thrift Opportunity |
| Lifestyle Balanced Portfolio | Financial Trends |
| Lifestyle Conservative Portfolio | Income Securities |
| Lifestyle Growth Portfolio | Investors Trust |
| Lifestyle Moderate Portfolio | Patriot Global Dividend |
| | Patriot Preferred Dividend |
| SECTOR | Patriot Premium Dividend I |
| Financial Industries Fund | Patriot Premium Dividend II |
| Health Sciences Fund | Patriot Select Dividend |
| Real Estate Fund | Preferred Income |
| Regional Bank Fund | Preferred Income II |
| Technology Fund | Preferred Income III |
| Technology Leaders Fund | Tax-Advantaged Dividend |
For more complete information on any John Hancock Fund and an Open-End fund prospectus, which includes charges and expenses, call your financial professional, or John Hancock Funds at 1-800-225-5291 for Open-End fund information and 1-800-852-0218 for Closed-End fund information. Please read the Open-End fund prospectus carefully before investing or sending money.

1-800-225-5291
1-800-554-6713 (TDD)
1-800-338-8080 EASI-Line
www.jhfunds. com
Now available: electronic delivery
www.jhfunds.com/edelivery
This report is for the information of the shareholders of John Hancock Greater China Opportunities Fund.
0800A 10/06
12/06

CEO corner

| TABLE OF CONTENTS |
|
| |
| Your fund at a glance |
| page 1 |
|
| |
| Manager’s report |
| page 2 |
|
| |
| A look at performance |
| page 6 |
|
| |
| Your expenses |
| page 8 |
|
| |
| Fund’s investments |
| page 1 0 |
|
| |
| Financial statements |
| page 1 3 |
|
| |
| Notes to financial |
| statements |
| page 2 0 |
|
| |
| Trustees and officers |
| page 3 0 |
|
| |
| For more information |
| page 3 6 |
|
To Our Shareholders,
The future has arrived at John Hancock Funds.
We have always been firm believers in the powerful role the Internet can play in providing fund information to our shareholders and prospective investors. Recently, we launched a redesigned, completely overhauled Web site that is more visually pleasing, easier to navigate and, most importantly, provides more fund information and learning tools without overwhelming the user.
Not long after we embarked on this major project, a study was released by the Investment Company Institute, the mutual fund industry’s main trade group, which found that an overwhelming majority of shareholders consider the Internet the “wave of the future” for accessing fund information.
Our new site sports fresher and faster ways to access account information. New innovations allow investors to view funds by risk level, track the performance of the John Hancock funds of their choice or sort funds by Morningstar, Inc.’s star ratings. Investors who own a John Hancock fund through a qualified retirement plan and don’t pay sales charges when making a purchase have the option of sorting by a “Load Waived” Morningstar Rating, thereby creating an apples-to-apples comparison with no-load funds that may also be available in their retirement plan.
The new site also has more educational tools and interactive modules to educate and assist investors with their financial goals, from college savings to retirement planning. A new “I want to…” feature allows investors to check performance, invest more money, update personal information or download prospectuses and forms quickly and easily.
In another of our ongoing efforts to provide our shareholders with top-notch service, we also redesigned our shareholder reports, as you may have noticed with this report. We hope the larger size, more colorful cover and redesigned presentation of the commentary and data tables will draw you in and make them easier to read.
After you’ve read your shareholder report, we encourage you to visit our new Web site — www.jhfunds.com — and take a tour. It’s easy, fast and fun and allows you to be in control of what you see and do. In short, it’s the wave of the future!
Sincerely,

Keith F. Hartstein,
President and Chief Executive Officer
This commentary reflects the CEO’s views as of October 31, 2006. They are subject to change at any time.
Your fund at a glance
The Fund seeks long-term capital appreciation by investing at least 80% of its assets in stocks of medium-capitalization companies (in the capitalization range of the Russell Midcap Growth Index) with above-average earnings growth.
Over the last twelve months
► The stock market posted strong gains, benefiting from an end to interest rate hikes and a decline in oil prices late in the period.
► Mid-cap stocks came out a bit ahead of large caps and slightly behind small caps.
► Technology and consumer discretionary stocks aided the Fund’s returns, while energy and health care investments detracted from performance.
John Hancock Mid Cap Growth Fund
Fund performance for the year ended October 31, 2006.
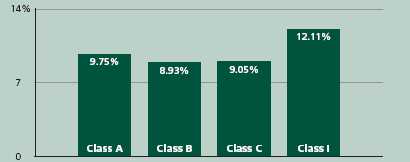
Total returns for the Fund are at net asset value with all distributions reinvested. These returns do not reflect the deduction of the maximum sales charge, which would reduce the performance shown above.
| Top 10 holdings | | | |
| Jarden Corp. | 6.5% | Gen-Probe, Inc. | 4.2% |
|
| Varian Semiconductor Equipment | | Trident Microsystems, Inc. | 4.1% |
|
|
| Associates, Inc. | 5.2% | Coach, Inc. | 4.0% |
|
| Comverse Technology, Inc. | 5.2% | Abercrombie & Fitch Co. (Class A) | 3.8% |
|
| Sotheby’s Holdings, Inc. (Class A) | 5.0% | Advance Auto Parts, Inc. | 3.7% |
|
| Quality Systems, Inc. | 4.7% | | |
| |
As a percentage of net assets on October 31, 2006.
1
Manager’s report
John Hancock
Mid Cap Growth Fund
Stocks posted strong gains for the year ended October 31, 2006, with the Standard & Poor’s 500 Index, a broad measure of the market’s performance, returning 16.34% . The market advanced nicely during the first half of the period, despite rising interest rates and climbing energy prices. Stocks, however, abruptly reversed course in May and early June, pressured by a global liquidity crunch and uncertainty over the Federal Reserve’s next move. The market rebounded over the summer, buoyed by the Fed’s decision to leave interest rates unchanged. Late in the summer, oil prices fell, as investors anticipated slower global economic growth, saw supply from the Gulf Coast come back on line and became less concerned about possible supply disruptions in the Middle East. The expectation of lower energy costs for both consumers and corporations helped spark a strong rally in October that brought the Dow Jones Ind ustrial Average to new highs. Stocks of all sizes benefited, with mid- and small-cap stocks coming out modestly ahead of large-cap issues for the year, and value stocks beating more expensive growth stocks.
Performance and strategy review
John Hancock Mid Cap Growth Fund’s Class A, Class B, Class C and Class I shares returned 9.75%, 8.93%, 9.05% and 12.11%, respectively, at net asset value for the 12 months ended October 31, 2006. These gains fell behind the 11.88% average return for the Morningstar group
SCORECARD
| INVESTMENT | | PERIOD’S PERFORMANCE... AND WHAT’S BEHIND THE NUMBERS |
| Sotheby’s Holdings | ▲ | Cost restructuring, strong art cycle |
| Rigel | ▼ | Disappointing clinical trials for new allergy drug |
| Pharmaceuticals | | |
| Grant Prideco | ▼ | Declining oil prices, decreased demand for services |
2

Portfolio Manager, MFC Global Investment Management (U.S.), LLC
Thomas P. Norton, CFA
“Stock selection in the technology
and consumer discretionary
sectors gave the biggest boost to
performance.”
of mid-cap growth funds over the same period.1 In addition, the Fund’s performance trailed the 14.51% return for the Russell Midcap Growth Index. Keep in mind that your net asset value return will be different from the Fund’s if you were not invested in the Fund for the entire period and did not reinvest all distributions. Long-term performance can be found on pages six and seven.
The Fund specifically targeted mid-cap companies with above-average earnings and revenue growth potential, sustainable competitive advantages and improving returns on invested capital. In addition, we looked for stocks with reasonable valuations. We continued to build the portfolio from the bottom up, using quantitative screens to help us identify potential opportunities and then narrowing our focus through our own research.
Strong returns from technology and consumer discretionary
Stock selection in the technology and consumer discretionary sectors gave the biggest boost to performance. In technology, Redback Networks, Inc. and MEMC Electronic Materials, Inc. were standouts. Redback, which makes routers used in wireless and wireline networks, benefited from improved product offerings that helped it gain ground over its competitors. MEMC Electronic sells polysilica, the raw material used to make the wafers on which semiconductors are imprinted. It also manufactures finished wafers. MEMC’s stock price climbed, as industry supply constraints drove up pricing for wafers and as the company began supplying finished wafers to the solar industry. The Fund also benefited from having an above-average stake in the technology sector, where returns outpaced those of the Russell index.
Mid Cap Growth Fund
3
In the consumer discretionary sector, some of our biggest winners were restructuring stories. Art auctioneer Sotheby’s Holdings, Inc., continued to benefit from a cost restructuring as well as a strong art cycle. Retailer Abercrombie & Fitch Co. saw strong gains after cutting costs and picking the right fashions to drive strong same-store sales. Starwood Hotels & Resorts Worldwide, Inc. saw profit margins and return on invested capital rise as the company sold some of its properties and began operating them for a fee. In addition, growth in the company’s time sharing business benefited returns.
Added gains from individual stock selection
Other top contributors to performance came from an array of sectors. Monster Worldwide, Inc., an Internet job-search company, benefited from growing demand for its services as well as the sale of some unrelated divisions. Cephalon, Inc. a biotechnology/pharmaceutical company that specializes in treatments for sleep and neurological disorders, had a strong run as the company came closer to gaining approval from the Food and Drug Administration for some new drugs. Phelps Dodge Corp., a leading copper company, also rallied nicely as increased demand and supply constraints drove commodity prices higher. We took profits and sold both Monster and Phelps Dodge.
Disappointing returns from energy and health care stocks
Investments in the energy and health care sectors, which did not perform as expected, caused the Fund to fall behind the index and its peer group. The Fund had an above-average stake in energy stocks, which were hurt by declining oil prices late in the period. Detractors included Grant Prideco, Inc., an energy service company that met or beat its earnings estimates throughout the year, but fell along with the sector. In health care, Rigel Pharmaceuticals, Inc. and PDL BioPharma, Inc. suffered steep downturns as promising drugs in development faltered. We sold Rigel, but kept PDL because of its strong royalty revenue stream. Selected stocks in the consumer discretionary sector also pressured performance. They included XM Satellite Radio Holdings, Inc. and Urban Outfitters, Inc. XM took a nosedive as subscriber growth slowed and the company ran into regulatory issues that slowed approvals for its new portable radios. XM also lost ground when popular radio personality Howard Stern signed with competitor Sirius Satellite (not in the portfolio).
| SECTOR DISTRIBUTION2 |
| Consumer discretionary | 35% |
| Information technology | 30% |
| Energy | 12% |
| Health care | 8% |
| Industrials | 6% |
| Materials | 3% |
| Consumer staples | 3% |
| Financials | 3% |
Mid Cap Growth Fund
4
Urban Outfitters, a retailer with a history of very strong earnings and revenue growth, declined because of a misstep with its fashion mix.
“The Fund had an above-average
stake in energy stocks, which
were hurt by declining oil prices
late in the period.”
Prone to optimism
As we look ahead to the coming year, we feel more optimistic than pessimistic. Oil prices seem to be headed down, which should lower costs and boost corporate profit margins. We also believe a more favorable interest rate environment could help stock returns. By period end, the Fed had met three times without raising rates, a sign that the days of interest rate hikes might be over. Looking ahead, we believe inflation numbers could fall, especially given that third quarter gross domestic product numbers were weaker than expected. We plan to monitor economic indicators closely for signs of a slowdown worldwide, while remaining focused on mid-cap companies with established businesses and strong earnings growth track records that can do well in any market environment.
This commentary reflects the views of the portfolio manager through the end of the Fund’s period discussed in this report. The manager’s statements reflect his own opinions. As such, they are in no way guarantees of future events, and are not intended to be used as investment advice or a recommendation regarding any specific security. They are also subject to change at any time as market and other conditions warrant.
1 Figures from Morningstar, Inc. include reinvested dividends and do not take into account sales charges. Actual load-adjusted performance is lower.
2 As a percentage of net assets on October 31, 2006.
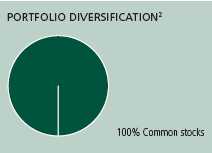
Mid Cap Growth Fund
5
A look at performance
For the periods ending October 31, 2006
| | | Average annual returns | | Cumulative total returns | | |
| | | with maximum sales charge (POP) | with maximum sales charge (POP) | |
| | Inception | | | | Since | | | | Since |
| Class | date | 1-year | 5-year | 10-year | inception | 1-year | 5-year | 10-year | inception |
|
| A | 11-1-93 | 4.24% | 5.59% | 2.00% | — | 4.24% | 31.27% | 21.92% | — |
|
| B | 11-1-93 | 3.93 | 5.61 | 1.95 | — | 3.93 | 31.38 | 21.27 | — |
|
| C | 6-1-98 | 8.05 | 5.95 | — | 0.86% | 8.05 | 33.52 | — | 7.52% |
|
| I1 | 3-1-02 | 12.11 | — | — | 6.83 | 12.11 | — | — | 36.15 |
|
Performance figures assume all distributions are reinvested. Returns with maximum sales charge reflect a sales charge on Class A shares of 5% and the applicable contingent deferred sales charge (CDSC) on Class B and Class C shares. The returns for Class C shares have been adjusted to reflect the elimination of the front-end sales charge effective July 15, 2004. The Class B shares’ CDSC declines annually between years 1–6 according to the following schedule: 5, 4, 3, 3, 2, 1%. No sales charge will be assessed after the sixth year. Class C shares held for less than one year are subject to a 1% CDSC. Sales charge is not applicable for Class I shares.
The returns reflect past results and should not be considered indicative of future performance. The return and principal value of an investment will fluctuate so that shares, when redeemed, may be worth more or less than their original cost. Due to market volatility, the Fund’s current performance may be higher or lower than the performance shown. For performance data current to the most recent month end, please call 1-800-225-5291 or visit the Fund’s Web site at www.jhfunds.com.
The performance table above and the chart on the next page do not reflect the deduction of taxes that a shareholder would pay on fund distributions or the redemption of fund shares.
The Fund’s performance results reflect any applicable expense reductions, without which the expenses would increase and results would have been less favorable.
1 For certain types of investors as described in the Fund’s Class I share prospectus.
Mid Cap Growth Fund
6
Growth of $10,000
This chart shows what happened to a hypothetical $10,000 investment in Class A shares for the period indicated. For comparison, we’ve shown the same investment in two separate indexes.
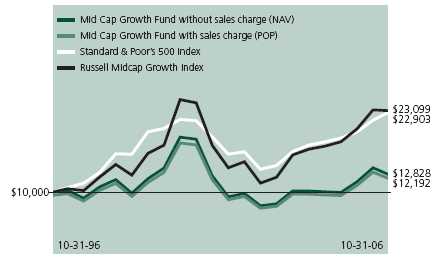
| | | Without sales | With maximum | | |
| Class | Period beginning | charge | sales charge | Index 1 | Index 2 |
|
| B1 | 10-31-96 | $12,127 | $12,127 | $22,903 | $23,099 |
|
| C1 | 6-1-98 | 10,752 | 10,752 | 14,398 | 16,822 |
|
| I 2 | 3-1-02 | 13,615 | 13,615 | 13,223 | 15,331 |
|
Assuming all distributions were reinvested for the period indicated, the table above shows the value of a $10,000 investment in the Fund’s Class B, Class C and Class I shares, respectively, as of October 31, 2006. The Class C shares investment with maximum sales charge has been adjusted to reflect the elimination of the front-end sales charge effective July 15, 2004. Performance of the classes will vary based on the difference in sales charges paid by shareholders investing in the different classes and the fee structure of those classes.
Standard & Poor’s 500 Index — Index 1 — is an unmanaged index that includes 500 widely traded common stocks.
Russell Midcap Growth Index — Index 2 — is an unmanaged index that contains those stocks from the Russell Midcap Index with a greater-than-average growth orientation.
It is not possible to invest directly in an index. Index figures do not reflect sales charges which would have resulted in lower values if they did.
1 No contingent deferred sales charge applicable.
2 For certain types of investors as described in the Fund’s Class I share prospectus.
Mid Cap Growth Fund
7
Your expenses
These examples are intended to help you understand your ongoing operating expenses.
Understanding fund expenses
As a shareholder of the Fund, you incur two types of costs:
■ Transaction costs which include sales charges (loads) on purchases or redemptions (varies by share class), minimum account fee charge, etc.
■ Ongoing operating expenses including management fees, distribution and service fees (if applicable) and other fund expenses.
We are going to present only your ongoing operating expenses here.
Actual expenses/actual returns
This example is intended to provide information about your fund’s actual ongoing operating expenses, and is based on your fund’s actual return. It assumes an account value of $1,000.00 on May 1, 2006, with the same investment held until October 31, 2006.
| | Account value | Ending value | Expenses paid during period |
| | on 5-1-06 | on 10-31-06 | ended 10-31-061 |
|
| Class A | $1,000.00 | $920.00 | $6.82 |
|
| Class B | 1,000.00 | 916.20 | 10.16 |
|
| Class C | 1,000.00 | 917.10 | 10.16 |
|
| Class I | 1,000.00 | 936.80 | 4.75 |
|
Together with the value of your account, you may use this information to estimate the operating expenses that you paid over the period. Simply divide your account value at October 31, 2006 by $1,000.00, then multiply it by the “expenses paid” for your share class from the table above. For example, for an account value of $8,600.00, the operating expenses should be calculated as follows:
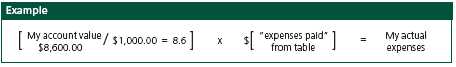
Mid Cap Growth Fund
8
Hypothetical example for comparison purposes
This table allows you to compare your fund’s ongoing operating expenses with those of any other fund. It provides an example of the Fund’s hypothetical account values and hypothetical expenses based on each class’s actual expense ratio and an assumed 5% annual return before expenses (which is not your fund’s actual return). It assumes an account value of $1,000.00 on May 1, 2006, with the same investment held until October 31, 2006. Look in any other fund shareholder report to find its hypothetical example and you will be able to compare these expenses.
| | Account value | Ending value | Expenses paid during period |
| | on 5-1-06 | on 10-31-06 | ended 10-31-061 |
|
| Class A | $1,000.00 | $1,018.10 | $7.16 |
|
| Class B | 1,000.00 | 1,014.60 | 10.68 |
|
| Class C | 1,000.00 | 1,014.60 | 10.68 |
|
| Class I | 1,000.00 | 1,020.30 | 4.95 |
|
Remember, these examples do not include any transaction costs, such as sales charges; therefore, these examples will not help you to determine the relative total costs of owning different funds. If transaction costs were included, your expenses would have been higher. See the prospectus for details regarding transaction costs.
1 Expenses are equal to the Fund’s annualized expense ratio of 1.41%, 2.10%, 2.11% and 0.97% for Class A, Class B, Class C and Class I, respectively, multiplied by the average account value over the period, multiplied by number of days in most recent fiscal half-year/365 or 366 (to reflect the one-half year period).
Mid Cap Growth Fund 9
Fund’s investments
F I N A N C I A L S T A T E M E N T S
Securities owned by the Fund on 10-31-06
This schedule is divided into two main categories: common stocks and short-term investments. Common stocks are further broken down by industry group. Short-term investments, which represent the Fund’s cash position, are listed last.
| Issuer | Shares | Value |
|
| Common stocks 99.72% | | $124,772,085 |
| (Cost $105,577,345) | | |
| Apparel, Accessories & Luxury Goods 3.99% | | 4,994,640 |
|
| Coach, Inc. (I) | 126,000 | 4,994,640 |
| Apparel Retail 6.56% | | 8,206,310 |
|
| Abercrombie & Fitch Co. (Class A) | 61,400 | 4,706,310 |
|
| Urban Outfitters, Inc. (I)(L) | 200,000 | 3,500,000 |
| Asset Management & Custody Banks 2.53% | | 3,169,431 |
|
| Affiliated Managers Group, Inc. (I)(L) | 31,650 | 3,169,431 |
| Auto Parts & Equipment 3.67% | | 4,587,620 |
|
| Advance Auto Parts, Inc. | 131,000 | 4,587,620 |
| Biotechnology 1.49% | | 1,859,770 |
|
| Cephalon, Inc. (I)(L) | 26,500 | 1,859,770 |
| Broadcasting & Cable TV 3.21% | | 4,016,870 |
|
| XM Satellite Radio Holdings, Inc. (Class A) (I)(L) | 344,500 | 4,016,870 |
| Coal & Consumable Fuels 2.25% | | 2,815,470 |
|
| Aventine Renewable Energy Holdings, Inc. (I) | 114,450 | 2,815,470 |
| Communications Equipment 5.22% | | 6,531,000 |
|
| Comverse Technology, Inc. (I) | 300,000 | 6,531,000 |
| Computer Storage & Peripherals 2.92% | | 3,650,790 |
|
| SanDisk Corp. (I) | 75,900 | 3,650,790 |
| Diversified Commercial Services 4.99% | | 6,237,700 |
|
| Sotheby’s | 164,150 | 6,237,700 |
| Electrical Components & Equipment 3.03% | | 3,794,400 |
|
| Rockwell Automation, Inc. | 61,200 | 3,794,400 |
| Electronic Manufacturing Services 2.04% | | 2,549,448 |
|
| Jabil Circuit, Inc. (I) | 88,800 | 2,549,448 |
| Health Care Services 2.57% | | 3,213,873 |
|
| PDL BioPharma, Inc. (I)(L) | 152,100 | 3,213,873 |
| Health Care Supplies 4.17% | | 5,217,830 |
|
| Gen-Probe, Inc. (I) | 109,000 | 5,217,830 |
See notes to financial statements
Mid Cap Growth Fund
10
F I N A N C I A L S T A T E M E N T S
| Issuer | Shares | Value |
|
| Hotels, Resorts & Cruise Lines 3.44% | | $4,301,280 |
|
| Starwood Hotels & Resorts Worldwide, Inc. | 72,000 | 4,301,280 |
| Household Appliances 2.48% | | 3,106,239 |
|
| iRobot Corp. (I)(L) | 151,450 | 3,106,239 |
| Internet Retail 2.83% | | 3,543,680 |
|
| Redback Networks, Inc. (I)(L) | 224,000 | 3,543,680 |
| Leisure Products 6.51% | | 8,149,470 |
|
| Jarden Corp. (I)(L) | 226,500 | 8,149,470 |
| Metal & Glass Containers 3.43% | | 4,286,520 |
|
| Crown Holdings, Inc. (I) | 220,500 | 4,286,520 |
| Oil & Gas Drilling 2.78% | | 3,476,870 |
|
| ENSCO International, Inc. | 71,000 | 3,476,870 |
| Oil & Gas Equipment & Services 4.55% | | 5,691,740 |
|
| BJ Services Co. | 71,000 | 2,141,360 |
|
| Grant Prideco, Inc. (I) | 94,000 | 3,550,380 |
| Oil & Gas Exploration & Production 4.89% | | 6,121,000 |
|
| Pinnacle Gas Resources Inc. (I)(S) | 300,000 | 3,300,000 |
|
| Toreador Resources Corp. (I) | 130,000 | 2,821,000 |
| Semiconductor Equipment 8.27% | | 10,354,275 |
|
| MEMC Electronic Materials, Inc. (I) | 106,650 | 3,786,075 |
|
| Varian Semiconductor Equipment Associates, Inc. (I)(L) | 180,000 | 6,568,200 |
| Semiconductors 4.15% | | 5,186,699 |
|
| Trident Microsystems, Inc. (I)(L) | 245,350 | 5,186,699 |
| Soft Drinks 3.04% | | 3,810,000 |
|
| Hansen Natural Corp. (I) | 120,000 | 3,810,000 |
| Systems Software 4.71% | | 5,899,160 |
|
| Quality Systems, Inc. (I)(L) | 139,000 | 5,899,160 |
See notes to financial statements
Mid Cap Growth Fund
11
F I N A N C I A L S T A T E M E N T S
| | Interest | Par value | |
| Issuer, description, maturity date | rate | (000) | Value |
|
| Short-term investments 29.41% | | | $36,796,636 |
| (Cost $36,796,636) | | | |
| Joint Repurchase Agreement 0.49% | | | 614,000 |
|
| Investment in a joint repurchase | | | |
| agreement transaction with | | | |
| Morgan Stanley — Dated 10-31-06 | | | |
| due 11-01-06 (secured by U.S. | | | |
| Treasury Inflation Indexed Bond | | | |
| 3.375% due 4-15-32). | | | |
| Maturity value: $614,090 | 5.270% | $614 | 614,000 |
| |
| | | Shares | |
| Cash Equivalents 28.92% | | | 36,182,636 |
|
| AIM Cash Investment Trust (T) | | 36,182,636 | 36,182,636 |
|
| |
| Total investments (cost $142,373,981) 129.13% | | | $161,568,721 |
|
| |
| Other assets and liabilities, net (29.13%) | | | ($36,444,475) |
|
| |
| Total net assets 100.00% | | | $125,124,246 |
(I) Non-income-producing security.
(L) All or a portion of this security is on loan as of October 31, 2006.
(S) This security is exempt from registration under Rule 144A of the Securities Act of 1933. Such security may be resold, normally to qualified institutional buyers, in transactions exempt from registration. Rule 144A securities amounted to $3,300,000 or 2.64% of the Fund’s net assets as of October 31, 2006.
(T) Represents investment of securities lending collateral.
The percentage shown for each investment category is the total value of that category as a percentage of the net assets of the Fund.
See notes to financial statements
Mid Cap Growth Fund
12
F I N A N C I A L S T A T E M E N T S
Financial statements
Statement of assets and liabilities 10-31-06
This Statement of Assets and Liabilities is the Fund’s balance sheet. It shows the value of what the Fund owns, is due and owes. You’ll also find the net asset value and the maximum offering price per share.
| Assets | |
|
| Investments at value (cost $142,373,981) including | $161,568,721 |
| $35,208,135 of securities loaned | |
| Cash | 463 |
| Receivable for shares sold | 28,767 |
| Interest receivable | 90 |
| Receivable from affiliates | 68,335 |
| Other assets | 19,695 |
| Total assets | 161,686,071 |
| |
| Liabilities | |
|
| Payable for shares repurchased | 171,459 |
| Payable upon receipt of securities loaned | 36,182,636 |
| Payable to affiliates | |
| Management fees | 88,067 |
| Distribution and service fees | 7,592 |
| Other | 37,911 |
| Other payables and accrued expenses | 74,160 |
| Total liabilities | 36,561,825 |
| |
| Net assets | |
|
| Capital paid-in | 172,811,984 |
| Accumulated net realized loss on investments | (66,860,880) |
| Net unrealized appreciation of investments | 19,194,740 |
| Accumulated net investment loss | (21,598) |
| Net assets | $125,124,246 |
| |
| Net asset value per share | |
|
| Based on net asset values and shares outstanding — the Fund has an | |
| unlimited number of shares authorized with no par value | |
| Class A ($100,021,471 ÷ 9,451,093 shares) | $10.58 |
| Class B ($21,691,704 ÷ 2,280,003 shares) | $9.51 |
| Class C ($3,360,865 ÷ 353,152 shares) | $9.52 |
| Class I ($50,206 ÷ 4,519 shares) | $11.11 |
| |
| Maximum offering price per share | |
|
| Class A1 ($10.58 ÷ 95%) | $11.14 |
1 On single retail sales of less than $50,000. On sales of $50,000 or more and on group sales the offering price is reduced.
See notes to financial statements
Mid Cap Growth Fund
13
F I N A N C I A L S T A T E M E N T S
Statement of operations For the year ended 10-31-06.
This Statement of Operations summarizes the Fund’s investment income earned and expenses incurred in operating the Fund. It also shows net gains (losses) for the period stated.
| Investment income | |
|
| Dividends (including special dividends of $342,430) | $677,502 |
| Interest | 120,738 |
| Securities lending | 109,773 |
| Total investment income | 908,013 |
| |
| Expenses | |
|
| Investment management fees (Note 2) | 1,102,252 |
| Distribution and service fees (Note 2) | 608,940 |
| Class A, B and C transfer agent fees (Note 2) | 538,549 |
| Class I transfer agent fees (Note 2) | 1,086 |
| Accounting and legal services fees (Note 2) | 24,682 |
| Compliance fees | 4,927 |
| Bluesky fees | 45,476 |
| Printing | 40,767 |
| Custodian fees | 32,389 |
| Professional fees | 28,555 |
| Trustees’ fees | 7,776 |
| Securities lending fees | 4,340 |
| Interest | 2,971 |
| Miscellaneous | 11,593 |
| Total expenses | 2,454,303 |
| Less expense reductions (Note 2) | (126,889) |
| Net expenses | 2,327,414 |
| Net investment loss | (1,419,401) |
| |
| Realized and unrealized gain | |
|
| Net realized gain on investments | 11,893,275 |
| Change in net unrealized appreciation (depreciation) of investments | 1,390,874 |
| Net realized and unrealized gain | 13,284,149 |
| Increase in net assets from operations | $11,864,748 |
See notes to financial statements
Mid Cap Growth Fund
14
F I N A N C I A L S T A T E M E N T S
Statement of changes in net assets
These Statements of Changes in Net Assets show how the value of the Fund’s net assets has changed during the last two periods. The difference reflects earnings less expenses, any investment gains and losses, distributions, if any, paid to shareholders and the net of Fund share transactions.
| | Year | Year |
| | ended | ended |
| | 10-31-05 | 10-31-06 |
| Increase (decrease) in net assets | | |
|
| From operations | | |
| Net investment loss | ($2,034,837) | ($1,419,401) |
| Net realized gain | 14,025,629 | 11,893,275 |
| Change in net unrealized appreciation (depreciation) | 7,653,313 | 1,390,874 |
| Increase in net assets resulting from operations | 19,644,105 | 11,864,748 |
| From Fund share transactions | (23,917,624) | (19,795,326) |
| |
| Net assets | | |
|
| Beginning of period | 137,328,343 | 133,054,824 |
| End of period1 | $133,054,824 | $125,124,246 |
1 Includes accumulated net investment loss of $21,598 and $21,598, respectively.
See notes to financial statements
Mid Cap Growth Fund
15
F I N A N C I A L S T A T E M E N T S
Financial highlights
The Financial highlights show how the Fund’s net asset value for a share has changed since the end of the previous period.
| CLASS A SHARES | | | | | |
| |
| Period ended | 10-31-02 | 10-31-03 | 10-31-04 | 10-31-05 | 10-31-06 |
| Per share operating performance | | | | | |
|
| Net asset value, beginning of period | $7.66 | $6.47 | $8.43 | $8.33 | $9.64 |
| Net investment loss1 | (0.11) | (0.11) | (0.12) | (0.12) | (0.09)10 |
| Net realized and unrealized | | | | | |
| gain (loss) on investments | (1.08) | 2.07 | 0.02 | 1.43 | 1.03 |
| Total from investment operations | (1.19) | 1.96 | (0.10) | 1.31 | 0.94 |
| Net asset value, end of period | $6.47 | $8.43 | $8.33 | $9.64 | $10.58 |
| Total return2 (%) | (15.54) | 30.29 | (1.19)3 | 15.733 | 9.75 |
|
| Ratios and supplemental data | | | | | |
| Net assets, end of period | | | | | |
| (in millions) | $85 | $107 | $98 | $101 | $100 |
| Ratio of net expenses to average | | | | | |
| net assets (%) | 1.89 | 1.98 | 1.75 | 1.74 | 1.55 |
| Ratio of gross expenses to average | | | | | |
| net assets (%) | 1.89 | 1.98 | 1.794 | 1.794 | 1.644 |
| Ratio of net investment loss | | | | | |
| to average net assets (%) | (1.52) | (1.62) | (1.44) | (1.35) | (0.89)10 |
| Portfolio turnover (%) | 2675 | 183 | 75 | 71 | 63 |
See notes to financial statements
Mid Cap Growth Fund
16
F I N A N C I A L S T A T E M E N T S
Financial highlights
| CLASS B SHARES | | | | | |
| |
| Period ended | 10-31-02 | 10-31-03 | 10-31-04 | 10-31-05 | 10-31-06 |
| Per share operating performance | | | | | |
|
| Net asset value, beginning of period | $7.13 | $5.98 | $7.74 | $7.59 | $8.73 |
| Net investment loss1 | (0.16) | (0.15) | (0.17) | (0.17) | (0.15)10 |
| Net realized and unrealized | | | | | |
| gain (loss) on investments | (0.99) | 1.91 | 0.02 | 1.31 | 0.93 |
| Total from investment operations | (1.15) | 1.76 | (0.15) | 1.14 | 0.78 |
| Net asset value, end of period | $5.98 | $7.74 | $7.59 | $8.73 | $9.51 |
| Total return2 (%) | (16.13) | 29.43 | (1.94)3 | 15.023 | 8.93 |
| |
| Ratios and supplemental data | | | | | |
|
| Net assets, end of period | | | | | |
| (in millions) | $46 | $48 | $34 | $26 | $22 |
| Ratio of net expenses to average | | | | | |
| net assets (%) | 2.56 | 2.67 | 2.45 | 2.44 | 2.25 |
| Ratio of gross expenses to average | | | | | |
| net assets (%) | 2.56 | 2.67 | 2.494 | 2.494 | 2.344 |
| Ratio of net investment loss | | | | | |
| to average net assets (%) | (2.20) | (2.31) | (2.14) | (2.03) | (1.59)10 |
| Portfolio turnover (%) | 2675 | 183 | 75 | 71 | 63 |
See notes to financial statements
Mid Cap Growth Fund
17
F I N A N C I A L S T A T E M E N T S
Financial highlights
| CLASS C SHARES | | | | | |
| |
| Period ended | 10-31-02 | 10-31-03 | 10-31-04 | 10-31-05 | 10-31-06 |
| Per share operating performance | | | | | |
|
| Net asset value, beginning of period | $7.13 | $5.99 | $7.74 | $7.59 | $8.73 |
| Net investment loss1 | (0.16) | (0.15) | (0.17) | (0.17) | (0.15)10 |
| Net realized and unrealized | | | | | |
| gain (loss) on investments | (0.98) | 1.90 | 0.02 | 1.31 | 0.94 |
| Total from investment operations | (1.14) | 1.75 | (0.15) | 1.14 | 0.79 |
| Net asset value, end of period | $5.99 | $7.74 | $7.59 | $8.73 | $9.52 |
| Total return2(%) | (15.99) | 29.22 | (1.94)3 | 15.023 | 9.05 |
| |
| Ratios and supplemental data | | | | | |
|
| Net assets, end of period | | | | | |
| (in millions) | $2 | $3 | $3 | $3 | $3 |
| Ratio of net expenses to average | | | | | |
| net assets (%) | 2.58 | 2.68 | 2.45 | 2.44 | 2.25 |
| Ratio of gross expenses to average | | | | | |
| net assets (%) | 2.58 | 2.68 | 2.494 | 2.494 | 2.344 |
| Ratio of net investment loss | | | | | |
| to average net assets (%) | (2.21) | (2.32) | (2.14) | (2.05) | (1.59)10 |
| Portfolio turnover (%) | 2675 | 183 | 75 | 71 | 63 |
See notes to financial statements
Mid Cap Growth Fund
18
F I N A N C I A L S T A T E M E N T S
Financial highlights
| CLASS I SHARES | | | | | |
| |
| Period ended | 10-31-026 | 10-31-03 | 10-31-04 | 10-31-05 | 10-31-06 |
| Per share operating performance | | | | | |
|
| Net asset value, beginning of period | $8.16 | $6.51 | $8.54 | $8.50 | $9.91 |
| Net investment loss1 | (0.06) | (0.06) | (0.06) | (0.06) | (0.03)10 |
| Net realized and unrealized | | | | | |
| gain (loss) on investments | (1.59) | 2.09 | 0.02 | 1.47 | 1.23 |
| Total from investment operations | (1.65) | 2.03 | (0.04) | 1.41 | 1.20 |
| Net asset value, end of period | $6.51 | $8.54 | $8.50 | $9.91 | $11.11 |
| Total return2 (%) | (20.22)7 | 31.18 | (0.47) | 16.59 | 12.11 |
| |
| Ratios and supplemental data | | | | | |
|
| Net assets, end of period | | | | | |
| (in millions) | $3 | $3 | $3 | $3 | $09 |
| Ratio of net expenses to average | | | | | |
| net assets (%) | 1.468 | 1.22 | 1.02 | 1.04 | 1.00 |
| Ratio of net investment loss | | | | | |
| to average net assets (%) | (1.00)8 | (0.85) | (0.71) | (0.65) | (0.27)10 |
| Portfolio turnover (%) | 2675 | 183 | 75 | 71 | 63 |
1 Based on the average of the shares outstanding.
2 Assumes dividend reinvestment and does not reflect the effect of sales charges.
3 Total returns would have been lower had certain expenses not been reduced during the periods shown.
4 Does not take into consideration expense reductions during the periods shown.
5 Excludes merger activity.
6 Class I shares began operations on 3-1-02.
7 Not annualized.
8 Annualized.
9 Less than $500,000.
10 Net investment loss per share and ratio of net investment loss to average net assets reflects a special dividend received by the Fund which amounted to the following amounts:
| | | Percentage |
| | Per share | of net assets |
|
| Class A | $0.03 | 0.25% |
|
| Class B | 0.02 | 0.25 |
|
| Class C | 0.02 | 0.25 |
|
| Class I | 0.03 | 0.28 |
See notes to financial statements
Mid Cap Growth Fund
19
Notes to financial statements
Note 1 Accounting policies
John Hancock Mid Cap Growth Fund (the “Fund”) is a diversified series of John Hancock Investment Trust III (the “Trust”), an open-end management investment company registered under the Investment Company Act of 1940 (the “1940 Act”), as amended. The investment objective of the Fund is to achieve long-term capital appreciation.
The Trustees have authorized the issuance of multiple classes of shares of the Fund, designated as Class A, Class B, Class C and Class I shares. The shares of each class represent an interest in the same portfolio of investments of the Fund and have equal rights as to voting, redemptions, dividends and liquidation, except that certain expenses, subject to the approval of the Trustees, may be applied differently to each class of shares in accordance with current regulations of the Securities and Exchange Commission and the Internal Revenue Service. Shareholders of a class that bears distribution and service expenses under the terms of a distribution plan have exclusive voting rights to that distribution plan. Class B shares will convert to Class A shares eight years after purchase.
Significant accounting policies of the Fund are as follows:
Valuation of investments
Securities in the Fund’s portfolio are valued on the basis of market quotations, valuations provided by independent pricing services or, if quotations are not readily available, or the value has been materially affected by events occurring after the close of a foreign market, at fair value as determined in good faith in accordance with procedures approved by the Trustees. Short-term debt investments which have a remaining maturity of 60 days or less may be valued at amortized cost, which approximates market value. Investments in AIM Cash Investment Trust are valued at their net asset value each business day. All portfolio transactions initially expressed in terms of foreign currencies have been translated into U.S. dollars as described in “Foreign currency translation” below.
Joint repurchase agreement
Pursuant to an exemptive order issued by the Securities and Exchange Commission, the Fund, along with other registered investment companies having a management contract with John Hancock Advisers, LLC (the “Adviser”), a wholly owned subsidiary of John Hancock Financial Services, Inc., a subsidiary of Manulife Financial Corporation (“MFC”), may participate in a joint repurchase agreement transaction. Aggregate cash balances are invested in one or more large repurchase agreements, whose underlying securities are obligations of the U.S. government and/or its agencies. The Fund’s custodian bank receives delivery of the underlying securities for the joint account on the Fund’s behalf. The Adviser is responsible for ensuring that the agreement is fully collateralized at all times.
Investment transactions
Investment transactions are accounted for on a trade date plus one basis for daily net asset value calculations. However, for financial reporting purposes, investment transactions are reported on trade date. Net realized gains and losses on sales of investments are determined on the identified cost basis.
Class allocations
Income, common expenses and realized and unrealized gains (losses) are determined at the fund level and allocated daily to each class of shares based on the appropriate net asset value of the respective classes. Distribution and service fees, if any, and transfer agent fees for Class I shares, are calculated daily at the class level based on the appropriate net asset value
Mid Cap Growth Fund
20
of each class and the specific expense rate(s) applicable to each class.
Expenses
The majority of expenses are directly identifiable to an individual fund. Expenses that are not readily identifiable to a specific fund are allocated in such a manner as deemed equitable, taking into consideration, among other things, the nature and type of expense and the relative size of the funds.
Bank borrowings
The Fund is permitted to have bank borrowings for temporary or emergency purposes, including the meeting of redemption requests that otherwise might require the untimely disposition of securities. The Fund has entered into a syndicated line of credit agreement with various banks. This agreement enables the Fund to participate, with other funds managed by the Adviser, in an unsecured line of credit with banks, which permits borrowings of up to $150 million, collectively. Interest is charged to each fund based on its borrowing. In addition, a commitment fee is charged to each fund based on the average daily unused portion of the line of credit, and is allocated among the participating funds. The Fund had no borrowing activity under the line of credit during the year ended October 31, 2006.
Securities lending
The Fund may lend securities to certain qualified brokers who pay the Fund negotiated lender fees. The loans are collateralized at all times with cash or securities with a market value at least equal to the market value of the securities on loan. As with other extensions of credit, the Fund may bear the risk of delay of the loaned securities in recovery or even loss of rights in the collateral, should the borrower of the securities fail financially. At October 31, 2006, the Fund loaned securities having a market value of $35,208,135 collateralized by cash in the amount of $36,182,636. The cash collateral was invested in a short-term instrument. Securities lending expenses are paid by the Fund to the Adviser.
Federal income taxes
The Fund qualifies as a “regulated investment company” by complying with the applicable provisions of the Internal Revenue Code and will not be subject to federal income tax on taxable income that is distributed to shareholders. Therefore, no federal income tax provision is required. For federal income tax purposes, the Fund has $66,860,880 of a capital loss carryforward available, to the extent provided by regulations, to offset future net realized capital gains. To the extent that such carryforward is used by the Fund, no capital gain distributions will be made. The loss carryforward expires as follows: October 31, 2008 — $410,842, October 31, 2009 — $41,443,592 and October 31, 2010 — $25,006,446. Capital loss carryforward utilized for the year ended October 31, 2006 amounted to $11,893,275. Availability of a certain amount of the loss carryforward, which was acquired on June 7, 2002 in a merger, may be limit ed in a given year.
New accounting pronouncements
In June 2006, Financial Accounting Standards Board (“FASB”) Interpretation No. 48, Accounting for Uncertainty in Income Taxes (the “Interpretation”) was issued and is effective for fiscal years beginning after December 15, 2006 and is to be applied to all open tax years as of the effective date. The Interpretation prescribes a minimum threshold for financial statement recognition of the benefit of a tax position taken or expected to be taken in a tax return, and requires certain expanded disclosures. Management is currently evaluating the application of the Interpretation to the Fund and has not at this time quantified the impact, if any, resulting from the adoption of the Interpretation on the Fund’s financial statements.
In September 2006, FASB Standard No. 157, Fair Value Measurements (“FAS 157”) was issued, and is effective for fiscal years beginning after November 15, 2007. FAS 157 defines fair value, establishing a framework for measuring fair value and expands disclosure about fair value measurements. Management is currently evaluating the application of FAS 157 to the Fund and its impact, if any, resulting from the adoption of FAS 157 on the Fund’s financial statements.
Mid Cap Growth Fund
21
Dividends, interest and distributions
Dividend income on investment securities is recorded on the ex-dividend date or, in the case of some foreign securities, on the date thereafter when the Fund identifies the dividend. Interest income on investment securities is recorded on the accrual basis. Foreign income may be subject to foreign withholding taxes, which are accrued as applicable.
The Fund records distributions to shareholders from net investment income and net realized gains, if any, on the ex-dividend date. There were no distributions during the years ended October 31, 2005 and October 31, 2006. Distributions paid by the Fund with respect to each class of shares are calculated in the same manner, at the same time and are in the same amount, except for the effect of expenses that may be applied differently to each class.
As of October 31, 2006, the Fund had no distributable earnings on a tax basis.
Such distributions and distributable earnings, on a tax basis, are determined in conformity with income tax regulations, which may differ from accounting principles generally accepted in the United States of America. Distributions in excess of tax basis earnings and profits, if any, are reported in the Fund’s financial statements as a return of capital.
Use of estimates
The preparation of these financial statements, in accordance with accounting principles generally accepted in the United States of America, incorporates estimates made by management in determining the reported amount of assets, liabilities, revenues and expenses of the Fund. Actual results could differ from these estimates.
Note 2
Management fee and transactions with affiliates and others
The Fund has an investment management contract with the Adviser. Under the investment management contract, the Fund pays a monthly management fee to the Adviser equivalent, on an annual basis, to the sum of: (a) 0.80% of the first $500,000,000 of the Fund’s average daily net asset value; (b) 0.75% of the next $500,000,000 and (c) 0.70% of the Fund’s average daily net asset value in excess of $1,000,000,000.
Effective December 31, 2005, the investment management teams of the Adviser were reorganized into Sovereign Asset Management LLC (“Sovereign”), a wholly owned indirect subsidiary of John Hancock Life Insurance Company (“JHLICO”), a subsidiary of MFC. The Adviser remains the principal advisor on the Fund and Sovereign acts as subadviser under the supervision of the Adviser. The restructuring did not have an impact on the Fund, which continues to be managed using the same investment philosophy and process. The Fund is not responsible for payment of the subadvisory fees.
Effective October 1, 2006, Sovereign changed its name to MFC Global Investment Management (U.S.), LLC.
The Fund has a Distribution Agreement with John Hancock Funds, LLC (“JH Funds”), a wholly owned subsidiary of the Adviser. The Fund has adopted Distribution Plans with respect to Class A, Class B and Class C, pursuant to Rule 12b-1 under the 1940 Act, as amended, to reimburse JH Funds for the services it provides as distributor of shares of the Fund. Accordingly, the Fund makes monthly payments to JH Funds at an annual rate not to exceed 0.30%, 1.00% and 1.00% of average daily net asset value of Class A, Class B and Class C, respectively. A maximum of 0.25% of such payments may be service fees, as defined by the Conduct Rules of the National Association of Securities Dealers. Under the Conduct Rules, curtailment of a portion of the Fund’s 12b-1 payments could occur under certain circumstances.
Expenses under the agreement described above for the year ended October 31, 2006 were as follows:
| | Distribution and |
| Share class | service fees |
|
| |
| Class A | $320,213 |
| Class B | 253,139 |
| Class C | 35,588 |
| Total | $608,940 |
Mid Cap Growth Fund
22
Class A shares are assessed up-front sales charges. During the year ended October 31, 2006, JH Funds received net up-front sales charges of $82,977 with regard to sales of Class A shares. Of this amount, $11,142 was retained and used for printing prospectuses, advertising, sales literature and other purposes, $57,807 was paid as sales commissions to unrelated broker-dealers and $14,028 was paid as sales commissions to sales personnel of Signator Investors, Inc. (“Signator Investors”), a related broker-dealer. The Adviser’s indirect parent JHLICO, is the indirect sole shareholder of Signator Investors.
Class B shares that are redeemed within six years of purchase are subject to a contingent deferred sales charge (“CDSC”) at declining rates, beginning at 5.00% of the lesser of the current market value at the time of redemption or the original purchase cost of the shares being redeemed. Class C shares that are redeemed within one year of purchase are subject to a CDSC at a rate of 1.00% of the lesser of the current market value at the time of redemption or the original purchase cost of the shares being redeemed. Proceeds from the CDSCs are paid to JH Funds and are used, in whole or in part, to defray its expenses for providing distribution-related services to the Fund in connection with the sale of Class B and Class C shares. During the year ended October 31, 2006, CDSCs received by JH Funds amounted to $42,129 for Class B shares and $473 for Class C shares.
The Fund has a transfer agent agreement with John Hancock Signature Services, Inc. (“Signature Services”), an indirect subsidiary of JHLICO. For Class A, Class B and Class C shares, the Fund pays a monthly transfer agent fee at an annual rate of 0.05% of each class’s average daily net asset value, plus a fee based on the number of shareholder accounts and reimbursement for certain out-of-pocket expenses, aggregated and allocated to each class on the basis of its relative net asset value. For Class I shares, the Fund pays a monthly transfer agent fee at a total annual rate of 0.05% of Class I average daily net asset value. Signature Services agreed to voluntarily reduce the Fund’s asset-based portion of the transfer agent fee if the total transfer agent fee exceeded the median transfer agency fee for comparable mutual funds by greater than 0.05% . Accordingly, the transfer agent expense for Class A, Class B and Class C sh ares was reduced by $58,554 for the year ended October 31, 2006. Signature Services terminated this reimbursement agreement June 30, 2006.
Effective July 1, 2006, the transfer agent has contractually limited transfer agent fees by implementing a transfer agent fee cap of 0.25% until June 30, 2007. Accordingly, the expense reductions related to transfer agent fee limitations amounted to $68,335 for the year ended October 31, 2006.
The Fund has an agreement with the Adviser and affiliates to perform necessary tax, accounting and legal services for the Fund. The compensation for the period amounted to $24,682. The Fund also paid the Adviser the amount of $562 for certain publishing services, included in the printing fees. The Fund reimbursed JHLICO for certain compliance costs, included in the Fund’s Statement of Operations.
Mr. James R. Boyle is Chairman of the Adviser, as well as affiliated Trustee of the Fund, and is compensated by the Adviser and/or its affiliates. The compensation of unaffiliated Trustees is borne by the Fund. The unaffiliated Trustees may elect to defer, for tax purposes, their receipt of this compensation under the John Hancock Group of Funds Deferred Compensation Plan. The Fund makes investments into other John Hancock funds, as applicable, to cover its liability for the deferred compensation. Investments to cover the Fund’s deferred compensation liability are recorded on the Fund’s books as an other asset. The deferred compensation liability and the related other asset are always equal and are marked to market on a periodic basis to reflect any income earned by the investments, as well as any unrealized gains or losses. The Deferred Compensation Plan investments had no impact on the operations of the Fund.
Mid Cap Growth Fund
23
Note 3
Fund share transactions
This listing illustrates the number of Fund shares sold and repurchased during the last two periods, along with the corresponding dollar value.
| | Year ended 10-31-05 | Year ended 10-31-06 |
| | Shares | Amount | Shares | Amount |
|
| Class A shares | | | | |
|
| Sold | 1,409,247 | $12,651,836 | 1,339,646 | $14,386,192 |
| Repurchased | (2,642,146) | (23,854,729) | (2,406,419) | (25,197,460) |
| Net decrease | (1,232,899) | ($11,202,893) | (1,066,773) | ($10,811,268) |
| |
| |
| Class B shares | | | | |
|
| Sold | 360,358 | $2,949,863 | 429,834 | $4,185,762 |
| Repurchased | (1,864,803) | (15,142,628) | (1,118,239) | (10,605,302) |
| Net decrease | (1,504,445) | ($12,192,765) | (688,405) | ($6,419,540) |
|
| |
| Class C shares | | | | |
|
| Sold | 71,585 | $588,127 | 97,325 | $953,562 |
| Repurchased | (97,294) | (795,276) | (111,323) | (1,036,697) |
| Net decrease | (25,709) | ($207,149) | (13,998) | ($83,135) |
| |
| |
| Class I shares | | | | |
|
| Sold | 34,207 | $316,376 | 63,358 | $704,996 |
| Repurchased | (69,584) | (631,193) | (318,605) | (3,186,379) |
| Net decrease | (35,377) | ($314,817) | (255,247) | ($2,481,383) |
| |
| |
| Net decrease | (2,798,430) | ($23,917,624) | (2,024,423) | ($19,795,326) |
Note 4
Investment transactions
Purchases and proceeds from sales or maturities of securities, other than short-term securities and obligations of the U.S. government, during the year ended October 31, 2006, aggregated $84,734,065 and $104,097,984, respectively.
The cost of investments owned on October 31, 2006, including short-term investments, for federal income tax purposes, was $142,373,981. Gross unrealized appreciation and depreciation of investments aggregated $26,329,126 and $7,134,386, respectively, resulting in net unrealized appreciation of $19,194,740.
Note 5
Reclassification of accounts
During the year ended October 31, 2006, the Fund reclassified amounts to reflect a decrease in accumulated net investment loss of $1,419,401 and a decrease in capital paid-in of $1,419,401. This represents the amounts necessary to report these balances on a tax basis, excluding certain temporary differences, as of October 31, 2006. Additional adjustments may be needed in subsequent reporting periods. These reclassifications, which have no impact on the net asset value of the Fund, are primarily attributable to certain differences in the computation of distributable income and capital gains under federal tax rules versus accounting principles generally accepted in the United States of America, book and tax differences in accounting for net operating loss. The calculation of net investment loss per share in the Fund’s Financial Highlights excludes these adjustments.
Mid Cap Growth Fund
24
Auditors’ report
Report of Independent Registered Public Accounting Firm
To the Board of Trustees of John Hancock Investment Trust III and Shareholders of John Hancock Mid Cap Growth Fund,
In our opinion, the accompanying statement of assets and liabilities, including the schedule of investments, and the related statements of operations and of changes in net assets and the financial highlights present fairly, in all material respects, the financial position of John Hancock Mid Cap Growth Fund (the “Fund”) as of October 31, 2006, the results of its operations, the changes in its net assets and the financial highlights for the periods indicated, in conformity with accounting principles generally accepted in the United States of America. These financial statements and financial highlights (hereafter referred to as “financial statements”) are the responsibility of the Fund’s management; our responsibility is to express an opinion on these financial statements based on our audits. We conducted our audits of these financial statements in accordance with the standards of the Public Company Accounting Oversight Board (United States). Those standards require that we plan and perform the audit to obtain reasonable assurance about whether the financial statements are free of material misstatement. An audit includes examining, on a test basis, evidence supporting the amounts and disclosures in the financial statements, assessing the accounting principles used and significant estimates made by management, and evaluating the overall financial statement presentation. We believe that our audits, which included confirmation of securities as of October 31, 2006 by correspondence with the custodian and brokers, provide a reasonable basis for our opinion.
PricewaterhouseCoopers LLP
Boston, Massachusetts
December 13, 2006
25
Tax information
Unaudited
For federal income tax purposes, the following information is furnished with respect to the distributions of the Fund, if any, paid during its taxable year ended October 31, 2006.
The Fund hereby designates the maximum amount allowable of its net taxable income as qualified dividend income as provided in the Jobs and Growth Tax Relief Reconciliation Act of 2003. This amount will be reflected on Form 1099-DIV for the calendar year 2006.
Shareholders will be mailed a 2006 U.S. Treasury Department Form 1099-DIV in January 2007. This will reflect the total of all distributions that are taxable for calendar year 2006.
26
Board Consideration of and Continuation of Investment Advisory Agreement and Sub-Advisory Agreement: John Hancock Mid Cap Growth Fund
The Investment Company Act of 1940 (the “1940 Act”) requires the Board of Trustees (the “Board”) of John Hancock Investment Trust III (the “Trust”), including a majority of the Trustees who have no direct or indirect interest in the investment advisory agreement and are not “interested persons” of the Trust, as defined in the 1940 Act (the “Independent Trustees”), annually to review and consider the continuation of: (i) the investment advisory agreement (the “Advisory Agreement”) with John Hancock Advisers, LLC (the “Adviser”) and (ii) the investment sub-advisory agreement (the “Sub-Advisory Agreement”) with MFC Global Investment Management (U.S.), LLC (the “Sub-Adviser”) for the John Hancock Mid Cap Growth Fund (the “Fund”). The Advisory Agreement and the Sub-Advisory Agreement are collectively referred to as the “Advisory Agreements.”
At meetings held on May 1–2 and June 5–6, 2006,1 the Board considered the factors and reached the conclusions described below relating to the selection of the Adviser and Sub-Adviser and the continuation of the Advisory Agreements. During such meetings, the Board’s Contracts/Operations Committee and the Independent Trustees also met in executive sessions with their independent legal counsel.
In evaluating the Advisory Agreements, the Board, including the Contracts/Operations Committee and the Independent Trustees, reviewed a broad range of information requested for this purpose by the Independent Trustees, including: (i) the investment performance of the Fund relative to a category of relevant funds (the “Category”) and a peer group of comparable funds (the “Peer Group”) each selected by Morningstar Inc. (“Morningstar”), an independent provider of investment company data, for a range of periods ended December 31, 2005; (ii) advisory and other fees incurred by, and the expense ratios of, the Fund relative to a Category and a Peer Group; (iii) the advisory fees of comparable portfolios of other clients of the Adviser and the Sub-Adviser; (iv) the Adviser’s financial results and condition, including its and certain of its affiliates’ profitability from services performed for the Fund; (v) br eakpoints in the Fund’s and the Peer Group’s fees, and information about economies of scale; (vi) the Adviser’s and Sub-Adviser’s record of compliance with applicable laws and regulations, with the Fund’s investment policies and restrictions and with the applicable Code of Ethics, and the structure and responsibilities of the Adviser’s and Sub-Adviser’s compliance department; (vii) the background and experience of senior management and investment professionals and (viii) the nature, cost and character of advisory and non-investment management services provided by the Adviser and its affiliates and by the Sub-Adviser.
The Board’s review and conclusions were based on a comprehensive consideration of all information presented to the Board and not the result of any single controlling factor. It was based on performance and other information as of December 31, 2005; facts may have changed between that date and the date of this shareholders report. The key factors considered by the Board and the conclusions reached are described below.
Nature, extent and quality of services
The Board considered the ability of the Adviser and the Sub-Adviser, based on their resources, reputation and other attributes, to attract and retain qualified investment professionals, including research, advisory and supervisory personnel. The Board further considered the compliance programs and compliance records of the Adviser and Sub-Adviser. In addition, the Board took into account the administrative services provided to the Fund by the Adviser and its affiliates.
Based on the above factors, together with those referenced below, the Board concluded that, within the context of its full deliberations, the nature, extent and quality of the investment advisory services provided to the Fund by the Adviser and Sub-Adviser were sufficient to support renewal of the Advisory Agreements.
27
Fund performance
The Board considered the performance results for the Fund over various time periods ended December 31, 2005. The Board also considered these results in comparison to the performance of the Category, as well as the Fund’s Peer Group and benchmark index. Morningstar determined the Category and the Peer Group for the Fund. The Board reviewed with a representative of Morningstar the methodology used by Morningstar to select the funds in the Category and the Peer Group. The Board noted the imperfect comparability of the Peer Group.
The Board noted that the Fund’s performance during the three-, five- and 10-year periods under review was lower than the performance of the Peer Group and Category medians, and its benchmark index, the Russell Midcap Growth Index. The Board also noted the Fund’s more recent performance during the one-year period under review was lower than the Peer Group median and the benchmark index, and higher than the Category median. The Adviser provided information to the Board regarding factors contributing to the Fund’s performance results, as well as the Adviser’s outlook and investment strategy for the near future. The Board indicated its intent to continue to monitor the Fund’s performance trends.
Investment advisory fee and sub-advisory fee rates and expenses
The Board reviewed and considered the contractual investment advisory fee rate payable by the Fund to the Adviser for investment advisory services (the “Advisory Agreement Rate”). The Board received and considered information comparing the Advisory Agreement Rate with the advisory fees for the Peer Group and Category. The Board noted that the Advisory Agreement Rate was not appreciably higher than the median rate of the Peer Group and Category.
The Board received and considered expense information regarding the Fund’s various components, including advisory fees, distribution and fees other than advisory and distribution fees, including transfer agent fees, custodian fees and other miscellaneous fees (e.g., fees for accounting and legal services). The Board also considered peer-adjusted comparisons for the transfer agent fees. The Board considered comparisons of these expenses to the Peer Group median. The Board also received and considered expense information regarding the Fund’s total operating expense ratio (“Gross Expense Ratio”) and total operating expense ratio after taking the fee waiver arrangement applicable to the Advisory Agreement Rate into account (“Net Expense Ratio”). The Board received and considered information comparing the Gross Expense Ratio and Net Expense Ratio o f the Fund to that of the Peer Group and Category medians. The Board noted that the Fund’s Gross and Net Expense Ratios were higher than the Peer Group and Category medians.
The Adviser also discussed the Morningstar data and rankings, and other relevant information, for the Fund. Based on the above-referenced considerations and other factors, the Board concluded that the Fund’s plans for improving overall performance and lowering the expenses supported the re-approval of the Advisory Agreements.
The Board also received information about the investment sub-advisory fee rate (the “Sub-Advisory Agreement Rate”) payable by the Adviser to the Sub-Adviser for investment sub-advisory services. The Board concluded that the Sub-Advisory Agreement Rate was fair and equitable, based on its consideration of the factors described here.
Profitability
The Board received and considered a detailed profitability analysis of the Adviser based on the Advisory Agreements, as well as on other relationships between the Fund and the Adviser and its affiliates, including the Sub-Adviser. The Board concluded that, in light of the costs of providing investment management and other services to the Fund, the profits and other ancillary benefits reported by the Adviser were not unreasonable.
Economies of scale
The Board received and considered general information regarding economies of scale with respect to the management of the Fund, including the Fund’s ability to appropriately benefit from economies of scale under the
28
Fund’s fee structure. The Board recognized the inherent limitations of any analysis of economies of scale, stemming largely from the Board’s understanding that most of the Adviser’s costs are not specific to individual Funds, but rather are incurred across a variety of products and services.
To the extent the Board and the Adviser were able to identify actual or potential economies of scale from Fund-specific or allocated expenses, in order to ensure that any such economies continue to be reasonably shared with the Fund as its assets increase, the Adviser and the Board agreed to continue the existing breakpoints to the Advisory Agreement Rate.
Information about services to other clients
The Board also received information about the nature, extent and quality of services and fee rates offered by the Adviser and Sub-Adviser to their other clients, including other registered investment companies, institutional investors and separate accounts. The Board concluded that the Advisory Agreement Rate and the Sub-Advisory Agreement Rate were not unreasonable, taking into account fee rates offered to others by the Adviser and Sub-Adviser, respectively, after giving effect to differences in services.
Other benefits to the Adviser
The Board received information regarding potential “fall-out” or ancillary benefits received by the Adviser and its affiliates as a result of the Adviser’s relationship with the Fund. Such benefits could include, among others, benefits directly attributable to the relationship of the Adviser with the Fund and benefits potentially derived from an increase in the business of the Adviser as a result of its relationship with the Fund (such as the ability to market to shareholders other financial products offered by the Adviser and its affiliates).
The Board also considered the effectiveness of the Adviser’s, Sub-Adviser’s and Fund’s policies and procedures for complying with the requirements of the federal securities laws, including those relating to best execution of portfolio transactions and brokerage allocation.
Other factors and broader review
As discussed above, the Board reviewed detailed materials received from the Adviser and Sub-Adviser as part of the annual re-approval process. The Board also regularly reviews and assesses the quality of the services that the Fund receives throughout the year. In this regard, the Board reviews reports of the Adviser and Sub-Adviser at least quarterly, which include, among other things, fund performance reports and compliance reports. In addition, the Board meets with portfolio managers and senior investment officers at various times throughout the year.
After considering the above-described factors and based on its deliberations and its evaluation of the information described above, the Board concluded that approval of the continuation of the Advisory Agreements for the Fund was in the best interest of the Fund and its shareholders. Accordingly, the Board unanimously approved the continuation of the Advisory Agreements.
1 The Board previously considered information about the Sub-Advisory Agreement at the September and December 2005 Board meetings in connection with the Adviser’s reorganization.
29
Trustees and Officers
This chart provides information about the Trustees and Officers who oversee your John Hancock fund. Officers elected by the Trustees manage the day-to-day operations of the Fund and execute policies formulated by the Trustees.
| Independent Trustees | | |
| |
| Name, age | | Number of |
| Position(s) held with Fund | Trustee | John Hancock |
| Principal occupation(s) and other | of Fund | funds overseen |
| directorships during past 5 years | since1 | by Trustee |
|
| Ronald R. Dion , Born: 1946 | 2005 | 53 |
| Independent Chairman (since 2005); Chairman and Chief Executive Officer, | | |
| R.M. Bradley & Co., Inc.; Director, The New England Council and Massachusetts | |
| Roundtable; Trustee, North Shore Medical Center; Director, Boston Stock | | |
| Exchange; Director, BJ’s Wholesale Club, Inc. and a corporator of the Eastern | | |
| Bank; Trustee, Emmanuel College; Director, Boston Municipal Research Bureau; | |
| Member of the Advisory Board, Carroll Graduate School of Management at | | |
| Boston College. | | |
|
| |
| James F. Carlin , Born: 1940 | 2005 | 53 |
| Director and Treasurer, Alpha Analytical Laboratories Inc. (chemical analysis) | | |
| (since 1985); Part Owner and Treasurer, Lawrence Carlin Insurance Agency, | | |
| Inc. (since 1995); Part Owner and Vice President, Mone Lawrence Carlin | | |
| Insurance Agency, Inc. (until 2005); Director and Treasurer, Rizzo Associates | | |
| (engineering) (until 2000); Chairman and CEO, Carlin Consolidated, Inc. | | |
| (management/investments) (since 1987); Director and Partner, Proctor Carlin | | |
| & Co., Inc. (until 1999); Trustee, Massachusetts Health and Education Tax | | |
| Exempt Trust (since 1993); Director of the following: Uno Restaurant Corp. | | |
| (until 2001), Arbella Mutual (insurance) (until 2000), HealthPlan Services, Inc. | | |
| (until 1999), Flagship Healthcare, Inc. (until 1999), Carlin Insurance Agency, Inc. | |
| (until 1999); Chairman, Massachusetts Board of Higher Education (until 1999). | |
|
| |
| Richard P. Chapman, Jr.,2 Born: 1935 | 1996 | 53 |
| President and Chief Executive Officer, Brookline Bancorp, Inc. (lending) (since | | |
| 1972); Chairman and Director, Lumber Insurance Co. (insurance) (until 2000); | | |
| Chairman and Director, Northeast Retirement Services, Inc. (retirement | | |
| administration) (since 1998); Vice Chairman, Northeastern University Board | | |
| of Trustees (since 2004). | | |
|
| |
| William H. Cunningham , Born: 1944 | 2005 | 158 |
| Former Chancellor, University of Texas System and former President of the | | |
| University of Texas, Austin, Texas; Chairman and CEO, IBT Technologies (until | | |
| 2001); Director of the following: Hire.com (until 2004), STC Broadcasting, Inc. | | |
| and Sunrise Television Corp. (until 2001), Symtx, Inc. (electronic manufacturing) | |
| (since 2001), Adorno/Rogers Technology, Inc. (until 2004), Pinnacle Foods | | |
| Corporation (until 2003), rateGenius (until 2003), Lincoln National Corporation | |
| (insurance) (since 2006), Jefferson-Pilot Corporation (diversified life insurance | | |
| company) (until 2006), New Century Equity Holdings (formerly Billing Concepts) | |
30
| Independent Trustees (continued) | | |
| |
| Name, age | | Number of |
| Position(s) held with Fund | Trustee | John Hancock |
| Principal occupation(s) and other | of Fund | funds overseen |
| directorships during past 5 years | since1 | by Trustee |
|
| William H. Cunningham , Born: 1944 (continued) | 2005 | 158 |
| (until 2001), eCertain (until 2001), ClassMap.com (until 2001), Agile Ventures | | |
| (until 2001), AskRed.com (until 2001), Southwest Airlines, Introgen and | | |
| Viasystems Group, Inc. (electronic manufacturer) (until 2003); Advisory | | |
| Director, Interactive Bridge, Inc. (college fundraising) (until 2001); Advisory | | |
| Director, Q Investments (until 2003); Advisory Director, JPMorgan Chase Bank | | |
| (formerly Texas Commerce Bank – Austin), LIN Television (since 2002), WilTel | | |
| Communications (until 2003) and Hayes Lemmerz International, Inc. | | |
| (diversified automotive parts supply company) (since 2003). | | |
|
| |
| Charles L. Ladner,2 Born: 1938 | 2004 | 158 |
| Chairman and Trustee, Dunwoody Village, Inc. (retirement services) (until 2003); | |
| Senior Vice President and Chief Financial Officer, UGI Corporation (public utility | |
| holding company) (retired 1998); Vice President and Director for AmeriGas, Inc. | |
| (retired 1998); Director of AmeriGas Partners, L.P. (gas distribution) (until 1997); | |
| Director, EnergyNorth, Inc. (until 1995); Director, Parks and History Association | |
| (until 2007). | | |
|
| |
| John A. Moore,2 Born: 1939 | 1993 | 53 |
| President and Chief Executive Officer, Institute for Evaluating Health Risks, | | |
| (nonprofit institution) (until 2001); Senior Scientist, Sciences International | | |
| (health research) (until 2003); Former Assistant Administrator and Deputy | | |
| Administrator, Environmental Protection Agency; Principal, Hollyhouse | | |
| (consulting) (since 2000); Director, CIIT Center for Health Science Research | | |
| (nonprofit research) (since 2002). | | |
|
| |
| Patti McGill Peterson,2 Born: 1943 | 1993 | 53 |
| Executive Director, Council for International Exchange of Scholars and Vice | | |
| President, Institute of International Education (since 1998); Senior Fellow, Cornell | |
| Institute of Public Affairs, Cornell University (until 1998); Former President of | | |
| Wells College and St. Lawrence University; Director, Niagara Mohawk Power | | |
| Corporation (until 2003); Director, Ford Foundation, International Fellowships | | |
| Program (since 2002); Director, Lois Roth Endowment (since 2002); Director, | | |
| Council for International Educational Exchange (since 2003). | | |
|
| |
| Steven R. Pruchansky, Born: 1944 | 2005 | 53 |
| Chairman and Chief Executive Officer, Greenscapes of Southwest Florida, Inc. | | |
| (since 2000); Director and President, Greenscapes of Southwest Florida, Inc. | | |
| (until 2000); Managing Director, JonJames, LLC (real estate) (since 2001); | | |
| Director, First Signature Bank & Trust Company (until 1991); Director, Mast | | |
| Realty Trust (until 1994); President, Maxwell Building Corp. (until 1991). | | |
31
| Non-Independent Trustee3 | | |
| |
| Name, age | | Number of |
| Position(s) held with Fund | Trustee | John Hancock |
| Principal occupation(s) and other | of Fund | funds overseen |
| directorships during past 5 years | since1 | by Trustee |
|
| James R. Boyle, Born: 1959 | 2005 | 260 |
| President, John Hancock Annuities; Executive Vice President, John Hancock | | |
| Life Insurance Company (since June, 2004); Chairman and Director, John | | |
| Hancock Advisers, LLC (the “Adviser”), John Hancock Funds, LLC and The | | |
| Berkeley Financial Group, LLC (“The Berkeley Group”) (holding company) (since | |
| 2005); President, U.S. Annuities; Senior Vice President, The Manufacturers | | |
| Life Insurance Company (U.S.A.) (until 2004). | | |
| |
| Principal officers who are not Trustees | | |
| |
| Name, age | | |
| Position(s) held with Fund | | Officer |
| Principal occupation(s) and | | of Fund |
| directorships during past 5 years | | since |
|
| Keith F. Hartstein, Born: 1956 | | 2005 |
| President and Chief Executive Officer | | |
| Senior Vice President, Manulife Financial Corporation (since 2004); Director, | | |
| President and Chief Executive Officer, the Adviser, The Berkeley Group, John | | |
| Hancock Funds, LLC (since 2005); Director, MFC Global Investment Management | |
| (U.S.), LLC (“MFC Global (U.S.)”) (since 2005); Director, John Hancock Signature | |
| Services, Inc. (since 2005); President and Chief Executive Officer, John Hancock | |
| Investment Management Services, LLC (since 2006); President and Chief Executive | |
| Officer, John Hancock Funds II, John Hancock Funds III and John Hancock Trust; | |
| Director, Chairman and President, NM Capital Management, Inc. (since 2005); | | |
| Chairman, Investment Company Institute Sales Force Marketing Committee | | |
| (since 2003); Director, President and Chief Executive Officer, MFC Global (U.S.) | |
| (2005–2006); Executive Vice President, John Hancock Funds, LLC (until 2005). | | |
|
| |
| Thomas M. Kinzler, Born: 1955 | | 2006 |
| Secretary and Chief Legal Officer | | |
| Vice President and Counsel, John Hancock Life Insurance Company (U.S.A.) | | |
| (since 2006); Secretary and Chief Legal Officer, John Hancock Funds, John | | |
| Hancock Funds II, John Hancock Funds III and John Hancock Trust (since 2006); | |
| Vice President and Associate General Counsel, Massachusetts Mutual Life | | |
| Insurance Company (1999–2006); Secretary and Chief Legal Counsel, MML | | |
| Series Investment Fund (2000–2006); Secretary and Chief Legal Counsel, | | |
| MassMutual Institutional Funds (2000–2004); Secretary and Chief Legal Counsel, | |
| MassMutual Select Funds and MassMutual Premier Funds (2004–2006). | | |
|
| |
| Francis V. Knox, Jr., Born: 1947 | | 2005 |
| Chief Compliance Officer | | |
| Vice President and Chief Compliance Officer, John Hancock Investment | | |
| Management Services, LLC, the Adviser and MFC Global (U.S.) (since 2005); | | |
| Vice President and Chief Compliance Officer, John Hancock Funds II, John | | |
| Hancock Funds III and John Hancock Trust (since 2005); Vice President and | | |
| Assistant Treasurer, Fidelity Group of Funds (until 2004); Vice President and | | |
| Ethics & Compliance Officer, Fidelity Investments (until 2001). | | |
32
| Principal officers who are not Trustees (continued) | |
| |
| Name, age | |
| Position(s) held with Fund | Officer |
| Principal occupation(s) and | of Fund |
| directorships during past 5 years | since |
|
| Gordon M. Shone, Born: 1956 | 2006 |
| Treasurer | |
| Treasurer, John Hancock Funds (since 2006), John Hancock Funds II, John | |
| Hancock Funds III and John Hancock Trust (since 2005); Vice President and | |
| Chief Financial Officer, John Hancock Trust (2003–2005); Senior Vice President, | |
| John Hancock Life Insurance Company (U.S.A.) (since 2001); Vice President, | |
| John Hancock Investment Management Services, Inc., John Hancock Advisers, | |
| LLC (since 2006) and The Manufacturers Life Insurance Company (U.S.A.) | |
| (1998–2000). | |
|
| |
| John G. Vrysen, Born: 1955 | 2005 |
| Chief Financial Officer | |
| Director, Executive Vice President and Chief Financial Officer, the Adviser, The | |
| Berkeley Group and John Hancock Funds, LLC (since 2005); Executive Vice | |
| President and Chief Financial Officer, John Hancock Investment Management | |
| Services, LLC (since 2005); Vice President and Chief Financial Officer, MFC Global | |
| (U.S.) (since 2005); Director, John Hancock Signature Services, Inc. (since 2005); | |
| Chief Financial Officer, John Hancock Funds II, John Hancock Funds III and John | |
| Hancock Trust (since 2005); Vice President and General Manager, Fixed Annuities, | |
| U.S. Wealth Management (until 2005); Vice President, Operations, Manulife | |
| Wood Logan (2000–2004). | |
The business address for all Trustees and Officers is 601 Congress Street, Boston, Massachusetts 02210-2805.
The Statement of Additional Information of the Fund includes additional information about members of the Board of Trustees of the Fund and is available, without charge, upon request, by calling 1-800-225-5291.
1Each Trustee serves until resignation, retirement age or until his or her successor is elected.
2Member of Audit Committee.
3Non-Independent Trustee holds positions with the Fund’s investment adviser, underwriter and certain other affiliates.
33
For more information
| The Fund’s proxy voting policies, procedures and records are available without charge, |
| upon request: | | |
| By phone | On the Fund’s Web site | On the SEC’s Web site |
| 1-800-225-5291 | www.jhfunds.com/proxy | www.sec.gov |
|
| |
| Investment adviser | Custodian | Legal counsel |
| John Hancock Advisers, LLC | The Bank of New York | Kirkpatrick & Lockhart |
| 601 Congress Street | One Wall Street | Nicholson Graham LLP |
| Boston, MA 02210-2805 | New York, NY 10286 | 1 Lincoln Street |
| | | Boston, MA 02110-2950 |
| Subadviser | Transfer agent | |
| MFC Global Investment | John Hancock Signature | Independent registered |
| Management (U.S.), LLC | Services, Inc. | public accounting firm |
| 101 Huntington Avenue | 1 John Hancock Way, | PricewaterhouseCoopers LLP |
| Boston, MA 02199 | Suite 1000 | 125 High Street |
| Principal distributor | Boston, MA 02217-1000 | Boston, MA 02110 |
| John Hancock Funds, LLC | | |
| 601 Congress Street | | |
| Boston, MA 02210-2805 | | |
The Fund’s investment objective, risks, charges and expenses are included in the prospectus and should be considered carefully before investing. For a prospectus, call your financial professional, call John Hancock Funds at 1-800-225-5291 or visit the Fund’s Web site at www.jhfunds.com. Please read the prospectus carefully before investing or sending money.
| How to contact us | |
|
| |
| Internet | www.jhfunds.com | |
|
| |
| Mail | Regular mail: | Express mail: |
| | John Hancock | John Hancock |
| | Signature Services, Inc. | Signature Services, Inc. |
| | 1 John Hancock Way, Suite 1000 | Mutual Fund Image Operations |
| | Boston, MA 02217-1000 | 380 Stuart Street |
| | | Boston, MA 02116 |
|
| |
| Phone | Customer service representatives | 1-800-225-5291 |
| | 24-hour automated information | 1-800-338-8080 |
| | TDD line | 1-800-554-6713 |
A listing of month-end portfolio holdings is available on our Web site, www.jhfunds.com. A more detailed portfolio holdings summary is available on a quarterly basis 60 days after the fiscal quarter on our Web site or upon request by calling 1-800-225-5291, or on the Securities and Exchange Commission’s Web site, www.sec.gov.
36
J O H N H A N C O C K F A M I L Y O F F U N D S
| EQUITY | INTERNATIONAL |
| Balanced Fund | Greater China Opportunities Fund |
| Classic Value Fund | International Classic Value Fund |
| Classic Value Fund II | International Core Fund |
| Core Equity Fund | International Fund |
| Focused Equity Fund | International Growth Fund |
| Growth Fund | |
| Growth Opportunities Fund | INCOME |
| Growth Trends Fund | Bond Fund |
| Intrinsic Value Fund | Government Income Fund |
| Large Cap Equity Fund | High Yield Fund |
| Large Cap Select Fund | Investment Grade Bond Fund |
| Mid Cap Equity Fund | Strategic Income Fund |
| Mid Cap Growth Fund | |
| Multi Cap Growth Fund | TAX-FREE INCOME |
| Small Cap Equity Fund | California Tax-Free Income Fund |
| Small Cap Fund | High Yield Municipal Bond Fund |
| Small Cap Intrinsic Value Fund | Massachusetts Tax-Free Income Fund |
| Sovereign Investors Fund | New York Tax-Free Income Fund |
| U.S. Core Fund | Tax-Free Bond Fund |
| U.S. Global Leaders Growth Fund | |
| Value Opportunities Fund | MONEY MARKET |
| | Money Market Fund |
| ASSET ALLOCATION FUND | U.S. Government Cash Reserve |
| Allocation Core Portfolio | |
| Allocation Growth + Value Portfolio | CLOSED END |
| Lifestyle Aggressive Portfolio | Bank & Thrift Opportunity |
| Lifestyle Balanced Portfolio | Financial Trends |
| Lifestyle Conservative Portfolio | Income Securities |
| Lifestyle Growth Portfolio | Investors Trust |
| Lifestyle Moderate Portfolio | Patriot Global Dividend |
| | Patriot Preferred Dividend |
| SECTOR | Patriot Premium Dividend I |
| Financial Industries Fund | Patriot Premium Dividend II |
| Health Sciences Fund | Patriot Select Dividend |
| Real Estate Fund | Preferred Income |
| Regional Bank Fund | Preferred Income II |
| Technology Fund | Preferred Income III |
| Technology Leaders Fund | Tax-Advantaged Dividend |
For more complete information on any John Hancock Fund and an Open-End fund prospectus, which includes charges and expenses, call your financial professional, or John Hancock Funds at 1-800-225-5291 for Open-End fund information and 1-800-852-0218 for Closed-End fund information. Please read the Open-End fund prospectus carefully before investing or sending money.

1-800-225-5291
1-800-554-6713 (TDD)
1-800-338-8080 EASI-Line
www.jhfunds. com
Now available: electronic delivery
www.jhfunds.com/edelivery
This report is for the information of the shareholders of John Hancock Mid Cap Growth Fund.
3900A 10/06
12/06


| TABLE OF CONTENTS |
|
| Your fund at a glance |
| page 1 |
|
| Managers’ report |
| page 2 |
|
| A look at performance |
| page 6 |
|
| Your expenses |
| page 8 |
|
| Fund’s investments |
| page 1 0 |
|
| Financial statements |
| page 1 4 |
|
| Notes to financial |
| statements |
| page 2 1 |
|
| Trustees and officers |
| page 3 3 |
|
| For more information |
| page 4 0 |
|
CEO corner
To Our Shareholders,
The future has arrived at John Hancock Funds.
We have always been firm believers in the powerful role the Internet can play in providing fund information to our shareholders and prospective investors. Recently, we launched a redesigned, completely overhauled Web site that is more visually pleasing, easier to navigate and, most importantly, provides more fund information and learning tools without overwhelming the user.
Not long after we embarked on this major project, a study was released by the Investment Company Institute, the mutual fund industry’s main trade group, which found that an overwhelming majority of shareholders consider the Internet the “wave of the future” for accessing fund information.
Our new site sports fresher and faster ways to access account information. New innovations allow investors to view funds by risk level, track the performance of the John Hancock funds of their choice or sort funds by Morningstar, Inc.’s star ratings. Investors who own a John Hancock fund through a qualified retirement plan and don’t pay sales charges when making a purchase have the option of sorting by a “Load Waived” Morningstar Rating, thereby creating an apples-to-apples comparison with no-load funds that may also be available in their retirement plan.
The new site also has more educational tools and interactive modules to educate and assist investors with their financial goals, from college savings to retirement planning. A new “I want to…” feature allows investors to check performance, invest more money, update personal information or download prospectuses and forms quickly and easily.
In another of our ongoing efforts to provide our shareholders with top-notch service, we also redesigned our shareholder reports, as you may have noticed with this report. We hope the larger size, more colorful cover and redesigned presentation of the commentary and data tables will draw you in and make them easier to read.
After you’ve read your shareholder report, we encourage you to visit our new Web site — www.jhfunds.com — and take a tour. It’s easy, fast and fun and allows you to be in control of what you see and do. In short, it’s the wave of the future!
Sincerely,

Keith F. Hartstein,
President and Chief Executive Officer |
This commentary reflects the CEO’s views as of October 31, 2006. They are subject to change at any time.
Your fund at a glance
The Fund seeks long-term growth of capital by normally investing at least 80% of its
assets in stocks of foreign companies. |
Over the last twelve months
► Equity performance was strong around the world, led by impressive gains from emerging countries.
► The Fund’s growth-oriented strategy weighed on results versus the benchmark, because investors favored international value stocks over growth stocks.
► Stock selection in Hong Kong, Ireland and the telecommunication services and information technology sectors benefited relative performance.
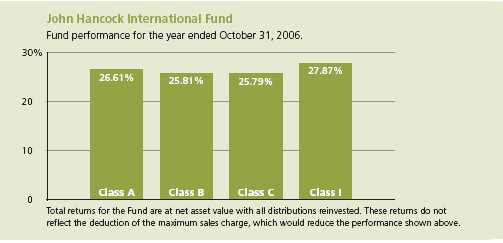
| Top 10 holdings | | | |
| | | |
| Sumitomo Mitsui Financial Group, Inc. | 3.0% | UBS AG | 2.4% |
|
| Toyota Motor Corp. | 2.5% | Veolia Environnment SA | 2.3% |
|
| ABB Ltd. | 2.5% | AXA | 2.2% |
|
| HSBC Holdings Plc | 2.4% | Nestle SA | 2.2% |
|
| Roche Holding AG | 2.4% | Lafarge SA | 2.1% |
|
As a percentage of net assets on October 31, 2006.
1
Managers’ report
John Hancock
International Fund |
International equity markets registered strong gains during the year ended October 31, 2006. U.S.-based investors further benefited from the appreciation of many foreign currencies versus the U.S. dollar, since this boosted international equity performance in dollar terms.
During the first half of the period, overseas stock markets advanced, as healthy economic and earnings growth globally eclipsed worries about inflation and tighter monetary policy from central banks worldwide. Equities sold off sharply in May, however, due to concerns over how newly appointed Federal Reserve Chairman Ben Bernanke would address the difficult combination of slowing growth and rising inflation in the United States. The downturn was short lived and investors bid stocks higher from June through October. The rally was driven by falling oil prices, a pause in U.S. monetary tightening and favorable developments within individual markets.
Equity performance was strong around the world, led by impressive gains from emerging countries, including China and India where economic growth was especially robust. Among developed countries, stocks in eurozone markets turned in some of the best results amid brisk takeover activity and the fastest pace of economic expansion in the region since 2000. Equity price appreciation in Japan was more subdued but still strong. The Bank of Japan raised interest rates in July
SCORECARD
| INVESTMENT | | PERIOD’S PERFORMANCE . . . AND WHAT’S BEHIND THE NUMBERS |
| | |
| C&C Group | ▲ | Successful product launch |
| Millicom | | |
| International | ▲ | Rapid subscriber growth |
| Cellular | | |
| Siemens | ▼ | Disappointing pace of restructuring |
2
Portfolio Managers, Nicholas-Applegate Capital Management, LLC
Horacio A. Valeiras, CFA, and Vince Willyard, CFA |
after five years of a near-zero interest rate policy, reflecting its confidence in the country’s economic recovery.
From a sector perspective, equity gains were also broad based. Utilities was the best-performing group, buoyed by healthy demand for high-yielding securities from aging populations funding retirement incomes. The materials sector was another standout performer, as prices of many commodities, such as copper and nickel, increased throughout much of the period.
“International equity markets
registered strong gains during
the year ended October 31, 2006.” |
Fund performance explainedFor the 12 months ended October 31, 2006, John Hancock International Fund’s Class A, Class B, Class C and Class I shares rose 26.61%, 25.81%, 25.79% and 27.87%, respectively, at net asset value. During the same time, the average foreign large-cap growth fund gained 25.97%, according to Morningstar, Inc.1, and the benchmark MSCI All Country World Ex-U.S. Index advanced 25.55% . Keep in mind that your net asset value return will be different from the Fund’s performance if you were not invested in the Fund for the entire period and did not reinvest all distributions. See pages six and seven for historical performance information.
The Fund’s holdings in the majority of countries and in all sectors of investment generated gains, resulting in a strong total return for the year. On a comparative basis, the Fund performed in line with its Morningstar peer group and the MSCI All Country World Ex-U.S. Index. Consistent with our investment philosophy, positions are concentrated in growth stocks, while the index contains both growth and value names. Stock selection in Germany, France and in the financials and health care sectors weighed on relative results.
International Fund
3
On the plus side, stock selection in Hong Kong and Ireland added value relative to the benchmark, as did an overweight in Ireland where consumer spending accelerated. Furthermore, select positions in the telecommunication services and information technology sectors favorably affected performance versus the index.
Top-performing stocks included C&C Group Plc, an Irish food and beverage distributor that had a successful product launch; Millicom International Cellular SA, a Luxembourger wireless telecommunication services company that experienced rapid subscriber growth; and Foxconn International Holdings Ltd., a Chinese handset manufacturer that benefited from market share gains with existing customers. Decliners included Siemens AG, a German industrial conglomerate whose pace of restructuring was slower than investors anticipated; Générale de Santé, a French health care services provider that fell on expectations that the government would lower hospital rates; and Hokuhoku Financial Group, Inc., a Japanese regional bank that was weak on concerns that a potential change in its capital structure would dilute earnings per share.
Fund moves
During the year, there were changes in the Fund’s country and sector weightings that resulted from our stock-by-stock investment decisions. Assets were shifted from Canada and emerging markets in the Asia Pacific region, including South Korea and China, in favor of opportunities identified in developed European countries, such as Switzerland and the United Kingdom. Changes in sector allocations included a decrease in the Fund’s materials and telecommunication services holdings and an increase in exposure to consumer staples and financials.
| SECTOR DISTRIBUTION2 |
| Financials | 28% |
| Consumer staples | 13% |
| Consumer discretionary | 12% |
| Industrials | 11% |
| Information technology | 8% |
| Health care | 7% |
| Telecommunication | |
| services | 7% |
| Energy | 6% |
| Utilities | 3% |
| Materials | 3% |
Holdings remained well diversified at the end of the period, with broad representation across countries and sectors. Compared to the benchmark, the Fund was overweight stocks in developed Asian countries, particularly Japan, and underweight Canadian equities. The Fund was overweight consumer staples and information technology stocks and underweight materials and energy.
International Fund
4
Outlook
While rising geopolitical tensions are always a risk, international equities seem poised for additional gains as 2007 approaches. Economic activity in emerging countries should remain robust and leading economic indicators in major developed countries outside of Japan are positive, despite recent declines. This supports our belief that the global economy will continue to grow, albeit at a more modest pace than in 2006. Although we anticipate further interest rate increases from the Bank of Japan and European Central Bank, commodity prices have fallen and inflationary pressures have eased in Europe. In addition, earnings growth should remain at healthy levels internationally, and most foreign markets still appear to be relatively undervalued based on price-to-earnings ratios. A slowdown in the global economy, tame inflation, good earnings growth and attractive valuations are an excellent recipe for higher share prices.
“The Fund’s holdings in the
majority of countries and in all
sectors of investment generated
gains, resulting in a strong total
return for the year.” |
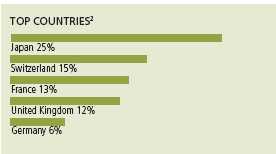
In this environment, we believe companies that can deliver strong earnings growth could once again command premium valuations relative to all others. The market seems to be rotating away from early cyclical stocks and sectors into more stable growth names, suggesting that several years of international value leadership may be coming to an end.
This commentary reflects the views of the portfolio management team through the end of the Fund’s period discussed in this report. The team’s statements reflect their own opinions. As such, they are in no way guarantees of future events, and are not intended to be used as investment advice or a recommendation regarding any specific security. They are also subject to change at any time as market and other conditions warrant.
International investing involves special risks such as political, economic and currency risks and differences in accounting standards and financial reporting.
1 Figures from Morningstar, Inc. include reinvested dividends and do not take into account sales charges. Actual load-adjusted performance is lower.
2 As a percentage of net assets on October 31, 2006.
International Fund
5
A look at performance
For the periods ending October 31, 2006
| | | Average annual returns | | Cumulative total returns | | |
| | | with maximum sales charge (POP) | with maximum sales charge (POP) | |
| | Inception | | | | Since | | | | | Since |
| Class | date | 1-year | 5-year | 10-year | inception | | 1-year | 5-year | 10-year | inception |
|
| A | 1-3-94 | 20.25% | 9.45% | 1.61% | — | | 20.25% | 57.10% | 17.32% | — |
|
| B | 1-3-94 | 20.81 | 9.56 | 1.55 | — | | 20.81 | 57.87 | 16.67 | — |
|
| C | 6-1-98 | 24.79 | 9.83 | — | 0.52% | | 24.79 | 59.79 | — | 4.49% |
|
| I1 | 3-1-02 | 27.87 | — | — | 12.36 | | 27.87 | — | — | 72.31 |
|
Performance figures assume all distributions are reinvested. Returns with maximum sales charge reflect a sales charge on Class A shares of 5%, and the applicable contingent deferred sales charge (CDSC) on Class B and Class C shares. The returns for Class C shares have been adjusted to reflect the elimination of the front-end sales charge effective July 15, 2004. The Class B shares’ CDSC declines annually between years 1–6 according to the following schedule: 5, 4, 3, 3, 2, 1%. No sales charge will be assessed after the sixth year. Class C shares held for less than one year are subject to a 1% CDSC. Sales charge is not applicable for Class I shares.
The returns reflect past results and should not be considered indicative of future performance. The return and principal value of an investment will fluctuate so that shares, when redeemed, may be worth more or less than their original cost. Due to market volatility, the Fund’s current performance may be higher or lower than the performance shown. For performance data current to the most recent month-end, please call 1-800-225-5291 or visit the Fund’s Web site at www.jhfunds.com.
The performance table above and the chart on the next page do not reflect the deduction of taxes that a shareholder would pay on fund distributions or the redemption of fund shares.
The Fund’s performance results reflect any applicable expense reductions, without which the expenses would increase and results would have been less favorable.
1 For certain types of investors as described in the Fund’s Class I share prospectus.
International Fund
6
Growth of $10,000
This chart shows what happened to a hypothetical $10,000 investment in Class A shares for the period indicated. For comparison, we’ve shown the same investment in the MSCI All Country World Ex-U.S. Index.
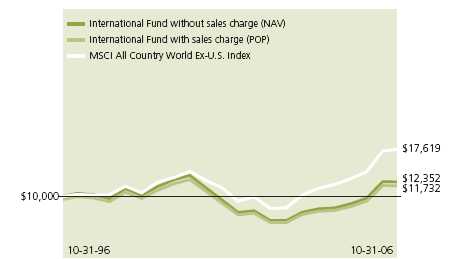
| | | | With maximum | |
| Class | Period beginning | Without sales charge | sales charge | Index |
|
| B1 | 10-31-96 | $11,667 | $11,667 | $17,619 |
|
| C1 | 6-1-98 | 10,449 | 10,449 | 15,571 |
|
| I 2 | 3-1-02 | 17,231 | 17,231 | 18,450 |
|
Assuming all distributions were reinvested for the period indicated, the table above shows the value of a $10,000 investment in the Fund’s Class B, Class C and Class I shares, respectively, as of October 31, 2006. The Class C shares investment with maximum sales charge has been adjusted to reflect the elimination of the front-end sales charge effective July 15, 2004. Performance of the classes will vary based on the difference in sales charges paid by shareholders investing in the different classes and the fee structure of those classes.
Morgan Stanley Capital International (MSCI) All Country World Ex-U.S. Index is an unmanaged index of freely traded stocks of foreign companies.
It is not possible to invest directly in an index. Index figures do not reflect sales charges which would have resulted in lower values if they did.
1 No contingent deferred sales charge applicable.
2 For certain types of investors as described in the Fund’s Class I share prospectus.
International Fund
7
Your expenses
These examples are intended to help you understand your ongoing
operating expenses. |
Understanding fund expenses
As a shareholder of the Fund, you incur two types of costs:
▪ Transaction costs which include sales charges (loads) on purchases or redemptions (varies by share class), minimum account fee charge, etc.
▪ Ongoing operating expenses including management fees, distribution and service fees (if applicable) and other fund expenses.
We are going to present only your ongoing operating expenses here.
Actual expenses/actual returns
This example is intended to provide information about your fund’s actual ongoing operating expenses, and is based on your fund’s actual return. It assumes an account value of $1,000.00 on May 1, 2006, with the same investment held until October 31, 2006.
| | Account value | Ending value | Expenses paid during period |
| | on 5-1-06 | on 10-31-06 | ended 10-31-061 |
|
| Class A | $1,000.00 | $995.60 | $8.78 |
|
| Class B | 1,000.00 | 992.80 | 12.26 |
|
| Class C | 1,000.00 | 992.80 | 12.26 |
|
| Class I | 1,000.00 | 1,002.10 | 6.05 |
|
Together with the value of your account, you may use this information to estimate the operating expenses that you paid over the period. Simply divide your account value at October 31, 2006 by $1,000.00, then multiply it by the “expenses paid” for your share class from the table above. For example, for an account value of $8,600.00, the operating expenses should be calculated as follows:
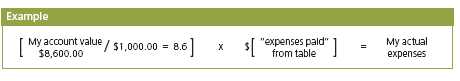
International Fund
8
Hypothetical example for comparison purposes
This table allows you to compare your fund’s ongoing operating expenses with those of any other fund. It provides an example of the Fund’s hypothetical account values and hypothetical expenses based on each class’s actual expense ratio and an assumed 5% annual return before expenses (which is not your fund’s actual return). It assumes an account value of $1,000.00 on May 1, 2006, with the same investment held until October 31, 2006. Look in any other fund shareholder report to find its hypothetical example and you will be able to compare these expenses.
| | Account value | Ending value | Expenses paid during period |
| | on 5-1-06 | on 10-31-06 | ended 10-31-061 |
|
| Class A | $1,000.00 | $1,016.40 | $8.87 |
|
| Class B | 1,000.00 | 1,012.90 | 12.38 |
|
| Class C | 1,000.00 | 1,012.90 | 12.38 |
|
| Class I | 1,000.00 | 1,019.16 | 6.10 |
|
Remember, these examples do not include any transaction costs, such as sales charges; therefore, these examples will not help you to determine the relative total costs of owning different funds. If transaction costs were included, your expenses would have been higher. See the prospectus for details regarding transaction costs.
1 Expenses are equal to the Fund’s annualized expense ratio of 1.75%, 2.45%, 2.45% and 1.20% for Class A, Class B, Class C and Class I, respectively, multiplied by the average account value over the period, multiplied by number of days in most recent fiscal half-year/365 or 366 (to reflect the one-half year period).
International Fund
9
Fund’s investments
F I N A N C I A L S T A T E M E N T S
Securities owned by the Fund on 10-31-06
This schedule is divided into three main categories: common stocks, warrants and short-
term investments. The common stocks and warrants are further broken down by country.
Short-term investments, which represent the Fund’s cash position, are listed last.
| Issuer | Shares | Value |
|
| Common stocks 96.51% | | $116,734,676 |
| (Cost $97,820,113) | | |
Canada 1.45% | | 1,750,957 |
|
| Suncor Energy, Inc. (Integrated Oil & Gas) | 14,600 | 1,123,879 |
|
| Teck Cominco Ltd. (Class B) (Diversified Metals & Mining) | 8,500 | 627,078 |
China 2.22% | | 2,690,187 |
|
| Foxconn International Holdings Ltd. (Communications Equipment) (I) | 284,000 | 943,594 |
|
| Industrial & Commercial Bank of China (Diversified Banks) (I) | 2,969,000 | 1,327,993 |
|
| Suntech Power Holding Co., Ltd., American Depositary Receipt (ADR) | | |
| (Electrical Components & Equipment) (I) | 16,100 | 418,600 |
France 12.51% | | 15,127,995 |
|
| AXA (Multi-Line Insurance) | 69,675 | 2,654,552 |
|
| BNP Paribas SA (Diversified Banks) | 21,930 | 2,411,370 |
|
| Lafarge SA (Construction Materials) | 18,993 | 2,552,653 |
|
| Silicon-On-Insulator Technologies (Semiconductors) (I) | 61,834 | 1,831,776 |
|
| Total SA (Integrated Oil & Gas) | 27,128 | 1,836,847 |
|
| Vallourec SA (Industrial Machinery) | 4,304 | 1,071,215 |
|
| Veolia Environnment SA (Multi-Utilities) | 45,235 | 2,769,582 |
Germany 5.72% | | 6,916,031 |
|
| Bayerische Motoren Werke (BMW) AG | | |
| (Automobile Manufacturers) | 18,433 | 1,058,478 |
|
| Hannover Rueckversicherung AG (Reinsurance) | 33,915 | 1,439,307 |
|
| Henkel KGaA (Household Products) | 13,946 | 1,866,328 |
|
| Puma AG Rudolf Dassler Sport (Footwear) | 2,561 | 909,623 |
|
| Solarworld AG (Electrical Components & Equipment) | 8,894 | 479,616 |
|
| Stada Arzneimittel AG (Pharmaceuticals) | 24,640 | 1,162,679 |
Hong Kong 2.65% | | 3,203,414 |
|
| AAC Acoustic Technology Holdings, Inc. | | |
| (Communications Equipment) (I) | 742,000 | 862,142 |
|
| Hutchison Telecommunications International Ltd. | | |
| (Wireless Telecommunication Services) (I) | 1,216,000 | 2,341,272 |
Hungary 1.10% | | 1,335,053 |
|
| MOL Magyar Olaj-es Gazipari Rt. (Integrated Oil & Gas) | 13,424 | 1,335,053 |
See notes to financial statements
International Fund
10
F I N A N C I A L S T A T E M E N T S
| Issuer | Shares | Value |
| | |
| Ireland 2.93% | | $3,546,276 |
|
| Bank of Ireland (Diversified Banks) | 64,610 | 1,301,290 |
|
| C&C Group Plc (Distillers & Vintners) | 135,093 | 2,244,986 |
| | |
| Italy 2.69% | | 3,257,856 |
|
| San Paolo IMI SpA (Diversified Banks) | 50,677 | 1,082,123 |
|
| UniCredito Italiano SpA (Diversified Banks) | 262,456 | 2,175,733 |
| | |
| Japan 24.69% | | 29,859,360 |
|
| Aoyama Trading Co., Ltd. (Apparel Retail) | 16,600 | 508,677 |
|
| ASICS Corp. (Footwear) | 94,000 | 1,257,292 |
|
| Calsonic Kansei Corp. (Auto Parts & Equipment) | 126,000 | 818,454 |
|
| Chugai Pharmaceutical Co., Ltd. (Pharmaceuticals) | 63,000 | 1,290,598 |
|
| Fuji Electric Holdings Co., Ltd. (Electrical Components & Equipment) | 237,000 | 1,286,603 |
|
| Haseko Corp. (Homebuilding) (I) | 397,000 | 1,362,247 |
|
| Isetan Co., Ltd. (Department Stores) | 85,300 | 1,499,876 |
|
| Japan Steel Works Ltd. (The) (Industrial Machinery) | 80,000 | 534,676 |
|
| Japan Tobacco, Inc. (Tobacco) | 544 | 2,368,145 |
|
| Mitsubishi Estate Co., Ltd. (Real Estate Management & Development) | 94,000 | 2,246,596 |
|
| Mitsubishi UFJ Financial Group, Inc. (Diversified Banks) | 160 | 2,007,597 |
|
| Mitsui & Co., Ltd. (Trading Companies & Distributors) | 70,000 | 954,206 |
|
| Nippon Electric Glass Co., Ltd. (Electronic Equipment Manufacturers) | 71,000 | 1,527,208 |
|
| Nitori Co., Ltd. (Homefurnishing Retail) | 25,030 | 1,012,694 |
|
| Sumitomo Mitsubishi Silicon Corp. (Semiconductors) | 28,600 | 2,031,087 |
|
| Sumitomo Mitsui Financial Group, Inc. (Diversified Banks) | 330 | 3,605,480 |
|
| Toyota Motor Corp. (Automobile Manufacturers) | 51,000 | 3,016,773 |
|
| Uni-Charm Corp. (Household Products) | 25,100 | 1,394,742 |
|
| Yakult Honsha Co., Ltd. (Packaged Foods & Meats) | 42,400 | 1,136,409 |
| | |
| Luxembourg 3.43% | | 4,152,882 |
|
| Millicom International Cellular SA | | |
| (Wireless Telecommunication Services) (I) | 36,400 | 1,815,632 |
|
| Stolt Offshore SA (Oil & Gas Equipment & Services) (I) | 77,200 | 1,395,654 |
|
| Tenaris SA, ADR (Oil & Gas Equipment & Services) | 24,400 | 941,596 |
| | |
| Mexico 1.28% | | 1,548,317 |
|
| Fomento Economico Mexicano SA de CV (Soft Drinks) | 26,100 | 252,671 |
|
| Fomento Economico Mexicano SA de CV, ADR (Soft Drinks) | 13,400 | 1,295,646 |
| | |
| Netherlands 1.02% | | 1,234,229 |
|
| Koninklijke (Royal) KPN NV (Integrated | | |
| Telecommunication Services) | 92,359 | 1,234,229 |
| | |
| Norway 1.88% | | 2,269,487 |
|
| Telenor ASA (Integrated Telecommunication Services) | 106,200 | 1,676,385 |
|
| TGS Nopec Geophysical Co. ASA (Oil & Gas Equipment & Services) (I) | 33,300 | 593,102 |
| | |
| Portugal 1.03% | | 1,247,320 |
|
| Banco Espirito Santo SA (Diversified Banks) | 78,684 | 1,247,320 |
See notes to financial statements
International Fund
11
F I N A N C I A L S T A T E M E N T S
| Issuer | Shares | Value |
| | |
| Singapore 1.93% | | $2,340,506 |
|
| DBS Group Holdings Ltd. (Diversified Banks) | 124,000 | 1,624,506 |
|
| SembCorp Marine Ltd. (Construction & Farm Machinery & Heavy Trucks) | 326,000 | 716,000 |
| | |
| South Korea 2.08% | | 2,514,148 |
|
| Daewoo Shipbuilding & Marine Engineering Co., Ltd. | | |
| (Construction & Farm Machinery & Heavy Trucks) | 42,150 | 1,355,492 |
|
| Kookmin Bank, ADR (Diversified Banks) | 14,600 | 1,158,656 |
| | |
| Sweden 1.23% | | 1,492,010 |
|
| Modern Times Group MTG AB (B Shares) (Broadcasting & Cable TV) | 25,900 | 1,492,010 |
| | |
| Switzerland 14.54% | | 17,583,589 |
|
| ABB Ltd. (Heavy Electrical Equipment) | 200,804 | 2,986,593 |
|
| Adecco SA (Human Resource & Employment Services) | 26,399 | 1,631,035 |
|
| Compagnie Financiere Richemont AG (Apparel, Accessories & | | |
| Luxury Goods) | 25,852 | 1,279,246 |
|
| Nestle SA (Packaged Foods & Meats) | 7,662 | 2,617,960 |
|
| Panalpina Welttransport Holding AG (Air Freight & Logistics) | 13,911 | 1,660,798 |
|
| Roche Holding AG (Pharmaceuticals) | 16,756 | 2,932,654 |
|
| Swiss Re (Reinsurance) | 19,183 | 1,573,072 |
|
| UBS AG (Diversified Capital Markets) | 48,586 | 2,902,231 |
| | |
| Taiwan 0.01% | | 6,299 |
|
| United Microelectronics Corp., ADR (Semiconductors) | 2,079 | 6,299 |
| | |
| United Kingdom 11.50% | | 13,908,612 |
|
| ARM Holdings Plc (Semiconductors) | 641,730 | 1,441,189 |
|
| AstraZeneca Plc (Pharmaceuticals) | 38,625 | 2,282,221 |
|
| Barclays Plc (Diversified Banks) | 146,487 | 1,976,666 |
|
| British American Tobacco Plc (Tobacco) | 51,816 | 1,412,225 |
|
| HSBC Holdings Plc (Diversified Banks) | 155,954 | 2,956,587 |
|
| International Power Plc (Independent Power Producers & | | |
| Energy Traders) | 186,669 | 1,191,792 |
|
| Scottish & Newcastle Plc (Brewers) | 113,715 | 1,223,220 |
|
| Shire Plc (Pharmaceuticals) | 78,097 | 1,424,712 |
| | |
| United States 0.62% | | 750,148 |
|
| Southern Copper Corp. (Diversified Metals & Mining) | 14,600 | 750,148 |
| |
| Issuer | Shares | Value |
|
| Warrants 2.04% | | $2,474,317 |
| (Cost $2,225,172) | | |
| | |
| India 0.81% | | 983,917 |
|
| Bharti Tele-Ventures Ltd. | | |
| (Integrated Telecommunication Services) (B)(I)(R) | 83,368 | 983,917 |
| | |
| Taiwan 1.23% | | 1,490,400 |
|
| Hon Hai Precision Industry Co., Ltd. | | |
| (Electronic Equipment Manufacturers) (I)(R) | 230,000 | 1,490,400 |
See notes to financial statements
International Fund
12
F I N A N C I A L S T A T E M E N T S
| | Interest | Par value | |
| Issuer, description, maturity date | rate | (000) | Value |
|
| Short-term investments 2.07% | | | $2,502,000 |
| (Cost $2,502,000) | | | |
| | | |
| Joint Repurchase Agreement 2.07% | | | 2,502,000 |
|
| Investment in a joint repurchase agreement transaction | | | |
| with Morgan Stanley — Dated 10-31-06 due 11-1-06 | | | |
| (secured by U.S. Treasury Inflation Indexed Bond 3.375% | | | |
| due 4-15-32) | 5.270% | $2,502 | 2,502,000 |
|
| |
| Total investments (cost $102,547,285) 100.62% | | | $121,710,993 |
|
| |
| Other assets and liabilities, net (0.62%) | | | ($755,190) |
|
| |
| Total net assets 100.00% | | | $120,955,803 |
(B) This security is fair valued in good faith under procedures established by the Board of Trustees. This security amounted to $983,917 or 0.81% of the Fund’s net assets as of October 31, 2006.
(I) Non-income-producing security.
(R) Equity-linked warrant.
The percentage shown for each investment category is the total value of that category as a percentage of the net assets of the Fund.
See notes to financial statements
International Fund
13
Financial statements
F I N A N C I A L S T A T E M E N T S
Statement of assets and liabilities 10-31-06
This Statement of Assets and Liabilities is the Fund’s balance sheet. It shows the value
of what the Fund owns, is due and owes. You’ll also find the net asset value and the
maximum offering price per share.
| Assets | |
|
| Investments at value (cost $102,547,285) | $121,710,993 |
| Foreign cash, at value (cost $826,341) | 826,503 |
| Receivable for investments sold | 2,245,936 |
| Receivable for shares sold | 147,433 |
| Dividends and interest receivable | 142,129 |
| Other assets | 11,358 |
| Total assets | 125,084,352 |
|
| Liabilities | |
|
| Due to custodian | 813,835 |
| Payable for investments purchased | 2,916,174 |
| Payable for shares repurchased | 157,709 |
| Payable to affiliates | |
| Management fees | 92,334 |
| Distribution and service fees | 7,761 |
| Other | 31,269 |
| Other payables and accrued expenses | 109,467 |
| Total liabilities | 4,128,549 |
|
| Net assets | |
|
| Capital paid-in | 150,341,974 |
| Accumulated net realized loss on investments | |
| and foreign currency transactions | (48,531,848) |
| Net unrealized appreciation of investments and translation | |
| of assets and liabilities in foreign currencies | 19,158,512 |
| Accumulated net investment loss | (12,835) |
| Net assets | $120,955,803 |
|
| Net asset value per share | |
|
| Based on net asset values and shares outstanding — the Fund has an | |
| unlimited number of shares authorized with no par value | |
| Class A ($91,727,121 ÷ 10,075,651 shares) | $9.10 |
| Class B ($24,012,387 ÷ 2,909,239 shares) | $8.25 |
| Class C ($5,102,206 ÷ 617,842 shares) | $8.26 |
| Class I ($114,089 ÷ 12,003 shares) | $9.51 |
|
| Maximum offering price per share | |
|
| Class A1 ($9.10 ÷ 95%) | $9.58 |
1 On single retail sales of less than $50,000. On sales of $50,000 or more and on group sales the offering price is reduced.
See notes to financial statements
International Fund
14
F I N A N C I A L S T A T E M E N T S
Statement of operations For the year ended 10-31-06.
This Statement of Operations summarizes the Fund’s investment income earned
and expenses incurred in operating the Fund. It also shows net gains (losses) for
the period stated.
| Investment income | |
| Dividends (net of foreign withholding taxes of $180,936) | $1,825,173 |
| Interest | 103,714 |
| |
| Total investment income | 1,928,887 |
|
| Expenses | |
|
| Investment management fees (Note 2) | 1,050,003 |
| Distribution and service fees (Note 2) | 565,229 |
| Class A, B and C transfer agent fees (Note 2) | 454,826 |
| Class I transfer agent fees (Note 2) | 724 |
| Accounting and legal services fees (Note 2) | 22,053 |
| Compliance fees | 3,495 |
| Custodian fees | 90,520 |
| Blue sky fees | 51,471 |
| Professional fees | 50,577 |
| Printing | 37,913 |
| Trustees’ fees | 6,108 |
| Interest | 2,437 |
| Miscellaneous | 25,146 |
| |
| Total expenses | 2,360,502 |
| Less expense reductions (Note 2) | (15,335) |
| |
| Net expenses | 2,345,167 |
| Net investment loss | (416,280) |
|
| Realized and unrealized gain (loss) | |
|
| Net realized gain (loss) on | |
| Investments | 19,588,323 |
| Foreign currency transactions | (318,819) |
| |
| Change in net unrealized appreciation (depreciation) of | |
| Investments | 7,339,247 |
| Translation of assets and liabilities in foreign currencies | (4,864) |
| |
| Net realized and unrealized gain | 26,603,887 |
| |
| Increase in net assets from operations | $26,187,607 |
See notes to financial statements
International Fund
15
F I N A N C I A L S T A T E M E N T S
Statement of changes in net assets
These Statements of Changes in Net Assets show how the value of the Fund’s net assets
has changed during the last two periods. The difference reflects earnings less expenses,
any investment gains and losses, distributions, if any, paid to shareholders and the net of
Fund share transactions.
| | Year | Year |
| | ended | ended |
| | 10-31-05 | 10-31-06 |
|
| Increase (decrease) in net assets | | |
|
| From operations | | |
| Net investment loss | ($442,075) | ($416,280) |
| Net realized gain | 14,558,323 | 19,269,504 |
| Change in net unrealized appreciation (depreciation) | 2,830,230 | 7,334,383 |
| | |
| Increase in net assets resulting from operations | 16,946,478 | 26,187,607 |
| | |
| Distributions to shareholders | | |
| From net realized gain | | |
| Class A | (1,112,572) | (7,182,340) |
| Class B | (483,477) | (2,506,385) |
| Class C | (70,732) | (445,786) |
| Class I | (22,383) | (134,042) |
| | (1,689,164) | (10,268,553) |
| From Fund share transactions | (7,706,210) | 3,034,543 |
|
| Net assets | | |
|
| Beginning of period | 94,451,102 | 102,002,206 |
| End of period1 | $102,002,206 | $120,955,803 |
1 Includes accumulated net investment loss of $12,835 and $12,835, respectively.
See notes to financial statements
International Fund
16
F I N A N C I A L S T A T E M E N T S
Financial highlights
The Financial highlights show how the Fund’s net asset value for a share has changed
since the end of the previous period.
| CLASS A SHARES | | | | | |
| |
| Period ended | 10-31-02 | 10-31-03 | 10-31-04 | 10-31-05 | 10-31-06 |
|
| Per share operating performance | | | | | |
| Net asset value, beginning of period | $6.18 | $5.10 | $6.21 | $6.78 | $7.94 |
| Net investment loss1 | (0.04) | (0.04) | (0.02) | (0.02) | (0.02) |
| Net realized and unrealized | | | | | |
| gain (loss) on investments | (1.04) | 1.15 | 0.59 | 1.30 | 1.96 |
| Total from investment operations | (1.08) | 1.11 | 0.57 | 1.28 | 1.94 |
| Less distributions | | | | | |
| From net realized gain | — | — | — | (0.12) | (0.78) |
| Net asset value, end of period | $5.10 | $6.21 | $6.78 | $7.94 | $9.10 |
| Total return2,3 (%) | (17.48) | 21.76 | 9.18 | 19.14 | 26.61 |
|
| Ratios and supplemental data | | | | | |
|
| Net assets, end of period | | | | | |
| (in millions) | $6 | $62 | $64 | $73 | $92 |
| Ratio of expenses to average | | | | | |
| net assets (%) | 2.38 | 2.45 | 2.04 | 2.08 | 1.80 |
| Ratio of gross expenses to average | | | | | |
| net assets4 (%) | 4.43 | 3.00 | 2.07 | 2.12 | 1.81 |
| Ratio of net investment loss | | | | | |
| to average net assets (%) | (0.68) | (0.63) | (0.27) | (0.24) | (0.18) |
| Portfolio turnover (%) | 2285 | 2165 | 201 | 176 | 124 |
See notes to financial statements
International Fund
17
F I N A N C I A L S T A T E M E N T S
Financial highlights
| CLASS B SHARES | | | | | |
| |
| Period ended | 10-31-02 | 10-31-03 | 10-31-04 | 10-31-05 | 10-31-06 |
|
| Per share operating performance | | | | | |
| Net asset value, beginning of period | $5.86 | $4.81 | $5.81 | $6.30 | $7.31 |
| Net investment loss1 | (0.08) | (0.07) | (0.06) | (0.07) | (0.07) |
| Net realized and unrealized | | | | | |
| gain (loss) on investments | (0.97) | 1.07 | 0.55 | 1.20 | 1.79 |
| Total from investment operations | (1.05) | 1.00 | 0.49 | 1.13 | 1.72 |
| Less distributions | | | | | |
| From net realized gain | — | — | — | (0.12) | (0.78) |
| Net asset value, end of period | $4.81 | $5.81 | $6.30 | $7.31 | $8.25 |
| Total return2,3 (%) | (17.92) | 20.79 | 8.43 | 18.20 | 25.81 |
|
| Ratios and supplemental data | | | | | |
|
| Net assets, end of period | | | | | |
| (in millions) | $5 | $30 | $26 | $24 | $24 |
| Ratio of expenses to average | | | | | |
| net assets (%) | 3.08 | 3.15 | 2.74 | 2.78 | 2.50 |
| Ratio of gross expenses to average | | | | | |
| net assets4 (%) | 5.13 | 3.70 | 2.77 | 2.82 | 2.51 |
| Ratio of net investment loss | | | | | |
| to average net assets (%) | (1.38) | (1.28) | (0.98) | (0.97) | (0.88) |
| Portfolio turnover (%) | 2285 | 2165 | 201 | 176 | 124 |
See notes to financial statements
International Fund
18
F I N A N C I A L S T A T E M E N T S
Financial highlights
| CLASS C SHARES | | | | | |
| |
| Period ended | 10-31-02 | 10-31-03 | 10-31-04 | 10-31-05 | 10-31-06 |
|
| Per share operating performance | | | | | |
| Net asset value, beginning of period | $5.87 | $4.81 | $5.81 | $6.30 | $7.32 |
| Net investment loss1 | (0.08) | (0.06) | (0.06) | (0.07) | (0.07) |
| Net realized and unrealized | | | | | |
| gain (loss) on investments | (0.98) | 1.06 | 0.55 | 1.21 | 1.79 |
| Total from investment operations | (1.06) | 1.00 | 0.49 | 1.14 | 1.72 |
| Less distributions | | | | | |
| From net realized gain | — | — | — | (0.12) | (0.78) |
| Net asset value, end of period | $4.81 | $5.81 | $6.30 | $7.32 | $8.26 |
| Total return2,3 (%) | (18.06) | 20.79 | 8.43 | 18.36 | 25.79 |
|
| Ratios and supplemental data | | | | | |
|
| Net assets, end of period | | | | | |
| (in millions) | $1 | $3 | $4 | $4 | $5 |
| Ratio of expenses to average | | | | | |
| net assets (%) | 3.08 | 3.15 | 2.73 | 2.78 | 2.50 |
| Ratio of gross expenses to average | | | | | |
| net assets4 (%) | 5.13 | 3.70 | 2.76 | 2.82 | 2.51 |
| Ratio of net investment loss | | | | | |
| to average net assets (%) | (1.38) | (1.11) | (0.96) | (1.00) | (0.88) |
| Portfolio turnover (%) | 2285 | 2165 | 201 | 176 | 124 |
See notes to financial statements
International Fund
19
F I N A N C I A L S T A T E M E N T S
Financial highlights
| CLASS I SHARES | | | | | |
| |
| Period ended | 10-31-026 | 10-31-03 | 10-31-04 | 10-31-05 | 10-31-06 |
|
| Per share operating performance | | | | | |
| Net asset value, beginning of period | $6.18 | $5.12 | $6.30 | $6.94 | $8.19 |
| Net investment income (loss)1 | (0.01) | 0.03 | 0.04 | 0.04 | 0.07 |
| Net realized and unrealized | | | | | |
| gain (loss) on investments | (1.05) | 1.15 | 0.60 | 1.33 | 2.03 |
| Total from investment operations | (1.06) | 1.18 | 0.64 | 1.37 | 2.10 |
| Less distributions | | | | | |
| From net realized gain | — | — | — | (0.12) | (0.78) |
| Net asset value, end of period | $5.12 | $6.30 | $6.94 | $8.19 | $9.51 |
| Total return2 (%) | (17.15)3,7 | 23.053 | 10.16 | 20.003 | 27.87 |
|
| Ratios and supplemental data | | | | | |
|
| Net assets, end of period | | | | | |
| (in millions) | $1 | $1 | $1 | $1 | $08 |
| Ratio of expenses to average | | | | | |
| net assets (%) | 2.049 | 1.60 | 1.17 | 1.32 | 1.18 |
| Ratio of gross expenses to average | | | | | |
| net assets (%) | 4.094,9 | 2.154 | 1.17 | 1.334 | 1.18 |
| Ratio of net investment income | | | | | |
| (loss) to average net assets (%) | (0.34)9 | 0.58 | 0.60 | 0.51 | 0.82 |
| Portfolio turnover (%) | 2285 | 2165 | 201 | 176 | 124 |
1 Based on the average of the shares outstanding.
2 Assumes dividend reinvestment and does not reflect the effect of sales charges.
3 Total returns would have been lower had certain expenses not been reduced during the periods shown.
4 Does not take into consideration expense reductions during the periods shown.
5 Excludes merger activity.
6 Class I shares began operations on 3-1-02.
7 Not annualized.
8 Less than $500,000.
9 Annualized.
See notes to financial statements
International Fund
20
Notes to financial statements
Note 1 Accounting policies
John Hancock International Fund (the “Fund”) is a diversified series of John Hancock Investment Trust III (the “Trust”), an open-end management investment company registered under the Investment Company Act of 1940 (the “1940 Act”), as amended. The investment objective of the Fund is to achieve long-term growth of capital.
The Trustees have authorized the issuance of multiple classes of shares of the Fund, designated as Class A, Class B, Class C and Class I shares. The shares of each class represent an interest in the same portfolio of investments of the Fund and have equal rights as to voting, redemptions, dividends and liquidation, except that certain expenses, subject to the approval of the Trustees, may be applied differently to each class of shares in accordance with current regulations of the Securities and Exchange Commission and the Internal Revenue Service. Shareholders of a class that bears distribution and service expenses under the terms of a distribution plan have exclusive voting rights to that distribution plan. Class B shares will convert to Class A shares eight years after purchase.
Significant accounting policies of the Fund
are as follows:
Valuation of investments
Securities in the Fund’s portfolio are valued on the basis of market quotations, valuations provided by independent pricing services or, if quotations are not readily available, or the value has been materially affected by events occurring after the close of a foreign market, at fair value as determined in good faith in accordance with procedures approved by the Trustees. Short-term debt investments which have a remaining maturity of 60 days or less may be valued at amortized cost, which approximates market value. All portfolio transactions initially expressed in terms of foreign currencies have been translated into U.S. dollars as described in “Foreign currency translation” below.
Joint repurchase agreement
Pursuant to an exemptive order issued by the Securities and Exchange Commission, the Fund, along with other registered investment companies having a management contract with John Hancock Advisers, LLC (the “Adviser”), a wholly owned subsidiary of John Hancock Financial Services, Inc., a subsidiary of Manulife Financial Corporation (“MFC”), may participate in a joint repurchase agreement transaction. Aggregate cash balances are invested in one or more large repurchase agreements, whose underlying securities are obligations of the U.S. government and/or its agencies. The Fund’s custodian bank receives delivery of the underlying securities for the joint account on the Fund’s behalf. The Adviser is responsible for ensuring that the agreement is fully collateralized at all times.
Foreign currency translation
All assets or liabilities initially expressed in terms of foreign currencies are translated into U.S. dollars based on London currency exchange quotations as of 4:00 p.m., London time, on the date of any determination of the net asset value of the Fund. Transactions affecting statement of operations accounts and net realized gain (loss) on investments are translated at the rates prevailing at the dates of the transactions.
The Fund does not isolate that portion of the results of operations resulting from changes in foreign exchange rates on investments from the fluctuations arising from changes in market prices of securities held. Such fluctuations are included with the net realized and unrealized gain or loss from investments.
International Fund
21
Reported net realized foreign currency exchange gains or losses arise from sales of foreign currency, currency gains or losses realized between the trade and settlement dates on securities transactions, and the difference between the amounts of dividends, interest and foreign withholding taxes recorded on the Fund’s books and the U.S. dollar equivalent of the amounts actually received or paid. Net unrealized foreign currency exchange gains and losses arise from changes in the value of assets and liabilities, other than investments in securities, resulting from changes in the exchange rates.
Investment transactions
Investment transactions are recorded as of the date of purchase, sale or maturity. Net realized gains and losses on sales of investments are determined on the identified cost basis. Capital gains realized on some foreign securities are subject to foreign taxes, which are accrued as applicable.
Class allocations
Income, common expenses and realized and unrealized gains (losses) are determined at the fund level and allocated daily to each class of shares based on the appropriate net asset value of the respective classes. Distribution and service fees, if any, and transfer agent fees for Class I shares, are calculated daily at the class level based on the appropriate net asset value of each class and the specific expense rate(s) applicable to each class.
Expenses
The majority of expenses are directly identifiable to an individual fund. Expenses that are not readily identifiable to a specific fund are allocated in such a manner as deemed equitable, taking into consideration, among other things, the nature and type of expense and the relative sizes of the funds.
Bank borrowings
The Fund is permitted to have bank borrowings for temporary or emergency purposes, including the meeting of redemption requests that otherwise might require the untimely disposition of securities. The Fund has entered into a syndicated line of credit agreement with various banks. This agreement enables the Fund to participate, with other funds managed by the Adviser, in an unsecured line of credit with banks, which permits borrowings of up to $150 million, collectively. Interest is charged to each fund based on its borrowing. In addition, a commitment fee is charged to each fund based on the average daily unused portion of the line of credit, and is allocated among the participating funds. The Fund had no borrowing activity under the line of credit during the year ended October 31, 2006.
Equity-linked warrants
The Fund may buy and sell equity-linked warrants. The Fund purchases the equity-linked warrants from a broker, who in turn purchases the shares in the local market and issues a call warrant hedged on the underlying holding. If the Fund exercises its call and closes its position, the shares are sold and the warrant redeemed with the proceeds. Each warrant represents one share of the underlying stock, therefore the price, performance and liquidity of the warrant are all directly linked to the underlying stock. The warrants can be redeemed for 100% of the value of the underlying stock, less transaction costs. Equity-linked warrants are subject to risks related to the counterparty’s ability to perform under the contract, and to the market risk of the underlying holding. The Fund may also suffer losses if it is unable to sell outstanding equity-linked warrants or reduce its exposure through offsetting transactions.
Forward foreign currency exchange contracts
The Fund may enter into forward foreign currency exchange contracts as a hedge against the effect of fluctuations in currency exchange rates. A forward foreign currency exchange contract involves an obligation to purchase or sell a specific currency at a future date at a set price. The aggregate principal amounts of the contracts are marked to market daily at the applicable foreign currency exchange rates. Any resulting unrealized gains and losses are included in the determination of the Fund’s daily net asset value. The Fund records realized gains and losses at the time the forward foreign currency exchange contracts are closed out. Risks may arise upon entering these contracts from the potential inability of counterparties to
International Fund
22
meet the terms of the contracts and from unanticipated movements in the value of a foreign currency relative to the U.S. dollar. These contracts involve market or credit risk in excess of the unrealized gain or loss reflected in the Fund’s Statement of Assets and Liabilities.
The Fund may also purchase and sell forward contracts to facilitate the settlement of foreign currency denominated portfolio transactions, under which it intends to take delivery of the foreign currency. Such contracts normally involve no market risk if they are offset by the currency amount of the underlying transactions.
The Fund had no open forward foreign currency exchange contracts on October 31, 2006.
Federal income taxes
The Fund qualifies as a “regulated investment company” by complying with the applicable provisions of the Internal Revenue Code and will not be subject to federal income tax on taxable income that is distributed to shareholders. Therefore, no federal income tax provision is required. For federal income tax purposes, the Fund has $63,646,226 of a capital loss carryforward available, to the extent provided by regulations, to offset future net realized capital gains. To the extent that such carryforward is used by the Fund, no capital gain distributions will be made. The loss carryforward expires as follows: October 31, 2007 — $281,698, October 31, 2008 — $45,512,568, October 31, 2009 — $13,925,126 and October 31, 2010 — $3,926,834. Capital loss carryforward utilized for the year ended October 31, 2006 amounted to $3,710,589. Availability of a certain amount of the carryforwards, which were acquired in a merger on June 7, 2002, May 9, 2003 and on September 26, 2003, may be limited in a given year.
New accounting pronouncements
In June 2006, Financial Accounting Standards Board (“FASB”) Interpretation No. 48, Accounting for Uncertainty in Income Taxes (the “Interpretation”) was issued, and is effective for fiscal years beginning after December 15, 2006 and is to be applied to all open tax years as of the effective date. The Interpretation prescribes a minimum threshold for financial statement recognition of the benefit of a tax position taken or expected to be taken in a tax return, and requires certain expanded disclosures. Management is currently evaluating the application of the Interpretation of the Fund, and has not at this time quantified the impact, if any, resulting from adoption of the Interpretation on the Fund’s financial statements.
In September 2006, FASB Standard No. 157, Fair Value Measurements (the “FAS 157”) was issued, and is effective for fiscal years beginning after November 15, 2007. FAS 157 defines fair value, establishing a framework for measuring fair value and expands disclosure about fair value measurements. Management is currently evaluating the application of FAS 157 to the Fund, and its impact, if any, resulting from the adoption of FAS 157 on the Fund’s financial statements.
Dividends, interest and distributions
Dividend income on investment securities is recorded on the ex-dividend date or, in the case of some foreign securities, on the date thereafter when the Fund identifies the dividend. Interest income on investment securities is recorded on the accrual basis. Foreign income may be subject to foreign withholding taxes, which are accrued as applicable.
The Fund records distributions to shareholders from net investment income and net realized gains, if any, on the ex-dividend date. During the year ended October 31, 2005, the tax character of distributions paid was as follows: long-term capital gain: $1,689,164. During the year ended October 31, 2006, the tax character of distributions paid was as follows: ordinary income $3,501,979 and long-term capital gain $6,766,574. Distributions paid by the Fund with respect to each class of shares are calculated in the same manner, at the same time and are in the same amount, except for the effect of expenses that may be applied differently to each class.
As of October 31, 2006, the components of distributable earnings on a tax basis included $6,890,063 of undistributed ordinary income and $8,239,924 of undistributed long-term gain.
International Fund
23
Such distributions and distributable earnings, on a tax basis, are determined in conformity with income tax regulations, which may differ from accounting principles generally accepted in the United States of America. Distributions in excess of tax basis earnings and profits, if any, are reported in the Fund’s financial statements as a return of capital.
Use of estimates
The preparation of these financial statements, in accordance with accounting principles generally accepted in the United States of America, incorporates estimates made by management in determining the reported amount of assets, liabilities, revenues and expenses of the Fund. Actual results could differ from these estimates.
Note 2
Management fee and transactions with
affiliates and others
The Fund has an investment management contract with the Adviser. Under the investment management contract, the Fund pays a monthly management fee to the Adviser equivalent, on an annual basis, to the sum of: (a) 0.90% of the first $100,000,000 of the Fund’s average daily net asset value; (b) 0.80% of the next $200,000,000; (c) 0.75% of the next $200,000,000 and (d) 0.625% of the Fund’s average daily net asset value in excess of $500,000,000. The Adviser has a subadvisory agreement with Nicholas-Applegate Capital Management LP. The Fund is not responsible for payment of the subadvisory fees.
Effective December 31, 2005, the investment management teams of the Adviser were reorganized into Sovereign Asset Management LLC (“Sovereign”), a wholly owned indirect subsidiary of John Hancock Life Insurance Company (“JHLICO”), a subsidiary of MFC. The Adviser remains the principal advisor on the Fund and Sovereign acts as subadviser under the supervision of the Adviser. The restructuring did not have an impact on the Fund, which continues to be managed using the same investment philosophy and process. The Fund is not responsible for payment of the subadvisory fees.
Effective October 1, 2006, Sovereign changed its name to MFC Global Investment Management (U.S.), LLC.
The Adviser has agreed to limit the Fund’s total expenses, excluding the distribution and service fees and transfer agent fees, to 1.27% of the Fund’s average daily net asset value, on an annual basis, and net operating expenses for Class A, Class B and Class C shares to 2.35%, 3.05% and 3.05%, respectively, at least until February 28, 2008. There were no expense reductions related to the Fund’s total expense limitation for the year ended October 31, 2006. The Adviser reserves the right to terminate these limitations in the future.
The Fund has a Distribution Agreement with John Hancock Funds, LLC (“JH Funds”), a wholly owned subsidiary of the Adviser. The Fund has adopted Distribution Plans with respect to Class A, Class B and Class C, pursuant to Rule 12b-1 under the 1940 Act, as amended, to reimburse JH Funds for the services it provides as distributor of shares of the Fund. Accordingly, the Fund makes monthly payments to JH Funds at an annual rate not to exceed 0.30%, 1.00% and 1.00% of average daily net asset value of Class A, Class B and Class C, respectively. A maximum of 0.25% of such payments may be service fees, as defined by the Conduct Rules of the National Association of Securities Dealers. Under the Conduct Rules, curtailment of a portion of the Fund’s 12b-1 payments could occur under certain circumstances.
Expenses under the agreement described above for the year ended October 31, 2006 were as follows:
| | Distribution and |
| Share class | service fees |
|
| |
| Class A | $260,482 |
| Class B | 255,811 |
| Class C | 48,936 |
| Total | $565,229 |
Class A shares are assessed up-front sales charges. During the year ended October 31, 2006, JH Funds received net up-front sales charges of $124,988 with regard to sales of Class A shares. Of this amount, $19,191 was
International Fund
24
retained and used for printing prospectuses, advertising, sales literature and other purposes, $90,961 was paid as sales commissions to unrelated broker-dealers and $14,836 was paid as sales commissions to sales personnel of Signator Investors, Inc. (“Signator Investors”), a related broker-dealer. The Adviser’s indirect parent, JHLICO is the indirect sole shareholder of Signator Investors.
Class B shares that are redeemed within six years of purchase are subject to a contingent deferred sales charge (“CDSC”) at declining rates, beginning at 5.00% of the lesser of the current market value at the time of redemption or the original purchase cost of the shares being redeemed. Class C shares that are redeemed within one year of purchase are subject to a CDSC at a rate of 1.00% of the lesser of the current market value at the time of redemption or the original purchase cost of the shares being redeemed. Proceeds from the CDSCs are paid to JH Funds and are used, in whole or in part, to defray its expenses for providing distribution-related services to the Fund in connection with the sale of Class B and Class C shares. During the year ended October 31, 2006, CDSCs received by JH Funds amounted to $58,376 for Class B shares and $9,855 for Class C shares.
The Fund has a transfer agent agreement with John Hancock Signature Services, Inc., (“Signature Services”), an indirect subsidiary of JHLICO. For Class A, Class B and Class C shares, the Fund pays a monthly transfer agent fee at an annual rate of 0.05% of each class’s average daily net asset value, plus a fee based on the number of shareholder accounts and reimbursement for certain out-of-pocket expenses, aggregated and allocated to each class on the basis of its relative net asset value. For Class I shares, the Fund pays a monthly transfer agent fee at a total annual rate of 0.05% of Class I average daily net asset value. Signature Services agreed to limit Class A, Class B and Class C shares transfer agent fee to 0.78% of each class’s average daily net asset value, until June 30, 2006. Signature Services also agreed to voluntarily reduce the Fund’s asset-based portion of the transfer agent fee for Class A, Class B and Class C shares, if the tota l transfer agent fee exceeded the median transfer agency fee for comparable mutual funds by greater than 0.05% . Accordingly, the transfer agent expense for Class A, Class B and Class C shares was reduced by $15,335 for the year ended October 31, 2006. Signature Services terminated this reimbursement agreement June 30, 2006.
Effective July 1, 2006, the transfer agent has contractually limited transfer agent fees by implementing a transfer agent fee cap of 0.40% until June 30, 2007. There were no expense reductions under this limitation during the year ended October 31, 2006.
The Fund has an agreement with the Adviser and affiliates to perform necessary tax, accounting and legal services for the Fund. The compensation for the year amounted to $22,053. The Fund also paid the adviser the amount of $562 for certain publishing services, included in the printing fees. The Fund reimbursed JHLICO for certain compliance costs, included in the Fund’s Statement of Operations.
Mr. James R. Boyle is Chairman of the Adviser, as well as affiliated Trustee of the Fund, and is compensated by the Adviser and/or its affiliates. The compensation of unaffiliated Trustees is borne by the Fund. The unaffiliated Trustees may elect to defer, for tax purposes, their receipt of this compensation under the John Hancock Group of Funds Deferred Compensation Plan. The Fund makes investments into other John Hancock funds, as applicable, to cover its liability for the deferred compensation. Investments to cover the Fund’s deferred compensation liability are recorded on the Fund’s books as an other asset. The deferred compensation liability and the related other asset are always equal and are marked to market on a periodic basis to reflect any income earned by the investments, as well as any unrealized gains or losses. The Deferred Compensation Plan investments had no impact on the operations of the Fund.
International Fund
25
Note 3
Fund share transactions |
This listing illustrates the number of Fund shares sold, reinvested and repurchased during the last two periods, along with the corresponding dollar value.
| | Year ended 10-31-05 | Year ended 10-31-06 |
| | Shares | Amount | Shares | Amount |
|
| Class A shares | | | | |
|
| Sold | 1,907,087 | $14,310,047 | 2,254,177 | $19,173,017 |
| Issued in reorganization | 153,373 | 1,067,479 | 928,761 | 6,909,982 |
| Repurchased | (2,248,267) | (16,706,148) | (2,315,885) | (19,644,913) |
| Net increase (decrease) | (187,807) | ($1,328,622) | 867,053 | $6,438,086 |
|
| Class B shares | | | | |
|
| Sold | 735,091 | $5,111,257 | 886,215 | $6,910,240 |
| Issued in reorganization | 71,179 | 459,815 | 353,037 | 2,397,118 |
| Repurchased | (1,661,206) | (11,394,043) | (1,549,859) | (11,909,920) |
| Net decrease | (854,936) | ($5,822,971) | (310,607) | ($2,602,562) |
|
| Class C shares | | | | |
|
| Sold | 216,694 | $1,484,170 | 221,135 | $1,717,101 |
| Issued in reorganization | 10,744 | 69,404 | 64,902 | 440,684 |
| Repurchased | (291,681) | (1,993,970) | (208,540) | (1,618,900) |
| Net increase (decrease) | (64,243) | ($440,396) | 77,497 | $538,885 |
|
| Class I shares | | | | |
|
| Sold | 51,705 | $398,210 | 115,992 | $1,032,029 |
| Repurchased | 3,135 | 22,383 | 17,408 | 134,042 |
| Repurchased | (71,242) | (534,814) | (290,738) | (2,505,937) |
| Net decrease | (16,402) | ($114,221) | (157,338) | ($1,339,866) |
|
| Net increase (decrease) | (1,123,388) | ($7,706,210) | 476,605 | $3,034,543 |
|
Note 4
Investment transactions
Purchases and proceeds from sales or maturities of securities, other than short-term securities and obligations of the U.S. government, during the period ended October 31, 2006, aggregated $144,295,258 and $152,804,470, respectively.
The cost of investments owned on October 31, 2006, including short-term investments, for federal income tax purposes, was $102,562,894. Gross unrealized appreciation and depreciation of investments aggregated $20,204,296 and $1,056,197, respectively, resulting in net unrealized appreciation of $19,148,099. The difference between book basis and tax basis net unrealized appreciation of investments is attributable primarily to the tax deferral of losses on certain sales of securities.
Note 5
Reclassification of accounts
During the year ended October 31, 2006, the Fund reclassified amounts to reflect an increase in accumulated net realized loss on investments of $57,293, a decrease in accumulated net investment loss of $416,280 and a decrease in capital paid-in of $358,987. This represents the amounts necessary to report these balances on a tax basis, excluding certain temporary differences, as of October 31, 2006. Additional adjustments may be needed in subsequent reporting periods. These reclassifications, which have no impact on the net asset value of the Fund, are primarily attributable to certain differences in the computation of distributable income and capital gains under federal tax rules versus accounting principles generally accepted in the United States of America, book and tax differences in accounting expired capital loss
International Fund
26
carryforwards and certain foreign currency adjustments. The calculation of net investment loss per share in the Fund’s Financial Highlights excludes these adjustments.
International Fund
27
Auditors’ report
Report of Independent Registered Public Accounting Firm |
To the Board of Trustees of John Hancock Investment Trust III
and Shareholders of John Hancock International Fund, |
In our opinion, the accompanying statement of assets and liabilities, including the schedule of investments, and the related statements of operations and of changes in net assets and the financial highlights present fairly, in all material respects, the financial position of John Hancock International Fund (the “Fund”) at October 31, 2006, the results of its operations, the changes in its net assets and the financial highlights for the periods indicated, in conformity with accounting principles generally accepted in the United States of America. These financial statements and financial highlights (hereafter referred to as “financial statements”) are the responsibility of the Fund’s management; our responsibility is to express an opinion on these financial statements based on our audits. We conducted our audits of these financial statements in accordance with the standards of the Public Company Accounting Oversight Board (United States). Those standards require that we plan and perform the audits to obtain reasonable assurance about whether the financial statements are free of material misstatement. An audit includes examining, on a test basis, evidence supporting the amounts and disclosures in the financial statements, assessing the accounting principles used and significant estimates made by management, and evaluating the overall financial statement presentation. We believe that our audits, which included confirmation of securities at October 31, 2006 by correspondence with the custodian and brokers, provide a reasonable basis for our opinion.
PricewaterhouseCoopers LLP
Boston, Massachusetts
December 13, 2006 |
28
For federal income tax purposes, the following information is furnished with respect to the distributions of the Fund, if any, paid during its taxable year ended October 31, 2006.
The Fund has designated distributions to shareholders of $6,766,574 as capital gain dividends.
With respect to the ordinary dividends paid by the Fund for the fiscal year ended October 31, 2006, 3.13% of the dividends qualify for the corporate dividends-received deduction.
The Fund hereby designates the maximum amount allowable of its net taxable income as qualified dividend income as provided in the Jobs and Growth Tax Relief Reconciliation Act of 2003. This amount will be reflected on Form 1099-DIV for the calendar year 2006.
Shareholders will be mailed a 2006 U.S. Treasury Department Form 1099-DIV in January 2007. This will reflect the total of all distributions that are taxable for calendar year 2006.
29
Board Consideration of and
Continuation of Investment
Advisory Agreement and
Sub-Advisory Agreement:
John Hancock International Fund
The Investment Company Act of 1940 (the “1940 Act”) requires the Board of Trustees (the “Board”) of John Hancock Investment Trust III (the “Trust”), including a majority of the Trustees who have no direct or indirect interest in the investment advisory agreement and are not “interested persons” of the Trust, as defined in the 1940 Act (the “Independent Trustees”), annually to review and consider the continuation of: (i) the investment advisory agreement (the “Advisory Agreement”) with John Hancock Advisers, LLC (the “Adviser”) and (ii) the investment sub-advisory agreement (the “Sub-Advisory Agreement”) with Nicholas-Applegate Capital Management LLC (the “Sub-Adviser”) for the John Hancock International Fund (the “Fund”). The Advisory Agreement with the Adviser and the Sub-Advisory Agreement with the Sub-Adviser are collectively referred to as the “Advisory Agreements .”
At meetings held on May 1–2 and June 5–6, 2006,1 the Board considered the factors and reached the conclusions described below relating to the selection of the Adviser and Sub-Adviser and the continuation of the Advisory Agreements. During such meetings, the Board’s Contracts/Operations Committee and the Independent Trustees also met in executive sessions with their independent legal counsel.
In evaluating the Advisory Agreements, the Board, including the Contracts/Operations Committee and the Independent Trustees, reviewed a broad range of information requested for this purpose by the Independent Trustees, including: (i) the investment performance of the Fund relative to a category of relevant funds (the “Category”) and a peer group of comparable funds (the “Peer Group”) each selected by Morningstar Inc. (“Morningstar”), an independent provider of investment company data, for a range of periods ended December 31, 2005; (ii) advisory and other fees incurred by, and the expense ratios of, the Fund relative to a Category and a Peer Group; (iii) the advisory fees of comparable portfolios of other clients of the
Adviser and the Sub-Adviser; (iv) the Adviser’s financial results and condition, including its and certain of its affiliates’ profitability from services performed for the Fund; (v) breakpoints in the Fund’s and the Peer Group’s fees, and information about economies of scale; (vi) the Adviser’s and Sub-Adviser’s record of compliance with applicable laws and regulations, with the Fund’s investment policies and restrictions and with the applicable Code of Ethics, and the structure and responsibilities of the Adviser’s and Sub-Adviser’s compliance department; (vii) the background and experience of senior management and investment professionals and (viii) the nature, cost and character of advisory and non-investment management services provided by the Adviser and its affiliates and by the Sub-Adviser.
The Board’s review and conclusions were based on a comprehensive consideration of all information presented to the Board and not the result of any single controlling factor. It was based on performance and other information as of December 31, 2005; facts may have changed between that date and the date of this shareholders report. The key factors considered by the Board and the conclusions reached are described below.
Nature, extent and quality of services
The Board considered the ability of the Adviser and the Sub-Adviser, based on their resources, reputation and other attributes, to attract and retain qualified investment professionals, including research, advisory and supervisory personnel. The Board further considered the compliance programs and compliance records of the Adviser and Sub-Adviser. In addition, the Board took into account the administrative services provided to the Fund by the Adviser and its affiliates.
Based on the above factors, together with those referenced below, the Board concluded that, within the context of its full deliberations, the nature, extent and quality of the investment advisory services provided to the Fund by the Adviser and Sub-Adviser were sufficient to support renewal of the Advisory Agreements.
30
Fund performance
The Board considered the performance results for the Fund over various time periods ended December 31, 2005. The Board also considered these results in comparison to the performance of the Category, as well as the Fund’s Peer Group and benchmark index. Morningstar determined the Category and the Peer Group for the Fund. The Board reviewed with a representative of Morningstar the methodology used by Morningstar to select the funds in the Category and the Peer Group. The Board noted the imperfect comparability of the Peer Group.
The Board noted that the Fund’s performance during the five- and 10-year periods under review was equal to the performance of the Peer Group median and lower than the performance of the Category median, and its benchmark index — the MSCI EAFE Index. The Board also noted that the performance of the Fund for the three-year period was higher than the median of its Category and Peer Group, and was lower than the performance of its benchmark index. The Board viewed favorably that the Fund’s more recent performance during the one-year period under review was appreciably higher than the Peer Group and Category medians and its benchmark index.
Investment advisory fee and sub-advisory
fee rates and expenses
The Board reviewed and considered the contractual investment advisory fee rate payable by the Fund to the Adviser for investment advisory services (the “Advisory Agreement Rate”). The Board received and considered information comparing the Advisory Agreement Rate with the advisory fees for the Peer Group and Category. The Board noted that the Advisory Agreement Rate was equal to the median rate of the Peer Group and lower than the Category.
The Board received and considered expense information regarding the Fund’s various components, including advisory fees, distribution and fees other than advisory and distribution fees, including transfer agent fees, custodian fees and other miscellaneous fees (e.g., fees for accounting and legal services). The Board also considered peer-adjusted comparisons for the transfer agent fees. The Board considered comparisons of these expenses to the Peer Group median. The Board also received and considered expense information regarding the Fund’s total operating expense ratio (“Gross Expense Ratio”) and total operating expense ratio after taking the fee waiver arrangement applicable to the Advisory Agreement Rate into account (“Net Expense Ratio”). The Board received and considered information comparing the Gross Expense Ratio and Net Expense Ratio of the Fund to that of the Peer Group and Category medians. The Board noted that the Fund’s Gross and Net Expense Ratios were higher than the median of its Peer Group and Category.
The Adviser also discussed the Morningstar data and rankings, and other relevant information, for the Fund. Based on the above-referenced considerations and other factors, the Board concluded that the Fund’s overall performance and expenses supported the re-approval of the Advisory Agreements.
The Board also received information about the investment sub-advisory fee rate (the “Sub-Advisory Agreement Rate”) payable by the Adviser to the Sub-Adviser for investment sub-advisory services. The Board concluded that the Sub-Advisory Agreement Rate was fair and equitable, based on its consideration of the factors described here.
Profitability
The Board received and considered a detailed profitability analysis of the Adviser based on the Advisory Agreements, as well as on other relationships between the Fund and the Adviser and its affiliates. The Board concluded that, in light of the costs of providing investment management and other services to the Fund, the profits and other ancillary benefits reported by the Adviser were not unreasonable.
The Board did not consider profitability information with respect to the Sub-Adviser, which is not affiliated with the Adviser. The Board considered that the Sub-Advisory Rate paid to the Sub-Adviser had been negotiated by the Adviser on an arm’s length basis and that the Sub-Adviser’s separate profitability from its relationship with the Fund was not a material factor in determining whether to renew the agreement.
31
Economies of scale
The Board received and considered general information regarding economies of scale with respect to the management of the Fund, including the Fund’s ability to appropriately benefit from economies of scale under the Fund’s fee structure. The Board recognized the inherent limitations of any analysis of economies of scale, stemming largely from the Board’s understanding that most of the Adviser’s costs are not specific to individual Funds, but rather are incurred across a variety of products and services.
To the extent the Board and the Adviser were able to identify actual or potential economies of scale from Fund-specific or allocated expenses, in order to ensure that any such economies continue to be reasonably shared with the Fund as its assets increase, the Adviser and the Board agreed to continue the existing breakpoints to the Advisory Agreement Rate.
Information about services to other clients
The Board also received information about the nature, extent and quality of services and fee rates offered by the Adviser and Sub-Adviser to their other clients, including other registered investment companies, institutional investors and separate accounts. The Board concluded that the Advisory Agreement Rate and the Sub-Advisory Agreement Rate were not unreasonable, taking into account fee rates offered to others by the Adviser and Sub-Adviser, respectively, after giving effect to differences in services.
Other benefits to the Adviser
The Board received information regarding potential “fall-out” or ancillary benefits received by the Adviser and its affiliates as a result of the Adviser’s relationship with the Fund. Such benefits could include, among others, benefits directly attributable to the relationship of the Adviser with the Fund and benefits potentially derived from an increase in the business of the Adviser as a result of its relationship with the Fund (such as the ability to market to shareholders other financial products offered by the Adviser and its affiliates).
The Board also considered the effectiveness of the Adviser’s, Sub-Adviser’s and Fund’s policies and procedures for complying with the requirements of the federal securities laws, including those relating to best execution of portfolio transactions and brokerage allocation.
Other factors and broader review
As discussed above, the Board reviewed detailed materials received from the Adviser and Sub-Adviser as part of the annual re-approval process. The Board also regularly reviews and assesses the quality of the services that the Fund receives throughout the year. In this regard, the Board reviews reports of the Adviser and Sub-Adviser at least quarterly, which include, among other things, fund performance reports and compliance reports. In addition, the Board meets with portfolio managers and senior investment officers at various times throughout the year.
After considering the above-described factors and based on its deliberations and its evaluation of the information described above, the Board concluded that approval of the continuation of the Advisory Agreements for the Fund was in the best interest of the Fund and its shareholders. Accordingly, the Board unanimously approved the continuation of the Advisory Agreements.
1 The Board previously considered information about the Sub-Advisory Agreement at the September and December 2005 Board meetings in connection with the Adviser’s reorganization.
32
Trustees and Officers
This chart provides information about the Trustees and Officers who oversee
your John Hancock fund. Officers elected by the Trustees manage the day-to-day
operations of the Fund and execute policies formulated by the Trustees.
| Independent Trustees | | |
| |
| Name, age | | Number of |
| Position(s) held with Fund | Trustee | John Hancock |
| Principal occupation(s) and other | of Fund | funds overseen |
| directorships during past 5 years | since1 | by Trustee |
|
|
| Ronald R. Dion , Born: 1946 | 2005 | 53 |
|
| Independent Chairman (since 2005); Chairman and Chief Executive Officer, | | |
| R.M. Bradley & Co., Inc.; Director, The New England Council and Massachusetts | |
| Roundtable; Trustee, North Shore Medical Center; Director, Boston Stock | | |
| Exchange; Director, BJ’s Wholesale Club, Inc. and a corporator of the Eastern | | |
| Bank; Trustee, Emmanuel College; Director, Boston Municipal Research Bureau; | |
| Member of the Advisory Board, Carroll Graduate School of Management at | | |
| Boston College. | | |
|
|
| James F. Carlin , Born: 1940 | 2005 | 53 |
|
| Director and Treasurer, Alpha Analytical Laboratories Inc. (chemical analysis) | | |
| (since 1985); Part Owner and Treasurer, Lawrence Carlin Insurance Agency, | | |
| Inc. (since 1995); Part Owner and Vice President, Mone Lawrence Carlin | | |
| Insurance Agency, Inc. (until 2005); Director and Treasurer, Rizzo Associates | | |
| (engineering) (until 2000); Chairman and CEO, Carlin Consolidated, Inc. | | |
| (management/investments) (since 1987); Director and Partner, Proctor Carlin | | |
| & Co., Inc. (until 1999); Trustee, Massachusetts Health and Education Tax | | |
| Exempt Trust (since 1993); Director of the following: Uno Restaurant Corp. | | |
| (until 2001), Arbella Mutual (insurance) (until 2000), HealthPlan Services, Inc. | | |
| (until 1999), Flagship Healthcare, Inc. (until 1999), Carlin Insurance Agency, Inc. | |
| (until 1999); Chairman, Massachusetts Board of Higher Education (until 1999). | |
|
|
| Richard P. Chapman, Jr.,2 Born: 1935 | 1996 | 53 |
|
| President and Chief Executive Officer, Brookline Bancorp, Inc. (lending) (since | | |
| 1972); Chairman and Director, Lumber Insurance Co. (insurance) (until 2000); | | |
| Chairman and Director, Northeast Retirement Services, Inc. (retirement | | |
| administration) (since 1998); Vice Chairman, Northeastern University Board | | |
| of Trustees (since 2004). | | |
|
|
| William H. Cunningham , Born: 1944 | 2005 | 158 |
|
| Former Chancellor, University of Texas System and former President of the | | |
| University of Texas, Austin, Texas; Chairman and CEO, IBT Technologies (until | | |
| 2001); Director of the following: Hire.com (until 2004), STC Broadcasting, Inc. | | |
| and Sunrise Television Corp. (until 2001), Symtx, Inc. (electronic manufacturing) | |
| (since 2001), Adorno/Rogers Technology, Inc. (until 2004), Pinnacle Foods | | |
| Corporation (until 2003), rateGenius (until 2003), Lincoln National Corporation | |
| (insurance) (since 2006), Jefferson-Pilot Corporation (diversified life insurance | | |
| company) (until 2006), New Century Equity Holdings (formerly Billing Concepts) | |
33
| Independent Trustees (continued) | | |
| |
| Name, age | | Number of |
| Position(s) held with Fund | Trustee | John Hancock |
| Principal occupation(s) and other | of Fund | funds overseen |
| directorships during past 5 years | since1 | by Trustee |
|
|
| William H. Cunningham , Born: 1944 (continued) | 2005 | 158 |
|
| (until 2001), eCertain (until 2001), ClassMap.com (until 2001), Agile Ventures | | |
| (until 2001), AskRed.com (until 2001), Southwest Airlines, Introgen and | | |
| Viasystems Group, Inc. (electronic manufacturer) (until 2003); Advisory | | |
| Director, Interactive Bridge, Inc. (college fundraising) (until 2001); Advisory | | |
| Director, Q Investments (until 2003); Advisory Director, JPMorgan Chase Bank | | |
| (formerly Texas Commerce Bank – Austin), LIN Television (since 2002), WilTel | | |
| Communications (until 2003) and Hayes Lemmerz International, Inc. | | |
| (diversified automotive parts supply company) (since 2003). | | |
|
| |
| Charles L. Ladner,2 Born: 1938 | 2004 | 158 |
|
| Chairman and Trustee, Dunwoody Village, Inc. (retirement services) (until 2003); | |
| Senior Vice President and Chief Financial Officer, UGI Corporation (public utility | |
| holding company) (retired 1998); Vice President and Director for AmeriGas, Inc. | |
| (retired 1998); Director of AmeriGas Partners, L.P. (gas distribution) (until 1997); | |
| Director, EnergyNorth, Inc. (until 1995); Director, Parks and History Association | |
| (until 2007). | | |
|
| |
| John A. Moore,2 Born: 1939 | 1994 | 53 |
|
| President and Chief Executive Officer, Institute for Evaluating Health Risks, | | |
| (nonprofit institution) (until 2001); Senior Scientist, Sciences International | | |
| (health research) (until 2003); Former Assistant Administrator and Deputy | | |
| Administrator, Environmental Protection Agency; Principal, Hollyhouse | | |
| (consulting) (since 2000); Director, CIIT Center for Health Science Research | | |
| (nonprofit research) (since 2002). | | |
|
| |
| Patti McGill Peterson,2 Born: 1943 | 1994 | 53 |
|
| Executive Director, Council for International Exchange of Scholars and Vice | | |
| President, Institute of International Education (since 1998); Senior Fellow, Cornell | |
| Institute of Public Affairs, Cornell University (until 1998); Former President of | | |
| Wells College and St. Lawrence University; Director, Niagara Mohawk Power | | |
| Corporation (until 2003); Director, Ford Foundation, International Fellowships | | |
| Program (since 2002); Director, Lois Roth Endowment (since 2002); Director, | | |
| Council for International Educational Exchange (since 2003). | | |
|
| |
| Steven R. Pruchansky, Born: 1944 | 2005 | 53 |
|
| Chairman and Chief Executive Officer, Greenscapes of Southwest Florida, Inc. | | |
| (since 2000); Director and President, Greenscapes of Southwest Florida, Inc. | | |
| (until 2000); Managing Director, JonJames, LLC (real estate) (since 2001); | | |
| Director, First Signature Bank & Trust Company (until 1991); Director, Mast | | |
| Realty Trust (until 1994); President, Maxwell Building Corp. (until 1991). | | |
34
| Non-Independent Trustee3 | | |
| |
| Name, age | | Number of |
| Position(s) held with Fund | Trustee | John Hancock |
| Principal occupation(s) and other | of Fund | funds overseen |
| directorships during past 5 years | since1 | by Trustee |
|
| James R. Boyle, Born: 1959 | 2005 | 260 |
|
| President, John Hancock Annuities; Executive Vice President, John Hancock | | |
| Life Insurance Company (since June, 2004); Chairman and Director, John | | |
| Hancock Advisers, LLC (the “Adviser”), John Hancock Funds, LLC and The | | |
| Berkeley Financial Group, LLC (“The Berkeley Group”) (holding company) (since | |
| 2005); President, U.S. Annuities; Senior Vice President, The Manufacturers | | |
| Life Insurance Company (U.S.A.) (until 2004). | | |
| |
| Principal officers who are not Trustees | | |
| |
| Name, age | | |
| Position(s) held with Fund | | Officer |
| Principal occupation(s) and | | of Fund |
| directorships during past 5 years | | since |
|
| Keith F. Hartstein, Born: 1956 | | 2005 |
|
| President and Chief Executive Officer | | |
| Senior Vice President, Manulife Financial Corporation (since 2004); Director, | | |
| President and Chief Executive Officer, the Adviser, The Berkeley Group, John | | |
| Hancock Funds, LLC (since 2005); Director, MFC Global Investment Management | |
| (U.S.), LLC (“MFC Global (U.S.)”) (since 2005); Director, John Hancock Signature | |
| Services, Inc. (since 2005); President and Chief Executive Officer, John Hancock | |
| Investment Management Services, LLC (since 2006); President and Chief Executive | |
| Officer, John Hancock Funds II, John Hancock Funds III and John Hancock Trust; | |
| Director, Chairman and President, NM Capital Management, Inc. (since 2005); | | |
| Chairman, Investment Company Institute Sales Force Marketing Committee | | |
| (since 2003); Director, President and Chief Executive Officer, MFC Global (U.S.) | |
| (2005–2006); Executive Vice President, John Hancock Funds, LLC (until 2005). | | |
|
| |
| Thomas M. Kinzler, Born: 1955 | | 2006 |
|
| Secretary and Chief Legal Officer | | |
| Vice President and Counsel, John Hancock Life Insurance Company (U.S.A.) | | |
| (since 2006); Secretary and Chief Legal Officer, John Hancock Funds, John | | |
| Hancock Funds II, John Hancock Funds III and John Hancock Trust (since 2006); | |
| Vice President and Associate General Counsel, Massachusetts Mutual Life | | |
| Insurance Company (1999–2006); Secretary and Chief Legal Counsel, MML | | |
| Series Investment Fund (2000–2006); Secretary and Chief Legal Counsel, | | |
| MassMutual Institutional Funds (2000–2004); Secretary and Chief Legal Counsel, | |
| MassMutual Select Funds and MassMutual Premier Funds (2004–2006). | | |
|
| |
| Francis V. Knox, Jr., Born: 1947 | | 2005 |
|
| Chief Compliance Officer | | |
| Vice President and Chief Compliance Officer, John Hancock Investment | | |
| Management Services, LLC, the Adviser and MFC Global (U.S.) (since 2005); | | |
| Vice President and Chief Compliance Officer, John Hancock Funds II, John | | |
| Hancock Funds III and John Hancock Trust (since 2005); Vice President and | | |
| Assistant Treasurer, Fidelity Group of Funds (until 2004); Vice President and | | |
| Ethics & Compliance Officer, Fidelity Investments (until 2001). | | |
35
| Principal officers who are not Trustees (continued) | |
| |
| Name, age | |
| Position(s) held with Fund | Officer |
| Principal occupation(s) and | of Fund |
| directorships during past 5 years | since |
|
| Gordon M. Shone, Born: 1956 | 2006 |
|
| Treasurer | |
| Treasurer, John Hancock Funds (since 2006), John Hancock Funds II, John | |
| Hancock Funds III and John Hancock Trust (since 2005); Vice President and | |
| Chief Financial Officer, John Hancock Trust (2003–2005); Senior Vice President, | |
| John Hancock Life Insurance Company (U.S.A.) (since 2001); Vice President, | |
| John Hancock Investment Management Services, Inc., John Hancock Advisers, | |
| LLC (since 2006) and The Manufacturers Life Insurance Company (U.S.A.) | |
| (1998–2000). | |
|
| |
| John G. Vrysen, Born: 1955 | 2005 |
|
| Chief Financial Officer | |
| Director, Executive Vice President and Chief Financial Officer, the Adviser, The | |
| Berkeley Group and John Hancock Funds, LLC (since 2005); Executive Vice | |
| President and Chief Financial Officer, John Hancock Investment Management | |
| Services, LLC (since 2005); Vice President and Chief Financial Officer, MFC Global | |
| (U.S.) (since 2005); Director, John Hancock Signature Services, Inc. (since 2005); | |
| Chief Financial Officer, John Hancock Funds II, John Hancock Funds III and John | |
| Hancock Trust (since 2005); Vice President and General Manager, Fixed Annuities, | |
| U.S. Wealth Management (until 2005); Vice President, Operations, Manulife | |
| Wood Logan (2000–2004). | |
The business address for all Trustees and Officers is 601 Congress Street, Boston, Massachusetts 02210-2805.
The Statement of Additional Information of the Fund includes additional information about members of the Board of Trustees of the Fund and is available, without charge, upon request, by calling 1-800-225-5291.
1Each Trustee serves until resignation, retirement age or until his or her successor is elected.
2Member of Audit Committee.
3Non-Independent Trustee holds positions with the Fund’s investment adviser, underwriter and certain other affiliates.
36
For more information
The Fund’s proxy voting policies, procedures and records are available without charge,
upon request: |
| By phone | On the Fund’s Web site | On the SEC’s Web site |
| 1-800-225-5291 | www.jhfunds.com/proxy | www.sec.gov |
|
| |
| Investment adviser | Custodian | Legal counsel |
| John Hancock Advisers, LLC | The Bank of New York | Kirkpatrick & Lockhart |
| 601 Congress Street | One Wall Street | Nicholson Graham LLP |
| Boston, MA 02210-2805 | New York, NY 10286 | 1 Lincoln Street |
| | | Boston, MA 02110-2950 |
| Subadviser | Transfer agent | |
| Nicholas-Applegate Capital | John Hancock Signature | Independent registered |
| Management, LLC | Services, Inc. | public accounting firm |
| 600 West Broadway | 1 John Hancock Way, | PricewaterhouseCoopers LLP |
| San Diego, CA 92101 | Suite 1000 | 125 High Street |
| Principal distributor | Boston, MA 02217-1000 | Boston, MA 02110 |
| John Hancock Funds, LLC | | |
| 601 Congress Street | | |
| Boston, MA 02210-2805 | | |
The Fund’s investment objective, risks, charges and expenses are included in the prospectus and should be considered carefully before investing. For a prospectus, call your financial professional, call John Hancock Funds at 1-800-225-5291 or visit the Fund’s Web site at www.jhfunds.com. Please read the prospectus carefully before investing or sending money.
| How to contact us | |
|
| |
| Internet | www.jhfunds.com | |
|
| |
| Mail | Regular mail: | Express mail: |
| | John Hancock | John Hancock |
| | Signature Services, Inc. | Signature Services, Inc. |
| | 1 John Hancock Way, Suite 1000 | Mutual Fund Image Operations |
| | Boston, MA 02217-1000 | 380 Stuart Street |
| | | Boston, MA 02116 |
|
| |
| Phone | Customer service representatives | 1-800-225-5291 |
| | 24-hour automated information | 1-800-338-8080 |
| | TDD line | 1-800-554-6713 |
A listing of month-end portfolio holdings is available on our Web site, www.jhfunds.com. A more detailed portfolio holdings summary is available on a quarterly basis 60 days after the fiscal quarter on our Web site or upon request by calling 1-800-225-5291, or on the Securities and Exchange Commission’s Web site, www.sec.gov.
40
J O H N H A N C O C K F A M I L Y O F F U N D S
| EQUITY | INTERNATIONAL |
| Balanced Fund | Greater China Opportunities Fund |
| Classic Value Fund | International Classic Value Fund |
| Classic Value Fund II | International Core Fund |
| Core Equity Fund | International Fund |
| Focused Equity Fund | International Growth Fund |
| Growth Fund | |
| Growth Opportunities Fund | INCOME |
| Growth Trends Fund | Bond Fund |
| Intrinsic Value Fund | Government Income Fund |
| Large Cap Equity Fund | High Yield Fund |
| Large Cap Select Fund | Investment Grade Bond Fund |
| Mid Cap Equity Fund | Strategic Income Fund |
| Mid Cap Growth Fund | |
| Multi Cap Growth Fund | Tax-Free |
| Small Cap Equity Fund | California Tax-Free Income Fund |
| Small Cap Fund | High Yield Municipal Bond Fund |
| Small Cap Intrinsic Value Fund | Massachusetts Tax-Free Income Fund |
| Sovereign Investors Fund | New York Tax-Free Income Fund |
| U.S. Core Fund | Tax-Free Bond Fund |
| U.S. Global Leaders Growth Fund | |
| Value Opportunities Fund | Money Market |
| | Money Market Fund |
| Asset Allocation & Lifestyle | U.S. Government Cash Reserve |
| Allocation Core Portfolio | |
| Allocation Growth + Value Portfolio | Closed-End |
| Lifestyle Aggressive Portfolio | Bank & Thrift Opportunity |
| Lifestyle Balanced Portfolio | Financial Trends |
| Lifestyle Conservative Portfolio | Income Securities |
| Lifestyle Growth Portfolio | Investors Trust |
| Lifestyle Moderate Portfolio | Patriot Global Dividend |
| | Patriot Preferred Dividend |
| Sector | Patriot Premium Dividend I |
| Financial Industries Fund | Patriot Premium Dividend II |
| Health Sciences Fund | Patriot Select Dividend |
| Real Estate Fund | Preferred Income |
| Regional Bank Fund | Preferred Income II |
| Technology Fund | Preferred Income III |
| Technology Leaders Fund | Tax-Advantaged Dividend |
For more complete information on any John Hancock Fund and an Open-End fund prospectus, which includes charges and expenses, call your financial professional, or John Hancock Funds at 1-800-225-5291 for Open-End fund information and 1-800-852-0218 for Closed-End fund information. Please read the Open-End fund prospectus carefully before investing or sending money.

1-800-225-5291
1-800-554-6713 (TDD)
1-800-338-8080 EASI-Line
www.jhfunds. com |
Now available: electronic delivery
www.jhfunds. com/edelivery |
This report is for the information of the shareholders of John Hancock International Fund.
ITEM 2. CODE OF ETHICS.
As of the end of the period, October 31, 2006, the registrant has adopted a code of ethics, as defined in Item 2 of Form N-CSR, that applies to its Chief Executive Officer, Chief Financial Officer and Treasurer (respectively, the principal executive officer, the principal financial officer and the principal accounting officer, the “Senior Financial Officers”). A copy of the code of ethics is filed as an exhibit to this Form N-CSR.
ITEM 3. AUDIT COMMITTEE FINANCIAL EXPERT.
Charles L. Ladner is the audit committee financial expert and is “independent”, pursuant to general instructions on Form N-CSR Item 3.
ITEM 4. PRINCIPAL ACCOUNTANT FEES AND SERVICES.
(a) Audit Fees
The aggregate fees billed for professional services rendered by the principal accountant(s) for the audit of the registrant’s annual financial statements or services that are normally provided by the accountant(s) in connection with statutory and regulatory filings or engagements amounted to $82,470 for the fiscal year ended October 31, 2005 (broken out as follows: John Hancock International Fund - $37,890, John Hancock Mid Cap Growth Fund - $28,080 and John Hancock Greater China Opportunities Fund - $16,500) and $74,650 for the fiscal year ended October 31, 2006 (broken out as follows: John Hancock International Fund - $32,000, John Hancock Mid Cap Growth Fund - $23,650 and John Hancock Greater China Opportunities Fund - $19,000 ). John Hancock Greater China Opportunities Fund commenced operations on June 8, 2005. These fees were billed to the registrant and were approved by the registrant’s audit committee.
(b) Audit-Related Services
There were no audit-related fees during the fiscal year ended October 31, 2005 and fiscal year ended October 31, 2006 billed to the registrant or to the registrant's investment adviser (not including any sub-adviser whose role is primarily portfolio management and is subcontracted with or overseen by another investment adviser), and any entity controlling, controlled by, or under common control with the adviser that provides ongoing services to the registrant ("control affiliates").
(c) Tax Fees
The aggregate fees billed for professional services rendered by the principal accountant(s) for the tax compliance, tax advice and tax planning (“tax fees”) amounted to $9,400 for the fiscal year ended October 31, 2005 (broken out as follows: John Hancock International Fund - $3,900, John Hancock Mid Cap Growth Fund - $3,000 and John Hancock Greater China Opportunities Fund - $2,500) and $9,750 for the fiscal year ended October 31, 2006 (broken out as follows: John Hancock International Fund - $3,500, John Hancock Mid Cap Growth Fund - $2,750 and John Hancock Greater China Opportunities Fund - $3,500). The nature of the services comprising the tax fees was the review of the registrant’s income tax returns and tax distribution requirements. These fees were billed to the registrant and were approved by the registrant’s audit committee. There were no tax fees billed to the control affiliates.
(d) All Other Fees
There were no other fees during the fiscal year ended October 31, 2005 and fiscal year ended October 31, 2006 billed to the registrant or to the control affiliates.
(e)(1) See attachment "Approval of Audit, Audit-related, Tax and Other Services", with the audit committee pre-approval policies and procedures.
(e)(2) There were no fees that were approved by the audit committee pursuant to the de minimis exception for the fiscal years ended October 31, 2005 and October 31, 2006 on behalf of the
registrant or on behalf of the control affiliates that relate directly to the operations and financial reporting of the registrant.
(f) According to the registrant’s principal accountant, for the fiscal year ended October 31, 2006, the percentage of hours spent on the audit of the registrant's financial statements for the most recent fiscal year that were attributed to work performed by persons who were not full-time, permanent employees of principal accountant was less than 50%.
(g) The aggregate non-audit fees billed by the registrant's accountant(s) for services rendered to the registrant and rendered to the registrant's control affiliates for each of the last two fiscal years of the registrant were $212,062 for the fiscal year ended October 31, 2005 and $520,432 for the fiscal year ended October 31, 2006.
(h) The audit committee of the registrant has considered the non-audit services provided by the registrant’s principal accountant(s) to the control affiliates and has determined that the services that were not pre-approved are compatible with maintaining the principal accountant(s)' independence.
ITEM 5. AUDIT COMMITTEE OF LISTED REGISTRANTS.
The registrant has a separately-designated standing audit committee comprised of independent trustees. The members of the audit committee are as follows:
Dr. John A. Moore - Chairman
Richard P. Chapman, Jr.
Charles L. Ladner
Patti McGill Peterson
ITEM 6. SCHEDULE OF INVESTMENTS.
Not applicable.
ITEM 7. DISCLOSURE OF PROXY VOTING POLICIES AND PROCEDURES FOR CLOSED-
END MANAGEMENT INVESTMENT COMPANIES.
Not applicable.
ITEM 8. PORTFOLIO MANAGERS OF CLOSED-END MANAGEMENT INVESTMENT
COMPANIES.
Not applicable.
ITEM 9. PURCHASES OF EQUITY SECURITIES BY CLOSED-END MANAGEMENT
INVESTMENT COMPANY AND AFFILIATED PURCHASERS.
Not applicable.
ITEM 10. SUBMISSION OF MATTERS TO A VOTE OF SECURITY HOLDERS.
The registrant has adopted procedures by which shareholders August recommend nominees to the registrant's Board of Trustees. A copy of the procedures is filed as an exhibit to this Form N-CSR. See attached “John Hancock Funds – Governance Committee Charter”.
ITEM 11. CONTROLS AND PROCEDURES.
(a) Based upon their evaluation of the registrant's disclosure controls and procedures as conducted within 90 days of the filing date of this Form N-CSR, the registrant's principal executive officer and principal financial officer have concluded that those disclosure controls and procedures provide reasonable assurance that the material information required to be disclosed by the registrant on this report is recorded, processed, summarized and reported within the time periods specified in the Securities and Exchange Commission's rules and forms.
(b) There were no changes in the registrant's internal control over financial reporting that occurred during the registrant's most recent fiscal half-year (the registrant's second fiscal half-year in the case of an annual report) that have materially affected, or are reasonably likely to materially affect, the registrant's internal control over financial reporting.
ITEM 12. EXHIBITS.
(a)(1) Code of Ethics for Senior Financial Officers is attached.
(a)(2) Separate certifications for the registrant's principal executive officer and principal financial officer, as required by Section 302 of the Sarbanes-Oxley Act of 2002 and Rule 30a-2(a) under the Investment Company Act of 1940, are attached.
(b) Separate certifications for the registrant's principal executive officer and principal financial officer, as required by 18 U.S.C. Section 1350, as adopted pursuant to Section 906 of the Sarbanes-Oxley Act of 2002, and Rule 30a-2(b) under the Investment Company Act of 1940, are attached. The certifications furnished pursuant to this paragraph are not deemed to be "filed" for purposes of Section 18 of the Securities Exchange Act of 1934, or otherwise subject to the liability of that section. Such certifications are not deemed to be incorporated by reference into any filing under the Securities Act of 1933 or the Securities Exchange Act of 1934, except to the extent that the Registrant specifically incorporates them by reference.
(c)(1) Approval of Audit, Audit-related, Tax and Other Services is attached.
(c)(2) Submission of Matters to a Vote of Security Holders is attached. See attached “John Hancock Funds – Governance Committee Charter”.
(c)(3) Contact person at the registrant.
(c)(4) Proxy Voting Policies and Procedures are attached.
SIGNATURES
Pursuant to the requirements of the Securities Exchange Act of 1934 and the Investment Company Act of 1940, the registrant has duly caused this report to be signed on its behalf by the undersigned, thereunto duly authorized.
John Hancock Investment Trust III
By: /s/ Keith F. Hartstein
-------------------------------------
Keith F. Hartstein
President and Chief Executive Officer
Date: January 2, 2007
Pursuant to the requirements of the Securities Exchange Act of 1934 and the Investment Company Act of 1940, this report has been signed below by the following persons on behalf of the registrant and in the capacities and on the dates indicated.
By: /s/ Keith F. Hartstein
-------------------------------------
Keith F. Hartstein
President and Chief Executive Officer
Date: January 2, 2007
By: /s/ John G. Vrysen
-------------------------------------
John G. Vrysen
Chief Financial Officer
Date: January 2, 2007